Item 1. Report to Stockholders.
2 Q1 2020 Annual Report
THE WEITZ PHILOSOPHY
Finding quality at a discount
There are no shortcuts in value investing. At Weitz, we dig for opportunities using a robust quality scoring process. We analyze hundreds of ideas to find strong, well-managed but undervalued companies that offer reasonable risk-adjusted returns. It’s simple – but it’s not easy. We do the due diligence, analyze, ask tough questions and push for answers. We wait for the right opportunities. Then, and only then, do we invest your money.
Fundamental Research-Driven Process
Our research-driven investment approach means deeply understanding our investable universe so we can capitalize on opportunities that arise out of market inefficiencies. Each of our analysts focuses on finding opportunities in specific industries, ensuring deep, ongoing research within their own areas of expertise. We also encourage a generalist mentality where all investment team members vet new ideas. All investment decisions are backed by thorough analysis, logical strategies, extensive debate and our team’s commitment to long-term growth.
Bottom-Up Focus
Our focus is on finding well-run companies with strong fundamentals and outstanding long-term prospects. Valuation is our North Star. When a security is selling at a significant discount to its intrinsic value, that’s when we buy. And when it’s not selling at a discount, we have the discipline and patience to wait for the price to come our way.
High-Conviction Investing
We believe there are a limited number of great investment ideas and that intrinsic value doesn’t change with the daily ebbs and flows of the market. Our high-conviction approach means we know what we own inside and out, allowing our funds to be highly concentrated.
Today we are responsible for approximately $3 billion in investments for our shareholders – individuals, corporations, pension plans, foundations and endowments. And our commitment remains the same: to put your goals first. Always. We do so through our expertise, our flexibility, and our drive to uncover investments that can help you preserve and grow wealth.
We’re right beside you
Weitz employees have a strong commitment of investing their own assets in our mutual funds. By aligning our goals with yours, you can have confidence that we’re treating your money as if it were our own.
Q1 2020 Annual Report 3
Beginning on January 1, 2021, paper copies of the Fund’s shareholder reports will no longer be sent by mail unless specifically requested from the Fund or from your financial intermediary (such as a financial adviser). Instead, the reports will be made available at weitzinvestments.com and you will be notified by mail each time a report is posted. You will continue to receive other Fund regulatory documents (such as prospectuses or supplements) in paper unless you have elected to receive all Fund documents electronically.
If you would like to continue to receive the Fund’s future shareholder reports in paper free of charge after January 1, 2021, you may make that request (1) by contacting your financial intermediary; or (2) if you invest directly with the Fund, by calling 800-304-9745.
If you already receive shareholder reports and other Fund documents electronically, you will not be affected by this change, and you need not take any action. If you do not receive shareholder reports and other Fund documents electronically but would like to do so, contact your financial intermediary or, if you invest directly with the Fund, call 800-304-9745. An election to receive shareholder reports electronically will apply to all Funds held with the Weitz Funds and may apply to all funds held with your financial intermediary.
The management of Weitz Funds has chosen paper for the 84 page report from a paper manufacturer certified under the Sustainable Forestry Initiative ® standard.
Portfolio composition is subject to change at any time and references to specific securities, industries, and sectors referenced in this report are not recommendations to purchase or sell any particular security. Current and future portfolio holdings are subject to risk. See the Schedules of Investments included in this report for the percent of assets in each of the Funds invested in particular industries or sectors.
4 Q1 2020 Annual Report
VALUE MATTERSApril 7, 2020 Dear Fellow Shareholder,
The first quarter of 2020 felt like stepping through the looking glass into another world. COVID-19 is the story of the moment. Attempts to slow its spread have put the country and much of the world in a kind of “time out” that has paralyzed economies and raised anxiety levels everywhere. Our first priorities are to make sure that our colleagues, friends, families and clients are physically safe and that we are as prepared as possible for a siege that could last weeks or months.
The daily reports on new cases as well as the shortages of tests and medical supplies are keeping the country on edge. Healthcare systems in a growing number of hot spots are struggling to build capacity ahead of the mounting cases. The good news is that the country has taken notice, and addressing the shortages is now a priority. New and more widely available tests should allow for more effective policy responses. Increased production of personal protective equipment (PPE) for medical professionals, ventilators and thousands of temporary hospital beds will help us manage through the crisis. Potential drug treatments are being tested, and while the ultimate defense, an effective vaccine, may be a year or more away, it seems highly likely that one will be developed. When that happens, it will be clear that we can coexist with this virus, if not eradicate it.
It will likely take a while to get the upper hand on the virus, but we do not doubt that the country will get through it. In the meantime, our business continuity strategy has enabled our team to work remotely without disruption. As always, we continue our fundamental research and business model analysis. And, we stay in contact with company management teams, with a focus on understanding the impact this new reality will have on their businesses. The future will be different for most companies, and we aspire to own the ones that can thrive in a post-COVID world.
1st Quarter Results
The volatility in stock and bond markets in the first quarter was extreme. A number of companies’ stock prices fell over 50%, rallied significantly and then sagged again as rumors, margin calls and other non-fundamental factors played havoc with trading. The quarterly performance reflected in the table following this letter could have been very different if the quarter had ended on a different day, and they will no doubt be out of date by the time you read this letter. Quarterly results are rarely predictive of longer-term results, and all we can tell for sure is that investors are extremely confused and afraid.
Our stock funds were all down for the quarter, though some fared better than others, which was at least partly due to the portfolio weightings of some very large, mature companies that generally held up better than smaller companies. One bright spot in terms of relative performance was the Partners III Opportunity Fund, which is structurally different from our other equity portfolios, being partly hedged and generally less exposed to the stock market. But it was not immune from the carnage. [See Partners III’s portfolio holdings later in this report for securities sold short, which includes hedges against, and therefore less overall exposure to, the S&P 500.]
Our fixed income funds, in spite of severe bond market chaos, did their jobs of providing ballast for investors’ portfolios. Returns ranged from small gains for the Ultra Short Government Fund and the Nebraska Tax-Free Income Fund to small declines for the Short Duration Income Fund and the Core Plus Income Fund. The leaders of our fixed income team, Tom Carney and Nolan Anderson, made some very opportunistic purchases during the quarter, and though corporate and asset-backed bond prices are currently depressed, we believe shareholders will benefit from these portfolio maneuvers. Tom and Nolan will elaborate further in their Fixed Income Insights.
We do not relish using red ink in our reports, but we feel good about the stocks and bonds that we own and the moves that our portfolio managers made during the quarter. This update is short on specific investments details, but our portfolio managers provide a lot of information about this busy quarter in their individual fund perspectives.
"The future will be different for most companies, and we aspire to own the ones that can thrive in a post-COVID world."
Changing Changelessness
So, we have a recession (“a rose by any other name…”). It is a big one that came on suddenly. But with a combined 80+ years of industry experience between the two of us, we’ve managed through many recessions and bear markets. Whatever the cause, the stock and bond market reactions are ultimately driven by people, and people react in predictable ways. Hence the excuse to dust off “changing changelessness,” the favorite catchphrase of my (Wally’s) high school Latin teacher, Dr. Romeo (yes, that was his real name).
There are some unique aspects of the current economic situation, including the threat of catching a potentially deadly disease. And while the odds of becoming infected and developing dangerous symptoms is low, the disease is new and not well understood. So, understandably, anxiety is high. On top of that, there’s an oil price war raging between Russia and Saudi Arabia while, simultaneously, demand for oil has collapsed. This has a very specific and devastating impact on the domestic “oil patch” (and those who live in it, serve it and lend to it).
Q1 2020 Annual Report 5
What makes the current situation so jarring is that the economy more or less shut down overnight. Generally, recessions begin in a weak sector or two, spread to others and gradually affect the whole economy. This time, as communities across the country began to stay at home, it was as if the power switch for the economy was suddenly flipped off.
It is small comfort that St. Louis Fed president James Bullard prefers to call this recession a “National Pandemic Adjustment Period.” The disruption to lives and economic activity feels like the real thing. But the country has, in effect, been put into an “induced coma” to allow it to heal, making it plausible that the patient’s recovery may be quicker and more robust once the coma is lifted. That is the hope of policymakers. Extraordinary monetary and fiscal measures are now in place to sustain the economy during this period. Stimulative measures (e.g. infrastructure spending) are likely to follow to make sure the recovery is powerful.
The Liquidity Crisis
In response to the Great Financial Crisis of 2008-09, the Federal Reserve (Fed) lowered interest rates and flooded the markets with newly created money. That was a reasonable policy response, and the economy recovered. By keeping credit cheap and readily available long after the crisis was over, they arguably encouraged imprudent lending and excessive borrowing.
A great deal of borrowing is done on a short-term basis because short rates are generally lower than longer-term rates. The expectation is that collateral will maintain its value and loans will be renewed or extended. Periodically, lenders become concerned about the creditworthiness of borrowers and “tighten” or withdraw credit. This results in forced sales of collateral, including stocks and bonds. In extreme cases, distress selling of assets turns into a figurative run on the bank. The sudden shutdown of economic activity in response to the virus has raised the prospect of loan defaults by individuals and companies and has triggered a classic liquidity crisis.
Fortunately, the Fed and Treasury learned important lessons during the last crisis, and being independent entities, they have been able to swing into action very quickly. Their focus has been on the bond markets, which are much larger than the stock market and more crucial to day-to-day economic activity. They started with treasuries and AAA bonds. Stabilizing the market for the most risk-averse investors was key to restoring faith in the rest of the credit markets. Multiple trillions of dollars have been injected to assure credit is available to desperate, but creditworthy, borrowers. Most of this money is not at risk and will not be lost by the government, but its presence restores confidence.
This process is not complete as of the end of March, but there are signs that the credit markets are settling down and reopening for normal lending and borrowing. This is a critical first step to addressing the bigger issue of the recession. Credit must be available for normal business activities and for companies that must make workout arrangements with their creditors. When buyers and sellers can transact because they want to and not because they have to, business can return to normal. With an end to the liquidity crisis, hopefully within a few weeks, the country will be able to address a more familiar and manageable challenge – the recession.
Lower Earnings, Changing Business Models, Opportunities for Patient Investors
Investing in any environment, but particularly during a recession, requires patience, discipline and realistic expectations. But as history has shown time and time again, it can be done. Based on the assumption that the economy will remain subdued for months, we are building a prolonged recession into the earnings models we use to estimate business values. Each business is different, and we are just beginning to understand how companies are impacted by people staying home as well as the potential benefits to come from the smorgasbord of fiscal and monetary programs. If Bullard and other economists are correct and we have a V-shaped recovery, that will be a bonus.
One of the complicating factors is that the public health prescription of shutting down the economy and having everyone stay at home is the flip side of the economic health prescription of getting everybody back to work. Hopefully, with widespread testing and effective treatment, our policymakers will find the right balance between isolating the sick, protecting the most vulnerable and carefully reopening the country. The polarized
“Investing in any environment, but particularly during a recession, requires patience, discipline and realistic expectations.”
political climate may complicate the policy discussion, but whether done well or poorly, the U.S. (and the rest of the world) will eventually reopen for business and life.
Investing in the Thick of the Crisis
We are remaining invested. Given the extreme uncertainty as to the length and depth of the health crisis and economic recession, we are being conservative in our assessments of business values. On the other hand, in periods of market distress, stock prices usually overshoot to the downside and subsequent recoveries can be just as explosive to the upside. Bear markets scare some investors and wear out others. At some point, the markets turn, usually for no apparent reason. We do not know when this bear will end, nobody does. But we firmly
6 Q1 2020 Annual Report
believe that if we try to sidestep it and to “get back in when the coast is clear,” we will miss the initial snapback and an important part of potential future returns.
We are emphasizing quality over absolute cheapness. All stocks have been affected by the recent decline, and some of those most obviously impacted by the pandemic look extraordinarily cheap. Investors have a way of extrapolating the negatives of the recent past far into the future and pricing stocks accordingly. We are looking for mispriced assets, but we are not interested in any stock for which the investment thesis begins, “If this company survives the recession….” On the contrary, the recent extreme volatility has created an opportunity for us to buy more of some of our favorite stocks and to establish positions in some great businesses which we have aspired to own for some time. These very high-quality stocks may not bounce as rapidly initially, but we believe they will provide very strong returns for our portfolios over the next 5-10 years.
We are trying to anticipate behavioral changes by consumers and workers. One of the most interesting questions our investment team has been discussing is “How will consumer behavior change as a result of the pandemic?” Human nature does not seem to change over time, but an extended period of working remotely and social distancing may have lasting impacts. Attitudes toward the role of government may also change. The relative values of Netflix vs. movie theaters may seem clear, but all industries will be affected. We are trying to be imaginative about potential changes and to be humble about our ability to predict.
Management is key. Quality of management and corporate culture are always important criteria for evaluating a business. We need to be able to trust management to keep the balance sheet strong and adjust the business model to fit changing conditions. With the “downside” protected (first things first!), some of our companies will be able to “play offense.” Berkshire Hathaway is famous for being there to “help” other companies in a crisis. Warren Buffett has made legendary investments in times of financial stress as has John Malone at Liberty Media. Other CEOs have also been adept at acquiring assets and businesses opportunistically.
Recognizing a market bottom. The stock market always turns back up before it is clear that the danger has passed. All investors will be watching the shape of the infection curve and trying to predict the end of the COVID crisis. There will probably be several false starts and the market’s bottoming process may take many months. We will not be able to “call the bottom” accurately, but that is not our objective.
Our goals are to (a) preserve capital, (b) understand evolving risks and opportunities, and (c) position our portfolios for strong returns over the coming years.
Outlook
As a country, we are experiencing something new and surreal, and the psychological trauma may be more significant than the physical or economic. As investors, we are less certain than usual about how near-term events will unfold. The good news is that the country’s capacity to respond to the healthcare emergency is ramping up rapidly. The human ingenuity being displayed in dealing with shortages and developing treatments has been very encouraging. The government has made unprecedented financial and policy responses. Stories of extraordinary work by healthcare workers and ordinary people are amazing. China and other Asian countries that were affected early are beginning to reopen. There are logical reasons for hope and optimism even if our fears and uncertainty persist.
“There are logical reasons for hope and optimism even if our fears and uncertainty persist.”
We are especially thankful to our colleagues who are capably working under new and unusual circumstances and for our clients who have been very supportive through this entire situation. We are in this together, and we believe that we will get through it and return to a changed, but recognizable, version of normal.
As always, we’re here to support you and want to ensure you’re as informed as possible. Please don’t hesitate to reach out to your Weitz representative if we can be of assistance.
Best regards,
 |  |
| | |
| Wally Weitz | Brad Hinton |
wally@weitzinvestments.com | brad@weitzinvestments.com |
As of 3/31/2020, the following portfolio company constituted a portion of the net assets of Balanced Fund, Hickory Fund, Partners III Opportunity Fund, Partners Value Fund, and Value Fund as follows: Berkshire Hathaway Inc.-Class B: 2.5%, 0%, 11.1%, 7.1%, and 7.4%.
Over time, the Liberty Media family of companies has included a large number of entities, including these current portfolio companies, which as of 3/31/2020, constituted a portion of the net assets of Balanced Fund, Hickory Fund, Partners III Opportunity Fund, Partners Value Fund, and Value Fund as follows:
• Charter Communications, Inc.-Class A: 1.8%, 0%, 0%, 0%, and 0%.
• GCI Liberty, Inc.-Class A: 0%, 4.0%, 0.5%, 0%, and 0%.
• Liberty Braves Group-Series A & C: 0%, 1.3%, 0%, 0%, and 0%.
• Liberty Broadband Corp.-Series A & C: 0%, 9.0%, 5.5%, 6.9%, and 0%.
• Liberty Broadband Corp.-Series C: 0%, 0%, 0%, 0%, and 7.1%.
• Liberty Formula One Group-Series A & C: 0%, 1.2%, 0%, 0%, and 0%.
• Liberty Global plc-Class C: 0%, 3.0%, 4.6%, 3.0%, and 2.0%.
• Liberty Latin America Ltd.-Class C: 0%, 2.8%, 0.7%, 2.4%, and 0%.
• Liberty SiriusXM Group-Series A & C: 0%, 4.3%, 3.6%, 4.4%, and 0%.
• Liberty SiriusXM Group-Series C: 0%, 0%, 0%, 0%, and 2.7%.
Qurate Retail, Inc.-Series A: 0%, 2.4%, 1.0%, 0%, and 0%.
Portfolio composition is subject to change at any time. Current and future portfolio holdings are subject to risk.
Q1 2020 Annual Report 7
This page intentionally left blank
8 Q1 2020 Annual Report
DISCLOSURES
Data quoted is past performance and current performance may be lower or higher. Past performance is no guarantee of future results. Investment return and principal value of an investment will fluctuate, and shares, when redeemed, may be worth more or less than their original cost. All investments involve risks, including possible loss of principal. Please visit weitzinvestments. com for the most recent month-end performance.
Investment results reflect applicable fees and expenses and assume all distributions are reinvested but do not reflect the deduction of taxes an investor would pay on distributions or share redemptions. Net and Gross Expense Ratios are as of the Fund’s most recent prospectus. Certain Funds have entered into fee waiver and/or expense reimbursement arrangements with the Investment Advisor. In these cases, the Advisor has contractually agreed to waive a portion of the Advisor’s fee and reimburse certain expenses (excluding taxes, interest, brokerage costs, acquired fund fees and expenses and extraordinary expenses) to limit the total annual fund operating expenses of the Class’s average daily net assets through Contractual Expiration Date of 07/31/2020. The Net Expense Ratio reflects the total annual fund operating expenses of the Fund after taking into account any such fee waiver and/or expense reimbursement, if any; total returns would have been lower had there been no waivers or reimbursements.
Performance quoted for the Balanced, Partners Value and Value Funds’ Institutional Class shares before their inception is derived from the historical performance of the Investor Class shares, which have not been adjusted for the expenses of the Institutional Class shares, had they, returns would have been different.
Performance quoted for the Partners III Opportunity and Short Duration Income Funds’ Investor Class shares before their inception is derived from the historical performance of the Institutional Class shares, which have not been adjusted for the expenses of the Institutional Class shares, had they, returns would have been different.
Index performance is hypothetical and is shown for illustrative purposes only. You cannot invest directly in an index. See page 81 for a description of all indices. The Since Inception return for the Russell 1000 Value and CPI +1% is from 5/31/1986 and 12/31/1988, respectively. All other indices Since Inception return are since the Fund’s inception. The inception date of the Bloomberg Barclays 1-3 Year U.S. Aggregate and 5-Year Municipal Bond was 12/31/1992 and 1/29/1988, respectively.
On 12/29/2006, the Nebraska Tax-Free Income Fund succeeded to substantially all of the assets of Weitz Income Partners Limited Partnership. On 12/31/1993, Partners Value Fund succeeded to substantially all of the assets of Weitz Partners II Limited Partnership. On 12/30/2005, Partners III Opportunity Fund succeeded to substantially all of the assets of Weitz Partners III Limited Partnership. The investment objectives, policies and restrictions of the Funds are materially equivalent to those of the Partnerships, and the Partnerships were managed at all times with full investment authority by the Investment Adviser. The performance information includes performance for the Partnerships. The Partnerships were not registered under the Investment Company Act of 1940 and, therefore, were not subject to certain investment or other restrictions or requirements imposed by the 1940 Act or the Internal Revenue Code. If the Partnerships had been registered under the 1940 Act, the Partnerships’ performance might have been adversely affected.
Effective 12/16/2016, the Ultra Short Government Fund revised its principal investment strategies. Prior to that date, the Fund operated as a “government money market fund” and maintained a stable net asset value of $1.00 per share. Performance prior to 12/16/2016 reflects the Fund’s prior principal investment strategies and may not be indicative of future performance results.
Effective 12/16/2016, the Short Duration Income Fund revised its principal investment strategies. Since that time the Fund has generally maintained an average effective duration between one to three and a half years. Prior to that date, the Fund maintained a dollar–weighted average maturity of between two to five years. Performance prior to 12/16/2016 reflects the Fund’s prior principal investment strategies and may not be indicative of future performance results.
Effective 03/29/2019, the Hickory Fund invests the majority of its assets in the common stock of medium–sized companies, which the Fund considers to be companies with a market capitalization, at the time of initial purchase, of greater than $1 billion and less than or equal to the market capitalization of the largest company in the Russell Midcap Index. Prior to that date, the Fund invested the majority of its assets in the common stock of smaller– and medium–sized companies, which the Fund considered to be companies with a market capitalization, at the time of initial purchase, of less than $10 billion.
Q1 2020 Annual Report 9
| | | | | | | | | | |
| | | | ANNUALIZED | | | |
| | | | | | Since Fund
| Inception | Net | Gross |
| EQUITY | QTD | YTD | 1 YR | 5 YR | 10 YR
| Inception* | Date | Expense | Expense
|
| Hickory Fund (WEHIX) | (27.69)% | (27.69)% | (15.67)% | (2.20)% | 5.85% | 8.20% | 4/1/1993* | 1.09% | 1.27% |
Russell Midcap® | (27.07) | (27.07) | (18.31) | 1.85 | 8.77 | 9.52 | | | |
| Partners III Opportunity Fund - Investor (WPOIX) | (16.30) | (16.30) | (6.40) | 0.70 | 7.33 | 11.55 | 8/1/2011 | 2.13 | 2.13 |
| Partners III Opportunity Fund - Institutional (WPOPX) | (16.17) | (16.17) | (5.83) | 1.22 | 7.72 | 11.66 | 6/1/1983* | 1.56 | 1.56 |
S&P 500® | (19.60) | (19.60) | (6.98) | 6.73 | 10.53 | 10.42 | | | |
Russell 3000® | (20.90) | (20.90) | (9.13) | 5.77 | 10.15 | 10.14 | | | |
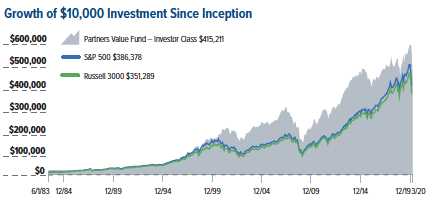
| Partners Value Fund - Investor (WPVLX) | (26.32) | (26.32) | (14.82) | (2.00) | 6.01 | 10.64 | 6/1/1983* | 1.09 | 1.27 |
| Partners Value Fund - Institutional (WPVIX) | (26.26) | (26.26) | (14.59) | (1.75) | 6.16 | 10.68 | 7/31/2014 | 0.89 | 1.07 |
S&P 500® | (19.60) | (19.60) | (6.98) | 6.73 | 10.53 | 10.42 | | | |
Russell 3000® | (20.90) | (20.90) | (9.13) | 5.77 | 10.15 | 10.14 | | | |
| Value Fund - Investor (WVALX) | (18.98) | (18.98) | (5.77) | 2.53 | 8.27 | 9.61 | 5/9/1986* | 1.09 | 1.23 |
| Value Fund - Institutional (WVAIX) | (18.94) | (18.94) | (5.55) | 2.76 | 8.41 | 9.65 | 7/31/2014 | 0.89 | 1.08 |
S&P 500® | (19.60) | (19.60) | (6.98) | 6.73 | 10.53 | 9.72 | | | |
Russell 1000® | (20.22) | (20.22) | (8.03) | 6.22 | 10.39 | 9.69 | | | |
| | | | | | | | | | |
| | | | ANNUALIZED | | | |
| | | | | | Since Fund | Inception | Net | Gross |
| ALLOCATION | QTD | YTD | 1 YR | 5 YR | 10 YR | Inception* | Date | Expense | Expense |
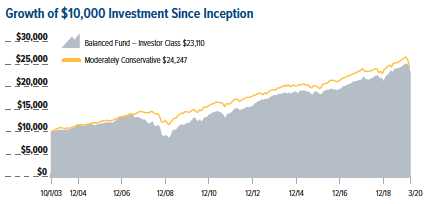
| Balanced Fund - Investor (WBALX) | (7.95)% | (7.95)% | 0.35% | 3.77% | 6.01% | 5.20% | 10/1/2003* | 0.85% | 1.30% |
| Balanced Fund - Institutional (WBAIX) | (7.89) | (7.89) | 0.45 | 3.79 | 6.02 | 5.21 | 3/29/2019 | 0.70 | 0.97 |
Morningstar Moderately Conservative Target Risk | (8.16) | (8.16) | (0.81) | 3.56 | 5.11 | 5.51 | | | |
| | | | | | | | | | |
| | | | ANNUALIZED | | | |
| | | | | | Since Fund
| Inception | Net | Gross |
| FIXED INCOME | QTD | YTD | 1 YR | 5 YR | 10 YR
| Inception* | Date | Expense | Expense
|
| Core Plus Income Fund - Investor (WCPNX) | (3.12)% | (3.12)% | 1.38% | 2.70% | N/A% | 2.89% | 7/31/2014* | 0.50% | 1.42% |
| Core Plus Income Fund - Institutional (WCPBX) | (2.99) | (2.99) | 1.56 | 2.93 | N/A | 3.11 | 7/31/2014* | 0.40 | 0.96 |
Bloomberg Barclays U.S. Aggregate Bond | 3.15 | 3.15 | 8.93 | 3.35 | N/A | 3.65 | | | |
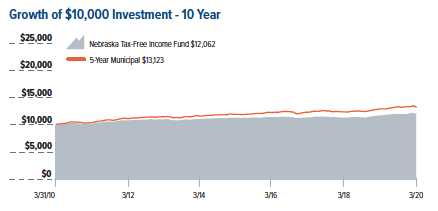
| Nebraska Tax-Free Income Fund (WNTFX) | 0.38 | 0.38 | 2.55 | 1.31 | 1.89 | 4.45 | 10/1/1985* | 0.45 | 0.89 |
Bloomberg Barclays 5-Year Municipal Bond | (1.04) | (1.04) | 2.19 | 2.07 | 2.75 | N/A | | | |
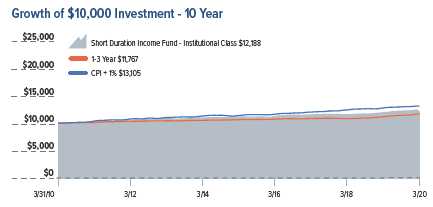
| Short Duration Income Fund - Investor (WSHNX) | (2.19) | (2.19) | 0.26 | 1.27 | 1.81 | 4.82 | 8/1/2011 | 0.55 | 0.92 |
| Short Duration Income Fund - Institutional (WEFIX) | (2.15) | (2.15) | 0.44 | 1.49 | 2.00 | 4.89 | 12/23/1988* | 0.48 | 0.63 |
Bloomberg Barclays 1-3 Year U.S. Aggregate | 1.79 | 1.79 | 4.63 | 1.93 | 1.64 | N/A | | | |
U.S. Consumer Price Index (CPI) Plus 1.00% | 0.69 | 0.69 | 2.56 | 2.82 | 2.74 | 3.49 | | | |
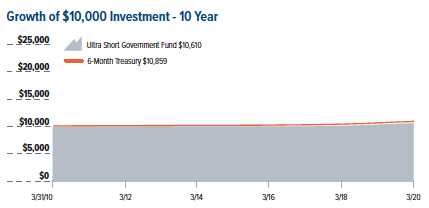
| Ultra Short Government Fund (SAFEX) | 0.75 | 0.75 | 2.44 | 1.16 | 0.59 | 2.36 | 8/1/1991* | 0.20 | 0.61 |
ICE BofAML U.S. 6-Month Treasury Bill | 0.94 | 0.94 | 2.85 | 1.44 | 0.83 | 2.93 | | | |
* Denotes the Funds inception date and the date from which Since Inception Performance is calculated.
10 Q1 2020 Annual Report
April 16, 2020
Dear Fellow Shareholder,
The analogies to describe the year’s first quarter, particularly the month of March, could seemingly fill a book. The unfortunate human and economic drama that continues to unfold across the globe will certainly be forever etched on the world’s collective memory. And while it’s important to provide this update on the markets (as out of date as it may soon become in this rapidly changing environment), our hearts, minds and prayers remain with all of those who have suffered and are suffering the direct human effects of the coronavirus outbreak. It’s also important to remember those who have suffered direct economic consequences resulting from the fight against the disease, including a historic number of job losses. Since the whole world is in this predicament together, hopefully the words from World Health Organization chief Tedros Adhanom Ghebreyesus will bring solace: that the “amazing spirit of human solidarity must become more infectious than the virus itself” and that “we can only succeed together.”
Market Update
The placid beginning to the year, with gently rising stock and bond prices, increasingly became unnerved as evidence grew that COVID-19 would not abide by any national or continental border. The overall market unease that had been rising due to the spread of this invisible enemy escalated on March 8 as Saudi Arabia and Russia initiated an oil price war that led to the biggest oil price decline in decades. In market parlance, a single black swan is a rare sight (just as they’re rare outside of their native Australian habitat), but in March, a viral outbreak and an oil spat among OPEC+ members was akin to two black swan sightings in the same month. If the COVID-19 outbreak in China was like the butterfly effect where a local event had international repercussions, the OPEC+ price war was the Titanic hitting the iceberg. Collapsing aggregate demand due to efforts to slow the spread of the coronavirus was met by an upward supply shock as Saudi Arabia and Russia tried to outmatch each other in flooding the world with oil.
The result was dislocations in both the stock and bond markets which hadn’t occurred since the Great Recession of 2008, and that was quickly morphing into a discussion that “D”, as in Depression, was a more likely descriptor for today. Markets froze and arguably seized up, particularly fixed-income markets, with price discovery becoming challenging. Many mutual funds/index funds and ETFs faced liquidity issues during this period. In order to meet redemption requests, massive bid-lists in the hundreds of millions (looking to sell) were distributed on a Sunday (something that this management has never seen before). Buyers became scarce, if existent at all, and clearing prices for those who had to sell certain types of investments were frequently at significant discounts to not only the price at which they had been valued only a day before but arguably at a meaningful discount to true intrinsic value.
At Weitz, we are pleased to report that we did not have to sell any investments at what we considered to be an unwanted and unwarranted discount. While we may have experienced meaningful (unrealized) markdowns on fixed-income securities we own due to others having to sell them at markdowns, we also benefited from liquidity in the form of U.S. Treasuries and other highly rated securities. We’ve never forgotten the sage advice a long-time shareholder in Indianapolis imparted many years ago about the importance of having real liquidity at the times you need it most.
To help mitigate the market’s liquidity issues, the Federal Reserve (Fed) intervened to support the flow of credit to households and businesses by reducing the Federal Funds rate to a range of 0-0.25% (down 1.5% since year end) and flooding the market with liquidity. These liquidity mechanisms were aimed to support a variety of markets experiencing stress – including Treasuries, agency commercial and residential mortgage-backed securities, corporate bonds, asset-backed securities, municipal bonds, commercial paper, a program to support small businesses and more. “Essentially unlimited” and “we’re not going to run out of ammunition” were comments used by Fed Chair Jerome Powell to reinforce the Fed’s resolve to take drastic action to help support the economy. One area, however, that did not benefit from the recent monetary or fiscal largesse was non-agency mortgage-backed securities, which had a direct impact on long-time portfolio holding Redwood Trust (RWT). Please see our fixed-income funds quarterly commentaries for a more detailed discussion of this and other portfolio-specific topics.
Coupled with the massive fiscal stimulus from Washington, a semblance of calm (albeit with uneasy undertones) settled on the markets by quarter end. One could possibly compare this calm to the eye of a hurricane.
Q1 2020 Annual Report 11
We collectively seem to have survived its first impact, which took the form of a significant liquidity event. The next phase of the storm, while difficult to predict with any certainty, may involve solvency issues related to the economic downshift so many businesses are experiencing. We are preparing for that possibility.
The graph below shows the changes of select Treasury rates over the past quarter and year. Across the yield curve (a line that plots yields / interest rates of bonds with differing maturity dates), interest rates have precipitously declined by a full percent (100 basis points) or more.
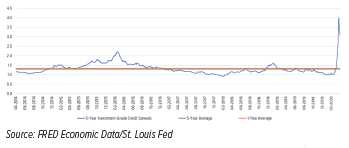
Spreads on corporate bonds went sharply upward in the first quarter resulting in meaningful underperformance compared to U.S. Treasury bonds. A broad measure of investment-grade corporate bond spreads, compiled by ICE BofAML, rose as high as 400 basis points, nearly three times its level at year end, before receding to 305 basis points as of March 31. The chart below depicts the path of investment-grade credit spreads for the past five years (blue line) against the one- (orange) and five-year (gray) averages. Overall, corporate bond credit spreads are meaningfully above where they have been over the last five years – and we feel offer compelling value across many industries.
First Quarter Results
Our fixed income funds, despite severe bond market dislocations, did their jobs of providing ballast for investors’ portfolios. Returns ranged from small gains for the Ultra Short Government Fund and the Nebraska Tax-Free Income Fund to small declines for the Short Duration Income Fund and the Core Plus Income Fund.
Like our equity teammates, we do not relish using red ink in our reports. Negative returns are frustrating, but they often come with a proverbial silver lining. When securities prices are being set as much (or more) by fear than reality, it can present opportunities for those able and willing to take advantage of dislocations between price and value. We believe that the net effect of any unrealized depreciation (which we generally expect to recover at or before maturity) on the investments we already own and the new investments that have been added to the portfolios have meaningfully improved our forward return profile.
For additional insights, please see this quarter’s Value Matters from Co-Chief Investment Officers Wally Weitz and Brad Hinton. We are arguably biased, but we think the message is particularly insightful this quarter. Also, please review the equity and balanced funds’ Quarterly Commentaries for detailed analysis around specific moves our equity portfolio managers made during the quarter.
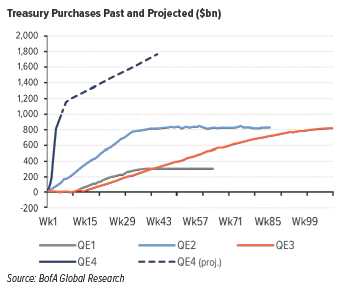
Unintended Consequences
The following two charts present topics to analyze in depth another day – but they are ones we will be monitoring in the months and quarters ahead. In an effort to support the flow of credit in the U.S. financial system, the Fed has embarked on its largest quantitative easing program ever, projected to be orders of magnitude larger than previous iterations. Its balance sheet could reach a previously unfathomable $9 trillion, more than double where it stood at the end of 2019 and $8 trillion higher than its level prior to the Great Recessison.
The Fed is presently fighting the specter of deflation, but its ugly twin, inflation, may reappear sometime in the not-too-distant future with damaging purchasing power implications for fixed-income investors. Even if the health pandemic recedes sooner than some predict, governments around the globe are likely to continue their elevated spending whether or not it remains necessary to do so. Worries of a deflationary bust might quickly turn into an almighty inflationary boom.
12 Q1 2020 Annual Report
Outlook – what a difference a month can make
In several of our previous quarterly correspondence pieces, we had bemoaned the lack of favorable risk/ reward opportunities to deploy capital on behalf of our shareholders (see the “price is what you pay – value is what you receive” section in our Q4 2019 Fixed Income Insights on our website). And as the second month of the new year was ending, we had considered penning a commentary letter about how poor forward returns appeared at the time. Well, March came crashing upon all of us as rising fear about the coronavirus invasion turned markets into what seemed like a version of Rod Serling’s Twilight Zone (specifically 1960’s classic The Monsters are Due on Maple Street, in which mysterious, frightening events suddenly turn a neighborhood upside down). The financial markets became unnerved and increasingly fearful. The U.S. credit default swap index on North American investment grade debt (often dubbed the ‘fear gauge’) that was referenced in our previous Fixed Income Insights went from an all-time low to a multi-year high.

The result has been a rapid repricing of credit risk that has meaningfully and favorably shifted the risk/ reward relationship. At quarter end, the forward returns (as measured by yield-to-worst) for our fixed-income portfolios are at levels they have not been at in many years. We believe this is a solid starting place.
In our fixed income investments, we strive to (a) preserve capital, (b) maintain a strong liquidity position, (c) understand evolving risks and opportunities, (d) selectively take advantage of favorable risk/reward opportunities, and (e) conduct consistent, thorough research and credit surveillance.
Q1 2020 Annual Report 13
While these are difficult times, rest assured that we remain ready to take advantage of any further valuation disparities that may develop, and we strive to remain your trusted partner.
 |  |
| | |
| Tom Carney | Nolan Anderson |
tom@weitzinvestments.com | nolan@weitzinvestments.com |
As of 3/31/2020, the following portfolio company constituted a portion of the net assets of Balanced Fund, Core Plus Income Fund, Hickory Fund, Nebraska Tax-Free Income Fund, Partners III Opportunity Fund, Partners Value Fund, Short Duration Income Fund, Ultra Short Government Fund and Value Fund as follows: Redwood Trust, Inc.: 0.5%, 1.3%, 1.7%, 0%, 1.1%, 1.5%, 2.1%, 0%, and 0%.
Portfolio composition is subject to change at any time. Current and future portfolio holdings are subject to risk.
Definitions: Investment Grade Bonds are those securities rated at least BBB- by one or more credit ratings agencies. Non-Investment Grade Bonds are those securities (commonly referred to as “high yield” or “junk” bonds) rated below BBB- by two or more credit ratings agencies. Yield to Worst (YTW) is the lowest potential yield that can be received on a bond portfolio without the issuers actually defaulting.
14 Q1 2020 Annual Report
CoStar Group: Dominant Services with a World of White Space
By Jon Baker, CFA
CoStar Group is a leading provider of commercial real estate information services. With an army of researchers, a massive proprietary database, and a track record of consistent investment, its services have become essential tools for real estate professionals. The group has built a wide moat that we believe is unlikely to be crossed by any competitor. CoStar Group scores high in our quality assessment and has a clean balance sheet. We have been able to buy the company at what we believe is a significant discount to intrinsic value, making it a prime example of our Quality-at-a-Discount (QuaD) investing approach.
Founded in 1987, the group has grown into the largest provider of data, analytics, and online marketplaces to the commercial real estate industries in the United States and the United Kingdom. CoStar Group currently has three businesses that attract our interest. They are:
| • | CoStar Suite: The group’s original real estate data service. |
| • | LoopNet: A listing venue for for-sale and for-lease commercial properties. |
| • | Apartments.com: Along with related subsequent acquisitions, a collection of online consumer marketplaces serving the U.S. apartment rental market. |
Prior to its 2012 acquisition, LoopNet (at least tangentially) competed with the group’s original service, CoStar Suite. Now under the same roof, a delineation of purpose exists, and the two can invest and grow without collisions of effort.
Weathering the Storm
Before we delve any deeper into the businesses themselves, let’s give reality its due. COVID-19 will likely exact payment in some form from nearly every business we could own. This period of upheaval will undoubtedly impact CoStar’s customers, and their renewal rates –normally above 90% – are unlikely to be spared in the coming year. But as we look at what the business could become over the next decade, we and other owners have several things working in our favor. CoStar has over a billion dollars in cash on the balance sheet and no debt. While management has a history of creating value through acquisitions, they have never mortgaged the company’s future to do so. Each of the group’s three primary businesses dominates its field. They are all plumbing massive, growing markets. They enjoy high incremental margins and earn very attractive returns on capital. Each business has exhibited great operating momentum coming into this period, and none lies directly in the crosshairs of the virus itself.
CoStar Suite
The group’s original data service, CoStar Suite, began as an outsourced research department serving commercial real estate brokerages in the Washington, D.C., area. Over the decades, it expanded along two axes: deepening coverage within existing markets and expanding to new ones. As coverage grew, so too did CoStar’s universe of users, starting with brokers and expanding to lenders, owners, and service providers. New market expansion requires an upfront investment in data gathering, which is expensed through the income statement. Thus, any period of CoStar’s accelerating coverage has taken a chunk out of reported earnings in a way that misrepresents underlying value creation. This may well happen again with an acceleration in Europe, and we would welcome it.
The beating heart of CoStar’s subscription business is a research department some 1,600 strong, tracking 110 billion square feet of real estate across 400 markets and 1,400 submarkets. The annual research budget alone dwarfs the relevant revenue of any competitor. Additionally, CoStar’s own investment in data collection is effectively doubled by input from its subscribers themselves. That user effort is unlikely to be duplicated on a second network, especially one offering only a fraction of CoStar’s audience. This inexorably growing layer cake of data uniquely offers comparability across both geography and time – something no upstart could approach without immense losses over a period of many years. CoStar Suite’s cost to serve each new subscriber is effectively zero, and the cost to research its next geographic market can be leveraged over the largest user base in the industry. With a management team intent on continually growing both subscribers and coverage, we believe CoStar Suite has a global glide path and will never be caught from behind.
LoopNet
Whereas CoStar Suite is a ‘free to submit, pay to view’ subscription-based information service, sister company LoopNet is a ‘pay to submit, free to view’ marketing venue. LoopNet has aggregated the largest audience of commercial real estate professionals in the U.S. To put the tremendous size of its audience in perspective, LoopNet’s web traffic is 22x that of its 50 largest
Q1 2020 Annual Report 15
competitors combined. Anyone wishing to put for-sale or for-lease opportunities in front of that audience must pay the ferryman.
While only about a quarter of CoStar Suite’s size, LoopNet boasts higher margins, has been growing more quickly and is about to benefit from a widened marketing aperture. As international expansion continues, we believe management will want to own information services as well as marketing venues in each geographical region it serves.
Apartments.com
Lastly, and perhaps most importantly, we have 2014 addition Apartments.com and related subsequent acquisitions. These are websites that allow apartment owners to advertise vacancies to apartment hunters. The business reminds us of online travel agent Booking. com’s early years in Europe. Both of these online marketplaces serve as an intermediary, helping two ultra-fragmented groups make sense of one another in a highly efficient manner.
While Apartments.com has large fixed costs, its marginal costs to serve each next renter or landlord approach zero. Thus, topline growth falls disproportionally to the pre-marketing income line, creating additional capacity for marketing investment, which spurs further growth and so on. As the largest player in the U.S., Apartments. com is the only apartment listing platform that can efficiently buy national television advertising. Along with a scaled investment in user experience, the business’s greater branding increases conversion rates on search engine marketing (SEM) investment. Higher conversion means higher returns on SEM and – for an aggressive management team that is not remotely solving for near-term margin maximization – perhaps the ability to tip nearly all other players off the board.
Search-engine marketing (SEM) is the practice of marketing a business using paid advertisements that appear on search engine results pages.
In 2019, Apartments.com and CoStar Group’s other apartment rental websites already had two-thirds click share in the U.S. In second place was the highly leveraged, and now bankrupt, RentPath with 17% share. While RentPath had been aggressively shopped for 18 months, a stalking-horse bid from CoStar Group was the only interest surfaced. It’s likely that CoStar’s acquisition of RentPath will either be approved by the Department of Justice, or RentPath will evaporate (and its volumes potentially move to Apartments.com regardless). If this set of circumstances doesn’t already trouble competitors, they should consider the additional $100 million in marketing expenditure, on top of an already industry-dwarfing $150 million in 2019, that CoStar Group intends to spend this year.
Click share is the number of clicks received compared to the estimated total number of achievable clicks in a search or marketing campaign.
About two-thirds of large apartment communities already advertise on CoStar Group’s rental websites. But as the company continues to invest in both consumer awareness and utility, their share of assisted transactions can continue to deepen. There is also a massive, yet largely untapped, population of smaller communities and independent owners to which CoStar is turning its gaze.
Biggest Threats
As is the case with the online travel agents, Google will be an ever-present threat to the apartment rentals business. However, like Booking.com, Apartments.com’s approach to customer acquisition is SEM-heavy and more closely aligned with Google’s goals than free-riding marketing models. In addition, Apartments.com has access to real-time market data from both CoStar Suite and the apartment rental sites that can be shared with paying landlords. And unlike Booking.com, Apartments.com is already looking to get its hooks deeper into both renters and landlords via other convenient services, offered at no additional cost.
Regarding other players in real estate services, including household names such as Zillow and Redfin, we believe CoStar Group’s industry-leading research investment and marketing budget will allow the company’s data services and marketplaces to remain unrivaled.
Despite CoStar’s dominant position, we don’t currently see any cause for anti-trust concern. The ongoing RentPath acquisition aside, we believe the company’s future acquisition activity will focus upon complementary – rather than competing – markets and services. Because of this, we believe CoStar is unlikely to raise alarm bells with regulators.
16 Q1 2020 Annual Report
Competent Hands at the Wheel
None of the futures discussed here are given. Each of these businesses may need to pivot somewhat from the approaches that have earned each so much success to date. But CoStar Group is governed by a rarity – a founder and team that have managed adaptably for decades, with a balance of both prudence and aggressiveness. With respect to discretionary investment – both organic and acquired – CoStar’s management team has hit for both power and a high batting average. They also have the means and mindset to continue to invest through this period of uncertainty. If all is right in the world by next year, there will certainly be stocks of less advantaged companies that will outperform CoStar’s. But for the coming decade, we believe the qualities of CoStar Group’s businesses can make it a meaningful creator of wealth for the Funds’ shareholders.
As of 03/31/2020, each of the following portfolio companies constituted a portion of the net assets of Balanced Fund, Hickory Fund, Partners III Opportunity Fund, Partners Value Fund, and Value Fund as follows: Alphabet, Inc.-Class C (GOOG) 1.9%, 0%, 5.2%, 6.4%, and 7.1%. CoStar Group, Inc. (CSGP) 0%, 2.8%, 0.7%, 2.8%, and 2.7%.
As of 03/31/2020 Booking Holdings, Inc. (BKNG), Redfin Corp. (RDFN) and Zillow Group, Inc. (ZG) were not held in any Weitz Funds.
Holdings are subject to change and may not be representative of current or future investments.
Jon Baker, CFA, joined Weitz Investments in 1997. Prior to joining the firm, he audited equity funds (including the Weitz Funds) as a certified public accountant at McGladrey & Pullen. Jon has a bachelor’s in accounting and computer applications from the University of Notre Dame.
Q1 2020 Annual Report 17
This page intentionally left blank
18 Q1 2020 Annual Report
Portfolio Managers: Wally Weitz, CFA & Drew Weitz
Investment Style: Mid-Cap Value
The Hickory Fund returned -27.69% in the first quarter of 2020, compared to -27.07% for the Russell Midcap index (the Fund’s primary benchmark). For the year ending March 31, 2020, the Fund returned -15.67% compared to -18.31% for the benchmark.
The COVID-19 crisis has unfurled at an alarming pace, disrupting our daily lives and the global economy seemingly overnight. The situation remains incredibly dynamic as investors grapple with the consequences of the virus itself, the potential consequences of shutting down economies (both here and abroad) and the power of monetary policy and fiscal stimulus to combat the recession. The magnitude of this uncertainty has manifested itself in violent swings in stock prices, volatility we’ve not experienced since the Great Financial Crisis of 2008-2009. Against this highly fluid backdrop, our commentary reflects performance and activity through March 31, a period that incorporates the beginning of the pandemic but obviously not its eventual resolution.
Stocks and other risk assets were pummeled as the economy ground to a near halt in March, and only three stocks contributed positively to performance. EverArc Holdings and Equity Commonwealth both derive nearly all their value from the large sums of cash sitting on their balance sheets. Acquisition vehicle EverArc Holdings raised capital in late 2019 and continues to evaluate opportunities to purchase one or more operating businesses. Market-wide asset price declines suggest improving potential returns when EverArc ultimately deploys its war chest of cash. In recent years, Equity Commonwealth opted to capitalize on frothy commercial real estate prices by liquidating nearly all its portfolio for cash. Today, this war chest gives chairman Sam Zell and company lots of optionality for value creation. Lastly, as the market swooned, we initiated a new position in IDEX Corp. (maker of highly engineered pumps, dispensing solutions, and other components enabling the movement of fluids and gasses) which has delivered strong early returns.
The rest of our holdings participated in the sell-off to varying degrees, but long-time holding Redwood Trust deserves individual attention. The non-agency mortgage market is under tremendous duress, and we believe the initial shock was more about liquidity than solvency. Extreme volatility in loan portfolio pricing stemming from the COVID-19 pandemic has pressured the sector’s funding model, with no relief from government intervention in sight. Redwood’s management has equal measures of integrity, resolve and experience; if anyone can safely navigate these waters, we like their chances. The team has taken several difficult, decisive steps to shore up liquidity, and we think they have invested (and marked) with appropriate conservatism. The potential upside case is clear, yet we cannot be sure that this unprecedented disruption will not further impair their business. More to follow next quarter.
Other top detractors include several companies that participate in elements of the auto industry (CarMax, Axalta and Liberty SiriusXM) as investors first feared supply chain shocks for auto manufacturers and then demand shocks from fewer vehicle sales and miles driven. There is no doubt that business (and earnings) will be challenged for these (and nearly all) companies in the coming quarters, but we remain confident that their long-term prospects are sound. Colfax’s recent purchase of medical devices and services company DJO (and sale of its Air & Gas Handling business) improved its business mix, but its overall cyclicality and balance sheet leverage had investors heading to the exits. We believe management’s strategy is sound, but we ultimately sold our shares to pursue potentially more attractive opportunities.
On balance, the Fund was a seller of equities in the quarter, including actions that we took towards portfolio reshaping. In addition to Colfax, we closed our positions in Perspecta and Fortune Brands to take advantage of the new opportunity set. We also trimmed relative outperformers LICT Corp and Black Knight to manage their weights as their position sizes rose relative to the rest of our portfolio holdings. In addition, we reduced our position in Expedia Group by nearly two-thirds in late February and early March as the potential travel slowdown started coming into focus. On the buy side, we continue to build up newer positions at lower price points (e.g. First Hawaiian, Markel and Vulcan Materials), as well as older holdings where investors’ fear appeared overdone (e.g. Liberty Global and Liberty Latin America). We initiated three new positions in the portfolio, including IDEX Corp. (mentioned above), CoStar Group and HEICO Corporation (detailed below). These three companies are characterized by the highest Weitz Quality Scores (Q1’s or Q2’s on a Q1-Q7 ranking) and strong balance sheets with low-to-no net debt.
CoStar Group is the leading provider of data, analytics and marketing services to commercial real estate brokers and tenants as well as the operator of the rental marketplace, Apartments.com. Research Analyst Jon Baker, CFA, details the business and our investment thesis in this quarter’s Analyst Corner feature. HEICO Corporation’s largest segment designs, manufactures and sells FAA-approved jet engine and other aircraft replacement parts, typically at price points below those offered by original equipment manufacturers (OEMs). With airlines all but grounded, aftermarket demand for HEICO parts and overhaul services has surely suffered. However, we think it is unlikely that air travel is permanently impaired. As planes return to service, HEICO’s value proposition will help them gain market share. HEICO’s conservative balance should allow them to not only survive this temporary halt but to continue their strategy of bolt-on acquisitions at attractive prices to accelerate business value growth.
As we move into the second quarter, much is still uncertain. Although there are some encouraging headlines and governments around the globe are acting aggressively to head off the worst, we are proceeding with caution. Using our quality-at-a-discount or “QuaD investing” framework, we continue to seek (and act upon) investment opportunities which we believe can deliver superior returns over a multi-year time horizon, even while the near-term outlook remains clouded. We appreciate our shareholders’ trust and the opportunity to invest alongside you.
Q1 2020 Annual Report 19
| | | | | | | | | | | |
| Returns | | | | Annualized
| | |
| | | | | | | | Since Fund | | |
| | | | | | | | Inception | Net | Gross |
| QTD | YTD | 1 YR | 3 YR | 5 YR | 10 YR | 20 YR | (4/1/1993) | Expense | Expense |
| WEHIX | (27.69)% | (27.69)% | (15.67)% | (4.13)% | (2.20)% | 5.85% | 3.61% | 8.20% | 1.09% | 1.27% |
| Russell Midcap | (27.07) | (27.07) | (18.31) | (0.81) | 1.85 | 8.77 | 6.79 | 9.52 | | |
| | |
| Top 10 Stock Holdings | |
| % of Net Assets |
Liberty Broadband Corp. - Series A & C | 9.0 |
LICT Corp. | 6.3 |
Laboratory Corp. of America Holdings | 4.7 |
Equity Commonwealth | 4.6 |
EverArc Holdings Ltd. | 4.4 |
Liberty SiriusXM Group - Series A & C | 4.3 |
GCI Liberty, Inc. - Class A | 4.0 |
ACI Worldwide, Inc. | 3.8 |
Black Knight, Inc. | 3.4 |
Markel Corp. | 3.4 |
| 47.9 |
| | | | |
| Top Performers | | | |
| | Average | |
| | Return | Weight | Contribution |
| EverArc Holdings Ltd. | 11.1% | 3.2% | 0.26% |
| IDEX Corp. | (19.5) | 0.2 | 0.24 |
| Equity Commonwealth | (3.4) | 3.6 | 0.04 |
| | |
| Industry Breakdown | |
| % of Net Assets |
Communication Services | 31.9 |
Information Technology | 15.1 |
Industrials | 9.3 |
Consumer Discretionary | 9.2 |
Materials | 8.9 |
Financials | 7.6 |
Health Care | 4.7 |
Real Estate | 4.6 |
Other Common Stock & Warrants | 4.4 |
Cash Equivalents/Other | 4.3 |
| 100.0 |
| | | | |
| Bottom Performers | | | |
| | Average | |
| Return | Weight | Contribution |
Redwood Trust, Inc. | (68.6)% | 3.7% | (3.89)% |
Colfax Corp. | (45.6) | 3.1 | (2.09) |
Liberty SiriusXM Group - Series A & C | (34.4) | 4.4 | (1.66) |
Axalta Coating Systems Ltd. | (43.2) | 3.5 | (1.62) |
CarMax, Inc. | (38.6) | 3.7 | (1.54) |
Data quoted is past performance and current performance may be lower or higher. Past performance is no guarantee of future results. Investment return and principal value of an investment will fluctuate, and shares, when redeemed, may be worth more or less than their original cost. All investments involve risks, including possible loss of principal. Please visit weitzinvestments.com for the most recent month-end performance.
Investment results reflect applicable fees and expenses and assume all distributions are reinvested but do not reflect the deduction of taxes an investor would pay on distributions or share redemptions. Net and Gross Expense Ratios are as of the Fund’s most recent prospectus. The Fund has entered into fee waiver and/or expense reimbursement arrangements with the Investment Advisor. The Advisor has contractually agreed to waive a portion of the Advisor’s fee and reimburse certain expenses (excluding taxes, interest, brokerage costs, acquired fund fees and expenses and extraordinary expenses) to limit the total annual fund operating expenses of the Class’s average daily net assets through 07/31/2020. The Net Expense Ratio reflects the total annual fund operating expenses of the Fund after taking into account any such fee waiver and/or expense reimbursement, if any; total returns would have been lower had there been no waivers or reimbursements.
See page 8 for additional performance disclosures. See page 81 for a description of all indices.
Contributions to Fund performance are based on actual daily holdings. Securities may have been bought or sold during the quarter. Return shown is the actual quarterly return of the security or combination of share classes.
Source (Top Performers, Bottom Performers): FactSet Analytics
20 Q1 2020 Annual Report
PARTNERS III OPPORTUNITY FUND
Portfolio Manager: Wally Weitz, CFA
Investment Style: Multi-Cap Alternative
The Partners III Opportunity Fund’s Institutional Class returned -16.17% in the first quarter of 2020 compared to -19.60% for the S&P 500 (the Fund’s primary benchmark) and -20.90% for the Russell 3000. For the year ending March 31, 2020, the Fund returned -5.83% compared to -6.98% for the S&P 500 and -9.13% for the Russell 3000.
There was extreme volatility in the stock and bond markets during the first quarter of 2020. The COVID-19 crisis has unfolded at an alarming pace, putting the country and much of the world in a kind of economic “time out.” Investors are encouraged to read our latest Value Matters for a deeper analysis of the current investing climate. As detailed below, Fund performance was helped by some very large, mature companies that generally outperformed smaller companies, while the Fund’s index short positions provided some additional ballast. Nevertheless, we were not immune from the swoon. We always prefer to report relative outperformance but acknowledge that does not fully dull the sting of negative absolute results.
Despite the overall gloom, there were a few bright spots in the quarterly numbers. Acquisition vehicle EverArc Holdings raised capital in late 2019 and continues to evaluate opportunities to purchase one or more operating businesses. Market-wide asset price declines suggest improving potential returns when EverArc ultimately deploys its war chest of cash. Amazon managed a small positive return likely due to a shift in retail market share as consumers adjusted to shelter-in-place orders. We also generated positive returns from our sales of Expedia Group and Colfax, which were valuation-driven and completed before the market impact of the outbreak was truly underway. Not surprisingly, our index short positions collectively delivered the greatest positive contributions, providing a partial hedge for the portfolio’s decline.
Our remaining holdings participated to varying degrees in the overall sell-off. Berkshire Hathaway’s position size magnified its market-like return, while others like Liberty Global and Liberty SiriusXM suffered more meaningful markdowns as investors struggled to project the duration and depth of the coming recession, and investors grew even more negative on DXC Technology, despite progress on their divestiture plan (and planned debt reduction). We empathize with investors’ near-term uncertainty, but we remain focused on the businesses’ long-term opportunities which we believe are sound.
Long-time holding Redwood Trust faces a less clear path. The non-agency mortgage market is under tremendous duress, and we believe the initial shock was more about liquidity than solvency. Extreme volatility in loan portfolio pricing stemming from the COVID-19 pandemic has pressured the sector’s funding model, with no relief from government intervention in sight. Redwood’s management has equal measures of integrity, resolve and experience; if anyone can safely navigate these waters, we like their chances. The team has taken several difficult, decisive steps to shore up liquidity, and we think they have invested (and marked) with appropriate conservatism. The upside case is clear, yet we also cannot be sure that this unprecedented disruption will not further impair their business. More to follow next quarter.
We were active on both the buy and sell sides of the ledger during the first quarter. In addition to Colfax and Expedia, we also completed a sale of Perspecta, while we began two new company investments and one new long ETF position. Among our new investments is CoStar Group, the leading provider of data, analytics and marketing services to commercial real estate brokers and tenants as well as the operator of the rental marketplace, Apartments.com. Research Analyst Jon Baker, CFA, provides a more detailed description and summary of our investment thesis in this quarter’s Analyst Corner feature. We also began buying Vulcan Materials (a high-quality provider of aggregates and other building materials to both private and public-sector customers) late in the quarter after its shares were swept up in the overall market decline. We also added a significant new holding of the Financial Select Sector SPDR ETF. Financial stocks (banks, in particular) have disproportionately slumped as rock-bottom interest rates pressure banks’ ability to earn an attractive margin on their loans while an economic slowdown creates concern around consumer and commercial credit. It’s true that banks played a central role in the Great Financial Crisis of 2008-2009, but today banks are much better capitalized and not the epicenter of our current troubles. We believe the magnitude of these declines has been overdone. In the past, we have constructed “baskets” of individual securities to express an “industry thesis.” Today, we can simply and efficiently do the same by purchasing the sector ETF instead.
Within the short book, we closed our SiriusXM short (a hedge that had protected prior gains in Liberty SiriusXM) at a gain and covered the remaining shares of our Dollar General short at a loss. On balance, we reduced our index short position during the quarter, covering layers of our S&P 500 Index ETF short at various levels during the market decline. Though our Index shorts were positive to the portfolio during the market’s quarter decline, the shares covered resulted in a loss. These moves resulted in a gross short exposure equal to 11% of net assets at quarter end (down from 19% on December 31). Our gross long exposure also declined to 90% (from 97%) during the quarter, resulting in an effective net long position of 79% of net assets.
Despite an uncertain near term, we are confident that the world will recover from the current health crisis. As we continue to navigate through this difficult period, our goal remains unchanged: to identify attractive investment opportunities that can deliver strong returns for years to come.
Q1 2020 Annual Report 21
| | | | | | | | | | | |
| Returns | | | | Annualized | | |
| | | | | | | | Since Fund | | |
| | | | | | | | Inception | Net | Gross |
| QTD | YTD | 1 YR | 3 YR | 5 YR | 10 YR | 20 YR | (6/1/1983) | Expense | Expense |
| WPOIX - Investor Class | (16.30)% | (16.30)% | (6.40)% | 1.67% | 0.70% | 7.33% | 8.58% | 11.55% | 2.13% | 2.13% |
| WPOPX - Institutional Class | (16.17) | (16.17) | (5.83) | 2.24 | 1.22 | 7.72 | 8.78 | 11.66 | 1.56 | 1.56 |
| S&P 500 | (19.60) | (19.60) | (6.98) | 5.10 | 6.73 | 10.53 | 4.79 | 10.42 | | |
| Russell 3000 | (20.90) | (20.90) | (9.13) | 4.00 | 5.77 | 10.15 | 4.91 | 10.14 | | |
| | |
| Top 10 Holdings | |
| % of Net Assets |
Berkshire Hathaway Inc. - Class B | 11.1 |
Intelligent Systems Corp. | 9.3 |
Liberty Broadband Corp. - Series A & C | 5.5 |
Visa Inc. - Class A | 5.3 |
Markel Corp. | 5.3 |
Alphabet, Inc. - Class C | 5.2 |
Mastercard Inc. - Class A | 5.2 |
Liberty Global plc - Class C | 4.6 |
The Financial Select Sector SPDR Fund | 4.5 |
Facebook, Inc. - Class A | 4.2 |
| 60.2 |
| | | | |
| Top Performers | | | |
| | Average | |
| Return | Weight | Contribution |
SPDR S&P 500 ETF Trust (short) | (19.4)% | (14.6)% | 3.33% |
EverArc Holdings Ltd. | 11.1 | 3.3 | 0.32 |
Invesco QQQ Trust, Series 1 (short) | (10.3) | (1.5) | 0.25 |
Sirius XM Holdings, Inc. (short) | (30.8) | (0.9) | 0.23 |
Amazon.com, Inc. | 5.5 | 2.4 | 0.18 |
| | |
| Industry Breakdown | |
| % of Net Assets |
Information Technology | 27.5 |
Communication Services | 24.3 |
Financials | 19.0 |
Consumer Discretionary | 5.1 |
Health Care | 2.7 |
Materials | 2.4 |
Industrials | 0.7 |
Other Common Stock & Warrants | 4.0 |
Exchange Traded Funds | 4.5 |
Securities Sold Short | (11.2) |
Short Proceeds/Other | 21.0 |
| 100.0 |
| | | | |
| Bottom Performers | | | |
| | Average | |
| Return | Weight | Contribution |
Berkshire Hathaway Inc. - Class B | (19.3)% | 10.9% | (2.23)% |
Redwood Trust, Inc. | (68.6) | 2.2 | (2.00) |
Liberty SiriusXM Group - Series A & C | (34.4) | 4.2 | (1.75) |
DXC Technology Co. | (64.8) | 2.1 | (1.69) |
Liberty Global plc - Class C | (27.9) | 5.2 | (1.48) |
Data quoted is past performance and current performance may be lower or higher. Past performance is no guarantee of future results. Investment return and principal value of an investment will fluctuate, and shares, when redeemed, may be worth more or less than their original cost. All investments involve risks, including possible loss of principal. Please visit weitzinvestments.com for the most recent month-end performance.
Investment results reflect applicable fees and expenses and assume all distributions are reinvested but do not reflect the deduction of taxes an investor would pay on distributions or share redemptions. Net and Gross Expense Ratios are as of the Fund’s most recent prospectus.
See page 8 for additional performance disclosures. See page 81 for a description of all indices.
Contributions to Fund performance are based on actual daily holdings. Securities may have been bought or sold during the quarter. Return shown is the actual quarterly return of the security or combination of share classes.
Source (Top Performers, Bottom Performers): FactSet Analytics
22 Q1 2020 Annual Report
Portfolio Managers: Wally Weitz, CFA & Brad Hinton, CFA
Investment Style: Multi-Cap Value
The Partners Value Fund’s Institutional Class returned -26.26% during the first quarter compared to -20.90% for the Russell 3000 and -19.60% for the S&P 500, the Fund’s primary benchmark. For the year ending March 31, 2020, the Fund’s Institutional Class returned -14.59% compared to -9.13% for the Russell 3000 and -6.98% for the S&P 500. The markets quickly took back most of the Fund’s 2019 outsized gains. The March swoon was particularly harsh for small-cap stocks, mid-cap stocks and all but the highest-quality companies.
The COVID-19 outbreak has taken center stage and upended life around the globe. The U.S. economy has temporarily ground to a near halt. The short-term effects, reactions and implications are unprecedented, and the Fund declined more than its benchmark during this turmoil. Before we get into stock specifics, it is helpful to highlight a few broad themes:
Large-cap stocks declined far less than small- and mid-cap stocks
We wrote last quarter about the concept of splitting the portfolio into a large-cap basket and a mid-cap basket. More than 70 percent of the quarter’s negative contribution came from our mid-cap basket. In fact, our large-cap basket would have outperformed the broader market indices by several hundred basis points on a stand-alone basis.
Higher-quality stocks declined far less than lower-quality stocks
Our proprietary quality scoring (QS) system rates stocks on a QS1-QS7 scale, with QS1 being the highest quality. Our portfolio consists of companies rated QS1-QS4 only; we generally exclude low-quality (QS5-QS7) businesses. QS1 and QS2 stocks held up well, performing slightly better than the broad market. Our QS3 stocks were impacted more, and our QS4 stocks gapped even lower still. QS3 and QS4 stocks accounted for roughly two-thirds of the quarter’s negative contribution.
These trends are not surprising in a cascading market correction. We strongly believe that through a market cycle, mid-cap companies should have a prominent place in a multi-cap, best-ideas strategy. We also believe that carefully curated, well-researched QS3 and QS4 companies can add excess return to a portfolio over the long haul. To paraphrase Warren Buffett, we are willing to endure a lumpier path to a higher place. This view, too, has been out of favor as recent mid-quality volatility has been mostly one-sided. Mid-sized, mid-quality stocks have often meant double trouble in this market environment.
Expedia Group and IDEX were the only positive contributors to results during the quarter. We sold Expedia Group at a large gain after the company reported encouraging earnings and before the COVID-19 outbreak took hold. The fortuitous sale was triggered by our valuation discipline. In contrast, we bought multi-platform industrial IDEX into the teeth of the drawdown, and the stock enjoyed a nice bounce by quarter end. Detractors included Colfax, Liberty SiriusXM and CarMax, which all fit the mid-sized, mid-quality mold. We sold Colfax to upgrade the portfolio, while we think the other two stocks have tremendous return potential from their quarter end, depressed price levels.
Long-time holding Redwood Trust faces a less clear path. The non-agency mortgage market is under tremendous duress, and we believe the initial shock was more about liquidity than solvency. Extreme volatility in loan portfolio pricing stemming from the COVID-19 pandemic has pressured the sector’s funding model, with no relief from government intervention in sight. Redwood’s management has equal measures of integrity, resolve and experience; if anyone can safely navigate these waters, we like their chances. The team has taken several difficult, decisive steps to shore up liquidity, and we think they have invested (and marked) with appropriate conservatism. The upside case is clear, yet we also cannot be sure that this unprecedented disruption will not further impair their business. More to follow next quarter.
For the year ending March 31, 2020, Liberty Broadband, Marvell Technology and Expedia (sold) were the largest contributors. Marvell is a good example of a mid-sized, mid-quality company that bucked the trend and helped fund performance. Beyond Redwood Trust, material detractors included Qurate Retail, Colfax and DXC Technology. We sold these three stocks to focus on more durable companies as the opportunity set widened, with little sacrifice to the Fund’s return potential in our view.
As volatility increased throughout the quarter, we took several steps to reshape and improve the portfolio. Drawing on excellent work from the equity research team, we bought CoStar Group (real estate information, analytics and marketplaces), HEICO (aerospace products) and IDEX (multi-platform industrials). In addition to timely sales of travel companies Expedia and Booking Holdings, we eliminated Colfax, Qurate Retail and TransDigm Group. We also materially increased our positions in Markel, Vulcan Materials and ACI Worldwide. We think the resulting portfolio is sturdier, with an even more attractive risk-reward profile.
Valuation remains our North Star, and we think our stocks are attractively priced despite the negative headlines and hazy 2020 outlook. Our appraisals are more fluid than usual given the extreme nature of the COVID-19 disruption. Wider ranges are more useful than point estimates, and our current view is that the portfolio currently trades at a price-to-value in the low to mid 70s. Even with some margin for error, these discounted valuation levels suggest above-average long run return potential.
Q1 2020 Annual Report 23
| | | | | | | | | | | |
| Returns | | | | Annualized | | |
| | | | | | | | Since Fund | | |
| | | | | | | | Inception | Net | Gross |
| QTD | YTD | 1 YR | 3 YR | 5 YR | 10 YR | 20 YR | (6/1/1983) | Expense | Expense |
| WPVLX - Investor Class | (26.32)% | (26.32)% | (14.82)% | (3.08)% | (2.00)% | 6.01% | 4.96% | 10.64% | 1.09% | 1.27% |
| WPVIX - Institutional Class | (26.26) | (26.26) | (14.59) | (2.82) | (1.75) | 6.16 | 5.03 | 10.68 | 0.89 | 1.07 |
| S&P 500 | (19.60) | (19.60) | (6.98) | 5.10 | 6.73 | 10.53 | 4.79 | 10.42 | | |
| Russell 3000 | (20.90) | (20.90) | (9.13) | 4.00 | 5.77 | 10.15 | 4.91 | 10.14 | | |
| | |
| Top 10 Stock Holdings | |
| % of Net Assets |
Berkshire Hathaway Inc. - Class B | 7.1 |
Liberty Broadband Corp. - Series A & C | 6.9 |
Alphabet, Inc. - Class C | 6.4 |
Liberty SiriusXM Group - Series A & C | 4.4 |
Laboratory Corp. of America Holdings | 4.3 |
Visa Inc. - Class A | 4.2 |
Black Knight, Inc. | 4.0 |
Vulcan Materials Co. | 3.5 |
Mastercard Inc. - Class A | 3.5 |
Markel Corp. | 3.4 |
| 47.7 |
| | | | |
| Top Performers | | | |
| Average | |
| Return | Weight | Contribution |
Expedia Group, Inc. | (47.8)% | 1.2% | 0.22% |
IDEX Corp. | (19.5) | 0.1 | 0.18 |
| | |
| Industry Breakdown | |
| % of Net Assets |
Information Technology | 27.8 |
Communication Services | 26.1 |
Financials | 17.9 |
Materials | 10.2 |
Industrials | 5.7 |
Consumer Discretionary | 5.0 |
Health Care | 4.3 |
Cash Equivalents/Other | 3.0 |
| 100.0 |
| | | | |
| Bottom Performers | | | |
| | Average | |
| Return | Weight | Contribution |
Redwood Trust, Inc. | (68.6)% | 3.2% | (3.28)% |
Colfax Corp. | (45.6) | 2.6 | (1.82) |
Liberty SiriusXM Group - Series A & C | (34.4) | 4.6 | (1.72) |
CarMax, Inc. | (38.6) | 3.1 | (1.28) |
Laboratory Corp. of America Holdings | (25.3) | 4.1 | (1.25) |
Data quoted is past performance and current performance may be lower or higher. Past performance is no guarantee of future results. Investment return and principal value of an investment will fluctuate, and shares, when redeemed, may be worth more or less than their original cost. All investments involve risks, including possible loss of principal. Please visit weitzinvestments.com for the most recent month-end performance.
Investment results reflect applicable fees and expenses and assume all distributions are reinvested but do not reflect the deduction of taxes an investor would pay on distributions or share redemptions. Net and Gross Expense Ratios are as of the Fund’s most recent prospectus. The Fund has entered into fee waiver and/or expense reimbursement arrangements with the Investment Advisor. The Advisor has contractually agreed to waive a portion of the Advisor’s fee and reimburse certain expenses (excluding taxes, interest, brokerage costs, acquired fund fees and expenses and extraordinary expenses) to limit the total annual fund operating expenses of the Class’s average daily net assets through 07/31/2020. The Net Expense Ratio reflects the total annual fund operating expenses of the Fund after taking into account any such fee waiver and/or expense reimbursement, if any; total returns would have been lower had there been no waivers or reimbursements.
See page 8 for additional performance disclosures. See page 81 for a description of all indices.
Contributions to Fund performance are based on actual daily holdings. Securities may have been bought or sold during the quarter. Return shown is the actual quarterly return of the security or combination of share classes.
Source (Top Performers, Bottom Performers): FactSet Analytics
24 Q1 2020 Annual Report
Portfolio Manager: Brad Hinton, CFA
Investment Style: Large-Cap Value
The Value Fund’s Institutional Class returned -18.94% for the first quarter compared to -20.22% for the Russell 1000 and -19.60% for the S&P 500, the Fund’s primary benchmark. For the fiscal year ending March 31, 2020, the Fund’s Institutional Class returned -5.55% compared to -8.03% for the Russell 1000 and -6.98% for the S&P 500.
We wrote last quarter about leopards and cheetahs. Sometimes Mother Nature unleashes a fury that sends even apex predators scrambling for cover. The COVID-19 outbreak had a chilling effect on global financial markets. Stocks and other risk assets were pummeled as the economy ground to a near halt in March. Our portfolio was not immune, though the Fund held up modestly better than our benchmark large-cap index.
Hiding places were few and far between. Amazon managed a modest quarterly gain, and new holding S&P Global – a collection of four terrific business lines: debt ratings, financial markets data, commodity price benchmarks and indices –contributed to results due to timely purchases. The rest of our holdings endured moderate to heavy markdowns. CarMax, JPMorgan Chase and Liberty SiriusXM each fell more than 30%, our most severe percentage declines. These businesses will take hits to 2020 earnings, as will most companies, but we think their durable franchises remain intact. In time, we expect all three to resume growing economic value. For the long-term investor, our view is that these setbacks will prove to be temporary.
For the year ending March 31, 2020, Liberty Broadband, Amazon and a pair of stocks that we sold out of (TransDigm Group and Booking Holdings) were the largest contributors to results. LabCorp, Liberty Global, Berkshire Hathaway and Dollar Tree (also sold) were the most significant detractors. Despite the usual gains and losses at the security level, our more concentrated Fund outperformed broader large-cap indices (and notably the passive ETFs based on them) during this turbulent twelve-month period. One small step in the right direction for active managers.
We took several actions to improve the portfolio before and during the market turmoil. Research Analyst Jon Baker, CFA, made a great call that helped protect capital by encouraging us to sell Booking Holdings early in the COVID-19 crisis. He was rightly concerned about the impact on travel industry business values, well before such worries showed up in stock prices. He also recommended that we buy CoStar Group, a leading provider of real estate information, analytics and marketplaces that has been on our radar for 20 years. Though not a household name, CoStar is one of the few businesses that earns our highest rating (a “QS1”) on all six of our quality score metrics. Jon describes our investment thesis for this world-class company in this quarter’s Analyst Corner.
As the crisis deepened in March, we continued reshaping the portfolio. We added S&P Global, another company that fits our quality-at-a-discount approach (“QuaD investing”) like a glove. We opportunistically bought the stock on one of the market’s many hard risk-off days. We also eliminated Dollar Tree. Despite being a disappointing investment, the stock was relatively stout for most of the quarter. We sold it to focus on similarly discounted, higher conviction holdings. For example, we beefed up positions in JPMorgan Chase, Oracle and Vulcan Materials.
The activity described above is a function of diligent legwork done well before a downdraft takes hold. Our equity team continued to research new companies throughout the bull market, even when immediate purchases seemed unlikely. This approach takes discipline, patience and a clear sense of purpose. Over the past year, we more explicitly tiered our investment universe and prioritized our company coverage. This team effort led to clear improvements in two-way communication, efficiency and throughput. Credit to our talented and experienced analysts, as well as Director of Equity Research Drew Weitz and Deputy Director of Research Barton Hooper, CFA, for leading this enhanced research process.
The portfolio is focused and well aligned with our vision for successful large-cap investing. We have ownership stakes in 26 companies, with the top ten representing roughly half of the portfolio. Each position is significant enough to matter, yet none can individually make or break our results. Valuation appraisals are more fluid than usual given the extreme nature of the COVID-19 disruption. Wider ranges are more useful than point estimates, and our current view is that the portfolio trades at a price-to-value in the high 70s to low 80s. Even with some margin for error, these discounted valuation levels suggest the potential for solid long-run returns.
Q1 2020 Annual Report 25
| | | | | | | | | | | |
| Returns | | | | Annualized | | |
| | | | | | | | Since Fund | | |
| | | | | | | | Inception | Net | Gross |
| QTD | YTD | 1 YR | 3 YR | 5 YR | 10 YR | 20 YR | (5/9/1986) | Expense | Expense |
| WVALX - Investor Class | (18.98)% | (18.98)% | (5.77)% | 3.92% | 2.53% | 8.27% | 5.65% | 9.61% | 1.09% | 1.23% |
| WVAIX - Institutional Class | (18.94) | (18.94) | (5.55) | 4.17 | 2.76 | 8.41 | 5.71 | 9.65 | 0.89 | 1.08 |
| S&P 500 | (19.60) | (19.60) | (6.98) | 5.10 | 6.73 | 10.53 | 4.79 | 9.72 | | |
| Russell 1000 | (20.22) | (20.22) | (8.03) | 4.64 | 6.22 | 10.39 | 4.88 | 9.69 | | |
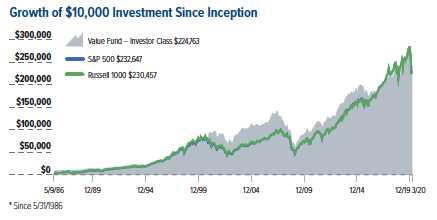
| | |
| Top 10 Stock Holdings | |
| % of Net Assets |
Berkshire Hathaway Inc. - Class B | 7.4 |
Alphabet, Inc. - Class C | 7.1 |
Liberty Broadband Corp. - Series C | 7.1 |
Thermo Fisher Scientific Inc. | 4.3 |
Facebook, Inc. - Class A | 4.2 |
Visa Inc. - Class A | 4.2 |
Oracle Corp. | 4.0 |
JPMorgan Chase & Co. | 4.0 |
Danaher Corp. | 3.9 |
Mastercard Inc. - Class A | 3.8 |
| 50.0 |
| | | | |
| Top Performers | | | |
| Average | |
| Return | Weight | Contribution |
S&P Global Inc. | (10.0)% | 0.4% | 0.26% |
Amazon.com, Inc. | 5.5 | 2.8 | 0.22 |
| | |
| Industry Breakdown | |
| % of Net Assets |
Communication Services | 26.0 |
Information Technology | 20.9 |
Financials | 20.3 |
Health Care | 11.8 |
Materials | 6.3 |
Consumer Discretionary | 5.4 |
Industrials | 2.7 |
Consumer Staples | 2.4 |
Cash Equivalents/Other | 4.2 |
| 100.0 |
| | | | |
| Bottom Performers | | | |
| | Average | |
| Return | Weight | Contribution |
Berkshire Hathaway Inc. - Class B | (19.3)% | 7.4% | (1.48)% |
Liberty SiriusXM Group - Series C | (34.3) | 3.2 | (1.25) |
Laboratory Corp. of America Holdings | (25.3) | 4.0 | (1.22) |
JPMorgan Chase & Co. | (35.0) | 3.6 | (1.21) |
CarMax, Inc. | (38.6) | 2.6 | (1.08) |
Data quoted is past performance and current performance may be lower or higher. Past performance is no guarantee of future results. Investment return and principal value of an investment will fluctuate, and shares, when redeemed, may be worth more or less than their original cost. All investments involve risks, including possible loss of principal. Please visit weitzinvestments.com for the most recent month-end performance.
Investment results reflect applicable fees and expenses and assume all distributions are reinvested but do not reflect the deduction of taxes an investor would pay on distributions or share redemptions. Net and Gross Expense Ratios are as of the Fund’s most recent prospectus. The Fund has entered into fee waiver and/or expense reimbursement arrangements with the Investment Advisor. The Advisor has contractually agreed to waive a portion of the Advisor’s fee and reimburse certain expenses (excluding taxes, interest, brokerage costs, acquired fund fees and expenses and extraordinary expenses) to limit the total annual fund operating expenses of the Class’s average daily net assets through 07/31/2020. The Net Expense Ratio reflects the total annual fund operating expenses of the Fund after taking into account any such fee waiver and/or expense reimbursement, if any; total returns would have been lower had there been no waivers or reimbursements.
See page 8 for additional performance disclosures. See page 81 for a description of all indices.
Contributions to Fund performance are based on actual daily holdings. Securities may have been bought or sold during the quarter. Return shown is the actual quarterly return of the security or combination of share classes.
Source (Top Performers, Bottom Performers): FactSet Analytics
26 Q1 2020 Annual Report
Portfolio Manager: Brad Hinton, CFA
Investment Style: Conservative Allocation
The Balanced Fund’s Institutional Class returned -7.89% for the first quarter compared to -8.16% for the Morningstar Moderately Conservative Target Risk Index (the primary benchmark). For the year ending March 31, 2020, the Fund’s Institutional Class returned +0.45% compared to -0.81% for the primary benchmark. While the markets reclaimed much of last year’s outsized gains, total returns well above inflation over multi-year periods have helped our investors retain and build wealth.
The COVID-19 outbreak has taken center stage and upended life around the globe. The U.S. economy has temporarily ground to a near halt. The short-term effects, reactions and implications are unprecedented. Fear, uncertainty and doubt are running rampant, and not without reason. Unchecked, this cocktail of insidious emotions can derail the best-laid investment plans. Our balanced investment strategy is designed to make sure this doesn’t happen to our shareholders.
We believe the best course of action for long-term investors is to stay the course, take a fresh look at your asset allocation, and consider rebalancing in line with your investment plan. As you will see in this commentary, that’s what we have been doing on behalf of our shareholders. We do not enjoy experiencing or reporting negative returns, even for short windows of time. Yet, temporary setbacks come with the territory, and they often set the stage for better days ahead. You will find seeds of optimism sprinkled throughout this report.
First, though, we acknowledge that the near-term path has rarely been hazier. The news may very well get worse before it gets better, and 2020 earnings for many companies will be in shambles. We have little conviction around the shape (U, W, V or other) of the eventual, and inevitable, economic recovery. But it’s important for investors to understand that current asset prices already reflect quite a bit of bad news.
The key is to look well beyond the immediate crisis at hand. Our core belief is that we will get through this eventually. It may be at great cost, but in time human ingenuity will prevail. We have been collecting attractively priced securities across the portfolio at a gradual, measured pace for the past month. We have room to do much more. The longer your investment horizon, the more confidence we have that these investments will bear fruit.
The Fund was resilient through the quarter’s extreme market turmoil. Broad stock market indices fell roughly 20%, while pockets of the fixed income market buckled. Our bonds did their job, providing sturdy ballast as intended. The bond portfolio delivered modest positive returns overall, primarily from heavy weightings of dull, but steady, Treasury notes. Stocks were another story. Microsoft eked out a small gain, while new holdings S&P Global and IDEX Corporation contributed modestly to quarterly returns due to timely purchases. There were few other places to hide. We think markdowns in durable companies ranging from Berkshire Hathaway and JPMorgan Chase to Lab Corp and Martin Marietta Materials are likely to be recouped in time.
Long-time holding Redwood Trust faces a less clear path. The non-agency mortgage market is under tremendous duress, and we believe the initial shock was more about liquidity than solvency. Extreme volatility in loan portfolio pricing stemming from the COVID-19 pandemic has pressured the sector’s funding model, with no relief from government intervention in sight. Redwood’s management has equal measures of integrity, resolve and experience; if anyone can safely navigate these waters, we like their chances. The team has taken several difficult, decisive steps to shore up liquidity, and we think they have invested (and marked) with appropriate conservatism. The potential upside case is clear, yet we also cannot be sure that this unprecedented disruption will not further impair their business. More to follow next quarter.
For the year ending March 31, 2020, Microsoft, Charter Communications and Marvell Technology (sold last year) were the largest contributors. In addition to Redwood Trust, detractors included Charles Schwab and Diageo plc. Our collective stock portfolio held up far better than the broader equity markets due to our ‘up-in-quality’ positioning. Our bond portfolio delivered positive returns across government, corporate and securitized holdings. While absolute returns were ho-hum, it was another strong year relative to our conservative allocation peers.
As volatility ramped up in March, we got busy. Drawing on excellent work from our equity research team, we bought new positions in S&P Global (ratings, benchmarks and analytics) and a trio of high-quality industrials (IDEX, Fortive and Honeywell). This intentional, active rebalancing into equities is a valuable feature of the strategy. In effect, we are natural buyers at lower prices when stocks fall. We also reshaped our materials exposure by adding to Vulcan Materials, trimming Linde plc and selling Axalta Coating Systems. In our view, aggregates companies have the best risk-adjusted outlook in the materials sector.
In the bond market, spreads widened and so did the opportunity set. Our fixed income teammates unearthed value across the spectrum. We added corporate bonds (AutoZone and Berkshire Hathaway) and a diverse basket of very high credit quality securitized assets. Our approach has been deliberate and measured, with an emphasis on sleep-well-at-night assets. We do not have any high yield exposure, though our mindset on credit has shifted from a “buyers strike” to looking for the right strikes at which to swing. While we have focused on safety and soundness to date, we are also keenly aware that ballast at one price can become an anchor at another. By the time our Treasury securities mature, if not sooner, we are likely to redeploy proceeds in better yielding alternatives that pass our risk filters.
In our view, the Fund remains well positioned to achieve our three investment objectives: long-term capital appreciation, capital preservation and current income. We own equity stakes in 28 companies representing 40.6% of net assets. Fixed income holdings include corporate bonds (8.6%), securitized debt (12.7%), Treasury securities (36.6%) and cash equivalents (1.5%). The sell-off in the first quarter has brought prices of securities to more attractive levels, considerably improving the long-run return outlook, and we have capacity to lean even more into new opportunities as our team uncovers them.
Gratitude provides solace when the world is turned upside down. In these trying times, we are especially grateful for our investors for placing their trust in us and allowing us to steward their assets.
Definitions: Investment Grade Bonds are those securities rated at least BBB- by one or more credit ratings agencies. Non-Investment Grade Bonds are those securities (commonly referred to as “high yield” or “junk” bonds) rated below BBB- by two or more credit ratings agencies.
Q1 2020 Annual Report 27
| | | | | | | | | | |
| Returns | | | | | | | | | |
| | | | Annualized
| | |
| | | | | | | Since Fund | | |
| | | | | | | Inception | Net | Gross |
| QTD | YTD | 1 YR | 3 YR | 5 YR | 10 YR | (10/1/2003) | Expense | Expense |
| WBALX - Investor Class | (7.95)% | (7.95)% | 0.35% | 4.49% | 3.77% | 6.01% | 5.20% | 0.85% | 1.30% |
| WBAIX - Institutional Class | (7.89) | (7.89) | 0.45 | 4.53 | 3.79 | 6.02 | 5.21 | 0.70 | 0.97 |
| Moderately Conservative | (8.16) | (8.16) | (0.81) | 3.40 | 3.56 | 5.11 | 5.51 | | |
| | | |
| 30-Day SEC Yield | | |
Share Class | Subsidized | Unsubsidized |
Investor | 0.46% | 0.14% |
Institutional | 0.61 | 0.32 |
| | |
| Industry Breakdown | |
| % of Net Assets |
Information Technology | 11.5 |
Financials | 10.1 |
Health Care | 5.3 |
Communication Services | 4.9 |
Materials | 4.3 |
Industrials | 3.2 |
Consumer Staples | 1.3 |
Total Common Stocks | 40.6 |
U.S. Treasury Notes | 36.6 |
Corporate Bonds | 8.6 |
Mortgage-Backed Securities | 6.5 |
Asset-Backed Securities | 5.8 |
Commercial Mortgage-Backed Securities | 0.4 |
Cash Equivalents/Other | 1.5 |
Total Bonds & Cash Equivalents | 59.4 |
| 100.0 |
| | |
| Top 10 Stock Holdings | |
| % of Net Assets |
Berkshire Hathaway Inc. - Class B | 2.5 |
Thermo Fisher Scientific Inc. | 2.1 |
Microsoft Corp. | 2.1 |
Alphabet, Inc. - Class C | 1.9 |
Vulcan Materials Co. | 1.8 |
Visa Inc. - Class A | 1.8 |
Charter Communications, Inc. - Class A | 1.8 |
Mastercard Inc. - Class A | 1.7 |
Aon plc - Class A | 1.7 |
Laboratory Corp. of America Holdings | 1.6 |
| 19.0 |
| | | | |
| Top Stock Performers | | | |
| | Average | |
| Return | Weight | Contribution |
S&P Global Inc. | (10.0)% | 0.2% | 0.13% |
IDEX Corp. | (19.5) | 0.2 | 0.03 |
Microsoft Corp. | 0.3 | 2.1 | 0.01 |
| | | | |
| Bottom Stock Performers | | | |
| | Average | |
| Return | Weight | Contribution |
Redwood Trust, Inc. | (68.6)% | 1.3% | (1.10)% |
JPMorgan Chase & Co. | (35.0) | 1.7 | (0.63) |
Berkshire Hathaway Inc. - Class B | (19.3) | 2.6 | (0.51) |
Laboratory Corp. of America Holdings | (25.3) | 1.8 | (0.50) |
The Charles Schwab Corp. | (29.0) | 1.6 | (0.48) |
| | |
| Fixed Income Attributes | |
Portfolio Summary | |
Average Maturity | 1.7 years |
Average Effective Maturity | 1.7 years |
Average Duration | 1.6 years |
Average Effective Duration | 1.6 years |
Average Coupon | 2.2% |
| | |
| Credit Quality | |
Underlying Securities | % of Bond Portfolio |
U.S. Treasury | 61.9 |
U.S. Government Agency Mortgage | |
Related Securities | 7.0 |
AAA | 10.8 |
AA | 2.4 |
A | 7.8 |
BBB | 8.2 |
Cash Equivalents | 1.9 |
| 100.0 |
Data quoted is past performance and current performance may be lower or higher. Past performance is no guarantee of future results. Investment return and principal value of an investment will fluctuate, and shares, when redeemed, may be worth more or less than their original cost. All investments involve risks, including possible loss of principal. Please visit weitzinvestments.com for the most recent month-end performance.
Investment results reflect applicable fees and expenses and assume all distributions are reinvested but do not reflect the deduction of taxes an investor would pay on distributions or share redemptions. Net and Gross Expense Ratios are as of the Fund’s most recent prospectus. The Fund has entered into fee waiver and/or expense reimbursement arrangements with the Investment Advisor. The Advisor has contractually agreed to waive a portion of the Advisor’s fee and reimburse certain expenses (excluding taxes, interest, brokerage costs, acquired fund fees and expenses and extraordinary expenses) to limit the total annual fund operating expenses of the Class’s average daily net assets through 07/31/2020. The Net Expense Ratio reflects the total annual fund operating expenses of the Fund after taking into account any such fee waiver and/or expense reimbursement, if any; total returns would have been lower had there been no waivers or reimbursements.
See page 8 for additional performance disclosures. See page 81 for a description of all indices.
The Fund receives credit quality ratings on portfolio securities when available from credit rating agencies. The Fund itself has not been rated by a credit rating agency. Ratings and portfolio credit quality may change over time. A security is “investment grade” when it has received a credit quality rating of at least BBB. If a security has received different ratings from more than one rating agency, then the highest rating is used. Mortgage related securities issued and guaranteed by government sponsored agencies such as Fannie Mae and Freddie Mac are generally not rated by rating agencies. Securities which are not rated do not necessarily indicate low quality. Fannie Mae’s and Freddie Mac’s senior long-term debt are currently rating Aaa and AAA by Moody’s and Fitch, respectively.
Contributions to Fund performance are based on actual daily holdings. Securities may have been bought or sold during the quarter. Return shown is the actual quarterly return of the security or combination of share classes.
Source (Fixed Income Attributes, Credit Quality, and Maturity Distribution): Bloomberg Analytics
Source (Top Performers, Bottom Performers): FactSet Analytics
28 Q1 2020 Annual Report
Portfolio Managers: Tom Carney, CFA & Nolan Anderson
Investment Style: Intermediate-Term Bond
Core Plus Income Fund’s Institutional Class returned -2.99% for the quarter compared to a +3.15% return for the Bloomberg Barclays U.S. Aggregate Bond Index, the Fund’s primary benchmark. For the year ending March 31, 2020, the Fund’s Institutional Class returned +1.56% compared to a +8.93% return for the benchmark. The dramatic repricing of credit risk during the year’s first quarter is the principal reason for the Fund lagging in performance. A significant portion (approximately 73%) of the benchmark is comprised of Treasury and federal agency or federal agency mortgage-backed securities compared to the Fund weighting of nearly 20%.
We do not enjoy experiencing negative returns, particularly when we thought overall positioning was tilted more toward defense than offense. Yet, temporary setbacks inevitably occur, and they often set the stage for better days ahead. An example of that is the Fund’s overall yield-to-worst (YTW) of 6.6% at quarter-end. This YTW is an all-time high, and the new investments that we’ve added to the portfolios have meaningfully improved our forward return profile. Overall, we like what we own, and our YTW at quarter end compares quite favorably with the benchmark’s YTW of 1.6%.
Gently rising stock and bond prices at the beginning of the year increasingly became unnerved as evidence grew that COVID-19 would not abide by any national or continental border. Then on March 8, Saudi Arabia and Russia initiated an oil price war that started the biggest decline of oil prices in modern times. The result was dislocations in both the stock and bond markets which hadn’t occurred since the Great Financial Crisis of 2008-2009. Markets arguably seized up, particularly fixed-income markets, with price discovery becoming challenging. Clearing prices for those who had to sell certain types of investments were frequently at significant discounts. At Weitz, we are pleased to report that we did not have to sell any investments at what we considered to be an unwanted and unwarranted discount, although we have experienced meaningful (unrealized) markdowns on fixed-income securities we own due to others having to sell them at markdowns.
Portfolio Positioning
The table below shows the change in allocation to various sectors, from Q4 2019 to Q1 2020 and from March 31, 2019, to March 31, 2020. This summary shows how we have allocated capital over time. Since our goal is to seek to invest in sectors that we believe offer the best risk-adjusted returns, our allocations may change significantly quarter over quarter and year over year.
| | | | | | |
| | | Qtr Over | | |
| | | Qtr | | Yr Over Yr |
| | | Change | | Change |
| Sector (% of Net Assets) | 3/31/2020 | 12/31/2019
| (bps) | 3/31/19 | (bps) |
| Corporate Bonds | 35.0 | 24.9 | +1010 | 25.8 | +920 |
| Corporate Convertible Bonds | 1.2 | 1.5 | -30 | 1.5 | -30 |
| Asset-Backed Securities (ABS) | 28.8 | 30.0 | -120 | 22.5 | +630 |
| Commercial Mortgage-Backed | | | | | |
| Securities (CMBS) | 11.0 | 10.0 | +100 | 8.0 | +300 |
| Agency Mortgage-Backed (MBS) | 1.6 | 1.6 | 0 | 1.4 | +20 |
| Non-Agency Mortgage Backed | | | | | |
| (RMBS) | 2.6 | 2.9 | -30 | 1.9 | +70 |
| Taxable Municipal Bonds | 0.4 | 0.4 | 0 | 0.5 | -10 |
| U.S. Treasury | 18.1 | 24.5 | -640 | 29.8 | -1170 |
| Common Stock | 0.1 | 0.2 | -10 | 0.3 | -20 |
| Cash & Equivalents | 1.2 | 4.0 | -280 | 8.3 | -710 |
| Total | 100.0 | 100.0 | | 100.0 | |
| High Yield+ | 12.5 | 8.0 | 4500 | 13.0 | -50 |
|
| Effective duration (years) | 4.6 | 4.0 | +0.6 | 4.6 | 0.0 |
| Effective maturity (years) | 5.8 | 4.9 | +0.9 | 5.8 | 0.0 |
| + High-Yield exposure (as of 3/31/2020) consists of investments in the Corporate, Corporate Convertible, ABS and CMBS sectors. |
Last quarter, we significantly increased our corporate bond exposure by over 10% of the Fund’s net assets. We funded the majority of these investments with maturity proceeds from U.S. Treasuries. A significant widening in credit spreads drove the shift in capital allocation. On a year-over-year basis, our Treasury portfolio has shrunk from 30% of Fund assets to less than 20%. While U.S. Treasuries provide historically low nominal yields, they nonetheless provide portfolio diversification and risk management benefits, which we believe are prudent during these unprecedented economic times.
As of March 31, 2020, our high-yield exposure was 12.5%, up from 8.0% as of December 31, 2019. We took advantage of significant spread widening during the quarter, and we maintain ample capacity to take advantage of further bouts of market volatility.
Overall portfolio metrics as measured by average effective maturity and average effective duration changed moderately in the first quarter. The average effective maturity increased to 5.8 years from 4.9 years, and the average effective duration increased to 4.6 years from 4.0 years (versus 5.7 years for the Bloomberg Barclays U.S. Agg on March 31, 2020). These measures provide a guide to the Fund’s interest rate sensitivity. A lower average effective maturity and shorter average effective duration reduce the Fund’s price sensitivity to changes in interest rates (either up or down).
Top Quarterly Contributors
Sector allocation and security selection were the key drivers of performance.
| • | U.S. Treasury Bonds: Our U.S. Treasury holdings were the primary contributor to fund performance during the quarter. While our Treasury weighting declined throughout the quarter, the increase in average duration to over 13 years aided performance as long-term interest rates declined precipitously. |
Q1 2020 Annual Report 29
| • | Agency Mortgage-Backed Securities (MBS): MBS contributed modestly to results in the quarter as strong coupon income was nearly offset by overall spread widening. |
Top Quarterly Detractors
| • | Corporate Bonds: Poor corporate bond sector and security selection was the most significant driver of our relative underperformance, especially in high yield securities. While no sector was spared, our energy holdings significantly underperformed, followed by travel and leisure exposure. With regard to energy, we note the unprecedented stress facing the sector and the present oil price collapse. We entered 2020 with energy exposure of less than 4%. Our holdings consisted primarily of midstream oriented credits, including investment grade companies Energy Transfer, MPLX and Plains All American. However, our largest midstream holding was NGL Energy Partners, a high yield credit that recently completed a significant business transformation that we viewed as credit positive. In short, the company sold seasonal and more volatile cash flowing assets for more stable, fee-based assets. However, it did so employing leverage and, in hindsight, the timing couldn’t have been worse. While NGL now owns the largest and only fully integrated water solutions system in the Northern Delaware basin, it faces the very real prospect of declining volumes across its system. Positively, the assets are 100% backed by large independent and integrated investment grade producers, including a valuable long-term contract with Exxon. The company has no bond maturities until November 2023. We expect the company to cut costs, minimize new investments and eliminate its distribution to pay down debt. We added to our position as bond prices declined significantly during the quarter. |
Given the significant widening in energy spreads, we added new exploration & production (E&P) and midstream credits to the portfolio. Our new E&P investments primarily consist of investment grade producers Concho Resources, Diamondback Energy, Parsley Energy and WPX Energy. These four companies all have strong management teams, maintain conservative balance sheets, are among the lowest cost operators, and consistently use hedges to help protect cash flows from extreme commodity price movements. All of the companies are expected to generate positive free cash flow in 2020 due to expected hedging gains. In addition, they are cutting costs as quickly as possible while reducing drilling activity. We believe all four E&P’s will exit 2020 with <2x leverage at $25-30 oil. They also maintain ample borrowing base capacity and have minimal debt maturities over the next few years.
In midstream, we purchased longer duration bonds in investment grade companies Enterprise Product Partners and MPLX. While not immune from the significant decline in energy prices, both companies have very large asset footprints and relatively stable cash flow streams that we believe will help them manage through the downturn. To sum it up, our total energy allocation was below 10% at quarter end. We will continue our portfolio due diligence throughout this sector.
| • | Commercial Mortgage-Backed Securities (CMBS): CMBS was the second largest detractor to performance. Given the decade plus commercial real estate cycle heading into this downturn, our investments were underwritten with defaults and losses in mind. However, we understand this is a unique downturn, and no one can predict its magnitude and duration. After speaking with some of our sponsors and re-underwriting our investments, we continue to feel good about our current portfolio. All of our investments have an average life of less than three years and have significant credit support. We will be vigilant with our monthly credit surveillance as we monitor all aspects of each securitization that we own. Maintaining our portfolio diligence is key to our ongoing portfolio management and enables us to selectively take advantage of future investment opportunities. |
| • | Asset Backed Securities (ABS): About a year ago, as we noticed that risks in the corporate bond market had been growing for some time, we thought the environment was well suited for building a diversified, high-quality, low-duration portfolio of ABS. So, we did. Over the past year, we continued to increase our ABS exposure to almost 30% of the portfolio. Consumer ABS led the way, as most measures of overall consumer health were as strong as ever heading into this crisis. As the crisis unfolded, along with the unprecedented and abrupt stop to almost all consumer and business activity on a national scale, the resulting bond spread widening across the credit markets has caused our ABS holdings to suffer unrealized markdowns. For the time being, the government may be the largest driver of consumption by providing direct support to consumers as well as a safety net for small businesses that are being negatively impacted. While a large fiscal stimulus is a very positive development, it is too early to know who will receive what amount of money, when it will be spent, and how it will be used. |
Despite increased credit and liquidity risks, we believe our ABS portfolio overall remains well protected from permanent loss of capital. Our portfolio is well diversified across sectors, has an overall duration of 1.3 years, and is high quality. In addition, issuer concentration is limited, with only one issuer representing more than 2% exposure. As is the case with our CMBS portfolio, we continue to maintain our customary portfolio due diligence in this sector.
| • | Corporate Convertible Bonds and Common Stock: Corporate convertible bonds and common stock (issued by long-time holding Redwood Trust) were the largest detractors to results in the quarter. Redwood’s principal business, the non-agency mortgage market, came under tremendous duress in the first quarter, and we believe the initial shock was more about liquidity than solvency. Extreme volatility in loan portfolio pricing stemming from the COVID-19 pandemic has pressured the company’s (and the overall sector’s) funding model, with no relief from government intervention in sight. Redwood’s management has equal measures of integrity, resolve and experience; if anyone can safely navigate these waters, we like their chances. The Redwood team has taken several difficult, decisive steps to shore up liquidity, and we think they have invested (and marked) with appropriate conservatism. The |
30 Q1 2020 Annual Report
potential upside case is clear, yet we also cannot be sure that this unprecedented disruption will not further impair their business. More to follow next quarter.
Outlook - what a difference a month can make
In several of our previous quarterly correspondence pieces, we had bemoaned the lack of favorable risk/reward opportunities to deploy capital on behalf of our shareholders (see the “price is what you pay – value is what you receive” section in our 2019 year-end Fixed Income Insights on our website.) And as the second month of the new year was ending, we had considered penning a commentary about how poor forward returns appeared at the time. Well, March came crashing upon all of us as rising fear about the coronavirus invasion turned markets into what seemed a version of Rod Serling’s Twilight Zone (specifically 1960’s The Monsters are Due on Maple Street, in which mysterious, frightening events suddenly turn a neighborhood upside down). The financial markets became unnerved and increasingly fearful.
The result has been a rapid repricing of credit risk that has meaningfully and favorably shifted the risk/reward relationship going forward. At quarter-end, the forward returns (as measured by YTW) for our fixed-income portfolios are at levels they have not been at in many years. We believe this is a solid starting place.
In our fixed income investments, we strive to (a) preserve capital, (b) maintain a strong liquidity position, (c) understand evolving risks and opportunities, (d) selectively take advantage of favorable risk/reward opportunities, and (e) conduct consistent/thorough research and credit surveillance.
Rest assured that we remain ready to take advantage of any further risk/reward opportunities that may develop, and we strive to remain your trusted partner.
Definitions: Investment grade bonds are those securities rated at least BBB- by one or more credit ratings agencies. Non-investment grade bonds are those securities (commonly referred to as “high yield” or “junk” bonds) rated below BBB- by two or more credit ratings agencies. Yield-to-worst (YTW) is the lowest potential yield that can be received on a bond portfolio without the issuers actually defaulting.
Q1 2020 Annual Report 31
| | | | | | | | | |
| Returns | | | | | | | | |
| | | | Annualized
| | |
| | | | | | Since Fund | | |
| | | | | | Inception | Net | Gross |
| QTD | YTD | 1 YR | 3 YR | 5 YR | (7/31/2014) | Expense | Expense |
| WCPNX - Investor Class | (3.12)% | (3.12)% | 1.38% | 2.44% | 2.70% | 2.89% | 0.50% | 1.42% |
| WCPBX - Institutional Class | (2.99) | (2.99) | 1.56 | 2.67 | 2.93 | 3.11 | 0.40 | 0.96 |
| Bloomberg Barclays U.S. Aggregate Bond | 3.15 | 3.15 | 8.93 | 4.82 | 3.35 | 3.65 | | |
| | | |
| 30-Day SEC Yield | | |
Share Class | Subsidized | Unsubsidized |
Investor | 3.40% | 2.81% |
Institutional | 3.50 | 3.18 |
| | |
| Fixed Income Attributes | |
Portfolio Summary | |
| Average Maturity | 5.9 years |
| Average Effective Maturity | 5.8 years |
| Average Duration | 4.7 years |
| Average Effective Duration | 4.6 years |
| Average Coupon | 3.6% |
| | |
| Maturity Distribution | |
Maturity Type | % of Portfolio |
| Cash Equivalents | 0.6 |
| Less than 1 Year | 21.3 |
| 1 - 3 Years | 29.6 |
| 3 - 5 Years | 13.1 |
| 5 - 7 Years | 13.3 |
| 7 - 10 Years | 9.7 |
| 10 - 20 Years | 2.9 |
| 20 Years or more | 9.4 |
Common Stocks | 0.1 |
| | 100.0 |
| | |
| Credit Quality | |
Underlying Securities | % of Portfolio |
| U.S. Treasury | 18.2 |
| U.S. Government Agency Mortgage | |
| Related Securities | 1.6 |
| AAA | 6.8 |
| AA | 9.4 |
| A | 14.8 |
| BBB | 35.8 |
| BB | 6.5 |
| B | 4.6 |
| CCC | 0.4 |
| Non-Rated | 1.2 |
| Common Stocks | 0.1 |
Cash Equivalents | 0.6 |
| | 100.0 |
Data quoted is past performance and current performance may be lower or higher. Past performance is no guarantee of future results. Investment return and principal value of an investment will fluctuate, and shares, when redeemed, may be worth more or less than their original cost. All investments involve risks, including possible loss of principal. Please visit weitzinvestments.com for the most recent month-end performance.
Investment results reflect applicable fees and expenses and assume all distributions are reinvested but do not reflect the deduction of taxes an investor would pay on distributions or share redemptions. Net and Gross Expense Ratios are as of the Fund’s most recent prospectus. The Fund has entered into fee waiver and/or expense reimbursement arrangements with the Investment Advisor. The Advisor has contractually agreed to waive a portion of the Advisor’s fee and reimburse certain expenses (excluding taxes, interest, brokerage costs, acquired fund fees and expenses and extraordinary expenses) to limit the total annual fund operating expenses of the Class’s average daily net assets through 07/31/2020. The Net Expense Ratio reflects the total annual fund operating expenses of the Fund after taking into account any such fee waiver and/or expense reimbursement, if any; total returns would have been lower had there been no waivers or reimbursements.
See page 8 for additional performance disclosures. See page 81 for a description of all indices.
The Fund receives credit quality ratings on portfolio securities when available from credit rating agencies. The Fund itself has not been rated by a credit rating agency. Ratings and portfolio credit quality may change over time. A security is “investment grade” when it has received a credit quality rating of at least BBB. If a security has received different ratings from more than one rating agency, then the highest rating is used. Mortgage related securities issued and guaranteed by government sponsored agencies such as Fannie Mae and Freddie Mac are generally not rated by rating agencies. Securities which are not rated do not necessarily indicate low quality. Fannie Mae’s and Freddie Mac’s senior long-term debt are currently rating Aaa and AAA by Moody’s and Fitch, respectively.
Source (Fixed Income Attributes, Credit Quality, and Maturity Distribution): Bloomberg Analytics
32 Q1 2020 Annual Report
NEBRASKA TAX-FREE INCOME FUND
Portfolio Manager: Tom Carney, CFA
Investment Style: Municipal-State Bond
The Nebraska Tax-Free Income Fund returned +0.38% in the first quarter of 2020 compared to a -1.04% return for the Bloomberg Barclays 5-Year Municipal Bond Index, the Fund’s primary benchmark. For the year ending March 31, 2020, the Fund’s total return was +2.55% compared to a +2.19% return for the benchmark.
Overview
The municipal bond market experienced historic volatility in the month of March, completely disconnecting from the traditional “flight to quality” it often enjoys alongside U.S. Treasuries. An overall flight to cash across all financial markets and growing credit concerns surrounding state and local governments’ ability to weather negative economic implications associated with the COVID-19 pandemic led to lower prices and higher yields across all sectors of the municipal bond marketplace. Municipal bonds meaningfully underperformed Treasuries for the quarter as yield ratios of municipal bonds relative to comparable U.S. Treasuries moved higher. For example, the ratio of the 5-year AAA-rated municipal bond to the 5-year Treasury increased from 67% to 307% during the quarter (at one point in March, the ratio was as high as 650%). To have municipal bond yields exceed Treasury yields is unusual at any time. But to do so on the order of magnitude experienced in 2020’s first quarter is completely unprecedented. For additional perspective, this ratio never exceeded 240% during the Great Financial Crisis of 2008-2009. This ratio remains a reasonably useful tool in measuring the relative attractiveness of tax-free municipal bonds compared to U.S. Treasury bonds. All else equal, the higher the ratio of municipal bond yields to U.S. Treasury yields, the more appealing municipal bonds become, given their tax-advantaged status. This ratio went from one of its lowest readings at the beginning of 2020 to its highest ever.
For more on our views regarding the fixed-income and equity markets in general, please read our quarterly Fixed Income Insights and Value Matters.
Top Quarterly Contributors
All sectors contributed positive results in the quarter. Leading segments included:
| • | Combined utility revenue bonds issued by Lincoln Nebraska Electric System, Municipal Energy System of Nebraska, and Omaha Nebraska Metropolitan Utilities District |
| • | School district general obligation bonds issued by Sarpy County Nebraska Bellevue School District, Douglas County Nebraska Omaha School District, and Cass County Nebraska Weeping Water Public Schools |
| • | Electricity and public power revenue bonds issued by Nebraska Public Power District, Omaha Public Power District, and Public Power Generation Agency of Nebraska |
| • | Hospital revenue bonds issued by Nebraska Medicine and Madonna Rehabilitation Hospital |
| • | General revenue bonds issued by Boys Town Village |
| • | Lease revenue bonds issued by Omaha Nebraska Public Facilities Corporation and the state of Nebraska |
| • | Higher education revenue bonds issued by University of Nebraska (Kearney Student Housing Project), Nebraska State College |
| • | Facilities Corporation, University of Nebraska-Lincoln Water and sewer revenue bonds issued by Omaha Nebraska Sanitary Sewer District |
Top Quarterly Detractors
| • | Airport revenue bonds issued by Austin, Texas; Port of Seattle, Washington; and San Diego, California. |
For the year ending March 31, 2020, all segments contributed positively to Fund results.
Turning to portfolio metrics, both the average effective duration and the average effective maturity of the Fund were unchanged in the quarter at 3.4 years each. Overall asset quality remains high, with approximately 83% rated A or better by one or more nationally recognized statistical rating organizations. Additional details regarding the breakdown of our holdings are on the next page. Our investments may be broad, but our philosophy is the same: we strive to own only those investments we believe compensate us for the incremental credit risk. Our overall goal is to invest in a portfolio of bonds of varying maturities that we believe offer attractive risk-adjusted returns, taking into consideration the general level of interest rates and the credit quality of each investment.
Q1 2020 Annual Report 33
| | | | | | | | | | | |
| Returns | | | | Annualized
| | |
| | | | | | | | Since Fund | | |
| | | | | | | | Inception | Net | Gross |
| QTD | YTD | 1 YR | 3 YR | 5 YR | 10 YR | 20 YR | (10/01/1985) | Expense | Expense |
| WNTFX | 0.38% | 0.38% | 2.55% | 1.97% | 1.31% | 1.89% | 3.21% | 4.45% | 0.45% | 0.89% |
| 5-Year Municipal Bond | (1.04) | (1.04) | 2.19 | 2.41 | 2.07 | 2.75 | 3.97 | N/A | | |
| | | |
| 30-Day SEC Yield | |
| Subsidized | Unsubsidized |
| | 1.19% | 0.65% |
| | |
| Fixed Income Attributes | |
Portfolio Summary | |
| Average Maturity | 5.7 years |
| Average Effective Maturity | 3.4 years |
| Average Duration | 3.1 years |
| Average Effective Duration | 3.4 years |
| Average Coupon | 3.5% |
| Municipals exempt from federal and | |
| Nebraska income taxes | 91.6% |
| Municipals subject to alternative | |
| minimum tax | 4.4% |
| | |
| Maturity Distribution | |
Maturity Type | % of Portfolio |
| Cash Equivalents | 4.3 |
| Less than 1 Year | 13.9 |
| 1 - 3 Years | 38.7 |
| 3 - 5 Years | 11.5 |
| 5 - 7 Years | 22.1 |
7 - 10 Years | 9.5 |
| | 100.0 |
| | |
| Sector Breakdown | |
| % of Net Assets |
| Power | 18.2 |
| Hospital | 10.6 |
| Certificates of Participation | 8.8 |
| General | 6.6 |
| Lease | 5.9 |
| Higher Education | 5.5 |
| Water/Sewer | 5.3 |
| Airport/Transportation | 2.8 |
Housing | 1.1 |
Total Revenue | 64.8 |
| School District | 10.1 |
| City/Subdivision | 6.5 |
| County | 3.3 |
Natural Resource District | 0.6 |
Total General Obligation | 20.5 |
| Escrow/Pre-Refunded | 9.4 |
Cash Equivalents/Other | 5.3 |
| | 100.0 |
| | |
| State Breakdown | |
| % of Net Assets |
| Nebraska | 91.6 |
| Texas | 0.9 |
| Washington | 0.8 |
| California | 0.7 |
| Arizona | 0.4 |
| Colorado | 0.3 |
Cash Equivalents/Other | 5.3 |
| | 100.0 |
| | |
| Credit Quality | |
Underlying Securities | % of Portfolio |
| AAA | 4.2 |
| AA | 55.3 |
| A | 23.6 |
| BBB | 2.5 |
| Non-Rated | 10.1 |
Cash Equivalents | 4.3 |
| | 100.0 |
Data quoted is past performance and current performance may be lower or higher. Past performance is no guarantee of future results. Investment return and principal value of an investment will fluctuate, and shares, when redeemed, may be worth more or less than their original cost. All investments involve risks, including possible loss of principal. Please visit weitzinvestments.com for the most recent month-end performance.
Investment results reflect applicable fees and expenses and assume all distributions are reinvested but do not reflect the deduction of taxes an investor would pay on distributions or share redemptions. Net and Gross Expense Ratios are as of the Fund’s most recent prospectus. The Fund has entered into fee waiver and/or expense reimbursement arrangements with the Investment Advisor. The Advisor has contractually agreed to waive a portion of the Advisor’s fee and reimburse certain expenses (excluding taxes, interest, brokerage costs, acquired fund fees and expenses and extraordinary expenses) to limit the total annual fund operating expenses of the Class’s average daily net assets through 07/31/2020. The Net Expense Ratio reflects the total annual fund operating expenses of the Fund after taking into account any such fee waiver and/or expense reimbursement, if any; total returns would have been lower had there been no waivers or reimbursements.
See page 8 for additional performance disclosures. See page 81 for a description of all indices.
The Fund receives credit quality ratings on portfolio securities when available from credit rating agencies. The Fund itself has not been rated by a credit rating agency. Ratings and portfolio credit quality may change over time. A security is “investment grade” when it has received a credit quality rating of at least BBB. If a security has received different ratings from more than one rating agency, then the highest rating is used.
Source (Fixed Income Attributes, Credit Quality, and Maturity Distribution): Bloomberg Analytics
34 Q1 2020 Annual Report
SHORT DURATION INCOME FUND
Portfolio Managers: Tom Carney, CFA & Nolan Anderson
Investment Style: Short-Term Bond
The Short Duration Income Fund’s Institutional Class returned -2.15% in the first quarter of 2020 compared to a +1.79% return for the Bloomberg Barclays 1-3 Year U.S. Aggregate Index (Bloomberg Barclays U.S. Agg 1-3), our Fund’s primary benchmark. For the year ending March 31, 2020, the Short Duration Income Fund’s Institutional Class returned +0.44% compared to a +4.63% return for the benchmark. The dramatic repricing of credit risk during the year’s first quarter is the principal reason for the Fund lagging its primary benchmark. A significant portion (more than 75%) of the benchmark is comprised of Treasury and federal agency or federal agency mortgage-backed securities compared to the Fund weighting of 32.7%.
We do not enjoy experiencing negative returns, even for short windows of time. Yet, temporary setbacks inevitably occur, and they often set the stage for better days ahead. An example of that is the Fund’s overall yield-to-worst (YTW) of 4.2% at quarter end. This YTW is at a multi-year high, and the new investments we’ve added to the portfolios have meaningfully improved our forward return profile. Overall, we like what we own and our YTW at quarter end compares quite favorably with the benchmark’s YTW of 0.97%.
Gently rising stock and bond prices at the beginning of the year increasingly became unnerved as evidence grew that COVID-19 would not abide by any national or continental border. Then on March 8, Saudi Arabia and Russia initiated an oil price war that started the biggest decline of oil prices in modern times. The result was dislocations in both the stock and bond markets which hadn’t occurred since the Great Financial Crisis of 2008-2009. Markets arguably seized up, particularly fixed-income markets, with price discovery becoming challenging. Clearing prices for those who had to sell certain types of investments were frequently at significant discounts. At Weitz, we are pleased to report that we did not have to sell any investments at what we considered to be an unwanted and unwarranted discount, although we have experienced meaningful (unrealized) markdowns on fixed-income securities we own due to others having to sell them at markdowns.
Portfolio Positioning
The table below shows the change in allocation to various sectors from Q4 2019 to Q1 2020 and from March 31, 2019, to March 31, 2020. This summary shows how we have allocated capital over time. Since our goal is to invest in sectors that we believe offer the best risk-adjusted returns, our allocations may change significantly quarter over quarter and year over year.
| | | | | | |
| | | Qtr Over | | |
| | | Qtr | | Yr Over Yr |
| | | Change | | Change |
| Sector (% Net Assets) | 3/31/2020
| 12/31/2019
| (bps) | 3/31/2019 | (bps) |
| Corporate Bonds | 20.2 | 19.6 | +60 | 35.6 | -1540 |
| Corporate Convertible Bonds | 1.8 | 2.4 | -60 | 3.4 | -160 |
| Asset-Backed Securities (ABS) | 28.5 | 23.7 | +480 | 14.5 | +1400 |
| Commercial Mortgage-Backed | | | | | |
| Securities (CMBS) | 6.0 | 4.5 | +150 | 3.2 | +280 |
| Agency Mortgage-Backed (MBS) | 14.5 | 12.7 | +180 | 11.7 | +280 |
| Non-Agency Mortgage Backed | | | | | |
| (RMBS) | 9.4 | 8.8 | +60 | 5.3 | +410 |
| Taxable Municipal Bonds | 0.2 | 0.2 | 0 | 0.2 | 0 |
| U.S. Treasury | 18.2 | 25.5 | -730 | 25.1 | -690 |
| Common Stocks | 0.3 | 0.6 | -30 | 0.5 | -20 |
| Cash & Equivalents | 0.9 | 2.0 | -110 | 0.5 | +40 |
| Total | 100.0 | 100.0 | | 100.0 | |
| High Yield+ | 4.5 | 4.3 | +20 | 7.9 | -340 |
|
| Effective duration (years) | 1.6 | 1.6 | 0.0 | 1.7 | -0.1 |
| Effective maturity (years) | 1.8 | 1.7 | +0.1 | 1.9 | -0.1 |
| + High-Yield exposure (as of 3/31/2020) consists of investments in the Corporate, Corporate Convertible, ABS and CMBS sectors. |
Last quarter, we continued to increase our exposure to shorter-duration (1-2 year) securitized products, including automobile, consumer and equipment asset-backed securities. Agency and non-agency mortgage backed (RMBS) securities also increased.
Our allocation to corporate bonds increased for the first time in several quarters as we selectively took advantage of widening spreads (lower prices) to add to, or initiate, positions.
Overall portfolio metrics as measured by average maturity and average effective duration changed modestly compared to the previous quarter. The average effective maturity increased to 1.8 years from 1.7 years, and the average effective duration was unchanged at 1.6 years. These measures provide a guide to the Fund’s interest rate sensitivity. A lower average effective maturity and shorter average effective duration reduce the Fund’s price sensitivity to changes in interest rates (either up or down).
Top Quarterly Contributors
| • | U.S. Treasury bonds performed well in the quarter as coupon income more than offset modest (unrealized) price declines as interest rates rose. |
| • | Agency mortgage-backed securities (MBS) contributed modestly to results in the quarter as strong coupon income was nearly offset by overall spread widening. |
Top Quarterly Detractors
| • | Corporate convertible bonds and common stock (issued by long-time holding Redwood Trust) were the largest detractors to results in the quarter. Redwood’s principal business, the non-agency mortgage market, came under tremendous duress in the first quarter, and we believe the initial shock was more about liquidity than solvency. Extreme volatility in loan portfolio pricing stemming from the COVID-19 pandemic has pressured the company’s (and the overall industry’s) funding model, with no relief from government intervention in sight. Redwood’s management has equal measures of integrity, resolve and experience; |
Q1 2020 Annual Report 35
if anyone can safely navigate these waters, we like their chances. The Redwood team has taken several difficult, decisive steps to shore up liquidity, and we think they have invested (and marked) with appropriate conservatism. The potential upside case is clear, yet we also cannot be sure that this unprecedented disruption will not further impair their business. More to follow next quarter.
| • | Corporate bonds, overall, detracted from results in the quarter due to widening credit spreads resulting in price declines. Primary detractors included bonds in the energy and leisure-related industries. |
| • | Securitized products (principally ABS, CMBS and RMBS) also detracted from results as investors fled nearly every fixed income segment that wasn’t backed by the full, faith and credit of the U.S. government. Please see the ABS update segment below for further details on the Fund’s investments. |
One-year results for the Fund were positive overall with contributors and detractors principally consisting of the same segments as those mentioned above.
Asset-Backed Securities Update
About a year ago, as we noticed that risks in the corporate bond market had been growing for some time, we thought the environment was well suited for building a diversified, high-quality, low-duration portfolio of ABS. So, we did. Over the past year, we roughly doubled our ABS exposure to almost 30% of the portfolio. Consumer ABS led the way, as most measures of overall consumer health were as strong as ever heading into this crisis. As the crisis unfolded, along with the unprecedented and abrupt stop to almost all consumer and business activity on a national scale, the resulting bond spread widening across the credit markets has caused our ABS holdings to suffer unrealized markdowns. For the time being, the government may be the largest driver of consumption by providing direct support to consumers as well as a safety net for small businesses being negatively impacted. While large fiscal stimulus is a very positive development, it is too early to know who will receive money or loans and when, and how, it will be used.
In addition to the market dislocations and broadening of spreads detailed earlier in this letter, we believe the situation was exacerbated by Dodd-Frank regulations enacted after the Great Financial Crisis of 2008-2009, which increased capital constraints on the large dealer banks and limited their risk-taking ability, thus arguably magnifying the sell-off as they were unable to step in as intermediaries and cushion the fall. While we always believed the ABS markets could become challenged, we did not envision the sort of price volatility we experienced in March.
So, is what we thought to be safe simply not so? How are we thinking about ABS going forward? Despite increased credit and liquidity risks, we believe our ABS portfolio, overall, remains well protected from permanent loss of capital. The table to the right provides a breakdown of our ABS exposure by sector, duration and credit quality. In short, our portfolio is well diversified across sectors, has an overall duration of less than one year, and is high quality. In addition, issuer concentration is limited, with only one issuer representing more than 2% exposure. Further, ABS can be structured to include many protections for investors, the most important of which today are requirements that underlying loan payments first be applied to senior securities (senior tranches) before being applied to junior securities (junior tranches).
These protections benefit senior tranche investors in two important ways: first, money that is repaid is no longer at risk and can be reinvested elsewhere. Second, after payments are received over time the residual investment has a lower risk profile (i.e. a lower principal balance at risk compared against the underlying assets). As of March 31, 2020, approximately 75% of our ABS portfolio is paying down on a monthly basis. While this downturn may be more significant than the Great Financial Crisis, we believe, as a whole, our ABS portfolio can withstand significantly worse loss performance than what occurred over a decade ago.
Our portfolio duration is also a very important factor. While there is significant near-term risk of loan extensions across our ABS holdings as borrowers seek temporary relief to survive the downturn, with an overall duration of 0.87, we expect almost half of our ABS portfolio may amortize or pay-off over the next 12 months. In terms of risk management, we will remain vigilant with our monthly credit surveillance, monitoring all aspects of each securitization that we own. We have also stepped up our sponsor outreach over the past month – in certain cases we may ask for monthly conference calls. We continue to maintain our customary level of portfolio diligence in this sector, which is key to our ongoing portfolio management and enables us to selectively take advantage of further investment opportunities. We will be cautious, learn and remain patient during this uncertain environment. We look forward to providing you further updates as the economy and market conditions evolve.
| | | | |
| Asset-Backed Securities (ABS) | | | |
| % of Assets | Duration | Credit Quality* |
Automobile | 9.2% | 0.83 | AA+ |
Consumer | 9.2% | 0.78 | A+ |
Equipment | 5.7% | 1.29 | AA+ |
Fleet Lease | 2.1% | 1.02 | AAA |
Mobile Phone | 1.4% | 0.49 | AAA |
Small Business | 0.3% | 0.99 | A |
Student Loan | 0.6% | 1.13 | AAA |
| 28.5% | 0.87 | |
* Weighted average credit quality per sector.
|
Outlook - what a difference a month can make
In several of our previous quarterly correspondence pieces, we had bemoaned the lack of favorable risk/reward opportunities to deploy capital on behalf of our shareholders (see the “price is what you pay – value is what you receive” section in our 2019 year-end Fixed Income Insights on our website.) And as the second month of the new year was ending, we had considered penning a commentary about how poor forward returns appeared at the time. Well, March came crashing upon all of us as rising fear about the coronavirus invasion turned markets into what seemed like a version of Rod Serling’s Twilight Zone (specifically 1960’s classic The Monsters are Due on Maple Street, in which mysterious, frightening events suddenly turn a neighborhood upside down). The financial markets became unnerved and increasingly fearful.
36 Q1 2020 Annual Report
The result has been a rapid repricing of credit risk that has meaningfully and favorably shifted the risk/reward relationship going forward. At quarter end, the forward returns (as measured by YTW) for our fixed-income portfolios are at levels they have not been at in many years. We believe this is a solid starting place.
In our fixed income investments, we strive to (a) preserve capital, (b) maintain a strong liquidity position, (c) understand evolving risks and opportunities, (d) selectively take advantage of favorable risk/reward opportunities, and (e) conduct consistent, thorough research and credit surveillance.
Rest assured that we remain ready to take advantage of any further risk/reward opportunities that may develop, and we strive to remain your trusted partner.
Definitions: Investment grade bonds are those securities rated at least BBB- by one or more credit rating agencies. Non-investment grade bonds are those securities (commonly referred to as “high yield” or “junk” bonds) rated below BBB- by two or more credit rating agencies. Yield-to-worst (YTW) is the lowest potential yield that can be received on a bond portfolio without the issuers actually defaulting.
Q1 2020 Annual Report 37
| | | | | | | | | | | |
| Returns | | | | | | | | | | |
| | | | Annualized | | |
| | | | | | | | Since Fund | | |
| | | | | | | | Inception | Net | Gross |
| QTD | YTD | 1 YR | 3 YR | 5 YR | 10 YR | 20 YR | (12/23/1988)
| Expense | Expense |
| WSHNX - Investor Class | (2.19)% | (2.19)% | 0.26% | 1.21% | 1.27% | 1.81% | 3.72% | 4.82% | 0.55% | 0.92% |
| WEFIX - Institutional Class | (2.15) | (2.15) | 0.44 | 1.41 | 1.49 | 2.00 | 3.81 | 4.89 | 0.48 | 0.63 |
| Bloomberg Barclays 1-3 Year U.S. Aggregate | 1.79 | 1.79 | 4.63 | 2.62 | 1.93 | 1.64 | 3.25 | N/A | | |
| CPI + 1% | 0.69 | 0.69 | 2.56 | 2.94 | 2.82 | 2.74 | 3.10 | 3.49* | | |
| | | |
| 30-Day SEC Yield | | |
Share Class | Subsidized | Unsubsidized |
| Investor | 2.28% | 1.91% |
| Institutional | 2.35 | 2.23 |
| | |
| Fixed Income Attributes | |
Portfolio Summary | |
| Average Maturity | 1.8 years |
| Average Effective Maturity | 1.8 years |
| Average Duration | 1.7 years |
| Average Effective Duration | 1.6 years |
| Average Coupon | 2.9% |
| | |
| Credit Quality | |
| Underlying Securities | % of Portfolio |
| U.S. Treasury | 18.3 |
| U.S. Government Agency Mortgage | |
| Related Securities | 14.5 |
| AAA | 23.2 |
| AA | 8.9 |
| A | 12.9 |
| BBB | 16.9 |
| BB | 1.8 |
| B | 0.7 |
| CCC | 0.1 |
| Non-Rated | 1.9 |
| Common Stocks | 0.3 |
| Cash Equivalents | 0.5 |
| | 100.0 |
| | |
| Maturity Distribution | |
Maturity Type | % of Portfolio |
| Cash Equivalents | 0.5 |
| Less than 1 Year | 30.0 |
| 1 - 3 Years | 55.0 |
| 3 - 5 Years | 13.3 |
| 5 - 7 Years | 0.9 |
Common Stocks | 0.3 |
| | 100.0 |
Data quoted is past performance and current performance may be lower or higher. Past performance is no guarantee of future results. Investment return and principal value of an investment will fluctuate, and shares, when redeemed, may be worth more or less than their original cost. All investments involve risks, including possible loss of principal. Please visit weitzinvestments.com for the most recent month-end performance.
Investment results reflect applicable fees and expenses and assume all distributions are reinvested but do not reflect the deduction of taxes an investor would pay on distributions or share redemptions. Net and Gross Expense Ratios are as of the Fund’s most recent prospectus. The Fund has entered into fee waiver and/or expense reimbursement arrangements with the Investment Advisor. The Advisor has contractually agreed to waive a portion of the Advisor’s fee and reimburse certain expenses (excluding taxes, interest, brokerage costs, acquired fund fees and expenses and extraordinary expenses) to limit the total annual fund operating expenses of the Class’s average daily net assets through 07/31/2020. The Net Expense Ratio reflects the total annual fund operating expenses of the Fund after taking into account any such fee waiver and/or expense reimbursement, if any; total returns would have been lower had there been no waivers or reimbursements.
See page 8 for additional performance disclosures. See page 81 for a description of all indices.
The Fund receives credit quality ratings on portfolio securities when available from credit rating agencies. The Fund itself has not been rated by a credit rating agency. Ratings and portfolio credit quality may change over time. A security is “investment grade” when it has received a credit quality rating of at least BBB. If a security has received different ratings from more than one rating agency, then the highest rating is used. Mortgage related securities issued and guaranteed by government sponsored agencies such as Fannie Mae and Freddie Mac are generally not rated by rating agencies. Securities which are not rated do not necessarily indicate low quality. Fannie Mae’s and Freddie Mac’s senior long-term debt are currently rating Aaa and AAA by Moody’s and Fitch, respectively.
Source (Fixed Income Attributes, Credit Quality, and Maturity Distribution): Bloomberg Analytics
38 Q1 2020 Annual Report
ULTRA SHORT GOVERNMENT FUND
Portfolio Managers: Tom Carney, CFA & Nolan Anderson
Investment Style: Ultra-Short-Term Bond
The Ultra Short Government Fund returned +0.75% in the first calendar quarter compared to a +0.94% return for the ICE BofAML US 6-Month Treasury Bill Index (6-Month Treasury), the Fund’s primary benchmark. For the year ending March 31, 2020, the Fund returned +2.44% compared to a +2.85% return for the benchmark. The Fund’s results in the quarter lagged those of its benchmark as strong income returns were partially offset by modest (unrealized) price declines in certain Fund holdings in the asset-backed securities and corporate bond segments.
Overview
The first quarter of 2020 experienced tremendous dislocation and turbulence in the financial markets resulting from efforts to contain the COVID-19 pandemic. The Federal Reserve (Fed) subsequently embarked on a series of actions to support the flow of credit to households and businesses, including reducing the Federal Funds rate to a range of 0-0.25% (down 1.5% since year end). Please see this quarter’s Fixed Income Insights and Value Matters for a deeper analysis and commentary on the events of last quarter.
The Fed’s monetary policy decisions (e.g., changes in short-term interest rates) will continue to affect all investments within our opportunity set. As a result, our yield and return will invariably follow the path dictated by the Fed’s monetary policy, as we frequently reinvest maturities with holdings that mature in a short period of time. As of March 31, 2020, 80.6% of our portfolio was invested in U.S. Treasury notes, 12.9% in investment-grade asset-backed securities, 5.2% in investment-grade corporate bonds and 1.3% in a high-quality money market fund. The average effective duration at March 31 was unchanged from the previous quarter at 0.4 years. The Fund’s subsidized 30-day yield decreased approximately 1% in the quarter to 0.60% as of March 31. Given that the Fed is likely to hold short-term interest rates at or near zero for the foreseeable future, the Fund’s 30-day yield will likely continue to decline in the months and quarters ahead.
Under normal market conditions, the Fund will invest at least 80% of its net assets in obligations issued or guaranteed by the U.S. government and its government-related entities. The balance of Fund assets may be invested in U.S. investment-grade debt securities. Additionally, the Fund will maintain an average effective duration of one year or less. Duration is a measure of how sensitive the portfolio may be to changes in interest rates. All else equal, a lower-duration bond portfolio is less sensitive to changes in interest rates than a higher-duration bond portfolio. Over time, this shorter-term focus (duration of less than one year) is intended to generate higher total returns than cash or money market funds, while also taking less interest rate risk than a bond portfolio with a higher duration.
The Fund’s principal investment strategies and objectives of providing current income, preserving capital and maintaining liquidity remain our long-term goals. Overall, we are pleased to report that the Fund has exceedingly accomplished its main objectives in the first quarter – arguably one of the most challenging quarters in years.
Definitions: 30-Day SEC Yield represents net investment income earned by a fund over a 30-day period, expressed as an annual percentage rate based on the Fund’s share price at the end of the 30-day period. Subsidized yield reflects fee waivers and/or expense reimbursements during the period. Without such fee waivers and/or expense reimbursements, if any; yields would have been lower. Unsubsidized yield does not adjust for any fee waivers and/or expense reimbursement in effect.
Q1 2020 Annual Report 39
| | | | | | | | | | | |
| Returns | | | | | | | | | | |
| | | | Annualized
| | |
| | | | | | | | Since Fund | | |
| | | | | | | | Inception | Net | Gross |
| QTD | YTD | 1 YR | 3 YR | 5 YR | 10 YR | 20 YR | (8/1/1991) | Expense | Expense |
| SAFEX | 0.75% | 0.75% | 2.44% | 1.85% | 1.16% | 0.59% | 1.51% | 2.36% | 0.20% | 0.61% |
| ICE BofAML U.S. 6-Month Treasury Bill | 0.94 | 0.94 | 2.85 | 2.09 | 1.44 | 0.83 | 2.03 | 2.93 | | |
| | | |
| 30-Day SEC Yield | | |
| Subsidized | Unsubsidized |
| | 0.60% | 0.11% |
| | |
| Fixed Income Attributes | |
Portfolio Summary | |
| Average Maturity | 0.4 years |
| Average Effective Maturity | 0.4 years |
| Average Duration | 0.4 years |
| Average Effective Duration | 0.4 years |
| Average Coupon | 2.0% |
| | |
| Credit Quality | |
Underlying Securities | % of Portfolio |
| U.S. Treasury | 80.7 |
| AAA | 8.2 |
| AA | 4.1 |
| A | 4.1 |
| BBB | 1.7 |
Cash Equivalents | 1.2 |
| | 100.0 |
| | |
| Maturity Distribution | |
| Maturity Type | % of Portfolio |
| Cash Equivalents | 1.2 |
| Less than 1 Year | 96.8 |
| 1 - 3 Years | 2.0 |
| | 100.0 |
Data quoted is past performance and current performance may be lower or higher. Past performance is no guarantee of future results. Investment return and principal value of an investment will fluctuate, and shares, when redeemed, may be worth more or less than their original cost. All investments involve risks, including possible loss of principal. Please visit weitzinvestments.com for the most recent month-end performance.
Investment results reflect applicable fees and expenses and assume all distributions are reinvested but do not reflect the deduction of taxes an investor would pay on distributions or share redemptions. Net and Gross Expense Ratios are as of the Fund’s most recent prospectus. The Fund has entered into fee waiver and/or expense reimbursement arrangements with the Investment Advisor. The Advisor has contractually agreed to waive a portion of the Advisor’s fee and reimburse certain expenses (excluding taxes, interest, brokerage costs, acquired fund fees and expenses and extraordinary expenses) to limit the total annual fund operating expenses of the Class’s average daily net assets through 07/31/2020. The Net Expense Ratio reflects the total annual fund operating expenses of the Fund after taking into account any such fee waiver and/or expense reimbursement, if any; total returns would have been lower had there been no waivers or reimbursements.
Effective 12/16/2016, the Ultra Short Government Fund revised its principal investment strategies. Prior to that date, the Fund operated as a “government money market fund” and maintained a stable net asset value of $1.00 per share. Performance prior to 12/16/2016 reflects the Fund’s prior principal investment strategies and may not be indicative of future performance results.
See page 8 for additional performance disclosures. See page 81 for a description of all indices.
The Fund receives credit quality ratings on portfolio securities when available from credit rating agencies. The Fund itself has not been rated by a credit rating agency. Ratings and portfolio credit quality may change over time. A security is “investment grade” when it has received a credit quality rating of at least BBB. If a security has received different ratings from more than one rating agency, then the highest rating is used.
Source (Fixed Income Attributes, Credit Quality, and Maturity Distribution): Bloomberg Analytics
40 Q1 2020 Annual Report
HICKORY FUND
March 31, 2020
| | | | |
| Common Stocks – 95.7% | | | |
| % of Net | | |
| Communication Services | Assets | Shares | $ Value |
| |
| Cable & Satellite | 19.1 | | |
| Liberty Broadband Corp.* | |
| Series A | 27,500 | 2,942,500 |
| Series C | 112,006 | 12,401,304 |
| Liberty SiriusXM Group* | |
| Series A | 50,000 | 1,584,500 |
| Series C | 180,000 | 5,691,600 |
Liberty Global plc - Class C* (b) | 325,000 | 5,105,750 |
Liberty Latin America Ltd. - Class C* (b) | 475,000 | 4,873,500 |
| |
| Integrated Telecommunication Services | 6.3 | | |
| LICT Corp.* | 718 | 10,770,000 |
| |
| Alternative Carriers | 4.0 | | |
| GCI Liberty, Inc. - Class A* | 120,000 | 6,836,400 |
| |
| Movies & Entertainment | 2.5 | | |
| Liberty Braves Group* | |
| Series A | 11,000 | 214,500 |
| Series C | 105,000 | 2,001,300 |
| Liberty Formula One Group* | |
| Series A | 27,500 | 710,050 |
| Series C | 50,000 | 1,361,500 |
| | 31.9 | | 54,492,904 |
| Information Technology |
| |
| Application Software | 9.4 | | |
| ACI Worldwide, Inc.* | 270,000 | 6,520,500 |
| Guidewire Software, Inc.* | 70,000 | 5,551,700 |
| Box, Inc. - Class A* | 280,000 | 3,931,200 |
| |
| Data Processing & Outsourced Services | 3.4 | | |
| Black Knight, Inc.* | 100,000 | 5,806,000 |
| |
| Semiconductors | 2.3 | | |
Marvell Technology Group Ltd.(b) | 175,000 | 3,960,250 |
| 15.1 | | 25,769,650 |
| Industrials |
| |
| Industrial Machinery | 4.8 | | |
| Ingersoll Rand Inc.* | 230,000 | 5,704,000 |
| IDEX Corp. | 17,500 | 2,416,925 |
| |
| Research & Consulting Services | 2.8 | | |
| CoStar Group, Inc.* | 8,250 | 4,844,482 |
| |
| Aerospace & Defense | 1.7 | | |
| HEICO Corp. - Class A | 45,000 | 2,875,500 |
| | 9.3 | | 15,840,907 |
| Consumer Discretionary |
| |
| Internet & Direct Marketing Retail | 3.4 | | |
| Qurate Retail, Inc. - Series A* | 675,000 | 4,120,875 |
| Expedia Group, Inc. | 30,000 | 1,688,100 |
| |
| Automotive Retail | 3.1 | | |
| CarMax, Inc.* | 100,000 | 5,383,000 |
| |
| Distributors | 2.7 | | |
| LKQ Corp.* | 225,000 | 4,614,750 |
| 9.2 | | 15,806,725 |
| | | | |
| | % of Net | | |
| Materials | Assets | Shares | $ Value |
| | | | |
| Construction Materials | 6.1 | | |
| Summit Materials, Inc. - Class A* | 350,000 | 5,250,000 |
| Vulcan Materials Co. | 47,500 | 5,133,325 |
| | | |
| Specialty Chemicals | 2.8 | | |
Axalta Coating Systems Ltd.* (b) | 280,000 | 4,835,600 |
| | 8.9 | | 15,218,925 |
| Financials |
| | | | |
| Property & Casualty Insurance | 3.4 | | |
| Markel Corp.* | 6,250 | 5,799,313 |
| | | |
| Regional Banks | 2.5 | | |
| First Hawaiian, Inc. | 260,000 | 4,297,800 |
| | | |
| Mortgage REITs | 1.7 | | |
| Redwood Trust, Inc. | 580,000 | 2,934,800 |
| | 7.6 | | 13,031,913 |
| Health Care |
| | | | |
| Health Care Services | 4.7 | | |
| Laboratory Corp. of America Holdings* | 63,000 | 7,962,570 |
| | | |
| Real Estate |
| | | | |
| Office REITs | 4.6 | | |
| Equity Commonwealth | 250,000 | 7,927,500 |
| | | |
| Other |
| | | | |
| Other | 4.4 | | |
EverArc Holdings Ltd.* (b) (c) | 500,000 | 7,500,000 |
| Total Common Stocks (Cost $131,766,085) | | | 163,551,094 |
| |
| Warrants – 0.0% | | | |
| | | |
EverArc Holdings Ltd.* (b) (c) (d) (Cost $5,000) | 500,000 | 75,000 |
| | | |
| Cash Equivalents – 4.5% |
| |
| State Street Institutional U.S. Government Money |
Market Fund - Premier Class 0.32%(a) | 7,715,613 | 7,715,613 |
| Total Cash Equivalents (Cost $7,715,613) | | | 7,715,613 |
| Total Investments in Securities (Cost $139,486,698) | | 171,341,707 |
| Other Liabilities in Excess of Other Assets - (0.2%) | | (374,007) |
| Net Assets - 100% | | | 170,967,700 |
| Net Asset Value Per Share | 38.80 |
| |
* | Non-income producing
|
(a) | Rate presented represents the annualized 7-day yield at March 31, 2020.
|
(b) | Foreign domiciled entity
|
(c) | Security is exempt from registration under Rule 144A of the Securities Act of 1933. This security may be resold in transactions that are exempt from registration, normally to qualified institutional buyers.
|
(d) | The expiration date has yet to be determined but will be set based on the terms outlined in the prospectus.
|
| The accompanying notes form an integral part of these financial statements. |
Q1 2020 Annual Report 41
PARTNERS III OPPORTUNITY FUND
Schedule of Investments
March 31, 2020
| | | | |
| Common Stocks – 85.7% | | | |
| | % of Net | | |
| Information Technology | Assets | Shares | $ Value |
| |
| Data Processing & Outsourced Services | 12.6 | | |
Mastercard Inc. - Class A(c) | 120,000 | 28,987,200 |
| Visa Inc. - Class A | 185,000 | 29,807,200 |
| Black Knight, Inc.* | 200,000 | 11,612,000 |
| |
| Application Software | 10.6 | | |
Intelligent Systems Corp.* † | 1,539,000 | 52,310,610 |
| Box, Inc. - Class A* | 500,000 | 7,020,000 |
| |
| Semiconductors | 2.9 | | |
Texas Instruments, Inc.(c) | 165,000 | 16,488,450 |
| |
| IT Consulting & Other Services | 1.4 | | |
| DXC Technology Co. | 600,000 | 7,830,000 |
| | 27.5 | | 154,055,460 |
| Communication Services |
| |
| Cable & Satellite | 14.4 | | |
Liberty Broadband Corp.* (c) | |
| Series A | 100,000 | 10,700,000 |
| Series C | 180,000 | 19,929,600 |
Liberty Global plc - Class C* (c) (d) | 1,650,000 | 25,921,500 |
Liberty SiriusXM Group* (c) | |
| Series A | 200,000 | 6,338,000 |
| Series C | 450,000 | 14,229,000 |
Liberty Latin America Ltd. - Class C* (c) (d) | 380,000 | 3,898,800 |
| |
| Interactive Media & Services | 9.4 | | |
Alphabet, Inc. - Class C* (c) | 25,000 | 29,070,250 |
Facebook, Inc. - Class A* (c) | 140,000 | 23,352,000 |
| |
| Alternative Carriers | 0.5 | | |
GCI Liberty, Inc. - Class A* (c) | 50,000 | 2,848,500 |
| | 24.3 | | 136,287,650 |
| Financials |
| |
| Multi-Sector Holdings | 11.1 | | |
Berkshire Hathaway Inc. - Class B* (c) | 340,000 | 62,162,200 |
| |
| Property & Casualty Insurance | 5.3 | | |
Markel Corp.* (c) | 32,000 | 29,692,480 |
| |
| Investment Banking & Brokerage | 1.5 | | |
| The Charles Schwab Corp. | 250,000 | 8,405,000 |
| |
| Mortgage REITs | 1.1 | | |
Redwood Trust, Inc.(c) | 1,200,000 | 6,072,000 |
| | 19.0 | | 106,331,680 |
| Consumer Discretionary |
| |
| Internet & Direct Marketing Retail | 3.8 | | |
Amazon.com, Inc.* (c) | 8,000 | 15,597,760 |
Qurate Retail, Inc. - Series A* (c) | 900,000 | 5,494,500 |
| |
| Automotive Retail | 1.3 | | |
| CarMax, Inc.* | 140,000 | 7,536,200 |
| | 5.1 | | 28,628,460 |
| Health Care |
| |
| Health Care Services | 2.7 | | |
Laboratory Corp. of America Holdings* (c) | 120,000 | 15,166,800 |
| |
| Materials | | | |
| |
| Construction Materials | 2.4 | | |
Summit Materials, Inc. - Class A* (c) | 800,000 | 12,000,000 |
| Vulcan Meterials Co. | 15,000 | 1,621,050 |
| | 2.4 | | 13,621,050 |
| | | | |
| | | $ Principal | |
| | % of Net | Amount | |
| Industrials | Assets | or Shares | $ Value |
| | | | |
| Research & Consulting Services | 0.7 | | |
| CoStar Group, Inc.* | 7,000 | 4,110,470 |
| | | |
| Other |
| | | | |
| Other | 4.0 | | |
EverArc Holdings Ltd.* (d) (e) | 1,500,000 | 22,500,000 |
| Total Common Stocks (Cost $306,368,422) | | 480,701,570 |
| |
| Exchange Traded Funds – 4.5% |
| | | |
The Financial Select Sector SPDR Fund(c) (Cost $26,350,540) | 1,200,000 | 24,984,000 |
| | | |
| Warrants – 0.0% | | | |
| | | |
EverArc Holdings Ltd.* (d) (e) (f) (Cost $15,000) | 1,500,000 | 225,000 |
| | | |
| Cash Equivalents – 9.9% | | | |
| | | |
U.S. Treasury Bill 1.59% 4/09/20(a) | 17,000,000 | 16,999,840 |
| | | |
| State Street Institutional U.S. Government Money |
Market Fund - Premier Class 0.32%(b) | 38,589,811 | 38,589,811 |
| Total Cash Equivalents (Cost $55,583,923) | | 55,589,651 |
| Total Investments in Securities (Cost $388,317,885) | | 561,500,221 |
Due From Broker(c) - 11.7% | 65,684,396 |
| Securities Sold Short - (11.2%) | (62,974,000) |
| Options Written - (0.0%) | (18,000) |
| Other Liabilities in Excess of Other Assets - (0.6%) | (3,473,336) |
| Net Assets - 100% | | | 560,719,281 |
| Net Asset Value Per Share - Investor Class | 12.84 |
| Net Asset Value Per Share - Institutional Class | 13.43 |
| | |
| Securities Sold Short – (11.2%) |
| | | |
| Invesco QQQ Trust, Series 1 | 60,000 | (11,424,000) |
| SPDR S&P 500 ETF Trust | 200,000 | (51,550,000) |
| Total Securities Sold Short (proceeds $54,494,195) | | (62,974,000) |
| | | | |
| Options Written* – (0.0%) | | Shares | |
| | subject | |
| | $ Notional | to option | $ Value |
| Covered Call Options | | | |
| The Financial Select Sector SPDR | | | |
| Fund, July 2020 / $27 | 2,700,000 | 100,000 | (18,000) |
| Total Options Written (premiums received $131,403) | | (18,000) |
| | |
* | Non-income producing
|
† | Non-controlled affiliate
|
(a) | Interest rate presented represents the yield to maturity at the date of purchase.
|
(b) | Rate presented represents the annualized 7-day yield at March 31, 2020.
|
(c)
| Fully or partially pledged as collateral on securities sold short and outstanding written options. |
(d) | Foreign domiciled entity
|
(e) | Security is exempt from registration under Rule 144A of the Securities Act of 1933. This security may be resold in transactions that are exempt from registration, normally to qualified institutional buyers.
|
(f) | The expiration date has yet to be determined but will be set based on the terms outlined in the prospectus.
|
The accompanying notes form an integral part of these financial statements.
42 Q1 2020 Annual Report
PARTNERS VALUE FUND
Schedule of Investments
March 31, 2020
| | | | |
| Common Stocks – 97.0% | | | |
| | % of Net | | |
| Information Technology | Assets | Shares | $ Value |
| |
| Data Processing & Outsourced Services | 11.7 | | |
| Visa Inc. - Class A | 105,000 | 16,917,600 |
| Black Knight, Inc.* | 275,000 | 15,966,500 |
| Mastercard Inc. - Class A | 57,500 | 13,889,700 |
| |
| Application Software | 7.4 | | |
| ACI Worldwide, Inc.* | 550,000 | 13,282,500 |
| Guidewire Software, Inc.* | 125,000 | 9,913,750 |
| Box, Inc. - Class A* | 450,000 | 6,318,000 |
| |
| Semiconductors | 5.7 | | |
| Texas Instruments, Inc. | 120,000 | 11,991,600 |
Marvell Technology Group Ltd.(b) | 480,000 | 10,862,400 |
| |
| Systems Software | 3.0 | | |
| Oracle Corp. | 250,000 | 12,082,500 |
| | 27.8 | | 111,224,550 |
| Communication Services |
| |
| Cable & Satellite | 16.7 | | |
| Liberty Broadband Corp.* | |
| Series A | 65,000 | 6,955,000 |
| Series C | 185,000 | 20,483,200 |
| Liberty SiriusXM Group* | |
| Series A | 120,000 | 3,802,800 |
| Series C | 435,000 | 13,754,700 |
Liberty Global plc - Class C* (b) | 760,000 | 11,939,600 |
Liberty Latin America Ltd. - Class C* (b) | 950,000 | 9,747,000 |
| |
| Interactive Media & Services | 9.4 | | |
| Alphabet, Inc. - Class C* | 22,000 | 25,581,820 |
| Facebook, Inc. - Class A* | 72,500 | 12,093,000 |
| | 26.1 | | 104,357,120 |
| Financials | | |
| |
| Multi-Sector Holdings | 7.1 | | |
| Berkshire Hathaway Inc. - Class B* | 155,000 | 28,338,650 |
| |
| Property & Casualty Insurance | 3.4 | | |
| Markel Corp.* | 14,500 | 13,454,405 |
| |
| Investment Banking & Brokerage | 3.0 | | |
| The Charles Schwab Corp. | 365,000 | 12,271,300 |
| |
| Insurance Brokers | 2.9 | | |
Aon plc - Class A(b) | 70,000 | 11,552,800 |
| |
| Mortgage REITs | 1.5 | | |
| Redwood Trust, Inc. | 1,200,000 | 6,072,000 |
| | 17.9 | | 71,689,155 |
| Materials |
| |
| Construction Materials | 8.0 | | |
| Vulcan Materials Co. | 130,000 | 14,049,100 |
| Summit Materials, Inc. - Class A* | 650,000 | 9,750,000 |
| Martin Marietta Materials, Inc. | 45,000 | 8,515,350 |
| |
| Specialty Chemicals | 2.2 | | |
Axalta Coating Systems Ltd.* (b) | 500,000 | 8,635,000 |
| | 10.2 | | 40,949,450 |
| | | | |
| | | | |
| | % of Net | | |
| Industrials | Assets | Shares | $ Value |
| | | | |
| Research & Consulting Services | 2.8 | | |
| CoStar Group, Inc.* | 19,000 | 11,156,990 |
| | | |
| Aerospace & Defense | 1.7 | | |
| HEICO Corp. - Class A | 110,000 | 7,029,000 |
| | | |
| Industrial Machinery | 1.2 | | |
| IDEX Corp. | 33,819 | 4,670,742 |
| | 5.7 | | 22,856,732 |
| Consumer Discretionary |
| | | | |
| Automotive Retail | 2.7 | | |
| CarMax, Inc.* | 200,000 | 10,766,000 |
| | | |
| Distributors | 2.3 | | |
| LKQ Corp.* | 450,000 | 9,229,500 |
| | 5.0 | | 19,995,500 |
| Health Care |
| | | | |
| Health Care Services | 4.3 | | |
| Laboratory Corp. of America Holdings* | 135,000 | 17,062,650 |
| Total Common Stocks (Cost $299,183,555) | | | 388,135,157 |
| |
| Cash Equivalents – 3.2% | | | |
| |
| State Street Institutional U.S. Government Money |
Market Fund - Premier Class 0.32%(a) | 12,940,098 | 12,940,098 |
| Total Cash Equivalents (Cost $12,940,098) | | 12,940,098 |
| Total Investments in Securities (Cost $312,123,653) | | 401,075,255 |
| Other Liabilities in Excess of Other Assets - (0.2%) | | (957,069) |
| Net Assets - 100% | | | 400,118,186 |
| Net Asset Value Per Share - Investor Class | 23.32 |
| Net Asset Value Per Share - Institutional Class | 23.70 |
| | |
* | Non-income producing
|
(a) | Rate presented represents the annualized 7-day yield at March 31, 2020.
|
(b) | Foreign domiciled entity
|
The accompanying notes form an integral part of these financial statements.
Q1 2020 Annual Report 43
VALUE FUND
Schedule of Investments
March 31, 2020
| | | | |
| Common Stocks – 95.8% | | | |
| | % of Net | | |
| Communication Services | Assets | Shares | $ Value |
| | | | |
| Cable & Satellite | 14.7 | | |
| Liberty Broadband Corp. - Series C* | 420,000 | 46,502,400 |
| Comcast Corp. - Class A | 560,000 | 19,252,800 |
| Liberty SiriusXM Group - Series C* | 575,000 | 18,181,500 |
Liberty Global plc - Class C* (b) | 850,000 | 13,353,500 |
| | | |
| Interactive Media & Services | 11.3 | | |
| Alphabet, Inc. - Class C* | 40,000 | 46,512,400 |
| Facebook, Inc. - Class A* | 165,000 | 27,522,000 |
| | 26.0 | | 171,324,600 |
| Information Technology |
| | | | |
| Data Processing & Outsourced Services | 8.0 | | |
| Visa Inc. - Class A | 170,000 | 27,390,400 |
| Mastercard Inc. - Class A | 105,000 | 25,363,800 |
| | | |
| Systems Software | 4.0 | | |
| Oracle Corp. | 550,000 | 26,581,500 |
| | | |
| Semiconductors | 3.4 | | |
| Analog Devices, Inc. | 250,000 | 22,412,500 |
| | | |
| Application Software | 3.1 | | |
| salesforce.com, inc.* | 140,000 | 20,157,200 |
| | | |
| IT Consulting & Other Services | 2.4 | | |
Accenture plc - Class A(b) | 95,000 | 15,509,700 |
| | 20.9 | | 137,415,100 |
| Financials |
| | | | |
| Multi-Sector Holdings | 7.4 | | |
| Berkshire Hathaway Inc. - Class B* | 265,000 | 48,449,950 |
| | | |
| Diversified Banks | 4.0 | | |
| JPMorgan Chase & Co. | 290,000 | 26,108,700 |
| | | |
| Insurance Brokers | 3.7 | | |
Aon plc - Class A(b) | 150,000 | 24,756,000 |
| | | |
| Investment Banking & Brokerage | 2.9 | | |
| The Charles Schwab Corp. | 575,000 | 19,331,500 |
| | | |
| Financial Exchanges & Data | 2.3 | | |
| S&P Global Inc. | 62,500 | 15,315,625 |
| | 20.3 | | 133,961,775 |
| Health Care |
| | | | |
| Life Sciences Tools & Services | 4.3 | | |
| Thermo Fisher Scientific Inc. | 100,000 | 28,360,000 |
| | | |
| Health Care Equipment | 3.9 | | |
| Danaher Corp. | 185,000 | 25,605,850 |
| | | |
| Health Care Services | 3.6 | | |
| Laboratory Corp. of America Holdings* | 187,500 | 23,698,125 |
| | 11.8 | | 77,663,975 |
| | | | |
| | | | |
| | % of Net | |
| Materials | Assets | Shares | $ Value |
| | | | |
| Construction Materials | 3.7 | | |
| Vulcan Materials Co. | 225,000 | 24,315,750 |
| | | |
| Industrial Gases | 2.6 | | |
Linde plc(b) | 100,000 | 17,300,000 |
| | 6.3 | | 41,615,750 |
| Consumer Discretionary |
| | | | |
| Internet & Direct Marketing Retail | 3.4 | | |
| Amazon.com, Inc.* | 11,500 | 22,421,780 |
| | | |
| Automotive Retail | 2.0 | | |
| CarMax, Inc.* | 240,000 | 12,919,200 |
| | 5.4 | | 35,340,980 |
| Industrials |
| | | | |
| Research & Consulting Services | 2.7 | | |
| CoStar Group, Inc.* | 30,000 | 17,616,300 |
| | | |
| Consumer Staples |
| | | | |
| Distillers & Vintners | 2.4 | | |
Diageo plc - Sponsored ADR(b) | 125,000 | 15,890,000 |
| Total Common Stocks (Cost $422,572,452) | | 630,828,480 |
| |
| Cash Equivalents – 4.3% |
| |
| State Street Institutional U.S. Government Money |
Market Fund - Premier Class 0.32%(a) | 28,501,605 | 28,501,605 |
| Total Cash Equivalents (Cost $28,501,605) | | 28,501,605 |
| Total Investments in Securities (Cost $451,074,057) | | 659,330,085 |
| Other Liabilities in Excess of Other Assets - (0.1%) | | (342,165) |
| Net Assets - 100% | | | 658,987,920 |
| Net Asset Value Per Share - Investor Class | 37.98 |
| Net Asset Value Per Share - Institutional Class | 38.55 |
| | |
* | Non-income producing
|
(a) | Rate presented represents the annualized 7-day yield at March 31, 2020.
|
(b) | Foreign domiciled entity
|
The accompanying notes form an integral part of these financial statements.
44 Q1 2020 Annual Report
BALANCED FUND
Schedule of Investments
March 31, 2020
| | | | |
| Common Stocks – 40.6% | | | |
| | % of Net | | |
| Information Technology | Assets | Shares | $ Value |
| | | | |
| Systems Software | 3.7 | | |
Microsoft Corp.
| 17,500 | 2,759,925 |
| Oracle Corp. | 42,500
| 2,054,025 |
| | | |
| Data Processing & Outsourced Services | 3.5 | | |
| Visa Inc. - Class A | 15,000
| 2,416,800 |
Mastercard Inc. - Class A
| 9,250 | 2,234,430 |
| | | |
| Semiconductors | 2.1 | | |
| Analog Devices, Inc. | 17,500
| 1,568,875 |
| Texas Instruments, Inc. | 12,500
| 1,249,125 |
| | | |
| Application Software | 1.2 | | |
Guidewire Software, Inc.*
| 20,000 | 1,586,200 |
| | | |
| IT Consulting & Other Services | 1.0 | | |
Accenture plc - Class A(c) | 8,000
| 1,306,080 |
| | 11.5 | | 15,175,460 |
| Financials |
| | | | |
| Multi-Sector Holdings | 2.5 | | |
Berkshire Hathaway Inc. - Class B*
| 18,000 | 3,290,940 |
| | | |
| Insurance Brokers | 1.7 | | |
Aon plc - Class A(c) | 13,500
| 2,228,040 |
| | | |
| Investment Banking & Brokerage | 1.5 | | |
| The Charles Schwab Corp. | 60,000
| 2,017,200 |
| | | |
| Diversified Banks | 1.5 | | |
| JPMorgan Chase & Co. | 22,000
| 1,980,660 |
| | | |
| Property & Casualty Insurance | 1.3 | | |
| Markel Corp.* | 1,800
| 1,670,202 |
| | | |
| Financial Exchanges & Data | 1.1 | | |
| S&P Global Inc. | 6,000
| 1,470,300 |
| | | |
| Mortgage REITs | 0.5 | | |
| Redwood Trust, Inc. | 125,000
| 632,500 |
| | 10.1 | | 13,289,842 |
| Health Care |
| | | | |
| Life Sciences Tools & Services | 2.1 | | |
| Thermo Fisher Scientific Inc. | 10,000
| 2,836,000 |
| | | |
| Health Care Services | 1.6 | | |
| Laboratory Corp. of America Holdings* | 17,000
| 2,148,630 |
| | | |
| Health Care Equipment | 1.6 | | |
| Danaher Corp. | 15,000
| 2,076,150 |
| | 5.3 | | 7,060,780 |
| Communication Services |
| | | | |
| Cable & Satellite | 3.0 | | |
| Charter Communications, Inc. - Class A* | 5,500
| 2,399,705 |
| Comcast Corp. - Class A | 45,000
| 1,547,100 |
| | | |
| Interactive Media & Services | 1.9 | | |
| Alphabet, Inc. - Class C* | 2,200
| 2,558,182 |
| | 4.9 | | 6,504,987 |
| Materials | | | |
| | | | |
| Construction Materials | 3.0 | | |
Vulcan Materials Co.
| 22,500 | 2,431,575 |
| Martin Marietta Materials, Inc. | 8,000
| 1,513,840 |
| | | |
| Industrial Gases | 1.3 | | |
Linde plc(c) | 10,000
| 1,730,000 |
| | 4.3 | | 5,675,415 |
| | | | |
| | | $ Principal | |
| | % of Net | Amount | |
| Industrials | Assets | or Shares | $ Value |
| |
| Industrial Machinery | 2.2 | | |
| IDEX Corp. | 11,000 | 1,519,210 |
| Fortive Corp. | 25,000 | 1,379,750 |
| |
| Industrial Conglomerates | 1.0 | | |
| Honeywell International Inc. | 10,000 | 1,337,900 |
| |
| | 3.2 | | 4,236,860 |
| Consumer Staples |
| |
| Distillers & Vintners | 1.3 | | |
Diageo plc - Sponsored ADR(c) | 14,000 | 1,779,680 |
| Total Common Stocks (Cost $40,323,789) | | | 53,723,024 |
| |
| |
| Corporate Bonds – 8.6% | | | |
| |
| Aon plc 5.0% 9/30/20 | 895,000 | 904,085 |
| AutoZone, Inc. 3.625% 4/15/25 | 500,000 | 507,510 |
| Bank of America Corp. 2.25% 4/21/20 | 1,000,000 | 999,850 |
| Berkshire Hathaway Inc. | |
| 2.2% 3/15/21 | 500,000 | 503,623 |
| Finance Corp. | | |
| 4.25% 1/15/21 | 300,000 | 307,498 |
| Broadcom Corp. 2.2% 1/15/21 | 1,000,000 | 987,291 |
| EOG Resources, Inc. 4.4% 6/01/20 | 300,000 | 299,708 |
| First Republic Bank 2.5% 6/06/22 | 1,000,000 | 986,035 |
| FLIR Systems, Inc. 3.125% 6/15/21 | 825,000 | 826,122 |
| Goldman Sachs Group, Inc. 2.6% 12/27/20 | 500,000 | 500,108 |
| JPMorgan Chase & Co. 3.375% 5/01/23 | 500,000 | 522,451 |
| Manufacturers & Traders Trust Co. 2.625% 1/25/21 | 425,000 | 426,495 |
| Markel Corp. | |
| 4.9% 7/01/22 | 410,000 | 412,324 |
| 3.625% 3/30/23 | 500,000 | 485,987 |
| U.S. Bancorp | |
| 2.35% 1/29/21 | 1,000,000 | 997,634 |
| 2.4% 7/30/24 | 500,000 | 500,882 |
| Wells Fargo & Co. 4.6% 4/01/21 | 1,250,000 | 1,277,576 |
| Total Corporate Bonds (Cost $11,489,481) | | | 11,445,179 |
| |
| Asset-Backed Securities – 5.8% | | | |
| |
ARI Fleet Lease Trust (ARIFL)(b) | | | |
| 2020-A CL A2 — 1.77% 8/15/28 | 250,000 | 249,624 |
Commercial Credit Group Receivables Trust (CCG)(b) |
| 2017-1 CL B — 2.75% 11/14/23 | 500,000 | 499,812 |
| 2019-2 CL A2 — 2.11% 3/15/27 | 500,000 | 496,863 |
Dell Equipment Finance Trust (DEFT)(b) | |
| 2017-2 CL C — 2.73% 10/24/22 | 500,000 | 499,098 |
| Drive Auto Receivables Trust (DRIVE) | |
| 2018-2 CL C — 3.63% 8/15/24 | 257,363 | 258,401 |
DT Auto Owner Trust (DTAOT)(b) | |
| 2016-4A CL D — 3.77% 10/17/22 | 136,631 | 136,562 |
Enterprise Fleet Financing LLC (EFF)(b) | |
| 2019-2 CL A1 — 2.26663% 8/20/20 | 92,876 | 92,726 |
| 2017-2 CL A3 — 2.22% 1/20/23 | 500,000 | 498,540 |
| 2019-2 CL A2 — 2.29% 2/20/25 | 400,000 | 400,443 |
| 2020-1 CL A2 — 1.78% 12/22/25 | 500,000 | 497,817 |
Exeter Automobile Receivables Trust (EART)(b) |
| 2019-3A CL A — 2.59% 9/15/22 | 115,911 | 115,273 |
| 2020-1A CL A — 2.05% 6/15/23 | 218,469 | 216,328 |
GLS Auto Receivables Trust (GCAR)(b) | |
| 2020-1A CL A — 2.17% 2/15/24 | 241,631 | 238,274 |
Great America Leasing Receivables Trust (GALC)(b) |
| 2020-1 CL A2 — 1.76% 6/15/22 | 500,000 | 496,332 |
Hewlett-Packard Financial Services Equipment Trust (HPEFS)(b) |
| 2019-1A CL A2 — 2.19% 9/20/29 | 250,000 | 248,208 |
| 2020-1A CL A2 — 1.73% 2/20/30 | 250,000 | 246,874 |
The accompanying notes form an integral part of these financial statements.
Q1 2020 Annual Report 45
| | | |
| | | |
| | $ Principal | |
| | Amount | $ Value |
| |
Marlette Funding Trust (MFT)(b) | |
| 2019-2A CL A — 3.13% 7/16/29 | 283,358 | 272,431 |
| 2019-3A CL A — 2.69% 9/17/29 | 308,869 | 299,274 |
OneMain Financial Issuance Trust (OMFIT)(b) |
| 2016-1A CL B — 4.57% 2/20/29 | 250,000 | 246,610 |
Prosper Marketplace Issuance Trust (PMIT)(b) |
| 2019-3A CL A — 3.19% 7/15/25 | 259,007 | 248,939 |
Securitized Term Auto Receivables Trust (SSTRT)(b) (c) |
| 2019-CRTA CL B — 2.453% 3/25/26 | 208,291 | 206,666 |
Social Professional Loan Program LLC (SOFI)(b) |
| 2018-A CL A2A — 2.39% 2/25/42 | 399,527 | 399,808 |
SoFi Consumer Loan Program LLC (SCLP)(b) |
| 2019-2 CL A — 3.01% 4/25/28 | 273,269 | 265,420 |
| 2019-3 CL A — 2.9% 5/25/28 | 302,094 | 293,255 |
Upstart Securitization Trust (UPST)(b) | |
| 2018-1 CL C — 4.997% 8/20/25 | 246,803 | 242,335 |
| Total Asset-Backed Securities (Cost $7,738,962) | | 7,665,913 |
| |
| Commercial Mortgage-Backed Securities – 0.4% | |
| |
GPMT Ltd. (GPMT)(b) (c) | |
| 2018-FL1 CL A — 1.67288% 11/21/35 | |
| Floating Rate (Mthly LIBOR + 90) (Cost $478,611) | 503,801 | 482,238 |
|
| Mortgage-Backed Securities – 6.5% | | |
|
| Federal Home Loan Mortgage Corporation | | |
| |
| Collateralized Mortgage Obligations | |
| 3649 CL BW — 4.0% 3/15/25 | 36,400 | 38,506 |
| |
| Pass-Through Securities | |
| J14649 — 3.5% 4/01/26 | 66,058 | 69,634 |
| E02948 — 3.5% 7/01/26 | 101,176 | 106,750 |
| J16663 — 3.5% 9/01/26 | 63,977 | 67,515 |
| ZS8692 — 2.5% 4/01/33 | 385,485 | 401,120 |
| | 683,525 |
| Federal National Mortgage Association |
| |
| Pass-Through Securities | |
| MA0464 — 3.5% 6/01/20 | 1,717 | 1,808 |
| AR8198 — 2.5% 3/01/23 | 65,192 | 67,751 |
| MA1502 — 2.5% 7/01/23 | 57,704 | 59,970 |
| 995755 — 4.5% 5/01/24 | 7,675 | 8,098 |
| AB1769 — 3.0% 11/01/25 | 57,492 | 60,507 |
| AB3902 — 3.0% 11/01/26 | 110,033 | 115,488 |
| AK3264 — 3.0% 2/01/27 | 87,129 | 91,452 |
| AB 6291 — 3.0% 9/01/27 | 486,695 | 510,079 |
| MA3189 — 2.5% 11/01/27 | 423,990 | 440,758 |
| MA3791 — 2.5% 9/01/29 | 874,151 | 912,076 |
| BM5708 — 3.0% 12/01/29 | 393,618 | 412,498 |
| AS7698 — 2.5% 8/01/31 | 972,799 | 1,012,926 |
| AS7701 — 2.5% 8/01/31 | 559,889 | 586,248 |
| MA3540 — 3.5% 12/01/33 | 391,000 | 412,250 |
| | 4,691,909 |
| |
| Government National Mortgage Association |
| |
| Pass-Through Securities | |
| G2 5255 — 3.0% 12/20/26 | 110,916 | 116,164 |
| |
| Non-Government Agency | | |
| |
| Collateralized Mortgage Obligations | |
J.P. Morgan Mortgage Trust (JPMMT)(b) (d) | |
| 2014-5 CL A1 — 2.959147% 10/25/29 | 162,278 | 164,076 |
| 2017-3 CL 2A2 — 2.5% 8/25/47 | 665,021 | 667,562 |
| | | |
| | $ Principal | |
| | Amount | |
| | or Shares | $ Value |
| |
Sequoia Mortgage Trust (SEMT)(b) (d) | |
| 2017-CH1 CL A11 — 3.5% 8/25/47 | 176,141 | 176,321 |
| 2018-CH2 CL A12 — 4.0% 6/25/48 | 294,718 | 296,874 |
| 2018-CH4 CL A10 — 4.5% 10/25/48 | 272,035 | 271,130 |
| 2019-CH2 CL A1 — 4.5% 8/25/49 | 316,634 | 317,129 |
| 2019-CH3 CL A10 — 4.0% 9/25/49 | 375,130 | 381,224 |
| 2019-4 CL A4 — 3.5% 11/25/49 | 276,586 | 277,980 |
| 2020-2 CL A4 — 3.5% 3/25/50 | 297,619 | 299,212 |
| 2020-3 CL A4 — 3.0% 4/25/50 | 300,000 | 301,401 |
| | 3,152,909 |
| Total Mortgage-Backed Securities (Cost $8,513,783) | | 8,644,507 |
| |
| U.S. Treasury – 36.6% | | |
| |
| U.S. Treasury Notes | | |
| 1.375% 4/30/20 | 1,000,000 | 1,001,039 |
| 1.5% 5/15/20 | 1,000,000 | 1,001,716 |
| 1.5% 6/15/20 | 2,000,000 | 2,005,817 |
| 1.375% 8/31/20 | 1,000,000 | 1,005,274 |
| 2.0% 9/30/20 | 1,000,000 | 1,009,316 |
| 1.625% 10/15/20 | 2,000,000 | 2,016,133 |
| 1.75% 10/31/20 | 2,000,000 | 2,018,867 |
| 2.0% 11/30/20 | 2,000,000 | 2,025,274 |
| 1.125% 2/28/21 | 2,000,000 | 2,018,320 |
| 2.0% 2/28/21 | 1,000,000 | 1,017,363 |
| 2.375% 4/15/21 | 1,000,000 | 1,023,301 |
| 1.375% 5/31/21 | 2,000,000 | 2,029,453 |
| 2.625% 6/15/21 | 1,000,000 | 1,030,274 |
| 1.125% 8/31/21 | 2,000,000 | 2,026,367 |
| 1.5% 9/30/21 | 2,000,000 | 2,038,711 |
| 1.875% 11/30/21 | 2,000,000 | 2,055,508 |
| 1.75% 2/28/22 | 2,000,000 | 2,058,359 |
| 1.75% 4/30/22 | 2,000,000 | 2,063,516 |
| 1.875% 4/30/22 | 1,000,000 | 1,034,102 |
| 2.125% 6/30/22 | 2,000,000 | 2,085,859 |
| 1.875% 7/31/22 | 1,000,000 | 1,037,383 |
| 2.0% 7/31/22 | 1,000,000 | 1,041,250 |
| 1.875% 8/31/22 | 2,000,000 | 2,078,359 |
| 2.0% 11/30/22 | 1,000,000 | 1,045,859 |
| 2.0% 2/15/23 | 1,000,000 | 1,049,531 |
| 2.5% 3/31/23 | 2,000,000 | 2,132,500 |
| 1.625% 5/31/23 | 2,000,000 | 2,083,359 |
| 2.5% 8/15/23 | 2,000,000 | 2,148,047 |
| 2.125% 11/30/23 | 2,000,000 | 2,131,641 |
| 2.0% 4/30/24 | 1,000,000 | 1,067,305 |
| Total U.S. Treasury (Cost $46,805,318) | | 48,379,803 |
| |
| Cash Equivalents – 1.6% | | |
| |
| State Street Institutional U.S. Government Money | | |
Market Fund - Premier Class 0.32%(a) | 2,061,046 | 2,061,046 |
| Total Cash Equivalents (Cost $2,061,046) | | 2,061,046 |
| Total Investments in Securities (Cost $117,410,990) | | 132,401,710 |
| Other Liabilities in Excess of Other Assets - (0.1%) | | (128,600) |
| Net Assets - 100% | | 132,273,110 |
| Net Asset Value Per Share - Investor Class | 13.54 |
| Net Asset Value Per Share - Institutional Class | 13.55 |
| |
| * | Non-income producing |
(a)
| Rate presented represents the annualized 7-day yield at March 31, 2020. |
(b)
| Security is exempt from registration under Rule 144A of the Securities Act of 1933. This security may be resold in transactions that are exempt from registration, normally to qualified institutional buyers. |
(c)
| Foreign domiciled entity |
(d)
| The interest rate resets periodically based on the weighted average coupons of the underlying mortgage-related or asset-backed obligations. |
The accompanying notes form an integral part of these financial statements.
46 Q1 2020 Annual Report
CORE PLUS INCOME FUND
Schedule of Investments
March 31, 2020
| | | |
| Corporate Bonds – 35.0% | | |
| | $ Principal | |
| | Amount | $ Value |
| |
Air Canada 7.75% 4/15/21(b) (c) | 250,000 | 245,300 |
| Alexandria Real Estate Equities, Inc. 3.95% 1/15/28 | 366,000 | 375,693 |
American Airlines Group Inc. 3.75% 3/01/25(b) | 1,000,000 | 705,625 |
| American Tower Corp. 2.95% 1/15/25 | 500,000 | 500,405 |
Ashtead U.S. Holdings, Inc. 4.0% 5/01/28(b) (c) | 250,000 | 216,125 |
Beacon Roofing Supply, Inc. 4.875% 11/01/25(b) | 323,000 | 293,528 |
| Berkshire Hathaway Inc. Finance Corp. 4.25% 1/15/49 | 500,000 | 618,482 |
| Booking Holdings Inc. | |
| 3.65% 3/15/25 | 100,000 | 100,557 |
| 3.55% 3/15/28 | 464,000 | 471,465 |
| Boston Properties LP 3.125% 9/01/23 | 555,000 | 566,376 |
| Broadcom Corp. 3.125% 1/15/25 | 350,000 | 336,207 |
| CA, Inc. 3.6% 8/15/22 | 973,000 | 913,850 |
| Calumet Specialty Products Partners LP 7.625% 1/15/22 | 357,000 | 279,687 |
| Carlisle Companies Inc. | | |
| 3.5% 12/01/24 | 532,000 | 514,442 |
| 3.75% 12/01/27 | 500,000 | 518,769 |
| CenturyLink, Inc. | |
| 5.625% 4/01/20 | 250,000 | 250,000 |
| 6.75% 12/01/21 (Qwest Corp.) | 1,250,000 | 1,276,096 |
| Charter Communications, Inc. | | |
| CCO Holdings, LLC | | |
5.125% 5/01/23(b) | 300,000 | 304,877 |
| Operating, LLC | | |
| 4.2% 3/15/28 | 650,000 | 668,733 |
Colfax Corp. 6.0% 2/15/24(b) | 1,000,000 | 1,001,255 |
| CommScope Holding Company, Inc. 5.0% 6/15/21 | 38,000 | 37,951 |
| Computer Sciences Corp. 4.45% 9/15/22 | 500,000 | 516,319 |
| Concho Resources Inc. 4.375% 1/15/25 | 500,000 | 427,354 |
Cox Communications, Inc. 3.5% 8/15/27(b) | 842,000 | 824,540 |
| Diamondback Energy, Inc. | |
| 2.875% 12/01/24 | 600,000 | 420,456 |
| 5.375% 5/31/25 | 289,000 | 213,787 |
| 3.25% 12/01/26 | 75,000 | 53,153 |
| 3.5% 12/01/29 | 100,000 | 70,927 |
| Discovery, Inc. 2.95% 3/20/23 | 750,000 | 749,363 |
| Dollar Tree, Inc. 3.7% 5/15/23 | 75,000 | 76,292 |
| Energy Transfer Operating, LP | |
| 2.9% 5/15/25 | 500,000 | 423,656 |
| 4.75% 1/15/26 | 200,000 | 177,114 |
| Enterprise Products Partners LP 4.45% 2/15/43 | 990,000 | 940,161 |
| EPR Properties 4.75% 12/15/26 | 250,000 | 227,755 |
| EQT Corp. 3.0% 10/01/22 | 500,000 | 421,250 |
| Equifax Inc. 2.3% 6/01/21 | 100,000 | 97,283 |
| Equinix, Inc. 5.375% 5/15/27 | 500,000 | 501,665 |
| Expedia Group, Inc. | |
| 3.8% 2/15/28 | 1,050,000 | 910,533 |
| 3.25% 2/15/30 | 90,000 | 73,813 |
frontdoor, inc. 6.75% 8/15/26(b) | 144,000 | 139,110 |
| General Electric Co. | |
| 4.65% 10/17/21 | 591,000 | 602,987 |
| 2.7% 10/09/22 | 245,000 | 241,299 |
| L Brands, Inc. 6.694% 1/15/27 | 1,080,000 | 788,986 |
| Level 3 Parent LLC 5.25% 3/15/26 | 750,000 | 753,694 |
| Lexington Realty Trust 4.4% 6/15/24 | 610,000 | 600,167 |
| Markel Corp. | |
| 4.9% 7/01/22 | 250,000 | 251,417 |
| 3.625% 3/30/23 | 200,000 | 194,395 |
| 3.5% 11/01/27 | 550,000 | 502,782 |
Marvell Technology Group Ltd. 4.2% 6/22/23(c) | 300,000 | 307,226 |
| Matador Resources Co. 5.875% 9/15/26 | 650,000 | 186,696 |
| Micron Technology, Inc. 4.185% 2/15/27 | 500,000 | 507,483 |
Molex Electronics Technologies, LLC 3.9% 4/15/25(b) | 300,000 | 323,432 |
| MPLX LP | |
6.25% 10/15/22(b) | 1,000,000 | 901,100 |
| 4.875% 6/01/25 | 190,000 | 156,740 |
| 4.0% 3/15/28 | 85,000 | 75,717 |
| 4.7% 4/15/48 | 551,000 | 428,603 |
MSCI Inc. 4.75% 8/01/26(b) | 150,000 | 148,795 |
| | | |
| | $ Principal | |
| | Amount | $ Value |
| |
| NGL Energy Partners LP | |
| 7.5% 11/01/23 | 1,518,000 | 538,844 |
| 6.125% 3/01/25 | 1,333,000 | 464,877 |
| 7.5% 4/15/26 | 400,000 | 142,847 |
NXP BV 4.625% 6/01/23(b) (c) | 100,000 | 103,051 |
| Occidental Petroleum Corp. | |
| 3.4% 4/15/26 | 715,000 | 344,145 |
| 4.3% 8/15/39 | 100,000 | 42,676 |
| OneMain Holdings, Inc. 5.375% 11/15/29 (Springleaf Finance) | 900,000 | 828,963 |
Parsley Energy LLC 5.25% 8/15/25(b) | 1,000,000 | 768,745 |
| PDC Energy, Inc. | |
| 6.125% 9/15/24 | 500,000 | 271,248 |
| 5.75% 5/15/26 | 777,000 | 440,345 |
| Physicians Realty Trust 4.3% 3/15/27 | 575,000 | 537,271 |
| Plains All American Pipeline, LP 3.55% 12/15/29 | 798,000 | 548,325 |
| QVC, Inc. 4.375% 3/15/23 | 500,000 | 473,465 |
| RELX plc 3.5% 3/16/23 | 770,000 | 802,653 |
Seagate Technology plc(c) | |
| 4.25% 3/01/22 | 595,000 | 596,633 |
| 4.75% 6/01/23 | 400,000 | 401,083 |
Silversea Cruise Holding Ltd. 7.25% 2/01/25(b) (c) | 1,075,000 | 923,151 |
Sirius XM Radio Inc. 3.875% 8/01/22(b) | 500,000 | 501,864 |
Sprint Spectrum Co. LLC 3.36% 3/20/23(b) (d) | 261,750 | 261,423 |
| STORE Capital Corp. | |
| 4.5% 3/15/28 | 503,000 | 503,257 |
| 4.625% 3/15/29 | 500,000 | 506,018 |
| TC PipeLines LP 4.65% 6/15/21 | 160,000 | 159,016 |
| Tempur Sealy International, Inc. 5.625% 10/15/23 | 1,008,000 | 943,735 |
| United Airlines Holdings, Inc. 4.875% 1/15/25 | 200,000 | 173,749 |
| Western Midstream Operating, LP 4.05% 2/01/30 | 300,000 | 132,699 |
| WPX Energy, Inc. | |
| 5.75% 6/01/26 | 75,000 | 43,273 |
| 5.25% 10/15/27 | 500,000 | 277,775 |
| 4.5% 1/15/30 | 377,000 | 206,125 |
| Total Corporate Bonds (Cost $40,113,008) | | 36,368,729 |
| |
| Corporate Convertible Bonds – 1.2% | | |
| |
| Redwood Trust, Inc. | |
| 4.75% 8/15/23 | 850,000 | 555,400 |
| 5.625% 7/15/24 | 700,000 | 387,843 |
5.75% 10/01/25(b) | 500,000 | 308,416 |
| Total Corporate Convertible Bonds (Cost $1,789,153) | | 1,251,659 |
| |
| Asset-Backed Securities – 28.8% | | |
| |
American Credit Acceptance Receivables Trust (ACAR)(b) | | |
| 2019-4 CL B — 2.43% 10/12/23 | 500,000 | 477,684 |
| AmeriCredit Automobile Receivables Trust (AMCAR) |
| 2017-1 CL D — 3.13% 1/18/23 | 69,000 | 68,269 |
Arivo Acceptance Auto Loan Receivables Trust (ARIVO)(b) | | |
| 2019-1 CL A — 2.99% 7/15/24 | 936,887 | 920,224 |
Ascentium Equipment Receivables Trust (ACER)(b) |
| 2017-1A CL D — 3.8% 1/10/24 | 216,000 | 217,509 |
| 2018-2A CL B — 3.76% 5/10/24 | 213,000 | 217,089 |
Avant Loans Funding Trust (AVNT)(b) | |
| 2019-B CL A — 2.72% 10/15/26 | 309,174 | 301,236 |
BCC Funding XVI LLC (BCCFC)(b) | |
| 2019-1A CL A2 — 2.46% 8/20/24 | 500,000 | 486,549 |
| CarMax Auto Owner Trust (CARMX) | |
| 2017-2 CL B — 2.41% 12/15/22 | 90,000 | 89,886 |
| 2017-2 CL C — 2.6% 2/15/23 | 53,000 | 52,671 |
| 2017-4 CL C — 2.7% 10/16/23 | 51,000 | 50,715 |
Carvana Auto Receivables Trust (CRVNA)(b) |
| 2019-1A CL C — 3.5% 2/15/24 | 700,000 | 693,059 |
The accompanying notes form an integral part of these financial statements.
Q1 2020 Annual Report 47
| | | |
| $ Principal | |
| Amount | $ Value |
|
Chesapeake Funding II LLC (CFII)(b) | |
| 2017-3A CL D — 3.38% 8/15/29 | 550,000 | 548,604 |
Commercial Credit Group Receivables Trust (CCG)(b) |
| 2017-1 CL B — 2.75% 11/14/23 | 410,000 | 409,846 |
| 2018-1 CL B — 3.09% 6/16/25 | 620,000 | 611,476 |
| 2019-1 CL B — 3.22% 9/14/26 | 750,000 | 753,002 |
Conn Funding II, LP (CONN)(b) | |
| 2019-A CL A — 3.4% 10/16/23 | 148,564 | 144,499 |
| 2019-B CL A — 2.66% 6/17/24 | 341,337 | 323,889 |
Dell Equipment Finance Trust (DEFT)(b) | |
| 2017-2 CL B — 2.47% 10/24/22 | 200,000 | 199,514 |
| 2018-1 CL B — 3.34% 6/22/23 | 590,000 | 592,752 |
| 2018-2 CL C — 3.72% 10/22/23 | 225,000 | 227,568 |
| 2019-1 CL C — 3.14% 3/22/24 | 750,000 | 752,163 |
Driven Brands Funding, LLC (HONK)(b) | |
| 2019-2A CL A2 — 3.981% 10/20/49 | 498,750 | 466,553 |
DT Auto Owner Trust (DTAOT)(b) | |
| 2016-4A CL D — 3.77% 10/17/22 | 33,182 | 33,165 |
| 2019-3A CL D — 2.96% 4/15/25 | 1,000,000 | 968,140 |
Enterprise Fleet Financing LLC (EFF)(b) | |
| 2017-2 CL A2 — 1.97% 1/20/23 | 32,533 | 32,508 |
| 2019-2 CL A2 — 2.29% 2/20/25 | 500,000 | 500,554 |
Exeter Automobile Receivables Trust (EART)(b) |
| 2016-2A CL C — 5.96% 2/15/22 | 76,055 | 76,117 |
| 2017-2A CL B — 2.82% 5/16/22 | 34,985 | 34,922 |
| 2019-3A CL A — 2.59% 9/15/22 | 115,911 | 115,273 |
| 2017-1A CL C — 3.95% 12/15/22 | 571,899 | 551,162 |
| 2018-2A CL C — 3.69% 3/15/23 | 150,000 | 150,119 |
| 2017-3A CL C — 3.68% 7/17/23 | 88,000 | 85,753 |
First Investors Auto Owners Trust (FIAOT)(b) |
| 2015-2A CL D — 4.22% 12/15/21 | 242,477 | 242,459 |
| 2016-2A CL B — 2.21% 7/15/22 | 141,261 | 141,078 |
| 2016-2A CL C — 2.53% 7/15/22 | 116,000 | 115,323 |
| 2017-1A CL B — 2.67% 4/17/23 | 187,000 | 186,481 |
| 2017-1A CL C — 2.95% 4/17/23 | 505,000 | 502,185 |
| 2018-1A CL C — 3.69% 6/17/24 | 177,000 | 175,814 |
Foundation Finance Trust (FFIN)(b) | |
| 2019-1A CL A — 3.86% 11/15/34 | 478,159 | 457,792 |
Freedom Financial (FREED)(b) | |
| 2020-FP1 CL A — 2.52% 3/18/27 | 458,079 | 436,133 |
| 2020-FP1 CL B — 3.06% 3/18/27 | 500,000 | 473,519 |
GLS Auto Receivables Trust (GCAR)(b) | |
| 2018-2A CL A — 3.25% 4/18/22 | 252,582 | 250,647 |
| 2019-2A CL A — 3.06% 4/17/23 | 189,030 | 185,037 |
| 2019-3A CL A — 2.58% 7/17/23 | 170,200 | 168,700 |
| 2019-4A CL A — 2.47% 11/15/23 | 418,263 | 391,703 |
| 2020-1A CL A — 2.17% 2/15/24 | 483,262 | 476,548 |
GM Financial Automobile Leasing Trust (GMALT) |
| 2018-3 CL C — 3.7% 7/20/22 | 550,000 | 552,182 |
Hertz Fleet Lease Funding LP (HFLF)(b) | |
| 2018-1 CL A2 — 3.23% 5/10/32 | 257,197 | 257,295 |
Jersey Mike’s Funding, LLC (JMIKE)(b) | |
| 2019-1A CL A2 — 4.433% 2/15/50 | 1,000,000 | 887,300 |
Marlette Funding Trust (MFT)(b) | |
| 2018-3A CL A — 3.2% 9/15/28 | 44,949 | 44,664 |
| 2018-4A CL B — 4.21% 12/15/28 | 250,000 | 235,876 |
| 2019-2A CL B — 3.53% 7/16/29 | 500,000 | 407,377 |
| 2019-3A CL A — 2.69% 9/17/29 | 308,869 | 299,274 |
| 2019-4A CL A — 2.39% 12/17/29 | 397,178 | 383,764 |
MMAF Equipment Finance LLC (MMAF)(b) | |
| 2016-AA CL A4 — 1.76% 1/17/23 | 283,522 | 281,681 |
| 2017-AA CL A4 — 2.41% 8/16/24 | 485,000 | 483,401 |
Oasis Securitization Funding, LLC (OASIS)(b) |
| 2020-1A CL A — 3.8196% 1/15/32 | 469,180 | 467,074 |
Octane Receivables Trust (OCTL)(b) | |
| 2019-1A CL A — 3.16% 9/20/23 | 856,215 | 852,687 |
OneMain Direct Auto Receivables Trust (ODART)(b) |
| 2017-2A CL C — 2.82% 7/15/24 | 285,000 | 283,760 |
| 2017-2A CL D — 3.42% 10/15/24 | 800,000 | 797,652 |
| | | |
| | $ Principal | |
| | Amount | $ Value |
| |
OneMain Financial Issuance Trust (OMFIT)(b) |
| 2015-3A CL A — 3.63% 11/20/28 | 225,000 | 213,309 |
Pawnee Equipment Receivables LLC (PWNE)(b) |
| 2019-1 CL A2 — 2.29% 10/15/24 | 500,000 | 493,837 |
| 2019-1 CL D — 2.86% 10/15/24 | 500,000 | 491,370 |
Prosper Marketplace Issuance Trust (PMIT)(b) |
| 2019-1A CL A — 3.54% 4/15/25 | 124,557 | 123,325 |
| 2019-1A CL B — 4.03% 4/15/25 | 500,000 | 476,202 |
| 2019-3A CL A — 3.19% 7/15/25 | 259,007 | 248,939 |
| 2019-2A CL A — 3.2% 9/15/25 | 85,815 | 83,771 |
| Santander Drive Auto Receivables Trust (SDART) |
| 2017-1 CL C — 2.58% 5/16/22 | 28,101 | 28,082 |
Securitized Term Auto Receivables Trust (SSTRT)(b) (c) |
| 2019-CRTA CL C — 2.849% 3/25/26 | 833,166 | 826,732 |
Sierra Timeshare Receivables Funding LLC (SRFC)(b) |
| 2019-2A CL B — 2.82% 5/20/36 | 520,512 | 513,231 |
Small Business Lending Trust (SBIZ)(b) | |
| 2020-A CL A — 2.62% 12/15/26 | 470,813 | 459,606 |
SoFi Consumer Loan Program LLC (SCLP)(b) |
| 2016-2 CL A — 3.09% 10/27/25 | 42,593 | 41,860 |
| 2016-3 CL A — 3.05% 12/26/25 | 11,817 | 11,708 |
| 2017-1 CL A — 3.28% 1/26/26 | 10,696 | 10,511 |
| 2019-3 CL A — 2.9% 5/25/28 | 302,094 | 293,255 |
Upgrade Receivables Trust (UPGR)(b) | |
| 2018-1A CL C — 5.17% 11/15/24 | 100,000 | 96,484 |
| 2019-1A CL B — 4.09% 3/15/25 | 1,117,000 | 1,072,276 |
Upstart Securitization Trust (UPST)(b) | |
| 2017-2 CL C — 5.59% 3/20/25 | 493,400 | 453,769 |
| 2018-1 CL C — 4.997% 8/20/25 | 771,258 | 757,298 |
| 2019-1 CL B — 4.19% 4/20/26 | 500,000 | 468,468 |
| 2019-2 CL B — 3.734% 9/20/29 | 750,000 | 603,026 |
| 2020-1 CL A — 2.322% 4/22/30 | 389,000 | 367,491 |
Verizon Owner Trust (VZOT)(b) | |
| 2017-2A CL C — 2.38% 12/20/21 | 100,000 | 100,057 |
Westlake Automobile Receivables Trust (WLAKE)(b) |
| 2018-1A CL C — 2.92% 5/15/23 | 154,822 | 153,183 |
| Total Asset-Backed Securities (Cost $30,954,568) | | 29,977,666 |
| |
| Commercial Mortgage-Backed Securities – 11.0% | |
| |
BDS Ltd. (BDS)(b) | |
| 2018-FL1 CL B — 2.05013% 1/15/35 | | |
| Floating Rate (Mthly LIBOR + 125) | 670,967 | 657,787 |
BXMT Ltd. (BXMT)(b) (c) | |
| 2017-FL1 CL A — 1.67013% 6/15/35 | | |
| Floating Rate (Mthly LIBOR + 87) | 233,738 | 224,418 |
Exantas Capital Corp. Ltd. (XAN)(b) (c) | |
| 2018-RS06 CL D — 3.30013% 6/15/35 | |
| Floating Rate (Mthly LIBOR + 250) | 1,500,000 | 1,403,055 |
| 2019-RS07 CL A — 1.80013% 4/15/36 | |
| Floating Rate (Mthly LIBOR + 100) | 757,567 | 702,897 |
GPMT Ltd. (GPMT)(b) (c) | |
| 2018-FL1 CL C — 2.92288% 11/19/35 | |
| Floating Rate (Mthly LIBOR + 215) | 1,028,000 | 914,800 |
| 2018-FL1 CL D — 3.72288% 11/21/35 | |
| Floating Rate (Mthly LIBOR + 295) | 1,096,000 | 921,602 |
Hilton USA Trust (HILT)(b) | |
| 2016-SFP CL E — 5.519097% 11/05/35 | 840,000 | 766,651 |
PFP Ltd. (PFP)(b) (c) | |
| 2019-5 CL C — 2.70463% 4/14/36 | | |
| Floating Rate (Mthly LIBOR + 200) | 500,000 | 459,210 |
ReadyCap Commercial Mortgage Trust (RCMT)(b) |
| 2019-FL3 CL A — 1.94663% 3/25/34 | | |
| Floating Rate (Mthly LIBOR + 100) | 673,000 | 643,708 |
| 2018-FL2 CL C — 2.84663% 6/25/35 | | |
| Floating Rate (Mthly LIBOR + 190) | 750,000 | 712,690 |
| 2018-FL2 CL D — 3.64663% 6/25/35 | | |
| Floating Rate (Mthly LIBOR + 270) | 2,130,000 | 1,949,618 |
The accompanying notes form an integral part of these financial statements.
48 Q1 2020 Annual Report
CORE PLUS INCOME FUND (CONTINUED)
Schedule of Investments
March 31, 2020
| | | |
| | | |
| | $ Principal | |
| | Amount | $ Value |
| |
RETL (RETL)(b) | |
| 2019-RVP CL C — 2.80463% 3/15/36 | |
| Floating Rate (Mthly LIBOR + 210) | 1,250,000 | 1,107,327 |
VMC Finance LLC (VMC)(b) | |
| 2018-FL2 CL C — 2.75013% 10/15/35 | |
| Floating Rate (Mthly LIBOR + 195) | 1,000,000 | 945,616 |
| Total Commercial Mortgage-Backed Securities (Cost $12,283,241) | 11,409,379 |
| |
| Mortgage-Backed Securities – 4.2% | | |
| |
| Federal Home Loan Mortgage Corporation |
| |
| Pass-Through Securities | |
| C91945 — 3.0% 8/1/37 | 847,022 | 897,476 |
| |
| Federal National Mortgage Association |
| |
| Pass-Through Securities | |
| 932836 — 3.0% 12/01/25 | 47,001 | 49,312 |
| MA3443 — 4.0% 8/01/48 | 636,125 | 680,205 |
| | | 729,517 |
| |
| Non-Government Agency |
| |
| Collateralized Mortgage Obligations | |
COLT Funding LLC (COLT)(b) (e) | |
| 2019-4 CL A1 — 2.579% 11/25/49 | 202,866 | 198,664 |
Deephaven Residential Mortgage Trust (DRMT)(b) (e) |
| 2019-3A CL A1 — 2.964% 7/25/59 | 368,737 | 355,726 |
| 2019-4A CL A1 — 2.791% 10/25/59 | 450,598 | 428,178 |
Flagstar Mortgage Trust (FSMT)(b) (e) | |
| 2017-1 CL 2A2 — 3.0% 3/25/47 | 212,810 | 215,839 |
J.P. Morgan Mortgage Trust (JPMMT)(b) (e) | |
| 2016-3 CL 2A1 — 3.0% 10/25/46 | 216,220 | 218,850 |
| 2017-3 CL 2A2 — 2.5% 8/25/47 | 232,757 | 233,647 |
| 2018-6 CL 2A2 — 3.0% 12/25/48 | 201,308 | 203,218 |
Sequoia Mortgage Trust (SEMT)(b) (e) | |
| 2017-CH1 CL A11 — 3.5% 8/25/47 | 140,913 | 141,057 |
| 2018-CH2 CL A12 — 4.0% 6/25/48 | 294,718 | 296,874 |
| 2019-CH2 CL A1 — 4.5% 8/25/49 | 474,950 | 475,693 |
| | 2,767,746 |
| Total Mortgage-Backed Securities (Cost $4,334,153) | | 4,394,739 |
| |
| Taxable Municipal Bonds – 0.4% | | |
| |
| Alderwood Water and Wastewater District, | | |
| Washington, Water & Sewer Revenue, Series B, | | |
| 5.15% 12/01/25 (Cost $400,000) | 400,000 | 401,048 |
| |
| U.S. Treasury – 18.1% | | |
| |
| U.S. Treasury Notes/Bonds | | |
| 1.5% 8/15/26 | 2,850,000 | 3,023,005 |
| 2.0% 11/15/26 | 1,650,000 | 1,806,814 |
| 2.25% 2/15/27 | 1,000,000 | 1,115,977 |
| 2.375% 5/15/27 | 2,000,000 | 2,257,188 |
| 3.5% 2/15/39 | 2,100,000 | 2,990,367 |
| 2.5% 5/15/46 | 6,100,000 | 7,675,754 |
| Total U.S. Treasury (Cost $15,267,445) | | 18,869,105 |
| | | |
| Common Stocks – 0.1% | | |
| Shares | $ Value |
| | | |
| Redwood Trust, Inc. (Cost $335,339) | 27,000 | 136,620 |
| | | |
| Cash Equivalents – 1.0% | | |
| |
| State Street Institutional U.S. Government Money |
Market Fund - Premier Class 0.32%(a) | 1,043,057 | 1,043,057 |
| Total Cash Equivalents (Cost $1,043,057) | | 1,043,057 |
| Total Investments in Securities (Cost $106,519,964) | | 103,852,002 |
| Other Assets Less Other Liabilities - 0.2% | | 196,849 |
| Net Assets - 100% | | 104,048,851 |
| Net Asset Value Per Share - Investor Class | 10.14 |
| Net Asset Value Per Share - Institutional Class | 10.15 |
| | |
(a) | Rate presented represents the annualized 7-day yield at March 31, 2020.
|
(b) | Security is exempt from registration under Rule 144A of the Securities Act of 1933. This security may be resold in transactions that are exempt from registration, normally to qualified institutional buyers.
|
(c) | Foreign domiciled entity
|
(d) | Annual sinking fund
|
(e)
| The interest rate resets periodically based on the weighted average coupons of the underlying mortgage-related or asset-backed obligations. |
The accompanying notes form an integral part of these financial statements.
Q1 2020 Annual Report 49
NEBRASKA TAX-FREE INCOME FUND
Schedule of Investments
March 31, 2020
| | | | |
| Municipal Bonds – 94.7% | | | |
| % of Net
| $ Principal | |
| Assets
| Amount | $ Value |
| |
| Arizona | 0.4 | | |
| Arizona Industrial Development Authority, | | | |
| Revenue, Lincoln South Beltway Project, | | | |
| Series 2020, 5.0%, 2/01/23 | 100,000 | 108,055 |
| |
| California | 0.7 | | |
| San Diego County Regional Airport Authority, | | | |
| Subordinate Airport Revenue, Series 2017B, | | | |
| AMT, 5.0%, 7/01/25 | | 200,000 | 230,622 |
| |
| Colorado | 0.3 | | |
| Colorado Bridge Enterprise, Senior Revenue, | | | |
| Central 70 Project, Series 2017, AMT, 4.0%, 12/31/23 | 100,000 | 107,966 |
| |
| Nebraska | 91.6 | | |
| Blair, Water System Revenue, Series 2016, AMT, | | | |
| 2.65%, 12/15/24 | 100,000 | 100,240 |
| 2.85%, 12/15/25 | 100,000 | 100,456 |
| 3.0%, 12/15/26 | 100,000 | 100,434 |
| 3.1%, 12/15/27 | 100,000 | 100,330 |
| 3.2%, 12/15/28 | 100,000 | 100,393 |
| Buffalo County, General Obligation, Kearney Public Schools | | |
| District 0007, Series 2016, 3.0%, 12/15/24 | 250,000 | 268,820 |
| Cass County, General Obligation, Refunding, Weeping | | |
| Water Public School District 0022, Series 2017 | | |
| 2.05%, 12/15/25 | 375,000 | 378,806 |
| 2.2%, 12/15/26 | 250,000 | 253,230 |
| Chadron, Sales Tax and General Obligation, Aquatic Center, | | |
| Series 2016, 1.6%, 7/15/22 | 400,000 | 400,080 |
| Columbus, Combined Revenue, Refunding, Series 2016, | | |
| AGM Insured | | | |
| 4.0%, 12/15/26 | 100,000 | 115,955 |
| 4.0%, 12/15/27 | 100,000 | 117,446 |
| Dawson Public Power District, Electric System Revenue, | | |
| Refunding, Series 2016A | |
| 2.0%, 6/15/26 | 170,000 | 170,473 |
| 2.1%, 6/15/27 | 105,000 | 105,244 |
| Series 2016B | |
| 2.5%, 6/15/28 | 135,000 | 135,949 |
| 3.0%, 6/15/29 | 245,000 | 248,246 |
| 3.0%, 6/15/30 | 355,000 | 359,501 |
| Douglas County, General Obligation, |
| Omaha Public School District 0001, Series 2016, |
| 5.0%, 12/15/29 | 350,000 | 432,862 |
| Westside Community School District 0066, Series 2015, | | |
| 2.5%, 12/01/22 | 250,000 | 257,777 |
| Douglas County, Hospital Authority #2, Revenue, | | | |
| Madonna Rehabilitation Hospital Project, Series 2014, | | |
| 5.0%, 5/15/26 | 500,000 | 567,750 |
| Refunding, Nebraska Medicine, Series 2016, | | | |
| 4.0%, 5/15/32 | 700,000 | 771,421 |
| Douglas County, Hospital Authority #3, Revenue, Refunding, | | |
| Nebraska Methodist Health System, Series 2015 | | | |
| 5.0%, 11/01/20 | 100,000 | 102,020 |
| 5.0%, 11/01/21 | 100,000 | 105,623 |
| 5.0%, 11/01/22 | 250,000 | 272,502 |
| Fremont, Combined Utility Revenue, Series 2014B, | | |
| 3.0%, 7/15/21 | 370,000 | 378,088 |
| Lincoln-Lancaster County, Public Building Commission, | | |
| Lease Revenue, Series 2016, 3.0%, 12/01/25 | 500,000 | 544,760 |
| Lincoln, Educational Facilities, Revenue, Refunding, | | |
| Nebraska Wesleyan University Project, Series 2012, | | |
| 2.5%, 4/01/21 | 425,000 | 430,419 |
| Lincoln, Electric System Revenue, Refunding, | | | |
| Series 2012, 5.0%, 9/01/28, Pre-Refunded 9/01/22 @ 100 | 1,000,000 | 1,091,390 |
| Lincoln, General Obligation, Highway Allocation Fund, | | |
| Refunding, Series 2016 | | | |
| 5.0%, 5/15/22 | 100,000 | 108,157 |
| 5.0%, 5/15/23 | 135,000 | 150,957 |
| | | |
| | $ Principal | |
| | Amount | $ Value |
| |
| Madison County, Hospital Authority #1, Revenue, Refunding, | | |
| Faith Regional Health Services Project, Series 2017A | | |
| 5.0%, 7/01/21 | 475,000 | 493,126 |
| 5.0%, 7/01/23 | 250,000 | 273,175 |
| Metropolitan Utilities District of Omaha, Gas System Revenue, | | |
| Series 2018, 4.0%, 12/01/27 | 450,000 | 505,359 |
| Municipal Energy Agency of Nebraska, Power Supply | | |
| System Revenue, Refunding, |
| 2012 Series A, 5.0%, 4/01/29 | 300,000 | 321,123 |
| 2016 Series A | |
| 5.0%, 4/01/21 | 250,000 | 259,440 |
| 5.0%, 4/01/27 | 350,000 | 426,769 |
| Nebraska, Certificates of Participation, | | |
| Series 2017B, 1.35%, 7/15/20 | 785,000 | 785,126 |
| Series 2015C, 1.7%, 9/15/20 | 200,000 | 200,090 |
| Series 2018A, 2.1%, 7/15/21 | 860,000 | 869,400 |
| Nebraska Educational, Health, Cultural, and Social Services | | |
| Finance Authority, Revenue, Refunding, Immanuel Retirement | | |
| Communities Obligated Group, Series 2019A, 4.0%, 1/01/34 | 110,000 | 119,962 |
| Nebraska Investment Finance Authority, Single | | |
| Family Housing Revenue, | | |
| 2016 Series C, 1.85%, 3/01/23 | 100,000 | 100,716 |
| 2019 Series A, 2.05%, 9/01/24 | 120,000 | 121,800 |
| Nebraska Public Power District, Revenue, | | |
| 2012 Series A | | |
| 4.0%, 1/01/21 | 500,000 | 510,905 |
| 5.0%, 1/01/21 | 500,000 | 514,615 |
| 2015 Series A-2 | |
| 5.0%, 1/01/24 | 225,000 | 239,764 |
| 5.0%, 1/01/24, Pre-Refunded 1/01/22 @ 100 | 25,000 | 26,660 |
| 2016 Series C, 5.0%, 1/01/35 | 480,000 | 563,962 |
| Nebraska State Colleges, Facilities Corp., Deferred | | |
| Maintenance Revenue, Refunding, Series 2016, | | |
| AGM Insured, 4.0%, 7/15/28 | 750,000 | 843,622 |
| North Platte, Sewer System Revenue, Refunding, Series 2015, | | |
| 3.0%, 6/15/24 | 250,000 | 251,132 |
| Omaha-Douglas County, General Obligation, Public Building | | |
| Commission, Series 2014, 5.0%, 5/01/26, | | |
| Pre-Refunded 5/01/22 @ 100 | 725,000 | 783,776 |
| Omaha, General Obligation, Refunding, |
| Series 2012B, 3.0%, 11/15/24 | 400,000 | 416,920 |
| Various Purpose and Refunding, Series 2016A |
| 4.0%, 4/15/22 | 315,000 | 332,933 |
| 4.0%, 4/15/23 | 185,000 | 200,390 |
| Omaha Public Facilities Corp., Lease Revenue, | | |
| Omaha Baseball Stadium Project | |
| Refunding, Series 2016A, 4.0%, 6/01/28 | 585,000 | 660,336 |
| Series 2010, 4.125%, 6/01/29 | 650,000 | 653,230 |
| Refunding, Series 2019C | |
| 4.0%, 4/01/33 | 340,000 | 396,464 |
4.0%, 4/01/39(b) | 500,000 | 569,335 |
| Omaha Public Power District, Electric System Revenue, | | |
| 2015 Series A, 2.85%, 2/01/27 | 500,000 | 527,455 |
| Omaha, Sanitary Sewerage System Revenue, | | |
| Refunding, Series 2016 | |
| 5.0%, 4/01/26 | 250,000 | 303,138 |
| 4.0%, 4/01/31 | 350,000 | 399,154 |
| Series 2014, 5.0%, 11/15/22 | 200,000 | 219,670 |
| Omaha, Special Tax Revenue Redevelopment, | | |
| Series 2019A, 4.0%, 1/15/33 | 260,000 | 303,082 |
| Papillion, General Obligation, Tax Supported | | |
| Recreational Facilities, Series 2017, 3.0%, 9/15/24 | 420,000 | 433,763 |
| Papillion-La Vista, General Obligation, Sarpy County | | |
| School District #27, Refunding, Series 2017A | | |
| 2.05%, 12/01/24 | 150,000 | 152,243 |
| 2.2%, 12/01/25 | 150,000 | 152,538 |
| 2.3%, 12/01/26 | 275,000 | 279,450 |
The accompanying notes form an integral part of these financial statements.
50 Q1 2020 Annual Report
NEBRASKA TAX-FREE INCOME FUND (CONTINUED)
Schedule of Investments
March 31, 2020
| | | | |
| | % of Net | $ Principal | |
| | Assets | Amount | $ Value |
| |
| Papio-Missouri River Natural Resources District, General | | |
| Obligation, Flood Protection and Water Quality Enhancement, | | |
| Refunding, |
| Series 2015 | |
| 2.0%, 12/15/20 | 100,000 | 100,150 |
| 2.25%, 12/15/21 | 100,000 | 100,164 |
| Series 2017, 5.0%, 12/15/26, Pre-Refunded | | |
| 6/15/22 @ 100 | 185,000 | 200,867 |
| Public Power Generation Agency, Revenue, Refunding, | | |
| Whelan Energy Center Unit 2, 2015 Series A, 5.0%, 1/01/28 | 200,000 | 231,982 |
| Sarpy County, General Obligation, Bellevue Public School | | |
| District 0001, Series 2017, 5.0%, 12/15/29 | 550,000 | 689,981 |
| Sarpy County, Certificates of Participation, | | | |
| Series 2016, 1.75%, 6/15/26 | 500,000 | 502,850 |
| Seward County, Limited Tax General Obligation, Refunding, | | |
| Series 2019, 3.0%, 12/15/30 | 605,000 | 633,774 |
| Southeast Community College Area, Certificates of | | |
| Participation, Series 2018, 3.0%, 12/15/22 | 400,000 | 418,660 |
| Thayer County, General Obligation Hospital, Refunding, | | |
| Series 2017, 1.3%, 9/01/20 | 400,000 | 399,924 |
| University of Nebraska, Facilities Corp., Revenue, Refunding, | | |
| Health Center and College of Nursing Projects, Series 2016, | | |
| 5.0%, 7/15/29 | 380,000 | 460,393 |
| University of Nebraska, University Revenue, | | | |
| Kearney Student Housing Project, Series 2017, | | |
| Escrowed to Maturity | |
| 3.0%, 7/01/25 | 100,000 | 109,233 |
| 2.5%, 7/01/26 | 210,000 | 226,120 |
| 3.0%, 7/01/27 | 100,000 | 112,235 |
| Refunding, Lincoln Student Fees and Facilities | | |
| Series 2012, 5.0%, 7/01/23, Pre-Refunded | | |
| 7/01/22 @ 100 | 250,000 | 271,870 |
| Refunding, Omaha Student Housing Project, | | |
| Series 2017A, 5.0%, 5/15/30, Pre-Refunded | | |
| 11/15/27 @ 100 | 100,000 | 127,339 |
| Upper Republican Natural Resources District, Limited | | |
| Obligation Occupation Tax, River Flow Enhancement, | | |
| Refunding, Series 2017B, AGM Insured | | | |
| 4.0%, 12/15/25 | 245,000 | 261,942 |
| 4.0%, 12/15/27 | 395,000 | 422,622 |
| Village of Boys Town, Revenue, Refunding, Boys Town Project, | |
| Series 2017, 3.0%, 9/01/28 | 700,000 | 765,562 |
| Washington County, General Obligation, Refunding, | | |
| Blair Community School District 0001, | | | |
| Series 2015, 2.5%, 12/15/24 | 305,000 | 306,501 |
| | 28,822,121 |
| Texas | 0.9 | | |
| Austin, Airport System Revenue, Series 2017B, | | |
| AMT, 5.0%, 11/15/26 | 250,000 | 295,825 |
| |
| Washington | 0.8 | | |
| Port of Seattle, Intermediate Lien Revenue, | | | |
| Series 2017C, AMT, 5.0%, 5/01/26 | 200,000 | 235,984 |
| Total Municipal Bonds (Cost $29,117,468) | | | 29,800,573 |
| | | |
| Cash Equivalents – 4.7% | | |
| | |
| Shares | $ Value |
| | | |
| State Street Institutional U.S. Government Money | | |
Market Fund - Premier Class 0.32%(a) | 1,467,004 | 1,467,004 |
| Total Cash Equivalents (Cost $1,467,004) | | 1,467,004 |
| Total Investments in Securities (Cost $30,584,472) | | 31,267,577 |
| Other Asset Less Other Liabilities - 0.6% | | 196,926 |
| Net Assets - 100% | | 31,464,503 |
| Net Asset Value Per Share | 10.07 |
| | |
(a)
| Rate presented represents the annualized 7-day yield at March 31, 2020. |
(b) | Security designated to cover an unsettled bond purchase.
|
The accompanying notes form an integral part of these financial statements.
Q1 2020 Annual Report 51
SHORT DURATION INCOME FUND
Schedule of Investments
March 31, 2020
| | | |
| Corporate Bonds – 20.2% | | |
| | $ Principal | |
| | Amount | $ Value |
| |
Air Canada 7.75% 4/15/21(b) (c) | 250,000 | 245,300 |
American Airlines Group Inc. 3.75% 3/01/25(b) | 750,000 | 529,219 |
| American Tower Corp. 2.25% 1/15/22 | 5,000,000 | 4,884,317 |
| Anheuser-Busch InBev Finance Inc. 3.3% 2/01/23 | 4,294,000 | 4,424,161 |
| Bank of America Corp. 2.25% 4/21/20 | 8,000,000 | 7,998,799 |
| Boston Properties LP 3.125% 9/01/23 | 9,560,000 | 9,755,957 |
| Calumet Specialty Products Partners LP 7.625% 1/15/22 | 900,000 | 705,092 |
| Capital One Financial Corp. 2.5% 5/12/20 | 5,000,000 | 4,997,962 |
| Capital One N.A. 2.65% 8/08/22 | 2,000,000 | 1,983,179 |
| Carlisle Companies Inc. 3.5% 12/01/24 | 500,000 | 483,498 |
| CenturyLink, Inc. | |
| 5.625% 4/01/20 | 750,000 | 750,000 |
| 6.75% 12/01/21 (Qwest Corp.) | 1,150,000 | 1,174,008 |
Colfax Corp. 6.0% 2/15/24(b) | 1,000,000 | 1,001,255 |
| Computer Sciences Corp. 4.45% 9/15/22 | 325,000 | 335,608 |
Cox Communications, Inc. 3.25% 12/15/22(b) | 5,000,000 | 5,071,723 |
| Diamondback Energy, Inc. 2.875% 12/01/24 | 3,379,000 | 2,367,869 |
| Discovery, Inc. | |
| 2.8% 6/15/20 | 2,036,000 | 2,031,312 |
| 2.95% 3/20/23 | 4,338,000 | 4,334,316 |
| Energy Transfer Operating LP 5.2% 2/01/22 | 3,500,000 | 3,296,132 |
| EQT Corp. 3.0% 10/01/22 | 1,180,000 | 994,150 |
| Equifax Inc. 2.3% 6/01/21 | 2,900,000 | 2,821,219 |
| First Republic Bank 2.5% 6/06/22 | 4,200,000 | 4,141,349 |
| FLIR Systems, Inc. 3.125% 6/15/21 | 4,971,000 | 4,977,760 |
| General Electric Co. 4.65% 10/17/21 | 1,236,000 | 1,261,070 |
| General Motors Financial Company, Inc. 3.55% 4/09/21 | 1,250,000 | 1,198,056 |
| Goldman Sachs Group, Inc. 2.6% 12/27/20 | 1,500,000 | 1,500,323 |
| JPMorgan Chase & Co. 3.375% 5/01/23 | 3,956,000 | 4,133,633 |
| Kinder Morgan, Inc. 3.95% 9/01/22 | 2,000,000 | 1,984,160 |
| Lennar Corp. 4.75% 4/01/21 | 558,000 | 555,467 |
| Level 3 Parent LLC 5.25% 3/15/26 | 1,455,000 | 1,462,166 |
| Markel Corp. 4.9% 7/01/22 | 3,850,000 | 3,871,824 |
| Matador Resources Co. 5.875% 9/15/26 | 500,000 | 143,612 |
MetLife Global Funding I 2.4% 6/17/22(b) | 1,000,000 | 1,006,542 |
| MPLX LP | |
| 3.375% 3/15/23 | 1,000,000 | 925,655 |
6.25% 10/15/22(b) | 210,000 | 189,231 |
| NGL Energy Partners LP | |
| 6.125% 3/01/25 | 1,490,000 | 519,630 |
| 7.5% 11/01/23 | 4,555,000 | 1,616,888 |
| Occidental Petroleum Corp. 2.6% 8/13/21 | 1,000,000 | 800,802 |
Parsley Energy LLC 5.25% 8/15/25(b) | 663,000 | 509,678 |
| PDC Energy, Inc. 6.125% 9/15/24 | 1,200,000 | 650,994 |
| Pioneer Natural Resources Co. 3.95% 7/15/22 | 2,000,000 | 1,928,633 |
| QVC, Inc. 4.375% 3/15/23 | 3,000,000 | 2,840,791 |
| RELX plc 3.5% 3/16/23 | 1,800,000 | 1,876,330 |
Seagate Technology plc 4.25% 3/01/22(c) | 2,850,000 | 2,857,822 |
Silversea Cruise Holding Ltd. 7.25% 2/01/25(b) (c) | 3,545,000 | 3,044,251 |
| Simon Property Group, LP 2.75% 2/01/23 | 1,593,000 | 1,546,000 |
Sprint Spectrum Co. LLC 3.36% 3/20/23(b) (d) | 1,781,250 | 1,779,023 |
| Tempur Sealy International, Inc. 5.625% 10/15/23 | 1,478,000 | 1,383,770 |
| U.S. Bancorp | |
| 2.35% 1/29/21 | 14,000,000 | 13,966,869 |
| 2.4% 7/30/24 | 500,000 | 500,882 |
| Wells Fargo & Co. | |
| 4.6% 4/01/21 | 5,745,000 | 5,871,739 |
| 2.1% 7/26/21 | 10,100,000 | 10,093,672 |
| 3.5% 3/08/22 | 7,900,000 | 8,058,535 |
WM. Wrigley Jr. Co. 3.375% 10/21/20(b) | 700,000 | 695,764 |
| WPX Energy, Inc. 5.25% 10/15/27 | 600,000 | 333,330 |
| Total Corporate Bonds (Cost $154,847,525) | | 148,411,327 |
| | | |
| Corporate Convertible Bonds – 1.8% | | |
| | $ Principal | |
| | Amount | $ Value |
| |
| Redwood Trust, Inc. | |
| 4.75% 8/15/23 | 12,500,000 | 8,167,651 |
| 5.625% 7/15/24 | 6,300,000 | 3,490,588 |
5.75% 10/01/25(b) | 3,000,000 | 1,850,493 |
| Total Corporate Convertible Bonds (Cost $20,591,753) | | 13,508,732 |
| |
| Asset-Backed Securities – 28.5% | | |
| |
American Credit Acceptance Receivables Trust (ACAR)(b) | | |
| 2019-2 CL A — 2.85% 7/12/22 | 332,273 | 329,799 |
| 2019-4 CL A — 2.18% 2/13/23 | 2,379,611 | 2,339,556 |
| 2020-1 CL A — 1.89% 4/13/23 | 2,877,554 | 2,841,907 |
| 2019-4 CL B — 2.43% 10/12/23 | 2,500,000 | 2,388,418 |
| 2020-1 CL B — 2.08% 12/13/23 | 2,500,000 | 2,419,814 |
ARI Fleet Lease Trust (ARIFL)(b) | |
| 2018-B CL A2 — 3.22% 8/16/27 | 703,608 | 704,325 |
| 2019-A CL A2A — 2.41% 11/15/27 | 900,000 | 891,216 |
| 2020-A CL A2 — 1.77% 8/15/28 | 1,750,000 | 1,747,368 |
Avant Loans Funding Trust (AVNT)(b) | |
| 2019-B CL A — 2.72% 10/15/26 | 927,522 | 903,709 |
BCC Funding XVI LLC (BCCFC)(b) | |
| 2019-1A CL A2 — 2.46% 8/20/24 | 4,500,000 | 4,378,944 |
Carvana Auto Receivables Trust (CRVNA)(b) |
| 2019-2A CL A2 — 2.6% 1/18/22 | 2,657,929 | 2,589,016 |
| 2019-1A CL B — 3.29% 8/15/23 | 5,000,000 | 4,953,910 |
| 2019-1A CL C — 3.5% 2/15/24 | 300,000 | 297,025 |
Chesapeake Funding II LLC (CFII)(b) | |
| 2017-3A CL D - 3.38% 8/15/29 | 385,000 | 384,022 |
Commercial Credit Group Receivables Trust (CCG)(b) |
| 2017-1 CL B — 2.75% 11/14/23 | 1,580,000 | 1,579,407 |
| 2019-1 CL B — 3.22% 9/14/26 | 250,000 | 251,001 |
| 2019-2 CL A2 — 2.11% 3/15/27 | 2,500,000 | 2,484,316 |
Conn Funding II, LP (CONN)(b) | |
| 2018-A CL A — 3.25% 1/15/23 | 244,353 | 238,775 |
| 2019-A CL A — 3.4% 10/16/23 | 247,607 | 240,832 |
| 2019-B CL A — 2.66% 6/17/24 | 1,024,011 | 971,667 |
Dell Equipment Finance Trust (DEFT)(b) | |
| 2017-2 CL C — 2.73% 10/24/22 | 2,579,000 | 2,574,347 |
| 2019-1 CL C — 3.14% 3/22/24 | 2,750,000 | 2,757,931 |
| Drive Auto Receivables Trust (DRIVE) | |
| 2019-4 CL A2A — 2.32% 6/15/22 | 1,380,021 | 1,375,650 |
| 2017-1 CL D — 3.84% 3/15/23 | 4,930,478 | 4,920,431 |
| 2018-2 CL C — 3.63% 8/15/24 | 3,538,744 | 3,553,009 |
DT Auto Owner Trust (DTAOT)(b) | |
| 2016-4A CL D — 3.77% 10/17/22 | 936,901 | 936,423 |
| 2019-3A CL B — 2.6% 5/15/23 | 2,600,000 | 2,574,863 |
| 2019-4A CL A — 2.17% 5/15/23 | 1,403,357 | 1,392,097 |
Enterprise Fleet Financing LLC (EFF)(b) | |
| 2019-2 CL A1 — 2.26663% 8/20/20 | 464,381 | 463,630 |
| 2017-2 CL A3 — 2.22% 1/20/23 | 800,000 | 797,663 |
| 2019-2 CL A2 — 2.29% 2/20/25 | 2,600,000 | 2,602,882 |
| 2020-1 CL A2 — 1.78% 12/22/25 | 3,500,000 | 3,484,716 |
Exeter Automobile Receivables Trust (EART)(b) |
| 2016-2A CL C — 5.96% 2/15/22 | 808,086 | 808,747 |
| 2019-3A CL A — 2.59% 9/15/22 | 927,289 | 922,184 |
| 2020-1A CL A — 2.05% 6/15/23 | 2,840,097 | 2,812,262 |
First Investors Auto Owners Trust (FIAOT)(b) |
| 2016-2A CL B — 2.21% 7/15/22 | 197,765 | 197,510 |
| 2019-2A CL A — 2.21% 9/16/24 | 2,061,146 | 2,044,239 |
Foundation Finance Trust (FFIN)(b) | |
| 2019-1A CL A — 3.86% 11/15/34 | 2,937,261 | 2,812,153 |
Foursight Capital Automobile Receivables Trust (FCRT)(b) | | |
| 2017-1 CL B — 3.05% 12/15/22 | 1,090,000 | 1,085,045 |
| 2020-1 CL A2 — 1.97% 9/15/23 | 2,500,000 | 2,456,498 |
Freedom Financial (FREED)(b) | |
| 2020-FP1 CL A — 2.52% 3/18/27 | 2,290,395 | 2,180,666 |
The accompanying notes form an integral part of these financial statements.
52 Q1 2020 Annual Report
SHORT DURATION INCOME FUND (CONTINUED)
Schedule of Investments
March 31, 2020
| | | |
| | $ Principal | |
| | Amount | $ Value |
| |
GLS Auto Receivables Trust (GCAR)(b) | |
| 2018-1A CL A — 2.82% 7/15/22 | 1,399,352 | 1,393,842 |
| 2018-3A CL A — 3.35% 8/15/22 | 345,551 | 343,707 |
| 2019-2A CL A — 3.06% 4/17/23 | 1,155,181 | 1,130,780 |
| 2019-3A CL A — 2.58% 7/17/23 | 1,702,003 | 1,687,003 |
| 2019-4A CL A — 2.47% 11/15/23 | 2,927,841 | 2,741,921 |
| 2020-1A CL A — 2.17% 2/15/24 | 4,107,730 | 4,050,654 |
Great America Leasing Receivables Trust (GALC)(b) |
| 2020-1 CL A2 — 1.76% 6/15/22 | 7,500,000 | 7,444,986 |
Hertz Fleet Lease Funding LP (HFLF)(b) | |
| 2018-1 CL A1 — 1.36263% 5/10/32 | | |
| Floating Rate (Mthly LIBOR + 50) | 2,780,506 | 2,762,066 |
| 2018-1 CL A2 — 3.23% 5/10/32 | 1,320,740 | 1,321,243 |
Hewlett-Packard Financial Services Equipment Trust (HPEFS)(b) | | |
| 2019-1A CL A2 — 2.19% 9/20/29 | 1,000,000 | 992,832 |
| 2019-1A CL D — 2.72% 9/20/29 | 1,000,000 | 982,053 |
| 2020-1A CL A2 — 1.73% 2/20/30 | 1,750,000 | 1,728,120 |
| 2020-1A CL A3 — 1.76% 2/20/30 | 3,500,000 | 3,447,330 |
Marlette Funding Trust (MFT)(b) | |
| 2018-1A CL C — 3.69% 3/15/28 | 1,832,000 | 1,802,198 |
| 2018-3A CL A — 3.2% 9/15/28 | 1,022,594 | 1,016,098 |
| 2018-4A CL A — 3.71% 12/15/28 | 869,777 | 847,361 |
| 2019-1A CL A — 3.44% 4/16/29 | 710,820 | 687,450 |
| 2019-2A CL A — 3.13% 7/16/29 | 1,416,790 | 1,362,154 |
| 2019-3A CL A — 2.69% 9/17/29 | 2,779,821 | 2,693,470 |
| 2019-4A CL A — 2.39% 12/17/29 | 2,780,247 | 2,686,352 |
| 2020-1A CL A — 2.24% 3/15/30 | 1,835,418 | 1,781,662 |
MMAF Equipment Finance LLC (MMAF)(b) | |
| 2016-AA CL A4 — 1.76% 1/17/23 | 1,749,738 | 1,738,376 |
Octane Receivables Trust (OCTL)(b) | |
| 2019-1A CL A — 3.16% 9/20/23 | 4,281,076 | 4,263,436 |
OneMain Direct Auto Receivables Trust (ODART)(b) |
| 2017-2A CL B — 2.55% 11/14/23 | 4,787,864 | 4,774,373 |
| 2017-2A CL C — 2.82% 7/15/24 | 900,000 | 896,086 |
| 2017-2A CL D — 3.42% 10/15/24 | 500,000 | 498,532 |
OneMain Financial Issuance Trust (OMFIT)(b) |
| 2016-1A CL B — 4.57% 2/20/29 | 2,285,000 | 2,254,011 |
| 2018-1A CL B — 3.61% 3/14/29 | 1,500,000 | 1,346,996 |
Pawnee Equipment Receivables LLC (PWNE)(b) |
| 2019-1 CL A2 — 2.29% 10/15/24 | 9,500,000 | 9,382,899 |
Prestige Auto Receivables Trust (PART)(b) | |
| 2018-1A CL A2 — 2.97% 12/15/21 | 238,663 | 238,506 |
Prosper Marketplace Issuance Trust (PMIT)(b) |
| 2019-1A CL A — 3.54% 4/15/25 | 186,836 | 184,987 |
| 2019-1A CL B — 4.03% 4/15/25 | 4,000,000 | 3,809,617 |
| 2019-3A CL A — 3.19% 7/15/25 | 2,201,558 | 2,115,981 |
| 2019-2A CL A — 3.2% 9/15/25 | 429,073 | 418,857 |
Securitized Term Auto Receivables Trust (SSTRT)(b) (c) | | |
| 2019-CRTA CL B — 2.453% 3/25/26 | 1,666,331 | 1,653,328 |
| 2019-CRTA CL C — 2.849% 3/25/26 | 1,249,749 | 1,240,098 |
Sierra Timeshare Receivables Funding LLC (SRFC)(b) | | |
| 2019-2A CL A — 2.59% 5/20/36 | 1,388,033 | 1,370,974 |
| 2019-2A CL B — 2.82% 5/20/36 | 173,504 | 171,077 |
Small Business Lending Trust (SBIZ)(b) | |
| 2020-A CL A — 2.62% 12/15/26 | 2,354,069 | 2,298,032 |
Social Professional Loan Program LLC (SOFI)(b) |
| 2018-A CL A2A — 2.39% 2/25/42 | 998,817 | 999,520 |
| 2019-B CL A1FX — 2.78% 8/17/48 | 3,091,016 | 3,100,489 |
SoFi Consumer Loan Program LLC (SCLP)(b) |
| 2016-2 CL A — 3.09% 10/27/25 | 515,986 | 507,099 |
| 2016-3 CL A — 3.05% 12/26/25 | 106,352 | 105,371 |
| 2017-1 CL A — 3.28% 1/26/26 | 149,746 | 147,157 |
| 2019-2 CL A — 3.01% 4/25/28 | 1,366,347 | 1,327,101 |
| 2019-3 CL A — 2.9% 5/25/28 | 3,927,219 | 3,812,315 |
| 2019-4 CL A — 2.45% 8/25/28 | 1,821,379 | 1,751,876 |
| 2020-1 CL A — 2.02% 1/25/29 | 2,048,107 | 1,909,893 |
Upgrade Receivables Trust (UPGR)(b) | |
| 2018-1A CL A — 3.76% 11/15/24 | 87,549 | 86,725 |
| 2019-1A CL A — 3.48% 3/15/25 | 330,948 | 328,437 |
| 2019-1A CL B — 4.09% 3/15/25 | 6,800,000 | 6,527,730 |
| | | |
| | $ Principal | |
| | Amount | $ Value |
| |
Upstart Securitization Trust (UPST)(b) | |
| 2017-1 CL C — 6.35% 6/20/24 | 1,915,089 | 1,860,502 |
| 2017-2 CL C — 5.59% 3/20/25 | 2,467,002 | 2,268,845 |
| 2018-1 CL C — 4.997% 8/20/25 | 3,146,733 | 3,089,776 |
| 2019-1 CL A — 3.45% 4/20/26 | 136,210 | 135,328 |
| 2019-2 CL B — 3.734% 9/20/29 | 1,250,000 | 1,005,044 |
| 2019-3 CL A — 2.684% 1/21/30 | 4,332,044 | 4,309,936 |
| 2020-1 CL A — 2.322% 4/22/30 | 5,000,000 | 4,723,540 |
Verizon Owner Trust (VZOT)(b) | |
| 2018-1A CL A1A — 2.82% 9/20/22 | 10,500,000 | 10,523,118 |
Westlake Automobile Receivables Trust (WLAKE)(b) |
| 2018-3A CL A2A — 2.98% 1/18/22 | 618,382 | 617,696 |
| World Omni Select Auto Trust (WOSAT) | |
| 2019-A CL A2A — 2.06% 8/15/23 | 3,700,415 | 3,694,434 |
| Total Asset-Backed Securities (Cost $214,226,266) | | 210,079,353 |
| |
| Commercial Mortgage-Backed Securities – 6.0% | |
| |
BDS Ltd. (BDS)(b) | | |
| 2018-FL1 CL B — 2.05013% 1/15/35 | | |
| Floating Rate (Mthly LIBOR + 125) | 957,157 | 938,355 |
BXMT Ltd. (BXMT)(b) (c) | |
| 2017-FL1 CL A — 1.67013% 6/15/35 | | |
| Floating Rate (Mthly LIBOR + 87) | 233,738 | 224,418 |
Exantas Capital Corp. Ltd. (XAN)(b) (c) | |
| 2018-RS06 CL D — 3.30013% 6/15/35 | |
| Floating Rate (Mthly LIBOR + 250) | 6,000,000 | 5,612,220 |
| 2019-RS07 CL A — 1.80013% 4/15/36 | |
| Floating Rate (Mthly LIBOR + 100) | 4,142,946 | 3,843,968 |
GPMT Ltd. (GPMT)(b) (c) | |
| 2018-FL1 CL C — 2.92288% 11/19/35 | |
| Floating Rate (Mthly LIBOR + 215) | 7,300,000 | 6,496,146 |
| 2018-FL1 CL D — 3.72288% 11/21/35 | |
| Floating Rate (Mthly LIBOR + 295) | 4,500,000 | 3,783,951 |
Hilton USA Trust (HILT)(b) | |
| 2016-SFP CL E — 5.519097% 11/05/35 | 4,300,000 | 3,924,521 |
PFP Ltd. (PFP)(b) (c) | |
| 2019-5 CL B — 2.35463% 4/14/36 | | |
| Floating Rate (Mthly LIBOR + 165) | 2,500,000 | 2,320,150 |
| 2019-5 CL C — 2.70463% 4/14/36 | | |
| Floating Rate (Mthly LIBOR + 200) | 500,000 | 459,210 |
ReadyCap Commercial Mortgage Trust (RCMT)(b) |
| 2018-FL2 CL C — 2.84663% 6/25/35 | | |
| Floating Rate (Mthly LIBOR + 190) | 750,000 | 712,690 |
| 2018-FL2 CL D — 3.64663% 6/25/35 | | |
| Floating Rate (Mthly LIBOR + 270) | 10,200,000 | 9,336,198 |
RETL (RETL)(b) | |
| 2019-RVP CL C — 2.80463% 3/15/36 | |
| Floating Rate (Mthly LIBOR + 210) | 2,750,000 | 2,436,120 |
VMC Finance LLC (VMC)(b) | |
| 2018-FL2 CL C — 2.75013% 10/15/35 | |
| Floating Rate (Mthly LIBOR + 195) | 4,200,000 | 3,971,590 |
| Total Commercial Mortgage-Backed Securities (Cost $47,558,081) | 44,059,537 |
The accompanying notes form an integral part of these financial statements.
Q1 2020 Annual Report 53
| | | |
| Mortgage-Backed Securities – 23.9% | | |
| | $ Principal | |
| Federal Home Loan Mortgage Corporation | Amount | $ Value |
| |
| Collateralized Mortgage Obligations | |
| 3649 CL BW — 4.0% 3/15/25 | 935,490 | 989,603 |
| 4107 CL LW — 1.75% 8/15/27 | 3,920,510 | 3,968,771 |
| 4281 CL AG — 2.5% 12/15/28 | 698,552 | 709,668 |
| 4107 CL LA — 2.5% 5/15/31 | 6,957,621 | 7,239,239 |
| 3003 CL LD — 5.0% 12/15/34 | 880,849 | 1,017,854 |
| 2952 CL PA — 5.0% 2/15/35 | 381,829 | 419,851 |
| 3620 CL PA — 4.5% 12/15/39 | 810,842 | 885,203 |
| 3842 CL PH — 4.0% 4/15/41 | 924,834 | 1,032,981 |
| | 16,263,170 |
| |
| Pass-Through Securities | |
| G18190 — 5.5% 6/01/22 | 7,444 | 7,748 |
| G13300 — 4.5% 5/01/23 | 55,135 | 58,163 |
| G18296 — 4.5% 2/01/24 | 151,795 | 160,466 |
| G18306 — 4.5% 4/01/24 | 321,914 | 340,478 |
| G13517 — 4.0% 5/01/24 | 229,965 | 242,223 |
| G18308 — 4.0% 5/01/24 | 334,331 | 352,479 |
| E02804 — 3.0% 12/01/25 | 1,477,378 | 1,550,132 |
| J13949 — 3.5% 12/01/25 | 2,281,869 | 2,407,608 |
| J14649 — 3.5% 4/01/26 | 1,821,302 | 1,919,907 |
| E02948 — 3.5% 7/01/26 | 3,945,858 | 4,163,258 |
| J16663 — 3.5% 9/01/26 | 3,841,694 | 4,054,100 |
| E03033 — 3.0% 2/01/27 | 2,328,013 | 2,443,610 |
| E03048 — 3.0% 2/01/27 | 4,491,916 | 4,715,297 |
| ZS8692 — 2.5% 4/01/33 | 1,927,426 | 2,005,598 |
| G01818 — 5.0% 5/01/35 | 1,057,092 | 1,178,357 |
| | 25,599,424 |
| | 41,862,594 |
| Federal National Mortgage Association | | |
| |
| Collateralized Mortgage Obligations | |
| 2010-145 CL PA — 4.0% 10/25/24 | 128,562 | 130,065 |
| 2010-54 CL WA — 3.75% 6/25/25 | 372,373 | 382,943 |
| | 513,008 |
| |
| Pass-Through Securities | |
| MA0464 — 3.5% 6/01/20 | 27,083 | 28,506 |
| 357985 — 4.5% 9/01/20 | 2,878 | 3,009 |
| 888595 — 5.0% 1/01/22 | 22,168 | 23,352 |
| 888439 — 5.5% 6/01/22 | 30,308 | 31,187 |
| AR8198 — 2.5% 3/01/23 | 1,909,798 | 1,984,783 |
| MA1502 — 2.5% 7/01/23 | 1,673,417 | 1,739,121 |
| 995960 — 5.0% 12/01/23 | 123,269 | 129,910 |
| AD0629 — 5.0% 2/01/24 | 135,476 | 142,730 |
| 930667 — 4.5% 3/01/24 | 259,577 | 274,859 |
| 890112 — 4.0% 4/01/24 | 203,857 | 214,840 |
| 995693 — 4.5% 4/01/24 | 276,722 | 289,970 |
| AA4315 — 4.0% 4/01/24 | 428,485 | 451,696 |
| AA5510 — 4.0% 4/01/24 | 108,232 | 114,095 |
| MA0043 — 4.0% 4/01/24 | 159,552 | 168,192 |
| 995692 — 4.5% 5/01/24 | 257,805 | 272,936 |
| 995755 — 4.5% 5/01/24 | 376,064 | 396,781 |
| 931739 — 4.0% 8/01/24 | 121,540 | 128,155 |
| AD7073 — 4.0% 6/01/25 | 394,881 | 416,342 |
| AE0031 — 5.0% 6/01/25 | 286,669 | 302,399 |
| AL0471 — 5.5% 7/01/25 | 663,779 | 702,722 |
| 310139 — 3.5% 11/01/25 | 2,706,608 | 2,854,540 |
| AB1769 — 3.0% 11/01/25 | 1,322,311 | 1,391,665 |
| AH3429 — 3.5% 1/01/26 | 7,076,312 | 7,465,048 |
| AB2251 — 3.0% 2/01/26 | 1,609,718 | 1,690,153 |
| AB3902 — 3.0% 11/01/26 | 1,124,018 | 1,179,742 |
| AB4482 — 3.0% 2/01/27 | 2,627,110 | 2,757,162 |
| AK3264 — 3.0% 2/01/27 | 2,840,421 | 2,981,342 |
| AL1366 — 2.5% 2/01/27 | 2,080,378 | 2,164,148 |
| | | |
| | $ Principal | |
| | Amount | $ Value |
| |
| AB6291 — 3.0% 9/01/27 | 1,148,850 | 1,204,048 |
| MA3189 — 2.5% 11/01/27 | 1,998,810 | 2,077,860 |
| MA3791 — 2.5% 9/01/29 | 4,315,036 | 4,502,240 |
| BM5708 — 3.0% 12/01/29 | 2,755,323 | 2,887,487 |
| MA0587 — 4.0% 12/01/30 | 3,194,407 | 3,493,455 |
| BA4767 — 2.5% 1/01/31 | 2,233,612 | 2,321,726 |
| AS7698 — 2.5% 8/01/31 | 2,067,198 | 2,152,468 |
| AS7701 — 2.5% 8/01/31 | 2,799,446 | 2,931,242 |
| 555531 — 5.5% 6/01/33 | 2,097,401 | 2,364,042 |
| MA3540 — 3.5% 12/01/33 | 3,519,004 | 3,710,251 |
| 725232 — 5.0% 3/01/34 | 192,130 | 213,399 |
| 995112 — 5.5% 7/01/36 | 918,954 | 1,041,873 |
| | 59,199,476 |
| | 59,712,484 |
| Government National Mortgage Association |
| |
| Pass-Through Securities | |
| G2 5255 — 3.0% 12/20/26 | 5,022,920 | 5,260,583 |
| |
| Non-Government Agency |
| |
| Collateralized Mortgage Obligations | |
Bunker Hill Loan Depositary Trust (BHLD)(b) (f) |
| 2019-3 CL A1 — 2.724% 11/25/59 | 3,746,308 | 3,647,975 |
Citigroup Mortgage Loan Trust, Inc. (CMLTI)(b) (e) |
| 2014-A CL A — 4.0% 1/25/35 | 858,949 | 873,161 |
COLT Funding LLC (COLT)(b) (e) | |
| 2019-4 CL A1 — 2.579% 11/25/49 | 4,057,318 | 3,973,279 |
Deephaven Residential Mortgage Trust (DRMT)(b) (e) |
| 2018-4A CL A1 — 4.08% 10/25/58 | 2,524,784 | 2,569,761 |
| 2019-3A CL A1 — 2.964% 7/25/59 | 3,318,629 | 3,201,534 |
| 2019-4A CL A1 — 2.791% 10/25/59 | 1,351,794 | 1,284,533 |
Flagstar Mortgage Trust (FSMT)(b) (e) | |
| 2017-1 CL 2A2 — 3.0% 3/25/47 | 2,219,299 | 2,250,892 |
J.P. Morgan Mortgage Trust (JPMMT)(b) (e) | |
| 2014-2 CL 2A2 — 3.5% 6/25/29 | 2,085,748 | 2,088,006 |
| 2014-5 CL A1 — 2.959147% 10/25/29 | 4,706,063 | 4,758,202 |
| 2016-3 CL 2A1 — 3.0% 10/25/46 | 2,078,959 | 2,104,241 |
| 2017-3 CL 2A2 — 2.5% 8/25/47 | 9,077,534 | 9,112,227 |
| 2018-6 CL 2A2 — 3.0% 12/25/48 | 3,153,821 | 3,183,753 |
Sequoia Mortgage Trust (SEMT)(e) | |
| 2012-4 CL A1 — 3.5% 9/25/42 | 1,703,290 | 1,688,907 |
| 2013-4 CL A3 — 1.55% 4/25/43 | 4,868,096 | 4,728,243 |
2017-CH1 CL A11 — 3.5% 8/25/47(b) | 1,444,358 | 1,445,836 |
2018-CH2 CL A12 — 4.0% 6/25/48(b) | 2,720,476 | 2,740,376 |
2018-CH4 CL A10 — 4.5% 10/25/48(b) | 3,419,750 | 3,408,369 |
2019-CH2 CL A1 — 4.5% 8/25/49(b) | 1,108,218 | 1,109,950 |
2019-CH3 CL A10 — 4.0% 9/25/49(b) | 3,001,040 | 3,049,795 |
2019-4 CL A4 — 3.5% 11/25/49(b) | 2,489,277 | 2,501,819 |
2019-5 CL A4 — 3.5% 12/25/49(b) | 3,306,205 | 3,366,979 |
2020-1 CL A4 — 3.5% 2/25/50(b) | 946,273 | 958,682 |
2020-2 CL A4 — 3.5% 3/25/50(b) | 2,678,572 | 2,692,908 |
2020-3 CL A4 — 3.0% 4/25/50(b) | 2,700,000 | 2,712,611 |
| | 69,452,039 |
| Total Mortgage-Backed Securities (Cost $171,707,061) | | 176,287,700 |
The accompanying notes form an integral part of these financial statements.
54 Q1 2020 Annual Report
SHORT DURATION INCOME FUND (CONTINUED)
Schedule of Investments
March 31, 2020
| | | |
| Taxable Municipal Bonds – 0.2% | $ Principal | |
| | Amount | |
| | or Shares | $ Value |
| | | |
| Kansas Development Finance Authority Revenue, | | |
| Series 2015H | | |
| 2.608% 4/15/20 | 500,000 | 500,220 |
| 2.927% 4/15/21 | 750,000 | 760,965 |
| Total Taxable Municipal Bonds (Cost $1,250,000) | | 1,261,185 |
| |
| U.S. Treasury – 18.2% | | |
| |
| U.S. Treasury Notes | | |
| 2.0% 11/30/20 | 4,000,000 | 4,050,547 |
| 1.125% 2/28/21 | 15,000,000 | 15,137,402 |
| 2.25% 3/31/21 | 12,000,000 | 12,252,422 |
| 1.375% 4/30/21 | 10,000,000 | 10,134,766 |
| 2.625% 6/15/21 | 10,000,000 | 10,302,734 |
| 1.125% 7/31/21 | 15,000,000 | 15,191,309 |
| 2.0% 7/31/22 | 17,000,000 | 17,701,250 |
| 2.0% 2/15/23 | 7,000,000 | 7,346,719 |
| 1.5% 2/28/23 | 25,000,000 | 25,896,485 |
| 2.0% 5/31/24 | 15,000,000 | 16,028,906 |
| Total U.S. Treasury (Cost $129,468,887) | | 134,042,540 |
| |
| Common Stocks – 0.3% | | |
| |
| Redwood Trust, Inc. (Cost $4,158,141) | 410,000 | 2,074,600 |
| |
| Cash Equivalents – 0.9% | | |
| |
| State Street Institutional U.S. Government Money |
Market Fund - Premier Class 0.32%(a) | 6,445,698 | 6,445,698 |
| Total Cash Equivalents (Cost $6,445,698) | | 6,445,698 |
| Total Investments in Securities (Cost $750,253,412) | | 736,170,672 |
| Other Liabilities in Excess of Other Assets - 0.0% | | (80,667) |
| Net Assets - 100% | | 736,090,005 |
| Net Asset Value Per Share - Investor Class | 11.93 |
| Net Asset Value Per Share - Institutional Class | 11.95 |
| | |
(a) | Rate presented represents the annualized 7-day yield at March 31, 2020.
|
(b) | Security is exempt from registration under Rule 144A of the Securities Act of 1933. This security may be resold in transactions that are exempt from registration, normally to qualified institutional buyers.
|
(c) | Foreign domiciled entity
|
(d) | Annual sinking fund
|
(e)
| The interest rate resets periodically based on the weighted average coupons of the underlying mortgage-related or asset-backed obligations. |
(f) | Security is a “step-up” bond where the coupon rate increases or steps up at a predetermined date. Coupon rate presented represents the rate at March 31, 2020.
|
The accompanying notes form an integral part of these financial statements.
Q1 2020 Annual Report 55
ULTRA SHORT GOVERNMENT FUND
Schedule of Investments
March 31, 2020
| | | |
| Corporate Bonds – 5.2% | | |
| | $ Principal | |
| | Amount | $ Value |
| |
| Berkshire Hathaway Inc. 2.2% 3/15/21 | 500,000 | 503,623 |
| Caterpillar Financial Services Corp. 2.95% 5/15/20 | 650,000 | 650,385 |
| Discovery, Inc. 2.8% 6/15/20 | 1,000,000 | 997,698 |
| Enterprise Products Partners LP 2.8% 2/15/21 | 200,000 | 199,783 |
| UnitedHealth Group Inc. 2.7% 7/15/20 | 700,000 | 700,109 |
WM. Wrigley Jr. Co. 3.375% 10/21/20(b) | 700,000 | 695,764 |
| Total Corporate Bonds (Cost $3,748,566) | | 3,747,362 |
| |
| Asset-Backed Securities – 12.9% | | |
| |
American Credit Acceptance Receivables Trust (ACAR)(b) | | |
| 2019-2 CL A — 2.85% 7/12/22 | 166,137 | 164,900 |
| 2020-1 CL A — 1.89% 4/13/23 | 479,592 | 473,651 |
ARI Fleet Lease Trust (ARIFL)(b) | |
| 2018-A CL A2 — 2.55% 10/15/26 | 528,279 | 527,078 |
| 2019-A CL A2A — 2.41% 11/15/27 | 690,000 | 683,266 |
Commercial Credit Group Receivables Trust (CCG)(b) |
| 2017-1 CL B - 2.75% 11/14/23 | 900,000 | 899,662 |
| Drive Auto Receivables Trust (DRIVE) | |
| 2018-2 CL C — 3.63% 8/15/24 | 579,067 | 581,401 |
DT Auto Owner Trust (DTAOT)(b) | |
| 2016-4A CL D — 3.77% 10/17/22 | 549,922 | 549,642 |
| 2019-4A CL A — 2.17% 5/15/23 | 392,940 | 389,787 |
Enterprise Fleet Financing LLC (EFF)(b) | |
| 2017-1 CL A3 — 2.6% 7/20/22 | 760,000 | 758,346 |
Exeter Automobile Receivables Trust (EART)(b) |
| 2020-1A CL A — 2.05% 6/15/23 | 436,938 | 432,656 |
GLS Auto Receivables Trust (GCAR)(b) | |
| 2018-1A CL A — 2.82% 7/15/22 | 825,573 | 822,323 |
| 2019-3A CL A — 2.58% 7/17/23 | 170,200 | 168,700 |
Great America Leasing Receivables Trust (GALC)(b) |
| 2020-1 CL A2 — 1.76% 6/15/22 | 737,000 | 731,594 |
Marlette Funding Trust (MFT)(b) | |
| 2018-3A CL A — 3.2% 9/15/28 | 56,186 | 55,830 |
| 2019-2A CL A — 3.13% 7/16/29 | 283,358 | 272,431 |
MMAF Equipment Finance LLC (MMAF)(b) | |
| 2016-AA CL A4 — 1.76% 1/17/23 | 230,058 | 228,564 |
Prosper Marketplace Issuance Trust (PMIT)(b) |
| 2019-3A CL A — 3.19% 7/15/25 | 259,007 | 248,939 |
| 2019-2A CL A — 3.2% 9/15/25 | 171,629 | 167,543 |
Social Professional Loan Program LLC (SOFI)(b) |
| 2018-A CL A2A — 2.39% 2/25/42 | 317,624 | 317,847 |
Upgrade Receivables Trust (UPGR)(b) | |
| 2018-1A CL A — 3.76% 11/15/24 | 59,095 | 58,539 |
| 2019-1A CL A — 3.48% 3/15/25 | 110,316 | 109,479 |
Verizon Owner Trust (VZOT)(b) | |
| 2018-1A CL A1A — 2.82% 9/20/22 | 650,000 | 651,431 |
| Total Asset-Backed Securities (Cost $9,352,366) | | 9,293,609 |
| | | |
| U.S. Treasury – 80.6% | $ Principal | |
| | Amount | |
| | or Shares | $ Value |
| |
| U.S. Treasury Notes | |
| 2.375% 4/30/20 | 20,000,000 | 20,036,715 |
| 2.5% 6/30/20 | 2,000,000 | 2,011,962 |
| 1.375% 8/31/20 | 12,000,000 | 12,063,281 |
| 2.0% 9/30/2020 | 1,000,000 | 1,009,316 |
| 1.625% 10/15/20 | 11,000,000 | 11,088,731 |
| 1.75% 11/15/20 | 750,000 | 757,720 |
| 1.625% 11/30/20 | 7,000,000 | 7,070,410 |
| 2.0% 1/15/21 | 4,000,000 | 4,060,312 |
| Total U.S. Treasury (Cost $57,814,298) | | 58,098,447 |
| |
| Cash Equivalents – 1.3% | | |
| |
| State Street Institutional U.S. Government Money |
Market Fund - Premier Class 0.32%(a) | 915,594 | 915,594 |
| Total Cash Equivalents (Cost $915,594) | | 915,594 |
| Total Investments in Securities (Cost $71,830,824) | | 72,055,012 |
| Other Assets Less Other Liabilities - 0.0% | | 47,406 |
| Net Assets - 100% | | 72,102,418 |
| Net Asset Value Per Share | 10.03 |
| | |
(a) | Rate presented represents the annualized 7-day yield at March 31, 2020.
|
(b) | Security is exempt from registration under Rule 144A of the Securities Act of 1933. This security may be resold in transactions that are exempt from registration, normally, to qualified institutional buyers.
|
The accompanying notes form an integral part of these financial statements.
56 Q1 2020 Annual Report
STATEMENTS OF ASSETS AND LIABILITIES
March 31, 2020
| | | | | | | | | | | | | | | | | | | | |
| (In U.S. dollars, except share data) | | | | | | | | | | | | | | Nebraska | | Short | | | |
| | | | Partners III | | Partners | | | | | | Core Plus | | Tax-Free | | Duration | | Ultra Short | |
| | Hickory | | Opportunity
| | Value | | Value | | Balanced | | Income | | Income | | Income | | Government | |
| | |
| Assets: | | | | | | | | | | | | | | | | | | | |
Investments in securities at value(a): | | | | | | | | | | | | | | | | | | | |
| Unaffiliated issuers | | 171,341,707
| | 509,189,611
| | 401,075,255
| | 659,330,085
| | 132,401,710
| | 103,852,002
| | 31,267,577
| | 736,170,672
| | 72,055,012 | |
| Non-controlled affiliates | | — | | 52,310,610 | | — | | — | | — | | — | | — | | — | | — | |
| | | 171,341,707
| | 561,500,221
| | 401,075,255
| | 659,330,085
| | 132,401,710
| | 103,852,002
| | 31,267,577
| | 736,170,672
| | 72,055,012 | |
| Accrued interest and dividends receivable | | 190,420 | | 455,653 | | 391,628 | | 378,783 | | 419,193 | | 758,119 | | 300,595 | | 2,900,449 | | 412,324 | |
Due from broker
| | — | | 65,684,396 | | — | | — | | — | | — | | — | | — | | — | |
| Receivable for securities sold | | 29,999 | | 2,442,507 | | 5,754,293 | | — | | — | | — | | — | | — | | — | |
Receivable for fund shares sold
| | 24,318 | | 91,707 | | 35,721 | | 237,795 | | 87,940 | | 47,588 | | 20,000 | | 646,634 | | — | |
| Total assets | | 171,586,444
| | 630,174,484
| | 407,256,897
| | 659,946,663
| | 132,908,843
| | 104,657,709 | | 31,588,172
| | 739,717,755
| | 72,467,336 | |
| Liabilities: | | | | | | | | | | | | | | | | | | | |
| Dividends payable on securities sold short | | — | | 330,984 | | — | | — | | — | | — | | — | | — | | — | |
| Due to adviser | | 174,904 | | 637,826 | | 384,812 | | 603,499 | | 85,152 | | 39,197 | | 13,461 | | 319,459 | | 11,308 | |
Options written, at value(b) | | — | | 18,000 | | — | | — | | — | | — | | — | | — | | — | |
Payable for securities purchased
| | 325,044 | | 5,417,588 | | 4,296,157 | | — | | 543,791 | | 453,417 | | 108,208 | | 2,375,040 | | — | |
| Payable for fund shares redeemed | | 118,796 | | 76,805 | | 2,457,742 | | 355,244 | | 6,790 | | 116,244 | | 2,000 | | 933,251 | | 350,068 | |
Securities sold short(c) | | — | | 62,974,000 | | — | | — | | — | | — | | — | | — | | — | |
| Other | | — | | — | | — | | — | | — | | — | | — | | — | | 3,542 | |
| Total liabilities | | 618,744 | | 69,455,203 | | 7,138,711 | | 958,743 | | 635,733 | | 608,858 | | 123,669
| | 3,627,750 | | 364,918 | |
| Net assets | | 170,967,700
| | 560,719,281
| | 400,118,186
| | 658,987,920
| | 132,273,110
| | 104,048,851 | | 31,464,503
| | 736,090,005
| | 72,102,418 | |
| Composition of net assets: | | | | | | | | | | | | | | | | | | | |
| Paid-in capital | | 135,374,244 | | 367,674,084 | | 295,622,589 | | 429,627,519 | | 116,578,644 | | 105,214,927
| | 30,895,159
| | 749,427,291
| | 71,874,857 | |
| Total distributable earnings | | 35,593,456 | | 193,045,197 | | 104,495,597 | | 229,360,401 | | 15,694,466 | | (1,166,076 | ) | 569,344 | | (13,337,286 | ) | 227,561 | |
| Net assets | | 170,967,700
| | 560,719,281
| | 400,118,186
| | 658,987,920
| | 132,273,110
| | 104,048,851
| | 31,464,503
| | 736,090,005
| | 72,102,418 | |
Net assets(d): | | | | | | | | | | | | | | | | | | | |
| Investor Class | | 170,967,700
| | 19,286,571 | | 183,718,451 | | 448,258,556 | | 47,590,794 | | 25,920,824 | | 31,464,503 | | 60,845,308 | | | |
| Institutional Class | | | | 541,432,710 | | 216,399,735 | | 210,729,364 | | 84,682,316 | | 78,128,027 | | | | 675,244,697 | | 72,102,418 | |
Shares outstanding(d)(e): | | | | | | | | | | | | | | | | | | | |
| Investor Class | | 4,406,837 | | 1,502,145 | | 7,877,696 | | 11,802,275 | | 3,514,810 | | 2,555,474 | | 3,123,929 | | 5,100,242 | | | |
| Institutional Class | | | | 40,322,543 | | 9,132,133 | | 5,466,371 | | 6,249,956 | | 7,700,133 | | | | 56,514,579 | | 7,191,734 | |
Net asset value, offering and redemption price(d): | | | | | | | | | | | | | | | | | | | |
| Investor Class | | 38.80 | | 12.84 | | 23.32 | | 37.98 | | 13.54 | | 10.14 | | 10.07 | | 11.93 | | | |
| Institutional Class | | | | 13.43 | | 23.70 | | 38.55 | | 13.55 | | 10.15 | | | | 11.95 | | 10.03 | |
(a) Cost of investments in securities: | | | | | | | | | | | | | | | | | | | |
| Unaffiliated issuers | | 139,486,698 | | 387,168,786 | | 312,123,653 | | 451,074,057 | | 117,410,990 | | 106,519,964 | | 30,584,472 | | 750,253,412 | | 71,830,824 | |
| Non-controlled affiliates | | — | | 1,149,099 | | — | | — | | — | | — | | — | | — | | — | |
| | 139,486,698
| | 388,317,885
| | 312,123,653
| | 451,074,057
| | 117,410,990
| | 106,519,964 | | 30,584,472
| | 750,253,412
| | 71,830,824 | |
(b) Premiums from options written | | — | | 131,403 | | — | | — | | — | | — | | — | | — | | — | |
(c) Proceeds from short sales | | — | | 54,494,195 | | — | | — | | — | | — | | — | | — | | — | |
(d) Funds with a single share class are shown with the Investor Class, except for the Ultra Short Government Fund which has been designated Institutional Class
| |
(e) Indefinite number of no par value shares authorized
| |
The accompanying notes form an integral part of these financial statements.
Q1 2020 Annual Report 57
STATEMENTS OF OPERATIONS
Year ended March 31, 2020
| | | | | | | | | | | | | | | | | | | | |
| | | | | | | | | | | | | | Nebraska | | Short | | | |
| | | | Partners III | | Partners | | | | | | Core Plus | | Tax-Free | | Duration | | Ultra Short | |
| (In U.S. dollars) | | Hickory | | Opportunity | | Value | | Value | | Balanced | | Income | | Income | | Income | | Government | |
| | |
| Investment income: | | | | | | | | | | | | | | | | | | | |
| Dividends | | 1,439,322 | | 2,896,976 | | 5,137,270 | | 6,392,822 | | 640,846 | | 14,953 | | — | | 275,472 | | — | |
| Interest | | 170,227 | | 2,122,399 | | 301,459 | | 625,347 | | 1,776,022 | | 3,498,595 | | 722,512 | | 23,619,254 | | 1,774,722 | |
| Total investment income | | 1,609,549 | | 5,019,375 | | 5,438,729 | | 7,018,169 | | 2,416,868 | | 3,513,548 | | 722,512 | | 23,894,726 | | 1,774,722 | |
| Fees and expenses: | | | | | | | | | | | | | | | | | | | |
| Investment advisory | | 2,285,697 | | 6,663,445 | | 5,268,699 | | 7,301,830 | | 877,551 | | 409,849 | | 129,947 | | 3,354,248 | | 224,322 | |
| Administrative | | 337,838 | | 411,424 | | 434,164 | | 524,526 | | 196,507 | | 166,124 | | 73,341 | | 508,070 | | 104,797 | |
| Servicing: | | | | | | | | | | | | | | | | | | | |
Investor Class
| | — | | 62,522 | | 541,838 | | 1,016,684 | | 76,260 | | 63,997 | | — | | 197,868 | | — | |
Institutional Class
| | — | | 218,105 | | 90,469 | | 48,122 | | 10,000 | | 33,869 | | — | | 792,507 | | 10,000 | |
| Custody and fund accounting | | 70,674 | | 117,426 | | 97,257 | | 123,586 | | 85,370 | | 97,404 | | 81,663 | | 165,838 | | 75,571 | |
| Dividends on securities sold short | | — | | 1,869,960 | | — | | — | | — | | — | | — | | — | | — | |
| Professional | | 43,619 | | 91,436 | | 78,432 | | 95,087 | | 43,359 | | 35,106 | | 27,748 | | 100,408 | | 32,103 | |
| Registration | | 24,847 | | 48,146 | | 46,456 | | 51,750 | | 52,024 | | 35,057 | | 5,099 | | 58,082 | | 23,643 | |
| Sub-transfer agent | | 94,000 | | 95,850 | | 125,623 | | 238,385 | | 65,638 | | 46,396 | | 24,858 | | 102,368 | | 34,563 | |
| Trustees | | 31,045 | | 90,254 | | 80,366 | | 110,067 | | 17,965 | | 13,349 | | 4,415 | | 113,205 | | 10,269 | |
| Other | | 46,721 | | 66,603 | | 91,755 | | 153,859 | | 24,377 | | 16,372 | | 8,119 | | 174,280 | | 15,480 | |
| | | 2,934,441 | | 9,735,171 | | 6,855,059 | | 9,663,896 | | 1,449,051 | | 917,523 | | 355,190 | | 5,566,874 | | 530,748 | |
| Less expenses waived/reimbursed by | | | | | | | | | | | | | | | | | |
| investment adviser | | (113,979 | ) | — | | (496,225 | ) | (519,038 | ) | (431,621 | ) | (462,630 | ) | (51,989 | ) | (1,423,181 | ) | (381,200 | ) |
| Net expenses | | 2,820,462 | | 9,735,171 | | 6,358,834 | | 9,144,858 | | 1,017,430 | | 454,893 | | 303,201 | | 4,143,693 | | 149,548 | |
| Net investment income (loss) | | (1,210,913 | ) | (4,715,796 | ) | (920,105 | ) | (2,126,689 | ) | 1,399,438 | | 3,058,655 | | 419,311 | | 19,751,033 | | 1,625,174 | |
| Realized and unrealized gain (loss) on investments: | | | | | | | | | | | | | | | | | | | |
| Net realized gain (loss): | | | | | | | | | | | | | | | | | | | |
| Unaffiliated issuers | | 8,005,140 | | 39,143,338 | | 34,725,781 | | 41,006,763 | | 2,687,370 | | 1,815,193 | | 2,746 | | 2,263,477 | | 39,926 | |
| Non-controlled affiliates | | — | | 30,795,863 | | — | | — | | — | | — | | — | | — | | — | |
| Securities sold short | | — | | (6,010,527 | ) | — | | — | | — | | — | | — | | — | | — | |
| Net realized gain (loss) | | 8,005,140 | | 63,928,674 | | 34,725,781 | | 41,006,763 | | 2,687,370 | | 1,815,193 | | 2,746 | | 2,263,477 | | 39,926 | |
| Net unrealized appreciation (depreciation): | | | | | | | | | | | | | | | | | | | |
| Unaffiliated issuers | | (39,028,846 | ) | (87,391,889 | ) | (102,198,646 | ) | (72,902,938 | ) | (3,832,524 | ) | (3,794,598 | ) | 397,121 | | (16,698,930 | ) | 179,684 | |
| Non-controlled affiliates | | — | | (18,442,910 | ) | — | | — | | — | | — | | — | | — | | — | |
Options written
| | — | | 113,403 | | — | | — | | — | | — | | — | | — | | — | |
| Securities sold short | | — | | 16,935,305 | | — | | — | | — | | — | | — | | — | | — | |
| Net unrealized appreciation (depreciation) | | (39,028,846 | ) | (88,786,091 | ) | (102,198,646 | ) | (72,902,938 | ) | (3,832,524 | ) | (3,794,598 | ) | 397,121 | | (16,698,930 | ) | 179,684 | |
Net realized and unrealized gain (loss) on investments
| | (31,023,706 | ) | (24,857,417 | ) | (67,472,865 | ) | (31,896,175 | ) | (1,145,154 | ) | (1,979,405 | ) | 399,867 | | (14,435,453 | ) | 219,610 | |
| Net increase (decrease) in net assets resulting | | | | | | | | | | | | | | | | | | | |
| from operations | | (32,234,619 | ) | (29,573,213 | ) | (68,392,970 | ) | (34,022,864 | ) | 254,284 | | 1,079,250 | | 819,178 | | 5,315,580 | | 1,844,784 | |
The accompanying notes form an integral part of these financial statements.
58 Q1 2020 Annual Report
STATEMENTS OF CHANGES IN NET ASSETS
| | | | | | | | | | | | | | | | | | |
| | | Hickory | | Partners III Opportunity | | Partners Value | | Value | |
| | Year ended March 31, | | Year ended March 31, | | Year ended March 31, | | Year ended March 31, | |
| (In U.S. dollars) | | 2020 | | 2019 | | 2020 | | 2019 | | 2020 | | 2019 | | 2020 | | 2019 | |
| | |
| Increase (decrease) in net assets: | | | | | | | | | | | | | | | | | |
| From operations: | | | | | | | | | | | | | | | | | |
Net investment income (loss)
| | (1,210,913 | ) | (223,156 | ) | (4,715,796 | ) | (4,278,604 | ) | (920,105 | ) | (1,537,501 | ) | (2,126,689 | ) | (3,040,881 | ) |
Net realized gain (loss)
| | 8,005,140 | | 13,289,038 | | 63,928,674 | | 12,527,475 | | 34,725,781 | | 55,606,091 | | 41,006,763 | | 58,714,069 | |
Net unrealized appreciation (depreciation)
| | (39,028,846 | ) | (9,136,061 | ) | (88,786,091 | ) | 55,470,630 | | (102,198,646 | ) | (39,084,576 | ) | (72,902,938 | ) | 10,821,105 | |
| Net increase (decrease) in net assets | | | | | | | | | | | | | | | | | |
| resulting from operations | | (32,234,619 | ) | 3,929,821 | | (29,573,213 | ) | 63,719,501 | | (68,392,970 | ) | 14,984,014 | | (34,022,864 | ) | 66,494,293 | |
Distributions to shareholders(a): | | | | | | | | | | | | | | | | | |
| Investor Class | | (4,410,185 | ) | (24,299,497 | ) | (1,504,044 | ) | (1,558,657 | ) | (19,224,059 | ) | (22,162,561 | ) | (27,497,303 | ) | (51,250,335 | ) |
| Institutional Class | | (41,290,214 | ) | (42,258,488 | ) | (23,314,351 | ) | (24,393,419 | ) | (11,915,327 | ) | (20,081,985 | ) |
| Total distributions | | (4,410,185 | ) | (24,299,497 | ) | (42,794,258 | ) | (43,817,145 | ) | (42,538,410 | ) | (46,555,980 | ) | (39,412,630 | ) | (71,332,320 | ) |
Fund share transactions(a): | | | | | | | | | | | | | | | | | |
| Investor Class | | (3,131,490 | ) | (11,494,405 | ) | 108,957 | | (3,425,684 | ) | (32,659,494 | ) | (47,086,780 | ) | (43,700,150 | ) | (33,189,385 | ) |
| Institutional Class | | (5,524,434 | ) | (31,815,832 | ) | (44,099,450 | ) | 6,345,315 | | 7,376,195 | | 21,370,925 | |
| Net increase (decrease) from fund | | | | | | | | | | | | | | | | | |
| share transactions | | (3,131,490 | ) | (11,494,405 | ) | (5,415,477 | ) | (35,241,516 | ) | (76,758,944 | ) | (40,741,465 | ) | (36,323,955 | ) | (11,818,460 | ) |
| | |
| Total increase (decrease) in net assets | | (39,776,294 | ) | (31,864,081 | ) | (77,782,948 | ) | (15,339,160 | ) | (187,690,324 | ) | (72,313,431 | ) | (109,759,449 | ) | (16,656,487 | ) |
| Net assets: | | | | | | | | | | | | | | | | | |
| Beginning of period | | 210,743,994 | | 242,608,075 | | 638,502,229 | | 653,841,389 | | 587,808,510 | | 660,121,941 | | 768,747,369 | | 785,403,856 | |
| End of period | | 170,967,700 | | 210,743,994 | | 560,719,281 | | 638,502,229 | | 400,118,186 | | 587,808,510 | | 658,987,920 | | 768,747,369 | |
| | |
(a) Funds with a single share class are shown with the Investor Class, except for the Ultra Short Government Fund which has been designated Institutional Class | |
The accompanying notes form an integral part of these financial statements.
Q1 2020 Annual Report 59
| | | | | | | | | | | | | | | | | | | | |
| Balanced | | Core Plus Income | | Nebraska Tax-Free Income | | Short Duration Income | | Ultra Short Government | |
| Year ended March 31, | | Year ended March 31, | | Year ended March 31, | | Year ended March 31, | | Year ended March 31, | |
| 2020 | | 2019 | | 2020 | | 2019 | | 2020 | | 2019 | | 2020 | | 2019 | | 2020 | | 2019 | |
| | | | | | | | | | | | | | | | | | | | |
| | | | | | | | | | | | | | | | | | | | |
| | | | | | | | | | | | | | | | | | | | |
1,399,438 | | 1,196,280 | | 3,058,655 | | 1,543,045 | | 419,311 | | 715,859 | | 19,751,033 | | 23,377,820 | | 1,625,174 | | 2,179,921 | |
2,687,370 | | 2,964,909 | | 1,815,193 | | (102,923 | ) | 2,746 | | (63,635 | ) | 2,263,477 | | 1,665,103 | | 39,926 | | 7,936 | |
(3,832,524 | ) | 3,239,393 | | (3,794,598 | ) | 1,509,695 | | 397,121 | | 840,952 | | (16,698,930 | ) | 4,055,457 | | 179,684 | | 82,538 | |
| | | | | | | | | | | | | | | | | | | | |
| 254,284 | | 7,400,582 | | 1,079,250 | | 2,949,817 | | 819,178 | | 1,493,176 | | 5,315,580 | | 29,098,380 | | 1,844,784 | | 2,270,395 | |
| | | | | | | | | | | | | | | | | | | | |
(962,256 | ) | (10,777,688 | ) | (795,621 | ) | (281,443 | ) | (422,709 | ) | (737,927 | ) | (1,570,346 | ) | (2,006,765 | ) | | | | |
(1,704,967 | ) | — | | (2,472,797 | ) | (1,266,681 | ) | | | | | (18,386,052 | ) | (21,592,551 | ) | (1,667,656 | ) | (2,181,531 | ) |
| (2,667,223 | ) | (10,777,688 | ) | (3,268,418 | ) | (1,548,124 | ) | (422,709 | ) | (737,927 | ) | (19,956,398 | ) | (23,599,316 | ) | (1,667,656 | ) | (2,181,531 | ) |
| | | | | | | | | | | | | | | | | | | | |
6,230,770 | | 5,738,990 | | 7,652,215 | | 11,244,474 | | (6,979,787 | ) | (21,311,359 | ) | (8,791,247 | ) | (42,670,992 | ) | | | | |
4,024,205 | | — | | 20,058,322 | | 26,712,981 | | | | | | (140,176,579 | ) | (194,329,528 | ) | (25,518,668 | ) | (6,806,883 | ) |
| | | | | | | | | | | | | | | | | | | | |
| 10,254,975 | | 5,738,990 | | 27,710,537 | | 37,957,455 | | (6,979,787 | ) | (21,311,359 | ) | (148,967,826 | ) | (237,000,520 | ) | (25,518,668 | ) | (6,806,883 | ) |
| | | | | | | | | | | | | | | | | | | | |
| 7,842,036 | | 2,361,884 | | 25,521,369 | | 39,359,148 | | (6,583,318 | ) | (20,556,110 | ) | (163,608,644 | ) | (231,501,456 | ) | (25,341,540 | ) | (6,718,019 | ) |
| | | | | | | | | | | | | | | | | | | | |
124,431,074 | | 122,069,190 | | 78,527,482 | | 39,168,334 | | 38,047,821 | | 58,603,931 | | 899,698,649 | | 1,131,200,105 | | 97,443,958 | | 104,161,977 | |
| 132,273,110 | | 124,431,074 | | 104,048,851 | | 78,527,482 | | 31,464,503 | | 38,047,821 | | 736,090,005 | | 899,698,649 | | 72,102,418 | | 97,443,958 | |
The accompanying notes form an integral part of these financial statements.
60 Q1 2020 Annual Report
STATEMENT OF CASH FLOWS
Year ended March 31, 2020
| | | | |
| Partners III Opportunity | |
| (In U.S. dollars) | | | |
| Increase (decrease) in cash: | | | |
| Cash flows from operating activities: | | | |
| Net decrease in net assets from operations | | (29,573,213 | ) |
| Adjustments to reconcile net decrease in net assets from operations to net cash provided by operating activities: | | | |
| Purchases of investment securities | | (154,225,939 | ) |
| Proceeds from sale of investment securities | | 229,350,547 | |
| Proceeds from securities sold short | | 24,432,741 | |
| Short positions covered | | (46,577,162 | ) |
| Purchase of short-term investment securities, net | | (41,015,565 | ) |
| Net unrealized depreciation on investments, options and securities sold short | | 88,786,091 | |
| Net realized gain on investments and securities sold short | | (63,928,674 | ) |
| Increase in accrued interest and dividends receivable | | (371,460 | ) |
| Decrease in due from broker | | 35,469,105 | |
| Decrease in receivable for securities sold | | 679,891 | |
| Increase in receivable for fund shares sold | | (64,896 | ) |
| Decrease in dividends payable on securities sold short | | (88,277 | ) |
| Decrease in due to adviser | | (34,128 | ) |
| Increase in payable for securities purchased | | 5,417,588 | |
| Decrease in payable for fund shares redeemed | | (46,914 | ) |
| Net cash provided by operating activities | | 48,209,735 | |
| | | | |
| Cash flows from financing activities: | | | |
| Proceeds from sales of fund shares | | 49,913,383 | |
| Payments for redemptions of fund shares | | (94,285,624 | ) |
| Cash distributions to shareholders | | (3,837,494 | ) |
| Net cash used in financing activities | | (48,209,735 | ) |
| | | |
|
| Net increase (decrease) in cash | | — | |
| Cash: | |
| Balance, beginning of period | | — | |
| Balance, end of period | | — | |
Noncash financing activities: | | | |
| Reinvestment of shareholder distributions | | 38,956,764 | |
The accompanying notes form an integral part of these financial statements.
Q1 2020 Annual Report 61
This page intentionally left blank
The accompanying notes form an integral part of these financial statements.
62 Q1 2020 Annual Report
FINANCIAL HIGHLIGHTS
The following financial information provides selected data, in U.S. dollars, for a share outstanding throughout the periods indicated.
| | | | | | | | | | | | | | | | | | | | | | |
| | | | | Income (loss) from Investment Operations | | | Distributions | |
Years ended March 31, unless otherwise noted | | Net asset value, beginning of period | | | Net investment income (loss) | | | Net gain (loss) on securities (realized and unrealized)
| | | Total from investment operations | | | Dividends from net investment income | | | Distributions from realized gains | | | Total distributions
| |
| | |
| Hickory | | | | | | | | | | | | | | | | | | | | | |
| 2020 | | | 46.86 | | | | (0.28 | ) | | | (6.82 | ) | | | (7.10 | ) | | | — | | | | (0.96 | ) | | | (0.96 | ) |
| 2019 | | | 51.58 | | | | (0.05 | ) | | | 0.71 | | | | 0.66 | | | | — | | | | (5.38 | ) | | | (5.38 | ) |
| 2018 | | | 53.11 | | | | (0.37 | ) | | | 1.55 | | | | 1.18 | | | | — | | | | (2.71 | ) | | | (2.71 | ) |
| 2017 | | | 47.59 | | | | (0.25 | ) | | | 5.77 | | | | 5.52 | | | | — | | | | — | | | | — | |
| 2016 | | | 59.51 | | | | (0.30 | ) | | | (4.79 | ) | | | (5.09 | ) | | | — | | | | (6.83 | ) | | | (6.83 | ) |
| | |
| Partners III Opportunity - Investor Class | | | | | | | | | | | | | | | | | | | | | | | | | | | | |
| 2020 | | | 14.67 | | | | (0.20 | )(a) | | | (0.59 | ) | | | (0.79 | ) | | | — | | | | (1.04 | ) | | | (1.04 | ) |
| 2019 | | | 14.28 | | | | (0.17 | )(a) | | | 1.58 | | | | 1.41 | | | | — | | | | (1.02 | ) | | | (1.02 | ) |
| 2018 | | | 14.74 | | | | (0.19 | )(a) | | | 0.40 | | | | 0.21 | | | | — | | | | (0.67 | ) | | | (0.67 | ) |
| 2017 | | | 13.73 | | | | (0.20 | )(a) | | | 1.40 | | | | 1.20 | | | | — | | | | (0.19 | ) | | | (0.19 | ) |
| 2016 | | | 17.12 | | | | (0.25 | )(a) | | | (1.30 | ) | | | (1.55 | ) | | | — | | | | (1.84 | ) | | | (1.84 | ) |
| | |
| Partners III Opportunity - Institutional Class | | | | | | | | | | | | | | | | | | | | | | | | | | | | |
| 2020 | | | 15.21 | | | | (0.11 | )(a) | | | (0.63 | ) | | | (0.74 | ) | | | — | | | | (1.04 | ) | | | (1.04 | ) |
| 2019 | | | 14.69 | | | | (0.09 | )(a) | | | 1.63 | | | | 1.54 | | | | — | | | | (1.02 | ) | | | (1.02 | ) |
| 2018 | | | 15.07 | | | | (0.12 | )(a) | | | 0.41 | | | | 0.29 | | | | — | | | | (0.67 | ) | | | (0.67 | ) |
| 2017 | | | 13.96 | | | | (0.13 | )(a) | | | 1.43 | | | | 1.30 | | | | — | | | | (0.19 | ) | | | (0.19 | ) |
| 2016 | | | 17.31 | | | | (0.19 | )(a) | | | (1.32 | ) | | | (1.51 | ) | | | — | | | | (1.84 | ) | | | (1.84 | ) |
| | |
| Partners Value - Investor Class | | | | | | | | | | | | | | | | | | | | | | | | | | | | |
| 2020 | | | 29.45 | | | | (0.09 | )(a) | | | (3.80 | ) | | | (3.89 | ) | | | — | | | | (2.24 | ) | | | (2.24 | ) |
| 2019 | | | 31.31 | | | | (0.12 | )(a) | | | 0.63 | | | | 0.51 | | | | — | | | | (2.37 | ) | | | (2.37 | ) |
| 2018 | | | 30.72 | | | | (0.15 | )(a) | | | 1.47 | | | | 1.32 | | | | — | | | | (0.73 | ) | | | (0.73 | ) |
| 2017 | | | 27.66 | | | | (0.09 | )(a) | | | 3.15 | | | | 3.06 | | | | — | | | | — | | | | — | |
| 2016 | | | 35.05 | | | | (0.14 | )(a) | | | (3.47 | ) | | | (3.61 | ) | | | — | | | | (3.78 | ) | | | (3.78 | ) |
| | |
| Partners Value - Institutional Class | | | | | | | | | | | | | | | | | | | | | | | | | | | | |
| 2020 | | | 29.82 | | | | (0.01 | )(a) | | | (3.87 | ) | | | (3.88 | ) | | | — | | | | (2.24 | ) | | | (2.24 | ) |
| 2019 | | | 31.59 | | | | (0.04 | )(a) | | | 0.64 | | | | 0.60 | | | | — | | | | (2.37 | ) | | | (2.37 | ) |
| 2018 | | | 30.91 | | | | (0.06 | )(a) | | | 1.47 | | | | 1.41 | | | | — | | | | (0.73 | ) | | | (0.73 | ) |
| 2017 | | | 27.75 | | | | (0.02 | )(a) | | | 3.18 | | | | 3.16 | | | | — | | | | — | | | | — | |
| 2016 | | | 35.09 | | | | (0.08 | )(a) | | | (3.48 | ) | | | (3.56 | ) | | | — | | | | (3.78 | ) | | | (3.78 | ) |
| | |
| Value - Investor Class | | | | | | | | | | | | | | | | | | | | | | | | | | | | |
| 2020 | | | 42.31 | | | | (0.15 | )(a) | | | (1.98 | ) | | | (2.13 | ) | | | — | | | | (2.20 | ) | | | (2.20 | ) |
| 2019 | | | 42.92 | | | | (0.19 | )(a) | | | 3.60 | | | | 3.41 | | | | — | | | | (4.02 | ) | | | (4.02 | ) |
| 2018 | | | 42.20 | | | | (0.18 | )(a) | | | 3.96 | | | | 3.78 | | | | — | | | | (3.06 | ) | | | (3.06 | ) |
| 2017 | | | 38.43 | | | | (0.16 | )(a) | | | 3.93 | | | | 3.77 | | | | — | | | | — | | | | — | |
| 2016 | | | 46.93 | | | | (0.25 | )(a) | | | (3.27 | ) | | | (3.52 | ) | | | — | | | | (4.98 | ) | | | (4.98 | ) |
| | |
| Value - Institutional Class | | | | | | | | | | | | | | | | | | | | | | | | | | | | |
| 2020 | | | 42.82 | | | | (0.05 | )(a) | | | (2.02 | ) | | | (2.07 | ) | | | — | | | | (2.20 | ) | | | (2.20 | ) |
| 2019 | | | 43.29 | | | | (0.09 | )(a) | | | 3.64 | | | | 3.55 | | | | — | | | | (4.02 | ) | | | (4.02 | ) |
| 2018 | | | 42.44 | | | | (0.09 | )(a) | | | 4.00 | | | | 3.91 | | | | — | | | | (3.06 | ) | | | (3.06 | ) |
| 2017 | | | 38.56 | | | | (0.08 | )(a) | | | 3.96 | | | | 3.88 | | | | — | | | | — | | | | — | |
| 2016 | | | 46.99 | | | | (0.17 | )(a) | | | (3.28 | ) | | | (3.45 | ) | | | — | | | | (4.98 | ) | | | (4.98 | ) |
| (a) | Based on average daily shares outstanding |
| (b) | Included in the expense ratio is 0.00%, 0.00%, 0.00%, 0.08% and 0.27% related to interest expense and 0.29%, 0.40%, 0.47%, 0.54% and 0.50% related to dividend expense on securities sold short for the periods ended March 31, 2020, 2019, 2018, 2017 and 2016, respectively. |
| (c) | Included in the expense ratio is 0.00%, 0.00%, 0.00%, 0.08% and 0.27% related to interest expense and 0.28%, 0.40%, 0.47%, 0.55% and 0.51% related to dividend expense on securities sold short for the periods ended March 31, 2020, 2019, 2018, 2017 and 2016, respectively. |
The accompanying notes form an integral part of these financial statements.
Q1 2020 Annual Report 63
| | | | | | | | | | | | | | | | | | | | |
| | | | Ratios/Supplemental Data | |
| | | | | | | | | | Ratio of expenses to average net assets | | | | | | | |
Net asset value, end of period | | | Total Return (%) | | | Net assets, end of period ($000) | | | Prior to fee waivers (%) | | | Net of fee waivers (%) | | | Ratio of net investment income (loss) to average net assets (%) | | | Portfolio turnover rate (%) | |
| | |
| | |
| | 38.80 | | | | (15.67 | ) | | | 170,968 | | | | 1.28 | | | | 1.23 | | | | (0.53 | ) | | | 30 | |
| | 46.86 | | | | 2.30 | | | | 210,744 | | | | 1.27 | | | | 1.27 | | | | (0.10 | ) | | | 28 | |
| | 51.58 | | | | 2.15 | | | | 242,608 | | | | 1.24 | | | | 1.24 | | | | (0.65 | ) | | | 20 | |
| | 53.11 | | | | 11.60 | | | | 272,499 | | | | 1.25 | | | | 1.25 | | | | (0.44 | ) | | | 7 | |
| | 47.59 | | | | (9.04 | ) | | | 298,170 | | | | 1.24 | | | | 1.24 | | | | (0.50 | ) | | | 27 | |
| | |
| | |
| | 12.84 | | | | (6.40 | ) | | | 19,287 | | | | 2.04 | (b) | | | 2.04 | (b) | | | (1.29 | ) | | | 32 | |
| | 14.67 | | | | 10.63 | | | | 21,881 | | | | 2.13 | (b) | | | 2.13 | (b) | | | (1.23 | ) | | | 38 | |
| | 14.28 | | | | 1.49 | | | | 24,808 | | | | 2.14 | (b) | | | 2.14 | (b) | | | (1.30 | ) | | | 31 | |
| | 14.74 | | | | 8.94 | | | | 28,561 | | | | 2.29 | (b) | | | 2.29 | (b) | | | (1.43 | ) | | | 23 | |
| | 13.73 | | | | (9.56 | ) | | | 35,461 | | | | 2.33 | (b) | | | 2.33 | (b) | | | (1.63 | ) | | | 46 | |
| | |
| | |
| | 13.43 | | | | (5.83 | ) | | | 541,433 | | | | 1.44 | (c) | | | 1.44 | (c) | | | (0.69 | ) | | | 32 | |
| | 15.21 | | | | 11.25 | | | | 616,621 | | | | 1.56 | (c) | | | 1.56 | (c) | | | (0.66 | ) | | | 38 | |
| | 14.69 | | | | 2.01 | | | | 629,034 | | | | 1.63 | (c) | | | 1.63 | (c) | | | (0.79 | ) | | | 31 | |
| | 15.07 | | | | 9.52 | | | | 661,165 | | | | 1.80 | (c) | | | 1.80 | (c) | | | (0.93 | ) | | | 23 | |
| | 13.96 | | | | (9.20 | ) | | | 677,019 | | | | 1.95 | (c) | | | 1.95 | (c) | | | (1.26 | ) | | | 46 | |
| | |
| | |
| | 23.32 | | | | (14.82 | ) | | | 183,718 | | | | 1.29 | | | | 1.24 | | | | (0.31 | ) | | | 26 | |
| | 29.45 | | | | 2.50 | | | | 265,250 | | | | 1.27 | | | | 1.27 | | | | (0.39 | ) | | | 38 | |
| | 31.31 | | | | 4.28 | | | | 328,648 | | | | 1.25 | | | | 1.25 | | | | (0.46 | ) | | | 12 | |
| | 30.72 | | | | 11.06 | | | | 429,226 | | | | 1.27 | | | | 1.24 | | | | (0.33 | ) | | | 16 | |
| | 27.66 | | | | (10.61 | ) | | | 531,353 | | | | 1.26 | | | | 1.18 | | | | (0.45 | ) | | | 31 | |
| | |
| | |
| | 23.70 | | | | (14.59 | ) | | | 216,400 | | | | 1.08 | | | | 0.97 | | | | (0.04 | ) | | | 26 | |
| | 29.82 | | | | 2.78 | | | | 322,558 | | | | 1.07 | | | | 0.99 | | | | (0.12 | ) | | | 38 | |
| | 31.59 | | | | 4.55 | | | | 331,474 | | | | 1.07 | | | | 0.99 | | | | (0.20 | ) | | | 12 | |
| | 30.91 | | | | 11.39 | | | | 309,497 | | | | 1.07 | | | | 0.99 | | | | (0.08 | ) | | | 16 | |
| | 27.75 | | | | (10.45 | ) | | | 297,290 | | | | 1.07 | | | | 0.99 | | | | (0.25 | ) | | | 31 | |
| | |
| | |
| | 37.98 | | | | (5.77 | ) | | | 448,259 | | | | 1.24 | | | | 1.20 | | | | (0.33 | ) | | | 16 | |
| | 42.31 | | | | 9.04 | | | | 541,168 | | | | 1.23 | | | | 1.23 | | | | (0.46 | ) | | | 32 | |
| | 42.92 | | | | 9.23 | | | | 578,345 | | | | 1.22 | | | | 1.22 | | | | (0.42 | ) | | | 15 | |
| | 42.20 | | | | 9.81 | | | | 638,993 | | | | 1.24 | | | | 1.22 | | | | (0.42 | ) | | | 24 | |
| | 38.43 | | | | (8.05 | ) | | | 738,086 | | | | 1.23 | | | | 1.18 | | | | (0.59 | ) | | | 47 | |
| | |
| | |
| | 38.55 | | | | (5.55 | ) | | | 210,729 | | | | 1.09 | | | | 0.97 | | | | (0.10 | ) | | | 16 | |
| | 42.82 | | | | 9.32 | | | | 227,580 | | | | 1.08 | | | | 0.99 | | | | (0.22 | ) | | | 32 | |
| | 43.29 | | | | 9.46 | | | | 207,059 | | | | 1.09 | | | | 0.99 | | | | (0.20 | ) | | | 15 | |
| | 42.44 | | | | 10.06 | | | | 191,299 | | | | 1.10 | | | | 0.99 | | | | (0.19 | ) | | | 24 | |
| | 38.56 | | | | (7.88 | ) | | | 192,310 | | | | 1.08 | | | | 0.99 | | | | (0.39 | ) | | | 47 | |
The accompanying notes form an integral part of these financial statements.
64 Q1 2020 Annual Report
FINANCIAL HIGHLIGHTS (CONTINUED)
The following financial information provides selected data, in U.S. dollars, for a share outstanding throughout the periods indicated.
| | | | | | | | | | | | | | | | | | | | | | |
| | | | | |
| | | | | Income (loss) from Investment Operations | | | Distributions | |
Years ended March 31, unless otherwise noted | | Net asset value, beginning of period | | | Net investment income (loss) | | | Net gain (loss) on securities (realized and unrealized) | | | Total from investment operations | | | Dividends from net investment income | | | Distributions from realized gains | | | Total distributions | |
| | |
| Balanced - Investor Class | | | | | | | | | | | | | | | | | | | | | |
| 2020 | | | 13.76 | | | | 0.13 | (a) | | | (0.07 | ) | | | 0.06 | | | | (0.15 | ) | | | (0.13 | ) | | | (0.28 | ) |
| 2019 | | | 14.20 | | | | 0.14 | | | | 0.66 | | | | 0.80 | | | | (0.13 | ) | | | (1.11 | ) | | | (1.24 | ) |
| 2018 | | | 13.63 | | | | 0.08 | | | | 0.87 | | | | 0.95 | | | | (0.05 | ) | | | (0.33 | ) | | | (0.38 | ) |
| 2017 | | | 13.24 | | | | 0.01 | | | | 0.80 | | | | 0.81 | | | | (0.03 | ) | | | (0.39 | ) | | | (0.42 | ) |
| 2016 | | | 14.07 | | | | 0.02 | | | | (0.13 | ) | | | (0.11 | ) | | | — | | | | (0.72 | ) | | | (0.72 | ) |
| | |
| Balanced - Institutional Class | | | | | | | | | | | | | | | | | | | | | | | | | | | | |
2020(b) | | | 13.75 | | | | 0.16 | (a) | | | (0.08 | ) | | | 0.08 | | | | (0.15 | ) | | | (0.13 | ) | | | (0.28 | ) |
| | |
| Core Plus Income - Investor Class | | | | | | | | | | | | | | | | | | | | | | | | | | | | |
| 2020 | | | 10.31 | | | | 0.30 | (a) | | | (0.16 | ) | | | 0.14 | | | | (0.29 | ) | | | (0.02 | ) | | | (0.31 | ) |
| 2019 | | | 10.09 | | | | 0.27 | (a) | | | 0.21 | | | | 0.48 | | | | (0.26 | ) | | | — | | | | (0.26 | ) |
| 2018 | | | 10.23 | | | | 0.23 | (a) | | | (0.12 | ) | | | 0.11 | | | | (0.22 | ) | | | (0.03 | ) | | | (0.25 | ) |
| 2017 | | | 10.15 | | | | 0.23 | (a) | | | 0.21 | | | | 0.44 | | | | (0.23 | ) | | | (0.13 | ) | | | (0.36 | ) |
| 2016 | | | 10.21 | | | | 0.22 | (a) | | | (0.04 | ) | | | 0.18 | | | | (0.22 | ) | | | (0.02 | ) | | | (0.24 | ) |
| | |
| Core Plus Income - Institutional Class | | | | | | | | | | | | | | | | | | | | | | | | | | | | |
| 2020 | | | 10.32 | | | | 0.32 | (a) | | | (0.16 | ) | | | 0.16 | | | | (0.31 | ) | | | (0.02 | ) | | | (0.33 | ) |
| 2019 | | | 10.10 | | | | 0.29 | (a) | | | 0.21 | | | | 0.50 | | | | (0.28 | ) | | | — | | | | (0.28 | ) |
| 2018 | | | 10.23 | | | | 0.25 | (a) | | | (0.11 | ) | | | 0.14 | | | | (0.24 | ) | | | (0.03 | ) | | | (0.27 | ) |
| 2017 | | | 10.15 | | | | 0.25 | (a) | | | 0.21 | | | | 0.46 | | | | (0.25 | ) | | | (0.13 | ) | | | (0.38 | ) |
| 2016 | | | 10.20 | | | | 0.25 | (a) | | | (0.04 | ) | | | 0.21 | | | | (0.24 | ) | | | (0.02 | ) | | | (0.26 | ) |
| | |
| Nebraska Tax-Free Income | | | | | | | | | | | | | | | | | | | | | | | | | | | | |
| 2020 | | | 9.95 | | | | 0.13 | | | | 0.12 | | | | 0.25 | | | | (0.13 | ) | | | — | | | | (0.13 | ) |
| 2019 | | | 9.76 | | | | 0.14 | | | | 0.19 | | | | 0.33 | | | | (0.14 | ) | | | — | | | | (0.14 | ) |
| 2018 | | | 9.90 | | | | 0.14 | | | | (0.15 | ) | | | (0.01 | ) | | | (0.13 | ) | | | — | | | | (0.13 | ) |
| 2017 | | | 10.12 | | | | 0.17 | | | | (0.22 | ) | | | (0.05 | ) | | | (0.17 | ) | | | — | | | | (0.17 | ) |
| 2016 | | | 10.19 | | | | 0.18 | | | | (0.06 | ) | | | 0.12 | | | | (0.19 | ) | | | — | | | | (0.19 | ) |
| | |
| Short Duration Income - Investor Class | | | | | | | | | | | | | | | | | | | | | | | | | | | | |
| 2020 | | | 12.17 | | | | 0.27 | (a) | | | (0.23 | ) | | | 0.04 | | | | (0.28 | ) | | | — | | | | (0.28 | ) |
| 2019 | | | 12.09 | | | | 0.26 | (a) | | | 0.09 | | | | 0.35 | | | | (0.27 | ) | | | — | | | | (0.27 | ) |
| 2018 | | | 12.27 | | | | 0.23 | (a) | | | (0.18 | ) | | | 0.05 | | | | (0.23 | ) | | | — | | | | (0.23 | ) |
| 2017 | | | 12.28 | | | | 0.23 | (a) | | | 0.04 | | | | 0.27 | | | | (0.24 | )(e) | | | (0.04 | ) | | | (0.28 | ) |
| 2016 | | | 12.48 | | | | 0.22 | (a) | | | (0.15 | ) | | | 0.07 | | | | (0.23 | ) | | | (0.04 | ) | | | (0.27 | ) |
| | |
| Short Duration Income - Institutional Class | | | | | | | | | | | | | | | | | | | | | | | | | | | | |
| 2020 | | | 12.19 | | | | 0.29 | (a) | | | (0.23 | ) | | | 0.06 | | | | (0.30 | ) | | | — | | | | (0.30 | ) |
| 2019 | | | 12.11 | | | | 0.29 | (a) | | | 0.09 | | | | 0.38 | | | | (0.30 | ) | | | — | | | | (0.30 | ) |
| 2018 | | | 12.29 | | | | 0.26 | (a) | | | (0.18 | ) | | | 0.08 | | | | (0.26 | ) | | | — | | | | (0.26 | ) |
| 2017 | | | 12.30 | | | | 0.26 | (a) | | | 0.04 | | | | 0.30 | | | | (0.27 | )(e) | | | (0.04 | ) | | | (0.31 | ) |
| 2016 | | | 12.50 | | | | 0.25 | (a) | | | (0.15 | ) | | | 0.10 | | | | (0.26 | ) | | | (0.04 | ) | | | (0.30 | ) |
| | |
| Ultra Short Government | | | | | | | | | | | | | | | | | | | | | | | | | | | | |
| 2020 | | | 10.01 | | | | 0.21 | | | | 0.03 | | | | 0.24 | | | | (0.21 | ) | | | (0.01 | ) | | | (0.22 | ) |
| 2019 | | | 10.00 | | | | 0.20 | | | | 0.01 | | | | 0.21 | | | | (0.20 | ) | | | — | | | | (0.20 | ) |
| 2018 | | | 10.00 | | | | 0.09 | | | | —# | | | | 0.09 | | | | (0.09 | ) | | | — | | | | (0.09 | ) |
2017(c) | | | 10.00 | | | | 0.03 | | | | —# | | | | 0.03 | | | | (0.03 | ) | | | — | | | | (0.03 | ) |
2016(c) | | | 10.00 | | | | —# | | | | —# | | | | —# | | | | —# | | | | —# | | | | —# | |
| |
#
| Amount less than $0.01
|
(a) | Based on average daily shares outstanding
|
(b) | Initial offering of shares on March 29, 2019
|
(c) | Prior to December 16, 2016, this Fund was known as the Government Money Market Fund. Per share amounts have been adjusted to reflect a 1-for-10 reverse split, which was effective December 16, 2016. In addition, on December 16, 2016, the Fund changed from a constant $1.00 net asset value per share money market fund to an ultra short government fund (that is not a money market fund).
|
(d) | Because calculations of portfolio turnover exclude securities whose maturity or expiration date was one year or less when the Fund acquired the securities, the Fund has no portfolio turnover information to report for this period.
|
(e) | Includes a return of capital distribution of less than $0.01.
|
The accompanying notes form an integral part of these financial statements.
Q1 2020 Annual Report 65
| | | | | | | | | | | | | | | | | | | | |
| | | | Ratios/Supplemental Data
| |
| | | | | | | | | | Ratio of expenses to average net assets | | | | | | | |
Net asset value, end of period | | | Total Return (%) | | | Net assets, end of period ($000) | | | Prior to fee waivers (%) | | | Net of fee waivers (%) | | | Ratio of net investment income (loss) to average net assets (%) | | | Portfolio turnover rate (%) | |
| | |
| | |
| | 13.54 | | | | 0.35 | | | | 47,591 | | | | 1.20 | | | | 0.85 | | | | 0.94 | | | | 32 | |
| | 13.76 | | | | 6.18 | | | | 124,431 | | | | 1.00 | | | | 0.88 | | | | 0.98 | | | | 33 | |
| | 14.20 | | | | 7.06 | | | | 122,069 | | | | 1.05 | | | | 1.00 | | | | 0.55 | | | | 40 | |
| | 13.63 | | | | 6.32 | | | | 118,189 | | | | 1.11 | | | | 1.11 | | | | 0.10 | | | | 26 | |
| | 13.24 | | | | (0.80 | ) | | | 111,488 | | | | 1.11 | | | | 1.11 | | | | 0.12 | | | | 35 | |
| | |
| | |
| | 13.55 | | | | 0.45 | | | | 84,682 | | | | 1.00 | | | | 0.70 | | | | 1.09 | | | | 32 | |
| | |
| | |
| | 10.14 | | | | 1.38 | | | | 25,921 | | | | 1.18 | | | | 0.57 | | | | 2.85 | | | | 51 | |
| | 10.31 | | | | 4.78 | | | | 18,840 | | | | 1.42 | | | | 0.60 | | | | 2.76 | | | | 33 | |
| | 10.09 | | | | 1.20 | | | | 7,274 | | | | 1.65 | | | | 0.60 | | | | 2.26 | | | | 43 | |
| | 10.23 | | | | 4.41 | | | | 6,522 | | | | 1.90 | | | | 0.77 | | | | 2.26 | | | | 54 | |
| | 10.15 | | | | 1.78 | | | | 4,809 | | | | 2.35 | | | | 0.85 | | | | 2.20 | | | | 26 | |
| | |
| | |
| | 10.15 | | | | 1.56 | | | | 78,128 | | | | 0.80 | | | | 0.40 | | | | 3.02 | | | | 51 | |
| | 10.32 | | | | 5.07 | | | | 59,687 | | | | 0.96 | | | | 0.40 | | | | 2.93 | | | | 33 | |
| | 10.10 | | | | 1.40 | | | | 31,895 | | | | 1.09 | | | | 0.40 | | | | 2.47 | | | | 43 | |
| | 10.23 | | | | 4.61 | | | | 23,854 | | | | 1.22 | | | | 0.57 | | | | 2.47 | | | | 54 | |
| | 10.15 | | | | 2.06 | | | | 15,108 | | | | 1.37 | | | | 0.65 | | | | 2.39 | | | | 26 | |
| | |
| | |
| | 10.07 | | | | 2.55 | | | | 31,465 | | | | 1.10 | | | | 0.94 | | | | 1.29 | | | | 7 | |
| | 9.95 | | | | 3.46 | | | | 38,048 | | | | 0.89 | | | | 0.89 | | | | 1.39 | | | | 9 | |
| | 9.76 | | | | (0.07 | ) | | | 58,604 | | | | 0.84 | | | | 0.84 | | | | 1.41 | | | | 24 | |
| | 9.90 | | | | (0.54 | ) | | | 62,973 | | | | 0.79 | | | | 0.79 | | | | 1.66 | | | | 29 | |
| | 10.12 | | | | 1.20 | | | | 64,134 | | | | 0.78 | | | | 0.78 | | | | 1.82 | | | | 13 | |
| | |
| | |
| | 11.93 | | | | 0.26 | | | | 60,845 | | | | 0.95 | | | | 0.65 | | | | 2.20 | | | | 51 | |
| | 12.17 | | | | 2.95 | | | | 71,002 | | | | 0.92 | | | | 0.68 | | | | 2.17 | | | | 23 | |
| | 12.09 | | | | 0.44 | | | | 113,238 | | | | 0.91 | | | | 0.68 | | | | 1.93 | | | | 34 | |
| | 12.27 | | | | 2.15 | | | | 94,817 | | | | 0.93 | | | | 0.80 | | | | 1.85 | | | | 38 | |
| | 12.28 | | | | 0.58 | | | | 100,948 | | | | 0.91 | | | | 0.85 | | | | 1.77 | | | | 23 | |
| | |
| | |
| | 11.95 | | | | 0.44 | | | | 675,245 | | | | 0.64 | | | | 0.48 | | | | 2.37 | | | | 51 | |
| | 12.19 | | | | 3.18 | | | | 828,697 | | | | 0.63 | | | | 0.48 | | | | 2.37 | | | | 23 | |
| | 12.11 | | | | 0.63 | | | | 1,017,962 | | | | 0.62 | | | | 0.48 | | | | 2.12 | | | | 34 | |
| | 12.29 | | | | 2.38 | | | | 1,103,272 | | | | 0.62 | | | | 0.58 | | | | 2.07 | | | | 38 | |
| | 12.30 | | | | 0.83 | | | | 1,155,054 | | | | 0.62 | | | | 0.62 | | | | 2.00 | | | | 23 | |
| | |
| | |
| | 10.03 | | | | 2.44 | | | | 72,102 | | | | 0.71 | | | | 0.20 | | | | 2.18 | | | | 46 | |
| | 10.01 | | | | 2.17 | | | | 97,444 | | | | 0.61 | | | | 0.20 | | | | 2.05 | | | | 148 | |
| | 10.00 | | | | 0.94 | | | | 104,162 | | | | 0.60 | | | | 0.20 | | | | 0.94 | | | | 25 | |
| | 10.00 | | | | 0.25 | | | | 98,029 | | | | 0.66 | | | | 0.14 | | | | 0.25 | | | | — | |
| | 10.00 | | | | 0.03 | | | | 106,689 | | | | 0.70 | | | | 0.05 | | | | 0.03 | | |
| (d) |
The accompanying notes form an integral part of these financial statements.
66 Q1 2020 Annual Report
NOTES TO FINANCIAL STATEMENTS
March 31, 2020
(1) Organization
The Weitz Funds (the “Trust”) is registered under the Investment Company Act of 1940 (the “’40 Act”) as an open-end management investment company issuing shares in series, each series representing a distinct portfolio with its own investment objectives and policies. At March 31, 2020, the Trust had nine series in operation: Hickory Fund, Partners III Opportunity Fund, Partners Value Fund, Value Fund, Balanced Fund, Core Plus Income Fund, Nebraska Tax-Free Income Fund, Short Duration Income Fund and Ultra Short Government Fund (individually, a “Fund”, collectively, the “Funds”).
On March 29, 2019, the Balanced Fund divided their outstanding shares whereby the shares held in accounts with balances exceeding $1.0 million were designated Institutional Class shares. All remaining shares, that were not designated as new Institutional Class shares, were renamed Investor Class shares.
Currently, the Partners III Opportunity, Partners Value, Value, Balanced, Core Plus Income and Short Duration Income Funds each offer two classes of shares: Institutional Class and Investor Class shares. Each class of shares has identical rights and privileges, except with respect to certain class specific expenses such as administration and shareholder servicing fees, voting rights on matters affecting a single class of shares and exchange privileges. Income, realized and unrealized gains and losses, and expenses of the Funds not directly attributable to a specific class of shares are allocated to the two classes on the basis of daily net assets of each class. Fees and expenses relating to a specific class are charged directly to that share class. All other Funds offer one class of shares.
The investment objective of the Hickory, Partners III Opportunity, Partners Value and Value Funds (the “Weitz Equity Funds”) is capital appreciation.
The investment objectives of the Balanced Fund are long-term capital appreciation, capital preservation and current income.
The investment objectives of the Core Plus Income Fund are current income and capital preservation.
The investment objective of the Nebraska Tax-Free Income Fund is current income that is exempt from both federal and Nebraska personal income taxes, consistent with the preservation of capital.
The investment objective of the Short Duration Income Fund is current income consistent with the preservation of capital.
Effective December 16, 2016, the Government Money Market Fund’s name was changed to the Ultra Short Government Fund and the Fund ceased operating as a “money market fund” pursuant to Rule 2a-7 of the ’40 Act. While the Ultra Short Government Fund’s investment strategy changed, its investment objective remained the same, which is current income consistent with the preservation of capital and maintenance of liquidity.
Investment strategies and risk factors of each Fund are discussed in the Funds’ Prospectus.
(2) Significant Accounting Policies
The Funds are investment companies and apply the accounting and reporting guidance of the Financial Accounting Standards Board (“FASB”) Accounting Standards Codification Topic 946 Financial Services –Investment Companies. The following accounting policies are in accordance with accounting principles generally accepted in the United States.
(a) Valuation of Investments
Investments are carried at value determined using the following valuation methods:
• Securities traded on a national or regional securities exchange are valued at the last sales price; if there were no sales on that day, securities are valued at the mean between the latest available and representative bid and ask prices; securities listed on the NASDAQ exchange are valued using the NASDAQ Official Closing Price (“NOCP”). Generally, the NOCP will be the last sales price unless the reported trade for the security is outside the range of the bid/ask price. In such cases, the NOCP will be normalized to the nearer of the bid or ask price.
• Short sales traded on a national or regional securities exchange are valued at the last sales price; if there were no sales on that day, short sales are valued at the mean between the latest available and representative bid and ask prices.
• Securities not listed on an exchange are valued at the mean between the latest available and representative bid and ask prices, if available.
• The value of certain debt securities for which market quotations are not readily available may be based upon current market prices of securities that are comparable in coupon, rating and maturity or an appropriate matrix utilizing similar factors.
Q1 2020 Annual Report 67
• The value of a traded option is the last sales price at which such option is traded or, in the absence of a sale on or about the close of the exchange, the mean of the closing bid and ask prices.
• Money market funds are valued at the quoted net asset value.
• The value of securities for which market quotations are not readily available or are deemed unreliable, including restricted and not readily marketable securities, is determined in good faith in accordance with procedures approved by the Trust’s Board of Trustees. Such valuation procedures and methods for valuing securities may include, but are not limited to: multiple of earnings, multiple of book value, discount from value of a similar freely-traded security, purchase price, private transaction in the security or related securities, the nature and duration of restrictions on disposition of the security and a combination of these and other factors.
The Trust has established a Pricing Committee, composed of officers and employees of Weitz Investment Management, Inc., to supervise the daily valuation process. The Board of Trustees has also established a Valuation Committee, composed of the independent Trustees, to oversee the Pricing Committee and the valuation process. The Pricing Committee provides oversight of the approved procedures, evaluates the effectiveness of the pricing policies and reports to the Valuation Committee of the Board of Trustees. When determining the reliability of third party pricing information, the Pricing Committee, among other things, monitors the daily change in prices and reviews transactions among market participants.
(b) Option Transactions
The Funds, except for the Ultra Short Government Fund, may purchase put or call options. When a Fund purchases an option, an amount equal to the premium paid is recorded as an asset and is subsequently marked-to-market daily. Premiums paid for purchasing options that expire unexercised are recognized on the expiration date as realized losses. If an option is exercised, the premium paid is subtracted from the proceeds of the sale or added to the cost of the purchase to determine whether a Fund has realized a gain or loss on the related investment transaction. When a Fund enters into a closing transaction, a Fund realizes a gain or loss depending upon whether the amount from the closing transaction is greater or less than the premium paid.
The Funds, except for the Ultra Short Government Fund, may write put or call options. When a Fund writes an option, an amount equal to the premium received is recorded as a liability and is subsequently marked-to-market daily. Premiums received for writing options that expire unexercised are recognized on the expiration date as realized gains. If an option is exercised, the premium received is subtracted from the cost of the purchase or added to the proceeds of the sale to determine whether a Fund has realized a gain or loss on the related investment transaction. When a Fund enters into a closing transaction, a Fund realizes a gain or loss depending upon whether the amount from the closing transaction is greater or less than the premium received.
The Funds attempt to limit market risk and enhance their income by writing (selling) covered call options. The risk in writing a covered call option is that a Fund gives up the opportunity of profit if the market price of the financial instrument increases. A Fund also has the additional risk of not being able to enter into a closing transaction if a liquid secondary market does not exist. The risk in writing a put option is that a Fund is obligated to purchase the financial instrument underlying the option at prices which may be significantly different than the current market price.
(c) Securities Sold Short
The Funds, except for the Ultra Short Government Fund, may engage in selling securities short, which obligates a Fund to replace a security borrowed by purchasing the same security at the current market value. A Fund incurs a loss if the price of the security increases between the date of the short sale and the date on which the Fund replaces the borrowed security. A Fund realizes a gain if the price of the security declines between those dates.
(d) Federal Income Taxes
It is the policy of each Fund to comply with all sections of the Internal Revenue Code applicable to regulated investment companies and to distribute all of its taxable income to shareholders; therefore, no provision for income or excise taxes is required.
Net investment income and net realized gains may differ for financial statement and tax purposes. The character of distributions made during the year from net investment income or net realized gains may differ from their ultimate characterization for federal income tax purposes. Also, due to the timing of dividend distributions, the fiscal year in which amounts are distributed may differ from the year that the income or realized gains were recorded by the Funds.
The Funds have reviewed their tax positions taken on federal income tax returns, for each of the three open tax years and as of March 31, 2020, and have determined that no provisions for income taxes are required in the Funds’ financial statements.
68 Q1 2020 Annual Report
The following permanent differences between net asset components for financial reporting and tax purposes were reclassified at the end of the fiscal year (in U.S. dollars):
| | | | | | | |
| | Partners III | | Core Plus | Short | Ultra Short |
| Hickory | Opportunity | Balanced | Income | Duration Income | Government |
Paid-in capital | (945,830) | (4,691,878) | — | — | — | — |
Accumulated undistributed net investment income | 945,830 | 4,691,878 | 24,262 | 19,764 | 222,154 | 3,077 |
Accumulated net realized gain (loss) | — | — | (24,262) | (19,764) | (222,154) | (3,077) |
The differences are primarily due to net operating losses and principal paydown adjustments. These reclassifications have no impact on the net asset value of the Funds.
(e) Securities Transactions
Securities transactions are accounted for on the date the securities are purchased or sold (trade date). Realized gains or losses are determined by specifically identifying the security sold.
Income dividends less foreign tax withholding (if any), dividends on short positions and distributions to shareholders are recorded on the ex-dividend date. Interest, including amortization of discount or premium, is accrued as earned.
(f) Dividend Policy
The Funds declare and distribute income dividends and capital gains distributions as may be required to qualify as a regulated investment company under the Internal Revenue Code.
Generally, the Core Plus Income, Nebraska Tax-Free Income and Short Duration Income Funds pay income dividends on a quarterly basis. The Ultra Short Government Fund declares dividends daily and pays dividends monthly. All dividends and distributions are reinvested automatically, unless the shareholder elects otherwise.
(g) Other
Expenses that are directly related to a Fund are charged directly to that Fund. Other operating expenses of the Trust are prorated to each Fund on the basis of relative net assets or another appropriate basis. Income, realized and unrealized gains and losses and expenses (other than class specific expenses) are allocated to each class of shares based on its relative net assets, except that each class separately bears expenses related specifically to that class, such as transfer agent fees and registration fees.
(h) Use of Estimates
The preparation of financial statements in conformity with accounting principles generally accepted in the United States requires management to make estimates and assumptions that affect the reported amounts of assets and liabilities and disclosure of contingent assets and liabilities at the date of the financial statements and the reported amounts of increase and decrease in net assets from operations during the period. Actual results could differ from those estimates.
(3) Fund Share Transactions
| | | | | |
| Year ended March 31, 2020 | Year ended March 31, 2019 |
| Shares | $ Amount | Shares | $ Amount |
| | | | | |
| Hickory | | | | |
| Sales | 628,112 | 31,374,951 | 170,654 | 8,014,587 |
| Redemptions | (795,574) | (38,508,451) | (822,497) | (39,002,996) |
| Reinvestment of distributions | 76,852 | 4,002,010 | 446,107 | 19,494,004 |
| Net increase (decrease) | (90,610) | (3,131,490) | (205,736) | (11,494,405) |
|
| Partners III Opportunity - Investor Class | | | | |
| Sales | 652,358 | 9,799,849 | 294,479 | 4,067,026 |
| Redemptions | (741,127) | (11,192,844) | (655,497) | (9,043,479) |
| Reinvestment of distributions | 98,868 | 1,501,952 | 116,278 | 1,550,769 |
| Net increase (decrease) | 10,099 | 108,957 | (244,740) | (3,425,684) |
|
| Partners III Opportunity- Institutional Class | | | | |
| Sales | 2,760,610 | 40,113,534 | 1,829,920 | 25,203,517 |
| Redemptions | (5,355,717) | (83,092,780) | (7,051,229) | (97,707,830) |
| Reinvestment of distributions | 2,364,636 | 37,454,812 | 2,955,880 | 40,688,481 |
| Net increase (decrease) | (230,471) | (5,524,434) | (2,265,429) | (31,815,832) |
|
| Partners Value - Investor Class | | | | |
| Sales | 133,202 | 3,997,794 | 146,142 | 4,364,563 |
| Redemptions | (1,855,096) | (54,544,330) | (2,402,752) | (72,149,436) |
| Reinvestment of distributions | 593,747 | 17,887,042 | 767,368 | 20,698,093 |
| Net increase (decrease) | (1,128,147) | (32,659,494) | (1,489,242) | (47,086,780) |
Q1 2020 Annual Report 69
| | | | | |
| Year ended March 31, 2020 | Year ended March 31, 2019 |
| Shares | $ Amount | Shares | $ Amount |
|
| Partners Value - Institutional Class | | | | |
| Sales | 84,582 | 2,625,636 | 833,821 | 23,144,352 |
| Redemptions | (2,366,832) | (64,957,793) | (1,182,566) | (35,013,267) |
| Reinvestment of distributions | 596,465 | 18,232,707 | 672,923 | 18,214,230 |
| Net increase (decrease) | (1,685,785) | (44,099,450) | 324,178 | 6,345,315 |
|
| Value - Investor Class | | | | |
| Sales | 553,120 | 24,812,734 | 488,270 | 20,678,838 |
| Redemptions | (2,130,290) | (94,898,377) | (2,441,039) | (103,175,771) |
| Reinvestment of distributions | 589,299 | 26,385,493 | 1,267,758 | 49,307,548 |
| Net increase (decrease) | (987,871) | (43,700,150) | (685,011) | (33,189,385) |
|
| Value - Institutional Class | | | | |
| Sales | 533,699 | 24,167,638 | 510,651 | 21,645,012 |
| Redemptions | (635,757) | (28,294,845) | (446,172) | (18,519,050) |
| Reinvestment of distributions | 253,397 | 11,503,402 | 467,010 | 18,244,963 |
| Net increase (decrease) | 151,339 | 7,376,195 | 531,489 | 21,370,925 |
|
| Balanced - Investor Class | | | | |
| Sales | 1,287,713 | 18,333,781 | 720,238 | 9,795,497 |
| Redemptions | (912,588) | (13,043,269) | (892,254) | (12,214,879) |
| Reinvestment of distributions | 64,399 | 940,258 | 625,309 | 8,158,372 |
| Net increase (decrease) | 439,524 | 6,230,770 | 453,293 | 5,738,990 |
|
| Balanced - Institutional Class* | | | | |
| Sales | 366,767 | 5,261,344 | — | — |
| Redemptions | (206,534) | (2,942,106) | — | — |
| Reinvestment of distributions | 116,803 | 1,704,967 | — | — |
| Net increase (decrease) | 277,036 | 4,024,205 | — | — |
|
| Core Plus Income - Investor Class | | | | |
| Sales | 1,588,065 | 16,669,695 | 1,278,803 | 12,989,194 |
| Redemptions | (936,110) | (9,813,102) | (200,126) | (2,025,409) |
| Reinvestment of distributions | 76,532 | 795,622 | 27,744 | 280,689 |
| Net increase (decrease) | 728,487 | 7,652,215 | 1,106,421 | 11,244,474 |
|
| Core Plus Income - Institutional Class | | | | |
| Sales | 2,792,619 | 29,278,210 | 2,848,144 | 28,943,192 |
| Redemptions | (1,113,942) | (11,667,490) | (345,446) | (3,483,328) |
| Reinvestment of distributions | 235,421 | 2,447,602 | 124,077 | 1,253,117 |
| Net increase (decrease) | 1,914,098 | 20,058,322 | 2,626,775 | 26,712,981 |
|
| Nebraska Tax-Free Income | | | | |
| Sales | 192,535 | 1,944,756 | 52,501 | 512,640 |
| Redemptions | (910,264) | (9,084,753) | (2,265,403) | (22,147,390) |
| Reinvestment of distributions | 16,038 | 160,210 | 33,070 | 323,391 |
| Net increase (decrease) | (701,691) | (6,979,787) | (2,179,832) | (21,311,359) |
|
| Short Duration Income - Investor Class | | | | |
| Sales | 1,198,159 | 14,684,019 | 963,173 | 11,644,226 |
| Redemptions | (2,061,992) | (25,034,666) | (4,658,661) | (56,316,664) |
| Reinvestment of distributions | 128,225 | 1,559,400 | 165,890 | 2,001,446 |
| Net increase (decrease) | (735,608) | (8,791,247) | (3,529,598) | (42,670,992) |
|
| Short Duration Income - Institutional Class | | | | |
| Sales | 11,407,805 | 140,106,388 | 11,654,236 | 141,207,251 |
| Redemptions | (24,391,319) | (298,463,116) | (29,451,330) | (356,860,657) |
| Reinvestment of distributions | 1,492,259 | 18,180,149 | 1,764,204 | 21,323,878 |
| Net increase (decrease) | (11,491,255) | (140,176,579) | (16,032,890) | (194,329,528) |
|
| Ultra Short Government | | | | |
| Sales | 5,221,248 | 52,278,882 | 5,127,468 | 51,274,680 |
| Redemptions | (7,929,699) | (79,407,885) | (5,992,514) | (59,925,220) |
| Reinvestment of distributions | 160,823 | 1,610,335 | 184,347 | 1,843,657 |
| Net increase (decrease) | (2,547,628) | (25,518,668) | (680,699) | (6,806,883) |
* Initial offering of shares on March 29, 2019
70 Q1 2020 Annual Report
4) Related Party Transactions
Each Fund has retained Weitz Investment Management, Inc. (the “Adviser”) as its investment adviser. In addition, the Trust has an agreement with Weitz Securities, Inc. (the “Distributor”), a company under common control with the Adviser, to act as distributor for shares of the Trust. Certain officers of the Trust are also officers and directors of the Adviser and the Distributor.
Under the terms of management and investment advisory agreements, the Adviser is paid a monthly fee based on average daily net assets. The annual investment advisory fee schedule for each of the Weitz Equity Funds is as follows:
| | | |
Hickory Fund: | | |
| Greater Than | Less Than or Equal To | Rate |
| $ 0 | $2,500,000,000 | 1.00% |
| 2,500,000,000 | 5,000,000,000 | 0.90% |
| 5,000,000,000 | | 0.80% |
| | | |
Partners III Opportunity Fund: | | |
| Greater Than | Less Than or Equal To | Rate |
| $ 0 | $ 1,000,000,000 | 1.00% |
| 1,000,000,000 | 2,000,000,000 | 0.95% |
| 2,000,000,000 | 3,000,000,000 | 0.90% |
| 3,000,000,000 | 5,000,000,000 | 0.85% |
| 5,000,000,000 | | 0.80% |
| | | |
Partners Value and Value Funds: | |
| Greater Than | Less Than or Equal To | Rate |
| $ 0 | $ 1,000,000,000 | 0.90% |
| 1,000,000,000 | 2,000,000,000 | 0.85% |
| 2,000,000,000 | 3,000,000,000 | 0.80% |
| 3,000,000,000 | 5,000,000,000 | 0.75% |
| 5,000,000,000 | | 0.70% |
The Balanced Fund pays the Adviser, on a monthly basis, an annual advisory fee equal to 0.65% of the Fund’s average daily net assets.
The Core Plus Income, Nebraska Tax-Free Income and Short Duration Income Funds each pay the Adviser, on a monthly basis, an annual advisory fee equal to 0.40% of the respective Fund’s average daily net assets.
The Ultra Short Government Fund pays the Adviser, on a monthly basis, an annual advisory fee equal to 0.30% of the Fund’s average daily net assets .
The Adviser also provides administrative services, including shareholder administrative services, to each Fund pursuant to agreements which provide that the Funds will pay the Adviser a monthly fee based on the average daily net assets of each respective Fund and/or a fee per account, plus third party expenses directly related to providing such services.
The Adviser pays all direct operating expenses of the Funds and is subsequently reimbursed by the Funds. Any amounts outstanding at year end are included in the amounts shown on the Statements of Assets and Liabilities as “Due to Adviser.” The amount listed under “Due to Adviser” is net of any expenses waived/reimbursed by the Adviser. Through July 31, 2020, the Adviser has agreed in writing to reimburse or to pay directly a portion of the Funds’ expenses to limit the net annual operating expense ratio (excluding taxes, interest, brokerage costs, acquired fund fees and expenses and extraordinary expenses). The current expense caps and dollar amount of expenses reimbursed during the year ended March 31, 2020, are as follows:
| | | | | | | | | | | | | | | | | | | | | | | | | |
| | Annual Operating Expense Ratio Cap* | |
| | Hickory | | | Partners Value | | | Value | | | Balanced | | | Core Plus Income | | | Nebraska Tax-Free Income | | | Short Duration Income | | | Ultra Short Government | |
Annual Operating Expense Cap(a): | | | | | | | | | | | | | | | | | | | | | | | | |
| Investor Class | | | 1.09 | % | | | 1.09 | % | | | 1.09 | % | | | 0.85 | % | | | 0.50 | % | | | 0.45 | % | | | 0.55 | % | | | |
| Institutional Class | | | | | | | 0.89 | % | | | 0.89 | % | | | 0.70 | % | | | 0.40 | % | | | | | | | 0.48 | % | | | 0.20 | % |
| Expenses Reimbursed by the Adviser: | | | | | | | | | | | | | | | | | | | | | | | | | | | | | | | | |
| Investor Class | | | 113,979 | | | | 128,676 | | | | 220,268 | | | | 169,308 | | | | 158,007 | | | | 51,989 | | | | 214,340 | | | | | |
| Institutional Class | | | | | | | 367,549 | | | | 298,770 | | | | 262,313 | | | | 304,623 | | | | | | | | 1,208,841 | | | | 381,200 | |
(a) Prior to 1/2/2020: | | | | | | | | | | | | | | | | | | | | | | | | | | | | | | | | |
| Investor Class | | | — | | | | 1.30 | % | | | 1.30 | % | | | 0.85 | % | | | 0.60 | % | | | — | | | | 0.68 | % | | | | |
| Institutional Class | | | | | | | 0.99 | % | | | 0.99 | % | | | 0.70 | % | | | 0.40 | % | | | | | | | 0.48 | % | | | 0.20 | % |
* Funds with a single share class are shown with the Investor Class, except for the Ultra Short Government Fund which has been designated Institutional Class.
As of March 31, 2020, the controlling shareholder of the Adviser held shares totaling approximately 21%, 38%, 6%, 35%, 47%, 58% and 15% of the Hickory, Partners III Opportunity, Partners Value, Balanced, Core Plus Income, Nebraska Tax-Free Income and Ultra Short Government Funds, respectively.
Q1 2020 Annual Report 71
(5) Distributions to Shareholders and Distributable Earnings
The tax character of distributions paid by the Funds are summarized as follows (in U.S. dollars):
| | | | | | | | | |
| Year ended March 31, | Year ended March 31, | Year ended March 31, | Year ended March 31, |
| Distributions paid from: | 2020 | 2019 | 2020 | 2019 | 2020 | 2019 | 2020 | 2019 |
| Hickory | Partners III Opportunity | Partners Value | Value |
| Long-term capital gains | 4,410,185 | 24,299,497 | 42,794,258 | 43,817,145 | 42,538,410 | 46,555,980 | 39,412,630 | 71,332,320 |
| Total distributions | 4,410,185 | 24,299,497 | 42,794,258 | 43,817,145 | 42,538,410 | 46,555,980 | 39,412,630 | 71,332,320 |
| | | | | | | | | |
| Balanced | Core Plus Income | Nebraska Tax-Free Income | Short Duration Income |
| Ordinary income | 2,042,382 | 1,387,977 | 3,138,806 | 1,548,124 | 319 | 524 | 19,956,398 | 23,599,316 |
| Tax-exempt income | — | — | — | — | 422,390 | 737,403 | — | — |
| Long-term capital gains | 624,841 | 9,389,711 | 129,612 | — | — | — | — | — |
| Total distributions | 2,667,223 | 10,777,688 | 3,268,418 | 1,548,124 | 422,709 | 737,927 | 19,956,398 | 23,599,316 |
| | |
| | | | | | |
| Ultra Short Government | | | | | | |
| Ordinary income | 1,667,656 | 2,181,531 | | | | | | |
| Total distributions | 1,667,656 | 2,181,531 | | | | | | |
As of March 31, 2020, the components of net assets on a tax basis were as follows (in U.S. dollars):
| | | | | | |
| | | Partners III | | | |
| | Hickory | Opportunity | Partners Value | Value | Balanced |
| Cost of investments | 139,486,698 | 333,692,287 | 312,123,653 | 451,074,057 | 117,410,990 |
| |
| Gross unrealized appreciation | 52,542,424 | 217,502,850 | 136,128,150 | 222,435,043 | 17,661,165 |
| Gross unrealized depreciation | (20,687,415) | (52,686,916) | (47,176,548) | (14,179,015) | (2,670,445) |
| Net unrealized appreciation (depreciation) | 31,855,009 | 164,815,934 | 88,951,602 | 208,256,028 | 14,990,720 |
| |
| Undistributed ordinary income | — | — | — | — | 344,964 |
| Qualified late year ordinary loss deferral | (315,224) | (993,301) | (514,313) | (93,772) | — |
| Undistributed long-term gains | 4,053,671 | 29,222,564 | 16,540,593 | 21,198,145 | 358,782 |
| Post October capital loss deferral | — | — | (482,285) | — | — |
| Paid-in capital | 135,374,244 | 367,674,084 | 295,622,589 | 429,627,519 | 116,578,644 |
| Net assets | 170,967,700 | 560,719,281 | 400,118,186 | 658,987,920 | 132,273,110 |
| | | | | | |
| | | | Nebraska | Short Duration | Ultra Short |
| | | Core Plus Income | Tax-Free Income | Income | Government |
| Cost of investments | | 106,549,951 | 30,584,472 | 750,253,412 | 71,830,824 |
| |
| Gross unrealized appreciation | | 4,670,645 | 688,891 | 10,314,750 | 298,180 |
| Gross unrealized depreciation | | (7,368,594) | (5,786) | (24,397,490) | (73,992) |
| Net unrealized appreciation (depreciation) | | (2,697,949) | 683,105 | (14,082,740) | 224,188 |
| |
| Undistributed ordinary income | | 676,169 | — | 456,980 | 6,915 |
| Undistributed tax-exempt income | | — | 20,393 | — | — |
| Other temporary differences | | — | — | — | (3,542) |
| Undistributed long-term gains | | 855,704 | — | 288,474 | — |
| Capital loss carryforwards | | — | (134,154) | — | — |
| Paid-in capital | | 105,214,927 | 30,895,159 | 749,427,291 | 71,874,857 |
| Net assets | | 104,048,851 | 31,464,503 | 736,090,005 | 72,102,418 |
The Hickory, Partners III Opportunity, Partners Value and Value Funds elected to defer ordinary losses arising after December 31, 2019. Such losses are treated for tax purposes as arising on April 1, 2020.
The Partners Value Fund elected to defer realized capital losses arising after October 31, 2019. Such losses are treated for tax purposes as arising on April 1, 2020.
Capital loss carryforwards represent tax basis capital losses that may be carried over to offset future realized capital gains, if any. To the extent that carryforwards are used, no capital gains distributions will be made. During the fiscal year, the Funds utilized capital loss carryforwards to offset realized capital gains. The character and utilization of the carryforwards are as follows (in U.S. dollars):
| | | | |
| Core Plus | Nebraska Tax-Free | Short Duration |
| Income | Income | Income |
| Long term (no expiration) | — | (134,154) | — |
| Capital loss carryforwards utilized | 25,096 | — | 1,287,025 |
72 Q1 2020 Annual Report
(6) Securities Transactions
Purchases and proceeds from maturities or sales of investment securities of the Funds for the year ended March 31, 2020, excluding short-term securities and U.S. government obligations, are summarized as follows (in U.S. dollars):
| | | | | | | | | | |
| Hickory | Partners III Opportunity | Partners Value | Value | Balanced | Core Plus Income | Nebraska Tax-Free Income | Short Duration Income | Ultra Short Government |
| Purchases | 65,909,992 | 200,803,101 | 143,812,837 | 125,596,162 | 36,692,015 | 75,039,885 | 2,129,930 | 400,339,855 | 14,943,034 |
| Proceeds | 76,322,392 | 253,705,292 | 250,476,524 | 196,849,023 | 31,792,295 | 32,893,815 | 9,950,984 | 448,816,768 | 17,534,844 |
(a) Options Written
The locations in the Statements of Assets and Liabilities as of March 31, 2020, of the Funds’ derivative positions, none of which are designated as hedging instruments are as follows (in U.S. dollars):
| | | | | | | |
| | | | | Average | Gross |
| | | Fair Value of | Month-End | Notional Amount |
| Fund | Type of Derivative | Location | Asset Derivatives | Liability Derivatives | Notional Amount | Outstanding |
Partners III Opportunity | Call options written | Options written, at value | — | (18,000) | 225,000 | 2,700,000 |
Transactions in derivative instruments during the year ended March 31, 2020, are recorded in the following locations in the Statements of Operations (in U.S. dollars):
| | | | | | | |
| Fund | Type of Derivative | Location | Realized Gain (Loss) | | Location | Change in Unrealized Gain (Loss) |
Partners III Opportunity | Call options written | Net realized gain (loss) - options written | — | | Net unrealized appreciation (depreciation) - options written | 113,403 |
(7) Affiliated Issuers
Affiliated issuers, as defined under the Investment Company Act of 1940, are those in which a Fund’s holdings of an issuer represent 5% or more of the outstanding voting securities of the issuer. A summary of each Fund’s holdings in the securities of such issuers is set forth below:
| | | | | | | | | |
| Number of | | | Number of | | | | Change in |
| Shares Held | Gross | Gross | Shares Held | Value | Dividend | Realized | Unrealized |
| March 31, 2019 | Additions | Reductions | March 31, 2020 | March 31, 2020 | Income | Gain (Loss) | Gain (Loss) |
|
| Partners III Opportunity: | | | | | | | | |
Intelligent Systems Corp. | 2,270,000 | — | (731,000) | 1,539,000 | $52,310,610 | $ — | $30,795,863 | $(18,442,910) |
(8) Contingencies
Each Fund indemnifies the Trust’s officers and trustees for certain liabilities that might arise from their performance of their duties to each of the Funds. Additionally, in the normal course of business the Funds enter into contracts that contain a variety of representations and warranties and which provide general indemnifications. The Funds’ maximum exposure under these arrangements is unknown, as this would involve future claims that may be made against the Funds that have not yet occurred. However, based on experience, the Funds expect the risk of loss to be remote.
(9) Financial Instruments With Off-Balance Sheet Risks
Option contracts written and securities sold short result in off-balance sheet risk as the Fund’s ultimate obligation to satisfy the terms of the contract or the sale of securities sold short may exceed the amount recognized in the Statements of Assets and Liabilities.
The Funds are required to maintain collateral in a segregated account to provide adequate margin as determined by the broker.
(10) Margin Borrowing Agreement
The Partners III Opportunity Fund has a margin account with its prime broker, Bank of America Merrill Lynch, under which the Fund may borrow against the value of its securities, subject to regulatory limitations. Interest accrues at the federal funds rate plus 0.625% (0.705% at March 31, 2020). Interest is accrued daily and paid monthly. The Partners III Opportunity Fund held a cash balance of $65,684,396, with the broker at March 31, 2020.
The Partners III Opportunity Fund is exposed to credit risk from its prime broker who effects transactions and extends credit pursuant to a prime brokerage agreement. The Adviser attempts to minimize the credit risk by monitoring credit exposure and the creditworthiness of the prime broker.
Q1 2020 Annual Report 73
(11) Concentration of Credit Risk
Approximately 92% of the Nebraska Tax-Free Income Fund’s net assets are in obligations of political subdivisions of the State of Nebraska, which are subject to the credit risk associated with the non-performance of such issuers.
(12) Fair Value Measurements
Various inputs are used in determining the value of the Fund’s investments. These inputs are used in determining the value of the Funds’ investments and are summarized in the following fair value hierarchy:
• Level 1 – quoted prices in active markets for identical securities;
• Level 2 – other significant observable inputs (including quoted prices for similar securities);
• Level 3 – significant unobservable inputs (including the Funds’ own assumptions in determining the fair value of investments).
The inputs or methodology used for valuing securities are not an indication of the risk associated with investing in those securities.
A description of the valuation techniques applied to the Funds’ major categories of assets and liabilities measured at fair value on a recurring basis follows.
• Equity securities and ETFs. Securities traded on a national securities exchange (or reported on the NASDAQ national market) are stated at the last reported sales price on the day of valuation. To the extent these securities are actively traded and valuation adjustments are not applied, they are categorized in Level 1 of the fair value hierarchy. Preferred stock and other equities traded on inactive markets or valued by reference to similar instruments are categorized in Level 2.
• Corporate and Municipal bonds. The fair values of corporate and municipal bonds are estimated using various techniques, which may consider recently executed transactions in securities of the issuer or comparable issuers, market price quotations (where observable), bond spreads and fundamental data relating to the issuer. Although most corporate and municipal bonds are categorized in Level 2 of the fair value hierarchy, in instances where lower relative weight is placed on transaction prices, quotations, or similar observable inputs, they are categorized in Level 3.
• Asset-backed securities. The fair values of asset-backed securities (including non-government agency mortgage- backed securities and interest-only securities) are generally estimated based on models that consider the estimated cash flows of each tranche of the entity, a benchmark yield and an estimated tranche specific spread to the benchmark yield based on the unique attributes of the tranche. Certain securities are valued principally using dealer quotations. To the extent the inputs are observable and timely, the values are categorized in Level 2 of the fair value hierarchy; otherwise they are categorized as Level 3.
• U.S. Government securities. U.S. Government securities are normally valued using a model that incorporates market observable data such as reported sales of similar securities, broker quotes, yields, bids, offers and reference data. Certain securities are valued principally using dealer quotations. U.S. Government securities are categorized in Level 1 or Level 2 of the fair value hierarchy depending on the inputs used and market activity levels for specific securities.
• U.S. agency securities. U.S. agency securities are comprised of two main categories consisting of agency issued debt and mortgage-backed securities. Agency issued debt securities are generally valued in a manner similar to U.S. Government securities. Mortgage-backed securities include collateralized mortgage obligations, to-be-announced (TBA) securities and mortgage pass-through certificates. Mortgage-backed securities are generally valued using dealer quotations. Depending on market activity levels and whether quotations or other data are used, these securities are typically categorized in Level 2 of the fair value hierarchy.
• Restricted and/or illiquid securities. Restricted and/or illiquid securities for which quotations are not readily available are valued in accordance with procedures approved by the Trust’s Board of Trustees. Restricted securities issued by publicly traded companies are generally valued at a discount to similar publicly traded securities. Restricted or illiquid securities issued by nonpublic entities are valued by reference to comparable public entities or fundamental data relating to the issuer or both. Depending on the relative significance of valuation inputs, these instruments are classified in either Level 2 or Level 3 of the fair value hierarchy.
• Derivative instruments. Listed derivatives, such as the Funds’ equity option contracts and warrants, that are valued based on closing prices from the exchange or the mean of the closing bid and ask prices are generally categorized in Level 1 or Level 2 of the fair value hierarchy depending on the market activity levels.
74 Q1 2020 Annual Report
The following is a summary of inputs used, in U.S. dollars, as of March 31, 2020, in valuing the Funds’ assets and liabilities carried at fair value. The Schedule of Investments for each Fund provides a detailed breakdown of each category.
| | | | | | | | | | | | | |
| Hickory | |
| | Level 1 | | | Level 2 | | | Level 3 | | | Total | |
| Assets: | | | | | | | | | | | | |
Investments in Securities: | | | | | | | | | | | | |
Common Stocks | | | | | | | | | | | | |
| Communication Services | | | 43,722,904 | | | | 10,770,000 | | | | — | | | | 54,492,904 | |
| Other | | | 101,558,190 | | | | 7,500,000 | | | | — | | | | 109,058,190 | |
Warrants | | | — | | | | 75,000 | | | | — | | | | 75,000 | |
Cash Equivalents | | | 7,715,613 | | | | — | | | | — | | | | 7,715,613 | |
Total Investments in Securities | | | 152,996,707 | | | | 18,345,000 | | | | — | | | | 171,341,707 | |
| | | | | | | | | | | | | |
| Partners III Opportunity | |
| | Level 1 | | | Level 2 | | | Level 3 | | | Total | |
| Assets: | | | | | | | | | | | | |
Investments in Securities: | | | | | | | | | | | | |
Common Stocks | | | 458,201,570 | | | | 22,500,000 | | | | — | | | | 480,701,570 | |
Exchange Traded Funds | | | 24,984,000 | | | | — | | | | — | | | | 24,984,000 | |
Warrants | | | — | | | | 225,000 | | | | — | | | | 225,000 | |
Cash Equivalents | | | 55,589,651 | | | | — | | | | — | | | | 55,589,651 | |
Total Investments in Securities | | | 538,775,221 | | | | 22,725,000 | | | | — | | | | 561,500,221 | |
| Liabilities: | | | | | | | | | | | | | | | | |
Securities Sold Short | | | (62,974,000 | ) | | | — | | | | — | | | | (62,974,000 | ) |
Options Written | | | (18,000 | ) | | | — | | | | — | | | | (18,000 | ) |
| | | | | | | | | | | | | |
| Partners Value | |
| | Level 1 | | | Level 2 | | | Level 3 | | | Total | |
| Assets: | | | | | | | | | | | | |
Investments in Securities: | | | | | | | | | | | | |
Common Stocks | | | 388,135,157 | | | | — | | | | — | | | | 388,135,157 | |
Cash Equivalents | | | 12,940,098 | | | | — | | | | — | | | | 12,940,098 | |
Total Investments in Securities | | | 401,075,255 | | | | — | | | | — | | | | 401,075,255 | |
| | | | | | | | | | | | | |
| Value | |
| | Level 1 | | | Level 2 | | | Level 3 | | | Total | |
| Assets: | | | | | | | | | | | | |
Investments in Securities: | | | | | | | | | | | | |
Common Stocks | | | 630,828,480 | | | | — | | | | — | | | | 630,828,480 | |
Cash Equivalents | | | 28,501,605 | | | | — | | | | — | | | | 28,501,605 | |
Total Investments in Securities | | | 659,330,085 | | | | — | | | | — | | | | 659,330,085 | |
| | | | | | | | | | | | | |
| Balanced | |
| | Level 1 | | | Level 2 | | | Level 3 | | | Total | |
| Assets: | | | | | | | | | | | | |
Investments in Securities: | | | | | | | | | | | | |
Common Stocks | | | 53,723,024 | | | | — | | | | — | | | | 53,723,024 | |
Corporate Bonds | | | — | | | | 11,445,179 | | | | — | | | | 11,445,179 | |
Asset-Backed Securities | | | — | | | | 7,665,913 | | | | — | | | | 7,665,913 | |
Commercial Mortgage-Backed | | | — | | | | 482,238 | | | | — | | | | 482,238 | |
Securities | | | | | | | | | | | | | | | | |
Mortgage-Backed Securities | | | — | | | | 8,644,507 | | | | — | | | | 8,644,507 | |
U.S. Treasury | | | — | | | | 48,379,803 | | | | — | | | | 48,379,803 | |
Cash Equivalents | | | 2,061,046 | | | | — | | | | — | | | | 2,061,046 | |
Total Investments in Securities | | | 55,784,070 | | | | 76,617,640 | | | | — | | | | 132,401,710 | |
| | | | | | | | | | | | | |
| Core Plus Income | |
| | Level 1 | | | Level 2 | | | Level 3 | | | Total | |
| Assets: | | | | | | | | | | | | |
Investments in Securities: | | | | | | | | | | | | |
Corporate Bonds | | | — | | | | 36,368,729 | | | | — | | | | 36,368,729 | |
Corporate Convertible Bonds | | | — | | | | 1,251,659 | | | | — | | | | 1,251,659 | |
Asset-Backed Securities | | | — | | | | 29,977,666 | | | | — | | | | 29,977,666 | |
Commercial Mortgage-Backed | | | — | | | | 11,409,379 | | | | — | | | | 11,409,379 | |
Securities | | | | | | | | | | | | | | | | |
Mortgage-Backed Securities | | | — | | | | 4,394,739 | | | | — | | | | 4,394,739 | |
Taxable Municipal Bonds | | | — | | | | 401,048 | | | | — | | | | 401,048 | |
U.S. Treasury | | | — | | | | 18,869,105 | | | | — | | | | 18,869,105 | |
Common Stocks | | | 136,620 | | | | — | | | | — | | | | 136,620 | |
Cash Equivalents | | | 1,043,057 | | | | — | | | | — | | | | 1,043,057 | |
Total Investments in Securities | | | 1,179,677 | | | | 102,672,325 | | | | — | | | | 103,852,002 | |
| | | | | | | | | | | | | |
| Nebraska Tax-Free Income | |
| | Level 1 | | | Level 2 | | | Level 3 | | | Total | |
| Assets: | | | | | | | | | | | | |
Investments in Securities: | | | | | | | | | | | | |
Municipal Bonds | | | — | | | | 29,800,573 | | | | — | | | | 29,800,573 | |
Cash Equivalents | | | 1,467,004 | | | | — | | | | — | | | | 1,467,004 | |
Total Investments in Securities | | | 1,467,004 | | | | 29,800,573 | | | | — | | | | 31,267,577 | |
Q1 2020 Annual Report 75
| | | | | | | | | | | | | |
| Short Duration Income | |
| | Level 1 | | | Level 2 | | | Level 3 | | | Total | |
| Assets: | | | | | | | | | | | | |
Investments in Securities: | | | | | | | | | | | | |
Corporate Bonds | | | — | | | | 148,411,327 | | | | — | | | | 148,411,327 | |
Corporate Convertible Bonds | | | — | | | | 13,508,732 | | | | — | | | | 13,508,732 | |
Asset-Backed Securities | | | — | | | | 210,079,353 | | | | — | | | | 210,079,353 | |
Commercial Mortgage-Backed | | | — | | | | 44,059,537 | | | | — | | | | 44,059,537 | |
Securities | | | | | | | | | | | | | | | | |
Mortgage-Backed Securities | | | — | | | | 176,287,700 | | | | — | | | | 176,287,700 | |
Taxable Municipal Bonds | | | — | | | | 1,261,185 | | | | — | | | | 1,261,185 | |
U.S. Treasury | | | — | | | | 134,042,540 | | | | — | | | | 134,042,540 | |
Common Stocks | | | 2,074,600 | | | | — | | | | — | | | | 2,074,600 | |
Cash Equivalents | | | 6,445,698 | | | | — | | | | — | | | | 6,445,698 | |
Total Investments in Securities | | | 8,520,298 | | | | 727,650,374 | | | | — | | | | 736,170,672 | |
| | | | | | | | | | | | | |
| Ultra Short Government | |
| | Level 1 | | | Level 2 | | | Level 3 | | | Total | |
| Assets: | | | | | | | | | | | | |
Investments in Securities: | | | | | | | | | | | | |
Corporate Bonds | | | — | | | | 3,747,362 | | | | — | | | | 3,747,362 | |
Asset-Backed Securities | | | — | | | | 9,293,609 | | | | — | | | | 9,293,609 | |
U.S. Treasury | | | — | | | | 58,098,447 | | | | — | | | | 58,098,447 | |
Cash Equivalents | | | 915,594 | | | | — | | | | — | | | | 915,594 | |
Total Investments in Securities | | | 915,594 | | | | 71,139,418 | | | | — | | | | 72,055,012 | |
During the year ended March 31, 2020, there were no transfers into or out of Level 3.
During the year ended March 31, 2020, there were no assets in which significant unobservable inputs (Level 3) were used.
(13) Subsequent Events
As noted in the Value Matters and Fixed Income Insights letters at the beginning of this Report, the COVID-19 pandemic has affected economies worldwide. For the period of time from March 31, 2020 to the date of this Report, none of the Funds have experienced a significant decrease in net asset value or a significant increase in shareholder redemptions as a result of the COVID-19 pandemic.
Management has evaluated the impact of all other subsequent events on the Funds through the date the financial statements were issued and has determined that there were no additional subsequent events requiring recognition or disclosure in the financial statements.
(14) Recent Accounting Pronouncements
In August 2018, the FASB issued ASU 2018-13, Fair Value Measurement (Topic 820). The standard eliminates, adds and modifies certain disclosure requirements for fair value measurements. Entities will no longer be required to disclose the amount of and reasons for transfers between Level 1 and Level 2, but public companies will be required to disclose the range and weighted average used to develop significant unobservable inputs for Level 3 securities. The guidance is effective for fiscal years beginning after December 15, 2019, and interim periods within those fiscal years. Early adoption would be permitted for all entities. The Funds have determined this ASU will not have a material impact on the financial statements as they do not have any Level 3 securities, nor do they have a history of transfers between levels.
76 Q1 2020 Annual Report
REPORT OF INDEPENDENT REGISTERED PUBLIC ACCOUNTING FIRM
To the Shareholders and the Board of Trustees of The Weitz Funds
Opinion on the Financial Statements
We have audited the accompanying statements of assets and liabilities of The Weitz Funds (the “Trust”) (comprising the Hickory Fund, Partners III Opportunity Fund, Partners Value Fund, Value Fund, Balanced Fund, Core Plus Income Fund, Nebraska Tax-Free Income Fund, Short Duration Income Fund and Ultra Short Government Fund (collectively referred to as the “Funds”)), including the schedules of investments, as of March 31, 2020, and the related statements of operations and cash flows (as applicable) for the year then ended, the statements of changes in net assets for each of the two years in the period then ended, the financial highlights for each of the five years in the period then ended and the related notes (collectively referred to as the “financial statements”). In our opinion, the financial statements present fairly, in all material respects, the financial position of each of the Funds comprising The Weitz Funds at March 31, 2020, the results of their operations and their cash flows (as applicable) for the year then ended, the changes in their net assets for each of the two years in the period then ended and their financial highlights for each of the five years in the period then ended, in conformity with U.S. generally accepted accounting principles.
Basis for Opinion
These financial statements are the responsibility of the Trust’s management. Our responsibility is to express an opinion on each of the Funds’ financial statements based on our audits. We are a public accounting firm registered with the Public Company Accounting Oversight Board (United States) (“PCAOB”) and are required to be independent with respect to the Trust in accordance with the U.S. federal securities laws and the applicable rules and regulations of the Securities and Exchange Commission and the PCAOB.
We conducted our audits in accordance with the standards of the PCAOB. Those standards require that we plan and perform the audit to obtain reasonable assurance about whether the financial statements are free of material misstatement, whether due to error or fraud. The Trust is not required to have, nor were we engaged to perform, an audit of the Trust’s internal control over financial reporting. As part of our audits we are required to obtain an understanding of internal control over financial reporting but not for the purpose of expressing an opinion on the effectiveness of the Trust’s internal control over financial reporting. Accordingly, we express no such opinion.
Our audits included performing procedures to assess the risks of material misstatement of the financial statements, whether due to error or fraud, and performing procedures that respond to those risks. Such procedures included examining, on a test basis, evidence regarding the amounts and disclosures in the financial statements. Our procedures included confirmation of securities owned as of March 31, 2020, by correspondence with the custodian and brokers. Our audits also included evaluating the accounting principles used and significant estimates made by management, as well as evaluating the overall presentation of the financial statements. We believe that our audits provide a reasonable basis for our opinion.
We have served as the auditor of one or more of The Weitz Funds investment companies since 2004.
Minneapolis, MN
May 19, 2020
Q1 2020 Annual Report 77
ACTUAL AND HYPOTHETICAL EXPENSES
FOR COMPARISON PURPOSES
Example
As a shareholder of one or more of the Funds, you incur two types of costs: (1) transaction costs, including any transaction fees that you may be charged if you purchase or redeem your Fund shares through certain financial institutions; and (2) ongoing costs, including management fees and other Fund expenses. This Example is intended to help you understand your ongoing costs (in dollars) of investing in the Funds and to compare these costs with the ongoing costs of investing in other mutual funds. The Example is based on an investment of $1,000 invested at the beginning of the period and held for the entire period from October 1, 2019 through March 31, 2020.
Actual Expenses
The first line for each Fund in the table below provides information about actual account values and actual expenses. You may use the information in this line, together with the amount you invested, to estimate the expenses that you paid over the period. Simply divide your account value by $1,000 (for example, an account value of $8,600 divided by $1,000 = 8.6), then multiply the result by the number in the first line under the heading entitled “Expenses Paid from 10/01/19 –3/31/20” to estimate the expenses you paid on your account during this period.
Hypothetical Example for Comparison Purposes
The second line for each Fund in the table below provides information about hypothetical account values and hypothetical expenses based on the actual expense ratio of each Fund and an assumed rate of return of 5% per year before expenses, which is not the actual return of the Fund. The hypothetical account values and expenses may not be used to estimate the actual ending account balance or expenses you paid for the period. You may use this information to compare the ongoing costs of investing in a specific Weitz Fund to other funds. To do so, compare this 5% hypothetical example with the 5% hypothetical examples that appear in the shareholder reports of the other funds.
Please note that the expenses shown in the table are meant to highlight your ongoing costs only and do not reflect any transactional costs charged by certain financial institutions. Therefore, the second line of the table is useful in comparing ongoing costs only, and will not help you determine the relative total costs of owning different funds. In addition, if you incurred transactional fees, your costs would have been higher. Actual and hypothetical expenses for each Fund are provided in this table.
| | | | | | |
| | Beginning Account Value 10/01/19 | Ending Account Value 3/31/20 | Annualized Expense Ratio | Expenses Paid from 10/01/19-3/31/20(1) |
| | | | | |
| Actual | $1,000.00 | $ 770.68 | 1.19% | $ 5.27 |
| Hypothetical(2) | 1,000.00 | 1,019.05 | 1.19 | 6.01 |
| | | | | | |
Partners III Opportunity - Investor Class
| Actual | 1,000.00 | 878.91 | 2.05 | 9.63 |
| Hypothetical(2) | 1,000.00 | 1,014.75 | 2.05 | 10.33 |
| | | | | |
| Partners III Opportunity - Institutional Class | Actual | 1,000.00 | 881.82 | 1.44 | 6.77 |
| Hypothetical(2) | 1,000.00 | 1,017.80 | 1.44 | 7.26 |
| | | | | |
| Partners Value - Investor Class | Actual | 1,000.00 | 788.81 | 1.19 | 5.32 |
| Hypothetical(2) | 1,000.00 | 1,019.05 | 1.19 | 6.01 |
| | |
| | |
| Partners Value - Institutional Class | Actual | 1,000.00 | 789.89 | 0.94 | 4.21 |
| Hypothetical(2) | 1,000.00 | 1,020.30 | 0.94 | 4.75 |
| | | | | | |
| Actual | 1,000.00 | 864.52 | 1.17 | 5.45 |
| Hypothetical(2) | 1,000.00 | 1,019.15 | 1.17 | 5.91 |
| | | | | |
| Value - Institutional Class | Actual | 1,000.00 | 865.47 | 0.94 | 4.38 |
| Hypothetical(2) | 1,000.00 | 1,020.30 | 0.94 | 4.75 |
| | | | | |
| Balanced - Investor Class | Actual | 1,000.00 | 948.76 | 0.85 | 4.14 |
| Hypothetical(2) | 1,000.00 | 1,020.75 | 0.85 | 4.29 |
| | | | | |
| Balanced - Institutional Class | Actual | 1,000.00 | 949.77 | 0.70 | 3.41 |
| Hypothetical(2) | 1,000.00 | 1,021.50 | 0.70 | 3.54 |
| | | | | |
| Core Plus Income - Investor Class | Actual | 1,000.00 | 969.20 | 0.55 | 2.71 |
| Hypothetical(2) | 1,000.00 | 1,022.25 | 0.55 | 2.78 |
| | | | | |
| Core Plus Income - Institutional Class | Actual | 1,000.00 | 971.00 | 0.40 | 1.97 |
| Hypothetical(2) | 1,000.00 | 1,023.00 | 0.40 | 2.02 |
| | | | | |
| Nebraska Tax-Free Income | Actual | 1,000.00 | 1,007.63 | 0.79 | 3.97 |
| Hypothetical(2) | 1,000.00 | 1,021.05 | 0.79 | 3.99 |
| | | | | |
| Short Duration Income - Investor Class | Actual | 1,000.00 | 982.69 | 0.62 | 3.07 |
| Hypothetical(2) | 1,000.00 | 1,021.90 | 0.62 | 3.13 |
| | | | | |
| Short Duration Income - Institutional Class | Actual | 1,000.00 | 983.53 | 0.48 | 2.38 |
| Hypothetical(2) | 1,000.00 | 1,022.60 | 0.48 | 2.43 |
| | | | | |
| Ultra Short Government | Actual | 1,000.00 | 1,011.46 | 0.20 | 1.01 |
| Hypothetical(2) | 1,000.00 | 1,024.00 | 0.20 | 1.01 |
| |
(1) | Expenses are equal to the annualized expense ratio for the Fund, multiplied by the average account value over the period, multiplied by the number of days in the most recent fiscal half year (183/366).
|
(2) | Assumes 5% total return before expenses. |
78 Q1 2020 Annual Report
Proxy Voting Policy
A description of the Funds’ proxy voting policies and procedures is available without charge, upon request by (i) calling 800-304-9745, (ii) on the Funds’ website at weitzinvestments.com; and (iii) on the SEC’s website at sec.gov.
Information on how each of the Funds voted proxies relating to portfolio securities during each twelve month period ended June 30 is available: (i) on the Funds’ website at weitzinvestments.com and (ii) on the SEC’s website at sec.gov.
Form N-PORT
The Funds file complete schedules of investments with the Securities and Exchange Commission as of June 30 and December 31 of each year on Form N-PORT. The Funds’ Form N-PORT can be reviewed and copied at the SEC’s Public Reference Room in Washington, D.C. or on the SEC’s website at sec.gov.
Liquidity Risk Management Program
The Funds have adopted and implemented a Liquidity Risk Management Policy (the “Policy”) in accordance with Rule 22e-4 under the Investment Company Act of 1940, as amended. The Policy seeks to assess and manage each Fund’s liquidity risk, which is the risk that a Fund could not meet requests to redeem Fund shares without significant dilution of the remaining investors’ interests in the Fund. The Funds’ Board of Trustees (“Board”) has appointed Weitz Investment Management, Inc., the Funds’ investment adviser (“Weitz”), to administer the Policy. Weitz has delegated certain day-to-day administration responsibilities to the Liquidity Risk Management Committee (“Committee”), which consists of certain Weitz portfolio management, trading, compliance, and accounting personnel. Weitz also may engage one or more third parties to perform certain functions under the Policy.
The Board met on February 11, 2020 and received a report (the “Liquidity Report”) from Weitz addressing the operation of the Policy and assessing the adequacy and effectiveness of its implementation, including the operation of each Fund’s highly liquid investment minimum (“HLIM”). The Liquidity Report discussed key components of the Policy, including the assessment of the Funds’ liquidity risk, classification of each Fund’s portfolio investments into one of four liquidity categories, 15% limit on the Funds’ holdings of illiquid investments, and HLIM requirements. As reflected in the Liquidity Report, Weitz considers the Policy to be reasonably designed to assess and manage the Funds’ liquidity risk and believes it has been adequately and effectively implemented.
Tax Information
Of the distributions paid during the fiscal year, the amounts that may be considered qualified dividend income and for corporate shareholders, the amounts that may qualify for the corporate dividends received deduction, are summarized as follows (in U.S. dollars):
| | |
| Balanced |
Qualified dividend income | 526,608 |
Corporate dividends received deduction | 397,594 |
The information and distributions reported herein may differ from the information and distributions reported to shareholders for the calendar year ended December 31, 2019, which was reported in conjunction with your 2019 Form 1099-DIV.
Q1 2020 Annual Report 79
INFORMATION ABOUT THE TRUSTEES AND OFFICERS
The individuals listed below serve as Trustees or Officers of the Trust. Each Trustee of the Weitz Funds serves until a successor is elected and qualified or until resignation. Each Officer of the Weitz Funds is elected annually by the Trustees.
The address of all Trustees and Officers is 1125 South 103rd Street, Suite 200, Omaha, Nebraska 68124.
| Independent Trustees Lorraine Chang (Age: 69) Position(s) Held with Trust: Trustee; Chair, Board of Trustees Length of Service (Beginning Date): 1997 Principal Occupation(s) During Past 5 Years: Independent Management Consultant Number of Portfolios Overseen in Fund Complex: 9 Other Directorships During Past 5 Years: N/A
John W. Hancock (Age: 72) Position(s) Held with Trust: Trustee Length of Service (Beginning Date): 1986 Principal Occupation(s) During Past 5 Years: CPA, Hancock & Dana, PC, an accounting firm Number of Portfolios Overseen in Fund Complex: 9 Other Directorships During Past 5 Years: N/A Roland J. Santoni (Age: 78) Position(s) Held with Trust: Trustee Length of Service (Beginning Date): 2004 Principal Occupation(s) During Past 5 Years: Retired (April 2018 to Present), Director (2010 to April 2018), Gary and Mary West Foundation; Partner (2012 to April 2018), West Partners, a private equity firm Number of Portfolios Overseen in Fund Complex: 9 Other Directorships During Past 5 Years: N/A
Delmer L. Toebben (Age: 89) Position(s) Held with Trust: Trustee Length of Service (Beginning Date): 1996 Principal Occupation(s) During Past 5 Years: Retired Number of Portfolios Overseen in Fund Complex: 9 Other Directorships During Past 5 Years: N/A
Justin B. Wender (Age: 50) Position(s) Held with Trust: Trustee Length of Service (Beginning Date): 2009 Principal Occupation(s) During Past 5 Years: Managing Partner, Stella Point Capital, LP, a private equity firm Number of Portfolios Overseen in Fund Complex: 9 Other Directorships During Past 5 Years: International Money Express, Inc., an international money transfer company (2018 to Present) | Interested Trustees* Wallace R. Weitz (Age: 70) Position(s) Held with Trust: President; Portfolio Manager; Trustee Length of Service (Beginning Date): 1986 Principal Occupation(s) During Past 5 Years: President, Weitz Funds; Co-Chief Investment Officer (2017 to Present), Chief Investment Officer (2015 to 2017), and Portfolio Manager, Weitz Investment Management, Inc. Number of Portfolios Overseen in Fund Complex: 9 Other Directorships During Past 5 Years: Cable One, Inc., a cable television, internet and telephone services company Thomas R. Pansing (Age: 74) Position(s) Held with Trust: Trustee Length of Service (Beginning Date): 1986 Principal Occupation(s) During Past 5 Years: Partner, Pansing Hogan Ernst & Bachman LLP, a law firm Number of Portfolios Overseen in Fund Complex: 9 Other Directorships During Past 5 Years: N/A
* Mr. Weitz is a Director and Officer of Weitz Investment Management, Inc., investment adviser to the Weitz Funds, and as such is considered an “interested person” of the Trust, as that term is defined in the Investment Company Act of 1940 (an “Interested Trustee”). Mr. Pansing performs certain legal services for the investment adviser and the Weitz Funds and, therefore, is also classified as an “Interested Trustee.” |
80 Q1 2020 Annual Report
| Officers Shar M. Bennett (Age: 45) Position(s) Held with Trust: Assistant Treasurer Length of Service (Beginning Date): 2018 Principal Occupation(s) During Past 5 Years: Assistant Treasurer (November 2018 to Present), Weitz Funds; Vice President, Director of Fund Administration (November 2018 to Present), Director of Accounting (April 2004 to November 2018), Weitz Investment Management, Inc. James J. Boyne (Age: 53) Position(s) Held with Trust: Vice President and Treasurer Length of Service (Beginning Date): 2018 Principal Occupation(s) During Past 5 Years: Vice President, Treasurer (November 2018 to Present), Weitz Funds; President and Treasurer (November 2018 to Present), Weitz Investment Management, Inc.; Executive Director (2013 to 2018), Steamboat Springs Winter Sports Club Thomas D. Carney (Age: 56) Position(s) Held with Trust: Vice President Length of Service (Beginning Date): 2015 Principal Occupation(s) During Past 5 Years: Vice President (2015 to Present), Weitz Funds; Portfolio Manager, Weitz Investment Management, Inc. John R. Detisch (Age: 55) Position(s) Held with Trust: Vice President, General Counsel, Secretary and Chief Compliance Officer Length of Service (Beginning Date): 2011 Principal Occupation(s) During Past 5 Years: Vice President, General Counsel, Secretary and Chief Compliance Officer, Weitz Funds; Vice President, General Counsel, Assistant Secretary and Chief Compliance Officer, Weitz Investment Management, Inc. | Martha J. Gilchrist (Age: 57) Position(s) Held with Trust: Vice President Length of Service (Beginning Date): 2018 Principal Occupation(s) During Past 5 Years: Vice President (November 2018 to Present), Weitz Funds; Vice President (2015 to Present), Director of Finance (November 2018 to Present), Director of Operations (April 2004 to November 2018), Weitz Investment Management, Inc. Bradley P. Hinton (Age: 52) Position(s) Held with Trust: Vice President Length of Service (Beginning Date): 2006 Principal Occupation(s) During Past 5 Years: Vice President, Weitz Funds; Co-Chief Investment Officer (2017 to Present), Director of Research (2004 to 2017), Vice President and Portfolio Manager, Weitz Investment Management, Inc. Andrew S. Weitz (Age 40)* Position(s) Held with Trust: Vice President Length of Service (Beginning Date): 2018 Principal Occupation(s) During Past 5 Years: Vice President (2018 to Present), Weitz Funds; Vice President and Director of Equity Research (2017 to Present), and Portfolio Manager, Weitz Investment Management, Inc. * Mr. Weitz is the son of Wallace R. Weitz who serves as a Trustee and President of the Trust and who also serves as Chairman of Weitz Investment Management, Inc. |
The Statement of Additional Information for the Weitz Funds, which can be obtained without charge by calling 800-304-9745, includes additional information about the Trustees and Officers of the Weitz Funds.
Q1 2020 Annual Report 81
The following indices are used as benchmarks for the various mutual funds offered by Weitz Funds. Index performance is hypothetical and is shown for illustrative purposes only. You cannot invest directly in an index.
| | |
Bloomberg Barclays 1-3 Year U.S. Aggregate Index | The Bloomberg Barclays 1-3 Year U.S. Aggregate Index is generally representative of the market for investment grade, U.S. dollar denominated, fixed-rate taxable bonds with maturities from one to three years. |
|
Bloomberg Barclays 5-Year Municipal Bond Index | The Bloomberg Barclays 5-Year Municipal Bond Index is a capitalization weighted bond index generally representative of major municipal bonds of all quality ratings with an average maturity of approximately five years. |
|
Bloomberg Barclays U.S. Aggregate Bond Index | The Bloomberg Barclays U.S. Aggregate Bond Index is a broad-based benchmark that measures the investment grade, U.S. dollar-denominated, fixed-rate taxable bond market. |
|
|
| CPI + 1.00% | The CPI + 1% is created by adding 1% to the annual percentage change in the Consumer Price Index (“CPI”) as determined by the U.S. Department of Labor Statistics. There can be no guarantee that the CPI will reflect the level of inflation at any time. |
|
ICE BofAML US 6-Month Treasury Bill Index | The ICE BofAML US 6-Month Treasury Bill Index is generally representative of the market for U.S. Treasury Bills. |
|
Morningstar Moderately Conservative Target Risk Index | The Morningstar Moderately Conservative Target Risk Index is an asset allocation index comprised of constituent Morningstar indices and reflects global equity market exposure of 40% based on an asset allocation methodology derived by Ibbotson Associates, a Morningstar company. |
|
|
Russell 1000® Index | The Russell 1000 Index measures the performance of the large-cap segment of the U.S. equity universe. It is a subset of the Russell 3000 Index and includes approximately 1,000 of the largest securities based on a combination of their market cap and current index membership. |
|
Russell 3000® Index | The Russell 3000 Index measures the performance of the largest 3,000 U.S. companies representing approximately 98% of the investable U.S. equity market. |
|
Russell Midcap® Index | The Russell Midcap Index tracks the performance of the 800 next-largest U.S. companies, after the 1,000 largest U.S. companies. |
|
S&P 500® Index | The S&P 500 is an unmanaged index consisting of 500 companies generally representative of the market for the stocks of large-size U.S. companies. |
82 Q1 2020 Annual Report
| Board of Trustees Lorraine Chang John W. Hancock Thomas R. Pansing, Jr. Roland J. Santoni Delmer L. Toebben Wallace R. Weitz Justin B. Wender Investment Adviser Weitz Investment Management, Inc. 1125 South 103rd Street, Suite 200 Omaha, NE 68124-1071 (800) 304-9745 Custodian State Street Bank and Trust Company Officers Wallace R. Weitz, President Shar M. Bennett, Assistant Treasurer James J. Boyne, Vice President & Treasurer Thomas D. Carney, Vice President John R. Detisch, Vice President, Secretary & Chief Compliance Officer Martha J. Gilchrist, Vice President Bradley P. Hinton, Vice President Andrew S. Weitz, Vice President | Distributor Weitz Securities, Inc. Transfer Agent and Dividend Paying Agent Weitz Investment Management, Inc. Sub-Transfer Agent DST Asset Manager Solutions, Inc.
NASDAQ symbols: Hickory Fund - WEHIX Partners III Opportunity Fund Investor Class - WPOIX Institutional Class - WPOPX Partners Value Fund Investor Class - WPVLX Institutional Class - WPVIX Value Fund Investor Class - WVALX Institutional Class - WVAIX Balanced Fund Investor Class - WBALX Institutional Class - WBAIX Core Plus Income Fund Investor Class - WCPNX Institutional Class - WCPBX Nebraska Tax-Free Income Fund - WNTFX Short Duration Income Fund Investor Class - WSHNX Institutional Class - WEFIX Ultra Short Government Fund - SAFEX |
Beginning on January 1, 2021, paper copies of this report will no longer be sent by mail (unless specifically requested). Instead, the reports will be made available at weitzinvestments.com and you will be notified by mail each time a report is posted. For additional information, please see the notice contained on the Table of Contents page of this report.
Investors should consider carefully the investment objectives, risks, and charges and expenses of a fund before investing. This and other important information is contained in the prospectus and summary prospectus, which may be obtained at weitzinvesments.com or from a financial advisor. Please read the prospectus carefully before investing.
5/26/2020

Item 2. Code of Ethics.
As of the end of the period covered by this report, the Registrant has adopted a code of ethics that applies to the Registrant’s principal executive officer, principal financial officer, principal accounting officer or controller, or persons performing similar functions, regardless of whether these individuals are employed by the Registrant or a third party (the “Code of Ethics”). During the period covered by this report, there were no amendments, nor did the Registrant grant any waivers, including any implicit waivers, from any provision of the Code of Ethics. The Code of Ethics is attached hereto as Exhibit 12(a)(1).
Item 3. Audit Committee Financial Expert.
The Registrant’s board of trustees has determined that the Registrant has at least one “audit committee financial expert” (as defined in Item 3 of Form N-CSR) serving on its audit committee. John Hancock is an “audit committee financial expert” and is “independent” (as each term is defined in Item 3 of Form N-CSR).
Item 4. Principal Accountant Fees and Services.
| (a) | Audit Fees. Fees for audit services provided to the Registrant were $255,640 and $280,640 for the fiscal years ended March 31, 2020 and 2019, respectively. |
| (b) | Audit Related Fees. The aggregate fees billed in each of the last two fiscal years for audit related-services by the principal accountant that are reasonably related to the performance of the audit of the Registrant’s financial statements and are not reported under paragraph (a) of this item were $31,340 and $31,340 for the fiscal years ended March 31, 2020 and 2019, respectively. The fees, paid by Weitz Investment Management, Inc., the Registrant’s investment adviser and transfer agent, were payment for the principal accountant performing internal control reviews of the Registrant’s transfer agent. |
| (c) | Tax Fees. Fees for tax services, which consisted of income and excise tax compliance services, were $44,800 and $44,800 for the fiscal years ended March 31, 2020 and 2019, respectively. |
| (d) | All Other Fees. Fees for all other services totaled $13,210 and $13,210 for the fiscal years ended March 31, 2020 and 2019, respectively. |
| (e) | (1) The Registrant’s Audit Committee has adopted Pre-Approval Policies and Procedures. The Audit Committee must pre-approve all audit services and non-audit services that the principal accountant provides to the Registrant. The Audit Committee must also pre-approve any engagement of the principal accountant to provide non-audit services to the Registrant’s investment adviser, or any affiliate of the adviser that provides ongoing services to the Registrant, if such non-audit services directly impact the Registrant’s operations and financial reporting. |
(2) No services described in items (b) were pre-approved by the Audit Committee pursuant to Rule 2‑01(c)(7)(i)(c) of Regulation S-X.
| (f) | All of the work in connection with the audit of the Registrant during the years ended March 31, 2020 and 2019 was performed by full-time employees of the Registrant’s principal accountant. |
| (g) | The aggregate fees billed by the principal accountant for non-audit services to the Registrant, the Registrant’s investment adviser and any entity controlling, controlled by, or under common control with the adviser that provides ongoing services to the Registrant were $150,405 and $157,445 for the years ended March 31, 2020 and 2019, respectively. |
| (h) | The Registrant’s Audit Committee has considered whether the provision of non-audit services that were rendered to the Registrant’s investment adviser, and any entity controlling, controlled by, or under common control with the adviser that provides ongoing services to the Registrant that were not pre-approved pursuant to paragraph (c)(7)(ii) of Rule 2-01 of Regulation S-X is compatible with maintaining the principal auditor’s independence. |
Item 5. Audit Committee of Listed Registrants.
Not applicable.
Item 6. Schedule of Investments.
The Schedule of Investments in Securities of unaffiliated issuers is included as part of the Report to Shareholders filed under Item 1.
Item 7. Disclosure of Proxy Voting Policies and Procedures for Closed-End Investment Companies.
Not applicable.
Item 8. Portfolio Managers of Closed-End Investment Companies.
Not applicable.
Item 9. Purchases of Equity Securities by Closed-End Management Investment Company and Affiliated Purchasers.
Not applicable.
Item 10. Submissions of Matters to a Vote of Security Holders.
Not applicable.
Item 11. Controls and Procedures.
(a) Based on an evaluation of the Disclosure Controls and Procedures (as defined in Rule 30a-3(c) under the Investment Company Act of 1940) (the "Disclosure Controls") as of a date within 90 days prior to the filing date (the "Filing Date") of this report on Form N-CSR (the "Report"), the Registrant's principal executive officer and principal financial officer have concluded that the Disclosure Controls are reasonably designed to ensure that information required to be disclosed by the Registrant in the Report is recorded, processed, summarized and reported by the Filing Date, including ensuring that information required to be disclosed in the Report is accumulated and communicated to the Registrant's management, including the Registrant's principal executive officer and principal financial officer, as appropriate to allow timely decisions regarding required disclosure.
(b) There were no changes in the Registrant's internal control over financial reporting (as defined in Rule 30a-3(d) under the Investment Company Act of 1940) that occurred during the Registrant's second fiscal half-year of the period covered by this report that has materially affected, or is reasonably likely to materially affect, the Registrant's internal control over financial reporting.
Item 12. Exhibits
(a)(3) Not applicable.
SIGNATURES
Pursuant to the requirements of the Securities Exchange Act of 1934 and the Investment Company Act of 1940, the Registrant has duly caused this report to be signed on its behalf by the undersigned, thereunto duly authorized.
The Weitz Funds
By (Signature and Title)*
/s/ Wallace R. Weitz
Wallace R. Weitz, President
Date: May 26, 2020
Pursuant to the requirements of the Securities Exchange Act of 1934 and the Investment Company Act of 1940, this report has been signed below by the following persons on behalf of the Registrant and in the capacities and on the dates indicated.
By: (Signature and Title)*
/s/ Wallace R. Weitz
Wallace R. Weitz, President
Date: May 26, 2020
By: (Signature and Title)*
/s/ James J. Boyne
James J. Boyne, Vice President and Treasurer
Date: May 26, 2020
* Print the name and title of each signing officer under his or her signature.