Weitz Investment Management, Inc.
The Weitz Funds
Suite 200
1125 South 103 Street
Omaha, NE 68124-1071
(Name and address of agent for service)
Form N-CSR is to be used by management investment companies to file reports with the Commission not later than 10 days after the transmission to stockholders of any report that is required to be transmitted to stockholders under Rule 30e-1 under the Investment Company Act of 1940 (17 CFR 270.30e-1). The Commission may use the information provided on Form N-CSR in its regulatory, disclosure review, inspection, and policymaking roles.
A registrant is required to disclose the information specified by Form N-CSR, and the Commission will make this information public. A registrant is not required to respond to the collection of information contained in Form N‑CSR unless the Form displays a currently valid Office of Management and Budget (“OMB”) control number. Please direct comments concerning the accuracy of the information collection burden estimate and any suggestions for reducing the burden to Secretary, Securities and Exchange Commission, 450 Fifth Street, NW, Washington, DC 20549-0609. The OMB has reviewed this collection of information under the clearance requirements of 44 U.S.C. § 3507.
Item 1. Report to Stockholders.
THE WEITZ PHILOSOPHY
Value investing the Weitz Way.
There are no shortcuts in value investing. At Weitz, we dig. And dig some more. We look at hundreds of investment ideas. Our goal: find strong, well-managed but undervalued companies that offer reasonable risk-adjusted returns. It’s no easy task. We do the due diligence. Analyze. Ask tough questions and get the answers. We wait for the right opportunity. Then and only then do we invest your money. Welcome to the Weitz Way.
We’re in it with you:
Our employees have the majority of their investable assets in our mutual funds. This alignment of goals allows us to guarantee that we’re treating clients’ money as if it were our own.
We focus on what we know:
Each of our analysts is a generalist with ever-growing, defined circles of competence. They can spot opportunities anywhere and bring them to the team for consideration.
We think for ourselves:
Our philosophy of independent thinking and high-conviction portfolios enables us to take advantage of value-priced equities and bonds that offer reasonable risk-adjusted returns.
Today we are responsible for approximately $4 billion in investments for our shareholders – individuals, corporations, pension plans, foundations and endowments. And our commitment remains the same: to put our clients first. Always. We do so through our expertise, our flexibility, and our drive to uncover investments that can help them preserve and grow wealth.
Drew Weitz
Portfolio Manager
Wally Weitz, CFA
President, Portfolio Manager
Brad Hinton, CFA
Portfolio Manager
2 | Q1 2019 ANNUAL REPORT
WEITZINVESTMENTS.COM
Beginning on January 1, 2021, paper copies of the Fund’s shareholder reports will no longer be sent by mail, unless you specifically request paper copies of the reports from the Fund or from your financial intermediary (such as a financial adviser). Instead, the reports will be made available on the Fund’s website https://weitzinvestments.com/our_funds/default.fs. and you will be notified by mail each time a report is posted, and the mailing will provide a website link to access the report. You will continue to receive other Fund regulatory documents (such as prospectuses or supplements) in paper unless you have elected to receive all Fund documents electronically as described below.
If you would like to continue to receive the Fund’s future shareholder reports in paper free of charge after January 1, 2021, you can make that request (1) by contacting your financial intermediary, if you invest through a financial intermediary; or (2) if you invest directly with the Fund, by calling 800-304-9745.
If you already receive shareholder reports and other Fund documents electronically, you will not be affected by this change and you need not take any action. If you do not receive shareholder reports and other Fund documents electronically but would like to do so, contact your financial intermediary or, if you invest directly with the Fund, call 800-304-9745. An election to receive shareholder reports in paper will apply to all Funds held with the Weitz Funds and may apply to all funds held with your financial intermediary.
TABLE OF CONTENTS
Value Matters | 4 |
Performance Summary | 7 |
Fixed Income Insights | 8 |
Analyst Corner | 10 |
Value Fund | 12 |
Partners Value Fund | 14 |
Partners III Opportunity Fund | 16 |
Hickory Fund | 18 |
Balanced Fund | 20 |
Core Plus Income Fund | 22 |
Short Duration Income Fund | 24 |
Ultra Short Government Fund | 26 |
Nebraska Tax-Free Income Fund | 28 |
Schedule of Investments | 30 |
Financial Statements | 46 |
Notes to Financial Statements | 56 |
Report of Independent Registered | |
Public Accounting Firm | 65 |
Actual and Hypothetical Expenses for | |
Comparison Purposes | 66 |
Other Information | 67 |
Index Descriptions | 70 |
The management of Weitz Funds has chosen paper for the 72 page report from a paper manufacturer certified under the Sustainable Forestry Initiative ® standard.
Portfolio composition is subject to change at any time and references to specific securities, industries, and sectors referenced in this report are not recommendations to purchase or sell any particular security. Current and future portfolio holdings are subject to risk. See the Schedules of Investments included in this report for the percent of assets in each of the Funds invested in particular industries or sectors.
3 | Q1 2019 ANNUAL REPORT
VALUE MATTERS
April 2, 2019
Dear Fellow Investor,
It Was a Good Quarter
In 2018, business values generally rose, but a nearly 20% decline in the fourth quarter brought stock market indices into negative territory for the year and made stock valuations much more attractive. We thought the stage was set for good returns going forward, but we would not have guessed that a rebound would be immediate.
Market sentiment changed dramatically as the new year began, and the S&P 500 charged ahead by 13.65% in the first quarter. Our stocks participated and all four stock funds earned double-digit gains that outpaced the S&P 500. The Balanced Fund, with less than 50% of assets currently invested in stocks, earned a very strong return as well. Our bond funds also turned in very solid results for the quarter and fiscal year. Tom and Nolan elaborate in their separate Fixed Income Insights. March 31 is the fiscal year end for all our funds, so this quarter’s Quarterly Commentaries will include detailed analysis of results for both the three- and twelve-month periods.
The first-quarter equity numbers would make for good annual returns, so we will not expect this pace to continue. But the year is off to a good start, and it would seem fair for shareholders to celebrate a little. The performance table following this letter shows year-to-date returns as well as the annualized returns for longer periods. As usual, we suggest investors focus on much longer time frames. Ten-, twenty- and thirty-year compounded returns don’t guarantee future success, but we believe they support the idea that our version of value investing works over time.
It was a good quarter. We look forward to an interesting year and hope to build on the first quarter’s results.
Interest Rates Matter and Won’t Always Be This Low
The buyer of a business focuses on two key questions: How much cash will the business generate in the future for its owners? And how much should she pay today for that stream of cash? The first is about earnings (E). The second is about valuation or price in relation to earnings (P/E).
Choosing the appropriate P/E involves comparisons among investment alternatives, current and future. One of the choices available to a prospective business (or stock) buyer is an investment in “safe” bonds such as Treasury securities. If interest rates on these bonds are relatively low (as they are today), they pose little competition to stocks, and stock buyers will feel tempted (or compelled) to “pay up” for a company’s earnings. Thus, the P/E rises. But if interest rates rise substantially, a dollar of stock earnings becomes less attractive relative to the return available from the safer bond. Thus, some shareholders sell stocks to buy bonds, and P/E ratios decline. Since long-term investors generally plan to hold their shares over a period of years, the average level of interest rates over time is more important to them than the current level. Hence, investors’ fascination with “Fed watching” and other strategies to try to predict the future path of interest rates.
A combination of factors has produced historically low interest rates over the past ten years, the Fed’s monetary policy being the most visible. The tepid recovery from the last recession and the deflationary forces unleashed by the Internet (Amazon, Uber, Airbnb, etc.) also help explain why rates have remained low. Many believe that today’s rates represent a new normal in which low rates are relatively permanent and historically high stock valuations are justified. Skeptics (including us) suspect that cheap and widely available credit produced by the Fed’s quantitative easing, along with stimulative fiscal policy in the form of tax cuts and increased deficit spending, will eventually lead to increases in the price of credit, i.e., higher interest rates. We are not predicting hyper-inflation or even a return to the double-digit rates of the 1980s. Rather, we expect modestly higher rates, on average, that would act as a bit of a headwind for stock valuations.
We Don’t Know What the Economy Will Do Next, But We Don’t NEED to Know
The current slowdown in the U.S. economy may turn into a recession and cause interest rates to move even lower. Or the economy could regain momentum, continue to grow for several more years and set off inflationary forces that lead to higher rates. We believe that both will happen, possibly multiple times, over the next 10-20 years. We cannot predict how these changes will unfold, but the nice thing about investing in good businesses is that we do not need to know. Companies with strong competitive positions, able management and liquid balance sheets will take advantage of whatever opportunities come along.
In fact, periods of economic adversity can accelerate a company’s business value growth. The mortgage crisis and recession in 2007-09 allowed Berkshire Hathaway to make some very high-return investments in companies such as Goldman Sachs and Bank of America. When SiriusXM was facing bankruptcy in 2009, Liberty Media came to its rescue with a loan of about $430 million that not only bore a double-digit interest rate but came with virtually free shares of a preferred stock convertible into 40% of the company. Their stake in SiriusXM is worth over $18 billion today. Comcast and Danaher were able to help GE with its periodic need to shore up its balance sheet by buying businesses from GE on favorable terms.
4 | Q1 2019 ANNUAL REPORT
WEITZINVESTMENTS.COM
Further, when uncertainty over economic growth, Fed policy, etc. plagues nervous investors, the resulting volatility often creates opportunities for us to sell the expensive and buy the cheap. Price moves of individual stocks and of the market in general often carry much further in both directions than is justified by changes in underlying business values. We welcome the volatility.
Companies and Industries Evolve, But Basic Investing Principles Still Hold
Our focus on business value growth over the next 5-10 years does not mean that we ignore changing business models and industry structures. We have owned some companies for long periods. For example, Berkshire has been in our portfolios continuously since our opening day in 1983. However, we have tried to recognize changing business realities in building our portfolios. Newspapers were great businesses at one time. Then they were not. The economics of TV and radio stations have ebbed and flowed. Cable was primarily a video business, but now its broadband services are more important. Traditional advertising agencies were once essentially collectors of royalties on (rising) consumer spending. Now, TV, radio and print advertising sales have been badly eroded by the advent of Google, Facebook and other digital advertisers. These relative newcomers can offer sophisticated targeting of ads and greater clarity as to the return on an advertiser’s investment. Software and online commerce and services have changed almost every type of business. Estimating future cash flows in this arena is a challenge, but for companies with superior products and entrenched competitive positions, we believe that the 5-10 year outlook can be predictable enough to make intelligent valuation estimates.
The business plans and accounting for these companies can be very different from those of traditional old economy businesses. Many technology companies spend massive amounts of capital on R&D and customer acquisition, and these costs are written off as they are incurred. This depresses current earnings, and some growing, successful businesses can appear unprofitable and unfit to be considered value stocks. Yet, this is not so different from cable companies in the 1980s and ‘90s that spent huge amounts of capital up front to build cable and broadband plant while waiting for subscribers to sign up for their services. When the number of customers reached critical mass—paying growing amounts of recurring cable fees—and spending on plant tapered off, these companies gushed free cash flow. We still aspire to buy shares of a company’s stock at a significant discount to what an informed investor would pay per share for the whole business. If we can do this, we will have Ben Graham’s “margin of safety” to improve our odds of success.
Outlook
Brexit and a fragile EU, trade wars with China, global tensions and shooting wars, and the spectacle of political wrangling at home will undoubtedly cause anxious moments for investors from time to time. The world can be a messy and dangerous place, but from the narrow point of view of stock and bond investors, we think our prospects are good. Economic, political and regulatory changes usually unfold gradually enough that intelligent managements (and investors) can cope with adversity and find ways to take advantage of opportunities. We look forward to an interesting year and hope to build on the first quarter’s results.
Thank you again for allowing us to invest for you. We look forward to seeing you at our annual meeting at the Omaha Regency Marriott on May 22. The meeting will begin at 4:30, and there will be plenty of time for Q&A.
Sincerely,
| | |
Wally Weitz
wally@weitzinvestments.com | Brad Hinton
brad@weitzinvestments.com |
As of March 31, 2019, each of the following portfolio companies constituted a portion of the net assets of Value Fund, Partners Value Fund, Partners III Opportunity Fund, Hickory Fund, and Balanced Fund as follows: Alphabet, Inc. (Parent of Google)-Class C: 6.1%, 5.6%, 5.0%, 0%, and 2.1%. Amazon.com, Inc.: 2.1%, 0%, 1.7%, 0%, and 0%. Berkshire Hathaway Inc.-Class B: 6.9%, 5.8%, 10.4%, 0%, and 2.4%. Comcast Corp.-Class A: 3.0%, 2.4%, 0%, 0%, and 1.4%. Danaher Corp.: 3.1%, 0%, 0%, 0%, and 1.6%. Facebook, Inc.-Class A: 3.9%, 3.2%, 3.3%, 0%, and 0%. Liberty Broadband Corp.-Series A & C: 0%, 5.7%, 6.8%, 8.7%, and 0%. Liberty Broadband Corp.-Series C: 6.9%, 0%, 0%, 0%, and 0%. Liberty Formula One Group-Series A & C: 0%, 0%, 1.1%, 2.5%, and 0%. Liberty SiriusXM Group-Series A & C: 0%, 3.9%, 3.6%, 4.2%, and 0%. Liberty SiriusXM Group-Series C: 3.0%, 0%, 0%, 0%, and 0%. Portfolio composition is subject to change at any time. Current and future portfolio holdings are subject to risk.
Included is a reference to the term “margin of safety”. This term refers to purchasing securities at a price that is less than our estimate of intrinsic value. A potential “margin of safety” may limit downside risk and optimize the potential for growth.
5 | Q1 2019 ANNUAL REPORT
DISCLOSURES
These performance numbers reflect the deduction of annual operating expenses which as stated in the most recent prospectus, and expressed as a percentage of each Fund’s or Class’s net assets, are: Value – Investor Class, 1.22%; Value – Institutional Class, 1.09% (gross); Partners Value – Investor Class, 1.25%; Partners Value – Institutional Class, 1.07% (gross); Partners III Opportunity – Investor Class, 2.14%; Partners III Opportunity – Institutional Class – 1.63%; Hickory, 1.24%; Balanced –Investor Class, 1.30% (gross); Core Plus Income – Investor Class, 1.65% (gross); Core Plus Income – Institutional Class, 1.09% (gross); Short Duration Income – Investor Class, 0.91% (gross); Short Duration Income – Institutional Class, 0.62% (gross); Ultra Short Government, 0.60% (gross); and Nebraska Tax-Free Income, 0.85%. See the Financial Highlights on pages 52 and 54 for more current expense ratios. The returns assume reinvestment of dividends and redemption at the end of each period. Total returns shown include fee waivers and expense reimbursements, if any; total returns would have been lower had there been no waivers and/or reimbursements.
Performance data represents past performance, which does not guarantee future results. The investment return and the principal value of an investment in any of the Funds will fluctuate so that an investor’s shares, when redeemed, may be worth more or less than the original cost. Current performance may be higher or lower than the performance data quoted. Performance data current to the most recent month end may be obtained at www.weitzinvestments.com/funds_and_performance/ fund_performance.fs. Index performance is hypothetical and is shown for illustrative purposes only. See page 70 for a description of all indices.
(a) On the last business day of 1993, 2005 and 2006, the Partners Value, Partners III Opportunity and Nebraska Tax-Free Income Funds (the “Funds”) succeeded to substantially all of the assets of Weitz Partners II Limited Partnership, Weitz Partners III Limited Partnership and Weitz Income Partners Limited Partnership (the“Partnerships”), respectively. The investment objectives, policies and restrictions of the Funds are materially equivalent to those of their respective Partnership and the Partnerships were managed at all times with full investment authority by the investment adviser. The performance information includes performance for the Partnerships. The Partnerships were not registered under the Investment Company Act of 1940 and, therefore, were not subject to certain investment or other restrictions or requirements imposed by the 1940 Act or the Internal Revenue Code. If the Partnerships had been registered under the 1940 Act, the Partnerships’ performance might have been adversely affected.
(b) Institutional Class shares of the Value, Partners Value and Balanced Funds became available for sale on July 31, 2014; July 31, 2014; and March 29, 2019, respectively. For performance prior to those dates, these tables include the actual performance of each Fund’s Investor Class (and use the actual expenses of each Fund’s Investor Class) without adjustment. For any such period of time, the performance of each Fund’s Institutional Class would have been similar to the performance of each Fund’s Investor Class, because the shares of both classes are invested in the same portfolio of securities, but the classes bear different expenses. The investment adviser has agreed in writing to limit the total annual fund operating expenses (excluding taxes, interest, brokerage costs, acquired fund fees and expenses and extraordinary expenses) to 1.30% and 0.99%, respectively, of each Class’s average daily net assets for the Investor and Institutional Class shares of the Value and Partners Value Funds through July 31, 2019; and to 0.85% and 0.70%, respectively, of each Class’s average daily net assets for the Investor and Institutional Class shares of the Balanced Fund through July 31, 2020.
(c) Investor Class shares of the Partners III Opportunity and Short Duration Income Funds became available for sale on August 1, 2011. For performance prior to that date, these tables include the actual performance of each Fund’s Institutional Class (and use the actual expenses of each Fund’s Institutional Class) without adjustment. For any such period of time, the performance of each Fund’s Investor Class would have been similar to the performance of each Fund’s Institutional Class, because the shares of both classes are invested in the same portfolio of securities, but the classes bear different expenses. The investment adviser has agreed in writing to limit the total annual fund operating expenses of the Short Duration Income Fund’s – Investor and Institutional Class shares (excluding taxes, interest, brokerage costs, acquired fund fees and expenses and extraordinary expenses) to 0.68% and 0.48%, respectively, of each Class’s average daily net assets through July 31, 2019.
(d) The Fund’s past performance is not necessarily an indication of how the Fund will perform in the future. From and after March 29, 2019, the Fund has generally invested the majority of its assets in the common stock of medium-sized companies, which the Fund considers to be companies with a market capitalization, at the time of initial purchase, of greater than $1 billion and less than or equal to the market capitalization of the largest company in the Russell Midcap Index. Prior to that date, the Fund invested the majority of its assets in the common stock of smaller- and medium-sized companies, which the Fund considered to be companies with a market capitalization, at the time of initial purchase, of less than $10 billion.
(e) The investment adviser has agreed in writing to limit the total annual fund operating expenses of the Core Plus Income Fund’s Investor and Institutional Class shares (excluding taxes, interest, brokerage costs, acquired fund fees and expenses and extraordinary expenses) to 0.60% and 0.40%, respectively, of each Class’s average daily net assets through July 31, 2019.
(f) The Fund’s past performance is not necessarily an indication of how the Fund will perform in the future. From and after December 16, 2016, the Fund has generally maintained an average effective duration between one to three and a half years. Prior to that date, the Fund maintained a dollar-weighted average maturity of between two to five years.
(g) The Fund’s past performance is not necessarily an indication of how the Fund will perform in the future. Effective December 16, 2016, the Fund revised its principal investment strategies and policies to permit the Fund to invest in a diversified portfolio of short-term debt securities and to have a fluctuating net asset value. Prior to that date, the Fund operated as a “government money market fund” as defined under Rule 2a-7 of the Investment Company Act of 1940 and maintained a stable net asset value of $1.00 per share. The Fund’s past performance reflects the Fund’s prior principal investment strategies and policies. The investment adviser has agreed in writing to limit the total annual fund operating expenses of the Ultra Short Government Fund (excluding taxes, interest, brokerage costs, acquired fund fees and expenses and extraordinary expenses) to 0.20% of the Fund’s average daily net assets through July 31, 2019.
(h) Since inception performance for the Russell 1000 Value and CPI +1% is from May 31, 1986 and December 31, 1988, respectively. The inception date of the Bloomberg Barclays 1-3 Year U.S. Aggregate and 5-Year Municipal Bond was December 31, 1992 and January 29, 1988, respectively.
6 | Q1 2019 ANNUAL REPORT
WEITZINVESTMENTS.COM
PERFORMANCE SUMMARY
| | | | | | | | | | |
| | | | | Annualized | | | | | |
| | Inception | Since | | | | | | | |
Fund Name | Date | Inception | 30-year | 20-year | 10-year | 5-year | 3-year | 1-year | Quarter |
Value(b) | 5/09/86 | | | | | | | | |
Investor | | 10.12% | 10.23% | 6.45% | 13.81% | 5.79% | 9.36% | 9.04% | 15.32% |
Institutional | | 10.15 | 10.26 | 6.51 | 13.92 | 6.01 | 9.62 | 9.32 | 15.42 |
| Russell 1000 | | 10.28 | 10.29 | 6.33 | 16.05 | 10.63 | 13.52 | 9.30 | 14.00 |
Russell 1000 Value(h) | | 10.05 | 9.92 | 6.68 | 14.52 | 7.72 | 10.45 | 5.67 | 11.93 |
| |
Partners Value(a)(b) | 6/01/83 | | | | | | | | |
Investor | | 11.45 | 10.39 | 6.35 | 12.56 | 2.95 | 5.89 | 2.50 | 15.26 |
Institutional | | 11.48 | 10.43 | 6.41 | 12.69 | 3.18 | 6.17 | 2.78 | 15.36 |
| |
Partners III | | | | | | | | | |
Opportunity(a)(c) | 6/01/83 | | | | | | | | |
Investor | | 12.10 | 11.47 | 8.62 | 13.40 | 3.51 | 6.95 | 10.63 | 19.37 |
Institutional | | 12.20 | 11.58 | 8.79 | 13.74 | 3.99 | 7.52 | 11.25 | 19.48 |
| Russell 3000 | | 10.73 | 10.20 | 6.48 | 16.00 | 10.36 | 13.48 | 8.77 | 14.04 |
| Russell 3000 Value | | 10.92 | 9.93 | 6.87 | 14.50 | 7.56 | 10.50 | 5.30 | 11.93 |
| |
Hickory(d) | 4/01/93 | 9.24 | — | 4.90 | 12.92 | 2.81 | 5.26 | 2.30 | 16.65 |
| Russell Midcap | | 10.76 | — | 9.33 | 16.88 | 8.81 | 11.82 | 6.47 | 16.54 |
| Russell 2500 | | 10.30 | — | 9.59 | 16.23 | 7.79 | 12.56 | 4.48 | 15.82 |
| |
| S&P 500 | | — | 10.17 | 6.04 | 15.92 | 10.91 | 13.51 | 9.50 | 13.65 |
| |
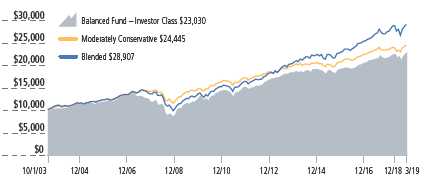
Balanced(b) | 10/01/03 | 5.53 | — | — | 9.52 | 4.46 | 6.52 | 6.18 | 8.18 |
| Moderately Conservative | | 5.94 | — | — | 7.40 | 4.43 | 6.16 | 4.62 | 6.72 |
| Blended Index | | 7.08 | — | — | 10.86 | 7.48 | 8.79 | 7.69 | 9.05 |
| |
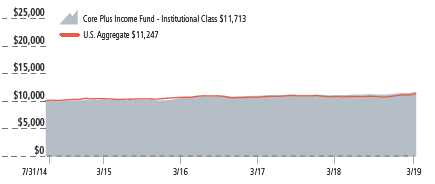
Core Plus Income(e) | 7/31/14 | | | | | | | | |
Investor | | 3.22 | — | — | — | — | 3.45 | 4.78 | 2.62 |
Institutional | | 3.44 | — | — | — | — | 3.68 | 5.07 | 2.76 |
| U.S. Aggregate Bond | | 2.55 | — | — | — | — | 2.03 | 4.48 | 2.94 |
| |
Short Duration | | | | | | | | | |
Income(c)(f) | 12/23/88 | | | | | | | | |
Investor | | 4.98 | 4.97 | 3.76 | 2.81 | 1.55 | 1.84 | 2.95 | 1.47 |
Institutional | | 5.04 | 5.03 | 3.85 | 2.98 | 1.78 | 2.06 | 3.18 | 1.53 |
1-3 Year U.S. Aggregate(h) | | — | — | 3.21 | 1.65 | 1.24 | 1.34 | 3.05 | 1.22 |
CPI + 1%(h) | | 3.52 | 3.50 | 3.21 | 2.82 | 2.49 | 3.23 | 2.88 | 1.43 |
| |
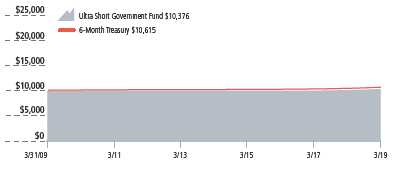
Ultra Short | | | | | | | | | |
Government(g) | 8/01/91 | 2.36 | — | 1.62 | 0.37 | 0.68 | 1.12 | 2.17 | 0.69 |
| 6-Month Treasury | | 2.93 | — | 2.14 | 0.60 | 0.90 | 1.33 | 2.26 | 0.65 |
| |
Nebraska Tax-Free | | | | | | | | | |
Income(a) | 10/01/85 | 4.51 | 4.17 | 3.06 | 2.14 | 1.23 | 0.93 | 3.46 | 1.85 |
5-Year Municipal Bond(h) | | — | 4.98 | 3.90 | 3.12 | 2.23 | 1.79 | 4.42 | 2.11 |
7 | Q1 2019 ANNUAL REPORT
FIXED INCOME INSIGHTS
April 8, 2019
Dear Fellow Investor,
If the Federal Reserve was the market’s “boogie man” in 2018 for raising short-term interest rates, it didn’t take long for it to become the “Candy Man” (a la Sammy Davis Jr.) in 2019. On January 4, Fed Chairman Jerome Powell told a conference for economists that the central bank would be patient in deciding whether to continue raising short-term interest rates. This message, which signaled at least a pause in any further rate increases, was an immediate balm (like “a groovy lemon pie” from the famous crooner’s lyrics) to jittery investors fresh off a tough 2018. Equity markets jumped over 3 percent on that day, and fixed income credit markets firmed up (lower credit spreads and higher prices). That set the stage for what became further gains for both stock and bond investors in this year’s first quarter. The S&P 500, for example, closed out its best quarter in nearly a decade. And fixed income investors experienced meaningful price gains as a result of declining U.S. Treasury interest rates and shrinking credit spreads.
Weitz equity and balanced funds delivered particularly strong first quarter results. Please see Wally and Brad’s Value Matters Letter and the equity and Balanced funds’ Quarterly Commentaries for detailed analysis of results.
Weitz fixed income funds also delivered good results in the year’s first quarter and during the past twelve months. Further detail about contributors to performance can be found in the fixed income funds’ Quarterly Commentaries.
The only gray cloud to the quarter’s otherwise silver lining was precipitated by late March manufacturing reports out of Germany that dealt a blow to Europe’s economic outlook, triggering fresh concerns about the global economy and tripping the alarm on one of the market’s more reliable recession indicators. The news reverberated through markets, sending Germany’s 10-year bund yield below zero for the first time since 2016. In the U.S., investors drove the yield for the 10-year Treasury lower than the 3-month Treasury bill for the first time since just before the Great Recession. Such an inversion of the yield curve, where interest rates on 3-month Treasury bills are higher than 10-year Treasury bonds, has historically been a reasonably reliable recession indicator if it persists long enough. While not a perfect indicator, a consecutive 10-day inversion of the 3-month/10-year Treasury yield has preceded, by a year or two, each of the last seven recessions. The first quarter’s inversion lasted for five days before ending slightly positive and has remained positive into early April.
The graph below shows the changes of select Treasury rates over the past quarter and year.
A distinct outcome in the first quarter as evidenced in the graph above has been an inversion of a portion of the U.S. Treasury yield curve, particularly between 2-year and 5-year bond rates. Time will tell whether this flat-to-inverted yield curve is the “canary in the coal mine” signaling recession risk. At present, though, domestic economic signals continue to appear sound (e.g., consumer and business confidence, and employment and wage growth, to name a few). Some to much of the Treasury rate reaction/progression in the first quarter can be traced to the surprisingly dovish, or neutral, stance on interest rates by the Federal Reserve and by market participants’ anticipation of when/if the Fed may start cutting/lowering short-term interest rates.
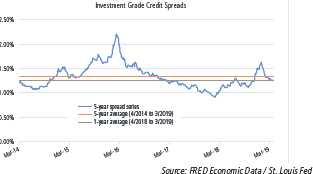
As mentioned, corporate bonds and other credit-sensitive securities had strong quarterly performance and outperformed Treasury bonds as credit spreads narrowed, particularly for non-investment-grade or high-yield bonds. A broad measure of investment-grade1 corporate bond spreads, compiled by ICE BofAML, decreased to 127 basis points as of March 31, down 32 basis points in the quarter. Spreads remain marginally higher (10 basis points) than they were a year ago.
The charts that follow highlight a couple variables that we use to help inform our investment process. The core of that process is to do fundamental credit work, one security at a time, identifying those companies/credits that we believe provide reasonable-to-good risk adjusted returns for any incremental risk assumed. However, those potential returns are ebbing and flowing based on whether a company/ credit is becoming more or less credit worthy—and based on investor perceptions (i.e., the behavioral aspects of fear and greed).
The first chart graphs broad investment grade spreads over the past five years as well as the one- and five-year average. Besides identifying favorable credit opportunities one at a time by fundamental credit analysis, our future/forward returns are enhanced when we can invest when others are more fearful (i.e., when credit spreads are above a 5-year average, for example). Our credit investments in 2015/16 are the most recent example of overlaying deep fundamental work, when credit spreads were at the high end of a historical range. Conversely, our caution in 2017/18, which resulted in shrinking corporate credit exposure in 2017/18, was the result of the marketplace being greedier/ less fearful. We again took advantage of a more favorable investment environment in late 2018, but the duration of the dislocation was too short to make meaningful headway. Overall, we believe this macro data, in conjunction with our fundamental credit work, will help enhance long-term returns by taking advantage of what the market presents us.
8 | Q1 2019 ANNUAL REPORT
WEITZINVESTMENTS.COM
The next chart graphs the relative attractiveness of investing in corporate credit as compared to the “risk free” alternative, again using the past five years as a baseline. Since our investment mandate is not predicated on mimicking a particular index, we have the flexibility either to own a high percentage of credit investments (such as corporate bonds) or none at all. The graph below provides a framework to help inform that decision by depicting the incremental return an investor receives for taking credit risk – in this case across the broad investment-grade corporate universe. Like with investment spreads, our goal is to invest more heavily in credit when our incremental unit of return is high, or at least higher than a longer-term average, so the prospects for outsized forward returns are enhanced. Again, the graph helps explain why we were more constructive on credit investments in 2015/16 and less so in 2017/18.
U.S. Investment Grade: Spread as a % of Yield to Worst1 (Spread/YTW)
Structured / Asset-Backed Securities (ABS): A Growing Area of Expertise
One area in which we have meaningfully exercised our willingness to be index agnostic is in the approximately $1.7 trillion asset-backed securities market. This segment of the nearly $43 trillion fixed income marketplace is not represented in most fixed income indexes yet includes a broad array of investment opportunities secured by autos, credit cards, fleet equipment, commercial mortgages, student loans, mobile phones, cellular towers, other consumer loans and many other assets.
We have spent nearly 10 years becoming more familiar with this segment of the bond market, particularly since the arrival of teammate Nolan Anderson. Our approach to this asset class has been no different than any other credit investment—namely, developing a thorough understanding of the asset class backing each security before making any investment, whether its autos, fleet equipment, etc. Additionally, we have spent significant time conducting due diligence with the sponsors/issuers of each investment (either by phone or shoe-leather contact). To date, this work has culminated in due diligence on nearly 50 different sponsors/issuers, with current investments across approximately two dozen in our taxable fixed income funds.
Asset-backed securities, by their nature, are constructed with a senior-to-subordinate structure. A significant majority of this roughly $1.7 trillion segment is rated the highest (AAA) by one of the independent rating agencies and has been the primary area in which we have focused our investment efforts to date. We purposefully started at the top (the most structurally protected) to enhance/ensure capital preservation, but our aperture to accept properly priced credit risk further down the capital structure has improved over the years.
Why invest in this segment? The short answer is we believe ABS presents opportunities to deploy capital on behalf of our shareholders in assets and cash flows that we understand and that enhance returns over comparable corporate bond alternatives. Stay tuned for the long answer, as we plan to produce white papers on various segments of this asset class in the coming quarters.
Please see all the fund commentaries for additional information regarding first quarter 2019 portfolio activity and current positioning. Our fixed income investment philosophy is straightforward. We believe the key to winning is not losing. Permanent losses of capital are a bane to long-term compounding—and especially so in fixed income investing. We avoid making bold or specific predictions about the direction and pace at which interest rates or credit spreads might move in the future. Caution has arguably always been our calling card in managing fixed income assets on behalf of clients—we want to be properly compensated for any risks we assume. We are index agnostic and prefer to individually select assets. We concentrate in the ideas that we believe best represent attractive risk-adjusted returns, taking into consideration the general level of interest rates and the credit quality of each investment.
This year has certainly started off strong for equity and fixed income investors. It seems plausible that the first quarter’s robust returns have been partly borrowed from the future. And time will tell whether the Fed’s dovish tilt on interest rates coupled with progress on the trade dispute between the U.S. and China may help the global outlook: “make the world taste good” (to continue the Candy Man theme). In the meantime, we intend to stick to our knitting and welcome any volatility that may ensue, particularly when it results in a disconnect between price and value. We look forward to taking advantage of any valuation disparities that may develop in 2019 and hope to continue to earn your investing trust.
Sincerely,
1Definitions: Investment Grade: We consider investment grade to be those securities rated at least BBB- by one or more credit ratings agencies. Yield-to-worst (YTW): the lowest potential yield (most conservative yield) that can be received on a bond without the issuer actually defaulting. YTW is calculated by using worst-case scenario provisions, including prepayments, calls and sinking funds. Furthermore, YTW is a forward-looking estimate that ignores capital gains.
9 | Q1 2019 ANNUAL REPORT
ANALYST CORNER
An Introduction to CarMax, Inc.
By Jon Baker, CFA
CarMax is the largest used-car retailer in the United States, with a growing network of over 200 locations across 100 television markets. The company spent its first nine years as a subsidiary of parent company, Circuit City, before being spun out on its own in 2002. For both the past 5- and 10-year periods, CarMax has grown its used-vehicle unit sales in excess of 7% compounded (and at a faster pace prior). Despite decades of greater-than-industry growth, the company still sells only a low-single-digit percentage share of U.S. used vehicles up to 10 years old and has a credible glide path to much higher share over the coming years.
Selling used cars is a competitive business, yet CarMax has grown profitably over the decades by disassociating itself from the behaviors that earn used-car dealers their spotty reputations. All vehicle pricing is “no haggle.” CarMax sales associates are paid fixed commissions, regardless of the vehicle sold. Additionally, CarMax makes a cash offer on every car presented at their door, telling consumers, “We’ll buy your car even if you don’t buy ours.” Each piece of their consumer offer–vehicle pricing, trade-in, financing and service plan–competes on its own merit.
Over the past decade, same-store unit sales growth for CarMax stores open one year or more has averaged about +4%. Still, the most recent two-year period has seen the lowest rate of same-store growth since the Great Recession. We see a couple contributing headwinds. First, recent data from Manheim’s wholesale auctions suggests used-vehicle pricing remains near historic highs relative to that of new vehicles. Such a narrow gap between new- and used-vehicle pricing is likely indicative of cyclically aggressive competitive behavior, an issue we’ve seen before and that we expect will again revert to CarMax’s benefit.
Second, we have seen the growth of online offerings such as that of Carvana. Though selling only about one-seventh of CarMax’s recent volumes, Carvana is growing rapidly and has likely taken some wind out of CarMax’s sails in common markets. Admittedly later to the e-commerce game, CarMax has spent the past few years developing an online buying option to enhance its best-in-class physical store experience. We believe the resultant physical-online hybrid will be a step-change improvement in an already advantaged CarMax consumer experience, allowing CarMax to serve the greatest percentage of shoppers in the manner of their choice. Crucially, this evolution rides the same rail of customer primacy CarMax has ridden since the opening of its first store in 1993.
Already shipping upwards of 2 million vehicles per year within its network, CarMax has the procurement heft, refurbishment capacity, IT budget, advertising scale and brand awareness to layer on a compelling e-commerce option for those consumers who prefer it. In testing for the past few years, CarMax’s first commercial omni-channel market was launched in the Atlanta area in December, and these capabilities will roll out to the bulk of their footprint in the coming year.
Early returns from the first live market have been promising, with same-market volumes up double digits. Also encouraging is the way the company talks about future investment. Three customer experience centers will be added this year, each serving multi-state regions and each more efficiently performing work currently tasked to local store associates. The removal of operating expense incurred by physical stores combined with the ability to conduct the entire car-buying experience from home—including test drives, financing and taking delivery of a vehicle—means that future physical consumer “touchpoints” can eventually be far different from those of the legacy store base. Those touchpoints can be much less costly, less time consuming to develop and can quickly allow for a physical presence in new, smaller markets or greater coverage and convenience in existing markets than the legacy store model alone can afford.
10 | Q1 2019 ANNUAL REPORT
WEITZINVESTMENTS.COM
This evolution may begin to take some wind from Carvana’s sails, or it may not. But with a combined low-single-digit share of used-vehicle sales between them, it may not matter. By better adapting their physical presence to consumers’ evolving preferences and by pressing the advantages a national network confers, we believe the other 95%+ of the market can keep both companies happy and growing for many years to come. Carvana has burned cash every year of its existence, including over half a billion dollars in 2018 alone. We have opted instead for the long-profitable CarMax, trading at 14 times forward earnings and buying back its undervalued shares. We value CarMax in the low-to-mid $90s per share.
As of March 31, 2019, each of the following portfolio companies constituted a portion of the net assets of Value Fund, Partners Value Fund, Partners III Opportunity Fund, and Hickory Fund as follows: CarMax, Inc. 3.9%, 3.9%, 2.8%, and 3.3%. Current and future portfolio holdings are subject to risk.
Jon Baker, CFA®, joined Weitz Investment Management, Inc. in 1997. Prior to joining Weitz, Jon audited equity funds as a certified public accountant at McGladrey & Pullen. He holds a bachelor’s degree in accounting and computer applications from the University of Notre Dame. Jon has been a CFA® charterholder since 2001.
11 | Q1 2019 ANNUAL REPORT
VALUE FUND
Investment Style: Large-Cap Value Portfolio Manager: Brad Hinton, CFA
The Value Fund’s Institutional Class returned +15.42% for the first quarter compared to +14.00% for the Russell 1000. For the fiscal year, the Fund’s Institutional Class returned +9.32% compared to +9.30% for the Russell 1000. Fund investors enjoyed a very strong finish to an all-around solid fiscal year.
One of our core investing beliefs is that human behavior and market sentiment are more volatile than intrinsic business values. This tenet has been on full display in the past nine months. Two quarters ago, we wrote about it being the “best of times” for domestic equity investors. Last quarter, we wrote about a late 2018 environment where almost all stock prices were hammered. This quarter, stocks are off to one of their best starts in a decade as risk assets roared higher. Since last summer, Mr. Market’s mood swings have put investors on a roller-coaster ride, and not one for the faint of heart.
Our job is to take advantage of these swings in emotion. As you would expect, we have actively reshaped the portfolio throughout this extended market turmoil. Portfolio turnover for the fiscal year was 32%, well above the prior two years. During the quarter, we sold Twenty-First Century Fox as the stock approached our value estimate, before the Disney deal closed. We also reversed course and eliminated Mohawk Industries and Allergan at losses. We simply paid too much for these companies, primarily because we overestimated parts of both businesses. While the stocks trade at low valuations, their growth and durability outlooks are too opaque for our taste, so we sold them. We added JPMorgan Chase, a global financial services leader with several dominant franchises across business lines. We were able to purchase shares at an estimated price-to-value cheaper than the rest of the Fund’s portfolio. We also materially increased our positions in Booking Holdings, CarMax, Liberty Sirius XM Group and TransDigm Group at attractive prices.
Top contributors for the fiscal year were Visa and Mastercard (payment networks), TransDigm Group (aircraft components) and Thermo Fisher Scientific (life science tools and diagnostics). Visa and Mastercard posted strong results with robust underlying business-value growth. We have happily maintained large core positions at fair prices in these competitively advantaged payment card networks. TransDigm Group delivered solid revenue and cash flow results. We expect the recently closed Esterline Technologies acquisition to add another growth engine to the story. Thermo Fisher continues to pair strong operating results with savvy capital allocation. This durable compounder is gaining share within profitable, growing markets, leading to persistent, double-digit earnings growth.
Liberty Global (European broadband) and a trio of subsequently sold positions (Mohawk Industries, DXC Technologies and Allergan) were the largest detractors for the fiscal year. While Liberty Global’s operating results remain mixed, the announced sale of its troubled Swiss business, at an attractive price, was yet another strategic positive. We continue to think the stock is undervalued, perhaps materially so if the pending sale of German and Eastern European assets to Vodafone Group is approved and closed this year. We “cleared the decks” with the sales mentioned above, as we were able to make several quality upgrades at reasonable prices due to increased market volatility. While remaining disciplined on valuation, we have tried to better follow Peter Lynch’s famous advice to avoid “cutting the flowers and watering the weeds” within the portfolio.
A rundown of the Fund’s top and bottom first quarter contributors is shown in the table on the following page. As always, we encourage investors to focus on longer-term results. Since adopting its large-company mandate on June 30, 2008, the Fund’s Institutional Class has generated average annual returns of +8.65% compared to +10.00% for the Russell 1000. While our large-cap stock picking has been quite good, average cash levels over this 10-year period of nearly 18% tamped down realized returns.
Our primary value add for investors is stock picking, period. We have done it well for nearly thirty-six years, and that is how we intend to generate excess returns going forward. Several process enhancements (quality scoring, discount rate, sell discipline, focus on durability) have given us the tools to invest effectively in better businesses. The Fund has become more fully invested, on our terms, patiently and without compromising on valuation. Now, investors should expect cash levels as a percentage of net assets in the single digits going forward. We expect cash levels to remain below 5% of net assets under a broad range of market conditions.
Your portfolio is focused, more fully invested and well aligned with our vision for successful large-cap investing. We have ownership stakes in 26 companies, with the top ten representing nearly half of the portfolio. Each position is significant enough to matter, yet none can individually make or break our results. The collection trades at less than 90% of our value estimate, offering adequate return potential from both value growth and by closing the gap between price and value. We think the three-to-five-year outlook is bright, and we look forward to reporting on the Fund’s progress throughout the year. Thank you once again for your investment and continued confidence in Weitz and our large-cap strategy.
12 | Q1 2019 ANNUAL REPORT
WEITZINVESTMENTS.COM
| | | | | | | | |
Returns | | | Annualized | | | | |
| | Since | | | | | | |
| | Inception | | | | | | |
| | (5/9/1986) | 20-year | 10-year | 5-year | 3-year | 1-year | Quarter |
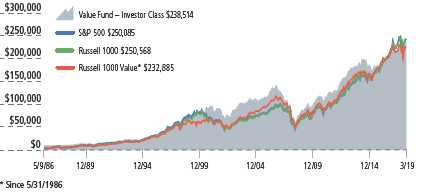
WVALX - Investor Class | 10.12% | 6.45% | 13.81% | 5.79% | 9.36% | 9.04% | 15.32% |
WVAIX - Institutional Class | 10.15 | 6.51 | 13.92 | 6.01 | 9.62 | 9.32 | 15.42 |
| S&P 500 | 10.27 | 6.04 | 15.92 | 10.91 | 13.51 | 9.50 | 13.65 |
| Russell 1000 | 10.28 | 6.33 | 16.05 | 10.63 | 13.52 | 9.30 | 14.00 |
| Russell 1000 Value | 10.05 | 6.68 | 14.52 | 7.72 | 10.45 | 5.67 | 11.93 |
Growth of $10,000
This chart depicts the change in the value of a $10,000 investment in the Value Fund – Investor Class for the period since inception (5/9/86) through March 31, 2019, as compared with the growth of the Standard & Poor’s 500, Russell 1000 and Russell 1000 Value Indices during the same period. Index performance is hypothetical and is shown for illustrative purposes only.
Top 10 Stock Holdings | | | |
| | | | % of Net Assets |
| Berkshire Hathaway Inc. - Class B | | | 6.9 |
| Liberty Broadband Corp. - Series C | | | 6.9 |
| Alphabet, Inc. - Class C | | | 6.1 |
| Laboratory Corp. of America Holdings | | | 5.0 |
| Visa Inc. - Class A | | | 4.2 |
| Mastercard Inc. - Class A | | | 4.1 |
| Booking Holdings Inc. | | | 4.0 |
| Facebook, Inc. - Class A | | | 3.9 |
| CarMax, Inc. | | | 3.9 |
| Dollar Tree, Inc. | | | 3.8 |
| | | | 48.8 |
Top Performers | Average | |
| | Return | Weight | Contribution |
| Liberty Broadband Corp. - Series C | 27.4% | 7.3% | 1.93% |
| Facebook, Inc. - Class A | 27.2 | 3.8 | 0.99 |
| Laboratory Corp. of America Holdings | 21.1 | 4.8 | 0.98 |
| Mastercard Inc. - Class A | 25.0 | 4.0 | 0.95 |
| Oracle Corp. | 19.4 | 4.3 | 0.88 |
| | | | |
Industry Breakdown | | | |
| | | | % of Net Assets |
| Communication Services | | | 25.7 |
| Information Technology | | | 17.1 |
| Financials | | | 15.8 |
| Consumer Discretionary | | | 13.8 |
| Health Care | | | 11.5 |
| Materials | | | 6.2 |
| Industrials | | | 3.0 |
| Consumer Staples | | | 2.4 |
| Cash Equivalents/Other | | | 4.5 |
| | | | 100.0 |
| |
Bottom Performers | Average | |
| | Return | Weight | Contribution |
| Berkshire Hathaway Inc. - Class B | (1.6)% | 7.2% | (0.15)% |
| JPMorgan Chase & Co. | 4.6 | 0.8 | (0.07) |
Contributions to Fund performance are based on actual daily holdings. Securities may have been bought or sold during the quarter. Source: FactSet Portfolio Analytics Return shown is the actual quarterly return of the security or combination of share classes.
Returns assume reinvestment of dividends and redemption at the end of each period, and reflect the deduction of annual operating expenses which as stated in its most recent prospectus are 1.22% and 1.09% (gross) of the Fund’s Investor and Institutional Class net assets, respectively. Total returns shown include fee waivers and expense reimbursements, if any; total returns would have been lower had there been no waivers and/or reimbursements.Performance data represents past performance, which does not guarantee future results. The investment return and the principal value of an investment in this Fund will fluctuate so that an investor’s shares, when redeemed, may be worth more or less than the original cost. Current performance may be higher or lower than the performance data quoted. Performance data current to the most recent month-end may be obtained at www.weitzinvestments.com/funds_and_ performance/fund_ performance.fs.
See page 6 for additional performance disclosures. See page 70 for a description of all indices.
Performance information does not reflect the deduction of taxes that a shareholder would pay on Fund distributions or the redemption of Fund shares.
13 | Q1 2019 ANNUAL REPORT
PARTNERS VALUE FUND
Investment Style: Multi-Cap Value
Co-Portfolio Managers: Wally Weitz, CFA & Brad Hinton, CFA
The Partners Value Fund’s Institutional Class returned +15.36% during the first quarter compared to +14.04% for the Russell 3000. For the fiscal year, the Fund’s Institutional Class returned +2.78% compared to +8.77% for the Russell 3000. We liked the valuation setup at year end but would not have predicted the quick reversal. Stocks rebounded sharply as fears about trade conflicts, Fed actions and global growth subsided. We were well positioned to benefit, and Fund investors enjoyed a very strong finish to an otherwise lackluster fiscal year.
Last quarter we described a general environment where the smaller the business, the more punishing the short-term markdown. Let’s take a closer look at what has happened since then with the three small companies we highlighted.
Total returns | Q4 18 | Q1 19 | Q4 18-Q1 19 |
| Colfax Corporation | -42.0% | +42.0% | -17.7% |
| Summit Materials | -31.8% | +28.0% | -12.7% |
| Liberty Latin America | -29.4% | +33.5% | -5.7% |
Several observations:
• Despite the outsized first-quarter gains, we think there is more return potential in the tank. We liked these stocks before the V-shaped turmoil began last fall; after rechecking our assumptions, we still think they are cheap.
• If a stock goes down by 42% and then goes up by 42%, you are not back to where you started. Not even close. Percentage moves can be deceiving.
• We can add value by making good decisions in volatile times. We bought more Colfax shares in November and December when the stock swooned. Then we sold some of our holdings at higher prices in March after the stock bounced back sharply. These transactions allowed us to generate incremental economic gains by buying low and selling higher, while also realizing tax losses by selling older, higher-cost shares.
• These decisions are not one-size-fits-all. While we bought more Summit shares in the fourth quarter at progressively lower prices, we continue to hold them all because the valuation is so compelling. With Liberty Latin America, we did not transact during this six-month period, as we viewed our position size as appropriate for the risk-return profile of the stock.
These are just extreme examples from one corner of our portfolio, but they do highlight the noise that comes along with quarterly reporting. Most stock prices moved far more than their underlying business values, in both directions. A full rundown of this quarter’s top contributors and detractors is shown in the table on the following page.
For the fiscal year, the Fund’s top contributors were Visa and Mastercard (payment networks), Discovery (non-fiction entertainment) and TransDigm Group (aircraft components). Visa and Mastercard posted strong results with robust underlying business-value growth. We have happily maintained large core positions at fair prices in these competitively advantaged payment card networks. Our patience with Discovery was rewarded when the company announced deals for additional skinny bundle carriage that cheered investors. We exited the position last fall when the stock hit $30 per share, near our value estimate. Recent addition TransDigm Group has been a quick winner due to solid revenue and cash flow results coupled with warranted enthusiasm over the recently closed Esterline Technologies acquisition.
Liberty Global, Qurate Retail and DXC Technologies were the largest detractors for the fiscal year. While Liberty Global’s operating results remain mixed, the announced sale of its troubled Swiss business, at an attractive price, was yet another strategic positive. We continue to think the stock is undervalued, perhaps materially so if the pending sale of German and Eastern European assets to Vodafone Group is approved and closed this year. While top-line trends stabilized at Qurate’s flagship QVC business, margins dipped and so did the stock price. The company continues to generate free cash flow, but any near-term growth will likely come from HSN synergy harvesting and share repurchases. Not particularly inspiring, but the stock is cheap and the business is more resilient than many believe. DXC Technology is a different type of “return-to-par” story. Our investment thesis laid out in last fall’s Analyst Corner remains intact, though it may take time for the market to respond as the company repositions and improves its business mix.
We have been active over the past six months, investing aggressively while upgrading portfolio quality along the way. New adds this quarter included software companies Box and Guidewire Software. Box provides enterprise-grade, cloud content management solutions. While the market opportunity is large, and Box has a healthy early lead, billings and revenue growth have decelerated as the company moves from point product selling to solution selling. We think they are on the right strategic path and expect growth to reaccelerate, driving longer-term margin expansion and significant return potential. Guidewire is the leader in next-generation core processing systems for insurance companies. Guidewire’s strength in policy, billing and claims systems has created an enviable moat, and the company is leveraging that strength to provide other services to their customers, such as analytics and digital portals. Our research suggests a long growth runway at increasingly attractive margins. Allergan’s business value progression has disappointed investors, multiple times on multiple fronts. While the stock trades at a low valuation, we sold our position at a loss to focus on higher-conviction ideas.
The resulting multi-cap portfolio is focused, concentrated and more fully invested while staying true to our valuation discipline. We own 30 businesses, with position sizes generally ranging from 2% to 6% (average position size: 3.2%). The Fund’s top ten holdings represent 47% of net assets. While the Fund may screen as a large-cap offering, we think the extra edge will likely be our sizeable small- and mid-sized company holdings. For context, over half of the Fund is invested in companies with market caps under $20 billion.
Valuation remains our North Star, and in our team’s view, our stocks are reasonably priced even after sizeable first quarter gains. The estimated price-to-value of the portfolio is in the very low 80s. From these levels, we have a chance to earn healthy long-term returns both from business value growth and by closing the gap between price and value. We look forward to reporting on the Fund’s progress in future quarters. Thank you once again for your investment and continued confidence in Weitz and our multi-cap strategy.
14 | Q1 2019 ANNUAL REPORT
WEITZINVESTMENTS.COM
| | | | | | | | |
Returns | | | Annualized | | | | |
| | Since | | | | | | |
| | Inception | | | | | | |
| | (6/1/1983) | 20-year | 10-year | 5-year | 3-year | 1-year | Quarter |
WPVLX - Investor Class | 11.45% | 6.35% | 12.56% | 2.95% | 5.89% | 2.50% | 15.26% |
WPVIX - Institutional Class | 11.48 | 6.41 | 12.69 | 3.18 | 6.17 | 2.78 | 15.36 |
| S&P 500 | 10.95 | 6.04 | 15.92 | 10.91 | 13.51 | 9.50 | 13.65 |
| Russell 3000 | 10.73 | 6.48 | 16.00 | 10.36 | 13.48 | 8.77 | 14.04 |
| Russell 3000 Value | 10.92 | 6.87 | 14.50 | 7.56 | 10.50 | 5.30 | 11.93 |
Growth of $10,000
This chart depicts the change in the value of a $10,000 investment in the Partners Value Fund - Investor Class for the period since inception (6/1/83) through March 31, 2019, as compared with the growth of the Standard & Poor’s 500, Russell 3000 and Russell 3000 Value Indices during the same period. Index performance is hypothetical and is shown for illustrative purposes only.
| | | | |
Top 10 Stock Holdings | | | |
| | | | % of Net Assets |
| Berkshire Hathaway Inc. - Class B | | | 5.8 |
| Liberty Broadband Corp. - Series A & C | | | 5.7 |
| Alphabet, Inc. - Class C | | | 5.6 |
| Mastercard Inc. - Class A | | | 4.7 |
| Laboratory Corp. of America Holdings | | | 4.7 |
| Visa Inc. - Class A | | | 4.7 |
| Liberty Global plc - Class C | | | 4.1 |
| Liberty SiriusXM Group - Series A & C | | | 3.9 |
| CarMax, Inc. | | | 3.9 |
| Redwood Trust, Inc. | | | 3.7 |
| | | | 46.8 |
Top Performers | Average | |
| | Return | Weight | Contribution |
| Liberty Broadband Corp. - Series A & C | 27.5% | 5.9% | 1.57% |
| Colfax Corp. | 42.0 | 3.1 | 1.14 |
| Mastercard Inc. - Class A | 25.0 | 4.6 | 1.08 |
| Laboratory Corp. of America Holdings | 21.1 | 4.6 | 0.92 |
| Facebook, Inc. - Class A | 27.2 | 3.4 | 0.88 |
| | | | |
Industry Breakdown | | | |
| | | | % of Net Assets |
| Communication Services | | | 27.3 |
| Information Technology | | | 27.1 |
| Financials | | | 14.5 |
| Materials | | | 8.3 |
| Industrials | | | 7.9 |
| Consumer Discretionary | | | 5.9 |
| Health Care | | | 4.7 |
| Cash Equivalents/Other | | | 4.3 |
| | | | 100.0 |
| |
| |
Bottom Performers | Average | |
| | Return | Weight | Contribution |
| Qurate Retail, Inc. - Series A | (18.1)% | 2.6% | (0.41)% |
| Berkshire Hathaway Inc. - Class B | (1.6) | 5.6 | (0.12) |
| Box, Inc.- Class A | 14.4 | 0.4 | (0.05) |
Contributions to Fund performance are based on actual daily holdings. Securities may have been bought or sold during the quarter. Source: FactSet Portfolio Analytics Return shown is the actual quarterly return of the security or combination of share classes.
Returns assume reinvestment of dividends and redemption at the end of each period, and reflect the deduction of annual operating expenses which as stated in its most recent prospectus are 1.25% and 1.07% (gross) of the Fund’s Investor and Institutional Class net assets, respectively. Total returns shown include fee waivers and expense reimbursements, if any; total returns would have been lower had there been no waivers and/or reimbursements.Performance data represents past performance, which does not guarantee future results. The investment return and the principal value of an investment in this Fund will fluctuate so that an investor’s shares, when redeemed, may be worth more or less than the original cost. Current performance may be higher or lower than the performance data quoted. Performance data current to the most recent month-end may be obtained at www.weitzinvestments.com/funds_and_ performance/fund_ performance.fs.
See page 6 for additional performance disclosures. See page 70 for a description of all indices.
Performance information does not reflect the deduction of taxes that a shareholder would pay on Fund distributions or the redemption of Fund shares.
15 | Q1 2019 ANNUAL REPORT
PARTNERS III OPPORTUNITY FUND
Investment Style: Multi-Cap Alternative
Portfolio Manager: Wally Weitz, CFA
The Partners III Opportunity Fund’s Institutional Class returned +19.48% in the first calendar quarter compared to +13.65% for the S&P 500 and +14.04% for the Russell 3000. For the fiscal year ended March 31, the Partners III Opportunity Fund’s Institutional Class returned +11.25% compared to +9.50% for the S&P 500 and +8.77% for the Russell 3000.
Investors flipped the script between the final quarter of 2018 and the first quarter of 2019. At the start of the year, we believed conditions were favorable for good returns going forward but were surprised by the strength and speed of the current rebound. We are nevertheless pleased to deliver strong absolute and relative performance for both the quarter and fiscal year periods. As we wrote in Value Matters, these first quarter results would make for good annual returns, so we will not expect this pace to continue. That said, we still feel that conditions warrant a more assertive posture, and the Fund’s effective net long position remains in the low 80% range.
The performance discussion for both the calendar quarter and fiscal year is dominated by Intelligent Systems ( “INS,” +147% in the first quarter; +525% for the fiscal year). Until somewhat recently, Intelligent Systems was a small, unknown technology company, whose CoreCard operation provides processing for credit card providers and software that helps clients manage various credit programs. Although not a traditional start-up (INS has created or incubated technology businesses for over 35 years), its CoreCard operation has recently disclosed the signing of several new important client relationships that have transformed the company’s trajectory. Despite an under the radar profile, CoreCard’s doubling of revenue and transition from loss making to profit generating has not gone unnoticed by investors or, lately, the press. Growth comparisons are always skewed by the onboarding of new clients, and while we (and management) believe CoreCard’s growth prospects remain strong, the pace of growth will certainly slow. Nevertheless, the financial results clearly demonstrate the profile of the business has changed and has captured Wall Street’s imagination.
Beyond INS, quarterly performance by our other equity holdings was generally strong and broad-based. Core positions Liberty Broadband (+27%) and Mastercard (+25%) joined INS on the honor roll, as did prior quarter laggards Liberty Global (+17%) and Colfax (+42%). This broad strength was more than sufficient to overcome the headwind created by the quarter’s top detractor, our index short position against the S&P 500 (+14%). Berkshire Hathaway (-2%) simply didn’t participate in the rally, but its outsized portfolio weighting lands it in the detractors’ ledger. Qurate Retail’s (-18%) decline was more meaningful, as investors fret its investment in online and digital commerce is too late, too expensive and can’t compete with Amazon. We agree that retail competition is fierce, but we feel the stock’s decline has been too punitive.
For the fiscal year, payments companies Mastercard (+35%) and Visa (+31%) joined INS as top contributors, thanks to their continued strong results. Liberty Global (-20%) and DXC Technology (-25%) joined Qurate Retail (-36%) and our short against the S&P500 (+9%) as the top detractors. Liberty Global recently announced an agreement to sell its troubled Swiss business at a very attractive price. This transaction, along with the pending sale of its German and Eastern European businesses to Vodafone, has the potential to unlock significant value for shareholders if and when they close. Our “return-to-par” investment thesis for DXC Technologies (an Analyst Corner feature in 2018) remains intact, though it may take time for the market to respond as it repositions and improves its business mix.
We were fairly active in the first quarter. The net of this activity left the Fund’s long and short books relatively unchanged from a percentage of gross assets perspective, but we believe better positions the portfolio going forward. In broad strokes, we trimmed to manage the position size of several large, high-conviction holdings such as Liberty Broadband and Berkshire Hathaway while exiting our remaining small positions in Liberty Braves and Discovery. We also sold our remaining Allergan shares in order to continue building initial positions in newer portfolio entrants such as Amazon and Black Knight.
We also initiated new positions in online travel agency Booking Holdings and enterprise content control platform provider Box. Both are examples of opportunities the Internet has unleashed upon our economy. Shareholders are likely familiar with (and probably have used) one of Booking’s many online consumer-oriented platforms (Priceline.com, Booking.com, OpenTable, Kayak, etc.). The tailwind of travel and leisure bookings transitioning from offline to online models, while no longer in the early stages, still has plenty of runway left, and Booking will continue to be a primary beneficiary of this secular growth. Box provides software solutions that help businesses transition to the cloud with services such as enabling collaboration between groups, managing access to sensitive data and helping secure against threats, to name a few. As the complexity of Box’s solutions has grown, so has the selling process for its sales force, and investors have grown impatient as new sales bookings have recently slowed. We believe the slowdown is temporary. Box’s market opportunity is huge, and we believe they’re on the right path to capture it.
Looking ahead, we think it unlikely that the stock market can keep up the first quarter’s breakneck pace, though we can’t know for certain. Regardless, we remain focused on investing in good businesses with strong competitive positions, able management and strong balance sheets that can capitalize on whatever opportunities come their way. We like our collection of businesses and feel that the conditions are still favorable for good long-term shareholder returns. As always, we appreciate your trust and the opportunity to invest our capital alongside yours.
Effective Net Long means (i) the sum of a portfolio’s long positions (such as common stocks, or derivatives where the price increases when an index or position rises), minus (ii) the sum of a portfolio’s short positions (such as, derivatives where the price increases when an index or position falls).
16 | Q1 2019 ANNUAL REPORT
WEITZINVESTMENTS.COM
| | | | | | | | |
Returns | | | Annualized | | | | |
| | Since | | | | | | |
| | Inception | | | | | | |
| | (6/1/1983) | 20-year | 10-year | 5-year | 3-year | 1-year | Quarter |
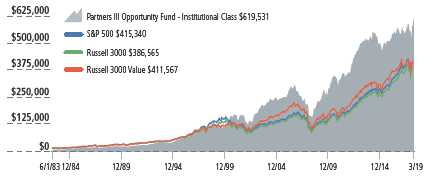
WPOIX - Investor Class | 12.10% | 8.62% | 13.40% | 3.51% | 6.95% | 10.63% | 19.37% |
WPOPX - Institutional Class | 12.20 | 8.79 | 13.74 | 3.99 | 7.52 | 11.25 | 19.48 |
| S&P 500 | 10.95 | 6.04 | 15.92 | 10.91 | 13.51 | 9.50 | 13.65 |
| Russell 3000 | 10.73 | 6.48 | 16.00 | 10.36 | 13.48 | 8.77 | 14.04 |
| Russell 3000 Value | 10.92 | 6.87 | 14.50 | 7.56 | 10.50 | 5.30 | 11.93 |
Growth of $10,000
This chart depicts the change in the value of a $10,000 investment in the Partners III Opportunity Fund - Institutional Class for the period since inception (6/1/83) through March 31, 2019, as compared with the growth of the Standard & Poor’s 500, Russell 3000 and Russell 3000 Value Indices during the same period. Index performance is hypothetical and is shown for illustrative purposes only.
| | |
Top 10 Stock Holdings | |
| | % of Net Assets |
| Intelligent Systems Corp. | 11.4 |
| Berkshire Hathaway Inc. - Class B | 10.4 |
| Liberty Broadband Corp. - Series A & C | 6.8 |
| Liberty Global plc - Class C | 6.3 |
| Mastercard Inc. - Class A | 5.0 |
| Alphabet, Inc. - Class C | 5.0 |
| Visa Inc. - Class A | 4.9 |
| Laboratory Corp. of America Holdings | 3.6 |
| Liberty SiriusXM Group - Series A & C | 3.6 |
| DXC Technology Co. | 3.5 |
| | 60.5 |
| |
Top Performers | Average | |
| | Return | Weight | Contribution |
| Intelligent Systems Corp. | 147.2% | 8.0% | 7.80% |
| Liberty Broadband Corp. - Series A & C | 27.5 | 8.6 | 2.50 |
| Mastercard Inc. - Class A | 25.0 | 5.2 | 1.28 |
| Liberty Global plc - Class C | 17.3 | 6.4 | 1.12 |
| Colfax Corp. | 42.0 | 2.9 | 1.10 |
| | |
Industry Breakdown | |
| | % of Net Assets |
| Information Technology | 33.6 |
| Communication Services | 29.0 |
| Financials | 17.3 |
| Consumer Discretionary | 6.8 |
| Industrials | 4.4 |
| Health Care | 3.6 |
| Materials | 2.0 |
| Securities Sold Short | (15.0) |
| Short Proceeds/Other | 18.3 |
| | 100.0 |
| |
Bottom Performers | Average | |
| | Return | Weight | Contribution |
| SPDR S&P 500 ETF Trust (short) | 13.5% | (15.5)% | (2.17)% |
| Berkshire Hathaway Inc. - Class B | (1.6) | 11.9 | (0.31) |
| Box, Inc. - Class A | 14.4 | 0.4 | (0.28) |
| Qurate Retail, Inc. - Series A | (18.1) | 1.7 | (0.27) |
| Markel Corp. | (4.0) | 1.9 | (0.09) |
Contributions to Fund performance are based on actual daily holdings. Securities may have been bought or sold during the quarter. Source: FactSet Portfolio Analytics Return shown is the actual quarterly return of the security or combination of share classes.
Returns assume reinvestment of dividends and redemption at the end of each period, and reflect the deduction of annual operating expenses which as stated in its most recent prospectus are 2.14% and 1.63% of the Fund’s Investor and Institutional Class net assets, respectively. Total returns shown include fee waivers and expense reimbursements, if any; total returns would have been lower had there been no waivers and/or reimbursements. Performance data represents past performance, which does not guarantee future results. The investment return and the principal value of an investment in this Fund will fluctuate so that an investor’s shares, when redeemed, may be worth more or less than the original cost. Current performance may be higher or lower than the performance data quoted. Performance data current to the most recent month-end may be obtained at www.weitzinvestments.com/funds_and_ performance/fund_ performance.fs.See page 6 for additional performance disclosures. See page 70 for a description of all indices.
Performance information does not reflect the deduction of taxes that a shareholder would pay on Fund distributions or the redemption of Fund shares.
17 | Q1 2019 ANNUAL REPORT
HICKORY FUND
Investment Style: Mid-Cap Value
Co-Portfolio Managers: Wally Weitz, CFA & Drew Weitz
The Hickory Fund returned +16.65% in the first calendar quarter compared to +16.54% for the Russell Midcap Index (the Fund’s primary benchmark) and +15.82% for the Russell 2500 Index. For the fiscal year ended March 31, the Fund returned +2.30% compared to +6.47% for the Russell Midcap and +4.48% for the Russell 2500.
The stock market performance of the last six months reminds us of the old joke, “If you don’t like the weather, wait a minute and it will change.” Tempestuous investor sentiment at year end turned suddenly serene in the first quarter, particularly as the Federal Reserve struck a more accommodative tone and fears of imminent recession receded to the background. We certainly had not forecast such a rapid recovery (we avoid such predictions altogether) but were pleased to deliver strong absolute performance in the first quarter (and a very modest relative performance “win,” as well).
Price declines in the fourth quarter were sufficient to drive a number of potential new and existing investments into our desired “strike zone.” Although the recovery off the December low has been swift, we continue to find the valuation environment constructive and were again net buyers during the quarter. Looking back over the full fiscal year, the degree of recent portfolio activity stands out. Our residual cash position declined from nearly 21% a year ago to under 3% at March 31, leaving the Fund nearly fully invested for the first time in many years.
Buying stocks at attractive prices is always more fun than the alternative, but equally important is the quality of the businesses being bought. We attempt to quantify the quality for each investment by assigning a numeric value from one (highest) to seven (lowest) that considers factors, such as managerial acumen, competitive position, returns on investment, etc. (Importantly, investors should know that “quality” isn’t a proxy for “safety”; even the highest-quality business can see its share price suffer.) This Quality Score is one of many attributes we consider when determining the price at which an investment looks attractive. But all else equal, when two businesses trade at comparable valuations, we likely will be more drawn to the higher-quality company. Like price-to-value (P/V) estimates, our Quality Scores (QS) can also be aggregated at the portfolio level, and we are pleased to report that as the Fund’s invested level has risen, the portfolio’s overall QS estimate has improved, too. Hence, although our portfolio P/V is largely unchanged from the start of the fiscal year (in the high 70s), we are happily more invested in what we deem to be a higher-quality portfolio.
Portfolio gains were widespread in the first quarter. Liberty Broadband (+27%) and GCI Liberty (+35%) contributed outsized gains this quarter. Both are investors in Charter Communications, which rallied as management outlined a greater-than-expected decline in required investment spending. That projected decline (and resultant increase in free cash flow) is a key component of our investment thesis for Charter and an important step forward for investors’ confidence. Colfax (+42%) shares recovered as investors grew more comfortable with its acquisition of DJO Global (orthopedic devices) and the outlook for the combined businesses. Summit Materials (+28%) and Liberty Latin America (+33%) rounded out the quarter’s top five contributors. Qurate Retail (-18%) and Tupperware Brands (-18%) were the only negative performance contributors. Qurate’s QVC continues to adopt online and other digital channels as quickly as possible. However, this evolution does require investment, and shareholders were disappointed by the double whammy of lower margins and perceptions of a slowing retail economy, not to mention the ever-present threat of Amazon. We acknowledge that competition in retail is fierce but feel the recent declines were too punitive. We underestimated the degree of difficulty Tupperware is facing around the world. Although we had trimmed our position prior to Tupperware’s recent disappointing earnings call and dividend cut, we did not escape unscathed. We have continued selling our position in order to reinvest in other, higher-conviction ideas.
For the Fiscal year, Tupperware and Qurate were joined by Lions Gate Entertainment as the top detractors to performance. We have been underwhelmed by progress at Lions Gate’s film and television production businesses and elected to sell our position to reinvest elsewhere. ACI Worldwide (+39%), LICT Corp (+24%) and XO Group (+59%) earned top marks for the fiscal year.
As mentioned above, portfolio activity this quarter was skewed toward purchases. We initiated a new position in used-vehicle retailer CarMax. Investors are encouraged to read our Analyst Corner feature on CarMax this quarter for a more detailed discussion of our investment thesis. We also increased our net exposure to the building materials industry, trimming some of our Summit Materials holdings to help fund a new position in Eagle Materials at attractive prices.
Finally, during the first quarter we announced an important update to the Hickory Fund’s investment mandate. Effective March 29, the Hickory Fund’s focus will now be mid-cap companies rather than its prior small- and mid-cap (SMID) mandate. We believe this update to be evolutionary, not revolutionary. Our investment philosophy and process have not changed. Rather, we are excited to execute them now against the full range of mid-cap opportunities (as opposed to our prior self-imposed $10 billion market-cap limitation). Going forward, the Russell Midcap Index will be the Fund’s primary benchmark, as it better reflects our updated investment focus. Although our primary goal is to expand the universe of attractive investment opportunities, we believe these changes also help clarify Hickory’s identity for our investors and financial advisor stakeholders. Investors should review our prospectus for more detailed information about the Fund’s investment focus and objective.
18 | Q1 2019 ANNUAL REPORT
WEITZINVESTMENTS.COM
| | | | | | | | |
Returns | | | Annualized | | | | |
| | Since | | | | | | |
| | Inception | | | | | | |
| | (4/1/1993) | 20-year | 10-year | 5-year | 3-year | 1-year | Quarter |
WEHIX | 9.24% | 4.90% | 12.92% | 2.81% | 5.26% | 2.30% | 16.65% |
| Russell Midcap | 10.76 | 9.33 | 16.88 | 8.81 | 11.82 | 6.47 | 16.54 |
| Russell 2500 | 10.30 | 9.59 | 16.23 | 7.79 | 12.56 | 4.48 | 15.82 |
| S&P 500 | 9.46 | 6.04 | 15.92 | 10.91 | 13.51 | 9.50 | 13.65 |
Growth of $10,000
This chart depicts the change in the value of a $10,000 investment in the Hickory Fund for the period since inception (4/1/93) through March 31, 2019, as compared with the growth of the Russell Midcap, Russell 2500 and Standard & Poor’s 500 Indices during the same period. Index performance is hypothetical and is shown for illustrative purposes only.
| | |
Top 10 Stock Holdings | |
| | % of Net Assets |
| Liberty Broadband Corp. - Series A & C | 8.7 |
| LICT Corp. | 6.3 |
| Laboratory Corp. of America Holdings | 4.6 |
| Redwood Trust, Inc. | 4.4 |
| GCI Liberty, Inc. - Class A | 4.3 |
| Colfax Corp. | 4.2 |
| Liberty SiriusXM Group - Series A & C | 4.2 |
| Guidewire Software, Inc. | 4.1 |
| Black Knight, Inc. | 4.0 |
| Equity Commonwealth | 3.9 |
| | 48.7 |
| |
Top Performers | | | |
| | Average | |
| | Return | Weight | Contribution |
| Liberty Broadband Corp. - Series A & C | 27.5% | 8.8% | 2.36% |
| Colfax Corp. | 42.0 | 4.2 | 1.57 |
| GCI Liberty, Inc. - Class A | 35.1 | 4.2 | 1.39 |
| Summit Materials, Inc. - Class A | 28.0 | 3.7 | 1.10 |
| Liberty Latin America Ltd. - Class C | 33.5 | 3.3 | 1.00 |
| | |
Industry Breakdown | |
| | % of Net Assets |
| Communication Services | 33.9 |
| Information Technology | 15.2 |
| Materials | 13.3 |
| Consumer Discretionary | 11.2 |
| Industrials | 11.1 |
| Health Care | 4.6 |
| Financials | 4.4 |
| Real Estate | 3.9 |
| Cash Equivalents/Other | 2.4 |
| | 100.0 |
| |
| |
Bottom Performers | | | |
| | Average | |
| | Return | Weight | Contribution |
| Qurate Retail, Inc. - Series A | (18.1)% | 3.4% | (0.53)% |
| Tupperware Brands Corp. | (18.1) | 2.1 | (0.34) |
Contributions to Fund performance are based on actual daily holdings. Securities may have been bought or sold during the quarter. Source: FactSet Portfolio Analytics Return shown is the actual quarterly return of the security or combination of share classes.
Returns assume reinvestment of dividends and redemption at the end of each period, and reflect the deduction of the Fund’s annual operating expenses which as stated in its most recent prospectus are 1.24% of the Fund’s net assets. Total returns shown include fee waivers and expense reimbursements, if any; total returns would have been lower had there been no waivers and/ or reimbursements. Performance data represents past performance, which does not guarantee future results. The investment return and the principal value of an investment in this Fund will fluctuate so that an investor’s shares, when redeemed, may be worth more or less than the original cost. Current performance may be higher or lower than the performance data quoted. Performance data current to the most recent month-end may be obtained at www.weitzinvestments.com/funds_and_ performance/fund_ performance.fs.See page 6 for additional performance disclosures. See page 70 for a description of all indices.
Performance information does not reflect the deduction of taxes that a shareholder would pay on Fund distributions or the redemption of Fund shares.
19 | Q1 2019 ANNUAL REPORT
BALANCED FUND
Investment Style: Conservative Allocation
Portfolio Manager: Brad Hinton, CFA
The Balanced Fund returned +8.18% for the first quarter compared to +6.72% for the Morningstar Moderately Conservative Target Risk Index (the primary benchmark) and +9.05% for the legacy Blended Index. For the fiscal year, the Fund returned +6.18% compared to +4.62% for the primary benchmark and +7.69% for the legacy Blended Index. Longer term, total returns well above inflation have helped our investors steadily build wealth.
Risk assets soared as a V-shaped rebound took hold in the first quarter. In a near mirror image of late 2018, easing fears about trade conflicts, global growth, short-term interest rates and energy prices fueled positive returns across most asset classes. The Fund enjoyed strong gains, with thirteen holdings rising by more than 20% and another eleven stocks posting double-digit returns. Stocks did most of the heavy lifting, though our short-term and high-quality bond portfolio also delivered modest positive returns. A rundown of the Fund’s top and bottom quarterly performers is shown in the table on the following page.
The fiscal year’s wild market ride seemed tailor-made for conservative allocation investing. The Fund posted very solid absolute and relative returns, with far less “edge” than an all-equity strategy. Top contributors for the fiscal year were Visa and Mastercard (payment networks), Thermo Fisher Scientific (life science tools and diagnostics) and Linde plc (industrial gases). Visa and Mastercard reported strong results with robust underlying business value growth. We have happily maintained large core positions in these competitively advantaged payment card networks at fair prices. Thermo Fisher continues to pair strong operating results with savvy capital allocation. This durable compounder is gaining share within profitable, growing markets, leading to persistent, double-digit earnings growth. Praxair and Linde combined last fall to create a global industrial gas powerhouse, now named Linde plc. Long-time Praxair CEO Steve Angel will continue to guide this high-quality business, which we expect to compound value for years to come.
Anheuser-Busch InBev (beer), Mohawk Industries (flooring) and Allergan (specialty pharma) were the largest detractors for the fiscal year. Normally, in this section we write about temporary price declines and reasons why we continue to like the stocks. Given ample opportunities to “high grade” the portfolio, we sold all three of these companies instead. Healthy interim dividends helped mitigate our soggy “back to the well” experience with AB InBev. We effectively swapped housing-related exposures by selling Mohawk and buying Eagle Materials. As detailed below, this move has already paid off handsomely for investors. Allergan’s business-value progression has disappointed investors, multiple times on multiple fronts. While the stock trades at a low valuation, we exited our investment at a loss to focus on higher-conviction ideas. Charles Schwab was the largest detractor among stocks still in the portfolio. The stock will likely bounce around as interest rates fluctuate, but the company continues to grow client assets and take market share. We think Schwab remains well positioned to be a long-term winner.
Eagle Materials was our only new stock in the quarter. Eagle manufactures cement, gypsum wallboard and aggregates. Management has allocated capital between the businesses flexibly and well, with a focus on long-term, full-cycle returns. We were able to purchase Eagle in January at a significant discount to our value estimate. With “help” from a new activist investor pushing for a breakup of the company, the stock has returned nearly 30% from our purchase price (and we still think it is cheap). We added short-maturity corporate bonds issued by PPG Industries (coatings) and Fidelity National Information Services (payment services). Our team also continued to find value in high-quality, asset-backed securities. Please see this quarter’s Fixed Income Insights letter for a detailed discussion of this growing area of expertise at Weitz.
We own equity stakes in 29 companies representing 45.5% of net assets. Our fixed income holdings include corporate bonds (16.4%), Treasury securities (28.7%), securitized debt (4.2%) and cash equivalents (5.2%). The average life of our bond portfolio fell modestly as time marched on and short-dated bonds matured. Reinvestment options were generally unattractive with lower interest rates and tighter credit spreads. Under current market conditions, we would expect to increase our holdings of high-quality, short-maturity asset-backed securities in coming quarters.
In our view, the Fund remains well positioned to achieve our three investment objectives: long-term capital appreciation, capital preservation and current income. We think our stocks are reasonably priced, even after sizeable first quarter gains. Our bonds should provide ballast if the investing winds change, along with a layer of current income. We do not have strong views on the next few quarters, but we feel very good about the three-to-five-year outlook. Thank you again for your continued investment and confidence in our firm. We look forward to updating you on portfolio developments throughout the year.
20 | Q1 2019 ANNUAL REPORT
WEITZINVESTMENTS.COM
| | | | | | | |
Returns | | | | | | |
| | Annualized | | |
| | Since | | | | | |
| | Inception | | | | | |
| | (10/1/2003) | 10-year | 5-year | 3-year | 1-year | Quarter |
WBALX | 5.53% | 9.52% | 4.46% | 6.52% | 6.18% | 8.18% |
| Moderately Conservative | 5.94 | 7.40 | 4.43 | 6.16 | 4.62 | 6.72 |
| Blended | 7.08 | 10.86 | 7.48 | 8.79 | 7.69 | 9.05 |
Growth of $10,000
This chart depicts the change in the value of a $10,000 investment in the Balanced Fund for the period since inception (10/1/03) through March 31, 2019, as compared with the growth of the Moderately Conservative and Blended Indices during the same period. Index performance is hypothetical and is shown for illustrative purposes only.
| | |
Top 10 Stock Holdings | |
| | % of Net Assets |
| Berkshire Hathaway Inc. - Class B | 2.4 |
| Laboratory Corp. of America Holdings | 2.2 |
| Thermo Fisher Scientific Inc. | 2.2 |
| Visa Inc. - Class A | 2.1 |
| Linde plc | 2.1 |
| Mastercard Inc. - Class A | 2.1 |
| Alphabet, Inc. - Class C | 2.1 |
| Diageo plc - Sponsored ADR | 2.0 |
| Charter Communications, Inc. - Class A | 2.0 |
| The Charles Schwab Corp. | 1.7 |
| | 20.9 |
| |
Top Stock Performers | | | |
| | Average | |
| | Return | Weight | Contribution |
| Charter Communications, Inc. - Class A | 21.7% | 2.1% | 0.48% |
| Laboratory Corp. of America Holdings | 21.1 | 2.4 | 0.46 |
| Mastercard Inc. - Class A | 25.0 | 1.9 | 0.44 |
| Thermo Fisher Scientific Inc. | 22.4 | 2.0 | 0.43 |
| Compass Minerals International, Inc. | 32.2 | 1.2 | 0.38 |
| | |
Industry Breakdown | |
| | % of Net Assets |
| Information Technology | 13.5 |
| Financials | 8.1 |
| Materials | 8.0 |
| Health Care | 6.0 |
| Communication Services | 5.5 |
| Consumer Staples | 3.2 |
| Industrials | 1.2 |
Total Common Stocks | 45.5 |
| U.S. Treasury Notes | 28.7 |
| Corporate Bonds | 16.4 |
| Asset-Backed Securities | 2.3 |
| Mortgage-Backed Securities | 1.9 |
| Cash Equivalents/Other | 5.2 |
Total Bonds & Cash Equivalents | 54.5 |
| | 100.0 |
Bottom Stock Performers | | | |
| | Average | |
| | Return | Weight | Contribution |
| Berkshire Hathaway Inc. - Class B | (1.6)% | 2.5% | (0.04)% |
Contributions to Fund performance are based on actual daily holdings. Securities may have been bought or sold during the quarter. Source: FactSet Portfolio Analytics Return shown is the actual quarterly return of the security or combination of share classes.
Returns assume reinvestment of dividends and redemption at the end of each period, and reflect the deduction of the Fund’s annual operating expenses which as stated in its most recent prospectus are 1.30% (gross) of the Fund’s Investor Class net assets. Total returns shown include fee waivers and expense reimbursements, if any; total returns would have been lower had there been no waivers and/or reimbursements. Performance data represents past performance, which does not guarantee future results. The investment return and the principal value of an investment in this Fund will fluctuate so that an investor’s shares, when redeemed, may be worth more or less than the original cost. Current performance may be higher or lower than the performance data quoted. Performance data current to the most recent month-end may be obtained at www.weitzinvestments.com/funds_and_ performance/fund_ performance.fs.See page 6 for additional performance disclosures. See page 70 for a description of all indices.
Performance information does not reflect the deduction of taxes that a shareholder would pay on Fund distributions or the redemption of Fund shares.
21 | Q1 2019 ANNUAL REPORT
CORE PLUS INCOME FUND
Investment Style: Intermediate-Term Bond
Co-Portfolio Managers: Tom Carney, CFA & Nolan Anderson
Core Plus Income Fund’s Institutional Class returned +2.76% for the first calendar quarter compared to a +2.94% return for the Bloomberg Barclays U.S. Aggregate Bond Index (Bloomberg Barclays U.S. Agg), our primary benchmark. For the fiscal year ended March 31, Core Plus Income Fund’s Institutional Class returned +5.07% compared to a 4.48% return for the Bloomberg Barclays U.S. Agg. The Fund’s performance table following this letter shows returns over various holding periods.
Portfolio Positioning
The table below shows the change in allocation to various sectors from the most recent quarter and compared to a year ago. This summary provides a view over time of how we have allocated capital.
Since our goal is to invest in sectors that we believe offer the best risk-adjusted returns, our allocations may change significantly over time.
| | | | | |
| | | | | Quarter/ |
| | | | | Quarter |
Sector (% of Portfolio) | 3/31/2019 | 12/31/2018 | 3/31/2018 | Change (bps) |
| Corporate Bonds | 27.6 | 24.7 | 28.4 | +290 |
| Corporate Convertible Bonds | 1.6 | 1.7 | 2.5 | -10 |
| Asset-Backed Securities (ABS) | 23.9 | 21.8 | 26.7 | +210 |
| Commercial Mortgage-Backed | | | | |
| Securities (CMBS) | 8.5 | 5.4 | 3.1 | +310 |
| Agency Mortgage-Backed (MBS) | 1.4 | 1.9 | 0.2 | -50 |
| Non-Agency Mortgage Backed | | | | |
| (RMBS) | 2.0 | 2.7 | 4.1 | -70 |
| Taxable Municipal Bonds | 0.6 | 0.7 | 1.1 | -10 |
| U.S. Treasury | 31.8 | 37.0 | 32.9 | -520 |
| Other | 0.3 | 0.4 | 0.9 | -10 |
| Cash & Equivalents | 2.3 | 3.7 | 0.1 | -140 |
Total | 100.0 | 100.0 | 100.0 | |
High Yield* | 13.0 | 11.4 | 12.9 | +160 |
| |
| Effective duration (years) | 4.6 | 4.6 | 4.1 | 0.0 |
| Effective maturity (years) | 5.8 | 5.7 | 4.7 | +0.1 |
| *High Yield exposure (as of 3/31/2019) consists of investments in the Corporate, Corporate Convertible, ABS and MBS sectors. |
Over the past fiscal year, the primary shift in asset allocation was toward commercial mortgage-backed securities (CMBS). We highlighted our increased activity in the commercial real estate collateralized loan obligation (CRE CLO) market in last quarter’s letter, and we plan to expand on our thoughts in a white paper in the second quarter. We continue to believe the sector provides strong relative value compared to higher-quality, shorter-duration (1-3 year average life) corporate bond alternatives.
As of March 31, our high-yield exposure was 13.0%, up from 11.4% as of December 31 (the maximum permitted is 25%). Note that approximately 4% of our high-yield exposure is to split-rated credits (i.e., bonds rated investment grade1 by one or more rating agencies) that would be counted as investment-grade exposure if held within the Barclays Indexes. Since the Fund’s inception, we have flexed our high-yield allocation meaningfully–from a low of 5.9% to a maximum of 24.9%.
Overall portfolio metrics as measured by average effective maturity and average effective duration were relatively consistent with the prior quarter. The average effective maturity increased to 5.8 years from 5.7 years, and the average effective duration was unchanged at 4.6 years (versus 5.8 years for the Bloomberg Barclays U.S. Agg). These measures (duration and average maturity) provide a guide to the Fund’s interest rate sensitivity. A lower average effective maturity and shorter average effective duration reduce the Fund’s price sensitivity to changes in interest rates (either up or down). Should longer-term interest rates and/ or credit spreads increase to provide sufficient risk-adjusted returns, we remain willing to increase our portfolio duration.
Top Fiscal Year Contributors
Sector allocation and curve positioning were the key drivers of performance.
• U.S. Treasury Bonds: Our U.S. Treasury holdings were the largest contributor to performance during the fiscal year. We added length to our Treasury portfolio during the year (increasing duration from 8.1 years to 9.6 years), particularly from June through September, when longer term yields rose significantly.
• Corporate Bonds: Corporate credit performance was solid as strong coupon income more than offset widening spreads during the year. Primary contributors included industrials, REITs, energy and communications.
• Securitized Products (ABS, CMBS, MBS and RMBS):
Securitized products continued to perform at or above expectations with respect to credit performance and overall average life progression1 while providing steady income and selective price appreciation.
Top Fiscal Year Detractors
No segment contributed negative results in the fiscal year.
First Quarter Investment Activity
New investment activity was weighted toward securitized products and corporate bonds. In ABS, we added to our auto, consumer and fleet lease ABS. In CMBS, we added to our CRE CLO exposure with new investments in both the new issue and secondary markets. We also added a seasoned, single-asset, single-borrower (SASB) investment secured by two Hilton hotels located in San Francisco. In corporate credit, we added some longer-duration (10-30 year) investment-grade issuers as well as a notable 5-year new-issue, high-yield investment in Colfax Corporation, which is among the latest crossover ideas from our equity teammates.
Fund Strategy
Our approach consists of primarily investing in a portfolio of high-quality bonds, while maintaining an overall portfolio average duration of 3½ to 7 years. Our goal is to capture attractive coupon income and potential price appreciation from investing in longer-duration bonds. We do not and will not try to mimic any particular index as we construct our portfolio.
We may also invest up to 25% in fixed income securities that are not considered investment grade but have favorable risk/reward characteristics (such as high-yield and convertible bonds, preferred and convertible preferred stock).
We believe our flexible mandate will benefit shareholders over the long term. We seek out potentially mispriced securities and select portfolio assets one security at a time based on our view of opportunities in the marketplace. Our fixed income research is not dependent on but often benefits from the work our equity teammates conduct on companies and industries in the course of their due diligence.
Overall, we strive to be adequately compensated for the risks assumed in order to maximize investment (or reinvestment) yield and to avoid making interest rate bets, particularly ones that depend on interest rates going down.
1Definitions: Investment Grade: We consider investment grade to be those securities rated at least BBB- by one or more credit ratings agencies. Average Life Progression: A measure of repayment speed for a collateral pool (for example, a collection of mortgages may serve as the collateral pool for an issuance of mortgage-backed securities).
22 | Q1 2019 ANNUAL REPORT
WEITZINVESTMENTS.COM
| | | | | |
Returns | | | | |
| Annualized | | |
| | Since Inception | | | |
| | (7/31/2014) | 3-year | 1-year | Quarter |
WCPNX - Investor Class | 3.22% | 3.45% | 4.78% | 2.62% |
WCPBX - Institutional Class | 3.44 | 3.68 | 5.07 | 2.76 |
| Bloomberg Barclays U.S. Aggregate Bond | 2.55 | 2.03 | 4.48 | 2.94 |
Growth of $10,000
This chart depicts the change in the value of a $10,000 investment in the Core Plus Income Fund – Institutional Class for the period since inception (7/31/14) through March 31, 2019, as compared with the growth of the U.S. Aggregate Bond Index during the same period. Index performance is hypothetical and is shown for illustrative purposes only.
| | |
Credit Quality(a)(d) | |
Underlying Securities | % of Portfolio |
| U.S. Treasury | 31.8 |
| U.S. Government Agency Mortgage | 1.5 |
Related Securities(b) | |
| Aaa/AAA | 7.3 |
| Aa/AA | 7.5 |
| A/A | 13.1 |
| Baa/BBB | 23.2 |
| Ba/BB | 7.5 |
| B/B | 3.0 |
| Caa/CCC | 0.9 |
| Non-Rated | 1.6 |
| Common Stocks | 0.3 |
| Cash Equivalents | 2.3 |
| | 100.0 |
| | |
Financial Attributes | |
| |
Portfolio Summary | |
Average Maturity(d) | 6.0 years |
Average Effective Maturity(d) | 5.8 years |
Average Duration(d) | 4.6 years |
Average Effective Duration(d) | 4.6 years |
Average Coupon(d) | 3.7% |
| 30-Day SEC Yield - Investor Class | 2.93% |
| 30-Day SEC Yield - Institutional Class | 3.12% |
| |
Maturity Distribution(d) | |
| |
Maturity Type | % of Portfolio |
| Cash Equivalents | 2.3 |
| Less than 1 Year | 22.0 |
| 1 - 3 Years | 20.4 |
| 3 - 5 Years | 11.3 |
| 5 - 7 Years | 14.3 |
| 7 - 10 Years | 19.9 |
| 10 Years or more | 9.5 |
| Common Stocks | 0.3 |
| | 100.0 |
(a) | The Fund receives credit quality ratings on underlying securities of the Portfolio when available from credit rating agencies. The Fund will use one rating for an underlying security if that is all that is provided. Ratings and portfolio credit quality may change over time. The Fund itself has not been rated by an independent rating agency. |
(b) | Mortgage related securities issued and guaranteed by government-sponsored entities such as Fannie Mae and Freddie Mac are generally not rated by ratings agencies. Securities which are not rated do not necessarily indicate low quality. Fannie Mae’s and Freddie Mac’s senior long-term debt are currently rated Aaa and AAA by Moody’s and Fitch, respectively. |
(c) | Percent of net assets |
(d) | Source: Bloomberg Analytics |
Returns assume reinvestment of dividends and redemption at the end of each period, and reflect the deduction of annual operating expenses which as stated in its most recent prospectus are 1.65% (gross) and 1.09% (gross) of the Fund’s Investor and Institutional Class net assets, respectively. Total returns shown include fee waivers and expense reimbursements, if any; total returns would have been lower had there been no waivers and/or reimbursements. Past performance does not guarantee future results. The investment return and the principal value of an investment in this Fund will fluctuate so that an investor’s shares, when redeemed, may be worth more or less than the original cost. Current performance may be higher or lower than the performance data quoted. Performance data current to the most recent month-end may be obtained at www.weitzinvestments.com/funds_and_ performance/fund_ performance.fs.See page 6 for additional performance disclosures. See page 70 for a description of all indices.
Performance information does not reflect the deduction of taxes that a shareholder would pay on Fund distributions or the redemption of Fund shares.
23 | Q1 2019 ANNUAL REPORT
SHORT DURATION INCOME FUND
Investment Style: Short-Term Bond
Co-Portfolio Managers: Tom Carney, CFA & Nolan Anderson
The Short Duration Income Fund’s Institutional Class returned +1.53% in the first calendar quarter compared to a +1.22% return for the Bloomberg Barclays 1-3 Year U.S. Aggregate Index (Bloomberg Barclays U.S. Agg 1-3), our Fund’s primary benchmark. For the fiscal year ended March 31, the Short Duration Income Fund’s Institutional Class returned +3.18% compared to a +3.05% return for the benchmark. The Fund’s performance table following this letter shows returns over various holding periods for the Fund, its primary index and the CPI + 1% for comparison purposes.
Portfolio Positioning
The table below shows the change in allocation to various sectors from the most recent quarter and compared to a year ago. This summary provides a view over time of how we have allocated capital.
Since our goal is to invest in sectors that we believe offer the best risk-adjusted returns, our allocations may change significantly over time.
| | | | | |
| | | | | Quarter/ |
| | | | | Quarter |
Sector (% Net Assets) | 3/31/2019 | 12/31/2018 | 3/31/2018 | Change (bps) |
| Corporate Bonds | 35.6 | 35.9 | 38.5 | -30 |
| Corporate Convertible Bonds | 3.4 | 3.7 | 5.5 | -30 |
| Asset-Backed Securities (ABS) | 14.5 | 12.7 | 9.3 | +180 |
| Commercial Mortgage-Backed | | | | |
| Securities (CMBS) | 3.2 | 3.1 | 0.8 | +10 |
| Agency Mortgage-Backed (MBS) | 11.7 | 12.0 | 11.9 | -30 |
| Non-Agency Mortgage Backed | | | | |
| (RMBS) | 5.3 | 5.5 | 4.3 | -20 |
| Taxable Municipal Bonds | 0.2 | 0.2 | 0.4 | 0 |
| U.S. Treasury | 25.1 | 25.9 | 26.6 | -80 |
| Common Stocks | 0.5 | 0.4 | 0.8 | +10 |
| Cash & Equivalents | 0.5 | 0.6 | 1.9 | -10 |
Total | 100.0 | 100.0 | 100.0 | |
High Yield* | 7.7 | 7.6 | 10.6 | +10 |
| |
| Effective duration (years) | 1.7 | 1.8 | 1.9 | -0.1 |
| Effective maturity (years) | 1.9 | 2.0 | 2.1 | -0.1 |
| *High Yield exposure (as of 3/31/2019) consists of investments in the Corporate, Corporate Convertible, ABS and MBS sectors. |
Over the past fiscal year, we continued to increase our exposure to shorter-duration (1-2 year) securitized products, including automobile ABS, consumer ABS, CMBS and RMBS. Our shift in capital allocation toward securitized products has been driven by our ability to achieve spread pickup relative to investment-grade1 corporate bonds, without taking incremental credit risk.
As of March 31, our high-yield exposure increased slightly to 7.7% from 7.6% on December 31 (our maximum threshold is 15%). Our high-yield exposure continues to be concentrated in primarily higher-quality, shorter-term bonds that we believe have attractive risk/reward profiles.
Overall portfolio metrics as measured by average maturity and average effective duration declined compared to a year ago. The average effective maturity declined to 1.9 years from 2.0 years, and the average effective duration declined to 1.7 years from 1.8 years. These changes are principally the result of the flattening of the yield curve whereby we can earn comparable returns in shorter-term securities with less duration risk. Additionally, it increases our ability to source shorter-duration securitized assets (mentioned earlier) that have also shaped the overall portfolio metrics. These measures (duration and average maturity) provide a guide to the Fund’s interest rate sensitivity. A lower average effective maturity and shorter average effective duration reduce the Fund’s price sensitivity to changes in interest rates (either up or down).
Top Fiscal Year Contributors
• The corporate bond segment was the largest contributor to results in the fiscal year, as strong coupon income more than offset widening credit spreads. Primary contributors included the real estate investment trust (REIT), bank and consumer sectors, representing both cyclical and non-cyclical segments.
• Securitized Products (ABS, CMBS, MBS and RMBS) continued to perform at or above expectations with respect to credit performance and average life progression1 while providing steady income and limited price volatility during the fiscal year.
• The U.S. Treasury bonds segment performed well in the fiscal year as strong coupon income was supplemented by (unrealized) price appreciation as interest rates modestly declined.
• The Fund’s small allocation to equity experienced strong performance in the fiscal year as Redwood Trust (+12.4%) capped a transformational year with the acquisition of 5 Arches, an originator of business-purpose real estate loans. We believe the company remains well positioned to optimize its core competencies in housing credit that will deliver sustainable and profitable growth in per-share earnings and dividends for shareholders.
Top Fiscal Year Detractors
• No segment contributed negative results in the fiscal year–primarily the result of solid security and sector selection as well as overall yield curve positioning, particularly in the corporate bond segment.
First Quarter Investment Activity
New investment activity was weighted toward shorter-duration securitized products (one- to three-year average life), including auto asset-backed securities (ABS), consumer ABS and commercial mortgage-backed securities (CMBS).
Our approach to securitized products remains focused on identifying investments with robust structural protections backed by experienced sponsors and management teams with proven track records through various economic and capital market cycles. Please see our Fixed Income Insights letter to shareholders for further information on this topic–and stay tuned for more detailed discussions on this investment area (structured products) in future white papers.
Fund Strategy
Our approach consists primarily of investing in a portfolio of high-quality, short- to intermediate-term bonds, where we believe we can capture most of the coupon returns of long-term bonds with less interest rate risk. The portfolio is managed to maintain an average duration of 1 to 3½ years. We do not and will not try to mimic any particular index as we construct our portfolio.
We may also invest up to 15% in fixed income securities that are not considered investment grade but have favorable risk/reward characteristics (such as high-yield and convertible bonds, preferred and convertible preferred stock). A small percentage of Fund assets may also be invested in high-dividend-paying common stocks, such as longtime Fund holding Redwood Trust. These types of investments have generally enhanced our long-term returns.
We believe our flexible mandate will benefit shareholders over the long term. We seek out potentially mispriced securities and select portfolio assets one security at a time based on our view of opportunities in the marketplace. Our fixed income research is not dependent on but often benefits from the work our equity teammates conduct on companies and industries in the course of their due diligence.
Overall, we strive to be adequately compensated for the risks assumed in order to maximize investment (or reinvestment) yield and to avoid making interest rate bets, particularly ones that depend on interest rates going down.
1Definitions: Investment Grade: We consider investment grade to be those securities rated at least BBB- by one or more credit ratings agencies. Average Life Progression: A measure of repayment speed for a collateral pool (for example, a collection of mortgages may serve as the collateral pool for an issuance of mortgage-backed securities).
24 | Q1 2019 ANNUAL REPORT
WEITZINVESTMENTS.COM
| | | | | | | | |
Returns | | | Annualized | | | | |
| | Since Inception | | | | | | |
| | (12/23/1988) | 20-year | 10-year | 5-year | 3-year | 1-year | Quarter |
WSHNX - Investor Class | 4.98% | 3.76% | 2.81% | 1.55% | 1.84% | 2.95% | 1.47% |
WEFIX - Institutional Class | 5.04 | 3.85 | 2.98 | 1.78 | 2.06 | 3.18 | 1.53 |
| Bloomberg Barclays 1-3 Year U.S. Aggregate | — | 3.21 | 1.65 | 1.24 | 1.34 | 3.05 | 1.22 |
| CPI + 1% | 3.52* | 3.21 | 2.82 | 2.49 | 3.23 | 2.88 | 1.43 |
| * Since 12/31/1988 | | | | | | | |
Growth of $10,000
This chart depicts the change in the value of a $10,000 investment in the Short Duration Income Fund – Institutional Class for the period March 31, 2009 through March 31, 2019, as compared with the growth of the 1-3 Year U.S. Aggregate and CPI + 1% Indices during the same period. Index performance is hypothetical and is shown for illustrative purposes only.
| | |
Credit Quality(a)(d) | |
Underlying Securities | % of Portfolio |
| U.S. Treasury | 25.2 |
| U.S. Government Agency Mortgage | 11.7 |
Related Securities(b) | |
| Aaa/AAA | 10.0 |
| Aa/AA | 5.3 |
| A/A | 18.2 |
| Baa/BBB | 21.2 |
| Ba/BB | 3.1 |
| B/B | 1.2 |
| Caa/CCC | 0.1 |
| Non-Rated | 3.5 |
| Common Stocks | 0.5 |
| | 100.0 |
| | |
Financial Attributes | |
Portfolio Summary | |
Average Maturity(d) | 1.9 years |
Average Effective Maturity(d) | 1.9 years |
Average Duration(d) | 1.7 years |
Average Effective Duration(d) | 1.7 years |
Average Coupon(d) | 3.4% |
| 30-Day SEC Yield - Investor Class | 2.51% |
| 30-Day SEC Yield - Institutional Class | 2.71% |
Maturity Distribution(d) | |
Maturity Type | % of Portfolio |
| Less than 1 Year | 37.3 |
| 1 - 3 Years | 42.3 |
| 3 - 5 Years | 12.8 |
| 5 - 7 Years | 6.4 |
| 7 - 10 Years | 0.7 |
| Common Stocks | 0.5 |
| | 100.0 |
(a) | The Fund receives credit quality ratings on underlying securities of the Portfolio when available from credit rating agencies. The Fund will use one rating for an underlying security if that is all that is provided. Ratings and portfolio credit quality may change over time. The Fund itself has not been rated by an independent rating agency. |
(b) | Mortgage related securities issued and guaranteed by government-sponsored entities such as Fannie Mae and Freddie Mac are generally not rated by ratings agencies. Securities which are not rated do not necessarily indicate low quality. |
| | Fannie Mae’s and Freddie Mac’s senior long-term debt are currently rated Aaa and AAA by Moody’s and Fitch, respectively. |
(c) | Percent of net assets |
(d) | Source: Bloomberg Analytics |
Returns assume reinvestment of dividends and redemption at the end of each period, and reflect the deduction of annual operating expenses which as stated in its most recent prospectus are 0.91% (gross) and 0.62% (gross) of the Fund’s Investor and Institutional Class net assets, respectively. Total returns shown include fee waivers and expense reimbursements, if any; total returns would have been lower had there been no waivers and/or reimbursements. Past performance does not guarantee future results. The investment return and the principal value of an investment in this Fund will fluctuate so that an investor’s shares, when redeemed, may be worth more or less than the original cost. Current performance may be higher or lower than the performance data quoted. Performance data current to the most recent month-end may be obtained at www.weitzinvestments.com/funds_and_ performance/fund_ performance.fs.See page 6 for additional performance disclosures. See page 70 for a description of all indices.
Performance information does not reflect the deduction of taxes that a shareholder would pay on Fund distributions or the redemption of Fund shares.
25 | Q1 2019 ANNUAL REPORT
ULTRA SHORT GOVERNMENT FUND
Investment Style: Ultra-Short-Term Bond
Co-Portfolio Managers: Tom Carney, CFA & Nolan Anderson
The Ultra Short Government Fund returned +0.69% in the first calendar quarter compared to a +0.65% return for the ICE BofAML US 6-Month Treasury Bill Index (6-Month Treasury), our Fund’s primary benchmark. For the fiscal year ended March 31, the Ultra Short Government Fund returned +2.17% compared to a +2.26% return for the benchmark. The Fund’s performance table following this letter shows returns over various holding periods.
Fiscal Year Review
The Ultra Short Government Fund’s second fiscal year went well. Income as measured by the Fund’s 30-day yield has increased, credit quality has remained high and liquidity has been strong.
Short-term interest rates rose steadily in the past year. Three- and six-month Treasury bills (a surrogate for the Fund’s opportunity set) rose, but less than the full percent by which the Federal Reserve raised the federal funds rate. They both closed the quarter at 2.4%. The primary reason Treasury bills did not keep pace with the Federal Reserve’s increases was growing investor expectations that the Fed was getting closer to the end of its tightening campaign, after increasing the federal funds rate nine times since the end of 2015. Those expectations were confirmed in January of 2019 when the Fed expressed a desire to be “patient” with respect to any further rate increases. Market participants have subsequently begun to anticipate when the Fed may begin an easing cycle and start cutting/lowering short-term interest rates.
The Fund’s results in the first calendar quarter slightly edged out its primary benchmark, as modest price appreciation in most Fund holdings enhanced strong income returns in the overall portfolio. The Fund’s fiscal-year results modestly lagged the primary benchmark principally due to our decision to maintain a shorter average life/duration than the benchmark, until recently (this quarter). Like most market participants, we now believe the Fed will likely not raise short-term interest rates in 2019 and have increased the Fund’s duration accordingly (slightly above the benchmark’s duration of 0.5 years).
The Federal Reserve’s monetary policy decisions (e.g., changes in short-term interest rates) will continue to affect all investments within our opportunity set. As a result, our yield and return will invariably follow the path dictated by the Federal Reserve’s monetary policy, as we frequently reinvest holdings that mature in a short period of time. As of March 31, 83.1% of our portfolio was invested in U.S. Treasury notes, 15.4% was invested in investment grade corporate bonds and asset backed securities, with the balance in a high-quality State Street money market fund. The average effective duration of our portfolio at March 31 was 0.7 years, up from 0.5 at year end and from 0.3 a year ago. The Fund’s 30-day yield increased meaningfully to 2.34% as of March 31, up nearly 0.75% from a year ago.
The Fund’s principal investment strategies and objectives of providing current income, protecting principal and providing liquidity remain our long-term goals. Under normal market conditions, the Fund will invest at least 80% of its net assets in obligations issued or guaranteed by the U.S. government and its government-related entities. The balance of Fund assets may be invested in U.S. investment-grade debt securities. We consider investment grade to be those securities rated at least BBB- by one or more credit rating agencies. Additionally, the Fund will maintain an average effective duration of one year or less. Duration is a measure of how sensitive the portfolio may be to changes in interest rates. All else equal, a lower-duration portfolio of bonds is less sensitive to changes in interest rates than a portfolio of bonds with a higher duration. Over time, this shorter-term focus (duration of less than one year) is intended to generate higher total returns than cash or money market funds, while also taking less interest rate risk than a portfolio of bonds with a higher duration.
| |
Growth of $10,000 |
| This chart depicts the change in the value of a $10,000 investment in the Ultra Short Government Fund for the period March 31, 2009 through March 31, 2019, as compared with the growth of the 6-Month Treasury Index during the same period. Index performance is hypothetical and is shown for illustrative purposes only. |
| | | | |
Returns | | | |
| | Annualized | |
| | 10-Year | 5-Year | 1-Year |
SAFEX | 0.37% | 0.68% | 2.17% |
| 6-Month Treasury | 0.60 | 0.90 | 2.26 |
| | |
Sector Breakdown | |
| |
| | % of Net Assets |
| U.S. Treasury | 83.1 |
| Asset-Backed Securities | 12.6 |
| Corporate Bonds | 2.8 |
| Cash Equivalents/Other | 1.5 |
| | 100.0 |
Returns assume reinvestment of dividends and redemption at the end of each period, and reflect the deduction of the Fund’s annual operating expenses which as stated in its most recent prospectus are 0.60% (gross) of the Fund’s net assets. Total returns shown include fee waivers and expense reimbursements, if any; total returns would have been lower had there been no waivers and/ or reimbursements. Performance data represents past performance, which does not guarantee future results. The investment return and the principal value of an investment in this Fund will fluctuate so that an investor’s shares, when redeemed, may be worth more or less than the original cost. Current performance may be higher or lower than the performance data quoted. Performance data current to the most recent month-end may be obtained at www.weitzinvestments.com/funds_and_ performance/fund_ performance.fs.The Fund’s past performance is not necessarily an indication of how the Fund will perform in the future. Effective December 16, 2016, the Fund revised its principal investment strategies and policies to permit the Fund to invest in a diversified portfolio of short-term debt securities and to have a fluctuating net asset value. Prior to that date, the Fund operated as a “government money market fund” as defined under Rule 2a-7 of the Investment Company Act of 1940 and maintained a stable net asset value of $1.00 per share. The Fund’s past performance reflects the Fund’s prior principal investment strategies and policies.
See page 6 for additional performance disclosures. See page 70 for a description of all indices.
Performance information does not reflect the deduction of taxes that a shareholder would pay on Fund distributions or the redemption of Fund shares.
26 | Q1 2019 ANNUAL REPORT
WEITZINVESTMENTS.COM
This page intentionally left blank
27 | Q1 2019 ANNUAL REPORT
NEBRASKA TAX-FREE INCOME FUND
Investment Style: Municipal-State Bond
Portfolio Manager: Tom Carney, CFA
Nebraska Tax-Free Income Fund returned +1.85% in the first calendar quarter compared to a +2.11% return for the Bloomberg Barclays 5-Year Municipal Bond Index, our primary benchmark. For the fiscal year ended March 31, the Nebraska Tax-Free Income Fund’s total return was +3.46% compared to a +4.42% return for the benchmark. The Fund’s performance table following this letter shows returns over various holding periods.
Fiscal Year Review
Strong performance in the first quarter capped a strong fiscal year for municipal bond investors, our Fund included. Interest rates declined across the term structure or yield curve as the market reacted to news of ongoing trade tensions, signs of slowing global economic growth and the likelihood that the Federal Reserve would slow or stop its campaign of tightening monetary policy by increasing short-term interest rates.
On a relative basis, municipal bonds outperformed Treasuries for the fiscal year as yield ratios of municipal bonds relative to comparable U.S. Treasuries moved lower. The ratio of the 5-year AAA-rated municipal bond to the 5-year Treasury, for example, declined 7% during the quarter and 10% since March 31, 2018.
Demand for municipal bonds has remained strong even as (net) new issue supply has declined. A principal reason for the consistently strong demand is a byproduct of the 2017 tax overhaul that included a cap of $10,000 on the deduction of state and local taxes. Tax-free income from municipal bonds has become even more attractive because of that cap.
State of the State
Since our Fund is made up of predominantly Nebraska-based investments, the following points from Governor Pete Rickett’s State of the State Address highlight the strength and fiscal soundness of the 37th state in the union:
“We are the number one state for fiscal condition; number two for cost of doing business and regulatory environment; we have the third-highest wage growth since 2014; we have the fourth-best workforce participation rate; Forbes says we are the fifth-best state for business; and we have the sixth-lowest unemployment rate in the country.”
These attributes do not guarantee the success of any particular investment within the Fund, but they do reinforce the strength of the Nebraska economy and general fiscal conservatism that is broadly shared in the state.
Top Fiscal Year Contributors
• Electricity and public power revenue bonds issued by Dawson Nebraska Public Power District, Fremont Nebraska Combined Utility System, Lincoln Nebraska Electric System, Municipal Energy System of Nebraska and Nebraska Public Power District.
• Primary and secondary general obligation bonds issued by Douglas County Nebraska Omaha School District and Sarpy County Nebraska Bellevue School District.
• Higher education revenue bonds issued by Nebraska State College Facilities Corporation, Lincoln Nebraska Education Facilities (Nebraska Wesleyan University) and University of Nebraska Facilities Corporation (Health Center and College of Nursing Projects).
• General purpose revenue bonds issued by Omaha Nebraska Public Facilities Corporation, Lincoln-Lancaster County Nebraska Public Building Commission and Nebraska State Certificates of Participation.
• Water and sewer revenue bonds issued by Blair Nebraska, Omaha Nebraska and Upper Republican Natural Resource District Nebraska.
• Hospital bond segment led by Douglas County Nebraska Hospital Authority revenue bonds issued for Madonna Rehabilitation Hospital.
Top Fiscal Year Detractors
• No segment contributed negative results in the fiscal year.
Turning to portfolio metrics, over the past year, the average effective duration of our Fund was unchanged at 3.7 years, and the average effective maturity of our bonds decreased to 3.9 years from 4.1 years. Overall asset quality of our portfolio remains high, with approximately 84% rated A or better by a number of nationally recognized statistical rating organizations, credit rating agencies recognized by the U.S. Securities and Exchange Commission.
Please see the following page for additional details regarding the breakdown of our investment holdings by state, sector and rating. Our investments may be broad, but our analysis is the same. We strive to own only those investments we believe compensate us for the incremental credit risk we assume. Our overall goal is to invest in a portfolio of bonds of varying maturities that we believe offer attractive risk-adjusted returns, taking into consideration the general level of interest rates and the credit quality of each investment.
Thank you for your continued investment and confidence in our firm.
The Fund seeks income that is exempt from federal and Nebraska personal income taxes, but income from the Fund may be subject to federal alternative minimum tax and capital gains taxes.
28 | Q1 2019 ANNUAL REPORT
WEITZINVESTMENTS.COM
| | | | | | | | |
Returns | | | | | | | |
| | | | Annualized | | | | |
| | Since Inception | | | | | | |
| | (10/01/1985) | 20-year | 10-year | 5-year | 3-year | 1-year | Quarter |
WNTFX | 4.51% | 3.06% | 2.14% | 1.23% | 0.93% | 3.46% | 1.85% |
| 5-Year Municipal Bond | — | 3.90 | 3.12 | 2.23 | 1.79 | 4.42 | 2.11 |
Growth of $10,000
This chart depicts the change in the value of a $10,000 investment in the Nebraska Tax-Free Income Fund for the period March 31, 2009 through March 31, 2019, as compared with the growth of the 5-Year Municipal Bond Index during the same period. Index performance is hypothetical and is shown for illustrative purposes only.
| | |
State Breakdown | |
| | % of Net Assets |
| Nebraska | 92.6 |
| Texas | 3.1 |
| Florida | 1.5 |
| Washington | 0.6 |
| California | 0.6 |
| Colorado | 0.3 |
| Cash Equivalents/Other | 1.3 |
| | 100.0 |
| |
Credit Quality(a)(c) | |
Underlying Securities | % of Portfolio |
| Aaa/AAA | 4.1 |
| Aa/AA | 53.8 |
| A/A | 26.5 |
| Baa/BBB | 5.3 |
| Non-Rated | 10.0 |
| Cash Equivalents | 0.3 |
| | 100.0 |
| |
Sector Breakdown | |
| | % of Net Assets |
| Power | 20.1 |
| Higher Education | 12.2 |
| Hospital | 9.3 |
| Certificates of Participation | 8.6 |
| Lease | 7.1 |
| Airport/Transportation | 6.2 |
| Water/Sewer | 4.3 |
| General | 1.8 |
| Housing | 0.9 |
Total Revenue | 70.5 |
| School District | 9.8 |
| City/Subdivision | 7.6 |
| County | 4.1 |
| Natural Resource District | 1.6 |
Total General Obligation | 23.1 |
| Pre-Refunded | 5.1 |
| Cash Equivalents/Other | 1.3 |
| | 100.0 |
| | |
Financial Attributes | |
| |
Portfolio Summary | |
Average Maturity(c) | 5.7 years |
Average Effective Maturity(c) | 3.9 years |
Average Duration(c) | 3.5 years |
Average Effective Duration(c) | 3.7 years |
Average Coupon(c) | 3.7% |
| 30-Day SEC Yield | 1.15% |
| Municipals exempt from federal | 92.6% |
| and Nebraska income taxes | |
| Municipals subject to alternative | 6.5% |
| minimum tax | |
| | |
Maturity Distribution(c) | |
| |
Maturity Type | % of Portfolio |
| Cash Equivalents | 0.3 |
| Less than 1 Year | 15.7 |
| 1 - 3 Years | 23.8 |
| 3 - 5 Years | 23.3 |
| 5 - 7 Years | 12.7 |
| 7 - 10 Years | 24.2 |
| | 100.0 |
(a) | The Fund receives credit quality ratings on underlying securities of the Portfolio when available from credit rating agencies. The Fund will use one rating for an underlying security if that is all that is provided. Ratings and portfolio credit quality may change over time. The Fund itself has not been rated by an independent rating agency. |
(b) | Percent of net assets. |
(c) | Source: Bloomberg Analytics |
Returns assume reinvestment of dividends and redemption at the end of each period, and reflect the deduction of the Fund’s annual operating expenses which as stated in its most recent prospectus are 0.85% of the Fund’s net assets. Total returns shown include fee waivers and expense reimbursements, if any; total returns would have been lower had there been no waivers and/or reimbursements. Past performance does not guarantee future results. The investment return and the principal value of an investment in this Fund will fluctuate so that an investor’s shares, when redeemed, may be worth more or less than the original cost. Current performance may be higher or lower than the performance data quoted. Performance data current to the most recent month-end may be obtained at www.weitzinvestments.com/funds_and_ performance/fund_ performance.fs.See page 6 for additional performance disclosures. See page 70 for a description of all indices.
Performance information does not reflect the deduction of taxes that a shareholder would pay on Fund distributions or the redemption of Fund shares.
29 | Q1 2019 ANNUAL REPORT
VALUE FUND
Schedule of Investments
March 31, 2019
| | | | |
Common Stocks – 95.5% | | | |
| | % of Net | | |
Communication Services | Assets | Shares | $ Value |
| | | | |
Cable & Satellite | 15.7 | | |
| Liberty Broadband Corp. - Series C* | | 575,000 | 52,750,500 |
| Liberty SiriusXM Group - Series C* | | 600,000 | 22,944,000 |
| Comcast Corp. - Class A | | 570,000 | 22,788,600 |
Liberty Global plc - Class C* (c) | | 900,000 | 21,789,000 |
| |
Interactive Media & Services | 10.0 | | |
| Alphabet, Inc. - Class C* | | 40,000 | 46,932,400 |
| Facebook, Inc. - Class A* | | 180,000 | 30,004,200 |
| | 25.7 | | 197,208,700 |
Information Technology | | | |
| |
Data Processing & Outsourced Services | 8.3 | | |
| Visa Inc. - Class A | | 205,000 | 32,018,950 |
| Mastercard Inc. - Class A | | 135,000 | 31,785,750 |
Systems Software | 3.3 | | |
| Oracle Corp. | | 475,000 | 25,512,250 |
Semiconductors | 3.3 | | |
| Analog Devices, Inc. | | 240,000 | 25,264,800 |
IT Consulting & Other Services | 2.2 | | |
Accenture plc - Class A(c) | | 95,000 | 16,721,900 |
| | 17.1 | | 131,303,650 |
Financials | | | |
| |
Multi-Sector Holdings | 6.9 | | |
| Berkshire Hathaway Inc. - Class B* | | 265,000 | 53,235,850 |
Investment Banking & Brokerage | 3.0 | | |
| The Charles Schwab Corp. | | 540,000 | 23,090,400 |
Diversified Banks | 3.0 | | |
| JPMorgan Chase & Co. | | 225,000 | 22,776,750 |
Insurance Brokers | 2.9 | | |
Aon plc - Class A(c) | | 130,000 | 22,191,000 |
| | 15.8 | | 121,294,000 |
Consumer Discretionary | | | |
| |
Internet & Direct Marketing Retail | 6.1 | | |
| Booking Holdings Inc.* | | 17,500 | 30,535,925 |
| Amazon.com, Inc.* | | 9,500 | 16,917,125 |
Automotive Retail | 3.9 | | |
| CarMax, Inc.* | | 425,000 | 29,665,000 |
General Merchandise Stores | 3.8 | | |
| Dollar Tree, Inc.* | | 275,000 | 28,886,000 |
| | 13.8 | | 106,004,050 |
Health Care | | | |
| |
Health Care Services | 5.0 | | |
| Laboratory Corp. of America Holdings* | | 250,000 | 38,245,000 |
Life Sciences Tools & Services | 3.4 | | |
| Thermo Fisher Scientific Inc. | | 95,000 | 26,003,400 |
Health Care Equipment | 3.1 | | |
| Danaher Corp. | | 185,000 | 24,423,700 |
| | 11.5 | | 88,672,100 |
| | | | |
| | | $ Principal | |
| | % of Net | Amount or | |
Materials | Assets | Shares | $ Value |
| | | | |
Industrial Gases | 3.5 | | |
Linde plc(c) | | 155,000 | 27,269,150 |
Construction Materials | 2.7 | | |
| Vulcan Materials Co. | | 175,000 | 20,720,000 |
| | 6.2 | | 47,989,150 |
Industrials | | | |
Aerospace & Defense | 3.0 | | |
| TransDigm Group, Inc.* | | 50,000 | 22,699,500 |
Consumer Staples | | | |
Distillers & Vintners | 2.4 | | |
Diageo plc - Sponsored ADR(c) | | 115,000 | 18,815,150 |
Total Common Stocks (Cost $452,827,367) | | 733,986,300 |
| |
Cash Equivalents – 4.4% | | | |
| |
| U.S. Treasury Bills, 2.40% to 2.43%, | | | |
4/02/19 to 4/09/19(a) | | 20,000,000 | 19,994,047 |
| State Street Institutional U.S. Government Money | | |
Market Fund - Premier Class 2.39%(b) | | 14,129,596 | 14,129,596 |
Total Cash Equivalents (Cost $34,123,610) | | 34,123,643 |
Total Investments in Securities (Cost $486,950,977) | 768,109,943 |
| Other Assets Less Other Liabilities - 0.1% | | | 637,426 |
Net Assets - 100% | | | 768,747,369 |
Net Asset Value Per Share - Investor Class | | 42.31 |
Net Asset Value Per Share - Institutional Class | | 42.82 |
| * | Non-income producing |
(a) | Interest rates presented represent the yield to maturity at the date of purchase. |
(b) | Rate presented represents the annualized 7-day yield at March 31, 2019. |
(c) | Foreign domiciled entity |
The accompanying notes form an integral part of these financial statements.
30 | Q1 2019 ANNUAL REPORT
WEITZINVESTMENTS.COM
PARTNERS VALUE FUND
Schedule of Investments
March 31, 2019
| | | | |
Common Stocks – 95.7% | | | |
| | % of Net | | |
Communication Services | Assets | Shares | $ Value |
| |
Cable & Satellite | 18.5 | | |
| Liberty Broadband Corp.* | | | |
| Series A | | 65,000 | 5,956,600 |
| Series C | | 300,000 | 27,522,000 |
Liberty Global plc - Class C* (c) | | 1,000,000 | 24,210,000 |
| Liberty SiriusXM Group* | | | |
| Series A | | 145,000 | 5,536,100 |
| Series C | | 450,000 | 17,208,000 |
Liberty Latin America Ltd. - Class C* (c) | | 725,000 | 14,101,250 |
| Comcast Corp. - Class A | | 350,000 | 13,993,000 |
| |
Interactive Media & Services | 8.8 | | |
| Alphabet, Inc. - Class C* | | 28,000 | 32,852,680 |
| Facebook, Inc. - Class A* | | 115,000 | 19,169,350 |
| | 27.3 | | 160,548,980 |
Information Technology | | | |
| |
Data Processing & Outsourced Services 12.6 | | |
| Mastercard Inc. - Class A | | 118,000 | 27,783,100 |
| Visa Inc. - Class A | | 175,000 | 27,333,250 |
| Black Knight, Inc.* | | 350,000 | 19,075,000 |
| |
Semiconductors | 6.2 | | |
| Texas Instruments, Inc. | | 200,000 | 21,214,000 |
Marvell Technology Group Ltd.(c) | | 750,000 | 14,917,500 |
| |
Application Software | 3.1 | | |
| Box, Inc.- Class A* | | 600,000 | 11,586,000 |
| Guidewire Software, Inc.* | | 69,750 | 6,776,910 |
| |
IT Consulting & Other Services | 2.7 | | |
| DXC Technology Co. | | 250,000 | 16,077,500 |
| |
Systems Software | 2.5 | | |
| Oracle Corp. | | 275,000 | 14,770,250 |
| | 27.1 | | 159,533,510 |
Financials | | | |
| |
Multi-Sector Holdings | 5.8 | | |
| Berkshire Hathaway Inc. - Class B* | | 170,000 | 34,151,300 |
| |
Mortgage REITs | 3.7 | | |
| Redwood Trust, Inc. | | 1,350,000 | 21,802,500 |
| |
Investment Banking & Brokerage | 2.9 | | |
| The Charles Schwab Corp. | | 400,000 | 17,104,000 |
| |
Insurance Brokers | 2.1 | | |
Aon plc - Class A(c) | | 71,000 | 12,119,700 |
| | 14.5 | | 85,177,500 |
Materials | | | |
| |
Construction Materials | 6.2 | | |
| Summit Materials, Inc. - Class A* | | 900,000 | 14,283,000 |
| Vulcan Materials Co. | | 95,000 | 11,248,000 |
| Martin Marietta Materials, Inc. | | 55,000 | 11,064,900 |
| |
Specialty Chemicals | 2.1 | | |
Axalta Coating Systems Ltd.* (c) | | 480,000 | 12,100,800 |
| | 8.3 | | 48,696,700 |
| | | | |
| | | $ Principal | |
| | % of Net | Amount | |
Industrials | Assets | or Shares | $ Value |
| | | | |
Industrial Machinery | 5.4 | | |
| Colfax Corp.* | | 620,000 | 18,401,600 |
| Stanley Black & Decker, Inc. | | 100,000 | 13,617,000 |
Aerospace & Defense | 2.5 | | |
| TransDigm Group, Inc.* | | 32,000 | 14,527,680 |
| | 7.9 | | 46,546,280 |
Consumer Discretionary | | | |
Automotive Retail | 3.9 | | |
| CarMax, Inc.* | | 325,000 | 22,685,000 |
Internet & Direct Marketing Retail | 2.0 | | |
| Qurate Retail, Inc. - Series A* | | 750,000 | 11,985,000 |
| | 5.9 | | 34,670,000 |
Health Care | | | |
Health Care Services | 4.7 | | |
| Laboratory Corp. of America Holdings* | | 180,000 | 27,536,400 |
Total Common Stocks (Cost $371,559,140) | | 562,709,370 |
| |
Cash Equivalents – 4.4% | | | |
| |
| U.S. Treasury Bills, 2.40% to 2.43%, | | | |
4/02/19 to 4/09/19(a) | | 15,000,000 | 14,994,376 |
| State Street Institutional U.S. Government Money | | |
Market Fund - Premier Class 2.39%(b) | | 10,643,743 | 10,643,743 |
Total Cash Equivalents (Cost $25,638,101) | | 25,638,119 |
Total Investments in Securities (Cost $397,197,241) | | 588,347,489 |
| Other Liabilities in Excess of Other Assets - (0.1%) | | (538,979) |
Net Assets - 100% | | | 587,808,510 |
Net Asset Value Per Share - Investor Class | | 29.45 |
Net Asset Value Per Share - Institutional Class | | 29.82 |
| * | Non-income producing |
(a) | Interest rates presented represent the yield to maturity at the date of purchase. |
(b) | Rate presented represents the annualized 7-day yield at March 31, 2019. |
(c) | Foreign domiciled entity |
The accompanying notes form an integral part of these financial statements.
31 | Q1 2019 ANNUAL REPORT
PARTNERS III OPPORTUNITY FUND
Schedule of Investments
March 31, 2019
| | | | |
Common Stocks – 96.7% | | | |
| | % of Net | | |
Information Technology | Assets | Shares | $ Value |
| |
Application Software | 12.6 | | |
Intelligent Systems Corp.* † | | 2,270,000 | 72,503,800 |
| Box, Inc. - Class A* | | 400,000 | 7,724,000 |
| |
Data Processing & Outsourced Services 11.7 | | |
Mastercard Inc. - Class A(c) | | 135,000 | 31,785,750 |
| Visa Inc. - Class A | | 200,000 | 31,238,000 |
| Black Knight, Inc.* | | 220,000 | 11,990,000 |
| |
Semiconductors | 4.7 | | |
Texas Instruments, Inc.(c) | | 170,000 | 18,031,900 |
Marvell Technology Group Ltd.(d) | | 600,000 | 11,934,000 |
| |
IT Consulting & Other Services | 4.6 | | |
| DXC Technology Co. | | 350,000 | 22,508,500 |
| Perspecta Inc. | | 350,000 | 7,077,000 |
| | 33.6 | | 214,792,950 |
Communication Services | | | |
| |
Cable & Satellite | 19.6 | | |
Liberty Broadband Corp.* (c) | | | |
| Series A | | 100,000 | 9,164,000 |
| Series C | | 370,000 | 33,943,800 |
Liberty Global plc - Class C* (c) (d) | | 1,650,000 | 39,946,500 |
Liberty SiriusXM Group* (c) | | | |
| Series A | | 200,000 | 7,636,000 |
| Series C | | 400,000 | 15,296,000 |
GCI Liberty, Inc. - Class A* (c) | | 200,000 | 11,122,000 |
Liberty Latin America Ltd. - Class C* (c) (d) | | 400,000 | 7,780,000 |
| |
Interactive Media & Services | 8.3 | | |
Alphabet, Inc. - Class C* (c) | | 27,000 | 31,679,370 |
Facebook, Inc. - Class A* (c) | | 130,000 | 21,669,700 |
| |
Movies & Entertainment | 1.1 | | |
Liberty Formula One Group* (c) | | | |
| Series A | | 50,000 | 1,702,000 |
| Series C | | 150,000 | 5,257,500 |
| | 29.0 | | 185,196,870 |
Financials | | | |
| |
Multi-Sector Holdings | 10.4 | | |
Berkshire Hathaway Inc. - Class B* (c) | | 330,000 | 66,293,700 |
| |
Mortgage REITs | 2.5 | | |
Redwood Trust, Inc.(c) | | 1,000,000 | 16,150,000 |
| |
Investment Banking & Brokerage | 2.4 | | |
| The Charles Schwab Corp. | | 350,000 | 14,966,000 |
| |
Property & Casualty Insurance | 2.0 | | |
Markel Corp.* (c) | | 13,000 | 12,951,120 |
| | 17.3 | | 110,360,820 |
Consumer Discretionary | | | |
| |
Internet & Direct Marketing Retail | 4.0 | | |
Amazon.com, Inc.* (c) | | 6,000 | 10,684,500 |
Qurate Retail, Inc. - Series A* (c) | | 500,000 | 7,990,000 |
| Booking Holdings Inc.* | | 4,000 | 6,979,640 |
| |
Automotive Retail | 2.8 | | |
| CarMax, Inc.* | | 250,000 | 17,450,000 |
| | 6.8 | | 43,104,140 |
| | | | |
| | | $ Principal | |
| | % of Net | Amount | |
Industrials | Assets | or Shares | $ Value |
| | | | |
Industrial Machinery | 3.0 | | |
Colfax Corp.* (c) | | 650,000 | 19,292,000 |
| | | | |
Aerospace & Defense | 1.4 | | |
Wesco Aircraft Holdings, Inc.* (c) | | 1,000,000 | 8,790,000 |
| | 4.4 | | 28,082,000 |
Health Care | | | |
| | | | |
Health Care Services | 3.6 | | |
Laboratory Corp. of America Holdings* (c) | 150,000 | 22,947,000 |
| | | |
Materials | | | |
| | | | |
Construction Materials | 2.0 | | |
Summit Materials, Inc. - Class A* (c) | | 800,000 | 12,696,000 |
Total Common Stocks (Cost $338,162,652) | | 617,179,780 |
| |
Cash Equivalents – 2.2% | | |
| |
| U.S. Treasury Bills, 2.40% to 2.43%, | | | |
4/02/19 to 4/09/19(a) | | 7,000,000 | 6,998,612 |
| State Street Institutional U.S. Government Money | | |
Market Fund - Premier Class 2.39%(b) | 7,195,068 | 7,195,068 |
Total Cash Equivalents (Cost $14,193,673) | | 14,193,680 |
Total Investments in Securities (Cost $352,356,325) | | 631,373,460 |
Due From Broker(c) - 15.8% | | | 101,153,501 |
| Securities Sold Short - (15.0%) | | | (96,043,200) |
| Other Assets Less Other Liabilities - 0.3% | | 2,018,468 |
Net Assets - 100% | | | 638,502,229 |
Net Asset Value Per Share - Investor Class | | 14.67 |
Net Asset Value Per Share - Institutional Class | | 15.21 |
| | | |
Securities Sold Short – (15.0%) | | |
| |
| SPDR S&P 500 ETF Trust | | 340,000 | (96,043,200) |
Total Securities Sold Short (proceeds $70,628,090) | | (96,043,200) |
| * | Non-income producing |
| † | Controlled affiliate |
(a) | Interest rates presented represent the yield to maturity at the date of purchase. |
(b) | Rate presented represents the annualized 7-day yield at March 31, 2019. |
(c) | Fully or partially pledged as collateral on securities sold short. |
(d) | Foreign domiciled entity |
The accompanying notes form an integral part of these financial statements.
32 | Q1 2019 ANNUAL REPORT
WEITZINVESTMENTS.COM
HICKORY FUND
Schedule of Investments
March 31, 2019
| | | | |
Common Stocks – 97.6% | | | |
| | % of Net | | |
Communication Services | Assets | Shares | $ Value |
| |
Cable & Satellite | 23.6 | | |
| Liberty Broadband Corp.* | | | |
| Series A | | 30,000 | 2,749,200 |
| Series C | | 170,000 | 15,595,800 |
| GCI Liberty, Inc. - Class A* | | 162,000 | 9,008,820 |
| Liberty SiriusXM Group* | | | |
| Series A | | 50,000 | 1,909,000 |
| Series C | | 180,000 | 6,883,200 |
Liberty Latin America Ltd. - Class C* (c) | | 379,600 | 7,383,220 |
Liberty Global plc - Class C* (c) | | 250,000 | 6,052,500 |
| |
Integrated Telecommunication Services | 6.3 | | |
| LICT Corp.* | | 849 | 13,329,300 |
| |
Movies & Entertainment | 4.0 | | |
| Liberty Formula One Group* | | | |
| Series A | | 27,500 | 936,100 |
| Series C | | 125,000 | 4,381,250 |
| Liberty Braves Group* | | | |
| Series A | | 11,000 | 307,340 |
| Series C | | 105,000 | 2,915,850 |
| | 33.9 | | 71,451,580 |
Information Technology | | | |
| |
Application Software | 7.6 | | |
| Guidewire Software, Inc.* | | 90,000 | 8,744,400 |
| ACI Worldwide, Inc.* | | 220,000 | 7,231,400 |
| |
Data Processing & Outsourced Services | 4.0 | | |
| Black Knight, Inc.* | | 155,000 | 8,447,500 |
| |
Semiconductors | 1.9 | | |
Marvell Technology Group Ltd.(c) | | 200,000 | 3,978,000 |
| |
IT Consulting & Other Services | 1.7 | | |
| Perspecta Inc. | | 180,000 | 3,639,600 |
| | 15.2 | | 32,040,900 |
Materials | | | |
| |
Construction Materials | 5.8 | | |
| Summit Materials, Inc. - Class A* | | 450,000 | 7,141,500 |
| Eagle Materials Inc. | | 60,000 | 5,058,000 |
| |
Specialty Chemicals | 3.3 | | |
Axalta Coating Systems Ltd.* (c) | | 275,000 | 6,932,750 |
| |
Diversified Metals & Mining | 3.1 | | |
| Compass Minerals International, Inc. | | 120,000 | 6,524,400 |
| |
Metal & Glass Containers | 1.1 | | |
| Myers Industries, Inc. | | 140,000 | 2,395,400 |
| | 13.3 | | 28,052,050 |
Consumer Discretionary | | | |
| |
Internet & Direct Marketing Retail | 5.2 | | |
| Qurate Retail, Inc. - Series A* | | 350,000 | 5,593,000 |
| Liberty Expedia Holdings, Inc. - Series A* | | 125,000 | 5,350,000 |
| |
Automotive Retail | 4.9 | | |
| CarMax, Inc.* | | 100,000 | 6,980,000 |
| Murphy USA Inc.* | | 40,000 | 3,424,800 |
| | | | |
| | | $ Principal | |
% of Net | Amount | |
Assets | or Shares | $ Value |
| | | | |
Housewares & Specialties | 1.1 | | |
| Tupperware Brands Corp. | | 91,778 | 2,347,681 |
11.2 | | 23,695,481 |
Industrials | | | |
| | | | |
Industrial Machinery | 7.3 | | |
| Colfax Corp.* | | 300,000 | 8,904,000 |
| Gardner Denver Holdings, Inc.* | | 230,000 | 6,396,300 |
| | | | |
Aerospace & Defense | 2.1 | | |
| Wesco Aircraft Holdings, Inc.* | | 500,000 | 4,395,000 |
| | | | |
Building Products | 1.7 | | |
| Fortune Brands Home & Security, Inc. | | 75,000 | 3,570,750 |
11.1 | | 23,266,050 |
Health Care | | | |
| | | | |
Health Care Services | 4.6 | | |
| Laboratory Corp. of America Holdings* | | 63,000 | 9,637,740 |
| | | | |
Financials | | | |
| | | | |
Mortgage REITs | 4.4 | | |
| Redwood Trust, Inc. | | 580,000 | 9,367,000 |
| | | | |
Real Estate | | | |
| | | | |
Office REITs | 3.9 | | |
| Equity Commonwealth | | 250,000 | 8,172,500 |
Total Common Stocks (Cost $134,799,446) | | | 205,683,301 |
| |
Cash Equivalents – 2.5% | | | |
| |
U.S. Treasury Bill 2.40% 4/02/19(a) | | 2,000,000 | 1,999,868 |
| State Street Institutional U.S. Government Money | | | |
Market Fund - Premier Class 2.39%(b) | | 3,298,120 | 3,298,120 |
Total Cash Equivalents (Cost $5,297,988) | | | 5,297,988 |
Total Investments in Securities (Cost $140,097,434) | | 210,981,289 |
| Other Liabilities in Excess of Other Assets - (0.1%) | | | (237,295) |
Net Assets - 100% | | | 210,743,994 |
Net Asset Value Per Share | | | 46.86 |
| * | Non-income producing |
(a) | Interest rate presented represents the yield to maturity at the date of purchase. |
(b) | Rate presented represents the annualized 7-day yield at March 31, 2019. |
(c) | Foreign domiciled entity |
The accompanying notes form an integral part of these financial statements.
33 | Q1 2019 ANNUAL REPORT
BALANCED FUND
Schedule of Investments
March 31, 2019
| | | | |
Common Stocks – 45.5% | | | |
| | % of Net | | |
Information Technology | Assets | Shares | $ Value |
| |
| Data Processing & Outsourced Services | 4.2 | | |
| Visa Inc. - Class A | | 17,000 | 2,655,230 |
| Mastercard Inc. - Class A | | 11,000 | 2,589,950 |
| |
Semiconductors | 3.4 | | |
| Analog Devices, Inc. | | 15,000 | 1,579,050 |
Marvell Technology Group Ltd.(e) | | 70,000 | 1,392,300 |
| Texas Instruments, Inc. | | 12,500 | 1,325,875 |
| |
Systems Software | 3.2 | | |
| Microsoft Corp. | | 17,500 | 2,063,950 |
| Oracle Corp. | | 35,000 | 1,879,850 |
| |
Application Software | 1.6 | | |
| Guidewire Software, Inc.* | | 20,000 | 1,943,200 |
| |
IT Consulting & Other Services | 1.1 | | |
Accenture plc - Class A(e) | | 8,000 | 1,408,160 |
| | 13.5 | | 16,837,565 |
Financials | | | |
| |
Multi-Sector Holdings | 2.4 | | |
| Berkshire Hathaway Inc. - Class B* | | 15,000 | 3,013,350 |
| |
Investment Banking & Brokerage | 1.7 | | |
| The Charles Schwab Corp. | | 50,000 | 2,138,000 |
| |
Mortgage REITs | 1.6 | | |
| Redwood Trust, Inc. | | 120,000 | 1,938,000 |
| |
Diversified Banks | 1.4 | | |
| JPMorgan Chase & Co. | | 17,000 | 1,720,910 |
| |
Insurance Brokers | 1.0 | | |
Aon plc - Class A(e) | | 7,500 | 1,280,250 |
| | 8.1 | | 10,090,510 |
Materials | | | |
| |
Construction Materials | 3.8 | | |
| Vulcan Materials Co. | | 15,000 | 1,776,000 |
| Eagle Materials Inc. | | 18,500 | 1,559,550 |
| Martin Marietta Materials, Inc. | | 7,000 | 1,408,260 |
| |
Industrial Gases | 2.1 | | |
Linde plc(e) | | 15,000 | 2,638,950 |
| |
Diversified Metals & Mining | 1.1 | | |
| Compass Minerals International, Inc. | | 25,000 | 1,359,250 |
| |
Specialty Chemicals | 1.0 | | |
Axalta Coating Systems Ltd.* (e) | | 50,000 | 1,260,500 |
| | 8.0 | | 10,002,510 |
Health Care | | | |
| |
Health Care Services | 2.2 | | |
| Laboratory Corp. of America Holdings* | | 18,000 | 2,753,640 |
| |
Life Sciences Tools & Services | 2.2 | | |
| Thermo Fisher Scientific Inc. | | 10,000 | 2,737,200 |
| |
Health Care Equipment | 1.6 | | |
| Danaher Corp. | | 15,000 | 1,980,300 |
| | 6.0 | | 7,471,140 |
| | | | |
| | | $ Principal | |
| | % of Net | Amount | |
Communication Services | Assets | or Shares | $ Value |
| |
Cable & Satellite | 3.4 | | |
| Charter Communications, Inc. - Class A* | | 7,000 | 2,428,370 |
| Comcast Corp. - Class A | | 45,000 | 1,799,100 |
| | | | |
Interactive Media & Services | 2.1 | | |
| Alphabet, Inc. - Class C* | | 2,200 | 2,581,282 |
| | 5.5 | | 6,808,752 |
Consumer Staples | | | |
| |
Distillers & Vintners | 2.0 | | |
Diageo plc - Sponsored ADR(e) | | 15,000 | 2,454,150 |
| | | | |
Packaged Foods & Meats | 1.2 | | |
| Mondelez International, Inc. - Class A | | 30,000 | 1,497,600 |
| | 3.2 | | 3,951,750 |
Industrials | | | |
| |
Industrial Machinery | 1.2 | | |
| Stanley Black & Decker, Inc. | | 11,000 | 1,497,870 |
Total Common Stocks (Cost $37,890,142) | | 56,660,097 |
| |
Corporate Bonds – 15.6% | | | |
| |
| American Express Credit Corp. 8.125% 5/20/19 | 500,000 | 503,528 |
| Bank of America Corp. 2.25% 4/21/20 | | 1,000,000 | 994,919 |
| Berkshire Hathaway Inc. Finance Corp. 4.25% 1/15/21 | 300,000 | 309,765 |
| Broadcom Corp. 2.2% 1/15/21 | | 1,000,000 | 984,839 |
| Capital One Bank USA, N.A. | | | |
| 2.3% 6/05/19 | | 250,000 | 249,828 |
| 8.8% 7/15/19 | | 500,000 | 508,435 |
| Capital One N.A. 2.4% 9/05/19 | | 350,000 | 349,347 |
| Discovery, Inc. 2.2% 9/20/19 | | 1,000,000 | 996,070 |
| Equity Commonwealth 5.875% 9/15/20 | | 700,000 | 716,509 |
| Fidelity National Information Services, Inc. | | | |
| 3.625% 10/15/20 | | 2,231,000 | 2,255,493 |
| First Republic Bank 2.375% 6/17/19 | | 1,200,000 | 1,198,882 |
| Fortive Corp. 1.8% 6/15/19 | | 500,000 | 497,937 |
| Goldman Sachs Group, Inc. 2.6% 12/27/20 | | 500,000 | 497,538 |
| JPMorgan Chase & Co. | | | |
| 6.3% 4/23/19 | | 270,000 | 270,564 |
| 3.15063% 3/09/21 Floating Rate (Qtrly LIBOR + 55) | 750,000 | 750,970 |
The Manitowoc Company, Inc. 12.75% 8/15/21(d) | 500,000 | 534,950 |
| Markel Corp. | | | |
| 7.125% 9/30/19 | | 1,014,000 | 1,032,864 |
| 4.9% 7/01/22 | | 410,000 | 432,960 |
| 3.625% 3/30/23 | | 500,000 | 504,045 |
| PPG Industries, Inc. 2.3% 11/15/19 | | 2,177,000 | 2,172,746 |
| QVC, Inc. 3.125% 4/01/19 | | 500,000 | 500,000 |
| U.S. Bancorp 2.35% 1/29/21 | | 1,000,000 | 996,642 |
| Wells Fargo & Co. | | | |
| 2.125% 4/22/19 | | 800,000 | 799,766 |
| 4.6% 4/01/21 | | 1,250,000 | 1,291,800 |
Total Corporate Bonds (Cost $19,390,830) | | 19,350,397 |
The accompanying notes form an integral part of these financial statements.
34 | Q1 2019 ANNUAL REPORT
WEITZINVESTMENTS.COM
| | | |
Corporate Convertible Bonds – 0.8% | | |
| | $ Principal | |
| | Amount | $ Value |
| |
| Redwood Trust, Inc. 5.625% 11/15/19 (Cost $999,297) | 1,000,000 | 1,008,781 |
| |
Asset-Backed Securities – 2.3%(c) | | |
| |
Commercial Credit Group Receivables Trust (CCG)(d) | | |
| 2017-1 CL B — 2.75% 2023 (1.6 years) | 500,000 | 498,585 |
| Drive Auto Receivables Trust (DRIVE) | | |
| 2018-1 CL B — 2.88% 2022 (0.2 years) | 393,224 | 393,254 |
| 2018-4 CL A3 — 3.04% 2021 (0.3 years) | 500,000 | 500,414 |
Flagship Credit Auto Trust (FCAT)(d) | | |
| 2014-2 CL C — 3.95% 2020 (0.1 years) | 137,031 | 137,197 |
SoFi Consumer Loan Program LLC (SCLP)(d) | | |
| 2017-6 CL A1 — 2.2% 2026 (0.2 years) | 185,300 | 184,808 |
Springleaf Funding Trust (SLFT)(d) | | |
| 2015-AA CL A — 3.16% 2024 (0.0 years) | 627,399 | 627,463 |
Upstart Securitization Trust (UPST)(d) | | |
| 2017-2 CL B — 3.748% 2025 (0.6 years) | 500,000 | 500,211 |
Total Asset-Backed Securities (Cost $2,841,134) | | 2,841,932 |
| |
Mortgage-Backed Securities – 1.9%(c) | | |
| |
Federal Home Loan Mortgage Corporation | | |
| |
Collateralized Mortgage Obligations | | |
| 3649 CL BW — 4.0% 2025 (2.2 years) | 53,449 | 54,709 |
| |
Pass-Through Securities | | |
| J14649 — 3.5% 2026 (2.6 years) | 90,649 | 92,866 |
| E02948 — 3.5% 2026 (2.7 years) | 137,811 | 141,325 |
| J16663 — 3.5% 2026 (2.8 years) | 82,250 | 84,262 |
| | | 373,162 |
Federal National Mortgage Association | | |
| |
Pass-Through Securities | | |
| MA0464 — 3.5% 2020 (0.5 years) | 21,371 | 21,873 |
| AR8198 — 2.5% 2023 (1.6 years) | 110,265 | 109,847 |
| MA1502 — 2.5% 2023 (1.7 years) | 91,445 | 91,099 |
| 995755 — 4.5% 2024 (1.9 years) | 12,622 | 12,988 |
| AB1769 — 3.0% 2025 (2.5 years) | 79,215 | 80,261 |
| AB3902 — 3.0% 2026 (2.9 years) | 144,735 | 146,652 |
| AK3264 — 3.0% 2027 (2.9 years) | 114,553 | 116,070 |
| | | 578,790 |
Government National Mortgage Association | | |
| |
Pass-Through Securities | | |
| G2 5255 — 3.0% 2026 (3.0 years) | 148,060 | 149,880 |
| |
Non-Government Agency | | |
| |
Collateralized Mortgage Obligations | | |
J.P. Morgan Mortgage Trust (JPMMT)(d) (f) | | |
| 2014-5 CL A1 — 2.984822% 2029 (3.9 years) | 209,931 | 209,898 |
| 2017-3 CL 2A2 — 2.5% 2047 (5.4 years) | 782,319 | 768,938 |
Sequoia Mortgage Trust (SEMT)(d) (f) | | |
| 2017-CH1 CL A11 — 3.5% 2047 (1.9 years) | 338,628 | 339,805 |
| | | 1,318,641 |
Total Mortgage-Backed Securities (Cost $2,420,099) | 2,420,473 |
| | | |
U.S. Treasury – 28.7% | $ Principal | |
| | Amount | |
| | or Shares | $ Value |
| |
U.S. Treasury Notes | | |
| 1.25% 4/30/19 | 1,000,000 | 999,450 |
| 1.625% 7/31/19 | 1,000,000 | 997,266 |
| 1.625% 8/31/19 | 1,000,000 | 996,406 |
| 1.5% 10/31/19 | 1,000,000 | 994,570 |
| 1.375% 12/15/19 | 1,000,000 | 992,793 |
| 1.25% 1/31/20 | 1,000,000 | 990,391 |
| 1.375% 2/15/20 | 1,000,000 | 991,074 |
| 1.375% 4/30/20 | 1,000,000 | 989,277 |
| 1.5% 5/15/20 | 1,000,000 | 990,313 |
| 1.5% 6/15/20 | 1,000,000 | 989,494 |
| 1.375% 8/31/20 | 1,000,000 | 986,230 |
| 2.0% 9/30/20 | 1,000,000 | 994,980 |
| 2.0% 11/30/20 | 2,000,000 | 1,989,453 |
| 2.0% 2/28/21 | 1,000,000 | 994,648 |
| 2.375% 4/15/21 | 1,000,000 | 1,002,129 |
| 1.375% 5/31/21 | 2,000,000 | 1,962,930 |
| 2.625% 6/15/21 | 1,000,000 | 1,008,223 |
| 1.125% 8/31/21 | 1,000,000 | 973,789 |
| 1.875% 11/30/21 | 2,000,000 | 1,981,250 |
| 1.75% 2/28/22 | 1,000,000 | 986,699 |
| 1.875% 4/30/22 | 1,000,000 | 989,707 |
| 2.125% 6/30/22 | 2,000,000 | 1,994,219 |
| 2.0% 7/31/22 | 1,000,000 | 993,008 |
| 1.875% 8/31/22 | 1,000,000 | 988,613 |
| 2.0% 11/30/22 | 1,000,000 | 992,344 |
| 2.0% 2/15/23 | 1,000,000 | 991,836 |
| 2.5% 3/31/23 | 2,000,000 | 2,021,328 |
| 1.625% 5/31/23 | 2,000,000 | 1,952,227 |
| 2.5% 8/15/23 | 2,000,000 | 2,022,852 |
Total U.S. Treasury (Cost $35,674,443) | | 35,757,499 |
| |
Cash Equivalents – 5.0% | | |
| |
U.S. Treasury Bills, 2.40% to 2.43%, 4/02/19 to 4/09/19(a) | 6,000,000 | 5,998,214 |
| |
| State Street Institutional U.S. Government Money | | |
Market Fund - Premier Class 2.39%(b) | 183,310 | 183,310 |
Total Cash Equivalents (Cost $6,181,514) | | 6,181,524 |
Total Investments in Securities (Cost $105,397,459) | | 124,220,703 |
| Other Assets Less Other Liabilities - 0.2% | | 210,371 |
Net Assets - 100% | | 124,431,074 |
Net Asset Value Per Share - Investor Class | | 13.76 |
Net Asset Value Per Share - Institutional Class | | 13.75 |
| * | Non-income producing |
(a) | Interest rates presented represent the yield to maturity at the date of purchase. |
(b) | Rate presented represents the annualized 7-day yield at March 31, 2019. |
(c) | Number of years indicated represents estimated average life. |
(d) | Security is exempt from registration under Rule 144A of the Securities Act of 1933. This security may be resold in transactions that are exempt from registration, normally to qualified institutional buyers. |
(e) | Foreign domiciled entity |
(f) | The interest rate resets periodically based on the weighted average coupons of the underlying mortgage-related or asset-backed obligations. |
The accompanying notes form an integral part of these financial statements.
35 | Q1 2019 ANNUAL REPORT
CORE PLUS INCOME FUND
Schedule of Investments
March 31, 2019
| | | |
Corporate Bonds – 25.8% | | |
| | $ Principal | |
| | Amount | $ Value |
| |
| Andeavor Logistics LP 6.25% 10/15/22 | 1,000,000 | 1,030,000 |
| Anheuser-Busch InBev Finance Inc. 3.3% 2/01/23 | 200,000 | 203,057 |
| Bank of America Corp. 2.25% 4/21/20 | 300,000 | 298,476 |
Beacon Roofing Supply, Inc. 4.875% 11/01/25(c) | 100,000 | 95,375 |
| Berkshire Hathaway Inc. Finance Corp. | | |
| 3.0% 5/15/22 | 200,000 | 203,474 |
| 4.25% 1/15/49 | 500,000 | 524,583 |
| Boardwalk Pipelines LLC 5.75% 9/15/19 | 225,000 | 227,384 |
| Boston Properties LP 3.125% 9/01/23 | 555,000 | 558,915 |
| Broadcom Corp. 3.125% 1/15/25 | 350,000 | 335,877 |
| Calumet Specialty Products Partners LP | | |
| 6.5% 4/15/21 | 350,000 | 343,875 |
| 7.625% 1/15/22 | 357,000 | 331,118 |
| Carlisle Companies Inc. 3.5% 12/01/24 | 532,000 | 532,197 |
| CenturyLink, Inc. 5.625% 4/01/20 | 250,000 | 255,735 |
| Charter Communications Operating, LLC 4.2% 3/15/28 | 650,000 | 646,183 |
| CNX Resources Corp. 5.875% 4/15/22 | 60,000 | 60,150 |
Colfax Corp. 6.0% 2/15/24(c) | 1,000,000 | 1,045,000 |
| Comcast Corp. 3.95% 10/15/25 | 500,000 | 523,602 |
| Computer Sciences Corp. 4.45% 9/15/22 | 500,000 | 513,773 |
Cox Communications, Inc. 3.5% 8/15/27(c) | 842,000 | 825,350 |
| Discovery, Inc. 2.95% 3/20/23 | 400,000 | 396,623 |
| Dollar Tree, Inc. 3.7% 5/15/23 | 75,000 | 76,134 |
| Dominion Resources, Inc. 2.962% 7/01/19 | 100,000 | 100,021 |
| Donnelley Financial Solutions, Inc. 8.25% 10/15/24 | 333,000 | 336,330 |
| EPR Properties 5.75% 8/15/22 | 400,000 | 426,319 |
| Equifax Inc. 2.3% 6/01/21 | 100,000 | 98,203 |
| Equity Commonwealth 5.875% 9/15/20 | 1,319,000 | 1,350,107 |
| Expedia Group, Inc. 3.8% 2/15/28 | 750,000 | 724,799 |
| FLIR Systems, Inc. 3.125% 6/15/21 | 400,000 | 398,920 |
frontdoor, inc. 6.75% 8/15/26(c) | 144,000 | 147,600 |
Invista B.V. 4.25% 10/15/19(c) | 288,000 | 290,638 |
| JPMorgan Chase & Co. 3.15063% 3/09/21 | | |
| Floating Rate (Qtrly LIBOR + 55) | 150,000 | 150,194 |
| L Brands, Inc. 5.625% 2/15/22 | 40,000 | 41,700 |
The Manitowoc Company, Inc. 12.75% 8/15/21(c) | 550,000 | 588,445 |
| Markel Corp. | | |
| 7.125% 9/30/19 | 125,000 | 127,325 |
| 4.9% 7/01/22 | 250,000 | 264,000 |
| 3.625% 3/30/23 | 200,000 | 201,618 |
| 3.5% 11/01/27 | 550,000 | 524,603 |
Marvell Technology Group Ltd. 4.2% 6/22/23(d) | 300,000 | 306,189 |
| MPLX LP 4.875% 6/01/25 | 190,000 | 202,570 |
| NGL Energy Partners LP | | |
| 7.5% 11/01/23 | 408,000 | 424,157 |
| 6.125% 3/01/25 | 290,000 | 281,300 |
NXP BV 4.625% 6/01/23(c) (d) | 100,000 | 104,100 |
| QVC, Inc. 3.125% 4/01/19 | 100,000 | 100,000 |
| Range Resources Corp. 5.0% 8/15/22 | 301,000 | 299,495 |
| RELX plc 3.5% 3/16/23 | 770,000 | 780,914 |
Silversea Cruise Holding Ltd. 7.25% 2/01/25(c) (d) | 650,000 | 706,225 |
Sprint Spectrum Co. LLC 3.36% 3/20/23(c) (e) | 436,250 | 437,210 |
| STORE Capital Corp. | | |
| 4.5% 3/15/28 | 503,000 | 508,088 |
| 4.625% 3/15/29 | 500,000 | 508,039 |
| TC PipeLines LP 4.65% 6/15/21 | 160,000 | 164,118 |
| | | |
| | $ Principal | |
| | Amount | $ Value |
| |
| Wells Fargo & Co. | | |
| 4.6% 4/01/21 | 400,000 | 413,376 |
| 2.1% 7/26/21 | 200,000 | 196,952 |
Total Corporate Bonds (Cost $19,893,111) | | 20,230,436 |
| |
Corporate Convertible Bonds – 1.5% | | |
| |
| Redwood Trust, Inc. | | |
| 5.625% 11/15/19 | 150,000 | 151,317 |
| 4.75% 8/15/23 | 350,000 | 336,409 |
| 5.625% 7/15/24 | 700,000 | 684,948 |
Total Corporate Convertible Bonds (Cost $1,192,510) | 1,172,674 |
| |
Asset-Backed Securities – 22.5%(b) | | |
| |
| AmeriCredit Automobile Receivables Trust (AMCAR) | | |
| 2015-2 CL D — 3.0% 2021 (0.5 years) | 110,000 | 110,063 |
| 2017-1 CL D — 3.13% 2023 (2.2 years) | 69,000 | 69,187 |
Ascentium Equipment Receivables Trust (ACER)(c) | | |
| 2016-2A CL E — 6.79% 2024 (0.9 years) | 422,000 | 434,638 |
| 2018-2A CL B — 3.76% 2024 (3.3 years) | 213,000 | 217,511 |
| CarMax Auto Owner Trust (CARMX) | | |
| 2017-2 CL B — 2.41% 2022 (2.6 years) | 90,000 | 89,222 |
| 2017-2 CL C — 2.6% 2023 (2.9 years) | 53,000 | 52,430 |
| 2017-4 CL C — 2.7% 2023 (3.3 years) | 51,000 | 50,444 |
Carvana Auto Receivables Trust (CRVNA)(c) | | |
| 2019-1A CL C — 3.9% 2024 (3.1 years) | 700,000 | 703,145 |
Chesapeake Funding II LLC (CFII)(c) | | |
| 2017-3A CL D — 3.38% 2029 (1.8 years) | 550,000 | 550,188 |
Commercial Credit Group Receivables Trust (CCG)(c) | | |
| 2017-1 CL B — 2.75% 2023 (1.6 years) | 410,000 | 408,840 |
Credit Acceptance Auto Loan Trust (CAALT)(c) | | |
| 2016-2A CL C — 4.29% 2024 (0.4 years) | 260,000 | 261,027 |
| 2016-3A CL B — 2.94% 2024 (0.7 years) | 427,000 | 425,780 |
Dell Equipment Finance Trust (DEFT)(c) | | |
| 2017-2 CL B — 2.47% 2022 (1.3 years) | 100,000 | 99,569 |
| 2018-2 CL C — 3.72% 2023 (2.5 years) | 100,000 | 101,929 |
| Drive Auto Receivables Trust (DRIVE) | | |
2017-AA CL D — 4.16% 2024 (1.3 years)(c) | 290,000 | 293,616 |
| 2018-1 CL D — 3.81% 2024 (1.4 years) | 590,000 | 595,117 |
DT Auto Owner Trust (DTAOT)(c) | | |
| 2016-3A CL C — 3.15% 2022 (0.0 years) | 7,128 | 7,130 |
| 2017-4A CL C — 2.86% 2023 (0.5 years) | 140,000 | 139,856 |
| 2018-1A CL B — 3.04% 2022 (0.6 years) | 300,000 | 300,162 |
| 2016-4A CL D — 3.77% 2022 (0.9 years) | 85,000 | 85,578 |
Enterprise Fleet Financing LLC (EFF)(c) | | |
| 2017-2 CL A2 — 1.97% 2023 (0.5 years) | 203,689 | 202,780 |
Exeter Automobile Receivables Trust (EART)(c) | | |
| 2018-2A CL A — 2.79% 2021 (0.2 years) | 67,220 | 67,219 |
| 2017-3A CL A — 2.05% 2021 (0.3 years) | 88,412 | 88,151 |
| 2016-3A CL B — 2.84% 2021 (0.3 years) | 262,234 | 262,441 |
| 2017-2A CL B — 2.82% 2022 (0.6 years) | 160,000 | 159,859 |
| 2016-2A CL C — 5.96% 2022 (0.7 years) | 480,000 | 489,537 |
| 2017-1A CL C — 3.95% 2022 (1.2 years) | 650,000 | 656,030 |
| 2018-2A CL C — 3.69% 2023 (1.4 years) | 150,000 | 151,220 |
| 2017-3A CL C — 3.68% 2023 (1.9 years) | 88,000 | 88,817 |
The accompanying notes form an integral part of these financial statements.
36 | Q1 2019 ANNUAL REPORT
WEITZINVESTMENTS.COM
| | | |
| | $ Principal | |
| | Amount | $ Value |
| |
First Investors Auto Owners Trust (FIAOT)(c) | | |
| 2015-2A CL D — 4.22% 2021 (1.1 years) | 287,000 | 289,044 |
| 2017-1A CL B — 2.67% 2023 (1.1 years) | 187,000 | 186,314 |
| 2016-2A CL C — 2.53% 2022 (1.5 years) | 116,000 | 115,044 |
| 2017-1A CL C — 2.95% 2023 (1.6 years) | 505,000 | 503,805 |
| 2018-1A CL C — 3.69% 2024 (2.2 years) | 177,000 | 179,387 |
Flagship Credit Auto Trust (FCAT)(c) | | |
| 2014-2 CL C — 3.95% 2020 (0.1 years) | 252,138 | 252,442 |
| 2015-2 CL B — 3.08% 2021 (0.2 years) | 157,183 | 157,232 |
Foundation Finance Trust (FFIN)(c) | | |
| 2019-1A CL A — 3.86% 2034 (2.1 years) | 700,000 | 700,767 |
General Motors (GFORT)(c) | | |
| 2017-3 CL C — 2.46% 2021 (0.4 years) | 100,000 | 99,746 |
| 2017-1 CL C — 2.97% 2022 (0.8 years) | 100,000 | 99,994 |
Hertz Fleet Lease Funding LP (HFLF)(c) | | |
| 2018-1 CL A2 — 3.23% 2032 (1.1 years) | 370,000 | 370,845 |
Marlette Funding Trust (MFT)(c) | | |
| 2016-1A CL B — 4.78% 2023 (0.0 years) | 50,257 | 50,293 |
| 2016-1A CL C — 9.09% 2023 (0.0 years) | 100,000 | 100,538 |
| 2017-1A CL A — 2.827% 2024 (0.0 years) | 4,663 | 4,663 |
| 2017-1A CL B — 4.114% 2024 (0.3 years) | 350,000 | 351,153 |
| 2018-2A CL A — 3.06% 2028 (0.5 years) | 85,300 | 85,278 |
| 2018-3A CL A — 3.2% 2028 (0.6 years) | 246,138 | 246,302 |
OneMain Direct Auto Receivables Trust (ODART)(c) | | |
| 2017-1A CL B — 2.88% 2021 (0.4 years) | 200,000 | 199,931 |
| 2017-2A CL C — 2.82% 2024 (1.6 years) | 285,000 | 283,519 |
| 2017-2A CL D — 3.42% 2024 (1.9 years) | 300,000 | 298,718 |
OneMain Financial Issuance Trust (OMFIT)(c) | | |
| 2015-1A CL A — 3.19% 2026 (0.1 years) | 15,844 | 15,866 |
| 2015-2A CL C — 4.32% 2025 (0.2 years) | 164,290 | 164,580 |
| 2015-2A CL D — 5.64% 2025 (0.9 years) | 380,000 | 381,881 |
| 2016-2A CL C — 5.67% 2028 (1.0 years) | 510,000 | 513,708 |
| 2015-1A CL D — 6.63% 2026 (1.2 years) | 400,000 | 407,408 |
Prosper Marketplace Issuance Trust (PMIT)(c) | | |
| 2019-1A CL A — 3.54% 2025 (0.8 years) | 473,430 | 474,318 |
| Santander Drive Auto Receivables Trust (SDART) | | |
| 2016-3 CL B — 1.89% 2021 (0.1 years) | 64,110 | 64,064 |
| 2015-5 CL C — 2.74% 2021 (0.1 years) | 30,546 | 30,538 |
| 2014-5 CL D — 3.21% 2021 (0.2 years) | 50,094 | 50,109 |
| 2015-4 CL D — 3.53% 2021 (0.7 years) | 100,000 | 100,390 |
| 2015-5 CL D — 3.65% 2021 (0.7 years) | 245,000 | 246,229 |
| 2017-1 CL C — 2.58% 2022 (0.7 years) | 131,000 | 130,661 |
| 2016-3 CL D — 2.8% 2022 (1.4 years) | 400,000 | 399,735 |
SoFi Consumer Loan Program LLC (SCLP)(c) | | |
| 2016-2 CL A — 3.09% 2025 (0.7 years) | 179,431 | 179,647 |
| 2016-3 CL A — 3.05% 2025 (0.7 years) | 50,352 | 50,377 |
| 2017-1 CL A — 3.28% 2026 (0.9 years) | 31,374 | 31,490 |
Springleaf Funding Trust (SLFT)(c) | | |
| 2015-AA CL A — 3.16% 2024 (0.0 years) | 25,096 | 25,099 |
| 2015-AA CL C — 5.04% 2024 (1.0 years) | 200,000 | 200,880 |
Upgrade Receivables Trust (UPGR)(c) | | |
| 2018-1A CL C — 5.17% 2024 (2.1 years) | 100,000 | 101,114 |
Upstart Securitization Trust (UPST)(c) | | |
| 2018-1 CL B — 3.887% 2025 (0.4 years) | 738,036 | 739,362 |
| 2017-2 CL B — 3.748% 2025 (0.6 years) | 250,000 | 250,105 |
| 2019-1 CL B — 4.19% 2026 (1.7 years) | 500,000 | 502,632 |
| 2017-2 CL C — 5.59% 2025 (1.7 years) | 500,000 | 508,078 |
Verizon Owner Trust (VZOT)(c) | | |
| 2017-2A CL C — 2.38% 2021 (1.6 years) | 100,000 | 99,229 |
Westlake Automobile Receivables Trust (WLAKE)(c) | | |
| 2017-1A CL C — 2.7% 2022 (0.5 years) | 117,000 | 116,794 |
| 2018-1A CL C — 2.92% 2023 (1.1 years) | 188,000 | 187,877 |
Total Asset-Backed Securities (Cost $17,648,083) | | 17,708,672 |
| | | |
Commercial Mortgage-Backed | | |
Securities – 8.0%(b) | $ Principal | |
| | Amount | $ Value |
| |
Arbor Realty Collateralized Loan Obligation Ltd. (ARCLO)(c) (d) | |
| 2017-FL1 CL B — 4.98375% 2027 Floating Rate | | |
| (Mthly LIBOR + 250) (2.7 years) | 800,000 | 806,184 |
BSPRT Ltd. (BSPRT)(c) (d) | | |
| 2017-FL2 CL B — 3.88375% 2034 Floating Rate | | |
| (Mthly LIBOR + 140) (0.1 years) | 250,000 | 249,488 |
| 2017-FL2 CL C — 4.63375% 2034 Floating Rate | | |
| (Mthly LIBOR + 215) (0.5 years) | 250,000 | 250,087 |
BXMT Ltd. (BXMT)(c) (d) | | |
| 2017-FL1 CL A — 3.35375% 2035 Floating Rate | | |
| (Mthly LIBOR + 87) (0.4 years) | 500,000 | 500,594 |
GPMT Ltd. (GPMT)(c) (d) | | |
| 2018-FL1 CL C — 4.63675% 2035 Floating Rate | | |
| (Mthly LIBOR + 215) (1.7 years) | 550,000 | 545,875 |
Greystone Commercial Real Estate Notes (GSTNE)(c) (d) | | |
| 2017-FL1A CL B — 5.23375% 2027 Floating Rate | | |
| (Mthly LIBOR + 275) (2.3 years) | 104,925 | 105,991 |
Hilton USA Trust (HILT)(c) | | |
| 2016-SFP CL E — 5.519097% 2035 (4.6 years) | 700,000 | 715,322 |
Ladder Capital Commercial Mortgage Securities LLC (LCCM)(c) | |
| 2017-FL1 CL A — 3.36375% 2034 Floating Rate | | |
| (Mthly LIBOR + 88) (0.2 years) | 371,506 | 371,744 |
PFP Ltd. (PFP)(c) | | |
| 2017-3 CL C — 4.98375% 2035 Floating Rate | | |
| (Mthly LIBOR + 250) (0.3 years) | 168,736 | 169,054 |
| 2017-3 CL D — 5.98375% 2035 Floating Rate | | |
| (Mthly LIBOR + 350) (0.5 years) | 750,000 | 751,399 |
Readycap Commercial Mortgage Trust (RCMT)(c) | | |
| 2019-FL3 CL A — 3.5% 2034 Floating Rate | | |
| (Mthly LIBOR + 100) (2.2 years) | 673,000 | 673,000 |
Resource Capital Corp. Ltd. (RSO)(c) (d) | | |
| 2017-CRE5 CL B — 4.48375% 2034 Floating Rate | | |
| (Mthly LIBOR + 200) (0.6 years) | 142,248 | 142,293 |
TPG Real Estate Finance Ltd. (TRTX)(c) (d) | | |
| 2018-FL1 CL AS — 3.43375% 2035 Floating Rate | | |
| (Mthly LIBOR + 95) (0.5 years) | 400,000 | 399,773 |
| 2018-FL1 CL C — 4.38375% 2035 Floating Rate | | |
| (Mthly LIBOR + 190) (0.7 years) | 200,000 | 200,508 |
VMC Finance LLC (VMC)(c) | | |
| 2018-FL1 CL AS — 3.68375% 2035 Floating Rate | | |
| (Mthly LIBOR + 120) (1.2 years) | 400,000 | 398,448 |
Total Commercial Mortgage-Backed Securities (Cost $6,274,020) | 6,279,760 |
| |
Mortgage-Backed Securities – 3.3%(b) | | |
| |
Federal National Mortgage Association | | |
| |
Pass-Through Securities | | |
| 932836 — 3.0% 2025 (2.6 years) | 66,713 | 67,591 |
| MA3443 — 4.0% 2048 (5.6 years) | 971,416 | 1,001,864 |
| | | 1,069,455 |
Non-Government Agency | | |
| |
Collateralized Mortgage Obligations | | |
COLT Funding LLC (COLT)(c) (f) | | |
| 2017-2 CL A1A — 2.415% 2047 (1.2 years) | 141,721 | 141,628 |
Flagstar Mortgage Trust (FSMT)(c) (f) | | |
| 2017-1 CL 2A2 — 3.0% 2047 (4.9 years) | 269,535 | 269,979 |
The accompanying notes form an integral part of these financial statements.
37 | Q1 2019 ANNUAL REPORT
CORE PLUS INCOME FUND (CONTINUED)
| | | |
| | $ Principal | |
| | Amount | $ Value |
| |
J.P. Morgan Mortgage Trust (JPMMT)(c) (f) | | |
| 2018-6 CL 2A2 — 3.0% 2048 (4.4 years) | 267,774 | 267,216 |
| 2016-3 CL 2A1 — 3.0% 2046 (5.1 years) | 269,765 | 269,555 |
| 2017-3 CL 2A2 — 2.5% 2047 (5.4 years) | 273,812 | 269,128 |
Sequoia Mortgage Trust (SEMT)(c) (f) | | |
| 2017-CH1 CL A11 — 3.5% 2047 (1.9 years) | 270,902 | 271,844 |
| | | 1,489,350 |
Total Mortgage-Backed Securities (Cost $2,532,072) | 2,558,805 |
| |
Taxable Municipal Bonds – 0.5% | | |
| |
| Alderwood Water and Wastewater District, Washington, | | |
| Water & Sewer Revenue, Series B, 5.15% 12/01/25 | | |
| (Cost $409,042) | 400,000 | 411,116 |
| |
U.S. Treasury – 29.8% | | |
| |
U.S. Treasury Notes/Bonds | | |
| 2.0% 2/15/25 | 970,000 | 954,806 |
| 2.125% 5/15/25 | 2,500,000 | 2,475,586 |
| 2.25% 11/15/25 | 3,500,000 | 3,486,465 |
| 1.625% 5/15/26 | 1,500,000 | 1,431,826 |
| 1.5% 8/15/26 | 850,000 | 802,188 |
| 2.0% 11/15/26 | 1,650,000 | 1,611,264 |
| 2.25% 2/15/27 | 1,875,000 | 1,862,329 |
| 2.375% 5/15/27 | 2,000,000 | 2,004,180 |
| 2.75% 2/15/28 | 2,250,000 | 2,316,665 |
| 3.5% 2/15/39 | 2,100,000 | 2,384,566 |
| 2.5% 5/15/46 | 4,350,000 | 4,099,280 |
Total U.S. Treasury (Cost $22,762,501) | | 23,429,155 |
| | | |
Common Stocks – 0.3% | | |
| | Shares | $ Value |
| | | |
| Redwood Trust, Inc. (Cost $192,471) | 14,850 | 239,828 |
| |
Cash Equivalents – 5.6% | | |
| State Street Institutional U.S. Government Money | | |
Market Fund - Premier Class 2.39%(a) | 4,398,639 | 4,398,639 |
Total Cash Equivalents (Cost $4,398,639) | | 4,398,639 |
Total Investments in Securities (Cost $75,302,449) | | 76,429,085 |
| Other Assets Less Other Liabilities – 2.7% | | 2,098,397 |
Net Assets - 100% | | 78,527,482 |
Net Asset Value Per Share - Investor Class | | 10.31 |
Net Asset Value Per Share - Institutional Class | | 10.32 |
(a) | Rate presented represents the annualized 7-day yield at March 31, 2019. |
(b) | Number of years indicated represents estimated average life. |
(c) | Security is exempt from registration under Rule 144A of the Securities Act of 1933. This security may be resold in transactions that are exempt from registration, normally to qualified institutional buyers. |
(d) | Foreign domiciled entity |
(e) | Annual sinking fund |
(f) | The interest rate resets periodically based on the weighted average coupons of the underlying mortgage-related or asset-backed obligations. |
The accompanying notes form an integral part of these financial statements.
38 | Q1 2019 ANNUAL REPORT
WEITZINVESTMENTS.COM
SHORT DURATION INCOME FUND
Schedule of Investments
March 31, 2019
| | | |
Corporate Bonds – 35.6% | | |
| | $ Principal | |
| | Amount | $ Value |
| |
| American Express Co. 8.125% 5/20/19 | 5,616,000 | 5,655,624 |
| American Express Credit Corp. 2.25% 8/15/19 | 11,042,000 | 11,025,098 |
| Andeavor Logistics LP 6.25% 10/15/22 | 210,000 | 216,300 |
| Anheuser-Busch InBev Finance Inc. 3.3% 2/01/23 | 4,800,000 | 4,873,377 |
| Bank of America Corp. 2.25% 4/21/20 | 12,000,000 | 11,939,026 |
| Berkshire Hathaway Inc. | | |
| 2.1% 8/14/19 | 2,750,000 | 2,744,337 |
| Finance Corp. | | |
| 3.1025% 1/10/20 Floating Rate (Qtrly LIBOR + 32) | 7,000,000 | 7,017,785 |
| 2.9% 10/15/20 | 3,000,000 | 3,020,971 |
| 4.25% 1/15/21 | 4,200,000 | 4,336,705 |
| Boardwalk Pipelines LLC 5.75% 9/15/19 | 11,008,000 | 11,124,634 |
| Boston Properties LP 3.125% 9/01/23 | 9,560,000 | 9,627,440 |
| Calumet Specialty Products Partners LP 7.625% 1/15/22 | 900,000 | 834,750 |
| Capital One Bank USA, N.A. | | |
| 2.3% 6/05/19 | 7,000,000 | 6,995,197 |
| 8.8% 7/15/19 | 3,500,000 | 3,559,044 |
| Capital One Financial Corp. 2.5% 5/12/20 | 5,000,000 | 4,985,490 |
| Capital One N.A. 2.4% 9/05/19 | 2,000,000 | 1,996,268 |
| Carlisle Companies Inc. 3.5% 12/01/24 | 500,000 | 500,185 |
| CenturyLink, Inc. 5.625% 4/01/20 | 750,000 | 767,205 |
Colfax Corp. 6.0% 2/15/24(c) | 1,000,000 | 1,045,000 |
| Comcast Corp. 5.15% 3/01/20 | 3,000,000 | 3,066,208 |
| Computer Sciences Corp. 4.45% 9/15/22 | 325,000 | 333,952 |
| Discovery, Inc. 2.95% 3/20/23 | 1,600,000 | 1,586,492 |
| Dominion Resources, Inc. 2.962% 7/01/19 | 9,883,000 | 9,885,124 |
| eBay, Inc. 2.2% 8/01/19 | 3,000,000 | 2,994,308 |
| EPR Properties 5.75% 8/15/22 | 2,600,000 | 2,771,076 |
| Equifax Inc. 2.3% 6/01/21 | 2,900,000 | 2,847,886 |
| Equity Commonwealth 5.875% 9/15/20 | 14,195,000 | 14,529,777 |
| Express Scripts Holding Co. | | |
| 2.25% 6/15/19 | 8,955,000 | 8,941,711 |
| 7.25% 6/15/19 | 5,217,000 | 5,259,945 |
| Fifth Third Bank 1.625% 9/27/19 | 2,000,000 | 1,989,431 |
| First Republic Bank 2.375% 6/17/19 | 2,753,000 | 2,750,436 |
| Flir Systems, Inc. 3.125% 6/15/21 | 2,600,000 | 2,592,977 |
| Ford Motor Credit Co. LLC | | |
| 2.021% 5/03/19 | 10,000,000 | 9,991,093 |
| 1.897% 8/12/19 | 1,000,000 | 995,889 |
| Fortive Corp. 1.8% 6/15/19 | 750,000 | 746,906 |
| General Motors Financial Company, Inc. 3.55% 4/09/21 | 1,250,000 | 1,257,104 |
| Goldman Sachs Group, Inc. | | |
| 3.40825% 12/13/19 Floating Rate (Qtrly LIBOR + 80) | 6,250,000 | 6,274,975 |
| 3.93238% 4/23/20 Floating Rate (Qtrly LIBOR + 116) | 5,479,000 | 5,522,838 |
| 2.6% 12/27/20 | 1,500,000 | 1,492,614 |
Invista B.V. 4.25% 10/15/19(c) | 4,980,000 | 5,025,623 |
| JPMorgan Chase & Co. | | |
| 6.3% 4/23/19 | 2,500,000 | 2,505,223 |
| 3.15063% 3/09/21 Floating Rate (Qtrly LIBOR + 55) | 1,850,000 | 1,852,394 |
| JPMorgan Chase Bank, N.A. 3.1915% 9/23/19 Floating | | |
| Rate (Qtrly LIBOR + 59) | 12,000,000 | 12,026,271 |
| Lennar Corp. 4.5% 6/15/19 | 3,977,000 | 3,979,486 |
The Manitowoc Company, Inc. 12.75% 8/15/21(c) | 8,950,000 | 9,575,605 |
| Markel Corp. | | |
| 7.125% 9/30/19 | 11,859,000 | 12,079,617 |
| 5.35% 6/01/21 | 10,000,000 | 10,433,896 |
| 4.9% 7/01/22 | 3,850,000 | 4,065,599 |
| Omnicom Group, Inc. 6.25% 7/15/19 | 6,181,000 | 6,238,005 |
| Plains All American Pipeline, LP 2.6% 12/15/19 | 1,345,000 | 1,340,492 |
| QVC, Inc. 3.125% 4/01/19 | 1,611,000 | 1,611,000 |
| Range Resources Corp. 5.0% 8/15/22 | 6,000,000 | 5,970,000 |
| RELX plc 3.5% 3/16/23 | 1,800,000 | 1,825,514 |
| | | |
| | $ Principal | |
| | Amount | $ Value |
| |
Silversea Cruise Holding Ltd. 7.25% 2/01/25(d) | 1,545,000 | 1,678,643 |
Sprint Spectrum Co. LLC 3.36% 3/20/23(c) (e) | 2,968,750 | 2,975,281 |
| U.S. Bancorp 2.35% 1/29/21 | 14,000,000 | 13,952,995 |
| U.S. Bank, N.A. 3.09925% 1/24/20 Floating Rate | | |
| (Qtrly LIBOR + 32) | 7,000,000 | 7,015,305 |
| Walt Disney Co. 0.875% 7/12/19 | 1,000,000 | 995,174 |
| Wells Fargo & Co. | | |
| 2.125% 4/22/19 | 2,800,000 | 2,799,181 |
| 4.6% 4/01/21 | 5,745,000 | 5,937,112 |
| 2.1% 7/26/21 | 10,100,000 | 9,946,067 |
| 3.5% 3/08/22 | 7,900,000 | 8,055,326 |
| Wells Fargo Bank, N.A. 2.15% 12/06/19 | 10,000,000 | 9,966,323 |
Total Corporate Bonds (Cost $319,311,200) | | 319,945,310 |
| |
Corporate Convertible Bonds – 3.4% | | |
| |
| Redwood Trust, Inc. | | |
| 5.625% 11/15/19 | 14,850,000 | 14,980,400 |
| 4.75% 8/15/23 | 10,000,000 | 9,611,702 |
| 5.625% 7/15/24 | 6,300,000 | 6,164,530 |
Total Corporate Convertible Bonds (Cost $31,094,424) | 30,756,632 |
| |
Asset-Backed Securities – 14.5%(b) | | |
| |
ARI Fleet Lease Trust (ARIFL)(c) | | |
| 2018-B CL A2 — 3.22% 2027 (1.3 years) | 1,000,000 | 1,004,787 |
Ascentium Equipment Receivables Trust (ACER)(c) | | |
| 2018-1A CL A2 — 2.92% 2020 (0.4 years) | 3,801,864 | 3,805,530 |
| 2016-2A CL E — 6.79% 2024 (0.9 years) | 1,600,000 | 1,647,917 |
Carvana Auto Receivables Trust (CRVNA)(c) | | |
| 2019-1A CL B — 3.29% 2023 (2.4 years) | 5,000,000 | 5,016,602 |
| 2019-1A CL C — 3.9% 2024 (3.1 years) | 300,000 | 301,348 |
Chesapeake Funding II LLC (CFII)(c) | | |
| 2017-3A CL D - 3.38% 2029 (1.8 years) | 385,000 | 385,132 |
Conn Funding II, LP (CONN)(c) | | |
| 2018-A CL A — 3.25% 2023 (0.2 years) | 812,859 | 814,165 |
Credit Acceptance Auto Loan Trust (CAALT)(c) | | |
| 2016-2A CL B — 3.18% 2024 (0.2 years) | 1,185,000 | 1,185,046 |
| 2016-2A CL C — 4.29% 2024 (0.4 years) | 300,000 | 301,185 |
| Drive Auto Receivables Trust (DRIVE) | | |
| 2018-1 CL B — 2.88% 2022 (0.2 years) | 1,572,896 | 1,573,017 |
| 2018-4 CL A3 — 3.04% 2021 (0.3 years) | 2,500,000 | 2,502,068 |
| 2017-1 CL D — 3.84% 2023 (1.1 years) | 6,000,000 | 6,048,325 |
Exeter Automobile Receivables Trust (EART)(c) | | |
| 2015-1A CL C — 4.1% 2020 (0.2 years) | 176,221 | 176,519 |
| 2018-2A CL A — 2.79% 2021 (0.2 years) | 2,487,150 | 2,487,110 |
| 2017-3A CL A — 2.05% 2021 (0.3 years) | 906,226 | 903,548 |
| 2018-3A CL A — 2.9% 2022 (0.4 years) | 1,970,987 | 1,970,864 |
| 2016-2A CL C — 5.96% 2022 (0.7 years) | 5,100,000 | 5,201,328 |
Foundation Finance Trust (FFIN)(c) | | |
| 2019-1A CL A — 3.86% 2034 (2.1 years) | 4,300,000 | 4,304,709 |
GLS Auto Receivables Trust (GCAR)(c) | | |
| 2018-1A CL A — 2.82% 2022 (0.8 years) | 420,287 | 419,681 |
| 2018-3A CL A — 3.35% 2022 (0.8 years) | 1,171,372 | 1,173,257 |
Hertz Fleet Lease Funding LP (HFLF)(c) | | |
| 2018-1 CL A1 — 2.99275% 2032 Floating Rate | | |
| (Mthly LIBOR + 50) (1.1 years) | 4,000,000 | 4,000,918 |
| 2018-1 CL A2 — 3.23% 2032 (1.1 years) | 1,900,000 | 1,904,338 |
The accompanying notes form an integral part of these financial statements.
39 | Q1 2019 ANNUAL REPORT
SHORT DURATION INCOME FUND (CONTINUED)
| | | |
| | $ Principal | |
| | Amount | $ Value |
| |
Marlette Funding Trust (MFT)(c) | | |
| 2016-1A CL B — 4.78% 2023 (0.0 years) | 251,283 | 251,466 |
| 2017-1A CL A — 2.827% 2024 (0.0 years) | 69,946 | 69,943 |
| 2017-2A CL A — 2.39% 2024 (0.0 years) | 104,690 | 104,667 |
| 2017-3A CL A — 2.36% 2024 (0.2 years) | 566,196 | 565,427 |
| 2017-1A CL B — 4.114% 2024 (0.3 years) | 1,650,000 | 1,655,437 |
| 2018-1A CL A — 2.61% 2028 (0.3 years) | 1,438,966 | 1,436,562 |
| 2017-2A CL B — 3.19% 2024 (0.3 years) | 3,000,000 | 2,999,986 |
| 2018-2A CL A — 3.06% 2028 (0.5 years) | 1,742,556 | 1,742,105 |
| 2018-3A CL A — 3.2% 2028 (0.6 years) | 5,599,644 | 5,603,370 |
| 2018-4A CL A — 3.71% 2028 (1.0 years) | 2,101,389 | 2,116,376 |
| 2019-1A CL A — 3.44% 2029 (1.0 years) | 1,500,000 | 1,505,207 |
| 2018-1A CL C — 3.69% 2028 (1.5 years) | 1,832,000 | 1,829,933 |
OneMain Direct Auto Receivables Trust (ODART)(c) | | |
| 2017-2A CL B — 2.55% 2023 (1.2 years) | 7,000,000 | 6,959,061 |
OneMain Financial Issuance Trust (OMFIT)(c) | | |
| 2015-2A CL C — 4.32% 2025 (0.2 years) | 3,942,952 | 3,949,930 |
| 2016-2A CL B — 5.94% 2028 (0.5 years) | 1,195,000 | 1,204,957 |
| 2015-2A CL D — 5.64% 2025 (0.9 years) | 6,000,000 | 6,029,694 |
| 2016-2A CL C — 5.67% 2028 (1.0 years) | 2,500,000 | 2,518,179 |
| 2015-1A CL D — 6.63% 2026 (1.2 years) | 1,600,000 | 1,629,632 |
Prestige Auto Receivables Trust (PART)(c) | | |
| 2018-1A CL A2 — 2.97% 2021 (0.5 years) | 3,889,735 | 3,891,329 |
Prosper Marketplace Issuance Trust (PMIT)(c) | | |
| 2019-1A CL A — 3.54% 2025 (0.8 years) | 710,145 | 711,477 |
Social Professional Loan Program LLC (SOFI)(c) | | |
| 2019-B CL A1FX — 2.78% 2048 (1.5 years) | 6,000,000 | 5,991,797 |
SoFi Consumer Loan Program LLC (SCLP)(c) | | |
| 2017-6 CL A1 — 2.2% 2026 (0.2 years) | 926,498 | 924,042 |
| 2018-1 CL A1 — 2.55% 2027 (0.3 years) | 456,496 | 455,341 |
| 2016-2 CL A — 3.09% 2025 (0.7 years) | 2,173,675 | 2,176,298 |
| 2016-3 CL A — 3.05% 2025 (0.7 years) | 453,171 | 453,392 |
| 2017-1 CL A — 3.28% 2026 (0.9 years) | 439,233 | 440,854 |
Springleaf Funding Trust (SLFT)(c) | | |
| 2015-AA CL A — 3.16% 2024 (0.0 years) | 947,372 | 947,469 |
| 2015-AA CL C — 5.04% 2024 (1.0 years) | 6,800,000 | 6,829,911 |
Upgrade Receivables Trust (UPGR)(c) | | |
| 2019-1A CL A — 3.48% 2025 (1.0 years) | 1,500,000 | 1,504,031 |
Upstart Securitization Trust (UPST)(c) | | |
| 2018-2 CL A — 3.33% 2025 (0.4 years) | 1,822,920 | 1,823,205 |
| 2018-1 CL B — 3.887% 2025 (0.4 years) | 1,968,095 | 1,971,632 |
| 2019-1 CL A — 3.45% 2026 (0.6 years) | 2,179,000 | 2,182,658 |
| 2017-2 CL B — 3.748% 2025 (0.6 years) | 2,000,000 | 2,000,842 |
| 2017-1 CL C — 6.35% 2024 (1.0 years) | 3,000,000 | 3,059,283 |
| 2017-2 CL C — 5.59% 2025 (1.7 years) | 2,500,000 | 2,540,389 |
Westlake Automobile Receivables Trust (WLAKE)(c) | | |
| 2018-3A CL A2A — 2.98% 2022 (0.7 years) | 3,000,000 | 3,003,842 |
Total Asset-Backed Securities (Cost $130,053,273) | | 130,207,118 |
| |
Commercial Mortgage-Backed Securities – 3.2%(b) | |
| |
Arbor Realty Collateralized Loan Obligation Ltd. (ARCLO)(c) (d) | |
| 2017-FL1 CL B — 4.98375% 2027 Floating Rate | | |
| (Mthly LIBOR + 250) (2.7 years) | 6,000,000 | 6,046,378 |
BXMT Ltd. (BXMT)(c) (d) | | |
| 2017-FL1 CL A — 3.35375% 2035 Floating Rate | | |
| (Mthly LIBOR + 87) (0.4 years) | 500,000 | 500,594 |
GPMT Ltd. (GPMT)(c) (d) | | |
| 2018-FL1 CL A — 3.38675% 2035 | | |
| (Mthly LIBOR + 90) (1.0 years) | 3,812,795 | 3,808,887 |
| 2018-FL1 CL C — 4.63675% 2035 Floating Rate | | |
| (Mthly LIBOR + 215) (1.7 years) | 3,300,000 | 3,275,250 |
| | | |
| | $ Principal | |
| | Amount | $ Value |
| |
Hilton USA Trust (HILT)(c) | | |
| 2016-SFP CL E — 5.519097% 2035 (4.6 years) | 4,300,000 | 4,394,120 |
PFP Ltd. (PFP)(c) | | |
| 2017-3 CL C — 4.98375% 2035 Floating Rate | | |
| (Mthly LIBOR + 250) (0.3 years) | 2,024,830 | 2,028,647 |
| 2017-3 CL D — 5.98375% 2035 Floating Rate | | |
| (Mthly LIBOR + 350) (0.5 years) | 1,250,000 | 1,252,331 |
TPG Real Estate Finance Ltd. (TRTX)(c) (d) | | |
| 2018-FL1 CL A — 3.23375% 2035 Floating Rate | | |
| (Mthly LIBOR + 75) (0.4 years) | 1,739,743 | 1,740,931 |
| 2018-FL1 CL C — 4.38375% 2035 Floating Rate | | |
| (Mthly LIBOR + 190) (0.7 years) | 4,500,000 | 4,511,430 |
VMC Finance LLC (VMC)(c) | | |
| 2018-FL1 CL A — 3.30375% 2035 Floating Rate | | |
| (Mthly LIBOR + 82) (0.7 years) | 1,298,920 | 1,294,580 |
Total Commercial Mortgage-Backed Securities (Cost $28,837,743) | 28,853,148 |
| |
Mortgage-Backed Securities – 17.0%(b) | | |
| |
Federal Home Loan Mortgage Corporation | | |
| |
Collateralized Mortgage Obligations | | |
| 4281 CL AG — 2.5% 2028 (2.1 years) | 1,031,495 | 1,016,224 |
| 3649 CL BW — 4.0% 2025 (2.2 years) | 1,373,641 | 1,406,027 |
| 2952 CL PA — 5.0% 2035 (2.8 years) | 424,679 | 443,148 |
| 3620 CL PA — 4.5% 2039 (3.3 years) | 1,006,325 | 1,057,028 |
| 4107 CL LA — 2.5% 2031 (4.1 years) | 6,957,642 | 6,759,314 |
| 3842 CL PH — 4.0% 2041 (4.2 years) | 1,112,638 | 1,170,947 |
| 3003 CL LD — 5.0% 2034 (4.3 years) | 1,117,039 | 1,220,837 |
| 4107 CL LW — 1.75% 2027 (7.0 years) | 3,920,532 | 3,631,313 |
| | | 16,704,838 |
Pass-Through Securities | | |
| G18190 — 5.5% 2022 (1.3 years) | 13,828 | 14,281 |
| G13300 — 4.5% 2023 (1.6 years) | 86,640 | 89,312 |
| G18296 — 4.5% 2024 (1.9 years) | 230,474 | 237,567 |
| G18306 — 4.5% 2024 (1.9 years) | 490,207 | 505,370 |
| G13517 — 4.0% 2024 (1.9 years) | 333,729 | 344,674 |
| G18308 — 4.0% 2024 (2.0 years) | 504,780 | 521,335 |
| J13949 — 3.5% 2025 (2.5 years) | 3,135,163 | 3,220,681 |
| E02804 — 3.0% 2025 (2.6 years) | 1,981,789 | 2,008,571 |
| J14649 — 3.5% 2026 (2.6 years) | 2,499,316 | 2,560,458 |
| E02948 — 3.5% 2026 (2.7 years) | 5,374,645 | 5,511,702 |
| J16663 — 3.5% 2026 (2.8 years) | 4,938,888 | 5,059,710 |
| E03033 — 3.0% 2027 (2.9 years) | 3,094,132 | 3,136,016 |
| E03048 — 3.0% 2027 (2.9 years) | 5,946,715 | 6,027,353 |
| G01818 — 5.0% 2035 (4.5 years) | 1,258,645 | 1,356,841 |
| | | 30,593,871 |
| | | 47,298,709 |
Federal National Mortgage Association | | |
| |
Collateralized Mortgage Obligations | | |
| 2010-145 CL PA — 4.0% 2024 (1.0 years) | 318,225 | 319,966 |
| 2010-54 CL WA — 3.75% 2025 (1.7 years) | 595,391 | 599,779 |
| |
| | | 919,745 |
The accompanying notes form an integral part of these financial statements.
40 | Q1 2019 ANNUAL REPORT
WEITZINVESTMENTS.COM
| | | |
| | $ Principal | |
| | Amount | $ Value |
| |
Pass-Through Securities | | |
| MA0464 — 3.5% 2020 (0.5 years) | 337,009 | 344,921 |
| 357985 — 4.5% 2020 (0.7 years) | 15,006 | 15,275 |
| 888595 — 5.0% 2022 (1.0 years) | 54,961 | 56,236 |
| 888439 — 5.5% 2022 (1.1 years) | 64,897 | 66,452 |
| AD0629 — 5.0% 2024 (1.3 years) | 246,502 | 253,015 |
| 995960 — 5.0% 2023 (1.4 years) | 215,045 | 220,348 |
| 995693 — 4.5% 2024 (1.6 years) | 457,548 | 470,632 |
| AR8198 — 2.5% 2023 (1.6 years) | 3,230,223 | 3,217,978 |
| AL0471 — 5.5% 2025 (1.6 years) | 1,086,224 | 1,126,717 |
| MA1502 — 2.5% 2023 (1.7 years) | 2,651,907 | 2,641,858 |
| AE0031 — 5.0% 2025 (1.7 years) | 447,273 | 459,978 |
| 995692 — 4.5% 2024 (1.8 years) | 388,105 | 399,264 |
| 995755 — 4.5% 2024 (1.9 years) | 618,497 | 636,413 |
| 890112 — 4.0% 2024 (1.9 years) | 312,350 | 321,930 |
| 930667 — 4.5% 2024 (1.9 years) | 388,141 | 399,398 |
| AA4315 — 4.0% 2024 (1.9 years) | 657,496 | 677,660 |
| MA0043 — 4.0% 2024 (1.9 years) | 254,443 | 262,246 |
| AA5510 — 4.0% 2024 (1.9 years) | 157,541 | 162,385 |
| 931739 — 4.0% 2024 (2.1 years) | 174,943 | 180,335 |
| AD7073 — 4.0% 2025 (2.3 years) | 559,193 | 576,342 |
| 310139 — 3.5% 2025 (2.5 years) | 3,756,520 | 3,844,710 |
| AH3429 — 3.5% 2026 (2.5 years) | 9,836,863 | 10,092,699 |
| AB1769 — 3.0% 2025 (2.5 years) | 1,821,948 | 1,846,009 |
| AB2251 — 3.0% 2026 (2.6 years) | 2,244,060 | 2,273,640 |
| AB3902 — 3.0% 2026 (2.9 years) | 1,478,506 | 1,498,081 |
| AK3264 — 3.0% 2027 (2.9 years) | 3,734,436 | 3,783,896 |
| AB4482 — 3.0% 2027 (3.0 years) | 3,517,993 | 3,564,643 |
| AL1366 — 2.5% 2027 (3.0 years) | 2,635,934 | 2,635,573 |
| MA0587 — 4.0% 2030 (4.0 years) | 3,923,580 | 4,080,874 |
| 555531 — 5.5% 2033 (4.3 years) | 2,549,270 | 2,796,240 |
| 725232 — 5.0% 2034 (4.3 years) | 231,751 | 249,484 |
| 995112 — 5.5% 2036 (4.6 years) | 1,105,078 | 1,216,290 |
| | | 50,371,522 |
| | | 51,291,267 |
Government National Mortgage Association | | |
| |
Pass-Through Securities | | |
| G2 5255 — 3.0% 2026 (3.0 years) | 6,704,989 | 6,787,416 |
| |
Non-Government Agency | | |
| |
Collateralized Mortgage Obligations | | |
Citigroup Mortgage Loan Trust, Inc. (CMLTI)(c) (f) | | |
| 2014-A CL A — 4.0% 2035 (4.6 years) | 1,193,741 | 1,232,146 |
COLT Funding LLC (COLT)(c) (f) | | |
| 2017-2 CL A1A — 2.415% 2047 (1.2 years) | 2,004,828 | 2,003,516 |
Deephaven Residential Mortgage Trust (DRMT)(c) (f) | | |
| 2018-4A CL A1 — 4.08% 2058 (1.7 years) | 4,581,048 | 4,651,283 |
Flagstar Mortgage Trust (FSMT)(c) (f) | | |
| 2017-1 CL 2A2 — 3.0% 2047 (4.9 years) | 2,810,863 | 2,815,494 |
J.P. Morgan Mortgage Trust (JPMMT)(c) (f) | | |
| 2014-2 CL 2A2 — 3.5% 2029 (2.6 years) | 3,036,425 | 3,079,599 |
| 2014-5 CL A1 — 2.984822% 2029 (3.9 years) | 6,087,990 | 6,087,040 |
| 2018-6 CL 2A2 — 3.0% 2048 (4.4 years) | 4,195,122 | 4,186,392 |
| 2016-3 CL 2A1 — 3.0% 2046 (5.1 years) | 2,593,794 | 2,591,768 |
| 2017-3 CL 2A2 — 2.5% 2047 (5.4 years) | 10,678,657 | 10,495,999 |
Sequoia Mortgage Trust (SEMT)(f) | | |
2017-CH1 CL A11 — 3.5% 2047 (1.9 years)(c) | 2,776,746 | 2,786,405 |
| 2013-4 CL A3 — 1.55% 2043 (6.6 years) | 6,017,474 | 5,651,116 |
| 2012-4 CL A1 — 3.5% 2042 (10.2 years) | 2,392,669 | 2,400,602 |
| | | 47,981,360 |
Total Mortgage-Backed Securities (Cost $152,003,947) | 153,358,752 |
| | | |
Taxable Municipal Bonds – 0.2% | $ Principal | |
| | Amount | |
| | or Shares | $ Value |
| |
| Kansas Development Finance Authority Revenue, Series 2015H | |
| 2.258% 4/15/19 | 1,000,000 | 999,800 |
| 2.608% 4/15/20 | 500,000 | 499,295 |
| 2.927% 4/15/21 | 750,000 | 753,188 |
Total Taxable Municipal Bonds (Cost $2,250,000) | | 2,252,283 |
| |
U.S. Treasury – 25.1% | | |
| |
U.S. Treasury Notes | | |
| 1.375% 1/31/20 | 15,000,000 | 14,874,023 |
| 1.625% 3/15/20 | 15,000,000 | 14,891,895 |
| 1.375% 8/31/20 | 10,000,000 | 9,862,305 |
| 2.125% 8/31/20 | 15,000,000 | 14,954,590 |
| 2.75% 9/30/20 | 21,000,000 | 21,125,508 |
| 2.0% 11/30/20 | 20,000,000 | 19,894,531 |
| 1.125% 2/28/21 | 15,000,000 | 14,675,391 |
| 2.25% 3/31/21 | 12,000,000 | 11,997,187 |
| 1.375% 4/30/21 | 10,000,000 | 9,820,312 |
| 2.625% 6/15/21 | 10,000,000 | 10,082,227 |
| 1.125% 7/31/21 | 15,000,000 | 14,618,848 |
| 2.0% 7/31/22 | 17,000,000 | 16,881,133 |
| 2.0% 2/15/23 | 7,500,000 | 7,438,769 |
| 1.5% 2/28/23 | 15,000,000 | 14,596,289 |
| 2.0% 5/31/24 | 15,000,000 | 14,821,582 |
| 2.25% 10/31/24 | 15,000,000 | 14,986,230 |
Total U.S. Treasury (Cost $226,562,777) | | 225,520,820 |
| |
Common Stocks – 0.5% | | |
| |
| Redwood Trust, Inc. (Cost $2,767,259) | 285,000 | 4,602,750 |
| |
Cash Equivalents – 0.3% | | |
| |
| State Street Institutional U.S. Government Money | | |
Market Fund – Premier Class 2.39%(a) | 2,280,633 | 2,280,633 |
Total Cash Equivalents (Cost $2,280,633) | | 2,280,633 |
Total Investments in Securities (Cost $895,161,256) | | 897,777,446 |
| Other Assets Less Other Liabilities – 0.2% | | 1,921,203 |
Net Assets - 100% | | 899,698,649 |
Net Asset Value Per Share - Investor Class | | 12.17 |
Net Asset Value Per Share - Institutional Class | | 12.19 |
(a) | Rate presented represents the annualized 7-day yield at March 31, 2019. |
(b) | Number of years indicated represents estimated average life. |
(c) | Security is exempt from registration under Rule 144A of the Securities Act of 1933. This security may be resold in transactions that are exempt from registration, normally to qualified institutional buyers. |
(d) | Foreign domiciled entity |
(e) | Annual sinking fund |
(f) | The interest rate resets periodically based on the weighted average coupons of the underlying mortgage-related or asset-backed obligations. |
The accompanying notes form an integral part of these financial statements.
41 | Q1 2019 ANNUAL REPORT
ULTRA SHORT GOVERNMENT FUND
Schedule of Investments
March 31, 2019
| | | |
Corporate Bonds – 2.8% | | |
| | $ Principal | |
| | Amount | $ Value |
| |
| Goldman Sachs Group, Inc. 5.375% 3/15/20 | 610,000 | 624,391 |
| Kinder Morgan, Inc. 3.05% 12/01/19 | 2,085,000 | 2,087,370 |
Total Corporate Bonds (Cost $2,710,631) | | 2,711,761 |
| |
Asset-Backed Securities – 12.6%(b) | | |
| |
ARI Fleet Lease Trust (ARIFL)(c) | | |
| 2018-A CL A2 — 2.55% 2026 (0.9 years) | 1,309,124 | 1,307,110 |
Ascentium Equipment Receivables Trust (ACER)(c) | | |
| 2016-1A CL D — 5.23% 2020 (0.4 years) | 475,000 | 478,947 |
| 2016-2A CL D — 4.2% 2022 (0.9 years) | 268,000 | 269,886 |
| CarMax Auto Owner Trust (CARMX) | | |
| 2018-1 CL A2B — 2.63375% 2021 Floating Rate | | |
| (Mthly LIBOR + 15) (0.4 years) | 482,236 | 482,177 |
Commercial Credit Group Receivables Trust (CCG)(c) | | |
| 2018-2 CL A1 — 2.47% 2019 (0.1 years) | 360,291 | 360,153 |
| 2017-1 CL B — 2.75% 2023 (1.6 years) | 900,000 | 897,454 |
Credit Acceptance Auto Loan Trust (CAALT)(c) | | |
| 2016-2A CL B — 3.18% 2024 (0.2 years) | 755,000 | 755,029 |
| Drive Auto Receivables Trust (DRIVE) | | |
| 2018-4 CL A2A — 2.78% 2020 (0.1 years) | 360,474 | 360,469 |
| 2018-1 CL B — 2.88% 2022 (0.2 years) | 786,448 | 786,508 |
Enterprise Fleet Financing LLC (EFF)(c) | | |
| 2016-2 CL A2 — 1.74% 2022 (0.2 years) | 340,289 | 339,513 |
Exeter Automobile Receivables Trust (EART)(c) | | |
| 2018-2A CL A — 2.79% 2021 (0.2 years) | 134,441 | 134,438 |
| 2018-3A CL A — 2.9% 2022 (0.4 years) | 492,747 | 492,716 |
Great America Leasing Receivables (GALC)(c) | | |
| 2016-1 CL A4 — 1.99% 2022 (0.4 years) | 1,095,232 | 1,090,095 |
Marlette Funding Trust (MFT)(c) | | |
| 2018-3A CL A — 3.2% 2028 (0.6 years) | 307,673 | 307,878 |
SoFi Consumer Loan Program LLC (SCLP)(c) | | |
| 2017-6 CL A1 — 2.2% 2026 (0.2 years) | 529,031 | 527,628 |
Springleaf Funding Trust (SLFT)(c) | | |
| 2015-AA CL A — 3.16% 2024 (0.0 years) | 1,254,797 | 1,254,926 |
Upgrade Receivables Trust (UPGR)(c) | | |
| 2019-1A CL A — 3.48% 2025 (1.0 years) | 500,000 | 501,344 |
Upstart Securitization Trust (UPST)(c) | | |
| 2017-2 CL B — 3.748% 2025 (0.6 years) | 250,000 | 250,105 |
Westlake Automobile Receivables Trust (WLAKE)(c) | | |
| 2019-1A CL A1 — 2.76846% 2020 (0.2 years) | 1,711,558 | 1,711,761 |
Total Asset-Backed Securities (Cost $12,305,449) | | 12,308,137 |
| | | |
U.S. Treasury – 83.1% | $ Principal | |
| | Amount | |
| | or Shares | $ Value |
| |
U.S. Treasury Notes | | |
| 1.625% 7/31/19 | 10,300,000 | 10,271,836 |
| 0.75% 8/15/19 | 4,500,000 | 4,471,172 |
| 1.75% 9/30/19 | 11,000,000 | 10,962,188 |
| 1.5% 10/31/19 | 12,000,000 | 11,934,844 |
| 1.0% 11/15/19 | 10,000,000 | 9,911,523 |
| 1.375% 1/15/20 | 9,000,000 | 8,926,875 |
| 2.375% 4/30/20 | 24,500,000 | 24,496,650 |
Total U.S. Treasury (Cost $80,934,402) | | 80,975,088 |
| |
Cash Equivalents – 1.9% | | |
| |
| State Street Institutional U.S. Government Money | | |
Market Fund - Premier Class 2.39%(a) | 1,829,605 | 1,829,605 |
Total Cash Equivalents (Cost $1,829,605) | | 1,829,605 |
Total Investments in Securities (Cost $97,780,087) | | 97,824,591 |
| Other Liabilities in Excess of Other Assets – (0.4%) | | (380,633) |
Net Assets - 100% | | 97,443,958 |
Net Asset Value Per Share | | 10.01 |
(a) | Rate presented represents the annualized 7-day yield at March 31, 2019. |
(b) | Number of years indicated represents estimated average life. |
(c) | Security is exempt from registration under Rule 144A of the Securities Act of 1933. This security may be resold in transactions that are exempt from registration, normally, to qualified institutional buyers. |
The accompanying notes form an integral part of these financial statements.
42 | Q1 2019 ANNUAL REPORT
WEITZINVESTMENTS.COM
NEBRASKA TAX-FREE INCOME FUND
Schedule of Investments
March 31, 2019
| | | | |
Municipal Bonds – 98.7% | | | |
| % of Net | $ Principal | |
| Assets | Amount | $ Value |
| |
California | 0.6 | | |
| San Diego County Regional Airport Authority, | | | |
| Subordinate Airport Revenue, Series 2017B, | | | |
| AMT, 5.0%, 7/01/25 | | 200,000 | 234,914 |
| |
Colorado | 0.3 | | |
| Colorado Bridge Enterprise, Senior Revenue, | | | |
| Central 70 Project, Series 2017, AMT, 4.0%, 12/31/23 | 100,000 | 107,908 |
| |
Florida | 1.5 | | |
| Greater Orlando Aviation Authority, Priority | | | |
| Subordinated Airport Facilities Revenue, | | | |
| Series 2017A, AMT, 5.0%, 10/01/25 | | 500,000 | 588,195 |
| |
Nebraska | 92.6 | | |
| Blair, Water System Revenue, Series 2016, AMT, | | | |
| 2.65%, 12/15/24 | | 100,000 | 98,983 |
| 2.85%, 12/15/25 | | 100,000 | 99,678 |
| 3.0%, 12/15/26 | | 100,000 | 99,026 |
| 3.1%, 12/15/27 | | 100,000 | 98,185 |
| 3.2%, 12/15/28 | | 100,000 | 98,039 |
| Buffalo County, General Obligation, Kearney Public Schools | | |
| District 0007, Series 2016, 3.0%, 12/15/24 | | 250,000 | 265,292 |
| Cass County, General Obligation, Refunding, Weeping | | |
| Water Public School District 0022, Series 2017 | | | |
| 2.05%, 12/15/25 | | 375,000 | 372,139 |
| 2.2%, 12/15/26 | | 250,000 | 249,770 |
| Chadron, Sales Tax and General Obligation, Aquatic Center, | | |
| Series 2016, 1.6%, 7/15/22 | | 400,000 | 395,144 |
| Columbus, Combined Revenue, Refunding, Series 2016, | | |
| AGM Insured | | | |
| 4.0%, 12/15/26 | | 100,000 | 114,034 |
| 4.0%, 12/15/27 | | 100,000 | 114,043 |
| Cornhusker Public Power District, Electric System Revenue, | | |
| Refunding, Series 2014, 2.25%, 7/01/22 | | 260,000 | 260,476 |
| Dawson Public Power District, Electric System Revenue, | | |
| Refunding, Series 2016A | | | |
| 2.0%, 6/15/26 | | 170,000 | 170,036 |
| 2.1%, 6/15/27 | | 105,000 | 103,795 |
| Series 2016B | | | |
| 2.5%, 6/15/28 | | 135,000 | 135,385 |
| 3.0%, 6/15/29 | | 245,000 | 247,631 |
| 3.0%, 6/15/30 | | 355,000 | 358,117 |
| Douglas County, Educational Facility Revenue, Refunding, | | |
| Creighton University Project, Series 2010A, 5.6%, 7/01/25, | | |
| Pre-Refunded 7/01/20 @ 100 | | 400,000 | 419,820 |
| Douglas County, General Obligation, | | | |
| Omaha Public School District 0001, Series 2016, | | |
| 5.0%, 12/15/29 | | 350,000 | 423,706 |
| Westside Community School District 0066, Series 2015, | | |
| 2.5%, 12/01/22 | | 250,000 | 256,557 |
| Douglas County, Hospital Authority #2, Revenue, | | | |
| Madonna Rehabilitation Hospital Project, Series 2014, | | |
| 5.0%, 5/15/26 | | 500,000 | 560,610 |
| Nebraska Medicine, Series 2016, 4.0%, 5/15/32 | 700,000 | 754,880 |
| Douglas County, Hospital Authority #3, Revenue, Refunding, | |
| Nebraska Methodist Health System, Series 2015 | | | |
| 4.0%, 11/01/19 | | 110,000 | 111,294 |
| 5.0%, 11/01/20 | | 100,000 | 104,739 |
| 5.0%, 11/01/21 | | 100,000 | 107,574 |
| 5.0%, 11/01/22 | | 250,000 | 275,917 |
| Fremont, Combined Utility Revenue, Series 2014B, | | |
| 3.0%, 7/15/21 | | 370,000 | 380,334 |
| Hamilton County, General Obligation, Hampton Public School | |
| District 0091, Series 2016, 1.0%, 12/15/19 | | 300,000 | 298,287 |
| | | |
$ Principal | |
| | Amount | $ Value |
| |
| Lincoln-Lancaster County, Public Building Commission, | | |
| Lease Revenue, Series 2016, 3.0%, 12/01/25 | 500,000 | 535,530 |
| Lincoln, Airport Authority, Revenue, 2014 Series C | | |
| 2.0%, 7/01/19 | 190,000 | 190,236 |
| 2.0%, 7/01/21 | 195,000 | 195,565 |
| Lincoln, Educational Facilities, Revenue, Refunding, | | |
| Nebraska Wesleyan University Project, Series 2012 | | |
| 2.25%, 4/01/19 | 645,000 | 645,000 |
| 2.5%, 4/01/21 | 425,000 | 431,230 |
| Lincoln, Electric System Revenue, Refunding, | | |
| Series 2012, 5.0%, 9/01/28 | 1,000,000 | 1,105,400 |
| Lincoln, General Obligation, Highway Allocation Fund, | | |
| Refunding, Series 2016 | | |
| 5.0%, 5/15/22 | 100,000 | 110,574 |
| 5.0%, 5/15/23 | 135,000 | 153,346 |
| Lincoln, General Obligation, West Haymarket Joint Public Agency, | |
| Series 2011, 5.0%, 12/15/26 | 300,000 | 326,559 |
| Madison County, Hospital Authority #1, Revenue, | | |
| Faith Regional Health Services Project, Series 2018, | | |
| 3.0%, 7/01/19 | 100,000 | 100,212 |
| Refunding, Faith Regional Health Services Project, Series 2017A | |
| 5.0%, 7/01/21 | 475,000 | 503,918 |
| 5.0%, 7/01/23 | 250,000 | 276,578 |
| Metropolitan Utilities District of Omaha, Gas System Revenue, | |
| Series 2018, 4.0%, 12/01/27 | 450,000 | 498,478 |
| Municipal Energy Agency of Nebraska, Power Supply | | |
| System Revenue, Refunding, | | |
| 2009 Series A, BHAC Insured, | | |
| 5.0%, 4/01/20, Pre-Refunded 4/01/19 @ 100 | 500,000 | 500,000 |
| 2012 Series A, 5.0%, 4/01/29 | 300,000 | 325,560 |
| 2016 Series A | | |
| 5.0%, 4/01/21 | 250,000 | 266,132 |
| 5.0%, 4/01/27 | 350,000 | 422,436 |
| Nebraska, Certificates of Participation, | | |
| Series 2015C | | |
| 1.45%, 9/15/19 | 360,000 | 359,262 |
| 1.7%, 9/15/20 | 200,000 | 200,018 |
| Series 2017B, 1.35%, 7/15/20 | 785,000 | 779,309 |
| Series 2018A, 2.1%, 7/15/21 | 860,000 | 867,525 |
| Nebraska Investment Finance Authority, Single Family | | |
| Housing Revenue, | | |
| 2016 Series C, 1.85%, 3/01/23 | 100,000 | 99,916 |
| 2019 Series A, 2.05%, 9/01/24 | 120,000 | 120,012 |
| Nebraska Public Power District, Revenue, | | |
| 2012 Series A | | |
| 4.0%, 1/01/21 | 500,000 | 520,585 |
| 5.0%, 1/01/21 | 500,000 | 529,165 |
| 2015 Series A-2, 5.0%, 1/01/24 | 250,000 | 272,340 |
2016 Series C, 5.0%, 1/01/35(b) | 480,000 | 554,741 |
| Nebraska State Colleges, Facilities Corp., Deferred | | |
| Maintenance Revenue, Refunding, Series 2016, | | |
| AGM Insured, 4.0%, 7/15/28 | 750,000 | 832,762 |
| Nebraska State Colleges, Student Fees and Facilities Revenue, | | |
| Wayne State College Project, Series 2016, 3.0%, 7/01/19 | 120,000 | 120,386 |
| North Platte, Sewer System Revenue, Refunding, Series 2015, | | |
| 3.0%, 6/15/24 | 250,000 | 253,342 |
| Omaha-Douglas County, General Obligation, Public Building | | |
| Commission, Series 2014, 5.0%, 5/01/26 | 725,000 | 794,774 |
| Omaha, General Obligation, Refunding, | | |
| Series 2012B, 3.0%, 11/15/24 | 400,000 | 416,464 |
| Various Purpose and Refunding, Series 2016A | | |
| 4.0%, 4/15/22 | 815,000 | 873,126 |
| 4.0%, 4/15/23 | 185,000 | 202,166 |
The accompanying notes form an integral part of these financial statements.
43 | Q1 2019 ANNUAL REPORT
NEBRASKA TAX-FREE INCOME FUND (CONTINUED)
| | | |
$ Principal | |
| | Amount | $ Value |
| |
| Omaha, Public Facilities Corp., Lease Revenue, | | |
| Omaha Baseball Stadium Project | | |
| Refunding, Series 2016A, 4.0%, 6/01/28 | 1,335,000 | 1,487,564 |
| Series 2009 | | |
| 4.125%, 6/01/25, Pre-Refunded 6/01/19 @ 100 | 250,000 | 251,065 |
| 5.0%, 6/01/23, Pre-Refunded 6/01/19 @ 100 | 770,000 | 774,374 |
| Series 2010, 4.125%, 6/01/29 | 650,000 | 666,556 |
| Omaha Public Power District, Electric System Revenue, | | |
| 2015 Series A, 2.85%, 2/01/27 | 500,000 | 518,780 |
| Omaha, Sanitary Sewerage System Revenue, | | |
| Refunding, Series 2016 | | |
| 5.0%, 4/01/26 | 250,000 | 302,260 |
| 4.0%, 4/01/31 | 350,000 | 382,127 |
| Series 2014, 5.0%, 11/15/22 | 200,000 | 223,844 |
| Papillion, General Obligation, Tax Supported Recreational | | |
| Facilities, Series 2017, 3.0%, 9/15/24 | 420,000 | 434,133 |
| Papillion-La Vista, General Obligation, Sarpy County | | |
| School District #27, Refunding, Series 2017A | | |
| 2.05%, 12/01/24 | 150,000 | 151,314 |
| 2.2%, 12/01/25 | 150,000 | 151,670 |
| 2.3%, 12/01/26 | 275,000 | 277,574 |
| Papio-Missouri River Natural Resources District, General | | |
| Obligation, Flood Protection and Water Quality Enhancement, | | |
| Refunding, Series 2017, 5.0%, 12/15/26 | 185,000 | 203,533 |
| Series 2015 | | |
| 2.0%, 12/15/20 | 100,000 | 100,355 |
| 2.25%, 12/15/21 | 100,000 | 100,416 |
| 4.0%, 12/15/24 | 100,000 | 102,805 |
| 4.0%, 12/15/25 | 100,000 | 102,806 |
| Public Power Generation Agency, Revenue, Refunding, | | |
| Whelan Energy Center Unit 2, 2015 Series A, 5.0%, 1/01/28 | 200,000 | 229,674 |
| Sarpy County, General Obligation, Bellevue Public School | | |
| District 0001, Series 2017 | | |
| 5.0%, 12/15/27 | 250,000 | 306,483 |
| 5.0%, 12/15/29 | 550,000 | 670,758 |
| Sarpy County, Certificates of Participation, | | |
| Series 2016, 1.75%, 6/15/26 | 500,000 | 492,970 |
| Sarpy County, Recovery Zone Facility Certificates of | | |
| Participation, Series 2010, 2.6%, 12/15/19 | 135,000 | 136,033 |
| South Sioux City, Combined Electric, Water and Sewer Revenue, | |
| Refunding, Series 2014A | | |
| 1.9%, 6/01/20 | 280,000 | 280,602 |
| 2.25%, 6/01/21 | 250,000 | 250,933 |
| Southeast Community College Area, Certificates of Participation, | |
| Series 2018, 3.0%, 12/15/22 | 400,000 | 418,756 |
| Thayer County, General Obligation Hospital, Refunding, | | |
| Series 2017, 1.3%, 9/01/20 | 400,000 | 395,980 |
| University of Nebraska, Facilities Corp., | | |
| Lease Rental Revenue, NCTA Education Center/Student Housing | |
| Project, Series 2011, 3.75%, 6/15/19 | 285,000 | 286,280 |
| Revenue, Refunding, Health Center and College of Nursing | | |
| Projects, Series 2016, 5.0%, 7/15/29 | 380,000 | 458,006 |
| University of Nebraska, University Revenue, | | |
| Kearney Student Housing Project, Series 2017 | | |
| 3.0%, 7/01/25 | 100,000 | 106,256 |
| 2.5%, 7/01/26 | 210,000 | 216,720 |
| 3.0%, 7/01/27 | 100,000 | 106,967 |
| Lincoln Student Fees and Facilities | | |
| Refunding, Series 2012, 5.0%, 7/01/23 | 750,000 | 829,388 |
| Series 2015A, 2.0%, 7/01/19 | 600,000 | 600,582 |
| Refunding, Omaha Student Housing Project, | | |
| Series 2017A, 5.0%, 5/15/30 | 100,000 | 121,774 |
| Upper Republican Natural Resources District, Limited | | |
| Obligation Occupation Tax, River Flow Enhancement, | | |
| Refunding, Series 2017B, AGM Insured | | |
| 4.0%, 12/15/25 | 245,000 | 263,333 |
| 4.0%, 12/15/27 | 395,000 | 422,520 |
| | | | |
| | | $ Principal | |
| | % of Net | Amount | |
| | Assets | or Shares | $ Value |
| |
| Village of Boys Town, Revenue, Refunding, Boys Town Project, | |
| Series 2017, 3.0%, 9/01/28 | | 700,000 | 731,339 |
| Washington County, General Obligation, Refunding, Blair | | |
| Community School District 0001, Series 2015, | | |
| 2.5%, 12/15/24 | | 305,000 | 308,077 |
| | | | 35,220,745 |
Texas | 3.1 | | |
| Angelina County Junior College District, Limited Tax | | |
| General Obligation, Series 2009, AGM Insured, | | |
| 4.25%, 2/15/23 | | 250,000 | 250,567 |
| Austin, Airport System Revenue, Series 2017B, AMT, | | |
| 5.0%, 11/15/26 | | 250,000 | 295,820 |
| El Paso International Airport, Revenue, Series 2018, AMT, | | |
| 5.0%, 8/15/20 | | 500,000 | 521,815 |
| Harris County, Tax and Subordinate Lien Revenue, | | |
| Refunding, Series 2009C, 5.0%, 8/15/23 | | 110,000 | 111,403 |
| | | | 1,179,605 |
Washington | 0.6 | | |
| Port of Seattle, Intermediate Lien Revenue, | | | |
| Series 2017C, AMT, 5.0%, 5/01/26 | | 200,000 | 236,214 |
Total Municipal Bonds (Cost $37,281,597) | | 37,567,581 |
| |
Cash Equivalents – 0.7% | | | |
| |
| State Street Institutional U.S. Government Money | | |
Market Fund – Premier Class 2.39%(a) | | 254,789 | 254,789 |
Total Cash Equivalents (Cost $254,789) | | 254,789 |
Total Investments in Securities (Cost $37,536,386) | | 37,822,370 |
| Other Asset Less Other Liabilities – 0.6% | | | 225,451 |
Net Assets – 100% | | | 38,047,821 |
Net Asset Value Per Share | | | 9.95 |
(a) | Rate presented represents the annualized 7-day yield at March 31, 2019. |
(b) | Security designated to cover an unsettled bond purchase. |
The accompanying notes form an integral part of these financial statements.
44 | Q1 2019 ANNUAL REPORT
This page intentionally left blank
45 | Q1 2019 ANNUAL REPORT
STATEMENTS OF ASSETS AND LIABILITIES
| | | | | | | | Short | | Nebraska |
(In U.S. dollars, | | Partners | Partners III | | | Core Plus | Duration | Ultra Short | Tax-Free |
except share data) | Value | Value | Opportunity | Hickory | Balanced | Income | Income | Government | Income |
| |
Assets: | | | | | | | | | |
| Investments in securities at value: | | | | | | | | | |
Unaffiliated issuers(a) | 768,109,943 | 588,347,489 | 558,869,660 | 210,981,289 | 124,220,703 | 76,429,085 | 897,777,446 | 97,824,591 | 37,822,370 |
Controlled affiliates(a) | — | — | 72,503,800 | — | — | — | — | — | — |
| | 768,109,943 | 588,347,489 | 631,373,460 | 210,981,289 | 124,220,703 | 76,429,085 | 897,777,446 | 97,824,591 | 37,822,370 |
| Accrued interest and dividends receivable | 207,263 | 52,432 | 84,193 | 54,982 | 495,158 | 443,207 | 5,273,885 | 551,985 | 393,646 |
| Due from broker | — | — | 101,153,501 | — | — | — | — | — | — |
| Receivable for securities sold | 11,296,905 | 146,363 | 3,122,398 | 228,140 | 303,674 | — | 4,024,051 | — | — |
| Receivable for fund shares sold | 8,640 | 6,797 | 26,811 | 2 | — | 4,657,319 | 461,383 | 5,000 | — |
Total assets | 779,622,751 | 588,553,081 | 735,760,363 | 211,264,413 | 125,019,535 | 81,529,611 | 907,536,765 | 98,381,576 | 38,216,016 |
Liabilities: | | | | | | | | | |
| Dividends payable on securities sold short | — | — | 419,261 | — | — | — | — | — | — |
| Due to adviser | 869,702 | 636,749 | 671,954 | 261,256 | 89,318 | 26,542 | 379,639 | 17,121 | 48,195 |
| Payable for securities purchased | 9,913,583 | — | — | — | 499,125 | 2,661,874 | 6,047,871 | 898,425 | 120,000 |
| Payable for fund shares redeemed | 92,097 | 107,822 | 123,719 | 259,163 | 18 | 313,713 | 1,410,606 | 330 | — |
Securities sold short(b) | — | — | 96,043,200 | — | — | — | — | — | — |
| Other | — | — | — | — | — | — | — | 21,742 | — |
Total liabilities | 10,875,382 | 744,571 | 97,258,134 | 520,419 | 588,461 | 3,002,129 | 7,838,116 | 937,618 | 168,195 |
Net assets | 768,747,369 | 587,808,510 | 638,502,229 | 210,743,994 | 124,431,074 | 78,527,482 | 899,698,649 | 97,443,958 | 38,047,821 |
Composition of net assets: | | | | | | | | | |
| Paid-in capital | 465,951,474 | 372,381,533 | 377,781,439 | 139,451,564 | 106,323,669 | 77,504,390 | 898,395,117 | 97,393,525 | 37,874,946 |
| Total distributable earnings | 302,795,895 | 215,426,977 | 260,720,790 | 71,292,430 | 18,107,405 | 1,023,092 | 1,303,532 | 50,433 | 172,875 |
Net assets | 768,747,369 | 587,808,510 | 638,502,229 | 210,743,994 | 124,431,074 | 78,527,482 | 899,698,649 | 97,443,958 | 38,047,821 |
Net assets(c): | | | | | | | | | |
| Investor Class | 541,167,664 | 265,250,483 | 21,881,110 | 210,743,994 | 42,304,832 | 18,840,458 | 71,001,709 | | 38,047,821 |
| Institutional Class | 227,579,705 | 322,558,027 | 616,621,119 | | 82,126,242 | 59,687,024 | 828,696,940 | 97,443,958 | |
Shares outstanding(c) (d): | | | | | | | | | |
| Investor Class | 12,790,146 | 9,005,843 | 1,492,046 | 4,497,447 | 3,075,286 | 1,826,987 | 5,835,850 | | 3,825,620 |
| Institutional Class | 5,315,032 | 10,817,918 | 40,553,014 | | 5,972,920 | 5,786,035 | 68,005,834 | 9,739,362 | |
Net asset value, offering and redemption price(c): | | | | | | | | | |
| Investor Class | 42.31 | 29.45 | 14.67 | 46.86 | 13.76 | 10.31 | 12.17 | | 9.95 |
| Institutional Class | 42.82 | 29.82 | 15.21 | | 13.75 | 10.32 | 12.19 | 10.01 | |
| |
(a) Cost of investments in securities: | | | | | | | | | |
| Unaffiliated issuers | 486,950,977 | 397,197,241 | 349,456,946 | 140,097,434 | 105,397,459 | 75,302,449 | 895,161,256 | 97,780,087 | 37,536,386 |
| Controlled affiliates | — | — | 2,899,379 | — | — | — | — | — | — |
| | 486,950,977 | 397,197,241 | 352,356,325 | 140,097,434 | 105,397,459 | 75,302,449 | 895,161,256 | 97,780,087 | 37,536,386 |
(b) Proceeds from short sales | — | — | 70,628,090 | — | — | — | — | — | — |
(c) | Funds with a single share class are shown with the Investor Class, except for the Ultra Short Government Fund which has been designated Institutional Class |
(d) | Indefinite number of no par value shares authorized |
The accompanying notes form an integral part of these financial statements.
46 | Q1 2019 ANNUAL REPORT
STATEMENTS OF OPERATIONS
| | |
Year ended March 31, 2019 |
| |
| |
| | | | | | | | Short | | Nebraska |
| | | Partners | Partners III | | | Core Plus | Duration | Ultra Short | Tax-Free |
(In U.S. dollars) | Value | Value | Opportunity | Hickory | Balanced | Income | Income | Government | Income |
| |
Investment income: | | | | | | | | | |
| Dividends: | | | | | | | | | |
Unaffiliated issuers(a) | 4,709,807 | 4,309,868 | 2,817,286 | 2,007,029 | 746,402 | 12,355 | 253,639 | — | — |
| Interest | 1,218,154 | 1,074,292 | 2,797,656 | 616,177 | 1,524,799 | 1,762,241 | 28,087,989 | 2,392,536 | 1,172,746 |
Total investment income | 5,927,961 | 5,384,160 | 5,614,942 | 2,623,206 | 2,271,201 | 1,774,596 | 28,341,628 | 2,392,536 | 1,172,746 |
Fees and expenses: | | | | | | | | | |
| Investment advisory | 6,934,390 | 5,545,849 | 6,263,026 | 2,238,099 | 811,118 | 212,287 | 3,976,061 | 318,923 | 205,782 |
| Administrative | 508,195 | 446,482 | 393,044 | 317,879 | 197,278 | 101,595 | 583,240 | 133,177 | 101,065 |
| Servicing: | | | | | | | | | |
| Investor Class | 993,786 | 605,369 | 57,142 | — | — | 15,694 | 270,703 | — | — |
| Institutional Class | 37,908 | 84,961 | 203,489 | — | — | 21,199 | 930,095 | 10,631 | — |
| Custody and fund accounting | 108,584 | 90,343 | 104,252 | 61,909 | 75,357 | 79,984 | 169,180 | 66,316 | 76,900 |
| Dividends on securities sold short | — | — | 2,498,845 | — | — | — | — | — | — |
| Professional | 96,620 | 82,483 | 83,310 | 44,729 | 35,700 | 32,015 | 115,771 | 34,448 | 29,438 |
| Registration | 47,074 | 43,396 | 44,834 | 23,858 | 22,575 | 33,877 | 69,522 | 24,381 | 5,340 |
| Sub-transfer agent | 213,169 | 119,054 | 89,880 | 87,329 | 39,624 | 43,639 | 110,618 | 33,242 | 25,029 |
| Trustees | 91,110 | 73,245 | 74,096 | 26,570 | 14,461 | 6,208 | 119,677 | 12,732 | 6,128 |
| Other | 144,115 | 92,978 | 81,628 | 45,989 | 18,185 | 7,204 | 192,246 | 15,299 | 7,205 |
| | 9,174,951 | 7,184,160 | 9,893,546 | 2,846,362 | 1,214,298 | 553,702 | 6,537,113 | 649,149 | 456,887 |
| Less expenses waived/reimbursed by investment adviser | (206,109) | (262,499) | — | — | (139,377) | (322,151) | (1,573,305) | (436,534) | — |
Net expenses | 8,968,842 | 6,921,661 | 9,893,546 | 2,846,362 | 1,074,921 | 231,551 | 4,963,808 | 212,615 | 456,887 |
Net investment income (loss) | (3,040,881) | (1,537,501) | (4,278,604) | (223,156) | 1,196,280 | 1,543,045 | 23,377,820 | 2,179,921 | 715,859 |
Realized and unrealized gain (loss) on investments: | | | | | | | | |
| Net realized gain (loss): | | | | | | | | | |
| Unaffiliated issuers | 58,714,069 | 55,606,091 | 37,887,775 | 13,289,038 | 2,964,909 | (102,923) | 1,665,103 | 7,936 | (63,635) |
| Options written | — | — | 421,518 | — | — | — | — | — | — |
| Securities sold short | — | — | (25,781,818) | — | — | — | — | — | — |
Net realized gain (loss) | 58,714,069 | 55,606,091 | 12,527,475 | 13,289,038 | 2,964,909 | (102,923) | 1,665,103 | 7,936 | (63,635) |
| Net unrealized appreciation (depreciation): | | | | | | | | | |
| Unaffiliated issuers | 10,821,105 | (39,084,576) | (25,042,982) | (9,136,061) | 3,239,393 | 1,509,695 | 4,055,457 | 82,538 | 840,952 |
| Controlled affiliates | — | — | 60,904,100 | — | — | — | — | — | — |
| Options written | — | — | (265,185) | — | — | — | — | — | — |
| Securities sold short | — | — | 19,874,697 | — | — | — | — | — | — |
| Net unrealized appreciation (depreciation) | 10,821,105 | (39,084,576) | 55,470,630 | (9,136,061) | 3,239,393 | 1,509,695 | 4,055,457 | 82,538 | 840,952 |
| Net realized and unrealized gain (loss) on investments | 69,535,174 | 16,521,515 | 67,998,105 | 4,152,977 | 6,204,302 | 1,406,772 | 5,720,560 | 90,474 | 777,317 |
Net increase (decrease) in net assets resulting from operations | 66,494,293 | 14,984,014 | 63,719,501 | 3,929,821 | 7,400,582 | 2,949,817 | 29,098,380 | 2,270,395 | 1,493,176 |
| |
(a) Foreign taxes withheld | — | — | — | 7,425 | 7,358 | — | — | — | — |
The accompanying notes form an integral part of these financial statements.
47 | Q1 2019 ANNUAL REPORT
STATEMENTS OF CHANGES IN NET ASSETS
| | | | | | | | | |
| | Value | Partners Value | Partners III Opportunity | Hickory |
| | Year ended March 31, | Year ended March 31, | Year ended March 31, | Year ended March 31, |
(In U.S. dollars) | 2019 | 2018 | 2019 | 2018 | 2019 | 2018 | 2019 | 2018 |
| |
| Increase (decrease) in net assets: | | | | | | | |
| From operations: | | | | | | | | |
| Net investment income (loss) | (3,040,881) | (3,008,861) | (1,537,501) | (2,419,845) | (4,278,604) | (5,545,655) | (223,156) | (1,731,750) |
| Net realized gain (loss) | 58,714,069 | 62,971,261 | 55,606,091 | 35,922,927 | 12,527,475 | 47,907,638 | 13,289,038 | 23,837,210 |
Net unrealized appreciation (depreciation) | 10,821,105 | 13,403,481 | (39,084,576) | (1,698,449) | 55,470,630 | (28,886,726) | (9,136,061) | (15,569,568) |
| |
Net increase (decrease) | | | | | | | | |
in net assets resulting | | | | | | | | |
from operations | 66,494,293 | 73,365,881 | 14,984,014 | 31,804,633 | 63,719,501 | 13,475,257 | 3,929,821 | 6,535,892 |
Distributions to shareholders(a)(b): | | | | | | | |
| Investor Class | (51,250,335) | (43,230,191) | (22,162,561) | (8,283,431) | (1,558,657) | (1,237,322) | (24,299,497) | (12,830,462) |
| Institutional Class | (20,081,985) | (14,133,559) | (24,393,419) | (7,418,949) | (42,258,488) | (28,992,835) | | |
| |
Total distributions | (71,332,320) | (57,363,750) | (46,555,980) | (15,702,380) | (43,817,145) | (30,230,157) | (24,299,497) | (12,830,462) |
Fund share transactions(a): | | | | | | | | |
| Investor Class | (33,189,385) | (72,382,271) | (47,086,780) | (109,960,340) | (3,425,684) | (2,909,506) | (11,494,405) | (23,596,529) |
| Institutional Class | 21,370,925 | 11,492,448 | 6,345,315 | 15,256,368 | (31,815,832) | (16,220,456) | | |
| |
Net increase (decrease) from fund share transactions | (11,818,460) | (60,889,823) | (40,741,465) | (94,703,972) | (35,241,516) | (19,129,962) | (11,494,405) | (23,596,529) |
| |
Total increase (decrease) in net assets | (16,656,487) | (44,887,692) | (72,313,431) | (78,601,719) | (15,339,160) | (35,884,862) | (31,864,081) | (29,891,099) |
| Net assets: | | | | | | | | |
| Beginning of period | 785,403,856 | 830,291,548 | 660,121,941 | 738,723,660 | 653,841,389 | 689,726,251 | 242,608,075 | 272,499,174 |
| |
End of period | 768,747,369 | 785,403,856 | 587,808,510 | 660,121,941 | 638,502,229 | 653,841,389 | 210,743,994 | 242,608,075 |
(a) | Funds with a single share class are shown with the Investor Class, except for the Ultra Short Government Fund which has been designated Institutional Class |
(b) | For the year ended March 31, 2018, distributions to shareholders from the Value, Partners Value, Partners III Opportunity, Hickory, Balanced, Core Plus Income, Short Duration Income, Ultra Short Government and Nebraska Tax-Free Income Funds were $0; $0; $0; $0; $452,372; $906,094; $24,670,337; $940,684 and $818,694, respectively, from net investment income and $57,363,750; $15,702,380; $30,230,157; $12,830,462; $2,851,555; $106,268; $0; $0 and $0, respectively, from realized gains. As of March 31, 2018, undistributed net investment income (loss) for the Value, Partners Value, Partners III Opportunity, Hickory, Balanced, Core Plus Income, Short Duration Income, Ultra Short Government and Nebraska Tax-Free Income Funds was ($737,540); ($371,208); ($910,390); ($224,897); $221,238; $30,606; $550,610; $1,610 and $45,860, respectively. |
The accompanying notes form an integral part of these financial statements.
48 | Q1 2019 ANNUAL REPORT
| | | | | | | | | | |
| | | | | Short Duration | Ultra Short | Nebraska |
Balanced | Core Plus Income | Income | Government | Tax-Free Income |
Year ended March 31, | Year ended March 31, | Year ended March 31, | Year ended March 31, | Year ended March 31, |
2019 | 2018 | 2019 | 2018 | 2019 | 2018 | 2019 | 2018 | 2019 | 2018 |
| |
| |
| |
| 1,196,280 | 671,396 | 1,543,045 | 931,498 | 23,377,820 | 25,078,748 | 2,179,921 | 940,684 | 715,859 | 862,206 |
| 2,964,909 | 7,257,714 | (102,923) | (6,975) | 1,665,103 | 1,415,995 | 7,936 | (228) | (63,635) | (34,006) |
| 3,239,393 | 356,714 | 1,509,695 | (493,281) | 4,055,457 | (18,992,174) | 82,538 | (2,236) | 840,952 | (846,001) |
| |
| |
| |
7,400,582 | 8,285,824 | 2,949,817 | 431,242 | 29,098,380 | 7,502,569 | 2,270,395 | 938,220 | 1,493,176 | (17,801) |
| (10,777,688) | (3,303,927) | (281,443) | (178,193) | (2,006,765) | (2,045,826) | | | (737,927) | (818,694) |
| — | | (1,266,681) | (834,169) | (21,592,551) | (22,624,511) | (2,181,531) | (940,684) | | |
| | | | | | | | | | |
(10,777,688) | (3,303,927) | (1,548,124) | (1,012,362) | (23,599,316) | (24,670,337) | (2,181,531) | (940,684) | (737,927) | (818,694) |
| 5,738,990 | (1,101,597) | 11,244,474 | 851,560 | (42,670,992) | 20,043,162 | | | (21,311,359) | (3,532,391) |
| — | | 26,712,981 | 8,522,073 | (194,329,528) | (69,764,710) | (6,806,883) | 6,135,346 | | |
| | | | | | | | | | |
5,738,990 | (1,101,597) | 37,957,455 | 9,373,633 | (237,000,520) | (49,721,548) | (6,806,883) | 6,135,346 | (21,311,359) | (3,532,391) |
| | | | | | | | | | |
2,361,884 | 3,880,300 | 39,359,148 | 8,792,513 | (231,501,456) | (66,889,316) | (6,718,019) | 6,132,882 | (20,556,110) | (4,368,886) |
| | | | | | | | | | |
| 122,069,190 | 118,188,890 | 39,168,334 | 30,375,821 | 1,131,200,105 | 1,198,089,421 | 104,161,977 | 98,029,095 | 58,603,931 | 62,972,817 |
| | | | | | | | | | |
124,431,074 | 122,069,190 | 78,527,482 | 39,168,334 | 899,698,649 | 1,131,200,105 | 97,443,958 | 104,161,977 | 38,047,821 | 58,603,931 |
The accompanying notes form an integral part of these financial statements.
49 | Q1 2019 ANNUAL REPORT
STATEMENT OF CASH FLOWS
| | | |
| Partners III Opportunity | |
| |
(In U.S. dollars) | Year ended March 31, 2019 | |
| |
Increase (decrease) in cash: | |
| |
| Cash flows from operating activities: | |
| Net increase in net assets from operations | 63,719,501 |
| Adjustments to reconcile net increase in net assets from operations to net cash provided by operating activities: | |
| Purchases of investment securities | (188,987,743) |
| Proceeds from sale of investment securities | 231,258,780 |
| Short positions covered | (97,484,421) |
| Sale of short-term investment securities, net | 36,063,545 |
| Net unrealized appreciation on investments, options and short sales | (55,470,630) |
| Net realized gain on investments, options and short sales | (12,527,475) |
| Decrease in accrued interest and dividends receivable | 82,154 |
| Decrease in due from broker | 106,607,266 |
| Decrease in receivable for securities sold | — |
| Decrease in receivable for fund shares sold | 12,353 |
| Increase in receivable for securities sold | (3,122,398) |
| Decrease in dividends payable on securities sold short | (232,833) |
| Decrease in due to adviser | (37,219) |
| Decrease in payable for securities purchased | (891,731) |
| Increase in payable for fund shares redeemed | 69,512 |
Net cash provided by operating activities | 79,058,661 |
| |
| Cash flows from financing activities: | |
| Proceeds from sales of fund shares | 29,270,543 |
| Payments for redemptions of fund shares | (106,751,309) |
| Cash distributions to shareholders | (1,577,895) |
Net cash used in financing activities | (79,058,661) |
| |
| Net increase (decrease) in cash | — |
| Cash: | |
| Balance, beginning of period | — |
| |
Balance, end of period | — |
| |
| Noncash financing activities: | |
| Reinvestment of shareholder distributions | 42,239,250 |
The accompanying notes form an integral part of these financial statements.
50 | Q1 2019 ANNUAL REPORT
This page intentionally left blank
51 | Q1 2019 ANNUAL REPORT
FINANCIAL HIGHLIGHTS
The following financial information provides selected data, in U.S. dollars, for a share outstanding throughout the periods indicated.
| | | | | | | | | | | | | | | | | | | | | | |
| | | | | | Income (loss) from Investment Operations | | | Distributions | |
| | | | | | | | | Net gain (loss) | | | | | | Dividends | | | | | | | |
| | | | | | | | | on securities | | | Total from | | | from net | | | Distributions | | | | |
Years ended March 31, | | Net asset value, | | | Net investment | | | (realized | | | investment | | | investment | | | from | | | Total | |
unless otherwise noted | | beginning of period | | | income (loss) | | | and unrealized) | | | operations | | | income | | | realized gains | | | distributions | |
| | |
Value – Investor Class | | | | | | | | | | | | | | | | | | | |
| 2019 | | | 42.92 | | | | (0.19 | )(a) | | | 3.60 | | | | 3.41 | | | | — | | | | (4.02 | ) | | | (4.02 | ) |
| 2018 | | | 42.20 | | | | (0.18 | )(a) | | | 3.96 | | | | 3.78 | | | | — | | | | (3.06 | ) | | | (3.06 | ) |
| 2017 | | | 38.43 | | | | (0.16 | )(a) | | | 3.93 | | | | 3.77 | | | | — | | | | — | | | | — | |
| 2016 | | | 46.93 | | | | (0.25 | )(a) | | | (3.27 | ) | | | (3.52 | ) | | | — | | | | (4.98 | ) | | | (4.98 | ) |
| 2015 | | | 46.20 | | | | (0.24 | )(a) | | | 4.76 | | | | 4.52 | | | | — | | | | (3.79 | ) | | | (3.79 | ) |
| | |
Value – Institutional Class | | | | | | | | | | | | | | | | | | | | | | | | | |
| 2019 | | | 43.29 | | | | (0.09 | )(a) | | | 3.64 | | | | 3.55 | | | | — | | | | (4.02 | ) | | | (4.02 | ) |
| 2018 | | | 42.44 | | | | (0.09 | )(a) | | | 4.00 | | | | 3.91 | | | | — | | | | (3.06 | ) | | | (3.06 | ) |
| 2017 | | | 38.56 | | | | (0.08 | )(a) | | | 3.96 | | | | 3.88 | | | | — | | | | — | | | | — | |
| 2016 | | | 46.99 | | | | (0.17 | )(a) | | | (3.28 | ) | | | (3.45 | ) | | | — | | | | (4.98 | ) | | | (4.98 | ) |
Eight months ended 3/31/2015(b) | | | 44.80 | | | | (0.26 | )(a) | | | 4.50 | | | | 4.24 | | | | — | | | | (2.05 | ) | | | (2.05 | ) |
| | |
Partners Value – Investor Class | | | | | | | | | | | | | | | | | | | | | | | | | |
| 2019 | | | 31.31 | | | | (0.12 | )(a) | | | 0.63 | | | | 0.51 | | | | — | | | | (2.37 | ) | | | (2.37 | ) |
| 2018 | | | 30.72 | | | | (0.15 | )(a) | | | 1.47 | | | | 1.32 | | | | — | | | | (0.73 | ) | | | (0.73 | ) |
| 2017 | | | 27.66 | | | | (0.09 | )(a) | | | 3.15 | | | | 3.06 | | | | — | | | | — | | | | — | |
| 2016 | | | 35.05 | | | | (0.14 | )(a) | | | (3.47 | ) | | | (3.61 | ) | | | — | | | | (3.78 | ) | | | (3.78 | ) |
| 2015 | | | 33.20 | | | | (0.14 | )(a) | | | 3.09 | | | | 2.95 | | | | — | | | | (1.10 | ) | | | (1.10 | ) |
| | |
Partners Value - Institutional Class | | | | | | | | | | | | | | | | | | | | | | | | | |
| 2019 | | | 31.59 | | | | (0.04 | )(a) | | | 0.64 | | | | 0.60 | | | | — | | | | (2.37 | ) | | | (2.37 | ) |
| 2018 | | | 30.91 | | | | (0.06 | )(a) | | | 1.47 | | | | 1.41 | | | | — | | | | (0.73 | ) | | | (0.73 | ) |
| 2017 | | | 27.75 | | | | (0.02 | )(a) | | | 3.18 | | | | 3.16 | | | | — | | | | — | | | | — | |
| 2016 | | | 35.09 | | | | (0.08 | )(a) | | | (3.48 | ) | | | (3.56 | ) | | | — | | | | (3.78 | ) | | | (3.78 | ) |
Eight months ended 3/31/2015(b) | | | 33.22 | | | | (0.11 | )(a) | | | 2.91 | | | | 2.80 | | | | — | | | | (0.93 | ) | | | (0.93 | ) |
| | |
Partners III Opportunity – Investor Class | | | | | | | | | | | | | | | | | | | | | |
| 2019 | | | 14.28 | | | | (0.17 | )(a) | | | 1.58 | | | | 1.41 | | | | — | | | | (1.02 | ) | | | (1.02 | ) |
| 2018 | | | 14.74 | | | | (0.19 | )(a) | | | 0.40 | | | | 0.21 | | | | — | | | | (0.67 | ) | | | (0.67 | ) |
| 2017 | | | 13.73 | | | | (0.20 | )(a) | | | 1.40 | | | | 1.20 | | | | — | | | | (0.19 | ) | | | (0.19 | ) |
| 2016 | | | 17.12 | | | | (0.25 | )(a) | | | (1.30 | ) | | | (1.55 | ) | | | — | | | | (1.84 | ) | | | (1.84 | ) |
| 2015 | | | 16.43 | | | | (0.22 | )(a) | | | 1.41 | | | | 1.19 | | | | — | | | | (0.50 | ) | | | (0.50 | ) |
| | |
Partners III Opportunity – Institutional Class | | | | | | | | | | | | | | | | | | | | | |
| 2019 | | | 14.69 | | | | (0.09 | )(a) | | | 1.63 | | | | 1.54 | | | | — | | | | (1.02 | ) | | | (1.02 | ) |
| 2018 | | | 15.07 | | | | (0.12 | )(a) | | | 0.41 | | | | 0.29 | | | | — | | | | (0.67 | ) | | | (0.67 | ) |
| 2017 | | | 13.96 | | | | (0.13 | )(a) | | | 1.43 | | | | 1.30 | | | | — | | | | (0.19 | ) | | | (0.19 | ) |
| 2016 | | | 17.31 | | | | (0.19 | )(a) | | | (1.32 | ) | | | (1.51 | ) | | | — | | | | (1.84 | ) | | | (1.84 | ) |
| 2015 | | | 16.55 | | | | (0.17 | )(a) | | | 1.43 | | | | 1.26 | | | | — | | | | (0.50 | ) | | | (0.50 | ) |
| | |
Hickory | | | | | | | | | | | | | | | | | | | | | | | | | |
| 2019 | | | 51.58 | | | | (0.05 | ) | | | 0.71 | | | | 0.66 | | | | — | | | | (5.38 | ) | | | (5.38 | ) |
| 2018 | | | 53.11 | | | | (0.37 | ) | | | 1.55 | | | | 1.18 | | | | — | | | | (2.71 | ) | | | (2.71 | ) |
| 2017 | | | 47.59 | | | | (0.25 | ) | | | 5.77 | | | | 5.52 | | | | — | | | | — | | | | — | |
| 2016 | | | 59.51 | | | | (0.30 | ) | | | (4.79 | ) | | | (5.09 | ) | | | — | | | | (6.83 | ) | | | (6.83 | ) |
| 2015 | | | 57.87 | | | | (0.35 | ) | | | 5.00 | | | | 4.65 | | | | — | | | | (3.01 | ) | | | (3.01 | ) |
| * | Annualized |
| † | Not Annualized |
(a) | Based on average daily shares outstanding |
(b) | Initial offering of shares on July 31, 2014 |
(c) | Included in the expense ratio is 0.00%, 0.00%, 0.08%, 0.27% and 0.24% related to interest expense and 0.40%, 0.47%, 0.54%, 0.50% and 0.29% related to dividend expense on securities sold short for the periods ended March 31, 2019, 2018, 2017, 2016 and 2015, respectively. |
(d) | Included in the expense ratio is 0.00%, 0.00%, 0.08%, 0.27% and 0.24% related to interest expense and 0.40%, 0.47%, 0.55%, 0.51% and 0.29% related to dividend expense on securities sold short for the periods ended March 31, 2019, 2018, 2017, 2016 and 2015, respectively. |
The accompanying notes form an integral part of these financial statements.
52 | Q1 2019 ANNUAL REPORT
| | | | | | | | | | | | | | | | | | | | |
| | | | | | | | | | Ratios/Supplemental Data | | | | | | | |
| | | | | | | | | | Ratio of expenses | | | | | | | |
| | | | | | | | | | to average net assets | | | | | | | |
| | | | | | | | | | | | | | | | Ratio of net | | | | |
| | | | | | | | | | | | | | | | investment income | | | Portfolio | |
Net asset value, | | | | | | Net assets, end of | | | Prior to fee | | | Net of fee | | | (loss) to average | | | turnover | |
end of period | | | Total Return (%) | | | period ($000) | | | waivers (%) | | | waivers (%) | | | net assets (%) | | | rate (%) | |
| | |
| | |
| | 42.31 | | | | 9.04 | | | | 541,168 | | | | 1.23 | | | | 1.23 | | | | (0.46 | ) | | | 32 | |
| | 42.92 | | | | 9.23 | | | | 578,345 | | | | 1.22 | | | | 1.22 | | | | (0.42 | ) | | | 15 | |
| | 42.20 | | | | 9.81 | | | | 638,993 | | | | 1.24 | | | | 1.22 | | | | (0.42 | ) | | | 24 | |
| | 38.43 | | | | (8.05 | ) | | | 738,086 | | | | 1.23 | | | | 1.18 | | | | (0.59 | ) | | | 47 | |
| | 46.93 | | | | 10.19 | | | | 940,646 | | | | 1.20 | | | | 1.18 | | | | (0.54 | ) | | | 36 | |
| | |
| | |
| | 42.82 | | | | 9.32 | | | | 227,580 | | | | 1.08 | | | | 0.99 | | | | (0.22 | ) | | | 32 | |
| | 43.29 | | | | 9.46 | | | | 207,059 | | | | 1.09 | | | | 0.99 | | | | (0.20 | ) | | | 15 | |
| | 42.44 | | | | 10.06 | | | | 191,299 | | | | 1.10 | | | | 0.99 | | | | (0.19 | ) | | | 24 | |
| | 38.56 | | | | (7.88 | ) | | | 192,310 | | | | 1.08 | | | | 0.99 | | | | (0.39 | ) | | | 47 | |
| | 46.99 | | | | 9.57 | † | | | 200,254 | | | | 1.08 | * | | | 0.99 | * | | | (0.87 | )* | | | 36 | |
| | |
| | |
| | 29.45 | | | | 2.50 | | | | 265,250 | | | | 1.27 | | | | 1.27 | | | | (0.39 | ) | | | 38 | |
| | 31.31 | | | | 4.28 | | | | 328,648 | | | | 1.25 | | | | 1.25 | | | | (0.46 | ) | | | 12 | |
| | 30.72 | | | | 11.06 | | | | 429,226 | | | | 1.27 | | | | 1.24 | | | | (0.33 | ) | | | 16 | |
| | 27.66 | | | | (10.61 | ) | | | 531,353 | | | | 1.26 | | | | 1.18 | | | | (0.45 | ) | | | 31 | |
| | 35.05 | | | | 8.99 | | | | 789,853 | | | | 1.22 | | | | 1.18 | | | | (0.42 | ) | | | 26 | |
| | |
| | |
| | 29.82 | | | | 2.78 | | | | 322,558 | | | | 1.07 | | | | 0.99 | | | | (0.12 | ) | | | 38 | |
| | 31.59 | | | | 4.55 | | | | 331,474 | | | | 1.07 | | | | 0.99 | | | | (0.20 | ) | | | 12 | |
| | 30.91 | | | | 11.39 | | | | 309,497 | | | | 1.07 | | | | 0.99 | | | | (0.08 | ) | | | 16 | |
| | 27.75 | | | | (10.45 | ) | | | 297,290 | | | | 1.07 | | | | 0.99 | | | | (0.25 | ) | | | 31 | |
| | 35.09 | | | | 8.51 | † | | | 317,973 | | | | 1.05 | * | | | 0.99 | * | | | (0.49 | )* | | | 26 | |
| | |
| | |
| | 14.67 | | | | 10.63 | | | | 21,881 | | | | 2.13 | (c) | | | 2.13 | (c) | | | (1.23 | ) | | | 38 | |
| | 14.28 | | | | 1.49 | | | | 24,808 | | | | 2.14 | (c) | | | 2.14 | (c) | | | (1.30 | ) | | | 31 | |
| | 14.74 | | | | 8.94 | | | | 28,561 | | | | 2.29 | (c) | | | 2.29 | (c) | | | (1.43 | ) | | | 23 | |
| | 13.73 | | | | (9.56 | ) | | | 35,461 | | | | 2.33 | (c) | | | 2.33 | (c) | | | (1.63 | ) | | | 46 | |
| | 17.12 | | | | 7.38 | | | | 68,490 | | | | 2.06 | (c) | | | 2.01 | (c) | | | (1.33 | ) | | | 45 | |
| | |
| | |
| | 15.21 | | | | 11.25 | | | | 616,621 | | | | 1.56 | (d) | | | 1.56 | (d) | | | (0.66 | ) | | | 38 | |
| | 14.69 | | | | 2.01 | | | | 629,034 | | | | 1.63 | (d) | | | 1.63 | (d) | | | (0.79 | ) | | | 31 | |
| | 15.07 | | | | 9.52 | | | | 661,165 | | | | 1.80 | (d) | | | 1.80 | (d) | | | (0.93 | ) | | | 23 | |
| | 13.96 | | | | (9.20 | ) | | | 677,019 | | | | 1.95 | (d) | | | 1.95 | (d) | | | (1.26 | ) | | | 46 | |
| | 17.31 | | | | 7.76 | | | | 1,014,821 | | | | 1.69 | (d) | | | 1.69 | (d) | | | (1.00 | ) | | | 45 | |
| | |
| | |
| | 46.86 | | | | 2.30 | | | | 210,744 | | | | 1.27 | | | | 1.27 | | | | (0.10 | ) | | | 28 | |
| | 51.58 | | | | 2.15 | | | | 242,608 | | | | 1.24 | | | | 1.24 | | | | (0.65 | ) | | | 20 | |
| | 53.11 | | | | 11.60 | | | | 272,499 | | | | 1.25 | | | | 1.25 | | | | (0.44 | ) | | | 7 | |
| | 47.59 | | | | (9.04 | ) | | | 298,170 | | | | 1.24 | | | | 1.24 | | | | (0.50 | ) | | | 27 | |
| | 59.51 | | | | 8.31 | | | | 445,167 | | | | 1.23 | | | | 1.23 | | | | (0.54 | ) | | | 26 | |
The accompanying notes form an integral part of these financial statements.
53 | Q1 2019 ANNUAL REPORT
FINANCIAL HIGHLIGHTS (CONTINUED)
The following financial information provides selected data, in U.S. dollars, for a share outstanding throughout the periods indicated.
| | | | | | | | | | | | | | | | | | | | | | |
| | | | | | Income (loss) from Investment Operations | | | Distributions | |
| | | | | | | | | Net gain (loss) | | | | | | Dividends | | | | | | | |
| | | | | | | | | on securities | | | Total from | | | from net | | | Distributions | | | | |
Years ended March 31, | | Net asset value, | | | Net investment | | | (realized | | | investment | | | investment | | | from | | | Total | |
unless otherwise noted | | beginning of period | | | income (loss) | | | and unrealized) | | | operations | | | income | | | realized gains | | | distributions | |
| | |
Balanced | | | | | | | | | | | | | | | | | | | | | |
| 2019 | | | 14.20 | | | | 0.14 | | | | 0.66 | | | | 0.80 | | | | (0.13 | ) | | | (1.11 | ) | | | (1.24 | ) |
| 2018 | | | 13.63 | | | | 0.08 | | | | 0.87 | | | | 0.95 | | | | (0.05 | ) | | | (0.33 | ) | | | (0.38 | ) |
| 2017 | | | 13.24 | | | | 0.01 | | | | 0.80 | | | | 0.81 | | | | (0.03 | ) | | | (0.39 | ) | | | (0.42 | ) |
| 2016 | | | 14.07 | | | | 0.02 | | | | (0.13 | ) | | | (0.11 | ) | | | — | | | | (0.72 | ) | | | (0.72 | ) |
| 2015 | | | 14.22 | | | | (0.02 | ) | | | 0.54 | | | | 0.52 | | | | — | | | | (0.67 | ) | | | (0.67 | ) |
| | |
Core Plus Income – Investor Class | | | | | | | | | | | | | | | | | | | | | | | | | |
| 2019 | | | 10.09 | | | | 0.27 | (a) | | | 0.21 | | | | 0.48 | | | | (0.26 | ) | | | — | | | | (0.26 | ) |
| 2018 | | | 10.23 | | | | 0.23 | (a) | | | (0.12 | ) | | | 0.11 | | | | (0.22 | ) | | | (0.03 | ) | | | (0.25 | ) |
| 2017 | | | 10.15 | | | | 0.23 | (a) | | | 0.21 | | | | 0.44 | | | | (0.23 | ) | | | (0.13 | ) | | | (0.36 | ) |
| 2016 | | | 10.21 | | | | 0.22 | (a) | | | (0.04 | ) | | | 0.18 | | | | (0.22 | ) | | | (0.02 | ) | | | (0.24 | ) |
Eight months ended 3/31/2015(b) | | | 10.00 | | | | 0.09 | (a) | | | 0.20 | | | | 0.29 | | | | (0.08 | ) | | | — | | | | (0.08 | ) |
| | |
Core Plus Income – Institutional Class | | | | | | | | | | | | | | | | | | | | | | | | | |
| 2019 | | | 10.10 | | | | 0.29 | (a) | | | 0.21 | | | | 0.50 | | | | (0.28 | ) | | | — | | | | (0.28 | ) |
| 2018 | | | 10.23 | | | | 0.25 | (a) | | | (0.11 | ) | | | 0.14 | | | | (0.24 | ) | | | (0.03 | ) | | | (0.27 | ) |
| 2017 | | | 10.15 | | | | 0.25 | (a) | | | 0.21 | | | | 0.46 | | | | (0.25 | ) | | | (0.13 | ) | | | (0.38 | ) |
| 2016 | | | 10.20 | | | | 0.25 | (a) | | | (0.04 | ) | | | 0.21 | | | | (0.24 | ) | | | (0.02 | ) | | | (0.26 | ) |
Eight months ended 3/31/2015(b) | | | 10.00 | | | | 0.10 | (a) | | | 0.20 | | | | 0.30 | | | | (0.10 | ) | | | — | | | | (0.10 | ) |
| | |
Short Duration Income – Investor Class | | | | | | | | | | | | | | | | | | | | | | | | | |
| 2019 | | | 12.09 | | | | 0.26 | (a) | | | 0.09 | | | | 0.35 | | | | (0.27 | ) | | | — | | | | (0.27 | ) |
| 2018 | | | 12.27 | | | | 0.23 | (a) | | | (0.18 | ) | | | 0.05 | | | | (0.23 | ) | | | — | | | | (0.23 | ) |
| 2017 | | | 12.28 | | | | 0.23 | (a) | | | 0.04 | | | | 0.27 | | | | (0.24 | )(e) | | | (0.04 | ) | | | (0.28 | ) |
| 2016 | | | 12.48 | | | | 0.22 | (a) | | | (0.15 | ) | | | 0.07 | | | | (0.23 | ) | | | (0.04 | ) | | | (0.27 | ) |
| 2015 | | | 12.49 | | | | 0.19 | (a) | | | 0.02 | | | | 0.21 | | | | (0.21 | ) | | | (0.01 | ) | | | (0.22 | ) |
| | |
Short Duration Income – Institutional Class | | | | | | | | | | | | | | | | | | | | | | | | | |
| 2019 | | | 12.11 | | | | 0.29 | (a) | | | 0.09 | | | | 0.38 | | | | (0.30 | ) | | | — | | | | (0.30 | ) |
| 2018 | | | 12.29 | | | | 0.26 | (a) | | | (0.18 | ) | | | 0.08 | | | | (0.26 | ) | | | — | | | | (0.26 | ) |
| 2017 | | | 12.30 | | | | 0.26 | (a) | | | 0.04 | | | | 0.30 | | | | (0.27 | )(e) | | | (0.04 | ) | | | (0.31 | ) |
| 2016 | | | 12.50 | | | | 0.25 | (a) | | | (0.15 | ) | | | 0.10 | | | | (0.26 | ) | | | (0.04 | ) | | | (0.30 | ) |
| 2015 | | | 12.51 | | | | 0.22 | (a) | | | 0.02 | | | | 0.24 | | | | (0.24 | ) | | | (0.01 | ) | | | (0.25 | ) |
| | |
Ultra Short Government | | | | | | | | | | | | | | | | | | | | | | | | | |
| 2019 | | | 10.00 | | | | 0.20 | | | | 0.01 | | | | 0.21 | | | | (0.20 | ) | | | — | | | | (0.20 | ) |
| 2018 | | | 10.00 | | | | 0.09 | | | | — | # | | | 0.09 | | | | (0.09 | ) | | | — | | | | (0.09 | ) |
2017(c) | | | 10.00 | | | | 0.03 | | | | — | # | | | 0.03 | | | | (0.03 | ) | | | — | | | | (0.03 | ) |
2016(c) | | | 10.00 | | | | — | # | | | — | # | | | — | # | | | — | # | | | — | # | | | — | # |
2015(c) | | | 10.00 | | | | — | # | | | — | # | | | — | # | | | — | # | | | — | | | | — | # |
| | |
Nebraska Tax-Free Income | | | | | | | | | | | | | | | | | | | | | | | | | |
| 2019 | | | 9.76 | | | | 0.14 | | | | 0.19 | | | | 0.33 | | | | (0.14 | ) | | | — | | | | (0.14 | ) |
| 2018 | | | 9.90 | | | | 0.14 | | | | (0.15 | ) | | | (0.01 | ) | | | (0.13 | ) | | | — | | | | (0.13 | ) |
| 2017 | | | 10.12 | | | | 0.17 | | | | (0.22 | ) | | | (0.05 | ) | | | (0.17 | ) | | | — | | | | (0.17 | ) |
| 2016 | | | 10.19 | | | | 0.18 | | | | (0.06 | ) | | | 0.12 | | | | (0.19 | ) | | | — | | | | (0.19 | ) |
| 2015 | | | 10.19 | | | | 0.22 | | | | — | # | | | 0.22 | | | | (0.22 | ) | | | — | | | | (0.22 | ) |
| * | Annualized |
| † | Not Annualized |
| # | Amount less than $0.01 |
(a) | Based on average daily shares outstanding |
(b) | Initial offering of shares on July 31, 2014 |
(c) | Prior to December 16, 2016, this Fund was known as the Government Money Market Fund. Per share amounts have been adjusted to reflect a 1-for-10 reverse split, which was effective December 16, 2016. In addition, on December 16, 2016, the Fund changed from a constant $1.00 net asset value per share money market fund to an ultra short government fund (that is not a money market fund). |
(d) | Because calculations of portfolio turnover exclude securities whose maturity or expiration date was one year or less when the Fund acquired the securities, the Fund has no portfolio turnover information to report for this period. |
(e) | Includes a return of capital distribution of less than $0.01. |
The accompanying notes form an integral part of these financial statements.
54 | Q1 2019 ANNUAL REPORT
| | | | | | | | | | | | | | | | | | | | |
| | | | | | | | | | Ratios/Supplemental Data | | | | | | | |
| | | | | | | | | | Ratio of expenses | | | | | | | |
| | | | | | | | | | to average net assets | | | | | | | |
| | | | | | | | | | | | | | | | Ratio of net | | | | |
| | | | | | | | | | | | | | | | investment income | | | Portfolio | |
Net asset value, | | | | | | Net assets, end of | | | Prior to fee | | | Net of fee | | | (loss) to average | | | turnover | |
end of period | | | Total Return (%) | | | period ($000) | | | waivers (%) | | | waivers (%) | | | net assets (%) | | | rate (%) | |
| | |
| | |
| | 13.76 | | | | 6.18 | | | | 124,431 | | | | 1.00 | | | | 0.88 | | | | 0.98 | | | | 33 | |
| | 14.20 | | | | 7.06 | | | | 122,069 | | | | 1.05 | | | | 1.00 | | | | 0.55 | | | | 40 | |
| | 13.63 | | | | 6.32 | | | | 118,189 | | | | 1.11 | | | | 1.11 | | | | 0.10 | | | | 26 | |
| | 13.24 | | | | (0.80 | ) | | | 111,488 | | | | 1.11 | | | | 1.11 | | | | 0.12 | | | | 35 | |
| | 14.07 | | | | 3.73 | | | | 125,578 | | | | 1.09 | | | | 1.09 | | | | (0.12 | ) | | | 37 | |
| | |
| | |
| | 10.31 | | | | 4.78 | | | | 18,840 | | | | 1.42 | | | | 0.60 | | | | 2.76 | | | | 33 | |
| | 10.09 | | | | 1.20 | | | | 7,274 | | | | 1.65 | | | | 0.60 | | | | 2.26 | | | | 43 | |
| | 10.23 | | | | 4.41 | | | | 6,522 | | | | 1.90 | | | | 0.77 | | | | 2.26 | | | | 54 | |
| | 10.15 | | | | 1.78 | | | | 4,809 | | | | 2.35 | | | | 0.85 | | | | 2.20 | | | | 26 | |
| | 10.21 | | | | 2.90 | † | | | 3,950 | | | | 3.17 | * | | | 0.85 | * | | | 1.39 | * | | | 8 | † |
| | |
| | |
| | 10.32 | | | | 5.07 | | | | 59,687 | | | | 0.96 | | | | 0.40 | | | | 2.93 | | | | 33 | |
| | 10.10 | | | | 1.40 | | | | 31,895 | | | | 1.09 | | | | 0.40 | | | | 2.47 | | | | 43 | |
| | 10.23 | | | | 4.61 | | | | 23,854 | | | | 1.22 | | | | 0.57 | | | | 2.47 | | | | 54 | |
| | 10.15 | | | | 2.06 | | | | 15,108 | | | | 1.37 | | | | 0.65 | | | | 2.39 | | | | 26 | |
| | 10.20 | | | | 2.96 | † | | | 11,804 | | | | 2.54 | * | | | 0.65 | * | | | 1.56 | * | | | 8 | † |
| | |
| | |
| | 12.17 | | | | 2.95 | | | | 71,002 | | | | 0.92 | | | | 0.68 | | | | 2.17 | | | | 23 | |
| | 12.09 | | | | 0.44 | | | | 113,238 | | | | 0.91 | | | | 0.68 | | | | 1.93 | | | | 34 | |
| | 12.27 | | | | 2.15 | | | | 94,817 | | | | 0.93 | | | | 0.80 | | | | 1.85 | | | | 38 | |
| | 12.28 | | | | 0.58 | | | | 100,948 | | | | 0.91 | | | | 0.85 | | | | 1.77 | | | | 23 | |
| | 12.48 | | | | 1.64 | | | | 113,709 | | | | 0.89 | | | | 0.84 | | | | 1.51 | | | | 30 | |
| | |
| | |
| | 12.19 | | | | 3.18 | | | | 828,697 | | | | 0.63 | | | | 0.48 | | | | 2.37 | | | | 23 | |
| | 12.11 | | | | 0.63 | | | | 1,017,962 | | | | 0.62 | | | | 0.48 | | | | 2.12 | | | | 34 | |
| | 12.29 | | | | 2.38 | | | | 1,103,272 | | | | 0.62 | | | | 0.58 | | | | 2.07 | | | | 38 | |
| | 12.30 | | | | 0.83 | | | | 1,155,054 | | | | 0.62 | | | | 0.62 | | | | 2.00 | | | | 23 | |
| | 12.50 | | | | 1.88 | | | | 1,291,524 | | | | 0.61 | | | | 0.61 | | | | 1.73 | | | | 30 | |
| | |
| | |
| | 10.01 | | | | 2.17 | | | | 97,444 | | | | 0.61 | | | | 0.20 | | | | 2.05 | | | | 148 | |
| | 10.00 | | | | 0.94 | | | | 104,162 | | | | 0.60 | | | | 0.20 | | | | 0.94 | | | | 25 | |
| | 10.00 | | | | 0.25 | | | | 98,029 | | | | 0.66 | | | | 0.14 | | | | 0.25 | | | | — | |
| | 10.00 | | | | 0.03 | | | | 106,689 | | | | 0.70 | | | | 0.05 | | | | 0.03 | | | | (d) |
| | 10.00 | | | | 0.01 | | | | 108,453 | | | | 0.67 | | | | 0.01 | | | | 0.01 | | | | (d) |
| | |
| | |
| | 9.95 | | | | 3.46 | | | | 38,048 | | | | 0.89 | | | | 0.89 | | | | 1.39 | | | | 9 | |
| | 9.76 | | | | (0.07 | ) | | | 58,604 | | | | 0.84 | | | | 0.84 | | | | 1.41 | | | | 24 | |
| | 9.90 | | | | (0.54 | ) | | | 62,973 | | | | 0.79 | | | | 0.79 | | | | 1.66 | | | | 29 | |
| | 10.12 | | | | 1.20 | | | | 64,134 | | | | 0.78 | | | | 0.78 | | | | 1.82 | | | | 13 | |
| | 10.19 | | | | 2.14 | | | | 70,002 | | | | 0.75 | | | | 0.75 | | | | 2.14 | | | | 12 | |
The accompanying notes form an integral part of these financial statements.
55 | Q1 2019 ANNUAL REPORT
NOTES TO FINANCIAL STATEMENTS
March 31, 2019
(1) Organization
The Weitz Funds (the “Trust”) is registered under the Investment Company Act of 1940 (the “’40 Act”) as an open-end management investment company issuing shares in series, each series representing a distinct portfolio with its own investment objectives and policies. At March 31, 2019, the Trust had nine series in operation: Value Fund, Partners Value Fund, Partners III Opportunity Fund, Hickory Fund, Balanced Fund, Core Plus Income Fund, Short Duration Income Fund, Ultra Short Government Fund and Nebraska Tax-Free Income Fund (individually, a “Fund”, collectively, the “Funds”).
On March 29, 2019, the Balanced Fund divided their outstanding shares whereby the shares held in accounts with balances exceeding $1.0 million were designated Institutional Class shares. All remaining shares, that were not designated as new Institutional Class shares, were renamed Investor Class shares.
Currently, the Value, Partners Value, Partners III Opportunity, Balanced, Core Plus Income and Short Duration Income Funds each offer two classes of shares: Institutional Class and Investor Class shares. Each class of shares has identical rights and privileges, except with respect to certain class specific expenses such as administration and shareholder servicing fees, voting rights on matters affecting a single class of shares and exchange privileges. Income, realized and unrealized gains and losses, and expenses of the Funds not directly attributable to a specific class of shares are allocated to the two classes on the basis of daily net assets of each class. Fees and expenses relating to a specific class are charged directly to that share class. All other Funds offer one class of shares.
The investment objective of the Value, Partners Value, Partners III Opportunity and Hickory Funds (the “Weitz Equity Funds”) is capital appreciation.
The investment objectives of the Balanced Fund are long-term capital appreciation, capital preservation and current income.
The investment objectives of the Core Plus Income Fund are current income and capital preservation.
The investment objective of the Short Duration Income Fund is current income consistent with the preservation of capital.
Effective December 16, 2016, the Government Money Market Fund’s name was changed to the Ultra Short Government Fund and the Fund ceased operating as a “money market fund” pursuant to Rule 2a-7 of the ’40 Act. While the Ultra Short Government Fund’s investment strategy changed, its investment objective remained the same, which is current income consistent with the preservation of capital and maintenance of liquidity.
The investment objective of the Nebraska Tax-Free Income Fund is current income that is exempt from both federal and Nebraska personal income taxes, consistent with the preservation of capital.
Investment strategies and risk factors of each Fund are discussed in the Funds’ Prospectus.
(2) Significant Accounting Policies
The Funds are investment companies and apply the accounting and reporting guidance of the Financial Accounting Standards Board (FASB) Accounting Standards Codification Topic 946 Financial Services – Investment Companies. The following accounting policies are in accordance with accounting principles generally accepted in the United States.
(a) Valuation of Investments
Investments are carried at value determined using the following valuation methods:
| · | Securities traded on a national or regional securities exchange are valued at the last sales price; if there were no sales on that day, securities are valued at the mean between the latest available and representative bid and ask prices; securities listed on the NASDAQ exchange are valued using the NASDAQ Official Closing Price (“NOCP”). Generally, the NOCP will be the last sales price unless the reported trade for the security is outside the range of the bid/ask price. In such cases, the NOCP will be normalized to the nearer of the bid or ask price. |
| · | Short sales traded on a national or regional securities exchange are valued at the last sales price; if there were no sales on that day, short sales are valued at the mean between the latest available and representative bid and ask prices. |
| · | Securities not listed on an exchange are valued at the mean between the latest available and representative bid and ask prices, if available. |
| · | The value of certain debt securities for which market quotations are not readily available may be based upon current market prices of securities that are comparable in coupon, rating and maturity or an appropriate matrix utilizing similar factors. |
| · | The value of a traded option is the last sales price at which such option is traded or, in the absence of a sale on or about the close of the exchange, the mean of the closing bid and ask prices. |
| · | Money market funds are valued at the quoted net asset value. |
| · | The value of securities for which market quotations are not readily available or are deemed unreliable, including restricted and not readily marketable securities, is determined in good faith in accordance with procedures approved by the Trust’s Board of Trustees. Such valuation procedures and methods for valuing securities may include, but are not limited to: multiple of earnings, multiple of book value, discount from value of a similar freely-traded security, purchase price, private transaction in the security or related securities, the nature and duration of restrictions on disposition of the security and a combination of these and other factors. |
The Trust has established a Pricing Committee, composed of officers and employees of Weitz Investment Management, Inc., to supervise the daily valuation process. The Board of Trustees has also established a Valuation Committee, composed of the independent Trustees, to oversee the Pricing Committee and the valuation process. The Pricing Committee provides oversight of the approved procedures, evaluates the effectiveness of the pricing policies and reports to the Valuation Committee of the Board of Trustees. When determining the reliability of third party pricing information, the Pricing Committee, among other things, monitors the daily change in prices and reviews transactions among market participants.
(b) Option Transactions
The Funds, except for the Ultra Short Government Fund, may purchase put or call options. When a Fund purchases an option, an amount equal to the premium paid is recorded as an asset and is subsequently marked-to-market daily. Premiums paid for purchasing options that expire unexercised are recognized on the expiration date as realized losses. If an option is exercised, the premium paid is subtracted from the proceeds of the sale or added to the cost of the purchase to determine whether a Fund has realized a gain or loss on the related investment transaction. When a Fund enters into a closing transaction, a Fund realizes a gain or loss depending upon whether the amount from the closing transaction is greater or less than the premium paid.
The Funds, except for the Ultra Short Government Fund, may write put or call options. When a Fund writes an option, an amount equal to the premium received is recorded as a liability and is subsequently marked-to-market daily. Premiums received for writing options that expire unexercised are recognized on the expiration date as realized gains. If an option is exercised, the premium received is subtracted from the cost of
56 | Q1 2019 ANNUAL REPORT
the purchase or added to the proceeds of the sale to determine whether a Fund has realized a gain or loss on the related investment transaction. When a Fund enters into a closing transaction, a Fund realizes a gain or loss depending upon whether the amount from the closing transaction is greater or less than the premium received.
The Funds attempt to limit market risk and enhance their income by writing (selling) covered call options. The risk in writing a covered call option is that a Fund gives up the opportunity of profit if the market price of the financial instrument increases. A Fund also has the additional risk of not being able to enter into a closing transaction if a liquid secondary market does not exist. The risk in writing a put option is that a Fund is obligated to purchase the financial instrument underlying the option at prices which may be significantly different than the current market price.
(c) Securities Sold Short
The Funds, except for the Ultra Short Government Fund, may engage in selling securities short, which obligates a Fund to replace a security borrowed by purchasing the same security at the current market value. A Fund incurs a loss if the price of the security increases between the date of the short sale and the date on which the Fund replaces the borrowed security. A Fund realizes a gain if the price of the security declines between those dates.
(d) Federal Income Taxes
It is the policy of each Fund to comply with all sections of the Internal Revenue Code applicable to regulated investment companies and to distribute all of its taxable income to shareholders; therefore, no provision for income or excise taxes is required.
Net investment income and net realized gains may differ for financial statement and tax purposes. The character of distributions made during the year from net investment income or net realized gains may differ from their ultimate characterization for Federal income tax purposes. Also, due to the timing of dividend distributions, the fiscal year in which amounts are distributed may differ from the year that the income or realized gains were recorded by the Funds.
The Funds have reviewed their tax positions taken on federal income tax returns, for each of the three open tax years and as of March 31, 2019, and have determined that no provisions for income taxes are required in the Funds’ financial statements.
The following permanent differences between net asset components for financial reporting and tax purposes were reclassified at the end of the fiscal year (in U.S. dollars):
| | | | | | | | | | | | | |
| | | Value | | | Partners Value | | | Partners III Opportunity | | | Hickory | |
| Paid-in capital | | | (2,839,871 | ) | | | (1,533,001 | ) | | | (4,219,610 | ) | | | (166,379 | ) |
| Accumulated undistributed net investment income | | | 2,839,871 | | | | 1,533,001 | | | | 4,219,610 | | | | 166,379 | |
| Accumulated net realized gain (loss) | | | — | | | | — | | | | — | | | | — | |
| The differences are primarily due to net operating losses. These reclassifications have no impact on the net asset value of the Funds. |
(e) Securities Transactions
Securities transactions are accounted for on the date the securities are purchased or sold (trade date). Realized gains or losses are determined by specifically identifying the security sold.
Income dividends less foreign tax withholding (if any), dividends on short positions and distributions to shareholders are recorded on the ex-dividend date. Interest, including amortization of discount or premium, is accrued as earned.
(f) Dividend Policy
The Funds declare and distribute income dividends and capital gains distributions as may be required to qualify as a regulated investment company under the Internal Revenue Code.
Generally, the Core Plus Income, Short Duration Income and Nebraska Tax-Free Income Funds pay income dividends on a quarterly basis. The Ultra Short Government Fund declares dividends daily and pays dividends monthly. All dividends and distributions are reinvested automatically, unless the shareholder elects otherwise.
(g) Other
Expenses that are directly related to a Fund are charged directly to that Fund. Other operating expenses of the Trust are prorated to each Fund on the basis of relative net assets or another appropriate basis. Income, realized and unrealized gains and losses and expenses (other than class specific expenses) are allocated to each class of shares based on its relative net assets, except that each class separately bears expenses related specifically to that class, such as transfer agent fees and registration fees.
(h) Use of Estimates
The preparation of financial statements in conformity with accounting principles generally accepted in the United States requires management to make estimates and assumptions that affect the reported amounts of assets and liabilities and disclosure of contingent assets and liabilities at the date of the financial statements and the reported amounts of increase and decrease in net assets from operations during the period. Actual results could differ from those estimates.
| | | | | | | | | | | | | |
(3) Fund Share Transactions | |
| | |
| | | Year ended March 31, 2019 | | | Year ended March 31, 2018 | |
| | | Shares | | | $ Amount | | | Shares | | | $ Amount | |
Value – Investor Class | | | | | | | | | | | | |
| Sales | | | 488,270 | | | | 20,678,838 | | | | 245,819 | | | | 10,559,055 | |
| Redemptions | | | (2,441,039 | ) | | | (103,175,771 | ) | | | (2,904,810 | ) | | | (124,648,038 | ) |
| Reinvestment of distributions | | | 1,267,758 | | | | 49,307,548 | | | | 992,054 | | | | 41,706,712 | |
| Net increase (decrease) | | | (685,011 | ) | | | (33,189,385 | ) | | | (1,666,937 | ) | | | (72,382,271 | ) |
57 | Q1 2019 ANNUAL REPORT
| | | | | | | | | | | | | |
| | | Year ended March 31, 2019 | | | Year ended March 31, 2018 | |
| | | Shares | | | $ Amount | | | Shares | | | $ Amount | |
| | |
Value – Institutional Class | | | | | | | | | | | | |
| Sales | | | 510,651 | | | | 21,645,012 | | | | 370,081 | | | | 15,871,158 | |
| Redemptions | | | (446,172 | ) | | | (18,519,050 | ) | | | (397,304 | ) | | | (17,225,992 | ) |
| Reinvestment of distributions | | | 467,010 | | | | 18,244,963 | | | | 303,459 | | | | 12,847,282 | |
| Net increase (decrease) | | | 531,489 | | | | 21,370,925 | | | | 276,236 | | | | 11,492,448 | |
| | |
Partners Value – Investor Class | | | | | | | | | | | | | | | | |
| Sales | | | 146,142 | | | | 4,364,563 | | | | 196,491 | | | | 6,186,772 | |
| Redemptions | | | (2,402,752 | ) | | | (72,149,436 | ) | | | (3,919,027 | ) | | | (123,923,405 | ) |
| Reinvestment of distributions | | | 767,368 | | | | 20,698,093 | | | | 246,710 | | | | 7,776,293 | |
| Net increase (decrease) | | | (1,489,242 | ) | | | (47,086,780 | ) | | | (3,475,826 | ) | | | (109,960,340 | ) |
| |
Partners Value – Institutional Class | | | | | | | | | | | | | | | | |
| Sales | | | 833,821 | | | | 23,144,352 | | | | 825,840 | | | | 26,291,070 | |
| Redemptions | | | (1,182,566 | ) | | | (35,013,267 | ) | | | (522,436 | ) | | | (16,636,524 | ) |
| Reinvestment of distributions | | | 672,923 | | | | 18,214,230 | | | | 176,269 | | | | 5,601,822 | |
| Net increase (decrease) | | | 324,178 | | | | 6,345,315 | | | | 479,673 | | | | 15,256,368 | |
| | |
Partners III Opportunity – Investor Class | | | | | | | | | | | | | | | | |
| Sales | | | 294,479 | | | | 4,067,026 | | | | 547,742 | | | | 7,949,833 | |
| Redemptions | | | (655,497 | ) | | | (9,043,479 | ) | | | (834,808 | ) | | | (12,091,006 | ) |
| Reinvestment of distributions | | | 116,278 | | | | 1,550,769 | | | | 86,582 | | | | 1,231,667 | |
| Net increase (decrease) | | | (244,740 | ) | | | (3,425,684 | ) | | | (200,484 | ) | | | (2,909,506 | ) |
| | |
Partners III Opportunity – Institutional Class | | | | | | | | | | | | | | | | |
| Sales | | | 1,829,920 | | | | 25,203,517 | | | | 3,547,724 | | | | 52,545,124 | |
| Redemptions | | | (7,051,229 | ) | | | (97,707,830 | ) | | | (6,330,477 | ) | | | (93,950,423 | ) |
| Reinvestment of distributions | | | 2,955,880 | | | | 40,688,481 | | | | 1,725,691 | | | | 25,184,843 | |
| Net increase (decrease) | | | (2,265,429 | ) | | | (31,815,832 | ) | | | (1,057,062 | ) | | | (16,220,456 | ) |
| | |
Hickory | | | | | | | | | | | | | | | | |
| Sales | | | 170,654 | | | | 8,014,587 | | | | 193,055 | | | | 10,396,158 | |
| Redemptions | | | (822,497 | ) | | | (39,002,996 | ) | | | (808,482 | ) | | | (43,866,640 | ) |
| Reinvestment of distributions | | | 446,107 | | | | 19,494,004 | | | | 188,188 | | | | 9,873,953 | |
| Net increase (decrease) | | | (205,736 | ) | | | (11,494,405 | ) | | | (427,239 | ) | | | (23,596,529 | ) |
| | |
Balanced – Investor Class | | | | | | | | | | | | | | | | |
| Sales | | | 720,238 | | | | 9,795,497 | | | | 486,654 | | | | 6,915,990 | |
| Redemptions | | | (892,254 | ) | | | (12,214,879 | ) | | | (742,365 | ) | | | (10,508,805 | ) |
| Reinvestment of distributions | | | 625,309 | | | | 8,158,372 | | | | 177,478 | | | | 2,491,218 | |
| Net increase (decrease) | | | 453,293 | | | | 5,738,990 | | | | (78,233 | ) | | | (1,101,597 | ) |
| | |
Core Plus Income – Investor Class | | | | | | | | | | | | | | | | |
| Sales | | | 1,278,803 | | | | 12,989,194 | | | | 239,325 | | | | 2,451,341 | |
| Redemptions | | | (200,126 | ) | | | (2,025,409 | ) | | | (169,645 | ) | | | (1,735,968 | ) |
| Reinvestment of distributions | | | 27,744 | | | | 280,689 | | | | 13,301 | | | | 136,187 | |
| Net increase (decrease) | | | 1,106,421 | | | | 11,244,474 | | | | 82,981 | | | | 851,560 | |
| | |
Core Plus Income – Institutional Class | | | | | | | | | | | | | | | | |
| Sales | | | 2,848,144 | | | | 28,943,192 | | | | 1,157,490 | | | | 11,888,041 | |
| Redemptions | | | (345,446 | ) | | | (3,483,328 | ) | | | (399,693 | ) | | | (4,079,800 | ) |
| Reinvestment of distributions | | | 124,077 | | | | 1,253,117 | | | | 69,788 | | | | 713,832 | |
| Net increase (decrease) | | | 2,626,775 | | | | 26,712,981 | | | | 827,585 | | | | 8,522,073 | |
58 | Q1 2019 ANNUAL REPORT
| | | | | | | | | | | | | |
| | | Year ended March 31, 2019 | | | Year ended March 31, 2018 | |
| | | Shares | | | $ Amount | | | Shares | | | $ Amount | |
| | |
Short Duration Income – Investor Class | | | | | | | | | | | | |
| Sales | | | 963,173 | | | | 11,644,226 | | | | 4,946,676 | | | | 60,560,427 | |
| Redemptions | | | (4,658,661 | ) | | | (56,316,664 | ) | | | (3,475,321 | ) | | | (42,556,897 | ) |
| Reinvestment of distributions | | | 165,890 | | | | 2,001,446 | | | | 167,243 | | | | 2,039,632 | |
| Net increase (decrease) | | | (3,529,598 | ) | | | (42,670,992 | ) | | | 1,638,598 | | | | 20,043,162 | |
| | |
Short Duration Income – Institutional Class | | | | | | | | | | | | | | | | |
| Sales | | | 11,654,236 | | | | 141,207,251 | | | | 18,905,284 | | | | 232,351,392 | |
| Redemptions | | | (29,451,330 | ) | | | (356,860,657 | ) | | | (26,428,380 | ) | | | (324,179,104 | ) |
| Reinvestment of distributions | | | 1,764,204 | | | | 21,323,878 | | | | 1,804,816 | | | | 22,063,002 | |
| Net increase (decrease) | | | (16,032,890 | ) | | | (194,329,528 | ) | | | (5,718,280 | ) | | | (69,764,710 | ) |
| | |
Ultra Short Government | | | | | | | | | | | | | | | | |
| Sales | | | 5,127,468 | | | | 51,274,680 | | | | 4,617,178 | | | | 46,164,098 | |
| Redemptions | | | (5,992,514 | ) | | | (59,925,220 | ) | | | (4,086,722 | ) | | | (40,860,827 | ) |
| Reinvestment of distributions | | | 184,347 | | | | 1,843,657 | | | | 83,219 | | | | 832,075 | |
| Net increase (decrease) | | | (680,699 | ) | | | (6,806,883 | ) | | | 613,675 | | | | 6,135,346 | |
| | |
Nebraska Tax-Free Income | | | | | | | | | | | | | | | | |
| Sales | | | 52,501 | | | | 512,640 | | | | 223,108 | | | | 2,206,241 | |
| Redemptions | | | (2,265,403 | ) | | | (22,147,390 | ) | | | (634,561 | ) | | | (6,283,254 | ) |
| Reinvestment of distributions | | | 33,070 | | | | 323,391 | | | | 54,910 | | | | 544,622 | |
| Net increase (decrease) | | | (2,179,832 | ) | | | (21,311,359 | ) | | | (356,543 | ) | | | (3,532,391 | ) |
4) Related Party Transactions
Each Fund has retained Weitz Investment Management, Inc. (the “Adviser”) as its investment adviser. In addition, the Trust has an agreement with Weitz Securities, Inc. (the “Distributor”), a company under common control with the Adviser, to act as distributor for shares of the Trust. Certain officers of the Trust are also officers and directors of the Adviser and the Distributor.
Under the terms of management and investment advisory agreements, the Adviser is paid a monthly fee based on average daily net assets. The annual investment advisory fee schedule for each of the Weitz Equity Funds is as follows:
| Value and Partners Value Funds: | |
Greater Than | Less Than or Equal To | Rate |
| $ 0 | $1,000,000,000 | 0.90% |
| 1,000,000,000 | 2,000,000,000 | 0.85% |
| 2,000,000,000 | 3,000,000,000 | 0.80% |
| 3,000,000,000 | 5,000,000,000 | 0.75% |
| 5,000,000,000 | | 0.70% |
| |
| Partners III Opportunity Fund: | |
Greater Than | Less Than or Equal To | Rate |
| $ 0 | $1,000,000,000 | 1.00% |
| 1,000,000,000 | 2,000,000,000 | 0.95% |
| 2,000,000,000 | 3,000,000,000 | 0.90% |
| 3,000,000,000 | 5,000,000,000 | 0.85% |
| 5,000,000,000 | | 0.80% |
| | | |
| Hickory Fund: | | |
Greater Than | Less Than or Equal To | Rate |
| $ 0 | $2,500,000,000 | 1.00% |
| 2,500,000,000 | 5,000,000,000 | 0.90% |
| 5,000,000,000 | | 0.80% |
The Balanced Fund pays the Adviser, on a monthly basis, an annual advisory fee equal to 0.65% of the Fund’s average daily net assets.
The Core Plus Income, Short Duration Income and Nebraska Tax-Free Income Funds each pay the Adviser, on a monthly basis, an annual advisory fee equal to 0.40% of the respective Fund’s average daily net assets.
The Ultra Short Government Fund pays the Adviser, on a monthly basis, an annual advisory fee equal to 0.30% of the Fund’s average daily net assets .
The Adviser also provides administrative services, including shareholder administrative services, to each Fund pursuant to agreements which provide that the Funds will pay the Adviser a monthly fee based on the average daily net assets of each respective Fund and/or a fee per account, plus third party expenses directly related to providing such services.
59 | Q1 2019 ANNUAL REPORT
Through July 31, 2019, and for the Balanced Fund through July 31, 2020, the Adviser has agreed in writing to reimburse or to pay directly a portion of the Funds’ expenses to limit the net annual operating expense ratio (excluding taxes, interest, brokerage costs, acquired fund fees and expenses and extraordinary expenses). The expense caps and dollar amount of expenses reimbursed during the year ended March 31, 2019, are as follows:
| | | | | | | | | | | | | | | | | | | |
| | | Annual Operating Expense Ratio Cap* | |
| | |
| | | | | | Partners | | | | | | Core Plus | | | Short Duration | | | Ultra Short | |
| | | Value | | | Value | | | Balanced | | | Income | | | Income | | | Government | |
Annual Operating Expense Cap*: | | | | | | | | | | | | | | | | |
| Investor Class | | | 1.30 | % | | | 1.30 | % | | | 0.85 | % | | | 0.60 | % | | | 0.68 | % | | | |
| Institutional Class | | | 0.99 | % | | | 0.99 | % | | | 0.70 | % | | | 0.40 | % | | | 0.48 | % | | | 0.20 | % |
Expenses Reimbursed by the Adviser: | | | | | | | | | | | | | | | | | | | | | |
| Investor Class | | | — | | | | — | | | | 139,377 | | | | 79,779 | | | | 1,339,281 | | | | | |
| Institutional Class | | | 206,109 | | | | 262,499 | | | | | | | | 242,372 | | | | 234,024 | | | | 436,534 | |
* Funds with a single share class are shown with the Investor Class, except for the Ultra Short Government Fund which has been designated Institutional Class.
As of March 31, 2019, the controlling shareholder of the Adviser held shares totaling approximately 5%, 38%, 22%, 37%, 46%, 12% and 66% of the Partners Value, Partners III Opportunity, Hickory, Balanced, Core Plus Income, Ultra Short Government and Nebraska Tax-Free Income Funds, respectively.
(5) Distributions to Shareholders and Distributable Earnings
The tax character of distributions paid by the Funds are summarized as follows (in U.S. dollars):
| | | | | | | | | | | | | | | | | | | | | | | | | |
| | | Year ended March 31, | | | Year ended March 31, | | | Year ended March 31, | | | Year ended March 31, | |
Distributions paid from: | | 2019 | | | 2018 | | | 2019 | | | 2018 | | | 2019 | | | 2018 | | | 2019 | | | 2018 | |
| | | | | | | | | | | | | | | | | | | |
| | | Value | | | Partners Value | | | Partners III Opportunity | | | Hickory | |
| | | | | | | | | | | | | | | | | | | |
| Ordinary income | | | — | | | | — | | | | — | | | | — | | | | — | | | | — | | | | — | | | | 154,488 | |
| Long-term capital gains | | | 71,332,320 | | | | 57,363,750 | | | | 46,555,980 | | | | 15,702,380 | | | | 43,817,145 | | | | 30,230,157 | | | | 24,299,497 | | | | 12,675,974 | |
| Total distributions | | | 71,332,320 | | | | 57,363,750 | | | | 46,555,980 | | | | 15,702,380 | | | | 43,817,145 | | | | 30,230,157 | | | | 24,299,497 | | | | 12,830,462 | |
| | |
| | | Balanced | | | Core Plus Income | | | Short Duration Income | | | Ultra Short Government | |
| | | | | | | | | | | | | | | | | |
| Ordinary income | | | 1,387,977 | | | | 832,062 | | | | 1,548,124 | | | | 924,524 | | | | 23,599,316 | | | | 24,670,337 | | | | 2,181,531 | | | | 940,684 | |
| Long-term capital gains | | | 9,389,711 | | | | 2,471,865 | | | | — | | | | 87,838 | | | | — | | | | — | | | | — | | | | — | |
| Total distributions | | | 10,777,688 | | | | 3,303,927 | | | | 1,548,124 | | | | 1,012,362 | | | | 23,599,316 | | | | 24,670,337 | | | | 2,181,531 | | | | 940,684 | |
| | |
| | | Nebraska Tax-Free Income | | | | | | | | | | | | | | | | | | | | | | | | | |
| | | | | | | | | | | | | | | | | | | | | | | | | | | | |
| Ordinary income | | | 524 | | | | 26,345 | | | | | | | | | | | | | | | | | | | | | | | | | |
| Tax-exempt income | | | 737,403 | | | | 792,349 | | | | | | | | | | | | | | | | | | | | | | | | | |
| Total distributions | | | 737,927 | | | | 818,694 | | | | | | | | | | | | | | | | | | | | | | | | | |
| |
| As of March 31, 2019, the components of net assets on a tax basis were as follows (in U.S. dollars): |
| |
| | | | | | | | | Partners III | | | | | | | |
| | | Value | | | Partners Value | | | Opportunity | | | Hickory | | | Balanced | |
| Cost of investments | | | 486,950,977 | | | | 397,197,241 | | | | 281,728,235 | | | | 140,097,434 | | | | 105,397,459 | |
| | | | | | | | | | | | | | | | | | | | | |
| Gross unrealized appreciation | | | 284,844,599 | | | | 204,050,661 | | | | 284,635,088 | | | | 78,169,873 | | | | 19,616,506 | |
| Gross unrealized depreciation | | | (3,685,633 | ) | | | (12,900,413 | ) | | | (31,033,063 | ) | | | (7,286,018 | ) | | | (793,262 | ) |
| Net unrealized appreciation (depreciation) | | | 281,158,966 | | | | 191,150,248 | | | | 253,602,025 | | | | 70,883,855 | | | | 18,823,244 | |
| | | | | | | | | | | | | | | | | | | | | |
| Undistributed ordinary income | | | — | | | | — | | | | — | | | | — | | | | 291,372 | |
| Qualified late year ordinary loss deferral | | | (938,549 | ) | | | (375,708 | ) | | | (969,384 | ) | | | (281,674 | ) | | | — | |
| Undistributed long-term gains | | | 22,575,478 | | | | 24,652,437 | | | | 8,088,149 | | | | 690,249 | | | | — | |
| Post October capital loss deferral | | | — | | | | — | | | | — | | | | — | | | | (1,007,211 | ) |
| Paid-in capital | | | 465,951,474 | | | | 372,381,533 | | | | 377,781,439 | | | | 139,451,564 | | | | 106,323,669 | |
| Net assets | | | 768,747,369 | | | | 587,808,510 | | | | 638,502,229 | | | | 210,743,994 | | | | 124,431,074 | |
60 | Q1 2019 ANNUAL REPORT
| | | | | | | | | | | | | |
| | | | | | Short Duration | | | Ultra Short | | | Nebraska Tax-Free | |
| | | Core Plus Income | | | Income | | | Government | | | Income | |
| Cost of investments | | | 75,302,449 | | | | 895,161,256 | | | | 97,780,087 | | | | 37,536,386 | |
| | | | | | | | | | | | | | | | | |
| Gross unrealized appreciation | | | 1,249,532 | | | | 6,895,542 | | | | 49,472 | | | | 346,288 | |
| Gross unrealized depreciation | | | (122,896 | ) | | | (4,279,352 | ) | | | (4,968 | ) | | | (60,304 | ) |
| Net unrealized appreciation (depreciation) | | | 1,126,636 | | | | 2,616,190 | | | | 44,504 | | | | 285,984 | |
| | | | | | | | | | | | | | | | | |
| Undistributed ordinary income | | | 33,584 | | | | 440,192 | | | | 27,671 | | | | — | |
| Undistributed tax-exempt income | | | — | | | | — | | | | — | | | | 23,791 | |
| Other temporary differences | | | — | | | | — | | | | (21,742 | ) | | | — | |
| Undistributed long-term gains | | | — | | | | — | | | | — | | | | — | |
| Capital loss carryforwards | | | (25,096 | ) | | | (1,287,025 | ) | | | — | | | | (69,658 | ) |
| Post October capital loss deferral | | | (112,032 | ) | | | (465,825 | ) | | | — | | | | (67,242 | ) |
| Paid-in capital | | | 77,504,390 | | | | 898,395,117 | | | | 97,393,525 | | | | 37,874,946 | |
| Net assets | | | 78,527,482 | | | | 899,698,649 | | | | 97,443,958 | | | | 38,047,821 | |
The Value, Partners Value, Partners III Opportunity and Hickory Funds elected to defer ordinary losses arising after December 31, 2018. Such losses are treated for tax purposes as arising on April 1, 2019.
The Balanced, Core Plus Income, Short Duration Income and Nebraska Tax-Free Income Funds elected to defer realized capital losses arising after October 31, 2018. Such losses are treated for tax purposes as arising on April 1, 2019.
Capital loss carryforwards represent tax basis capital losses that may be carried over to offset future realized capital gains, if any. To the extent that carryforwards are used, no capital gains distributions will be made. During the fiscal year, the Funds utilized capital loss carryforwards to offset realized capital gains. The character and utilization of the carryforwards are as follows (in U.S. dollars):
| | | | | | | | | | | | | |
| | | Core Plus | | | Short Duration | | | Ultra Short | | | Nebraska Tax-Free | |
| | | Income | | | Income | | | Government | | | Income | |
| Short term (no expiration) | | | (25,096 | ) | | | (811,498 | ) | | | — | | | | — | |
| Long term (no expiration) | | | — | | | | (475,527 | ) | | | — | | | | (69,658 | ) |
| Capital loss carryforwards utilized | | | — | | | | 2,019,850 | | | | 586 | | | | 3,608 | |
(6) Securities Transactions
Purchases and proceeds from maturities or sales of investment securities of the Funds for the year ended March 31, 2019, excluding short-term securities and U.S. government obligations, are summarized as follows (in U.S. dollars):
| | | | | | | | | | |
| | | | | | | | Short | | Nebraska |
| | | Partners | Partners III | | | Core Plus | Duration | Ultra Short | Tax-Free |
| | Value | Value | Opportunity | Hickory | Balanced | Income | Income | Government | Income |
| Purchases | 223,643,825 | 213,842,293 | 284,800,389 | 62,307,788 | 26,987,259 | 33,012,794 | 174,224,199 | 22,456,667 | 4,389,023 |
| Proceeds | 245,152,595 | 230,663,844 | 229,111,249 | 53,049,823 | 36,606,875 | 12,491,843 | 313,238,940 | 12,502,923 | 22,252,683 |
(a) Options Written
The locations in the Statements of Assets and Liabilities as of March 31, 2019, of the Funds’ derivative positions, none of which are designated as hedging instruments are as follows (in U.S. dollars):
| | | | | | | |
| | | | | | Average | Gross |
| | | | Fair Value of | Month-End | Notional |
| | | | | Liability | Notional | Amount |
Fund | Type of Derivative | Location | Asset Derivatives | Derivatives | Amount | Outstanding |
| Partners III Opportunity | Call options written | Options written, at value | — | — | 4,107,125 | — |
| Partners III Opportunity | Put options written | Options written, at value | — | — | 839,667 | — |
Transactions in derivative instruments during the year ended March 31, 2019, are recorded in the following locations in the Statements of Operations (in U.S. dollars):
| | | | | | |
| | | | | | Change in |
| | | | Realized | | Unrealized |
Fund | Type of Derivative | Location | Gain (Loss) | Location | Gain (Loss) |
| Partners III Opportunity | Call options written | Net realized gain (loss) - options written | 759,948 | Net unrealized appreciation (depreciation) - options written | (265,185) |
| Partners III Opportunity | Put options written | Net realized gain (loss) - options written | (338,430) | Net unrealized appreciation (depreciation) - options written | — |
61 | Q1 2019 ANNUAL REPORT
(7) Affiliated Issuers
Affiliated issuers, as defined under the Investment Company Act of 1940, are those in which a Fund’s holdings of an issuer represent 5% or more of the outstanding voting securities of the issuer. A summary of each Fund’s holdings in the securities of such issuers is set forth below:
| | | | | | | | | |
| | Number of | | | Number of | | | | Change in |
| | Shares Held | Gross | Gross | Shares Held | Value | Dividend | Realized | Unrealized |
| | March 31, 2018 | Additions | Reductions | March 31, 2019 | March 31, 2019 | Income | Gain (Loss) | Gain (Loss) |
Partners III Opportunity: | | | | | | | | |
| Intelligent Systems Corp.† | 2,270,000 | — | — | 2,270,000 | $72,503,800 | $ — | $ — | $60,904,100 |
† Controlled affiliate in which the Fund owns 25% or more of the outstanding voting securities.
(8) Contingencies
Each Fund indemnifies the Trust’s officers and trustees for certain liabilities that might arise from their performance of their duties to each of the Funds. Additionally, in the normal course of business the Funds enter into contracts that contain a variety of representations and warranties and which provide general indemnifications. The Funds’ maximum exposure under these arrangements is unknown, as this would involve future claims that may be made against the Funds that have not yet occurred. However, based on experience, the Funds expect the risk of loss to be remote.
(9) Financial Instruments With Off-Balance Sheet Risks
Option contracts written and securities sold short result in off-balance sheet risk as the Fund’s ultimate obligation to satisfy the terms of the contract or the sale of securities sold short may exceed the amount recognized in the Statements of Assets and Liabilities.
The Funds are required to maintain collateral in a segregated account to provide adequate margin as determined by the broker.
(10) Margin Borrowing Agreement
The Partners III Opportunity Fund has a margin account with its prime broker, Bank of America Merrill Lynch, under which the Fund may borrow against the value of its securities, subject to regulatory limitations. Interest accrues at the federal funds rate plus 0.625% (3.025% at March 31, 2019). Interest is accrued daily and paid monthly. The Partners III Opportunity Fund held a cash balance of $101,153,501, with the broker at March 31, 2019.
The Partners III Opportunity Fund is exposed to credit risk from its prime broker who effects transactions and extends credit pursuant to a prime brokerage agreement. The Adviser attempts to minimize the credit risk by monitoring credit exposure and the creditworthiness of the prime broker.
(11) Concentration of Credit Risk
Approximately 93% of the Nebraska Tax-Free Income Fund’s net assets are in obligations of political subdivisions of the State of Nebraska, which are subject to the credit risk associated with the non-performance of such issuers.
(12) Fair Value Measurements
Various inputs are used in determining the value of the Fund’s investments. These inputs are used in determining the value of the Funds’ investments and are summarized in the following fair value hierarchy:
| • | Level 1 – quoted prices in active markets for identical securities; |
| • | Level 2 – other significant observable inputs (including quoted prices for similar securities); |
| • | Level 3 – significant unobservable inputs (including the Funds’ own assumptions in determining the fair value of investments). |
The inputs or methodology used for valuing securities are not an indication of the risk associated with investing in those securities.
A description of the valuation techniques applied to the Funds’ major categories of assets and liabilities measured at fair value on a recurring basis follows.
| · | Equity securities. Securities traded on a national securities exchange (or reported on the NASDAQ national market) are stated at the last reported sales price on the day of valuation. To the extent these securities are actively traded and valuation adjustments are not applied, they are categorized in Level 1 of the fair value hierarchy. Preferred stock and other equities traded on inactive markets or valued by reference to similar instruments are categorized in Level 2. |
| · | Corporate and Municipal bonds. The fair values of corporate and municipal bonds are estimated using various techniques, which may consider recently executed transactions in securities of the issuer or comparable issuers, market price quotations (where observable), bond spreads and fundamental data relating to the issuer. Although most corporate and municipal bonds are categorized in Level 2 of the fair value hierarchy, in instances where lower relative weight is placed on transaction prices, quotations, or similar observable inputs, they are categorized in Level 3. |
| · | Asset-backed securities. The fair values of asset-backed securities (including non-government agency mortgage- backed securities and interest-only securities) are generally estimated based on models that consider the estimated cash flows of each tranche of the entity, a benchmark yield and an estimated tranche specific spread to the benchmark yield based on the unique attributes of the tranche.
Certain securities are valued principally using dealer quotations. To the extent the inputs are observable and timely, the values would be categorized in Level 2 of the fair value hierarchy; otherwise they would be categorized as Level 3. |
| · | U.S. Government securities. U.S. Government securities are normally valued using a model that incorporates market observable data such as reported sales of similar securities, broker quotes, yields, bids, offers and reference data. Certain securities are valued principally using dealer quotations. U.S. Government securities are categorized in Level 1 or Level 2 of the fair value hierarchy depending on the inputs used and market activity levels for specific securities. |
| · | U.S. agency securities. U.S. agency securities are comprised of two main categories consisting of agency issued debt and mortgage- backed securities. Agency issued debt securities are generally valued in a manner similar to U.S. Government securities. Mortgage- backed securities include collateralized mortgage obligations, to-be-announced (TBA) securities and mortgage pass-through certificates. Mortgage-backed securities are generally valued using dealer quotations. Depending on market activity levels and whether quotations or other data are used, these securities are typically categorized in Level 2 of the fair value hierarchy. |
| · | Restricted and/or illiquid securities. Restricted and/or illiquid securities for which quotations are not readily available are valued in accordance with procedures approved by the Trust’s Board of Trustees. Restricted securities issued by publicly traded companies are generally valued at a discount to similar publicly traded securities. Restricted or illiquid securities issued by nonpublic entities may be valued by reference to comparable public entities or |
62 | Q1 2019 ANNUAL REPORT
fundamental data relating to the issuer or both. Depending on the relative significance of valuation inputs, these instruments may be classified in either Level 2 or Level 3 of the fair value hierarchy.
| · | Derivative instruments. Listed derivatives, such as the Funds’ equity option contracts, that are valued based on closing prices from the exchange or the mean of the closing bid and ask prices are generally categorized in Level 1 of the fair value hierarchy. |
The following is a summary of inputs used, in U.S. dollars, as of March 31, 2019, in valuing the Funds’ assets and liabilities carried at fair value. The Schedule of Investments for each Fund provides a detailed breakdown of each category.
| | | | | |
| Value |
| | Level 1 | Level 2 | Level 3 | Total |
Assets: | | | | |
| Investments in Securities: | | | | |
| Common Stocks | 733,986,300 | — | — | 733,986,300 |
| Cash Equivalents | 34,123,643 | — | — | 34,123,643 |
| Total | | | | |
| Investments in | | | | |
| Securities | 768,109,943 | — | — | 768,109,943 |
| | | | | |
| Partners Value |
| | Level 1 | Level 2 | Level 3 | Total |
Assets: | | | | |
| Investments in Securities: | | | | |
| Common Stocks | 562,709,370 | — | — | 562,709,370 |
| Cash Equivalents | 25,638,119 | — | — | 25,638,119 |
| Total | | | | |
| Investments in | | | | |
| Securities | 588,347,489 | — | — | 588,347,489 |
| | | | | |
| Partners III Opportunity |
| | Level 1 | Level 2 | Level 3 | Total |
Assets: | | | | |
| Investments in Securities: | | | | |
| Common Stocks | | | | |
| Information | | | | |
| Technology | 142,289,150 | 72,503,800 | — | 214,792,950 |
| Other | 402,386,830 | — | — | 402,386,830 |
| Cash Equivalents | 14,193,680 | — | — | 14,193,680 |
| Total | | | | |
| Investments in | | | | |
| Securities | 558,869,660 | 72,503,800 | — | 631,373,460 |
Liabilities: | | | | |
| Securities | | | | |
| Sold Short | (96,043,200) | — | — | (96,043,200) |
| | | | | |
| Hickory |
| | Level 1 | Level 2 | Level 3 | Total |
Assets: | | | | |
| Investments in Securities: | | | | |
| Common Stocks | | | | |
| Communication | | | | |
| Services | 58,122,280 | 13,329,300 | — | 71,451,580 |
| Other | 134,231,721 | — | — | 134,231,721 |
| Cash Equivalents | 5,297,988 | — | — | 5,297,988 |
| Total | | | | |
| Investments in | | | | |
| Securities | 197,651,989 | 13,329,300 | — | 210,981,289 |
| |
| Balanced |
| | Level 1 | Level 2 | Level 3 | Total |
Assets: | | | | |
| Investments in Securities: | | | | |
| Common Stocks | 56,660,097 | — | — | 56,660,097 |
| Corporate Bonds | — | 19,350,397 | — | 19,350,397 |
| Corporate | | | | |
| Convertible | | | | |
| Bonds | — | 1,008,781 | — | 1,008,781 |
| Asset-Backed | | | | |
| Securities | — | 2,841,932 | — | 2,841,932 |
| Mortgage- | | | | |
| Backed Securities | — | 2,420,473 | — | 2,420,473 |
| U.S. Treasury | — | 35,757,499 | — | 35,757,499 |
| Cash Equivalents | 6,181,524 | — | — | 6,181,524 |
| Total | | | | |
| Investments in | | | | |
| Securities | 62,841,621 | 61,379,082 | — | 124,220,703 |
| |
| Core Plus Income |
| | Level 1 | Level 2 | Level 3 | Total |
Assets: | | | | |
| Investments in Securities: | | | | |
| Corporate Bonds | — | 20,230,436 | — | 20,230,436 |
| Corporate | | | | |
| Convertible | | | | |
| Bonds | — | 1,172,674 | — | 1,172,674 |
| Asset-Backed | | | | |
| Securities | — | 17,708,672 | — | 17,708,672 |
| Commercial | | | | |
| Mortgage- | | | | |
| Backed Securities | — | 6,279,760 | — | 6,279,760 |
| Mortgage- | | | | |
| Backed Securities | — | 2,558,805 | — | 2,558,805 |
| Taxable | | | | |
| Municipal Bonds | — | 411,116 | — | 411,116 |
| U.S. Treasury | — | 23,429,155 | — | 23,429,155 |
| Common Stocks | 239,828 | — | — | 239,828 |
| Cash Equivalents | 4,398,639 | — | — | 4,398,639 |
| Total | | | | |
| Investments in | | | | |
| Securities | 4,638,467 | 71,790,618 | — | 76,429,085 |
63 | Q1 2019 ANNUAL REPORT
| | | | | |
| Short Duration Income |
| | Level 1 | Level 2 | Level 3 | Total |
Assets: | | | | |
| Investments in Securities: | | | | |
| Corporate Bonds | — | 319,945,310 | — | 319,945,310 |
| Corporate | | | | |
| Convertible | | | | |
| Bonds | — | 30,756,632 | — | 30,756,632 |
| Asset-Backed | | | | |
| Securities | — | 130,207,118 | — | 130,207,118 |
| Commercial | | | | |
| Mortgage- | | | | |
| Backed Securities | — | 28,853,148 | — | 28,853,148 |
| Mortgage- | | | | |
| Backed Securities | — | 153,358,752 | — | 153,358,752 |
| Taxable | | | | |
| Municipal Bonds | — | 2,252,283 | — | 2,252,283 |
| U.S. Treasury | — | 225,520,820 | — | 225,520,820 |
| Common Stocks | 4,602,750 | — | — | 4,602,750 |
| Cash Equivalents | 2,280,633 | — | — | 2,280,633 |
| Total | | | | |
| Investments in | | | | |
| Securities | 6,883,383 | 890,894,063 | — | 897,777,446 |
| |
| Ultra Short Government |
| | Level 1 | Level 2 | Level 3 | Total |
Assets: | | | | |
| Investments in Securities: | | | | |
| Corporate Bonds | — | 2,711,761 | — | 2,711,761 |
| Asset-Backed | | | | |
| Securities | — | 12,308,137 | — | 12,308,137 |
| U.S. Treasury | — | 80,975,088 | — | 80,975,088 |
| Cash Equivalents | 1,829,605 | — | — | 1,829,605 |
| Total | | | | |
| Investments in | | | | |
| Securities | 1,829,605 | 95,994,986 | — | 97,824,591 |
| | | | | |
| Nebraska Tax-Free Income |
| | Level 1 | Level 2 | Level 3 | Total |
Assets: | | | | |
| Investments in Securities: | | | | |
| Municipal Bonds | — | 37,567,581 | — | 37,567,581 |
| Cash Equivalents | 254,789 | — | — | 254,789 |
| Total | | | | |
| Investments in | | | | |
| Securities | 254,789 | 37,567,581 | — | 37,822,370 |
For transfers between the levels within the fair value hierarchy, the Funds have adopted a policy of recognizing the transfers as of the date of the underlying event which caused the transfer. During the year ended March 31, 2019, there were no transfers between Level 1, Level 2 and Level 3.
During the year ended March 31, 2019, there were no assets in which significant unobservable inputs (Level 3) were used.
(13) Subsequent Events
Management has evaluated the impact of all subsequent events on the Funds through the date the financial statements were issued and has determined that there were no additional subsequent events requiring recognition or disclosure in the financial statements.
(14) Recent Accounting Pronouncements
In August 2018, the FASB issued ASU 2018-13, Fair Value Measurement (Topic 820). The standard eliminates, adds and modifies certain disclosure requirements for fair value measurements. Entities will no longer be required to disclose the amount of and reasons for transfers between Level 1 and Level 2, but public companies will be required to disclose the range and weighted average used to develop significant unobservable inputs for Level 3 securities. The guidance is effective for fiscal years beginning after December 15, 2019, and interim periods within those fiscal years. Early adoption would be permitted for all entities. The Funds have determined this ASU will not have a material impact on the financial statements as they do not have any Level 3 securities, nor do they have a history of transfers between levels.
64 | Q1 2019 ANNUAL REPORT
REPORT OF INDEPENDENT REGISTERED PUBLIC ACCOUNTING FIRM
To the Shareholders and the Board of Trustees of The Weitz Funds
Opinion on the Financial Statements
We have audited the accompanying statements of assets and liabilities of The Weitz Funds (the “Trust”) (comprising Value Fund, Partners Value Fund, Partners III Opportunity Fund, Hickory Fund, Balanced Fund, Core Plus Income Fund, Short Duration Income Fund, Ultra Short Government Fund, and Nebraska Tax-Free Income Fund (collectively referred to as the “Funds”)), including the schedules of investments, as of March 31, 2019, and the related statements of operations, cash flows (as applicable), changes in net assets and the financial highlights for each of the periods indicated in the table below and the related notes (collectively referred to as the “financial statements”). In our opinion, the financial statements present fairly, in all material respects, the financial position of each of the Funds comprising The Weitz Funds at March 31, 2019, the results of their operations, cash flows (as applicable), changes in net assets and financial highlights for each of the periods indicated in the table below, in conformity with U.S. generally accepted accounting principles.
| | | | | |
Funds comprising The Weitz Funds | Statement of operations | Statements of changes in net assets | Statement of cash flows | Financial Highlights |
Value Fund Partners Value Fund Hickory Fund Balanced Fund Short Duration Income Fund Ultra Short Government Fund Nebraska Tax-Free Income Fund | For the year ended March 31, 2019 | For each of the two years in the period ended March 31, 2019 | N/A | For each of the five years in the period ended March 31, 2019 |
Core Plus Income Fund | For the year ended March 31, 2019 | For each of the two years in the period ended March 31, 2019 | N/A | For each of the four years in the period ended March 31, 2019 and the period from July 31, 2014 (commencement of operations) through March 31, 2015 |
Partners III Opportunity Fund | For the year ended March 31, 2019 | For each of the two years in the period ended March 31, 2019 | For the year ended March 31, 2019 | For each of the five years in the period ended March 31, 2019 |
Basis for Opinion
These financial statements are the responsibility of the Trust’s management. Our responsibility is to express an opinion on each of the Funds’ financial statements based on our audits. We are a public accounting firm registered with the Public Company Accounting Oversight Board (United States) (“PCAOB”) and are required to be independent with respect to the Trust in accordance with the U.S. federal securities laws and the applicable rules and regulations of the Securities and Exchange Commission and the PCAOB.
We conducted our audits in accordance with the standards of the PCAOB. Those standards require that we plan and perform the audit to obtain reasonable assurance about whether the financial statements are free of material misstatement, whether due to error or fraud. The Trust is not required to have, nor were we engaged to perform, an audit of the Trust’s internal control over financial reporting. As part of our audits we are required to obtain an understanding of internal control over financial reporting but not for the purpose of expressing an opinion on the effectiveness of the Trust’s internal control over financial reporting. Accordingly, we express no such opinion.
Our audits included performing procedures to assess the risks of material misstatement of the financial statements, whether due to error or fraud, and performing procedures that respond to those risks. Such procedures included examining, on a test basis, evidence regarding the amounts and disclosures in the financial statements. Our procedures included confirmation of securities owned as of March 31, 2019, by correspondence with the custodian and brokers. Our audits also included evaluating the accounting principles used and significant estimates made by management, as well as evaluating the overall presentation of the financial statements. We believe that our audits provide a reasonable basis for our opinion.
We have served as the auditor of one or more of The Weitz Funds investment companies since 2004.
Cincinnati, Ohio
May 17, 2019
65 | Q1 2019 ANNUAL REPORT
ACTUAL AND HYPOTHETICAL EXPENSES
FOR COMPARISON PURPOSES
Example
As a shareholder of one or more of the Funds, you incur two types of costs: (1) transaction costs, including any transaction fees that you may be charged if you purchase or redeem your Fund shares through certain financial institutions; and (2) ongoing costs, including management fees and other Fund expenses. This Example is intended to help you understand your ongoing costs (in dollars) of investing in the Funds and to compare these costs with the ongoing costs of investing in other mutual funds. The Example is based on an investment of $1,000 invested at the beginning of the period and held for the entire period from October 1, 2018 through March 31, 2019.
Actual Expenses
The first line for each Fund in the table below provides information about actual account values and actual expenses. You may use the information in this line, together with the amount you invested, to estimate the expenses that you paid over the period. Simply divide your account value by $1,000 (for example, an account value of $8,600 divided by $1,000 = 8.6), then multiply the result by the number in the first line under the heading entitled “Expenses Paid from 10/01/18 – 3/31/19” to estimate the expenses you paid on your account during this period.
Hypothetical Example for Comparison Purposes
The second line for each Fund in the table below provides information about hypothetical account values and hypothetical expenses based on the actual expense ratio of each Fund and an assumed rate of return of 5% per year before expenses, which is not the actual return of the Fund. The hypothetical account values and expenses may not be used to estimate the actual ending account balance or expenses you paid for the period. You may use this information to compare the ongoing costs of investing in a specific Weitz Fund to other funds. To do so, compare this 5% hypothetical example with the 5% hypothetical examples that appear in the shareholder reports of the other funds.
Please note that the expenses shown in the table are meant to highlight your ongoing costs only and do not reflect any transactional costs charged by certain financial institutions. Therefore, the second line of the table is useful in comparing ongoing costs only, and will not help you determine the relative total costs of owning different funds. In addition, if you incurred transactional fees, your costs would have been higher. Actual and hypothetical expenses for each Fund are provided in this table.
| | | | | | |
| | | Beginning Account Value 10/01/18 | Ending Account Value 3/31/19 | Annualized Expense Ratio | Expenses Paid from 10/01/18-3/31/19(1) |
Value - Investor Class | Actual | $1,000.00 | $1,007.59 | 1.24% | $6.21 |
| | Hypothetical(2) | 1,000.00 | 1,018.80 | 1.24 | 6.24 |
Value - Institutional Class | Actual | 1,000.00 | 1,008.90 | 0.99 | 4.96 |
| | Hypothetical(2) | 1,000.00 | 1,020.05 | 0.99 | 4.99 |
Partners Value - Investor Class | Actual | 1,000.00 | 968.58 | 1.28 | 6.28 |
| | Hypothetical(2) | 1,000.00 | 1,018.60 | 1.28 | 6.44 |
Partners Value - Institutional Class | Actual | 1,000.00 | 970.16 | 0.99 | 4.86 |
| | Hypothetical(2) | 1,000.00 | 1,020.05 | 0.99 | 4.99 |
Partners III Opportunity - Investor Class | Actual | 1,000.00 | 1,050.60 | 2.08 | 10.63 |
| | Hypothetical(2) | 1,000.00 | 1,014.60 | 2.08 | 10.45 |
Partners III Opportunity - Institutional Class | Actual | 1,000.00 | 1,053.79 | 1.51 | 7.73 |
| | Hypothetical(2) | 1,000.00 | 1,017.45 | 1.51 | 7.60 |
Hickory | Actual | 1,000.00 | 979.28 | 1.29 | 6.37 |
| | Hypothetical(2) | 1,000.00 | 1,018.55 | 1.29 | 6.49 |
Balanced | Actual | 1,000.00 | 1,020.79 | 0.85 | 4.28 |
| | Hypothetical(2) | 1,000.00 | 1,020.75 | 0.85 | 4.28 |
Core Plus Income - Investor Class | Actual | 1,000.00 | 1,042.38 | 0.60 | 3.06 |
| | Hypothetical(2) | 1,000.00 | 1,022.00 | 0.60 | 3.02 |
Core Plus Income - Institutional Class | Actual | 1,000.00 | 1,044.32 | 0.40 | 2.04 |
| | Hypothetical(2) | 1,000.00 | 1,023.00 | 0.40 | 2.02 |
Short Duration Income - Investor Class | Actual | 1,000.00 | 1,022.13 | 0.68 | 3.43 |
| | Hypothetical(2) | 1,000.00 | 1,021.60 | 0.68 | 3.43 |
Short Duration Income - Institutional Class | Actual | 1,000.00 | 1,023.43 | 0.48 | 2.42 |
| | Hypothetical(2) | 1,000.00 | 1,022.60 | 0.48 | 2.42 |
Ultra Short Government | Actual | 1,000.00 | 1,012.56 | 0.20 | 1.00 |
| | Hypothetical(2) | 1,000.00 | 1,024.00 | 0.20 | 1.01 |
Nebraska Tax-Free Income | Actual | 1,000.00 | 1,032.56 | 0.94 | 4.76 |
| | Hypothetical(2) | 1,000.00 | 1,020.30 | 0.94 | 4.73 |
(1) | Expenses are equal to the annualized expense ratio for the Fund, multiplied by the average account value over the period, multiplied by the number of days in the most recent fiscal half year (182/365). |
(2) | Assumes 5% total return before expenses. |
66 | Q1 2019 ANNUAL REPORT
OTHER INFORMATION
Proxy Voting Policy
A description of the Funds’ proxy voting policies and procedures is available without charge, upon request by (i) calling 800-304-9745, (ii) on the Funds’ website at weitzinvestments.com; and (iii) on the SEC’s website at sec.gov.
Information on how each of the Funds voted proxies relating to portfolio securities during each twelve month period ended June 30 is available: (i) on the Funds’ website at weitzinvestments.com and (ii) on the SEC’s website at sec.gov.
Form N-Q
The Funds file complete schedules of their portfolio holdings with the Securities and Exchange Commission for the first and third quarters of each fiscal year on Form N-Q. The Funds’ Form N-Q is available on the SEC’s website at sec.gov and may be reviewed and copied at the SEC’s Public Reference Room in Washington DC. Information on the operation of the Public Reference Room may be obtained by calling 800 SEC-0330. A list of the Funds’ quarter-end holdings is available on the Funds’ website at weitzinvestments.com within 15 days after the end of each quarter and remains available on the website until the list is updated in the subsequent quarter.
Tax Information
Of the distributions paid during the fiscal year, the amounts that may be considered qualified dividend income and for corporate shareholders, the amounts that may qualify for the corporate dividends received deduction, are summarized as follows (in U.S. dollars):
| | | |
| | Hickory | Balanced |
| Qualified dividend income | 235,487 | 619,279 |
| Corporate dividends received deduction | 161,237 | 428,020 |
The information and distributions reported herein may differ from the information and distributions reported to shareholders for the calendar year ended December 31, 2018, which was reported in conjunction with your 2018 Form 1099-DIV.
67 | Q1 2019 ANNUAL REPORT
INFORMATION ABOUT THE TRUSTEES AND OFFICERS
The individuals listed below serve as Trustees or Officers of the Trust. Each Trustee of the Weitz Funds serves until a successor is elected and qualified or until resignation. Each Officer of the Weitz Funds is elected annually by the Trustees.
The address of all Trustees and Officers is 1125 South 103rd Street, Suite 200, Omaha, Nebraska 68124.
Independent Trustees
Lorraine Change (Age: 68)
Position(s) Held with Trust: Trustee; Chair, Board of Trustees
Length of Service (Beginning Date): 1997
Principal Occupation(s) During Past 5 Years: Independent Management Consultant
Number of Portfolios Overseen in Fund Complex: 9
Other Directorships During Past 5 Years: N/A
John W. Hancock (Age: 71)
Position(s) Held with Trust: Trustee
Length of Service (Beginning Date): 1986
Principal Occupation(s) During Past 5 Years: CPA, Hancock & Dana, PC, an accounting firm
Number of Portfolios Overseen in Fund Complex: 9
Other Directorships During Past 5 Years: N/A
Roland J. Santoni (Age: 77)
Position(s) Held with Trust: Trustee
Length of Service (Beginning Date): 2004
Principal Occupation(s) During Past 5 Years: Retired (April 2018 to Present), Director (2010 to April 2018), Gary and Mary West Foundation; Partner (2012 to April 2018), West Partners, a private equity firm
Number of Portfolios Overseen in Fund Complex: 9
Other Directorships During Past 5 Years: N/A
Delmer L. Toebben (Age: 88)
Position(s) Held with Trust: Trustee
Length of Service (Beginning Date): 1996
Principal Occupation(s) During Past 5 Years: Retired
Number of Portfolios Overseen in Fund Complex: 9
Other Directorships During Past 5 Years: N/A
Justin B. Wender (Age: 49)
Position(s) Held with Trust: Trustee
Length of Service (Beginning Date): 2009
Principal Occupation(s) During Past 5 Years: Managing Partner, Stella Point Capital, LP, a private equity firm
Number of Portfolios Overseen in Fund Complex: 9
Other Directorships During Past 5 Years: International Money Express, Inc., an international money transfer company (2018 to Present)
Interested Trustees*
Wallace R. Weitz (Age: 69)
Position(s) Held with Trust: President; Portfolio Manager; Trustee
Length of Service (Beginning Date): 1986
Principal Occupation(s) During Past 5 Years: President, Weitz Funds; Co-Chief Investment Officer (2017 to Present), Chief Investment Officer (2015 to 2017), President (1983 to 2014), Weitz Investment Management, Inc.
Number of Portfolios Overseen in Fund Complex: 9
Other Directorships During Past 5 Years: Cable One, Inc., a cable television, internet and telephone services company
Thomas R. Pansing (Age: 73)
Position(s) Held with Trust: Trustee
Length of Service (Beginning Date): 1986
Principal Occupation(s) During Past 5 Years: Partner, Pansing Hogan Ernst & Bachman LLP, a law firm
Number of Portfolios Overseen in Fund Complex: 9
Other Directorships During Past 5 Years: N/A
| * | Mr. Weitz is a Director and Officer of Weitz Investment Management, Inc., investment adviser to the Weitz Funds, and as such is considered an “ interested person” of the Trust, as that term is defined in the Investment Company Act of 1940 (an “Interested Trustee”). Mr. Pansing performs certain legal services for the investment adviser and the Weitz Funds and, therefore, is also classified as an “Interested Trustee.” |
68 | Q1 2019 ANNUAL REPORT
Officers
Shar M. Bennett (Age: 44)
Position(s) Held with Trust: Assistant Treasurer
Length of Service (Beginning Date): 2018
Principal Occupation(s) During Past 5 Years: Assistant Treasurer (November 2018 to Present), Weitz Funds; Vice President, Director of Fund Administration (November 2018 to Present), Director of Accounting (April 2004 to November 2018), Weitz Investment Management, Inc.
James J. Boyne (Age: 52)
Position(s) Held with Trust: Vice President and Treasurer
Length of Service (Beginning Date): 2018
Principal Occupation(s) During Past 5 Years: Vice President, Treasurer (November 2018 to Present), Weitz Funds; President and Treasurer (November 2018 to Present), Weitz Investment Management, Inc.; Executive Director (2013 to 2018), Steamboat Springs Winter Sports Club
Thomas D. Carney (Age: 55)
Position(s) Held with Trust: Vice President
Length of Service (Beginning Date): 2015
Principal Occupation(s) During Past 5 Years: Vice President (2015 to Present), Weitz Funds; Portfolio Manager, Weitz Investment Management, Inc.
John R. Detisch (Age: 54)
Position(s) Held with Trust: Vice President, General Counsel, Secretary and Chief Compliance Officer
Length of Service (Beginning Date): 2011
Principal Occupation(s) During Past 5 Years: Vice President, General Counsel, Secretary and Chief Compliance Officer, Weitz Funds; Vice President, General Counsel, Assistant Secretary and Chief Compliance Officer, Weitz Investment Management, Inc.
Martha J. Gilchrist (Age: 56)
Position(s) Held with Trust: Vice President
Length of Service (Beginning Date): 2018
Principal Occupation(s) During Past 5 Years: Vice President (November 2018 to Present), Weitz Funds; Vice President (2015 to Present), Director of Finance (November 2018 to Present), Director of Operations (April 2004 to November 2018), Weitz Investment Management, Inc.
Bradley P. Hinton (Age: 51)
Position(s) Held with Trust: Vice President
Length of Service (Beginning Date): 2006
Principal Occupation(s) During Past 5 Years: Vice President, Weitz Funds; Co-Chief Investment Officer (2017 to Present), Director of Research (2004 to 2017), Vice President and Portfolio Manager, Weitz Investment Management, Inc.
Andrew S. Weitz (Age 39)
Position(s) Held with Trust: Vice President
Length of Service (Beginning Date): 2018
Principal Occupation(s) During Past 5 Years: Vice President (2018 to Present), Weitz Funds; Vice President and Director of Equity Research (2017 to Present), and Portfolio Manager, Weitz Investment Management, Inc.
The Statement of Additional Information for the Weitz Funds, which can be obtained without charge by calling 800-304-9745, includes additional information about the Trustees and Officers of the Weitz Funds.
69 | Q1 2019 ANNUAL REPORT
INDEX DESCRIPTIONS
| | |
Russell 1000® | The Russell 1000 Index measures the performance of the large-cap segment of the U.S. equity universe. It is a subset of the Russell 3000 Index and includes approximately 1,000 of the largest securities based on a combination of their market cap and current index membership. |
| |
Russell 1000® Value | The Russell 1000 Value Index measures the performance of the large-cap value segment of the U.S. equity universe. It includes those Russell 1000 companies with lower price-to-book ratios and lower expected growth values. |
| |
Russell 3000® | The Russell 3000 Index measures the performance of the largest 3,000 U.S. companies representing approximately 98% of the investable U.S. equity market. |
| |
Russell 3000® Value | The Russell 3000 Value Index measures the performance of the broad value segment of the U.S. equity value universe. It includes those Russell 3000 companies with lower price-to-book ratios and lower forecasted growth values. |
| |
Russell Midcap® | The Russell Midcap Index tracks the performance of the 800 next-largest U.S. companies, after the 1,000 largest U.S. companies. |
| |
Russell 2500® | The Russell 2500 Index measures the performance of the small to mid-cap segment of the U.S. equity universe, commonly referred to as “SMID” cap. The Russell 2500 Index is a subset of the Russell 3000 Index. It includes approximately 2,500 of the smallest securities based on a combination of their market cap and current index membership. |
| |
S&P 500® | The S&P 500 is an unmanaged index consisting of 500 companies generally representative of the market for the stocks of large-size U.S. companies. |
| |
| Moderately Conservative | The Morningstar Moderately Conservative Target Risk Index is an asset allocation index comprised of constituent Morningstar indices and reflects global equity market exposure of 40% based on an asset allocation methodology derived by Ibbotson Associates, a Morningstar company. |
| |
| Blended | The Blended Index blends the S&P 500 with the Bloomberg Barclays Intermediate U.S. Government/Credit Index by weighting their total returns at 60% and 40%, respectively. The portfolio is rebalanced monthly. |
| |
Bloomberg Barclays U.S. Aggregate Bond Bloomberg Barclays 1-3 Year U.S. Aggregate | The Bloomberg Barclays U.S. Aggregate Bond Index is a broad-based benchmark that measures the investment grade, U.S. dollar-denominated, fixed-rate taxable bond market. The Bloomberg Barclays 1-3 Year U.S. Aggregate Index is generally representative of the market for investment grade, U.S. dollar denominated, fixed-rate taxable bonds with maturities from one to three years. |
| |
Bloomberg Barclays Intermediate U.S. Government/Credit CPI + 1% | The Bloomberg Barclays Intermediate U.S. Government/Credit Index (“BIGC”) is the non- securitized portion of the U.S. Aggregate Index and includes Treasuries, government-related issues and corporates with maturities from one to ten years. The CPI + 1% is created by adding 1% to the annual percentage change in the Consumer Price Index (“CPI”) as determined by the U.S. Department of Labor Statistics. There can be no guarantee that the CPI will reflect the exact level of inflation at any time. |
| |
ICE BofAML US 6-Month Treasury Bill Bloomberg Barclays 5-Year Municipal Bond | The ICE BofAML US 6-Month Treasury Bill Index is an unmanaged index that is generally representative of the market for U.S. Treasury Bills. The Bloomberg Barclays 5-Year Municipal Bond Index is a capitalization weighted bond index created by Bloomberg Barclays intended to be representative of major municipal bonds of all quality ratings with an average maturity of approximately five years. |
70 | Q1 2019 ANNUAL REPORT
Board of Trustees
Lorraine Chang
John W. Hancock
Thomas R. Pansing, Jr.
Roland J. Santoni
Delmer L. Toebben
Wallace R. Weitz
Justin B. Wender
Investment Adviser
Weitz Investment Management, Inc.
1125 South 103rd Street, Suite 200
Omaha, NE 68124-1071
(800) 304-9745
Custodian
State Street Bank and Trust Company
Officers
Wallace R. Weitz, President
Shar M. Bennett, Assistant Treasurer
James J. Boyne, Vice President & Treasurer
Thomas D. Carney, Vice President
John R. Detisch, Vice President, Secretary & Chief Compliance Officer
Martha J. Gilchrist, Vice President
Bradley P. Hinton, Vice President
Andrew S. Weitz, Vice President
Distributor
Weitz Securities, Inc.
Transfer Agent and Dividend Paying Agent
Weitz Investment Management, Inc.
Sub-Transfer Agent
DST Asset Manager Solutions, Inc.
NASDAQ symbols:
Value Fund
Investor Class - WVALX
Institutional Class - WVAIX
Partners Value Fund
Investor Class - WPVLX
Institutional Class - WPVIX
Partners III Opportunity Fund
Investor Class - WPOIX
Institutional Class - WPOPX
Hickory Fund - WEHIX
Balanced Fund
Investor Class - WBALX
Institutional Class - WBAIX
Core Plus Income Fund
Investor Class - WCPNX
Institutional Class - WCPBX
Short Duration Income Fund
Investor Class - WSHNX
Institutional Class - WEFIX
Ultra Short Government Fund - SAFEX
Nebraska Tax-Free Income Fund - WNTFX
Beginning on January 1, 2021, paper copies of this report will no longer be sent by mail (unless specifically requested). Instead, the reports will be made available on the Weitz Funds’ website, and you will be notified by mail each time a report is posted and the mailing will provide a website link to access the report. For additional information, please see the notice contained on the Table of Contents page of this report.
An investor should consider carefully the investment objectives, risks, and charges and expenses of the Funds before investing. The Funds’ Prospectus contains this and other information about the Funds. The Prospectus should be read carefully before investing.
5/24/19
71 | Q1 2019 ANNUAL REPORT
Item 2. Code of Ethics.
As of the end of the period covered by this report, the Registrant has adopted a code of ethics that applies to the Registrant’s principal executive officer, principal financial officer, principal accounting officer or controller, or persons performing similar functions, regardless of whether these individuals are employed by the Registrant or a third party (the “Code of Ethics”). During the period covered by this report, there were no amendments, nor did the Registrant grant any waivers, including any implicit waivers, from any provision of the Code of Ethics. The Code of Ethics is attached hereto as Exhibit 12(a)(1).
Item 3. Audit Committee Financial Expert.
The Registrant’s board of trustees has determined that the Registrant has at least one “audit committee financial expert” (as defined in Item 3 of Form N-CSR) serving on its audit committee. John Hancock is an “audit committee financial expert” and is “independent” (as each term is defined in Item 3 of Form N-CSR).
Item 4. Principal Accountant Fees and Services.
(2) No services described in items (b) were pre-approved by the Audit Committee pursuant to Rule 2‑01(c)(7)(i)(c) of Regulation S-X.
Item 5. Audit Committee of Listed Registrants.
Not applicable.
Item 6. Schedule of Investments.
The Schedule of Investments in Securities of unaffiliated issuers is included as part of the Report to Shareholders filed under Item 1.
Item 7. Disclosure of Proxy Voting Policies and Procedures for Closed-End Investment Companies.
Not applicable.
Item 8. Portfolio Managers of Closed-End Investment Companies.
Not applicable.
Item 9. Purchases of Equity Securities by Closed-End Management Investment Company and Affiliated Purchasers.
Not applicable.
Item 10. Submissions of Matters to a Vote of Security Holders.
Not applicable.
Item 11. Controls and Procedures.
(a) Based on an evaluation of the Disclosure Controls and Procedures (as defined in Rule 30a-3(c) under the Investment Company Act of 1940) (the “Disclosure Controls”) as of a date within 90 days prior to the filing date (the “Filing Date”) of this report on Form N-CSR (the “Report”), the Registrant’s principal executive officer and principal financial officer have concluded that the Disclosure Controls are reasonably designed to ensure that information required to be disclosed by the Registrant in the Report is recorded, processed, summarized and reported by the Filing Date, including ensuring that information required to be disclosed in the Report is accumulated and communicated to the Registrant’s management, including the Registrant’s principal executive officer and principal financial officer, as appropriate to allow timely decisions regarding required disclosure.
(b) There were no changes in the Registrant’s internal control over financial reporting (as defined in Rule 30a-3(d) under the Investment Company Act of 1940) that occurred during the Registrant’s second fiscal half-year of the period covered by this report that has materially affected, or is reasonably likely to materially affect, the Registrant’s internal control over financial reporting.
Item 12. Exhibits
(a)(1) The Code of Ethics is attached hereto.
(a)(2) The certifications required by Rule 30a-2(a) of the Investment Company Act of 1940 are attached hereto.
(a)(3) Not applicable.
(b) The certifications required by Rule 30a-2(b) of the Investment Company Act of 1940 and Section 906 of the Sarbanes-Oxley Act of 2002 are attached hereto.
Pursuant to the requirements of the Securities Exchange Act of 1934 and the Investment Company Act of 1940, the Registrant has duly caused this report to be signed on its behalf by the undersigned, thereunto duly authorized.
Wallace R. Weitz, President
Pursuant to the requirements of the Securities Exchange Act of 1934 and the Investment Company Act of 1940, this report has been signed below by the following persons on behalf of the Registrant and in the capacities and on the dates indicated.
Wallace R. Weitz, President
James J. Boyne, Vice President and Treasurer
* Print the name and title of each signing officer under his or her signature.