ANNUAL REPORT
March 31, 2021
EQUITY
Weitz Hickory Fund
Weitz Partners III Opportunity Fund
Weitz Partners Value Fund
Weitz Value Fund
ALLOCATION
Weitz Balanced Fund
FIXED INCOME
Weitz Core Plus Income Fund
Weitz Nebraska Tax-Free Income Fund
Weitz Short Duration Income Fund
Weitz Ultra Short Government Fund
PLEASE NOTE: Beginning January 1, 2021, shareholder reports will no longer be automatically sent by mail. See inside for more information.
2 Q1 2021 Annual Report
THE WEITZ PHILOSOPHY
Finding quality at a discount
There are no shortcuts in value investing. At Weitz, we dig for opportunities using a robust quality scoring process. We analyze hundreds of ideas to find strong, well-managed but undervalued companies that offer reasonable risk-adjusted returns. It’s simple – but it’s not easy. We do the due diligence, analyze, ask tough questions and push for answers. We wait for the right opportunities. Then, and only then, do we invest your money.
Fundamental Research-Driven Process
Our research-driven investment approach means deeply understanding our investable universe so we can capitalize on opportunities that arise out of market inefficiencies. Each of our analysts focuses on finding opportunities in specific industries, ensuring deep, ongoing research within their own areas of expertise. We also encourage a generalist mentality where all investment team members vet new ideas. All investment decisions are backed by thorough analysis, logical strategies, extensive debate and our team’s commitment to long-term growth.
Bottom-Up Focus
Our focus is on finding well-run companies with strong fundamentals and outstanding long-term prospects. Valuation is our North Star. When a security is selling at a significant discount to its intrinsic value, that’s when we buy. And when it’s not selling at a discount, we have the discipline and patience to wait for the price to come our way.
High-Conviction Investing
We believe there are a limited number of great investment ideas and that intrinsic value doesn’t change with the daily ebbs and flows of the market. Our high-conviction approach means we know what we own inside and out, allowing our funds to be highly concentrated.
Today we are responsible for approximately $3 billion in investments for our shareholders – individuals, corporations, pension plans, foundations and endowments. And our commitment remains the same: to put your goals first. Always. We do so through our expertise, our flexibility, and our drive to uncover investments that can help you preserve and grow wealth.
We’re right beside you
Weitz employees have a strong commitment of investing their own assets in our mutual funds. By aligning our goals with yours, you can have confidence that we’re treating your money as if it were our own.
Q1 2021 Annual Report 3
TABLE OF CONTENTS
Beginning on January 1, 2021, paper copies of the Fund’s shareholder reports will no longer be sent by mail unless specifically requested from the Fund or from your financial intermediary (such as a financial adviser). Instead, the reports will be made available at weitzinvestments.com and you will be notified by mail each time a report is posted. You will continue to receive other Fund regulatory documents (such as prospectuses or supplements) in paper unless you have elected to receive all Fund documents electronically.
If you would like to continue to receive the Fund’s future shareholder reports in paper free of charge after January 1, 2021, you may make that request (1) by contacting your financial intermediary; or (2) if you invest directly with the Fund, by calling 800-304-9745.
If you already receive shareholder reports and other Fund documents electronically, you will not be affected by this change, and you need not take any action. If you do not receive shareholder reports and other Fund documents electronically but would like to do so, contact your financial intermediary or, if you invest directly with the Fund, call 800-304-9745. An election to receive shareholder reports electronically will apply to all Funds held with the Weitz Funds and may apply to all funds held with your financial intermediary.
Value Matters | 4 |
Fixed Income Insights | 6 |
Performance Summary | 9 |
Analyst Corner | 10 |
Balanced Fund | 12 |
Core Plus Income Fund | 14 |
Hickory Fund | 18 |
Nebraska Tax-Free Income Fund | 20 |
Partners III Opportunity Fund | 24 |
Partners Value Fund | 26 |
Short Duration Income Fund | 28 |
Ultra Short Government Fund | 32 |
Value Fund | 34 |
Schedule of Investments | 36 |
Financial Statements | 54 |
Notes to Financial Statements | 64 |
Report of Independent Registered | |
Public Accounting Firm | 73 |
Actual and Hypothetical Expenses for | |
Comparison Purposes | 74 |
Other Information | 75 |
Information about the Trustees | |
and Officers | 76 |
Index Descriptions | 78 |
The management of Weitz Funds has chosen paper for the 80 page report from a paper manufacturer certified under the Sustainable Forestry Initiative ® standard.
Portfolio composition is subject to change at any time and references to specific securities, industries, and sectors referenced in this report are not recommendations to purchase or sell any particular security. Current and future portfolio holdings are subject to risk. See the Schedules of Investments included in this report for the percent of assets in each of the Funds invested in particular industries or sectors.
4 Q1 2021 Annual Report
VALUE MATTERS
April 2, 2021
Dear Clients and Fellow Shareholders,
The first quarter of 2021 was a good one for our four stock funds. Gains ranged from +7.11% (for Partners III Opportunity) to +8.71% (for Hickory), and each fund beat its index. Twelve-month numbers were strong: +39.25% (Partners III) to +59.17% (Hickory), as the funds benefitted from an accident of the calendar, with the period beginning near the March 2020 bear market bottom. The Balanced Fund continued its stellar performance among “Conservative Allocation” funds with gains of +3.62% for the quarter and +21.74% for the 12 months.
Our bond funds held up remarkably well in the face of a sharp rise in yields (and drop in bond prices) during the quarter. Our Short Duration and Core Plus Income Funds had anticipated rising yields and held the average maturity of their bonds at the short ends of the ranges allowed by their charters. Short Duration’s total return was +0.66% for the quarter and Core Plus had a negative total return of -0.84%. To put these results in perspective, a seemingly insignificant rise in rates from 0.91% to 1.74% (as the 10-year Treasury bond experienced in the quarter) causes a 10-year bond to drop in price by about 5%. Tom and Nolan provide full details of a tumultuous quarter in the bond market in their latest “Fixed Income Insights.”
We feel good about these results. The past 12 months have been unprecedented in mind-boggling ways, and we think that our focus on Quality at a Discount investing has served us well.
Spring 2021 – How Are We Doing?
As we have written since the beginning of the pandemic, the answer to the question “how are we doing?” depends on who you are and what business you are in. For individuals, could you work from home? Were you an “essential service” worker who had to be in harm’s way? Did you work in travel, hospitality, entertainment, or another industry that was crippled by the pandemic and lose your job? If your livelihood was impaired, did you get by with government payments (that will end), and were your rent and mortgage payments “suspended” (but not forgiven)?
Companies face the same mixed bag. Some were major beneficiaries of the pandemic (Zoom, Netflix, Amazon) and others were nearly (or actually) put out of business (airlines, restaurants, theaters). Strong, liquid companies used the Fed’s cheap credit to extend debt maturities and lower interest costs while badly impacted companies borrowed billions to keep their doors open but will exit the pandemic with impaired balance sheets. Each industry will have its own recovery path, and the pace and strengths of those paths will vary widely.
Investors have been tossed about by extreme volatility in both the stock and bond markets. Savers trying to live on investment income had been suffering from low interest rates for a decade, and the Fed’s redoubled efforts to maintain liquidity exacerbated the income investors’ problem. Stock and bond investors have had to make assessments of the viability of all types of businesses in a post-COVID world. Stock prices tend to reflect expectations rather than current reality, so the task for investors is further complicated by the fact that we have no historical precedent for a pandemic recovery of this magnitude.
In short, it is very hard to generalize about “how we are doing.” The aggregate economic data paint a picture of a fairly robust recovery from recession lows. The “direction” of most indicators is positive, yet Treasury Secretary Yellen and Fed Chair Powell said as recently as late March that the economy needed “even more help” to counter the impact of COVID. The narrative of the bull market seems to be that the economy is so weak that continued low interest rates are assured, justifying high P/E ratios, yet a strong, reopening economy will provide prosperity and strong company earnings. This apparent internal contradiction has always troubled us. Nevertheless, we continue to live with the ambiguity, and we remain focused on individual company business values. In the words of famed value investor Seth Klarman, we worry top-down (macro-economic factors), but we invest bottom-up (one stock at a time).
What’s Next?
The biggest issue for investors is the future path of interest rates. Higher yields on bonds present stiffer competition and lower P/E ratios for stocks. This is why stock investors are so fixated on predicting changes in rates and why the Fed’s “promise” not to raise rates for two more years has made many investors feel that they can “pay up” for stocks with impunity.
Inflationary and deflationary forces have been in a titanic struggle for a long time, and it would be presumptuous of us to make a prediction as to what they will do next. Rates have ranged between (roughly) 0% and 20% over the course of our investment careers. They are near 0% now because of Fed manipulation. We do not try to predict rates, but investors should understand that 0% is probably not the “equilibrium” interest rate for the U.S. economy.
A moderate increase in rates, especially if the change is gradual, is not a problem for us. The stock market would probably wobble, but conservative investors and strong businesses can cope with higher rates. Speculators, though, who have borrowed at these very low rates to leverage their bets could find rising rates problematic. Each bull market spawns its own crop of speculative excesses, and the current version is no exception. Here are thumbnails on a few of the more colorful current examples:
Electric vehicles (along with battery makers and hydrogen fuel cell companies) have captured investors’ imaginations. Much has been written about the valuation of Tesla (its market cap recently approached the value of all other auto companies in the world combined). But at least Tesla has a product on the road. Nikola, Lordstown Motors, and some other startups have ideas for products that have been met with considerable skepticism, yet some have market caps in the billions.
The Robinhood online brokerage firm and Reddit online “communities” have been in the news in connection with “short squeezes” that have sent individual stocks soaring and inflicted losses in the billions on some large hedge funds. GameStop, a retail purveyor of videogames (whose best days are probably behind it), began 2021 at under $20 per share. Three weeks later, it had more than doubled. Then it took off, rising from $43 on Jan 21, to an intraday high of $483 on Jan 27, and closed at $54 on Feb 4. Quite a roundtrip for a two-week period (and the volatility continued during the balance of the quarter).
Bitcoin is a digital “token” based on “blockchain” technology. (We think of blockchain as an accounting ledger in which each transaction adds another increment to the structure, like building a “drip castle” at the beach. Blockchain technology itself is proving to have significant real-world applications.) Bitcoin is one of the best known of many cryptocurrencies. Bitcoin can be used as a
Q1 2021 Annual Report 5
medium of exchange and has value as long as others think it has value. It has serious fans who may be right in predicting that it has an important role as an alternative currency. On the other hand, Seth Klarman calls crypto “catnip for techies” and Warren Buffett has referred to Bitcoin as “probably rat poison squared.” We are skeptical about its future, but as neutral observers, we would suggest that Bitcoin���s price move from $6,446 on March 31, 2020, to $58,275 on March 31, 2021, shows evidence of speculative fever.
Finally, we come to NFTs – “Non-Fungible Tokens.” As an imperfectly informed layperson, we would describe NFTs as digital files (pictures or text) which can be “tokenized” through blockchain technology so that each is “unique.” They are, essentially, nothing… but one can “own” them. Thus, they can be bought and sold. This sounds to us like the made-up card game of TEGWAR (“The Exciting Game Without Any Rules”) that Mark Harris wrote about in his 1950’s novels, Southpaw and Bang the Drum Slowly. In the game, veteran baseball players would fleece the rookies by making up the rules as they went along, counting on the rookies’ embarrassment at not knowing how to play. Well, “harmless fun” at a few dollars per NFT, but a token attached to a collection of digital works by an artist known as Beeple recently sold at Christie’s for $69 million. Surely there is more to this story that will come out over time, but in our opinion, NFTs have a certain Emperor’s New Clothes aura.
Speculation is a natural part of securities markets. It is not evil. We have noticed, though, that in an interconnected world, when a speculative trading vehicle implodes, there can be collateral damage for innocent bystanders. (For example, the Mortgage Crisis of 2007 became the Great Financial Crisis of 2008-09 when the financial problems of some weaker institutions triggered a more general liquidity crisis for the whole economy. No prediction here… we just want to be alert to potential dangers.)
Outlook
Vaccines are here, the reopening of the global economy is proceeding, and corporations are generally finding ways to cope with the impact of the pandemic. We are optimistic about the future in general and, in particular, the growth in business value of our companies.
The issue that gives us pause is the level of stock (and bond!) valuations. We believe that the recovery news will be good, but it may not be as good, or come as quickly, as stock prices seem to be anticipating. This is not a disaster by any means, but some combination of earnings disappointments and rising interest rates may well interrupt the remarkable rebound from March 2020 lows. If something really scares investors and triggers another stock market “demolition derby,” as it did a year ago, our portfolios hold heavily armored vehicles that should bring us safely out the other end. Our returns may, or may not, have borrowed a little from the future, but we believe that our collection of businesses is positioned to serve us well over the next several years. That is what counts.
Thanks again for trusting us with your investments.
Sincerely,

Wally Weitz wally@weitzinvestments.com
Brad Hinton brad@weitzinvestments.com
For funds that offer more than one share class, performance provided herein is for that of the fund’s Investor Class. Please see page 9 for the funds’ Performance Summary.
As of 03/31/2021, the following portfolio company constituted a portion of the net assets of Balanced Fund, Hickory Fund, Partners III Opportunity Fund, Partners Value Fund, and Value Fund as follows:
• Amazon.com, Inc. (AMZN) 0.0%, 0.0 %, 2.5%, 0.0%, 2.8%
• GameStop Corp. (GME) 0.0%, 0.0%, 0.0%, 0.0%, 0.0%
• Lordstown Motors Corp. (RIDE) 0.0%, 0.0%, 0.0%, 0.0%, 0.0%
• Netflix, Inc. (NFLX) 0.0%, 0.0%, 0.0%, 0.0%, 0.0%
• Nikola Corporation (NKLA) 0.0%, 0.0%, 0.0%, 0.0%, 0.0%
• Tesla, Inc. (TSLA) 0.0%, 0.0%, 0.0%, 0.0%, 0.0%
• Zoom Video Communications, Inc. (ZM) 0.0%, 0.0%, 0.0%, 0.0%, 0.0%
Portfolio composition is subject to change at any time. Current and future portfolio holdings are subject to risk.
New Transfer Agent
We recently introduced FIS Investor Services as the Weitz Funds new transfer agent. This transition includes changes to online systems and service options. Of course, our client service colleagues are always ready to help if you need assistance.
6 Q1 2021 Annual Report
FIXED INCOME INSIGHTS
April 2, 2021
Dear Fellow Shareholder,
“What a difference a year makes.” It’s a phrase that might often be considered cliché – except for those with firsthand experience of the investment extremes of the past 12 months. The pessimism and fear so rampant a year ago as an economic hurricane was crashing across the world from a virus-induced global shutdown has been replaced with optimism and hope of economic revival. Stock prices have generally soared, and most bond prices (U.S. Treasuries being the exception) have more than recovered from the markdowns in those darker, scarier days a year ago.
The first quarter continued the positive trend of economic good news – but provided evidence reinforcing our year-end comments and warnings about low forward return prospects and why investment starting points matter. Without so much as a hint of the Federal Reserve withdrawing or tapering its support of the U.S. bond market (namely, keeping short-term interest rates at zero and buying $120 billion a month of primarily government securities), bond investors decided to throw a version of 2013’s taper tantrum and vote with their feet (sell) as economic strength and/or inflation concerns weighed on sentiment. The result was an acceleration of a move upward in longer-term U.S. Treasury interest rates that began last summer, albeit from historically low levels. For context, the 30-year Treasury had the worst first-quarter return since 1919, and investment-grade bonds (whose valuation always begins from a Treasury rate) had their worst first quarter return since 1980.
Weitz fixed income funds held their own in the first quarter. The Weitz Short Duration Income Fund posted positive results and the Weitz Core Plus Income Fund, while down modestly, posted strong relative quarterly returns compared to its index. The key driver to both funds’ outperformance in the quarter was having positioned them with historic low duration, in the case of Weitz Short Duration Income, and meaningfully less duration than its index or peers, in the case of Weitz Core Plus Income. Further detail about contributors to performance can be found in each fixed income fund’s quarterly commentary.
Fixed Income Market Update
The graph below shows the changes of select Treasury rates over the past quarter and year.
 Source: Bloomberg
The Treasury curve steepened meaningfully in the first quarter as longer rates (particularly 10- and 30-year) rose. The 10-year Treasury rate has more than doubled from where it was a year ago and has risen significantly since year-end. The 30-year Treasury rate increased nearly 50% in the quarter, precipitating its worst first-quarter return in over 100 years. Shorter rates (0- to 3-year) remained anchored close to zero given the Fed’s resolve to leave the Fed Funds rate at or near zero.
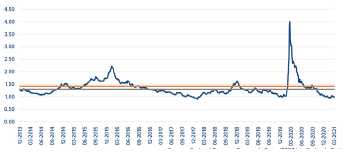
Spreads on corporate bonds continued to decline modestly in the first quarter. A broad measure of investment-grade corporate bond spreads, compiled by ICE BofA, continued their decline in the quarter -- from 103 basis points as of December 31 to 97 basis points on March 31. Declining corporate bond spread resulted in slight relative outperformance compared to U.S. Treasury bonds. This was small comfort for most corporate bond investors as investment-grade bonds still experienced their worst first-quarter return in decades. The chart below depicts the path of investment-grade credit spreads for the past 5 years (blue line) against the one-(orange) and five-year (gray) averages.
Source: Federal Reserve Economic Data (FRED) – St. Louis Fed
Overall, investment-grade corporate bond credit spreads are well below their 1- and 5-year averages and are only 7 basis points above the post-Great Recession lows set in early 2018. Viewed from an even longer time frame of 10 years, investment-grade corporate bond credit spreads have rarely been as low as they were at quarter end. Using daily data from the St. Louis Federal Reserve Economic Data, investment-grade corporate spreads have only been lower than Q1’s 97 basis points 1.6% of the time, or 43 out of 2,610 total observations. Economic optimism could plausibly push spreads even lower, but history is certainly not on its side.
Q1 2021 Annual Report 7
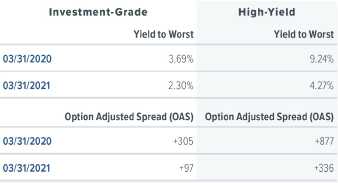
The table below provides a view of the changes for the broad investment-grade and high-yield universes that have transpired over the past year, as reported by ICE BofA. Yields and spreads have declined meaningfully, benefitting bond investors, including our bond funds, but the declines have left forward return prospects in yet another tough starting place.
Outlook
“The future should be viewed not as a fixed outcome that’s destined to happen and capable of being predicted, but as a range of possibilities and, hopefully on a basis of insight into their respective likelihoods, as a probability distribution.” – Howard Marks, Oaktree Capital
“Success in investing doesn’t correlate with I.Q. once you’re above the level of 125. Once you have ordinary intelligence, what you need is the temperament to control the urges that get other people into trouble in investing.” – Warren Buffett, Berkshire Hathaway Inc.
The two quotes above by very successful investors seemed fitting to place within the context of an outlook section. ‘Outlooks,’ by their nature, are simply guesses about a very unpredictable future. But those guesses can and should be informed by the current environment and relative to history. While we have cheered the year-to-date rise in base rates (U.S. Treasury) since it modestly improves forward return prospects, we are sober enough to realize that 10-year Treasury rates of less than 2% are still woefully low by historic standards – especially should inflation rear its long-dormant head. Couple this with credit spreads, especially investment-grade, that are at or near 10-year lows, we think it prudent to remain defensive. With respect to interest rate risk, we believe we have positioned our funds defensively by maintaining low duration. We will continue to strive to maintain the right ‘temperament’ that has historically allowed us to take advantage of the ‘pitches’ (preferably fat ones) that the markets invariably offer us and grow/learn in areas that are complementary to our core investment process.
Our fixed income funds have flexible mandates that allow us to navigate any environment by identifying the most favorable investment opportunities wherever we can find them. Just as important, we have the freedom to avoid areas where price and value appear the least favorable – which have recently been those areas most influenced by price-insensitive index investors and Fed intervention.
Our goals are to (a) preserve capital, (b) maintain a strong liquidity position, (c) understand evolving risks and opportunities, (d) conduct consistent/thorough credit surveillance, and (e) selectively take advantage of favorable risk/reward opportunities. These have long been and will continue to be our investment marching orders. We believe keeping these objectives front of mind while maintaining the ‘temperament,’ as referenced in Mr. Buffett’s quote, should continue to serve us and our fellow investors well in the quarters and years ahead.
For more on our market outlook, we encourage you to read Wally and Brad’s latest Value Matters, and for additional information regarding first quarter portfolio activity and current positioning, please see the fund commentaries later in this report. We remain ready to take advantage of valuation disparities that may develop and hope to continue to earn your trust.
Tom Carney tom@weitzinvestments.com
Nolan Anderson nolan@weitzinvestments.com
Definitions: Investment Grade: We consider investment grade to be those securities rated at least BBB- by one or more credit ratings agencies. Non-Investment Grade: We consider non-investment grade securities (commonly referred to as “high yield” or “junk” bonds) to be those rated BB+ and below. 30-Day SEC Yield represents net investment income earned by a fund over a 30-day period, expressed as an annual percentage rate based on the fund’s share price at the end of the 30-day period. Subsidized yield reflects fee waivers and/or expense reimbursements during the period. Without such fee waivers and/or expense reimbursements, if any; yields would have been lower. Unsubsidized yield does not adjust for any fee waivers and/or expense reimbursements in effect. Option Adjusted Spread: A “spread” compares the interest rate on a particular bond against a “base line” bond (typically a U.S. Treasury bond). When a bond issuer (or bondholder) has the option to exercise a right (for example, if the issuer can call a bond before its stated maturity date), then the “Option Adjusted Spread” takes into account the possibility that this option might be exercised—so a bond’s Option Adjusted Spread may be more (or less) than its regular spread. Yield to worst (YTW) is the lowest potential yield that can be received on a bond portfolio without the underlying issuers defaulting.
8 Q1 2021 Annual Report
DISCLOSURES
Data quoted is past performance and current performance may be lower or higher. Past performance is no guarantee of future results. Investment return and principal value of an investment will fluctuate, and shares, when redeemed, may be worth more or less than their original cost. All investments involve risks, including possible loss of principal. Please visit weitzinvestments. com for the most recent month-end performance.
Investment results reflect applicable fees and expenses and assume all distributions are reinvested but do not reflect the deduction of taxes an investor would pay on distributions or share redemptions. Net and Gross Expense Ratios are as of the Fund’s most recent prospectus. Certain Funds have entered into fee waiver and/or expense reimbursement arrangements with the Investment Advisor. In these cases, the Advisor has contractually agreed to waive a portion of the Advisor’s fee and reimburse certain expenses (excluding taxes, interest, brokerage costs, acquired fund fees and expenses and extraordinary expenses) to limit the total annual fund operating expenses of the Class’s average daily net assets through Contractual Expiration Date of 07/31/2021. The Net Expense Ratio reflects the total annual fund operating expenses of the Fund after taking into account any such fee waiver and/or expense reimbursement, if any; total returns would have been lower had there been no waivers or reimbursements.
Performance quoted for the Balanced, Partners Value and Value Funds’ Institutional Class shares before their inception is derived from the historical performance of the Investor Class shares, which have not been adjusted for the expenses of the Institutional Class shares, had they, returns would have been different.
Performance quoted for the Partners III Opportunity and Short Duration Income Funds’ Investor Class shares before their inception is derived from the historical performance of the Institutional Class shares, which have not been adjusted for the expenses of the Institutional Class shares, had they, returns would have been different.
Index performance is hypothetical and is shown for illustrative purposes only. You cannot invest directly in an index. See page 81 for a description of all indices. The Since Inception return for the Russell 1000 Value and CPI + 1% is from 5/31/1986 and 12/31/1988, respectively. All other indices Since Inception return are since the Fund’s inception. The inception date of the Bloomberg Barclays 1-3 Year U.S. Aggregate and 5-Year Municipal Bond was 12/31/1992 and 1/29/1988, respectively.
On 12/29/2006, the Nebraska Tax-Free Income Fund succeeded to substantially all of the assets of Weitz Income Partners Limited Partnership. On 12/31/1993, Partners Value Fund succeeded to substantially all of the assets of Weitz Partners II Limited Partnership. On 12/30/2005, Partners III Opportunity Fund succeeded to substantially all of the assets of Weitz Partners III Limited Partnership. The investment objectives, policies and restrictions of the Funds are materially equivalent to those of the Partnerships, and the Partnerships were managed at all times with full investment authority by the Investment Adviser. The performance information includes performance for the Partnerships. The Partnerships were not registered under the Investment Company Act of 1940 and, therefore, were not subject to certain investment or other restrictions or requirements imposed by the 1940 Act or the Internal Revenue Code. If the Partnerships had been registered under the 1940 Act, the Partnerships’ performance might have been adversely affected.
Effective 12/16/2016, the Ultra Short Government Fund revised its principal investment strategies. Prior to that date, the Fund operated as a “government money market fund” and maintained a stable net asset value of $1.00 per share. Performance prior to 12/16/2016 reflects the Fund’s prior principal investment strategies and may not be indicative of future performance results.
Effective 12/16/2016, the Short Duration Income Fund revised its principal investment strategies. Since that time the Fund has generally maintained an average effective duration between one to three and a half years. Prior to that date, the Fund maintained a dollar–weighted average maturity of between two to five years. Performance prior to 12/16/2016 reflects the Fund’s prior principal investment strategies and may not be indicative of future performance results.
Effective 03/29/2019, the Hickory Fund invests the majority of its assets in the common stock of medium–sized companies, which the Fund considers to be companies with a market capitalization, at the time of initial purchase, of greater than $1 billion and less than or equal to the market capitalization of the largest company in the Russell Midcap Index. Prior to that date, the Fund invested the majority of its assets in the common stock of smaller– and medium–sized companies, which the Fund considered to be companies with a market capitalization, at the time of initial purchase, of less than $10 billion.
Q1 2021 Annual Report 9
PERFORMANCE SUMMARY
| | | | | | | | | | |
| | | | ANNUALIZED | | | |
| | | | | | Since Fund | Inception | Net | Gross |
| EQUITY | QTD | YTD | 1 YR | 5 YR | 10 YR | Inception*
| Date | Expense
| Expense
|
| Hickory Fund (WEHIX) | 8.71% | 8.71% | 59.17% | 9.38% | 8.06% | 9.70% | 4/1/1993* | 1.09% | 1.13% |
Russell Midcap® | 8.14 | 8.14 | 73.64 | 14.67 | 12.47 | 11.34 |
|
|
|
| Partners III Opportunity Fund - Investor (WPOIX) | 7.11 | 7.11 | 39.25 | 9.78 | 8.55 | 12.21 | 8/1/2011 | 2.03 | 2.03 |
| Partners III Opportunity Fund - Institutional (WPOPX) | 7.30 | 7.30 | 40.11 | 10.40 | 9.01 | 12.33 | 6/1/1983* | 1.44 | 1.44 |
S&P 500® | 6.17 | 6.17 | 56.35 | 16.29 | 13.91 | 11.44 |
|
|
|
Russell 3000® | 6.35 | 6.35 | 62.53 | 16.64 | 13.79 | 11.27 |
|
|
|
| Partners Value Fund - Investor (WPVLX) | 8.34 | 8.34 | 58.17 | 9.85 | 8.90 | 11.69 | 6/1/1983* | 1.09 | 1.13 |
| Partners Value Fund - Institutional (WPVIX) | 8.37 | 8.37 | 58.43 | 10.12 | 9.07 | 11.73 | 7/31/2014 | 0.89 | 0.93 |
S&P 500® | 6.17 | 6.17 | 56.35 | 16.29 | 13.91 | 11.44 |
|
|
|
Russell 3000® | 6.35 | 6.35 | 62.53 | 16.64 | 13.79 | 11.27 |
|
|
|
| Value Fund - Investor (WVALX) | 7.38 | 7.38 | 56.97 | 14.11 | 11.69 | 10.74 | 5/9/1986* | 1.08 | 1.08 |
| Value Fund - Institutional (WVAIX) | 7.42 | 7.42 | 57.28 | 14.37 | 11.85 | 10.79 | 7/31/2014 | 0.89 | 0.94 |
S&P 500® | 6.17 | 6.17 | 56.35 | 16.29 | 13.91 | 10.84 |
|
|
|
Russell 1000® | 5.91 | 5.91 | 60.59 | 16.66 | 13.97 | 10.90 |
|
|
|
|
| | | | ANNUALIZED | | | |
|
|
|
|
|
| Since Fund | Inception | Net | Gross |
| ALLOCATION | QTD | YTD | 1 YR | 5 YR | 10 YR | Inception*
| Date | Expense
| Expense |
| Balanced Fund - Investor (WBALX) | 3.62% | 3.62% | 21.74% | 8.11% | 6.91% | 6.08% | 10/1/2003* | 0.85% | 1.14% |
| Balanced Fund - Institutional (WBAIX) | 3.69 | 3.69 | 21.93 | 8.16 | 6.94 | 6.10 | 3/29/2019 | 0.70 | 0.95 |
Morningstar Moderately Conservative Target Risk | 0.31 | 0.31 | 22.18 | 7.71 | 6.21 | 6.40 |
|
|
|
|
| | | | ANNUALIZED | | | |
| | | | | | Since Fund | Inception | Net | Gross |
| FIXED INCOME | QTD | YTD | 1 YR | 5 YR | 10 YR
| Inception* | Date | Expense | Expense
|
| Core Plus Income Fund - Investor (WCPNX) | (0.84)% | (0.84)% | 12.79% | 4.83% | N/A% | 4.32% | 7/31/2014* | 0.50% | 1.18% |
| Core Plus Income Fund - Institutional (WCPBX) | (0.73) | (0.73) | 12.88 | 5.03 | N/A | 4.52 | 7/31/2014* | 0.40 | 0.80 |
Bloomberg Barclays U.S. Aggregate Bond | (3.37) | (3.37) | 0.71 | 3.10 | N/A | 3.20 |
|
|
|
| Nebraska Tax-Free Income Fund (WNTFX) | (0.56) | (0.56) | 2.67 | 1.60 | 1.97 | 4.40 | 10/1/1985* | 0.45 | 1.10 |
Bloomberg Barclays 5-Year Municipal Bond | (0.31) | (0.31) | 5.07 | 2.52 | 2.93 | N/A |
|
|
|
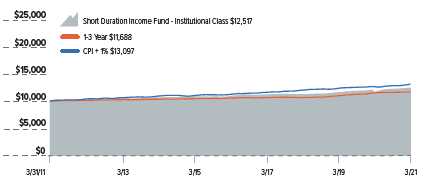
| Short Duration Income Fund - Investor (WSHNX) | 0.66 | 0.66 | 6.29 | 2.40 | 2.08 | 4.87 | 8/1/2011 | 0.55 | 0.95 |
| Short Duration Income Fund - Institutional (WEFIX) | 0.67 | 0.67 | 6.32 | 2.57 | 2.27 | 4.93 | 12/23/1988* | 0.48 | 0.64 |
Bloomberg Barclays 1-3 Year U.S. Aggregate | (0.07) | (0.07) | 1.19 | 1.96 | 1.57 | N/A |
|
|
|
U.S. Consumer Price Index (CPI) Plus 1.00% | 1.94 | 1.94 | 3.65 | 3.18 | 2.73 | 3.49 |
|
|
|
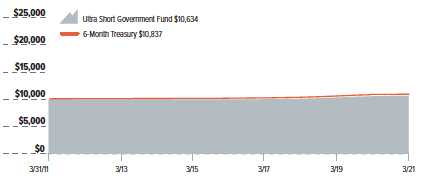
| Ultra Short Government Fund (SAFEX) | 0.03 | 0.03 | 0.29 | 1.22 | 0.62 | 2.29 | 8/1/1991* | 0.20 | 0.71 |
ICE BofA U.S. 6-Month Treasury Bill | 0.04 | 0.04 | 0.16 | 1.40 | 0.81 | 2.84 |
|
|
|
* | Denotes the Funds inception date and the date from which Since Inception Performance is calculated. |
10 Q1 2021 Annual Report
ANALYST CORNER
AutoZone (AZO)
By Jon Baker, CFA,
Research Analyst
Downshifting Into 2021 With the Straightaway in Sight
Over the past 40 years, AutoZone has grown into the largest retailer of aftermarket auto parts in the U.S. As the company continues to serve the do-it-yourself auto repair market, its commercial supply business has also begun to turn the corner.
AutoZone (AZO) will be a familiar name to most readers – not only for its well-known slogan (“Get in the zone – AutoZone”) but for its expansive retail presence. It is the largest retailer of aftermarket automotive parts in the U.S. and plans to open its landmark 6,000th store this year.
AutoZone’s history began in 1979 when entrepreneur Joseph R. “Pitt” Hyde III opened its first location – then named Auto Shack. In 1984, Hyde and private equity firm KKR took Auto Shack’s parent company private, and within four years had divested its sibling operations to focus on the growing auto parts chain. Rebranded as AutoZone, the business returned to public equity markets in 1991.
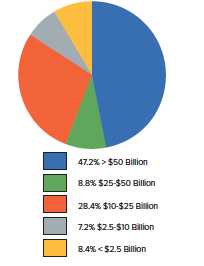
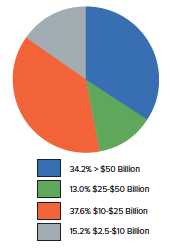
The aftermarket auto parts industry encompasses the direct sale of parts to consumers as well as commercial sales to auto repair shops. AutoZone holds a sub-15% share of the estimated $90-100 billion relevant parts market, similar to that of competitor O’Reilly Auto Parts. AutoZone and its three largest competitors (O’Reilly, Advance Auto Parts, and Genuine Parts) collectively claim less than half of the domestic market, and we expect them to continue to chip away at the remaining share over time.
As vehicles age, rack up miles, and lose value, they tend to pass from higher to lower-income owners. This transition often entails maintenance and repair work performed by franchised dealers for newer, especially warrantied, vehicles; do-it-for-me (DIFM) repair shops for middle-aged vehicles; and do-it-yourself (DIY) consumers for higher-mileage vehicles. Over time, as vehicles have become more technologically advanced, maintenance and repairs have become more complex in turn, spurring DIFM to grow somewhat faster than DIY – a trend we expect to continue. This trend toward DIFM is typically muted during recessions, as the ranks of the value-conscious swell and then reaccelerates in improving environments as vehicle owners begin to spend more freely on third-party services.
Among AutoZone’s largest competitors, O’Reilly Auto Parts has long made its DIFM business a cultural priority. DIFM accounts for roughly 40% of O’Reilly’s sales compared to a little over 20% for AutoZone. O’Reilly’s commercial focus, along with more recent and impactful acquisitiveness, has served its shareholders well over the years. Commercial accounts require speedy delivery, and that means having a robust supply chain that positions inventory – even sporadically purchased items – nearer to purchasers. For the past several years, AutoZone has grown its number of hub stores, mega-hub stores, and distribution centers, resulting in a physical network that more closely resembles that of O’Reilly. AutoZone’s commercial sales were already perking up pre-COVID, and we expect that the company is much better situated today to benefit from a post-recession shift from DIY back to DIFM volumes. Company management says they believe they are “in the early innings of a transformational growth story.”
Still, the DIY side of the house remains AutoZone’s bread and butter, and this area of the business showed particular strength during the COVID pandemic. For those who live or work outside of large urban areas, having a working vehicle is critical to maintaining one’s income, especially if one’s job cannot be done remotely. With stimulus payments in hand, AutoZone’s customers poured more money into their vehicles than in prior recessions. This resulted in a level of DIY sales we believe AutoZone is unlikely to repeat this year.
While last year’s DIY volumes may prove difficult to achieve again in 2021, we believe the medium-term prospects remain good for AutoZone’s consumer-facing business. New car sales fell substantially leading up to and during 2009. Fewer new vehicles sold during that time naturally created a lack of older vehicles as the years passed. The population of older vehicles (for example, those 6-12 years old) typically addressed by AutoZone’s DIY business has shrunk approximately 20% over the past decade, but it stopped declining in 2020 and we believe is likely to increase by 25% over the coming several years. A more plentiful supply of older vehicles should make them relatively cheaper in time and help shift more of them into DIY customers’ hands.
Like many companies, AutoZone held onto excess cash until the fog of COVID had largely lifted. The company entered 2021 with financial leverage well below its target. At the time of the Funds’ investment, we estimated that AutoZone’s near-term free cash flow and incremental borrowing (to achieve its leverage target) could fund the repurchase of approximately 20% of the company’s outstanding shares.
We believe AutoZone’s DIY and DIFM businesses can both perform better over the next several years than they have in the past. While the COVID-related sales windfall of 2020 may result in 2021 sales that appear weak in comparison, we expect sustained revenue growth to resume thereafter. AutoZone’s improving long-term operating fundamentals should result in a continued ability to deploy substantial amounts of capital on behalf of shareholders. The expected growth ‘pause’ helped knock some price out of the stock and created an opportunity for us to purchase a high-quality business at an attractive price; a great example of our Quality at a Discount investing approach in action.
As of 03/31/2021, each of the following portfolio companies constituted a portion of the net assets of Balanced Fund, Hickory Fund, Partners III Opportunity Fund, Partners Value Fund, and Value Fund as follows: Advance Auto Parts, Inc. (AAP) 0.0%, 0.0%, 0.0%, 0.0%, 0.0%; AutoZone, Inc. (AZO) 1.7%, 4.1%, 1.1%, 2.3%, 2.7%; Genuine Parts Company (GPC) 0.0%, 0.0%, 0.0%, 0.0%, 0.0%; O’Reilly Automotive, Inc. (ORLY) 0.0%, 0.0%, 0.0%, 0.0%, 0.0%.
Jon Baker, CFA, joined Weitz Investments in 1997. Prior to joining the firm, he audited equity funds (including the Weitz Funds) as a certified public accountant at McGladrey & Pullen. Jon has a bachelor’s in accounting and computer applications from the University of Notre Dame.
Q1 2021 Annual Report 11
This page intentionally left blank
12 Q1 2021 Annual Report
BALANCED FUND
Portfolio Manager: Brad Hinton, CFA
Investment Style: Conservative Allocation
The Balanced Fund’s Institutional Class returned +3.69% for the first quarter compared to +0.31% for the Morningstar Moderately Conservative Target Risk Index. For the fiscal year ending March 31, 2021, the Fund’s Institutional Class returned +21.93% compared to +22.18% for the index.
Total returns well above inflation have helped our investors retain, and steadily build, wealth. Over a 10-year period, the Fund’s Institutional Class has returned 6.94% annualized compared to 6.21% for the index.
The “economic reopening” trade continued in the first quarter with some vigor. Smaller companies, cyclical businesses and other value-oriented fare were the strongest beneficiaries. Aggressive growth stocks, which had dominated the return scoreboard for several years, lagged considerably. Against this backdrop, the Fund’s stocks delivered strong returns, leading the Fund to outperform its index for the quarter.
Bonds generally declined in value as the 10-year Treasury yield nearly doubled from 0.91% to 1.74% during the quarter. As yields rise, bond prices fall. For example, here is the quarterly performance for three bond ETFs – these markdowns are not for the faint of heart:
• The iShares 20+ Year Treasury Bond ETF (ticker TLT) returned -13.98%,
• The iShares iBoxx $ Investment Grade corporate bond ETF (ticker LQD) returned -5.51%,
• The iShares Core U.S. Aggregate Bond ETF (ticker AGG) returned -3.39%.
In contrast, the Fund’s short-maturity collection of high-quality bonds did not lose value in the quarter, fulfilling its role as dull, but effective, portfolio ballast.
Financial stocks enjoyed healthy first-quarter gains. Charles Schwab and JPMorgan Chase were outsized contributors as investors refocused on earning power in “normal” times. Google parent Alphabet provided new disclosures that highlighted the profitability of its services businesses and the upside potential of its Cloud Platform. Companies far removed from the mega-cap glare, such as LabCorp, AutoZone, and Vulcan Materials, also delivered exceptional returns; we can often develop more of a research edge in businesses that are not under the constant attention of the industry and financial media. Charter Communications, Visa and Thermo Fisher Scientific were modest quarterly detractors. All have been significant long-term winners, and all continue to have bright outlooks.
Stocks rebounded from their pandemic lows throughout the Fund’s fiscal year, with most soaring higher. LabCorp and Thermo Fisher Scientific experienced revenue growth from helping society deal with the COVID-19 outbreak, and their core businesses showed resilience. Charles Schwab’s stock nearly doubled, and the TD Ameritrade acquisition solidified the company’s strategic position. Alphabet and Microsoft both posted terrific results and enjoy sustained long-term tailwinds. Not surprisingly given the strength of the overall market, the Fund had no equity detractors for the fiscal year.
Our team is continually working to improve the portfolio as we process new information. Timely additions to AutoZone, Comcast, and Markel enhanced quarterly returns. We trimmed position sizes in Thermo Fisher and Alphabet on stock price strength. This type of limited, periodic rebalancing is disciplined but not mechanical. Decisions are based on stock prices relative to our value estimates, fundamental progress at each business, quality score considerations, and analyst conviction.
We wrote last quarter about the fixed income “winter” caused by extremely low interest rates. As described above, bonds indeed suffered an “arctic blast” to start the year. While modestly higher starting yields are welcome green shoots, investors should not confuse them with a return to full springtime glory. We added some four- to five-year Treasuries as yields increased, but our overall positioning remains quite defensive. If base rates and/ or spreads continue to rise, expect us to increase risk exposure prudently and with due caution.
The Fund’s portfolio continues to evolve with market conditions. We own common equity stakes in 29 companies totaling 44.6% of net assets. High-yielding, hybrid securities represent another 2.7% of the Fund. Fixed income holdings include investment-grade corporate bonds (3.9%), securitized debt (10.9%), Treasury securities (26.3%), and cash equivalents (11.6%). We have plenty of capacity to lean into new opportunities as our team uncovers them.
We think the Fund remains well-positioned to provide long-term capital appreciation and capital preservation. Meaningful current income will be more challenging for the time being. As always, we encourage investors to evaluate the strategy on a total-return basis over longer time horizons. Thank you for your investment and continued confidence in the Fund and our firm.
Definitions: Investment Grade Bonds are those securities rated at least BBB-.
Q1 2021 Annual Report 13
| Returns | | | | | | | | | |
| | | | | Annualized | | | | |
|
|
|
|
|
|
| Since Fund |
|
|
|
|
|
|
|
|
| Inception | Net | Gross |
| QTD | YTD | 1 YR | 3 YR | 5 YR | 10 YR | (10/1/2003) | Expense | Expense |
| WBALX - Investor Class | 3.62% | 3.62% | 21.74% | 9.06% | 8.11% | 6.91% | 6.08% | 0.85% | 1.14% |
| WBAIX - Institutional Class | 3.69 | 3.69 | 21.93 | 9.16 | 8.16 | 6.94 | 6.10 | 0.70 | 0.95 |
| Moderately Conservative | 0.31 | 0.31 | 22.18 | 8.23 | 7.71 | 6.21 | 6.40 |
|
|
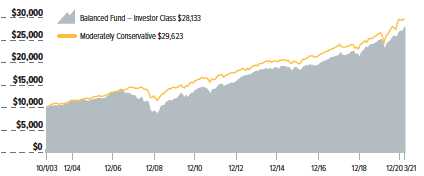
Growth of $10,000 Investment Since Inception
| Top 10 Stock Holdings | |
| % of Net Assets |
| Aon plc - Class A | 2.2 |
| Berkshire Hathaway Inc. - Class B | 2.2 |
| The Charles Schwab Corp. | 2.2 |
| Laboratory Corp. of America Holdings | 2.1 |
| Microsoft Corp. | 2.0 |
| Alphabet, Inc. - Class C | 1.9 |
| Vulcan Materials Co. | 1.8 |
| Markel Corp. | 1.8 |
| Thermo Fisher Scientific Inc. | 1.8 |
| AutoZone, Inc. | 1.7 |
| | 19.7 |
| Top Stock Performers | | | |
| | Average | |
| Return
| Weight
| Contribution |
| The Charles Schwab Corp. | 23.3% | 2.1% | 0.46% |
| Laboratory Corp. of America Holdings | 25.3 | 2.0 | 0.45 |
| Alphabet, Inc. - Class C | 18.1 | 1.9 | 0.34 |
| AutoZone, Inc. | 18.5 | 1.3 | 0.28 |
| JPMorgan Chase & Co. | 20.7 | 1.4 | 0.27 |
| | | | |
| Bottom Stock Performers | | | |
| Average | |
| Return
| Weight
| Contribution |
| Charter Communications, Inc. - Class A | (6.7)% | 1.6% | (0.12)% |
| Visa Inc. - Class A | (3.1) | 1.6 | (0.05) |
| Thermo Fisher Scientific Inc. | (2.0) | 1.9 | (0.02) |
| Mastercard Inc. - Class A | (0.1) | 1.6 | – |
| Fidelity National Information Services, Inc. | (0.3) | 1.5 | – |
| 30-Day SEC Yield | | |
Share Class | Subsidized
| Unsubsidized |
| Investor | (0.09)% | (0.35)% |
| Institutional | 0.06 | (0.09) |
| Industry Breakdown | |
| % of Net Assets |
| Information Technology | 11.6 |
| Financials | 11.6 |
| Health Care | 5.5 |
| Communication Services | 5.0 |
| Materials | 4.4 |
| Industrials | 3.3 |
| Consumer Discretionary | 1.7 |
| Consumer Staples | 1.5 |
| Total Common Stocks | 44.6 |
| U.S. Treasury Notes | 26.3 |
| Asset-Backed Securities | 7.2 |
| Corporate Bonds | 3.9 |
| Mortgage-Backed Securities | 3.3 |
| Non-Convertible Preferred Stocks | 1.7 |
| Corporate Convertible Bonds | 1.0 |
| Commercial Mortgage-Backed Securities | 0.4 |
| Cash Equivalents/Other | 11.6 |
| Total Bonds & Cash Equivalents | 55.4 |
| | 100.0 |
| Fixed Income Attributes | |
Portfolio Summary | |
| Average Maturity | 1.7 years |
| Average Effective Maturity | 1.8 years |
| Average Duration | 1.5 years |
| Average Effective Duration | 1.5 years |
| Average Coupon | 1.7% |
| Credit Quality | |
Underlying Securities | % of Bond Portfolio |
| U.S. Treasury | 47.5 |
| U.S. Government Agency Mortgage Related Securities | 3.3 |
| AAA | 13.0 |
| AA | 3.2 |
| A | 0.6 |
| BBB | 6.7 |
| BB | 3.1 |
| Non-Rated | 1.8 |
| Cash Equivalents | 20.8 |
| | 100.0 |
Data quoted is past performance and current performance may be lower or higher. Past performance is no guarantee of future results. Investment return and principal value of an investment will fluctuate, and shares, when redeemed, may be worth more or less than their original cost. All investments involve risks, including possible loss of principal. Please visit weitzinvestments.com for the most recent month-end performance.
Investment results reflect applicable fees and expenses and assume all distributions are reinvested but do not reflect the deduction of taxes an investor would pay on distributions or share redemptions. Net and Gross Expense Ratios are as of the Fund’s most recent prospectus. The Fund has entered into fee waiver and/or expense reimbursement arrangements with the Investment Advisor. The Advisor has contractually agreed to waive a portion of the Advisor’s fee and reimburse certain expenses (excluding taxes, interest, brokerage costs, acquired fund fees and expenses and extraordinary expenses) to limit the total annual fund operating expenses of the Class’s average daily net assets through 07/31/2021. The Net Expense Ratio reflects the total annual fund operating expenses of the Fund after taking into account any such fee waiver and/or expense reimbursement, if any; total returns would have been lower had there been no waivers or reimbursements.
See page 8 for additional performance disclosures. See page 81 for a description of all indices.
Credit ratings are assigned to underlying securities utilizing ratings from a Nationally Recognized Statistical Rating Organization (NRSRO) such as Moody’s and Fitch, or other rating agencies and applying the following hierarchy: security is determined to be Investment Grade if it has been rated at least BBB- by one credit rating agency; once determined to be Investment Grade (BBB- and above) or Non-Investment Grade (BB+ and below) where multiple ratings are available, the lowest rating is assigned. Mortgage-related securities issued and guaranteed by government-sponsored agencies such as Fannie Mae and Freddie Mac are generally not rated by rating agencies. Securities that are not rated do not necessarily indicate low quality. Ratings are shown in the Fitch scale (e.g., AAA). Ratings and portfolio credit quality may change over time. The Fund itself has not been rated by a credit rating agency.
Contributions to Fund performance are based on actual daily holdings. Securities may have been bought or sold during the quarter. Return shown is the actual quarterly return of the security or combination of share classes.
Source (Fixed Income Attributes, Credit Quality, and Maturity Distribution): Bloomberg Analytics
Source (Top Performers, Bottom Performers): FactSet Analytics
14 Q1 2021 Annual Report
CORE PLUS INCOME FUND
Portfolio Managers: Tom Carney, CFA & Nolan Anderson
Investment Style: Intermediate-Term Bond
The Core Plus Income Fund’s Institutional Class returned -0.73% for the first quarter compared to -3.37% for the Bloomberg Barclays U.S. Aggregate Bond Index. For the fiscal year ending March 31, 2021, the Fund’s Institutional Class returned +12.88% compared to +0.71% for the index. Our significantly lower-than-index duration profile of 4.5 years, versus 6.3 years for the index, drove outperformance, while strong sector and security selection, led by high-yield securities, drove our strong absolute and relative performance over the past 12 months.
Given the significant rise in longer-term interest rates during the quarter, the Fund’s overall yield to worst (YTW) declined to 2.4% as of March 31, 2021, from 2.7% as of December 31, 2020. As a reminder, YTW has historically been a reasonable predictor of forward returns. And while prospective returns in fixed income remain challenging, our YTW at quarter-end remains quite favorable compared to the index’s YTW of 1.6%.
Last quarter we discussed the myriad of challenges fixed income investors faced with near-record-low yields across U.S. fixed income markets. Moreover, we discussed the risk/ return imbalance in the U.S. corporate bond market given its 20-year high sensitivity to movements in interest rates while the compensation in yield hit an all-time record low of less than 1.75%. While the timing was not expected, we are not surprised that U.S. corporate bonds – as measured by the Bloomberg Barclays U.S. Investment Grade Corporate Bond Index – had their worst quarter of performance since the Great Financial Crisis with a return of -4.65%. Positively, rising interest rates have led to a greater than 50 bps increase in the YTW for the Bloomberg Barclays U.S. Investment Grade Corporate Bond Index, ending the quarter at 2.28%. Despite this improvement, the overall investment-grade market remains far from a target-rich environment.
Portfolio Positioning
The table below shows how we have allocated portfolio capital to various sectors, from the time periods of December 31, 2020, to March 31, 2021, and from March 31, 2020, to March 31, 2021. Since our goal is to invest in sectors that we believe offer the best risk-adjusted returns, our allocations may change significantly over time.
| |
|
|
|
|
|
|
|
| Qtr Over Qtr |
| Yr Over Yr |
| Sector (% of Net Assets) | 3/31/2021 | 12/31/2020
| Change | 3/31/2020
| Change |
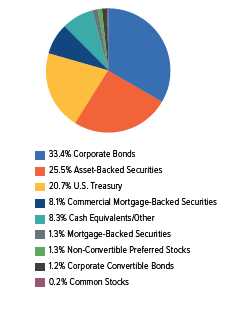
| Corporate Bonds | 33.4 | 35.4 | -2.0 | 35.0 | -1.6 |
| Corporate Convertible Bonds | 1.2 | 1.4 | -0.2 | 1.2 | +0.0 |
| Asset-Backed Securities (ABS) | 25.5 | 26.1 | -0.6 | 28.8 | -3.3 |
| Corporate Collateralized | 6.9 | 3.8 | +3.1 | 0.0 | +6.9 |
| Loan Obligations (CLOs)* |
|
|
|
|
|
| Commercial Mortgage-Backed | 8.1 | 7.5 | +0.6 | 11.0 | -2.9 |
| Securities (CMBS) |
|
|
|
|
|
| Agency Mortgage-Backed (MBS) | 0.5 | 0.7 | -0.2 | 1.6 | -1.1 |
| Non-Agency Mortgage Backed |
|
|
|
|
|
| (RMBS) | 0.8 | 1.3 | -0.5 | 2.6 | -1.8 |
| Non-Convertible Preferred Stock | 1.3 | 1.5 | -0.2 | 0.0 | +1.3 |
| Taxable Municipal Bonds | 0.0 | 0.0 | +0.0 | 0.4 | -0.4 |
| U.S. Treasury | 20.7 | 15.2 | +5.5 | 18.1 | +2.6 |
| Common Stock | 0.2 | 0.2 | +0.0 | 0.1 | +0.1 |
| Cash & Equivalents | 8.3 | 10.7 | -2.4 | 1.2 | +7.1 |
| Total | 100.0 | 100.0 |
| 100.0 |
|
| High Yield** | 16.8 | 14.8 | +2.0 | 12.5 | +4.3 |
| |
| Effective duration (years) | 4.5 | 4.2 | +0.3 | 4.6 | -0.1 |
| Effective maturity (years) | 6.3 | 5.3 | +1.0 | 5.8 | +0.5 |
* | Corporate CLOs are included in the ABS segment in the Fund’s schedule of investments but are additionally called out separately for the purposes of the discussion. |
** | High-Yield exposure (as of 03/31/2021) consists of investments in the Corporate, Corporate Convertible, ABS, and CMBS sectors. |
First quarter investment activity was led by U.S. Treasuries and corporate (CLOs). The largest declines in sector allocation were asset-backed securities (ABS), cash, and corporate bonds. Given the material increase in interest rates during the quarter, we increased our allocation to intermediate and longer-term U.S. Treasuries. Within corporate CLOs, we added to our middle-market CLO positions, which now represents approximately 7% of assets. We invested in AA-rated tranches issued by Blackstone, Cerberus, Fortress, and Golub. We also participated in two broadly syndicated loan transactions, purchasing the AA-rated tranches issued by Fidelity and Palmer Square. We maintain a positive view on investment-grade CLO tranches and believe the risk/reward remains attractive, especially relative to short-intermediate duration corporate bonds.
As of March 31, 2021, our high-yield exposure as a percent of net assets was 16.8%, up from 14.8% on December 31, 2020, (the portfolio’s high-yield limit is 25%). In terms of overall portfolio metrics, the average effective maturity increased to 6.3 years from 5.3 years, and the average effective duration increased to 4.5 years from 4.2 years on December 31, 2020. These measures provide a guide to the Fund’s interest rate sensitivity. A lower average effective maturity and shorter average effective duration reduce the Fund’s price sensitivity to changes in interest rates (either up or down).
Top Quarterly Contributors
Sector allocation and security selection were the key drivers of performance.
• High-Yield Corporate Bonds: Our high-yield corporate bond segment was the largest positive contributor during the quarter as credit spreads tightened, particularly in cyclical sectors such as energy, airlines, leisure, and retail. NGL Energy was the largest positive contributor, followed by American Airlines, VistaJet, and Limited Brands.
• Commercial Mortgage-Backed Securities (CMBS): Our CMBS segment experienced modest price appreciation and solid coupon income in the quarter as overall credit performance remains solid across our various commercial real estate CLOs and single-asset, single-borrower holdings.
• Asset-Backed Securities (ABS): Our ABS investments across all categories (e.g., auto, consumer, equipment, and fleet lease) provided solid coupon income and capital appreciation while also continuing to exhibit better-than-anticipated credit performance.
Top Quarterly Detractors
• U.S. Treasury Bonds: Our U.S. Treasury holdings were the primary detractor to performance. With an effective duration of approximately 13 years, our Treasury portfolio was negatively impacted by rising longer-term (20-30 year) interest rates as the yield curve steepened during the quarter.
Q1 2021 Annual Report 15
Top Fiscal Year Contributors
• Corporate Bonds: Our investments in a wide variety of corporate bonds, including high yield, were the largest positive contributors to performance during the fiscal year ending March 31, 2021.
• Asset-Backed Securities (ABS): Our ABS investments across all categories (e.g., auto, consumer, equipment, fleet lease) provided solid coupon income and capital appreciation while also continuing to exhibit better-than-anticipated credit performance.
• Commercial Mortgage-Backed Securities (CMBS): Our CMBS segment experienced modest price appreciation and solid coupon income in the fiscal year as overall credit performance remains solid across our various commercial real estate CLOs and single-asset, single-borrower holdings.
Top Fiscal Year Detractors
• U.S. Treasury Bonds: Our U.S. Treasury holdings were the primary detractor to performance during the fiscal year ending March 31, 2021. With an effective duration of approximately 13 years, our Treasury portfolio was negatively impacted by rising longer-term (20-30 year) interest rates as the yield curve steepened
Fund Strategy
Our approach consists primarily of investing in a diversified portfolio of high-quality bonds while maintaining an overall portfolio average duration of 3.5 years to 7 years. Our goal is to capture attractive coupon income and potential price appreciation by investing in longer-duration and lower-quality bonds when attractively priced. We may invest up to 25% in fixed-income securities that are not considered investment-grade (such as high-yield and convertible bonds as well as preferred and convertible preferred stock) but have favorable risk/reward characteristics.
We do not, and will not, try to mimic any particular index as we construct our portfolio. We believe our flexible mandate and concentrated portfolio will benefit investors over the long term. We utilize a bottom-up, research-driven approach and select portfolio assets one security at a time based on our view of opportunities in the marketplace. Our fixed income research is not dependent on, but often benefits from, the due diligence work our equity teammates conduct on companies and industries.
Overall, we strive to be adequately compensated for the risks assumed in order to maximize investment (or reinvestment) yield and to avoid making interest rate bets, particularly ones that depend on interest rates going down. We have often maintained a lower duration profile than the index, particularly in very low-yield environments. Our shorter duration profile has benefited shareholders in periods of rising interest rates.
Maintaining a diversified portfolio and liquidity reserves is a key element of our risk management approach. As a result, we have not held back from owning U.S. Treasury bonds, and at times like now, ample cash reserves. We believe this approach has served clients well, particularly in extreme market environments like the pandemic brought upon us in March 2020.
Definitions: Average effective duration provides a measure of a fund’s interest-rate sensitivity. The longer a fund’s duration, the more sensitive the fund is to shifts in interest rates. Average effective maturity is the weighted average of the maturities of a fund’s underlying bonds. Investment Grade Bonds are those securities rated at least BBB-. Non-Investment Grade Bonds are those securities (commonly referred to as “high yield” or “junk” bonds) rated BB+ and below. Middle market CLOs refer to collateralized loan obligations backed by loans made to smaller companies, which companies generally have earnings before interest, taxes, and amortization of less than $75 million. Yield to worst (YTW) is the lowest potential yield that can be received on a bond portfolio without the underlying issuers defaulting.
16 Q1 2021 Annual Report
| Returns | | | | | | | | |
| | | | | Annualized | | | |
|
|
|
|
|
| Since Fund |
|
|
|
|
|
|
|
| Inception | Net | Gross |
| QTD | YTD | 1 YR | 3 YR | 5 YR | (7/31/2014) | Expense | Expense |
| WCPNX - Investor Class | (0.84)% | (0.84)% | 12.79% | 6.21% | 4.83% | 4.32% | 0.50% | 1.18% |
| WCPBX - Institutional Class | (0.73) | (0.73) | 12.88 | 6.40 | 5.03 | 4.52 | 0.40 | 0.80 |
| Bloomberg Barclays U.S. Aggregate Bond | (3.37) | (3.37) | 0.71 | 4.65 | 3.10 | 3.20 |
|
|
Growth of $10,000 Investment Since Inception
| | |
| Fixed Income Attributes | |
Portfolio Summary | |
| Average Maturity | 6.4 years |
| Average Effective Maturity | 6.3 years |
| Average Duration | 4.5 years |
| Average Effective Duration | 4.5 years |
| Average Coupon | 3.3% |
| |
| Maturity Distribution | |
Maturity Type | % of Portfolio |
| Cash Equivalents | 7.7 |
| Less than 1 Year | 18.2 |
| 1 - 3 Years | 20.4 |
| 3 - 5 Years | 7.1 |
| 5 - 7 Years | 20.6 |
| 7 - 10 Years | 8.2 |
| 10 - 20 Years | 8.0 |
| 20 Years or more | 9.6 |
| Common Stocks | 0.2 |
| 100.0 |
| | |
| Credit Quality | |
Underlying Securities | % of Portfolio |
| U.S. Treasury | 20.8 |
| U.S. Government Agency Mortgage | |
| Related Securities | 0.5 |
| AAA | 4.5 |
| AA | 8.2 |
| A | 13.2 |
| BBB | 27.9 |
| BB | 9.0 |
| B | 3.5 |
| CCC | 3.2 |
| Non-Rated | 1.3 |
| Common Stocks | 0.2 |
| Cash Equivalents | 7.7 |
| | 100.0 |
| | | |
| 30-Day SEC Yield |
|
|
Share Class | Subsidized
| Unsubsidized
|
| Investor | 2.18% | 1.68% |
| Institutional | 2.28 | 1.74 |
Asset Allocation
% of Net Assets
Data quoted is past performance and current performance may be lower or higher. Past performance is no guarantee of future results. Investment return and principal value of an investment will fluctuate, and shares, when redeemed, may be worth more or less than their original cost. All investments involve risks, including possible loss of principal. Please visit weitzinvestments.com for the most recent month-end performance.
Investment results reflect applicable fees and expenses and assume all distributions are reinvested but do not reflect the deduction of taxes an investor would pay on distributions or share redemptions. Net and Gross Expense Ratios are as of the Fund’s most recent prospectus. The Fund has entered into fee waiver and/or expense reimbursement arrangements with the Investment Advisor. The Advisor has contractually agreed to waive a portion of the Advisor’s fee and reimburse certain expenses (excluding taxes, interest, brokerage costs, acquired fund fees and expenses and extraordinary expenses) to limit the total annual fund operating expenses of the Class’s average daily net assets through 07/31/2021. The Net Expense Ratio reflects the total annual fund operating expenses of the Fund after taking into account any such fee waiver and/or expense reimbursement, if any; total returns would have been lower had there been no waivers or reimbursements.
See page 8 for additional performance disclosures. See page 81 for a description of all indices.
Credit ratings are assigned to underlying securities utilizing ratings from a Nationally Recognized Statistical Rating Organization (NRSRO) such as Moody’s and Fitch, or other rating agencies and applying the following hierarchy: security is determined to be Investment Grade if it has been rated at least BBB- by one credit rating agency; once determined to be Investment Grade (BBB- and above) or Non-Investment Grade (BB+ and below) where multiple ratings are available, the lowest rating is assigned. Mortgage-related securities issued and guaranteed by government-sponsored agencies such as Fannie Mae and Freddie Mac are generally not rated by rating agencies. Securities that are not rated do not necessarily indicate low quality. Ratings are shown in the Fitch scale (e.g., AAA). Ratings and portfolio credit quality may change over time. The Fund itself has not been rated by a credit rating agency.
Source (Fixed Income Attributes, Credit Quality, and Maturity Distribution): Bloomberg Analytics
Q1 2021 Annual Report 17
This page intentionally left blank
18 Q1 2021 Annual Report
HICKORY FUND
Portfolio Managers: Wally Weitz, CFA & Drew Weitz
Investment Style: Mid-Cap Value
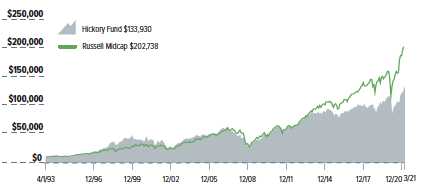
The Hickory Fund returned +8.71% in the first quarter, compared to +8.14% for the Russell Midcap Index. For the fiscal year ending March 31, 2021, the Fund returned +59.17% compared to +73.64% for the benchmark.
The “reopening” trade that began in earnest with positive vaccine trial results in November continued into the first quarter of the new year. Cyclical businesses that depend on a stronger economy, as well as industries that depend on the customers’ ability to be physically present (travel, hospitality, and live events to name a few), have been leading the market higher. At the same time, the stronger economic outlook and potential for faster inflation has forced investors to contemplate an increase in interest rates. As we wrote last quarter, higher interest rates diminish the present value of future cash flows and reduce investors’ appetite to pay up for faster growing companies.
With these market dynamics on display within the portfolio, the Fund delivered strong results in the first quarter. Beyond the benefit of “reopening,” gains were led by companies experiencing positive, company-specific developments. Used car dealer CarMax was our top contributor, as the nationwide roll-out of its omnichannel car buying experience (at a dealership, online, or a combination of the two) continues to win fans in the form of new customers and investors alike. Summit Materials shares rallied as the market began to anticipate how the new presidential administration’s infrastructure plans may result in healthy incremental demand for years to come. And shares of LabCorp rose after management announced it would review the company’s structure and capital allocation strategy, acquiescing to pressure from an activist shareholder.
The broad rally resulted in very few portfolio holdings with a negative return for the quarter. Enterprise software providers CoStar Group, Black Knight and Guidewire Software lagged as software companies generally fell out of favor, while Liberty Broadband’s modest decline reflects investors’ general belief that a government controlled by Democrats (specifically, the Federal Communications Commission) may create a less friendly regulatory environment for cable/broadband providers. Broadband providers have been a popular “political football” for many years, but we judge drastic regulatory changes that negatively impact our investments to be unlikely.
With the benefit of hindsight, we can see the recent fiscal year began near the pandemic market trough. Given the powerful market rally, twelve-month returns across nearly the entire portfolio were very strong. Our top 12-month contributors feature four investments that nearly, or more than, doubled in the past twelve months: CarMax, LabCorp, Qurate Retail and Ingersoll Rand. Liberty Broadband’s largest position size magnified its more modest return making it a top quarterly contributor as well. EverArc experienced a very modest decline. As an acquisition vehicle holding cash and without an operating business, its shares did not participate in the COVID-induced sell-off and have remained largely unchanged during the subsequent recovery. We sold Liberty Formula One at a slight loss as we opted to reinvest that capital into more attractive investment opportunities as the economy began to show signs of recovery.
As the rally has continued, portfolio activity skewed modestly toward trimming our strongest performers (including CarMax, Summit Materials, Qurate Retail and First Hawaiian) and our larger portfolio holdings (including Liberty Broadband, LabCorp and LICT Corp). On the buy side, we modestly increased our positions in LKQ, Box and Markel, but most notably we initiated a new position in AutoZone, a specialty retailer of auto parts and accessories. AutoZone continues to have success with its traditional do-it-yourself customers, and it is still in the early stages of rolling out its commercial account business that reaches do-it-for-me customers. We believe both efforts have significant growth potential for years to come and are led by a management team that has demonstrated a consistent ability to grow the per-share value of their business. Investors can learn more about our investment thesis in Jon Baker’s Analyst Corner feature.
Looking ahead, we remain encouraged by the prospects for our portfolio. Trading at an estimated price-to-value ratio in the low-to-mid 90’s, it seems likely to us that the pace of returns may slow as the economic recovery plays “catch up” to the stock market. Nevertheless, we feel our businesses can still generate acceptable returns. Meanwhile, our Quality at a Discount investment philosophy remains hard at work; our investment team continues to investigate additional high-quality businesses, and we will be ready to acquire those companies’ shares when they trade at a discount to our value estimates.
Q1 2021 Annual Report 19
| Returns | | | | | | Annualized | | | | |
|
|
|
|
|
|
|
| Since Fund |
|
|
|
|
|
|
|
|
|
| Inception | Net | Gross |
| QTD | YTD | 1 YR | 3 YR | 5 YR | 10 YR | 20 YR | (4/1/1993) | Expense | Expense |
| WEHIX | 8.71% | 8.71% | 59.17% | 11.15% | 9.38% | 8.06% | 6.72% | 9.70% | 1.09% | 1.13% |
| Russell Midcap | 8.14 | 8.14 | 73.64 | 14.73 | 14.67 | 12.47 | 10.48 | 11.34 |
|
|
Growth of $10,000 Investment Since Inception
Capitalization
| Top 10 Stock Holdings | |
| % of Net Assets |
| Liberty Broadband Corp. - Series A & C | 8.0 |
| LICT Corp. | 5.2 |
| Laboratory Corp. of America Holdings | 5.1 |
| Liberty SiriusXM Group - Series A & C | 4.8 |
| LKQ Corp. | 4.5 |
| CarMax, Inc. | 4.4 |
| Markel Corp. | 4.3 |
| AutoZone, Inc. | 4.1 |
| Liberty Global plc - Class C | 3.6 |
| Axalta Coating Systems Ltd. | 3.5 |
| | 47.5 |
| Industry Breakdown | |
| % of Net Assets |
| Communication Services | 26.3 |
| Consumer Discretionary | 14.6 |
| Information Technology | 13.2 |
| Materials | 11.5 |
| Industrials | 10.7 |
| Financials | 8.8 |
| Health Care | 5.1 |
| Other Common Stock & Warrants | 3.4 |
| Non-Convertible Preferred Stocks | 1.7 |
| Cash Equivalents/Other | 4.7 |
| | 100.0 |
| Top Stock Performers | | | |
| Average |
|
| Return | Weight | Contribution |
| CarMax, Inc. | 40.4% | 4.5% | 1.61% |
| Summit Materials, Inc. - Class A | 39.5 | 2.9 | 1.19 |
| Laboratory Corp. of America Holdings | 25.3 | 4.8 | 1.15 |
| LICT Corp. | 22.9 | 5.3 | 1.14 |
| LKQ Corp. | 20.1 | 4.2 | 0.77 |
| | | | |
| Bottom Stock Performers | | | |
| Average |
|
| Return | Weight | Contribution |
| Guidewire Software, Inc. | (21.1)% | 3.3% | (0.78)% |
| Liberty Broadband Corp. - Series A & C | (6.5) | 8.5 | (0.53) |
| Black Knight, Inc. | (16.3) | 2.7 | (0.49) |
| CoStar Group, Inc. | (11.1) | 3.5 | (0.43) |
| HEICO Corp. - Class A | (2.9) | 2.9 | (0.09) |
Data quoted is past performance and current performance may be lower or higher. Past performance is no guarantee of future results. Investment return and principal value of an investment will fluctuate, and shares, when redeemed, may be worth more or less than their original cost. All investments involve risks, including possible loss of principal. Please visit weitzinvestments.com for the most recent month-end performance.
Investment results reflect applicable fees and expenses and assume all distributions are reinvested but do not reflect the deduction of taxes an investor would pay on distributions or share redemptions. Net and Gross Expense Ratios are as of the Fund’s most recent prospectus. The Fund has entered into fee waiver and/or expense reimbursement arrangements with the Investment Advisor. The Advisor has contractually agreed to waive a portion of the Advisor’s fee and reimburse certain expenses (excluding taxes, interest, brokerage costs, acquired fund fees and expenses and extraordinary expenses) to limit the total annual fund operating expenses of the Class’s average daily net assets through 07/31/2021. The Net Expense Ratio reflects the total annual fund operating expenses of the Fund after taking into account any such fee waiver and/or expense reimbursement, if any; total returns would have been lower had there been no waivers or reimbursements.
See page 8 for additional performance disclosures. See page 81 for a description of all indices.
Contributions to Fund performance are based on actual daily holdings. Securities may have been bought or sold during the quarter. Return shown is the actual quarterly return of the security or combination of share classes.
Source (Top Performers, Bottom Performers): FactSet Analytics
20 Q1 2021 Annual Report
NEBRASKA TAX-FREE INCOME FUND
Portfolio Manager: Tom Carney, CFA
Investment Style: Municipal-State Bond
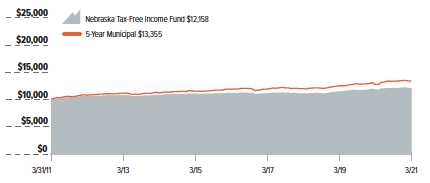
The Nebraska Tax-Free Income Fund returned -0.56% in the first quarter compared to a -0.31% return for the Bloomberg Barclays 5-Year Municipal Bond Index. For the fiscal year ending March 31, 2021, the Fund’s total return was +2.67% compared to a +5.07% return for the index. The Fund has underperformed the index year-to-date due to the Fund’s holdings in longer maturity, longer duration investments, where rising interest rates had more of a price impact in the first quarter. The Fund underperformed for the fiscal year due to the higher weighting in bonds maturing in under 5 years (approximately 63% of Fund assets) which proved to be a detractor for much of 2020. While the Fund has an overall duration comparable to the index, the Fund’s investments are distributed across the yield curve, with bonds maturing in less than a year as well as those maturing in more than 10 years. The index only includes bonds that mature within a 4-to-6-year timeframe.
Overview
Most municipal bond investors experienced price declines in the first quarter of 2021 as dramatic increases in U.S. Treasury bond yields pulled most other fixed income asset classes lower in price. Despite the price declines, municipal bonds modestly outperformed Treasuries in the quarter as yield ratios of municipal bonds relative to comparable U.S. Treasuries continued to move lower. The ratio of the 5-year AAA-rated municipal bond to the 5-year Treasury, for example, declined from 59% on December 31, 2020, to 54% on March 31, 2021 (the lowest in over 20 years). This ratio remains a reasonably useful tool in measuring the relative attractiveness of tax-free municipal bonds compared to U.S. Treasury bonds. All else equal, the higher the ratio of municipal bond yields to U.S. Treasury yields, the more appealing municipal bonds become, given their tax-advantaged status. While it is possible that this ratio could decline further, it is more likely that future returns will increasingly be a function of movement in the U.S. Treasury market, as it is the base rate(s) upon which all other fixed-income markets take their primary cue.
State and local governments, like the rest of the economy, have been adversely impacted by government-ordered shutdowns/ quarantines to curb the spread of COVID-19. This undoubtedly took its toll on employment, economic growth and municipal finances. Positively, state governments took decisive action to reduce expenditures in anticipation of revenue declines. In many cases, municipal revenues did not decline as much as forecast. This has resulted in municipal finances, particularly in Nebraska, that are in better shape than originally estimated. In addition, municipalities have benefited from substantial federal stimulus – especially the latest iteration, which offers wide discretion on how local governments deploy these federal infusions.
For more on our views regarding the fixed income and equity markets, please read our quarterly Fixed Income Insights and Value Matters.
Nebraska ‘State of the State’
“Even as we’ve had to overcome the challenge of the pandemic, the work of Nebraskans everywhere has kept the state of the state strong.” – Nebraska Governor Pete Ricketts
In a January 2021 address to the state legislature and fellow Nebraskans, Governor Pete Ricketts spoke of the “grit, tenacity, and determination to work” that has long been the “Nebraska Way” in outlining the progress Nebraska has made in dealing with the challenge brought about by the coronavirus pandemic. Whether it is the pandemic of 2020 or the historic floods of 2019, the state has met each “new challenge in the same spirit we have for generations.”
The fiscal proof of that spirit can be seen in the economic and fiscal strength the state finds itself in as it begins a new year. According to the U.S. Bureau of Labor Statistics, Nebraska’s 2.9% unemployment rate as of March 2021 is tied for the lowest in the nation and is lower than it was in November 2019 (pre-COVID-19). This has resulted in one of the highest labor force participation rates in the nation (68.5%). In terms of economic growth, Nebraska was amongst the nation’s top-10 in the fourth quarter of 2020 according to the U.S. Bureau of Economic Analysis.
Since its entry into the Union in 1866, Nebraska has been fiscally conservative and a good steward of its citizens’ resources. The challenges brought about by the pandemic will likely be yet another chapter in the state’s long history of how adversity brings about “the best in Nebraskans.”
Top Quarterly Contributors
• No segment generated positive results in the quarter.
Top Quarterly Detractors
• School district general obligation bonds issued by Papillion-La Vista, Nebraska, School District and Lancaster County, Nebraska, School District.
• Combined utility revenue bonds issued by Grand Island Combined Utilities and Columbus Combined Revenue.
• Lease revenue bonds issued by Omaha, Nebraska, Public Facilities Corporation.
• Tax-supported lease revenue bonds issued by Lincoln-Lancaster, Nebraska, Public Building Commission.
• Higher education revenue bonds issued by University of Nebraska Facilities Corporation (Health Center and College of Nursing Projects) and University of Nebraska (Kearney Student Housing Project).
• General revenue bonds issued by Boys Town Village.
• Hospital revenue bonds issued by Nebraska Medicine and Madonna Rehabilitation Hospital.
For the fiscal year, all segments contributed positively to Fund results. Leading segments included combined utility, school district, hospital, higher education, electricity and public power bonds.
Q1 2021 Annual Report 21
Turning to portfolio metrics, the average effective duration of the Fund increased to 3.8 years on March 31, 2021, from 3.4 years at year-end. Average effective maturity increased to 3.7 years from 3.4 years. Overall asset quality remains high, with approximately 88% rated A or better by one or more of the nationally recognized statistical rating organizations.
See the following page for additional details regarding the breakdown of our holdings. Our investments are broad, and they are all backed by a consistent philosophy: we strive to own only those investments we believe compensate us for the incremental credit risk. Our overall goal is to invest in a portfolio of bonds of varying maturities that we believe offer attractive risk-adjusted returns, taking into consideration the general level of interest rates and the credit quality of each investment.
Definitions: Average effective duration provides a measure of a fund’s interest-rate sensitivity. The longer a fund’s duration, the more sensitive the fund is to shifts in interest rates. Average effective maturity is the weighted average of the maturities of a fund’s underlying bonds. Yield to worst (YTW) is the lowest potential yield that can be received on a bond portfolio without the issuers actually defaulting.
22 Q1 2021 Annual Report
| Returns | | | | | | Annualized | | | | |
| | | | | | | | Since Fund | | |
| | | | | | | | Inception | Net | Gross |
| QTD | YTD | 1 YR | 3 YR | 5 YR | 10 YR | 20 YR | (10/01/1985) | Expense | Expense |
| WNTFX | (0.56)% | (0.56)% | 2.67% | 2.89% | 1.60% | 1.97% | 2.88% | 4.40% | 0.45% | 1.10% |
| 5-Year Municipal Bond | (0.31) | (0.31) | 5.07 | 3.88 | 2.52 | 2.93 | 3.75 | N/A |
|
|
Growth of $10,000 Investment - 10 Year
| 30-Day SEC Yield | |
| Subsidized
| Unsubsidized |
| | 0.48% | (0.11)% |
| Fixed Income Attributes | |
Portfolio Summary | |
| Average Maturity | 6.4 years |
| Average Effective Maturity | 3.7 years |
| Average Duration | 3.4 years |
| Average Effective Duration | 3.8 years |
| Average Coupon | 3.6% |
Municipals exempt from federal and Nebraska income taxes
| 89.1% |
| Municipals subject to alternative minimum tax | 3.9% |
| State Breakdown | |
| % of Net Assets |
| Nebraska | 89.1 |
| Texas | 1.2 |
| Washington | 1.0 |
| California | 0.7 |
| Utah | 0.4 |
| Arizona | 0.3 |
| Colorado | 0.3 |
| Cash Equivalents/Other | 7.0 |
| | 100.0 |
| Maturity Distribution | |
Maturity Type | % of Portfolio |
| Cash Equivalents | 5.9 |
| Less than 1 Year | 14.5 |
| 1 - 3 Years | 22.4 |
| 3 - 5 Years | 21.0 |
| 5 - 7 Years | 19.7 |
| 7 - 10 Years | 15.6 |
| 10 - 20 Years | 0.9 |
| | 100.0 |
| Credit Quality | |
Underlying Securities | % of Portfolio |
| AAA | 3.7 |
| AA | 62.6 |
| A | 21.8 |
| BBB | 2.1 |
| Non-Rated | 3.9 |
| Cash Equivalents | 5.9 |
| | 100.0 |
| Sector Breakdown | |
| % of Net Assets |
| Power | 16.1 |
| Hospital | 10.6 |
| Certificates of Participation | 7.0 |
| General | 6.6 |
| Water/Sewer | 6.5 |
| Higher Education | 5.5 |
| Lease | 4.8 |
| Airport/Transportation | 2.5 |
| Housing | 1.9 |
| Total Revenue | 61.5 |
| School District | 11.7 |
| City/Subdivision | 5.2 |
| County | 3.8 |
| Natural Resource District | 0.3 |
| Total General Obligation | 21.0 |
| Escrow/Pre-Refunded | 10.5 |
| Cash Equivalents/Other | 7.0 |
| | 100.0 |
Data quoted is past performance and current performance may be lower or higher. Past performance is no guarantee of future results. Investment return and principal value of an investment will fluctuate, and shares, when redeemed, may be worth more or less than their original cost. All investments involve risks, including possible loss of principal. Please visit weitzinvestments.com for the most recent month-end performance.
Investment results reflect applicable fees and expenses and assume all distributions are reinvested but do not reflect the deduction of taxes an investor would pay on distributions or share redemptions. Net and Gross Expense Ratios are as of the Fund’s most recent prospectus. The Fund has entered into fee waiver and/or expense reimbursement arrangements with the Investment Advisor. The Advisor has contractually agreed to waive a portion of the Advisor’s fee and reimburse certain expenses (excluding taxes, interest, brokerage costs, acquired fund fees and expenses and extraordinary expenses) to limit the total annual fund operating expenses of the Class’s average daily net assets through 07/31/2021. The Net Expense Ratio reflects the total annual fund operating expenses of the Fund after taking into account any such fee waiver and/or expense reimbursement, if any; total returns would have been lower had there been no waivers or reimbursements.
See page 8 for additional performance disclosures. See page 81 for a description of all indices.
Credit ratings are assigned to underlying securities utilizing ratings from a Nationally Recognized Statistical Rating Organization (NRSRO) such as Moody’s and Fitch, or other rating agencies and applying the following hierarchy: security is determined to be Investment Grade if it has been rated at least BBB- by one credit rating agency; once determined to be Investment Grade (BBB- and above) or Non-Investment Grade (BB+ and below) where multiple ratings are available, the lowest rating is assigned. Ratings and portfolio credit quality may change over time. The Fund itself has not been rated by a credit rating agency.
Source (Fixed Income Attributes, Credit Quality, and Maturity Distribution): Bloomberg Analytics
Q1 2021 Annual Report 23
This page intentionally left blank
24 Q1 2021 Annual Report
PARTNERS III OPPORTUNITY FUND
Portfolio Manager: Wally Weitz, CFA & Drew Weitz
Investment Style: Multi-Cap Alternative
The Partners III Opportunity Fund’s Institutional Class returned +7.30% in the first quarter compared to +6.17% for the S&P 500 and +6.35% for the Russell 3000. For the fiscal year ending March 31, 2021, the Fund returned +40.11% compared to +56.35% for the S&P 500 and +62.53% for the Russell 3000.
The “reopening” trade that began in earnest with positive vaccine trial results in November continued into the first quarter of the new year. Cyclical businesses that depend on a stronger economy, as well as industries that depend on their customers’ ability to be physically present (travel, hospitality, and live events to name a few), have been leading the market higher. Conversely, “stay at home” winners took a breather, as did many of the market’s growth darlings as investors were forced to contemplate a future with higher interest rates.
Against this backdrop, the Fund delivered solid returns in the first quarter, with CarMax and Summit Materials sharing the top contributor title. The nationwide rollout of CarMax’s omnichannel buying experience (at a dealership, online, or a combination of the two) continues to win fans in the form of new customers and investors alike. Summit enjoyed outsized gains as investors began to anticipate how the new presidential administration’s infrastructure plans may result in healthy incremental demand for years to come. Berkshire Hathaway’s outperformance, modest by comparison but magnified by its portfolio weight, was also a top contributor.
Enterprise software providers CoStar Group and Black Knight both lagged for the quarter as software companies generally fell out of favor, while Liberty Broadband’s modest decline reflects investors’ general belief that a government controlled by Democrats (specifically, the Federal Communications Commission) may create a less friendly regulatory environment for cable/broadband providers. Broadband providers have been a popular “political football” for many years, but we judge drastic regulatory changes that negatively impact our investments to be unlikely.
With the benefit of hindsight, we can see that the recent fiscal year began near the pandemic market trough. Given the powerful market rally, twelve-month returns across nearly the entire portfolio were very strong. Berkshire’s solid stock performance, coupled with its large position size, earned it the top-contributor moniker for the trailing twelve months. Alphabet and Facebook shares prospered as pandemic lockdowns reinforced the importance and dominance of their digital advertising businesses. LabCorp’s COVID-related businesses have generated temporarily elevated earnings and cash flow. Shares rose further as management announced a review of the company’s structure and capital allocation strategy in response to an activist campaign. Detractors were few and mostly immaterial, with modest declines experienced by EverArc, Liberty Latin America, and a collection of call options written during the fiscal year.
The top detractors for the quarter and fiscal year were our short positions in ETFs tracking the S&P 500 and Nasdaq 100. Although we report the isolated impact of these shorts each quarter, investors should note they are managed as an integrated piece of the overall portfolio. On a standalone basis, they not surprisingly produced a headwind during the recent prolific rally (just as they provided ballast during last year’s market drawdown). We flex the size of these short positions in response to overall market conditions and lean toward (or away from) one index or another under different valuation environments. We also utilize them (and other tools, like options) to manage our long equity exposures. For example, if several of the businesses we own temporarily see their valuations become stretched, increasing the index short position allows us to reduce a portion of that equity risk exposure without selling shares (and potentially realizing taxable gains for shareholders) and remove the potential “timing” decision of when to buy them back.
We were active on both the buy and sell sides of the trading ledger during the quarter. We trimmed several positions on strength and to manage position sizes (including Berkshire Hathaway, CarMax, Intelligent Systems Corporation, Qurate Retail and Charles Schwab). Although we did not exit any positions during the quarter, investors may note that we have call options written against our full position in Summit Materials. As mentioned earlier, we sometimes use options to manage our long equity exposures. In Summit’s case, investors’ infrastructure enthusiasm drove up both Summit’s equity and the premiums (i.e., the price of a call or put option) for option contracts for its shares. By selling call options on our shares and collecting these premiums, we earn some additional “rent” on our shares. Additionally, should Summit’s equity price exceed the “strike” prices of these options at their expiration, we believe the potential sale proceeds combined with the premiums already collected would represent an attractive return. Our trims funded new positions in Dun & Bradstreet (detailed below) and AutoZone (a specialty retailer of auto parts and the subject of research analyst Jon Baker’s Analyst Corner feature which provides a deeper dive into our expectations and investment thesis). Our trims also allowed us to continue building our FIS position and make opportunistic additions to Box, Aon, Liberty Broadband and others. In total, our gross long exposure (97% of net assets) and short exposure (18% of net assets) remain generally unchanged, resulting in an effective net long position of 79% of net assets.
Dun & Bradstreet collects and provides proprietary data used by businesses to understand the credit risk of their counterparties. Under the management of its Chairman Bill Foley and CEO Anthony Jabbour, who both joined the company in 2019, Dun & Bradstreet has moved to modernize its technology, improve its sales and contracting practices, invest in new data and capabilities to enhance its value to customers, and evaluate potential acquisitions to boost each of these efforts. Our positive experience with Black Knight (where Foley and Jabbour are also Chairman and CEO, respectively) bolsters our confidence in these efforts while the market takes a “wait and see” approach.
Looking ahead, we are optimistic about global economies reopening, and we feel confident in the ability of our companies to navigate the impact of the pandemic. That said, we are mindful that markets have rebounded ahead of these events, and we remain cautious that the magnitude and speed of the economic recovery may not perfectly align with investor expectations. We believe our portfolio of growing, quality businesses are well-positioned for the next several years, with any interim volatility being a potential opportunity for long-term-minded investors.
Definitions: Effective net is the effective long (the sum of the portfolio’s long positions, such as common stocks, or derivatives where the price increases when an index or position rises) minus the effective short (the sum of the portfolio’s short positions, such as derivatives where the price increases when an index or position falls). Option premiums are the current market price of an options contract.
Q1 2021 Annual Report 25
| | | | | | | | | | | |
| Returns | | | | | | Annualized | | | | |
|
|
|
|
|
|
|
| Since Fund |
|
|
|
|
|
|
|
|
|
| Inception | Net | Gross |
| QTD | YTD | 1 YR | 3 YR | 5 YR | 10 YR | 20 YR | (6/1/1983) | Expense | Expense |
| WPOIX - Investor Class | 7.11% | 7.11% | 39.25% | 12.97% | 9.78% | 8.55% | 8.31% | 12.21% | 2.03% | 2.03% |
| WPOPX - Institutional Class | 7.30 | 7.30 | 40.11 | 13.65 | 10.40 | 9.01 | 8.54 | 12.33 | 1.44 | 1.44 |
| S&P 500 | 6.17 | 6.17 | 56.35 | 16.78 | 16.29 | 13.91 | 8.47 | 11.44 |
|
|
| Russell 3000 | 6.35 | 6.35 | 62.53 | 17.12 | 16.64 | 13.79 | 8.85 | 11.27 |
|
|
Growth of $10,000 Investment Since Inception
Capitalization
| | |
| Top 10 Stock Holdings | |
| % of Net Assets |
| Berkshire Hathaway Inc. - Class B | 10.0 |
| Markel Corp. | 5.9 |
| Liberty SiriusXM Group - Series A & C | 5.7 |
| Liberty Broadband Corp. - Series A & C | 5.1 |
| Alphabet, Inc. - Class C | 5.0 |
| Visa Inc. - Class A | 4.6 |
| Mastercard Inc. - Class A | 4.6 |
| Liberty Global plc - Class C | 4.4 |
| Facebook, Inc. - Class A | 4.3 |
| Intelligent Systems Corp. | 4.3 |
| | 53.9 |
| Industry Breakdown | |
| % of Net Assets |
| Communication Services | 24.5 |
| Financials | 23.5 |
| Information Technology | 22.8 |
| Consumer Discretionary | 7.3 |
| Materials | 4.7 |
| Health Care | 4.1 |
| Industrials | 3.2 |
| Other Common Stock & Warrants | 3.6 |
| Non-Convertible Preferred Stocks | 2.9 |
| Securities Sold Short | (18.3) |
| Short Proceeds/Other | 21.7 |
| | 100.0 |
| | | | |
| Top Performers | | | |
| Average |
|
| Return | Weight | Contribution |
| CarMax, Inc. | 40.4% | 2.7% | 1.07% |
| Summit Materials, Inc. - Class A | 39.5 | 3.1 | 1.07 |
| Berkshire Hathaway Inc. - Class B | 10.2 | 10.7 | 1.06 |
| Laboratory Corp. of America Holdings | 25.3 | 4.1 | 1.00 |
| Alphabet, Inc. - Class C | 18.1 | 5.2 | 0.97 |
| Bottom Performers | | | |
| Average |
|
| Return | Weight | Contribution |
| SPDR S&P 500 ETF Trust (short) | 6.4% | (12.7)% | (0.80)% |
| Black Knight, Inc. | (16.3) | 2.0 | (0.36) |
| Liberty Broadband Corp. - Series A & C | (6.5) | 4.9 | (0.30) |
| CoStar Group, Inc. | (11.1) | 2.1 | (0.23) |
| Visa Inc. - Class A | (3.1) | 4.7 | (0.18) |
Data quoted is past performance and current performance may be lower or higher. Past performance is no guarantee of future results. Investment return and principal value of an investment will fluctuate, and shares, when redeemed, may be worth more or less than their original cost. All investments involve risks, including possible loss of principal. Please visit weitzinvestments.com for the most recent month-end performance.
Investment results reflect applicable fees and expenses and assume all distributions are reinvested but do not reflect the deduction of taxes an investor would pay on distributions or share redemptions. Net and Gross Expense Ratios are as of the Fund’s most recent prospectus.
See page 8 for additional performance disclosures. See page 81 for a description of all indices.
Contributions to Fund performance are based on actual daily holdings. Securities may have been bought or sold during the quarter. Return shown is the actual quarterly return of the security or combination of share classes.
Source (Top Performers, Bottom Performers): FactSet Analytics
26 Q1 2021 Annual Report
PARTNERS VALUE FUND
Portfolio Managers: Wally Weitz, CFA, Brad Hinton, CFA & Drew Weitz
Investment Style: Multi-Cap Value
The Partners Value Fund’s Institutional Class returned +8.37% for the first quarter compared to +6.17% for the S&P 500 and +6.35% for the Russell 3000. For the fiscal year ending March 31, 2021, the Fund’s Institutional Class returned +58.43% compared to +56.35% for the S&P 500 and +62.53% for the Russell 3000.
The long-awaited resurgence of our mid- and small-cap stocks continued in the first quarter, driving improved Fund returns. The “economic reopening” trade persisted with some vigor. Cyclical businesses and other value-oriented fare were the strongest beneficiaries. Aggressive growth stocks, which had dominated the return scoreboard for several years, lagged considerably.
The Fund’s mid-cap basket (generally, companies with market capitalization less than $30 billion) made up 55.5% of net assets and delivered double-digit returns in the quarter, paced by outsized gains at CarMax, Summit Materials and LabCorp. CarMax is accelerating its customer-friendly omnichannel rollout, Summit Materials is poised for infrastructure spending tailwinds, and LabCorp’s board is reviewing the company’s structure and capital-allocation strategy to unlock value. As software stocks fell out of favor, Guidewire and Black Knight gave back a portion of their substantial unrealized gains. We think these hiccups will prove temporary as our business value estimates have remained sturdy (and, in fact, have grown).
The Fund’s large-cap basket (generally, companies with market capitalization greater than $30 billion) made up 41.3% of the Fund’s net assets and generated satisfactory mid-single-digit returns in the quarter. Notable contributors included Alphabet and Charles Schwab. Google parent Alphabet provided new disclosures that highlighted the profitability of its services businesses and the upside potential of its Cloud Platform. Charles Schwab rose as investors refocused on earning power in more “normal” times. CoStar Group, Liberty Broadband, and Visa were the three primary (and modest) large-cap quarterly detractors. All have been long-term winners for the Fund, and all continue to have bright outlooks.
Stocks rebounded from their pandemic lows throughout the Fund’s fiscal year, with most soaring higher. LabCorp, CarMax and LKQ more than doubled in price. Charles Schwab nearly joined them in the triple-digit return club, while Alphabet returned more than 75%. We could go on, and the rest of the list would sound equally impressive. Not surprisingly given the strength of the overall market, the Fund had no detractors for the fiscal year.
We added AutoZone to the portfolio during the quarter. We first owned this leading specialty auto parts retailer more than a decade ago, so analyst Jon Baker, CFA, and our team know the company and industry well. AutoZone has been a per-share value creation machine. We think the company still has room to grow stores at healthy rates for years to come, and the outlook for its do-it-for-me business looks especially bright. Jon describes our investment thesis for AutoZone in this quarter’s Analyst Corner.
We sold Oracle after nearly a decade of ownership. The stock delivered double-digit annualized returns but fell short of many tech peers. The bar is set high for the concentrated large-cap basket, and at current prices, Oracle is no longer among our top ideas.
Our team is continually working to improve the portfolio as we process new information. We reduced the Fund’s ACI Worldwide position as the stock responded to takeover chatter and the growing influence of an activist investor. We also trimmed positions in Summit Materials and Vulcan Materials on stock price strength. We added modestly to positions in Aon and Liberty Broadband at discounts to our value estimates. This type of limited, periodic rebalancing is disciplined but not mechanical. Decisions are based on stock prices relative to our value estimates, fundamental progress at each business, quality score considerations, and analyst conviction.
We believe that investing in businesses of all sizes, using our Quality at a Discount approach, will be an enduring advantage of a multi-cap strategy. Drew Weitz hit the ground running with the portfolio management team in July. He has focused primarily on our mid-cap basket and holdings with more of a traditional value tilt, which suits his investing style well. Mid-cap additions such as AutoZone, First Republic Bank, HEICO and IDEX are well aligned with our collective vision for a successful “go anywhere” equity portfolio. We look forward to building on recent momentum to see what the next few years bring.
Valuation remains our North Star, and we think our stocks remain reasonably priced despite strong recent returns. Business value growth has been solid and encouraging. Our current estimation is that the portfolio trades at a price-to-value in the low-to-mid-90s. These valuation levels suggest adequate long-term return potential from both our mid- and large-cap holdings.
Q1 2021 Annual Report 27
| Returns | | | | | | Annualized | | | | |
|
|
|
|
|
|
|
| Since Fund |
|
|
|
|
|
|
|
|
|
| Inception | Net | Gross |
| QTD | YTD | 1 YR | 3 YR | 5 YR | 10 YR | 20 YR | (6/1/1983) | Expense | Expense |
| WPVLX - Investor Class | 8.34% | 8.34% | 58.17% | 11.36% | 9.85% | 8.90% | 6.34% | 11.69% | 1.09% | 1.13% |
| WPVIX - Institutional Class | 8.37 | 8.37 | 58.43 | 11.62 | 10.12 | 9.07 | 6.42 | 11.73 | 0.89 | 0.93 |
| S&P 500 | 6.17 | 6.17 | 56.35 | 16.78 | 16.29 | 13.91 | 8.47 | 11.44 |
|
|
| Russell 3000 | 6.35 | 6.35 | 62.53 | 17.12 | 16.64 | 13.79 | 8.85 | 11.27 |
|
|
Growth of $10,000 Investment Since Inception
Capitalization
| Top 10 Stock Holdings | |
| % of Net Assets |
| Alphabet, Inc. - Class C | 5.9 |
| Berkshire Hathaway Inc. - Class B | 5.3 |
| Liberty SiriusXM Group - Series A & C | 4.8 |
| Liberty Broadband Corp. - Series A & C | 4.7 |
| The Charles Schwab Corp. | 4.2 |
| Laboratory Corp. of America Holdings | 4.2 |
| Aon plc - Class A | 4.1 |
| Visa Inc. - Class A | 3.9 |
| CarMax, Inc. | 3.8 |
| Vulcan Materials Co. | 3.7 |
| | 44.6 |
| Industry Breakdown | |
| % of Net Assets |
| Communication Services | 25.3 |
| Information Technology | 19.9 |
| Financials | 18.9 |
| Materials | 11.1 |
| Consumer Discretionary | 9.6 |
| Industrials | 7.9 |
| Health Care | 4.2 |
| Cash Equivalents/Other | 3.1 |
| 100.0 |
| Top Stock Performers | | | |
| Average |
|
| Return | Weight | Contribution |
| CarMax, Inc. | 40.4% | 3.7% | 1.31% |
| Summit Materials, Inc. - Class A | 39.5 | 2.6 | 1.06 |
| Alphabet, Inc. - Class C | 18.1 | 5.8 | 1.01 |
| Laboratory Corp. of America Holdings | 25.3 | 4.0 | 0.97 |
| The Charles Schwab Corp. | 23.3 | 4.0 | 0.86 |
| Bottom Stock Performers | | | |
| Average |
|
| Return | Weight | Contribution |
| Guidewire Software, Inc. | (21.1)% | 2.8% | (0.69)% |
| Black Knight, Inc. | (16.3) | 2.6 | (0.46) |
| CoStar Group, Inc. | (11.1) | 3.8 | (0.46) |
| Liberty Broadband Corp. - Series A & C | (6.5) | 4.6 | (0.34) |
| Visa Inc. - Class A | (3.1) | 3.9 | (0.14) |
Data quoted is past performance and current performance may be lower or higher. Past performance is no guarantee of future results. Investment return and principal value of an investment will fluctuate, and shares, when redeemed, may be worth more or less than their original cost. All investments involve risks, including possible loss of principal. Please visit weitzinvestments.com for the most recent month-end performance.
Investment results reflect applicable fees and expenses and assume all distributions are reinvested but do not reflect the deduction of taxes an investor would pay on distributions or share redemptions. Net and Gross Expense Ratios are as of the Fund’s most recent prospectus. The Fund has entered into fee waiver and/or expense reimbursement arrangements with the Investment Advisor. The Advisor has contractually agreed to waive a portion of the Advisor’s fee and reimburse certain expenses (excluding taxes, interest, brokerage costs, acquired fund fees and expenses and extraordinary expenses) to limit the total annual fund operating expenses of the Class’s average daily net assets through 07/31/2021. The Net Expense Ratio reflects the total annual fund operating expenses of the Fund after taking into account any such fee waiver and/or expense reimbursement, if any; total returns would have been lower had there been no waivers or reimbursements.
See page 8 for additional performance disclosures. See page 81 for a description of all indices.
Contributions to Fund performance are based on actual daily holdings. Securities may have been bought or sold during the quarter. Return shown is the actual quarterly return of the security or combination of share classes.
Source (Top Performers, Bottom Performers): FactSet Analytics
28 Q1 2021 Annual Report
SHORT DURATION INCOME FUND
Portfolio Managers: Tom Carney, CFA & Nolan Anderson
Investment Style: Short-Term Bond
The Short Duration Income Fund’s Institutional Class returned +0.67% in the first quarter compared to a -0.07% return for the Bloomberg Barclays 1-3 Year U.S. Aggregate Index. For the fiscal year ending March 31, 2021, the Short Duration Income Fund’s Institutional Class returned +6.32% compared to a +1.19% return for the index. It is undoubtedly pleasing to report on the strong absolute and relative results of the past quarter and 12 months. And while we are fully aware that these results are now in the past, they are solid affirmation (to us and hopefully to our fellow investors) of an investment process that has been decades in the making – and one that is always striving to learn from both our victories and especially our (and others’) failures.
Portfolio Positioning
The table below shows the change in allocation to various sectors, from the prior quarter and from the prior year. This summary provides a view over time of how we have allocated capital. Since our goal is to invest in sectors that we believe offer the best risk-adjusted returns, our allocations may change significantly over time.
|
|
| Qtr Over Qtr |
| Yr Over Yr |
| Sector (% Net Assets) | 3/31/2021 | 12/31/2020
| Change | 3/31/2020
| Change |
| Corporate Bonds | 16.1 | 15.0 | +1.1 | 20.2 | -4.1 |
| Corporate Convertible Bonds | 2.8 | 2.7 | +0.1 | 1.8 | +1.0 |
| Asset-Backed Securities (ABS) | 34.9 | 33.8 | +1.1 | 28.5 | +6.4 |
| Corporate Collateralized | 7.0 | 4.2 | +2.8 | 0.0 | +7.0 |
| Loan Obligations (CLOs)* |
|
|
|
|
|
| Commercial Mortgage-Backed |
|
|
|
|
|
| Securities (CMBS) | 7.7 | 7.0 | +0.7 | 6.0 | +1.7 |
| Agency Mortgage-Backed (MBS) | 10.3 | 11.5 | -1.2 | 14.5 | -4.2 |
| Non-Agency Mortgage-Backed |
|
|
|
|
|
| (RMBS) | 6.7 | 8.1 | -1.4 | 9.4 | -2.7 |
| Taxable Municipal Bonds | 0.1 | 0.1 | +0.0 | 0.2 | -0.1 |
| U.S. Treasury | 17.6 | 17.9 | -0.3 | 18.2 | -0.6 |
| Common Stocks | 0.6 | 0.5 | +0.1 | 0.3 | +0.3 |
| Cash & Equivalents | 3.2 | 3.4 | -0.2 | 0.9 | +2.3 |
| Total | 100.0 | 100.0 |
| 100.0 |
|
| High Yield** | 6.3 | 5.5 | +0.8 | 4.5 | +1.8 |
| |
| Effective duration (years) | 1.3 | 1.1 | +0.2 | 1.6 | -0.3 |
| Effective maturity (years) | 2.2 | 1.6 | +0.6 | 1.8 | +0.4 |
* Corporate CLOs are included in the ABS segment in the Fund’s schedule of investments but are additionally called out separately for the purposes of the discussion.
|
** High-Yield exposure (as of 03/31/2021) consists of investments in the Corporate, Corporate Convertible, ABS and CMBS sectors.
|
Investment activity during the quarter was once again led by corporate CLOs as we continued adding to our middle-market CLO portfolio, which now represents about 7% of assets. We maintain a positive view on investment-grade CLO tranches and believe the risk/reward remains attractive, especially relative to shorter-duration corporate bonds. Overall, we continue to source more favorable credit-related opportunities outside of price-insensitive index areas and those sectors whose prices have been and continue to be directly influenced by the Federal Reserve’s various policy tools (such as structured products).
While the Fund’s overall U.S. Treasury weighting declined modestly in the quarter, we did take advantage of the dramatic increase in Treasury interest rates to initiate a position (approximately 2.5%) in 7-year Treasury bonds as their interest rate more than doubled in the first three months of the year.
Overall portfolio metrics as measured by average maturity and average effective duration increased from the previous quarter. Average effective maturity increased to 2.2 from 1.5 years and average effective duration increased to 1.3 from 1.1 years at year-end. These measures provide a guide to the Fund’s interest rate sensitivity. A lower average effective maturity and shorter average effective duration reduce the Fund’s price sensitivity to changes in interest rates (either up or down).
Of note, the Fund’s duration hit an all-time low at year-end. While we did take advantage of the first quarter’s increase in U.S. Treasury rates to increase the Fund’s duration to 1.3 years (e.g., the 7-year Treasury investment mentioned earlier), the current environment still presents historically low reinvestment opportunities across the yield curve. This coupled with pent-up demand from an economy that appears to be recovering and likely continued monetary and fiscal policy stimulus points to a potential inflationary pickup. We therefore believe it prudent to maintain a defensive position with respect to interest rates.
Top Quarterly Contributors
Sector allocation and security selection were the key drivers of performance.
• Corporate and Convertible Bonds: Corporate and convertible bonds generated nearly half of the Fund’s total return in the quarter as solid coupon income was enhanced by capital appreciation while credit spreads continued to decline, particularly in cyclical sectors such as airlines, energy, and leisure. Noteworthy contributors include Redwood Trust convertible bonds and corporate bonds issued by NGL Energy Partners, American Airlines, and Silversea Cruise.
• Asset-Backed Securities (ABS): Our ABS investments across all categories (e.g., auto, consumer, equipment, and fleet lease) provided solid coupon income and modest capital appreciation while also continuing to exhibit better-than-anticipated credit performance.
o Corporate CLOs: Corporate CLOs performed well in the quarter as coupon income was supplemented by price appreciation. Most of our CLO investments have been made in the senior-most portions of securitizations of middle-market loans. Notable contributors included middle market CLOs issued by Alliance Bernstein and Brightwood Capital.
• Commercial Mortgage-Backed Securities (CMBS): Our CMBS segment experienced meaningful price appreciation in the quarter as business plans continued to progress among our various commercial real-estate CLOs, such as Granite Point, VMC Finance, and Exantas, and our SASB (single-asset single-borrower) holdings from Hilton and Retail Value.
Q1 2021 Annual Report 29
Top Quarterly Detractors
• U.S. Treasuries: Treasuries detracted modestly (less than 5 basis points) from results in the quarter, but the Fund’s shorter average life and duration cushioned this segment from interest rate increases (price declines) in longer-term Treasuries. For example, the 5-year Treasury increased more than 2.5 times in the quarter, from 0.36% on December 31, 2020, to nearly 1% on March 31, 2021. Therefore, the value of a 5-year Treasury bond declined by about 2.5% during the quarter, effectively wiping out more than the lifetime value of the bond’s coupon income. A good reminder that starting points (both high and low) matter a lot.
Fiscal year results
Results for the fiscal year were powered by every Fund segment, with notable strength in each of the quarterly contributors mentioned above. While the U.S. Treasury segment experienced price declines year-over-year, coupon income more than made up for unrealized price declines.
Fund Strategy
Our approach consists primarily of investing in a diversified portfolio of high-quality bonds while maintaining an overall portfolio average duration of 1.0 to 3.5 years. We may invest up to 15% in fixed-income securities that are not considered investment-grade (such as high-yield and convertible bonds as well as preferred and convertible preferred stock) and we do so when we perceive the risk/reward characteristics to be favorable.
We do not, and will not, try to mimic any index as we construct our portfolio. We believe our flexible mandate is a differentiator that allows us to navigate any environment – particularly today’s environment of challenging returns. We utilize a bottom-up, research-driven approach and select portfolio assets one security at a time based on our view of opportunities in the marketplace. Our fixed income research is not dependent on, but often benefits from, the due diligence efforts our equity teammates conduct on companies and industries.
Overall, we strive to be adequately compensated for the risks assumed while seeking to maximize investment (or reinvestment) income and avoid making interest-rate bets, particularly ones that depend on interest rates going down.
Maintaining a diversified portfolio and liquidity reserves is a key element of our risk management approach. We believe this approach has served clients well, particularly in extreme market environments like the pandemic brought upon us last March.
Our goals remain the same. Namely (a) preserve capital, (b) maintain a strong liquidity position, (c) understand evolving risks and opportunities, (d) conduct consistent/thorough credit surveillance, and (e) selectively take advantage of favorable risk/reward opportunities. We remain ready to take advantage of any further valuation disparities that may develop and hope to continue to earn your trust.
Definitions: Average effective duration provides a measure of a fund’s interest-rate sensitivity. The longer a fund’s duration, the more sensitive the fund is to shifts in interest rates. Average effective maturity is the weighted average of the maturities of a fund’s underlying bonds. Investment Grade Bonds are those securities rated at least BBB-. Non-Investment Grade Bonds are those securities (commonly referred to as “high yield” or “junk” bonds) rated BB+ and below. Middle market refers to smaller companies, generally with earnings before interest, taxes, and amortization of generally less than $75 million. Yield to worst (YTW) is the lowest potential yield that can be received on a bond portfolio without the underlying issuers defaulting.
30 Q1 2021 Annual Report
| Returns | | | | | | | | | | |
| | | | | | Annualized | | | | |
|
|
|
|
|
|
|
| Since Fund |
|
|
|
|
|
|
|
|
|
| Inception | Net | Gross |
| QTD | YTD | 1 YR | 3 YR | 5 YR | 10 YR | 20 YR | (12/23/1988) | Expense | Expense |
| WSHNX - Investor Class | 0.66% | 0.66% | 6.29% | 3.14% | 2.40% | 2.08% | 3.42% | 4.87% | 0.55% | 0.95% |
| WEFIX - Institutional Class | 0.67 | 0.67 | 6.32 | 3.29 | 2.57 | 2.27 | 3.52 | 4.93 | 0.48 | 0.64 |
| Bloomberg Barclays 1-3 Year U.S. Aggregate | (0.07) | (0.07) | 1.19 | 2.94 | 1.96 | 1.57 | 2.83 | N/A |
|
|
| CPI + 1% | 1.94 | 1.94 | 3.65 | 3.03 | 3.18 | 2.73 | 3.08 | 3.49* |
|
|
* Since 12/31/1988 | | | | | | | | | | |
Growth of $10,000 Investment - 10 Year
| Fixed Income Attributes | |
Portfolio Summary | |
| Average Maturity | 1.9 years |
| Average Effective Maturity | 2.2 years |
| Average Duration | 1.4 years |
| Average Effective Duration | 1.3 years |
| Average Coupon | 2.6% |
| Maturity Distribution | |
Maturity Type | % of Portfolio |
| Cash Equivalents | 2.4 |
| Less than 1 Year | 33.8 |
| 1 - 3 Years | 45.6 |
| 3 - 5 Years | 7.2 |
| 5 - 7 Years | 3.3 |
| 7 - 10 Years | 2.4 |
| 10 - 20 Years | 4.7 |
| Common Stocks | 0.6 |
| | 100.0 |
| Credit Quality | |
Underlying Securities | % of Portfolio |
| U.S. Treasury | 17.7 |
| U.S. Government Agency Mortgage | |
| Related Securities | 10.4 |
| AAA | 27.4 |
| AA | 10.4 |
| A | 8.8 |
| BBB | 15.9 |
| BB | 2.3 |
| B | 0.3 |
| CCC | 1.0 |
| Non-Rated | 2.8 |
| Common Stocks | 0.6 |
| Cash Equivalents | 2.4 |
| | 100.0 |
| 30-Day SEC Yield | | |
Share Class | Subsidized | Unsubsidized |
| Investor | 1.30% | 0.78% |
| Institutional | 1.37 | 1.24 |
Asset Allocation
% of Net Assets
Data quoted is past performance and current performance may be lower or higher. Past performance is no guarantee of future results. Investment return and principal value of an investment will fluctuate, and shares, when redeemed, may be worth more or less than their original cost. All investments involve risks, including possible loss of principal. Please visit weitzinvestments.com for the most recent month-end performance.
Investment results reflect applicable fees and expenses and assume all distributions are reinvested but do not reflect the deduction of taxes an investor would pay on distributions or share redemptions. Net and Gross Expense Ratios are as of the Fund’s most recent prospectus. The Fund has entered into fee waiver and/or expense reimbursement arrangements with the Investment Advisor. The Advisor has contractually agreed to waive a portion of the Advisor’s fee and reimburse certain expenses (excluding taxes, interest, brokerage costs, acquired fund fees and expenses and extraordinary expenses) to limit the total annual fund operating expenses of the Class’s average daily net assets through 07/31/2021. The Net Expense Ratio reflects the total annual fund operating expenses of the Fund after taking into account any such fee waiver and/or expense reimbursement, if any; total returns would have been lower had there been no waivers or reimbursements.
See page 8 for additional performance disclosures. See page 81 for a description of all indices.
Credit ratings are assigned to underlying securities utilizing ratings from a Nationally Recognized Statistical Rating Organization (NRSRO) such as Moody’s and Fitch, or other rating agencies and applying the following hierarchy: security is determined to be Investment Grade if it has been rated at least BBB- by one credit rating agency; once determined to be Investment Grade (BBB- and above) or Non-Investment Grade (BB+ and below) where multiple ratings are available, the lowest rating is assigned. Mortgage-related securities issued and guaranteed by government-sponsored agencies such as Fannie Mae and Freddie Mac are generally not rated by rating agencies. Securities that are not rated do not necessarily indicate low quality. Ratings are shown in the Fitch scale (e.g., AAA). Ratings and portfolio credit quality may change over time. The Fund itself has not been rated by a credit rating agency.
Source (Fixed Income Attributes, Credit Quality, and Maturity Distribution): Bloomberg Analytics
Q1 2021 Annual Report 31
This page intentionally left blank
32 Q1 2021 Annual Report
ULTRA SHORT GOVERNMENT FUND
Portfolio Managers: Tom Carney, CFA & Nolan Anderson
Investment Style: Ultra-Short-Term Bond
The Ultra Short Government Fund returned +0.03% in the first quarter compared to a +0.04% return for the ICE BofA US 6-Month Treasury Bill Index (6-Month Treasury). For the fiscal year ending March 31, 2021, the Fund returned +0.29% compared to a +0.16% return for the index. Given the short duration nature of the Fund, fiscal year performance consisted exclusively of coupon income on investments. Overall Fund returns have been greatly reduced as a result of the Federal Reserve’s monetary policy of keeping short-term interest rates at/near zero.
Overview
The Federal Reserve (Fed) made no changes in short-term monetary policy during the quarter (leaving rates at/near zero). Fixed income investors are still grappling with the impact of the Fed’s new monetary policy framework and quantitative easing (QE) program on the overall level of interest rates, but the impact on short-term rates remains clear: zero interest-rate policy (ZIRP) is here to stay for at least the next few years. The unprecedented amount of QE and fiscal spending will have repercussions down the road, and one potential consequence could be higher-than-anticipated inflation.
Longer-term interest rates will react to expectations of higher, or actual, inflation. But the Fed has telegraphed that they intend to wait for the proverbial ‘whites of inflation’s eyes’ (using a Bunker Hill analogy) before making any changes to short-term interest rates. Our Fund’s yield and return will invariably follow the path dictated by the Fed’s monetary policy, as we frequently reinvest maturities with holdings that mature in a short period of time. But lower (short-term interest rates) for longer (maybe much longer) appears to be the path of returns for our Ultra Short Government Fund.
The Fed’s monetary policy decisions (e.g., changes in short-term interest rates) will continue to affect all investments within our opportunity set. As of March 31, 2021, 80.3% of our portfolio was invested in U.S. Treasury notes, 15.3% in investment-grade asset-backed securities, 1.4% in investment-grade commercial mortgage-backed securities, 0.6% in investment-grade corporate bonds, and 2.4% in a high-quality money market fund and cash equivalents. The average effective duration on March 31, 2021, was unchanged from the previous quarter at 0.4 years. The Fund’s 30-day yield decreased approximately 3 basis points in the quarter to 0.20% as of March 31, 2021. Given that the Fed is likely to hold short-term interest rates at or near zero for the foreseeable future, the Fund’s 30-day yield will likely continue to decline in the months and quarters to follow.
Under normal market conditions, the Fund will invest at least 80% of its net assets in obligations issued or guaranteed by the U.S. government and its government-related entities. The balance of Fund assets may be invested in U.S. investment-grade debt securities. Additionally, the Fund will maintain an average effective duration of one year or less. Duration is a measure of how sensitive the portfolio may be to changes in interest rates. All else being equal, a lower-duration bond portfolio is less sensitive to changes in interest rates than a bond portfolio with a higher duration. Over time, this shorter-term focus (duration of less than one year) is intended to generate total returns that are higher than cash or money market funds, while also taking less interest rate risk than a bond portfolio with a higher duration.
The Fund’s principal investment strategies and objectives of providing current income, protecting principal and providing liquidity remain our primary goals. While the Fund’s current income will likely remain pressured (i.e. drift lower) by the current ultra-low nominal reinvestment environment, we believe we can continue to add value via security selection in the U.S. investment-grade debt segment. However, protecting principal and providing liquidity will always come first.
Definitions: 30-Day SEC Yield represents net investment income earned by a fund over a 30-day period, expressed as an annual percentage rate based on the Fund’s share price at the end of the 30-day period. Subsidized yield reflects fee waivers and/or expense reimbursements during the period. Without such fee waivers and/ or expense reimbursements, if any; yields would have been lower. Unsubsidized yield does not adjust for any fee waivers and/or expense reimbursement in effect. Average effective duration provides a measure of a fund’s interest-rate sensitivity. The longer a fund’s duration, the more sensitive the fund is to shifts in interest rates. Investment Grade Bonds are those securities rated at least BBB-. Non-Investment Grade Bonds are those securities (commonly referred to as “high yield” or “junk” bonds) rated BB+ and below.
Q1 2021 Annual Report 33
| Returns | | | | | | | | | | |
| | | | | | Annualized | | | | |
| | | | | | | | Since Fund | | |
| | | | | | | | Inception | Net | Gross |
| QTD | YTD | 1 YR | 3 YR | 5 YR | 10 YR | 20 YR | (8/1/1991) | Expense | Expense |
| SAFEX | 0.03% | 0.03% | 0.29% | 1.63% | 1.22% | 0.62% | 1.24% | 2.29% | 0.20% | 0.71% |
| ICE BofA U.S. 6-Month Treasury Bill | 0.04 | 0.04 | 0.16 | 1.75 | 1.40 | 0.81 | 1.70 | 2.84 |
|
|
Growth of $10,000 Investment - 10 Year
| Fixed Income Attributes | |
Portfolio Summary | |
| Average Maturity | 0.4 years |
| Average Effective Maturity | 0.4 years |
| Average Duration | 0.4 years |
| Average Effective Duration | 0.4 years |
| Average Coupon | 2.0% |
| Maturity Distribution | |
Maturity Type | % of Portfolio |
| Cash Equivalents | 1.9 |
| Less than 1 Year | 97.2 |
| 1 - 3 Years | 0.9 |
| | 100.0 |
| | |
| Credit Quality | |
Underlying Securities | % of Portfolio |
| U.S. Treasury | 80.8 |
| AAA | 13.3 |
| AA | 2.4 |
| A | 1.0 |
| BBB | 0.6 |
| Cash Equivalents | 1.9 |
| | 100.0 |
| | | |
| 30-Day SEC Yield | | |
| Subsidized | Unsubsidized |
| | 0.20% | (0.41)% |
Asset Allocation
% of Net Assets
Data quoted is past performance and current performance may be lower or higher. Past performance is no guarantee of future results. Investment return and principal value of an investment will fluctuate, and shares, when redeemed, may be worth more or less than their original cost. All investments involve risks, including possible loss of principal. Please visit weitzinvestments.com for the most recent month-end performance.
Investment results reflect applicable fees and expenses and assume all distributions are reinvested but do not reflect the deduction of taxes an investor would pay on distributions or share redemptions. Net and Gross Expense Ratios are as of the Fund’s most recent prospectus. The Fund has entered into fee waiver and/or expense reimbursement arrangements with the Investment Advisor. The Advisor has contractually agreed to waive a portion of the Advisor’s fee and reimburse certain expenses (excluding taxes, interest, brokerage costs, acquired fund fees and expenses and extraordinary expenses) to limit the total annual fund operating expenses of the Class’s average daily net assets through 07/31/2021. The Net Expense Ratio reflects the total annual fund operating expenses of the Fund after taking into account any such fee waiver and/or expense reimbursement, if any; total returns would have been lower had there been no waivers or reimbursements.
Effective 12/16/2016, the Ultra Short Government Fund revised its principal investment strategies. Prior to that date, the Fund operated as a “government money market fund” and maintained a stable net asset value of $1.00 per share. Performance prior to 12/16/2016 reflects the Fund’s prior principal investment strategies and may not be indicative of future performance results.
See page 8 for additional performance disclosures. See page 81 for a description of all indices.
Credit ratings are assigned to underlying securities utilizing ratings from a Nationally Recognized Statistical Rating Organization (NRSRO) such as Moody’s and Fitch, or other rating agencies and applying the following hierarchy: security is determined to be Investment Grade if it has been rated at least BBB- by one credit rating agency; once determined to be Investment Grade (BBB- and above) or Non-Investment Grade (BB+ and below) where multiple ratings are available, the lowest rating is assigned. Ratings and portfolio credit quality may change over time. The Fund itself has not been rated by a credit rating agency.
Source (Fixed Income Attributes, Credit Quality, and Maturity Distribution): Bloomberg Analytics
34 Q1 2021 Annual Report
VALUE FUND
Portfolio Manager: Brad Hinton, CFA
Investment Style: Large-Cap Value
The Value Fund’s Institutional Class returned +7.42% for the first quarter compared to +6.17% for the S&P 500 and +6.24% for the Morningstar Large-Cap Blend category. For the fiscal year ending March 31, 2021, the Fund’s Institutional Class returned +57.28% compared to +56.35% for the index and +56.53% for the category.
The “economic reopening” trade continued in the first quarter with some vigor. Smaller companies, cyclical businesses, and other value-oriented fare were the strongest beneficiaries. Aggressive growth stocks, which had dominated the return scoreboard for several years, lagged considerably. But as these winds shifted, our all-weather strategy held its own. The Weitz Quality at a Discount (QuaD) investing framework means owning a collection of high-quality businesses, purchased at sensible prices, with a longer time horizon than most investors. This enduring approach depends on analyzing companies well, not on timing the inevitable factor and style rotations along the way.
Financial stocks enjoyed healthy first-quarter gains. Charles Schwab and JPMorgan Chase were outsized contributors as investors refocused on earning power in “normal” times. Google parent Alphabet provided new disclosures that highlighted the profitability of its services businesses and the upside potential of its Cloud Platform. Companies far removed from the mega-cap glare, such as LabCorp, CarMax, and Vulcan Materials, also delivered exceptional returns; we can often develop more of a research edge in businesses that are not under the constant attention of the industry and financial media. The five primary (and modest) quarterly detractors were CoStar Group, Liberty Broadband, Amazon, Visa, and Salesforce.com. All have been long-term winners, and all continue to have bright outlooks.
Stocks rebounded from their pandemic lows throughout the Fund’s fiscal year, with most soaring higher. LabCorp and CarMax more than doubled in price. Charles Schwab nearly joined them in the triple-digit return club, while digital advertising giants Alphabet and Facebook both returned more than 75%. We could go on, and the rest of the list would sound equally impressive. Not surprisingly given the strength of the overall market, the Fund had no material detractors for the fiscal year.
We added AutoZone to the portfolio during the quarter. We first owned this leading specialty auto parts retailer more than a decade ago, so analyst Jon Baker, CFA, and our team know the company and industry well. AutoZone has been a per-share value creation machine. We think the company still has room to grow stores at healthy rates for years to come, and the outlook for its do-it-for-me business looks especially bright. Jon describes our investment thesis for AutoZone in this quarter’s Analyst Corner.
We sold Diageo after twelve years of very profitable ownership. The global spirits company has done a fine job of growing earnings, and the stock has enjoyed an extra boost from substantial, multiple expansions along the way. While the business is in good hands, we think a repeat of our mid-double-digit annualized return experience is far less likely. We simply see better risk/reward profiles in the Fund’s other quality holdings.
Our team is continually working to improve the portfolio as we process new information. We increased position sizes in Facebook, Aon, and Fidelity National Information Services at discounts to our value estimates during the quarter. We trimmed positions in stocks such as Linde, JPMorgan Chase, and Analog Devices on stock price strength. This type of limited, periodic rebalancing is disciplined but not mechanical. Decisions are based on stock prices relative to our value estimates, fundamental progress at each business, quality score considerations, and analyst conviction.
Again, our investment philosophy is straightforward; we buy high-quality businesses at a discount to what we think they are worth. This QuaD investing approach is timeless, and it transcends traditional growth and value labels. The bar for portfolio entry is tougher than ever to clear, and competition for capital is increasingly robust. Credit again to our talented and experienced analyst team for their hard work on behalf of our investors.
The portfolio is focused and well-aligned with our vision for successful large-cap investing. We have concentrated ownership stakes in 26 companies, with the top ten representing roughly 47% of the portfolio. Each position is significant enough to matter, yet none can individually make or break our results. Our current estimation is that the portfolio trades at a price-to-value in the upper 90s. Several core holdings still have a chance for outsized gains over a multi-year period. Most, however, are priced for adequate return potential primarily from expected growth in per-share business value.
Q1 2021 Annual Report 35
| Returns |
|
|
|
|
| Annualized |
|
|
|
|
|
|
|
|
|
|
|
| Since Fund |
|
|
|
|
|
|
|
|
|
| Inception | Net | Gross |
| QTD | YTD | 1 YR | 3 YR | 5 YR | 10 YR | 20 YR | (5/9/1986) | Expense | Expense |
| WVALX - Investor Class | 7.38% | 7.38% | 56.97% | 17.27% | 14.11% | 11.69% | 6.99% | 10.74% | 1.08% | 1.08% |
| WVAIX - Institutional Class | 7.42 | 7.42 | 57.28 | 17.54 | 14.37 | 11.85 | 7.07 | 10.79 | 0.89 | 0.94 |
| S&P 500 | 6.17 | 6.17 | 56.35 | 16.78 | 16.29 | 13.91 | 8.47 | 10.84 |
|
|
| Russell 1000 | 5.91 | 5.91 | 60.59 | 17.31 | 16.66 | 13.97 | 8.78 | 10.90 |
|
|
Growth of $10,000 Investment Since Inception
Capitalization
| Top 10 Stock Holdings | |
| % of Net Assets |
| Alphabet, Inc. - Class C | 6.7 |
| Berkshire Hathaway Inc. - Class B | 5.5 |
| Aon plc - Class A | 5.0 |
| The Charles Schwab Corp. | 4.8 |
| Liberty Broadband Corp. - Series C | 4.5 |
| Facebook, Inc. - Class A | 4.4 |
| Laboratory Corp. of America Holdings | 4.1 |
| Vulcan Materials Co. | 4.0 |
| Visa Inc. - Class A | 3.9 |
| Mastercard Inc. - Class A | 3.8 |
| | 46.7 |
| Industry Breakdown |
|
| % of Net Assets |
| Information Technology | 24.6 |
| Communication Services | 22.2 |
| Financials | 20.3 |
| Health Care | 11.4 |
| Consumer Discretionary | 9.1 |
| Materials | 6.3 |
| Industrials | 3.3 |
| Cash Equivalents/Other | 2.8 |
| 100.0 |
| Top Stock Performers | | | |
| | Average | |
| | Return | Weight | Contribution |
| CarMax, Inc. | 40.4% | 3.7% | 1.36% |
| Alphabet, Inc. - Class C | 18.1 | 6.6 | 1.14 |
| The Charles Schwab Corp. | 23.3 | 4.7 | 1.05 |
| Laboratory Corp. of America Holdings | 25.3 | 4.1 | 0.99 |
| JPMorgan Chase & Co. | 20.7 | 2.9 | 0.58 |
| Bottom Stock Performers | | | |
| | Average | |
| | Return | Weight | Contribution |
| CoStar Group, Inc. | (11.1)% | 3.4% | (0.39)% |
| Liberty Broadband Corp. - Series C | (5.2) | 4.7 | (0.28) |
| Amazon.com, Inc. | (5.0) | 3.0 | (0.16) |
| Visa Inc. - Class A | (3.1) | 4.0 | (0.15) |
| salesforce.com, inc. | (4.8) | 3.0 | (0.14) |
Data quoted is past performance and current performance may be lower or higher. Past performance is no guarantee of future results. Investment return and principal value of an investment will fluctuate, and shares, when redeemed, may be worth more or less than their original cost. All investments involve risks, including possible loss of principal. Please visit weitzinvestments.com for the most recent month-end performance.
Investment results reflect applicable fees and expenses and assume all distributions are reinvested but do not reflect the deduction of taxes an investor would pay on distributions or share redemptions. Net and Gross Expense Ratios are as of the Fund’s most recent prospectus. The Fund has entered into fee waiver and/or expense reimbursement arrangements with the Investment Advisor. The Advisor has contractually agreed to waive a portion of the Advisor’s fee and reimburse certain expenses (excluding taxes, interest, brokerage costs, acquired fund fees and expenses and extraordinary expenses) to limit the total annual fund operating expenses of the Class’s average daily net assets through 07/31/2021. The Net Expense Ratio reflects the total annual fund operating expenses of the Fund after taking into account any such fee waiver and/or expense reimbursement, if any; total returns would have been lower had there been no waivers or reimbursements.
See page 8 for additional performance disclosures. See page 81 for a description of all indices.
Contributions to Fund performance are based on actual daily holdings. Securities may have been bought or sold during the quarter. Return shown is the actual quarterly return of the security or combination of share classes.
Source (Top Performers, Bottom Performers): FactSet Analytics
36 Q1 2021 Annual Report
BALANCED FUND
Schedule of Investments
March 31, 2021
| Common Stocks — 44.6% | | | |
| | % of Net | | |
| Information Technology | Assets | Shares | $ Value |
| Data Processing & Outsourced Services | 4.6 | | |
| Mastercard Inc. - Class A | 9,250 | 3,293,463 |
| Visa Inc. - Class A | 15,000 | 3,175,950 |
| Fidelity National Information Services, Inc. | 22,000 | 3,093,420 |
| Systems Software | 3.5 | | |
| Microsoft Corp. | 17,500 | 4,125,975 |
| Oracle Corp. | 42,500 | 2,982,225 |
| Semiconductors | 2.4 | | |
| Analog Devices, Inc. | 17,500 | 2,713,900 |
| Texas Instruments, Inc. | 12,500 | 2,362,375 |
| IT Consulting & Other Services | 1.1 | | |
Accenture plc - Class A(d) | 8,000 | 2,210,000 |
| | 11.6 | | 23,957,308 |
| Financials | | | |
| Insurance Brokers | 2.2 | | |
Aon plc - Class A(d) | 20,000 | 4,602,200 |
| Multi-Sector Holdings | 2.2 | | |
| Berkshire Hathaway Inc. - Class B* | 18,000 | 4,598,460 |
| Investment Banking & Brokerage | 2.2 | | |
| The Charles Schwab Corp. | 70,000 | 4,562,600 |
| Property & Casualty Insurance | 1.8 | | |
| Markel Corp.* | 3,250 | 3,703,765 |
| Diversified Banks | 1.5 | | |
| JPMorgan Chase & Co. | 20,000 | 3,044,600 |
| Financial Exchanges & Data | 1.0 | | |
| S&P Global Inc. | 6,000 | 2,117,220 |
| Mortgage REITs | 0.7 | | |
| Redwood Trust, Inc. | 125,000 | 1,301,250 |
| | 11.6
| | 23,930,095 |
| Health Care | | | |
| Health Care Services | 2.1 | | |
| Laboratory Corp. of America Holdings* | 17,000 | 4,335,510 |
| Life Sciences Tools & Services | 1.8 | | |
| Thermo Fisher Scientific Inc. | 8,000 | 3,651,040 |
| Health Care Equipment | 1.6 | | |
| Danaher Corp. | 15,000 | 3,376,200 |
| | 5.5 | | 11,362,750 |
| Communication Services | | | |
| Cable & Satellite | 3.1 | | |
| Comcast Corp. - Class A | 60,000 | 3,246,600 |
| Charter Communications, Inc. - Class A* | 5,000 | 3,085,100 |
| Interactive Media & Services | 1.9 | | |
| Alphabet, Inc. - Class C* | 1,900 | 3,930,397 |
| 5.0
| | 10,262,097 |
| | | | $ Principal | |
| | | % of Net | Amount | |
| Materials | Assets | or Shares | $ Value |
| Construction Materials | 3.2 | | |
| Vulcan Materials Co. | 22,500 | 3,796,875 |
| Martin Marietta Materials, Inc. | 8,000 | 2,686,560 |
| |
| Industrial Gases | 1.2 | | |
Linde plc(d) | 9,000 | 2,521,260 |
| | 4.4 | | 9,004,695 |
| |
| Industrials | | | |
| Industrial Machinery | 2.1 | | |
| IDEX Corp. | 11,000 | 2,302,520 |
| Fortive Corp. | 30,000 | 2,119,200 |
| |
| Industrial Conglomerates | 1.2 | | |
| Honeywell International Inc. | 11,000 | 2,387,770 |
| | 3.3 | | 6,809,490 |
| |
| Consumer Discretionary | | | |
| Automotive Retail | 1.7 | | |
| AutoZone, Inc.* | 2,500 | 3,510,750 |
| |
| Consumer Staples | | | |
| Distillers & Vintners | 1.5 | | |
Diageo plc - Sponsored ADR(d) | 18,000 | 2,955,780 |
| Total Common Stocks (Cost $48,308,148) | | | 91,792,965 |
|
| Non-Convertible Preferred Stocks – 1.7% | | |
| Qurate Retail, Inc. 8.0% 3/15/31 (Cost 3,461,303) | 35,000 | 3,557,750 |
| |
| Corporate Bonds — 3.9% | | | |
| AutoZone, Inc. 3.625% 4/15/25 | 500,000 | 545,007 |
| First Republic Bank 2.5% 6/06/22 | 2,185,000 | 2,234,423 |
| JPMorgan Chase & Co. 3.375% 5/01/23 | 500,000 | 529,383 |
| Markel Corp. | | | |
| 4.9% 7/01/22 | 410,000 | 431,851 |
| 3.625% 3/30/23 | 500,000 | 530,008 |
| Oracle Corp. 1.9% 9/15/21 | 1,000,000 | 1,005,916 |
| U.S. Bancorp 2.4% 7/30/24 | 500,000 | 527,261 |
| Wells Fargo & Co. | | | |
| 4.6% 4/01/21 | 1,250,000 | 1,250,000 |
| 3.5% 3/08/22 | 1,000,000 | 1,030,142 |
| Total Corporate Bonds (Cost $7,921,809) | | | 8,083,991 |
| |
| Corporate Convertible Bonds — 1.0% | | |
| Redwood Trust, Inc. 5.625% 7/15/24 (Cost $1,854,291) | 2,000,000 | 1,988,263 |
| |
| Asset-Backed Securities — 7.2% | | | |
| Automobile | | | |
American Credit Acceptance Receivables Trust (ACAR)(c) | | |
| | 2020-4 CL A — 0.53% 3/13/24 | 348,103 | 348,317 |
Chase Auto Credit Linked Notes (CACLN)(c) | | | |
| | 2020-1 CL B — 0.991% 1/25/28 | 617,878 | 619,821 |
| | 2020-2 CL B — 0.84% 2/25/28 | 95,815 | 95,960 |
| | 2021-1 CL B — 0.875% 9/25/28 | 750,000 | 750,292 |
DT Auto Owner Trust (DTAOT)(c) | | | |
| | 2020-3A CL A — 0.54% 4/15/24 | 327,509 | 327,958 |
| | 2018-3A CL C — 3.79% 7/15/24 | 348,072 | 350,803 |
The accompanying notes form an integral part of these financial statements.
Q1 2021 Annual Report 37
| $ Principal | |
| | Amount | $ Value |
Exeter Automobile Receivables Trust (EART)(c) | | | |
| 2019-2A CL B — 3.06% 5/15/23 | 39,476 | 39,547 |
| 2020-1A CL A — 2.05% 6/15/23 | 37,424 | 37,506 |
| 2020-2A CL A — 1.13% 8/15/23 | 74,995 | 75,160 |
Foursight Capital Automobile Receivables Trust (FCRT)(c) | | |
| 2020-1 CL A1 — 0.26978% 2/15/22 | 794,713 | 794,769 |
GLS Auto Receivables Trust (GCAR)(c) | | | |
| 2020-1A CL A — 2.17% 2/15/24 | 107,691 | 108,606 |
| 2020-4A CL A — 0.52% 2/15/24 | 415,971 | 416,206 |
| 2021-1A CL A — 0.34% 5/15/24 | 710,000 | 710,061 |
| 2020-2A CL A — 1.58% 8/15/24 | 134,263 | 135,416 |
Securitized Term Auto Receivables Trust (SSTRT)(c) (d) | | |
| 2019-CRTA CL B — 2.453% 3/25/26 | 124,497 | 126,753 |
| | 4,937,175 |
| Collateralized Loan Obligations | | | |
ABPCI Direct Lending Fund CLO X LP (ABPCI)(c) (d) | | | |
| 2020-10A CL A1A — 2.19647% 1/20/32 | | | |
| Floating Rate (Qtrly LIBOR + 195) | 500,000 | 502,053 |
BlackRock Rainier CLO VI, Ltd. (BLKMM)(c) (d) | | | |
| 2021-6A CL A — 1.88762% 4/20/33 | | | |
| Floating Rate (Qtrly LIBOR + 170) | 500,000 | 499,994 |
Cerberus Loan Funding XXVIII LP (CERB)(c) (d) | | | |
| 2020-1A CL A — 2.09125% 10/15/31 | | | |
| Floating Rate (Qtrly LIBOR + 185) | 500,000 | 500,223 |
Fortress Credit Opportunities XV CLO Ltd. (FCO)(c) (d)
| | |
| 2021-15A CL AT — 1.74513% 4/25/33 | | | |
| Floating Rate (Qtrly LIBOR + 155) | 500,000 | 500,000 |
Palmer Square Loan Funding 2021-1, Ltd. (PSTAT)(c) (d) | | |
| 2021-1A CL A2 — 1.40495% 4/20/29 | | | |
| Floating Rate (Qtrly LIBOR + 125) | 500,000 | 500,014 |
| | 2,502,284 |
| Consumer & Specialty Finance | | | |
Affirm Asset Securitization Trust (AFFRM)(c) | | | |
| 2021-A CL A — 0.88% 8/15/25 | 100,000 | 100,136 |
Marlette Funding Trust (MFT)(c) | | | |
| 2019-2A CL A — 3.13% 7/16/29 | 83,582 | 84,194 |
| 2019-3A CL A — 2.69% 9/17/29 | 88,981 | 89,569 |
OneMain Financial Issuance Trust (OMFIT)(c) | | | |
| 2018-1A CL A — 3.3% 3/14/29 | 482,516 | 484,364 |
Prosper Marketplace Issuance Trust (PMIT)(c) | | | |
| 2019-3A CL A — 3.19% 7/15/25 | 8,446 | 8,455 |
SoFi Consumer Loan Program LLC (SCLP)(c) | | | |
| 2019-2 CL A — 3.01% 4/25/28 | 72,595 | 73,211 |
| 2019-3 CL A — 2.9% 5/25/28 | 96,606 | 97,396 |
Upstart Securitization Trust (UPST)(c) | | | |
| 2019-1 CL B — 4.19% 4/20/26 | 20,509 | 20,540 |
| 2019-2 CL A — 2.897% 9/20/29 | 188,438 | 189,353 |
| | 1,147,218 |
| Equipment | | | |
Ascentium Equipment Receivables Trust (ACER)(c) | | | |
| 2017-1A CL B — 2.85% 10/10/21 | 278,010 | 278,759 |
Commercial Credit Group Receivables Trust (CCG)(c) | | |
| 2019-2 CL A2 — 2.11% 3/15/27 | 308,177 | 312,227 |
Dell Equipment Finance Trust (DEFT)(c) | | | |
| 2020-2 CL A2 — 0.47% 10/24/22 | 700,000 | 700,893 |
Great America Leasing Receivables Trust (GALC)(c) | | |
| 2020-1 CL A2 — 1.76% 6/15/22 | 331,086 | 332,792 |
Hewlett-Packard Financial Services Equipment Trust (HPEFS)(c) | | |
| 2021-1A CL A1 — 0.1653% 3/21/22 | 500,000 | 500,024 |
| 2019-1A CL A2 — 2.19% 9/20/29 | 29,270 | 29,309 |
| 2020-1A CL A2 — 1.73% 2/20/30 | 150,881 | 151,714 |
Octane Receivables Trust (OCTL)(c) | | | |
| 2020-1A CL A — 1.71% 2/20/25 | 393,633 | 397,296 |
| $ Principal | |
| Amount | $ Value |
Stonebriar Commercial Finance Equipment Leasing LLC (SCFET)(c) | |
| | 2021-1A CL A1 — 0.23387% 3/11/22 | 378,420 | 378,418 |
| | 2020-1A CL A2 — 0.68% 10/20/25 | 468,694 | 469,697 |
| | 3,551,129 |
| Fleet Lease | | |
ARI Fleet Lease Trust (ARIFL)(c) | | |
| | 2020-A CL A2 — 1.77% 8/15/28 | 196,937 | 198,344 |
Chesapeake Funding II LLC (CFII)(c) | | |
| | 2021-1A CL A1 - 0.47% 4/15/33 | 500,000 | 500,670 |
Enterprise Fleet Financing LLC (EFF)(c) | | |
| | 2021-1 CL A1 — 0.16793% 3/21/22 | 374,437 | 374,455 |
| | 2018-1 CL A2 — 2.87% 10/20/23 | 18,916 | 18,960 |
| | 2019-2 CL A2 — 2.29% 2/20/25 | 252,250 | 256,141 |
| | 2020-1 CL A2 — 1.78% 12/22/25 | 415,618 | 421,502 |
Wheels SPV2, LLC (WHLS)(c) | | |
| | 2020-1A CL A2 — 0.51% 8/20/29 | 1,000,000 | 1,001,389 |
| | 2,771,461 |
| Total Asset-Backed Securities (Cost $14,867,815) | | 14,909,267 |
| | |
| Commercial Mortgage-Backed Securities — 0.4% | |
| |
BFLD Trust 2020-OBRK (BFLD)(c) | | |
| | 2020-OBRK CL A — 2.156% 11/15/28 | | |
| | Floating Rate (Mthly LIBOR + 205) | 125,000 | 126,409 |
BPCRE 2021-FL1, Ltd. (BPCRE)(c) (d) | | |
| | 2021-FL1 CL AS — 1.256% 2/15/37 | | |
| | Floating Rate (Mthly LIBOR + 115) | 500,000 | 500,156 |
GPMT Ltd. (GPMT)(c) (d) | | |
| | 2018-FL1 CL A — 1.01025% 11/21/35 | | |
| | Floating Rate (Mthly LIBOR + 90) | 243,004 | 242,579 |
| |
| Total Commercial Mortgage-Backed Securities (Cost $863,027) | 869,144 |
| |
| Mortgage-Backed Securities — 3.3% | | |
| |
| Federal Home Loan Mortgage Corporation | | |
| Collateralized Mortgage Obligations | | |
| 3649 CL BW — 4.0% 3/15/25 | 22,332 | 23,364 |
| |
| Pass-Through Securities | | |
| J14649 — 3.5% 4/01/26 | 35,209 | 37,563 |
| E02948 — 3.5% 7/01/26 | 77,758 | 83,021 |
| J16663 — 3.5% 9/01/26 | 42,841 | 45,734 |
| ZS8692 — 2.5% 4/01/33 | 239,945 | 249,669 |
| | 439,351 |
| Federal National Mortgage Association | | |
| Pass-Through Securities | | |
| AR8198 — 2.5% 3/01/23 | 32,589 | 33,909 |
| MA1502 — 2.5% 7/01/23 | 30,257 | 31,483 |
| 995755 — 4.5% 5/01/24 | 4,832 | 5,094 |
| AB1769 — 3.0% 11/01/25 | 36,626 | 38,790 |
| AB3902 — 3.0% 11/01/26 | 75,124 | 79,460 |
| AK3264 — 3.0% 2/01/27 | 59,540 | 62,977 |
| AB 6291 — 3.0% 9/01/27 | 335,677 | 354,889 |
| MA3189 — 2.5% 11/01/27 | 277,560 | 288,818 |
| MA3791 — 2.5% 9/01/29 | 528,241 | 550,748 |
| BM5708 — 3.0% 12/01/29 | 285,922 | 301,678 |
| AS7698 — 2.5% 8/01/31 | 755,424 | 790,179 |
| AS7701 — 2.5% 8/01/31 | 456,562 | 479,475 |
| MA3540 — 3.5% 12/01/33 | 181,004 | 193,309 |
| 3,210,809 |
The accompanying notes form an integral part of these financial statements.
38 Q1 2021 Annual Report
BALANCED FUND (CONTINUED)
Schedule of Investments
March 31, 2021
| | $ Principal | |
| Government National Mortgage Association | Amount | $ Value |
| Pass-Through Securities | | |
| G2 5255 — 3.0% 12/20/26 | 74,442 | 78,526 |
| |
| Non-Government Agency | | |
| Collateralized Mortgage Obligations | | |
J.P. Morgan Mortgage Trust (JPMMT)(c) (e)
| | |
| | 2014-5 CL A1 — 2.92975% 10/25/29 | 115,599 | 119,169 |
| | 2016-3 CL 2A1 — 3.0% 10/25/46 | 321,617 | 324,956 |
| | 2017-3 CL 2A2 — 2.5% 8/25/47 | 365,626 | 370,326 |
| | 2020-7 CL A4 — 3.0% 1/25/51 | 328,346 | 334,185 |
| | 2020-8 CL A4 — 3.0% 3/25/51 | 388,164 | 396,714 |
J.P. Morgan Wealth Management (JPMWM)(c) (e) | | |
| | 2020-ATR1 CL A4 — 3.0% 2/25/50 | 392,686 | 398,154 |
Sequoia Mortgage Trust (SEMT)(c) (e) | | |
| | 2017-CH1 CL A11 — 3.5% 8/25/47 | 17,929 | 17,949 |
| | 2018-CH2 CL A12 — 4.0% 6/25/48 | 43,875 | 43,962 |
| | 2019-CH2 CL A1 — 4.5% 8/25/49 | 461,750 | 471,344 |
| | 2019-CH3 CL A10 — 4.0% 9/25/49 | 101,800 | 102,886 |
| | 2019-4 CL A4 — 3.5% 11/25/49 | 71,846 | 72,443 |
| | 2020-2 CL A4 — 3.5% 3/25/50 | 125,488 | 127,356 |
| 2020-3 CL A4 — 3.0% 4/25/50 | 176,998 | 180,028 |
| 2,959,472 |
| Total Mortgage-Backed Securities (Cost $6,555,101) | | 6,688,158 |
| | | |
| U.S. Treasury — 26.3% | | |
| U.S. Treasury Notes | | |
| | 1.375% 5/31/21 | 2,000,000 | 2,004,334 |
| | 2.625% 6/15/21 | 1,000,000 | 1,005,283 |
| | 1.75% 7/31/21 | 3,000,000 | 3,017,211 |
| | 1.125% 8/31/21 | 2,000,000 | 2,009,146 |
| | 1.5% 9/30/21 | 2,000,000 | 2,014,631 |
| | 1.5% 10/31/21 | 3,000,000 | 3,025,371 |
| | 1.875% 11/30/21 | 2,000,000 | 2,024,353 |
| | 1.75% 2/28/22 | 2,000,000 | 2,030,497 |
| | 0.375% 3/31/22 | 3,000,000 | 3,009,206 |
| | 1.75% 4/30/22 | 2,000,000 | 2,036,000 |
| | 1.875% 4/30/22 | 1,000,000 | 1,019,289 |
| | 2.125% 6/30/22 | 2,000,000 | 2,050,547 |
| | 1.875% 7/31/22 | 1,000,000 | 1,023,594 |
| | 2.0% 7/31/22 | 1,000,000 | 1,025,312 |
| | 1.875% 8/31/22 | 2,000,000 | 2,049,766 |
| | 2.0% 11/30/22 | 3,000,000 | 3,093,047 |
| | 2.0% 2/15/23 | 1,000,000 | 1,034,512 |
| | 2.5% 3/31/23 | 2,000,000 | 2,093,633 |
| | 1.625% 5/31/23 | 2,000,000 | 2,061,914 |
| | 2.5% 8/15/23 | 2,000,000 | 2,108,789 |
| | 2.125% 11/30/23 | 2,000,000 | 2,099,023 |
| | 2.125% 2/29/24 | 2,000,000 | 2,104,023 |
| | 2.0% 4/30/24 | 1,000,000 | 1,049,785 |
| | 0.375% 4/30/25 | 1,000,000 | 987,676 |
| | 2.75% 8/31/25 | 2,000,000 | 2,172,773 |
| | 0.5% 2/28/26 | 4,000,000 | 3,922,188 |
| | 1.5% 8/15/26 | 2,000,000 | 2,048,594 |
| Total U.S. Treasury (Cost $53,285,791) | | 54,120,497 |
| Cash Equivalents — 11.5% | | $ Principal | |
| | Amount | |
| | or Shares | $ Value |
U.S. Treasury Bills, 0.05% to 0.09%, 4/29/21 to 9/09/21(a) | 23,000,000 | 22,999,226 |
State Street Institutional U.S. Government Money | | | |
Market Fund - Premier Class 0.04%(b) | 782,080 | 782,080 |
| Total Cash Equivalents (Cost $23,778,963) | | | 23,781,306 |
| Total Investments in Securities (Cost $160,896,248) | | 205,791,341 |
| Other Assets Less Other Liabilities - 0.1% | | | 221,695 |
| Net Assets - 100% | | | 206,013,036 |
| Net Asset Value Per Share - Investor Class | 16.30 |
| Net Asset Value Per Share - Institutional Class | 16.31 |
| * | Non-income producing |
(a)
| Interest rates presented represent the yield to maturity at the date of purchase. |
(b)
| Rate presented represents the annualized 7-day yield at March 31, 2021. |
(c)
| Security is exempt from registration under Rule 144A of the Securities Act of 1933. This security may be resold in transactions that are exempt from registration, normally to qualified institutional buyers.
|
(d)
| Foreign domiciled entity |
(e)
| The interest rate resets periodically based on the weighted average coupons of the underlying mortgage-related or asset-backed obligations.
|
The accompanying notes form an integral part of these financial statements.
Q1 2021 Annual Report 39
CORE PLUS INCOME FUND
Schedule of Investments
March 31, 2021
| Corporate Bonds – 33.4% | | |
| | $ Principal |
|
| Amount | $ Value |
Abercrombie & Fitch Holding Co. 8.75% 7/15/25(b) | 1,158,000 | 1,281,761 |
Air Canada 7.75% 4/15/21(b) (c) | 250,000 | 250,488 |
| Alexandria Real Estate Equities, Inc. 3.95% 1/15/28 | 366,000 | 407,272 |
American Airlines Group Inc. 3.75% 3/01/25(b) | 1,000,000 | 854,830 |
Ashtead U.S. Holdings, Inc.(b) (c) |
|
| 4.375% 8/15/27 | 1,000,000 | 1,045,000 |
| 4.0% 5/01/28 | 670,000 | 701,584 |
Beacon Roofing Supply, Inc. 4.875% 11/01/25(b) | 323,000 | 330,854 |
| Berkshire Hathaway Inc. Finance Corp. 4.25% 1/15/49 | 500,000 | 580,312 |
| Booking Holdings Inc. 3.55% 3/15/28 | 464,000 | 507,048 |
| Boston Properties LP 3.125% 9/01/23 | 555,000 | 584,756 |
Broadcom Corp. 3.419% 4/15/33(b) | 350,000 | 351,863 |
| Broadcom Inc. 3.459% 9/15/26 | 1,014,000 | 1,088,789 |
| Calumet Specialty Products Partners LP 7.625% 1/15/22 | 357,000 | 357,362 |
| Carlisle Companies Inc. |
|
| | 3.5% 12/01/24 | 532,000 | 577,005 |
| | 3.75% 12/01/27 | 500,000 | 551,318 |
| CenturyLink, Inc. 6.75% 12/01/21 (Qwest Corp.) | 1,250,000 | 1,292,969 |
| Charter Communications Operating, LLC 4.2% 3/15/28 | 650,000 | 716,907 |
| Choice Hotels International, Inc. 3.7% 1/15/31 | 250,000 | 263,329 |
Colfax Corp. 6.0% 2/15/24(b) | 1,000,000 | 1,031,500 |
| Computer Sciences Corp. 4.45% 9/15/22 | 500,000 | 521,208 |
Cox Communications, Inc. 3.5% 8/15/27(b) | 842,000 | 915,794 |
Delta Airlines, Inc. 4.75% 10/20/28(b) | 1,100,000 | 1,197,100 |
| Diamondback Energy, Inc. |
|
| | 2.875% 12/01/24 | 600,000 | 633,262 |
| | 5.375% 5/31/25 | 289,000 | 298,196 |
| | 3.25% 12/01/26 | 75,000 | 79,144 |
| | 3.5% 12/01/29 | 100,000 | 103,860 |
| Donnelley Financial Solutions Inc. 8.25% 10/15/24 | 905,000 | 945,725 |
Element Fleet Management Corp. 3.85% 6/15/25(b) (c) | 1,000,000 | 1,054,727 |
| Energy Transfer Operating, LP |
|
| | 2.9% 5/15/25 | 500,000 | 520,804 |
| | 4.75% 1/15/26 | 200,000 | 222,206 |
| Enterprise Products Partners LP 4.45% 2/15/43 | 990,000 | 1,079,655 |
| EPR Properties |
|
| | 4.75% 12/15/26 | 250,000 | 263,011 |
| | 4.95% 4/15/28 | 330,000 | 340,057 |
| EQT Corp. 3.0% 10/01/22 | 801,000 | 815,738 |
| Expedia Group, Inc. |
|
| | 3.8% 2/15/28 | 484,000 | 512,941 |
| | 3.25% 2/15/30 | 90,000 | 90,682 |
frontdoor, inc. 6.75% 8/15/26(b) | 144,000 | 153,540 |
| Highwoods Realty LP 2.6% 2/01/31 | 500,000 | 489,426 |
| Host Hotels & Resorts, LP 3.375% 12/15/29 | 612,000 | 607,724 |
| iStar, Inc. 4.25% 8/01/25 | 1,375,000 | 1,387,925 |
| L Brands, Inc. 6.694% 1/15/27 | 2,445,000 | 2,776,603 |
| Lennar Corp. 4.75% 5/30/25 | 622,000 | 693,919 |
| Level 3 Parent LLC 5.25% 3/15/26 | 750,000 | 773,438 |
| Lexington Realty Trust 2.7% 9/15/30 | 500,000 | 489,048 |
| Markel Corp. |
|
| | 4.9% 7/01/22 | 250,000 | 263,324 |
| | 3.625% 3/30/23 | 200,000 | 212,003 |
| | 3.5% 11/01/27 | 550,000 | 604,157 |
| Marriott International Inc. 2.85% 4/15/31 | 500,000 | 491,148 |
Marvell Technology Group Ltd. 4.2% 6/22/23(c) | 300,000 | 321,128 |
| Matador Resources Co. 5.875% 9/15/26 | 650,000 | 633,750 |
| Micron Technology, Inc. 4.185% 2/15/27 | 500,000 | 555,763 |
Mileage Plus Holdings LLC 6.5% 6/20/27(b) | 1,000,000 | 1,097,500 |
Molex Electronics Technologies, LLC 3.9% 4/15/25(b) | 565,000 | 576,018 |
| MPLX LP |
|
|
| | 4.875% 6/01/25 | 190,000 | 214,198 |
| | 4.0% 3/15/28 | 85,000 | 93,927 |
| | 4.7% 4/15/48 | 551,000 | 597,984 |
MSCI Inc. 4.75% 8/01/26(b) | 150,000 | 155,475 |
| NGL Energy Partners LP |
|
| | 7.5% 11/01/23 | 1,518,000 | 1,467,716 |
| | 6.125% 3/01/25 | 833,000 | 709,612 |
| | 7.5% 4/15/26 | 400,000 | 341,750 |
| | $ Principal |
|
| Amount | $ Value |
| Occidental Petroleum Corp. |
|
| | 3.4% 4/15/26 | 715,000 | 695,159 |
| | 4.3% 8/15/39 | 100,000 | 85,051 |
| Office Properties Income Trust |
| | 4.15% 2/01/22 | 150,000 | 153,354 |
| | 4.0% 7/15/22 | 1,733,000 | 1,778,067 |
| PDC Energy, Inc. |
|
| | 6.125% 9/15/24 | 500,000 | 514,000 |
| | 5.75% 5/15/26 | 777,000 | 806,915 |
| Physicians Realty Trust 4.3% 3/15/27 | 1,271,000 | 1,397,632 |
| Plains All American Pipeline, LP |
|
| | 3.55% 12/15/29 | 798,000 | 796,539 |
| | 4.3% 1/31/43 | 75,000 | 69,229 |
| QVC, Inc. 4.375% 3/15/23 | 500,000 | 525,000 |
| RELX plc 4.0% 3/18/29 | 500,000 | 552,080 |
Silversea Cruise Holding Ltd. 7.25% 2/01/25(b) (c) | 875,000 | 907,266 |
Sirius XM Radio Inc. 3.875% 8/01/22(b) | 500,000 | 502,500 |
| Springleaf Finance Corp. 5.375% 11/15/29 |
|
|
| | (OneMain Holdings Inc.) | 900,000 | 959,625 |
Sprint Spectrum Co. LLC 3.36% 3/20/23(b) (d) | 87,250 | 88,041 |
| STORE Capital Corp. |
|
| | 4.5% 3/15/28 | 503,000 | 554,278 |
| | 4.625% 3/15/29 | 500,000 | 556,772 |
| T-Mobile US Inc. |
|
| | 2.625% 4/15/26 | 250,000 | 255,169 |
| | 3.375% 4/15/29 | 1,250,000 | 1,261,719 |
| Tempur Sealy International, Inc. 5.5% 6/15/26 | 750,000 | 778,125 |
| United Airlines Holdings, Inc. 4.875% 1/15/25 | 200,000 | 204,101 |
| VEREIT, Inc. 3.95% 8/15/27 | 575,000 | 631,655 |
VistaJet Malto Finance plc. 10.5% 6/01/24(b) (c) | 1,000,000 | 1,092,500 |
| WPX Energy, Inc. |
|
| | 5.75% 6/01/26 | 75,000 | 78,653 |
| | 5.25% 10/15/27 | 500,000 | 533,605 |
| | 4.5% 1/15/30 | 920,000 | 992,027 |
| Total Corporate Bonds (Cost $50,685,478) |
| 54,845,195 |
| | | |
| Corporate Convertible Bonds – 1.2% | | |
| Redwood Trust, Inc. | |
| | 4.75% 8/15/23 | 850,000 | 852,125 |
| | 5.625% 7/15/24 | 700,000 | 695,892 |
| 5.75% 10/01/25 | 500,000 | 500,650 |
| Total Corporate Convertible Bonds (Cost $1,843,520) |
| 2,048,667 |
| | | |
| Asset-Backed Securities — 25.5% |
|
|
| Automobile |
|
|
American Credit Acceptance Receivables Trust (ACAR) (b) |
| | 2019-4 CL B — 2.43% 10/12/23 | 500,000 | 501,842 |
| AmeriCredit Automobile Receivables Trust (AMCAR) |
| | 2017-1 CL D — 3.13% 1/18/23 | 69,000 | 69,867 |
Arivo Acceptance Auto Loan Receivables Trust (ARIVO)(b) |
| | 2019-1 CL A — 2.99% 7/15/24 | 438,601 | 444,146 |
| | 2021-1 CL A — 1.19% 1/15/27 | 185,440 | 186,243 |
| CarMax Auto Owner Trust (CARMX) |
|
| | 2017-2 CL B — 2.41% 12/15/22 | 90,000 | 90,519 |
| | 2017-2 CL C — 2.6% 2/15/23 | 53,000 | 53,320 |
| | 2017-4 CL C — 2.7% 10/16/23 | 51,000 | 51,809 |
Carvana Auto Receivables Trust (CRVNA)(b) |
| | 2019-1A CL C — 3.5% 2/15/24 | 700,000 | 717,235 |
Chase Auto Credit Linked Notes (CACLN)(b) |
| | 2020-1 CL D — 1.886% 1/25/28 | 617,878 | 622,679 |
DT Auto Owner Trust (DTAOT)(b) |
|
| | 2019-3A CL D — 2.96% 4/15/25 | 1,000,000 | 1,035,309 |
The accompanying notes form an integral part of these financial statements.
40 Q1 2021 Annual Report
CORE PLUS INCOME FUND (CONTINUED)
Schedule of Investments
March 31, 2021
| $ Principal |
|
| Amount | $ Value |
Exeter Automobile Receivables Trust (EART)(b) |
| 2017-1A CL C — 3.95% 12/15/22 | 70,593 | 70,804 |
| 2018-2A CL C — 3.69% 3/15/23 | 17,083 | 17,118 |
| 2017-3A CL C — 3.68% 7/17/23 | 77,081 | 78,468 |
First Investors Auto Owners Trust (FIAOT)(b) |
| 2017-1A CL C — 2.95% 4/17/23 | 183,472 | 184,244 |
| 2017-1A CL D — 3.6% 4/17/23 | 300,000 | 303,751 |
| 2017-3A CL C — 3.0% 1/16/24 | 521,000 | 526,445 |
| 2017-3A CL D — 3.44% 3/15/24 | 571,000 | 586,529 |
| 2018-1A CL C — 3.69% 6/17/24 | 942,696 | 951,196 |
GLS Auto Receivables Trust (GCAR)(b) |
|
| 2019-2A CL A — 3.06% 4/17/23 | 36,655 | 36,784 |
| 2019-3A CL A — 2.58% 7/17/23 | 50,093 | 50,457 |
| 2019-4A CL A — 2.47% 11/15/23 | 155,903 | 157,384 |
| 2020-1A CL A — 2.17% 2/15/24 | 215,382 | 217,212 |
| 2020-2A CL B — 3.16% 6/16/25 | 750,000 | 783,863 |
Securitized Term Auto Receivables Trust (SSTRT)(b) (c) |
| 2019-CRTA CL C — 2.849% 3/25/26 | 497,986 | 509,103 |
| | 8,246,327 |
| Collateralized Loan Obligations |
|
ABPCI Direct Lending Fund CLO X LP (ABPCI)(b) (c) |
| 2019-5A CL A2A — 2.924% 4/20/31 |
|
|
| Floating Rate (Qtrly LIBOR + 270) | 250,000 | 248,686 |
| 2020-10A CL B1 — 2.59647% 1/20/32 |
|
| Floating Rate (Qtrly LIBOR + 235) | 1,000,000 | 1,000,581 |
Ballyrock CLO 2016-1 Ltd. (BALLY)(b) (c) |
|
| 2016-1A CL BR2 — 1.59125% 10/15/28 |
|
| Floating Rate (Qtrly LIBOR + 135) | 1,000,000 | 999,998 |
BlackRock Elbert CLO V, Ltd (ELB)(b) (c) |
|
| 2020-5A CL A1 — 2.16363% 12/15/31 |
|
| Floating Rate (Qtrly LIBOR + 190) | 500,000 | 501,428 |
BlackRock Rainier CLO VI, Ltd. (BLKMM)(b) (c) |
| 2021-6A CL B — 2.23762% 4/20/33 |
|
|
| Floating Rate (Qtrly LIBOR + 205) | 1,800,000 | 1,799,971 |
Brightwood Capital MM CLO 2020-1, Ltd (BWCAP)(b) (c) |
|
| 2020-1A CL A — 2.08388% 12/15/28 |
|
|
| Floating Rate (Qtrly LIBOR + 190) | 1,271,895 | 1,274,430 |
Cerberus Loan Funding XXVIII LP (CERB)(b) (c) |
| 2020-1A CL B — 2.79125% 10/15/31 |
|
| Floating Rate (Qtrly LIBOR + 255) | 500,000 | 500,061 |
| 2020-1A CL C — 3.94125% 10/15/31 |
|
| Floating Rate (Qtrly LIBOR + 370) | 500,000 | 499,268 |
| 2020-2A CL B — 2.83285% 10/15/32 |
|
|
| Floating Rate (Qtrly LIBOR + 260) | 500,000 | 500,222 |
| 2021-2A CL B — 1.0% 4/22/33 |
|
| Floating Rate (Qtrly LIBOR + 190) | 1,500,000 | 1,500,000 |
Fortress Credit Opportunities XV CLO Ltd. (FCO)(b) (c) |
| 2021-15A CL B — 2.04513% 4/25/33 |
|
|
| Floating Rate (Qtrly LIBOR + 185) | 1,500,000 | 1,500,000 |
Golub Capital Partners CLO Ltd. (GOCAP)(b) (c) |
| 2016-31A CL CR — 3.095133% 8/05/30 |
|
| Floating Rate (Qtrly LIBOR + 290) | 1,000,000 | 990,741 |
Lake Shore MM III LLC (LSHR)(b) |
|
| 2020-1A CL B — 3.42873% 10/15/29 |
|
|
| Floating Rate (Qtrly LIBOR + 320) | 500,000 | 502,877 |
Palmer Square Loan Funding 2021-1, Ltd. (PSTAT)(b) (c) |
|
| 2021-1A CL B — 1.95495% 4/20/29 |
|
|
| Floating Rate (Qtrly LIBOR + 180) | 1,000,000 | 1,000,033 |
| | 12,818,296 |
| Consumer & Specialty Finance |
|
Affirm Asset Securitization Trust (AFFRM)(b) |
| 2020-A CL A — 2.1% 2/18/25 | 250,000 | 252,792 |
| 2020-A CL B — 3.54% 2/18/25 | 250,000 | 255,631 |
| 2021-A CL D — 3.49% 8/15/25 | 750,000 | 755,442 |
Avant Loans Funding Trust (AVNT)(b) |
|
| 2019-B CL A — 2.72% 10/15/26 | 35,006 | 35,065 |
| $ Principal |
|
| Amount | $ Value |
Conn Funding II, LP (CONN)(b) |
|
| 2019-A CL A — 3.4% 10/16/23 | 43,415 | 43,637 |
| 2020-A CL A — 1.71% 6/16/25 | 165,897 | 166,491 |
Foundation Finance Trust (FFIN)(b) |
|
| 2019-1A CL A — 3.86% 11/15/34 | 329,211 | 340,849 |
Freedom Financial (FREED)(b) |
|
| 2019-2 CL B — 3.19% 11/18/26 | 400,000 | 406,497 |
| 2020-FP1 CL A — 2.52% 3/18/27 | 168,500 | 169,670 |
| 2020-FP1 CL B — 3.06% 3/18/27 | 500,000 | 509,035 |
Marlette Funding Trust (MFT)(b) |
|
| 2018-4A CL B — 4.21% 12/15/28 | 250,000 | 252,257 |
| 2019-2A CL B — 3.53% 7/16/29 | 500,000 | 510,106 |
| 2019-3A CL A — 2.69% 9/17/29 | 88,981 | 89,569 |
| 2019-4A CL A — 2.39% 12/17/29 | 162,689 | 163,958 |
OneMain Financial Issuance Trust (OMFIT)(b) |
| 2015-3A CL A — 3.63% 11/20/28 | 105,760 | 105,897 |
| 2017-1A CL A1 — 2.37% 9/14/32 | 87,997 | 88,143 |
Pagaya AI Debt Selection Trust 2020-3 (PAID)(b) |
| 2020-3 CL B — 3.22% 5/17/27 | 1,000,000 | 1,025,513 |
| 2021-1 CL A — 1.18% 11/15/27 | 1,500,000 | 1,505,430 |
Prosper Marketplace Issuance Trust (PMIT)(b) |
| 2019-1A CL B — 4.03% 4/15/25 | 132,191 | 132,616 |
| 2019-3A CL A — 3.19% 7/15/25 | 8,446 | 8,455 |
SoFi Consumer Loan Program LLC (SCLP)(b) |
| 2018-4 CL C — 4.17% 11/26/27 | 750,000 | 768,808 |
| 2019-3 CL A — 2.9% 5/25/28 | 96,606 | 97,396 |
Upgrade Receivables Trust (UPGR)(b) |
| 2018-1A CL C — 5.17% 11/15/24 | 9,291 | 9,307 |
| 2019-2A CL B — 3.51% 10/15/25 | 775,000 | 778,686 |
Upstart Securitization Trust (UPST)(b) |
|
| 2017-2 CL C — 5.59% 3/20/25 | 192,243 | 193,017 |
| 2018-2 CL C — 5.494% 12/22/25 | 203,501 | 205,703 |
| 2019-1 CL B — 4.19% 4/20/26 | 20,509 | 20,540 |
| 2019-2 CL B — 3.734% 9/20/29 | 750,000 | 765,374 |
| 2020-1 CL A — 2.322% 4/22/30 | 194,744 | 196,702 |
| 2020-1 CL B — 1.89% 3/20/31 | 250,000 | 250,025 |
| 2020-1 CL C — 4.06% 3/20/31 | 250,000 | 249,756 |
| | 10,352,367 |
| Equipment |
|
Ascentium Equipment Receivables Trust (ACER)(b) |
| 2017-1A CL D — 3.8% 1/10/24 | 216,000 | 217,192 |
BCC Funding XVI LLC (BCCFC)(b) |
|
| 2019-1A CL A2 — 2.46% 8/20/24 | 312,197 | 316,112 |
Commercial Credit Group Receivables Trust (CCG)(b) |
| 2018-1 CL B — 3.09% 6/16/25 | 594,053 | 596,503 |
| 2019-1 CL B — 3.22% 9/14/26 | 750,000 | 776,476 |
| 2019-2 CL B — 2.55% 3/15/27 | 300,000 | 308,813 |
Dell Equipment Finance Trust (DEFT)(b) |
|
| 2018-1 CL B — 3.34% 6/22/23 | 374,381 | 375,308 |
| 2018-2 CL C — 3.72% 10/22/23 | 225,000 | 228,406 |
| 2019-1 CL C — 3.14% 3/22/24 | 750,000 | 763,069 |
MMAF Equipment Finance LLC (MMAF)(b) |
|
| 2016-AA CL A4 — 1.76% 1/17/23 | 54,915 | 55,143 |
| 2017-AA CL A4 — 2.41% 8/16/24 | 261,136 | 263,183 |
Octane Receivables Trust (OCTL)(b) |
|
| 2019-1A CL A — 3.16% 9/20/23 | 368,410 | 372,588 |
| 2020-1A CL B — 1.98% 6/20/25 | 940,000 | 954,318 |
Pawnee Equipment Receivables LLC (PWNE)(b) |
| 2019-1 CL A2 — 2.29% 10/15/24 | 301,609 | 305,411 |
| 2019-1 CL D — 2.86% 10/15/24 | 500,000 | 491,200 |
Stonebriar Commercial Finance Equipment Leasing LLC (SCFET)(b) |
|
| 2019-2A CL A2 — 2.47% 4/20/26 | 186,000 | 191,104 |
| | 6,214,826 |
| Fleet Lease |
|
Chesapeake Funding II LLC (CFII)(b) |
|
| 2017-3A CL D — 3.38% 8/15/29 | 550,000 | 552,756 |
The accompanying notes form an integral part of these financial statements.
Q1 2021 Annual Report 41
| | $ Principal | |
| Amount | $ Value |
Enterprise Fleet Financing LLC (EFF)(b) |
|
| 2019-2 CL A2 — 2.29% 2/20/25 | 315,313 | 320,177 |
Hertz Fleet Lease Funding LP (HFLF)(b) |
|
| 2018-1 CL A2 — 3.23% 5/10/32 | 110,786 | 110,973 |
| 983,906 |
| Litigation Funding |
|
Oasis Securitization Funding, LLC (OASIS)(b) |
| 2020-1A CL A — 3.8196% 1/15/32 | 210,038 | 211,230 |
| Small Business |
|
Bankers Healthcare Group Securitization Trust (BHG)(b) |
| 2020-A CL A — 2.56% 9/17/31 | 570,052 | 571,786 |
Small Business Lending Trust (SBIZ)(b) |
|
| 2020-A CL A — 2.62% 12/15/26 | 169,486 | 170,171 |
| 741,957 |
| Timeshare |
|
Hilton Grand Vacations Trust (HGVT)(b) |
|
| 2020-AA CL B — 4.22% 2/25/39 | 379,178 | 405,167 |
Sierra Timeshare Receivables Funding LLC (SRFC)(b) |
| 2019-2A CL B — 2.82% 5/20/36 | 331,579 | 338,290 |
| 743,457 |
| Whole Business |
|
Driven Brands Funding, LLC (HONK)(b) |
|
| 2019-2A CL A2 — 3.981% 10/20/49 | 493,750 | 513,967 |
Jersey Mike’s Funding, LLC (JMIKE)(b) |
|
| 2019-1A CL A2 — 4.433% 2/15/50 | 1,000,000 | 1,062,248 |
| 1,576,215 |
| Total Asset-Backed Securities (Cost $41,394,738) |
| 41,888,581 |
| | |
| Commercial Mortgage-Backed Securities – 8.1% |
|
AREIT 2018-CRE1 Trust (AREIT)(b) |
|
|
| 2018-CRE2 CL C — 2.00613% 11/14/35 |
|
| Floating Rate (Mthly LIBOR + 190) | 372,406 | 373,512 |
BFLD Trust 2020-OBRK (BFLD)(b) |
|
| 2020-OBRK CL A — 2.156% 11/15/28 |
|
|
| Floating Rate (Mthly LIBOR + 205) | 940,000 | 950,591 |
BPCRE 2021-FL1, Ltd. (BPCRE)(b) (c) |
|
|
| 2021-FL1 CL D — 2.706% 2/15/37 |
|
|
| Floating Rate (Mthly LIBOR + 260) | 1,193,000 | 1,195,814 |
BXMT Ltd. (BXMT)(b) (c) |
|
| 2017-FL1 CL A — 0.9775% 6/15/35 |
|
|
| Floating Rate (Mthly LIBOR + 87) | 139,133 | 139,113 |
Exantas Capital Corp. Ltd. (XAN)(b) |
|
| 2020-RS08 CL C — 2.2575% 3/15/35 |
|
|
| Floating Rate (Mthly LIBOR + 215) | 1,250,000 | 1,253,846 |
| 2020-RS08 CL D — 2.6075% 3/15/35 |
|
|
| Floating Rate (Mthly LIBOR + 250) | 1,276,000 | 1,279,346 |
| 2019-RS07 CL A — 1.1075% 4/15/36(c) |
|
| Floating Rate (Mthly LIBOR + 100) | 292,428 | 292,864 |
GPMT Ltd. (GPMT)(b) (c) |
|
| 2018-FL1 CL C — 2.26025% 11/19/35 |
|
| Floating Rate (Mthly LIBOR + 215) | 1,028,000 | 1,014,482 |
| 2018-FL1 CL D — 3.06025% 11/21/35 |
|
| Floating Rate (Mthly LIBOR + 295) | 1,096,000 | 1,090,498 |
Hilton USA Trust (HILT)(b) |
|
| 2016-SFP CL E — 5.519097% 11/05/35 | 840,000 | 848,186 |
LoanCore 2018-CRE1 Issuer, Ltd. (LNCR)(b) (c) |
| 2018-CRE1 CL C — 2.656% 5/15/28 |
|
|
| Floating Rate (Mthly LIBOR + 255) | 1,000,000 | 1,000,019 |
PFP Ltd. (PFP)(b) (c) |
|
| 2019-5 CL C — 2.10613% 4/14/36 |
|
|
| Floating Rate (Mthly LIBOR + 200) | 1,500,000 | 1,493,400 |
| | $ Principal |
|
| Amount | $ Value |
| RETL (RETL)(b) |
|
| | 2019-RVP CL C — 2.206% 3/15/36 |
|
|
| | Floating Rate (Mthly LIBOR + 210) | 1,044,642 | 1,041,953 |
VMC Finance LLC (VMC)(b) |
|
| | 2018-FL2 CL C — 2.0575% 10/15/35 |
|
|
| | Floating Rate (Mthly LIBOR + 195) | 1,400,000 | 1,394,568 |
| Total Commercial Mortgage-Backed Securities (Cost $13,359,506) | 13,368,192 |
| Mortgage-Backed Securities – 1.3% |
|
|
| Federal Home Loan Mortgage Corporation |
| Pass-Through Securities |
|
| | C91945 — 3.0% 8/1/37 | 480,266 | 500,893 |
| Federal National Mortgage Association |
| Pass-Through Securities |
|
| | 932836 — 3.0% 12/01/25 | 30,444 | 32,197 |
| | MA3443 — 4.0% 8/01/48 | 257,605 | 276,911 |
| | 309,108 |
| Non-Government Agency |
| Collateralized Mortgage Obligations |
|
COLT Funding LLC (COLT)(b) (e) |
|
| | 2019-4 CL A1 — 2.579% 11/25/49 | 113,937 | 115,063 |
Deephaven Residential Mortgage Trust (DRMT)(b) (e) |
| | 2019-3A CL A1 — 2.964% 7/25/59 | 208,494 | 210,259 |
| | 2019-4A CL A1 — 2.791% 10/25/59 | 254,794 | 257,914 |
Flagstar Mortgage Trust (FSMT)(b) (e) |
|
| | 2017-1 CL 2A2 — 3.0% 3/25/47 | 135,819 | 138,491 |
J.P. Morgan Mortgage Trust (JPMMT)(b) (e) |
|
| | 2016-3 CL 2A1 — 3.0% 10/25/46 | 128,647 | 129,982 |
| | 2017-3 CL 2A2 — 2.5% 8/25/47 | 127,969 | 129,614 |
| | 2018-6 CL 2A2 — 3.0% 12/25/48 | 105,197 | 107,943 |
Sequoia Mortgage Trust (SEMT)(b) (e) |
|
| | 2017-CH1 CL A11 — 3.5% 8/25/47 | 14,343 | 14,359 |
| | 2018-CH2 CL A12 — 4.0% 6/25/48 | 43,875 | 43,962 |
| | 2019-CH2 CL A1 — 4.5% 8/25/49 | 197,893 | 202,004 |
| | 1,349,591 |
| Total Mortgage-Backed Securities (Cost $2,099,194) |
| 2,159,592 |
| | |
| U.S. Treasury — 20.7% |
|
| U.S. Treasury Notes/Bonds |
|
|
| | 1.5% 8/15/26 | 4,850,000 | 4,967,840 |
| | 2.0% 11/15/26 | 1,650,000 | 1,731,630 |
| | 2.25% 2/15/27 | 1,000,000 | 1,062,363 |
| | 2.375% 5/15/27 | 2,000,000 | 2,138,086 |
| | 1.125% 2/29/28 | 4,000,000 | 3,930,625 |
| | 1.5% 2/15/30 | 2,750,000 | 2,716,807 |
| | 3.5% 2/15/39 | 2,100,000 | 2,518,770 |
| | 1.875% 2/15/41 | 1,750,000 | 1,629,961 |
| | 2.5% 5/15/46 | 6,900,000 | 7,034,496 |
| | 2.25% 8/15/49 | 6,500,000 | 6,287,861 |
| Total U.S. Treasury (Cost $33,726,814) |
| 34,018,439 |
The accompanying notes form an integral part of these financial statements.
42 Q1 2021 Annual Report
CORE PLUS INCOME FUND (CONTINUED)
Schedule of Investments
March 31, 2021
| Common Stocks – 0.2% | | |
| $ Principal | |
| Amount | |
| or Shares | $ Value |
| Redwood Trust, Inc. (Cost $318,052) | 27,000 | 281,070 |
| | |
| Non-Convertible Preferred Stocks – 1.3% | |
| Qurate Retail, Inc. 8.0% 3/15/2031 (Cost $2,031,076) | 20,300 | 2,063,495 |
| | | |
| Cash Equivalents – 9.1% | | |
| State Street Institutional U.S. Government Money |
Market Fund - Premier Class 0.04%(a) | 14,892,219 | 14,892,219 |
| Total Cash Equivalents (Cost $14,892,219) | | 14,892,219 |
| Total Investments in Securities (Cost $160,350,597) | | 165,565,450 |
| Other Liabilities in Excess of Other Assets - (0.8%) | | (1,318,067) |
| Net Assets - 100% | | 164,247,383 |
| Net Asset Value Per Share - Investor Class | 10.86 |
| Net Asset Value Per Share - Institutional Class | 10.87 |
| (a) | Rate presented represents the annualized 7-day yield at March 31, 2021. |
(b)
| Security is exempt from registration under Rule 144A of the Securities Act of 1933. This security may be resold in transactions that are exempt from registration, normally to qualified institutional buyers. |
(c)
| Foreign domiciled entity |
(d)
| Annual sinking fund |
(e)
| The interest rate resets periodically based on the weighted average coupons of the underlying mortgage-related or asset-backed obligations.
|
The accompanying notes form an integral part of these financial statements.
Q1 2021 Annual Report 43
HICKORY FUND
Schedule of Investments
March 31, 2021
| Common Stocks – 93.6% | | | |
| | % of Net |
|
|
| Communication Services | Assets | Shares | $ Value |
| Cable & Satellite | 12.8 |
|
|
| Liberty Broadband Corp.* |
|
| Series A | 23,750 | 3,447,313 |
| Series C | 90,000 | 13,513,500 |
| Liberty SiriusXM Group* |
|
| Series A | 50,000 | 2,204,000 |
| Series C | 180,000 | 7,939,800 |
| |
| Alternative Carriers | 6.8 |
|
|
Liberty Global plc - Class C* (c) | 300,000 | 7,662,000 |
Liberty Latin America Ltd. - Class C* (c) | 525,000 | 6,814,500 |
| |
| Integrated Telecommunication Services | 5.2 |
|
|
| LICT Corp.* | 510 | 11,156,250 |
| |
| Movies & Entertainment | 1.5 |
|
|
| Liberty Braves Group* |
|
| Series A | 11,000 | 313,610 |
| Series C | 105,000 | 2,921,100 |
| | 26.3 |
| 55,972,073 |
| Consumer Discretionary |
| Automotive Retail | 8.5 |
|
|
| CarMax, Inc.* | 70,000 | 9,286,200 |
| AutoZone, Inc.* | 6,200 | 8,706,660 |
| |
| Distributors | 4.5 |
|
|
| LKQ Corp.* | 225,000 | 9,524,250 |
| |
| Internet & Direct Marketing Retail | 1.6 |
|
|
| Qurate Retail, Inc. - Series A | 300,000 | 3,528,000 |
| | 14.6 |
| 31,045,110 |
| Information Technology |
| Application Software | 8.6 |
|
|
| Box, Inc. - Class A* | 275,000 | 6,314,000 |
| ACI Worldwide, Inc.* | 160,000 | 6,088,000 |
| Guidewire Software, Inc.* | 57,500 | 5,843,725 |
| |
| Data Processing & Outsourced Services | 2.3 |
|
|
| Black Knight, Inc.* | 67,500 | 4,994,325 |
| |
| Electronic Components | 2.3 |
|
|
| Dolby Laboratories, Inc. | 50,000 | 4,936,000 |
| | 13.2 |
| 28,176,050 |
| Materials |
| Construction Materials | 8.0 |
|
|
| Martin Marietta Materials, Inc. | 18,500 | 6,212,670 |
| Summit Materials, Inc. - Class A* | 200,000 | 5,604,000 |
| Vulcan Materials Co. | 30,000 | 5,062,500 |
| |
| Specialty Chemicals | 3.5 |
|
|
Axalta Coating Systems Ltd.* (c) | 255,000 | 7,542,900 |
| | 11.5 |
| 24,422,070 |
| Industrials |
| Industrial Machinery | 4.7 |
|
|
| Ingersoll Rand Inc.* | 130,000 | 6,397,300 |
| IDEX Corp. | 17,500 | 3,663,100 |
| |
| Research & Consulting Services | 3.2 |
|
|
| CoStar Group, Inc.* | 8,250 | 6,780,592 |
| |
| Aerospace & Defense | 2.8 |
|
|
| HEICO Corp. - Class A | 52,000 | 5,907,200 |
| | 10.7 |
| 22,748,192 |
| |
| $ Principal |
|
| | % of Net | Amount |
|
| Financials | Assets | or Shares | $ Value |
| Regional Banks | 4.5 |
|
|
| First Republic Bank | 33,000 | 5,502,750 |
| First Hawaiian, Inc. | 150,000 | 4,105,500 |
| Property & Casualty Insurance | 4.3 |
|
|
| Markel Corp.* | 8,000 | 9,116,960 |
| 8.8 |
| 18,725,210 |
| Health Care |
| Health Care Services | 5.1 |
|
|
| Laboratory Corp. of America Holdings* | 42,500 | 10,838,775 |
| Other |
| Other | 3.4 |
|
|
EverArc Holdings Ltd.* (c) (d) | 500,000 | 7,250,000 |
| Total Common Stocks (Cost $103,546,881) |
|
| 199,177,480 |
| |
| Non-Convertible Preferred Stocks – 1.7% |
|
|
| Qurate Retail, Inc. 8.0% 3/15/31 (Cost $2,581,983) | 35,000 | 3,557,750 |
| | | |
| Warrants – 0.0% |
|
|
|
EverArc Holdings Ltd.* (c) (d) (e) (Cost $5,000) | 500,000 | 100,000 |
| | | |
| Cash Equivalents – 4.7% |
|
|
|
U.S. Treasury Bill 0.08% 5/27/21(a) | 5,000,000 | 4,999,942 |
| State Street Institutional U.S. Government Money |
|
|
Market Fund - Premier Class 0.04%(b) | 4,942,598 | 4,942,598 |
| Total Cash Equivalents (Cost $9,941,992) |
|
| 9,942,540 |
| Total Investments in Securities (Cost $116,075,856) |
| 212,777,770 |
| Other Liabilities in Excess of Other Assets - 0.0% |
| (2,426) |
| Net Assets - 100% |
|
| 212,775,344 |
| Net Asset Value Per Share | 56.68 |
*
| Non-income producing |
(a)
| Interest rate presented represents the yield to maturity at the date of purchase. |
(b)
| Rate presented represents the annualized 7-day yield at March 31, 2021. |
(c)
| Foreign domiciled entity |
| (d) | Security is exempt from registration under Rule 144A of the Securities Act of 1933. This security may be resold in transactions that are exempt from registration, normally to qualified institutional buyers. |
(e)
| The expiration date has yet to be determined but will be set based on the terms outlined in the prospectus.
|
The accompanying notes form an integral part of these financial statements.
44 Q1 2021 Annual Report
NEBRASKA TAX-FREE INCOME FUND
Schedule of Investments
March 31, 2021
| Municipal Bonds – 93.0% | | | |
| | | % of Net | $ Principal |
|
| | Assets | Amount | $ Value |
| Arizona | 0.3 |
|
|
| Arizona Industrial Development Authority, |
|
|
|
| Revenue, Lincoln South Beltway Project, |
|
|
|
| Series 2020, 5.0%, 2/01/23 | 100,000 | 108,233 |
| California | 0.7 |
|
|
| San Diego County Regional Airport Authority, |
|
|
| Subordinate Airport Revenue, Series 2017B, |
|
|
|
| AMT, 5.0%, 7/01/25 | 200,000 | 235,851 |
| Colorado | 0.3 |
|
|
| Colorado Bridge Enterprise, Senior Revenue, |
|
|
| Central 70 Project, Series 2017, AMT, |
|
|
|
| 4.0%, 12/31/23 | 100,000 | 108,229 |
| Nebraska | 89.1 |
|
|
| Bellevue, General Obligation, Refunding, |
|
|
|
| Series 2020A, 3.0%, 9/15/32 | 500,000 | 524,453 |
| Blair, Water System Revenue, Series 2016, AMT, |
|
|
| | 2.65%, 12/15/24 | 100,000 | 100,446 |
| | 2.85%, 12/15/25 | 100,000 | 100,472 |
| | 3.0%, 12/15/26 | 100,000 | 100,435 |
| | 3.1%, 12/15/27 | 100,000 | 100,373 |
| | 3.2%, 12/15/28 | 100,000 | 100,356 |
| Buffalo County, General Obligation, Kearney Public |
|
|
| Schools District 0007, Series 2016, 3.0%, 12/15/24 | 250,000 | 272,237 |
| Cass County, General Obligation, Refunding, Weeping |
|
|
| Water Public School District 0022, Series 2017 |
|
|
| | 2.05%, 12/15/25 | 375,000 | 380,551 |
| | 2.2%, 12/15/26 | 250,000 | 253,839 |
| Columbus, Combined Revenue, Refunding, |
|
| | Series 2016, AGM Insured |
|
| 4.0%, 12/15/26 | 100,000 | 116,569 |
| 4.0%, 12/15/27 | 100,000 | 118,338 |
| | Series 2020, 4.0%, 6/15/33 | 200,000 | 238,277 |
| Dawson Public Power District, Electric System Revenue, |
|
|
| | Refunding, Series 2016A |
|
| 2.0%, 6/15/26 | 170,000 | 170,453 |
| 2.1%, 6/15/27 | 105,000 | 105,251 |
| | Series 2016B |
|
| 2.5%, 6/15/28 | 135,000 | 135,540 |
| 3.0%, 6/15/29 | 245,000 | 246,458 |
| 3.0%, 6/15/30 | 355,000 | 356,917 |
| Dodge County, General Obligation, Refunding, North |
|
|
| Bend Central Public School District 0595, Series 2020, |
|
|
| 1.9%, 6/15/32 | 200,000 | 201,326 |
| Douglas County, General Obligation, |
|
|
|
| | Bennington Public School District 0059, |
| Series 2020B, 3.0%, 12/15/32 | 100,000 | 105,801 |
| | Omaha Public School District 0001, Series 2016, |
| 5.0%, 12/15/29 | 350,000 | 431,528 |
| | Westside Community School District 0066, Series 2015, |
|
|
| 2.5%, 12/01/22 | 250,000 | 259,668 |
| Douglas County, Hospital Authority #2, Revenue, |
|
|
| | Madonna Rehabilitation Hospital Project, Series 2014, |
| 5.0%, 5/15/26 | 500,000 | 562,118 |
| | Refunding, Nebraska Medicine, Series 2016 |
| 5.0%, 5/15/30 | 140,000 | 164,613 |
| 4.0%, 5/15/32 | 700,000 | 777,477 |
| Douglas County, Hospital Authority #3, Revenue, Refunding, |
|
|
| Nebraska Methodist Health System, Series 2015 |
|
|
| | 5.0%, 11/01/21 | 100,000 | 102,650 |
| | 5.0%, 11/01/22 | 250,000 | 268,005 |
| Fremont, Combined Utility Revenue, Series 2014B, |
| 3.0%, 7/15/21 | 370,000 | 372,916 |
| Grand Island, General Obligation, Highway Allocation Fund, |
|
|
| Series 2020 |
|
|
| | 3.0%, 11/15/27 | 150,000 | 164,212 |
| | 3.0%, 11/15/30 | 150,000 | 161,393 |
| $ Principal |
|
| Amount | $ Value |
| Grand Island, Combined Utilities Revenue, Refunding, |
|
|
| Series 2020A, AGM Insured |
|
|
| 4.0%, 8/15/35 | 205,000 | 244,071 |
| 4.0%, 8/15/36 | 125,000 | 148,142 |
| Gretna, General Obligation, Certificates of Participation, |
| Series 2021, 4.0%, 12/15/25 | 500,000 | 562,127 |
| Lancaster County, General Obligation, Refunding, |
|
| Lincoln Public School District 0001, Series 2017, |
|
|
| 4.0%, 1/15/33 | 250,000 | 293,934 |
| Lincoln-Lancaster County, Public Building Commission, |
|
| Lease Revenue, Series 2016, 3.0%, 12/01/25 | 500,000 | 552,084 |
| Lincoln, Educational Facilities, Revenue, Refunding, |
|
|
| Nebraska Wesleyan University Project, Series 2012, |
|
|
| 2.5%, 4/01/21 | 425,000 | 425,000 |
| Lincoln, Electric System Revenue, Refunding, |
| Series 2012, 5.0%, 9/01/28, Pre-Refunded 9/01/22 @ 100 | 1,000,000 | 1,067,190 |
| Lincoln, General Obligation, Highway Allocation Fund, |
| Refunding, Series 2016 |
|
|
| 5.0%, 5/15/22 | 100,000 | 105,405 |
| 5.0%, 5/15/23 | 135,000 | 148,647 |
| Madison County, Hospital Authority #1, Revenue, Refunding, |
|
|
| Faith Regional Health Services Project, Series 2017A |
|
| 5.0%, 7/01/21 | 475,000 | 479,791 |
| 5.0%, 7/01/23 | 250,000 | 274,041 |
| Metropolitan Utilities District of Omaha, Gas System Revenue, |
| Series 2018, 4.0%, 12/01/27 | 450,000 | 505,703 |
| Municipal Energy Agency of Nebraska, Power Supply |
| System Revenue, Refunding, |
|
|
| 2012 Series A, 5.0%, 4/01/29 | 300,000 | 313,517 |
| 2016 Series A |
|
| 5.0%, 4/01/21 | 250,000 | 250,000 |
| 5.0%, 4/01/27 | 350,000 | 428,677 |
| Nebraska, Certificates of Participation, |
|
|
| Series 2018A, 2.1%, 7/15/21 | 860,000 | 864,317 |
| Series 2021A, 2.0%, 4/01/26 | 150,000 | 157,323 |
| Nebraska Cooperative Republican Platte Enhancement Project, |
|
| River Flow Enhancement Revenue, Refunding, |
|
|
| Series 2020A, 2.0%, 12/15/29 | 250,000 | 257,564 |
| Nebraska Educational, Health, Cultural, and Social Services |
| Finance Authority, Revenue, Refunding, Immanuel Retirement |
| Communities Obligated Group, Series 2019A, 4.0%, 1/01/34 | 110,000 | 122,603 |
| Nebraska Investment Finance Authority, Single Family |
|
|
| Housing Revenue, |
|
| 2016 Series C, 1.85%, 3/01/23 | 100,000 | 102,635 |
| 2019 Series A, 2.05%, 9/01/24 | 120,000 | 125,271 |
| 2020 Series C, 2.0%, 9/01/35 | 325,000 | 324,090 |
| Nebraska Public Power District, Revenue, |
|
|
| 2015 Series A-2 |
|
| 5.0%, 1/01/24 | 225,000 | 232,530 |
| 5.0%, 1/01/24, Pre-Refunded 1/01/22 @ 100 | 25,000 | 25,897 |
| 2016 Series C, 5.0%, 1/01/35 | 480,000 | 568,768 |
| Nebraska State Colleges, Facilities Corp., Deferred |
|
|
| Maintenance Revenue, Refunding, Series 2016, AGM Insured, |
|
|
| 4.0%, 7/15/28 | 750,000 | 852,321 |
| North Platte, Sewer System Revenue, Refunding, Series 2015, |
|
|
| 3.0%, 6/15/24 | 250,000 | 250,421 |
| Omaha-Douglas County, General Obligation, |
|
|
| Public Building Commission, |
|
|
| Series 2014, 5.0%, 5/01/26, Pre-Refunded 5/01/22 @ 100 | 725,000 | 762,980 |
| Series 2020B Bonds of the Series 2019B, 5.0%, 5/01/32 | 550,000 | 707,134 |
| Omaha, General Obligation, Refunding, |
|
|
| Series 2012B, 3.0%, 11/15/24 | 400,000 | 418,337 |
| Various Purpose and Refunding |
|
|
| Series 2016A |
|
|
| 4.0%, 4/15/22 | 315,000 | 327,517 |
| 4.0%, 4/15/23 | 185,000 | 199,062 |
| Series 2020A |
|
|
| 3.0%, 4/15/34 | 100,000 | 110,641 |
| 3.0%, 4/15/35 | 100,000 | 110,354 |
The accompanying notes form an integral part of these financial statements.
Q1 2021 Annual Report 45
| $ Principal |
|
| Amount | $ Value |
| Omaha Public Facilities Corp., Lease Revenue, Refunding, |
|
|
| | Omaha Baseball Stadium Project, |
|
|
| | Series 2016A, 4.0%, 6/01/28 | 585,000 | 674,585 |
| | Series 2019C |
|
| | 4.0%, 4/01/33 | 340,000 | 402,161 |
| | 4.0%, 4/01/39 | 500,000 | 578,839 |
| | Series 2020A, 4.0%, 6/01/31 | 155,000 | 189,308 |
| Omaha Public Power District, Electric System Revenue, |
|
|
| | 2015 Series A, 2.85%, 2/01/27 | 500,000 | 531,419 |
| | 2015 Series C, 5.0%, 2/01/39 | 150,000 | 173,239 |
| Omaha, Sanitary Sewerage System Revenue, |
|
|
| | Refunding, |
|
|
| | Series 2016 |
|
|
| | | 5.0%, 4/01/26 | 250,000 | 303,809 |
| | 4.0%, 4/01/31 | 350,000 | 401,810 |
| | Series 2020A, 4.0%, 4/01/34 | 100,000 | 121,786 |
| | Series 2014, 5.0%, 11/15/22 | 200,000 | 215,603 |
| Omaha, Special Tax Revenue Redevelopment, |
|
|
| Series 2019A, 4.0%, 1/15/33 | 260,000 | 310,166 |
| Papillion, General Obligation, Tax Supported |
|
|
| Recreational Facilities, Series 2017, 3.0%, 9/15/24, |
|
|
| Pre-Refunded 5/11/22 @ 100 | 420,000 | 433,198 |
| Papillion Municipal Facilities Corp., Building Refunding, |
|
|
| | Public Works and Park Maintenance Facilities, Series 2021, |
| | 2.0%, 12/15/32 | 100,000 | 102,556 |
| | 2.0%, 12/15/34, Pre-Refunded 6/15/22 @ 100 | 200,000 | 204,031 |
| Papillion-La Vista, General Obligation, Sarpy County |
|
|
| School District #27, Refunding, |
|
|
| | Series 2017A |
|
| | 2.05%, 12/01/24 | 150,000 | 152,340 |
| | 2.2%, 12/01/25 | 150,000 | 152,379 |
| | 2.3%, 12/01/26 | 275,000 | 279,065 |
| | Series 2020B, 4.0%, 12/01/35 | 400,000 | 479,856 |
| Papio-Missouri River Natural Resources District, General |
|
|
| Obligation, Flood Protection and Water Quality Enhancement, |
|
|
| Refunding, |
|
|
| | Series 2015, 2.25%, 12/15/21 | 100,000 | 100,147 |
| | Series 2017, 5.0%, 12/15/26, Pre-Refunded 6/15/22 @ 100 | 185,000 | 195,795 |
| Public Power Generation Agency, Revenue, Refunding, |
|
|
| Whelan Energy Center Unit 2, |
|
|
| | 2015 Series A, 5.0%, 1/01/28 | 500,000 | 576,912 |
| | 2016 Series A, 5.0%, 1/01/32 | 140,000 | 168,537 |
| Saline, Educational Facilities, Revenue, Refunding, |
|
|
| Doane University Project, Series 2020A, |
|
|
| 3.0%, 2/15/31 | 200,000 | 212,892 |
| Sarpy County, General Obligation, Bellevue Public School |
|
|
| District 0001, Series 2017, 5.0%, 12/15/29 | 550,000 | 695,101 |
| Sarpy County, Certificates of Participation, |
|
|
| Series 2016, 1.75%, 6/15/26 | 500,000 | 502,165 |
| Saunders County, General Obligation, Ashland-Greenwood |
|
|
| Public Schools, District 0001, Series 2021, 3.0%, 12/15/42, |
|
|
| Pre-Refunded 7/1/22 @ 100 | 100,000 | 109,813 |
| Seward County, Limited Tax General Obligation, Refunding, |
|
|
| Series 2019, 3.0%, 12/15/30 | 605,000 | 638,948 |
| Southeast Community College Area, Certificates |
|
|
| of Participation, Series 2018, 3.0%, 12/15/22 | 400,000 | 419,284 |
| University of Nebraska, Facilities Corp., Revenue, Refunding, |
|
|
| Health Center and College of Nursing Projects, Series 2016, |
|
|
| 5.0%, 7/15/29 | 380,000 | 458,417 |
| University of Nebraska, University Revenue, |
|
|
| | Kearney Student Housing Project, Series 2017, |
|
| | Escrowed to Maturity |
|
| | 3.0%, 7/01/25 | 100,000 | 110,472 |
| | 2.5%, 7/01/26 | 210,000 | 230,547 |
| | 3.0%, 7/01/27 | 100,000 | 113,688 |
| | Refunding, Lincoln Student Fees and Facilities |
| | Series 2012, 5.0%, 7/01/23, Pre-Refunded |
|
|
| | 7/01/22 @ 100 | 250,000 | 265,131 |
| | Refunding, Omaha Student Housing Project, |
| | Series 2017A, 5.0%, 5/15/30, Pre-Refunded |
|
|
| | 11/15/27 @ 100 | 100,000 | 127,658 |
| $ Principal |
|
|
| % of Net | Amount |
|
|
| Assets | or Shares | $ Value |
| Upper Republican Natural Resources District, Limited |
|
|
| Obligation Occupation Tax, River Flow Enhancement, |
|
|
| Refunding, Series 2017B, AGM Insured |
|
|
|
| 4.0%, 12/15/25 | 245,000 | 259,826 |
| 4.0%, 12/15/27 | 395,000 | 418,528 |
| Village of Boys Town, Revenue, Refunding, Boys Town Projects, |
|
| Series 2017, 3.0%, 9/01/28 | 700,000 | 786,271 |
| Series 2020, 3.0%, 7/01/35 | 325,000 | 357,919 |
| 31,764,967 |
| Texas | 1.2 |
|
|
| Austin, Airport System Revenue, Series 2017B, AMT, |
| 5.0%, 11/15/26 | 250,000 | 304,442 |
| Austin, Electric Utility System Revenue, Refunding, |
| Series 2020A, 5.0%, 11/15/35 | 100,000 | 131,927 |
| 436,369 |
| Utah | 0.4 |
|
|
| Salt Lake City, Public Utilities Revenue, Series 2020, |
|
|
| 5.0%, 2/1/35 | 100,000 | 127,454 |
| Washington | 1.0 |
|
|
| Pierce County, General Obligation, Tacoma School |
|
|
| District #10, Series 2020B, Washington State School |
|
|
| District Credit Enhancement Program, 4.0%, 12/01/35 | 100,000 | 123,057 |
| Port of Seattle, Intermediate Lien Revenue, |
|
|
| Series 2017C, AMT, 5.0%, 5/01/26 | 200,000 | 239,655 |
| 362,712 |
| Total Municipal Bonds (Cost $32,129,416) |
|
| 33,143,815 |
| | | | |
| Cash Equivalents – 6.3% |
|
|
|
| State Street Institutional U.S. Government Money |
|
|
Market Fund - Premier Class 0.04%(a) | 2,237,149 | 2,237,149 |
| Total Cash Equivalents (Cost $2,237,149) |
|
| 2,237,149 |
| Total Investments in Securities (Cost $34,366,565) |
| 35,380,964 |
| Other Assets Less Other Liabilities - 0.7% |
|
| 257,075 |
| Net Assets - 100% |
|
| 35,638,039 |
| Net Asset Value Per Share | 10.18 |
(a) Rate presented represents the annualized 7-day yield at March 31, 2021. |
The accompanying notes form an integral part of these financial statements.
46 Q1 2021 Annual Report
PARTNERS III OPPORTUNITY FUND
Schedule of Investments
March 31, 2021
| Common Stocks – 93.6% | | | |
| | % of Net |
|
|
| Communication Services | Assets | Shares | $ Value |
| Cable & Satellite | 10.8 |
|
|
Liberty SiriusXM Group* (c) |
|
| Series A | 250,000 | 11,020,000 |
| Series C | 550,000 | 24,260,500 |
Liberty Broadband Corp.* (c) |
|
| Series A | 60,000 | 8,709,000 |
| Series C | 150,000 | 22,522,500 |
| |
| Interactive Media & Services | 9.3 |
|
|
Alphabet, Inc. - Class C* (c) | 15,000 | 31,029,450 |
Facebook, Inc. - Class A* (c) | 90,000 | 26,507,700 |
| |
| Alternative Carriers | 4.4 |
|
|
Liberty Global plc - Class C* (c) (d) | 1,060,000 | 27,072,400 |
| | 24.5 |
| 151,121,550 |
| Financials |
| Multi-Sector Holdings | 10.0 |
|
|
Berkshire Hathaway Inc. - Class B* (c) | 240,000 | 61,312,800 |
| |
| Property & Casualty Insurance | 5.9 |
|
|
Markel Corp.* (c) | 32,000 | 36,467,840 |
| |
| Insurance Brokers | 4.1 |
|
|
Aon plc - Class A(d) | 110,000 | 25,312,100 |
| |
| Investment Banking & Brokerage | 3.5 |
|
|
| The Charles Schwab Corp. | 325,000 | 21,183,500 |
| | 23.5 |
| 144,276,240 |
| Information Technology |
| Data Processing & Outsourced Services | 13.8 |
|
|
| Visa Inc. - Class A | 135,000 | 28,583,550 |
Mastercard Inc. - Class A(c) | 80,000 | 28,484,000 |
| Fidelity National Information Services, Inc. | 120,000 | 16,873,200 |
| Black Knight, Inc.* | 150,000 | 11,098,500 |
| |
| Application Software | 6.2 |
|
|
Intelligent Systems Corp.* † | 645,000 | 26,386,950 |
| Box, Inc. - Class A* | 500,000 | 11,480,000 |
| |
| Semiconductors | 2.8 |
|
|
Texas Instruments, Inc.(c) | 90,000 | 17,009,100 |
| | 22.8 |
| 139,915,300 |
| Consumer Discretionary |
| Internet & Direct Marketing Retail | 4.0 |
|
|
Amazon.com, Inc.* (c) | 5,000 | 15,470,400 |
Qurate Retail, Inc. - Series A(c) | 800,000 | 9,408,000 |
| |
| Automotive Retail | 3.3 |
|
|
CarMax, Inc.* (c) | 100,000 | 13,266,000 |
| AutoZone, Inc.* | 5,000 | 7,021,500 |
| | 7.3 |
| 45,165,900 |
| Materials |
| Construction Materials | 4.7 |
|
|
Summit Materials, Inc. - Class A* (c) | 750,000 | 21,015,000 |
| Vulcan Materials Co. | 45,000 | 7,593,750 |
| | 4.7 |
| 28,608,750 |
| Health Care |
| Health Care Services | 4.1 |
|
|
Laboratory Corp. of America Holdings* (c) | 100,000 | 25,503,000 |
| | |
| $ Principal |
|
| | % of Net | Amount |
|
| Industrials | | Assets | or Shares | $ Value |
| Research & Consulting Services | 3.2 |
|
|
| CoStar Group, Inc.* | 15,000 | 12,328,350 |
| Dun & Bradstreet Holdings, Inc.* | 300,000 | 7,143,000 |
| | 3.2 |
| 19,471,350 |
| Other |
| Other | 3.5 |
|
|
EverArc Holdings Ltd.* (d) (e) | 1,500,000 | 21,750,000 |
| Total Common Stocks (Cost $257,754,294) |
|
| 575,812,090 |
| |
| Non-Convertible Preferred Stocks – 2.9% |
|
|
Qurate Retail, Inc. 8.0% 3/15/31(c) (Cost $15,834,323) | 175,000 | 17,788,750 |
| | | |
| Warrants – 0.1% | |
|
|
|
EverArc Holdings Ltd.* (d) (e) (f) (Cost $15,000) | 1,500,000 | 300,000 |
| | | |
| Cash Equivalents – 4.2% |
U.S. Treasury Bill 0.08% 5/27/21(a) | 5,000,000 | 4,999,941 |
| State Street Institutional U.S. Government Money |
Market Fund - Premier Class 0.04%(b) | 21,108,868 | 21,108,868 |
| Total Cash Equivalents (Cost $26,108,261) |
|
| 26,108,809 |
| Total Investments in Securities (Cost $299,711,878) |
| 620,009,649 |
Due From Broker(c) - 17.7% | 108,967,589 |
| Securities Sold Short - (17.9%) | (110,423,700) |
| Options Written - (0.4%) | (2,301,000) |
| Other Liabilities in Excess of Other Assets - (0.2%) | (991,066) |
| Net Assets - 100% | |
|
| 615,261,472 |
| Net Asset Value Per Share - Investor Class | 15.67 |
| Net Asset Value Per Share - Institutional Class | 16.60 |
| | |
| Securities Sold Short – (17.9%) |
|
|
|
| Invesco QQQ Trust, Series 1 | 90,000 | (28,721,700) |
| Sirius XM Holdings Inc. | 400,000 | (2,436,000) |
| SPDR S&P 500 ETF Trust | 200,000 | (79,266,000) |
| Total Securities Sold Short (proceeds $65,127,478) |
| (110,423,700) |
| | | |
| Options Written* – (0.4%) | |
| Shares |
|
| | subject |
|
| | | $ Notional | to option |
|
| Covered Call Options |
|
| Summit Materials, Inc. - Class A, May 2021 / $25 | 10,000,000 | 400,000 | (1,720,000) |
| Summit Materials, Inc. - Class A, May 2021 / $30 | 10,500,000 | 350,000 | (581,000) |
| Total Options Written (premiums received $2,123,746) |
| (2,301,000) |
*
| Non-income producing
|
† | Non-controlled affiliate |
(a) | Interest rate presented represents the yield to maturity at the date of purchase.
|
(b) | Rate presented represents the annualized 7-day yield at March 31, 2021.
|
(c) | Fully or partially pledged as collateral on securities sold short and outstanding written options.
|
(d) | Foreign domiciled entity
|
(e) | Security is exempt from registration under Rule 144A of the Securities Act of 1933. This security may be resold in transactions that are exempt from registration, normally to qualified institutional buyers. |
| (f) | The expiration date has yet to be determined but will be set based on the terms outlined in the prospectus.
|
|
The accompanying notes form an integral part of these financial statements.
Q1 2021 Annual Report 47
PARTNERS VALUE FUND
Schedule of Investments
March 31, 2021
| Common Stocks – 96.9% | | | | |
| | | % of Net |
|
|
| Communication Services | | Assets | Shares | $ Value |
| Cable & Satellite | 9.5 |
|
|
| Liberty SiriusXM Group* |
|
| Series A | 120,000 | 5,289,600 |
| Series C | 435,000 | 19,187,850 |
| Liberty Broadband Corp.* |
|
| Series A | 70,000 | 10,160,500 |
| Series C | 90,000 | 13,513,500 |
| |
| Interactive Media & Services | 9.1 |
|
|
| Alphabet, Inc. - Class C* | 14,500 | 29,995,135 |
| Facebook, Inc. - Class A* | 55,000 | 16,199,150 |
| |
| Alternative Carriers | 6.7 |
|
|
Liberty Global plc - Class C* (c) | 725,000 | 18,516,500 |
Liberty Latin America Ltd. - Class C* (c) | 1,205,550 | 15,648,039 |
| | | 25.3 |
| 128,510,274 |
| Information Technology |
| Data Processing & Outsourced Services | 9.7 |
|
|
| Visa Inc. - Class A | 92,500 | 19,585,025 |
| Mastercard Inc. - Class A | 50,000 | 17,802,500 |
| Black Knight, Inc.* | 160,000 | 11,838,400 |
| |
| Application Software | 7.0 |
|
|
| ACI Worldwide, Inc.* | 350,000 | 13,317,500 |
| Guidewire Software, Inc.* | 120,000 | 12,195,600 |
| Box, Inc. - Class A* | 450,000 | 10,332,000 |
| |
| Semiconductors | 3.2 |
|
|
| Texas Instruments, Inc. | 85,000 | 16,064,150 |
| | 19.9 |
| 101,135,175 |
| Financials |
| Multi-Sector Holdings | 5.3 |
|
|
| Berkshire Hathaway Inc. - Class B* | 105,000 | 26,824,350 |
| |
| Investment Banking & Brokerage | 4.2 |
|
|
| The Charles Schwab Corp. | 325,000 | 21,183,500 |
| |
| Insurance Brokers | 4.1 |
|
|
Aon plc - Class A(c) | 90,000 | 20,709,900 |
| |
| Property & Casualty Insurance | 3.2 |
|
|
| Markel Corp.* | 14,500 | 16,524,490 |
| |
| Regional Banks | 2.1 |
|
|
| First Republic Bank | 64,000 | 10,672,000 |
| | 18.9 |
| 95,914,240 |
| Materials |
| Construction Materials | 8.4 |
|
|
| Vulcan Materials Co. | 113,000 | 19,068,750 |
| Martin Marietta Materials, Inc. | 42,500 | 14,272,350 |
| Summit Materials, Inc. - Class A* | 340,000 | 9,526,800 |
| |
| Specialty Chemicals | 2.7 |
|
|
Axalta Coating Systems Ltd.* (c) | 465,000 | 13,754,700 |
| | 11.1 |
| 56,622,600 |
| Consumer Discretionary |
| Automotive Retail | 6.1 |
|
|
| CarMax, Inc.* | 145,000 | 19,235,700 |
| AutoZone, Inc.* | 8,500 | 11,936,550 |
| |
| Distributors | 3.5 |
|
|
| LKQ Corp.* | 425,000 | 17,990,250 |
| | 9.6 |
| 49,162,500 |
| | | $ Principal | |
| | % of Net | Amount |
|
| Industrials | Assets | or Shares | $ Value |
| Research & Consulting Services | 3.6 |
|
|
| CoStar Group, Inc.* | 22,000 | 18,081,580 |
| Aerospace & Defense | 2.7 |
|
|
| HEICO Corp. - Class A | 120,000 | 13,632,000 |
| Industrial Machinery | 1.6 |
|
|
| IDEX Corp. | 40,000 | 8,372,800 |
| | 7.9 |
| 40,086,380 |
| Health Care |
| Health Care Services | 4.2 |
|
|
| Laboratory Corp. of America Holdings* | 83,000 | 21,167,490 |
| Total Common Stocks (Cost $247,145,970) |
|
| 492,598,659 |
| | | | |
| Cash Equivalents – 3.2% |
|
|
|
U.S. Treasury Bill 0.08% 5/27/21(a) | 5,000,000 | 4,999,942 |
| State Street Institutional U.S. Government Money |
Market Fund - Premier Class 0.04%(b) | 11,457,467 | 11,457,467 |
| Total Cash Equivalents (Cost $16,456,861) |
| 16,457,409 |
| Total Investments in Securities (Cost $263,602,831) |
| 509,056,068 |
| Other Liabilities in Excess of Other Assets - (0.1%) |
| (441,802) |
| Net Assets - 100% |
|
| 508,614,266 |
| Net Asset Value Per Share - Investor Class | 33.01 |
| Net Asset Value Per Share - Institutional Class | 33.67 |
* Non-income producing |
(a) Interest rate presented represents the yield to maturity at the date of purchase. |
(b) Rate presented represents the annualized 7-day yield at March 31, 2021. |
(c) Foreign domiciled entity |
The accompanying notes form an integral part of these financial statements.
48 Q1 2021 Annual Report
SHORT DURATION INCOME FUND
Schedule of Investments
March 31, 2021
| Corporate Bonds – 16.1% | | |
| | $ Principal |
|
| | Amount | $ Value |
Abercrombie & Fitch Holding Co. 8.75% 7/15/25(b) | 425,000 | 470,422 |
Air Canada 7.75% 4/15/21(b) (c) | 250,000 | 250,488 |
American Airlines Group Inc. 3.75% 3/01/25(b) | 750,000 | 641,122 |
| American Tower Corp. 2.25% 1/15/22 | 5,000,000 | 5,070,407 |
Ashtead U.S. Holdings, Inc. 4.375% 8/15/27(b) (c) | 3,000,000 | 3,135,000 |
| Boeing Co. 4.508% 5/1/2023 | 1,000,000 | 1,070,692 |
| Boston Properties LP 3.125% 9/01/23 | 9,560,000 | 10,072,557 |
| Calumet Specialty Products Partners LP 7.625% 1/15/22 | 900,000 | 900,913 |
| Carlisle Companies Inc. 3.5% 12/01/24 | 500,000 | 542,297 |
| CenturyLink, Inc. 6.75% 12/01/21 (Qwest Corp.) | 1,150,000 | 1,189,531 |
Colfax Corp. 6.0% 2/15/24(b) | 1,000,000 | 1,031,500 |
| Computer Sciences Corp. 4.45% 9/15/22 | 325,000 | 338,785 |
Cox Communications, Inc. 3.25% 12/15/22(b) | 5,000,000 | 5,228,969 |
| Delta Airlines, Inc. 3.625% 3/15/22 | 1,905,000 | 1,926,575 |
| Diamondback Energy, Inc. 2.875% 12/01/24 | 3,379,000 | 3,566,322 |
| Discovery, Inc. 2.95% 3/20/23 | 2,277,000 | 2,380,250 |
| Energy Transfer Operating LP 5.2% 2/01/22 | 3,500,000 | 3,591,419 |
| EQT Corp. 3.0% 10/01/22 | 1,180,000 | 1,201,712 |
| Equifax Inc. 2.3% 6/01/21 | 2,900,000 | 2,904,044 |
Expedia Group, Inc. 3.6% 12/15/23(b) | 2,000,000 | 2,129,773 |
| First Republic Bank 2.5% 6/06/22 | 4,200,000 | 4,295,000 |
| General Motors Financial Company, Inc. 3.55% 4/09/21 | 1,250,000 | 1,250,442 |
| iStar, Inc. 4.25% 8/01/25 | 2,402,000 | 2,424,579 |
| JPMorgan Chase & Co. 3.375% 5/01/23 | 3,956,000 | 4,188,478 |
| Kimco Realty Corp. 3.125% 06/01/2023 | 495,000 | 519,035 |
| Kinder Morgan, Inc. 3.95% 9/01/22 | 2,000,000 | 2,081,091 |
| L Brands, Inc. 6.694% 1/15/27 | 1,000,000 | 1,135,625 |
| Lennar Corp. 4.875% 12/15/23 | 1,951,000 | 2,133,575 |
| Level 3 Parent LLC 5.25% 3/15/26 | 1,455,000 | 1,500,469 |
| Markel Corp. 4.9% 7/01/22 | 3,850,000 | 4,055,186 |
| Matador Resources Co. 5.875% 9/15/26 | 500,000 | 487,500 |
MetLife Global Funding I 2.4% 6/17/22(b) | 1,000,000 | 1,026,077 |
Mileage Plus Holdings LLC 6.5% 6/20/27(b) | 1,000,000 | 1,097,500 |
| MPLX LP 3.375% 3/15/23 | 1,000,000 | 1,048,172 |
| NGL Energy Partners LP |
|
| 7.5% 11/01/23 | 4,555,000 | 4,404,116 |
| 6.125% 3/01/25 | 990,000 | 843,356 |
NXP BV 4.625% 06/01/2023(b) (c) | 3,500,000 | 3,793,191 |
| Occidental Petroleum Corp. 2.6% 8/13/21 | 1,000,000 | 1,004,375 |
| Office Properties Income Trust |
|
| 4.15% 2/01/22 | 2,581,000 | 2,638,703 |
| 4.0% 7/15/22 | 1,000,000 | 1,026,005 |
| PDC Energy, Inc. 6.125% 9/15/24 | 1,200,000 | 1,233,600 |
| QVC, Inc. 4.375% 3/15/23 | 3,000,000 | 3,150,000 |
| RELX plc 3.5% 3/16/23 | 1,800,000 | 1,896,436 |
Silversea Cruise Holding Ltd. 7.25% 2/01/25(b) (c) | 3,545,000 | 3,675,722 |
| Simon Property Group, LP 2.75% 2/01/23 | 1,593,000 | 1,646,619 |
Sprint Spectrum Co. LLC 3.36% 3/20/23(b) (d) | 887,500 | 895,545 |
| U.S. Bancorp 2.4% 7/30/24 | 500,000 | 527,261 |
| Wells Fargo & Co. 3.5% 3/08/22 | 7,900,000 | 8,138,126 |
| WPX Energy, Inc. 5.25% 10/15/27 | 600,000 | 640,326 |
| Xerox Corp. 4.375% 03/15/23 | 1,370,000 | 1,435,931 |
| Total Corporate Bonds (Cost $107,758,920) |
| 111,834,819 |
| | |
| Corporate Convertible Bonds – 2.8% |
|
| Redwood Trust, Inc. |
|
| 4.75% 8/15/23 | 10,000,000 | 10,025,000 |
| 5.625% 7/15/24 | 6,300,000 | 6,263,029 |
| 5.75% 10/01/25 | 3,000,000 | 3,003,900 |
| Total Corporate Convertible Bonds (Cost $18,352,293) |
| 19,291,929 |
| Asset-Backed Securitiess – 34.9% | | |
| | $ Principal |
|
| Amount | $ Value |
| Automobile |
|
American Credit Acceptance Receivables Trust (ACAR)(b) |
| | 2019-4 CL A — 2.18% 2/13/23 | 44,596 | 44,623 |
| | 2020-1 CL A — 1.89% 4/13/23 | 617,576 | 618,795 |
| | 2019-4 CL B — 2.43% 10/12/23 | 2,500,000 | 2,509,211 |
| | 2020-3 CL A — 0.62% 10/13/23 | 1,206,972 | 1,208,149 |
| | 2020-1 CL B — 2.08% 12/13/23 | 2,500,000 | 2,515,713 |
| | 2020-2 CL A — 1.65% 12/13/23 | 678,136 | 681,012 |
| | 2020-4 CL A — 0.53% 3/13/24 | 1,392,412 | 1,393,267 |
Arivo Acceptance Auto Loan Receivables Trust (ARIVO)(b) |
| | 2021-1A CL A — 1.19% 1/15/27 | 927,202 | 931,217 |
| CarMax Auto Owner Trust (CARMX) |
|
| | 2017-2 CL C — 2.6% 2/15/23 | 1,070,000 | 1,076,463 |
Carvana Auto Receivables Trust (CRVNA)(b) |
| | 2019-1A CL B — 3.29% 8/15/23 | 3,876,851 | 3,906,406 |
| | 2019-1A CL C — 3.5% 2/15/24 | 300,000 | 307,387 |
| | 2019-3A CL B — 2.51% 4/15/24 | 400,000 | 406,014 |
Chase Auto Credit Linked Notes (CACLN)(b) |
| | 2020-1 CL B — 0.991% 1/25/28 | 1,853,634 | 1,859,464 |
| | 2020-2 CL B — 0.84% 2/25/28 | 1,820,482 | 1,823,242 |
| | 2021-1 CL B — 0.875% 9/25/28 | 6,250,000 | 6,252,434 |
| Drive Auto Receivables Trust (DRIVE) |
|
| | 2017-1 CL D — 3.84% 3/15/23 | 1,508,071 | 1,521,634 |
DT Auto Owner Trust (DTAOT)(b) |
| | 2019-3A CL B — 2.6% 5/15/23 | 2,216,670 | 2,225,474 |
| | 2019-4A CL A — 2.17% 5/15/23 | 263,858 | 264,462 |
| | 2020-3A CL A — 0.54% 4/15/24 | 327,509 | 327,958 |
| | 2018-3A CL C — 3.79% 7/15/24 | 4,873,001 | 4,911,245 |
Exeter Automobile Receivables Trust (EART)(b) |
| | 2020-1A CL A — 2.05% 6/15/23 | 486,514 | 487,573 |
| | 2017-3A CL C — 3.68% 7/17/23 | 960,009 | 977,281 |
| | 2020-2A CL A — 1.13% 8/15/23 | 524,965 | 526,119 |
First Investors Auto Owners Trust (FIAOT)(b) |
| | 2019-2A CL A — 2.21% 9/16/24 | 899,089 | 907,625 |
Foursight Capital Automobile Receivables Trust (FCRT)(b) |
| | 2021-1 CL A1 — 0.26978% 2/15/22 | 1,192,070 | 1,192,154 |
| | 2020-1 CL A2 — 1.97% 9/15/23 | 1,026,507 | 1,031,602 |
| | 2021-1 CL A2 — 0.4% 8/15/24 | 1,250,000 | 1,250,315 |
GLS Auto Receivables Trust (GCAR)(b) |
|
| | 2019-2A CL A — 3.06% 4/17/23 | 224,000 | 224,794 |
| | 2019-3A CL A — 2.58% 7/17/23 | 500,930 | 504,575 |
| | 2020-3A CL A — 0.69% 10/16/23 | 557,212 | 557,982 |
| | 2019-4A CL A — 2.47% 11/15/23 | 1,091,319 | 1,101,689 |
| | 2020-1A CL A — 2.17% 2/15/24 | 3,123,037 | 3,149,570 |
| | 2021-1A CL A — 0.34% 5/15/24 | 3,000,000 | 3,000,259 |
| | 2020-2A CL A — 1.58% 8/15/24 | 1,751,255 | 1,766,290 |
| | 2020-3A CL B — 1.38% 8/15/24 | 1,000,000 | 1,008,620 |
| | 2020-2A CL B — 3.16% 6/16/25 | 250,000 | 261,288 |
| Santander Drive Auto Receivables Trust (SDART) |
| | 2020-1 CL A2A — 2.07% 1/17/23 | 552,260 | 553,489 |
Securitized Term Auto Receivables Trust (SSTRT)(b) (c) |
| | 2019-CRTA CL B — 2.453% 3/25/26 | 995,972 | 1,014,025 |
| | 2019-CRTA CL C — 2.849% 3/25/26 | 746,979 | 763,654 |
United Auto Credit Securitization Trust (UACST)(b) |
| | 2020-1 CL A — 0.85% 5/10/22 | 436,988 | 437,191 |
| | 2021-1 CL A — 0.34% 7/10/23 | 500,000 | 500,008 |
Westlake Automobile Receivables Trust (WLAKE)(b) |
| | 2020-2A CL A2A — 0.93% 2/15/24 | 3,023,257 | 3,031,961 |
| World Omni Select Auto Trust (WOSAT) |
|
| | 2019-A CL A2A — 2.06% 8/15/23 | 781,713 | 784,944 |
| | 59,817,178 |
| Collateralized Loan Obligations |
|
ABPCI Direct Lending Fund CLO X LP (ABPCI)(b) (c) |
| | 2020-10A CL A1A — 2.19647% 1/20/32 |
|
| | Floating Rate (Qtrly LIBOR + 195) | 6,500,000 | 6,526,686 |
Ballyrock CLO 2016-1 Ltd. (BALLY)(b) (c) |
|
| | 2016-1A CL BR2 — 1.59125% 10/15/28 |
|
| | Floating Rate (Qtrly LIBOR + 135) | 4,000,000 | 3,999,992 |
The accompanying notes form an integral part of these financial statements.
Q1 2021 Annual Report 49
| | $ Principal |
|
| | Amount | $ Value |
BlackRock Elbert CLO V, Ltd (ELB)(b) (c) |
|
| 2020-5A CL A1 — 2.16363% 12/15/31 |
|
| Floating Rate (Qtrly LIBOR + 190) | 4,000,000 | 4,011,421 |
BlackRock Rainier CLO VI, Ltd. (BLKMM)(b) (c) |
| 2021-6A CL A — 1.88762% 4/20/33 |
|
|
| Floating Rate (Qtrly LIBOR + 170) | 5,500,000 | 5,499,940 |
Brightwood Capital MM CLO 2020-1, Ltd (BWCAP)(b) (c) |
|
| 2020-1A CL A — 2.08388% 12/15/28 |
|
|
| Floating Rate (Qtrly LIBOR + 190) | 5,283,255 | 5,293,786 |
Cerberus Loan Funding XXVIII LP (CERB)(b) (c) |
| 2020-1A CL A — 2.09125% 10/15/31 |
|
| Floating Rate (Qtrly LIBOR + 185) | 5,500,000 | 5,502,453 |
| 2020-2A CL A — 2.13285% 10/15/32 |
|
|
| Floating Rate (Qtrly LIBOR + 190) | 4,500,000 | 4,501,229 |
| 2021-2A CL A — 1.0% 4/22/33 |
|
|
| Floating Rate (Qtrly LIBOR + 162) | 3,000,000 | 3,000,000 |
Fortress Credit Opportunities XV CLO Ltd. (FCO)(b) (c) |
| 2021-15A CL AT — 1.74513% 4/25/33 |
|
| Floating Rate (Qtrly LIBOR + 155) | 3,500,000 | 3,500,000 |
Golub Capital Partners CLO Ltd. (GOCAP)(b) (c) |
| 2016-31A CL CR — 3.09513% 8/05/30 |
|
| Floating Rate (Qtrly LIBOR + 290) | 1,000,000 | 990,741 |
| Lake Shore MM III LLC (LSHR)(b) |
|
| 2020-1A CL A — 2.52873% 10/15/29 |
|
|
| Floating Rate (Qtrly LIBOR + 230) | 3,000,000 | 3,001,338 |
Palmer Square Loan Funding 2021-1, Ltd. (PSTAT)(b) (c) |
|
| 2021-1A CL A2 — 1.40495% 4/20/29 |
|
|
| Floating Rate (Qtrly LIBOR + 125) | 3,000,000 | 3,000,082 |
| 48,827,668 |
| Consumer & Specialty Finance | |
|
|
Affirm Asset Securitization Trust (AFFRM)(b) |
| 2020-A CL A — 2.1% 2/18/25 | 6,750,000 | 6,825,394 |
| 2021-A CL A — 0.88% 8/15/25 | 2,150,000 | 2,152,936 |
Avant Loans Funding Trust (AVNT)(b) |
|
| 2019-B CL A — 2.72% 10/15/26 | 105,018 | 105,195 |
Conn Funding II, LP (CONN)(b) |
|
| 2019-A CL A — 3.4% 10/16/23 | 72,358 | 72,728 |
| 2020-A CL A — 1.71% 6/16/25 | 248,846 | 249,736 |
Foundation Finance Trust (FFIN)(b) |
|
| 2019-1A CL A — 3.86% 11/15/34 | 2,022,294 | 2,093,785 |
Freedom Financial (FREED)(b) |
|
| 2020-FP1 CL A — 2.52% 3/18/27 | 842,498 | 848,348 |
| 2020-3FP CL A — 2.4% 9/20/27 | 386,589 | 388,122 |
| 2021-1CP CL A — 0.66% 3/20/28 | 1,392,383 | 1,393,318 |
Marlette Funding Trust (MFT)(b) |
|
| 2018-4A CL A — 3.71% 12/15/28 | 32,342 | 32,380 |
| 2019-1A CL A — 3.44% 4/16/29 | 163,072 | 164,009 |
| 2019-2A CL A — 3.13% 7/16/29 | 417,912 | 420,970 |
| 2019-3A CL A — 2.69% 9/17/29 | 800,829 | 806,123 |
| 2019-4A CL A — 2.39% 12/17/29 | 1,138,823 | 1,147,706 |
| 2020-1A CL A — 2.24% 3/15/30 | 524,721 | 526,780 |
| 2020-2A CL A — 1.02% 9/16/30 | 1,196,270 | 1,198,024 |
OneMain Financial Issuance Trust (OMFIT)(b) |
| 2018-1A CL A — 3.3% 3/14/29 | 11,691,363 | 11,736,141 |
| 2018-1A CL B — 3.61% 3/14/29 | 1,500,000 | 1,540,601 |
| 2017-1A CL A1 — 2.37% 9/14/32 | 725,978 | 727,181 |
Pagaya AI Debt Selection Trust 2020-3 (PAID)(b) |
| 2020-3 CL A — 2.1% 5/17/27 | 2,713,523 | 2,732,990 |
| 2021-1 CL A — 1.18% 11/15/27 | 6,500,000 | 6,523,530 |
Prosper Marketplace Issuance Trust (PMIT)(b) |
| 2019-1A CL B — 4.03% 4/15/25 | 1,057,530 | 1,060,929 |
| 2019-3A CL A — 3.19% 7/15/25 | 71,794 | 71,865 |
SoFi Consumer Loan Program LLC (SCLP)(b) |
| 2018-4 CL C — 4.17% 11/26/27 | 3,450,000 | 3,536,515 |
| 2019-2 CL A — 3.01% 4/25/28 | 362,974 | 366,055 |
| 2019-3 CL A — 2.9% 5/25/28 | 1,255,884 | 1,266,145 |
| 2019-4 CL A — 2.45% 8/25/28 | 695,076 | 701,289 |
| 2020-1 CL A — 2.02% 1/25/29 | 905,010 | 913,921 |
| | $ Principal |
|
| Amount | $ Value |
Upgrade Receivables Trust (UPGR)(b) |
|
| 2019-1A CL C — 5.15% 3/15/25 | 702,095 | 705,968 |
| 2019-2A CL B — 3.51% 10/15/25 | 7,000,000 | 7,033,293 |
Upstart Securitization Trust (UPST)(b) |
|
| 2017-1 CL C — 6.35% 6/20/24 | 293,056 | 293,820 |
| 2017-2 CL C — 5.59% 3/20/25 | 961,214 | 965,088 |
| 2018-2 CL C — 5.494% 12/22/25 | 1,119,258 | 1,131,367 |
| 2019-1 CL B — 4.19% 4/20/26 | 385,567 | 386,150 |
| 2019-2 CL B — 3.734% 9/20/29 | 1,250,000 | 1,275,623 |
| 2019-3 CL A — 2.684% 1/21/30 | 1,667,883 | 1,680,095 |
| 2020-1 CL A — 2.322% 4/22/30 | 3,168,975 | 3,200,832 |
| 2020-3 CL A — 1.702% 11/20/30 | 3,615,157 | 3,644,883 |
| 2021-1 CL A — 0.87% 3/20/31 | 1,933,320 | 1,935,550 |
| | 71,855,385 |
| Equipment |
|
Amur Equipment Finance Receivables VIII LLC (AXIS)(b) |
| 2020-1A CL A2 — 1.68% 8/20/25 �� | 1,291,818 | 1,300,955 |
Ascentium Equipment Receivables Trust (ACER)(b) |
| 2017-1A CL D — 3.8% 1/10/24 | 490,000 | 492,704 |
BCC Funding XVI LLC (BCCFC)(b) |
| 2019-1A CL A2 — 2.46% 8/20/24 | 2,809,773 | 2,845,005 |
| 2020-1 CL A2 — 0.91% 8/20/25 | 750,000 | 753,203 |
Commercial Credit Group Receivables Trust (CCG)(b) |
| 2019-1 CL B — 3.22% 9/14/26 | 250,000 | 258,825 |
| 2019-2 CL A2 — 2.11% 3/15/27 | 1,540,884 | 1,561,138 |
Dell Equipment Finance Trust (DEFT)(b) |
|
| 2019-1 CL C — 3.14% 3/22/24 | 2,750,000 | 2,797,919 |
Dext ABS 2020-1, LLC (DEXT)(b) |
|
| 2020-1 CL A — 1.46% 2/16/27 | 2,985,818 | 2,995,053 |
Great America Leasing Receivables Trust (GALC)(b) |
| 2020-1 CL A2 — 1.76% 6/15/22 | 4,966,296 | 4,991,882 |
Hewlett-Packard Financial Services Equipment Trust (HPEFS)(b) |
| 2019-1A CL A2 — 2.19% 9/20/29 | 117,080 | 117,235 |
| 2019-1A CL D — 2.72% 9/20/29 | 1,000,000 | 1,022,417 |
| 2020-1A CL A2 — 1.73% 2/20/30 | 1,056,166 | 1,061,997 |
| 2020-1A CL A3 — 1.76% 2/20/30 | 3,500,000 | 3,549,289 |
| 2021-1A CL A1 — 0.1653% 3/21/22 | 1,000,000 | 1,000,047 |
MMAF Equipment Finance LLC (MMAF)(b) |
|
| 2016-AA CL A4 — 1.76% 1/17/23 | 338,907 | 340,309 |
Octane Receivables Trust (OCTL)(b) |
| 2019-1A CL A — 3.16% 9/20/23 | 1,842,052 | 1,862,938 |
| 2020-1A CL A — 1.71% 2/20/25 | 5,904,501 | 5,959,442 |
Pawnee Equipment Receivables LLC (PWNE)(b) |
| 2019-1 CL A2 — 2.29% 10/15/24 | 5,730,562 | 5,802,810 |
| 2020-1 CL A — 1.37% 11/17/25 | 3,171,936 | 3,183,156 |
| | 41,896,324 |
| Fleet Lease |
|
|
ARI Fleet Lease Trust (ARIFL)(b) |
|
| 2018-B CL A2 — 3.22% 8/16/27 | 266,864 | 268,203 |
| 2019-A CL A2A — 2.41% 11/15/27 | 460,105 | 464,120 |
| 2020-A CL A2 — 1.77% 8/15/28 | 1,378,558 | 1,388,405 |
Chesapeake Funding II LLC (CFII)(b) |
|
| 2017-3A CL D - 3.38% 8/15/29 | 385,000 | 386,929 |
| 2021-1A CL A1 - 0.47% 4/15/33 | 2,500,000 | 2,503,352 |
Enterprise Fleet Financing LLC (EFF)(b) |
|
| 2019-2 CL A2 — 2.29% 2/20/25 | 1,639,628 | 1,664,920 |
| 2020-1 CL A2 — 1.78% 12/22/25 | 2,909,327 | 2,950,511 |
Hertz Fleet Lease Funding LP (HFLF)(b) |
|
| 2018-1 CL A1 — 0.606% 5/10/32 |
|
|
| Floating Rate (Mthly LIBOR + 50) | 1,197,684 | 1,197,933 |
| 2018-1 CL A2 — 3.23% 5/10/32 | 568,900 | 569,859 |
| | 11,394,232 |
| Small Business |
|
Bankers Healthcare Group Securitization Trust (BHG)(b) |
| 2020-A CL A — 2.56% 9/17/31 | 4,940,450 | 4,955,481 |
The accompanying notes form an integral part of these financial statements.
SHORT DURATION INCOME FUND (CONTINUED)
Schedule of Investments
March 31, 2021
| | | $ Principal |
|
| | Amount | $ Value |
Small Business Lending Trust (SBIZ)(b) |
|
| | 2020-A CL A — 2.62% 12/15/26 | 847,430 | 850,853 |
| | 5,806,334 |
| Timeshare |
|
Hilton Grand Vacations Trust (HGVT)(b) |
|
| | 2020-AA CL A — 2.74% 2/25/39 | 379,178 | 394,711 |
Sierra Timeshare Receivables Funding LLC (SRFC)(b) |
| | 2019-2A CL A — 2.59% 5/20/36 | 884,211 | 908,394 |
| | 2019-2A CL B — 2.82% 5/20/36 | 110,526 | 112,763 |
| | 2020-2A CL A — 1.33% 7/20/37 | 1,500,468 | 1,514,581 |
| | 2,930,449 |
| Total Asset-Backed Securities (Cost $241,096,925) |
| 242,527,570 |
| | |
| Commercial Mortgage-Backed Securities – 7.7% |
|
BFLD Trust 2020-OBRK (BFLD)(b) |
|
| | 2020-OBRK CL A — 2.156% 11/15/28 |
|
|
| | Floating Rate (Mthly LIBOR + 205) | 2,625,000 | 2,654,575 |
BPCRE 2021-FL1, Ltd. (BPCRE)(b) (c) |
|
| | 2021-FL1 CL AS — 1.256% 2/15/37 |
|
|
| | Floating Rate (Mthly LIBOR + 115) | 4,000,000 | 4,001,250 |
BPR Trust (BPR)(b) |
|
| | 2021-KEN CL A — 1.356% 2/15/29 |
|
|
| | Floating Rate (Mthly LIBOR + 125) | 3,000,000 | 3,003,400 |
BXMT Ltd. (BXMT)(b) (c) |
|
| | 2017-FL1 CL A — 0.9775% 6/15/35 |
|
|
| | Floating Rate (Mthly LIBOR + 87) | 139,133 | 139,112 |
Exantas Capital Corp. Ltd. (XAN)(b) |
|
| | 2020-RS08 CL C — 2.2575% 3/15/35 |
|
|
| | Floating Rate (Mthly LIBOR + 215) | 3,750,000 | 3,761,539 |
| | 2020-RS08 CL D — 2.6075% 3/15/35 |
|
|
| | Floating Rate (Mthly LIBOR + 250) | 1,500,000 | 1,503,934 |
| | 2019-RS07 CL A — 1.1075% 4/15/36(c) |
|
| | Floating Rate (Mthly LIBOR + 100) | 3,655,353 | 3,660,806 |
GPMT Ltd. (GPMT)(b) (c) |
|
| | 2018-FL1 CL C — 2.26025% 11/19/35 |
|
| | Floating Rate (Mthly LIBOR + 215) | 7,300,000 | 7,204,005 |
| | 2018-FL1 CL D — 3.06025% 11/21/35 |
|
| | Floating Rate (Mthly LIBOR + 295) | 4,500,000 | 4,477,408 |
Hilton USA Trust (HILT)(b) |
|
| | 2016-SFP CL E — 5.519097% 11/05/35 | 4,300,000 | 4,341,905 |
PFP Ltd. (PFP)(b) (c) |
|
| | 2019-5 CL B — 1.75613% 4/14/36 |
|
|
| | Floating Rate (Mthly LIBOR + 165) | 2,500,000 | 2,497,159 |
| | 2019-5 CL C — 2.10613% 4/14/36 |
|
|
| | Floating Rate (Mthly LIBOR + 200) | 1,500,000 | 1,493,400 |
| | 2021-7 CL AS — 1.25% 4/14/38 |
|
|
| | Floating Rate (Mthly LIBOR + 115) | 4,500,000 | 4,498,875 |
ReadyCap Commercial Mortgage Trust (RCMT)(b) |
| | 2020-FL4 CL A — 2.25863% 2/25/35 |
|
|
| | Floating Rate (Mthly LIBOR + 215) | 3,999,890 | 4,015,730 |
RETL (RETL)(b) |
|
| | 2019-RVP CL C — 2.206% 3/15/36 |
|
|
| | Floating Rate (Mthly LIBOR + 210) | 2,298,212 | 2,292,298 |
VMC Finance LLC (VMC)(b) |
|
| | 2018-FL2 CL C — 2.0575% 10/15/35 |
|
|
| | Floating Rate (Mthly LIBOR + 195) | 4,200,000 | 4,183,703 |
| Total Commercial Mortgage-Backed Securities (Cost $53,806,680) | 53,729,099 |
| Mortgage-Backed Securities – 17.0% | | |
| | $ Principal |
|
| | Amount | $ Value |
| Federal Home Loan Mortgage Corporation |
|
|
| Collateralized Mortgage Obligations |
|
| 3649 CL BW — 4.0% 3/15/25 | 573,943 | 600,448 |
| 4107 CL LW — 1.75% 8/15/27 | 3,920,490 | 3,930,447 |
| 4281 CL AG — 2.5% 12/15/28 | 418,009 | 425,942 |
| 4107 CL LA — 2.5% 5/15/31 | 6,957,598 | 7,063,080 |
| 3003 CL LD — 5.0% 12/15/34 | 656,078 | 754,226 |
| 2952 CL PA — 5.0% 2/15/35 | 307,118 | 336,528 |
| 3620 CL PA — 4.5% 12/15/39 | 606,873 | 659,520 |
| 3842 CL PH — 4.0% 4/15/41 | 708,583 | 775,949 |
| | 14,546,140 |
| Pass-Through Securities |
|
| G18190 — 5.5% 6/01/22 | 2,798 | 2,855 |
| G13300 — 4.5% 5/01/23 | 29,163 | 30,633 |
| G18296 — 4.5% 2/01/24 | 81,889 | 86,106 |
| G18306 — 4.5% 4/01/24 | 183,369 | 192,838 |
| G13517 — 4.0% 5/01/24 | 139,837 | 148,881 |
| G18308 — 4.0% 5/01/24 | 196,833 | 209,564 |
| E02804 — 3.0% 12/01/25 | 1,006,364 | 1,064,394 |
| J13949 — 3.5% 12/01/25 | 1,549,904 | 1,654,572 |
| J14649 — 3.5% 4/01/26 | 970,775 | 1,035,661 |
| E02948 — 3.5% 7/01/26 | 3,032,565 | 3,237,843 |
| J16663 — 3.5% 9/01/26 | 2,572,476 | 2,746,196 |
| E03033 — 3.0% 2/01/27 | 1,595,776 | 1,688,417 |
| ZS8692 — 2.5% 4/01/33 | 1,199,723 | 1,248,344 |
| G01818 — 5.0% 5/01/35 | 808,666 | 926,122 |
| | 14,272,426 |
| | 28,818,566 |
| Federal National Mortgage Association |
| Collateralized Mortgage Obligations |
|
| 2010-54 CL WA — 3.75% 6/25/25 | 200,414 | 205,315 |
| |
| Pass-Through Securities |
|
| 888595 — 5.0% 1/01/22 | 4,422 | 4,643 |
| 888439 — 5.5% 6/01/22 | 7,358 | 7,441 |
| AR8198 — 2.5% 3/01/23 | 954,692 | 993,383 |
| MA1502 — 2.5% 7/01/23 | 877,458 | 913,018 |
| 995960 — 5.0% 12/01/23 | 53,954 | 56,654 |
| AD0629 — 5.0% 2/01/24 | 51,272 | 53,838 |
| 930667 — 4.5% 3/01/24 | 158,523 | 166,693 |
| 890112 — 4.0% 4/01/24 | 112,281 | 119,490 |
| 995693 — 4.5% 4/01/24 | 136,758 | 143,652 |
| AA4315 — 4.0% 4/01/24 | 240,694 | 256,192 |
| AA5510 — 4.0% 4/01/24 | 62,421 | 66,466 |
| MA0043 — 4.0% 4/01/24 | 92,573 | 98,542 |
| 995692 — 4.5% 5/01/24 | 136,413 | 143,365 |
| 995755 — 4.5% 5/01/24 | 236,760 | 249,616 |
| 931739 — 4.0% 8/01/24 | 74,831 | 79,677 |
| AD7073 — 4.0% 6/01/25 | 240,270 | 255,952 |
| AE0031 — 5.0% 6/01/25 | 158,185 | 166,278 |
| AL0471 — 5.5% 7/01/25 | 357,820 | 373,824 |
| 310139 — 3.5% 11/01/25 | 1,734,228 | 1,851,024 |
| AB1769 — 3.0% 11/01/25 | 842,404 | 892,163 |
| AH3429 — 3.5% 1/01/26 | 4,586,202 | 4,894,722 |
| AB2251 — 3.0% 2/01/26 | 1,118,964 | 1,187,116 |
| AB3902 — 3.0% 11/01/26 | 767,406 | 811,705 |
| AB4482 — 3.0% 2/01/27 | 1,842,324 | 1,948,758 |
| AK3264 — 3.0% 2/01/27 | 1,941,020 | 2,053,036 |
| AL1366 — 2.5% 2/01/27 | 1,461,243 | 1,526,091 |
| AB6291 — 3.0% 9/01/27 | 792,371 | 837,721 |
| MA3189 — 2.5% 11/01/27 | 1,308,498 | 1,361,571 |
| MA3791 — 2.5% 9/01/29 | 2,607,535 | 2,718,636 |
| BM5708 — 3.0% 12/01/29 | 2,001,457 | 2,111,744 |
| MA0587 — 4.0% 12/01/30 | 2,350,327 | 2,545,159 |
The accompanying notes form an integral part of these financial statements.
Q1 2021 Annual Report 51
| | $ Principal |
|
| Amount | $ Value |
| BA4767 — 2.5% 1/01/31 | 1,572,554 | 1,642,349 |
| AS7698 — 2.5% 8/01/31 | 1,605,275 | 1,679,130 |
| AS7701 — 2.5% 8/01/31 | 2,282,809 | 2,397,372 |
| 555531 — 5.5% 6/01/33 | 1,653,901 | 1,926,386 |
| MA3540 — 3.5% 12/01/33 | 1,629,033 | 1,739,777 |
| 725232 — 5.0% 3/01/34 | 151,231 | 174,872 |
| 995112 — 5.5% 7/01/36 | 732,975 | 858,379 |
| | 39,511,750 |
| Government National Mortgage Association |
| Pass-Through Securities |
|
| G2 5255 — 3.0% 12/20/26 | 3,371,181 | 3,556,125 |
| |
| Non-Government Agency |
| Collateralized Mortgage Obligations |
|
Bunker Hill Loan Depositary Trust (BHLD)(b) (f) |
| | 2019-3 CL A1 — 2.724% 11/25/59 | 2,604,090 | 2,667,084 |
Citigroup Mortgage Loan Trust, Inc. (CMLTI)(b) (e) |
| | 2014-A CL A — 4.0% 1/25/35 | 640,963 | 676,907 |
COLT Funding LLC (COLT)(b) (e) |
|
| | 2019-4 CL A1 — 2.579% 11/25/49 | 2,278,733 | 2,301,265 |
Deephaven Residential Mortgage Trust (DRMT)(b) (e) |
| | 2019-3A CL A1 — 2.964% 7/25/59 | 1,876,448 | 1,892,328 |
| | 2019-4A CL A1 — 2.791% 10/25/59 | 764,383 | 773,742 |
Flagstar Mortgage Trust (FSMT)(b) (e) |
|
| | 2017-1 CL 2A2 — 3.0% 3/25/47 | 1,416,400 | 1,444,264 |
Goldman Sachs Mortgage-Backed Securities Trust (GSMBS)(b) (e) |
| | 2020-NQM1 CL A1 — 1.382% 9/27/60 | 1,382,301 | 1,388,845 |
J.P. Morgan Mortgage Trust (JPMMT)(b) (e) |
|
| | 2014-2 CL 2A2 — 3.5% 6/25/29 | 1,480,909 | 1,514,950 |
| | 2014-5 CL A1 — 2.92975% 10/25/29 | 3,352,368 | 3,455,902 |
| | 2016-3 CL 2A1 — 3.0% 10/25/46 | 2,523,407 | 2,549,606 |
| | 2017-3 CL 2A2 — 2.5% 8/25/47 | 4,990,795 | 5,054,955 |
| | 2018-6 CL 2A2 — 3.0% 12/25/48 | 1,648,091 | 1,691,103 |
| | 2020-7 CL A4 — 3.0% 1/25/51 | 985,038 | 1,002,555 |
| | 2020-8 CL A4 — 3.0% 3/25/51 | 1,164,491 | 1,190,142 |
| | 2021-4 CL A4 — 2.5% 8/25/51 | 3,000,000 | 3,085,312 |
J.P. Morgan Wealth Management Mortgage Trust (JPMWM)(b) (e) |
| | 2020-ATR1 CL A4 — 3.0% 2/25/50 | 4,843,121 | 4,910,567 |
Sequoia Mortgage Trust (SEMT)(e) |
|
| | 2012-4 CL A1 — 3.5% 9/25/42 | 860,883 | 873,805 |
| | 2013-4 CL A3 — 1.55% 4/25/43 | 820,616 | 821,773 |
| | 2017-CH1 CL A11 — 3.5% 8/25/47(b) | 147,017 | 147,181 |
| | 2018-CH2 CL A12 — 4.0% 6/25/48(b) | 405,000 | 405,801 |
| | 2019-CH2 CL A1 — 4.5% 8/25/49(b) | 2,836,464 | 2,895,396 |
| | 2019-CH3 CL A10 — 4.0% 9/25/49(b) | 814,400 | 823,091 |
| | 2019-4 CL A4 — 3.5% 11/25/49(b) | 646,616 | 651,987 |
| | 2019-5 CL A4 — 3.5% 12/25/49(b) | 1,316,853 | 1,334,124 |
| | 2020-1 CL A4 — 3.5% 2/25/50(b) | 275,225 | 277,220 |
| | 2020-2 CL A4 — 3.5% 3/25/50(b) | 1,129,390 | 1,146,202 |
| | 2020-3 CL A4 — 3.0% 4/25/50(b) | 1,592,980 | 1,620,257 |
| | 46,596,364 |
| Total Mortgage-Backed Securities (Cost $114,461,835) |
| 118,482,805 |
| | | |
| Taxable Municipal Bonds – 0.1% |
|
|
| Kansas Development Finance Authority Revenue, Series 2015H |
| | 2.927% 4/15/21 (Cost $750,000) | 750,000 | 750,539 |
| U.S. Treasury – 17.6% |
| U.S. Treasury Notes |
|
| | 1.375% 4/30/21 | 10,000,000 | 10,010,612 |
| | 2.625% 6/15/21 | 10,000,000 | 10,052,834 |
| | 1.125% 7/31/21 | 15,000,000 | 15,054,410 |
| | | $ Principal |
|
| | Amount |
|
| or Shares | $ Value |
| | 2.0% 7/31/22 | 17,000,000 | 17,430,313 |
| | 2.0% 2/15/23 | 7,000,000 | 7,241,582 |
| | 1.5% 2/28/23 | 25,000,000 | 25,641,602 |
| | 2.0% 5/31/24 | 15,000,000 | 15,754,980 |
| | 1.875% 7/31/26 | 5,000,000 | 5,223,730 |
| | 1.125% 2/29/28 | 16,000,000 | 15,722,500 |
| Total U.S. Treasury (Cost $119,889,032) |
| 122,132,563 |
| | | |
| Common Stocks – 0.6% |
|
|
| Redwood Trust, Inc. (Cost $3,881,691) | 410,000 | 4,268,100 |
| Cash Equivalents – 2.9% |
|
|
| State Street Institutional U.S. Government Money |
Market Fund - Premier Class 0.04%(a) | 19,790,400 | 19,790,400 |
| Total Cash Equivalents (Cost $19,790,400) |
| 19,790,400 |
| Total Investments in Securities (Cost $679,787,776) |
| 692,807,824 |
| Other Assets Less Other Liabilities - 0.3% |
| 2,265,515 |
| Net Assets - 100% |
| 695,073,339 |
| Net Asset Value Per Share - Investor Class | 12.37 |
| Net Asset Value Per Share - Institutional Class | 12.39 |
(a)
| Rate presented represents the annualized 7-day yield at March 31, 2021. |
(b)
| Security is exempt from registration under Rule 144A of the Securities Act of 1933. This security may be resold in transactions that are exempt from registration, normally to qualified institutional buyers. |
(c)
| Foreign domiciled entity |
(d)
| Annual sinking fund |
(e)
| The interest rate resets periodically based on the weighted average coupons of the underlying mortgage-related or asset-backed obligations.
|
(f)
| Security is a “step-up” bond where the coupon rate increases or steps up at a predetermined date. Coupon rate presented represents the rate at March 31, 2021. |
The accompanying notes form an integral part of these financial statements.
52 Q1 2021 Annual Report
ULTRA SHORT GOVERNMENT FUND
Schedule of Investments
March 31, 2021
| Corporate Bonds – 0.6% | | |
| $ Principal |
|
| | Amount | $ Value |
| Dominion Energy, Inc. 2.0% 8/15/21 (Cost 502,392) | 500,000 | 502,360 |
| | | |
| Asset-Backed Securities — 15.3% |
| Automobile |
|
American Credit Acceptance Receivables Trust (ACAR)(b) |
| | 2020-1 CL A — 1.89% 4/13/23 | 102,929 | 103,133 |
| | 2020-3 CL A — 0.62% 10/13/23 | 241,395 | 241,630 |
| | 2020-4 CL A — 0.53% 3/13/24 | 348,103 | 348,317 |
Carvana Auto Receivables Trust (CRVNA)(b) |
| | 2019-2A CL B — 2.74% 12/15/23 | 350,000 | 354,147 |
DT Auto Owner Trust (DTAOT)(b) |
|
| | 2019-4A CL A — 2.17% 5/15/23 | 73,880 | 74,049 |
| | 2020-3A CL A — 0.54% 4/15/24 | 163,754 | 163,979 |
Exeter Automobile Receivables Trust (EART)(b) |
| | 2020-1A CL A — 2.05% 6/15/23 | 74,848 | 75,011 |
First Investors Auto Owners Trust (FIAOT)(b) |
| | 2017-1A CL D — 3.6% 4/17/23 | 317,000 | 320,964 |
Foursight Capital Automobile Receivables Trust (FCRT)(b) |
| | 2021-1 CL A1 — 0.26978% 2/15/22 | 794,713 | 794,769 |
GLS Auto Receivables Trust (GCAR)(b) |
|
| | 2019-3A CL A — 2.58% 7/17/23 | 50,093 | 50,457 |
| | 2020-1A CL A — 2.17% 2/15/24 | 430,764 | 434,423 |
| | 2020-4A CL A — 0.52% 2/15/24 | 519,964 | 520,257 |
| Santander Drive Auto Receivables Trust (SDART) |
| | 2020-1 CL A2A — 2.07% 1/17/23 | 69,033 | 69,186 |
United Auto Credit Securitization Trust (UACST)(b) |
| | 2020-1 CL A — 0.85% 5/10/22 | 54,624 | 54,649 |
| | 2021-1 CL A — 0.34% 7/10/23 | 500,000 | 500,008 |
| | 2019-1 CL C — 3.16% 8/12/24 | 176,718 | 177,173 |
Westlake Automobile Receivables Trust (WLAKE)(b) |
| | 2020-2A CL A2A — 0.93% 2/15/24 | 566,861 | 568,493 |
| | 4,850,645 |
| Consumer & Specialty Finance |
|
Marlette Funding Trust (MFT)(b) |
|
| | 2019-2A CL A — 3.13% 7/16/29 | 250,747 | 252,582 |
| | 2020-2A CL A — 1.02% 9/16/30 | 765,613 | 766,735 |
OneMain Financial Issuance Trust (OMFIT)(b) |
| | 2018-1A CL A — 3.3% 3/14/29 | 723,774 | 726,546 |
| | 2017-1A CL A1 — 2.37% 9/14/32 | 65,998 | 66,107 |
Prosper Marketplace Issuance Trust (PMIT)(b) |
| | 2019-3A CL A — 3.19% 7/15/25 | 8,446 | 8,455 |
Upstart Securitization Trust (UPST)(b) |
|
| | 2019-1 CL B — 4.19% 4/20/26 | 20,509 | 20,540 |
| | 2019-2 CL A — 2.897% 9/20/29 | 284,164 | 285,544 |
| | 2020-1 CL A — 2.322% 4/22/30 | 500,628 | 505,661 |
| | 2,632,170 |
| Equipment |
|
Ascentium Equipment Receivables Trust (ACER)(b) |
| | 2017-1A CL B — 2.85% 10/10/21 | 295,386 | 296,181 |
BCC Funding XVI LLC (BCCFC)(b) |
|
| | 2020-1 CL A1 — 0.30965% 10/20/21 | 139,621 | 139,637 |
| | 2018-1A CL B — 3.39% 8/21/23 | 323,321 | 325,198 |
Dell Equipment Finance Trust (DEFT)(b) |
|
| | 2020-2 CL A2 — 0.47% 10/24/22 | 400,000 | 400,510 |
Great America Leasing Receivables Trust (GALC)(b) |
| | 2020-1 CL A2 — 1.76% 6/15/22 | 488,021 | 490,535 |
Hewlett-Packard Financial Services Equipment Trust (HPEFS)(b) |
| | 2021-1A CL A1 — 0.1653% 3/21/22 | 500,000 | 500,024 |
MMAF Equipment Finance LLC (MMAF)(b) |
|
|
| | 2016-AA CL A4 — 1.76% 1/17/23 | 146,389 | 146,995 |
Stonebriar Commercial Finance Equipment Leasing LLC (SCFET)(b) |
| | 2021-1A CL A1 — 0.23387% 3/11/22 | 378,420 | 378,419 |
| | 2020-1A CL A2 — 0.68% 10/20/25 | 468,694 | 469,697 |
| | 3,147,196 |
| | $ Principal |
|
| | Amount |
|
| or Shares | $ Value |
| Fleet Lease |
|
ARI Fleet Lease Trust (ARIFL)(b) |
|
| | 2019-A CL A2A — 2.41% 11/15/27 | 352,747 | 355,825 |
| | 2020-A CL A2 — 1.77% 8/15/28 | 846,829 | 852,878 |
Enterprise Fleet Financing LLC (EFF)(b) |
|
| | 2021-1 CL A1 — 0.16793% 3/21/22 | 374,437 | 374,455 |
| | 1,583,158 |
| Mobile |
|
Verizon Owner Trust (VZOT)(b) |
|
| | 2018-1A CL A1A — 2.82% 9/20/22 | 43,412 | 43,510 |
| Total Asset-Backed Securities (Cost $12,233,870) |
| 12,256,679 |
| | |
| Commercial Mortgage-Backed Securities – 1.4% |
|
AREIT 2018-CRE1 Trust (AREIT)(b) |
|
| | 2018-CRE2 CL A — 1.08613% 11/14/35 |
|
| | Floating Rate (Mthly LIBOR + 98) | 415,311 | 416,203 |
GPMT Ltd. (GPMT)(b) (c) |
|
| | 2018-FL1 CL A — 1.01025% 11/21/35 |
|
| | Floating Rate (Mthly LIBOR + 90) | 667,502 | 666,334 |
| Total Commercial Mortgage-Backed Securities (Cost $1,081,201) | 1,082,537 |
| | | |
| U.S. Treasury – 80.3% |
|
|
| U.S. Treasury Notes |
|
| | 2.375% 4/15/21 | 2,000,000 | 2,001,788 |
| | 2.125% 5/31/21 | 9,000,000 | 9,030,626 |
| | 2.625% 6/15/21 | 17,000,000 | 17,089,818 |
| | 1.125% 8/31/21 | 19,000,000 | 19,086,883 |
| | 2.75% 9/15/21 | 7,000,000 | 7,086,728 |
| | 2.875% 10/15/21 | 9,750,000 | 9,899,068 |
| Total U.S. Treasury (Cost $64,179,332) |
| 64,194,911 |
| | | |
| Cash Equivalents — 1.9% |
|
|
| State Street Institutional U.S. Government Money |
|
|
Market Fund - Premier Class 0.04%(a) | 1,528,526 | 1,528,526 |
| Total Cash Equivalents (Cost $1,528,526) |
| 1,528,526 |
| Total Investments in Securities (Cost $79,525,321) |
| 79,565,013 |
| Other Assets Less Other Liabilities - 0.5% |
| 372,469 |
| Net Assets - 100% |
| 79,937,482 |
| Net Asset Value Per Share | 10.00 |
(a) | Rate presented represents the annualized 7-day yield at March 31, 2021. |
(b) | Security is exempt from registration under Rule 144A of the Securities Act of 1933. This security may be resold in transactions that are exempt from registration, normally, to qualified institutional buyers. |
(c) | Foreign domiciled entity |
The accompanying notes form an integral part of these financial statements.
Q1 2021 Annual Report 53
VALUE FUND
Schedule of Investments
March 31, 2021
| Common Stocks – 97.2% | | | |
| | % of Net |
|
|
| Information Technology | Assets | Shares | $ Value |
| Data Processing & Outsourced Services | 11.5 |
|
|
| Visa Inc. - Class A | 170,000 | 35,994,100 |
| Mastercard Inc. - Class A | 100,000 | 35,605,000 |
| Fidelity National Information Services, Inc. | 250,000 | 35,152,500 |
| Systems Software | 3.8 |
|
|
| Oracle Corp. | 500,000 | 35,085,000 |
| Semiconductors | 3.8 |
|
|
| Analog Devices, Inc. | 225,000 | 34,893,000 |
| IT Consulting & Other Services | 2.8 |
|
|
Accenture plc - Class A(c) | 95,000 | 26,243,750 |
| Application Software | 2.7 |
|
|
| salesforce.com, inc.* | 120,000 | 25,424,400 |
| | 24.6 |
| 228,397,750 |
| Communication Services |
| Interactive Media & Services | 11.1 |
|
|
| Alphabet, Inc. - Class C* | 30,000 | 62,058,900 |
| Facebook, Inc. - Class A* | 140,000 | 41,234,200 |
| |
|
|
|
| Cable & Satellite | 11.1 |
|
|
| Liberty Broadband Corp. - Series C* | 280,000 | 42,042,000 |
| Liberty SiriusXM Group - Series C* | 700,000 | 30,877,000 |
| Comcast Corp. - Class A | 550,000 | 29,760,500 |
| | 22.2 |
| 205,972,600 |
| Financials |
| Multi-Sector Holdings | 5.5 |
|
|
| Berkshire Hathaway Inc. - Class B* | 200,000 | 51,094,000 |
| Insurance Brokers | 5.0 |
|
|
Aon plc - Class A(c) | 200,000 | 46,022,000 |
| Investment Banking & Brokerage | 4.8 |
|
|
| The Charles Schwab Corp. | 680,000 | 44,322,400 |
| Diversified Banks | 2.6 |
|
|
| JPMorgan Chase & Co. | 162,500 | 24,737,375 |
| Financial Exchanges & Data | 2.4 |
|
|
| S&P Global Inc. | 62,500 | 22,054,375 |
| | 20.3 |
| 188,230,150 |
| Health Care |
| Health Care Services | 4.1 |
|
|
| Laboratory Corp. of America Holdings* | 150,000 | 38,254,500 |
| Life Sciences Tools & Services | 3.7 |
|
|
| Thermo Fisher Scientific Inc. | 75,000 | 34,228,500 |
| Health Care Equipment | 3.6 |
|
|
| Danaher Corp. | 150,000 | 33,762,000 |
| | 11.4 |
| 106,245,000 |
| |
| $ Principal |
|
| | % of Net | Amount |
|
| Materials | Assets | Shares | $ Value |
| Automotive Retail | 6.3 |
|
|
| CarMax, Inc.* | 250,000 | 33,165,000 |
| AutoZone, Inc.* | 17,500 | 24,575,250 |
| Internet & Direct Marketing Retail | 2.8 |
|
|
| Amazon.com, Inc.* | 8,500 | 26,299,680 |
| | 9.1 |
| 84,039,930 |
| Materials |
| Construction Materials | 4.0 |
|
|
| Vulcan Materials Co. | 220,000 | 37,125,000 |
| Industrial Gases | 2.3 |
|
|
Linde plc(c) | 75,000 | 21,010,500 |
| | 6.3 |
| 58,135,500 |
| Industrials |
| Research & Consulting Services | 3.3 |
|
|
| CoStar Group, Inc.* | 37,500 | 30,820,875 |
| Total Common Stocks (Cost $429,718,862) |
|
| 901,841,805 |
| |
| Cash Equivalents – 2.9% |
|
U.S. Treasury Bills, 0.08%, 4/29/21 to 5/27/21(a) | 13,000,000 | 12,999,872 |
| State Street Institutional U.S. Government Money |
Market Fund - Premier Class 0.04%(b) | 13,534,201 | 13,534,201 |
| Total Cash Equivalents (Cost $26,532,796) |
| 26,534,073 |
| Total Investments in Securities (Cost $456,251,658) |
| 928,375,878 |
| Other Liabilities in Excess of Other Assets - (0.1%) |
| (737,579) |
| Net Assets - 100% |
|
| 927,638,299 |
| Net Asset Value Per Share – Investor Class | 54.30 |
| Net Asset Value Per Share – Institutional Class | 55.31 |
| * | Non-income producing |
| (a) | Interest rate presented represents the yield to maturity at the date of purchase. |
(b)
| Rate presented represents the annualized 7-day yield at March 31, 2021. |
(c)
| Foreign domiciled entity |
The accompanying notes form an integral part of these financial statements.
54 Q1 2021 Annual Report
STATEMENTS OF ASSETS AND LIABILITIES
March 31, 2021
| (In U.S. dollars, except share data) | Balanced | Core Plus Income
| Hickory | Nebraska Tax-Free Income | Partners III Opportunity | Partners Value | Short Duration Income | Ultra Short Government | Value |
| Assets: | | | | | | | | | |
Investments in securities at value(a): | | | |
| Unaffiliated issuers | 205,791,341
| 165,565,450
| 212,777,770
| 35,380,964
| 593,622,699
| 509,056,068
| 692,807,824
| 79,565,013
| 928,375,878 |
Non-controlled affiliates
| — | — | — | — | 26,386,950
| — | — | — | — |
| 205,791,341 | 165,565,450
| 212,777,770 | 35,380,964
| 620,009,649 | 509,056,068 | 692,807,824
| 79,565,013
| 928,375,878 |
| Accrued interest and dividends receivable | 356,261
| 892,702 | 146
| 332,990
| 576
| 370
| 2,297,120
| 383,864
| 204,932 |
| Due from broker | — | — | — | — | 108,967,589
| — | — | — | — |
| Receivable for securities sold | — | — | 197,998
| — | — | — | — | — | — |
| Receivable for fund shares sold | 34,060
| 222,950
| 409
| 95,000
| 7,888
| 911
| 4,025,341
| — | 2,879 |
| Cash | — | 30,106
| — | — | — | — | — | — | — |
| Total assets | 206,181,662
| 166,711,208 | 212,976,323 | 35,808,954
| 728,985,702 | 509,057,349 | 699,130,285 | 79,948,877
| 928,583,689 |
| Liabilities: | | | | | | | | | |
| Dividends payable on securities sold short | — | — | — | — | 291,079
| — | — | — | — |
| Due to adviser | 129,501
| 55,405
| 196,279
| 13,575
| 681,079
| 421,913
| 289,301
| 7,290
| 796,962 |
Options written, at value(b) | — | — | — | — | 2,301,000
| — | — | — | — |
| Payable for securities purchased | — | 2,197,602
| — | 157,340
| — | — | 3,000,000
| — | — |
| Payable for fund shares redeemed | 39,125
| 210,818
| 4,700
| — | 27,372
| 21,170
| 767,645
| 3,885
| 148,428 |
Securities sold short(c) | — | — | — | — | 110,423,700
| — | — | — | — |
| Other | — | — | — | — | — | — | — | 220 | — |
| Total liabilities | 168,626
| 2,463,825
| 200,979
| 170,915 | 113,724,230
| 443,083
| 4,056,946
| 11,395
| 945,390 |
| Net assets | 206,013,036
| 164,247,383 | 212,775,344 | 35,638,039
| 615,261,472
| 508,614,266 | 695,073,339 | 79,937,482 | 927,638,299
|
|
| Composition of net assets: | | | | | | | | | |
| Paid-in capital | 159,042,398
| 158,553,179
| 106,825,758
| 34,737,521
| 297,358,100
| 242,170,973
| 681,573,269
| 79,891,938
| 417,518,551 |
| Total distributable earnings | 46,970,638
| 5,694,204
| 105,949,586
| 900,518
| 317,903,372
| 266,443,293
| 13,500,070
| 45,544
| 510,119,748 |
| Net assets | 206,013,036
| 164,247,383 | 212,775,344 | 35,638,039
| 615,261,472 | 508,614,266 | 695,073,339 | 79,937,482 | 927,638,299
|
Net assets(d): | | | | | | | | | |
| Investor Class | 64,736,312
| 53,943,936
| 212,775,344
| 35,638,039
| 22,790,902
| 231,481,515
| 36,857,264
| | 616,461,747 |
| Institutional Class | 141,276,724
| 110,303,447
| | | 592,470,570
| 277,132,751
| 658,216,075
| 79,937,482
| 311,176,552 |
Shares outstanding(d) (e): | | | | | | | | | |
| Investor Class | 3,971,037
| 4,966,227
| 3,753,867
| 3,499,639
| 1,454,429
| 7,013,049
| 2,979,365
| | 11,353,646 |
| Institutional Class | 8,662,158
| 10,151,141
| | | 35,692,233
| 8,229,630
| 53,104,703
| 7,991,021
| 5,626,390 |
Net asset value, offering and redemption price(d): | | | | | | | | | |
| Investor Class | 16.30
| 10.86
| 56.68
| 10.18
| 15.67
| 33.01 | 12.37
| | 54.30 |
| Institutional Class | 16.31
| 10.87
| | | 16.60
| 33.67 | 12.39
| 10.00 | 55.31 |
(a) Cost of investments in securities: | | | | | | | | | |
| Unaffiliated issuers | 160,896,248
| 160,350,597
| 116,075,856
| 34,366,565
| 299,260,378
| 263,602,831
| 679,787,776 | 79,525,321 | 456,251,658 |
| Non-controlled affiliates | — | — | — | — | 451,500
| — | — | — | — |
| 160,896,248 | 160,350,597
| 116,075,856 | 34,366,565 | 299,711,878 | 263,602,831 | 679,787,776
| 79,525,321 | 456,251,658
|
(b) Premiums from options written | — | — | — | — | 2,123,746
| — | — | — | — |
(c) Proceeds from short sales | — | — | — | — | 65,127,478
| — | — | — | — |
(d) Funds with a single share class are shown with the Investor Class, except for the Ultra Short Government Fund which has been designated Institutional Class
|
(e) Indefinite number of no par value shares authorized
| | | | | | | |
The accompanying notes form an integral part of these financial statements.
Q1 2021 Annual Report 55
STATEMENTS OF OPERATIONS
Year Ended March 31, 2021
|
|
| | |
|
Core Plus Income
| Hickory
| Nebraska
Tax-Free
Income
| Partners III
Opportunity
| Partners
Value
| Short
Duration
Income | Ultra Short
Government |
|
| (In U.S. dollars) | Balanced | Value |
| Investment income: | | | | | | | | | |
| Dividends | 791,914 | 244,502 | 1,607,195 | — | 5,720,327 | 537,704 | (44,800) | — | 5,396,083 |
| Interest | 1,501,792 | 4,635,416 | 7,994 | 678,822 | 45,612 | 15,894 | 19,923,070 | 580,755 | 29,978 |
| Total investment income | 2,293,706 | 4,879,918 | 1,615,189 | 678,822 | 5,765,939 | 553,598 | 19,878,270 | 580,755 | 5,426,061 |
| Fees and expenses: |
|
|
|
|
|
|
|
|
|
| Investment advisory | 1,097,314 | 495,023 | 1,676,604 | 136,392 | 5,737,643 | 3,693,977 | 2,890,788 | 250,338 | 6,514,118 |
| Administrative: |
|
|
|
|
|
|
|
|
|
| Investor Class | 89,214 | 69,892 | 279,391 | 77,737 | 50,473 | 184,923 | 78,218 | 112,602 | 321,884 |
| Institutional Class | 144,008 | 116,488 | | | 321,094 | 200,490 | 370,982 | | 205,793 |
| Servicing: |
|
|
|
|
|
|
|
| Investor Class | 96,677 | 85,716 | — | — | 53,273 | 400,887 | 124,328 | — | 915,088 |
| Institutional Class | 19,278 | 38,131 | — | — | 138,173 | 60,919 | 674,920 | 12,365 | 45,479 |
| Custody and fund accounting | 89,687 | 99,223 | 70,613 | 80,614 | 108,633 | 77,881 | 158,940 | 76,040 | 120,535 |
| Dividends on securities sold short | — | — | — | — | 1,302,018 | — | — | — | — |
| Interest | — | — | — | — | 428,530 | — | — | — | — |
| Professional | 41,748 | 37,928 | 44,118 | 28,178 | 79,587 | 73,963 | 98,688 | 32,058 | 95,348 |
| Registration: |
|
|
|
|
|
|
|
|
|
| Investor Class | 14,130 | 13,671 | 18,029 | 3,391 | 12,750 | 15,705 | 12,757 | | 23,681 |
| Institutional Class | 12,294 | 37,242 | | | 26,058 | 15,821 | 46,066 | 25,256 | 17,198 |
| Sub-transfer agent: |
|
|
|
|
|
|
|
|
|
| Investor Class | 43,329 | 30,331 | 83,229 | 31,809 | 32,416 | 73,884 | 31,965 | | 168,833 |
| Institutional Class | 35,264 | 32,650 | | | 76,398 | 48,983 | 80,337 | 41,932 | 52,599 |
| Trustees | 25,484 | 17,841 | 27,170 | 5,013 | 84,837 | 67,071 | 109,443 | 12,979 | 117,916 |
| Other | 25,729 | 21,204 | 41,038 | 7,254 | 74,236 | 79,589 | 171,254 | 16,056 | 152,321 |
| 1,734,156 | 1,095,340 | 2,240,192 | 370,388 | 8,526,119 | 4,994,093 | 4,848,686 | 579,626 | 8,750,793 |
| Less expenses waived/reimbursed by investment adviser | (396,915) | (564,326) | (201,488) | (216,947) | — | (444,046) | (1,348,071) | (441,246) | (350,570) |
| Net expenses | 1,337,241 | 531,014 | 2,038,704 | 153,441 | 8,526,119 | 4,550,047 | 3,500,615 | 138,380 | 8,400,223 |
| Net investment income (loss) | 956,465 | 4,348,904 | (423,515) | 525,381 | (2,760,180) | (3,996,449) | 16,377,655 | 442,375 | (2,974,162) |
| Realized and unrealized gain (loss) on investments: |
|
|
|
|
|
|
|
|
|
| Net realized gain (loss): |
|
|
|
|
|
|
|
|
| Unaffiliated issuers | 2,621,712 | 1,101,368 | 21,840,885 | 7,108 | 53,779,000 | 57,010,711 | 1,608,033 | 21,436 | 95,417,622 |
Non-controlled affiliates
| — | — | — | — | 32,173,901 | — | — | — | — |
| Options written | — | — | — | — | 301,556 | — | — | — | — |
| Securities sold short | — | — | — | — | 445,132 | — | — | — | — |
| Net realized gain (loss) | 2,621,712 | 1,101,368 | 21,840,885 | 7,108 | 86,699,589 | 57,010,711 | 1,608,033 | 21,436 | 95,417,622 |
| Net unrealized appreciation (depreciation): |
|
|
|
|
|
|
| Unaffiliated issuers | 29,904,373 | 7,882,815 | 64,846,905 | 331,294 | 172,341,496 | 156,501,635 | 27,102,788 | (184,496) | 263,868,192 |
| Non-controlled affiliates | — | — | — | — | (25,226,061) | — | — | — | — |
| Options written | — | — | — | — | (290,657) | — | — | — | — |
| Securities sold short | — | — | — | — | (36,816,417) | — | — | — | — |
| Net unrealized appreciation (depreciation) | 29,904,373 | 7,882,815 | 64,846,905 | 331,294
| 110,008,361 | 156,501,635 | 27,102,788 | (184,496) | 263,868,192
|
Net realized and unrealized gain (loss) on investments
| 32,526,085 | 8,984,183 | 86,687,790 | 338,402 | 196,707,950 | 213,512,346 | 28,710,821 | (163,060) | 359,285,814 |
Net increase (decrease) in net assets resulting from operations | 33,482,550 | 13,333,087 | 86,264,275 | 863,783
| 193,947,770 | 209,515,897 | 45,088,476 | 279,315 | 356,311,652
|
The accompanying notes form an integral part of these financial statements.
56 Q1 2021 Annual Report
STATEMENTS OF CHANGES IN NET ASSETS
| | Balanced | Core Plus Income | Hickory | Nebraska Tax-Free Income |
| Year ended March 31, | Year ended March 31, | Year ended March 31, | Year ended March 31, |
| (In U.S. dollars) | 2021 | 2020 | 2021 | 2020 | 2021 | 2020 | 2021 | 2020 |
| Increase (decrease) in net assets: |
|
|
|
|
|
|
|
|
| From operations: |
|
|
|
|
|
|
|
|
| Net investment income (loss) | 956,465 | 1,399,438 | 4,348,904 | 3,058,655 | (423,515) | (1,210,913) | 525,381 | 419,311 |
| Net realized gain (loss) | 2,621,712 | 2,687,370 | 1,101,368 | 1,815,193 | 21,840,885 | 8,005,140 | 7,108 | 2,746 |
| Net unrealized appreciation (depreciation) | 29,904,373 | (3,832,524) | 7,882,815 | (3,794,598) | 64,846,905 | (39,028,846) | 331,294 | 397,121 |
Net increase (decrease) in net assets resulting from operations | 33,482,550 | 254,284 | 13,333,087 | 1,079,250 | 86,264,275 | (32,234,619) | 863,783 | 819,178 |
Distributions to shareholders(a): |
|
|
|
|
|
|
|
|
| Investor Class | (656,103) | (962,256) | (1,859,305) | (795,621) | (16,261,119) | (4,410,185) | (532,609) | (422,709) |
| Institutional Class | (1,550,275) | (1,704,967) | (4,613,502) | (2,472,797) | | | |
|
| Total distributions | (2,206,378) | (2,667,223) | (6,472,807) | (3,268,418) | (16,261,119) | (4,410,185) | (532,609) | (422,709) |
Fund share transactions(a): |
|
|
|
|
|
|
|
|
| Investor Class | 6,852,810 | 6,230,770 | 26,374,424 | 7,652,215 | (28,195,512) | (3,131,490) | 3,842,362 | (6,979,787) |
| Institutional Class | 35,610,944 | 4,024,205 | 26,963,828 | 20,058,322 | | | |
|
Net increase (decrease) from fund share transactions | 42,463,754 | 10,254,975 | 53,338,252 | 27,710,537 | (28,195,512) | (3,131,490) | 3,842,362 | (6,979,787) |
| Total increase (decrease) in net assets | 73,739,926 | 7,842,036 | 60,198,532 | 25,521,369 | 41,807,644 | (39,776,294) | 4,173,536 | (6,583,318) |
| Net assets: |
|
|
|
|
|
|
|
|
| Beginning of period | 132,273,110 | 124,431,074 | 104,048,851 | 78,527,482 | 170,967,700 | 210,743,994 | 31,464,503 | 38,047,821 |
| End of period | 206,013,036 | 132,273,110 | 164,247,383 | 104,048,851 | 212,775,344 | 170,967,700 | 35,638,039 | 31,464,503 |
(a) | Funds with a single share class are shown with the Investor Class, except for the Ultra Short Government Fund which has been designated Institutional Class |
The accompanying notes form an integral part of these financial statements.
Q1 2021 Annual Report 57
| Partners III Opportunity | Partners Value | Short Duration Income | Ultra Short Government | Value |
| Year ended March 31, | Year ended March 31, | Year ended March 31, | Year ended March 31, | Year ended March 31, |
| 2021 | 2020 | 2021 | 2020 | 2021 | 2020 | 2021 | 2020 | 2021 | 2020 |
|
|
| (2,760,180) | (4,715,796) | (3,996,449) | (920,105) | 16,377,655 | 19,751,033 | 442,375 | 1,625,174 | (2,974,162) | (2,126,689) |
| 86,699,589 | 63,928,674 | 57,010,711 | 34,725,781 | 1,608,033 | 2,263,477 | 21,436 | 39,926 | 95,417,622 | 41,006,763 |
| 110,008,361 | (88,786,091) | 156,501,635 | (102,198,646) | 27,102,788 | (16,698,930) | (184,496) | 179,684 | 263,868,192 | (72,902,938) |
| 193,947,770 | (29,573,213) | 209,515,897 | (68,392,970) | 45,088,476 | 5,315,580 | 279,315 | 1,844,784 | 356,311,652 | (34,022,864) |
| | | | | | | |
(2,655,486)
| (1,504,044)
| (23,516,752)
| (19,224,059)
| (1,123,622)
| (1,570,346)
| | | (51,127,886)
| (27,497,303) |
(68,738,315)
| (41,290,214)
| (27,501,161)
| (23,314,351)
| (17,127,498)
| (18,386,052)
| (461,332)
| (1,667,656)
| (24,424,419)
| (11,915,327) |
(71,393,801)
| (42,794,258)
| (51,017,913)
| (42,538,410)
| (18,251,120)
| (19,956,398)
| (461,332)
| (1,667,656)
| (75,552,305)
| (39,412,630) |
| |
| (789,442) | 108,957 | (24,205,471) | (32,659,494) | (26,075,286) | (8,791,247) | | | (21,737,802) | (43,700,150) |
| (67,222,336) | (5,524,434) | (25,796,433) | (44,099,450) | (41,778,736) | (140,176,579) | 8,017,081 | (25,518,668) | 9,628,834 | 7,376,195 |
| (68,011,778) | (5,415,477) | (50,001,904) | (76,758,944) | (67,854,022) | (148,967,826) | 8,017,081 | (25,518,668) | (12,108,968) | (36,323,955) |
| 54,542,191 | (77,782,948) | 108,496,080 | (187,690,324) | (41,016,666) | (163,608,644) | 7,835,064 | (25,341,540) | 268,650,379 | (109,759,449) |
| | | | | | | | | | |
| 560,719,281 | 638,502,229 | 400,118,186 | 587,808,510 | 736,090,005 | 899,698,649 | 72,102,418 | 97,443,958 | 658,987,920 | 768,747,369 |
| 615,261,472 | 560,719,281 | 508,614,266 | 400,118,186 | 695,073,339 | 736,090,005 | 79,937,482 | 72,102,418 | 927,638,299 | 658,987,920 |
The accompanying notes form an integral part of these financial statements.
58 Q1 2021 Annual Report
STATEMENT OF CASH FLOWS
Year ended March 31, 2021
| Partners III Opportunity |
| (In U.S. dollars) | |
| Increase (decrease) in cash: | |
| Cash flows from operating activities: | |
| Net increase in net assets from operations | 193,947,770 |
| Adjustments to reconcile net increase in net assets from operations to net cash provided by operating activities: | |
| Purchases of investment securities | (114,259,456) |
| Proceeds from sale of investment securities | 261,621,640 |
| Proceeds from securities sold short | 18,550,844 |
| Short positions covered | (7,472,429) |
| Sale of short-term investment securities, net | 29,490,623 |
| Net unrealized appreciation on investments, options and securities sold short | (110,008,361) |
| Net realized gain on investments, options and securities sold short | (86,699,589) |
| Decrease in accrued interest and dividends receivable | 455,077 |
| Increase in due from broker | (43,283,193) |
| Decrease in receivable for securities sold | 2,442,507 |
| Decrease in receivable for fund shares sold | 83,819 |
| Decrease in dividends payable on securities sold short | (39,905) |
| Increase in due to adviser | 43,253 |
| Decrease in payable for securities purchased | (5,417,588) |
| Decrease in payable for fund shares redeemed | (49,433) |
| Net cash provided by operating activities | 139,405,579 |
| Cash flows from financing activities: | |
| Proceeds from sales of fund shares | 26,998,928 |
| Payments for redemptions of fund shares | (148,305,532) |
| Cash distributions to shareholders | (18,098,975) |
| Net cash used in financing activities | (139,405,579) |
|
| Net increase (decrease) in cash | — |
| Cash: | | |
| Balance, beginning of period | — |
| Balance, end of period | — |
|
Supplemental disclosure of cash flow information: | |
| Cash payments for interest | 428,530 |
Noncash financing activities: | |
| Reinvestment of shareholder distributions | 53,294,826 |
The accompanying notes form an integral part of these financial statements.
Q1 2021 Annual Report 59
This page intentionally left blank
60 Q1 2021 Annual Report
FINANCIAL HIGHLIGHTS
The following financial information provides selected data, in U.S. dollars, for a share outstanding throughout the periods indicated.
| |
| | Income (loss) from Investment Operations | | | Distributions | |
| Net gain (loss) on securities (realized and unrealized) | Total from investment operations | | Dividends from net investment income
|
|
Years ended March 31, unless otherwise noted | Net asset value, beginning of period
| Net investment income (loss) | Distributions from realized gains | Total distributions |
| Balanced - Investor Class | | | | | | | | |
| 2021 | 13.54 | 0.07(a) | 2.86 | 2.93 | | (0.08) | (0.09) | (0.17) |
| 2020 | 13.76 | 0.13(a) | (0.07) | 0.06 | | (0.15) | (0.13) | (0.28) |
| 2019 | 14.20 | 0.14 | 0.66 | 0.80 | | (0.13) | (1.11) | (1.24) |
| 2018 | 13.63 | 0.08 | 0.87 | 0.95 | | (0.05) | (0.33) | (0.38) |
| 2017 | 13.24 | 0.01 | 0.80 | 0.81 | | (0.03) | (0.39) | (0.42) |
| Balanced - Institutional Class |
|
|
|
| |
|
|
|
| 2021 | 13.55 | 0.09(a) | 2.87 | 2.96 | | (0.11) | (0.09) | (0.20) |
2020(b) | 13.75 | 0.16(a) | (0.08) | 0.08 | | (0.15) | (0.13) | (0.28) |
| Core Plus Income - Investor Class |
|
|
|
| |
|
|
|
| 2021 | 10.14 | 0.37(a) | 0.91 | 1.28 | | (0.37) | (0.19) | (0.56) |
| 2020 | 10.31 | 0.30(a) | (0.16) | 0.14 | | (0.29) | (0.02) | (0.31) |
| 2019 | 10.09 | 0.27(a) | 0.21 | 0.48 | | (0.26) | — | (0.26) |
| 2018 | 10.23 | 0.23(a) | (0.12) | 0.11 | | (0.22) | (0.03) | (0.25) |
| 2017 | 10.15 | 0.23(a) | 0.21 | 0.44 | | (0.23) | (0.13) | (0.36) |
| Core Plus Income - Institutional Class |
|
|
|
| |
|
|
|
| 2021 | 10.15 | 0.38(a) | 0.91 | 1.29 | | (0.38) | (0.19) | (0.57) |
| 2020 | 10.32 | 0.32(a) | (0.16) | 0.16 | | (0.31) | (0.02) | (0.33) |
| 2019 | 10.10 | 0.29(a) | 0.21 | 0.50 | | (0.28) | — | (0.28) |
| 2018 | 10.23 | 0.25(a) | (0.11) | 0.14 | | (0.24) | (0.03) | (0.27) |
| 2017 | 10.15 | 0.25(a) | 0.21 | 0.46 | | (0.25) | (0.13) | (0.38) |
| Hickory |
|
|
|
| |
|
|
|
| 2021 | 38.80 | (0.13) | 22.42 | 22.29 | | — | (4.41) | (4.41) |
| 2020 | 46.86 | (0.28) | (6.82) | (7.10) | | — | (0.96) | (0.96) |
| 2019 | 51.58 | (0.05) | 0.71 | 0.66 | | — | (5.38) | (5.38) |
| 2018 | 53.11 | (0.37) | 1.55 | 1.18 | | — | (2.71) | (2.71) |
| 2017 | 47.59 | (0.25) | 5.77 | 5.52 | | — | — | — |
| Nebraska Tax-Free Income |
|
|
|
| |
|
|
|
| 2021 | 10.07 | 0.16 | 0.11 | 0.27 | | (0.16) | — | (0.16) |
| 2020 | 9.95 | 0.13 | 0.12 | 0.25 | | (0.13) | — | (0.13) |
| 2019 | 9.76 | 0.14 | 0.19 | 0.33 | | (0.14) | — | (0.14) |
| 2018 | 9.90 | 0.14 | (0.15) | (0.01) | | (0.13) | — | (0.13) |
| 2017 | 10.12 | 0.17 | (0.22) | (0.05) | | (0.17) | — | (0.17) |
| Partners III Opportunity - Investor Class |
|
|
|
| |
|
|
|
| 2021 | 12.84 | (0.16)(a) | 4.92 | 4.76 | | — | (1.93) | (1.93) |
| 2020 | 14.67 | (0.20)(a) | (0.59) | (0.79) | | — | (1.04) | (1.04) |
| 2019 | 14.28 | (0.17)(a) | 1.58 | 1.41 | | — | (1.02) | (1.02) |
| 2018 | 14.74 | (0.19)(a) | 0.40 | 0.21 | | — | (0.67) | (0.67) |
| 2017 | 13.73 | (0.20)(a) | 1.40 | 1.20 | | — | (0.19) | (0.19) |
| Partners III Opportunity - Institutional Class |
|
|
|
| |
|
|
|
| 2021 | 13.43 | (0.07)(a) | 5.17 | 5.10 | | — | (1.93) | (1.93) |
| 2020 | 15.21 | (0.11)(a) | (0.63) | (0.74) | | — | (1.04) | (1.04) |
| 2019 | 14.69 | (0.09)(a) | 1.63 | 1.54 | | — | (1.02) | (1.02) |
| 2018 | 15.07 | (0.12)(a) | 0.41 | 0.29 | | — | (0.67) | (0.67) |
| 2017 | 13.96 | (0.13)(a) | 1.43 | 1.30 | | — | (0.19) | (0.19) |
(a) | Based on average daily shares outstanding |
(b) | Initial offering of shares on March 29, 2019 |
(c) | Included in the expense ratio is 0.07%, 0.00%, 0.00%, 0.00% and 0.08% related to interest expense and 0.23%, 0.29%, 0.40%, 0.47% and 0.54% related to dividend expense on securities sold short for the periods ended March 31, 2021, 2020, 2019, 2018 and 2017, respectively. |
(d) | Included in the expense ratio is 0.07%, 0.00%, 0.00%, 0.00% and 0.08% related to interest expense and 0.23%, 0.28%, 0.40%, 0.47% and 0.55% related to dividend expense on securities sold short for the periods ended March 31, 2021, 2020, 2019, 2018 and 2017, respectively. |
The accompanying notes form an integral part of these financial statements.
Q1 2021 Annual Report 61
| | | | | | | |
| | | Ratios/Supplemental Data | | |
| | | Ratio of expenses | | |
| | | to average net assets | | |
| | Ratio of net
| |
| | investment income | Portfolio |
| Net asset value, | | Net assets, end of | Prior to fee | Net of fee | (loss) to average | turnover |
| end of period | Total Return (%) | period ($000) | waivers (%) | waivers (%) | net assets (%) | rate (%) |
|
| 16.30 | 21.74 | 64,736 | 1.14 | 0.85 | 0.44 | 29 |
| 13.54 | 0.35 | 47,591 | 1.20 | 0.85 | 0.94 | 32 |
| 13.76 | 6.18 | 124,431 | 1.00 | 0.88 | 0.98 | 33 |
| 14.20 | 7.06 | 122,069 | 1.05 | 1.00 | 0.55 | 40 |
| 13.63 | 6.32 | 118,189 | 1.11 | 1.11 | 0.10 | 26 |
| |
| 16.31 | 21.93 | 141,277 | 0.89 | 0.70 | 0.58 | 29 |
| 13.55 | 0.45 | 84,682 | 1.00 | 0.70 | 1.09 | 32 |
| |
| 10.86 | 12.79 | 53,944 | 1.09 | 0.50 | 3.42 | 38 |
| 10.14 | 1.38 | 25,921 | 1.18 | 0.57 | 2.85 | 51 |
| 10.31 | 4.78 | 18,840 | 1.42 | 0.60 | 2.76 | 33 |
| 10.09 | 1.20 | 7,274 | 1.65 | 0.60 | 2.26 | 43 |
| 10.23 | 4.41 | 6,522 | 1.90 | 0.77 | 2.26 | 54 |
| |
| 10.87 | 12.88 | 110,303 | 0.80 | 0.40 | 3.54 | 38 |
| 10.15 | 1.56 | 78,128 | 0.80 | 0.40 | 3.02 | 51 |
| 10.32 | 5.07 | 59,687 | 0.96 | 0.40 | 2.93 | 33 |
| 10.10 | 1.40 | 31,895 | 1.09 | 0.40 | 2.47 | 43 |
| 10.23 | 4.61 | 23,854 | 1.22 | 0.57 | 2.47 | 54 |
| |
| 56.68 | 59.17 | 212,775 | 1.20 | 1.09 | (0.23) | 16 |
| 38.80 | (15.67) | 170,968 | 1.28 | 1.23 | (0.53) | 30 |
| 46.86 | 2.30 | 210,744 | 1.27 | 1.27 | (0.10) | 28 |
| 51.58 | 2.15 | 242,608 | 1.24 | 1.24 | (0.65) | 20 |
| 53.11 | 11.60 | 272,499 | 1.25 | 1.25 | (0.44) | 7 |
| |
| 10.18 | 2.67 | 35,638 | 1.09 | 0.45 | 1.54 | 13 |
| 10.07 | 2.55 | 31,465 | 1.10 | 0.94 | 1.29 | 7 |
| 9.95 | 3.46 | 38,048 | 0.89 | 0.89 | 1.39 | 9 |
| 9.76 | (0.07) | 58,604 | 0.84 | 0.84 | 1.41 | 24 |
| 9.90 | (0.54) | 62,973 | 0.79 | 0.79 | 1.66 | 29 |
| |
| 15.67 | 39.25 | 22,791 | 2.09(c) | 2.09(c) | (1.08) | 23 |
| 12.84 | (6.40) | 19,287 | 2.04(c) | 2.04(c) | (1.29) | 32 |
| 14.67 | 10.63 | 21,881 | 2.13(c) | 2.13(c) | (1.23) | 38 |
| 14.28 | 1.49 | 24,808 | 2.14(c) | 2.14(c) | (1.30) | 31 |
| 14.74 | 8.94 | 28,561 | 2.29(c) | 2.29(c) | (1.43) | 23 |
| |
| |
| 16.60 | 40.11 | 592,471 | 1.46(d) | 1.46(d) | (0.46) | 23 |
| 13.43 | (5.83) | 541,433 | 1.44(d) | 1.44(d) | (0.69) | 32 |
| 15.21 | 11.25 | 616,621 | 1.56(d) | 1.56(d) | (0.66) | 38 |
| 14.69 | 2.01 | 629,034 | 1.63(d) | 1.63(d) | (0.79) | 31 |
| 15.07 | 9.52 | 661,165 | 1.80(d) | 1.80(d) | (0.93) | 23 |
The accompanying notes form an integral part of these financial statements.
62 Q1 2021 Annual Report
FINANCIAL HIGHLIGHTS (CONTINUED)
The following financial information provides selected data, in U.S. dollars, for a share outstanding throughout the periods indicated.
|
|
|
| Income (loss) from Investment Operations | |
| Distributions |
|
|
| |
|
| Net gain (loss) on securities (realized and unrealized) | Total from investment operations | | Dividends from net investment income | Distributions from realized gains |
|
| Net asset value, beginning of period | Net investment income (loss) | Total distributions |
Years ended March 31, unless otherwise noted |
| Partners Value - Investor Class |
|
|
|
| |
|
|
|
| 2021 | 23.32 | (0.28)(a) | 13.30 | 13.02 | | — | (3.33) | (3.33) |
| 2020 | 29.45 | (0.09)(a) | (3.80) | (3.89) | | — | (2.24) | (2.24) |
| 2019 | 31.31 | (0.12)(a) | 0.63 | 0.51 | | — | (2.37) | (2.37) |
| 2018 | 30.72 | (0.15)(a) | 1.47 | 1.32 | | — | (0.73) | (0.73) |
| 2017 | 27.66 | (0.09)(a) | 3.15 | 3.06 | | — | — | — |
| Partners Value - Institutional Class |
|
|
|
| |
|
|
|
| 2021 | 23.70 | (0.23)(a) | 13.53 | 13.30 | | — | (3.33) | (3.33) |
| 2020 | 29.82 | (0.01)(a) | (3.87) | (3.88) | | — | (2.24) | (2.24) |
| 2019 | 31.59 | (0.04)(a) | 0.64 | 0.60 | | — | (2.37) | (2.37) |
| 2018 | 30.91 | (0.06)(a) | 1.47 | 1.41 | | — | (0.73) | (0.73) |
| 2017 | 27.75 | (0.02)(a) | 3.18 | 3.16 | | — | — | — |
| Short Duration Income - Investor Class |
|
|
|
| |
|
|
|
| 2021 | 11.93 | 0.27(a) | 0.48 | 0.75 | | (0.29) | (0.02) | (0.31) |
| 2020 | 12.17 | 0.27(a) | (0.23) | 0.04 | | (0.28) | — | (0.28) |
| 2019 | 12.09 | 0.26(a) | 0.09 | 0.35 | | (0.27) | — | (0.27) |
| 2018 | 12.27 | 0.23(a) | (0.18) | 0.05 | | (0.23) | — | (0.23) |
| 2017 | 12.28 | 0.23(a) | 0.04 | 0.27 | | (0.24)(c) | (0.04) | (0.28) |
| Short Duration Income - Institutional Class |
|
|
|
| |
|
|
|
| 2021 | 11.95 | 0.28(a) | 0.47 | 0.75 | | (0.29) | (0.02) | (0.31) |
| 2020 | 12.19 | 0.29(a) | (0.23) | 0.06 | | (0.30) | — | (0.30) |
| 2019 | 12.11 | 0.29(a) | 0.09 | 0.38 | | (0.30) | — | (0.30) |
| 2018 | 12.29 | 0.26(a) | (0.18) | 0.08 | | (0.26) | — | (0.26) |
| 2017 | 12.30 | 0.26(a) | 0.04 | 0.30 | | (0.27)(c) | (0.04) | (0.31) |
| Ultra Short Government |
|
|
|
| |
|
|
|
| 2021 | 10.03 | 0.06 | (0.03) | 0.03 | | (0.06) | —# | (0.06) |
| 2020 | 10.01 | 0.21 | 0.03 | 0.24 | | (0.21) | (0.01) | (0.22) |
| 2019 | 10.00 | 0.20 | 0.01 | 0.21 | | (0.20) | — | (0.20) |
| 2018 | 10.00 | 0.09 | —# | 0.09 | | (0.09) | — | (0.09) |
2017(b) | 10.00 | 0.03 | —# | 0.03 | | (0.03) | — | (0.03) |
| Value - Investor Class |
|
|
|
| |
|
|
|
| 2021 | 37.98 | (0.21)(a) | 21.14 | 20.93 | | — | (4.61) | (4.61) |
| 2020 | 42.31 | (0.15)(a) | (1.98) | (2.13) | | — | (2.20) | (2.20) |
| 2019 | 42.92 | (0.19)(a) | 3.60 | 3.41 | | — | (4.02) | (4.02) |
| 2018 | 42.20 | (0.18)(a) | 3.96 | 3.78 | | — | (3.06) | (3.06) |
| 2017 | 38.43 | (0.16)(a) | 3.93 | 3.77 | | — | — | — |
| Value - Institutional Class |
|
|
|
| |
|
|
|
| 2021 | 38.55 | (0.11)(a) | 21.48 | 21.37 | | — | (4.61) | (4.61) |
| 2020 | 42.82 | (0.05)(a) | (2.02) | (2.07) | | — | (2.20) | (2.20) |
| 2019 | 43.29 | (0.09)(a) | 3.64 | 3.55 | | — | (4.02) | (4.02) |
| 2018 | 42.44 | (0.09)(a) | 4.00 | 3.91 | | — | (3.06) | (3.06) |
| 2017 | 38.56 | (0.08)(a) | 3.96 | 3.88 | | — | — | — |
#
| Amount less than $0.01 |
(a) | Based on average daily shares outstanding |
(b) | Prior to December 16, 2016, this Fund was known as the Government Money Market Fund. Per share amounts have been adjusted to reflect a 1-for-10 reverse split, which was effective December 16, 2016. In addition, on December 16, 2016, the Fund changed from a constant $1.00 net asset value per share money market fund to an ultra short government fund (that is not a money market fund). |
(c) | Includes a return of capital distribution of less than $0.01. |
The accompanying notes form an integral part of these financial statements.
Q1 2021 Annual Report 63
| | | Ratios/Supplemental Data | | |
| | | Ratio of expenses | | |
| | | to average net assets | | |
| | Ratio of net |
|
| | investment income | Portfolio |
| Net asset value, |
| Net assets, end of | Prior to fee | Net of fee | (loss) to average | turnover |
| end of period | Total Return (%) | period ($000) | waivers (%) | waivers (%) | net assets (%) | rate (%) |
| |
| 33.01 | 58.17 | 231,482 | 1.18 | 1.09 | (0.97) | 7 |
| 23.32 | (14.82) | 183,718 | 1.29 | 1.24 | (0.31) | 26 |
| 29.45 | 2.50 | 265,250 | 1.27 | 1.27 | (0.39) | 38 |
| 31.31 | 4.28 | 328,648 | 1.25 | 1.25 | (0.46) | 12 |
| 30.72 | 11.06 | 429,226 | 1.27 | 1.24 | (0.33) | 16 |
| |
| 33.67 | 58.43 | 277,133 | 0.99 | 0.89 | (0.77) | 7 |
| 23.70 | (14.59) | 216,400 | 1.08 | 0.97 | (0.04) | 26 |
| 29.82 | 2.78 | 322,558 | 1.07 | 0.99 | (0.12) | 38 |
| 31.59 | 4.55 | 331,474 | 1.07 | 0.99 | (0.20) | 12 |
| 30.91 | 11.39 | 309,497 | 1.07 | 0.99 | (0.08) | 16 |
| |
| 12.37 | 6.29 | 36,857 | 1.02 | 0.55 | 2.23 | 45 |
| 11.93 | 0.26 | 60,845 | 0.95 | 0.65 | 2.20 | 51 |
| 12.17 | 2.95 | 71,002 | 0.92 | 0.68 | 2.17 | 23 |
| 12.09 | 0.44 | 113,238 | 0.91 | 0.68 | 1.93 | 34 |
| 12.27 | 2.15 | 94,817 | 0.93 | 0.80 | 1.85 | 38 |
| |
| 12.39 | 6.32 | 658,216 | 0.65 | 0.48 | 2.27 | 45 |
| 11.95 | 0.44 | 675,245 | 0.64 | 0.48 | 2.37 | 51 |
| 12.19 | 3.18 | 828,697 | 0.63 | 0.48 | 2.37 | 23 |
| 12.11 | 0.63 | 1,017,962 | 0.62 | 0.48 | 2.12 | 34 |
| 12.29 | 2.38 | 1,103,272 | 0.62 | 0.58 | 2.07 | 38 |
| |
| 10.00 | 0.29 | 79,937 | 0.69 | 0.17 | 0.53 | 138 |
| 10.03 | 2.44 | 72,102 | 0.71 | 0.20 | 2.18 | 46 |
| 10.01 | 2.17 | 97,444 | 0.61 | 0.20 | 2.05 | 148 |
| 10.00 | 0.94 | 104,162 | 0.60 | 0.20 | 0.94 | 25 |
| 10.00 | 0.25 | 98,029 | 0.66 | 0.14 | 0.25 | — |
| |
| 54.30 | 56.97 | 616,462 | 1.11 | 1.09 | (0.43) | 14 |
| 37.98 | (5.77) | 448,259 | 1.24 | 1.20 | (0.33) | 16 |
| 42.31 | 9.04 | 541,168 | 1.23 | 1.23 | (0.46) | 32 |
| 42.92 | 9.23 | 578,345 | 1.22 | 1.22 | (0.42) | 15 |
| 42.20 | 9.81 | 638,993 | 1.24 | 1.22 | (0.42) | 24 |
| |
| 55.31 | 57.28 | 311,177 | 0.97 | 0.89 | (0.23) | 14 |
| 38.55 | (5.55) | 210,729 | 1.09 | 0.97 | (0.10) | 16 |
| 42.82 | 9.32 | 227,580 | 1.08 | 0.99 | (0.22) | 32 |
| 43.29 | 9.46 | 207,059 | 1.09 | 0.99 | (0.20) | 15 |
| 42.44 | 10.06 | 191,299 | 1.10 | 0.99 | (0.19) | 24 |
The accompanying notes form an integral part of these financial statements.
64 Q1 2021 Annual Report
NOTES TO FINANCIAL STATEMENTS
March 31, 2021
(1) Organization
The Weitz Funds (the “Trust”) is registered under the Investment Company Act of 1940 (the “’40 Act”) as an open-end management investment company issuing shares in series, each series representing a distinct portfolio with its own investment objectives and policies. At March 31, 2021, the Trust had nine series in operation: Balanced Fund, Core Plus Income Fund, Hickory Fund, Nebraska Tax-Free Income Fund, Partners III Opportunity Fund, Partners Value Fund, Short Duration Income Fund, Ultra Short Government Fund and Value Fund (individually, a “Fund”, collectively, the “Funds”).
On March 29, 2019, the Balanced Fund divided their outstanding shares whereby the shares held in accounts with balances exceeding $1.0 million were designated Institutional Class shares. All remaining shares, that were not designated as new Institutional Class shares, were renamed Investor Class shares.
Currently, the Balanced, Core Plus Income, Partners III Opportunity, Partners Value, Short Duration Income and Value Funds each offer two classes of shares: Institutional Class and Investor Class shares. Each class of shares has identical rights and privileges, except with respect to certain class specific expenses such as administration and shareholder servicing fees, voting rights on matters affecting a single class of shares and exchange privileges. Income, realized and unrealized gains and losses, and expenses of the Funds not directly attributable to a specific class of shares are allocated to the two classes on the basis of daily net assets of each class. Fees and expenses relating to a specific class are charged directly to that share class. All other Funds offer one class of shares.
The investment objective of the Hickory, Partners III Opportunity, Partners Value and Value Funds (the “Weitz Equity Funds”) is capital appreciation.
The investment objectives of the Balanced Fund are long-term capital appreciation, capital preservation and current income.
The investment objectives of the Core Plus Income Fund are current income and capital preservation.
The investment objective of the Nebraska Tax-Free Income Fund is current income that is exempt from both federal and Nebraska personal income taxes, consistent with the preservation of capital.
The investment objective of the Short Duration Income Fund is current income consistent with the preservation of capital.
Effective December 16, 2016, the Government Money Market Fund’s name was changed to the Ultra Short Government Fund and the Fund ceased operating as a “money market fund” pursuant to Rule 2a-7 of the ’40 Act. While the Ultra Short Government Fund’s investment strategy changed, its investment objective remained the same, which is current income consistent with the preservation of capital and maintenance of liquidity.
Investment strategies and risk factors of each Fund are discussed in the Funds’ Prospectus.
(2) Significant Accounting Policies
The Funds are investment companies and apply the accounting and reporting guidance of the Financial Accounting Standards Board (“FASB”) Accounting Standards Codification Topic 946 Financial Services – Investment Companies. The following accounting policies are in accordance with accounting principles generally accepted in the United States.
(a) Valuation of Investments
Investments are carried at fair value determined using the following valuation methods:
• Securities traded on a national or regional securities exchange are valued at the last sales price; if there were no sales on that day, securities are valued at the mean between the latest available and representative bid and ask prices; securities listed on the NASDAQ exchange are valued using the NASDAQ Official Closing Price (“NOCP”). Generally, the NOCP will be the last sales price unless the reported trade for the security is outside the range of the bid/ask price. In such cases, the NOCP will be normalized to the nearer of the bid or ask price.
• Short sales traded on a national or regional securities exchange are valued at the last sales price; if there were no sales on that day, short sales are valued at the mean between the latest available and representative bid and ask prices.
• Securities not listed on an exchange are valued at the mean between the latest available and representative bid and ask prices, if available.
• The value of certain debt securities for which market quotations are not readily available may be based upon current market prices of securities that are comparable in coupon, rating and maturity or an appropriate matrix utilizing similar factors.
• The value of a traded option is the last sales price at which such option is traded or, in the absence of a sale on or about the close of the exchange, the mean of the closing bid and ask prices.
• Money market funds are valued at the quoted net asset value.
• The value of securities for which market quotations are not readily available or are deemed unreliable, including restricted and not readily marketable securities, is determined in good faith in accordance with procedures approved by the Trust’s Board of Trustees. Such valuation procedures and methods for valuing securities may include, but are not limited to: multiple of earnings, multiple of book value, discount from value of a similar freely-traded security, purchase price, private transaction in the security or related securities, the nature and duration of restrictions on disposition of the security and a combination of these and other factors.
The Trust has established a Pricing Committee, composed of officers and employees of Weitz Investment Management, Inc., to supervise the daily valuation process. The Board of Trustees has also established a Valuation Committee, composed of the independent Trustees, to oversee the Pricing Committee and the valuation process. The Pricing Committee provides oversight of the approved procedures, evaluates the effectiveness of the pricing policies and reports to the Valuation Committee of the Board of Trustees. When determining the reliability of third party pricing information, the Pricing Committee, among other things, monitors the daily change in prices and reviews transactions among market participants.
(b) Option Transactions
The Funds, except for the Ultra Short Government Fund, may purchase put or call options. When a Fund purchases an option, an amount equal to the premium paid is recorded as an asset and is subsequently marked-to-market daily. Premiums paid for purchasing options that expire unexercised are recognized on the expiration date as realized losses. If an option is exercised, the premium paid is subtracted from the proceeds of the sale or added to the cost of the purchase to determine whether a Fund has realized a gain or loss on the related investment transaction. When a Fund enters into a closing transaction, a Fund realizes a gain or loss depending upon whether the amount from the closing transaction is greater or less than the premium paid.
Q1 2021 Annual Report 65
The Funds, except for the Ultra Short Government Fund, may write put or call options. When a Fund writes an option, an amount equal to the premium received is recorded as a liability and is subsequently marked-to-market daily. Premiums received for writing options that expire unexercised are recognized on the expiration date as realized gains. If an option is exercised, the premium received is subtracted from the cost of the purchase or added to the proceeds of the sale to determine whether a Fund has realized a gain or loss on the related investment transaction. When a Fund enters into a closing transaction, a Fund realizes a gain or loss depending upon whether the amount from the closing transaction is greater or less than the premium received.
The Funds attempt to limit market risk and enhance their income by writing (selling) covered call options. The risk in writing a covered call option is that a Fund gives up the opportunity of profit if the market price of the financial instrument increases. A Fund also has the additional risk of not being able to enter into a closing transaction if a liquid secondary market does not exist. The risk in writing a put option is that a Fund is obligated to purchase the financial instrument underlying the option at prices which may be significantly different than the current market price.
(c) Securities Sold Short
The Funds, except for the Ultra Short Government Fund, may engage in selling securities short, which obligates a Fund to replace a security borrowed by purchasing the same security at the current market value. A Fund incurs a loss if the price of the security increases between the date of the short sale and the date on which the Fund replaces the borrowed security. A Fund realizes a gain if the price of the security declines between those dates.
(d) Federal Income Taxes
It is the policy of each Fund to comply with all sections of the Internal Revenue Code applicable to regulated investment companies and to distribute all of its taxable income to shareholders; therefore, no provision for income or excise taxes is required.
Net investment income and net realized gains may differ for financial statement and tax purposes. The character of distributions made during the year from net investment income or net realized gains may differ from their ultimate characterization for federal income tax purposes. Also, due to the timing of dividend distributions, the fiscal year in which amounts are distributed may differ from the year that the income or realized gains were recorded by the Funds.
The Funds have reviewed their tax positions taken on federal income tax returns, for each of the three open tax years and as of March 31, 2021, and have determined that no provisions for income taxes are required in the Funds’ financial statements.
The following permanent differences between net asset components for financial reporting and tax purposes were reclassified at the end of the fiscal year (in U.S. dollars):
|
| Partners III | Partners |
| Hickory | Opportunity | Value |
Paid-in capital | (352,974) | (2,304,206) | (3,449,712) |
Accumulated undistributed net investment income | 352,974 | 2,304,206 | 3,702,512 |
Accumulated net realized gain (loss) | — | — | (252,800) |
The differences are primarily due to net operating losses and principal paydown adjustments. These reclassifications have no impact on the net asset value of the Funds.
(e) Securities Transactions
Securities transactions are accounted for on the date the securities are purchased or sold (trade date). Realized gains or losses are determined by specifically identifying the security sold.
Income dividends less foreign tax withholding (if any), dividends on short positions and distributions to shareholders are recorded on the ex-dividend date. Interest, including amortization of discount or premium, is accrued as earned.
(f) Dividend Policy
The Funds declare and distribute income dividends and capital gains distributions as may be required to qualify as a regulated investment company under the Internal Revenue Code.
Generally, the Core Plus Income, Nebraska Tax-Free Income and Short Duration Income Funds pay income dividends on a quarterly basis. The Ultra Short Government Fund declares dividends daily and pays dividends monthly. All dividends and distributions are reinvested automatically, unless the shareholder elects otherwise.
(g) Other
Expenses that are directly related to a Fund are charged directly to that Fund. Other operating expenses of the Trust are prorated to each Fund on the basis of relative net assets or another appropriate basis. Income, realized and unrealized gains and losses and expenses (other than class specific expenses) are allocated to each class of shares based on its relative net assets, except that each class separately bears expenses related specifically to that class, such as administration, shareholder servicing fees, transfer agent fees and registration fees.
(h) Use of Estimates
The preparation of financial statements in conformity with accounting principles generally accepted in the United States requires management to make estimates and assumptions that affect the reported amounts of assets and liabilities and disclosure of contingent assets and liabilities at the date of the financial statements and the reported amounts of increase and decrease in net assets from operations during the period. Actual results could differ from those estimates.
66 Q1 2021 Annual Report
| (3) Fund Share Transactions | | | | |
|
| Year Ended March 31, 2021 | Year Ended March 31, 2020 |
| Shares | $ Amount | Shares | $ Amount |
| Balanced - Investor Class |
|
|
|
|
| Sales | 1,697,889 | 25,475,094 | 1,287,713 | 18,333,781 |
| Redemptions | (1,283,914) | (19,264,627) | (912,588) | (13,043,269) |
| Reinvestment of distributions | 42,252 | 642,343 | 64,399 | 940,258 |
| Net increase (decrease) | 456,227 | 6,852,810 | 439,524 | 6,230,770 |
| |
| Balanced - Institutional Class |
|
|
|
|
| Sales | 3,043,994 | 45,148,998 | 366,767 | 5,261,344 |
| Redemptions | (733,631) | (11,088,329) | (206,534) | (2,942,106) |
| Reinvestment of distributions | 101,839 | 1,550,275 | 116,803 | 1,704,967 |
| Net increase (decrease) | 2,412,202 | 35,610,944 | 277,036 | 4,024,205 |
|
| Core Plus Income - Investor Class |
|
|
|
|
| Sales | 3,143,566 | 34,328,594 | 1,588,065 | 16,669,695 |
| Redemptions | (903,433) | (9,810,202) | (936,110) | (9,813,102) |
| Reinvestment of distributions | 170,620 | 1,856,032 | 76,532 | 795,622 |
| Net increase (decrease) | 2,410,753 | 26,374,424 | 728,487 | 7,652,215 |
|
| Core Plus Income - Institutional Class |
|
|
|
|
| Sales | 3,216,543 | 35,191,273 | 2,792,619 | 29,278,210 |
| Redemptions | (1,189,786) | (12,840,947) | (1,113,942) | (11,667,490) |
| Reinvestment of distributions | 424,251 | 4,613,502 | 235,421 | 2,447,602 |
| Net increase (decrease) | 2,451,008 | 26,963,828 | 1,914,098 | 20,058,322 |
|
| Hickory |
|
|
|
|
| Sales | 80,791 | 3,877,078 | 628,112 | 31,374,951 |
| Redemptions | (1,012,267) | (46,086,957) | (795,574) | (38,508,451) |
| Reinvestment of distributions | 278,506 | 14,014,367 | 76,852 | 4,002,010 |
| Net increase (decrease) | (652,970) | (28,195,512) | (90,610) | (3,131,490) |
|
| Nebraska Tax-Free Income |
|
|
|
|
| Sales | 576,188 | 5,895,791 | 192,535 | 1,944,756 |
| Redemptions | (250,964) | (2,569,821) | (910,264) | (9,084,753) |
| Reinvestment of distributions | 50,486 | 516,392 | 16,038 | 160,210 |
| Net increase (decrease) | 375,710 | 3,842,362 | (701,691) | (6,979,787) |
|
| Partners III Opportunity - Investor Class |
|
|
|
|
| Sales | 360,865 | 5,201,533 | 652,358 | 9,799,849 |
| Redemptions | (595,786) | (8,641,471) | (741,127) | (11,192,844) |
| Reinvestment of distributions | 187,205 | 2,650,496 | 98,868 | 1,501,952 |
| Net increase (decrease) | (47,716) | (789,442) | 10,099 | 108,957 |
|
| Partners III Opportunity- Institutional Class |
|
|
|
|
| Sales | 1,431,383 | 21,797,395 | 2,760,610 | 40,113,534 |
| Redemptions | (9,436,984) | (139,664,061) | (5,355,717) | (83,092,780) |
| Reinvestment of distributions | 3,375,291 | 50,644,330 | 2,364,636 | 37,454,812 |
| Net increase (decrease) | (4,630,310) | (67,222,336) | (230,471) | (5,524,434) |
|
| Partners Value - Investor Class |
|
|
|
|
| Sales | 118,014 | 3,432,100 | 133,202 | 3,997,794 |
| Redemptions | (1,732,031) | (49,399,655) | (1,855,096) | (54,544,330) |
| Reinvestment of distributions | 749,370 | 21,762,084 | 593,747 | 17,887,042 |
| Net increase (decrease) | (864,647) | (24,205,471) | (1,128,147) | (32,659,494) |
|
| Partners Value - Institutional Class |
|
|
|
|
| Sales | 108,101 | 3,204,826 | 84,582 | 2,625,636 |
| Redemptions | (1,679,678) | (48,849,233) | (2,366,832) | (64,957,793) |
| Reinvestment of distributions | 669,074 | 19,847,974 | 596,465 | 18,232,707 |
| Net increase (decrease) | (902,503) | (25,796,433) | (1,685,785) | (44,099,450) |
Q1 2021 Annual Report 67
| Year Ended March 31, 2021 | Year Ended March 31, 2020 |
| Shares | $ Amount | Shares | $ Amount |
|
| Short Duration Income - Investor Class |
|
|
|
|
| Sales | 906,992 | 11,210,315 | 1,198,159 | 14,684,019 |
| Redemptions | (3,118,400) | (38,401,761) | (2,061,992) | (25,034,666) |
| Reinvestment of distributions | 90,531 | 1,116,160 | 128,225 | 1,559,400 |
| Net increase (decrease) | (2,120,877) | (26,075,286) | (735,608) | (8,791,247) |
|
| Short Duration Income - Institutional Class | | | | |
| Sales | 16,775,005 | 207,486,700 | 11,407,805 | 140,106,388 |
| Redemptions | (21,518,457) | (265,740,217) | (24,391,319) | (298,463,116) |
| Reinvestment of distributions | 1,333,576 | 16,474,781 | 1,492,259 | 18,180,149 |
| Net increase (decrease) | (3,409,876) | (41,778,736) | (11,491,255) | (140,176,579) |
| |
| Ultra Short Government | | | | |
| Sales | 9,378,206 | 93,878,694 | 5,221,248 | 52,278,882 |
| Redemptions | (8,622,982) | (86,302,970) | (7,929,699) | (79,407,885) |
| Reinvestment of distributions | 44,063 | 441,357 | 160,823 | 1,610,335 |
| Net increase (decrease) | 799,287 | 8,017,081 | (2,547,628) | (25,518,668) |
|
| Value - Investor Class | | | | |
| Sales | 266,343 | 12,968,801 | 553,120 | 24,812,734 |
| Redemptions | (1,734,667) | (83,630,679) | (2,130,290) | (94,898,377) |
| Reinvestment of distributions | 1,019,695 | 48,924,076 | 589,299 | 26,385,493 |
| Net increase (decrease) | (448,629) | (21,737,802) | (987,871) | (43,700,150) |
|
| Value - Institutional Class | | | | |
| Sales | 537,894 | 27,085,280 | 533,699 | 24,167,638 |
| Redemptions | (845,652) | (40,373,047) | (635,757) | (28,294,845) |
| Reinvestment of distributions | 467,777 | 22,916,601 | 253,397 | 11,503,402 |
| Net increase (decrease) | 160,019 | 9,628,834 | 151,339 | 7,376,195 |
4) Related Party Transactions
Each Fund has retained Weitz Investment Management, Inc. (the “Adviser”) as its investment adviser. In addition, the Trust has an agreement with Weitz Securities, Inc. (the “Distributor”), a company under common control with the Adviser, to act as distributor for shares of the Trust. Certain officers of the Trust are also officers and directors of the Adviser and the Distributor.
Under the terms of management and investment advisory agreements, the Adviser is paid a monthly fee based on average daily net assets. The annual investment advisory fee schedule for each of the Funds is as follows:
Per the most recent prospectus dated July 31, 2020:
| | | | |
| Greater Than ($) | Less Than or Equal To ($) | Rate (%) |
| Balanced | 0 |
| 0.60 |
| Core Plus Income | 0 |
| 0.40 |
| Hickory | 0 | 5,000,000,000 | 0.85 |
| 5,000,000,000 |
| 0.80 |
| Nebraska Tax-Free Income | 0 |
| 0.40 |
| Partners III Opportunity | 0 | 1,000,000,000 | 1.00 |
| 1,000,000,000 | 2,000,000,000 | 0.95 |
| 2,000,000,000 | 3,000,000,000 | 0.90 |
| 3,000,000,000 | 5,000,000,000 | 0.85 |
| 5,000,000,000 |
| 0.80 |
| Partners Value | 0 | 5,000,000,000 | 0.75 |
| 5,000,000,000 |
| 0.70 |
| Short Duration Income | 0 |
| 0.40 |
| Ultra Short Government | 0 |
| 0.30 |
| Value | 0 | 5,000,000,000 | 0.75 |
| 5,000,000,000 |
| 0.70 |
Prior to July 31, 2020, the following funds had a different annual investment advisory fee schedule as shown below:
| Greater Than ($) | Less Than or Equal To ($) | Rate (%) |
| Balanced | 0 |
| 0.65 |
| Hickory | 0 | 2,500,000,000 | 1.00 |
| 2,500,000,000 | 5,000,000,000 | 0.90 |
| 5,000,000,000 |
| 0.80 |
|
| Partners Value | 0 | 1,000,000,000 | 0.90 |
| 1,000,000,000 | 2,000,000,000 | 0.85 |
| 2,000,000,000 | 3,000,000,000 | 0.80 |
| 3,000,000,000 | 5,000,000,000 | 0.75 |
| 5,000,000,000 |
| 0.70 |
|
| Value | 0 | 1,000,000,000 | 0.90 |
| 1,000,000,000 | 2,000,000,000 | 0.85 |
| 2,000,000,000 | 3,000,000,000 | 0.80 |
| 3,000,000,000 | 5,000,000,000 | 0.75 |
| 5,000,000,000 |
| 0.70 |
The Adviser also provides administrative services, including shareholder administrative services, to each Fund pursuant to agreements which provide that the Funds will pay the Adviser a monthly fee based on the average daily net assets of each respective Fund and/or a fee per account, plus third party expenses directly related to providing such services.
68 Q1 2021 Annual Report
The Adviser pays all direct operating expenses of the Funds and is subsequently reimbursed by the Funds. Any amounts outstanding are included in the amounts shown on the Statements of Assets and Liabilities as “Due to Adviser.” The amount listed under “Due to Adviser” is net of any expenses waived/reimbursed by the Adviser. Through July 31, 2021, the Adviser has agreed in writing to reimburse or to pay directly a portion of the Funds’ expenses to limit the net annual operating expense ratio (excluding taxes, interest, brokerage costs, acquired fund fees and expenses and extraordinary expenses). The current expense caps and dollar amount of expenses reimbursed during the year ended March 31, 2021, are as follows:
| | | Annual Operating Expense Ratio Cap* | | | |
|
|
|
| Nebraska |
| Short |
|
|
|
| Core Plus |
| Tax-Free | Partners | Duration | Ultra Short |
|
| Balanced | Income | Hickory | Income | Value | Income | Government | Value |
| Annual Operating Expense Cap: |
|
|
|
|
|
|
|
|
| Investor Class | 0.85% | 0.50% | 1.09% | 0.45% | 1.09% | 0.55% |
| 1.09% |
| Institutional Class | 0.70% | 0.40% |
|
| 0.89% | 0.48% | 0.20%† | 0.89% |
| Expenses Reimbursed by the Adviser: |
|
|
|
|
|
|
|
|
| Investor Class | 167,584 | 215,234 | 201,488 | 216,947 | 189,891 | 212,061 |
| 123,865 |
| Institutional Class | 229,331 | 349,092 |
|
| 254,155 | 1,136,010 | 441,246 | 226,705 |
| * Funds with a single share class are shown with the Investor Class, except for the Ultra Short Government Fund which has been designated Institutional Class. |
| † Effective January 25, 2021, the Adviser voluntarily lowered the Ultra Short Government’s expense cap to 0.10%. |
As of March 31, 2021, the controlling shareholder of the Adviser held shares totaling approximately 28%, 34%, 24%, 53%, 39% and 25% of the Balanced, Core Plus Income, Hickory, Nebraska Tax-Free Income, Partners III Opportunity and Ultra Short Government Funds, respectively.
(5) Distributions to Shareholders and Distributable Earnings
The tax character of distributions paid by the Funds are summarized as follows (in U.S. dollars):
| Year Ended March 31, | Year Ended March 31, | Year Ended March 31, | Year Ended March 31,
|
| Distributions paid from: | 2021 | 2020 | 2021 | 2020 | 2021 | 2020 | 2021 | 2020 |
| Balanced |
| Core Plus Income |
| Hickory | Nebraska Tax-Free Income |
| Ordinary income | 1,476,000 | 2,042,382 | 5,556,107 | 3,138,806 | – | – | 59 | 319 |
| Tax-exempt income | – | – | – | – | – | – | 532,550 | 422,390 |
| Long-term capital gains | 730,378 | 624,841 | 916,700 | 129,612 | 16,261,119 | 4,410,185 | – | – |
| Total distributions | 2,206,378 | 2,667,223 | 6,472,807 | 3,268,418 | 16,261,119 | 4,410,185 | 532,609 | 422,709 |
| |
| Partners III Opportunity | Partners Value | Short Duration Income | Ultra Short Government |
| Ordinary income | – | – | – | – | 17,637,543 | 19,956,398 | 460,852 | 1,667,656 |
| Long-term capital gains | 71,393,801 | 42,794,258 | 51,017,913 | 42,538,410 | 613,577 | – | 480 | – |
| Total distributions | 71,393,801 | 42,794,258 | 51,017,913 | 42,538,410 | 18,251,120 | 19,956,398 | 461,332 | 1,667,656 |
| Value
|
| Long-term capital gains | 75,552,305
| 39,412,630 |
| Total distributions | 75,552,305 | 39,412,630 |
As of March 31, 2021, the components of net assets on a tax basis were as follows (in U.S. dollars):
|
|
|
| Nebraska | Partners III |
| Balanced | Core Plus Income | Hickory | Tax-Free Income | Opportunity |
Cost of investments | 160,896,383 | 160,407,328 | 116,075,856 | 34,366,565 | 232,495,149 |
|
Gross unrealized appreciation | 44,980,247 | 6,172,688 | 97,590,146 | 1,059,212 | 320,622,078 |
Gross unrealized depreciation | (85,289) | (1,014,566) | (888,232) | (44,813) | (45,832,278) |
Net unrealized appreciation (depreciation) | 44,894,958 | 5,158,122 | 96,701,914 | 1,014,399 | 274,789,800 |
|
Undistributed ordinary income | 139,578 | 536,082 | – | – | – |
Qualified late year ordinary loss deferral | – | – | (385,765) | – | (1,449,275) |
Undistributed tax-exempt income | – | – | – | 13,165 | – |
Undistributed long-term gains | 1,937,879 | – | 9,633,437 | – | 44,562,847 |
Capital loss carryforwards | – | – | – | (127,046) | – |
Post October capital loss deferral | (1,777) | – | – | – | – |
Paid-in capital | 159,042,398 | 158,553,179 | 106,825,758 | 34,737,521 | 297,358,100 |
Net assets | 206,013,036 | 164,247,383 | 212,775,344 | 35,638,039 | 615,261,472 |
Q1 2021 Annual Report 69
|
|
|
|
|
| Partners | Short Duration | Ultra Short |
|
| Value | Income | Government | Value |
Cost of investments | 263,602,831 | 679,793,605 | 79,525,321 | 456,251,658 |
Gross unrealized appreciation | 250,596,495 | 13,665,218 | 42,587 | 472,124,220 |
Gross unrealized depreciation | (5,143,258) | (650,999) | (2,895) | – |
Net unrealized appreciation (depreciation) | 245,453,237 | 13,014,219 | 39,692 | 472,124,220 |
Undistributed ordinary income | – | 428,324 | 11,327 | 393,177 |
Qualified late year ordinary loss deferral | (808,250) | – | – | – |
Other temporary differences | – | – | (220) | – |
Undistributed long-term gains | 21,798,306 | 57,527 | – | 37,602,351 |
Post October capital loss deferral | – | – | (5,255) | – |
Paid-in capital | 242,170,973 | 681,573,269 | 79,891,938 | 417,518,551 |
Net assets | 508,614,266 | 695,073,339 | 79,937,482 | 927,638,299 |
The Hickory, Partners III Opportunity and Partners Value Funds elected to defer ordinary losses arising after December 31, 2020. Such losses are treated for tax purposes as arising on April 1, 2021.
The Balanced and Ultra Short Government Funds elected to defer realized capital losses arising after October 31, 2020. Such losses are treated for tax purposes as arising on April 1, 2021.
Capital loss carryforwards represent tax basis capital losses that may be carried over to offset future realized capital gains, if any. To the extent that carryforwards are used, no capital gains distributions will be made. During the fiscal year, the Funds utilized capital loss carryforwards to offset realized capital gains. The character and utilization of the carryforwards are as follows (in U.S. Dollars):
| Nebraska Tax-Free |
| Income |
Long term (no expiration) | (127,046) |
Capital loss carryforwards utilized | 7,108 |
(6) Securities Transactions
Purchases and proceeds from maturities or sales of investment securities of the Funds for the year ended March 31, 2021, excluding short-term securities and U.S. government obligations, are summarized as follows (in U.S. dollars):
|
|
|
|
|
|
|
|
|
|
|
|
|
| Nebraska |
|
| Short |
|
|
|
| Core Plus |
| Tax-Free | Partners III | Partners | Duration | Ultra Short |
|
| Balanced | Income | Hickory | Income | Opportunity | Value | Income | Government | Value |
Purchases | 41,119,981 | 63,564,562 | 28,370,205 | 7,591,420 | 121,416,941 | 30,366,563 | 291,310,390 | 17,796,735 | 107,489,035 |
Proceeds | 28,387,132 | 43,511,480 | 75,531,007 | 4,190,000 | 277,137,719 | 138,031,972 | 364,313,885 | 14,099,543 | 195,556,043 |
(a) Options Written
The locations in the Statements of Assets and Liabilities as of March 31, 2021, of the Funds’ derivative positions, none of which are designated as hedging instruments, are as follows (in U.S. dollars):
| | | | | Average | Gross |
| | | Fair Value of | Month-End | Notional Amount |
| Fund | Type of Derivative | Location | Asset Derivatives | Liability Derivatives | Notional Amount | Outstanding |
Partners III Opportunity | Call options written | Options written, at value | — | (2,301,000) | 5,383,333 | 20,500,000 |
Transactions in derivative instruments during the year ended March 31, 2021, are recorded in the following locations in the Statements of Operations (in U.S. dollars):
| | | Realized | | Change in |
| Fund | Type of Derivative | Location | Gain (Loss) | Location | Unrealized Gain (Loss) |
Partners III Opportunity | Call options written | Net realized gain (loss) - options written | 301,556 | Net unrealized appreciation (depreciation) - options written | (290,657) |
(7) Affiliated Issuers
Affiliated issuers, as defined under the Investment Company Act of 1940, are those in which a Fund’s holdings of an issuer represent 5% or more of the outstanding voting securities of the issuer. A summary of each Fund’s holdings in the securities of such issuers is set forth below:
|
| | |
| | | |
|
|
|
|
|
|
|
|
|
|
| Number of Shares Held March 31, 2020 | Gross Additions
| Gross Reductions
| Number of Shares Held March 31, 2021 | Value March 31, 2021 | Dividend Income
| Realized Gain (Loss) | Change in Unrealized Gain (Loss) |
| Partners III Opportunity: | | | | | | | | |
Intelligent Systems Corp. | 1,539,000 | – | (894,000) | 645,000 | $26,386,950 | $ – | $32,173,901 | $(25,226,061) |
(8) Contingencies
Each Fund indemnifies the Trust’s officers and trustees for certain liabilities that might arise from their performance of their duties to each of the Funds. Additionally, in the normal course of business the Funds enter into contracts that contain a variety of representations and warranties and which provide general indemnifications. The Funds’ maximum exposure under these arrangements is unknown, as this would involve future claims that may be made against the Funds that have not yet occurred. However, based on experience, the Funds expect the risk of loss to be remote.
70 Q1 2021 Annual Report
(9) Financial Instruments With Off-Balance Sheet Risks
Option contracts written and securities sold short result in off-balance sheet risk as the Funds’ ultimate obligation to satisfy the terms of the contract or the sale of securities sold short may exceed the amount recognized in the Statements of Assets and Liabilities.
The Funds are required to maintain collateral in a segregated account to provide adequate margin as determined by the broker.
(10) Margin Borrowing Agreement
The Partners III Opportunity Fund has a margin account with its prime broker, Bank of America Merrill Lynch, under which the Fund may borrow against the value of its securities, subject to regulatory limitations. Interest accrues at the federal funds rate plus 0.625% (0.695% at March 31, 2021). Interest is accrued daily and paid monthly. The Partners III Opportunity Fund held a cash balance of $108,967,589, with the broker at March 31, 2021.
The Partners III Opportunity Fund is exposed to credit risk from its prime broker who effects transactions and extends credit pursuant to a prime brokerage agreement. The Adviser attempts to minimize the credit risk by monitoring credit exposure and the creditworthiness of the prime broker.
(11) Concentration of Credit Risk
Approximately 89% of the Nebraska Tax-Free Income Funds’ net assets are in obligations of political subdivisions of the State of Nebraska, which are subject to the credit risk associated with the non-performance of such issuers.
(12) Fair Value Measurements
Various inputs are used in determining the value of the Fund’s investments. These inputs are used in determining the value of the Funds’ investments and are summarized in the following fair value hierarchy:
• Level 1 – quoted prices in active markets for identical securities;
• Level 2 – other significant observable inputs (including quoted prices for similar securities);
• Level 3 – significant unobservable inputs (including the Funds’ own assumptions in determining the fair value of investments).
The inputs or methodology used for valuing securities are not an indication of the risk associated with investing in those securities.
A description of the valuation techniques applied to the Funds’ major categories of assets and liabilities measured at fair value on a recurring basis follows.
• Equity securities and Exchange-traded funds. Securities traded on a national securities exchange (or reported on the NASDAQ national market) are stated at the last reported sales price on the day of valuation. To the extent these securities are actively traded and valuation adjustments are not applied, they are categorized in Level 1 of the fair value hierarchy. Preferred stock and other equities traded on inactive markets or valued by reference to similar instruments are categorized in Level 2.
• Corporate and Municipal bonds. The fair values of corporate and municipal bonds are estimated using various techniques, which may consider recently executed transactions in securities of the issuer or comparable issuers, market price quotations (where observable), bond spreads and fundamental data relating to the issuer. Although most corporate and municipal bonds are categorized in Level 2 of the fair value hierarchy, in instances where lower relative weight is placed on transaction prices, quotations, or similar observable inputs, they are categorized in Level 3.
• Asset-backed securities. The fair values of asset-backed securities (including non-government agency mortgage- backed securities and interest-only securities) are generally estimated based on models that consider the estimated cash flows of each tranche of the entity, a benchmark yield and an estimated tranche specific spread to the benchmark yield based on the unique attributes of the tranche. Certain securities are valued principally using dealer quotations. To the extent the inputs are observable and timely, the values are categorized in Level 2 of the fair value hierarchy; otherwise they are categorized as Level 3.
• U.S. Government securities. U.S. Government securities are normally valued using a model that incorporates market observable data such as reported sales of similar securities, broker quotes, yields, bids, offers and reference data. Certain securities are valued principally using dealer quotations. U.S. Government securities are categorized in Level 1 or Level 2 of the fair value hierarchy depending on the inputs used and market activity levels for specific securities.
• U.S. agency securities. U.S. agency securities are comprised of two main categories consisting of agency issued debt and mortgage-backed securities. Agency issued debt securities are generally valued in a manner similar to U.S. Government securities. Mortgage-backed securities include collateralized mortgage obligations, to-be-announced (TBA) securities and mortgage pass-through certificates. Mortgage-backed securities are generally valued using dealer quotations. Depending on market activity levels and whether quotations or other data are used, these securities are typically categorized in Level 2 of the fair value hierarchy.
• Restricted and/or illiquid securities. Restricted and/or illiquid securities for which quotations are not readily available are valued in accordance with procedures approved by the Trust’s Board of Trustees. Restricted securities issued by publicly traded companies are generally valued at a discount to similar publicly traded securities. Restricted or illiquid securities issued by nonpublic entities are valued by reference to comparable public entities or fundamental data relating to the issuer or both. Depending on the relative significance of valuation inputs, these instruments are classified in either Level 2 or Level 3 of the fair value hierarchy.
• Derivative instruments. Listed derivatives, such as the Funds’ equity option contracts and warrants, that are valued based on closing prices from the exchange or the mean of the closing bid and ask prices are generally categorized in Level 1 or Level 2 of the fair value hierarchy depending on the market activity levels.
The following is a summary of inputs used, in U.S. dollars, as of March 31, 2021, in valuing the Funds’ assets and liabilities carried at fair value. The Schedule of Investments for each Fund provides a detailed breakdown of each category.
Q1 2021 Annual Report 71
| Balanced |
| Level 1 | Level 2 | Level 3 | Total |
| Assets: |
|
|
|
|
Investments in Securities: |
|
|
|
|
Common Stocks | 91,792,965 | – | – | 91,792,965 |
Non-Convertible Preferred Stocks | 3,557,750 | – | – | 3,557,750 |
Corporate Bonds | – | 8,083,991 | – | 8,083,991 |
Corporate Convertible Bonds | – | 1,988,263 | – | 1,988,263 |
Asset-Backed Securities | – | 14,909,267 | – | 14,909,267 |
Commercial Mortgage-Backed | – | 869,144 | – | 869,144 |
Securities |
|
|
|
|
Mortgage-Backed Securities | – | 6,688,158 | – | 6,688,158 |
U.S. Treasury | – | 54,120,497 | – | 54,120,497 |
Cash Equivalents | 23,781,306 | – | – | 23,781,306 |
Total Investments in Securities | 119,132,021 | 86,659,320 | – | 205,791,341 |
|
| Core Plus Income |
| Level 1 | Level 2 | Level 3 | Total |
| Assets: |
|
|
|
|
Investments in Securities: |
|
|
|
|
Corporate Bonds | – | 54,845,195 | – | 54,845,195 |
Corporate Convertible Bonds | – | 2,048,667 | – | 2,048,667 |
Asset-Backed Securities | – | 41,888,581 | – | 41,888,581 |
Commercial Mortgage-Backed | – | 13,368,192 | – | 13,368,192 |
Securities |
|
|
|
|
Mortgage-Backed Securities | – | 2,159,592 | – | 2,159,592 |
U.S. Treasury | – | 34,018,439 | – | 34,018,439 |
Common Stocks | 281,070 | – | – | 281,070 |
Non-Convertible Preferred Stocks | 2,063,495 | – | – | 2,063,495 |
Cash Equivalents | 14,892,219 | – | – | 14,892,219 |
Total Investments in Securities | 17,236,784 | 148,328,666 | – | 165,565,450 |
|
| Hickory |
| Level 1 | Level 2 | Level 3 | Total |
| Assets: |
|
|
|
|
Investments in Securities: |
|
|
|
|
Common Stocks |
|
|
|
|
| Communication Services | 44,815,823 | 11,156,250 | – | 55,972,073 |
| Other | 135,955,407 | 7,250,000 | – | 143,205,407 |
Non-Convertible Preferred Stocks | 3,557,750 | – | – | 3,557,750 |
Warrants | – | 100,000 | – | 100,000 |
Cash Equivalents | 9,942,540 | – | – | 9,942,540 |
Total Investments in Securities | 194,271,520 | 18,506,250 | – | 212,777,770 |
| | | | | |
| Nebraska Tax-Free Income |
| Level 1 | Level 2 | Level 3 | Total |
| Assets: | | | | |
Investments in Securities: | | | | |
Municipal Bonds | – | 33,143,815 | – | 33,143,815 |
Cash Equivalents | 2,237,149 | – | – | 2,237,149 |
Total Investments in Securities | 2,237,149 | 33,143,815 | – | 35,380,964 |
|
| Partners III Opportunity |
| Level 1 | Level 2 | Level 3 | Total |
| Assets: | | | | |
Investments in Securities: | | | | |
Common Stocks | 554,062,090 | 21,750,000 | – | 575,812,090 |
Non-Convertible Preferred Stocks | 17,788,750 | – | – | 17,788,750 |
Warrants | – | 300,000 | – | 300,000 |
Cash Equivalents | 26,108,809 | – | – | 26,108,809 |
Total Investments in Securities | 597,959,649 | 22,050,000 | – | 620,009,649 |
| Liabilities: | | | | |
Securities Sold Short | (110,423,700) | – | – | (110,423,700) |
Options Written | (2,301,000) | – | – | (2,301,000) |
|
| Partners Value |
| Level 1 | Level 2 | Level 3 | Total |
| Assets: | | | | |
Investments in Securities: | | | | |
Common Stocks | 492,598,659 | – | – | 492,598,659 |
Cash Equivalents | 16,457,409 | – | – | 16,457,409 |
Total Investments in Securities | 509,056,068 | – | – | 509,056,068 |
|
| Short Duration Income |
| Level 1 | Level 2 | Level 3 | Total |
| Assets: | | | | |
Investments in Securities: | | | | |
Corporate Bonds | – | 111,834,819 | – | 111,834,819 |
Corporate Convertible Bonds | – | 19,291,929 | – | 19,291,929 |
Asset-Backed Securities | – | 242,527,570 | – | 242,527,570 |
Commercial Mortgage-Backed | – | 53,729,099 | – | 53,729,099 |
Securities | | | | |
Mortgage-Backed Securities | – | 118,482,805 | – | 118,482,805 |
Taxable Municipal Bonds | – | 750,539 | – | 750,539 |
U.S. Treasury | – | 122,132,563 | – | 122,132,563 |
Common Stocks | 4,268,100 | – | – | 4,268,100 |
Cash Equivalents | 19,790,400 | – | – | 19,790,400 |
Total Investments in Securities | 24,058,500 | 668,749,324 | – | 692,807,824 |
72 Q1 2021 Annual Report
| Ultra Short Government |
| Level 1 | Level 2 | Level 3 | Total |
| Assets: | | | | |
Investments in Securities: | | | | |
Corporate Bonds | – | 502,360 | – | 502,360 |
Asset-Backed Securities | – | 12,256,679 | – | 12,256,679 |
Commercial Mortgage-Backed | – | 1,082,537 | | 1,082,537 |
Securities | | | | |
U.S. Treasury | – | 64,194,911 | – | 64,194,911 |
Cash Equivalents | 1,528,526 | – | – | 1,528,526 |
Total Investments in Securities | 1,528,526 | 78,036,487 | – | 79,565,013 |
|
| Value |
| Level 1 | Level 2 | Level 3 | Total |
| Assets: | | | | |
Investments in Securities: | | | | |
Common Stocks | 901,841,805 | – | – | 901,841,805 |
Cash Equivalents | 26,534,073 | – | – | 26,534,073 |
Total Investments in Securities | 928,375,878 | – | – | 928,375,878 |
During the year ended March 31, 2021, there were no transfers into or out of Level 3.
During the year ended March 31, 2021, there were no assets in which significant unobservable inputs (Level 3) were used.
(13) Subsequent Event
Management has evaluated the impact of all subsequent events on the Funds through the date the financial statements were issued and has determined that there were no subsequent events requiring recognition or disclosure in the financial statements.
(14) Recent Accounting Pronouncements
In March 2020, the FASB issued ASU 2020-04, Reference Rate Reform (Topic 848). The amendments in this update provide optional guidance to ease the potential burden in accounting for (or recognizing the effects of) reference rate reform on financial reporting and are effective for all entities as of March 12, 2020 through December 31, 2022. The Funds are in the process of evaluating the securities that reference LIBOR.
In addition, in January 2021, the FASB issued ASU 2021-01. This ASU made some clarifications regarding derivative instruments that are affected by changes to the interest rates used for discounting, margining or contract price alignment due to the reference rate reform fall within the scope of Topic 848. The ASU is effective upon issuance and can be implemented through December 31, 2022. The Funds are in the process of evaluating the effect of this ASU.
Q1 2021 Annual Report 73
REPORT OF INDEPENDENT REGISTERED PUBLIC ACCOUNTING FIRM
To the Shareholders and the Board of Trustees of The Weitz Funds
Opinion on the Financial Statements
We have audited the accompanying statements of assets and liabilities of The Weitz Funds (the “Trust”) (comprising the Balanced Fund, Core Plus Income Fund, Hickory Fund, Nebraska Tax-Free Income Fund, Partners III Opportunity Fund, Partners Value Fund, Short Duration Income Fund, Ultra Short Government Fund and Value Fund (collectively referred to as the “Funds”)), including the schedules of investments, as of March 31, 2021, and the related statements of operations of the Funds and the statement of cash flows of the Partners III Opportunity Fund for the year then ended, the statements of changes in net assets for each of the two years in the period then ended, the financial highlights for each of the five years in the period then ended and the related notes (collectively referred to as the “financial statements”). In our opinion, the financial statements present fairly, in all material respects, the financial position of each of the Funds comprising The Weitz Funds at March 31, 2021, the results of their operations and the cash flows of Partners III Opportunity Fund for the year then ended, the changes in their net assets for each of the two years in the period then ended and their financial highlights for each of the five years in the period then ended, in conformity with U.S. generally accepted accounting principles.
Basis for Opinion
These financial statements are the responsibility of the Trust’s management. Our responsibility is to express an opinion on each of the Funds’ financial statements based on our audits. We are a public accounting firm registered with the Public Company Accounting Oversight Board (United States) (“PCAOB”) and are required to be independent with respect to the Trust in accordance with the U.S. federal securities laws and the applicable rules and regulations of the Securities and Exchange Commission and the PCAOB.
We conducted our audits in accordance with the standards of the PCAOB. Those standards require that we plan and perform the audit to obtain reasonable assurance about whether the financial statements are free of material misstatement, whether due to error or fraud. The Trust is not required to have, nor were we engaged to perform, an audit of the Trust’s internal control over financial reporting. As part of our audits we are required to obtain an understanding of internal control over financial reporting but not for the purpose of expressing an opinion on the effectiveness of the Trust’s internal control over financial reporting. Accordingly, we express no such opinion.
Our audits included performing procedures to assess the risks of material misstatement of the financial statements, whether due to error or fraud, and performing procedures that respond to those risks. Such procedures included examining, on a test basis, evidence regarding the amounts and disclosures in the financial statements. Our procedures included confirmation of securities owned as of March 31, 2021, by correspondence with the custodian and brokers. Our audits also included evaluating the accounting principles used and significant estimates made by management, as well as evaluating the overall presentation of the financial statements. We believe that our audits provide a reasonable basis for our opinion.
We have served as the auditor of one or more of The Weitz Funds investment companies since 2004.
Minneapolis, MN
May 18, 2021
74 Q1 2021 Annual Report
ACTUAL AND HYPOTHETICAL EXPENSES
FOR COMPARISON PURPOSES
Example
As a shareholder of one or more of the Funds, you incur two types of costs: (1) transaction costs, including any transaction fees that you may be charged if you purchase or redeem your Fund shares through certain financial institutions; and (2) ongoing costs, including management fees and other Fund expenses. This Example is intended to help you understand your ongoing costs (in dollars) of investing in the Funds and to compare these costs with the ongoing costs of investing in other mutual funds. The Example is based on an investment of $1,000 invested at the beginning of the period and held for the entire period from October 1, 2020 through March 31, 2021.
Actual Expenses
The first line for each Fund in the table below provides information about actual account values and actual expenses. You may use the information in this line, together with the amount you invested, to estimate the expenses that you paid over the period. Simply divide your account value by $1,000 (for example, an account value of $8,600 divided by $1,000 = 8.6), then multiply the result by the number in the first line under the heading entitled “Expenses Paid from 10/01/20 –3/31/21” to estimate the expenses you paid on your account during this period.
Hypothetical Example for Comparison Purposes
The second line for each Fund in the table below provides information about hypothetical account values and hypothetical expenses based on the actual expense ratio of each Fund and an assumed rate of return of 5% per year before expenses, which is not the actual return of the Fund. The hypothetical account values and expenses may not be used to estimate the actual ending account balance or expenses you paid for the period. You may use this information to compare the ongoing costs of investing in a specific Weitz Fund to other funds. To do so, compare this 5% hypothetical example with the 5% hypothetical examples that appear in the shareholder reports of the other funds.
Please note that the expenses shown in the table are meant to highlight your ongoing costs only and do not reflect any transactional costs charged by certain financial institutions. Therefore, the second line of the table is useful in comparing ongoing costs only, and will not help you determine the relative total costs of owning different funds. In addition, if you incurred transactional fees, your costs would have been higher. Actual and hypothetical expenses for each Fund are provided in this table.
| | | | | | |
| | Beginning Account | Ending Account | Annualized | Expenses Paid from |
| | Value 10/01/20 | Value 3/31/21 | Expense Ratio | 10/01/20-3/31/21(1) |
Balanced - Investor Class
| Actual | $1,000.00 | $1,084.46 | 0.85% | $4.42 |
| Hypothetical(2) | 1,000.00 | 1,020.75 | 0.85 | 4.28 |
Balanced - Institutional Class
| Actual | 1,000.00 | 1,085.26 | 0.70 | 3.64 |
| Hypothetical(2) | 1,000.00 | 1,021.50 | 0.70 | 3.53 |
| Core Plus Income - Investor Class | Actual | 1,000.00 | 1,016.53 | 0.50 | 2.51 |
| Hypothetical(2) | 1,000.00 | 1,022.50 | 0.50 | 2.52 |
| Core Plus Income - Institutional Class | Actual | 1,000.00 | 1,017.91 | 0.40 | 2.01 |
| Hypothetical(2) | 1,000.00 | 1,023.00 | 0.40 | 2.02 |
| Hickory | Actual | 1,000.00 | 1,284.35 | 1.09 | 6.21 |
| Hypothetical(2) | 1,000.00 | 1,019.55 | 1.09 | 5.49 |
Nebraska Tax-Free Income
| Actual | 1,000.00 | 1,003.20 | 0.45 | 2.25 |
| Hypothetical(2) | 1,000.00 | 1,022.75 | 0.45 | 2.27 |
| Partners III Opportunity - Investor Class | Actual | 1,000.00 | 1,164.93 | 2.12 | 11.44 |
| Hypothetical(2) | 1,000.00 | 1,014.40 | 2.12 | 10.65 |
| Partners III Opportunity - Institutional Class | Actual | 1,000.00 | 1,168.76 | 1.47 | 7.95 |
| Hypothetical(2) | 1,000.00 | 1,017.65 | 1.47 | 7.39 |
| Partners Value - Investor Class | Actual | 1,000.00 | 1,249.38 | 1.09 | 6.11 |
| Hypothetical(2) | 1,000.00 | 1,019.55 | 1.09 | 5.49 |
| Partners Value - Institutional Class | Actual | 1,000.00 | 1,250.20 | 0.89 | 4.99 |
| Hypothetical(2) | 1,000.00 | 1,020.55 | 0.89 | 4.48 |
| Short Duration Income - Investor Class | Actual | 1,000.00 | 1,014.69 | 0.55 | 2.76 |
| Hypothetical(2) | 1,000.00 | 1,022.25 | 0.55 | 2.77 |
| Short Duration Income - Institutional Class | Actual | 1,000.00 | 1,014.83 | 0.48 | 2.41 |
| Hypothetical(2) | 1,000.00 | 1,022.60 | 0.48 | 2.42 |
| Ultra Short Government | Actual | 1,000.00 | 1,000.28 | 0.14 | 0.70 |
| Hypothetical(2) | 1,000.00 | 1,024.30 | 0.14 | 0.71 |
| Value - Investor Class | Actual | 1,000.00 | 1,182.36 | 1.09 | 5.93 |
| Hypothetical(2) | 1,000.00 | 1,019.55 | 1.09 | 5.49 |
| Value - Institutional Class | Actual | 1,000.00 | 1,183.68 | 0.89 | 4.85 |
| Hypothetical(2) | 1,000.00 | 1,020.55 | 0.89 | 4.48 |
| (1) | Expenses are equal to the annualized expense ratio for the Fund, multiplied by the average account value over the period, multiplied by the number of days in the most recent fiscal half year (182/365). |
(2)
| Assumes 5% total return before expenses. |
Q1 2021 Annual Report 75
OTHER INFORMATION
Proxy Voting Policy
A description of the Funds’ proxy voting policies and procedures is available without charge, upon request by (i) calling 800-304-9745, (ii) on the Funds’ website at weitzinvestments.com; and (iii) on the SEC’s website at sec.gov.
Information on how each of the Funds voted proxies relating to portfolio securities during each twelve month period ended June 30 is available: (i) on the Funds’ website at weitzinvestments. com and (ii) on the SEC’s website at sec.gov.
Form N-PORT
The Funds file complete schedules of investments with the Securities and Exchange Commission as of June 30 and December 31 of each year on Form N-PORT. The Funds’ Form N-PORT can be reviewed and copied at the SEC’s Public Reference Room in Washington, D.C. or on the SEC’s website at sec.gov.
Liquidity Risk Management Program
The Funds have adopted and implemented a Liquidity Risk Management Policy (the “Policy”) in accordance with Rule 22e-4 under the Investment Company Act of 1940, as amended. The Policy seeks to assess and manage each Fund’s liquidity risk, which is the risk that a Fund could not meet requests to redeem Fund shares without significant dilution of the remaining investors’ interests in the Fund. The Funds’ Board of Trustees (“Board”) has appointed Weitz Investment Management, Inc., the Funds’ investment adviser (“Weitz”), to administer the Policy. Weitz has delegated certain day-to-day administration responsibilities to the Liquidity Risk Management Committee (“Committee”), which consists of certain Weitz portfolio management, compliance, and accounting personnel. Weitz also may engage one or more third parties to perform certain functions under the Policy.
The Board met on February 9, 2021 and received a report (the “Liquidity Report”) from Weitz addressing the operation of the Policy and assessing the adequacy and effectiveness of its implementation, including the operation of each Fund’s highly liquid investment minimum (“HLIM”). The Liquidity Report discussed key components of the Policy, including the assessment of the Funds’ liquidity risk, classification of each Fund’s portfolio investments into one of four liquidity categories, 15% limit on the Funds’ holdings of illiquid investments, and HLIM requirements. As reflected in the Liquidity Report, Weitz considers the Policy to be reasonably designed to assess and manage the Funds’ liquidity risk and believes it has been adequately and effectively implemented.
Tax Information
Of the distributions paid during the fiscal year, the amounts that may be considered qualified dividend income and for corporate shareholders, the amounts that may qualify for the corporate dividends received deduction, are summarized as follows (in U.S. dollars):
| | | |
| Balanced | Core Plus Income |
Qualified dividend income | 701,085 | 204,090 |
Corporate dividends received deduction | 560,971 | 204,090 |
The information and distributions reported herein may differ from the information and distributions reported to shareholders for the calendar year ended December 31, 2020, which was reported in conjunction with your 2020 Form 1099-DIV.
76 Q1 2021 Annual Report
INFORMATION ABOUT THE TRUSTEES AND
OFFICERS
The individuals listed below serve as Trustees or Officers of the Trust. Each Trustee of the Weitz Funds serves until a successor is elected and qualified or until resignation. Each Officer of the Weitz Funds is elected annually by the Trustees.
The address of all Trustees and Officers is 1125 South 103rd Street, Suite 200, Omaha, Nebraska 68124.
Independent Trustees
Lorraine Chang (Age: 70)
Position(s) Held with Trust: Trustee; Chair, Board of Trustees
Length of Service (Beginning Date): 1997
Principal Occupation(s) During Past 5 Years: Retired
(September 2020 to Present); Independent Management
Consultant (January 2009 to September 2020)
Number of Portfolios Overseen in Fund Complex: 9
Other Directorships During Past 5 Years: N/A
John W. Hancock (Age: 73)
Position(s) Held with Trust: Trustee
Length of Service (Beginning Date): 1986
Principal Occupation(s) During Past 5 Years: CPA, Hancock
& Dana, PC, an accounting firm
Number of Portfolios Overseen in Fund Complex: 9
Other Directorships During Past 5 Years: N/A
Roland J. Santoni (Age: 79)
Position(s) Held with Trust: Trustee
Length of Service (Beginning Date): 2004
Principal Occupation(s) During Past 5 Years: Retired (April
2018 to Present), Director (2010 to April 2018), Gary and
Mary West Foundation; Partner (2012 to April 2018), West
Partners, a private equity firm
Number of Portfolios Overseen in Fund Complex: 9
Other Directorships During Past 5 Years: N/A
Delmer L. Toebben (Age: 90)
Position(s) Held with Trust: Trustee
Length of Service (Beginning Date): 1996
Principal Occupation(s) During Past 5 Years: Retired
Number of Portfolios Overseen in Fund Complex: 9
Other Directorships During Past 5 Years: N/A
Justin B. Wender (Age: 51)
Position(s) Held with Trust: Trustee
Length of Service (Beginning Date): 2009
Principal Occupation(s) During Past 5 Years: Managing
Partner, Stella Point Capital, LP, a private equity firm
Number of Portfolios Overseen in Fund Complex: 9
Other Directorships During Past 5 Years: International
Money Express, Inc., an international money transfer
company (2018 to Present)
Interested Trustees*
Wallace R. Weitz (Age: 71)
Position(s) Held with Trust: President; Portfolio
Manager; Trustee
Length of Service (Beginning Date): 1986
Principal Occupation(s) During Past 5 Years: President,
Weitz Funds; Co-Chief Investment Officer (2017 to Present),
Chief Investment Officer (2015 to 2017), and Portfolio
Manager, Weitz Investment Management, Inc.
Number of Portfolios Overseen in Fund Complex: 9
Other Directorships During Past 5 Years: Cable One, Inc., a
cable television, internet and telephone services company
Thomas R. Pansing (Age: 75)
Position(s) Held with Trust: Trustee
Length of Service (Beginning Date): 1986
Principal Occupation(s) During Past 5 Years: Partner,
Pansing Hogan Ernst & Bachman LLP, a law firm
Number of Portfolios Overseen in Fund Complex: 9
Other Directorships During Past 5 Years: N/A
* Mr. Weitz is a Director and Officer of Weitz Investment Management, Inc., investment adviser to the Weitz Funds, and as such is considered an “interested person” of the Trust, as that term is defined in the Investment Company Act of 1940 (an “Interested Trustee”). Mr. Pansing performs certain legal services for the investment adviser and the Weitz Funds and, therefore, is also classified as an “Interested Trustee.”
Q1 2021 Annual Report 77
Officers
Shar M. Bennett (Age: 46)
Position(s) Held with Trust: Vice President and Assistant Treasurer
Length of Service (Beginning Date): 2018
Principal Occupation(s) During Past 5 Years: Assistant
Treasurer (November 2018 to Present), Weitz Funds; Vice
President, Director of Fund Administration (November 2018
to Present), Director of Accounting (April 2004 to November
2018), Weitz Investment Management, Inc.
James J. Boyne (Age: 54)
Position(s) Held with Trust: Vice President and Treasurer
Length of Service (Beginning Date): 2018
Principal Occupation(s) During Past 5 Years: Vice President,
Treasurer (November 2018 to Present), Weitz Funds;
President and Treasurer (November 2018 to Present), Weitz
Investment Management, Inc.; Executive Director (2013 to
2018), Steamboat Springs Winter Sports Club
Thomas D. Carney (Age: 57)
Position(s) Held with Trust: Vice President
Length of Service (Beginning Date): 2015
Principal Occupation(s) During Past 5 Years: Vice President
(2015 to Present), Weitz Funds; Portfolio Manager, Weitz
Investment Management, Inc.
John R. Detisch (Age: 56)
Position(s) Held with Trust: Vice President, General
Counsel, Secretary and Chief Compliance Officer
Length of Service (Beginning Date): 2011
Principal Occupation(s) During Past 5 Years: Vice President,
General Counsel, Secretary and Chief Compliance Officer,
Weitz Funds; Vice President, General Counsel, Assistant
Secretary and Chief Compliance Officer, Weitz Investment
Management, Inc.
Martha J. Gilchrist (Age: 58)
Position(s) Held with Trust: Vice President
Length of Service (Beginning Date): 2018
Principal Occupation(s) During Past 5 Years: Vice President
(November 2018 to Present), Weitz Funds; Vice President
(2015 to Present), Director of Finance (November 2018 to
Present), Director of Operations (April 2004 to November
2018), Weitz Investment Management, Inc.
Bradley P. Hinton (Age: 53)
Position(s) Held with Trust: Vice President
Length of Service (Beginning Date): 2006
Principal Occupation(s) During Past 5 Years: Vice President,
Weitz Funds; Co-Chief Investment Officer (2017 to Present),
Director of Research (2004 to 2017), Vice President and
Portfolio Manager, Weitz Investment Management, Inc.
Andrew S. Weitz (Age 41)*
Position(s) Held with Trust: Vice President
Length of Service (Beginning Date): 2018
Principal Occupation(s) During Past 5 Years: Vice President
(2018 to Present), Weitz Funds; Vice President and Director
of Equity Research (2017 to Present), and Portfolio Manager,
Weitz Investment Management, Inc.
* Mr. Weitz is the son of Wallace R. Weitz who serves as a Trustee and President of the Trust and who also serves as Chairman of Weitz Investment Management, Inc.
The Statement of Additional Information for the Weitz Funds, which can be obtained without charge by calling 800-304-9745, includes additional information about the Trustees and Officers of the Weitz Funds.
78 Q1 2021 Annual Report
INDEX DESCRIPTIONS
The following indices are used as benchmarks for the various mutual funds offered by Weitz Funds. Index performance is hypothetical and is shown for illustrative purposes only. You cannot invest directly in an index.
| Bloomberg Barclays | The Bloomberg Barclays 1-3 Year U.S. Aggregate Index is generally representative |
| 1-3 Year U.S. Aggregate | of the market for investment grade, U.S. dollar denominated, fixed-rate taxable |
| Index | bonds with maturities from one to three years. |
|
| Bloomberg Barclays | The Bloomberg Barclays 5-Year Municipal Bond Index is a capitalization weighted |
| 5-Year Municipal Bond | bond index generally representative of major municipal bonds of all quality ratings |
| Index | with an average maturity of approximately five years. |
|
| Bloomberg Barclays U.S. | The Bloomberg Barclays U.S. Aggregate Bond Index is a broad-based benchmark |
| Aggregate Bond Index | that measures the investment grade, U.S. dollar-denominated, fixed-rate taxable |
| bond market. |
|
| CPI + 1.00% | The CPI + 1% is created by adding 1% to the annual percentage change in the |
| Consumer Price Index (“CPI”) as determined by the U.S. Department of Labor |
| Statistics. There can be no guarantee that the CPI will reflect the level of inflation |
| at any time. |
|
| ICE BofA US 6-Month | The ICE BofA US 6-Month Treasury Bill Index is generally representative of the |
| Treasury Bill Index | market for U.S. Treasury Bills. |
|
| Morningstar Moderately | The Morningstar Moderately Conservative Target Risk Index is an asset allocation |
| Conservative Target | index comprised of constituent Morningstar indices and reflects global equity |
| Risk Index | market exposure of 40% based on an asset allocation methodology derived by |
| Ibbotson Associates, a Morningstar company. |
|
| Russell 1000® Index | The Russell 1000 Index measures the performance of the large-cap segment of |
| the U.S. equity universe. It is a subset of the Russell 3000 Index and includes |
| approximately 1,000 of the largest securities based on a combination of their |
| market cap and current index membership. |
|
Russell 3000® Index | The Russell 3000 Index measures the performance of the largest 3,000 U.S. |
| companies representing approximately 98% of the investable U.S. equity market. |
|
Russell Midcap® Index | The Russell Midcap Index tracks the performance of the 800 next-largest U.S. |
| companies, after the 1,000 largest U.S. companies. |
|
S&P 500® Index | The S&P 500 is an unmanaged index consisting of 500 companies generally |
| representative of the market for the stocks of large-size U.S. companies. |
Q1 2021 Annual Report 79
Board of Trustees
Lorraine Chang
John W. Hancock
Thomas R. Pansing, Jr.
Roland J. Santoni
Delmer L. Toebben
Wallace R. Weitz
Justin B. Wender
Investment Adviser
Weitz Investment Management, Inc.
1125 South 103rd Street, Suite 200
Omaha, NE 68124-1071
(800) 304-9745
Custodian
Citibank, N.A.
Officers
Wallace R. Weitz, President
Shar M. Bennett, Vice President &
Assistant Treasurer
James J. Boyne, Vice President & Treasurer
Thomas D. Carney, Vice President
John R. Detisch, Vice President, Secretary &
Chief Compliance Officer
Martha J. Gilchrist, Vice President
Bradley P. Hinton, Vice President
Andrew S. Weitz, Vice President
Distributor
Weitz Securities, Inc.
Transfer Agent and Dividend
Paying Agent
FIS Investor Services LLC
NASDAQ symbols:
Balanced Fund
Investor Class - WBALX
Institutional Class - WBAIX
Core Plus Income Fund
Investor Class - WCPNX
Institutional Class - WCPBX
Hickory Fund - WEHIX
Nebraska Tax-Free Income Fund - WNTFX
Partners III Opportunity Fund
Investor Class - WPOIX
Institutional Class - WPOPX
Partners Value Fund
Investor Class - WPVLX
Institutional Class - WPVIX
Short Duration Income Fund
Investor Class - WSHNX
Institutional Class - WEFIX
Ultra Short Government Fund - SAFEX
Value Fund
Investor Class - WVALX
Institutional Class - WVAIX
Beginning on January 1, 2021, paper copies of this report will no longer be sent by mail (unless specifically requested). Instead, the reports will be made available at weitzinvestments.com and you will be notified by mail each time a report is posted. For additional information, please see the notice contained on the Table of Contents page of this report.
Investors should consider carefully the investment objectives, risks, and charges and expenses of a fund before investing. This and other important information is contained in the prospectus and summary prospectus, which may be obtained at weitzinvestments.com or from a financial advisor. Please read the prospectus carefully before investing.
5/25/2021
AR 3.31.2021
Item 2. Code of Ethics.
As of the end of the period covered by this report, the Registrant has adopted a code of ethics that applies to the Registrant’s principal executive officer, principal financial officer, principal accounting officer or controller, or persons performing similar functions, regardless of whether these individuals are employed by the Registrant or a third party (the “Code of Ethics”). During the period covered by this report, there were no amendments, nor did the Registrant grant any waivers, including any implicit waivers, from any provision of the Code of Ethics. The Code of Ethics is attached hereto as Exhibit 12(a)(1).
Item 3. Audit Committee Financial Expert.
The Registrant’s board of trustees has determined that the Registrant has at least one “audit committee financial expert” (as defined in Item 3 of Form N-CSR) serving on its audit committee. John Hancock is an “audit committee financial expert” and is “independent” (as each term is defined in Item 3 of Form N-CSR).
Item 4. Principal Accountant Fees and Services.
| (a) | Audit Fees. Fees for audit services provided to the Registrant were $255,640 and $255,640 for the fiscal years ended March 31, 2021 and 2020, respectively. |
| (b) | Audit Related Fees. The aggregate fees billed in each of the last two fiscal years for audit related-services by the principal accountant that are reasonably related to the performance of the audit of the Registrant’s financial statements and are not reported under paragraph (a) of this item were $31,340 and $31,340 for the fiscal years ended March 31, 2021 and 2020, respectively. The fees, paid by Weitz Investment Management, Inc., the Registrant’s investment adviser and transfer agent, were payment for the principal accountant performing internal control reviews of the Registrant’s transfer agent. |
| (c) | Tax Fees. Fees for tax services, which consisted of income and excise tax compliance services, were $44,800 and $44,800 for the fiscal years ended March 31, 2021 and 2020, respectively. |
| (d) | All Other Fees. Fees for all other services totaled $13,210 and $13,210 for the fiscal years ended March 31, 2021 and 2020, respectively. |
| (e) | (1) The Registrant’s Audit Committee has adopted Pre-Approval Policies and Procedures. The Audit Committee must pre-approve all audit services and non-audit services that the principal accountant provides to the Registrant. The Audit Committee must also pre-approve any engagement of the principal accountant to provide non-audit services to the Registrant’s investment adviser, or any affiliate of the adviser that provides ongoing services to the Registrant, if such non-audit services directly impact the Registrant’s operations and financial reporting. |
(2) No services described in items (b) were pre-approved by the Audit Committee pursuant to Rule 2‑01(c)(7)(i)(c) of Regulation S-X.
| (f) | All of the work in connection with the audit of the Registrant during the years ended March 31, 2021 and 2020 was performed by full-time employees of the Registrant’s principal accountant. |
| (g) | The aggregate fees billed by the principal accountant for non-audit services to the Registrant, the Registrant’s investment adviser and any entity controlling, controlled by, or under common control with the adviser that provides ongoing services to the Registrant were $154,765 and $150,405 for the years ended March 31, 2021 and 2020, respectively. |
| (h) | The Registrant’s Audit Committee has considered whether the provision of non-audit services that were rendered to the Registrant’s investment adviser, and any entity controlling, controlled by, or under common control with the adviser that provides ongoing services to the Registrant that were not pre-approved pursuant to paragraph (c)(7)(ii) of Rule 2-01 of Regulation S-X is compatible with maintaining the principal auditor’s independence. |
Item 5. Audit Committee of Listed Registrants.
Not applicable.
Item 6. Schedule of Investments.
The Schedule of Investments in Securities of unaffiliated issuers is included as part of the Report to Shareholders filed under Item 1.
Item 7. Disclosure of Proxy Voting Policies and Procedures for Closed-End Investment Companies.
Not applicable.
Item 8. Portfolio Managers of Closed-End Investment Companies.
Not applicable.
Item 9. Purchases of Equity Securities by Closed-End Management Investment Company and Affiliated Purchasers.
Not applicable.
Item 10. Submissions of Matters to a Vote of Security Holders.
Not applicable.
Item 11. Controls and Procedures.
(a) Based on an evaluation of the Disclosure Controls and Procedures (as defined in Rule 30a-3(c) under the Investment Company Act of 1940) (the “Disclosure Controls”) as of a date within 90 days prior to the filing date (the “Filing Date”) of this report on Form N-CSR (the “Report”), the Registrant’s principal executive officer and principal financial officer have concluded that the Disclosure Controls are reasonably designed to ensure that information required to be disclosed by the Registrant in the Report is recorded, processed, summarized and reported by the Filing Date, including ensuring that information required to be disclosed in the Report is accumulated and communicated to the Registrant’s management, including the Registrant’s principal executive officer and principal financial officer, as appropriate to allow timely decisions regarding required disclosure.
(b) There were no changes in the Registrant’s internal control over financial reporting (as defined in Rule 30a-3(d) under the Investment Company Act of 1940) that occurred during the Registrant’s second fiscal half-year of the period covered by this report that has materially affected, or is reasonably likely to materially affect, the Registrant’s internal control over financial reporting.
Item 12. Exhibits
(a)(3) Not applicable.
SIGNATURES
Pursuant to the requirements of the Securities Exchange Act of 1934 and the Investment Company Act of 1940, the Registrant has duly caused this report to be signed on its behalf by the undersigned, thereunto duly authorized.
The Weitz Funds
By (Signature and Title)*
/s/ Wallace R. Weitz
Wallace R. Weitz, President
Date: June 2, 2021
Pursuant to the requirements of the Securities Exchange Act of 1934 and the Investment Company Act of 1940, this report has been signed below by the following persons on behalf of the Registrant and in the capacities and on the dates indicated.
By: (Signature and Title)*
/s/ Wallace R. Weitz
Wallace R. Weitz, President
Date: June 2, 2021
By: (Signature and Title)*
/s/ James J. Boyne
James J. Boyne, Vice President and Treasurer
Date: June 2, 2021
* Print the name and title of each signing officer under his or her signature.