As filed with the Securities and Exchange Commission on January 23, 2015.
Registration No. 333-________
U.S. SECURITIES AND EXCHANGE COMMISSION
WASHINGTON, D.C. 20549
FORM N-14
REGISTRATION STATEMENT UNDER THE SECURITIES ACT OF 1933 [X]
[ ] Pre-Effective Amendment No. ___
[ ] Post-Effective Amendment No. ____
PRINCIPAL VARIABLE CONTRACTS FUNDS, INC.
(Exact name of Registrant as specified in charter)
655 9th Street, Des Moines, Iowa 50309
(Address of Registrant's Principal Executive Offices)
515-235-9328
(Registrant's Telephone Number, Including Area Code)
Adam U. Shaikh
Assistant Counsel, Principal Variable Contracts Funds, Inc.
The Principal Financial Group
Des Moines, Iowa 50392
(Name and Address of Agent for Service)
|
| |
| Copies of all communications to: |
| | |
| | JOSHUA B. DERINGER |
| | Drinker Biddle & Reath, LLP |
| | One Logan Square, Ste 2000 |
| | Philadelphia, PA 19103-6996 |
| | 215-988-2959 |
Approximate date of proposed public offering: As soon as practicable after this Registration Statement becomes effective.
Title of Securities Being Registered: Class 1 and Class 2 Shares, par value $.01 per share.
No filing fee is due because an indefinite number of shares have been registered in reliance on Section 24(f) under the Investment Company Act of 1940, as amended.
PRINCIPAL VARIABLE CONTRACTS FUNDS, INC.
655 9th Street
Des Moines, Iowa 50392
1-800-222-5852
February ____, 2015
Dear Shareholder:
A Special Meeting of Shareholders of Principal Variable Contracts Funds, Inc. ("PVC") will be held at 655 9th Street, Des Moines, Iowa 50392, on April 10, 2015, 10:00 a.m. Central Time (the "Meeting").
At the Meeting, the shareholders of each of the series of PVC listed in the first column below (each an "Acquired Fund") will be asked to consider and approve a Plan of Acquisition (a "Plan") providing for its reorganization into the PVC series listed in the second column below (the "Acquiring Fund") (each a reorganization and, collectively, the "Reorganization"). As indicated, the Acquiring Fund is the same in each reorganization.
|
| | |
| ACQUIRED FUND | | ACQUIRING FUND |
| SmallCap Growth Account II | | SmallCap Blend Account |
| SmallCap Value Account I | | SmallCap Blend Account |
Under the Plans and with respect to each reorganization: (i) the Acquiring Fund will acquire all the assets, subject to all the liabilities, of an Acquired Fund in exchange for shares of the Acquiring Fund; (ii) the Acquiring Fund shares will be distributed to the shareholders of the Acquired Fund; and (iii) the Acquired Fund will liquidate and terminate. As a result of the Reorganization, each shareholder of an Acquired Fund will become a shareholder of the Acquiring Fund. The total value of all shares of the Acquiring Fund issued in the Reorganization to an Acquired Fund will equal the total value of the net assets of the Acquired Fund. The number of full and fractional shares of the Acquiring Fund received by a shareholder of an Acquired Fund will be equal in value to the value of that shareholder’s shares of the Acquired Fund as of the close of regularly scheduled trading on the New York Stock Exchange ("NYSE") on the closing date of the Reorganization. Holders of Class 1 and Class 2 of an Acquired Fund will receive, respectively, Class 1 and Class 2 shares of the Acquiring Fund. The Reorganization is expected to occur as of the close of regularly scheduled trading on the NYSE on April 24, 2015. All share classes of each Acquired Fund will vote in the aggregate and not by class with respect to the Reorganization. The implementation of the Reorganization as to one Acquired Fund is not contingent upon its implementation as to the other Acquired Fund.
The value of your investment will not be affected by the Reorganization. Furthermore, in the opinion of legal counsel, no gain or loss will be recognized by any shareholder for federal income tax purposes as a result of the Reorganization.
*****
Enclosed you will find a Notice of Special Meeting of Shareholders, a Proxy Statement/Prospectus, and a voting instruction card for the shares of each Acquired Fund attributable to your variable contract or policy as of February 6, 2015, the record date for the Meeting. The Proxy Statement/Prospectus provides background information and concisely describes in detail the matters to be voted on at the Meeting.
The Board of Directors has unanimously voted in favor of the proposed Reorganization and recommends that you vote FOR the Proposal.
In order for shares to be voted at the Meeting, we urge you to read the Proxy Statement/Prospectus and then complete and mail your voting instruction card(s) in the enclosed postage-paid envelope, allowing sufficient time for receipt by us by April 9, 2015. As a convenience, we offer three options by which to vote your shares:
By Internet: Follow the instructions located on your proxy card.
By Phone: The phone number is located on your proxy card. Be sure you have your control number, as printed on your proxy card, available at the time you call.
By Mail: Sign your proxy card and enclose it in the postage-paid envelope provided in this proxy package.
We appreciate your taking the time to respond to this important matter. Your vote is important. If you have any questions regarding the Reorganization, please call our shareholder services department toll free at 1-800-222-5852.
Sincerely,
Nora M. Everett
President and Chief Executive Officer
PRINCIPAL VARIABLE CONTRACTS FUNDS, INC.
655 9th Street
Des Moines, Iowa 50392
1-800-222-5852
NOTICE OF SPECIAL MEETING OF SHAREHOLDERS
To the Shareholders of the SmallCap Growth Account II and SmallCap Value Account I:
Notice is hereby given that a Special Meeting of Shareholders (the "Meeting") of the SmallCap Growth Account II and SmallCap Value Account I (collectively, the "Acquired Funds"), each a separate series of Principal Variable Contracts Funds, Inc. ("PVC"), will be held at 655 9th Street, Des Moines, Iowa 50392, on April 10, 2015, at 10:00 a.m. Central Time. A Proxy Statement/Prospectus providing information about the following proposals to be voted on at the Meeting is included with this notice. The Meeting is being held to consider and vote on such proposals as well as any other business that may properly come before the Meeting or any adjournment thereof:
| |
| Proposal 1: | Approval of a Plan of Acquisition providing for the reorganization of the SmallCap Growth Account II into the SmallCap Blend Account. (Only shareholders of the SmallCap Growth Account II will vote on this proposal.) |
| |
| Proposal 2: | Approval of a Plan of Acquisition providing for the reorganization of the SmallCap Value Account I into the SmallCap Blend Account. (Only shareholders of the SmallCap Value Account I will vote on this proposal.) |
The Board of Directors of PVC recommends that shareholders of the Acquired Funds vote FOR the Proposals.
Approval of the Proposal will require the affirmative vote of the holders of at least a "Majority of the Outstanding Voting Securities" (as defined in the accompanying Proxy Statement/Prospectus) of the applicable Acquired Fund.
Each shareholder of record at the close of business on February 6, 2015 is entitled to receive notice of and to vote at the Meeting.
Please read the attached Proxy Statement/Prospectus.
By order of the Board of Directors
Nora M. Everett
President and Chief Executive Officer
February ____, 2015
Des Moines, Iowa
PRINCIPAL VARIABLE CONTRACTS FUNDS, INC.
655 9th Street, Des Moines, Iowa 50392
1-800-222-5852
—————————
PROXY STATEMENT/PROSPECTUS
SPECIAL MEETING OF SHAREHOLDERS TO BE HELD APRIL 10, 2015
RELATING TO THE REORGANIZATION OF:
1) THE SMALLCAP GROWTH ACCOUNT II INTO THE SMALLCAP BLEND ACCOUNT
2) THE SMALLCAP VALUE ACCOUNT I INTO THE SMALLCAP BLEND ACCOUNT
This Proxy Statement/Prospectus is furnished in connection with the solicitation by the Board of Directors (the "Board" or "Directors") of Principal Variable Contracts Funds, Inc. ("PVC") of proxies to be used at a Special Meeting of Shareholders of PVC to be held at 655 9th Street, Des Moines, Iowa 50392, on April 10, 2015, at 10:00 a.m. Central Time (the "Meeting").
At the Meeting, shareholders of each of the series of PVC listed in the first column below (each, an "Acquired Fund") will be asked to consider and approve a Plan of Acquisition (a "Plan") providing for its reorganization into the PVC series listed in the second column below (the "Acquiring Fund").
|
| | |
| ACQUIRED FUND | | ACQUIRING FUND |
| SmallCap Growth Account II | | SmallCap Blend Account |
| SmallCap Value Account I | | SmallCap Blend Account |
Under the Plans and with respect to each reorganization: (i) the Acquiring Fund will acquire all the assets, subject to all the liabilities, of an Acquired Fund in exchange for shares of the Acquiring Fund; (ii) the Acquiring Fund shares will be distributed to the shareholders of the Acquired Fund; and (iii) the Acquired Fund will liquidate and terminate. As a result of the Reorganization, each shareholder of an Acquired Fund will become a shareholder of the Acquiring Fund. The total value of all shares of the Acquiring Fund issued in the Reorganization to an Acquired Fund will equal the total value of the net assets of the Acquired Fund. The number of full and fractional shares of the Acquiring Fund received by a shareholder of an Acquired Fund will be equal in value to the value of that shareholder’s shares of the Acquired Fund as of the close of regularly scheduled trading on the New York Stock Exchange ("NYSE") on the closing date of the Reorganization. Holders of Class 1 and Class 2 of an Acquired Fund will receive, respectively, Class 1 and Class 2 shares of the Acquiring Fund. The Reorganization is expected to occur as of the close of regularly scheduled trading on the NYSE on April 17, 2015. All share classes of each Acquired Fund will vote in the aggregate and not by class with respect to the Reorganization. The implementation of the Reorganization as to one Acquired Fund is not contingent upon its implementation as to the other Acquired Fund.
This Proxy Statement/Prospectus contains information shareholders should know before voting on the Reorganization. Please read it carefully and retain it for future reference. The Annual and Semi-Annual Reports to Shareholders of PVC contain additional information about the investments of the Acquired and Acquiring Funds, and the Annual Report contains discussions of the market conditions and investment strategies that significantly affected the Acquired and Acquiring Funds during the fiscal year ended December 31, 2013. Copies of these reports may be obtained without charge by writing PVC at the address noted above or by calling our shareholder services department toll free at 1-800-247-4123. The Annual Report for the fiscal year ended December 31, 2014 is expected to be sent to shareholders on or about February ____, 2015.
A Statement of Additional Information dated February ____, 2015 (the "Statement of Additional Information") relating to this Proxy Statement/Prospectus has been filed with the Securities and Exchange Commission ("SEC") and is incorporated by reference into this Proxy Statement/Prospectus. PVC’s Prospectus, dated May 1, 2014 and as supplemented through the date of this registration statement (File No. 02-35570) and the Statement of Additional Information for PVC, dated May 1, 2014 and as supplemented through the date of this registration statement ("PVC SAI"), have been filed with the SEC and, insofar as they relate to the Acquired Funds, are incorporated by reference into this Proxy Statement/Prospectus. PVC’s prospectus sets forth concisely the information about the Funds that a prospective investor ought to know before investing. Copies of these documents may be obtained without charge by writing to PVC at the address noted above or by calling our shareholder services department toll free at 1-800-222-5852. You may also call our shareholder services department toll fee at 1-800-222-5852 if you have any questions regarding the Reorganization.
PVC is subject to the informational requirements of the Securities Exchange Act of 1934 and the Investment Company Act of 1940 (the "1940 Act") and files reports, proxy materials and other information with the SEC. Such reports, proxy materials and other information may be inspected and copied at the Public Reference Room of the SEC at 100 F Street, N.E., Washington, D.C. 20549 (information on the operation of the Public Reference Room may be obtained by calling the SEC at 1-202-551-5850). Such materials are also available on the SEC’s EDGAR Database on its Internet site at www.sec.gov, and copies may be obtained, after paying a duplicating fee, by email request addressed to publicinfo@sec.gov or by writing to the SEC’s Public Reference Room.
Important Notice Regarding Availability of Proxy Statement for the Shareholders’ Meeting to be Held on April 10, 2014. This Proxy Statement is available on the Internet at www.2voteproxy.com/PVCSC.
The SEC has not approved or disapproved these securities or passed upon the accuracy or adequacy of this Proxy Statement/Prospectus. Any representation to the contrary is a criminal offense.
The date of this Proxy Statement/Prospectus is February ____, 2015.
|
| | |
| TABLE OF CONTENTS |
| INTRODUCTION | |
| THE REORGANIZATION | |
| PROPOSAL 1: | Approval of a Plan of Acquisition Providing for the Reorganization of the SmallCap Growth Account II into the SmallCap Blend Account | |
| | Comparison of Acquired and Acquiring Funds | |
| | Comparison of Investment Objectives and Strategies | |
| | Comparison of Principal Investment Risks | |
| | Fees and Expenses of the Funds | |
| | Performance | |
| | Reasons for the Reorganization | |
| | Board Consideration of the Reorganization | |
| PROPOSAL 2: | Approval of a Plan of Acquisition Providing for the Reorganization of the SmallCap Value Account I into the SmallCap Blend Account | |
| | Comparison of Acquired and Acquiring Funds | |
| | Comparison of Investment Objectives and Strategies | |
| | Comparison of Principal Investment Risks | |
| | Fees and Expenses of the Funds | |
| | Performance | |
| | Reasons for the Reorganization | |
| | Board Consideration of the Reorganization | |
| INFORMATION ABOUT THE REORGANIZATION | |
| | Plans of Acquisition | |
| | Description of the Securities to Be Issued | |
| | Federal Income Tax Consequences | |
| CAPITALIZATION | |
| ADDITIONAL INFORMATION ABOUT THE FUNDS | |
| | Certain Investment Strategies and Related Risks of the Funds | |
| | Multiple Classes of Shares | |
| | Costs of Investing in the Funds | |
| | Distribution Plans and Intermediary Compensation | |
| | Pricing of Fund Shares | |
| | Purchase of Fund Shares | |
| | Sale of Fund Shares | |
| | Frequent Trading and Market Timing (Abusive Trading Practices) | |
| | Dividends and Distributions | |
| | Tax Considerations | |
| | Portfolio Holdings Information | |
| VOTING INFORMATION | |
| OUTSTANDING SHARES AND SHARE OWNERSHIP | |
| FINANCIAL HIGHLIGHTS | |
| FINANCIAL STATEMENTS | |
| LEGAL MATTERS | |
| OTHER INFORMATION | |
| APPENDIX A Forms of Plans of Acquisition | |
INTRODUCTION
This Proxy Statement/Prospectus is being furnished to shareholders of the Acquired Funds to provide information regarding the Plans and the Reorganization.
Principal Variable Contracts Funds, Inc. PVC is a Maryland corporation and an open-end management investment company registered with the SEC under the 1940 Act. PVC currently offers 39 separate series or funds (the "PVC Funds"), including the Acquired and Acquiring Funds. The sponsor of PVC is Principal Life Insurance Company ("Principal Life"), and the investment advisor to the PVC Funds is Principal Management Corporation ("PMC"). Principal Funds Distributor, Inc. (the "Distributor" or "PFD") is the distributor for all share classes of the Acquired and Acquiring Funds. Principal Life, an insurance company organized in 1879 under the laws of Iowa, PMC and PFD are indirect, wholly-owned subsidiaries of Principal Financial Group, Inc. ("PFG"). Their address is the Principal Financial Group, Des Moines, Iowa 50392.
Investment Management. Pursuant to an investment advisory agreement with PVC with respect to each of the Acquired and Acquiring Funds, PMC provides investment advisory services and certain corporate administrative services to the Funds. As permitted by the investment advisory agreement, PMC has entered into sub-advisory agreements with respect to each of the Acquired and Acquiring Funds as follows:
|
| |
| Acquired Fund | Sub-Advisor |
| SmallCap Growth Account II | Emerald Advisers, Inc. ("Emerald") |
| SmallCap Value Account I | J.P. Morgan Investment Management Inc. ("J.P. Morgan") |
| | |
| Acquiring Fund | Sub-Advisor |
| SmallCap Blend Account | Principal Global Investors ("PGI") |
PMC and each sub-advisor are registered with the SEC as investment advisors under the Investment Advisers Act of 1940.
Emerald is located at 3175 Oregon Pike, Leola, PA 17540.
J.P. Morgan is located at 270 Park Avenue, New York, NY 10017.
PGI is located at 801 Grand Avenue, Des Moines, IA 50392. PGI is an affiliate of PFG and PMC.
THE REORGANIZATION
At its meeting held on December 9, 2014, the Board of Directors of PVC (the "Board"), including all the Directors who are not "interested persons" (as defined in the 1940 Act) of PVC (the "Independent Directors"), approved the Reorganization pursuant to the Plans providing for the combination of each Acquired Fund into the Acquiring Fund. The Board concluded with respect to each combination that the Reorganization is in the best interests of the Acquired Fund and the Acquiring Fund and that the interests of existing shareholders of each Fund will not be diluted as a result of the Reorganization. The factors that the Board considered in deciding to approve the Reorganization as to each Acquired Fund is discussed under each proposal under "Information About the Reorganization – Board Consideration of the Reorganization."
The Reorganization contemplates: (i) the transfer of all the assets, subject to all of the liabilities, of each Acquired Fund to the Acquiring Fund in exchange for shares of the Acquiring Fund; (ii) the distribution to Acquired Fund shareholders of the Acquiring Fund shares; and (iii) the liquidation and termination of each Acquired Fund. As a result of the Reorganization, each shareholder of an Acquired Fund will become a shareholder of the Acquiring Fund. In the Reorganization, the Acquiring Fund will issue to each Acquired Fund a number of shares with a total value equal to the total value of the net assets of the Acquired Fund, and each shareholder of the Acquired Fund will receive a number of full and fractional shares of the Acquiring Fund with a value equal to the value of that shareholder’s shares of the Acquired Fund, as of the close of regularly scheduled trading on the NYSE on the closing date of the Reorganization (the "Effective Time"). The closing date of the Reorganization is expected to be April 17, 2015. Holders of Class 1 and Class 2 shares of an Acquired Fund will receive, respectively, Class 1 and Class 2 shares of the Acquiring Fund. The terms and conditions of the Reorganization are more fully described below in this Proxy Statement/Prospectus and in the Forms of the Plans attached hereto as Appendix A. The implementation of the Reorganization as to one Acquired Fund is not contingent upon its implementation as to the other Acquired Fund.
The Board believes that the Reorganization of the SmallCap Growth Account II into the SmallCap Blend Fund under Proposal 1 will serve the best interests of the shareholders of both Funds. The SmallCap Blend Fund has outperformed the SmallCap Growth Account II over the one-, three-, and five-year periods ended September 30, 2014. The Funds have the same investment objectives in that both seek to provide long-term growth of capital, and they also have similar principal policies and risks in that both invest principally in equity securities of companies with small market capitalizations. The SmallCap Blend Account also has a lower advisory fee than the SmallCap Growth Account II. The Board noted that, although the Annual Fund Operating Expenses table for this prospectus/proxy shows the SmallCap Blend Account having an expense ratio higher than that of the SmallCap Growth Account II post-reorganization, that the expense ratios includes an item entitled "Acquired Fund Fees and Expenses" ("AFFE"). The Board noted that a fund whose expense ratio includes AFFE does not actually pay the AFFE from its assets as an expense, as is the case with expenses other than AFFE that are included in the Annual Fund Operating Expenses table, but rather experiences the effect of AFFE on the performance of the fund. The Board believes that the SmallCap Blend Account is expected to have a lower expense ratio post-reorganization than the SmallCap Growth Account II when the expense ratios of the two funds are compared on a consistent basis. The Board believes combining the Funds will not result in any dilution of the interests of existing shareholders of the Funds.
The Board believes that the Reorganization of the SmallCap Value Account I into the SmallCap Blend Account under Proposal 2 will serve the best interests of the shareholders of both Funds. The SmallCap Blend Account has outperformed the SmallCap Value Account I over the one-, three- and five-year periods ended September 30, 2014. The Funds have the same investment objectives in that both seek to provide long-term growth of capital, and they also have similar principal policies and risks in that both invest principally in equity securities of companies with small market capitalizations. The SmallCap Blend Account has a lower advisory fee than the SmallCap Value Account I and the SmallCap Value Account I shareholders are expected to see lower overall net operating expense ratios with respect to all share classes. Combining the Funds will not result in any dilution of the interests of existing shareholders of the Funds.
In the opinion of legal counsel, each reorganization will qualify as a tax-free reorganization and, for federal income tax purposes, no gain or loss will be recognized as a result of the reorganization by the Acquired or Acquiring Fund shareholders. Please see "Information About the Reorganization – Federal Income Tax Consequences" for a discussion the tax consequences to each Acquired Fund and its shareholders of disposing of portfolio securities, as described below, and their relation to available pre-reorganization capital losses of that Acquired Fund.
The Reorganization will not result in any material change in the purchase, redemption, and exchange procedures followed with respect to the distribution of shares. See "Additional Information About the Funds – Purchases, Redemptions and Exchanges of Shares."
With respect to the reorganization of the SmallCap Growth Account II into the SmallCap Blend Fund under Proposal 1, the SmallCap Growth Account II is expected to achieve the greatest benefit from the reorganization.The expenses and out-of-pocket fees to be incurred by the SmallCap Growth Account II in connection with the Reorganization, including printing, mailing, and legal fees are expected to total $22,000.The SmallCap Growth Account II will pay any trading costs associated with disposing, prior to the Reorganization, of any portfolio securities of the SmallCap Growth Account II that would not be compatible with the investment objectives and strategies of the SmallCap Blend Account and reinvesting the proceeds in securities that would be compatible. The SmallCap Growth Account II is expected to dispose of approximately 91% of its portfolio securities. The explicit trading costs (brokerage costs) are estimated to be $65,000 with an approximate gain of $11,556,000 on a U.S. GAAP basis. The per share capital gain is estimated to be $3.27.
With respect to the reorganization of the SmallCap Value Account I into the SmallCap Blend Account under Proposal 2, the SmallCap Value Account I is expected to achieve the greatest benefit from the reorganization. The expenses and out-of-pocket fees incurred by the SmallCap Value Account I in connection with the Reorganization, including printing, mailing, and legal fees will are expected to total $37,000.The SmallCap Value Account I will pay any trading costs associated with disposing, prior to the Reorganization, of any portfolio securities of the SmallCap Value Account I that would not be compatible with the investment objectives and strategies of the SmallCap Blend Account I and reinvesting the proceeds in securities that would be compatible. The SmallCap Value Account I is expected to dispose of approximately 93% of its portfolio securities. The explicit trading costs (brokerage costs) are estimated to be $111,000 with an approximate gain of $19,008,000 on a U.S. GAAP basis. The per share capital gain is estimated to be $3.82.
PROPOSAL 1:
Approval of a Plan of Acquisition Providing for the Reorganization of the
SmallCap Growth Account II into the SmallCap Blend Account
Shareholders of the SmallCap Growth Account II (the "Acquired Fund") are being asked to approve the reorganization of the Acquired Fund into the SmallCap Blend Account (the "Acquiring Fund.) Under Proposal 2, the shareholders of a second Fund, the SmallCap Value Account I, are being asked to approve the reorganization of that Fund into the Acquiring Fund.
Comparison of Acquired and Acquiring Funds
The following table provides comparative information with respect to the Acquired and Acquiring Funds. As indicated in the table, the Funds have the same investment objectives in that both Funds seek to provide long-term growth of capital. In addition, both Funds invest primarily in equity securities of companies with small market capitalizations. The Funds differ principally in that the Acquired Fund invests in securities with a growth orientation while the Acquiring Fund invests in securities with a blend of growth and value orientations. Further, the Acquired Fund invests a portion of its assets pursuant to an enhanced index strategy as described below. |
| | | |
SmallCap Growth Account II (Acquired Fund) | SmallCap Blend Account (Acquiring Fund) |
| Approximate Net Assets as of June 30, 2014 (unaudited) | |
| $64,937,000 | $67,870,000 |
| Investment Advisor: | PMC (for both Funds) | |
| Sub-Advisors and Portfolio Managers: |
| Emerald | PGI |
Joseph W. Garner has been with Emerald since 1994. He earned a B.A. in Economics from Millersville University and an M.B.A. from the Katz Graduate School of Business, University of Pittsburgh. Kenneth G. Mertz II has been with Emerald since 1992. He earned a B.A. in Economics from Millersville University. Mr. Mertz has earned the right to use the Chartered Financial Analyst designation. Stacey L. Sears has been with Emerald since 1992. She earned a B.S. in Business Administration from Millersville University and an M.B.A. from Villanova University. | Phil Nordhus has been with PGI since 1990. He earned a bachelor’s degree in Economics from Kansas State University and an M.B.A. from Drake University. Mr. Nordhus has earned the right to use the Chartered Financial Analyst designation. Brian W. Pattinson has been with PGI since 1994. He earned a bachelor's degree and an M.B.A. in Finance from the University of Iowa. Mr. Pattinson has earned the right to use the Chartered Financial Analyst designation. |
| PMC | |
Mariateresa Monaco has worked as a Portfolio Manager for Principal since 2009. Previously, she worked as a Portfolio Manager for Principal Global Investors, LLC, where she worked as a Portfolio Manager since 2005. She earned a master’s degree in Electrical Engineering from Politecnico di Torino, Italy, a master’s degree in Electrical Engineering from Northeastern University, and an M.B.A. from the Sloan School of Management at the Massachusetts Institute of Technology. | |
|
| | | |
| Comparison of Investment Objectives and Strategies |
| Investment Objective: | Both Funds seek to provide long-term growth of capital. | |
| Principal Investment Strategies: | |
Under normal circumstances, the Fund invests at least 80% of its net assets, plus any borrowings for investment purposes, in equity securities of companies with small market capitalizations at the time of each purchase. For this Fund, companies with small market capitalizations are those with market capitalizations equal to or smaller than the greater of 1) $2.5 billion or 2) the highest market capitalization of the companies comprising the Russell 2000® Growth Index (as of December 31, 2014, this range was between approximately $31 million and $7.3 billion). The Fund invests in growth equity securities; growth orientation emphasizes buying equity securities of companies whose potential for growth of capital and earnings is expected to be above average. PMC invests between 10% and 35% of the Fund's assets in equity securities in an attempt to match or exceed the performance of the Fund's benchmark index (listed in the Average Annual Total Returns table) by purchasing securities in the index while slightly overweighting and underweighting certain individual equity securities relative to their weight in the index. | Under normal circumstances, the Fund invests at least 80% of its net assets, plus any borrowings for investment purposes, in equity securities of companies with small market capitalizations at the time of each purchase. For this Fund, companies with small market capitalizations are those with market capitalizations within the range of companies comprising the Russell 2000® Index (as of December 31, 2014, this range was between approximately $19 million and $7.3 billion). The Fund invests in equity securities with value and/or growth characteristics and constructs an investment portfolio that has a "blend" of equity securities with these characteristics. Investing in value equity securities is an investment strategy that emphasizes buying equity securities that appear to be undervalued. The growth orientation selection emphasizes buying equity securities of companies whose potential for growth of capital and earnings is expected to be above average. The Fund does not have a policy of preferring one of these categories over the other. |
The investment objective of each Fund may be changed by the Board without shareholder approval.
Additional information about the investment strategies and the types of securities in which the Funds may invest is discussed below under "Certain Investment Strategies and Related Risks of the Funds" as well as in the Statement of Additional Information.
The Statement of Additional Information provides further information about the portfolio manager(s) for each Fund, including information about compensation, other accounts managed and ownership of Fund shares.
Comparison of Principal Investment Risks
In deciding whether to approve the Reorganization, shareholders should consider the amount and character of investment risk involved in the respective investment objectives and strategies of the Acquired and Acquiring Funds. Because the Funds have identical investment objectives and substantially similar principal policies, the Funds’ risks are substantially similar. As described below, the Funds also have some different risks. Many factors affect the value of investments in the Funds, and it is possible to lose money by investing in either Fund.
Risks Applicable to both Funds:
Equity Securities Risk. The value of equity securities could decline if the issuer’s financial condition declines or in response to overall market and economic conditions. A fund's principal market segment(s), such as large cap, mid cap or small cap stocks, or growth or value stocks, may underperform other market segments or the equity markets as a whole. Investments in smaller companies and mid-size companies may involve greater risk and price volatility than investments in larger, more mature companies.
Growth Stock Risk. If growth companies do not increase their earnings at a rate expected by investors, the market price of the stock may decline significantly, even if earnings show an absolute increase. Growth company stocks also typically lack the dividend yield that can lessen price declines in market downturns.
Risk Applicable to the Acquiring Fund:
Value Stock Risk. The market may not recognize the intrinsic value of value stocks for a long time, or they may be appropriately priced at the time of purchase.
Fees and Expenses of the Funds
Fees and Expenses as a % of average daily net assets
The following table shows: (a) the ratios of expenses to average net assets of the Acquired Funds for the fiscal year ended December 31, 2013; (b) the ratios of expenses to average net assets of the Acquiring Fund for the fiscal year ended December 31, 2013; and (c) the pro forma expense ratios of the Acquiring Fund for the fiscal year ending December 31, 2013 assuming that the Reorganization had taken place at the commencement of that fiscal year, and (d) the pro forma expense ratios of the Acquiring Fund for the fiscal year ended December 31, 2013, assuming that the Reorganization under both Proposals 1 and 2 had taken place at the commencement of that fiscal year.
Annual Fund Operating Expenses (expenses that you pay each year as a percentage of the value of your investment)
|
| | | | | | | | |
| | Class | Management Fees | 12b-1 Fees | Other Expenses | Acquired Fund Fees & Expenses | Total Operating Expense Ratio | Fee Waiver | Total Operating Expenses After Fee Waiver |
| (a) SmallCap Growth Account II (Acquired Fund) |
| | 1 | 1.00% | N/A | 0.05% | – | 1.05% | (0.10)%(1) | 0.95% |
| | 2 | 1.00% | 0.25% | 0.05% | – | 1.30% | (0.10)%(1) | 1.20% |
| (b) SmallCap Blend Account ( Acquiring Fund) |
| | 1 | 0.85% | N/A | 0.02% | 0.10% | 0.97% | – | 0.97% |
| | 2 | 0.85% | 0.25% | 0.02% | 0.10% | 1.22% | – | 1.22% |
(c) SmallCap Blend Fund (Acquiring Fund) (Pro forma assuming Reorganization) |
| | 1 | 0.85% | N/A | 0.01% | 0.10% | 0.96% | – | 0.96% |
| | 2 | 0.85% | 0.25% | 0.01% | 0.10% | 1.21% | – | 1.21% |
(d) SmallCap Blend Fund (Acquiring Fund) (Pro forma assuming Reorganization and second fund Reorganization under Proposal 2) |
| | 1 | 0.85% | N/A | 0.01% | 0.10% | 0.96% | – | 0.96% |
| | 2 | 0.85% | 0.25% | 0.01% | 0.10% | 1.21% | – | 1.21% |
| |
(1) | Principal Management Corporation ("Principal"), the investment advisor, has contractually agreed to limit the Fund's Management Fees through the period ending April 30, 2016. The fee waiver will reduce the Fund's Management Fees by 0.10% (expressed as a percent of average net assets on an annualized basis). It is expected that the fee waiver will continue through the period disclosed; however, Principal Variable Contracts Funds, Inc. and Principal, the parties to the agreement, may agree to terminate the fee waiver prior to the end of the period. |
Examples: The following examples are intended to help you compare the costs of investing in shares of the Acquired and Acquiring Funds. The Example assumes that you invest $10,000 in the Fund for the time periods indicated and then redeem all of your shares at the end of those periods. The Example also assumes that your investment has a 5% return each year and that the Fund’s operating expenses remain the same. If separate account expenses and contract level expenses were included, expenses would be higher. The examples should not be considered a representation of future expense of the Acquired or Acquiring fund. Actual expense may be greater or less than those shown. |
| | | | | | | | | | | | | |
| If you sell your shares at the end of the period: | 1 Year | 3 Years | 5 Years | 10 Years |
| SmallCap Growth Account II (Acquired Fund) | Class 1 | $ | 97 |
| $ | 321 |
| $ | 566 |
| $ | 1,270 |
|
| | Class 2 | 122 |
| 399 |
| 700 |
| 1,556 |
|
| | | | | | |
| SmallCap Blend Account (Acquiring Fund) | Class 1 | 99 |
| 309 |
| 536 |
| 1,190 |
|
| | Class 2 | 124 |
| 387 |
| 670 |
| 1,477 |
|
| | | | | | |
| SmallCap Blend Account (Acquiring Fund) | Class 1 | 98 |
| 306 |
| 531 |
| 1,178 |
|
| (Pro forma assuming Reorganization) | Class 2 | 124 |
| 387 |
| 670 |
| 1,477 |
|
| | | | | | |
| SmallCap Blend Account (Acquiring Fund) | Class 1 | 98 |
| 306 |
| 531 |
| 1,178 |
|
| (Pro forma assuming Reorganization and second fund Reorganization under Proposal 2) | Class 2 | 124 |
| 387 |
| 670 |
| 1,477 |
|
Portfolio Turnover
Each Fund pays transaction costs, such as commissions, when it buys and sells securities (or "turns over" its portfolio). A higher portfolio turnover rate may indicate higher transaction costs and may result in higher taxes for shareholders who hold Fund shares in a taxable account. These costs, which are not reflected in annual fund operating expenses or in the example, affect Fund performance. During the most recent fiscal year, the portfolio turnover rate for the Acquired Fund was 72.8% of the average value of its portfolio while the portfolio turnover rate for the Acquiring Fund was 78.1%.
Investment Management Fees/Sub-Advisory Arrangements
Each Fund pays its investment advisor, PMC, an advisory fee which for each Fund is calculated as a percentage of the Fund’s average daily net assets pursuant to the following fee schedule:
|
| |
SmallCap Growth Account II (Acquired Fund) | SmallCap Blend Account (Acquiring Fund) |
First $100 million 1.00% Next $100 million 0.95% Next $100 million 0.90% Next $100 million 0.85% Over $400 million 0.80% | First $100 million 0.85% Next $100 million 0.80% Next $100 million 0.75% Next $100 million 0.70% Over $400 million 0.65% |
The sub-advisor to each Fund receives sub-advisory fees paid by PMC and not by the Fund.
A discussion of the basis of the Board’s approval of the advisory and sub-advisory agreements with respect to the Acquired and Acquiring Funds is available in PVC’s Annual Report to Shareholders for the fiscal year ended December 31, 2013.
Performance
The following information provides an indicator of the risks of investing in the Funds. The bar chart below shows how the Acquired Fund’s total return has varied year-by-year, while the table below shows each Fund’s performance over time (along with the returns of a broad-based market index for reference). Annual returns do not reflect any applicable sales charges and would be lower if they did. A Fund's past performance (before and after taxes) is not necessarily an indication of how the Fund will perform in the future. You may get updated performance information online at www.principalfunds.com or by calling 1-800-222-5852.
Performance of the Class 2 shares of the SmallCap Growth Account II for periods prior to inception of the class (January 8, 2007) reflects performance of the Class 1 shares, which have the same investments as Class 2 shares, but has been adjusted downward to reflect the higher expenses of Class 2 shares.
For periods prior to the inception date of Class 2 Shares (February 17, 2015) of the SmallCap Blend Account, performance shown in the table for Class 2 shares is based on the performance of the Fund's Class 1 shares adjusted to reflect the fees and expenses of the Class 2 shares. The adjustments result in performance for such periods that is no higher than the historical performance of the Class 1 shares, which were first sold on May 1, 1998.
Calendar Year Total Returns (%) as of 12/31 each year (Class 1 Shares)
SmallCap Growth Account II (Acquired Fund)
|
| | | |
| Highest return for a quarter during the period of the bar chart above: | Q1 '12 | 18.63 | % |
| Lowest return for a quarter during the period of the bar chart above: | Q4 '08 | (28.78 | )% |
| | | |
| Year-to-date return for the quarter ending September 30, 2014: (4.75)% | | |
|
| | | |
| Average Annual Total Returns (%) |
| For the periods ended December 31, 2013 | 1 Year | 5 Years | 10 Years |
| SmallCap Growth Account II - Class 1 (inception 05/01/1998) | 47.42% | 22.34% | 8.16% |
| SmallCap Growth Account II - Class 2 (inception 01/08/2007) | 46.98% | 22.02% | 7.87% |
| Russell 2000 Growth Index (reflects no deduction for fees, expenses, or taxes) | 43.30% | 22.58% | 9.41% |
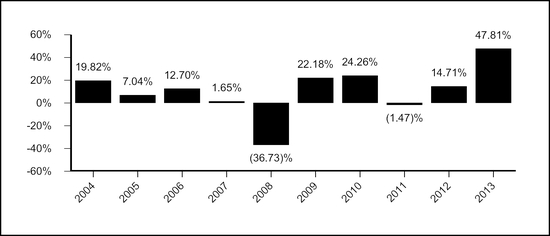
Calendar Year Total Returns (%) as of 12/31 each year (Class 1 Shares)
SmallCap Blend Fund (Acquiring Fund)
|
| | | |
| Highest return for a quarter during the period of the bar chart above: | Q4 '11 | 18.26 | % |
| Lowest return for a quarter during the period of the bar chart above: | Q4 '08 | (26.33 | )% |
| | | |
| Year-to-date return for the quarter ending September 30, 2014: (3.35)% | | |
|
| | | |
| Average Annual Total Returns (%) |
| For the periods ended December 31, 2013 | 1 Year | 5 Year | 10 Year |
| SmallCap Blend Account - Class 1 (inception 05/01/1998) | 47.81% | 20.46% | 8.96% |
| SmallCap Blend Account - Class 2 (inception 02/17/2015) | 47.46% | 20.17% | 8.70% |
| Russell 2000 Index (reflects no deduction for fees, expenses, or taxes) | 38.82% | 20.08% | 9.07% |
Reasons for the Reorganization
The Board believes that the reorganization will serve the best interests of the shareholders of both the Acquired and Acquiring Funds. The Board believes that the Reorganization of the Acquired Fund into the Acquiring Fund under Proposal 1 will serve the best interests of the shareholders of both Funds. The Acquiring Fund has outperformed the Acquired Fund over the one-, three-, and five-year periods ended September 30, 2014. The Funds have the same investment objectives in that both seek to provide long-term growth of capital, and they also have similar principal policies and risks in that both invest principally in equity securities of companies with small market capitalizations. The Acquiring Fund also has a lower advisory fee than the Acquired Fund. The Board noted that, although the Annual Fund Operating Expenses table for this prospectus/proxy shows the Acquiring Fund having an expense ratio higher than that of the Acquired Fund post-reorganization, that the expense ratios includes an item entitled "Acquired Fund Fees and Expenses" ("AFFE"). The Board noted that a fund whose expense ratio includes AFFE does not actually pay the AFFE from its assets as an expense, as is the case with expenses other than AFFE that are included in the Annual Fund Operating Expenses table, but rather experiences the effect of AFFE on the performance of the fund. The Board believes that the Acquiring Fund is expected to have a lower expense ratio post-reorganization than the Acquired Fund when the expense ratios of the two funds are compared on a consistent basis. The Board believes combining the Funds will not result in any dilution of the interests of existing shareholders of the Funds.
Board Consideration of the Reorganization
At its December 9, 2014 meeting, the Board considered information presented by PMC, and the Independent Directors were assisted by independent legal counsel. The Board requested and evaluated such information as it deemed necessary to consider the Reorganization. At the meeting, the Board unanimously approved the Reorganization after concluding that participation in the Reorganization is in the best interests of the Acquired Fund and the Acquiring Fund and that the interests of existing shareholders of the Funds will not be diluted as a result of the Reorganization.
In determining whether to approve the Reorganization, the Board made inquiry into a number of matters and considered, among others, the following factors, in no order of priority:
| |
| (1) | the investment objectives and principal investment strategies and risks of the Funds; |
| |
| (2) | identical fundamental investment restrictions; |
| |
| (3) | estimated trading costs associated with disposing of any portfolio securities of the Acquired Fund and reinvesting the proceeds in connection with the Reorganization; |
| |
| (4) | expense ratios and available information regarding the fees and expenses of the Funds; |
| |
| (5) | the estimated out-of-pocket expenses to be paid by the Acquired Fund related to the Reorganization; |
| |
| (6) | comparative investment performance of and other information pertaining to the Funds; |
| |
| (7) | the prospects for growth of and for achieving economies of scale by the Acquired Fund in combination with the Acquiring Fund; |
| |
| (8) | the absence of any material differences in the rights of shareholders of the Funds; |
| |
| (9) | the financial strength, investment experience and resources of PGI, which currently serves as sub-advisor to the Acquiring Fund; |
| |
| (10) | any direct or indirect benefits, including potential economic benefits, expected to be derived by PMC and its affiliates from the Reorganization; |
| |
| (11) | the direct or indirect federal income tax consequences of the Reorganization, including the expected tax-free nature of the Reorganization and the impact of any federal income tax loss carry forwards and the estimated capital gain or loss expected to be incurred in connection with disposing of any portfolio securities that would not be compatible with the investment objectives and strategies of the Acquiring Fund; |
| |
| (12) | the fact that the Reorganization will not result in any dilution of Acquired or Acquiring Fund shareholder values; |
| |
| (13) | the terms and conditions of the Plan; and |
| |
| (14) | possible alternatives to the Reorganization including liquidation of the Acquired Fund or continuing the Acquired Fund as currently operated. |
The Board’s decision to recommend approval of the Reorganization was based on a number of factors, including the following:
| |
| (1) | it should be reasonable for shareholders of the Acquired Fund to have similar investment expectations after the Reorganization because the Funds have the same investment objectives and substantially similar principal investment strategies and risks; |
| |
| (2) | PGI as sub-advisor responsible for managing the assets of the Acquiring Fund may be expected to provide high quality investment advisory services and personnel for the foreseeable future; |
| |
| (3) | the Acquiring Fund has a lower advisory fee than the Acquired Fund and the Board noted that, although the Annual Fund Operating Expenses table for this prospectus/proxy shows the Acquiring Fund having an expense ratio higher than that of the Acquired Fund post-reorganization, that the expense ratios includes an item entitled "Acquired Fund Fees and Expenses" ("AFFE"). The Board noted that a fund whose expense ratio includes AFFE does not actually pay the AFFE from its assets as an expense, as is the case with expenses other than AFFE that are included in the Annual Fund Operating Expenses table, but rather experiences the effect of AFFE on the performance of the fund. The Board believes that the Acquiring Fund is expected to have a lower expense ratio post-reorganization than the Acquired Fund when the expense ratios of the two funds are compared on a consistent basis; |
| |
| (4) | the Acquiring Fund has outperformed the Acquired Fund for the one-, three-, and five-year periods ended September 30, 2014. ; and |
| |
| (5) | the combination of the Acquired and Acquiring Funds may be expected to afford shareholders of the Acquired Fund on an ongoing basis greater prospects for growth and efficient management. |
PROPOSAL 2:
Approval of a Plan of Acquisition Providing for the Reorganization of the
SmallCap Value Account I into the SmallCap Blend Account
Shareholders of the SmallCap Value Account I (the "Acquired Fund") are being asked to approve the reorganization of the Acquired Fund into the SmallCap Blend Account (the "Acquiring Fund"). Under Proposal 1, the shareholders of a second Fund, the SmallCap Growth Account II, are being asked to approve the reorganization of that Fund into the Acquiring Fund.
Comparison of Acquired and Acquiring Funds
The following table provides comparative information with respect to the Acquired and Acquiring Funds. As indicated in the table, the Funds have the same investment objectives in that both Funds seek to provide long-term growth of capital. In addition, both Funds invest primarily in equity securities of companies with small market capitalizations. The Funds differ principally in that the Acquired Fund invests in securities with a value orientation while the Acquiring Fund invests in securities with a blend of value and growth orientations. Further, the Acquired Fund invests a portion of its assets pursuant to an enhanced index strategy as described below.
|
| | | |
SmallCap Value Account I (Acquired Fund) | SmallCap Blend Account (Acquiring Fund) |
| Approximate Net Assets as of June 30, 2014 (unaudited) | |
| $113,109,000 | $67,870,000 |
| Investment Advisor: | PMC (for both funds) | |
| Sub-Advisors and Portfolio Managers: | |
| J.P. Morgan | PGI |
Phillip D. Hart has been with J.P. Morgan since 2003. Mr. Hart earned a B.A. in Economics from Cornell University. He has earned the right to use the Chartered Financial Analyst designation. Dennis S. Ruhl has been with J.P. Morgan since 1999. He earned B.S. degrees in Mathematics and Computer Science and an M.Eng. in Computer Science from Massachusetts Institute of Technology. Mr. Ruhl has earned the right to use the Chartered Financial Analyst designation. | Phil Nordhus has been with PGI since 1990. He earned a bachelor’s degree in Economics from Kansas State University and an M.B.A. from Drake University. Mr. Nordhus has earned the right to use the Chartered Financial Analyst designation. Brian W. Pattinson has been with PGI since 1994. He earned a bachelor's degree and an M.B.A. in Finance from the University of Iowa. Mr. Pattinson has earned the right to use the Chartered Financial Analyst designation. |
| PMC | |
Mariateresa Monaco has worked as a Portfolio Manager for Principal since 2009. Previously, she worked as a Portfolio Manager for Principal Global Investors, LLC, where she worked as a Portfolio Manager since 2005. She earned a master’s degree in Electrical Engineering from Politecnico di Torino, Italy, a master’s degree in Electrical Engineering from Northeastern University, and an M.B.A. from the Sloan School of Management at the Massachusetts Institute of Technology. | |
|
| | | |
| Comparison of Investment Objectives and Strategies |
| Investment Objective: | Both Funds seek to provide long-term growth of capital. | |
| Principal Investment Strategies: | |
Under normal circumstances, the Fund invests at least 80% of its net assets, plus any borrowings for investment purposes, in a diversified group of equity securities of U.S. companies with small market capitalizations at the time of each purchase. For this Fund, companies with small market capitalizations are those with market capitalizations within the range of companies comprising the Russell 2000® Value Index (as of December 31, 2014, this range was between approximately $19 million and $5 billion). The Fund invests in value equity securities, an investment strategy that emphasizes buying equity securities that appear to be undervalued. The Fund invests in real estate investment trusts. PMC invests between 10% and 35% of the Fund's assets in equity securities in an attempt to match or exceed the performance of the Fund's benchmark index (listed in the Average Annual Total Returns table) by purchasing securities in the index while slightly overweighting and underweighting certain individual equity securities relative to their weight in the index. | Under normal circumstances, the Fund invests at least 80% of its net assets, plus any borrowings for investment purposes, in equity securities of companies with small market capitalizations at the time of each purchase. For this Fund, companies with small market capitalizations are those with market capitalizations within the range of companies comprising the Russell 2000® Index (as of December 31, 2014, this range was between approximately $19 million and $7.3 billion). The Fund invests in equity securities with value and/or growth characteristics and constructs an investment portfolio that has a "blend" of equity securities with these characteristics. Investing in value equity securities is an investment strategy that emphasizes buying equity securities that appear to be undervalued. The growth orientation selection emphasizes buying equity securities of companies whose potential for growth of capital and earnings is expected to be above average. The Fund does not have a policy of preferring one of these categories over the other. |
The investment objective of each Fund may be changed by the Board without shareholder approval.
Additional information about the investment strategies and the types of securities in which the Funds may invest is discussed below under "Certain Investment Strategies and Related Risks of the Funds" as well as in the Statement of Additional Information.
The Statement of Additional Information provides further information about the portfolio manager(s) for each Fund, including information about compensation, other accounts managed and ownership of Fund shares.
Comparison of Principal Investment Risks
In deciding whether to approve the Reorganization, shareholders should consider the amount and character of investment risk involved in the respective investment objectives and strategies of the Acquired and Acquiring Funds. Because the Funds have identical investment objectives and substantially similar principal policies, the Funds’ risks are substantially similar. As described below, the Funds also have some different risks. Many factors affect the value of investments in the Funds, and it is possible to lose money by investing in either Fund.
Risks Applicable to both Funds:
Equity Securities Risk. The value of equity securities could decline if the issuer’s financial condition declines or in response to overall market and economic conditions. A fund's principal market segment(s), such as large cap, mid cap or small cap stocks, or growth or value stocks, may underperform other market segments or the equity markets as a whole. Investments in smaller companies and mid-size companies may involve greater risk and price volatility than investments in larger, more mature companies.
Value Stock Risk. The market may not recognize the intrinsic value of value stocks for a long time, or they may be appropriately priced at the time of purchase.
Risks Applicable to the Acquired Fund:
Real Estate Investment Trusts ("REITs") Risk. A REIT could fail to qualify for tax-free pass-through of income under the Internal Revenue Code, and fund shareholders will indirectly bear their proportionate share of the expenses of REITs in which the fund invests.
Real Estate Securities Risk. Real estate securities are subject to the risks associated with direct ownership of real estate, including declines in value, adverse economic conditions, increases in expenses, regulatory changes and environmental problems. Investing in securities of companies in the real estate industry, subjects a fund to the special risks associated with the real estate market including factors such as loss to casualty or condemnation, changes in real estate values, property taxes, interest rates, cash flow of underlying real estate assets, occupancy rates, government regulations affecting zoning, land use and rents, and the management skill and creditworthiness of the issuer.
Risk Applicable to the Acquiring Fund:
Growth Stock Risk. If growth companies do not increase their earnings at a rate expected by investors, the market price of the stock may decline significantly, even if earnings show an absolute increase. Growth company stocks also typically lack the dividend yield that can lessen price declines in market downturns.
Fees and Expenses of the Funds
Fees and Expenses as a % of average daily net assets
The following table shows: (a) the ratios of expenses to average net assets of the Acquired Fund for the fiscal year ended December 31, 2013; (b) the ratios of expenses to average net assets of the Acquiring Fund for the fiscal year ended December 31, 2013; and (c) the pro forma expense ratios of the Acquiring Fund for the fiscal year ending December 31, 2013 assuming that the Reorganization had taken place at the commencement of that fiscal year, and (d) the pro forma expense ratios of the Acquiring Fund for the fiscal year ended December 31, 2013, assuming that the Reorganization under both Proposals 1 and 2 had taken place at the commencement of that fiscal year.
Annual Fund Operating Expenses (expenses that you pay each year as a percentage of the value of your investment)
|
| | | | | | | | |
| | Class | Management Fees | 12b-1 Fees | Other Expenses | Acquired Fund Fees & Expenses | Total Operating Expense Ratio | Fee Waiver | Total Operating Expenses |
| (a) SmallCap Value Account I (Acquired Fund) |
| | 1 | 1.09% | N/A | 0.05% | 0.09% | 1.23% | (0.15)%(1)(2) | 1.08% |
| | 2 | 1.09% | 0.25% | 0.05% | 0.09% | 1.48% | (0.15)%(1)(2) | 1.33% |
| (b) SmallCap Blend Account ( Acquiring Fund) |
| | 1 | 0.85% | N/A | 0.02% | 0.10% | 0.97% | – | 0.97% |
| | 2 | 0.85% | 0.25% | 0.02% | 0.10% | 1.22% | – | 1.22% |
(c) SmallCap Blend Fund (Acquiring Fund) (Pro forma assuming Reorganization) |
| | 1 | 0.85% | N/A | 0.01% | 0.10% | 0.96% | – | 0.96% |
| | 2 | 0.85% | 0.25% | 0.01% | 0.10% | 1.21% | – | 1.21% |
(d) SmallCap Blend Fund (Acquiring Fund) (Pro forma assuming Reorganization and second fund Reorganization under Proposal 1) |
| | 1 | 0.85% | N/A | 0.01% | 0.10% | 0.96% | – | 0.96% |
| | 2 | 0.85% | 0.25% | 0.01% | 0.10% | 1.21% | – | 1.21% |
| |
(1) | Principal Management Corporation ("Principal"), the investment advisor, has contractually agreed to limit the Fund's Management Fees through the period ending April 30, 2016. The fee waiver will reduce the Fund's Management Fees by 0.02% (expressed as a percent of average net assets on an annualized basis). It is expected that the fee waiver will continue through the period disclosed; however, Principal Variable Contracts Funds, Inc. and Principal, the parties to the agreement, may agree to terminate the fee waiver prior to the end of the period. |
| |
(2) | Principal Management Corporation ("Principal"), the investment advisor, has contractually agreed to limit the Fund’s expenses by paying, if necessary, expenses normally payable by the Fund, (excluding interest expense, expenses related to fund investments, acquired fund fees and expenses, and other extraordinary expenses) to maintain a total level of operating expenses (expressed as a percent of average net assets on an annualized basis) not to exceed 0.99% for Class 1 and 1.24% for Class 2 shares. It is expected that the expense limit will continue through the period ending April 30, 2016; however, Principal Variable Contracts, Inc. and Principal, the parties to the agreement, may agree to terminate the expense limit prior to the end of the period. |
Examples: The following examples are intended to help you compare the costs of investing in shares of the Acquired and Acquiring Funds. The Example assumes that you invest $10,000 in the Fund for the time periods indicated and then redeem all of your shares at the end of those periods. The Example also assumes that your investment has a 5% return each year and that the Fund’s operating expenses remain the same. If separate account expenses and contract level expenses were included, expenses would be higher. The examples should not be considered a representation of future expense of the Acquired or Acquiring fund. Actual expense may be greater or less than those shown.
|
| | | | | | | | | | | | | |
| If you sell your shares at the end of the period: | 1 Year | 3 Years | 5 Years | 10 Years |
| SmallCap Value Account I (Acquired Fund) | Class 1 | $ | 110 |
| $ | 370 |
| $ | 656 |
| $ | 1,471 |
|
| | Class 2 | 135 |
| 448 |
| 789 |
| 1,751 |
|
| | | | | | |
| SmallCap Blend Account (Acquiring Fund) | Class 1 | 99 |
| 309 |
| 536 |
| 1,190 |
|
| | Class 2 | 124 |
| 387 |
| 670 |
| 1,477 |
|
| | | | | | |
| SmallCap Value Account I (Acquiring Fund) | Class 1 | 98 |
| 306 |
| 531 |
| 1,178 |
|
| (Pro forma assuming Reorganization) | Class 2 | 124 |
| 387 |
| 670 |
| 1,477 |
|
| | | | | | |
| SmallCap Blend Account (Acquiring Fund) | Class 1 | 98 |
| 306 |
| 531 |
| 1,178 |
|
| (Pro forma assuming Reorganization and | Class 2 | 124 |
| 387 |
| 670 |
| 1,477 |
|
| second fund Reorganization under Proposal 1) | | | | | |
Portfolio Turnover
Each of the Funds pays transaction costs, such as commissions, when it buys and sells securities (or "turns over" its portfolio). A higher portfolio turnover rate may indicate higher transaction costs and may result in higher taxes for shareholders who hold Fund shares in a taxable account. These costs, which are not reflected in annual fund operating expenses or in the example, affect the Fund’s performance. During the most recent fiscal year, the portfolio turnover rate for the Acquired Fund was 57.0% of the average value of its portfolio while the portfolio turnover rate for the Acquiring Fund was 78.1%.
Investment Management Fees/Sub-Advisory Arrangements
Each Fund pays its investment advisor, PMC, an advisory fee which for each Fund is calculated as a percentage of the Fund’s average daily net assets pursuant to the following fee schedule: |
| |
SmallCap Value Account I (Acquired Fund) | SmallCap Blend Account (Acquiring Fund) |
First $100 million 1.10% Next $100 million 1.05% Next $100 million 1.00% Next $100 million 0.95% Over $400 million 0.90% | First $100 million 0.85% Next $100 million 0.80% Next $100 million 0.75% Next $100 million 0.70% Over $400 million 0.65% |
The sub-advisor to each Fund receives sub-advisory fees paid by PMC and not by the Fund.
A discussion of the basis of the Board’s approval of the advisory and sub-advisory agreements with respect to the Acquired and Acquiring Funds is available in PVC’s Annual Report to Shareholders for the fiscal year ended December 31, 2013.
Performance
The following information provides an indicator of the risks of investing in the Funds. The bar chart below shows how each Fund’s total return has varied year-by-year, while the table below shows each Fund’s performance over time (along with the returns of a broad-based market index for reference). Annual returns do not reflect any applicable sales charges and would be lower if they did. A Fund's past performance (before and after taxes) is not necessarily an indication of how the Fund will perform in the future. You may get updated performance information online at www.principalfunds.com or by calling 1-800-222-5852.
For periods prior to the inception date of Class 2 Shares (February 17, 2015) of the SmallCap Blend Account, performance shown in the table for Class 2 shares is based on the performance of the Fund's Class 1 shares adjusted to reflect the fees and expenses of the Class 2 shares. The adjustments result in performance for such periods that is no higher than the historical performance of the Class 1 shares, which were first sold on May 1, 1998.
Calendar Year Total Returns (%) as of 12/31 each year (Class 1 Shares)
SmallCap Value Account I (Acquired Fund)
|
| | | |
| Highest return for a quarter during the period of the bar chart above: | Q3 ‘09 | 21.31 | % |
| Lowest return for a quarter during the period of the bar chart above: | Q4 '08 | (25.12 | )% |
| | | |
| Year-to-date return for the quarter ending September 30, 2014: (3.45)% | | |
|
| | | |
| Average Annual Total Returns |
| For the periods ended December 31, 2013 | 1 Year | 5 Years | 10 Years |
| SmallCap Value Account I - Class 1 (inception 05/01/1998) | 39.76% | 19.15% | 8.67% |
| SmallCap Value Account I - Class 2 (inception 01/08/2007) | 39.44% | 18.86% | 8.42% |
| Russell 2000 Value Index (reflects no deduction for fees, expenses, or taxes) | 34.52% | 17.64% | 8.61% |
Calendar Year Total Returns (%) as of 12/31 each year (Class 1 Shares)
SmallCap Blend Fund (Acquiring Fund)
|
| | | |
| Highest return for a quarter during the period of the bar chart above: | Q4 '11 | 18.26 | % |
| Lowest return for a quarter during the period of the bar chart above: | Q4 '08 | (26.33 | )% |
| | | |
| Year-to-date return for the quarter ending September 30, 2014: (3.35)% | | |
|
| | | |
| Average Annual Total Returns (%) |
| For the periods ended December 31, 2013 | 1 Year | 5 Year | 10 Year |
| SmallCap Blend Account - Class 1 (inception 05/01/1998) | 47.81% | 20.46% | 8.96% |
| SmallCap Blend Account - Class 2 (inception 02/17/2015) | 47.46% | 20.17% | 8.70% |
| Russell 2000 Index (reflects no deduction for fees, expenses, or taxes) | 38.82% | 20.08% | 9.07% |
Reasons for the Reorganization
The Board believes that the Reorganization will serve the best interests of the shareholders of both the Acquired and Acquiring Funds. The Acquiring Fund has outperformed the Acquired Fund over the one-, three- and five-year periods ended September 30, 2014. The Funds have the same investment objectives in that both seek to provide long-term growth of capital, and they also have similar principal policies and risks in that both invest principally in equity securities of companies with small market capitalizations. The Acquiring Fund has a lower advisory fee than the Acquired Fund and the Acquired Fund shareholders are expected to see lower overall net operating expense ratios with respect to all share classes. Combining the Funds will not result in any dilution of the interests of existing shareholders of the Funds.
Board Consideration of the Reorganization
At its December 9, 2014 meeting, the Board considered information presented by PMC, and the Independent Directors were assisted by independent legal counsel. The Board requested and evaluated such information as it deemed necessary to consider the Reorganization. At the meeting, the Board unanimously approved the Reorganization after concluding that participation in the Reorganization is in the best interests of the Acquired Fund and the Acquiring Fund and that the interests of existing shareholders of the Funds will not be diluted as a result of the Reorganization.
In determining whether to approve the Reorganization, the Board made inquiry into a number of matters and considered, among others, the following factors, in no order of priority:
| |
| (1) | the investment objectives and principal investment strategies and risks of the Funds; |
| |
| (2) | identical fundamental investment restrictions; |
| |
| (3) | estimated trading costs associated with disposing of any portfolio securities of the Acquired Fund and reinvesting the proceeds in connection with the Reorganization; |
| |
| (4) | expense ratios and available information regarding the fees and expenses of the Funds; |
| |
| (5) | the estimated out-of-pocket expenses to be paid by the Acquired Fund related to the Reorganization; |
| |
| (6) | comparative investment performance of and other information pertaining to the Funds; |
| |
| (7) | the prospects for growth of and for achieving economies of scale by the Acquired Fund in combination with the Acquiring Fund; |
| |
| (8) | the absence of any material differences in the rights of shareholders of the Funds; |
| |
| (9) | the financial strength, investment experience and resources of PGI, which currently serves as sub-advisor to the Acquiring Fund; |
| |
| (10) | any direct or indirect benefits, including potential economic benefits, expected to be derived by PMC and its affiliates from the Reorganization; |
| |
| (11) | the direct or indirect federal income tax consequences of the Reorganization, including the expected tax-free nature of the Reorganization and the impact of any federal income tax loss carry forwards and the estimated capital gain or loss expected to be incurred in connection with disposing of any portfolio securities that would not be compatible with the investment objectives and strategies of the Acquiring Fund; |
| |
| (12) | the fact that the Reorganization will not result in any dilution of Acquired or Acquiring Fund shareholder values; |
| |
| (13) | the terms and conditions of the Plan; and |
| |
| (14) | possible alternatives to the Reorganization including liquidation of the Acquired Fund or continuing the Acquired Fund as currently operated. |
The Board’s decision to recommend approval of the Reorganization was based on a number of factors, including the following:
| |
| (1) | it should be reasonable for shareholders of the Acquired Fund to have similar investment expectations after the Reorganization because the Funds have the same investment objectives and substantially similar principal investment strategies and risks; |
| |
| (2) | PGI as sub-advisor responsible for managing the assets of the Acquiring Fund may be expected to provide high quality investment advisory services and personnel for the foreseeable future; |
| |
| (3) | The Acquiring Fund has lower advisory fee rates and is expected to have lower expense ratios following the Reorganization; |
| |
| (4) | the Acquiring Fund has outperformed the Acquired Fund for the one-, three- and five-year periods ended September 30, 2014 ; and |
| |
| (5) | the combination of the Acquired and Acquiring Funds may be expected to afford shareholders of the Acquired Fund on an ongoing basis greater prospects for growth and efficient management. |
INFORMATION ABOUT THE REORGANIZATION
Plans of Acquisition
The terms of the Plans are summarized below. The summary is qualified in its entirety by reference to the Forms of the Plans attached as Appendix A to this Proxy Statement/Prospectus.
Under each Plan, the Acquiring Fund will acquire all the assets, subject to all the liabilities, of the Acquired Fund. We expect that the closing date will be April 17, 2015, or such earlier or later date as PMC may determine, and that the Effective Time of the Reorganization will be as of the close of regularly scheduled trading on the NYSE (normally 3:00 p.m., Central Time) on that date. Each Fund will determine its net asset values as of the close of trading on the NYSE using the procedures described in its then current prospectus (the procedures applicable to the Acquired Fund and the Acquiring Fund are identical). The Acquiring Fund will issue to the Acquired Fund a number of shares of each share class with a total value equal to the total value of the net assets of the corresponding share class of the Acquired Fund outstanding at the Effective Time.
Immediately after the Effective Time, each Acquired Fund will distribute to its shareholders Acquiring Fund shares of the same class as the Acquired Fund shares each shareholder owns in exchange for all Acquired Fund shares of that class. Acquired Fund shareholders will receive a number of full and fractional shares of the Acquiring Fund that are equal in value to the value of the shares of the Acquired Fund that are surrendered in the exchange. In connection with the exchange, the Acquiring Fund will credit on its books an appropriate number of its shares to the account of each Acquired Fund shareholder, and each Acquired Fund will cancel on its books all its shares registered to the account of that shareholder. After the Effective Time, each Acquired Fund will be dissolved in accordance with applicable law.
The Plans may be amended, but no amendment may be made which in the opinion of the Board would materially adversely affect the interests of the shareholders of the Acquired Funds. The Board may abandon and terminate either or both of the Plans at any time before the Effective Time if it believes that consummation of the transactions contemplated by the Plan(s) would not be in the best interests of the shareholders of any or all of the Funds.
Under the Plan related to the Reorganization of the SmallCap Growth Account II into the SmallCap Blend Account, the SmallCap Growth Account II will pay all expenses and out-of-pocket fees incurred and allocated to it in connection with the Reorganization. The SmallCap Growth Account II will pay these costs regardless of whether the Reorganization is consummated.
Under the Plan related to the Reorganization of the SmallCap Value Account I into the SmallCap Blend Account, the SmallCap Value Account I will pay all expenses and out-of-pocket costs incurred and allocated to it in connection with the transaction contemplated under this Plan. The SmallCap Value Account I will pay these costs regardless of whether the Reorganization is consummated.
If a Reorganization is not consummated for any reason, the Board will consider other possible courses of action, including the liquidation (and termination) of an Acquired Fund.
Description of the Securities to Be Issued
PVC is a Maryland corporation that is authorized to issue its shares of common stock in separate series and separate classes of series. Each of the Acquired and Acquiring Funds is a separate series of PVC, and the Class 1 and Class 2 shares of common stock of the Acquiring Funds to be issued in connection with the Reorganization represent interests in the assets belonging to that series and have identical dividend, liquidation and other rights, except that expenses allocated to a particular series or class are borne solely by that series or class and may cause differences in rights as described herein. Expenses related to the distribution of, and other identified expenses properly allocated to, the shares of a particular series or class are charged to, and borne solely by, that series or class, and the bearing of expenses by a particular series or class may be appropriately reflected in the net asset value attributable to, and the dividend and liquidation rights of, that series or class.
All shares of PVC have equal voting rights and are voted in the aggregate and not by separate series or class of shares except that shares are voted by series or class: (i) when expressly required by Maryland law or the 1940 Act and (ii) on any matter submitted to shareholders which the Board has determined affects the interests of only a particular series or class.
The share classes of the Acquired Funds have the same rights with respect to the Acquired Funds that the share classes of the Acquiring Fund have with respect to the Acquiring Fund.
Shares of all Funds, when issued, have no cumulative voting rights, are fully paid and non-assessable, have no preemptive or conversion rights and are freely transferable. Each fractional share has proportionately the same rights as are provided for a full share.
Federal Income Tax Consequences
To be considered a tax-free "reorganization" under Section 368 of the Internal Revenue Code of 1986, as amended (the "Code"), a reorganization must exhibit a continuity of business enterprise. Because, with respect to the reorganization under each of Proposal 1 and Proposal 2, the Acquiring Fund will use a portion of the Acquired Fund’s assets in its business and will continue the Acquired Fund’s historic business, the combination of the Acquired Fund into the Acquiring Fund will exhibit a continuity of business enterprise. Therefore each combination will be considered a tax-free "reorganization" under applicable provisions of the Code. In the opinion of tax counsel to PVC, no gain or loss will be recognized by either of the Acquired Funds or their shareholders in connection with each combination, the tax cost basis of the Acquiring Fund shares received by shareholders of the Acquired Fund will equal the tax cost basis of their shares in the Acquired Fund, and their holding periods for the Acquiring Fund shares will include their holding periods for the Acquired Fund shares.
Capital Loss Carryforward. As of December 31, 2013, the SmallCap Growth Account II had an accumulated capital loss carryforwards of approximately $14,019,000. After the Reorganization, these losses will be available to the Acquiring Fund to offset its capital gains, although the amount of offsetting losses in any given year may be limited. As a result of this limitation, it is possible that the Acquiring Fund may not be able to use these losses as rapidly as an Acquired Fund might have, and part of these losses may not be usable at all. The ability of the Acquiring Fund to utilize the accumulated capital loss carryforwards in the future depends upon a variety of factors that cannot be known in advance, including the existence of capital gains against which these losses may be offset. In addition, the benefits of any capital loss carryforward of an Acquired Fund currently are available only to shareholders of that Acquired Fund. After the Reorganization, however, these benefits will inure to the benefit of all shareholders of the Acquiring Fund.
Capital Gains from Disposition of Portfolio Securities. The disposition of portfolio securities by the Acquired Funds prior to and in connection with the Reorganization could result in the Acquired Funds incurring long-term and short-term capital gains. However, it is expected that the available capital loss carryforwards for the Acquired Funds, described above, will offset any such capital gains. To the extent any such capital gains are not offset, they will be passed through to the shareholders of the Acquired Funds and subject to taxation as described below.
Distribution of Income and Gains. Prior to the Reorganization, each Acquired Fund, whose taxable year will end as a result of the Reorganization, will declare to its shareholders of record one or more distributions of all of its previously undistributed net investment income and net realized capital gain, including capital gains on any securities disposed of in connection with the Reorganization. Such distributions will be made to shareholders before the Reorganization. An Acquired Fund shareholder will be required to include any such distributions in such shareholder’s taxable income. This may result in the recognition of income that could have been deferred or might never have been realized had the Reorganization not occurred.
The foregoing is only a summary of the principal federal income tax consequences of the Reorganization and should not be considered to be tax advice. There can be no assurance that the Internal Revenue Service will concur on all or any of the issues discussed above. You may wish to consult with your own tax advisors regarding the federal, state, and local tax consequences with respect to the foregoing matters and any other considerations which may apply in your particular circumstances.
CAPITALIZATION
The following tables show as of June 30, 2014: (i) the capitalization of the Acquired Fund; (ii) the capitalization of the Acquiring Fund; and (iii) the pro forma combined capitalization of the Acquiring Fund, adjusted to reflect the estimated expenses of the Reorganization, as if the Reorganization had occurred as of that date. As of June 30, 2014, the Acquired Fund and Acquiring Fund both had two outstanding classes of shares: Class 1 & Class 2 shares.
The Acquired Funds will pay any trading costs associated with disposing of any portfolio securities. These trading costs are estimated to be $111,000 for SmallCap Value Account I and $65,000 for SmallCap Growth Account II. The estimated gain (net of trading costs) would be approximately $19,008,000 ($3.82 per share) on a U.S. GAAP basis for SmallCap Value Account I. The estimated gain (net of trading costs) would be approximately $11,556,000 ($3.27 per share) on a U.S. GAAP basis for SmallCap Growth Account II. |
| | | | | | | | | | |
| | Net Assets (000s) | NAV | Shares (000s) |
| (1) SmallCap Growth Account II | Class 1 | $ | 112,974 |
| $ | 22.75 |
| 4,965 |
| |
| (Acquired Fund) | Class 2 | 135 |
| 22.62 |
| 6 |
| |
| | | $ | 113,109 |
| | 4,971 |
| |
| | | | | | |
| (2) SmallCap Value Account I | Class 1 | $ | 61,124 |
|
| $18.38 |
| 3,325 |
| |
| (Acquired Fund) | Class 2 | 3,813 |
| 18.04 |
| 211 |
| |
| | | $ | 64,937 |
| | 3,536 |
| |
| | | | | | |
| (3) SmallCap Blend Account | Class 1 | $ | 67,870 |
|
| $14.61 |
| 4,646 |
| |
| (Acquiring Fund) | Class 2 | — |
| | — |
| |
| | | $ | 67,870 |
| | 4,646 |
| |
| | | | | | |
| Reduction in net assets and decrease in net asset | Class 1 | $ | (36 | ) | | (2) |
| |
| values per share of the Acquired Fund to reflect the | Class 2 | (1 | ) | | — |
| ** |
| estimated expenses of the reorganization | | | | | |
| (assuming the combination of (1) and (3)) | | | | | |
| | | | | | |
| Increase in shares outstanding of the Acquired Fund | Class 1 | | | 2,767 |
| |
| to reflect the exchange for shares of the Acquiring Fund. | Class 2 | | | 3 |
| |
| (assuming the combination of (1) and (3)) | | | | | |
| | | | | | |
| | | | | | |
| (3) SmallCap Blend Account | Class 1 | $ | 180,808 |
| $ | 14.61 |
| 12,376 |
| |
| (Acquiring Fund) | Class 2 | 135 |
| 14.61 |
| 9 |
| |
| (assuming the combination of (1) and (3)) | | $ | 180,942 |
| | 12,386 |
| |
| | | | | | |
| Reduction in net assets and decrease in net asset | Class 1 | (22 | ) | | (1 | ) | |
| values per share of the Acquired Fund to reflect the | Class 2 | * |
| | ** |
| |
| estimated expenses of the reorganization | | | | | |
| (assuming the combination of (2) and (3)) | | | | | |
| | | | | | |
| Increase in shares outstanding of the Acquired Fund | Class 1 | | | 858 |
| |
| to reflect the exchange for shares of the Acquiring Fund. | Class 2 | | | 50 |
| |
| (assuming the combination of (2) and (3)) | | | | | |
| | | | | | |
| (3) SmallCap Blend Account | Class 1 | $ | 128,972 |
| $ | 14.61 |
| 8,828 |
| |
| (Acquiring Fund) | Class 2 | 3,813 |
| 14.61 |
| 261 |
| |
| (assuming the combination of (2) and (3)) | | $ | 132,785 |
| | 9,089 |
| |
| | | | | | |
| Reduction in net assets and decrease in net asset | Class 1 | $ | (58 | ) | | (3 | ) | |
| values per share of the Acquired Fund to reflect the | Class 2 | (1 | ) | | ** |
| |
| estimated expenses of the reorganization | | | | | |
| (assuming the combination of of (1), (2) and (3)) | | | | | |
| | | | | | |
| Increase in shares outstanding of the Acquired Fund | Class 1 | | | 3,625 |
| |
| to reflect the exchange for shares of the Acquiring Fund. | Class 2 | | | 53 |
| |
| (assuming the combination of of (1), (2) and (3)) | | | | | |
| | | | | | |
| (3) SmallCap Blend Account | Class 1 | $ | 241,910 |
| $ | 14.61 |
| 16,561 |
| |
| (Acquiring Fund) | Class 2 | 3,947 |
| 14.61 |
| 270 |
| |
| (assuming the combination of (1), (2) and (3)) | | $ | 245,857 |
| | 16,831 |
| |
| | | | | | |
| * Less than $500 | | | | | |
| ** Less than 500 shares | | | | | |
ADDITIONAL INFORMATION ABOUT THE FUNDS
Certain Investment Strategies and Related Risks of the Funds
This section provides information about certain investment strategies and related risks of the Funds. The Statement of Additional Information contains additional information about investment strategies and their related risks.
Some of the principal investment risks vary between the Funds and the variations are described above. The value of each Fund’s securities may fluctuate on a daily basis. As with all mutual funds, as the values of each Fund’s assets rise or fall, the Fund’s share price changes. If an investor sells Fund shares when their value is less than the price the investor paid, the investor will lose money. As with any security, the securities in which the Funds invest have associated risk.
The table below identifies the strategies and risks that apply to the Funds and indicates for each Fund whether such strategies and risks are principal, non-principal or not applicable.
|
| | | |
| INVESTMENT STRATEGIES AND RISKS | SMALLCAP BLEND | SMALLCAP GROWTH II | SMALLCAP VALUE I |
| Convertible Securities | Non-Principal | Non-Principal | Non-Principal |
| Derivatives | Non-Principal | Non-Principal | Non-Principal |
| Equity Securities | Principal | Principal | Principal |
| Exchange Traded Funds (ETFs) | Non-Principal | Non-Principal | Non-Principal |
| Fixed-Income Securities | Non-Principal | Non-Principal | Non-Principal |
| Foreign Securities | Non-Principal | Non-Principal | Non-Principal |
| Hedging | Non-Principal | Non-Principal | Non-Principal |
| Initial Public Offerings ("IPOs") | Non-Principal | Non-Principal | Non-Principal |
| Leverage | Non-Principal | Non-Principal | Non-Principal |
Liquidity Risk(1) | Non-Principal | Non-Principal | Non-Principal |
Management Risk(1) | Non-Principal | Non-Principal | Non-Principal |
Market Volatility and Issuer Risk(1) | Non-Principal | Non-Principal | Non-Principal |
| Master Limited Partnerships | Non-Principal | Non-Principal | Non-Principal |
| Portfolio Turnover | Non-Principal | Non-Principal | Non-Principal |
| Preferred Securities | Non-Principal | Non-Principal | Non-Principal |
| Real Estate Investment Trusts | Non-Principal | Non-Principal | Principal |
| Real Estate Securities | Non-Principal | Non-Principal | Principal |
| Repurchase Agreements | Non-Principal | Non-Principal | Non-Principal |
| Royalty Trusts | Non-Principal | Non-Principal | Non-Principal |
| Small and Medium Market Capitalization Companies | Principal | Principal | Principal |
| Temporary Defensive Measures | Non-Principal | Non-Principal | Non-Principal |
| |
(1) | These risks are not deemed principal for purposes of this table because they apply to almost all funds; however, in certain circumstances, they could significantly affect the net asset value, yield, and total return. |
Convertible Securities. Convertible securities are usually fixed-income securities that a fund has the right to exchange for equity securities at a specified conversion price. Convertible securities could also include corporate bonds, notes, or preferred stocks of U.S. or foreign issuers. The option allows the fund to realize additional returns if the market price of the equity securities exceeds the conversion price. For example, the fund may hold fixed-income securities that are convertible into shares of common stock at a conversion price of $10 per share. If the market value of the shares of common stock reached $12, the fund could realize an additional $2 per share by converting its fixed-income securities.
Convertible securities have lower yields than comparable fixed-income securities. In addition, at the time a convertible security is issued the conversion price exceeds the market value of the underlying equity securities. Thus, convertible securities may provide lower returns than non-convertible fixed-income securities or equity securities depending upon changes in the price of the underlying equity securities. However, convertible securities permit the fund to realize some of the potential appreciation of the underlying equity securities with less risk of losing its initial investment.
Depending on the features of the convertible security, the fund will treat a convertible security as either a fixed-income or equity security for purposes of investment policies and limitations because of the unique characteristics of convertible securities. Funds that invest in convertible securities may invest in convertible securities that are below investment grade. Many convertible securities are relatively illiquid.
Derivatives. A fund may invest in certain derivative strategies to earn income, manage or adjust the risk profile of the fund, replace more direct investments, or obtain exposure to certain markets. Generally, a derivative is a financial arrangement, the value of which is derived from, or based on, a traditional security, asset, or market index. Certain derivative securities are described more accurately as index/structured securities. Index/structured securities are derivative securities whose value or performance is linked to other equity securities (such as depositary receipts), currencies, interest rates, indices, or other financial indicators (reference indices).
There are many different types of derivatives and many different ways to use them. Futures, forward contracts, and options are commonly used for traditional hedging purposes to attempt to protect a fund from loss due to changing interest rates, securities prices, asset values, or currency exchange rates and as a low-cost method of gaining exposure to a particular market without investing directly in those securities or assets. A fund may enter into put or call options, futures contracts, options on futures contracts, over-the-counter swap contracts (e.g., interest rate swaps, total return swaps and credit default swaps), currency futures contracts and options, options on currencies, and forward currency contracts or currency swaps for both hedging and non-hedging purposes. A fund also may use foreign currency options and foreign currency forward and swap contracts to increase exposure to a foreign currency or to shift exposure to foreign currency fluctuations from one country to another. A forward currency contract involves a privately negotiated obligation to purchase or sell a specific currency at a future date at a price set in the contract. A fund will not hedge currency exposure to an extent greater than the approximate aggregate market value of the securities held or to be purchased by the fund (denominated or generally quoted or currently convertible into the currency). A fund may enter into forward commitment agreements, which call for the fund to purchase or sell a security on a future date at a fixed price. A fund may also enter into contracts to sell its investments either on demand or at a specific interval.
Generally, a fund may not invest in a derivative security unless the reference index or the instrument to which it relates is an eligible investment for the fund or the reference currency relates to an eligible investment for the fund.
The return on a derivative security may increase or decrease, depending upon changes in the reference index or instrument to which it relates. If a fund's Sub-Advisor hedges market conditions incorrectly or employs a strategy that does not correlate well with the fund's investment, these techniques could result in a loss. These techniques may increase the volatility of a fund and may involve a small investment of cash relative to the magnitude of the risk assumed.
The risks associated with derivative investments include:
| |
| • | the risk that the underlying security, currency, interest rate, market index, or other financial asset will not move in the direction Principal Management Corporation ("Principal") and/or Sub-Advisor anticipated; |
| |
| • | the possibility that there may be no liquid secondary market which may make it difficult or impossible to close out a position when desired; |
| |
| • | the risk that adverse price movements in an instrument can result in a loss substantially greater than a fund's initial investment; |
| |
| • | the possibility that the counterparty may fail to perform its obligations; and |
| |
| • | the inability to close out certain hedged positions to avoid adverse tax consequences. |
Swap agreements involve the risk that the party with whom the fund has entered into the swap will default on its obligation to pay the fund and the risk that the fund will not be able to meet its obligations to pay the other party to the agreement.
A fund may enter into credit default swap agreements as a "buyer" or "seller" of credit protection. Credit default swap agreements involve special risks because they may be difficult to value, are highly susceptible to liquidity and credit risk, and generally pay a return to the party that has paid the premium only in the event of an actual default by the issuer of the underlying obligation (as opposed to a credit downgrade or other indication of financial difficulty). Credit default swaps can increase credit risk because the fund has exposure to both the issuer of the referenced obligation and the counterparty to the credit default swap.
Forward, swap, and futures contracts are subject to special risk considerations. The primary risks associated with the use of these contracts are (a) the imperfect correlation between the change in market value of the instruments held by the fund and the price of the forward or futures contract; (b) possible lack of a liquid secondary market for a forward, swap, or futures contract and the resulting inability to close a forward, swap, or futures contract when desired; (c) losses caused by unanticipated market movements, which are potentially unlimited; (d) the sub-advisor’s inability to predict correctly the direction of securities prices, interest rates, currency exchange rates, asset values, and other economic factors; (e) the possibility that the counterparty will default in the performance of its obligations; and (f) if the fund has insufficient cash, it may have to sell securities from its portfolio to meet daily variation margin requirements, and the fund may have to sell securities at a time when it may be disadvantageous to do so.
For currency contracts, there is also a risk of government action through exchange controls that would restrict the ability of the fund to deliver or receive currency.
Some of the risks associated with options include imperfect correlation, counterparty risk, difference in trading hours for the options markets and the markets for the underlying securities (rate movements can take place in the underlying markets that cannot be reflected in the options markets), and an insufficient liquid secondary market for particular options.
Equity Securities. Equity securities include common stocks, convertible securities, depositary receipts, rights (a right is an offering of common stock to investors who currently own shares which entitle them to buy subsequent issues at a discount from the offering price), and warrants (a warrant grants its owner the right to purchase securities from the issuer at a specified price, normally higher than the current market price). Common stocks, the most familiar type, represent an equity (ownership) interest in a corporation. The value of a company's stock may fall as a result of factors directly relating to that company, such as decisions made by its management or lower demand for the company's products or services. A stock's value may also fall because of factors affecting not just the company, but also companies in the same industry or in a number of different industries, such as increases in production costs. The value of a company's stock may also be affected by changes in financial markets that are relatively unrelated to the company or its industry, such as changes in interest rates or currency exchange rates. In addition, a company's stock generally pays dividends only after the company invests in its own business and makes required payments to holders of its bonds and other debt. For this reason, the value of a company's stock will usually react more strongly than its bonds and other debt to actual or perceived changes in the company's financial condition or prospects. Some funds focus their investments on certain market capitalization ranges. Market capitalization is defined as total current market value of a company's outstanding equity securities. The market capitalization of companies in the fund’s portfolios and their related indexes will change over time and, the fund will not automatically sell a security just because it falls outside of the market capitalization range of its index(es). Stocks of smaller companies may be more vulnerable to adverse developments than those of larger companies.
Exchange Traded Funds ("ETFs"). Generally, ETFs invest in a portfolio of stocks, bonds or other assets. Often ETFs are a type of index or actively managed fund bought and sold on a securities exchange. An ETF trades like common stock. Shares in an index ETF represent an interest in a fixed portfolio of securities designed to track a particular market index. A fund could purchase shares issued by an ETF to gain exposure to a portion of the U.S. or a foreign market while awaiting purchase of underlying securities or for other reasons. The risks of owning an ETF generally reflect the risks of owning the underlying securities or other assets they are designed to track, although ETFs have management fees that increase their costs. Fund shareholders indirectly bear their proportionate share of the expenses of the ETFs in which the fund invests.
Fixed-Income Securities. Fixed-income securities include bonds and other debt instruments that are used by issuers to borrow money from investors (some examples include corporate bonds, convertible securities, mortgage-backed securities, U.S. government securities and asset-backed securities). The issuer generally pays the investor a fixed, variable, or floating rate of interest. The amount borrowed must be repaid at maturity. Some debt securities, such as zero coupon bonds, do not pay current interest, but are sold at a discount from their face values.
| |
| • | Interest Rate Changes: Fixed-income securities are sensitive to changes in interest rates. In general, fixed-income security prices rise when interest rates fall and fall when interest rates rise. If interest rates fall, issuers of callable bonds may call (repay) securities with high interest rates before their maturity dates; this is known as call risk. In this case, a fund would likely reinvest the proceeds from these securities at lower interest rates, resulting in a decline in the fund's income. Floating rate securities generally are less sensitive to interest rate changes but may decline in value if their interest rates do not rise as much, or as quickly, as interest rates in general. Conversely, floating rate securities will not generally increase in value if interest rates decline. Average duration is a mathematical calculation of the average life of a bond (or bonds in a bond fund) that serves as a useful measure of its price risk. Duration is an estimate of how much the value of the bonds held by a fund will fluctuate in response to a change in interest rates. For example, if a fund has an average duration of 4 years and interest rates rise by 1%, the value of the bonds held by the fund will decline by approximately 4%, and if the interest rates decline by 1%, the value of the bonds held by the fund will increase by approximately 4%. Longer term bonds and zero coupon bonds are generally more sensitive to interest rate changes. Duration, which measures price sensitivity to interest rate changes, is not necessarily equal to average maturity. |
| |
| • | Credit Risk: Fixed-income security prices are also affected by the credit quality of the issuer. Investment-grade debt securities are medium and high quality securities. Some bonds, such as lower grade or "junk" bonds, may have speculative characteristics and may be particularly sensitive to economic conditions and the financial condition of the issuers. Credit risk refers to the possibility that the issuer of the security will not be able to make principal and interest payments when due. |
Foreign Securities. Principal defines foreign securities as those issued by:
| |
| • | companies with their principal place of business or principal office outside the U.S. or |
| |
| • | companies whose principal securities trading market is outside the U.S. |
Foreign companies may not be subject to the same uniform accounting, auditing, and financial reporting practices as are required of U.S. companies. In addition, there may be less publicly available information about a foreign company than about a U.S. company. Securities of many foreign companies are less liquid and more volatile than securities of comparable U.S. companies. Commissions on foreign securities exchanges may be generally higher than those on U.S. exchanges.
Foreign markets also have different clearance and settlement procedures than those in U.S. markets. In certain markets there have been times when settlements have been unable to keep pace with the volume of securities transactions, making it difficult to conduct these transactions. Delays in settlement could result in temporary periods when a portion of fund assets is not invested and earning no return. If a fund is unable to make intended security purchases due to settlement problems, the fund may miss attractive investment opportunities. In addition, a fund may incur a loss as a result of a decline in the value of its portfolio if it is unable to sell a security.
With respect to certain foreign countries, there is the possibility of expropriation or confiscatory taxation, political or social instability, or diplomatic developments that could affect a fund's investments in those countries. In addition, a fund may also suffer losses due to nationalization, expropriation, or differing accounting practices and treatments. Investments in foreign securities are subject to laws of the foreign country that may limit the amount and types of foreign investments. Changes of governments or of economic or monetary policies, in the U.S. or abroad, changes in dealings between nations, currency convertibility or exchange rates could result in investment losses for a fund. Finally, even though certain currencies may be convertible into U.S. dollars, the conversion rates may be artificial relative to the actual market values and may be unfavorable to fund investors. To protect against future uncertainties in foreign currency exchange rates, the funds are authorized to enter into certain foreign currency exchange transactions.
Foreign securities are often traded with less frequency and volume, and therefore may have greater price volatility, than is the case with many U.S. securities. Brokerage commissions, custodial services, and other costs relating to investment in foreign countries are generally more expensive than in the U.S. Though the fund intends to acquire the securities of foreign issuers where there are public trading markets, economic or political turmoil in a country in which a fund has a significant portion of its assets or deterioration of the relationship between the U.S. and a foreign country may reduce the liquidity of a fund's portfolio. The fund may have difficulty meeting a large number of redemption requests. Furthermore, there may be difficulties in obtaining or enforcing judgments against foreign issuers.
A fund may choose to invest in a foreign company by purchasing depositary receipts. Depositary receipts are certificates of ownership of shares in a foreign-based issuer held by a bank or other financial institution. They are alternatives to purchasing the underlying security but are subject to the foreign securities risks to which they relate.
Hedging. Hedging is a strategy that can be used to limit or offset investment risk. The success of a fund’s hedging strategy will be subject to the Sub-Adviser’s ability to correctly assess the degree of correlation between the performance of the instruments used in the hedging strategy and the performance of the investments in the portfolio being hedged. Since the characteristics of many securities change as markets change or time passes, the success of a fund’s hedging strategy will also be subject to the Sub-Adviser’s ability to continually recalculate, readjust, and execute hedges in an efficient and timely manner. For a variety of reasons, the Sub-Adviser may not seek to establish a perfect correlation between such hedging instruments and the portfolio holdings being hedged. Such imperfect correlation may prevent a fund from achieving the intended hedge or expose a fund to risk of loss. In addition, it is not possible to hedge fully or perfectly against any risk, and hedging entails its own costs.
Initial Public Offerings ("IPOs"). An IPO is a company's first offering of stock to the public. IPO risk is that the market value of IPO shares will fluctuate considerably due to factors such as the absence of a prior public market, unseasoned trading, the small number of shares available for trading, and limited information about the issuer. The purchase of IPO shares may involve high transaction costs. IPO shares are subject to market risk and liquidity risk. In addition, the market for IPO shares can be speculative and/or inactive for extended periods of time. The limited number of shares available for trading in some IPOs may make it more difficult for a fund to buy or sell significant amounts of shares without an unfavorable impact on prevailing prices. Investors in IPO shares can be affected by substantial dilution in the value of their shares by sales of additional shares and by concentration of control in existing management and principal shareholders.
When a fund's asset base is small, a significant portion of the fund's performance could be attributable to investments in IPOs because such investments would have a magnified impact on the fund. As the fund's assets grow, the effect of the fund's investments in IPOs on the fund's performance probably will decline, which could reduce the fund's performance. Because of the price volatility of IPO shares, a fund may choose to hold IPO shares for a very short period. This may increase the turnover of the fund's portfolio and lead to increased expenses to the fund, such as commissions and transaction costs. By selling IPO shares, the fund may realize taxable gains it will subsequently distribute to shareholders.
Leverage. If a fund makes investments in futures contracts, forward contracts, swaps and other derivative instruments, these instruments provide the economic effect of financial leverage by creating additional investment exposure, as well as the potential for greater loss. If a fund uses leverage through activities such as borrowing, entering into short sales, purchasing securities on margin or on a "when-issued" basis or purchasing derivative instruments in an effort to increase its returns, the fund has the risk of magnified capital losses that occur when losses affect an asset base, enlarged by borrowings or the creation of liabilities, that exceeds the net assets of the fund. The net asset value of a fund employing leverage will be more volatile and sensitive to market movements. Leverage may involve the creation of a liability that requires the fund to pay interest. Leveraging may cause a fund to liquidate portfolio positions to satisfy its obligations or to meet segregation requirements when it may not be advantageous to do so. To the extent that a fund is not able to close out a leveraged position because of market illiquidity, a fund’s liquidity may be impaired to the extent that it has a substantial portion of liquid assets segregated or earmarked to cover obligations.
Liquidity Risk. A fund is exposed to liquidity risk when trading volume, lack of a market maker, or legal restrictions impair the fund's ability to sell particular securities or close derivative positions at an advantageous price. Funds with principal investment strategies that involve securities of companies with smaller market capitalizations, foreign securities, derivatives, high yield bonds and bank loans or securities with substantial market and/or credit risk tend to have the greatest exposure to liquidity risk.
Management Risk. If a Sub-Advisor's investment strategies do not perform as expected, the fund could underperform other funds with similar investment objectives or lose money.
| |
| • | Active Management: The performance of a fund that is actively managed will reflect in part the ability of Principal and/or Sub-Advisor(s) to make investment decisions that are suited to achieving the fund's investment objective. Actively managed funds are prepared to invest in securities, sectors, or industries differently from the benchmark. |
| |
| • | Passive Management: Index funds use a passive, or indexing, investment approach. Pure index funds do not attempt to manage market volatility, use defensive strategies or reduce the effect of any long-term periods of poor stock or bond performance. Index funds attempt to replicate their relevant target index by investing primarily in the securities held by the index in approximately the same proportion of the weightings in the index. However, because of the difficulty of executing some relatively small securities trades, such funds may not always be invested in the less heavily weighted securities held by the index. An index fund's ability to match the performance of their relevant index may be affected by many factors, such as fund expenses, the timing of cash flows into and out of the fund, changes in securities markets, and changes in the composition of the index. Some index funds may invest in index futures and/or exchange traded funds on a daily basis to gain exposure to the Index in an effort to minimize tracking error relative to the benchmark. |
Market Volatility and Issuer Risk. The value of a fund's portfolio securities may go down in response to overall stock or bond market movements. Markets tend to move in cycles, with periods of rising prices and periods of falling prices. Stocks tend to go up and down in value more than bonds. If the fund's investments are concentrated in certain sectors, its performance could be worse than the overall market. The value of an individual security or particular type of security can be more volatile than the market as a whole and can perform differently from the value of the market as a whole. The value of a security may decline for reasons directly related to the issuer, such as management performance, financial leverage, and reduced demand for the issuer’s goods or services. It is possible to lose money when investing in a fund.
Master Limited Partnerships. Master limited partnerships ("MLPs") tend to pay relatively higher distributions than other types of companies. The amount of cash that each individual MLP can distribute to its partners will depend on the amount of cash it generates from operations, which will vary from quarter to quarter depending on factors affecting the market generally and on factors affecting the particular business lines of the MLP. Available cash will also depend on the MLPs' level of operating costs (including incentive distributions to the general partner), level of capital expenditures, debt service requirements, acquisition costs (if any), fluctuations in working capital needs and other factors. The benefit derived from investment in MLPs depends largely on the MLPs being treated as partnerships for federal income tax purposes. As a partnership, an MLP has no federal income tax liability at the entity level. If, as a result of a change in current law or a change in an MLP's business, an MLP was treated as a corporation for federal income tax purposes, the MLP would be obligated to pay federal income tax on its income at the corporate tax rate. If an MLP was classified as a corporation for federal income tax purposes, the amount of cash available for distribution would be reduced and the distributions received might be taxed entirely as dividend income.
Portfolio Turnover. "Portfolio Turnover" is the term used in the industry for measuring the amount of trading that occurs in a fund's portfolio during the year. For example, a 100% turnover rate means that on average every security in the portfolio has been replaced once during the year. Funds that engage in active trading may have high portfolio turnover rates. Funds with high turnover rates (more than 100%) often have higher transaction costs (which are paid by the fund) and may lower the fund's performance. Please consider all the factors when you compare the turnover rates of different funds. You should also be aware that the "total return" line in the Financial Highlights section reflects portfolio turnover costs.
Preferred Securities. Preferred securities generally pay fixed rate dividends and/or interest (though some are adjustable rate) and typically have "preference" over common stock in payment priority and the liquidation of a company's assets - preference means that a company must pay on its preferred securities before paying on its common stock, and the claims of preferred securities holders are typically ahead of common stockholders' claims on assets in a corporate liquidation. Holders of preferred securities usually have no right to vote for corporate directors or on other matters. The market value of preferred securities is sensitive to changes in interest rates as they are typically fixed income securities - the fixed-income payments are expected to be the primary source of long-term investment return. While some preferred securities are issued with a final maturity date, others are perpetual in nature. In certain instances, a final maturity date may be extended and/or the final payment of principal may be deferred at the issuer’s option for a specified time without triggering an event of default for the issuer. In addition, an issuer of preferred securities may have the right to redeem the securities before their stated maturity date. For instance, for certain types of preferred securities, a redemption may be triggered by a change in federal income tax or securities laws. As with call provisions, a redemption by the issuer may reduce the return of the security held by the fund. Preferred securities may be subject to provisions that allow an issuer, under certain circumstances to skip (indefinitely) or defer (possibly up to 10 years) distributions. If a fund owns a preferred security that is deferring its distribution, the fund may be required to report income for tax purposes while it is not receiving any income.
Preferred securities are typically issued by corporations, generally in the form of interest or dividend bearing instruments, or by an affiliated business trust of a corporation, generally in the form of beneficial interests in subordinated debentures or similarly structured securities. The preferred securities market is generally divided into the $25 par "retail" and the $1,000 par "institutional" segments. The $25 par segment includes securities that are listed on the New York Stock Exchange (exchange traded), which trade and are quoted with accrued dividend or interest income, and which are often callable at par value five years after their original issuance date. The institutional segment includes $1,000 par value securities that are not exchange-listed (over the counter), which trade and are quoted on a "clean" price, i.e., without accrued dividend or interest income, and which often have a minimum of 10 years of call protection from the date of their original issuance. Preferred securities can also be issued by real estate investment trusts and involve risks similar to those associated with investing in real estate investment trust companies.
Real Estate Investment Trusts. Real estate investment trust securities ("REITs") involve certain unique risks in addition to those risks associated with investing in the real estate industry in general (such as possible declines in the value of real estate, lack of availability of mortgage funds, or extended vacancies of property). REITs are characterized as: equity REITs, which primarily own property and generate revenue from rental income; mortgage REITs, which invest in real estate mortgages; and hybrid REITs, which combine the characteristics of both equity and mortgage REITs. Equity REITs may be affected by changes in the value of the underlying property owned by the REITs, while mortgage REITs may be affected by the quality of any credit extended. REITs are dependent upon management skills, are not diversified, and are subject to heavy cash flow dependency, risks of default by borrowers, and self-liquidation. As an investor in a REIT, the fund will be subject to the REIT’s expenses, including management fees, and will remain subject to the fund's advisory fees with respect to the assets so invested. REITs are also subject to the possibilities of failing to qualify for the special tax treatment accorded REITs under the Internal Revenue Code, and failing to maintain their exemptions from registration under the 1940 Act.
Investment in REITs involves risks similar to those associated with investing in small market capitalization companies. REITs may have limited financial resources, may trade less frequently and in a limited volume, and may be subject to more abrupt or erratic price movements than larger company securities.
Real Estate Securities, Investing in securities of companies in the real estate industry subjects a fund to the special risks associated with the real estate market and the real estate industry in general. Generally, companies in the real estate industry are considered to be those that have principal activity involving the development, ownership, construction, management or sale of real estate; have significant real estate holdings, such as hospitality companies, healthcare facilities, supermarkets, mining, lumber and/or paper companies; and/or provide products or services related to the real estate industry, such as financial institutions that make and/or service mortgage loans and manufacturers or distributors of building supplies. Securities of companies in the real estate industry are sensitive to factors such as loss to casualty or condemnation, changes in real estate values, property taxes, interest rates, cash flow of underlying real estate assets, occupancy rates, government regulations affecting zoning, land use and rents, and the management skill and creditworthiness of the issuer. Companies in the real estate industry may also be subject to liabilities under environmental and hazardous waste laws.
Repurchase Agreements. Repurchase agreements typically involve the purchase of debt securities from a financial institution such as a bank, savings and loan association, or broker-dealer. A repurchase agreement provides that the fund sells back to the seller and that the seller repurchases the underlying securities at a specified price on a specific date. Repurchase agreements may be viewed as loans by a fund collateralized by the underlying securities. This arrangement results in a fixed rate of return that is not subject to market fluctuation while the fund holds the security. In the event of a default or bankruptcy by a selling financial institution, the affected fund bears a risk of loss. To minimize such risks, the fund enters into repurchase agreements only with parties a Sub-Advisor deems creditworthy (those that are large, well-capitalized, and well-established financial institutions). In addition, the value of the securities collateralizing the repurchase agreement is, and during the entire term of the repurchase agreement remains, at least equal to the repurchase price, including accrued interest.
Royalty Trusts. A royalty trust generally acquires an interest in natural resource or chemical companies and distributes the income it receives to its investors. A sustained decline in demand for natural resource and related products could adversely affect royalty trust revenues and cash flows. Such a decline could result from a recession or other adverse economic conditions, an increase in the market price of the underlying commodity, higher taxes or other regulatory actions that increase costs, or a shift in consumer demand. Rising interest rates could harm the performance and limit the capital appreciation of royalty trusts because of the increased availability of alternative investments at more competitive yields. Fund shareholders will indirectly bear their proportionate share of the royalty trusts' expenses.
Small and Medium Market Capitalization Companies. Funds may invest in securities of companies with small- or mid-sized market capitalizations. Market capitalization is defined as total current market value of a company's outstanding common stock. Investments in companies with smaller market capitalizations may involve greater risks and price volatility (wide, rapid fluctuations) than investments in larger, more mature companies. Small companies may be less significant within their industries and may be at a competitive disadvantage relative to their larger competitors. While smaller companies may be subject to these additional risks, they may also realize more substantial growth than larger or more established companies.
Smaller companies may be less mature than larger companies. At this earlier stage of development, the companies may have limited product lines, reduced market liquidity for their shares, limited financial resources, or less depth in management than larger or more established companies. Unseasoned issuers are companies with a record of less than three years continuous operation, including the operation of predecessors and parents. Unseasoned issuers by their nature have only a limited operating history that can be used for evaluating the company's growth prospects. As a result, these securities may place a greater emphasis on current or planned product lines and the reputation and experience of the company's management and less emphasis on fundamental valuation factors than would be the case for more mature growth companies.
Temporary Defensive Measures. From time to time, as part of its investment strategy, funds may invest without limit in cash and cash equivalents for temporary defensive purposes in response to adverse market, economic, or political conditions. To the extent that a fund is in a defensive position, it may lose the benefit of upswings and limit its ability to meet its investment objective. For this purpose, cash equivalents include: bank notes, bank certificates of deposit, bankers' acceptances, repurchase agreements, commercial paper, and commercial paper master notes, which are floating rate debt instruments without a fixed maturity. In addition, the fund may purchase U.S. government securities, preferred stocks, and debt securities, whether or not convertible into or carrying rights for common stock.
There is no limit on the extent to which a fund may take temporary defensive measures. In taking such measures, a fund may fail to achieve its investment objective.
Multiple Classes of Shares
The Board of Directors of PVC has adopted an 18f-3 Plan for each of the Funds. Under these plans, the Acquired and Acquiring Funds offer Class 1 and Class 2 shares. The shares are the same except for differences in class expenses, including any Rule 12b-1, excessive trading or other fees.
Costs of Investing in the Funds
Fees and Expenses of the Funds
The fees and expenses of the Funds are described below. Depending on the class of your shares, you may incur ongoing fees. Ongoing fees are the operating expenses of a Fund and include fees paid to the Fund’s manager, underwriter and others who provide ongoing services to the Fund.
Ongoing fees
Ongoing Fees reduce the value of each share. Because they are ongoing, they increase the cost of investing in the Funds.
Each Fund pays ongoing fees to PMC and others who provide services to the Fund. These fees include:
| |
| • | Management Fee – Through the Management Agreement with the Fund, PMC has agreed to provide investment advisory services and administrative services to the Fund. |
| |
| • | Other Expenses – A portion of expenses that are allocated to all classes of the Fund. |
| |
| • | Distribution Fee – Each of the Funds has adopted a distribution plan under Rule 12b-1 of the 1940 Act for its Class 2 shares. Each Fund pays a distribution fee based on the average daily net asset value (NAV) of the Fund. These fees pay distribution and other expenses for the sale of Fund shares and for services provided to shareholders. Over time, these fees may exceed other types of sales charges. |
Distribution Plans and Intermediary Compensation
Distribution and/or Service (12b-1) Fees. Principal Funds Distributor, Inc. (the "Distributor") is the distributor for the shares of the Fund. The Distributor is an affiliate of Principal Life Insurance Company and with it is a subsidiary of Principal Financial Group, Inc. and member of the Principal Financial Group®.
The Fund has adopted a distribution plan pursuant to Rule 12b-1 under the Investment Company Act for the Class 2 shares of the Funds. Under the 12b-1 Plan, each Fund makes payments from its assets attributable to the Class 2 shares to the Fund's Distributor for distribution-related expenses and for providing services to shareholders of that share class. Payments under the 12b-1 plans are made by the Fund to the Distributor pursuant to the 12b-1 Plan regardless of the expenses incurred by the Distributor.
When the Distributor receives Rule 12b-1 fees, it may pay some or all of them to financial intermediaries whose customers are Class 2 shareholders for sales support services and for providing services to shareholders of that share class. Financial intermediaries may include, among others, broker-dealers, registered investment advisers, banks, trust companies, pension plan consultants, retirement plan administrators, and insurance companies.
Because Rule 12b-1 fees are paid out of Fund assets and are ongoing fees, over time they will increase the cost of your investment in the Funds and may cost you more than other types of sales charges.
The maximum annualized Rule 12b-1 fee for distribution related expenses and/or for providing services to shareholders (as a percentage of average daily net assets) for the Class 2 shares of each of the Funds is 0.25%.
Payments under the 12b-1 Plan will not automatically terminate for Funds that are closed to new investors or to additional purchases by existing shareholders. The Fund Board will determine whether to terminate, modify, or leave unchanged the 12b-1 Plan if the Board directs the closure of an Fund.
Payments to Financial Professionals and Their Firms. Financial intermediaries receive compensation from the Distributor and its affiliates for marketing, selling, and/or providing services to variable annuities and variable life insurance contracts that invest in the Funds. Financial intermediaries also receive compensation for marketing, selling, and/or providing services to certain retirement plans that offer the Funds as investment options. Financial intermediaries may include, among others, broker/dealers, registered investment advisors, banks, trust companies, pension plan consultants, retirement plan administrators, and insurance companies. Financial Professionals who deal with investors on an individual basis are typically associated with a financial intermediary. The Distributor and its affiliates may fund this compensation from various sources, including any Rule 12b-1 Plan fee that the Funds pay to the Distributor. Individual Financial Professionals may receive some or all of the amounts paid to the financial intermediary with which he or she is associated.
Ongoing Payments. In the case of Class 2 shares, and pursuant to the Rule 12b-1 Plan applicable to the Class 2 shares, the Distributor generally makes ongoing payments to your financial intermediary at an annual rate of 0.25% of average net assets attributable to your indirect investment in the Funds. In addition, the Distributor or Principal may make from its own resources ongoing payments to an insurance company, which payments will generally not exceed 0.27% of the average net assets of the Funds held by the insurance company in its separate accounts. The payments are for distribution support and/or administrative services and may be made with respect to either or both classes of shares of the Funds.
Other Payments to Intermediaries. In addition to any commissions that may be paid at the time of sale and ongoing payments, the Distributor and its affiliates, at their expense, currently provide additional payments to financial intermediaries that sell variable annuities and variable life insurance contracts that may be funded by shares of the Funds, or may sell shares of the Funds to retirement plans for distribution services. Although payments made to each qualifying financial intermediary in any given year may vary, such payments will generally not exceed 0.25% of the current year’s sales of applicable variable annuities and variable life insurance contracts that may be funded by account shares, or 0.25% of the current year’s sales of Fund shares to retirement plans by that financial intermediary.
Additionally, in some cases the Distributor and its affiliates will provide payments or reimbursements in connection with the costs of conferences, educational seminars, due diligence trips, training and marketing efforts related to the Funds for the financial intermediary's personnel and/or their clients and potential clients. Such activities may be sponsored by financial intermediaries or the Distributor. The costs associated with such activities may include travel, lodging, entertainment, and meals. In some cases the Distributor will also provide payment or reimbursement for expenses associated with transactions ("ticket") charges and general marketing expenses.
For more information, see the Statement of Additional Information (SAI). See also the section titled "Certain Information Common to All Funds - Payments to Broker-Dealers and Other Financial Intermediaries" in this Prospectus.
Your variable life insurance or variable annuity contract or your retirement plan may impose other charges and expenses, some of which may also be used in connection with the sale of such contracts in addition to those described in the Prospectus. The amount and applicability of any insurance contract fee are determined and disclosed separately within the prospectus for your insurance contract.
The payments described in this prospectus may create a conflict of interest by influencing your Financial Professional or your financial intermediary to recommend one variable annuity, variable life insurance policy or mutual fund over another, or to recommend one Fund or share class of the Fund over another Fund or share class. Ask your Financial Professional or visit your financial intermediary's website for more information about the total amounts paid to them by Principal and its affiliates, and by sponsors of other mutual funds your Financial Professional may recommend to you.
Your financial intermediary may charge you additional fees other than those disclosed in this prospectus. Ask your Financial Professional about any fees and commissions they charge.
Pricing of Fund Shares
Each Fund’s shares are bought and sold at the current net asset value ("NAV") per share. Each Fund’s NAV is calculated each day the New York Stock Exchange ("NYSE") is open (shares are not priced on the days on which the NYSE is closed for trading). The NYSE is closed on the following holidays: New Year’s Day, Martin Luther King, Jr. Day, Washington’s Birthday/Presidents’ Day, Good Friday, Memorial Day, Independence Day, Labor Day, Thanksgiving Day, and Christmas. The NAV is determined at the close of business of the NYSE (normally 3:00 p.m. Central Time). When an order to buy or sell shares is received, the share price used to fill the order is the next price calculated after the order is received in proper form.
For all Funds, the NAV is calculated by:
| |
| • | taking the current market value of the total assets of the Fund |
| |
| • | subtracting liabilities of the Fund |
| |
| • | dividing the remainder proportionately into the classes of the Fund |
| |
| • | subtracting the liabilities of each class |
| |
| • | dividing the remainder by the total number of shares owned in that class. |
Notes:
| |
| • | If market quotations are not readily available for a security owned by an Fund, its fair value is determined using a policy adopted by the Directors. Fair valuation pricing is subjective and creates the possibility that the fair value determined for a security may differ materially from the value that could be realized upon the sale of the security. |
| |
| • | An Fund's securities may be traded on foreign securities markets that generally complete trading at various times during the day prior to the close of the NYSE. Foreign securities and currencies are converted to U.S. dollars using the exchange rate in effect at the close of the NYSE. Securities traded outside of the Western Hemisphere are valued using a fair value policy adopted by the Fund. These fair valuation procedures are intended to discourage shareholders from investing in the Fund for the purpose of engaging in market timing or arbitrage transactions. |
| |
| • | The trading of foreign securities generally or in a particular country or countries may not take place on all days the NYSE is open, or may trade on days the NYSE is closed. Thus, the value of the foreign securities held by the Fund may change on days when shareholders are unable to purchase or redeem shares. |
| |
| • | Certain securities issued by companies in emerging market countries may have more than one quoted valuation at any point in time. These may be referred to as local price and premium price. The premium price is often a negotiated price that may not consistently represent a price at which a specific transaction can be effected. The Fund has a policy to value such securities at a price at which the Sub-Advisor expects the securities may be sold. |
Purchase of Fund Shares
Principal Variable Contracts Funds, Inc. offers funds in two share classes: 1 and 2. Funds available in multiple share classes have the same investments, but differing expenses. Classes 1 and 2 shares are available in this prospectus.
Shares are purchased from the Fund’s principal underwriter ("Distributor") on any business day (normally any day when the New York Stock Exchange is open for regular trading) upon request through the insurance company issuing the variable annuity, variable life contract, or the trustees or administrators of the qualified retirement plan offering the Fund. There are no sales charges on shares of the Funds; however, your variable contract may impose a charge. There are no restrictions on amounts to be invested in shares of the Funds.
The Fund, at its discretion, may permit the purchase of shares using securities as consideration (a purchase in-kind) in accordance with procedures approved by the Fund’s Board of Directors. Each Fund will value securities used to purchase its shares using the same method the Fund uses to value its portfolio securities as described in this prospectus.
Shareholder accounts for each Fund are maintained under an open account system. Under this system, an account is opened and maintained for each investor. Each investment is confirmed by sending the investor a statement of account showing the current purchase and the total number of shares owned. The statement of account is treated by each Fund as evidence of ownership of Fund shares. Share certificates are not issued.
| |
| Note: | No salesperson, broker-dealer or other person is authorized to give information or make representations about an Fund other than those contained in this Prospectus. Information or representations not contained in this prospectus may not be relied upon as having been provided or made by the Principal Variable Contracts Funds, Inc., an Fund, Principal, any Sub-Advisor, or PFD. |
Sale of Fund Shares
Variable contracts owners should refer to the variable contract product prospectus for details on how to allocate policy or contract value. Qualified plan participants should refer to the qualified plan documents.
Each Fund sells its shares upon request on any business day (normally any day when the New York Stock Exchange is open for regular trading) upon request through the insurance company issuing the variable annuity, variable life contract, or the trustees or administrators of the qualified retirement plan offering the Fund. There is no charge for the redemption. Shares are redeemed at the NAV per share next computed after the request is received by the Fund in proper and complete form.
Sale proceeds are generally sent within three business days after the request is received in proper form. However, the right to sell shares may be suspended up to seven days, as permitted by federal securities law, during any period when 1) trading on the NYSE is restricted as determined by the SEC or when the NYSE is closed for reasons other than weekends and holidays or 2) an emergency exists, as determined by the SEC, as a result of which a) disposal by a fund of securities owned by it is not reasonably practicable, b) it is not reasonably practicable for a fund to fairly determine the value of its net assets, or c) the SEC permits suspension for the protection of security holders.
If payments are delayed and the instruction is not canceled by the shareholder’s written instruction, the amount of the transaction is determined as of the first valuation date following the expiration of the permitted delay. The transaction occurs within five days thereafter.
In addition, payments on surrender requests submitted before a related premium payment made by check has cleared may be delayed up to seven days. This permits payment to be collected on the check.
Distributions in Kind. The Fund may determine that it would be detrimental to the remaining shareholders of an Fund to make payment of a redemption order wholly or partly in cash. Under certain circumstances, therefore, each of the accounts may pay the redemption proceeds in whole or in part by a distribution "in kind" of securities from the Fund’s portfolio in lieu of cash. If an Fund pays the redemption proceeds in kind, the redeeming shareholder might incur brokerage or other costs in selling the securities for cash. Each Fund will value securities used to pay redemptions in kind using the same method the Fund uses to value its portfolio securities as described in this prospectus.
Frequent Trading and Market Timing (Abusive Trading Practices)
The Funds are not designed for, and do not knowingly accommodate, frequent purchases and redemptions ("excessive trading") of Fund shares by investors. If you intend to trade frequently and/or use market timing investment strategies, do not purchase shares of these Funds.
Frequent purchases and redemptions pose a risk to the Funds because they may:
| |
| • | Disrupt the management of the Funds by: |
| |
| • | forcing the Fund to hold short-term (liquid) assets rather than investing for long-term growth, which results in lost investment opportunities for the Fund and |
| |
| • | causing unplanned portfolio turnover; |
| |
| • | Hurt the portfolio performance of the Fund; and |
| |
| • | Increase expenses of the Fund due to: |
| |
| • | increased broker-dealer commissions and |
| |
| • | increased recordkeeping and related costs. |
If we are not able to identify such excessive trading practices, the Funds and their shareholders may be harmed. The harm of undetected excessive trading in shares of the underlying Funds in which the funds of funds (for example, Diversified Balanced Account, Diversified Balanced Managed Volatility Account, Diversified Growth Account, Diversified Growth Managed Volatility Account, Diversified Income Account, Principal LifeTime Accounts or Strategic Asset Management Portfolios) invest could flow through to the funds of funds as they would for any fund shareholder.
Certain Funds may be at greater risk of harm due to frequent purchase and redemptions. For example, those Funds that invest in foreign securities may appeal to investors attempting to take advantage of time-zone arbitrage. This risk is particularly relevant to the Diversified International and International Emerging Market Accounts. The Fund has adopted fair valuation procedures. These procedures are intended to discourage market timing transactions in shares of the Funds.
As the Funds are only available through variable annuity or variable life contracts or to qualified retirement plans, the Fund must rely on the insurance company that issues the contract, or the trustees or administrators of qualified retirement plans, ("intermediary") to monitor customer trading activity to identify and take action against excessive trading. There can be no certainty that the intermediary will identify and prevent excessive trading in all instances. When an intermediary identifies excessive trading, it will act to curtail such trading in a fair and uniform manner. If an intermediary is unable to identify such abusive trading practices, the abuses described above may negatively impact the Funds.
If an intermediary, or the Fund, deems excessive trading practices to be occurring, it will take action that may include, but is not limited to:
| |
| • | Rejecting exchange instructions from a shareholder or other person authorized by the shareholder to direct exchanges; |
| |
| • | Restricting submission of exchange requests by, for example, allowing exchange requests to be submitted by 1st class U.S. mail only and disallowing requests made via the internet, by facsimile, by overnight courier, or by telephone; |
| |
| • | Limiting the dollar amount of an exchange and/or the number of exchanges during a year; |
| |
| • | Requiring a holding period of a minimum of 30 days before permitting exchanges among the Funds where there is evidence of at least one round-trip exchange (exchange or redemption of shares that were purchased within 30 days of the exchange/redemption); and |
| |
| • | Taking such other action as directed by the Fund. |
The Fund Board of Directors has found the imposition of a redemption fee with respect to redemptions from Class 1 and Class 2 shares of the Funds is neither necessary nor appropriate in light of measures taken by intermediaries through which such shares are currently available. Each intermediary’s excessive trading policies and procedures will be reviewed by Fund management prior to making shares of the Fund available through such intermediary to determine whether, in management’s opinion, such procedures are reasonably designed to prevent excessive trading in Fund shares.
In order to prevent excessive trading, the Fund has reserved the right to accept or reject, without prior written notice, any exchange requests (an exchange request is a redemption request coupled with a request to purchase shares with the proceeds of the redemption; such restriction applies to the purchase of fund shares in an exchange request and does not restrict a shareholder from requesting a redemption). In some instances, an exchange may be completed prior to a determination of abusive trading. In those instances, the intermediary will reverse an exchange (within one business day of the exchange) and return the account holdings to the positions held prior to the exchange. The intermediary will give you notice in writing in this instance.
Dividends and Distributions
The Funds earn dividends, interest, and other income from investments and distribute this income (less expenses) as dividends. The Funds also realize capital gains from investments and distribute these gains (less any losses) as capital gain distributions. The Funds normally make dividends and capital gain distributions at least annually, in August. Dividends and capital gain distributions are automatically reinvested in additional shares of the Fund making the distribution.
Tax Considerations
The Fund intends to comply with applicable variable asset diversification regulations. If the Fund fails to comply with such regulations, contracts invested in the Fund will not be treated as annuity, endowment, or life insurance contracts under the Internal Revenue Code.
Contract owners should review the applicable contract prospectus for information concerning the federal income tax treatment of their contracts and distributions from the Fund to the separate accounts.
Contract owners are urged to consult their tax advisors regarding the status of their contracts under state and local tax laws.
Portfolio Holdings Information
A description of PVC’s policies and procedures with respect to disclosure of the Funds’ portfolio securities is available in the Statement of Additional Information.
VOTING INFORMATION
Voting procedures. If you complete and return the enclosed proxy card(s), the persons named as proxies will vote your shares as you indicate or for approval of each matter for which there is no indication. You may revoke your proxy at any time prior to the proxy’s exercise by: (i) sending written notice to the Secretary of Principal Variable Contracts Funds, Inc. at Principal Financial Group, Des Moines, Iowa 50392, prior to the Meeting; (ii) subsequent execution and return of another proxy prior to the Meeting; or (iii) being present and voting in person at the Meeting after giving oral notice of the revocation to the Chairman of the Meeting.
Voting rights. Only shareholders of record at the close of business on January 30, 2015 (the "Record Date"), are entitled to vote. The shareholders of each class of shares of each Acquired Fund will vote together on the proposed Reorganization and on any other matter submitted to such shareholders. You are entitled to one vote on each matter submitted to the shareholders of each Acquired Fund for each share of the Fund that you hold, and fractional votes for fractional shares held. Each Proposal requires for approval the affirmative vote of a "Majority of the Outstanding Voting Securities," which is a term defined in the 1940 Act to mean, the affirmative vote of the lesser of (1) 67% or more of the voting securities of the Acquired Fund present at the Meeting, if the holders of more than 50% of the outstanding voting securities of the Acquired Fund are present in person or by proxy, or (2) more than 50% of the outstanding voting securities of the Acquired Fund. The approval of one Reorganization is not contingent upon approval of any other Reorganization.
The number of votes eligible to be cast at the Meeting as of the Record Date and other share ownership information are set forth below under the heading "Outstanding Shares and Share Ownership".
Quorum requirements. A quorum must be present at the Meeting for the transaction of business. The presence in person or by proxy of one-third of the shares of an Acquired Fund outstanding at the close of business on the Record Date constitutes a quorum for a meeting of that Fund. Abstentions and broker non-votes (proxies from brokers or nominees indicating that they have not received instructions from the beneficial owners on an item for which the broker or nominee does not have discretionary power) are counted toward a quorum but do not represent votes cast for any issue. Under the 1940 Act, the affirmative vote necessary to approve a proposal may be determined with reference to a percentage of votes present at the Meeting, which would have the effect of counting abstentions as if they were votes against a proposal.
In the event the necessary quorum to transact business or the vote required to approve a proposal is not obtained at the Meeting, the persons named as proxies or any shareholder present at the Meeting may propose one or more adjournments of the Meeting in accordance with applicable law to permit further solicitation of proxies. Any such adjournment as to the Proposal or any other matter will require the affirmative vote of the holders of a majority of the shares of the Acquired Fund cast at the Meeting. The persons named as proxies and any shareholder present at the Meeting will vote for or against any adjournment in their discretion.
Solicitation procedures. PVC intends to solicit proxies by mail. Officers or employees of PVC, PMC or their affiliates may make additional solicitations by telephone, internet, facsimile or personal contact. They will not be specially compensated for these services. Brokerage houses, banks and other fiduciaries may be requested to forward soliciting materials to their principals and to obtain authorization for the execution of proxies. For those services, they will be reimbursed by PMC for their out-of-pocket expenses.
Expenses of the Meeting. The expenses of the Meeting will be treated as an expense related to the Reorganization and will be paid by the Acquired Funds.
OUTSTANDING SHARES AND SHARE OWNERSHIP
The following table shows as of January 30, 2015, the Record Date, the number of shares outstanding for each class of the Acquired and Acquiring Funds:
SmallCap Growth Account II SmallCap Value Account I SmallCap Blend Account
(Acquired Fund) (Acquired Fund) (Acquiring Fund)
Shares Shares Shares
Share Class Outstanding Share Class Outstanding Share Class Outstanding
1 1 1
2 2 2
TO BE FILED BY AMENDMENT.
As of the January 30, 2015 Record Date, the Directors and Officers of PVC together owned less than 1% of the outstanding shares of any class of shares of the Acquired or Acquiring Funds.
As of the January 30, 2015 Record Date, the following persons owned of record, or were known by PVC to own beneficially, 5% or more of the outstanding shares of any class of shares of the Acquiring Fund:
Percentage
Acquiring Share of
Fund Class Name/Address of Shareholder Ownership
TO BE FILED BY AMENDMENT.
As of the January 30, 2015 Record Date, the following persons owned of record, or were known by PVC to own beneficially, 5% or more of the outstanding shares of any class of shares of the Acquired Funds:
Percentage
Acquired Share of
Fund Class Name/Address of Shareholder Ownership
TO BE FILED BY AMENDMENT.
FINANCIAL HIGHLIGHTS
The financial highlights table for each of the Acquired Funds and the Acquiring Fund is intended to help investors understand the financial performance of each Fund for the past five fiscal years (or since inception in the case of a Fund in operation for less than five years) and for the semi-annual period ended April 30, 2014. Certain information reflects financial results for a single share of a Fund. The total returns in the tables represent the rate that an investor would have earned (or lost) on an investment in a particular Fund (assuming reinvestment of all dividends and distributions). Information for the fiscal years ended December 31, 2009, through December 31, 2013, has been audited by Ernst & Young LLP, Independent Registered Public Accounting Firm, whose report, along with each Fund’s financial statements, is included in PVC’s Annual Report to Shareholders for the fiscal year ended December 31, 2013. Copies of this report are available on request as described above. Information for the semi-annual period ended April 30, 2014, has not been audited.
FINANCIAL HIGHLIGHTS
PRINCIPAL VARIABLE CONTRACTS FUNDS, INC.
(unaudited)
Selected date for a share of Capital Stock outstanding throughout each year ended December 31 (except as noted):
|
| | | | | | | | | | | | | | | | | | | |
| | Net Asset Value, Beginning of Period | Net Investment Income (Loss)(a) | Net Realized and Unrealized Gain (Loss) on Investments | Total From Investment Operations | Dividends from Net Investment Income | Total Dividends and Distributions | Net Asset Value, End of Period |
| SMALLCAP BLEND ACCOUNT | | | | |
| Class 1 shares | | | | | | | |
| 2014(c) | $ | 13.79 |
| $ | 0.01 |
| $ | 0.81 |
| $ | 0.82 |
| $– |
| $– |
| $ | 14.61 |
|
| 2013 | 9.36 |
| 0.04 |
| 4.43 |
| 4.47 |
| (0.04 | ) | (0.04 | ) | 13.79 |
|
| 2012 | 8.16 |
| 0.07 |
| 1.13 |
| 1.20 |
| – |
| – |
| 9.36 |
|
| 2011 | 8.31 |
| (0.01 | ) | (0.11 | ) | (0.12 | ) | (0.03 | ) | (0.03 | ) | 8.16 |
|
| 2010 | 6.72 |
| 0.03 |
| 1.59 |
| 1.62 |
| (0.03 | ) | (0.03 | ) | 8.31 |
|
| 2009 | 5.54 |
| 0.04 |
| 1.18 |
| 1.22 |
| (0.04 | ) | (0.04 | ) | 6.72 |
|
| SMALLCAP GROWTH ACCOUNT II |
| Class 1 shares | | | | | | | |
| 2014(c) | 18.31 |
| (0.05 | ) | 0.12 |
| 0.07 |
| – |
| – |
| 18.38 |
|
| 2013 | 12.42 |
| (0.10 | ) | 5.99 |
| 5.89 |
| – |
| – |
| 18.31 |
|
| 2012 | 10.68 |
| (0.06 | ) | 1.80 |
| 1.74 |
| – |
| – |
| 12.42 |
|
| 2011 | 11.17 |
| (0.08 | ) | (0.41 | ) | (0.49 | ) | – |
| – |
| 10.68 |
|
| 2010 | 8.80 |
| (0.05 | ) | 2.42 |
| 2.37 |
| – |
| – |
| 11.17 |
|
| 2009 | 6.68 |
| (0.05 | ) | 2.17 |
| 2.12 |
| – |
| – |
| 8.80 |
|
| Class 2 shares | | | | | | | |
| 2014(c) | 17.99 |
| (0.07 | ) | 0.12 |
| 0.05 |
| – |
| – |
| 18.04 |
|
| 2013 | 12.24 |
| (0.14 | ) | 5.89 |
| 5.75 |
| – |
| – |
| 17.99 |
|
| 2012 | 10.54 |
| (0.09 | ) | 1.79 |
| 1.70 |
| – |
| – |
| 12.24 |
|
| 2011 | 11.06 |
| (0.11 | ) | (0.41 | ) | (0.52 | ) | – |
| – |
| 10.54 |
|
| 2010 | 8.73 |
| (0.08 | ) | 2.41 |
| 2.33 |
| – |
| – |
| 11.06 |
|
| 2009 | 6.65 |
| (0.07 | ) | 2.15 |
| 2.08 |
| – |
| – |
| 8.73 |
|
| SMALLCAP VALUE ACCOUNT I |
| Class 1 shares | | | | | | | |
| 2014(c) | 21.74 |
| 0.03 |
| 0.98 |
| 1.01 |
| – |
| – |
| 22.75 |
|
| 2013 | 15.72 |
| 0.14 |
| 6.08 |
| 6.22 |
| (0.20 | ) | (0.20 | ) | 21.74 |
|
| 2012 | 13.02 |
| 0.17 |
| 2.65 |
| 2.82 |
| (0.12 | ) | (0.12 | ) | 15.72 |
|
| 2011 | 13.52 |
| 0.09 |
| (0.58 | ) | (0.49 | ) | (0.01 | ) | (0.01 | ) | 13.02 |
|
| 2010 | 10.81 |
| 0.08 |
| 2.73 |
| 2.81 |
| (0.10 | ) | (0.10 | ) | 13.52 |
|
| 2009 | 9.51 |
| 0.09 |
| 1.42 |
| 1.51 |
| (0.21 | ) | (0.21 | ) | 10.81 |
|
| Class 2 shares | | | | | | | |
| 2014(c) | 21.64 |
| 0.01 |
| 0.97 |
| 0.98 |
| – |
| – |
| 22.62 |
|
| 2013 | 15.67 |
| 0.09 |
| 6.07 |
| 6.16 |
| (0.19 | ) | (0.19 | ) | 21.64 |
|
| 2012 | 12.99 |
| 0.13 |
| 2.64 |
| 2.77 |
| (0.09 | ) | (0.09 | ) | 15.67 |
|
| 2011 | 13.52 |
| 0.05 |
| (0.58 | ) | (0.53 | ) | – |
| – |
| 12.99 |
|
| 2010 | 10.82 |
| 0.06 |
| 2.73 |
| 2.79 |
| (0.09 | ) | (0.09 | ) | 13.52 |
|
| 2009 | 9.51 |
| 0.07 |
| 1.42 |
| 1.49 |
| (0.18 | ) | (0.18 | ) | 10.82 |
|
|
| | | | | | | | | | |
| Total Return (b) | Net Assets, End of Period (in thousands) | Ratio of Expenses to Average Net Assets | Ratio of Net Investment Income to Average Net Assets | Portfolio Turnover Rate |
| | | | | |
| | | | | |
| 5.95 %(d) |
| $ | 67,870 |
| 0.87 %(e) |
| 0.14 %(e) |
| 73.1 %(e) |
|
| 47.81 |
| 64,785 |
| 0.87 |
| 0.38 |
| 78.1 |
|
| 14.71 |
| 47,469 |
| 0.89 |
| 0.76 |
| 94.5 |
|
| (1.47) |
| 47,155 |
| 0.88 |
| (0.09 | ) | 69.1 |
|
| 24.26 |
| 57,287 |
| 0.88 |
| 0.38 |
| 69.0 |
|
| 22.18 |
| 52,533 |
| 0.88 |
| 0.63 |
| 87.5 |
|
| | | | | |
| | | | | |
| 0.38 (d) |
| 61,124 |
| 0.94 (e),(f) |
| (0.51)(e) |
| 65.2 (e) |
|
| 47.42 |
| 65,466 |
| 0.95 (f) |
| (0.65 | ) | 72.8 |
|
| 16.29 |
| 49,224 |
| 1.06 (f) |
| (0.53 | ) | 77.5 |
|
| (4.39 | ) | 47,596 |
| 1.04 (f) |
| (0.75 | ) | 94.3 |
|
| 26.93 |
| 56,856 |
| 1.03 (f) |
| (0.59 | ) | 82.2 |
|
| 31.74 |
| 77,315 |
| 1.02 (f) |
| (0.68 | ) | 134.6 |
|
| | | | | |
| 0.28 (d) |
| 3,813 |
| 1.19 (e),(f) |
| (0.76)(e) |
| 65.2 (e) |
|
| 46.98 |
| 3,917 |
| 1.20 (f) |
| (0.90 | ) | 72.8 |
|
| 16.13 |
| 2,864 |
| 1.31 (f) |
| (0.78 | ) | 77.5 |
|
| (4.70 | ) | 2,653 |
| 1.29 (f) |
| (0.99 | ) | 94.3 |
|
| 26.69 |
| 3,015 |
| 1.28 (f) |
| (0.82 | ) | 82.2 |
|
| 31.28 |
| 2,529 |
| 1.27 (f) |
| (0.93 | ) | 134.6 |
|
| | | | | |
| | | | | |
| 4.65 (d) |
| 112,974 |
| 0.99 (e),(f) |
| 0.31 (e) |
| 57.0 (e) |
|
| 39.76 |
| 117,194 |
| 0.99 (f) |
| 0.75 |
| 57.0 |
|
| 21.73 |
| 101,259 |
| 0.99 (f) |
| 1.19 |
| 43.2 |
|
| (3.66 | ) | 100,321 |
| 0.99 (f) |
| 0.70 |
| 72.2 |
|
| 26.06 |
| 114,144 |
| 0.99 (f) |
| 0.70 |
| 63.8 |
|
| 16.20 |
| 133,755 |
| 1.00 (f) |
| 0.99 |
| 75.9 |
|
| | | | | |
| 4.53 (d) |
| 135 |
| 1.24 (e),(f) |
| 0.07 (e) |
| 57.0 (e) |
|
| 39.44 |
| 110 |
| 1.24 (f) |
| 0.50 |
| 57.0 |
|
| 21.40 |
| 85 |
| 1.24 (f) |
| 0.92 |
| 43.2 |
|
| (3.89 | ) | 94 |
| 1.24 (f) |
| 0.37 |
| 72.2 |
|
| 25.81 |
| 169 |
| 1.24 (f) |
| 0.52 |
| 63.8 |
|
| 15.88 |
| 104 |
| 1.25 (f) |
| 0.74 |
| 75.9 |
|
|
| |
| (a) | Calculated based on average shares outstanding during the period. |
| (b) | Total return does not reflect charges attributable to separate accounts. Inclusion of these charges would reduce the amounts shown. |
| (c) | Six months ended June 30, 2014 |
| (d) | Total return amounts have not been annualized. |
| (e) | Computed on an annualized basis. |
| (f) | Reflects Manager's contractual expense limit. |
FINANCIAL STATEMENTS
The financial statements of the Acquiring Fund and the Acquired Funds included in PVC’s Annual Report to Shareholders for the fiscal year ended December 31, 2013 have been incorporated by reference into the Statement of Additional Information and have been so incorporated by reference in reliance on the report of Ernst & Young LLP, Independent Registered Public Accounting Firm. The unaudited financial statements of the Acquiring Fund and the Acquired Funds included in PVC’s Semi-Annual Report to Shareholders for the six-month period ended June 30, 2014 have also been incorporated by reference into the Statement of Additional Information. Copies of these reports are available on request as described above.
LEGAL MATTERS
Certain matters concerning the issuance of shares of the Acquiring Fund will be passed upon by Adam U. Shaikh, Esq., Assistant Counsel to PVC. Certain tax consequences of the Reorganization will be passed upon for the Acquiring Fund by Randy Lee Bergstrom, Esq., Assistant Tax Counsel to PVC, and for the Acquired Funds by Carolyn F. Kolks, Esq., Assistant Tax Counsel to PVC.
OTHER INFORMATION
PVC is not required to hold annual meetings of shareholders and, therefore, it cannot be determined when the next meeting of shareholders will be held. Shareholder proposals to be presented at any future meeting of shareholders of any PVC Fund must be received by PVC a reasonable time before its solicitation of proxies for that meeting in order for such proposals to be considered for inclusion in the proxy materials related to that meeting.
BY ORDER OF THE BOARD OF DIRECTORS
February ____, 2015
Des Moines, Iowa
Appendix A
FORM OF
PLAN OF ACQUISITION
SmallCap Growth Account II and
SmallCap Blend Account
The Board of Directors of Principal Variable Contracts Funds, Inc., a Maryland corporation (the "Fund"), deems it advisable that the SmallCap Blend Account series of the Fund ("SCBA") acquire all of the assets of the SmallCap Growth Account II series of the Fund ("SCGII") in exchange for the assumption by SCBA of all of the liabilities of SCGII and shares issued by SCBA which are thereafter to be distributed by SCGII pro rata to its shareholders in complete liquidation and termination of SCGII and in exchange for all of SCGII’s outstanding shares.
SCGII will transfer to SCBA, and SCBA will acquire from SCGII, all of the assets of SCGII on the Closing Date and will assume from SCGII all of the liabilities of SCGII in exchange for the issuance of the number of shares of SCBA determined as provided in the following paragraphs, which shares will be subsequently distributed pro rata to the shareholders of SCGII in complete liquidation and termination of SCGII and in exchange for all of SCGII’s outstanding shares. SCGII will not issue, sell or transfer any of its shares after the Closing Date, and only redemption requests received by SCGII in proper form prior to the Closing Date shall be fulfilled by SCGII. Redemption requests received by SCGII thereafter will be treated as requests for redemption of those shares of SCBA allocable to the shareholder in question.
SCGII will declare, and SCBA may declare, to its shareholders of record on or prior to the Closing Date a dividend or dividends which, together with all previous such dividends, shall have the effect of distributing to its shareholders all of its income (computed without regard to any deduction for dividends paid) and all of its net realized capital gains, if any, as of the Closing Date.
On the Closing Date, SCBA will issue to SCGII a number of full and fractional shares of SCBA, taken at their then net asset value, having an aggregate net asset value equal to the aggregate value of the net assets of SCGII. The aggregate value of the net assets of SCGII and SCBA shall be determined in accordance with the then current Prospectus of SCBA as of close of regularly scheduled trading on the New York Stock Exchange on the Closing Date.
The closing of the transactions contemplated in this Plan (the "Closing") shall be held at the offices of Principal Management Corporation, 650 8th Street, Des Moines, Iowa 50392 at 3:00 p.m. Central Time on ________, 2015, or on such earlier or later date as fund management may determine. The date on which the Closing is to be held as provided in this Plan shall be known as the "Closing Date."
In the event that on the Closing Date (a) the New York Stock Exchange is closed for other than customary weekend and holiday closings or (b) trading on said Exchange is restricted or (c) an emergency exists as a result of which it is not reasonably practicable for SCBA or SCGII to fairly determine the value of its assets, the Closing Date shall be postponed until the first business day after the day on which trading shall have been fully resumed.
As soon as practicable after the Closing, SCGII shall (a) distribute on a pro rata basis to the shareholders of record of SCGII at the close of business on the Closing Date the shares of SCBA received by SCGII at the Closing in exchange for all of SCGII’s outstanding shares, and (b) be liquidated in accordance with applicable law and the Fund’s Articles of Incorporation.
For purposes of the distribution of shares of SCBA to shareholders of SCGII, SCBA shall credit its books an appropriate number its shares to the account of each shareholder of SCGII. No certificates will be issued for shares of SCBA. After the Closing Date and until surrendered, each outstanding certificate, if any, which, prior to the Closing Date, represented shares of SCGII, shall be deemed for all purposes of the Fund’s Articles of Incorporation and Bylaws to evidence the appropriate number of shares of SCBA to be credited on the books of SCBA in respect of such shares of SCGII as provided above.
Prior to the Closing Date, SCGII shall deliver to SCBA a list setting forth the assets to be assigned, delivered and transferred to SCBA, including the securities then owned by SCGII and the respective federal income tax bases (on an identified cost basis) thereof, and the liabilities to be assumed by SCBA pursuant to this Plan.
All of SCGII’s portfolio securities shall be delivered by SCGII’s custodian on the Closing Date to SCBA or its custodian, either endorsed in proper form for transfer in such condition as to constitute good delivery thereof in accordance with the practice of brokers or, if such securities are held in a securities depository within the meaning of Rule 17f-4 under the Investment Company Act of 1940, transferred to an account in the name of SCBA or its custodian with said depository. All cash to be delivered pursuant
to this Plan shall be transferred from SCGII’s account at its custodian to SCBA’s account at its custodian. If on the Closing Date SCGII is unable to make good delivery to SCBA’s custodian of any of SCGII’s portfolio securities because such securities have not yet been delivered to SCGII’s custodian by its brokers or by the transfer agent for such securities, then the delivery requirement with respect to such securities shall be waived, and SCGII shall deliver to SCBA’s custodian on or by said Closing Date with respect to said undelivered securities executed copies of an agreement of assignment in a form satisfactory to SCBA, and a due bill or due bills in form and substance satisfactory to the custodian, together with such other documents including brokers’ confirmations, as may be reasonably required by SCBA.
This Plan may be abandoned and terminated, whether before or after action thereon by the shareholders of SCGII and notwithstanding favorable action by such shareholders, if the Board of Directors believe that the consummation of the transactions contemplated hereunder would not be in the best interests of the shareholders of either Fund. This Plan may be amended by the Board of Directors at any time, except that after approval by the shareholders of SCGII no amendment may be made with respect to the Plan which in the opinion of the Board of Directors materially adversely affects the interests of the shareholders of SCGII.
Except as expressly provided otherwise in this Plan, SCGII will pay or cause to be paid all out-of-pocket fees and expenses incurred in connection with the transactions contemplated under this Plan, including, but not limited to, accountants’ fees, legal fees, registration fees, and printing expenses.
IN WITNESS WHEREOF, each of the parties hereto has caused this Plan to be executed by its ________ and __________ as of the _______th day of __________, 2015.
PRINCIPAL VARIABLE CONTRACTS FUNDS, INC.
on behalf of the following Acquired Fund:
SmallCap Growth Account II
By:
Nora M. Everett, President
PRINCIPAL VARIABLE CONTRACTS FUNDS, INC.
on behalf of the following Acquiring Fund:
SmallCap Blend Account
By:
Michael J. Beer, Executive Vice President
FORM OF
PLAN OF ACQUISITION
SmallCap Value Account I and
SmallCap Blend Account
The Board of Directors of Principal Variable Contracts Funds, Inc., a Maryland corporation (the "Fund"), deems it advisable that the SmallCap Blend Account series of the Fund ("SCBA") acquire all of the assets of the SmallCap Value Account I series of the Fund ("SCVI") in exchange for the assumption by SCBA of all of the liabilities of SCVI and shares issued by SCBA which are thereafter to be distributed by SCVI pro rata to its shareholders in complete liquidation and termination of SCVI and in exchange for all of SCVI’s outstanding shares.
SCVI will transfer to SCBA, and SCBA will acquire from SCVI, all of the assets of SCVI on the Closing Date and will assume from SCVI all of the liabilities of SCVI in exchange for the issuance of the number of shares of SCBA determined as provided in the following paragraphs, which shares will be subsequently distributed pro rata to the shareholders of SCVI in complete liquidation and termination of SCVI and in exchange for all of SCVI’s outstanding shares. SCVI will not issue, sell or transfer any of its shares after the Closing Date, and only redemption requests received by SCVI in proper form prior to the Closing Date shall be fulfilled by SCVI. Redemption requests received by SCVI thereafter will be treated as requests for redemption of those shares of SCBA allocable to the shareholder in question.
SCVI will declare, and SCBA may declare, to its shareholders of record on or prior to the Closing Date a dividend or dividends which, together with all previous such dividends, shall have the effect of distributing to its shareholders all of its income (computed without regard to any deduction for dividends paid) and all of its net realized capital gains, if any, as of the Closing Date.
On the Closing Date, SCBA will issue to SCVI a number of full and fractional shares of SCBA, taken at their then net asset value, having an aggregate net asset value equal to the aggregate value of the net assets of SCVI. The aggregate value of the net assets of SCVI and SCBA shall be determined in accordance with the then current Prospectus of SCBA as of close of regularly scheduled trading on the New York Stock Exchange on the Closing Date.
The closing of the transactions contemplated in this Plan (the "Closing") shall be held at the offices of Principal Management Corporation, 650 8th Street, Des Moines, Iowa 50392 at 3:00 p.m. Central Time on ________, 2015, or on such earlier or later date as fund management may determine. The date on which the Closing is to be held as provided in this Plan shall be known as the "Closing Date."
In the event that on the Closing Date (a) the New York Stock Exchange is closed for other than customary weekend and holiday closings or (b) trading on said Exchange is restricted or (c) an emergency exists as a result of which it is not reasonably practicable for SCBA or SCVI to fairly determine the value of its assets, the Closing Date shall be postponed until the first business day after the day on which trading shall have been fully resumed.
As soon as practicable after the Closing, SCVI shall (a) distribute on a pro rata basis to the shareholders of record of SCVI at the close of business on the Closing Date the shares of SCBA received by SCVI at the Closing in exchange for all of SCVI’s outstanding shares, and (b) be liquidated in accordance with applicable law and the Fund’s Articles of Incorporation.
For purposes of the distribution of shares of SCBA to shareholders of SCVI, SCBA shall credit its books an appropriate number its shares to the account of each shareholder of SCVI. No certificates will be issued for shares of SCBA. After the Closing Date and until surrendered, each outstanding certificate, if any, which, prior to the Closing Date, represented shares of SCVI, shall be deemed for all purposes of the Fund’s Articles of Incorporation and Bylaws to evidence the appropriate number of shares of SCBA to be credited on the books of SCBA in respect of such shares of SCVI as provided above.
Prior to the Closing Date, SCVI shall deliver to SCBA a list setting forth the assets to be assigned, delivered and transferred to SCBA, including the securities then owned by SCVI and the respective federal income tax bases (on an identified cost basis) thereof, and the liabilities to be assumed by SCBA pursuant to this Plan.
All of SCVI’s portfolio securities shall be delivered by SCVI’s custodian on the Closing Date to SCBA or its custodian, either endorsed in proper form for transfer in such condition as to constitute good delivery thereof in accordance with the practice of brokers or, if such securities are held in a securities depository within the meaning of Rule 17f-4 under the Investment Company Act of 1940, transferred to an account in the name of SCBA or its custodian with said depository. All cash to be delivered pursuant to this Plan shall be transferred from SCVI’s account at its custodian to SCBA’s account at its custodian. If on the Closing Date SCVI is unable
to make good delivery to SCBA’s custodian of any of SCVI’s portfolio securities because such securities have not yet been delivered to SCVI’s custodian by its brokers or by the transfer agent for such securities, then the delivery requirement with respect to such securities shall be waived, and SCVI shall deliver to SCBA’s custodian on or by said Closing Date with respect to said undelivered securities executed copies of an agreement of assignment in a form satisfactory to SCBA, and a due bill or due bills in form and substance satisfactory to the custodian, together with such other documents including brokers’ confirmations, as may be reasonably required by SCBA.
This Plan may be abandoned and terminated, whether before or after action thereon by the shareholders of SCVI and notwithstanding favorable action by such shareholders, if the Board of Directors believe that the consummation of the transactions contemplated hereunder would not be in the best interests of the shareholders of either Fund. This Plan may be amended by the Board of Directors at any time, except that after approval by the shareholders of SCVI no amendment may be made with respect to the Plan which in the opinion of the Board of Directors materially adversely affects the interests of the shareholders of SCVI.
Except as expressly provided otherwise in this Plan, SCVI will pay or cause to be paid all out-of-pocket fees and expenses incurred in connection with the transactions contemplated under this Plan, including, but not limited to, accountants’ fees, legal fees, registration fees, and printing expenses.
IN WITNESS WHEREOF, each of the parties hereto has caused this Plan to be executed by its ________ and __________ as of the _______th day of __________, 2015.
PRINCIPAL VARIABLE CONTRACTS FUNDS, INC.
on behalf of the following Acquired Fund:
SmallCap Value Account I
By:
Nora M. Everett, President
PRINCIPAL VARIABLE CONTRACTS FUNDS, INC.
on behalf of the following Acquiring Fund:
SmallCap Blend Account
By:
Michael J. Beer, Executive Vice President
PO BOX 55909
BOSTON, MA 02205-5909
Your Vote is Important!
Vote by Internet
Please go to the electronic voting site at www.2voteproxy.com/PVCSC. Follow the on-line instructions. If you vote by internet, you do not have to return your voting instructions card.
Vote by Telephone
Please call us toll free at 1-800-830-3542, and follow the instructions provided. If you vote by telephone, you do not have to return your voting instructions card.
Vote by Mail
Complete, sign and date your voting instructions card and return it promptly in the envelope provided.
Please ensure the address below shows through the window of the enclosed postage paid return envelope.
PROXY TABULATOR
PO BOX 55909
BOSTON, MA 02205-9100
PRINCIPAL VARIABLE CONTRACTS FUNDS, INC. - SMALLCAP GROWTH ACCOUNT II
Des Moines, Iowa 50392
PROXY FOR A SPECIAL MEETING OF SHAREHOLDERS
APRIL 10, 2015
The undersigned hereby instructs Principal Life Insurance Company (the “Insurance Company”) to vote all shares of Principal Variable Contracts Funds, Inc. that are attributable to his or her variable annuity or variable life insurance contract at the Special Meeting of Shareholders to be held April 10, 2015 at 10:00 a.m., Central Time, and any adjournments thereof, as indicated on the reverse side or in the discretion of the Insurance Company upon such other matters as may properly come before the Meeting.
Check the appropriate box on the reverse side of this card, date the card and sign exactly as your name appears. Your signature acknowledges receipt of the Notice of Special Meeting of Shareholders and the Proxy Statement/Prospectus, both dated __________, 2015. Shares will be voted as you instruct. If no direction is made, voting will be FOR the proposal listed on the reverse side.
These voting instructions are solicited by the Insurance Company in connection with the solicitation of proxies by the Board of Directors of Principal Variable Contracts Funds, Inc.
| |
NOTE: | PLEASE SIGN EXACTLY AS YOUR NAME APPEARS ON THIS VOTING INSTRUCTIONS CARD. PLEASE MARK, SIGN, DATE, AND MAIL YOUR CARD IN THE ENCLOSED POSTAGE-PAID ENVELOPE. If shares are held jointly, either party may sign. If executed by a corporation, an authorized officer must sign. Executors, administrators, and trustees should so indicate when signing |
_____________________________ _____________________________ _____________________________
Signature Signature (if held jointly) Date
Important Notice Regarding the Availability of Proxy Materials for the
PRINCIPAL FUNDS, INC. - SMALLCAP GROWTH ACCOUNT II
Special Shareholder Meeting to Be Held on April 10, 2015
The Proxy Statement/Prospectus for this meeting is available at:
www.2voteproxy.com/PVCSC
PLEASE VOTE YOUR PROXY TODAY!
TO VOTE YOUR PROXY BY MAIL, PLEASE COMPLETE AND RETURN THIS CARD IN THE ENCLOSED POSTAGE-PAID ENVELOPE. YOU ALSO MAY VOTE A PROXY BY TOUCH-TONE PHONE OR VIA THE INTERNET.
The Board of Directors recommends that shareholders vote FOR the following proposal.
TO VOTE, MARK BOX BELOW IN BLUE OR BLACK INK AS FOLLOWS: n
FOR AGAINST ABSTAIN
| |
| 1. | Approval of a Plan of Acquisition providing for the reorganization of the ¨ ¨ ¨ |
SmallCap Growth Account II (the “Acquired Fund”) into the SmallCap Blend
Account (the "Acquiring Fund")
YOUR VOTE IS IMPORTANT! PLEASE SIGN, DATE, AND RETURN YOUR CARD TODAY.
PO BOX 55909
BOSTON, MA 02205-5909
Your Vote is Important!
Vote by Internet
Please go to the electronic voting site at www.2voteproxy.com/PVCSC. Follow the on-line instructions. If you vote by internet, you do not have to return your voting instructions card.
Vote by Telephone
Please call us toll free at 1-800-830-3542, and follow the instructions provided. If you vote by telephone, you do not have to return your voting instructions card.
Vote by Mail
Complete, sign and date your voting instructions card and return it promptly in the envelope provided.
Please ensure the address below shows through the window of the enclosed postage paid return envelope.
PROXY TABULATOR
PO BOX 55909
BOSTON, MA 02205-9100
PRINCIPAL VARIABLE CONTRACTS FUNDS, INC. - SMALLCAP VALUE ACCOUNT I
Des Moines, Iowa 50392
PROXY FOR A SPECIAL MEETING OF SHAREHOLDERS
APRIL 10, 2015
The undersigned hereby instructs Principal Life Insurance Company (the “Insurance Company”) to vote all shares of Principal Variable Contracts Funds, Inc. that are attributable to his or her variable annuity or variable life insurance contract at the Special Meeting of Shareholders to be held April 10, 2015 at 10:00 a.m., Central Time, and any adjournments thereof, as indicated on the reverse side or in the discretion of the Insurance Company upon such other matters as may properly come before the Meeting.
Check the appropriate box on the reverse side of this card, date the card and sign exactly as your name appears. Your signature acknowledges receipt of the Notice of Special Meeting of Shareholders and the Proxy Statement/Prospectus, both dated __________, 2015. Shares will be voted as you instruct. If no direction is made, voting will be FOR the proposal listed on the reverse side.
These voting instructions are solicited by the Insurance Company in connection with the solicitation of proxies by the Board of Directors of Principal Variable Contracts Funds, Inc.
| |
NOTE: | PLEASE SIGN EXACTLY AS YOUR NAME APPEARS ON THIS VOTING INSTRUCTIONS CARD. PLEASE MARK, SIGN, DATE, AND MAIL YOUR CARD IN THE ENCLOSED POSTAGE-PAID ENVELOPE. If shares are held jointly, either party may sign. If executed by a corporation, an authorized officer must sign. Executors, administrators, and trustees should so indicate when signing |
_____________________________ _____________________________ _____________________________
Signature Signature (if held jointly) Date
Important Notice Regarding the Availability of Proxy Materials for the
PRINCIPAL FUNDS, INC. - SMALLCAP VALUE ACCOUNT I
Special Shareholder Meeting to Be Held on April 10, 2015
The Proxy Statement/Prospectus for this meeting is available at:
www.2voteproxy.com/PVCSC
PLEASE VOTE YOUR PROXY TODAY!
TO VOTE YOUR PROXY BY MAIL, PLEASE COMPLETE AND RETURN THIS CARD IN THE ENCLOSED POSTAGE-PAID ENVELOPE. YOU ALSO MAY VOTE A PROXY BY TOUCH-TONE PHONE OR VIA THE INTERNET.
The Board of Directors recommends that shareholders vote FOR the following proposal.
TO VOTE, MARK BOX BELOW IN BLUE OR BLACK INK AS FOLLOWS: n
FOR AGAINST ABSTAIN
| |
| 1. | Approval of a Plan of Acquisition providing for the reorganization of the ¨ ¨ ¨ |
SmallCap Value Account I (the “Acquired Fund”) into the Principal
SmallCap Blend Account (the "Acquiring Fund")
YOUR VOTE IS IMPORTANT! PLEASE SIGN, DATE, AND RETURN YOUR CARD TODAY.
PART B
INFORMATION REQUIRED IN
A STATEMENT OF ADDITIONAL INFORMATION
PRINCIPAL VARIABLE CONTRACTS FUNDS, INC.
655 9th Street
Des Moines, Iowa 50392
STATEMENT OF ADDITIONAL INFORMATION
Dated: February ___, 2015
This Statement of Additional Information is available to the shareholders of the SmallCap Growth Account II and the SmallCap Value Account I (the "Acquired Funds"), in connection with the proposed reorganization of the Acquired Funds into the SmallCap Blend Account (the "Acquiring Fund") (the "Reorganization"). Each of the Acquired and Acquiring Funds is a separate series of Principal Variable Contracts Funds, Inc. ("PVC").
This Statement of Additional Information is not a prospectus and should be read in conjunction with the Proxy Statement/Prospectus dated February ___, 2015, relating to the Special Meeting of Shareholders of the Acquired Fund to be held on April 10, 2015. The Proxy Statement/Prospectus, which describes the proposed Reorganization, may be obtained without charge by writing to Principal Management Corporation, 655 9th Street, Des Moines, Iowa 50392, or by calling toll free at 1-800-222-5852.
TABLE OF CONTENTS
| |
| (1) | Statement of Additional Information dated May 1, 2014 as amended and restated November 18, 2014, included in Post-Effective Amendment No. 93 to the registration statement on Form N-1A (File No. 002-35570) filed on November 12, 2014, and supplements thereto dated and filed on December 12, 2014 and January 9, 2015. |
| |
| (2) | Audited Financial Statements of the Acquired Fund and the Acquiring Fund included in PVC's Annual Report to Shareholders for the fiscal year ended December 31, 2013. |
| |
| (3) | The unaudited financial statements of the Acquired Funds and the Acquiring Fund included in PVC's Semi-Annual Report to Shareholders for the six-month period ended June 30, 2014. |
| |
| (4) | Pro Forma Financial Statements |
INFORMATION INCORPORATED BY REFERENCE
This Statement of Additional Information incorporates by reference the following documents (or designated portions thereof) that have been filed with the Securities and Exchange Commission (File Nos. 002-35570; and 811-01944).
| |
| (1) | The Statement of Additional Information of Principal Variable Contracts Funds, Inc. (“PVC”) dated May 1, 2014 as amended and restated November 18, 2014, (including Supplements dated December 12, 2014 and January 9, 2015, and also filed via EDGAR those dates). |
| |
| (2) | The financial statements of the Acquired Funds and the Acquiring Fund included in PVC's Annual Report to Shareholders for the fiscal year ended December 31, 2013, which have been audited by Ernst & Young LLP, Independent Registered Public Accounting Firm, as filed on Form N-CSR on February 26, 2014. |
| |
| (3) | The unaudited financial statements of the Acquired Funds and Acquiring Fund included in PVC’s Semi-Annual Report to Shareholders for the six-month period June 30, 2014, as filed on Form N-CSRS on August 27, 2014. |
The Annual and Semi-Annual Reports to Shareholders of PVC are available upon request and without charge by calling toll-free at 1-800-222-5852.
PRO FORMA FINANCIAL STATEMENTS
On December 9, 2014 the Board of Directors of PVC approved a Plan of Acquisition whereby, the SmallCap Blend Account (the "Acquiring Fund") will acquire all the assets of the SmallCap Growth Account II and the SmallCap Value Account I (the "Acquired Funds"), subject to the liabilities of the Acquired Funds, in exchange for a number of shares equal in value to the pro rata net assets of shares of the Acquired Fund (the "Reorganization").
Shown below are unaudited pro forma financial statements for the combined Acquiring Fund, assuming the Reorganization had been consummated as of June 30, 2014. The first table presents pro forma Statements of Assets and Liabilities for the combined Acquiring Fund. The second table presents pro forma Statements of Operations for the combined Acquiring Fund. The third table presents a pro forma Schedule of Investments for the combined Acquiring Fund.
Please see the accompanying notes for additional information about the pro forma financial statements. The pro forma schedules of investments and statements of assets and liabilities and operations should be read in conjunction with the historical financial statements of the Acquired Funds and the Acquiring Fund incorporated by reference in the Statement of Additional Information.
|
| | | | | | | | | | | | | | | | | | | |
| Statements of Assets and Liabilities |
| Principal Variable Contracts Funds, Inc. |
| June 30, 2014 (unaudited) |
| Amounts in thousands |
| | SmallCap Value Account I | | SmallCap Growth Account II | | SmallCap Blend Account | | Pro Forma Adjustments | | Pro Forma SmallCap Blend Account |
| Investment in securities--at cost | $ | 89,616 |
| | $ | 54,959 |
| | $ | 50,105 |
| | $ | — |
| | $ | 194,680 |
|
| Assets | | | | | | | | | |
| Investment in securities--at value | $ | 114,466 |
| | $ | 70,212 |
| | $ | 67,763 |
| | $ | — |
| | $ | 252,441 |
|
| Cash | 21 |
| | 6 |
| | 6 |
| | — |
| | 33 |
|
| Deposits with counterparty | 351 |
| | 200 |
| | 51 |
| | — |
| | 602 |
|
| Receivables: | | | | | | | | | |
| Dividends and interest | 175 |
| | 13 |
| | 51 |
| | — |
| | 239 |
|
| Expense reimbursement from Manager | 13 |
| | 5 |
| | — |
| | — |
| | 18 |
|
| Fund shares sold | 257 |
| | 43 |
| | 13 |
| | — |
| | 313 |
|
| Investment securities sold | 5,370 |
| | 1,903 |
| | 120 |
| | — |
| | 7,393 |
|
| Variation margin on financial derivative instruments | 28 |
| | 16 |
| | 8 |
| | — |
| | 52 |
|
| Total Assets | 120,681 |
| | 72,398 |
| | 68,012 |
| | — |
| | 261,091 |
|
| | | | | | | | | | |
| Liabilities | | | | | | | | | |
| Accrued management and investment advisory fees | 100 |
| | 52 |
| | 46 |
| | — |
| | 198 |
|
| Accrued distribution fees | — |
| | 1 |
| | — |
| | — |
| | 1 |
|
| Accrued directors'expenses | 2 |
| | 1 |
| | 1 |
| | — |
| | 4 |
|
| Accrued other expenses | 23 |
| | 12 |
| | 6 |
| | — |
| | 41 |
|
| Payables: | | | | | | | | | |
| Fund shares redeemed | 33 |
| | 122 |
| | 39 |
| | — |
| | 194 |
|
| Investment securities purchased | 5,647 |
| | 1,974 |
| | 50 |
| | — |
| | 7,671 |
|
| Reorganization costs | — |
| | — |
| | — |
| | 59 |
| (b) | 59 |
|
| Collateral obligation on securities loaned, at value | 1,767 |
| | 5,299 |
| | — |
| | — |
| | 7,066 |
|
| Total Liabilities | 7,572 |
| | 7,461 |
| | 142 |
| | 59 |
| | 15,234 |
|
| Net Assets Applicable to Outstanding Shares | $ | 113,109 |
| | $ | 64,937 |
| | $ | 67,870 |
| | $ | (59 | ) | | $ | 245,857 |
|
| | | | | | | | | | |
| Net Assets Consist of: | | | | | | | | | |
| Capital Shares and additional paid-in-capital | $ | 67,880 |
| | $ | 58,863 |
| | $ | 43,193 |
| | $ | — |
| | $ | 169,936 |
|
| Accumulated undistributed (overdistributed) net investment income (loss) | 1,117 |
| | (174 | ) | | 285 |
| | (59 | ) | (b) | 1,169 |
|
| Accumulated undistributed (overdistributed) net realized gain (loss) | 19,144 |
| | (9,063 | ) | | 6,723 |
| | — |
| | 16,804 |
|
| Net unrealized appreciation (depreciation) of investments | 24,968 |
| | 15,311 |
| | 17,669 |
| | — |
| | 57,948 |
|
| Total Net Assets | $ | 113,109 |
| | $ | 64,937 |
| | $ | 67,870 |
| | $ | (59 | ) | | $ | 245,857 |
|
| | | | | | | | | | |
| Capital Stock (par value: $.01 a share): | | | | | | | | | |
| Shares authorized | 300,000 |
| | 300,000 |
| | 100,000 |
| | | | 100,000 |
|
| Net Asset Value Per Share: | | | | | | | | | |
| Class 1: Net Assets | $ | 112,974 |
| | $ | 61,124 |
| | $ | 67,870 |
| | $ | (58 | ) | (b) | $ | 241,910 |
|
| Shares issued and outstanding | 4,965 |
| | 3,325 |
| | 4,646 |
| | 3,626 |
| (a) | 16,561 |
|
| Net asset value per share | $ | 22.75 |
| | $ | 18.38 |
| | $ | 14.61 |
| | | | $ | 14.61 |
|
| | | | | | | | | | |
| Class 2: Net Assets | $ | 135 |
| | $ | 3,813 |
| | N/A |
| | $ | (1 | ) | (b) | $ | 3,947 |
|
| Shares issued and outstanding | 6 |
| | 211 |
| | | | 53 |
| (a) | 270 |
|
| Net asset value per share | $ | 22.62 |
| | $ | 18.04 |
| | | | | | $ | 14.61 |
|
| | | | | | | | | | |
| | | | | | | | | | |
| (a) Reflects new shares issued, net of retired shares of SmallCap Value Account I and SmallCap Growth Account II |
| (b) Reduction in net assets to reflect the estimated expenses of the Reorganization. |
| | | | | | | | | | |
| See accompanying notes. | | | | | | | | | |
|
| | | | | | | | | | | | | | | | | | | | |
| STATEMENTS OF OPERATIONS |
| Principal Variable Contracts Funds, Inc. |
| Twelve Months Ended June 30, 2014 (unaudited) |
| | Amounts in thousands | SmallCap Value Account I | | SmallCap Growth Account II | | SmallCap Blend Account | | Pro Forma Adjustments | | Pro Forma SmallCap Blend Account |
| Net Investment Income (Loss) | | | | | | | | | |
| Income: | | | | | | | | | |
| | Dividends | $ | 1,608 |
| | $ | 175 |
| | $ | 615 |
| | $ | — |
| | $ | 2,398 |
|
| | Withholding tax | (1 | ) | | — |
| | — |
| | — |
| | (1 | ) |
| | Interest | 2 |
| | 1 |
| | — |
| | — |
| | 3 |
|
| | Securities lending - net | 18 |
| | 57 |
| | — |
| | — |
| | 75 |
|
| | Total Income | 1,627 |
| | 233 |
| | 615 |
| | — |
| | 2,475 |
|
| Expenses: | | | | | | | | | |
| | Management and investment advisory fees | 1,240 |
| | 659 |
| | 527 |
| | (972 | ) | (b) | 1,454 |
|
| | Distribution Fees - Class 2 | — |
| | 10 |
| | — |
| | — |
| | 10 |
|
| | Custodian fees | 48 |
| | 24 |
| | 8 |
| | (72 | ) | (a) | 8 |
|
| | Directors' expenses | 4 |
| | 3 |
| | 4 |
| | — |
| | 11 |
|
| | Professional fees | 3 |
| | 3 |
| | 3 |
| | (6 | ) | (a) | 3 |
|
| | Other expenses | 1 |
| | — |
| | — |
| | — |
| | 1 |
|
| | Total Gross Expenses | 1,296 |
| | 699 |
| | 542 |
| | (1,050 | ) | | 1,487 |
|
| | Less: Reimbursement from Manager | 22 |
| | 66 |
| | — |
| | — |
| | 88 |
|
| | Less: Reimbursement from Manager - Class 1 | 150 |
| | — |
| | — |
| | — |
| | 150 |
|
| | Total Net Expenses | 1,124 |
| | 633 |
| | 542 |
| | (1,050 | ) | | 1,249 |
|
| | Net Investment Income (Loss) | 503 |
| | (400 | ) | | 73 |
| | 1,050 |
| | 1,226 |
|
| | | | | | | | | | | |
| Net Realized and Unrealized Gain (Loss) on Investments and Futures | | | | | | | | | |
| Net realized gain (loss) from: | | | | | | | | | |
| | Investment transactions | 19,179 |
| | 10,978 |
| | 9,273 |
| | — |
| | 39,430 |
|
| | Futures contracts | 1,081 |
| | 559 |
| | 211 |
| | — |
| | 1,851 |
|
| Change in unrealized appreciation/depreciation of: | | | | | | | | | |
| | Investments | 4,157 |
| | 2,515 |
| | 8,085 |
| | — |
| | 14,757 |
|
| | Futures contracts | 152 |
| | 71 |
| | 9 |
| | — |
| | 232 |
|
| | Net Realized and Unrealized Gain (Loss) on Investments and Futures | 24,569 |
| | 14,123 |
| | 17,578 |
| | — |
| | 56,270 |
|
| | Net Increase (Decrease) in Net Assets Resulting from Operations | $ | 25,072 |
| | $ | 13,723 |
| | $ | 17,651 |
| | $ | 1,050 |
| | $ | 57,496 |
|
| | | | | | | | | | | |
| (a) To adjust expenses to reflect the Combined Fund's estimated fees and expenses, based on elimination of duplicate services. |
| (b) Management and investment advisory fees decreased to reflect annual percentage rate of Acquiring Fund. |
| | | | | | | | | | | |
| See accompanying notes. | | | | | | | | | |
|
|
| Schedule of Investments |
| (unaudited) |
| June 30, 2014 |
|
| | | | | | | | | | | | | | | | | | | | | |
| INVESTMENT COMPANIES - 5.92% | SmallCap Value Account I Shares Held | SmallCap Value Account I Value (000's) | SmallCap Growth Account II Shares Held | SmallCap Growth Account II Value (000's) | SmallCap Blend Account Shares Held | SmallCap Blend Account Value (000's) | | Combined Portfolio Shares Held | Combined Portfolio Value (000's) |
| Publicly Traded Investment Fund - 5.92% | | | | | | | | |
| BlackRock Liquidity Funds FedFund Portfolio | — |
| $ | — |
| 0 |
| $ | — |
| 1,597,158 |
| $ | 1,597 |
| | 1,597,158 |
| $ | 1,597 |
|
| BlackRock Liquidity Funds TempFund Portfolio * | 1,935,894 |
| 1,936 |
| 1,566,174 |
| 1,566 |
| 0 |
| 0 |
| | 3,502,068 |
| 3,502 |
|
| Goldman Sachs Financial Square Funds - Government Fund (a), * | 1,766,987 |
| 1,767 |
| 5,298,639 |
| 5,299 |
| 0 |
| 0 |
| | 7,065,626 |
| 7,066 |
|
| Goldman Sachs Financial Square Funds - Money Market Fund * | 1,686,609 |
| 1,686 |
| 518,953 |
| 519 |
| 0 |
| 0 |
| | 2,205,562 |
| 2,205 |
|
| JP Morgan Prime Money Market Fund * | 117,873 |
| 118 |
| 62,418 |
| 62 |
| 0 |
| 0 |
| | 180,291 |
| 180 |
|
| | | $ | 5,507 |
| | $ | 7,446 |
| | $ | 1,597 |
| | | $ | 14,550 |
|
| TOTAL INVESTMENT COMPANIES | | $ | 5,507 |
| | $ | 7,446 |
| | $ | 1,597 |
| | | $ | 14,550 |
|
| COMMON STOCKS - 96.73% | SmallCap Value Account I Shares Held | SmallCap Value Account I Value (000's) | SmallCap Growth Account II Shares Held | SmallCap Growth Account II Value (000's) | SmallCap Blend Account Shares Held | SmallCap Blend Account Value (000's) | | Combined Portfolio Shares Held | Combined Portfolio Value (000's) |
| Advertising - 0.02% | | | | | | | | |
| Harte-Hanks Inc * | 1,769 |
| $ | 13 |
| — |
| $ | — |
| — |
| $ | — |
| | 1,769 |
| $ | 13 |
|
| Marchex Inc * | — |
| — |
| 743 |
| 9 |
| — |
| — |
| | 743 |
| 9 |
|
| MDC Partners Inc * | 661 |
| 14 |
| — |
| — |
| — |
| — |
| | 661 |
| 14 |
|
| Sizmek Inc (b),* | 792 |
| 8 |
| — |
| — |
| — |
| — |
| | 792 |
| 8 |
|
| | | $ | 35 |
| | $ | 9 |
| | $ | — |
| | $ | 44 |
|
| Aerospace & Defense - 0.92% | | | | | | | | |
| AAR Corp * | 15,868 |
| 438 |
| — |
| — |
| — |
| — |
| | 15,868 |
| 438 |
|
| Astronics Corp (b),* | — |
| — |
| 10,411 |
| 588 |
| — |
| — |
| | 10,411 |
| 588 |
|
| Cubic Corp * | 450 |
| 20 |
| — |
| — |
| — |
| — |
| | 450 |
| 20 |
|
| Curtiss-Wright Corp * | 3,358 |
| 220 |
| 183 |
| 12 |
| — |
| — |
| | 3,541 |
| 232 |
|
| Ducommun Inc (b),* | 241 |
| 6 |
| 94 |
| 2 |
| — |
| — |
| | 335 |
| 8 |
|
| Esterline Technologies Corp (b),* | 787 |
| 91 |
| — |
| — |
| — |
| — |
| | 787 |
| 91 |
|
| GenCorp Inc (b),* | — |
| — |
| 759 |
| 15 |
| — |
| — |
| | 759 |
| 15 |
|
| HEICO Corp * | — |
| — |
| 982 |
| 51 |
| — |
| — |
| | 982 |
| 51 |
|
| Kaman Corp * | 318 |
| 14 |
| 319 |
| 14 |
| — |
| — |
| | 637 |
| 28 |
|
| Kratos Defense & Security Solutions Inc (b),* | 1,606 |
| 12 |
| — |
| — |
| — |
| — |
| | 1,606 |
| 12 |
|
| Moog Inc (b),* | 1,987 |
| 144 |
| 98 |
| 7 |
| — |
| — |
| | 2,085 |
| 151 |
|
| Orbital Sciences Corp (b),* | 1,489 |
| 44 |
| — |
| — |
| — |
| — |
| | 1,489 |
| 44 |
|
| Teledyne Technologies Inc (b),* | 696 |
| 68 |
| 126 |
| 12 |
| — |
| — |
| | 822 |
| 80 |
|
| Triumph Group Inc * | 7,300 |
| 510 |
| — |
| — |
| — |
| — |
| | 7,300 |
| 510 |
|
| | | $ | 1,567 |
| | $ | 701 |
| | $ | — |
| | $ | 2,268 |
|
| Agriculture - 0.18% | | | | | | | | |
| Alico Inc * | 97 |
| 4 |
| 60 |
| 2 |
| — |
| — |
| | 157 |
| 6 |
|
| Alliance One International Inc (b),* | 3,353 |
| 8 |
| — |
| — |
| — |
| — |
| | 3,353 |
| 8 |
|
| Andersons Inc/The * | 6,277 |
| 324 |
| 373 |
| 19 |
| — |
| — |
| | 6,650 |
| 343 |
|
| Tejon Ranch Co (b),* | 453 |
| 15 |
| — |
| — |
| — |
| — |
| | 453 |
| 15 |
|
| Universal Corp/VA * | 508 |
| 28 |
| — |
| — |
| — |
| — |
| | 508 |
| 28 |
|
| Vector Group Ltd (c),* | 886 |
| 18 |
| 677 |
| 14 |
| — |
| — |
| | 1,563 |
| 32 |
|
| | | $ | 397 |
| | $ | 35 |
| | $ | — |
| | $ | 432 |
|
| Airlines - 1.41% | | | | | | | | |
| Allegiant Travel Co * | — |
| — |
| 194 |
| 23 |
| — |
| — |
| | 194 |
| 23 |
|
| Hawaiian Holdings Inc (b),* | 34,600 |
| 474 |
| 1,020 |
| 14 |
| — |
| — |
| | 35,620 |
| 488 |
|
| JetBlue Airways Corp (b),* | 5,128 |
| 56 |
| 793 |
| 8 |
| — |
| — |
| | 5,921 |
| 64 |
|
| Republic Airways Holdings Inc (b),* | 28,195 |
| 306 |
| — |
| — |
| — |
| — |
| | 28,195 |
| 306 |
|
| SkyWest Inc * | 35,613 |
| 435 |
| — |
| — |
| — |
| — |
| | 35,613 |
| 435 |
|
| Spirit Airlines Inc (b),* | — |
| — |
| 27,557 |
| 1,743 |
| 6,290 |
| 398 |
| | 33,847 |
| 2,141 |
|
| | | $ | 1,271 |
| | $ | 1,788 |
| | $ | 398 |
| | $ | 3,457 |
|
| Apparel - 1.05% | | | | | | | | |
| Columbia Sportswear Co * | 161 |
| 13 |
| 136 |
| 11 |
| — |
| — |
| | 297 |
| 24 |
|
| Crocs Inc (b),* | 1,594 |
| 24 |
| — |
| — |
| — |
| — |
| | 1,594 |
| 24 |
|
| G-III Apparel Group Ltd (b),* | 300 |
| 24 |
| 263 |
| 22 |
| 7,180 |
| 586 |
| | 7,743 |
| 632 |
|
| Iconix Brand Group Inc (b),* | 9,026 |
| 387 |
| 232 |
| 10 |
| 11,000 |
| 472 |
| | 20,258 |
| 869 |
|
| Oxford Industries Inc * | — |
| — |
| 213 |
| 14 |
| — |
| — |
| | 213 |
| 14 |
|
| RG Barry Corp * | 2,248 |
| 43 |
| 15 |
| — |
| — |
| — |
| | 2,263 |
| 43 |
|
| Sequential Brands Group Inc (b),(c),* | — |
| — |
| 301 |
| 4 |
| — |
| — |
| | 301 |
| 4 |
|
| Skechers U.S.A. Inc (b) | 366 |
| 17 |
| 425 |
| 20 |
| 18,590 |
| 850 |
| | 19,381 |
| 887 |
|
| Steven Madden Ltd (b),* | — |
| — |
| 874 |
| 30 |
| — |
| — |
| | 874 |
| 30 |
|
| Unifi Inc (b),* | 567 |
| 16 |
| — |
| — |
| — |
| — |
| | 567 |
| 16 |
|
|
| | | | | | | | | | | | | | | | | | | | | |
COMMON STOCKS (continued) | SmallCap Value Account I Shares Held | SmallCap Value Account I Value (000's) | SmallCap Growth Account II Shares Held | SmallCap Growth Account II Value (000's) | SmallCap Blend Account Shares Held | SmallCap Blend Account Value (000's) | | Combined Portfolio Shares Held | Combined Portfolio Value (000's) |
| Apparel (continued) | | | | | | | | |
Weyco Group Inc * | 226 |
| $ | 6 |
| — |
| $ | — |
| — |
| $ | — |
| | 226 |
| $ | 6 |
|
Wolverine World Wide Inc * | — |
| — |
| 1,456 |
| 38 |
| — |
| — |
| | 1,456 |
| 38 |
|
| | | $ | 530 |
| | $ | 149 |
| | $ | 1,908 |
| | | $ | 2,587 |
|
| Automobile Manufacturers - 0.01% | | | | | | | | | |
Wabash National Corp (b),* | — |
| — |
| 1,012 |
| 14 |
| — |
| — |
| | 1,012 |
| 14 |
|
| | | | | | | | | | |
| Automobile Parts & Equipment - 1.30% | | | | | | | | | |
Accuride Corp (b),* | — |
| — |
| 791 |
| 4 |
| — |
| — |
| | 791 |
| 4 |
|
American Axle & Manufacturing Holdings Inc (b),* | — |
| — |
| 995 |
| 19 |
| — |
| — |
| | 995 |
| 19 |
|
Commercial Vehicle Group Inc (b),* | — |
| — |
| 599 |
| 6 |
| — |
| — |
| | 599 |
| 6 |
|
Cooper Tire & Rubber Co * | 23,371 |
| 701 |
| 176 |
| 5 |
| — |
| — |
| | 23,547 |
| 706 |
|
Cooper-Standard Holding Inc (b),* | 312 |
| 21 |
| — |
| — |
| — |
| — |
| | 312 |
| 21 |
|
Dana Holding Corp * | 13,104 |
| 320 |
| 1,149 |
| 28 |
| — |
| — |
| | 14,253 |
| 348 |
|
Dorman Products Inc (b),* | — |
| — |
| 397 |
| 20 |
| — |
| — |
| | 397 |
| 20 |
|
Douglas Dynamics Inc * | — |
| — |
| 483 |
| 8 |
| — |
| — |
| | 483 |
| 8 |
|
Federal-Mogul Holdings Corp (b),* | 770 |
| 16 |
| — |
| — |
| — |
| — |
| | 770 |
| 16 |
|
Gentherm Inc (b),* | — |
| — |
| 510 |
| 23 |
| — |
| — |
| | 510 |
| 23 |
|
Meritor Inc (b) | 1,112 |
| 15 |
| 757 |
| 10 |
| 24,747 |
| 323 |
| | 26,616 |
| 348 |
|
Modine Manufacturing Co (b),* | 819 |
| 13 |
| 312 |
| 5 |
| — |
| — |
| | 1,131 |
| 18 |
|
Remy International Inc * | 6,226 |
| 145 |
| — |
| — |
| — |
| — |
| | 6,226 |
| 145 |
|
Standard Motor Products Inc * | 286 |
| 13 |
| 268 |
| 12 |
| — |
| — |
| | 554 |
| 25 |
|
Strattec Security Corp * | — |
| — |
| 61 |
| 4 |
| — |
| — |
| | 61 |
| 4 |
|
Superior Industries International Inc * | 880 |
| 18 |
| — |
| — |
| — |
| — |
| | 880 |
| 18 |
|
Tenneco Inc (b),* | — |
| — |
| 8,574 |
| 563 |
| — |
| — |
| | 8,574 |
| 563 |
|
Titan International Inc * | 920 |
| 15 |
| — |
| — |
| — |
| — |
| | 920 |
| 15 |
|
Tower International Inc (b),* | — |
| — |
| 303 |
| 11 |
| 23,840 |
| 878 |
| | 24,143 |
| 889 |
|
| | | $ | 1,277 |
| | $ | 718 |
| | $ | 1,201 |
| | | $ | 3,196 |
|
| Banks - 9.60% | | | | | | | | | |
1st Source Corp * | 1,581 |
| 48 |
| — |
| — |
| — |
| — |
| | 1,581 |
| 48 |
|
American National Bankshares Inc * | 291 |
| 6 |
| — |
| — |
| — |
| — |
| | 291 |
| 6 |
|
Ameris Bancorp * | 5,492 |
| 119 |
| — |
| — |
| — |
| — |
| | 5,492 |
| 119 |
|
Ames National Corp * | 347 |
| 8 |
| — |
| — |
| — |
| — |
| | 347 |
| 8 |
|
Arrow Financial Corp * | 406 |
| 11 |
| — |
| — |
| — |
| — |
| | 406 |
| 11 |
|
BancFirst Corp * | 273 |
| 17 |
| — |
| — |
| — |
| — |
| | 273 |
| 17 |
|
BancorpSouth Inc * | 2,373 |
| 58 |
| — |
| — |
| — |
| — |
| | 2,373 |
| 58 |
|
Bank of Kentucky Financial Corp/The * | 1,018 |
| 36 |
| — |
| — |
| — |
| — |
| | 1,018 |
| 36 |
|
Bank of Marin Bancorp * | 1,426 |
| 65 |
| — |
| — |
| — |
| — |
| | 1,426 |
| 65 |
|
Bank of the Ozarks Inc * | 388 |
| 13 |
| 36,510 |
| 1,221 |
| — |
| — |
| | 36,898 |
| 1,234 |
|
| BankUnited Inc | — |
| — |
| — |
| — |
| 20,530 |
| 687 |
| | 20,530 |
| 687 |
|
Banner Corp * | 2,992 |
| 118 |
| — |
| — |
| — |
| — |
| | 2,992 |
| 118 |
|
BBCN Bancorp Inc * | 6,798 |
| 109 |
| — |
| — |
| — |
| — |
| | 6,798 |
| 109 |
|
BNC Bancorp * | 1,400 |
| 24 |
| — |
| — |
| — |
| — |
| | 1,400 |
| 24 |
|
Boston Private Financial Holdings Inc * | 5,819 |
| 78 |
| — |
| — |
| — |
| — |
| | 5,819 |
| 78 |
|
Bridge Bancorp Inc * | 417 |
| 10 |
| — |
| — |
| — |
| — |
| | 417 |
| 10 |
|
Bryn Mawr Bank Corp * | 508 |
| 15 |
| — |
| — |
| — |
| — |
| | 508 |
| 15 |
|
Camden National Corp * | 1,086 |
| 42 |
| — |
| — |
| — |
| — |
| | 1,086 |
| 42 |
|
Capital Bank Financial Corp (b),* | 528 |
| 12 |
| — |
| — |
| — |
| — |
| | 528 |
| 12 |
|
Capital City Bank Group Inc * | 474 |
| 7 |
| — |
| — |
| — |
| — |
| | 474 |
| 7 |
|
Cardinal Financial Corp * | 709 |
| 13 |
| — |
| — |
| — |
| — |
| | 709 |
| 13 |
|
Cass Information Systems Inc * | — |
| — |
| 244 |
| 12 |
| — |
| — |
| | 244 |
| 12 |
|
Cathay General Bancorp * | 6,518 |
| 167 |
| — |
| — |
| — |
| — |
| | 6,518 |
| 167 |
|
| Center Bancorp Inc | 1,655 |
| 32 |
| — |
| — |
| — |
| — |
| | 1,655 |
| 32 |
|
Century Bancorp Inc/MA * | 128 |
| 5 |
| — |
| — |
| — |
| — |
| | 128 |
| 5 |
|
Chemical Financial Corp * | 2,728 |
| 77 |
| — |
| — |
| — |
| — |
| | 2,728 |
| 77 |
|
Citizens & Northern Corp * | 3,755 |
| 73 |
| — |
| — |
| — |
| — |
| | 3,755 |
| 73 |
|
City Holding Co * | 4,190 |
| 189 |
| — |
| — |
| — |
| — |
| | 4,190 |
| 189 |
|
CNB Financial Corp/PA * | 549 |
| 9 |
| — |
| — |
| — |
| — |
| | 549 |
| 9 |
|
CoBiz Financial Inc * | 1,912 |
| 21 |
| 39,073 |
| 421 |
| — |
| — |
| | 40,985 |
| 442 |
|
Columbia Banking System Inc * | 3,249 |
| 85 |
| — |
| — |
| — |
| — |
| | 3,249 |
| 85 |
|
Community Bank System Inc * | 2,101 |
| 76 |
| — |
| — |
| — |
| — |
| | 2,101 |
| 76 |
|
Community Trust Bancorp Inc * | 4,180 |
| 143 |
| — |
| — |
| — |
| — |
| | 4,180 |
| 143 |
|
CommunityOne Bancorp (b),(c),* | 3,100 |
| 30 |
| — |
| — |
| — |
| — |
| | 3,100 |
| 30 |
|
ConnectOne Bancorp Inc * | 500 |
| 25 |
| — |
| — |
| — |
| — |
| | 500 |
| 25 |
|
CU Bancorp (b),* | 358 |
| 7 |
| — |
| — |
| — |
| — |
| | 358 |
| 7 |
|
Customers Bancorp Inc (b),* | 17,002 |
| 341 |
| 16,426 |
| 329 |
| — |
| — |
| | 33,428 |
| 670 |
|
CVB Financial Corp * | 25,990 |
| 417 |
| — |
| — |
| — |
| — |
| | 25,990 |
| 417 |
|
|
| | | | | | | | | | | | | | | | | | | | | |
COMMON STOCKS (continued) | SmallCap Value Account I Shares Held | SmallCap Value Account I Value (000's) | SmallCap Growth Account II Shares Held | SmallCap Growth Account II Value (000's) | SmallCap Blend Account Shares Held | SmallCap Blend Account Value (000's) | | Combined Portfolio Shares Held | Combined Portfolio Value (000's) |
| Banks (continued) | | | | | | | | |
Eagle Bancorp Inc (b),* | 214 |
| $ | 7 |
| 380 |
| $ | 13 |
| — |
| $ | — |
| | 594 |
| $ | 20 |
|
East West Bancorp Inc * | 3,935 |
| 138 |
| — |
| — |
| — |
| — |
| | 3,935 |
| 138 |
|
Enterprise Bancorp Inc/MA * | 274 |
| 6 |
| — |
| — |
| — |
| — |
| | 274 |
| 6 |
|
Enterprise Financial Services Corp * | 8,429 |
| 152 |
| — |
| — |
| — |
| — |
| | 8,429 |
| 152 |
|
Fidelity Southern Corp * | 7,928 |
| 103 |
| — |
| — |
| — |
| — |
| | 7,928 |
| 103 |
|
Financial Institutions Inc * | 4,514 |
| 106 |
| — |
| — |
| — |
| — |
| | 4,514 |
| 106 |
|
First Bancorp Inc/ME * | 828 |
| 15 |
| — |
| — |
| — |
| — |
| | 828 |
| 15 |
|
First BanCorp/Puerto Rico (b),* | 12,629 |
| 69 |
| — |
| — |
| — |
| — |
| | 12,629 |
| 69 |
|
First Bancorp/Troy NC * | 2,348 |
| 43 |
| — |
| — |
| — |
| — |
| | 2,348 |
| 43 |
|
First Busey Corp * | 12,454 |
| 72 |
| — |
| — |
| — |
| — |
| | 12,454 |
| 72 |
|
First Business Financial Services Inc * | 941 |
| 45 |
| — |
| — |
| — |
| — |
| | 941 |
| 45 |
|
First Citizens BancShares Inc/NC * | 558 |
| 137 |
| — |
| — |
| — |
| — |
| | 558 |
| 137 |
|
First Commonwealth Financial Corp * | 33,675 |
| 311 |
| — |
| — |
| — |
| — |
| | 33,675 |
| 311 |
|
First Community Bancshares Inc/VA * | 6,560 |
| 94 |
| — |
| — |
| — |
| — |
| | 6,560 |
| 94 |
|
First Connecticut Bancorp Inc/Farmington CT * | 662 |
| 11 |
| — |
| — |
| — |
| — |
| | 662 |
| 11 |
|
First Financial Bancorp * | 7,621 |
| 131 |
| — |
| — |
| — |
| — |
| | 7,621 |
| 131 |
|
First Financial Bankshares Inc * | 602 |
| 19 |
| 448 |
| 14 |
| — |
| — |
| | 1,050 |
| 33 |
|
First Financial Corp/IN * | 1,711 |
| 55 |
| — |
| — |
| — |
| — |
| | 1,711 |
| 55 |
|
First Internet Bancorp * | — |
| — |
| 3,580 |
| 74 |
| — |
| — |
| | 3,580 |
| 74 |
|
First Interstate BancSystem Inc * | 13,765 |
| 374 |
| — |
| — |
| 10,740 |
| 292 |
| | 24,505 |
| 666 |
|
First Merchants Corp * | 9,892 |
| 209 |
| — |
| — |
| 3,269 |
| 69 |
| | 13,161 |
| 278 |
|
First Midwest Bancorp Inc/IL * | 9,850 |
| 167 |
| — |
| — |
| — |
| — |
| | 9,850 |
| 167 |
|
First NBC Bank Holding Co (b),* | 7,436 |
| 249 |
| 19,130 |
| 641 |
| — |
| — |
| | 26,566 |
| 890 |
|
| First of Long Island Corp/The | 1,108 |
| 43 |
| — |
| — |
| 2,390 |
| 93 |
| | 3,498 |
| 136 |
|
FirstMerit Corp * | 56,995 |
| 1,126 |
| — |
| — |
| — |
| — |
| | 56,995 |
| 1,126 |
|
FNB Corp/PA * | 3,940 |
| 51 |
| — |
| — |
| — |
| — |
| | 3,940 |
| 51 |
|
German American Bancorp Inc * | 1,269 |
| 35 |
| — |
| — |
| — |
| — |
| | 1,269 |
| 35 |
|
| Glacier Bancorp Inc | 1,840 |
| 52 |
| — |
| — |
| 12,147 |
| 345 |
| | 13,987 |
| 397 |
|
Great Southern Bancorp Inc * | 2,879 |
| 92 |
| — |
| — |
| — |
| — |
| | 2,879 |
| 92 |
|
Guaranty Bancorp * | 529 |
| 7 |
| — |
| — |
| — |
| — |
| | 529 |
| 7 |
|
Hampton Roads Bankshares Inc (b),* | 4,900 |
| 8 |
| — |
| — |
| — |
| — |
| | 4,900 |
| 8 |
|
Hancock Holding Co * | 1,997 |
| 71 |
| — |
| — |
| — |
| — |
| | 1,997 |
| 71 |
|
Hanmi Financial Corp * | 37,983 |
| 800 |
| — |
| — |
| — |
| — |
| | 37,983 |
| 800 |
|
Heartland Financial USA Inc * | 565 |
| 14 |
| — |
| — |
| — |
| — |
| | 565 |
| 14 |
|
Heritage Commerce Corp * | 802 |
| 7 |
| — |
| — |
| — |
| — |
| | 802 |
| 7 |
|
Home BancShares Inc/AR * | — |
| — |
| 645 |
| 21 |
| — |
| — |
| | 645 |
| 21 |
|
Horizon Bancorp/IN * | 3,226 |
| 70 |
| — |
| — |
| — |
| — |
| | 3,226 |
| 70 |
|
Iberiabank Corp * | 2,643 |
| 182 |
| — |
| — |
| — |
| — |
| | 2,643 |
| 182 |
|
Independent Bank Corp/Rockland MA * | 4,215 |
| 162 |
| — |
| — |
| — |
| — |
| | 4,215 |
| 162 |
|
Independent Bank Group Inc * | — |
| — |
| 88 |
| 5 |
| — |
| — |
| | 88 |
| 5 |
|
International Bancshares Corp * | 1,351 |
| 36 |
| — |
| — |
| — |
| — |
| | 1,351 |
| 36 |
|
Lakeland Bancorp Inc * | 1,401 |
| 15 |
| — |
| — |
| — |
| — |
| | 1,401 |
| 15 |
|
Lakeland Financial Corp * | 394 |
| 15 |
| — |
| — |
| — |
| — |
| | 394 |
| 15 |
|
MainSource Financial Group Inc * | 6,655 |
| 115 |
| — |
| — |
| — |
| — |
| | 6,655 |
| 115 |
|
MB Financial Inc * | 1,365 |
| 37 |
| — |
| — |
| — |
| — |
| | 1,365 |
| 37 |
|
Mercantile Bank Corp * | 647 |
| 15 |
| — |
| — |
| — |
| — |
| | 647 |
| 15 |
|
Merchants Bancshares Inc/VT * | 989 |
| 32 |
| — |
| — |
| — |
| — |
| | 989 |
| 32 |
|
Metro Bancorp Inc (b),* | 509 |
| 12 |
| — |
| — |
| — |
| — |
| | 509 |
| 12 |
|
MidSouth Bancorp Inc * | 314 |
| 6 |
| — |
| — |
| — |
| — |
| | 314 |
| 6 |
|
MidWestOne Financial Group Inc * | 251 |
| 6 |
| — |
| — |
| — |
| — |
| | 251 |
| 6 |
|
National Bankshares Inc (c),* | 254 |
| 8 |
| — |
| — |
| — |
| — |
| | 254 |
| 8 |
|
National Penn Bancshares Inc * | 12,120 |
| 129 |
| — |
| — |
| — |
| — |
| | 12,120 |
| 129 |
|
NBT Bancorp Inc * | 9,791 |
| 235 |
| — |
| — |
| — |
| — |
| | 9,791 |
| 235 |
|
Northrim BanCorp Inc * | 239 |
| 6 |
| — |
| — |
| — |
| — |
| | 239 |
| 6 |
|
OFG Bancorp * | 1,115 |
| 21 |
| — |
| — |
| — |
| — |
| | 1,115 |
| 21 |
|
Old Line Bancshares Inc * | 300 |
| 5 |
| — |
| — |
| — |
| — |
| | 300 |
| 5 |
|
Old National Bancorp/IN * | 2,527 |
| 36 |
| — |
| — |
| — |
| — |
| | 2,527 |
| 36 |
|
Opus Bank (b),* | 183 |
| 5 |
| 22,140 |
| 643 |
| — |
| — |
| | 22,323 |
| 648 |
|
Pacific Continental Corp * | 673 |
| 9 |
| — |
| — |
| — |
| — |
| | 673 |
| 9 |
|
PacWest Bancorp * | 3,100 |
| 134 |
| 9,250 |
| 399 |
| — |
| — |
| | 12,350 |
| 533 |
|
Park National Corp (c),* | 281 |
| 22 |
| — |
| — |
| — |
| — |
| | 281 |
| 22 |
|
Park Sterling Corp * | 7,200 |
| 47 |
| — |
| — |
| — |
| — |
| | 7,200 |
| 47 |
|
Peapack Gladstone Financial Corp * | 432 |
| 9 |
| — |
| — |
| — |
| — |
| | 432 |
| 9 |
|
Penns Woods Bancorp Inc * | 170 |
| 8 |
| — |
| — |
| — |
| — |
| | 170 |
| 8 |
|
Peoples Bancorp Inc/OH * | 3,762 |
| 99 |
| — |
| — |
| — |
| — |
| | 3,762 |
| 99 |
|
|
| | | | | | | | | | | | | | | | | | | | | |
COMMON STOCKS (continued) | SmallCap Value Account I Shares Held | SmallCap Value Account I Value (000's) | SmallCap Growth Account II Shares Held | SmallCap Growth Account II Value (000's) | SmallCap Blend Account Shares Held | SmallCap Blend Account Value (000's) | | Combined Portfolio Shares Held | Combined Portfolio Value (000's) |
| Banks (continued) | | | | | | | | |
Peoples Financial Services Corp * | 800 |
| $ | 41 |
| — |
| $ | — |
| — |
| $ | — |
| | 800 |
| $ | 41 |
|
Pinnacle Financial Partners Inc * | 17,844 |
| 704 |
| — |
| — |
| — |
| — |
| | 17,844 |
| 704 |
|
Preferred Bank/Los Angeles CA (b),* | 8,741 |
| 206 |
| — |
| — |
| — |
| — |
| | 8,741 |
| 206 |
|
| PrivateBancorp Inc | 25,238 |
| 733 |
| — |
| — |
| 26,640 |
| 774 |
| | 51,878 |
| 1,507 |
|
Prosperity Bancshares Inc * | 1,692 |
| 106 |
| — |
| — |
| — |
| — |
| | 1,692 |
| 106 |
|
Renasant Corp * | 771 |
| 22 |
| — |
| — |
| — |
| — |
| | 771 |
| 22 |
|
Republic Bancorp Inc/KY * | 2,291 |
| 54 |
| — |
| — |
| — |
| — |
| | 2,291 |
| 54 |
|
S&T Bancorp Inc * | 739 |
| 18 |
| — |
| — |
| — |
| — |
| | 739 |
| 18 |
|
Sandy Spring Bancorp Inc * | 632 |
| 16 |
| — |
| — |
| — |
| — |
| | 632 |
| 16 |
|
Seacoast Banking Corp of Florida (b),* | 631 |
| 7 |
| — |
| — |
| — |
| — |
| | 631 |
| 7 |
|
Sierra Bancorp * | 4,758 |
| 75 |
| — |
| — |
| — |
| — |
| | 4,758 |
| 75 |
|
Simmons First National Corp * | 1,811 |
| 71 |
| — |
| — |
| — |
| — |
| | 1,811 |
| 71 |
|
South State Corp * | 2,240 |
| 137 |
| — |
| — |
| — |
| — |
| | 2,240 |
| 137 |
|
Southside Bancshares Inc (c),* | 3,114 |
| 90 |
| — |
| — |
| — |
| — |
| | 3,114 |
| 90 |
|
Southwest Bancorp Inc * | 16,964 |
| 289 |
| — |
| — |
| — |
| — |
| | 16,964 |
| 289 |
|
Square 1 Financial Inc (b),* | 1,700 |
| 32 |
| 17,838 |
| 339 |
| — |
| — |
| | 19,538 |
| 371 |
|
State Bank Financial Corp * | 795 |
| 13 |
| — |
| — |
| — |
| — |
| | 795 |
| 13 |
|
Stock Yards Bancorp Inc * | 1,824 |
| 55 |
| — |
| — |
| — |
| — |
| | 1,824 |
| 55 |
|
Suffolk Bancorp (b),* | 416 |
| 9 |
| — |
| — |
| — |
| — |
| | 416 |
| 9 |
|
| Susquehanna Bancshares Inc | 15,231 |
| 161 |
| — |
| — |
| 49,790 |
| 526 |
| | 65,021 |
| 687 |
|
Talmer Bancorp Inc (b) | 643 |
| 9 |
| 9,249 |
| 128 |
| 16,600 |
| 229 |
| | 26,492 |
| 366 |
|
Taylor Capital Group Inc (b),* | 2,829 |
| 60 |
| — |
| — |
| — |
| — |
| | 2,829 |
| 60 |
|
Texas Capital Bancshares Inc (b),* | 583 |
| 31 |
| 224 |
| 12 |
| — |
| — |
| | 807 |
| 43 |
|
Tompkins Financial Corp * | 1,565 |
| 76 |
| — |
| — |
| — |
| — |
| | 1,565 |
| 76 |
|
TowneBank/Portsmouth VA * | 992 |
| 16 |
| — |
| — |
| — |
| — |
| | 992 |
| 16 |
|
Trico Bancshares * | 612 |
| 14 |
| — |
| — |
| — |
| — |
| | 612 |
| 14 |
|
Tristate Capital Holdings Inc (b),* | 3,100 |
| 44 |
| — |
| — |
| — |
| — |
| | 3,100 |
| 44 |
|
TrustCo Bank Corp NY * | 2,280 |
| 15 |
| — |
| — |
| — |
| — |
| | 2,280 |
| 15 |
|
Trustmark Corp * | 4,501 |
| 111 |
| — |
| — |
| — |
| — |
| | 4,501 |
| 111 |
|
UMB Financial Corp * | 9,775 |
| 620 |
| — |
| — |
| — |
| — |
| | 9,775 |
| 620 |
|
Umpqua Holdings Corp * | 4,224 |
| 76 |
| — |
| — |
| — |
| — |
| | 4,224 |
| 76 |
|
Union Bankshares Corp * | 3,695 |
| 94 |
| — |
| — |
| — |
| — |
| | 3,695 |
| 94 |
|
United Bankshares Inc/WV * | 1,444 |
| 47 |
| — |
| — |
| — |
| — |
| | 1,444 |
| 47 |
|
| United Community Banks Inc/GA | 935 |
| 15 |
| — |
| — |
| 29,000 |
| 475 |
| | 29,935 |
| 490 |
|
Univest Corp of Pennsylvania * | 625 |
| 13 |
| — |
| — |
| — |
| — |
| | 625 |
| 13 |
|
Valley National Bancorp * | 4,869 |
| 48 |
| — |
| — |
| — |
| — |
| | 4,869 |
| 48 |
|
VantageSouth Bancshares Inc (b),* | 760 |
| 5 |
| — |
| — |
| — |
| — |
| | 760 |
| 5 |
|
ViewPoint Financial Group Inc * | 869 |
| 23 |
| — |
| — |
| — |
| — |
| | 869 |
| 23 |
|
Walker & Dunlop Inc (b),* | 623 |
| 9 |
| — |
| — |
| — |
| — |
| | 623 |
| 9 |
|
Washington Trust Bancorp Inc * | 349 |
| 13 |
| — |
| — |
| — |
| — |
| | 349 |
| 13 |
|
| Webster Financial Corp | 6,385 |
| 201 |
| — |
| — |
| 24,755 |
| 781 |
| | 31,140 |
| 982 |
|
WesBanco Inc * | 14,056 |
| 436 |
| — |
| — |
| 6,800 |
| 211 |
| | 20,856 |
| 647 |
|
West Bancorporation Inc * | 6,683 |
| 102 |
| — |
| — |
| — |
| — |
| | 6,683 |
| 102 |
|
Westamerica Bancorporation * | 580 |
| 30 |
| — |
| — |
| — |
| — |
| | 580 |
| 30 |
|
Western Alliance Bancorp (b) | 854 |
| 20 |
| 595 |
| 14 |
| 20,600 |
| 490 |
| | 22,049 |
| 524 |
|
Wilshire Bancorp Inc * | 44,410 |
| 457 |
| — |
| — |
| — |
| — |
| | 44,410 |
| 457 |
|
Wintrust Financial Corp * | 1,077 |
| 50 |
| — |
| — |
| — |
| — |
| | 1,077 |
| 50 |
|
Yadkin Financial Corp (b),* | 5,700 |
| 107 |
| — |
| — |
| — |
| — |
| | 5,700 |
| 107 |
|
| | | $ | 14,382 |
| | $ | 4,286 |
| | $ | 4,972 |
| | $ | 23,640 |
|
| Beverages - 0.02% | | | | | | | | |
Boston Beer Co Inc/The (b),* | — |
| — |
| 119 |
| 27 |
| — |
| — |
| | 119 |
| 27 |
|
Coca-Cola Bottling Co Consolidated * | — |
| — |
| 96 |
| 7 |
| — |
| — |
| | 96 |
| 7 |
|
Craft Brew Alliance Inc (b),* | 248 |
| 3 |
| 203 |
| 2 |
| — |
| — |
| | 451 |
| 5 |
|
Farmer Bros Co (b),* | — |
| — |
| 138 |
| 3 |
| — |
| — |
| | 138 |
| 3 |
|
National Beverage Corp (b),* | — |
| — |
| 269 |
| 5 |
| — |
| — |
| | 269 |
| 5 |
|
| | | $ | 3 |
| | $ | 44 |
| | $ | — |
| | $ | 47 |
|
| Biotechnology - 3.23% | | | | | | | | |
Acceleron Pharma Inc (b),(c) | — |
| — |
| 372 |
| 13 |
| 1,580 |
| 54 |
| | 1,952 |
| 67 |
|
Acorda Therapeutics Inc (b),* | — |
| — |
| 591 |
| 20 |
| — |
| — |
| | 591 |
| 20 |
|
Aegerion Pharmaceuticals Inc (b),* | 5,000 |
| 160 |
| 422 |
| 13 |
| — |
| — |
| | 5,422 |
| 173 |
|
Alder Biopharmaceuticals Inc (b),* | — |
| — |
| 181 |
| 4 |
| — |
| — |
| | 181 |
| 4 |
|
Alnylam Pharmaceuticals Inc (b),* | 129 |
| 8 |
| 12,606 |
| 796 |
| 1,170 |
| 74 |
| | 13,905 |
| 878 |
|
AMAG Pharmaceuticals Inc (b),* | 255 |
| 5 |
| 335 |
| 7 |
| — |
| — |
| | 590 |
| 12 |
|
ANI Pharmaceuticals Inc (b),* | — |
| — |
| 6,026 |
| 207 |
| — |
| — |
| | 6,026 |
| 207 |
|
Applied Genetic Technologies Corp/DE (b),(c),* | 1,600 |
| 37 |
| — |
| — |
| — |
| — |
| | 1,600 |
| 37 |
|
Ardelyx Inc (b),(c) | 4,100 |
| 66 |
| — |
| — |
| 4,860 |
| 78 |
| | 8,960 |
| 144 |
|
Arena Pharmaceuticals Inc (b),(c),* | — |
| — |
| 3,164 |
| 18 |
| — |
| — |
| | 3,164 |
| 18 |
|
ARIAD Pharmaceuticals Inc (b),(c),* | — |
| — |
| 2,374 |
| 15 |
| — |
| — |
| | 2,374 |
| 15 |
|
BIND Therapeutics Inc (b) | — |
| — |
| — |
| — |
| 12,004 |
| 158 |
| | 12,004 |
| 158 |
|
BioCryst Pharmaceuticals Inc (b),* | 517 |
| 7 |
| 801 |
| 10 |
| — |
| — |
| | 1,318 |
| 17 |
|
|
| | | | | | | | | | | | | | | | | | | | | |
COMMON STOCKS (continued) | SmallCap Value Account I Shares Held | SmallCap Value Account I Value (000's) | SmallCap Growth Account II Shares Held | SmallCap Growth Account II Value (000's) | SmallCap Blend Account Shares Held | SmallCap Blend Account Value (000's) | | Combined Portfolio Shares Held | Combined Portfolio Value (000's) |
| Biotechnology (continued) | | | | | | | | |
Bluebird Bio Inc (b) | — |
| $ | — |
| 242 |
| $ | 9 |
| 1,958 |
| $ | 76 |
| | 2,200 |
| $ | 85 |
|
Cambrex Corp (b),* | — |
| — |
| 27,564 |
| 570 |
| 5,240 |
| 108 |
| | 32,804 |
| 678 |
|
Celldex Therapeutics Inc (b),* | 7,800 |
| 127 |
| 1,029 |
| 17 |
| — |
| — |
| | 8,829 |
| 144 |
|
CTI BioPharma Corp (b),(c),* | — |
| — |
| 3,078 |
| 9 |
| — |
| — |
| | 3,078 |
| 9 |
|
Cubist Pharmaceuticals Inc (b) | — |
| — |
| — |
| — |
| 1,610 |
| 112 |
| | 1,610 |
| 112 |
|
Cytokinetics Inc (b),* | 1,243 |
| 6 |
| — |
| — |
| — |
| — |
| | 1,243 |
| 6 |
|
Cytokinetics Inc - Warrants (b),(d),(e) | — |
| — |
| — |
| — |
| 12,207 |
| — |
| | 12,207 |
| — |
|
Dendreon Corp (b),(c),* | — |
| — |
| 3,738 |
| 9 |
| — |
| — |
| | 3,738 |
| 9 |
|
Dicerna Pharmaceuticals Inc (b),(c),* | 4,200 |
| 95 |
| 80 |
| 2 |
| — |
| — |
| | 4,280 |
| 97 |
|
Dynavax Technologies Corp (b) | 9,448 |
| 15 |
| — |
| — |
| — |
| — |
| | 9,448 |
| 15 |
|
Eleven Biotherapeutics Inc (b),(c) | 1,200 |
| 16 |
| — |
| — |
| 3,743 |
| 49 |
| | 4,943 |
| 65 |
|
Emergent Biosolutions Inc (b),* | 547 |
| 12 |
| 112 |
| 2 |
| — |
| — |
| | 659 |
| 14 |
|
Endocyte Inc (b),(c),* | — |
| — |
| 723 |
| 5 |
| — |
| — |
| | 723 |
| 5 |
|
Enzo Biochem Inc (b),* | — |
| — |
| 775 |
| 4 |
| — |
| — |
| | 775 |
| 4 |
|
Epizyme Inc (b),(c),* | — |
| — |
| 14,450 |
| 450 |
| 2,840 |
| 88 |
| | 17,290 |
| 538 |
|
Exact Sciences Corp (b),(c),* | — |
| — |
| 1,067 |
| 18 |
| 11,747 |
| 200 |
| | 12,814 |
| 218 |
|
Exelixis Inc (b),(c),* | — |
| — |
| 2,825 |
| 10 |
| — |
| — |
| | 2,825 |
| 10 |
|
Fate Therapeutics Inc (b) | — |
| — |
| — |
| — |
| 7,900 |
| 50 |
| | 7,900 |
| 50 |
|
Five Prime Therapeutics Inc (b),(c),* | — |
| — |
| 391 |
| 6 |
| — |
| — |
| | 391 |
| 6 |
|
Foundation Medicine Inc (b),(c),* | — |
| — |
| 316 |
| 8 |
| — |
| — |
| | 316 |
| 8 |
|
Galena Biopharma Inc (b),* | — |
| — |
| 2,672 |
| 8 |
| — |
| — |
| | 2,672 |
| 8 |
|
Genocea Biosciences Inc (b) | — |
| — |
| — |
| — |
| 4,619 |
| 87 |
| | 4,619 |
| 87 |
|
Halozyme Therapeutics Inc (b),* | — |
| — |
| 1,402 |
| 14 |
| — |
| — |
| | 1,402 |
| 14 |
|
Idenix Pharmaceuticals Inc (b),(c),* | — |
| — |
| 1,273 |
| 31 |
| — |
| — |
| | 1,273 |
| 31 |
|
ImmunoGen Inc (b),(c),* | — |
| — |
| 1,237 |
| 15 |
| — |
| — |
| | 1,237 |
| 15 |
|
Inovio Pharmaceuticals Inc (b),(c),* | — |
| — |
| 1,213 |
| 13 |
| — |
| — |
| | 1,213 |
| 13 |
|
Insmed Inc (b) | — |
| — |
| 499 |
| 10 |
| 6,510 |
| 130 |
| | 7,009 |
| 140 |
|
Intercept Pharmaceuticals Inc (b),* | — |
| — |
| 843 |
| 199 |
| 420 |
| 99 |
| | 1,263 |
| 298 |
|
InterMune Inc (b),* | 366 |
| 16 |
| 10,160 |
| 449 |
| — |
| — |
| | 10,526 |
| 465 |
|
Intrexon Corp (b),(c),* | — |
| — |
| 11,132 |
| 279 |
| — |
| — |
| | 11,132 |
| 279 |
|
Isis Pharmaceuticals Inc (b),(c),* | — |
| — |
| 9,341 |
| 321 |
| — |
| — |
| | 9,341 |
| 321 |
|
Ligand Pharmaceuticals Inc (b),* | — |
| — |
| 298 |
| 19 |
| — |
| — |
| | 298 |
| 19 |
|
MacroGenics Inc (b),* | 500 |
| 11 |
| 12,082 |
| 263 |
| 4,530 |
| 98 |
| | 17,112 |
| 372 |
|
Marrone Bio Innovations Inc (b) | — |
| — |
| — |
| — |
| 7,220 |
| 84 |
| | 7,220 |
| 84 |
|
Medicines Co/The (b),* | 3,515 |
| 102 |
| 921 |
| 27 |
| — |
| — |
| | 4,436 |
| 129 |
|
Medivation Inc (b) | — |
| — |
| — |
| — |
| 1,220 |
| 94 |
| | 1,220 |
| 94 |
|
Merrimack Pharmaceuticals Inc (b),(c),* | — |
| — |
| 1,247 |
| 9 |
| — |
| — |
| | 1,247 |
| 9 |
|
Momenta Pharmaceuticals Inc (b),* | — |
| — |
| 1,090 |
| 13 |
| — |
| — |
| | 1,090 |
| 13 |
|
NewLink Genetics Corp (b) | — |
| — |
| — |
| — |
| 2,490 |
| 66 |
| | 2,490 |
| 66 |
|
Novavax Inc (b),* | — |
| — |
| 3,014 |
| 14 |
| — |
| — |
| | 3,014 |
| 14 |
|
NPS Pharmaceuticals Inc (b),* | 264 |
| 9 |
| 13,006 |
| 430 |
| 6,614 |
| 219 |
| | 19,884 |
| 658 |
|
OncoMed Pharmaceuticals Inc (b),* | — |
| — |
| 286 |
| 7 |
| — |
| — |
| | 286 |
| 7 |
|
OvaScience Inc (b),(c),* | — |
| — |
| 9,961 |
| 91 |
| — |
| — |
| | 9,961 |
| 91 |
|
Pacific Biosciences of California Inc (b),* | — |
| — |
| 1,302 |
| 8 |
| — |
| — |
| | 1,302 |
| 8 |
|
PDL BioPharma Inc (c),* | — |
| — |
| 2,337 |
| 23 |
| — |
| — |
| | 2,337 |
| 23 |
|
Peregrine Pharmaceuticals Inc (b),* | — |
| — |
| 3,716 |
| 7 |
| — |
| — |
| | 3,716 |
| 7 |
|
Prothena Corp PLC (b),* | 539 |
| 12 |
| 130 |
| 3 |
| — |
| — |
| | 669 |
| 15 |
|
Puma Biotechnology Inc (b),* | — |
| — |
| 299 |
| 20 |
| — |
| — |
| | 299 |
| 20 |
|
Repligen Corp (b),* | — |
| — |
| 463 |
| 10 |
| — |
| — |
| | 463 |
| 10 |
|
Retrophin Inc (b),* | — |
| — |
| 481 |
| 6 |
| — |
| — |
| | 481 |
| 6 |
|
RTI Surgical Inc (b),* | 2,139 |
| 9 |
| — |
| — |
| — |
| — |
| | 2,139 |
| 9 |
|
Sangamo BioSciences Inc (b),* | — |
| — |
| 970 |
| 15 |
| — |
| — |
| | 970 |
| 15 |
|
Seattle Genetics Inc (b) | — |
| — |
| — |
| — |
| 1,950 |
| 75 |
| | 1,950 |
| 75 |
|
Spectrum Pharmaceuticals Inc (b),(c),* | 1,796 |
| 15 |
| 354 |
| 3 |
| — |
| ��� |
| | 2,150 |
| 18 |
|
Sunesis Pharmaceuticals Inc (b),* | — |
| — |
| — |
| — |
| 13,240 |
| 86 |
| | 13,240 |
| 86 |
|
Synageva BioPharma Corp (b),(c),* | — |
| — |
| 264 |
| 28 |
| — |
| — |
| | 264 |
| 28 |
|
Theravance Biopharma Inc (b),* | — |
| — |
| 282 |
| 9 |
| — |
| — |
| | 282 |
| 9 |
|
Theravance Inc (b),(c),* | — |
| — |
| 988 |
| 29 |
| — |
| — |
| | 988 |
| 29 |
|
Ultragenyx Pharmaceutical Inc (b),(c),* | 3,000 |
| 135 |
| 1,330 |
| 60 |
| — |
| — |
| | 4,330 |
| 195 |
|
Verastem Inc (b),(c),* | — |
| — |
| 17,651 |
| 160 |
| — |
| — |
| | 17,651 |
| 160 |
|
Versartis Inc (b) | — |
| — |
| — |
| — |
| 1,481 |
| 42 |
| | 1,481 |
| 42 |
|
XOMA Corp (b),* | 35,900 |
| 165 |
| — |
| — |
| — |
| — |
| | 35,900 |
| 165 |
|
ZIOPHARM Oncology Inc (b),(c),* | — |
| — |
| 1,909 |
| 8 |
| — |
| — |
| | 1,909 |
| 8 |
|
| | | $ | 1,028 |
| | $ | 4,823 |
| | $ | 2,127 |
| | $ | 7,978 |
|
| Building Materials - 0.99% | | | | | | | | |
AAON Inc * | — |
| — |
| 416 |
| 14 |
| — |
| — |
| | 416 |
| 14 |
|
|
| | | | | | | | | | | | | | | | | | | | | |
COMMON STOCKS (continued) | SmallCap Value Account I Shares Held | SmallCap Value Account I Value (000's) | SmallCap Growth Account II Shares Held | SmallCap Growth Account II Value (000's) | SmallCap Blend Account Shares Held | SmallCap Blend Account Value (000's) | | Combined Portfolio Shares Held | Combined Portfolio Value (000's) |
| Building Materials (continued) | | | | | | | | |
Apogee Enterprises Inc * | — |
| $ | — |
| 12,086 |
| $ | 421 |
| — |
| $ | — |
| | 12,086 |
| $ | 421 |
|
Boise Cascade Co (b),* | — |
| — |
| 500 |
| 14 |
| — |
| — |
| | 500 |
| 14 |
|
Comfort Systems USA Inc * | 1,055 |
| 17 |
| 226 |
| 4 |
| — |
| — |
| | 1,281 |
| 21 |
|
Continental Building Products Inc (b),* | — |
| — |
| 209 |
| 3 |
| — |
| — |
| | 209 |
| 3 |
|
Drew Industries Inc * | — |
| — |
| 333 |
| 17 |
| — |
| — |
| | 333 |
| 17 |
|
Eagle Materials Inc * | — |
| — |
| — |
| — |
| 2,740 |
| 258 |
| | 2,740 |
| 258 |
|
Gibraltar Industries Inc (b),* | 6,741 |
| 105 |
| — |
| — |
| — |
| — |
| | 6,741 |
| 105 |
|
Griffon Corp * | 1,131 |
| 14 |
| 190 |
| 2 |
| — |
| — |
| | 1,321 |
| 16 |
|
Headwaters Inc (b),* | — |
| — |
| 1,072 |
| 15 |
| — |
| — |
| | 1,072 |
| 15 |
|
Louisiana-Pacific Corp (b),* | 2,948 |
| 44 |
| — |
| — |
| — |
| — |
| | 2,948 |
| 44 |
|
Masonite International Corp (b),* | 533 |
| 30 |
| — |
| — |
| — |
| — |
| | 533 |
| 30 |
|
Nortek Inc (b),(c),* | — |
| — |
| 114 |
| 10 |
| — |
| — |
| | 114 |
| 10 |
|
Patrick Industries Inc (b),* | — |
| — |
| 157 |
| 7 |
| — |
| — |
| | 157 |
| 7 |
|
PGT Inc (b),* | — |
| — |
| 1,072 |
| 9 |
| 27,080 |
| 230 |
| | 28,152 |
| 239 |
|
Quanex Building Products Corp * | 805 |
| 14 |
| — |
| — |
| — |
| — |
| | 805 |
| 14 |
|
Simpson Manufacturing Co Inc * | 921 |
| 34 |
| 77 |
| 3 |
| — |
| — |
| | 998 |
| 37 |
|
Texas Industries Inc (b),* | 78 |
| 7 |
| 255 |
| 24 |
| — |
| — |
| | 333 |
| 31 |
|
Trex Co Inc (b),* | — |
| — |
| 38,916 |
| 1,122 |
| — |
| — |
| | 38,916 |
| 1,122 |
|
Universal Forest Products Inc * | 500 |
| 24 |
| — |
| — |
| — |
| — |
| | 500 |
| 24 |
|
| | | $ | 289 |
| | $ | 1,665 |
| | $ | 488 |
| | $ | 2,442 |
|
| Chemicals - 1.47% | | | | | | | | |
A Schulman Inc * | 7,865 |
| 304 |
| 154 |
| 6 |
| — |
| — |
| | 8,019 |
| 310 |
|
Aceto Corp * | 846 |
| 15 |
| 129 |
| 2 |
| — |
| — |
| | 975 |
| 17 |
|
Axiall Corp * | 9,016 |
| 426 |
| — |
| — |
| 4,240 |
| 201 |
| | 13,256 |
| 627 |
|
Balchem Corp * | — |
| — |
| 435 |
| 23 |
| — |
| — |
| | 435 |
| 23 |
|
Chemtura Corp (b),* | — |
| — |
| 1,222 |
| 32 |
| — |
| — |
| | 1,222 |
| 32 |
|
Ferro Corp (b),* | — |
| — |
| 1,063 |
| 13 |
| — |
| — |
| | 1,063 |
| 13 |
|
Hawkins Inc * | 822 |
| 31 |
| 38 |
| 1 |
| — |
| — |
| | 860 |
| 32 |
|
HB Fuller Co * | — |
| — |
| 649 |
| 31 |
| — |
| — |
| | 649 |
| 31 |
|
Innophos Holdings Inc * | — |
| — |
| 162 |
| 9 |
| — |
| — |
| | 162 |
| 9 |
|
Innospec Inc * | 1,387 |
| 60 |
| 115 |
| 5 |
| — |
| — |
| | 1,502 |
| 65 |
|
Intrepid Potash Inc (b),(c),* | 1,408 |
| 24 |
| — |
| — |
| — |
| — |
| | 1,408 |
| 24 |
|
Kraton Performance Polymers Inc (b),* | 1,532 |
| 35 |
| — |
| — |
| — |
| — |
| | 1,532 |
| 35 |
|
Kronos Worldwide Inc * | 2,359 |
| 37 |
| — |
| — |
| — |
| — |
| | 2,359 |
| 37 |
|
Minerals Technologies Inc * | 7,029 |
| 461 |
| 217 |
| 14 |
| — |
| — |
| | 7,246 |
| 475 |
|
Oil-Dri Corp of America * | 137 |
| 4 |
| 27 |
| 1 |
| — |
| — |
| | 164 |
| 5 |
|
Olin Corp * | 1,995 |
| 54 |
| — |
| — |
| — |
| — |
| | 1,995 |
| 54 |
|
OM Group Inc * | 764 |
| 25 |
| — |
| — |
| 16,260 |
| 527 |
| | 17,024 |
| 552 |
|
OMNOVA Solutions Inc (b),* | — |
| — |
| 1,115 |
| 10 |
| — |
| — |
| | 1,115 |
| 10 |
|
PolyOne Corp * | — |
| — |
| 23,263 |
| 980 |
| — |
| — |
| | 23,263 |
| 980 |
|
Quaker Chemical Corp * | 146 |
| 11 |
| 136 |
| 11 |
| — |
| — |
| | 282 |
| 22 |
|
Sensient Technologies Corp * | 1,177 |
| 66 |
| 65 |
| 4 |
| — |
| — |
| | 1,242 |
| 70 |
|
Stepan Co * | 288 |
| 15 |
| 200 |
| 11 |
| — |
| — |
| | 488 |
| 26 |
|
Taminco Corp (b),* | 170 |
| 4 |
| 538 |
| 13 |
| — |
| — |
| | 708 |
| 17 |
|
Tronox Ltd * | 1,284 |
| 34 |
| — |
| — |
| — |
| — |
| | 1,284 |
| 34 |
|
Zep Inc * | 5,936 |
| 104 |
| 202 |
| 4 |
| — |
| — |
| | 6,138 |
| 108 |
|
| | | $ | 1,710 |
| | $ | 1,170 |
| | $ | 728 |
| | $ | 3,608 |
|
| Coal - 0.09% | | | | | | | | |
Alpha Natural Resources Inc (b),(c),* | 4,711 |
| 17 |
| — |
| — |
| — |
| — |
| | 4,711 |
| 17 |
|
Arch Coal Inc * | 4,547 |
| 17 |
| — |
| — |
| — |
| — |
| | 4,547 |
| 17 |
|
Cloud Peak Energy Inc (b),* | 1,552 |
| 29 |
| — |
| — |
| — |
| — |
| | 1,552 |
| 29 |
|
Hallador Energy Co * | 244 |
| 2 |
| — |
| — |
| — |
| — |
| | 244 |
| 2 |
|
SunCoke Energy Inc (b),* | 768 |
| 17 |
| 721 |
| 16 |
| — |
| — |
| | 1,489 |
| 33 |
|
Westmoreland Coal Co (b),* | 3,554 |
| 128 |
| — |
| — |
| — |
| — |
| | 3,554 |
| 128 |
|
| | | $ | 210 |
| | $ | 16 |
| | $ | — |
| | $ | 226 |
|
| Commercial Services - 5.03% | | | | | | | | |
ABM Industries Inc * | 22,163 |
| 598 |
| — |
| — |
| 18,180 |
| 491 |
| | 40,343 |
| 1,089 |
|
Acacia Research Corp (c),* | 1,045 |
| 19 |
| — |
| — |
| — |
| — |
| | 1,045 |
| 19 |
|
Advisory Board Co/The (b),* | — |
| — |
| 455 |
| 24 |
| — |
| — |
| | 455 |
| 24 |
|
Albany Molecular Research Inc (b),* | 875 |
| 18 |
| — |
| — |
| — |
| — |
| | 875 |
| 18 |
|
American Public Education Inc (b),* | — |
| — |
| 373 |
| 13 |
| — |
| — |
| | 373 |
| 13 |
|
AMN Healthcare Services Inc (b),* | 1,087 |
| 13 |
| — |
| — |
| — |
| — |
| | 1,087 |
| 13 |
|
ARC Document Solutions Inc (b),* | 9,900 |
| 58 |
| 930 |
| 5 |
| — |
| — |
| | 10,830 |
| 63 |
|
Arrowhead Research Corp (b),* | — |
| — |
| 747 |
| 11 |
| — |
| — |
| | 747 |
| 11 |
|
Ascent Capital Group Inc (b),* | 306 |
| 20 |
| — |
| — |
| — |
| — |
| | 306 |
| 20 |
|
Barrett Business Services Inc * | — |
| — |
| 166 |
| 8 |
| — |
| — |
| | 166 |
| 8 |
|
Bright Horizons Family Solutions Inc (b),* | — |
| — |
| 451 |
| 19 |
| — |
| — |
| | 451 |
| 19 |
|
Brink's Co/The * | 1,011 |
| 28 |
| — |
| — |
| — |
| — |
| | 1,011 |
| 28 |
|
Capella Education Co * | — |
| — |
| 247 |
| 13 |
| — |
| — |
| | 247 |
| 13 |
|
|
| | | | | | | | | | | | | | | | | | | | | |
COMMON STOCKS (continued) | SmallCap Value Account I Shares Held | SmallCap Value Account I Value (000's) | SmallCap Growth Account II Shares Held | SmallCap Growth Account II Value (000's) | SmallCap Blend Account Shares Held | SmallCap Blend Account Value (000's) | | Combined Portfolio Shares Held | Combined Portfolio Value (000's) |
| Commercial Services (continued) | | | | | | | |
Cardtronics Inc (b),* | — |
| $ | — |
| 653 |
| $ | 22 |
| — |
| $ | — |
| | 653 |
| $ | 22 |
|
Carriage Services Inc * | 481 |
| 8 |
| — |
| — |
| — |
| — |
| | 481 |
| 8 |
|
CBIZ Inc (b),* | 1,419 |
| 13 |
| — |
| — |
| — |
| — |
| | 1,419 |
| 13 |
|
CDI Corp * | 3,339 |
| 48 |
| — |
| — |
| — |
| — |
| | 3,339 |
| 48 |
|
Cenveo Inc (b),(c),* | 52,400 |
| 194 |
| — |
| — |
| — |
| — |
| | 52,400 |
| 194 |
|
Chemed Corp (c),* | — |
| — |
| 256 |
| 24 |
| — |
| — |
| | 256 |
| 24 |
|
Civeo Corp (b),* | 2,256 |
| 56 |
| — |
| — |
| — |
| — |
| | 2,256 |
| 56 |
|
Convergys Corp * | 2,356 |
| 50 |
| — |
| — |
| — |
| — |
| | 2,356 |
| 50 |
|
Corporate Executive Board Co * | — |
| — |
| 496 |
| 34 |
| 5,100 |
| 348 |
| | 5,596 |
| 382 |
|
CorVel Corp (b),* | — |
| — |
| 270 |
| 12 |
| — |
| — |
| | 270 |
| 12 |
|
CRA International Inc (b),* | 380 |
| 9 |
| — |
| — |
| — |
| — |
| | 380 |
| 9 |
|
Cross Country Healthcare Inc (b),* | 32,913 |
| 215 |
| — |
| — |
| — |
| — |
| | 32,913 |
| 215 |
|
Deluxe Corp * | 582 |
| 34 |
| 379 |
| 22 |
| — |
| — |
| | 961 |
| 56 |
|
Electro Rent Corp * | 547 |
| 9 |
| 27 |
| — |
| — |
| — |
| | 574 |
| 9 |
|
Ennis Inc * | 1,021 |
| 16 |
| — |
| — |
| — |
| — |
| | 1,021 |
| 16 |
|
Euronet Worldwide Inc (b),* | — |
| — |
| 726 |
| 35 |
| — |
| — |
| | 726 |
| 35 |
|
EVERTEC Inc * | — |
| — |
| 833 |
| 20 |
| — |
| — |
| | 833 |
| 20 |
|
ExamWorks Group Inc (b),* | — |
| — |
| 466 |
| 15 |
| — |
| — |
| | 466 |
| 15 |
|
ExlService Holdings Inc (b),* | 436 |
| 13 |
| 314 |
| 9 |
| — |
| — |
| | 750 |
| 22 |
|
Forrester Research Inc * | — |
| — |
| 247 |
| 9 |
| — |
| — |
| | 247 |
| 9 |
|
Franklin Covey Co (b),* | 154 |
| 3 |
| 146 |
| 3 |
| — |
| — |
| | 300 |
| 6 |
|
FTI Consulting Inc (b),* | 1,008 |
| 38 |
| — |
| — |
| — |
| — |
| | 1,008 |
| 38 |
|
Global Cash Access Holdings Inc (b),* | 6,828 |
| 60 |
| — |
| — |
| — |
| — |
| | 6,828 |
| 60 |
|
Grand Canyon Education Inc (b),* | — |
| — |
| 659 |
| 30 |
| — |
| — |
| | 659 |
| 30 |
|
Green Dot Corp (b),* | 40,026 |
| 760 |
| — |
| — |
| — |
| — |
| | 40,026 |
| 760 |
|
H&E Equipment Services Inc (b),* | — |
| — |
| 19,265 |
| 700 |
| — |
| — |
| | 19,265 |
| 700 |
|
Hackett Group Inc/The * | 681 |
| 4 |
| — |
| — |
| — |
| — |
| | 681 |
| 4 |
|
Healthcare Services Group Inc * | — |
| — |
| 876 |
| 26 |
| — |
| — |
| | 876 |
| 26 |
|
Heartland Payment Systems Inc * | — |
| — |
| 528 |
| 22 |
| — |
| — |
| | 528 |
| 22 |
|
Heidrick & Struggles International Inc * | 5,589 |
| 104 |
| — |
| — |
| — |
| — |
| | 5,589 |
| 104 |
|
Hill International Inc (b),* | — |
| — |
| 434 |
| 3 |
| — |
| — |
| | 434 |
| 3 |
|
HMS Holdings Corp (b),* | — |
| — |
| 1,278 |
| 26 |
| — |
| — |
| | 1,278 |
| 26 |
|
Huron Consulting Group Inc (b),* | 493 |
| 35 |
| 72 |
| 5 |
| 10,350 |
| 733 |
| | 10,915 |
| 773 |
|
ICF International Inc (b),* | 477 |
| 17 |
| — |
| — |
| — |
| — |
| | 477 |
| 17 |
|
Information Services Group Inc (b),* | — |
| — |
| 741 |
| 4 |
| — |
| — |
| | 741 |
| 4 |
|
Insperity Inc * | | | | | | |
ITT Educational Services Inc (b),(c),* | — |
| — |
| 357 |
| 12 |
| — |
| — |
| | 357 |
| 12 |
|
JTH Holding Inc (b) | 773 |
| 13 |
| 42 |
| 1 |
| — |
| — |
| | 815 |
| 14 |
|
K12 Inc (b),* | — |
| — |
| 98 |
| 3 |
| — |
| — |
| | 98 |
| 3 |
|
Kelly Services Inc * | 713 |
| 17 |
| 398 |
| 10 |
| — |
| — |
| | 1,111 |
| 27 |
|
Kforce Inc * | 19,639 |
| 337 |
| — |
| — |
| — |
| — |
| | 19,639 |
| 337 |
|
Korn/Ferry International (b) | — |
| — |
| 25,232 |
| 547 |
| — |
| — |
| | 25,232 |
| 547 |
|
Landauer Inc * | 2,382 |
| 70 |
| 8,914 |
| 262 |
| 26,070 |
| 766 |
| | 37,366 |
| 1,098 |
|
LifeLock Inc (b),* | — |
| — |
| 225 |
| 9 |
| — |
| — |
| | 225 |
| 9 |
|
Live Nation Entertainment Inc (b) | 10,800 |
| 151 |
| 1,183 |
| 17 |
| — |
| — |
| | 11,983 |
| 168 |
|
Matthews International Corp * | 4,200 |
| 104 |
| — |
| — |
| 26,530 |
| 655 |
| | 30,730 |
| 759 |
|
MAXIMUS Inc * | 661 |
| 27 |
| — |
| — |
| — |
| — |
| | 661 |
| 27 |
|
McGrath RentCorp * | — |
| — |
| 994 |
| 43 |
| — |
| — |
| | 994 |
| 43 |
|
Medifast Inc (b),* | 540 |
| 20 |
| — |
| — |
| — |
| — |
| | 540 |
| 20 |
|
MoneyGram International Inc (b),* | — |
| — |
| 311 |
| 9 |
| — |
| — |
| | 311 |
| 9 |
|
Monro Muffler Brake Inc * | 1,048 |
| 15 |
| — |
| — |
| — |
| — |
| | 1,048 |
| 15 |
|
Monster Worldwide Inc (b),* | — |
| — |
| 454 |
| 24 |
| — |
| — |
| | 454 |
| 24 |
|
Multi-Color Corp * | 2,332 |
| 15 |
| — |
| — |
| — |
| — |
| | 2,332 |
| 15 |
|
National Research Corp (b),* | 181 |
| 7 |
| 175 |
| 7 |
| — |
| — |
| | 356 |
| 14 |
|
Navigant Consulting Inc (b),* | 226 |
| 3 |
| 197 |
| 3 |
| — |
| — |
| | 423 |
| 6 |
|
On Assignment Inc (b),* | 1,246 |
| 22 |
| — |
| — |
| — |
| — |
| | 1,246 |
| 22 |
|
PAREXEL International Corp (b),* | — |
| — |
| 798 |
| 28 |
| 10,600 |
| 377 |
| | 11,398 |
| 405 |
|
Paylocity Holding Corp (b),* | — |
| — |
| 828 |
| 44 |
| 12,260 |
| 648 |
| | 13,088 |
| 692 |
|
Performant Financial Corp (b),* | 1,700 |
| 37 |
| — |
| — |
| — |
| — |
| | 1,700 |
| 37 |
|
PHH Corp (b),* | — |
| — |
| 637 |
| 6 |
| — |
| — |
| | 637 |
| 6 |
|
PRGX Global Inc (b),* | 10,077 |
| 232 |
| — |
| — |
| — |
| — |
| | 10,077 |
| 232 |
|
Providence Service Corp/The (b),* | 1,094 |
| 7 |
| — |
| — |
| — |
| — |
| | 1,094 |
| 7 |
|
Quad/Graphics Inc * | — |
| — |
| 251 |
| 9 |
| — |
| — |
| | 251 |
| 9 |
|
Rent-A-Center Inc/TX * | 16,005 |
| 357 |
| — |
| — |
| — |
| — |
| | 16,005 |
| 357 |
|
Resources Connection Inc * | 1,104 |
| 32 |
| — |
| — |
| — |
| — |
| | 1,104 |
| 32 |
|
RPX Corp (b),* | 14,597 |
| 192 |
| — |
| — |
| — |
| — |
| | 14,597 |
| 192 |
|
RR Donnelley & Sons Co * | 13,169 |
| 234 |
| 106 |
| 2 |
| 15,124 |
| 268 |
| | 28,399 |
| 504 |
|
ServiceMaster Global Holdings Inc (b),* | 4,918 |
| 83 |
| — |
| — |
| — |
| — |
| | 4,918 |
| 83 |
|
Sotheby's * | 9,100 |
| 166 |
| — |
| — |
| — |
| — |
| | 9,100 |
| 166 |
|
SP Plus Corp (b),* | — |
| — |
| 775 |
| 33 |
| — |
| — |
| | 775 |
| 33 |
|
Steiner Leisure Ltd (b),* | — |
| — |
| 326 |
| 7 |
| — |
| — |
| | 326 |
| 7 |
|
|
| | | | | | | | | | | | | | | | | | | | | |
COMMON STOCKS (continued) | SmallCap Value Account I Shares Held | SmallCap Value Account I Value (000's) | SmallCap Growth Account II Shares Held | SmallCap Growth Account II Value (000's) | SmallCap Blend Account Shares Held | SmallCap Blend Account Value (000's) | | Combined Portfolio Shares Held | Combined Portfolio Value (000's) |
| Commercial Services (continued) | | | | | | | |
Strayer Education Inc (b),* | — |
| $ | — |
| 256 |
| $ | 13 |
| — |
| $ | — |
| | 256 |
| $ | 13 |
|
Team Health Holdings Inc (b),* | — |
| — |
| 1,000 |
| 50 |
| 9,480 |
| 473 |
| | 10,480 |
| 523 |
|
Team Inc (b),* | — |
| — |
| 300 |
| 12 |
| — |
| — |
| | 300 |
| 12 |
|
TeleTech Holdings Inc (b),* | 262 |
| 8 |
| 205 |
| 6 |
| — |
| — |
| | 467 |
| 14 |
|
TrueBlue Inc (b),* | 14,900 |
| 411 |
| 602 |
| 17 |
| — |
| — |
| | 15,502 |
| 428 |
|
Universal Technical Institute Inc * | 829 |
| 10 |
| — |
| — |
| — |
| — |
| | 829 |
| 10 |
|
Viad Corp * | 8,784 |
| 210 |
| — |
| — |
| — |
| — |
| | 8,784 |
| 210 |
|
Vistaprint NV (b),* | — |
| — |
| 474 |
| 19 |
| — |
| — |
| | 474 |
| 19 |
|
Weight Watchers International Inc (c),* | — |
| — |
| 577 |
| 12 |
| — |
| — |
| | 577 |
| 12 |
|
WEX Inc (b),* | — |
| — |
| 564 |
| 59 |
| — |
| — |
| | 564 |
| 59 |
|
Xoom Corp (b),* | — |
| — |
| 444 |
| 12 |
| — |
| — |
| | 444 |
| 12 |
|
| | | $ | 5,237 |
| | $ | 2,390 |
| | $ | 4,759 |
| | $ | 12,386 |
|
| Computers - 2.57% | | | | | | | | |
A10 Networks Inc (b),(c) | — |
| — |
| 263 |
| 4 |
| 11,840 |
| 158 |
| | 12,103 |
| 162 |
|
CACI International Inc (b),* | 556 |
| 39 |
| — |
| — |
| — |
| — |
| | 556 |
| 39 |
|
Carbonite Inc (b),* | — |
| — |
| 400 |
| 5 |
| — |
| — |
| | 400 |
| 5 |
|
CIBER Inc (b),* | 2,790 |
| 14 |
| — |
| — |
| — |
| — |
| | 2,790 |
| 14 |
|
Computer Task Group Inc * | 541 |
| 9 |
| — |
| — |
| — |
| — |
| | 541 |
| 9 |
|
Cray Inc (b),(c),* | — |
| — |
| 604 |
| 16 |
| — |
| — |
| | 604 |
| 16 |
|
Datalink Corp (b),* | 708 |
| 7 |
| — |
| — |
| — |
| — |
| | 708 |
| 7 |
|
Digimarc Corp * | — |
| — |
| 147 |
| 5 |
| — |
| — |
| | 147 |
| 5 |
|
Dot Hill Systems Corp (b),* | — |
| — |
| 1,361 |
| 6 |
| — |
| — |
| | 1,361 |
| 6 |
|
Electronics For Imaging Inc (b),* | 3,800 |
| 172 |
| 693 |
| 31 |
| — |
| — |
| | 4,493 |
| 203 |
|
Engility Holdings Inc (b),* | 11,118 |
| 425 |
| — |
| — |
| — |
| — |
| | 11,118 |
| 425 |
|
EPAM Systems Inc (b),* | — |
| — |
| 14,419 |
| 631 |
| — |
| — |
| | 14,419 |
| 631 |
|
FleetMatics Group PLC (b),* | — |
| — |
| 414 |
| 13 |
| — |
| — |
| | 414 |
| 13 |
|
Fusion-io Inc (b),* | 2,256 |
| 26 |
| — |
| — |
| — |
| — |
| | 2,256 |
| 26 |
|
Icad Inc (b),* | — |
| — |
| 10,380 |
| 67 |
| — |
| — |
| | 10,380 |
| 67 |
|
iGate Corp (b),* | — |
| — |
| 505 |
| 18 |
| — |
| — |
| | 505 |
| 18 |
|
Immersion Corp (b),* | — |
| — |
| 617 |
| 8 |
| — |
| — |
| | 617 |
| 8 |
|
Insight Enterprises Inc (b),* | 10,973 |
| 337 |
| — |
| — |
| — |
| — |
| | 10,973 |
| 337 |
|
j2 Global Inc * | — |
| — |
| 668 |
| 34 |
| — |
| — |
| | 668 |
| 34 |
|
LivePerson Inc (b),* | — |
| — |
| 1,227 |
| 12 |
| — |
| — |
| | 1,227 |
| 12 |
|
Luxoft Holding Inc (b),* | — |
| — |
| 178 |
| 6 |
| — |
| — |
| | 178 |
| 6 |
|
Manhattan Associates Inc (b),* | — |
| — |
| 1,134 |
| 39 |
| 27,920 |
| 961 |
| | 29,054 |
| 1,000 |
|
Mentor Graphics Corp * | 2,300 |
| 50 |
| — |
| — |
| — |
| — |
| | 2,300 |
| 50 |
|
MTS Systems Corp * | — |
| — |
| 234 |
| 16 |
| — |
| — |
| | 234 |
| 16 |
|
NetScout Systems Inc (b),* | — |
| — |
| 525 |
| 23 |
| 21,880 |
| 970 |
| | 22,405 |
| 993 |
|
Nimble Storage Inc (b) | — |
| — |
| — |
| — |
| 5,270 |
| 162 |
| | 5,270 |
| 162 |
|
Qualys Inc (b),* | — |
| — |
| 456 |
| 12 |
| — |
| — |
| | 456 |
| 12 |
|
Quantum Corp (b),* | 8,009 |
| 10 |
| 2,026 |
| 2 |
| — |
| — |
| | 10,035 |
| 12 |
|
Science Applications International Corp * | — |
| — |
| 603 |
| 27 |
| — |
| — |
| | 603 |
| 27 |
|
Spansion Inc (b),* | 33,700 |
| 710 |
| 896 |
| 19 |
| — |
| — |
| | 34,596 |
| 729 |
|
Super Micro Computer Inc (b),* | — |
| — |
| 514 |
| 13 |
| — |
| — |
| | 514 |
| 13 |
|
Sykes Enterprises Inc (b),* | 936 |
| 20 |
| 79 |
| 2 |
| — |
| — |
| | 1,015 |
| 22 |
|
Synaptics Inc (b),* | — |
| — |
| 536 |
| 49 |
| — |
| — |
| | 536 |
| 49 |
|
Syntel Inc (b),* | — |
| — |
| 224 |
| 19 |
| — |
| — |
| | 224 |
| 19 |
|
Transact Technologies Inc * | — |
| — |
| 3,980 |
| 41 |
| — |
| — |
| | 3,980 |
| 41 |
|
Unisys Corp (b),* | 30,328 |
| 750 |
| 443 |
| 11 |
| — |
| — |
| | 30,771 |
| 761 |
|
Varonis Systems Inc (b),* | 11,900 |
| 345 |
| — |
| — |
| — |
| — |
| | 11,900 |
| 345 |
|
Virtusa Corp (b),* | — |
| — |
| 373 |
| 13 |
| — |
| — |
| | 373 |
| 13 |
|
Vocera Communications Inc (b),* | — |
| — |
| 424 |
| 6 |
| — |
| — |
| | 424 |
| 6 |
|
| | | $ | 2,914 |
| | $ | 1,148 |
| | $ | 2,251 |
| | $ | 6,313 |
|
| Consumer Products - 0.50% | | | | | | | | |
ACCO Brands Corp (b),* | 16,216 |
| 104 |
| — |
| — |
| — |
| — |
| | 16,216 |
| 104 |
|
Central Garden and Pet Co - A Shares (b),* | 4,291 |
| 40 |
| — |
| — |
| — |
| — |
| | 4,291 |
| 40 |
|
CSS Industries Inc * | 362 |
| 10 |
| — |
| — |
| — |
| — |
| | 362 |
| 10 |
|
Helen of Troy Ltd (b),* | 17,031 |
| 1,032 |
| 158 |
| 9 |
| — |
| — |
| | 17,189 |
| 1,041 |
|
Tumi Holdings Inc (b),* | — |
| — |
| 695 |
| 14 |
| — |
| — |
| | 695 |
| 14 |
|
WD-40 Co * | — |
| — |
| 225 |
| 17 |
| — |
| — |
| | 225 |
| 17 |
|
| | | $ | 1,186 |
| | $ | 40 |
| | $ | — |
| | $ | 1,226 |
|
| Cosmetics & Personal Care - 0.04% | | | | | | | | |
Elizabeth Arden Inc (b),* | 540 |
| 12 |
| — |
| — |
| — |
| — |
| | 540 |
| 12 |
|
Revlon Inc (b),* | 2,686 |
| 82 |
| 87 |
| 3 |
| — |
| — |
| | 2,773 |
| 85 |
|
| | | $ | 94 |
| | $ | 3 |
| | $ | — |
| | $ | 97 |
|
| Distribution & Wholesale - 1.17% | | | | | | | | |
Beacon Roofing Supply Inc (b),* | 927 |
| 31 |
| 243 |
| 8 |
| — |
| — |
| | 1,170 |
| 39 |
|
Core-Mark Holding Co Inc * | 1,668 |
| 76 |
| 72 |
| 3 |
| — |
| — |
| | 1,740 |
| 79 |
|
Houston Wire & Cable Co * | 417 |
| 5 |
| — |
| — |
| — |
| — |
| | 417 |
| 5 |
|
|
| | | | | | | | | | | | | | | | | | | | | |
COMMON STOCKS (continued) | SmallCap Value Account I Shares Held | SmallCap Value Account I Value (000's) | SmallCap Growth Account II Shares Held | SmallCap Growth Account II Value (000's) | SmallCap Blend Account Shares Held | SmallCap Blend Account Value (000's) | | Combined Portfolio Shares Held | Combined Portfolio Value (000's) |
| Distribution & Wholesale (continued) | | | | | | | |
MWI Veterinary Supply Inc (b),* | — |
| $ | — |
| 10,812 |
| $ | 1,536 |
| — |
| $ | — |
| | 10,812 |
| $ | 1,536 |
|
Owens & Minor Inc * | 1,475 |
| 50 |
| — |
| — |
| — |
| — |
| | 1,475 |
| 50 |
|
Pool Corp * | — |
| — |
| 676 |
| 38 |
| — |
| — |
| | 676 |
| 38 |
|
Rentrak Corp (b) | — |
| — |
| — |
| — |
| 2,428 |
| 127 |
| | 2,428 |
| 127 |
|
ScanSource Inc (b),* | 2,066 |
| 79 |
| — |
| — |
| — |
| — |
| | 2,066 |
| 79 |
|
United Stationers Inc * | 7,990 |
| 331 |
| — |
| — |
| — |
| — |
| | 7,990 |
| 331 |
|
Watsco Inc * | — |
| — |
| 380 |
| 39 |
| — |
| — |
| | 380 |
| 39 |
|
WESCO International Inc (b),* | — |
| — |
| 6,470 |
| 559 |
| — |
| — |
| | 6,470 |
| 559 |
|
| | | $ | 572 |
| | $ | 2,183 |
| | $ | 127 |
| | $ | 2,882 |
|
| Diversified Financial Services - 2.02% | | | | | | | | |
Aircastle Ltd * | 7,182 |
| 128 |
| — |
| — |
| — |
| — |
| | 7,182 |
| 128 |
|
Altisource Asset Management Corp (b),* | — |
| — |
| 14 |
| 10 |
| — |
| — |
| | 14 |
| 10 |
|
Altisource Portfolio Solutions SA (b),* | — |
| — |
| 185 |
| 21 |
| — |
| — |
| | 185 |
| 21 |
|
Arlington Asset Investment Corp * | 16,855 |
| 460 |
| — |
| — |
| — |
| — |
| | 16,855 |
| 460 |
|
BGC Partners Inc * | 22,211 |
| 165 |
| 1,082 |
| 8 |
| — |
| — |
| | 23,293 |
| 173 |
|
Blackhawk Network Holdings Inc (b),* | — |
| — |
| 744 |
| 21 |
| — |
| — |
| | 744 |
| 21 |
|
Calamos Asset Management Inc * | 718 |
| 10 |
| — |
| — |
| — |
| — |
| | 718 |
| 10 |
|
Cohen & Steers Inc * | — |
| — |
| 241 |
| 10 |
| — |
| — |
| | 241 |
| 10 |
|
Consumer Portfolio Services Inc (b),* | 755 |
| 6 |
| — |
| — |
| — |
| — |
| | 755 |
| 6 |
|
Cowen Group Inc (b) | 47,470 |
| 200 |
| — |
| — |
| 62,200 |
| 262 |
| | 109,670 |
| 462 |
|
Credit Acceptance Corp (b),* | — |
| — |
| 117 |
| 14 |
| — |
| — |
| | 117 |
| 14 |
|
Diamond Hill Investment Group Inc * | — |
| — |
| 66 |
| 8 |
| — |
| — |
| | 66 |
| 8 |
|
Ellie Mae Inc (b),* | — |
| — |
| 358 |
| 11 |
| — |
| — |
| | 358 |
| 11 |
|
Encore Capital Group Inc (b),* | — |
| — |
| 223 |
| 10 |
| — |
| — |
| | 223 |
| 10 |
|
Evercore Partners Inc - Class A * | — |
| — |
| 11,084 |
| 639 |
| 1,450 |
| 84 |
| | 12,534 |
| 723 |
|
Federal Agricultural Mortgage Corp * | 370 |
| 12 |
| — |
| — |
| — |
| — |
| | 370 |
| 12 |
|
Financial Engines Inc * | — |
| — |
| 654 |
| 30 |
| — |
| — |
| | 654 |
| 30 |
|
FXCM Inc * | 951 |
| 14 |
| — |
| — |
| — |
| — |
| | 951 |
| 14 |
|
Greenhill & Co Inc * | — |
| — |
| 4,740 |
| 234 |
| — |
| — |
| | 4,740 |
| 234 |
|
Higher One Holdings Inc (b),* | — |
| — |
| 743 |
| 3 |
| — |
| — |
| | 743 |
| 3 |
|
Home Loan Servicing Solutions Ltd * | 1,798 |
| 41 |
| — |
| — |
| — |
| — |
| | 1,798 |
| 41 |
|
INTL. FCStone Inc (b),* | 372 |
| 7 |
| 104 |
| 2 |
| — |
| — |
| | 476 |
| 9 |
|
Investment Technology Group Inc (b) | 9,930 |
| 168 |
| — |
| — |
| 11,300 |
| 191 |
| | 21,230 |
| 359 |
|
Janus Capital Group Inc * | 3,650 |
| 46 |
| — |
| — |
| — |
| — |
| | 3,650 |
| 46 |
|
JGWPT Holdings Inc (b),* | 4,400 |
| 50 |
| — |
| — |
| — |
| — |
| | 4,400 |
| 50 |
|
KCG Holdings Inc (b),* | 1,521 |
| 18 |
| — |
| — |
| — |
| — |
| | 1,521 |
| 18 |
|
Ladder Capital Corp (b),* | 576 |
| 10 |
| — |
| — |
| — |
| — |
| | 576 |
| 10 |
|
Manning & Napier Inc * | 2,290 |
| 40 |
| — |
| — |
| — |
| — |
| | 2,290 |
| 40 |
|
MarketAxess Holdings Inc * | — |
| — |
| 484 |
| 26 |
| — |
| — |
| | 484 |
| 26 |
|
Marlin Business Services Corp * | 300 |
| 5 |
| — |
| — |
| — |
| — |
| | 300 |
| 5 |
|
| Medley Capital Corp | — |
| — |
| — |
| — |
| 17,240 |
| 225 |
| | 17,240 |
| 225 |
|
Moelis & Co (b),* | 4,300 |
| 145 |
| 2,370 |
| 80 |
| — |
| — |
| | 6,670 |
| 225 |
|
Nelnet Inc * | 5,980 |
| 248 |
| — |
| — |
| — |
| — |
| | 5,980 |
| 248 |
|
Nicholas Financial Inc * | 371 |
| 5 |
| — |
| — |
| — |
| — |
| | 371 |
| 5 |
|
Oppenheimer Holdings Inc * | 369 |
| 9 |
| — |
| — |
| — |
| — |
| | 369 |
| 9 |
|
Outerwall Inc (b),(c),* | — |
| — |
| 296 |
| 18 |
| — |
| — |
| | 296 |
| 18 |
|
Piper Jaffray Cos (b),* | 8,494 |
| 439 |
| — |
| — |
| — |
| — |
| | 8,494 |
| 439 |
|
Portfolio Recovery Associates Inc (b),* | — |
| — |
| 637 |
| 38 |
| — |
| — |
| | 637 |
| 38 |
|
Pzena Investment Management Inc * | — |
| — |
| 269 |
| 3 |
| — |
| — |
| | 269 |
| 3 |
|
RCS Capital Corp * | — |
| — |
| 93 |
| 2 |
| — |
| — |
| | 93 |
| 2 |
|
Regional Management Corp (b),* | 1,995 |
| 31 |
| — |
| — |
| — |
| — |
| | 1,995 |
| 31 |
|
Springleaf Holdings Inc (b),* | 776 |
| 20 |
| — |
| — |
| — |
| — |
| | 776 |
| 20 |
|
Stifel Financial Corp (b),* | 1,572 |
| 74 |
| — |
| — |
| — |
| — |
| | 1,572 |
| 74 |
|
SWS Group Inc (b),* | 1,052 |
| 8 |
| — |
| — |
| — |
| — |
| | 1,052 |
| 8 |
|
Virtus Investment Partners Inc * | — |
| — |
| 85 |
| 18 |
| — |
| — |
| | 85 |
| 18 |
|
Waddell & Reed Financial Inc * | — |
| — |
| — |
| — |
| 8,002 |
| 501 |
| | 8,002 |
| 501 |
|
WageWorks Inc (b),* | — |
| — |
| 446 |
| 22 |
| — |
| — |
| | 446 |
| 22 |
|
Walter Investment Management Corp (b),(c),* | 803 |
| 24 |
| — |
| — |
| — |
| — |
| | 803 |
| 24 |
|
Westwood Holdings Group Inc * | — |
| — |
| 164 |
| 10 |
| — |
| — |
| | 164 |
| 10 |
|
WisdomTree Investments Inc (b),* | — |
| — |
| 6,258 |
| 77 |
| — |
| — |
| | 6,258 |
| 77 |
|
World Acceptance Corp (b),(c),* | — |
| — |
| 189 |
| 14 |
| — |
| — |
| | 189 |
| 14 |
|
| | | $ | 2,383 |
| | $ | 1,329 |
| | $ | 1,263 |
| | $ | 4,975 |
|
|
| | | | | | | | | | | | | | | | | | | | | |
COMMON STOCKS (continued) | SmallCap Value Account I Shares Held | SmallCap Value Account I Value (000's) | SmallCap Growth Account II Shares Held | SmallCap Growth Account II Value (000's) | SmallCap Blend Account Shares Held | SmallCap Blend Account Value (000's) | | Combined Portfolio Shares Held | Combined Portfolio Value (000's) |
| Electric - 2.33% | | | | | | | | |
Allete Inc * | 872 |
| $ | 45 |
| — |
| $ | — |
| — |
| $ | — |
| | 872 |
| $ | 45 |
|
| Avista Corp | 1,752 |
| 59 |
| — |
| — |
| 15,146 |
| 508 |
| | 16,898 |
| 567 |
|
Black Hills Corp * | 1,299 |
| 80 |
| — |
| — |
| — |
| — |
| | 1,299 |
| 80 |
|
Cleco Corp * | 7,214 |
| 425 |
| — |
| — |
| — |
| — |
| | 7,214 |
| 425 |
|
Dynegy Inc (b),* | 24,771 |
| 861 |
| — |
| — |
| — |
| — |
| | 24,771 |
| 861 |
|
El Paso Electric Co * | 7,175 |
| 288 |
| — |
| — |
| — |
| — |
| | 7,175 |
| 288 |
|
Empire District Electric Co/The (c),* | 5,720 |
| 146 |
| — |
| — |
| — |
| — |
| | 5,720 |
| 146 |
|
EnerNOC Inc (b),* | 664 |
| 13 |
| 215 |
| 4 |
| — |
| — |
| | 879 |
| 17 |
|
IDACORP Inc * | 9,951 |
| 576 |
| — |
| — |
| — |
| — |
| | 9,951 |
| 576 |
|
MGE Energy Inc * | 3,525 |
| 140 |
| — |
| — |
| — |
| — |
| | 3,525 |
| 140 |
|
NorthWestern Corp * | 7,125 |
| 372 |
| — |
| — |
| — |
| — |
| | 7,125 |
| 372 |
|
NRG Yield Inc (c) | 420 |
| 22 |
| — |
| — |
| 12,030 |
| 626 |
| | 12,450 |
| 648 |
|
Ormat Technologies Inc * | 386 |
| 11 |
| 153 |
| 4 |
| — |
| — |
| | 539 |
| 15 |
|
Otter Tail Corp * | 1,020 |
| 31 |
| — |
| — |
| — |
| — |
| | 1,020 |
| 31 |
|
PNM Resources Inc * | 9,927 |
| 291 |
| — |
| — |
| — |
| — |
| | 9,927 |
| 291 |
|
Portland General Electric Co * | 11,586 |
| 402 |
| — |
| — |
| — |
| — |
| | 11,586 |
| 402 |
|
UIL Holdings Corp * | 3,026 |
| 117 |
| — |
| — |
| — |
| — |
| | 3,026 |
| 117 |
|
Unitil Corp * | 2,933 |
| 99 |
| — |
| — |
| — |
| — |
| | 2,933 |
| 99 |
|
UNS Energy Corp * | 6,872 |
| 415 |
| — |
| — |
| — |
| — |
| | 6,872 |
| 415 |
|
Westar Energy Inc * | 5,100 |
| 195 |
| — |
| — |
| — |
| — |
| | 5,100 |
| 195 |
|
| | | $ | 4,588 |
| | $ | 8 |
| | $ | 1,134 |
| | | $ | 5,730 |
|
| Electrical Components & Equipment - 1.56% | | | | | | | | |
Acuity Brands Inc * | — |
| — |
| 6,490 |
| 897 |
| 3,340 |
| 462 |
| | 9,830 |
| 1,359 |
|
Advanced Energy Industries Inc (b),* | 93 |
| 2 |
| 547 |
| 11 |
| — |
| — |
| | 640 |
| 13 |
|
Belden Inc * | — |
| — |
| 649 |
| 51 |
| — |
| — |
| | 649 |
| 51 |
|
Encore Wire Corp * | — |
| — |
| 60 |
| 3 |
| — |
| — |
| | 60 |
| 3 |
|
EnerSys * | 8,657 |
| 596 |
| 165 |
| 11 |
| 13,740 |
| 945 |
| | 22,562 |
| 1,552 |
|
Generac Holdings Inc (b),* | — |
| — |
| 1,010 |
| 49 |
| 7,000 |
| 341 |
| | 8,010 |
| 390 |
|
General Cable Corp * | 7,542 |
| 193 |
| — |
| — |
| — |
| — |
| | 7,542 |
| 193 |
|
GrafTech International Ltd (b),* | 2,538 |
| 26 |
| — |
| — |
| — |
| — |
| | 2,538 |
| 26 |
|
Insteel Industries Inc * | — |
| — |
| 375 |
| 7 |
| — |
| — |
| | 375 |
| 7 |
|
Littelfuse Inc * | 1,914 |
| 178 |
| 296 |
| 28 |
| — |
| — |
| | 2,210 |
| 206 |
|
Powell Industries Inc * | 227 |
| 15 |
| — |
| — |
| — |
| — |
| | 227 |
| 15 |
|
Universal Display Corp (b),(c),* | — |
| — |
| 597 |
| 19 |
| — |
| — |
| | 597 |
| 19 |
|
| | | $ | 1,010 |
| | $ | 1,076 |
| | $ | 1,748 |
| | | $ | 3,834 |
|
| Electronics - 1.85% | | | | | | | | |
American Science & Engineering Inc * | 265 |
| 18 |
| 30 |
| 2 |
| — |
| — |
| | 295 |
| 20 |
|
Analogic Corp * | 261 |
| 20 |
| — |
| — |
| — |
| — |
| | 261 |
| 20 |
|
Applied Optoelectronics Inc (b),* | — |
| — |
| 13,557 |
| 315 |
| — |
| — |
| | 13,557 |
| 315 |
|
Badger Meter Inc * | — |
| — |
| 213 |
| 11 |
| — |
| — |
| | 213 |
| 11 |
|
Bel Fuse Inc * | 1,291 |
| 33 |
| — |
| — |
| — |
| — |
| | 1,291 |
| 33 |
|
Benchmark Electronics Inc (b),* | 23,308 |
| 594 |
| — |
| — |
| — |
| — |
| | 23,308 |
| 594 |
|
Brady Corp * | 5,952 |
| 177 |
| — |
| — |
| — |
| — |
| | 5,952 |
| 177 |
|
Checkpoint Systems Inc (b),* | 976 |
| 14 |
| — |
| — |
| — |
| — |
| | 976 |
| 14 |
|
Coherent Inc (b),* | 545 |
| 36 |
| 41 |
| 3 |
| — |
| — |
| | 586 |
| 39 |
|
CTS Corp * | 808 |
| 15 |
| — |
| — |
| — |
| — |
| | 808 |
| 15 |
|
ESCO Technologies Inc * | 637 |
| 22 |
| — |
| — |
| — |
| — |
| | 637 |
| 22 |
|
FARO Technologies Inc (b),* | 57 |
| 3 |
| 16,549 |
| 813 |
| — |
| — |
| | 16,606 |
| 816 |
|
FEI Co * | — |
| — |
| 620 |
| 56 |
| — |
| — |
| | 620 |
| 56 |
|
Fluidigm Corp (b) | — |
| — |
| 370 |
| 11 |
| 2,748 |
| 81 |
| | 3,118 |
| 92 |
|
GoPro Inc (b),* | 1,400 |
| 57 |
| — |
| — |
| — |
| — |
| | 1,400 |
| 57 |
|
GSI Group Inc (b),* | 7,353 |
| 94 |
| — |
| — |
| — |
| — |
| | 7,353 |
| 94 |
|
II-VI Inc (b),* | 1,246 |
| 18 |
| — |
| — |
| — |
| — |
| | 1,246 |
| 18 |
|
Imprivata Inc (b),* | 1,200 |
| 20 |
| — |
| — |
| — |
| — |
| | 1,200 |
| 20 |
|
InvenSense Inc (b),(c),* | — |
| — |
| 903 |
| 21 |
| — |
| — |
| | 903 |
| 21 |
|
Itron Inc (b),* | 954 |
| 39 |
| — |
| — |
| — |
| — |
| | 954 |
| 39 |
|
Kemet Corp (b),* | 1,630 |
| 9 |
| — |
| — |
| — |
| — |
| | 1,630 |
| 9 |
|
Measurement Specialties Inc (b),* | — |
| — |
| 237 |
| 20 |
| — |
| — |
| | 237 |
| 20 |
|
Mesa Laboratories Inc * | — |
| — |
| 62 |
| 5 |
| — |
| — |
| | 62 |
| 5 |
|
Methode Electronics Inc * | — |
| — |
| 11,002 |
| 420 |
| — |
| — |
| | 11,002 |
| 420 |
|
Multi-Fineline Electronix Inc (b),* | 331 |
| 4 |
| — |
| — |
| — |
| — |
| | 331 |
| 4 |
|
Newport Corp (b),* | 157 |
| 3 |
| 804 |
| 15 |
| — |
| — |
| | 961 |
| 18 |
|
NVE Corp (b),* | 100 |
| 6 |
| 47 |
| 3 |
| — |
| — |
| | 147 |
| 9 |
|
OSI Systems Inc (b),* | 363 |
| 24 |
| 103 |
| 7 |
| — |
| — |
| | 466 |
| 31 |
|
Park Electrochemical Corp * | 501 |
| 14 |
| — |
| — |
| — |
| — |
| | 501 |
| 14 |
|
Plexus Corp (b),* | 523 |
| 23 |
| 265 |
| 11 |
| — |
| — |
| | 788 |
| 34 |
|
Rofin-Sinar Technologies Inc (b),* | 689 |
| 17 |
| — |
| — |
| — |
| — |
| | 689 |
| 17 |
|
Rogers Corp (b),* | 272 |
| 18 |
| 116 |
| 8 |
| — |
| — |
| | 388 |
| 26 |
|
Sanmina Corp (b),* | 46,573 |
| 1,061 |
| — |
| — |
| — |
| — |
| | 46,573 |
| 1,061 |
|
Sparton Corp (b),* | 0 |
| — |
| 229 |
| 6 |
| — |
| — |
| | 229 |
| 6 |
|
Stoneridge Inc (b),* | 25,100 |
| 269 |
| — |
| — |
| — |
| — |
| | 25,100 |
| 269 |
|
|
| | | | | | | | | | | | | | | | | | | | | |
COMMON STOCKS (continued) | SmallCap Value Account I Shares Held | SmallCap Value Account I Value (000's) | SmallCap Growth Account II Shares Held | SmallCap Growth Account II Value (000's) | SmallCap Blend Account Shares Held | SmallCap Blend Account Value (000's) | | Combined Portfolio Shares Held | Combined Portfolio Value (000's) |
| Electronics (continued) | | | | | | | | |
Taser International Inc (b),* | — |
| $ | — |
| 756 |
| $ | 10 |
| — |
| $ | — |
| | 756 |
| $ | 10 |
|
TTM Technologies Inc (b),* | 2,070 |
| 17 |
| — |
| — |
| — |
| — |
| | 2,070 |
| 17 |
|
Viasystems Group Inc (b),* | 142 |
| 2 |
| 5 |
| — |
| — |
| — |
| | 147 |
| 2 |
|
Vishay Precision Group Inc (b),* | 458 |
| 7 |
| — |
| — |
| — |
| — |
| | 458 |
| 7 |
|
Watts Water Technologies Inc * | 559 |
| 34 |
| 49 |
| 3 |
| — |
| — |
| | 608 |
| 37 |
|
Woodward Inc * | 528 |
| 26 |
| 651 |
| 33 |
| — |
| — |
| | 1,179 |
| 59 |
|
| | | $ | 2,694 |
| | $ | 1,773 |
| | $ | 81 |
| | $ | 4,548 |
|
| Energy - Alternate Sources - 0.99% | | | | | | | | |
Enphase Energy Inc (b),* | — |
| — |
| 414 |
| 4 |
| — |
| — |
| | 414 |
| 4 |
|
FutureFuel Corp * | 1,431 |
| 24 |
| 123 |
| 2 |
| — |
| — |
| | 1,554 |
| 26 |
|
Green Plains Inc * | 18,077 |
| 595 |
| 407 |
| 13 |
| — |
| — |
| | 18,484 |
| 608 |
|
NextEra Energy Partners LP (b) | — |
| — |
| — |
| — |
| 1,993 |
| 67 |
| | 1,993 |
| 67 |
|
Pacific Ethanol Inc (b),* | 7,178 |
| 110 |
| — |
| — |
| — |
| — |
| | 7,178 |
| 110 |
|
| Pattern Energy Group Inc | — |
| — |
| 501 |
| 17 |
| 28,797 |
| 953 |
| | 29,298 |
| 970 |
|
Plug Power Inc (b),(c),* | 3,492 |
| 16 |
| — |
| — |
| — |
| — |
| | 3,492 |
| 16 |
|
Renewable Energy Group Inc (b),* | 43,641 |
| 500 |
| — |
| — |
| — |
| — |
| | 43,641 |
| 500 |
|
REX American Resources Corp (b),* | 1,445 |
| 106 |
| 113 |
| 8 |
| — |
| — |
| | 1,558 |
| 114 |
|
Solazyme Inc (b),* | — |
| — |
| 965 |
| 11 |
| — |
| — |
| | 965 |
| 11 |
|
| | | $ | 1,351 |
| | $ | 55 |
| | $ | 1,020 |
| | $ | 2,426 |
|
| Engineering & Construction - 1.68% | | | | | | | | |
AECOM Technology Corp (b) | — |
| — |
| — |
| — |
| 11,970 |
| 385 |
| | 11,970 |
| 385 |
|
Aegion Corp (b),* | 851 |
| 20 |
| 107 |
| 3 |
| — |
| — |
| | 958 |
| 23 |
|
Argan Inc * | 274 |
| 10 |
| 111 |
| 4 |
| — |
| — |
| | 385 |
| 14 |
|
Dycom Industries Inc (b),* | 135 |
| 4 |
| 444 |
| 14 |
| — |
| — |
| | 579 |
| 18 |
|
EMCOR Group Inc * | 14,374 |
| 640 |
| — |
| — |
| 13,960 |
| 622 |
| | 28,334 |
| 1,262 |
|
Exponent Inc * | — |
| — |
| 194 |
| 14 |
| — |
| — |
| | 194 |
| 14 |
|
Granite Construction Inc * | 831 |
| 30 |
| — |
| — |
| — |
| — |
| | 831 |
| 30 |
|
MasTec Inc (b),* | — |
| — |
| 880 |
| 27 |
| 13,870 |
| 427 |
| | 14,750 |
| 454 |
|
Mistras Group Inc (b),* | — |
| — |
| 370 |
| 9 |
| — |
| — |
| | 370 |
| 9 |
|
MYR Group Inc (b),* | 512 |
| 13 |
| — |
| — |
| — |
| — |
| | 512 |
| 13 |
|
Sterling Construction Co Inc (b),* | — |
| — |
| 30 |
| — |
| — |
| — |
| | 30 |
| — |
|
Tutor Perini Corp (b),* | 9,793 |
| 311 |
| 20,700 |
| 657 |
| 18,900 |
| 600 |
| | 49,393 |
| 1,568 |
|
VSE Corp * | 4,953 |
| 348 |
| — |
| — |
| — |
| — |
| | 4,953 |
| 348 |
|
| | | $ | 1,376 |
| | $ | 728 |
| | $ | 2,034 |
| | $ | 4,138 |
|
| Entertainment - 1.00% | | | | | | | | |
AMC Entertainment Holdings Inc * | 2,756 |
| 69 |
| — |
| — |
| — |
| — |
| | 2,756 |
| 69 |
|
Carmike Cinemas Inc (b),* | — |
| — |
| 7,890 |
| 277 |
| — |
| — |
| | 7,890 |
| 277 |
|
Churchill Downs Inc * | 168 |
| 15 |
| 129 |
| 12 |
| — |
| — |
| | 297 |
| 27 |
|
Eros International PLC (b),* | 4,348 |
| 66 |
| 160 |
| 3 |
| — |
| — |
| | 4,508 |
| 69 |
|
International Speedway Corp * | 685 |
| 23 |
| — |
| — |
| — |
| — |
| | 685 |
| 23 |
|
Isle of Capri Casinos Inc (b),* | 778 |
| 7 |
| — |
| — |
| — |
| — |
| | 778 |
| 7 |
|
Marriott Vacations Worldwide Corp (b) | 724 |
| 42 |
| — |
| — |
| 10,300 |
| 604 |
| | 11,024 |
| 646 |
|
Multimedia Games Holding Co Inc (b),* | — |
| — |
| 29,785 |
| 882 |
| — |
| — |
| | 29,785 |
| 882 |
|
National CineMedia Inc * | 994 |
| 17 |
| — |
| — |
| — |
| — |
| | 994 |
| 17 |
|
Penn National Gaming Inc (b),* | 1,642 |
| 20 |
| — |
| — |
| — |
| — |
| | 1,642 |
| 20 |
|
Pinnacle Entertainment Inc (b),* | — |
| — |
| 756 |
| 19 |
| — |
| — |
| | 756 |
| 19 |
|
Reading International Inc (b),* | 650 |
| 5 |
| — |
| — |
| — |
| — |
| | 650 |
| 5 |
|
Scientific Games Corp (b),* | — |
| — |
| 23,870 |
| 266 |
| — |
| — |
| | 23,870 |
| 266 |
|
Speedway Motorsports Inc * | 5,633 |
| 103 |
| — |
| — |
| — |
| — |
| | 5,633 |
| 103 |
|
Vail Resorts Inc * | — |
| — |
| 532 |
| 41 |
| — |
| — |
| | 532 |
| 41 |
|
| | | $ | 367 |
| | $ | 1,500 |
| | $ | 604 |
| | $ | 2,471 |
|
| Environmental Control - 0.25% | | | | | | | | |
Calgon Carbon Corp (b),* | — |
| — |
| 807 |
| 18 |
| — |
| — |
| | 807 |
| 18 |
|
Ceco Environmental Corp * | 756 |
| 12 |
| — |
| — |
| — |
| — |
| | 756 |
| 12 |
|
Darling Ingredients Inc (b),* | 2,760 |
| 57 |
| 413 |
| 9 |
| — |
| — |
| | 3,173 |
| 66 |
|
GSE Holding Inc (b),* | 1,600 |
| — |
| — |
| — |
| — |
| — |
| | 1,600 |
| — |
|
MSA Safety Inc * | — |
| — |
| 362 |
| 21 |
| — |
| — |
| | 362 |
| 21 |
|
| Tetra Tech Inc | 1,480 |
| 41 |
| 117 |
| 3 |
| 16,100 |
| 443 |
| | 17,697 |
| 487 |
|
US Ecology Inc * | — |
| — |
| 296 |
| 14 |
| — |
| — |
| | 296 |
| 14 |
|
| | | $ | 110 |
| | $ | 65 |
| | $ | 443 |
| | $ | 618 |
|
| Food - 0.68% | | | | | | | | |
B&G Foods Inc * | 98 |
| 3 |
| 767 |
| 25 |
| — |
| — |
| | 865 |
| 28 |
|
Boulder Brands Inc (b),* | 0 |
| — |
| 722 |
| 10 |
| — |
| — |
| | 722 |
| 10 |
|
Calavo Growers Inc * | 0 |
| — |
| 291 |
| 10 |
| — |
| — |
| | 291 |
| 10 |
|
Cal-Maine Foods Inc * | 0 |
| — |
| 221 |
| 16 |
| — |
| — |
| | 221 |
| 16 |
|
Chiquita Brands International Inc (b),* | 48,600 |
| 527 |
| — |
| — |
| — |
| — |
| | 48,600 |
| 527 |
|
Dean Foods Co * | 1,953 |
| 34 |
| — |
| — |
| — |
| — |
| | 1,953 |
| 34 |
|
Fresh Del Monte Produce Inc * | 824 |
| 25 |
| — |
| — |
| — |
| — |
| | 824 |
| 25 |
|
|
| | | | | | | | | | | | | | | | | | | | | |
COMMON STOCKS (continued) | SmallCap Value Account I Shares Held | SmallCap Value Account I Value (000's) | SmallCap Growth Account II Shares Held | SmallCap Growth Account II Value (000's) | SmallCap Blend Account Shares Held | SmallCap Blend Account Value (000's) | | Combined Portfolio Shares Held | Combined Portfolio Value (000's) |
| Food (continued) | | | | | | | | |
Fresh Market Inc/The (b),(c),* | — |
| $ | — |
| 611 |
| $ | 21 |
| — |
| $ | — |
| | 611 |
| $ | 21 |
|
Ingles Markets Inc * | 452 |
| 12 |
| — |
| — |
| — |
| — |
| | 452 |
| 12 |
|
J&J Snack Foods Corp * | — |
| — |
| 217 |
| 20 |
| — |
| — |
| | 217 |
| 20 |
|
John B Sanfilippo & Son Inc * | 296 |
| 8 |
| — |
| — |
| — |
| — |
| | 296 |
| 8 |
|
Lancaster Colony Corp * | 173 |
| 16 |
| 166 |
| 16 |
| — |
| — |
| | 339 |
| 32 |
|
Nutrisystem Inc * | — |
| — |
| 681 |
| 12 |
| — |
| — |
| | 681 |
| 12 |
|
Pinnacle Foods Inc * | 7,051 |
| 232 |
| — |
| — |
| — |
| — |
| | 7,051 |
| 232 |
|
Post Holdings Inc (b),* | 1,105 |
| 56 |
| — |
| — |
| — |
| — |
| | 1,105 |
| 56 |
|
Sanderson Farms Inc * | 118 |
| 12 |
| 283 |
| 28 |
| — |
| — |
| | 401 |
| 40 |
|
Seaboard Corp (b),* | 6 |
| 18 |
| — |
| — |
| — |
| — |
| | 6 |
| 18 |
|
Seneca Foods Corp - Class A (b),* | 310 |
| 10 |
| — |
| — |
| — |
| — |
| | 310 |
| 10 |
|
Snyder's-Lance Inc * | 883 |
| 23 |
| — |
| — |
| — |
| — |
| | 883 |
| 23 |
|
SpartanNash Co * | 17,732 |
| 373 |
| — |
| — |
| — |
| — |
| | 17,732 |
| 373 |
|
SUPERVALU Inc (b),* | 2,000 |
| 16 |
| — |
| — |
| — |
| — |
| | 2,000 |
| 16 |
|
Tootsie Roll Industries Inc * | 56 |
| 2 |
| 447 |
| 13 |
| — |
| — |
| | 503 |
| 15 |
|
TreeHouse Foods Inc (b),* | 445 |
| 36 |
| 273 |
| 22 |
| — |
| — |
| | 718 |
| 58 |
|
United Natural Foods Inc (b),* | — |
| — |
| 743 |
| 48 |
| — |
| — |
| | 743 |
| 48 |
|
Village Super Market Inc * | 242 |
| 6 |
| — |
| — |
| — |
| — |
| | 242 |
| 6 |
|
Weis Markets Inc * | 425 |
| 19 |
| — |
| — |
| — |
| — |
| | 425 |
| 19 |
|
| | | $ | 1,428 |
| | $ | 241 |
| | $ | — |
| | $ | 1,669 |
|
| Forest Products & Paper - 0.22% | | | | | | | | |
Clearwater Paper Corp (b),* | — |
| — |
| 304 |
| 19 |
| — |
| — |
| | 304 |
| 19 |
|
Deltic Timber Corp * | — |
| — |
| 142 |
| 8 |
| — |
| — |
| | 142 |
| 8 |
|
Domtar Corp * | 2,400 |
| 103 |
| — |
| — |
| — |
| — |
| | 2,400 |
| 103 |
|
KapStone Paper and Packaging Corp (b),* | — |
| — |
| 1,258 |
| 42 |
| — |
| — |
| | 1,258 |
| 42 |
|
Neenah Paper Inc * | 289 |
| 15 |
| 193 |
| 10 |
| — |
| — |
| | 482 |
| 25 |
|
Orchids Paper Products Co * | — |
| — |
| 123 |
| 4 |
| — |
| — |
| | 123 |
| 4 |
|
PH Glatfelter Co * | 3,280 |
| 87 |
| 365 |
| 10 |
| — |
| — |
| | 3,645 |
| 97 |
|
Resolute Forest Products Inc (b),* | 9,363 |
| 157 |
| — |
| — |
| — |
| — |
| | 9,363 |
| 157 |
|
Schweitzer-Mauduit International Inc * | 1,852 |
| 81 |
| 105 |
| 4 |
| — |
| — |
| | 1,957 |
| 85 |
|
| | | $ | 443 |
| | $ | 97 |
| | $ | — |
| | $ | 540 |
|
| Gas - 0.93% | | | | | | | | |
Chesapeake Utilities Corp * | 1,580 |
| 113 |
| — |
| — |
| — |
| — |
| | 1,580 |
| 113 |
|
Laclede Group Inc/The * | 5,085 |
| 247 |
| — |
| — |
| — |
| — |
| | 5,085 |
| 247 |
|
New Jersey Resources Corp * | 5,128 |
| 293 |
| — |
| — |
| — |
| — |
| | 5,128 |
| 293 |
|
Northwest Natural Gas Co * | 5,969 |
| 282 |
| — |
| — |
| — |
| — |
| | 5,969 |
| 282 |
|
ONE Gas Inc * | 1,086 |
| 41 |
| — |
| — |
| — |
| — |
| | 1,086 |
| 41 |
|
Piedmont Natural Gas Co Inc * | 2,210 |
| 83 |
| — |
| — |
| — |
| — |
| | 2,210 |
| 83 |
|
South Jersey Industries Inc * | 1,188 |
| 72 |
| — |
| — |
| — |
| — |
| | 1,188 |
| 72 |
|
Southwest Gas Corp * | 8,673 |
| 457 |
| — |
| — |
| 6,610 |
| 349 |
| | 15,283 |
| 806 |
|
WGL Holdings Inc * | 7,920 |
| 341 |
| — |
| — |
| — |
| — |
| | 7,920 |
| 341 |
|
| | | $ | 1,929 |
| | $ | — |
| | $ | 349 |
| | $ | 2,278 |
|
| Hand & Machine Tools - 0.01% | | | | | | | | |
Franklin Electric Co Inc * | 93 |
| 4 |
| 665 |
| 27 |
| — |
| — |
| | 758 |
| 31 |
|
| | | | | | | | | |
| Healthcare - Products - 2.10% | | | | | | | | |
Abaxis Inc * | — |
| — |
| 322 |
| 14 |
| — |
| — |
| | 322 |
| 14 |
|
ABIOMED Inc (b),(c),* | — |
| — |
| 564 |
| 14 |
| — |
| — |
| | 564 |
| 14 |
|
Accuray Inc (b),(c),* | — |
| — |
| 1,108 |
| 10 |
| — |
| — |
| | 1,108 |
| 10 |
|
Affymetrix Inc (b),* | 1,698 |
| 15 |
| 411 |
| 4 |
| — |
| — |
| | 2,109 |
| 19 |
|
Amedica Corp (b) | — |
| — |
| — |
| — |
| 8,350 |
| 38 |
| | 8,350 |
| 38 |
|
AngioDynamics Inc (b),* | 919 |
| 15 |
| — |
| — |
| — |
| — |
| | 919 |
| 15 |
|
AtriCure Inc (b),* | 258 |
| 5 |
| 10,413 |
| 191 |
| — |
| — |
| | 10,671 |
| 196 |
|
Atrion Corp * | — |
| — |
| 36 |
| 12 |
| — |
| — |
| | 36 |
| 12 |
|
BioTelemetry Inc (b),* | — |
| — |
| 354 |
| 3 |
| — |
| — |
| | 354 |
| 3 |
|
Cantel Medical Corp * | — |
| — |
| 477 |
| 17 |
| — |
| — |
| | 477 |
| 17 |
|
Cardiovascular Systems Inc (b),* | — |
| — |
| 379 |
| 12 |
| — |
| — |
| | 379 |
| 12 |
|
Cepheid (b),* | — |
| — |
| 12,395 |
| 594 |
| — |
| — |
| | 12,395 |
| 594 |
|
Cerus Corp (b),(c),* | — |
| — |
| 1,653 |
| 7 |
| — |
| — |
| | 1,653 |
| 7 |
|
Chindex International Inc (b),* | — |
| — |
| 281 |
| 7 |
| — |
| — |
| | 281 |
| 7 |
|
CONMED Corp * | 667 |
| 30 |
| — |
| — |
| — |
| — |
| | 667 |
| 30 |
|
CryoLife Inc * | 1,028 |
| 9 |
| — |
| — |
| — |
| — |
| | 1,028 |
| 9 |
|
Cyberonics Inc (b),* | 0 |
| — |
| 402 |
| 25 |
| — |
| — |
| | 402 |
| 25 |
|
Cynosure Inc (b),* | 7,580 |
| 161 |
| 12,666 |
| 269 |
| — |
| — |
| | 20,246 |
| 430 |
|
DexCom Inc (b),* | 0 |
| — |
| 1,079 |
| 43 |
| 6,220 |
| 247 |
| | 7,299 |
| 290 |
|
Endologix Inc (b),* | 0 |
| — |
| 913 |
| 14 |
| — |
| — |
| | 913 |
| 14 |
|
Exactech Inc (b),* | 286 |
| 7 |
| — |
| — |
| — |
| — |
| | 286 |
| 7 |
|
Genomic Health Inc (b),* | 0 |
| — |
| 377 |
| 10 |
| — |
| — |
| | 377 |
| 10 |
|
Globus Medical Inc (b),* | — |
| — |
| 947 |
| 23 |
| — |
| — |
| | 947 |
| 23 |
|
Greatbatch Inc (b),* | 2,157 |
| 106 |
| — |
| — |
| — |
| — |
| | 2,157 |
| 106 |
|
Haemonetics Corp (b),* | 1,112 |
| 39 |
| 102 |
| 4 |
| — |
| — |
| | 1,214 |
| 43 |
|
Hanger Inc (b),* | 823 |
| 26 |
| — |
| — |
| — |
| — |
| | 823 |
| 26 |
|
|
| | | | | | | | | | | | | | | | | | | | | |
COMMON STOCKS (continued) | SmallCap Value Account I Shares Held | SmallCap Value Account I Value (000's) | SmallCap Growth Account II Shares Held | SmallCap Growth Account II Value (000's) | SmallCap Blend Account Shares Held | SmallCap Blend Account Value (000's) | | Combined Portfolio Shares Held | Combined Portfolio Value (000's) |
| Healthcare - Products (continued) | | | | | | | |
HeartWare International Inc (b),* | — |
| $ | — |
| 239 |
| $ | 21 |
| — |
| $ | — |
| | 239 |
| $ | 21 |
|
ICU Medical Inc (b),* | 313 |
| 19 |
| — |
| — |
| — |
| — |
| | 313 |
| 19 |
|
Inogen Inc (b),(c),* | — |
| — |
| 13,009 |
| 293 |
| — |
| — |
| | 13,009 |
| 293 |
|
Insulet Corp (b),* | — |
| — |
| 779 |
| 31 |
| 5,670 |
| 225 |
| | 6,449 |
| 256 |
|
Integra LifeSciences Holdings Corp (b),* | 395 |
| 19 |
| 232 |
| 11 |
| — |
| — |
| | 627 |
| 30 |
|
Invacare Corp * | 751 |
| 14 |
| — |
| — |
| — |
| — |
| | 751 |
| 14 |
|
K2M Group Holdings Inc (b),* | 3,000 |
| 45 |
| 11,750 |
| 175 |
| 14,670 |
| 218 |
| | 29,420 |
| 438 |
|
LDR Holding Corp (b) | — |
| — |
| 3,556 |
| 89 |
| 5,840 |
| 146 |
| | 9,396 |
| 235 |
|
Luminex Corp (b),* | — |
| — |
| 542 |
| 9 |
| — |
| — |
| | 542 |
| 9 |
|
Masimo Corp (b),* | — |
| — |
| 710 |
| 17 |
| — |
| — |
| | 710 |
| 17 |
|
Merge Healthcare Inc (b),* | — |
| — |
| 1,545 |
| 3 |
| — |
| — |
| | 1,545 |
| 3 |
|
Meridian Bioscience Inc * | — |
| — |
| 603 |
| 12 |
| — |
| — |
| | 603 |
| 12 |
|
Merit Medical Systems Inc (b),* | 1,020 |
| 15 |
| — |
| — |
| — |
| — |
| | 1,020 |
| 15 |
|
MiMedx Group Inc (b),* | — |
| — |
| 2,155 |
| 15 |
| — |
| — |
| | 2,155 |
| 15 |
|
NanoString Technologies Inc (b),* | — |
| — |
| 18,791 |
| 280 |
| — |
| — |
| | 18,791 |
| 280 |
|
Natus Medical Inc (b),* | 2,300 |
| 58 |
| 422 |
| 11 |
| — |
| — |
| | 2,722 |
| 69 |
|
Navidea Biopharmaceuticals Inc (b),* | — |
| — |
| 2,421 |
| 4 |
| — |
| — |
| | 2,421 |
| 4 |
|
NuVasive Inc (b),* | 15,477 |
| 551 |
| 561 |
| 20 |
| — |
| — |
| | 16,038 |
| 571 |
|
NxStage Medical Inc (b),* | — |
| — |
| 884 |
| 13 |
| — |
| — |
| | 884 |
| 13 |
|
OraSure Technologies Inc (b),* | 9,324 |
| 80 |
| — |
| — |
| 5,400 |
| 47 |
| | 14,724 |
| 127 |
|
Orthofix International NV (b),* | 440 |
| 16 |
| — |
| — |
| — |
| — |
| | 440 |
| 16 |
|
Oxford Immunotec Global PLC (b),* | — |
| — |
| 294 |
| 5 |
| — |
| — |
| | 294 |
| 5 |
|
PhotoMedex Inc (b),(c),(d),* | 361 |
| 4 |
| — |
| — |
| — |
| — |
| | 361 |
| 4 |
|
Quidel Corp (b),* | — |
| — |
| 668 |
| 15 |
| — |
| — |
| | 668 |
| 15 |
|
Rockwell Medical Inc (b),(c),* | 1,285 |
| 15 |
| 149 |
| 2 |
| — |
| — |
| | 1,434 |
| 17 |
|
Spectranetics Corp/The (b),* | — |
| — |
| 587 |
| 13 |
| — |
| — |
| | 587 |
| 13 |
|
STAAR Surgical Co (b),* | — |
| — |
| 871 |
| 15 |
| 8,600 |
| 144 |
| | 9,471 |
| 159 |
|
STERIS Corp * | — |
| — |
| 859 |
| 46 |
| — |
| — |
| | 859 |
| 46 |
|
SurModics Inc (b),* | 407 |
| 9 |
| 52 |
| 1 |
| — |
| — |
| | 459 |
| 10 |
|
Symmetry Medical Inc (b),* | 1,402 |
| 12 |
| — |
| — |
| — |
| — |
| | 1,402 |
| 12 |
|
Tandem Diabetes Care Inc (b),* | — |
| — |
| 190 |
| 3 |
| — |
| — |
| | 190 |
| 3 |
|
Thoratec Corp (b),* | — |
| — |
| 8,325 |
| 290 |
| — |
| — |
| | 8,325 |
| 290 |
|
Tornier NV (b),* | 831 |
| 19 |
| — |
| — |
| — |
| — |
| | 831 |
| 19 |
|
TriVascular Technologies Inc (b),(c),* | 1,800 |
| 28 |
| 168 |
| 3 |
| — |
| — |
| | 1,968 |
| 31 |
|
Utah Medical Products Inc * | — |
| — |
| 77 |
| 4 |
| — |
| — |
| | 77 |
| 4 |
|
Vascular Solutions Inc (b),* | — |
| — |
| 390 |
| 9 |
| — |
| — |
| | 390 |
| 9 |
|
Volcano Corp (b),* | — |
| — |
| 698 |
| 12 |
| — |
| — |
| | 698 |
| 12 |
|
West Pharmaceutical Services Inc * | — |
| — |
| 1,007 |
| 42 |
| — |
| — |
| | 1,007 |
| 42 |
|
Wright Medical Group Inc (b),* | 620 |
| 20 |
| 337 |
| 11 |
| — |
| — |
| | 957 |
| 31 |
|
Zeltiq Aesthetics Inc (b),* | — |
| — |
| 658 |
| 10 |
| — |
| — |
| | 658 |
| 10 |
|
| | | $ | 1,337 |
| | $ | 2,758 |
| | $ | 1,065 |
| | $ | 5,160 |
|
| Healthcare - Services - 1.95% | | | | | | | | |
Acadia Healthcare Co Inc (b),* | — |
| — |
| 23,403 |
| 1,065 |
| — |
| — |
| | 23,403 |
| 1,065 |
|
Addus HomeCare Corp (b),* | 181 |
| 4 |
| 13 |
| — |
| — |
| — |
| | 194 |
| 4 |
|
Air Methods Corp (b),* | — |
| — |
| 566 |
| 29 |
| — |
| — |
| | 566 |
| 29 |
|
Alliance HealthCare Services Inc (b),* | 113 |
| 3 |
| 45 |
| 1 |
| — |
| — |
| | 158 |
| 4 |
|
Almost Family Inc (b),* | 586 |
| 13 |
| — |
| — |
| — |
| — |
| | 586 |
| 13 |
|
Amedisys Inc (b),* | 1,197 |
| 20 |
| — |
| — |
| — |
| — |
| | 1,197 |
| 20 |
|
Amsurg Corp (b),* | 543 |
| 25 |
| 157 |
| 7 |
| — |
| — |
| | 700 |
| 32 |
|
Bio-Reference Labs Inc (b),* | — |
| — |
| 357 |
| 11 |
| — |
| — |
| | 357 |
| 11 |
|
Capital Senior Living Corp (b),* | — |
| — |
| 420 |
| 10 |
| — |
| — |
| | 420 |
| 10 |
|
Centene Corp (b),* | — |
| — |
| — |
| — |
| 7,130 |
| 539 |
| | 7,130 |
| 539 |
|
Emeritus Corp (b),* | — |
| — |
| 591 |
| 19 |
| — |
| — |
| | 591 |
| 19 |
|
Ensign Group Inc/The * | 36 |
| 1 |
| 419 |
| 13 |
| — |
| — |
| | 455 |
| 14 |
|
Envision Healthcare Holdings Inc (b) | — |
| — |
| — |
| — |
| 15,700 |
| 564 |
| | 15,700 |
| 564 |
|
Five Star Quality Care Inc (b),* | 1,590 |
| 8 |
| — |
| — |
| — |
| — |
| | 1,590 |
| 8 |
|
Gentiva Health Services Inc (b),* | — |
| — |
| 742 |
| 11 |
| — |
| — |
| | 742 |
| 11 |
|
HealthSouth Corp * | 494 |
| 18 |
| 966 |
| 35 |
| 16,200 |
| 581 |
| | 17,660 |
| 634 |
|
Healthways Inc (b),* | 445 |
| 8 |
| 372 |
| 6 |
| — |
| — |
| | 817 |
| 14 |
|
IPC The Hospitalist Co Inc (b),* | 261 |
| 11 |
| 243 |
| 11 |
| — |
| — |
| | 504 |
| 22 |
|
| Kindred Healthcare Inc | 6,706 |
| 155 |
| — |
| — |
| 22,430 |
| 518 |
| | 29,136 |
| 673 |
|
LHC Group Inc (b),* | 521 |
| 11 |
| — |
| — |
| — |
| — |
| | 521 |
| 11 |
|
Magellan Health Inc (b),* | 644 |
| 40 |
| — |
| — |
| — |
| — |
| | 644 |
| 40 |
|
Molina Healthcare Inc (b),* | 12,050 |
| 538 |
| 413 |
| 18 |
| — |
| — |
| | 12,463 |
| 556 |
|
National Healthcare Corp * | 248 |
| 14 |
| — |
| — |
| — |
| — |
| | 248 |
| 14 |
|
NeoStem Inc (b),(c),* | 464 |
| 3 |
| 243 |
| 2 |
| — |
| — |
| | 707 |
| 5 |
|
RadNet Inc (b),* | 2,100 |
| 14 |
| 699 |
| 5 |
| — |
| — |
| | 2,799 |
| 19 |
|
Select Medical Holdings Corp * | 176 |
| 3 |
| 1,063 |
| 16 |
| — |
| — |
| | 1,239 |
| 19 |
|
Skilled Healthcare Group Inc (b),* | 87 |
| — |
| 437 |
| 3 |
| — |
| — |
| | 524 |
| 3 |
|
|
| | | | | | | | | | | | | | | | | | | | | |
COMMON STOCKS (continued) | SmallCap Value Account I Shares Held | SmallCap Value Account I Value (000's) | SmallCap Growth Account II Shares Held | SmallCap Growth Account II Value (000's) | SmallCap Blend Account Shares Held | SmallCap Blend Account Value (000's) | | Combined Portfolio Shares Held | Combined Portfolio Value (000's) |
| Healthcare - Services (continued) | | | | | | | |
Surgical Care Affiliates Inc (b),* | 24 |
| $ | 1 |
| 269 |
| $ | 8 |
| — |
| $ | — |
| | 293 |
| $ | 9 |
|
Triple-S Management Corp (b),* | 5,849 |
| 105 |
| — |
| — |
| — |
| — |
| | 5,849 |
| 105 |
|
Universal American Corp/NY * | 1,390 |
| 11 |
| — |
| — |
| — |
| — |
| | 1,390 |
| 11 |
|
US Physical Therapy Inc * | — |
| — |
| 286 |
| 10 |
| — |
| — |
| | 286 |
| 10 |
|
WellCare Health Plans Inc (b),* | 3,948 |
| 295 |
| 75 |
| 6 |
| — |
| — |
| | 4,023 |
| 301 |
|
| | | $ | 1,301 |
| | $ | 1,286 |
| | $ | 2,202 |
| | $ | 4,789 |
|
| Holding Companies - Diversified - 0.25% | | | | | | | | |
Harbinger Group Inc (b),* | 1,233 |
| 15 |
| — |
| — |
| — |
| — |
| | 1,233 |
| 15 |
|
Horizon Pharma Inc (b),(c),* | — |
| — |
| 36,732 |
| 581 |
| — |
| — |
| | 36,732 |
| 581 |
|
National Bank Holdings Corp * | 989 |
| 20 |
| — |
| — |
| — |
| — |
| | 989 |
| 20 |
|
| | | $ | 35 |
| | $ | 581 |
| | $ | — |
| | $ | 616 |
|
| Home Builders - 0.37% | | | | | | | | |
Cavco Industries Inc (b),* | — |
| — |
| 148 |
| 13 |
| — |
| — |
| | 148 |
| 13 |
|
Century Communities Inc (b),(c),* | 4,600 |
| 102 |
| — |
| — |
| — |
| — |
| | 4,600 |
| 102 |
|
Installed Building Products Inc (b) | — |
| — |
| — |
| — |
| 21,840 |
| 268 |
| | 21,840 |
| 268 |
|
KB Home (c),* | — |
| — |
| 786 |
| 15 |
| 18,170 |
| 339 |
| | 18,956 |
| 354 |
|
LGI Homes Inc (b),* | 399 |
| 7 |
| 127 |
| 2 |
| — |
| — |
| | 526 |
| 9 |
|
M/I Homes Inc (b),* | 591 |
| 14 |
| — |
| — |
| — |
| — |
| | 591 |
| 14 |
|
MDC Holdings Inc * | 815 |
| 25 |
| — |
| — |
| — |
| — |
| | 815 |
| 25 |
|
Meritage Homes Corp (b),* | 817 |
| 34 |
| — |
| — |
| — |
| — |
| | 817 |
| 34 |
|
New Home Co Inc/The (b),* | 150 |
| 2 |
| — |
| — |
| — |
| — |
| | 150 |
| 2 |
|
Ryland Group Inc/The * | 980 |
| 39 |
| — |
| — |
| — |
| — |
| | 980 |
| 39 |
|
Standard Pacific Corp (b),* | 3,027 |
| 26 |
| — |
| — |
| — |
| — |
| | 3,027 |
| 26 |
|
TRI Pointe Homes Inc (b),(c),* | 540 |
| 9 |
| — |
| — |
| — |
| — |
| | 540 |
| 9 |
|
William Lyon Homes (b),* | 553 |
| 17 |
| — |
| — |
| — |
| — |
| | 553 |
| 17 |
|
Winnebago Industries Inc (b),* | — |
| — |
| 408 |
| 10 |
| — |
| — |
| | 408 |
| 10 |
|
| | | $ | 275 |
| | $ | 40 |
| | $ | 607 |
| | $ | 922 |
|
| Home Furnishings - 0.63% | | | | | | | | |
American Woodmark Corp (b),* | — |
| — |
| 250 |
| 8 |
| — |
| — |
| | 250 |
| 8 |
|
Daktronics Inc * | 401 |
| 5 |
| 602 |
| 7 |
| — |
| — |
| | 1,003 |
| 12 |
|
DTS Inc/CA (b),* | 439 |
| 8 |
| 108 |
| 2 |
| — |
| — |
| | 547 |
| 10 |
|
Flexsteel Industries Inc * | 182 |
| 6 |
| — |
| — |
| — |
| — |
| | 182 |
| 6 |
|
iRobot Corp (b),(c),* | — |
| — |
| 410 |
| 17 |
| — |
| — |
| | 410 |
| 17 |
|
Kimball International Inc * | 34,017 |
| 569 |
| — |
| — |
| — |
| — |
| | 34,017 |
| 569 |
|
La-Z-Boy Inc * | 279 |
| 6 |
| 656 |
| 15 |
| — |
| — |
| | 935 |
| 21 |
|
Select Comfort Corp (b),* | — |
| — |
| 671 |
| 14 |
| — |
| — |
| | 671 |
| 14 |
|
Skullcandy Inc (b),* | 28,460 |
| 206 |
| — |
| — |
| — |
| — |
| | 28,460 |
| 206 |
|
TiVo Inc (b),* | 32,754 |
| 423 |
| 857 |
| 11 |
| — |
| — |
| | 33,611 |
| 434 |
|
Universal Electronics Inc (b),* | 4,800 |
| 235 |
| 234 |
| 11 |
| — |
| — |
| | 5,034 |
| 246 |
|
| | | $ | 1,458 |
| | $ | 85 |
| | $ | — |
| | $ | 1,543 |
|
| Housewares - 0.05% | | | | | | | | |
Libbey Inc (b),* | — |
| — |
| 497 |
| 13 |
| — |
| — |
| | 497 |
| 13 |
|
Lifetime Brands Inc * | 7,062 |
| 111 |
| — |
| — |
| — |
| — |
| | 7,062 |
| 111 |
|
NACCO Industries Inc * | 179 |
| 9 |
| — |
| — |
| — |
| — |
| | 179 |
| 9 |
|
| | | $ | 120 |
| | $ | 13 |
| | $ | — |
| | $ | 133 |
|
| Insurance - 3.91% | | | | | | | | |
Ambac Financial Group Inc (b),* | 940 |
| 26 |
| — |
| — |
| — |
| — |
| | 940 |
| 26 |
|
American Equity Investment Life Holding Co * | 38,269 |
| 941 |
| — |
| — |
| 17,962 |
| 442 |
| | 56,231 |
| 1,383 |
|
Amerisafe Inc * | 8,840 |
| 360 |
| — |
| — |
| — |
| — |
| | 8,840 |
| 360 |
|
AmTrust Financial Services Inc * | 5,510 |
| 231 |
| 19,665 |
| 822 |
| — |
| — |
| | 25,175 |
| 1,053 |
|
Argo Group International Holdings Ltd * | 623 |
| 32 |
| — |
| — |
| — |
| — |
| | 623 |
| 32 |
|
Aspen Insurance Holdings Ltd * | 5,300 |
| 241 |
| — |
| — |
| — |
| — |
| | 5,300 |
| 241 |
|
Assured Guaranty Ltd * | 8,500 |
| 208 |
| — |
| — |
| — |
| — |
| | 8,500 |
| 208 |
|
Atlas Financial Holdings Inc (b),* | — |
| — |
| 243 |
| 4 |
| — |
| — |
| | 243 |
| 4 |
|
Baldwin & Lyons Inc * | 349 |
| 9 |
| — |
| — |
| — |
| — |
| | 349 |
| 9 |
|
CNO Financial Group Inc * | 61,087 |
| 1,087 |
| — |
| — |
| 47,550 |
| 846 |
| | 108,637 |
| 1,933 |
|
Crawford & Co * | 627 |
| 6 |
| 229 |
| 2 |
| — |
| — |
| | 856 |
| 8 |
|
EMC Insurance Group Inc * | 166 |
| 5 |
| — |
| — |
| — |
| — |
| | 166 |
| 5 |
|
Employers Holdings Inc * | 360 |
| 8 |
| 512 |
| 11 |
| — |
| — |
| | 872 |
| 19 |
|
Enstar Group Ltd (b),* | 178 |
| 27 |
| — |
| — |
| — |
| — |
| | 178 |
| 27 |
|
Essent Group Ltd (b),* | — |
| — |
| 529 |
| 11 |
| — |
| — |
| | 529 |
| 11 |
|
FBL Financial Group Inc * | 333 |
| 15 |
| — |
| — |
| — |
| — |
| | 333 |
| 15 |
|
Federated National Holding Co * | 0 |
| — |
| 232 |
| 6 |
| — |
| — |
| | 232 |
| 6 |
|
Fidelity & Guaranty Life * | 2,588 |
| 61 |
| — |
| — |
| — |
| — |
| | 2,588 |
| 61 |
|
First American Financial Corp * | 2,664 |
| 74 |
| — |
| — |
| — |
| — |
| | 2,664 |
| 74 |
|
Global Indemnity PLC (b),* | 293 |
| 8 |
| — |
| — |
| — |
| — |
| | 293 |
| 8 |
|
Greenlight Capital Re Ltd (b),* | 674 |
| 22 |
| — |
| — |
| — |
| — |
| | 674 |
| 22 |
|
Hallmark Financial Services Inc (b),* | 520 |
| 5 |
| — |
| — |
| — |
| — |
| | 520 |
| 5 |
|
| Hanover Insurance Group Inc/The | — |
| — |
| — |
| — |
| 9,432 |
| 595 |
| | 9,432 |
| 595 |
|
HCI Group Inc * | 100 |
| 4 |
| 142 |
| 6 |
| — |
| — |
| | 242 |
| 10 |
|
|
| | | | | | | | | | | | | | | | | | | | | |
COMMON STOCKS (continued) | SmallCap Value Account I Shares Held | SmallCap Value Account I Value (000's) | SmallCap Growth Account II Shares Held | SmallCap Growth Account II Value (000's) | SmallCap Blend Account Shares Held | SmallCap Blend Account Value (000's) | | Combined Portfolio Shares Held | Combined Portfolio Value (000's) |
| Insurance (continued) | | | | | | | |
Heritage Insurance Holdings Inc (b),* | — |
| $ | — |
| 156 |
| $ | 2 |
| — |
| $ | — |
| | 156 |
| $ | 2 |
|
Hilltop Holdings Inc (b),* | 24,230 |
| 515 |
| — |
| — |
| — |
| — |
| | 24,230 |
| 515 |
|
| Horace Mann Educators Corp | 1,763 |
| 55 |
| — |
| — |
| 15,770 |
| 493 |
| | 17,533 |
| 548 |
|
Infinity Property & Casualty Corp * | 224 |
| 15 |
| 95 |
| 6 |
| — |
| — |
| | 319 |
| 21 |
|
Kansas City Life Insurance Co * | 153 |
| 7 |
| — |
| — |
| — |
| — |
| | 153 |
| 7 |
|
Kemper Corp * | 1,107 |
| 41 |
| — |
| — |
| — |
| — |
| | 1,107 |
| 41 |
|
Maiden Holdings Ltd * | 34,165 |
| 413 |
| 153 |
| 2 |
| — |
| — |
| | 34,318 |
| 415 |
|
MGIC Investment Corp (b),* | 4,130 |
| 38 |
| 1,790 |
| 16 |
| — |
| — |
| | 5,920 |
| 54 |
|
Montpelier Re Holdings Ltd ADR* | 1,010 |
| 32 |
| — |
| — |
| — |
| — |
| | 1,010 |
| 32 |
|
National General Holdings Corp * | 845 |
| 15 |
| — |
| — |
| — |
| — |
| | 845 |
| 15 |
|
National Western Life Insurance Co * | 54 |
| 13 |
| — |
| — |
| — |
| — |
| | 54 |
| 13 |
|
Navigators Group Inc/The (b),* | 251 |
| 17 |
| — |
| — |
| — |
| — |
| | 251 |
| 17 |
|
NMI Holdings Inc (b),* | 1,056 |
| 11 |
| — |
| — |
| — |
| — |
| | 1,056 |
| 11 |
|
OneBeacon Insurance Group Ltd * | 857 |
| 13 |
| — |
| — |
| — |
| — |
| | 857 |
| 13 |
|
Platinum Underwriters Holdings Ltd * | 596 |
| 39 |
| — |
| — |
| — |
| — |
| | 596 |
| 39 |
|
Primerica Inc * | 1,301 |
| 62 |
| — |
| — |
| — |
| — |
| | 1,301 |
| 62 |
|
Radian Group Inc * | 3,024 |
| 45 |
| 869 |
| 13 |
| — |
| — |
| | 3,893 |
| 58 |
|
RLI Corp * | 1,041 |
| 48 |
| — |
| — |
| — |
| — |
| | 1,041 |
| 48 |
|
Safety Insurance Group Inc * | 307 |
| 16 |
| — |
| — |
| — |
| — |
| | 307 |
| 16 |
|
Selective Insurance Group Inc * | 8,073 |
| 200 |
| — |
| — |
| — |
| — |
| | 8,073 |
| 200 |
|
| StanCorp Financial Group Inc | — |
| — |
| — |
| — |
| 5,700 |
| 365 |
| | 5,700 |
| 365 |
|
State Auto Financial Corp * | 568 |
| 13 |
| — |
| — |
| — |
| — |
| | 568 |
| 13 |
|
Stewart Information Services Corp * | 3,421 |
| 106 |
| — |
| — |
| — |
| — |
| | 3,421 |
| 106 |
|
Symetra Financial Corp * | 16,695 |
| 380 |
| — |
| — |
| — |
| — |
| | 16,695 |
| 380 |
|
Third Point Reinsurance Ltd (b),* | 1,351 |
| 21 |
| — |
| — |
| — |
| — |
| | 1,351 |
| 21 |
|
United Fire Group Inc * | 3,255 |
| 95 |
| — |
| — |
| — |
| — |
| | 3,255 |
| 95 |
|
United Insurance Holdings Corp * | — |
| — |
| 344 |
| 6 |
| — |
| — |
| | 344 |
| 6 |
|
Universal Insurance Holdings Inc * | 61 |
| 1 |
| 667 |
| 9 |
| — |
| — |
| | 728 |
| 10 |
|
| Validus Holdings Ltd | — |
| — |
| — |
| — |
| 10,191 |
| 390 |
| | 10,191 |
| 390 |
|
| | | $ | 5,581 |
| | $ | 916 |
| | $ | 3,131 |
| | $ | 9,628 |
|
| Internet - 2.10% | | | | | | | | |
1-800-Flowers.com Inc (b),* | 893 |
| 5 |
| — |
| — |
| — |
| — |
| | 893 |
| 5 |
|
Bankrate Inc (b),* | 1,409 |
| 25 |
| — |
| — |
| — |
| — |
| | 1,409 |
| 25 |
|
Barracuda Networks Inc (b) | — |
| — |
| 179 |
| 6 |
| 11,430 |
| 355 |
| | 11,609 |
| 361 |
|
Blucora Inc (b),* | 980 |
| 18 |
| — |
| — |
| — |
| — |
| | 980 |
| 18 |
|
Blue Nile Inc (b),* | — |
| — |
| 293 |
| 8 |
| — |
| — |
| | 293 |
| 8 |
|
Boingo Wireless Inc (b),* | 833 |
| 6 |
| — |
| — |
| — |
| — |
| | 833 |
| 6 |
|
Borderfree Inc (b),* | — |
| — |
| 123 |
| 2 |
| — |
| — |
| | 123 |
| 2 |
|
| CDW Corp/DE | — |
| — |
| — |
| — |
| 26,893 |
| 857 |
| | 26,893 |
| 857 |
|
ChannelAdvisor Corp (b),* | — |
| — |
| 14,670 |
| 387 |
| — |
| — |
| | 14,670 |
| 387 |
|
Chegg Inc (b),(c),* | 19,338 |
| 136 |
| 31,220 |
| 220 |
| — |
| — |
| | 50,558 |
| 356 |
|
Cinedigm Corp (b),* | 2,120 |
| 5 |
| — |
| — |
| — |
| — |
| | 2,120 |
| 5 |
|
Cogent Communications Holdings Inc * | — |
| — |
| 673 |
| 23 |
| — |
| — |
| | 673 |
| 23 |
|
comScore Inc (b),* | — |
| — |
| 519 |
| 18 |
| — |
| — |
| | 519 |
| 18 |
|
Constant Contact Inc (b),* | — |
| — |
| 447 |
| 14 |
| — |
| — |
| | 447 |
| 14 |
|
Conversant Inc (b),* | — |
| — |
| 972 |
| 25 |
| — |
| — |
| | 972 |
| 25 |
|
Coupons.com Inc (b),(c),* | 2,000 |
| 53 |
| — |
| — |
| — |
| — |
| | 2,000 |
| 53 |
|
Dice Holdings Inc (b),* | 944 |
| 7 |
| 283 |
| 2 |
| — |
| — |
| | 1,227 |
| 9 |
|
ePlus Inc (b),* | 148 |
| 9 |
| 4 |
| — |
| — |
| — |
| | 152 |
| 9 |
|
FireEye Inc (b),(c),* | 1,700 |
| 69 |
| — |
| — |
| — |
| — |
| | 1,700 |
| 69 |
|
FTD Cos Inc (b),* | 432 |
| 14 |
| — |
| — |
| — |
| — |
| | 432 |
| 14 |
|
Global Eagle Entertainment Inc (b),* | — |
| — |
| 23,770 |
| 295 |
| — |
| — |
| | 23,770 |
| 295 |
|
Global Sources Ltd (b),* | 597 |
| 5 |
| 55 |
| — |
| — |
| — |
| | 652 |
| 5 |
|
GrubHub Inc (b),(c),* | — |
| — |
| 202 |
| 7 |
| — |
| — |
| | 202 |
| 7 |
|
HealthStream Inc (b),* | — |
| — |
| 477 |
| 12 |
| — |
| — |
| | 477 |
| 12 |
|
HomeAway Inc (b),* | — |
| — |
| 22,765 |
| 793 |
| — |
| — |
| | 22,765 |
| 793 |
|
Intralinks Holdings Inc (b) | 13,668 |
| 121 |
| — |
| — |
| 20,830 |
| 185 |
| | 34,498 |
| 306 |
|
Lionbridge Technologies Inc (b),* | 500 |
| 3 |
| 1,294 |
| 8 |
| — |
| — |
| | 1,794 |
| 11 |
|
Liquidity Services Inc (b),* | 954 |
| 15 |
| — |
| — |
| — |
| — |
| | 954 |
| 15 |
|
magicJack VocalTec Ltd (b),* | 229 |
| 3 |
| 295 |
| 4 |
| — |
| — |
| | 524 |
| 7 |
|
Mavenir Systems Inc (b) | — |
| — |
| 219 |
| 3 |
| 15,600 |
| 236 |
| | 15,819 |
| 239 |
|
ModusLink Global Solutions Inc (b),(c),* | 1,407 |
| 5 |
| — |
| — |
| — |
| — |
| | 1,407 |
| 5 |
|
New Media Investment Group Inc (b),* | 1,076 |
| 15 |
| — |
| — |
| — |
| — |
| | 1,076 |
| 15 |
|
NIC Inc * | 0 |
| — |
| 944 |
| 15 |
| — |
| — |
| | 944 |
| 15 |
|
|
| | | | | | | | | | | | | | | | | | | | | |
COMMON STOCKS (continued) | SmallCap Value Account I Shares Held | SmallCap Value Account I Value (000's) | SmallCap Growth Account II Shares Held | SmallCap Growth Account II Value (000's) | SmallCap Blend Account Shares Held | SmallCap Blend Account Value (000's) | | Combined Portfolio Shares Held | Combined Portfolio Value (000's) |
| Internet (continued) | | | | | | | |
OpenTable Inc (b),* | — |
| $ | — |
| 331 |
| $ | 34 |
| — |
| $ | — |
| | 331 |
| $ | 34 |
|
OPOWER Inc (b),(c),* | 200 |
| 4 |
| 160 |
| 3 |
| — |
| — |
| | 360 |
| 7 |
|
Orbitz Worldwide Inc (b),* | 1,014 |
| 9 |
| 568 |
| 5 |
| — |
| — |
| | 1,582 |
| 14 |
|
Perficient Inc (b),* | 433 |
| 8 |
| 510 |
| 10 |
| — |
| — |
| | 943 |
| 18 |
|
Q2 Holdings Inc (b),* | 200 |
| 3 |
| 204 |
| 3 |
| — |
| — |
| | 404 |
| 6 |
|
QuinStreet Inc (b),* | 1,247 |
| 7 |
| — |
| — |
| — |
| — |
| | 1,247 |
| 7 |
|
Reis Inc * | 279 |
| 6 |
| 12 |
| — |
| — |
| — |
| | 291 |
| 6 |
|
RetailMeNot Inc (b),* | — |
| — |
| 391 |
| 10 |
| — |
| — |
| | 391 |
| 10 |
|
RingCentral Inc (b),* | 19,200 |
| 290 |
| — |
| — |
| — |
| — |
| | 19,200 |
| 290 |
|
Rubicon Project Inc/The (b) | 2,300 |
| 30 |
| — |
| — |
| 9,712 |
| 125 |
| | 12,012 |
| 155 |
|
Sapient Corp (b),* | — |
| — |
| 1,607 |
| 26 |
| — |
| — |
| | 1,607 |
| 26 |
|
Shutterfly Inc (b),* | 364 |
| 16 |
| 299 |
| 13 |
| — |
| — |
| | 663 |
| 29 |
|
Shutterstock Inc (b),(c),* | — |
| — |
| 218 |
| 18 |
| — |
| — |
| | 218 |
| 18 |
|
SPS Commerce Inc (b),* | — |
| — |
| 233 |
| 15 |
| — |
| — |
| | 233 |
| 15 |
|
Stamps.com Inc (b),* | — |
| — |
| 325 |
| 11 |
| — |
| — |
| | 325 |
| 11 |
|
TechTarget Inc (b),* | 446 |
| 4 |
| — |
| — |
| — |
| — |
| | 446 |
| 4 |
|
TeleCommunication Systems Inc (b),* | 1,777 |
| 6 |
| — |
| — |
| — |
| — |
| | 1,777 |
| 6 |
|
Trulia Inc (b),(c),* | — |
| — |
| 435 |
| 21 |
| — |
| — |
| | 435 |
| 21 |
|
VASCO Data Security International Inc (b),* | — |
| — |
| 666 |
| 8 |
| — |
| — |
| | 666 |
| 8 |
|
VirnetX Holding Corp (b),* | — |
| — |
| 540 |
| 10 |
| — |
| — |
| | 540 |
| 10 |
|
Web.com Group Inc (b),* | — |
| — |
| 744 |
| 22 |
| — |
| — |
| | 744 |
| 22 |
|
WebMD Health Corp (b),* | 8,100 |
| 391 |
| 557 |
| 27 |
| — |
| — |
| | 8,657 |
| 418 |
|
XO Group Inc (b),* | — |
| — |
| 609 |
| 7 |
| — |
| — |
| | 609 |
| 7 |
|
YuMe Inc (b),* | 651 |
| 4 |
| — |
| — |
| — |
| — |
| | 651 |
| 4 |
|
Zendesk Inc (b) | — |
| — |
| — |
| — |
| 1,278 |
| 22 |
| | 1,278 |
| 22 |
|
Zix Corp (b),* | — |
| — |
| 1,469 |
| 5 |
| — |
| — |
| | 1,469 |
| 5 |
|
| | | $ | 1,292 |
| | $ | 2,090 |
| | $ | 1,780 |
| | $ | 5,162 |
|
| Investment Companies - 0.01% | | | | | | | | |
Caesars Acquisition Co (b),* | 1,106 |
| 14 |
| — |
| — |
| — |
| — |
| | 1,106 |
| 14 |
|
| | | | | | | | | |
| Iron & Steel - 0.18% | | | | | | | | |
AK Steel Holding Corp (b),(c),* | 2,959 |
| 24 |
| — |
| — |
| — |
| — |
| | 2,959 |
| 24 |
|
Commercial Metals Co * | 21,885 |
| 379 |
| — |
| — |
| — |
| — |
| | 21,885 |
| 379 |
|
Schnitzer Steel Industries Inc * | 664 |
| 17 |
| — |
| — |
| — |
| — |
| | 664 |
| 17 |
|
Shiloh Industries Inc (b),* | 226 |
| 4 |
| 177 |
| 3 |
| — |
| — |
| | 403 |
| 7 |
|
Universal Stainless & Alloy Products Inc (b),* | 263 |
| 8 |
| — |
| — |
| — |
| — |
| | 263 |
| 8 |
|
| | | $ | 432 |
| | $ | 3 |
| | $ | — |
| | $ | 435 |
|
| Leisure Products & Services - 0.64% | | | | | | | | |
Arctic Cat Inc * | 301 |
| 12 |
| — |
| — |
| — |
| — |
| | 301 |
| 12 |
|
Black Diamond Inc (b),* | 875 |
| 10 |
| 26,007 |
| 292 |
| — |
| — |
| | 26,882 |
| 302 |
|
Brunswick Corp/DE * | 1,121 |
| 47 |
| 6,162 |
| 260 |
| — |
| — |
| | 7,283 |
| 307 |
|
Callaway Golf Co * | 1,678 |
| 14 |
| — |
| — |
| — |
| — |
| | 1,678 |
| 14 |
|
ClubCorp Holdings Inc * | — |
| — |
| 495 |
| 9 |
| — |
| — |
| | 495 |
| 9 |
|
Diamond Resorts International Inc (b),* | — |
| — |
| 449 |
| 10 |
| — |
| — |
| | 449 |
| 10 |
|
Escalade Inc * | 280 |
| 5 |
| — |
| — |
| — |
| — |
| | 280 |
| 5 |
|
Fox Factory Holding Corp (b),* | — |
| — |
| 253 |
| 4 |
| — |
| — |
| | 253 |
| 4 |
|
Interval Leisure Group Inc * | 328 |
| 7 |
| 451 |
| 10 |
| — |
| — |
| | 779 |
| 17 |
|
Johnson Outdoors Inc * | 187 |
| 5 |
| — |
| — |
| — |
| — |
| | 187 |
| 5 |
|
Life Time Fitness Inc (b),* | 933 |
| 45 |
| 52 |
| 2 |
| — |
| — |
| | 985 |
| 47 |
|
Malibu Boats Inc (b),* | — |
| — |
| 12,058 |
| 243 |
| — |
| — |
| | 12,058 |
| 243 |
|
Nautilus Inc (b),* | 434 |
| 5 |
| 433 |
| 5 |
| — |
| — |
| | 867 |
| 10 |
|
Sabre Corp (b) | — |
| — |
| — |
| — |
| 30,000 |
| 601 |
| | 30,000 |
| 601 |
|
| | | $ | 150 |
| | $ | 835 |
| | $ | 601 |
| | $ | 1,586 |
|
| Lodging - 0.07% | | | | | | | | |
Boyd Gaming Corp (b),* | — |
| — |
| 789 |
| 10 |
| — |
| — |
| | 789 |
| 10 |
|
Caesars Entertainment Corp (b),* | 929 |
| 17 |
| — |
| — |
| — |
| — |
| | 929 |
| 17 |
|
Intrawest Resorts Holdings Inc (b),(c),* | 357 |
| 4 |
| — |
| — |
| — |
| — |
| | 357 |
| 4 |
|
La Quinta Holdings Inc (b),* | 4,661 |
| 89 |
| — |
| — |
| — |
| — |
| | 4,661 |
| 89 |
|
Marcus Corp/The * | 702 |
| 13 |
| — |
| — |
| — |
| — |
| | 702 |
| 13 |
|
Monarch Casino & Resort Inc (b),* | 147 |
| 2 |
| — |
| — |
| — |
| — |
| | 147 |
| 2 |
|
Orient-Express Hotels Ltd (b) | 2,084 |
| 30 |
| — |
| — |
| — |
| — |
| | 2,084 |
| 30 |
|
| | | $ | 155 |
| | $ | 10 |
| | $ | — |
| | $ | 165 |
|
| Machinery - Construction & Mining - 0.12% | | | | | | | | |
Astec Industries Inc * | 484 |
| 21 |
| — |
| — |
| — |
| — |
| | 484 |
| 21 |
|
Hyster-Yale Materials Handling Inc * | 3,000 |
| 266 |
| 155 |
| 14 |
| — |
| — |
| | 3,155 |
| 280 |
|
| | | $ | 287 |
| | $ | 14 |
| | $ | — |
| | $ | 301 |
|
|
| | | | | | | | | | | | | | | | | | | | | |
COMMON STOCKS (continued) | SmallCap Value Account I Shares Held | SmallCap Value Account I Value (000's) | SmallCap Growth Account II Shares Held | SmallCap Growth Account II Value (000's) | SmallCap Blend Account Shares Held | SmallCap Blend Account Value (000's) | | Combined Portfolio Shares Held | Combined Portfolio Value (000's) |
| Machinery - Diversified - 1.00% | | | | | | | | |
Adept Technology Inc (b),* | — |
| $ | — |
| 11,830 |
| $ | 124 |
| — |
| $ | — |
| | 11,830 |
| $ | 124 |
|
Alamo Group Inc * | 257 |
| 14 |
| — |
| — |
| — |
| — |
| | 257 |
| 14 |
|
Albany International Corp * | 579 |
| 22 |
| — |
| — |
| — |
| — |
| | 579 |
| 22 |
|
Altra Industrial Motion Corp * | — |
| — |
| 399 |
| 15 |
| — |
| — |
| | 399 |
| 15 |
|
Applied Industrial Technologies Inc * | 6,788 |
| 344 |
| 223 |
| 11 |
| — |
| — |
| | 7,011 |
| 355 |
|
Briggs & Stratton Corp * | 21,271 |
| 435 |
| — |
| — |
| — |
| — |
| | 21,271 |
| 435 |
|
Chart Industries Inc (b),* | — |
| — |
| 391 |
| 32 |
| — |
| — |
| | 391 |
| 32 |
|
Cognex Corp (b),* | — |
| — |
| 1,291 |
| 50 |
| — |
| — |
| | 1,291 |
| 50 |
|
Columbus McKinnon Corp/NY * | 639 |
| 17 |
| 65 |
| 2 |
| — |
| — |
| | 704 |
| 19 |
|
DXP Enterprises Inc (b),* | — |
| — |
| 190 |
| 14 |
| — |
| — |
| | 190 |
| 14 |
|
Gerber Scientific Inc (b),(d),(e) | 1,974 |
| — |
| — |
| — |
| — |
| — |
| | 1,974 |
| — |
|
Global Power Equipment Group Inc * | 644 |
| 11 |
| — |
| — |
| — |
| — |
| | 644 |
| 11 |
|
Gorman-Rupp Co/The * | — |
| — |
| 319 |
| 11 |
| — |
| — |
| | 319 |
| 11 |
|
Hurco Cos Inc * | 877 |
| 25 |
| — |
| — |
| — |
| — |
| | 877 |
| 25 |
|
Kadant Inc * | 9,235 |
| 355 |
| 35 |
| 1 |
| — |
| — |
| | 9,270 |
| 356 |
|
Lindsay Corp (c),* | 72 |
| 6 |
| 160 |
| 14 |
| — |
| — |
| | 232 |
| 20 |
|
Manitex International Inc (b),* | — |
| — |
| 327 |
| 5 |
| — |
| — |
| | 327 |
| 5 |
|
Middleby Corp/The (b),* | 100 |
| 8 |
| 10,950 |
| 906 |
| — |
| — |
| | 11,050 |
| 914 |
|
Tennant Co * | — |
| — |
| 272 |
| 21 |
| — |
| — |
| | 272 |
| 21 |
|
Twin Disc Inc * | 83 |
| 3 |
| 135 |
| 4 |
| — |
| — |
| | 218 |
| 7 |
|
| | | $ | 1,240 |
| | $ | 1,210 |
| | $ | — |
| | $ | 2,450 |
|
| Media - 0.84% | | | | | | | | |
AH Belo Corp * | 705 |
| 8 |
| — |
| — |
| — |
| — |
| | 705 |
| 8 |
|
Crown Media Holdings Inc (b),* | 972 |
| 4 |
| 651 |
| 2 |
| — |
| — |
| | 1,623 |
| 6 |
|
Cumulus Media Inc (b),* | 1,578 |
| 10 |
| 2,080 |
| 14 |
| 75,230 |
| 496 |
| | 78,888 |
| 520 |
|
Daily Journal Corp (b),* | 35 |
| 7 |
| — |
| — |
| — |
| — |
| | 35 |
| 7 |
|
Entercom Communications Corp (b),* | 5,602 |
| 60 |
| — |
| — |
| — |
| — |
| | 5,602 |
| 60 |
|
EW Scripps Co/The (b),* | 23,110 |
| 489 |
| — |
| — |
| — |
| — |
| | 23,110 |
| 489 |
|
Gray Television Inc (b),* | — |
| — |
| 1,121 |
| 15 |
| — |
| — |
| | 1,121 |
| 15 |
|
Houghton Mifflin Harcourt Co (b),* | 2,277 |
| 44 |
| — |
| — |
| — |
| — |
| | 2,277 |
| 44 |
|
Journal Communications Inc (b),* | 20,977 |
| 186 |
| — |
| — |
| — |
| — |
| | 20,977 |
| 186 |
|
Lee Enterprises Inc (b),* | 1,921 |
| 9 |
| — |
| — |
| — |
| — |
| | 1,921 |
| 9 |
|
Markit Ltd (b),* | 7,900 |
| 213 |
| — |
| — |
| — |
| — |
| | 7,900 |
| 213 |
|
Martha Stewart Living Omnimedia Inc (b),* | — |
| — |
| 510 |
| 2 |
| — |
| — |
| | 510 |
| 2 |
|
McClatchy Co/The (b),* | 2,195 |
| 12 |
| — |
| — |
| — |
| — |
| | 2,195 |
| 12 |
|
Media General Inc (b),(c),* | 1,315 |
| 27 |
| — |
| — |
| — |
| — |
| | 1,315 |
| 27 |
|
Meredith Corp * | 896 |
| 43 |
| — |
| — |
| — |
| — |
| | 896 |
| 43 |
|
New York Times Co/The * | 3,209 |
| 49 |
| — |
| — |
| — |
| — |
| | 3,209 |
| 49 |
|
Nexstar Broadcasting Group Inc (c),* | — |
| — |
| 376 |
| 19 |
| — |
| — |
| | 376 |
| 19 |
|
Saga Communications Inc * | 129 |
| 5 |
| 31 |
| 1 |
| — |
| — |
| | 160 |
| 6 |
|
Salem Communications Corp * | 389 |
| 4 |
| — |
| — |
| — |
| — |
| | 389 |
| 4 |
|
Scholastic Corp * | 641 |
| 22 |
| — |
| — |
| — |
| — |
| | 641 |
| 22 |
|
Sinclair Broadcast Group Inc * | 6,455 |
| 224 |
| 877 |
| 31 |
| — |
| — |
| | 7,332 |
| 255 |
|
Time Inc (b),* | 2,668 |
| 65 |
| — |
| — |
| — |
| — |
| | 2,668 |
| 65 |
|
| | | $ | 1,481 |
| | $ | 84 |
| | $ | 496 |
| | $ | 2,061 |
|
| Metal Fabrication & Hardware - 0.99% | | | | | | | | |
Ampco-Pittsburgh Corp * | 3,811 |
| 87 |
| — |
| — |
| — |
| — |
| | 3,811 |
| 87 |
|
CIRCOR International Inc * | 65 |
| 5 |
| 233 |
| 18 |
| — |
| — |
| | 298 |
| 23 |
|
Global Brass & Copper Holdings Inc * | 7,900 |
| 133 |
| — |
| — |
| — |
| — |
| | 7,900 |
| 133 |
|
Haynes International Inc * | 262 |
| 15 |
| — |
| — |
| — |
| — |
| | 262 |
| 15 |
|
LB Foster Co * | 5,052 |
| 274 |
| — |
| — |
| — |
| — |
| | 5,052 |
| 274 |
|
Mueller Industries Inc * | 473 |
| 14 |
| 544 |
| 16 |
| — |
| — |
| | 1,017 |
| 30 |
|
Mueller Water Products Inc - Class A * | — |
| — |
| 2,338 |
| 20 |
| — |
| — |
| | 2,338 |
| 20 |
|
NN Inc * | 2,731 |
| 70 |
| 373 |
| 10 |
| — |
| — |
| | 3,104 |
| 80 |
|
Northwest Pipe Co (b),* | 364 |
| 15 |
| — |
| — |
| — |
| — |
| | 364 |
| 15 |
|
Olympic Steel Inc * | 260 |
| 6 |
| 54 |
| 1 |
| — |
| — |
| | 314 |
| 7 |
|
Omega Flex Inc * | — |
| — |
| 65 |
| 1 |
| — |
| — |
| | 65 |
| 1 |
|
RBC Bearings Inc * | — |
| — |
| 340 |
| 22 |
| — |
| — |
| | 340 |
| 22 |
|
Rexnord Corp (b),* | — |
| — |
| 1,102 |
| 31 |
| — |
| — |
| | 1,102 |
| 31 |
|
RTI International Metals Inc (b),* | 681 |
| 18 |
| — |
| — |
| — |
| — |
| | 681 |
| 18 |
|
Sun Hydraulics Corp * | — |
| — |
| 317 |
| 13 |
| — |
| — |
| | 317 |
| 13 |
|
Worthington Industries Inc * | 16,200 |
| 697 |
| 776 |
| 33 |
| 21,810 |
| 939 |
| | 38,786 |
| 1,669 |
|
| | | $ | 1,334 |
| | $ | 165 |
| | $ | 939 |
| | $ | 2,438 |
|
| Mining - 0.57% | | | | | | | | |
Century Aluminum Co (b),* | 1,117 |
| 17 |
| — |
| — |
| — |
| — |
| | 1,117 |
| 17 |
|
Globe Specialty Metals Inc * | 4,400 |
| 91 |
| 951 |
| 20 |
| — |
| — |
| | 5,351 |
| 111 |
|
|
| | | | | | | | | | | | | | | | | | | | | |
COMMON STOCKS (continued) | SmallCap Value Account I Shares Held | SmallCap Value Account I Value (000's) | SmallCap Growth Account II Shares Held | SmallCap Growth Account II Value (000's) | SmallCap Blend Account Shares Held | SmallCap Blend Account Value (000's) | | Combined Portfolio Shares Held | Combined Portfolio Value (000's) |
| Mining (continued) | | | | | | | |
Gold Resource Corp * | — |
| $ | — |
| 788 |
| $ | 4 |
| — |
| $ | — |
| | 788 |
| $ | 4 |
|
Hecla Mining Co * | 7,168 |
| 25 |
| — |
| — |
| — |
| — |
| | 7,168 |
| 25 |
|
Horsehead Holding Corp (b),* | 1,096 |
| 20 |
| — |
| — |
| — |
| — |
| | 1,096 |
| 20 |
|
Kaiser Aluminum Corp * | 456 |
| 33 |
| — |
| — |
| — |
| — |
| | 456 |
| 33 |
|
Materion Corp * | 393 |
| 15 |
| 184 |
| 7 |
| — |
| — |
| | 577 |
| 22 |
|
Stillwater Mining Co (b),* | 272 |
| 5 |
| 1,672 |
| 29 |
| — |
| — |
| | 1,944 |
| 34 |
|
United States Lime & Minerals Inc * | — |
| — |
| 42 |
| 3 |
| — |
| — |
| | 42 |
| 3 |
|
US Silica Holdings Inc * | — |
| — |
| 10,810 |
| 599 |
| 9,600 |
| 532 |
| | 20,410 |
| 1,131 |
|
| | | $ | 206 |
| | $ | 662 |
| | $ | 532 |
| | $ | 1,400 |
|
| Miscellaneous Manufacturing - 0.83% | | | | | | | | |
Actuant Corp * | 1,805 |
| 63 |
| — |
| — |
| — |
| — |
| | 1,805 |
| 63 |
|
| AO Smith Corp | — |
| — |
| — |
| — |
| 15,770 |
| 782 |
| | 15,770 |
| 782 |
|
AZZ Inc * | — |
| — |
| 377 |
| 17 |
| — |
| — |
| | 377 |
| 17 |
|
Barnes Group Inc * | 1,332 |
| 51 |
| — |
| — |
| — |
| — |
| | 1,332 |
| 51 |
|
Blount International Inc (b),* | — |
| — |
| 1,168 |
| 16 |
| — |
| — |
| | 1,168 |
| 16 |
|
Chase Corp * | 25 |
| 1 |
| 137 |
| 5 |
| — |
| — |
| | 162 |
| 6 |
|
CLARCOR Inc * | 103 |
| 6 |
| 735 |
| 45 |
| — |
| — |
| | 838 |
| 51 |
|
EnPro Industries Inc (b),* | — |
| — |
| 333 |
| 24 |
| — |
| — |
| | 333 |
| 24 |
|
Fabrinet (b),* | 687 |
| 14 |
| — |
| — |
| — |
| — |
| | 687 |
| 14 |
|
Federal Signal Corp * | 1,509 |
| 22 |
| — |
| — |
| — |
| — |
| | 1,509 |
| 22 |
|
GP Strategies Corp (b),* | 166 |
| 4 |
| 231 |
| 6 |
| — |
| — |
| | 397 |
| 10 |
|
Handy & Harman Ltd (b),* | 153 |
| 4 |
| — |
| — |
| — |
| — |
| | 153 |
| 4 |
|
Harsco Corp * | — |
| — |
| 1,025 |
| 27 |
| — |
| — |
| | 1,025 |
| 27 |
|
Hillenbrand Inc * | — |
| — |
| 924 |
| 30 |
| — |
| — |
| | 924 |
| 30 |
|
John Bean Technologies Corp * | — |
| — |
| 427 |
| 13 |
| — |
| — |
| | 427 |
| 13 |
|
Koppers Holdings Inc * | 1,500 |
| 58 |
| 303 |
| 12 |
| — |
| — |
| | 1,803 |
| 70 |
|
Lydall Inc (b),* | 84 |
| 2 |
| 332 |
| 9 |
| — |
| — |
| | 416 |
| 11 |
|
Movado Group Inc * | 410 |
| 17 |
| 187 |
| 8 |
| — |
| — |
| | 597 |
| 25 |
|
Myers Industries Inc * | — |
| — |
| 625 |
| 13 |
| — |
| — |
| | 625 |
| 13 |
|
NL Industries Inc * | 255 |
| 2 |
| — |
| — |
| — |
| — |
| | 255 |
| 2 |
|
Park-Ohio Holdings Corp * | 2,100 |
| 122 |
| 205 |
| 12 |
| — |
| — |
| | 2,305 |
| 134 |
|
Polypore International Inc (b),(c),* | — |
| — |
| 661 |
| 32 |
| — |
| — |
| | 661 |
| 32 |
|
Proto Labs Inc (b),* | — |
| — |
| 5,427 |
| 445 |
| — |
| — |
| | 5,427 |
| 445 |
|
Raven Industries Inc * | — |
| — |
| 475 |
| 16 |
| — |
| — |
| | 475 |
| 16 |
|
Smith & Wesson Holding Corp (b),* | — |
| — |
| 810 |
| 12 |
| — |
| — |
| | 810 |
| 12 |
|
Standex International Corp * | 930 |
| 70 |
| 134 |
| 10 |
| — |
| — |
| | 1,064 |
| 80 |
|
Sturm Ruger & Co Inc (c),* | — |
| — |
| 281 |
| 17 |
| — |
| — |
| | 281 |
| 17 |
|
Tredegar Corp * | 590 |
| 14 |
| — |
| — |
| — |
| — |
| | 590 |
| 14 |
|
TriMas Corp (b),* | 188 |
| 7 |
| 588 |
| 22 |
| — |
| — |
| | 776 |
| 29 |
|
| | | $ | 457 |
| | $ | 791 |
| | $ | 782 |
| | $ | 2,030 |
|
| Office & Business Equipment - 0.01% | | | | | | | | |
Eastman Kodak Co (b),* | 632 |
| 15 |
| — |
| — |
| — |
| — |
| | 632 |
| 15 |
|
| | | | | | | | | |
| Office Furnishings - 0.25% | | | | | | | | |
Herman Miller Inc * | — |
| — |
| 751 |
| 23 |
| — |
| — |
| | 751 |
| 23 |
|
HNI Corp * | 93 |
| 4 |
| 636 |
| 25 |
| — |
| — |
| | 729 |
| 29 |
|
Interface Inc * | — |
| — |
| 888 |
| 17 |
| — |
| — |
| | 888 |
| 17 |
|
Knoll Inc * | — |
| — |
| 773 |
| 13 |
| — |
| — |
| | 773 |
| 13 |
|
Steelcase Inc * | 14,500 |
| 219 |
| 1,214 |
| 18 |
| 20,140 |
| 305 |
| | 35,854 |
| 542 |
|
| | | $ | 223 |
| | $ | 96 |
| | $ | 305 |
| | $ | 624 |
|
| Oil & Gas - 3.81% | | | | | | | | |
Abraxas Petroleum Corp (b),* | — |
| — |
| 1,949 |
| 12 |
| — |
| — |
| | 1,949 |
| 12 |
|
Adams Resources & Energy Inc * | 77 |
| 6 |
| 2 |
| — |
| — |
| — |
| | 79 |
| 6 |
|
Apco Oil and Gas International Inc (b),* | 288 |
| 4 |
| 33 |
| — |
| — |
| — |
| | 321 |
| 4 |
|
Approach Resources Inc (b),(c),* | 815 |
| 18 |
| 462 |
| 10 |
| — |
| — |
| | 1,277 |
| 28 |
|
Bill Barrett Corp (b),* | 1,038 |
| 28 |
| — |
| — |
| — |
| — |
| | 1,038 |
| 28 |
|
Bonanza Creek Energy Inc (b),* | — |
| — |
| 598 |
| 34 |
| — |
| — |
| | 598 |
| 34 |
|
Callon Petroleum Co (b),* | 1,525 |
| 18 |
| — |
| — |
| — |
| — |
| | 1,525 |
| 18 |
|
Carrizo Oil & Gas Inc (b),* | — |
| — |
| 674 |
| 47 |
| 11,920 |
| 825 |
| | 12,594 |
| 872 |
|
Clayton Williams Energy Inc (b),* | — |
| — |
| 87 |
| 12 |
| — |
| — |
| | 87 |
| 12 |
|
Comstock Resources Inc * | 1,051 |
| 30 |
| — |
| — |
| — |
| — |
| | 1,051 |
| 30 |
|
Contango Oil & Gas Co (b),* | 421 |
| 18 |
| — |
| — |
| — |
| — |
| | 421 |
| 18 |
|
CVR Energy Inc (c),* | 1,900 |
| 92 |
| — |
| — |
| — |
| — |
| | 1,900 |
| 92 |
|
Delek US Holdings Inc * | 16,488 |
| 465 |
| 458 |
| 13 |
| — |
| — |
| | 16,946 |
| 478 |
|
Diamondback Energy Inc (b),* | 0 |
| — |
| 8,396 |
| 746 |
| — |
| — |
| | 8,396 |
| 746 |
|
| Energy XXI Bermuda Ltd | 11,035 |
| 261 |
| — |
| — |
| 20,550 |
| 486 |
| | 31,585 |
| 747 |
|
Equal Energy Ltd * | 6,639 |
| 36 |
| — |
| — |
| — |
| — |
| | 6,639 |
| 36 |
|
EXCO Resources Inc * | 31,900 |
| 188 |
| — |
| — |
| — |
| — |
| | 31,900 |
| 188 |
|
Gastar Exploration Inc (b),* | — |
| — |
| 1,315 |
| 11 |
| — |
| — |
| | 1,315 |
| 11 |
|
Goodrich Petroleum Corp (b),* | — |
| — |
| 401 |
| 11 |
| — |
| — |
| | 401 |
| 11 |
|
|
| | | | | | | | | | | | | | | | | | | | | |
COMMON STOCKS (continued) | SmallCap Value Account I Shares Held | SmallCap Value Account I Value (000's) | SmallCap Growth Account II Shares Held | SmallCap Growth Account II Value (000's) | SmallCap Blend Account Shares Held | SmallCap Blend Account Value (000's) | | Combined Portfolio Shares Held | Combined Portfolio Value (000's) |
| Oil & Gas (continued) | | | | | | | |
Halcon Resources Corp (b),(c),* | 5,447 |
| $ | 40 |
| — |
| $ | — |
| — |
| $ | — |
| | 5,447 |
| $ | 40 |
|
Hercules Offshore Inc (b),* | 3,470 |
| 14 |
| — |
| — |
| — |
| — |
| | 3,470 |
| 14 |
|
Kodiak Oil & Gas Corp (b),* | — |
| — |
| 4,019 |
| 58 |
| 57,480 |
| 836 |
| | 61,499 |
| 894 |
|
Magnum Hunter Resources Corp (b),* | — |
| — |
| 84,463 |
| 693 |
| — |
| — |
| | 84,463 |
| 693 |
|
Magnum Hunter Resources Corp - Warrants (b),(d),(e) | 362 |
| — |
| 11,865 |
| — |
| — |
| — |
| | 12,227 |
| — |
|
Matador Resources Co (b),* | 773 |
| 23 |
| 624 |
| 18 |
| — |
| — |
| | 1,397 |
| 41 |
|
Memorial Resource Development Corp (b),* | 2,500 |
| 61 |
| — |
| — |
| — |
| — |
| | 2,500 |
| 61 |
|
North Atlantic Drilling Ltd * | 1,347 |
| 14 |
| 448 |
| 5 |
| — |
| — |
| | 1,795 |
| 19 |
|
Northern Oil and Gas Inc (b),* | 1,626 |
| 26 |
| — |
| — |
| — |
| — |
| | 1,626 |
| 26 |
|
Panhandle Oil and Gas Inc * | 800 |
| 45 |
| 153 |
| 9 |
| — |
| — |
| | 953 |
| 54 |
|
Parker Drilling Co (b),* | 37,336 |
| 244 |
| — |
| — |
| — |
| — |
| | 37,336 |
| 244 |
|
Parsley Energy Inc (b),* | 1,500 |
| 36 |
| 461 |
| 11 |
| — |
| — |
| | 1,961 |
| 47 |
|
PDC Energy Inc (b),* | 805 |
| 51 |
| 58 |
| 4 |
| — |
| — |
| | 863 |
| 55 |
|
Penn Virginia Corp (b),* | 1,202 |
| 20 |
| 44,180 |
| 749 |
| — |
| — |
| | 45,382 |
| 769 |
|
PetroQuest Energy Inc (b),* | — |
| — |
| 1,264 |
| 9 |
| — |
| — |
| | 1,264 |
| 9 |
|
Resolute Energy Corp (b),* | 1,646 |
| 14 |
| — |
| — |
| — |
| — |
| | 1,646 |
| 14 |
|
Rex Energy Corp (b),* | — |
| — |
| 725 |
| 13 |
| — |
| — |
| | 725 |
| 13 |
|
Rosetta Resources Inc (b),* | 1,298 |
| 71 |
| 178 |
| 10 |
| — |
| — |
| | 1,476 |
| 81 |
|
RSP Permian Inc (b) | 543 |
| 18 |
| 211 |
| 7 |
| 13,840 |
| 449 |
| | 14,594 |
| 474 |
|
Sanchez Energy Corp (b),* | 380 |
| 14 |
| 17,618 |
| 662 |
| — |
| — |
| | 17,998 |
| 676 |
|
Stone Energy Corp (b),* | 15,320 |
| 716 |
| — |
| — |
| — |
| — |
| | 15,320 |
| 716 |
|
Swift Energy Co (b),(c),* | 1,061 |
| 14 |
| — |
| — |
| — |
| — |
| | 1,061 |
| 14 |
|
Synergy Resources Corp (b),* | — |
| — |
| 988 |
| 13 |
| — |
| — |
| | 988 |
| 13 |
|
TransAtlantic Petroleum Ltd (b),* | 4,700 |
| 53 |
| — |
| — |
| — |
| — |
| | 4,700 |
| 53 |
|
Trecora Resources (b),* | — |
| — |
| 431 |
| 5 |
| — |
| — |
| | 431 |
| 5 |
|
Triangle Petroleum Corp (b),* | 1,417 |
| 17 |
| 962 |
| 11 |
| — |
| — |
| | 2,379 |
| 28 |
|
Vaalco Energy Inc (b),* | 41,091 |
| 297 |
| — |
| — |
| — |
| — |
| | 41,091 |
| 297 |
|
Vantage Drilling Co (b),* | 7,705 |
| 15 |
| — |
| — |
| — |
| — |
| | 7,705 |
| 15 |
|
Vertex Energy Inc (b),* | — |
| — |
| 267 |
| 3 |
| — |
| — |
| | 267 |
| 3 |
|
W&T Offshore Inc * | 861 |
| 14 |
| 302 |
| 5 |
| — |
| — |
| | 1,163 |
| 19 |
|
Warren Resources Inc (b),* | 88,075 |
| 546 |
| — |
| — |
| — |
| — |
| | 88,075 |
| 546 |
|
Western Refining Inc * | 1,000 |
| 38 |
| 788 |
| 30 |
| — |
| — |
| | 1,788 |
| 68 |
|
| | | $ | 3,565 |
| | $ | 3,211 |
| | $ | 2,596 |
| | $ | 9,372 |
|
| Oil & Gas Services - 1.99% | | | | | | | | |
Basic Energy Services Inc (b) | 5,300 |
| 155 |
| 479 |
| 14 |
| 13,940 |
| 407 |
| | 19,719 |
| 576 |
|
C&J Energy Services Inc (b),* | 26,939 |
| 910 |
| 594 |
| 20 |
| — |
| — |
| | 27,533 |
| 930 |
|
CARBO Ceramics Inc * | — |
| — |
| 292 |
| 45 |
| 0 |
| — |
| | 292 |
| 45 |
|
Dawson Geophysical Co * | 3,700 |
| 106 |
| — |
| — |
| — |
| 0 |
| | 3,700 |
| 106 |
|
Exterran Holdings Inc * | 1,467 |
| 66 |
| — |
| — |
| — |
| 0 |
| | 1,467 |
| 66 |
|
Flotek Industries Inc (b),* | — |
| — |
| 700 |
| 23 |
| 14,487 |
| 466 |
| | 15,187 |
| 489 |
|
Forum Energy Technologies Inc (b),* | 6,909 |
| 252 |
| 6,902 |
| 251 |
| — |
| — |
| | 13,811 |
| 503 |
|
Geospace Technologies Corp (b),* | 246 |
| 14 |
| 184 |
| 10 |
| — |
| — |
| | 430 |
| 24 |
|
Gulf Island Fabrication Inc * | 329 |
| 7 |
| 121 |
| 3 |
| — |
| — |
| | 450 |
| 10 |
|
| Gulfmark Offshore Inc | 680 |
| 31 |
| — |
| — |
| 9,830 |
| 444 |
| | 10,510 |
| 475 |
|
Helix Energy Solutions Group Inc (b),* | 17,501 |
| 460 |
| — |
| — |
| — |
| — |
| | 17,501 |
| 460 |
|
Hornbeck Offshore Services Inc (b),* | 864 |
| 41 |
| — |
| — |
| — |
| — |
| | 864 |
| 41 |
|
ION Geophysical Corp (b),* | 24,036 |
| 101 |
| — |
| — |
| — |
| — |
| | 24,036 |
| 101 |
|
Key Energy Services Inc (b),* | 3,181 |
| 29 |
| — |
| — |
| — |
| — |
| | 3,181 |
| 29 |
|
Matrix Service Co (b),* | — |
| — |
| 391 |
| 13 |
| — |
| — |
| | 391 |
| 13 |
|
McDermott International Inc (b),* | 4,965 |
| 40 |
| — |
| — |
| — |
| — |
| | 4,965 |
| 40 |
|
Mitcham Industries Inc (b),* | 489 |
| 7 |
| — |
| — |
| — |
| — |
| | 489 |
| 7 |
|
Natural Gas Services Group Inc (b),* | 458 |
| 15 |
| — |
| — |
| — |
| — |
| | 458 |
| 15 |
|
Newpark Resources Inc (b),* | 2,054 |
| 26 |
| — |
| — |
| — |
| — |
| | 2,054 |
| 26 |
|
Pioneer Energy Services Corp (b),* | 637 |
| 11 |
| 668 |
| 12 |
| — |
| — |
| | 1,305 |
| 23 |
|
RPC Inc * | — |
| — |
| — |
| — |
| 17,110 |
| 402 |
| | 17,110 |
| 402 |
|
SEACOR Holdings Inc (b),* | 469 |
| 39 |
| — |
| — |
| — |
| — |
| | 469 |
| 39 |
|
Superior Energy Services Inc * | 5,076 |
| 183 |
| — |
| — |
| — |
| — |
| | 5,076 |
| 183 |
|
Tesco Corp * | 5,335 |
| 114 |
| 70 |
| 1 |
| — |
| — |
| | 5,405 |
| 115 |
|
Tetra Technologies Inc (b),* | 1,650 |
| 19 |
| — |
| — |
| — |
| — |
| | 1,650 |
| 19 |
|
Thermon Group Holdings Inc (b),* | — |
| — |
| 402 |
| 11 |
| — |
| — |
| | 402 |
| 11 |
|
Willbros Group Inc (b),* | 10,800 |
| 133 |
| 905 |
| 11 |
| — |
| — |
| | 11,705 |
| 144 |
|
| | | $ | 2,759 |
| | $ | 414 |
| | $ | 1,719 |
| | $ | 4,892 |
|
| Packaging & Containers - 0.31% | | | | | | | | |
Berry Plastics Group Inc (b),* | 815 |
| 21 |
| 647 |
| 17 |
| — |
| — |
| | 1,462 |
| 38 |
|
Graphic Packaging Holding Co (b),* | 37,700 |
| 441 |
| 4,866 |
| 57 |
| — |
| — |
| | 42,566 |
| 498 |
|
Rock-Tenn Co * | 2,000 |
| 211 |
| — |
| — |
| — |
| — |
| | 2,000 |
| 211 |
|
|
| | | | | | | | | | | | | | | | | | | | | |
COMMON STOCKS (continued) | SmallCap Value Account I Shares Held | SmallCap Value Account I Value (000's) | SmallCap Growth Account II Shares Held | SmallCap Growth Account II Value (000's) | SmallCap Blend Account Shares Held | SmallCap Blend Account Value (000's) | | Combined Portfolio Shares Held | Combined Portfolio Value (000's) |
| Packaging & Containers (continued) | | | | | | | |
UFP Technologies Inc (b),* | 204 |
| $ | 5 |
| — |
| $ | — |
| — |
| $ | — |
| | 204 |
| $ | 5 |
|
| | | $ | 678 |
| | $ | 74 |
| | $ | — |
| | $ | 752 |
|
| Pharmaceuticals - 2.29% | | | | | | | | |
ACADIA Pharmaceuticals Inc (b),(c),* | — |
| — |
| 935 |
| 21 |
| — |
| — |
| | 935 |
| 21 |
|
Achaogen Inc (b) | 1,100 |
| 15 |
| — |
| — |
| 5,900 |
| 82 |
| | 7,000 |
| 97 |
|
Actinium Pharmaceuticals Inc (b),(c),* | — |
| — |
| 449 |
| 3 |
| — |
| — |
| | 449 |
| 3 |
|
Adamas Pharmaceuticals Inc (b),* | — |
| — |
| 6,919 |
| 127 |
| — |
| — |
| | 6,919 |
| 127 |
|
Akorn Inc (b),* | — |
| — |
| 898 |
| 30 |
| — |
| — |
| | 898 |
| 30 |
|
Alimera Sciences Inc (b),(c),* | — |
| — |
| 515 |
| 3 |
| — |
| — |
| | 515 |
| 3 |
|
Amphastar Pharmaceuticals Inc (b),* | 10,400 |
| 104 |
| — |
| — |
| — |
| — |
| | 10,400 |
| 104 |
|
Anacor Pharmaceuticals Inc (b),(c),* | 754 |
| 13 |
| 271 |
| 5 |
| — |
| — |
| | 1,025 |
| 18 |
|
Anika Therapeutics Inc (b),* | — |
| — |
| 207 |
| 10 |
| — |
| — |
| | 207 |
| 10 |
|
Antares Pharma Inc (b),* | — |
| — |
| 2,643 |
| 7 |
| — |
| — |
| | 2,643 |
| 7 |
|
Aratana Therapeutics Inc (b) | — |
| — |
| — |
| — |
| 9,871 |
| 154 |
| | 9,871 |
| 154 |
|
Array BioPharma Inc (b),* | — |
| — |
| 2,296 |
| 11 |
| 30,400 |
| 139 |
| | 32,696 |
| 150 |
|
Auspex Pharmaceuticals Inc (b),* | 400 |
| 9 |
| — |
| — |
| — |
| — |
| | 400 |
| 9 |
|
Auxilium Pharmaceuticals Inc (b),(c),* | — |
| — |
| 718 |
| 14 |
| — |
| — |
| | 718 |
| 14 |
|
AVANIR Pharmaceuticals Inc (b),(c),* | — |
| — |
| 2,302 |
| 13 |
| — |
| — |
| | 2,302 |
| 13 |
|
BioDelivery Sciences International Inc (b),* | — |
| — |
| 947 |
| 11 |
| — |
| — |
| | 947 |
| 11 |
|
Bio-Path Holdings Inc (b),* | — |
| — |
| 1,665 |
| 5 |
| — |
| — |
| | 1,665 |
| 5 |
|
BioScrip Inc (b),* | 1,429 |
| 12 |
| — |
| — |
| — |
| — |
| | 1,429 |
| 12 |
|
BioSpecifics Technologies Corp (b),* | — |
| — |
| 82 |
| 2 |
| — |
| — |
| | 82 |
| 2 |
|
Cara Therapeutics Inc (b),(c),* | 4,800 |
| 82 |
| 122 |
| 2 |
| — |
| — |
| | 4,922 |
| 84 |
|
Cerulean Pharma Inc (b) | — |
| — |
| — |
| — |
| 11,520 |
| 67 |
| | 11,520 |
| 67 |
|
Clovis Oncology Inc (b),* | — |
| — |
| 355 |
| 15 |
| 1,930 |
| 80 |
| | 2,285 |
| 95 |
|
Concert Pharmaceuticals Inc (b) | — |
| — |
| — |
| — |
| 9,200 |
| 93 |
| | 9,200 |
| 93 |
|
Corcept Therapeutics Inc (b),(c),* | — |
| — |
| 1,262 |
| 4 |
| — |
| — |
| | 1,262 |
| 4 |
|
Cytori Therapeutics Inc (b),(c),* | — |
| — |
| 1,038 |
| 3 |
| — |
| — |
| | 1,038 |
| 3 |
|
Depomed Inc (b),* | — |
| — |
| 21,581 |
| 300 |
| — |
| — |
| | 21,581 |
| 300 |
|
Durata Therapeutics Inc (b),* | — |
| — |
| 310 |
| 5 |
| — |
| — |
| | 310 |
| 5 |
|
Dyax Corp (b),* | — |
| — |
| 1,961 |
| 19 |
| — |
| — |
| | 1,961 |
| 19 |
|
Egalet Corp (b),(c),* | 1,000 |
| 13 |
| — |
| — |
| — |
| — |
| | 1,000 |
| 13 |
|
Enanta Pharmaceuticals Inc (b),* | — |
| — |
| 234 |
| 10 |
| — |
| — |
| | 234 |
| 10 |
|
Flexion Therapeutics Inc (b),* | 1,500 |
| 20 |
| — |
| — |
| — |
| — |
| | 1,500 |
| 20 |
|
Furiex Pharmaceuticals Inc (b),* | — |
| — |
| 104 |
| 11 |
| — |
| — |
| | 104 |
| 11 |
|
Heron Therapeutics Inc (b),* | — |
| — |
| 13,860 |
| 171 |
| — |
| — |
| | 13,860 |
| 171 |
|
Hyperion Therapeutics Inc (b),* | — |
| — |
| 198 |
| 5 |
| — |
| — |
| | 198 |
| 5 |
|
Impax Laboratories Inc (b),* | 17,221 |
| 516 |
| 307 |
| 9 |
| — |
| — |
| | 17,528 |
| 525 |
|
Infinity Pharmaceuticals Inc (b),* | — |
| — |
| 1,099 |
| 14 |
| — |
| — |
| | 1,099 |
| 14 |
|
Insys Therapeutics Inc (b),* | — |
| — |
| 226 |
| 7 |
| — |
| — |
| | 226 |
| 7 |
|
Ironwood Pharmaceuticals Inc (b),* | — |
| — |
| 1,723 |
| 26 |
| — |
| — |
| | 1,723 |
| 26 |
|
Keryx Biopharmaceuticals Inc (b),(c),* | — |
| — |
| 1,308 |
| 20 |
| 8,780 |
| 135 |
| | 10,088 |
| 155 |
|
Kite Pharma Inc (b),* | 1,800 |
| 52 |
| 920 |
| 27 |
| — |
| — |
| | 2,720 |
| 79 |
|
Lannett Co Inc (b),* | 5,300 |
| 263 |
| 371 |
| 18 |
| — |
| — |
| | 5,671 |
| 281 |
|
Liberator Medical Holdings Inc * | — |
| — |
| 714 |
| 3 |
| — |
| — |
| | 714 |
| 3 |
|
MannKind Corp (b),(c),* | — |
| — |
| 2,895 |
| 32 |
| — |
| — |
| | 2,895 |
| 32 |
|
Nature's Sunshine Products Inc * | 409 |
| 7 |
| — |
| — |
| — |
| — |
| | 409 |
| 7 |
|
Nektar Therapeutics (b),* | 1,153 |
| 15 |
| 1,035 |
| 13 |
| 10,630 |
| 136 |
| | 12,818 |
| 164 |
|
Neogen Corp (b),* | — |
| — |
| 522 |
| 21 |
| — |
| — |
| | 522 |
| 21 |
|
Neurocrine Biosciences Inc (b),* | — |
| — |
| 10,975 |
| 163 |
| — |
| — |
| | 10,975 |
| 163 |
|
Northwest Biotherapeutics Inc (b),(c),* | — |
| — |
| 806 |
| 5 |
| — |
| — |
| | 806 |
| 5 |
|
Nutraceutical International Corp (b),* | 326 |
| 8 |
| — |
| — |
| — |
| — |
| | 326 |
| 8 |
|
Omega Protein Corp (b),* | 716 |
| 10 |
| — |
| — |
| — |
| — |
| | 716 |
| 10 |
|
OPKO Health Inc (b),(c),* | — |
| — |
| 2,842 |
| 25 |
| — |
| — |
| | 2,842 |
| 25 |
|
Orexigen Therapeutics Inc (b),* | — |
| — |
| 1,478 |
| 9 |
| 19,340 |
| 120 |
| | 20,818 |
| 129 |
|
Osiris Therapeutics Inc (b),(c),* | — |
| — |
| 394 |
| 6 |
| — |
| — |
| | 394 |
| 6 |
|
Pacira Pharmaceuticals Inc/DE (b),* | — |
| — |
| 514 |
| 47 |
| — |
| — |
| | 514 |
| 47 |
|
Pain Therapeutics Inc (b),* | — |
| — |
| 863 |
| 5 |
| — |
| — |
| | 863 |
| 5 |
|
Pernix Therapeutics Holdings Inc (b),* | — |
| — |
| 753 |
| 7 |
| — |
| — |
| | 753 |
| 7 |
|
PharMerica Corp (b),* | 717 |
| 20 |
| — |
| — |
| — |
| — |
| | 717 |
| 20 |
|
Phibro Animal Health Corp * | 4,000 |
| 88 |
| 332 |
| 7 |
| — |
| — |
| | 4,332 |
| 95 |
|
Portola Pharmaceuticals Inc (b),(c),* | — |
| — |
| 11,423 |
| 334 |
| — |
| — |
| | 11,423 |
| 334 |
|
|
| | | | | | | | | | | | | | | | | | | | | |
COMMON STOCKS (continued) | SmallCap Value Account I Shares Held | SmallCap Value Account I Value (000's) | SmallCap Growth Account II Shares Held | SmallCap Growth Account II Value (000's) | SmallCap Blend Account Shares Held | SmallCap Blend Account Value (000's) | | Combined Portfolio Shares Held | Combined Portfolio Value (000's) |
| Pharmaceuticals (continued) | | | | | | | |
POZEN Inc (b),* | — |
| $ | — |
| 618 |
| $ | 5 |
| — |
| $ | — |
| | 618 |
| $ | 5 |
|
Prestige Brands Holdings Inc (b),* | — |
| — |
| 744 |
| 25 |
| 18,360 |
| 622 |
| | 19,104 |
| 647 |
|
Raptor Pharmaceutical Corp (b),* | — |
| — |
| 795 |
| 9 |
| — |
| — |
| | 795 |
| 9 |
|
Receptos Inc (b),* | — |
| — |
| 349 |
| 15 |
| — |
| — |
| | 349 |
| 15 |
|
Relypsa Inc (b),* | — |
| — |
| 382 |
| 9 |
| — |
| — |
| | 382 |
| 9 |
|
Revance Therapeutics Inc (b),(c),* | 3,000 |
| 102 |
| 97 |
| 3 |
| 2,530 |
| 86 |
| | 5,627 |
| 191 |
|
Sagent Pharmaceuticals Inc (b),* | 156 |
| 4 |
| 445 |
| 12 |
| — |
| — |
| | 601 |
| 16 |
|
Sarepta Therapeutics Inc (b),(c),* | — |
| — |
| 12,595 |
| 375 |
| — |
| — |
| | 12,595 |
| 375 |
|
SciClone Pharmaceuticals Inc (b),* | 547 |
| 3 |
| 936 |
| 5 |
| — |
| — |
| | 1,483 |
| 8 |
|
SCYNEXIS Inc (b) | — |
| — |
| — |
| — |
| 8,020 |
| 64 |
| | 8,020 |
| 64 |
|
Sucampo Pharmaceuticals Inc (b),* | — |
| — |
| 324 |
| 2 |
| — |
| — |
| | 324 |
| 2 |
|
Supernus Pharmaceuticals Inc (b),(c),* | — |
| — |
| 664 |
| 7 |
| — |
| — |
| | 664 |
| 7 |
|
Synutra International Inc (b),* | — |
| — |
| 370 |
| 3 |
| — |
| — |
| | 370 |
| 3 |
|
Threshold Pharmaceuticals Inc (b),* | — |
| — |
| 1,116 |
| 4 |
| — |
| — |
| | 1,116 |
| 4 |
|
USANA Health Sciences Inc (b),(c),* | — |
| — |
| 142 |
| 11 |
| — |
| — |
| | 142 |
| 11 |
|
Vanda Pharmaceuticals Inc (b),(c),* | — |
| — |
| 785 |
| 13 |
| 7,391 |
| 120 |
| | 8,176 |
| 133 |
|
Vivus Inc (b),(c),* | — |
| — |
| 2,386 |
| 13 |
| — |
| — |
| | 2,386 |
| 13 |
|
Zafgen Inc (b),(c) | 1,700 |
| 34 |
| — |
| — |
| 3,800 |
| 75 |
| | 5,500 |
| 109 |
|
Zogenix Inc (b),(c),* | — |
| — |
| 2,340 |
| 5 |
| — |
| — |
| | 2,340 |
| 5 |
|
ZS Pharma Inc (b),(c),* | 1,000 |
| 29 |
| 3,840 |
| 110 |
| — |
| — |
| �� | 4,840 |
| 139 |
|
| | | $ | 1,419 |
| | $ | 2,231 |
| | $ | 1,973 |
| | $ | 5,623 |
|
| Pipelines - 0.29% | | | | | | | | |
Primoris Services Corp * | — |
| — |
| 19,601 |
| 565 |
| — |
| — |
| | 19,601 |
| 565 |
|
SemGroup Corp * | 1,200 |
| 95 |
| 560 |
| 44 |
| — |
| — |
| | 1,760 |
| 139 |
|
| | | $ | 95 |
| | $ | 609 |
| | $ | — |
| | $ | 704 |
|
| Private Equity - 0.15% | | | | | | | | |
GSV Capital Corp (b),(c),* | — |
| — |
| 34,279 |
| 362 |
| — |
| — |
| | 34,279 |
| 362 |
|
| | | | | | | | | |
| Publicly Traded Investment Fund - 0.05% | | | | | | | | |
| THL Credit Inc | — |
| — |
| — |
| — |
| 8,690 |
| 122 |
| | 8,690 |
| 122 |
|
| | | | | | | | | |
| Real Estate - 0.18% | | | | | | | | |
Alexander & Baldwin Inc * | 7,818 |
| 324 |
| — |
| — |
| — |
| — |
| | 7,818 |
| 324 |
|
Altisource Residential Corp * | 1,230 |
| 32 |
| — |
| — |
| — |
| — |
| | 1,230 |
| 32 |
|
Forestar Group Inc (b),* | 810 |
| 16 |
| — |
| — |
| — |
| — |
| | 810 |
| 16 |
|
HFF Inc * | — |
| — |
| 552 |
| 20 |
| — |
| — |
| | 552 |
| 20 |
|
Kennedy-Wilson Holdings Inc * | 1,313 |
| 35 |
| — |
| — |
| — |
| — |
| | 1,313 |
| 35 |
|
St Joe Co/The (b),(c),* | — |
| — |
| 746 |
| 19 |
| — |
| — |
| | 746 |
| 19 |
|
| | | $ | 407 |
| | $ | 39 |
| | $ | — |
| | $ | 446 |
|
| REITS - 8.11% | | | | | | | | |
Acadia Realty Trust * | 3,701 |
| 104 |
| 240 |
| 7 |
| — |
| — |
| | 3,941 |
| 111 |
|
AG Mortgage Investment Trust Inc * | 607 |
| 11 |
| — |
| — |
| — |
| — |
| | 607 |
| 11 |
|
Agree Realty Corp * | 581 |
| 18 |
| — |
| — |
| — |
| — |
| | 581 |
| 18 |
|
Alexander's Inc * | — |
| — |
| 33 |
| 12 |
| — |
| — |
| | 33 |
| 12 |
|
American Assets Trust Inc * | 741 |
| 26 |
| 171 |
| 6 |
| — |
| — |
| | 912 |
| 32 |
|
American Campus Communities Inc * | 7,700 |
| 294 |
| — |
| — |
| — |
| — |
| | 7,700 |
| 294 |
|
American Capital Mortgage Investment Corp * | 1,247 |
| 25 |
| — |
| — |
| — |
| — |
| | 1,247 |
| 25 |
|
American Realty Capital Healthcare Trust Inc * | 3,539 |
| 39 |
| — |
| — |
| — |
| — |
| | 3,539 |
| 39 |
|
American Residential Properties Inc (b),* | 672 |
| 13 |
| — |
| — |
| — |
| — |
| | 672 |
| 13 |
|
Anworth Mortgage Asset Corp * | 89,335 |
| 461 |
| — |
| — |
| — |
| — |
| | 89,335 |
| 461 |
|
Apollo Commercial Real Estate Finance Inc * | 1,207 |
| 20 |
| — |
| — |
| — |
| — |
| | 1,207 |
| 20 |
|
Apollo Residential Mortgage Inc * | 688 |
| 11 |
| — |
| — |
| — |
| — |
| | 688 |
| 11 |
|
Armada Hoffler Properties Inc * | 1,800 |
| 17 |
| — |
| — |
| — |
| — |
| | 1,800 |
| 17 |
|
ARMOUR Residential REIT Inc * | 7,919 |
| 34 |
| — |
| — |
| — |
| — |
| | 7,919 |
| 34 |
|
Ashford Hospitality Prime Inc * | 5,580 |
| 96 |
| — |
| — |
| — |
| — |
| | 5,580 |
| 96 |
|
Ashford Hospitality Trust Inc * | 46,237 |
| 533 |
| — |
| — |
| — |
| — |
| | 46,237 |
| 533 |
|
Associated Estates Realty Corp * | 1,203 |
| 22 |
| — |
| — |
| — |
| — |
| | 1,203 |
| 22 |
|
Aviv REIT Inc * | 504 |
| 14 |
| — |
| — |
| — |
| — |
| | 504 |
| 14 |
|
| Brandywine Realty Trust | — |
| — |
| — |
| — |
| 49,430 |
| 771 |
| | 49,430 |
| 771 |
|
Campus Crest Communities Inc * | 1,402 |
| 12 |
| — |
| — |
| — |
| — |
| | 1,402 |
| 12 |
|
Capstead Mortgage Corp * | 61,962 |
| 815 |
| — |
| — |
| — |
| — |
| | 61,962 |
| 815 |
|
Cedar Realty Trust Inc * | 28,100 |
| 176 |
| — |
| — |
| — |
| — |
| | 28,100 |
| 176 |
|
Chambers Street Properties * | 4,952 |
| 40 |
| — |
| — |
| — |
| — |
| | 4,952 |
| 40 |
|
|
| | | | | | | | | | | | | | | | | | | | | |
COMMON STOCKS (continued) | SmallCap Value Account I Shares Held | SmallCap Value Account I Value (000's) | SmallCap Growth Account II Shares Held | SmallCap Growth Account II Value (000's) | SmallCap Blend Account Shares Held | SmallCap Blend Account Value (000's) | | Combined Portfolio Shares Held | Combined Portfolio Value (000's) |
| REITS (continued) | | | | | | | |
Chatham Lodging Trust * | 5,890 |
| $ | 129 |
| — |
| $ | — |
| — |
| $ | — |
| | 5,890 |
| $ | 129 |
|
Chesapeake Lodging Trust * | 9,859 |
| 298 |
| — |
| — |
| — |
| — |
| | 9,859 |
| 298 |
|
| Colony Financial Inc | 2,439 |
| 57 |
| — |
| — |
| 24,600 |
| 571 |
| | 27,039 |
| 628 |
|
CoreSite Realty Corp * | 11,300 |
| 374 |
| 265 |
| 9 |
| — |
| — |
| | 11,565 |
| 383 |
|
Cousins Properties Inc * | 62,893 |
| 783 |
| — |
| — |
| — |
| — |
| | 62,893 |
| 783 |
|
| CubeSmart | 3,052 |
| 56 |
| — |
| — |
| 14,000 |
| 257 |
| | 17,052 |
| 313 |
|
CyrusOne Inc * | 6,000 |
| 149 |
| — |
| — |
| — |
| — |
| | 6,000 |
| 149 |
|
CYS Investments Inc * | 19,122 |
| 173 |
| — |
| — |
| — |
| — |
| | 19,122 |
| 173 |
|
| DCT Industrial Trust Inc | 72,705 |
| 597 |
| — |
| — |
| — |
| — |
| | 72,705 |
| 597 |
|
DiamondRock Hospitality Co * | 64,940 |
| 832 |
| — |
| — |
| — |
| — |
| | 64,940 |
| 832 |
|
DuPont Fabros Technology Inc * | 1,136 |
| 31 |
| 461 |
| 12 |
| — |
| — |
| | 1,597 |
| 43 |
|
EastGroup Properties Inc * | 1,066 |
| 68 |
| 449 |
| 29 |
| — |
| — |
| | 1,515 |
| 97 |
|
| Education Realty Trust Inc | 19,210 |
| 206 |
| — |
| — |
| 20,314 |
| 218 |
| | 39,524 |
| 424 |
|
Empire State Realty Trust Inc * | — |
| — |
| 1,163 |
| 19 |
| — |
| — |
| | 1,163 |
| 19 |
|
| EPR Properties | 3,984 |
| 222 |
| — |
| — |
| 7,500 |
| 419 |
| | 11,484 |
| 641 |
|
Equity One Inc * | 1,652 |
| 39 |
| — |
| — |
| — |
| — |
| | 1,652 |
| 39 |
|
Excel Trust Inc * | 1,262 |
| 17 |
| — |
| — |
| — |
| — |
| | 1,262 |
| 17 |
|
Extra Space Storage Inc * | 3,000 |
| 160 |
| — |
| — |
| — |
| — |
| | 3,000 |
| 160 |
|
FelCor Lodging Trust Inc * | 20,547 |
| 216 |
| — |
| — |
| — |
| — |
| | 20,547 |
| 216 |
|
First Industrial Realty Trust Inc * | 39,738 |
| 749 |
| — |
| — |
| 36,960 |
| 697 |
| | 76,698 |
| 1,446 |
|
First Potomac Realty Trust * | 1,275 |
| 17 |
| — |
| — |
| — |
| — |
| | 1,275 |
| 17 |
|
Franklin Street Properties Corp * | 4,569 |
| 57 |
| — |
| — |
| — |
| — |
| | 4,569 |
| 57 |
|
Geo Group Inc/The * | 5,416 |
| 193 |
| — |
| — |
| — |
| — |
| | 5,416 |
| 193 |
|
Getty Realty Corp * | 3,419 |
| 65 |
| — |
| — |
| — |
| — |
| | 3,419 |
| 65 |
|
Gladstone Commercial Corp * | 578 |
| 10 |
| — |
| — |
| — |
| — |
| | 578 |
| 10 |
|
Glimcher Realty Trust * | — |
| — |
| 1,662 |
| 18 |
| — |
| — |
| | 1,662 |
| 18 |
|
Government Properties Income Trust * | 3,520 |
| 89 |
| — |
| — |
| — |
| — |
| | 3,520 |
| 89 |
|
Gramercy Property Trust Inc * | 2,133 |
| 13 |
| — |
| — |
| — |
| — |
| | 2,133 |
| 13 |
|
Hatteras Financial Corp * | 2,017 |
| 40 |
| — |
| — |
| — |
| — |
| | 2,017 |
| 40 |
|
Healthcare Realty Trust Inc * | 2,513 |
| 64 |
| — |
| — |
| — |
| — |
| | 2,513 |
| 64 |
|
Hersha Hospitality Trust * | 109,112 |
| 733 |
| — |
| — |
| — |
| — |
| | 109,112 |
| 733 |
|
Highwoods Properties Inc * | 2,358 |
| 99 |
| — |
| — |
| — |
| — |
| | 2,358 |
| 99 |
|
Home Properties Inc * | 1,000 |
| 64 |
| — |
| — |
| — |
| — |
| | 1,000 |
| 64 |
|
Hudson Pacific Properties Inc * | 1,098 |
| 28 |
| — |
| — |
| — |
| — |
| | 1,098 |
| 28 |
|
Inland Real Estate Corp * | 2,284 |
| 24 |
| — |
| — |
| — |
| — |
| | 2,284 |
| 24 |
|
Invesco Mortgage Capital Inc * | 2,709 |
| 47 |
| — |
| — |
| — |
| — |
| | 2,709 |
| 47 |
|
Investors Real Estate Trust * | 2,655 |
| 24 |
| — |
| — |
| — |
| — |
| | 2,655 |
| 24 |
|
iStar Financial Inc (b),* | 1,794 |
| 27 |
| — |
| — |
| — |
| — |
| | 1,794 |
| 27 |
|
| Kite Realty Group Trust | 42,940 |
| 263 |
| — |
| — |
| — |
| — |
| | 42,940 |
| 263 |
|
LaSalle Hotel Properties * | 4,175 |
| 148 |
| — |
| — |
| — |
| — |
| | 4,175 |
| 148 |
|
Lexington Realty Trust * | 4,295 |
| 47 |
| — |
| — |
| — |
| — |
| | 4,295 |
| 47 |
|
LTC Properties Inc * | 6,911 |
| 270 |
| — |
| — |
| — |
| — |
| | 6,911 |
| 270 |
|
Mack-Cali Realty Corp * | 1,853 |
| 40 |
| — |
| — |
| — |
| — |
| | 1,853 |
| 40 |
|
Medical Properties Trust Inc * | 4,577 |
| 61 |
| — |
| — |
| — |
| — |
| | 4,577 |
| 61 |
|
Monmouth Real Estate Investment Corp * | 1,727 |
| 17 |
| — |
| — |
| — |
| — |
| | 1,727 |
| 17 |
|
National Health Investors Inc * | — |
| — |
| 530 |
| 33 |
| — |
| — |
| | 530 |
| 33 |
|
| New Residential Investment Corp | 5,891 |
| 37 |
| — |
| — |
| — |
| — |
| | 5,891 |
| 37 |
|
New York Mortgage Trust Inc * | 1,652 |
| 13 |
| — |
| — |
| — |
| — |
| | 1,652 |
| 13 |
|
New York REIT Inc * | 3,681 |
| 41 |
| — |
| — |
| — |
| — |
| | 3,681 |
| 41 |
|
| NorthStar Realty Finance Corp | — |
| — |
| — |
| — |
| 32,860 |
| 571 |
| | 32,860 |
| 571 |
|
One Liberty Properties Inc * | 449 |
| 10 |
| — |
| — |
| — |
| — |
| | 449 |
| 10 |
|
Parkway Properties Inc/Md * | 19,786 |
| 409 |
| — |
| — |
| — |
| — |
| | 19,786 |
| 409 |
|
Pebblebrook Hotel Trust * | 1,595 |
| 59 |
| — |
| — |
| — |
| — |
| | 1,595 |
| 59 |
|
Pennsylvania Real Estate Investment Trust * | 5,537 |
| 104 |
| — |
| — |
| — |
| — |
| | 5,537 |
| 104 |
|
PennyMac Mortgage Investment Trust * | 19,846 |
| 435 |
| — |
| — |
| — |
| — |
| | 19,846 |
| 435 |
|
Potlatch Corp * | 14,700 |
| 609 |
| 523 |
| 22 |
| — |
| — |
| | 15,223 |
| 631 |
|
PS Business Parks Inc * | 252 |
| 21 |
| 158 |
| 13 |
| — |
| — |
| | 410 |
| 34 |
|
RAIT Financial Trust * | 29,479 |
| 244 |
| — |
| — |
| — |
| — |
| | 29,479 |
| 244 |
|
Ramco-Gershenson Properties Trust * | 7,181 |
| 120 |
| — |
| — |
| — |
| — |
| | 7,181 |
| 120 |
|
Redwood Trust Inc * | 33,764 |
| 657 |
| — |
| — |
| — |
| — |
| | 33,764 |
| 657 |
|
Resource Capital Corp * | 3,300 |
| 19 |
| — |
| — |
| — |
| — |
| | 3,300 |
| 19 |
|
Retail Opportunity Investments Corp * | 1,896 |
| 30 |
| — |
| — |
| — |
| — |
| | 1,896 |
| 30 |
|
| RLJ Lodging Trust | 3,502 |
| 101 |
| — |
| — |
| 25,130 |
| 726 |
| | 28,632 |
| 827 |
|
Rouse Properties Inc * | 2,875 |
| 49 |
| — |
| — |
| — |
| — |
| | 2,875 |
| 49 |
|
Ryman Hospitality Properties Inc * | 553 |
| 27 |
| 358 |
| 17 |
| — |
| — |
| | 911 |
| 44 |
|
Sabra Health Care REIT Inc * | 102 |
| 3 |
| 713 |
| 21 |
| — |
| — |
| | 815 |
| 24 |
|
Saul Centers Inc * | — |
| — |
| 185 |
| 9 |
| — |
| — |
| | 185 |
| 9 |
|
Select Income REIT * | 963 |
| 29 |
| — |
| — |
| — |
| — |
| | 963 |
| 29 |
|
Silver Bay Realty Trust Corp * | 803 |
| 13 |
| — |
| — |
| — |
| — |
| | 803 |
| 13 |
|
|
| | | | | | | | | | | | | | | | | | | | | |
COMMON STOCKS (continued) | SmallCap Value Account I Shares Held | SmallCap Value Account I Value (000's) | SmallCap Growth Account II Shares Held | SmallCap Growth Account II Value (000's) | SmallCap Blend Account Shares Held | SmallCap Blend Account Value (000's) | | Combined Portfolio Shares Held | Combined Portfolio Value (000's) |
| REITS (continued) | | | | | | | |
Sovran Self Storage Inc * | 156 |
| $ | 12 |
| 453 |
| $ | 35 |
| — |
| $ | — |
| | 609 |
| $ | 47 |
|
STAG Industrial Inc * | 962 |
| 23 |
| — |
| — |
| — |
| — |
| | 962 |
| 23 |
|
Starwood Waypoint Residential Trust (b),* | 817 |
| 21 |
| — |
| — |
| — |
| — |
| | 817 |
| 21 |
|
Strategic Hotels & Resorts Inc (b),* | 1,208 |
| 14 |
| 2,404 |
| 28 |
| 22,637 |
| 265 |
| | 26,249 |
| 307 |
|
Summit Hotel Properties Inc * | 2,112 |
| 22 |
| — |
| — |
| — |
| — |
| | 2,112 |
| 22 |
|
Sun Communities Inc * | 2,600 |
| 130 |
| 517 |
| 26 |
| — |
| — |
| | 3,117 |
| 156 |
|
| Sunstone Hotel Investors Inc | 38,402 |
| 574 |
| — |
| — |
| 48,300 |
| 721 |
| | 86,702 |
| 1,295 |
|
Terreno Realty Corp * | 697 |
| 13 |
| — |
| — |
| — |
| — |
| | 697 |
| 13 |
|
UMH Properties Inc * | 540 |
| 5 |
| — |
| — |
| — |
| — |
| | 540 |
| 5 |
|
Universal Health Realty Income Trust * | — |
| — |
| 274 |
| 12 |
| — |
| — |
| | 274 |
| 12 |
|
Urstadt Biddle Properties Inc * | 216 |
| 4 |
| 442 |
| 9 |
| — |
| — |
| | 658 |
| 13 |
|
Washington Real Estate Investment Trust * | 1,392 |
| 36 |
| — |
| — |
| — |
| — |
| | 1,392 |
| 36 |
|
Western Asset Mortgage Capital Corp * | 866 |
| 12 |
| — |
| — |
| — |
| — |
| | 866 |
| 12 |
|
Winthrop Realty Trust * | 7,360 |
| 113 |
| — |
| — |
| — |
| — |
| | 7,360 |
| 113 |
|
| | | $ | 14,386 |
| | $ | 337 |
| | $ | 5,216 |
| | $ | 19,939 |
|
| Retail - 7.37% | | | | | | | | |
American Eagle Outfitters Inc * | 4,063 |
| 46 |
| — |
| — |
| — |
| — |
| | 4,063 |
| 46 |
|
America's Car-Mart Inc/TX (b),* | 236 |
| 9 |
| — |
| — |
| — |
| — |
| | 236 |
| 9 |
|
ANN Inc (b),* | — |
| — |
| 685 |
| 28 |
| — |
| — |
| | 685 |
| 28 |
|
Asbury Automotive Group Inc (b),* | — |
| — |
| 450 |
| 31 |
| — |
| — |
| | 450 |
| 31 |
|
Barnes & Noble Inc (b),* | 47,948 |
| 1,093 |
| — |
| — |
| — |
| — |
| | 47,948 |
| 1,093 |
|
Biglari Holdings Inc (b),* | 35 |
| 15 |
| — |
| — |
| — |
| — |
| | 35 |
| 15 |
|
BJ's Restaurants Inc (b),* | 433 |
| 15 |
| — |
| — |
| — |
| — |
| | 433 |
| 15 |
|
Bloomin' Brands Inc (b),* | — |
| — |
| 1,136 |
| 26 |
| — |
| — |
| | 1,136 |
| 26 |
|
Bob Evans Farms Inc (c),* | 477 |
| 24 |
| — |
| — |
| — |
| — |
| | 477 |
| 24 |
|
Brown Shoe Co Inc * | 10,118 |
| 290 |
| 478 |
| 14 |
| 31,310 |
| 896 |
| | 41,906 |
| 1,200 |
|
Buckle Inc/The * | — |
| — |
| 406 |
| 18 |
| — |
| — |
| | 406 |
| 18 |
|
Buffalo Wild Wings Inc (b),* | — |
| — |
| 272 |
| 45 |
| — |
| — |
| | 272 |
| 45 |
|
Build-A-Bear Workshop Inc (b),* | 1,400 |
| 19 |
| 200 |
| 3 |
| — |
| — |
| | 1,600 |
| 22 |
|
Burlington Stores Inc (b),* | 111 |
| 4 |
| 376 |
| 12 |
| — |
| — |
| | 487 |
| 16 |
|
Casey's General Stores Inc * | — |
| — |
| 556 |
| 39 |
| — |
| — |
| | 556 |
| 39 |
|
Cash America International Inc * | 14,493 |
| 644 |
| — |
| — |
| — |
| — |
| | 14,493 |
| 644 |
|
Cato Corp/The * | 3,032 |
| 93 |
| 130 |
| 4 |
| — |
| — |
| | 3,162 |
| 97 |
|
Cheesecake Factory Inc/The * | — |
| — |
| 774 |
| 36 |
| — |
| — |
| | 774 |
| 36 |
|
Children's Place Inc/The * | 7,633 |
| 378 |
| — |
| — |
| — |
| — |
| | 7,633 |
| 378 |
|
Christopher & Banks Corp (b),* | — |
| — |
| 41,674 |
| 365 |
| — |
| — |
| | 41,674 |
| 365 |
|
Chuy's Holdings Inc (b),* | — |
| — |
| 7,773 |
| 282 |
| — |
| — |
| | 7,773 |
| 282 |
|
Citi Trends Inc (b),* | 555 |
| 12 |
| — |
| — |
| — |
| — |
| | 555 |
| 12 |
|
Conn's Inc (b),(c),* | — |
| — |
| 351 |
| 17 |
| 11,630 |
| 574 |
| | 11,981 |
| 591 |
|
Cracker Barrel Old Country Store Inc * | 1,443 |
| 143 |
| 228 |
| 23 |
| — |
| — |
| | 1,671 |
| 166 |
|
Denny's Corp (b),* | 773 |
| 5 |
| 1,683 |
| 11 |
| — |
| — |
| | 2,456 |
| 16 |
|
Destination Maternity Corp * | 3,024 |
| 69 |
| 43 |
| 1 |
| — |
| — |
| | 3,067 |
| 70 |
|
Dillard's Inc * | 2,600 |
| 303 |
| — |
| — |
| — |
| — |
| | 2,600 |
| 303 |
|
DineEquity Inc * | 244 |
| 19 |
| 148 |
| 12 |
| — |
| — |
| | 392 |
| 31 |
|
Diversified Restaurant Holdings Inc (b),(c),* | — |
| — |
| 16,175 |
| 77 |
| — |
| — |
| | 16,175 |
| 77 |
|
Einstein Noah Restaurant Group Inc * | — |
| — |
| 212 |
| 3 |
| — |
| — |
| | 212 |
| 3 |
|
Express Inc (b),* | 1,917 |
| 33 |
| — |
| — |
| — |
| — |
| | 1,917 |
| 33 |
|
Ezcorp Inc (b),* | 4,440 |
| 51 |
| — |
| — |
| — |
| — |
| | 4,440 |
| 51 |
|
Famous Dave's of America Inc (b),* | — |
| — |
| 106 |
| 3 |
| — |
| — |
| | 106 |
| 3 |
|
Fiesta Restaurant Group Inc (b),* | — |
| — |
| 326 |
| 15 |
| — |
| — |
| | 326 |
| 15 |
|
Finish Line Inc/The * | 781 |
| 23 |
| 274 |
| 8 |
| — |
| — |
| | 1,055 |
| 31 |
|
First Cash Financial Services Inc (b),* | — |
| — |
| 374 |
| 22 |
| — |
| — |
| | 374 |
| 22 |
|
Five Below Inc (b),* | — |
| — |
| 7,643 |
| 305 |
| — |
| — |
| | 7,643 |
| 305 |
|
Francesca's Holdings Corp (b),* | — |
| — |
| 955 |
| 14 |
| — |
| — |
| | 955 |
| 14 |
|
Fred's Inc * | 911 |
| 14 |
| — |
| — |
| — |
| — |
| | 911 |
| 14 |
|
Genesco Inc (b),* | 529 |
| 43 |
| 48 |
| 4 |
| — |
| — |
| | 577 |
| 47 |
|
Group 1 Automotive Inc * | 478 |
| 40 |
| 100 |
| 8 |
| — |
| — |
| | 578 |
| 48 |
|
Guess? Inc * | 9,800 |
| 264 |
| — |
| — |
| — |
| — |
| | 9,800 |
| 264 |
|
Haverty Furniture Cos Inc * | 724 |
| 18 |
| — |
| — |
| — |
| — |
| | 724 |
| 18 |
|
Hibbett Sports Inc (b),* | — |
| — |
| 377 |
| 20 |
| — |
| — |
| | 377 |
| 20 |
|
HSN Inc * | — |
| — |
| 491 |
| 29 |
| — |
| — |
| | 491 |
| 29 |
|
Jack in the Box Inc * | — |
| — |
| 12,817 |
| 767 |
| — |
| — |
| | 12,817 |
| 767 |
|
Kate Spade & Co (b),* | — |
| — |
| 11,430 |
| 436 |
| — |
| — |
| | 11,430 |
| 436 |
|
Kirkland's Inc (b),* | 8,353 |
| 155 |
| — |
| — |
| 12,181 |
| 226 |
| | 20,534 |
| 381 |
|
Krispy Kreme Doughnuts Inc (b),* | — |
| — |
| 950 |
| 15 |
| — |
| — |
| | 950 |
| 15 |
|
|
| | | | | | | | | | | | | | | | | | | | | |
COMMON STOCKS (continued) | SmallCap Value Account I Shares Held | SmallCap Value Account I Value (000's) | SmallCap Growth Account II Shares Held | SmallCap Growth Account II Value (000's) | SmallCap Blend Account Shares Held | SmallCap Blend Account Value (000's) | | Combined Portfolio Shares Held | Combined Portfolio Value (000's) |
| Retail (continued) | | | | | | | |
Lands' End Inc (b),(c),* | 398 |
| $ | 13 |
| — |
| $ | — |
| — |
| $ | — |
| | 398 |
| $ | 13 |
|
Lithia Motors Inc * | — |
| — |
| 8,116 |
| 764 |
| — |
| — |
| | 8,116 |
| 764 |
|
Lumber Liquidators Holdings Inc (b),* | — |
| — |
| 3,703 |
| 282 |
| — |
| — |
| | 3,703 |
| 282 |
|
MarineMax Inc (b),* | 893 |
| 15 |
| 23,767 |
| 398 |
| — |
| — |
| | 24,660 |
| 413 |
|
Mattress Firm Holding Corp (b),(c),* | — |
| — |
| 221 |
| 11 |
| — |
| — |
| | 221 |
| 11 |
|
Men's Wearhouse Inc * | 237 |
| 13 |
| 562 |
| 31 |
| — |
| — |
| | 799 |
| 44 |
|
Michaels Cos Inc/The (b),* | 3,100 |
| 53 |
| — |
| — |
| — |
| — |
| | 3,100 |
| 53 |
|
Office Depot Inc (b),* | 12,934 |
| 74 |
| — |
| — |
| 171,666 |
| 977 |
| | 184,600 |
| 1,051 |
|
Pantry Inc/The (b),* | 20,600 |
| 334 |
| — |
| — |
| — |
| — |
| | 20,600 |
| 334 |
|
Papa John's International Inc * | — |
| — |
| 465 |
| 20 |
| — |
| — |
| | 465 |
| 20 |
|
PC Connection Inc * | 331 |
| 7 |
| — |
| — |
| — |
| — |
| | 331 |
| 7 |
|
| Penske Automotive Group Inc | — |
| — |
| 10,410 |
| 515 |
| 12,585 |
| 623 |
| | 22,995 |
| 1,138 |
|
Pep Boys-Manny Moe & Jack/The (b),* | 1,123 |
| 13 |
| — |
| — |
| — |
| — |
| | 1,123 |
| 13 |
|
PetMed Express Inc (c),* | — |
| — |
| 477 |
| 6 |
| — |
| — |
| | 477 |
| 6 |
|
Pier 1 Imports Inc * | — |
| — |
| 1,390 |
| 21 |
| — |
| — |
| | 1,390 |
| 21 |
|
Popeyes Louisiana Kitchen Inc (b),* | — |
| — |
| 346 |
| 15 |
| — |
| — |
| | 346 |
| 15 |
|
PriceSmart Inc * | — |
| — |
| 267 |
| 23 |
| — |
| — |
| | 267 |
| 23 |
|
Red Robin Gourmet Burgers Inc (b),* | — |
| — |
| 7,999 |
| 570 |
| 7,324 |
| 521 |
| | 15,323 |
| 1,091 |
|
Regis Corp * | 1,021 |
| 14 |
| — |
| — |
| — |
| — |
| | 1,021 |
| 14 |
|
Restoration Hardware Holdings Inc (b),* | — |
| — |
| 446 |
| 42 |
| — |
| — |
| | 446 |
| 42 |
|
Rite Aid Corp (b),* | 128,200 |
| 919 |
| — |
| — |
| 152,120 |
| 1,091 |
| | 280,320 |
| 2,010 |
|
Roundy's Inc * | 18,600 |
| 103 |
| — |
| — |
| — |
| — |
| | 18,600 |
| 103 |
|
Rush Enterprises Inc - Class A (b),* | — |
| — |
| 364 |
| 13 |
| — |
| — |
| | 364 |
| 13 |
|
Ruth's Hospitality Group Inc * | 21,266 |
| 263 |
| 523 |
| 6 |
| — |
| — |
| | 21,789 |
| 269 |
|
Shoe Carnival Inc * | 560 |
| 12 |
| — |
| — |
| — |
| — |
| | 560 |
| 12 |
|
Sonic Automotive Inc * | 964 |
| 26 |
| — |
| — |
| — |
| — |
| | 964 |
| 26 |
|
Sonic Corp (b),* | 582 |
| 13 |
| 648 |
| 14 |
| — |
| — |
| | 1,230 |
| 27 |
|
Stage Stores Inc * | 758 |
| 14 |
| — |
| — |
| — |
| — |
| | 758 |
| 14 |
|
Susser Holdings Corp (b),* | — |
| — |
| 231 |
| 19 |
| — |
| — |
| | 231 |
| 19 |
|
Systemax Inc (b),* | 4,217 |
| 61 |
| — |
| — |
| — |
| — |
| | 4,217 |
| 61 |
|
Texas Roadhouse Inc * | — |
| — |
| 907 |
| 24 |
| — |
| — |
| | 907 |
| 24 |
|
Tile Shop Holdings Inc (b),(c),* | — |
| — |
| 38,484 |
| 588 |
| — |
| — |
| | 38,484 |
| 588 |
|
Tilly's Inc (b),* | — |
| — |
| 17,815 |
| 143 |
| — |
| — |
| | 17,815 |
| 143 |
|
Tuesday Morning Corp (b),* | 294 |
| 5 |
| 799 |
| 14 |
| — |
| — |
| | 1,093 |
| 19 |
|
Vera Bradley Inc (b),(c),* | — |
| — |
| 512 |
| 11 |
| — |
| — |
| | 512 |
| 11 |
|
Vitamin Shoppe Inc (b),* | 370 |
| 16 |
| 228 |
| 10 |
| — |
| — |
| | 598 |
| 26 |
|
| Wendy's Co/The | — |
| — |
| — |
| — |
| 74,380 |
| 634 |
| | 74,380 |
| 634 |
|
West Marine Inc (b),* | 656 |
| 7 |
| — |
| — |
| — |
| — |
| | 656 |
| 7 |
|
World Fuel Services Corp * | 2,000 |
| 98 |
| — |
| — |
| — |
| — |
| | 2,000 |
| 98 |
|
Zoe's Kitchen Inc (b),(c),* | 2,400 |
| 83 |
| — |
| — |
| — |
| — |
| | 2,400 |
| 83 |
|
Zumiez Inc (b),* | 13,154 |
| 363 |
| 373 |
| 10 |
| — |
| — |
| | 13,527 |
| 373 |
|
| | | $ | 6,341 |
| | $ | 6,243 |
| | $ | 5,542 |
| | $ | 18,126 |
|
| Savings & Loans - 1.21% | | | | | | | | |
Astoria Financial Corp * | 2,201 |
| 30 |
| — |
| — |
| — |
| — |
| | 2,201 |
| 30 |
|
B of I Holding Inc (b),* | — |
| — |
| 200 |
| 15 |
| — |
| — |
| | 200 |
| 15 |
|
Bank Mutual Corp * | 1,812 |
| 10 |
| — |
| — |
| — |
| — |
| | 1,812 |
| 10 |
|
BankFinancial Corp * | 2,069 |
| 23 |
| — |
| — |
| — |
| — |
| | 2,069 |
| 23 |
|
BBX Capital Corp (b),* | 309 |
| 6 |
| — |
| — |
| — |
| — |
| | 309 |
| 6 |
|
Berkshire Hills Bancorp Inc * | 2,713 |
| 63 |
| — |
| — |
| — |
| — |
| | 2,713 |
| 63 |
|
Brookline Bancorp Inc * | 1,690 |
| 16 |
| — |
| — |
| — |
| — |
| | 1,690 |
| 16 |
|
Capitol Federal Financial Inc * | 3,729 |
| 45 |
| — |
| — |
| — |
| — |
| | 3,729 |
| 45 |
|
Charter Financial Corp/MD * | 7,300 |
| 81 |
| — |
| — |
| — |
| — |
| | 7,300 |
| 81 |
|
Dime Community Bancshares Inc * | 796 |
| 13 |
| — |
| — |
| — |
| — |
| | 796 |
| 13 |
|
ESB Financial Corp * | 464 |
| 6 |
| — |
| — |
| — |
| — |
| | 464 |
| 6 |
|
EverBank Financial Corp * | 1,903 |
| 38 |
| — |
| — |
| — |
| — |
| | 1,903 |
| 38 |
|
First Defiance Financial Corp * | 3,062 |
| 87 |
| — |
| — |
| — |
| — |
| | 3,062 |
| 87 |
|
First Financial Northwest Inc * | 570 |
| 6 |
| — |
| — |
| — |
| — |
| | 570 |
| 6 |
|
First Niagara Financial Group Inc * | 10,546 |
| 92 |
| — |
| — |
| — |
| — |
| | 10,546 |
| 92 |
|
Flagstar Bancorp Inc (b),* | 42,300 |
| 766 |
| — |
| — |
| — |
| — |
| | 42,300 |
| 766 |
|
Flushing Financial Corp * | 4,649 |
| 95 |
| — |
| — |
| — |
| — |
| | 4,649 |
| 95 |
|
Fox Chase Bancorp Inc * | 464 |
| 8 |
| — |
| — |
| — |
| — |
| | 464 |
| 8 |
|
HomeStreet Inc * | 11,400 |
| 209 |
| — |
| — |
| — |
| — |
| | 11,400 |
| 209 |
|
HomeTrust Bancshares Inc (b),* | 791 |
| 12 |
| — |
| — |
| — |
| — |
| | 791 |
| 12 |
|
Investors Bancorp Inc * | 6,592 |
| 73 |
| — |
| — |
| — |
| — |
| | 6,592 |
| 73 |
|
Meridian Interstate Bancorp Inc (b) | — |
| — |
| 187 |
| 5 |
| — |
| — |
| | 187 |
| 5 |
|
Northfield Bancorp Inc * | 1,136 |
| 15 |
| — |
| — |
| — |
| — |
| | 1,136 |
| 15 |
|
|
| | | | | | | | | | | | | | | | | | | | | |
COMMON STOCKS (continued) | SmallCap Value Account I Shares Held | SmallCap Value Account I Value (000's) | SmallCap Growth Account II Shares Held | SmallCap Growth Account II Value (000's) | SmallCap Blend Account Shares Held | SmallCap Blend Account Value (000's) | | Combined Portfolio Shares Held | Combined Portfolio Value (000's) |
| Savings & Loans (continued) | | | | | | | |
Northwest Bancshares Inc * | 2,340 |
| $ | 32 |
| — |
| $ | — |
| — |
| $ | — |
| | 2,340 |
| $ | 32 |
|
OceanFirst Financial Corp * | 2,827 |
| 47 |
| — |
| — |
| — |
| — |
| | 2,827 |
| 47 |
|
Oritani Financial Corp * | 1,183 |
| 18 |
| — |
| — |
| 15,312 |
| 236 |
| | 16,495 |
| 254 |
|
Pacific Premier Bancorp Inc (b),* | — |
| — |
| 15,297 |
| 215 |
| — |
| — |
| | 15,297 |
| 215 |
|
| Provident Financial Services Inc | 6,111 |
| 106 |
| — |
| — |
| 18,550 |
| 321 |
| | 24,661 |
| 427 |
|
Sterling Bancorp/DE * | 2,111 |
| 25 |
| — |
| — |
| — |
| — |
| | 2,111 |
| 25 |
|
Territorial Bancorp Inc * | 410 |
| 9 |
| — |
| — |
| — |
| — |
| | 410 |
| 9 |
|
United Financial Bancorp Inc * | 926 |
| 13 |
| 190 |
| 3 |
| — |
| — |
| | 1,116 |
| 16 |
|
Washington Federal Inc * | 2,461 |
| 55 |
| — |
| — |
| — |
| — |
| | 2,461 |
| 55 |
|
WSFS Financial Corp * | 2,598 |
| 192 |
| — |
| — |
| — |
| — |
| | 2,598 |
| 192 |
|
| | | $ | 2,191 |
| | $ | 238 |
| | $ | 557 |
| | $ | 2,986 |
|
| Semiconductors - 2.46% | | | | | | | | |
Alpha & Omega Semiconductor Ltd (b),* | 17,541 |
| 163 |
| — |
| — |
| — |
| — |
| | 17,541 |
| 163 |
|
Ambarella Inc (b),* | — |
| — |
| 439 |
| 14 |
| — |
| — |
| | 439 |
| 14 |
|
Amkor Technology Inc (b),* | 44,316 |
| 495 |
| 1,004 |
| 11 |
| — |
| — |
| | 45,320 |
| 506 |
|
Applied Micro Circuits Corp (b),* | — |
| — |
| 937 |
| 10 |
| — |
| — |
| | 937 |
| 10 |
|
Brooks Automation Inc * | 1,606 |
| 17 |
| — |
| — |
| — |
| — |
| | 1,606 |
| 17 |
|
Cabot Microelectronics Corp (b),* | 141 |
| 6 |
| 301 |
| 13 |
| — |
| — |
| | 442 |
| 19 |
|
Cascade Microtech Inc (b),* | 430 |
| 6 |
| — |
| — |
| — |
| — |
| | 430 |
| 6 |
|
Cavium Inc (b),* | — |
| — |
| 11,980 |
| 595 |
| — |
| — |
| | 11,980 |
| 595 |
|
CEVA Inc (b),* | 846 |
| 12 |
| — |
| — |
| — |
| — |
| | 846 |
| 12 |
|
Cirrus Logic Inc (b),* | 7,307 |
| 167 |
| 418 |
| 10 |
| — |
| — |
| | 7,725 |
| 177 |
|
Cypress Semiconductor Corp (b),* | — |
| — |
| 2,024 |
| 22 |
| — |
| — |
| | 2,024 |
| 22 |
|
Diodes Inc (b),* | 415 |
| 12 |
| 416 |
| 12 |
| — |
| — |
| | 831 |
| 24 |
|
DSP Group Inc (b),* | 743 |
| 6 |
| — |
| — |
| — |
| — |
| | 743 |
| 6 |
|
Emulex Corp (b),* | 3,050 |
| 17 |
| — |
| — |
| — |
| — |
| | 3,050 |
| 17 |
|
Entegris Inc (b),* | 1,466 |
| 20 |
| 1,146 |
| 16 |
| 64,410 |
| 885 |
| | 67,022 |
| 921 |
|
Fairchild Semiconductor International Inc (b),* | 2,950 |
| 46 |
| — |
| — |
| — |
| — |
| | 2,950 |
| 46 |
|
First Solar Inc (b),* | 8,000 |
| 568 |
| — |
| — |
| — |
| — |
| | 8,000 |
| 568 |
|
GT Advanced Technologies Inc (b),(c),* | — |
| — |
| 1,733 |
| 32 |
| — |
| — |
| | 1,733 |
| 32 |
|
Hittite Microwave Corp * | — |
| — |
| 399 |
| 31 |
| — |
| — |
| | 399 |
| 31 |
|
Inphi Corp (b),* | — |
| — |
| 24,267 |
| 356 |
| — |
| — |
| | 24,267 |
| 356 |
|
Integrated Device Technology Inc (b),* | 838 |
| 13 |
| 1,246 |
| 19 |
| — |
| — |
| | 2,084 |
| 32 |
|
Integrated Silicon Solution Inc (b),* | 19,333 |
| 286 |
| — |
| — |
| — |
| — |
| | 19,333 |
| 286 |
|
International Rectifier Corp (b),* | 1,662 |
| 46 |
| — |
| — |
| — |
| — |
| | 1,662 |
| 46 |
|
Intersil Corp * | 2,692 |
| 40 |
| — |
| — |
| — |
| — |
| | 2,692 |
| 40 |
|
IPG Photonics Corp (b),(c),* | — |
| — |
| 3,462 |
| 238 |
| — |
| — |
| | 3,462 |
| 238 |
|
IXYS Corp * | 1,703 |
| 21 |
| — |
| — |
| — |
| — |
| | 1,703 |
| 21 |
|
Lattice Semiconductor Corp (b),* | — |
| — |
| 1,752 |
| 14 |
| — |
| — |
| | 1,752 |
| 14 |
|
Microsemi Corp (b),* | 720 |
| 19 |
| 22,175 |
| 594 |
| — |
| — |
| | 22,895 |
| 613 |
|
MKS Instruments Inc * | 10,071 |
| 315 |
| — |
| — |
| — |
| — |
| | 10,071 |
| 315 |
|
Monolithic Power Systems Inc * | — |
| — |
| 575 |
| 24 |
| — |
| — |
| | 575 |
| 24 |
|
OmniVision Technologies Inc (b),* | 1,264 |
| 28 |
| — |
| — |
| — |
| — |
| | 1,264 |
| 28 |
|
Pericom Semiconductor Corp (b),* | 6,582 |
| 60 |
| — |
| — |
| — |
| — |
| | 6,582 |
| 60 |
|
Photronics Inc (b),* | 1,555 |
| 13 |
| — |
| — |
| — |
| — |
| | 1,555 |
| 13 |
|
Pixelworks Inc (b),* | — |
| — |
| 9,850 |
| 75 |
| — |
| — |
| | 9,850 |
| 75 |
|
PLX Technology Inc (b),* | — |
| — |
| 1,007 |
| 7 |
| — |
| — |
| | 1,007 |
| 7 |
|
PMC-Sierra Inc (b),* | 2,852 |
| 22 |
| — |
| — |
| — |
| — |
| | 2,852 |
| 22 |
|
Power Integrations Inc * | — |
| — |
| 451 |
| 26 |
| — |
| — |
| | 451 |
| 26 |
|
QLogic Corp (b),* | 2,148 |
| 22 |
| — |
| — |
| — |
| — |
| | 2,148 |
| 22 |
|
Rambus Inc (b),* | — |
| — |
| 1,446 |
| 21 |
| — |
| — |
| | 1,446 |
| 21 |
|
Rudolph Technologies Inc (b),* | 1,025 |
| 10 |
| — |
| — |
| — |
| — |
| | 1,025 |
| 10 |
|
Semtech Corp (b),* | — |
| — |
| 855 |
| 22 |
| — |
| — |
| | 855 |
| 22 |
|
Silicon Image Inc (b),* | 1,368 |
| 7 |
| 912 |
| 5 |
| — |
| — |
| | 2,280 |
| 12 |
|
Silicon Laboratories Inc (b),* | 320 |
| 16 |
| 443 |
| 22 |
| — |
| — |
| | 763 |
| 38 |
|
Tessera Technologies Inc * | 796 |
| 18 |
| — |
| — |
| — |
| — |
| | 796 |
| 18 |
|
TriQuint Semiconductor Inc (b),* | — |
| — |
| 2,175 |
| 34 |
| — |
| — |
| | 2,175 |
| 34 |
|
Ultra Clean Holdings Inc (b),* | 44,955 |
| 407 |
| 211 |
| 2 |
| — |
| — |
| | 45,166 |
| 409 |
|
Veeco Instruments Inc (b),* | 836 |
| 31 |
| — |
| — |
| — |
| — |
| | 836 |
| 31 |
|
Xcerra Corp (b),* | 3,400 |
| 31 |
| — |
| — |
| — |
| — |
| | 3,400 |
| 31 |
|
| | | $ | 2,940 |
| | $ | 2,225 |
| | $ | 885 |
| | $ | 6,050 |
|
| Software - 3.93% | | | | | | | | |
2U Inc (b),(c) | 4,000 |
| 67 |
| — |
| — |
| 18,100 |
| 304 |
| | 22,100 |
| 371 |
|
ACI Worldwide Inc (b),* | — |
| — |
| 579 |
| 32 |
| — |
| — |
| | 579 |
| 32 |
|
Actuate Corp (b),* | 6,955 |
| 33 |
| — |
| — |
| — |
| — |
| | 6,955 |
| 33 |
|
Acxiom Corp (b),* | 1,786 |
| 39 |
| — |
| — |
| 27,630 |
| 600 |
| | 29,416 |
| 639 |
|
Advent Software Inc * | 0 |
| — |
| 739 |
| 24 |
| 17,375 |
| 566 |
| | 18,114 |
| 590 |
|
Amber Road Inc (b) | 0 |
| — |
| 184 |
| 3 |
| 14,454 |
| 233 |
| | 14,638 |
| 236 |
|
American Software Inc/Georgia * | 0 |
| — |
| 568 |
| 6 |
| — |
| — |
| | 568 |
| 6 |
|
Aspen Technology Inc (b),* | 0 |
| — |
| 1,322 |
| 61 |
| 24,120 |
| 1,119 |
| | 25,442 |
| 1,180 |
|
|
| | | | | | | | | | | | | | | | | | | | | |
COMMON STOCKS (continued) | SmallCap Value Account I Shares Held | SmallCap Value Account I Value (000's) | SmallCap Growth Account II Shares Held | SmallCap Growth Account II Value (000's) | SmallCap Blend Account Shares Held | SmallCap Blend Account Value (000's) | | Combined Portfolio Shares Held | Combined Portfolio Value (000's) |
| Software - (continued) | | | | | | | |
Audience Inc (b),* | 1,200 |
| $ | 14 |
| — |
| $ | — |
| — |
| $ | — |
| | 1,200 |
| $ | 14 |
|
AVG Technologies NV (b),* | — |
| — |
| 567 |
| 11 |
| — |
| — |
| | 567 |
| 11 |
|
Avid Technology Inc (b),* | 12,200 |
| 90 |
| — |
| — |
| — |
| — |
| | 12,200 |
| 90 |
|
Blackbaud Inc * | — |
| — |
| 663 |
| 24 |
| 9,510 |
| 340 |
| | 10,173 |
| 364 |
|
Bottomline Technologies de Inc (b),* | 227 |
| 7 |
| 486 |
| 15 |
| — |
| — |
| | 713 |
| 22 |
|
Callidus Software Inc (b),* | — |
| — |
| 957 |
| 11 |
| — |
| — |
| | 957 |
| 11 |
|
CommVault Systems Inc (b),* | — |
| — |
| 676 |
| 33 |
| — |
| — |
| | 676 |
| 33 |
|
Computer Programs & Systems Inc * | — |
| — |
| 160 |
| 10 |
| — |
| — |
| | 160 |
| 10 |
|
Compuware Corp * | 67,902 |
| 678 |
| — |
| — |
| — |
| — |
| | 67,902 |
| 678 |
|
Cornerstone OnDemand Inc (b),* | — |
| — |
| 675 |
| 31 |
| — |
| — |
| | 675 |
| 31 |
|
CSG Systems International Inc * | 1,319 |
| 35 |
| 319 |
| 8 |
| — |
| — |
| | 1,638 |
| 43 |
|
Cvent Inc (b),* | — |
| — |
| 406 |
| 12 |
| — |
| — |
| | 406 |
| 12 |
|
Dealertrack Technologies Inc (b),* | — |
| — |
| 563 |
| 25 |
| — |
| — |
| | 563 |
| 25 |
|
Demandware Inc (b),* | — |
| — |
| 431 |
| 30 |
| — |
| — |
| | 431 |
| 30 |
|
Digi International Inc (b),* | 961 |
| 9 |
| — |
| — |
| — |
| — |
| | 961 |
| 9 |
|
Digital River Inc (b),* | 5,873 |
| 91 |
| — |
| — |
| — |
| — |
| | 5,873 |
| 91 |
|
Ebix Inc (c),* | 1,100 |
| 16 |
| — |
| — |
| — |
| — |
| | 1,100 |
| 16 |
|
Envestnet Inc (b),* | — |
| — |
| 489 |
| 24 |
| — |
| — |
| | 489 |
| 24 |
|
Epiq Systems Inc * | 1,129 |
| 16 |
| — |
| — |
| — |
| — |
| | 1,129 |
| 16 |
|
Everyday Health Inc (b),* | — |
| — |
| 12,337 |
| 228 |
| — |
| — |
| | 12,337 |
| 228 |
|
Fair Isaac Corp * | — |
| — |
| 521 |
| 33 |
| — |
| — |
| | 521 |
| 33 |
|
Five9 Inc (b),(c),* | 2,600 |
| 19 |
| 252 |
| 2 |
| — |
| — |
| | 2,852 |
| 21 |
|
Glu Mobile Inc (b),(c),* | — |
| — |
| 85,327 |
| 426 |
| — |
| — |
| | 85,327 |
| 426 |
|
Guidance Software Inc (b),* | — |
| — |
| 403 |
| 4 |
| — |
| — |
| | 403 |
| 4 |
|
Guidewire Software Inc (b),* | — |
| — |
| 6,881 |
| 280 |
| — |
| — |
| | 6,881 |
| 280 |
|
ICG Group Inc (b) | 760 |
| 16 |
| — |
| — |
| — |
| — |
| | 760 |
| 16 |
|
Imperva Inc (b),* | 6,400 |
| 168 |
| 3,310 |
| 87 |
| — |
| — |
| | 9,710 |
| 255 |
|
Infoblox Inc (b),* | 261 |
| 3 |
| — |
| — |
| — |
| — |
| | 261 |
| 3 |
|
Interactive Intelligence Group Inc (b),* | — |
| — |
| 225 |
| 13 |
| — |
| — |
| | 225 |
| 13 |
|
Kofax Ltd (b),* | — |
| — |
| 1,065 |
| 9 |
| — |
| — |
| | 1,065 |
| 9 |
|
ManTech International Corp/VA * | 550 |
| 16 |
| — |
| — |
| — |
| — |
| | 550 |
| 16 |
|
MedAssets Inc (b),* | — |
| — |
| 888 |
| 20 |
| 9,510 |
| 217 |
| | 10,398 |
| 237 |
|
Medidata Solutions Inc (b),* | — |
| — |
| 775 |
| 33 |
| — |
| — |
| | 775 |
| 33 |
|
MicroStrategy Inc (b),* | — |
| — |
| 130 |
| 18 |
| — |
| — |
| | 130 |
| 18 |
|
MobileIron Inc (b) | — |
| — |
| — |
| — |
| 12,109 |
| 115 |
| | 12,109 |
| 115 |
|
Monotype Imaging Holdings Inc * | — |
| — |
| 555 |
| 16 |
| — |
| — |
| | 555 |
| 16 |
|
Omnicell Inc (b),* | — |
| — |
| 490 |
| 14 |
| — |
| — |
| | 490 |
| 14 |
|
Paycom Software Inc (b),(c),* | 2,934 |
| 42 |
| — |
| — |
| — |
| — |
| | 2,934 |
| 42 |
|
PDF Solutions Inc (b),* | — |
| — |
| 13,066 |
| 278 |
| — |
| — |
| | 13,066 |
| 278 |
|
Pegasystems Inc * | — |
| — |
| 507 |
| 11 |
| — |
| — |
| | 507 |
| 11 |
|
Progress Software Corp (b),* | 1,192 |
| 29 |
| — |
| — |
| — |
| — |
| | 1,192 |
| 29 |
|
Proofpoint Inc (b),* | 800 |
| 30 |
| 21,934 |
| 822 |
| — |
| — |
| | 22,734 |
| 852 |
|
QAD Inc * | — |
| — |
| 124 |
| 3 |
| — |
| — |
| | 124 |
| 3 |
|
Qlik Technologies Inc (b),* | — |
| — |
| 18,877 |
| 427 |
| — |
| — |
| | 18,877 |
| 427 |
|
Quality Systems Inc * | — |
| — |
| 719 |
| 11 |
| — |
| — |
| | 719 |
| 11 |
|
RealPage Inc (b),* | — |
| — |
| 743 |
| 17 |
| — |
| — |
| | 743 |
| 17 |
|
Sapiens International Corp NV (b),* | 504 |
| 4 |
| — |
| — |
| — |
| — |
| | 504 |
| 4 |
|
Seachange International Inc (b),* | 1,181 |
| 10 |
| — |
| — |
| — |
| — |
| | 1,181 |
| 10 |
|
SS&C Technologies Holdings Inc (b),* | — |
| — |
| 979 |
| 43 |
| — |
| — |
| | 979 |
| 43 |
|
Synchronoss Technologies Inc (b),* | — |
| — |
| 424 |
| 15 |
| — |
| — |
| | 424 |
| 15 |
|
SYNNEX Corp (b) | 635 |
| 46 |
| 70 |
| 5 |
| 10,550 |
| 769 |
| | 11,255 |
| 820 |
|
Take-Two Interactive Software Inc (b),* | 2,120 |
| 47 |
| 173 |
| 4 |
| — |
| — |
| | 2,293 |
| 51 |
|
Tangoe Inc (b),* | — |
| — |
| 875 |
| 13 |
| — |
| — |
| | 875 |
| 13 |
|
Tyler Technologies Inc (b),* | — |
| — |
| 474 |
| 43 |
| — |
| — |
| | 474 |
| 43 |
|
Ultimate Software Group Inc/The (b),* | — |
| — |
| 4,376 |
| 605 |
| — |
| — |
| | 4,376 |
| 605 |
|
Verint Systems Inc (b),* | 106 |
| 5 |
| 767 |
| 38 |
| — |
| — |
| | 873 |
| 43 |
|
| | | $ | 1,530 |
| | $ | 3,878 |
| | $ | 4,263 |
| | $ | 9,671 |
|
| Storage & Warehousing - 0.29% | | | | | | | | |
Mobile Mini Inc * | 898 |
| 43 |
| — |
| — |
| — |
| — |
| | 898 |
| 43 |
|
Wesco Aircraft Holdings Inc (b),* | 1,056 |
| 21 |
| 32,012 |
| 639 |
| — |
| — |
| | 33,068 |
| 660 |
|
| | | $ | 64 |
| | $ | 639 |
| | $ | — |
| | $ | 703 |
|
| Supranational Bank - 0.05% | | | | | | | | |
Banco Latinoamericano de Comercio Exterior SA * | 3,929 |
| 117 |
| — |
| — |
| — |
| — |
| | 3,929 |
| 117 |
|
|
| | | | | | | | | | | | | | | | | | | | | |
COMMON STOCKS (continued) | SmallCap Value Account I Shares Held | SmallCap Value Account I Value (000's) | SmallCap Growth Account II Shares Held | SmallCap Growth Account II Value (000's) | SmallCap Blend Account Shares Held | SmallCap Blend Account Value (000's) | | Combined Portfolio Shares Held | Combined Portfolio Value (000's) |
| Telecommunications - 2.77% | | | | | | | | |
8x8 Inc (b),* | — |
| $ | — |
| 46,503 |
| $ | 376 |
| — |
| $ | — |
| | 46,503 |
| $ | 376 |
|
ADTRAN Inc * | 785 |
| 18 |
| 659 |
| 15 |
| — |
| — |
| | 1,444 |
| 33 |
|
Aerohive Networks Inc (b) | — |
| — |
| — |
| — |
| 16,410 |
| 135 |
| | 16,410 |
| 135 |
|
Alliance Fiber Optic Products Inc (c),* | — |
| — |
| 273 |
| 5 |
| — |
| — |
| | 273 |
| 5 |
|
Anixter International Inc * | 354 |
| 35 |
| 181 |
| 18 |
| — |
| — |
| | 535 |
| 53 |
|
ARRIS Group Inc (b),* | 27,400 |
| 891 |
| — |
| — |
| 34,299 |
| 1,116 |
| | 61,699 |
| 2,007 |
|
Aruba Networks Inc (b),* | — |
| — |
| 16,019 |
| 281 |
| — |
| — |
| | 16,019 |
| 281 |
|
Black Box Corp * | 617 |
| 15 |
| — |
| — |
| — |
| — |
| | 617 |
| 15 |
|
CalAmp Corp (b),* | — |
| — |
| 10,966 |
| 238 |
| — |
| — |
| | 10,966 |
| 238 |
|
Calix Inc (b),* | 1,490 |
| 12 |
| — |
| — |
| — |
| — |
| | 1,490 |
| 12 |
|
Cbeyond Inc (b),* | 972 |
| 10 |
| — |
| — |
| — |
| — |
| | 972 |
| 10 |
|
Ciena Corp (b),* | — |
| — |
| 1,334 |
| 29 |
| — |
| — |
| | 1,334 |
| 29 |
|
Cincinnati Bell Inc (b),* | 3,850 |
| 15 |
| 1,594 |
| 6 |
| — |
| — |
| | 5,444 |
| 21 |
|
Clearfield Inc (b),* | — |
| — |
| 258 |
| 4 |
| — |
| — |
| | 258 |
| 4 |
|
Comtech Telecommunications Corp * | 407 |
| 15 |
| — |
| — |
| — |
| — |
| | 407 |
| 15 |
|
Consolidated Communications Holdings Inc * | 540 |
| 12 |
| 571 |
| 13 |
| — |
| — |
| | 1,111 |
| 25 |
|
DigitalGlobe Inc (b),* | 1,588 |
| 44 |
| — |
| — |
| — |
| — |
| | 1,588 |
| 44 |
|
EarthLink Holdings Corp * | 3,679 |
| 14 |
| — |
| — |
| — |
| — |
| | 3,679 |
| 14 |
|
Enventis Corp * | — |
| — |
| 321 |
| 5 |
| — |
| — |
| | 321 |
| 5 |
|
FairPoint Communications Inc (b),(c),* | — |
| — |
| 420 |
| 6 |
| — |
| — |
| | 420 |
| 6 |
|
Finisar Corp (b),* | 213 |
| 4 |
| 1,349 |
| 27 |
| — |
| — |
| | 1,562 |
| 31 |
|
General Communication Inc (b),* | — |
| — |
| 745 |
| 8 |
| — |
| — |
| | 745 |
| 8 |
|
Globalstar Inc (b),* | 5,739 |
| 24 |
| — |
| — |
| — |
| — |
| | 5,739 |
| 24 |
|
Gogo Inc (b),* | — |
| — |
| 710 |
| 14 |
| — |
| — |
| | 710 |
| 14 |
|
GTT Communications Inc (b),* | — |
| — |
| 319 |
| 3 |
| — |
| — |
| | 319 |
| 3 |
|
Harmonic Inc (b),* | 2,438 |
| 18 |
| 294 |
| 2 |
| — |
| — |
| | 2,732 |
| 20 |
|
Hawaiian Telcom Holdco Inc (b),* | 382 |
| 11 |
| — |
| — |
| — |
| — |
| | 382 |
| 11 |
|
IDT Corp - Class B * | 2,886 |
| 50 |
| 341 |
| 6 |
| — |
| — |
| | 3,227 |
| 56 |
|
Infinera Corp (b),* | — |
| — |
| 1,406 |
| 13 |
| — |
| — |
| | 1,406 |
| 13 |
|
Inteliquent Inc * | 43,400 |
| 602 |
| 734 |
| 10 |
| — |
| — |
| | 44,134 |
| 612 |
|
Intelsat SA (b),* | 16,127 |
| 304 |
| 160 |
| 3 |
| — |
| — |
| | 16,287 |
| 307 |
|
InterDigital Inc/PA * | — |
| — |
| 610 |
| 29 |
| — |
| — |
| | 610 |
| 29 |
|
Iridium Communications Inc (b),(c),* | 1,621 |
| 14 |
| — |
| — |
| — |
| — |
| | 1,621 |
| 14 |
|
Ixia (b),* | 1,200 |
| 14 |
| 150 |
| 2 |
| — |
| — |
| | 1,350 |
| 16 |
|
KVH Industries Inc (b),* | 90 |
| 1 |
| 310 |
| 4 |
| — |
| — |
| | 400 |
| 5 |
|
Leap Wireless International Inc - Rights (b),(d),(e),* | 1,093 |
| 3 |
| 282 |
| 1 |
| — |
| — |
| | 1,375 |
| 4 |
|
LogMeIn Inc (b),* | — |
| — |
| 354 |
| 17 |
| — |
| — |
| | 354 |
| 17 |
|
Loral Space & Communications Inc (b),* | — |
| — |
| 166 |
| 12 |
| — |
| — |
| | 166 |
| 12 |
|
Lumos Networks Corp * | — |
| — |
| 366 |
| 5 |
| — |
| — |
| | 366 |
| 5 |
|
Netgear Inc (b),* | 929 |
| 32 |
| — |
| — |
| — |
| — |
| | 929 |
| 32 |
|
NeuStar Inc (b),(c),* | — |
| — |
| 820 |
| 21 |
| — |
| — |
| | 820 |
| 21 |
|
NTELOS Holdings Corp * | 341 |
| 4 |
| 362 |
| 5 |
| — |
| — |
| | 703 |
| 9 |
|
Numerex Corp (b),* | 93 |
| 1 |
| — |
| — |
| — |
| — |
| | 93 |
| 1 |
|
Oplink Communications Inc (b),* | 648 |
| 11 |
| — |
| — |
| — |
| — |
| | 648 |
| 11 |
|
Orbcomm Inc (b),* | 1,590 |
| 11 |
| 36,580 |
| 241 |
| — |
| — |
| | 38,170 |
| 252 |
|
Plantronics Inc * | 132 |
| 6 |
| 591 |
| 28 |
| 12,460 |
| 599 |
| | 13,183 |
| 633 |
|
Polycom Inc (b),* | 1,771 |
| 22 |
| 937 |
| 12 |
| — |
| — |
| | 2,708 |
| 34 |
|
Preformed Line Products Co * | 88 |
| 5 |
| — |
| — |
| — |
| — |
| | 88 |
| 5 |
|
Premiere Global Services Inc (b),* | 933 |
| 12 |
| 225 |
| 3 |
| — |
| — |
| | 1,158 |
| 15 |
|
RF Micro Devices Inc (b),* | — |
| — |
| 4,261 |
| 41 |
| 85,960 |
| 824 |
| | 90,221 |
| 865 |
|
RigNet Inc (b),* | — |
| — |
| 280 |
| 15 |
| — |
| — |
| | 280 |
| 15 |
|
Ruckus Wireless Inc (b),* | — |
| — |
| 1,100 |
| 13 |
| — |
| — |
| | 1,100 |
| 13 |
|
Shenandoah Telecommunications Co * | 90 |
| 3 |
| 513 |
| 16 |
| — |
| — |
| | 603 |
| 19 |
|
ShoreTel Inc (b),* | — |
| — |
| 1,415 |
| 9 |
| — |
| — |
| | 1,415 |
| 9 |
|
Sonus Networks Inc (b),* | — |
| — |
| 3,120 |
| 11 |
| — |
| — |
| | 3,120 |
| 11 |
|
Telenav Inc (b),* | 27,556 |
| 157 |
| — |
| — |
| — |
| — |
| | 27,556 |
| 157 |
|
Tessco Technologies Inc * | 191 |
| 6 |
| 8 |
| — |
| — |
| — |
| | 199 |
| 6 |
|
Ubiquiti Networks Inc (b),(c),* | — |
| — |
| 442 |
| 20 |
| — |
| — |
| | 442 |
| 20 |
|
| USA Mobility Inc | 826 |
| 13 |
| — |
| — |
| — |
| — |
| | 826 |
| 13 |
|
ViaSat Inc (b),* | — |
| — |
| 506 |
| 29 |
| — |
| — |
| | 506 |
| 29 |
|
Vonage Holdings Corp (b),* | 3,783 |
| 14 |
| 18,460 |
| 69 |
| — |
| — |
| | 22,243 |
| 83 |
|
West Corp * | 655 |
| 18 |
| 459 |
| 12 |
| — |
| — |
| | 1,114 |
| 30 |
|
| | | $ | 2,441 |
| | $ | 1,697 |
| | $ | 2,674 |
| | $ | 6,812 |
|
| Textiles - 0.03% | | | | | | | | |
Culp Inc * | 272 |
| 5 |
| 27 |
| — |
| — |
| — |
| | 299 |
| 5 |
|
G&K Services Inc * | 479 |
| 25 |
| — |
| — |
| — |
| — |
| | 479 |
| 25 |
|
|
| | | | | | | | | | | | | | | | | | | | | |
COMMON STOCKS (continued) | SmallCap Value Account I Shares Held | SmallCap Value Account I Value (000's) | SmallCap Growth Account II Shares Held | SmallCap Growth Account II Value (000's) | SmallCap Blend Account Shares Held | SmallCap Blend Account Value (000's) | | Combined Portfolio Shares Held | Combined Portfolio Value (000's) |
| Textiles (continued) | | | | | | | | |
UniFirst Corp/MA * | 354 |
| $ | 37 |
| — |
| $ | — |
| — |
| $ | — |
| | 354 |
| $ | 37 |
|
| | | $ | 67 |
| | $ | — |
| | $ | — |
| | $ | 67 |
|
| Transportation - 1.09% | | | | | | | | |
Air Transport Services Group Inc (b),* | 1,878 |
| 16 |
| — |
| — |
| — |
| — |
| | 1,878 |
| 16 |
|
| ArcBest Corp | 4,675 |
| 203 |
| 351 |
| 15 |
| 5,460 |
| 237 |
| | 10,486 |
| 455 |
|
Atlas Air Worldwide Holdings Inc (b),* | 562 |
| 21 |
| — |
| — |
| — |
| — |
| | 562 |
| 21 |
|
Bristow Group Inc * | 862 |
| 69 |
| — |
| — |
| — |
| — |
| | 862 |
| 69 |
|
Echo Global Logistics Inc (b),* | — |
| — |
| 533 |
| 10 |
| — |
| — |
| | 533 |
| 10 |
|
Era Group Inc (b),* | 489 |
| 14 |
| — |
| — |
| — |
| — |
| | 489 |
| 14 |
|
Forward Air Corp * | — |
| — |
| 447 |
| 22 |
| — |
| — |
| | 447 |
| 22 |
|
GasLog Ltd * | 754 |
| 24 |
| — |
| — |
| — |
| — |
| | 754 |
| 24 |
|
Heartland Express Inc * | — |
| — |
| 690 |
| 15 |
| — |
| — |
| | 690 |
| 15 |
|
HUB Group Inc (b),* | — |
| — |
| 539 |
| 27 |
| — |
| — |
| | 539 |
| 27 |
|
Knight Transportation Inc * | — |
| — |
| 870 |
| 21 |
| — |
| — |
| | 870 |
| 21 |
|
Knightsbridge Tankers Ltd * | 13,366 |
| 189 |
| — |
| — |
| — |
| — |
| | 13,366 |
| 189 |
|
Marten Transport Ltd * | 580 |
| 13 |
| 223 |
| 5 |
| — |
| — |
| | 803 |
| 18 |
|
Matson Inc * | 7,275 |
| 195 |
| 336 |
| 9 |
| — |
| — |
| | 7,611 |
| 204 |
|
Navigator Holdings Ltd (b) | — |
| — |
| — |
| — |
| 10,440 |
| 307 |
| | 10,440 |
| 307 |
|
Navios Maritime Holdings Inc * | 1,658 |
| 17 |
| — |
| — |
| — |
| — |
| | 1,658 |
| 17 |
|
Nordic American Tankers Ltd * | 1,633 |
| 16 |
| — |
| — |
| — |
| — |
| | 1,633 |
| 16 |
|
PHI Inc (b),* | 428 |
| 19 |
| 17 |
| 1 |
| — |
| — |
| | 445 |
| 20 |
|
Quality Distribution Inc (b),* | 6,300 |
| 94 |
| — |
| — |
| — |
| — |
| | 6,300 |
| 94 |
|
Roadrunner Transportation Systems Inc (b),* | — |
| — |
| 22,849 |
| 642 |
| — |
| — |
| | 22,849 |
| 642 |
|
Safe Bulkers Inc * | 1,395 |
| 14 |
| — |
| — |
| — |
| — |
| | 1,395 |
| 14 |
|
Saia Inc (b),* | — |
| — |
| 362 |
| 16 |
| — |
| — |
| | 362 |
| 16 |
|
Scorpio Bulkers Inc (b),* | 2,814 |
| 25 |
| — |
| — |
| — |
| — |
| | 2,814 |
| 25 |
|
Scorpio Tankers Inc * | 4,036 |
| 41 |
| — |
| — |
| — |
| — |
| | 4,036 |
| 41 |
|
Ship Finance International Ltd * | 1,392 |
| 26 |
| — |
| — |
| — |
| — |
| | 1,392 |
| 26 |
|
Swift Transportation Co (b),* | 7,300 |
| 184 |
| 1,081 |
| 27 |
| — |
| — |
| | 8,381 |
| 211 |
|
Teekay Tankers Ltd * | 2,368 |
| 10 |
| — |
| — |
| — |
| — |
| | 2,368 |
| 10 |
|
Universal Truckload Services Inc * | 1,600 |
| 41 |
| 126 |
| 3 |
| — |
| — |
| | 1,726 |
| 44 |
|
USA Truck Inc (b),* | 224 |
| 4 |
| — |
| — |
| — |
| — |
| | 224 |
| 4 |
|
UTI Worldwide Inc (b),* | 1,911 |
| 20 |
| — |
| — |
| — |
| — |
| | 1,911 |
| 20 |
|
Werner Enterprises Inc * | 812 |
| 21 |
| — |
| — |
| — |
| — |
| | 812 |
| 21 |
|
XPO Logistics Inc (b),(c),* | 884 |
| 25 |
| — |
| — |
| — |
| — |
| | 884 |
| 25 |
|
YRC Worldwide Inc (b),(c),* | 597 |
| 17 |
| — |
| — |
| — |
| — |
| | 597 |
| 17 |
|
| | | $ | 1,318 |
| | $ | 813 |
| | $ | 544 |
| | $ | 2,675 |
|
| Trucking & Leasing - 0.28% | | | | | | | | |
AMERCO * | 2,200 |
| 640 |
| — |
| — |
| — |
| — |
| | 2,200 |
| 640 |
|
General Finance Corp (b),* | — |
| — |
| 251 |
| 3 |
| — |
| — |
| | 251 |
| 3 |
|
Greenbrier Cos Inc/The * | — |
| — |
| 404 |
| 23 |
| — |
| — |
| | 404 |
| 23 |
|
TAL International Group Inc * | 465 |
| 21 |
| — |
| — |
| — |
| — |
| | 465 |
| 21 |
|
Textainer Group Holdings Ltd * | 301 |
| 11 |
| — |
| — |
| — |
| — |
| | 301 |
| 11 |
|
| | | $ | 672 |
| | $ | 26 |
| | $ | — |
| | $ | 698 |
|
| Water - 0.08% | | | | | | | | |
American States Water Co * | 2,855 |
| 95 |
| 76 |
| 2 |
| — |
| — |
| | 2,931 |
| 97 |
|
Artesian Resources Corp * | 1,200 |
| 27 |
| — |
| — |
| — |
| — |
| | 1,200 |
| 27 |
|
California Water Service Group * | 2,838 |
| 69 |
| — |
| — |
| — |
| — |
| | 2,838 |
| 69 |
|
SJW Corp * | — |
| — |
| 99 |
| 3 |
| — |
| — |
| | 99 |
| 3 |
|
York Water Co * | — |
| — |
| 224 |
| 5 |
| — |
| — |
| | 224 |
| 5 |
|
| | | $ | 191 |
| | $ | 10 |
| | $ | — |
| | $ | 201 |
|
| | | | | | | | | | |
| TOTAL COMMON STOCKS | | $ | 108,959 |
| | $ | 62,766 |
| | $ | 66,166 |
| | | $ | 237,891 |
|
| Total Investments | | $ | 114,466 |
| | $ | 70,212 |
| | $ | 67,763 |
| | | $ | 252,441 |
|
| Liabilities in Excess of Other Assets, Net- (2.65)% | | $ | (1,357 | ) | | $ | (5,275 | ) | | $ | 107 |
| | | $ | (6,525 | ) |
| Reorganization Costs - (0.00%) | | $ | — |
| | $ | — |
| | $ | — |
| | | $ | (59 | ) |
| TOTAL NET ASSETS - 100.00% | | $ | 113,109 |
| | $ | 64,937 |
| | $ | 67,870 |
| | | $ | 245,857 |
|
|
| |
| * | The security or a portion of the security will be disposed of in order to meet the investment objectives and strategies of the Acquiring Fund. |
| (a) | Security was purchased with the cash proceeds from securities loans. |
| (b) | Non-Income Producing Security |
| (c) | Security or a portion of the security was on loan at the end of the period. |
| (d) | Security is Illiquid |
| (e) | Fair value of these investments is determined in good faith by the Manager under procedures established and periodically reviewed by the Board of Directors. At the end of the period, the fair value of these securities totaled $3, $1 and $0 or 0.00% of net assets. |
|
| | | | | | | | | |
| Portfolio Summary (unaudited) | | | |
| Sector/Country | | SmallCap Value Account I | SmallCap Growth Account II | SmallCap Blend Account | Combined Portfolio |
| Financial | | 34.79 | % | 11.57 | % | 22.49 | % | 25.24 | % |
| Consumer, Non-cyclical | | 11.86 | % | 21.33 | % | 17.87 | % | 16.02 | % |
| Consumer, Cyclical | | 11.39 | % | 22.03 | % | 16.65 | % | 15.65 | % |
| Industrial | | 11.53 | % | 14.04 | % | 10.40 | % | 11.88 | % |
| Technology | | 6.54 | % | 11.17 | % | 10.90 | % | 8.97 | % |
| Energy | | 7.05 | % | 6.64 | % | 7.86 | % | 7.17 | % |
| Exchange Traded Funds | | 4.87 | % | 11.47 | % | 2.35 | % | 5.92 | % |
| Communications | | 4.64 | % | 5.97 | % | 7.29 | % | 5.73 | % |
| Utilities | | 5.94 | % | 0.03 | % | 2.18 | % | 3.34 | % |
| Basic Materials | | 2.46 | % | 2.98 | % | 1.85 | % | 2.43 | % |
| Diversified | | 0.03 | % | 0.89 | % | 0.00 | % | 0.25 | % |
| Government | | 0.10 | % | 0.00 | % | 0.00 | % | 0.05 | % |
| Liabilities in Excess of Other Assets, Net | | (1.20 | )% | (8.12 | )% | 0.16 | % | (2.65 | )% |
| TOTAL NET ASSETS | | 100.00 | % | 100.00 | % | 100.00 | % | 100.00 | % |
|
| | | | | | | | | | | | |
| SmallCap Value Account I | | Futures Contracts | | |
| Type | Long/Short | Contracts | Notional Value | Fair Value | Unrealized Appreciation/(Depreciation) |
| Russell 2000 Mini; September 2014 * | Long | 34 |
| $ | 3,929 |
| $ | 4,047 |
| $ | 118 |
|
| Total | | | $ | 118 |
|
| Amounts in thousands except contracts |
|
| | | | | | | | | | | | |
| SmallCap Growth Account II | | Futures Contracts | | |
| Type | Long/Short | Contracts | Notional Value | Fair Value | Unrealized Appreciation/(Depreciation) |
| Russell 2000 Mini; September 2014 * | Long | 19 |
| $ | 2,204 |
| $ | 2,262 |
| $ | 58 |
|
| Total | | | $ | 58 |
|
| Amounts in thousands except contracts |
|
| | | | | | | | | | | | |
| SmallCap Blend Account | | Futures Contracts | | |
| Type | Long/Short | Contracts | Notional Value | Fair Value | Unrealized Appreciation/(Depreciation) |
| Russell 2000 Mini; September 2014 | Long | 10 |
| $ | 1,179 |
| $ | 1,190 |
| $ | 11 |
|
| Total | | | $ | 11 |
|
| Amounts in thousands except contracts |
Pro Forma Notes to Financial Statements
June 30, 2014
(unaudited)
_________________________________________________________________________________________________________________
1. Description of the Funds
SmallCap Value Account I, SmallCap Growth Account II and SmallCap Blend Account are series of Principal Variable Contracts Funds, Inc. (the “Fund”). The Fund is registered under the Investment Company Act of 1940, as amended, as an open-end management investment company.
2. Basis of Combination
On December 9, 2014, the Board of Directors of Principal Variable Contracts Funds, Inc., SmallCap Value Account I and SmallCap Growth Account II approved an Agreement and Plan of Reorganization (the “Reorganization”) whereby, SmallCap Blend Account will acquire all the assets of SmallCap Value Account I and SmallCap Growth Account II subject to the liabilities of such Accounts, in exchange for a number of shares equal to the pro rata net assets of SmallCap Blend Account.
The Reorganization will be accounted for as a tax-free reorganization of investment companies. The pro forma combined financial statements are presented for the information of the reader and may not necessarily be representative of what the actual combined financial statements would have been had the Reorganization occurred at June 30, 2014. The unaudited pro forma schedules of investments and statements of assets and liabilities reflect the financial position of SmallCap Value Account I, SmallCap Growth Account II and SmallCap Blend Account at June 30, 2014. The unaudited pro forma statements of operations reflect the results of operations of SmallCap Value Account I, SmallCap Growth Account II and SmallCap Blend Account for the twelve months ended June 30, 2014. The statements have been derived from the Accounts’ respective books and records utilized in calculating daily net asset value at the dates indicated above for SmallCap Value Account I, SmallCap Growth Account II and SmallCap Blend Account under U.S. generally accepted accounting principles. In accordance with U.S. generally accepted accounting principles, the fair value of the assets of SmallCap Value Account I and SmallCap Growth Account II will become the cost basis of such assets transferred to SmallCap Blend Account on the date of the combination and the results of operations of SmallCap Blend Account for pre-combination periods will not be restated.
SmallCap Value Account I and SmallCap Growth Account II will pay all expenses and out-of-pocket fees incurred in connection with the Reorganization, including printing, mailing, and legal fees. These expenses and fees are expected to total $59,072. SmallCap Value Account I and SmallCap Growth Account II will pay any trading costs associated with disposing of any portfolio securities that would not be compatible with the investment objectives and strategies of SmallCap Blend Account and reinvesting the proceeds in securities that would be compatible. These trading costs are estimated to be $110,986 and $65,183 for SmallCap Value Account I and SmallCap Growth Account II, respectively. The estimated gain would be $19,008,000 ($3.82 per share) for SmallCap Value Account I and $11,556,000 ($3.27 per share) for SmallCap Growth Account II on a U.S.GAAP basis.
The pro forma schedules of investments and statements of assets and liabilities and operations should be read in conjunction with the historical financial statements of the Accounts incorporated by reference in the Statements of Additional Information.
3. Significant Accounting Policies
The preparation of financial statements in conformity with U.S. generally accepted accounting principles requires management to make estimates and assumptions that affect the reported amounts of assets and liabilities and disclosure of contingent assets and liabilities at the date of the financial statements and the reported amounts of revenues and expenses during the reporting period. Actual results could differ from those estimates. The following summarizes the significant accounting policies of the Accounts:
Security Valuation. SmallCap Value Account I, SmallCap Growth Account II and SmallCap Blend Account (the Accounts) value securities for which market quotations are readily available at market value, which is determined using the last reported sale price. If no sales are reported, as is regularly the case for some securities traded over-the-counter, securities are valued using the last reported bid price or an evaluated bid price provided by a pricing service. Pricing services use modeling techniques that incorporate security characteristics, market conditions and dealer-supplied valuations to determine an evaluated bid price. When reliable market quotations are not considered to be readily available, which may be the case, for example, with respect to restricted securities, certain debt securities, preferred stocks, and foreign securities, the investments are valued at their fair value as determined in good faith by the Manager under procedures established and periodically reviewed by the Fund’s Board of Directors.
The value of foreign securities used in computing the net asset value per share is generally determined as of the close of the foreign exchange where the security is principally traded. Events that occur after the close of the applicable foreign market or exchange but prior to the calculation of the Accounts’ net asset values are reflected in the Accounts’ net asset values and these securities are valued at fair value as determined in good faith by the Manager under procedures established and periodically reviewed by the Fund’s Board of Directors. Many factors are reviewed in the course of making a good faith determination of a security’s fair value, including, but not limited to, price movements in ADRs, futures contracts, industry indices, general indices, and foreign currencies.
Pro Forma Notes to Financial Statements
June 30, 2014
(unaudited)
_________________________________________________________________________________________________________________
3. Significant Accounting Policies (Continued)
To the extent the Accounts invest in foreign securities listed on foreign exchanges which trade on days on which the Accounts do not determine net asset values, for example weekends and other customary national U.S. holidays, the Accounts’ net asset values could be significantly affected on days when shareholders cannot purchase or redeem shares.
Certain securities issued by companies in emerging market countries may have more than one quoted valuation at any given point in time, sometimes referred to as a “local” price and a “premium” price. The premium price is often a negotiated price, which may not consistently represent a price at which a specific transaction can be effected. It is the policy of the Accounts to value such securities at prices at which it is expected those shares may be sold, and the Manager or any sub-advisor is authorized to make such determinations subject to such oversight by the Fund’s Board of Directors as may occasionally be necessary.
Currency Translation. Foreign holdings are translated to U.S. dollars using the exchange rate at the daily close of the New York Stock Exchange. The identified cost of the Accounts’ holdings is translated at approximate rates prevailing when acquired. Income and expense amounts are translated at approximate rates prevailing when received or paid, with daily accruals of such amounts reported at approximate rates prevailing at the date of valuation. Since the carrying amount of the foreign securities is determined based on the exchange rate and market values at the close of the period, it is not practicable to isolate that portion of the results of operations arising as a result of changes in the foreign exchange rates from the fluctuations arising from changes in the market prices of securities during the period.
Net realized foreign exchange gains or losses arise from sales of foreign currencies, currency gains or losses realized between trade and settlement dates on security transactions, and the difference between the amount of dividends and foreign withholding taxes recorded on the books and the U.S. dollar equivalent of the amounts actually received or paid. Net unrealized appreciation (depreciation) on translation of assets and liabilities in foreign currencies arise from changes in the exchange rate relating to assets and liabilities, other than investments in securities, purchased and held in non-U.S. denominated currencies.
Income and Investment Transactions. The Accounts record investment transactions on a trade date basis. The identified cost basis has been used in determining the net realized gain or loss from investment transactions and unrealized appreciation or depreciation of investments. The Accounts record dividend income on the ex-dividend date, except dividend income from foreign securities whereby the ex-dividend date has passed; such dividends are recorded as soon as the Accounts are informed of the ex-dividend date. Interest income is recognized on an accrual basis. Discounts and premiums on securities are accreted/amortized over the lives of the respective securities. The Accounts allocate daily all income and realized and unrealized gains or losses to each class of shares based upon the relative proportion of the value of shares outstanding of each class.
Expenses. Expenses directly attributed to a particular Account are charged to that Account. Other expenses not directly attributed to a particular Account are apportioned among the registered investment companies managed by the Manager.
Management fees are allocated daily to each class of shares based upon the relative proportion of the value of shares outstanding of each class. Expenses specifically attributable to a particular class are charged directly to such class and are included separately in the statements of operations.
Distributions to Shareholders. Dividends and distributions to shareholders of the Accounts are recorded on the ex-dividend date. Dividends and distributions to shareholders from net investment income and net realized gain from investments and foreign currency transactions are determined in accordance with federal tax regulations, which may differ from U.S. generally accepted accounting principles. These differences are primarily due to differing treatments for net operating losses, foreign currency transactions, futures contracts, certain defaulted securities, sales of Passive Foreign Investment Companies, losses deferred due to wash sales, tax straddles, mortgage-backed securities, certain preferred securities, swap agreements, and limitations imposed by Sections 381-384 of the Internal Revenue Code. Permanent book and tax basis differences are reclassified within the capital accounts based on federal tax-basis treatment; temporary differences do not require reclassification. To the extent dividends and distributions exceed current and accumulated earnings and profits for federal income tax purposes, they are reported as return of capital distributions.
Pro Forma Notes to Financial Statements
June 30, 2014
(unaudited)
_________________________________________________________________________________________________________________
3. Significant Accounting Policies (Continued)
Federal Income Taxes. No provision for federal income taxes is considered necessary because each of the Accounts intends to qualify as a “regulated investment company” under the Internal Revenue Code and intends to distribute each year substantially all of its net investment income and realized capital gains to shareholders.
Management evaluates tax positions taken or expected to be taken in the course of preparing the Accounts’ tax returns to determine whether it is “more likely than not” that each tax position would be sustained upon examination by a taxing authority based on the technical merits of the position. Tax positions not deemed to meet the more likely than not threshold would be recorded as a tax benefit or expense in the current year. During the period ended June 30, 2014, the Accounts did not record any such tax benefit or expense in the accompanying financial statements. The statute of limitations remains open for the fiscal years from 2011-2014. No examinations are in progress at this time.
4. Operating Policies
Borrowings. Pursuant to an exemptive order issued by the Securities and Exchange Commission, the Accounts and other registered investment companies managed by the Manager may participate in an interfund lending facility (“Facility”). The Facility allows the Accounts to borrow money from or loan money to the other participants. Loans under the Facility are made to handle unusual and/or unanticipated short-term cash requirements. Interest paid and received on borrowings is the average of the current repurchase agreement rate and the bank loan rate (the higher of (i) the Federal Funds Rate or (ii) the One Month LIBOR rate plus 1.00%). During the period ended June 30, 2014, SmallCap Value Account I, SmallCap Growth Account II and SmallCap Blend Account each loaned to the Facility. The interest received is included in interest on the statements of operations.
In addition, the Accounts participate with other registered investment companies managed by the Manager in an unsecured joint line of credit with a bank which allows the participants to borrow up to $75 million, collectively. Borrowings are made solely to facilitate the handling of unusual and/or unanticipated short-term cash requirements. Interest is charged to each participant, based on its borrowings, at a rate equal to the higher of the Federal Funds Rate or the One Month LIBOR rate plus 1.00%. Additionally, a commitment fee is charged at an annual rate of .08% on the amount of the line of credit. During the period ended June 30, 2014, SmallCap Blend Account borrowed against the line of credit. The interest expense associated with these borrowings is included in other expenses on the statement of operations.
Foreign Currency Contracts. The Accounts may be subject to foreign currency exchange rate risk in the normal course of pursuing such Account’s investment objective. The Accounts may use foreign currency contracts to gain exposure to, or hedge against changes in the value of foreign currencies. Certain of the Accounts enter into forward contracts to purchase or sell foreign currencies at a specified future date at a fixed exchange rate. Forward foreign currency contracts are valued at the forward rate, and are marked-to-market daily. The change in market value is recorded by the Accounts as an unrealized gain or loss. When the contract is closed, the Accounts record a realized gain or loss equal to the difference between the value of the contract at the time it was opened and the value at the time it was closed.
The use of forward foreign currency contracts does not eliminate the fluctuations in underlying prices of the Accounts’ portfolio securities, but it does establish a rate of exchange that can be achieved in the future. Although forward foreign currency contracts limit the risk of loss due to a decline in the value of the hedged currency, they also limit any potential gain that might result should the value of the currency increase. In addition, the Accounts could be exposed to risks if the counterparties to the contracts are unable to meet the terms of their contracts or if the value of the currency changes unfavorably to the U.S. dollar.
Futures Contracts. The Accounts are subject to equity price risk, interest rate risk, and foreign currency exchange rate risk in the normal course of pursuing their investment objectives. The Accounts may enter into futures contracts to hedge against changes in or to gain exposure to, change in the value of equities, interest rates and foreign currencies. Initial margin deposits are made by cash deposits or segregation of specific securities as may be required by the exchange on which the transaction was conducted. Pursuant to the contracts, an account agrees to receive from or pay to the broker, an amount of cash equal to the daily fluctuation in the value of the contract. Such receipts or payments are known as “variation margin” and are recorded by the account as a variation margin receivable or payable on futures contracts. During the period the futures contracts are open, daily changes in the value of the contracts are recognized as unrealized gains or losses. These unrealized gains or losses are included as a component of net unrealized appreciation (depreciation) of investments on the statements of assets and liabilities. When the contracts are closed, the Account recognizes a realized gain or loss equal to the difference between the proceeds from, or cost of, the closing transaction and the Account’s cost basis in the contract. There is minimal counterparty credit risk to the Accounts because futures are exchange traded and the exchange’s clearinghouse, as counterparty to all exchange traded futures, guarantees the futures against default.
Pro Forma Notes to Financial Statements
June 30, 2014
(unaudited)
_________________________________________________________________________________________________________________
4. Operating Policies (Continued)
Illiquid Securities. Illiquid securities generally cannot be sold or disposed of in the ordinary course of business (within seven calendar days) at approximately the value at which each of the Accounts has valued the investments. This may have an adverse effect on each of the Accounts’ ability to dispose of particular illiquid securities at fair market value and may limit each of the Accounts’ ability to obtain accurate market quotations for purposes of valuing the securities.
Indemnification. Under the Fund’s by-laws present and past officers, directors and employees are indemnified against certain liabilities arising out of the performance of their duties. In addition, in the normal course of business the Fund may enter into a variety of contracts that may contain representations and warranties which provide general indemnifications. The Fund’s maximum exposure under these arrangements is unknown, as this would involve future claims that may be made against the Fund.
Joint Trading Account. The Accounts may, pursuant to an exemptive order issued by the Securities and Exchange Commission, transfer uninvested funds into a joint trading account. The order permits the participating Accounts’ cash balances to be deposited into a single joint account along with the cash of other registered investment companies managed by the Manager. These balances may be invested in one or more short-term instruments or repurchase agreements that are collateralized by U.S. government securities. Earnings from the joint trading account are allocated to each of the Accounts based on their pro rata participating ownership interest in the joint trading account.
Rebates. Subject to best execution, the Accounts may direct certain portfolio transactions to brokerage firms that, in turn, have agreed to rebate a portion of the related brokerage commission to the Accounts in cash. Commission rebates are included as a component of realized gain from investment transactions in the statements of operations.
Repurchase Agreements. The Accounts may invest in repurchase agreements that are fully collateralized, typically by U.S. government or U.S. government agency securities. It is the Accounts’ policy that its custodian takes possession of the underlying collateral securities. The fair value of the collateral is at all times at least equal to the total amount of the repurchase obligation. In the event of default on the obligation to repurchase, the Accounts have the right to liquidate the collateral and apply the proceeds in satisfaction of the obligation. In the event the seller of a repurchase agreement defaults, the Accounts could experience delays in the realization of the collateral.
Restricted Securities. The Accounts may invest in securities that are subject to legal or contractual restrictions on resale. These securities generally may be resold in transactions exempt from registration or to the public if the securities are registered. Disposal of these securities may involve time-consuming negotiations and expense, and prompt sale at an acceptable price may be difficult.
Securities Lending. To earn additional income, the Accounts may lend portfolio securities to approved brokerage firms. The Accounts receive collateral, in the form of cash, against the loaned securities. During the period of the loan, the borrower must maintain collateral in an amount not less than 102% of the market value of the loaned securities. The market value of the loaned securities is determined at the close of business of the Accounts and any additional required collateral is delivered to the Accounts on the next business day. The cash collateral received is usually invested in an SEC-registered money market mutual fund and the Accounts could realize a loss on such investments. Further, the Accounts could experience a delay in recovering its securities and possible loss of income or value if the borrower fails to return them. Security lending income represents the income earned on investing cash collateral, less rebates paid to borrowers and any lending agent fees associated with the loan, plus any premium received for lending certain types of securities. Security lending income is shown in each account’s statement of operations. As of June 30, 2014, the Accounts had securities on loan as follows (in thousands):
|
| | | | | | | |
| | Market Value | | Collateral Value |
| SmallCap Growth Account II | $ | 5,143 |
| | $ | 5,299 |
|
| SmallCap Value Account I | 1,715 |
| | 1,767 |
|
Pro Forma Notes to Financial Statements
June 30, 2014
(unaudited)
_________________________________________________________________________________________________________________
4. Operating Policies (Continued)
Derivatives. The following tables provide information about where in the statements of assets and liabilities and statements of operations information about derivatives can be found (amounts shown in thousands):
|
| | | | | | | | | |
| | Asset Derivatives June 30, 2014 | | | Liability Derivatives June 30, 2014 | |
| Derivatives not accounted for as hedging instruments | Statement of Assets and Liabilities Location | Fair Value | | Statement of Assets and Liabilities Location | Fair Value |
| SmallCap Blend Account | | | | |
| Equity contracts | Receivables, Net Assets Consist of Net unrealized appreciation (depreciation) of investments | $ | 11 |
| * | Payables, Net Assets Consist of Net unrealized appreciation (depreciation) of investments | $ | — |
|
| SmallCap Growth Account II | | | | |
| Equity contracts | Receivables, Net Assets Consist of Net unrealized appreciation (depreciation) of investments | $ | 58 |
| * | Payables, Net Assets Consist of Net unrealized appreciation (depreciation) of investments | $ | — |
|
| SmallCap Value Account I | | | | |
| Equity contracts | Receivables, Net Assets Consist of Net unrealized appreciation (depreciation) of investments | $ | 118 |
| * | Payables, Net Assets Consist of Net unrealized appreciation (depreciation) of investments | $ | — |
|
| |
| * | Includes cumulative unrealized appreciation/depreciation of futures contracts as shown in the schedules of investments. Only the portion of the unrealized appreciation/depreciation not yet cash settled is shown in the statements of assets and liabilities as variation margin. |
|
| | | | | | | |
| Derivatives not accounted for as hedging instruments | Location of Gain or (Loss) on Derivatives Recognized in Operations | Realized Gain or (Loss) on Derivatives Recognized in Operations | Change in Unrealized Appreciation/(Depreciation) of Derivatives Recognized in Operations |
| SmallCap Blend Account | | |
| Equity contracts | Net realized gain (loss) from Futures contracts/Change in unrealized appreciation/(depreciation) of Futures contracts | $ | 145 |
| $ | (35 | ) |
| SmallCap Growth Account II | | |
| Equity contracts | Net realized gain (loss) from Futures contracts/Change in unrealized appreciation/(depreciation) of Futures contracts | $ | 156 |
| $ | (67 | ) |
| SmallCap Value Account I | | |
| Equity contracts | Net realized gain (loss) from Futures contracts/Change in unrealized appreciation/(depreciation) of Futures contracts | $ | 378 |
| $ | (286 | ) |
Long equity futures contracts are used to obtain market exposure for the cash balances that are maintained by the Accounts and the notional values of the futures contracts will vary in accordance with changing cash balances. The level of other derivative activity disclosed in the schedules of investments is representative of the level of derivative activity used in the Accounts throughout the year ended June 30, 2014.
Pro Forma Notes to Financial Statements
June 30, 2014
(unaudited)
_________________________________________________________________________________________________________________
5. Fair Valuation
Fair value is defined as the price that the Accounts would receive upon selling a security in a timely transaction to an independent buyer in the principal or most advantageous market of the security at the measurement date. In determining fair value, the Accounts use various valuation approaches, including market, income and/or cost approaches. A hierarchy for inputs is used in measuring fair value that maximizes the use of observable inputs and minimizes the use of unobservable inputs by requiring that the most observable inputs be used when available.
Observable inputs are inputs that reflect the assumptions market participants would use in pricing the asset or liability developed based on market data obtained from sources independent of the Accounts. Unobservable inputs are inputs that reflect the Accounts own estimates about the estimates market participants would use in pricing the asset or liability developed based on the best information available in the circumstances.
The three-tier hierarchy of inputs is summarized in the three broad levels listed below.
| |
| • | Level 1 - Quoted prices are available in active markets for identical securities as of the reporting date. The type of securities included in Level 1 includes listed equities and listed derivatives. |
| |
| • | Level 2 - Other significant observable inputs (including quoted prices for similar investments, interest rates, prepayments speeds, credit risk, etc.) Investments which are generally included in this category include corporate bonds, senior floating rate interests, and municipal bonds. |
| |
| • | Level 3 - Significant unobservable inputs (including the Accounts’ assumptions in determining the fair value of investments.) Investments which are generally included in this category include certain corporate bonds and certain mortgage backed securities. |
The availability of observable inputs can vary from security to security and is affected by a wide variety of factors, including, for example, the type of security, whether the security is new and not yet established in the market place, and other characteristics particular to the transaction. To the extent that valuation is based on models or inputs that are less observable or unobservable in the market, the determination of fair value requires more judgment. Accordingly, the degree of judgment exercised by the Accounts in determining fair value is greatest for instruments categorized in Level 3.
In certain cases, the inputs used to measure fair value may fall into different levels of the fair value hierarchy. In such cases, for disclosure purposes the level in the fair value hierarchy within which the fair value measurement in its entirety falls is determined based on the lowest level input that is significant to the fair value measurement in its entirety.
Fair value is a market based measure considered from the perspective of a market participant who holds the asset rather than an entity specific measure. Therefore, even when market assumptions are not readily available, the Account’s own assumptions are set to reflect those that market participants would use in pricing the asset or liability at the measurement date. The Accounts use prices and inputs that are current as of the measurement date.
Investments which are generally included in the Level 3 category are primarily valued using quoted prices from brokers and dealers participating in the market for these investments. These investments are classified as Level 3 investments due to the lack of market transparency and market corroboration to support these quoted prices. Valuation models may be used as the pricing source for other investments classified as Level 3. Valuation models rely on one or more significant unobservable inputs such as prepayment rates, probability of default, or loss severity in the event of default. Significant increases in any of those inputs in isolation would result in a significantly lower fair value measurement.
The fair values of these entities are dependent on economic, political and other considerations. The values of the underlying investee entities may be affected by significant changes in the economic conditions, changes in government policies, and other factors (e.g., natural disasters, accidents, conflicts, etc.)
Fair value of these investments is determined in good faith by the Manager under procedures established and periodically reviewed by the Account’s Board of Directors. The Manager has established a Valuation Committee of senior officers and employees, with the responsibility of overseeing the pricing and valuation of all securities, including securities where market quotations are not readily available. The Valuation Committee meets monthly and reports directly to the Board of Directors. The Pricing Group who reports to the Valuation Committee relies on the established Pricing Policies to determine fair valuation. Included in the Pricing Policies is an overview of the approved valuation technique established for each asset class. The Pricing Group will consider all appropriate information available when determining fair valuation.
Pro Forma Notes to Financial Statements
June 30, 2014
(unaudited)
_________________________________________________________________________________________________________________
5. Fair Valuation (continued)
The Pricing Group relies on externally provided valuation inputs to determine the value of Level 3 securities. Security values are updated as new information becomes available. Valuation data and changes in valuation amounts are reviewed on a daily basis based on specified criteria for the security, asset class, and other factors. In addition, valuation data is periodically compared to actual transactions executed by the Accounts (i.e., purchase/sales) and differences between transaction prices and prior period valuation data are investigated based on specified tolerances.
The inputs or methodology used for valuing securities are not necessarily an indication of the risk associated with investing in those instruments. For example, short-term securities held in Money Market Account are valued using amortized cost, as permitted under Rule 2a-7 of the Investment Company Act of 1940. Generally, amortized cost approximates the current fair value of these securities, but because the value is not obtained from a quoted price in an active market, such securities are reflected as Level 2.
The beginning of the period timing recognition is being adopted for the significant transfers between levels of each Account’s assets and liabilities. There were no significant transfers into or out of Level 3. In addition, there were no transfers between Levels 1 and 2 at the end of the period.
The following is a summary of the inputs used as of June 30, 2014 in valuing the Funds' securities carried at value (amounts shown in thousands):
|
| | | | | | | | |
| Fund | Level 1 - Quoted Prices | Level 2 - Other Significant Observable Inputs | Level 3 - Significant Unobservable Inputs | Totals (Level 1,2,3) |
| SmallCap Blend Account | | | | |
| Common Stocks* | $ | 66,166 | $ | — | $ | — | $ | 66,166 |
| Investment Companies | | 1,597 | | — | | — | | 1,597 |
| Total investments in securities | $ | 67,763 | $ | — | $ | — | $ | 67,763 |
| Assets | | | | |
| Equity Contracts** | | | | |
| Futures | $ | 11 | $ | — | $ | — | $ | 11 |
| |
| SmallCap Growth Account II | | | | |
| Common Stocks | | | | |
| Basic Materials | $ | 1,932 | $ | — | $ | — | $ | 1,932 |
| Communications | | 3,879 | | 1 | | — | | 3,880 |
| Consumer, Cyclical | | 14,313 | | — | | — | | 14,313 |
| Consumer, Non-cyclical | | 13,851 | | — | | — | | 13,851 |
| Diversified | | 581 | | — | | — | | 581 |
| Energy | | 4,305 | | — | | — | | 4,305 |
| Financial | | 7,507 | | — | | — | | 7,507 |
| Industrial | | 9,128 | | — | | — | | 9,128 |
| Technology | | 7,251 | | — | | — | | 7,251 |
| Utilities | | 18 | | — | | — | | 18 |
| Investment Companies | | 7,446 | | — | | — | | 7,446 |
| Total investments in securities | $ | 70,211 | $ | 1 | $ | — | $ | 70,212 |
| Assets | | | | |
| Equity Contracts** | | | | |
| Futures | $ | 58 | $ | — | $ | — | $ | 58 |
Pro Forma Notes to Financial Statements
June 30, 2014
(unaudited)
_________________________________________________________________________________________________________________
5. Fair Valuation (continued)
|
| | | | | | | | | | | |
| Fund | Level 1 - Quoted Prices | Level 2 - Other Significant Observable Inputs | Level 3 - Significant Unobservable Inputs | Totals (Level 1,2,3) |
| SmallCap Value Account I | | | | |
| Common Stocks | | | | |
| Basic Materials | $ | 2,791 |
| $ | — |
| $ | — | $ | 2,791 |
|
| Communications | | 5,246 |
| | 3 |
| | — | | 5,249 |
|
| Consumer, Cyclical | | 12,870 |
| | — |
| | — | | 12,870 |
|
| Consumer, Non-cyclical | | 13,430 |
| | — |
| | — | | 13,430 |
|
| Diversified | | 35 |
| | — |
| | — | | 35 |
|
| Energy | | 7,980 |
| | — |
| | — | | 7,980 |
|
| Financial | | 39,344 |
| | — |
| | — | | 39,344 |
|
| Government | | 117 |
| | — |
| | — | | 117 |
|
| Industrial | | 13,036 |
| | — |
| | — | | 13,036 |
|
| Technology | | 7,399 |
| | — |
| | — | | 7,399 |
|
| Utilities | | 6,708 |
| | — |
| | — | | 6,708 |
|
| Investment Companies | | 5,507 |
| | — |
| | — | | 5,507 |
|
| Total investments in securities | $ | 114,463 |
| $ | 3 |
| $ | — | $ | 114,466 |
|
| Assets | | | | |
| Equity Contracts** | | | | |
| Futures | $ | 118 |
| $ | — |
| $ | — | $ | 118 |
|
| |
| * | For additional detail regarding sector classifications, please see the Schedules of Investments |
| |
| ** | Futures and swap agreements are valued at the unrealized appreciation (depreciation) of the instrument. |
6. Capital Shares
The pro forma net asset value per share assumes issuance of shares of SmallCap Blend Account that would have been issued at June 30, 2014, in connection with the Reorganization. The number of shares assumed to be issued is equal to the net assets of SmallCap Value Account I and SmallCap Growth Account II as of June 30, 2014, divided by the net asset value per share of SmallCap Blend Account as of June 30, 2014. The pro forma number of shares outstanding, by class, for the combined Account can be found on the statement of assets and liabilities.
7. Pro Forma Adjustments
The accompanying pro forma financial statements reflect changes in Account shares as if the Reorganization had taken place on June 30, 2014. The expenses of SmallCap Value Account I and SmallCap Growth Account II were adjusted assuming the fee structure of SmallCap Blend Account was in effect for the twelve months ended June 30, 2014.
PART C
OTHER INFORMATION
Item 15. Indemnification
Under Section 2-418 of the Maryland General Corporation Law, with respect to any proceedings against a present or former director, officer, agent or employee (a "corporate representative") of the Registrant, the Registrant may indemnify the corporate representative against judgments, fines, penalties, and amounts paid in settlement, and against expenses, including attorneys' fees, if such expenses were actually incurred by the corporate representative in connection with the proceeding, unless it is established that:
(i) The act or omission of the corporate representative was material to the matter giving rise to the proceeding; and
1. Was committed in bad faith; or
2. Was the result of active and deliberate dishonesty; or
(ii) The corporate representative actually received an improper personal benefit in money, property, or services; or
(iii) In the case of any criminal proceeding, the corporate representative had reasonable cause to believe that the act or omission was unlawful.
If a proceeding is brought by or on behalf of the Registrant, however, the Registrant may not indemnify a corporate representative who has been adjudged to be liable to the Registrant. Under the Registrant's Articles of Incorporation and Bylaws, directors and officers of the Registrant are entitled to indemnification by the Registrant to the fullest extent permitted under Maryland law and the Investment Company Act of 1940. Reference is made to Article VI, Section 7 of the Registrant's Articles of Incorporation, Article 12 of the Registrant's Bylaws and Section 2-418 of the Maryland General Corporation Law.
The Registrant has agreed to indemnify, defend and hold the Distributor, its officers and directors, and any person who controls the Distributor within the meaning of Section 15 of the Securities Act of 1933, free and harmless from and against any and all claims, demands, liabilities and expenses (including the cost of investigating or defending such claims, demands or liabilities and any counsel fees incurred in connection therewith) which the Distributor, its officers, directors or any such controlling person may incur under the Securities Act of 1933, or under common law or otherwise, arising out of or based upon any untrue statement of a material fact contained in the Registrant's registration statement or prospectus or arising out of or based upon any alleged omission to state a material fact required to be stated in either thereof or necessary to make the statements in either thereof not misleading, except insofar as such claims, demands, liabilities or expenses arise out of or are based upon any such untrue statement or omission made in conformity with information furnished in writing by the Distributor to the Registrant for use in the Registrant's registration statement or prospectus: provided, however, that this indemnity agreement, to the extent that it might require indemnity of any person who is also an officer or director of the Registrant or who controls the Registrant within the meaning of Section 15 of the Securities Act of 1933, shall not inure to the benefit of such officer, director or controlling person unless a court of competent jurisdiction shall determine, or it shall have been determined by controlling precedent that such result would not be against public policy as expressed in the Securities Act of 1933, and further provided, that in no event shall anything contained herein be so construed as to protect the Distributor against any liability to the Registrant or to its security holders to which the Distributor would otherwise be subject by reason of willful misfeasance, bad faith, or gross negligence, in the performance of its duties, or by reason of its reckless disregard of its obligations under this Agreement. The Registrant's agreement to indemnify the Distributor, its officers and directors and any such controlling person as aforesaid is expressly conditioned upon the Registrant being promptly notified of any action brought against the Distributor, its officers or directors, or any such controlling person, such notification to be given by letter or telegram addressed to the Registrant.
Insofar as indemnification for liabilities arising under the Securities Act of 1933 may be permitted to directors, officers and controlling persons of the registrant pursuant to the foregoing provisions, or otherwise, the registrant has been advised that in the opinion of the Securities and Exchange Commission such indemnification is against public policy as expressed in the Act and is, therefore, unenforceable. In the event that a claim for indemnification against such liabilities (other than the payment by the registrant of expenses incurred or paid by a director, officer or controlling person of the registrant in the successful defense of any action, suit or proceeding) is asserted by such director, officer or controlling person in connection with the securities being registered, the registrant will, unless in the opinion of its counsel the matter has been settled by controlling precedent, submit to a court of appropriate jurisdiction the question whether such indemnification by it is against public policy as expressed in the Act and will be governed by the final adjudication of such issue.
Item 16. Exhibits.
Unless otherwise stated, all filing references are to File No. 033-59474
|
| | | | |
| (1) | (a) | Amendment and Restatement of the Articles of Incorporation dated 08/09/2012 – Filed as Ex-99(a)(1) on 02/14/2013 (Accession No. 0001144204-13-008876) |
| | (b) | Articles Supplementary dated 02/06/2013 - Filed as Ex-99(a)(2) on 04/18/2013 (Accession No. 0000012601-13-000026) |
| | (c) | Articles of Amendment effective 05/01/2013 - Filed as Ex-99(a)(3) on 08/16/2013 (Accession No. 0000012601-13-000132) |
| | (d) | Articles Supplementary dated 09/04/2013 - Filed as Ex-99(a)(4) on 10/31/2013 (Accession No. 0000012601-13-000180) |
| | (e) | Articles Supplementary dated 11/07/2014 - Filed as Ex-99(a)(5) on 11/12/2014 (Accession No. 0000012601-14-000231) |
| (2) | By-laws – Filed as Ex-99 (b) on 03/02/2011 (Accession No. 0000898745-11-000061) |
| (3) | N/A |
| (4) | Form of Plan of Reorganization (filed herewith as Appendix A to the Proxy Statement/Prospectus) |
| (5) | Included in Exhibits 1 and 2 hereto. |
| (6) | (a) | Amended and Restated Management Agreement dated 10/31/2013 - Filed as Ex-99(d)(1) on 10/31/2013 (Accession No. 0000012601-13-000180) |
| | (b) | (1) | Amended & Restated Sub-Advisory Agreement — Emerald dated 01/01/2010 – Filed as Ex-99(d)(8)(a) on 03/02/2011 (Accession No. 0000898745-11-000061) |
| | | (2) | Amended & Restated Sub-Advisory Agreement — JP Morgan dated 01/01/2010 – Filed as Ex-99(d)(10)(a) on 03/02/2011 (Accession No. 0000898745-11-000061) |
| | | (3) | Amended and Restated Sub-Advisory Agreement - Principal Global Investors, LLC dated 11/01/2014 - Filed as Ex-99(d)(10) on 11/12/2014 (Accession No. 0000012601-14-000231) |
| (7) | Distribution Agreement dated 12/14/2009 – Filed as Ex-99(e)(3) on 03/02/2011 (Accession No. 0000898745-11-000061) |
| (8) | N/A |
| (9) | Custody Agreement between The Bank of New York Mellon and Principal Variable Contracts Funds, Inc. dated 11/11/2011 – Filed as Ex-99(g) on 02/14/2013 (Accession No. 0001144204-13-008876) |
| (10) | Rule 12b-1 Plan |
| | (a) | Amended Distribution Plan and Agreement Class 2 Shares dated 01/01/2014 – Filed as Ex-99(m)(6) on 02/27/2014 (Accession No. 0000012601-14-000039) |
| | (b) | Amended Distribution Plan and Agreement - Class 2 Shares dated 11/25/2014 – Filed as Ex-99(m)(2) on 12/16/2014 (Accession No. 0000012601-14-000271) |
| | (c) | Form of Amended Distribution Plan and Agreement - Class 2 Shares dated _______________ – Filed as Ex-99(m)(3) on 12/16/2014 (Accession No. 0000012601-14-000271) |
| (11) | Opinion and Consent of counsel, regarding legality of issuance of shares and other matters * |
| (12) | Opinion and Consent of ______________________________ on tax matters ** |
| (13) | N/A |
| (14) | Consent of Independent Registered Public Accountants |
| | (a) | Consent of Ernst & Young LLP * |
| (15) | N/A |
| (16) | Powers of Attorney * |
| (17) | (a) | (1) | The Prospectus for Class 1 and Class 2, dated May 1, 2014, included in Post-Effective Amendment No. 90 to the registration statement on Form N-1A (File No. 002-35570) filed on April 25, 2014 (Accession No. 0000012601-14-000055) |
| | | (2) | Supplements to the Class 1 and Class 2 shares Prospectus dated and filed June 17, 2014, July 15, 2014, November 12, 2014, and December 12, 2014 |
| | (b) | (1) | Statement of Additional Information dated May 1, 2014 as amended and restated November 18, 2014, included in Post-Effective Amendment No. 93 to the registration statement on Form N-1A (File No. 002-35570) filed on November 12, 2014 (Accession No. 0000012601-14-000231) |
| | | (2) | Supplements to the Statement of Additional Information dated and filed on December 12, 2014, and January 9, 2015 |
|
| | | | |
| | (c) | Annual Report of Principal Variable Contracts Funds, Inc. for the fiscal year ended October 31, 2014 filed on Form N-CSR on February 26, 2014 (Accession No. 0000012601-14-000029) |
| | (d) | Semi-Annual Report of Principal Variable Contracts Funds, Inc. for the six-month period June 30, 2014 filed on Form N-CSRS on August 27, 2014 (Accession No. 0000012601-14-000178) |
| |
| ** | To be filed by amendment. |
Item 17. Undertakings
(1) The undersigned Registrant agrees that prior to any public reoffering of the securities registered through the use of a prospectus which is a part of this Registration Statement by any person or party who is deemed to be an underwriter within the meaning of Rule 145(c) of the Securities Act of 1933, the reoffering prospectus will contain the information called for by the applicable registration form for re-offerings by persons who may be deemed underwriters, in addition to the information called for by the other items of the applicable form.
(2) The undersigned Registrant agrees that every prospectus that is filed under paragraph (1) above will be filed as part of an amendment to the Registration Statement and will not be used until the amendment is effective, and that, in determining any liability under the Securities Act of 1933, each post-effective amendment shall be deemed to be a new registration statement for the securities offered therein, and the offering of the securities at that time shall be deemed to be the initial bona fide offering of them.
(3) The undersigned Registrant agrees to file a post-effective amendment to this Registration Statement which will include an opinion of counsel regarding the tax consequences of the proposed reorganization.
SIGNATURES
Pursuant to the requirements of the Securities Act of 1933 and the Investment Company Act of 1940, the Registrant has duly caused this Registration Statement to be signed on its behalf by the undersigned, duly authorized in the City of Des Moines and State of Iowa, on the 23rd of January, 2015.
|
| |
| | Principal Variable Contracts Funds, Inc. (Registrant)
/s/ N. M. Everett _____________________________________ N. M. Everett Chair, President and Chief Executive Officer |
| |
Attest:
/s/ Beth Wilson ______________________________________ Beth Wilson Vice President and Secretary | |
|
| | |
| Pursuant to the requirements of the Securities Act of 1933, this Registration Statement has been signed below by the following persons in the capacities and on the dates indicated. |
| Signature | Title | Date |
| | | |
/s/ N. M. Everett __________________________ N. M. Everett | Chair, President and Chief Executive Officer (Principal Executive Officer) | January 23, 2015 |
| | |
/s/ L. A. Rasmussen __________________________ L. A. Rasmussen | Vice President, Controller and Chief Financial Officer (Principal Financial Officer and Controller) | January 23, 2015 |
| | |
/s/ M. J. Beer __________________________ M. J. Beer | Executive Vice President and Director | January 23, 2015 |
| | |
(E. Ballantine)* __________________________ E. Ballantine | Director | January 23, 2015 |
| | |
(L. T. Barnes)* __________________________ L. T. Barnes | Director | January 23, 2015 |
| | |
(C. Damos)* __________________________ C. Damos | Director | January 23, 2015 |
| | |
(M. A. Grimmett)* __________________________ M. A. Grimmett | Director | January 23, 2015 |
| | |
(F. S. Hirsch)* __________________________ F. S. Hirsch | Director | January 23, 2015 |
| | |
(T. Huang)* __________________________ T. Huang | Director | January 23, 2015 |
| | |
(W. C. Kimball)* __________________________ W. C. Kimball | Director | January 23, 2015 |
| | |
(K. McMillan)* __________________________ K. McMillan | Director | January 23, 2015 |
| | |
(D. Pavelich)* __________________________ D. Pavelich | Director | January 23, 2015 |
| | |
| | /s/ M. J. Beer _______________________________ M. J. Beer Executive Vice President and Director
* Pursuant to Powers of Attorney filed herewith |
EXHIBIT INDEX
|
| |
| Exhibit No. | Description |
| 4 | Form of Plan of Reorganization (filed herewith as Appendix A to the Proxy Statement/Prospectus) |
| | |
| 11 | Opinion and Consent of counsel regarding legality of issuance of shares and other matters |
| | |
| 12 | Opinion and Consent of ________________________ - on tax matters** |
| | |
| 14(a) | Consent of Ernst & Young LLP, Independent Registered Public Accountants |
| | |
| 16(a) | Power of Attorney |
| | |
| ** to be filed by amendment |