As filed with the Securities and Exchange Commission on March 8, 2019.
Registration No. 333-________
U.S. SECURITIES AND EXCHANGE COMMISSION
WASHINGTON, D.C. 20549
FORM N-14
REGISTRATION STATEMENT UNDER THE SECURITIES ACT OF 1933 [X]
[ ] Pre-Effective Amendment No. ___
[ ] Post-Effective Amendment No. ___
PRINCIPAL VARIABLE CONTRACTS FUNDS, INC.
(Exact Name of Registrant as Specified in Charter)
711 High Street, Des Moines, Iowa 50392
(Address of Registrant's Principal Executive Offices)
515-247-5419
(Registrant's Telephone Number, Including Area Code)
Laura B. Latham
Assistant Counsel and Assistant Secretary, Principal Variable Contracts Funds, Inc.
The Principal Financial Group
Des Moines, Iowa 50392
(Name and Address of Agent for Service)
Approximate date of proposed public offering: As soon as practicable after this Registration Statement becomes effective.
Title of Securities Being Registered: Class 1 and Class 2 Shares, par value $.01 per share.
No filing fee is due because an indefinite number of shares have been registered in reliance on Section 24(f) under the Investment Company Act of 1940, as amended.
It is proposed that this filing will become effective on April 8, 2019, pursuant to Rule 488.
PRINCIPAL VARIABLE CONTRACTS FUNDS, INC.
711 High Street
Des Moines, Iowa 50392
1 (800) 222-5852
April __, 2019
Dear Contract Owner:
A Special Meeting of Shareholders (the "Meeting") of each of the Income Account ("Income"), the LargeCap Growth Account ("LargeCap Growth"), and the Multi-Asset Income Account ("Multi-Asset Income"), all series of Principal Variable Contracts Funds, Inc. (“PVC”), will be held at 655 9th Street, Des Moines, Iowa 50392, on May 31, 2019 at (i) 10:30 a.m., Central Time, for Income, (ii) 10:45 a.m., Central Time, for LargeCap Growth, and (iii) 11:00 a.m., Central Time, for Multi-Asset Income.
At the Meeting, the shareholders of each of Income, LargeCap Growth, and Multi-Asset Income (each, an "Acquired Fund" and, together, the "Acquired Funds") will be asked to consider and approve a Plan of Acquisition (a "Plan") providing for its reorganization into the corresponding PVC series listed in the second column below (each, an "Acquiring Fund").
|
| |
| ACQUIRED FUND | ACQUIRING FUND |
Income Account (Class 1 and Class 2) | Core Plus Bond Account (Class 1) |
| | |
LargeCap Growth Account (Class 1 and Class 2) | LargeCap Growth Account I (Class 1) |
| | |
Multi-Asset Income Account (Class 1 and Class 2) | SAM (Strategic Asset Management) Flexible Income Account (Class 1 and Class 2) |
The Acquired Funds' shareholders of record are insurance company separate accounts that offer variable life and variable annuity contracts. You are receiving these materials because you own a variable annuity contract or variable life insurance policy issued by an insurance company that is a shareholder of record, and you have allocated contract value of such contract or policy to one or more Acquired Funds. As a result, you have the right to instruct your insurance company how to vote the shares of the Acquired Funds that represent your contract value. Your insurance company will vote, in accordance with your instructions, the number of Acquired Fund shares that represents that portion of your contract value invested in each of the Acquired Funds as of March 29, 2019, the record date for the Meeting.
Under each Plan: (i) the applicable Acquiring Fund will acquire all the assets, subject to all the liabilities, of the corresponding Acquired Fund in exchange for shares of the Acquiring Fund; and (ii) the Acquiring Fund shares will be distributed to the shareholders of the Acquired Fund in complete liquidation and termination of the Acquired Fund (each, a “Reorganization”). As a result of each Reorganization, each shareholder of the applicable Acquired Fund will become a shareholder of the corresponding Acquiring Fund. The total value of all shares of each Acquiring Fund issued in each Reorganization will equal the total value of the net assets of the corresponding Acquired Fund. The number of full and fractional shares of the Acquiring Fund received by a shareholder of the Acquired Fund will be equal in value to the value of that shareholder’s shares of the Acquired Fund as of the close of regularly scheduled trading on the New York Stock Exchange (“NYSE”) on the closing date of the Reorganization.
For Income and LargeCap Growth, holders of Class 1 and Class 2 shares of each Acquired Fund will receive Class 1 shares of the corresponding Acquiring Fund. For Multi-Asset Income, holders of Class 1 and Class 2 shares of the Acquired Fund will receive, respectively, Class 1 and Class 2 shares of the Acquiring Fund. Each Reorganization is expected to occur on or about the close of regularly scheduled trading on the NYSE on June 7, 2019. All share classes of each Acquired Fund will vote in the aggregate and not by class with respect to that Fund's Reorganization. Effective following the close of business on June 14, 2019, the Class 2
shares of the Core Plus Bond Account will automatically convert to Class 1 shares of the Core Plus Bond Account, and the Class 2 shares of LargeCap Growth Account I will automatically convert to Class 1 shares of the LargeCap Growth Account I.
*****
Enclosed you will find a Notice of Special Meeting of Shareholders, a Proxy Statement/Prospectus, and a voting instruction card for the shares of the Acquired Fund to which you had allocated contract value as of March 29, 2019, the record date for the Meeting. The Proxy Statement/Prospectus provides background information and describes in detail the proposals to be voted on at the Meeting.
The PVC Board of Directors has voted in favor of each proposed Reorganization and recommends that you vote FOR each Proposal.
In order for the shares of the Acquired Fund to which you had allocated contract value as of the record date to be voted at the Meeting, we urge you to read the Proxy Statement/Prospectus and then give your voting instructions in one of the following three ways:
By Internet: Follow the instructions located on your voting instruction card.
By Phone: The phone number is located on your voting instruction card. Be sure you have your control number, as printed on your voting instruction card, available when you call.
By Mail: Complete and sign your voting instruction card and enclose it in the postage-paid envelope provided in this proxy package, allowing sufficient time for receipt by us by May 30, 2019.
We appreciate you taking the time to respond to this important matter. Your vote is important. If you have any questions regarding your Fund's Reorganization, please call our Shareholder Services Department toll-free at 1 (800) 222-5852.
Sincerely,
Michael J. Beer
President and Chief Executive Officer
PRINCIPAL VARIABLE CONTRACTS FUNDS, INC.
711 High Street
Des Moines, Iowa 50392
1 (800) 222-5852
NOTICE OF SPECIAL MEETING OF SHAREHOLDERS
To the Contract Owners of the Income Account, the LargeCap Growth Account, and the Multi-Asset Income Account:
Notice is hereby given that a Special Meeting of Shareholders (the “Meeting”) of the Income Account ("Income"), the LargeCap Growth Account ("LargeCap Growth"), and the Multi-Asset Income Account ("Multi-Asset Income") (each, an "Acquired Fund" and, collectively, the “Acquired Funds”), each a series of Principal Variable Contracts Funds, Inc. (“PVC”), will be held at 655 9th Street, Des Moines, Iowa 50392, on May 31, 2019 at (i) 10:30 a.m., Central Time, for Income, (ii) 10:45 a.m., Central Time, for LargeCap Growth, and (iii) 11:00 a.m., Central Time, for Multi-Asset Income. A Proxy Statement/Prospectus providing information about the following proposals to be voted on at the Meeting is included with this notice. The Meeting is being held to consider and vote on such proposals as well as any other business that may properly come before the Meeting or any adjournment or postponement thereof.
| |
| Proposal 1: | Approval of a Plan of Acquisition providing for the reorganization of the Income Account (Class 1 and Class 2) into the Core Plus Bond Account (Class 1). |
(Only shareholders of the Income Account will vote on this proposal.)
| |
| Proposal 2: | Approval of a Plan of Acquisition providing for the reorganization of the LargeCap Growth Account (Class 1 and Class 2) into the LargeCap Growth Account I (Class 1). |
(Only shareholders of the LargeCap Growth Account will vote on this proposal.)
| |
| Proposal 3: | Approval of a Plan of Acquisition providing for the reorganization of the Multi-Asset Income Account (Class 1 and Class 2) into the SAM (Strategic Asset Management) Flexible Income Account (Class 1 and Class 2). |
(Only shareholders of the Multi-Asset Income Account will vote on this proposal.)
The PVC Board of Directors recommends that shareholders of each Acquired Fund vote FOR the Proposals.
Approval of each Proposal will require the affirmative vote of the holders of at least a “Majority of the Outstanding Voting Securities” (as defined in the accompanying Proxy Statement/Prospectus under "Voting Information - Voting rights") of the applicable Acquired Fund.
Each shareholder of record of each Acquired Fund at the close of business on March 29, 2019, the record date for the Meeting (the "Record Date"), is entitled to receive notice of and to vote at the Meeting and any adjournments or postponements thereof. The Acquired Funds' shareholders of record are insurance company separate accounts that offer variable life and variable annuity contracts. You are receiving these materials because you own a variable annuity contract or variable life insurance policy issued by an insurance company that is a shareholder of record, and you have allocated contract value of such contract or policy to one or more Acquired Funds. As a result, you have the right to instruct your insurance company how to vote the shares of the Acquired Funds that represent your contract value. Your insurance company will vote, in accordance with your instructions, the number of Acquired Fund shares that represents that portion of your contract value invested in each of the Acquired Funds as of the Record Date.
Please read the attached Proxy Statement/Prospectus.
By order of the Board of Directors
Michael J. Beer
President and Chief Executive Officer
April __, 2019
Des Moines, Iowa
PRINCIPAL VARIABLE CONTRACTS FUNDS, INC.
711 High Street
Des Moines, Iowa 50392
1 (800) 222-5852
---------------------------------
PROXY STATEMENT/PROSPECTUS
SPECIAL MEETING OF SHAREHOLDERS
TO BE HELD MAY 31, 2019
RELATING TO THE REORGANIZATION OF:
| |
| 1) | THE INCOME ACCOUNT (Class 1 and Class 2) INTO THE CORE PLUS BOND ACCOUNT (Class 1) |
| |
| 2) | THE LARGECAP GROWTH ACCOUNT (Class 1 and Class 2) INTO THE LARGECAP GROWTH ACCOUNT I (Class 1) |
| |
| 3) | THE MULTI-ASSET INCOME ACCOUNT (Class 1 and Class 2) INTO THE SAM (Strategic Asset Management) FLEXIBLE INCOME ACCOUNT (Class 1 and Class 2) |
This Proxy Statement/Prospectus is furnished in connection with the solicitation of proxies by the Board of Directors (the “Board” or “Directors”) of Principal Variable Contracts Funds, Inc. (“PVC”) to be used at a Special Meeting of Shareholders (the "Meeting") of the Income Account ("Income"), the LargeCap Growth Account ("LargeCap Growth"), and the Multi-Asset Income Account ("Multi-Asset Income"), all series of PVC, to be held at 655 9th Street, Des Moines, Iowa 50392, on May 31, 2019 at (i) 10:30 a.m., Central Time, for Income, (ii) 10:45 a.m., Central Time, for LargeCap Growth, and (iii) 11:00 a.m., Central Time, for Multi‑Asset Income.
At the Meeting, the shareholders of each of Income, LargeCap Growth, and Multi-Asset Income (each, an "Acquired Fund" and, together, the "Acquired Funds") will be asked to consider and approve a Plan of Acquisition (each, a "Plan") providing for its reorganization into the corresponding PVC series listed in the second column below (each, an "Acquiring Fund" and, together, the "Acquiring Funds") (the Acquired Funds and Acquiring Funds, together, the "Funds"). Each of these Funds is a separate series of PVC. PVC is a Maryland corporation and an open-end management investment company registered with the Securities and Exchange Commission (the "SEC") under the Investment Company Act of 1940, as amended (the "1940 Act").
|
| |
| ACQUIRED FUND | ACQUIRING FUND |
Income Account (Class 1 and Class 2) | Core Plus Bond Account (Class 1) |
| | |
LargeCap Growth Account (Class 1 and Class 2) | LargeCap Growth Account I (Class 1) |
| | |
Multi-Asset Income Account (Class 1 and Class 2) | SAM (Strategic Asset Management) Flexible Income Account (Class 1 and Class 2) |
All shares of the Acquired Funds are owned of record by insurance company separate accounts ("Separate Accounts") established to fund benefits under variable annuity contracts and variable life insurance policies (each, a "Contract") issued by such insurance companies (each, an "Insurance Company"). Persons holding Contracts are referred to herein as "Contract Owners."
Under each Plan: (i) the applicable Acquiring Fund will acquire all the assets, subject to all the liabilities, of the corresponding Acquired Fund in exchange for shares of the Acquiring Fund; and (ii) the Acquiring Fund shares will be distributed to the shareholders of the Acquired Fund in complete liquidation and termination of the Acquired Fund (each, a “Reorganization”). As a result of each Reorganization, each shareholder of the applicable Acquired Fund will become a shareholder of the corresponding Acquiring Fund. The total value of all shares of each Acquiring Fund issued in each Reorganization will equal the total value of the net assets of
the corresponding Acquired Fund. The number of full and fractional shares of the Acquiring Fund received by a shareholder of the Acquired Fund will be equal in value to the value of that shareholder’s shares of the Acquired Fund as of the close of regularly scheduled trading on the New York Stock Exchange (“NYSE”) on the closing date of the Reorganization.
| |
| 1) | Holders of Class 1 and Class 2 shares of the Income Account (Acquired Fund) will receive Class 1 shares of the Core Plus Bond Account (Acquiring Fund). |
| |
| 2) | Holders of Class 1 and Class 2 shares of the LargeCap Growth Account (Acquired Fund) will receive Class 1 shares of the LargeCap Growth Account I (Acquiring Fund). |
| |
| 3) | Holders of Class 1 and Class 2 shares of the Multi-Asset Income Account (Acquired Fund) will receive, respectively, Class 1 and Class 2 shares of the SAM (Strategic Asset Management) Flexible Income Account (Acquiring Fund). |
Each Reorganization is expected to occur on or about the close of regularly scheduled trading on the NYSE on June 7, 2019. Effective following the close of business on June 14, 2019, the Class 2 shares of the Core Plus Bond Account will automatically convert to Class 1 shares of the Core Plus Bond Account, and the Class 2 shares of LargeCap Growth Account I will automatically convert to Class 1 shares of the LargeCap Growth Account I.
Approval of each Reorganization will require the affirmative vote of the holders of at least a “Majority of the Outstanding Voting Securities” (as defined below in this Proxy Statement/Prospectus under "Voting Information - Voting rights") of the applicable Acquired Fund. All share classes of each Acquired Fund will vote in the aggregate and not by class with respect to that Fund's Reorganization. The terms and conditions of each Reorganization are more fully described below in this Proxy Statement/Prospectus and in the Forms of Plans of Acquisition, which are attached hereto as Appendix A.
This Proxy Statement/Prospectus contains information shareholders should know before voting on any Reorganization. Please read it carefully and retain it for future reference. The Annual and Semi-Annual Reports to Shareholders of PVC contain additional information about the investments of each Acquired Fund and Acquiring Fund. The Annual Report contains discussions of the market conditions and investment strategies that significantly affected these Funds during the fiscal year ended December 31, 2018. Copies of these reports may be obtained at no charge by calling our Shareholder Services Department toll-free at 1 (800) 222-5852 or online at www.principalfunds.com/prospectuses-pvc.
The Statement of Additional Information dated April ____, 2019 (the "Statement of Additional Information") relating to this Proxy Statement/Prospectus has been filed with the SEC (File No. 333-______) and is incorporated by reference into this Proxy Statement/Prospectus. PVC’s Prospectus dated May 1, 2018 and as supplemented, and the Statement of Additional Information for PVC dated May 1, 2018 and as supplemented, have been filed with the SEC (File No. 002-35570). Copies of these documents may be obtained without charge by writing to Principal Variable Contracts Funds, Inc., P.O. Box 219971, Kansas City, MO 64121-9971 or by calling our Shareholder Services Department toll-free at 1 (800) 222-5852. You may also call our Shareholder Services Department toll free at 1 (800) 222-5852 if you have any questions regarding your Fund's Reorganization.
PVC is subject to the informational requirements of the Securities Exchange Act of 1934, as amended, and the 1940 Act, and files reports, proxy materials, and other information with the SEC. Such reports, proxy materials, and other information are available on the SEC’s EDGAR Database on its Internet site at www.sec.gov.
Important Notice Regarding Availability of Proxy Statement/Prospectus for the Shareholders’ Meeting to be Held on May 31, 2019.
This Proxy Statement/Prospectus is available on the Internet at:
https://www.
The SEC has not approved or disapproved these securities or passed upon the
accuracy or adequacy of this Proxy Statement/Prospectus. Any representation to the
contrary is a criminal offense.
The date of this Proxy Statement/Prospectus is April __, 2019.
|
| | |
| TABLE OF CONTENTS | | |
| | Page |
| | | |
| INTRODUCTION | | |
| THE REORGANIZATIONS | | |
PROPOSAL 1: Approval of a Plan of Acquisition Providing for the Reorganization of the Income Account into the Core Plus Bond Account | | |
| Comparison of Acquired and Acquiring Funds | | |
| Comparison of Investment Objectives and Strategies | | |
| Comparison of Principal Investment Risks | | |
| Fees and Expenses of the Funds | | |
| Performance | | |
| Board Consideration of the Reorganization | | |
PROPOSAL 2: Approval of a Plan of Acquisition Providing for the Reorganization of the LargeCap Growth Account into the LargeCap Growth Account I | | |
| Comparison of Acquired and Acquiring Funds | | |
| Comparison of Investment Objectives and Strategies | | |
| Comparison of Principal Investment Risks | | |
| Fees and Expenses of the Funds | | |
| Performance | | |
| Board Consideration of the Reorganization | | |
PROPOSAL 3: Approval of a Plan of Acquisition Providing for the Reorganization of the Multi-Asset Income Account into the SAM (Strategic Asset Management) Flexible Income Account | | |
| Comparison of Acquired and Acquiring Funds | | |
| Comparison of Investment Objectives and Strategies | | |
| Comparison of Principal Investment Risks | | |
| Fees and Expenses of the Funds | | |
| Performance | | |
| Board Consideration of the Reorganization | | |
| INFORMATION ABOUT THE REORGANIZATION | | |
| Plans of Acquisition | | |
| Description of the Securities to Be Issued | | |
| Federal Income Tax Consequences | | |
| CAPITALIZATION | | |
| ADDITIONAL INFORMATION ABOUT INVESTMENT STRATEGIES AND RISKS | | |
| ADDITIONAL INFORMATION ABOUT THE FUNDS | | |
| Multiple Classes of Shares | | |
| Intermediary Compensation | | |
| Dividends and Distributions | | |
| Pricing of Fund Shares | | |
| TAX INFORMATION | | |
|
| | |
| TABLE OF CONTENTS | | |
| (continued) | Page |
| | | |
| DISTRIBUTION PLAN AND ADDITIONAL INFORMATION REGARDING INTERMEDIARY COMPENSATION | | |
| ONGOING FEES | | |
| Frequent Trading and Market Timing (Abusive Trading Practices) | | |
| Eligible Purchasers | | |
| Shareholder Rights | | |
| Purchase of Fund Shares | | |
| Sale of Fund Shares | | |
| Restricted Transfers | | |
| Financial Statements | | |
| Portfolio Holdings Information | | |
| VOTING INFORMATION | | |
| OUTSTANDING SHARES AND SHARE OWNERSHIP | | |
| FINANCIAL HIGHLIGHTS | | |
| FINANCIAL STATEMENTS | | |
| LEGAL MATTERS | | |
| OTHER INFORMATION | | |
| APPENDIX A - Forms of Plans of Acquisitions | | |
| APPENDIX B - Description of Bond Ratings | | |
INTRODUCTION
This Proxy Statement/Prospectus is being furnished to shareholders of the Acquired Funds to provide information regarding the Plan and the Reorganization.
Principal Variable Contracts Funds, Inc. PVC is a Maryland corporation and an open-end management investment company registered with the SEC under the 1940 Act. PVC currently offers 36 separate series (the “PVC Accounts”), including the Acquired and Acquiring Funds. The sponsor of PVC is Principal Life Insurance Company (“Principal Life”), and the investment advisor to the PVC Accounts is Principal Global Investors, LLC (“PGI”). Principal Funds Distributor, Inc. (the “Distributor” or “PFD”) is the distributor for all share classes. Principal Life is an insurance company organized in 1879 under the laws of Iowa. Principal Life, PGI, and PFD are indirect, wholly-owned subsidiaries of Principal Financial Group, Inc. (“PFG”). Principal Life’s and PGI’s address is the Principal Financial Group, 711 High Street, Des Moines, Iowa 50392, and PFD’s address is 620 Coolidge Drive, Suite 300, Folsom, CA 95630.
Investment Management. Pursuant to an investment advisory agreement with PVC, PGI provides investment advisory services and is also responsible for, among other things, administering the business and affairs of each PVC Account. PGI is also responsible for selecting, contracting with, compensating, and monitoring the performance of any sub‑advisors that manage the investment of the assets of the PVC Accounts pursuant to sub-advisory agreements.
PGI is located at 801 Grand Avenue, Des Moines, IA 50392. PGI is an indirect, wholly-owned subsidiary of PFG.
THE REORGANIZATIONS
At its meeting held on December 11, 2018, the PVC Board of Directors (the “Board”), including all the Directors who are not “interested persons” (as defined in the 1940 Act) of PVC (the “Independent Directors”), approved each Reorganization pursuant to the corresponding Plan providing for the combination of each Acquired Fund into the corresponding Acquiring Fund. The Board concluded that each Reorganization is in the best interests of the applicable Acquired Fund and the corresponding Acquiring Fund and that the interests of existing shareholders of each Fund will not be diluted as a result of the Reorganization. The factors that the Board considered in deciding to approve each Reorganization as to each Acquired Fund are discussed in each Proposal under “Board Consideration of the Reorganization.”
Each Reorganization contemplates: (i) the transfer of all the assets, subject to all of the liabilities, of the applicable Acquired Fund to the corresponding Acquiring Fund in exchange for shares of the Acquiring Fund; and (ii) the distribution to Acquired Fund shareholders of the Acquiring Fund shares in complete liquidation and termination of the Acquired Fund. As a result of each Reorganization, each shareholder of the applicable Acquired Fund will become a shareholder of the corresponding Acquiring Fund. In each Reorganization, the applicable Acquiring Fund will issue to the corresponding Acquired Fund a number of shares with a total value equal to the total value of the net assets of the Acquired Fund, and each shareholder of the Acquired Fund will receive a number of full and fractional shares of the Acquiring Fund with a value equal to the value of that shareholder’s shares of the Acquired Fund, as of the close of regularly scheduled trading on the NYSE on the closing date of the Reorganization (the “Effective Time”). The closing date of each Reorganization is expected to be on or about June 7, 2019.
Holders of Class 1 and Class 2 shares of the Income Account will receive Class 1 shares of the Core Plus Bond Account.
Holders of Class 1 and Class 2 shares of the LargeCap Growth Account will receive Class 1 shares of the LargeCap Growth Account I.
Holders of Class 1 and Class 2 shares of the Multi-Asset Income Account will receive, respectively, Class 1 and Class 2 shares of the SAM (Strategic Asset Management) Flexible Income Account.
Effective following the close of business on June 14, 2019, the Class 2 shares of the Core Plus Bond Account will automatically convert to Class 1 shares of the Core Plus Bond Account, and the Class 2 shares of LargeCap Growth Account I will automatically convert to Class 1 shares of the LargeCap Growth Account I.
All share classes of each Acquired Fund will vote in the aggregate and not by class with respect to the Reorganization. The terms and conditions of each Reorganization are more fully described below in this Proxy Statement/Prospectus and in the Forms of Plans of Acquisition, which are attached hereto as Appendix A.
Proposal 1: Reorganization of the Income Account into the Core Plus Bond Account
In the opinion of legal counsel, the Reorganization is expected to be considered a taxable transaction for federal income tax purposes, and the Acquired Fund will recognize capital gains or losses on the Effective Date; however, since the taxable impact of the transaction does not flow through to the Contract Owners of the insurance company separate accounts that own the Acquired Fund shares, the Reorganization is not expected to be a taxable event for federal income tax purposes for Contract Owners. The taxable impact of capital gains realized in connection with repositioning the Acquired Fund's portfolio in connection with the Reorganization is not expected to flow through to the Contract Owners of the insurance company separate accounts that own the Acquired Fund shares. Please see “Information About the Reorganization - Federal Income Tax Consequences" for additional information about the federal income tax consequences of the Reorganization.
The Reorganization will not result in any material change in the purchase and redemption procedures followed with respect to the distribution of shares. See “Ongoing Fees - Purchase of Fund Shares" and "Ongoing Fees - Sale of Fund Shares.”
The direct expenses and out-of-pocket fees incurred in connection with the Reorganization, including printing, mailing, and solicitation costs and audit fees, will be paid by the Acquired Fund shareholders because the benefits of the Reorganization to Acquired Fund shareholders (as described under "Proposal 1 - Board Consideration of the Reorganization") are expected to outweigh these expenses and fees within twelve months. The costs are estimated to be $5,350. If the Reorganization is approved, the PVC SAM Portfolios, which are other series of PVC that own shares of the Acquired Fund, are expected to redeem their entire investment prior to the Effective Time, leaving approximately $14 million in assets under management in the Acquired Fund. The Acquired Fund will reposition its remaining portfolio prior to the Effective Time for the purpose of transferring only those assets that are consistent with the Acquiring Fund's investment strategy. The estimated trading costs are $28,000 (or 0.01% of the Acquiring Fund's net assets). It is expected that, for the entire repositioning, approximately $1.1 million (or 8.6%) of the portfolio securities of the Acquired Fund will be disposed of and new securities purchased. Each of the Acquired Fund and Acquiring Fund qualifies, and following the Reorganization it is expected that the Acquiring Fund will continue to qualify, as a Regulated Investment Company (“RIC”) for tax purposes.
Proposal 2: Reorganization of the LargeCap Growth Account into the LargeCap Growth Account I
In the opinion of legal counsel, the Reorganization is expected to qualify as a tax-free reorganization for federal income tax purposes, and no gain or loss will be recognized as a result of the Reorganization by the Acquired Fund or Acquiring Fund shareholders. The taxable impact of capital gains realized in connection with repositioning the Acquired Fund's portfolio in connection with the Reorganization is not expected to flow through to the Contract Owners of the insurance company separate accounts that own the Acquired Fund shares. Please see “Information About the Reorganization - Federal Income Tax Consequences" for additional information about the federal income tax consequences of the Reorganization.
The Reorganization will not result in any material change in the purchase and redemption procedures followed with respect to the distribution of shares. See “Ongoing Fees - Purchase of Fund Shares" and "Ongoing Fees - Sale of Fund Shares."
The direct expenses and out-of-pocket fees incurred in connection with the Reorganization, including printing, mailing, and solicitation costs and audit fees, will be paid by the Acquired Fund shareholders because the benefits of the Reorganization to Acquired Fund shareholders (as described under "Proposal 2 - Board Consideration of the Reorganization") are expected to outweigh these expenses and fees within twelve months. The costs are estimated to be $16,850. The Acquired Fund will reposition its portfolio prior to the Reorganization for the purpose of transferring only those assets that are consistent with the Acquiring Fund's investment strategy. Based on commission rates typically paid by the Acquired Fund, it is estimated that in connection with the repositioning of the assets of the Acquired Fund, the Acquired Fund will incur brokerage commissions of $16,500 (or 1.3 basis points). It is expected that for the entire repositioning, approximately 69% of the portfolio securities of the Acquired Fund will be disposed of and new securities purchased. Each of the Acquired Fund and Acquiring Fund qualifies, and following the Reorganization it is expected that the Acquiring Fund will continue to qualify, as a RIC for tax purposes.
Proposal 3: Reorganization of the Multi-Asset Income Account into the SAM (Strategic Asset Management) Flexible Income Account
In the opinion of legal counsel, the Reorganization is expected to qualify as a tax-free reorganization for federal income tax purposes, and no gain or loss will be recognized as a result of the Reorganization by the Acquired Fund or Acquiring Fund shareholders. The taxable impact of capital gains realized in connection with repositioning the Acquired Fund's portfolio in connection with the Reorganization is not expected to flow through to the Contract Owners of the insurance company separate accounts that own the Acquired Fund shares. Please see “Information About the Reorganization - Federal Income Tax Consequences" for additional information about the federal income tax consequences of the Reorganization.
The Reorganization will not result in any material change in the purchase and redemption procedures followed with respect to the distribution of shares. See “Ongoing Fees - Purchase of Fund Shares" and "Ongoing Fees - Sale of Fund Shares."
The direct expenses and out-of-pocket fees incurred in connection with the Reorganization, including printing, mailing, and solicitation costs and audit fees, will be paid by the Acquired Fund shareholders because the benefits of the Reorganization to Acquired Fund shareholders (as described under "Proposal 3 - Board Consideration of the Reorganization") are expected to outweigh these expenses and fees within twelve months; however, due to expense caps currently in place for the Acquired Fund and low assets under management, PGI will end up bearing these expenses and fees. The costs are estimated to be $4,850. The Acquired Fund will reposition its portfolio prior to the Reorganization for the purpose of transferring only those assets that are consistent with the Acquiring Fund's investment strategy. Since the transition is occurring between two fund-of-fund accounts that hold internal funds, the Acquired Fund will redeem its underlying funds and transfer cash on the designated day to complete the Reorganization. There are no brokerage commissions associated with these trades. Each of the Acquired Fund and Acquiring Fund qualifies, and following the Reorganization it is expected that the Acquiring Fund will continue to qualify, as a RIC for tax purposes.
PROPOSAL 1:
APPROVAL OF A PLAN OF ACQUISITION
PROVIDING FOR THE REORGANIZATION OF THE
INCOME ACCOUNT INTO THE CORE PLUS BOND ACCOUNT
Shareholders of the Income Account (the “Acquired Fund”) are being asked to approve the Plan, which provides for the reorganization of the Acquired Fund into the Core Plus Bond Account (the “Acquiring Fund”).
Comparison of Acquired and Acquiring Funds
The following tables provide comparative information with respect to the Acquired and Acquiring Funds. As indicated in the tables, the Funds have similar objectives in that the Acquired Fund seeks to provide a high level of current income consistent with preservation of capital while the Acquiring Fund seeks to provide current income and, as a secondary objective, capital appreciation. The Funds also have similar investment strategies and risks in that both Funds employ a strategy that focuses on a diversified pool of fixed-income securities, typically corporate bonds (both investment grade and below investment grade), asset-backed securities, and U.S. Treasury and agency bonds. The principal differences are that the maximum allowance for below investment grade corporate bonds and bank loans is higher within the Acquired Fund, and the Acquiring Fund utilizes derivatives as a principal strategy. |
| | |
Income Account (Acquired Fund) | | Core Plus Bond Account (Acquiring Fund) |
| Approximate Net Assets as of December 31, 2018: |
| $181,771,064 | | $281,520,295 |
| INVESTMENT ADVISOR |
| PGI | | PGI |
| | | |
| PGI PORTFOLIO MANAGERS |
John R. Friedl has been with Principal® since 2017. Prior thereto, he was with Edge Asset Management, Inc. (which merged with and into PGI in 2017) since 1998. He earned a B.A. in Communications and History from the University of Washington and a master's degree in Finance from Seattle University. Mr. Friedl has earned the right to use the Chartered Financial Analyst designation. Ryan P. McCann has been with Principal® since 2010. He earned a B.A. in Business Administration from Washington State University. Mr. McCann has earned the right to use the Chartered Financial Analyst designation. Scott J. Peterson has been with Principal® since 2002. He earned a bachelor’s degree in Mathematics from Brigham Young University and an M.B.A. from New York University’s Stern School of Business. Mr. Peterson has earned the right to use the Chartered Financial Analyst designation. | | William C. Armstrong has been with Principal® since 1992. He earned a bachelor’s degree from Kearney State College and an M.B.A. from the University of Iowa. Mr. Armstrong has earned the right to use the Chartered Financial Analyst designation. Tina Paris has been with Principal® since 2001. She earned a bachelor's degree in Finance and Economics from the University of Northern Iowa and an M.B.A with an emphasis in Finance from the University of Iowa. Ms. Paris has earned the right to use the Chartered Financial Analyst designation. Timothy R. Warrick has been with Principal® since 1990. He earned a bachelor’s degree in Accounting and Economics from Simpson College and an M.B.A. in Finance from Drake University. Mr. Warrick has earned the right to use the Chartered Financial Analyst designation. |
Comparison of Investment Objectives and Strategies
|
| | |
Income Account (Acquired Fund) | | Core Plus Bond Account (Acquiring Fund) |
| | | |
| INVESTMENT OBJECTIVES |
| The Acquired Fund seeks to provide a high level of current income consistent with preservation of capital. | | The Acquiring Fund seeks to provide current income and, as a secondary objective, capital appreciation. |
| | | |
| PRINCIPAL INVESTMENT STRATEGIES |
| | | |
Under normal circumstances, the Acquired Fund invests primarily in a diversified pool of fixed-income securities including corporate securities, U.S. government securities, and mortgage-backed securities (securitized products) (including collateralized mortgage obligations). The Acquired Fund may invest up to 35% of its assets in below investment grade bonds (sometimes called “high yield bonds” or "junk bonds") which are rated, at the time of purchase, Ba1 or lower by Moody's Investors Service, Inc. ("Moody's") and BB+ or lower by S&P Global Ratings ("S&P Global") (if the bond has been rated by only one of those agencies, that rating will determine whether the bond is below investment grade; if the bond has not been rated by either of those agencies, those selecting such investments will determine whether the bond is of a quality comparable to those rated below investment grade; if securities are rated differently by the rating agencies, the highest rating is used). The Acquired Fund also invests in foreign securities. Under normal circumstances, the Acquired Fund maintains an average portfolio duration that is within ±25% of the duration of the Bloomberg Barclays U.S. Aggregate Bond Index, which as of December 31, 2018 was 5.87 years. The Acquired Fund is not managed to a particular maturity. | | Under normal circumstances, the Acquiring Fund invests at least 80% of its net assets, plus any borrowings for investment purposes, in bonds or other debt securities at the time of purchase. Such investments include securities issued or guaranteed by the U.S. government or its agencies or instrumentalities (including collateralized mortgage obligations); asset-backed securities or mortgage-backed securities (securitized products); corporate bonds; and securities issued or guaranteed by foreign governments payable in U.S. dollars. The Acquiring Fund invests in investment-grade securities, and with respect to up to 20% of its assets, in below investment grade securities (sometimes called “high yield” or "junk") which are rated at the time of purchase Ba1 or lower by Moody's Investors Service, Inc. ("Moody's") and BB+ or lower by S&P Global Ratings ("S&P Global") (if the security has been rated by only one of those agencies, that rating will determine whether the security is below investment grade; if the security has not been rated by either of those agencies, those selecting such investments will determine whether the security is of a quality comparable to those rated below investment grade. If securities are rated differently by the rating agencies, the highest rating is used). The Acquiring Fund invests in foreign securities. The Acquiring Fund is not managed to a particular maturity. Under normal circumstances, the Acquiring Fund maintains an average portfolio duration that is within ±25% of the duration of the Bloomberg Barclays U.S. Aggregate Bond Index, which as of December 31, 2018 was 5.87 years. The Acquiring Fund actively trades portfolio securities. The Acquiring Fund enters into dollar roll transactions which may involve leverage. The Acquiring Fund invests in derivatives, included Treasury futures and interest rate swaps to manage the fixed-income exposure (including for hedging purposes) and credit default swaps to increase or decrease, in an efficient manner, exposures to certain sectors or individual issuers. A derivative is a financial arrangement, the value of which is derived from, or based on, a traditional security, asset, or market index. |
Temporary Defensive Investing
For temporary defensive purposes in times of unusual or adverse market, economic, or political conditions, each Fund may invest up to 100% of its assets in cash and cash equivalents. In taking such defensive measures, either Fund may fail to achieve its investment objective.
Fundamental Investment Restrictions
The Funds are subject to identical fundamental investment restrictions, which may not be changed without a shareholder vote. These fundamental restrictions deal with such matters as the issuance of senior securities, purchasing or selling real estate or commodities, borrowing money, making loans, underwriting securities of other issuers, diversification or concentration of investments, and short sales of securities. The fundamental investment restrictions of the Funds are described in the Statement of Additional Information under "Description of the Funds' Investments and Risks - Fundamental Restrictions."
Additional Information
The investment objective of each Fund may be changed by the Board without shareholder approval.
Additional information about the investment strategies and the types of securities in which the Funds may invest is discussed below under “Additional Information About Investment Strategies and Risks” as well as in the Statement of Additional Information.
The Statement of Additional Information provides further information about the portfolio manager(s) for each Fund, including information about compensation, other accounts managed, and ownership of Fund shares.
Comparison of Principal Investment Risks
In deciding whether to approve the Reorganization, shareholders should consider the amount and character of investment risk involved in the respective investment objectives and strategies of the Acquired and Acquiring Funds.
Principal Risks Applicable to Both Funds:
The following principal risks are applicable to the Acquired Fund and the Acquiring Fund:
Fixed-Income Securities Risk. Fixed-income securities are subject to interest rate, credit quality, and liquidity risks. The market value of fixed-income securities generally declines when interest rates rise and generally increases when interest rates fall. Higher interest rates may adversely affect the liquidity of certain fixed-income securities. Moreover, an issuer of fixed-income securities could default on its payment obligations due to increased interest rates or for other reasons.
Foreign Currency Risk. Risks of investing in securities denominated in, or that trade in, foreign (non-U.S.) currencies include changes in foreign exchange rates and foreign exchange restrictions.
Foreign Securities Risk. The risks of foreign securities include loss of value as a result of: political or economic instability; nationalization, expropriation or confiscatory taxation; settlement delays; and limited government regulation (including less stringent reporting, accounting, and disclosure standards than are required of U.S. companies).
High Yield Securities Risk. High yield fixed-income securities (commonly referred to as "junk bonds") are subject to greater credit quality risk than higher rated fixed-income securities and should be considered speculative.
Portfolio Duration Risk. Portfolio duration is a measure of the expected life of a fixed-income security and its sensitivity to changes in interest rates. The longer a fund's average portfolio duration, the more sensitive the fund will be to changes in interest rates, which means funds with longer average portfolio durations may be more volatile than those with shorter durations.
Real Estate Securities Risk. Investing in real estate securities subjects the fund to the risks associated with the real estate market (which are similar to the risks associated with direct ownership in real estate), including declines in real estate values, loss due to casualty or condemnation, property taxes, interest rate changes, increased expenses, cash flow of underlying real estate assets, regulatory changes (including zoning, land use and rents), and environmental problems, as well as to the risks related to the management skill and creditworthiness of the issuer.
Redemption and Large Transaction Risk. Ownership of the fund's shares may be concentrated in one or a few large investors (such as funds of funds, institutional investors, and asset allocation programs) that may redeem or purchase shares in large quantities. These transactions may cause the fund to sell securities to meet redemptions or to invest additional cash at times it would not otherwise do so, which may result in increased transaction costs, increased expenses, changes to expense ratios, and adverse effects to fund performance. Such transactions may also accelerate the realization of taxable income if sales of portfolio securities result in gains. Moreover, reallocations by large shareholders among share classes of a fund may result in changes to the expense ratios of affected classes, which may increase the expenses paid by shareholders of the class that experienced the redemption.
Securitized Products Risk. Investments in securitized products are subject to risks similar to traditional fixed income securities, such as credit, interest rate, liquidity, prepayment, extension, and default risk, as well as additional risks associated with the nature of the assets and the servicing of those assets. Unscheduled prepayments on securitized products may have to be reinvested at lower rates. A reduction in prepayments may increase the effective maturities of these securities, exposing them to the risk of decline in market value over time (extension risk).
U.S. Government Securities Risk. Yields available from U.S. government securities are generally lower than yields from many other fixed-income securities.
U.S. Government-Sponsored Securities Risk. Securities issued by U.S. government-sponsored enterprises such as the Federal Home Loan Mortgage Corporation, the Federal National Mortgage Association, and the Federal Home Loan Banks are not issued or guaranteed by the U.S. government.
Additional Principal Risks of Investing in the Acquiring Fund:
The following are additional principal risks of investing in the Acquiring Fund that are not principal risks of investing in the Acquired Fund:
Counterparty Risk. Counterparty risk is the risk that the counterparty to a contract or other obligation will be unable or unwilling to honor its obligations.
Derivatives Risk. Derivatives may not move in the direction anticipated by the portfolio manager. Transactions in derivatives may increase volatility, cause the liquidation of portfolio positions when not advantageous to do so and result in disproportionate losses that may be substantially greater than a fund's initial investment.
| |
| • | Credit Default Swaps. Credit default swaps involve special risks in addition to those associated with swaps generally because they are difficult to value, are highly susceptible to liquidity and credit risk, and generally pay a return to the party that has paid the premium only in the event of an actual default by the issuer of the underlying obligation (as opposed to a credit downgrade or other indication of financial difficulty). The protection “buyer” in a credit default contract may be obligated to pay the protection “seller” an up-front payment or a periodic stream of payments over the term of the contract provided generally that no credit event on a reference obligation has occurred. If a credit event occurs, the seller generally must pay the buyer the “par value” (i.e., full notional value) of the swap in exchange for an equal face amount of deliverable obligations of the reference entity described in the swap, or the seller may be required to deliver the related net cash amount, if the swap is cash settled. The Fund may be either the buyer or seller in the transaction. |
| |
| • | Currency Contracts. Derivatives related to currency contracts involve the specific risk of government action through exchange controls that would restrict the ability of the fund to deliver or receive currency. |
| |
| • | Futures and Swaps. These derivative instruments involve specific risks, including: the imperfect correlation between the change in market value of the instruments held by the fund and the price of the instruments; possible lack of a liquid secondary market for an instrument and the resulting inability to close it when desired; counterparty risk; and if the fund has insufficient cash, it may have to sell securities from its portfolio to meet any applicable daily variation margin requirements. |
Hedging Risk. A fund that implements a hedging strategy using derivatives and/or securities could expose the fund to the risk that can arise when a change in the value of a hedge does not match a change in the value of the asset it hedges. In other words, the change in value of the hedge could move in a direction that does not match the change in value of the underlying asset, resulting in a risk of loss to the fund.
Leverage Risk. Leverage created by borrowing or certain types of transactions or investments may impair the fund’s liquidity, cause it to liquidate positions at an unfavorable time, increase volatility of the fund’s net asset value, or diminish the fund’s performance.
Portfolio Turnover (Active Trading) Risk. High portfolio turnover (more than 100%) caused by actively trading portfolio securities may result in accelerating the realization of taxable gains and losses, lower fund performance and increased brokerage costs.
Additional Principal Risks of Investing in the Acquired Fund:
There are no additional principal risks of investing in the Acquired Fund that are not included above in "Principal Risks Applicable to Both Funds."
Fees and Expenses of the Funds
Fees and Expenses as a % of average daily net assets
The following table shows: (a) the ratios of expenses to average net assets of the Acquired Fund for the fiscal year ended December 31, 2018; (b) the ratios of expenses to average net assets of the Acquiring Fund for the fiscal year ended December 31, 2018; and (c) the pro forma expense ratios of the Acquiring Fund for the fiscal year ended December 31, 2018, assuming that the Reorganization had taken place at the commencement of the fiscal year ended December 31, 2018.
These fees and expenses do not include the effect of any sales charge, separate account expenses or other contract level expenses which may be applied at the variable life insurance or variable annuity product level. If such charges or fees were included, overall expenses would be higher and would lower the Acquired and Acquiring Funds’ performance.
Holders of Class 1 and Class 2 shares of the Income Account will receive Class 1 shares of the Core Plus Bond Account.
Annual Fund Operating Expenses
(Expenses that you pay each year as a percentage of the value of your investment)
|
| | |
Income Account (Acquired Fund) | | |
| | Class 1 | Class 2 |
| Management Fees | 0.50% | 0.50% |
| Distribution and/or Service (12b-1) Fees | N/A | 0.25% |
| Other Expenses | 0.01% | 0.01% |
| Total Annual Account Operating Expenses | 0.51% | 0.76% |
|
| | |
Core Plus Bond Account (Acquiring Fund) | | |
| | Class 1 | Class 2 |
| Management Fees | 0.45% | 0.45% |
| Distribution and/or Service (12b-1) Fees | N/A | 0.25% |
| Other Expenses | 0.02% | 0.02% |
| Acquired Funds Fees and Expenses | 0.01% | 0.01% |
| Total Annual Account Operating Expenses | 0.48% | 0.73% |
|
| | | |
Core Plus Bond Account (Acquiring Fund) (Pro forma assuming Reorganization) |
| | Class 1 | Class 2 | |
| Management Fees | 0.40% | 0.40% | |
| Distribution and/or Service (12b-1) Fees | N/A | 0.25% | |
| Other Expenses | 0.01% | 0.01% | |
| Acquired Funds Fees and Expenses | 0.01% | 0.01% | |
| Total Annual Account Operating Expenses | 0.42% | 0.67% | (1) (2) |
(1) Effective following the close of business on June 14, 2019, the Class 2 shares will automatically convert to Class 1 shares.
(2) If the Reorganization is approved, the PVC SAM Portfolios, which are other series of PVC that own shares of the Acquired Fund, are expected to redeem their entire investment prior to the Effective Time. If such redemption occurs, the pro forma annual account operating expenses are expected to be 0.47% for Class 1 and 0.72% for Class 2.
Examples: The following examples are intended to help you compare the costs of investing in shares of the Acquired and Acquiring Funds. The examples assume that fund expenses continue at the rates shown in the table above, that you invest $10,000 in the particular fund for the time periods indicated and that all dividends and distributions are reinvested. The examples also assume that your investment has a 5% return each year. If separate account expenses and contract level expenses were included, expenses would be higher. The examples should not be considered a representation of future expense of the Acquired or Acquiring Fund. Actual expense may be greater or less than those shown. |
| | | | | |
| ACCOUNT | | 1 Year | 3 Years | 5 Years | 10 Years |
| | | | | | |
Income (Acquired Fund) | Class 1 | $52 | $164 | $285 | $640 |
Income (Acquired Fund) | Class 2 | 78 | 243 | 422 | 942 |
| | | | | | |
Core Plus Bond (Acquiring Fund) | Class 1 | $49 | $154 | $269 | $604 |
Core Plus Bond (Acquiring Fund) | Class 2 | 75 | 233 | 406 | 906 |
| | | | | | |
Core Plus Bond (Acquiring Fund) (Pro forma assuming Reorganization) | Class 1 | $43 | $135 | $235 | $530 |
Core Plus Bond (Acquiring Fund) (Pro forma assuming Reorganization) | Class 2 | 68 | 214 | 373 | 835 |
Portfolio Turnover
Each Fund pays transaction costs, such as commissions, when it buys and sells securities (or “turns over” its portfolio). A higher portfolio turnover rate may indicate higher transaction fees. These costs, which are not reflected in annual fund operating expenses or in the example, affect the Fund’s performance. During the most recent fiscal year, the portfolio turnover rate for the Acquired Fund was 9.4% of the average value of its portfolio while the portfolio turnover rate for the Acquiring Fund was 127.5%
Investment Management Fees
The Funds each pay their investment advisor, PGI, an advisory fee which for each Fund is calculated as a percentage of the Fund’s average daily net assets pursuant to the following fee schedule:
|
| | | |
Income Account
(Acquired Fund) | Core Plus Bond Account
(Acquiring Fund) |
| First $2 Billion | 0.50% | First $100 Million | 0.50% |
| Over $2 Billion | 0.45% | Next $100 Million | 0.45% |
| | | Next $100 Million | 0.40% |
| | | Next $100 Million | 0.35% |
| | | Thereafter | 0.30% |
The fee each Fund paid (as a percentage of the Fund's average daily net assets) for the fiscal year ended December 31, 2018 was:
|
| | | |
Income Account
(Acquired Fund) | Core Plus Bond Account
(Acquiring Fund) |
| 0.50% | 0.45% |
Availability of the discussions regarding the basis for the Board of Directors' approval of the management agreement and any sub-advisory agreements is as follows:
|
| |
| | Annual Report to Shareholders for the period ending December 31, 2018 |
| Account | Management Agreement |
Income (Acquired Fund) | X |
Core Plus Bond (Acquiring Fund) | X |
Performance
The following information provides some indication of the risks of investing in the Acquiring and Acquired Funds by showing their performance from year to year and by showing how the Acquiring and Acquired Fund’s average annual returns for 1, 5, and 10 years compare with those of one or more broad measures of market performance.
Past performance is not necessarily an indication of how the Funds will perform in the future. Performance figures for the Funds do not include any separate account expenses, cost of insurance, or other contract-level expenses; total returns for the Funds would be lower if such expenses were included.
Calendar Year Total Return (%) as of 12/31 Each Year
Income Account (Acquired Fund)
|
| | | |
| Highest return for a quarter during the period of the bar chart above: | Q2 '09 | 7.98 | % |
| Lowest return for a quarter during the period of the bar chart above: | Q2 '13 | (2.39 | )% |
|
| | | |
| Average Annual Total Returns |
| For the periods ended December 31, 2018 | 1 Year | 5 Years | 10 Years |
| Income Account - Class 1 | 0.78% | 3.26% | 5.84% |
| Income Account - Class 2 | 0.47% | 3.01% | 5.58% |
| Bloomberg Barclays U.S. Aggregate Bond Index (reflects no deduction for fees, expenses, or taxes) | 0.01% | 2.52% | 3.48% |
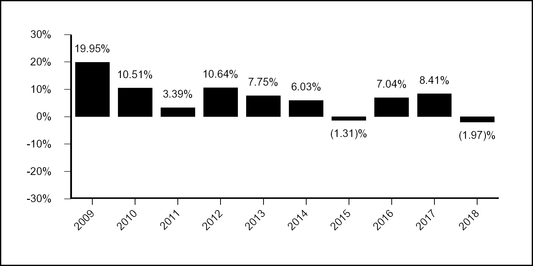
Calendar Year Total Return (%) as of 12/31 Each Year
Core Plus Bond Account (Acquiring Fund)
For periods prior to the inception date of Class 2 shares (May 1, 2015), the performance shown in the table for Class 2 shares is that of the Acquiring Fund's Class 1 shares, adjusted to reflect the fees and expenses of the Class 2 shares. These adjustments result in performance for such periods that is no higher than the historical performance of the Class 1 shares.
|
| | | |
| Highest return for a quarter during the period of the bar chart above: | Q3 '09 | 9.32 | % |
| Lowest return for a quarter during the period of the bar chart above: | Q4 '16 | (2.53 | )% |
|
| | | |
| Average Annual Total Returns |
| For the periods ended December 31, 2018 | 1 Year | 5 Years | 10 Years |
| Core Plus Bond Account - Class 1 | (1.41)% | 2.41% | 5.67% |
| Core Plus Bond Account - Class 2 | (1.63)% | 2.15% | 5.40% |
| Bloomberg Barclays U.S. Aggregate Bond Index (reflects no deduction for fees, expenses, or taxes) | 0.01% | 2.52% | 3.48% |
Board Consideration of the Reorganization
At its December 11, 2018 meeting, the PVC Board of Directors considered information presented by PGI. The Board requested and evaluated such information as it deemed necessary to consider the proposed Reorganization of the Acquired Fund into the Acquiring Fund. At the meeting, the Board approved the Reorganization after concluding that participation in the Reorganization is in the best interests of the Acquired Fund and the Acquiring Fund and that the interests of existing shareholders of each Fund will not be diluted as a result of the Reorganization.
In determining whether to approve the Reorganization, the Board made inquiry into a number of matters and considered, among other things, the following factors, in no order of priority:
| |
| • | the prospects for growth of and for achieving economies of scale by the Acquired Fund as compared to those of the Acquiring Fund, including the anticipated redemption by affiliated fund-of-fund products of assets invested in the Acquiring Fund; |
| |
| • | the Funds’ similar investment objectives and principal investment strategies and risks, and identical fundamental investment restrictions; |
| |
| • | the Funds’ current management fee rates and expense ratios and the expected management fee rate and expense ratio of the Acquired Fund following the Reorganization; |
| |
| • | the expected automatic conversion of Class 2 shares of the Acquiring Fund into Class 1 shares and that Class 2 shareholders of the Acquired Fund would become Class 1 shareholders of the Acquiring Fund in the Reorganization; |
| |
| • | the estimated costs of the Reorganization, including audit and proxy-related costs, and that such costs will be borne by the Acquired Fund; |
| |
| • | the estimated trading costs associated with disposing of any portfolio securities of the Acquired Fund and reinvesting the proceeds in connection with the Reorganization; |
| |
| • | information regarding the Funds’ investment performance and risk-return profiles; |
| |
| • | the direct or indirect federal income tax consequences of the Reorganization and their expected impact on Contract Owners of the insurance separate accounts that own the Acquired Fund shares; |
| |
| • | any direct or indirect benefits, including potential economic benefits, expected to be derived by PGI and its affiliates from the Reorganization; |
| |
| • | the absence of any material differences in the rights of shareholders of the Funds; |
| |
| • | the Reorganization will not result in the dilution of the interests of shareholders of the Acquired Fund or the Acquiring Fund; |
| |
| • | the terms and conditions of the Plan; and |
| |
| • | possible alternatives to the Reorganization, including liquidation of the Acquired Fund. |
The Board recommends that Acquired Fund shareholders vote to approve the Reorganization for the following reasons:
| |
| • | based on information provided by PGI, the Board expects a significant withdrawal of assets from the Acquired Fund as a result of the anticipated redemption by affiliated fund-of-funds products of assets invested in the Acquired Fund and believes there is otherwise a lack of foreseeable demand or prospects for scalable growth for the Acquired Fund; |
| |
| • | based on information provided by PGI, the Board believes the prospects for growth and for achieving economies of scale are better for the Acquiring Fund than the Acquired Fund; |
| |
| • | the Reorganization is expected to result in a decrease in the expense ratio for all shareholders of the Acquired Fund; |
| |
| • | the Acquired Fund and the Acquiring Fund have similar investment objectives and principal investment strategies and risks; and |
| |
| • | based on information provided by PGI, the Board believes all Acquired Fund shareholders will receive comparable investment performance post-Reorganization. |
PROPOSAL 2:
APPROVAL OF A PLAN OF ACQUISITION
PROVIDING FOR THE REORGANIZATION OF THE
LARGECAP GROWTH ACCOUNT INTO THE
LARGECAP GROWTH ACCOUNT I
Shareholders of the LargeCap Growth Account (the “Acquired Fund”) are being asked to approve the Plan, which provides for the reorganization of the Acquired Fund into the LargeCap Growth Account I (the “Acquiring Fund”).
Comparison of Acquired and Acquiring Funds
The following tables provide comparative information with respect to the Acquired and Acquiring Funds. As indicated in the tables, the Funds have the same objective in that both Funds seek long-term growth of capital. The Funds also have similar investment strategies and risks in that both in that both Funds employ a strategy that focuses on large capitalization growth securities. The principal differences are that the Acquiring Fund is multi-managed, and the Acquired Fund employs a more passive ehanced index strategy on up to 30% of the Fund's assets.
|
| | |
LargeCap Growth Account (Acquired Fund) | | LargeCap Growth Account I (Acquiring Fund) |
| Approximate Net Assets as of December 31, 2018: |
| $100,289,522 | | $299,298,482 |
| INVESTMENT ADVISOR |
| PGI | | PGI |
| | | |
| SUB-ADVISORS |
| Columbus Circle Investors ("CCI") | | Brown Advisory, LLC |
| | | T. Rowe Price Associates, Inc. |
| | | |
| CCI PORTFOLIO MANAGERS | | PGI PORTFOLIO MANAGERS |
Thomas J. Bisighini has been with CCI since 2004. He earned a B.S. from Bentley College and an M.B.A. in Finance from Fordham University. Mr. Bisighini has earned the right to use the Chartered Financial Analyst designation. Anthony Rizza has been with CCI since 1991. He earned a B.S. in Business from the University of Connecticut. Mr. Rizza has earned the right to use the Chartered Financial Analyst designation. | | The Acquiring Fund has two sub-advisors. For the Acquiring Fund, a team at PGI consisting of James Fennessey and Randy Welch, determines the portion of the Acquiring Fund's assets each sub-advisor will manage and may, from time to time, reallocate Fund assets between PGI acting in a discretionary advisory capacity and the sub-advisors. The decision to do so may be based on a variety of factors, including but not limited to: the investment capacity of PGI and each sub-advisor, portfolio diversification, volume of net cash flows, fund liquidity, investment performance, investment strategies, changes in PGI or each sub-advisor's firm or investment professionals or changes in the number of sub-advisors. Ordinarily, reallocations of Fund assets among sub-advisors occur as a sub-advisor liquidates assets in the normal course of portfolio management or with net new cash flows; however, at times existing Fund assets may be reallocated among sub-advisors. This team shares equally in the day-to-day portfolio management responsibility and agrees on allocation decisions. James W. Fennessey has been with Principal® since 2000. He is the Head of the Manager Research Team that is responsible for analyzing, interpreting, and coordinating investment performance data and evaluation of the investment managers under the due diligence process that monitors investment managers used by the Principal Funds. Mr. Fennessey earned a B.S. in Business Administration, with an emphasis in Finance, and a minor in Economics from Truman State University. He has earned the right to use the Chartered Financial Analyst designation. Randy L. Welch has been with Principal® since 1989 and oversees the functions of the Manager Selection & Investment Support Team, which includes investment manager research, investment consulting, performance analysis, and attribution. He is also responsible for the due diligence process that monitors investment managers on Principal's platform. Mr. Welch is an affiliate member of the Chartered Financial Analysts (CFA) Institute. Mr. Welch earned a B.A. in Business/Finance from Grand View College and an M.B.A. from Drake University. |
Comparison of Investment Objectives and Strategies
|
| | |
LargeCap Growth Account (Acquired Fund) | | LargeCap Growth Account I (Acquiring Fund) |
| | | |
| INVESTMENT OBJECTIVES |
| The Acquired Fund seeks long-term growth of capital. | | The Acquiring Fund seeks long-term growth of capital. |
| | | |
| PRINCIPAL INVESTMENT STRATEGIES |
| | | |
Under normal circumstances, the Acquired Fund invests at least 80% of its net assets, plus any borrowings for investment purposes, in equity securities of companies with large market capitalizations at the time of purchase. For the Acquired Fund, companies with large market capitalizations are those with market capitalizations within the range of companies comprising the Russell 1000® Growth Index (as of December 31, 2018, this range was between approximately $921.7 million and $780.4 billion). The Acquired Fund invests in growth equity securities; growth orientation emphasizes buying equity securities of companies whose potential for growth of capital and earnings is expected to be above average. | | Under normal circumstances, the Acquiring Fund invests at least 80% of its net assets, plus any borrowings for investment purposes, in equity securities of companies with large market capitalizations at the time of purchase. For the Acquiring Fund, companies with large market capitalizations are those with market capitalizations within the range of companies comprising the Russell 1000® Growth Index (as of December 31, 2018, this range was between approximately $921.7 million and $780.4 billion). The Acquired Fund invests in growth equity securities; growth orientation emphasizes buying equity securities of companies whose potential for growth of capital and earnings is expected to be above average. Principal Global Investors, LLC invests up to 30% of the Acquiring Fund's assets in equity securities in an attempt to match or exceed the performance of the Russell 1000® Growth Index by purchasing securities in the index while slightly overweighting and underweighting certain individual equity securities relative to their weight in the index. The Acquiring Fund's remaining assets are managed by the sub-advisors. |
Temporary Defensive Investing
For temporary defensive purposes in times of unusual or adverse market, economic, or political conditions, each Fund may invest up to 100% of its assets in cash and cash equivalents. In taking such defensive measures, either Fund may fail to achieve its investment objective.
Fundamental Investment Restrictions
The Funds are subject to identical fundamental investment restrictions, which may not be changed without a shareholder vote. These fundamental restrictions deal with such matters as the issuance of senior securities, purchasing or selling real estate or commodities, borrowing money, making loans, underwriting securities of other issuers, diversification or concentration of investments, and short sales of securities. The fundamental investment restrictions of the Funds are described in the Statement of Additional Information under "Description of the Funds' Investments and Risks - Fundamental Restrictions."
Additional Information
The investment objective of each Fund may be changed by the Board without shareholder approval.
Additional information about the investment strategies and the types of securities in which the Funds may invest is discussed below under “Additional Information About Investment Strategies and Risks” as well as in the Statement of Additional Information.
The Statement of Additional Information provides further information about the portfolio manager(s) for each Fund, including information about compensation, other accounts managed, and ownership of Fund shares.
Comparison of Principal Investment Risks
In deciding whether to approve the Reorganization, shareholders should consider the amount and character of investment risk involved in the respective investment objectives and strategies of the Acquired and Acquiring Funds.
Principal Risks Applicable to Both Funds:
The following principal risks are applicable to the Acquired Fund and the Acquiring Fund. There are no additional principal risks of investing in either the Acquired Fund or the Acquiring Fund that are not included below.
Equity Securities Risk. The value of equity securities could decline if the issuer’s financial condition declines or in response to overall market and economic conditions. A fund's principal market segment(s) (such as market capitalization or style) may underperform other market segments or the equity markets as a whole.
Growth Stock Risk. If growth companies do not increase their earnings at a rate expected by investors, the market price of the stock may decline significantly, even if earnings show an absolute increase. Growth company stocks also typically lack the dividend yield that can lessen price declines in market downturns.
Fees and Expenses of the Funds
Fees and Expenses as a % of average daily net assets
The following table shows: (a) the ratios of expenses to average net assets of the Acquired Fund for the fiscal year ended December 31, 2018; (b) the ratios of expenses to average net assets of the Acquiring Fund for the fiscal year ended December 31, 2018; and (c) the pro forma expense ratios of the Acquiring Fund for the fiscal year ended December 31, 2018, assuming that the Reorganization had taken place at the commencement of the fiscal year ended December 31, 2018.
These fees and expenses do not include the effect of any sales charge, separate account expenses or other contract level expenses which may be applied at the variable life insurance or variable annuity product level. If such charges or fees were included, overall expenses would be higher and would lower the Acquired and Acquiring Funds’ performance.
Holders of Class 1 and Class 2 shares of the LargeCap Growth Account will receive Class 1 shares of the LargeCap Growth Account I.
Annual Fund Operating Expenses
(Expenses that you pay each year as a percentage of the value of your investment)
|
| | |
LargeCap Growth Account (Acquired Fund) | | |
| | Class 1 | Class 2 |
| Management Fees | 0.68% | 0.68% |
| Distribution and/or Service (12b-1) Fees | N/A | 0.25% |
Other Expenses (1) | 0.01% | 0.01% |
| Total Annual Account Operating Expenses | 0.69% | 0.94% |
|
| | |
LargeCap Growth Account I (Acquiring Fund) | | |
| | Class 1 | Class 2 |
| Management Fees | 0.75% | 0.75% |
| Distribution and/or Service (12b-1) Fees | N/A | 0.25% |
Other Expenses (1) | 0.01% | 0.01% |
| Total Annual Account Operating Expenses | 0.76% | 1.01% |
Fee Waiver (2) | (0.02)% | (0.02)% |
| Total Annual Account Operating Expenses after Fee Waiver | 0.74% | 0.99% |
|
| | | |
LargeCap Growth Account I (Acquiring Fund) (Pro forma assuming Reorganization) |
| | Class 1 | Class 2 | |
| Management Fees | 0.71% | 0.71% | |
| Distribution and/or Service (12b-1) Fees | N/A | 0.25% | |
Other Expenses (1) | 0.01% | 0.01% | |
| Total Annual Account Operating Expenses | 0.72% | 0.97% | |
Expense Reimbursement and Fee Waiver (2)(3) | (0.03)% | (0.03)% | |
| Total Annual Account Operating Expenses after Expense Reimbursement and Fee Waiver | 0.69% | 0.94% | (4) |
(1) There were no acquired fund fees and expenses during the period.
(2) Principal Global Investors, LLC ("PGI"), the investment advisor, has contractually agreed to limit the Fund's management fees through the period ending April 30, 2020. The fee waiver will reduce the Fund's management fees by 0.016% (expressed as a percent of average net assets on an annualized basis). It is expected that the fee waiver will continue through the period disclosed; however, Principal Variable Contracts Funds, Inc. and PGI the parties to the agreement, may mutually agree to terminate the fee waiver prior to the end of the period.
(3) Effective with the Reorganization, Principal Global Investors, LLC ("PGI"), the investment advisor, has contractually agreed to limit the Fund's expenses by paying, if necessary, expenses normally payable by the Fund (excluding interest expense, expenses related to fund investments, acquired fund fees and expenses, and other extraordinary expenses) to maintain a total level of operating expenses (expressed as a percent of average net assets on an annualized basis) not to exceed 0.69% for Class 1 and 0.94% for Class 2 shares. It is expected that the expense limits will continue through the period ending April 30, 2021; however, Principal Variable Contracts Funds, Inc. and PGI, the parties to the agreement, may mutually agree to terminate the expense limits prior to the end of the period.
(4) Effective following the close of business on June 14, 2019, the Class 2 shares will automatically convert to Class 1 shares.
Examples: The following examples are intended to help you compare the costs of investing in shares of the Acquired and Acquiring Funds. The examples assume that fund expenses continue at the rates shown in the table above, that you invest $10,000 in the particular fund for the time periods indicated and that all dividends and distributions are reinvested. The examples also assume that your investment has a 5% return each year. If separate account expenses and contract level expenses were included, expenses would be higher. The examples should not be considered a representation of future expense of the Acquired or Acquiring Fund. Actual expense may be greater or less than those shown. |
| | | | | |
| ACCOUNT | | 1 Year | 3 Years | 5 Years | 10 Years |
| | | | | | |
LargeCap Growth (Acquired Fund) | Class 1 | $70 | $221 | $384 | $859 |
LargeCap Growth (Acquired Fund) | Class 2 | 96 | 300 | 520 | 1,155 |
| | | | | | |
LargeCap Growth I (Acquiring Fund) | Class 1 | $76 | $241 | $420 | $940 |
LargeCap Growth I (Acquiring Fund) | Class 2 | 101 | 320 | 556 | 1,234 |
| | | | | | |
LargeCap Growth I (Acquiring Fund) (Pro forma assuming Reorganization) | Class 1 | $70 | $227 | $398 | $892 |
LargeCap Growth I (Acquiring Fund) (Pro forma assuming Reorganization) | Class 2 | 96 | 306 | 533 | 1,187 |
Portfolio Turnover
Each Fund pays transaction costs, such as commissions, when it buys and sells securities (or “turns over” its portfolio). A higher portfolio turnover rate may indicate higher transaction fees. These costs, which are not reflected in annual fund operating expenses or in the example, affect the Fund’s performance. During the most recent fiscal year, the portfolio turnover rate for the Acquired Fund was 77.8% of the average value of its portfolio while the portfolio turnover rate for the Acquiring Fund was 36.9%.
Investment Management Fees
The Funds each pay their investment advisor, PGI, an advisory fee which for each Fund is calculated as a percentage of the Fund’s average daily net assets pursuant to the following fee schedule:
|
| | | |
LargeCap Growth Account (Acquired Fund) | LargeCap Growth Account I (Acquiring Fund) |
| First $500 Million | 0.68% | First $100 Million | 0.80% |
| Next $500 Million | 0.63% | Next $100 Million | 0.75% |
| Next $1 Billion | 0.61% | Next $100 Million | 0.70% |
| Next $1 Billion | 0.56% | Next $100 Million | 0.65% |
| Over $3 Billion | 0.51% | Thereafter | 0.60% |
The fee each Fund paid (as a percentage of the Fund's average daily net assets) for the fiscal year ended December 31, 2018 was:
|
| | | |
LargeCap Growth Account (Acquired Fund) | LargeCap Growth Account I (Acquiring Fund) |
| 0.68% | 0.75% |
Availability of the discussions regarding the basis for the Board of Directors' approval of the management agreement and any sub-advisory agreements is as follows:
|
| |
| | Annual Report to Shareholders for the period ending December 31, 2018 |
| Account | Management Agreement |
LargeCap Growth (Acquired Fund) | X |
LargeCap Growth I (Acquiring Fund) | X |
Performance
The following information provides some indication of the risks of investing in the Acquiring and Acquired Funds by showing their performance from year to year and by showing how the Acquiring and Acquired Fund’s average annual returns for 1, 5, and 10 years compare with those of one or more broad measures of market performance.
Past performance is not necessarily an indication of how the Funds will perform in the future. Performance figures for the Funds do not include any separate account expenses, cost of insurance, or other contract-level expenses; total returns for the Funds would be lower if such expenses were included.
Calendar Year Total Return (%) as of 12/31 Each Year
LargeCap Growth Account (Acquired Fund)
|
| | | |
| Highest return for a quarter during the period of the bar chart above: | Q1 '12 | 17.54 | % |
| Lowest return for a quarter during the period of the bar chart above: | Q4 '18 | (20.22 | )% |
|
| | | |
| Average Annual Total Returns |
| For the periods ended December 31, 2018 | 1 Year | 5 Years | 10 Years |
| LargeCap Growth Account - Class 1 | (7.30)% | 6.71% | 12.04% |
| LargeCap Growth Account - Class 2 | (7.54)% | 6.44% | 11.77% |
| Russell 1000 Growth Index (reflects no deduction for fees, expenses, or taxes) | (1.51)% | 10.40% | 15.29% |
Calendar Year Total Return (%) as of 12/31 Each Year
LargeCap Growth Account I (Acquiring Fund)
For periods prior to the inception date of Class 2 shares (May 1, 2015), the performance shown in the table for Class 2 shares is that of the Acquiring Fund's Class 1 shares adjusted to reflect the fees and expenses of the Class 2 shares. These adjustments result in performance for such periods that is no higher than the historical performance of the Class 1 shares.
|
| | | |
| Highest return for a quarter during the period of the bar chart above: | Q2 '09 | 19.90 | % |
| Lowest return for a quarter during the period of the bar chart above: | Q3 '11 | (15.04 | )% |
|
| | | |
| Average Annual Total Returns |
| For the periods ended December 31, 2018 | 1 Year | 5 Years | 10 Years |
| LargeCap Growth Account I - Class 1 | 3.60% | 10.43% | 16.83% |
| LargeCap Growth Account I - Class 2 | 3.36% | 10.17% | 16.55% |
| Russell 1000 Growth Index (reflects no deduction for fees, expenses, or taxes) | (1.51)% | 10.40% | 15.29% |
Board Consideration of the Reorganization
At its December 11, 2018 meeting, the PVC Board of Directors considered information presented by PGI. The Board requested and evaluated such information as it deemed necessary to consider the proposed Reorganization of the Acquired Fund into the Acquiring Fund. At the meeting, the Board approved the Reorganization after concluding that participation in the Reorganization is in the best interests of the Acquired Fund and the Acquiring Fund and that the interests of existing shareholders of each Fund will not be diluted as a result of the Reorganization.
In determining whether to approve the Reorganization, the Board made inquiry into a number of matters and considered, among other things, the following factors, in no order of priority:
| |
| • | the prospects for growth of and for achieving economies of scale by the Acquired Fund as compared to those of the Acquiring Fund; |
| |
| • | the Funds’ identical investment objectives, similar principal investment strategies and risks, and identical fundamental investment restrictions; |
| |
| • | the Funds’ current management fee rates and expense ratios and the expected management fee rate and expense ratio of the Acquired Fund following the Reorganization; |
| |
| • | the expected automatic conversion of Class 2 shares of the Acquiring Fund into Class 1 shares and that Class 2 shareholders of the Acquired Fund would become Class 1 shareholders of the Acquiring Fund in the Reorganization; |
| |
| • | the estimated costs of the Reorganization, including audit and proxy-related costs, and that such costs will be borne by the Acquired Fund; |
| |
| • | the estimated trading costs associated with disposing of any portfolio securities of the Acquired Fund and reinvesting the proceeds in connection with the Reorganization; |
| |
| • | information regarding the Funds’ investment performance and risk-return profiles; |
| |
| • | the direct or indirect federal income tax consequences of the Reorganization and their expected impact on Contract Owners of the insurance separate accounts that own the Acquired Fund shares; |
| |
| • | any direct or indirect benefits, including potential economic benefits, expected to be derived by PGI and its affiliates from the Reorganization; |
| |
| • | the absence of any material differences in the rights of shareholders of the Funds; |
| |
| • | the Reorganization will not result in the dilution of the interests of shareholders of the Acquired Fund or the Acquiring Fund; |
| |
| • | the terms and conditions of the Plan; and |
| |
| • | possible alternatives to the Reorganization, including liquidation of the Acquired Fund. |
The Board recommends that Acquired Fund shareholders vote to approve the Reorganization for the following reasons:
| |
| • | based on information provided by PGI, the Board believes there is a lack of foreseeable demand or prospects for scalable growth for the Acquired Fund; |
| |
| • | the Reorganization is expected to result in the same expense ratio for Class 1 shareholders of the Acquired Fund and a decreased expense ratio for the Class 2 shareholders of the Acquired Fund (who will receive Class 1 shares of the Acquiring Fund in the Reorganization), taking into account the expense cap that will be added to Class 1 shares of the Acquiring Fund post-Reorganization; |
| |
| • | the Acquired Fund and the Acquiring Fund have the same investment objective and similar principal investment strategies and risks; and |
| |
| • | based on information provided by PGI, the Acquired Fund has underperformed its benchmark and peer group in recent years, and the Acquiring Fund had a lower risk profile (as measured by the standard deviations of the Funds' respective returns) compared to the Acquired Fund over the three- and five-year time periods ended September 30, 2018, while exhibiting better returns. |
PROPOSAL 3:
APPROVAL OF A PLAN OF ACQUISITION
PROVIDING FOR THE REORGANIZATION OF THE
MULTI-ASSET INCOME ACCOUNT INTO THE
SAM (Strategic Asset Management) FLEXIBLE INCOME ACCOUNT
Shareholders of the Multi-Asset Income Account (the “Acquired Fund”) are being asked to approve the Plan, which provides for the reorganization of the Acquired Fund into the SAM (Strategic Asset Management) Flexible Income Account (the “Acquiring Fund”).
Comparison of Acquired and Acquiring Funds
The following tables provide comparative information with respect to the Acquired and Acquiring Funds. As indicated in the tables, the Funds have similar objectives in that the Acquired Fund seeks current income while the Acquiring Fund seeks to provide a high level of total return (consisting of reinvestment of income with some capital appreciation). The Funds also have similar investment strategies and risks in that both Funds employ of fund-of-fund strategy that focuses on a diversified allocation mix of actively managed domestic and foreign equity and fixed-income funds. The principal differences are that the Acquired Fund has more exposure to derivatives due to its investments in underlying funds, and the Acquiring Fund has investments in more underlying funds.
|
| | |
Multi-Asset Income Account (Acquired Fund) | | SAM (Strategic Asset Management) Flexible Income Account (Acquiring Fund) |
| Approximate Net Assets as of December 31, 2018: |
| $383,608 | | $182,674,770 |
| INVESTMENT ADVISOR |
| PGI | | PGI |
| | | |
| PGI PORTFOLIO MANAGERS | | PGI PORTFOLIO MANAGERS |
Scott Smith has been with Principal® since 1999. He earned a bachelor’s degree in Finance from Iowa State University. | | Charles D. Averill has been with Principal® since1990. He earned a bachelor’s degree in Economics from Reed College and an M.A. in Economics from Princeton University. Mr. Averill has earned the right to use the Chartered Financial Analyst designation. Todd A. Jablonski has been with Principal® since 2010. He earned a bachelor’s degree in Economics from the University of Virginia and an M.B.A. with an emphasis in Quantitative Finance from New York University's Stern School of Business. Mr. Jablonski has earned the right to use the Chartered Financial Analyst designation. Gregory L. Tornga has been with Principal® since 2011. He earned a bachelor’s degree from the University of Michigan and an M.B.A. from the Argyros School of Business at Chapman University. Mr. Tornga has earned the right to use the Chartered Financial Analyst designation. |
Comparison of Investment Objectives and Strategies
|
| | |
Multi-Asset Income Account (Acquired Fund) | | SAM (Strategic Asset Management) Flexible Income Account (Acquiring Fund) |
| | | |
| INVESTMENT OBJECTIVES |
| The Acquired Fund seeks current income. | | The Acquiring Fund seeks to provide a high level of total return (consisting of reinvestment of income with some capital appreciation). |
| | | |
| PRINCIPAL INVESTMENT STRATEGIES |
| | | |
The Acquired Fund is a fund of funds and invests in funds of Principal Funds, Inc. ("PFI").The Acquired Fund's underlying funds consist of domestic and foreign equity funds, fixed-income funds, and other funds that aim to offer diversification beyond traditional equity and fixed income securities. The diversification of the Acquired Fund is designed to moderate overall price volatility and cushion severe losses in any one investment sector. Under normal circumstances, the Acquired Fund allocates a majority of its assets to underlying funds that invest in fixed income securities (including high-yield bonds, preferred securities, commercial mortgage-backed securities (“CMBS”) (securitized products)) and a portion of its assets to underlying funds that invest in equity securities (including equity securities of domestic and foreign companies principally engaged in the real estate industry, including real estate investment trusts, and growth and value equities of domestic and foreign companies, including those in emerging markets). These investments may be denominated in foreign currencies. The Acquired Fund invests in these types of underlying funds in an effort to provide incremental fixed-income yields over a portfolio of government securities and equity dividend yields, while diversifying the fixed-income risks. The Acquired Fund's underlying funds utilize derivative strategies. A derivative is a financial arrangement, the value of which is derived from, or based on, a traditional security, asset, or market index. Specifically, the underlying funds invest in swaps, including interest rate, credit default and/or total return swaps, and Treasury futures to efficiently manage the fixed-income exposure. The Acquired Fund allocates its investments among the underlying funds based on qualitative and quantitative analysis. Without shareholder approval, the Acquired Fund may alter the allocations and/or add, substitute or remove underlying funds (including investing in other investment companies) when it deems appropriate. | | The SAM Portfolios operate as funds of funds and invest principally in funds and exchange-traded funds ("ETFs") of Principal Funds, Inc., PVC, and Principal Exchange-Traded Funds (“Underlying Funds”). The SAM Portfolios generally categorize each Underlying Fund as a fixed-income, equity, or specialty fund based on its investment profile. Each SAM Portfolio typically allocates its assets among Underlying Funds, and within predetermined percentage ranges, as determined by the SAM Portfolio in accordance with its outlook for the economy, the financial markets and the relative market valuations of the Underlying Funds. The asset class diversification of the SAM Portfolio is designed to moderate overall price volatility and cushion severe losses in any one investment sector. The Portfolio generally invests: • between 55% and 95% of its assets in fixed-income funds, and less than 40% in any one fixed-income fund; such funds generally invest in fixed income instruments such as high yield securities (or “junk” bonds), real estate securities, securitized products, government and government-sponsored securities, and corporate bonds; • between 5% and 45% of its assets in equity funds, and less than 30% in any one equity fund; such funds generally invest in equity securities of domestic and foreign companies, including value stock; and • less than 20% of its assets in specialty funds, and less than 20% in any one specialty fund; such funds generally offer unique combinations of traditional equity securities and fixed-income securities or use alternative investment strategies that aim to offer diversification beyond traditional equity and fixed-income securities and include investments in such assets as infrastructure, commodities, currencies, and natural resources companies. The SAM Portfolio may temporarily exceed these percentage ranges for short periods, and may alter the percentage ranges when it deems appropriate. |
Temporary Defensive Investing
For temporary defensive purposes in times of unusual or adverse market, economic, or political conditions, each Fund may invest up to 100% of its assets in cash and cash equivalents. In taking such defensive measures, either Fund may fail to achieve its investment objective.
Fundamental Investment Restrictions
The Funds are subject to identical fundamental investment restrictions, which may not be changed without a shareholder vote. These fundamental restrictions deal with such matters as the issuance of senior securities, purchasing or selling real estate or commodities, borrowing money, making loans, underwriting securities of other issuers, diversification or concentration of investments, and short sales of securities. The fundamental investment restrictions of the Funds are described in the Statement of Additional Information under "Description of the Funds' Investments and Risks - Fundamental Restrictions."
Additional Information
The investment objective of each Fund may be changed by the Board without shareholder approval.
Additional information about the investment strategies and the types of securities in which the Funds may invest is discussed below under “Additional Information About Investment Strategies and Risks” as well as in the Statement of Additional Information.
The Statement of Additional Information provides further information about the portfolio manager(s) for each Fund, including information about compensation, other accounts managed, and ownership of Fund shares.
Comparison of Principal Investment Risks
In deciding whether to approve the Reorganization, shareholders should consider the amount and character of investment risk involved in the respective investment objectives and strategies of the Acquired and Acquiring Funds.
Principal Risks Applicable to Both Funds:
The following principal risks are applicable to the Acquired Fund and the Acquiring Fund:
Fund of Funds Risk. Account shareholders bear indirectly their proportionate share of the expenses of other investment companies in which the Account invests ("underlying funds"). The Account's selection and weighting of asset classes and allocation of investments in underlying funds may cause it to underperform other funds with a similar investment objective. The Account's performance and risks correspond directly to the performance and risks of the underlying funds in which it invests, proportionately in accordance with the weightings of such investments, and there is no assurance that the underlying funds will achieve their investment objectives. Management of the Account entails potential conflicts of interest: the Account invests in affiliated underlying funds; and the Advisor and its affiliates may earn different fees from different underlying funds and may have an incentive to allocate more Account assets to underlying funds from which they receive higher fees.
Principal Risks due to the Funds' Investments in Underlying Funds
Equity Securities Risk. The value of equity securities could decline if the issuer’s financial condition declines or in response to overall market and economic conditions. A fund's principal market segment(s) (such as market capitalization or style) may underperform other market segments or the equity markets as a whole.
| |
| • | Value Stock Risk. Value stocks may continue to be undervalued by the market for extended periods, including the entire period during which the stock is held by a fund, or the events that would cause the stock price to increase may not occur as anticipated or at all. Moreover, a stock that appears to be undervalued actually may be appropriately priced at a low level and therefore would not be profitable for the fund. |
Fixed-Income Securities Risk. Fixed-income securities are subject to interest rate, credit quality, and liquidity risks. The market value of fixed-income securities generally declines when interest rates rise and generally increases when interest rates fall. Higher interest rates may adversely affect the liquidity of certain fixed-income securities. Moreover, an issuer of fixed-income securities could default on its payment obligations due to increased interest rates or for other reasons.
Foreign Currency Risk. Risks of investing in securities denominated in, or that trade in, foreign (non-U.S.) currencies include changes in foreign exchange rates and foreign exchange restrictions.
Foreign Securities Risk. The risks of foreign securities include loss of value as a result of: political or economic instability; nationalization, expropriation or confiscatory taxation; settlement delays; and limited government regulation (including less stringent reporting, accounting, and disclosure standards than are required of U.S. companies).
High Yield Securities Risk. High yield fixed-income securities (commonly referred to as "junk bonds") are subject to greater credit quality risk than higher rated fixed-income securities and should be considered speculative.
Portfolio Duration Risk. Portfolio duration is a measure of the expected life of a fixed-income security and its sensitivity to changes in interest rates. The longer a fund's average portfolio duration, the more sensitive the fund will be to changes in interest rates, which means funds with longer average portfolio durations may be more volatile than those with shorter durations.
Real Estate Securities Risk. Investing in real estate securities subjects the fund to the risks associated with the real estate market (which are similar to the risks associated with direct ownership in real estate), including declines in real estate values, loss due to casualty or condemnation, property taxes, interest rate changes, increased expenses, cash flow of underlying real estate assets, regulatory changes (including zoning, land use and rents), and environmental problems, as well as to the risks related to the management skill and creditworthiness of the issuer.
Redemption and Large Transaction Risk. Ownership of the fund's shares may be concentrated in one or a few large investors (such as funds of funds, institutional investors, and asset allocation programs) that may redeem or purchase shares in large quantities. These transactions may cause the fund to sell securities to meet redemptions or to invest additional cash at times it would not otherwise do so, which may result in increased transaction costs, increased expenses, changes to expense ratios, and adverse effects to fund performance. Such transactions may also accelerate the realization of taxable income if sales of portfolio securities result in gains. Moreover, reallocations by large shareholders among share classes of a fund may result in changes to the expense ratios of affected classes, which may increase the expenses paid by shareholders of the class that experienced the redemption.
Securitized Products Risk. Investments in securitized products are subject to risks similar to traditional fixed income securities, such as credit, interest rate, liquidity, prepayment, extension, and default risk, as well as additional risks associated with the nature of the assets and the servicing of those assets. Unscheduled prepayments on securitized products may have to be reinvested at lower rates. A reduction in prepayments may increase the effective maturities of these securities, exposing them to the risk of decline in market value over time (extension risk).
Additional Principal Risks of Investing in the Acquiring Fund:
The following are additional principal risks of investing in the Acquiring Fund that are not principal risks of investing in the Acquired Fund:
Principal Risks due to the Fund's Investments in Underlying Funds
U.S. Government Securities Risk. Yields available from U.S. government securities are generally lower than yields from many other fixed-income securities.
U.S. Government-Sponsored Securities Risk. Securities issued by U.S. government-sponsored enterprises such as the Federal Home Loan Mortgage Corporation, the Federal National Mortgage Association, and the Federal Home Loan Banks are not issued or guaranteed by the U.S. government.
Additional Principal Risks of Investing in the Acquired Fund:
The following are additional principal risks of investing in the Acquired Fund that are not principal risks of investing in the Acquiring Fund:
Principal Risks due to the Fund's Investments in Underlying Funds
Counterparty Risk. Counterparty risk is the risk that the counterparty to a contract or other obligation will be unable or unwilling to honor its obligations.
Derivatives Risk. Derivatives may not move in the direction anticipated by the portfolio manager. Transactions in derivatives may increase volatility, cause the liquidation of portfolio positions when not advantageous to do so and result in disproportionate losses that may be substantially greater than a fund's initial investment.
| |
| • | Credit Default Swaps. Credit default swaps involve special risks in addition to those associated with swaps generally because they are difficult to value, are highly susceptible to liquidity and credit risk, and generally pay a return to the party that has paid the premium only in the event of an actual default by the issuer of the underlying obligation (as opposed to a credit downgrade or other indication of financial difficulty). The protection “buyer” in a credit default contract may be obligated to pay the protection “seller” an up-front payment or a periodic stream of payments over the term of the contract provided generally that no credit event on a reference obligation has occurred. If a credit event occurs, the seller generally must pay the buyer the “par value” (i.e., full notional value) of the swap in exchange for an equal face amount of deliverable obligations of the reference entity described in the swap, or the seller may be required to deliver the related net cash amount, if the swap is cash settled. The Fund may be either the buyer or seller in the transaction. |
| |
| • | Currency Contracts. Derivatives related to currency contracts involve the specific risk of government action through exchange controls that would restrict the ability of the fund to deliver or receive currency. |
| |
| • | Forward Contracts, Futures and Swaps. These derivative instruments involve specific risks, including: the imperfect correlation between the change in market value of the instruments held by the fund and the price of the instruments; possible lack of a liquid secondary market for an instrument and the resulting inability to close it when desired; counterparty risk; and if the fund has insufficient cash, it may have to sell securities from its portfolio to meet any applicable daily variation margin requirements. |
Emerging Markets Risk. Investments in emerging market countries may have more risk than those in developed market countries because the emerging markets are less developed and more illiquid. Emerging market countries can also be subject to increased social, economic, regulatory, and political uncertainties and can be extremely volatile.
Equity Securities Risk. The value of equity securities could decline if the issuer’s financial condition declines or in response to overall market and economic conditions. A fund's principal market segment(s) (such as market capitalization or style) may underperform other market segments or the equity markets as a whole.
| |
| • | Growth Stock Risk. If growth companies do not increase their earnings at a rate expected by investors, the market price of the stock may decline significantly, even if earnings show an absolute increase. Growth company stocks also typically lack the dividend yield that can lessen price declines in market downturns. |
| |
| • | Small and Medium Market Capitalization Companies Risk. Investments in small and medium sized companies may involve greater risk and price volatility than investments in larger, more mature companies. |
Industry Concentration Risk. A fund that concentrates investments in a particular industry or group of industries has greater exposure than other funds to market, economic and other factors affecting that industry or group of industries.
| |
| • | Real Estate. A fund concentrating in the real estate industry is subject to the risks associated with direct ownership of real estate, securities of companies in the real estate industry, and/or real estate investment trusts. |
Preferred Securities Risk. Because preferred securities have a lower priority claim on assets or earnings than senior bonds and other debt instruments in a company's capital structure, they are subject to greater credit and liquidation risk than more senior debt instruments. In addition, preferred securities are subject to other risks, such as limited or no voting rights, deferring or skipping distributions, interest rate risk, and redeeming the security prior to any stated maturity date.
Real Estate Investment Trusts (“REITs”) Risk. In addition to risks associated with investing in real estate securities, REITs are dependent upon management skills, are not diversified, and are subject to heavy cash flow dependency, risks of default by borrowers, and self-liquidation. Investment in REITs also involves risks similar to risks of investing in small market capitalization companies, such as limited financial resources, less frequent and limited volume trading, and may be subject to more abrupt or erratic price movements than larger company securities. A REIT could fail to qualify for tax-free pass-through of income under the Internal Revenue Code. Fund shareholders will indirectly bear their proportionate share of the expenses of REITs in which the fund invests.
Fees and Expenses of the Funds
Fees and Expenses as a % of average daily net assets
The following table shows: (a) the ratios of expenses to average net assets of the Acquired Fund for the fiscal year ended December 31, 2018; (b) the ratios of expenses to average net assets of the Acquiring Fund for the fiscal year ended December 31, 2018; and (c) the pro forma expense ratios of the Acquiring Fund for the fiscal year ended December 31, 2018, assuming that the Reorganization had taken place at the commencement of the fiscal year ended December 31, 2018.
These fees and expenses do not include the effect of any sales charge, separate account expenses or other contract level expenses which may be applied at the variable life insurance or variable annuity product level. If such charges or fees were included, overall expenses would be higher and would lower the Acquired and Acquiring Funds’ performance.
Holders of Class 1 and Class 2 shares of the Multi-Asset Income Account will receive, respectively, Class 1 and Class 2 shares of the SAM (Strategic Asset Management) Flexible Income Account.
Annual Fund Operating Expenses
(Expenses that you pay each year as a percentage of the value of your investment)
|
| | |
Multi-Asset Income Account (Acquired Fund) | | |
| | Class 1 | Class 2 |
| Management Fees | 0.03% | 0.03% |
| Distribution and/or Service (12b-1) Fees | N/A | 0.25% |
| Other Expenses | 1.75% | 1.75% |
| Acquired Funds Fees and Expenses | 0.71% | 0.71% |
| Total Annual Account Operating Expenses | 2.49% | 2.74% |
Expense Reimbursement (1) | (1.70)% | (1.70)% |
| Total Annual Account Operating Expenses after Expense Reimbursement | 0.79% | 1.04% |
|
| | |
SAM Flexible Income Account (Acquiring Fund) | | |
| | Class 1 | Class 2 |
| Management Fees | 0.23% | 0.23% |
| Distribution and/or Service (12b-1) Fees | N/A | 0.25% |
| Other Expenses | —% | —% |
| Acquired Funds Fees and Expenses | 0.51% | 0.51% |
| Total Annual Account Operating Expenses | 0.74% | 0.99% |
|
| | | |
SAM Flexible Income Account (Acquiring Fund) (Pro forma assuming Reorganization) | | | |
| | Class 1 | Class 2 | |
| Management Fees | 0.23% | 0.23% | |
| Distribution and/or Service (12b-1) Fees | N/A | 0.25% | |
| Other Expenses | —% | —% | |
| Acquired Funds Fees and Expenses | 0.51% | 0.51% | |
| Total Annual Account Operating Expenses | 0.74% | 0.99% | |
(1) Principal Global Investors, LLC ("PGI"), the investment advisor, has contractually agreed to limit the Fund's expenses by paying, if necessary, expenses normally payable by the Fund (excluding interest expense, expenses related to fund investments, acquired fund fees and expenses, and other extraordinary expenses) to maintain a total level of operating expenses (expressed as a percent of average net assets on an annualized basis) not to exceed 0.08% for Class 1 and 0.33% for Class 2 shares. It is expected that the expense limits will continue through the period ending April 30, 2020; however, Principal Variable Contracts Funds, Inc. and PGI, the parties to the agreement, may mutually agree to terminate the expense limits prior to the end of the period.
Examples: The following examples are intended to help you compare the costs of investing in shares of the Acquired and Acquiring Funds. The examples assume that fund expenses continue at the rates shown in the table above, that you invest $10,000 in the particular fund for the time periods indicated and that all dividends and distributions are reinvested. The examples also assume that your investment has a 5% return each year. If separate account expenses and contract level expenses were included, expenses would be higher. The examples should not be considered a representation of future expense of the Acquired or Acquiring Fund. Actual expense may be greater or less than those shown. |
| | | | | |
| ACCOUNT | | 1 Year | 3 Years | 5 Years | 10 Years |
Multi-Asset Income (Acquired Fund) | Class 1 | $81 | $613 | $1,172 | $2,697 |
Multi-Asset Income (Acquired Fund) | Class 2 | 106 | 689 | 1,298 | 2,946 |
| | | | | | |
SAM Flexible Income (Acquiring Fund) | Class 1 | $76 | $237 | $411 | $918 |
SAM Flexible Income (Acquiring Fund) | Class 2 | 101 | 315 | 547 | 1,213 |
| | | | | | |
SAM Flexible Income (Acquiring Fund) (Pro forma assuming Reorganization) | Class 1 | $76 | $237 | $411 | $918 |
SAM Flexible Income (Acquiring Fund) (Pro forma assuming Reorganization) | Class 2 | 101 | 315 | 547 | 1,213 |
Portfolio Turnover
Each Fund pays transaction costs, such as commissions, when it buys and sells securities (or “turns over” its portfolio). A higher portfolio turnover rate may indicate higher transaction fees. These costs, which are not reflected in annual fund operating expenses or in the example, affect the Fund’s performance. During the most recent fiscal year, the portfolio turnover rate for the Acquired Fund was 32.9% of the average value of its portfolio while the portfolio turnover rate for the Acquiring Fund was 19.9%.
Investment Management Fees
The Funds each pay their investment advisor, PGI, an advisory fee which for each Fund is calculated as a percentage of the Fund’s average daily net assets pursuant to the following fee schedule:
|
| | | |
Multi-Asset Income Account (Acquired Fund) | SAM (Strategic Asset Management) Flexible Income Account(1) (Acquiring Fund) |
| Overall Fee | 0.03% | First $1 Billion | 0.25% |
| | | Over $1 Billion | 0.20% |
(1) Breakpoints are based on aggregate SAM Portfolio net assets. |
The fee each Fund paid (as a percentage of the Fund's average daily net assets) for the fiscal year ended December 31, 2018 was:
|
| | | |
Multi-Asset Income Account (Acquired Fund) | SAM (Strategic Asset Management) Flexible Income Account (Acquiring Fund) |
| 0.03% | 0.23% |
Availability of the discussions regarding the basis for the Board of Directors' approval of the management agreement and any sub-advisory agreements is as follows:
|
| |
| | Annual Report to Shareholders for the period ending December 31, 2018 |
| Account | Management Agreement |
Multi-Asset Income (Acquired Fund) | X |
SAM Flexible Income (Acquiring Fund) | X |
Performance
The following information provides some indication of the risks of investing in the Acquiring and Acquired Funds by showing their performance from year to year and by showing how the Acquiring and Acquired Fund’s average annual returns for 1, 5, and 10 years (or, if shorter, the life of the Fund) compare with those of one or more broad measures of market performance.
Past performance is not necessarily an indication of how the Funds will perform in the future. Performance figures for the Funds do not include any separate account expenses, cost of insurance, or other contract-level expenses; total returns for the Funds would be lower if such expenses were included.
Life of Account returns for the Acquired Fund are measured from the date the Acquired Fund's shares were first sold (July 28, 2015).
Calendar Year Total Return (%) as of 12/31 Each Year
Multi-Asset Income Account (Acquired Fund)
|
| | | |
| Highest return for a quarter during the period of the bar chart above: | Q1 '17 | 3.71 | % |
| Lowest return for a quarter during the period of the bar chart above: | Q4 '18 | (5.33 | )% |
|
| | |
| Average Annual Total Returns |
| For the periods ended December 31, 2018 | 1 Year | Life of Account |
| Multi-Asset Income Account - Class 1 | (5.63)% | 3.06% |
| Multi-Asset Income Account - Class 2 | (5.93)% | 2.81% |
| Bloomberg Barclays Global Credit Index (reflects no deduction for fees, expenses, or taxes) | (3.29)% | 2.72% |
| MSCI ACWI Value Index NR (reflects withholding taxes on foreign dividends, but no deduction for fees, expenses, or other taxes) | (10.79)% | 3.42% |
| Bloomberg Barclays Global High Yield Index (reflects no deduction for fees, expenses, or taxes) | (4.06)% | 4.56% |
| Multi-Asset Income Blended Index (except as noted for MSCI ACWI Value NR, reflects no deduction for fees, expenses, or taxes) | (6.07)% | 3.62% |
The blended index is used to show the performance of the various asset classes used by the Acquired Fund, and the Average Annual Total Returns table shows performance of the components of the blended index. The weightings for the Multi-Asset Income Blended Index are 35% Bloomberg Barclays Global Credit Index, 35% MSCI ACWI Value Index, and 30% Bloomberg Barclays Global High Yield Index.
Calendar Year Total Return (%) as of 12/31 Each Year
SAM Flexible Income Account (Acquiring Fund)
|
| | | |
| Highest return for a quarter during the period of the bar chart above: | Q2 '09 | 10.44 | % |
| Lowest return for a quarter during the period of the bar chart above: | Q3 '11 | (4.80 | )% |
|
| | | |
| Average Annual Total Returns |
| For the periods ended December 31, 2018 | 1 Year | 5 Years | 10 Years |
| SAM Flexible Income Portfolio - Class 1 | (1.97)% | 3.55% | 6.88% |
| SAM Flexible Income Portfolio - Class 2 | (2.20)% | 3.29% | 6.61% |
| Bloomberg Barclays U.S. Aggregate Bond Index (reflects no deduction for fees, expenses, or taxes) | 0.01% | 2.52% | 3.48% |
Russell 3000 Index (reflects no deduction for fees, expenses, or taxes) | (5.24)% | 7.91% | 13.18% |
| MSCI EAFE Index NR (reflects withholding taxes on foreign dividends, but no deduction for fees, expenses, or other taxes) | (13.79)% | 0.53% | 6.32% |
| SAM Flexible Income Blended Index (except as noted for MSCI EAFE Index NR, reflects no deduction for fees, expenses, or taxes) | (1.56)% | 3.62% | 5.72% |
Performance of a blended index shows how the Acquiring Fund's performance compares to a blend of indices with similar investment objectives. Performance of the components of the blended index is also shown. The weightings for SAM Flexible Income Blended Index are 75% Bloomberg Barclays U.S. Aggregate Bond Index, 20% Russell 3000® Index, and 5% MSCI EAFE Index NR. The custom or blended index returns reflect the allocation in effect for the time period(s) for which the fund returns are disclosed. Previous weightings or allocations of the custom or blended index are not restated.
Board Consideration of the Reorganization
At its December 11, 2018 meeting, the PVC Board of Directors considered information presented by PGI. The Board requested and evaluated such information as it deemed necessary to consider the proposed Reorganization of the Acquired Fund into the Acquiring Fund. At the meeting, the Board approved the Reorganization after concluding that participation in the Reorganization is in the best interests of the Acquired Fund and the Acquiring Fund and that the interests of existing shareholders of each Fund will not be diluted as a result of the Reorganization.
In determining whether to approve the Reorganization, the Board made inquiry into a number of matters and considered, among other things, the following factors, in no order of priority:
| |
| • | the prospects for growth of and for achieving economies of scale by the Acquired Fund as compared to those of the Acquiring Fund; |
| |
| • | the Funds’ similar investment objectives and principal investment strategies and risks, and identical fundamental investment restrictions; |
| |
| • | the Funds’ current management fee rates and expense ratios and the expected management fee rate and expense ratio of the Acquired Fund following the Reorganization; |
| |
| • | the estimated costs of the Reorganization, including audit and proxy-related costs, and that such costs will effectively be borne by PGI and not the Funds; |
| |
| • | the estimated trading costs associated with disposing of any portfolio securities of the Acquired Fund and reinvesting the proceeds in connection with the Reorganization; |
| |
| • | information regarding the Funds’ investment performance and risk-return profiles; |
| |
| • | the direct or indirect federal income tax consequences of the Reorganization and their expected impact on Contract Owners of the insurance separate accounts that own the Acquired Fund shares; |
| |
| • | any direct or indirect benefits, including potential economic benefits, expected to be derived by PGI and its affiliates from the Reorganization; |
| |
| • | the absence of any material differences in the rights of shareholders of the Funds; |
| |
| • | the Reorganization will not result in the dilution of the interests of shareholders of the Acquired Fund or the Acquiring Fund; |
| |
| • | the terms and conditions of the Plan; and |
| |
| • | possible alternatives to the Reorganization, including liquidation of the Acquired Fund. |
The Board recommends that Acquired Fund shareholders vote to approve the Reorganization for the following reasons:
| |
| • | based on information provided by PGI, the Board believes there is a lack of foreseeable demand or prospects for scalable growth for the Acquired Fund; |
| |
| • | based on information provided by PGI, the Board believes the prospects for growth and for achieving economies of scale are better for the Acquiring Fund than the Acquired Fund; |
| |
| • | the post-Reorganization expense ratio for each share class of the Acquiring Fund is expected to decrease compared to the pre-Reorganization expense ratio for the corresponding share class of the Acquired Fund; |
| |
| • | the costs of the Reorganization will be borne by PGI due to the expense caps currently in place and low assets under management for the Acquired Fund; |
| |
| • | the Acquired Fund and the Acquiring Fund have similar investment objectives and principal investment strategies and risks; and |
| |
| • | based on information provided by PGI, the Acquired Fund has had inconsistent performance over the three-year period ending September 30, 2018. |
INFORMATION ABOUT THE REORGANIZATION
Plans of Acquisition
The terms of each Plan are summarized below. The summary is qualified in its entirety by reference to the Forms of the Plans, which are attached as Appendix A to this Proxy Statement/Prospectus.
Under each Plan, the applicable Acquiring Fund will acquire all the assets and assume all the liabilities of the corresponding Acquired Fund. We expect that the closing date will be June 7, 2019, or such earlier or later date as PGI may determine, and that the Effective Time of each Reorganization will be as of the close of regularly scheduled trading on the NYSE (normally 3:00 p.m., Central Time) on that date. Each Fund will determine its net asset values as of the close of trading on the NYSE using the procedures described in its then-current prospectus (the procedures applicable to each Acquired Fund and the corresponding Acquiring Fund are identical). For Income and LargeCap Growth, each Acquiring Fund will issue to the corresponding Acquired Fund a number of shares with a total value equal to the total value of the net assets of the Class 1 and Class 2 shares of each Acquired Fund outstanding at the Effective Time. For Multi-Asset Income, the Acquiring Fund will issue to the Acquired Fund a number of shares with a total value equal to the total value of the net assets of the corresponding share class of the Acquired Fund outstanding at the Effective Time.
Immediately after the Effective Time, each Acquired Fund will distribute to its shareholders Acquiring Fund shares as follows:
| |
| 1) | Holders of Class 1 and Class 2 shares of the Income Account (Acquired Fund) will receive Class 1 shares of the Core Plus Bond Account (Acquiring Fund) |
| |
| 2) | Holders of Class 1 and Class 2 shares of the LargeCap Growth Account (Acquired Fund) will receive Class 1 shares of the LargeCap Growth Account I (Acquiring Fund) |
| |
| 3) | Holders of Class 1 and Class 2 shares of the Multi-Asset Income Account (Acquired Fund) will receive, respectively, Class 1 and Class 2 shares of the SAM (Strategic Asset Management) Flexible Income Account (Acquiring Fund) |
Effective following the close of business on June 14, 2019, the Class 2 shares of the Core Plus Bond Account will automatically convert to Class 1 shares of the Core Plus Bond Account, and the Class 2 shares of LargeCap Growth Account I will automatically convert to Class 1 shares of the LargeCap Growth Account I.
Acquired Fund shareholders will receive a number of full and fractional shares of the corresponding Acquiring Fund that are equal in value to the value of the shares of each Acquired Fund that are surrendered in the exchange. In connection with the exchange, each Acquiring Fund will credit on its books an appropriate number of its shares to the account of each Acquired Fund shareholder, and each Acquired Fund will cancel on its books all its shares registered to the account of that shareholder. After the Effective Time, each Acquired Fund will be terminated in accordance with applicable law.
Each Plan may be amended by the Board, except that after approval by the shareholders of each Acquired Fund, no amendment may be made that, in the opinion of the Board, would materially adversely affect the interests of the shareholders of the Acquired Fund. The Board may abandon and terminate each Plan at any time before the Effective Time if it believes that consummation of the transactions contemplated by the Plan would not be in the best interests of the shareholders of either of the Funds.
Under the Plans, the Acquired Fund shareholders will pay all proxy expenses and out-of-pocket fees incurred in connection with the Reorganization, as well as the trading costs associated with the sale and purchase of portfolio securities to reposition the Acquired Fund's portfolio in advance of the Reorganization, which costs will be reflected in the net asset value of the shares, except that, for Proposal 3 only (Reorganization of the Multi-Asset Income Account into the SAM (Strategic Asset Management) Flexible Income Account), PGI will bear these costs due to expense caps and low assets under management for the Multi-Asset Income Account.
If any Plan is not consummated for any reason, the Board will consider other possible courses of action.
Description of the Securities to Be Issued
PVC is a Maryland corporation that is authorized to issue its shares of common stock in separate series and separate classes of series. The Acquired and Acquiring Funds are each a separate series of PVC, and the Class 1 (and Class 2 shares for the SAM (Strategic Asset Management) Flexible Income Account) of common stock of each Acquiring Fund to be issued in connection with each Reorganization represent interests in the assets belonging to that series and have identical dividend, liquidation and other rights, except that expenses allocated to a particular series or class are borne solely by that series or class and may cause differences in rights as described herein. Expenses related to the distribution of, and other identified expenses properly allocated to, the shares of a particular series or class are charged to, and borne solely by, that series or class, and the bearing of expenses by a particular series or class may be appropriately reflected in the net asset value attributable to, and the dividend and liquidation rights of, that series or class.
All shares of PVC have equal voting rights and are voted in the aggregate and not by separate series or class of shares except that shares are voted by series or class: (i) when expressly required by Maryland law or the 1940 Act and (ii) on any matter submitted to shareholders which the Board has determined affects the interests of only a particular series or class.
The share classes of each Acquired Fund have the same rights with respect to the Acquired Fund that the share classes of each Acquiring Fund have with respect to the Acquiring Fund.
Shares of all Funds, when issued, have no cumulative voting rights, are fully paid and non-assessable, have no preemptive or conversion rights and are freely transferable. Each fractional share has proportionately the same rights as are provided for a full share.
Federal Income Tax Consequences
To be considered a tax-free “reorganization” under Section 368 of the Internal Revenue Code of 1986, amended (the “Code”), there must not be a known plan or intention by a majority of the shareholders of the Acquired Fund to liquidate their interests in the Acquired Fund or Acquiring Fund and a reorganization must exhibit a continuity of business enterprise.
For Proposal 1 (Reorganization of the Income Account into the Core Plus Bond Account), because the Acquired Fund and Acquiring Fund have been notified by a majority of shareholders of the Acquired Fund of their intent to liquidate their interest in the Acquired Fund prior or as part of the Reorganization , the Reorganization will likely be considered a taxable reorganization under applicable provisions of the Code. The principal federal income tax considerations that are expected to result from the Reorganization include the following: the Acquired Fund will recognize gain or loss on the sale immediately before the Effective Time of all, or substantially all, of its assets for cash; the Acquired Fund more likely than not will recognize gain or loss on the transfer of its remaining assets to the Acquiring Fund; since the tax attributes of the Acquired Fund do not flow through to the Contract Owners of the insurance separate accounts that own the Acquired Fund, the distributions of taxable income are not expected to be a taxable for the Contract Owners; the Acquiring Fund will recognize no gain or loss as a result of the Reorganization; the aggregate tax basis of the shares of the Acquiring Fund to be received by a shareholder of the Acquired Fund more likely than not will be equal to the fair market value of such Acquiring Fund shares on the date of distribution; and the holding period of the shares of the Acquiring Fund received by a shareholder of the Acquired Fund more likely than not will begin on the day following the date of receipt of the Acquiring Fund shares. As of December 31, 2018, Acquired Fund had an approximate accumulated capital loss carryover of $19,000, which may be used to offset taxable gains recognized by the Acquired Fund as part of the Reorganization.
For Proposal 2 (Reorganization of the LargeCap Growth Account into the LargeCap Growth Account I) and Proposal 3 (Reorganization of the Multi-Asset Income Account into the SAM (Strategic Asset Management) Flexible Income Account), because the Acquiring Fund could use all of the Acquired Fund’s assets in its business, acquire most of the Acquired Fund’s assets in its business, and will continue the Acquired Fund’s historic business, the combination of the Acquired Fund into the Acquiring Fund will exhibit a continuity of business enterprise. Therefore, each such combination is expected to qualify as a tax-free “reorganization” under applicable provisions of the Code. In the opinion of tax counsel to PVC, no gain or loss will be recognized by the Acquired Fund or its shareholders in connection with the combination, the tax cost basis of the Acquiring Fund shares received by shareholders of the Acquired Fund will equal the tax cost basis of their shares in the Acquired Fund, and their holding periods for the Acquiring Fund shares will include their holding periods for the Acquired Fund shares.
Capital Loss Carryforward. As of December 31, 2018, the LargeCap Growth Account and Multi-Asset Income Account had approximate accumulated capital loss carryforwards of $0.(1) If it is later determined that these Acquired Funds had accumulated capital loss carryforwards, then after the applicable Reorganization, these losses will be available to the corresponding Acquiring Fund to offset its capital gains, although the amount of offsetting losses in any given year may be limited. As a result of this limitation, it is possible that an Acquiring Fund may not be able to use these losses as rapidly as its corresponding Acquired Fund might have, and part of these losses may not be usable at all. The ability of an Acquiring Fund to utilize the accumulated capital loss carryforwards in the future depends upon a variety of factors that cannot be known in advance, including the existence of capital gains against which these losses may be offset. In addition, the benefits of any capital loss carryforward of an Acquired Fund currently are available only to shareholders of that Acquired Fund. After the applicable Reorganization, however, these benefits will inure to the benefit of all shareholders of the corresponding Acquiring Fund.
(1) The capital loss carryforward for the Income Account is set forth above under "Federal Income Tax Consequences."
Capital Gains from Disposition of Portfolio Securities. The disposition of portfolio securities by any Acquired Fund prior to and in connection with its Reorganization could result in such Acquired Fund incurring long-term and short-term capital gains. Any such net capital gains will be passed through to the shareholders of the Acquired Fund and will be subject to taxation as described below.
Distribution of Income and Gains. Prior to each Reorganization, each Acquired Fund, whose taxable year will end as a result of the Reorganization, will declare to its shareholders of record one or more distributions of all of its previously undistributed net investment income and net realized capital gain, including capital gains on any securities disposed of in connection with the Reorganization. Such distributions will be made to shareholders before the Reorganization. Since the tax attributes of the Acquired Fund do not flow through to the Contract Owners of the insurance separate accounts that own the Acquired Fund, the distributions are not expected to be a taxable event for federal income tax purposes for the Contract Owners.
The foregoing is only a summary of the principal federal income tax consequences of each Reorganization and should not be considered to be tax advice. There can be no assurance that the Internal Revenue Service will concur on all or any of the issues discussed above. You may wish to consult with your own tax advisors regarding the federal, state, and local tax consequences with respect to the foregoing matters and any other considerations which may apply in your particular circumstances.
CAPITALIZATION
Proposal 1: Reorganization of the Income Account into the Core Plus Bond Account
The following tables show as of December 31, 2018: (i) the capitalization of the Acquired Fund; (ii) the capitalization of the Acquiring Fund; and (iii) the pro forma combined capitalization of the Acquiring Fund, adjusted to reflect the estimated expenses of the Reorganization, as if the Reorganization had occurred as of that date. As of December 31, 2018, the Acquired Fund and the Acquiring Fund had outstanding Class 1 and Class 2 shares.
The Acquired Fund shareholders will pay all expenses and out-of-pocket fees incurred in connection with the Reorganization. The expenses and fees the Income Account will pay are expected to total $5,350. The Acquired Fund shareholders will pay any trading costs associated with disposing of any portfolio securities. These trading costs are estimated to be $28,000 (0.01% of Core Plus Bond Account net assets). The estimated gain (net of trading costs) would be approximately $1,509,000 ($0.08 per share) on a U.S. GAAP basis.
|
| | | | | | | | | | |
| | | 12/31/18 | |
| | | | |
| | | Net Assets | | Shares | |
| | | (000s) | NAV | (000s) | |
| Income Account | Class 1 | $ | 178,598 |
| $ | 10.01 |
| 17,851 |
| |
| (Acquired Fund) | Class 2 | 3,173 |
| 9.96 |
| 319 |
| |
| | | $ | 181,771 |
| | 18,170 |
| |
| | | | | | |
| Core Plus Bond Account | Class 1 | $ | 280,760 |
| $ | 10.81 |
| 25,984 |
| |
| (Acquiring Fund) | Class 2 | 760 |
| 10.73 |
| 71 |
| |
| | | $ | 281,520 |
| | 26,055 |
| |
| | | | | | |
| Reduction in net assets and decrease in net asset | Class 1 | $ | (34 | ) | ($0.00) |
| (3 | ) | |
| values per share of the Acquired Fund to reflect the | Class 2 | — |
| $0.00 |
| — |
| |
| estimated expenses of the trading costs | | | | | |
| associated with disposing of portfolio securities | | | | | |
| Decrease in shares outstanding of the Acquired Fund | Class 1 | | | (1,329) |
| |
| to reflect the exchange for shares of the Acquiring Fund. | Class 2 | | | (25) |
| (1) |
| | | | | | |
| Core Plus Bond Account | Class 1 | $ | 462,497 |
| $ | 10.81 |
| 42,797 |
| |
| (Acquiring Fund) | Class 2 | 760 |
| 10.73 |
| 71 |
| (2) |
| (Pro forma assuming Reorganization) | | $ | 463,257 |
| | 42,868 |
| |
(1) Exchanging into Class 1 of the Acquiring Fund
(2) Effective following the close of business on June 14, 2019, the Class 2 shares will automatically convert to Class 1 shares.
Proposal 2: Reorganization of the LargeCap Growth Account into the LargeCap Growth Account I
The following tables show as of December 31, 2018: (i) the capitalization of the Acquired Fund; (ii) the capitalization of the Acquiring Fund; and (iii) the pro forma combined capitalization of the Acquiring Fund, adjusted to reflect the estimated expenses of the Reorganization, as if the Reorganization had occurred as of that date. As of December 31, 2018, the Acquired Fund and the Acquiring Fund had outstanding Class 1 and Class 2 shares.
The Acquired Fund will pay all expenses and out-of-pocket fees incurred in connection with the Reorganization. The expenses and fees the LargeCap Growth Account will pay are expected to total $16,850. The Acquired Fund will pay any trading costs associated with disposing of any portfolio securities. These trading costs are estimated to be $16,500. The estimated loss, including trading costs, would be approximately $1,363,000 ($0.37 per share) on a U.S. GAAP basis.
|
| | | | | | | | | | |
| | | 12/31/18 | |
| | | | |
| | | Net Assets | | Shares | |
| | | (000s) | NAV | (000s) | |
| | | | | | |
| LargeCap Growth Account | Class 1 | $ | 98,106 |
| $ | 28.25 |
| 3,472 |
| |
| (Acquired Fund) | Class 2 | 2,184 |
| 28.06 |
| 78 |
| |
| | | $ | 100,290 |
| | 3,550 |
| |
| | | | | | |
| | | | | | |
| LargeCap Growth Account I | Class 1 | $ | 296,139 |
| $ | 30.10 |
| 9,838 |
| |
| (Acquiring Fund) | Class 2 | 3,159 |
| 29.84 |
| 106 |
| |
| | | $ | 299,298 |
| | 9,944 |
| |
| | | | | | |
| Reduction in net assets and decrease in net asset | Class 1 | $ | (33 | ) | ($0.01) |
| (1 | ) | |
| values per share of the Acquired Fund to reflect the | Class 2 | 0 |
| $0.00 |
| 0 |
| |
| estimated expenses of the trading costs | | | | | |
| associated with disposing of portfolio securities | | | | | |
| | | | | | |
| Decrease in shares outstanding of the Acquired Fund | Class 1 | | | (213 | ) | |
| to reflect the exchange for shares of the Acquiring Fund. | Class 2 | | | (6 | ) | (1) |
| | | | | | |
| | | | | | |
| LargeCap Growth Account I | Class 1 | $ | 396,396 |
| $ | 30.10 |
| 13,168 |
| |
| (Acquiring Fund) | Class 2 | 3,159 |
| 29.84 |
| 106 |
| (2) |
| (Pro forma assuming Reorganization) | | $ | 399,555 |
| | 13,274 |
| |
(1) Exchanging into Class 1 of the Acquiring Fund
(2) Effective following the close of business on June 14, 2019, the Class 2 shares will automatically convert to Class 1 shares.
Proposal 3: Reorganization of the Multi-Asset Income Account into the SAM (Strategic Asset Management) Flexible Income Account
The following tables show as of December 31, 2018: (i) the capitalization of the Acquired Fund; (ii) the capitalization of the Acquiring Fund; and (iii) the pro forma combined capitalization of the Acquiring Fund, adjusted to reflect the estimated expenses of the Reorganization, as if the Reorganization had occurred as of that date. As of December 31, 2018, the Acquired Fund and the Acquiring Fund had outstanding Class 1 and Class 2 shares.
The Acquired Fund will pay all expenses and out-of-pocket fees incurred in connection with the Reorganization. The expenses and fees the Multi-Asset Income Account will pay are expected to total $4,850. However, due to the expense limitations in place, these costs will be borne by PGI. The Acquired Fund will pay any trading costs associated with disposing of any portfolio securities. These trading costs are estimated to be negligible. The estimated loss would be approximately $33,661 ($0.90 per share) on a U.S. GAAP basis.
|
| | | | | | | | |
| | | 12/31/18 |
| | | |
| | | Net Assets | | Shares |
| | | (000s) | NAV | (000s) |
| Multi-Asset Income Account | Class 1 | $ | 330 |
| $ 10.30 |
| 32 |
|
| (Acquired Fund) | Class 2 | 54 |
| 10.21 |
| 5 |
|
| | | $ | 384 |
| | 37 |
|
| | | | | |
| SAM Flexible Income Account | Class 1 | $ | 157,019 |
| $ 11.86 |
| 13,242 |
|
| (Acquiring Fund) | Class 2 | 25,656 |
| 11.74 |
| 2,185 |
|
| | | $ | 182,675 |
| | 15,427 |
|
| | | | | |
| Reduction in net assets and decrease in net asset | Class 1 | $ | (4 | ) | ($0.13) |
| (0) |
|
| values per share of the Acquired Fund to reflect the | Class 2 | $ | (1 | ) | ($0.20) |
| (0) |
|
| estimated expenses of the trading costs | | | | |
| associated with disposing of portfolio securities | | | | |
| Increase in shares outstanding of the Acquired Fund | Class 1 | | | (4) |
|
| to reflect the exchange for shares of the Acquiring Fund. | Class 2 | | | (0) |
|
| | | | | |
| SAM Flexible Income Account | Class 1 | $ | 157,345 |
| $ 11.86 |
| 13,270 |
|
| (Acquiring Fund) | Class 2 | 25,709 |
| 11.74 |
| 2,190 |
|
| (Pro forma assuming Reorganization) | | $ | 183,054 |
| | 15,460 |
|
ADDITIONAL INFORMATION ABOUT
INVESTMENT STRATEGIES AND RISKS
Each Fund's investment objective is described in the comparison section for the Funds under "Comparison of Investment Objectives and Strategies." The comparison section also describes each Fund's principal investment strategies, including the types of securities in which each Fund invests, and the principal risks of investing in each Fund. The principal investment strategies are not the only investment strategies available to each Fund, but they are the ones each Fund primarily uses to achieve its investment objective.
Except for Fundamental Restrictions described in the Fund's Statement of Additional Information, the Board of Directors may change any Fund's objective or investment strategies without a shareholder vote if it determines such a change is in the best interests of the Fund. If there is a material change to a Fund's investment objective or investment strategies, you should consider whether the Fund remains an appropriate investment for you. There is no guarantee that each Fund will meet its objective.
Each Fund is designed to be a portion of an investor's portfolio. No Fund is intended to be a complete investment program. Investors should consider the risks of the Fund before making an investment; it is possible to lose money by investing in a Fund.
Active Management
The performance of a fund that is actively managed (including hybrid funds or passively-managed funds that use a sampling approach that includes some actively-managed components) will reflect in part the ability of those managing the investments of the fund to make investment decisions that are suited to achieving the fund's investment objective. Actively-managed funds may invest differently from the benchmark against which the Fund's performance is compared. When making decisions about whether to buy or sell equity securities, considerations may include, among other things, a company’s strength in fundamentals, its potential for earnings growth over time, its ability to navigate certain macroeconomic environments, the current price of its securities relative to their perceived worth and relative to others in its industry, and analysis from computer models. When making decisions about whether to buy or sell fixed-income investments, considerations may include, among other things, the strength of certain sectors of the fixed-income market relative to others, interest rates, a range of economic, political and financial factors, the balance between supply and demand for certain asset classes, the credit quality of individual issuers, the fundamental strengths of corporate and municipal issuers, and other general market conditions.
Models, which may assist portfolio managers and analysts in formulating their securities trading and allocation decisions by providing investment and risk management insights, may also expose a fund to risks. Models may be predictive in nature, which models depend heavily on the accuracy and reliability of historical data that is supplied by others and may be incorrect or incorrectly input. The fund bears the risk that the quantitative models used will not be successful in identifying trends or in determining the size and direction of investment positions that will enable the fund to achieve its investment objective. In addition, “model prices” will often differ substantially from market prices, especially for instruments with complex characteristics, such as derivative instruments.
An active fund's investment performance depends upon the successful allocation of the fund's assets among asset classes, geographical regions, industry sectors, and specific issuers and investments. There is no guarantee that these allocation techniques and decisions will produce the desired results. It is possible to lose money on an investment in a fund as a result of these allocation decisions. If a fund's investment strategies do not perform as expected, the fund could underperform other funds with similar investment objectives or lose money. Moreover, buying and selling securities to adjust the fund’s asset allocation may increase portfolio turnover and generate transaction costs.
Investment advisors with large assets under management in a Fund, or in other funds that have the same strategy as a Fund, may have difficulty fully investing such Fund's assets according to its investment objective due to potential liquidity constraints and high transaction costs. Typically, small-cap, mid-cap and emerging market equity funds are more susceptible to such a risk. A Fund may add additional investment advisors or close the Fund to new investors to address such risks.
Passive Management (Index Funds)
Index funds use a passive, or indexing, investment approach. Funds that are pure index funds do not attempt to manage market volatility, use defensive strategies, or reduce the effect of any long-term periods of poor stock or bond performance. Some index funds attempt to fully replicate their relevant target index by investing primarily in the securities held by the index in approximately the same proportion of the weightings in the index. However, because of the difficulty of executing some relatively small securities trades, other index funds may use a "sampling" approach and may not be invested in the less heavily weighted securities held by the index. Some index funds may invest in index futures and/or exchange-traded funds on a daily basis in an effort to minimize tracking error relative to the benchmark.
It is unlikely that an index fund's performance will perfectly correlate with the performance of the fund's relevant index. An index fund's ability to match the performance of its index may be affected by many factors, such as fund expenses, the timing of cash flows into and out of the fund, changes in securities markets, and changes in the composition of the index.
Cash Management
Funds may have uninvested cash balances pending investment in other securities, pending payment of redemptions, or in other circumstances where liquidity is necessary or desirable. A Fund may hold uninvested cash; invest it in cash equivalents such as money market funds, including the Principal Funds, Inc. Government Money Market Fund; lend it to other Funds pursuant to the Funds' interfund lending facility; and/or invest in other instruments that those managing the Fund's assets deem appropriate for cash management purposes. Generally, these types of investments offer less potential for gains than other types of securities. To attempt to provide returns similar to its benchmark, a Fund may invest uninvested cash in stock index futures contracts or exchange-traded funds (“ETFs”), including Principal Exchange-Traded Funds ETFs. In selecting such investments, the Advisor may have conflicts of interest due to economic or other incentives to make or retain an investment in certain affiliated funds instead of in other investments that may be appropriate for the Fund.
Liquidity
Certain fund holdings may be deemed to be less liquid or illiquid because they cannot be readily sold without significantly impacting the value of the holdings. A fund is exposed to liquidity risk when trading volume, lack of a market maker, or legal restrictions impair its ability to sell particular securities or close derivative positions at an advantageous price. Funds with principal investment strategies that involve securities of companies with smaller market capitalizations, foreign securities, derivatives, high yield bonds and bank loans or securities with substantial market and/or credit risk tend to have the greatest exposure to liquidity risk.
Liquidity risk also refers to the risk of unusually high redemption requests, redemption requests by certain large shareholders such as institutional investors or asset allocators, or other unusual market conditions that may make it difficult for a fund to sell investments within the allowable time period to meet redemptions. Meeting such redemption requests could require a fund to sell securities at reduced prices or under unfavorable conditions, which would reduce the value of the fund.
Market Volatility and Securities Issuers
The value of a fund's portfolio securities may decrease in response to overall stock or bond market movements. Markets tend to move in cycles, with periods of rising prices and periods of falling prices. Stocks tend to go up and down in value more than bonds. If a fund's investments are concentrated in certain sectors, its performance could be worse than the overall market. The value of an individual security or particular type of security can be more volatile than the market as a whole and can perform differently from the value of the market as a whole. The value of a security may decline for reasons directly related to the issuer, such as management performance, financial leverage, and reduced demand for the issuer’s goods or services.
Temporary Defensive Measures
From time to time, as part of its investment strategy, a Fund may invest without limit in cash and cash equivalents for temporary defensive purposes in response to adverse market, economic, or political conditions. For this purpose, cash equivalents include: bank notes, bank certificates of deposit, bankers' acceptances, repurchase agreements, commercial paper, and commercial paper master notes, which are floating rate debt instruments without a fixed maturity. In addition, a Fund may purchase U.S. government securities, preferred stocks, and debt securities, whether or not convertible into or carrying rights for common stock. There is no limit on the extent to which a Fund may take temporary defensive measures. In taking such measures, a Fund may lose the benefit of upswings and may limit its ability to meet, or fail to achieve, its investment objective.
Strategy and Risk Table
The following table lists each Fund and identifies whether the strategies and risks discussed in this section (listed in alphabetical order) are principal, non-principal (meaning they are relevant to a Fund but to a lesser degree than those designated as principal), or not applicable for each Fund. The risks described below for each Fund that operates as a fund of funds (as identified in the table) include risks at both the fund of funds level and underlying funds level. Each fund is also subject to the risks of any underlying funds in which it invests.
The term “Fund,” as used in this section, includes any of the underlying funds in which a fund of funds may invest from time to time, at the discretion of Principal Global Investors, LLC ("PGI").
|
| | | | |
INVESTMENT STRATEGIES AND RISKS | CORE PLUS BOND |
INCOME |
LARGECAP GROWTH |
LARGECAP GROWTH I |
| Bank Loans (also known as Senior Floating Rate Interests) | Non-Principal | Non-Principal | Not Applicable | Not Applicable |
| Contingent Convertible Securities ("CoCos") | Non-Principal | Non-Principal | Not Applicable | Not Applicable |
| Convertible Securities | Non-Principal | Non-Principal | Non-Principal | Non-Principal |
| Counterparty Risk | Principal | Non-Principal | Not Applicable | Not Applicable |
| Derivatives | Principal | Non-Principal | Not Applicable | Non-Principal |
| Emerging Markets | Non-Principal | Non-Principal | Not Applicable | Non-Principal |
| Equity Securities | Not Applicable | Non-Principal | Principal | Principal |
| Not Applicable | Non-Principal | Principal | Principal |
• Small and Medium Market Capitalization Companies | Not Applicable | Non-Principal | Non-Principal | Non-Principal |
| Not Applicable | Non-Principal | Non-Principal | Non-Principal |
| Fixed-Income Securities | Principal | Principal | Non-Principal | Non-Principal |
| Foreign Currency | Principal | Principal | Not Applicable | Non-Principal |
| Foreign Securities | Principal | Principal | Non-Principal | Non-Principal |
| Fund of Funds | Not Applicable | Not Applicable | Not Applicable | Not Applicable |
| Hedging | Principal | Non-Principal | Not Applicable | Non-Principal |
| High Yield Securities | Principal | Principal | Not Applicable | Not Applicable |
| Industry Concentration | Not Applicable | Not Applicable | Not Applicable | Not Applicable |
| Investment Company Securities | Non-Principal | Non-Principal | Non-Principal | Non-Principal |
| Leverage | Principal | Non-Principal | Not Applicable | Non-Principal |
| Master Limited Partnerships ("MLPs") | Not Applicable | Not Applicable | Non-Principal | Non-Principal |
| Municipal Obligations and AMT-Subject Bonds | Non-Principal | Non-Principal | Not Applicable | Not Applicable |
| Portfolio Duration | Principal | Principal | Not Applicable | Not Applicable |
| Portfolio Turnover (Active Trading) | Principal | Non-Principal | Non-Principal | Non-Principal |
| Preferred Securities | Non-Principal | Non-Principal | Non-Principal | Non-Principal |
| Real Estate Investment Trusts ("REITs") | Non-Principal | Non-Principal | Non-Principal | Non-Principal |
| Real Estate Securities | Principal | Principal | Non-Principal | Non-Principal |
| Redemption and Large Transaction Risk | Principal | Principal | Not Applicable | Not Applicable |
| Securitized Products | Principal | Principal | Not Applicable | Not Applicable |
| Short Sales | Not Applicable | Not Applicable | Not Applicable | Not Applicable |
| U.S. Government and U.S. Government Sponsored Securities | Principal | Principal | Not Applicable | Not Applicable |
| Volatility Mitigation | Non-Principal | Not Applicable | Not Applicable | Not Applicable |
|
| | |
INVESTMENT STRATEGIES AND RISKS | MULTI-ASSET INCOME | SAM FLEXIBLE INCOME |
| Bank Loans (also known as Senior Floating Rate Interests) | Non-Principal | Non-Principal |
| Contingent Convertible Securities ("CoCos") | Non-Principal | Non-Principal |
| Convertible Securities | Non-Principal | Non-Principal |
| Counterparty Risk | Principal | Non-Principal |
| Derivatives | Principal | Non-Principal |
| Emerging Markets | Principal | Non-Principal |
| Equity Securities | Principal | Principal |
| Principal | Non-Principal |
• Small and Medium Market Capitalization Companies | Principal | Non-Principal |
| Principal | Principal |
| Fixed-Income Securities | Principal | Principal |
| Foreign Currency | Principal | Principal |
| Foreign Securities | Principal | Principal |
| Fund of Funds | Principal | Principal |
| Hedging | Non-Principal | Non-Principal |
| High Yield Securities | Principal | Principal |
| Industry Concentration | Principal | Not Applicable |
| Investment Company Securities | Principal | Principal |
| Leverage | Non-Principal | Non-Principal |
| Master Limited Partnerships ("MLPs") | Non-Principal | Non-Principal |
| Municipal Obligations and AMT-Subject Bonds | Non-Principal | Non-Principal |
| Portfolio Duration | Principal | Principal |
| Portfolio Turnover (Active Trading) | Non-Principal | Non-Principal |
| Preferred Securities | Principal | Non-Principal |
| Real Estate Investment Trusts ("REITs") | Principal | Non-Principal |
| Real Estate Securities | Principal | Principal |
| Redemption and Large Transaction Risk | Principal | Principal |
| Securitized Products | Principal | Principal |
| Short Sales | Not Applicable | Non-Principal |
| U.S. Government and U.S. Government Sponsored Securities | Non-Principal | Principal |
| Volatility Mitigation | Not Applicable | Not Applicable |
Bank Loans (also known as Senior Floating Rate Interests)
Bank loans typically hold the most senior position in the capital structure of a business entity (the "Borrower"), are secured by specific collateral, and have a claim on the Borrower's assets and/or stock that is senior to that held by the Borrower's unsecured subordinated debtholders and stockholders. The proceeds of bank loans primarily are used to finance leveraged buyouts, recapitalizations, mergers, acquisitions, stock repurchases, dividends, and, to a lesser extent, to finance internal growth and for other corporate purposes. Bank loans are typically structured and administered by a financial institution that acts as the agent of the lenders participating in the bank loan. Most bank loans that will be purchased by a fund are rated below-investment-grade (sometimes called “junk”) or will be comparable if unrated, which means they are more likely to default than investment-grade loans. A default could lead to non-payment of income which would result in a reduction of income to the fund, and there can be no assurance that the liquidation of any collateral would satisfy the Borrower's obligation in the event of non-payment of scheduled interest or principal payments, or that such collateral could be readily liquidated. Most bank loans are not traded on any national securities exchange. Bank loans generally have less liquidity than investment-grade bonds and there may be less public information available about them. Bank loan interests may not be considered “securities,” and purchasers therefore may not be entitled to rely on the anti-fraud protections of the federal securities laws.
The primary and secondary market for bank loans may be subject to irregular trading activity, wide bid/ask spreads and extended trade settlement periods, which may cause a fund to be unable to realize full value and thus cause a material decline in a fund's net asset value. Because transactions in bank loans may be subject to extended settlement periods, a fund may not receive proceeds from the sale of a bank loan for a period of time after the sale. As a result, sale proceeds may not be available to make additional investments or to meet a fund’s redemption obligations for a period of time after the sale of the bank loans, which could lead to a fund having to sell other investments, borrow to meet obligations, or borrow to remain fully invested while awaiting settlement.
Bank loans pay interest at rates which are periodically reset by reference to a base lending rate plus a spread. These base lending rates are generally the prime rate offered by a designated U.S. bank or the London InterBank Offered Rate (LIBOR) or the prime rate offered by one or more major U.S. banks.
Bank loans generally are subject to mandatory and/or optional prepayment. Because of these prepayment conditions and because there may be significant economic incentives for the borrower to repay, prepayments may occur.
Contingent Convertible Securities ("CoCos")
Contingent convertible securities (“CoCos”) are hybrid debt securities intended to either convert into equity or have their principal written down upon the occurrence of certain “triggers.” The triggers are generally linked to regulatory capital thresholds or regulatory actions calling into question the issuing banking institution’s continued viability as a going-concern, if the conversion trigger were not exercised. CoCos’ unique equity conversion or principal write-down features are tailored to the issuing banking institution and its regulatory requirements. Some additional risks associated with CoCos include, but are not limited to, the following:
| |
| • | The occurrence of a conversion event is inherently unpredictable and depends on many factors, some of which will be outside the issuer’s control. Because of the uncertainty regarding whether a conversion event will occur, it may be difficult to predict when, if at all, a CoCo will be converted to equity, and a fund may suffer losses as a result. |
| |
| • | CoCos may have no stated maturity and fully discretionary coupons. This means coupon (i.e., interest) payments can be canceled at the banking institution’s discretion or at the request of the relevant regulatory authority in order to help the bank absorb losses, without causing a default. |
| |
| • | CoCos are usually issued in the form of subordinated debt instruments to provide the appropriate regulatory capital treatment. If an issuer liquidates, dissolves or winds-up before a conversion to equity has occurred, the rights and claims of the holders of the CoCos (such as a fund) against the issuer generally rank junior to the claims of holders of unsubordinated obligations of the issuer. In addition, if the CoCos are converted into the issuer’s underlying equity securities after a conversion event (i.e., a “trigger”), each holder will be further subordinated. |
| |
| • | The value of CoCos is unpredictable and is influenced by many factors including, without limitation: the creditworthiness of the issuer and/or fluctuations in such issuer’s applicable capital ratios; supply and demand for CoCos; general market conditions and available liquidity; and economic, financial and political events that affect the issuer, its particular market or the financial markets in general. Moreover, the performance of CoCos may be correlated with one another and as a result negative information of one issuer may cause decline in the value of CoCos of many other issuers. |
Due to these features, CoCos may have substantially greater risk than other securities in times of financial stress. If the trigger level is breached, the issuer's decision to write down, write off or convert a CoCo may result in the Fund's complete loss on an investment in CoCos with no chance of recovery even if the issuer remains in existence.
Convertible Securities
Convertible securities are usually fixed-income securities that a fund has the right to exchange for equity securities at a specified conversion price. Convertible securities could also include corporate bonds, notes, or preferred stocks of U.S. or foreign issuers. Convertible securities allow a fund to realize additional returns if the market price of the equity securities exceeds the conversion price. For example, a fund may hold fixed-income securities that are convertible into shares of common stock at a conversion price of $10 per share. If the market value of the shares of common stock reached $12, the fund could realize an additional $2 per share by converting its fixed-income securities.
Convertible securities have lower yields than comparable fixed-income securities. In addition, at the time a convertible security is issued the conversion price exceeds the market value of the underlying equity securities. Thus, convertible securities may provide lower returns than non-convertible fixed-income securities or equity securities depending upon changes in the price of the underlying equity securities. However, convertible securities permit a fund to realize some of the potential appreciation of the underlying equity securities with less risk of losing its initial investment.
Depending on the features of the convertible security, a fund will treat a convertible security as a fixed-income security, equity security, or preferred security for purposes of investment policies and limitations because of the unique characteristics of convertible securities. Funds that invest in convertible securities may invest in convertible securities that are below investment grade (sometimes referred to as "junk"). Many convertible securities are relatively illiquid.
Counterparty Risk
Counterparty risk is the risk that the counterparty to a contract or other obligation will be unable or unwilling to honor its obligations. If a counterparty fails to meet its contractual obligations, goes bankrupt, or otherwise experiences a business interruption, a fund could miss investment opportunities or otherwise hold investments it would prefer to sell, resulting in losses for the fund. In addition, a fund may suffer losses if a counterparty fails to comply with applicable laws or other requirements. Counterparty risk is pronounced during unusually adverse market conditions and is particularly acute in environments in which financial services firms are exposed to systemic risks.
Derivatives
Generally, a derivative is a financial arrangement, the value of which is derived from, or based on, a traditional security, asset, or market index. A fund may invest in certain derivative strategies to earn income, manage or adjust the risk profile of the fund, replace more direct investments, or obtain exposure to certain markets. A fund may enter into forward commitment agreements, which call for the fund to purchase or sell a security on a future date at a fixed price. A fund may also enter into contracts to sell its investments either on demand or at a specific interval.
The risks associated with derivative investments include:
| |
| • | increased volatility of a fund and/or the failure of the investment to mitigate volatility as intended; |
| |
| • | the inability of those managing investments of the fund to predict correctly the direction of securities prices, interest rates, currency exchange rates, asset values, and other economic factors; |
| |
| • | losses caused by unanticipated market movements, which may be substantially greater than a fund's initial investment and are potentially unlimited; |
| |
| • | the possibility that there may be no liquid secondary market, which may make it difficult or impossible to close out a position when desired; |
| |
| • | the possibility that the counterparty may fail to perform its obligations; and |
| |
| • | the inability to close out certain hedged positions to avoid adverse tax consequences. |
There are many different types of derivatives and many different ways to use them. The specific derivatives that are principal strategies of each Fund are listed in its Fund Summary.
| |
| • | Commodity Index-Linked Notes are derivative debt instruments issued by U.S. and foreign banks, brokerage firms, insurance companies and other corporations with principal and/or coupon payments linked to the performance of commodity indices. These notes expose a fund to movements in commodity prices. They are also subject to credit, counterparty, and interest rate risk. Commodity index-linked notes are often leveraged, increasing the volatility of each note's market value relative to changes in the underlying commodity index. At the maturity of the note, a fund may receive more or less principal than it originally invested. A fund may also receive interest payments on the note that are less than the stated coupon interest payments. |
| |
| • | Credit Default Swap Agreements may be entered into by a fund as a "buyer" or "seller" of credit protection. Credit default swap agreements involve special risks because they may be difficult to value, are highly susceptible to liquidity and credit risk, and generally pay a return to the party that has paid the premium only in the event of an actual default by the issuer of the underlying obligation (as opposed to a credit downgrade or other indication of financial difficulty). Credit default swaps can increase credit risk because a fund has exposure to both the issuer of the referenced obligation and the counterparty to the credit default swap. |
| |
| • | Foreign Currency Contracts (such as foreign currency options and foreign currency forward and swap agreements) may be used by funds to increase exposure to a foreign currency or to shift exposure to foreign currency fluctuations from one country to another. A forward currency contract involves a privately negotiated obligation to purchase or sell a specific currency at a future date at a price set in the contract. For currency contracts, there is also a risk of government action through exchange controls that would restrict the ability of a fund to deliver or receive currency. |
| |
| • | Forwards, futures contracts and options thereon (including commodities futures); options (including put or call options); and swap agreements and over-the-counter swap agreements (e.g., interest rate swaps, total return swaps and credit default swaps) may be used by funds for hedging purposes in order to try to mitigate or protect against potential losses due to changing interest rates, securities prices, asset values, currency exchange rates, and other market conditions; non-hedging purposes to seek to increase the fund’s income or otherwise enhance return; and as a low-cost method of gaining exposure to a particular market without investing directly in those securities or assets. |
These derivative investments are subject to special risk considerations, particularly the imperfect correlation between the change in market value of the instruments held by a fund and the price of the derivative instrument. If a fund has insufficient cash, it may have to sell securities from its portfolio to meet daily variation margin requirements, even when it may be disadvantageous to do so. Options and Swap Agreements also involve counterparty risk. With respect to options, there may be difference in trading hours for the options markets and the markets for the underlying securities (rate movements can take place in the underlying markets that cannot be reflected in the options markets) and an insufficient liquid secondary market for particular options.
| |
| • | Index/structured securities. Certain derivative securities are described more accurately as index/structured securities, which are derivative securities whose value or performance is linked to other equity securities (such as depositary receipts), currencies, interest rates, indices, or other financial indicators (reference indices). |
Emerging Markets
The Funds consider a security to be tied economically to an emerging market country (an “emerging market security”) if the issuer of the security has its principal place of business or principal office in an emerging market country, has its principal securities trading market in an emerging market country, or derives a majority of its revenue from emerging market countries.
Usually, the term “emerging market country” (also called a "developing country") means any country that is considered to be an emerging country by the international financial community (including the MSCI Emerging Markets Index or Bloomberg Barclays Emerging Markets USD Aggregate Bond Index). These countries generally exclude the U.S., Canada, Japan, Hong Kong, Singapore, Australia, New Zealand, and most nations located in Western Europe.
Investments in companies of emerging market countries are subject to higher risks than investments in companies in more developed countries. These risks include:
| |
| • | increased social, political, and economic instability; |
| |
| • | a smaller market for these securities and low or nonexistent trading volume that results in a lack of liquidity and greater price volatility; |
| |
| • | lack of publicly available information, including reports of payments of dividends or interest on outstanding securities; |
| |
| • | foreign government policies that may restrict opportunities, including restrictions on investment in issuers or industries deemed sensitive to national interests; |
| |
| • | relatively new capital market structure or market-oriented economy; |
| |
| • | the possibility that recent favorable economic developments may be slowed or reversed by unanticipated political or social events in these countries; |
| |
| • | restrictions that may make it difficult or impossible for a fund to vote proxies, exercise shareholder rights, pursue legal remedies, and obtain judgments in foreign courts; and |
| |
| • | possible losses through the holding of securities in domestic and foreign custodial banks and depositories. |
In addition, many developing countries have experienced substantial and, in some periods, extremely high rates of inflation for many years. Inflation and rapid fluctuations in inflation rates have had and may continue to have negative effects on the economies, currencies, interest rates, and securities markets of those countries.
Repatriation of investment income, capital, and proceeds of sales by foreign investors may require governmental registration and/or approval in some developing countries. A fund could be adversely affected by delays in or a refusal to grant any required governmental registration or approval for repatriation.
Further, the economies of developing countries generally are heavily dependent upon international trade and, accordingly, have been and may continue to be adversely affected by trade barriers, exchange controls, managed adjustments in relative currency values and other protectionist measures imposed or negotiated by the countries with which they trade.
Equity Securities
Equity securities include common stocks, convertible securities, depositary receipts, rights (an offering of common stock to investors who currently own shares which entitle them to buy subsequent issues at a discount from the offering price), and warrants (the right to purchase securities from the issuer at a specified price, normally higher than the current market price). Common stocks, the most familiar type, represent an equity (ownership) interest in a corporation. The value of a company's stock may fall as a result of factors directly relating to that company, such as decisions made by its management or lower demand for the company's products or services. A stock's value may also fall because of factors affecting not just the company, but also companies in the same industry or in a number of different industries, such as increases in production costs. The value of a company's stock may also be affected by changes in financial markets that are relatively unrelated to the company or its industry, such as changes in interest rates or currency exchange rates. In addition, a company's stock generally pays dividends only after the company invests in its own business and makes required payments to holders of its bonds and other debt. For this reason, the value of a company's stock will usually react more strongly than its bonds and other debt to actual or perceived changes in the company's financial condition or prospects.
Some funds focus their investments on certain market capitalization ranges. Market capitalization is defined as total current market value of a company's outstanding equity securities. The market capitalization of companies in a fund’s portfolios and their related indexes will change over time, and, except to the extent consistent with its principal investment strategies (for example, for an index fund that uses a replication strategy), a fund will not automatically sell a security just because it falls outside of the market capitalization range of its index(es).
Growth Stock
The prices of growth stocks may be based largely on expectations of future earnings, and their prices can decline rapidly and significantly in reaction to negative news about such factors as earnings, revenues, the economy, political developments, or other news. Growth stocks may underperform value stocks and stocks in other broad style categories (and the stock market as a whole) over any period of time and may shift in and out of favor with investors generally, sometimes rapidly, depending on changes in market, economic, and other factors. As a result, a fund that holds substantial investments in growth stocks may underperform other funds that invest more broadly or favor different investment styles. Because growth companies typically reinvest their earnings, growth stocks typically do not pay dividends at levels associated with other types of stocks, if at all.
Small and Medium Market Capitalization Companies
Investments in companies with smaller market capitalizations may involve greater risks and price volatility (wide, rapid fluctuations) than investments in larger, more mature companies. Small company stocks may decline in price as large company stocks rise, or rise in price while larger company stocks decline. The net asset value of a fund that invests a substantial portion of its assets in small company stocks may therefore be more volatile than the shares of a fund that invests solely in larger company stocks. Small companies may be less significant within their industries and may be at a competitive disadvantage relative to their larger competitors. Smaller companies may be less mature than larger companies. At this earlier stage of development, the companies may have limited product lines, reduced market liquidity for their shares, limited financial resources, or less depth in management than larger or more established companies. While smaller companies may be subject to these additional risks, they may also realize more substantial growth than larger or more established companies.
Unseasoned issuers are companies with a record of less than three years continuous operation, including the operation of predecessors and parents. Many unseasoned issuers also may be small companies and involve the risks and price volatility associated with smaller companies. Unseasoned issuers by their nature have only a limited operating history that can be used for evaluating the company's growth prospects. As a result, these securities may place a greater emphasis on current or planned product lines and the reputation and experience of the company's management and less emphasis on fundamental valuation factors than would be the case for more mature growth companies.
Value Stock
Value stocks present the risk that they may decline in price or never reach their expected full market value because the market fails to recognize the stock's intrinsic worth. Value stocks may underperform growth stocks and stocks in other broad style categories (and the stock market as a whole) over any period of time and may shift in and out of favor with investors generally, sometimes rapidly, depending on changes in market, economic, and other factors. As a result, a fund that holds substantial investments in value stocks may underperform other funds that invest more broadly or favor different investment styles.
Fixed-Income Securities
Fixed-income securities include bonds and other debt instruments that are used by issuers to borrow money from investors (examples include corporate bonds, convertible securities, mortgage-backed securities, U.S. government securities and asset-backed securities). The issuer of a fixed-income security generally pays the investor a fixed, variable, or floating rate of interest. The amount borrowed must be repaid at maturity. Some debt securities, such as zero coupon bonds, do not pay current interest, but are sold at a discount from their face values.
Fixed-income securities are sensitive to changes in interest rates. In general, fixed-income security prices rise when interest rates fall and fall when interest rates rise. An increase in interest rates from the current, historically low interest rate environment may lead to heightened volatility and redemptions alongside reduced liquidity and dealer market-making capacity in fixed income markets. If interest rates fall, issuers of callable bonds may call (repay) securities with high interest rates before their maturity dates; this is known as call risk. In this case, a fund would likely reinvest the proceeds from these securities at lower interest rates, resulting in a decline in the fund's income. Floating rate securities generally are less sensitive to interest rate changes but may decline in value if their interest rates do not rise as much, or as quickly, as interest rates in general. Conversely, floating rate securities will not generally increase in value if interest rates decline.
Fixed-income securities are also affected by the credit quality of the issuer. Investment-grade debt securities are medium and high quality securities. Some bonds, such as lower grade or "junk" bonds, may have speculative characteristics and may be particularly sensitive to economic conditions and the financial condition of the issuers. Credit risk refers to the possibility that the issuer of the security will not be able to make principal and interest payments when due.
Funds may invest in fixed-income securities of companies with small- or medium-sized market capitalizations. Investments in companies with smaller market capitalizations may involve greater risks, price volatility (wide, rapid fluctuations), and less liquidity than investments in larger, more mature companies.
Foreign Currency
Certain of a fund’s investments will be denominated in foreign currencies or traded in securities markets in which settlements are made in foreign currencies. Any income on such investments is generally paid to a fund in foreign currencies. In addition, funds may engage in foreign currency transactions for both hedging and investment purposes, as well as to increase exposure to a foreign currency or to shift exposure to foreign currency fluctuations from one country to another.
The value of foreign currencies relative to the U.S. dollar varies continually, causing changes in the dollar value of a fund’s portfolio investments (even if the local market price of the investments is unchanged) and changes in the dollar value of a fund’s income available for distribution to its shareholders. The effect of changes in the dollar value of a foreign currency on the dollar value of a fund’s assets and on the net investment income available for distribution may be favorable or unfavorable. Transactions in non-U.S. currencies are also subject to many of the risks of investing in foreign (non-U.S.) securities; for example, changes in foreign economies and political climates are more likely to affect a fund that has foreign currency exposure than a fund that invests exclusively in U.S. companies and currency. There also may be less government supervision of foreign markets, resulting in non-uniform accounting practices and less publicly available information. Transactions in foreign currencies, foreign currency denominated debt and certain foreign currency options, futures contracts and forward contracts (and similar instruments) may give rise to ordinary income or loss to the extent such income or loss results from fluctuations in the value of the foreign currency concerned.
A fund may incur costs in connection with conversions between various currencies. In addition, a fund may be required to liquidate portfolio assets, or may incur increased currency conversion costs, to compensate for a decline in the dollar value of a foreign currency occurring between the time when a fund declares and pays a dividend, or between the time when a fund accrues and pays an operating expense in U.S. dollars. To protect against a change in the foreign currency exchange rate between the date on which a fund contracts to purchase or sell a security and the settlement date for the purchase or sale, to gain exposure to one or more foreign currencies or to “lock in” the equivalent of a dividend or interest payment in another currency, a fund might purchase or sell a foreign currency on a spot (i.e., cash) basis at the prevailing spot rate.
Currency hedging involves some of the same general risks and considerations as other transactions with similar instruments (i.e., derivative instruments) and hedging. Currency transactions are also subject to additional risks. Because currency control is of great importance to the issuing governments and influences economic planning and policy, purchases and sales of currency and related instruments can be adversely affected by government exchange controls, limitations or restrictions on repatriation of currency, and manipulations or exchange restrictions imposed by governments. These forms of governmental actions can result in losses to a fund if it is unable to deliver or receive currency or monies in settlement of obligations.
They could also cause hedges the fund has entered into to be rendered useless, resulting in full currency exposure as well as incurring transaction costs. Settlement of a currency forward contract for the purchase of most currencies must occur at a bank based in the issuing nation. The ability to establish and close out positions on trading options on currency futures contracts is subject to the maintenance of a liquid market that may not always be available.
Foreign Securities
The Funds consider a security to be tied economically to countries outside the U.S. (a “foreign security”) if the issuer of the security has its principal place of business or principal office outside the U.S., has its principal securities trading market outside the U.S., or derives a majority of its revenue from outside the U.S.
Foreign companies may not be subject to the same uniform accounting, auditing, and financial reporting practices as are required of U.S. companies. In addition, there may be less publicly available information about a foreign company than about a U.S. company. Securities of many foreign companies are less liquid and more volatile than securities of comparable U.S. companies. Commissions on foreign securities exchanges may be generally higher than those on U.S. exchanges.
Foreign markets also have different clearance and settlement procedures than those in U.S. markets. In certain markets there have been times when settlements have been unable to keep pace with the volume of securities transactions, making it difficult to conduct these transactions. Delays in settlement could result in temporary periods when a portion of fund assets is not invested and earning no return. If a fund is unable to make intended security purchases due to settlement problems, the fund may miss attractive investment opportunities. In addition, a fund may incur a loss as a result of a decline in the value of its portfolio if it is unable to sell a security.
With respect to certain foreign countries, there is the possibility of nationalization, expropriation or confiscatory taxation, political or social instability, or diplomatic developments that could affect a fund's investments in those countries. In addition, a fund may also suffer losses due to differing accounting practices and treatments. Investments in foreign securities are subject to laws of the foreign country that may limit the amount and types of foreign investments. Changes of governments or of economic or monetary policies, in the U.S. or abroad, changes in dealings between nations, currency convertibility or exchange rates could result in investment losses for a fund.
Foreign securities are often traded with less frequency and volume, and therefore may have greater price volatility, than is the case with many U.S. securities. Brokerage commissions, custodial services, and other costs relating to investment in foreign countries are generally more expensive than in the U.S. Though the fund intends to acquire the securities of foreign issuers where there are public trading markets, economic or political turmoil in a country in which a fund has a significant portion of its assets or deterioration of the relationship between the U.S. and a foreign country may reduce the liquidity of a fund's portfolio. The fund may have difficulty meeting a large number of redemption requests. Furthermore, there may be difficulties in obtaining or enforcing judgments against foreign issuers.
A fund may invest in a foreign company by purchasing depositary receipts. Depositary receipts are certificates of ownership of shares in a foreign-based issuer held by a bank or other financial institution. They are alternatives to purchasing the underlying security but are subject to the foreign securities risks to which they relate.
If a fund’s portfolio is over-weighted in a certain geographic region, any negative development affecting that region will have a greater impact on the fund than a fund that is not over-weighted in that region.
Fund of Funds
The performance and risks of a fund of funds directly correspond to the performance and risks of the underlying funds in which the fund invests.
As of December 31, 2018, the PVC Principal LifeTime Accounts’, PVC SAM Portfolios’, Diversified Balanced Account, Diversified Balanced Managed Volatility Account, Diversified Balanced Volatility Control Account, Diversified Growth Account, Diversified Growth Managed Volatility Account, Diversified Growth Volatility Control Account, Diversified Income Account and Multi-Asset Income Account assets were allocated among the underlying funds as identified in the tables below.
|
| | | | | | | | | | | | | | |
| Underlying Fund | Principal LifeTime Strategic Income Account | Principal LifeTime 2010 Account | Principal LifeTime 2020 Account | Principal LifeTime 2030 Account | Principal LifeTime 2040 Account | Principal LifeTime 2050 Account | Principal LifeTime 2060 Account |
| Core Plus Bond Account | 22.4 | % | 19.2 | % | 16.9 | % | 13.9 | % | 10.3 | % | 5.3 | % | 2.2 | % |
| LargeCap Growth Fund I | 0.0 | % | 2.8 | % | 4.4 | % | 8.6 | % | 10.3 | % | 11.5 | % | 11.9 | % |
|
| | | | |
Underlying Fund | Multi-Asset Income Account | SAM Flexible Income Portfolio |
| Blue Chip Fund | 0.0 | % | 1.0 | % |
| EDGE MidCap Fund | 0.0 | % | 1.4 | % |
| Equity Income Account | 0.0 | % | 6.2 | % |
| Equity Income Fund | 6.4 | % | 0.0 | % |
| Global Diversified Income Fund | 44.4 | % | 4.9 | % |
| Global Real Estate Securities Fund | 6.3 | % | 3.7 | % |
| Government & High Quality Bond Account | 0.0 | % | 11.5 | % |
| High Yield Fund | 0.0 | % | 4.2 | % |
| High Yield Fund I | 15.1 | % | 0.0 | % |
| Income Account | 0.0 | % | 23.4 | % |
| Inflation Protection Fund | 0.0 | % | 6.7 | % |
| International Fund I | 5.5 | % | 0.0 | % |
| Preferred Securities Fund | 15.1 | % | 5.0 | % |
| Principal Active Global Dividend Income ETF | 0.0 | % | 6.7 | % |
| Principal EDGE Active Income ETF | 0.0 | % | 3.1 | % |
| Principal Government Money Market Fund | 0.0 | % | 0.9 | % |
| Principal Investment Grade Corporate Active ETF | 0.0 | % | 3.2 | % |
| Principal U.S. Mega-Cap Multi-Factor Index ETF | 0.0 | % | 3.5 | % |
| Real Estate Debt Income Fund | 7.2 | % | 1.9 | % |
| Short-Term Income Fund | 0.0 | % | 12.7 | % |
A fund of funds indirectly bears its pro-rata share of the expenses of the underlying funds in which it invests, as well as directly incurring expenses. Therefore, investment in a fund of funds is more costly than investing directly in shares of the underlying funds. Generally, if an underlying fund offers multiple classes of shares for investment by funds of funds, the Funds will purchase shares of the class with the lowest expense ratio (expressed as a percent of average net assets on an annualized basis) at the time of purchase.
If you are considering investing in a Principal LifeTime Account, you should take into account your estimated retirement date and risk tolerance. In general, each Principal LifeTime Account is managed with the assumption that the investor will invest in a Principal LifeTime Account whose stated date is closest to the date the shareholder retires. Choosing a fund targeting an earlier date represents a more conservative choice; choosing a fund with a later date represents a more aggressive choice. It is important to note that the retirement year of the fund you select should not necessarily represent the specific year you intend to start drawing retirement assets. It should be a guide only. Generally, the potential for higher returns over time is accompanied by the higher risk of a decline in the value of your principal. Investors should realize that the Principal LifeTime Accounts are not a complete solution to their retirement needs. Investors must weigh many factors when considering when to retire, what their retirement needs will be, and what sources of income they may have.
There are five Strategic Asset Management ("SAM") Portfolios, including Flexible Income. The SAM Portfolios offer long-term investors different asset allocation strategies having different levels of potential investment risk and reward. The SAM Portfolios share the same risks but often with different levels of exposure. In general, relative to the other Portfolios, the Flexible Income Portfolio should offer investors the potential for a high level of income and a low level of capital growth, while exposing them to a low level of principal risk.
Funds of funds can be subject to payment in kind liquidity risk: If an underlying fund pays a redemption request by the fund wholly or partly by a distribution-in-kind of portfolio securities rather than in cash, the fund may hold such portfolio securities until those managing the investments of the fund determine that it is appropriate to dispose of them.
Management of funds of funds entails potential conflicts of interest: a fund of fund may invest in affiliated underlying funds; and those who manage the fund's investments and their affiliates may earn different fees from different underlying funds and may have an incentive to allocate more fund of fund assets to underlying funds from which they receive higher fees.
Hedging
Hedging is a strategy that can be used to limit or offset investment risk. The success of a fund’s hedging strategy will be subject to the ability of those managing the fund's investments to correctly assess the degree of correlation between the performance of the instruments used in the hedging strategy and the performance of the investments in the portfolio being hedged. Since the characteristics of many securities change as markets change or time passes, the success of a fund’s hedging strategy will also be subject to the ability of those managing the fund's investments to continually recalculate, readjust, and execute hedges in an efficient and timely manner. For a variety of reasons, those managing the fund's investments may not seek to establish a perfect correlation between such hedging instruments and the portfolio holdings being hedged. Such imperfect correlation may prevent a fund from achieving the intended hedge or expose a fund to risk of loss. In addition, it is not possible to hedge fully or perfectly against any risk, and hedging entails its own costs.
High Yield Securities
Below investment grade bonds, which are rated at the time of purchase Ba1 or lower by Moody's Investors Service, Inc. ("Moody's") and BB+ or lower by S&P Global Ratings ("S&P Global") (if the bond has been rated by only one of those agencies, that rating will determine if the bond is below investment grade; if the bond has not been rated by either of those agencies, those managing investments of the fund will determine whether the bond is of a quality comparable to those rated below investment grade), are sometimes referred to as high yield or "junk bonds" and are considered speculative. Such securities could be in default at time of purchase. Each fund of funds may invest in underlying funds that may invest in such securities.
Investment in high yield bonds involves special risks in addition to the risks associated with investment in highly rated debt securities. High yield bonds may be regarded as predominantly speculative with respect to the issuer's continuing ability to meet principal and interest payments. Moreover, under certain circumstances, such securities may be less liquid than higher rated debt securities.
Analysis of the creditworthiness of issuers of high yield securities may be more complex than for issuers of higher quality debt securities. The ability of a fund to achieve its investment objective may, to the extent of its investment in high yield bonds, be more dependent on such credit analysis than would be the case if the fund were investing in higher quality bonds.
High yield bonds may be more susceptible to real or perceived adverse economic and competitive industry conditions than higher-grade bonds. The prices of high yield bonds have been found to be less sensitive to interest rate changes than more highly rated investments, but more sensitive to adverse economic downturns or individual corporate developments. If the issuer of high yield bonds defaults, a fund may incur additional expenses to seek recovery. To the extent that such high yield issuers undergo a corporate restructuring, such high yield securities may become exchanged for or converted into reorganized equity of the underlying issuer. High yield bonds oftentimes include complex legal covenants that impose various degrees of restriction on the issuer’s ability to take certain actions, such as distribute cash to equity holders, incur additional indebtedness, and dispose of assets. To the extent that a bond indenture or loan agreement does not contain sufficiently protective covenants or otherwise permits the issuer to take certain actions to the detriment of the holder of the fixed-income security, the underlying value of such fixed-income security may decline.
The secondary market on which high yield bonds are traded may be less liquid than the market for higher-grade bonds. Less liquidity in the secondary trading market could adversely affect the price at which a fund could sell a high yield bond and could adversely affect and cause large fluctuations in the daily price of the fund's shares. Adverse publicity and investor perceptions, whether or not based on fundamental analysis, may decrease the value and liquidity of high yield bonds, especially in a thinly traded market.
The use of credit ratings for evaluating high yield bonds also involves certain risks. For example, credit ratings evaluate the safety of principal and interest payments, not the market value risk of high yield bonds. Also, credit rating agencies may fail to change credit ratings in a timely manner to reflect subsequent events. If a credit rating agency changes the rating of a portfolio security held by a fund, the fund may retain the security if those managing the investments of the fund think it is in the best interest of shareholders.
Industry Concentration
A fund that concentrates its investments (invests more than 25% of its net assets) in a particular industry (or group of industries) is more exposed to the overall condition of the particular industry than a fund that invests in a wider variety of industries. A particular industry could be affected by economic, business, supply-and-demand, political, or regulatory factors. Companies within the same industry could react similarly to such factors. As a result, a fund’s concentration in a particular industry would increase the possibility that the fund’s performance will be affected by such factors.
Investment Company Securities
Securities of other investment companies, including shares of closed-end investment companies, unit investment trusts, various exchange-traded funds ("ETFs"), and other open-end investment companies, represent interests in professionally managed portfolios that may invest in a variety of instruments. Certain types of investment companies, such as closed-end investment companies, issue a fixed number of shares that trade on a stock exchange or over-the-counter at a premium or a discount to their net asset value. Others are continuously offered at net asset value, but may also be traded in the secondary market. ETFs are often structured to perform in a similar fashion to a broad-based securities index. Investing in ETFs involves generally the same risks as investing directly in the underlying instruments. Investing in ETFs involves the risk that they will not perform in exactly the same fashion, or in response to the same factors, as the index or underlying instruments. Shares of ETFs may trade at prices other than NAV.
A fund that invests in another investment company is subject to the risks associated with direct ownership of the securities in which such investment company invests. Fund shareholders indirectly bear their proportionate share of the expenses of each such investment company, including its advisory and administrative fees. The Fund would also continue to pay its own advisory fees and other expenses. Consequently, the Fund and its shareholders would, in effect, absorb two levels of fees with respect to investments in other investment companies.
A fund may invest in affiliated underlying funds, and those who manage such fund's investments and their affiliates may earn different fees from different underlying funds and may have an incentive to allocate more fund assets to underlying funds from which they receive higher fees.
Leverage
If a fund makes investments in futures contracts, forward contracts, swaps and certain other derivative instruments, these instruments provide the economic effect of financial leverage by creating additional investment exposure, as well as the potential for greater loss. If a fund uses leverage through activities such as borrowing, entering into short sales, purchasing securities on margin or on a “when-issued” basis or purchasing derivative instruments in an effort to increase its returns, the fund has the risk of magnified capital losses that occur when losses affect an asset base, enlarged by borrowings or the creation of liabilities, that exceeds the net assets of the fund. The net asset value of a fund employing leverage will be more volatile and sensitive to market movements. Leverage may involve the creation of a liability that requires the fund to pay interest. Leveraging may cause a fund to liquidate portfolio positions to satisfy its obligations or to meet segregation requirements when it may not be advantageous to do so. To the extent that a fund is not able to close out a leveraged position because of market illiquidity, a fund’s liquidity may be impaired to the extent that it has a substantial portion of liquid assets segregated or earmarked to cover obligations.
Master Limited Partnerships ("MLPs")
A master limited partnership ("MLP") that invests in a particular industry (e.g., oil and gas) will be harmed by detrimental economic events within that industry. For example, the business of certain MLPs is affected by supply and demand for energy commodities because such MLPs derive revenue and income based upon the volume of the underlying commodity produced, transported, processed, distributed, and/or marketed. Many MLPs are also subject to various federal, state and local environmental laws and health and safety laws as well as laws and regulations specific to their particular activities.
MLPs tend to pay relatively higher distributions than other types of companies. The amount of cash that an MLP can distribute to its partners will depend on the amount of cash it generates from operations, which will vary from quarter to quarter depending on factors affecting the market generally and on factors affecting the particular business lines of the MLP. Available cash will also depend on the MLP's level of operating costs (including incentive distributions to the general partner), level of capital expenditures, debt service requirements, acquisition costs (if any), fluctuations in working capital needs and other factors.
Certain benefits derived from investment in MLPs depend largely on the MLPs being treated as partnerships for federal income tax purposes. As a partnership, an MLP has no federal income tax liability at the entity level. MLPs taxed as partnerships file a partnership tax return for U.S. federal, state, and local income tax purposes and communicate the Fund's allocable share of the MLP's income, gains, losses, deductions, and expenses via a "Schedule K-1."
If, as a result of a change in current law or a change in an MLP's business, an MLP was treated as a corporation for federal income tax purposes, the MLP would be obligated to pay federal income tax on its income at the corporate tax rate. If an MLP was classified as a corporation for federal income tax purposes, the amount of cash available for distribution would be reduced and the distributions received might be taxed entirely as dividend income.
To the extent a distribution received by a fund from an MLP is treated as a return of capital, the fund's adjusted tax basis in the interests of the MLP will be reduced, which may increase the fund's tax liability upon the sale of the interests in the MLP or upon subsequent distributions in respect of such interests.
Municipal Obligations and AMT-Subject Bonds
The term “municipal obligations” generally is understood to include debt obligations issued by municipalities to obtain funds for various public purposes. The two principal classifications of municipal bonds are "general obligation" and "revenue" bonds. General obligation bonds are secured by the issuer's pledge of its full faith and credit, with either limited or unlimited taxing power for the payment of principal and interest. Revenue bonds are not supported by the issuer's full taxing authority; generally, they are payable only from the revenues of a particular facility, a class of facilities, or the proceeds of another specific revenue source.
AMT-subject bonds are municipal obligations issued to finance certain "private activities," such as bonds used to finance airports, housing projects, student loan programs, and water and sewer projects. Interest on AMT-subject bonds is an item of tax preference for purposes of the federal individual alternative minimum tax ("AMT"). See "Tax Considerations" for a discussion of the tax consequences of investing in the fund.
Current federal income tax laws limit the types and volume of bonds qualifying for the federal income tax exemption of interest, which may have an effect upon the ability of the fund to purchase sufficient amounts of tax-exempt securities.
Portfolio Duration
Average duration is a mathematical calculation of the average life of a bond (or for a bond fund, the average life of the fund's underlying bonds, weighted by the percentage of the fund's assets that each represents) that serves as a useful measure of its price risk. Duration is an estimate of how much the value of the bonds held by a fund will fluctuate in response to a change in interest rates. For example, if a fund has an average duration of 4 years and interest rates rise by 1%, the value of the bonds held by the fund will decline by approximately 4%, and if the interest rates decline by 1%, the value of the bonds held by the fund will increase by approximately 4%. Longer term bonds and zero coupon bonds are generally more sensitive to interest rate changes. Duration, which measures price sensitivity to interest rate changes, is not necessarily equal to average maturity.
Portfolio Turnover (Active Trading)
"Portfolio Turnover" is the term used in the industry for measuring the amount of trading that occurs in a fund's portfolio during the year. For example, a 100% turnover rate means that on average every security in the portfolio has been replaced once during the year. Funds with high turnover rates (more than 100%) are considered actively-traded and often have higher transaction costs (which are paid by the fund), and may lower the fund's performance. High portfolio turnover can result in a lower capital gain distribution due to higher transaction costs added to the basis of the assets or can result in lower ordinary income distributions to shareholders when the transaction costs cannot be added to the basis of assets. Both events reduce fund performance.
Please consider all the factors when you compare the turnover rates of different funds. You should also be aware that the "total return" line in the Financial Highlights section reflects portfolio turnover costs.
Preferred Securities
Preferred securities include preferred stock and various types of junior subordinated debt and trust preferred securities. Preferred securities may pay fixed rate or adjustable rate distributions and generally have a payment "preference" over common stock, but are junior to the issuer's senior debt in a liquidation of the issuer’s assets. Preference would mean that a company must pay on its preferred securities before paying on its common stock, and that any claims of the preferred security holder would typically be ahead of common stockholders' claims on assets in a corporate liquidation.
Holders of preferred securities usually have no right to vote for corporate directors or on other matters. The market value of preferred securities is sensitive to changes in interest rates as they are typically fixed income securities; the fixed-income payments are expected to be the primary source of long-term investment return. While some preferred securities are issued with a final maturity date, others are perpetual in nature. In certain instances, a final maturity date may be extended and/or the final payment of principal may be deferred at the issuer’s option for a specified time without triggering an event of default for the issuer. In addition, an issuer of preferred securities may have the right to redeem the securities before their stated maturity date. For instance, for certain types of preferred securities, a redemption may be triggered by a change in federal income tax or securities laws. As with call provisions, a redemption by the issuer may reduce the return of the security held by the fund. Preferred securities may be subject to provisions that allow an issuer, under certain circumstances to skip (indefinitely) or defer (possibly up to 10 years) distributions. If a fund owns a preferred security that is deferring its distribution, the fund may be required to report income for tax purposes while it is not receiving any income.
Preferred securities are typically issued by corporations, generally in the form of interest or dividend bearing instruments, or by an affiliated business trust of a corporation, generally in the form of beneficial interests in subordinated debentures or similarly structured securities. The preferred securities market is generally divided into the $25 par “retail” and the $1,000 par “institutional” segments. The $25 par segment includes securities that are listed on the New York Stock Exchange (exchange traded), which trade and are quoted with accrued dividend or interest income, and which are often callable at par value five years after their original issuance date. The institutional segment includes $1,000 par value securities that are not exchange-listed (over the counter), which trade and are quoted on a “clean” price, i.e., without accrued dividend or interest income, and which often have a minimum of 10 years of call protection from the date of their original issuance. Preferred securities can also be issued by real estate investment trusts and involve risks similar to those associated with investing in real estate investment trust companies.
Real Estate Investment Trusts ("REITs")
REITs involve certain unique risks in addition to the risks associated with investing in the real estate industry in general (such as possible declines in the value of real estate, lack of availability of mortgage funds, or extended vacancies of property). REITs are characterized as: equity REITs, which primarily own property and generate revenue from rental income; mortgage REITs, which invest in real estate mortgages; and hybrid REITs, which combine the characteristics of both equity and mortgage REITs. Equity REITs may be affected by changes in the value of the underlying property owned by the REITs, while mortgage REITs may be affected by the quality of any credit extended. REITs are dependent upon management skills, are not diversified, and are subject to heavy cash flow dependency, risks of default by borrowers, and self-liquidation. A fund that invests in a REIT is subject to the REIT’s expenses, including management fees, and will remain subject to the fund's advisory fees with respect to the assets so invested. REITs are also subject to the possibilities of failing to qualify for the special tax treatment accorded REITs under the Code, and failing to maintain their exemptions from registration under the 1940 Act.
Regular REIT dividends received by a Fund from a REIT will not qualify for the corporate dividends-received deduction and generally will not constitute qualified dividend income for U.S. income tax purposes. Any distribution of income attributable to regular REIT dividends from a Fund's investment in a REIT will not qualify for the deduction that would be available to a non-corporate shareholder were the shareholder to own such REIT directly.
Investment in REITs also involves risks similar to those associated with investing in small market capitalization companies. REITs may have limited financial resources, may trade less frequently and in a limited volume, and may be subject to more abrupt or erratic price movements than larger company securities.
Real Estate Securities
Investing in securities of companies in the real estate industry subjects a fund to the special risks associated with the real estate market and the real estate industry in general. Generally, companies in the real estate industry are considered to be those that have principal activity involving the development, ownership, construction, management or sale of real estate; have significant real estate holdings, such as hospitality companies, healthcare facilities, supermarkets, mining, lumber and/or paper companies; and/or provide products or services related to the real estate industry, such as financial institutions that make and/or service mortgage loans and manufacturers or distributors of building supplies. Securities of companies in the real estate industry are sensitive to factors such as loss to casualty or condemnation, changes in real estate values, property taxes, interest rates, cash flow of underlying real estate assets, occupancy rates, government regulations affecting zoning, land use and rents, and the management skill and creditworthiness of the issuer. Companies in the real estate industry may also be subject to liabilities under environmental and hazardous waste laws.
Redemption and Large Transaction Risk
Ownership of the fund's shares may be concentrated in one or a few large investors (such as funds of funds, institutional investors, and asset allocation programs) that may redeem or purchase shares in large quantities. These transactions may cause the fund to sell securities to meet redemptions or to invest additional cash at times it would not otherwise do so, which may result in increased transaction costs, increased expenses, changes to expense ratios, and adverse effects to fund performance. Such transactions may also accelerate the realization of taxable income if sales of portfolio securities result in gains. Moreover, reallocations by large shareholders among share classes of a fund may result in changes to the expense ratios of affected classes, which may increase the expenses paid by shareholders of the class that experienced the redemption.
As of December 31, 2018, Principal Funds, Inc. ("PFI") and Principal Variable Contracts Funds, Inc. ("PVC") funds of funds owned the following percentages, in the aggregate, of the outstanding shares of the underlying funds listed below. Principal Global Investors, LLC ("PGI") is the advisor to the funds of funds and each of the underlying funds. PGI is committed to minimizing the potential impact of redemption and large transaction risk on underlying funds to the extent consistent with pursuing the investment objectives of the funds of funds that it manages. However, PGI and its affiliates may face conflicts of interest in fulfilling their responsibilities to all such funds.
|
| |
| Account | Total Percentage of Outstanding Shares Owned |
| Core Plus Bond | 24.18% |
| Income | 92.64% |
Securitized Products
Securitized products are fixed income instruments that represent interests in underlying pools of collateral or assets. The value of the securitized product is derived from the performance, value, and cash flows of the underlying asset(s). The specific securitized products that are principal strategies of each Fund are listed in its Fund Summary. A fund’s investments in securitized products are subject to risks similar to traditional fixed income securities, such as credit, interest rate, liquidity, prepayment, extension, and default risk, as well as additional risks associated with the nature of the assets and the servicing of those assets. Prepayment risk may make it difficult to calculate the average life of a fund’s investment in securitized products. Securitized products are generally issued as pass-through certificates, which represent the right to receive principal and interest payments collected on the underlying pool of assets, which are passed through to the security holder. Therefore, repayment depends on the cash flows generated by the underlying pool of assets. The securities may be rated as investment-grade or below-investment-grade.
| |
| • | Mortgage-backed securities (“MBS”) represent an interest in a pool of underlying mortgage loans secured by real property. MBS are sensitive to changes in interest rates, but may respond to these changes differently from other fixed income securities due to the possibility of prepayment of the underlying mortgage loans. If interest rates fall and the underlying loans are prepaid faster than expected, the fund may have to reinvest the prepaid principal in lower yielding securities, thus reducing the fund’s income. Conversely, rising interest rates tend to discourage refinancings and the underlying loans may be prepaid more slowly than expected, reducing a fund’s potential to reinvest the principal in higher yielding securities and extending the duration of the underlying loans. In addition, when market conditions result in an increase in default rates on the underlying loans and the foreclosure values of the underlying real estate is less than the outstanding amount due on the underlying loan, collection of the full amount of accrued interest and principal on these investments may be doubtful. The risk of such defaults is generally higher in the case of underlying mortgage pools that include sub-prime mortgages (mortgages granted to borrowers whose credit histories would not support conventional mortgages). |
| |
| • | Commercial mortgage-backed securities (“CMBS”) represent an interest in a pool of underlying commercial mortgage loans secured by real property such as retail, office, hotel, multi-family, and industrial properties. Certain CMBS are issued in several classes with different levels of yield and credit protection, and the CMBS class in which a fund invests usually influences the interest rate, credit, and prepayment risks. |
| |
| • | Asset-backed securities (“ABS”) are backed by non-mortgage assets such as company receivables, truck and auto loans, student loans, leases and credit card receivables. ABS entail credit risk. They also may present a risk that, in the event of default, the liquidation value of the underlying assets may be inadequate to pay any unpaid interest or principal. |
Short Sales
A fund enters into a short sale by selling a security it has borrowed (typically from a broker or other institution) with the hope of purchasing the same security at a later date at a lower price. A fund may also take a short position in a derivative instrument, such as a future, forward or swap. If the market price of the security or derivatives increases, the fund will suffer a (potentially unlimited) loss when it replaces the security or derivative at the higher price. In certain cases, purchasing a security to cover a short position can itself cause the price of the security to rise further, thereby exacerbating the loss. In addition, a fund may not always be able to borrow the security at a particular time or at an acceptable price. Before a fund replaces a borrowed security, it is required to designate on its books cash or liquid assets as collateral to cover the fund’s short position, marking the collateral to market daily. This obligation limits a fund’s investment flexibility, as well as its ability to meet redemption requests or other current obligations. A short position in a derivative instrument involves the risk of a theoretically unlimited increase in the value of the underlying instrument. Short sales also involve transaction and other costs that will reduce potential fund gains and increase potential fund losses.
Certain funds may also invest the proceeds received from short selling securities, which creates additional leverage. Using such leverage allows the fund to use the proceeds to purchase additional securities, thereby increasing its exposure to assets, such that its total assets may be greater than its capital. Leverage also magnifies the volatility of changes in the value of the fund’s portfolio. The effect of the use of leverage by the fund in a market that moves adversely to its investments could result in substantial losses to the fund, which would be greater than if the fund were not leveraged. Because a short position loses value as the security’s price increases, the loss on a short sale is theoretically unlimited.
The short sale proceeds utilized by a fund to leverage investments are collateralized by all or a portion of such fund’s portfolio. Accordingly, a fund may pledge securities in order to effect short sales, utilize short sale proceeds or otherwise obtain leverage for investment or other purposes. Should the securities pledged to brokers to secure the fund’s margin accounts decline in value, the fund could be subject to a “margin call”, pursuant to which the fund must either deposit additional funds or securities with the broker or suffer mandatory liquidation of all or a portion of the pledged securities to compensate for the decline in value. The banks and dealers that provide leverage to the fund have discretion to change the fund’s margin requirements at any time. Changes by counterparties in the foregoing may result in large margin calls, loss of leverage and forced liquidations of positions at disadvantageous prices. The utilization of short sale proceeds for leverage will cause the fund to be subject to higher transaction fees and other costs.
U.S. Government and U.S. Government-Sponsored Securities
U.S. Government securities, such as Treasury bills, notes and bonds and mortgage-backed securities guaranteed by the Government National Mortgage Association (Ginnie Mae), are supported by the full faith and credit of the United States; others are supported by the right of the issuer to borrow from the U.S. Treasury; others are supported by the discretionary authority of the U.S. Government to purchase the agency's obligations; and still others are supported only by the credit of the issuing agency, instrumentality, or enterprise.
Although U.S. Government-sponsored enterprises such as the Federal Home Loan Mortgage Corporation (Freddie Mac) and the Federal National Mortgage Association (Fannie Mae) may be chartered or sponsored by Congress, they are not funded by Congressional appropriations, and their securities are not issued by the U.S. Treasury nor supported by the full faith and credit of the U.S. Government.
There is no assurance that the U.S. Government would provide financial support to its agencies and instrumentalities if not required to do so. In addition, certain governmental entities have been subject to regulatory scrutiny regarding their accounting policies and practices and other concerns that may result in legislation, changes in regulatory oversight and/or other consequences that could adversely affect the credit quality, availability, or investment character of securities issued by these entities. The value and liquidity of U.S. Government securities may be affected adversely by changes in the ratings of those securities.
Volatility Mitigation
Volatility mitigation strategies may increase fund transaction costs, which could increase losses or reduce gains. These strategies may not protect the fund from market declines and may reduce the fund’s participation in market gains.
ADDITIONAL INFORMATION ABOUT THE FUNDS
Multiple Classes of Shares
The PVC Board of Directors has adopted an 18f-3 Plan for each of the Funds. Under these plans, the Acquired and Acquiring Funds all offer Class 1 and 2 shares as of the anticipated date of each Reorganization. The shares of Class 1 and Class 2 are the same except for differences in purchaser eligibility, class expenses, including any Rule 12b-1, excessive trading or other fees, as described elsewhere in this Proxy Statement/Prospectus. Additional share classes may be offered in the future by the Acquiring Funds.
Effective following the close of business on June 14, 2019, the Class 2 shares of the Core Plus Bond Account will automatically convert to Class 1 shares of the Core Plus Bond Account, and the Class 2 shares of LargeCap Growth Account I will automatically convert to Class 1 shares of the LargeCap Growth Account I.
Intermediary Compensation
If you purchase through a broker-dealer or other financial intermediary (such as a bank, insurance company, investment adviser, etc.), the Fund and its related companies may pay the intermediary for the sale of Fund shares and related services. These payments may create a conflict of interest by influencing the broker-dealer or other intermediary and your salesperson to recommend the Fund over another investment, to recommend one Fund or share class of the Fund over another Fund or share class, or to recommend one variable annuity, variable life insurance policy or mutual fund over another. Ask your salesperson or visit your financial intermediary's website for more information.
Dividends and Distributions
The Funds earn dividends, interest, and other income from investments and distribute this income (less expenses) as dividends. The Funds also realize capital gains from investments and distribute these gains (less any losses) as capital gain distributions. The Funds make dividends and capital gain distributions at least annually, in August. Dividends and capital gain distributions are automatically reinvested in additional shares of the Fund making the distribution.
To the extent that distributions the Funds pays are derived from a source other than net income (such as a return of capital), you will receive a notice disclosing the source of such distributions. You may request a copy of all such notices, free of charge, by telephoning 1-800-222-5852. The amounts and sources of distributions included in such notices are estimates only and you should not rely upon them for purposes of reporting income taxes. The Fund will send shareholders a Form 1099-DIV for the calendar year that will tell shareholders how to report these distributions for federal income tax purposes.
Pricing of Fund Shares
Each Fund's shares are bought and sold at the current net asset value (“NAV”) per share. Each Fund's NAV is calculated each day the New York Stock Exchange (“NYSE”) is open (shares are not priced on the days on which the NYSE is closed for trading). The NYSE is closed on the following holidays: New Year’s Day, Martin Luther King, Jr. Day, Washington’s Birthday/Presidents’ Day, Good Friday, Memorial Day, Independence Day, Labor Day, Thanksgiving Day, and Christmas. The NAV is determined at the close of business of the NYSE (normally 3:00 p.m. Central Time). When an order to buy or sell shares is received, the share price used to fill the order is the next price calculated after we receive the order in proper form.
The Funds'' NAV is calculated by:
| |
| • | taking the current market value of the total assets of the Fund |
| |
| • | subtracting liabilities of the Fund |
| |
| • | dividing the remainder proportionately into the classes of the Fund |
| |
| • | subtracting the liability of each class |
| |
| • | dividing the remainder by the total number of shares outstanding for that class |
With respect to any portion of a Fund's assets invested in other registered investment companies, that portion of the Fund's NAV is calculated based on the price (NAV or market, as applicable) of such other registered investment companies.
The Funds will not treat an intraday unscheduled disruption in NYSE trading as a closure of the NYSE and will price its shares as of 3:00 p.m. Central Time, if the particular disruption directly affects only the NYSE.
Notes:
| |
| • | If market quotations are not readily available for a security owned by an Account, its fair value is determined using a policy adopted by the Directors. Fair valuation pricing is subjective and creates the possibility that the fair value determined for a security may differ materially from the value that could be realized upon the sale of the security. |
| |
| • | An Account's securities may be traded on foreign securities markets that generally complete trading at various times during the day before the close of the NYSE. Foreign securities and currencies are converted to U.S. dollars using the exchange rate in effect at the close of the NYSE. Securities traded outside of the Western Hemisphere are valued using a fair value policy adopted by the Fund. These fair valuation procedures are intended to discourage shareholders from investing in the Account for the purpose of engaging in market timing or arbitrage transactions. |
| |
| • | The trading of foreign securities generally or in a particular country or countries may not take place on all days the NYSE is open, or may trade on days the NYSE is closed. Thus, the value of the foreign securities held by the Account or by an underlying Account or Fund may change on days when shareholders are unable to purchase or redeem shares. |
| |
| • | Certain securities issued by companies in emerging market countries may have more than one quoted valuation at any point in time. These may be referred to as local price and premium price. The premium price is often a negotiated price that may not consistently represent a price at which a specific transaction can be effected. The Fund has a policy to value such securities at a price at which the Advisor expects the securities may be sold. |
TAX INFORMATION
Each Acquiring Fund intends to comply with applicable variable asset diversification regulations. If any Acquiring Fund fails to comply with such regulations, contracts invested in such Acquiring Fund will not be treated as annuity, endowment, or life insurance contracts under the Internal Revenue Code.
Contract Owners should review the applicable contract prospectus for information concerning the federal income tax treatment of their contracts and distributions from the Acquiring Fund to the separate accounts.
Contract Owners are urged to consult their tax advisors regarding the status of their contracts under state and local tax laws.
DISTRIBUTION PLAN AND ADDITIONAL INFORMATION REGARDING
INTERMEDIARY COMPENSATION
Distribution and/or Service (12b-1) Fees. Principal Funds Distributor, Inc. ("PFD" or the "Distributor") is the distributor for the shares of the Funds. The Distributor is an affiliate of Principal Life Insurance Company, a subsidiary of Principal Financial Group, Inc. and a member of Principal®.
PVC has adopted a distribution plan pursuant to Rule 12b-1 under the 1940 Act for the Class 2 shares of the Funds. Under the 12b-1 plan, each Fund makes payments from its assets attributable to the Class 2 shares to the Fund's Distributor for distribution-related expenses and for providing services to shareholders of that share class. Payments under the 12b-1 plan are made by the Fund to the Distributor pursuant to the 12b-1 plan regardless of the expenses incurred by the Distributor.
When the Distributor receives Rule 12b-1 fees, it may pay some or all of them to financial intermediaries whose customers are Class 2 shareholders for sales support services and for providing services to shareholders of that share class. Financial intermediaries may include, among others, broker-dealers, registered investment advisers, banks, trust companies, pension plan consultants, retirement plan administrators, and insurance companies.
Because Rule 12b-1 fees are paid out of Fund assets and are ongoing fees, over time they will increase the cost of your investment in the Fund and may cost you more than other types of sales charges.
The maximum annualized Rule 12b-1 fee for distribution related expenses and/or for providing services to shareholders (as a percentage of average daily net assets) for the Class 2 shares of each Fund is 0.25%.
Payments under the 12b-1 plan will not automatically terminate for Funds that are closed to new investors or to additional purchases by existing shareholders. The Fund Board will determine whether to terminate, modify, or leave unchanged the 12b-1 plan if the Board directs the closure of a Fund.
Payments to Financial Professionals and Their Firms. Financial intermediaries receive compensation from the Distributor and its affiliates for marketing, selling, and/or providing services to variable annuities and variable life insurance contracts that invest in the Funds. Financial intermediaries also receive compensation for marketing, selling, and/or providing services to certain retirement plans that offer the Funds as investment options. Financial intermediaries may include, among others, broker/dealers, registered investment advisors, banks, trust companies, pension plan consultants, retirement plan administrators, and insurance companies. Financial professionals who deal with investors on an individual basis are typically associated with a financial intermediary. The Distributor and its affiliates may fund this compensation from various sources, including any Rule 12b-1 Plan fee that the Funds pay to the Distributor. Individual Financial Professionals may receive some or all of the amounts paid to the financial intermediary with which he or she is associated.
Ongoing Payments. In the case of Class 2 shares, and pursuant to the Rule 12b-1 plan applicable to the Class 2 shares, the Distributor generally makes ongoing payments to your financial intermediary at an annual rate of 0.25% of average net assets attributable to your indirect investment in the Fund. In addition, the Distributor or PGI may make from its own resources ongoing payments to an insurance company, which payments will generally not exceed 0.27% of the average net assets of the Funds held by the insurance company in its separate accounts. The payments are for distribution support and/or administrative services and may be made with respect to either or both classes of shares of the Funds.
Other Payments to Intermediaries. In addition to any commissions that may be paid at the time of sale and ongoing payments, the Distributor and its affiliates, at their expense, currently provide additional payments to financial intermediaries that sell variable annuities and variable life insurance contracts that may be funded by shares of the Funds, or may sell shares of the Funds to retirement plans for distribution services. Although payments made to each qualifying financial intermediary in any given year may vary, such payments will generally not exceed 0.25% of the current year’s sales of applicable variable annuities and variable life insurance contracts that may be funded by Fund shares, or 0.25% of the current year’s sales of Fund shares to retirement plans by that financial intermediary.
Additionally, in some cases the Distributor and its affiliates will provide payments or reimbursements in connection with the costs of conferences, educational seminars, due diligence trips, training and marketing efforts related to the Funds for the financial intermediary's personnel and/or their clients and potential clients.
Such activities may be sponsored by financial intermediaries or the Distributor. The costs associated with such activities may include travel, lodging, entertainment, and meals. In some cases the Distributor will also provide payment or reimbursement for expenses associated with transactions ("ticket") charges and general marketing expenses.
For more information, see the Statement of Additional Information for each Acquiring Fund. See also the section titled "Additional Information About the Funds - Intermediary Compensation" in this Proxy Statement/Prospectus.
Your variable life insurance or variable annuity contract or your retirement plan may impose other charges and expenses, some of which may also be used in connection with the sale of such contracts in addition to those described in this Proxy Statement/Prospectus. The amount and applicability of any insurance contract fee are determined and disclosed separately within the prospectus for your insurance contract.
The payments described in this Proxy Statement/Prospectus may create a conflict of interest by influencing your Financial Professional or your financial intermediary to recommend one variable annuity, variable life insurance policy or mutual fund over another, or to recommend one Fund or share class of the Fund over another Fund or share class. Ask your Financial Professional or visit your financial intermediary's website for more information about the total amounts paid to them by PGI and its affiliates, and by sponsors of other investment companies your Financial Professional may recommend to you.
Your financial intermediary may charge you additional fees other than those disclosed in this Proxy Statement/Prospectus. Ask your Financial Professional about any fees and commissions they charge.
ONGOING FEES
Ongoing fees reduce the value of each share. Because they are ongoing, they increase the cost of investing in the PVC Funds.
Each Fund pays ongoing fees to PGI and others who provide services to the Fund. These fees include:
| |
| • | Management Fee - Through the Management Agreement with the Fund, PGI has agreed to provide investment advisory services and corporate administrative services to the Fund. |
| |
| • | Distribution Fee - Each Fund has adopted a distribution plan under Rule 12b-1 of the Investment Company Act of 1940 for its Class 2 shares. Under the plan, Class 2 shares of each Fund pay a distribution fee based on the average daily net asset value (NAV) of the Fund. These fees pay distribution and other expenses for sale of Fund shares and for services provided to shareholders. Because they are ongoing fees, over time they will increase the cost of your investment and may cost you more than paying other types of sales charges. |
| |
| • | Other Expenses - A portion of expenses that are allocated to all classes of the Fund. |
Frequent Trading and Market Timing (Abusive Trading Practices)
The Funds are not designed for, and do not knowingly accommodate, frequent purchases and redemptions (“excessive trading”) of Fund shares by investors. If you intend to trade frequently and/or use market timing investment strategies, do not purchase shares of these Funds.
Frequent purchases and redemptions pose a risk to the Funds because they may:
| |
| • | Disrupt the management of the Funds by: |
| |
| • | forcing the Fund to hold short-term (liquid) assets rather than investing for long-term growth, which results in lost investment opportunities for the Fund and |
| |
| • | causing unplanned portfolio turnover; |
| |
| • | Hurt the portfolio performance of the Fund; and |
| |
| • | Increase expenses of the Fund due to: |
| |
| • | increased broker-dealer commissions and |
| |
| • | increased recordkeeping and related costs. |
If PVC is not able to identify such excessive trading practices, the Funds and their shareholders may be harmed. The harm of undetected excessive trading in shares of the underlying funds will affect the Acquiring Funds as it would for any fund shareholder.
Certain funds may be at greater risk of harm due to frequent purchase and redemptions. For example, those funds that invest in foreign securities may appeal to investors attempting to take advantage of time-zone arbitrage. PVC has adopted fair valuation procedures. These procedures are intended to discourage market timing transactions in shares of the Funds.
As the Funds are only available through variable annuity or variable life contracts or to qualified retirement plans, PVC must rely on the insurance company that issues the contract, or the trustees or administrators of qualified retirement plans, (“intermediary”) to monitor customer trading activity to identify and take action against excessive trading. There can be no certainty that the intermediary will identify and prevent excessive trading in all instances. When an intermediary identifies excessive trading, it will act to curtail such trading in a fair and uniform manner. If an intermediary is unable to identify such abusive trading practices, the abuses described above may negatively impact the Funds.
If an intermediary, or PVC, deems excessive trading practices to be occurring, it will take action that may include, but is not limited to:
| |
| • | Rejecting exchange instructions from a shareholder or other person authorized by the shareholder to direct exchanges; |
| |
| • | Restricting submission of exchange requests by, for example, allowing exchange requests to be submitted by 1st class U.S. mail only and disallowing requests made via the internet, by facsimile, by overnight courier, or by telephone; |
| |
| • | Limiting the dollar amount of an exchange and/or the number of exchanges during a year; |
| |
| • | Requiring a holding period of a minimum of 30 days before permitting exchanges among the Funds where there is evidence of at least one round-trip exchange (exchange or redemption of shares that were purchased within 30 days of the exchange/redemption); and |
| |
| • | Taking such other action as directed by PVC. |
The PVC Board of Directors has found the imposition of a redemption fee with respect to redemptions from Class 1 shares of the Funds is neither necessary nor appropriate in light of measures taken by intermediaries through which such shares are currently available. Each intermediary’s excessive trading policies and procedures will be reviewed by Fund management prior to making shares of the Fund available through such intermediary to determine whether, in management’s opinion, such procedures are reasonably designed to prevent excessive trading in Fund shares.
In order to prevent excessive trading, PVC has reserved the right to accept or reject, without prior written notice, any exchange requests (an exchange request is a redemption request coupled with a request to purchase shares with the proceeds of the redemption; such restriction applies to the purchase of fund shares in an exchange request and does not restrict a shareholder from requesting a redemption). In some instances, an exchange may be completed prior to a determination of abusive trading. In those instances, the intermediary will reverse an exchange (within one business day of the exchange) and return the account holdings to the positions held prior to the exchange. The intermediary will give you notice in writing in this instance.
Eligible Purchasers
Only certain eligible purchasers may buy shares of the Funds. Eligible purchasers are limited to 1) separate accounts of Principal Life or of other insurance companies, 2) Principal Life or any of its subsidiaries or affiliates, 3) trustees of other managers of any qualified profit sharing, incentive, or bonus plan established by Principal Life or any subsidiary or affiliate of such company, for employees of such company, subsidiary, or affiliate. Such trustees or managers may buy Fund shares only in their capacities as trustees or managers and not for their personal accounts. PVC's Board of Directors reserves the right to broaden or limit the designation of eligible purchaser.
Each Fund serves as the underlying investment vehicle for variable annuity contracts and variable life insurance policies that are funded through separate accounts established by Principal Life and by other insurance companies as well as for certain qualified plans. It is possible that in the future, it may not be advantageous for variable life insurance separate accounts, variable annuity separate accounts, and qualified plan investors to invest in the Funds at the same time. Although neither Principal Life nor PVC currently foresees any such disadvantage, PVC’s Board of Directors monitors events in order to identify any material conflicts between such policy owners, contract holders, and qualified plan investors. Material conflict could result from, for example, 1) changes in state insurance laws, 2) changes in Federal income tax law, 3) changes in the investment management of a Fund, or 4) differences in voting instructions between those given by policy owners, those given by contract holders, and those given by qualified plan investors. Should it be necessary, the Board would determine what action, if any, should be taken. Such action could include the sale of Fund shares by one or more of the separate accounts or qualified plans, which could have adverse consequences.
PGI may recommend to the Board, and the Board may elect, to close certain Funds or share classes to new investors or close certain Funds or share classes to new and existing investors.
Shareholder Rights
Each shareholder of a Fund is eligible to vote, either in person or by proxy, at all shareholder meetings for that Fund. This includes the right to vote on the election of directors, selection of independent auditors, and other matters submitted to meetings of shareholders of the Fund. Each share has equal rights with every other share of the Fund as to dividends, earnings, voting, assets, and redemption. Shares are fully paid, non-assessable, and have no preemptive or appraisal rights. Shares of a Fund are issued as full or fractional shares. Each fractional share has proportionately the same rights including voting as are provided for a full share. Shareholders of PVC may remove any director with or without cause by the vote of a majority of the votes entitled to be cast at a meeting of all Fund shareholders.
The bylaws of PVC also provide that PVC does not need to hold an annual meeting of shareholders unless one of the following is required to be acted upon by shareholders under the 1940 Act: election of directors, approval of an investment advisory agreement, ratification of the selection of independent auditors, and approval of the distribution agreement. PVC intends to hold shareholder meetings only when required by law and at such other times when the Board of Directors deems it to be appropriate.
Shareholder inquiries should be directed to: Principal Variable Contracts Funds, Inc., P.O. Box 219971, Kansas City, MO 64121-9971 or by calling our Shareholder Services Department toll-free at 1 (800) 222-5852.
Principal Life votes each Fund’s shares allocated to each of its separate accounts registered under the 1940 Act and attributable to variable annuity contracts or variable life insurance policies participating in the separate accounts. The shares are voted in accordance with instructions received from contract holders, policy owners, participants, and annuitants. Other shares of each Fund held by each separate account, including shares for which no timely voting instructions are received, are voted in proportion to the instructions that are received with respect to contracts or policies participating in that separate account. Principal Life will vote the shares based upon the instructions received from Contract Owners regardless of the number of Contract Owners who provide such instructions. A potential effect of this proportional voting is that a small number of Contract Owners may determine the outcome of a shareholder vote if only a small number of Contract Owners provide voting instructions. Shares of each of the Funds held in the general account of Principal Life or in the unregistered separate accounts are voted in proportion to the instructions that are received with respect to contracts and policies participating in its registered and unregistered separate accounts. If Principal Life determines, under applicable law, that a Fund’s shares held in one or more separate accounts or in its general account need not be voted according to the instructions that are received, it may vote those Fund shares in its own right. Shares held by retirement plans are voted in accordance with the governing documents of the plans.
Purchase of Fund Shares
PVC offers funds in two share classes: 1 and 2. Funds available in multiple share classes have the same investments, but differing expenses.
Shares are purchased from the Funds' Distributor on any business day (normally any day when the NYSE is open for regular trading) upon request through the insurance company issuing the variable annuity, variable life contract, or the trustees or administrators of the qualified retirement plan offering a Fund. There are no sales charges on shares of the Funds; however, your variable contract may impose a charge. There are no restrictions on amounts to be invested in shares of the Funds.
The Funds, at their discretion, may permit the purchase of shares using securities as consideration (a purchase in-kind) in accordance with procedures approved by PVC’s Board of Directors. Each Fund will value securities used to purchase its shares using the same method the Fund uses to value its portfolio securities as described in this Proxy Statement/Prospectus.
Shareholder accounts for each Fund are maintained under an open account system. Under this system, an account is opened and maintained for each investor. Each investment is confirmed by sending the investor a statement of account showing the current purchase and the total number of shares owned. The statement of account is treated by each Fund as evidence of ownership of Fund shares. Share certificates are not issued.
| |
| Note: | No salesperson, broker-dealer or other person is authorized to give information or make representations about a Fund other than those contained in this Proxy Statement/Prospectus. Information or representations not contained in this Proxy Statement/Prospectus may not be relied upon as having been provided or made by PVC, a Fund, PGI, any sub-advisor, or PFD. |
Sale of Fund Shares
Variable contracts owners should refer to the variable contract product prospectus for details on how to allocate policy or contract value. Qualified plan participants should refer to the qualified plan documents.
Each Fund sells its shares on any business day (normally any day when the NYSE is open for regular trading) upon request through the insurance company issuing the variable annuity, variable life contract, or the trustees or administrators of the qualified retirement plan offering the Fund. There is no charge for the redemption. Shares are redeemed at the NAV per share next computed after the request is received by the Fund in proper and complete form.
Sale proceeds are generally sent within three business days after the request is received in proper form. However, the right to sell shares may be suspended up to seven days, as permitted by federal securities law, during any period when 1) trading on the NYSE is restricted as determined by the SEC or when the NYSE is closed for reasons other than weekends and holidays or 2) an emergency exists, as determined by the SEC, as a result of which a) disposal by a fund of securities owned by it is not reasonably practicable, b) it is not reasonably practicable for a fund to fairly determine the value of its net assets, or c) the SEC permits suspension for the protection of security holders.
If payments are delayed and the instruction is not canceled by the shareholder’s written instruction, the amount of the transaction is determined as of the first valuation date following the expiration of the permitted delay. The transaction occurs within five days thereafter.
In addition, payments on surrender requests submitted before a related premium payment made by check has cleared may be delayed up to seven days. This permits payment to be collected on the check.
Distributions in Kind. PVC may determine that it would be detrimental to the remaining shareholders of a Fund to make payment of a redemption order wholly or partly in cash. Under certain circumstances, therefore, each of the Funds may pay the redemption proceeds in whole or in part by a distribution “in kind” of securities from the Fund’s portfolio in lieu of cash. If a Fund pays the redemption proceeds in kind, the redeeming shareholder might incur brokerage or other costs in selling the securities for cash. In addition, the securities received will be subject to market risk until sold. Typically, such in kind redemptions would be distributed pro rata. Each Fund will value securities used to pay redemptions in kind using the same method the Fund uses to value its portfolio securities as described in this prospectus.
Under normal circumstances, the Funds expect to meet redemption requests through holdings of cash, the sale of investments held in cash equivalents, and/or by selling liquid index futures or other instruments used for cash management purposes. In situations in which such holdings are not sufficient to meet redemption requests, a Fund will typically borrow money through the Fund's interfund lending facility or through a bank line-of-credit. Funds may also choose to sell portfolio assets for the purpose of meeting such requests. Each Fund further reserves the right to distribute “in kind” securities from the Fund's portfolio in lieu (in whole or in part) of cash under certain circumstances, including under stressed market conditions.
Restricted Transfers
Shares of each of the Funds may be transferred to an eligible purchaser. However, if a Fund is requested to transfer shares to other than an eligible purchaser, the Fund has the right, at its election, to purchase the shares at the net asset value next calculated after the receipt of the transfer request. However, the Fund must give written notification to the transferee(s) of the shares of the election to buy the shares within seven days of the request. Settlement for the shares shall be made within the seven-day period.
Financial Statements
Shareholders will receive an annual financial statement for the corresponding Acquiring Fund, audited by the Acquiring Fund’s independent registered public accounting firm. Shareholders will also receive a semiannual financial statement that is unaudited.
Portfolio Holdings Information
A description of PVC’s policies and procedures with respect to disclosure of the Funds’ portfolio securities is available in PVC's Statement of Additional Information.
VOTING INFORMATION
Voting procedures. PVC is furnishing this Proxy Statement/Prospectus to you in connection with the solicitation of proxies on behalf of the Board to be used at the Meeting. If you complete and return the enclosed voting instruction card, your insurance company will vote your shares of the Funds that represent your contract value as you indicate or for approval of each proposal for which there is no indication. You may change your vote and revoke your proxy at any time before it is voted at the Meeting in any of the following ways: (i) by sending a written notice of revocation to the Meeting Secretary of Principal Variable Contracts Funds, Inc., in care of Principal Financial Group, 711 High Street, Des Moines Iowa 50392; (ii) by submitting another properly signed card at a later date to the Meeting Secretary of Principal Variable Contracts Funds, Inc., in care of Principal Financial Group, 711 High Street, Des Moines Iowa 50392; (iii) by submitting another proxy by telephone or via the Internet at a later date; or (iv) being present and voting in person at the Meeting after giving oral notice of the revocation to the Chair of the Meeting.
PVC has hired AST Fund Solutions ("AST") to send proxy solicitations. The parties to the agreement are AST and Principal Life Insurance Company, Inc. and its affiliates. The estimated cost of the solicitation for each Reorganization is as follows:
|
| | |
| ACQUIRED FUND | ACQUIRING FUND | ESTIMATED COST OF SOLICITATION |
Income Account (Class 1 and Class 2) | Core Plus Bond Account (Class 1) | $3,500 |
| | | |
LargeCap Growth Account (Class 1 and Class 2) | LargeCap Growth Account I (Class 1) | $3,000 |
| | | |
Multi-Asset Income Account (Class 1 and Class 2) | SAM (Strategic Asset Management) Flexible Income Account (Class 1 and Class 2) | $15,000 |
These costs will be paid by Acquired Fund shareholders; however, due to expense caps currently in place for the Multi-Asset Income Account and low assets under management, PGI will end up bearing these costs for Proposal 3.
Voting rights. Only shareholders of record at the close of business on March 29, 2019 (the "Record Date") are entitled to vote. The shareholders of each Acquired Fund subject to the proposal will vote together and not by class of shares for all proposals. You are entitled to one vote on each proposal submitted to the shareholders of an Acquired Fund for each share of that Acquired Fund that you hold, and fractional votes for fractional shares held. Each proposal requires for approval the affirmative vote of a "Majority of the Outstanding Voting Securities," which is a term defined in the 1940 Act to mean, with respect to an Acquired Fund, the affirmative vote of the lesser of (1) 67% or more of the voting securities of the Acquired Fund present in person or by proxy at the meeting of that Acquired Fund, if the holders of more than 50% of the outstanding voting securities of the Acquired Fund are present in person or by proxy, or (2) more than 50% of the outstanding voting securities of the Acquired Fund.
The number of votes eligible to be cast at the Meeting as of the Record Date and other share ownership information are set forth below under the heading "Outstanding Shares and Share Ownership" in this Proxy Statement/Prospectus.
Quorum requirements. A quorum must be present at the Meeting for the transaction of business of any Acquired Fund. The presence in person or by proxy of one-third of the shares of each applicable Acquired Fund outstanding at the close of business on the Record Date constitutes a quorum for the Meeting of that Acquired Fund, and shares subject to proportional voting (as described below) are counted for purposes of determining a quorum. Abstentions and broker non-votes are counted toward a quorum but do not represent votes cast for any issue. Under the 1940 Act, the affirmative vote necessary to approve a proposal may be determined with reference to a percentage of votes present at the Meeting, which would have the effect of counting abstentions and broker non-votes as if they were votes against a Proposal.
In the event the necessary quorum to transact business or the vote required to approve a proposal is not obtained at the Meeting, the persons named as proxies or any shareholder present at the Meeting may propose one or more adjournments of the Meeting in accordance with applicable law to permit further solicitation of proxies. Any such adjournment as to a proposal or any other matter with respect to an Acquired Fund will require the affirmative vote of the holders of a majority of the shares of the Acquired Fund present in person or by proxy at the Meeting. The persons named as proxies and any shareholder present at the Meeting will vote for or against any adjournment in their discretion.
Contract Owner Voting Instructions. Shares of PVC Funds are sold to separate accounts of insurance companies and are used to fund benefits under Contracts. Each Contract Owner has the right to instruct his or her insurance company how to vote the shares of the Acquired Funds that represent his or her contract value. You can do so by marking voting instructions on the voting instruction card(s) enclosed with this Proxy Statement/Prospectus and then signing, dating and mailing the voting instruction card(s) in the envelope provided. If a card is not marked to indicate voting instructions, but is signed, dated and returned, it will be treated as an instruction to vote the shares in favor of the Proposals. Your insurance company will vote the shares for which it receives timely voting instructions from Contract Owners in accordance with those instructions. Your insurance company will vote the shares for which it does not receive timely voting instructions from Contract Owners in the same proportion as votes cast by Contract Owners. Accordingly, there are not expected to be any broker non-votes. Because of the proportional voting described above, it is unlikely that quorum requirements for the Meeting will not be satisfied, and, as a result, a small number of Contract Owners can determine the outcome of the voting.
Solicitation Procedures. PVC intends to retain AST to solicit proxies by mail. Officers or employees of AST or their affiliates may make additional solicitations by telephone, internet, facsimile or personal contact. They will be compensated for these services. Brokerage houses, banks and other fiduciaries may be requested to forward soliciting materials to their principals and to obtain authorization for the execution of proxies.
Expenses of mailing. The direct expenses and out-of-pocket fees incurred in connection with each Reorganization, including printing, mailing, solicitation costs, and audit fees, will be paid for by the Acquired Fund shareholders; however, due to expense caps currently in place for the Multi-Asset Income Account and low assets under management, PGI will end up bearing these costs for Proposal 3.
OUTSTANDING SHARES AND SHARE OWNERSHIP
The following table shows as of March 29, 2019, the Record Date, the number of shares outstanding for each class of the Acquired and Acquiring Funds:
|
| | | |
| Income Account | Core Plus Bond Account |
| (Acquired Fund) | (Acquiring Fund) |
| Share Class | Shares Outstanding | Share Class | Shares Outstanding |
| Class 1 | TO BE FILED BY | Class 1 | TO BE FILED BY |
| Class 2 | AMENDMENT | Class 2 | AMENDMENT |
|
| | | |
| LargeCap Growth Account | LargeCap Growth Account I |
| (Acquired Fund) | (Acquiring Fund) |
| Share Class | Shares Outstanding | Share Class | Shares Outstanding |
| Class 1 | TO BE FILED BY | Class 1 | TO BE FILED BY |
| Class 2 | AMENDMENT | Class 2 | AMENDMENT |
|
| | | |
| Multi-Asset Income Account | SAM (Strategic Asset Management) Flexible Income Account |
| (Acquired Fund) | (Acquiring Fund) |
| Share Class | Shares Outstanding | Share Class | Shares Outstanding |
| Class 1 | TO BE FILED BY | Class 1 | TO BE FILED BY |
| Class 2 | AMENDMENT | Class 2 | AMENDMENT |
As of the March 29, 2019 Record Date, the Directors and Officers of PVC together owned less than 1% of the outstanding shares of any class of shares of the Acquired or Acquiring Funds.
As of the March 29, 2019 Record Date, the following persons owned of record, or were known by PVC to own beneficially, 5% or more of the outstanding shares of each Acquired Fund:
Income Account
|
| | | |
| Acquired Fund | Share Class | Name/Address of Shareholder | Percent of Ownership |
| | | | |
| TO BE FILED BY AMENDMENT |
LargeCap Growth Account
|
| | | |
| Acquiring Fund | Share Class | Name/Address of Shareholder | Percent of Ownership |
| | | | |
| TO BE FILED BY AMENDMENT |
Multi-Asset Income Account
|
| | | |
| Acquiring Fund | Share Class | Name/Address of Shareholder | Percent of Ownership |
| | | | |
| TO BE FILED BY AMENDMENT |
FINANCIAL HIGHLIGHTS
The financial highlights table for each Acquired Fund and each Acquiring Fund is intended to help investors understand the financial performance of each Fund for the past five fiscal years (or since inception in the case of a Fund in operation for less than five years). Certain information reflects financial results for a single share of a Fund. The total returns in the tables represent the rate that an investor would have earned (or lost) on an investment in a particular Fund (assuming reinvestment of all dividends and distributions). Information for the fiscal years ended December 31, 2014 through December 31, 2018 has been audited by Ernst & Young LLP, Independent Registered Public Accounting Firm, whose report, along with each Fund’s financial statements, is included in PVC’s Annual Report to Shareholders for the fiscal year ended December 31, 2018. Copies of these reports are available upon request as described above.
FINANCIAL HIGHLIGHTS
PRINCIPAL VARIABLE CONTRACTS FUNDS, INC.
(unaudited)
Selected data for a share of Capital Stock outstanding throughout each year ended December 31 (except as noted):
|
| | | | | |
| CORE PLUS BOND ACCOUNT |
| Class 1 Shares | 2018 | 2017 | 2016 | 2015 | 2014 |
| Net Asset Value, Beginning of Period | $11.35 | $11.15 | $11.05 | $11.46 | $11.24 |
| Net Investment Income (Loss)(a) | 0.36 | 0.35 | 0.32 | 0.32 | 0.31 |
| Net Realized and Unrealized Gain (Loss) on Investments | (0.52) | 0.18 | 0.14 | (0.37) | 0.28 |
| Total From Investment Operations | (0.16) | 0.53 | 0.46 | (0.05) | 0.59 |
| Dividends from Net Investment Income | (0.38) | (0.33) | (0.36) | (0.36) | (0.37) |
| Total Dividends and Distributions | (0.38) | (0.33) | (0.36) | (0.36) | (0.37) |
| Net Asset Value, End of Period | $10.81 | $11.35 | $11.15 | $11.05 | $11.46 |
| Total Return(b) | (1.41)% | 4.81% | 4.09% | (0.48)% | 5.24% |
| Net Assets, End of Period (in thousands) | $280,760 | $293,662 | $292,436 | $290,032 | $321,735 |
| Ratio/Supplemental Data: | | | | | |
| Ratio of Expenses to Average Net Assets | 0.47% | 0.46% | 0.46% | 0.46% | 0.45% |
| Ratio of Net Investment Income to Average Net Assets | 3.27% | 3.08% | 2.79% | 2.80% | 2.74% |
| Portfolio Turnover Rate | 127.5% | 123.5% | 155.1% | 177.2% | 205.6% |
| | | | | | |
| CORE PLUS BOND ACCOUNT |
| Class 2 Shares | 2018 | 2017 | 2016 | 2015(e) | |
| Net Asset Value, Beginning of Period | $11.28 | $11.11 | $11.03 | $11.62 | |
| Net Investment Income (Loss)(a) | 0.33 | 0.32 | 0.29 | 0.19 | |
| Net Realized and Unrealized Gain (Loss) on Investments | (0.51) | 0.18 | 0.14 | (0.42) | |
| Total From Investment Operations | (0.18) | 0.50 | 0.43 | (0.23) | |
| Dividends from Net Investment Income | (0.37) | (0.33) | (0.35) | (0.36) | |
| Total Dividends and Distributions | (0.37) | (0.33) | (0.35) | (0.36) | |
| Net Asset Value, End of Period | $10.73 | $11.28 | $11.11 | $11.03 | |
| Total Return(b) | (1.63)% | 4.50% | 3.82% | (2.03)% (d) | |
| Net Assets, End of Period (in thousands) | $760 | $592 | $232 | $28 | |
| Ratio/Supplemental Data: | | | | | |
| Ratio of Expenses to Average Net Assets | 0.72% | 0.71% | 0.71% | 0.71% (c) | |
| Ratio of Net Investment Income to Average Net Assets | 3.03% | 2.80% | 2.55% | 2.58% (c) | |
| Portfolio Turnover Rate | 127.5% | 123.5% | 155.1% | 177.2% (c) | |
FINANCIAL HIGHLIGHTS
PRINCIPAL VARIABLE CONTRACTS FUNDS, INC.
(unaudited)
|
| | | | | | | | | | |
| INCOME ACCOUNT |
| Class 1 Shares | 2018 | 2017 | 2016 | 2015 | 2014 |
| Net Asset Value, Beginning of Period | $10.39 | $10.34 | $10.24 | $10.78 | $10.68 |
| Net Investment Income (Loss)(a) | 0.36 |
| 0.36 |
| 0.38 |
| 0.39 |
| 0.43 |
|
| Net Realized and Unrealized Gain (Loss) on Investments | (0.28 | ) | 0.16 |
| 0.21 |
| (0.46 | ) | 0.16 |
|
| Total From Investment Operations | 0.08 |
| 0.52 |
| 0.59 |
| (0.07 | ) | 0.59 |
|
| Dividends from Net Investment Income | (0.46 | ) | (0.47 | ) | (0.49 | ) | (0.47 | ) | (0.49 | ) |
| Total Dividends and Distributions | (0.46 | ) | (0.47 | ) | (0.49 | ) | (0.47 | ) | (0.49 | ) |
| Net Asset Value, End of Period | $10.01 | $10.39 | $10.34 | $10.24 | $10.78 |
| Total Return(b) | 0.78 | % | 5.12 | % | 5.72 | % | (0.71 | )% | 5.55 | % |
| Net Assets, End of Period (in thousands) | $178,598 | $220,194 | $228,874 | $254,751 | $275,597 |
| Ratio/Supplemental Data: | | | | | |
| Ratio of Expenses to Average Net Assets | 0.51 | % | 0.51 | % | 0.51 | % | 0.51 | % | 0.51 | % |
| Ratio of Net Investment Income to Average Net Assets | 3.53 | % | 3.47 | % | 3.66 | % | 3.62 | % | 3.95 | % |
| Portfolio Turnover Rate | 9.4 | % | 8.7 | % | 8.1 | % | 12.6 | % | 16.6 | % |
| | | | | | |
| INCOME ACCOUNT |
| Class 2 Shares | 2018 | 2017 | 2016 | 2015 | 2014 |
| Net Asset Value, Beginning of Period | $10.35 | $10.30 | $10.20 | $10.73 | $10.63 |
| Net Investment Income (Loss)(a) | 0.33 |
| 0.34 |
| 0.36 |
| 0.36 |
| 0.40 |
|
| Net Realized and Unrealized Gain (Loss) on Investments | (0.28 | ) | 0.16 |
| 0.21 |
| (0.45 | ) | 0.16 |
|
| Total From Investment Operations | 0.05 |
| 0.50 |
| 0.57 |
| (0.09 | ) | 0.56 |
|
| Dividends from Net Investment Income | (0.44 | ) | (0.45 | ) | (0.47 | ) | (0.44 | ) | (0.46 | ) |
| Total Dividends and Distributions | (0.44 | ) | (0.45 | ) | (0.47 | ) | (0.44 | ) | (0.46 | ) |
| Net Asset Value, End of Period | $9.96 | $10.35 | $10.30 | $10.20 | $10.73 |
| Total Return(b) | 0.47 | % | 4.87 | % | 5.52 | % | (0.92 | )% | 5.26 | % |
| Net Assets, End of Period (in thousands) | $3,173 | $2,869 | $2,695 | $2,445 | $3,036 |
| Ratio/Supplemental Data: | | | | | |
| Ratio of Expenses to Average Net Assets | 0.76 | % | 0.76 | % | 0.76 | % | 0.76 | % | 0.76 | % |
| Ratio of Net Investment Income to Average Net Assets | 3.27 | % | 3.22 | % | 3.40 | % | 3.38 | % | 3.71 | % |
| Portfolio Turnover Rate | 9.4 | % | 8.7 | % | 8.1 | % | 12.6 | % | 16.6 | % |
|
| |
| (a) | Calculated based on average shares outstanding during the period. |
| (b) | Total return does not reflect charges attributable to separate accounts. Inclusion of these charges would reduce the amounts shown. |
| (c) | Computed on an annualized basis. |
| (d) | Total return amounts have not been annualized. |
| (e) | Period from May 1, 2015 date operations commenced, through December 31, 2015. |
FINANCIAL HIGHLIGHTS
PRINCIPAL VARIABLE CONTRACTS FUNDS, INC.
(unaudited)
Selected data for a share of Capital Stock outstanding throughout each year ended December 31 (except as noted):
|
| | | | | |
| LARGECAP GROWTH ACCOUNT |
| Class 1 Shares | 2018 | 2017 | 2016 | 2015 | 2014 |
| Net Asset Value, Beginning of Period | $32.79 | $24.40 | $25.79 | $24.60 | $22.26 |
| Net Investment Income (Loss)(a) | 0.02 | 0.07 | 0.11 | 0.06 | 0.03 |
| Net Realized and Unrealized Gain (Loss) on Investments | (1.91) | 8.43 | (1.43) | 1.17 | 2.44 |
| Total From Investment Operations | (1.89) | 8.50 | (1.32) | 1.23 | 2.47 |
| Dividends from Net Investment Income | (0.08) | (0.11) | (0.07) | (0.04) | (0.13) |
| Distributions from Realized Gains | (2.57) | – | – | – | – |
| Total Dividends and Distributions | (2.65) | (0.11) | (0.07) | (0.04) | (0.13) |
| Net Asset Value, End of Period | $28.25 | $32.79 | $24.40 | $25.79 | $24.60 |
| Total Return(b) | (7.30)% | 34.89% | (5.13)% | 4.98% | 11.12% |
| Net Assets, End of Period (in thousands) | $98,106 | $119,450 | $96,198 | $118,385 | $123,091 |
| Ratio/Supplemental Data: | | | | | |
| Ratio of Expenses to Average Net Assets | 0.69% | 0.69% | 0.69% | 0.69% | 0.69% |
| Ratio of Net Investment Income to Average Net Assets | 0.05% | 0.23% | 0.43% | 0.23% | 0.13% |
| Portfolio Turnover Rate | 77.8% | 72.3% | 78.2% | 47.1% | 67.2% |
| | | | | | |
| LARGECAP GROWTH ACCOUNT |
| Class 2 Shares | 2018 | 2017 | 2016 | 2015 | 2014 |
| Net Asset Value, Beginning of Period | $32.63 | $24.29 | $25.69 | $24.53 | $22.20 |
| Net Investment Income (Loss)(a) | (0.07) | (0.02) | 0.04 | – | (0.03) |
| Net Realized and Unrealized Gain (Loss) on Investments | (1.90) | 8.40 | (1.42) | 1.16 | 2.44 |
| Total From Investment Operations | (1.97) | 8.38 | (1.38) | 1.16 | 2.41 |
| Dividends from Net Investment Income | (0.03) | (0.04) | (0.02) | – | (0.08) |
| Distributions from Realized Gains | (2.57) | – | – | – | – |
| Total Dividends and Distributions | (2.60) | (0.04) | (0.02) | – | (0.08) |
| Net Asset Value, End of Period | $28.06 | $32.63 | $24.29 | $25.69 | $24.53 |
| Total Return(b) | (7.54)% | 34.54% | (5.38)% | 4.73% | 10.85% |
| Net Assets, End of Period (in thousands) | $2,184 | $1,452 | $923 | $1,090 | $661 |
| Ratio/Supplemental Data: | | | | | |
| Ratio of Expenses to Average Net Assets | 0.94% | 0.94% | 0.94% | 0.94% | 0.94% |
| Ratio of Net Investment Income to Average Net Assets | (0.20)% | (0.06)% | 0.17% | (0.01)% | (0.11)% |
| Portfolio Turnover Rate | 77.8% | 72.3% | 78.2% | 47.1% | 67.2% |
FINANCIAL HIGHLIGHTS
PRINCIPAL VARIABLE CONTRACTS FUNDS, INC.
(unaudited)
|
| | | | | |
| LARGECAP GROWTH ACCOUNT I |
| Class 1 Shares | 2018 | 2017 | 2016 | 2015 | 2014 |
| Net Asset Value, Beginning of Period | $31.18 | $24.55 | $26.33 | $28.70 | $32.58 |
| Net Investment Income (Loss)(a) | 0.03 | 0.01 | 0.01 | 0.02 | 0.03 |
| Net Realized and Unrealized Gain (Loss) on Investments | 1.41 | 8.13 | 0.34 | 2.26 | 2.46 |
| Total From Investment Operations | 1.44 | 8.14 | 0.35 | 2.28 | 2.49 |
| Dividends from Net Investment Income | (0.01) | (0.01) | – | (0.07) | (0.04) |
| Distributions from Realized Gains | (2.51) | (1.50) | (2.13) | (4.58) | (6.33) |
| Total Dividends and Distributions | (2.52) | (1.51) | (2.13) | (4.65) | (6.37) |
| Net Asset Value, End of Period | $30.10 | $31.18 | $24.55 | $26.33 | $28.70 |
| Total Return(b) | 3.60% | 33.71% | 1.26% | 7.77% | 8.61% |
| Net Assets, End of Period (in thousands) | $296,139 | $302,147 | $244,058 | $252,386 | $239,629 |
| Ratio/Supplemental Data: | | | | | |
| Ratio of Expenses to Average Net Assets | 0.74% (c) | 0.75% (c) | 0.76% (c) | 0.76% (c) | 0.76% (c) |
| Ratio of Net Investment Income to Average Net Assets | 0.08% | 0.03% | 0.04% | 0.07% | 0.11% |
| Portfolio Turnover Rate | 36.9% | 36.2% | 36.8% | 38.6% | 38.9% |
| |
| LARGECAP GROWTH ACCOUNT I |
| Class 2 Shares | 2018 | 2017 | 2016 | 2015(d) | |
| Net Asset Value, Beginning of Period | $30.99 | $24.46 | $26.29 | $30.30 | |
| Net Investment Income (Loss)(a) | (0.02) | (0.07) | (0.05) | (0.03) | |
| Net Realized and Unrealized Gain (Loss) on Investments | 1.38 | 8.10 | 0.35 | 0.67 | |
| Total From Investment Operations | 1.36 | 8.03 | 0.30 | 0.64 | |
| Dividends from Net Investment Income | – | – | – | (0.07) | |
| Distributions from Realized Gains | (2.51) | (1.50) | (2.13) | (4.58) | |
| Total Dividends and Distributions | (2.51) | (1.50) | (2.13) | (4.65) | |
| Net Asset Value, End of Period | $29.84 | $30.99 | $24.46 | $26.29 | |
| Total Return(b) | 3.36% | 33.38% | 1.07% | 1.94% (e) | |
| Net Assets, End of Period (in thousands) | $3,159 | $702 | $127 | $501 | |
| Ratio/Supplemental Data: | | | | | |
| Ratio of Expenses to Average Net Assets | 0.99% (c) | 1.00% | 1.01% (c) | 1.01% (c),(f) | |
| Ratio of Net Investment Income to Average Net Assets | (0.07)% | (0.25)% | (0.21)% | (0.19)% (f) | |
| Portfolio Turnover Rate | 36.9% | 36.2% | 36.8% | 38.6% (f) | |
|
| |
| (a) | Calculated based on average shares outstanding during the period. |
| (b) | Total return does not reflect charges attributable to separate accounts. Inclusion of these charges would reduce the amounts shown. |
| (c) | Reflects Manager's contractual expense limit. |
| (d) | Period from May 1, 2015 date operations commenced, through December 31, 2015. |
| (e) | Total return amounts have not been annualized. |
| (f) | Computed on an annualized basis. |
FINANCIAL HIGHLIGHTS
PRINCIPAL VARIABLE CONTRACTS FUNDS, INC.
(unaudited)
Selected data for a share of Capital Stock outstanding throughout each year ended December 31 (except as noted):
|
| | | | |
| MULTI-ASSET INCOME ACCOUNT |
| Class 1 Shares | 2018 | 2017 | 2016 | 2015(e) |
| Net Asset Value, Beginning of Period | $11.24 | $10.24 | $9.72 | $10.00 |
| Net Investment Income (Loss)(a) | 0.51 | 0.46 | 0.66 | 0.24 |
| Net Realized and Unrealized Gain (Loss) on Investments | (1.13) | 0.76 | 0.11 | (0.52) |
| Total From Investment Operations | (0.62) | 1.22 | 0.77 | (0.28) |
| Dividends from Net Investment Income | (0.29) | (0.19) | (0.23) | – |
| Distributions from Realized Gains | (0.03) | (0.03) | (0.02) | – |
| Total Dividends and Distributions | (0.32) | (0.22) | (0.25) | – |
| Net Asset Value, End of Period | $10.30 | $11.24 | $10.24 | $9.72 |
| Total Return(b) | (5.63)% | 11.99% | 7.96% | (2.80)% (f) |
| Net Assets, End of Period (in thousands) | $329 | $241 | $183 | $10 |
| Ratio/Supplemental Data: | | | | |
| Ratio of Expenses to Average Net Assets | 0.08% (c) | 0.08% (c) | 0.08% (c) | 0.08% (c),(g) |
| Ratio of Net Investment Income to Average Net Assets | 4.68% | 4.23% | 6.46% | 5.67% (g) |
| Portfolio Turnover Rate | 32.9% | 22.7% | 61.0% | 0.0% |
| | | | | |
| MULTI-ASSET INCOME ACCOUNT | | | | |
| Class 2 Shares | 2018 | 2017 | 2016 | 2015(e) |
| Net Asset Value, Beginning of Period | $11.18 | $10.20 | $9.71 | $10.00 |
| Net Investment Income (Loss)(a) | 0.50 | 0.49 | 0.46 | 0.23 |
| Net Realized and Unrealized Gain (Loss) on Investments | (1.15) | 0.71 | 0.28 | (0.52) |
| Total From Investment Operations | (0.65) | 1.20 | 0.74 | (0.29) |
| Dividends from Net Investment Income | (0.29) | (0.19) | (0.23) | – |
| Distributions from Realized Gains | (0.03) | (0.03) | (0.02) | – |
| Total Dividends and Distributions | (0.32) | (0.22) | (0.25) | – |
| Net Asset Value, End of Period | $10.21 | $11.18 | $10.20 | $9.71 |
| Total Return(b) | (5.93)% | 11.84% | 7.65% | (2.90)% (f) |
| Net Assets, End of Period (in thousands) | $54 | $26 | $10 | $10 |
| Ratio/Supplemental Data: | | | | |
| Ratio of Expenses to Average Net Assets | 0.33% (c) | 0.33% (c) | 0.33% (c) | 0.33% (c),(g) |
| Ratio of Net Investment Income to Average Net Assets | 4.57% | 4.56% | 4.57% | 5.41% (g) |
| Portfolio Turnover Rate | 32.9% | 22.7% | 61.0% | 0.0% |
FINANCIAL HIGHLIGHTS
PRINCIPAL VARIABLE CONTRACTS FUNDS, INC.
(unaudited)
|
| | | | | |
| SAM FLEXIBLE INCOME PORTFOLIO |
| Class 1 Shares | 2018 | 2017 | 2016 | 2015 | 2014 |
| Net Asset Value, Beginning of Period | $12.95 | $12.45 | $12.27 | $13.22 | $13.72 |
| Net Investment Income (Loss)(a) | 0.40 | 0.47 | 0.42 | 0.40 | 0.49 |
| Net Realized and Unrealized Gain (Loss) on Investments | (0.63) | 0.56 | 0.44 | (0.56) | 0.33 |
| Total From Investment Operations | (0.23) | 1.03 | 0.86 | (0.16) | 0.82 |
| Dividends from Net Investment Income | (0.53) | (0.44) | (0.43) | (0.47) | (0.52) |
| Distributions from Realized Gains | (0.33) | (0.09) | (0.25) | (0.32) | (0.80) |
| Total Dividends and Distributions | (0.86) | (0.53) | (0.68) | (0.79) | (1.32) |
| Net Asset Value, End of Period | $11.86 | $12.95 | $12.45 | $12.27 | $13.22 |
| Total Return(b) | (1.97)% | 8.41% | 7.04% | (1.31)% | 6.03% |
| Net Assets, End of Period (in thousands) | $157,019 | $194,742 | $196,393 | $200,828 | $215,309 |
| Ratio/Supplemental Data: | | | | | |
| Ratio of Expenses to Average Net Assets | 0.23% (d) | 0.23% (d) | 0.23% (d) | 0.23% (d) | 0.23% (d) |
| Ratio of Net Investment Income to Average Net Assets | 3.19% | 3.69% | 3.32% | 3.05% | 3.55% |
| Portfolio Turnover Rate | 19.9% | 29.3% | 17.1% | 25.2% | 18.8% |
| |
| SAM FLEXIBLE INCOME PORTFOLIO |
| Class 2 Shares | 2018 | 2017 | 2016 | 2015 | 2014 |
| Net Asset Value, Beginning of Period | $12.83 | $12.34 | $12.17 | $13.12 | $13.62 |
| Net Investment Income (Loss)(a) | 0.38 | 0.45 | 0.38 | 0.37 | 0.45 |
| Net Realized and Unrealized Gain (Loss) on Investments | (0.63) | 0.54 | 0.44 | (0.56) | 0.33 |
| Total From Investment Operations | (0.25) | 0.99 | 0.82 | (0.19) | 0.78 |
| Dividends from Net Investment Income | (0.51) | (0.41) | (0.40) | (0.44) | (0.48) |
| Distributions from Realized Gains | (0.33) | (0.09) | (0.25) | (0.32) | (0.80) |
| Total Dividends and Distributions | (0.84) | (0.50) | (0.65) | (0.76) | (1.28) |
| Net Asset Value, End of Period | $11.74 | $12.83 | $12.34 | $12.17 | $13.12 |
| Total Return(b) | (2.20)% | 8.13% | 6.73% | (1.55)% | 5.80% |
| Net Assets, End of Period (in thousands) | $25,656 | $23,003 | $20,085 | $21,108 | $19,836 |
| Ratio/Supplemental Data: | | | | | |
| Ratio of Expenses to Average Net Assets | 0.48% (d) | 0.48% (d) | 0.48% (d) | 0.48% (d) | 0.48% (d) |
| Ratio of Net Investment Income to Average Net Assets | 3.07% | 3.57% | 3.06% | 2.85% | 3.27% |
| Portfolio Turnover Rate | 19.9% | 29.3% | 17.1% | 25.2% | 18.8% |
|
| |
| (a) | Calculated based on average shares outstanding during the period. |
| (b) | Total return does not reflect charges attributable to separate accounts. Inclusion of these charges would reduce the amounts shown. |
| (c) | Reflects Manager's contractual expense limit. |
| (d) | Does not include expenses of the investment companies in which the Portfolio invests. |
| (e) | Period from July 28, 2015 date operations commenced, through December 31, 2015. |
| (f) | Total return amounts have not been annualized. |
| (g) | Computed on an annualized basis. |
FINANCIAL STATEMENTS
The financial statements of each Acquiring Fund and Acquired Fund included in PVC’s Annual Report to Shareholders for the fiscal year ended December 31, 2018 are incorporated by reference into the Statement of Additional Information and have been so incorporated by reference in reliance on the report of Ernst & Young LLP, Independent Registered Public Accounting Firm. Copies of these reports are available upon request as described above.
LEGAL MATTERS
Certain matters concerning the issuance of shares of each Acquiring Fund will be passed upon by Adam U. Shaikh, Esq., Assistant Counsel to PVC. Certain tax consequences of two of the Reorganizations will be passed upon for each Acquiring Fund by Randy Lee Bergstrom, Esq., Assistant Tax Counsel to PVC, and for each Acquired Fund by Jared A. Yepsen, Esq., Assistant Tax Counsel to PVC.
OTHER INFORMATION
The next annual meeting of PVC shareholders is April 25, 2019. Shareholder proposals to be presented at that meeting must be received by PVC a reasonable time before its solicitation of proxies for that meeting in order for such proposals to be considered for inclusion in the proxy materials related to that meeting.
BY ORDER OF THE BOARD OF DIRECTORS
April ___, 2019
Des Moines, Iowa
Appendix A
FORM OF
PLAN OF ACQUISITION
Income Account and Core Plus Bond Account
The Board of Directors of Principal Variable Contracts Funds, Inc., a Maryland corporation (the “Fund”), deems it advisable that the Core Plus Bond Account series of the Fund (“Core Plus”) acquire all of the assets of the Income Account series of the Fund (“Income”), in exchange for the assumption by Core Plus of all of the liabilities of Income and for shares issued by Core Plus which are thereafter to be distributed by Income pro rata to its shareholders in complete liquidation and termination of Income and in exchange for all of Income’s outstanding shares.
Income will transfer to Core Plus, and Core Plus will acquire from Income, all of the assets of Income on the Closing Date and will assume from Income all of the liabilities of Income in exchange for the issuance of the number of Class 1 shares of Core Plus determined as provided in the following paragraphs. Class 1 shares of Core Plus will be subsequently distributed pro rata to the shareholders of Income in complete liquidation and termination of Income and in exchange for all of Income’s outstanding Class 1 and 2 shares. Income will not issue, sell or transfer any of its shares after the Closing Date, and only redemption requests received by Income in proper form prior to the Closing Date shall be fulfilled by Income. Redemption requests received by Income thereafter will be treated as requests for redemption of those shares of Core Plus allocable to the shareholder in question.
Income will declare, and Core Plus may declare, to its shareholders of record on or prior to the Closing Date a dividend or dividends which, together with all previous such dividends, shall have the effect of distributing to its shareholders all of its income (computed without regard to any deduction for dividends paid) and all of its net realized capital gains, if any, as of the Closing Date.
On the Closing Date, Core Plus will issue to Income a number of full and fractional Class 1 shares of Core Plus, taken at their then net asset value, having an aggregate net asset value equal to the aggregate value of the net assets of the Class 1 and Class 2 shares of Income. The aggregate value of the net assets of Income and Core Plus shall be determined in accordance with the then current Prospectus of the Fund as of close of regularly scheduled trading on the New York Stock Exchange on the Closing Date.
The closing of the transactions contemplated in this Plan (the “Closing”) shall be held at the offices of Principal Global Investors, LLC, 711 High Street, Des Moines, Iowa 50392 at 3:00 p.m. Central Time on June 7, 2019, or on such other date as fund management may determine. The date on which the Closing is to be held as provided in this Plan shall be known as the “Closing Date.”
In the event that on the Closing Date (a) the New York Stock Exchange is closed for other than customary weekend and holiday closings or (b) trading on said Exchange is restricted or (c) an emergency exists as a result of which it is not reasonably practicable for Core Plus or Income to fairly determine the value of its assets, the Closing Date shall be postponed until the first business day after the day on which trading shall have been fully resumed.
As soon as practicable after the Closing, Income shall (a) distribute on a pro rata basis to the Class 1 and 2 shareholders of record of Income at the close of business on the Closing Date the Class 1 shares of Core Plus received by Income at the Closing in exchange for all of Income’s outstanding shares, and (b) be liquidated in accordance with applicable law and the Fund’s Articles of Incorporation.
For purposes of the distribution of shares of Core Plus to shareholders of Income, Core Plus shall credit its books an appropriate number and class of its shares to the account of each shareholder of Income. No certificates will be issued for shares of Core Plus. After the Closing Date and until surrendered, each outstanding certificate, if any, which, prior to the Closing Date, represented shares of Income, shall be deemed for all purposes of the Fund’s Articles of Incorporation and Bylaws to evidence the appropriate number and class of shares of Core Plus to be credited on the books of Core Plus in respect of such shares of Income as provided above.
Income will, within a reasonable period of time before the Closing Date, furnish Core Plus with a list of Income’s portfolio securities and other investments. Core Plus will, within a reasonable period of time before the Closing Date, identify the securities, if any, on Income’s list referred to in the foregoing sentence that Core Plus wishes to receive from Income and otherwise how Core Plus wishes Income’s portfolio to be repositioned prior to the Closing in accordance with Core Plus’s investment objective, policies and strategies. Income, if requested by Core Plus, will reposition its portfolio as directed by Core Plus prior to the Closing. In addition, if it is determined that the portfolios of Income and Core Plus, when aggregated, would contain investments exceeding certain percentage limitations applicable to Core Plus with respect to such investments, Income, if requested by Core Plus, will dispose of a sufficient amount of such investments as may be necessary to avoid violating such limitations as of the Closing.
Prior to the Closing Date, Income shall deliver to Core Plus a list setting forth the assets to be assigned, delivered and transferred to Core Plus, including the securities then owned by Income and the respective federal income tax bases (on an identified cost basis) thereof, and the liabilities to be assumed by Core Plus pursuant to this Plan.
All of Income’s portfolio securities shall be delivered by Income’s custodian on the Closing Date to Core Plus or its custodian, either endorsed in proper form for transfer in such condition as to constitute good delivery thereof in accordance with the practice of brokers or, if such securities are held in a securities depository within the meaning of Rule 17f-4 under the Investment Company Act of 1940, transferred to an account in the name of Core Plus or its custodian with said depository. All cash to be delivered pursuant to this Plan shall be transferred from Income’s account at its custodian to Core Plus’s account at its custodian. If on the Closing Date Income is unable to make good delivery to Core Plus’s custodian of any of Income’s portfolio securities because such securities have not yet been delivered to Income’s custodian by its brokers or by the transfer agent for such securities, then the delivery requirement with respect to such securities shall be waived, and Income shall deliver to Core Plus’s custodian on or by said Closing Date with respect to said undelivered securities executed copies of an agreement of assignment in a form satisfactory to Core Plus, and a due bill or due bills in form and substance satisfactory to the custodian, together with such other documents including brokers’ confirmations, as may be reasonably required by Core Plus.
This Plan may be abandoned and terminated, whether before or after action thereon by the shareholders of Income and notwithstanding favorable action by such shareholders, if the Board of Directors believe that the consummation of the transactions contemplated hereunder would not be in the best interests of the shareholders of either fund. This Plan may be amended by the Board of Directors at any time, except that after approval by the shareholders of Income no amendment may be made with respect to the Plan which in the opinion of the Board of Directors materially adversely affects the interests of the shareholders of Income.
Except as expressly provided otherwise in this Plan, Income will pay or cause to be paid all out-of-pocket fees and expenses incurred in connection with the transactions contemplated under this Plan, including, but not limited to, accountants’ fees, legal fees, registration fees, and printing expenses.
IN WITNESS WHEREOF, each of the parties hereto has caused this Plan to be executed as of the _____ day of _________, 2019.
|
| | |
| | | PRINCIPAL VARIABLE CONTRACTS FUNDS, INC. on behalf of the following Acquired Fund: Income Account |
| | | |
| | By: | |
| | | Michael J. Beer |
| | | President and Chief Executive Officer |
| | | |
| | | PRINCIPAL VARIABLE CONTRACTS FUNDS, INC. on behalf of the following Acquiring Fund: Core Plus Bond Account |
| | | |
| | By: | |
| | | Adam U. Shaikh |
| | | Assistant Counsel |
FORM OF
PLAN OF ACQUISITION
LargeCap Growth Account and LargeCap Growth Account I
The Board of Directors of Principal Variable Contracts Funds, Inc., a Maryland corporation (the “Fund”), deems it advisable that the LargeCap Growth Account I series of the Fund (“LCGI”) acquire all of the assets of LargeCap Growth Account series of the Fund (“LCG”), in exchange for the assumption by LCGI of all of the liabilities of LCG and for shares issued by LCGI which are thereafter to be distributed by LCG pro rata to its shareholders in complete liquidation and termination of LCG and in exchange for all of LCG’s outstanding shares.
LCG will transfer to LCGI, and LCGI will acquire from LCG, all of the assets of LCG on the Closing Date and will assume from LCG all of the liabilities of LCG in exchange for the issuance of the number of Class 1 shares of LCGI determined as provided in the following paragraphs. Class 1 shares of LCGI will be subsequently distributed pro rata to the shareholders of LCG in complete liquidation and termination of LCG and in exchange for all of LCG’s outstanding Class 1 and 2 shares. LCG will not issue, sell or transfer any of its shares after the Closing Date, and only redemption requests received by LCG in proper form prior to the Closing Date shall be fulfilled by LCG. Redemption requests received by LCG thereafter will be treated as requests for redemption of those shares of LCGI allocable to the shareholder in question.
LCG will declare, and LCGI may declare, to its shareholders of record on or prior to the Closing Date a dividend or dividends which, together with all previous such dividends, shall have the effect of distributing to its shareholders all of its LCG (computed without regard to any deduction for dividends paid) and all of its net realized capital gains, if any, as of the Closing Date.
On the Closing Date, LCGI will issue to LCG a number of full and fractional Class 1 shares of LCGI, taken at their then net asset value, having an aggregate net asset value equal to the aggregate value of the net assets of the Class 1 and Class 2 shares of LCG. The aggregate value of the net assets of LCG and LCGI shall be determined in accordance with the then current Prospectus of the Fund as of close of regularly scheduled trading on the New York Stock Exchange on the Closing Date.
The closing of the transactions contemplated in this Plan (the “Closing”) shall be held at the offices of Principal Global Investors, LLC, 711 High Street, Des Moines, Iowa 50392 at 3:00 p.m. Central Time on June 7, 2019, or on such other date as fund management may determine. The date on which the Closing is to be held as provided in this Plan shall be known as the “Closing Date.”
In the event that on the Closing Date (a) the New York Stock Exchange is closed for other than customary weekend and holiday closings or (b) trading on said Exchange is restricted or (c) an emergency exists as a result of which it is not reasonably practicable for LCGI or LCG to fairly determine the value of its assets, the Closing Date shall be postponed until the first business day after the day on which trading shall have been fully resumed.
As soon as practicable after the Closing, LCG shall (a) distribute on a pro rata basis to the Class 1 and 2 shareholders of record of LCG at the close of business on the Closing Date the Class 1 shares of LCGI received by LCG at the Closing in exchange for all of LCG’s outstanding shares, and (b) be liquidated in accordance with applicable law and the Fund’s Articles of Incorporation.
For purposes of the distribution of shares of LCGI to shareholders of LCG, LCGI shall credit its books an appropriate number and class of its shares to the account of each shareholder of LCG. No certificates will be issued for shares of LCGI. After the Closing Date and until surrendered, each outstanding certificate, if any, which, prior to the Closing Date, represented shares of LCG, shall be deemed for all purposes of the Fund’s Articles of Incorporation and Bylaws to evidence the appropriate number and class of shares of LCGI to be credited on the books of LCGI in respect of such shares of LCG as provided above.
LCG will, within a reasonable period of time before the Closing Date, furnish LCGI with a list of LCG’s portfolio securities and other investments. LCGI will, within a reasonable period of time before the Closing Date, identify the securities, if any, on LCG’s list referred to in the foregoing sentence that LCGI wishes to receive from LCG and otherwise how LCGI wishes LCG’s portfolio to be repositioned prior to the Closing in accordance with LCGI’s investment objective, policies and strategies. LCG, if requested by LCGI, will reposition its portfolio as directed by LCGI prior to the Closing. In addition, if it is determined that the portfolios of LCG and LCGI, when aggregated, would contain investments exceeding certain percentage limitations applicable to LCGI with respect to such investments, LCG, if requested by LCGI, will dispose of a sufficient amount of such investments as may be necessary to avoid violating such limitations as of the Closing. Notwithstanding the foregoing, nothing herein will require LCG to dispose of or purchase any investments or securities if, in the reasonable judgment of the Board of Directors or Principal Global Investors, LLC, the investment adviser to LCG and LCGI, such disposition would adversely affect the status of the transactions contemplated in this Plan as a “reorganization,” as such term is used in Section 368(a) of the Internal Revenue Code of 1986, as amended, or would otherwise not be in the best interests of LCG.
Prior to the Closing Date, LCG shall deliver to LCGI a list setting forth the assets to be assigned, delivered and transferred to LCGI, including the securities then owned by LCG and the respective federal LCG tax bases (on an identified cost basis) thereof, and the liabilities to be assumed by LCGI pursuant to this Plan.
All of LCG’s portfolio securities shall be delivered by LCG’s custodian on the Closing Date to LCGI or its custodian, either endorsed in proper form for transfer in such condition as to constitute good delivery thereof in accordance with the practice of brokers or, if such securities are held in a securities depository within the meaning of Rule 17f-4 under the Investment Company Act of 1940, transferred to an account in the name of LCGI or its custodian with said depository. All cash to be delivered pursuant to this Plan shall be transferred from LCG’s account at its custodian to LCGI’s account at its custodian. If on the Closing Date LCG is unable to make good delivery to LCGI’s custodian of any of LCG’s portfolio securities because such securities have not yet been delivered to LCG’s custodian by its brokers or by the transfer agent for such securities, then the delivery requirement with respect to such securities shall be waived, and LCG shall deliver to LCGI’s custodian on or by said Closing Date with respect to said undelivered securities executed copies of an agreement of assignment in a form satisfactory to LCGI, and a due bill or due bills in form and substance satisfactory to the custodian, together with such other documents including brokers’ confirmations, as may be reasonably required by LCGI.
This Plan may be abandoned and terminated, whether before or after action thereon by the shareholders of LCG and notwithstanding favorable action by such shareholders, if the Board of Directors believe that the consummation of the transactions contemplated hereunder would not be in the best interests of the shareholders of either fund. This Plan may be amended by the Board of Directors at any time, except that after approval by the shareholders of LCG no amendment may be made with respect to the Plan which in the opinion of the Board of Directors materially adversely affects the interests of the shareholders of LCG.
Except as expressly provided otherwise in this Plan, LCG will pay or cause to be paid all out-of-pocket fees and expenses incurred in connection with the transactions contemplated under this Plan, including, but not limited to, accountants’ fees, legal fees, registration fees, and printing expenses.
IN WITNESS WHEREOF, each of the parties hereto has caused this Plan to be executed as of the _____ day of _________, 2019.
|
| | |
| | | PRINCIPAL VARIABLE CONTRACTS FUNDS, INC. on behalf of the following Acquired Fund: LargeCap Growth Account |
| | | |
| | By: | |
| | | Michael J. Beer |
| | | President and Chief Executive Officer |
| | | |
| | | PRINCIPAL VARIABLE CONTRACTS FUNDS, INC. on behalf of the following Acquiring Fund: LargeCap Growth Account I |
| | | |
| | By: | |
| | | Adam U. Shaikh |
| | | Assistant Counsel |
FORM OF
PLAN OF ACQUISITION
SAM Flexible Income Account and Multi-Asset Income Account
The Board of Directors of Principal Variable Contracts Funds, Inc., a Maryland corporation (the “Fund”), deems it advisable that the Strategic Asset Management Flexible Income Account series of the Fund (“SAM”) acquire all of the assets of the Multi-Asset Income Account series of the Fund (“Multi-Asset”), in exchange for the assumption by SAM of all of the liabilities of Multi-Asset and for shares issued by SAM which are thereafter to be distributed by Multi-Asset pro rata to its shareholders in complete liquidation and termination of Multi-Asset and in exchange for all of Multi-Asset’s outstanding shares.
Multi-Asset will transfer to SAM, and SAM will acquire from Multi-Asset, all of the assets of Multi-Asset on the Closing Date and will assume from Multi-Asset all of the liabilities of Multi-Asset in exchange for the issuance of the number and class of shares of SAM determined as provided in the following paragraphs, which shares will be subsequently distributed pro rata to the shareholders of Multi-Asset of the corresponding class in complete liquidation and termination of Multi-Asset and in exchange for all of Multi-Asset’s outstanding Class 1 and 2 shares. Multi-Asset will not issue, sell or transfer any of its shares after the Closing Date, and only redemption requests received by Multi-Asset in proper form prior to the Closing Date shall be fulfilled by Multi-Asset. Redemption requests received by Multi-Asset thereafter will be treated as requests for redemption of those shares of SAM allocable to the shareholder in question.
Multi-Asset will declare, and SAM may declare, to its shareholders of record on or prior to the Closing Date a dividend or dividends which, together with all previous such dividends, shall have the effect of distributing to its shareholders all of its income (computed without regard to any deduction for dividends paid) and all of its net realized capital gains, if any, as of the Closing Date.
On the Closing Date, SAM will issue to Multi-Asset a number of full and fractional Class 1 and 2 shares of SAM, taken at their then net asset value, having an aggregate net asset value equal to the aggregate value of the net assets of the corresponding share class of Multi-Asset. The aggregate value of the net assets of Multi-Asset and SAM shall be determined in accordance with the then current Prospectus of the Fund as of close of regularly scheduled trading on the New York Stock Exchange on the Closing Date.
The closing of the transactions contemplated in this Plan (the “Closing”) shall be held at the offices of Principal Global Investors, LLC, 711 High Street, Des Moines, Iowa 50392 at 3:00 p.m. Central Time on June 7, 2019, or on such other date as fund management may determine. The date on which the Closing is to be held as provided in this Plan shall be known as the “Closing Date.”
In the event that on the Closing Date (a) the New York Stock Exchange is closed for other than customary weekend and holiday closings or (b) trading on said Exchange is restricted or (c) an emergency exists as a result of which it is not reasonably practicable for SAM or Multi-Asset to fairly determine the value of its assets, the Closing Date shall be postponed until the first business day after the day on which trading shall have been fully resumed.
As soon as practicable after the Closing, Multi-Asset shall (a) distribute on a pro rata basis to the Class 1 and 2 shareholders of record of Multi-Asset at the close of business on the Closing Date the shares of SAM of the corresponding class received by Multi-Asset at the Closing in exchange for all of Multi-Asset’s outstanding shares, and (b) be liquidated in accordance with applicable law and the Fund’s Articles of Incorporation.
For purposes of the distribution of shares of SAM to shareholders of Multi-Asset, SAM shall credit its books an appropriate number and class of its shares to the account of each shareholder of Multi-Asset. No certificates will be issued for shares of SAM. After the Closing Date and until surrendered, each outstanding certificate, if any, which, prior to the Closing Date, represented shares of Multi-Asset, shall be deemed for all purposes of the Fund’s Articles of Incorporation and Bylaws to evidence the appropriate number and class of shares of SAM to be credited on the books of SAM in respect of such shares of Multi-Asset as provided above.
Multi-Asset will, within a reasonable period of time before the Closing Date, furnish SAM with a list of Multi-Asset’s portfolio securities and other investments. SAM will, within a reasonable period of time before the Closing Date, identify the securities, if any, on Multi-Asset’s list referred to in the foregoing sentence that SAM wishes to receive from Multi-Asset and otherwise how SAM wishes Multi-Asset’s portfolio to be repositioned prior to the Closing in accordance with SAM’s investment objective, policies and strategies. Multi-Asset, if requested by SAM, will reposition its portfolio as directed by SAM prior to the Closing. In addition, if it is determined that the portfolios of Multi-Asset and SAM, when aggregated, would contain investments exceeding certain percentage limitations applicable to SAM with respect to such investments, Multi-Asset, if requested by SAM, will dispose of a sufficient amount of such investments as may be necessary to avoid violating such limitations as of the Closing. Notwithstanding the foregoing, nothing herein will require Multi-Asset to dispose of or purchase any investments or securities if, in the reasonable judgment of the Board of Directors or Principal Global Investors, LLC, the investment adviser to Multi-Asset and SAM, such disposition would adversely affect the status of the transactions contemplated in this Plan as a “reorganization,” as such term is used in Section 368(a) of the Internal Revenue Code of 1986, as amended, or would otherwise not be in the best interests of Multi-Asset.
Prior to the Closing Date, Multi-Asset shall deliver to SAM a list setting forth the assets to be assigned, delivered and transferred to SAM, including the securities then owned by Multi-Asset and the respective federal income tax bases (on an identified cost basis) thereof, and the liabilities to be assumed by SAM pursuant to this Plan.
All of Multi-Asset’s portfolio securities shall be delivered by Multi-Asset’s custodian on the Closing Date to SAM or its custodian, either endorsed in proper form for transfer in such condition as to constitute good delivery thereof in accordance with the practice of brokers or, if such securities are held in a securities depository within the meaning of Rule 17f-4 under the Investment Company Act of 1940, transferred to an account in the name of SAM or its custodian with said depository. All cash to be delivered pursuant to this Plan shall be transferred from Multi-Asset’s account at its custodian to SAM’s account at its custodian. If on the Closing Date Multi-Asset is unable to make good delivery to SAM’s custodian of any of Multi-Asset’s portfolio securities because such securities have not yet been delivered to Multi-Asset’s custodian by its brokers or by the transfer agent for such securities, then the delivery requirement with respect to such securities shall be waived, and Multi-Asset shall deliver to SAM’s custodian on or by said Closing Date with respect to said undelivered securities executed copies of an agreement of assignment in a form satisfactory to SAM, and a due bill or due bills in form and substance satisfactory to the custodian, together with such other documents including brokers’ confirmations, as may be reasonably required by SAM.
This Plan may be abandoned and terminated, whether before or after action thereon by the shareholders of Multi-Asset and notwithstanding favorable action by such shareholders, if the Board of Directors believe that the consummation of the transactions contemplated hereunder would not be in the best interests of the shareholders of either fund. This Plan may be amended by the Board of Directors at any time, except that after approval by the shareholders of Multi-Asset no amendment may be made with respect to the Plan which in the opinion of the Board of Directors materially adversely affects the interests of the shareholders of Multi-Asset.
Except as expressly provided otherwise in this Plan, Multi-Asset will pay or cause to be paid all out-of-pocket fees and expenses incurred in connection with the transactions contemplated under this Plan, including, but not limited to, accountants’ fees, legal fees, registration fees, and printing expenses.
IN WITNESS WHEREOF, each of the parties hereto has caused this Plan to be executed as of the _____ day of _________, 2019.
|
| | |
| | | PRINCIPAL VARIABLE CONTRACTS FUNDS, INC. on behalf of the following Acquired Fund: Multi-Asset Income Account |
| | | |
| | By: | |
| | | Michael J. Beer |
| | | President and Chief Executive Officer |
| | | |
| | | PRINCIPAL VARIABLE CONTRACTS FUNDS, INC. on behalf of the following Acquiring Fund: SAM Flexible Income Account |
| | | |
| | By: | |
| | | Adam U. Shaikh |
| | | Assistant Counsel |
APPENDIX B – DESCRIPTION OF BOND RATINGS
Moody's Investors Service, Inc. Rating Definitions:
Long-Term Obligation Ratings
Ratings assigned on Moody's global long-term obligation rating scales are forward-looking opinions of the relative credit risk of financial obligations issued by non-financial corporates, financial institutions, structured finance vehicles, project finance vehicles, and public sector entities. Long-term ratings are assigned to issuers or obligations with an original maturity of one year or more and reflect both on the likelihood of default on contractually promised payments and the expected financial loss suffered in the event of default.1
1 For certain structured finance, preferred stock and hybrid securities in which payment default events are either not defined or do not match investor’s expectations for timely payment, the ratings reflect the likelihood of impairment and the expected financial loss in the event of impairment.
| |
| Aaa: | Obligations rated Aaa are judged to be of the highest quality, subject to the lowest level of credit risk. |
| |
| Aa: | Obligations rated Aa are judged to be of high quality and are subject to very low credit risk. |
| |
| A: | Obligations rated A are considered upper-medium grade and are subject to low credit risk. |
| |
| Baa: | Obligations rated Baa are subject to moderate credit risk. They are considered medium-grade and as such may possess certain speculative characteristics. |
| |
| Ba: | Obligations rated Ba are judged to be speculative and are subject to substantial credit risk. |
| |
| B: | Obligations rated B are considered speculative and are subject to high credit risk. |
| |
| Caa: | Obligations rated Caa are judged to be speculative of poor standing and are subject to very high credit risk. |
| |
| Ca: | Obligations rated Ca are highly speculative and are likely in, or very near, default, with some prospect of recovery of principal and interest. |
| |
| C: | Obligations rated C are the lowest rated class of bonds and are typically in default, with little prospect for recovery of principal or interest. |
NOTE: Moody's appends numerical modifiers, 1, 2, and 3 to each generic rating classification from Aa through Caa. The modifier 1 indicates that the obligation ranks in the higher end of its generic rating category, the modifier 2 indicates a mid-range ranking, and the modifier 3 indicates a ranking in the lower end of that generic rating category. Additionally, a “(hyb)” indicator is appended to all ratings of hybrid securities issued by banks, issuers, financial companies, and securities firms.*
* By their terms, hybrid securities allow for the omission of scheduled dividends, interest, or principal payments, which can potentially result in impairment if such an omission occurs. Hybrid securities may also be subject to contractually allowable write-downs of principal that could result in impairment. Together the hybrid indicator, the long-term obligation rating assigned to a hybrid security is an expression of the relative credit risk associated with that security.
SHORT-TERM NOTES: Short-term ratings are assigned to obligations with an original maturity of thirteen months or less and reflect both on the likelihood of a default on contractually promised payments and the expected financial loss suffered in the event of default. Moody's employs the following three designations, all judged to be investment grade, to indicate the relative repayment ability of rated issuers:
Issuers rated Prime-1 (or related supporting institutions) have a superior ability to repay short-term debt obligations.
Issuers rated Prime-2 (or related supporting institutions) have a strong ability to repay short-term debt obligations.
Issuers rated Prime-3 (or related supporting institutions) have an acceptable ability to repay short-term promissory obligations.
Issuers rated Not Prime do not fall within any of the Prime rating categories.
US MUNICIPAL SHORT-TERM DEBT: The Municipal Investment Grade (MIG) scale is used to rate US municipal bonds of up to five years maturity. MIG ratings are divided into three levels - MIG 1 through MIG 3 - while speculative grade short-term obligations are designated SG.
MIG 1 denotes superior credit quality, afforded excellent protection from highly reliable liquidity support, or demonstrated broad-based access to the market for refinancing.
MIG 2 denotes strong credit quality with ample margins of protection, although not as large as in the preceding group.
MIG 3 notes are of acceptable credit quality. Liquidity and cash-flow protection may be narrow and market access for refinancing is likely to be less well-established.
SG denotes speculative-grade credit quality and may lack sufficient margins of protection.
Description of S&P Global Ratings' Credit Rating Definitions:
S&P Global's credit rating, both long-term and short-term, is a forward-looking opinion of the creditworthiness of an obligor with respect to a specific obligation. This assessment takes into consideration the creditworthiness of guarantors, insurers, or other forms of credit enhancement on the obligation.
The credit rating is not a recommendation to purchase, sell or hold a security, inasmuch as it does not comment as to market price or suitability for a particular investor.
The ratings are statements of opinion as of the date they are expressed furnished by the issuer or obtained by S&P Global Ratings from other sources S&P Global Ratings considers reliable. S&P Global Ratings does not perform an audit in connection with any rating and may, on occasion, rely on unaudited financial information. The ratings may be changed, suspended, or withdrawn as a result of changes in, or unavailability of, such information, or for other circumstances.
The ratings are based, in varying degrees, on the following considerations:
| |
| • | Likelihood of payment - capacity and willingness of the obligor to meet its financial commitment on an obligation in accordance with the terms of the obligation; |
| |
| • | Nature of and provisions of the financial obligation; |
| |
| • | Protection afforded by, and relative position of, the financial obligation in the event of bankruptcy, reorganization, or other arrangement under the laws of bankruptcy and other laws affecting creditor's rights. |
LONG-TERM CREDIT RATINGS:
| |
| AAA: | Obligations rated ‘AAA’ have the highest rating assigned by S&P Global Ratings. The obligor’s capacity to meet its financial commitment on the obligation is extremely strong. |
| |
| AA: | Obligations rated ‘AA’ differ from the highest-rated issues only in small degree. The obligor’s capacity to meet its financial commitment on the obligation is very strong. |
| |
| A: | Obligations rated ‘A’ have a strong capacity to meet financial commitment on the obligation although they are somewhat more susceptible to the adverse effects of changes in circumstances and economic conditions than obligations in higher-rated categories. |
| |
| BBB: | Obligations rated ‘BBB’ exhibit adequate protection parameters; however, adverse economic conditions or changing circumstances are more likely to lead to a weakened capacity to meet financial commitment on the obligation. |
| |
| BB, B, CCC, | Obligations rated ‘BB’, ‘B’, ‘CCC’, ‘CC’, and ‘C’ are regarded, on balance, as having significant |
| |
| CC, and C: | speculative characteristics. ‘BB’ indicates the lowest degree of speculation and ‘C’ the highest degree of speculation. While such obligations will likely have some quality and protective characteristics, these may be outweighed by large uncertainties or major risk exposures to adverse conditions. |
| |
| BB: | Obligations rated ‘BB’ are less vulnerable to nonpayment than other speculative issues. However it faces major ongoing uncertainties or exposure to adverse business, financial, or economic conditions which could lead to the obligor’s inadequate capacity to meet its financial commitment on the obligation. |
| |
| B: | Obligations rated ‘B’ are more vulnerable to nonpayment than ‘BB’ but the obligor currently has the capacity to meet its financial commitment on the obligation. Adverse business, financial, or economic conditions will likely impair this capacity. |
| |
| CCC: | Obligations rated ‘CCC’ are currently vulnerable to nonpayment and is dependent upon favorable business, financial, and economic conditions for the obligor to meet its financial commitment on the obligation. If adverse business, financial, or economic conditions occur, the obligor is not likely to have the capacity to meet its financial commitment on the obligation. |
| |
| CC: | Obligations rated ‘CC’ are currently highly vulnerable to nonpayment. The ‘CC’ rating is used when a default has not yet occurred but S&P Global Ratings expects default to be a virtual certainty, regardless of anticipated time to default. |
| |
| C: | The rating ‘C’ is highly vulnerable to nonpayment, the obligation is expected to have lower relative seniority or lower ultimate recovery compared to higher rated obligations. |
| |
| D: | Obligations rated ‘D’ are in default, or in breach of an imputed promise. For non-hybrid capital instruments, the ‘D’ rating category is used when payments on an obligation are not made on the date due, unless S&P Global Ratings believes that such payments will be made within five business days in the absence of a stated grace period or within the earlier of the stated grace period or 30 calendar days. The rating will also be used upon filing for bankruptcy petition or the taking of similar action and where default is a virtual certainty. If an obligation is subject to a distressed exchange offer the rating is lowered to ‘D’. |
Plus (+) or Minus (-): The ratings from ‘AA’ to ‘CCC’ may be modified by the addition of a plus or minus sign to show relative standing within the major rating categories.
| |
| NR: | Indicates that no rating has been requested, that there is insufficient information on which to base a rating or that S&P Global Ratings does not rate a particular type of obligation as a matter of policy. |
SHORT-TERM CREDIT RATINGS: Ratings are graded into four categories, ranging from ‘A-1’ for the highest quality obligations to ‘D’ for the lowest.
| |
| A-1: | This is the highest category. The obligor’s capacity to meet its financial commitment on the obligation is strong. Within this category, certain obligations are designated with a plus sign (+). This indicates that the obligor’s capacity to meet its financial commitment on these obligations is extremely strong. |
| |
| A-2: | Issues carrying this designation are somewhat more susceptible to the adverse effects of the changes in circumstances and economic conditions than obligations in higher rating categories. However, the obligor’s capacity to meet its financial commitment on the obligation is satisfactory. |
| |
| A-3: | Issues carrying this designation exhibit adequate capacity to meet their financial obligations. However, adverse economic conditions or changing circumstances are more likely to lead to a weakened capacity of the obligor to meet it financial commitment on the obligation. |
| |
| B: | Issues rated ‘B’ are regarded as vulnerable and have significant speculative characteristics. The obligor has capacity to meet financial commitments; however, it faces major ongoing uncertainties which could lead to obligor’s inadequate capacity to meet its financial obligations. |
| |
| C: | This rating is assigned to short-term debt obligations that are currently vulnerable to nonpayment and is dependent upon favorable business, financial, and economic conditions to meet its financial commitment on the obligation. |
| |
| D: | This rating indicates that the issue is either in default or in breach of an imputed promise. For non-hybrid capital instruments, the ‘D’ rating category is used when payments on an obligation are not made on the date due, unless S&P Global Ratings believes that such payments will be made within five business days in the absence of a stated grace period or within the earlier of the stated grace period or 30 calendar days. The rating will also be used upon filing for bankruptcy petition or the taking of similar action and where default is a virtual certainty. If an obligation is subject to a distressed exchange offer the rating is lowered to ‘D’. |
MUNICIPAL SHORT-TERM NOTE RATINGS: S&P Global Ratings rates U.S. municipal notes with a maturity of less than three years as follows:
| |
| SP-1: | A strong capacity to pay principal and interest. Issues that possess a very strong capacity to pay debt service is given a "+" designation. |
| |
| SP-2: | A satisfactory capacity to pay principal and interest, with some vulnerability to adverse financial and economic changes over the terms of the notes. |
| |
| SP-3: | A speculative capacity to pay principal and interest. |

PROXY CARD SIGN, DATE AND VOTE ON THE REVERSE SIDE PROXY VOTING OPTIONS YOUR VOTE IS IMPORTANT. PLEASE CAST YOUR PROXY VOTE 1. MAIL your signed and voted proxy back TODAY! in the postage-paid envelope provided 2. ONLINE at proxyonline.com using your proxy control number found below SHAREHOLDER’S REGISTRATION PRINTED HERE ***BOXES FOR TYPESETTING PURPOSES ONLY*** 3. By PHONE when you dial toll-free 1-888-227-9349 to reach an automated THIS BOX AND BOX ABOVE ARE NOT PRINTED ON ACTUAL PROXY touchtone voting line BALLOTS. THEY IDENTIFY LOCATION OF WINDOWS ON OUTBOUND 6x9 ENVELOPES. CONTROL NUMBER 12345678910 PRINCIPAL VARIABLE CONTRACTS FUNDS, INC. (“PVC”) INCOME ACCOUNT DES MOINES, IOWA PROXY FOR A SPECIAL MEETING OF SHAREHOLDERS TO BE HELD ON MAY 31, 2019 [INSURANCE COMPANY NAME HERE] The undersigned, revoking any previously executed voting instruction cards, hereby directs the above-named Insurance Company to vote all shares of the Income Account, in which the undersigned had an interest as a policy owner on March 29, 2019, at the meeting of shareholders of the Income Account to be held May 31, 2019 at 10:30 a.m., Central Time, and any adjournments or postponements thereof, that the undersigned shareholder would be entitled to vote if personally present. Receipt of the related Proxy Statement/Prospectus and accompanying Notice of Special Meeting of Shareholders that describes the proposal to be considered and voted on is hereby acknowledged. If you fail to return this Voting Instruction Card, depending on your separate account, the Insurance Company will vote all shares of the Income Account attributable to your account value in proportion to the votes of policy owners allocating assets to such Account for which voting instructions are received by the Insurance Company. Shares will be voted in the manner specified in this Voting Instruction Card when properly executed and delivered. If no direction is made when the duly executed Voting Instruction Card is returned, the Insurance Company will vote in favor of the Proposal. Important Notice Regarding the Availability of Proxy Materials for this Special Meeting of Shareholders to Be Held on May 31, 2019. The Proxy Statement/Prospectus for this meeting is available at: proxyonline.com/docs/pvcf2019.pdf [PROXY ID NUMBER HERE] [BAR CODE HERE] [CUSIP HERE]

INCOME ACCOUNT PROXY CARD YOUR SIGNATURE IS REQUIRED FOR YOUR VOTE TO BE COUNTED. _______________________________________________________________ Please sign this proxy card exactly as your name appears on the SIGNATURE (AND TITLE IF APPLICABLE) DATE books of PVC. Joint owners should each sign personally. Directors and other fiduciaries should indicate the capacity in which they sign. If a corporation, this signature should be that of an authorized officer _______________________________________________________________ who should state his or her title. SIGNATURE (JOINT OWNERS) DATE This proxy is solicited on behalf of PVC’s Board of Directors, and the Proposal has been approved by the Board of Directors and recommended for approval by shareholders. When properly executed, this proxy will be voted as indicated or “FOR” the proposal if no choice is indicated. The proxy will be voted in accordance with the proxy holders’ best judgment as to any other matters that may arise at the special meeting. THE BOARD OF DIRECTORS OF PRINCIPAL VARIABLE CONTRACTS FUNDS, INC. RECOMMENDS THAT YOU VOTE “FOR” THE PROPOSAL. TO VOTE, MARK CIRCLES BELOW IN BLUE OR BLACK INK AS FOLLOWS. Example: ● FOR AGAINST ABSTAIN 1. Approval of a Plan of Acquisition providing for the reorganization of the Income Account (Class 1 and Class 2) into the Core Plus Bond Account (Class 1). ○ ○ ○ THANK YOU FOR VOTING [PROXY ID NUMBER HERE] [BAR CODE HERE] [CUSIP HERE]

PROXY CARD SIGN, DATE AND VOTE ON THE REVERSE SIDE PROXY VOTING OPTIONS YOUR VOTE IS IMPORTANT. PLEASE CAST YOUR PROXY VOTE 1. MAIL your signed and voted proxy back TODAY! in the postage-paid envelope provided 2. ONLINE at proxyonline.com using your proxy control number found below SHAREHOLDER’S REGISTRATION PRINTED HERE ***BOXES FOR TYPESETTING PURPOSES ONLY*** 3. By PHONE when you dial toll-free 1-888-227-9349 to reach an automated THIS BOX AND BOX ABOVE ARE NOT PRINTED ON ACTUAL PROXY touchtone voting line BALLOTS. THEY IDENTIFY LOCATION OF WINDOWS ON OUTBOUND 6x9 ENVELOPES. CONTROL NUMBER 12345678910 PRINCIPAL VARIABLE CONTRACTS FUNDS, INC. (“PVC”) INCOME ACCOUNT DES MOINES, IOWA PROXY FOR A SPECIAL MEETING OF SHAREHOLDERS TO BE HELD ON MAY 31, 2019 This proxy is solicited on behalf of the Board of Directors of PVC. The undersigned shareholder appoints Michael J. Beer, Laura B. Latham, and Adam U. Shaikh, and each of them separately, Proxies, with power of substitution, and authorizes them to represent and to vote as designated on this ballot, at the meeting of shareholders of the Income Account to be held May 31, 2019 at 10:30 a.m., Central Time, and any adjournments or postponements thereof, all the shares of the Income Account that the undersigned shareholder would be entitled to vote if personally present. Check the appropriate box on the reverse side of this ballot, date the ballot, and sign exactly as your name appears. Your signature acknowledges receipt of the Notice of Special Meeting of Shareholders and the Proxy Statement/Prospectus. Shares will be voted as you instruct. If no direction is made, the proxy will be voted FOR the proposal listed on the reverse side. The Proxies will also be authorized to vote in their discretion upon such other matters that may properly come before the meeting. Important Notice Regarding the Availability of Proxy Materials for this Special Meeting of Shareholders to Be Held on May 31, 2019. The Proxy Statement/Prospectus for this meeting is available at: proxyonline.com/docs/pvcf2019.pdf [PROXY ID NUMBER HERE] [BAR CODE HERE] [CUSIP HERE]

INCOME ACCOUNT PROXY CARD YOUR SIGNATURE IS REQUIRED FOR YOUR VOTE TO BE COUNTED. _______________________________________________________________ Please sign this proxy card exactly as your name appears on the SIGNATURE (AND TITLE IF APPLICABLE) DATE books of PVC. Joint owners should each sign personally. Directors and other fiduciaries should indicate the capacity in which they sign. If a corporation, this signature should be that of an authorized officer _______________________________________________________________ who should state his or her title. SIGNATURE (JOINT OWNERS) DATE This proxy is solicited on behalf of PVC’s Board of Directors, and the Proposal has been approved by the Board of Directors and recommended for approval by shareholders. When properly executed, this proxy will be voted as indicated or “FOR” the proposal if no choice is indicated. The proxy will be voted in accordance with the proxy holders’ best judgment as to any other matters that may arise at the special meeting. THE BOARD OF DIRECTORS OF PRINCIPAL VARIABLE CONTRACTS FUNDS, INC. RECOMMENDS THAT YOU VOTE “FOR” THE PROPOSAL. TO VOTE, MARK CIRCLES BELOW IN BLUE OR BLACK INK AS FOLLOWS. Example: ● FOR AGAINST ABSTAIN 1. Approval of a Plan of Acquisition providing for the reorganization of the Income Account (Class 1 and Class 2) into the Core Plus Bond Account (Class 1). ○ ○ ○ THANK YOU FOR VOTING [PROXY ID NUMBER HERE] [BAR CODE HERE] [CUSIP HERE]

PROXY CARD SIGN, DATE AND VOTE ON THE REVERSE SIDE PROXY VOTING OPTIONS YOUR VOTE IS IMPORTANT. PLEASE CAST YOUR PROXY VOTE 1. MAIL your signed and voted proxy back TODAY! in the postage-paid envelope provided 2. ONLINE at proxyonline.com using your proxy control number found below SHAREHOLDER’S REGISTRATION PRINTED HERE ***BOXES FOR TYPESETTING PURPOSES ONLY*** 3. By PHONE when you dial toll-free 1-888-227-9349 to reach an automated THIS BOX AND BOX ABOVE ARE NOT PRINTED ON ACTUAL PROXY touchtone voting line BALLOTS. THEY IDENTIFY LOCATION OF WINDOWS ON OUTBOUND 6x9 ENVELOPES. CONTROL NUMBER 12345678910 PRINCIPAL VARIABLE CONTRACTS FUNDS, INC. (“PVC”) LARGECAP GROWTH ACCOUNT DES MOINES, IOWA PROXY FOR A SPECIAL MEETING OF SHAREHOLDERS TO BE HELD ON MAY 31, 2019 [INSURANCE COMPANY NAME HERE] The undersigned, revoking any previously executed voting instruction cards, hereby directs the above-named Insurance Company to vote all shares of the LargeCap Growth Account, in which the undersigned had an interest as a policy owner on March 29, 2019, at the meeting of shareholders of the LargeCap Growth Account to be held May 31, 2019 at 10:45 a.m., Central Time, and any adjournments or postponements thereof, that the undersigned shareholder would be entitled to vote if personally present. Receipt of the related Proxy Statement/Prospectus and accompanying Notice of Special Meeting of Shareholders that describes the proposal to be considered and voted on is hereby acknowledged. If you fail to return this Voting Instruction Card, depending on your separate account, the Insurance Company will vote all shares of the LargeCap Growth Account attributable to your account value in proportion to the votes of policy owners allocating assets to such Account for which voting instructions are received by the Insurance Company. Shares will be voted in the manner specified in this Voting Instruction Card when properly executed and delivered. If no direction is made when the duly executed Voting Instruction Card is returned, the Insurance Company will vote in favor of the Proposal. Important Notice Regarding the Availability of Proxy Materials for this Special Meeting of Shareholders to Be Held on May 31, 2019. The Proxy Statement/Prospectus for this meeting is available at: proxyonline.com/docs/pvcf2019.pdf [PROXY ID NUMBER HERE] [BAR CODE HERE] [CUSIP HERE]

LARGECAP GROWTH ACCOUNT PROXY CARD YOUR SIGNATURE IS REQUIRED FOR YOUR VOTE TO BE COUNTED. _______________________________________________________________ Please sign this proxy card exactly as your name appears on the SIGNATURE (AND TITLE IF APPLICABLE) DATE books of PVC. Joint owners should each sign personally. Directors and other fiduciaries should indicate the capacity in which they sign. If a corporation, this signature should be that of an authorized officer _______________________________________________________________ who should state his or her title. SIGNATURE (JOINT OWNERS) DATE This proxy is solicited on behalf of PVC’s Board of Directors, and the Proposal has been approved by the Board of Directors and recommended for approval by shareholders. When properly executed, this proxy will be voted as indicated or “FOR” the proposal if no choice is indicated. The proxy will be voted in accordance with the proxy holders’ best judgment as to any other matters that may arise at the special meeting. THE BOARD OF DIRECTORS OF PRINCIPAL VARIABLE CONTRACTS FUNDS, INC. RECOMMENDS THAT YOU VOTE “FOR” THE PROPOSAL. TO VOTE, MARK CIRCLES BELOW IN BLUE OR BLACK INK AS FOLLOWS. Example: ● FOR AGAINST ABSTAIN 2. Approval of a Plan of Acquisition providing for the reorganization of the LargeCap Growth Account (Class 1 and Class 2) into the LargeCap Growth Account I (Class 1). ○ ○ ○ THANK YOU FOR VOTING [PROXY ID NUMBER HERE] [BAR CODE HERE] [CUSIP HERE]

PROXY CARD SIGN, DATE AND VOTE ON THE REVERSE SIDE PROXY VOTING OPTIONS YOUR VOTE IS IMPORTANT. PLEASE CAST YOUR PROXY VOTE 1. MAIL your signed and voted proxy back TODAY! in the postage-paid envelope provided 2. ONLINE at proxyonline.com using your proxy control number found below SHAREHOLDER’S REGISTRATION PRINTED HERE ***BOXES FOR TYPESETTING PURPOSES ONLY*** 3. By PHONE when you dial toll-free 1-888-227-9349 to reach an automated THIS BOX AND BOX ABOVE ARE NOT PRINTED ON ACTUAL PROXY touchtone voting line BALLOTS. THEY IDENTIFY LOCATION OF WINDOWS ON OUTBOUND 6x9 ENVELOPES. CONTROL NUMBER 12345678910 PRINCIPAL VARIABLE CONTRACTS FUNDS, INC. (“PVC”) LARGECAP GROWTH ACCOUNT DES MOINES, IOWA PROXY FOR A SPECIAL MEETING OF SHAREHOLDERS TO BE HELD ON MAY 31, 2019 This proxy is solicited on behalf of the Board of Directors of PVC. The undersigned shareholder appoints Michael J. Beer, Laura B. Latham, and Adam U. Shaikh, and each of them separately, Proxies, with power of substitution, and authorizes them to represent and to vote as designated on this ballot, at the meeting of shareholders of the LargeCap Growth Account to be held May 31, 2019 at 10:45 a.m., Central Time, and any adjournments or postponements thereof, all the shares of the LargeCap Growth Account that the undersigned shareholder would be entitled to vote if personally present. Check the appropriate box on the reverse side of this ballot, date the ballot, and sign exactly as your name appears. Your signature acknowledges receipt of the Notice of Special Meeting of Shareholders and the Proxy Statement/Prospectus. Shares will be voted as you instruct. If no direction is made, the proxy will be voted FOR the proposal listed on the reverse side. The Proxies will also be authorized to vote in their discretion upon such other matters that may properly come before the meeting. Important Notice Regarding the Availability of Proxy Materials for this Special Meeting of Shareholders to Be Held on May 31, 2019. The Proxy Statement/Prospectus for this meeting is available at: proxyonline.com/docs/pvcf2019.pdf [PROXY ID NUMBER HERE] [BAR CODE HERE] [CUSIP HERE]

LARGECAP GROWTH ACCOUNT PROXY CARD YOUR SIGNATURE IS REQUIRED FOR YOUR VOTE TO BE COUNTED. _______________________________________________________________ Please sign this proxy card exactly as your name appears on the SIGNATURE (AND TITLE IF APPLICABLE) DATE books of PVC. Joint owners should each sign personally. Directors and other fiduciaries should indicate the capacity in which they sign. If a corporation, this signature should be that of an authorized officer _______________________________________________________________ who should state his or her title. SIGNATURE (JOINT OWNERS) DATE This proxy is solicited on behalf of PVC’s Board of Directors, and the Proposal has been approved by the Board of Directors and recommended for approval by shareholders. When properly executed, this proxy will be voted as indicated or “FOR” the proposal if no choice is indicated. The proxy will be voted in accordance with the proxy holders’ best judgment as to any other matters that may arise at the special meeting. THE BOARD OF DIRECTORS OF PRINCIPAL VARIABLE CONTRACTS FUNDS, INC. RECOMMENDS THAT YOU VOTE “FOR” THE PROPOSAL. TO VOTE, MARK CIRCLES BELOW IN BLUE OR BLACK INK AS FOLLOWS. Example: ● FOR AGAINST ABSTAIN 2. Approval of a Plan of Acquisition providing for the reorganization of the LargeCap Growth Account (Class 1 and Class 2) into the LargeCap Growth Account I (Class 1). ○ ○ ○ THANK YOU FOR VOTING [PROXY ID NUMBER HERE] [BAR CODE HERE] [CUSIP HERE]

PROXY CARD SIGN, DATE AND VOTE ON THE REVERSE SIDE PROXY VOTING OPTIONS YOUR VOTE IS IMPORTANT. PLEASE CAST YOUR PROXY VOTE 1. MAIL your signed and voted proxy back TODAY! in the postage-paid envelope provided 2. ONLINE at proxyonline.com using your proxy control number found below SHAREHOLDER’S REGISTRATION PRINTED HERE ***BOXES FOR TYPESETTING PURPOSES ONLY*** 3. By PHONE when you dial toll-free 1-888-227-9349 to reach an automated THIS BOX AND BOX ABOVE ARE NOT PRINTED ON ACTUAL PROXY touchtone voting line BALLOTS. THEY IDENTIFY LOCATION OF WINDOWS ON OUTBOUND 6x9 ENVELOPES. CONTROL NUMBER 12345678910 PRINCIPAL VARIABLE CONTRACTS FUNDS, INC. (“PVC”) MULTI-ASSET INCOME ACCOUNT DES MOINES, IOWA PROXY FOR A SPECIAL MEETING OF SHAREHOLDERS TO BE HELD ON MAY 31, 2019 [INSURANCE COMPANY NAME HERE] The undersigned, revoking any previously executed voting instruction cards, hereby directs the above-named Insurance Company to vote all shares of the Multi-Asset Income Account, in which the undersigned had an interest as a policy owner on March 29, 2019, at the meeting of shareholders of the Multi-Asset Income Account to be held May 31, 2019 at 11:00 a.m., Central Time, and any adjournments or postponements thereof, that the undersigned shareholder would be entitled to vote if personally present. Receipt of the related Proxy Statement/Prospectus and accompanying Notice of Special Meeting of Shareholders that describes the proposal to be considered and voted on is hereby acknowledged. If you fail to return this Voting Instruction Card, depending on your separate account, the Insurance Company will vote all shares of the Multi- Asset Income Account attributable to your account value in proportion to the votes of policy owners allocating assets to such Account for which voting instructions are received by the Insurance Company. Shares will be voted in the manner specified in this Voting Instruction Card when properly executed and delivered. If no direction is made when the duly executed Voting Instruction Card is returned, the Insurance Company will vote in favor of the Proposal. Important Notice Regarding the Availability of Proxy Materials for this Special Meeting of Shareholders to Be Held on May 31, 2019. The Proxy Statement/Prospectus for this meeting is available at: proxyonline.com/docs/pvcf2019.pdf [PROXY ID NUMBER HERE] [BAR CODE HERE] [CUSIP HERE]

MULTI-ASSET INCOME ACCOUNT PROXY CARD YOUR SIGNATURE IS REQUIRED FOR YOUR VOTE TO BE COUNTED. _______________________________________________________________ Please sign this proxy card exactly as your name appears on the SIGNATURE (AND TITLE IF APPLICABLE) DATE books of PVC. Joint owners should each sign personally. Directors and other fiduciaries should indicate the capacity in which they sign. If a corporation, this signature should be that of an authorized officer _______________________________________________________________ who should state his or her title. SIGNATURE (JOINT OWNERS) DATE This proxy is solicited on behalf of PVC’s Board of Directors, and the Proposal has been approved by the Board of Directors and recommended for approval by shareholders. When properly executed, this proxy will be voted as indicated or “FOR” the proposal if no choice is indicated. The proxy will be voted in accordance with the proxy holders’ best judgment as to any other matters that may arise at the special meeting. THE BOARD OF DIRECTORS OF PRINCIPAL VARIABLE CONTRACTS FUNDS, INC. RECOMMENDS THAT YOU VOTE “FOR” THE PROPOSAL. TO VOTE, MARK CIRCLES BELOW IN BLUE OR BLACK INK AS FOLLOWS. Example: ● FOR AGAINST ABSTAIN 2. Approval of a Plan of Acquisition providing for the reorganization of the Multi-Asset Income Account (Class 1 and Class 2) into the SAM (Strategic Asset Management) Flexible Income Account (Class 1 and Class 2). ○ ○ ○ THANK YOU FOR VOTING [PROXY ID NUMBER HERE] [BAR CODE HERE] [CUSIP HERE]

PROXY CARD SIGN, DATE AND VOTE ON THE REVERSE SIDE PROXY VOTING OPTIONS YOUR VOTE IS IMPORTANT. PLEASE CAST YOUR PROXY VOTE 1. MAIL your signed and voted proxy back TODAY! in the postage-paid envelope provided 2. ONLINE at proxyonline.com using your proxy control number found below SHAREHOLDER’S REGISTRATION PRINTED HERE ***BOXES FOR TYPESETTING PURPOSES ONLY*** 3. By PHONE when you dial toll-free 1-888-227-9349 to reach an automated THIS BOX AND BOX ABOVE ARE NOT PRINTED ON ACTUAL PROXY touchtone voting line BALLOTS. THEY IDENTIFY LOCATION OF WINDOWS ON OUTBOUND 6x9 ENVELOPES. CONTROL NUMBER 12345678910 PRINCIPAL VARIABLE CONTRACTS FUNDS, INC. (“PVC”) MULTI-ASSET INCOME ACCOUNT DES MOINES, IOWA PROXY FOR A SPECIAL MEETING OF SHAREHOLDERS TO BE HELD ON MAY 31, 2019 This proxy is solicited on behalf of the Board of Directors of PVC. The undersigned shareholder appoints Michael J. Beer, Laura B. Latham, and Adam U. Shaikh, and each of them separately, Proxies, with power of substitution, and authorizes them to represent and to vote as designated on this ballot, at the meeting of shareholders of the Multi-Asset Income Account to be held May 31, 2019 at 11:00 a.m., Central Time, and any adjournments or postponements thereof, all the shares of the Multi-Asset Income Account that the undersigned shareholder would be entitled to vote if personally present. Check the appropriate box on the reverse side of this ballot, date the ballot, and sign exactly as your name appears. Your signature acknowledges receipt of the Notice of Special Meeting of Shareholders and the Proxy Statement/Prospectus. Shares will be voted as you instruct. If no direction is made, the proxy will be voted FOR the proposal listed on the reverse side. The Proxies will also be authorized to vote in their discretion upon such other matters that may properly come before the meeting. Important Notice Regarding the Availability of Proxy Materials for this Special Meeting of Shareholders to Be Held on May 31, 2019. The Proxy Statement/Prospectus for this meeting is available at: proxyonline.com/docs/pvcf2019.pdf [PROXY ID NUMBER HERE] [BAR CODE HERE] [CUSIP HERE]

MULTI-ASSET INCOME ACCOUNT PROXY CARD YOUR SIGNATURE IS REQUIRED FOR YOUR VOTE TO BE COUNTED. _______________________________________________________________ Please sign this proxy card exactly as your name appears on the SIGNATURE (AND TITLE IF APPLICABLE) DATE books of PVC. Joint owners should each sign personally. Directors and other fiduciaries should indicate the capacity in which they sign. If a corporation, this signature should be that of an authorized officer _______________________________________________________________ who should state his or her title. SIGNATURE (JOINT OWNERS) DATE This proxy is solicited on behalf of PVC’s Board of Directors, and the Proposal has been approved by the Board of Directors and recommended for approval by shareholders. When properly executed, this proxy will be voted as indicated or “FOR” the proposal if no choice is indicated. The proxy will be voted in accordance with the proxy holders’ best judgment as to any other matters that may arise at the special meeting. THE BOARD OF DIRECTORS OF PRINCIPAL VARIABLE CONTRACTS FUNDS, INC. RECOMMENDS THAT YOU VOTE “FOR” THE PROPOSAL. TO VOTE, MARK CIRCLES BELOW IN BLUE OR BLACK INK AS FOLLOWS. Example: ● FOR AGAINST ABSTAIN 3. Approval of a Plan of Acquisition providing for the reorganization of the Multi-Asset Income Account (Class 1 and Class 2) into the SAM (Strategic Asset Management) Flexible Income Account (Class 1 and Class 2). ○ ○ ○ THANK YOU FOR VOTING [PROXY ID NUMBER HERE] [BAR CODE HERE] [CUSIP HERE]
PART B
PRINCIPAL VARIABLE CONTRACTS FUNDS, INC.
711 High Street
Des Moines, Iowa 50392
STATEMENT OF ADDITIONAL INFORMATION
Dated: April ___, 2019
This Statement of Additional Information is available to the shareholders of the Income Account, the LargeCap Growth Account, and the Multi-Asset Income Account (the "Acquired Funds") in connection with the proposed reorganization of each Acquired Fund into the Core Plus Bond Account, the LargeCap Growth Account I, and the SAM (Strategic Asset Management) Flexible Income Account, respectively, (the "Acquiring Funds") (each, a "Reorganization"). The Acquired and Acquiring Funds are each a separate series of Principal Variable Contracts Funds, Inc. ("PVC").
This Statement of Additional Information is not a prospectus and should be read in conjunction with the Proxy Statement/Prospectus dated April ___, 2019, relating to the Special Meeting of Shareholders of the Acquired Funds to be held on May 31, 2019 at (i) 10:30 a.m., Central Time, for the Income Account, (ii) 10:45 a.m., Central Time, for the LargeCap Growth Account, and (iii) 11:00 a.m., Central Time, for the Multi-Asset Income Account. The Proxy Statement/Prospectus, which describes each proposed Reorganization, may be obtained without charge by writing to Principal Variable Contracts Funds, Inc., P.O. Box 219971, Kansas City, MO 64121-9971 or by calling toll-free at 1 (800) 222-5852.
TABLE OF CONTENTS
| |
| (1) | Statement of Additional Information of PVC dated May 1, 2018, as supplemented on June 18, 2018, July 30, 2018, August 10, 2018, September 17, 2018, October 9, 2018, December 17, 2018, and February 15, 2019. |
| |
| (2) | Audited Financial Statements of the Acquired Funds and the Acquiring Funds included in PVC's Annual Report to Shareholders for the fiscal year ended December 31, 2018. |
| |
| (3) | Pro Forma Financial Statements. |
INFORMATION INCORPORATED BY REFERENCE
This Statement of Additional Information incorporates by reference the following documents (or designated portions thereof) that have been filed with the Securities and Exchange Commission (File Nos. 002-35570; and 811-01944).
| |
| (1) | The Statement of Additional Information of Principal Variable Contracts Funds, Inc. dated May 1, 2018, including Supplements dated June 18, 2018, July 30, 2018, August 10, 2018, September 17, 2018, October 9, 2018, December 17, 2018, and February 15, 2019, and filed via EDGAR on those dates. |
| |
| (2) | The financial statements of the Acquired Funds and the Acquiring Funds included in PVC's Annual Report to Shareholders for the fiscal year ended December 31, 2018, which have been audited by Ernst & Young LLP, Independent Registered Public Accounting Firm, as filed on Form N-CSR on February 26, 2019. |
The Annual and Semi-Annual Reports to Shareholders of PVC are available upon request and without charge by calling toll-free at 1 (800) 222-5852 or online at www.principalfunds.com.
PRO FORMA FINANCIAL STATEMENTS
On December 11, 2018, the PVC Board of Directors approved Plans of Acquisition whereby the Core Plus Bond Account, the LargeCap Growth Account I, and the SAM (Strategic Asset Management) Flexible Income Account (the "Acquiring Funds") will acquire all the assets of the Income Account, the LargeCap Growth Account, and the Multi-Asset Income Account, respectively, (the "Acquired Funds"), subject to the liabilities of the Acquired Funds, in exchange for a number of shares equal in value to the pro rata net assets of shares of the Acquired Funds (each, a "Reorganization").
Shown below are unaudited pro forma financial statements for the combined Core Plus Bond Account and LargeCap Growth Account I (the "combined Acquiring Funds"), assuming each corresponding Reorganization had been consummated as of December 31, 2018. The first table presents pro forma Statements of Assets and Liabilities for the combined Acquiring Funds. The second table presents pro forma Statements of Operations for the combined Acquiring Funds. The third table presents a pro forma Schedule of Investments for the combined Acquiring Funds.
Pro forma combining financial statements for the SAM (Strategic Asset Management) Flexible Income Account (the Acquiring Account") are not included because as of March 7, 2019, the assets of the Multi-Asset Income Account, the Acquired Account, constituted less than 10% of the assets of the Acquiring Account.
Please see the accompanying notes for additional information about the pro forma financial statements. The pro forma Schedules of Investments and Statements of Assets and Liabilities and Operations should be read in conjunction with the historical financial statements of the Acquired Funds and the Acquiring Funds incorporated by reference in the Statements of Additional Information.
Pro Forma Statements of Assets and Liabilities
Principal Variable Contracts Funds, Inc.
December 31, 2018 (unaudited)
Amounts in thousands
|
| | | | | | | | | | | | | | | |
| | Core Plus Bond Account | | Income Account | | Pro Forma Adjustments | | Pro Forma Core Plus Bond Account |
| Investment in securities--at cost | $ | 310,864 |
| | $ | 176,788 |
| | $ | — |
| | $ | 487,652 |
|
| Investment in affiliated securities--at cost | $ | 3,894 |
| | $ | 1,795 |
| | $ | — |
| | $ | 5,689 |
|
| Assets | | | | | | | |
| Investment in securities--at value | $ | 301,182 |
| | $ | 179,127 |
| | $ | — |
| | $ | 480,309 |
|
| Investment in affiliated securities--at value | 3,894 |
| | 1,795 |
| | — |
| | 5,689 |
|
| Cash | 14 |
| | — |
| | — |
| | 14 |
|
| Deposits with counterparty | 9 |
| | — |
| | — |
| | 9 |
|
| Receivables: | | | | | — |
| | |
| Dividends and interest | 2,153 |
| | 1,565 |
| | — |
| | 3,718 |
|
| Fund shares sold | 110 |
| | 27 |
| | — |
| | 137 |
|
| Investment securities sold | 498 |
| | — |
| | — |
| | 498 |
|
| Variation margin on futures | 45 |
| | — |
| | — |
| | 45 |
|
| Total Assets | 307,905 |
| | 182,514 |
| | — |
| | 490,419 |
|
| Liabilities | | | | | | | |
| Accrued management and investment advisory fees | 110 |
| | 78 |
| | — |
| | 188 |
|
| Accrued distribution fees | — |
| | 1 |
| | — |
| | 1 |
|
| Accrued directors' expenses | 1 |
| | 1 |
| | — |
| | 2 |
|
| Accrued other expenses | 9 |
| | 4 |
| | — |
| | 13 |
|
| Cash overdraft | — |
| | 39 |
| | — |
| | 39 |
|
| Deposits from counterparty | — |
| | — |
| | — |
| | — |
|
| Payables: | | | | | | | |
| Fund shares redeemed | 3,073 |
| | 620 |
| | — |
| | 3,693 |
|
| Investment securities purchased | 23,156 |
| | — |
| | — |
| | 23,156 |
|
| Unrealized loss on unfunded loan commitments | $ | 1 |
| | — |
| | — |
| | $ | 1 |
|
| Variation margin on futures | 21 |
| | — |
| | — |
| | 21 |
|
| Variation margin on swaps | 14 |
| | — |
| | — |
| | 14 |
|
| Reorganization and transition costs | — |
| | — |
| | 34 |
| (b) | 34 |
|
| Total Liabilities | $ | 26,385 |
| | $ | 743 |
| | $ | 34 |
| | $ | 27,162 |
|
| Net Assets Applicable to Outstanding Shares | $ | 281,520 |
| | $ | 181,771 |
| | $ | (34 | ) | | $ | 463,257 |
|
| | | | | | | | |
| Net Assets Consist of: | | | | | | | |
| Capital shares and additional paid-in-capital | $ | 288,552 |
| | $ | 172,824 |
| | $ | — |
| | $ | 461,376 |
|
| Total distributable earnings (loss) | $ | (7,032 | ) | | $ | 8,947 |
| | $ | (34 | ) | (b) | $ | 1,881 |
|
| Total Net Assets | 281,520 |
| | 181,771 |
| | (34 | ) | | 463,257 |
|
| Capital Stock (par value: $.01 per share): | | | | | | | |
| Shares authorized | 400,000 |
| | 200,000 |
| | | | |
| Net Asset Value Per Share: | | | | | | | |
| Class 1: Net Assets | 280,760 |
| | 178,598 |
| | 3,139 |
| (b),(c) | 462,497 |
|
| Shares issued and outstanding | $ | 25,984 |
| | $ | 17,851 |
| | $ | (1,038 | ) | (a),(b),(c) | $ | 42,797 |
|
| Net Asset Value per share | $ | 10.81 |
| | $ | 10.01 |
| | | | $ | 10.81 |
|
| Class 2: Net Assets | $ | 760 |
| | $ | 3,173 |
| | (3,173 | ) | (c) | $ | 760 |
|
| Shares issued and outstanding | $ | 71 |
| | $ | 319 |
| | (319 | ) | (c) | $ | 71 |
|
| Net Asset Value per share | $ | 10.73 |
| | $ | 9.96 |
| | | | $ | 10.73 |
|
| | | | | | | | |
| (a) Reflects new shares issued, net of retired shares of Income Account. |
| (b) Reduction in net assets to reflect the estimated expenses of the Reorganization and transition costs associated with disposing of portfolio securities. |
| (c) Reflects Class 2 shares transferring into Class 1 shares. |
See accompanying notes.
Pro Forma Statements of Assets and Liabilities
Principal Variable Contracts Funds, Inc.
December 31, 2018 (unaudited)
Amounts in thousands
|
| | | | | | | | | | | | | | | |
| Amounts in thousands, except per share amounts | LargeCap Growth Account | | LargeCap Growth Account I | | Pro Forma Adjustments | | Pro Forma LargeCap Growth Account I |
| Investment in securities--at cost | $ | 90,794 |
| | $ | 215,944 |
| | $ | — |
| | $ | 306,738 |
|
| Investment in affiliated securities--at cost | $ | 2,326 |
| | $ | 6,401 |
| | $ | — |
| | $ | 8,727 |
|
| Assets | | | | | | | |
| Investment in securities--at value | $ | 97,684 |
| | $ | 292,341 |
| | $ | — |
| | $ | 390,025 |
|
| Investment in affiliated securities--at value | 2,326 |
| | 6,372 |
| | — |
| | 8,698 |
|
| Cash | — |
| | 11 |
| | — |
| | 11 |
|
| Deposits with counterparty | — |
| | 12 |
| | — |
| | 12 |
|
| Receivables: | | | | | | | |
| Dividends and interest | 32 |
| | 543 |
| | — |
| | 575 |
|
| Expense reimbursement from Manager | — |
| | 4 |
| | — |
| | 4 |
|
| Fund shares sold | 164 |
| | 139 |
| | — |
| | 303 |
|
| Investment securities sold | 165 |
| | 161 |
| | — |
| | 326 |
|
| Variation margin on futures | – |
| | 4 |
| | — |
| | 4 |
|
| Total Assets | 100,371 |
| | 299,587 |
| | — |
| | 399,958 |
|
| Liabilities | | | | | | | |
| Accrued management and investment advisory fees | 59 |
| | 194 |
| | — |
| | 253 |
|
| Accrued distribution fees | 1 |
| | 1 |
| | — |
| | 2 |
|
| Accrued directors' expenses | 1 |
| | 2 |
| | — |
| | 3 |
|
| Accrued other expenses | 3 |
| | 8 |
| | — |
| | 11 |
|
| Deposits from counterparty | — |
| | — |
| | — |
| | — |
|
| Payables: | | | | | | | |
| Fund shares redeemed | 17 |
| | 84 |
| | – |
| | 101 |
|
| Reorganization and transition costs | — |
| | — |
| | 33 |
| (b) | 33 |
|
| Total Liabilities | $ | 81 |
| | 289 |
| | 33 |
| | $ | 403 |
|
| Net Assets Applicable to Outstanding Shares | 100,290 |
| | 299,298 |
| | (33 | ) | | 399,555 |
|
| | | | | | | | |
| Net Assets Consist of: | | | | | | | |
| Capital shares and additional paid-in-capital | $ | 74,720 |
| | $ | 189,089 |
| | $ – |
| | $ | 263,809 |
|
| Total distributable earnings (loss) | $ | 25,570 |
| | $ | 110,209 |
| | $ | (33 | ) | (b) | $ | 135,746 |
|
| Total Net Assets | $ | 100,290 |
| | $ | 299,298 |
| | $ | (33 | ) | | $ | 399,555 |
|
| Capital Stock (par value: $.01 per share): | | | | | | | |
| Shares authorized | $ | 300,000 |
| | $ | 200,000 |
| | $ | — |
| | $ | 500,000 |
|
| Net Asset Value Per Share: | | | | | | | |
| Class 1: Net Assets | 98,106 |
| | 296,139 |
| | 2,151 |
| (b),(c) | 396,396 |
|
| Shares issued and outstanding | $ | 3,472 |
| | $ | 9,838 |
| | $ | (142 | ) | (a),(b),(c) | $ | 13,168 |
|
| Net Asset Value per share | 28.25 |
| | 30.1 |
| | $ |
| | $ | 30.10 |
|
| Class 2: Net Assets | $ | 2,184 |
| | $ | 3,159 |
| | $ | (2,184 | ) | (c) | $ | 3,159 |
|
| Shares issued and outstanding............................................. | 78 |
| | 106 |
| | (78 | ) | (c) | 106 |
|
| Net Asset Value per share.................................................. | $ | 28.06 |
| | $ | 29.84 |
| | $ |
| | $ | 29.84 |
|
| | | | | | | | |
| (a) Reflects new shares issued, net of retired shares of LargeCap Growth Account. |
| (b) Reduction in net assets to reflect the estimated expenses of the Reorganization and transition costs associated with disposing of portfolio securities. |
| (c) Reflects Class 2 shares transferring into Class 1 shares |
See accompanying notes.
Pro Forma Statements of Operations
Principal Variable Contracts Funds, Inc.
Twelve Months Ended December 31, 2018 (unaudited)
|
| | | | | | | | | | | | | | | |
| Amounts in thousands | Core Plus Bond Account | | Income Account | | Pro Forma Adjustments | | Pro Forma Core Plus Bond Account |
| Net Investment Income (Loss) | | | | | | | |
| Income: | | | | | | | |
| Dividends from affiliated securities | $ | 184 |
| | $ | 76 |
| | $ | — |
| | $ | 260 |
|
| Dividends | 8 |
| | — |
| | — |
| | 8 |
|
| Withholding tax | (1) |
| | — |
| | — |
| | (1) |
|
| Interest | 10,555 |
| | 8,014 |
| | — |
| | 18,569 |
|
| Total Income | 10,746 |
| | 8,090 |
| | — |
| | 18,836 |
|
| Expenses: | | | | | | | |
| Management and investment advisory fees | 1,301 |
| | 1,002 |
| | (339) |
| (a) | 1,964 |
|
| Distribution Fees - Class 2 | 2 |
| | 8 |
| | — |
| | 10 |
|
| Custodian fees | 25 |
| | 3 |
| | (3) |
| (b) | 25 |
|
| Directors' expenses | 8 |
| | 6 |
| | (3) |
| (b) | 11 |
|
| Professional fees | 5 |
| | 5 |
| | (5) |
| (b) | 5 |
|
| Total Expenses | 1,341 |
| | 1,024 |
| | (350) |
| | 2,015 |
|
| Net Investment Income (Loss) | 9,405 |
| | 7,066 |
| | 350 |
| | 16,821 |
|
| | | | | | | | |
| Net Realized and Unrealized Gain (Loss) on Investments, Futures and Swap agreements | | | | | | | |
| Net realized gain (loss) from: | | | | | | | |
| Investment transactions | (3,944) |
| | 3,115 |
| | — |
| | (829) |
|
| Futures contracts | 83 |
| | — |
| | — |
| | 83 |
|
| Swap agreements | (219) |
| | — |
| | — |
| | (219) |
|
| Change in unrealized appreciation/depreciation of: | | | | | | | |
| Investments | (10,085) |
| | (9,259) |
| | — |
| | (19,344) |
|
| Futures contracts | 238 |
| | — |
| | — |
| | 238 |
|
| Swap agreements | 207 |
| | — |
| | — |
| | 207 |
|
| Net Realized and Unrealized Gain (Loss) on Investments, Futures and Swap agreements | (13,720) |
| | (6,144) |
| | — |
| | (19,864) |
|
| Net Increase (Decrease) in Net Assets Resulting from Operations | $ | (4,315 | ) | | $ | 922 |
| | $ | 350 |
| | $ | (3,043 | ) |
| | | | | | | | |
| (a) Management and investment advisory fees decreased to reflect annual percentage rate of Acquiring Fund. |
| (b) To adjust expenses to reflect the Combined Fund's estimated fees and expenses, based on elimination of duplicate services. |
| | | | | | | | |
| See accompanying notes. | | | | | | | |
Pro Forma Statements of Operations
Principal Variable Contracts Funds, Inc.
Twelve Months Ended December 31, 2018 (unaudited)
|
| | | | | | | | | | | | | | | |
| Amounts in thousands | LargeCap Growth Account | | LargeCap Growth Account I | | Pro Forma Adjustments | | Pro Forma Large Cap Growth Account I |
| Net Investment Income (Loss) | | | | | | | |
| Income: | | | | | | | |
| Dividends from affiliated securities | $ | 32 |
| | $ | 122 |
| | $ | — |
| | $ | 154 |
|
| Dividends | 860 |
| | 2,557 |
| | — |
| | 3,417 |
|
| Withholding tax | — |
| | (9) |
| | — |
| | (9) |
|
| Interest | — |
| | 4 |
| | — |
| | 4 |
|
| Total Income | 892 |
| | 2,674 |
| | — |
| | 3,566 |
|
| Expenses: | | | | | | | |
| Management and investment advisory fees | 824 |
| | 2,436 |
| | (61) |
| (a) | 3,199 |
|
| Distribution fees - Class 2 | 5 |
| | 5 |
| | — |
| | 10 |
|
| Custodian fees | 2 |
| | 20 |
| | (2) |
| (b) | 20 |
|
| Directors' expenses | 4 |
| | 8 |
| | (3) |
| (b) | 9 |
|
| Professional fees | 4 |
| | 5 |
| | (4) |
| (b) | 5 |
|
| Total Gross Expenses | 839 |
| | 2,474 |
| | (70) |
| | 3,243 |
|
| Less: Reimbursement from Manager | — |
| | 53 |
| | 19 |
| (a) | 72 |
|
| Total Net Expenses | 839 |
| | 2,421 |
| | (89) |
| | 3,171 |
|
| Net Investment Income (Loss) | 53 |
| | 253 |
| | 89 |
| | 395 |
|
| | | | | | | | |
| Net Realized and Unrealized Gain (Loss) on Investments and Futures | | | | | | | |
| Net realized gain (loss) from: | | | | | | | |
| Investment transactions | 18,641 |
| | 38,873 |
| | — |
| | 57,514 |
|
| Futures contracts | – |
| | 185 |
| | — |
| | 185 |
|
| Change in unrealized appreciation/depreciation of: | | | | | | | |
| Investments | (25,599) |
| | (27,288) |
| | — |
| | (52,887) |
|
| Investments in affiliated securities | – |
| | (29) |
| | — |
| | (29) |
|
| Futures contracts | – |
| | (70) |
| | — |
| | (70) |
|
| Net Realized and Unrealized Gain (Loss) on Investments and Futures | (6,958) |
| | 11,671 |
| | — |
| | 4,713 |
|
| Net Increase (Decrease) in Net Assets Resulting from Operations | $ | (6,905 | ) | | $ | 11,924 |
| | $ | — |
| | $ | 5,019 |
|
| | | | | | | | |
| | | | | | | | |
| (a) Management and investment advisory fees decreased and waivers increased to reflect annual percentage rate of Acquiring Fund. |
| (b) To adjust expenses to reflect the Combined Fund's estimated fees and expenses, based on elimination of duplicate services. |
| | | | | | | | |
| See accompanying notes. | | | | | | | |
| | | | | | | | | | | | | | | | | | | |
| Proforma Schedule of Investments | | | | | | | | | | | | | | | | | |
| December 31, 2018 | | | | | | | | | | | | | | | | | |
| |
| | | | | | | | | | Core Plus Bond | Core Plus Bond | | | Combined | | | Combined | |
| | | | | | Income Account | | Income Account | | Account Shares | Account Value | | | Portfolio Shares | Portfolio Value | |
| COMMON STOCKS - 1.18% | | | Shares Held | | Value (000's) | | Held | (000 | 's) | | Held | | | (000 | 's) |
| Electric - 0.06% | | | | | | | | | | | | | | | | | |
| GenOn Energy - Class A (a),(b),(c) | | | 2,032 | $ | 284 | | — | $ | | — | | | 2,032 | $ | | 284 | |
| |
| Oil & Gas - 0.09% | | | | | | | | | | | | | | | | | |
| Patterson-UTI Energy Inc | | | — | | — | | 3,386 | | | 35 | | | 3,386 | | | 35 | |
| Riviera Resources Inc/Linn (a),(c) | | | 16,155 | | 255 | | — | | | — | | | 16,155 | | | 255 | |
| Roan Resources Inc (a),(c) | | | 16,155 | | 136 | | — | | | — | | | 16,155 | | | 136 | |
| | | | | | | $ | 391 | | | $ | | 35 | | | | $ | | 426 | |
| Transportation - 1.03% | | | | | | | | | | | | | | | | | |
| Trailer Bridge Inc (a),(b),(c),(d),(e) | | | 25,472 | | 4,735 | | — | | | — | | | 25,472 | | | 4,735 | |
| TOTAL COMMON STOCKS | | | | $ | 5,410 | | | $ | | 35 | | | | $ | | 5,445 | |
| | | | | | | | | | Core Plus Bond | Core Plus Bond | | | Combined | | | Combined | |
| | | | | | Income Account | | Income Account | | Account Shares | Account Value | | | Portfolio Shares | Portfolio Value | |
| INVESTMENT COMPANIES - 1.23% | | | Shares Held | | Value (000's) | | Held | (000 | 's) | | Held | | | (000 | 's) |
| Money Market Funds - 1.23% | | | | | | | | | | | | | | | | | |
| Principal Government Money Market Fund | | | 1,795,275 | | 1,795 | | 3,893,898 | | | 3,894 | | | 5,689,173 | | | 5,689 | |
| 2.11%(f),(g) | | | | | | | | | | | | | | | | | | | |
| TOTAL INVESTMENT COMPANIES | | | | $ | 1,795 | | | $ | | 3,894 | | | | $ | | 5,689 | |
| | | | | | | | | | Core Plus Bond | Core Plus Bond | | | Combined | | | Combined | |
| | | | | | Income Account | | Income Account | | Account Shares | Account Value | | | Portfolio Shares | Portfolio Value | |
| PREFERRED STOCKS - 0.03% | | | Shares Held | | Value (000's) | | Held | (000 | 's) | | Held | | | (000 | 's) |
| Agriculture - 0.00% | | | | | | | | | | | | | | | | | |
| Pinnacle Operating Corp 0.00% (a),(d),(e) | | | — | $ | — | | 81,952 | $ | | 8 | | | 81,952 | $ | | 8 | |
| |
| Telecommunications - 0.03% | | | | | | | | | | | | | | | | | |
| Verizon Communications Inc 5.90%, | | | — | | — | | 5,000 | | | 127 | | | 5,000 | | | 127 | |
| 02/15/2054 | | | | | | | | | | | | | | | | | | | |
| TOTAL PREFERRED STOCKS | | | | $ | — | | | $ | | 135 | | | | $ | | 135 | |
| | | | | | | | | | Core Plus Bond | | | | | | Combined | | | | |
| | | | | | Income Account | | | | Account | Core Plus Bond | | | Portfolio | | | Combined | |
| | | | | | Principal | | Income Account | | Principal | Account Value | | | Principal | Portfolio Value | |
| BONDS - 63.98% | | | Amount (000's) | | Value (000's) | | Amount (000's) | (000 | 's) | | Amount (000's) | | | (000 | 's) |
| Aerospace & Defense - 0.58% | | | | | | | | | | | | | | | | | |
| Air 2 US | | | | | | | | | | | | | | | | | | | |
| 8.63%, 10/1/2020(h) | | $ | — | $ | — | $ | 4 | | $ | 4 | | $ | 4 | $ | 4 | |
| BBA US Holdings Inc | | | | | | | | | | | | | | | | | |
| 5.38%, 5/1/2026(h) | | | — | | — | | 25 | | | 24 | | | 25 | | | 24 | |
| Bombardier Inc | | | | | | | | | | | | | | | | | |
| 6.13%, 1/15/2023(h) | | | — | | — | | 30 | | | 28 | | | 30 | | | 28 | |
| 7.50%, 3/15/2025(h) | | | — | | — | | 355 | | | 335 | | | 355 | | | 335 | |
| Triumph Group Inc | | | | | | | | | | | | | | | | | |
| 7.75%, 8/15/2025 | | | — | | — | | 220 | | | 194 | | | 220 | | | 194 | |
| United Technologies Corp | | | | | | | | | | | | | | | | | |
| 2.80%, 5/4/2024 | | | — | | — | | 420 | | | 396 | | | 420 | | | 396 | |
| 3.10%, 6/1/2022 | | | — | | — | | 215 | | | 210 | | | 215 | | | 210 | |
| 3.95%, 8/16/2025 | | | — | | — | | 390 | | | 387 | | | 390 | | | 387 | |
| 4.13%, 11/16/2028 | | | — | | — | | 890 | | | 882 | | | 890 | | | 882 | |
| 4.45%, 11/16/2038 | | | — | | — | | 115 | | | 112 | | | 115 | | | 112 | |
| 4.63%, 11/16/2048 | | | — | | — | | 100 | | | 97 | | | 100 | | | 97 | |
See accompanying notes.
| | | | | | | | | | | | | | | | |
| | | | | | | | Core Plus Bond | | | | Combined | | | |
| | | | | | Income Account | | Account | Core Plus Bond | | | Portfolio | | Combined | |
| | | | | | Principal | Income Account | Principal | Account Value | | | Principal | | Portfolio Value | |
| BONDS (continued) | | | Amount (000's) | Value (000's) | Amount (000's) | (000 | 's) | | Amount (000's) | | (000 | 's) |
| Aerospace & Defense (continued) | | | | | | | | | | | | | | |
| United Technologies Corp (continued) | | | | | | | | | | | | | | |
| 5.40 | %, | 5/1/2035 | | $ | — $ | — | $ | 40 | $ | 42 | | $ | 40 | $ | 42 | |
| | | | | | $ | — | | $ | | 2,711 | | | $ | | 2,711 | |
| Agriculture - 0.77% | | | | | | | | | | | | | | |
| Altria Group Inc | | | | | | | | | | | | | | |
| 2.85 | %, | 8/9/2022 | | | — | — | 480 | | 461 | | | 480 | | 461 | |
| 4.00 | %, | 1/31/2024 | | | — | — | 235 | | 231 | | | 235 | | 231 | |
| 4.50 | %, | 5/2/2043 | | | — | — | 240 | | 200 | | | 240 | | 200 | |
| 5.38 | %, | 1/31/2044 | | | — | — | 530 | | 494 | | | 530 | | 494 | |
| BAT Capital Corp | | | | | | | | | | | | | | |
| 2.76 | %, | 8/15/2022 | | | — | — | 140 | | 132 | | | 140 | | 132 | |
| 3.20 | %, | 8/14/2020 | | | — | — | 200 | | 198 | | | 200 | | 198 | |
| 3 Month USD LIBOR + 0.59% | | | | | | | | | | | | | | |
| 3.22 | %, | 8/15/2024 | | | — | — | 170 | | 157 | | | 170 | | 157 | |
| 4.54 | %, | 8/15/2047 | | | — | — | | 90 | | 72 | | | 90 | | 72 | |
| Imperial Brands Finance PLC | | | | | | | | | | | | | | |
| 3.75 | %, | 7/21/2022(h) | | | — | — | 220 | | 218 | | | 220 | | 218 | |
| Philip Morris International Inc | | | | | | | | | | | | | | |
| 1.88 | %, | 2/25/2021 | | | — | — | | 80 | | 78 | | | 80 | | 78 | |
| 2.38 | %, | 8/17/2022 | | | — | — | 120 | | 115 | | | 120 | | 115 | |
| 4.38 | %, | 11/15/2041 | | | — | — | | 20 | | 18 | | | 20 | | 18 | |
| Pinnacle Operating Corp | | | | | | | | | | | | | | |
| 9.00 | %, | 5/15/2023(h) | | | — | — | 118 | | 76 | | | 118 | | 76 | |
| Reynolds American Inc | | | | | | | | | | | | | | |
| 5.70 | %, | 8/15/2035 | | | — | — | 300 | | 293 | | | 300 | | 293 | |
| 5.85 | %, | 8/15/2045 | | | — | — | | 90 | | 84 | | | 90 | | 84 | |
| 6.88 | %, | 5/1/2020 | | | — | — | 580 | | 603 | | | 580 | | 603 | |
| 7.00 | %, | 8/4/2041 | | | — | — | 120 | | 129 | | | 120 | | 129 | |
| | | | | | $ | — | | $ | | 3,559 | | | $ | | 3,559 | |
| Airlines - 0.56% | | | | | | | | | | | | | | |
| American Airlines 2013-1 Class B Pass Through | | | | | | | | | | | | | | |
| Trust | | | | | | | | | | | | | | | | |
| 5.63 | %, | 7/15/2022(h) | | | — | — | 146 | | 147 | | | 146 | | 147 | |
| American Airlines 2013-2 Class A Pass Through | | | | | | | | | | | | | | |
| Trust | | | | | | | | | | | | | | | | |
| 4.95 | %, | 7/15/2024 | | | — | — | 736 | | 747 | | | 736 | | 747 | |
| American Airlines 2014-1 Class A Pass Through | | | | | | | | | | | | | | |
| Trust | | | | | | | | | | | | | | | | |
| 3.70 | %, | 4/1/2028 | | | — | — | 128 | | 124 | | | 128 | | 124 | |
| American Airlines 2015-1 Class A Pass Through | | | | | | | | | | | | | | |
| Trust | | | | | | | | | | | | | | | | |
| 3.38 | %, | 11/1/2028 | | | — | — | | 25 | | 24 | | | 25 | | 24 | |
| American Airlines 2015-1 Class B Pass Through | | | | | | | | | | | | | | |
| Trust | | | | | | | | | | | | | | | | |
| 3.70 | %, | 11/1/2024 | | | — | — | | 14 | | 13 | | | 14 | | 13 | |
| American Airlines 2016-3 Class A Pass Through | | | | | | | | | | | | | | |
| Trust | | | | | | | | | | | | | | | | |
| 3.25 | %, | 4/15/2030 | | | — | — | 212 | | 202 | | | 212 | | 202 | |
| American Airlines 2017-1 Class AA Pass | | | | | | | | | | | | | | |
| Through Trust | | | | | | | | | | | | | | |
| 3.65 | %, | 8/15/2030 | | | — | — | 152 | | 150 | | | 152 | | 150 | |
See accompanying notes.
| | | | | | | | | | | | | | | | | |
| | | | | | | | | | Core Plus Bond | | | | | Combined | | | |
| | | | | | Income Account | | | | Account | | Core Plus Bond | | | Portfolio | | Combined | |
| | | | | | Principal | | Income Account | | Principal | | Account Value | | | Principal | | Portfolio Value | |
| BONDS (continued) | | | Amount (000's) | | Value (000's) | | Amount (000's) | | (000 | 's) | | Amount (000's) | | (000 | 's) |
| Airlines (continued) | | | | | | | | | | | | | | | |
| Continental Airlines 2007-1 Class A Pass | | | | | | | | | | | | | | | |
| Through Trust | | | | | | | | | | | | | | | |
| 5.98 | %, | 10/19/2023 | | $ | — | $ | — | $ | 96 | $ | 100 | | $ | 96 | $ | 100 | |
| Continental Airlines 2012-1 Class A Pass | | | | | | | | | | | | | | | |
| Through Trust | | | | | | | | | | | | | | | |
| 4.15 | %, | 10/11/2025 | | | — | | — | | 339 | | 338 | | | 339 | | 338 | |
| United Airlines 2014-2 Class A Pass Through | | | | | | | | | | | | | | | |
| Trust | | | | | | | | | | | | | | | | | |
| 3.75 | %, | 3/3/2028 | | | — | | — | | 249 | | 243 | | | 249 | | 243 | |
| |
| United Airlines 2018-1 Class A Pass Through | | | | | | | | | | | | | | | |
| Trust | | | | | | | | | | | | | | | | | |
| 3.70 | %, | 9/1/2031 | | | — | | — | | 205 | | 200 | | | 205 | | 200 | |
| United Airlines 2018-1 Class AA Pass Through | | | | | | | | | | | | | | | |
| Trust | | | | | | | | | | | | | | | | | |
| 3.50 | %, | 9/1/2031 | | | — | | — | | 200 | | 196 | | | 200 | | 196 | |
| US Airways 2001-1G Pass Through Trust | | | | | | | | | | | | | | | |
| 7.08 | %, | 9/20/2022 | | | — | | — | | 10 | | 11 | | | 10 | | 11 | |
| US Airways 2013-1 Class A Pass Through Trust | | | | | | | | | | | | | | | |
| 3.95 | %, | 5/15/2027 | | | — | | — | | 108 | | 109 | | | 108 | | 109 | |
| | | | | | $ | | — | | | $ | 2,604 | | | | $ | 2,604 | |
| Apparel - 0.09% | | | | | | | | | | | | | | | |
| Under Armour Inc | | | | | | | | | | | | | | | |
| 3.25 | %, | 6/15/2026 | | | 500 | | 419 | | — | | — | | | 500 | | 419 | |
| Automobile Asset Backed Securities - 4.22% | | | | | | | | | | | | | | | |
| Ally Auto Receivables Trust 2016-2 | | | | | | | | | | | | | | | |
| 1.35 | %, | 5/15/2020 | | | — | | — | | 78 | | 78 | | | 78 | | 78 | |
| AmeriCredit Automobile Receivables 2015-4 | | | | | | | | | | | | | | | |
| 2.11 | %, | 1/8/2021 | | | — | | — | | 283 | | 283 | | | 283 | | 283 | |
| AmeriCredit Automobile Receivables Trust | | | | | | | | | | | | | | | |
| 2017-4 | | | | | | | | | | | | | | | | | |
| 2.63 | %, | 5/18/2021 | | | — | | — | | 856 | | 855 | | | 856 | | 855 | |
| 1.00 x 1 Month USD LIBOR + 0.18% | | | | | | | | | | | | | | | |
| Americredit Automobile Receivables Trust 2018- | | | | | | | | | | | | | | | |
| 2 | | | | | | | | | | | | | | | | | |
| 2.86 | %, | 11/18/2021 | | | — | | — | | 1,240 | | 1,238 | | | 1,240 | | 1,238 | |
| Capital Auto Receivables Asset Trust 2017-1 | | | | | | | | | | | | | | | |
| 2.70 | %, | 9/20/2022(h) | | | — | | — | | 585 | | 579 | | | 585 | | 579 | |
| Carmax Auto Owner Trust 2018-4 | | | | | | | | | | | | | | | |
| 2.66 | %, | 2/15/2022 | | | — | | — | | 2,000 | | 2,000 | | | 2,000 | | 2,000 | |
| 1.00 x 1 Month USD LIBOR + 0.20% | | | | | | | | | | | | | | | |
| Drive Auto Receivables Trust 2017-2 | | | | | | | | | | | | | | | |
| 2.25 | %, | 6/15/2021 | | | — | | — | | 97 | | 97 | | | 97 | | 97 | |
| Drive Auto Receivables Trust 2017-3 | | | | | | | | | | | | | | | |
| 2.30 | %, | 5/17/2021 | | | — | | — | | 280 | | 280 | | | 280 | | 280 | |
| Drive Auto Receivables Trust 2018-2 | | | | | | | | | | | | | | | |
| 2.83 | %, | 9/15/2020 | | | — | | — | | 394 | | 394 | | | 394 | | 394 | |
| Drive Auto Receivables Trust 2018-5 | | | | | | | | | | | | | | | |
| 2.78 | %, | 7/15/2021 | | | — | | — | | 750 | | 749 | | | 750 | | 749 | |
| 1.00 x 1 Month USD LIBOR + 0.32% | | | | | | | | | | | | | | | |
See accompanying notes.
| | | | | | | | | | | | | | | | | |
| | | | | | | | | Core Plus Bond | | | | | Combined | | | |
| | | | | | Income Account | | | Account | | Core Plus Bond | | | Portfolio | | Combined | |
| | | | | | Principal | Income Account | | Principal | | Account Value | | | Principal | | Portfolio Value | |
| BONDS (continued) | | | Amount (000's) | Value (000's) | | Amount (000's) | | (000 | 's) | | Amount (000's) | | (000 | 's) |
| Automobile Asset Backed Securities | | | | | | | | | | | | | | | |
| (continued) | | | | | | | | | | | | | | | | | |
| Ford Credit Auto Owner Trust 2016-A | | | | | | | | | | | | | | | |
| 1.39 | %, | 7/15/2020 | | $ | — $ | — | $ | | 85 | $ | 85 | | $ | 85 | $ | 85 | |
| GM Financial Automobile Leasing Trust 2016-3 | | | | | | | | | | | | | | | |
| 1.97 | %, | 5/20/2020 | | | — | — | | 300 | | 299 | | | 300 | | 299 | |
| 2.38 | %, | 5/20/2020 | | | — | — | | 300 | | 299 | | | 300 | | 299 | |
| GM Financial Automobile Leasing Trust 2017-1 | | | | | | | | | | | | | | | |
| 2.48 | %, | 8/20/2020 | | | — | — | | 300 | | 298 | | | 300 | | 298 | |
| 2.74 | %, | 8/20/2020 | | | — | — | | 200 | | 199 | | | 200 | | 199 | |
| GM Financial Automobile Leasing Trust 2017-2 | | | | | | | | | | | | | | | |
| 1.72 | %, | 1/21/2020 | | | — | — | | 269 | | 269 | | | 269 | | 269 | |
| GM Financial Automobile Leasing Trust 2017-3 | | | | | | | | | | | | | | | |
| 2.71 | %, | 1/21/2020 | | | — | — | | 207 | | 207 | | | 207 | | 207 | |
| 1.00 x 1 Month USD LIBOR + 0.24% | | | | | | | | | | | | | | | |
| GM Financial Automobile Leasing Trust 2018-2 | | | | | | | | | | | | | | | |
| 2.69 | %, | 7/20/2020 | | | — | — | | 2,978 | | 2,977 | | | 2,978 | | 2,977 | |
| 1.00 x 1 Month USD LIBOR + 0.22% | | | | | | | | | | | | | | | |
| GM Financial Automobile Leasing Trust 2018-3 | | | | | | | | | | | | | | | |
| 3.18 | %, | 6/21/2021 | | | — | — | | 600 | | 601 | | | 600 | | 601 | |
| Hertz Fleet Lease Funding LP | | | | | | | | | | | | | | | |
| 2.89 | %, | 5/10/2032(h) | | | — | — | | 500 | | 501 | | | 500 | | 501 | |
| 1.00 x 1 Month USD LIBOR + 0.50% | | | | | | | | | | | | | | | |
| Hyundai Auto Lease Securitization Trust 2017- | | | | | | | | | | | | | | | |
| C | | | | | | | | | | | | | | | | | |
| 2.46 | %, | 7/15/2022(h) | | | — | — | | 650 | | 644 | | | 650 | | 644 | |
| Hyundai Auto Receivables Trust 2017-A | | | | | | | | | | | | | | | |
| 1.48 | %, | 2/18/2020 | | | — | — | | | 14 | | 13 | | | 14 | | 13 | |
| Mercedes-Benz Auto Lease Trust 2018-A | | | | | | | | | | | | | | | |
| 2.41 | %, | 2/16/2021 | | | — | — | | 400 | | 398 | | | 400 | | 398 | |
| Nissan Auto Lease Trust 2017-A | | | | | | | | | | | | | | | |
| 2.66 | %, | 9/16/2019 | | | — | — | | 350 | | 350 | | | 350 | | 350 | |
| 1.00 x 1 Month USD LIBOR + 0.20% | | | | | | | | | | | | | | | |
| Santander Drive Auto Receivables Trust 2016-2 | | | | | | | | | | | | | | | |
| 2.08 | %, | 2/16/2021 | | | — | — | | | 22 | | 22 | | | 22 | | 22 | |
| Santander Drive Auto Receivables Trust 2018-2 | | | | | | | | | | | | | | | |
| 2.71 | %, | 10/15/2020 | | | — | — | | 605 | | 605 | | | 605 | | 605 | |
| 1.00 x 1 Month USD LIBOR + 0.25% | | | | | | | | | | | | | | | |
| 3.35 | %, | 7/17/2023 | | | — | — | | 500 | | 500 | | | 500 | | 500 | |
| Santander Drive Auto Receivables Trust 2018-3 | | | | | | | | | | | | | | | |
| 2.73 | %, | 3/15/2021 | | | — | — | | 1,162 | | 1,162 | | | 1,162 | | 1,162 | |
| 1.00 x 1 Month USD LIBOR + 0.27% | | | | | | | | | | | | | | | |
| Santander Drive Auto Receivables Trust 2018-5 | | | | | | | | | | | | | | | |
| 2.69 | %, | 7/15/2021 | | | — | — | | 3,000 | | 3,000 | | | 3,000 | | 3,000 | |
| 1.00 x 1 Month USD LIBOR + 0.23% | | | | | | | | | | | | | | | |
| Santander Retail Auto Lease Trust 2017-A | | | | | | | | | | | | | | | |
| 2.02 | %, | 3/20/2020(h) | | | — | — | | 297 | | 296 | | | 297 | | 296 | |
See accompanying notes.
| | | | | | | | | | | | | | | | | | |
| | | | | | | | | Core Plus Bond | | | | | Combined | | | |
| | | | | Income Account | | | Account | Core Plus Bond | | | Portfolio | | Combined | |
| | | | | Principal | Income Account | | Principal | Account Value | | | Principal | | Portfolio Value | |
| BONDS (continued) | | Amount (000's) | Value (000's) | | Amount (000's) | | (000 | 's) | | Amount (000's) | | (000 | 's) |
| Automobile Asset Backed Securities | | | | | | | | | | | | | | | | |
| (continued) | | | | | | | | | | | | | | | | | | |
| Wheels SPV 2 LLC | | | | | | | | | | | | | | | | |
| 1.88 | %, | 4/20/2026(h) | | $ | — $ | — | $ | 264 | $ | 262 | | $ | 264 | $ | 262 | |
| | | | | | $ | — | | | $ | | 19,540 | | | | $ | | 19,540 | |
| Automobile Floor Plan Asset Backed Securities - 0.66% | | | | | | | | | | | | | | |
| Ally Master Owner Trust | | | | | | | | | | | | | | | | |
| 2.89 | %, | 6/15/2022 | | | 1,000 | 1,002 | | — | | | — | | | 1,000 | | 1,002 | |
| 1.00 x 1 Month USD LIBOR + 0.43% | | | | | | | | | | | | | | | | |
| Ford Credit Floorplan Master Owner Trust A | | | | | | | | | | | | | | | | |
| 2.86 | %, | 10/15/2023 | | | 1,000 | 997 | | — | | | — | | | 1,000 | | 997 | |
| 1.00 x 1 Month USD LIBOR + 0.40% | | | | | | | | | | | | | | | | |
| |
| GMF Floorplan Owner Revolving Trust | | | | | | | | | | | | | | | | |
| 3.50 | %, | 9/15/2023(h) | | | — | — | | 300 | | | 304 | | | 300 | | 304 | |
| Navistar Financial Dealer Note Master Owner | | | | | | | | | | | | | | | | |
| Trust II | | | | | | | | | | | | | | | | | | |
| 3.14 | %, | 9/25/2023(h) | | | 750 | 750 | | — | | | — | | | 750 | | 750 | |
| 1.00 x 1 Month USD LIBOR + 0.63% | | | | | | | | | | | | | | | | |
| | | | | | $ | 2,749 | | | $ | | 304 | | | | $ | | 3,053 | |
| Automobile Manufacturers - 0.47% | | | | | | | | | | | | | | | | |
| Allison Transmission Inc | | | | | | | | | | | | | | | | |
| 5.00 | %, | 10/1/2024(h) | | | — | — | | 50 | | | 48 | | | | 50 | | 48 | |
| Daimler Finance North America LLC | | | | | | | | | | | | | | | | |
| 2.25 | %, | 3/2/2020(h) | | | — | — | | 445 | | | 439 | | | 445 | | 439 | |
| 2.70 | %, | 8/3/2020(h) | | | — | — | | 450 | | | 444 | | | 450 | | 444 | |
| 2.85 | %, | 1/6/2022(h) | | | — | — | | 180 | | | 176 | | | 180 | | 176 | |
| General Motors Co | | | | | | | | | | | | | | | | |
| 6.25 | %, | 10/2/2043 | | | — | — | | 30 | | | 28 | | | | 30 | | 28 | |
| 6.60 | %, | 4/1/2036 | | | — | — | | 275 | | | 268 | | | 275 | | 268 | |
| General Motors Financial Co Inc | | | | | | | | | | | | | | | | |
| 3.40 | %, | 1/5/2023 | | | — | — | | 450 | | | 427 | | | 450 | | 427 | |
| 3 Month USD LIBOR + 0.99% | | | | | | | | | | | | | | | | |
| 3.85 | %, | 1/5/2028 | | | — | — | | 100 | | | 87 | | | 100 | | 87 | |
| Navistar International Corp | | | | | | | | | | | | | | | | |
| 6.63 | %, | 11/1/2025(h) | | | — | — | | 270 | | | 260 | | | 270 | | 260 | |
| | | | | | $ | — | | | $ | | 2,177 | | | | $ | | 2,177 | |
| Automobile Parts & Equipment - 0.09% | | | | | | | | | | | | | | | | |
| American Axle & Manufacturing Inc | | | | | | | | | | | | | | | | |
| 6.25 | %, | 4/1/2025 | | | — | — | | 160 | | | 146 | | | 160 | | 146 | |
| Dana Inc | | | | | | | | | | | | | | | | | | |
| 5.50 | %, | 12/15/2024 | | | — | — | | 85 | | | 79 | | | | 85 | | 79 | |
| IHO Verwaltungs GmbH | | | | | | | | | | | | | | | | |
| 4.75%, PIK 5.50%, 9/15/2026 (h),(i),(j) | | | — | — | | 25 | | | 22 | | | | 25 | | 22 | |
| Schaeffler Finance BV | | | | | | | | | | | | | | | | |
| 4.75 | %, | 5/15/2023(h) | | | — | — | | 200 | | | 191 | | | 200 | | 191 | |
| | | | | | $ | — | | | $ | | 438 | | | | $ | | 438 | |
See accompanying notes.
| | | | | | | | | | | | | | | | | |
| | | | | | | | | | Core Plus Bond | | | | | Combined | | | |
| | | | | | Income Account | | | | Account | | Core Plus Bond | | | Portfolio | | Combined | |
| | | | | | Principal | | Income Account | | Principal | | Account Value | | | Principal | | Portfolio Value | |
| BONDS (continued) | | | Amount (000's) | | Value (000's) | | Amount (000's) | | (000 | 's) | | Amount (000's) | | (000 | 's) |
| Banks - 8.46% | | | | | | | | | | | | | | | |
| Banco General SA | | | | | | | | | | | | | | | |
| 4.13 | %, | 8/7/2027(h) | | $ | — | $ | — | $ | 200 | $ | 184 | | $ | 200 | $ | 184 | |
| Bank of America Corp | | | | | | | | | | | | | | | |
| 3.50 | %, | 5/17/2022(k) | | | — | | — | | 200 | | 200 | | | 200 | | 200 | |
| 3 Month USD LIBOR + 0.63% | | | | | | | | | | | | | | | |
| 4.20 | %, | 8/26/2024 | | | — | | — | | 695 | | 689 | | | 695 | | 689 | |
| 4.25 | %, | 10/22/2026 | | | — | | — | | 611 | | 594 | | | 611 | | 594 | |
| Bank of New York Mellon Corp/The | | | | | | | | | | | | | | | |
| 2.80 | %, | 5/4/2026 | | | 500 | | 471 | | — | | — | | | 500 | | 471 | |
| 4.62 | %, | 12/31/2049(k),(l) | | | — | | — | | 400 | | 359 | | | 400 | | 359 | |
| 3 Month USD LIBOR + 3.13% | | | | | | | | | | | | | | | |
| Barclays PLC | | | | | | | | | | | | | | | |
| 7.75 | %, | 12/31/2049(k),(l) | | | — | | — | | 200 | | 192 | | | 200 | | 192 | |
| USD Swap Semi-Annual 5 Year + 4.84% | | | | | | | | | | | | | | | |
| BNP Paribas SA | | | | | | | | | | | | | | | |
| 6.75 | %, | 12/31/2049(h),(k),(l) | | | — | | — | | 400 | | 390 | | | 400 | | 390 | |
| USD Swap Semi-Annual 5 Year + 4.92% | | | | | | | | | | | | | | | |
| BPCE SA | | | | | | | | | | | | | | | | | |
| 2.50 | %, | 7/15/2019 | | | — | | — | | 450 | | 448 | | | 450 | | 448 | |
| CIT Group Inc | | | | | | | | | | | | | | | |
| 4.13 | %, | 3/9/2021 | | | — | | — | | 75 | | 74 | | | 75 | | 74 | |
| 5.25 | %, | 3/7/2025 | | | — | | — | | 20 | | 20 | | | 20 | | 20 | |
| 5.80 | %, | 12/31/2049(k),(l) | | | — | | — | | 40 | | 36 | | | 40 | | 36 | |
| 3 Month USD LIBOR + 3.97% | | | | | | | | | | | | | | | |
| 6.13 | %, | 3/9/2028 | | | — | | — | | 40 | | 40 | | | 40 | | 40 | |
| Citigroup Inc | | | | | | | | | | | | | | | |
| 3.44 | %, | 7/24/2023 | | | — | | — | | 215 | | 210 | | | 215 | | 210 | |
| 3 Month USD LIBOR + 0.95% | | | | | | | | | | | | | | | |
| 3.52 | %, | 10/27/2028(k) | | | — | | — | | 940 | | 877 | | | 940 | | 877 | |
| 3 Month USD LIBOR + 1.15% | | | | | | | | | | | | | | | |
| 3.88 | %, | 3/26/2025 | | | 1,000 | | 967 | | — | | — | | | 1,000 | | 967 | |
| 4.13 | %, | 7/25/2028 | | | — | | — | | 745 | | 699 | | | 745 | | 699 | |
| 4.45 | %, | 9/29/2027 | | | — | | — | | 195 | | 188 | | | 195 | | 188 | |
| 4.50 | %, | 1/14/2022 | | | 1,000 | | 1,022 | | — | | — | | | 1,000 | | 1,022 | |
| 4.65 | %, | 7/23/2048 | | | — | | — | | 245 | | 239 | | | 245 | | 239 | |
| 4.75 | %, | 5/18/2046 | | | — | | — | | 155 | | 143 | | | 155 | | 143 | |
| Cooperatieve Rabobank UA | | | | | | | | | | | | | | | |
| 4.75 | %, | 1/15/2020(h) | | | — | | — | | 490 | | 498 | | | 490 | | 498 | |
| Credit Suisse Group AG | | | | | | | | | | | | | | | |
| 3.98 | %, | 12/14/2023(h) | | | — | | — | | 250 | | 249 | | | 250 | | 249 | |
| 3 Month USD LIBOR + 1.20% | | | | | | | | | | | | | | | |
| 7.13 | %, | 12/31/2049(k),(l) | | | — | | — | | 500 | | 494 | | | 500 | | 494 | |
| USD Swap Semi-Annual 5 Year + 5.11% | | | | | | | | | | | | | | | |
| 7.50 | %, | 12/31/2049(h),(k),(l) | | | — | | — | | 200 | | 195 | | | 200 | | 195 | |
| USD Swap Semi-Annual 5 Year + 4.60% | | | | | | | | | | | | | | | |
See accompanying notes.
| | | | | | | | | | | | | | | | | |
| | | | | | | | | | Core Plus Bond | | | | | Combined | | | |
| | | | | | Income Account | | | | Account | | Core Plus Bond | | | Portfolio | | Combined | |
| | | | | | Principal | | Income Account | | Principal | | Account Value | | | Principal | | Portfolio Value | |
| BONDS (continued) | | | Amount (000's) | | Value (000's) | | Amount (000's) | | (000 | 's) | | Amount (000's) | | (000 | 's) |
| Banks (continued) | | | | | | | | | | | | | | | |
| DBS Group Holdings Ltd | | | | | | | | | | | | | | | |
| 4.52 | %, | 12/11/2028(h),(k) | | $ | — | $ | — | $ | 515 | $ | 526 | | $ | 515 | $ | 526 | |
| USD Swap Rate NY 5 Year + 1.59% | | | | | | | | | | | | | | | |
| Discover Bank | | | | | | | | | | | | | | | |
| 3.10 | %, | 6/4/2020 | | | — | | — | | 345 | | 343 | | | 345 | | 343 | |
| First Republic Bank/CA | | | | | | | | | | | | | | | |
| 2.50 | %, | 6/6/2022 | | | — | | — | | 250 | | 242 | | | 250 | | 242 | |
| 4.63 | %, | 2/13/2047 | | | — | | — | | 500 | | 482 | | | 500 | | 482 | |
| Goldman Sachs Group Inc/The | | | | | | | | | | | | | | | |
| 3.49 | %, | 7/24/2023 | | | — | | — | | 1,160 | | 1,127 | | | 1,160 | | 1,127 | |
| 3 Month USD LIBOR + 1.00% | | | | | | | | | | | | | | | |
| 3.85 | %, | 1/26/2027 | | | — | | — | | 1,125 | | 1,058 | | | 1,125 | | 1,058 | |
| 5.38 | %, | 3/15/2020 | | | 2,000 | | 2,045 | | — | | — | | | 2,000 | | 2,045 | |
| 5.38 | %, | 12/31/2049(k),(l) | | | — | | — | | 580 | | 560 | | | 580 | | 560 | |
| 3 Month USD LIBOR + 3.92% | | | | | | | | | | | | | | | |
| 5.95 | %, | 1/15/2027 | | | — | | — | | 140 | | 147 | | | 140 | | 147 | |
| 6.75 | %, | 10/1/2037 | | | — | | — | | 375 | | 423 | | | 375 | | 423 | |
| ING Bank NV | | | | | | | | | | | | | | | |
| 5.00 | %, | 6/9/2021(h) | | | 1,000 | | 1,036 | | — | | — | | | 1,000 | | 1,036 | |
| JPMorgan Chase & Co | | | | | | | | | | | | | | | |
| 3.26 | %, | 1/10/2025 | | | — | | — | | 175 | | 168 | | | 175 | | 168 | |
| 3 Month USD LIBOR + 0.85% | | | | | | | | | | | | | | | |
| 3.63 | %, | 5/13/2024 | | | 1,000 | | 993 | | — | | — | | | 1,000 | | 993 | |
| 3.63 | %, | 12/1/2027 | | | — | | — | | 400 | | 372 | | | 400 | | 372 | |
| 4.62 | %, | 12/31/2049(k),(l) | | | — | | — | | 75 | | 64 | | | 75 | | 64 | |
| 3 Month USD LIBOR + 2.58% | | | | | | | | | | | | | | | |
| 4.95 | %, | 6/1/2045 | | | — | | — | | 290 | | 294 | | | 290 | | 294 | |
| 5.63 | %, | 8/16/2043 | | | — | | — | | 260 | | 286 | | | 260 | | 286 | |
| 5.99 | %, | 4/29/2049(l) | | | 717 | | 707 | | — | | — | | | 717 | | 707 | |
| 3 Month USD LIBOR + 3.47% | | | | | | | | | | | | | | | |
| Morgan Stanley | | | | | | | | | | | | | | | |
| 3.95 | %, | 4/23/2027 | | | — | | — | | 440 | | 415 | | | 440 | | 415 | |
| 5.00 | %, | 11/24/2025 | | | — | | — | | 285 | | 291 | | | 285 | | 291 | |
| 5.50 | %, | 7/28/2021 | | | 1,000 | | 1,048 | | — | | — | | | 1,000 | | 1,048 | |
| 5.55 | %, | 12/31/2049(k),(l) | | | — | | — | | 405 | | 393 | | | 405 | | 393 | |
| 3 Month USD LIBOR + 3.81% | | | | | | | | | | | | | | | |
| 6.25 | %, | 8/9/2026 | | | 850 | | 941 | | — | | — | | | 850 | | 941 | |
| 6.38 | %, | 7/24/2042 | | | — | | — | | 270 | | 330 | | | 270 | | 330 | |
| PNC Financial Services Group Inc/The | | | | | | | | | | | | | | | |
| 6.75 | %, | 7/29/2049 (k),(l) | | | 2,000 | | 2,032 | | — | | — | | | 2,000 | | 2,032 | |
| 3 Month USD LIBOR + 3.68% | | | | | | | | | | | | | | | |
| Popular Inc | | | | | | | | | | | | | | | | | |
| 6.13 | %, | 9/14/2023 | | | — | | — | | 70 | | 69 | | | 70 | | 69 | |
| Royal Bank of Canada | | | | | | | | | | | | | | | |
| 3.70 | %, | 10/5/2023 | | | — | | — | | 555 | | 557 | | | 555 | | 557 | |
See accompanying notes.
| | | | | | | | | | | | | | | | | |
| | | | | | | | | | Core Plus Bond | | | | | Combined | | | |
| | | | | | Income Account | | | | Account | | Core Plus Bond | | | Portfolio | | Combined | |
| | | | | | Principal | | Income Account | | Principal | | Account Value | | | Principal | | Portfolio Value | |
| BONDS (continued) | | | Amount (000's) | | Value (000's) | | Amount (000's) | | (000 | 's) | | Amount (000's) | | (000 | 's) |
| Banks (continued) | | | | | | | | | | | | | | | |
| Royal Bank of Scotland Group PLC | | | | | | | | | | | | | | | |
| 4.09 | %, | 5/15/2023 | | $ | — | $ | — | $ | 685 | $ | 664 | | $ | 685 | $ | 664 | |
| 3 Month USD LIBOR + 1.47% | | | | | | | | | | | | | | | |
| 5.13 | %, | 5/28/2024 | | | — | | — | | 805 | | 781 | | | 805 | | 781 | |
| Royal Bank of Scotland Group PLC (continued) | | | | | | | | | | | | | | | |
| 7.50 | %, | 12/31/2049(k),(l) | | | — | | — | | 425 | | 421 | | | 425 | | 421 | |
| USD Swap Semi-Annual 5 Year + 5.80% | | | | | | | | | | | | | | | |
| Santander UK PLC | | | | | | | | | | | | | | | |
| 5.00 | %, | 11/7/2023(h) | | | — | | — | | 460 | | 449 | | | 460 | | 449 | |
| Skandinaviska Enskilda Banken AB | | | | | | | | | | | | | | | |
| 5.75 | %, | 12/31/2049(k),(l) | | | — | | — | | 485 | | 472 | | | 485 | | 472 | |
| USD Swap Semi-Annual 5 Year + 3.85% | | | | | | | | | | | | | | | |
| State Street Corp | | | | | | | | | | | | | | | |
| 4.14 | %, | 12/3/2029(k) | | | — | | — | | 350 | | 361 | | | 350 | | 361 | |
| 3 Month USD LIBOR + 1.03% | | | | | | | | | | | | | | | |
| SunTrust Bank/Atlanta GA | | | | | | | | | | | | | | | |
| 2.75 | %, | 5/1/2023 | | | 1,000 | | 966 | | — | | — | | | 1,000 | | 966 | |
| 4.05 | %, | 11/3/2025 | | | — | | — | | 165 | | 168 | | | 165 | | 168 | |
| SunTrust Banks Inc | | | | | | | | | | | | | | | |
| 2.70 | %, | 1/27/2022 | | | 500 | | 488 | | — | | — | | | 500 | | 488 | |
| Svenska Handelsbanken AB | | | | | | | | | | | | | | | |
| 3.90 | %, | 11/20/2023 | | | — | | — | | 345 | | 348 | | | 345 | | 348 | |
| Synchrony Bank | | | | | | | | | | | | | | | |
| 3.00 | %, | 6/15/2022 | | | — | | — | | 650 | | 607 | | | 650 | | 607 | |
| UBS AG/London | | | | | | | | | | | | | | | |
| 4.50 | %, | 6/26/2048(h) | | | — | | — | | 200 | | 207 | | | 200 | | 207 | |
| UBS AG/Stamford CT | | | | | | | | | | | | | | | |
| 2.35 | %, | 3/26/2020 | | | — | | — | | 450 | | 446 | | | 450 | | 446 | |
| UBS Group Funding Switzerland AG | | | | | | | | | | | | | | | |
| 3.57 | %, | 8/15/2023(h) | | | — | | — | | 390 | | 382 | | | 390 | | 382 | |
| 3 Month USD LIBOR + 0.95% | | | | | | | | | | | | | | | |
| 6.87 | %, | 12/31/2049(k),(l) | | | — | | — | | 440 | | 440 | | | 440 | | 440 | |
| USD Swap Rate NY 5 Year + 5.50% | | | | | | | | | | | | | | | |
| 6.88 | %, | 12/31/2049(k),(l) | | | — | | — | | 450 | | 432 | | | 450 | | 432 | |
| USD Swap Semi-Annual 5 Year + 4.59% | | | | | | | | | | | | | | | |
| US Bancorp | | | | | | | | | | | | | | | | | |
| 3.15 | %, | 4/27/2027 | | | 2,000 | | 1,916 | | — | | — | | | 2,000 | | 1,916 | |
| 3.60 | %, | 9/11/2024 | | | 250 | | 249 | | — | | — | | | 250 | | 249 | |
| Wells Fargo & Co | | | | | | | | | | | | | | | |
| 4.40 | %, | 6/14/2046 | | | — | | — | | 140 | | 128 | | | 140 | | 128 | |
| 6.56 | %, | 12/31/2049(l) | | | 2,000 | | 1,987 | | 65 | | 65 | | | 2,065 | | 2,052 | |
| 3 Month USD LIBOR + 7.54% | | | | | | | | | | | | | | | |
| Zions Bancorp NA | | | | | | | | | | | | | | | |
| 3.50 | %, | 8/27/2021 | | | — | | — | | 790 | | 788 | | | 790 | | 788 | |
| | | | | | $ | | 16,868 | | | $ | 22,324 | | | | $ | 39,192 | |
See accompanying notes.
| | | | | | | | | | | | | | | | | |
| | | | | | | | | | Core Plus Bond | | | | Combined | | | |
| | | | | | Income Account | | | | Account | Core Plus Bond | | | Portfolio | | Combined | |
| | | | | | Principal | | Income Account | | Principal | Account Value | | | Principal | | Portfolio Value | |
| BONDS (continued) | | | Amount (000's) | | Value (000's) | | Amount (000's) | (000 | 's) | | Amount (000's) | | (000 | 's) |
| Beverages - 0.95% | | | | | | | | | | | | | | | |
| Anheuser-Busch Cos LLC / Anheuser-Busch | | | | | | | | | | | | | | | |
| InBev Worldwide Inc | | | | | | | | | | | | | | | |
| 3.65 | %, | 2/1/2026(h) | | $ | 500 | $ | 473 | $ | — | $ | — | | $ | 500 | $ | 473 | |
| 4.70 | %, | 2/1/2036(h) | | | 500 | | 464 | | 5 | | 5 | | | 505 | | 469 | |
| 4.90 | %, | 2/1/2046(h) | | | — | | — | | 725 | | 672 | | | 725 | | 672 | |
| Anheuser-Busch InBev Finance Inc | | | | | | | | | | | | | | | |
| 2.65 | %, | 2/1/2021 | | | — | | — | | 301 | | 296 | | | 301 | | 296 | |
| Anheuser-Busch InBev Worldwide Inc | | | | | | | | | | | | | | | |
| 2.50 | %, | 7/15/2022 | | | 750 | | 716 | | — | | — | | | 750 | | 716 | |
| 4.38 | %, | 4/15/2038 | | | — | | — | | 145 | | 129 | | | 145 | | 129 | |
| 4.75 | %, | 4/15/2058 | | | — | | — | | 70 | | 61 | | | 70 | | 61 | |
| Bacardi Ltd | | | | | | | | | | | | | | | | | |
| 4.70 | %, | 5/15/2028(h) | | | — | | — | | 140 | | 135 | | | 140 | | 135 | |
| Central American Bottling Corp | | | | | | | | | | | | | | | |
| 5.75 | %, | 1/31/2027 | | | — | | — | | 165 | | 162 | | | 165 | | 162 | |
| Constellation Brands Inc | | | | | | | | | | | | | | | |
| 4.40 | %, | 11/15/2025 | | | — | | — | | 230 | | 230 | | | 230 | | 230 | |
| Corp Lindley SA | | | | | | | | | | | | | | | |
| 6.75 | %, | 11/23/2021(h) | | | — | | — | | 44 | | 46 | | | 44 | | 46 | |
| 6.75 | %, | 11/23/2021 | | | — | | — | | 66 | | 69 | | | 66 | | 69 | |
| Keurig Dr Pepper Inc | | | | | | | | | | | | | | | |
| 3.55 | %, | 5/25/2021(h) | | | — | | — | | 275 | | 275 | | | 275 | | 275 | |
| 4.06 | %, | 5/25/2023(h) | | | — | | — | | 490 | | 488 | | | 490 | | 488 | |
| 4.42 | %, | 5/25/2025(h) | | | — | | — | | 170 | | 169 | | | 170 | | 169 | |
| | | | | | $ | | 1,653 | | | $ | 2,737 | | | | $ | 4,390 | |
| Biotechnology - 1.09% | | | | | | | | | | | | | | | |
| Amgen Inc | | | | | | | | | | | | | | | | | |
| 2.20 | %, | 5/11/2020 | | | — | | — | | 315 | | 311 | | | 315 | | 311 | |
| 3.63 | %, | 5/15/2022 | | | 500 | | 504 | | — | | — | | | 500 | | 504 | |
| 3.88 | %, | 11/15/2021 | | | 1,000 | | 1,013 | | — | | — | | | 1,000 | | 1,013 | |
| Celgene Corp | | | | | | | | | | | | | | | |
| 3.45 | %, | 11/15/2027 | | | 500 | | 455 | | — | | — | | | 500 | | 455 | |
| 3.90 | %, | 2/20/2028 | | | 500 | | 469 | | — | | — | | | 500 | | 469 | |
| 5.00 | %, | 8/15/2045 | | | — | | — | | 220 | | 204 | | | 220 | | 204 | |
| 5.25 | %, | 8/15/2043 | | | — | | — | | 30 | | 29 | | | 30 | | 29 | |
| Gilead Sciences Inc | | | | | | | | | | | | | | | |
| 2.50 | %, | 9/1/2023 | | | — | | — | | 50 | | 48 | | | 50 | | 48 | |
| 3.65 | %, | 3/1/2026 | | | 1,000 | | 980 | | — | | — | | | 1,000 | | 980 | |
| 4.40 | %, | 12/1/2021 | | | 1,000 | | 1,032 | | — | | — | | | 1,000 | | 1,032 | |
| | | | | | $ | | 4,453 | | | $ | 592 | | | | $ | 5,045 | |
| Building Materials - 0.05% | | | | | | | | | | | | | | | |
| BMC East LLC | | | | | | | | | | | | | | | |
| 5.50 | %, | 10/1/2024(h) | | | — | | — | | 105 | | 98 | | | 105 | | 98 | |
| Owens Corning | | | | | | | | | | | | | | | |
| 7.00 | %, | 12/1/2036 | | | — | | — | | 75 | | 83 | | | 75 | | 83 | |
See accompanying notes.
| | | | | | | | | | | | | | | | |
| | | | | | | | Core Plus Bond | | | | | Combined | | | |
| | | | | | Income Account | | Account | | Core Plus Bond | | | Portfolio | | Combined | |
| | | | | | Principal | Income Account | Principal | | Account Value | | | Principal | | Portfolio Value | |
| BONDS (continued) | | | Amount (000's) | Value (000's) | Amount (000's) | | (000 | 's) | | Amount (000's) | | (000 | 's) |
| Building Materials (continued) | | | | | | | | | | | | | | |
| Standard Industries Inc/NJ | | | | | | | | | | | | | | |
| 4.75 | %, | 1/15/2028(h) | | $ | — $ | — | $ | 75 | $ | 63 | | $ | 75 | $ | 63 | |
| | | | | | $ | — | | $ | | 244 | | | $ | | 244 | |
| Chemicals - 0.71% | | | | | | | | | | | | | | |
| Aruba Investments Inc | | | | | | | | | | | | | | |
| 8.75 | %, | 2/15/2023(h) | | | — | — | 105 | | 104 | | | 105 | | 104 | |
| Blue Cube Spinco LLC | | | | | | | | | | | | | | |
| 9.75 | %, | 10/15/2023 | | | — | — | | 40 | | 44 | | | 40 | | 44 | |
| Braskem Finance Ltd | | | | | | | | | | | | | | |
| 6.45 | %, | 2/3/2024 | | | — | — | 200 | | 210 | | | 200 | | 210 | |
| CF Industries Inc | | | | | | | | | | | | | | |
| 5.15 | %, | 3/15/2034 | | | — | — | 110 | | 92 | | | 110 | | 92 | |
| Consolidated Energy Finance SA | | | | | | | | | | | | | | |
| 6.50 | %, | 5/15/2026(h) | | | — | — | 165 | | 158 | | | 165 | | 158 | |
| 6.88 | %, | 6/15/2025(h) | | | — | — | 150 | | 143 | | | 150 | | 143 | |
| Dow Chemical Co/The | | | | | | | | | | | | | | |
| 5.55 | %, | 11/30/2048(h) | | | — | — | | 55 | | 56 | | | 55 | | 56 | |
| DowDuPont Inc | | | | | | | | | | | | | | |
| 5.32 | %, | 11/15/2038 | | | — | — | 190 | | 196 | | | 190 | | 196 | |
| 5.42 | %, | 11/15/2048 | | | — | — | 130 | | 135 | | | 130 | | 135 | |
| GCP Applied Technologies Inc | | | | | | | | | | | | | | |
| 5.50 | %, | 4/15/2026(h) | | | — | — | | 35 | | 34 | | | 35 | | 34 | |
| Israel Chemicals Ltd | | | | | | | | | | | | | | |
| 6.38 | %, | 5/31/2038(h) | | | — | — | | 95 | | 95 | | | 95 | | 95 | |
| Mexichem SAB de CV | | | | | | | | | | | | | | |
| 4.00 | %, | 10/4/2027(h) | | | — | — | 200 | | 182 | | | 200 | | 182 | |
| NOVA Chemicals Corp | | | | | | | | | | | | | | |
| 5.25 | %, | 6/1/2027(h) | | | — | — | 115 | | 102 | | | 115 | | 102 | |
| Olin Corp | | | | | | | | | | | | | | | | |
| 5.00 | %, | 2/1/2030 | | | — | — | 110 | | 96 | | | 110 | | 96 | |
| SABIC Capital II BV | | | | | | | | | | | | | | |
| 4.00 | %, | 10/10/2023(h) | | | — | — | 570 | | 567 | | | 570 | | 567 | |
| SASOL Financing USA LLC | | | | | | | | | | | | | | |
| 5.88 | %, | 3/27/2024 | | | — | — | 200 | | 200 | | | 200 | | 200 | |
| 6.50 | %, | 9/27/2028 | | | — | — | 200 | | 200 | | | 200 | | 200 | |
| Starfruit Finco BV / Starfruit US Holdco LLC | | | | | | | | | | | | | | |
| 8.00 | %, | 10/1/2026(h) | | | — | — | 160 | | 148 | | | 160 | | 148 | |
| Syngenta Finance NV | | | | | | | | | | | | | | |
| 5.18 | %, | 4/24/2028(h) | | | — | — | 310 | | 287 | | | 310 | | 287 | |
| Westlake Chemical Corp | | | | | | | | | | | | | | |
| 3.60 | %, | 8/15/2026 | | | 250 | 229 | | — | | — | | | 250 | | 229 | |
| | | | | | $ | 229 | | $ | | 3,049 | | | $ | | 3,278 | |
| Coal - 0.02% | | | | | | | | | | | | | | |
| Alliance Resource Operating Partners LP / | | | | | | | | | | | | | | |
| Alliance Resource Finance Corp | | | | | | | | | | | | | | |
| 7.50 | %, | 5/1/2025(h) | | | — | — | | 75 | | 75 | | | 75 | | 75 | |
See accompanying notes.
| | | | | | | | | | | | | | | | | |
| | | | | | | | | | Core Plus Bond | | | | | Combined | | | |
| | | | | Income Account | | | | Account | | Core Plus Bond | | | Portfolio | | Combined | |
| | | | | Principal | | Income Account | | Principal | | Account Value | | | Principal | | Portfolio Value | |
| BONDS (continued) | | Amount (000's) | | Value (000's) | | Amount (000's) | | (000 | 's) | | Amount (000's) | | (000 | 's) |
| Commercial Mortgage Backed Securities - 3.40% | | | | | | | | | | | | | |
| Banc of America Commercial Mortgage Trust | | | | | | | | | | | | | | | |
| 2015-UB | S7 | | | | | | | | | | | | | | | | |
| 3.71 | %, | 9/15/2048 | | $ | — | $ | — | $ | 500 | $ | 505 | | $ | 500 | $ | 505 | |
| BANK 2017-BNK9 | | | | | | | | | | | | | | | |
| 4.03 | %, | 11/15/2054(i) | | | — | | — | | 500 | | 498 | | | 500 | | 498 | |
| BBCMS MORTGAGE TRUST 2017-C1 | | | | | | | | | | | | | | | |
| 3.67 | %, | 2/15/2050 | | | — | | — | | 500 | | 498 | | | 500 | | 498 | |
| BENCHMARK 2018-B4 | | | | | | | | | | | | | | | |
| 4.12 | %, | 7/15/2051 | | | — | | — | | 500 | | 517 | | | 500 | | 517 | |
| Citigroup Commercial Mortgage Trust 2015- | | | | | | | | | | | | | | | |
| GC27 | | | | | | | | | | | | | | | | | |
| 3.57 | %, | 2/10/2048 | | | — | | — | | 900 | | 897 | | | 900 | | 897 | |
| Citigroup Commercial Mortgage Trust 2015- | | | | | | | | | | | | | | | |
| GC29 | | | | | | | | | | | | | | | | | |
| 4.14 | %, | 4/10/2048(i) | | | — | | — | | 500 | | 492 | | | 500 | | 492 | |
| Citigroup Commercial Mortgage Trust 2016- | | | | | | | | | | | | | | | |
| GC37 | | | | | | | | | | | | | | | | | |
| 3.58 | %, | 4/10/2049 | | | — | | — | | 350 | | 349 | | | 350 | | 349 | |
| Citigroup Commercial Mortgage Trust 2018-B2 | | | | | | | | | | | | | | | |
| 4.01 | %, | 3/10/2051 | | | — | | — | | 350 | | 357 | | | 350 | | 357 | |
| |
| COMM 2013-CCRE11 Mortgage Trust | | | | | | | | | | | | | | | |
| 1.10 | %, | 8/10/2050 (i),(m) | | | — | | — | | 6,712 | | 233 | | | 6,712 | | 233 | |
| COMM 2013-CCRE8 Mortgage Trust | | | | | | | | | | | | | | | |
| 3.96 | %, | 6/10/2046 (h),(i) | | | — | | — | | 350 | | 355 | | | 350 | | 355 | |
| COMM 2015-PC1 Mortgage Trust | | | | | | | | | | | | | | | |
| 4.29 | %, | 7/10/2050(i) | | | — | | — | | 250 | | 256 | | | 250 | | 256 | |
| COMM 2018-COR3 Mortgage Trust | | | | | | | | | | | | | | | |
| 4.23 | %, | 5/10/2051 | | | — | | — | | 1,000 | | 1,032 | | | 1,000 | | 1,032 | |
| Credit Suisse Commercial Mortgage Trust Series | | | | | | | | | | | | | | | |
| 2006-C5 | | | | | | | | | | | | | | | | | |
| 0.87 | %, | 12/15/2039(i),(m) | | | — | | — | | 137 | | — | | | 137 | | — | |
| DBUBS 2011-LC2 Mortgage Trust | | | | | | | | | | | | | | | |
| 4.54 | %, | 7/10/2044(h) | | | — | | — | | 750 | | 771 | | | 750 | | 771 | |
| GS Mortgage Securities Trust 2011-GC5 | | | | | | | | | | | | | | | |
| 1.34 | %, | 8/10/2044 (h),(i),(m) | | | — | | — | | 9,412 | | 255 | | | 9,412 | | 255 | |
| GS Mortgage Securities Trust 2012-GCJ7 | | | | | | | | | | | | | | | |
| 2.21 | %, | 5/10/2045 (i),(m) | | | — | | — | | 1,929 | | 81 | | | 1,929 | | 81 | |
| GS Mortgage Securities Trust 2013-GC16 | | | | | | | | | | | | | | | |
| 1.05 | %, | 11/10/2046(i),(m) | | | — | | — | | 1,972 | | 83 | | | 1,972 | | 83 | |
| GS Mortgage Securities Trust 2013-GCJ12 | | | | | | | | | | | | | | | |
| 3.78 | %, | 6/10/2046(i) | | | — | | — | | 250 | | 249 | | | 250 | | 249 | |
| GS Mortgage Securities Trust 2014-GC26 | | | | | | | | | | | | | | | |
| 1.01 | %, | 11/10/2047(i),(m) | | | — | | — | | 4,769 | | 213 | | | 4,769 | | 213 | |
| GS Mortgage Securities Trust 2015-GC34 | | | | | | | | | | | | | | | |
| 3.51 | %, | 10/10/2048 | | | — | | — | | 375 | | 374 | | | 375 | | 374 | |
| GS Mortgage Securities Trust 2015-GS1 | | | | | | | | | | | | | | | |
| 3.73 | %, | 11/10/2048 | | | — | | — | | 1,000 | | 1,011 | | | 1,000 | | 1,011 | |
See accompanying notes.
| | | | | | | | | | | | | | | | | |
| | | | | | | | | Core Plus Bond | | | | | Combined | | | |
| | | | | | Income Account | | | Account | | Core Plus Bond | | | Portfolio | | Combined | |
| | | | | | Principal | Income Account | | Principal | | Account Value | | | Principal | | Portfolio Value | |
| BONDS (continued) | | | Amount (000's) | Value (000's) | | Amount (000's) | | (000 | 's) | | Amount (000's) | | (000 | 's) |
| Commercial Mortgage Backed Securities | | | | | | | | | | | | | | | |
| (continued) | | | | | | | | | | | | | | | | | |
| |
| JP Morgan Chase Commercial Mortgage | | | | | | | | | | | | | | | |
| Securities Trust 2010-C1 | | | | | | | | | | | | | | | |
| 5.95 | %, | 6/15/2043(h) | | $ | — $ | — | $ | 400 | $ | 403 | | $ | 400 | $ | 403 | |
| JP Morgan Chase Commercial Mortgage | | | | | | | | | | | | | | | |
| Securities Trust 2011-C5 | | | | | | | | | | | | | | | |
| 5.41 | %, | 8/15/2046 (h),(i) | | | — | — | | 350 | | 361 | | | 350 | | 361 | |
| JP Morgan Chase Commercial Mortgage | | | | | | | | | | | | | | | |
| Securities Trust 2012-LC9 | | | | | | | | | | | | | | | |
| 1.53 | %, | 12/15/2047(i),(m) | | | — | — | | 2,424 | | 105 | | | 2,424 | | 105 | |
| JP Morgan Chase Commercial Mortgage | | | | | | | | | | | | | | | |
| Securities Trust 2013-C16 | | | | | | | | | | | | | | | |
| 0.95 | %, | 12/15/2046(i),(m) | | | — | — | | 8,254 | | 313 | | | 8,254 | | 313 | |
| JP Morgan Chase Commercial Mortgage | | | | | | | | | | | | | | | |
| Securities Trust 2016-JP3 | | | | | | | | | | | | | | | |
| 3.14 | %, | 8/15/2049 | | | — | — | | 500 | | 471 | | | 500 | | 471 | |
| JPMBB Commercial Mortgage Securities Trust | | | | | | | | | | | | | | | |
| 2014-C24 | | | | | | | | | | | | | | | | | |
| 4.39 | %, | 11/15/2047(i) | | | — | — | | 500 | | 497 | | | 500 | | 497 | |
| LB-UBS Commercial Mortgage Trust 2007-C1 | | | | | | | | | | | | | | | |
| 0.28 | %, | 2/15/2040 (i),(m) | | | — | — | | 511 | | — | | | 511 | | — | |
| Morgan Stanley Bank of America Merrill Lynch | | | | | | | | | | | | | | | |
| Trust 2012-C5 | | | | | | | | | | | | | | | |
| 1.47 | %, | 8/15/2045 (h),(i),(m) | | | — | — | | 3,400 | | 140 | | | 3,400 | | 140 | |
| |
| Morgan Stanley Bank of America Merrill Lynch | | | | | | | | | | | | | | | |
| Trust 2014-C14 | | | | | | | | | | | | | | | |
| 1.09 | %, | 2/15/2047 (i),(m) | | | — | — | | 7,749 | | 249 | | | 7,749 | | 249 | |
| Morgan Stanley Bank of America Merrill Lynch | | | | | | | | | | | | | | | |
| Trust 2014-C16 | | | | | | | | | | | | | | | |
| 1.12 | %, | 6/15/2047 (i),(m) | | | — | — | | 4,214 | | 158 | | | 4,214 | | 158 | |
| Morgan Stanley Bank of America Merrill Lynch | | | | | | | | | | | | | | | |
| Trust 2015-C26 | | | | | | | | | | | | | | | |
| 3.89 | %, | 10/15/2048(i) | | | — | — | | 250 | | 251 | | | 250 | | 251 | |
| Morgan Stanley Bank of America Merrill Lynch | | | | | | | | | | | | | | | |
| Trust 2015-C27 | | | | | | | | | | | | | | | |
| 3.75 | %, | 12/15/2047 | | | — | — | | 100 | | 101 | | | 100 | | 101 | |
| Morgan Stanley Bank of America Merrill Lynch | | | | | | | | | | | | | | | |
| Trust 2016-C30 | | | | | | | | | | | | | | | |
| 3.18 | %, | 9/15/2049 | | | — | — | | 500 | | 480 | | | 500 | | 480 | |
| MSBAM Commercial Mortgage Securities Trust | | | | | | | | | | | | | | | |
| 2012-CKSV | | | | | | | | | | | | | | | |
| 1.08 | %, | 10/15/2030(h),(i),(m) | | | — | — | | 3,583 | | 119 | | | 3,583 | | 119 | |
| UBS Commercial Mortgage Trust 2012-C1 | | | | | | | | | | | | | | | |
| 3.40 | %, | 5/10/2045 | | | — | — | | 146 | | 147 | | | 146 | | 147 | |
| UBS-Barclays Commercial Mortgage Trust | | | | | | | | | | | | | | | |
| 2012-C3 | | | | | | | | | | | | | | | | | |
| 3.09 | %, | 8/10/2049 | | | — | — | | 255 | | 254 | | | 255 | | 254 | |
| UBS-Barclays Commercial Mortgage Trust | | | | | | | | | | | | | | | |
| 2012-C4 | | | | | | | | | | | | | | | | | |
| 1.64 | %, | 12/10/2045(h),(i),(m) | | | — | — | | 1,243 | | 62 | | | 1,243 | | 62 | |
| 3.32 | %, | 12/10/2045(h) | | | — | — | | 500 | | 498 | | | 500 | | 498 | |
| UBS-Barclays Commercial Mortgage Trust | | | | | | | | | | | | | | | |
| 2013-C5 | | | | | | | | | | | | | | | | | |
| 3.18 | %, | 3/10/2046 | | | — | — | | 335 | | 335 | | | 335 | | 335 | |
| 4.08 | %, | 3/10/2046 (h),(i) | | | — | — | | 175 | | 159 | | | 175 | | 159 | |
See accompanying notes.
| | | | | | | | | | | | | | | | | |
| | | | | | | | | Core Plus Bond | | | | | Combined | | | |
| | | | | | Income Account | | | Account | | Core Plus Bond | | | Portfolio | | Combined | |
| | | | | | Principal | Income Account | | Principal | | Account Value | | | Principal | | Portfolio Value | |
| BONDS (continued) | | | Amount (000's) | Value (000's) | | Amount (000's) | | (000 | 's) | | Amount (000's) | | (000 | 's) |
| Commercial Mortgage Backed Securities | | | | | | | | | | | | | | | |
| (continued) | | | | | | | | | | | | | | | | | |
| Wells Fargo Commercial Mortgage Trust 2015- | | | | | | | | | | | | | | | |
| NXS1 | | | | | | | | | | | | | | | | | |
| 3.66 | %, | 5/15/2048(i) | | $ | — $ | — | $ | 500 | $ | 491 | | $ | 500 | $ | 491 | |
| Wells Fargo Commercial Mortgage Trust 2017- | | | | | | | | | | | | | | | |
| C38 | | | | | | | | | | | | | | | | | |
| 3.45 | %, | 7/15/2050 | | | — | — | | 500 | | 490 | | | 500 | | 490 | |
| WFRBS Commercial Mortgage Trust 2013-C12 | | | | | | | | | | | | | | | |
| 1.28 | %, | 3/15/2048 (h),(i),(m) | | | — | — | | 3,007 | | 127 | | | 3,007 | | 127 | |
| WFRBS Commercial Mortgage Trust 2014-C22 | | | | | | | | | | | | | | | |
| 4.07 | %, | 9/15/2057(i) | | | — | — | | 500 | | 512 | | | 500 | | 512 | |
| | | | | | $ | — | | | $ | 15,749 | | | | $ | | 15,749 | |
| Commercial Services - 0.42% | | | | | | | | | | | | | | | |
| Ahern Rentals Inc | | | | | | | | | | | | | | | |
| 7.38 | %, | 5/15/2023(h) | | | — | — | | 170 | | 136 | | | 170 | | 136 | |
| DP World Ltd | | | | | | | | | | | | | | | |
| 6.85 | %, | 7/2/2037 | | | — | — | | 100 | | 111 | | | 100 | | 111 | |
| ERAC USA Finance LLC | | | | | | | | | | | | | | | |
| 7.00 | %, | 10/15/2037(h) | | | 1,000 | 1,243 | | — | | — | | | 1,000 | | 1,243 | |
| Garda World Security Corp | | | | | | | | | | | | | | | |
| 8.75 | %, | 5/15/2025(h) | | | — | — | | 130 | | 119 | | | 130 | | 119 | |
| Refinitiv US Holdings Inc | | | | | | | | | | | | | | | |
| 6.25 | %, | 5/15/2026(h) | | | — | — | | 30 | | 29 | | | | 30 | | 29 | |
| 8.25 | %, | 11/15/2026(h) | | | — | — | | 45 | | 41 | | | | 45 | | 41 | |
| TMS International Corp | | | | | | | | | | | | | | | |
| 7.25 | %, | 8/15/2025(h) | | | — | — | | 90 | | 84 | | | | 90 | | 84 | |
| United Rentals North America Inc | | | | | | | | | | | | | | | |
| 4.63 | %, | 10/15/2025 | | | — | — | | 75 | | 67 | | | | 75 | | 67 | |
| 4.88 | %, | 1/15/2028 | | | — | — | | 25 | | 22 | | | | 25 | | 22 | |
| 5.75 | %, | 11/15/2024 | | | — | — | | 100 | | 96 | | | 100 | | 96 | |
| 5.88 | %, | 9/15/2026 | | | — | — | | 15 | | 14 | | | | 15 | | 14 | |
| | | | | | $ | 1,243 | | | $ | 719 | | | | $ | | 1,962 | |
| Computers - 1.09% | | | | | | | | | | | | | | | |
| Apple Inc | | | | | | | | | | | | | | | | | |
| 2.40 | %, | 5/3/2023 | | | 1,750 | 1,692 | | — | | — | | | 1,750 | | 1,692 | |
| 2.75 | %, | 1/13/2025 | | | — | — | | 220 | | 212 | | | 220 | | 212 | |
| 2.85 | %, | 5/11/2024 | | | — | — | | 665 | | 649 | | | 665 | | 649 | |
| 3.00 | %, | 2/9/2024 | | | — | — | | 445 | | 440 | | | 445 | | 440 | |
| 3.35 | %, | 2/9/2027 | | | — | — | | 1,095 | | 1,067 | | | 1,095 | | 1,067 | |
| Dell International LLC / EMC Corp | | | | | | | | | | | | | | | |
| 7.13 | %, | 6/15/2024(h) | | | — | — | | 415 | | 422 | | | 415 | | 422 | |
| 8.35 | %, | 7/15/2046(h) | | | — | — | | 500 | | 541 | | | 500 | | 541 | |
| West Corp | | | | | | | | | | | | | | | | | |
| 8.50 | %, | 10/15/2025(h) | | | — | — | | 20 | | 16 | | | | 20 | | 16 | |
| | | | | | $ | 1,692 | | | $ | 3,347 | | | | $ | | 5,039 | |
See accompanying notes.
| | | | | | | | | | | | | | | | | |
| | | | | | | | Core Plus Bond | | | | | Combined | | | |
| | | | | | Income Account | | Account | | Core Plus Bond | | | Portfolio | | Combined | |
| | | | | | Principal | Income Account | Principal | | Account Value | | | Principal | | Portfolio Value | |
| BONDS (continued) | | | Amount (000's) | Value (000's) | Amount (000's) | | (000 | 's) | | Amount (000's) | | (000 | 's) |
| Consumer Products - 0.03% | | | | | | | | | | | | | | | |
| Prestige Brands Inc | | | | | | | | | | | | | | | |
| 6.38 | %, | 3/1/2024(h) | | $ | — $ | — | $ | 85 | $ | 82 | | $ | | 85 | $ | 82 | |
| Spectrum Brands Inc | | | | | | | | | | | | | | | |
| 5.75 | %, | 7/15/2025 | | | — | — | | 75 | | 71 | | | | 75 | | 71 | |
| | | | | | $ | — | | $ | | 153 | | | | $ | | 153 | |
| Credit Card Asset Backed Securities - 0.55% | | | | | | | | | | | | | | | |
| Cabela's Credit Card Master Note Trust | | | | | | | | | | | | | | | |
| 3.13 | %, | 7/17/2023 | | | 500 | 501 | | — | | — | | | 500 | | 501 | |
| 1.00 x 1 Month USD LIBOR + 0.67% | | | | | | | | | | | | | | | |
| Capital One Multi-Asset Execution Trust | | | | | | | | | | | | | | | |
| 2.00 | %, | 1/17/2023 | | | — | — | 500 | | 495 | | | 500 | | 495 | |
| Chase Issuance Trust | | | | | | | | | | | | | | | |
| 2.76 | %, | 1/15/2022 | | | — | — | 1,000 | | 1,000 | | | 1,000 | | 1,000 | |
| 1.00 x 1 Month USD LIBOR + 0.30% | | | | | | | | | | | | | | | |
| 2.87 | %, | 5/15/2021 | | | — | — | 550 | | 550 | | | 550 | | 550 | |
| 1.00 x 1 Month USD LIBOR + 0.41% | | | | | | | | | | | | | | | |
| | | | | | $ | 501 | | $ | | 2,045 | | | | $ | | 2,546 | |
| Distribution & Wholesale - 0.14% | | | | | | | | | | | | | | | |
| American Builders & Contractors Supply Co | | | | | | | | | | | | | | | |
| Inc | | | | | | | | | | | | | | | | | |
| 5.75 | %, | 12/15/2023(h) | | | — | — | | 95 | | 94 | | | | 95 | | 94 | |
| 5.88 | %, | 5/15/2026(h) | | | — | — | | 55 | | 52 | | | | 55 | | 52 | |
| Ferguson Finance PLC | | | | | | | | | | | | | | | |
| 4.50 | %, | 10/24/2028(h) | | | — | — | 340 | | 340 | | | 340 | | 340 | |
| Global Partners LP / GLP Finance Corp | | | | | | | | | | | | | | | |
| 7.00 | %, | 6/15/2023 | | | — | — | | 80 | | 76 | | | | 80 | | 76 | |
| H&E Equipment Services Inc | | | | | | | | | | | | | | | |
| 5.63 | %, | 9/1/2025 | | | — | — | | 90 | | 82 | | | | 90 | | 82 | |
| | | | | | $ | — | | $ | | 644 | | | | $ | | 644 | |
| Diversified Financial Services - 1.15% | | | | | | | | | | | | | | | |
| Ally Financial Inc | | | | | | | | | | | | | | �� | |
| 5.75 | %, | 11/20/2025 | | | — | — | 360 | | 358 | | | 360 | | 358 | |
| Brookfield Finance Inc | | | | | | | | | | | | | | | |
| 3.90 | %, | 1/25/2028 | | | — | — | 245 | | 231 | | | 245 | | 231 | |
| 4.70 | %, | 9/20/2047 | | | — | — | 390 | | 359 | | | 390 | | 359 | |
| Brookfield Finance LLC | | | | | | | | | | | | | | | |
| 4.00 | %, | 4/1/2024 | | | — | — | 750 | | 741 | | | 750 | | 741 | |
| Credit Acceptance Corp | | | | | | | | | | | | | | | |
| 6.13 | %, | 2/15/2021 | | | — | — | 105 | | 105 | | | 105 | | 105 | |
| 7.38 | %, | 3/15/2023 | | | — | — | 115 | | 117 | | | 115 | | 117 | |
| E*TRADE Financial Corp | | | | | | | | | | | | | | | |
| 5.30 | %, | 12/31/2049(k),(l) | | | — | — | 280 | | 232 | | | 280 | | 232 | |
| 3 Month USD LIBOR + 3.16% | | | | | | | | | | | | | | | |
| Jefferies Group LLC | | | | | | | | | | | | | | | |
| 6.25 | %, | 1/15/2036(c) | | | 1,425 | 1,429 | | — | | — | | | 1,425 | | 1,429 | |
See accompanying notes.
| | | | | | | | | | | | | | | | | |
| | | | | | | | | | Core Plus Bond | | | | | Combined | | | |
| | | | | | Income Account | | | | Account | | Core Plus Bond | | | Portfolio | | Combined | |
| | | | | | Principal | | Income Account | | Principal | | Account Value | | | Principal | | Portfolio Value | |
| BONDS (continued) | | | Amount (000's) | | Value (000's) | | Amount (000's) | | (000 | 's) | | Amount (000's) | | (000 | 's) |
| Diversified Financial Services (continued) | | | | | | | | | | | | | | | |
| Jefferies Group LLC / Jefferies Group Capital | | | | | | | | | | | | | | | |
| Finance Inc | | | | | | | | | | | | | | | | | |
| 4.15 | %, | 1/23/2030 | | $ | 500 | $ | 429 | $ | — | $ | — | | $ | 500 | $ | 429 | |
| Lions Gate Capital Holdings LLC | | | | | | | | | | | | | | | |
| 5.88 | %, | 11/1/2024(h) | | | — | | — | | 90 | | 89 | | | 90 | | 89 | |
| National Rural Utilities Cooperative Finance | | | | | | | | | | | | | | | |
| Corp | | | | | | | | | | | | | | | | | |
| 2.40 | %, | 4/25/2022 | | | — | | — | | 255 | | 248 | | | 255 | | 248 | |
| National Rural Utilities Cooperative Finance | | | | | | | | | | | | | | | |
| Corp (continued) | | | | | | | | | | | | | | | |
| 4.75 | %, | 4/30/2043(k) | | | — | | — | | 125 | | 119 | | | 125 | | 119 | |
| 3 Month USD LIBOR + 2.91% | | | | | | | | | | | | | | | |
| Navient Corp | | | | | | | | | | | | | | | |
| 6.13 | %, | 3/25/2024 | | | — | | — | | 130 | | 111 | | | 130 | | 111 | |
| 6.63 | %, | 7/26/2021 | | | — | | — | | 40 | | 39 | | | 40 | | 39 | |
| 6.75 | %, | 6/15/2026 | | | — | | — | | 70 | | 58 | | | 70 | | 58 | |
| Nuveen LLC | | | | | | | | | | | | | | | |
| 4.00 | %, | 11/1/2028(h) | | | — | | — | | 320 | | 330 | | | 320 | | 330 | |
| Springleaf Finance Corp | | | | | | | | | | | | | | | |
| 6.88 | %, | 3/15/2025 | | | — | | — | | 115 | | 103 | | | 115 | | 103 | |
| 7.13 | %, | 3/15/2026 | | | — | | — | | 115 | | 103 | | | 115 | | 103 | |
| SURA Asset Management SA | | | | | | | | | | | | | | | |
| 4.88 | %, | 4/17/2024(h) | | | — | | — | | 125 | | 124 | | | 125 | | 124 | |
| | | | | | $ | | 1,858 | | | $ | 3,467 | | | | $ | 5,325 | |
| Electric - 4.65% | | | | | | | | | | | | | | | |
| Alabama Power Co | | | | | | | | | | | | | | | |
| 4.15 | %, | 8/15/2044 | | | — | | — | | 120 | | 117 | | | 120 | | 117 | |
| Black Hills Corp | | | | | | | | | | | | | | | |
| 4.35 | %, | 5/1/2033 | | | 500 | | 501 | | — | | — | | | 500 | | 501 | |
| Clearway Energy Operating LLC | | | | | | | | | | | | | | | |
| 5.75 | %, | 10/15/2025(h) | | | — | | — | | 75 | | 72 | | | 75 | | 72 | |
| CMS Energy Corp | | | | | | | | | | | | | | | |
| 4.70 | %, | 3/31/2043 | | | — | | — | | 135 | | 137 | | | 135 | | 137 | |
| 4.88 | %, | 3/1/2044 | | | — | | — | | 130 | | 136 | | | 130 | | 136 | |
| Consolidated Edison Co of New York Inc | | | | | | | | | | | | | | | |
| 4.00 | %, | 12/1/2028 | | | — | | — | | 150 | | 154 | | | 150 | | 154 | |
| 4.63 | %, | 12/1/2054 | | | — | | — | | 150 | | 147 | | | 150 | | 147 | |
| Dominion Energy Inc | | | | | | | | | | | | | | | |
| 2.58 | %, | 7/1/2020 | | | — | | — | | 900 | | 886 | | | 900 | | 886 | |
| 3.90 | %, | 10/1/2025 | | | — | | — | | 115 | | 115 | | | 115 | | 115 | |
| 4.25 | %, | 6/1/2028 | | | — | | — | | 160 | | 160 | | | 160 | | 160 | |
| DTE Energy Co | | | | | | | | | | | | | | | |
| 6.38 | %, | 4/15/2033 | | | — | | — | | 85 | | 101 | | | 85 | | 101 | |
| Duke Energy Florida LLC | | | | | | | | | | | | | | | |
| 3.80 | %, | 7/15/2028 | | | — | | — | | 295 | | 298 | | | 295 | | 298 | |
| Electricite de France SA | | | | | | | | | | | | | | | |
| 5.63 | %, | 12/31/2049(h),(k),(l) | | | — | | — | | 280 | | 258 | | | 280 | | 258 | |
| USD Swap Semi-Annual 10 Year + 3.04% | | | | | | | | | | | | | | | |
See accompanying notes.
| | | | | | | | | | | | | | | | | |
| | | | | | | | | | Core Plus Bond | | | | | Combined | | | |
| | | | | | Income Account | | | | Account | | Core Plus Bond | | | Portfolio | | Combined | |
| | | | | | Principal | | Income Account | | Principal | | Account Value | | | Principal | | Portfolio Value | |
| BONDS (continued) | | | Amount (000's) | | Value (000's) | | Amount (000's) | | (000 | 's) | | Amount (000's) | | (000 | 's) |
| Electric (continued) | | | | | | | | | | | | | | | |
| Elwood Energy LLC | | | | | | | | | | | | | | | |
| 8.16 | %, | 7/5/2026 | | $ | — | $ | — | $ | 115 | $ | 126 | | $ | 115 | $ | 126 | |
| Enel Chile SA | | | | | | | | | | | | | | | |
| 4.88 | %, | 6/12/2028 | | | — | | — | | 150 | | 150 | | | 150 | | 150 | |
| Enel Finance International NV | | | | | | | | | | | | | | | |
| 2.88 | %, | 5/25/2022(h) | | | — | | — | | 200 | | 188 | | | 200 | | 188 | |
| Entergy Louisiana LLC | | | | | | | | | | | | | | | |
| 3.25 | %, | 4/1/2028 | | | 500 | | 481 | | — | | — | | | 500 | | 481 | |
| 4.20 | %, | 9/1/2048 | | | 500 | | 493 | | — | | — | | | 500 | | 493 | |
| Entergy Texas Inc | | | | | | | | | | | | | | | |
| 2.55 | %, | 6/1/2021 | | | 500 | | 492 | | — | | — | | | 500 | | 492 | |
| Exelon Corp | | | | | | | | | | | | | | | |
| 2.85 | %, | 6/15/2020 | | | — | | — | | 330 | | 327 | | | 330 | | 327 | |
| 3.50 | %, | 6/1/2022 | | | — | | — | | 125 | | 122 | | | 125 | | 122 | |
| Florida Power & Light Co | | | | | | | | | | | | | | | |
| 3.95 | %, | 3/1/2048 | | | — | | — | | 145 | | 142 | | | 145 | | 142 | |
| 4.13 | %, | 6/1/2048 | | | — | | — | | 105 | | 105 | | | 105 | | 105 | |
| Fortis Inc/Canada | | | | | | | | | | | | | | | |
| 2.10 | %, | 10/4/2021 | | | — | | — | | 185 | | 178 | | | 185 | | 178 | |
| 3.06 | %, | 10/4/2026 | | | — | | — | | 165 | | 151 | | | 165 | | 151 | |
| GenOn Energy Inc - Escrow | | | | | | | | | | | | | | | |
| 0.00 | %, | 10/15/2020(a),(b),(e) | | | 750 | | — | | — | | — | | | 750 | | — | |
| GenOn Energy Inc / NRG Americas Inc | | | | | | | | | | | | | | | |
| 9.39 | %, | 12/1/2023 | | | 163 | | 159 | | — | | — | | | 163 | | 159 | |
| 3 Month USD LIBOR + 6.50% | | | | | | | | | | | | | | | |
| Georgia Power Co | | | | | | | | | | | | | | | |
| 4.30 | %, | 3/15/2042 | | | — | | — | | 100 | | 92 | | | 100 | | 92 | |
| 4.30 | %, | 3/15/2043 | | | — | | — | | 80 | | 73 | | | 80 | | 73 | |
| Indiantown Cogeneration LP | | | | | | | | | | | | | | | |
| 9.77 | %, | 12/15/2020 | | | — | | — | | 50 | | 52 | | | 50 | | 52 | |
| Kentucky Utilities Co | | | | | | | | | | | | | | | |
| 3.30 | %, | 10/1/2025 | | | — | | — | | 190 | | 185 | | | 190 | | 185 | |
| LG&E & KU Energy LLC | | | | | | | | | | | | | | | |
| 4.38 | %, | 10/1/2021 | | | 1,000 | | 1,016 | | — | | — | | | 1,000 | | 1,016 | |
| Louisville Gas & Electric Co | | | | | | | | | | | | | | | |
| 3.30 | %, | 10/1/2025 | | | — | | — | | 115 | | 113 | | | 115 | | 113 | |
| Metropolitan Edison Co | | | | | | | | | | | | | | | |
| 3.50 | %, | 3/15/2023(h) | | | 1,000 | | 995 | | — | | — | | | 1,000 | | 995 | |
| NRG Energy Inc | | | | | | | | | | | | | | | |
| 6.25 | %, | 5/1/2024 | | | — | | — | | 105 | | 107 | | | 105 | | 107 | |
| 6.63 | %, | 1/15/2027 | | | — | | — | | 110 | | 111 | | | 110 | | 111 | |
| Oncor Electric Delivery Co LLC | | | | | | | | | | | | | | | |
| 5.25 | %, | 9/30/2040 | | | — | | — | | 120 | | 137 | | | 120 | | 137 | |
| 5.75 | %, | 3/15/2029(h) | | | 2,000 | | 2,334 | | — | | — | | | 2,000 | | 2,334 | |
| Pacific Gas & Electric Co | | | | | | | | | | | | | | | |
| 3.30 | %, | 3/15/2027 | | | — | | — | | 295 | | 243 | | | 295 | | 243 | |
See accompanying notes.
| | | | | | | | | | | | | | | | | |
| | | | | | | | | Core Plus Bond | | | | | | Combined | | | |
| | | | | | Income Account | | | Account | Core Plus Bond | | | Portfolio | | Combined | |
| | | | | | Principal | Income Account | | Principal | Account Value | | | Principal | | Portfolio Value | |
| BONDS (continued) | | | Amount (000's) | Value (000's) | | Amount (000's) | (000 | 's) | | Amount (000's) | | (000 | 's) |
| Electric (continued) | | | | | | | | | | | | | | | |
| Pacific Gas & Electric Co (continued) | | | | | | | | | | | | | | | |
| 3.30 | %, | 12/1/2027 | | $ | — $ | — | $ | 345 | | $ | 281 | | $ | 345 | $ | 281 | |
| 4.45 | %, | 4/15/2042 | | | — | — | | 80 | | | 64 | | | 80 | | 64 | |
| 5.13 | %, | 11/15/2043 | | | — | — | | 45 | | | 39 | | | 45 | | 39 | |
| PacifiCorp | | | | | | | | | | | | | | | | | |
| 3.85 | %, | 6/15/2021 | | | — | — | | 150 | | | 152 | | | 150 | | 152 | |
| 5.25 | %, | 6/15/2035 | | | 850 | 948 | | — | | | — | | | 850 | | 948 | |
| 6.25 | %, | 10/15/2037 | | | 500 | 624 | | — | | | — | | | 500 | | 624 | |
| PPL Electric Utilities Corp | | | | | | | | | | | | | | | |
| 3.95 | %, | 6/1/2047 | | | — | — | | 85 | | | 82 | | | 85 | | 82 | |
| 4.75 | %, | 7/15/2043 | | | — | — | | 115 | | | 125 | | | 115 | | 125 | |
| PPL WEM Ltd / Western Power Distribution | | | | | | | | | | | | | | | |
| Ltd | | | | | | | | | | | | | | | | | |
| 5.38 | %, | 5/1/2021(h) | | | — | — | | 440 | | | 454 | | | 440 | | 454 | |
| Solar Star Funding LLC | | | | | | | | | | | | | | | |
| 5.38 | %, | 6/30/2035(h) | | | 1,424 | 1,524 | | — | | | — | | | 1,424 | | 1,524 | |
| Southern Co/The | | | | | | | | | | | | | | | |
| 2.95 | %, | 7/1/2023 | | | — | — | | 145 | | | 140 | | | 145 | | 140 | |
| 5.50 | %, | 3/15/2057(k) | | | — | — | | 50 | | | 48 | | | 50 | | 48 | |
| 3 Month USD LIBOR + 3.63% | | | | | | | | | | | | | | | |
| Southwestern Electric Power Co | | | | | | | | | | | | | | | |
| 3.55 | %, | 2/15/2022 | | | 1,000 | 1,002 | | — | | | — | | | 1,000 | | 1,002 | |
| 3.85 | %, | 2/1/2048 | | | 1,000 | 888 | | — | | | — | | | 1,000 | | 888 | |
| State Grid Overseas Investment 2016 Ltd | | | | | | | | | | | | | | | |
| 3.50 | %, | 5/4/2027 | | | — | — | | 250 | | | 241 | | | 250 | | 241 | |
| TransAlta Corp | | | | | | | | | | | | | | | |
| 4.50 | %, | 11/15/2022 | | | 1,750 | 1,702 | | — | | | — | | | 1,750 | | 1,702 | |
| Tucson Electric Power Co | | | | | | | | | | | | | | | |
| 3.85 | %, | 3/15/2023 | | | 1,000 | 997 | | — | | | — | | | 1,000 | | 997 | |
| 4.85 | %, | 12/1/2048 | | | — | — | | 65 | | | 68 | | | 65 | | 68 | |
| Virginia Electric & Power Co | | | | | | | | | | | | | | | |
| 3.80 | %, | 4/1/2028 | | | — | — | | 180 | | | 181 | | | 180 | | 181 | |
| 4.60 | %, | 12/1/2048 | | | — | — | | 95 | | | 99 | | | 95 | | 99 | |
| 4.65 | %, | 8/15/2043 | | | — | — | | 65 | | | 67 | | | 65 | | 67 | |
| Vistra Energy Corp | | | | | | | | | | | | | | | |
| 8.13 | %, | 1/30/2026(h) | | | — | — | | 35 | | | 38 | | | 35 | | 38 | |
| Vistra Operations Co LLC | | | | | | | | | | | | | | | |
| 5.50 | %, | 9/1/2026(h) | | | — | — | | 120 | | | 115 | | | 120 | | 115 | |
| | | | | | $ | 14,156 | | | $ | | 7,377 | | | | $ | 21,533 | |
| Electrical Components & Equipment - 0.01% | | | | | | | | | | | | | | | |
| Energizer Gamma Acquisition Inc | | | | | | | | | | | | | | | |
| 6.38 | %, | 7/15/2026(h) | | | — | — | | 45 | | | 41 | | | 45 | | 41 | |
| Electronics - 0.19% | | | | | | | | | | | | | | | |
| Corning Inc | | | | | | | | | | | | | | | | | |
| 4.75 | %, | 3/15/2042 | | | 750 | 714 | | — | | | — | | | 750 | | 714 | |
See accompanying notes.
| | | | | | | | | | | | | | | | | | |
| | | | | | | | | Core Plus Bond | | | | | | Combined | | | |
| | | | | | Income Account | | | Account | Core Plus Bond | | | Portfolio | | Combined | |
| | | | | | Principal | Income Account | | Principal | Account Value | | | Principal | | Portfolio Value | |
| BONDS (continued) | | | Amount (000's) | Value (000's) | | Amount (000's) | | | (000 | 's) | | Amount (000's) | | (000 | 's) |
| Electronics (continued) | | | | | | | | | | | | | | | | |
| Sensata Technologies BV | | | | | | | | | | | | | | | | |
| 5.00 | %, | 10/1/2025(h) | | $ | — $ | — | $ | 155 | $ | | 146 | | $ | 155 | $ | 146 | |
| | | | | | $ | 714 | | | $ | | 146 | | | | $ | | 860 | |
| Engineering & Construction - 0.03% | | | | | | | | | | | | | | | | |
| MasTec Inc | | | | | | | | | | | | | | | | | | |
| 4.88 | %, | 3/15/2023 | | | — | — | | 70 | | | 68 | | | | 70 | | 68 | |
| Tutor Perini Corp | | | | | | | | | | | | | | | | |
| 6.88 | %, | 5/1/2025(h) | | | — | — | | 60 | | | 56 | | | | 60 | | 56 | |
| | | | | | $ | — | | | $ | | 124 | | | | $ | | 124 | |
| Entertainment - 0.18% | | | | | | | | | | | | | | | | |
| Boyne USA Inc | | | | | | | | | | | | | | | | |
| 7.25 | %, | 5/1/2025(h) | | | — | — | | 110 | | | 114 | | | 110 | | 114 | |
| Caesars Resort Collection LLC / CRC Finco Inc | | | | | | | | | | | | | | | | |
| 5.25 | %, | 10/15/2025(h) | | | — | — | | 160 | | | 138 | | | 160 | | 138 | |
| CCM Merger Inc | | | | | | | | | | | | | | | | |
| 6.00 | %, | 3/15/2022(h) | | | — | — | | 85 | | | 86 | | | | 85 | | 86 | |
| Eldorado Resorts Inc | | | | | | | | | | | | | | | | |
| 6.00 | %, | 4/1/2025 | | | — | — | | 35 | | | 34 | | | | 35 | | 34 | |
| 6.00 | %, | 9/15/2026(h) | | | — | — | | 95 | | | 90 | | | | 95 | | 90 | |
| 7.00 | %, | 8/1/2023 | | | — | — | | 50 | | | 51 | | | | 50 | | 51 | |
| Enterprise Development Authority/The | | | | | | | | | | | | | | | | |
| 12.00 | %, | 7/15/2024(h) | | | — | — | | 130 | | | 118 | | | 130 | | 118 | |
| International Game Technology PLC | | | | | | | | | | | | | | | | |
| 6.50 | %, | 2/15/2025(h) | | | — | — | | 200 | | | 197 | | | 200 | | 197 | |
| | | | | | $ | — | | | $ | | 828 | | | | $ | | 828 | |
| Environmental Control - 0.38% | | | | | | | | | | | | | | | | |
| Advanced Disposal Services Inc | | | | | | | | | | | | | | | | |
| 5.63 | %, | 11/15/2024(h) | | | 500 | 489 | | — | | | — | | | 500 | | 489 | |
| Republic Services Inc | | | | | | | | | | | | | | | | |
| 3.55 | %, | 6/1/2022 | | | 1,000 | 1,004 | | — | | | — | | | 1,000 | | 1,004 | |
| Waste Connections Inc | | | | | | | | | | | | | | | | |
| 4.25 | %, | 12/1/2028 | | | — | — | | 255 | | | 261 | | | 255 | | 261 | |
| | | | | | $ | 1,493 | | | $ | | 261 | | | | $ | | 1,754 | |
| Food - 1.02% | | | | | | | | | | | | | | | | |
| Cencosud SA | | | | | | | | | | | | | | | | |
| 4.38 | %, | 7/17/2027(h) | | | — | — | | 220 | | | 191 | | | 220 | | 191 | |
| General Mills Inc | | | | | | | | | | | | | | | | |
| 4.55 | %, | 4/17/2038 | | | — | — | | 240 | | | 223 | | | 240 | | 223 | |
| 4.70 | %, | 4/17/2048 | | | — | — | | 295 | | | 270 | | | 295 | | 270 | |
| Gruma SAB de CV | | | | | | | | | | | | | | | | |
| 4.88 | %, | 12/1/2024(h) | | | — | — | | 350 | | | 351 | | | 350 | | 351 | |
| Ingles Markets Inc | | | | | | | | | | | | | | | | |
| 5.75 | %, | 6/15/2023 | | | — | — | | 145 | | | 143 | | | 145 | | 143 | |
| JBS USA LUX SA / JBS USA Finance Inc | | | | | | | | | | | | | | | | |
| 5.75 | %, | 6/15/2025(h) | | | — | — | | 125 | | | 119 | | | 125 | | 119 | |
See accompanying notes.
| | | | | | | | | | | | | | | | |
| | | | | | | | | Core Plus Bond | | | | | Combined | | | |
| | | | | | Income Account | | | Account | | Core Plus Bond | | | Portfolio | | Combined | |
| | | | | | Principal | Income Account | | Principal | | Account Value | | | Principal | | Portfolio Value | |
| BONDS (continued) | | | Amount (000's) | Value (000's) | | Amount (000's) | | (000 | 's) | | Amount (000's) | | (000 | 's) |
| Food (continued) | | | | | | | | | | | | | | |
| JBS USA LUX SA / JBS USA Finance Inc | | | | | | | | | | | | | | |
| (continued) | | | | | | | | | | | | | | | | |
| 7.25 | %, | 6/1/2021(h) | | $ | — $ | — | $ | 95 | $ | 96 | | $ | 95 | $ | 96 | |
| Kraft Heinz Foods Co | | | | | | | | | | | | | | |
| 2.80 | %, | 7/2/2020 | | | — | — | | 460 | | 457 | | | 460 | | 457 | |
| 3.95 | %, | 7/15/2025 | | | 500 | 484 | | — | | — | | | 500 | | 484 | |
| McCormick & Co Inc/MD | | | | | | | | | | | | | | |
| 3.15 | %, | 8/15/2024 | | | — | — | | 325 | | 313 | | | 325 | | 313 | |
| 3.40 | %, | 8/15/2027 | | | — | — | | 220 | | 208 | | | 220 | | 208 | |
| Nestle Holdings Inc | | | | | | | | | | | | | | |
| 3.35 | %, | 9/24/2023(h) | | | — | — | | 525 | | 530 | | | 525 | | 530 | |
| 3.50 | %, | 9/24/2025(h) | | | — | — | | 540 | | 542 | | | 540 | | 542 | |
| Post Holdings Inc | | | | | | | | | | | | | | |
| 5.00 | %, | 8/15/2026(h) | | | — | — | | 180 | | 164 | | | 180 | | 164 | |
| 5.75 | %, | 3/1/2027(h) | | | — | — | | 30 | | 28 | | | 30 | | 28 | |
| Want Want China Finance Ltd | | | | | | | | | | | | | | |
| 2.88 | %, | 4/27/2022 | | | — | — | | 200 | | 195 | | | 200 | | 195 | |
| Wm Wrigley Jr Co | | | | | | | | | | | | | | |
| 3.38 | %, | 10/21/2020(h) | | | — | — | | 415 | | 416 | | | 415 | | 416 | |
| | | | | | $ | 484 | | | $ | 4,246 | | | | $ | 4,730 | |
| Forest Products & Paper - 0.10% | | | | | | | | | | | | | | |
| Domtar Corp | | | | | | | | | | | | | | |
| 6.25 | %, | 9/1/2042 | | | — | — | | 225 | | 220 | | | 225 | | 220 | |
| International Paper Co | | | | | | | | | | | | | | |
| 4.35 | %, | 8/15/2048 | | | — | — | | 250 | | 214 | | | 250 | | 214 | |
| Sappi Papier Holding GmbH | | | | | | | | | | | | | | |
| 7.50 | %, | 6/15/2032(h) | | | — | — | | 50 | | 47 | | | 50 | | 47 | |
| | | | | | $ | — | | | $ | 481 | | | | $ | 481 | |
| Gas - 0.07% | | | | | | | | | | | | | | |
| Dominion Energy Gas Holdings LLC | | | | | | | | | | | | | | |
| 4.80 | %, | 11/1/2043 | | | — | — | | 10 | | 10 | | | 10 | | 10 | |
| NGL Energy Partners LP / NGL Energy Finance | | | | | | | | | | | | | | |
| Corp | | | | | | | | | | | | | | | | |
| 7.50 | %, | 11/1/2023 | | | — | — | | 165 | | 159 | | | 165 | | 159 | |
| Southern Co Gas Capital Corp | | | | | | | | | | | | | | |
| 4.40 | %, | 5/30/2047 | | | — | — | | 165 | | 154 | | | 165 | | 154 | |
| | | | | | $ | — | | | $ | 323 | | | | $ | 323 | |
| Healthcare - Products - 0.41% | | | | | | | | | | | | | | |
| Abbott Laboratories | | | | | | | | | | | | | | |
| 2.90 | %, | 11/30/2021 | | | — | — | | 195 | | 193 | | | 195 | | 193 | |
| 3.75 | %, | 11/30/2026 | | | — | — | | 170 | | 168 | | | 170 | | 168 | |
| 4.90 | %, | 11/30/2046 | | | — | — | | 195 | | 205 | | | 195 | | 205 | |
| Agiliti Health Inc | | | | | | | | | | | | | | |
| 7.63 | %, | 8/15/2020 | | | — | — | | 165 | | 164 | | | 165 | | 164 | |
See accompanying notes.
| | | | | | | | | | | | | | | | | | |
| | | | | | | | | Core Plus Bond | | | | | | Combined | | | |
| | | | | | Income Account | | | Account | Core Plus Bond | | | Portfolio | | Combined | |
| | | | | | Principal | Income Account | | Principal | Account Value | | | Principal | | Portfolio Value | |
| BONDS (continued) | | | Amount (000's) | Value (000's) | | Amount (000's) | (000 | 's) | | Amount (000's) | | (000 | 's) |
| Healthcare - Products (continued) | | | | | | | | | | | | | | | | |
| Becton Dickinson and Co | | | | | | | | | | | | | | | | |
| 3.77 | %, | 6/6/2022 | | $ | — $ | — | $ | 165 | $ | | 162 | | $ | 165 | $ | 162 | |
| 3 Month USD LIBOR + 1.03% | | | | | | | | | | | | | | | | |
| Covidien International Finance SA | | | | | | | | | | | | | | | | |
| 4.20 | %, | 6/15/2020 | | | — | — | | 480 | | | 488 | | | 480 | | 488 | |
| DJO Finance LLC / DJO Finance Corp | | | | | | | | | | | | | | | | |
| 8.13 | %, | 6/15/2021(h) | | | — | — | | 75 | | | 77 | | | | 75 | | 77 | |
| Hill-Rom Holdings Inc | | | | | | | | | | | | | | | | |
| 5.75 | %, | 9/1/2023(h) | | | — | — | | 60 | | | 60 | | | | 60 | | 60 | |
| Kinetic Concepts Inc / KCI USA Inc | | | | | | | | | | | | | | | | |
| 7.88 | %, | 2/15/2021(h) | | | — | — | | 70 | | | 71 | | | | 70 | | 71 | |
| Medtronic Inc | | | | | | | | | | | | | | | | |
| 2.50 | %, | 3/15/2020 | | | — | — | | 65 | | | 64 | | | | 65 | | 64 | |
| 4.38 | %, | 3/15/2035 | | | — | — | | 245 | | | 251 | | | 245 | | 251 | |
| | | | | | $ | — | | | $ | | 1,903 | | | | $ | | 1,903 | |
| Healthcare - Services - 1.09% | | | | | | | | | | | | | | | | |
| AHP Health Partners Inc | | | | | | | | | | | | | | | | |
| 9.75 | %, | 7/15/2026(h) | | | — | — | | 80 | | | 81 | | | | 80 | | 81 | |
| Centene Corp | | | | | | | | | | | | | | | | |
| 4.75 | %, | 5/15/2022 | | | — | — | | 40 | | | 40 | | | | 40 | | 40 | |
| 5.38 | %, | 6/1/2026(h) | | | — | — | | 100 | | | 97 | | | 100 | | 97 | |
| 5.63 | %, | 2/15/2021 | | | — | — | | 40 | | | 40 | | | | 40 | | 40 | |
| 6.13 | %, | 2/15/2024 | | | — | — | | 60 | | | 62 | | | | 60 | | 62 | |
| Encompass Health Corp | | | | | | | | | | | | | | | | |
| 5.75 | %, | 11/1/2024 | | | 500 | 495 | | — | | | — | | | 500 | | 495 | |
| HCA Inc | | | | | | | | | | | | | | | | | | |
| 4.75 | %, | 5/1/2023 | | | — | — | | 245 | | | 241 | | | 245 | | 241 | |
| 5.00 | %, | 3/15/2024 | | | — | — | | 125 | | | 124 | | | 125 | | 124 | |
| 5.25 | %, | 4/15/2025 | | | — | — | | 105 | | | 105 | | | 105 | | 105 | |
| 5.38 | %, | 9/1/2026 | | | — | — | | 35 | | | 34 | | | | 35 | | 34 | |
| 5.50 | %, | 6/15/2047 | | | — | — | | 50 | | | 47 | | | | 50 | | 47 | |
| 5.88 | %, | 3/15/2022 | | | — | — | | 10 | | | 10 | | | | 10 | | 10 | |
| 7.50 | %, | 11/6/2033 | | | 250 | 263 | | — | | | — | | | 250 | | 263 | |
| MPH Acquisition Holdings LLC | | | | | | | | | | | | | | | | |
| 7.13 | %, | 6/1/2024(h) | | | — | — | | 75 | | | 70 | | | | 75 | | 70 | |
| Polaris Intermediate Corp | | | | | | | | | | | | | | | | |
| 8.50%, PIK 9.25%, 12/1/2022(h),(i),(j) | | | — | — | | 155 | | | 141 | | | 155 | | 141 | |
| Roche Holdings Inc | | | | | | | | | | | | | | | | |
| 3.14 | %, | 9/30/2019(h) | | | 500 | 500 | | — | | | — | | | 500 | | 500 | |
| 3 Month USD LIBOR + 0.34% | | | | | | | | | | | | | | | | |
| Surgery Center Holdings Inc | | | | | | | | | | | | | | | | |
| 8.88 | %, | 4/15/2021(h) | | | 2,000 | 1,995 | | — | | | — | | | 2,000 | | 1,995 | |
| Tenet Healthcare Corp | | | | | | | | | | | | | | | | |
| 4.63 | %, | 7/15/2024 | | | — | — | | 95 | | | 88 | | | | 95 | | 88 | |
| UnitedHealth Group Inc | | | | | | | | | | | | | | | | |
| 3.88 | %, | 12/15/2028 | | | — | — | | 425 | | | 431 | | | 425 | | 431 | |
See accompanying notes.
| | | | | | | | | | | | | | | | | | |
| | | | | | | | | | Core Plus Bond | | | | | | Combined | | | |
| | | | | | Income Account | | | | Account | Core Plus Bond | | | Portfolio | | Combined | |
| | | | | | Principal | | Income Account | | Principal | Account Value | | | Principal | | Portfolio Value | |
| BONDS (continued) | | | Amount (000's) | | Value (000's) | | Amount (000's) | | | (000 | 's) | | Amount (000's) | | (000 | 's) |
| Healthcare – Services (continued) | | | | | | | | | | | | | | | | |
| WellCare Health Plans Inc | | | | | | | | | | | | | | | | |
| 5.25 | %, | 4/1/2025 | | $ | — | $ | — | $ | 155 | | $ | 149 | | $ | 155 | $ | 149 | |
| 5.38 | %, | 8/15/2026(h) | | | — | | — | | 30 | | | 29 | | | 30 | | 29 | |
| | | | | | $ | | 3,253 | | | $ | | 1,789 | | | $ | | 5,042 | |
| Home Builders - 0.12% | | | | | | | | | | | | | | | | |
| Century Communities Inc | | | | | | | | | | | | | | | | |
| 5.88 | %, | 7/15/2025 | | | — | | — | | 165 | | | 145 | | | 165 | | 145 | |
| Lennar Corp | | | | | | | | | | | | | | | | |
| 4.50 | %, | 4/30/2024 | | | — | | — | | 151 | | | 143 | | | 151 | | 143 | |
| 4.88 | %, | 12/15/2023 | | | — | | — | | 40 | | | 38 | | | 40 | | 38 | |
| LGI Homes Inc | | | | | | | | | | | | | | | | |
| 6.88 | %, | 7/15/2026(h) | | | — | | — | | 75 | | | 67 | | | 75 | | 67 | |
| Taylor Morrison Communities Inc / Taylor | | | | | | | | | | | | | | | | |
| Morrison Holdings II Inc | | | | | | | | | | | | | | | | |
| 5.63 | %, | 3/1/2024(h) | | | — | | — | | 70 | | | 67 | | | 70 | | 67 | |
| Williams Scotsman International Inc | | | | | | | | | | | | | | | | |
| 7.88 | %, | 12/15/2022(h) | | | — | | — | | 95 | | | 93 | | | 95 | | 93 | |
| | | | | | $ | | — | | | $ | | 553 | | | $ | | 553 | |
| Home Equity Asset Backed Securities - 0.04% | | | | | | | | | | | | | | | | |
| Saxon Asset Securities Trust 2004-1 | | | | | | | | | | | | | | | | |
| 3.26 | %, | 3/25/2035 | | | — | | — | | 124 | | | 67 | | | 124 | | 67 | |
| 1.00 x 1 Month USD LIBOR + 1.70% | | | | | | | | | | | | | | | | |
| Specialty Underwriting & Residential Finance | | | | | | | | | | | | | | | | |
| Trust Series 2004-BC1 | | | | | | | | | | | | | | | | |
| 3.27 | %, | 2/25/2035 | | | — | | — | | 123 | | | 122 | | | 123 | | 122 | |
| 1.00 x 1 Month USD LIBOR + 0.77% | | | | | | | | | | | | | | | | |
| | | | | | $ | | — | | | $ | | 189 | | | $ | | 189 | |
| Housewares - 0.10% | | | | | | | | | | | | | | | | |
| Newell Brands Inc | | | | | | | | | | | | | | | | |
| 4.20 | %, | 4/1/2026 | | | 500 | | 489 | | — | | | — | | | 500 | | 489 | |
| Insurance - 2.29% | | | | | | | | | | | | | | | | |
| AIA Group Ltd | | | | | | | | | | | | | | | | |
| 3.20 | %, | 3/11/2025(h) | | | — | | — | | 410 | | | 395 | | | 410 | | 395 | |
| 3.90 | %, | 4/6/2028(h) | | | — | | — | | 625 | | | 625 | | | 625 | | 625 | |
| American International Group Inc | | | | | | | | | | | | | | | | |
| 3.90 | %, | 4/1/2026 | | | — | | — | | 805 | | | 774 | | | 805 | | 774 | |
| 4.50 | %, | 7/16/2044 | | | — | | — | | 305 | | | 272 | | | 305 | | 272 | |
| Arch Capital Finance LLC | | | | | | | | | | | | | | | | |
| 4.01 | %, | 12/15/2026 | | | — | | — | | 265 | | | 265 | | | 265 | | 265 | |
| 5.03 | %, | 12/15/2046 | | | — | | — | | 115 | | | 120 | | | 115 | | 120 | |
| AssuredPartners Inc | | | | | | | | | | | | | | | | |
| 7.00 | %, | 8/15/2025(h) | | | — | | — | | 60 | | | 54 | | | 60 | | 54 | |
| AXA Equitable Holdings Inc | | | | | | | | | | | | | | | | |
| 5.00 | %, | 4/20/2048(h) | | | — | | — | | 460 | | | 408 | | | 460 | | 408 | |
| AXA SA | | | | | | | | | | | | | | | | | | |
| 5.12 | %, | 1/17/2047(k) | | | — | | — | | 300 | | | 284 | | | 300 | | 284 | |
| 3 Month USD LIBOR + 3.88% | | | | | | | | | | | | | | | | |
See accompanying notes.
| | | | | | | | | | | | | | | | | | |
| | | | | | | | | | Core Plus Bond | | | | | Combined | | | |
| | | | | | Income Account | | | | Account | | Core Plus Bond | | | Portfolio | | Combined | |
| | | | | | Principal | | Income Account | | Principal | | Account Value | | | Principal | | Portfolio Value | |
| BONDS (continued) | | | Amount (000's) | | Value (000's) | | Amount (000's) | | (000 | 's) | | Amount (000's) | | (000 | 's) |
| Insurance (continued) | | | | | | | | | | | | | | | | |
| Fidelity National Financial Inc | | | | | | | | | | | | | | | | |
| 4.50 | %, | 8/15/2028(h) | | $ | 1,000 | $ | 988 | $ | — | $ | — | | $ | 1,000 | $ | 988 | |
| First American Financial Corp | | | | | | | | | | | | | | | | |
| 4.30 | %, | 2/1/2023(c) | | | 2,000 | | 2,008 | | — | | — | | | 2,000 | | 2,008 | |
| HUB International Ltd | | | | | | | | | | | | | | | | |
| 7.00 | %, | 5/1/2026(h) | | | — | | — | | 25 | | 23 | | | | 25 | | 23 | |
| Liberty Mutual Group Inc | | | | | | | | | | | | | | | | |
| 5.69 | %, | 3/7/2067(h) | | | — | | — | | 260 | | 242 | | | 260 | | 242 | |
| 3 Month USD LIBOR + 2.91% | | | | | | | | | | | | | | | | |
| Markel Corp | | | | | | | | | | | | | | | | |
| 3.50 | %, | 11/1/2027 | | | — | | — | | 130 | | 123 | | | 130 | | 123 | |
| 4.30 | %, | 11/1/2047 | | | — | | — | | 95 | | 83 | | | | 95 | | 83 | |
| 5.00 | %, | 4/5/2046 | | | — | | — | | 280 | | 278 | | | 280 | | 278 | |
| Nuveen Finance LLC | | | | | | | | | | | | | | | | |
| 4.13 | %, | 11/1/2024(h) | | | — | | — | | 640 | | 652 | | | 640 | | 652 | |
| Prudential Financial Inc | | | | | | | | | | | | | | | | |
| 5.63 | %, | 6/15/2043(k) | | | — | | — | | 225 | | 220 | | | 225 | | 220 | |
| 3 Month USD LIBOR + 3.92% | | | | | | | | | | | | | | | | |
| Prudential Financial Inc (continued) | | | | | | | | | | | | | | | | |
| 7.38 | %, | 6/15/2019 | | | 1,000 | | 1,018 | | — | | — | | | 1,000 | | 1,018 | |
| Voya Financial Inc | | | | | | | | | | | | | | | | |
| 5.65 | %, | 5/15/2053(k) | | | — | | — | | 475 | | 446 | | | 475 | | 446 | |
| 3 Month USD LIBOR + 3.58% | | | | | | | | | | | | | | | | |
| 6.13 | %, | 12/31/2049(k),(l) | | | — | | — | | 50 | | 47 | | | | 50 | | 47 | |
| US Treasury Yield Curve Rate T Note | | | | | | | | | | | | | | | | |
| Constant Maturity 5 Year + 3.36% | | | | | | | | | | | | | | | | |
| XLIT Ltd | | | | | | | | | | | | | | | | | | |
| 4.45 | %, | 3/31/2025 | | | — | | — | | 685 | | 681 | | | 685 | | 681 | |
| 4.89 | %, | 12/31/2049(l) | | | — | | — | | 235 | | 219 | | | 235 | | 219 | |
| 3 Month USD LIBOR + 2.46% | | | | | | | | | | | | | | | | |
| 5.50 | %, | 3/31/2045 | | | — | | — | | 375 | | 388 | | | 375 | | 388 | |
| | | | | | $ | | 4,014 | | | $ | 6,599 | | | | $ | | 10,613 | |
| Internet - 0.38% | | | | | | | | | | | | | | | | |
| Alibaba Group Holding Ltd | | | | | | | | | | | | | | | | |
| 3.40 | %, | 12/6/2027 | | | — | | — | | 200 | | 185 | | | 200 | | 185 | |
| Amazon.com Inc | | | | | | | | | | | | | | | | |
| 4.05 | %, | 8/22/2047 | | | 750 | | 733 | | — | | — | | | 750 | | 733 | |
| Baidu Inc | | | | | | | | | | | | | | | | | | |
| 4.38 | %, | 5/14/2024 | | | — | | — | | 400 | | 403 | | | 400 | | 403 | |
| Netflix Inc | | | | | | | | | | | | | | | | | | |
| 4.38 | %, | 11/15/2026 | | | — | | — | | 130 | | 118 | | | 130 | | 118 | |
| Tencent Holdings Ltd | | | | | | | | | | | | | | | | |
| 2.99 | %, | 1/19/2023(h) | | | — | | — | | 200 | | 194 | | | 200 | | 194 | |
| Zayo Group LLC / Zayo Capital Inc | | | | | | | | | | | | | | | | |
| 6.00 | %, | 4/1/2023 | | | — | | — | | 140 | | 133 | | | 140 | | 133 | |
| | | | | | $ | | 733 | | | $ | 1,033 | | | | $ | | 1,766 | |
See accompanying notes.
| | | | | | | | | | | | | | | | |
| | | | | | | | | Core Plus Bond | | | | | Combined | | | |
| | | | | | Income Account | | | Account | | Core Plus Bond | | | Portfolio | | Combined | |
| | | | | | Principal | Income Account | | Principal | | Account Value | | | Principal | | Portfolio Value | |
| BONDS (continued) | | | Amount (000's) | Value (000's) | | Amount (000's) | | (000's) | | | Amount (000's) | | (000 | 's) |
| Iron & Steel - 0.44% | | | | | | | | | | | | | | |
| AK Steel Corp | | | | | | | | | | | | | | |
| 6.38 | %, | 10/15/2025 | | $ | — $ | — | $ | 140 | $ | 108 | | $ | 140 | $ | 108 | |
| 7.50 | %, | 7/15/2023 | | | — | — | | 50 | | 50 | | | 50 | | 50 | |
| 7.63 | %, | 10/1/2021 | | | — | — | | 25 | | 22 | | | 25 | | 22 | |
| Allegheny Technologies Inc | | | | | | | | | | | | | | |
| 5.95 | %, | 1/15/2021 | | | 1,000 | 980 | | — | | — | | | 1,000 | | 980 | |
| 7.88 | %, | 8/15/2023 | | | 500 | 510 | | — | | — | | | 500 | | 510 | |
| Cleveland-Cliffs Inc | | | | | | | | | | | | | | |
| 4.88 | %, | 1/15/2024(h) | | | — | — | | 40 | | 37 | | | 40 | | 37 | |
| Commercial Metals Co | | | | | | | | | | | | | | |
| 4.88 | %, | 5/15/2023 | | | — | — | | 77 | | 73 | | | 77 | | 73 | |
| Vale Overseas Ltd | | | | | | | | | | | | | | |
| 4.38 | %, | 1/11/2022 | | | — | — | | 35 | | 36 | | | 35 | | 36 | |
| 6.25 | %, | 8/10/2026 | | | — | — | | 120 | | 129 | | | 120 | | 129 | |
| 6.88 | %, | 11/21/2036 | | | — | — | | 96 | | 110 | | | 96 | | 110 | |
| | | | | | $ | 1,490 | | | $ | 565 | | | | $ | 2,055 | |
| Leisure Products & Services - 0.04% | | | | | | | | | | | | | | |
| Constellation Merger Sub Inc | | | | | | | | | | | | | | |
| 8.50 | %, | 9/15/2025(h) | | | — | — | | 80 | | 72 | | | 80 | | 72 | |
| Silversea Cruise Finance Ltd | | | | | | | | | | | | | | |
| 7.25 | %, | 2/1/2025(h) | | | — | — | | 120 | | 127 | | | 120 | | 127 | |
| | | | | | $ | — | | | $ | 199 | | | | $ | 199 | |
| Lodging - 0.06% | | | | | | | | | | | | | | |
| Jack Ohio Finance LLC / Jack Ohio Finance 1 | | | | | | | | | | | | | | |
| Corp | | | | | | | | | | | | | | | | |
| 6.75 | %, | 11/15/2021(h) | | | — | — | | 140 | | 141 | | | 140 | | 141 | |
| Wynn Las Vegas LLC / Wynn Las Vegas Capital | | | | | | | | | | | | | | |
| Corp | | | | | | | | | | | | | | | | |
| 5.25 | %, | 5/15/2027(h) | | | — | — | | 110 | | 97 | | | 110 | | 97 | |
| 5.50 | %, | 3/1/2025(h) | | | — | — | | 50 | | 47 | | | 50 | | 47 | |
| | | | | | $ | — | | | $ | 285 | | | | $ | 285 | |
| Machinery - Construction & Mining - 0.02% | | | | | | | | | | | | | | |
| BWX Technologies Inc | | | | | | | | | | | | | | |
| 5.38 | %, | 7/15/2026(h) | | | — | — | | 75 | | 72 | | | 75 | | 72 | |
| Machinery - Diversified - 0.03% | | | | | | | | | | | | | | |
| Cloud Crane LLC | | | | | | | | | | | | | | |
| 10.13 | %, | 8/1/2024(h) | | | — | — | | 130 | | 134 | | | 130 | | 134 | |
| Media - 2.98% | | | | | | | | | | | | | | |
| 21st Century Fox America Inc | | | | | | | | | | | | | | |
| 3.00 | %, | 9/15/2022 | | | — | — | | 170 | | 168 | | | 170 | | 168 | |
| 5.40 | %, | 10/1/2043 | | | — | — | | 230 | | 265 | | | 230 | | 265 | |
| 6.15 | %, | 2/15/2041 | | | — | — | | 35 | | 44 | | | 35 | | 44 | |
| 6.20 | %, | 12/15/2034 | | | — | — | | 80 | | 97 | | | 80 | | 97 | |
| 6.40 | %, | 12/15/2035 | | | 1,000 | 1,248 | | 405 | | 505 | | | 1,405 | | 1,753 | |
| Altice Financing SA | | | | | | | | | | | | | | |
| 6.63 | %, | 2/15/2023(h) | | | — | — | | 200 | | 192 | | | 200 | | 192 | |
See accompanying notes.
| | | | | | | | | | | | | | | | | |
| | | | | | | | | | Core Plus Bond | | | | | Combined | | | |
| | | | | | Income Account | | | | Account | | Core Plus Bond | | | Portfolio | | Combined | |
| | | | | | Principal | | Income Account | | Principal | | Account Value | | | Principal | | Portfolio Value | |
| BONDS (continued) | | | Amount (000's) | | Value (000's) | | Amount (000's) | | (000 | 's) | | Amount (000's) | | (000 | 's) |
| Media (continued) | | | | | | | | | | | | | | | |
| AMC Networks Inc | | | | | | | | | | | | | | | |
| 4.75 | %, | 8/1/2025 | | $ | — | $ | — | $ | 115 | $ | 104 | | $ | 115 | $ | 104 | |
| 5.00 | %, | 4/1/2024 | | | — | | — | | 60 | | 57 | | | 60 | | 57 | |
| CCO Holdings LLC / CCO Holdings Capital | | | | | | | | | | | | | | | |
| Corp | | | | | | | | | | | | | | | | | |
| 5.13 | %, | 5/1/2023(h) | | | — | | — | | 430 | | 418 | | | 430 | | 418 | |
| 5.50 | %, | 5/1/2026(h) | | | — | | — | | 35 | | 34 | | | 35 | | 34 | |
| Charter Communications Operating LLC / | | | | | | | | | | | | | | | |
| Charter Communications Operating Capital | | | | | | | | | | | | | | | |
| 3.58 | %, | 7/23/2020 | | | — | | — | | 305 | | 305 | | | 305 | | 305 | |
| 5.75 | %, | 4/1/2048 | | | — | | — | | 250 | | 234 | | | 250 | | 234 | |
| 6.48 | %, | 10/23/2045 | | | — | | — | | 150 | | 154 | | | 150 | | 154 | |
| Comcast Corp | | | | | | | | | | | | | | | |
| 3.38 | %, | 2/15/2025 | | | — | | — | | 335 | | 328 | | | 335 | | 328 | |
| 3.95 | %, | 10/15/2025 | | | — | | — | | 200 | | 202 | | | 200 | | 202 | |
| 4.15 | %, | 10/15/2028 | | | — | | — | | 405 | | 411 | | | 405 | | 411 | |
| 4.20 | %, | 8/15/2034 | | | — | | — | | 160 | | 154 | | | 160 | | 154 | |
| 4.60 | %, | 10/15/2038 | | | — | | — | | 405 | | 409 | | | 405 | | 409 | |
| 4.60 | %, | 8/15/2045 | | | — | | — | | 160 | | 156 | | | 160 | | 156 | |
| 4.70 | %, | 10/15/2048 | | | — | | — | | 330 | | 334 | | | 330 | | 334 | |
| 6.45 | %, | 3/15/2037 | | | 2,000 | | 2,385 | | — | | — | | | 2,000 | | 2,385 | |
| CSC Holdings LLC | | | | | | | | | | | | | | | |
| 10.13 | %, | 1/15/2023(h) | | | — | | — | | 215 | | 231 | | | 215 | | 231 | |
| Discovery Communications LLC | | | | | | | | | | | | | | | |
| 5.00 | %, | 9/20/2037 | | | — | | — | | 205 | | 190 | | | 205 | | 190 | |
| DISH DBS Corp | | | | | | | | | | | | | | | |
| 5.88 | %, | 7/15/2022 | | | — | | — | | 300 | | 276 | | | 300 | | 276 | |
| 5.88 | %, | 11/15/2024 | | | — | | — | | 90 | | 73 | | | 90 | | 73 | |
| 7.75 | %, | 7/1/2026 | | | — | | — | | 20 | | 17 | | | 20 | | 17 | |
| Grupo Televisa SAB | | | | | | | | | | | | | | | |
| 5.00 | %, | 5/13/2045 | | | — | | — | | 200 | | 175 | | | 200 | | 175 | |
| Meredith Corp | | | | | | | | | | | | | | | |
| 6.88 | %, | 2/1/2026(h) | | | — | | — | | 220 | | 215 | | | 220 | | 215 | |
| Myriad International Holdings BV | | | | | | | | | | | | | | | |
| 4.85 | %, | 7/6/2027(h) | | | — | | — | | 200 | | 192 | | | 200 | | 192 | |
| NBCUniversal Media LLC | | | | | | | | | | | | | | | |
| 4.45 | %, | 1/15/2043 | | | — | | — | | 145 | | 140 | | | 145 | | 140 | |
| NBCUniversal Media LLC (continued) | | | | | | | | | | | | | | | |
| 5.15 | %, | 4/30/2020 | | | — | | — | | 505 | | 519 | | | 505 | | 519 | |
| Radiate Holdco LLC / Radiate Finance Inc | | | | | | | | | | | | | | | |
| 6.63 | %, | 2/15/2025(h) | | | — | | — | | 35 | | 30 | | | 35 | | 30 | |
| 6.88 | %, | 2/15/2023(h) | | | — | | — | | 40 | | 36 | | | 40 | | 36 | |
| Time Warner Cable LLC | | | | | | | | | | | | | | | |
| 5.88 | %, | 11/15/2040 | | | — | | — | | 135 | | 129 | | | 135 | | 129 | |
| 6.55 | %, | 5/1/2037 | | | 1,500 | | 1,539 | | — | | — | | | 1,500 | | 1,539 | |
| 6.75 | %, | 6/15/2039 | | | 500 | | 508 | | — | | — | | | 500 | | 508 | |
| Viacom Inc | | | | | | | | | | | | | | | | | |
| 4.25 | %, | 9/1/2023 | | | — | | — | | 110 | | 110 | | | 110 | | 110 | |
See accompanying notes.
| | | | | | | | | | | | | | | | | |
| | | | | | | | | Core Plus Bond | | | | | | Combined | | | |
| | | | | | Income Account | | | Account | Core Plus Bond | | | Portfolio | | Combined | |
| | | | | | Principal | Income Account | | Principal | Account Value | | | Principal | | Portfolio Value | |
| BONDS (continued) | | | Amount (000's) | Value (000's) | | Amount (000's) | | | (000 | 's) | | Amount (000's) | | (000 | 's) |
| Media (continued) | | | | | | | | | | | | | | | |
| Viacom Inc (continued) | | | | | | | | | | | | | | | |
| 4.38 | %, | 3/15/2043 | | $ | — $ | — | $ | 250 | $ | | 197 | | $ | 250 | $ | 197 | |
| Virgin Media Finance PLC | | | | | | | | | | | | | | | |
| 6.00 | %, | 10/15/2024(h) | | | — | — | | 200 | | | 192 | | | 200 | | 192 | |
| Warner Media LLC | | | | | | | | | | | | | | | |
| 2.10 | %, | 6/1/2019 | | | — | — | | 135 | | | 134 | | | 135 | | 134 | |
| 3.88 | %, | 1/15/2026 | | | — | — | | 175 | | | 167 | | | 175 | | 167 | |
| 4.05 | %, | 12/15/2023 | | | — | — | | 135 | | | 135 | | | 135 | | 135 | |
| 5.38 | %, | 10/15/2041 | | | — | — | | 130 | | | 125 | | | 130 | | 125 | |
| Ziggo Bond Co BV | | | | | | | | | | | | | | | |
| 6.00 | %, | 1/15/2027(h) | | | — | — | | 150 | | | 131 | | | 150 | | 131 | |
| Ziggo BV | | | | | | | | | | | | | | | | | |
| 5.50 | %, | 1/15/2027(h) | | | — | — | | 150 | | | 134 | | | 150 | | 134 | |
| | | | | | $ | 5,680 | | | $ | | 8,119 | | | | $ | 13,799 | |
| Metal Fabrication & Hardware - 0.01% | | | | | | | | | | | | | | | |
| Park-Ohio Industries Inc | | | | | | | | | | | | | | | |
| 6.63 | %, | 4/15/2027 | | | — | — | | 60 | | | 57 | | | 60 | | 57 | |
| Mining - 0.41% | | | | | | | | | | | | | | | |
| Corp Nacional del Cobre de Chile | | | | | | | | | | | | | | | |
| 4.50 | %, | 9/16/2025(h) | | | — | — | | 450 | | | 456 | | | 450 | | 456 | |
| First Quantum Minerals Ltd | | | | | | | | | | | | | | | |
| 7.50 | %, | 4/1/2025(h) | | | — | — | | 200 | | | 165 | | | 200 | | 165 | |
| FMG Resources August 2006 Pty Ltd | | | | | | | | | | | | | | | |
| 5.13 | %, | 3/15/2023(h) | | | — | — | | 80 | | | 75 | | | 80 | | 75 | |
| 5.13 | %, | 5/15/2024(h) | | | — | — | | 25 | | | 23 | | | 25 | | 23 | |
| Glencore Finance Canada Ltd | | | | | | | | | | | | | | | |
| 5.55 | %, | 10/25/2042(h) | | | — | — | | 255 | | | 230 | | | 255 | | 230 | |
| Glencore Funding LLC | | | | | | | | | | | | | | | |
| 3.88 | %, | 10/27/2027(h) | | | — | — | | 250 | | | 223 | | | 250 | | 223 | |
| Hudbay Minerals Inc | | | | | | | | | | | | | | | |
| 7.63 | %, | 1/15/2025(h) | | | — | — | | 60 | | | 59 | | | 60 | | 59 | |
| IAMGOLD Corp | | | | | | | | | | | | | | | |
| 7.00 | %, | 4/15/2025(h) | | | — | — | | 230 | | | 216 | | | 230 | | 216 | |
| Newmont Mining Corp | | | | | | | | | | | | | | | |
| 5.13 | %, | 10/1/2019 | | | — | — | | 150 | | | 152 | | | 150 | | 152 | |
| |
| Northwest Acquisitions ULC / Dominion Finco | | | | | | | | | | | | | | | |
| Inc | | | | | | | | | | | | | | | | | |
| 7.13 | %, | 11/1/2022(h) | | | — | — | | 35 | | | 35 | | | 35 | | 35 | |
| Taseko Mines Ltd | | | | | | | | | | | | | | | |
| 8.75 | %, | 6/15/2022(h) | | | — | — | | 150 | | | 135 | | | 150 | | 135 | |
| Teck Resources Ltd | | | | | | | | | | | | | | | |
| 3.75 | %, | 2/1/2023 | | | — | — | | 15 | | | 14 | | | 15 | | 14 | |
| 6.25 | %, | 7/15/2041 | | | — | — | | 125 | | | 118 | | | 125 | | 118 | |
| 8.50 | %, | 6/1/2024(h) | | | — | — | | 15 | | | 16 | | | 15 | | 16 | |
| | | | | | $ | — | | | $ | | 1,917 | | | | $ | 1,917 | |
See accompanying notes.
| | | | | | | | | | | | | | |
| | | | | | | | Core Plus Bond | | | | Combined | | | |
| | | | | Income Account | | | Account | | Core Plus Bond | | Portfolio | | Combined | |
| | | | | Principal | | Income Account | Principal | | Account Value | | Principal | | Portfolio Value | |
| BONDS (continued) | | Amount (000's) | | Value (000's) | Amount (000's) | | (000 | 's) | Amount (000's) | | (000 | 's) |
| Miscellaneous Manufacturers - 0.09% | | | | | | | | | | | | |
| General Electric Co | | | | | | | | | | | | |
| 4.50 | %, | 3/11/2044 | | — | $ | — | 90 | | 73 | | 90 | | 73 | |
| 5.55 | %, | 1/5/2026 | | — | | — | 180 | | 176 | | 180 | | 176 | |
| 6.88 | %, | 1/10/2039 | | — | | — | 145 | | 152 | | 145 | | 152 | |
| | | | | | $ | — | | $ | 401 | | | $ | 401 | |
| Mortgage Backed Securities - 1.06% | | | | | | | | | | | | |
| Fannie Mae REMIC Trust 2005-W2 | | | | | | | | | | | | |
| 2.71 | %, | 5/25/2035 | | — | | — | 47 | | 47 | | 47 | | 47 | |
| 1.00 x 1 Month USD LIBOR + 0.20% | | | | | | | | | | | | |
| Fannie Mae REMICS | | | | | | | | | | | | |
| 2.25 | %, | 7/25/2040 | | — | | — | 106 | | 103 | | 106 | | 103 | |
| 3.00 | %, | 4/25/2022(m) | | — | | — | 357 | | 13 | | 357 | | 13 | |
| 3.00 | %, | 4/25/2027(m) | | — | | — | 267 | | 23 | | 267 | | 23 | |
| 3.50 | %, | 11/25/2027(m) | | — | | — | 188 | | 17 | | 188 | | 17 | |
| 3.50 | %, | 7/25/2028(m) | | — | | — | 360 | | 34 | | 360 | | 34 | |
| 3.50 | %, | 3/25/2031(m) | | — | | — | 432 | | 32 | | 432 | | 32 | |
| 3.59 | %, | 2/25/2043(m) | | — | | — | 386 | | 61 | | 386 | | 61 | |
| (1.00) x 1 Month USD LIBOR + 6.10% | | | | | | | | | | | | |
| 3.59 | %, | 9/25/2046(m) | | — | | — | 332 | | 49 | | 332 | | 49 | |
| (1.00) x 1 Month USD LIBOR + 6.10% | | | | | | | | | | | | |
| 3.64 | %, | 9/25/2047(m) | | — | | — | 873 | | 163 | | 873 | | 163 | |
| (1.00) x 1 Month USD LIBOR + 6.15% | | | | | | | | | | | | |
| 3.99 | %, | 3/25/2022(m) | | — | | — | 31 | | 1 | | 31 | | 1 | |
| (1.00) x 1 Month USD LIBOR + 6.50% | | | | | | | | | | | | |
| Freddie Mac REMICS | | | | | | | | | | | | |
| 3.00 | %, | 9/15/2025(m) | | — | | — | 92 | | 3 | | 92 | | 3 | |
| 3.00 | %, | 3/15/2026(m) | | — | | — | 265 | | 10 | | 265 | | 10 | |
| 3.00 | %, | 5/15/2027(m) | | — | | — | 256 | | 17 | | 256 | | 17 | |
| 3.00 | %, | 10/15/2027(m) | | — | | — | 115 | | 10 | | 115 | | 10 | |
| 3.50 | %, | 11/15/2020(m) | | — | | — | 224 | | 6 | | 224 | | 6 | |
| 3.50 | %, | 9/15/2026(m) | | — | | — | 618 | | 54 | | 618 | | 54 | |
| 4.00 | %, | 11/15/2038(m) | | — | | — | 571 | | 44 | | 571 | | 44 | |
| Ginnie Mae | | | | | | | | | | | | | | |
| 3.63 | %, | 6/20/2046(m) | | — | | — | 790 | | 136 | | 790 | | 136 | |
| (1.00) x 1 Month USD LIBOR + 6.10% | | | | | | | | | | | | |
| 3.73 | %, | 11/20/2045(m) | | — | | — | 2,098 | | 350 | | 2,098 | | 350 | |
| (1.00) x 1 Month USD LIBOR + 6.20% | | | | | | | | | | | | |
| 3.73 | %, | 8/20/2047(m) | | — | | — | 953 | | 191 | | 953 | | 191 | |
| (1.00) x 1 Month USD LIBOR + 6.20% | | | | | | | | | | | | |
| 3.73 | %, | 9/20/2047(m) | | — | | — | 3,246 | | 657 | | 3,246 | | 657 | |
| (1.00) x 1 Month USD LIBOR + 6.20% | | | | | | | | | | | | |
| 3.78 | %, | 6/20/2044(m) | | — | | — | 1,168 | | 134 | | 1,168 | | 134 | |
| (1.00) x 1 Month USD LIBOR + 6.25% | | | | | | | | | | | | |
| 4.19 | %, | 4/16/2042(m) | | — | | — | 1,312 | | 261 | | 1,312 | | 261 | |
| (1.00) x 1 Month USD LIBOR + 6.65% | | | | | | | | | | | | |
| 4.50 | %, | 4/16/2044(m) | | — | | — | 316 | | 62 | | 316 | | 62 | |
See accompanying notes.
| | | | | | | | | | | | | | | | | |
| | | | | | | | | Core Plus Bond | | | | | Combined | | | |
| | | | | | Income Account | | | Account | | Core Plus Bond | | | Portfolio | | Combined | |
| | | | | | Principal | Income Account | | Principal | | Account Value | | | Principal | | Portfolio Value | |
| BONDS (continued) | | | Amount (000's) | Value (000's) | | Amount (000's) | | (000 | 's) | | Amount (000's) | | (000 | 's) |
| Mortgage Backed Securities (continued) | | | | | | | | | | | | | | | |
| HomeBanc Mortgage Trust 2005-5 | | | | | | | | | | | | | | | |
| 2.85 | %, | 1/25/2036 | | $ | — $ | — | $ | 324 | $ | 322 | | $ | 324 | $ | 322 | |
| 1.00 x 1 Month USD LIBOR + 0.34% | | | | | | | | | | | | | | | |
| JP Morgan Mortgage Trust 2016-2 | | | | | | | | | | | | | | | |
| 2.83 | %, | 6/25/2046 (h),(i) | | | — | — | | 485 | | 480 | | | 485 | | 480 | |
| JP Morgan Mortgage Trust 2016-3 | | | | | | | | | | | | | | | |
| 3.50 | %, | 10/25/2046(h),(i) | | | — | — | | 425 | | 420 | | | 425 | | 420 | |
| Sequoia Mortgage Trust 2016-3 | | | | | | | | | | | | | | | |
| 3.50 | %, | 11/25/2046(h),(i) | | | — | — | | 1,157 | | 1,142 | | | 1,157 | | 1,142 | |
| Washington Mutual Mortgage Pass-Through | | | | | | | | | | | | | | | |
| Certificates WMALT Series 2006-AR1 Trust | | | | | | | | | | | | | | | |
| 2.76 | %, | 2/25/2036 | | | — | — | | 91 | | 80 | | | | 91 | | 80 | |
| 1.00 x 1 Month USD LIBOR + 0.25% | | | | | | | | | | | | | | | |
| | | | | | $ | — | | | $ | 4,922 | | | | $ | | 4,922 | |
| Oil & Gas - 3.64% | | | | | | | | | | | | | | | |
| Ascent Resources Utica Holdings LLC / ARU | | | | | | | | | | | | | | | |
| Finance Corp | | | | | | | | | | | | | | | |
| 10.00 | %, | 4/1/2022(h) | | | — | — | | 78 | | 80 | | | | 78 | | 80 | |
| 7.00 | %, | 11/1/2026(h) | | | — | — | | 55 | | 50 | | | | 55 | | 50 | |
| BP Capital Markets America Inc | | | | | | | | | | | | | | | |
| 3.02 | %, | 1/16/2027 | | | — | — | | 165 | | 155 | | | 165 | | 155 | |
| 3.94 | %, | 9/21/2028 | | | 1,000 | 1,003 | | — | | — | | | 1,000 | | 1,003 | |
| BP Capital Markets PLC | | | | | | | | | | | | | | | |
| 3.16 | %, | 5/10/2019 | | | — | — | | 650 | | 650 | | | 650 | | 650 | |
| 3 Month USD LIBOR + 0.54% | | | | | | | | | | | | | | | |
| Canadian Natural Resources Ltd | | | | | | | | | | | | | | | |
| 3.85 | %, | 6/1/2027 | | | — | — | | 360 | | 340 | | | 360 | | 340 | |
| 3.90 | %, | 2/1/2025 | | | — | — | | 145 | | 141 | | | 145 | | 141 | |
| 4.95 | %, | 6/1/2047 | | | — | — | | 85 | | 82 | | | | 85 | | 82 | |
| Chesapeake Energy Corp | | | | | | | | | | | | | | | |
| 7.00 | %, | 10/1/2024 | | | — | — | | 115 | | 99 | | | 115 | | 99 | |
| 8.00 | %, | 1/15/2025 | | | — | — | | 95 | | 84 | | | | 95 | | 84 | |
| 8.00 | %, | 6/15/2027 | | | — | — | | 90 | | 76 | | | | 90 | | 76 | |
| Chesapeake Oil Op/Fin Escrow Shares | | | | | | | | | | | | | | | |
| 0.00 | %, | 11/15/2019(a),(b),(e) | | | — | — | | 90 | | — | | | | 90 | | — | |
| Concho Resources Inc | | | | | | | | | | | | | | | |
| 4.38 | %, | 1/15/2025 | | | — | — | | 250 | | 247 | | | 250 | | 247 | |
| Continental Resources Inc/OK | | | | | | | | | | | | | | | |
| 3.80 | %, | 6/1/2024 | | | — | — | | 770 | | 729 | | | 770 | | 729 | |
| 4.38 | %, | 1/15/2028 | | | — | — | | 360 | | 339 | | | 360 | | 339 | |
| 4.90 | %, | 6/1/2044 | | | — | — | | 470 | | 416 | | | 470 | | 416 | |
| CrownRock LP / CrownRock Finance Inc | | | | | | | | | | | | | | | |
| 5.63 | %, | 10/15/2025(h) | | | — | — | | 95 | | 85 | | | | 95 | | 85 | |
| Ecopetrol SA | | | | | | | | | | | | | | | |
| 7.38 | %, | 9/18/2043 | | | — | — | | 65 | | 72 | | | | 65 | | 72 | |
| Encana Corp | | | | | | | | | | | | | | | |
| 5.15 | %, | 11/15/2041 | | | — | — | | 115 | | 114 | | | 115 | | 114 | |
| 6.50 | %, | 5/15/2019 | | | — | — | | 810 | | 818 | | | 810 | | 818 | |
See accompanying notes.
| | | | | | | | | | | | | | | | | |
| | | | | | | | | | Core Plus Bond | | | | | Combined | | | |
| | | | | | Income Account | | | | Account | | Core Plus Bond | | | Portfolio | | Combined | |
| | | | | | Principal | | Income Account | | Principal | | Account Value | | | Principal | | Portfolio Value | |
| BONDS (continued) | | | Amount (000's) | | Value (000's) | | Amount (000's) | | (000 | 's) | | Amount (000's) | | (000 | 's) |
| Oil & Gas (continued) | | | | | | | | | | | | | | | |
| Encana Corp (continued) | | | | | | | | | | | | | | | |
| 6.50 | %, | 2/1/2038 | | $ | — | $ | — | $ | 45 | $ | 49 | | $ | 45 | $ | 49 | |
| Endeavor Energy Resources LP / EER Finance | | | | | | | | | | | | | | | |
| Inc | | | | | | | | | | | | | | | | | |
| 5.50 | %, | 1/30/2026(h) | | | — | | — | | 75 | | 77 | | | 75 | | 77 | |
| EP Energy LLC / Everest Acquisition Finance | | | | | | | | | | | | | | | |
| Inc | | | | | | | | | | | | | | | | | |
| 7.75 | %, | 5/15/2026(h) | | | — | | — | | 25 | | 22 | | | 25 | | 22 | |
| 8.00 | %, | 11/29/2024(h) | | | — | | — | | 155 | | 115 | | | 155 | | 115 | |
| Extraction Oil & Gas Inc | | | | | | | | | | | | | | | |
| 7.38 | %, | 5/15/2024(h) | | | — | | — | | 95 | | 78 | | | 95 | | 78 | |
| Gulfport Energy Corp | | | | | | | | | | | | | | | |
| 6.38 | %, | 5/15/2025 | | | — | | — | | 155 | | 137 | | | 155 | | 137 | |
| Halcon Resources Corp | | | | | | | | | | | | | | | |
| 6.75 | %, | 2/15/2025 | | | — | | — | | 65 | | 47 | | | 65 | | 47 | |
| Hess Infrastructure Partners LP / Hess | | | | | | | | | | | | | | | |
| Infrastructure Partners Finance Corp | | | | | | | | | | | | | | | |
| 5.63 | %, | 2/15/2026(h) | | | — | | — | | 100 | | 97 | | | 100 | | 97 | |
| Jagged Peak Energy LLC | | | | | | | | | | | | | | | |
| 5.88 | %, | 5/1/2026(h) | | | — | | — | | 75 | | 70 | | | 75 | | 70 | |
| Kerr-McGee Corp | | | | | | | | | | | | | | | |
| 7.88 | %, | 9/15/2031 | | | — | | — | | 115 | | 138 | | | 115 | | 138 | |
| Marathon Oil Corp | | | | | | | | | | | | | | | |
| 4.40 | %, | 7/15/2027 | | | — | | — | | 250 | | 238 | | | 250 | | 238 | |
| 5.20 | %, | 6/1/2045 | | | — | | — | | 135 | | 125 | | | 135 | | 125 | |
| 6.60 | %, | 10/1/2037 | | | — | | — | | 330 | | 370 | | | 330 | | 370 | |
| Marathon Petroleum Corp | | | | | | | | | | | | | | | |
| 4.75 | %, | 9/15/2044 | | | — | | — | | 36 | | 32 | | | 36 | | 32 | |
| MEG Energy Corp | | | | | | | | | | | | | | | |
| 6.50 | %, | 1/15/2025(h) | | | — | | — | | 85 | | 86 | | | 85 | | 86 | |
| Nabors Industries Inc | | | | | | | | | | | | | | | |
| 5.00 | %, | 9/15/2020 | | | 1,000 | | 962 | | — | | — | | | 1,000 | | 962 | |
| 5.50 | %, | 1/15/2023 | | | 250 | | 198 | | — | | — | | | 250 | | 198 | |
| 5.75 | %, | 2/1/2025 | | | — | | — | | 70 | | 53 | | | 70 | | 53 | |
| Newfield Exploration Co | | | | | | | | | | | | | | | |
| 5.38 | %, | 1/1/2026 | | | — | | — | | 480 | | 470 | | | 480 | | 470 | |
| 5.63 | %, | 7/1/2024 | | | — | | — | | 140 | | 142 | | | 140 | | 142 | |
| Oasis Petroleum Inc | | | | | | | | | | | | | | | |
| 6.25 | %, | 5/1/2026(h) | | | — | | — | | 40 | | 34 | | | 40 | | 34 | |
| 6.88 | %, | 1/15/2023 | | | — | | — | | 140 | | 129 | | | 140 | | 129 | |
| Petrobras Global Finance BV | | | | | | | | | | | | | | | |
| 6.25 | %, | 3/17/2024 | | | — | | — | | 155 | | 157 | | | 155 | | 157 | |
| 7.38 | %, | 1/17/2027 | | | — | | — | | 220 | | 226 | | | 220 | | 226 | |
| Petro-Canada | | | | | | | | | | | | | | | |
| 9.25 | %, | 10/15/2021 | | | 1,075 | | 1,231 | | — | | — | | | 1,075 | | 1,231 | |
| Petroleos Mexicanos | | | | | | | | | | | | | | | |
| 6.50 | %, | 3/13/2027 | | | — | | — | | 325 | | 305 | | | 325 | | 305 | |
| 6.50 | %, | 1/23/2029 | | | — | | — | | 70 | | 65 | | | 70 | | 65 | |
See accompanying notes.
| | | | | | | | | | | | | | | | | |
| | | | | | | | | | Core Plus Bond | | | | | Combined | | | |
| | | | | | Income Account | | | | Account | | Core Plus Bond | | | Portfolio | | Combined | |
| | | | | | Principal | | Income Account | | Principal | | Account Value | | | Principal | | Portfolio Value | |
| BONDS (continued) | | | Amount (000's) | | Value (000's) | | Amount (000's) | | (000 | 's) | | Amount (000's) | | (000 | 's) |
| Oil & Gas (continued) | | | | | | | | | | | | | | | |
| Phillips 66 | | | | | | | | | | | | | | | | | |
| 4.30 | %, | 4/1/2022 | | $ | 1,000 | $ | 1,027 | $ | — | $ | — | | $ | 1,000 | $ | 1,027 | |
| Rowan Cos Inc | | | | | | | | | | | | | | | |
| 4.88 | %, | 6/1/2022 | | | 750 | | 619 | | — | | — | | | 750 | | 619 | |
| Sanchez Energy Corp | | | | | | | | | | | | | | | |
| 7.25 | %, | 2/15/2023(h) | | | — | | — | | 80 | | 65 | | | 80 | | 65 | |
| Shell International Finance BV | | | | | | | | | | | | | | | |
| 4.00 | %, | 5/10/2046 | | | — | | — | | 80 | | 77 | | | 80 | | 77 | |
| Sinopec Group Overseas Development 2017 Ltd | | | | | | | | | | | | | | | |
| 2.50 | %, | 9/13/2022(h) | | | — | | — | | 325 | | 312 | | | 325 | | 312 | |
| Southwestern Energy Co | | | | | | | | | | | | | | | |
| 7.75 | %, | 10/1/2027 | | | — | | — | | 150 | | 142 | | | 150 | | 142 | |
| Suncor Energy Inc | | | | | | | | | | | | | | | |
| 4.00 | %, | 11/15/2047 | | | — | | — | | 85 | | 76 | | | 85 | | 76 | |
| Sunoco LP / Sunoco Finance Corp | | | | | | | | | | | | | | | |
| 4.88 | %, | 1/15/2023 | | | — | | — | | 100 | | 97 | | | 100 | | 97 | |
| 5.50 | %, | 2/15/2026 | | | — | | — | | 55 | | 52 | | | 55 | | 52 | |
| Ultra Resources Inc | | | | | | | | | | | | | | | |
| 6.88 | %, | 4/15/2022(h) | | | — | | — | | 65 | | 23 | | | 65 | | 23 | |
| Unit Corp | | | | | | | | | | | | | | | | | |
| 6.63 | %, | 5/15/2021 | | | — | | — | | 80 | | 73 | | | 80 | | 73 | |
| Valero Energy Corp | | | | | | | | | | | | | | | |
| 4.35 | %, | 6/1/2028 | | | — | | — | | 90 | | 89 | | | 90 | | 89 | |
| W&T Offshore Inc | | | | | | | | | | | | | | | |
| 9.75 | %, | 11/1/2023(h) | | | 250 | | 219 | | — | | — | | | 250 | | 219 | |
| Whiting Petroleum Corp | | | | | | | | | | | | | | | |
| 5.75 | %, | 3/15/2021 | | | 1,250 | | 1,187 | | 60 | | 57 | | | 1,310 | | 1,244 | |
| 6.25 | %, | 4/1/2023 | | | — | | — | | 75 | | 68 | | | 75 | | 68 | |
| 6.63 | %, | 1/15/2026 | | | — | | — | | 30 | | 26 | | | 30 | | 26 | |
| WildHorse Resource Development Corp | | | | | | | | | | | | | | | |
| 6.88 | %, | 2/1/2025 | | | — | | — | | 105 | | 99 | | | 105 | | 99 | |
| XTO Energy Inc | | | | | | | | | | | | | | | |
| 6.75 | %, | 8/1/2037 | | | 1,000 | | 1,324 | | — | | — | | | 1,000 | | 1,324 | |
| | | | | | $ | | 7,770 | | | $ | 9,095 | | | | $ | 16,865 | |
| Oil & Gas Services - 1.26% | | | | | | | | | | | | | | | |
| Archrock Partners LP / Archrock Partners | | | | | | | | | | | | | | | |
| Finance Corp | | | | | | | | | | | | | | | |
| 6.00 | %, | 4/1/2021 | | | 2,000 | | 1,920 | | — | | — | | | 2,000 | | 1,920 | |
| Archrock Partners LP / Archrock Partners | | | | | | | | | | | | | | | |
| Finance Corp (continued) | | | | | | | | | | | | | | | |
| 6.00 | %, | 10/1/2022 | | | — | | — | | 80 | | 75 | | | 80 | | 75 | |
| Baker Hughes a GE Co LLC / Baker Hughes Co- | | | | | | | | | | | | | | | |
| Obligor Inc | | | | | | | | | | | | | | | | | |
| 3.34 | %, | 12/15/2027 | | | — | | — | | 150 | | 138 | | | 150 | | 138 | |
| 4.08 | %, | 12/15/2047 | | | — | | — | | 540 | | 445 | | | 540 | | 445 | |
| Calfrac Holdings LP | | | | | | | | | | | | | | | |
| 8.50 | %, | 6/15/2026(h) | | | — | | — | | 115 | | 82 | | | 115 | | 82 | |
See accompanying notes.
| | | | | | | | | | | | | | | | | |
| | | | | | | | | Core Plus Bond | | | | | | Combined | | | |
| | | | | | Income Account | | | Account | Core Plus Bond | | | Portfolio | | Combined | |
| | | | | | Principal | Income Account | | Principal | Account Value | | | Principal | | Portfolio Value | |
| BONDS (continued) | | | Amount (000's) | Value (000's) | | Amount (000's) | (000 | 's) | | Amount (000's) | | (000 | 's) |
| Oil & Gas Services (continued) | | | | | | | | | | | | | | | |
| Halliburton Co | | | | | | | | | | | | | | | |
| 3.80 | %, | 11/15/2025 | | $ | — $ | — | $ | 125 | $ | | 121 | | $ | 125 | $ | 121 | |
| 4.75 | %, | 8/1/2043 | | | — | — | | 115 | | | 110 | | | 115 | | 110 | |
| PHI Inc | | | | | | | | | | | | | | | | | |
| 5.25 | %, | 3/15/2019 | | | — | — | | 25 | | | 17 | | | 25 | | 17 | |
| Schlumberger Holdings Corp | | | | | | | | | | | | | | | |
| 3.63 | %, | 12/21/2022(h) | | | 500 | 498 | | — | | | — | | | 500 | | 498 | |
| 4.00 | %, | 12/21/2025(h) | | | 500 | 494 | | — | | | — | | | 500 | | 494 | |
| Schlumberger Investment SA | | | | | | | | | | | | | | | |
| 3.30 | %, | 9/14/2021(h) | | | — | — | | 85 | | | 85 | | | 85 | | 85 | |
| USA Compression Partners LP / USA | | | | | | | | | | | | | | | |
| Compression Finance Corp | | | | | | | | | | | | | | | |
| 6.88 | %, | 4/1/2026(h) | | | — | — | | 70 | | | 67 | | | 70 | | 67 | |
| Weatherford International Ltd | | | | | | | | | | | | | | | |
| 4.50 | %, | 4/15/2022 | | | 250 | 146 | | 30 | | | 18 | | | 280 | | 164 | |
| 5.13 | %, | 9/15/2020 | | | 2,000 | 1,560 | | — | | | — | | | 2,000 | | 1,560 | |
| 8.25 | %, | 6/15/2023 | | | — | — | | 45 | | | 27 | | | 45 | | 27 | |
| 9.88 | %, | 2/15/2024 | | | — | — | | 50 | | | 30 | | | 50 | | 30 | |
| | | | | | $ | 4,618 | | | $ | | 1,215 | | | | $ | 5,833 | |
| Other Asset Backed Securities - 2.59% | | | | | | | | | | | | | | | |
| CNH Equipment Trust 2014-C | | | | | | | | | | | | | | | |
| 1.65 | %, | 9/15/2021 | | | — | — | | 216 | | | 216 | | | 216 | | 216 | |
| Dell Equipment Finance Trust 2017-2 | | | | | | | | | | | | | | | |
| 2.47 | %, | 10/24/2022(h) | | | — | — | | 500 | | | 495 | | | 500 | | 495 | |
| Dell Equipment Finance Trust 2018-1 | | | | | | | | | | | | | | | |
| 2.80 | %, | 10/22/2020(h) | | | — | — | | 2,450 | | | 2,453 | | | 2,450 | | 2,453 | |
| 1.00 x 1 Month USD LIBOR + 0.30% | | | | | | | | | | | | | | | |
| Drug Royalty II LP 2 | | | | | | | | | | | | | | | |
| 3.48 | %, | 7/15/2023(h) | | | 377 | 376 | | — | | | — | | | 377 | | 376 | |
| Drug Royalty III LP 1 | | | | | | | | | | | | | | | |
| 4.94 | %, | 4/15/2027(h) | | | 506 | 510 | | — | | | — | | | 506 | | 510 | |
| 1.00 x 3 Month USD LIBOR + 2.50% | | | | | | | | | | | | | | | |
| MMAF Equipment Finance LLC 2017-B | | | | | | | | | | | | | | | |
| 1.93 | %, | 10/15/2020(h) | | | — | — | | 270 | | | 269 | | | 270 | | 269 | |
| PFS Financing Corp | | | | | | | | | | | | | | | |
| 3.04 | %, | 3/15/2021(h) | | | 500 | 500 | | — | | | — | | | 500 | | 500 | |
| 1.00 x 1 Month USD LIBOR + 0.58% | | | | | | | | | | | | | | | |
| Trafigura Securitisation Finance PLC 2017-1 | | | | | | | | | | | | | | | |
| 3.31 | %, | 12/15/2020(h) | | | 1,000 | 1,005 | | — | | | — | | | 1,000 | | 1,005 | |
| 1.00 x 1 Month USD LIBOR + 0.85% | | | | | | | | | | | | | | | |
| Verizon Owner Trust 2017-1 | | | | | | | | | | | | | | | |
| 2.06 | %, | 9/20/2021(h) | | | — | — | | 1,500 | | | 1,489 | | | 1,500 | | 1,489 | |
| Verizon Owner Trust 2017-2 | | | | | | | | | | | | | | | |
| 1.92 | %, | 12/20/2021(h) | | | — | — | | 500 | | | 495 | | | 500 | | 495 | |
| Verizon Owner Trust 2017-3 | | | | | | | | | | | | | | | |
| 2.74 | %, | 4/20/2022(h) | | | 1,000 | 1,000 | | 2,350 | | | 2,349 | | | 3,350 | | 3,349 | |
| 2.00 x 1 Month USD LIBOR + 0.54% | | | | | | | | | | | | | | | |
See accompanying notes.
| | | | | | | | | | | | | | | | | | |
| | | | | | | | | Core Plus Bond | | | | | | Combined | | | |
| | | | | | Income Account | | | Account | Core Plus Bond | | | Portfolio | | Combined | |
| | | | | | Principal | Income Account | | Principal | Account Value | | | Principal | | Portfolio Value | |
| BONDS (continued) | | | Amount (000's) | Value (000's) | | Amount (000's) | | | (000 | 's) | | Amount (000's) | | (000 | 's) |
| Other Asset Backed Securities (continued) | | | | | | | | | | | | | | | | |
| Verizon Owner Trust 2018-1 | | | | | | | | | | | | | | | | |
| 2.82 | %, | 9/20/2022(h) | | $ | — $ | — | $ | 822 | $ | | 820 | | $ | 822 | $ | 820 | |
| | | | | | $ | 3,391 | | | $ | | 8,586 | | | | $ | | 11,977 | |
| Packaging & Containers - 0.53% | | | | | | | | | | | | | | | | |
| ARD Securities Finance SARL | | | | | | | | | | | | | | | | |
| 8.75%, PIK 8.75%, 1/31/2023 (h),(i),(j) | | | — | — | | 16 | | | 13 | | | | 16 | | 13 | |
| Ardagh Packaging Finance PLC / Ardagh | | | | | | | | | | | | | | | | |
| Holdings USA Inc | | | | | | | | | | | | | | | | |
| 6.00 | %, | 2/15/2025(h) | | | — | — | | 200 | | | 185 | | | 200 | | 185 | |
| BWAY Holding Co | | | | | | | | | | | | | | | | |
| 7.25 | %, | 4/15/2025(h) | | | — | — | | 175 | | | 157 | | | 175 | | 157 | |
| Crown Americas LLC / Crown Americas Capital | | | | | | | | | | | | | | | | |
| Corp V | | | | | | | | | | | | | | | | | | |
| 4.25 | %, | 9/30/2026 | | | — | — | | 43 | | | 39 | | | | 43 | | 39 | |
| Crown Americas LLC / Crown Americas Capital | | | | | | | | | | | | | | | | |
| Corp VI | | | | | | | | | | | | | | | | | | |
| 4.75 | %, | 2/1/2026(h) | | | — | — | | 180 | | | 170 | | | 180 | | 170 | |
| Crown Cork & Seal Co Inc | | | | | | | | | | | | | | | | |
| 7.38 | %, | 12/15/2026 | | | — | — | | 132 | | | 141 | | | 132 | | 141 | |
| Flex Acquisition Co Inc | | | | | | | | | | | | | | | | |
| 6.88 | %, | 1/15/2025(h) | | | — | — | | 145 | | | 129 | | | 145 | | 129 | |
| Packaging Corp of America | | | | | | | | | | | | | | | | |
| 4.50 | %, | 11/1/2023 | | | — | — | | 420 | | | 430 | | | 420 | | 430 | |
| Reynolds Group Issuer Inc / Reynolds Group | | | | | | | | | | | | | | | | |
| Issuer LLC / Reynolds Group Issuer | | | | | | | | | | | | | | | | |
| (Luxembourg) S.A. | | | | | | | | | | | | | | | | |
| 5.13 | %, | 7/15/2023(h) | | | — | — | | 140 | | | 133 | | | 140 | | 133 | |
| 5.94 | %, | 7/15/2021(h) | | | — | — | | 40 | | | 40 | | | | 40 | | 40 | |
| 3 Month USD LIBOR + 3.50% | | | | | | | | | | | | | | | | |
| 7.00 | %, | 7/15/2024(h) | | | — | — | | 15 | | | 14 | | | | 15 | | 14 | |
| Sealed Air Corp | | | | | | | | | | | | | | | | |
| 6.88 | %, | 7/15/2033(h) | | | 1,000 | 998 | | — | | | — | | | 1,000 | | 998 | |
| | | | | | $ | 998 | | | $ | | 1,451 | | | | $ | | 2,449 | |
| Pharmaceuticals - 1.15% | | | | | | | | | | | | | | | | |
| AbbVie Inc | | | | | | | | | | | | | | | | | | |
| 2.90 | %, | 11/6/2022 | | | 1,000 | 973 | | — | | | — | | | 1,000 | | 973 | |
| 3.38 | %, | 11/14/2021 | | | — | — | | 185 | | | 185 | | | 185 | | 185 | |
| 4.25 | %, | 11/14/2028 | | | — | — | | 90 | | | 87 | | | | 90 | | 87 | |
| Allergan Funding SCS | | | | | | | | | | | | | | | | |
| 3.85 | %, | 6/15/2024 | | | — | — | | 170 | | | 168 | | | 170 | | 168 | |
| 4.55 | %, | 3/15/2035 | | | — | — | | 15 | | | 14 | | | | 15 | | 14 | |
| Bausch Health Cos Inc | | | | | | | | | | | | | | | | |
| 5.63 | %, | 12/1/2021(h) | | | — | — | | 40 | | | 39 | | | | 40 | | 39 | |
| Bayer US Finance II LLC | | | | | | | | | | | | | | | | |
| 3.88 | %, | 12/15/2023(h) | | | — | — | | 200 | | | 196 | | | 200 | | 196 | |
| 4.38 | %, | 12/15/2028(h) | | | — | — | | 795 | | | 759 | | | 795 | | 759 | |
| Cigna Corp | | | | | | | | | | | | | | | | | | |
| 3.75 | %, | 7/15/2023(h) | | | — | — | | 185 | | | 184 | | | 185 | | 184 | |
| 4.13 | %, | 11/15/2025(h) | | | — | — | | 350 | | | 349 | | | 350 | | 349 | |
See accompanying notes.
| | | | | | | | | | | | | | | | | |
| | | | | | | | | Core Plus Bond | | | | | | Combined | | | |
| | | | | | Income Account | | | Account | Core Plus Bond | | | Portfolio | | Combined | |
| | | | | | Principal | Income Account | | Principal | Account Value | | | Principal | | Portfolio Value | |
| BONDS (continued) | | | Amount (000's) | Value (000's) | | Amount (000's) | (000 | 's) | | Amount (000's) | | (000 | 's) |
| Pharmaceuticals (continued) | | | | | | | | | | | | | | | |
| Cigna Corp (continued) | | | | | | | | | | | | | | | |
| 4.38 | %, | 10/15/2028(h) | | $ | — $ | — | $ | 645 | $ | | 649 | | $ | 645 | $ | 649 | |
| CVS Health Corp | | | | | | | | | | | | | | | |
| 4.30 | %, | 3/25/2028 | | | — | — | | 290 | | | 283 | | | 290 | | 283 | |
| 4.75 | %, | 12/1/2022 | | | — | — | | 215 | | | 222 | | | 215 | | 222 | |
| 4.78 | %, | 3/25/2038 | | | — | — | | 170 | | | 163 | | | 170 | | 163 | |
| 4.88 | %, | 7/20/2035 | | | — | — | | 190 | | | 184 | | | 190 | | 184 | |
| 5.00 | %, | 12/1/2024 | | | — | — | | 410 | | | 430 | | | 410 | | 430 | |
| 5.05 | %, | 3/25/2048 | | | — | — | | 10 | | | 10 | | | 10 | | 10 | |
| Valeant Pharmaceuticals International | | | | | | | | | | | | | | | |
| 8.50 | %, | 1/31/2027(h) | | | — | — | | 30 | | | 29 | | | 30 | | 29 | |
| Zoetis Inc | | | | | | | | | | | | | | | | | |
| 3.90 | %, | 8/20/2028 | | | — | — | | 320 | | | 314 | | | 320 | | 314 | |
| 4.45 | %, | 8/20/2048 | | | — | — | | 95 | | | 93 | | | 95 | | 93 | |
| | | | | | $ | 973 | | | $ | | 4,358 | | | | $ | 5,331 | |
| Pipelines - 2.99% | | | | | | | | | | | | | | | |
| Abu Dhabi Crude Oil Pipeline LLC | | | | | | | | | | | | | | | |
| 3.65 | %, | 11/2/2029(h) | | | — | — | | 200 | | | 190 | | | 200 | | 190 | |
| Andeavor Logistics LP / Tesoro Logistics | | | | | | | | | | | | | | | |
| Finance Corp | | | | | | | | | | | | | | | |
| 4.25 | %, | 12/1/2027 | | | — | — | | 160 | | | 151 | | | 160 | | 151 | |
| ANR Pipeline Co | | | | | | | | | | | | | | | |
| 9.63 | %, | 11/1/2021 | | | 1,000 | 1,159 | | — | | | — | | | 1,000 | | 1,159 | |
| Antero Midstream Partners LP / Antero | | | | | | | | | | | | | | | |
| Midstream Finance Corp | | | | | | | | | | | | | | | |
| 5.38 | %, | 9/15/2024 | | | — | — | | 75 | | | 70 | | | 75 | | 70 | |
| Buckeye Partners LP | | | | | | | | | | | | | | | |
| 3.95 | %, | 12/1/2026 | | | 500 | 439 | | — | | | — | | | 500 | | 439 | |
| 4.35 | %, | 10/15/2024 | | | 500 | 485 | | — | | | — | | | 500 | | 485 | |
| Cheniere Corpus Christi Holdings LLC | | | | | | | | | | | | | | | |
| 5.13 | %, | 6/30/2027 | | | — | — | | 75 | | | 71 | | | 75 | | 71 | |
| Columbia Pipeline Group Inc | | | | | | | | | | | | | | | |
| 3.30 | %, | 6/1/2020 | | | — | — | | 400 | | | 399 | | | 400 | | 399 | |
| 4.50 | %, | 6/1/2025 | | | 1,000 | 1,007 | | — | | | — | | | 1,000 | | 1,007 | |
| DCP Midstream Operating LP | | | | | | | | | | | | | | | |
| 5.35 | %, | 3/15/2020(h) | | | — | — | | 450 | | | 452 | | | 450 | | 452 | |
| El Paso Natural Gas Co LLC | | | | | | | | | | | | | | | |
| 7.50 | %, | 11/15/2026 | | | 2,100 | 2,438 | | — | | | — | | | 2,100 | | 2,438 | |
| Enable Midstream Partners LP | | | | | | | | | | | | | | | |
| 4.40 | %, | 3/15/2027 | | | — | — | | 145 | | | 135 | | | 145 | | 135 | |
| Enbridge Inc | | | | | | | | | | | | | | | |
| 6.00 | %, | 1/15/2077(k) | | | — | — | | 165 | | | 148 | | | 165 | | 148 | |
| 3 Month USD LIBOR + 3.89% | | | | | | | | | | | | | | | |
| Energy Transfer Operating LP | | | | | | | | | | | | | | | |
| 4.90 | %, | 3/15/2035 | | | — | — | | 100 | | | 89 | | | 100 | | 89 | |
| 5.15 | %, | 3/15/2045 | | | — | — | | 95 | | | 82 | | | 95 | | 82 | |
| EnLink Midstream Partners LP | | | | | | | | | | | | | | | |
| 4.40 | %, | 4/1/2024 | | | — | — | | 320 | | | 302 | | | 320 | | 302 | |
See accompanying notes.
| | | | | | | | | | | | | | | | | | |
| | | | | | | | | | Core Plus Bond | | | | | | Combined | | | |
| | | | | | Income Account | | | | Account | Core Plus Bond | | | Portfolio | | Combined | |
| | | | | | Principal | | Income Account | | Principal | Account Value | | | Principal | | Portfolio Value | |
| BONDS (continued) | | | Amount (000's) | | Value (000's) | | Amount (000's) | (000 | 's) | | Amount (000's) | | (000 | 's) |
| Pipelines (continued) | | | | | | | | | | | | | | | | |
| Enterprise Products Operating LLC | | | | | | | | | | | | | | | | |
| 4.85 | %, | 3/15/2044 | | $ | — | $ | — | $ | 135 | $ | | 131 | | $ | 135 | $ | 131 | |
| 5.38 | %, | 2/15/2078(k) | | | — | | — | | 250 | | | 207 | | | 250 | | 207 | |
| 3 Month USD LIBOR + 2.57% | | | | | | | | | | | | | | | | |
| Kinder Morgan Energy Partners LP | | | | | | | | | | | | | | | | |
| 4.70 | %, | 11/1/2042 | | | — | | — | | 300 | | | 261 | | | 300 | | 261 | |
| Kinder Morgan Inc/DE | | | | | | | | | | | | | | | | |
| 3.05 | %, | 12/1/2019 | | | — | | — | | 100 | | | 99 | | | 100 | | 99 | |
| 5.63 | %, | 11/15/2023(h) | | | — | | — | | 215 | | | 227 | | | 215 | | 227 | |
| MPLX LP | | | | | | | | | | | | | | | | | | |
| 4.50 | %, | 7/15/2023 | | | — | | — | | 290 | | | 293 | | | 290 | | 293 | |
| 4.80 | %, | 2/15/2029 | | | — | | — | | 65 | | | 65 | | | 65 | | 65 | |
| NuStar Logistics LP | | | | | | | | | | | | | | | | |
| 5.63 | %, | 4/28/2027 | | | — | | — | | 100 | | | 93 | | | 100 | | 93 | |
| ONEOK Partners LP | | | | | | | | | | | | | | | | |
| 3.80 | %, | 3/15/2020 | | | — | | — | | 390 | | | 391 | | | 390 | | 391 | |
| Plains All American Pipeline LP / PAA Finance | | | | | | | | | | | | | | | | |
| Corp | | | | | | | | | | | | | | | | | | |
| 4.50 | %, | 12/15/2026 | | | 500 | | 482 | | 95 | | | 91 | | | 595 | | 573 | |
| Sabine Pass Liquefaction LLC | | | | | | | | | | | | | | | | |
| 4.20 | %, | 3/15/2028 | | | — | | — | | 150 | | | 143 | | | 150 | | 143 | |
| 5.00 | %, | 3/15/2027 | | | — | | — | | 190 | | | 191 | | | 190 | | 191 | |
| 5.75 | %, | 5/15/2024 | | | — | | — | | 215 | | | 224 | | | 215 | | 224 | |
| Southeast Supply Header LLC | | | | | | | | | | | | | | | | |
| 4.25 | %, | 6/15/2024(h) | | | 750 | | 756 | | — | | | — | | | 750 | | 756 | |
| Southern Natural Gas Co LLC | | | | | | | | | | | | | | | | |
| 8.00 | %, | 3/1/2032 | | | 850 | | 1,081 | | — | | | — | | | 850 | | 1,081 | |
| Summit Midstream Holdings LLC / Summit | | | | | | | | | | | | | | | | |
| Midstream Finance Corp | | | | | | | | | | | | | | | | |
| 5.75 | %, | 4/15/2025 | | | — | | — | | 80 | | | 74 | | | 80 | | 74 | |
| Targa Resources Partners LP / Targa Resources | | | | | | | | | | | | | | | | |
| Partners Finance Corp | | | | | | | | | | | | | | | | |
| 5.88 | %, | 4/15/2026(h) | | | — | | — | | 60 | | | 58 | | | 60 | | 58 | |
| TransCanada PipeLines Ltd | | | | | | | | | | | | | | | | |
| 4.63 | %, | 3/1/2034 | | | — | | — | | 80 | | | 76 | | | 80 | | 76 | |
| 7.13 | %, | 1/15/2019 | | | — | | — | | 95 | | | 95 | | | 95 | | 95 | |
| Transportadora de Gas Internacional SA ESP | | | | | | | | | | | | | | | | |
| 5.55 | %, | 11/1/2028(h) | | | — | | — | | 200 | | | 202 | | | 200 | | 202 | |
| Western Gas Partners LP | | | | | | | | | | | | | | | | |
| 4.50 | %, | 3/1/2028 | | | — | | — | | 185 | | | 173 | | | 185 | | 173 | |
| 4.65 | %, | 7/1/2026 | | | — | | — | | 165 | | | 160 | | | 165 | | 160 | |
| 5.30 | %, | 3/1/2048 | | | — | | — | | 45 | | | 39 | | | 45 | | 39 | |
| 5.45 | %, | 4/1/2044 | | | — | | — | | 205 | | | 184 | | | 205 | | 184 | |
| Williams Cos Inc/The | | | | | | | | | | | | | | | | |
| 4.30 | %, | 3/4/2024 | | | — | | — | | 110 | | | 110 | | | 110 | | 110 | |
| 5.75 | %, | 6/24/2044 | | | — | | — | | 320 | | | 322 | | | 320 | | 322 | |
| | | | | | $ | | 7,847 | | | $ | | 5,998 | | | | $ | 13,845 | |
See accompanying notes.
| | | | | | | | | | | | | | | | | | |
| | | | | | | | | Core Plus Bond | | | | | | Combined | | | |
| | | | | | Income Account | | | Account | Core Plus Bond | | | Portfolio | | Combined | |
| | | | | | Principal | Income Account | | Principal | Account Value | | | Principal | | Portfolio Value | |
| BONDS (continued) | | | Amount (000's) | Value (000's) | | Amount (000's) | (000 | 's) | | Amount (000's) | | (000 | 's) |
| Private Equity - 0.04% | | | | | | | | | | | | | | | | |
| Icahn Enterprises LP / Icahn Enterprises Finance | | | | | | | | | | | | | | | | |
| Corp | | | | | | | | | | | | | | | | | | |
| 6.25 | %, | 2/1/2022 | | $ | — $ | — | $ | 105 | $ | | 104 | | $ | 105 | $ | 104 | |
| 6.38 | %, | 12/15/2025 | | | — | — | | 65 | | | 62 | | | | 65 | | 62 | |
| | | | | | $ | — | | | $ | | 166 | | | | $ | | 166 | |
| Regional Authority - 0.02% | | | | | | | | | | | | | | | | |
| Provincia de Buenos Aires/Argentina | | | | | | | | | | | | | | | | |
| 7.88 | %, | 6/15/2027 | | | — | — | | 150 | | | 108 | | | 150 | | 108 | |
| REITs - 3.68% | | | | | | | | | | | | | | | | |
| Alexandria Real Estate Equities Inc | | | | | | | | | | | | | | | | |
| 3.45 | %, | 4/30/2025 | | | — | — | | 865 | | | 833 | | | 865 | | 833 | |
| 4.30 | %, | 1/15/2026 | | | 1,000 | 1,000 | | — | | | — | | | 1,000 | | 1,000 | |
| 4.60 | %, | 4/1/2022 | | | 1,250 | 1,287 | | — | | | — | | | 1,250 | | 1,287 | |
| 4.70 | %, | 7/1/2030 | | | — | — | | 250 | | | 253 | | | 250 | | 253 | |
| Camden Property Trust | | | | | | | | | | | | | | | | |
| 4.10 | %, | 10/15/2028 | | | — | — | | 460 | | | 466 | | | 460 | | 466 | |
| CBL & Associates LP | | | | | | | | | | | | | | | | |
| 5.95 | %, | 12/15/2026 | | | 500 | 382 | | — | | | — | | | 500 | | 382 | |
| CC Holdings GS V LLC / Crown Castle GS III | | | | | | | | | | | | | | | | |
| Corp | | | | | | | | | | | | | | | | | | |
| 3.85 | %, | 4/15/2023 | | | — | — | | 510 | | | 505 | | | 510 | | 505 | |
| CubeSmart LP | | | | | | | | | | | | | | | | |
| 4.80 | %, | 7/15/2022(c) | | | 2,000 | 2,068 | | — | | | — | | | 2,000 | | 2,068 | |
| Equinix Inc | | | | | | | | | | | | | | | | | | |
| 5.38 | %, | 4/1/2023 | | | — | — | | 115 | | | 114 | | | 115 | | 114 | |
| 5.88 | %, | 1/15/2026 | | | — | — | | 40 | | | 40 | | | | 40 | | 40 | |
| Healthcare Realty Trust Inc | | | | | | | | | | | | | | | | |
| 3.63 | %, | 1/15/2028 | | | 1,000 | 939 | | — | | | — | | | 1,000 | | 939 | |
| Hospitality Properties Trust | | | | | | | | | | | | | | | | |
| 4.65 | %, | 3/15/2024 | | | 750 | 748 | | — | | | — | | | 750 | | 748 | |
| 4.95 | %, | 2/15/2027 | | | 1,000 | 980 | | — | | | — | | | 1,000 | | 980 | |
| 5.00 | %, | 8/15/2022 | | | 750 | 766 | | — | | | — | | | 750 | | 766 | |
| Iron Mountain Inc | | | | | | | | | | | | | | | | |
| 4.38 | %, | 6/1/2021(h) | | | — | — | | 115 | | | 114 | | | 115 | | 114 | |
| Iron Mountain US Holdings Inc | | | | | | | | | | | | | | | | |
| 5.38 | %, | 6/1/2026(h) | | | — | — | | 65 | | | 59 | | | | 65 | | 59 | |
| MGM Growth Properties Operating Partnership | | | | | | | | | | | | | | | | |
| LP / MGP Finance Co-Issuer Inc | | | | | | | | | | | | | | | | |
| 5.63 | %, | 5/1/2024 | | | — | — | | 90 | | | 89 | | | | 90 | | 89 | |
| Omega Healthcare Investors Inc | | | | | | | | | | | | | | | | |
| 5.25 | %, | 1/15/2026 | | | 500 | 509 | | — | | | — | | | 500 | | 509 | |
| Physicians Realty LP | | | | | | | | | | | | | | | | |
| 4.30 | %, | 3/15/2027 | | | 1,000 | 971 | | — | | | — | | | 1,000 | | 971 | |
| SBA Tower Trust | | | | | | | | | | | | | | | | |
| 2.90 | %, | 10/11/2044(h) | | | — | — | | 125 | | | 124 | | | 125 | | 124 | |
| Ventas Realty LP / Ventas Capital Corp | | | | | | | | | | | | | | | | |
| 3.25 | %, | 8/15/2022 | | | 1,750 | 1,729 | | — | | | — | | | 1,750 | | 1,729 | |
See accompanying notes.
| | | | | | | | | | | | | | | | | |
| | | | | | | | | Core Plus Bond | | | | Combined | | | |
| | | | | | Income Account | | | Account | Core Plus Bond | | | Portfolio | | Combined | |
| | | | | | Principal | | Income Account | Principal | Account Value | | | Principal | | Portfolio Value | |
| BONDS (continued) | | | Amount (000's) | | Value (000's) | Amount (000's) | (000 | 's) | | Amount (000's) | | (000 | 's) |
| REITs (continued) | | | | | | | | | | | | | | | |
| Welltower Inc | | | | | | | | | | | | | | | |
| 6.13 | %, | 4/15/2020 | | $ | 1,000 | $ | 1,031 | $ | — $ | — | | $ | 1,000 | $ | 1,031 | |
| Weyerhaeuser Co | | | | | | | | | | | | | | | |
| 4.70 | %, | 3/15/2021 | | | 2,000 | | 2,050 | | — | — | | | 2,000 | | 2,050 | |
| | | | | | $ | | 14,460 | | $ | 2,597 | | | | $ | | 17,057 | |
| Retail - 0.49% | | | | | | | | | | | | | | | |
| 1011778 BC ULC / New Red Finance Inc | | | | | | | | | | | | | | | |
| 5.00 | %, | 10/15/2025(h) | | | — | | — | 145 | 133 | | | 145 | | 133 | |
| Golden Nugget Inc | | | | | | | | | | | | | | | |
| 6.75 | %, | 10/15/2024(h) | | | — | | — | 130 | 123 | | | 130 | | 123 | |
| Home Depot Inc/The | | | | | | | | | | | | | | | |
| 3.25 | %, | 3/1/2022 | | | — | | — | 250 | 253 | | | 250 | | 253 | |
| 3.90 | %, | 12/6/2028 | | | — | | — | 130 | 133 | | | 130 | | 133 | |
| 5.88 | %, | 12/16/2036 | | | — | | — | 130 | 156 | | | 130 | | 156 | |
| IRB Holding Corp | | | | | | | | | | | | | | | |
| 6.75 | %, | 2/15/2026(h) | | | — | | — | | 75 | 66 | | | | 75 | | 66 | |
| JC Penney Corp Inc | | | | | | | | | | | | | | | |
| 8.63 | %, | 3/15/2025(h) | | | — | | — | | 25 | 13 | | | | 25 | | 13 | |
| KFC Holding Co/Pizza Hut Holdings LLC/Taco | | | | | | | | | | | | | | | |
| Bell of America LLC | | | | | | | | | | | | | | | |
| 5.00 | %, | 6/1/2024(h) | | | — | | — | | 40 | 39 | | | | 40 | | 39 | |
| L Brands Inc | | | | | | | | | | | | | | | |
| 6.88 | %, | 11/1/2035 | | | — | | — | | 90 | 75 | | | | 90 | | 75 | |
| McDonald's Corp | | | | | | | | | | | | | | | |
| 2.75 | %, | 12/9/2020 | | | — | | — | | 85 | 84 | | | | 85 | | 84 | |
| 3.80 | %, | 4/1/2028 | | | — | | — | 235 | 231 | | | 235 | | 231 | |
| 4.45 | %, | 9/1/2048 | | | — | | — | 495 | 471 | | | 495 | | 471 | |
| 4.88 | %, | 12/9/2045 | | | — | | — | | 80 | 81 | | | | 80 | | 81 | |
| Walmart Inc | | | | | | | | | | | | | | | |
| 3.40 | %, | 6/26/2023 | | | — | | — | 235 | 237 | | | 235 | | 237 | |
| 3.95 | %, | 6/28/2038 | | | — | | — | 160 | 158 | | | 160 | | 158 | |
| 4.05 | %, | 6/29/2048 | | | — | | — | | 10 | 10 | | | | 10 | | 10 | |
| | | | | | $ | | — | | $ | 2,263 | | | | $ | | 2,263 | |
| Savings & Loans - 0.24% | | | | | | | | | | | | | | | |
| First Niagara Financial Group Inc | | | | | | | | | | | | | | | |
| 7.25 | %, | 12/15/2021 | | | 500 | | 547 | | — | — | | | 500 | | 547 | |
| Nationwide Building Society | | | | | | | | | | | | | | | |
| 4.12 | %, | 10/18/2032(h),(k) | | | — | | — | 660 | 584 | | | 660 | | 584 | |
| USD Swap Rate NY 5 Year + 1.85% | | | | | | | | | | | | | | | |
| | | | | | $ | | 547 | | $ | 584 | | | | $ | | 1,131 | |
| Semiconductors - 0.44% | | | | | | | | | | | | | | | |
| NXP BV / NXP Funding LLC | | | | | | | | | | | | | | | |
| 3.88 | %, | 9/1/2022(h) | | | — | | — | 250 | 240 | | | 250 | | 240 | |
| 4.63 | %, | 6/15/2022(h) | | | — | | — | 470 | 463 | | | 470 | | 463 | |
| 4.63 | %, | 6/1/2023(h) | | | — | | — | 400 | 392 | | | 400 | | 392 | |
See accompanying notes.
| | | | | | | | | | | | | | | | | | |
| | | | | | | | | Core Plus Bond | | | | | | Combined | | | |
| | | | | | Income Account | | | Account | Core Plus Bond | | | Portfolio | | Combined | |
| | | | | | Principal | Income Account | | Principal | Account Value | | | Principal | | Portfolio Value | |
| BONDS (continued) | | | Amount (000's) | Value (000's) | | Amount (000's) | | | (000 | 's) | | Amount (000's) | | (000 | 's) |
| Semiconductors (continued) | | | | | | | | | | | | | | | | |
| QUALCOMM Inc | | | | | | | | | | | | | | | | |
| 3.25 | %, | 1/30/2023 | | $ | — $ | — | $ | 170 | $ | | 169 | | $ | 170 | $ | 169 | |
| 3 Month USD LIBOR + 0.73% | | | | | | | | | | | | | | | | |
| Texas Instruments Inc | | | | | | | | | | | | | | | | |
| 4.15 | %, | 5/15/2048 | | | — | — | | 215 | | | 215 | | | 215 | | 215 | |
| Xilinx Inc | | | | | | | | | | | | | | | | | | |
| 2.95 | %, | 6/1/2024 | | | — | — | | 570 | | | 544 | | | 570 | | 544 | |
| | | | | | $ | — | | | $ | | 2,023 | | | | $ | | 2,023 | |
| Software - 0.68% | | | | | | | | | | | | | | | | |
| Epicor Software Corp | | | | | | | | | | | | | | | | |
| 10.05 | %, | 6/30/2023(h) | | | — | — | | 59 | | | 57 | | | | 59 | | 57 | |
| 3 Month USD LIBOR + 7.25% | | | | | | | | | | | | | | | | |
| Fiserv Inc | | | | | | | | | | | | | | | | | | |
| 3.80 | %, | 10/1/2023 | | | — | — | | 200 | | | 201 | | | 200 | | 201 | |
| 4.20 | %, | 10/1/2028 | | | — | — | | 160 | | | 160 | | | 160 | | 160 | |
| Microsoft Corp | | | | | | | | | | | | | | | | |
| 3.70 | %, | 8/8/2046 | | | — | — | | 185 | | | 177 | | | 185 | | 177 | |
| 4.45 | %, | 11/3/2045 | | | — | — | | 110 | | | 117 | | | 110 | | 117 | |
| 4.50 | %, | 2/6/2057 | | | — | — | | 90 | | | 96 | | | | 90 | | 96 | |
| Oracle Corp | | | | | | | | | | | | | | | | | | |
| 2.50 | %, | 5/15/2022 | | | 500 | 489 | | — | | | — | | | 500 | | 489 | |
| 2.95 | %, | 11/15/2024 | | | — | — | | 175 | | | 171 | | | 175 | | 171 | |
| 2.95 | %, | 5/15/2025 | | | 1,000 | 957 | | — | | | — | | | 1,000 | | 957 | |
| 3.80 | %, | 11/15/2037 | | | — | — | | 275 | | | 257 | | | 275 | | 257 | |
| 4.00 | %, | 11/15/2047 | | | — | — | | 260 | | | 242 | | | 260 | | 242 | |
| 6.13 | %, | 7/8/2039 | | | — | — | | 180 | | | 216 | | | 180 | | 216 | |
| | | | | | $ | 1,446 | | | $ | | 1,694 | | | | $ | | 3,140 | |
| Sovereign - 1.05% | | | | | | | | | | | | | | | | |
| Argentine Republic Government International | | | | | | | | | | | | | | | | |
| Bond | | | | | | | | | | | | | | | | | | |
| 5.63 | %, | 1/26/2022 | | | — | — | | 335 | | | 283 | | | 335 | | 283 | |
| 5.88 | %, | 1/11/2028 | | | — | — | | 115 | | | 83 | | | 115 | | 83 | |
| 6.88 | %, | 1/26/2027 | | | — | — | | 100 | | | 76 | | | 100 | | 76 | |
| CoBank ACB | | | | | | | | | | | | | | | | |
| 6.25 | %, | 12/31/2049(k),(l) | | | — | — | | 115 | | | 115 | | | 115 | | 115 | |
| 3 Month USD LIBOR + 4.66% | | | | | | | | | | | | | | | | |
| Colombia Government International Bond | | | | | | | | | | | | | | | | |
| 5.00 | %, | 6/15/2045 | | | — | — | | 200 | | | 190 | | | 200 | | 190 | |
| Croatia Government International Bond | | | | | | | | | | | | | | | | |
| 6.00 | %, | 1/26/2024 | | | — | — | | 200 | | | 216 | | | 200 | | 216 | |
| 6.38 | %, | 3/24/2021 | | | — | — | | 200 | | | 210 | | | 200 | | 210 | |
| Dominican Republic International Bond | | | | | | | | | | | | | | | | |
| 6.00 | %, | 7/19/2028(h) | | | — | — | | 150 | | | 150 | | | 150 | | 150 | |
| Ecuador Government International Bond | | | | | | | | | | | | | | | | |
| 10.75 | %, | 3/28/2022 | | | — | — | | 200 | | | 202 | | | 200 | | 202 | |
| Egypt Government International Bond | | | | | | | | | | | | | | | | |
| 5.58 | %, | 2/21/2023(h) | | | — | — | | 200 | | | 190 | | | 200 | | 190 | |
See accompanying notes.
| | | | | | | | | | | | | | | | |
| | | | | | | | | Core Plus Bond | | | | | Combined | | | |
| | | | | | Income Account | | | Account | | Core Plus Bond | | | Portfolio | | Combined | |
| | | | | | Principal | Income Account | | Principal | | Account Value | | | Principal | | Portfolio Value | |
| BONDS (continued) | | | Amount (000's) | Value (000's) | | Amount (000's) | | (000 | 's) | | Amount (000's) | | (000 | 's) |
| Sovereign (continued) | | | | | | | | | | | | | | |
| Hungary Government International Bond | | | | | | | | | | | | | | |
| 5.38 | %, | 2/21/2023 | | $ | — $ | — | $ | 120 | $ | 127 | | $ | 120 | $ | 127 | |
| Indonesia Government International Bond | | | | | | | | | | | | | | |
| 5.38 | %, | 10/17/2023(h) | | | — | — | | 500 | | 522 | | | 500 | | 522 | |
| Mexico Government International Bond | | | | | | | | | | | | | | |
| 4.15 | %, | 3/28/2027 | | | — | — | | 200 | | 193 | | | 200 | | 193 | |
| Panama Government International Bond | | | | | | | | | | | | | | |
| 3.88 | %, | 3/17/2028 | | | — | — | | 200 | | 197 | | | 200 | | 197 | |
| Qatar Government International Bond | | | | | | | | | | | | | | |
| 3.25 | %, | 6/2/2026 | | | — | — | | 400 | | 386 | | | 400 | | 386 | |
| 3.88 | %, | 4/23/2023(h) | | | — | — | | 200 | | 202 | | | 200 | | 202 | |
| Russian Foreign Bond - Eurobond | | | | | | | | | | | | | | |
| 4.75 | %, | 5/27/2026 | | | — | — | | 200 | | 198 | | | 200 | | 198 | |
| Saudi Government International Bond | | | | | | | | | | | | | | |
| 2.38 | %, | 10/26/2021 | | | — | — | | 400 | | 385 | | | 400 | | 385 | |
| 4.00 | %, | 4/17/2025(h) | | | — | — | | 200 | | 198 | | | 200 | | 198 | |
| Turkey Government International Bond | | | | | | | | | | | | | | |
| 4.88 | %, | 10/9/2026 | | | — | — | | 200 | | 177 | | | 200 | | 177 | |
| 5.75 | %, | 3/22/2024 | | | — | — | | 400 | | 387 | | | 400 | | 387 | |
| Ukraine Government International Bond | | | | | | | | | | | | | | |
| 9.75 | %, | 11/1/2028(h) | | | — | — | | 200 | | 187 | | | 200 | | 187 | |
| | | | | | $ | — | | | $ | 4,874 | | | | $ | 4,874 | |
| Student Loan Asset Backed Securities - 1.12% | | | | | | | | | | | | | | |
| Navient Private Education Loan Trust 2018-B | | | | | | | | | | | | | | |
| 2.81 | %, | 12/15/2059(h) | | | — | — | | 2,250 | | 2,247 | | | 2,250 | | 2,247 | |
| 1.00 x 1 Month USD LIBOR + 0.35% | | | | | | | | | | | | | | |
| Navient Private Education Refi Loan Trust 2018- | | | | | | | | | | | | | | |
| A | | | | | | | | | | | | | | | | |
| 2.53 | %, | 2/18/2042(h) | | | — | — | | 399 | | 396 | | | 399 | | 396 | |
| Navient Private Education Refi Loan Trust 2018- | | | | | | | | | | | | | | |
| C | | | | | | | | | | | | | | | | |
| 3.01 | %, | 6/16/2042(h) | | | — | — | | 616 | | 614 | | | 616 | | 614 | |
| Navient Student Loan Trust 2017-3 | | | | | | | | | | | | | | |
| 2.81 | %, | 7/26/2066(h) | | | — | — | | 574 | | 574 | | | 574 | | 574 | |
| 1.00 x 1 Month USD LIBOR + 0.30% | | | | | | | | | | | | | | |
| Navient Student Loan Trust 2018-2 | | | | | | | | | | | | | | |
| 2.75 | %, | 3/25/2067(h) | | | — | — | | 193 | | 193 | | | 193 | | 193 | |
| 1.00 x 1 Month USD LIBOR + 0.24% | | | | | | | | | | | | | | |
| SMB Private Education Loan Trust 2017-B | | | | | | | | | | | | | | |
| 2.73 | %, | 6/17/2024(h) | | | — | — | | 791 | | 791 | | | 791 | | 791 | |
| 1.00 x 1 Month USD LIBOR + 0.27% | | | | | | | | | | | | | | |
| SoFi Professional Loan Program 2016-D LLC | | | | | | | | | | | | | | |
| 1.53 | %, | 4/25/2033(h) | | | — | — | | 4 | | 4 | | | 4 | | 4 | |
| Sofi Professional Loan Program 2017-B LLC | | | | | | | | | | | | | | |
| 1.83 | %, | 5/25/2040(h) | | | — | — | | 149 | | 148 | | | 149 | | 148 | |
See accompanying notes.
| | | | | | | | | | | | | | | | | | |
| | | | | | | | | Core Plus Bond | | | | | | Combined | | | |
| | | | | | Income Account | | | Account | Core Plus Bond | | | Portfolio | | Combined | |
| | | | | | Principal | Income Account | | Principal | Account Value | | | Principal | | Portfolio Value | |
| BONDS (continued) | | | Amount (000's) | Value (000's) | | Amount (000's) | (000 | 's) | | Amount (000's) | | (000 | 's) |
| Student Loan Asset Backed Securities | | | | | | | | | | | | | | | | |
| (continued) | | | | | | | | | | | | | | | | | | |
| Sofi Professional Loan Program 2018-A LLC | | | | | | | | | | | | | | | | |
| 2.39 | %, | 2/25/2042(h) | | $ | — $ | — | $ | 208 | $ | | 206 | | $ | 208 | $ | 206 | |
| | | | | | $ | — | | | $ | | 5,173 | | | | $ | | 5,173 | |
| Telecommunications - 1.92% | | | | | | | | | | | | | | | | |
| AT&T Inc | | | | | | | | | | | | | | | | | | |
| 4.30 | %, | 2/15/2030 | | | — | — | | 810 | | | 765 | | | 810 | | 765 | |
| 4.90 | %, | 8/15/2037 | | | — | — | | 325 | | | 303 | | | 325 | | 303 | |
| 5.15 | %, | 3/15/2042 | | | — | — | | 50 | | | 47 | | | | 50 | | 47 | |
| 5.45 | %, | 3/1/2047 | | | — | — | | 165 | | | 161 | | | 165 | | 161 | |
| 6.38 | %, | 3/1/2041 | | | — | — | | 135 | | | 146 | | | 135 | | 146 | |
| British Telecommunications PLC | | | | | | | | | | | | | | | | |
| 4.50 | %, | 12/4/2023 | | | — | — | | 200 | | | 203 | | | 200 | | 203 | |
| 5.13 | %, | 12/4/2028 | | | — | — | | 305 | | | 307 | | | 305 | | 307 | |
| Embarq Corp | | | | | | | | | | | | | | | | |
| 8.00 | %, | 6/1/2036 | | | — | — | | 75 | | | 68 | | | | 75 | | 68 | |
| Empresa Nacional de Telecomunicaciones SA | | | | | | | | | | | | | | | | |
| 4.75 | %, | 8/1/2026(h) | | | — | — | | 200 | | | 188 | | | 200 | | 188 | |
| Frontier Communications Corp | | | | | | | | | | | | | | | | |
| 8.50 | %, | 4/1/2026(h) | | | — | — | | 170 | | | 149 | | | 170 | | 149 | |
| 11.00 | %, | 9/15/2025 | | | — | — | | 130 | | | 81 | | | 130 | | 81 | |
| Goodman Networks Inc | | | | | | | | | | | | | | | | |
| 8.00 | %, | 5/11/2022 | | | — | — | | 31 | | | 11 | | | | 31 | | 11 | |
| GTT Communications Inc | | | | | | | | | | | | | | | | |
| 7.88 | %, | 12/31/2024(h) | | | — | — | | 120 | | | 104 | | | 120 | | 104 | |
| Intelsat Jackson Holdings SA | | | | | | | | | | | | | | | | |
| 5.50 | %, | 8/1/2023 | | | — | — | | 150 | | | 130 | | | 150 | | 130 | |
| 8.00 | %, | 2/15/2024(h) | | | — | — | | 90 | | | 93 | | | | 90 | | 93 | |
| 8.50 | %, | 10/15/2024(h) | | | — | — | | 115 | | | 111 | | | 115 | | 111 | |
| Level 3 Financing Inc | | | | | | | | | | | | | | | | |
| 5.13 | %, | 5/1/2023 | | | — | — | | 35 | | | 34 | | | | 35 | | 34 | |
| 5.38 | %, | 1/15/2024 | | | — | — | | 80 | | | 76 | | | | 80 | | 76 | |
| Level 3 Parent LLC | | | | | | | | | | | | | | | | |
| 5.75 | %, | 12/1/2022 | | | — | — | | 55 | | | 54 | | | | 55 | | 54 | |
| Ooredoo International Finance Ltd | | | | | | | | | | | | | | | | |
| 3.88 | %, | 1/31/2028 | | | — | — | | 250 | | | 239 | | | 250 | | 239 | |
| Qwest Corp | | | | | | | | | | | | | | | | | | |
| 6.75 | %, | 12/1/2021 | | | 2,000 | 2,045 | | — | | | — | | | 2,000 | | 2,045 | |
| Sprint Capital Corp | | | | | | | | | | | | | | | | |
| 8.75 | %, | 3/15/2032 | | | — | — | | 155 | | | 163 | | | 155 | | 163 | |
| Sprint Communications Inc | | | | | | | | | | | | | | | | |
| 6.00 | %, | 11/15/2022 | | | — | — | | 10 | | | 10 | | | | 10 | | 10 | |
| 7.00 | %, | 8/15/2020 | | | — | — | | 135 | | | 138 | | | 135 | | 138 | |
| Sprint Corp | | | | | | | | | | | | | | | | | | |
| 7.13 | %, | 6/15/2024 | | | — | — | | 140 | | | 139 | | | 140 | | 139 | |
| 7.63 | %, | 3/1/2026 | | | — | — | | 35 | | | 35 | | | | 35 | | 35 | |
See accompanying notes.
| | | | | | | | | | | | | | | | | |
| | | | | | | | | | Core Plus Bond | | | | | Combined | | | |
| | | | | | Income Account | | | | Account | | Core Plus Bond | | | Portfolio | | Combined | |
| | | | | | Principal | | Income Account | | Principal | | Account Value | | | Principal | | Portfolio Value | |
| BONDS (continued) | | | Amount (000's) | | Value (000's) | | Amount (000's) | | (000 | 's) | | Amount (000's) | | (000 | 's) |
| Telecommunications (continued) | | | | | | | | | | | | | | | |
| Sprint Corp (continued) | | | | | | | | | | | | | | | |
| 7.88 | %, | 9/15/2023 | | $ | 250 | $ | 256 | $ | 135 | $ | 138 | | $ | 385 | $ | 394 | |
| Sprint Spectrum Co LLC / Sprint Spectrum Co II | | | | | | | | | | | | | | | |
| LLC / Sprint Spectrum Co III LLC | | | | | | | | | | | | | | | |
| 3.36 | %, | 3/20/2023(h) | | | 172 | | 170 | | — | | — | | | 172 | | 170 | |
| 5.15 | %, | 3/20/2028(h) | | | 500 | | 491 | | — | | — | | | 500 | | 491 | |
| Telecom Italia Capital SA | | | | | | | | | | | | | | | |
| 6.38 | %, | 11/15/2033 | | | — | | — | | 25 | | 23 | | | 25 | | 23 | |
| Telefonica Emisiones SA | | | | | | | | | | | | | | | |
| 5.21 | %, | 3/8/2047 | | | — | | — | | 220 | | 201 | | | 220 | | 201 | |
| T-Mobile USA Inc | | | | | | | | | | | | | | | |
| 5.13 | %, | 4/15/2025 | | | — | | — | | 320 | | 311 | | | 320 | | 311 | |
| 6.00 | %, | 4/15/2024 | | | — | | — | | 95 | | 95 | | | 95 | | 95 | |
| 6.38 | %, | 3/1/2025 | | | 500 | | 505 | | — | | — | | | 500 | | 505 | |
| 6.50 | %, | 1/15/2024 | | | — | | — | | 30 | | 31 | | | 30 | | 31 | |
| 6.50 | %, | 1/15/2026 | | | — | | — | | 95 | | 97 | | | 95 | | 97 | |
| VEON Holdings BV | | | | | | | | | | | | | | | |
| 3.95 | %, | 6/16/2021(h) | | | — | | — | | 200 | | 193 | | | 200 | | 193 | |
| Verizon Communications Inc | | | | | | | | | | | | | | | |
| 4.50 | %, | 8/10/2033 | | | — | | — | | 270 | | 266 | | | 270 | | 266 | |
| 5.01 | %, | 8/21/2054 | | | — | | — | | 70 | | 68 | | | 70 | | 68 | |
| 5.25 | %, | 3/16/2037 | | | — | | — | | 260 | | 271 | | | 260 | | 271 | |
| | | | | | $ | | 3,467 | | | $ | 5,449 | | | | $ | 8,916 | |
| Transportation - 0.36% | | | | | | | | | | | | | | | |
| Burlington Northern Santa Fe LLC | | | | | | | | | | | | | | | |
| 4.15 | %, | 12/15/2048 | | | — | | — | | 165 | | 161 | | | 165 | | 161 | |
| 4.38 | %, | 9/1/2042 | | | — | | — | | 125 | | 125 | | | 125 | | 125 | |
| Canadian National Railway Co | | | | | | | | | | | | | | | |
| 4.45 | %, | 1/20/2049 | | | — | | — | | 305 | | 323 | | | 305 | | 323 | |
| CSX Corp | | | | | | | | | | | | | | | | | |
| 4.75 | %, | 11/15/2048 | | | — | | — | | 180 | | 182 | | | 180 | | 182 | |
| Eletson Holdings Inc / Eletson Finance US LLC / | | | | | | | | | | | | | | | |
| Agathonissos Finance LLC | | | | | | | | | | | | | | | |
| 9.62 | %, | 1/15/2022(i) | | | — | | — | | 121 | | 46 | | | 121 | | 46 | |
| Navios Maritime Acquisition Corp / Navios | | | | | | | | | | | | | | | |
| Acquisition Finance US Inc | | | | | | | | | | | | | | | |
| 8.13 | %, | 11/15/2021(h) | | | — | | — | | 305 | | 229 | | | 305 | | 229 | |
| Navios Maritime Holdings Inc / Navios Maritime | | | | | | | | | | | | | | | |
| Finance II US Inc | | | | | | | | | | | | | | | |
| 7.38 | %, | 1/15/2022(h) | | | — | | — | | 140 | | 88 | | | 140 | | 88 | |
| 11.25 | %, | 8/15/2022(h) | | | — | | — | | 105 | | 79 | | | 105 | | 79 | |
| Navios South American Logistics Inc / Navios | | | | | | | | | | | | | | | |
| Logistics Finance US Inc | | | | | | | | | | | | | | | |
| 7.25 | %, | 5/1/2022(h) | | | — | | — | | 185 | | 167 | | | 185 | | 167 | |
| Trailer Bridge Inc | | | | | | | | | | | | | | | |
| 0.00 | %, | 11/15/2019(a),(b),(e) | | | 2,000 | | — | | — | | — | | | 2,000 | | — | |
| Union Pacific Corp | | | | | | | | | | | | | | | |
| 3.50 | %, | 6/8/2023 | | | — | | — | | 220 | | 220 | | | 220 | | 220 | |
See accompanying notes.
| | | | | | | | | | | | | | | | | | |
| | | | | | | | | Core Plus Bond | | | | | | Combined | | | | |
| | | | | | Income Account | | | Account | Core Plus Bond | | | Portfolio | | | Combined | |
| | | | | | Principal | Income Account | | Principal | Account Value | | | Principal | Portfolio Value | |
| BONDS (continued) | | | Amount (000's) | Value (000's) | | Amount (000's) | (000 | 's) | | Amount (000's) | | | (000 | 's) |
| Transportation (continued) | | | | | | | | | | | | | | | | |
| Union Pacific Corp (continued) | | | | | | | | | | | | | | | | |
| 4.38 | %, | 11/15/2065 | | $ | — $ | — | $ | 60 | $ | | 55 | | $ | 60 | $ | | 55 | |
| | | | | | $ | — | | | $ | | 1,675 | | | | $ | | 1,675 | |
| Trucking & Leasing - 0.08% | | | | | | | | | | | | | | | | |
| Avolon Holdings Funding Ltd | | | | | | | | | | | | | | | | |
| 5.13 | %, | 10/1/2023(h) | | | — | — | | 10 | | | 9 | | | 10 | | | 9 | |
| 5.50 | %, | 1/15/2023(h) | | | — | — | | 180 | | | 175 | | | 180 | | | 175 | |
| DAE Funding LLC | | | | | | | | | | | | | | | | |
| 4.50 | %, | 8/1/2022(h) | | | — | — | | 50 | | | 48 | | | 50 | | | 48 | |
| 5.00 | %, | 8/1/2024(h) | | | — | — | | 95 | | | 92 | | | 95 | | | 92 | |
| 5.25 | %, | 11/15/2021(h) | | | — | — | | 25 | | | 24 | | | 25 | | | 24 | |
| Park Aerospace Holdings Ltd | | | | | | | | | | | | | | | | |
| 5.50 | %, | 2/15/2024(h) | | | — | — | | 35 | | | 34 | | | 35 | | | 34 | |
| | | | | | $ | — | | | $ | | 382 | | | | $ | | 382 | |
| TOTAL BONDS | | | $ | 109,688 | | | $ | | 186,733 | | | | $ | | 296,421 | |
| | | | | | | | | Core Plus Bond | | | | | | Combined | | | | |
| | | | | | Income Account | | | Account | Core Plus Bond | | | Portfolio | | | Combined | |
| | | | | | Principal | Income Account | | Principal | Account Value | | | Principal | Portfolio Value | |
| CONVERTIBLE BONDS - 0.25% | | | Amount (000's) | Value (000's) | | Amount (000's) | (000 | 's) | | Amount (000's) | | | (000 | 's) |
| Insurance - 0.25% | | | | | | | | | | | | | | | | |
| AmTrust Financial Services Inc | | | | | | | | | | | | | | | | |
| 2.75%, 12/15/2044 | | | 1,250 | 1,175 | | — | | | — | | | 1,250 | | | 1,175 | |
| TOTAL CONVERTIBLE BONDS | | | $ | 1,175 | | | $ | | — | | | | $ | | 1,175 | |
| | | | | | | | | Core Plus Bond | | | | | | Combined | | | | |
| | | | | | Income Account | | | Account | Core Plus Bond | | | Portfolio | | | Combined | |
| SENIOR FLOATING RATE INTERESTS - | | | Principal | Income Account | | Principal | Account Value | | | Principal | Portfolio Value | |
| 1.51% | | | | Amount (000's) | Value (000's) | | Amount (000's) | (000 | 's) | | Amount (000's) | | | (000 | 's) |
| Aerospace & Defense - 0.01% | | | | | | | | | | | | | | | | |
| TransDigm Inc | | | | | | | | | | | | | | | | |
| 5.02%, 6/9/2023(n) | | $ | — $ | — | $ | 35 | $ | | 33 | | $ | 35 | $ | | 33 | |
| US LIBOR + 2.50% | | | | | | | | | | | | | | | | |
| Automobile Manufacturers - 0.04% | | | | | | | | | | | | | | | | |
| Navistar Financial Corp | | | | | | | | | | | | | | | | |
| 6.31%, 7/30/2025(n) | | | — | — | | 160 | | | 152 | | | 160 | | | 152 | |
| US LIBOR + 3.75% | | | | | | | | | | | | | | | | |
| Navistar Inc | | | | | | | | | | | | | | | | | | |
| 5.89%, 11/6/2024(n) | | | — | — | | 59 | | | 57 | | | 59 | | | 57 | |
| US LIBOR + 3.50% | | | | | | | | | | | | | | | | |
| | | | | | $ | — | | | $ | | 209 | | | | $ | | 209 | |
| Automobile Parts & Equipment - 0.01% | | | | | | | | | | | | | | | | |
| American Axle & Manufacturing Inc | | | | | | | | | | | | | | | | |
| 4.75%, 4/6/2024(n) | | | — | — | | 43 | | | 41 | | | 43 | | | 41 | |
| US LIBOR + 2.25% | | | | | | | | | | | | | | | | |
| Chemicals - 0.06% | | | | | | | | | | | | | | | | |
| Aruba Investments Inc | | | | | | | | | | | | | | | | |
| 5.77%, 2/2/2022(n) | | | — | — | | 34 | | | 33 | | | 34 | | | 33 | |
| US LIBOR + 3.25% | | | | | | | | | | | | | | | | |
See accompanying notes.
| | | | | | | | | | | | | |
| | | | | | Core Plus Bond | | | | | Combined | | | |
| | | Income Account | | | Account | | Core Plus Bond | | | Portfolio | | Combined | |
| SENIOR FLOATING RATE INTERESTS | | Principal | Income Account | | Principal | | Account Value | | | Principal | | Portfolio Value | |
| (continued) | | Amount (000's) | Value (000's) | | Amount (000's) | | (000 | 's) | | Amount (000's) | | (000 | 's) |
| Chemicals (continued) | | | | | | | | | | | | | |
| Consolidated Energy Finance SA | | | | | | | | | | | | | |
| 4.71%, 5/7/2025(n) | $ | — $ | — | $ | 95 | $ | 92 | | $ | 95 | $ | 92 | |
| US LIBOR + 2.50% | | | | | | | | | | | | | |
| Emerald Performance Materials LLC | | | | | | | | | | | | | |
| 10.27%, 8/1/2022(n) | | — | — | | 105 | | 104 | | | 105 | | 104 | |
| US LIBOR + 6.75% | | | | | | | | | | | | | |
| Starfruit US Holdco LLC | | | | | | | | | | | | | |
| 5.60%, 10/1/2025(n) | | — | — | | 65 | | 62 | | | 65 | | 62 | |
| US LIBOR + 3.25% | | | | | | | | | | | | | |
| | | $ | — | | | $ | 291 | | | | $ | 291 | |
| Commercial Services - 0.09% | | | | | | | | | | | | | |
| Garda World Security Corp | | | | | | | | | | | | | |
| 6.24%, 5/24/2024(n) | | — | — | | 69 | | 66 | | | 69 | | 66 | |
| US LIBOR + 3.50% | | | | | | | | | | | | | |
| Prime Security Services Borrower LLC | | | | | | | | | | | | | |
| 5.27%, 5/2/2022(n) | | — | — | | 108 | | 103 | | | 108 | | 103 | |
| US LIBOR + 2.75% | | | | | | | | | | | | | |
| Refinitiv US Holdings Inc | | | | | | | | | | | | | |
| 6.27%, 9/18/2025(n) | | — | — | | 185 | | 175 | | | 185 | | 175 | |
| US LIBOR + 3.75% | | | | | | | | | | | | | |
| TMS International Corp | | | | | | | | | | | | | |
| 5.28%, 8/14/2024(n) | | — | — | | 64 | | 60 | | | 64 | | 60 | |
| US LIBOR + 2.75% | | | | | | | | | | | | | |
| | | $ | — | | | $ | 404 | | | | $ | 404 | |
| Computers - 0.04% | | | | | | | | | | | | | |
| Dell International LLC | | | | | | | | | | | | | |
| 4.53%, 9/7/2023(n) | | — | — | | 73 | | 70 | | | 73 | | 70 | |
| US LIBOR + 2.00% | | | | | | | | | | | | | |
| McAfee LLC | | | | | | | | | | | | | |
| 11.01%, 9/29/2025(n) | | — | — | | 118 | | 117 | | | 118 | | 117 | |
| US LIBOR + 8.50% | | | | | | | | | | | | | |
| | | $ | — | | | $ | 187 | | | | $ | 187 | |
| Consumer Products - 0.02% | | | | | | | | | | | | | |
| Prestige Brands Inc | | | | | | | | | | | | | |
| 4.52%, 1/26/2024(n) | | — | — | | 93 | | 90 | | | 93 | | 90 | |
| US LIBOR + 2.00% | | | | | | | | | | | | | |
| Diversified Financial Services - 0.08% | | | | | | | | | | | | | |
| Lions Gate Capital Holdings LLC | | | | | | | | | | | | | |
| 4.77%, 3/24/2025(n) | | — | — | | 94 | | 90 | | | 94 | | 90 | |
| US LIBOR + 2.25% | | | | | | | | | | | | | |
| Russell Investments US Institutional Holdco Inc | | | | | | | | | | | | | |
| 5.77%, 6/1/2023(n) | | — | — | | 286 | | 279 | | | 286 | | 279 | |
| US LIBOR + 3.25% | | | | | | | | | | | | | |
| | | $ | — | | | $ | 369 | | | | $ | 369 | |
See accompanying notes.
| | | | | | | | | | | | | |
| | | | | | Core Plus Bond | | | | | Combined | | | |
| | | Income Account | | | Account | | Core Plus Bond | | | Portfolio | | Combined | |
| SENIOR FLOATING RATE INTERESTS | | Principal | Income Account | | Principal | | Account Value | | | Principal | | Portfolio Value | |
| (continued) | | Amount (000's) | Value (000's) | | Amount (000's) | | (000 | 's) | | Amount (000's) | | (000 | 's) |
| Electric - 0.02% | | | | | | | | | | | | | |
| Vistra Operations Co LLC | | | | | | | | | | | | | |
| 4.47%, 12/14/2025(n) | $ | — $ | — | $ | 75 | $ | 72 | | $ | 75 | $ | 72 | |
| US LIBOR + 2.00% | | | | | | | | | | | | | |
| Electrical Components & Equipment - 0.03% | | | | | | | | | | | | | |
| Energizer Holdings Inc | | | | | | | | | | | | | |
| 0.00%, 12/17/2025(n),(o) | | — | — | | 160 | | 154 | | | 160 | | 154 | |
| US LIBOR + 2.25% | | | | | | | | | | | | | |
| Entertainment - 0.08% | | | | | | | | | | | | | |
| CCM Merger Inc | | | | | | | | | | | | | |
| 4.77%, 8/6/2021(n) | | — | — | | 99 | | 96 | | | 99 | | 96 | |
| US LIBOR + 2.25% | | | | | | | | | | | | | |
| Eldorado Resorts Inc | | | | | | | | | | | | | |
| 4.50%, 4/17/2024(n) | | — | — | | 20 | | 19 | | | 20 | | 19 | |
| US LIBOR + 2.25% | | | | | | | | | | | | | |
| Stars Group Holdings BV | | | | | | | | | | | | | |
| 6.30%, 6/27/2025(n) | | — | — | | 45 | | 43 | | | 45 | | 43 | |
| US LIBOR + 3.50% | | | | | | | | | | | | | |
| WMG Acquisition Corp | | | | | | | | | | | | | |
| 4.65%, 11/1/2023(n) | | — | — | | 214 | | 205 | | | 214 | | 205 | |
| US LIBOR + 2.13% | | | | | | | | | | | | | |
| | | $ | — | | | $ | 363 | | | | $ | 363 | |
| Environmental Control - 0.02% | | | | | | | | | | | | | |
| Filtration Group Corp | | | | | | | | | | | | | |
| 5.52%, 3/31/2025(n) | | — | — | | 74 | | 72 | | | 74 | | 72 | |
| US LIBOR + 3.00% | | | | | | | | | | | | | |
| Food - 0.03% | | | | | | | | | | | | | |
| JBS USA LUX SA | | | | | | | | | | | | | |
| 5.26%, 10/30/2022(n) | | — | — | | 68 | | 66 | | | 68 | | 66 | |
| US LIBOR + 2.50% | | | | | | | | | | | | | |
| Post Holdings Inc | | | | | | | | | | | | | |
| 4.32%, 5/24/2024(n) | | — | — | | 73 | | 70 | | | 73 | | 70 | |
| US LIBOR + 2.00% | | | | | | | | | | | | | |
| | | $ | — | | | $ | 136 | | | | $ | 136 | |
| Healthcare - Products - 0.03% | | | | | | | | | | | | | |
| DJO Finance LLC | | | | | | | | | | | | | |
| 5.71%, 6/8/2020(n) | | — | — | | 44 | | 44 | | | 44 | | 44 | |
| US LIBOR + 3.25% | | | | | | | | | | | | | |
| Kinetic Concepts Inc | | | | | | | | | | | | | |
| 6.05%, 2/2/2024(n) | | — | — | | 104 | | 99 | | | 104 | | 99 | |
| US LIBOR + 3.25% | | | | | | | | | | | | | |
| | | $ | — | | | $ | 143 | | | | $ | 143 | |
| Healthcare - Services - 0.09% | | | | | | | | | | | | | |
| Acadia Healthcare Co Inc | | | | | | | | | | | | | |
| 5.02%, 2/16/2023(n) | | — | — | | 43 | | 41 | | | 43 | | 41 | |
| US LIBOR + 2.50% | | | | | | | | | | | | | |
See accompanying notes.
| | | | | | | | | | | | | |
| | | | | | Core Plus Bond | | | | | Combined | | | |
| | | Income Account | | | Account | | Core Plus Bond | | | Portfolio | | Combined | |
| SENIOR FLOATING RATE INTERESTS | | Principal | Income Account | | Principal | | Account Value | | | Principal | | Portfolio Value | |
| (continued) | | Amount (000's) | Value (000's) | | Amount (000's) | | (000 | 's) | | Amount (000's) | | (000 | 's) |
| Healthcare - Services (continued) | | | | | | | | | | | | | |
| AHP Health Partners Inc | | | | | | | | | | | | | |
| 7.02%, 6/16/2025(n) | $ | — $ | — | $ | 70 | $ | 69 | | $ | 70 | $ | 69 | |
| US LIBOR + 4.50% | | | | | | | | | | | | | |
| MPH Acquisition Holdings LLC | | | | | | | | | | | | | |
| 5.55%, 6/7/2023(n) | | — | — | | 78 | | 74 | | | 78 | | 74 | |
| US LIBOR + 3.00% | | | | | | | | | | | | | |
| RegionalCare Hospital Partners Holdings Inc | | | | | | | | | | | | | |
| 7.13%, 11/14/2025(n) | | — | — | | 225 | | 213 | | | 225 | | 213 | |
| US LIBOR + 4.50% | | | | | | | | | | | | | |
| | | $ | — | | | $ | 397 | | | | $ | 397 | |
| Insurance - 0.07% | | | | | | | | | | | | | |
| Asurion LLC | | | | | | | | | | | | | |
| 5.52%, 11/3/2023(n) | | — | — | | 92 | | 88 | | | 92 | | 88 | |
| US LIBOR + 3.00% | | | | | | | | | | | | | |
| 9.02%, 8/4/2025(n) | | — | — | | 30 | | 29 | | | 30 | | 29 | |
| US LIBOR + 6.50% | | | | | | | | | | | | | |
| Genworth Holdings Inc | | | | | | | | | | | | | |
| 6.71%, 3/7/2023(n) | | — | — | | 149 | | 146 | | | 149 | | 146 | |
| US LIBOR + 4.50% | | | | | | | | | | | | | |
| HUB International Ltd | | | | | | | | | | | | | |
| 5.24%, 4/25/2025(n) | | — | — | | 85 | | 80 | | | 85 | | 80 | |
| US LIBOR + 3.00% | | | | | | | | | | | | | |
| | | $ | — | | | $ | 343 | | | | $ | 343 | |
| Leisure Products & Services - 0.02% | | | | | | | | | | | | | |
| ClubCorp Holdings Inc | | | | | | | | | | | | | |
| 5.55%, 9/18/2024(n) | | — | — | | 83 | | 78 | | | 83 | | 78 | |
| US LIBOR + 2.75% | | | | | | | | | | | | | |
| Lodging - 0.02% | | | | | | | | | | | | | |
| Caesars Resort Collection LLC | | | | | | | | | | | | | |
| 5.27%, 12/22/2024(n) | | — | — | | 49 | | 47 | | | 49 | | 47 | |
| US LIBOR + 2.75% | | | | | | | | | | | | | |
| Golden Nugget LLC | | | | | | | | | | | | | |
| 5.20%, 10/4/2023(n) | | — | — | | 14 | | 13 | | | 14 | | 13 | |
| US LIBOR + 2.75% | | | | | | | | | | | | | |
| Marriott Ownership Resorts Inc | | | | | | | | | | | | | |
| 4.77%, 8/29/2025(n) | | — | — | | 55 | | 54 | | | 55 | | 54 | |
| US LIBOR + 2.25% | | | | | | | | | | | | | |
| | | $ | — | | | $ | 114 | | | | $ | 114 | |
| Media - 0.01% | | | | | | | | | | | | | |
| Meredith Corp | | | | | | | | | | | | | |
| 5.27%, 1/31/2025(n) | | — | — | | 50 | | 49 | | | 50 | | 49 | |
| US LIBOR + 2.75% | | | | | | | | | | | | | |
See accompanying notes.
| | | | | | | | | | | | | |
| | | | | | Core Plus Bond | | | | | Combined | | | |
| | | Income Account | | | Account | | Core Plus Bond | | | Portfolio | | Combined | |
| SENIOR FLOATING RATE INTERESTS | | Principal | Income Account | | Principal | | Account Value | | | Principal | | Portfolio Value | |
| (continued) | | Amount (000's) | Value (000's) | | Amount (000's) | | (000 | 's) | | Amount (000's) | | (000 | 's) |
| Oil & Gas - 0.06% | | | | | | | | | | | | | |
| California Resources Corp | | | | | | | | | | | | | |
| 7.26%, 12/31/2022(n) | $ | — $ | — | $ | 155 | $ | 150 | | $ | 155 | $ | 150 | |
| US LIBOR + 4.75% | | | | | | | | | | | | | |
| 12.90%, 12/31/2021(n) | | — | — | | 140 | | 137 | | | 140 | | 137 | |
| US LIBOR + 10.37% | | | | | | | | | | | | | |
| | | $ | — | | | $ | 287 | | | | $ | 287 | |
| Packaging & Containers - 0.04% | | | | | | | | | | | | | |
| Berry Global Inc | | | | | | | | | | | | | |
| 4.39%, 10/1/2022(n) | | — | — | | 30 | | 29 | | | 30 | | 29 | |
| US LIBOR + 2.00% | | | | | | | | | | | | | |
| Caraustar Industries Inc | | | | | | | | | | | | | |
| 8.30%, 3/14/2022(n) | | — | — | | 98 | | 97 | | | 98 | | 97 | |
| US LIBOR + 5.50% | | | | | | | | | | | | | |
| CROWN Americas LLC | | | | | | | | | | | | | |
| 4.48%, 1/17/2025(n) | | — | — | | 19 | | 19 | | | 19 | | 19 | |
| US LIBOR + 2.00% | | | | | | | | | | | | | |
| Flex Acquisition Co Inc | | | | | | | | | | | | | |
| 5.35%, 12/29/2023(n) | | — | — | | 34 | | 32 | | | 34 | | 32 | |
| US LIBOR + 3.00% | | | | | | | | | | | | | |
| Reynolds Group Holdings Inc | | | | | | | | | | | | | |
| 5.27%, 2/5/2023(n) | | — | — | | 34 | | 33 | | | 34 | | 33 | |
| US LIBOR + 2.75% | | | | | | | | | | | | | |
| | | $ | — | | | $ | 210 | | | | $ | 210 | |
| Pharmaceuticals - 0.09% | | | | | | | | | | | | | |
| Valeant Pharmaceuticals International | | | | | | | | | | | | | |
| 5.13%, 11/14/2025(n) | | — | — | | 173 | | 163 | | | 173 | | 163 | |
| US LIBOR + 2.75% | | | | | | | | | | | | | |
| 5.38%, 5/19/2025(n) | | — | — | | 257 | | 245 | | | 257 | | 245 | |
| US LIBOR + 3.00% | | | | | | | | | | | | | |
| | | $ | — | | | $ | 408 | | | | $ | 408 | |
| Pipelines - 0.12% | | | | | | | | | | | | | |
| BCP Renaissance Parent LLC | | | | | | | | | | | | | |
| 6.03%, 10/31/2024(n) | | 498 | 483 | | — | | — | | | 498 | | 483 | |
| US LIBOR + 3.50% | | | | | | | | | | | | | |
| Centurion Pipeline Co LLC | | | | | | | | | | | | | |
| 6.05%, 9/26/2025(n) | | — | — | | 75 | | 71 | | | 75 | | 71 | |
| US LIBOR + 3.25% | | | | | | | | | | | | | |
| | | $ | 483 | | | $ | 71 | | | | $ | 554 | |
| REITs - 0.01% | | | | | | | | | | | | | |
| MGM Growth Properties Operating Partnership | | | | | | | | | | | | | |
| LP | | | | | | | | | | | | | |
| 4.52%, 4/25/2025(n) | | — | — | | 39 | | 37 | | | 39 | | 37 | |
| US LIBOR + 2.00% | | | | | | | | | | | | | |
See accompanying notes.
| | | | | | | | | | |
| | | | Core Plus Bond | | | | Combined | | | |
| | Income Account | | Account | | Core Plus Bond | | Portfolio | | Combined | |
| SENIOR FLOATING RATE INTERESTS | Principal | Income Account | Principal | | Account Value | | Principal | | Portfolio Value | |
| (continued) | Amount (000's) | Value (000's) | Amount (000's) | | (000 | 's) | Amount (000's) | | (000 | 's) |
| Retail - 0.11% | | | | | | | | | | |
| Academy Ltd | | | | | | | | | | |
| 6.35%, 7/1/2022(n) | — | — | 132 | | 87 | | 132 | | 87 | |
| US LIBOR + 4.00% | | | | | | | | | | |
| Beacon Roofing Supply Inc | | | | | | | | | | |
| 4.68%, 1/2/2025(n) | — | — | 35 | | 33 | | 35 | | 33 | |
| US LIBOR + 2.25% | | | | | | | | | | |
| GYP Holdings III Corp | | | | | | | | | | |
| 5.27%, 6/1/2025(n) | — | — | 60 | | 57 | | 60 | | 57 | |
| US LIBOR + 2.75% | | | | | | | | | | |
| IRB Holding Corp | | | | | | | | | | |
| 5.68%, 1/17/2025(n) | — | — | 110 | | 104 | | 110 | | 104 | |
| US LIBOR + 3.25% | | | | | | | | | | |
| JC Penney Corp Inc | | | | | | | | | | |
| 6.96%, 6/23/2023(n) | — | — | 42 | | 36 | | 42 | | 36 | |
| US LIBOR + 4.25% | | | | | | | | | | |
| KFC Holding Co | | | | | | | | | | |
| 4.09%, 4/3/2025(n) | — | — | 43 | | 42 | | 43 | | 42 | |
| US LIBOR + 1.75% | | | | | | | | | | |
| Michaels Stores Inc | | | | | | | | | | |
| 5.01%, 1/28/2023(n) | — | — | 38 | | 37 | | 38 | | 37 | |
| US LIBOR + 2.50% | | | | | | | | | | |
| PetSmart Inc | | | | | | | | | | |
| 5.38%, 3/11/2022(n) | — | — | 174 | | 137 | | 174 | | 137 | |
| US LIBOR + 3.00% | | | | | | | | | | |
| | $ | — | | $ | 533 | | | $ | 533 | |
| Software - 0.15% | | | | | | | | | | |
| Ivanti Software Inc | | | | | | | | | | |
| 11.35%, 1/20/2025(n) | 750 | 713 | — | | — | | 750 | | 713 | |
| US LIBOR + 9.00% | | | | | | | | | | |
| Telecommunications - 0.13% | | | | | | | | | | |
| Avaya Inc | | | | | | | | | | |
| 6.46%, 12/16/2024(n) | — | — | 223 | | 214 | | 223 | | 214 | |
| US LIBOR + 4.25% | | | | | | | | | | |
| Level 3 Parent LLC | | | | | | | | | | |
| 4.69%, 2/22/2024(n) | — | — | 45 | | 43 | | 45 | | 43 | |
| US LIBOR + 2.25% | | | | | | | | | | |
| Maxar Technologies Ltd | | | | | | | | | | |
| 5.15%, 10/5/2024(n) | — | — | 307 | | 282 | | 307 | | 282 | |
| US LIBOR + 2.75% | | | | | | | | | | |
| West Corp | | | | | | | | | | |
| 6.53%, 10/10/2024(n) | — | — | 79 | | 72 | | 79 | | 72 | |
| US LIBOR + 4.00% | | | | | | | | | | |
| | $ | — | | $ | 611 | | | $ | 611 | |
See accompanying notes.
| | | | | | | | | | | | | | |
| | | | | | | Core Plus Bond | | | | | Combined | | | |
| | Income Account | | | | Account | | Core Plus Bond | | | Portfolio | | Combined | |
| SENIOR FLOATING RATE INTERESTS | | Principal | | Income Account | | Principal | | Account Value | | | Principal | | Portfolio Value | |
| (continued) | Amount (000's) | | Value (000's) | | Amount (000's) | | (000 | 's) | | Amount (000's) | | (000 | 's) |
| Transportation - 0.01% | | | | | | | | | | | | | | |
| Navios Maritime Partners LP | | | | | | | | | | | | | | |
| 7.78%, 9/14/2020(n) | $ | — | $ | — | $ | 27 | $ | 27 | | $ | 27 | $ | 27 | |
| US LIBOR + 5.00% | | | | | | | | | | | | | | |
| Trucking & Leasing - 0.02% | | | | | | | | | | | | | | |
| Avolon TLB Borrower 1 US LLC | | | | | | | | | | | | | | |
| 4.47%, 1/15/2025(n) | | — | | — | | 87 | | 84 | | | 87 | | 84 | |
| US LIBOR + 2.00% | | | | | | | | | | | | | | |
| TOTAL SENIOR FLOATING RATE INTERESTS | | $ | 1,196 | | | $ | 5,813 | | | | $ | 7,009 | |
| | | | | | | Core Plus Bond | | | | | Combined | | | |
| | Income Account | | | | Account | | Core Plus Bond | | | Portfolio | | Combined | |
| U.S. GOVERNMENT & GOVERNMENT | | Principal | | Income Account | | Principal | | Account Value | | | Principal | | Portfolio Value | |
| AGENCY OBLIGATIONS - 36.72% | Amount (000's) | | Value (000's) | | Amount (000's) | | (000 | 's) | | Amount (000's) | | (000 | 's) |
| Federal Home Loan Mortgage Corporation (FHLMC) - 4.36% | | | | | | | | | | | | |
| 3.00%, 10/1/2042 | $ | 564 | $ | 555 | $ | — | $ | — | | $ | 564 | $ | 555 | |
| 3.00%, 11/1/2042 | | 566 | | 557 | | — | | — | | | 566 | | 557 | |
| 3.00%, 11/1/2042 | | — | | — | | 312 | | 307 | | | 312 | | 307 | |
| 3.00%, 3/1/2043 | | — | | — | | 1,367 | | 1,344 | | | 1,367 | | 1,344 | |
| 3.00%, 10/1/2046 | | — | | — | | 1,307 | | 1,277 | | | 1,307 | | 1,277 | |
| 3.00%, 12/1/2046 | | 1,379 | | 1,346 | | — | | — | | | 1,379 | | 1,346 | |
| 3.00%, 1/1/2047 | | — | | — | | 2,522 | | 2,466 | | | 2,522 | | 2,466 | |
| 3.50%, 10/1/2041 | | 555 | | 559 | | — | | — | | | 555 | | 559 | |
| 3.50%, 4/1/2042 | | 1,380 | | 1,390 | | — | | — | | | 1,380 | | 1,390 | |
| 3.50%, 4/1/2042 | | 679 | | 684 | | — | | — | | | 679 | | 684 | |
| 3.50%, 4/1/2045 | | 640 | | 642 | | — | | — | | | 640 | | 642 | |
| 3.50%, 3/1/2048 | | 1,421 | | 1,425 | | — | | — | | | 1,421 | | 1,425 | |
| 3.62%, 2/1/2037 | | — | | — | | 20 | | 21 | | | 20 | | 21 | |
| 1.00 x 12 Month USD LIBOR + 1.63% | | | | | | | | | | | | | | |
| 3.77%, 2/1/2034 | | — | | — | | 2 | | 2 | | | 2 | | 2 | |
| 1.00 x 12 Month USD LIBOR + 1.99% | | | | | | | | | | | | | | |
| 4.00%, 2/1/2045 | | 366 | | 374 | | — | | — | | | 366 | | 374 | |
| 4.00%, 2/1/2046 | | 686 | | 701 | | — | | — | | | 686 | | 701 | |
| 4.00%, 6/1/2046 | | 742 | | 759 | | — | | — | | | 742 | | 759 | |
| 4.00%, 4/1/2047 | | — | | — | | 439 | | 449 | | | 439 | | 449 | |
| 4.00%, 11/1/2047 | | — | | — | | 693 | | 709 | | | 693 | | 709 | |
| 4.50%, 7/1/2024 | | — | | — | | 20 | | 21 | | | 20 | | 21 | |
| 4.50%, 7/1/2039 | | 744 | | 779 | | — | | — | | | 744 | | 779 | |
| 4.50%, 10/1/2041 | | 415 | | 434 | | — | | — | | | 415 | | 434 | |
| 4.50%, 12/1/2043 | | — | | — | | 1,083 | | 1,127 | | | 1,083 | | 1,127 | |
| 4.50%, 9/1/2044 | | — | | — | | 265 | | 276 | | | 265 | | 276 | |
| 4.50%, 3/1/2046 | | — | | — | | 326 | | 342 | | | 326 | | 342 | |
| 5.00%, 8/1/2019 | | 10 | | 10 | | — | | — | | | 10 | | 10 | |
| 5.00%, 6/1/2031 | | — | | — | | 113 | | 119 | | | 113 | | 119 | |
| 5.00%, 10/1/2035 | | — | | — | | 42 | | 44 | | | 42 | | 44 | |
| 5.00%, 6/1/2041 | | — | | — | | 1,161 | | 1,235 | | | 1,161 | | 1,235 | |
| 6.00%, 6/1/2032 | | — | | — | | 25 | | 27 | | | 25 | | 27 | |
| 6.00%, 10/1/2032 | | — | | — | | 14 | | 15 | | | 14 | | 15 | |
See accompanying notes.
| | | | | | | | | | | | | | |
| | | | | | | Core Plus Bond | | | | | Combined | | | |
| | Income Account | | | | Account | | Core Plus Bond | | | Portfolio | | Combined | |
| U.S. GOVERNMENT & GOVERNMENT | | Principal | Income Account | | Principal | | Account Value | | | Principal | | Portfolio Value | |
| AGENCY OBLIGATIONS (continued) | Amount (000's) | Value (000's) | | Amount (000's) | | (000 | 's) | | Amount (000's) | | (000 | 's) |
| Federal Home Loan Mortgage Corporation (FHLMC) (continued) | | | | | | | | | | | |
| 6.00%, 1/1/2038 | $ | — | $ | — | $ | 65 | $ | 72 | | $ | 65 | $ | 72 | |
| 6.50%, 3/1/2029 | | — | | — | | 4 | | 4 | | | 4 | | 4 | |
| 6.50%, 5/1/2029 | | — | | — | | 5 | | 6 | | | 5 | | 6 | |
| 6.50%, 4/1/2031 | | — | | — | | 2 | | 2 | | | 2 | | 2 | |
| 6.50%, 2/1/2032 | | — | | — | | 5 | | 5 | | | 5 | | 5 | |
| 6.50%, 5/1/2032 | | — | | — | | 5 | | 5 | | | 5 | | 5 | |
| 6.50%, 4/1/2035 | | — | | — | | 8 | | 9 | | | 8 | | 9 | |
| 7.00%, 12/1/2029 | | — | | — | | 14 | | 15 | | | 14 | | 15 | |
| 7.00%, 6/1/2030 | | — | | — | | 4 | | 4 | | | 4 | | 4 | |
| 7.00%, 12/1/2030 | | — | | — | | 1 | | 1 | | | 1 | | 1 | |
| 7.00%, 1/1/2031 | | — | | — | | 2 | | 2 | | | 2 | | 2 | |
| 7.00%, 12/1/2031 | | — | | — | | 31 | | 32 | | | 31 | | 32 | |
| 7.50%, 4/1/2030 | | — | | — | | 1 | | 2 | | | 1 | | 2 | |
| 7.50%, 3/1/2031 | | — | | — | | 9 | | 10 | | | 9 | | 10 | |
| 8.00%, 9/1/2030 | | — | | — | | 33 | | 35 | | | 33 | | 35 | |
| 9.00%, 1/1/2025 | | 2 | | 3 | | — | | — | | | 2 | | 3 | |
| | | $ | | 10,218 | | | $ | 9,985 | | | | $ | 20,203 | |
| Federal National Mortgage Association (FNMA) - 15.31% | | | | | | | | | | | | |
| 2.50%, 3/1/2030 | | — | | — | | 551 | | 539 | | | 551 | | 539 | |
| 3.00%, 1/1/2028(p) | | — | | — | | 5,200 | | 5,187 | | | 5,200 | | 5,187 | |
| 3.00%, 10/1/2030 | | — | | — | | 1,549 | | 1,550 | | | 1,549 | | 1,550 | |
| 3.00%, 3/1/2034 | | — | | — | | 335 | | 333 | | | 335 | | 333 | |
| 3.00%, 3/1/2042 | | 1,032 | | 1,015 | | — | | — | | | 1,032 | | 1,015 | |
| 3.00%, 3/1/2042 | | 944 | | 928 | | — | | — | | | 944 | | 928 | |
| 3.00%, 5/1/2042 | | 529 | | 520 | | — | | — | | | 529 | | 520 | |
| 3.00%, 6/1/2042 | | 474 | | 466 | | — | | — | | | 474 | | 466 | |
| 3.00%, 6/1/2042 | | 961 | | 946 | | — | | — | | | 961 | | 946 | |
| 3.00%, 11/1/2042 | | — | | — | | 887 | | 872 | | | 887 | | 872 | |
| 3.00%, 5/1/2043 | | — | | — | | 195 | | 192 | | | 195 | | 192 | |
| 3.00%, 1/1/2046(p) | | — | | — | | 2,500 | | 2,437 | | | 2,500 | | 2,437 | |
| 3.50%, 4/1/2030 | | — | | — | | 399 | | 404 | | | 399 | | 404 | |
| 3.50%, 8/1/2034 | | — | | — | | 402 | | 409 | | | 402 | | 409 | |
| 3.50%, 12/1/2040 | | 752 | | 758 | | — | | — | | | 752 | | 758 | |
| 3.50%, 1/1/2041 | | — | | — | | 43 | | 43 | | | 43 | | 43 | |
| 3.50%, 12/1/2041 | | 249 | | 251 | | — | | — | | | 249 | | 251 | |
| 3.50%, 3/1/2042 | | 421 | | 425 | | — | | — | | | 421 | | 425 | |
| 3.50%, 4/1/2042 | | 817 | | 823 | | — | | — | | | 817 | | 823 | |
| 3.50%, 11/1/2042 | | — | | — | | 972 | | 981 | | | 972 | | 981 | |
| 3.50%, 1/1/2043(p) | | — | | — | | 1,625 | | 1,625 | | | 1,625 | | 1,625 | |
| 3.50%, 2/1/2043 | | 537 | | 541 | | — | | — | | | 537 | | 541 | |
| 3.50%, 7/1/2043 | | — | | — | | 316 | | 318 | | | 316 | | 318 | |
| 3.50%, 7/1/2043 | | — | | — | | 929 | | 936 | | | 929 | | 936 | |
| 3.50%, 9/1/2044 | | — | | — | | 2,174 | | 2,184 | | | 2,174 | | 2,184 | |
| 3.50%, 11/1/2044 | | — | | — | | 1,918 | | 1,925 | | | 1,918 | | 1,925 | |
| 3.50%, 3/1/2045 | | 655 | | 658 | | — | | — | | | 655 | | 658 | |
| 3.50%, 6/1/2045 | | 1,227 | | 1,231 | | — | | — | | | 1,227 | | 1,231 | |
See accompanying notes.
| | | | | | | | | | | | | |
| | | | | | Core Plus Bond | | | | | Combined | | | |
| | Income Account | | | Account | | Core Plus Bond | | | Portfolio | | Combined | |
| U.S. GOVERNMENT & GOVERNMENT | | Principal | Income Account | | Principal | | Account Value | | | Principal | | Portfolio Value | |
| AGENCY OBLIGATIONS (continued) | Amount (000's) | Value (000's) | | Amount (000's) | | (000 | 's) | | Amount (000's) | | (000 | 's) |
| Federal National Mortgage Association (FNMA) (continued) | | | | | | | | | | | |
| 3.50%, 11/1/2045 | $ | — $ | — | $ | 2,998 | $ | 3,018 | | $ | 2,998 | $ | 3,018 | |
| 3.50%, 11/1/2045 | | 846 | 849 | | — | | — | | | 846 | | 849 | |
| 3.50%, 4/1/2046 | | — | — | | 579 | | 581 | | | 579 | | 581 | |
| 3.50%, 5/1/2046 | | 756 | 758 | | — | | — | | | 756 | | 758 | |
| 3.50%, 8/1/2047 | | — | — | | 1,805 | | 1,816 | | | 1,805 | | 1,816 | |
| 3.50%, 10/1/2047 | | — | — | | 1,841 | | 1,849 | | | 1,841 | | 1,849 | |
| 3.50%, 11/1/2047 | | — | — | | 813 | | 815 | | | 813 | | 815 | |
| 3.50%, 3/1/2048 | | — | — | | 1,192 | | 1,196 | | | 1,192 | | 1,196 | |
| 4.00%, 10/1/2019 | | — | — | | 4 | | 4 | | | 4 | | 4 | |
| 4.00%, 8/1/2020 | | — | — | | 43 | | 44 | | | 43 | | 44 | |
| 4.00%, 3/1/2034 | | — | — | | 447 | | 463 | | | 447 | | 463 | |
| 4.00%, 9/1/2040 | | 1,018 | 1,047 | | — | | — | | | 1,018 | | 1,047 | |
| 4.00%, 11/1/2040 | | — | — | | 1,473 | | 1,515 | | | 1,473 | | 1,515 | |
| 4.00%, 5/1/2041 | | — | — | | 225 | | 231 | | | 225 | | 231 | |
| 4.00%, 10/1/2041 | | 535 | 551 | | — | | — | | | 535 | | 551 | |
| 4.00%, 10/1/2041 | | 368 | 378 | | — | | — | | | 368 | | 378 | |
| 4.00%, 11/1/2041 | | 591 | 607 | | — | | — | | | 591 | | 607 | |
| 4.00%, 4/1/2042 | | 330 | 339 | | — | | — | | | 330 | | 339 | |
| 4.00%, 9/1/2043 | | — | — | | 652 | | 670 | | | 652 | | 670 | |
| 4.00%, 11/1/2043 | | 1,238 | 1,274 | | — | | — | | | 1,238 | | 1,274 | |
| 4.00%, 11/1/2043 | | 453 | 465 | | — | | — | | | 453 | | 465 | |
| 4.00%, 2/1/2044 | | 1,453 | 1,494 | | — | | — | | | 1,453 | | 1,494 | |
| 4.00%, 6/1/2044 | | — | — | | 310 | | 319 | | | 310 | | 319 | |
| 4.00%, 9/1/2044 | | 434 | 443 | | — | | — | | | 434 | | 443 | |
| 4.00%, 5/1/2045 | | — | — | | 514 | | 526 | | | 514 | | 526 | |
| 4.00%, 9/1/2045 | | 1,391 | 1,420 | | — | | — | | | 1,391 | | 1,420 | |
| 4.00%, 12/1/2045 | | — | — | | 796 | | 814 | | | 796 | | 814 | |
| 4.00%, 8/1/2046 | | 1,075 | 1,102 | | — | | — | | | 1,075 | | 1,102 | |
| 4.00%, 1/1/2047 | | 790 | 807 | | — | | — | | | 790 | | 807 | |
| 4.00%, 4/1/2047 | | — | — | | 434 | | 444 | | | 434 | | 444 | |
| 4.00%, 5/1/2047 | | — | — | | 893 | | 910 | | | 893 | | 910 | |
| 4.00%, 6/1/2047 | | — | — | | 901 | | 922 | | | 901 | | 922 | |
| 4.00%, 9/1/2047 | | — | — | | 911 | | 929 | | | 911 | | 929 | |
| 4.00%, 10/1/2047 | | — | — | | 464 | | 473 | | | 464 | | 473 | |
| 4.00%, 1/1/2048(p) | | — | — | | 1,500 | | 1,529 | | | 1,500 | | 1,529 | |
| 4.00%, 4/1/2048 | | — | — | | 1,427 | | 1,462 | | | 1,427 | | 1,462 | |
| 4.33%, 7/1/2034 | | — | — | | 1 | | 1 | | | 1 | | 1 | |
| 1.00 x US Treasury Yield Curve Rate T | | | | | | | | | | | | | |
| Note Constant Maturity 1 Year + 2.21% | | | | | | | | | | | | | |
| 4.50%, 7/1/2025 | | — | — | | 51 | | 52 | | | 51 | | 52 | |
| 4.50%, 8/1/2040 | | 631 | 661 | | — | | — | | | 631 | | 661 | |
| 4.50%, 11/1/2040 | | — | — | | 876 | | 917 | | | 876 | | 917 | |
| 4.50%, 12/1/2040 | | 394 | 413 | | — | | — | | | 394 | | 413 | |
See accompanying notes.
| | | | | | | | | | | | | | |
| | | | | | | Core Plus Bond | | | | | Combined | | | |
| | Income Account | | | | Account | | Core Plus Bond | | | Portfolio | | Combined | |
| U.S. GOVERNMENT & GOVERNMENT | | Principal | | Income Account | | Principal | | Account Value | | | Principal | | Portfolio Value | |
| AGENCY OBLIGATIONS (continued) | Amount (000's) | | Value (000's) | | Amount (000's) | | (000 | 's) | | Amount (000's) | | (000 | 's) |
| Federal National Mortgage Association (FNMA) (continued) | | | | | | | | | | | | |
| 4.50%, 8/1/2041 | $ | 412 | $ | 431 | $ | — | $ | — | | $ | 412 | $ | 431 | |
| 4.50%, 9/1/2041 | | — | | — | | 270 | | 282 | | | 270 | | 282 | |
| 4.50%, 1/1/2042(p) | | — | | — | | 1,750 | | 1,812 | | | 1,750 | | 1,812 | |
| 4.50%, 5/1/2044 | | 557 | | 580 | | — | | — | | | 557 | | 580 | |
| 4.50%, 12/1/2044 | | — | | — | | 132 | | 138 | | | 132 | | 138 | |
| 4.50%, 6/1/2046 | | 587 | | 608 | | — | | — | | | 587 | | 608 | |
| 4.50%, 5/1/2047 | | 1,657 | | 1,717 | | — | | — | | | 1,657 | | 1,717 | |
| 4.50%, 5/1/2047 | | 385 | | 399 | | — | | — | | | 385 | | 399 | |
| 5.00%, 10/1/2041 | | — | | — | | 198 | | 210 | | | 198 | | 210 | |
| 5.00%, 1/1/2048(p) | | — | | — | | 500 | | 524 | | | 500 | | 524 | |
| 5.50%, 6/1/2019 | | — | | — | | 2 | | 2 | | | 2 | | 2 | |
| 5.50%, 7/1/2019 | | — | | — | | 1 | | 1 | | | 1 | | 1 | |
| 5.50%, 7/1/2019 | | — | | — | | 1 | | 1 | | | 1 | | 1 | |
| 5.50%, 8/1/2019 | | — | | — | | 2 | | 2 | | | 2 | | 2 | |
| 5.50%, 10/1/2019 | | — | | — | | 3 | | 3 | | | 3 | | 3 | |
| 5.50%, 10/1/2019 | | — | | — | | 4 | | 4 | | | 4 | | 4 | |
| 5.50%, 12/1/2022 | | — | | — | | 14 | | 15 | | | 14 | | 15 | |
| 5.50%, 7/1/2033 | | — | | — | | 257 | | 277 | | | 257 | | 277 | |
| 5.50%, 4/1/2035 | | — | | — | | 24 | | 25 | | | 24 | | 25 | |
| 5.50%, 8/1/2036 | | — | | — | | 510 | | 549 | | | 510 | | 549 | |
| 5.50%, 2/1/2037 | | — | | — | | 5 | | 6 | | | 5 | | 6 | |
| 5.50%, 5/1/2040 | | — | | — | | 43 | | 46 | | | 43 | | 46 | |
| 6.00%, 5/1/2031 | | — | | — | | 2 | | 3 | | | 2 | | 3 | |
| 6.00%, 7/1/2035 | | — | | — | | 160 | | 174 | | | 160 | | 174 | |
| 6.00%, 2/1/2037 | | — | | — | | 116 | | 125 | | | 116 | | 125 | |
| 6.00%, 2/1/2038 | | — | | — | | 59 | | 65 | | | 59 | | 65 | |
| 6.50%, 3/1/2032 | | — | | — | | 4 | | 4 | | | 4 | | 4 | |
| 6.50%, 4/1/2032 | | 38 | | 42 | | — | | — | | | 38 | | 42 | |
| 6.50%, 7/1/2037 | | — | | — | | 21 | | 24 | | | 21 | | 24 | |
| 6.50%, 7/1/2037 | | — | | — | | 36 | | 39 | | | 36 | | 39 | |
| 6.50%, 2/1/2038 | | — | | — | | 39 | | 44 | | | 39 | | 44 | |
| 6.50%, 3/1/2038 | | — | | — | | 15 | | 17 | | | 15 | | 17 | |
| 6.50%, 9/1/2038 | | — | | — | | 133 | | 149 | | | 133 | | 149 | |
| | | $ | | 24,947 | | | $ | 45,976 | | | | $ | 70,923 | |
| Government National Mortgage Association (GNMA) - 4.45% | | | | | | | | | | | | |
| 3.00%, 2/15/2043 | | — | | — | | 395 | | 390 | | | 395 | | 390 | |
| 3.00%, 7/20/2044 | | — | | — | | 614 | | 609 | | | 614 | | 609 | |
| 3.00%, 1/20/2046 | | — | | — | | 462 | | 456 | | | 462 | | 456 | |
| 3.00%, 7/20/2046 | | — | | — | | 749 | | 739 | | | 749 | | 739 | |
| 3.00%, 12/20/2046 | | — | | — | | 2,037 | | 2,008 | | | 2,037 | | 2,008 | |
| 3.50%, 4/20/2046 | | — | | — | | 218 | | 221 | | | 218 | | 221 | |
| 3.50%, 10/20/2046 | | — | | — | | 339 | | 341 | | | 339 | | 341 | |
| 3.50%, 7/20/2047 | | — | | — | | 1,361 | | 1,368 | | | 1,361 | | 1,368 | |
| 3.50%, 1/1/2048 | | — | | — | | 3,050 | | 3,069 | | | 3,050 | | 3,069 | |
| 3.75%, 7/20/2043 | | — | | — | | 117 | | 120 | | | 117 | | 120 | |
| 1.00 x US Treasury Yield Curve Rate T | | | | | | | | | | | | | | |
| Note Constant Maturity 1 Year + 1.50% | | | | | | | | | | | | | | |
See accompanying notes.
| | | | | | | | | | | | | | |
| | | | | | | Core Plus Bond | | | | | Combined | | | |
| | Income Account | | | | Account | | Core Plus Bond | | | Portfolio | | Combined | |
| U.S. GOVERNMENT & GOVERNMENT | | Principal | Income Account | | Principal | | Account Value | | | Principal | | Portfolio Value | |
| AGENCY OBLIGATIONS (continued) | Amount (000's) | Value (000's) | | Amount (000's) | | (000 | 's) | | Amount (000's) | | (000 | 's) |
| Government National Mortgage Association (GNMA) (continued) | | | | | | | | | | | |
| 4.00%, 2/15/2042 | $ | — | $ | — | $ | 154 | $ | 159 | | $ | 154 | $ | 159 | |
| 4.00%, 6/20/2046 | | — | | — | | 87 | | 89 | | | 87 | | 89 | |
| 4.00%, 1/1/2048 | | — | | — | | 2,000 | | 2,048 | | | 2,000 | | 2,048 | |
| 4.00%, 1/20/2048 | | — | | — | | 2,067 | | 2,137 | | | 2,067 | | 2,137 | |
| 4.50%, 9/15/2039 | | — | | — | | 622 | | 657 | | | 622 | | 657 | |
| 4.50%, 11/15/2040 | | — | | — | | 121 | | 126 | | | 121 | | 126 | |
| 4.50%, 1/1/2048 | | — | | — | | 3,635 | | 3,761 | | | 3,635 | | 3,761 | |
| 4.50%, 6/20/2048 | | — | | — | | 49 | | 51 | | | 49 | | 51 | |
| 5.00%, 2/15/2034 | | — | | — | | 247 | | 261 | | | 247 | | 261 | |
| 5.00%, 10/15/2034 | | — | | — | | 89 | | 94 | | | 89 | | 94 | |
| 5.00%, 10/20/2039 | | — | | — | | 48 | | 51 | | | 48 | | 51 | |
| 5.00%, 7/20/2040 | | — | | — | | 27 | | 29 | | | 27 | | 29 | |
| 5.00%, 2/15/2042 | | — | | — | | 99 | | 105 | | | 99 | | 105 | |
| 5.00%, 1/1/2048 | | — | | — | | 1,000 | | 1,041 | | | 1,000 | | 1,041 | |
| 5.50%, 12/20/2033 | | — | | — | | 120 | | 129 | | | 120 | | 129 | |
| 5.50%, 5/20/2035 | | — | | — | | 14 | | 15 | | | 14 | | 15 | |
| 6.00%, 1/20/2029 | | — | | — | | 23 | | 25 | | | 23 | | 25 | |
| 6.00%, 7/20/2029 | | — | | — | | 4 | | 4 | | | 4 | | 4 | |
| 6.00%, 12/15/2033 | | — | | — | | 29 | | 31 | | | 29 | | 31 | |
| 6.00%, 12/20/2036 | | — | | — | | 63 | | 68 | | | 63 | | 68 | |
| 6.50%, 3/20/2028 | | — | | — | | 4 | | 4 | | | 4 | | 4 | |
| 6.50%, 5/20/2029 | | — | | — | | 3 | | 4 | | | 3 | | 4 | |
| 6.50%, 12/15/2032 | | — | | — | | 349 | | 380 | | | 349 | | 380 | |
| 7.00%, 3/15/2031 | | — | | — | | 9 | | 10 | | | 9 | | 10 | |
| 7.50%, 5/15/2029 | | — | | — | | 15 | | 15 | | | 15 | | 15 | |
| 8.00%, 12/15/2030 | | — | | — | | 6 | | 7 | | | 6 | | 7 | |
| 9.00%, 2/15/2025 | | 2 | | 2 | | — | | — | | | 2 | | 2 | |
| | | $ | | 2 | | | $ | 20,622 | | | | $ | 20,624 | |
| U.S. Treasury - 12.60% | | | | | | | | | | | | | | |
| 1.25%, 10/31/2021 | | — | | — | | 1,555 | | 1,503 | | | 1,555 | | 1,503 | |
| 1.25%, 7/31/2023 | | — | | — | | 1,405 | | 1,329 | | | 1,405 | | 1,329 | |
| 1.50%, 8/15/2026 | | — | | — | | 1,420 | | 1,310 | | | 1,420 | | 1,310 | |
| 1.63%, 11/15/2022 | | 1,000 | | 968 | | — | | — | | | 1,000 | | 968 | |
| 1.63%, 10/31/2023 | | — | | — | | 370 | | 355 | | | 370 | | 355 | |
| 1.75%, 4/30/2022(q) | | — | | — | | 3,385 | | 3,307 | | | 3,385 | | 3,307 | |
| 1.75%, 5/15/2022 | | 2,000 | | 1,953 | | — | | — | | | 2,000 | | 1,953 | |
| 1.88%, 11/30/2021 | | — | | — | | 2,550 | | 2,508 | | | 2,550 | | 2,508 | |
| 2.00%, 5/31/2021 | | — | | — | | 720 | | 712 | | | 720 | | 712 | |
| 2.00%, 11/15/2021 | | 1,000 | | 987 | | — | | — | | | 1,000 | | 987 | |
| 2.00%, 10/31/2022 | | — | | — | | 4,500 | | 4,420 | | | 4,500 | | 4,420 | |
| 2.00%, 11/15/2026 | | 1,000 | | 955 | | — | | — | | | 1,000 | | 955 | |
| 2.13%, 11/30/2023(r) | | — | | — | | 1,140 | | 1,119 | | | 1,140 | | 1,119 | |
| 2.25%, 8/15/2027 | | 1,000 | | 968 | | — | | — | | | 1,000 | | 968 | |
| 2.25%, 8/15/2046 | | — | | — | | 1,090 | | 931 | | | 1,090 | | 931 | |
| 2.50%, 5/15/2024 | | 1,000 | | 998 | | — | | — | | | 1,000 | | 998 | |
| 2.63%, 7/31/2020 | | — | | — | | 3,000 | | 3,004 | | | 3,000 | | 3,004 | |
See accompanying notes.
| | | | | | | | | | | | | | | |
| | | | | | | | Core Plus Bond | | | | | Combined | | | |
| | Income Account | | | | | Account | | Core Plus Bond | | | Portfolio | | Combined | |
| U.S. GOVERNMENT & GOVERNMENT | | Principal | | Income Account | | | Principal | | Account Value | | | Principal | | Portfolio Value | |
| AGENCY OBLIGATIONS (continued) | Amount (000's) | | Value (000 | 's) | | Amount (000's) | | (000 | 's) | | Amount (000's) | | (000 | 's) |
| U.S. Treasury (continued) | | | | | | | | | | | | | | | |
| 2.63%, 11/15/2020 | $ | 2,000 | $ | 2,004 | | $ | — | $ | — | | $ | 2,000 | $ | 2,004 | |
| 2.75%, 2/15/2024 | | 1,000 | | 1,011 | | | — | | — | | | 1,000 | | 1,011 | |
| 2.75%, 8/15/2042 | | — | | — | | | 210 | | 201 | | | 210 | | 201 | |
| 2.75%, 11/15/2047 | | 1,000 | | 946 | | | — | | — | | | 1,000 | | 946 | |
| 2.88%, 5/15/2043 | | 1,000 | | 976 | | | — | | — | | | 1,000 | | 976 | |
| 2.88%, 8/15/2045 | | 1,000 | | 974 | | | 545 | | 531 | | | 1,545 | | 1,505 | |
| 2.88%, 11/15/2046 | | 1,000 | | 972 | | | — | | — | | | 1,000 | | 972 | |
| 3.00%, 11/15/2044 | | 1,000 | | 998 | | | 1,450 | | 1,448 | | | 2,450 | | 2,446 | |
| 3.00%, 5/15/2045 | | — | | — | | | 2,640 | | 2,635 | | | 2,640 | | 2,635 | |
| 3.00%, 11/15/2045 | | — | | — | | | 2,000 | | 1,996 | | | 2,000 | | 1,996 | |
| 3.13%, 5/15/2021 | | 1,000 | | 1,015 | | | — | | — | | | 1,000 | | 1,015 | |
| 3.13%, 8/15/2044 | | 1,000 | | 1,021 | | | — | | — | | | 1,000 | | 1,021 | |
| 3.38%, 5/15/2044 | | 1,000 | | 1,065 | | | — | | — | | | 1,000 | | 1,065 | |
| 3.38%, 11/15/2048 | | 1,000 | | 1,069 | | | — | | — | | | 1,000 | | 1,069 | |
| 3.50%, 2/15/2039 | | 1,000 | | 1,094 | | | — | | — | | | 1,000 | | 1,094 | |
| 3.63%, 2/15/2020 | | 2,000 | | 2,022 | | | — | | — | | | 2,000 | | 2,022 | |
| 3.63%, 2/15/2044 | | 1,000 | | 1,108 | | | — | | — | | | 1,000 | | 1,108 | |
| 3.75%, 8/15/2041 | | 1,000 | | 1,128 | | | — | | — | | | 1,000 | | 1,128 | |
| 3.75%, 11/15/2043 | | 2,000 | | 2,259 | | | 1,500 | | 1,694 | | | 3,500 | | 3,953 | |
| 4.75%, 2/15/2037 | | — | | — | | | 2,260 | | 2,880 | | | 2,260 | | 2,880 | |
| | | $ | | 26,491 | | | | $ | 31,883 | | | | $ | 58,374 | |
| TOTAL U.S. GOVERNMENT & GOVERNMENT AGENCY | | | | | | | | | | | | | |
| OBLIGATIONS | | $ | | 61,658 | | | | $ | 108,466 | | | | $ | 170,124 | |
| Total Investments | | $ | | 180,922 | | | | $ | 305,076 | | | | $ | 485,998 | |
| Other Assets and Liabilities - (4.90)% | | | | 849 | | | | | (23,556) | | | | | (22,741) | |
| TOTAL NET ASSETS - 100.00% | | $ | | 181,771 | | | | $ | 281,520 | | | | $ | 463,257 | |
| (a) | Non-income producing security |
| (b) | The value of these investments was determined using significant unobservable inputs. |
| (c) | The security or a portion of the security will be disposed of in order to meet the investment objectives and strategies of the Acquiring Account as determined by the Acquiring Account’s sub-advisors. |
| (d) | Restricted Security. Please see Restricted Security Sub-Schedule for more information. |
| (e) | Fair value of these investments is determined in good faith by the Manager under procedures established and periodically reviewed by the Board of Directors. Certain inputs used in the valuation may be unobservable; however, each security is evaluated individually for purposes of ASC 820 which results in not all securities being identified as Level 3 of the fair value hierarchy. At the end of the period, the fair value of these securities totaled $4,735 and $8 or 1.02% of net assets. |
| (f) | Affiliated Security. Security is either an affiliate (and registered under the Investment Company Act of 1940) or an affiliate as defined by the Investment Company Act of 1940 (controls 5.0% or more of the outstanding voting shares of the security). Please see affiliated sub-schedule for transactional information. |
| (g) | Current yield shown is as of period end. |
| (h) | Security exempt from registration under Rule 144A of the Securities Act of 1933. These securities may be resold in transactions exempt from registration, normally to qualified institutional buyers. At the end of the period, the value of these securities totaled $19,808 and $56,762 or 16.53% of net assets. |
| (i) | Certain variable rate securities are not based on a published reference rate and spread but are determined by the issuer or agent and are based on current market conditions. These securities do not indicate a reference rate and spread in their description. Rate shown is the rate in effect as of period end. |
| (j) | Payment in kind; the issuer has the option of paying additional securities in lieu of cash. |
| (k) | Rate shown is as of period end. The rate may be a variable or floating rate or a fixed rate which may convert to a variable or floating rate in the future. |
| (l) | Perpetual security. Perpetual securities pay an indefinite stream of interest, but they may be called by the issuer at an earlier date. Date shown, if any, reflects the next call date or final legal maturity date. Rate shown is as of period end. |
| (m) | Security is an Interest Only Strip. |
| (n) | Rate information disclosed is based on an average weighted rate of the underlying tranches as of period end. |
| (o) | This Senior Floating Rate Note will settle after December 31, 2018, at which time the interest rate will be determined. |
| (p) | Security was purchased in a "to-be-announced" ("TBA") transaction. See Notes to Financial Statements for additional information. |
| (q) | Security or a portion of the security was pledged to cover margin requirements for swap and/or swaption contracts. At the end of the period, the value of these securities totaled $— and $576 or 0.12% of net assets. |
| (r) | Security or a portion of the security was pledged to cover margin requirements for futures contracts. At the end of the period, the value of these securities totaled $— and $187 or 0.04% of net assets. |
See accompanying notes.
| | | | | | |
| Portfolio Summary (unaudited) | | | | | |
| | | | Core Plus Bond | | | |
| Sector | Income Account | | Account | | Combined Portfolio | |
| Mortgage Securities | 19.35 | % | 34.54 | % | 28.58 | % |
| Financial | 21.41 | % | 12.95 | % | 16.28 | % |
| Government | 14.57 | % | 13.10 | % | 13.68 | % |
| Energy | 11.61 | % | 5.96 | % | 8.18 | % |
| Asset Backed Securities | 3.66 | % | 12.74 | % | 9.17 | % |
| Consumer, Non-cyclical | 6.63 | % | 7.69 | % | 7.27 | % |
| Communications | 5.43 | % | 5.48 | % | 5.45 | % |
| Utilities | 7.95 | % | 2.76 | % | 4.79 | % |
| Industrial | 4.36 | % | 2.95 | % | 3.50 | % |
| Technology | 2.12 | % | 2.58 | % | 2.40 | % |
| Consumer, Cyclical | 0.50 | % | 4.01 | % | 2.64 | % |
| Basic Materials | 0.95 | % | 2.23 | % | 1.73 | % |
| Investment Companies | 0.99 | % | 1.38 | % | 1.23 | % |
| Other Assets and Liabilities | 0.47 | % | (8.37 | )% | (4.90 | )% |
| TOTAL NET ASSETS | 100.00 | % | 100.00 | % | 100.00 | % |
| | | | | | | | | | | | | |
| Affiliated Securities – Income Account | | December 31, 2017 | Purchases | | | | Sales | | December 31, 2018 | |
| | | Value | | Cost | | | Proceeds | | | Value | |
| Principal Government Money Market Fund 2.11% | $ | | 8,980 | $ | 51,346 | $ | | 58,531 | $ | | 1,795 | |
| | $ | | 8,980 | $ | 51,346 | $ | | 58,531 | $ | | 1,795 | |
| |
| |
| | | | Realized Gain/Loss | | Realized Gain from | | Change in Unrealized | |
| | | Income | on Investments | Capital Gain Distributions | | Gain/Loss | |
| Principal Government Money Market Fund 2.11% | $ | 76 | $ | — | $ | | | | — | | $ | — | |
| | $ | 76 | $ | — | $ | | | | — | | $ | — | |
| Amounts in thousands | | | | | | | | | | | | | |
| |
| Affiliated Securities – Core Plus Bond Account | | December 31, 2017 | Purchases | | | | Sales | | December 31, 2018 | |
| | | Value | | Cost | | | Proceeds | | | Value | |
| Principal Government Money Market Fund 2.11% | $ | | 4,938 | $ | 118,130 | $ | | 119,174 | $ | | 3,894 | |
| | $ | | 4,938 | $ | 118,130 | $ | | 119,174 | $ | | 3,894 | |
| |
| |
| | | | Realized Gain/Loss | | Realized Gain from | | Change in Unrealized | |
| | | Income | on Investments | Capital Gain Distributions | | Gain/Loss | |
| Principal Government Money Market Fund 2.11% | $ | 184 | $ | — | $ | | | | — | | $ | — | |
| | $ | 184 | $ | — | $ | | | | — | | $ | — | |
| Amounts in thousands | | | | | | | | | | | | | |
| |
| Restricted Securities – Income Account |
|
| Security Name | | Acquisition Date | | Cost | | | | Value | | Percent of Net Assets | |
| Pinnacle Operating Corp 0.00% - Core Plus Bond Account | | 03/09/2017 | $ | | 40 | | $ | | 8 | | 0.00 | % |
| Trailer Bridge Inc - Income Account | | 05/07/2012-12/22/2016 $ | 2,764 | | $ | 4,735 | | 2.60 | % |
| Total Combined Portfolio | | | | | | | | $ | 4,743 | | 2.60 | % |
| Amounts in thousands. | | | | | | | | | | | | | |
| |
| |
| |
| Futures Contracts – Core Plus Bond Account |
|
| Description and Expiration Date | | Type | Contracts | Notional Amount | Value and Unrealized Appreciation/(Depreciation) | |
| US 10 Year Note; March 2019 | | Short | 34 | $ | 4,149 | | | $ | | | | (104 | ) |
| US 10 Year Ultra Note; March 2019 | | Short | 17 | | 2,211 | | | | | | | (70 | ) |
| US 2 Year Note; March 2019 | | Long | 33 | | 7,006 | | | | | | | 47 | |
| US 5 Year Note; March 2019 | | Long | 78 | | 8,946 | | | | | | | 150 | |
| US Long Bond; March 2019 | | Long | 15 | | 2,190 | | | | | | | 102 | |
| US Ultra Bond; March 2019 | | Long | 23 | | 3,695 | | | | | | | 194 | |
| Total | | | | | | | | $ | | | | 319 | |
| |
| Amounts in thousands except contracts. | | | | | | | | | | | | | |
See accompanying notes.
| | | | | | | | | | | | | | | |
| Exchange Cleared Credit Default Swaps – Core Plus Bond Account |
|
| Buy Protection | | | | | | | | | | | | | | | |
| | Implied | | | | | | | | | | | | | | |
| | Credit Spread | | | | | | | | | | | | | | |
| | as of | | (Pay)/ | | | | | | | | | Unrealized | | | |
| | December 31, | | Receive | | Payment | | | Notional | | Upfront | | Appreciation/ | | | |
| Reference Entity | 2018 | (a) | Fixed Rate | | Frequency | Maturity Date | | Amount | | Payments/(Receipts) | | (Depreciation) | | Fair Value | |
| CDX. EM.29 | N/A | | (1.00 | )% | Quarterly | 06/20/2023 | $ | 6,500 | $ | 104 | $ | 135 | $ | 239 | |
| CDX. NA.HY.31 | N/A | | (5.00 | )% | Quarterly | 12/20/2023 | | 12,300 | | (317 | ) | 72 | | (245 | ) |
| Total | | | | | | | | $ | | (213 | ) $ | 207 | $ | (6 | ) |
Amounts in thousands.
(a) Implied credit spreads, represented in absolute terms, used in determining the market value of credit default swap agreements on corporate issues or sovereign issues as of period end serve as an indicator of the current status of the payment/performance risk and represent the likelihood or risk of default for the credit derivative. The implied credit spread of a particular referenced entity reflects the cost of buying/selling protection and may include upfront payments required to be made to enter into the agreement. Wider credit spreads represent a deterioration of the referenced entity's credit soundness and a greater likelihood or risk of default or other credit event occurring as defined under the terms of the agreement.
See accompanying notes.
| | | | | | | | | |
| Proforma Schedule of Investments | | | | | | | | | |
| |
| December 31, 2018 | | | | | | | | | |
| |
| |
| | LargeCap | LargeCap | LargeCap | | LargeCap | Combined | | Combined | |
| | Growth Account | Growth Account | Growth Account | | Growth Account | Portfolio Shares | | Portfolio Value | |
| COMMON STOCKS - 97.31% | Shares Held | Value (000's) | I Shares Held | | I Value (000's) | Held | | (000 | 's) |
| |
| Advertising - 0.01% | | | | | | | | | |
| Interpublic Group of Cos Inc/The | — $ | — | 262 | $ | 5 | 262 | $ | 5 | |
| Omnicom Group Inc | — | — | 423 | | 31 | 423 | | 31 | |
| | $ | — | $ | | 36 | | $ | 36 | |
| |
| Aerospace & Defense - 2.55% | | | | | | | | | |
| Boeing Co/The | — | — | 23,220 | | 7,488 | 23,220 | | 7,488 | |
| Curtiss-Wright Corp | — | — | 37 | | 4 | 37 | | 4 | |
| General Dynamics Corp | — | — | 219 | | 34 | 219 | | 34 | |
| Harris Corp | — | — | 320 | | 43 | 320 | | 43 | |
| HEICO Corp | — | — | 133 | | 10 | 133 | | 10 | |
| HEICO Corp - Class A | — | — | 237 | | 15 | 237 | | 15 | |
| Lockheed Martin Corp | — | — | 677 | | 177 | 677 | | 177 | |
| Northrop Grumman Corp | — | — | 6,108 | | 1,496 | 6,108 | | 1,496 | |
| Raytheon Co | — | — | 906 | | 139 | 906 | | 139 | |
| Spirit AeroSystems Holdings Inc | — | — | 10,078 | | 727 | 10,078 | | 727 | |
| TransDigm Group Inc (a) | — | — | 128 | | 44 | 128 | | 44 | |
| United Technologies Corp | — | — | 28 | | 3 | 28 | | 3 | |
| | $ | — | $ | | 10,180 | | $ | 10,180 | |
| |
| Agriculture - 0.40% | | | | | | | | | |
| Altria Group Inc | — | — | 5,490 | | 271 | 5,490 | | 271 | |
| Philip Morris International Inc | — | — | 19,636 | | 1,311 | 19,636 | | 1,311 | |
| | $ | — | $ | | 1,582 | | $ | 1,582 | |
| |
| Airlines - 0.01% | | | | | | | | | |
| Delta Air Lines Inc | — | — | 299 | | 15 | 299 | | 15 | |
| Southwest Airlines Co | — | — | 704 | | 33 | 704 | | 33 | |
| | $ | — | $ | | 48 | | $ | 48 | |
| |
| Apparel - 0.90% | | | | | | | | | |
| Carter's Inc | — | — | 132 | | 11 | 132 | | 11 | |
| Columbia Sportswear Co | — | — | 33 | | 3 | 33 | | 3 | |
| Hanesbrands Inc | — | — | 1,010 | | 13 | 1,010 | | 13 | |
| Michael Kors Holdings Ltd (a) | — | — | 238 | | 9 | 238 | | 9 | |
| NIKE Inc (b) | 28,000 | 2,076 | 19,544 | | 1,449 | 47,544 | | 3,525 | |
| Skechers U.S.A. Inc (a) | — | — | 245 | | 6 | 245 | | 6 | |
| Under Armour Inc - Class A (a) | — | — | 415 | | 7 | 415 | | 7 | |
| Under Armour Inc - Class C (a) | — | — | 434 | | 7 | 434 | | 7 | |
| VF Corp | — | — | 468 | | 33 | 468 | | 33 | |
| | $ | 2,076 | $ | | 1,538 | | $ | 3,614 | |
| |
| Automobile Manufacturers - 0.46% | | | | | | | | | |
| Tesla Inc (a) | — | — | 5,492 | | 1,828 | 5,492 | | 1,828 | |
| |
| |
| Automobile Parts & Equipment - 0.41% | | | | | | | | | |
| Allison Transmission Holdings Inc | — | — | 359 | | 16 | 359 | | 16 | |
| Aptiv PLC | — | — | 25,774 | | 1,587 | 25,774 | | 1,587 | |
| Lear Corp | — | — | 38 | | 5 | 38 | | 5 | |
| Visteon Corp (a) | — | — | 70 | | 4 | 70 | | 4 | |
| WABCO Holdings Inc (a) | — | — | 152 | | 16 | 152 | | 16 | |
| | $ | — | $ | | 1,628 | | $ | 1,628 | |
| |
| Banks - 0.69% | | | | | | | | | |
| BOK Financial Corp | — | — | 24 | | 2 | 24 | | 2 | |
| Comerica Inc | — | — | 51 | | 4 | 51 | | 4 | |
| East West Bancorp Inc | — | — | 65 | | 3 | 65 | | 3 | |
| Morgan Stanley | — | — | 24,383 | | 967 | 24,383 | | 967 | |
| Northern Trust Corp | — | — | 161 | | 13 | 161 | | 13 | |
| Pinnacle Financial Partners Inc | — | — | 109 | | 5 | 109 | | 5 | |
| Signature Bank/New York NY | — | — | 91 | | 9 | 91 | | 9 | |
| State Street Corp | — | — | 210 | | 13 | 210 | | 13 | |
| SVB Financial Group (a),(b) | 8,915 | 1,693 | 106 | | 20 | 9,021 | | 1,713 | |
| Synovus Financial Corp | — | — | 77 | | 2 | 77 | | 2 | |
| Texas Capital Bancshares Inc (a) | — | — | 111 | | 6 | 111 | | 6 | |
| Western Alliance Bancorp (a) | — | — | 192 | | 8 | 192 | | 8 | |
| | $ | 1,693 | $ | | 1,052 | | $ | 2,745 | |
| |
| Beverages - 0.77% | | | | | | | | | |
| Brown-Forman Corp - A Shares | — | — | 183 | | 9 | 183 | | 9 | |
| Coca-Cola Co/The (b) | 48,300 | 2,287 | 5,596 | | 265 | 53,896 | | 2,552 | |
| Constellation Brands Inc | — | — | 296 | | 48 | 296 | | 48 | |
See accompanying notes.
| | | | | | | | | |
| | LargeCap | LargeCap | LargeCap | | LargeCap | Combined | | Combined | |
| | Growth Account | Growth Account | Growth Account | | Growth Account | Portfolio Shares | | Portfolio Value | |
| COMMON STOCKS (continued) | Shares Held | Value (000's) | I Shares Held | | I Value (000's) | Held | | (000 | 's) |
| |
| Beverages (continued) | | | | | | | | | |
| Keurig Dr Pepper Inc | —$ | — | 557 | $ | 14 | 557 | $ | 14 | |
| Monster Beverage Corp (a) | — | — | 1,047 | | 51 | 1,047 | | 51 | |
| PepsiCo Inc | — | — | 3,560 | | 393 | 3,560 | | 3 | |
| | $ | 2,287 | $ | | 780 | | $ | 3,067 | |
| |
| Biotechnology - 1.60% | | | | | | | | | |
| Alexion Pharmaceuticals Inc (a) | — | — | 8,404 | | 818 | 8,404 | | 818 | |
| Alnylam Pharmaceuticals Inc (a) | — | — | 198 | | 14 | 198 | | 14 | |
| Amgen Inc | — | — | 1,552 | | 302 | 1,552 | | 302 | |
| Biogen Inc (a) | — | — | 485 | | 146 | 485 | | 146 | |
| BioMarin Pharmaceutical Inc (a) | — | — | 448 | | 38 | 448 | | 38 | |
| Bluebird Bio Inc (a) | — | — | 94 | | 9 | 94 | | 9 | |
| Celgene Corp (a) | — | — | 1,786 | | 115 | 1,786 | | 115 | |
| Exact Sciences Corp (a) | — | — | 301 | | 19 | 301 | | 19 | |
| Exelixis Inc (a) | — | — | 742 | | 15 | 742 | | 15 | |
| Gilead Sciences Inc | — | — | 2,454 | | 154 | 2,454 | | 154 | |
| Illumina Inc (a) | — | — | 276 | | 83 | 276 | | 83 | |
| Incyte Corp (a) | — | — | 443 | | 28 | 443 | | 28 | |
| Ionis Pharmaceuticals Inc (a) | — | — | 314 | | 17 | 314 | | 17 | |
| Regeneron Pharmaceuticals Inc (a) | — | — | 202 | | 75 | 202 | | 75 | |
| Sage Therapeutics Inc (a) | — | — | 114 | | 11 | 114 | | 11 | |
| Seattle Genetics Inc (a) | — | — | 268 | | 15 | 268 | | 15 | |
| Vertex Pharmaceuticals Inc (a),(b) | 12,604 | 2,089 | 14,636 | | 2,426 | 27,240 | | 4,515 | |
| | $ | 2,089 | $ | | 4,285 | | $ | 6,374 | |
| |
| Building Materials - 0.02% | | | | | | | | | |
| Armstrong World Industries Inc | — | — | 156 | | 9 | 156 | | 9 | |
| Eagle Materials Inc | — | — | 114 | | 7 | 114 | | 7 | |
| Lennox International Inc | — | — | 95 | | 21 | 95 | | 21 | |
| Martin Marietta Materials Inc | — | — | 147 | | 25 | 147 | | 25 | |
| Vulcan Materials Co | — | — | 313 | | 31 | 313 | | 31 | |
| | $ | — | $ | | 93 | | $ | 93 | |
| |
| Chemicals - 1.68% | | | | | | | | | |
| Axalta Coating Systems Ltd (a) | — | — | 233 | | 6 | 233 | | 6 | |
| Celanese Corp | — | — | 220 | | 20 | 220 | | 20 | |
| CF Industries Holdings Inc (b) | 43,900 | 1,910 | — | | — | 43,900 | | 1,910 | |
| Chemours Co/The | — | — | 458 | | 13 | 458 | | 13 | |
| FMC Corp | — | — | 139 | | 10 | 139 | | 10 | |
| International Flavors & Fragrances Inc | — | — | 121 | | 16 | 121 | | 16 | |
| Linde PLC | — | — | 638 | | 100 | 638 | | 100 | |
| LyondellBasell Industries NV | — | — | 547 | | 46 | 547 | | 46 | |
| NewMarket Corp | — | — | 22 | | 9 | 22 | | 9 | |
| PPG Industries Inc | — | — | 33 | | 3 | 33 | | 3 | |
| RPM International Inc | — | — | 77 | | 5 | 77 | | 5 | |
| Sherwin-Williams Co/The | — | — | 11,530 | | 4,536 | 11,530 | | 4,536 | |
| Univar Inc (a) | — | — | 129 | | 2 | 129 | | 2 | |
| Versum Materials Inc | — | — | 376 | | 10 | 376 | | 10 | |
| Westlake Chemical Corp | — | — | 94 | | 6 | 94 | | 6 | |
| WR Grace & Co | — | — | 137 | | 9 | 137 | | 9 | |
| | $ | 1,910 | $ | | 4,791 | | $ | 6,701 | |
| |
| Commercial Services - 4.60% | | | | | | | | | |
| Automatic Data Processing Inc | — | — | 829 | | 109 | 829 | | 109 | |
| Booz Allen Hamilton Holding Corp | — | — | 418 | | 19 | 418 | | 19 | |
| Cintas Corp | — | — | 21,987 | | 3,694 | 21,987 | | 3,694 | |
| CoreLogic Inc/United States (a) | — | — | 218 | | 7 | 218 | | 7 | |
| CoStar Group Inc (a) | — | — | 99 | | 33 | 99 | | 33 | |
| Ecolab Inc | — | — | 359 | | 53 | 359 | | 53 | |
| Euronet Worldwide Inc (a) | — | — | 99 | | 10 | 99 | | 10 | |
| FleetCor Technologies Inc (a),(b) | 8,433 | 1,566 | 10,401 | | 1,932 | 18,834 | | 3,498 | |
| Gartner Inc (a) | — | — | 251 | | 32 | 251 | | 32 | |
| Global Payments Inc | — | — | 15,034 | | 1,550 | 15,034 | | 1,550 | |
| Grand Canyon Education Inc (a) | — | — | 127 | | 12 | 127 | | 12 | |
| H&R Block Inc | — | — | 176 | | 4 | 176 | | 4 | |
| Moody's Corp | — | — | 312 | | 44 | 312 | | 44 | |
| Morningstar Inc | — | — | 56 | | 6 | 56 | | 6 | |
| PayPal Holdings Inc (a) | — | — | 86,591 | | 7,282 | 86,591 | | 7,282 | |
| Quanta Services Inc | — | — | 172 | | 5 | 172 | | 5 | |
| Robert Half International Inc | — | — | 349 | | 20 | 349 | | 20 | |
| Rollins Inc | — | — | 466 | | 17 | 466 | | 17 | |
| S&P Global Inc | — | — | 472 | | 80 | 472 | | 80 | |
| Sabre Corp | — | — | 684 | | 15 | 684 | | 15 | |
| Service Corp International/US | — | — | 228 | | 9 | 228 | | 9 | |
| ServiceMaster Global Holdings Inc (a) | — | — | 367 | | 13 | 367 | | 13 | |
See accompanying notes.
| | | | | | | | | |
| | LargeCap | LargeCap | LargeCap | | LargeCap | Combined | | Combined | |
| | Growth Account | Growth Account | Growth Account | | Growth Account | Portfolio Shares | | Portfolio Value | |
| COMMON STOCKS (continued) | Shares Held | Value (000's) | I Shares Held | | I Value (000's) | Held | | (000 | 's) |
| |
| Commercial Services (continued) | | | | | | | | | |
| Square Inc (a) | —$ | — | 746 | $ | 42 | 746 | $ | 42 | |
| Total System Services Inc | — | — | 501 | | 41 | 501 | | 41 | |
| TransUnion | — | — | 509 | | 29 | 509 | | 29 | |
| United Rentals Inc (a) | — | — | 221 | | 23 | 221 | | 23 | |
| Verisk Analytics Inc (a) | — | — | 432 | | 47 | 432 | | 47 | |
| Western Union Co/The | — | — | 505 | | 9 | 505 | | 9 | |
| WEX Inc (a) | — | — | 123 | | 17 | 123 | | 17 | |
| Worldpay Inc (a),(b) | 21,900 | 1,674 | 55 | | 4 | 21,955 | | 1,678 | |
| | $ | 3,240 | $ | | 15,158 | | $ | 18,398 | |
| |
| Computers - 2.91% | | | | | | | | | |
| Accenture PLC - Class A | — | — | 2,589 | | 365 | 2,589 | | 365 | |
| Apple Inc (b) | 23,850 | 3,762 | 26,234 | | 4,138 | 50,084 | | 7,900 | |
| Cognizant Technology Solutions Corp | — | — | 992 | | 63 | 992 | | 63 | |
| Dell Technologies Inc (a) | — | — | 56 | | 3 | 56 | | 3 | |
| EPAM Systems Inc (a) | — | — | 157 | | 18 | 157 | | 18 | |
| Fortinet Inc (a) | — | — | 403 | | 29 | 403 | | 29 | |
| Genpact Ltd | — | — | 113,129 | | 3,053 | 113,129 | | 3,053 | |
| International Business Machines Corp | — | — | 1,246 | | 142 | 1,246 | | 142 | |
| NCR Corp (a) | — | — | 357 | | 8 | 357 | | 8 | |
| NetApp Inc | — | — | 708 | | 42 | 708 | | 42 | |
| | $ | 3,762 | $ | | 7,861 | | $ | 11,623 | |
| |
| Consumer Products - 0.06% | | | | | | | | | |
| Avery Dennison Corp | — | — | 226 | | 20 | 226 | | 20 | |
| Church & Dwight Co Inc | — | — | 564 | | 37 | 564 | | 37 | |
| Clorox Co/The | — | — | 295 | | 46 | 295 | | 46 | |
| Kimberly-Clark Corp | — | — | 1,171 | | 133 | 1,171 | | 133 | |
| Spectrum Brands Holdings Inc | — | — | 89 | | 4 | 89 | | 4 | |
| | $ | — | $ | | 240 | | $ | 240 | |
| |
| Cosmetics & Personal Care - 1.79% | | | | | | | | | |
| Colgate-Palmolive Co | — | — | 297 | | 18 | 297 | | 18 | |
| Estee Lauder Cos Inc/The (b) | 15,161 | 1,973 | 29,770 | | 3,873 | 44,931 | | 5,846 | |
| Procter & Gamble Co/The (b) | 14,200 | 1,305 | — | | — | 14,200 | | 1,305 | |
| | $ | 3,278 | $ | | 3,891 | | $ | 7,169 | |
| |
| Distribution & Wholesale - 0.03% | | | | | | | | | |
| Fastenal Co | — | — | 781 | | 41 | 781 | | 41 | |
| HD Supply Holdings Inc (a) | — | — | 226 | | 8 | 226 | | 8 | |
| KAR Auction Services Inc | — | — | 373 | | 18 | 373 | | 18 | |
| LKQ Corp (a) | — | — | 194 | | 5 | 194 | | 5 | |
| Pool Corp | — | — | 110 | | 16 | 110 | | 16 | |
| Watsco Inc | — | — | 78 | | 11 | 78 | | 11 | |
| WW Grainger Inc | — | — | 125 | | 35 | 125 | | 35 | |
| | $ | — | $ | | 134 | | $ | 134 | |
| |
| Diversified Financial Services - 6.75% | | | | | | | | | |
| Alliance Data Systems Corp | — | — | 139 | | 21 | 139 | | 21 | |
| American Express Co | — | — | 1,360 | | 130 | 1,360 | | 130 | |
| Ameriprise Financial Inc | — | — | 71 | | 7 | 71 | | 7 | |
| Capital One Financial Corp (b) | 19,050 | 1,440 | 275 | | 21 | 19,325 | | 1,461 | |
| Charles Schwab Corp/The | — | — | 58,937 | | 2,448 | 58,937 | | 2,448 | |
| CME Group Inc | — | — | 77 | | 15 | 77 | | 15 | |
| Credit Acceptance Corp (a) | — | — | 29 | | 11 | 29 | | 11 | |
| Discover Financial Services | — | — | 424 | | 25 | 424 | | 25 | |
| E*TRADE Financial Corp | — | — | 179 | | 8 | 179 | | 8 | |
| Eaton Vance Corp | — | — | 321 | | 11 | 321 | | 11 | |
| Evercore Inc - Class A | — | — | 118 | | 8 | 118 | | 8 | |
| Interactive Brokers Group Inc - A Shares | — | — | 184 | | 10 | 184 | | 10 | |
| Intercontinental Exchange Inc | — | — | 17,787 | | 1,340 | 17,787 | | 1,340 | |
| Lazard Ltd | — | — | 305 | | 11 | 305 | | 11 | |
| LPL Financial Holdings Inc | — | — | 246 | | 15 | 246 | | 15 | |
| Mastercard Inc (b) | 15,548 | 2,933 | 3,054 | | 576 | 18,602 | | 3,509 | |
| OneMain Holdings Inc (a) | — | — | 78 | | 2 | 78 | | 2 | |
| Raymond James Financial Inc | — | — | 114 | | 9 | 114 | | 9 | |
| Santander Consumer USA Holdings Inc | — | — | 148 | | 3 | 148 | | 3 | |
| SEI Investments Co | — | — | 356 | | 16 | 356 | | 16 | |
| Synchrony Financial | — | — | 728 | | 17 | 728 | | 17 | |
| T Rowe Price Group Inc | — | — | 571 | | 53 | 571 | | 53 | |
| TD Ameritrade Holding Corp | — | — | 21,305 | | 1,043 | 21,305 | | 1,043 | |
| Virtu Financial Inc | — | — | 166 | | 4 | 166 | | 4 | |
| Visa Inc | 29,108 | 3,841 | 98,121 | | 12,946 | 127,229 | | 16,787 | |
| | $ | 8,214 | $ | | 18,750 | | $ | 26,964 | |
See accompanying notes.
| | | | | | | | | |
| | LargeCap | LargeCap | LargeCap | | LargeCap | Combined | | Combined | |
| | Growth Account | Growth Account | Growth Account | | Growth Account | Portfolio Shares | | Portfolio Value | |
| COMMON STOCKS (continued) | Shares Held | Value (000's) | I Shares Held | | I Value (000's) | Held | | (000 | 's) |
| |
| Electric - 0.22% | | | | | | | | | |
| Sempra Energy | —$ | — | 8,309 | $ | 899 | 8,309 | $ | 899 | |
| |
| |
| Electrical Components & Equipment - 0.03% | | | | | | | | | |
| AMETEK Inc | — | — | 152 | | 10 | 152 | | 10 | |
| Emerson Electric Co | — | — | 1,631 | | 97 | 1,631 | | 97 | |
| Energizer Holdings Inc | — | — | 130 | | 6 | 130 | | 6 | |
| Hubbell Inc | — | — | 112 | | 11 | 112 | | 11 | |
| Littelfuse Inc | — | — | 61 | | 11 | 61 | | 11 | |
| | $ | — | $ | | 135 | | $ | 135 | |
| |
| Electronics - 2.39% | | | | | | | | | |
| Allegion PLC | — | — | 234 | | 19 | 234 | | 19 | |
| Amphenol Corp | — | — | 46,551 | | 3,772 | 46,551 | | 3,772 | |
| Coherent Inc (a) | — | — | 73 | | 8 | 73 | | 8 | |
| FLIR Systems Inc | — | — | 116 | | 5 | 116 | | 5 | |
| Fortive Corp | — | — | 71,467 | | 4,835 | 71,467 | | 4,835 | |
| Gentex Corp | — | — | 553 | | 11 | 553 | | 11 | |
| Honeywell International Inc | — | — | 5,936 | | 784 | 5,936 | | 784 | |
| Mettler-Toledo International Inc (a) | — | — | 65 | | 37 | 65 | | 37 | |
| National Instruments Corp | — | — | 249 | | 11 | 249 | | 11 | |
| Sensata Technologies Holding PLC (a) | — | — | 278 | | 12 | 278 | | 12 | |
| Waters Corp (a) | — | — | 185 | | 35 | 185 | | 35 | |
| | $ | — | $ | | 9,529 | | $ | 9,529 | |
| |
| Engineering & Construction - 0.28% | | | | | | | | | |
| Jacobs Engineering Group Inc (b) | 19,100 | 1,116 | — | | — | 19,100 | | 1,116 | |
| |
| |
| Entertainment - 0.17% | | | | | | | | | |
| International Game Technology PLC | — | — | 122 | | 2 | 122 | | 2 | |
| Lions Gate Entertainment Corp - A shares | — | — | 195 | | 3 | 195 | | 3 | |
| Lions Gate Entertainment Corp - B shares | — | — | 240 | | 3 | 240 | | 3 | |
| Live Nation Entertainment Inc (a),(b) | 13,300 | 655 | — | | — | 13,300 | | 655 | |
| Six Flags Entertainment Corp | — | — | 196 | | 11 | 196 | | 11 | |
| | $ | 655 | $ | | 19 | | $ | 674 | |
| |
| Environmental Control - 0.30% | | | | | | | | | |
| Republic Services Inc | — | — | 84 | | 6 | 84 | | 6 | |
| Waste Connections Inc | — | — | 14,610 | | 1,085 | 14,610 | | 1,085 | |
| Waste Management Inc | — | — | 1,325 | | 118 | 1,325 | | 118 | |
| | $ | — | $ | | 1,209 | | $ | 1,209 | |
| |
| Food - 0.06% | | | | | | | | | |
| Campbell Soup Co | — | — | 342 | | 11 | 342 | | 11 | |
| General Mills Inc | — | — | 1,079 | | 42 | 1,079 | | 42 | |
| Hershey Co/The | — | — | 351 | | 38 | 351 | | 38 | |
| Kellogg Co | — | — | 353 | | 20 | 353 | | 20 | |
| McCormick & Co Inc/MD | — | — | 35 | | 5 | 35 | | 5 | |
| Post Holdings Inc (a) | — | — | 114 | | 10 | 114 | | 10 | |
| Sprouts Farmers Market Inc (a) | — | — | 387 | | 9 | 387 | | 9 | |
| Sysco Corp | — | — | 1,860 | | 117 | 1,860 | | 117 | |
| US Foods Holding Corp (a) | — | — | 132 | | 4 | 132 | | 4 | |
| | $ | — | $ | | 256 | | $ | 256 | |
| |
| Forest Products & Paper - 0.00% | | | | | | | | | |
| International Paper Co | — | — | 130 | | 5 | 130 | | 5 | |
| |
| |
| Hand & Machine Tools - 0.00% | | | | | | | | | |
| Lincoln Electric Holdings Inc | — | — | 183 | | 14 | 183 | | 14 | |
| |
| |
| Healthcare - Products - 9.55% | | | | | | | | | |
| Abbott Laboratories (b) | 18,600 | 1,345 | — | | — | 18,600 | | 1,345 | |
| ABIOMED Inc (a),(b) | 4,400 | 1,430 | 110 | | 36 | 4,510 | | 1,466 | |
| Align Technology Inc (a) | — | — | 202 | | 42 | 202 | | 42 | |
| Baxter International Inc | — | — | 113 | | 7 | 113 | | 7 | |
| Becton Dickinson and Co | — | — | 12,792 | | 2,882 | 12,792 | | 2,882 | |
| Bio-Techne Corp | — | — | 98 | | 14 | 98 | | 14 | |
| Boston Scientific Corp (a),(b) | 62,000 | 2,191 | 1,995 | | 71 | 63,995 | | 2,262 | |
| Bruker Corp | — | — | 159 | | 5 | 159 | | 5 | |
| Cantel Medical Corp | — | — | 105 | | 8 | 105 | | 8 | |
| Cooper Cos Inc/The | — | — | 23 | | 6 | 23 | | 6 | |
| Danaher Corp | — | — | 40,825 | | 4,210 | 40,825 | | 4,210 | |
| Edwards Lifesciences Corp (a) | — | — | 22,212 | | 3,402 | 22,212 | | 3,402 | |
| Henry Schein Inc (a) | — | — | 82 | | 6 | 82 | | 6 | |
| Hill-Rom Holdings Inc | — | — | 126 | | 11 | 126 | | 11 | |
See accompanying notes.
| | | | | | | | | |
| | LargeCap | LargeCap | LargeCap | | LargeCap | Combined | | Combined | |
| | Growth Account | Growth Account | Growth Account | | Growth Account | Portfolio Shares | | Portfolio Value | |
| COMMON STOCKS (continued) | Shares Held | Value (000's) | I Shares Held | | I Value (000's) | Held | | (000 | 's) |
| |
| Healthcare - Products (continued) | | | | | | | | | |
| ICU Medical Inc (a) | —$ | — | 45 | $ | 10 | 45 | $ | 10 | |
| IDEXX Laboratories Inc (a) | — | — | 223 | | 41 | 223 | | 41 | |
| Integra LifeSciences Holdings Corp (a) | — | — | 172 | | 8 | 172 | | 8 | |
| Intuitive Surgical Inc (a),(b) | 6,647 | 3,184 | 18,129 | | 8,683 | 24,776 | | 11,867 | |
| Masimo Corp (a) | — | — | 127 | | 14 | 127 | | 14 | |
| Penumbra Inc (a) | — | — | 81 | | 10 | 81 | | 10 | |
| ResMed Inc | — | — | 369 | | 42 | 369 | | 42 | |
| Stryker Corp | — | — | 19,460 | | 3,051 | 19,460 | | 3,051 | |
| Teleflex Inc | — | — | 25 | | 6 | 25 | | 6 | |
| Thermo Fisher Scientific Inc (b) | 11,103 | 2,485 | 22,006 | | 4,925 | 33,109 | | 7,410 | |
| Varian Medical Systems Inc (a) | — | — | 242 | | 27 | 242 | | 27 | |
| West Pharmaceutical Services Inc | — | — | 57 | | 6 | 57 | | 6 | |
| | $ | 10,635 | $ | | 27,523 | | $ | 38,158 | |
| |
| Healthcare - Services - 3.30% | | | | | | | | | |
| Anthem Inc | — | — | 7,157 | | 1,880 | 7,157 | | 1,880 | |
| Catalent Inc (a) | — | — | 122 | | 4 | 122 | | 4 | |
| Centene Corp (a) | — | — | 7,992 | | 922 | 7,992 | | 922 | |
| Charles River Laboratories International Inc (a) | — | — | 97 | | 11 | 97 | | 11 | |
| Chemed Corp | — | — | 44 | | 12 | 44 | | 12 | |
| DaVita Inc (a) | — | — | 193 | | 10 | 193 | | 10 | |
| Encompass Health Corp | — | — | 274 | | 17 | 274 | | 17 | |
| HCA Healthcare Inc | — | — | 18,900 | | 2,352 | 18,900 | | 2,352 | |
| Humana Inc | — | — | 4,287 | | 1,227 | 4,287 | | 1,227 | |
| Laboratory Corp of America Holdings (a) | — | — | 29 | | 4 | 29 | | 4 | |
| Molina Healthcare Inc (a) | — | — | 145 | | 17 | 145 | | 17 | |
| UnitedHealth Group Inc | — | — | 19,639 | | 4,892 | 19,639 | | 4,892 | |
| WellCare Health Plans Inc (a),(b) | 4,400 | 1,039 | 3,295 | | 778 | 7,695 | | 1,817 | |
| | $ | 1,039 | $ | | 12,126 | | $ | 13,165 | |
| |
| Home Builders - 0.02% | | | | | | | | | |
| DR Horton Inc | — | — | 574 | | 20 | 574 | | 20 | |
| Lennar Corp - A Shares | — | — | 439 | | 17 | 439 | | 17 | |
| Lennar Corp - B Shares | — | — | 96 | | 3 | 96 | | 3 | |
| NVR Inc (a) | — | — | 9 | | 22 | 9 | | 22 | |
| PulteGroup Inc | — | — | 326 | | 8 | 326 | | 8 | |
| Thor Industries Inc | — | — | 136 | | 7 | 136 | | 7 | |
| Toll Brothers Inc | — | — | 268 | | 9 | 268 | | 9 | |
| | $ | — | $ | | 86 | | $ | 86 | |
| |
| Housewares - 0.01% | | | | | | | | | |
| Scotts Miracle-Gro Co/The | — | — | 58 | | 4 | 58 | | 4 | |
| Toro Co/The | — | — | 306 | | 17 | 306 | | 17 | |
| | $ | — | $ | | 21 | | $ | 21 | |
| |
| Insurance - 0.12% | | | | | | | | | |
| Alleghany Corp | — | — | 7 | | 4 | 7 | | 4 | |
| American International Group Inc | — | — | 462 | | 18 | 462 | | 18 | |
| Aon PLC | — | — | 656 | | 95 | 656 | | 95 | |
| Arch Capital Group Ltd (a) | — | — | 229 | | 6 | 229 | | 6 | |
| Axis Capital Holdings Ltd | — | — | 40 | | 2 | 40 | | 2 | |
| Berkshire Hathaway Inc - Class B (a) | — | — | 683 | | 140 | 683 | | 140 | |
| Brown & Brown Inc | — | — | 93 | | 3 | 93 | | 3 | |
| Erie Indemnity Co | — | — | 62 | | 8 | 62 | | 8 | |
| Everest Re Group Ltd | — | — | 44 | | 10 | 44 | | 10 | |
| Markel Corp (a) | — | — | 3 | | 3 | 3 | | 3 | |
| Marsh & McLennan Cos Inc | — | — | 443 | | 35 | 443 | | 35 | |
| Progressive Corp/The | — | — | 1,683 | | 102 | 1,683 | | 102 | |
| RenaissanceRe Holdings Ltd | — | — | 15 | | 2 | 15 | | 2 | |
| Travelers Cos Inc/The | — | — | 245 | | 29 | 245 | | 29 | |
| Voya Financial Inc | — | — | 70 | | 3 | 70 | | 3 | |
| | $ | — | $ | | 460 | | $ | 460 | |
| |
| Internet - 19.07% | | | | | | | | | |
| Alibaba Group Holding Ltd ADR(a) | — | — | 35,792 | | 4,906 | 35,792 | | 4,906 | |
| Alphabet Inc - A Shares (a),(b) | 4,984 | 5,208 | 7,264 | | 7,590 | 12,248 | | 12,798 | |
| Alphabet Inc - C Shares (a) | — | — | 8,656 | | 8,965 | 8,656 | | 8,965 | |
| Amazon.com Inc (a) | 2,949 | 4,429 | 12,546 | | 18,844 | 15,495 | | 23,273 | |
| Booking Holdings Inc (a) | — | — | 3,860 | | 6,648 | 3,860 | | 6,648 | |
| CDW Corp/DE | — | — | 416 | | 34 | 416 | | 34 | |
| eBay Inc (a) | — | — | 379 | | 11 | 379 | | 11 | |
| Expedia Group Inc | — | — | 317 | | 36 | 317 | | 36 | |
| F5 Networks Inc (a) | — | — | 177 | | 29 | 177 | | 29 | |
| Facebook Inc (a) | — | — | 44,350 | | 5,814 | 44,350 | | 5,814 | |
| GoDaddy Inc (a) | — | — | 459 | | 30 | 459 | | 30 | |
See accompanying notes.
| | | | | | | | | | |
| | LargeCap | | LargeCap | LargeCap | | LargeCap | Combined | | Combined | |
| | Growth Account | | Growth Account | Growth Account | | Growth Account | Portfolio Shares | | Portfolio Value | |
| COMMON STOCKS (continued) | Shares Held | | Value (000's) | I Shares Held | | I Value (000's) | Held | | (000 | 's) |
| |
| Internet (continued) | | | | | | | | | | |
| GrubHub Inc (a),(b) | 20,800 | $ | 1,598 | 241 | $ | 18 | 21,041 | $ | 1,616 | |
| IAC/InterActiveCorp (a) | — | | — | 3,699 | | 677 | 3,699 | | 677 | |
| Match Group Inc | — | | — | 234 | | 10 | 234 | | 10 | |
| Netflix Inc (a),(b) | 7,932 | | 2,123 | 6,355 | | 1,701 | 14,287 | | 3,824 | |
| Okta Inc (a) | — | | — | 241 | | 15 | 241 | | 15 | |
| RingCentral Inc (a),(b) | 25,800 | | 2,127 | 195 | | 16 | 25,995 | | 2,143 | |
| Tencent Holdings Ltd ADR | — | | — | 81,793 | | 3,228 | 81,793 | | 3,228 | |
| Twilio Inc (a) | — | | — | 196 | | 17 | 196 | | 17 | |
| Twitter Inc (a),(b) | 69,400 | | 1,995 | 1,871 | | 54 | 71,271 | | 2,049 | |
| Uber Technologies Inc - Class A (a),(c),(d),(g) | — | | — | 116 | | 6 | 116 | | 6 | |
| VeriSign Inc (a) | — | | — | 288 | | 43 | 288 | | 43 | |
| Zendesk Inc (a) | — | | — | 287 | | 17 | 287 | | 17 | |
| Zillow Group Inc - A Shares (a) | — | | — | 139 | | 4 | 139 | | 4 | |
| | $ | | 17,480 | $ | | 58,713 | | $ | 76,193 | |
| |
| Iron & Steel - 0.00% | | | | | | | | | | |
| Steel Dynamics Inc | — | | — | 103 | | 3 | 103 | | 3 | |
| |
| |
| Leisure Products & Services - 0.00% | | | | | | | | | | |
| Brunswick Corp/DE | — | | — | 68 | | 3 | 68 | | 3 | |
| Polaris Industries Inc | — | | — | 164 | | 13 | 164 | | 13 | |
| | $ | | — | $ | | 16 | | $ | 16 | |
| |
| Lodging - 0.60% | | | | | | | | | | |
| Choice Hotels International Inc | — | | — | 114 | | 8 | 114 | | 8 | |
| Extended Stay America Inc | — | | — | 421 | | 7 | 421 | | 7 | |
| Hilton Grand Vacations Inc (a) | — | | — | 298 | | 8 | 298 | | 8 | |
| Hilton Worldwide Holdings Inc | — | | — | 20,109 | | 1,444 | 20,109 | | 1,444 | |
| Las Vegas Sands Corp | — | | — | 15,814 | | 823 | 15,814 | | 823 | |
| Marriott International Inc/MD | — | | — | 541 | | 59 | 541 | | 59 | |
| Wyndham Destinations Inc | — | | — | 301 | | 11 | 301 | | 11 | |
| Wyndham Hotels & Resorts Inc | — | | — | 276 | | 12 | 276 | | 12 | |
| Wynn Resorts Ltd | — | | — | 267 | | 26 | 267 | | 26 | |
| | $ | | — | $ | | 2,398 | | $ | 2,398 | |
| |
| Machinery - Construction & Mining - 1.20% | | | | | | | | | | |
| BWX Technologies Inc | — | | — | 55,425 | | 2,119 | 55,425 | | 2,119 | |
| Caterpillar Inc (b) | 20,147 | | 2,560 | 1,005 | | 128 | 21,152 | | 2,688 | |
| | $ | | 2,560 | $ | | 2,247 | | $ | 4,807 | |
| |
| Machinery - Diversified - 1.79% | | | | | | | | | | |
| Cognex Corp | — | | — | 437 | | 17 | 437 | | 17 | |
| Cummins Inc | — | | — | 154 | | 21 | 154 | | 21 | |
| Deere & Co (b) | 14,796 | | 2,207 | 609 | | 91 | 15,405 | | 2,298 | |
| Gardner Denver Holdings Inc (a) | — | | — | 217 | | 4 | 217 | | 4 | |
| Graco Inc | — | | — | 492 | | 21 | 492 | | 21 | |
| IDEX Corp | — | | — | 206 | | 26 | 206 | | 26 | |
| Nordson Corp | — | | — | 159 | | 19 | 159 | | 19 | |
| Rockwell Automation Inc | — | | — | 328 | | 49 | 328 | | 49 | |
| Roper Technologies Inc | — | | — | 17,570 | | 4,682 | 17,570 | | 4,682 | |
| Wabtec Corp | — | | — | 104 | | 7 | 104 | | 7 | |
| Xylem Inc/NY | — | | — | 280 | | 19 | 280 | | 19 | |
| | $ | | 2,207 | $ | | 4,956 | | $ | 7,163 | |
| |
| Media - 0.14% | | | | | | | | | | |
| AMC Networks Inc (a) | — | | — | 172 | | 9 | 172 | | 9 | |
| Cable One Inc | — | | — | 13 | | 11 | 13 | | 11 | |
| CBS Corp | — | | — | 897 | | 39 | 897 | | 39 | |
| Charter Communications Inc (a) | — | | — | 232 | | 66 | 232 | | 66 | |
| FactSet Research Systems Inc | — | | — | 97 | | 19 | 97 | | 19 | |
| Sirius XM Holdings Inc | — | | — | 3,617 | | 21 | 3,617 | | 21 | |
| Walt Disney Co/The | — | | — | 3,729 | | 409 | 3,729 | | 409 | |
| | $ | | — | $ | | 574 | | $ | 574 | |
| |
| Mining - 0.00% | | | | | | | | | | |
| Royal Gold Inc | — | | — | 70 | | 6 | 70 | | 6 | |
| Southern Copper Corp | — | | — | 228 | | 7 | 228 | | 7 | |
| | $ | | — | $ | | 13 | | $ | 13 | |
| |
| Miscellaneous Manufacturers - 0.10% | | | | | | | | | | |
| 3M Co | — | | — | 897 | | 171 | 897 | | 171 | |
| Donaldson Co Inc | — | | — | 352 | | 15 | 352 | | 15 | |
| Hexcel Corp | — | | — | 90 | | 5 | 90 | | 5 | |
| Illinois Tool Works Inc | — | | — | 1,070 | | 136 | 1,070 | | 136 | |
| Ingersoll-Rand PLC | — | | — | 686 | | 63 | 686 | | 63 | |
See accompanying notes.
| | | | | | | | | |
| | LargeCap | LargeCap | LargeCap | | LargeCap | Combined | | Combined | |
| | Growth Account | Growth Account | Growth Account | | Growth Account | Portfolio Shares | | Portfolio Value | |
| COMMON STOCKS (continued) | Shares Held | Value (000's) | I Shares Held | | I Value (000's) | Held | | (000 | 's) |
| |
| Miscellaneous Manufacturers (continued) | | | | | | | | | |
| Parker-Hannifin Corp | —$ | — | 76 | $ | 11 | 76 | $ | 11 | |
| | $ | — | $ | | 401 | | $ | 401 | |
| |
| Office & Business Equipment - 0.62% | | | | | | | | | |
| Zebra Technologies Corp (a),(b) | 15,500 | 2,468 | 149 | | 24 | 15,649 | | 2,492 | |
| |
| Oil & Gas - 0.51% | | | | | | | | | |
| Anadarko Petroleum Corp | — | — | 544 | | 24 | 544 | | 24 | |
| Antero Resources Corp (a) | — | — | 358 | | 3 | 358 | | 3 | |
| Apache Corp | — | — | 68 | | 2 | 68 | | 2 | |
| Cabot Oil & Gas Corp | — | — | 815 | | 18 | 815 | | 18 | |
| Cimarex Energy Co | — | — | 34 | | 2 | 34 | | 2 | |
| Concho Resources Inc (a) | — | — | 52 | | 5 | 52 | | 5 | |
| Continental Resources Inc/OK (a) | — | — | 108 | | 4 | 108 | | 4 | |
| Diamondback Energy Inc (b) | 10,987 | 1,018 | 70 | | 7 | 11,057 | | 1,025 | |
| EOG Resources Inc | — | — | 224 | | 20 | 224 | | 20 | |
| Kosmos Energy Ltd (a) | — | — | 149 | | 1 | 149 | | 1 | |
| Newfield Exploration Co (a) | — | — | 208 | | 3 | 208 | | 3 | |
| Parsley Energy Inc (a) | — | — | 465 | | 7 | 465 | | 7 | |
| Pioneer Natural Resources Co (b) | 6,650 | 875 | 269 | | 35 | 6,919 | | 910 | |
| | $ | 1,893 | $ | | 131 | | $ | 2,024 | |
| |
| Oil & Gas Services - 0.01% | | | | | | | | | |
| Halliburton Co | — | — | 1,644 | | 44 | 1,644 | | 44 | |
| RPC Inc | — | — | 59 | | — | 59 | | — | |
| | $ | — | $ | | 44 | | $ | 44 | |
| |
| Packaging & Containers - 0.01% | | | | | | | | | |
| Berry Global Group Inc (a) | — | — | 184 | | 9 | 184 | | 9 | |
| Crown Holdings Inc (a) | — | — | 333 | | 14 | 333 | | 14 | |
| Graphic Packaging Holding Co | — | — | 157 | | 2 | 157 | | 2 | |
| Packaging Corp of America | — | — | 241 | | 20 | 241 | | 20 | |
| Sealed Air Corp | — | — | 238 | | 8 | 238 | | 8 | |
| Silgan Holdings Inc | — | — | 82 | | 2 | 82 | | 2 | |
| | $ | — | $ | | 55 | | $ | 55 | |
| |
| Pharmaceuticals - 5.37% | | | | | | | | | |
| AbbVie Inc | — | — | 3,860 | | 356 | 3,860 | | 356 | |
| Agios Pharmaceuticals Inc (a) | — | — | 128 | | 6 | 128 | | 6 | |
| Alkermes PLC (a) | — | — | 390 | | 11 | 390 | | 11 | |
| AmerisourceBergen Corp | — | — | 422 | | 31 | 422 | | 31 | |
| Bristol-Myers Squibb Co | — | — | 2,808 | | 146 | 2,808 | | 146 | |
| Cigna Corp | — | — | 21,404 | | 4,065 | 21,404 | | 4,065 | |
| CVS Health Corp | — | — | 380 | | 25 | 380 | | 25 | |
| DexCom Inc (a),(b) | 13,900 | 1,665 | 33,794 | | 4,049 | 47,694 | | 5,714 | |
| Eli Lilly & Co (b) | 16,600 | 1,921 | 13,756 | | 1,592 | 30,356 | | 3,513 | |
| Herbalife Nutrition Ltd (a) | — | — | 96 | | 6 | 96 | | 6 | |
| Jazz Pharmaceuticals PLC (a) | — | — | 147 | | 18 | 147 | | 18 | |
| Johnson & Johnson | — | — | 911 | | 118 | 911 | | 118 | |
| McKesson Corp | — | — | 312 | | 34 | 312 | | 34 | |
| Merck & Co Inc | — | — | 335 | | 26 | 335 | | 26 | |
| Nektar Therapeutics (a) | — | — | 437 | | 14 | 437 | | 14 | |
| Neurocrine Biosciences Inc (a) | — | — | 226 | | 16 | 226 | | 16 | |
| PRA Health Sciences Inc (a) | — | — | 160 | | 15 | 160 | | 15 | |
| Premier Inc (a) | — | — | 94 | | 4 | 94 | | 4 | |
| Sarepta Therapeutics Inc (a),(b) | 10,600 | 1,157 | 159 | | 17 | 10,759 | | 1,174 | |
| TESARO Inc (a) | — | — | 100 | | 7 | 100 | | 7 | |
| Zoetis Inc | — | — | 71,888 | | 6,149 | 71,888 | | 6,149 | |
| | $ | 4,743 | $ | | 16,705 | | $ | 21,448 | |
| |
| Pipelines - 0.01% | | | | | | | | | |
| Cheniere Energy Inc (a) | — | — | 406 | | 24 | 406 | | 24 | |
| ONEOK Inc | — | — | 522 | | 28 | 522 | | 28 | |
| | $ | — | $ | | 52 | | $ | 52 | |
| |
| Real Estate - 0.01% | | | | | | | | | |
| CBRE Group Inc (a) | — | — | 385 | | 16 | 385 | | 16 | |
| Howard Hughes Corp/The (a) | — | — | 43 | | 4 | 43 | | 4 | |
| | $ | — | $ | | 20 | | $ | 20 | |
| |
| REITs - 1.35% | | | | | | | | | |
| Alexandria Real Estate Equities Inc | — | — | 25 | | 3 | 25 | | 3 | |
| American Tower Corp | — | — | 827 | | 131 | 827 | | 131 | |
| CoreSite Realty Corp | — | — | 99 | | 9 | 99 | | 9 | |
| Crown Castle International Corp | — | — | 937 | | 102 | 937 | | 102 | |
See accompanying notes.
| | | | | | | | | |
| | LargeCap | LargeCap | LargeCap | | LargeCap | Combined | | Combined | |
| | Growth Account | Growth Account | Growth Account | | Growth Account | Portfolio Shares | | Portfolio Value | |
| COMMON STOCKS (continued) | Shares Held | Value (000's) | I Shares Held | | I Value (000's) | Held | | (000 | 's) |
| |
| REITs (continued) | | | | | | | | | |
| Equinix Inc | —$ | — | 149 | $ | 52 | 149 | $ | 52 | |
| Equity LifeStyle Properties Inc | — | — | 215 | | 21 | 215 | | 21 | |
| Extra Space Storage Inc | — | — | 268 | | 24 | 268 | | 24 | |
| Gaming and Leisure Properties Inc | — | — | 198 | | 6 | 198 | | 6 | |
| Hudson Pacific Properties Inc | — | — | 54 | | 1 | 54 | | 1 | |
| Lamar Advertising Co | — | — | 191 | | 13 | 191 | | 13 | |
| Life Storage Inc | — | — | 8 | | 1 | 8 | | 1 | |
| Omega Healthcare Investors Inc | — | — | 50 | | 2 | 50 | | 2 | |
| Public Storage | — | — | 495 | | 100 | 495 | | 100 | |
| SBA Communications Corp (a) | — | — | 29,524 | | 4,780 | 29,524 | | 4,780 | |
| Simon Property Group Inc | — | — | 861 | | 145 | 861 | | 145 | |
| Taubman Centers Inc | — | — | 160 | | 7 | 160 | | 7 | |
| | $ | — | $ | | 5,397 | | $ | 5,397 | |
| |
| Retail - 5.63% | | | | | | | | | |
| Advance Auto Parts Inc | — | — | 67 | | 11 | 67 | | 11 | |
| AutoZone Inc (a) | — | — | 61 | | 51 | 61 | | 51 | |
| Best Buy Co Inc | — | — | 189 | | 10 | 189 | | 10 | |
| Burlington Stores Inc (a) | — | — | 180 | | 29 | 180 | | 29 | |
| CarMax Inc (a) | — | — | 284 | | 18 | 284 | | 18 | |
| Chipotle Mexican Grill Inc (a),(b) | 3,400 | 1,468 | 62 | | 27 | 3,462 | | 1,495 | |
| Costco Wholesale Corp | — | — | 20,018 | | 4,077 | 20,018 | | 4,077 | |
| Darden Restaurants Inc | — | — | 177 | | 18 | 177 | | 18 | |
| Dollar General Corp | — | — | 16,746 | | 1,810 | 16,746 | | 1,810 | |
| Dollar Tree Inc (a) | — | — | 124 | | 11 | 124 | | 11 | |
| Domino's Pizza Inc | — | — | 111 | | 28 | 111 | | 28 | |
| Dunkin' Brands Group Inc | — | — | 225 | | 14 | 225 | | 14 | |
| Five Below Inc (a),(b) | 14,700 | 1,504 | — | | — | 14,700 | | 1,504 | |
| Gap Inc/The | — | — | 127 | | 3 | 127 | | 3 | |
| Home Depot Inc/The | — | — | 5,320 | | 914 | 5,320 | | 914 | |
| L Brands Inc | — | — | 176 | | 5 | 176 | | 5 | |
| Lowe's Cos Inc | — | — | 1,539 | | 142 | 1,539 | | 142 | |
| Lululemon Athletica Inc (a),(b) | 9,950 | 1,210 | 255 | | 31 | 10,205 | | 1,241 | |
| McDonald's Corp | — | — | 5,171 | | 918 | 5,171 | | 918 | |
| Michaels Cos Inc/The (a) | — | — | 199 | | 3 | 199 | | 3 | |
| MSC Industrial Direct Co Inc | — | — | 87 | | 7 | 87 | | 7 | |
| Nordstrom Inc | — | — | 332 | | 15 | 332 | | 15 | |
| Nu Skin Enterprises Inc | — | — | 86 | | 5 | 86 | | 5 | |
| O'Reilly Automotive Inc (a) | — | — | 149 | | 51 | 149 | | 51 | |
| Restaurant Brands International Inc | — | — | 16,745 | | 876 | 16,745 | | 876 | |
| Ross Stores Inc | — | — | 19,646 | | 1,635 | 19,646 | | 1,635 | |
| Starbucks Corp | — | — | 2,476 | | 159 | 2,476 | | 159 | |
| Tapestry Inc | — | — | 204 | | 7 | 204 | | 7 | |
| Target Corp (b) | 25,900 | 1,712 | — | | — | 25,900 | | 1,712 | |
| Tiffany & Co (b) | 6,400 | 515 | 63 | | 5 | 6,463 | | 520 | |
| TJX Cos Inc/The | — | — | 80,867 | | 3,618 | 80,867 | | 3,618 | |
| Tractor Supply Co | — | — | 331 | | 28 | 331 | | 28 | |
| Ulta Beauty Inc (a),(b) | 6,000 | 1,469 | 150 | | 37 | 6,150 | | 1,506 | |
| Urban Outfitters Inc (a) | — | — | 243 | | 8 | 243 | | 8 | |
| Wendy's Co/The | — | — | 542 | | 8 | 542 | | 8 | |
| Williams-Sonoma Inc | — | — | 93 | | 5 | 93 | | 5 | |
| Yum China Holdings Inc | — | — | 118 | | 4 | 118 | | 4 | |
| Yum! Brands Inc | — | — | 174 | | 16 | 174 | | 16 | |
| | $ | 7,878 | $ | | 14,604 | | $ | 22,482 | |
| |
| Semiconductors - 2.42% | | | | | | | | | |
| Advanced Micro Devices Inc (a) | — | — | 2,359 | | 44 | 2,359 | | 44 | |
| Analog Devices Inc | — | — | 110 | | 9 | 110 | | 9 | |
| Applied Materials Inc | — | — | 4,539 | | 149 | 4,539 | | 149 | |
| ASML Holding NV - NY Reg Shares | — | — | 3,485 | | 542 | 3,485 | | 542 | |
| Broadcom Inc | — | — | 486 | | 124 | 486 | | 124 | |
| Cypress Semiconductor Corp | — | — | 882 | | 11 | 882 | | 11 | |
| Intel Corp (b) | 30,600 | 1,436 | — | | — | 30,600 | | 1,436 | |
| IPG Photonics Corp (a) | — | — | 99 | | 11 | 99 | | 11 | |
| KLA-Tencor Corp | — | — | 442 | | 40 | 442 | | 40 | |
| Lam Research Corp | — | — | 429 | | 58 | 429 | | 58 | |
| Marvell Technology Group Ltd | — | — | 510 | | 8 | 510 | | 8 | |
| Maxim Integrated Products Inc | — | — | 14,660 | | 745 | 14,660 | | 745 | |
| Microchip Technology Inc | — | — | 596 | | 43 | 596 | | 43 | |
| Micron Technology Inc (a) | — | — | 4,071 | | 129 | 4,071 | | 129 | |
| MKS Instruments Inc | — | — | 193 | | 12 | 193 | | 12 | |
| NVIDIA Corp | — | — | 1,096 | | 146 | 1,096 | | 146 | |
| NXP Semiconductors NV | — | — | 34,358 | | 2,518 | 34,358 | | 2,518 | |
| ON Semiconductor Corp (a) | — | — | 1,291 | | 21 | 1,291 | | 21 | |
| QUALCOMM Inc (b) | 26,700 | 1,519 | — | | — | 26,700 | | 1,519 | |
See accompanying notes.
| | | | | | | | | |
| | LargeCap | LargeCap | LargeCap | | LargeCap | Combined | | Combined | |
| | Growth Account | Growth Account | Growth Account | | Growth Account | Portfolio Shares | | Portfolio Value | |
| COMMON STOCKS (continued) | Shares Held | Value (000's) | I Shares Held | | I Value (000's) | Held | | (000 | 's) |
| |
| Semiconductors (continued) | | | | | | | | | |
| Skyworks Solutions Inc | —$ | — | 370 | $ | 25 | 370 | $ | 25 | |
| Teradyne Inc | — | — | 181 | | 6 | 181 | | 6 | |
| Texas Instruments Inc | — | — | 1,847 | | 175 | 1,847 | | 175 | |
| Xilinx Inc (b) | 21,400 | 1,823 | 677 | | 58 | 22,077 | | 1,881 | |
| | $ | 4,778 | $ | | 4,874 | | $ | 9,652 | |
| |
| Shipbuilding - 0.01% | | | | | | | | | |
| Huntington Ingalls Industries Inc | — | — | 103 | | 20 | 103 | | 20 | |
| |
| Software - 14.84% | | | | | | | | | |
| Activision Blizzard Inc | — | — | 14,108 | | 657 | 14,108 | | 657 | |
| Adobe Inc (a) | — | — | 17,613 | | 3,984 | 17,613 | | 3,984 | |
| Akamai Technologies Inc (a) | — | — | 435 | | 27 | 435 | | 27 | |
| ANSYS Inc (a) | — | — | 228 | | 33 | 228 | | 33 | |
| Aspen Technology Inc (a) | — | — | 211 | | 17 | 211 | | 17 | |
| athenahealth Inc (a) | — | — | 113 | | 15 | 113 | | 15 | |
| Atlassian Corp PLC (a) | — | — | 258 | | 23 | 258 | | 23 | |
| Autodesk Inc (a) | — | — | 28,107 | | 3,614 | 28,107 | | 3,614 | |
| Black Knight Inc (a) | — | — | 424 | | 19 | 424 | | 19 | |
| Broadridge Financial Solutions Inc | — | — | 333 | | 32 | 333 | | 32 | |
| Cadence Design Systems Inc (a) | — | — | 780 | | 34 | 780 | | 34 | |
| CDK Global Inc | — | — | 391 | | 19 | 391 | | 19 | |
| Cerner Corp (a) | — | — | 384 | | 20 | 384 | | 20 | |
| Citrix Systems Inc | — | — | 382 | | 39 | 382 | | 39 | |
| Dun & Bradstreet Corp/The | — | — | 63 | | 9 | 63 | | 9 | |
| Electronic Arts Inc (a) | — | — | 48,874 | | 3,857 | 48,874 | | 3,857 | |
| Fair Isaac Corp (a) | — | — | 91 | | 17 | 91 | | 17 | |
| Fidelity National Information Services Inc | — | — | 4,597 | | 472 | 4,597 | | 472 | |
| First Data Corp (a) | — | — | 1,576 | | 27 | 1,576 | | 27 | |
| Fiserv Inc (a) | — | — | 762 | | 56 | 762 | | 56 | |
| Intuit Inc | — | — | 39,711 | | 7,816 | 39,711 | | 7,816 | |
| Jack Henry & Associates Inc | — | — | 223 | | 28 | 223 | | 28 | |
| Manhattan Associates Inc (a) | — | — | 232 | | 10 | 232 | | 10 | |
| Microsoft Corp (b) | 53,330 | 5,417 | 145,487 | | 14,778 | 198,817 | | 20,195 | |
| MSCI Inc | — | — | 223 | | 33 | 223 | | 33 | |
| Oracle Corp | — | — | 511 | | 23 | 511 | | 23 | |
| Paychex Inc | — | — | 864 | | 56 | 864 | | 56 | |
| Paycom Software Inc (a) | — | — | 141 | | 17 | 141 | | 17 | |
| PTC Inc (a) | — | — | 323 | | 27 | 323 | | 27 | |
| RealPage Inc (a) | — | — | 214 | | 10 | 214 | | 10 | |
| Red Hat Inc (a) | — | — | 17,469 | | 3,068 | 17,469 | | 3,068 | |
| salesforce.com Inc (a) | — | — | 50,764 | | 6,953 | 50,764 | | 6,953 | |
| ServiceNow Inc (a),(b) | 12,393 | 2,206 | 6,482 | | 1,155 | 18,875 | | 3,361 | |
| Splunk Inc (a) | — | — | 11,244 | | 1,179 | 11,244 | | 1,179 | |
| SS&C Technologies Holdings Inc | — | — | 539 | | 24 | 539 | | 24 | |
| Synopsys Inc (a) | — | — | 73 | | 6 | 73 | | 6 | |
| Take-Two Interactive Software Inc (a) | — | — | 186 | | 19 | 186 | | 19 | |
| Teradata Corp (a) | — | — | 275 | | 11 | 275 | | 11 | |
| Tyler Technologies Inc (a) | — | — | 108 | | 20 | 108 | | 20 | |
| Ultimate Software Group Inc/The (a) | — | — | 84 | | 21 | 84 | | 21 | |
| Veeva Systems Inc (a) | — | — | 314 | | 28 | 314 | | 28 | |
| VMware Inc | — | — | 15,907 | | 2,181 | 15,907 | | 2,181 | |
| Workday Inc (a) | — | — | 7,814 | | 1,248 | 7,814 | | 1,248 | |
| | $ | 7,623 | $ | | 51,682 | | $ | 59,305 | |
| |
| Telecommunications - 0.64% | | | | | | | | | |
| Arista Networks Inc (a) | — | — | 150 | | 32 | 150 | | 32 | |
| Cisco Systems Inc (b) | 56,850 | 2,463 | — | | — | 56,850 | | 2,463 | |
| LogMeIn Inc | — | — | 122 | | 10 | 122 | | 10 | |
| Motorola Solutions Inc | — | — | 62 | | 7 | 62 | | 7 | |
| T-Mobile US Inc (a) | — | — | 559 | | 35 | 559 | | 35 | |
| Ubiquiti Networks Inc | — | — | 77 | | 8 | 77 | | 8 | |
| Zayo Group Holdings Inc (a) | — | — | 543 | | 12 | 543 | | 12 | |
| | $ | 2,463 | $ | | 104 | | $ | 2,567 | |
| |
| Transportation - 0.73% | | | | | | | | | |
| CH Robinson Worldwide Inc | — | — | 382 | | 32 | 382 | | 32 | |
| CSX Corp (b) | 25,700 | 1,597 | 1,473 | | 92 | 27,173 | | 1,689 | |
| Expeditors International of Washington Inc | — | — | 474 | | 32 | 474 | | 32 | |
| FedEx Corp | — | — | 465 | | 75 | 465 | | 75 | |
| Genesee & Wyoming Inc (a) | — | — | 68 | | 5 | 68 | | 5 | |
| JB Hunt Transport Services Inc | — | — | 242 | | 23 | 242 | | 23 | |
| Kansas City Southern | — | — | 6,573 | | 627 | 6,573 | | 627 | |
See accompanying notes.
| | | | | | | | | | |
| | LargeCap | | LargeCap | LargeCap | | LargeCap | Combined | | Combined | |
| | Growth Account | | Growth Account | Growth Account | | Growth Account | Portfolio Shares | | Portfolio Value | |
| COMMON STOCKS (continued) | Shares Held | | Value (000's) | I Shares Held | | I Value (000's) | Held | | (000 | 's) |
| |
| Transportation (continued) | | | | | | | | | | |
| Landstar System Inc | —$ | | — | 132 | $ | 13 | 132 | $ | 13 | |
| Old Dominion Freight Line Inc | — | | — | 189 | | 23 | 189 | | 23 | |
| Schneider National Inc | — | | — | 110 | | 2 | 110 | | 2 | |
| Union Pacific Corp | — | | — | 1,968 | | 272 | 1,968 | | 272 | |
| United Parcel Service Inc | — | | — | 1,301 | | 127 | 1,301 | | 127 | |
| | $ | | 1,597 | $ | | 1,323 | | $ | 2,920 | |
| |
| Water - 0.16% | | | | | | | | | | |
| American Water Works Co Inc | — | | — | 7,030 | | 638 | 7,030 | | 638 | |
| |
| TOTAL COMMON STOCKS | $ | | 97,684 | $ | | 291,151 | | $ | 388,835 | |
| | LargeCap | | LargeCap | LargeCap | | LargeCap | Combined | | Combined | |
| | Growth Account | | Growth Account | Growth Account | | Growth Account | Portfolio Shares | | Portfolio Value | |
| INVESTMENT COMPANIES - 2.18% | Shares Held | | Value (000's) | I Shares Held | | I Value (000's) | Held | | (000 | 's) |
| |
| Money Market Funds - 2.09% | | | | | | | | | | |
| Principal Government Money Market Fund 2.11%(b),(e),(f) | 2,326,191 | $ | 2,326 | 6,022,190 | $ | 6,022 | 8,348,381 | $ | 8,348 | |
| |
| Principal Exchange-Traded Funds - 0.09% | | | | | | | | | | |
| Principal Millennials Index ETF (e) | — | | — | 4,789 | | 150 | 4,789 | | 150 | |
| Principal Price Setters Index ETF (e) | — | | — | 1,616 | | 50 | 1,616 | | 50 | |
| Principal Sustainable Momentum Index ETF (e) | — | | — | 749 | | 18 | 749 | | 18 | |
| Principal U.S. Mega-Cap Multi-Factor Index ETF (e) | — | | — | 5,280 | | 132 | 5,280 | | 132 | |
| | $ | | — | $ | | 350 | | $ | 350 | |
| TOTAL INVESTMENT COMPANIES | $ | | 2,326 | $ | | 6,372 | | $ | 8,698 | |
| | LargeCap | | LargeCap | LargeCap | | LargeCap | Combined | | Combined | |
| | Growth Account | | Growth Account | Growth Account | | Growth Account | Portfolio Shares | | Portfolio Value | |
| CONVERTIBLE PREFERRED STOCKS - 0.24% | Shares Held | | Value (000's) | I Shares Held | | I Value (000's) | Held | | (000 | 's) |
| |
| Internet - 0.24% | | | | | | | | | | |
| Airbnb Inc - Series D 0.00% (a),(c),(d),(g) | — | | — | 3,936 | | 418 | 3,936 | | 418 | |
| Airbnb Inc - Series E 0.00% (a),(c),(d),(g) | — | | — | 1,119 | | 119 | 1,119 | | 119 | |
| Uber Technologies Inc - Series A | — | | — | 16 | | 1 | 16 | | 1 | |
| 0.00% (a),(c),(d),(g) | | | | | | | | | | |
| Uber Technologies Inc - Series B | — | | — | 44 | | 2 | 44 | | 2 | |
| 0.00% (a),(c),(d),(g) | | | | | | | | | | |
| Uber Technologies Inc - Series C-1 | — | | — | 12 | | 1 | 12 | | 1 | |
| 0.00% (a),(c),(d),(g) | | | | | | | | | | |
| Uber Technologies Inc - Series C-2 | — | | — | 9 | | — | 9 | | — | |
| 0.00% (a),(c),(d),(g) | | | | | | | | | | |
| Uber Technologies Inc - Series C-3 | — | | — | 1 | | — | 1 | | — | |
| 0.00% (a),(c),(d),(g) | | | | | | | | | | |
| Uber Technologies Inc - Series D | — | | — | 10 | | 1 | 10 | | 1 | |
| 0.00% (a),(c),(d),(g) | | | | | | | | | | |
| Uber Technologies Inc - Series E | — | | — | 5,745 | | 280 | 5,745 | | 280 | |
| 0.00% (a),(c),(d),(g) | | | | | | | | | | |
| Uber Technologies Inc - Series G | — | | — | 3,311 | | 161 | 3,311 | | 161 | |
| 0.00% (a),(c),(d),(g) | | | | | | | | | | |
| Uber Technologies Inc - Series G-1 | — | | — | 25 | | 1 | 25 | | 1 | |
| 0.00% (a),(c),(d),(g) | | | | | | | | | | |
| Uber Technologies Inc - Series Seed | — | | — | 42 | | 2 | 42 | | 2 | |
| 0.00% (a),(c),(d),(g) | | | | | | | | | | |
| | $ | | — | $ | | 986 | | $ | 986 | |
| TOTAL CONVERTIBLE PREFERRED STOCKS | $ | | — | $ | | 986 | | $ | 986 | |
| | LargeCap | | LargeCap | LargeCap | | LargeCap | Combined | | Combined | |
| | Growth Account | | Growth Account | Growth Account | | Growth Account | Portfolio Shares | | Portfolio Value | |
| PREFERRED STOCKS - 0.05% | Shares Held | | Value (000's) | I Shares Held | | I Value (000's) | Held | | (000 | 's) |
| |
| Software - 0.05% | | | | | | | | | | |
| Magic Leap Inc - Series C 0.00% | — $ | | — | 5,653 | | 153 | 5,653 | $ | 153 | |
| (a),(c),(d),(g) | | | | | | | | | | |
| Magic Leap Inc - Series D | — | | — | 1,903 | | 51 | 1,903 | | 51 | |
| 0.00% (a),(c),(d) | | | | | | | | | | |
| | $ | | — | $ | | 204 | | $ | 204 | |
| TOTAL PREFERRED STOCKS | $ | | — | $ | | 204 | | $ | 204 | |
| Total Investments | $ | | 100,010 | $ | | 298,713 | | $ | 398,723 | |
| Other Assets and Liabilities- 0.22% | $ | | 280 | $ | | 585 | | $ | 832 | |
| TOTAL NET ASSETS - 100.00% | $ | | 100,290 | $ | | 299,298 | | $ | 399,555 | |
| (a) | Non-income producing security |
| (b) | The security or a portion of the security will be disposed of in order to meet the investment objectives and strategies of the Acquiring Account as determined by the Acquiring Account’s sub-advisors. |
| (c) | Restricted Security. Please see Restricted Security Sub-Schedule for more information. |
See accompanying notes.
| (d) | Fair value of these investments is determined in good faith by the Manager under procedures established and periodically reviewed by the Board of Directors. Certain inputs used in the valuation may be unobservable; however, each security is evaluated individually for purposes of ASC 820 which results in not all securities being identified as Level 3 of the fair value hierarchy. At the end of the period, the fair value of these securities totaled $0 and $1,196 or 0.30% of net assets. |
| (e) | Affiliated Security. Security is either an affiliate (and registered under the Investment Company Act of 1940) or an affiliate as defined by the Investment Company Act of 1940 (controls 5.0% or more of the outstanding voting shares of the security). Please see affiliated sub-schedule for transactional information. |
| (f) | Current yield is as of period end. |
| (g) | The value of these investments was determined using significant unobservable inputs. |
| | | | | | |
| Portfolio Summary (unaudited) | | | | | |
| | LargeCap Growth | | LargeCap Growth | | | |
| Sector | Account | | Account I | | Combined Portfolio | |
| Consumer, Non-cyclical | 27.23 | % | 27.58 | % | 27.49 | % |
| Technology | 18.57 | % | 21.61 | % | 20.84 | % |
| Communications | 19.89 | % | 20.19 | % | 20.11 | % |
| Financial | 9.88 | % | 8.57 | % | 8.91 | % |
| Consumer, Cyclical | 10.58 | % | 7.47 | % | 8.24 | % |
| Industrial | 7.45 | % | 10.07 | % | 9.42 | % |
| Investment Companies | 2.32 | % | 2.01 | % | 2.09 | % |
| Basic Materials | 1.91 | % | 1.60 | % | 1.68 | % |
| Energy | 1.89 | % | 0.07 | % | 0.53 | % |
| Utilities | 0.00 | % | 0.51 | % | 0.38 | % |
| Domestic Equity Funds | 0.00 | % | 0.12 | % | 0.09 | % |
| Other Assets in Excess of Liabilities, Net | 0.28 | % | 0.20 | % | 0.22 | % |
| TOTAL NET ASSETS | 100.00 | % | 100.00 | % | 100.00 | % |
| | | | | | | | | | | | |
| Affiliated Securities – LargeCap Growth Account | | December 31, 2017 | | Purchases | | Sales | | | December 31, 2018 | |
| | | | Value | | Cost | | Proceeds | | | Value | |
| Principal Government Money Market Fund 2.11% | $ | | 1,377 | $ | 52,230 | $ | 51,281 | $ | | 2,326 | |
| | $ | | 1,377 | $ | 52,230 | $ | 51,281 | $ | | 2,326 | |
| |
| | | | Realized Gain/Loss | | | Realized Gain from | | Change in Unrealized | |
| | | Income | on Investments | | | Capital Gain Distributions | | Gain/Loss | |
| Principal Government Money Market Fund 2.11% | $ | 32 | $ | | — | $ | | | — | $ | — | |
| | $ | 32 | $ | | — | $ | | | — | $ | — | |
| Amounts in thousands | | | | | | | | | | | | |
| |
| |
| |
| |
| Affiliated Securities – LargeCap Growth Account I | | December 31, 2017 | | Purchases | | Sales | | | December 31, 2018 | |
| | | Value | | Cost | | Proceeds | | | Value | |
| Principal Government Money Market Fund 2.11% | $ | | 7,803 | $ | 85,094 | $ | 86,875 | $ | | 6,022 | |
| Principal Millennials Index ETF | | | — | | | 163 | | — | | | 150 | |
| Principal Price Setters Index ETF | | | — | | | 54 | | — | | | 50 | |
| Principal Sustainable Momentum Index ETF | | | — | | | 20 | | 1 | | | 18 | |
| Principal U.S. Mega-Cap Multi-Factor Index ETF | | | — | | | 143 | | — | | | 132 | |
| | $ | | 7,803 | $ | 85,474 | $ | 86,876 | $ | | 6,372 | |
| |
| | | | Realized Gain/Loss | | | Realized Gain from | | Change in Unrealized | |
| | | Income | on Investments | | | Capital Gain Distributions | | Gain/Loss | |
| Principal Government Money Market Fund 2.11% | $ | 121 | $ | | — | $ | | | — | $ | — | |
| Principal Millennials Index ETF | | — | | | — | | | | — | | (13 | ) |
| Principal Price Setters Index ETF | | — | | | — | | | | — | | (4 | ) |
| Principal Sustainable Momentum Index ETF | | — | | | — | | | | — | | (1 | ) |
| Principal U.S. Mega-Cap Multi-Factor Index ETF | | 1 | | | — | | | | — | | (11 | ) |
| | $ | 122 | $ | | — | $ | | | — | $ | (29 | ) |
| Amounts in thousands | | | | | | | | | | | | |
See accompanying notes.
| | | | | | | | | |
| Restricted Securities – LargeCap Growth Account I |
|
| Security Name | Acquisition Date | | | Cost | | Value | Percent of Net Assets | |
| Airbnb Inc - Series D - 0.00% | | 04/16/2014 | $ | | 160 | $ | 418 | 0.14 | % |
| Airbnb Inc - Series E - 0.00% | | 07/14/2015 | | | 104 | | 119 | 0.04 | % |
| Magic Leap Inc - Series C - 0.00% | | 01/20/2016 | | | 131 | | 153 | 0.05 | % |
| Magic Leap Inc - Series D - 0.00% | | 10/12/2017 | | | 51 | | 51 | 0.02 | % |
| Uber Technologies Inc - Class A | | 01/16/2018 | | | 4 | | 6 | 0.00 | % |
| Uber Technologies Inc - Series A - 0.00% | | 01/16/2018 | | | 1 | | 1 | 0.00 | % |
| Uber Technologies Inc - Series B - 0.00% | | 01/16/2018 | | | 2 | | 2 | 0.00 | % |
| Uber Technologies Inc - Series C-1 - 0.00% | | 01/16/2018 | | | — | | 1 | 0.00 | % |
| Uber Technologies Inc - Series C-2 - 0.00% | | 01/16/2018 | | | — | | — | 0.00 | % |
| Uber Technologies Inc - Series C-3 - 0.00% | | 01/16/2018 | | | — | | — | 0.00 | % |
| Uber Technologies Inc - Series D - 0.00% | | 01/16/2018 | | | — | | 1 | 0.00 | % |
| Uber Technologies Inc - Series E - 0.00% | 12/05/2014-1/16/2018 | | | 192 | | 280 | 0.09 | % |
| Uber Technologies Inc - Series G - 0.00% | | 12/3/2015 | | | 162 | | 161 | 0.05 | % |
| Uber Technologies Inc - Series G-1 - 0.00% | | 01/16/2018 | | | 1 | | 1 | 0.00 | % |
| Uber Technologies Inc - Series Seed - 0.00% | | 01/16/2018 | | | 1 | | 2 | 0.00 | % |
| Total | | | | | | $ | 1,196 | 0.39 | % |
| Amounts in thousands. | | | | | | | | | |
| |
| |
| |
| Futures Contracts – LargeCap Growth Account I |
|
| Description and Expiration Date | Type | Contracts | Notional Amount | | Value and Unrealized Appreciation/(Depreciation) | |
| S&P 500 Emini; March 2019 | Long | 9 | | $ | 1,127 | $ | | (2 | ) |
| Total | | | | | | $ | | (2 | ) |
| |
| Amounts in thousands except contracts. | | | | | | | | | |
See accompanying notes.
Pro Forma Notes to Financial Statements
December 31, 2018
(unaudited)
1. Description of the Funds
Core Plus Bond Account, Income Account, LargeCap Growth Account and LargeCap Growth Account I (the “Accounts”) are series of Principal Variable Contracts Funds, Inc. (the “Fund”). The Fund is registered under the Investment Company Act of 1940, as amended, as an open-end management investment company.
Each of the Funds is an investment company and applies specialized accounting and reporting under Accounting StandardsCodification Topic 946, Financial Services - Investment Companies. The Funds have not provided financial support and are not contractually required to provide financial support to any investee.
Both classes of shares for each of the Accounts represent interests in the same portfolio of investments and will vote together as a single class, except where otherwise required by law or as determined by the Fund’s Board of Directors. In addition, the Board of Directors declares separate dividends on each class of shares.
2. Basis of Combination
On December 11, 2018, the Board of Directors of the Fund approved an Agreement and Plan of Reorganization whereby, Core Plus Bond Account and LargeCap Growth Account I (the “Acquiring Funds”) will acquire all the assets of Income Account and LargeCap Growth Account, respectively, (“the Acquired Funds”) subject to the liabilities of the Acquired Funds, in exchange for a number of shares equal in value to the pro rata net assets of the Acquired Funds (the “Reorganization”).
The Reorganization of Core Plus Bond Account and Income Account will be accounted for as a taxable reorganization of investment companies. The Reorganization of LargeCap Growth Account I and LargeCap Account will be accounted for as a non-taxable reorganization of investment companies. The pro forma combined financial statements are presented for the information of the reader and may not necessarily be representative of what the actual combined financial statements would have been had the Reorganization occurred at December 31, 2018. The unaudited pro forma schedules of investments and statements of assets and liabilities reflect the financial position of the Acquiring Funds and the Acquired Funds at December 31, 2018. The unaudited pro forma statements of operations reflect the results of operations of Acquiring Funds and the Acquired Funds for the twelve months ended December 31, 2018. The statements have been derived from the Accounts’ respective books and records utilized in calculating daily net asset value at the dates indicated above for the Acquiring Funds and the Acquired Funds under U.S. generally accepted accounting principles (“U.S. GAAP”). In accordance with U.S. GAAP, the fair value of the assets of Acquired Funds will become the cost basis of such assets transferred to Acquiring Fund on the date of the combination and the results of operations of the Acquired Fund for pre-combination periods will not be restated. The Acquiring Funds will be the surviving entities for accounting purposes.
The Acquired Funds will pay all expenses and out-of-pocket fees incurred in connection with the Reorganization, including printing, mailing, and legal fees. These expenses and fees are expected to total $17,000 and $5,000 for LargeCap Growth Account and Income Account, respectively. The Acquired Funds will pay any trading costs associated with disposing of any portfolio securities that would not be compatible with the investment objectives and strategies of the Acquired Funds and reinvesting the proceeds in securities that would be compatible. These trading costs are estimated to be $17,000 and $28,000 for LargeCap Growth Account and Income Account, respectively. The estimated gain/(loss) would be $(1,363,000) ($0.37 per share) and $1,509,000 ($0.08 per share) for LargeCap Growth Account and Income Account, respectively, on a U.S. GAAP basis.
The pro forma schedules of investments and statements of assets and liabilities and statements of operations should be read in conjunction with the historical financial statements of the Accounts incorporated by reference in the Statements of Additional Information.
3. Significant Accounting Policies
The preparation of financial statements in conformity with U.S. GAAP requires management to make estimates and assumptions that affect the reported amounts of assets and liabilities and disclosure of contingent assets and liabilities at the date of the financial statements and the reported amounts of revenues and expenses during the reporting period. Actual results could differ from those estimates. The following summarizes the significant accounting policies of the Accounts:
Security Valuation. The Acquiring Funds and Acquired Funds may invest in Institutional shares of series of Principal Funds, Inc. which are valued at the closing net asset value per share of each respective fund on the day of valuation. In addition, certain of the Accounts invest in Principal Exchange-Traded Funds and other publicly traded investment funds, which are valued at the close of the exchange. The shares of the other series of the Fund, Principal Funds, Inc., Principal Exchange-Traded Funds, and other publicly traded investment funds are referred to as the “Underlying Funds”.
Pro Forma Notes to Financial Statements
December 31, 2018
(unaudited)
3. Significant Accounting Policies (Continued)
The Acquiring Funds and Acquired Funds value securities for which market quotations are readily available at fair value, which is determined using the last reported sale price. If no sales are reported, as is regularly the case for some securities traded over-the-counter, securities are valued using the last reported bid price or an evaluated bid price provided by a pricing service. Pricing services use modeling techniques that incorporate security characteristics such as current quotations by broker/dealers, coupon, maturity, quality, type of issue, trading characteristics, other yield and risk factors, and other market conditions to determine an evaluated bid price. When reliable market quotations are not considered to be readily available, which may be the case, for example, with respect to restricted securities, certain debt securities, preferred stocks, and foreign securities, the investments are valued at their fair value as determined in good faith by the Manager under procedures established and periodically reviewed by the Fund’s Board of Directors.
The value of foreign securities used in computing the net asset value per share is generally determined as of the close of the foreign exchange where the security is principally traded. Events that occur after the close of the applicable foreign market or exchange but prior to the calculation of the Accounts’ net asset values are reflected in the Accounts’ net asset values and these securities are valued at fair value as determined in good faith by the Manager under procedures established and periodically reviewed by the Fund’s Board of Directors. Many factors, provided by independent pricing services, are reviewed in the course of making a good faith determination of a security’s fair value, including, but not limited to, price movements in American depository receipts (“ADRs”), futures contracts, industry indices, general indices, and foreign currencies.
To the extent the Accounts invest in foreign securities listed on foreign exchanges which trade on days on which the Accounts do not determine net asset values, for example, weekends and other customary national U.S. holidays, the Accounts’ net asset values could be significantly affected on days when shareholders cannot purchase or redeem shares.
Certain securities issued by companies in emerging market countries may have more than one quoted valuation at any given point in time, sometimes referred to as a "local" price and a "premium" price. The premium price is often a negotiated price, which may not consistently represent a price at which a specific transaction can be effected. It is the policy of the Accounts to value such securities at prices at which it is expected those shares may be sold, and the Manager or any sub-advisor is authorized to make such determinations subject to such oversight by the Fund’s Board of Directors as may occasionally be necessary.
Currency Translation. Foreign holdings are translated to U.S. dollars using the exchange rate at the daily close of the New York Stock Exchange. The identified cost of the Accounts’ holdings is translated at approximate rates prevailing when acquired. Income and expense amounts are translated at approximate rates prevailing when received or paid, with daily accruals of such amounts reported at approximate rates prevailing at the date of valuation. Since the carrying amount of the foreign securities is determined based on the exchange rate and market values at the close of the period, it is not practicable to isolate that portion of the results of operations arising as a result of changes in the foreign exchange rates from the fluctuations arising from changes in the market prices of securities during the year.
Net realized foreign exchange gains or losses arise from sales of foreign currencies, currency gains or losses realized between trade and settlement dates on security transactions, and the difference between the amount of dividends, interest income, interest expense, and foreign withholding taxes recorded on the books and the U.S. dollar equivalent of the amounts actually received or paid. Net unrealized appreciation (depreciation) on translation of assets and liabilities in foreign currencies arise from changes in the exchange rate relating to assets and liabilities, other than investments in securities, purchased and held in non-U.S. denominated currencies.
Income and Investment Transactions. The Accounts record investment transactions on a trade date basis. Trade date for senior floating rate interests purchased in the primary market is considered the date on which the loan allocations are determined. Trade date for senior floating rate interests purchased in the secondary market is the date on which the transaction is entered into. The identified cost basis has been used in determining the net realized gain or loss from investment transactions and unrealized appreciation or depreciation of investments. The Accounts record dividend income on the ex-dividend date, except dividend income from foreign securities whereby the ex-dividend date has passed; such dividends are recorded as soon as the Accounts are informed of the ex-dividend date. Interest income is recognized on an accrual basis. Discounts and premiums on securities are accreted/amortized, respectively, on the level yield method over the lives of the respective securities. The Accounts allocate all income and realized and unrealized gains or losses on a daily basis to each class of shares based upon the relative proportion of the value of shares outstanding of each class.
Pro Forma Notes to Financial Statements
December 31, 2018
(unaudited)
3. Significant Accounting Policies (Continued)
Expenses. Expenses directly attributed to a particular account are charged to that account. Other expenses not directly attributed to a particular account are apportioned among the registered investment companies managed by the Manager. Management fees are allocated daily to each class of shares based upon the relative proportion of the value of shares outstanding of each class. Expenses specifically attributable to a particular class are charged directly to such class and are included separately in the statements of operations.
In addition to the expenses the Accounts bear directly, each of the Accounts may indirectly bear a pro rata share of the fees and expenses of the Underlying Funds in which they invest. Because the Underlying Funds have varied expense levels and each of the Accounts may own different proportions of the Underlying Funds at different times, the amount of expense incurred indirectly by each Account will vary. Expenses included in the statements of operations of the Accounts reflect the expenses of each Account and do not include any expenses associated with the Underlying Funds.
Distributions to Shareholders. Dividends and distributions to shareholders are recorded on the ex-dividend date. Dividends and distributions to shareholders from net investment income and net realized gain from investments and foreign currency transactions are determined in accordance with federal tax regulations, which may differ from U.S. GAAP. These differences are primarily due to differing treatments for net operating losses, mortgage-backed securities, certain defaulted securities, expiring capital loss carry forwards, certain preferred securities, amortization of premiums and discounts, options and futures contracts, sales of Passive Foreign Investment Companies, losses deferred due to wash sales, swap agreements, short sales, partnership investments, Real Estate Investment Trusts (“REITs”), utilization of earnings and profits distributed to shareholders on redemption of shares, and foreign currency transactions. Permanent book and tax basis differences are reclassified within the capital accounts based on federal tax-basis treatment; temporary differences do not require reclassification. To the extent dividends and distributions exceed current and accumulated earnings and profits for federal income tax purposes, they are reported as return of capital distributions.
Distributions from REITs may be characterized as ordinary income, net capital gain, or a return of capital to the account. The proper characterization of REIT distributions is generally not known until after the end of each calendar year. As such, estimates are used in reporting the character of income and distributions for financial statement purposes. Real Estate Securities Account receives substantial distributions from holdings in REITs.
Federal Income Taxes. No provision for federal income taxes is considered necessary because each of the Funds intends to qualify as a “regulated investment company” under the Internal Revenue Code and intends to distribute each year substantially all of its net investment income and realized capital gains to shareholders.
Management evaluates tax positions taken or expected to be taken in the course of preparing the Accounts’ tax returns to determine whether it is “more likely than not” that each tax position would be sustained upon examination by a taxing authority based on the technical merits of the position. Tax positions not deemed to meet the more likely than not threshold would be recorded as a tax benefit or expense in the current year. During the year ended December 31, 2018, the Accounts did not record any such tax benefit or expense in the accompanying financial statements. The statute of limitations remains open for the fiscal years from 2015-2017.
Foreign Taxes. Certain of the Accounts are subject to foreign income taxes imposed by certain countries in which they invest. Foreign income taxes are accrued by the Accounts as a reduction of income. These amounts are shown as withholding tax on the statements of operations. In consideration of recent decisions rendered by European courts, certain of the Accounts have filed additional tax reclaims for taxes withheld in prior years. Due to the uncertainty and timing of these reclaims, a corresponding receivable will only be recorded when both the amount is known and there are no significant uncertainties regarding collectability.
Gains realized upon the disposition of certain foreign securities held by certain of the Accounts may be subject to capital gains tax, payable prior to repatriation of sale proceeds. The tax is computed on certain net realized gains and, if any, is shown on the statements of operations. Realized losses in excess of gains may be carried forward to offset future gains. In addition, the Accounts accrue an estimated deferred tax liability for future gains on certain foreign securities. Any accrued tax liability is shown on the statements of assets and liabilities. At December 31, 2018, none of the Accounts had a deferred tax liability.
Recent Accounting Pronouncements. Effective August 17, 2018, the U.S. Securities and Exchange Commission (“SEC”) approved a final rule, Disclosure Update and Simplification. The SEC adopted amendments to certain disclosures that have become redundant or superseded in light of other SEC disclosure requirements, U.S. GAAP or changes in the information environment. As of December 31, 2018, the Accounts have adopted the new amendments.
Pro Forma Notes to Financial Statements
December 31, 2018
(unaudited)
3. Significant Accounting Policies (Continued)
In August 2018, the Financial Accounting Standards Board issued Accounting Standards Update (“ASU”) No. 2018-13, Fair Value Measurement (Topic 820): Disclosure Framework - Changes to the Disclosure Requirements for Fair Value Measurement, which amends and eliminates certain disclosure requirements for fair value as part of its framework project. The ASU is effective for annual and interim periods beginning after December 15, 2019. The early adoption of the removal or modification of disclosures and delay of adoption of the additional disclosures is permitted. As of December 31, 2018, the Accounts have adopted the removal and modification of applicable disclosures.
In March 2017, the Financial Accounting Standards Board issued ASU No. 2017-08, Premium Amortization on Purchased Callable Debt Securities, which amends the accounting standards to shorten the amortization period of certain purchased callable debt securities to the earliest call date. The ASU is effective for annual and interim periods beginning after December 15, 2018. The Accounts will adopt the new amendments for periods beginning after December 15, 2018.
4. Operating Policies
Borrowings. Pursuant to an exemptive order issued by the SEC, the Accounts and other registered investment companies managed by the Manager may participate in an interfund lending facility (“Facility”). The Facility allows the Accounts to borrow money from or loan money to the other participants. Loans under the Facility are made to handle unusual and/or unanticipated short-term cash requirements. Interest paid and received on borrowings is the average of the current repurchase agreement rate and the bank loan rate (the higher of (i) the Federal Funds Rate or (ii) the One Month LIBOR rate plus 1.00%). The interest income received is included in interest income on the statements of operations. The interest expense associated with these borrowings is included in other expenses on the statement of operations.
During the period ended December 31, 2018, the Accounts lending to the Facility were as follows (amounts in thousands):
|
| | |
| | Average Daily Amount Loaned | Weighted Average Annual Interest Rate |
| Core Plus Bond Account | $23 | 2.28% |
| Income Account | 1 | 2.45 |
| LargeCap Growth Account | 1 | 2.51 |
| LargeCap Growth Account I | 18 | 2.41 |
During the period ended December 31, 2018, the Accounts borrowing from the Facility was as follows (amounts in thousands):
|
| | |
| | Average Daily Outstanding Balance | Weighted Average Interest Rate |
| LargeCap Growth Account | $1 | 2.10% |
In addition, the Accounts participate with other registered investment companies managed by the Manager in an unsecured joint line of credit with a bank which allows the participants to borrow up to $100 million, collectively. Borrowings are made solely to facilitate the handling of unusual and/or unanticipated short-term cash requirements. Interest is charged to each participant, based on its borrowings, at a rate equal to the higher of the Federal Funds Rate or the One Month LIBOR rate plus 1.00%. Additionally, a commitment fee is charged at an annual rate of .15% on the amount of the line of credit which is allocated to each participating fund based on average net assets. During the year ended December 31, 2018, LargeCap Growth Account I borrowed against the line of credit. The average outstanding balance for the liability during the year ended December 31, 2018 was $5,000 at a weighted average annual interest rate of 3.43% for LargeCap Growth Account I. The interest expense associated with these borrowings is included in other expenses on the statements of operations. There were no outstanding borrowings as of December 31, 2018.
Counterparties. The Accounts may be exposed to counterparty risk, or the risk that another party with which the Accounts have unsettled or open transactions will fail to perform on their commitment. To the extent that unpaid amounts owed to the Accounts exceed a predetermined threshold agreed to with the counterparty, such counterparty shall advance collateral to the Accounts in the form of cash or cash equivalents equal in value to the unpaid amount owed to the Accounts. If the unpaid amount owed to the Accounts subsequently decreases, the Accounts would be required to return all or a portion of the collateral.
Pro Forma Notes to Financial Statements
December 31, 2018
(unaudited)
4. Operating Policies (Continued)
Deposits with Counterparty. Cash pledged as collateral is reflected as an asset on the statements of assets and liabilities as deposits with counterparty. There are a variety of security types which require varying levels of pledged collateral. Customer account agreements govern cleared derivatives transactions such as futures contracts and certain swap agreements. Such transactions require posting of initial margin as determined by each relevant clearing agency which is segregated in an account at a futures commission merchant (“FCM”) registered with the Commodity Futures Trading Commission. International Swaps and Derivatives Association (“ISDA”) accounts are maintained in a segregated account at the custodian for OTC Derivatives. Master Securities Forward Transaction Agreements (“MSFTA”) accounts are also maintained in a segregated account at the custodian for collateral related to forward currency contracts and “to-be-announced” (“TBA”) securities. Certain Accounts may pledge cash to a broker for securities sold short.
For the period ended December 31, 2018, deposits with counterparty were as follows (amounts in thousands):
|
| | | | |
| | FCM (Futures and Cleared Swaps) | MSFTA (Forward Currency Contracts and TBA Securities | ISDA (OTC Derivatives) | Total Deposits with Counterparty |
| Core Plus Bond Account | 0 | $8 | $1 | $9 |
| LargeCap Growth Account I | 12 | 0 | 0 | 12 |
Foreign Currency Contracts. Certain of the Accounts may be subject to foreign currency exchange rate risk in the normal course of pursuing such Accounts’ investment objectives. The Accounts may use foreign currency contracts to gain exposure to, or hedge against changes in the value of foreign currencies. Certain of the Accounts enter into forward contracts to purchase and sell foreign currencies at a specified future date at a fixed exchange rate. Forward foreign currency contracts are valued at the forward rate, and are marked-to-market daily. The change in fair value is recorded by the Accounts as an unrealized gain or loss. When the contract is closed, the Accounts record a realized gain or loss equal to the difference between the value of the contract at the time it was opened and the value at the time it was closed.
The use of forward foreign currency contracts does not eliminate the fluctuations in underlying prices of the Accounts’ portfolio securities, but it does establish a rate of exchange that can be achieved in the future. Although forward foreign currency contracts limit the risk of loss due to a decline in the value of the hedged currency, they also limit any potential gain that might result should the value of the currency increase. In addition, the Accounts could be exposed to risks if the counterparties to the contracts are unable to meet the terms of their contracts or if the value of the currency changes unfavorably to the U.S. dollar.
Futures Contracts. The Accounts are subject to equity price risk, interest rate risk, and foreign currency exchange rate risk in the normal course of pursuing their investment objectives. The Accounts may enter into futures contracts to hedge against changes in or to gain exposure to, change in the value of equities, interest rates and foreign currencies. Initial margin deposits are made by cash deposits or segregation of specific securities as may be required by the exchange on which the transaction was conducted. Pursuant to the contracts, an account agrees to receive from or pay to the broker, an amount of cash equal to the daily fluctuation in the value of the contract. Such receipts or payments are known as “variation margin” and are recorded by the account as a variation margin receivable or payable on financial derivative instruments. Futures contracts are marked to market daily at the closing settlement price or in the absence of such a price, the most recent quoted bid price. If there are no quotations available, the security is valued at the last available closing settlement price. During the period the futures contracts are open, daily changes in the fair value of the contracts are recognized as unrealized gains or losses. These unrealized gains or losses are included as a component of total distributable earnings (loss) on the statements of assets and liabilities. When the contracts are closed, the account recognizes a realized gain or loss equal to the difference between the proceeds from, or cost of, the closing transaction and the account’s cost basis in the contract. There is minimal counterparty credit risk to the Accounts because futures are exchange traded and the exchange’s clearinghouse, as counterparty to all exchange traded futures, guarantees the futures against default.
Illiquid Securities. Illiquid securities generally cannot be sold or disposed of in the ordinary course of business (within seven calendar days) at approximately the value at which each of the Accounts has valued the investments. This may have an adverse effect on each of the Accounts’ ability to dispose of particular illiquid securities at fair value and may limit each of the Accounts’ ability to obtain accurate market quotations for purposes of valuing the securities.
Pro Forma Notes to Financial Statements
December 31, 2018
(unaudited)
4. Operating Policies (Continued)
Indemnification. Under the Fund’s by-laws, present and past officers, directors and employees are indemnified against certain liabilities arising out of the performance of their duties. In addition, in the normal course of business, the Fund may enter into a variety of contracts that may contain representations and warranties which provide general indemnifications. The Fund’s maximum exposure under these arrangements is unknown, as this would involve future claims that may be made against the Fund.
Rebates. Subject to best execution, the Accounts may direct certain portfolio transactions to brokerage firms that, in turn, have agreed to rebate a portion of the related brokerage commission to the Accounts in cash. Commission rebates are included as a component of realized gain from investment transactions in the statements of operations.
Restricted Securities. Certain of the Accounts may invest in securities that are subject to legal or contractual restrictions on resale. These securities generally may be resold in transactions exempt from registration or to the public if the securities are registered. Disposal of these securities may involve time-consuming negotiations and expense, and prompt sale at an acceptable price may be difficult.
Senior Floating Rate Interests. The Accounts may invest in senior floating rate interests (bank loans). Senior floating rate interests typically hold the most senior position in the capital structure of a business entity (the “Borrower”), are secured by specific collateral and have a claim on the assets and/or stock of the Borrower that is senior to that held by subordinated debtholders and stockholders of the Borrower. Senior floating rate interests are typically structured and administered by a financial institution that acts as the agent of the lenders participating in the senior floating rate interest. Borrowers of senior floating rate interests are typically rated below-investment-grade, which means they are more likely to default than investment-grade loans. A default could lead to non-payment of income which would result in a reduction of income to the account and there can be no assurance that the liquidation of any collateral would satisfy the Borrower’s obligation in the event of non-payment of scheduled interest or principal payments, or that such collateral could be readily liquidated.
Senior floating rate interests pay interest at rates which are periodically reset by reference to a base lending rate plus a spread. These base lending rates are generally the prime rate offered by a designated U.S. bank or LIBOR rate.
Senior floating rate interests generally are subject to mandatory and/or optional prepayment. Because of these mandatory prepayment conditions and because there may be significant economic incentives for the Borrower to repay, prepayments of senior floating rate interests may occur. As a result, the actual remaining maturity of senior floating rate interests may be substantially less than stated maturities shown in the schedules of investments.
In connection with the senior floating rate interests, the Accounts may also enter into unfunded loan commitments (“commitments”). All or a portion of the commitments may be unfunded. The Accounts are obligated to fund these commitments at the Borrower’s discretion. Therefore, the Accounts must have funds sufficient to cover its contractual obligation. Commitments are marked to market daily and the unrealized gain or loss is shown as a separate line item called unrealized gain or loss on commitments on the statements of assets and liabilities. As of December 31, 2018, the commitments were as follows (amounts in thousands):
|
| | |
| | Unfunded Loan Commitment | Unrealized gain/loss |
| Core Plus Bond Account | $ 30 | $ (1) |
Swap Agreements. Core Plus Bond Account invested in swap agreements during the period. Swap agreements are negotiated agreements between an account and a counterparty to exchange a series of cash flows at specified intervals based upon, or calculated by reference to, changes in specified prices or rates for a specified amount of an underlying asset. An account may enter into credit default, interest rate, or total return swap agreements to manage its exposure to credit, interest rate, or market risk. In connection with these agreements, securities may be identified as collateral in accordance with the terms of the respective swap agreements to provide assets of value and recourse in the event of default or bankruptcy/insolvency.
Swap agreements are valued through a pricing service or using procedures established and periodically reviewed by the Fund’s Board of Directors; changes in value are recorded as unrealized gain or loss. These unrealized gains or losses are included as a component of total distributable earnings (loss) on investments on the statements of assets and liabilities.
Upon termination of swap agreements, the Accounts recognize a realized gain or loss. Net periodic payments to be received or paid are accrued daily and are recorded in the statements of operations as realized gains or losses.
Pro Forma Notes to Financial Statements
December 31, 2018
(unaudited)
4. Operating Policies (Continued)
Payments received or made at the beginning of the measurement period are reflected as such on the statements of assets and liabilities and represent payments made or received upon entering into the swap agreement to compensate for differences between the stated terms of the swap agreement and prevailing market conditions (credit spreads, interest rates, and other relevant factors). These upfront payments are amortized daily over the term of the swap agreement as realized gains or losses on the statements of operations.
Notional principal amounts are used to express the extent of involvement in these agreements. Risks may exceed amounts shown on the statements of assets and liabilities. These risks include changes in the returns of the underlying instruments, unfavorable interest rate fluctuation, that the counterparty to the agreements may default on its obligation to perform or disagree as to the meaning of contractual terms in the agreements, and the possible lack of liquidity with respect to the swap agreements.
The Accounts and any counterparty are required to maintain an agreement that requires the Accounts and that counterparty to monitor the net fair value of all derivative transactions entered into pursuant to the contract between the Accounts and such counterparty. If the net fair value of such derivatives transactions between the Accounts and that counterparty exceeds a certain threshold (as defined in the agreement), the Accounts or the counterparty are required to post cash and/or securities as collateral. Fair values of derivatives transactions presented in the financial statements are not netted with the fair values of other derivatives transactions or with any collateral amounts posted by the Accounts or any counterparty.
Credit default swaps involve commitments to pay a fixed rate at a predetermined frequency in exchange for a lump sum payment if a “credit event”, as defined in the agreement, affecting a third party occurs. Credit events may include a failure to pay interest, bankruptcy, restructuring, or other event as defined in the agreement. A “buyer” of credit protection agrees to pay a counterparty to assume the credit risk of an issuer upon the occurrence of a credit event. The “seller” of the protection receives periodic payments and agrees to assume the credit risk of an issuer upon the occurrence of a credit event. As the seller of credit protection, an account would add leverage to its portfolio because, in addition to its total net assets, an account would be subject to investment exposure on the notional amount of the swap.
If an account is a seller of protection and a credit event occurs, as defined under the terms of that particular swap agreement, the account will either (i) pay to the buyer of protection an amount equal to the notional amount of the swap and take delivery of the referenced obligation, other deliverable obligations or underlying securities comprising the referenced index or (ii) pay a net settlement amount in the form of cash or securities equal to the notional amount of the swap less the recovery value of the referenced obligation or underlying securities comprising the referenced index. If an account is a buyer of protection and a credit event occurs, as defined under the terms of that particular swap agreement, an account will either (i) receive from the seller of protection an amount equal to the notional amount of the swap and deliver the referenced obligation, other deliverable obligations or underlying securities comprising the referenced index or (ii) receive a net settlement amount in the form of cash or securities equal to the notional amount of the swap less the recovery value of the referenced obligation or underlying securities comprising the referenced index.
Credit default swap agreements on credit indices involve one party making a stream of payments to another party in exchange for the right to receive a specified return in the event of a write-down, principal shortfall, interest shortfall or default of all or part of the referenced entities comprising the credit index. A credit index is a basket of credit instruments or exposures designed to be representative of some part of the credit market as a whole. These indices are made up of reference credits that are judged by a poll of dealers to be the most liquid entities in the credit default swap market based on the sector of the index. Components of the indices may include, but are not limited to, investment grade securities, high yield securities, asset backed securities, emerging markets, and/or various credit ratings within each sector. Credit indices are traded using credit default swaps with standardized terms including a fixed spread and standard maturity dates. An index credit default swap references all the names in the index, and if there is a default, the credit event is settled based on that name’s weight in the index. The composition of the indices changes periodically, usually every six months, and for most indices, each name has an equal weight in the index. An account may use credit default swaps on credit indices to hedge a portfolio of credit default swaps or bonds, which is less expensive than it would be to buy many credit default swaps to achieve a similar effect. Credit default swaps on indices are benchmarks for protecting investors owning bonds against default, and traders use them to speculate on changes in credit quality.
For credit default swap agreements on asset-backed securities and credit indices, the quoted market prices and resulting values serve as the indicator of the current status of the payment/performance risk. Wider credit spreads and increasing values, in absolute terms when compared to the notional amount of the swap, represent a deterioration of the referenced entity’s credit soundness and a greater likelihood or risk of default or other credit event occurring as defined under the terms of the agreement.
Pro Forma Notes to Financial Statements
December 31, 2018
(unaudited)
4. Operating Policies (Continued)
The maximum potential amount of future payments (undiscounted) that an account as a seller of protection could be required to make under a credit default swap agreement would be an amount equal to the notional amount of the agreement. Notional amounts of all credit default swap agreements outstanding as of December 31, 2018 for which an account is the seller of protection are disclosed in the footnotes to the schedules of investments. These potential amounts would be partially offset by any recovery values of the respective referenced obligations, upfront payments received upon entering into the agreement, or net amounts received from the settlement of buy protection credit default swap agreements entered into by an account for the same referenced entity or entities. Interest rate swaps involve the commitment to exchange fixed or floating rate cash flows based on changes in the value of a specific reference rate.
Certain collateral amounts relate to exchange cleared swaps which are not subject to master netting agreements with counterparties.
To Be Announced Securities. The Accounts may trade portfolio securities on a TBA or when-issued basis. In a TBA or when-issued transaction, the Accounts commit to purchase or sell securities for which all specific information is not known at the time of the trade. Securities purchased on a TBA or when-issued basis are not settled until they are delivered to the Accounts, normally 15 to 30 days later. These transactions are subject to market fluctuations and their current value is determined in the same manner as for other portfolio securities.
Underlying Funds. An Underlying Fund to a fund of fund may experience relatively large redemptions or purchases as the fund of funds periodically reallocates or rebalances its assets. These transactions may accelerate the realization of taxable income if sales of portfolio securities result in gains and could increase transaction costs. In addition, when a fund of funds reallocates or redeems significant assets away from an Underlying Fund, the loss of assets to the Underlying Fund could result in increased expense ratios for that fund.
The Manager is the advisor to the Fund, Principal Variable Contracts Funds, Inc. and each of the Underlying Funds. Principal Real Estate Investors, LLC (“Principal-REI”) serves as sub-advisor to some of the Underlying Funds. The Manager and Principal-REI are committed to minimizing the potential impact of underlying fund risk on Underlying Funds to the extent consistent with pursuing the investment objectives of the fund of funds which it manages. Each may face conflicts of interest in fulfilling its responsibilities to all such funds.
As of December 31, 2018, series of the Fund owned the following percentages, in the aggregate, of the outstanding shares of the Accounts listed below:
|
| |
| Fund | Total Percentage of Outstanding Shares Owned |
| Core Plus Bond Account | 24.18% |
| Income Account | 92.64 |
U.S. Government Agencies or Government-Sponsored Enterprises. Certain of the Accounts may invest in U.S. Government agencies or government-sponsored enterprises. U.S. Government securities are obligations of, and in certain cases, guaranteed by, the U.S. Government or its agencies. The U.S. Government does not guarantee the net asset value of the Accounts’ shares. Some U.S. Government securities such as treasury bills, notes and bonds, and securities guaranteed by the Government National Mortgage Association (“GNMA”) are supported by the full faith and credit of the U.S. Government. Other securities, such as those of the Federal Home Loan Bank are supported by the right of the issuer to borrow from the U.S. Department of the Treasury. Still other securities, such as those of the Federal National Mortgage Association (“FNMA”), are supported by the discretionary authority of the U.S. Government to purchase the agency’s obligations.
Government related guarantors (those not backed by the full faith and credit of the U.S Government) include FNMA and the Federal Home Loan Mortgage Corporation (“FHLMC”). The FNMA is a government sponsored corporation the common stock of which is owned entirely by private stockholders. The FNMA purchases conventional residential mortgages from a list of approved seller/servicers which include state and federally chartered savings and loan associations, mutual savings banks, commercial banks, credit unions, and mortgage bankers. Pass-through securities issued by the FNMA are guaranteed as to the timely payment of principal and interest by the FNMA but are not backed by the full faith and credit of the U.S. Government. The FHLMC issues Participation Certificates which are pass-through securities, each representing an undivided interest in a pool of residential mortgages. The FHLMC guarantees the timely payment of interest and ultimate collection of principal, but Participation Certificates are not backed by the full faith and credit of the U.S. Government.
Pro Forma Notes to Financial Statements
December 31, 2018
(unaudited)
4. Operating Policies (Continued)
Derivatives. The following table provides information about where in the statements of assets and liabilities and statements of operations information about derivatives can be found (amounts in thousands):
|
| | | | | | | | | | |
| | Asset Derivatives October 31, 2018 | | | Liability Derivatives October 31, 2018 | | |
| | | | | | | |
| Derivatives not accounted for as hedging instruments | Statement of Assets and Liabilities Location | Fair Value | | Statement of Assets and Liabilities Location | Fair Value | |
| | | | | | | |
| Core Plus Bond Account | | | | | | |
| Credit Contracts | Receivables, Total distributable earnings (loss) | $ | 207 |
| * | Payables, Total distributable earnings (loss) | $ | — |
| |
| Interest rate contracts | Receivables, Total distributable earnings (loss) | $ | 493 |
| * | Payables, Total distributable earnings (loss) | $ | 174 |
| * |
| | Total | $ | 700 |
| * | | $ | 174 |
| * |
| | | | | | | |
| LargeCap Growth Account I | | | | | |
| Equity contracts | Receivables, Total distributable earnings (loss) | $ | — |
| | Payables, Total distributable earnings (loss) | $ | 2 |
| * |
*Includes cumulative unrealized appreciation/depreciation of exchange cleared swaps and futures contracts as shown in the schedules of investments. Only the portion of the unrealized appreciation/depreciation not yet cash settled is shown in the statements of assets and liabilities as variation margin.
|
| | | | | | | |
| Derivatives not accounted for as hedging instruments | Location of Gain or (Loss) on Derivatives Recognized in Statement of Operations | Net Realized Gain or (Loss) on Derivatives Recognized in Statement of Operations | Net Change in Unrealized Appreciation/(Depreciation) of Derivatives Recognized in Statement of Operations |
| Core Plus Bond Account | | | |
| Credit contracts | Net realized gain (loss) from Swap agreements/Net change in unrealized appreciation/(depreciation) of Swap agreements | $ | (219 | ) | $ | 207 |
|
| Interest rate contracts | Net realized gain (loss) from Futures contracts/Net change in unrealized appreciation/(depreciation) of Futures contracts | $ | 83 |
| $ | 238 |
|
| | Total | $ | (136 | ) | $ | 445 |
|
| LargeCap Growth Account I | | | |
| Equity contracts | Net realized gain (loss) from Futures contracts/Net change in unrealized appreciation/(depreciation) of Futures contracts | $ | 185 |
| $ | (70 | ) |
Long equity futures contracts are used to obtain market exposure for the cash balances that are maintained by certain of the Accounts and the notional values of the futures contracts will vary in accordance with changing cash balances. Long and short U.S. Treasury futures contracts are used to obtain interest rate exposure in order to manage duration of the Core Plus Bond Account.
The following table includes a summary of the average quarterly outstanding notional by derivative instrument type for the Variable: year ended December 31, 2018:
|
| | |
| Contract Type | Derivative Type | Average Notional (‘000) |
| Core Plus Bond Account | | |
| Credit Contracts | Exchange Cleared Credit Default Swaps - Buy Protection | $11,926 |
| Interest Rate Contracts | Futures - Long | 20,892 |
| | Futures - Short | 7,708 |
| LargeCap Growth Account I | | |
| Equity Contracts | Futures - Long | 4,924 |
5. Fair Valuation
Fair value is defined as the price that the Accounts would receive upon selling a security in a timely transaction to an independent buyer in the principal or most advantageous market of the security at the measurement date. In determining fair value, the Accounts may use one or more of the following approaches: market, income and/or cost. A hierarchy for inputs is used in measuring fair value that maximizes the use of observable inputs and minimizes the use of unobservable inputs by requiring that the most observable inputs be used when available.
Observable inputs are inputs that reflect the assumptions market participants would use in pricing the asset or liability developed based on market data obtained from sources independent of the Accounts. Unobservable inputs are inputs that reflect the account’s own estimates about the estimates market participants would use in pricing the asset or liability developed based on the best information available in the circumstances.
Pro Forma Notes to Financial Statements
December 31, 2018
(unaudited)
5. Fair Valuation (Continued)
The three-tier hierarchy of inputs is summarized in the three broad levels listed below.
| |
| • | Level 1 - Quoted prices are available in active markets for identical securities as of the reporting date. The type of securities included in Level 1 includes listed equities and listed derivatives. |
| |
| • | Level 2 - Other significant observable inputs (including quoted prices for similar investments, interest rates, prepayment speeds, credit risk, etc.). Investments which are generally included in this category include certain foreign equities, corporate bonds, senior floating rate interests, municipal bonds, and U.S. Government and Government Agency Obligations. |
| |
| • | Level 3 - Significant unobservable inputs (including the Accounts’ assumptions in determining the fair value of investments). Investments which may be included in this category include certain common stocks, corporate bonds, mortgage backed securities or senior floating rate interests. |
The availability of observable inputs can vary from security to security and is affected by a wide variety of factors, including, for example, the type of security, whether the security is new and not yet established in the market place, and other characteristics particular to the transaction. To the extent that valuation is based on models or inputs that are less observable or unobservable in the market, the determination of fair value requires more judgment. Accordingly, the degree of judgment exercised by the Accounts in determining fair value is greatest for instruments categorized in Level 3.
In certain cases, the inputs used to measure fair value may fall into different levels of the fair value hierarchy. In such cases, for disclosure purposes the level in the fair value hierarchy within which the fair value measurement in its entirety falls is determined based on the lowest level input that is significant to the fair value measurement in its entirety.
Fair value is a market based measure considered from the perspective of a market participant who holds the asset rather than an entity specific measure. Therefore, even when market assumptions are not readily available, the Accounts’ own assumptions are set to reflect those that market participants would use in pricing the asset or liability at the measurement date. The Accounts use prices and inputs that are current as of the measurement date, when available.
Investments which are included in the Level 3 category may be valued using indicative quoted prices from brokers and dealers participating in the market for these investments. These investments are classified as Level 3 investments due to the lack of market transparency and market corroboration to support these quoted prices. Valuation models may be used as the pricing source for other investments classified as Level 3. Valuation models rely on one or more significant unobservable inputs such as prepayment rates, probability of default, or loss severity in the event of default. Significant increases in any of those inputs in isolation would result in a significantly lower fair value measurement. Benchmark pricing procedures set the base price of a security based on current market data. The base price may be a broker-dealer quote, transaction price, or internal value based on relevant market data.
The fair values of these securities are dependent on economic, political, and other considerations. The values of such securities may be affected by significant changes in the economic conditions, changes in government policies, and other factors (e.g., natural disasters, accidents, conflicts, etc.).
Fair value of these investments is determined in good faith by the Manager under procedures established and periodically reviewed by the Fund’s Board of Directors. The Manager has established a valuation committee (“Valuation Committee”) of senior officers and employees, with the responsibility of overseeing the pricing and valuation of all securities, including securities where market quotations are not readily available. The Valuation Committee meets at least monthly and reports directly to the Board of Directors. A pricing group (“the Pricing Group”), who reports to the Valuation Committee, relies on the established pricing policies to determine fair valuation. Included in the pricing policies is an overview of the approved valuation approaches established for each asset class. The Pricing Group will consider all appropriate information available when determining fair valuation.
The Pricing Group relies on externally provided valuation inputs to determine the value of Level 3 securities. Security values are updated as new information becomes available. Valuation data and changes in valuation amounts are reviewed on a daily basis based on specified criteria for the security, asset class, and other factors. In addition, valuation data is periodically compared to actual transactions executed by the Accounts (i.e., purchases/sales) and differences between transaction prices and prior period valuation data are investigated based on specified tolerances.
The inputs or methodology used for valuing securities are not necessarily an indication of the risk associated with investing in those instruments.
Pro Forma Notes to Financial Statements
December 31, 2018
(unaudited)
5. Fair Valuation (Continued)
The following is a summary of the inputs used as of December 31, 2018 in valuing the Accounts’ securities carried at value (amounts shown in thousands):
|
| | | | |
| Fund | Level 1 - Quoted Prices | Level 2 - Other Significant Observable Inputs | Level 3 - Significant Unobservable Inputs | Totals (Level 1,2,3) |
| Core Plus Bond Account | | | | |
| Bonds* | - | 186,733 | - | 186,733 |
| Common Stocks* | 35 | - | - | 35 |
| Investment Companies | 3,894 | - | - | 3,894 |
| Preferred Stocks | | | | |
| Communications | 127 | - | - | 127 |
| Consumer, Non-cyclical | - | 8 | - | 8 |
| Senior Floating Rate Interests* | - | 5,813 | - | 5,813 |
| U.S. Government & Government Agency Obligations* | - | 108,466 | - | 108,466 |
| Total investments in securities | $4,056 | $301,020 | $— | $305,076 |
| Assets | | | | |
| Credit Contracts | | | | |
| Exchange Cleared Credit Default Swaps** | - | 207 | - | 207 |
| Interest Rate Contracts | | | | |
| Futures** | 493 | - | - | 493 |
| Liabilities | | | | |
| Interest Rate Contracts | | | | |
| Futures** | (174) | - | - | (174) |
| Income Account | | | | |
| Bonds* | - | 109,688 | - | 109,688 |
| Common Stocks | | | | |
| Energy | 391 | - | - | 391 |
| Industrial | - | - | 4,735 | 4,735 |
| Utilities | - | - | 284 | 284 |
| Convertible Bonds* | - | 1,175 | - | 1,175 |
| Investment Companies | 1,795 | - | - | 1,795 |
| Senior Floating Rate Interests* | - | 1,196 | - | 1,196 |
| U.S. Government & Government Agency Obligations* | - | 61,658 | - | 61,658 |
| Total investments in securities | $2,186 | $173,717 | $5,019 | $180,922 |
| LargeCap Growth Account | | | | |
| Common Stocks* | 97,684 | - | - | 97,684 |
| Investment Companies | 2,326 | - | - | 2,326 |
| Total investments in securities | $100,010 | 0 | 0 | $100,010 |
Pro Forma Notes to Financial Statements
December 31, 2018
(unaudited)
|
| | | | |
| Fund | Level 1 - Quoted Prices | Level 2 - Other Significant Observable Inputs | Level 3 - Significant Unobservable Inputs | Totals (Level 1,2,3) |
| LargeCap Growth Account I | | | | |
| Common Stocks | | | | |
| Basic Materials | 4,812 | - | - | 4,812 |
| Communications | 59,421 | - | 6 | 59,427 |
| Consumer, Cyclical | 22,320 | - | - | 22,320 |
| Consumer, Non-cyclical | 82,546 | - | - | 82,546 |
| Energy | 227 | - | - | 227 |
| Financial | 25,679 | - | - | 25,679 |
| Industrial | 30,162 | - | - | 30,162 |
| Technology | 64,441 | - | - | 64,441 |
| Utilities | 1,537 | - | - | 1,537 |
| Convertible Preferred Stocks | | | | |
| Communications | - | - | 986 | 986 |
| Investment Companies | 6,372 | - | - | 6,372 |
| Preferred Stocks | | | | |
| Technology | - | 51 | 153 | 204 |
| Total investments in securities | $297,517 | $51 | $1,145 | $298,713 |
| Liabilities | | | | |
| Equity Contracts | | | | |
| Futures** | (2) | - | - | (2) |
*For additional detail regarding sector classifications, please see the Schedule of Investments.
**Exchange cleared swaps and futures are presented at the unrealized appreciation/(depreciation) of the instrument.
Pro Forma Notes to Financial Statements
December 31, 2018
(unaudited)
5. Fair Valuation (Continued)
Certain detailed information is provided for those Accounts with significant investments in Level 3 securities. Quantitative information about the significant unobservable inputs used in the fair value measurements categorized within Level 3 of the fair value hierarchy is as follows (amounts in thousands):
|
| | | | | | | |
| Account | Asset Type | Fair Value as of December 31, 2018 | Valuation Technique | Unobservable Input | Input Valuations |
| | | | | | |
| Income Account | Common Stock | $ 4,735 | Enterprise Valuation Model* | EBITDA Multiples | 0.95 - 1.15x |
|
| | Common Stock | 284 | Indicative Market Quotations | Broker Quote | $ | 140.00 |
|
| | | $ 5,019 | | | |
*As of December 31, 2018, a Level 3 security changed its valuation approach from an enterprise valuation model with comparable company and discounted cash flow techniques to an enterprise valuation model with comparable company technique. The change in the valuation approach is driven by the Valuation Committee’s decision that prospective financial information is not updated timely to account for external market factors. The appropriateness of the fair value of this security is monitored by the Valuation Committee.
The changes in investments measured at fair value for which Level 3 inputs have been used to determine fair value are as follows (amounts in thousands):
|
| | | | | | | | | |
| Account | Value December 31, 2017 | Realized Gain/ (Loss) | Accrued Discounts/ Premiums and Change in Unrealized Gain/ (Loss) | Purchases | Proceeds from Sales | Transfers into Level 3* | Transfers Out of Level 3** | Value December 31, 2018 | Net Change in Unrealized Appreciation/ (Depreciation) on Investments Held at December 31, 2018 |
| Income Account |
| Common Stock | | | | | | | | | |
| Industrial | $ 3,630 | 0 | $ 1,105 | 0 | 0 | 0 | 0 | $ 4,735 | $ 1,105 |
| Utilities | 0 | 0 | 62 | 222 | 0 | 0 | 0 | 284 | 62 |
| Total | $ 3,630 | 0 | $ 1,167 | $ 222 | 0 | 0 | $ -- | $ 5,019 | $ 1,167 |
*Securities are transferred into Level 3 for a variety of reasons including, but not limited to:
1. Securities where trading has been halted
2. Securities that have certain restrictions on trading
3. Instances in which a security is not priced by a pricing services
**Securities are transferred out of Level 3 for a variety of reasons including, but not limited to:
1. Securities where trading resumes
2. Securities where trading restrictions have expired
3. Instances in which a price becomes available from a pricing service
At the end of the year, there were no other Accounts which had a significant Level 3 balance. During the year, there were no significant purchases, sales, or transfers into or out of Level 3, except as noted above.
6. Capital Shares
The pro forma net asset value per share assumes issuance of shares of the Acquiring Funds that would have been issued at December 31, 2018, in connection with the Reorganization. The number of shares assumed to be issued is equal to the net assets of the Acquired Funds as of October 31, 2018, divided by the net asset value per share of Acquiring Funds as of December 31, 2018. The pro forma number of shares outstanding, by class, for the combined account can be found on the pro forma statement of assets and liabilities.
7. Pro Forma Adjustments
The accompanying pro forma financial statements reflect changes in fund shares as if the Reorganization had taken place on December 31, 2018. The expenses of the Acquired Funds were adjusted assuming the fee structure of the Acquiring Funds was in effect for the twelve months ended December 31, 2018.
PART C
OTHER INFORMATION
Item 15. Indemnification
Under Section 2-418 of the Maryland General Corporation Law, with respect to any proceedings against a present or former director, officer, agent or employee (a "corporate representative") of the Registrant, the Registrant may indemnify the corporate representative against judgments, fines, penalties, and amounts paid in settlement, and against expenses, including attorneys' fees, if such expenses were actually incurred by the corporate representative in connection with the proceeding, unless it is established that:
(i) The act or omission of the corporate representative was material to the matter giving rise to the proceeding; and
1. Was committed in bad faith; or
2. Was the result of active and deliberate dishonesty; or
(ii) The corporate representative actually received an improper personal benefit in money, property, or services; or
(iii) In the case of any criminal proceeding, the corporate representative had reasonable cause to believe that the act or omission was unlawful.
If a proceeding is brought by or on behalf of the Registrant, however, the Registrant may not indemnify a corporate representative who has been adjudged to be liable to the Registrant. Under the Registrant's Articles of Incorporation and Bylaws, directors and officers of the Registrant are entitled to indemnification by the Registrant to the fullest extent permitted under Maryland law and the Investment Company Act of 1940. Reference is made to Article VI, Section 7 of the Registrant's Articles of Incorporation, Article 12 of the Registrant's Bylaws and Section 2-418 of the Maryland General Corporation Law.
The Registrant has agreed to indemnify, defend and hold the Distributor, its officers and directors, and any person who controls the Distributor within the meaning of Section 15 of the Securities Act of 1933, free and harmless from and against any and all claims, demands, liabilities and expenses (including the cost of investigating or defending such claims, demands or liabilities and any counsel fees incurred in connection therewith) which the Distributor, its officers, directors or any such controlling person may incur under the Securities Act of 1933, or under common law or otherwise, arising out of or based upon any untrue statement of a material fact contained in the Registrant's registration statement or prospectus or arising out of or based upon any alleged omission to state a material fact required to be stated in either thereof or necessary to make the statements in either thereof not misleading, except insofar as such claims, demands, liabilities or expenses arise out of or are based upon any such untrue statement or omission made in conformity with information furnished in writing by the Distributor to the Registrant for use in the Registrant's registration statement or prospectus: provided, however, that this indemnity agreement, to the extent that it might require indemnity of any person who is also an officer or director of the Registrant or who controls the Registrant within the meaning of Section 15 of the Securities Act of 1933, shall not inure to the benefit of such officer, director or controlling person unless a court of competent jurisdiction shall determine, or it shall have been determined by controlling precedent that such result would not be against public policy as expressed in the Securities Act of 1933, and further provided, that in no event shall anything contained herein be so construed as to protect the Distributor against any liability to the Registrant or to its security holders to which the Distributor would otherwise be subject by reason of willful misfeasance, bad faith, or gross negligence, in the performance of its duties, or by reason of its reckless disregard of its obligations under this Agreement. The Registrant's agreement to indemnify the Distributor, its officers and directors and any such controlling person as aforesaid is expressly conditioned upon the Registrant being promptly notified of any action brought against the Distributor, its officers or directors, or any such controlling person, such notification to be given by letter or telegram addressed to the Registrant.
Insofar as indemnification for liabilities arising under the Securities Act of 1933 may be permitted to directors, officers and controlling persons of the registrant pursuant to the foregoing provisions, or otherwise, the registrant has been advised that in the opinion of the Securities and Exchange Commission such indemnification is against public policy as expressed in the Act and is, therefore, unenforceable. In the event that a claim for indemnification against such liabilities (other than the payment by the registrant of expenses incurred or paid by a director, officer or controlling person of the registrant in the successful defense of any action, suit or proceeding) is asserted by such director, officer or controlling person in connection with the securities being registered, the registrant will, unless in the opinion of its counsel the matter has been settled by controlling precedent, submit to a court of appropriate jurisdiction the question whether such indemnification by it is against public policy as expressed in the Act and will be governed by the final adjudication of such issue.
Each director has entered into an indemnification agreement with the Fund. In addition, the interested directors each have available indemnifications from Principal Financial Group, Inc., the parent company of his/her employer, the Fund’s sponsor.
Item 16. Exhibits.
Unless otherwise stated, all filing references are to File No. 002-35570
|
| | | | |
| (1) | Articles of Restatement dated 02/14/2019 – Filed as Ex-99(a) on 02/28/2019 (Accession No. 0000012601-19-000024) |
| (2) | By-laws effective 12/14/2015 - Filed as Ex-99(b) on 02/23/2016 (Accession No. 0000012601-16-000309) |
| (3) | N/A |
| (4) | Forms of Plan of Reorganization (filed herewith as Appendix A to the Proxy Statement/Prospectus) |
| (5) | Included in Exhibits 1 and 2 hereto. |
| (6) | Amended and Restated Management Agreement dated 03/30/2017 - Filed as Ex-99(d)(2) on 04/26/2017 (Accession No. 0000012601-17-000115) |
| (7) | Distribution Agreement dated 12/14/2009 – Filed as Ex-99(e)(3) on 03/02/2011 (Accession No. 0000898745-11-000061) |
| (8) | N/A |
| (9) | Custody Agreement between The Bank of New York Mellon and Principal Variable Contracts Funds, Inc. dated 11/11/2011 – Filed as Ex-99(g) on 02/14/2013 (Accession No. 0001144204-13-008876) |
| (10) | Rule 12b-1 Plan |
| | (a) | Amended Distribution Plan and Agreement – Class 2 Shares dated 7/28/2015 - Filed as Ex-99(m)(1)a on 02/23/2016 (Accession No. 0000012601-16-000309) |
| | (b) | Amended Distribution Plan and Agreement – Class 2 Shares dated 03/30/2017 - Filed as Ex-99(m)(2) on 04/26/2017 (Accession No. 0000012601-17-000115) |
| (11) | Opinion and Consent of counsel, regarding legality of issuance of shares and other matters * |
| (12) | Opinion and Consent of ______________________________ on tax matters ** |
| (13) | N/A |
| (14) | Consent of Independent Registered Public Accountants |
| | (a) | Consent of Ernst & Young LLP * |
| (15) | N/A |
| (16) | Powers of Attorney * |
| (17) | (a) | (1) | The Prospectus for Class 1 and Class 2, dated May 1, 2018, included in Post-Effective Amendment No. 114 to the registration statement on Form N-1A (File No. 002-35570) filed on April 25, 2018 (Accession No. 0000012601-18-000087) |
| | | (2) | Supplements to the Class 1 and Class 2 shares Prospectus dated and filed June 18, 2018, July 13, 2018, September 17, 2018, October 9, 2018, December 17, 2018, and February 15, 2019. |
| | (b) | Statement of Additional Information dated May 1, 2018, dated May 1, 2018, included in Post-Effective Amendment No. 114 to the registration statement on Form N-1A (File No. 002-35570) filed on April 25, 2018 (Accession No. 0000012601-18-000087) |
| | (c) | Annual Report of Principal Variable Contracts Funds, Inc. for the fiscal year ended December 31, 2018 filed on Form N-CSR on February 26, 2019 (Accession No. 0000012601-18-000010) |
| |
| ** | To be filed by amendment. |
Item 17. Undertakings
(1) The undersigned Registrant agrees that prior to any public reoffering of the securities registered through the use of a prospectus which is a part of this Registration Statement by any person or party who is deemed to be an underwriter within the meaning of Rule 145(c) of the Securities Act of 1933, the reoffering prospectus will contain the information called for by the applicable registration form for re-offerings by persons who may be deemed underwriters, in addition to the information called for by the other items of the applicable form.
(2) The undersigned Registrant agrees that every prospectus that is filed under paragraph (1) above will be filed as part of an amendment to the Registration Statement and will not be used until the amendment is effective, and that, in determining any liability under the Securities Act of 1933, each post-effective amendment shall be deemed to be a new registration statement for the securities offered therein, and the offering of the securities at that time shall be deemed to be the initial bona fide offering of them.
(3) The undersigned Registrant agrees to file a post-effective amendment to this Registration Statement which will include an opinion of counsel regarding the tax consequences of the proposed reorganization.
|
| |
SIGNATURES |
| |
| Pursuant to the requirements of the Securities Act of 1933 and the Investment Company Act of 1940, the Fund has duly caused this registration statement to be signed on its behalf by the undersigned, duly authorized, in the city of Des Moines and State of Iowa, on the 8th day of March, 2019. |
| |
| | Principal Variable Contracts Funds, Inc. (Registrant)
/s/ M. J. Beer _____________________________________ M. J. Beer Director, President and Chief Executive Officer |
| |
Attest:
/s/ B. C. Wilson ______________________________________ Beth C. Wilson Vice President and Secretary | |
|
| | |
| Pursuant to the requirements of the Securities Act of 1933, this Amendment to the Registration Statement has been signed below by the following persons in the capacities and on the dates indicated. |
| Signature | Title | Date |
| | | |
/s/ M. J. Beer __________________________ Michael J. Beer | Director, President and Chief Executive Officer (Principal Executive Officer) | March 8, 2019 |
| | | |
/s/ T. W. Bollin __________________________ T. W. Bollin | Chief Financial Officer (Principal Financial Officer) | March 8, 2019 |
| |
/s/ S. L. Reece __________________________ S. L. Reece | Vice President and Controller (Controller) | March 8, 2019 |
| | | |
(E. Ballantine)* __________________________ E. Ballantine | Director | March 8, 2019 |
| |
(L. T. Barnes)* __________________________ L. T. Barnes | Director | March 8, 2019 |
| |
(C. Damos)* __________________________ C. Damos | Director | March 8, 2019 |
| | | |
(N. M. Everett)* __________________________ N. M. Everett | Chair | March 8, 2019 |
| |
(M. A. Grimmett)* __________________________ M. A. Grimmett | Director | March 8, 2019 |
| |
(P. G. Halter)* __________________________ P. G. Halter | Director | March 8, 2019 |
| | | |
(F. S. Hirsch)* __________________________ F. S. Hirsch | Director | March 8, 2019 |
| |
(T. Huang)* __________________________ T. Huang | Director | March 8, 2019 |
| |
(K. McMillan)* __________________________ K. McMillan | Director | March 8, 2019 |
| | | |
(E. A. Nickels)* __________________________ E. A. Nickels | Director | March 8, 2019 |
| | | |
(M. M. VanDeWeghe)* __________________________ M. M. VanDeWeghe | Director | March 8, 2019 |
| |
* Pursuant to Power of Attorney Previously filed as Ex-99(j)(3) on 12/16/2014 (Accession No. 0000012601-14-000271), filed for E. A. Nickels as Ex-99(j) (3) on 02/23/2016 (Accession No. 0000012601-16-000309), filed for Patrick G. Halter as Ex-99(j)(3) on 03/01/2018 (Accession No. 0000012601-18-000015) and filed for M. M. VanDeWeghe as Ex-99(j)(3) on 04/25/2018 (Accession No. 0000012601-18-000087). |
EXHIBIT INDEX
|
| | |
| Exhibit No. | | Description |
| 4 | | Forms of Plans of Reorganization (filed herewith as Appendix A to the Proxy Statement/Prospectus) |
| | | |
| 11 | | Opinion and Consent of counsel regarding legality of issuance of shares and other matters |
| | | |
| 12 | | Opinion and Consent of ________________________ - on tax matters ** |
| | | |
| 14 | (a) | Consent of Ernst & Young LLP, Independent Registered Public Accountants |
| | | |
| 16 | Power of Attorney |
| | (a) | Power of Attorney - Income Account into Core Plus Bond Account dated 12/11/2018 |
| | (b) | Power of Attorney - LargeCap Growth Account into LargeCap Growth Account I dated 12/11/2018 |
| | (c) | Power of Attorney - Multi-Asset Income Account into SAM (Strategic Asset Management) Flexible Income Account dated 12/11/2018 |
| | | |
| ** to be filed by amendment |