UNITED STATES
SECURITIES AND EXCHANGE COMMISSION
Washington, D.C. 20549
FORM N-CSR
CERTIFIED SHAREHOLDER REPORT OF REGISTERED
MANAGEMENT INVESTMENT COMPANIES
Investment Company Act File Number: 811-21454
| T. Rowe Price Diversified Mid-Cap Growth Fund, Inc. |
| (Exact name of registrant as specified in charter) |
| 100 East Pratt Street, Baltimore, MD 21202 |
| (Address of principal executive offices) |
| David Oestreicher |
| 100 East Pratt Street, Baltimore, MD 21202 |
| (Name and address of agent for service) |
Registrant’s telephone number, including area code: (410) 345-2000
Date of fiscal year end: December 31
Date of reporting period: June 30, 2015
Item 1. Report to Shareholders
 |
| Diversified Mid-Cap Growth Fund | June 30, 2015 |
The views and opinions in this report were current as of June 30, 2015. They are not guarantees of performance or investment results and should not be taken as investment advice. Investment decisions reflect a variety of factors, and the managers reserve the right to change their views about individual stocks, sectors, and the markets at any time. As a result, the views expressed should not be relied upon as a forecast of the fund’s future investment intent. The report is certified under the Sarbanes-Oxley Act, which requires mutual funds and other public companies to affirm that, to the best of their knowledge, the information in their financial reports is fairly and accurately stated in all material respects.
REPORTS ON THE WEB
Sign up for our E-mail Program, and you can begin to receive updated fund reports and prospectuses online rather than through the mail. Log in to your account at troweprice.com for more information.
Manager’s Letter
Fellow Shareholders
In an environment of modest U.S. economic growth and “flattish” stock and bond returns, mid-cap growth stocks produced solid gains in the first half of 2015, supported by corporate mergers and acquisitions (M&A), mostly favorable earnings, continued low interest rates, and massive quantitative easing efforts in Europe and Japan to stimulate their economies. Sluggish global growth; a stronger U.S. dollar, which makes domestically manufactured products relatively more expensive; and concerns that the Federal Reserve would soon raise short-term interest rates occasionally weighed on the market. As the period ended, equities reacted negatively to events in Greece, Puerto Rico, and China.
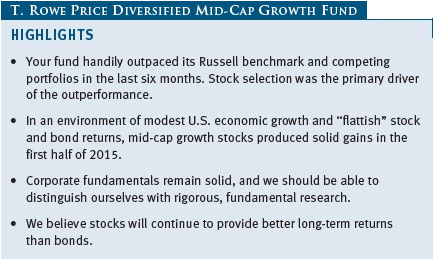
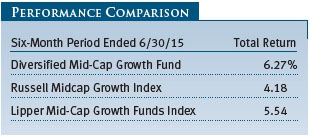
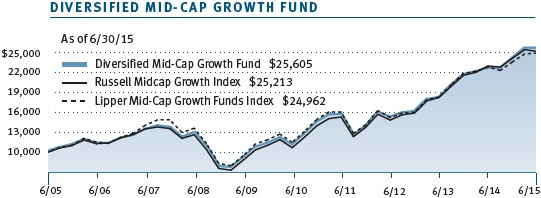
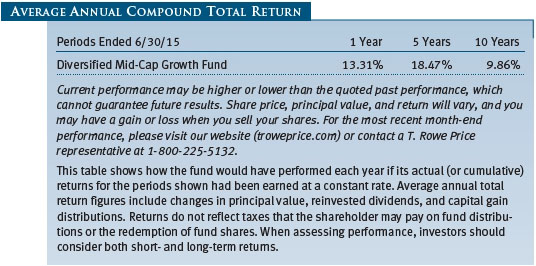
Your fund returned 6.27% in the first six months of 2015 and outpaced its unmanaged Russell benchmark by a comfortable margin. The fund also surpassed competing portfolios, as measured by the Lipper Mid-Cap Growth Funds Index.
Stock selection was the primary driver of outperformance versus the Russell index, especially in the financials, consumer discretionary, and health care sectors. Sector weightings in aggregate contributed slightly to our relative results, but most of the benefit stemmed from our overweight in health care. Stock selection in materials and consumer staples and an overweight to industrials and business services eroded our performance advantage.
The fund’s longer-term performance versus its competitors has been favorable. Lipper ranked the Diversified Mid-Cap Growth Fund in the top quartile of the mid-cap growth funds universe for the one- and five-year periods ended June 30, 2015. Based on cumulative total return, Lipper ranked the fund 67 of 425, 112 of 369, 77 of 333, and 75 of 236 mid-cap growth funds for the 1-, 3-, 5-, and 10-year periods ended June 30, 2015, respectively. (Results may vary for other periods. Past performance cannot guarantee future results.)
MARKET ENVIRONMENT
The U.S. economy contracted at an annualized rate of 0.2% in the first quarter, in part because of transitory factors, such as harsh winter weather, a stronger dollar, a West Coast ports strike, and plunging oil prices in the second half of 2014. However, growth has improved in the last few months, as evidenced by increased consumer spending, a pickup in exports, greater business fixed investment outside of the oil drilling industry, and solid jobs and income growth. Although inflation remains well contained, the Fed is poised to begin raising short-term interest rates later this year. The pace of rate hikes is likely to be gradual by historical standards.
Although there is a scarcity of growth in the world, corporations are financially very healthy, with strong balance sheets and cash flows that give them flexibility to increase spending and return capital to shareholders through dividends and stock buybacks. M&A activity has been generally robust, as some managements believe that is the best way to create value in a growth-starved environment. It is interesting to note that shares of acquiring companies are often performing well even after announcing a purchase that is being financed with significant new debt. Corporate earnings growth has moderated as the economic expansion has matured, and after several years of strong appreciation, stock valuations in general are modestly above historical averages. Still, underlying fundamentals remain solid, and we believe that stocks will continue to provide better long-term returns than bonds.
As measured by various Russell indexes, growth stocks surpassed value stocks across all market capitalizations. Most Russell Midcap Growth Index sectors produced mild gains or losses. The main exception on the plus side was health care, which far outpaced other sectors. Alternatively, utilities stocks and real estate investment trusts (REITs), which are proxies for bonds due to their relatively high dividend yields, fell sharply as long-term interest rates increased.
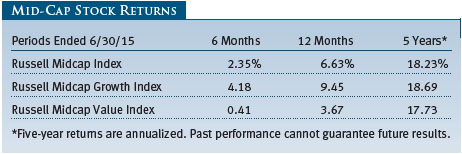
Looking at longer-term performance, we note that U.S. mid-cap companies have had excellent returns and outpaced large-caps. For the five years ended June 30, 2015, the Russell Midcap Index produced an average annual return of 18.23% versus 17.58% for the Russell 1000 Index. While growth stocks have outperformed value stocks across all market capitalizations in the last five years, the margin of growth stock outperformance was the smallest in the mid-cap space. Notably, U.S. stocks have decisively outperformed international stocks in that five-year time frame: The MSCI EAFE Index and the MSCI Emerging Markets Index produced annualized returns of 10.03% and 4.03%, respectively.
As our longer-term investors know, we are firm believers in mean reversion with regard to investment performance over long periods. We believe that an asset class’s above-average performance cannot persist indefinitely and that, eventually, a stretch of weaker performance will bring its total returns back in line with longer-term averages. Treasuries, which have produced significant returns since the end of 2007—the eve of the 2008 global financial crisis—are an excellent example of this. Interest rates, having fallen to historic lows, cannot remain at such low levels forever, especially in light of a growing economy and the Fed’s significant stimulus efforts over several years.
PORTFOLIO REVIEW
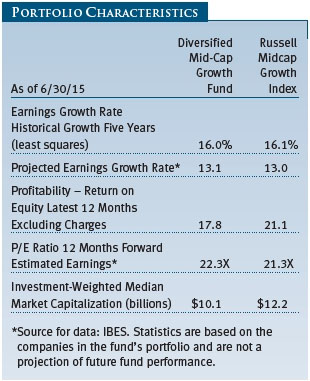
The Diversified Mid-Cap Growth Fund’s fundamental characteristics are similar to those of the Russell Midcap Growth Index, as indicated by the Portfolio Characteristics table on page 4. The portfolio’s $10.1 billion median market capitalization was a little lower than that of the Russell benchmark, while its 22.3 price/earnings (P/E) ratio and its historical and projected earnings growth rates are comparable to those of the index. These metrics reflect our commitment to mid-cap companies with excellent long-term growth prospects.
The fund’s return on equity (ROE), which measures how effectively and efficiently a company and its management are using stockholder investments, was 17.8% versus 21.1% for the benchmark. We consider a high ROE to be desirable, and we look for businesses that can sustain high profitability. One attribute not shown in the table is that our holdings have lower debt than businesses in the Russell index, based on certain long-term debt-to-equity measures. While ultra-low interest rates encourage borrowing and while investors are mostly unconcerned with companies that have high levels of debt, we believe there will be a time—perhaps when interest rates rise or when the economy turns down—when highly indebted companies will fall out of favor with investors.
Our time horizon for investing is longer than that of other mid-cap growth investors. Our 12-month portfolio turnover rate through June 30, 2015, was 19.3%, which is substantially less than the 2014 average of 69.5% for mid-cap growth funds, according to data from Morningstar Direct. (Morningstar only calculates portfolio turnover for its averages at year-end, using the most recent year-end portfolio turnover figures provided to Morningstar by each of the underlying funds in the average. The Morningstar data were quoted as of July 13, 2015.) This implies that our holding period for a typical stock is a little more than five years, whereas our average competitor holds a given stock for a little more than one year. Our relatively low turnover reflects our long-term commitment to the companies in which we invest.
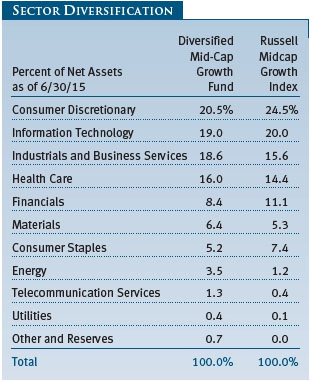
The Sector Diversification table on page 6 shows our allocations and those of the Russell index as of June 30. We have very little exposure to utilities and telecommunication services because there are few businesses in those sectors that meet our growth criteria. Relative to the Russell index, our largest overweight is industrials and business services; our biggest underweight is consumer discretionary.
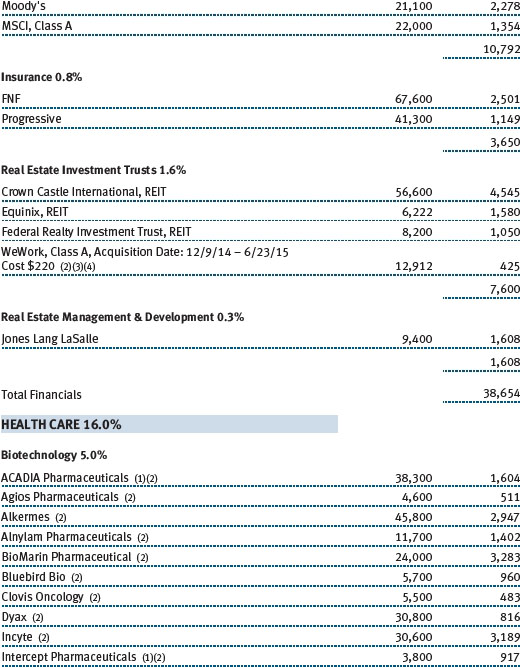
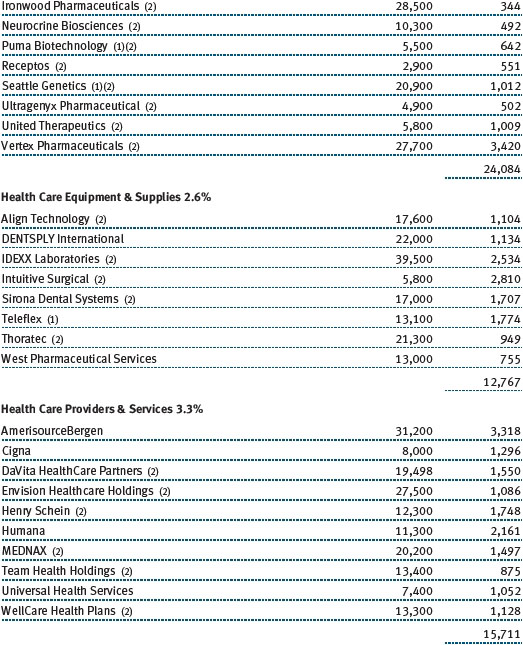
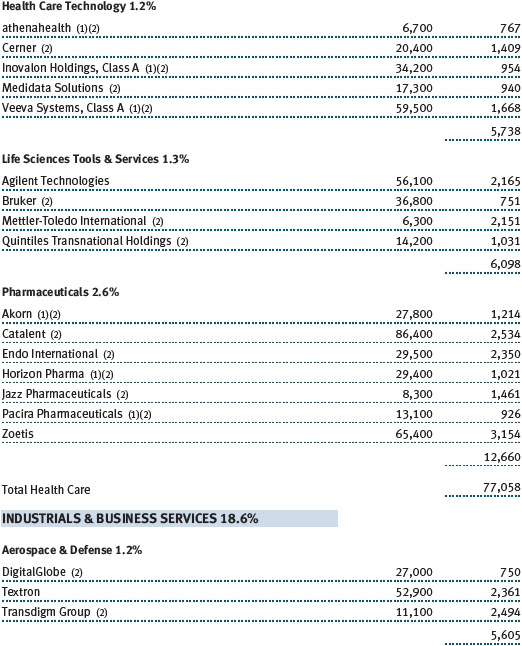
Health care stocks contributed the most to absolute performance. We emphasize innovative biotechnology companies with promising products to address large unmet medical needs or rare diseases. Biotechnology far outpaced other industries, and several holdings, such as Incyte, were among our best performers. Biotechs have been lifted by strong sales of various new drugs and promising FDA trial data or approvals for prospective medicines. Merger activity has also been a big factor; we cashed in on the acquisitions of Pharmacyclics and Synageva BioPharma. To reduce risks, we broadly diversify our biotech holdings. This enables us to hold—and, indeed, we have purchased—more biotech positions while maintaining the same relatively small aggregate allocation (5% of assets) to the industry. This reflects confidence in our firm’s research capabilities. Elsewhere in health care, we like service providers and distributors reflective of demographic factors and desires for increased access to health care services. Health insurer Humana and drug distributor AmerisourceBergen were top performers. Late in our reporting period, Humana stated that it was exploring strategic options, and in early July, the company agreed to be acquired by Aetna. Most of our holdings in other health care segments, including pharmaceuticals and life sciences, appreciated. (Please refer to the fund’s portfolio of investments for a complete list of holdings and the amount each represents in the portfolio.)
Our information technology stocks in aggregate produced solid returns. We are broadly diversified, but we favor companies with strong business models in industries with high barriers to entry and lower risk of commoditization. This is usually a “winner take all” space, where an industry leader emerges and eclipses its competitors. Hence, we try to avoid companies whose business models are impaired by competing products or services. Our gains were concentrated in the software, IT services, and semiconductor-related industries. In software, top contributors included ServiceNow and open source software company Red Hat; in IT services, Vantiv, CoreLogic, and Global Payments were standouts. In the semiconductor segment, our best performers were smartphone component supplier Skyworks Solutions and Altera, which we sold after the company agreed to be acquired by Intel. In other tech industries, LinkedIn, the social media site for professionals, was one of our worst performers. Shares sagged due to a less-than-stellar earnings report and some short-term challenges. However, we believe the company is poised for better performance in the 2016–2017 time frame. Data storage device maker SanDisk also disappointed.
Consumer discretionary companies, especially retailers, generally did well. Many companies in the sector have good business models, excellent cash flow, and other favorable attributes. We focus on leading companies within their respective niches. Our gains in the sector were concentrated in the Internet and catalog retailing segment and specialty retailers. Our top contributor in the entire portfolio was Netflix, thanks to very strong earnings and a favorable long-term outlook. Two car-related specialty retailers—O’Reilly Automotive and AutoZone—accounted for much of our gains in that industry. Disappointing holdings in other industries included media company Discovery Communications and clothing and fashion accessory maker Kate Spade. Luxury resort and gaming operator Wynn Resorts, which operates in Macau and Las Vegas, fell sharply due to weakening results in Macau.
Stocks in the financials sector produced positive returns. We underweighted REITs because we believe they are too expensive. However, one of our long-term holdings—data center operator Equinix, which recently converted to a REIT—performed well. Our capital markets companies mostly rose, led by online broker E*TRADE Financial and Lazard. We like strong niche companies in the diversified financial services segment, and our investments in MSCI, credit rating agency Moody’s, and McGraw Hill Financial, which owns Standard & Poor’s, produced good returns. In the insurance industry, title insurer FNF also produced good financial results and stock performance.
Many of our energy sector investments recovered partially from last year’s dismal performance, as oil prices rebounded from the multiyear lows reached in the first quarter. One of our oil and gas companies, Diamondback Energy, was among the fund’s top performers. Of course, as our longer-term investors know, we do not invest in energy companies based on commodity price forecasts, nor do we try to predict such movements. Rather, we seek differentiated service companies and low-cost producers with strong balance sheets, which should help them endure a period of significantly lower oil prices. Interestingly, despite the big year-over-year drop in prices, many oil drilling companies have continued their extraction efforts, which are exacerbating the global oversupply situation. This suggests that the recent oil price rebound may not be sustainable, which means we could have “lower for longer” energy costs.
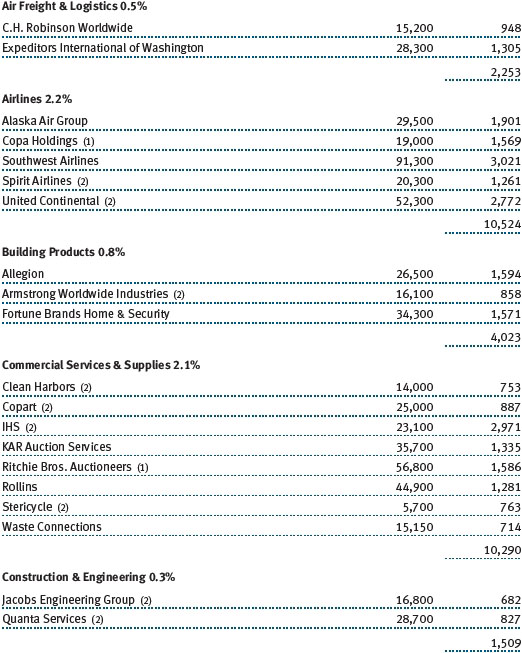
Our industrials and business services companies were lackluster in the last six months. We like attractively valued companies that are world-class in their respective niches. We also favor high-quality industrials with less cyclicality (i.e., their earnings are relatively steady throughout varying economic conditions). Poor performance of our airline holdings and railroad operator Kansas City Southern detracted from our results, especially versus competing mid-cap growth portfolios. The weak first-quarter economy weighed heavily on their shares. On the plus side, professional services companies Equifax, temporary staffing and recruiting company ManpowerGroup, and Verisk Analytics were major contributors. Several machinery stocks posted solid returns, too.
Materials stocks generally produced mild gains for the fund. This is a small sector, and the bulk of our positions are in the chemicals industry. Top contributors included construction materials company Vulcan Materials, paint maker Sherwin-Williams, and chemical company Celanese. We do not attempt to forecast or make investments based on commodity price fluctuations; rather, we seek differentiated companies that are well positioned for the long term.
Some of our consumer staples companies edged higher. We have an underweight in this sector because most company valuations are full, and some are too expensive. We favor food and beverage makers with strong brands, and some of our better performers were Flowers Foods, J.M. Smucker, and spirits maker Brown-Forman. Premium grocers Whole Foods Market and Fresh Market were lackluster.
OUTLOOK
Although we are not bearish on the equity market, we are not especially enthusiastic about near-term prospects for stocks. Shares have appreciated significantly over the last six years—rewarding investors who have stayed the course—but valuations are now above long-term averages. Also, corporate earnings growth has moderated as the expansion has aged, so investment gains in the years ahead are likely to be less robust than what we have seen thus far in this up cycle for the market. Still, stocks have dramatically better long-term prospects than bonds.
Long-term data continue to demonstrate that mid-cap stocks offer a favorable risk/reward trade-off versus large and smaller stocks. Underlying fundamentals for corporations remain solid, and the current environment—though unexciting—should enable us to distinguish ourselves through our dedication to rigorous, fundamental research.
Whether the market rises, falls, or stays flat, we expect to find good investment candidates. We believe active management of our mid-cap growth portfolio—built one stock at a time, based on our proprietary research, and focused on finding companies with sustainable growth and other favorable characteristics that can be held over long periods—will produce attractive long-term returns for our investors.
Thank you for your confidence in T. Rowe Price.
Respectfully submitted,

Donald J. Peters
Cochairman of the fund’s Investment Advisory Committee

Donald J. Easley
Cochairman of the fund’s Investment Advisory Committee
July 13, 2015
The committee cochairmen have day-to-day responsibility for managing the portfolio and work with committee members in developing and executing the fund’s investment program.
RISKS OF INVESTING
As with all equity funds, this fund’s share price can fall because of weakness in the broad market, a particular industry, or specific holdings. The market as a whole can decline for many reasons, including adverse political or economic developments here or abroad, changes in investor psychology, or heavy institutional selling. The prospects for an industry or company may deteriorate because of a variety of factors, including disappointing earnings or changes in the competitive environment. In addition, our assessment of companies held in the fund may prove incorrect, resulting in losses or poor performance even in a rising market. Finally, the fund’s investment approach could fall out of favor with the investing public, resulting in lagging performance versus other types of stock funds.
The stocks of mid-cap companies entail greater risk and are usually more volatile than the shares of large companies. In addition, growth stocks can be volatile for several reasons. Since they usually reinvest a high proportion of earnings in their own businesses, they may lack the dividends usually associated with value stocks that can cushion their decline in a falling market. Also, since investors buy these stocks because of their expected superior earnings growth, earnings disappointments often result in sharp price declines.
Diversification cannot assure a profit or protect against loss in a declining market.
GLOSSARY
Earnings growth rate – current fiscal year: Measures the annualized percent change in earnings per share from the prior fiscal year to the current fiscal year.
Lipper indexes: Fund benchmarks that consist of a small number (10 to 30) of the largest mutual funds in a particular category as tracked by Lipper Inc.
MSCI EAFE Index: An index that measures equity market performance of developed countries in the Europe, Australasia, and Far East regions.
MSCI Emerging Markets Index: A capitalization-weighted index of stocks from 23 emerging market countries that only includes securities that may be traded by foreign investors.
Price-to-earnings (P/E) ratio – 12 months forward: A valuation measure calculated by dividing the price of a stock by the analysts’ forecast of the next 12 months’ expected earnings. The ratio is a measure of how much investors are willing to pay for the company’s future earnings. The higher the P/E, the more investors are paying for the company’s earnings growth in the next 12 months.
Projected earnings growth rate (IBES): A company’s expected earnings per share growth rate for a given time period based on the forecast from the Institutional Brokers’ Estimate System, which is commonly referred to as IBES.
Real estate investment trusts (REITs): Publicly traded companies that own, develop, and operate apartment complexes, hotels, office buildings, and other commercial properties.
Return on equity (ROE) – current fiscal year: A valuation measure calculated by dividing the company’s current fiscal year net income by shareholders’ equity (i.e., the company’s book value). ROE measures how much a company earns on each dollar that common stock investors have put into the company. It indicates how effectively and efficiently a company and its management are using stockholder investments.
Russell Midcap Growth Index: An index that tracks the performance of mid-cap stocks with higher price-to-book ratios and higher forecast growth values.
Russell Midcap Index: An unmanaged index that tracks the performance of the 800 smallest companies in the Russell 1000 Index.
Russell Midcap Value Index: An index that tracks the performance of mid-cap stocks with lower price-to-book ratios and lower forecast growth values.
S&P 500 Index: An unmanaged index that tracks the stocks of 500 primarily large-cap U.S. companies.
S&P MidCap 400 Index: An unmanaged index that tracks the stocks of 400 U.S. mid-cap companies.
Note: MSCI makes no express or implied warranties or representations and shall have no liability whatsoever with respect to any MSCI data contained herein. The MSCI data may not be further redistributed or used as a basis for other indices or any securities or financial products. This report is not approved, reviewed, or produced by MSCI.
Note: Russell Investment Group is the source and owner of the trademarks, service marks, and copyrights related to the Russell indexes. Russell® is a trademark of Russell Investment Group.
Performance and Expenses
| Growth of $10,000 |
This chart shows the value of a hypothetical $10,000 investment in the fund over the past 10 fiscal year periods or since inception (for funds lacking 10-year records). The result is compared with benchmarks, which may include a broad-based market index and a peer group average or index. Market indexes do not include expenses, which are deducted from fund returns as well as mutual fund averages and indexes.
| Fund Expense Example |
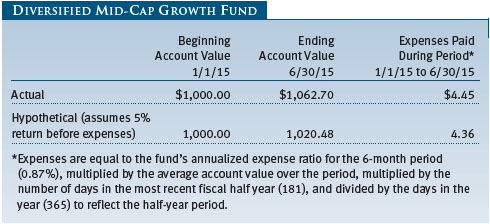
As a mutual fund shareholder, you may incur two types of costs: (1) transaction costs, such as redemption fees or sales loads, and (2) ongoing costs, including management fees, distribution and service (12b-1) fees, and other fund expenses. The following example is intended to help you understand your ongoing costs (in dollars) of investing in the fund and to compare these costs with the ongoing costs of investing in other mutual funds. The example is based on an investment of $1,000 invested at the beginning of the most recent six-month period and held for the entire period.
Actual Expenses
The first line of the following table (Actual) provides information about actual account values and expenses based on the fund’s actual returns. You may use the information on this line, together with your account balance, to estimate the expenses that you paid over the period. Simply divide your account value by $1,000 (for example, an $8,600 account value divided by $1,000 = 8.6), then multiply the result by the number on the first line under the heading “Expenses Paid During Period” to estimate the expenses you paid on your account during this period.
Hypothetical Example for Comparison Purposes
The information on the second line of the table (Hypothetical) is based on hypothetical account values and expenses derived from the fund’s actual expense ratio and an assumed 5% per year rate of return before expenses (not the fund’s actual return). You may compare the ongoing costs of investing in the fund with other funds by contrasting this 5% hypothetical example and the 5% hypothetical examples that appear in the shareholder reports of the other funds. The hypothetical account values and expenses may not be used to estimate the actual ending account balance or expenses you paid for the period.
Note: T. Rowe Price charges an annual account service fee of $20, generally for accounts with less than $10,000. The fee is waived for any investor whose T. Rowe Price mutual fund accounts total $50,000 or more; accounts electing to receive electronic delivery of account statements, transaction confirmations, prospectuses, and shareholder reports; or accounts of an investor who is a T. Rowe Price Preferred Services, Personal Services, or Enhanced Personal Services client (enrollment in these programs generally requires T. Rowe Price assets of at least $100,000). This fee is not included in the accompanying table. If you are subject to the fee, keep it in mind when you are estimating the ongoing expenses of investing in the fund and when comparing the expenses of this fund with other funds.
You should also be aware that the expenses shown in the table highlight only your ongoing costs and do not reflect any transaction costs, such as redemption fees or sales loads. Therefore, the second line of the table is useful in comparing ongoing costs only and will not help you determine the relative total costs of owning different funds. To the extent a fund charges transaction costs, however, the total cost of owning that fund is higher.
Unaudited
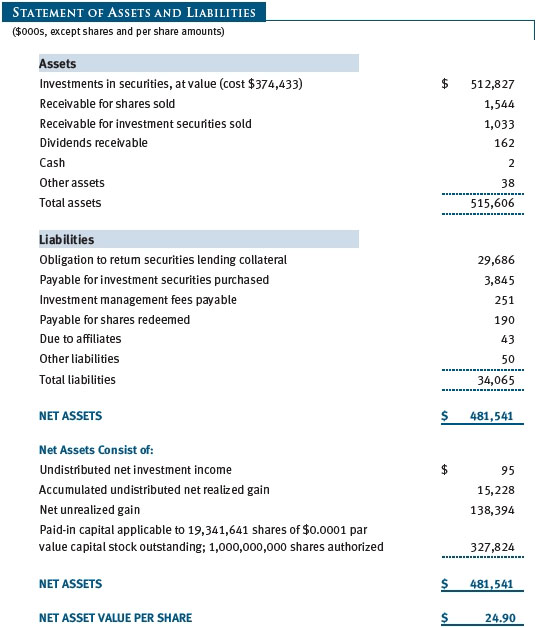
The accompanying notes are an integral part of these financial statements.
Unaudited
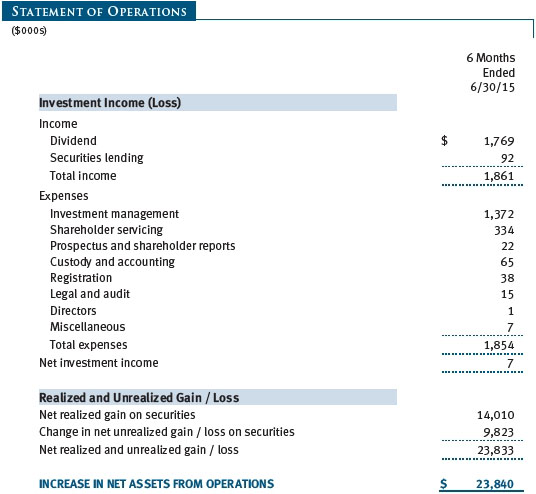
The accompanying notes are an integral part of these financial statements.
Unaudited
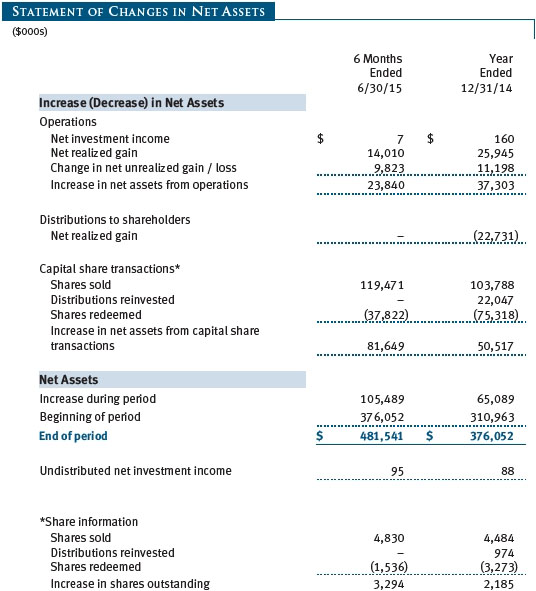
The accompanying notes are an integral part of these financial statements.
Unaudited
The accompanying notes are an integral part of these financial statements.
Unaudited
The accompanying notes are an integral part of these financial statements.
| Notes to Financial Statements |
T. Rowe Price Diversified Mid-Cap Growth Fund, Inc. (the fund), is registered under the Investment Company Act of 1940 (the 1940 Act) as a diversified, open-end management investment company. The fund commenced operations on December 31, 2003. The fund seeks to provide long-term capital growth by investing primarily in the common stocks of mid-cap growth companies.
NOTE 1 - SIGNIFICANT ACCOUNTING POLICIES
Basis of Preparation The fund is an investment company and follows accounting and reporting guidance in the Financial Accounting Standards Board (FASB) Accounting Standards Codification Topic 946 (ASC 946). The accompanying financial statements were prepared in accordance with accounting principles generally accepted in the United States of America (GAAP), including but not limited to ASC 946. GAAP requires the use of estimates made by management. Management believes that estimates and valuations are appropriate; however, actual results may differ from those estimates, and the valuations reflected in the accompanying financial statements may differ from the value ultimately realized upon sale or maturity.
Investment Transactions, Investment Income, and Distributions Income and expenses are recorded on the accrual basis. Dividends received from mutual fund investments are reflected as dividend income; capital gain distributions are reflected as realized gain/loss. Earnings on investments recognized as partnerships for federal income tax purposes reflect the tax character of such earnings. Dividend income and capital gain distributions are recorded on the ex-dividend date. Income tax-related interest and penalties, if incurred, would be recorded as income tax expense. Investment transactions are accounted for on the trade date. Realized gains and losses are reported on the identified cost basis. Distributions to shareholders are recorded on the ex-dividend date. Distributions from REITs are initially recorded as dividend income and, to the extent such represent a return of capital or capital gain for tax purposes, are reclassified when such information becomes available. Income distributions are declared and paid annually. Capital gain distributions, if any, are generally declared and paid by the fund annually.
New Accounting Guidance In June 2014, FASB issued Accounting Standards Update (ASU) No. 2014-11, Transfers and Servicing (Topic 860), Repurchase-to-Maturity Transactions, Repurchase Financings, and Disclosures. The ASU changes the accounting for certain repurchase agreements and expands disclosure requirements related to repurchase agreements, securities lending, repurchase-to-maturity and similar transactions. The ASU is effective for interim and annual reporting periods beginning after December 15, 2014. Adoption will have no effect on the fund’s net assets or results of operations.
In May 2015, FASB issued ASU No. 2015-07, Fair Value Measurement (Topic 820), Disclosures for Investments in Certain Entities That Calculate Net Asset Value per Share (or Its Equivalent). The ASU removes the requirement to categorize within the fair value hierarchy all investments for which fair value is measured using the net asset value per share practical expedient and amends certain disclosure requirements for such investments. The ASU is effective for interim and annual reporting periods beginning after December 15, 2015. Adoption will have no effect on the fund’s net assets or results of operations.
NOTE 2 - VALUATION
The fund’s financial instruments are valued and its net asset value (NAV) per share is computed at the close of the New York Stock Exchange (NYSE), normally 4 p.m. ET, each day the NYSE is open for business.
Fair Value The fund’s financial instruments are reported at fair value, which GAAP defines as the price that would be received to sell an asset or paid to transfer a liability in an orderly transaction between market participants at the measurement date. The T. Rowe Price Valuation Committee (the Valuation Committee) has been established by the fund’s Board of Directors (the Board) to ensure that financial instruments are appropriately priced at fair value in accordance with GAAP and the 1940 Act. Subject to oversight by the Board, the Valuation Committee develops and oversees pricing-related policies and procedures and approves all fair value determinations. Specifically, the Valuation Committee establishes procedures to value securities; determines pricing techniques, sources, and persons eligible to effect fair value pricing actions; oversees the selection, services, and performance of pricing vendors; oversees valuation-related business continuity practices; and provides guidance on internal controls and valuation-related matters. The Valuation Committee reports to the Board; is chaired by the fund’s treasurer; and has representation from legal, portfolio management and trading, operations, and risk management.
Various valuation techniques and inputs are used to determine the fair value of financial instruments. GAAP establishes the following fair value hierarchy that categorizes the inputs used to measure fair value:
Level 1 – quoted prices (unadjusted) in active markets for identical financial instruments that the fund can access at the reporting date
Level 2 – inputs other than Level 1 quoted prices that are observable, either directly or indirectly (including, but not limited to, quoted prices for similar financial instruments in active markets, quoted prices for identical or similar financial instruments in inactive markets, interest rates and yield curves, implied volatilities, and credit spreads)
Level 3 – unobservable inputs
Observable inputs are developed using market data, such as publicly available information about actual events or transactions, and reflect the assumptions that market participants would use to price the financial instrument. Unobservable inputs are those for which market data are not available and are developed using the best information available about the assumptions that market participants would use to price the financial instrument. GAAP requires valuation techniques to maximize the use of relevant observable inputs and minimize the use of unobservable inputs. When multiple inputs are used to derive fair value, the financial instrument is assigned to the level within the fair value hierarchy based on the lowest-level input that is significant to the fair value of the financial instrument. Input levels are not necessarily an indication of the risk or liquidity associated with financial instruments at that level but rather the degree of judgment used in determining those values.
Valuation Techniques Equity securities listed or regularly traded on a securities exchange or in the over-the-counter (OTC) market are valued at the last quoted sale price or, for certain markets, the official closing price at the time the valuations are made. OTC Bulletin Board securities are valued at the mean of the closing bid and asked prices. A security that is listed or traded on more than one exchange is valued at the quotation on the exchange determined to be the primary market for such security. Listed securities not traded on a particular day are valued at the mean of the closing bid and asked prices. Actively traded domestic equity securities generally are categorized in Level 1 of the fair value hierarchy. OTC Bulletin Board securities, certain preferred securities, and equity securities traded in inactive markets generally are categorized in Level 2 of the fair value hierarchy.
Investments in mutual funds are valued at the mutual fund’s closing NAV per share on the day of valuation and are categorized in Level 1 of the fair value hierarchy. Assets and liabilities other than financial instruments, including short-term receivables and payables, are carried at cost, or estimated realizable value, if less, which approximates fair value.
Thinly traded financial instruments and those for which the above valuation procedures are inappropriate or are deemed not to reflect fair value are stated at fair value as determined in good faith by the Valuation Committee. The objective of any fair value pricing determination is to arrive at a price that could reasonably be expected from a current sale. Financial instruments fair valued by the Valuation Committee are primarily private placements, restricted securities, warrants, rights, and other securities that are not publicly traded.
Subject to oversight by the Board, the Valuation Committee regularly makes good faith judgments to establish and adjust the fair valuations of certain securities as events occur and circumstances warrant. For instance, in determining the fair value of an equity investment with limited market activity, such as a private placement or a thinly traded public company stock, the Valuation Committee considers a variety of factors, which may include, but are not limited to, the issuer’s business prospects, its financial standing and performance, recent investment transactions in the issuer, new rounds of financing, negotiated transactions of significant size between other investors in the company, relevant market valuations of peer companies, strategic events affecting the company, market liquidity for the issuer, and general economic conditions and events. In consultation with the investment and pricing teams, the Valuation Committee will determine an appropriate valuation technique based on available information, which may include both observable and unobservable inputs. The Valuation Committee typically will afford greatest weight to actual prices in arm’s length transactions, to the extent they represent orderly transactions between market participants; transaction information can be reliably obtained; and prices are deemed representative of fair value. However, the Valuation Committee may also consider other valuation methods such as market-based valuation multiples; a discount or premium from market value of a similar, freely traded security of the same issuer; or some combination. Fair value determinations are reviewed on a regular basis and updated as information becomes available, including actual purchase and sale transactions of the issue. Because any fair value determination involves a significant amount of judgment, there is a degree of subjectivity inherent in such pricing decisions, and fair value prices determined by the Valuation Committee could differ from those of other market participants. Depending on the relative significance of unobservable inputs, including the valuation technique(s) used, fair valued securities may be categorized in Level 2 or 3 of the fair value hierarchy.
Valuation Inputs The following table summarizes the fund’s financial instruments, based on the inputs used to determine their fair values on June 30, 2015:
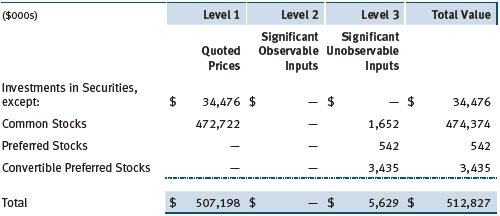
There were no material transfers between Levels 1 and 2 during the six months ended June 30, 2015.
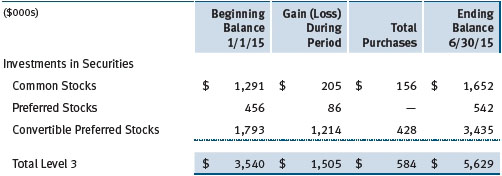
Following is a reconciliation of the fund’s Level 3 holdings for the six months ended June 30, 2015. Gain (loss) reflects both realized and change in unrealized gain/loss on Level 3 holdings during the period, if any, and is included on the accompanying Statement of Operations. The change in unrealized gain/loss on Level 3 instruments held at June 30, 2015, totaled $1,505,000 for the six months ended June 30, 2015.
NOTE 3 - OTHER INVESTMENT TRANSACTIONS
Consistent with its investment objective, the fund engages in the following practices to manage exposure to certain risks and/or to enhance performance. The investment objective, policies, program, and risk factors of the fund are described more fully in the fund’s prospectus and Statement of Additional Information.
Restricted Securities The fund may invest in securities that are subject to legal or contractual restrictions on resale. Prompt sale of such securities at an acceptable price may be difficult and may involve substantial delays and additional costs.
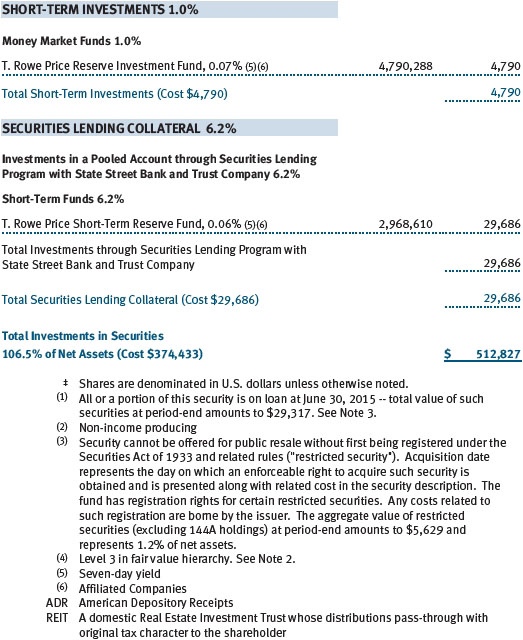
Securities Lending The fund may lend its securities to approved brokers to earn additional income. Its securities lending activities are administered by a lending agent in accordance with a securities lending agreement. Security loans generally do not have stated maturity dates and the fund may recall a security at any time. The fund receives collateral in the form of cash or U.S. government securities, valued at 102% to 105% of the value of the securities on loan. Collateral is maintained over the life of the loan in an amount not less than the value of loaned securities; any additional collateral required due to changes in security values is delivered to the fund the next business day. Cash collateral is invested by the lending agent(s) in accordance with investment guidelines approved by fund management. Additionally, the lending agent indemnifies the fund against losses resulting from borrower default. Although risk is mitigated by the collateral and indemnification, the fund could experience a delay in recovering its securities and a possible loss of income or value if the borrower fails to return the securities, collateral investments decline in value and the lending agent fails to perform. Securities lending revenue consists of earnings on invested collateral and borrowing fees, net of any rebates to the borrower, compensation to the lending agent, and other administrative costs. In accordance with GAAP, investments made with cash collateral are reflected in the accompanying financial statements, but collateral received in the form of securities is not. At June 30, 2015, the value of loaned securities was $29,317,000; the value of cash collateral and related investments was $29,686,000.
Other Purchases and sales of portfolio securities other than short-term securities aggregated $114,769,000 and $33,678,000, respectively, for the six months ended June 30, 2015.
NOTE 4 - FEDERAL INCOME TAXES
No provision for federal income taxes is required since the fund intends to continue to qualify as a regulated investment company under Subchapter M of the Internal Revenue Code and distribute to shareholders all of its taxable income and gains. Distributions determined in accordance with federal income tax regulations may differ in amount or character from net investment income and realized gains for financial reporting purposes. Financial reporting records are adjusted for permanent book/tax differences to reflect tax character but are not adjusted for temporary differences. The amount and character of tax-basis distributions and composition of net assets are finalized at fiscal year-end; accordingly, tax-basis balances have not been determined as of the date of this report.
At June 30, 2015, the cost of investments for federal income tax purposes was $374,547,000. Net unrealized gain aggregated $138,280,000 at period-end, of which $147,576,000 related to appreciated investments and $9,296,000 related to depreciated investments.
NOTE 5 - RELATED PARTY TRANSACTIONS
The fund is managed by T. Rowe Price Associates, Inc. (Price Associates), a wholly owned subsidiary of T. Rowe Price Group, Inc. (Price Group). The investment management agreement between the fund and Price Associates provides for an annual investment management fee, which is computed daily and paid monthly. The fee consists of an individual fund fee, equal to 0.35% of the fund’s average daily net assets, and a group fee. The group fee rate is calculated based on the combined net assets of certain mutual funds sponsored by Price Associates (the group) applied to a graduated fee schedule, with rates ranging from 0.48% for the first $1 billion of assets to 0.275% for assets in excess of $400 billion. The fund’s group fee is determined by applying the group fee rate to the fund’s average daily net assets. At June 30, 2015, the effective annual group fee rate was 0.29%.
In addition, the fund has entered into service agreements with Price Associates and two wholly owned subsidiaries of Price Associates (collectively, Price). Price Associates computes the daily share price and provides certain other administrative services to the fund. T. Rowe Price Services, Inc., provides shareholder and administrative services in its capacity as the fund’s transfer and dividend-disbursing agent. T. Rowe Price Retirement Plan Services, Inc., provides subaccounting and recordkeeping services for certain retirement accounts invested in the fund. For the six months ended June 30, 2015, expenses incurred pursuant to these service agreements were $47,000 for Price Associates; $223,000 for T. Rowe Price Services, Inc.; and $5,000 for T. Rowe Price Retirement Plan Services, Inc. The total amount payable at period-end pursuant to these service agreements is reflected as Due to Affiliates in the accompanying financial statements.
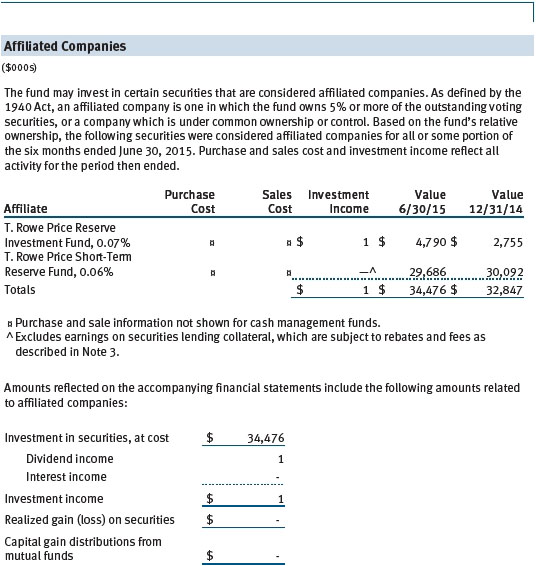
The fund may invest in the T. Rowe Price Reserve Investment Fund, the T. Rowe Price Government Reserve Investment Fund, or the T. Rowe Price Short-Term Reserve Fund (collectively, the Price Reserve Investment Funds), open-end management investment companies managed by Price Associates and considered affiliates of the fund. The Price Reserve Investment Funds are offered as short-term investment options to mutual funds, trusts, and other accounts managed by Price Associates or its affiliates and are not available for direct purchase by members of the public. The Price Reserve Investment Funds pay no investment management fees.
| Information on Proxy Voting Policies, Procedures, and Records |
A description of the policies and procedures used by T. Rowe Price funds and portfolios to determine how to vote proxies relating to portfolio securities is available in each fund’s Statement of Additional Information. You may request this document by calling 1-800-225-5132 or by accessing the SEC’s website, sec.gov.
The description of our proxy voting policies and procedures is also available on our website, troweprice.com. To access it, click on the words “Social Responsibility” at the top of our corporate homepage. Next, click on the words “Conducting Business Responsibly” on the left side of the page that appears. Finally, click on the words “Proxy Voting Policies” on the left side of the page that appears.
Each fund’s most recent annual proxy voting record is available on our website and through the SEC’s website. To access it through our website, follow the above directions to reach the “Conducting Business Responsibly” page. Click on the words “Proxy Voting Records” on the left side of that page, and then click on the “View Proxy Voting Records” link at the bottom of the page that appears.
| How to Obtain Quarterly Portfolio Holdings |
The fund files a complete schedule of portfolio holdings with the Securities and Exchange Commission for the first and third quarters of each fiscal year on Form N-Q. The fund’s Form N-Q is available electronically on the SEC’s website (sec.gov); hard copies may be reviewed and copied at the SEC’s Public Reference Room, 100 F St. N.E., Washington, DC 20549. For more information on the Public Reference Room, call 1-800-SEC-0330.
| Approval of Investment Management Agreement |
On March 13, 2015, the fund’s Board of Directors (Board), including a majority of the fund’s independent directors, approved the continuation of the investment management agreement (Advisory Contract) between the fund and its investment advisor, T. Rowe Price Associates, Inc. (Advisor). In connection with its deliberations, the Board requested, and the Advisor provided, such information as the Board (with advice from independent legal counsel) deemed reasonably necessary. The Board considered a variety of factors in connection with its review of the Advisory Contract, also taking into account information provided by the Advisor during the course of the year, as discussed below:
Services Provided by the Advisor
The Board considered the nature, quality, and extent of the services provided to the fund by the Advisor. These services included, but were not limited to, directing the fund’s investments in accordance with its investment program and the overall management of the fund’s portfolio, as well as a variety of related activities such as financial, investment operations, and administrative services; compliance; maintaining the fund’s records and registrations; and shareholder communications. The Board also reviewed the background and experience of the Advisor’s senior management team and investment personnel involved in the management of the fund, as well as the Advisor’s compliance record. The Board concluded that it was satisfied with the nature, quality, and extent of the services provided by the Advisor.
Investment Performance of the Fund
The Board reviewed the fund’s three-month, one-year, and year-by-year returns, as well as the fund’s average annualized total returns over the 3-, 5-, and 10-year periods, and compared these returns with a wide variety of previously agreed-upon comparable performance measures and market data, including those supplied by Lipper and Morningstar, which are independent providers of mutual fund data.
On the basis of this evaluation and the Board’s ongoing review of investment results, and factoring in the relative market conditions during certain of the performance periods, the Board concluded that the fund’s performance was satisfactory.
Costs, Benefits, Profits, and Economies of Scale
The Board reviewed detailed information regarding the revenues received by the Advisor under the Advisory Contract and other benefits that the Advisor (and its affiliates) may have realized from its relationship with the fund, including any research received under “soft dollar” agreements and commission-sharing arrangements with broker-dealers. The Board considered that the Advisor may receive some benefit from soft-dollar arrangements pursuant to which research is received from broker-dealers that execute the applicable fund’s portfolio transactions. The Board received information on the estimated costs incurred and profits realized by the Advisor from managing T. Rowe Price mutual funds. The Board also reviewed estimates of the profits realized from managing the fund in particular, and the Board concluded that the Advisor’s profits were reasonable in light of the services provided to the fund.
The Board also considered whether the fund benefits under the fee levels set forth in the Advisory Contract from any economies of scale realized by the Advisor. Under the Advisory Contract, the fund pays a fee to the Advisor for investment management services composed of two components—a group fee rate based on the combined average net assets of most of the T. Rowe Price mutual funds (including the fund) that declines at certain asset levels and an individual fund fee rate based on the fund’s average daily net assets—and the fund pays its own expenses of operations. At the March 13, 2015, meeting, the Board approved an additional 0.005% breakpoint to the group fee schedule, effective May 1, 2015. With the new breakpoint, the group fee rate will decline to 0.270% when the combined average net assets of the applicable T. Rowe Price funds exceed $500 billion. The Board concluded that the advisory fee structure for the fund continued to provide for a reasonable sharing of benefits from any economies of scale with the fund’s investors.
Fees
The Board was provided with information regarding industry trends in management fees and expenses, and the Board reviewed the fund’s management fee rate, operating expenses, and total expense ratio in comparison with fees and expenses of other comparable funds based on information and data supplied by Lipper. The information provided to the Board indicated that the fund’s management fee rate and total expense ratio were above the median for certain groups of comparable funds and at or below the median for comparable funds.
The Board also reviewed the fee schedules for institutional accounts and private accounts with similar mandates that are advised or subadvised by the Advisor and its affiliates. Management provided the Board with information about the Advisor’s responsibilities and services provided to institutional account clients, including information about how the requirements and economics of the institutional business are fundamentally different from those of the mutual fund business. The Board considered information showing that the mutual fund business is generally more complex from a business and compliance perspective than the institutional business and that the Advisor generally performs significant additional services and assumes greater risk in managing the fund and other T. Rowe Price mutual funds than it does for institutional account clients.
On the basis of the information provided and the factors considered, the Board concluded that the fees paid by the fund under the Advisory Contract are reasonable.
Approval of the Advisory Contract
As noted, the Board approved the continuation of the Advisory Contract. No single factor was considered in isolation or to be determinative to the decision. Rather, the Board concluded, in light of a weighting and balancing of all factors considered, that it was in the best interests of the fund and its shareholders for the Board to approve the continuation of the Advisory Contract (including the fees to be charged for services thereunder). The independent directors were advised throughout the process by independent legal counsel.
Item 2. Code of Ethics.
A code of ethics, as defined in Item 2 of Form N-CSR, applicable to its principal executive officer, principal financial officer, principal accounting officer or controller, or persons performing similar functions is filed as an exhibit to the registrant’s annual Form N-CSR. No substantive amendments were approved or waivers were granted to this code of ethics during the registrant’s most recent fiscal half-year.
Item 3. Audit Committee Financial Expert.
Disclosure required in registrant’s annual Form N-CSR.
Item 4. Principal Accountant Fees and Services.
Disclosure required in registrant’s annual Form N-CSR.
Item 5. Audit Committee of Listed Registrants.
Not applicable.
Item 6. Investments.
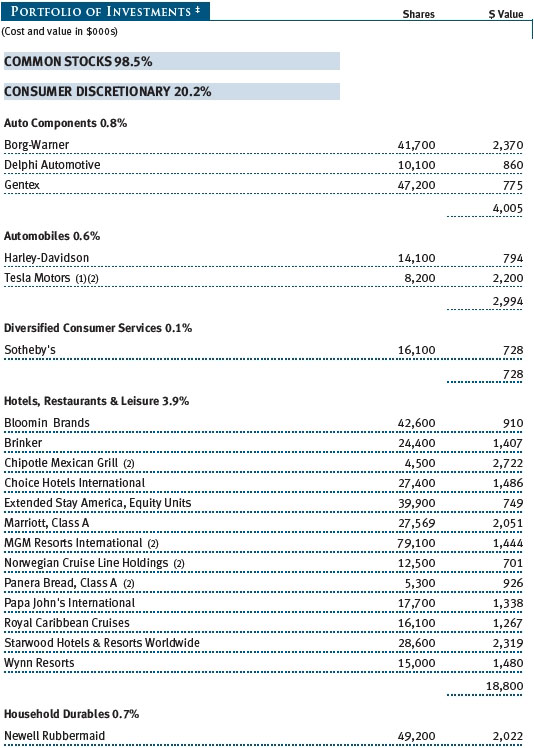
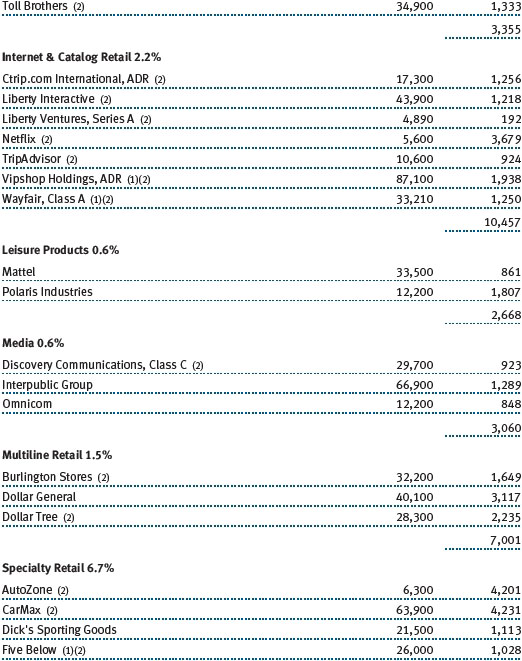
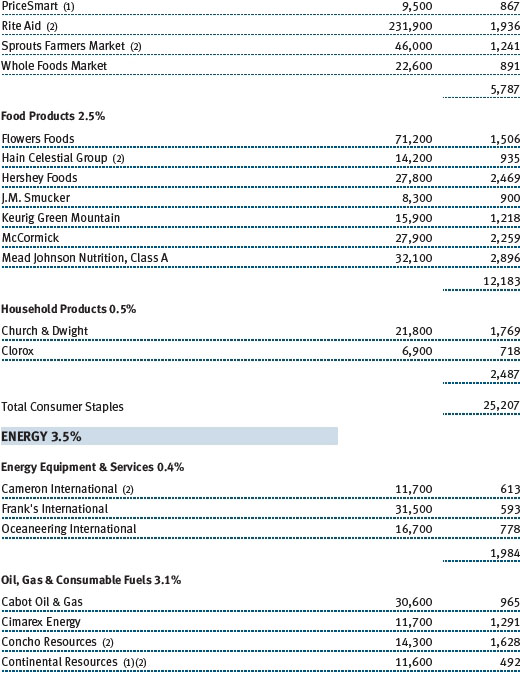
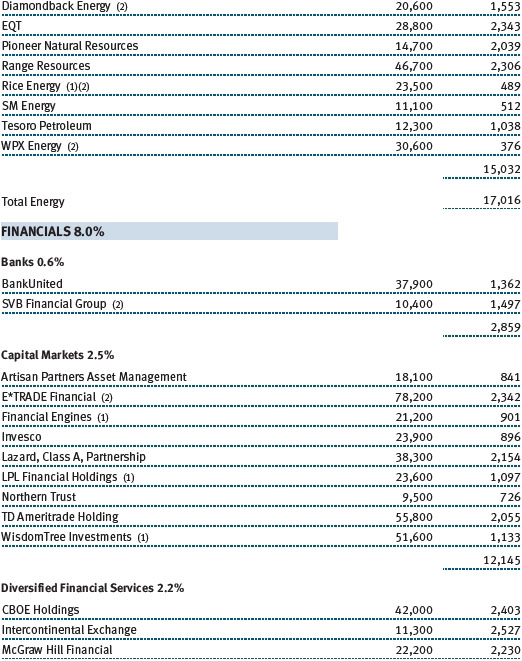
(a) Not applicable. The complete schedule of investments is included in Item 1 of this Form N-CSR.
(b) Not applicable.
Item 7. Disclosure of Proxy Voting Policies and Procedures for Closed-End Management Investment Companies.
Not applicable.
Item 8. Portfolio Managers of Closed-End Management Investment Companies.
Not applicable.
Item 9. Purchases of Equity Securities by Closed-End Management Investment Company and Affiliated Purchasers.
Not applicable.
Item 10. Submission of Matters to a Vote of Security Holders.
Not applicable.
Item 11. Controls and Procedures.
(a) The registrant’s principal executive officer and principal financial officer have evaluated the registrant’s disclosure controls and procedures within 90 days of this filing and have concluded that the registrant’s disclosure controls and procedures were effective, as of that date, in ensuring that information required to be disclosed by the registrant in this Form N-CSR was recorded, processed, summarized, and reported timely.
(b) The registrant’s principal executive officer and principal financial officer are aware of no change in the registrant’s internal control over financial reporting that occurred during the registrant’s second fiscal quarter covered by this report that has materially affected, or is reasonably likely to materially affect, the registrant’s internal control over financial reporting.
Item 12. Exhibits.
(a)(1) The registrant’s code of ethics pursuant to Item 2 of Form N-CSR is filed with the registrant’s annual Form N-CSR.
(3) Written solicitation to repurchase securities issued by closed-end companies: not applicable.
(b) A certification by the registrant's principal executive officer and principal financial officer, pursuant to Section 906 of the Sarbanes-Oxley Act of 2002 and required by Rule 30a-2(b) under the Investment Company Act of 1940, is attached.
SIGNATURES
Pursuant to the requirements of the Securities Exchange Act of 1934 and the Investment Company Act of 1940, the registrant has duly caused this report to be signed on its behalf by the undersigned, thereunto duly authorized.
T. Rowe Price Diversified Mid-Cap Growth Fund, Inc.
| By | /s/ Edward C. Bernard | |
| Edward C. Bernard | ||
| Principal Executive Officer | ||
| Date August 17, 2015 | ||
Pursuant to the requirements of the Securities Exchange Act of 1934 and the Investment Company Act of 1940, this report has been signed below by the following persons on behalf of the registrant and in the capacities and on the dates indicated.
| By | /s/ Edward C. Bernard | |
| Edward C. Bernard | ||
| Principal Executive Officer | ||
| Date August 17, 2015 | ||
| By | /s/ Catherine D. Mathews | |
| Catherine D. Mathews | ||
| Principal Financial Officer | ||
| Date August 17, 2015 | ||