UNITED STATES
SECURITIES AND EXCHANGE COMMISSION
Washington, D.C. 20549
FORM N-CSR
CERTIFIED SHAREHOLDER REPORT OF REGISTERED
MANAGEMENT INVESTMENT COMPANIES
Investment Company Act File Number: 811-21454
| T. Rowe Price Diversified Mid-Cap Growth Fund, Inc. |
| (Exact name of registrant as specified in charter) |
| 100 East Pratt Street, Baltimore, MD 21202 |
| (Address of principal executive offices) |
| David Oestreicher |
| 100 East Pratt Street, Baltimore, MD 21202 |
| (Name and address of agent for service) |
Registrant’s telephone number, including area code: (410) 345-2000
Date of fiscal year end: December 31
Date of reporting period: June 30, 2013
Item 1. Report to Shareholders
 |
| Diversified Mid-Cap Growth Fund | June 30, 2013 |
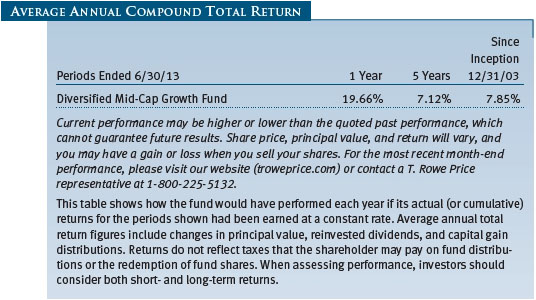
The views and opinions in this report were current as of June 30, 2013. They are not guarantees of performance or investment results and should not be taken as investment advice. Investment decisions reflect a variety of factors, and the managers reserve the right to change their views about individual stocks, sectors, and the markets at any time. As a result, the views expressed should not be relied upon as a forecast of the fund’s future investment intent. The report is certified under the Sarbanes-Oxley Act, which requires mutual funds and other public companies to affirm that, to the best of their knowledge, the information in their financial reports is fairly and accurately stated in all material respects.
REPORTS ON THE WEB
Sign up for our E-mail Program, and you can begin to receive updated fund reports and prospectuses online rather than through the mail. Log in to your account at troweprice.com for more information.
Manager’s Letter
Fellow Shareholders
Mid-cap growth stocks rose strongly in the first half of 2013. The advance was supported by an improving economic and employment outlook despite federal tax increases and automatic spending cuts that went into effect during the first quarter. Investor sentiment was also lifted by good corporate earnings reports and accommodative monetary policies from major central banks. The Federal Reserve maintained its commitment to keep short-term interest rates low while the economy recovers and suppressed long-term rates by purchasing $85 billion in fixed income securities every month. However, late in the period, a sharp increase in longer-term rates weighed on the market as the Fed signaled that it would begin tapering its asset purchases in the second half of 2013—if the economy improves in line with Fed expectations. Given the ongoing central bank manipulation of the fixed income markets, we continue to find that equities have more attractive valuations and long-term return potential versus fixed income alternatives.
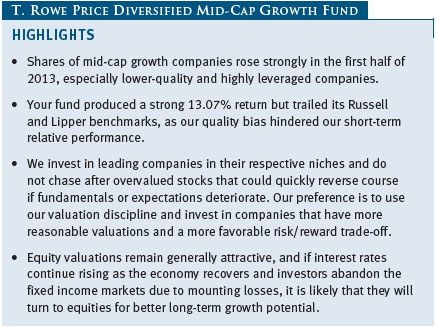
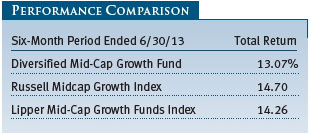
Your fund produced a strong 13.07% return in the first half of 2013. As shown in the Performance Comparison table, however, the fund trailed its Russell and Lipper benchmarks. Our quality bias hindered our short-term performance, as lower-quality and highly leveraged companies had a strong first half. Although short-term relative performance was disappointing, we have no intention of changing our successful long-term investment style in response.
The fund’s results versus the Russell index were hurt by poor performance among our holdings in the materials sector, particularly metals and mining companies, and weak relative performance of our consumer staples holdings. Our investments in energy and industrials and business services were generally subpar, and certain sector allocations—namely our overweight in the lagging information technology sector and an underweight in the strong consumer discretionary sector—also detracted slightly. On the plus side, our stock selection among financial stocks was excellent, helping relative performance. We’ll discuss portfolio holdings and sector allocations in greater detail in the Portfolio Review section of the letter.
MARKET ENVIRONMENT
The environment for U.S. equity investors remained very favorable in the first six months of 2013. The economy expanded at a moderate pace in the first quarter, employment growth has been strengthening, and the housing recovery has continued to gather steam. The Federal Reserve’s monetary policy stayed highly accommodative, and corporate fundamentals are still strong. Corporate balance sheets are flush with cash, and many companies continue to initiate or boost dividends or stock repurchase plans. We are surprised that merger and acquisition (M&A) activity remains below historical averages and that various companies facing significant challenges or competition have not opted to seek a buyer. Nevertheless, for those seeking long-term capital appreciation, it is still a great time to invest in stocks of quality companies.
Mid-cap stocks surpassed large caps in the first half of 2013 but narrowly trailed their small-cap peers. The Russell Midcap Index returned 15.45% versus 13.82% for the S&P 500 Index and 15.86% for the small-cap Russell 2000 Index. As measured by various Russell indexes, value stocks outperformed growth stocks among mid- and large-caps, while the opposite was true for small-caps.
All sectors in the Russell Midcap Growth Index produced positive returns. Consumer staples, consumer discretionary, and energy stocks fared best. Health care stocks were less robust but collectively outperformed the index, while financials and industrials and business services narrowly trailed. Utilities, information technology, materials, and telecommunication services lagged with modest to moderate gains.
In general, companies with the fastest anticipated earnings growth outperformed in the first half, as many investors seemed to be “chasing growth” or seeking the “next big thing.” Several companies that we did not own produced stellar returns, and we declined to chase after overvalued stocks that could quickly reverse course if fundamentals or expectations deteriorate even slightly. Our preference is to use our valuation discipline and invest in companies that have more reasonable valuations and a more favorable risk/reward trade-off.
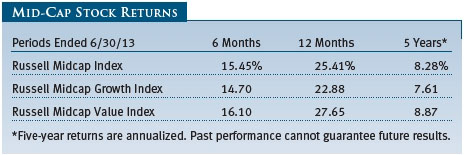
As shown in the table, mid-cap growth stocks produced good returns but underperformed their value counterparts in the first half of 2013, over the last 12 months, and during the turbulent five-year period ended June 30, 2013. Still, mid-caps in general have outpaced large-caps since mid-2008. For the five-year period ended June 30, 2013, the Russell Midcap Index produced an annualized return of 8.28% versus 7.01% for the S&P 500. Notably, U.S. mid-caps strongly outpaced equities in both developed and developing non-U.S. markets in that five-year stretch: The MSCI EAFE Index and the MSCI Emerging Markets Index produced annualized returns of -0.16% and -0.11%, respectively.
As our longer-term investors know, we believe that asset classes with an extended performance advantage will eventually experience a “reversion to the mean.” In other words, the outperforming asset class will inevitably experience a period of below-average returns that will offset some of its recent superior performance and bring returns back in line with the long-term average. Thus the sustained underperformance of non-U.S. equities and the current pronounced negative sentiment toward them make them worthy of consideration. However, we believe that the domestic mid-cap universe will continue to offer a wide variety of companies with superior long-term growth potential and other favorable characteristics relative to many businesses around the world. Long-term data find the mid-cap asset class to offer very favorable reward versus risk dynamics.
INVESTMENT STRATEGY
Before discussing the portfolio’s performance in detail, we would like to welcome new investors and thank all of our longer-term investors for their continuing confidence in our portfolio management abilities. Our reports to shareholders focus on fund activity and performance in the most recent 6- or 12-month periods, but our time horizon for investing is much longer, so we are prepared to wait for years for our investments to bear fruit. While the investment landscape is constantly changing and occasionally challenging, we remain committed to the same strategy and principles that have guided our management of the portfolio since its inception almost 10 years ago. We believe these will help us navigate through a variety of possible market and economic environments and provide patient investors with long-term capital growth:
- The Diversified Mid-Cap Growth Fund invests in stocks of mid-cap companies whose earnings are expected to grow at an above-average rate. We define mid-cap companies as those whose market capitalization at the time of purchase falls within the range of either the S&P MidCap 400 Index or the Russell Midcap Growth Index.
- We keep the fund fully invested because we believe that successful market timing is virtually impossible—you would need to be right twice—and that the costs associated with frequent trading reduce the likelihood of outperforming the market. We do not worry about short-term performance or try to forecast the direction of the economy or the market. Our focus is to find mid-cap companies with the best long-term growth potential.
- We use a number of proprietary quantitative models to identify and evaluate the characteristics of individual mid-cap growth companies and the portfolio as a whole.
- Stock selection is based on a combination of fundamental, bottom-up analysis and quantitative strategies in an attempt to identify companies with superior long-term appreciation prospects.
- We use a growth approach, looking for companies with a demonstrated ability to increase revenues, earnings, and cash flow consistently; capable management; attractive business niches; and a sustainable competitive advantage. We favor companies with above-average earnings growth and lower earnings variability.
- Valuations are also very important. We look for the best relative values among companies with the strongest businesses and managements.
- Unlike other mid-cap growth portfolios that are highly concentrated, the Diversified Mid-Cap Growth Fund typically invests in about 300 stocks. A high degree of diversification helps to mitigate the downside risk attributable to any single poorly performing security. We invest in companies that are early in their life cycles, and some will ultimately not be as successful as we hope. Accordingly, we balance risk with potential returns.
- Our time horizons are longer than those of other mid-cap growth investors. Our portfolio turnover rate for the 12-month period ended June 30, 2013, was 19.2%, which is substantially less than the 2012 average of about 87% for mid-cap growth funds, according to data from Morningstar Direct. (Morningstar only calculates portfolio turnover for their averages at year-end, using the most recent year-end portfolio turnover figures provided to Morningstar by each of the underlying funds in the average. The Morningstar data were quoted as of July 12, 2013.) This implies that our holding period for a typical stock is more than five years, whereas our average competitor holds a given stock for a little more than one year. Consequently, we view ourselves as long-term investors; we are not short-term speculators or day-traders. You may have noticed that the fund’s 12-month turnover rate has been declining over the last year. While a relatively low turnover is desirable from a tax and expense perspective, this trend reflects the fact that our analysts have been finding fewer new and attractive mid-cap investment ideas given the market’s brisk appreciation.
PORTFOLIO REVIEW
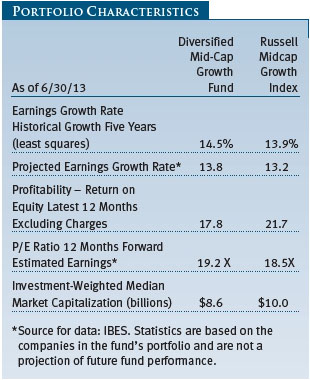
The Diversified Mid-Cap Growth Fund’s fundamental characteristics are somewhat similar to those of the Russell Midcap Growth Index, as indicated by the Portfolio Characteristics table on page 5. The portfolio’s median market capitalization ($8.6 billion), price/earnings (P/E) ratio (19.2), and projected earnings growth rate (13.8%) are all generally in line with those of the index. These metrics reflect our commitment to mid-cap companies with excellent long-term growth prospects.
The fund’s return on equity (ROE), which measures how effectively and efficiently a company and its management are using stockholder investments, is 17.8% versus 21.7% for the benchmark. We consider a high ROE to be desirable, and we look for businesses that can sustain high profitability. One positive not shown by the data is that our holdings have lower debt than businesses represented in the Russell index.
At the end of June, as shown in the Sector Diversification table on page 7, our largest commitments were to consumer discretionary, information technology, health care, and industrials and business services. We have very little exposure to utilities and telecommunication services because there are very few businesses in those sectors that meet our growth criteria. Relative to the Russell benchmark, we had underweights in the consumer discretionary, consumer staples, and financials sectors and material overweights in information technology and health care.
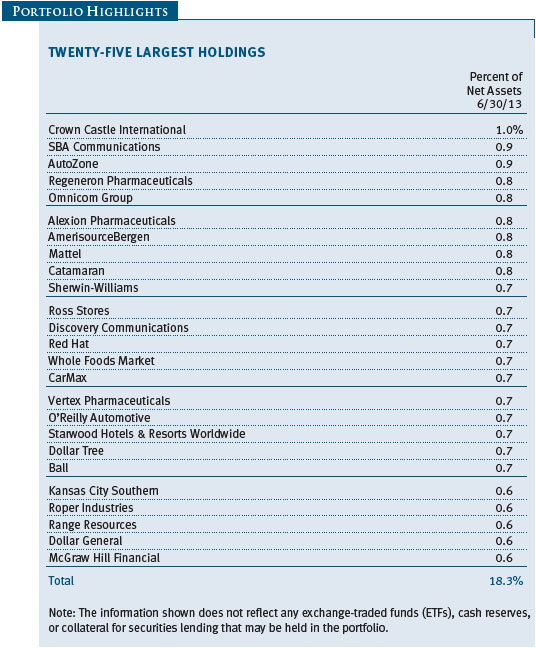
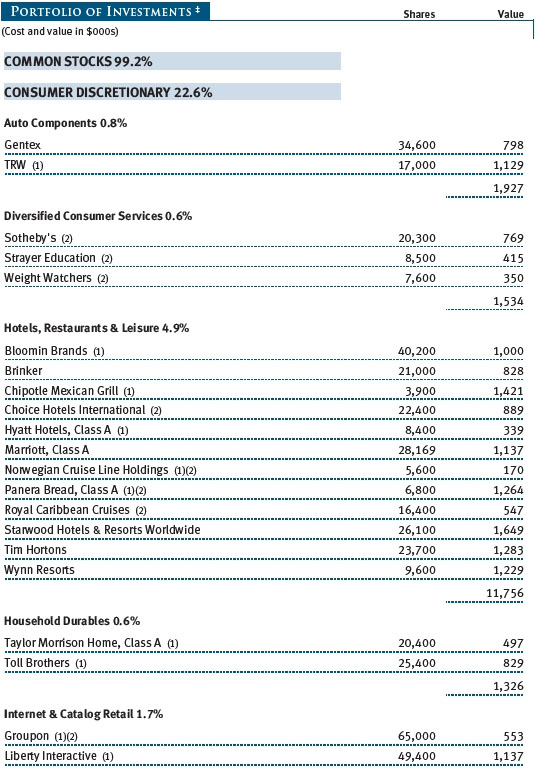
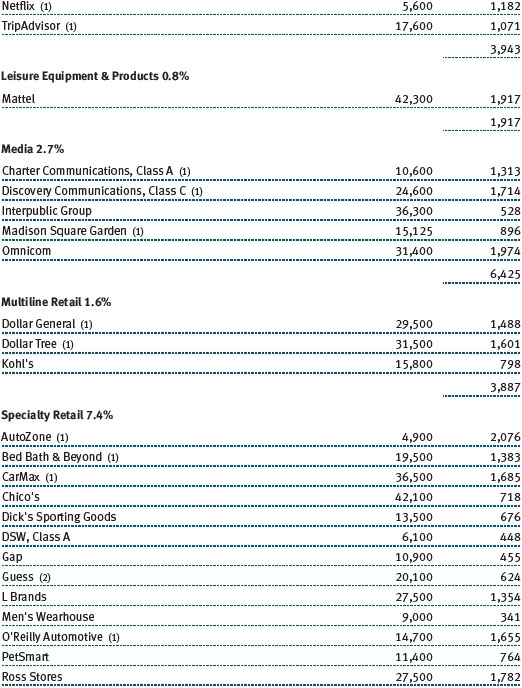
Consumer discretionary is our largest sector allocation. It is also our largest underweight versus the benchmark due in part to the challenge of finding attractive new investments relative to other sectors. Still, we find that many retailers, media companies, hotels, and restaurant operators have good business models, excellent cash flow, and other favorable attributes, and we aim to focus on leading companies in their respective niches. The economic recovery is providing a tailwind for many companies in the sector, and although we are underweighting the media industry, media companies Charter Communications and Omnicom Group were two of the fund’s top absolute contributors to performance. Auto parts retailers O’Reilly Automotive and AutoZone and used car dealer CarMax were also strong. Other significant contributors to our results include toy company Mattel, Chipotle Mexican Grill, video entertainment provider Netflix, and discount retailer Dollar Tree. (Please refer to the fund’s portfolio of investments for a complete list of holdings and the amount each represents in the portfolio.)
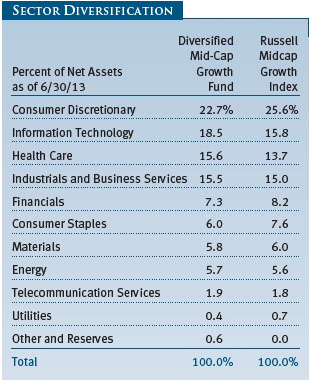
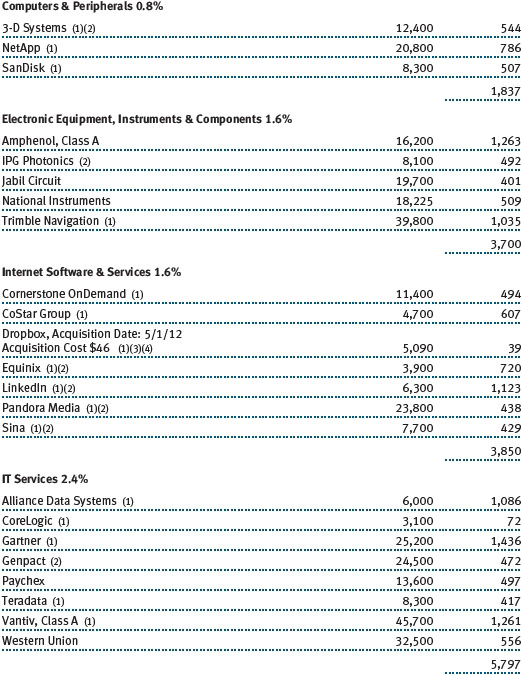
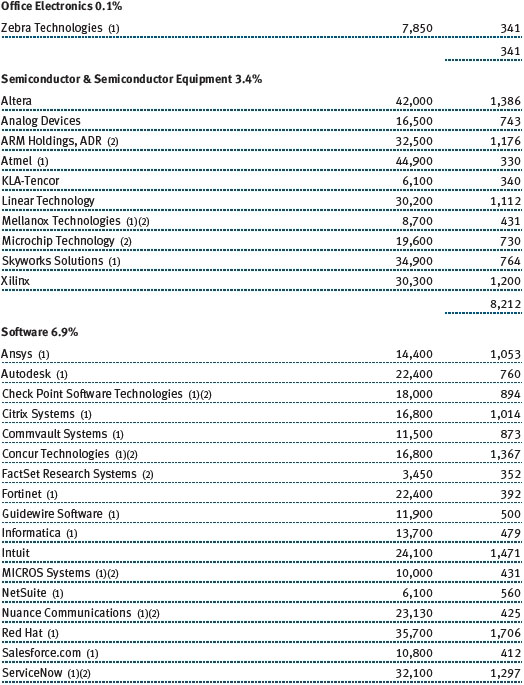
Information technology is our second-largest sector and our largest overweight versus the Russell index. While our stock selection was modestly favorable, our overweight in this underperforming sector worked against us. We are broadly diversified in the sector, but we favor companies with strong business models in industries with high barriers to entry and lower risk of commoditization. We consider technology to be a “winner take all” space in which an industry leader emerges and thrives because its products and services are broadly embraced (think of Apple’s line of iPhones in recent years) while smaller competitors are overlooked and struggle to stay relevant. As a result, selectivity is essential to avoid inexpensive companies with intractable disadvantages (i.e., a value trap). In the last six months, IT services companies were among our best performers in the sector, especially Vantiv and Gartner. Semiconductor-related companies were generally higher, but we eliminated several names in the last six months, continuing our efforts to reduce exposure to an industry suffering from a lack of growth and intensifying competition. Our gains in the software industry were concentrated in ServiceNow, Concur Technologies, and Workday, a provider of “cloud” software applications for corporate human resources and finance departments. Most remaining tech industries produced mild gains, but poor performance of F5 Networks and Aruba Networks weighed on the communications equipment industry. The wireless local area network space has grown more competitive due to tech giant Cisco Systems’ recent improved focus and execution.
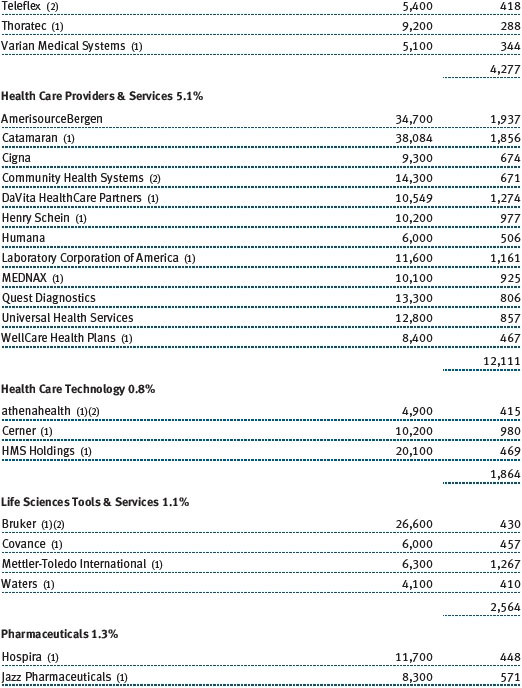
Our health care stocks produced solid gains and performed mostly in line with their benchmark peers in the last six months. We are overweighting the sector relative to the Russell benchmark, and we are currently emphasizing providers and services companies given demographic factors and growing demand for access to health care services. We are also overweighting biotechnology companies, but we have broad diversification in the industry to reduce our risks. Allocations to other industries, such as health care technology and life sciences, are notably smaller. Our providers and services companies advanced broadly, led by AmerisourceBergen, Universal Health Services, and Community Health Systems. Our biotechnology holdings also made a strong performance contribution, with gains concentrated in Vertex Pharmaceuticals and Regeneron Pharmaceuticals. Vertex was the portfolio’s largest absolute contributor to performance, as shares soared in April on news of favorable testing data for its cystic fibrosis drug. Regeneron also did very well amid brisk sales of Eylea, the company’s drug to treat macular degeneration. Infinity Pharmaceuticals, which we added in the last six months, was a major disappointment, however. Shares tumbled amid safety concerns about the company’s experimental leukemia drug. While a few of our pharmaceutical stocks performed well, equipment and supply companies sagged, led by Edwards Lifesciences.
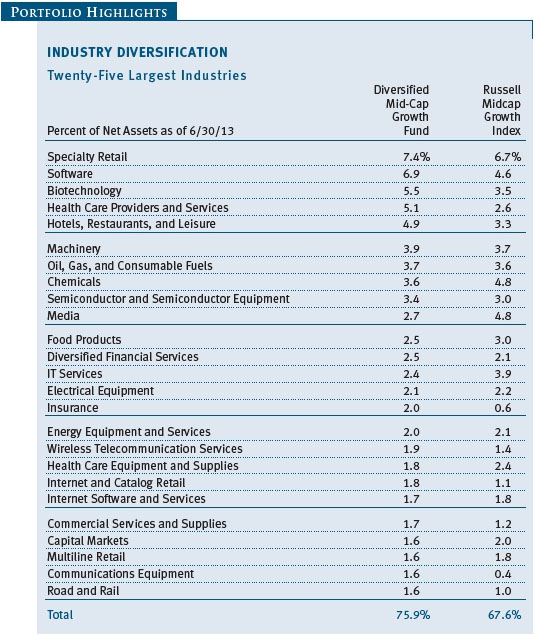
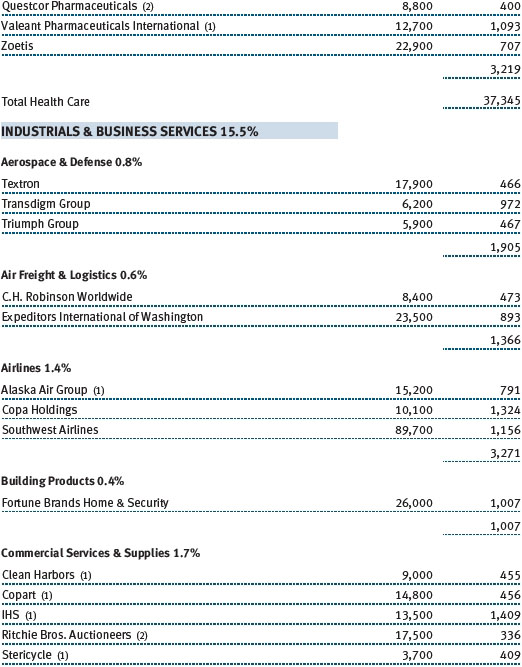
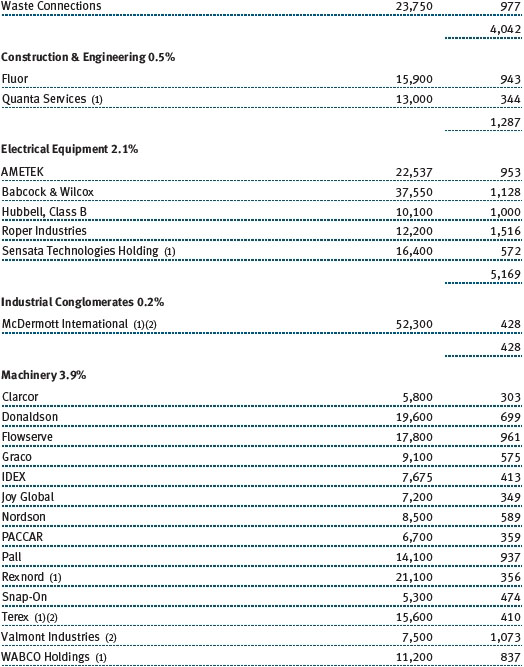
Industrials and business services stocks produced good returns in the last six months, but our holdings narrowly lagged their index peers. Our sector weighting is roughly in line with that of the Russell benchmark. Many industrials have attractive valuations and are world class in their respective niches. While some may have wide earnings variance due to the cyclical nature of their businesses, we tend to favor higher-quality industrials with greater earnings stability throughout the business cycle. Our road and rail stocks led the sector, especially Kansas City Southern. Machinery stocks rose broadly, led by Wabtec, and our airline stocks gained altitude, particularly Panama-based Copa Holdings, which serves the Caribbean region and Central America. The company’s rapid expansion is contributing to its strong earnings growth. However, air freight and logistics company C.H. Robinson Worldwide sagged due to weaker-than-expected first-quarter earnings and higher expenses. In response, we reduced our position size during the second quarter.
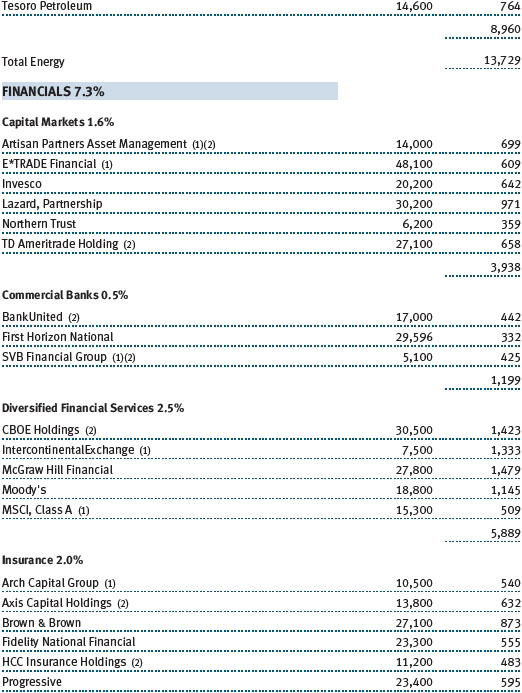
Our holdings in the financials sector, which is a relatively small part of the mid-cap growth universe, were among the best performers in the entire portfolio. As mentioned earlier, our stock selection versus the Russell index added to relative performance. Within the insurance industry, Brown & Brown and Axis Capital Holdings were strong performers. Among diversified financial services companies, our two operators of securities exchanges—CBOE Holdings and IntercontinentalExchange—produced excellent returns and were among the fund’s top absolute contributors. Capital markets companies were lifted by strong equity market performance and increased trading activity, and TD Ameritrade Holding and E*TRADE Financial were beneficiaries. Our commercial banks lagged with modest gains, and after several years of waiting patiently for a more robust recovery, we eliminated several of them in favor of better long-term opportunities.
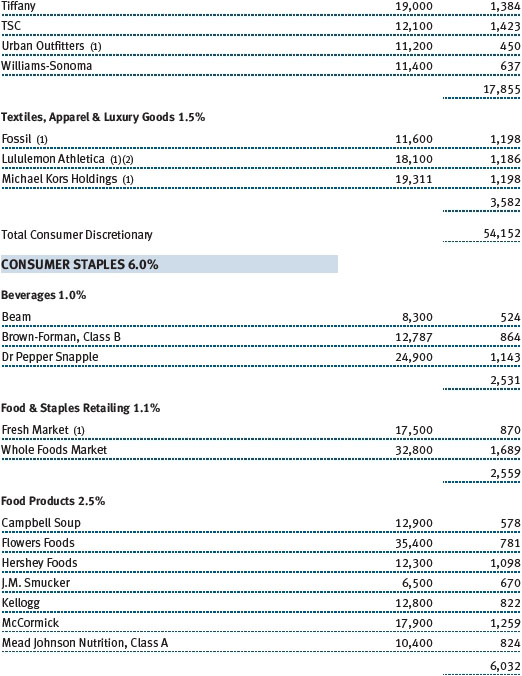
Our consumer staples holdings in aggregate produced strong absolute returns in the first half of 2013, but stock selection hurt our relative performance. Our sector underweighting, which is based on our belief that most companies in the sector are fairly valued, if not overvalued, also worked against us. Most of our positions are makers of food and beverage products with strong brands that we have owned for several years. In the last six months, bakery products maker Flowers Foods, Hershey Foods, Kellogg, and McCormick performed very well. Organic grocery store operator Whole Foods Market also did well. Our shares of beverage companies trailed with modest gains.
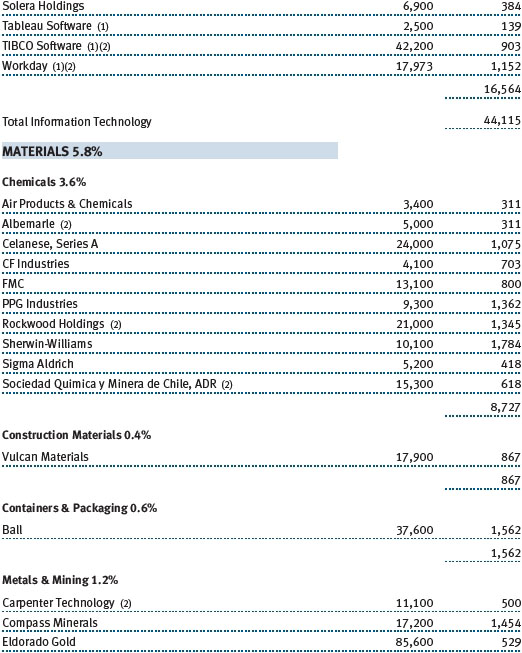
Our investments in the materials sector detracted from the fund’s absolute performance in the first half of the year. Our approach to the sector, as our long-term investors know, is to seek differentiated companies—primarily in the chemicals and metals and mining industries—that can add value to a commodity or are well positioned for the long term. Two of our chemicals companies—specialty chemical maker Rockwood Holdings and paint maker Sherwin-Williams—did very well. The former was lifted by the U.S. economic recovery, by plans to sell some of its business units, and by a dividend increase; the latter is benefiting from the housing market recovery. However, our metals and mining businesses fared poorly, declining sharply with metals prices amid slowing growth in resource-hungry China and other emerging markets. Eldorado Gold was a significant detractor. While we do not try to predict or invest based on commodity price trends, we believe maintaining a small allocation to gold-mining stocks provides a good hedge against inflation.
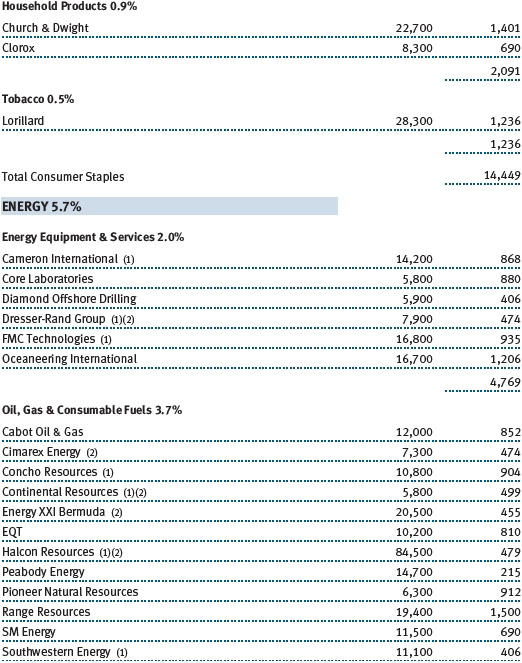
Energy stocks produced solid returns for the fund in the last six months, although our stock selection hurt our relative performance. As our long-term investors know, our energy investments are not made in an attempt to take advantage of short-term commodity price movements. Rather, we look to invest in differentiated service companies or those that are skilled at finding underlying resources, particularly the lowest-cost producers. Our energy equipment and services companies rose broadly, led by Oceaneering International, FMC Technologies, and Core Laboratories. Oil, gas, and consumable fuels companies trailed somewhat. Range Resources and Pioneer Natural Resources fared very well, but coal producer Peabody Energy was a disappointment.
OUTLOOK
The equity market environment turned somewhat challenging late in the second quarter, as the Federal Reserve’s plans to taper its asset purchases later this year led to a spike in long-term interest rates and increased stock market volatility that is worthy of some concern. Even though long-term rates are materially higher than they were at the beginning of the year, bonds remain a very unattractive asset class, and central bank manipulation is likely to keep interest rates fairly low for a few more years.
Equities remain attractive, though there is enough speculative activity in the market that gives us some pause. While the strong rebound in lower-quality and levered companies hurt our relative results in the first half of the year, it does suggest that the risk of financial distress is not being priced into the market. As market conditions return to a more normal state, investors may increasingly favor high-quality companies that offer growth at a reasonable price.
Our basic outlook has not changed in the last six months. We believe the current environment continues to provide patient investors who are willing to take prudent risks with a great opportunity to invest in equities for long-term capital growth. Consider the positives: The U.S. economy and corporate earnings are growing; the Federal Reserve is likely to keep short-term interest rates very low for the foreseeable future, corporations have substantial cash reserves on their strong balance sheets and have generally been responsible stewards of capital. In addition, equity valuations remain generally attractive, and bond returns are likely to be negative. If interest rates continue rising as the economy recovers and investors abandon the fixed income markets due to mounting losses, it is likely that they will turn to equities for better long-term growth potential.
Thank you for your confidence in T. Rowe Price.
Respectfully submitted,

Donald J. Peters
Cochairman of the fund’s Investment Advisory Committee

Donald J. Easley
Cochairman of the fund’s Investment Advisory Committee
July 17, 2013
The committee cochairmen have day-to-day responsibility for managing the portfolio and work with committee members in developing and executing the fund’s investment program.
RISKS OF INVESTING
As with all equity funds, this fund’s share price can fall because of weakness in the broad market, a particular industry, or specific holdings. The market as a whole can decline for many reasons, including adverse political or economic developments here or abroad, changes in investor psychology, or heavy institutional selling. The prospects for an industry or company may deteriorate because of a variety of factors, including disappointing earnings or changes in the competitive environment. In addition, our assessment of companies held in the fund may prove incorrect, resulting in losses or poor performance even in a rising market. Finally, the fund’s investment approach could fall out of favor with the investing public, resulting in lagging performance versus other types of stock funds.
The stocks of mid-cap companies entail greater risk and are usually more volatile than the shares of large companies. In addition, growth stocks can be volatile for several reasons. Since they usually reinvest a high proportion of earnings in their own businesses, they may lack the dividends usually associated with value stocks that can cushion their decline in a falling market. Also, since investors buy these stocks because of their expected superior earnings growth, earnings disappointments often result in sharp price declines.
Diversification cannot protect against loss in a declining market or assure a profit.
GLOSSARY
Earnings growth rate–current fiscal year: Measures the annualized percent change in earnings per share from the prior fiscal year to the current fiscal year.
Lipper indexes: Fund benchmarks that consist of a small number (10 to 30) of the largest mutual funds in a particular category as tracked by Lipper Inc.
Price-to-earnings (P/E) ratio–12 months forward: A valuation measure calculated by dividing the price of a stock by the analysts’ forecast of the next 12 months’ expected earnings. The ratio is a measure of how much investors are willing to pay for the company’s future earnings. The higher the P/E, the more investors are paying for a company’s earnings growth in the next 12 months.
Projected earnings growth rate (IBES): A company’s expected earnings per share growth rate for a given time period based on the forecast from the Institutional Broker’s Estimate System, which is commonly referred to as IBES.
Return on equity (ROE)–current fiscal year: A valuation measure calculated by dividing the company’s current fiscal year net income by shareholders’ equity (i.e., the company’s book value). ROE measures how much a company earns on each dollar that common stock investors have put into the company. It indicates how effectively and efficiently a company and its management are using stockholder investments.
Russell Midcap Growth Index: An index that tracks the performance of mid-cap stocks with higher price-to-book ratios and higher forecast growth values.
Russell Midcap Index: An unmanaged index that tracks the performance of the 800 smallest companies in the Russell 1000 Index.
Russell Midcap Value Index: An index that tracks the performance of mid-cap stocks with lower price-to-book ratios and lower forecast growth values.
S&P 500 Index: An unmanaged index that tracks the stocks of 500 primarily large-cap U.S. companies.
S&P MidCap 400 Index: An unmanaged index that tracks the stocks of 400 U.S. mid-cap companies.
Note: Russell Investment Group is the source and owner of the trademarks, service marks, and copyrights related to the Russell indexes. Russell® is a trademark of Russell Investment Group.
Performance and Expenses
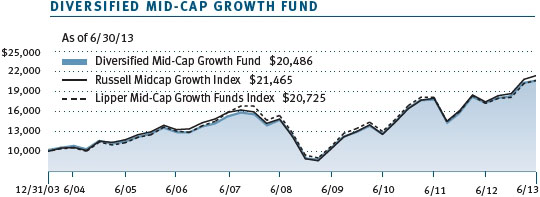
| Growth of $10,000 |
This chart shows the value of a hypothetical $10,000 investment in the fund over the past 10 fiscal year periods or since inception (for funds lacking 10-year records). The result is compared with benchmarks, which may include a broad-based market index and a peer group average or index. Market indexes do not include expenses, which are deducted from fund returns as well as mutual fund averages and indexes.
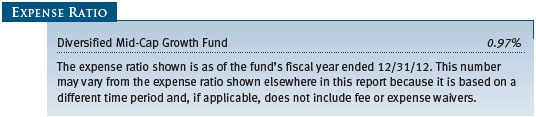
| Fund Expense Example |
As a mutual fund shareholder, you may incur two types of costs: (1) transaction costs, such as redemption fees or sales loads, and (2) ongoing costs, including management fees, distribution and service (12b-1) fees, and other fund expenses. The following example is intended to help you understand your ongoing costs (in dollars) of investing in the fund and to compare these costs with the ongoing costs of investing in other mutual funds. The example is based on an investment of $1,000 invested at the beginning of the most recent six-month period and held for the entire period.
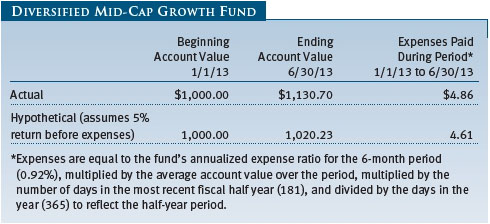
Actual Expenses
The first line of the following table (Actual) provides information about actual account values and expenses based on the fund’s actual returns. You may use the information on this line, together with your account balance, to estimate the expenses that you paid over the period. Simply divide your account value by $1,000 (for example, an $8,600 account value divided by $1,000 = 8.6), then multiply the result by the number on the first line under the heading “Expenses Paid During Period” to estimate the expenses you paid on your account during this period.
Hypothetical Example for Comparison Purposes
The information on the second line of the table (Hypothetical) is based on hypothetical account values and expenses derived from the fund’s actual expense ratio and an assumed 5% per year rate of return before expenses (not the fund’s actual return). You may compare the ongoing costs of investing in the fund with other funds by contrasting this 5% hypothetical example and the 5% hypothetical examples that appear in the shareholder reports of the other funds. The hypothetical account values and expenses may not be used to estimate the actual ending account balance or expenses you paid for the period.
Note: T. Rowe Price charges an annual account service fee of $20, generally for accounts with less than $10,000. The fee is waived for any investor whose T. Rowe Price mutual fund accounts total $50,000 or more; accounts electing to receive electronic delivery of account statements, transaction confirmations, prospectuses, and shareholder reports; or accounts of an investor who is a T. Rowe Price Preferred Services, Personal Services, or Enhanced Personal Services client (enrollment in these programs generally requires T. Rowe Price assets of at least $100,000). This fee is not included in the accompanying table. If you are subject to the fee, keep it in mind when you are estimating the ongoing expenses of investing in the fund and when comparing the expenses of this fund with other funds.
You should also be aware that the expenses shown in the table highlight only your ongoing costs and do not reflect any transaction costs, such as redemption fees or sales loads. Therefore, the second line of the table is useful in comparing ongoing costs only and will not help you determine the relative total costs of owning different funds. To the extent a fund charges transaction costs, however, the total cost of owning that fund is higher.
Unaudited
The accompanying notes are an integral part of these financial statements.
Unaudited


The accompanying notes are an integral part of these financial statements.
Unaudited
The accompanying notes are an integral part of these financial statements.
Unaudited
The accompanying notes are an integral part of these financial statements.
Unaudited
The accompanying notes are an integral part of these financial statements.
Unaudited
| Notes to Financial Statements |
T. Rowe Price Diversified Mid-Cap Growth Fund, Inc. (the fund), is registered under the Investment Company Act of 1940 (the 1940 Act) as a diversified, open-end management investment company. The fund commenced operations on December 31, 2003. The fund seeks to provide long-term capital growth by investing primarily in the common stocks of mid-cap growth companies.
NOTE 1 - SIGNIFICANT ACCOUNTING POLICIES
Basis of Preparation The accompanying financial statements were prepared in accordance with accounting principles generally accepted in the United States of America (GAAP), which require the use of estimates made by management. Management believes that estimates and valuations are appropriate; however, actual results may differ from those estimates, and the valuations reflected in the accompanying financial statements may differ from the value ultimately realized upon sale or maturity.
Investment Transactions, Investment Income, and Distributions Income and expenses are recorded on the accrual basis. Dividends received from mutual fund investments are reflected as dividend income; capital gain distributions are reflected as realized gain/loss. Earnings on investments recognized as partnerships for federal income tax purposes reflect the tax character of such earnings. Dividend income and capital gain distributions are recorded on the ex-dividend date. Income tax-related interest and penalties, if incurred, would be recorded as income tax expense. Investment transactions are accounted for on the trade date. Realized gains and losses are reported on the identified cost basis. Distributions to shareholders are recorded on the ex-dividend date. Income distributions are declared and paid annually. Capital gain distributions, if any, are generally declared and paid by the fund annually.
Rebates and Credits Subject to best execution, the fund may direct certain security trades to brokers who have agreed to rebate a portion of the related brokerage commission to the fund in cash. Commission rebates are reflected as realized gain on securities in the accompanying financial statements. Additionally, the fund earns credits on temporarily uninvested cash balances held at the custodian, which reduce the fund’s custody charges. Custody expense in the accompanying financial statements is presented before reduction for credits.
New Accounting Guidance In December 2011, the Financial Accounting Standards Board issued amended guidance requiring an entity to disclose information about offsetting and related arrangements to enable users of its financial statements to understand the effect of those arrangements on its financial position. The guidance is effective for fiscal years and interim periods beginning on or after January 1, 2013. Adoption had no effect on the fund’s net assets or results of operations.
NOTE 2 - VALUATION
The fund’s financial instruments are valued and its net asset value (NAV) per share is computed at the close of the New York Stock Exchange (NYSE), normally 4 p.m. ET, each day the NYSE is open for business.
Fair Value The fund’s financial instruments are reported at fair value, which GAAP defines as the price that would be received to sell an asset or paid to transfer a liability in an orderly transaction between market participants at the measurement date. The T. Rowe Price Valuation Committee (the Valuation Committee) has been established by the fund’s Board of Directors (the Board) to ensure that financial instruments are appropriately priced at fair value in accordance with GAAP and the 1940 Act. Subject to oversight by the Board, the Valuation Committee develops and oversees pricing-related policies and procedures and approves all fair value determinations. Specifically, the Valuation Committee establishes procedures to value securities; determines pricing techniques, sources, and persons eligible to effect fair value pricing actions; oversees the selection, services, and performance of pricing vendors; oversees valuation-related business continuity practices; and provides guidance on internal controls and valuation-related matters. The Valuation Committee reports to the fund’s Board; is chaired by the fund’s treasurer; and has representation from legal, portfolio management and trading, operations, and risk management.
Various valuation techniques and inputs are used to determine the fair value of financial instruments. GAAP establishes the following fair value hierarchy that categorizes the inputs used to measure fair value:
Level 1 – quoted prices (unadjusted) in active markets for identical financial instruments that the fund can access at the reporting date
Level 2 – inputs other than Level 1 quoted prices that are observable, either directly or indirectly (including, but not limited to, quoted prices for similar financial instruments in active markets, quoted prices for identical or similar financial instruments in inactive markets, interest rates and yield curves, implied volatilities, and credit spreads)
Level 3 – unobservable inputs
Observable inputs are developed using market data, such as publicly available information about actual events or transactions, and reflect the assumptions that market participants would use to price the financial instrument. Unobservable inputs are those for which market data are not available and are developed using the best information available about the assumptions that market participants would use to price the financial instrument. GAAP requires valuation techniques to maximize the use of relevant observable inputs and minimize the use of unobservable inputs. When multiple inputs are used to derive fair value, the financial instrument is assigned to the level within the fair value hierarchy based on the lowest-level input that is significant to the fair value of the financial instrument. Input levels are not necessarily an indication of the risk or liquidity associated with financial instruments at that level but rather the degree of judgment used in determining those values.
Valuation Techniques Equity securities listed or regularly traded on a securities exchange or in the over-the-counter (OTC) market are valued at the last quoted sale price or, for certain markets, the official closing price at the time the valuations are made. OTC Bulletin Board securities are valued at the mean of the closing bid and asked prices. A security that is listed or traded on more than one exchange is valued at the quotation on the exchange determined to be the primary market for such security. Listed securities not traded on a particular day are valued at the mean of the closing bid and asked prices. Actively traded domestic equity securities generally are categorized in Level 1 of the fair value hierarchy. OTC Bulletin Board securities and equity securities traded in inactive markets generally are categorized in Level 2 of the fair value hierarchy.
Investments in mutual funds are valued at the mutual fund’s closing net asset value per share on the day of valuation and are categorized in Level 1 of the fair value hierarchy. Assets and liabilities other than financial instruments, including short-term receivables and payables, are carried at cost, or estimated realizable value, if less, which approximates fair value.
Thinly traded financial instruments and those for which the above valuation procedures are inappropriate or are deemed not to reflect fair value are stated at fair value as determined in good faith by the Valuation Committee. The objective of any fair value pricing determination is to arrive at a price that could reasonably be expected from a current sale. Financial instruments fair valued by the Valuation Committee are primarily private placements, restricted securities, warrants, rights, and other securities that are not publicly traded.
Subject to oversight by the Board, the Valuation Committee regularly makes good faith judgments to establish and adjust the fair valuations of certain securities as events occur and circumstances warrant. For instance, in determining the fair value of an equity investment with limited market activity, such as a private placement or a thinly traded public company stock, the Valuation Committee considers a variety of factors, which may include, but are not limited to, the issuer’s business prospects, its financial standing and performance, recent investment transactions in the issuer, new rounds of financing, negotiated transactions of significant size between other investors in the company, relevant market valuations of peer companies, strategic events affecting the company, market liquidity for the issuer, and general economic conditions and events. In consultation with the investment and pricing teams, the Valuation Committee will determine an appropriate valuation technique based on available information, which may include both observable and unobservable inputs. The Valuation Committee typically will afford greatest weight to actual prices in arm’s length transactions, to the extent they represent orderly transactions between market participants; transaction information can be reliably obtained; and prices are deemed representative of fair value. However, the Valuation Committee may also consider other valuation methods such as market-based valuation multiples; a discount or premium from market value of a similar, freely traded security of the same issuer; or some combination. Fair value determinations are reviewed on a regular basis and updated as information becomes available, including actual purchase and sale transactions of the issue. Because any fair value determination involves a significant amount of judgment, there is a degree of subjectivity inherent in such pricing decisions and fair value prices determined by the Valuation Committee could differ from those of other market participants. Depending on the relative significance of unobservable inputs, including the valuation technique(s) used, fair valued securities may be categorized in Level 2 or 3 of the fair value hierarchy.
Valuation Inputs The following table summarizes the fund’s financial instruments, based on the inputs used to determine their fair values on June 30, 2013:
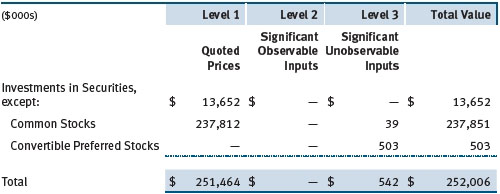
There were no material transfers between Levels 1 and 2 during the period.
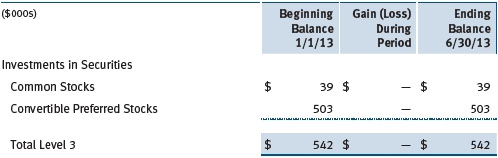
Following is a reconciliation of the fund’s Level 3 holdings for the six months ended June 30, 2013. Gain (loss) reflects both realized and change in unrealized gain/loss on Level 3 holdings during the period, if any, and is included on the accompanying Statement of Operations. The change in unrealized gain/loss on Level 3 instruments held at June 30, 2013, totaled $0 for the six months ended June 30, 2013.
NOTE 3 - OTHER INVESTMENT TRANSACTIONS
Consistent with its investment objective, the fund engages in the following practices to manage exposure to certain risks and/or to enhance performance. The investment objective, policies, program, and risk factors of the fund are described more fully in the fund’s prospectus and Statement of Additional Information.
Restricted Securities The fund may invest in securities that are subject to legal or contractual restrictions on resale. Prompt sale of such securities at an acceptable price may be difficult and may involve substantial delays and additional costs.
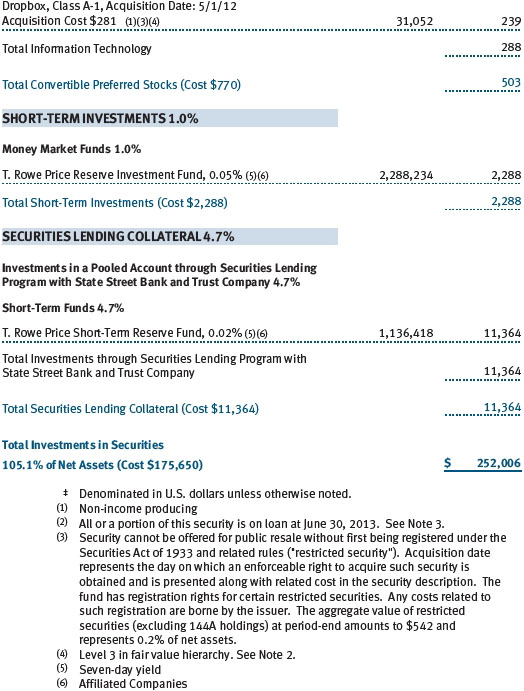
Securities Lending The fund lends its securities to approved brokers to earn additional income. Its securities lending activities are administered by a lending agent in accordance with a securities lending agreement. It receives as collateral cash and U.S. government securities valued at 102% to 105% of the value of the securities on loan. Collateral is maintained over the life of the loan in an amount not less than the value of loaned securities; any additional collateral required due to changes in security values is delivered to the fund the next business day. Cash collateral is invested by the fund’s lending agent(s) in accordance with investment guidelines approved by management. Additionally, the lending agent indemnifies the fund against losses resulting from borrower default. Although risk is mitigated by the collateral, the fund could experience a delay in recovering its securities and a possible loss of income or value if the borrower fails to return the securities, collateral investments decline in value, or the lending agent fails to perform. Securities lending revenue recognized by the fund consists of earnings on invested collateral and borrowing fees, net of any rebates to the borrower, compensation to the lending agent and other administrative costs. In accordance with GAAP, investments made with cash collateral are reflected in the accompanying financial statements, but collateral received in the form of securities is not. At June 30, 2013, the value of loaned securities was $11,114,000; the value of cash collateral and related investments was $11,364,000.
Other Purchases and sales of portfolio securities other than short-term securities aggregated $31,564,000 and $15,658,000, respectively, for the six months ended June 30, 2013.
NOTE 4 - FEDERAL INCOME TAXES
No provision for federal income taxes is required since the fund intends to continue to qualify as a regulated investment company under Subchapter M of the Internal Revenue Code and distribute to shareholders all of its taxable income and gains. Distributions determined in accordance with federal income tax regulations may differ in amount or character from net investment income and realized gains for financial reporting purposes. Financial reporting records are adjusted for permanent book/tax differences to reflect tax character but are not adjusted for temporary differences. The amount and character of tax-basis distributions and composition of net assets are finalized at fiscal year-end; accordingly, tax-basis balances have not been determined as of the date of this report.
The fund intends to retain realized gains to the extent of available capital loss carryforwards. As a result of the Regulated Investment Company Modernization Act of 2010, net capital losses realized on or after January 1, 2011 (effective date) may be carried forward indefinitely to offset future realized capital gains; however, post-effective losses must be used before pre-effective capital loss carryforwards with expiration dates. Accordingly, it is possible that all or a portion of the fund’s pre-effective capital loss carryforwards could expire unused. As of December 31, 2012, the fund had $6,869,000 of available capital loss carryforwards, which expire as follows: $2,121,000 in fiscal 2017; $4,748,000 have no expiration.
At June 30, 2013, the cost of investments for federal income tax purposes was $175,818,000. Net unrealized gain aggregated $76,188,000 at period-end, of which $80,302,000 related to appreciated investments and $4,114,000 related to depreciated investments.
NOTE 5 - RELATED PARTY TRANSACTIONS
The fund is managed by T. Rowe Price Associates, Inc. (Price Associates), a wholly owned subsidiary of T. Rowe Price Group, Inc. (Price Group). The investment management agreement between the fund and Price Associates provides for an annual investment management fee, which is computed daily and paid monthly. The fee consists of an individual fund fee, equal to 0.35% of the fund’s average daily net assets, and a group fee. The group fee rate is calculated based on the combined net assets of certain mutual funds sponsored by Price Associates (the group) applied to a graduated fee schedule, with rates ranging from 0.48% for the first $1 billion of assets to 0.275% for assets in excess of $400 billion. The fund’s group fee is determined by applying the group fee rate to the fund’s average daily net assets. At June 30, 2013, the effective annual group fee rate was 0.30%.
In addition, the fund has entered into service agreements with Price Associates and two wholly owned subsidiaries of Price Associates (collectively, Price). Price Associates computes the daily share price and provides certain other administrative services to the fund. T. Rowe Price Services, Inc., provides shareholder and administrative services in its capacity as the fund’s transfer and dividend disbursing agent. T. Rowe Price Retirement Plan Services, Inc., provides subaccounting and recordkeeping services for certain retirement accounts invested in the fund. For the six months ended June 30, 2013, expenses incurred pursuant to these service agreements were $45,000 for Price Associates; $130,000 for T. Rowe Price Services, Inc.; and $3,000 for T. Rowe Price Retirement Plan Services, Inc. The total amount payable at period-end pursuant to these service agreements is reflected as Due to Affiliates in the accompanying financial statements.
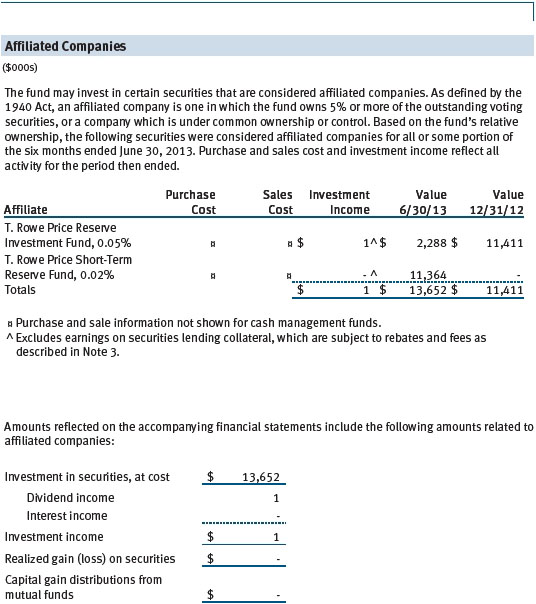
The fund may invest in the T. Rowe Price Reserve Investment Fund and the T. Rowe Price Government Reserve Investment Fund (collectively, the T. Rowe Price Reserve Investment Funds), open-end management investment companies managed by Price Associates and considered affiliates of the fund. The T. Rowe Price Reserve Investment Funds are offered as cash management options to mutual funds, trusts, and other accounts managed by Price Associates and/or its affiliates and are not available for direct purchase by members of the public. The T. Rowe Price Reserve Investment Funds pay no investment management fees.
| Information on Proxy Voting Policies, Procedures, and Records |
A description of the policies and procedures used by T. Rowe Price funds and portfolios to determine how to vote proxies relating to portfolio securities is available in each fund’s Statement of Additional Information. You may request this document by calling 1-800-225-5132 or by accessing the SEC’s website, sec.gov.
The description of our proxy voting policies and procedures is also available on our website, troweprice.com. To access it, click on the words “Social Responsibility” at the top of our corporate homepage. Next, click on the words “Conducting Business Responsibly” on the left side of the page that appears. Finally, click on the words “Proxy Voting Policies” on the left side of the page that appears.
Each fund’s most recent annual proxy voting record is available on our website and through the SEC’s website. To access it through our website, follow the above directions to reach the “Conducting Business Responsibly” page. Click on the words “Proxy Voting Records” on the left side of that page, and then click on the “View Proxy Voting Records” link at the bottom of the page that appears.
| How to Obtain Quarterly Portfolio Holdings |
The fund files a complete schedule of portfolio holdings with the Securities and Exchange Commission for the first and third quarters of each fiscal year on Form N-Q. The fund’s Form N-Q is available electronically on the SEC’s website (sec.gov); hard copies may be reviewed and copied at the SEC’s Public Reference Room, 100 F St. N.E., Washington, DC 20549. For more information on the Public Reference Room, call 1-800-SEC-0330.
| Approval of Investment Management Agreement |
On March 5, 2013, the fund’s Board of Directors (Board), including a majority of the fund’s independent directors, approved the continuation of the investment management agreement (Advisory Contract) between the fund and its investment advisor, T. Rowe Price Associates, Inc. (Advisor). In connection with their deliberations, the Board requested, and the Advisor provided, such information as the Board (with advice from independent legal counsel) deemed reasonably necessary. The Board considered a variety of factors in connection with its review of the Advisory Contract, also taking into account information provided by the Advisor during the course of the year, as discussed below:
Services Provided by the Advisor
The Board considered the nature, quality, and extent of the services provided to the fund by the Advisor. These services included, but were not limited to, directing the fund’s investments in accordance with its investment program and the overall management of the fund’s portfolio, as well as a variety of related activities such as financial, investment operations, and administrative services; compliance; maintaining the fund’s records and registrations; and shareholder communications. The Board also reviewed the background and experience of the Advisor’s senior management team and investment personnel involved in the management of the fund, as well as the Advisor’s compliance record. The Board concluded that it was satisfied with the nature, quality, and extent of the services provided by the Advisor.
Investment Performance of the Fund
The Board reviewed the fund’s three-month, one-year, and year-by-year returns, as well as the fund’s average annualized total returns over the three- and five-year and since-inception periods, and compared these returns with a wide variety of previously agreed upon comparable performance measures and market data, including those supplied by Lipper and Morningstar, which are independent providers of mutual fund data.
On the basis of this evaluation and the Board’s ongoing review of investment results, and factoring in the relative market conditions during certain of the performance periods, the Board concluded that the fund’s performance was satisfactory.
Costs, Benefits, Profits, and Economies of Scale
The Board reviewed detailed information regarding the revenues received by the Advisor under the Advisory Contract and other benefits that the Advisor (and its affiliates) may have realized from its relationship with the fund, including any research received under “soft dollar” agreements and commission-sharing arrangements with broker-dealers. The Board considered that the Advisor may receive some benefit from soft-dollar arrangements pursuant to which research is received from broker-dealers that execute the applicable fund’s portfolio transactions. The Board received information on the estimated costs incurred and profits realized by the Advisor from managing T. Rowe Price mutual funds. The Board also reviewed estimates of the profits realized from managing the fund in particular, and the Board concluded that the Advisor’s profits were reasonable in light of the services provided to the fund.
The Board also considered whether the fund benefits under the fee levels set forth in the Advisory Contract from any economies of scale realized by the Advisor. Under the Advisory Contract, the fund pays a fee to the Advisor for investment management services composed of two components—a group fee rate based on the combined average net assets of most of the T. Rowe Price mutual funds (including the fund) that declines at certain asset levels and an individual fund fee rate based on the fund’s average daily net assets—and the fund pays its own expenses of operations. The Board concluded that the advisory fee structure for the fund continued to provide for a reasonable sharing of benefits from any economies of scale with the fund’s investors.
Fees
The Board was provided with information regarding industry trends in management fees and expenses, and the Board reviewed the fund’s management fee rate, operating expenses, and total expense ratio in comparison with fees and expenses of other comparable funds based on information and data supplied by Lipper. The information provided to the Board indicated that the fund’s management fee rate was above the median for certain groups of comparable funds and at or below the median for other groups of comparable funds. The information also indicated that the total expense ratio was above the median for certain groups of comparable funds and below the median for other groups of comparable funds.
The Board also reviewed the fee schedules for institutional accounts and private accounts with similar mandates that are advised or subadvised by the Advisor and its affiliates. Management provided the Board with information about the Advisor’s responsibilities and services provided to institutional account clients, including information about how the requirements and economics of the institutional business are fundamentally different from those of the mutual fund business. The Board considered information showing that the mutual fund business is generally more complex from a business and compliance perspective than the institutional business and that the Advisor generally performs significant additional services and assumes greater risk in managing the fund and other T. Rowe Price mutual funds than it does for institutional account clients.
On the basis of the information provided and the factors considered, the Board concluded that the fees paid by the fund under the Advisory Contract are reasonable.
Approval of the Advisory Contract
As noted, the Board approved the continuation of the Advisory Contract. No single factor was considered in isolation or to be determinative to the decision. Rather, the Board concluded, in light of a weighting and balancing of all factors considered, that it was in the best interests of the fund and its shareholders for the Board to approve the continuation of the Advisory Contract (including the fees to be charged for services thereunder). The independent directors were advised throughout the process by independent legal counsel.
Item 2. Code of Ethics.
A code of ethics, as defined in Item 2 of Form N-CSR, applicable to its principal executive officer, principal financial officer, principal accounting officer or controller, or persons performing similar functions is filed as an exhibit to the registrant’s annual Form N-CSR. No substantive amendments were approved or waivers were granted to this code of ethics during the registrant’s most recent fiscal half-year.
Item 3. Audit Committee Financial Expert.
Disclosure required in registrant’s annual Form N-CSR.
Item 4. Principal Accountant Fees and Services.
Disclosure required in registrant’s annual Form N-CSR.
Item 5. Audit Committee of Listed Registrants.
Not applicable.
Item 6. Investments.
(a) Not applicable. The complete schedule of investments is included in Item 1 of this Form N-CSR.
(b) Not applicable.
Item 7. Disclosure of Proxy Voting Policies and Procedures for Closed-End Management Investment Companies.
Not applicable.
Item 8. Portfolio Managers of Closed-End Management Investment Companies.
Not applicable.
Item 9. Purchases of Equity Securities by Closed-End Management Investment Company and Affiliated Purchasers.
Not applicable.
Item 10. Submission of Matters to a Vote of Security Holders.
Not applicable.
Item 11. Controls and Procedures.
(a) The registrant’s principal executive officer and principal financial officer have evaluated the registrant’s disclosure controls and procedures within 90 days of this filing and have concluded that the registrant’s disclosure controls and procedures were effective, as of that date, in ensuring that information required to be disclosed by the registrant in this Form N-CSR was recorded, processed, summarized, and reported timely.
(b) The registrant’s principal executive officer and principal financial officer are aware of no change in the registrant’s internal control over financial reporting that occurred during the registrant’s second fiscal quarter covered by this report that has materially affected, or is reasonably likely to materially affect, the registrant’s internal control over financial reporting.
Item 12. Exhibits.
(a)(1) The registrant’s code of ethics pursuant to Item 2 of Form N-CSR is filed with the registrant’s annual Form N-CSR.
(2) Separate certifications by the registrant's principal executive officer and principal financial officer, pursuant to Section 302 of the Sarbanes-Oxley Act of 2002 and required by Rule 30a-2(a) under the Investment Company Act of 1940, are attached.
(3) Written solicitation to repurchase securities issued by closed-end companies: not applicable.
(b) A certification by the registrant's principal executive officer and principal financial officer, pursuant to Section 906 of the Sarbanes-Oxley Act of 2002 and required by Rule 30a-2(b) under the Investment Company Act of 1940, is attached.
SIGNATURES
Pursuant to the requirements of the Securities Exchange Act of 1934 and the Investment Company Act of 1940, the registrant has duly caused this report to be signed on its behalf by the undersigned, thereunto duly authorized.
T. Rowe Price Diversified Mid-Cap Growth Fund, Inc.
| By | /s/ Edward C. Bernard | |
| Edward C. Bernard | ||
| Principal Executive Officer | ||
| Date August 16, 2013 | ||
Pursuant to the requirements of the Securities Exchange Act of 1934 and the Investment Company Act of 1940, this report has been signed below by the following persons on behalf of the registrant and in the capacities and on the dates indicated.
| By | /s/ Edward C. Bernard | |
| Edward C. Bernard | ||
| Principal Executive Officer | ||
| Date August 16, 2013 | ||
| By | /s/ Gregory K. Hinkle | |
| Gregory K. Hinkle | ||
| Principal Financial Officer | ||
| Date August 16, 2013 | ||