UNITED STATES
SECURITIES AND EXCHANGE COMMISSION
Washington, D.C. 20549
FORM N-CSR
CERTIFIED SHAREHOLDER REPORT OF REGISTERED
MANAGEMENT INVESTMENT COMPANIES
Investment Company Act File Number: 811-21454
| T. Rowe Price Diversified Mid-Cap Growth Fund, Inc. |
| (Exact name of registrant as specified in charter) |
| 100 East Pratt Street, Baltimore, MD 21202 |
| (Address of principal executive offices) |
| David Oestreicher |
| 100 East Pratt Street, Baltimore, MD 21202 |
| (Name and address of agent for service) |
Registrant’s telephone number, including area code: (410) 345-2000
Date of fiscal year end: December 31
Date of reporting period: June 30, 2014
Item 1. Report to Shareholders
 |
| Diversified Mid-Cap Growth Fund | June 30, 2014 |
The views and opinions in this report were current as of June 30, 2014. They are not guarantees of performance or investment results and should not be taken as investment advice. Investment decisions reflect a variety of factors, and the managers reserve the right to change their views about individual stocks, sectors, and the markets at any time. As a result, the views expressed should not be relied upon as a forecast of the fund’s future investment intent. The report is certified under the Sarbanes-Oxley Act, which requires mutual funds and other public companies to affirm that, to the best of their knowledge, the information in their financial reports is fairly and accurately stated in all material respects.
REPORTS ON THE WEB
Sign up for our E-mail Program, and you can begin to receive updated fund reports and prospectuses online rather than through the mail. Log in to your account at troweprice.com for more information.
Manager’s Letter
Fellow Shareholders
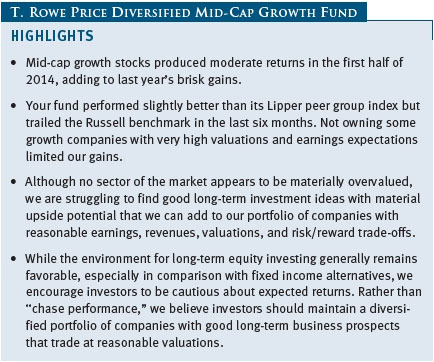
Mid-cap growth stocks produced moderate returns in the first half of 2014, adding to last year’s brisk gains. Corporate earnings growth remained positive, merger and acquisition (M&A) activity picked up, and the extraordinary low interest rate environment persisted—in fact, long-term Treasury yields declined, despite the Federal Reserve’s tapering of its asset purchases. While stocks, in general, are fairly valued and business fundamentals are broadly favorable, emerging pockets of speculation and heightened initial public offering (IPO) activity are signs that should encourage investors to have a healthy dose of caution in the near term. The long-term return potential for equities, however, remains much greater than that of fixed income investments.
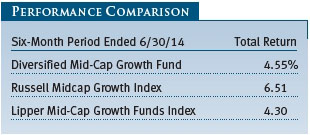
Your fund returned 4.55% in the first half of 2014. As shown in the Performance Comparison table, the fund performed slightly better than its Lipper peer group index but trailed the Russell benchmark in the last six months.
Our underperformance versus Russell was primarily due to our stock selection in various sectors; sector allocations in aggregate had a small positive impact on relative performance. While many of our holdings produced good absolute returns, what we did not own during the last six months—some growth companies with extraordinary valuations and high earnings expectations—performed better. Higher-yielding stocks, to which we have low exposure, also did very well as the low-rate environment prompted investors to continue “reaching for yield” and try to find it in the equity versus fixed income market.
As our longer-term investors know, we prefer to own stocks of companies that consistently produce solid earnings growth over time and have reasonable valuations and relatively low earnings variability. While our investments may not be as flashy as headline-grabbing “momentum” stocks that sometimes seem to rise relentlessly, we do not believe it would be prudent to abandon a solid long-term strategy of investing in good (but often unexciting) businesses in favor of chasing highflying stocks that have an increasingly unfavorable risk/reward trade-off. We also believe that reaching for yield—either in equities or in bonds—in this low-rate environment usually ends badly, as interest rates are more likely to rise than fall if the economy continues expanding and inflation picks up. Moreover, for several years investors have chased higher-yielding stocks to expensive valuations.
MARKET ENVIRONMENT
Despite a sharp weather-related contraction in the first quarter, which appears to be an aberration and not a sign of any underlying fragility in the economy, overall U.S. economic growth is continuing at a modest pace. A second-quarter rebound is being driven by stronger business and housing investment, sustained growth in labor income, as well as improving sales and manufacturing. Job growth also remains strong. Although the Federal Reserve is expected to finish tapering its asset purchases before the end of the year, the central bank’s monetary policy is likely to remain highly accommodative for some time to come. Corporate earnings growth remains favorable, and M&A activity in the first half of 2014 jumped more than 70% versus the first half of 2013—although several large deals are skewing the aggregate dollar value of the proposed transactions. IPO activity is up 60% from the first half of 2013, but we have noticed that the quality of companies coming to market has been deteriorating. Market volatility levels were quite low. Nevertheless, it is still a good time for investors seeking long-term capital growth to invest in quality companies—but near-term caution is advised.
As measured by various Russell indexes, mid-cap stocks outperformed large- and small-cap shares in the first six months of 2014. The Russell Midcap Index returned 8.67% versus 7.27% for the large-cap Russell 1000 Index and 3.19% for the small-cap Russell 2000 Index. Value stocks outperformed growth shares across all market capitalizations, particularly among mid-caps.
All sectors in the Russell Midcap Growth Index produced positive returns. In absolute terms, the telecommunication services and utilities sectors were top performers, although these are two of the smallest sectors in the index. Energy and materials did well, but these are also relatively small segments in the mid-cap growth universe. Health care and consumer staples stocks outpaced the index, while industrials and business services shares performed mostly in line with it. The consumer discretionary, financials, and information technology segments lagged with mild gains.
Companies with the most leverage (debt) generally had strong relative performance in the first half of the year. This is not surprising—as long as interest rates (and interest payments) remain low, having high levels of debt is advantageous. Similarly, higher-yielding stocks outperformed companies with lower dividend yields. When rates resume rising, we believe the performance of leveraged and higher-yielding companies will be less favorable.
Although no sector of the market appears to be materially overvalued, we are struggling to find good long-term investment ideas with material upside potential that we can add to our portfolio of companies with reasonable earnings, revenues, valuations, and risk/reward trade-offs. Many of our holdings are quietly growing their earnings over time, and we are willing to be patient for the broader market to recognize the true long-term earnings power of these good businesses. In fact, we are surprised that we have not had a greater number of our holdings become corporate acquisition targets.
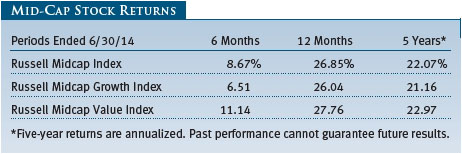
As shown in the Mid-Cap Stock Returns table, mid-cap growth stocks lagged their value counterparts in the first half of 2014 and over the last 12 months. The same was true for the five-year period ended June 30, 2014, but their absolute returns were still excellent.
Mid-caps have strongly outpaced large-caps since mid-2009. For the five-year period ended June 30, 2014—a mostly favorable period for equities as they recovered from the brutal 2008 downturn—the Russell Midcap Index produced an annualized return of 22.07% versus 18.83% for the S&P 500 Index.
Notably, U.S. stocks have outperformed equities in both developed and emerging markets in that five-year stretch: The MSCI EAFE Index and the MSCI Emerging Markets Index produced annualized returns of 12.27% and 9.58%, respectively. During the same period, U.S. shares also surpassed long-term bonds, as measured by the Citigroup 30-Year Treasury Index, which returned 7.09% on an annualized basis.
As our longer-term investors know, we believe that many U.S. mid-cap companies offer superior long-term growth potential and other favorable characteristics. Long-term data indicate that mid-caps offer a very favorable risk/reward trade-off. While we are pleased with their longer-term performance, we are cognizant that outperforming asset classes usually experience a “reversion to the mean” at some point. This means a period of superior performance for mid-caps could be followed by a period of subpar results that brings their returns back in line with long-term averages.
PORTFOLIO REVIEW
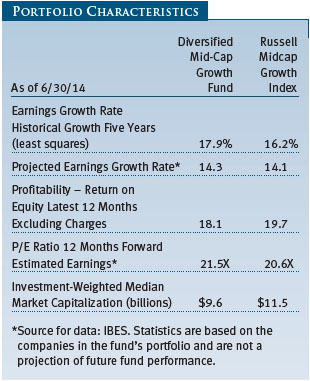
The Diversified Mid-Cap Growth Fund’s fundamental characteristics are somewhat similar to those of the Russell Midcap Growth Index, as indicated by the Portfolio Characteristics table on page 5. The portfolio’s median market capitalization ($9.6 billion) is a little lower than that of the Russell benchmark, while its price/earnings (P/E) ratio (21.5) and projected earnings growth rate (14.3%) are a little higher. These metrics reflect our commitment to mid-cap companies with excellent long-term growth prospects.
The fund’s return on equity (ROE), which measures how effectively and efficiently a company and its management are using stockholder investments, is 18.1% versus 19.7% for the benchmark. We consider a high ROE to be desirable, and we look for businesses that can sustain high profitability. One positive not shown by the data in the table is that our holdings have lower debt than businesses represented in the Russell index, based on certain long-term debt-to-equity measures.
Our time horizon for investing is longer than that of other mid-cap growth investors. Our portfolio turnover rate for the 12-month period ended June 30, 2014, was 26.2%, which is substantially less than the 2013 average of about 74.33% for mid-cap growth funds, according to data from Morningstar Direct. (Morningstar only calculates portfolio turnover for its averages at year-end, using the most recent year-end portfolio turnover figures provided to Morningstar by each of the underlying funds in the average. The Morningstar data were quoted as of July 16, 2014.) This implies that our holding period for a typical stock is about four years, whereas our average competitor holds a given stock for a little more than one year. Our relatively low turnover, which is desirable from a tax and expense perspective, reflects our long-term commitment to the companies in which we invest.
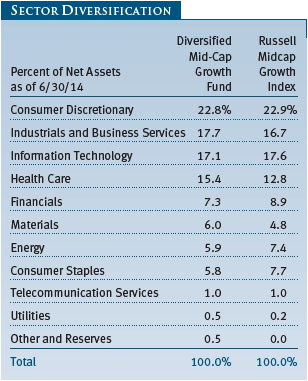
At the end of June, our largest commitments were to the consumer discretionary, industrials and business services, information technology, and health care sectors. We have very little exposure to utilities and telecommunication services because there are few businesses in those sectors that meet our growth criteria. Relative to the Russell index, we had underweights in the financials, energy, and consumer staples sectors and overweights in industrials and business services, health care, and materials.
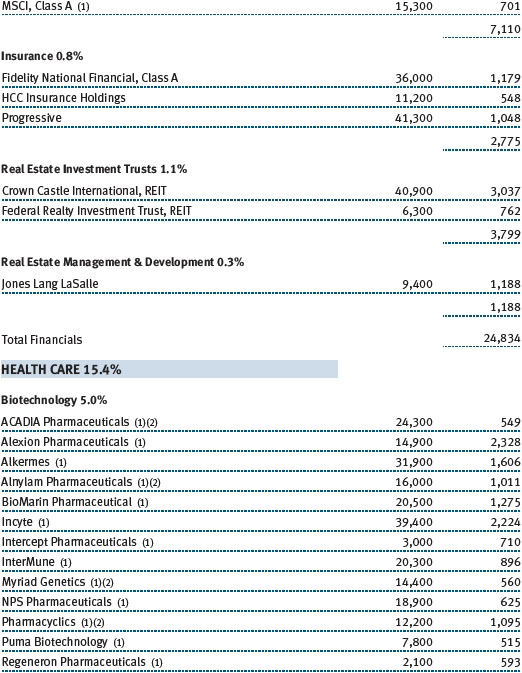
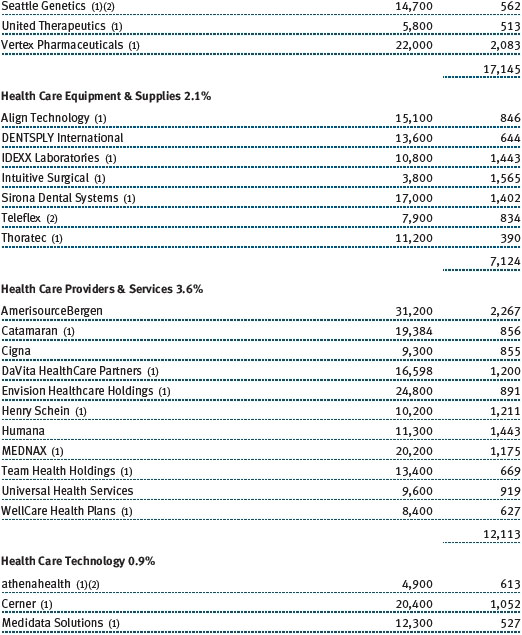
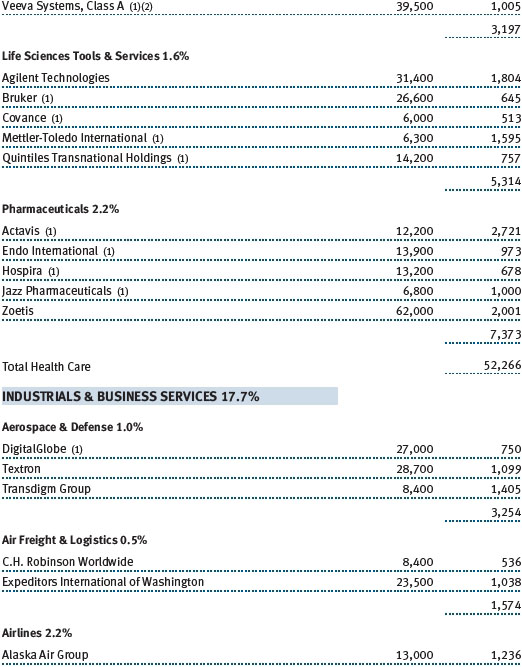
The health care sector contributed the most to our performance in absolute terms. We emphasize service providers and distributors due to demographic factors and demand for access to health care services. We also favor biotechnology companies, but we diversify these holdings to reduce risks. This period emphasized that in the volatile biotech industry, one will have big winners and losers and that risk control is essential. Biotechs were our top contributors in the sector, led by Alexion Pharmaceuticals and Vertex Pharmaceuticals. However, we did have a few missteps during the period, such as Puma Biotechnology, which plunged following the release of disappointing data on the company’s breast cancer treatment. Most of our pharmaceutical companies and our providers and services companies produced reasonable gains. Health care technology was one of the worst-performing industries in the portfolio. (Please refer to the fund’s portfolio of investments for a complete list of holdings and the amount each represents in the portfolio.)
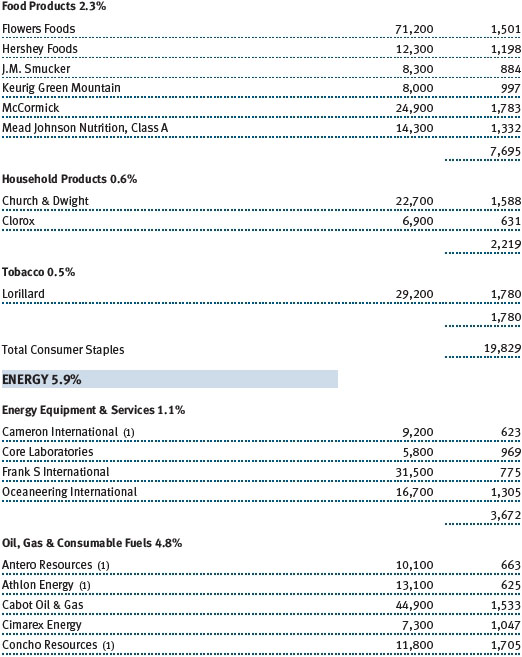
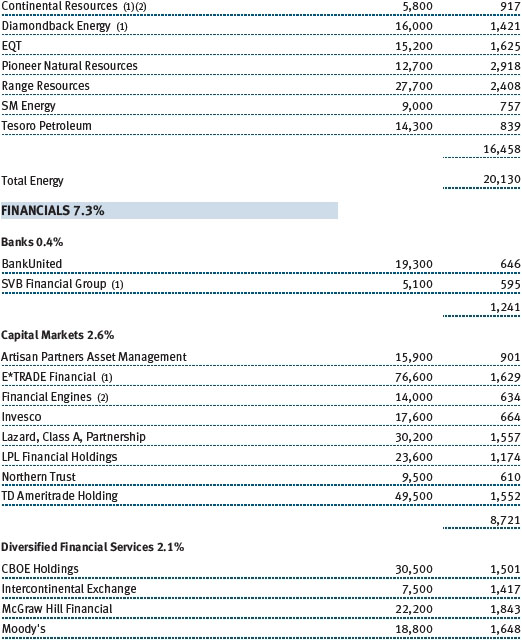
The energy sector did well, in part because of an increase in oil prices stemming from various geopolitical events. As our longer-term investors know, we do not attempt to forecast the direction of oil prices or adjust our energy sector allocation in response to short-term oil price movements. We look for differentiated service companies and those that are adept at extracting underlying resources at low costs. Oil and gas companies contributed significantly to performance, led by major exploration and production companies Pioneer Natural Resources, Concho Resources, and Diamondback Energy. With the exception of Cameron International, however, most of our energy equipment and services companies sagged.
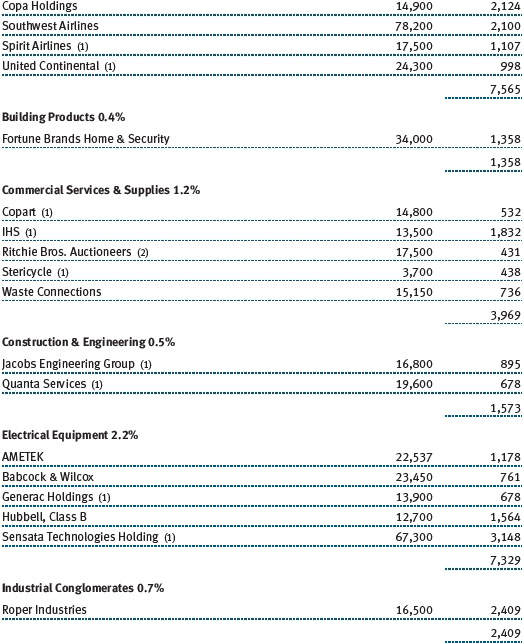
Industrials and business services companies were solid contributors to fund performance. We believe many companies in the sector have attractive valuations and are world-class in their respective niches. As the airline industry has consolidated, the companies are acting more rationally to generate reasonable returns on their invested capital. Three of our airline stocks were significant performance contributors: Southwest Airlines, Alaska Air Group, and Spirit Airlines, a low-cost airline serving North and South America that we added to the portfolio. Among electrical equipment stocks, Sensata Technologies Holding was a significant contributor to performance. Sensata makes sensors and controls used in a variety of industrial, automotive, and aerospace applications, and the company reported solid first-quarter earnings and revenue growth. Machinery stocks rose broadly, with solid performance contributions from WABCO Holdings, Xylem, and Wabtec, a high-quality industrial company that makes and services railroad and transit equipment. Its train control software is being widely implemented as safety becomes of increasing concern following several visible rail accidents. One of the weakest industries was road and rail, with Kansas City Southern among the fund’s largest detractors. Shares fell sharply at the beginning of the year when the company’s fourth-quarter earnings fell short of estimates and management became notably conservative with regard to 2014 earnings. Aerospace and defense companies also struggled.
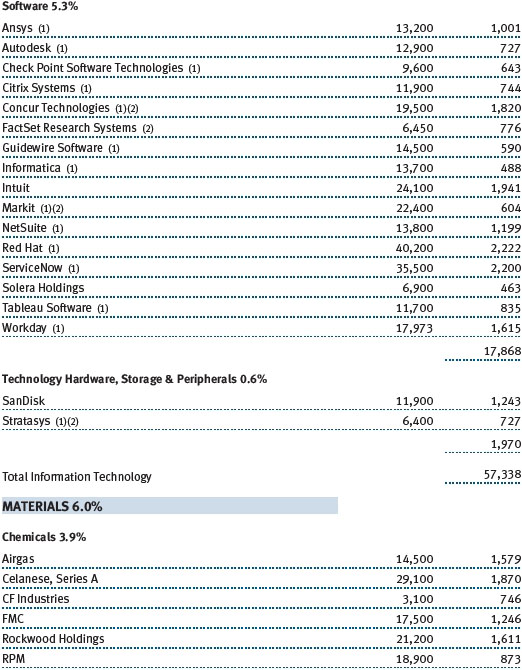
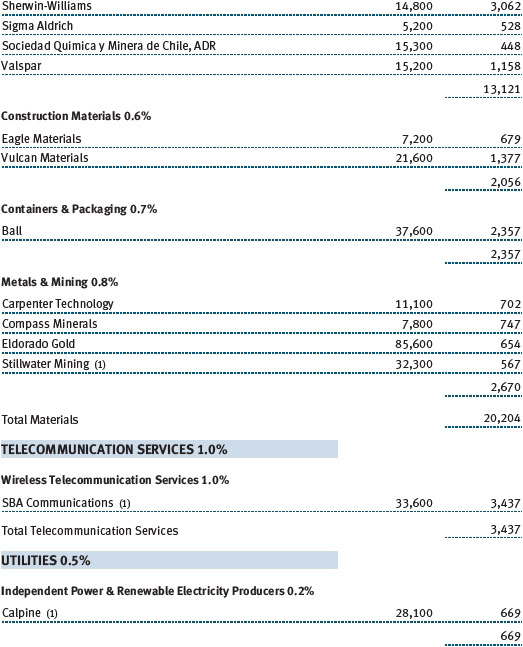
Materials stocks, though a fairly small part of the fund and the mid-cap growth universe, produced decent returns. As with energy companies, we do not make investments in the sector based on predictions of or in response to commodity price movements. We seek differentiated companies that are well positioned for the long term. Most of our holdings in the sector are chemical companies, and two strong performers were paint maker Sherwin-Williams and Celanese, a global diversified chemical company. The former continues to benefit from the recovery in the housing market; the latter has a new management that has improved operations and raised its earnings guidance for the full year. The company also has ethanol technology with significant long-term potential. Our metals and mining companies did well, recovering partially from a tough year in 2013. We continue to believe that a small allocation to gold-mining stocks can provide a small hedge against inflation.
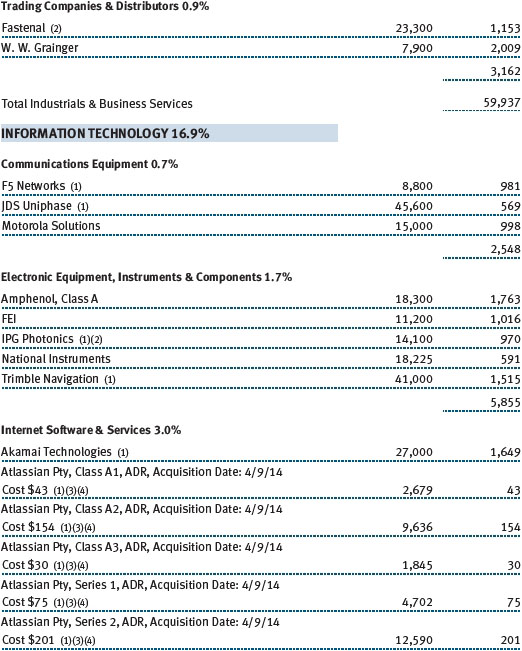
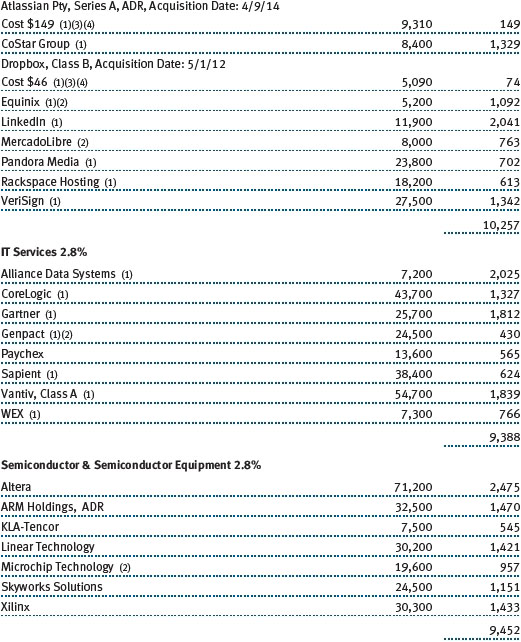
Information technology stocks added some value to the fund, though the sector’s absolute returns were subpar and our holdings generally trailed their peers in the index. We are broadly diversified in the sector but favor companies with strong business models in industries with high barriers to entry and lower risk of commoditization. We consider technology to be a “winner take all” space in which an industry leader emerges and thrives because its products and services are broadly embraced while smaller competitors are eclipsed. As a result, selectivity is essential. Certain parts of the tech sector, especially software-as-a-service companies and Internet/social media companies, experienced a sharp spring downturn. As a result, our Internet software and services companies fared poorly, especially LinkedIn, the provider of a social media site for professionals. IT services companies mostly sagged, weighed by poor performance of data and analytics company CoreLogic, which was hurt by a significant slowdown in mortgage origination activity and disappointing first-quarter earnings. On the plus side, semiconductor stocks outperformed other tech industries following years of sluggish performance due to lack of growth and growing competition. Skyworks Solutions led our holdings in the sector and was one of the portfolio’s top contributors. F5 Networks was strong in the communications equipment industry, but we eliminated Aruba Networks and Juniper Networks in favor of better long-term growth opportunities elsewhere.
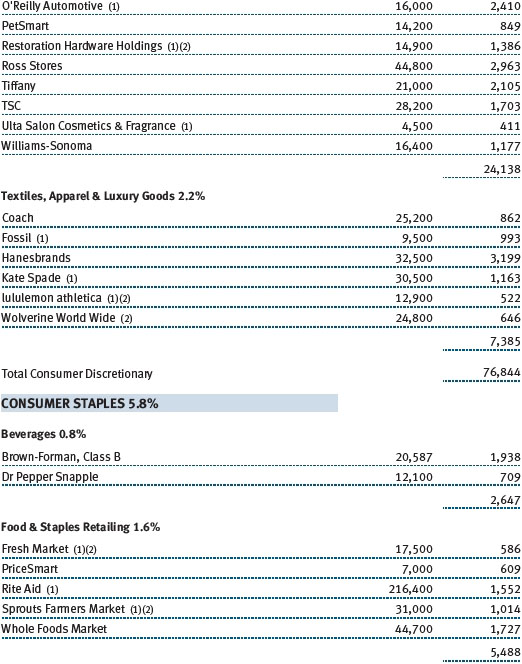
Companies in the consumer staples sector, one of the smallest in the mid-cap growth universe, produced moderate gains. We underweight this sector—many companies are fairly valued or expensive—but our holdings tend to have strong brands. Beverage and food products companies did well, led by spirits maker Brown-Forman and coffee company Keurig Green Mountain, respectively. Most of our food and staples retailers sagged, however, especially Whole Foods Market and Fresh Market. These sellers of premium groceries are struggling in the midst of a tougher consumer backdrop and a more competitive environment.
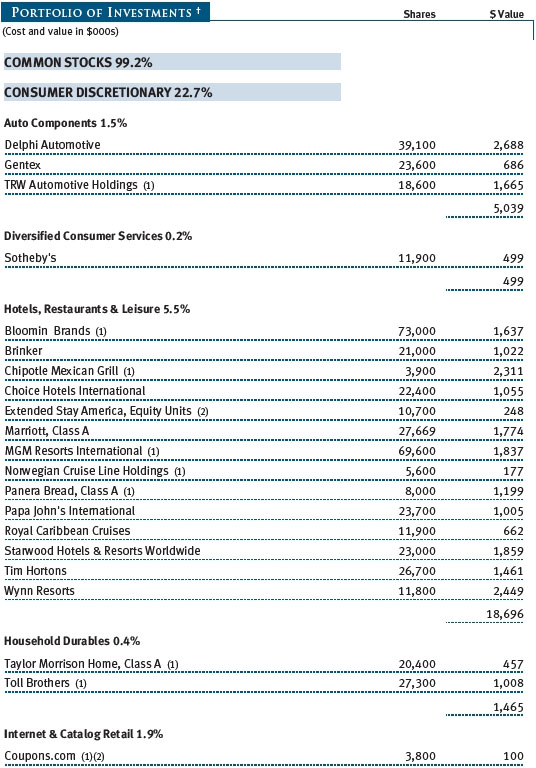
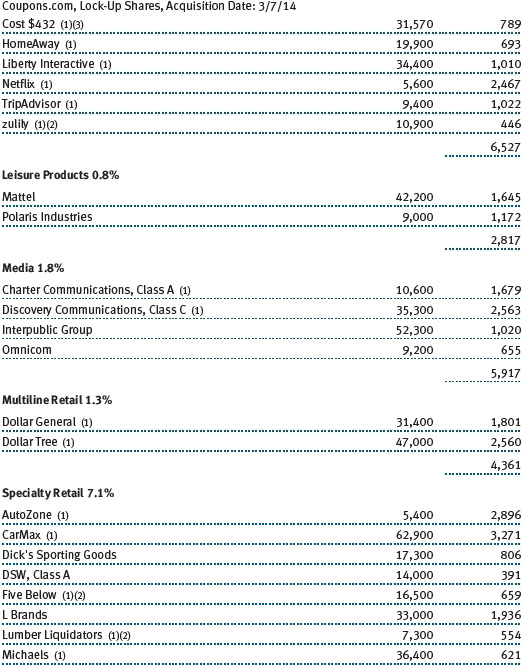
The consumer discretionary sector produced meager returns, as the tough consumer environment weighed on many businesses in this sector, too. We look for companies with good business models, excellent cash flow, and other favorable attributes, and we tend to focus on leading companies in their respective niches. Internet and catalog retailers were our best performers, especially Netflix. Hotel, restaurant, and leisure companies produced gains in aggregate, as strength in Marriott and Chipotle Mexican Grill offset poor performance of Panera Bread and Bloomin’ Brands, which owns several casual dining brands. Many of our specialty and multiline retailers declined, and we eliminated a few in favor of companies that we feel have better prospects, such as Restoration Hardware Holdings, an innovative retailer that seeks out the best small housewares and furniture designers around the world.
Financials sector stocks were fairly flat. Commercial real estate services provider Jones Lang LaSalle did well, whereas capital markets companies were mixed. Our low exposure to real estate investment trusts, which tend to have high yields and which performed very well—but which we believe are wildly expensive and are not good long-term growth investments—worked against us. Insurance companies performed worst in the sector, and we eliminated several of these holdings because we believe a softer pricing environment, especially for property and casualty insurers, will hurt their returns on equity.
OUTLOOK
We are surprised that the fixed income markets have done so well in the last six months. In fact, we think bonds are a terrible place for long-term investors considering that nominal interest rates and real (inflation-adjusted) returns are so low, that the economy is meandering upward, that the Federal Reserve is tapering its asset purchases, and that interest rates are likely to rise in the next few years.
In contrast, the environment for long-term equity investing generally remains favorable. The economy and corporate earnings are growing, though not at a spectacular pace, and stock valuations, in most cases, are fair—but they are higher than they were a few years ago. Also, low interest rates courtesy of several highly accommodative central banks around the world are encouraging investors to seek investments with higher returns and allowing corporations to borrow cheaply to expand their businesses and reduce their debt-servicing costs.
That said, we must also acknowledge that the equity market is very short-term focused and that the current low-volatility environment probably will not continue. We encourage investors to be cautious about expected returns. Heightened IPO and M&A activity and stocks with unrealistic expectations represent possible pitfalls for investors tempted to “chase performance.” Rather than seek out the “next big thing” or trendy investments that may ultimately disappoint, we believe equity investors would do well to maintain a diversified portfolio of companies with good long-term business prospects that trade at reasonable valuations, keep performance expectations in check, and wait patiently for sustainable gains to accumulate over time. Stock returns since March 2009 have been remarkable, but that pace of appreciation cannot continue.
Regardless of the market and economic environment, we remain committed to seeking out and investing in mid-cap growth companies with desirable attributes. These include a demonstrated ability to increase revenues, earnings, and cash flow consistently; high returns on equity; capable managements; and a sustainable competitive advantage. We believe such companies are excellent investments for those seeking long-term capital appreciation.
Thank you for your confidence in T. Rowe Price.
Respectfully submitted,

Donald J. Peters
Cochairman of the fund’s Investment Advisory Committee

Donald J. Easley
Cochairman of the fund’s Investment Advisory Committee
July 21, 2014
The committee cochairmen have day-to-day responsibility for managing the portfolio and work with committee members in developing and executing the fund’s investment program.
RISKS OF INVESTING
As with all equity funds, this fund’s share price can fall because of weakness in the broad market, a particular industry, or specific holdings. The market as a whole can decline for many reasons, including adverse political or economic developments here or abroad, changes in investor psychology, or heavy institutional selling. The prospects for an industry or company may deteriorate because of a variety of factors, including disappointing earnings or changes in the competitive environment. In addition, our assessment of companies held in the fund may prove incorrect, resulting in losses or poor performance even in a rising market. Finally, the fund’s investment approach could fall out of favor with the investing public, resulting in lagging performance versus other types of stock funds.
The stocks of mid-cap companies entail greater risk and are usually more volatile than the shares of large companies. In addition, growth stocks can be volatile for several reasons. Since they usually reinvest a high proportion of earnings in their own businesses, they may lack the dividends usually associated with value stocks that can cushion their decline in a falling market. Also, since investors buy these stocks because of their expected superior earnings growth, earnings disappointments often result in sharp price declines.
Diversification cannot protect against loss in a declining market or assure a profit.
GLOSSARY
Earnings growth rate – current fiscal year: Measures the annualized percent change in earnings per share from the prior fiscal year to the current fiscal year.
Lipper indexes: Fund benchmarks that consist of a small number (10 to 30) of the largest mutual funds in a particular category as defined by Lipper Inc.
Price-to-earnings (P/E) ratio – 12 months forward: A valuation measure calculated by dividing the price of a stock by the analysts’ forecast of the next 12 months’ expected earnings. The ratio is a measure of how much investors are willing to pay for the company’s future earnings. The higher the P/E, the more investors are paying for a company’s earnings growth in the next 12 months.
Projected earnings growth rate (IBES): A company’s expected earnings per share growth rate for a given time period based on the forecast from the Institutional Brokers’ Estimate System, which is commonly referred to as IBES.
Return on equity (ROE) – current fiscal year: A valuation measure calculated by dividing the company’s current fiscal year net income by shareholders’ equity (i.e., the company’s book value). ROE measures how much a company earns on each dollar that common stock investors have put into the company. It indicates how effectively and efficiently a company and its management are using stockholder investments.
Russell Midcap Growth Index: An index that tracks the performance of mid-cap stocks with higher price-to-book ratios and higher forecast growth values.
Russell Midcap Index: An unmanaged index that tracks the performance of the 800 smallest companies in the Russell 1000 Index.
Russell Midcap Value Index: An index that tracks the performance of mid-cap stocks with lower price-to-book ratios and lower forecast growth values.
S&P 500 Index: An unmanaged index that tracks the stocks of 500 primarily large-cap U.S. companies.
S&P MidCap 400 Index: An unmanaged index that tracks the stocks of 400 U.S. mid-cap companies.
Note: Russell Investment Group is the source and owner of the trademarks, service marks, and copyrights related to the Russell indexes. Russell® is a trademark of Russell Investment Group.
Note: MSCI makes no express or implied warranties or representations and shall have no liability whatsoever with respect to any MSCI data contained herein. The MSCI data may not be further redistributed or used as a basis for other indices or any securities or financial products. This report is not approved, reviewed, or produced by MSCI.
Performance and Expenses
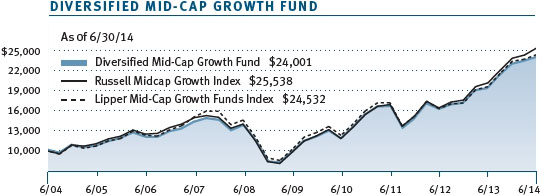
| Growth of $10,000 |
This chart shows the value of a hypothetical $10,000 investment in the fund over the past 10 fiscal year periods or since inception (for funds lacking 10-year records). The result is compared with benchmarks, which may include a broad-based market index and a peer group average or index. Market indexes do not include expenses, which are deducted from fund returns as well as mutual fund averages and indexes.

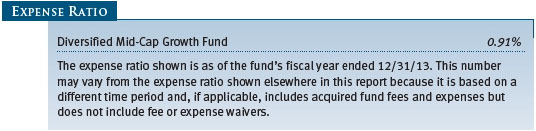
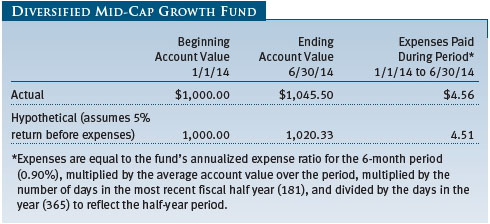
| Fund Expense Example |
As a mutual fund shareholder, you may incur two types of costs: (1) transaction costs, such as redemption fees or sales loads, and (2) ongoing costs, including management fees, distribution and service (12b-1) fees, and other fund expenses. The following example is intended to help you understand your ongoing costs (in dollars) of investing in the fund and to compare these costs with the ongoing costs of investing in other mutual funds. The example is based on an investment of $1,000 invested at the beginning of the most recent six-month period and held for the entire period.
Actual Expenses
The first line of the following table (Actual) provides information about actual account values and expenses based on the fund’s actual returns. You may use the information on this line, together with your account balance, to estimate the expenses that you paid over the period. Simply divide your account value by $1,000 (for example, an $8,600 account value divided by $1,000 = 8.6), then multiply the result by the number on the first line under the heading “Expenses Paid During Period” to estimate the expenses you paid on your account during this period.
Hypothetical Example for Comparison Purposes
The information on the second line of the table (Hypothetical) is based on hypothetical account values and expenses derived from the fund’s actual expense ratio and an assumed 5% per year rate of return before expenses (not the fund’s actual return). You may compare the ongoing costs of investing in the fund with other funds by contrasting this 5% hypothetical example and the 5% hypothetical examples that appear in the shareholder reports of the other funds. The hypothetical account values and expenses may not be used to estimate the actual ending account balance or expenses you paid for the period.
Note: T. Rowe Price charges an annual account service fee of $20, generally for accounts with less than $10,000. The fee is waived for any investor whose T. Rowe Price mutual fund accounts total $50,000 or more; accounts electing to receive electronic delivery of account statements, transaction confirmations, prospectuses, and shareholder reports; or accounts of an investor who is a T. Rowe Price Preferred Services, Personal Services, or Enhanced Personal Services client (enrollment in these programs generally requires T. Rowe Price assets of at least $100,000). This fee is not included in the accompanying table. If you are subject to the fee, keep it in mind when you are estimating the ongoing expenses of investing in the fund and when comparing the expenses of this fund with other funds.
You should also be aware that the expenses shown in the table highlight only your ongoing costs and do not reflect any transaction costs, such as redemption fees or sales loads. Therefore, the second line of the table is useful in comparing ongoing costs only and will not help you determine the relative total costs of owning different funds. To the extent a fund charges transaction costs, however, the total cost of owning that fund is higher.
Unaudited
The accompanying notes are an integral part of these financial statements.
Unaudited
The accompanying notes are an integral part of these financial statements.
Unaudited
The accompanying notes are an integral part of these financial statements.
Unaudited
The accompanying notes are an integral part of these financial statements.
Unaudited
The accompanying notes are an integral part of these financial statements.
Unaudited
| Notes to Financial Statements |
T. Rowe Price Diversified Mid-Cap Growth Fund, Inc. (the fund), is registered under the Investment Company Act of 1940 (the 1940 Act) as a diversified, open-end management investment company. The fund commenced operations on December 31, 2003. The fund seeks to provide long-term capital growth by investing primarily in the common stocks of mid-cap growth companies.
NOTE 1 - SIGNIFICANT ACCOUNTING POLICIES
Basis of Preparation The fund is an investment company and follows accounting and reporting guidance in the Financial Accounting Standards Board Accounting Standards Codification Topic 946 (ASC 946). The accompanying financial statements were prepared in accordance with accounting principles generally accepted in the United States of America (GAAP), including but not limited to ASC 946. GAAP requires the use of estimates made by management. Management believes that estimates and valuations are appropriate; however, actual results may differ from those estimates, and the valuations reflected in the accompanying financial statements may differ from the value ultimately realized upon sale or maturity.
Investment Transactions, Investment Income, and Distributions Income and expenses are recorded on the accrual basis. Dividends received from mutual fund investments are reflected as dividend income; capital gain distributions are reflected as realized gain/loss. Earnings on investments recognized as partnerships for federal income tax purposes reflect the tax character of such earnings. Dividend income and capital gain distributions are recorded on the ex-dividend date. Income tax-related interest and penalties, if incurred, would be recorded as income tax expense. Investment transactions are accounted for on the trade date. Realized gains and losses are reported on the identified cost basis. Distributions to shareholders are recorded on the ex-dividend date. Income distributions are declared and paid annually. Capital gain distributions, if any, are generally declared and paid by the fund annually.
Rebates Subject to best execution, the fund may direct certain security trades to brokers who have agreed to rebate a portion of the related brokerage commission to the fund in cash. Commission rebates are reflected as realized gain on securities in the accompanying financial statements.
NOTE 2 - VALUATION
The fund’s financial instruments are valued and its net asset value (NAV) per share is computed at the close of the New York Stock Exchange (NYSE), normally 4 p.m. ET, each day the NYSE is open for business.
Fair Value The fund’s financial instruments are reported at fair value, which GAAP defines as the price that would be received to sell an asset or paid to transfer a liability in an orderly transaction between market participants at the measurement date. The T. Rowe Price Valuation Committee (the Valuation Committee) has been established by the fund’s Board of Directors (the Board) to ensure that financial instruments are appropriately priced at fair value in accordance with GAAP and the 1940 Act. Subject to oversight by the Board, the Valuation Committee develops and oversees pricing-related policies and procedures and approves all fair value determinations. Specifically, the Valuation Committee establishes procedures to value securities; determines pricing techniques, sources, and persons eligible to effect fair value pricing actions; oversees the selection, services, and performance of pricing vendors; oversees valuation-related business continuity practices; and provides guidance on internal controls and valuation-related matters. The Valuation Committee reports to the fund’s Board; is chaired by the fund’s treasurer; and has representation from legal, portfolio management and trading, operations, and risk management.
Various valuation techniques and inputs are used to determine the fair value of financial instruments. GAAP establishes the following fair value hierarchy that categorizes the inputs used to measure fair value:
Level 1 – quoted prices (unadjusted) in active markets for identical financial instruments that the fund can access at the reporting date
Level 2 – inputs other than Level 1 quoted prices that are observable, either directly or indirectly (including, but not limited to, quoted prices for similar financial instruments in active markets, quoted prices for identical or similar financial instruments in inactive markets, interest rates and yield curves, implied volatilities, and credit spreads)
Level 3 – unobservable inputs
Observable inputs are developed using market data, such as publicly available information about actual events or transactions, and reflect the assumptions that market participants would use to price the financial instrument. Unobservable inputs are those for which market data are not available and are developed using the best information available about the assumptions that market participants would use to price the financial instrument. GAAP requires valuation techniques to maximize the use of relevant observable inputs and minimize the use of unobservable inputs. When multiple inputs are used to derive fair value, the financial instrument is assigned to the level within the fair value hierarchy based on the lowest-level input that is significant to the fair value of the financial instrument. Input levels are not necessarily an indication of the risk or liquidity associated with financial instruments at that level but rather the degree of judgment used in determining those values.
Valuation Techniques Equity securities listed or regularly traded on a securities exchange or in the over-the-counter (OTC) market are valued at the last quoted sale price or, for certain markets, the official closing price at the time the valuations are made. OTC Bulletin Board securities are valued at the mean of the closing bid and asked prices. A security that is listed or traded on more than one exchange is valued at the quotation on the exchange determined to be the primary market for such security. Listed securities not traded on a particular day are valued at the mean of the closing bid and asked prices. Actively traded domestic equity securities generally are categorized in Level 1 of the fair value hierarchy. OTC Bulletin Board securities, certain preferred securities, and equity securities traded in inactive markets generally are categorized in Level 2 of the fair value hierarchy.
Investments in mutual funds are valued at the mutual fund’s closing NAV per share on the day of valuation and are categorized in Level 1 of the fair value hierarchy. Assets and liabilities other than financial instruments, including short-term receivables and payables, are carried at cost, or estimated realizable value, if less, which approximates fair value.
Thinly traded financial instruments and those for which the above valuation procedures are inappropriate or are deemed not to reflect fair value are stated at fair value as determined in good faith by the Valuation Committee. The objective of any fair value pricing determination is to arrive at a price that could reasonably be expected from a current sale. Financial instruments fair valued by the Valuation Committee are primarily private placements, restricted securities, warrants, rights, and other securities that are not publicly traded.
Subject to oversight by the Board, the Valuation Committee regularly makes good faith judgments to establish and adjust the fair valuations of certain securities as events occur and circumstances warrant. For instance, in determining the fair value of an equity investment with limited market activity, such as a private placement or a thinly traded public company stock, the Valuation Committee considers a variety of factors, which may include, but are not limited to, the issuer’s business prospects, its financial standing and performance, recent investment transactions in the issuer, new rounds of financing, negotiated transactions of significant size between other investors in the company, relevant market valuations of peer companies, strategic events affecting the company, market liquidity for the issuer, and general economic conditions and events. In consultation with the investment and pricing teams, the Valuation Committee will determine an appropriate valuation technique based on available information, which may include both observable and unobservable inputs. The Valuation Committee typically will afford greatest weight to actual prices in arm’s length transactions, to the extent they represent orderly transactions between market participants; transaction information can be reliably obtained; and prices are deemed representative of fair value. However, the Valuation Committee may also consider other valuation methods such as market-based valuation multiples; a discount or premium from market value of a similar, freely traded security of the same issuer; or some combination. Fair value determinations are reviewed on a regular basis and updated as information becomes available, including actual purchase and sale transactions of the issue. Because any fair value determination involves a significant amount of judgment, there is a degree of subjectivity inherent in such pricing decisions, and fair value prices determined by the Valuation Committee could differ from those of other market participants. Depending on the relative significance of unobservable inputs, including the valuation technique(s) used, fair valued securities may be categorized in Level 2 or 3 of the fair value hierarchy.
Valuation Inputs The following table summarizes the fund’s financial instruments, based on the inputs used to determine their fair values on June 30, 2014:
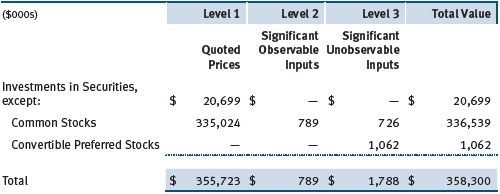
There were no material transfers between Levels 1 and 2 during the six months ended June 30, 2014.
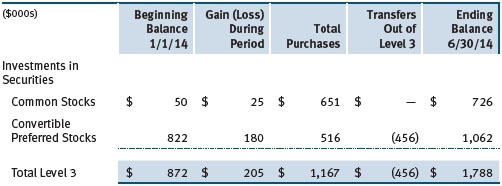
Following is a reconciliation of the fund’s Level 3 holdings for the six months ended June 30, 2014. Gain (loss) reflects both realized and change in unrealized gain/loss on Level 3 holdings during the period, if any, and is included on the accompanying Statement of Operations. The change in unrealized gain/loss on Level 3 instruments held at June 30, 2014, totaled $205,000 for the six months ended June 30, 2014. Transfers into and out of Level 3 are reflected at the value of the financial instrument at the beginning of the period. During the six months, transfers out of Level 3 were because observable market data became available for the security.
NOTE 3 - OTHER INVESTMENT TRANSACTIONS
Consistent with its investment objective, the fund engages in the following practices to manage exposure to certain risks and/or to enhance performance. The investment objective, policies, program, and risk factors of the fund are described more fully in the fund’s prospectus and Statement of Additional Information.
Restricted Securities The fund may invest in securities that are subject to legal or contractual restrictions on resale. Prompt sale of such securities at an acceptable price may be difficult and may involve substantial delays and additional costs.
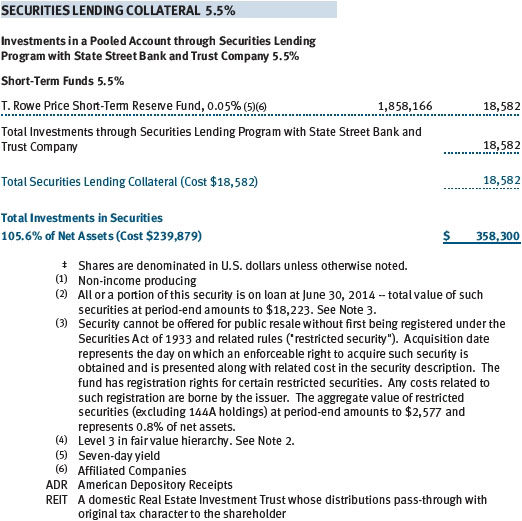
Securities Lending The fund may lend its securities to approved brokers to earn additional income. Its securities lending activities are administered by a lending agent in accordance with a securities lending agreement. It receives collateral in the form of cash or U.S. government securities, valued at 102% to 105% of the value of the securities on loan. Collateral is maintained over the life of the loan in an amount not less than the value of loaned securities; any additional collateral required due to changes in security values is delivered to the fund the next business day. Cash collateral is invested by the lending agent(s) in accordance with investment guidelines approved by fund management. Additionally, the lending agent indemnifies the fund against losses resulting from borrower default. Although risk is mitigated by the collateral and indemnification, the fund could experience a delay in recovering its securities and a possible loss of income or value if the borrower fails to return the securities, collateral investments decline in value and the lending agent fails to perform. Securities lending revenue consists of earnings on invested collateral and borrowing fees, net of any rebates to the borrower, compensation to the lending agent, and other administrative costs. In accordance with GAAP, investments made with cash collateral are reflected in the accompanying financial statements, but collateral received in the form of securities is not. At June 30, 2014, the value of loaned securities was $18,223,000; the value of cash collateral and related investments was $18,582,000.
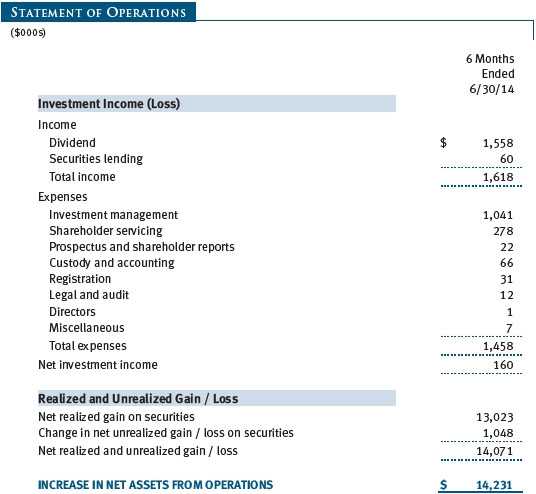
Other Purchases and sales of portfolio securities other than short-term securities aggregated $64,161,000 and $49,707,000, respectively, for the six months ended June 30, 2014.
NOTE 4 - FEDERAL INCOME TAXES
No provision for federal income taxes is required since the fund intends to continue to qualify as a regulated investment company under Subchapter M of the Internal Revenue Code and distribute to shareholders all of its taxable income and gains. Distributions determined in accordance with federal income tax regulations may differ in amount or character from net investment income and realized gains for financial reporting purposes. Financial reporting records are adjusted for permanent book/tax differences to reflect tax character but are not adjusted for temporary differences. The amount and character of tax-basis distributions and composition of net assets are finalized at fiscal year-end; accordingly, tax-basis balances have not been determined as of the date of this report.
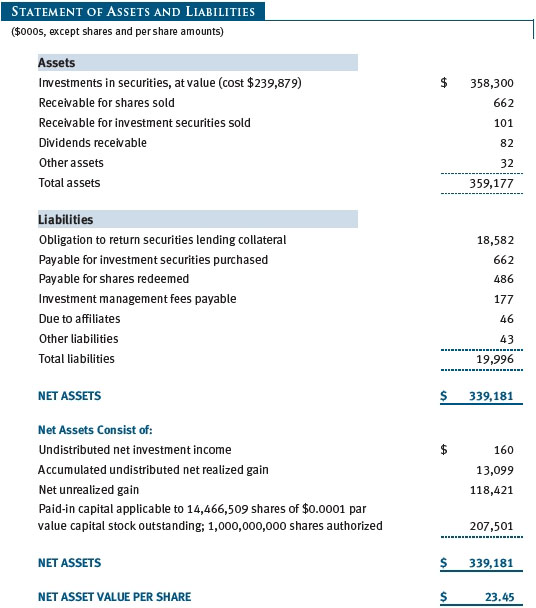
At June 30, 2014, the cost of investments for federal income tax purposes was $239,993,000. Net unrealized gain aggregated $118,307,000 at period-end, of which $122,677,000 related to appreciated investments and $4,370,000 related to depreciated investments.
NOTE 5 - RELATED PARTY TRANSACTIONS
The fund is managed by T. Rowe Price Associates, Inc. (Price Associates), a wholly owned subsidiary of T. Rowe Price Group, Inc. (Price Group). The investment management agreement between the fund and Price Associates provides for an annual investment management fee, which is computed daily and paid monthly. The fee consists of an individual fund fee, equal to 0.35% of the fund’s average daily net assets, and a group fee. The group fee rate is calculated based on the combined net assets of certain mutual funds sponsored by Price Associates (the group) applied to a graduated fee schedule, with rates ranging from 0.48% for the first $1 billion of assets to 0.275% for assets in excess of $400 billion. The fund’s group fee is determined by applying the group fee rate to the fund’s average daily net assets. At June 30, 2014, the effective annual group fee rate was 0.29%.
In addition, the fund has entered into service agreements with Price Associates and two wholly owned subsidiaries of Price Associates (collectively, Price). Price Associates computes the daily share price and provides certain other administrative services to the fund. T. Rowe Price Services, Inc., provides shareholder and administrative services in its capacity as the fund’s transfer and dividend-disbursing agent. T. Rowe Price Retirement Plan Services, Inc., provides subaccounting and recordkeeping services for certain retirement accounts invested in the fund. For the six months ended June 30, 2014, expenses incurred pursuant to these service agreements were $48,000 for Price Associates; $191,000 for T. Rowe Price Services, Inc.; and $3,000 for T. Rowe Price Retirement Plan Services, Inc. The total amount payable at period-end pursuant to these service agreements is reflected as Due to Affiliates in the accompanying financial statements.
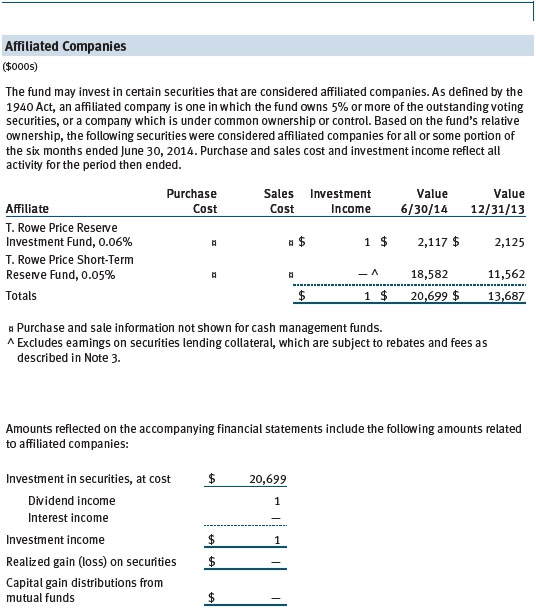
The fund may invest in the T. Rowe Price Reserve Investment Fund, the T. Rowe Price Government Reserve Investment Fund, or the T. Rowe Price Short-Term Reserve Fund (collectively, the Price Reserve Investment Funds), open-end management investment companies managed by Price Associates and considered affiliates of the fund. The Price Reserve Investment Funds are offered as short-term investment options to mutual funds, trusts, and other accounts managed by Price Associates or its affiliates and are not available for direct purchase by members of the public. The Price Reserve Investment Funds pay no investment management fees.
| Information on Proxy Voting Policies, Procedures, and Records |
A description of the policies and procedures used by T. Rowe Price funds and portfolios to determine how to vote proxies relating to portfolio securities is available in each fund’s Statement of Additional Information. You may request this document by calling 1-800-225-5132 or by accessing the SEC’s website, sec.gov.
The description of our proxy voting policies and procedures is also available on our website, troweprice.com. To access it, click on the words “Social Responsibility” at the top of our corporate homepage. Next, click on the words “Conducting Business Responsibly” on the left side of the page that appears. Finally, click on the words “Proxy Voting Policies” on the left side of the page that appears.
Each fund’s most recent annual proxy voting record is available on our website and through the SEC’s website. To access it through our website, follow the above directions to reach the “Conducting Business Responsibly” page. Click on the words “Proxy Voting Records” on the left side of that page, and then click on the “View Proxy Voting Records” link at the bottom of the page that appears.
| How to Obtain Quarterly Portfolio Holdings |
The fund files a complete schedule of portfolio holdings with the Securities and Exchange Commission for the first and third quarters of each fiscal year on Form N-Q. The fund’s Form N-Q is available electronically on the SEC’s website (sec.gov); hard copies may be reviewed and copied at the SEC’s Public Reference Room, 100 F St. N.E., Washington, DC 20549. For more information on the Public Reference Room, call 1-800-SEC-0330.
| Approval of Investment Management Agreement |
On April 30, 2014, the fund’s Board of Directors (Board), including a majority of the fund’s independent directors, approved the continuation of the investment management agreement (Advisory Contract) between the fund and its investment advisor, T. Rowe Price Associates, Inc. (Advisor). The April meeting followed a telephonic meeting held on March 4, 2014, during which the Board reviewed information and discussed the continuation of the Advisory Contract. In connection with its deliberations, the Board requested, and the Advisor provided, such information as the Board (with advice from independent legal counsel) deemed reasonably necessary. The Board considered a variety of factors in connection with its review of the Advisory Contract, also taking into account information provided by the Advisor during the course of the year, as discussed below:
Services Provided by the Advisor
The Board considered the nature, quality, and extent of the services provided to the fund by the Advisor. These services included, but were not limited to, directing the fund’s investments in accordance with its investment program and the overall management of the fund’s portfolio, as well as a variety of related activities such as financial, investment operations, and administrative services; compliance; maintaining the fund’s records and registrations; and shareholder communications. The Board also reviewed the background and experience of the Advisor’s senior management team and investment personnel involved in the management of the fund, as well as the Advisor’s compliance record. The Board concluded that it was satisfied with the nature, quality, and extent of the services provided by the Advisor.
Investment Performance of the Fund
The Board reviewed the fund’s three-month, one-year, and year-by-year returns, as well as the fund’s average annualized total returns over the 3-, 5-, and 10-year periods, and compared these returns with a wide variety of previously agreed-upon comparable performance measures and market data, including those supplied by Lipper and Morningstar, which are independent providers of mutual fund data.
On the basis of this evaluation and the Board’s ongoing review of investment results, and factoring in the relative market conditions during certain of the performance periods, the Board concluded that the fund’s performance was satisfactory.
Costs, Benefits, Profits, and Economies of Scale
The Board reviewed detailed information regarding the revenues received by the Advisor under the Advisory Contract and other benefits that the Advisor (and its affiliates) may have realized from its relationship with the fund, including any research received under “soft dollar” agreements and commission-sharing arrangements with broker-dealers. The Board considered that the Advisor may receive some benefit from soft-dollar arrangements pursuant to which research is received from broker-dealers that execute the applicable fund’s portfolio transactions. The Board received information on the estimated costs incurred and profits realized by the Advisor from managing T. Rowe Price mutual funds.
The Board also reviewed estimates of the profits realized from managing the fund in particular, and the Board concluded that the Advisor’s profits were reasonable in light of the services provided to the fund.
The Board also considered whether the fund benefits under the fee levels set forth in the Advisory Contract from any economies of scale realized by the Advisor. Under the Advisory Contract, the fund pays a fee to the Advisor for investment management services composed of two components—a group fee rate based on the combined average net assets of most of the T. Rowe Price mutual funds (including the fund) that declines at certain asset levels and an individual fund fee rate based on the fund’s average daily net assets—and the fund pays its own expenses of operations. The Board concluded that the advisory fee structure for the fund continued to provide for a reasonable sharing of benefits from any economies of scale with the fund’s investors.
Fees
The Board was provided with information regarding industry trends in management fees and expenses, and the Board reviewed the fund’s management fee rate, operating expenses, and total expense ratio in comparison with fees and expenses of other comparable funds based on information and data supplied by Lipper. The information provided to the Board indicated that the fund’s management fee rate and total expense ratio were above the median for certain groups of comparable funds and at or below the median for other groups of comparable funds.
The Board also reviewed the fee schedules for institutional accounts and private accounts with similar mandates that are advised or subadvised by the Advisor and its affiliates. Management provided the Board with information about the Advisor’s responsibilities and services provided to institutional account clients, including information about how the requirements and economics of the institutional business are fundamentally different from those of the mutual fund business. The Board considered information showing that the mutual fund business is generally more complex from a business and compliance perspective than the institutional business and that the Advisor generally performs significant additional services and assumes greater risk in managing the fund and other T. Rowe Price mutual funds than it does for institutional account clients.
On the basis of the information provided and the factors considered, the Board concluded that the fees paid by the fund under the Advisory Contract are reasonable.
Approval of the Advisory Contract
As noted, the Board approved the continuation of the Advisory Contract. No single factor was considered in isolation or to be determinative to the decision. Rather, the Board concluded, in light of a weighting and balancing of all factors considered, that it was in the best interests of the fund and its shareholders for the Board to approve the continuation of the Advisory Contract (including the fees to be charged for services thereunder). The independent directors were advised throughout the process by independent legal counsel.
Item 2. Code of Ethics.
A code of ethics, as defined in Item 2 of Form N-CSR, applicable to its principal executive officer, principal financial officer, principal accounting officer or controller, or persons performing similar functions is filed as an exhibit to the registrant’s annual Form N-CSR. No substantive amendments were approved or waivers were granted to this code of ethics during the registrant’s most recent fiscal half-year.
Item 3. Audit Committee Financial Expert.
Disclosure required in registrant’s annual Form N-CSR.
Item 4. Principal Accountant Fees and Services.
Disclosure required in registrant’s annual Form N-CSR.
Item 5. Audit Committee of Listed Registrants.
Not applicable.
Item 6. Investments.
(a) Not applicable. The complete schedule of investments is included in Item 1 of this Form N-CSR.
(b) Not applicable.
Item 7. Disclosure of Proxy Voting Policies and Procedures for Closed-End Management Investment Companies.
Not applicable.
Item 8. Portfolio Managers of Closed-End Management Investment Companies.
Not applicable.
Item 9. Purchases of Equity Securities by Closed-End Management Investment Company and Affiliated Purchasers.
Not applicable.
Item 10. Submission of Matters to a Vote of Security Holders.
Not applicable.
Item 11. Controls and Procedures.
(a) The registrant’s principal executive officer and principal financial officer have evaluated the registrant’s disclosure controls and procedures within 90 days of this filing and have concluded that the registrant’s disclosure controls and procedures were effective, as of that date, in ensuring that information required to be disclosed by the registrant in this Form N-CSR was recorded, processed, summarized, and reported timely.
(b) The registrant’s principal executive officer and principal financial officer are aware of no change in the registrant’s internal control over financial reporting that occurred during the registrant’s second fiscal quarter covered by this report that has materially affected, or is reasonably likely to materially affect, the registrant’s internal control over financial reporting.
Item 12. Exhibits.
(a)(1) The registrant’s code of ethics pursuant to Item 2 of Form N-CSR is filed with the registrant’s annual Form N-CSR.
(2) Separate certifications by the registrant's principal executive officer and principal financial officer, pursuant to Section 302 of the Sarbanes-Oxley Act of 2002 and required by Rule 30a-2(a) under the Investment Company Act of 1940, are attached.
(3) Written solicitation to repurchase securities issued by closed-end companies: not applicable.
(b) A certification by the registrant's principal executive officer and principal financial officer, pursuant to Section 906 of the Sarbanes-Oxley Act of 2002 and required by Rule 30a-2(b) under the Investment Company Act of 1940, is attached.
SIGNATURES
Pursuant to the requirements of the Securities Exchange Act of 1934 and the Investment Company Act of 1940, the registrant has duly caused this report to be signed on its behalf by the undersigned, thereunto duly authorized.
T. Rowe Price Diversified Mid-Cap Growth Fund, Inc.
| By | /s/ Edward C. Bernard | |
| Edward C. Bernard | ||
| Principal Executive Officer | ||
| Date August 18, 2014 | ||
Pursuant to the requirements of the Securities Exchange Act of 1934 and the Investment Company Act of 1940, this report has been signed below by the following persons on behalf of the registrant and in the capacities and on the dates indicated.
| By | /s/ Edward C. Bernard | |
| Edward C. Bernard | ||
| Principal Executive Officer | ||
| Date August 18, 2014 | ||
| By | /s/ Gregory K. Hinkle | |
| Gregory K. Hinkle | ||
| Principal Financial Officer | ||
| Date August 18, 2014 | ||