| UNITED STATES |
| SECURITIES AND EXCHANGE COMMISSION |
| Washington, D.C. 20549 |
FORM N-CSR |
CERTIFIED SHAREHOLDER REPORT OF REGISTERED |
MANAGEMENT INVESTMENT COMPANIES |
| Investment Company Act File Number: 811-21454 |
| T. Rowe Price Diversified Mid-Cap Growth Fund, Inc. |
| (Exact name of registrant as specified in charter) |
| 100 East Pratt Street, Baltimore, MD 21202 |
| (Address of principal executive offices) |
| David Oestreicher |
| 100 East Pratt Street, Baltimore, MD 21202 |
| (Name and address of agent for service) |
| Registrant’s telephone number, including area code: (410) 345-2000 |
| Date of fiscal year end: December 31 |
| Date of reporting period: June 30, 2011 |
Item 1: Report to Shareholders
 |
| Diversified Mid-Cap Growth Fund | June 30, 2011 |
The views and opinions in this report were current as of June 30, 2011. They are not guarantees of performance or investment results and should not be taken as investment advice. Investment decisions reflect a variety of factors, and the managers reserve the right to change their views about individual stocks, sectors, and the markets at any time. As a result, the views expressed should not be relied upon as a forecast of the fund’s future investment intent. The report is certified under the Sarbanes-Oxley Act, which requires mutual funds and other public companies to affirm that, to the best of their knowledge, the information in their financial reports is fairly and accurately stated in all material respects.
REPORTS ON THE WEB
Sign up for our E-mail Program, and you can begin to receive updated fund reports and prospectuses online rather than through the mail. Log in to your account at troweprice.com for more information.
Manager’s Letter
Fellow Shareholders
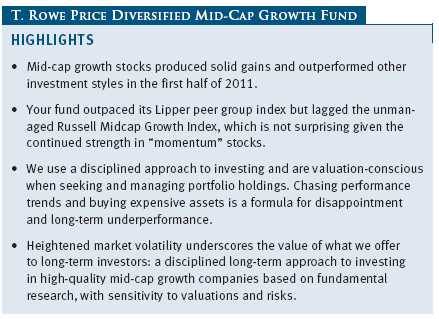
Mid-cap growth stocks produced solid gains and outperformed other investment styles in the first half of 2011. As the year began, equities advanced as the economy strengthened and the Federal Reserve was in the early stages of buying $600 billion in Treasury securities to suppress longer-term interest rates and promote economic growth. The rally was supported by healthy corporate earnings and some merger activity. Shares reached new bull market highs by the end of April, overcoming bearish factors such as political and social turmoil in various Middle Eastern and North African countries, a spike in oil prices, and a catastrophic earthquake and tsunami in Japan. Stocks retrenched in May and June, as European officials scrambled to develop and agree upon new financial assistance to prevent Greece from defaulting on or restructuring its sovereign debt.
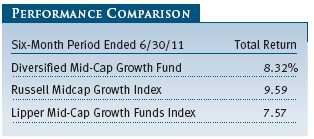
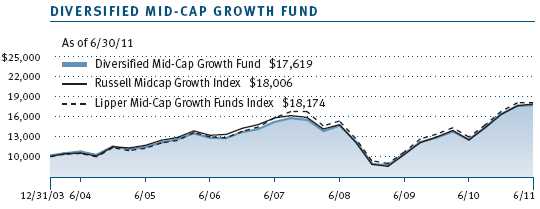
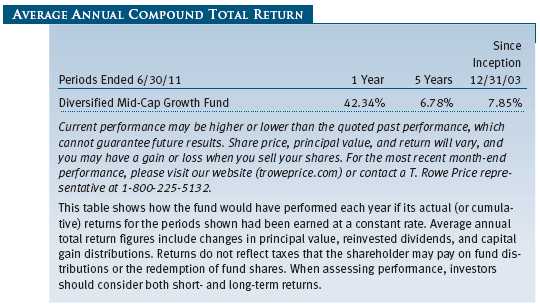
Your fund returned 8.32% in the last six months. As shown in the Performance Comparison table, the fund outperformed its Lipper peer group index but lagged the unmanaged Russell Midcap Growth Index. While we are pleased that the fund outperformed its typical competitor—something we usually expect in down markets—underperforming the Russell benchmark is not surprising given the continued strength in “momentum” stocks and our preference for quality companies with reasonable valuations. An issue for us has been that some solid businesses have garnered extraordinary valuations as investors have flocked to those companies that have “worked” and hope they will continue to do so. We remain disciplined in our approach; how much we pay for a company is an important part of our investment process.
MARKET ENVIRONMENT
Gross domestic product (GDP) growth has resulted in improved corporate profitability and balance sheets, but it has not translated into robust job growth. The Federal Reserve’s monetary policy remains highly accommodative, though the central bank recently ended its second quantitative easing program (also known as QE2), which entailed buying $600 billion in Treasuries since November 2010. With fixed income yields broadly compressed, equities have been and remain much more attractive investments. Considering that fixed income cash flows have been much greater than equity cash flows in the last few years, it is notable that major stock indexes have doubled in value since bottoming in March 2009.
In the first half of 2011, mid-cap stocks outperformed their smaller and larger peers. The Russell Midcap Index returned 8.08% versus 6.21% for the small-cap Russell 2000 Index and 6.02% for the large-cap S&P 500 Index. As measured by various Russell indexes, growth stocks outperformed value stocks across all market capitalizations. Within the Russell Midcap Growth Index, sector performance was mostly favorable. Consumer staples, utilities, and health care strongly outperformed, as investors favored defensive market segments that have lower sensitivity to the health of the economy. Consumer discretionary and materials stocks also did well, but most other sectors lagged the index with milder gains. Telecommunication services fell slightly.
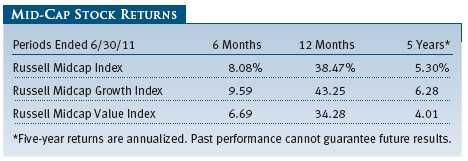
As shown in the table, mid-cap growth stocks have demonstrated a decisive performance advantage over their mid-cap value counterparts not only in the 6- and 12-month periods ended June 30, 2011, but also for the last five years. Mid-caps have generally outpaced their larger counterparts during that volatile time frame: For the five-year period ended June 30, 2011, the Russell Midcap Index produced an annualized return of 5.30% versus 2.94% for the S&P 500.
While the longer-term outperformance of mid-caps is encouraging, we are mindful, as our longer-term investors know, that it may not continue indefinitely. We believe asset classes that outperform for extended periods will eventually experience a period of underperformance—also known as a reversion to the mean. We have watched emerging markets equities produce superior returns in recent years relative to stocks in the U.S. and other developed markets and find it interesting that emerging markets have lagged thus far this year. In any event, we believe that chasing performance trends and buying expensive assets that have already outperformed for an extended period is a formula for disappointment and long-term underperformance.
We believe it is better to use a disciplined approach to investing and be valuation-conscious when seeking and managing portfolio holdings. We are not willing to buy shares of a company with an unfavorable risk/reward trade-off, even if we like its management, business prospects, or other attributes. For more information on how we select stocks and manage the fund, please see the next section.
INVESTMENT STRATEGY
Before discussing the portfolio’s performance in detail, we would like to welcome new investors and thank all of our longer-term investors for their continuing confidence in our portfolio management abilities. While the fund’s six-month results versus its competitors were favorable, our time horizon for investing is much longer, so it usually takes some time—perhaps years—before our investments bear fruit. We remain committed to the same strategy and the principles that have guided our management of the portfolio since its inception at the end of 2003. We believe these will help us navigate through the challenges of the years ahead and provide patient investors with long-term capital growth:
• The Diversified Mid-Cap Growth Fund invests in mid-cap stocks of companies whose earnings are expected to grow at an above-average rate. We define mid-cap companies as those whose market capitalization at the time of purchase falls within the range of either the S&P MidCap 400 Index or the Russell Midcap Growth Index.
• We keep the fund fully invested because we believe that successful market timing is virtually impossible—you would need to be right twice—and that the costs associated with frequent trading reduce the likelihood of outperforming the market. We do not worry about short-term performance or try to forecast the direction of the economy or the market. Our focus is to find mid-cap companies with the best long-term growth potential at reasonable valuations.
• Unlike other mid-cap growth portfolios that are highly concentrated, the Diversified Mid-Cap Growth Fund typically invests in about 300 stocks. More recently, the portfolio has held slightly more, which reflects that a greater number of companies have favorable prospects at the onset of an economic recovery. A high degree of diversification helps to mitigate the downside risk attributable to any single poorly performing security. We invest in companies that are early in their life cycles, and some will ultimately not be as successful as we hope. Accordingly, we balance risk with potential returns.
• Stock selection is based on a combination of fundamental, bottom-up analysis and quantitative strategies in an attempt to identify companies with superior long-term appreciation prospects. We use a growth approach, looking for companies with a demonstrated ability to increase revenues, earnings, and cash flow consistently; capable management; attractive business niches; and a sustainable competitive advantage. We favor companies with above-average earnings growth and lower earnings variability.
• Our time horizons are longer than those of other mid-cap growth investors. Our portfolio turnover rate in the 12-month period ended June 30, 2011, was 30.7%, which is substantially less than the 2010 average of about 101% for mid-cap growth funds, according to data from Morningstar Direct. (Morningstar only calculates portfolio turnover for its averages at year-end, using the most recent year-end portfolio turnover figures provided to Morningstar by each of the underlying funds in the average. The Morningstar data were quoted as of July 11, 2011.) This means our holding period for a typical stock is more than three years, whereas our average competitor holds a given stock for about one year. Consequently, we view ourselves as long-term investors; we are not short-term speculators or day traders.
• Valuations are also very important, as mentioned earlier. We look for the best relative values among companies with the strongest businesses and managements.
• We use a number of proprietary quantitative models to identify and evaluate the characteristics of individual mid-cap growth companies and the portfolio as a whole.
PORTFOLIO REVIEW
The Diversified Mid-Cap Growth Fund’s fundamental characteristics are similar to those of the Russell Midcap Growth Index, as indicated by the Portfolio Characteristics table. The portfolio’s median market capitalization ($8.1 billion), price/earnings (P/E) ratio (18.2), and projected earnings growth rate (13.8%) are all comparable to those of the index. These metrics reflect our commitment to companies with excellent long-term growth prospects.
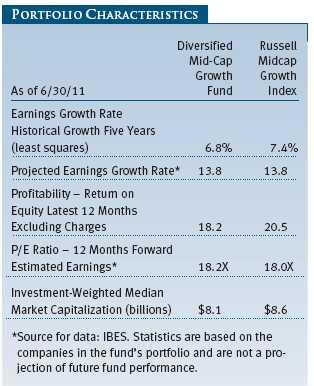
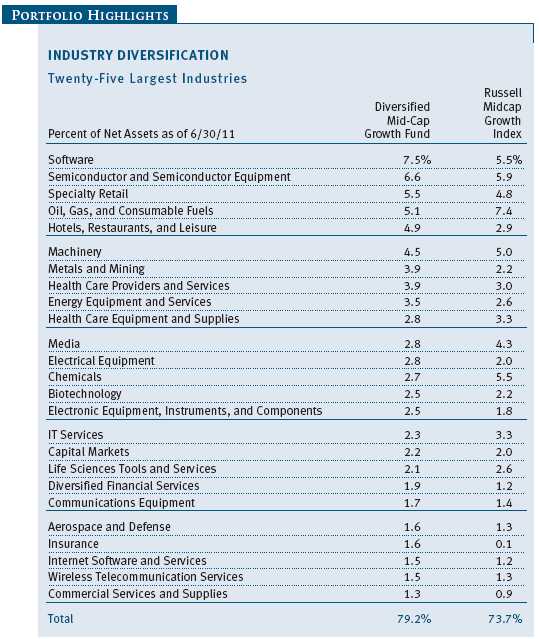
The fund’s return on equity (ROE), which measures how effectively and efficiently a company and its management are using stockholder investments, is 18.2% versus 20.5% for the benchmark. While a high ROE is desirable, we should note that our holdings have materially lower debt than businesses represented in the Russell index. We look for businesses throughout the mid-cap growth universe that can sustain high profitability. As of June 30, 2011, most of our sector allocations were generally consistent with those of the Russell index. In absolute terms, our largest commitments were information technology, consumer discretionary, industrials and business services, and health care. Our sector and industry allocations reflect where we find companies with the best risk/reward trade-off.
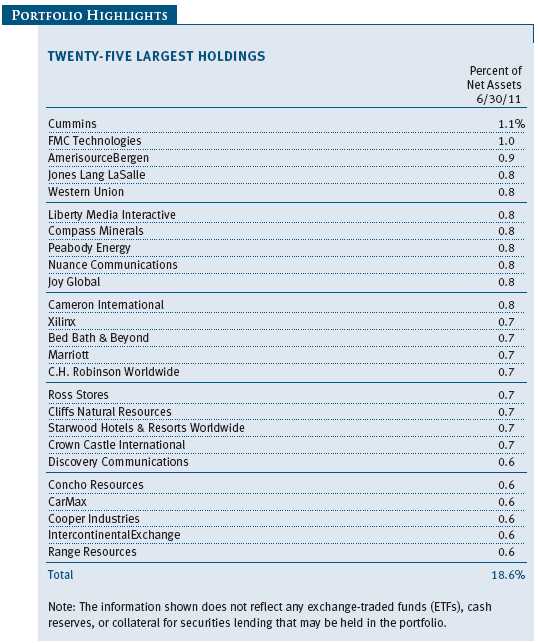
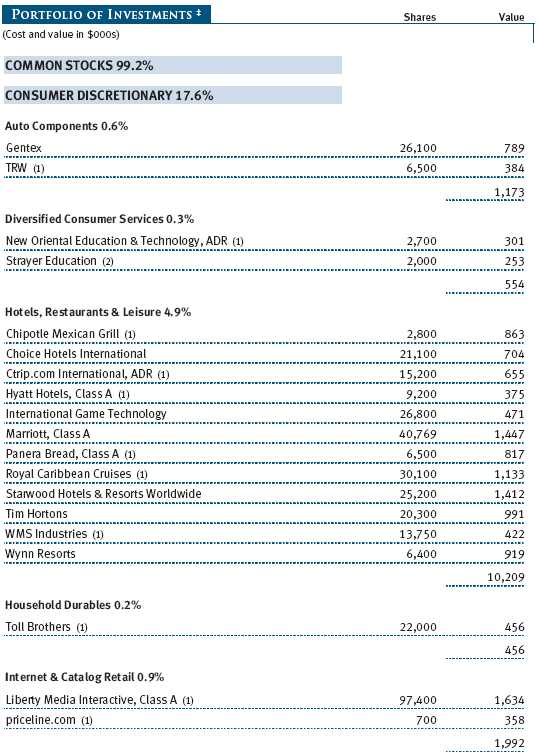
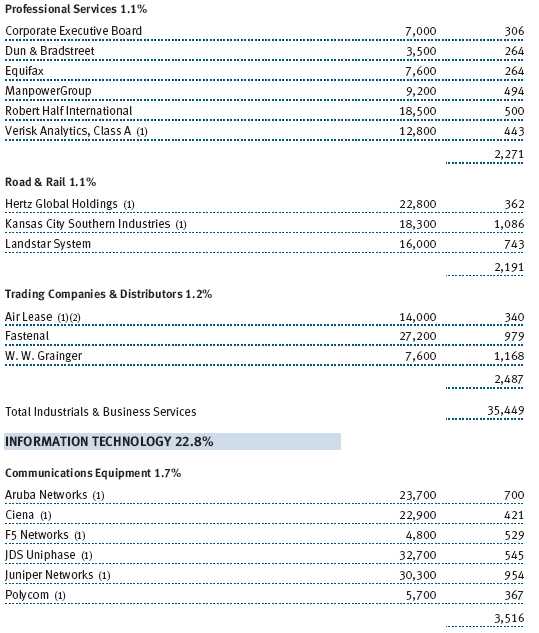
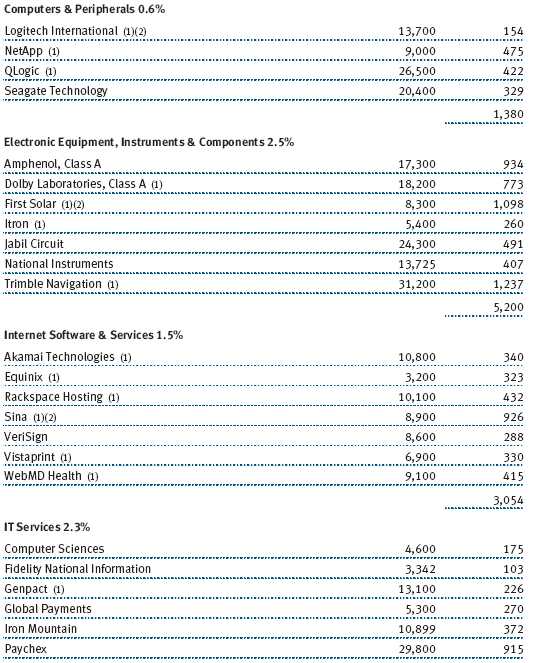
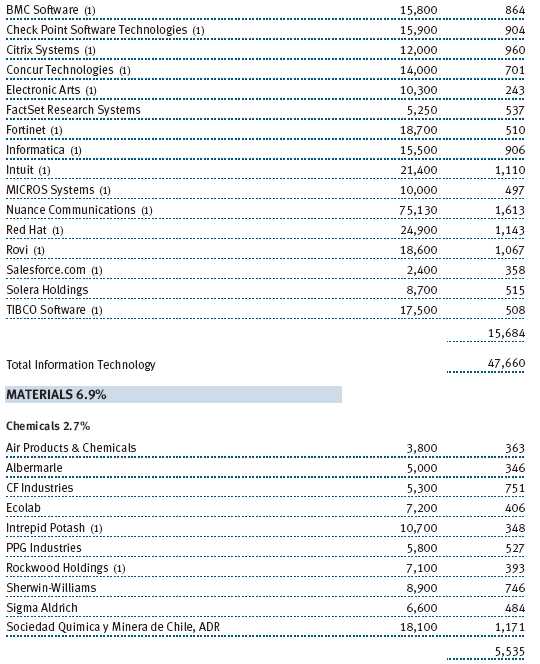
Information technology represented our largest sector allocation and largest sector overweight versus the benchmark at the end of our reporting period, as shown in the Sector Diversification table on page 7. We believe the sector features businesses with the best long-term growth potential, and our stock selection helped the fund’s relative performance. Currently, we favor tech companies with strong business models in industries that have high barriers to entry and low risk of commoditization, such as software. We also like semiconductor-related companies with quality business models and reasonable valuations. In absolute terms, information technology was one of the top contributing sectors to fund performance. Software stocks did best, led by Check Point Software Technologies, which is one of the world’s largest network security companies; speech and imaging software maker Nuance Communications; and Informatica, a provider of data integration software and services. Our semiconductor stocks were also strong, led by National Semiconductor, which surged on a takeover offer from Texas Instruments. Other tech industries were less robust, though IT services company Teradata and Chinese Internet software and services company Sina were two of the fund’s largest absolute contributors to performance. Teradata, a provider of data warehousing services, has been expanding into the “cloud” computer business, partially through acquisitions, and recently increased its revenue expectations for the year. Sina is a major Chinese Internet portal that has a micro-blogging service and generates revenue from advertising. Shares of this long-time fund holding continued to perform well with increased secular use of the Internet in China. (Please refer to the fund’s portfolio of investments for a complete list of holdings and the amount each represents in the portfolio.)
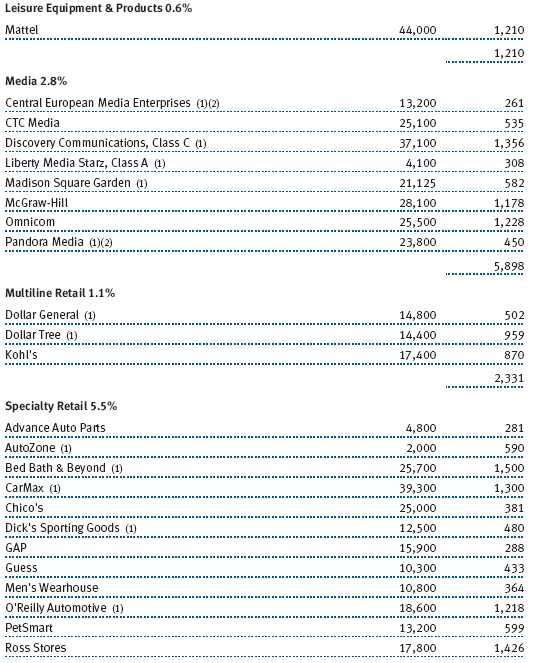
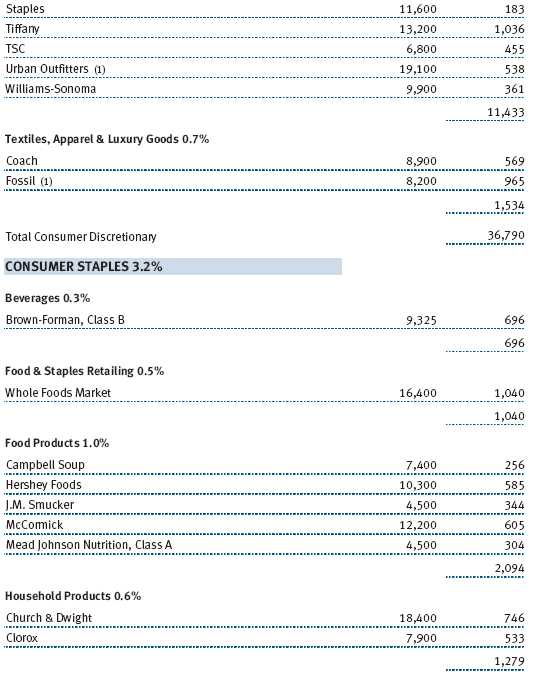
Consumer discretionary was our second-largest sector at the end of June, though we have a small underweight relative to the Russell benchmark. The sector includes an eclectic assortment of businesses, including retailers, media companies, homebuilders, hotels, and restaurants. We find that many companies in the sector have good business models, excellent cash flow, and other favorable attributes. Unfortunately, our stock selection limited the fund’s gains in the last six months. Certain momentum stocks in the benchmark, such as online movie rental company Netflix, performed very well, but we did not own them because of unforgiving valuations. Specialty retailers, which we favor currently, contributed the most, thanks to strength in discounter Ross Stores, iconic retailer Tiffany, and Bed Bath & Beyond. Media companies, which we are underweighting versus the Russell benchmark, generally lagged. One major exception was McGraw-Hill, a global information services provider, publisher, and owner of credit rating agency Standard & Poor’s. The company is benefiting from strong cash flows from its businesses and plans to repurchase a significant portion of its outstanding stock. Hotels, restaurants, and gaming companies were widely mixed. Chipotle Mexican Grill and Panera Bread did well, as their efficient operations generate high returns that allow them to open new locations and fund development of new products. However, Royal Caribbean Cruises and Marriott struggled as high oil and gas prices, economic uncertainty, and disruptions in some major tourist destinations around the world discouraged some business and leisure travel. Diversified consumer services companies, especially for-profit education businesses, were lackluster amid ongoing uncertainty about new government regulations. We eliminated several of them from the portfolio in favor of better long-term growth opportunities.
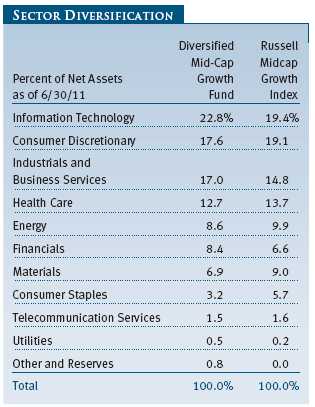
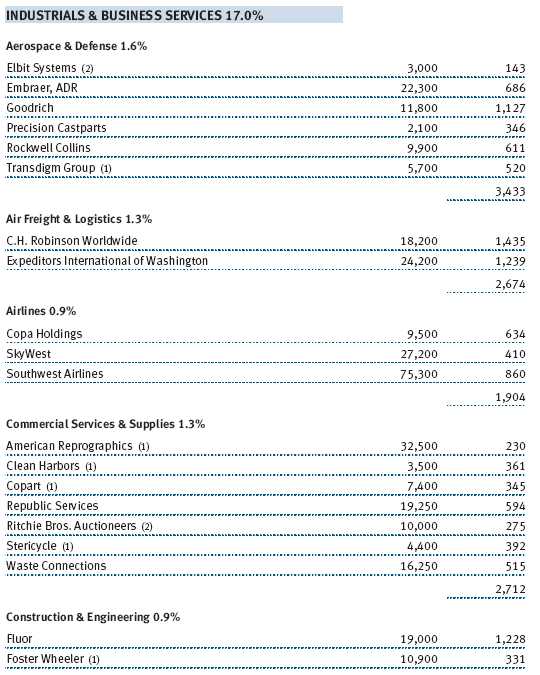
Industrials and business services, which represented 17% of assets at the end of June, produced good returns in the last six months, and stock selection helped our results versus the Russell benchmark. We are currently overweighting the sector, as many companies have attractive valuations and are world-class in their respective niches. While our holdings are currently more cyclical than those in the benchmark, we tend to favor industrials with greater earnings stability. In the last six months, our electrical equipment holdings did best, led by Rockwell Automation, which sells industrial automation control equipment to manufacturers. Among machinery stocks, mining equipment maker Joy Global and Wabtec, which sells components, services, and technologies to freight and passenger railroads worldwide, were strong performers, but engine maker Cummins disappointed. Companies in other underlying industries were generally lackluster, but there were a few exceptions. For example, in the aerospace segment, airplane component maker Precision Castparts continued to perform very well, but we began selling our position because its $25 billion market cap places the company out of the mid-cap universe. Also, Panama-based airline Copa Holdings did well due to increased passenger traffic and as the company looks to expand service to the Caribbean and Latin America. Professional services companies, such as staffing firms, sagged in the last six months as the labor market remained weak and business spending remained somewhat restrained.
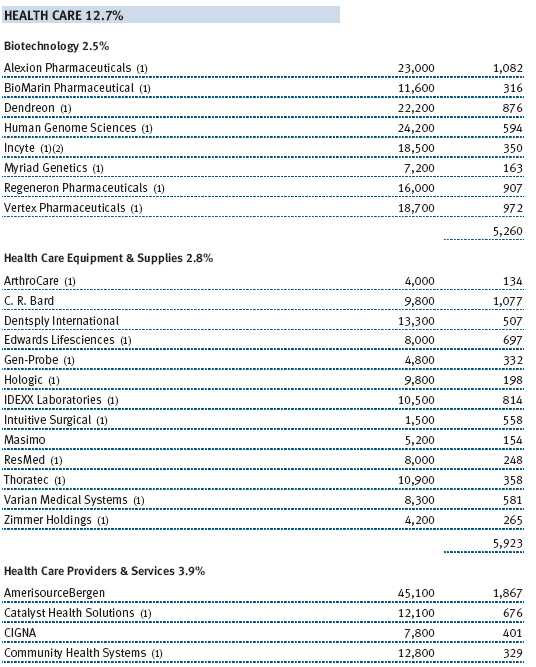
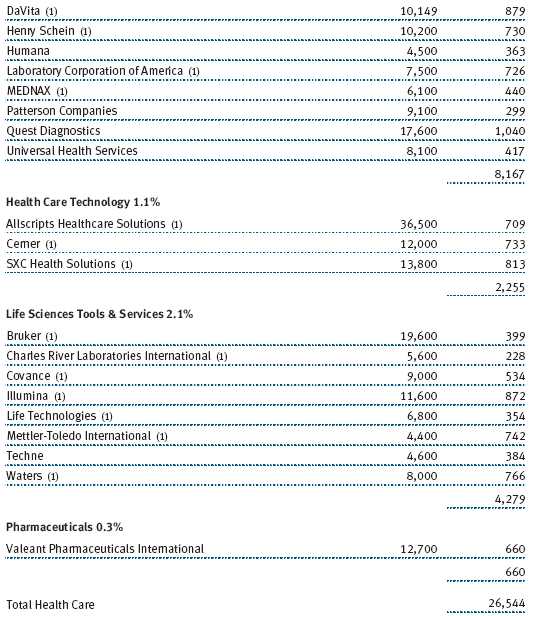
Shares in the health care sector contributed the most in absolute terms to the fund’s six-month performance, and good stock selection helped our relative performance. We are currently underweighting the sector versus the benchmark. Health care investing has been challenging for several years, in part because of a clouded outlook stemming from last year’s legislation, relentless pressure from payers (such as governments and insurance companies), and significant obstacles to innovation. Simply put, growing health care expenditures are becoming unaffordable. Still, the sector features some good long-term investment opportunities, and earnings have been favorable. We emphasize managed-care and volume-related companies reflective of demographic factors and desires for increased access to health care services, and we broadly diversify in the biotechnology sector to reduce risks. Biotechs did best for us in the last six months, led by Regeneron Pharmaceuticals. The company has had success bringing new medicines to the market and is getting closer to having Food and Drug Administration (FDA) approval of a new treatment for macular degeneration, an eye disease that usually affects the elderly. We like the company’s business model and that it has a European partner to fund its research. Our health care providers and services companies did very well, too, especially AmerisourceBergen, dialysis center operator DaVita, and CIGNA. Our equipment and supply companies broadly advanced, led by medical device makers C.R. Bard and Intuitive Surgical.
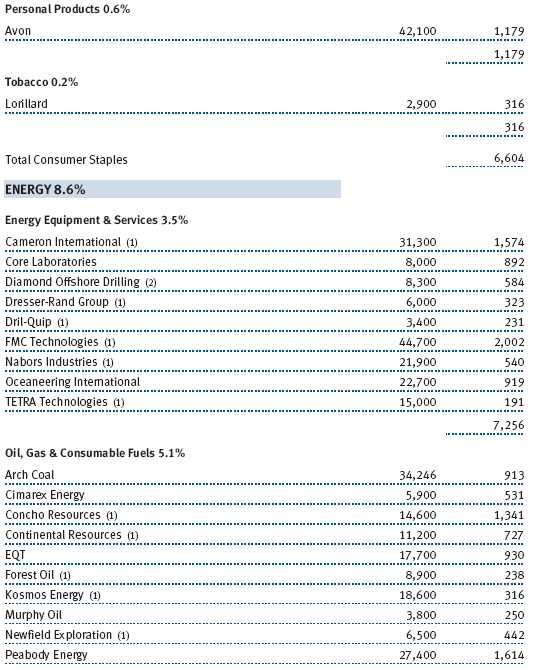
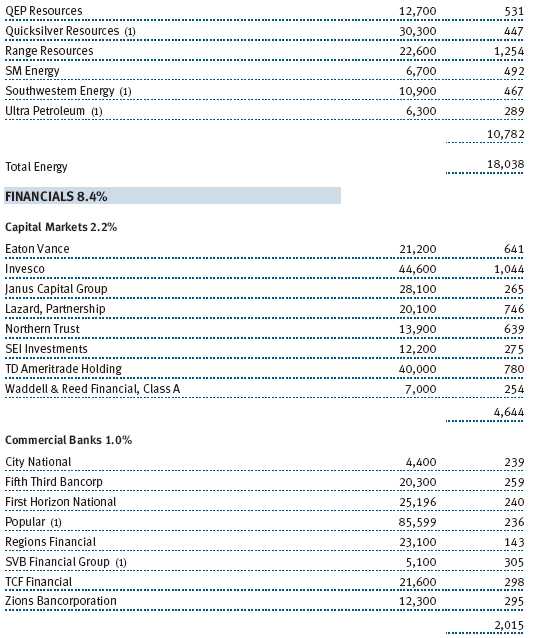
Energy stocks, which represented 8.6% of assets at the end of June, provided mild gains in absolute terms in the last six months. However, energy stocks pulled back sharply with oil prices in the last two months. As our longer-term investors know, our energy investments are not a play on oil price fluctuations. In fact, we make no attempt to forecast the direction of commodity prices or adjust the portfolio in response to short-term pricing trends. We seek differentiated service companies and those that are adept at finding underlying resources. In addition, we attempt to diversify our production-oriented holdings geographically to reduce risks. Two of our best-performing holdings in the sector were Core Laboratories, a Netherlands-based provider of various services to energy companies worldwide, and Range Resources, an independent natural gas company with operations primarily in the Appalachian region. One major detractor was Arch Coal, whose shares sagged as the energy sector retreated in the last few months. However, we believe that the company will benefit over time from the opening up of global export markets for coal.
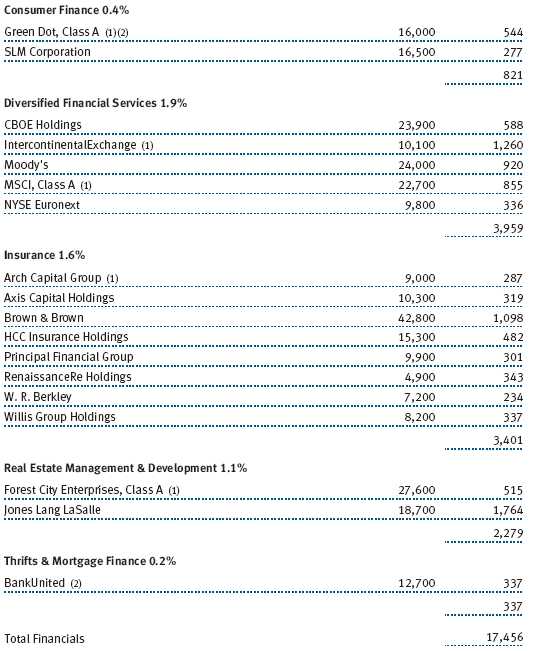
Financials stocks were mostly lackluster over the last six months. We had a material overweight in the sector versus the Russell index at the end of June. Unfortunately, our stock selection weighed on relative performance. On the plus side, securities-exchange company NYSE Euronext and credit rating agency Moody’s were two of our best performers in the sector. The performance of our insurance companies was subdued, but we like insurance underwriters and insurance brokers because we expect an improving pricing environment in the years ahead.
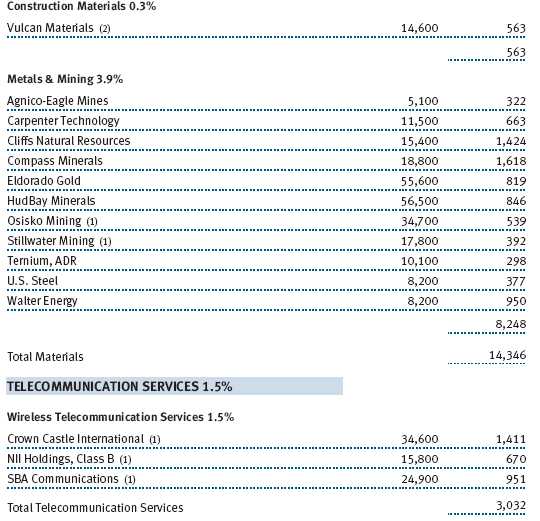
Our materials stocks in aggregate were flat in the first half of the year. As of June 30, 2011, we had a notable underweight relative to the benchmark. The main difference is the index’s higher exposure to commodity chemical companies. Chilean fertilizer company Sociedad Quimica y Minera de Chile did best, while our other chemical stocks generally produced mild gains. Our metals and mining companies were broadly mixed, as strength in specialty metals producer Carpenter Technology and metallurgical coal company Cliffs Natural Resources were offset by weakness in several other names.
The consumer staples sector, one of the smallest in the mid-cap growth universe, was very strong in the first half of 2011. Stocks in this traditionally defensive sector did well as investors turned risk averse due to concerns about the strength of the economic recovery. In addition, such companies are often able to pass along higher food and materials costs to consumers without significantly diminishing demand for their products. We are underweighting this sector because most companies are fairly valued, in our opinion, and some are too expensive. Unfortunately, stock selection and our underweight hurt the fund’s relative performance. Most of our staples holdings are makers of food products with strong brands, such as Hershey Foods and J.M. Smucker, both of which produced reasonable gains.
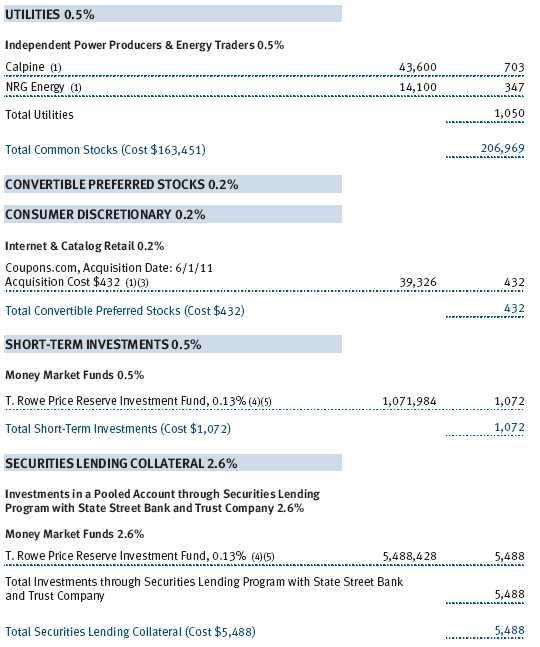
Utility stocks are a very small portion of the mid-cap growth universe, and we have very few investments in this space because most do not meet our growth and return on invested capital criteria. Our positions in two independent power producers generated a reasonable gain in the last six months. We continue to believe that these companies will benefit from increased demand for power as the economy recovers over time.
OUTLOOK
The economy has been growing slower than in past recoveries and will likely continue grinding forward at a slow pace, in part because of elevated national unemployment, housing sector weakness, and additional government regulations in a variety of sectors and industries. This environment is consistent with what typically occurs following a financial crisis.
Still, corporations are financially healthy, and corporate profits are at or near historic levels. While the stock market has risen significantly in the last two years, stock valuations in general are reasonable. With fixed income yields compressed because of massive, fear-driven cash flows into fixed income investments and extraordinary Federal Reserve stimulus measures in the last few years, equities should provide better long-term returns to investors.
The environment remains favorable for our investment management approach. In fact, the high degree of market volatility in recent years, while unsettling at times, underscores the value of what we offer to equity investors seeking long-term growth of capital. We use a disciplined approach to selecting and managing a broadly diversified portfolio of high-quality mid-cap growth investments. We are dedicated to fundamental research and maintain a long-term investment horizon. In addition, we are sensitive to valuations and seek companies with a good risk/reward trade-off. We believe these hallmarks of our investment approach will continue to serve fund investors well in the years ahead.
Thank you for your confidence in T. Rowe Price.
Respectfully submitted,

Donald J. Peters
Cochairman of the fund’s Investment Advisory Committee

Donald J. Easley
Cochairman of the fund’s Investment Advisory Committee
July 18, 2011
The committee cochairmen have day-to-day responsibility for managing the portfolio and work with committee members in developing and executing the fund’s investment program.
RISKS OF INVESTING
As with all equity funds, this fund’s share price can fall because of weakness in the broad market, a particular industry, or specific holdings. The market as a whole can decline for many reasons, including adverse political or economic developments here or abroad, changes in investor psychology, or heavy institutional selling. The prospects for an industry or company may deteriorate because of a variety of factors, including disappointing earnings or changes in the competitive environment. In addition, our assessment of companies held in the fund may prove incorrect, resulting in losses or poor performance even in a rising market. Finally, the fund’s investment approach could fall out of favor with the investing public, resulting in lagging performance versus other types of stock funds.
The stocks of mid-cap companies entail greater risk and are usually more volatile than the shares of large companies. In addition, growth stocks can be volatile for several reasons. Since they usually reinvest a high proportion of earnings in their own businesses, they may lack the dividends usually associated with value stocks that can cushion their decline in a falling market. Also, since investors buy these stocks because of their expected superior earnings growth, earnings disappointments often result in sharp price declines.
Diversification cannot assure a profit or protect against loss in a declining market.
GLOSSARY
Earnings growth rate (current fiscal year): Measures the annualized percent change in earnings per share from the prior fiscal year to the current fiscal year.
Lipper indexes: Consist of a small number (10 to 30) of the largest mutual funds in a particular category as tracked by Lipper Inc.
Price-to-earnings (P/E) ratio – 12 months forward: A valuation measure calculated by dividing the price of a stock by the analysts’ forecast of the next 12 months’ expected earnings. The ratio is a measure of how much investors are willing to pay for the company’s future earnings. The higher the P/E, the more investors are paying for a company’s earnings growth in the next 12 months.
Projected earnings growth rate (IBES): A company’s expected earnings per share growth rate for a given time period based on the forecast from the Institutional Broker’s Estimate System, which is commonly referred to as IBES.
Return on equity (ROE) – current fiscal year: A valuation measure calculated by dividing the company’s current fiscal year net income by shareholders’ equity (i.e., the company’s book value). ROE measures how much a company earns on each dollar that common stock investors have put into the company. It indicates how effectively and efficiently a company and its management are using stockholder investments.
Russell Midcap Growth Index: Measures the performance of those Russell Midcap companies with higher price-to-book ratios and higher forecasted growth values. The stocks are also members of the Russell 1000 Growth Index.
Russell Midcap Index: Measures the performance of the 800 smallest companies in the Russell 1000 Index.
Russell Midcap Value Index: Measures the performance of those Russell Midcap companies with lower price-to-book ratios and lower forecasted growth values. The stocks are also members of the Russell 1000 Value Index.
S&P MidCap 400 Index: An unmanaged index that tracks the stocks of 400 U.S. mid-cap companies.
Performance and Expenses
| GROWTH OF $10,000 |
This chart shows the value of a hypothetical $10,000 investment in the fund over the past 10 fiscal year periods or since inception (for funds lacking 10-year records). The result is compared with benchmarks, which may include a broad-based market index and a peer group average or index. Market indexes do not include expenses, which are deducted from fund returns as well as mutual fund averages and indexes.
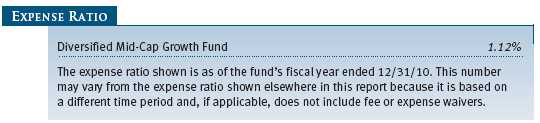
| FUND EXPENSE EXAMPLE |
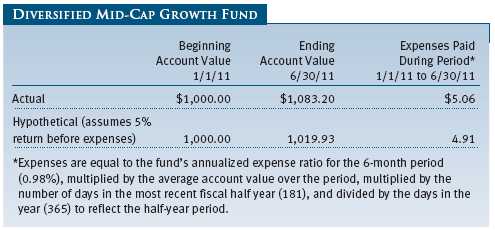
As a mutual fund shareholder, you may incur two types of costs: (1) transaction costs, such as redemption fees or sales loads, and (2) ongoing costs, including management fees, distribution and service (12b-1) fees, and other fund expenses. The following example is intended to help you understand your ongoing costs (in dollars) of investing in the fund and to compare these costs with the ongoing costs of investing in other mutual funds. The example is based on an investment of $1,000 invested at the beginning of the most recent six-month period and held for the entire period.
Actual Expenses
The first line of the following table (“Actual”) provides information about actual account values and expenses based on the fund’s actual returns. You may use the information on this line, together with your account balance, to estimate the expenses that you paid over the period. Simply divide your account value by $1,000 (for example, an $8,600 account value divided by $1,000 = 8.6), then multiply the result by the number on the first line under the heading “Expenses Paid During Period” to estimate the expenses you paid on your account during this period.
Hypothetical Example for Comparison Purposes
The information on the second line of the table (“Hypothetical”) is based on hypothetical account values and expenses derived from the fund’s actual expense ratio and an assumed 5% per year rate of return before expenses (not the fund’s actual return). You may compare the ongoing costs of investing in the fund with other funds by contrasting this 5% hypothetical example and the 5% hypothetical examples that appear in the shareholder reports of the other funds. The hypothetical account values and expenses may not be used to estimate the actual ending account balance or expenses you paid for the period.
Note: T. Rowe Price charges an annual account service fee of $20, generally for accounts with less than $10,000 ($1,000 for UGMA/UTMA). The fee is waived for any investor whose T. Rowe Price mutual fund accounts total $50,000 or more; accounts employing automatic investing; accounts electing to receive electronic delivery of account statements, transaction confirmations, and prospectuses and shareholder reports; accounts of an investor who is a T. Rowe Price Preferred Services, Personal Services, or Enhanced Personal Services client (enrollment in these programs generally requires T. Rowe Price assets of at least $100,000); and IRAs and other retirement plan accounts that utilize a prototype plan sponsored by T. Rowe Price (although a separate custodial or administrative fee may apply to such accounts). This fee is not included in the accompanying table. If you are subject to the fee, keep it in mind when you are estimating the ongoing expenses of investing in the fund and when comparing the expenses of this fund with other funds.
You should also be aware that the expenses shown in the table highlight only your ongoing costs and do not reflect any transaction costs, such as redemption fees or sales loads. Therefore, the second line of the table is useful in comparing ongoing costs only and will not help you determine the relative total costs of owning different funds. To the extent a fund charges transaction costs, however, the total cost of owning that fund is higher.
Unaudited
The accompanying notes are an integral part of these financial statements.
Unaudited

The accompanying notes are an integral part of these financial statements.
Unaudited
The accompanying notes are an integral part of these financial statements.
Unaudited
The accompanying notes are an integral part of these financial statements.
Unaudited
The accompanying notes are an integral part of these financial statements.
Unaudited
| NOTES TO FINANCIAL STATEMENTS |
T. Rowe Price Diversified Mid-Cap Growth Fund, Inc. (the fund), is registered under the Investment Company Act of 1940 (the 1940 Act) as a diversified, open-end management investment company. The fund commenced operations on December 31, 2003. The fund seeks to provide long-term capital growth by investing primarily in the common stocks of mid-cap growth companies.
NOTE 1 - SIGNIFICANT ACCOUNTING POLICIES
Basis of Preparation The accompanying financial statements were prepared in accordance with accounting principles generally accepted in the United States of America (GAAP), which require the use of estimates made by management. Management believes that estimates and valuations are appropriate; however, actual results may differ from those estimates, and the valuations reflected in the accompanying financial statements may differ from the value ultimately realized upon sale or maturity.
Investment Transactions, Investment Income, and Distributions Income and expenses are recorded on the accrual basis. Dividends received from mutual fund investments are reflected as dividend income; capital gain distributions are reflected as realized gain/loss. Dividend income and capital gain distributions are recorded on the ex-dividend date. Income tax-related interest and penalties, if incurred, would be recorded as income tax expense. Investment transactions are accounted for on the trade date. Realized gains and losses are reported on the identified cost basis. Distributions to shareholders are recorded on the ex-dividend date. Income distributions are declared and paid annually. Capital gain distributions, if any, are generally declared and paid by the fund annually.
Rebates and Credits Subject to best execution, the fund may direct certain security trades to brokers who have agreed to rebate a portion of the related brokerage commission to the fund in cash. Commission rebates are reflected as realized gain on securities in the accompanying financial statements. Additionally, the fund earns credits on temporarily uninvested cash balances held at the custodian, which reduce the fund’s custody charges. Custody expense in the accompanying financial statements is presented before reduction for credits.
NOTE 2 - VALUATION
The fund’s financial instruments are reported at fair value as defined by GAAP. The fund determines the values of its assets and liabilities and computes its net asset value per share at the close of the New York Stock Exchange (NYSE), normally 4 p.m. ET, each day that the NYSE is open for business.
Valuation Methods Equity securities listed or regularly traded on a securities exchange or in the over-the-counter (OTC) market are valued at the last quoted sale price or, for certain markets, the official closing price at the time the valuations are made, except for OTC Bulletin Board securities, which are valued at the mean of the latest bid and asked prices. A security that is listed or traded on more than one exchange is valued at the quotation on the exchange determined to be the primary market for such security. Listed securities not traded on a particular day are valued at the mean of the latest bid and asked prices for domestic securities and the last quoted sale price for international securities.
Investments in mutual funds are valued at the mutual fund’s closing net asset value per share on the day of valuation.
Other investments, including restricted securities, and those financial instruments for which the above valuation procedures are inappropriate or are deemed not to reflect fair value are stated at fair value as determined in good faith by the T. Rowe Price Valuation Committee, established by the fund’s Board of Directors.
Valuation Inputs Various inputs are used to determine the value of the fund’s financial instruments. These inputs are summarized in the three broad levels listed below:
Level 1 – quoted prices in active markets for identical financial instruments
Level 2 – observable inputs other than Level 1 quoted prices (including, but not limited to, quoted prices for similar financial instruments, interest rates, prepayment speeds, and credit risk)
Level 3 – unobservable inputs
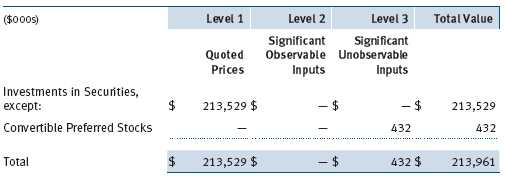
Observable inputs are those based on market data obtained from sources independent of the fund, and unobservable inputs reflect the fund’s own assumptions based on the best information available. The input levels are not necessarily an indication of the risk or liquidity associated with financial instruments at that level. The following table summarizes the fund’s financial instruments, based on the inputs used to determine their values on June 30, 2011:
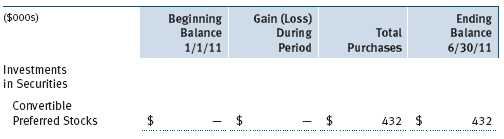
Following is a reconciliation of the fund’s Level 3 holdings for the six months ended June 30, 2011. Gain (loss) reflects both realized and change in unrealized gain (loss) on Level 3 holdings during the period, if any, and is included on the accompanying Statement of Operations. The change in unrealized gain (loss) on Level 3 instruments held at June 30, 2011, totaled $0 for the six months ended June 30, 2011.
NOTE 3 - OTHER INVESTMENT TRANSACTIONS
Consistent with its investment objective, the fund engages in the following practices to manage exposure to certain risks and/or to enhance performance. The investment objective, policies, program, and risk factors of the fund are described more fully in the fund’s prospectus and Statement of Additional Information.
Restricted Securities The fund may invest in securities that are subject to legal or contractual restrictions on resale. Prompt sale of such securities at an acceptable price may be difficult and may involve substantial delays and additional costs.
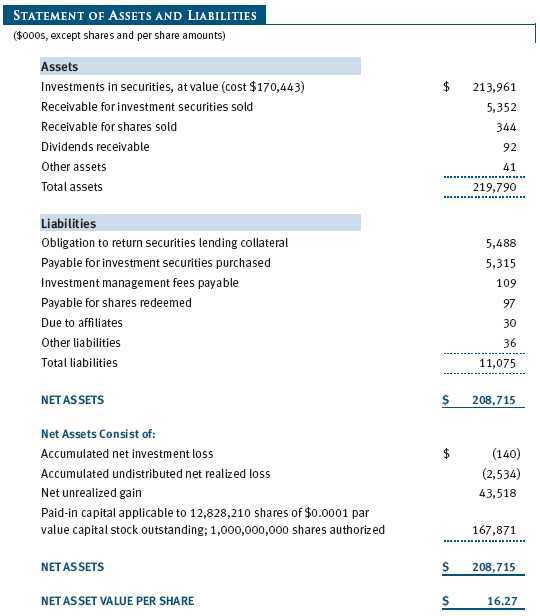
Securities Lending The fund lends its securities to approved brokers to earn additional income. It receives as collateral cash and U.S. government securities valued at 102% to 105% of the value of the securities on loan. Cash collateral is invested by the fund’s lending agent(s) in accordance with investment guidelines approved by management. Although risk is mitigated by the collateral, the fund could experience a delay in recovering its securities and a possible loss of income or value if the borrower fails to return the securities or if collateral investments decline in value. Securities lending revenue recognized by the fund consists of earnings on invested collateral and borrowing fees, net of any rebates to the borrower and compensation to the lending agent. In accordance with GAAP, investments made with cash collateral are reflected in the accompanying financial statements, but collateral received in the form of securities are not. On June 30, 2011, the value of loaned securities was $5,469,000 and cash collateral investments totaled $5,488,000.
American and Global Depository Receipts The fund may invest in American Depository Receipts (ADRs) and/or Global Depository Receipts (GDRs), certificates issued by U.S. and international banks that represent ownership of foreign securities held by the issuing bank. ADRs and GDRs are transferable, trade on established markets, and entitle the holder to all dividends and capital gains paid by the underlying foreign security. Issuing banks generally charge a security administration fee. Such fees are included in custody and accounting expense in the accompanying Statement of Operations.
Other Purchases and sales of portfolio securities other than short-term securities aggregated $73,179,000 and $34,215,000, respectively, for the six months ended June 30, 2011.
NOTE 4 - FEDERAL INCOME TAXES
No provision for federal income taxes is required since the fund intends to continue to qualify as a regulated investment company under Subchapter M of the Internal Revenue Code and distribute to shareholders all of its taxable income and gains. Distributions determined in accordance with federal income tax regulations may differ in amount or character from net investment income and realized gains for financial reporting purposes. Financial reporting records are adjusted for permanent book/tax differences to reflect tax character but are not adjusted for temporary differences. The amount and character of tax-basis distributions and composition of net assets are finalized at fiscal year-end; accordingly, tax-basis balances have not been determined as of the date of this report.
In accordance with federal tax regulations, the fund recognized capital losses in the current period for tax purposes that had been recognized in the prior fiscal year for financial reporting purposes. Such deferrals relate to net capital losses realized between November 1, 2010 and December 31, 2010, and totaled $215,000. The fund intends to retain realized gains to the extent of available capital loss carryforwards. As of December 31, 2010, the fund had $8,413,000 of unused capital loss carryforwards, which expire: $822,000 in fiscal 2016 and $7,591,000 in fiscal 2017.
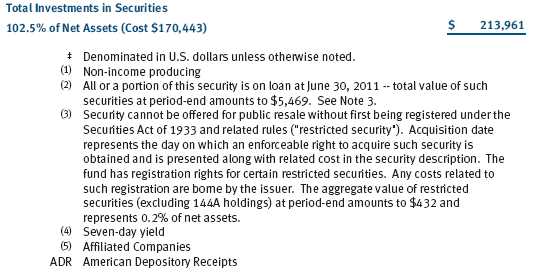
At June 30, 2011, the cost of investments for federal income tax purposes was $170,443,000. Net unrealized gain aggregated $43,518,000 at period-end, of which $48,341,000 related to appreciated investments and $4,823,000 related to depreciated investments.
NOTE 5 - RELATED PARTY TRANSACTIONS
The fund is managed by T. Rowe Price Associates, Inc. (Price Associates), a wholly owned subsidiary of T. Rowe Price Group, Inc. (Price Group). The investment management agreement between the fund and Price Associates provides for an annual investment management fee, which is computed daily and paid monthly. The fee consists of an individual fund fee, equal to 0.35% of the fund’s average daily net assets, and a group fee. The group fee rate is calculated based on the combined net assets of certain mutual funds sponsored by Price Associates (the group) applied to a graduated fee schedule, with rates ranging from 0.48% for the first $1 billion of assets to 0.28% for assets in excess of $300 billion. The fund’s group fee is determined by applying the group fee rate to the fund’s average daily net assets. At June 30, 2011, the effective annual group fee rate was 0.30%.
The fund was also subject to a contractual expense limitation through April 30, 2011. During the limitation period, Price Associates was required to waive its management fee and reimburse the fund for any expenses, excluding interest, taxes, brokerage commissions, and extraordinary expenses, that would otherwise cause the fund’s ratio of annualized total expenses to average net assets (expense ratio) to exceed its expense limitation of 1.50%. For a period of three years after the date of any reimbursement or waiver, the fund is required to repay Price Associates for expenses previously reimbursed and management fees waived to the extent its net assets have grown or expenses have declined sufficiently to allow repayment without causing the fund’s expense ratio to exceed its expense limitation. At June 30, 2011, there were no amounts subject to repayment.
In addition, the fund has entered into service agreements with Price Associates and two wholly owned subsidiaries of Price Associates (collectively, Price). Price Associates computes the daily share price and provides certain other administrative services to the fund. T. Rowe Price Services, Inc., provides shareholder and administrative services in its capacity as the fund’s transfer and dividend disbursing agent. T. Rowe Price Retirement Plan Services, Inc., provides subaccounting and recordkeeping services for certain retirement accounts invested in the fund. For the six months ended June 30, 2011, expenses incurred pursuant to these service agreements were $49,000 for Price Associates; $130,000 for T. Rowe Price Services, Inc.; and $3,000 for T. Rowe Price Retirement Plan Services, Inc. The total amount payable at period-end pursuant to these service agreements is reflected as Due to Affiliates in the accompanying financial statements.
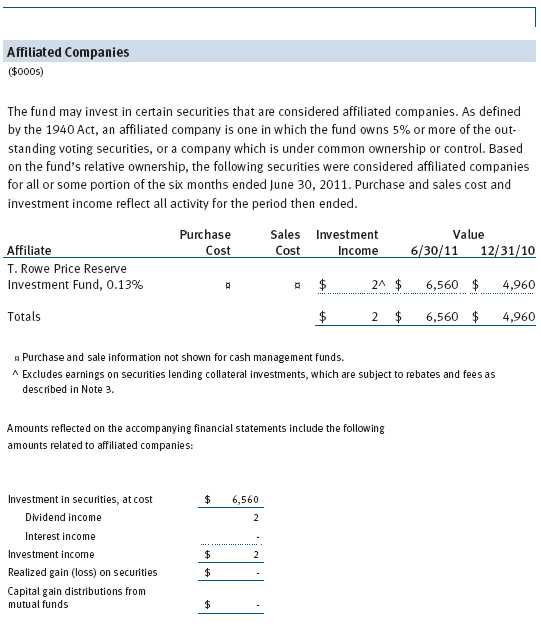
The fund may invest in the T. Rowe Price Reserve Investment Fund and the T. Rowe Price Government Reserve Investment Fund (collectively, the T. Rowe Price Reserve Investment Funds), open-end management investment companies managed by Price Associates and considered affiliates of the fund. The T. Rowe Price Reserve Investment Funds are offered as cash management options to mutual funds, trusts, and other accounts managed by Price Associates and/or its affiliates and are not available for direct purchase by members of the public. The T. Rowe Price Reserve Investment Funds pay no investment management fees.
| INFORMATION ON PROXY VOTING POLICIES, PROCEDURES, AND RECORDS |
A description of the policies and procedures used by T. Rowe Price funds and portfolios to determine how to vote proxies relating to portfolio securities is available in each fund’s Statement of Additional Information, which you may request by calling 1-800-225-5132 or by accessing the SEC’s website, sec.gov. The description of our proxy voting policies and procedures is also available on our website, troweprice.com. To access it, click on the words “Our Company” at the top of our corporate homepage. Then, when the next page appears, click on the words “Proxy Voting Policies” on the left side of the page.
Each fund’s most recent annual proxy voting record is available on our website and through the SEC’s website. To access it through our website, follow the directions above, then click on the words “Proxy Voting Records” on the right side of the Proxy Voting Policies page.
| HOW TO OBTAIN QUARTERLY PORTFOLIO HOLDINGS |
The fund files a complete schedule of portfolio holdings with the Securities and Exchange Commission for the first and third quarters of each fiscal year on Form N-Q. The fund’s Form N-Q is available electronically on the SEC’s website (sec.gov); hard copies may be reviewed and copied at the SEC’s Public Reference Room, 450 Fifth St. N.W., Washington, DC 20549. For more information on the Public Reference Room, call 1-800-SEC-0330.
| APPROVAL OF INVESTMENT MANAGEMENT AGREEMENT |
On March 9, 2011, the fund’s Board of Directors (Board) unanimously approved the continuation of the investment advisory contract (Contract) between the fund and its investment advisor, T. Rowe Price Associates, Inc. (Advisor). The Board considered a variety of factors in connection with its review of the Contract, also taking into account information provided by the Advisor during the course of the year, as discussed below:
Services Provided by the Advisor
The Board considered the nature, quality, and extent of the services provided to the fund by the Advisor. These services included, but were not limited to, management of the fund’s portfolio and a variety of related activities, as well as financial and administrative services, reporting, and communications. The Board also reviewed the background and experience of the Advisor’s senior management team and investment personnel involved in the management of the fund. The Board concluded that it was satisfied with the nature, quality, and extent of the services provided by the Advisor.
Investment Performance of the Fund
The Board reviewed the fund’s average annual total returns over the one-, three-, and five-year and since-inception periods, as well as the fund’s year-by-year returns, and compared these returns with a wide variety of previously agreed upon comparable performance measures and market data, including those supplied by Lipper and Morningstar, which are independent providers of mutual fund data. On the basis of this evaluation and the Board’s ongoing review of investment results, and factoring in the relative market conditions during certain of the performance periods, the Board concluded that the fund’s performance was satisfactory.
Costs, Benefits, Profits, and Economies of Scale
The Board reviewed detailed information regarding the revenues received by the Advisor under the Contract and other benefits that the Advisor (and its affiliates) may have realized from its relationship with the fund, including research received under “soft dollar” agreements and commission-sharing arrangements with broker-dealers. The Board considered that the Advisor may receive some benefit from soft-dollar arrangements pursuant to which research is received from broker-dealers that execute the applicable fund’s portfolio transactions. The Board also received information on the estimated costs incurred and profits realized by the Advisor and its affiliates from advising T. Rowe Price mutual funds, as well as estimates of the gross profits realized from managing the fund in particular. The Board concluded that the Advisor’s profits were reasonable in light of the services provided to the fund. The Board also considered whether the fund or other funds benefit under the fee levels set forth in the Contract from any economies of scale realized by the Advisor. Under the Contract, the fund pays a fee to the Advisor composed of two components—a group fee rate based on the aggregate assets of certain T. Rowe Price mutual funds (including the fund) that declines at certain asset levels and an individual fund fee rate that is assessed on the assets of the fund. The Board determined that it would be appropriate to introduce another breakpoint into the group fee rate, effective May 1, 2011, to allow fund shareholders to participate in additional economies of scale. The Board concluded that the advisory fee structure for the fund continued to provide for a reasonable sharing of benefits from any economies of scale with the fund’s investors.
Fees
The Board reviewed the fund’s management fee rate, operating expenses, and total expense ratio and compared them with fees and expenses of other comparable funds based on information and data supplied by Lipper. The information provided to the Board indicated that the fund’s management fee rate was at or below the median for comparable funds. The information also indicated that the fund’s total expense ratio was above the median for certain groups of comparable funds but below the median for other groups of comparable funds. The Board also reviewed the fee schedules for institutional accounts of the Advisor and its affiliates with similar mandates. Management provided the Board with information about the Advisor’s responsibilities and services provided to institutional account clients, which are more limited than its responsibilities for the fund and other T. Rowe Price mutual funds that it advises, and showing that the Advisor performs significant additional services and assumes greater risk for the fund and other T. Rowe Price mutual funds that it advises than it does for institutional account clients. On the basis of the information provided, the Board concluded that the fees paid by the fund under the Contract were reasonable.
Approval of the Contract
As noted, the Board approved the continuation of the Contract. No single factor was considered in isolation or to be determinative to the decision. Rather, the Board was assisted by the advice of independent legal counsel and concluded, in light of a weighting and balancing of all factors considered, that it was in the best interests of the fund to approve the continuation of the Contract (including the fees to be charged for services thereunder).
Item 2. Code of Ethics.
A code of ethics, as defined in Item 2 of Form N-CSR, applicable to its principal executive officer, principal financial officer, principal accounting officer or controller, or persons performing similar functions is filed as an exhibit to the registrant’s annual Form N-CSR. No substantive amendments were approved or waivers were granted to this code of ethics during the registrant’s most recent fiscal half-year.
Item 3. Audit Committee Financial Expert.
Disclosure required in registrant’s annual Form N-CSR.
Item 4. Principal Accountant Fees and Services.
Disclosure required in registrant’s annual Form N-CSR.
Item 5. Audit Committee of Listed Registrants.
Not applicable.
Item 6. Investments.
(a) Not applicable. The complete schedule of investments is included in Item 1 of this Form N-CSR.
(b) Not applicable.
Item 7. Disclosure of Proxy Voting Policies and Procedures for Closed-End Management Investment Companies.
Not applicable.
Item 8. Portfolio Managers of Closed-End Management Investment Companies.
Not applicable.
Item 9. Purchases of Equity Securities by Closed-End Management Investment Company and Affiliated Purchasers.
Not applicable.
Item 10. Submission of Matters to a Vote of Security Holders.
Not applicable.
Item 11. Controls and Procedures.
(a) The registrant’s principal executive officer and principal financial officer have evaluated the registrant’s disclosure controls and procedures within 90 days of this filing and have concluded that the registrant’s disclosure controls and procedures were effective, as of that date, in ensuring that information required to be disclosed by the registrant in this Form N-CSR was recorded, processed, summarized, and reported timely.
(b) The registrant’s principal executive officer and principal financial officer are aware of no change in the registrant’s internal control over financial reporting that occurred during the registrant’s second fiscal quarter covered by this report that has materially affected, or is reasonably likely to materially affect, the registrant’s internal control over financial reporting.
Item 12. Exhibits.
(a)(1) The registrant’s code of ethics pursuant to Item 2 of Form N-CSR is filed with the registrant’s annual Form N-CSR.
(2) Separate certifications by the registrant's principal executive officer and principal financial officer, pursuant to Section 302 of the Sarbanes-Oxley Act of 2002 and required by Rule 30a-2(a) under the Investment Company Act of 1940, are attached.
(3) Written solicitation to repurchase securities issued by closed-end companies: not applicable.
(b) A certification by the registrant's principal executive officer and principal financial officer, pursuant to Section 906 of the Sarbanes-Oxley Act of 2002 and required by Rule 30a-2(b) under the Investment Company Act of 1940, is attached.
SIGNATURES | |
| Pursuant to the requirements of the Securities Exchange Act of 1934 and the Investment | |
| Company Act of 1940, the registrant has duly caused this report to be signed on its behalf by the | |
| undersigned, thereunto duly authorized. | |
| T. Rowe Price Diversified Mid-Cap Growth Fund, Inc. | |
| By | /s/ Edward C. Bernard |
| Edward C. Bernard | |
| Principal Executive Officer | |
| Date | August 17, 2011 |
| Pursuant to the requirements of the Securities Exchange Act of 1934 and the Investment | |
| Company Act of 1940, this report has been signed below by the following persons on behalf of | |
| the registrant and in the capacities and on the dates indicated. | |
| By | /s/ Edward C. Bernard |
| Edward C. Bernard | |
| Principal Executive Officer | |
| Date | August 17, 2011 |
| By | /s/ Gregory K. Hinkle |
| Gregory K. Hinkle | |
| Principal Financial Officer | |
| Date | August 17, 2011 |