| UNITED STATES |
| SECURITIES AND EXCHANGE COMMISSION |
| Washington, D.C. 20549 |
FORM N-CSR |
CERTIFIED SHAREHOLDER REPORT OF REGISTERED |
MANAGEMENT INVESTMENT COMPANIES |
| Investment Company Act File Number: 811-21454 |
| T. Rowe Price Diversified Mid-Cap Growth Fund, Inc. |
| (Exact name of registrant as specified in charter) |
| 100 East Pratt Street, Baltimore, MD 21202 |
| (Address of principal executive offices) |
| David Oestreicher |
| 100 East Pratt Street, Baltimore, MD 21202 |
| (Name and address of agent for service) |
| Registrant’s telephone number, including area code: (410) 345-2000 |
| Date of fiscal year end: December 31 |
| Date of reporting period: June 30, 2009 |
Item 1: Report to Shareholders
 |
| Diversified Mid-Cap Growth Fund | June 30, 2009 |
The views and opinions in this report were current as of June 30, 2009. They are not guarantees of performance or investment results and should not be taken as investment advice. Investment decisions reflect a variety of factors, and the managers reserve the right to change their views about individual stocks, sectors, and the markets at any time. As a result, the views expressed should not be relied upon as a forecast of the fund’s future investment intent. The report is certified under the Sarbanes-Oxley Act, which requires mutual funds and other public companies to affirm that, to the best of their knowledge, the information in their financial reports is fairly and accurately stated in all material respects.
REPORTS ON THE WEB
Sign up for our E-mail Program, and you can begin to receive updated fund reports and prospectuses online rather than through the mail. Log in to your account at troweprice.com for more information.
Manager’s Letter
Fellow Shareholders
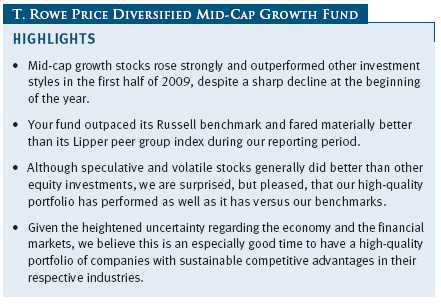
Mid-cap growth stocks rose strongly and outperformed other investment styles in the first half of 2009, despite a sharp decline at the beginning of the year. Investor sentiment improved dramatically starting in early March amid signs and hopes that the economy is in the process of stabilizing and that government measures to recapitalize the banks and the financial markets are starting to work. We remain concerned that an extended period of low interest rates, expansionary monetary policy, and significant federal fiscal stimulus may have very severe implications for future inflation once the economy recovers.
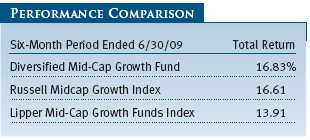
Your fund returned 16.83% in the six-month period ended June 30, 2009, recouping some of the deep losses suffered last year. As shown in the Performance Comparison table, the fund outpaced its Russell benchmark and fared materially better than its Lipper peer group index. Both sector allocations and good stock selection in various sectors contributed to our performance advantage. Speculative stocks had strong relative performance after a disastrous 2008. Although stocks of companies with the highest valuations and the highest growth expectations generally did better than other equity investments, we are surprised, but pleased, that our high-quality portfolio has performed as well as it has versus our benchmarks. Nevertheless, we know that the pain of last year’s losses remains with many of our investors.
MARKET ENVIRONMENT
The U.S. economy is currently in one of the longest and deepest recessions since the Great Depression. The economy shrank at an annualized rate of more than 5% in the fourth quarter of 2008 and in the first quarter of 2009. Consumer spending, stock prices, and home values have declined, and national unemployment increased to 9.5% by the end of our reporting period.
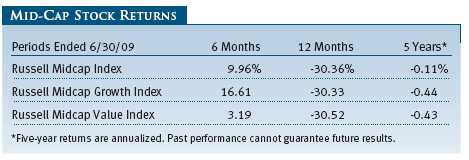
Equities plunged in the first two months of the year but rebounded sharply starting in early March. For the full six-month period, mid-cap shares surpassed their smaller and larger peers. The Russell Midcap Index returned 9.96% versus 3.16% for the large-cap S&P 500 Index and 2.64% for the small-cap Russell 2000 Index. Growth stocks did significantly better than value stocks across all market capitalizations in the last six months, but as shown in the table below, mid-cap growth and value stocks did about the same in the one- and five-year periods ended June 30, 2009.
Within the Russell Midcap Growth Index, all major sectors produced gains. Energy and materials stocks—which led the market up in the first half of 2008 and down in the second half—fared best as many commodity prices rebounded sharply from recent lows.
INVESTMENT STRATEGY
Before discussing the portfolio’s performance in detail, we would like to welcome new investors and thank all of our longer-term investors for their continuing confidence in our portfolio management abilities, especially during this protracted period of economic weakness. We, like you, are pleased to see the market’s improved performance in the last few months, though our time horizon for investing is much longer, and near-term uncertainty remains high. We remain committed to the same strategy and the principles that have guided our management of the portfolio since its inception. We believe these will help us navigate through what could be an extended period of anemic market performance and provide patient investors with long-term capital growth:
• The Diversified Mid-Cap Growth Fund invests in mid-cap stocks of companies whose earnings are expected to grow at an above-average rate. We define mid-cap companies as those whose market capitalization at the time of purchase falls within the range of either the S&P MidCap 400 Index or the Russell Midcap Growth Index.
• We keep the fund fully invested because we believe that successful market timing is virtually impossible—you would need to be right twice—and that the costs associated with frequent trading reduce the likelihood of outperforming the market. We do not spend undue time worrying about short-term performance or trying to forecast the direction of the economy or the market. Our focus is to find mid-cap companies with the best long-term growth potential.
• Unlike other mid-cap growth portfolios that are highly concentrated, the Diversified Mid-Cap Growth Fund will typically invest in about 275 stocks. This high degree of diversification helps to mitigate the downside risk attributable to any single poorly performing security. We invest in companies that are early in their life cycles, and it is inevitable that some will not be as successful as we hope. Accordingly, we balance risk with potential returns.
• Stock selection is based on a combination of fundamental, bottom-up analysis and quantitative strategies in an attempt to identify companies with superior long-term appreciation prospects. We use a growth approach, looking for companies with a demonstrated ability to increase revenues, earnings, and cash flow consistently; capable management; attractive business niches; and a sustainable competitive advantage. We favor companies with above-average earnings growth and lower earnings variability.
• Our time horizons are longer than those of other mid-cap growth investors. Our portfolio turnover rate in the last 12 months was 37.3%, which is substantially less than last year’s average of 124.5% for mid-cap growth funds, according to data from Morningstar Direct. (Morningstar only calculates portfolio turnover for their averages at year-end.) This means our holding period for a typical stock is almost three years, whereas our average competitor holds a given stock for less than one year. Consequently, we view ourselves as long-term investors; we are not short-term speculators or day-traders.
• Valuations are also very important: We look for the best relative values among companies with the strongest businesses and managements.
• We use a number of proprietary quantitative models to identify and evaluate the characteristics of individual mid-cap growth companies and the portfolio as a whole.
PORTFOLIO REVIEW
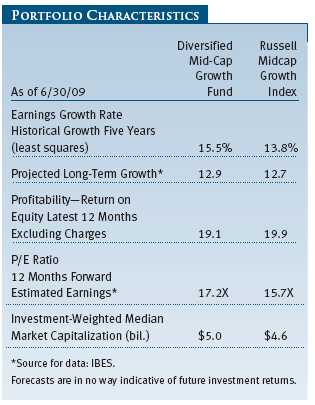
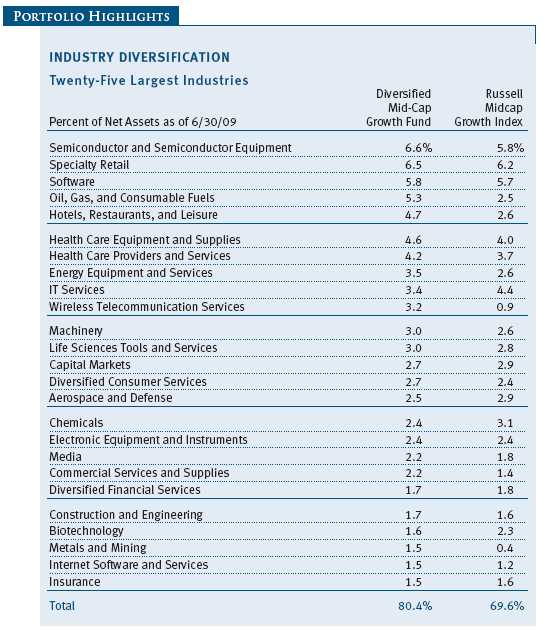
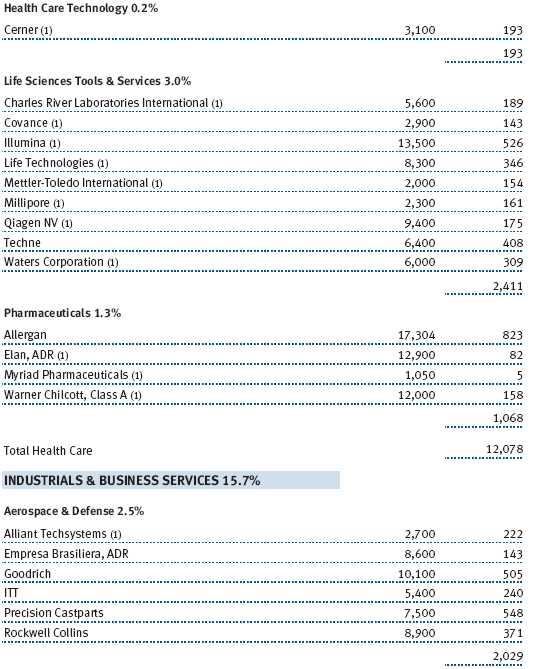
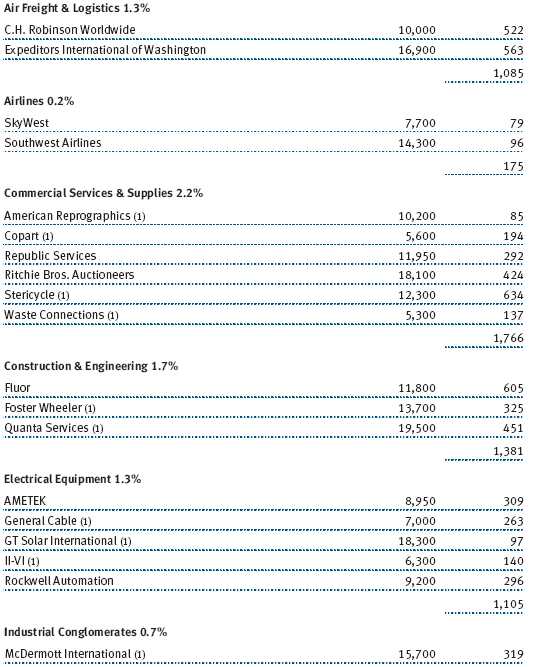
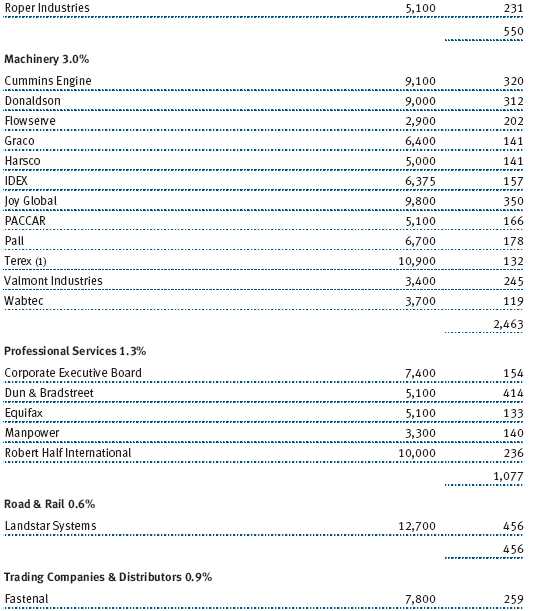
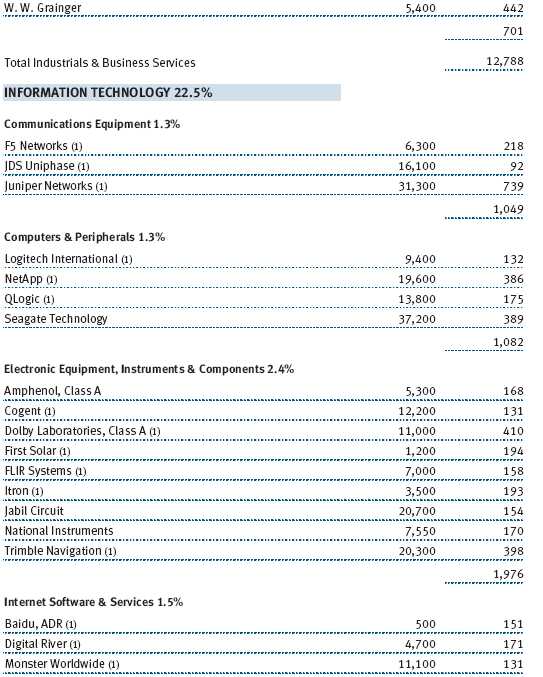
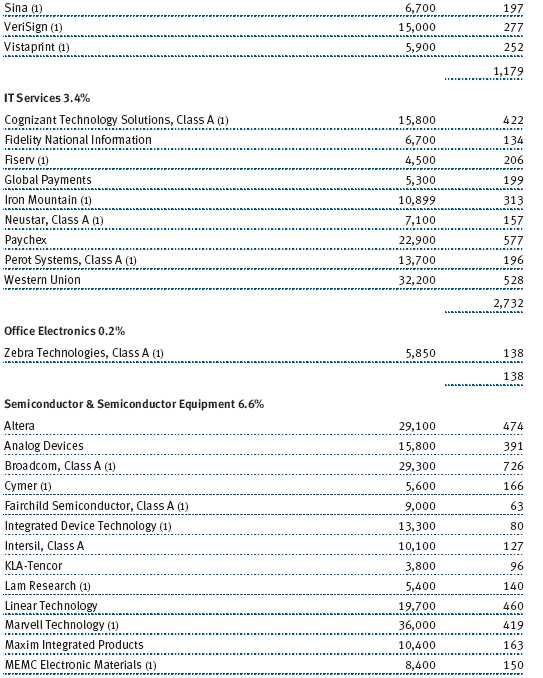
The Diversified Mid-Cap Growth Fund’s fundamental characteristics are similar to those of mid-cap growth benchmarks, such as the Russell Midcap Growth Index, as indicated by the Portfolio Characteristics table on the next page. The portfolio’s median market capitalization ($5.0 billion) and projected earnings growth rate (12.9%) are slightly larger than those of the index, while its 17.2 price/earnings (P/E) ratio is higher than that of the index. This reflects our commitment to companies with excellent long-term growth prospects. The fund’s return on equity (ROE), which measures how effectively and efficiently a company and its management are using stockholder investments, is an attractive 19.1% versus 19.9% for the benchmark. These 12-month trailing numbers have been declining due to the economic downturn as many cyclical companies have passed their peak levels of profitability. Nevertheless, we remain committed to finding and investing in companies that we believe can maintain high and sustainable profitability. Our sector allocations have some resemblance to those of the Russell index: Our largest sector commitments at the end of June were information technology, consumer discretionary, industrials and business services, and health care.
Information technology shares rallied in the last six months as technology spending has not been as weak as previously expected and investors were drawn to companies with strong balance sheets, low debt levels, and attractive valuations. Our holdings in the sector contributed the most to the fund’s absolute performance, led by semiconductor and software companies. We continue to find many attractively valued companies with strong business models, excellent longer-term prospects, and high barriers to entry in these and other tech industries.
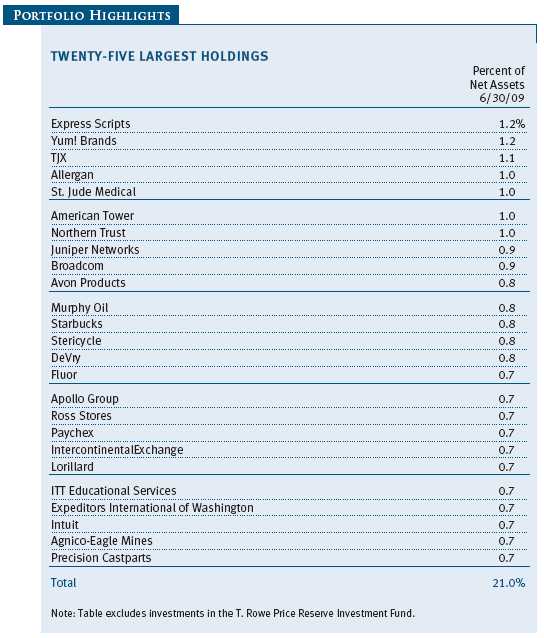
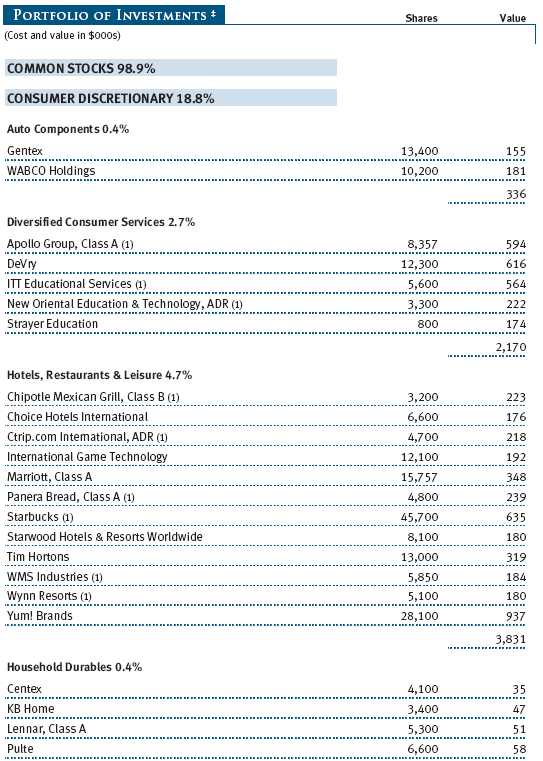
In terms of performance relative to the Russell benchmark, our stock selection among Internet software and services companies—particularly Vistaprint and Chinese search provider Baidu—was very beneficial. Vistaprint, which provides customized printed materials to small business clients, has built an impressive technology and analytical infrastructure over several years and should benefit from the fragmented nature of the small business printing industry. Although we underweight makers of computers and peripherals because we believe such companies have a higher risk of commoditization, one of the best-performing holdings in the entire portfolio was hard drive manufacturer Seagate Technology. Seagate has significant market share and projected that its sales for the rest of the year would be better than many had anticipated. (Please refer to the fund’s portfolio of investments for a complete listing of holdings and the amount each represents in the portfolio.)
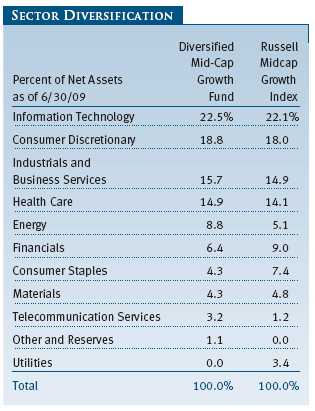
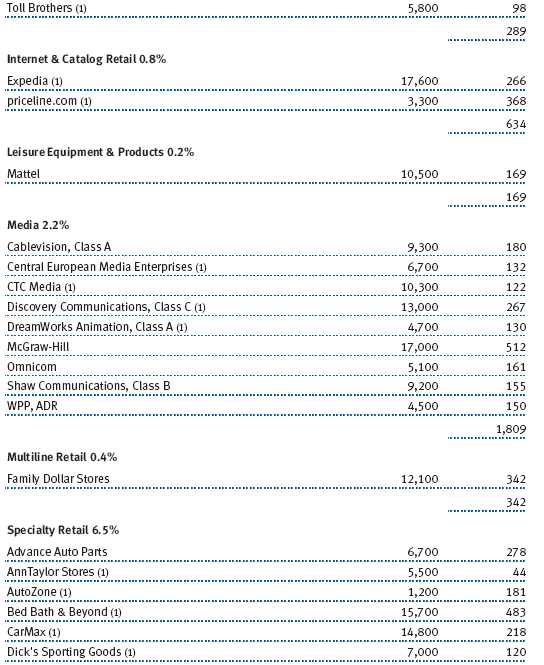
Stocks in the consumer discretionary sector—our second-largest sector allocation—produced strong returns since the end of 2008 amid hopes that an economic recovery will begin soon and encourage consumers to increase their spending on nonessentials. We favor this sector versus the Russell benchmark because many companies have good business models, excellent cash flow, and other favorable attributes, in our opinion. Our investments in specialty retailers did best in absolute terms, led by discounters TJX and Ross Stores, which are holding up well in a tough economic environment. Hotel, restaurant, and gaming stocks were less robust, but Ctrip.com International, a Chinese-oriented Internet travel agency similar to our Priceline.com and Expedia holdings, also did well. Unfortunately, our stock selection among diversified consumer services companies hurt our performance versus the Russell benchmark. For-profit education companies, which tend to do well during economic downturns as people seek to enhance their career prospects, generally lagged when stocks rallied sharply in the last few months. DeVry was one of our weakest holdings, but we are maintaining our position because the company has good long-term business prospects, good fundamentals, and an attractive valuation.
Industrials and business services stocks lagged in the last six months, hobbled by continuing economic weakness. However, strong performance of our investments in the sector helped results relative to the Russell benchmark and other mid-cap growth funds. We try to look for companies that are not especially cyclical and are market leaders in their niches—such as those that can benefit from steady, recurring revenues even during periods of economic weakness—rather than companies whose earnings and returns on capital are closely tied to the economy and will be very poor in a downturn. Our machinery stocks did best during our reporting period, led by mining equipment maker Joy Global.
Health care stocks tend to hold up well in an economic downturn, as health care needs are less cyclical. But the sector trailed others somewhat as the market rallied in the last few months, hindered by concerns about government reform proposals. Nevertheless, stock selection helped our results relative to competing mid-cap growth portfolios. We tend to focus on services companies and medical device makers, and these industries performed fairly well. Life sciences tools and services companies did best in the last six months, however, primarily due to strength in shares of Illumina and Life Technologies. Illumina provides systems that help researchers analyze people’s genes; some of the company’s largest customers are government agencies and pharmaceutical researchers. Life Technologies is a global biotechnology tools company whose services help researchers with their medical research. Pharmaceutical and biotechnology stocks were lackluster during our reporting period. We underweight pharmaceuticals and try to stay well diversified in the biotechnology industry to reduce the risks of investing in this segment.
Our stocks in the energy sector, which has notably less representation in the mid-cap growth universe than it did one year ago, produced excellent absolute returns as oil prices rose sharply from their lowest levels. Most of our holdings appreciated, but not as much as energy stocks generally. As our longer-term investors know, we do not invest in this sector based on an attempt to accurately predict commodity price trends. Rather, we prefer to invest in differentiated service companies or exploration companies with good organic production growth.
Financials produced moderate gains during our reporting period, as the group’s stellar second-quarter gains more than offset their significant first-quarter losses. Our diversified financial services companies did best, led by IntercontinentalExchange and CME Group. We like the business models of and long-term prospects for futures exchanges. As the financial markets rallied, asset managers Eaton Vance and BlackRock also fared well, but our insurance companies were disappointing. Nevertheless, we have been increasing our exposure to the industry because we foresee a more favorable pricing environment as economies and financial markets recover.
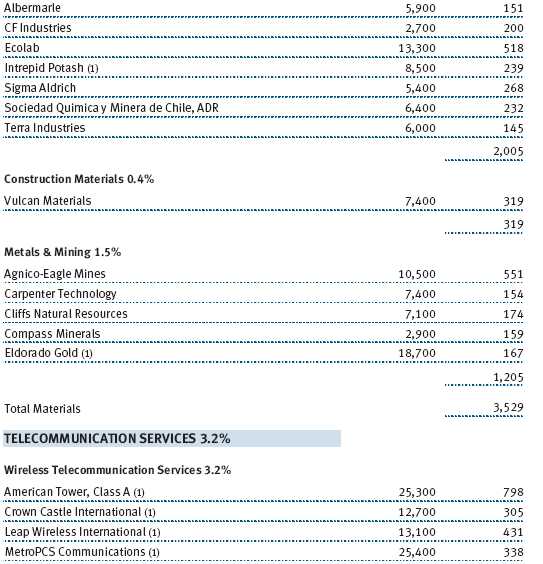
The materials sector was one of the strongest in our Russell benchmark, helped by a sharp bounce in the prices of various commodities. Our focus on differentiated companies that improve upon a commodity, rather than companies that are highly leveraged to commodity prices, was not rewarded as commodity prices spiked higher. During the first half of the year, we added several companies to the portfolio, including Chilean fertilizer and potash producer Sociedad Quimica y Minera de Chile and mining company Eldorado Gold.
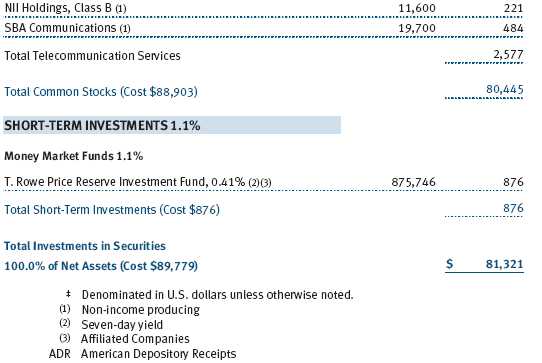
The telecommunication services sector, one of the smallest in the mid-cap growth universe, produced strong returns, and good stock selection on our part helped us outperform the Russell benchmark. We focus on wireless service providers with special situations and growth opportunities, and we are particularly attracted to tower operators with attractive business models. In the last six months, two of our best performers in the sector were tower operators SBA Communications and Crown Castle.
Utilities, one of the sectors that held up best as the market crumbled late last year, was one of the weakest sectors in the mid-cap growth universe during our reporting period. The fund has no exposure to utilities stocks—a stance that helped our performance relative to our benchmarks in the first half of the year. We did not find any companies that met our growth or return on invested capital criteria.
OUTLOOK
Although financial conditions appear to have stabilized, market and economic performance is likely to be anemic for some time. Given the heightened uncertainty regarding the economy and the financial markets, we believe this is an especially good time to have a high-quality portfolio of companies with sustainable competitive advantages in their respective industries. We remain committed to our strategy of seeking quality mid-cap companies with good business models, strong managements, and superior long-term appreciation prospects.
Thank you for your confidence in T. Rowe Price.
Respectfully submitted,
Donald J. Peters
Cochairman of the fund’s Investment Advisory Committee

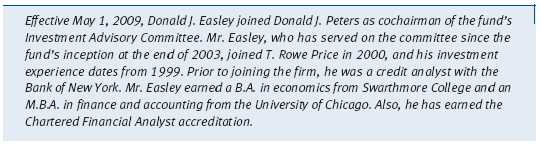
Donald J. Easley
Cochairman of the fund’s Investment Advisory Committee
July 22, 2009
The committee cochairmen have day-to-day responsibility for managing the portfolio and work with committee members in developing and executing the fund’s investment program.
RISKS OF INVESTING
As with all equity funds, this fund’s share price can fall because of weakness in the broad market, a particular industry, or specific holdings. The market as a whole can decline for many reasons, including adverse political or economic developments here or abroad, changes in investor psychology, or heavy institutional selling. The prospects for an industry or company may deteriorate because of a variety of factors, including disappointing earnings or changes in the competitive environment. In addition, our assessment of companies held in the fund may prove incorrect, resulting in losses or poor performance even in a rising market. Finally, the fund’s investment approach could fall out of favor with the investing public, resulting in lagging performance versus other types of stock funds.
The stocks of mid-cap companies entail greater risk and are usually more volatile than the shares of large companies. In addition, growth stocks can be volatile for several reasons. Since they usually reinvest a high proportion of earnings in their own businesses, they may lack the dividends usually associated with value stocks that can cushion their decline in a falling market. Also, since investors buy these stocks because of their expected superior earnings growth, earnings disappointments often result in sharp price declines.
Diversification cannot assure a profit or protect against loss in a declining market.
GLOSSARY
Lipper indexes: Consist of a small number (10 to 30) of the largest mutual funds in a particular category as tracked by Lipper Inc.
Price/earnings (P/E) ratio: A ratio that shows the “multiple” of earnings at which a stock is selling. It is calculated by dividing a stock’s current price by its current earnings per share. For example, if a stock’s price is $60 per share and the issuing company earns $2 per share, the P/E ratio is $60/$2, or 30.
Russell Midcap Index: Measures the performance of the 800 smallest companies in the Russell 1000 Index.
Russell Midcap Growth Index: Measures the performance of those Russell midcap companies with higher price-to-book ratios and higher forecasted growth values. The stocks are also members of the Russell 1000 Growth Index.
Russell Midcap Value Index: Measures the performance of those Russell midcap companies with lower price-to-book ratios and lower forecasted growth values. The stocks are also members of the Russell 1000 Value Index.
Russell 2000 Index: Tracks the stock performance of 2000 small U.S. companies.
S&P MidCap 400 Index: Tracks the stock performance of 400 U.S. mid-cap companies.
S&P 500 Index: Tracks the stock performance of 500 primarily large U.S. companies.
Performance and Expenses
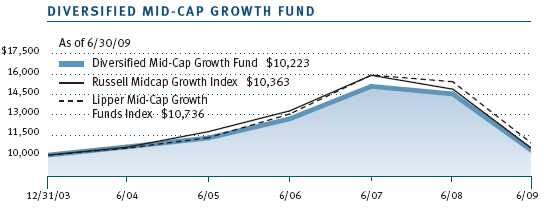
| GROWTH OF $10,000 |
This chart shows the value of a hypothetical $10,000 investment in the fund over the past 10 fiscal year periods or since inception (for funds lacking 10-year records). The result is compared with benchmarks, which may include a broad-based market index and a peer group average or index. Market indexes do not include expenses, which are deducted from fund returns as well as mutual fund averages and indexes.
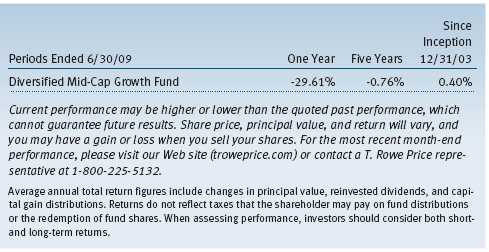
| AVERAGE ANNUAL COMPOUND TOTAL RETURN |
This table shows how the fund would have performed each year if its actual (or cumulative) returns for the periods shown had been earned at a constant rate.
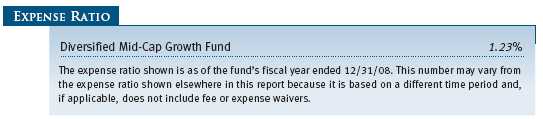
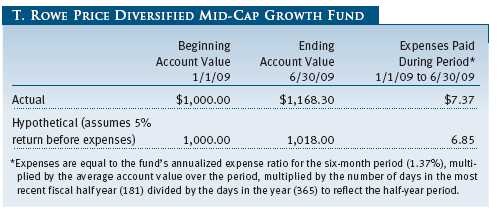
| FUND EXPENSE EXAMPLE |
As a mutual fund shareholder, you may incur two types of costs: (1) transaction costs, such as redemption fees or sales loads, and (2) ongoing costs, including management fees, distribution and service (12b-1) fees, and other fund expenses. The following example is intended to help you understand your ongoing costs (in dollars) of investing in the fund and to compare these costs with the ongoing costs of investing in other mutual funds. The example is based on an investment of $1,000 invested at the beginning of the most recent six-month period and held for the entire period.
Actual Expenses
The first line of the following table (“Actual”) provides information about actual account values and expenses based on the fund’s actual returns. You may use the information in this line, together with your account balance, to estimate the expenses that you paid over the period. Simply divide your account value by $1,000 (for example, an $8,600 account value divided by $1,000 = 8.6), then multiply the result by the number in the first line under the heading “Expenses Paid During Period” to estimate the expenses you paid on your account during this period.
Hypothetical Example for Comparison Purposes
The information on the second line of the table (“Hypothetical”) is based on hypothetical account values and expenses derived from the fund’s actual expense ratio and an assumed 5% per year rate of return before expenses (not the fund’s actual return). You may compare the ongoing costs of investing in the fund with other funds by contrasting this 5% hypothetical example and the 5% hypothetical examples that appear in the shareholder reports of the other funds. The hypothetical account values and expenses may not be used to estimate the actual ending account balance or expenses you paid for the period.
Note: T. Rowe Price charges an annual small-account maintenance fee of $10, generally for accounts with less than $2,000 ($500 for UGMA/UTMA). The fee is waived for any investor whose T. Rowe Price mutual fund accounts total $25,000 or more, accounts employing automatic investing, and IRAs and other retirement plan accounts that utilize a prototype plan sponsored by T. Rowe Price (although a separate custodial or administrative fee may apply to such accounts). This fee is not included in the accompanying table. If you are subject to the fee, keep it in mind when you are estimating the ongoing expenses of investing in the fund and when comparing the expenses of this fund with other funds.
You should also be aware that the expenses shown in the table highlight only your ongoing costs and do not reflect any transaction costs, such as redemption fees or sales loads. Therefore, the second line of the table is useful in comparing ongoing costs only and will not help you determine the relative total costs of owning different funds. To the extent a fund charges transaction costs, however, the total cost of owning that fund is higher.
Unaudited
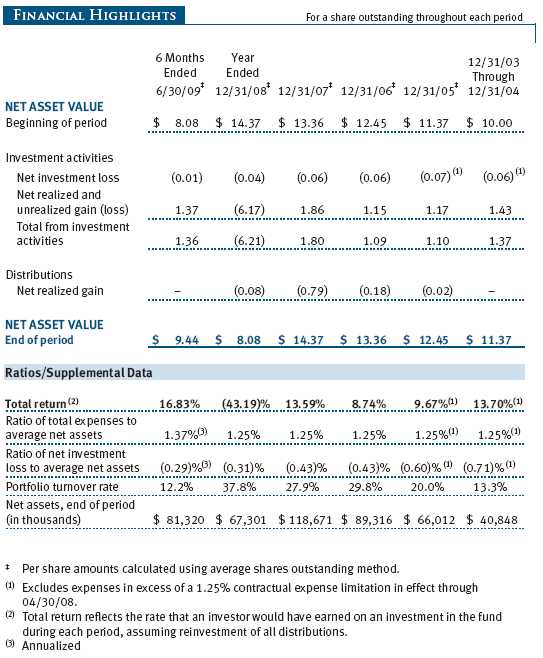
The accompanying notes are an integral part of these financial statements.
Unaudited
The accompanying notes are an integral part of these financial statements.
Unaudited
The accompanying notes are an integral part of these financial statements.
Unaudited
The accompanying notes are an integral part of these financial statements.
Unaudited
The accompanying notes are an integral part of these financial statements.
Unaudited
| NOTES TO FINANCIAL STATEMENTS |
T. Rowe Price Diversified Mid-Cap Growth Fund, Inc. (the fund), is registered under the Investment Company Act of 1940 (the 1940 Act) as a diversified, open-end management investment company. The fund commenced operations on December 31, 2003. The fund seeks to provide long-term capital growth by investing primarily in the common stocks of mid-cap growth companies.
NOTE 1 - SIGNIFICANT ACCOUNTING POLICIES
Basis of Preparation The accompanying financial statements were prepared in accordance with accounting principles generally accepted in the United States of America, which require the use of estimates made by fund management. Fund believes that estimates and security valuations are appropriate; however, actual results may differ from those estimates, and the security valuations reflected in the financial statements may differ from the value the fund ultimately realizes upon sale of the securities. Further, fund management believes no events have occurred between June 30, 2009 and August 20, 2009, the date of issuance of the financial statements, that require adjustment of, or disclosure in, the accompanying financial statements.
Investment Transactions, Investment Income, and Distributions Income and expenses are recorded on the accrual basis. Dividends received from mutual fund investments are reflected as dividend income; capital gain distributions are reflected as realized gain/loss. Dividend income and capital gain distributions are recorded on the ex-dividend date. Income tax-related interest and penalties, if incurred, would be recorded as income tax expense. Investment transactions are accounted for on the trade date. Realized gains and losses are reported on the identified cost basis. Distributions to shareholders are recorded on the ex-dividend date. Income distributions are declared and paid on an annual basis. Capital gain distributions, if any, are declared and paid by the fund, typically on an annual basis.
New Accounting Pronouncement On January 1, 2009, the fund adopted Statement of Financial Accounting Standards No. 161 (FAS 161), Disclosures about Derivative Instruments and Hedging Activities. FAS 161 requires enhanced disclosures about derivative and hedging activities, including how such activities are accounted for and their effect on financial position, performance and cash flows. Adoption of FAS 161 had no impact on the fund’s net assets or results of operations.
NOTE 2 - VALUATION
The fund’s investments are reported at fair value as defined under Statement of Financial Accounting Standards No. 157 (FAS 157), Fair Value Measurements. The fund values its investments and computes its net asset value per share at the close of the New York Stock Exchange (NYSE), normally 4 p.m. ET, each day that the NYSE is open for business.
Valuation Methods Equity securities listed or regularly traded on a securities exchange or in the over-the-counter (OTC) market are valued at the last quoted sale price or, for certain markets, the official closing price at the time the valuations are made, except for OTC Bulletin Board securities, which are valued at the mean of the latest bid and asked prices. A security that is listed or traded on more than one exchange is valued at the quotation on the exchange determined to be the primary market for such security. Listed securities not traded on a particular day are valued at the mean of the latest bid and asked prices for domestic securities and the last quoted sale price for international securities.
Investments in mutual funds are valued at the mutual fund’s closing net asset value per share on the day of valuation.
Other investments, including restricted securities, and those for which the above valuation procedures are inappropriate or are deemed not to reflect fair value are stated at fair value as determined in good faith by the T. Rowe Price Valuation Committee, established by the fund’s Board of Directors.
Valuation Inputs Various inputs are used to determine the value of the fund’s investments. These inputs are summarized in the three broad levels listed below:
Level 1 – quoted prices in active markets for identical securities
Level 2 – observable inputs other than Level 1 quoted prices (including, but not limited to, quoted prices for similar securities, interest rates, prepayment speeds, credit risk)
Level 3 – unobservable inputs
Observable inputs are those based on market data obtained from sources independent of the fund, and unobservable inputs reflect the fund’s own assumptions based on the best information available. The input levels are not necessarily an indication of the risk or liquidity associated with investments at that level. The fund’s investments are summarized by level, based on the inputs used to determine their values. On June 30, 2009, all of the fund’s investments were classified as Level 1.
NOTE 3 - OTHER INVESTMENT TRANSACTIONS
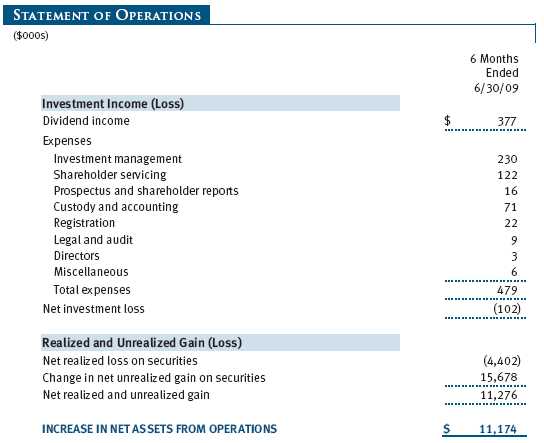
Purchases and sales of portfolio securities other than short-term securities aggregated $11,031,000 and $8,548,000, respectively, for the six months ended June 30, 2009.
NOTE 4 - FEDERAL INCOME TAXES
No provision for federal income taxes is required since the fund intends to continue to qualify as a regulated investment company under Subchapter M of the Internal Revenue Code and distribute to shareholders all of its taxable income and gains. Distributions are determined in accordance with Federal income tax regulations, which differ from generally accepted accounting principles, and, therefore, may differ in amount or character from net investment income and realized gains for financial reporting purposes. Financial reporting records are adjusted for permanent book/tax differences to reflect tax character but are not adjusted for temporary differences. The amount and character of tax-basis distributions and composition of net assets are finalized at fiscal year-end; accordingly, tax-basis balances have not been determined as of June 30, 2009.
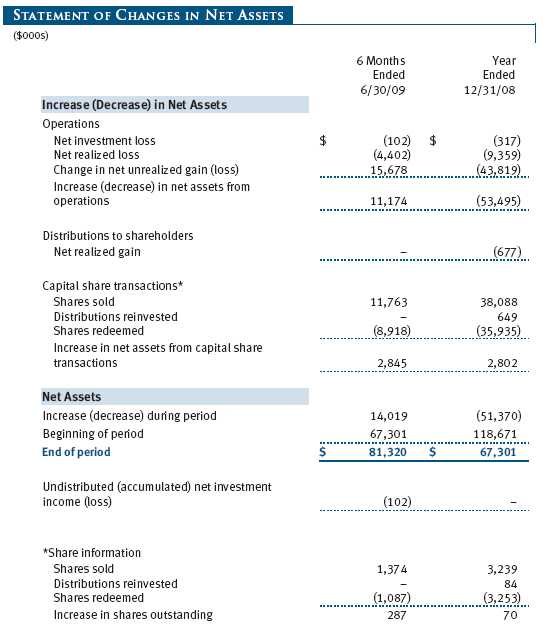
In accordance with federal tax regulations, the fund deferred recognition of certain capital loss amounts previously recognized in the prior fiscal year for financial reporting purposes until the current fiscal period for tax purposes. Such deferrals amounted to $4,340,000 and related to net capital losses realized between November 1 and the fund’s fiscal year-end date. Further, the fund intends to retain realized gains to the extent of available capital loss carryforwards. As of December 31, 2008, the fund had $4,926,000 of unused capital loss carryforwards, all of which expire in fiscal 2016.
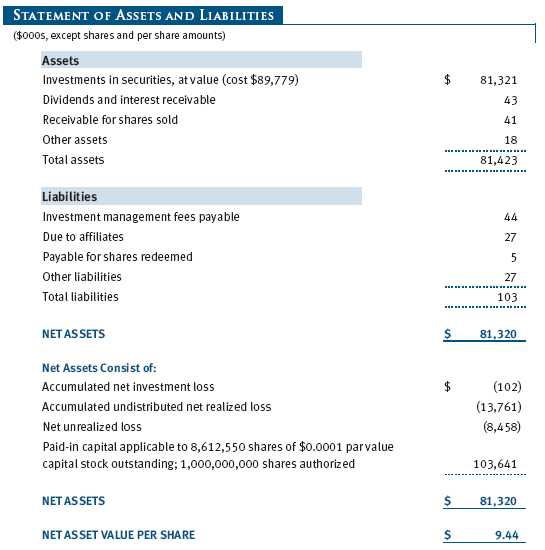
At June 30, 2009, the cost of investments for federal income tax purposes was $89,779,000. Net unrealized loss aggregated $8,458,000 at period-end, of which $9,228,000 related to appreciated investments and $17,686,000 related to depreciated investments.
NOTE 5 - RELATED PARTY TRANSACTIONS
The fund is managed by T. Rowe Price Associates, Inc. (the manager or Price Associates), a wholly owned subsidiary of T. Rowe Price Group, Inc. The investment management agreement between the fund and the manager provides for an annual investment management fee, which is computed daily and paid monthly. The fee consists of an individual fund fee, equal to 0.35% of the fund’s average daily net assets, and a group fee. The group fee rate is calculated based on the combined net assets of certain mutual funds sponsored by Price Associates (the group) applied to a graduated fee schedule, with rates ranging from 0.48% for the first $1 billion of assets to 0.285% for assets in excess of $220 billion. The fund’s group fee is determined by applying the group fee rate to the fund’s average daily net assets. At June 30, 2009, the effective annual group fee rate was 0.31%.
Effective May 1, 2009 through April 30, 2011, the fund is subject to a contractual expense limitation. During the limitation period, the manager is required to waive its management fee and reimburse the fund for any expenses, excluding interest, taxes, brokerage commissions, and extraordinary expenses, that would otherwise cause the fund’s ratio of annualized total expenses to average net assets (expense ratio) to exceed its expense limitation of 1.50%. For a period of three years after the date of any reimbursement or waiver, the fund is required to repay the manager for expenses previously reimbursed and management fees waived to the extent its net assets have grown or expenses have declined sufficiently to allow repayment without causing the fund’s expense ratio to exceed its expense limitation. For the six months ended June 30, 2009, the fund operated below its expense limitation.
In addition, the fund has entered into service agreements with Price Associates and two wholly owned subsidiaries of Price Associates (collectively, Price). Price Associates computes the daily share price and provides certain other administrative services to the fund. T. Rowe Price Services, Inc., provides shareholder and administrative services in its capacity as the fund’s transfer and dividend disbursing agent. T. Rowe Price Retirement Plan Services, Inc., provides subaccounting and recordkeeping services for certain retirement accounts invested in the fund. For the six months ended June 30, 2009, expenses incurred pursuant to these service agreements were $47,000 for Price Associates, $89,000 for T. Rowe Price Services, Inc., and $1,000 for T. Rowe Price Retirement Plan Services, Inc. The total amount payable at period-end pursuant to these service agreements is reflected as Due to Affiliates in the accompanying financial statements.
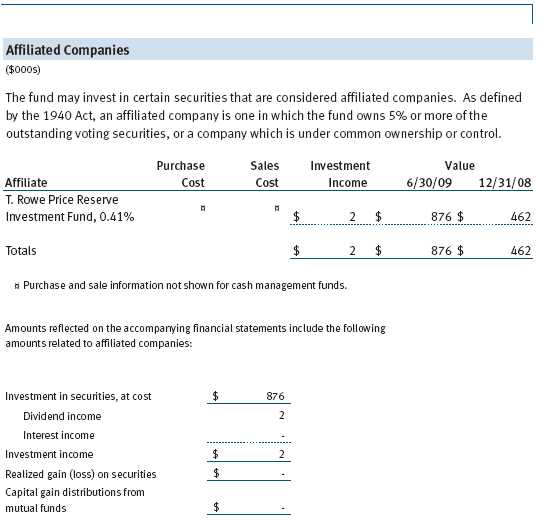
The fund may invest in the T. Rowe Price Reserve Investment Fund and the T. Rowe Price Government Reserve Investment Fund (collectively, the T. Rowe Price Reserve Investment Funds), open-end management investment companies managed by Price Associates and considered affiliates of the fund. The T. Rowe Price Reserve Investment Funds are offered as cash management options to mutual funds, trusts, and other accounts managed by Price Associates and/or its affiliates and are not available for direct purchase by members of the public. The T. Rowe Price Reserve Investment Funds pay no investment management fees.
| INFORMATION ON PROXY VOTING POLICIES, PROCEDURES, AND RECORDS |
A description of the policies and procedures used by T. Rowe Price funds and portfolios to determine how to vote proxies relating to portfolio securities is available in each fund’s Statement of Additional Information, which you may request by calling 1-800-225-5132 or by accessing the SEC’s Web site, www.sec.gov. The description of our proxy voting policies and procedures is also available on our Web site, www.troweprice.com. To access it, click on the words “Our Company” at the top of our corporate homepage. Then, when the next page appears, click on the words “Proxy Voting Policies” on the left side of the page.
Each fund’s most recent annual proxy voting record is available on our Web site and through the SEC’s Web site. To access it through our Web site, follow the directions above, then click on the words “Proxy Voting Records” on the right side of the Proxy Voting Policies page.
| HOW TO OBTAIN QUARTERLY PORTFOLIO HOLDINGS |
The fund files a complete schedule of portfolio holdings with the Securities and Exchange Commission for the first and third quarters of each fiscal year on Form N-Q. The fund’s Form N-Q is available electronically on the SEC’s Web site (www.sec.gov); hard copies may be reviewed and copied at the SEC’s Public Reference Room, 450 Fifth St. N.W., Washington, DC 20549. For more information on the Public Reference Room, call 1-800-SEC-0330.
| APPROVAL OF INVESTMENT MANAGEMENT AGREEMENT |
On March 10, 2009, the fund’s Board of Directors (Board) unanimously approved the investment advisory contract (Contract) between the fund and its investment manager, T. Rowe Price Associates, Inc. (Manager). The Board considered a variety of factors in connection with its review of the Contract, also taking into account information provided by the Manager during the course of the year, as discussed below:
Services Provided by the Manager
The Board considered the nature, quality, and extent of the services provided to the fund by the Manager. These services included, but were not limited to, management of the fund’s portfolio and a variety of related activities, as well as financial and administrative services, reporting, and communications. The Board also reviewed the background and experience of the Manager’s senior management team and investment personnel involved in the management of the fund. The Board concluded that it was satisfied with the nature, quality, and extent of the services provided by the Manager.
Investment Performance of the Fund
The Board reviewed the fund’s returns for the one-year, three-year, five-year, and since-inception periods as well as the fund’s year-by-year returns and compared these returns with previously agreed upon comparable performance measures and market data, including those supplied by Lipper and Morningstar, which are independent providers of mutual fund data. On the basis of this evaluation and the Board’s ongoing review of investment results, and factoring in the severity of the market turmoil in 2008, the Board concluded that the fund’s performance was satisfactory.
Costs, Benefits, Profits, and Economies of Scale
The Board reviewed detailed information regarding the revenues received by the Manager under the Contract and other benefits that the Manager (and its affiliates) may have realized from its relationship with the fund, including research received under “soft dollar” agreements. The Board noted that soft dollars were not used to pay for third-party, non-broker research during 2008. The Board also received information on the estimated costs incurred and profits realized by the Manager and its affiliates from advising T. Rowe Price mutual funds as well as estimates of the gross profits realized from managing the fund in particular. The Board concluded that the Manager’s profits were reasonable in light of the services provided to the fund. The Board also considered whether the fund or other funds benefit under the fee levels set forth in the Contract from any economies of scale realized by the Manager. Under the Contract, the fund pays a fee to the Manager composed of two components—a group fee rate based on the aggregate assets of certain T. Rowe Price mutual funds (including the fund) that declines at certain asset levels and an individual fund fee rate that is assessed on the assets of the fund. The Board concluded that the advisory fee structure for the fund continued to provide for a reasonable sharing of benefits from any economies of scale with the fund’s investors.
Fees
The Board reviewed the fund’s management fee rate, operating expenses, and total expense ratio and compared them with fees and expenses of other comparable funds based on information and data supplied by Lipper. The information provided to the Board indicated that the fund’s management fee rate (after including reimbursements by the fund to the Manager for previous fee waivers or expenses paid by the Manager) and expense ratio were both above the median for certain groups of comparable funds but at or below the median for other groups of comparable funds. The Board also reviewed the fee schedules for comparable privately managed accounts of the Manager and its affiliates. Management informed the Board that the Manager’s responsibilities for privately managed accounts are more limited than its responsibilities for the fund and other T. Rowe Price mutual funds that it or its affiliates advise. On the basis of the information provided, the Board concluded that the fees paid by the fund under the Contract were reasonable.
Approval of the Contract
As noted, the Board approved the continuation of the Contract. No single factor was considered in isolation or to be determinative to the decision. Rather, the Board concluded, in light of a weighting and balancing of all factors considered, that it was in the best interests of the fund to approve the continuation of the Contract, including the fees to be charged for services thereunder.
Item 2. Code of Ethics.
A code of ethics, as defined in Item 2 of Form N-CSR, applicable to its principal executive officer, principal financial officer, principal accounting officer or controller, or persons performing similar functions is filed as an exhibit to the registrant’s annual Form N-CSR. No substantive amendments were approved or waivers were granted to this code of ethics during the registrant’s most recent fiscal half-year.
Item 3. Audit Committee Financial Expert.
Disclosure required in registrant’s annual Form N-CSR.
Item 4. Principal Accountant Fees and Services.
Disclosure required in registrant’s annual Form N-CSR.
Item 5. Audit Committee of Listed Registrants.
Not applicable.
Item 6. Investments.
(a) Not applicable. The complete schedule of investments is included in Item 1 of this Form N-CSR.
(b) Not applicable.
Item 7. Disclosure of Proxy Voting Policies and Procedures for Closed-End Management Investment Companies.
Not applicable.
Item 8. Portfolio Managers of Closed-End Management Investment Companies.
Not applicable.
Item 9. Purchases of Equity Securities by Closed-End Management Investment Company and Affiliated Purchasers.
Not applicable.
Item 10. Submission of Matters to a Vote of Security Holders.
Not applicable.
Item 11. Controls and Procedures.
(a) The registrant’s principal executive officer and principal financial officer have evaluated the registrant’s disclosure controls and procedures within 90 days of this filing and have concluded that the registrant’s disclosure controls and procedures were effective, as of that date, in ensuring that information required to be disclosed by the registrant in this Form N-CSR was recorded, processed, summarized, and reported timely.
(b) The registrant’s principal executive officer and principal financial officer are aware of no change in the registrant’s internal control over financial reporting that occurred during the registrant’s second
fiscal quarter covered by this report that has materially affected, or is reasonably likely to materially affect, the registrant’s internal control over financial reporting.
Item 12. Exhibits.
(a)(1) The registrant’s code of ethics pursuant to Item 2 of Form N-CSR is filed with the registrant’s annual Form N-CSR.
(2) Separate certifications by the registrant's principal executive officer and principal financial officer, pursuant to Section 302 of the Sarbanes-Oxley Act of 2002 and required by Rule 30a-2(a) under the Investment Company Act of 1940, are attached.
(3) Written solicitation to repurchase securities issued by closed-end companies: not applicable.
(b) A certification by the registrant's principal executive officer and principal financial officer, pursuant to Section 906 of the Sarbanes-Oxley Act of 2002 and required by Rule 30a-2(b) under the Investment Company Act of 1940, is attached.
SIGNATURES | |
| Pursuant to the requirements of the Securities Exchange Act of 1934 and the Investment | |
| Company Act of 1940, the registrant has duly caused this report to be signed on its behalf by the | |
| undersigned, thereunto duly authorized. | |
| T. Rowe Price Diversified Mid-Cap Growth Fund, Inc. | |
| By | /s/ Edward C. Bernard |
| Edward C. Bernard | |
| Principal Executive Officer | |
| Date | August 20, 2009 |
| Pursuant to the requirements of the Securities Exchange Act of 1934 and the Investment | |
| Company Act of 1940, this report has been signed below by the following persons on behalf of | |
| the registrant and in the capacities and on the dates indicated. | |
| By | /s/ Edward C. Bernard |
| Edward C. Bernard | |
| Principal Executive Officer | |
| Date | August 20, 2009 |
| By | /s/ Gregory K. Hinkle |
| Gregory K. Hinkle | |
| Principal Financial Officer | |
| Date | August 20, 2009 |