Item 1: Report to Shareholders
 |
| Diversified Mid-Cap Growth Fund | June 30, 2007 |
The views and opinions in this report were current as of June 30, 2007. They are not guarantees of performance or investment results and should not be taken as investment advice. Investment decisions reflect a variety of factors, and the managers reserve the right to change their views about individual stocks, sectors, and the markets at any time. As a result, the views expressed should not be relied upon as a forecast of the fund’s future investment intent. The report is certified under the Sarbanes-Oxley Act, which requires mutual funds and other public companies to affirm that, to the best of their knowledge, the information in their financial reports is fairly and accurately stated in all material respects.
REPORTS ON THE WEB
Sign up for our E-mail Program, and you can begin to receive updated fund reports and prospectuses online rather than through the mail. Log in to your account at troweprice.com for more information.
Manager’s Letter
Fellow Shareholders
Mid-cap growth stocks outperformed other investment styles in the first half of 2007. Shares were boosted by better-than-expected earnings; the Federal Reserve’s steady monetary policy; signs of an economic pickup in the second quarter; and substantial merger and acquisition activity, including a marked increase in leveraged buyout (LBO) offers from private-equity firms. Takeover speculation and risk-seeking behavior were also significant factors. Guessing what companies would be acquired over the weekend has become fashionable.
HIGHLIGHTS
• Mid-cap growth stocks outperformed other investment styles in the first half of 2007. Takeover speculation and risk-seeking behavior were significant factors.
• Your fund produced an excellent return in the last six months and outperformed its primary benchmark, the Russell Midcap Growth Index.
• We still believe that asset classes that have had years of superior relative returns will eventually correct from illogical levels, while sectors that have materially lagged will do better as investors begin to appreciate their underlying value.
• Considering the speculative environment and our bias toward high-quality companies, we are pleased with the fund’s performance. But we are cautious because such strong relative returns cannot be sustained indefinitely.
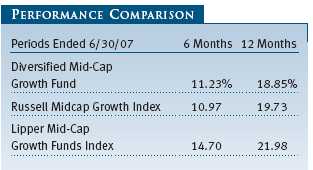
Your fund produced an excellent return of 11.23% in the last six months and a stronger 18.85% gain for the 12-month period ended June 30, 2007. As shown in the Performance Comparison table, the fund did better than its primary benchmark, the Russell Midcap Growth Index, in the last six months but trailed the Lipper peer group index. For the one-year period, the fund lagged both benchmarks.
In the last six months, the fund outperformed its Russell benchmark because of favorable stock selection, especially in the financials, health care, and telecommunication services sectors. However, our sector allocation decisions, such as underweightings in materials and energy, eroded some of our performance advantage. As longer-term shareholders know, we believe it is inherently impossible to accurately forecast commodity price movements (like short-term capital market movements) on a regular basis. Moreover, we also believe in mean reversion. Materials and energy have had monstrous runs over the last five years; accordingly, it is difficult to find investors who are not bullish and do not expect these trends to continue. Our exposure to energy and materials companies reflects our preference for differentiated businesses that are not highly leveraged to commodity prices and cyclical factors. It follows that we are overweighted in those sectors that have substantially underperformed over the last five years. The fund lagged other mid-cap growth portfolios in the last six months due to relatively weak stock selection in several sectors, particularly consumer discretionary and industrials and business services. Short-term relative performance has been driven to some extent by how much of one’s portfolio has been involved with takeover activity.
MARKET ENVIRONMENT
The economy showed signs of improvement in the last few months, following a year-long slowdown that culminated in an anemic 0.7% annualized rate of GDP growth in the first quarter of 2007. While the housing sector remained weak and investors were concerned about problems in the subprime mortgage market, manufacturing and capital spending have showed signs of accelerating. In addition, the national unemployment rate hovered around 4.5%, not far from six-year lows.
Although gasoline prices and other energy costs continued to press higher, and inflation remained above the Federal Reserve’s comfort zone, the central bank kept the federal funds target rate at 5.25% during our reporting period—in fact, for the last year—in anticipation that moderate growth would allow inflation pressures to ease over time. Following the Fed’s late-June monetary policy meeting, however, central bank officials acknowledged that “a sustained moderation in inflation pressures has yet to be convincingly demonstrated.”
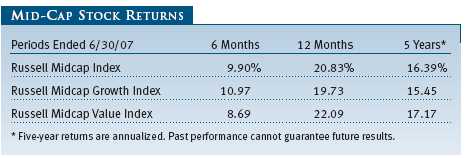
Mid-cap shares surpassed their smaller and larger peers in our reporting period. Since the end of 2006, the Russell Midcap Index returned 9.90% versus 6.96% for the large-cap S&P 500 Index and 6.45% for the small-cap Russell 2000 Index. As shown in the table on page 3, mid-cap growth stocks trumped value in the first half of the year but lagged over the 12-month and five-year periods.
Some of the market trends we have observed in recent years showed signs of reversing in the last six months. For example, large-cap shares performed better than small-caps, and growth stocks outpaced value across all market capitalizations. However, consider the following five-year trends:
• International stocks, particularly emerging market equities, have trounced domestic shares. The MSCI EAFE Index, a broad measure of large-cap stocks in Europe, Australasia, and the Far East, has outperformed the large-cap S&P 500 Index by about 7.5% per year on average, while the MSCI Emerging Markets Index has crushed the S&P 500 by almost 20% per year on average.
• Within the U.S. market, mid-cap stocks, as measured by the Russell Midcap Index, have outperformed the S&P 500 and the Russell 2000 Index by an average of about 5.7% and 2.5%, respectively.
• In addition, cyclical stocks in the energy, materials, and industrials and business services sectors have outperformed traditional growth sectors, such as health care and information technology, by a wide margin.
We do not know how long these trends will persist, but we believe in mean reversion: Asset classes that have had years of superior relative returns tend to be driven to illogical levels and will eventually correct, while sectors that have materially lagged will eventually perform better as investors begin to appreciate their underlying value.
INVESTMENT STRATEGY
Before discussing the portfolio in detail, we would like to welcome new shareholders to the fund and thank all of our longer-term investors for their continuing confidence in our investment abilities. For the benefit of all shareholders, here is a brief summary of our investment strategy and the principles that guide our management of the fund.
• The Diversified Mid-Cap Growth Fund invests in stocks of mid-cap companies whose earnings are expected to grow at an above-average rate. We define mid-cap companies as those whose market capitalization at the time of purchase falls within the range of either the S&P MidCap 400 Index or the Russell Midcap Growth Index.
• We intend to keep the fund fully invested because we believe that successful market timing is virtually impossible and that the costs associated with frequent trading reduce the likelihood of outperforming the market. We do not spend undue time worrying about short-term performance or trying to forecast the direction of the market. Our focus is to find mid-cap companies with the best long-term growth potential.
• Unlike other mid-cap growth portfolios that are highly concentrated, the Diversified Mid-Cap Growth Fund typically will invest in about 300 stocks. This high degree of diversification helps to mitigate the downside risk attributable to any single poorly performing security. It is notable that we are investing in companies that are early in their life cycles, and it is inevitable that some will not be as successful as we hope. Accordingly, we balance risk with potential returns.
• Stock selection is based on a combination of fundamental, bottom-up analysis and top-down quantitative strategies in an attempt to identify companies with superior long-term appreciation prospects. We use a growth approach, looking for companies with a demonstrated ability to increase revenues, earnings, and cash flow consistently; capable management; attractive business niches; and a sustainable competitive advantage. We favor companies with above-average earnings growth and lower earnings variability.
• Our time horizons are longer than other mid-cap growth investors. Our portfolio turnover rate in the 12-month period ended June 30, 2007, was 31.4%, which is substantially less than the average of 116% for mid-cap growth funds, according to data from Morningstar. This means our holding period for a typical stock is more than three years, whereas our average competitor holds a given stock for less than one year.
• Valuations are also very important: We look for the best relative values among companies with the strongest businesses and managements.
• We use a number of proprietary quantitative models to identify and evaluate the characteristics of individual mid-cap growth companies and the portfolio as a whole.
PORTFOLIO REVIEW
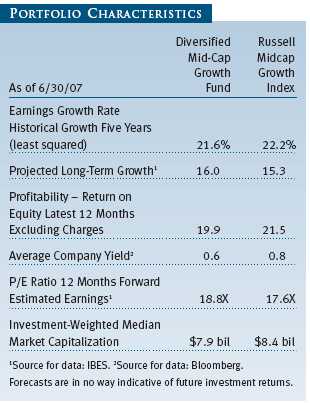
The Diversified Mid-Cap Growth Fund’s fundamental characteristics are similar to those of mid-cap growth benchmarks, such as the Russell Midcap Growth Index, as indicated by the Portfolio Characteristics table. The portfolio’s median market capitalization is similar to that of the index. Its average company yield (0.6%) is a bit lower than the benchmark’s, while its forward price/earnings (P/E) ratio (18.8X) and the projected earnings growth rate of our holdings (16.0%) are slightly higher. These reflect our commitment to companies with excellent long-term growth prospects. The fund’s return on equity (ROE), which measures how effectively and efficiently a company and its management are using stockholder investments, is lower than that of the index but still very high. The index has a higher cyclical orientation, and, at this stage of the economic cycle, many companies are at or near peak levels of profitability. We still believe that the best long-term equity investments are companies with high and, at least as importantly, sustainable profitability.
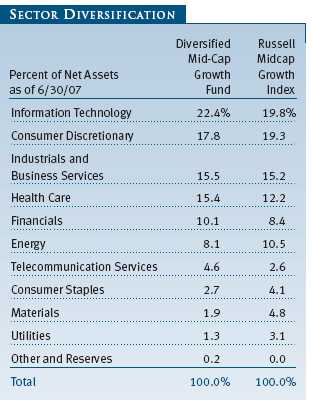
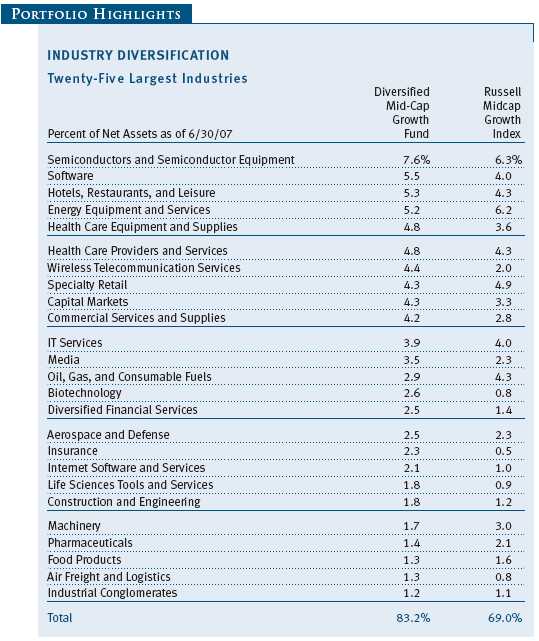
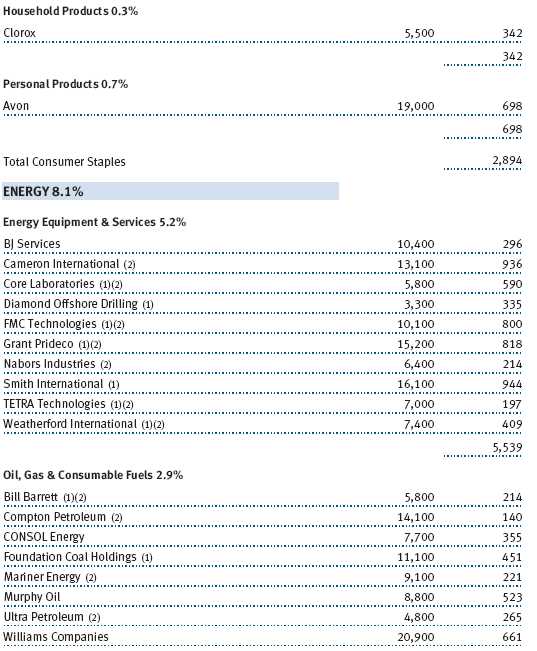
Our sector allocations have some resemblance to those of the index, though we have a few strategic overweightings or underweightings. Our largest sector commitments at the end of June were information technology, consumer discretionary, industrials and business services, and health care. Investments in the financials and energy sectors are smaller. We have very little exposure to utilities, materials, consumer staples, and telecommunication services stocks because there aren’t many companies in those segments that meet our growth criteria.
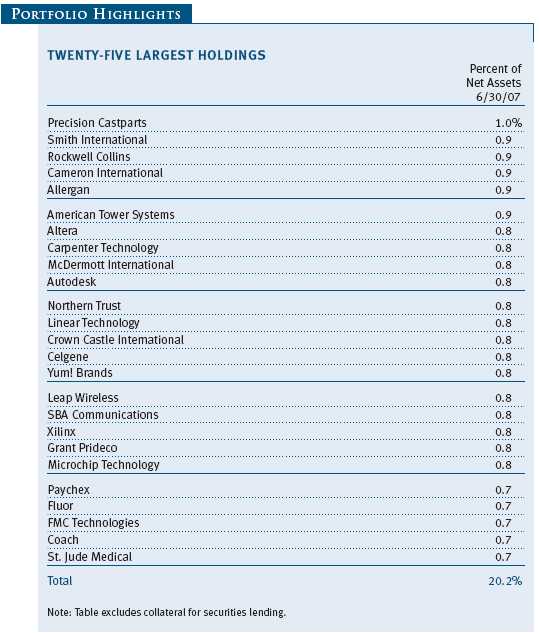
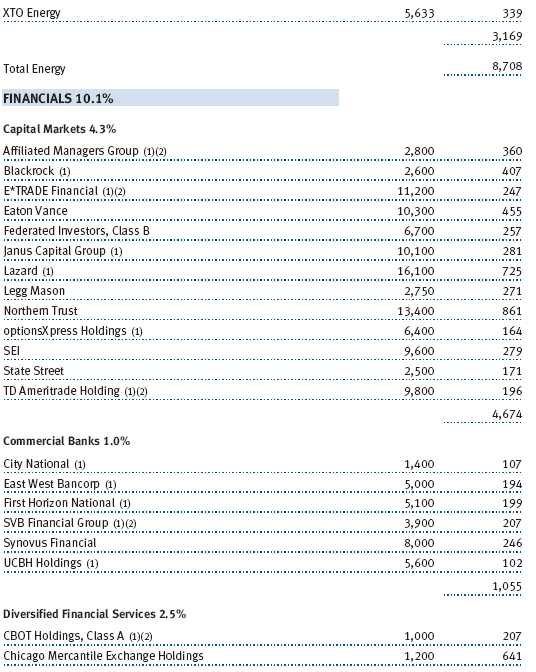
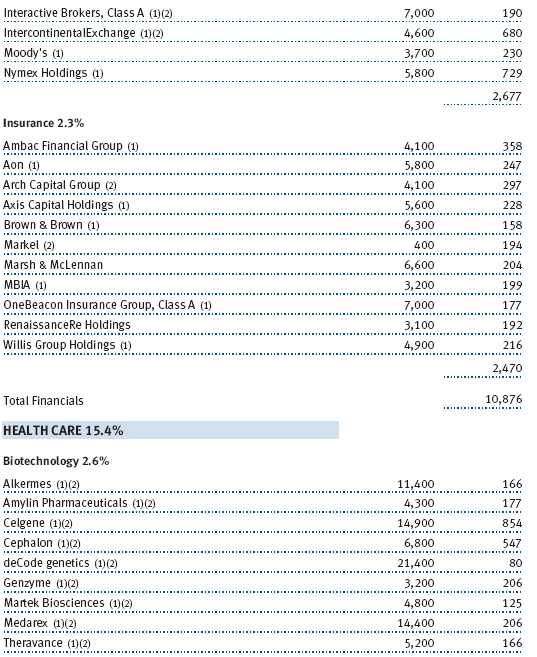
The financials sector, which we overweighted versus the Russell benchmark, lagged in the last six months, as investors were concerned about companies’ exposure to the problems in the subprime mortgage market. A sharp rise in longer-term interest rates in recent months also weighed on the sector, especially real estate investment trusts (REITs), which we avoided. Favorable stock selection in the sector greatly helped our performance. Capital market companies produced excellent results, buoyed by the strong equity market and by heightened merger activity. In fact, two of our holdings in this space were takeover targets: Investors Financial Services, which provides securities-related services to major global asset managers, was bought by State Street, and asset manager Nuveen Investments agreed to a private-equity takeover at the end of our reporting period. We continued to overweight capital markets companies because we believe they still have excellent long-term prospects and a good risk/return tradeoff. Securities and derivatives exchanges also did very well, as investors recognized that several of these companies have superior business models, strong managements, excellent long-term prospects, and the ability to boost revenues while containing costs. Some of our strongest contributors to performance were Intercontinental-Exchange (ICE), which reported good earnings following its acquisition of the New York Board of Trade; CBOT Holdings, which was acquired by Chicago Mercantile Exchange Holdings immediately after our reporting period following an intense bidding war with ICE; and International Securities Exchange, which also received a takeover offer. (Please refer to the fund’s portfolio of investments for a complete listing of holdings and the amount each represents in the portfolio.)
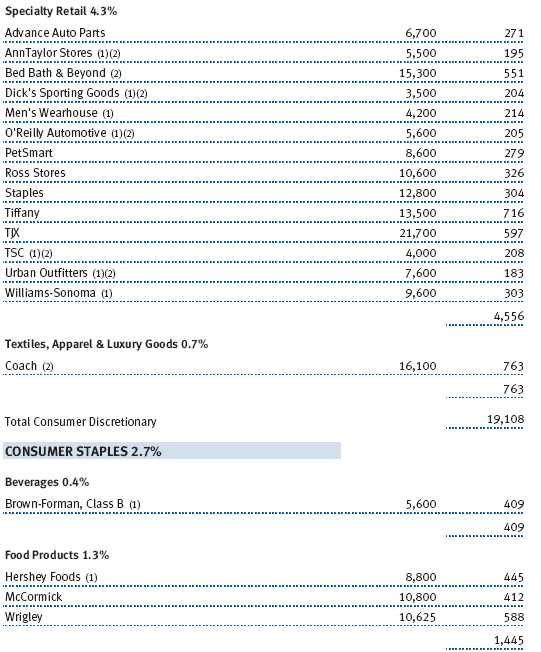
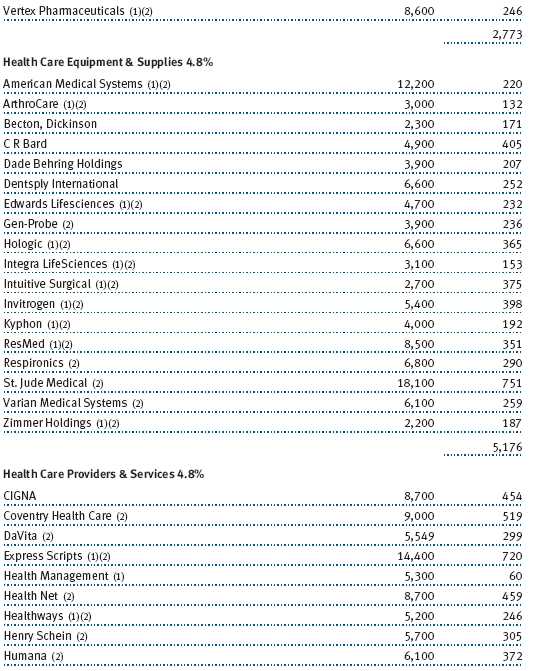
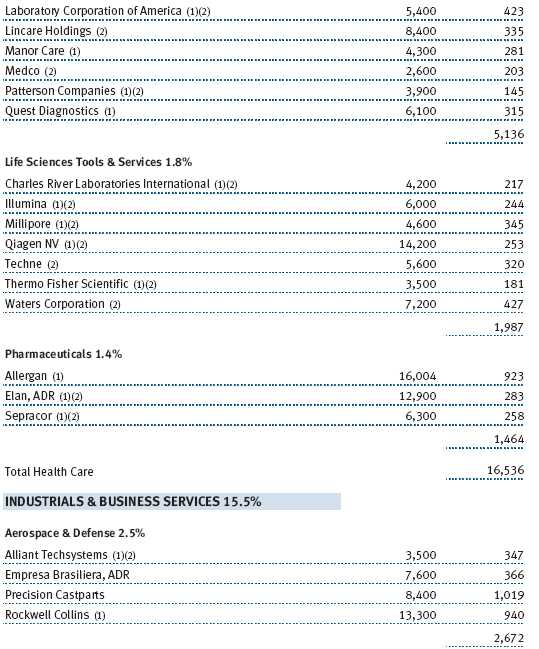
Our holdings in the health care sector, which we emphasized relative to the Russell benchmark, performed well in the first half of 2007. Good stock selection among providers and services companies greatly helped our results, especially pharmacy benefits managers Medco Health Solutions and Express Scripts, both of which issued favorable earnings reports and financial projections. Medical device makers also did well, led by St. Jude Medical, though ResMed suffered due to a product recall and earnings weakness. Two other strong performers were Ventana Medical Systems, a maker of equipment used to analyze human tissue, and biotechnology company MedImmune. The former received a hostile takeover offer from Swiss pharmaceutical giant Roche Holding AG in late June; the latter was recently acquired by U.K.-based drug company AstraZeneca. Underweighting mid-cap pharmaceuticals was also beneficial, as was our new position in Elan, which has some promising drugs in development, especially one concerning Alzheimer’s.
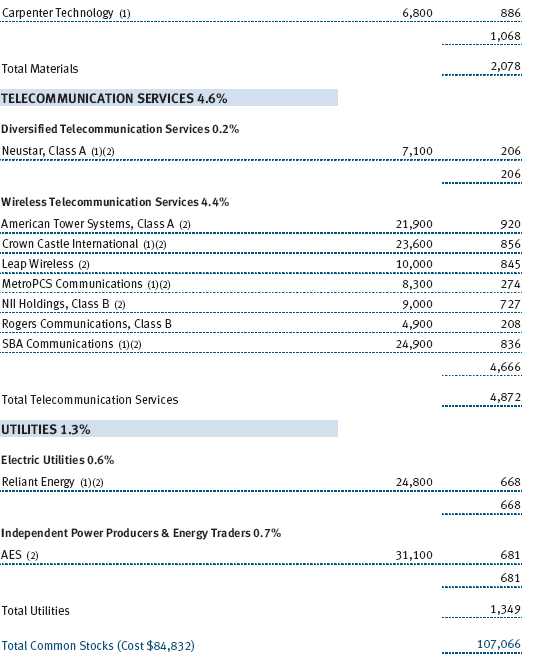
Telecommunication services stocks, which we overweighted, performed quite well amid strong fundamentals. We like tower operators with attractive business models and wireless service providers with special situations and growth opportunities, given the competitive nature of that business. Two of our largest contributors were Leap Wireless, a new portfolio holding that targets low-income customers, and SBA Communications. Metro PCS Communications, another new holding that we added after the company’s IPO in April, did well in anticipation of continued expansion into new markets.
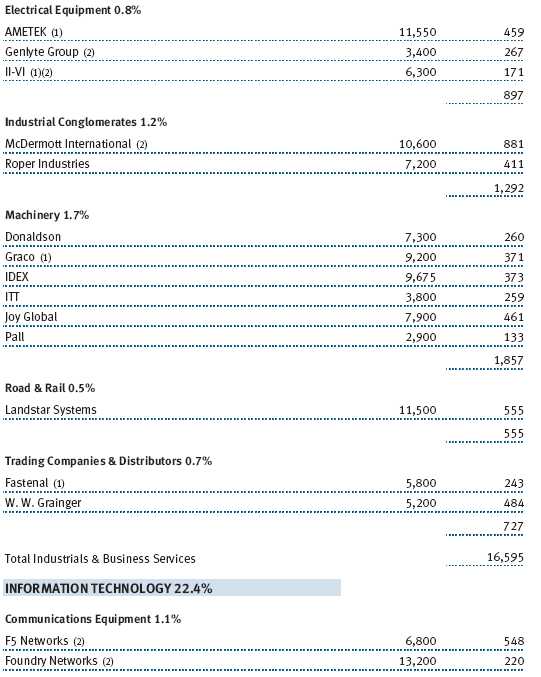
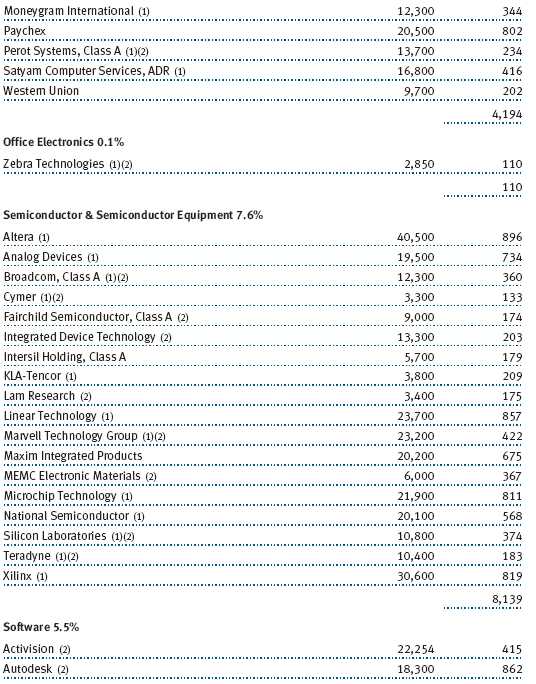
The information technology sector, which remains the largest in the fund and the Russell index, underperformed the more economically sensitive sectors of the market in the last six months. Our overweighting detracted slightly from our results, but this was offset by good stock selection. We continued to emphasize companies with strong business models in industries with high barriers to entry and low risk of commoditization, such as software and IT services. Semiconductor companies, which performed fairly well amid signs of improving business conditions in the last six months, also fit this mold; we prefer companies with quality business models and reasonable valuations. We maintain low exposure to companies that make computers and peripheral devices because they have a higher risk of commoditization. It is notable that technology is a sector in which we especially emphasize diversification.
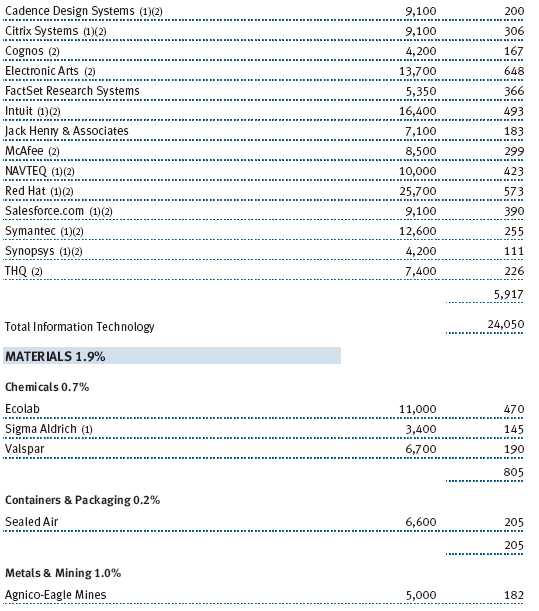
The materials sector is one of the smallest in the mid-cap growth universe, yet it was one of the best-performing market segments in the last six months. However, underweighting the sector and poor relative performance of our holdings worked against us. The best performers were businesses whose fortunes are closely tied to commodity prices; in contrast, our holdings are companies that improve upon an underlying commodity. Two examples are specialty chemical company Sigma-Aldrich and Ecolab, a global developer and marketer of premium cleaning and sanitizing products for business customers.
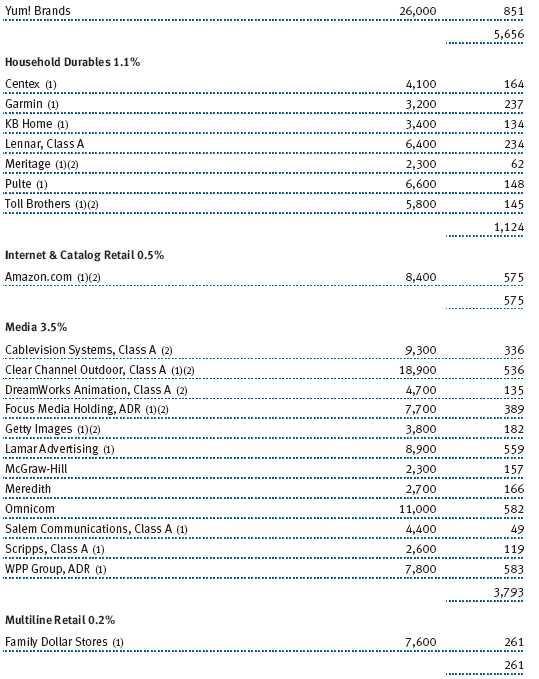
Consumer discretionary shares, which we underweighted slightly relative to the Russell index, lagged somewhat in the last six months amid concerns that high energy costs will crimp consumer spending. Homebuilding stocks were among the worst performers in the entire portfolio, as the housing market continued to struggle. Our stock selection among hotel, restaurant, and gaming companies was disadvantageous during our reporting period, but we still believe many of these businesses have good business models and long-term fundamentals, so we maintained our positions. Shuffle Master, which makes automatic card-shuffling and casino chip sorters, declined amid higher-than-expected expenses and earnings weakness. The next few quarters may be challenging, but we like the company’s long-term prospects as a vendor to casinos. Internet retailer Amazon.com performed very well. The company’s valuation is fairly rich and its long-term prospects are good, but we expect to eliminate our position because its market cap is well above that of other mid-caps.
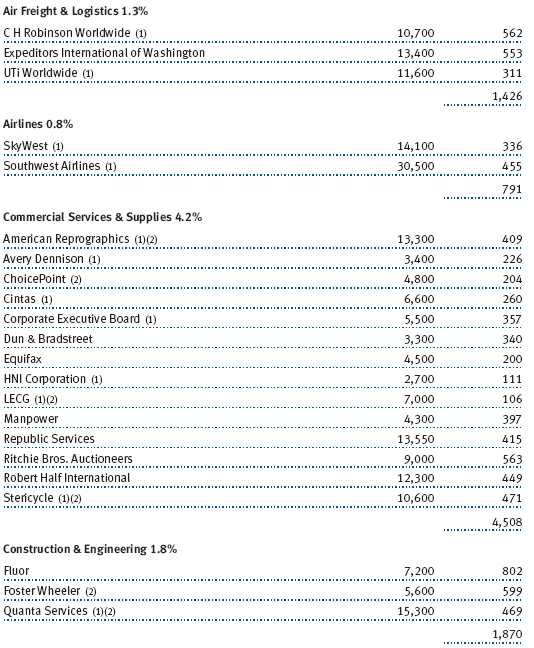
The industrials and business services sector outperformed, thanks in part to the economic upturn in recent months. Our slight underweighting relative to the benchmark for most of our reporting period and, to a greater extent, relatively weak stock selection detracted from our performance. We prefer businesses that are less cyclical, such as commercial services, whereas more cyclical companies—which have higher valuations following several years of strong performance—did better, helped by momentum investing. Corporate Executive Board fared poorly, as the company struggled with slowing growth and weaker-than-expected earnings following years of robust performance. SkyWest and Southwest Airlines, which we believe are the best-managed businesses in a brutal industry, also struggled amid rising costs.
FUND DISTRIBUTIONS
In mid-December 2007, the fund’s Board of Directors is likely to declare a distribution of dividends as well as short- and long-term capital gains. These distributions will be taxable to investors in nonretirement accounts. Because of the continuing equity bull market and the heightened takeover activity that has allowed us to realize substantial capital gains from the sale of companies being acquired, investors should expect a significant distribution of capital gains at the end of the year.
Taxable investors who are concerned about the tax consequences of such distributions might consider the T. Rowe Price Tax-Efficient Multi-Cap Growth Fund as an alternative investment. Like the Diversified Mid-Cap Growth Fund, the Tax-Efficient Multi-Cap Growth Fund focuses primarily on the mid- and small-cap segment and uses a similar investment process, but it is specifically managed to minimize taxable distributions to shareholders, and its objective is to produce the best possible long-term after-tax returns. In the Diversified Mid-Cap Growth Fund, we eliminate investments in good companies when their market capitalizations grow beyond that of a mid-cap company, whereas in the Tax-Efficient Multi-Cap Growth Fund, we will continue to hold such companies as long as they remain a good longer-term investment. Of course, there is no guarantee that the fund’s attempts to manage its portfolio in a tax-efficient manner will be successful. The fund is subject to market risk, including possible loss of principal. (Please remember that an exchange from one fund to another involves the sale of shares. In a nonretirement account, such a transaction could result in the realization of a capital gain.)
For more information on this fund, please visit our Web site, troweprice.com or call 1-800-225-5132 to request a prospectus or a briefer profile; each includes investment objectives, risks, fees, expenses, and other information that you should read and consider carefully before investing.
OUTLOOK
Mid-cap growth stocks have had excellent performance over the last few years. Brisk merger and LBO activity have created an environment in which many investors are speculating in the short term about what company is likely to be the next takeover target, rather than looking for solid businesses with good long-term growth prospects. Considering the speculative environment and our bias toward high-quality companies—many of which we still consider to be relatively inexpensive—we are pleased with the fund’s performance. We are cautious because such strong relative returns cannot be sustained indefinitely. We will continue to consider both the risk and reward potential when seeking long-term investments, and we believe that our steady strategy and long-term focus should provide much better capital preservation during tougher market environments than more aggressive strategies.
Thank you for your confidence in T. Rowe Price.
Respectfully submitted,

Donald J. Peters
Chairman of the fund’s Investment Advisory Committee
July 23, 2007
The committee chairman has day-to-day responsibility for managing the portfolio and works with committee members in developing and executing the fund’s investment program.
RISKS OF INVESTING
As with all equity funds, this fund’s share price can fall because of weakness in the broad market, a particular industry, or specific holdings. The market as a whole can decline for many reasons, including adverse political or economic developments here or abroad, changes in investor psychology, or heavy institutional selling. The prospects for an industry or company may deteriorate because of a variety of factors, including disappointing earnings or changes in the competitive environment. In addition, our assessment of companies held in the fund may prove incorrect, resulting in losses or poor performance even in a rising market. Finally, the fund’s investment approach could fall out of favor with the investing public, resulting in lagging performance versus other types of stock funds.
The stocks of mid-cap companies entail greater risk and are usually more volatile than the shares of large companies. In addition, growth stocks can be volatile for several reasons. Since they usually reinvest a high proportion of earnings in their own businesses, they may lack the dividends usually associated with value stocks that can cushion their decline in a falling market. Also, since investors buy these stocks because of their expected superior earnings growth, earnings disappointments often result in sharp price declines. Diversification cannot assure a profit or protect against loss in a declining market.
GLOSSARY
Fed funds target rate: An overnight lending rate set by the Federal Reserve and used by banks to meet reserve requirements. Banks also use the fed funds rate as a benchmark for their prime lending rates.
Lipper indexes: Consist of a small number (10 to 30) of the largest mutual funds in a particular category as tracked by Lipper Inc.
Price/earnings (P/E) ratio: A ratio shows the “multiple” of earnings at which a stock is selling. It is calculated by dividing a stock’s current price by its current earnings per share. For example, if a stock’s price is $60 per share and the issuing company earns $2 per share, the P/E ratio is $60/$2, or 30.
Russell 2000 Index: Tracks the stocks of 2,000 small U.S. companies.
Russell Midcap Index: Measures the performance of the 800 smallest companies in the Russell 1000 Index.
Russell Midcap Growth Index: Measures the performance of those Russell Midcap companies with higher price-to-book ratios and higher forecasted growth values. The stocks are also members of the Russell 1000 Growth Index.
Russell Midcap Value Index: Measures the performance of those Russell Midcap companies with lower price-to-book ratios and lower forecasted growth values. The stocks are also members of the Russell 1000 Value Index.
S&P 500 Index: Tracks the stocks of 500 mostly large U.S. companies.
S&P MidCap 400 Index: An unmanaged index that tracks the stocks of 400 U.S. mid-cap companies.
Performance and Expenses
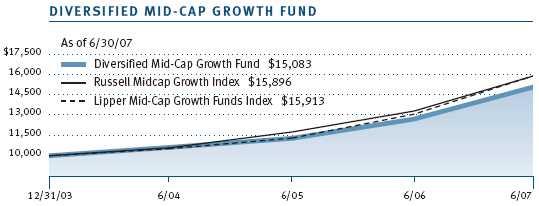
| GROWTH OF $10,000 |
This chart shows the value of a hypothetical $10,000 investment in the fund over the past 10 fiscal year periods or since inception (for funds lacking 10-year records). The result is compared with benchmarks, which may include a broad-based market index and a peer group average or index. Market indexes do not include expenses, which are deducted from fund returns as well as mutual fund averages and indexes.
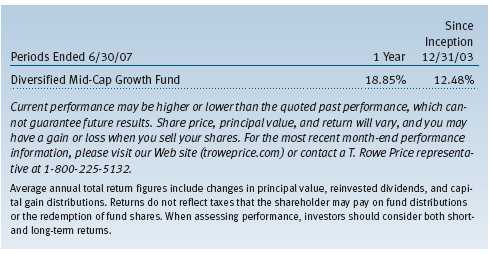
| AVERAGE ANNUAL COMPOUND TOTAL RETURN |
This table shows how the fund would have performed each year if its actual (or cumulative) returns for the periods shown had been earned at a constant rate.
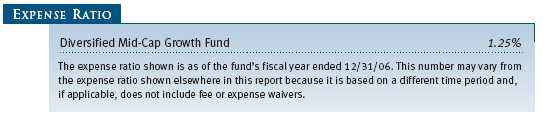
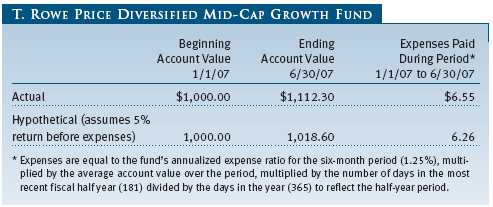
| FUND EXPENSE EXAMPLE |
As a mutual fund shareholder, you may incur two types of costs: (1) transaction costs, such as redemption fees or sales loads, and (2) ongoing costs, including management fees, distribution and service (12b-1) fees, and other fund expenses. The following example is intended to help you understand your ongoing costs (in dollars) of investing in the fund and to compare these costs with the ongoing costs of investing in other mutual funds. The example is based on an investment of $1,000 invested at the beginning of the most recent six-month period and held for the entire period.
Actual Expenses
The first line of the following table (“Actual”) provides information about actual account values and expenses based on the fund’s actual returns. You may use the information in this line, together with your account balance, to estimate the expenses that you paid over the period. Simply divide your account value by $1,000 (for example, an $8,600 account value divided by $1,000 = 8.6), then multiply the result by the number in the first line under the heading “Expenses Paid During Period” to estimate the expenses you paid on your account during this period.
Hypothetical Example for Comparison Purposes
The information on the second line of the table (“Hypothetical”) is based on hypothetical account values and expenses derived from the fund’s actual expense ratio and an assumed 5% per year rate of return before expenses (not the fund’s actual return). You may compare the ongoing costs of investing in the fund with other funds by contrasting this 5% hypothetical example and the 5% hypothetical examples that appear in the shareholder reports of the other funds. The hypothetical account values and expenses may not be used to estimate the actual ending account balance or expenses you paid for the period.
Note: T. Rowe Price charges an annual small-account maintenance fee of $10, generally for accounts with less than $2,000 ($500 for UGMA/UTMA). The fee is waived for any investor whose T. Rowe Price mutual fund accounts total $25,000 or more, accounts employing automatic investing, and IRAs and other retirement plan accounts that utilize a prototype plan sponsored by T. Rowe Price (although a separate custodial or administrative fee may apply to such accounts). This fee is not included in the accompanying table. If you are subject to the fee, keep it in mind when you are estimating the ongoing expenses of investing in the fund and when comparing the expenses of this fund with other funds.
You should also be aware that the expenses shown in the table highlight only your ongoing costs and do not reflect any transaction costs, such as redemption fees or sales loads. Therefore, the second line of the table is useful in comparing ongoing costs only and will not help you determine the relative total costs of owning different funds. To the extent a fund charges transaction costs, however, the total cost of owning that fund is higher.
Unaudited
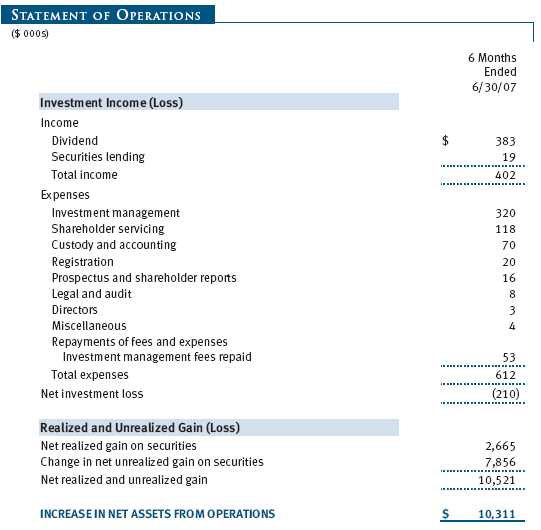
The accompanying notes are an integral part of these financial statements.
Unaudited

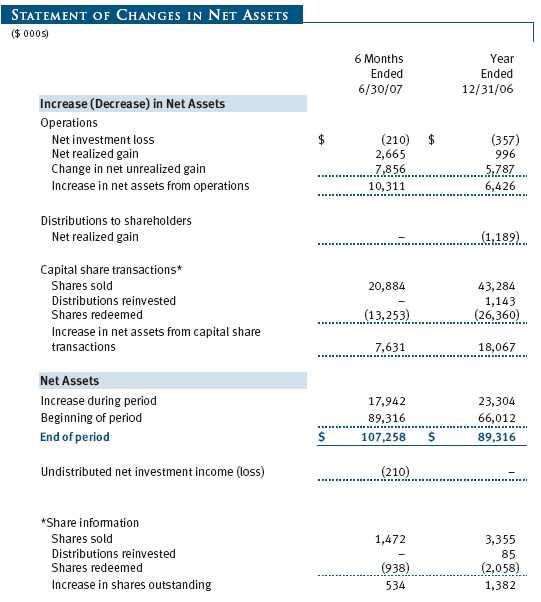
The accompanying notes are an integral part of these financial statements.
Unaudited
The accompanying notes are an integral part of these financial statements.
Unaudited
The accompanying notes are an integral part of these financial statements.
Unaudited
The accompanying notes are an integral part of these financial statements.
Unaudited
| NOTES TO FINANCIAL STATEMENTS |
NOTE 1 - SIGNIFICANT ACCOUNTING POLICIES
T. Rowe Price Diversified Mid-Cap Growth Fund, Inc. (the fund), is registered under the Investment Company Act of 1940 (the 1940 Act) as a diversified, open-end management investment company. The fund commenced operations on December 31, 2003. The fund seeks to provide long-term capital growth by investing primarily in the common stocks of mid-cap growth companies.
The accompanying financial statements were prepared in accordance with accounting principles generally accepted in the United States of America, which require the use of estimates made by fund management. Fund management believes that estimates and security valuations are appropriate; however, actual results may differ from those estimates, and the security valuations reflected in the financial statements may differ from the value the fund ultimately realizes upon sale of the securities.
Valuation The fund values its investments and computes its net asset value per share at the close of the New York Stock Exchange (NYSE), normally 4 p.m. ET, each day that the NYSE is open for business. Equity securities listed or regularly traded on a securities exchange or in the over-the-counter (OTC) market are valued at the last quoted sale price or, for certain markets, the official closing price at the time the valuations are made, except for OTC Bulletin Board securities, which are valued at the mean of the latest bid and asked prices. A security that is listed or traded on more than one exchange is valued at the quotation on the exchange determined to be the primary market for such security. Listed securities not traded on a particular day are valued at the mean of the latest bid and asked prices for domestic securities and the last quoted sale price for international securities.
Investments in mutual funds are valued at the mutual fund’s closing net asset value per share on the day of valuation.
Other investments, including restricted securities, and those for which the above valuation procedures are inappropriate or are deemed not to reflect fair value are stated at fair value as determined in good faith by the T. Rowe Price Valuation Committee, established by the fund’s Board of Directors.
Most foreign markets close before the close of trading on the NYSE. If the fund determines that developments between the close of a foreign market and the close of the NYSE will, in its judgment, materially affect the value of some or all of its portfolio securities, which in turn will affect the fund’s share price, the fund will adjust the previous closing prices to reflect the fair value of the securities as of the close of the NYSE, as determined in good faith by the T. Rowe Price Valuation Committee, established by the fund’s Board of Directors. A fund may also fair value securities in other situations, such as when a particular foreign market is closed but the fund is open. In deciding whether to make fair value adjustments, the fund reviews a variety of factors, including developments in foreign markets, the performance of U.S. securities markets, and the performance of instruments trading in U.S. markets that represent foreign securities and baskets of foreign securities. The fund uses outside pricing services to provide it with closing market prices and information used for adjusting those prices. The fund cannot predict when and how often it will use closing prices and when it will adjust those prices to reflect fair value. As a means of evaluating its fair value process, the fund routinely compares closing market prices, the next day’s opening prices in the same markets, and adjusted prices.
Currency Translation Assets, including investments, and liabilities denominated in foreign currencies are translated into U.S. dollar values each day at the prevailing exchange rate, using the mean of the bid and asked prices of such currencies against U.S. dollars as quoted by a major bank. Purchases and sales of securities, income, and expenses are translated into U.S. dollars at the prevailing exchange rate on the date of the transaction. The effect of changes in foreign currency exchange rates on realized and unrealized security gains and losses is reflected as a component of security gains and losses.
Investment Transactions, Investment Income, and Distributions Income and expenses are recorded on the accrual basis. Dividends received from mutual fund investments are reflected as dividend income; capital gain distributions are reflected as realized gain/loss. Dividend income and capital gain distributions are recorded on the ex-dividend date. Any income tax-related interest and penalties would be classified as income tax expense. Investment transactions are accounted for on the trade date. Realized gains and losses are reported on the identified cost basis. Distributions to shareholders are recorded on the ex-dividend date. Income distributions are declared and paid on an annual basis. Capital gain distributions, if any, are declared and paid by the fund, typically on an annual basis.
New Accounting Pronouncements Effective June 29, 2007, the fund adopted Financial Accounting Standards Board (“FASB”) Interpretation No. 48 (“FIN 48”), Accounting for Uncertainty in Income Taxes, a clarification of FASB Statement No. 109, Accounting for Income Taxes. FIN 48 establishes financial accounting and disclosure requirements for recognition and measurement of tax positions taken or expected to be taken on an income tax return. The adoption of FIN 48 had no impact on the fund’s net assets or results of operations.
In September 2006, the FASB released the Statement of Financial Accounting Standard No. 157 (“FAS 157”), Fair Value Measurements. FAS 157 clarifies the definition of fair value and establishes the framework for measuring fair value, as well as proper disclosure of this methodology in the financial statements. It will be effective for the fund’s fiscal year beginning January 1, 2008. Management is evaluating the effects of FAS 157; however, it is not expected to have a material impact on the fund’s net assets or results of operations.
NOTE 2 - INVESTMENT TRANSACTIONS
Consistent with its investment objective, the fund engages in the following practices to manage exposure to certain risks or to enhance performance. The investment objective, policies, program, and risk factors of the fund are described more fully in the fund’s prospectus and Statement of Additional Information.
Securities Lending The fund lends its securities to approved brokers to earn additional income. It receives as collateral cash and U.S. government securities valued at 102% to 105% of the value of the securities on loan. Cash collateral is invested in a money market pooled trust managed by the fund’s lending agent in accordance with investment guidelines approved by fund management. Collateral is maintained over the life of the loan in an amount not less than the value of loaned securities, as determined at the close of fund business each day; any additional collateral required due to changes in security values is delivered to the fund the next business day. Although risk is mitigated by the collateral, the fund could experience a delay in recovering its securities and a possible loss of income or value if the borrower fails to return the securities. Securities lending revenue recognized by the fund consists of earnings on invested collateral and borrowing fees, net of any rebates to the borrower and compensation to the lending agent. At June 30, 2007, the value of loaned securities was $24,609,000; aggregate collateral consisted of $25,169,000 in the money market pooled trust and U.S. government securities valued at $74,000.
Other Purchases and sales of portfolio securities, other than short-term securities, aggregated $21,690,000 and $14,430,000, respectively, for the six months ended June 30, 2007.
NOTE 3 - FEDERAL INCOME TAXES
No provision for federal income taxes is required since the fund intends to continue to qualify as a regulated investment company under Subchapter M of the Internal Revenue Code and distribute to shareholders all of its taxable income and gains. Federal income tax regulations differ from generally accepted accounting principles; therefore, distributions determined in accordance with tax regulations may differ in amount or character from net investment income and realized gains for financial reporting purposes. Financial reporting records are adjusted for permanent book/tax differences to reflect tax character. Financial records are not adjusted for temporary differences. The amount and character of tax-basis distributions and composition of net assets are finalized at fiscal year-end; accordingly, tax-basis balances have not been determined as of June 30, 2007.
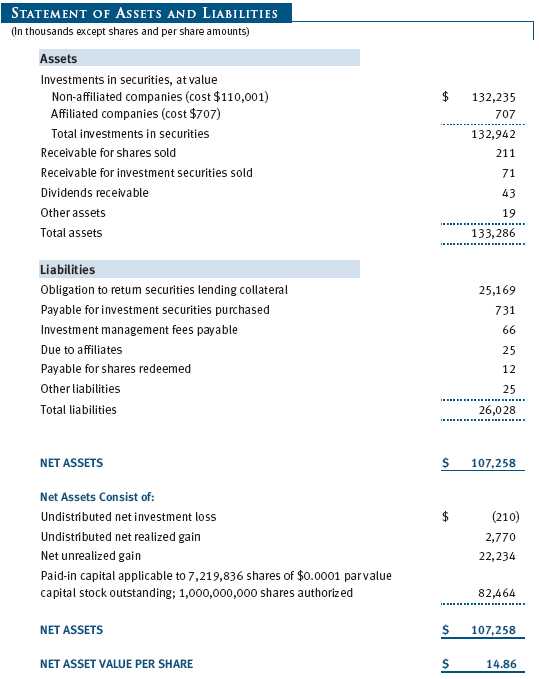
At June 30, 2007, the cost of investments for federal income tax purposes was $110,708,000. Net unrealized gain aggregated $22,234,000 at period-end, of which $24,395,000 related to appreciated investments and $2,161,000 related to depreciated investments.
NOTE 4 - RELATED PARTY TRANSACTIONS
The fund is managed by T. Rowe Price Associates, Inc. (the manager or Price Associates), a wholly owned subsidiary of T. Rowe Price Group, Inc. The investment management agreement between the fund and the manager provides for an annual investment management fee, which is computed daily and paid monthly. The fee consists of an individual fund fee, equal to 0.35% of the fund’s average daily net assets, and a group fee. The group fee rate is calculated based on the combined net assets of certain mutual funds sponsored by Price Associates (the group) applied to a graduated fee schedule, with rates ranging from 0.48% for the first $1 billion of assets to 0.285% for assets in excess of $220 billion. The fund’s group fee is determined by applying the group fee rate to the fund’s average daily net assets. At June 30, 2007, the effective annual group fee rate was 0.30%.
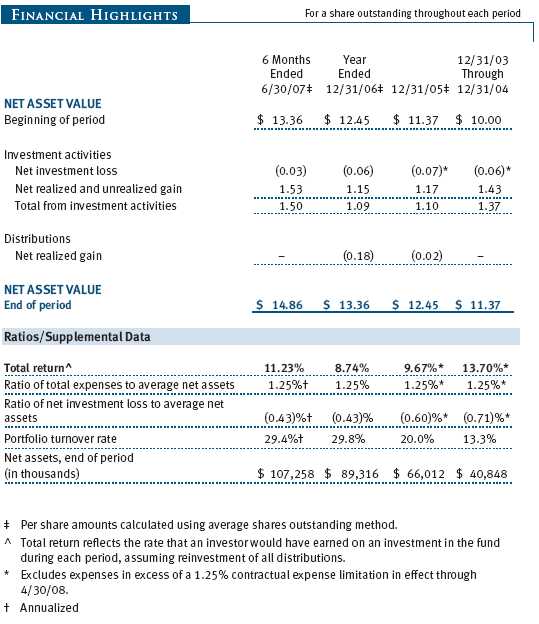
The fund is also subject to a contractual expense limitation through April 30, 2008. During the limitation period, the manager is required to waive its management fee and reimburse the fund for any expenses, excluding interest, taxes, brokerage commissions, and extraordinary expenses, that would otherwise cause the fund’s ratio of annualized total expenses to average net assets (expense ratio) to exceed its expense limitation of 1.25%. For a period of three years after the date of any reimbursement or waiver, the fund is required to repay the manager for expenses previously reimbursed and management fees waived to the extent its net assets have grown or expenses have declined sufficiently to allow repayment without causing the fund’s expense ratio to exceed its expense limitation. Pursuant to this agreement, management fees in the amount of $53,000 were repaid during the six months ended June 30, 2007. Including these amounts, management fees waived in the amount of $87,000 remain subject to repayment at June 30, 2007.
In addition, the fund has entered into service agreements with Price Associates and two wholly owned subsidiaries of Price Associates (collectively, Price). Price Associates computes the daily share price and provides certain other administrative services to the fund. T. Rowe Price Services, Inc., provides shareholder and administrative services in its capacity as the fund’s transfer and dividend disbursing agent. T. Rowe Price Retirement Plan Services, Inc., provides subaccounting and recordkeeping services for certain retirement accounts invested in the fund. For the six months ended June 30, 2007, expenses incurred pursuant to these service agreements were $50,000 for Price Associates, $93,000 for T. Rowe Price Services, Inc., and $0 for T. Rowe Price Retirement Plan Services, Inc. The total amount payable at period-end pursuant to these service agreements is reflected as Due to Affiliates in the accompanying financial statements.
The fund may invest in the T. Rowe Price Reserve Investment Fund and the T. Rowe Price Government Reserve Investment Fund (collectively, the T. Rowe Price Reserve Investment Funds), open-end management investment companies managed by Price Associates and affiliates of the fund. The T. Rowe Price Reserve Investment Funds are offered as cash management options to mutual funds, trusts, and other accounts managed by Price Associates and/or its affiliates, and are not available for direct purchase by members of the public. The T. Rowe Price Reserve Investment Funds pay no investment management fees. During the six months ended June 30, 2007, dividend income from the T. Rowe Price Reserve Investment Funds totaled $10,000, and the value of shares of the T. Rowe Price Reserve Investment Funds held at June 30, 2007, and December 31, 2006, was $707,000 and $94,000, respectively.
As of June 30, 2007, T. Rowe Price Group, Inc. and/or its wholly owned subsidiaries owned 152,246 shares of the fund, representing 2% of the fund’s net assets.
| INFORMATION ON PROXY VOTING POLICIES, PROCEDURES, AND RECORDS |
A description of the policies and procedures used by T. Rowe Price funds and portfolios to determine how to vote proxies relating to portfolio securities is available in each fund’s Statement of Additional Information, which you may request by calling 1-800-225-5132 or by accessing the SEC’s Web site, www.sec.gov. The description of our proxy voting policies and procedures is also available on our Web site, www.troweprice.com. To access it, click on the words “Company Info” at the top of our homepage for individual investors. Then, in the window that appears, click on the “Proxy Voting Policy” navigation button in the top left corner.
Each fund’s most recent annual proxy voting record is available on our Web site and through the SEC’s Web site. To access it through our Web site, follow the directions above, then click on the words “Proxy Voting Record” at the bottom of the Proxy Voting Policy page.
| HOW TO OBTAIN QUARTERLY PORTFOLIO HOLDINGS |
The fund files a complete schedule of portfolio holdings with the Securities and Exchange Commission for the first and third quarters of each fiscal year on Form N-Q. The fund’s Form N-Q is available electronically on the SEC’s Web site (www.sec.gov); hard copies may be reviewed and copied at the SEC’s Public Reference Room, 450 Fifth St. N.W., Washington, DC 20549. For more information on the Public Reference Room, call 1-800-SEC-0330.
| APPROVAL OF INVESTMENT MANAGEMENT AGREEMENT |
On March 7, 2007, the fund’s Board of Directors (Board) unanimously approved the investment advisory contract (Contract) between the fund and its investment manager, T. Rowe Price Associates, Inc. (Manager). The Board considered a variety of factors in connection with its review of the Contract, also taking into account information provided by the Manager during the course of the year, as discussed below:
Services Provided by the Manager
The Board considered the nature, quality, and extent of the services provided to the fund by the Manager. These services included, but were not limited to, management of the fund’s portfolio and a variety of related activities, as well as financial and administrative services, reporting, and communications. The Board also reviewed the background and experience of the Manager’s senior management team and investment personnel involved in the management of the fund. The Board concluded that it was satisfied with the nature, quality, and extent of the services provided by the Manager.
Investment Performance of the Fund
The Board reviewed the fund’s return for the one-year and since-inception periods and compared this with previously agreed upon comparable performance measures and market data, including those supplied by Lipper and Morningstar, which are independent providers of mutual fund data. On the basis of this evaluation and the Board’s ongoing review of investment results, the Board concluded that the fund’s performance was satisfactory.
Costs, Benefits, Profits, and Economies of Scale
The Board reviewed detailed information regarding the revenues received by the Manager under the Contract and other benefits that the Manager (and its affiliates) may have realized from its relationship with the fund, including research received under “soft dollar” agreements. The Board noted that soft dollars were not used to pay for third-party, non-broker research. The Board also received information on the estimated costs incurred and profits realized by the Manager and its affiliates from advising T. Rowe Price mutual funds as well as estimates of the gross profits realized from managing the fund in particular. The Board concluded that the Manager’s profits were reasonable in light of the services provided to the fund. The Board also considered whether the fund or other funds benefit under the fee levels set forth in the Contract from any economies of scale realized by the Manager. Under the Contract, the fund pays a fee to the Manager composed of two components—a group fee rate based on the aggregate assets of certain T. Rowe Price mutual funds (including the fund) that declines at certain asset levels and an individual fund fee rate that is assessed on the assets of the fund. The Board concluded that the advisory fee structure for the fund continued to provide for a reasonable sharing of benefits from any economies of scale with the fund’s investors.
Fees
The Board reviewed the fund’s management fee rate, operating expenses, and total expense ratio and compared them with fees and expenses of other comparable funds based on information and data supplied by Lipper. The information provided to the Board indicated that the fund’s management fee rate and expense ratio were generally at or below the median for comparable funds. The Board also reviewed the fee schedules for comparable privately managed accounts of the Manager and its affiliates. Management informed the Board that the Manager’s responsibilities for privately managed accounts are more limited than its responsibilities for the fund and other T. Rowe Price mutual funds that it or its affiliates advise. On the basis of the information provided, the Board concluded that the fees paid by the fund under the Contract were reasonable.
Approval of the Contract
As noted, the Board approved the continuation of the Contract. No single factor was considered in isolation or to be determinative to the decision. Rather, the Board concluded, in light of a weighting and balancing of all factors considered, that it was in the best interests of the fund to approve the continuation of the Contract, including the fees to be charged for services thereunder.
Item 2. Code of Ethics.
A code of ethics, as defined in Item 2 of Form N-CSR, applicable to its principal executive officer, principal financial officer, principal accounting officer or controller, or persons performing similar functions is filed as an exhibit to the registrant’s annual Form N-CSR. No substantive amendments were approved or waivers were granted to this code of ethics during the registrant’s most recent fiscal half-year.
Item 3. Audit Committee Financial Expert.
Disclosure required in registrant’s annual Form N-CSR.
Item 4. Principal Accountant Fees and Services.
Disclosure required in registrant’s annual Form N-CSR.
Item 5. Audit Committee of Listed Registrants.
Not applicable.
Item 6. Schedule of Investments.
Not applicable. The complete schedule of investments is included in Item 1 of this Form N-CSR.
Item 7. Disclosure of Proxy Voting Policies and Procedures for Closed-End Management Investment Companies.
Not applicable.
Item 8. Portfolio Managers of Closed-End Management Investment Companies.
Not applicable.
Item 9. Purchases of Equity Securities by Closed-End Management Investment Company and Affiliated Purchasers.
Not applicable.
Item 10. Submission of Matters to a Vote of Security Holders.
Not applicable.
Item 11. Controls and Procedures.
(a) The registrant’s principal executive officer and principal financial officer have evaluated the registrant’s disclosure controls and procedures within 90 days of this filing and have concluded that the registrant’s disclosure controls and procedures were effective, as of that date, in ensuring that information required to be disclosed by the registrant in this Form N-CSR was recorded, processed, summarized, and reported timely.
(b) The registrant’s principal executive officer and principal financial officer are aware of no change in the registrant’s internal control over financial reporting that occurred during the registrant’s second fiscal quarter covered by this report that has materially affected, or is reasonably likely to materially affect, the registrant’s internal control over financial reporting.
Item 12. Exhibits.(a)(1) The registrant’s code of ethics pursuant to Item 2 of Form N-CSR is filed with the registrant’s annual Form N-CSR.
(2) Separate certifications by the registrant's principal executive officer and principal financial officer, pursuant to Section 302 of the Sarbanes-Oxley Act of 2002 and required by Rule 30a-2(a) under the Investment Company Act of 1940, are attached.
(3) Written solicitation to repurchase securities issued by closed-end companies: not applicable.
(b) A certification by the registrant's principal executive officer and principal financial officer, pursuant to Section 906 of the Sarbanes-Oxley Act of 2002 and required by Rule 30a-2(b) under the Investment Company Act of 1940, is attached.
SIGNATURES | |
| Pursuant to the requirements of the Securities Exchange Act of 1934 and the Investment | |
| Company Act of 1940, the registrant has duly caused this report to be signed on its behalf by the | |
| undersigned, thereunto duly authorized. | |
| T. Rowe Price Diversified Mid-Cap Growth Fund, Inc. | |
| By | /s/ Edward C. Bernard |
| Edward C. Bernard | |
| Principal Executive Officer | |
| Date | August 17, 2007 |
| Pursuant to the requirements of the Securities Exchange Act of 1934 and the Investment | |
| Company Act of 1940, this report has been signed below by the following persons on behalf of | |
| the registrant and in the capacities and on the dates indicated. | |
| By | /s/ Edward C. Bernard |
| Edward C. Bernard | |
| Principal Executive Officer | |
| Date | August 17, 2007 |
| By | /s/ Joseph A. Carrier |
| Joseph A. Carrier | |
| Principal Financial Officer | |
| Date | August 17, 2007 |