Item 1: Report to Shareholders
 |
| Diversified Mid-Cap Growth Fund | June 30, 2006 |
The views and opinions in this report were current as of June 30, 2006. They are not guarantees of performance or investment results and should not be taken as investment advice. Investment decisions reflect a variety of factors, and the managers reserve the right to change their views about individual stocks, sectors, and the markets at any time. As a result, the views expressed should not be relied upon as a forecast of the fund’s future investment intent. The report is certified under the Sarbanes-Oxley Act of 2002, which requires mutual funds and other public companies to affirm that, to the best of their knowledge, the information in their financial reports is fairly and accurately stated in all material respects.
REPORTS ON THE WEB
Sign up for our E-mail Program, and you can begin to receive updated fund reports and prospectuses online rather than through the mail. Log in to your account at troweprice.com for more information.
Fellow Shareholders
Mid-cap growth stocks generally rose in the first half of 2006, but a sharp stock market decline from mid-May to mid-June erased a large portion of their earlier gains. Investor sentiment—which had been favorable amid hopes that the Federal Reserve would soon stop increasing short-term interest rates—deteriorated rapidly in mid-May due to concerns that rising inflation would force the central bank to raise rates more than investors had expected, which, in turn, could crimp economic and corporate profit growth. In response, investors became more risk averse and shunned traditional growth stocks and other aggressive investments.
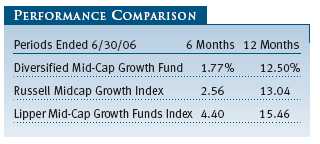
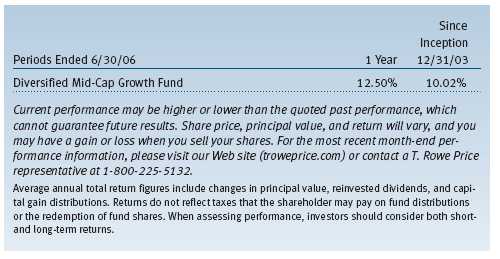
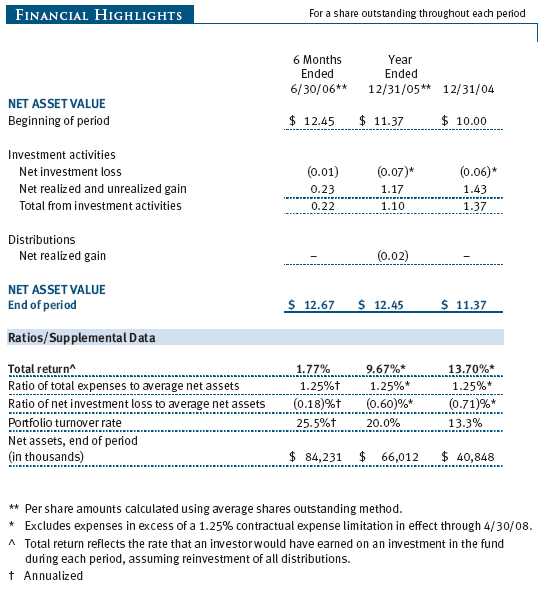
Your fund returned 1.77% in the first half of our fiscal year and a much stronger 12.50% in the 12-month period ended June 30, 2006. As shown in the Performance Comparison table, the fund lagged the Russell Midcap Growth Index slightly and its Lipper peer group index by a wider margin in both periods. In the last six months, fund performance was hurt by poor short-term performance of our information technology holdings—despite favorable long-term fundamentals—and weak stock selection in the industrials and business services category, which we have underweighted due to fairly expensive valuations. On the plus side, good stock selection in the consumer discretionary sector and overweighting telecommunication services stocks helped our relative results.
MARKET ENVIRONMENT
The economy accelerated at the beginning of 2006, expanding at a robust annualized rate of 5.6% in the first quarter versus a sluggish 1.7% in the final quarter of 2005 following last year’s hurricane assault on the Gulf Coast. In the second quarter, however, growth showed signs of moderating. Consumer spending decelerated amid rising interest rates and stubbornly high oil and gas prices. Also, gradually rising mortgage rates helped cool the housing market, and job growth softened. On the other hand, business investment has been strong, manufacturing activity seems healthy, and the unemployment rate dipped to a cyclical low of 4.6% in May and June. Rising inflation is another worrisome factor.
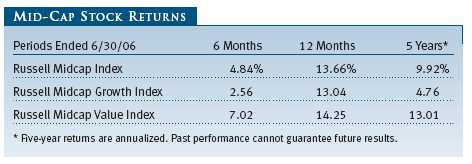
Mid-cap stocks outperformed large-cap shares in the first half of 2006 but trailed small-caps. The S&P MidCap 400 Index returned 4.24% versus 2.70% for the S&P 500 Index and 8.21% for the small-cap Russell 2000 Index. Among mid-caps, as measured by various Russell indexes, value stocks surpassed their growth counterparts; the value advantage over the last five years on an average annualized basis is 8.25% per year.
Over the last five years, there have been four primary trends: value dominating growth; smaller companies outperforming larger ones; foreign stocks outperforming domestic; and narrow market leadership. Based on the Russell 3000 Index, which is a broad measure of the U.S. stock market, the median stock has gained approximately 16.5% in the last five years versus a 115% gain in the energy sector and almost 65% in materials. In contrast, the information technology (-18%), telecommunication services (-16%), and health care (+5%) sectors have lagged badly, according to Wilshire Atlas. (All returns are cumulative and are based on the five-year period ended June 30, 2006. Past performance cannot guarantee future results.)
Our investment approach has a contrarian element, and we have emphasized those sectors that have underperformed for several years. We believe it is much easier to find attractive businesses at good valuations in these areas. We also tend to be more patient than other investors: our portfolio turnover in the 12-month period ended June 30, 2006, was about 25% versus an average of 110% for the mid-cap growth style, according to data from Morningstar Principia. One factor that has hindered our performance recently but should help going forward is that our fund is less economically sensitive than most mid-cap growth portfolios. As the Federal Reserve continues to raise short-term interest rates and the economic cycle lengthens, more differentiated companies tend to outperform.
INVESTMENT STRATEGY
Before we discuss the portfolio’s performance in detail, we would like to welcome new shareholders, thank all of our longer-term investors for their confidence in our investment abilities, and review the investment strategy and principles that guide our management of the portfolio.
• The Diversified Mid-Cap Growth Fund invests in mid-cap stocks of companies whose earnings are expected to grow at an above-average rate. We define mid-cap companies as those whose market capitalization at the time of purchase falls within the range of either the S&P MidCap 400 Index or the Russell Midcap Growth Index.
• We intend to keep the fund fully invested because we believe that successful market timing is virtually impossible and that the costs associated with frequent trading reduce the likelihood of outperforming the market. We do not spend undue time worrying about short-term performance or trying to forecast the direction of the market. Our focus is to find mid-cap companies with the best long-term growth potential.
• Unlike other mid-cap growth portfolios that are highly concentrated, the Diversified Mid-Cap Growth Fund will typically invest in about 300 stocks. This high degree of diversification helps to mitigate the downside risk attributable to any single poorly performing security. It is notable that we are investing in companies that are early in their life cycles, and it is inevitable that some will not be as successful as we hope. Accordingly, we balance risk with potential returns.
• Stock selection is based on a combination of fundamental, bottom-up analysis and top-down, quantitative strategies in an effort to identify companies with superior long-term appreciation prospects. We use a growth approach, looking for companies with a demonstrated ability to increase revenues, earnings, and cash flow consistently; capable management; attractive business niches; and a sustainable competitive advantage. We favor companies with above-average earnings growth and lower earnings variability.
• Valuations are also very important: we look for the best relative values among companies with the strongest businesses and managements.
• We use a number of proprietary quantitative models to identify and evaluate the characteristics of individual mid-cap growth companies and the portfolio as a whole.
PORTFOLIO REVIEW
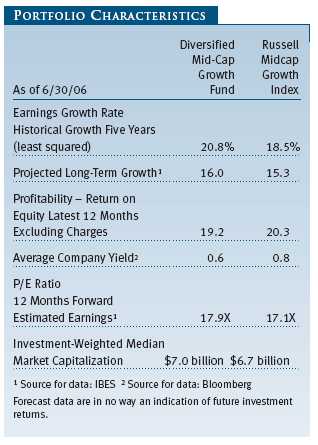
The Diversified Mid-Cap Growth Fund’s fundamental characteristics are similar to those of mid-cap growth benchmarks, such as the Russell Midcap Growth Index, as indicated by the Portfolio Characteristics table. The portfolio’s median market capitalization is comparable to that of the index. Its average company yield (0.6%) is a bit lower than the benchmark’s while its forward price/earnings (P/E) ratio (17.9X) and the projected earnings growth rate of our holdings (16.0%) are slightly higher. These are evidence of our commitment to companies with excellent long-term growth prospects. The fund’s return on equity, which measures how effectively and efficiently a company and its management are using stockholder investments, is lower than that of the index but still fairly high. We believe that companies with high and sustainable profitability are the best long-term investments.
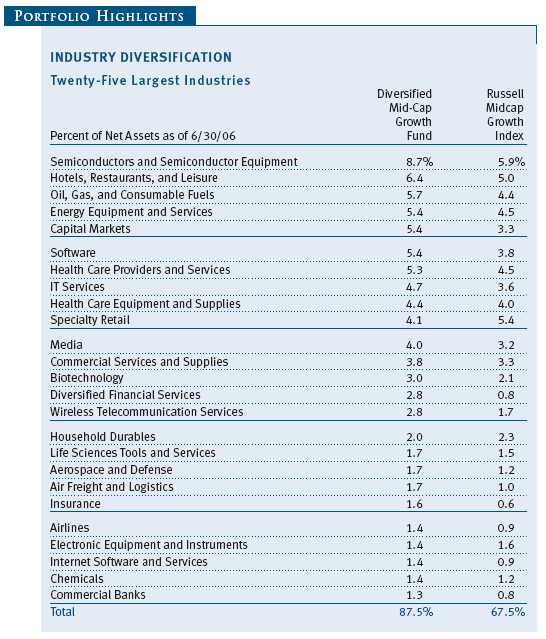
Our sector allocations have some resemblance to those of the index, though we have a few strategic overweightings or underweightings. Our three largest sector commitments are information technology, consumer discretionary, and health care. Investments in the industrials and business services, energy, and financials sectors are smaller. We have very little exposure to utilities, consumer staples, materials, and telecommunication services stocks because there aren’t many companies in those segments that meet our growth criteria.
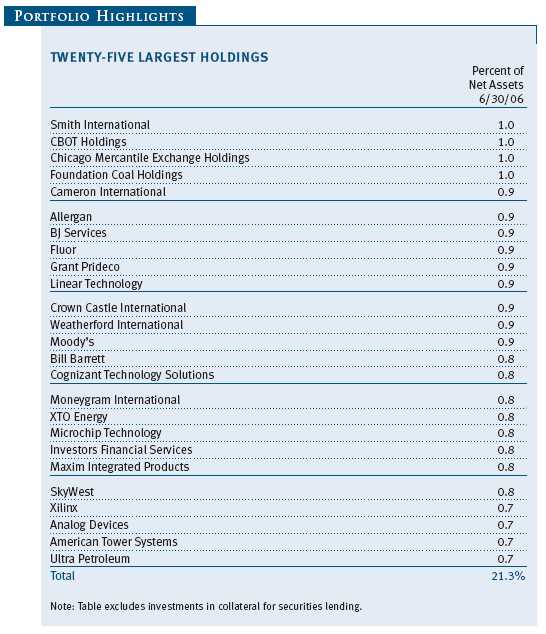
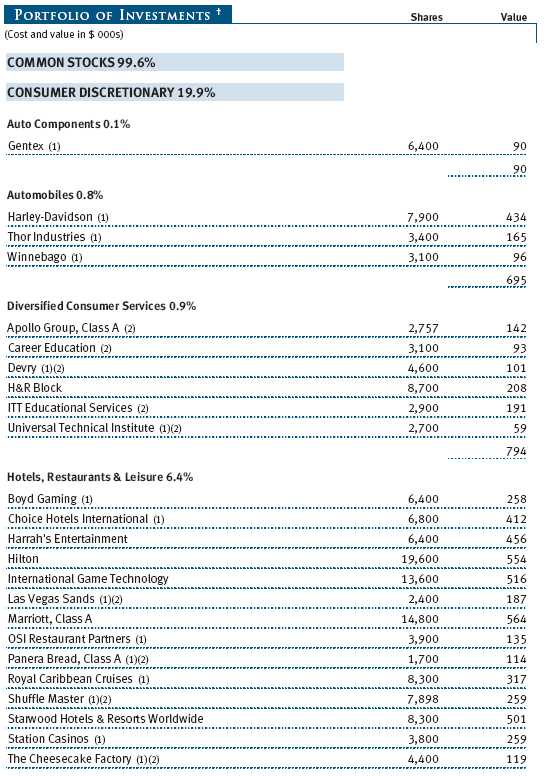
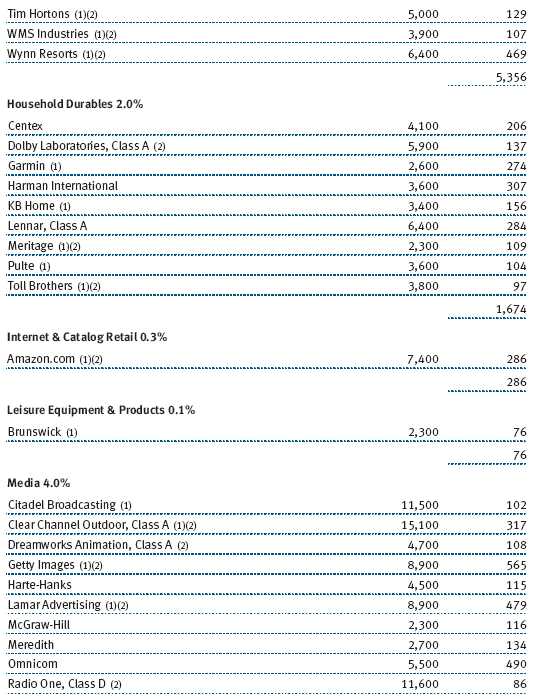
The consumer discretionary sector (19.9% of the fund’s net assets as of June 30), which we underweighted relative to the Russell benchmark, was sluggish in the last six months. However, favorable stock selection among hotel, restaurant, and leisure stocks—which we overweighted due to great fundamentals—substantially helped fund performance. Some of our top contributors in the sector and the entire portfolio were lodging companies Choice Hotels International and Marriott International and gaming operators Las Vegas Sands and Wynn Resorts. The household durables industry, particularly homebuilding stocks, fared poorly as the housing market cooled and companies reduced their earnings projections, but Garmin, a maker of portable Global Positioning System (GPS) devices, performed exceptionally well amid growing consumer demand. Media stocks continued to disappoint, and we eliminated several broadcasters and newspaper publishers as it became clear that the industry—given heightened competition from Internet media and satellite radio—is facing significant long-term challenges. (Please refer to the fund’s portfolio of investments for a complete listing of the fund’s holdings and the amount each represents in the portfolio.)
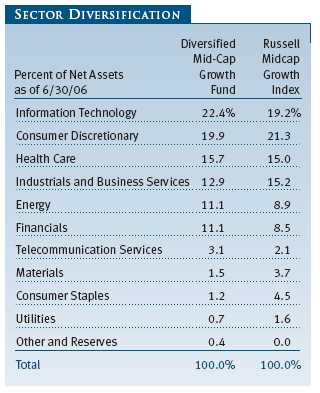
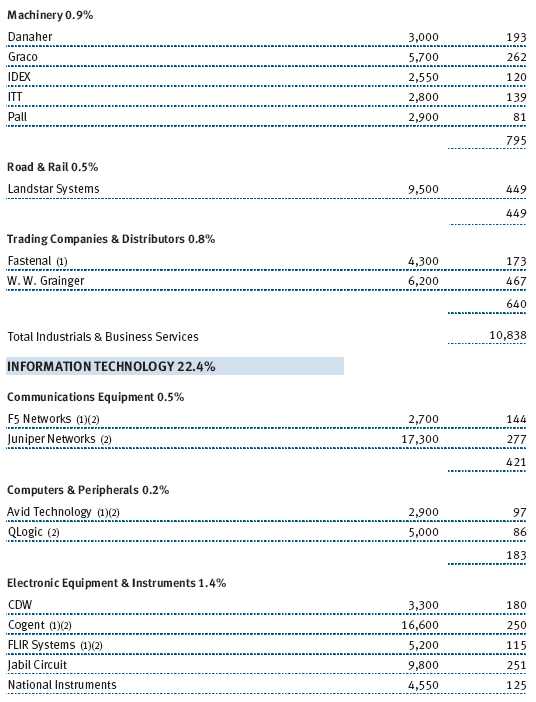
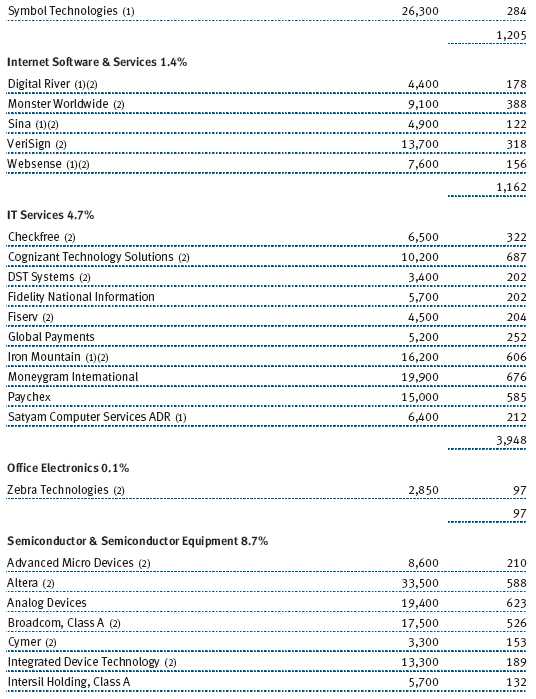
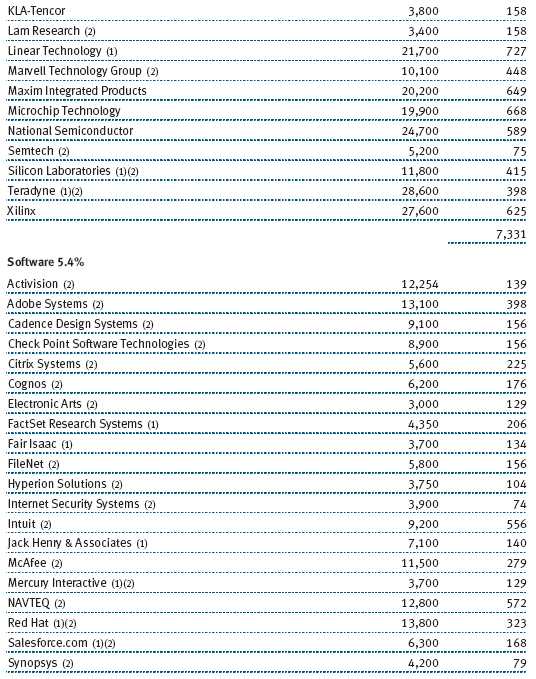
The information technology sector (our largest sector commitment, representing 22.4% of assets) performed worst in absolute terms and detracted the most from the fund’s relative results. We overweighted the sector relative to the Russell index and continued to favor companies with strong business models in industries with high barriers to entry and low risk of commoditization. Semiconductor companies fit this mold, but the poor short-term performance of our holdings, especially Marvell Technology Group, significantly subtracted value. Electronic and communications equipment companies declined, led by Cogent and Juniper Networks. Our underweighting in makers of computers and peripherals—which have a higher risk of commoditization—also worked against us. On the plus side, IT services companies such as Cognizant Technology Solutions did very well, helping offset the weakness in other tech industries.
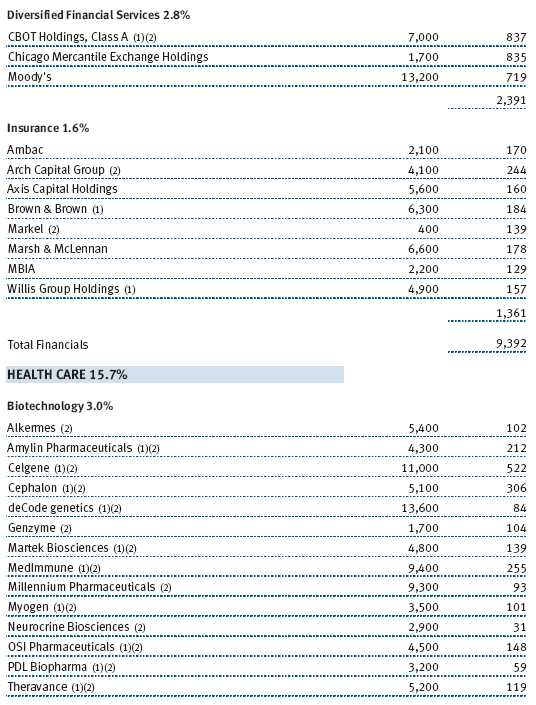
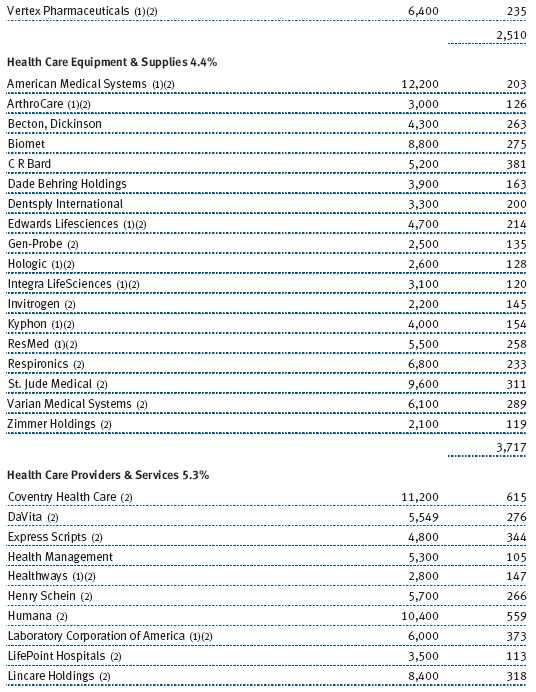
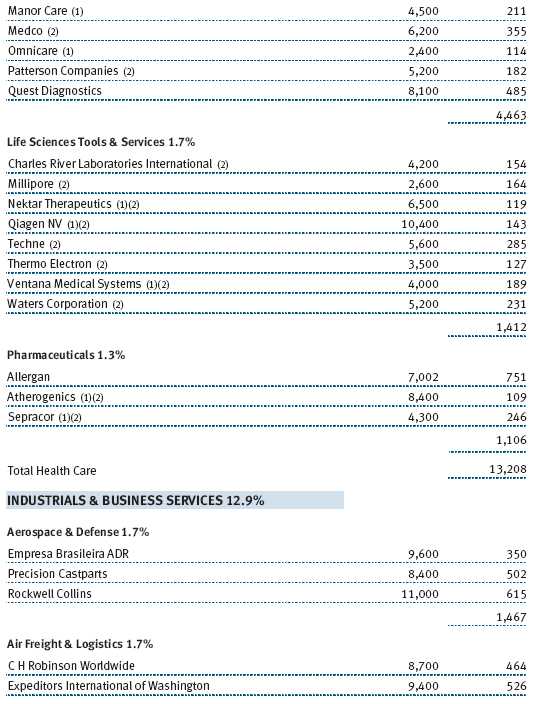
The performance of health care companies (15.7% of fund assets, a slight overweight relative to the Russell benchmark) in the mid-cap growth universe was mostly flat, as gains in most segments offset weakness among equipment and supply companies. Our life sciences tools and services holdings were led by Waters, a maker of analytical instruments with a strong niche, while our health care providers and services companies were lifted by Quest Diagnostics, a medical testing company that increased its financial projections for the year. Biotechnology stocks struggled in the second quarter as investors turned risk averse.
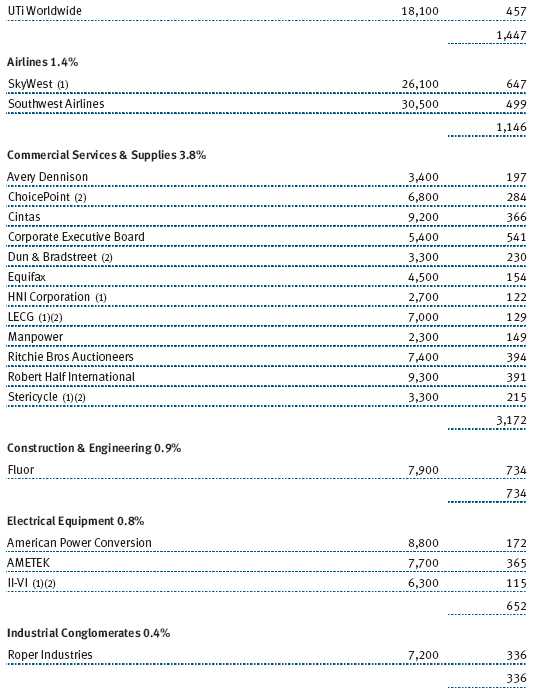
Industrials and business services stocks (12.9% of assets), which we underweighted relative to the Russell index, contributed the most to fund performance in absolute terms. Unfortunately, our air freight and logistics holdings did not perform as well as those in the benchmark, which limited our gains in the last six months. Although Expeditors International of Washington took flight due to stellar earnings growth, UTi Worldwide struggled amid declining profit margins. We still believe that both companies are well positioned to benefit from expanding globalization of trade. Concerns about rising jet fuel costs grounded our two regional airline stocks, SkyWest and Southwest Airlines, despite favorable trends such as brisk demand and rapid revenue growth.
The telecommunication services sector (3.1% of assets) produced robust returns in the first half of the year and was the best-performing sector in the fund and the benchmark. Good stock selection contributed to our results. Tower operators such as Crown Castle International and SBA Communications, which have some of the most attractive business models in the sector, did very well. Also, wireless service providers have benefited from good subscriber growth as well as industry consolidation, though competition is high, so we try to find companies with special situations and growth opportunities. One of our best holdings in the entire portfolio was NII Holdings, which serves rapidly growing markets in Latin America.
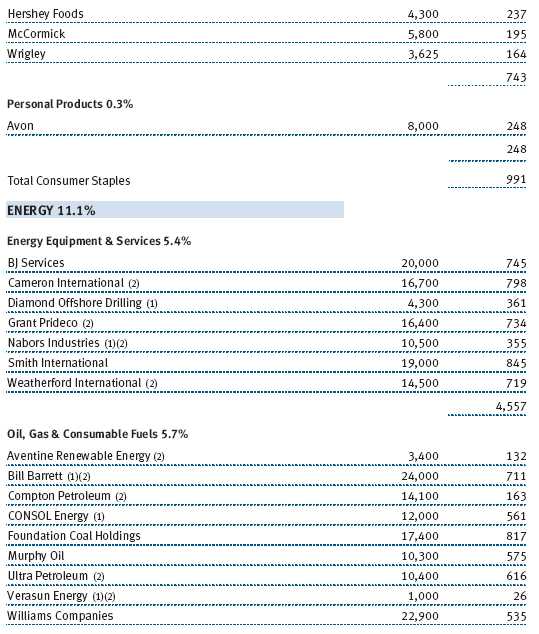
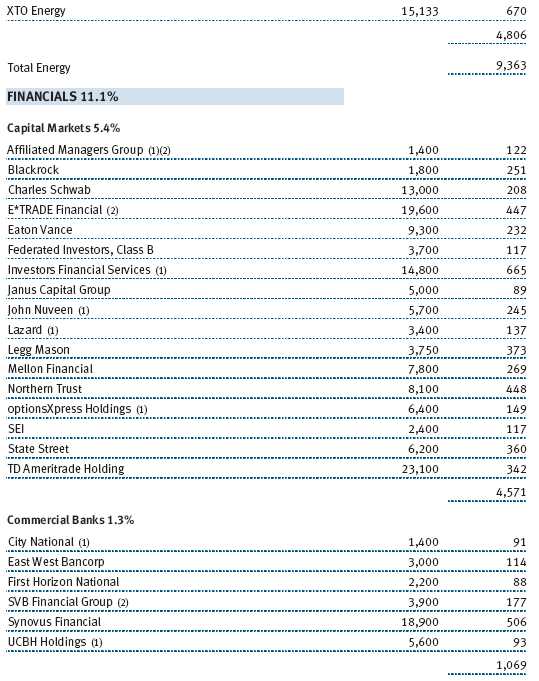
Most of our holdings in the energy sector (11.1% of assets) did well, despite a sharp correction from mid-May to mid-June. We added several names to the portfolio. We have overweighted oil service stocks relative to the benchmark as we find their business models attractive in a period of increased difficulty in developing energy reserves.
In aggregate, our holdings in the financials sector (also representing 11.1% of fund assets and an overweighting versus the benchmark) added value in the last six months. Capital markets companies, which we continued to emphasize due to excellent long-term prospects and a good risk/return trade-off, did best, led by asset manager Blackrock and trust bank Investors Financial Services. Online brokerage TD Ameritrade declined, however, after warning that the company’s earnings next year would be lower than anticipated. We expected the consolidated discount brokerage industry to be prosperous for several years.
FUND DISTRIBUTIONS
In mid-December 2006, the fund’s Board of Directors is likely to declare a distribution of dividends as well as short- and long-term capital gains. These distributions will be taxable to investors in non-retirement accounts. Taxable investors who are concerned about the tax consequences of such distributions might consider the T. Rowe Price Tax-Efficient Multi-Cap Growth Fund as an alternative investment. Like the Diversified Mid-Cap Growth Fund, the Tax-Efficient Multi-Cap Growth Fund focuses primarily on the mid- and small-cap segment and uses a similar investment process, but it is specifically managed to minimize taxable distributions to shareholders, and its objective is to produce the best possible long-term after-tax returns. In the Diversified Mid-Cap Growth Fund, we eliminate investments in good companies when their market capitalizations grow beyond that of a mid-cap company, whereas in the Tax-Efficient Multi-Cap Growth Fund, we will continue to hold such companies as long as they remain a good longer-term investment. Of course, there is no guarantee that the fund’s attempts to manage its portfolio in a tax-efficient manner will be successful. The fund is subject to market risk, including possible loss of principal.
For more information on this fund, please visit our Web site, troweprice.com, or call 1-800-225-5132 to request a prospectus or a briefer profile; each includes investment objectives, risks, fees, expenses, and other information that you should read and consider carefully before investing.
OUTLOOK
The equity market environment has become more challenging in recent months due to the possibility of additional rate increases from the Fed, inflation worries, signs of slower economic growth, and geopolitical instability. These concerns are legitimate and may lead investors to move from a risk-seeking posture to one that is more balanced.
In fact, recent volatility and investors’ sudden increased awareness of risks are likely to create a more favorable environment for our investment style in terms of relative performance. Some of the speculative activity in the market appears to have dissipated, and long-term investors seem more likely to focus increasingly on the types of investments that we favor: high-quality growth stocks of companies with solid fundamentals—such as strong business models and competent managements with a long-term orientation—that have the ability to grow their earnings at a strong or steady pace, even in tougher economic conditions. We will continue to balance risk and reward potential when seeking and analyzing current and prospective long-term investments for the fund and look forward to improved relative performance as the current business cycle matures.
Respectfully submitted,

Donald J. Peters
Chairman of the fund’s Investment Advisory Committee
July 17, 2006
The committee chairman has day-to-day responsibility for managing the portfolio and works with committee members in developing and executing the fund’s investment program.
RISKS OF INVESTING
As with all equity funds, this fund’s share price can fall because of weakness in the broad market, a particular industry, or specific holdings. The market as a whole can decline for many reasons, including adverse political or economic developments here or abroad, changes in investor psychology, or heavy institutional selling. The prospects for an industry or company may deteriorate because of a variety of factors, including disappointing earnings or changes in the competitive environment. In addition, our assessment of companies held in the fund may prove incorrect, resulting in losses or poor performance even in a rising market. Finally, the fund’s investment approach could fall out of favor with the investing public, resulting in lagging performance versus other types of stock funds.
The stocks of mid-cap companies entail greater risk and are usually more volatile than the shares of large companies. In addition, growth stocks can be volatile for several reasons. Since they usually reinvest a high proportion of earnings in their own businesses, they may lack the dividends usually associated with value stocks that can cushion their decline in a falling market. Also, since investors buy these stocks because of their expected superior earnings growth, earnings disappointments often result in sharp price declines.
Diversification cannot assure a profit or protect against loss in a declining market.
GLOSSARY
Fed funds target rate: An overnight lending rate set by the Federal Reserve and used by banks to meet reserve requirements. Banks also use the fed funds rate as a benchmark for their prime lending rates.
Lipper indexes: Consist of a small number (10 to 30) of the largest mutual funds in a particular category as tracked by Lipper Inc.
Price/earnings (P/E) ratio: A ratio that shows the “multiple” of earnings at which a stock is selling. It is calculated by dividing a stock’s current price by its current earnings per share. For example, if a stock’s price is $60 per share and the issuing company earns $2 per share, the P/E ratio is $60/$2, or 30.
Russell Midcap Growth Index: Measures the performance of those Russell Midcap companies with higher price-to-book ratios and higher forecasted growth values. The stocks are also members of the Russell 1000 Growth Index.
Russell Midcap Index: Measures the performance of the 800 smallest companies in the Russell 1000 Index.
Russell Midcap Value Index: Measures the performance of those Russell Midcap companies with lower price-to-book ratios and lower forecasted growth values. The stocks are also members of the Russell 1000 Value Index.
Russell 2000 Index: Tracks the performance of 2,000 small U.S. companies.
S&P MidCap 400 Index: Tracks the stocks of 400 U.S. mid-cap companies.
S&P 500 Index: Tracks the performance of 500 primarily large U.S. companies.
| GROWTH OF $10,000 |
This chart shows the value of a hypothetical $10,000 investment in the fund over the past 10 fiscal year periods or since inception (for funds lacking 10-year records). The result is compared with benchmarks, which may include a broad-based market index and a peer group average or index. Market indexes do not include expenses, which are deducted from fund returns as well as mutual fund averages and indexes.

| AVERAGE ANNUAL COMPOUND TOTAL RETURN |
This table shows how the fund would have performed each year if its actual (or cumulative) returns for the periods shown had been earned at a constant rate.
| FUND EXPENSE EXAMPLE |
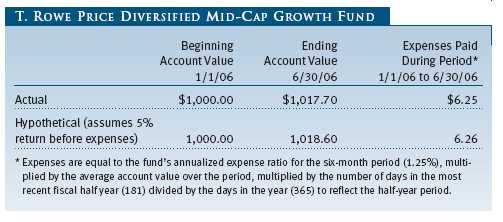
As a mutual fund shareholder, you may incur two types of costs: (1) transaction costs, such as redemption fees or sales loads, and (2) ongoing costs, including management fees, distribution and service (12b-1) fees, and other fund expenses. The following example is intended to help you understand your ongoing costs (in dollars) of investing in the fund and to compare these costs with the ongoing costs of investing in other mutual funds. The example is based on an investment of $1,000 invested at the beginning of the most recent six-month period and held for the entire period.
Actual Expenses
The first line of the following table (“Actual”) provides information about actual account values and actual expenses. You may use the information in this line, together with your account balance, to estimate the expenses that you paid over the period. Simply divide your account value by $1,000 (for example, an $8,600 account value divided by $1,000 = 8.6), then multiply the result by the number in the first line under the heading “Expenses Paid During Period” to estimate the expenses you paid on your account during this period.
Hypothetical Example for Comparison Purposes
The information on the second line of the table (“Hypothetical”) is based on hypothetical account values and expenses derived from the fund’s actual expense ratio and an assumed 5% per year rate of return before expenses (not the fund’s actual return). You may compare the ongoing costs of investing in the fund with other funds by contrasting this 5% hypothetical example and the 5% hypothetical examples that appear in the shareholder reports of the other funds. The hypothetical account values and expenses may not be used to estimate the actual ending account balance or expenses you paid for the period.
Note: T. Rowe Price charges an annual small-account maintenance fee of $10, generally for accounts with less than $2,000 ($500 for UGMA/UTMA). The fee is waived for any investor whose T. Rowe Price mutual fund accounts total $25,000 or more, accounts employing automatic investing, and IRAs and other retirement plan accounts that utilize a prototype plan sponsored by T. Rowe Price (although a separate custodial or administrative fee may apply to such accounts). This fee is not included in the accompanying table. If you are subject to the fee, keep it in mind when you are estimating the ongoing expenses of investing in the fund and when comparing the expenses of this fund with other funds.
You should also be aware that the expenses shown in the table highlight only your ongoing costs and do not reflect any transaction costs, such as redemption fees or sales loads. Therefore, the second line of the table is useful in comparing ongoing costs only and will not help you determine the relative total costs of owning different funds. To the extent a fund charges transaction costs, however, the total cost of owning that fund is higher.
Unaudited
The accompanying notes are an integral part of these financial statements.
Unaudited
The accompanying notes are an integral part of these financial statements.
Unaudited
The accompanying notes are an integral part of these financial statements.
Unaudited
The accompanying notes are an integral part of these financial statements.
Unaudited
The accompanying notes are an integral part of these financial statements.
Unaudited
| NOTES TO FINANCIAL STATEMENTS |
NOTE 1 - SIGNIFICANT ACCOUNTING POLICIES
T. Rowe Price Diversified Mid-Cap Growth Fund, Inc. (the fund), is registered under the Investment Company Act of 1940 (the 1940 Act) as a diversified, open-end management investment company. The fund commenced operations on December 31, 2003. The fund seeks to provide long-term capital growth by investing primarily in the common stocks of mid-cap growth companies.
The accompanying financial statements were prepared in accordance with accounting principles generally accepted in the United States of America, which require the use of estimates made by fund management. Fund management believes that estimates and security valuations are appropriate; however, actual results may differ from those estimates, and the security valuations reflected in the financial statements may differ from the value the fund ultimately realizes upon sale of the securities.
Valuation The fund values its investments and computes its net asset value per share at the close of the New York Stock Exchange (NYSE), normally 4 p.m. ET, each day that the NYSE is open for business. Equity securities listed or regularly traded on a securities exchange or in the over-the-counter (OTC) market are valued at the last quoted sale price or, for certain markets, the official closing price at the time the valuations are made, except for OTC Bulletin Board securities, which are valued at the mean of the latest bid and asked prices. A security that is listed or traded on more than one exchange is valued at the quotation on the exchange determined to be the primary market for such security. Listed securities not traded on a particular day are valued at the mean of the latest bid and asked prices for domestic securities and the last quoted sale price for international securities.
Investments in mutual funds are valued at the mutual fund’s closing net asset value per share on the day of valuation.
Other investments, including restricted securities, and those for which the above valuation procedures are inappropriate or are deemed not to reflect fair value are stated at fair value as determined in good faith by the T. Rowe Price Valuation Committee, established by the fund’s Board of Directors.
Rebates Subject to best execution, the fund may direct certain security trades to brokers who have agreed to rebate a portion of the related brokerage commission to the fund in cash. Commission rebates are reflected as realized gain on securities in the accompanying financial statements.
Investment Transactions, Investment Income, and Distributions Income and expenses are recorded on the accrual basis. Dividends received from mutual fund investments are reflected as dividend income; capital gain distributions are reflected as realized gain/loss. Dividend income and capital gain distributions are recorded on the ex-dividend date. Investment transactions are accounted for on the trade date. Realized gains and losses are reported on the identified cost basis. Distributions to shareholders are recorded on the ex-dividend date. Income distributions are declared and paid an annual basis. Capital gain distributions, if any, are declared and paid by the fund, typically on an annual basis.
NOTE 2 - INVESTMENT TRANSACTIONS
Consistent with its investment objective, the fund engages in the following practices to manage exposure to certain risks or to enhance performance. The investment objective, policies, program, and risk factors of the fund are described more fully in the fund’s prospectus and Statement of Additional Information.
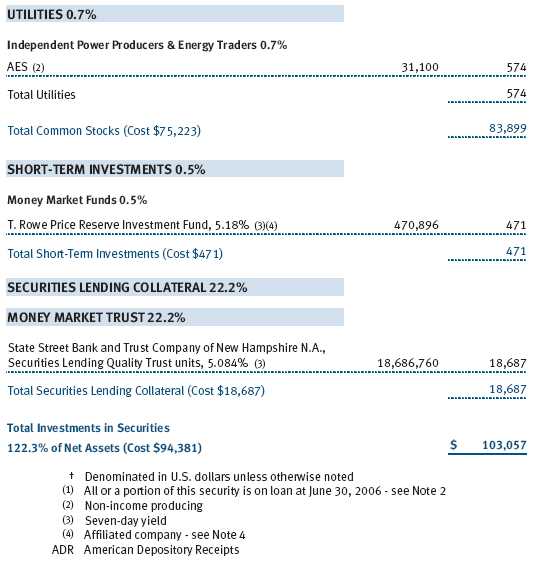
Securities Lending The fund lends its securities to approved brokers to earn additional income. It receives as collateral cash and U.S. government securities valued at 102% to 105% of the value of the securities on loan. Cash collateral is invested in a money market pooled trust managed by the fund’s lending agent in accordance with investment guidelines approved by fund management. Collateral is maintained over the life of the loan in an amount not less than the value of loaned securities, as determined at the close of fund business each day; any additional collateral required due to changes in security values is delivered to the fund the next business day. Although risk is mitigated by the collateral, the fund could experience a delay in recovering its securities and a possible loss of income or value if the borrower fails to return the securities. Securities lending revenue recognized by the fund consists of earnings on invested collateral and borrowing fees, net of any rebates to the borrower and compensation to the lending agent. At June 30, 2006, the value of loaned securities was $18,386,000; aggregate collateral consisted of $18,687,000 in the money market pooled trust.
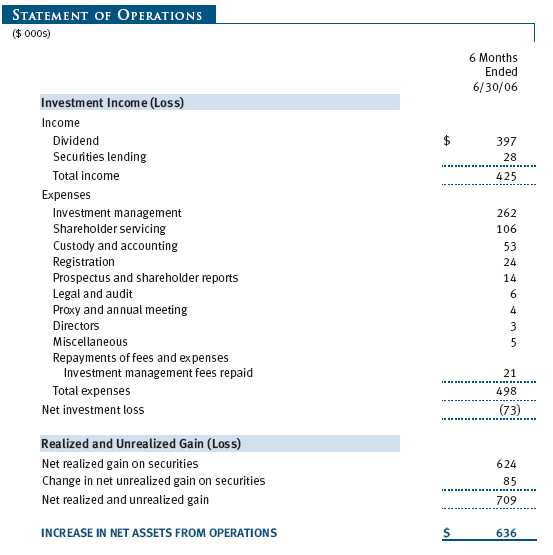
Other Purchases and sales of portfolio securities, other than short-term securities, aggregated $27,713,000 and $10,151,000, respectively, for the six months ended June 30, 2006.
NOTE 3 - FEDERAL INCOME TAXES
No provision for federal income taxes is required since the fund intends to continue to qualify as a regulated investment company under Subchapter M of the Internal Revenue Code and distribute to shareholders all of its taxable income and gains. Federal income tax regulations differ from generally accepted accounting principles; therefore, distributions determined in accordance with tax regulations may differ in amount or character from net investment income and realized gains for financial reporting purposes. Financial reporting records are adjusted for permanent book/tax differences to reflect tax character.
Financial records are not adjusted for temporary differences. The amount and character of tax-basis distributions and composition of net assets are finalized at fiscal year-end; accordingly, tax-basis balances have not been determined as of June 30, 2006.
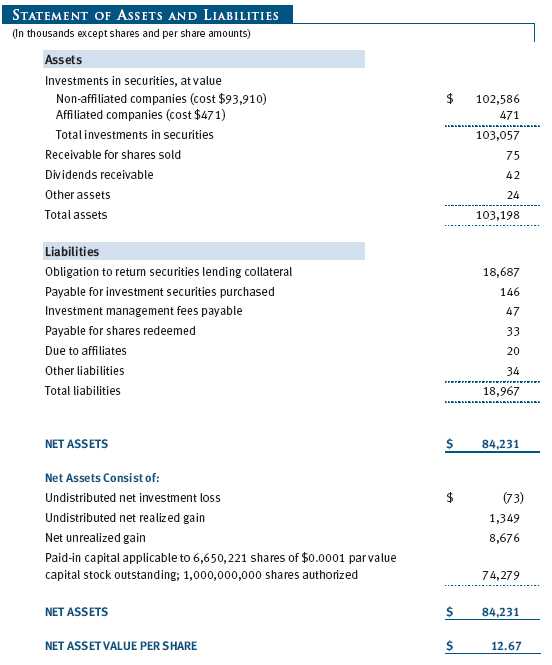
At June 30, 2006, the cost of investments for federal income tax purposes was $94,381,000. Net unrealized gain aggregated $8,676,000 at period-end, of which $12,798,000 related to appreciated investments and $4,122,000 related to depreciated investments.
NOTE 4 - RELATED PARTY TRANSACTIONS
The fund is managed by T. Rowe Price Associates, Inc. (the manager or Price Associates), a wholly owned subsidiary of T. Rowe Price Group, Inc. The investment management agreement between the fund and the manager provides for an annual investment management fee, which is computed daily and paid monthly. The fee consists of an individual fund fee, equal to 0.35% of the fund’s average daily net assets, and a group fee. The group fee rate is calculated based on the combined net assets of certain mutual funds sponsored by Price Associates (the group) applied to a graduated fee schedule, with rates ranging from 0.48% for the first $1 billion of assets to 0.29% for assets in excess of $160 billion. The fund’s group fee is determined by applying the group fee rate to the fund’s average daily net assets. At June 30, 2006, the effective annual group fee rate was 0.31%.
The fund is also subject to a contractual expense limitation through April 30, 2008. During the limitation period, the manager is required to waive its management fee and reimburse the fund for any expenses, excluding interest, taxes, brokerage commissions, and extraordinary expenses, that would otherwise cause the fund’s ratio of total expenses to average net assets (expense ratio) to exceed its expense limitation of 1.25%. For a period of three years after the date of any reimbursement or waiver, the fund is required to repay the manager for expenses previously reimbursed and management fees waived to the extent its net assets have grown or expenses have declined sufficiently to allow repayment without causing the fund’s expense ratio to exceed its expense limitation. Pursuant to this agreement, management fees in the amount of $21,000 were repaid during the six months ended June 30, 2006. Including these amounts, management fees waived in the amount of $174,000 remain subject to repayment at June 30, 2006.
In addition, the fund has entered into service agreements with Price Associates and two wholly owned subsidiaries of Price Associates (collectively, Price). Price Associates computes the daily share price and provides certain other administrative services to the fund. T. Rowe Price Services, Inc., provides shareholder and administrative services in its capacity as the fund’s transfer and dividend disbursing agent. T. Rowe Price Retirement Plan Services, Inc., provides subaccounting and recordkeeping services for certain retirement accounts invested in the fund. For the six months ended June 30, 2006, expenses incurred pursuant to these service agreements were $34,000 for Price Associates and $86,000 for T. Rowe Price Services, Inc. and $0 for the T. Rowe Price Retirement Plan Services, Inc. The total amount payable at period-end pursuant to these service agreements is reflected as Due to Affiliates in the accompanying financial statements.
The fund may invest in the T. Rowe Price Reserve Investment Fund and the T. Rowe Price Government Reserve Investment Fund (collectively, the T. Rowe Price Reserve Funds), open-end management investment companies managed by Price Associates and affiliates of the fund. The T. Rowe Price Reserve Funds are offered as cash management options to mutual funds, trusts, and other accounts managed by Price Associates and/or its affiliates, and are not available for direct purchase by members of the public. The T. Rowe Price Reserve Funds pay no investment management fees. During the six months ended June 30, 2006, dividend income from the T. Rowe Price Reserve Funds totaled $14,000, and the value of shares of the T. Rowe Price Reserve Funds held at June 30, 2006, and December 31, 2005, was $471,000 and $986,000, respectively.
As of June 30, 2006, T. Rowe Price Group, Inc. and/or its wholly owned subsidiaries owned 150,237 shares of the fund, representing 2% of the fund’s net assets.
| INFORMATION ON PROXY VOTING POLICIES, PROCEDURES, AND RECORDS |
A description of the policies and procedures used by T. Rowe Price funds and portfolios to determine how to vote proxies relating to portfolio securities is available in each fund’s Statement of Additional Information, which you may request by calling 1-800-225-5132 or by accessing the SEC’s Web site, www.sec.gov. The description of our proxy voting policies and procedures is also available on our Web site, www.troweprice.com. To access it, click on the words “Company Info” at the top of our homepage for individual investors. Then, in the window that appears, click on the “Proxy Voting Policy” navigation button in the top left corner.
Each fund’s most recent annual proxy voting record is available on our Web site and through the SEC’s Web site. To access it through our Web site, follow the directions above, then click on the words “Proxy Voting Record” at the bottom of the Proxy Voting Policy page.
| HOW TO OBTAIN QUARTERLY PORTFOLIO HOLDINGS |
The fund files a complete schedule of portfolio holdings with the Securities and Exchange Commission for the first and third quarters of each fiscal year on Form N-Q. The fund’s Form N-Q is available electronically on the SEC’s Web site (www.sec.gov); hard copies may be reviewed and copied at the SEC’s Public Reference Room, 450 Fifth St. N.W., Washington, DC 20549. For more information on the Public Reference Room, call 1-800-SEC-0330.
| APPROVAL OF INVESTMENT MANAGEMENT AGREEMENT |
On March 8, 2006, the fund’s Board of Directors unanimously approved the investment advisory contract (Contract) between the fund and its investment manager, T. Rowe Price Associates, Inc. (Manager). The Board considered a variety of factors in connection with its review of the Contract, also taking into account information provided by the Manager during the course of the year, as discussed below:
Services Provided by the Manager
The Board considered the nature, quality, and extent of the services provided to the fund by the Manager. These services included, but were not limited to, management of the fund’s portfolio and a variety of activities related to portfolio management. The Board also reviewed the background and experience of the Manager’s senior management team and investment personnel involved in the management of the fund. The Board concluded that it was satisfied with the nature, quality, and extent of the services provided by the Manager.
Investment Performance of the Fund
The Board reviewed the fund’s return for the one-year and since-inception periods and compared this with previously agreed upon comparable performance measures and market data, including those supplied by Lipper and Morningstar, which are independent providers of mutual fund data. On the basis of this evaluation and the Board’s ongoing review of investment results, the Board concluded that the fund’s performance was satisfactory.
Costs, Benefits, Profits, and Economies of Scale
The Board reviewed detailed information regarding the revenues received by the Manager under the Contract and other benefits that the Manager (and its affiliates) may have realized from its relationship with the fund, including research received under “soft dollar” agreements. The Board noted that the use of soft dollars as a means of paying for third-party, non-broker research had been eliminated. The Board also received information on the estimated costs incurred and profits realized by the Manager and its affiliates from advising T. Rowe Price mutual funds as well as estimates of the gross profits realized from managing the fund in particular. The Board concluded that the Manager’s profits were reasonable in light of the services provided to the fund. The Board also considered whether the fund or other funds benefit under the fee levels set forth in the Contract from any economies of scale realized by the Manager. Under the Contract, the fund pays a fee to the Manager composed of two components—a group fee rate based on the aggregate assets of certain T. Rowe Price mutual funds (including the fund) that declines at certain asset levels and an individual fund fee rate that is assessed on the assets of the fund. The Board concluded that the advisory fee structure for the fund continued to provide for a reasonable sharing of benefits from any economies of scale with the fund’s investors.
Fees
The Board reviewed the fund’s management fee rate, operating expenses, and total expense ratio and compared them with fees and expenses of other comparable funds based on information and data supplied by Lipper. The information provided to the Board indicated that the fund’s management fee rate and expense ratio were generally at or below the median for comparable funds. The Board also reviewed the fee schedules for comparable privately managed accounts of the Manager and its affiliates. Management informed the Board that the Manager’s responsibilities for privately managed accounts are more limited than its responsibilities for the fund and other T. Rowe Price mutual funds that it or its affiliates advise. On the basis of the information provided, the Board concluded that the fees paid by the fund under the Contract were reasonable.
Approval of the Contract
As noted, the Board approved the continuation of the Contract. No single factor was considered in isolation or to be determinative to the decision. Rather, the Board concluded, in light of a weighting and balancing of all factors considered, that it was in the best interests of the fund to approve the continuation of the Contract, including the fees to be charged for services thereunder.
Item 2. Code of Ethics.
A code of ethics, as defined in Item 2 of Form N-CSR, applicable to its principal executive officer, principal financial officer, principal accounting officer or controller, or persons performing similar functions is filed as an exhibit to the registrant’s annual Form N-CSR. No substantive amendments were approved or waivers were granted to this code of ethics during the registrant’s most recent fiscal half-year.
Item 3. Audit Committee Financial Expert.
Disclosure required in registrant’s annual Form N-CSR.
Item 4. Principal Accountant Fees and Services.
Disclosure required in registrant’s annual Form N-CSR.
Item 5. Audit Committee of Listed Registrants.
Not applicable.
Item 6. Schedule of Investments.
Not applicable. The complete schedule of investments is included in Item 1 of this Form N-CSR.
Item 7. Disclosure of Proxy Voting Policies and Procedures for Closed-End Management Investment Companies.
Not applicable.
Item 8. Portfolio Managers of Closed-End Management Investment Companies.
Not applicable.
Item 9. Purchases of Equity Securities by Closed-End Management Investment Company and Affiliated Purchasers.
Not applicable.
Item 10. Submission of Matters to a Vote of Security Holders.
Not applicable.
Item 11. Controls and Procedures.
(a) The registrant’s principal executive officer and principal financial officer have evaluated the registrant’s disclosure controls and procedures within 90 days of this filing and have concluded that the registrant’s disclosure controls and procedures were effective, as of that date, in ensuring that information required to be disclosed by the registrant in this Form N-CSR was recorded, processed, summarized, and reported timely.
(b) The registrant’s principal executive officer and principal financial officer are aware of no change in the registrant’s internal control over financial reporting that occurred during the registrant’s second fiscal quarter covered by this report that has materially affected, or is reasonably likely to materially affect, the registrant’s internal control over financial reporting.
Item 12. Exhibits.(a)(1) The registrant’s code of ethics pursuant to Item 2 of Form N-CSR is filed with the registrant’s annual Form N-CSR.
(2) Separate certifications by the registrant's principal executive officer and principal financial officer, pursuant to Section 302 of the Sarbanes-Oxley Act of 2002 and required by Rule 30a-2(a) under the Investment Company Act of 1940, are attached.
(3) Written solicitation to repurchase securities issued by closed-end companies: not applicable.
(b) A certification by the registrant's principal executive officer and principal financial officer, pursuant to Section 906 of the Sarbanes-Oxley Act of 2002 and required by Rule 30a-2(b) under the Investment Company Act of 1940, is attached.
SIGNATURES | |
| Pursuant to the requirements of the Securities Exchange Act of 1934 and the Investment | |
| Company Act of 1940, the registrant has duly caused this report to be signed on its behalf by the | |
| undersigned, thereunto duly authorized. | |
| T. Rowe Price Diversified Mid-Cap Growth Fund, Inc. | |
| By | /s/ Edward C. Bernard |
| Edward C. Bernard | |
| Principal Executive Officer | |
| Date | August 18, 2006 |
| Pursuant to the requirements of the Securities Exchange Act of 1934 and the Investment | |
| Company Act of 1940, this report has been signed below by the following persons on behalf of | |
| the registrant and in the capacities and on the dates indicated. | |
| By | /s/ Edward C. Bernard |
| Edward C. Bernard | |
| Principal Executive Officer | |
| Date | August 18, 2006 |
| By | /s/ Joseph A. Carrier |
| Joseph A. Carrier | |
| Principal Financial Officer | |
| Date | August 18, 2006 |