Item 1: Report to Shareholders
 |
| Diversified Mid-Cap Growth Fund | June 30, 2005 |
The views and opinions in this report were current as of June 30, 2005. They are not guarantees of performance or investment results and should not be taken as investment advice. Investment decisions reflect a variety of factors, and the managers reserve the right to change their views about individual stocks, sectors, and the markets at any time. As a result, the views expressed should not be relied upon as a forecast of the fund’s future investment intent. The report is certified under the Sarbanes-Oxley Act of 2002, which requires mutual funds and other public companies to affirm that, to the best of their knowledge, the information in their financial reports is fairly and accurately stated in all material respects.
REPORTS ON THE WEB
Sign up for our E-mail Program, and you can begin to receive updated fund reports and prospectuses online rather than through the mail. Log in to your account at troweprice.com for more information.
Fellow Shareholders
Mid-cap growth stocks were mostly flat in the first half of 2005, as second-quarter gains largely offset first-quarter losses, but they fared better than their small- and large-cap growth counterparts. The market’s attempts to advance were limited by investor concerns about the pace of economic growth amid surging oil prices—which reached $60 per barrel in late June—and rising short-term interest rates. The Federal Reserve lifted the fed funds target rate on four occasions during our reporting period, resulting in a less accommodative monetary policy. Nevertheless, economic growth remained robust and core inflation modest.
| PERFORMANCE COMPARISON |
| Periods Ended 6/30/05 | 6 Months | 12 Months |
| Diversified Mid-Cap Growth Fund | -0.79% | 6.21% |
| Russell Midcap Growth Index | 1.70 | 10.86 |
| Lipper Mid-Cap Growth Funds Index | -0.92 | 7.31 |
Your fund returned -0.79% in the last six months and 6.21% for the 12-month period ended June 30, 2005. As shown in the table, the fund held up slightly better than its Lipper benchmark in the six-month period but trailed over the last year. The fund also lagged the Russell Midcap Growth Index in both periods.
With the energy sector still dominating the equity market—in fact, it was one of the few sectors in our opportunity set that produced gains in the first half—our underweighting continued to work against us. Our style, which takes a broadly diversified approach and entails buying differentiated businesses, should do well relative to the benchmarks in periods when companies with consistent earnings growth are rewarded.
Trends do not last indefinitely, of course, and we believe investors will eventually discover that there are high-quality companies in many sectors capable of producing steady earnings growth that will not taper off as a cyclical trend comes to an end. Our investment approach is not reliant on forecasting commodity prices, and we will not own many companies that benefit disproportionately when various commodities spike in value.
MARKET ENVIRONMENT
Economic conditions were mostly favorable in the first half of 2005. Although the manufacturing sector decelerated somewhat, the economy expanded at a steady pace. New job growth continued at a reasonable rate, the unemployment rate hovered slightly above 5%, and inflation remained contained, despite surging oil prices.
Relatively low interest rates continued to provide a helpful stimulus to the economy. Although money market and short-term bond yields increased as the Federal Reserve raised the fed funds target rate from 2.25% to 3.25% in four quarter-point increments in the last six months, long-term interest rates unexpectedly declined. The result was a flattening of the Treasury yield curve, which currently indicates that long-term Treasury yields are not much higher than short-term yields.
Large-cap shares held up slightly better than small-caps, but mid-cap stocks decisively outperformed both segments in the last six months. The S&P MidCap 400 Index and the Russell Midcap Index returned 3.85% and 3.92%, respectively, versus -0.81% for the large-cap S&P 500 Index and -1.25% for the small-cap Russell 2000 Index. As measured by various Russell indexes, value stocks outperformed their growth counterparts across all market capitalizations, including the mid-cap space.
| MID-CAP STOCK RETURNS |
| Periods Ended 6/30/05 | 6 Months | 12 Months |
| Russell Midcap Index | 3.92% | 17.12% |
| Russell Midcap Growth Index | 1.70 | 10.86 |
| Russell Midcap Value Index | 5.51 | 21.80 |
Growth stocks have materially lagged value for several years, and we still believe it is reasonable to expect mean reversion and better relative performance from the growth style in the years ahead. However, one needs to consider that mid-caps have substantially outperformed larger companies. For the five-year period ended June 30, 2005, the Russell Midcap Index has had an annualized return of 7.34% versus an annualized return of -2.37% for the S&P 500 Index.
Most major mid-cap growth sectors declined in the first half of the year. The exceptions were health care, which was driven by the robust performance of providers and service companies, energy, and telecommunication services. Information technology shares fared worst. Most underlying industries declined, led by software stocks, but IT services companies held up well. Financials were also sluggish, especially insurers and commercial banks. Some companies tied to the capital markets performed well, but broad weakness among asset managers offset those gains. Consumer discretionary stocks generally declined, with media names continuing to struggle, but homebuilders and specialty retailers produced gains. In fact, some fashion-oriented retailers had extraordinary returns. (We usually avoid these businesses because it is difficult to consistently predict fashion trends.) Industrials and business services companies also lagged, though aerospace and defense stocks outperformed other areas in the sector.
INVESTMENT STRATEGY
Before discussing the portfolio’s performance in detail, we would like to welcome all new shareholders to the fund and review the investment strategy and principles that guide how we manage the portfolio.
- The fund invests in mid-cap stocks of companies whose earnings are expected to grow at an above-average rate. We define mid-cap companies as those whose market capitalization at the time of purchase falls within the range of either the S&P MidCap 400 Index or the Russell Midcap Growth Index.
- The fund will be fully invested because we believe that successful market timing is virtually impossible and that the costs associated with frequent trading reduce the likelihood of outperforming the market. We will not spend undue time worrying about short-term performance or trying to forecast the direction of the market. That allows us to focus on finding mid-cap companies that have the best long-term growth potential.
- Unlike other mid-cap growth portfolios that are highly concentrated, the Diversified Mid-Cap Growth Fund will typically invest in approximately 300 stocks. This high degree of diversification can help to reduce the downside risk attributable to any single poorly performing security. It is notable that we are investing in companies that are early in their life cycles, and it is inevitable that some will not be as successful as we hope. Accordingly, we balance risk with potential returns.
- Stock selection is based on a combination of fundamental, bottom-up analysis and top-down quantitative strategies in an effort to identify companies with superior long-term appreciation prospects. We use a growth approach, looking for companies with a demonstrated ability to increase revenues, earnings, and cash flow consistently; capable management; attractive business niches; and a sustainable competitive advantage. We favor companies with above-average earnings growth and lower earnings variability.
- Valuations are also important: we look for the best relative values among companies with the strongest businesses and managements.
- We use a number of proprietary quantitative models to identify and evaluate the characteristics of mid-cap growth companies and the entire portfolio.
PORTFOLIO REVIEW
The fund’s fundamental characteristics are similar to those of mid-cap growth benchmarks, such as the Russell Midcap Growth Index, as indicated by the Portfolio Characteristics table. The average company yield and projected earnings growth rate of our holdings are similar, while the portfolio’s forward price/earnings (P/E) ratio is slightly higher than that of the index, and our median market capitalization is a bit lower. The fund’s return on equity, which measures how effectively and efficiently a company and its management are using stockholder investments, is lower than that of the index but still fairly high. We believe that companies with high and sustainable profitability are good long-term investments.
| PORTFOLIO CHARACTERISTICS |
| Diversified | Russell | |
| Mid-Cap | Midcap | |
| Growth | Growth | |
| As of 6/30/05 | Fund | Index |
| Earnings Growth Rate | ||
| Historical Growth 5 Years | ||
| (least squared) | 11.6% | 14.1% |
| Projected Long-Term Growth1 | 15.9 | 15.2 |
| Profitability – Return on | ||
| Equity Latest 12 Months | ||
| Excluding Charges | 17.3 | 19.8 |
| Average Company Yield2 | 0.6 | 0.7 |
| P/E Ratio | ||
| 12 Months Forward | ||
| Estimated Earnings1 | 19.3X | 18.1X |
| Investment-Weighted Median | ||
| Market Capitalization | $5.4 billion | $6.3 billion |
| 1Source for data: IBES 2Source for data: Bloomberg |
| Forecast data are in no way an indication of future investment returns. |
Our sector allocations have some resemblance to those of the index, though we have a few strategic over- or under-weightings. Our largest investments are in the information technology, consumer discretionary, and health care sectors. Financials and industrials and business services companies represent lesser amounts, and we have very little exposure to consumer staples, materials, and telecommunication services stocks.
In the information technology sector (26.4% of assets as of June 30), which has dramatically underperformed for several years, our focus on better businesses remains the primary driver behind our overweights in semiconductor, software, and IT services companies. Technology stocks rebounded from first-quarter weakness in the last three months but remained in negative territory for the first half. However, good stock selection in the sector, such as communications equipment and display technologies company Corning and semiconductor companies Analog Devices, National Semiconductor, and Microchip Technology, helped our relative performance. Our largest emphasis in the sector is the semiconductor industry, particularly stocks with quality business models, which we believe are reasonably valued. Chip stocks posted a positive return in the second quarter, following weakness associated with an industry-wide inventory correction. (Please refer to the fund’s portfolio of investments for a complete listing of the fund’s holdings and the amount each represents in the portfolio.)
Health care stocks (19.8% of assets) contributed the most to fund performance in absolute terms, and good stock selection in services (WellChoice), medical devices (Kyphon), and biotechnology (Gilead Sciences and Vertex Pharmaceuticals) helped the fund’s relative performance. Within health care, we focus on services and equipment companies and maintain a diversified approach to the biotechnology industry. Health care services companies represent an attractive opportunity, given good fundamentals and reasonable valuations, and they have benefited in recent years from reasonable medical cost trends and utilization of technology to improve systems.
Despite its low representation in the fund and in our benchmarks, telecommunication services (2.2% of fund assets) was the fund’s best-performing sector. It was also a strong contributor to our relative results because of our positions in both wireless and traditional wire-line telecom firms. We view the tower business model as attractive, and American Tower Systems and Crown Castle International have performed well. In the highly competitive wireless services industry, which has benefited from good subscriber growth and industry consolidation, we seek special situations and growth opportunities, such as Nextel Partners.
| SECTOR DIVERSIFICATION |
| Percent of | Percent of | |
| Net Assets | Net Assets | |
| 12/31/04 | 6/30/05 | |
| Information Technology | 28.2% | 26.4% |
| Consumer Discretionary | 24.1 | 22.7 |
| Health Care | 19.0 | 19.8 |
| Financials | 13.6 | 13.1 |
| Industrials & Business Services | 8.1 | 8.4 |
| Energy | 3.0 | 4.6 |
| Telecommunication Services | 0.9 | 2.2 |
| Materials | 1.5 | 1.7 |
| Consumer Staples | 1.7 | 1.1 |
| Others and Reserves | -0.1 | 0.0 |
| Total | 100.0% | 100.0% |
| Historical weightings reflect current industry/sector classifications. | ||
In the consumer discretionary sector (22.7% of assets), there are many opportunities to invest in companies with exceptional business models and cash flow. We overweighted the hotel, restaurant, and leisure industry, but this posture, coupled with weak stock selection, particularly gambling-related companies Wynn Resorts and International Game Technology, hurt our relative performance. Media is no longer our largest overweight. The recovery in advertising spending in traditional mediums has been sluggish, and our overweight has weighed on relative performance, so we have trimmed our positions in radio and newspaper stocks.
The financials sector (13.1% of assets) is still one of our largest overweights relative to the Russell Midcap Growth Index. We continue to believe that the capital markets area—specifically trust banks and asset managers—offers the best risk/reward tradeoff in the mid-cap growth universe. Although overweighting capital markets companies helped our relative performance in the last six months, weak stock selection—such as owning trust bank Investors Financial Services and underweighting Legg Mason—more than offset this benefit. Stock selection in insurance and financial services also detracted from our results.
The energy sector (4.6% of assets) continued to enjoy the tailwind of rising oil prices, and all of our holdings in the sector were among our largest contributors to absolute performance. Unfortunately, our gains were limited by our underweighting of equipment and services companies. Our focus in the energy sector is not to make a call on the commodity, but rather to buy differentiated businesses with strong niches and exploration and production companies that have better-than-average expertise in finding resources via the drill bit. We underweighted the energy sector because we found better opportunities elsewhere.
OUTLOOK
The fundamentals of our holdings are very strong, and the environment for growth-oriented equities is good. Our fully-invested approach, which balances potential rewards with assumed risk, focuses on strong businesses and management with a long-term orientation. We believe that the stocks and sectors that we currently emphasize will help our relative performance as the economic recovery matures and as investors begin to favor companies that can grow their earnings consistently.
Respectfully submitted,

Donald J. Peters
Chairman of the fund’s Investment Advisory Committee
July 18, 2005
The committee chairman has day-to-day responsibility for managing the portfolio and works with committee members in developing and executing the fund’s investment program.
RISKS OF INVESTING
As with all equity funds, this fund’s share price can fall because of weakness in the broad market, a particular industry, or specific holdings. The market as a whole can decline for many reasons, including adverse political or economic developments here or abroad, changes in investor psychology, or heavy institutional selling. The prospects for an industry or company may deteriorate because of a variety of factors, including disappointing earnings or changes in the competitive environment. In addition, our assessment of companies held in the fund may prove incorrect, resulting in losses or poor performance even in a rising market. Finally, the fund’s investment approach could fall out of favor with the investing public, resulting in lagging performance versus other types of stock funds.
The stocks of mid-cap companies entail greater risk and are usually more volatile than the shares of large companies. In addition, growth stocks can be volatile for several reasons. Since they usually reinvest a high proportion of earnings in their own businesses, they may lack the dividends usually associated with value stocks that can cushion their decline in a falling market. Also, since investors buy these stocks because of their expected superior earnings growth, earnings disappointments often result in sharp price declines.
Diversification cannot protect against loss in a declining market or assure a profit.
GLOSSARY
Fed funds target rate: An overnight lending rate set by the Federal Reserve and used by banks to meet reserve requirements. Banks also use the fed funds rate as a benchmark for their prime lending rates.
Lipper indexes: Consist of a small number (10 to 30) of the largest mutual funds in a particular category as tracked by Lipper Inc.
Price/earnings (P/E) ratio: A ratio that shows the “multiple” of earnings at which a stock is selling. It is calculated by dividing a stock’s current price by its current earnings per share. For example, if a stock’s price is $60 per share and the issuing company earns $2 per share, the P/E ratio is $60/$2, or 30.
Russell 2000 Index: Measures the performance of the 2,000 smallest companies in the Russell 3000 Index.
Russell Midcap Index: Measures the performance of the 800 smallest companies in the Russell 1000 Index.
Russell Midcap Growth Index: Measures the performance of those Russell Midcap companies with higher price-to-book ratios and higher forecasted growth values. The stocks are also members of the Russell 1000 Growth Index.
Russell Midcap Value Index: Measures the performance of those Russell Midcap companies with lower price-to-book ratios and lower forecasted growth values. The stocks are also members of the Russell 1000 Value Index.
S&P 500 Index: Tracks the stocks of 500 primarily large U.S. companies.
S&P MidCap 400 Index: An unmanaged index that tracks the stocks of 400 U.S. mid-cap companies.
| PORTFOLIO HIGHLIGHTS |
| TWENTY-FIVE LARGEST HOLDINGS | |
| Percent of | |
| Net Assets | |
| 6/30/05 | |
| WellChoice | 1.0% |
| Station Casinos | 0.9 |
| Marriott | 0.9 |
| State Street | 0.9 |
| Franklin Resources | 0.9 |
| Northern Trust | 0.9 |
| Microchip Technology | 0.9 |
| Maxim Integrated Products | 0.9 |
| Linear Technology | 0.9 |
| National Semiconductor | 0.9 |
| Altera | 0.9 |
| Analog Devices | 0.9 |
| Xilinx | 0.9 |
| Moody’s | 0.8 |
| Quest Diagnostics | 0.8 |
| Weatherford International | 0.7 |
| Crown Castle International | 0.7 |
| American Tower Systems | 0.7 |
| Cooper Cameron | 0.7 |
| BJ Services | 0.7 |
| Boyd Gaming | 0.7 |
| XTO Energy | 0.7 |
| VERITAS Software | 0.7 |
| Cognizant Technology Solutions | 0.7 |
| WellPoint | 0.7 |
| Total | 20.4% |
Note: Table excludes securities lending collateral.
| PORTFOLIO HIGHLIGHTS |
| INDUSTRY DIVERSIFICATION | ||
| Twenty-Five Largest Industries | ||
| Percent of | Percent of | |
| Net Assets | Net Assets | |
| 12/31/04 | 6/30/05 | |
| Semiconductor and Semiconductor Equipment | 8.7% | 8.7% |
| Health Care Providers and Services | 7.4 | 7.7 |
| Capital Markets | 7.5 | 7.6 |
| Software | 6.9 | 6.9 |
| Hotels, Restaurants, and Leisure | 4.9 | 6.6 |
| Health Care Equipment and Supplies | 6.2 | 6.6 |
| Media | 6.9 | 5.5 |
| Biotechnology | 4.0 | 4.2 |
| Specialty Retail | 3.9 | 3.9 |
| Commercial Services and Supplies | 3.5 | 3.7 |
| IT Services | 3.9 | 3.6 |
| Energy Equipment and Services | 2.4 | 3.3 |
| Electronic Equipment and Instruments | 2.5 | 2.3 |
| Insurance | 2.9 | 2.1 |
| Wireless Telecommunication Services | 0.9 | 2.1 |
| Diversified Consumer Services | 2.4 | 2.0 |
| Communications Equipment | 2.3 | 1.8 |
| Internet Software and Services | 1.7 | 1.7 |
| Commercial Banks | 1.5 | 1.6 |
| Multiline Retail | 2.0 | 1.5 |
| Aerospace and Defense | 0.9 | 1.5 |
| Household Durables | 2.0 | 1.4 |
| Chemicals | 1.2 | 1.4 |
| Oil, Gas, and Consumable Fuels | 0.6 | 1.3 |
| Pharmaceuticals | 1.4 | 1.3 |
| Total | 88.5% | 90.3% |
| Historical weightings reflect current industry/sector classifications. | ||
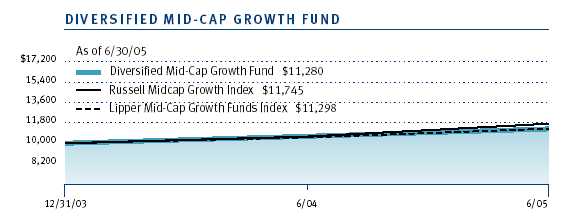
| GROWTH OF $10,000 |
This chart shows the value of a hypothetical $10,000 investment in the fund over the past 10 fiscal year periods or since inception (for funds lacking 10-year records). The result is compared with benchmarks, which may include a broad-based market index and a peer group average or index. Market indexes do not include expenses, which are deducted from fund returns as well as mutual fund averages and indexes.
| AVERAGE ANNUAL COMPOUND TOTAL RETURN |
This table shows how the fund and its benchmarks would have performed if their actual (or cumulative) returns for the periods shown had been earned at a constant rate.
| Since | ||
| Inception | ||
| Periods Ended 6/30/05 | 1 Year | 12/31/03 |
| Diversified Mid-Cap Growth Fund | 6.21% | 8.39% |
| Russell Midcap Growth Index | 10.86 | 11.36 |
| Lipper Mid-Cap Growth Funds Index | 7.31 | 8.48 |
Current performance may be higher or lower than the quoted past performance, which cannot guarantee future results. Share price, principal value, and return will vary, and you may have a gain or loss when you sell your shares. For the most recent month-end performance information, please visit our Web site (troweprice.com) or contact a T. Rowe Price representative at 1-800-225-5132.
Average annual total return figures include changes in principal value, reinvested dividends, and capital gain distributions. Returns do not reflect taxes that the shareholder may pay on fund distributions or the redemption of fund shares. When assessing performance, investors should consider both short- and long-term returns.
| FUND EXPENSE EXAMPLE |
As a mutual fund shareholder, you may incur two types of costs: (1) transaction costs such as redemption fees or sales loads and (2) ongoing costs, including management fees, distribution and service (12b-1) fees, and other fund expenses. The following example is intended to help you understand your ongoing costs (in dollars) of investing in the fund and to compare these costs with the ongoing costs of investing in other mutual funds. The example is based on an investment of $1,000 invested at the beginning of the most recent six-month period and held for the entire period.
Actual Expenses
The first line of the following table (“Actual”) provides information about actual account values and actual expenses. You may use the information in this line, together with your account balance, to estimate the expenses that you paid over the period. Simply divide your account value by $1,000 (for example, an $8,600 account value divided by $1,000 = 8.6), then multiply the result by the number in the first line under the heading “Expenses Paid During Period” to estimate the expenses you paid on your account during this period.
Hypothetical Example for Comparison Purposes
The information on the second line of the table (“Hypothetical”) is based on hypothetical account values and expenses derived from the fund’s actual expense ratio and an assumed 5% per year rate of return before expenses (not the fund’s actual return). You may compare the ongoing costs of investing in the fund with other funds by contrasting this 5% hypothetical example and the 5% hypothetical examples that appear in the shareholder reports of the other funds. The hypothetical account values and expenses may not be used to estimate the actual ending account balance or expenses you paid for the period.
Note: T. Rowe Price charges an annual small-account maintenance fee of $10, generally for accounts with less than $2,000 ($500 for UGMA/UTMA). The fee is waived for any investor whose T. Rowe Price mutual fund accounts total $25,000 or more, accounts employing automatic investing, and IRAs and other retirement plan accounts that utilize a prototype plan sponsored by T. Rowe Price (although a separate custodial or administrative fee may apply to such accounts). This fee is not included in the accompanying table. If you are subject to the fee, keep it in mind when you are estimating the ongoing expenses of investing in the fund and when comparing the expenses of this fund with other funds.
You should also be aware that the expenses shown in the table highlight only your ongoing costs and do not reflect any transaction costs, such as redemption fees or sales loads. Therefore, the second line of the table is useful in comparing ongoing costs only and will not help you determine the relative total costs of owning different funds. To the extent a fund charges transaction costs, however, the total cost of owning that fund is higher.
| T. ROWE PRICE DIVERSIFIED MID-CAP GROWTH FUND |
| Beginning | Ending | Expenses Paid | |
| Account Value | Account Value | During Period* | |
| 1/1/05 | 6/30/05 | 1/1/05 to 6/30/05 | |
| Actual | $1,000.00 | $992.10 | $6.17 |
| Hypothetical (assumes 5% | |||
| return before expenses) | 1,000.00 | 1,018.60 | 6.26 |
| * | Expenses are equal to the fund’s annualized expense ratio for the six-month period (1.25%), multi- |
| plied by the average account value over the period, multiplied by the number of days in the most | |
| recent fiscal half year (181) divided by the days in the year (365) to reflect the half-year period. |
| Unaudited | |
| FINANCIAL HIGHLIGHTS | For a share outstanding throughout each period |
| 6 Months | Year | |||
| Ended | Ended | |||
| 6/30/05** | 12/31/04 | |||
| NET ASSET VALUE | ||||
| Beginning of period | $ | 11.37 | $ | 10.00 |
| Investment activities | ||||
| Net investment income (loss) | (0.03)* | (0.06)* | ||
| Net realized and | ||||
| unrealized gain (loss) | (0.06) | 1.43 | ||
| Total from | ||||
| investment activities | (0.09) | 1.37 | ||
| NET ASSET VALUE | ||||
| End of period | $ | 11.28 | $ | 11.37 |
| Ratios/Supplemental Data | ||||
| Total return^ | (0.79)%* | 13.70%* | ||
| Ratio of total expenses to | ||||
| average net assets | 1.25%*† | 1.25%* | ||
| Ratio of net investment | ||||
| income (loss) to average | ||||
| net assets | (0.60)%*† | (0.71)%* | ||
| Portfolio turnover rate | 14.8%† | 13.3% | ||
| Net assets, end of period | ||||
| (in thousands) | $ | 48,253 | $ | 40,848 |
| ^ | Total return reflects the rate that an investor would have earned on an investment in the fund during each period, |
| assuming reinvestment of all distributions. | |
| * | Excludes expenses in excess of a 1.25% contractual expense limitation in effect through 4/30/06. |
| † | Annualized |
| ** Per share amounts calculated using average shares outstanding method. | |
The accompanying notes are an integral part of these financial statements.
| Unaudited | |
| PORTFOLIO OF INVESTMENTS (1) | Shares | Value |
| (Cost and value in $ 000s) |
| COMMON STOCKS 100.0% | ||
| CONSUMER DISCRETIONARY 22.7% | ||
| Auto Components 0.1% | ||
| Gentex | 3,800 | 69 |
| 69 | ||
| Automobiles 0.6% | ||
| Harley-Davidson | 1,300 | 64 |
| Thor Industries | 3,400 | 107 |
| Winnebago § | 3,100 | 102 |
| 273 | ||
| Diversified Consumer Services 2.0% | ||
| Apollo Group, Class A * | 3,757 | 294 |
| Career Education * | 3,100 | 113 |
| Devry * | 2,600 | 52 |
| Education Management * | 7,600 | 256 |
| H&R Block | 1,200 | 70 |
| ITT Educational Services *§ | 1,900 | 102 |
| Universal Technical Institute * | 2,700 | 90 |
| 977 | ||
| Hotels, Restaurants & Leisure 6.6% | ||
| Boyd Gaming | 6,500 | 332 |
| Choice Hotels International | 4,400 | 289 |
| Fairmont Hotels § | 4,200 | 146 |
| Harrah's Entertainment | 4,000 | 288 |
| Hilton | 4,000 | 96 |
| International Game Technology | 7,600 | 214 |
| Marriott, Class A | 6,700 | 457 |
| Outback Steakhouse | 1,500 | 68 |
| Royal Caribbean Cruises § | 6,000 | 290 |
| Ruby Tuesday § | 3,100 | 80 |
| Shuffle Master *§ | 5,098 | 143 |
| Station Casinos | 6,900 | 458 |
| The Cheesecake Factory * | 2,400 | 83 |
| WMS Industries *§ | 1,800 | 61 |
| Wynn Resorts *§ | 3,900 | 185 |
| 3,190 | ||
| Household Durables 1.4% | ||
| Centex | 1,300 | 92 |
| Harman International | 2,300 | 187 |
| KB Home | 1,400 | 107 |
| Lennar, Class A | 1,400 | 89 |
| Pulte | 1,100 | 93 |
| Toll Brothers *§ | 1,000 | 101 |
| 669 | ||
| Internet & Catalog Retail 0.3% | ||
| Amazon.com *§ | 4,200 | 139 |
| 139 | ||
| Leisure Equipment & Products 0.4% | ||
| Brunswick | 2,300 | 99 |
| Mattel | 4,800 | 88 |
| 187 | ||
| Media 5.5% | ||
| Citadel Broadcasting * | 5,000 | 57 |
| Cox Radio, Class A * | 6,800 | 107 |
| Cumulus Media, Class A * | 5,300 | 63 |
| Dreamworks Animation, Class A * | 2,600 | 68 |
| Entercom Communications * | 2,400 | 80 |
| Getty Images *§ | 4,300 | 319 |
| Harte-Hanks | 2,600 | 77 |
| Lamar Advertising * | 1,800 | 77 |
| McGraw-Hill | 2,000 | 89 |
| Meredith | 2,700 | 133 |
| New York Times, Class A | 3,700 | 115 |
| Omnicom | 3,100 | 248 |
| Radio One, Class D * | 6,600 | 84 |
| Regent Communications * | 10,600 | 62 |
| Rogers Communications, Class B | 3,500 | 115 |
| Salem Communications, Class A *§ | 6,400 | 127 |
| Scripps, Class A | 2,600 | 127 |
| Spanish Broadcasting, Class A *§ | 9,200 | 92 |
| Univision Communications, Class A * | 8,000 | 220 |
| Washington Post, Class B | 200 | 167 |
| Westwood One | 2,900 | 59 |
| WPP Group ADR | 3,600 | 184 |
| 2,670 | ||
| Multiline Retail 1.5% | ||
| Dollar General § | 13,700 | 279 |
| Dollar Tree Stores * | 4,500 | 108 |
| Family Dollar Stores | 10,400 | 272 |
| Fred's § | 3,100 | 51 |
| 710 | ||
| Specialty Retail 3.9% | ||
| Bed Bath & Beyond * | 5,800 | 242 |
| Men's Wearhouse * | 2,700 | 93 |
| O'Reilly Automotive * | 7,700 | 229 |
| PETsMART | 5,600 | 170 |
| Ross Stores | 7,600 | 220 |
| Staples | 7,500 | 160 |
| Tiffany | 8,700 | 285 |
| TJX | 11,500 | 280 |
| Williams-Sonoma * | 4,800 | 190 |
| 1,869 | ||
| Textiles, Apparel, & Luxury Goods 0.4% | ||
| Coach * | 6,300 | 212 |
| 212 | ||
| Total Consumer Discretionary | 10,965 | |
| CONSUMER STAPLES 1.1% | ||
| Beverages 0.2% | ||
| Cott *§ | 3,300 | 72 |
| 72 | ||
| Food Products 0.9% | ||
| Delta Pine & Land | 1,800 | 45 |
| Hershey Foods | 2,300 | 143 |
| McCormick | 2,300 | 75 |
| Tootsie Roll Industries § | 3,520 | 103 |
| Wrigley | 1,200 | 83 |
| 449 | ||
| Total Consumer Staples | 521 | |
| ENERGY 4.6% | ||
| Energy Equipment & Services 3.3% | ||
| Baker Hughes | 4,800 | 246 |
| BJ Services | 6,600 | 346 |
| Cooper Cameron * | 5,600 | 347 |
| Smith International | 4,900 | 312 |
| Weatherford International * | 6,100 | 354 |
| 1,605 | ||
| Oil, Gas & Consumable Fuels 1.3% | ||
| Murphy Oil | 6,000 | 313 |
| XTO Energy | 9,733 | 331 |
| 644 | ||
| Total Energy | 2,249 | |
| FINANCIALS 13.1% | ||
| Capital Markets 7.6% | ||
| A.G. Edwards | 1,600 | 72 |
| AmeriTrade * | 13,700 | 255 |
| AMVESCAP PLC ADR § | 4,000 | 48 |
| Charles Schwab | 19,900 | 224 |
| Eaton Vance | 12,400 | 297 |
| Federated Investors, Class B | 3,700 | 111 |
| Franklin Resources | 5,800 | 447 |
| Investors Financial Services § | 5,600 | 212 |
| John Nuveen § | 5,300 | 199 |
| Lazard *§ | 7,100 | 165 |
| Legg Mason | 2,750 | 286 |
| Mellon Financial | 9,800 | 281 |
| Northern Trust | 9,700 | 442 |
| Raymond James Financial | 2,400 | 68 |
| SEI | 2,400 | 90 |
| State Street | 9,300 | 449 |
| 3,646 | ||
| Commercial Banks 1.6% | ||
| Boston Private Financial § | 2,800 | 71 |
| City National | 900 | 64 |
| East West Bancorp | 3,000 | 101 |
| First Horizon National § | 1,200 | 51 |
| North Fork Bancorporation | 3,450 | 97 |
| SVB Financial Group *§ | 1,800 | 86 |
| Synovus Financial | 7,400 | 212 |
| UCBH Holdings § | 5,600 | 91 |
| 773 | ||
| Consumer Finance 0.6% | ||
| First Marblehead *§ | 2,500 | 88 |
| Moneygram International | 9,700 | 185 |
| 273 | ||
| Diversified Financial Services 0.8% | ||
| Moody's | 9,000 | 405 |
| 405 | ||
| Insurance 2.1% | ||
| Ambac | 2,100 | 147 |
| Arch Capital Group * | 1,600 | 72 |
| Arthur J. Gallagher § | 2,800 | 76 |
| Axis Capital Holdings | 2,200 | 62 |
| Brown & Brown | 2,000 | 90 |
| Markel * | 200 | 68 |
| Marsh & McLennan | 4,600 | 127 |
| MBIA | 2,200 | 130 |
| RenaissanceRe Holdings | 1,600 | 79 |
| Willis Group Holdings § | 4,900 | 160 |
| 1,011 | ||
| Thrifts & Mortgage Finance 0.4% | ||
| MGIC Investment | 1,300 | 85 |
| Radian | 1,400 | 66 |
| Triad Guaranty *§ | 900 | 45 |
| 196 | ||
| Total Financials | 6,304 | |
| HEALTH CARE 19.8% | ||
| Biotechnology 4.2% | ||
| Abgenix *§ | 9,800 | 84 |
| Amylin Pharmaceuticals *§ | 4,300 | 90 |
| Applera | 4,000 | 79 |
| Celgene *§ | 5,200 | 212 |
| Cephalon *§ | 2,600 | 104 |
| Charles River Laboratories International * | 2,100 | 101 |
| deCode genetics *§ | 7,200 | 68 |
| Diversa * | 12,900 | 67 |
| Genzyme * | 1,700 | 102 |
| Gilead Sciences * | 4,000 | 176 |
| Human Genome Sciences *§ | 7,700 | 89 |
| Martek Biosciences *§ | 2,800 | 106 |
| MedImmune * | 3,400 | 91 |
| Millennium Pharmaceuticals * | 9,300 | 86 |
| Neurocrine Biosciences *§ | 1,400 | 59 |
| OSI Pharmaceuticals * | 2,000 | 82 |
| Protein Design Labs *§ | 3,200 | 65 |
| Qiagen NV *§ | 10,400 | 120 |
| Techne * | 2,900 | 133 |
| Vertex Pharmaceuticals *§ | 6,200 | 104 |
| 2,018 | ||
| Health Care Equipment & Supplies 6.6% | ||
| ArthroCare *§ | 1,800 | 63 |
| Bausch & Lomb | 2,600 | 216 |
| Beckman Coulter | 2,000 | 127 |
| Becton, Dickinson | 2,100 | 110 |
| Biomet | 7,500 | 260 |
| C R Bard | 3,700 | 246 |
| Cooper Companies § | 1,800 | 110 |
| Dentsply International | 2,400 | 130 |
| Edwards Lifesciences * | 1,900 | 82 |
| Gen-Probe * | 2,500 | 91 |
| INAMED * | 1,500 | 100 |
| Integra LifeSciences *§ | 1,700 | 50 |
| Invitrogen * | 2,200 | 183 |
| Kyphon *§ | 5,800 | 202 |
| Millipore * | 1,700 | 96 |
| ResMed *§ | 1,600 | 106 |
| Respironics * | 2,800 | 101 |
| Smith & Nephew ADR § | 2,700 | 133 |
| St. Jude Medical * | 3,600 | 157 |
| Sybron Dental Specialties * | 1,600 | 60 |
| Varian Medical Systems * | 4,800 | 179 |
| Waters Corporation * | 4,600 | 171 |
| Wright Medical Group * | 3,900 | 104 |
| Zimmer Holdings * | 1,700 | 129 |
| 3,206 | ||
| Health Care Providers & Services 7.7% | ||
| Caremark RX * | 6,000 | 267 |
| Coventry Health Care * | 4,100 | 290 |
| DaVita * | 4,149 | 189 |
| Express Scripts * | 5,000 | 250 |
| Health Management, Class A | 5,300 | 139 |
| Henry Schein * | 4,400 | 183 |
| IMS Health | 5,800 | 144 |
| Laboratory Corporation of America * | 4,900 | 244 |
| Lincare Holdings * | 3,900 | 159 |
| Manor Care | 3,100 | 123 |
| Medco * | 5,300 | 283 |
| Omnicare | 3,200 | 136 |
| Patterson Companies *§ | 3,600 | 162 |
| Quest Diagnostics | 7,200 | 384 |
| WellChoice * | 6,600 | 458 |
| WellPoint * | 4,600 | 320 |
| 3,731 | ||
| Pharmaceuticals 1.3% | ||
| Allergan | 1,500 | 128 |
| Atherogenics *§ | 4,400 | 70 |
| IVAX * | 4,500 | 97 |
| Medicines Company * | 2,100 | 49 |
| Nektar Therapeutics *§ | 3,400 | 57 |
| Sepracor * | 3,400 | 204 |
| 605 | ||
| Total Health Care | 9,560 |
| INDUSTRIALS & BUSINESS SERVICES 8.4% | ||
| Aerospace & Defense 1.5% | ||
| Empresa Brasileira de Aeronautica ADR § | 6,100 | 202 |
| Mercury Computer Systems * | 2,100 | 58 |
| Precision Castparts | 1,900 | 148 |
| Rockwell Collins | 6,700 | 319 |
| 727 | ||
| Air Freight & Logistics 1.2% | ||
| C.H. Robinson Worldwide | 3,700 | 215 |
| Expeditors International of Washington | 4,700 | 234 |
| UTi Worldwide § | 1,600 | 112 |
| 561 | ||
| Airlines 0.4% | ||
| SkyWest § | 4,900 | 89 |
| Southwest Airlines | 6,000 | 84 |
| 173 | ||
| Building Products 0.1% | ||
| Trex *§ | 1,600 | 41 |
| 41 | ||
| Commercial Services & Supplies 3.7% | ||
| ARAMARK, Class B | 2,600 | 69 |
| Avery Dennison | 1,700 | 90 |
| ChoicePoint * | 6,100 | 244 |
| Cintas | 5,700 | 220 |
| Corporate Executive Board | 2,700 | 211 |
| Dun & Bradstreet * | 2,400 | 148 |
| Equifax | 2,900 | 104 |
| HNI Corporation | 1,700 | 87 |
| LECG *§ | 3,800 | 81 |
| Manpower | 4,400 | 175 |
| Robert Half International | 9,300 | 232 |
| Stericycle * | 2,500 | 126 |
| 1,787 | ||
| Electrical Equipment 0.3% | ||
| AMETEK | 1,500 | 63 |
| II-VI *§ | 3,600 | 66 |
| 129 |
| Industrial Conglomerates 0.2% | ||
| Roper Industries | 1,700 | 121 |
| 121 | ||
| Machinery 0.8% | ||
| Danaher | 2,000 | 104 |
| IDEX | 1,350 | 52 |
| ITT Industries | 1,400 | 137 |
| Pall | 2,900 | 88 |
| 381 | ||
| Road & Rail 0.2% | ||
| Landstar Systems * | 4,000 | 120 |
| 120 | ||
| Total Industrials & Business Services | 4,040 | |
| INFORMATION TECHNOLOGY 26.4% | ||
| Communications Equipment 1.8% | ||
| ADTRAN | 4,600 | 114 |
| Corning * | 10,300 | 171 |
| F5 Networks * | 2,700 | 128 |
| Juniper Networks *§ | 10,200 | 257 |
| Plantronics | 1,600 | 58 |
| Research In Motion * | 1,700 | 125 |
| 853 | ||
| Computers & Peripherals 1.0% | ||
| Lexmark International * | 4,300 | 279 |
| Network Appliance * | 4,800 | 136 |
| QLogic * | 2,500 | 77 |
| 492 | ||
| Electronic Equipment & Instruments 2.3% | ||
| CDW | 4,300 | 246 |
| Dolby Laboratories, Class A * | 2,900 | 64 |
| FLIR Systems * | 5,200 | 155 |
| Jabil Circuit * | 7,400 | 227 |
| Littelfuse * | 1,700 | 47 |
| Mettler-Toledo International * | 1,700 | 79 |
| Molex, Class A | 6,400 | 150 |
| National Instruments § | 2,350 | 50 |
| Symbol Technologies | 9,000 | 89 |
| 1,107 | ||
| Internet Software & Services 1.7% | ||
| MatrixOne * | 14,400 | 72 |
| Monster Worldwide * | 10,800 | 310 |
| Sina *§ | 4,900 | 137 |
| VeriSign * | 7,700 | 221 |
| Websense * | 1,200 | 58 |
| 798 | ||
| IT Services 3.6% | ||
| Affiliated Computer Services, Class A * | 2,400 | 123 |
| Certegy | 5,700 | 218 |
| Cognizant Technology Solutions * | 6,800 | 321 |
| DST Systems * | 3,400 | 159 |
| Fiserv * | 4,500 | 193 |
| Global Payments § | 2,100 | 142 |
| Iron Mountain * | 7,200 | 223 |
| Paychex | 8,700 | 283 |
| Sabre Holdings, Class A | 3,500 | 70 |
| 1,732 | ||
| Office Electronics 0.4% | ||
| Zebra Technologies * | 4,650 | 204 |
| 204 | ||
| Semiconductor & Semiconductor Equipment 8.7% | ||
| Altera * | 21,200 | 420 |
| AMIS Holdings * | 4,700 | 63 |
| Analog Devices | 11,100 | 414 |
| Broadcom, Class A * | 4,900 | 174 |
| Cymer *§ | 1,900 | 50 |
| Integrated Circuit Systems * | 2,700 | 56 |
| Intersil Holding, Class A | 5,700 | 107 |
| KLA-Tencor | 2,500 | 109 |
| Lam Research * | 3,400 | 98 |
| Linear Technology | 11,600 | 426 |
| Marvell Technology Group * | 5,400 | 205 |
| Maxim Integrated Products | 11,300 | 432 |
| Microchip Technology | 14,900 | 441 |
| National Semiconductor | 19,300 | 425 |
| Novellus Systems * | 5,000 | 124 |
| Semtech * | 5,200 | 87 |
| Silicon Laboratories *§ | 6,500 | 170 |
| Xilinx | 16,200 | 413 |
| 4,214 | ||
| Software 6.9% | ||
| Activision * | 6,266 | 104 |
| Adobe Systems | 6,300 | 180 |
| Cadence Design Systems * | 9,100 | 124 |
| Check Point Software Technologies * | 5,300 | 105 |
| Citrix Systems * | 5,600 | 121 |
| Cognos * | 4,700 | 161 |
| Electronic Arts * | 3,000 | 170 |
| FactSet Research Systems § | 2,850 | 102 |
| Fair Isaac | 2,500 | 91 |
| FileNet * | 2,000 | 50 |
| Hyperion Solutions * | 2,500 | 101 |
| Internet Security Systems * | 3,900 | 79 |
| Intuit * | 5,100 | 230 |
| Jack Henry & Associates | 7,100 | 130 |
| McAfee * | 7,800 | 204 |
| Mercury Interactive * | 6,300 | 242 |
| NAVTEQ * | 8,300 | 309 |
| Novell *§ | 14,100 | 87 |
| Red Hat *§ | 11,800 | 155 |
| Salesforce.com *§ | 5,000 | 102 |
| Synopsys * | 4,200 | 70 |
| THQ *§ | 2,600 | 76 |
| VERITAS Software * | 13,500 | 329 |
| 3,322 | ||
| Total Information Technology | 12,722 | |
| MATERIALS 1.7% | ||
| Chemicals 1.4% | ||
| Ecolab | 4,300 | 139 |
| Engelhard | 1,600 | 46 |
| Monsanto | 2,300 | 145 |
| Praxair | 2,300 | 107 |
| Sigma Aldrich | 900 | 50 |
| Symyx Technologies *§ | 2,700 | 76 |
| Valspar § | 2,700 | 130 |
| 693 | ||
| Containers & Packaging 0.3% | ||
| Sealed Air * | 2,300 | 115 |
| 115 | ||
| Total Materials | 808 | |
| TELECOMMUNICATION SERVICES 2.2% | ||
| Diversified Telecommunication Services 0.1% | ||
| Neustar, Class A * | 2,500 | 64 |
| 64 | ||
| Wireless Telecommunication Services 2.1% | ||
| American Tower Systems, Class A *§ | 16,600 | 349 |
| Crown Castle International * | 17,300 | 351 |
| Nextel Partners, Class A *§ | 12,700 | 320 |
| 1,020 | ||
| Total Telecommunication Services | 1,084 | |
| Total Common Stocks (Cost $44,295) | 48,253 | |
| SHORT-TERM INVESTMENTS 0.4% | ||
| Money Market Fund 0.4% | ||
| T. Rowe Price Reserve Investment Fund, 3.14% #† | 199,212 | 199 |
| Total Short-Term Investments (Cost $199) | 199 | |
| SECURITIES LENDING COLLATERAL 15.7% | ||
| Money Market Trust 15.7% | ||
| State Street Bank and Trust Company of New Hampshire N.A. | ||
| Securities Lending Quality Trust units, 3.194% # | 7,577,967 | 7,578 |
| Total Securities Lending Collateral (Cost $7,578) | 7,578 | |
| Total Investments in Securities | ||
| 116.1% of Net Assets (Cost $52,072) | $ 56,030 |
| (1) | Denominated in U.S. dollars unless |
| otherwise noted | |
| # | Seven-day yield |
| * | Non-income producing |
| § | All or a portion of this security is on loan |
| at June 30, 2005 – See Note 2 | |
| † | Affiliated company – See Note 4 |
| ADR | American Depository Receipts |
The accompanying notes are an integral part of these financial statements.
Unaudited
| STATEMENT OF ASSETS AND LIABILITIES |
| (In thousands except shares and per share amounts) |
| Assets | ||
| Investments in securities, at value | ||
| Affiliated companies (cost $199) | $ | 199 |
| Non-affiliated companies (cost $51,873) | 55,831 | |
| Total investments in securities | 56,030 | |
| Dividends receivable | 24 | |
| Receivable for shares sold | 69 | |
| Other assets | 21 | |
| Total assets | 56,144 | |
| Liabilities | ||
| Investment management fees payable | 20 | |
| Payable for investment securities purchased | 216 | |
| Payable for shares redeemed | 40 | |
| Obligation to return securities lending collateral | 7,578 | |
| Due to affiliates | 13 | |
| Other liabilities | 24 | |
| Total liabilities | 7,891 | |
| NET ASSETS | $ | 48,253 |
| Net Assets Consist of: | ||
| Undistributed net investment income (loss) | $ | (129) |
| Undistributed net realized gain (loss) | (44) | |
| Net unrealized gain (loss) | 3,958 | |
| Paid-in-capital applicable to 4,276,184 shares of | ||
| $0.0001 par value capital stock outstanding; | ||
| 1,000,000,000 shares authorized | 44,468 | |
| NET ASSETS | $ | 48,253 |
| NET ASSET VALUE PER SHARE | $ | 11.28 |
The accompanying notes are an integral part of these financial statements.
Unaudited
| STATEMENT OF OPERATIONS |
| ($ 000s) |
| 6 Months | ||
| Ended | ||
| 6/30/05 | ||
| Investment Income (Loss) | ||
| Income | ||
| Dividend | $ | 136 |
| Securities lending | 5 | |
| Total income | 141 | |
| Expenses | ||
| Investment management | 143 | |
| Custody and accounting | 71 | |
| Shareholder servicing | 60 | |
| Registration | 24 | |
| Prospectus and shareholder reports | 15 | |
| Legal and audit | 7 | |
| Directors | 2 | |
| Proxy and annual meeting | 1 | |
| Miscellaneous | 4 | |
| Reductions/repayments of fees and expenses | ||
| Investment management fees (waived) repaid | (57) | |
| Total expenses | 270 | |
| Net investment income (loss) | (129) | |
| Realized and Unrealized Gain (Loss) | ||
| Net realized gain (loss) on securities | (105) | |
| Change in net unrealized gain (loss) on securities | 96 | |
| Net realized and unrealized gain (loss) | (9) | |
| INCREASE (DECREASE) IN NET | ||
| ASSETS FROM OPERATIONS | $ | (138) |
The accompanying notes are an integral part of these financial statements.
Unaudited
| STATEMENT OF CHANGES IN NET ASSETS |
| ($ 000s) |
| 6 Months | Year | |||
| Ended | Ended | |||
| 6/30/05 | 12/31/04 | |||
| Increase (Decrease) in Net Assets | ||||
| Operations | ||||
| Net investment income (loss) | $ | (129) | $ | (215) |
| Net realized gain (loss) | (105) | 274 | ||
| Change in net unrealized gain (loss) | 96 | 3,862 | ||
| Increase (decrease) in net assets from operations | (138) | 3,921 | ||
| Capital share transactions * | ||||
| Shares sold | 12,904 | 44,317 | ||
| Shares redeemed | (5,361) | (7,490) | ||
| Increase (decrease) in net assets from capital | ||||
| share transactions | 7,543 | 36,827 | ||
| Net Assets | ||||
| Increase (decrease) during period | 7,405 | 40,748 | ||
| Beginning of period | 40,848 | 100 | ||
| End of period | $ | 48,253 | $ | 40,848 |
| (Including undistributed net investment income (loss) | ||||
| of $(129) at 6/30/05 and $0 at 12/31/04) | ||||
| *Share information | ||||
| Shares sold | 1,169 | 4,309 | ||
| Shares redeemed | (486) | (726) | ||
| Increase (decrease) in shares outstanding | 683 | 3,583 | ||
The accompanying notes are an integral part of these financial statements.
Unaudited
| NOTES TO FINANCIAL STATEMENTS |
NOTE 1 - SIGNIFICANT ACCOUNTING POLICIES
T. Rowe Price Diversified Mid-Cap Growth Fund, Inc. (the fund) is registered under the Investment Company Act of 1940 (the 1940 Act) as a diversified, open-end management investment company. The fund commenced operations on December 31, 2003. The fund seeks long-term growth of capital by investing primarily in common stocks of medium-sized growth companies.
The accompanying financial statements were prepared in accordance with accounting principles generally accepted in the United States of America, which require the use of estimates made by fund management. Fund management believes that estimates and security valuations are appropriate; however actual results may differ from those estimates, and the security valuations reflected in the financial statements may differ from the value the fund receives upon sale of the securities.
Valuation The fund values its investments and computes its net asset value per share at the close of the New York Stock Exchange (NYSE), normally 4 p.m. ET, each day that the NYSE is open for business. Equity securities listed or regularly traded on a securities exchange or in the over-the-counter market are valued at the last quoted sale price or, for certain markets, the official closing price at the time the valuations are made, except for OTC Bulletin Board securities, which are valued at the mean of the latest bid and asked prices. A security that is listed or traded on more than one exchange is valued at the quotation on the exchange determined to be the primary market for such security. Listed securities not traded on a particular day are valued at the mean of the latest bid and asked prices for domestic securities and the last quoted sale price for international securities.
Investments in mutual funds are valued at the mutual fund’s closing net asset value per share on the day of valuation.
Other investments, including restricted securities, and those for which the above valuation procedures are inappropriate or are deemed not to reflect fair value are stated at fair value as determined in good faith by the T. Rowe Price Valuation Committee, established by the fund’s Board of Directors.
Credits The fund earns credits on temporarily uninvested cash balances at the custodian that reduce the fund’s custody charges. Custody expense in the accompanying financial statements is presented before reduction for credits.
Investment Transactions, Investment Income, and Distributions Income and expenses are recorded on the accrual basis. Dividends received from mutual fund investments are reflected as dividend income; capital gain distributions are reflected as realized gain/loss. Dividend income and capital gain distributions are recorded on the ex-dividend date. Investment transactions are accounted for on the trade date. Realized gains and losses are reported on the identified cost basis. Distributions to shareholders are recorded on the ex-dividend date. Income distributions are declared and paid on an annual basis. Capital gain distributions, if any, are declared and paid by the fund, typically on an annual basis.
NOTE 2 - INVESTMENT TRANSACTIONS
Consistent with its investment objective, the fund engages in the following practices to manage exposure to certain risks or enhance performance. The investment objective, policies, program, and risk factors of the fund are described more fully in the fund’s prospectus and Statement of Additional Information.
Securities Lending The fund lends its securities to approved brokers to earn additional income. It receives as collateral cash and U.S. government securities valued at 102% to 105% of the value of the securities on loan. Cash collateral is invested in a money market pooled trust managed by the fund’s lending agent in accordance with investment guidelines approved by fund management. Collateral is maintained over the life of the loan in an amount not less than the value of loaned securities, as determined at the close of fund business each day; any additional collateral required due to changes in security values is delivered to the fund the next business day. Although risk is mitigated by the collateral, the fund could experience a delay in recovering its securities and a possible loss of income or value if the borrower fails to return the securities. Securities lending revenue recognized by the fund consists of earnings on invested collateral and borrowing fees, net of any rebates to the borrower and compensation to the lending agent. At June 30, 2005, the value of loaned securities was $7,375,000; aggregate collateral consisted of $7,578,000 in the money market pooled trust.
Other Purchases and sales of portfolio securities, other than short-term securities, aggregated $10,589,000 and $3,229,000, respectively, for the six months ended June 30, 2005.
NOTE 3 - FEDERAL INCOME TAXES
No provision for federal income taxes is required since the fund intends to continue to qualify as a regulated investment company under Subchapter M of the Internal Revenue Code and distribute to shareholders all of its taxable income and gains. Federal income tax regulations differ from generally accepted accounting principles; therefore, distributions determined in accordance with tax regulations may differ in amount or character from net investment income and realized gains for financial reporting purposes. Financial reporting records are adjusted for permanent book/tax differences to reflect tax character. Financial records are not adjusted for temporary differences. The amount and character of tax-basis distributions and composition of net assets are finalized at fiscal year-end; accordingly, tax-basis balances have not been determined as of June 30, 2005.
At June 30, 2005, the cost of investments for federal income tax purposes was $52,072,000. Net unrealized gain aggregated $3,958,000 at period-end, of which $6,219,000 related to appreciated investments and $2,261,000 related to depreciated investments.
NOTE 4 - RELATED PARTY TRANSACTIONS
The fund is managed by T. Rowe Price Associates, Inc. (the manager or Price Associates), a wholly owned subsidiary of T. Rowe Price Group, Inc. The investment management agreement between the fund and the manager provides for an annual investment management fee, which is computed daily and paid monthly. The fee consists of an individual fund fee, equal to 0.35% of the fund’s average daily net assets, and a group fee. The group fee rate is calculated based on the combined net assets of certain mutual funds sponsored by Price Associates (the group) applied to a graduated fee schedule, with rates ranging from 0.48% for the first $1 billion of assets to 0.29% for assets in excess of $160 billion. Prior to May 1, 2005, the maximum group fee rate in the graduated fee schedule had been 0.295% for assets in excess of $120 billion. The fund’s group fee is determined by applying the group fee rate to the fund’s average daily net assets. At June 30, 2005, the effective annual group fee rate was 0.31% .
The fund is also subject to a contractual expense limitation through April 30, 2006. During the limitation period, the manager is required to waive its management fee and reimburse the fund for any expenses, excluding interest, taxes, brokerage commissions, and extraordinary expenses, that would otherwise cause the fund’s ratio of total expenses to average net assets (expense ratio) to exceed its expense limitation of 1.25% . For a period of three years after the date of any reimbursement or waiver, the fund is required to repay the manager for expenses previously reimbursed and management fees waived to the extent its net assets have grown or expenses have declined sufficiently to allow repayment without causing the fund’s expense ratio to exceed its expense limitation. Pursuant to this agreement, at June 30, 2005, management fees waived in the amount of $186,000 remain subject to repayment by the fund.
In addition, the fund has entered into service agreements with Price Associates and two wholly owned subsidiaries of Price Associates (collectively, Price). Price Associates computes the daily share price and maintains the financial records of the fund. T. Rowe Price Services, Inc., provides shareholder and administrative services in its capacity as the fund’s transfer and dividend disbursing agent. T. Rowe Price Retirement Plan Services, Inc., provides subaccounting and recordkeeping services for certain retirement accounts invested in the fund. For the six months ended June 30, 2005, expenses incurred pursuant to these service agreements were $32,000 for Price Associates, $48,000 for T. Rowe Price Services, Inc., and less than $1,000 for T. Rowe Price Retirement Plan Services, Inc. The total amount payable at period end pursuant to these service agreements is reflected as due to affiliates in the accompanying financial statements.
The fund may invest in the T. Rowe Price Reserve Investment Fund and the T. Rowe Price Government Reserve Investment Fund (collectively, the Reserve Funds), open-end management investment companies managed by Price Associates and affiliates of the fund. The Reserve Funds are offered as cash management options to mutual funds, trusts, and other accounts managed by Price Associates and/or its affiliates, and are not available for direct purchase by members of the public. The Reserve Funds pay no investment management fees. During the six months ended June 30, 2005, dividend income from the Reserve Funds totaled $4,000, and the value of shares of the Reserve Funds held at June 30, 2005 and December 31, 2004 was $199,000 and $1,000, respectively.
As of June 30, 2005, T. Rowe Price Group, Inc. and/or its wholly owned subsidiaries owned 150,000 shares of the fund, representing 4% of the fund’s net assets.
| INFORMATION ON PROXY VOTING POLICIES, PROCEDURES, AND RECORDS |
A description of the policies and procedures used by T. Rowe Price funds and portfolios to determine how to vote proxies relating to portfolio securities is available in each fund’s Statement of Additional Information, which you may request by calling 1-800-225-5132 or by accessing the SEC’s Web site, www.sec.gov. The description of our proxy voting policies and procedures is also available on our Web site, www.troweprice.com. To access it, click on the words “Company Info” at the top of our homepage for individual investors. Then, in the window that appears, click on the “Proxy Voting Policy” navigation button in the top left corner.
Each fund’s most recent annual proxy voting record is available on our Web site and through the SEC’s Web site. To access it through our Web site, follow the directions above, then click on the words “Proxy Voting Record” at the bottom of the Proxy Voting Policy page.
| HOW TO OBTAIN QUARTERLY PORTFOLIO HOLDINGS |
The fund files a complete schedule of portfolio holdings with the Securities and Exchange Commission for the first and third quarters of each fiscal year on Form N-Q. The fund’s Form N-Q is available electronically on the SEC’s Web site (www.sec.gov); hard copies may be reviewed and copied at the SEC’s Public Reference Room, 450 Fifth St. N.W., Washington, DC 20549. For more information on the Public Reference Room, call 1-800-SEC-0330.
| APPROVAL OF INVESTMENT MANAGEMENT AGREEMENT |
On March 2, 2005, the fund’s Board of Directors unanimously approved the investment advisory contract (“Contract”) between the fund and its investment manager, T. Rowe Price Associates, Inc. (“Manager”). The Board considered a variety of factors in connection with its review of the Contract, also taking into account information provided by the Manager during the course of the year, as discussed below:
Services Provided by the Manager
The Board considered the nature, quality, and extent of the services provided to the fund by the Manager. These services included, but were not limited to, management of the fund’s portfolio and a variety of activities related to portfolio management. The Board also reviewed the background and experience of the Manager’s senior management team and investment personnel involved in the management of the fund. The Board concluded that it was satisfied with the nature, quality, and extent of the services provided by the Manager.
Investment Performance of the Fund
The Board reviewed the fund’s return since inception and compared this to previously agreed upon comparable performance measures and market data, including those supplied by Lipper and Morningstar, which are independent providers of mutual fund data. On the basis of this evaluation and the Board’s ongoing review of investment results, the Board concluded that the fund’s performance was satisfactory.
Costs, Benefits, Profits and Economies of Scale
The Board reviewed detailed information regarding the revenues received by the Manager under the Contract and other benefits that the Manager (and its affiliates) may have realized from its relationship with the fund, including research received under “soft dollar” agreements. The Board also received information on the estimated costs incurred and profits realized by the Manager and its affiliates from advising T. Rowe Price mutual funds. Because the Manager is currently waiving a significant portion of its fee for this particular fund, the Board was not provided with estimates of the gross profits realized from managing this fund. The Board concluded that the Manager’s profits from advising T. Rowe Price mutual funds were reasonable in light of the services provided to the fund. The Board also considered whether the fund or other funds benefit under the fee levels set forth in the Contract from any economies of scale realized by the Manager. Under the Contract, the fund pays a fee to the Manager composed of two components—a group fee rate based on the aggregate assets of certain T. Rowe Price mutual funds (including the fund) that declines at certain asset levels and an individual fund fee rate that is assessed on the assets of the fund. The Board concluded that an additional breakpoint should be added to the group fee component of the fees paid by the fund under the Contract at a level of $160 billion. The Board further concluded that, with this change, the advisory fee structure for the fund continued to provide for a reasonable sharing of benefits from any economies of scale with the fund’s investors.
Fees
The Board reviewed the Fund’s management fee rate, operating expenses and total expense ratio and compared them to fees and expenses of other comparable funds based on information and data supplied by Lipper. The information provided to the Board indicated that the fund’s management fee and expense ratio were generally below the medium for comparable funds. The Board also reviewed the fee schedules for comparable privately managed accounts of the Manager and its affiliates. Management informed the Board that the Manager’s responsibilities for privately managed accounts are more limited than its responsibilities for the fund and other T. Rowe Price mutual funds that it or its affiliates advise. On the basis of the information provided, the Board concluded that the fees paid by the fund under the Contract were reasonable.
Approval of the Contract
As noted, the Board approved the continuation of the Contract as amended to add an additional breakpoint to the group fee rate. No single factor was considered in isolation or to be determinative to the decision. Rather, the Board concluded, in light of a weighting and balancing of all factors considered, that it was in the best interests of the fund to approve the continuation of the Contract, including the fees to be charged for services thereunder.
A code of ethics, as defined in Item 2 of Form N-CSR, applicable to its principal executive officer, principal financial officer, principal accounting officer or controller, or persons performing similar functions is filed as an exhibit to the registrant’s annual Form N-CSR. No substantive amendments were approved or waivers were granted to this code of ethics during the registrant’s most recent fiscal half-year.
Item 3. Audit Committee Financial Expert.
Disclosure required in registrant’s annual Form N-CSR.
Item 4. Principal Accountant Fees and Services.
Disclosure required in registrant’s annual Form N-CSR.
Item 5. Audit Committee of Listed Registrants.
Not applicable.
Item 6. Schedule of Investments.
Not applicable. The complete schedule of investments is included in Item 1 of this Form N-CSR.
Item 7. Disclosure of Proxy Voting Policies and Procedures for Closed-End Management Investment Companies.
Not applicable.
Item 8. Portfolio Managers of Closed-End Management Investment Companies.
Not applicable.
Item 9. Purchases of Equity Securities by Closed-End Management Investment Company and Affiliated Purchasers.
Not applicable.
Item 10. Submission of Matters to a Vote of Security Holders.
Not applicable.
Item 11. Controls and Procedures.
(a) The registrant’s principal executive officer and principal financial officer have evaluated the registrant’s disclosure controls and procedures within 90 days of this filing and have concluded that the registrant’s disclosure controls and procedures were effective, as of that date, in ensuring that information required to be disclosed by the registrant in this Form N-CSR was recorded, processed, summarized, and reported timely.
(b) The registrant’s principal executive officer and principal financial officer are aware of no change in the registrant’s internal control over financial reporting that occurred during the registrant’s second fiscal quarter covered by this report that has materially affected, or is reasonably likely to materially affect, the registrant’s internal control over financial reporting.
Item 12. Exhibits.
(a)(1) The registrant’s code of ethics pursuant to Item 2 of Form N-CSR is filed with the registrant’s annual Form N-CSR.
(2) Separate certifications by the registrant's principal executive officer and principal financial officer, pursuant to Section 302 of the Sarbanes-Oxley Act of 2002 and required by Rule 30a-2(a) under the Investment Company Act of 1940, are attached.
(3) Written solicitation to repurchase securities issued by closed-end companies: not applicable.
(b) A certification by the registrant's principal executive officer and principal financial officer, pursuant to Section 906 of the Sarbanes-Oxley Act of 2002 and required by Rule 30a-2(b) under the Investment Company Act of 1940, is attached.
| SIGNATURES | |
| Pursuant to the requirements of the Securities Exchange Act of 1934 and the Investment | |
| Company Act of 1940, the registrant has duly caused this report to be signed on its behalf by the | |
| undersigned, thereunto duly authorized. | |
| T. Rowe Price Diversified Mid-Cap Growth Fund, Inc. | |
| By | /s/ James S. Riepe |
| James S. Riepe | |
| Principal Executive Officer | |
| Date | August 18, 2005 |
| Pursuant to the requirements of the Securities Exchange Act of 1934 and the Investment | |
| Company Act of 1940, this report has been signed below by the following persons on behalf of | |
| the registrant and in the capacities and on the dates indicated. | |
| By | /s/ James S. Riepe |
| James S. Riepe | |
| Principal Executive Officer | |
| Date | August 18, 2005 |
| By | /s/ Joseph A. Carrier |
| Joseph A. Carrier | |
| Principal Financial Officer | |
| Date | August 18, 2005 |