| UNITED STATES |
| SECURITIES AND EXCHANGE COMMISSION |
| Washington, D.C. 20549 |
FORM N-CSR |
CERTIFIED SHAREHOLDER REPORT OF REGISTERED |
MANAGEMENT INVESTMENT COMPANIES |
| Investment Company Act File Number: 811-21454 |
| T. Rowe Price Mid-Cap Growth Fund, Inc. |
| (Exact name of registrant as specified in charter) |
| 100 East Pratt Street, Baltimore, MD 21202 |
| (Address of principal executive offices) |
| David Oestreicher |
| 100 East Pratt Street, Baltimore, MD 21202 |
| (Name and address of agent for service) |
| Registrant’s telephone number, including area code: (410) 345-2000 |
| Date of fiscal year end: December 31 |
| Date of reporting period: June 30, 2008 |
Item 1: Report to Shareholders
 |
| Diversified Mid-Cap Growth Fund | June 30, 2008 |
The views and opinions in this report were current as of June 30, 2008. They are not guarantees of performance or investment results and should not be taken as investment advice. Investment decisions reflect a variety of factors, and the managers reserve the right to change their views about individual stocks, sectors, and the markets at any time. As a result, the views expressed should not be relied upon as a forecast of the fund’s future investment intent. The report is certified under the Sarbanes-Oxley Act, which requires mutual funds and other public companies to affirm that, to the best of their knowledge, the information in their financial reports is fairly and accurately stated in all material respects.
REPORTS ON THE WEB
Sign up for our E-mail Program, and you can begin to receive updated fund reports and prospectuses online rather than through the mail. Log in to your account at troweprice.com for more information.
Manager’s Letter
Fellow Shareholders
U.S. stocks declined in the first half of 2008, but mid-cap shares outperformed their smaller and larger peers, and growth stocks held up better than value across all market capitalizations. Risk aversion intensified as the U.S. credit crisis deepened, the economy and housing market weakened, and rising food and energy prices sapped consumer spending. The Federal Reserve slashed short-term interest rates and took other extraordinary measures to shore up the nation’s financial system. However, with inflationary pressures rising, the current regime of negative real (inflation-adjusted) interest rates is worrisome and will have unfavorable long-term ramifications.
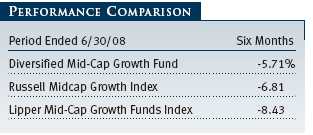
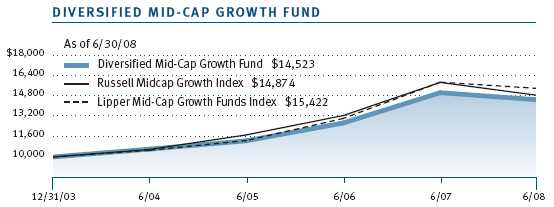
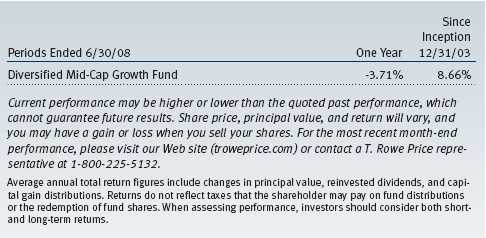
Your fund returned -5.71% in the first half of 2008. As shown in the Performance Comparison table, the fund performed better than its primary benchmark, the Russell Midcap Growth Index, as well as its Lipper peer group index.
HIGHLIGHTS
• U.S. stocks declined in the first half of 2008, but mid-cap shares outperformed their smaller and larger peers, and growth stocks held up better than value.
• Your fund fell moderately but outperformed its Russell benchmark and Lipper peer group index, helped by good stock selection in several sectors.
• Given the likelihood of higher inflation and growing demand for “hard” assets such as oil, gold, or other physical commodities that have inherent value, we decided to raise our energy sector weighting.
• Economic and financial market performance in the period ahead will be more challenging than in the last few years, but we believe the current risk-averse environment is one in which our mid-cap growth strategy will do well relative to others.
In the last six months, fund performance versus the Russell benchmark was helped by good stock selection in several sectors, particularly industrials and business services, information technology, and health care. On the downside, our sector allocations and weakness among financials eroded our performance advantage. Relative to competing mid-cap growth portfolios, fund performance benefited from favorable stock selection in most sectors, especially information technology, consumer discretionary, and industrials and business services. Sector weightings worked against us to a small extent.
Market leadership remained quite narrow in the first half of the year, with energy stocks producing strong gains and trouncing all other sectors. This pattern has prevailed for the last five years. We believe this performance reflects a growing investor preference for “hard” assets—such as oil, gold, or other physical commodities that have inherent value—rather than “soft” financial assets that are less tangible and may lose value in today’s inflationary environment. Other contributing factors include infrastructure growth in emerging economies and mercantilist policies pursued by some countries.
Despite the poor performance of equities thus far this year, we believe the current risk-averse environment is one in which our mid-cap growth strategy can outperform other mandates. Our bias toward high-quality companies—those with good business models, strong managements, and favorable long-term prospects—has contributed to our performance advantage and, in our opinion, helped us avoid larger losses since the credit crunch began and the speculative era concluded about one year ago.
MARKET ENVIRONMENT
Economic growth slowed significantly this year, with gross domestic product (GDP) expanding at an annualized rate of only 1.0% in the first quarter and expectations for roughly 1.5% growth in the second quarter. The housing market continued to deteriorate, and aggregate employment fell during the first half of the year. In addition, output in manufacturing and services sectors showed little or no growth, and inflation eroded consumers’ purchasing power. As a result, the economy is teetering on the edge of a recession—popularly defined as two consecutive quarters of negative GDP growth.
As subprime mortgage losses mounted and financial institutions cut back on lending to preserve capital and avoid additional losses, the Federal Reserve took several extraordinary actions to boost market liquidity—such as helping J.P. Morgan Chase acquire Bear Stearns and creating new credit facilities to allow investment banks and broker-dealers to borrow directly from the Fed. The central bank also aggressively reduced the fed funds target rate—an interbank lending rate that banks also use as a benchmark for their prime consumer lending rates—from 4.25% at the end of 2007 to 2.00% by the end of April.
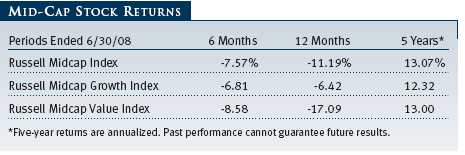
Mid-cap shares outperformed their smaller and larger peers in the last six months. The Russell Midcap Index returned -7.57% versus -9.37% for the small-cap Russell 2000 Index and -11.91% for the large-cap S&P 500 Index.
As shown in the table below, mid-cap growth stocks held up better than value in the 6- and 12-month periods ended June 30, 2008. For the most recent five-year period, mid-cap growth stocks narrowly lagged value. Although the mid-cap asset class is an attractive area, investors should keep in mind that it has outperformed for some time. Over the last five years, the Russell Midcap Index surpassed the S&P 500 by an average of about 5.5% per year and the Russell 2000 by about 2.8% per year.
Last year, we witnessed the beginning of a long-expected mean reversion in the U.S. following years of value stock outperformance, but other longer-term trends have yet to reverse. For example, international stocks, particularly emerging market equities, have outpaced U.S. stocks by a wide margin over the last five years. The MSCI EAFE Index, a broad measure of large-cap stocks in Europe, Australasia, and the Far East, has exceeded the large-cap S&P 500 Index by about 9.58% per year on average, while the MSCI Emerging Markets Index has had an incredible relative performance advantage of about 22.57% per year on average. Given the increasingly challenging economic and risk-averse market environment, we believe that these trends are likely to revert to the mean and that investors should not expect risky assets to maintain such strong performance advantages in the period ahead.
INVESTMENT STRATEGY
Before discussing the portfolio’s six-month performance in detail, we would like to welcome new shareholders to the fund and thank all of our longer-term investors for their continuing confidence in our portfolio management abilities. For the benefit of all shareholders, here is a brief summary of our investment strategy and the principles that guide our management of the portfolio.
• The Diversified Mid-Cap Growth Fund invests in mid-cap stocks of companies whose earnings are expected to grow at an above-average rate. We define mid-cap companies as those whose market capitalization at the time of purchase falls within the range of either the S&P MidCap 400 Index or the Russell Midcap Growth Index.
• We keep the fund fully invested because we believe that successful market timing is virtually impossible—you would need to be right twice—and that the costs associated with frequent trading reduce the likelihood of outperforming the market. We do not spend undue time worrying about short-term performance or trying to forecast the direction of the economy or the market. Our focus is to find mid-cap companies with the best long-term growth potential.
• Unlike other mid-cap growth portfolios that are highly concentrated, the Diversified Mid-Cap Growth Fund will typically invest in about 300 stocks. This high degree of diversification helps to mitigate the downside risk attributable to any single poorly performing security. It is notable that we are investing in companies that are early in their life cycles, and it is inevitable that some will not be as successful as we hope. Accordingly, we balance risk with potential returns.
• Stock selection is based on a combination of fundamental, bottom-up analysis and quantitative strategies in an attempt to identify companies with superior long-term appreciation prospects. We use a growth approach, looking for companies with a demonstrated ability to increase revenues, earnings, and cash flow consistently; capable management; attractive business niches; and a sustainable competitive advantage. We favor companies with above-average earnings growth and lower earnings variability.
• Our time horizons are longer than other mid-cap growth investors. Our portfolio turnover rate in the last 12 months was about 28%, which is substantially less than the average of 119% for mid-cap growth funds, according to data from Morningstar. This means our holding period for a typical stock is almost four years, whereas our average competitor holds a given stock for less than one year. Consequently, we view ourselves as long-term investors; we are not short-term speculators or day-traders.
• Valuations are also very important: We look for the best relative values among companies with the strongest businesses and managements.
• We use a number of proprietary quantitative models to identify and evaluate the characteristics of individual mid-cap growth companies and the portfolio as a whole.
PORTFOLIO REVIEW
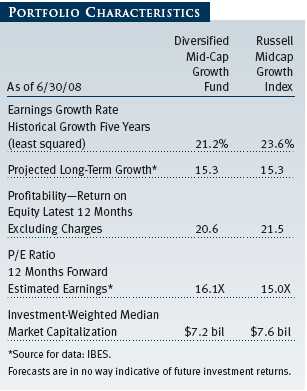
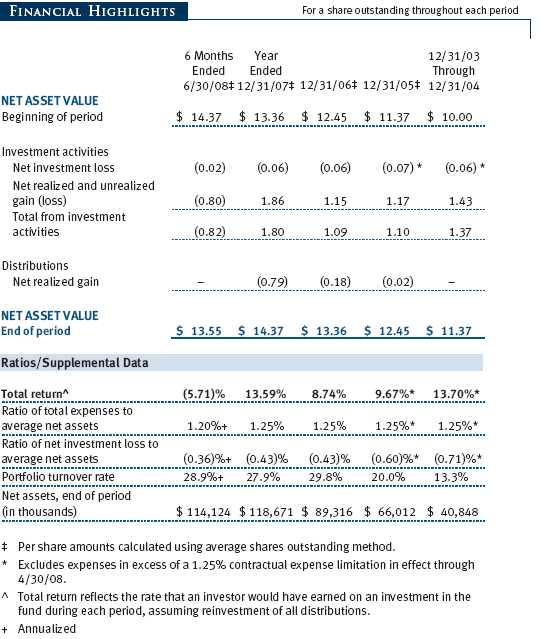
The Diversified Mid-Cap Growth Fund’s fundamental characteristics are similar to those of mid-cap growth benchmarks, such as the Russell Midcap Growth Index, as indicated by the Portfolio Characteristics table on page 6. The portfolio’s median market capitalization and the projected earnings growth rate of our holdings are in line with those of the index, while its forward price/earnings (P/E) ratio (16.1) is a little higher. This reflects our commitment to companies with excellent long-term growth prospects. The fund’s return on equity, which measures how effectively and efficiently a company and its management are using stockholder investments, is lower that that of the index but still very high. The index has a higher cyclical orientation, and, given the economic slowdown, many cyclical companies are probably near their peak levels of profitability. We believe that the best long-term equity investments are companies with high and, at least as important, sustainable profitability.
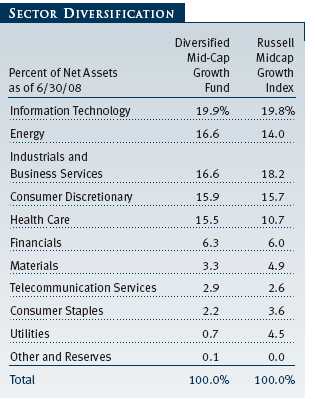
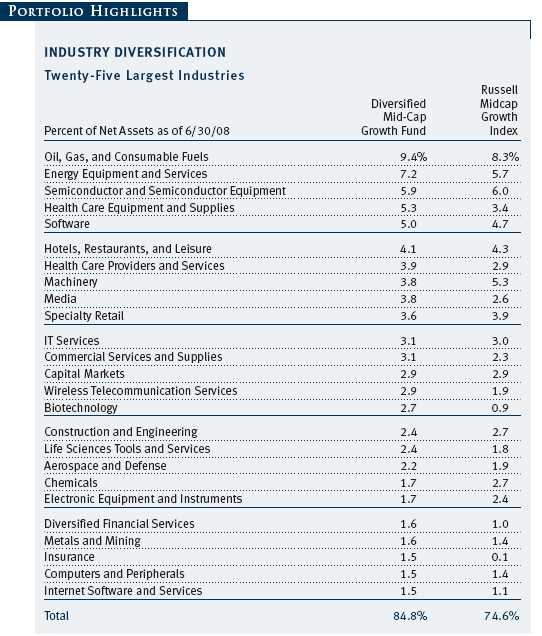
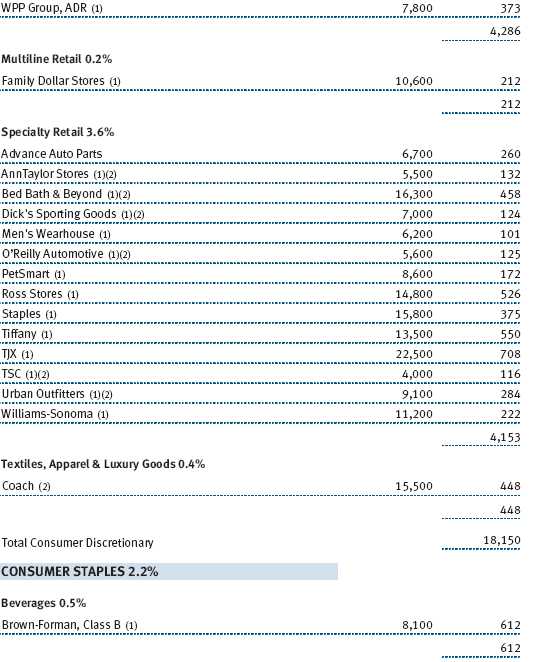
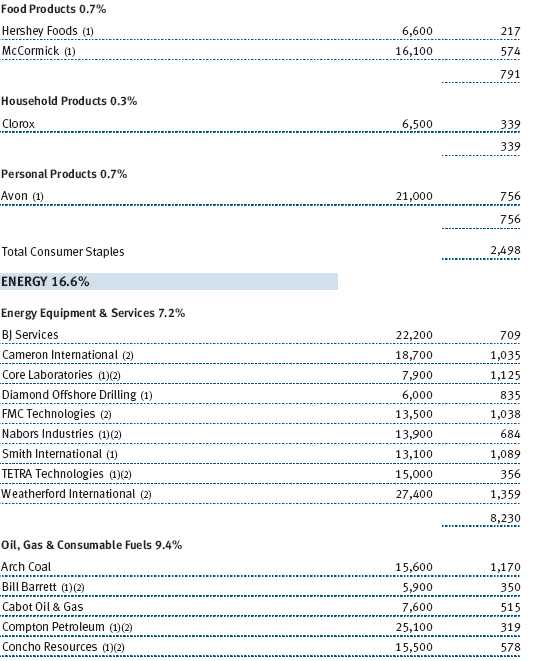
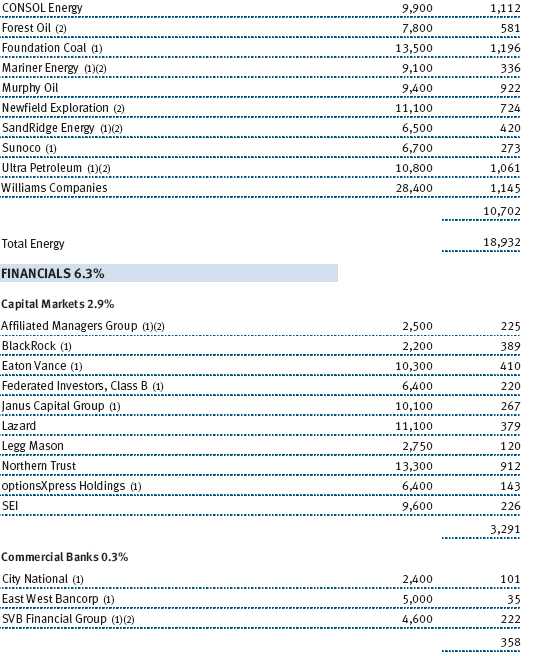
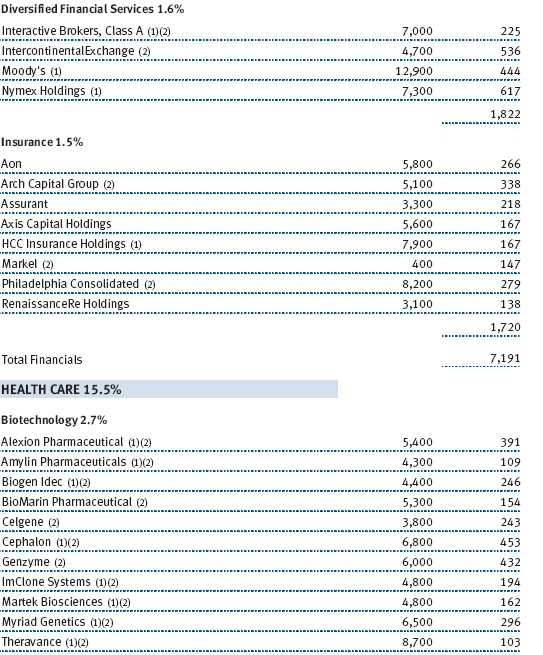
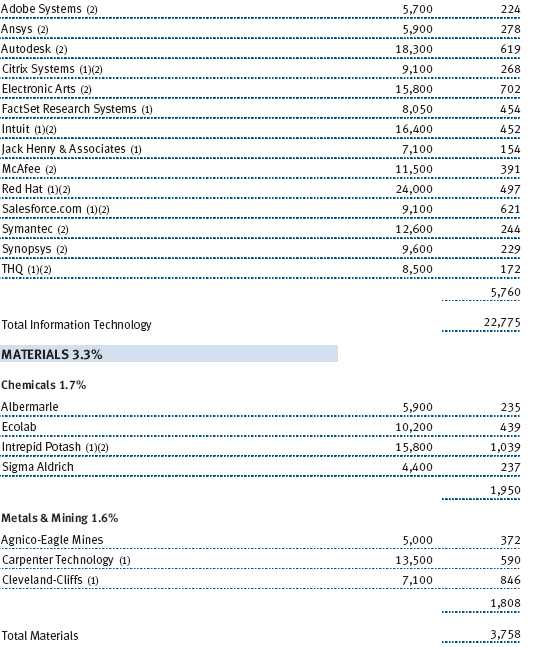
Our sector allocations have some resemblance to those of the Russell index, though we have a few strategic overweightings or underweightings, as shown in the Sector Diversification table on page 7. Our largest sector commitments at the end of June were information technology, energy, industrials and business services, consumer discretionary, and health care. Our financials sector allocation is notably smaller. We have very little exposure to utilities, consumer staples, telecommunication services, and materials stocks because few mid-cap companies in those segments meet our criteria for growth or return on invested capital.
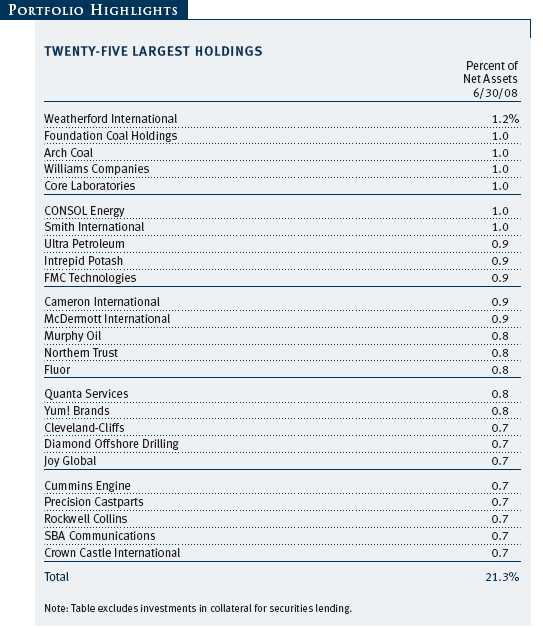
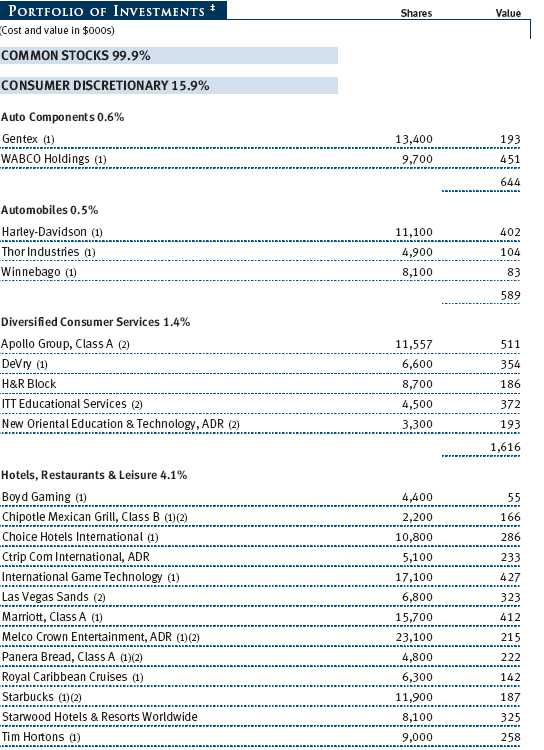
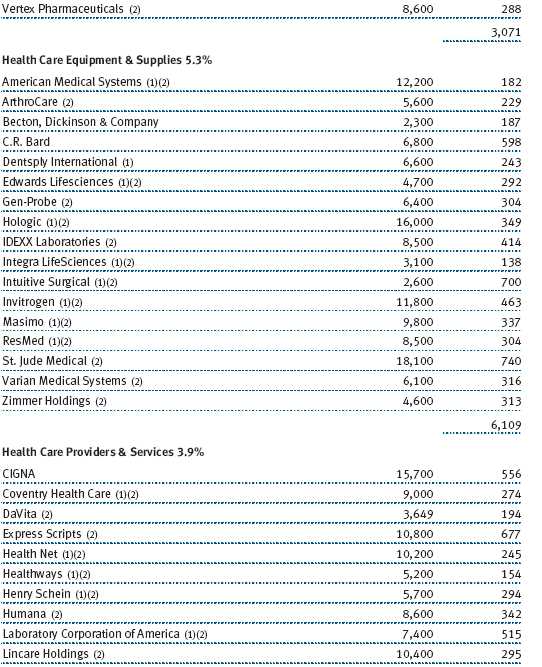
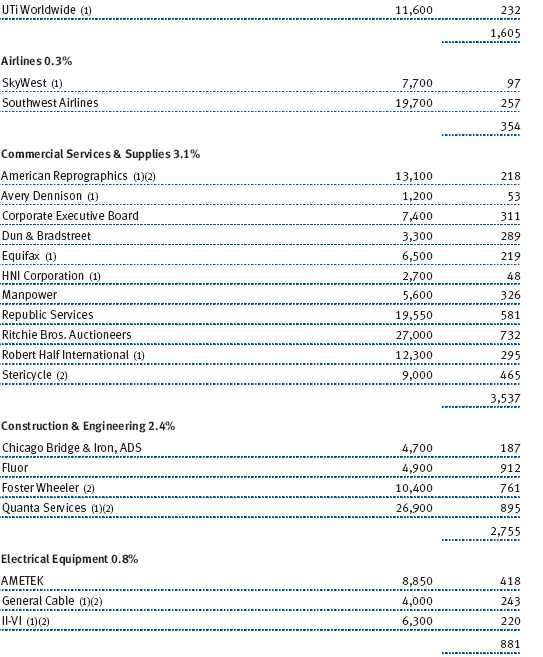
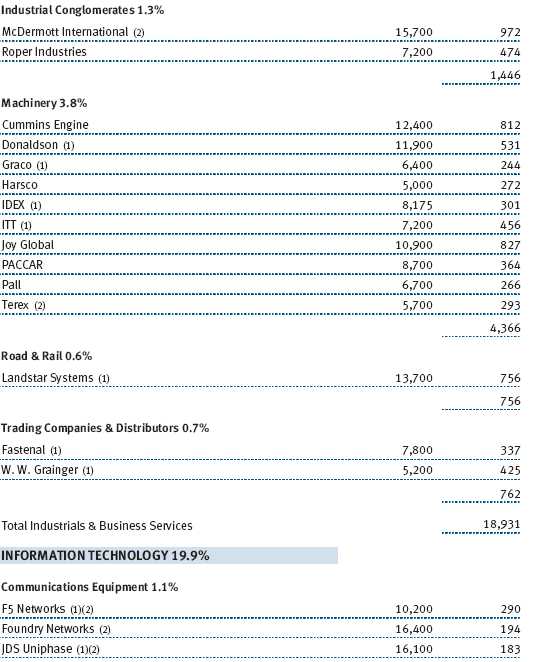
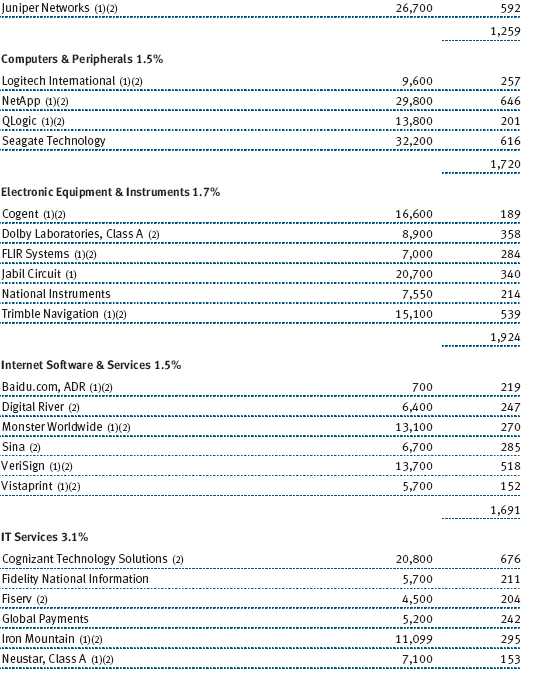
Good stock selection in the industrials and business services sector substantially helped our relative performance. We have been underweighting this sector versus the Russell benchmark, avoiding highly cyclical stocks whose valuations became expensive following several years of robust performance. We favor commercial services and supply companies, which tend to be less cyclical. In the last six months, construction and engineering companies Fluor and Quanta Services, both of which derive some of their business from the energy sector, produced excellent returns. Similarly, mining equipment maker Joy Global benefited from growing demand for coal. In addition, avoiding most of the troubled airline sector, which has been hammered by rising jet fuel costs, greatly helped our relative results. (Please refer to the fund’s portfolio of investments for a complete listing of holdings and the amount each represents in the portfolio.)
Relatively good stock selection in the information technology sector—where we emphasize companies with strong business models in industries with high barriers to entry—was also advantageous in the last six months. Our electronic equipment companies did best, led by Trimble Navigation, a new holding that provides global positioning products and services in industrial and agricultural applications, and FLIR Systems, which makes infrared imaging cameras for commercial and military use. Also, our preference for semiconductor companies with quality business models and reasonable valuations, such as Xilinx, helped us avoid weaker performers in the industry. Shares of software companies detracted from our results due to weakness in Autodesk and Electronic Arts. We continue to underweight makers of computers and peripherals because such companies have a higher risk of commoditization.
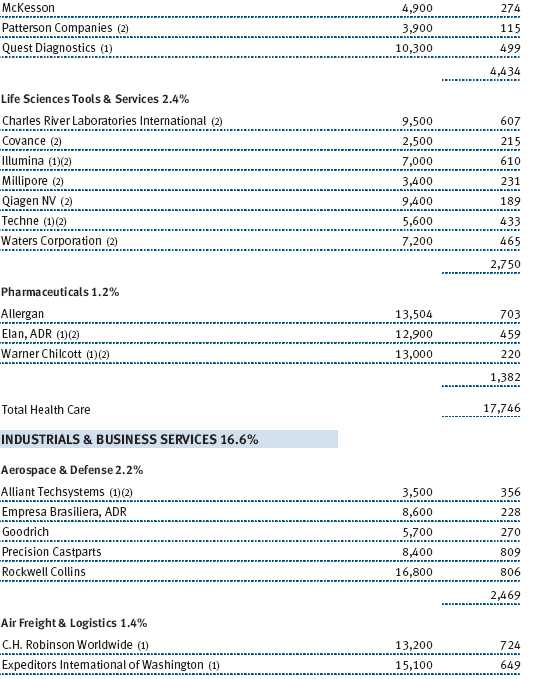
Health care stocks declined in the last six months. Although our holdings generally outperformed those in the Russell benchmark, our sector overweight eroded our performance advantage. Our focus on services companies and medical device makers was not rewarded in the last six months. However, life sciences companies contributed positively to our results, especially Illumina, whose products and services facilitate genetic analysis. Our biotechnology holdings also added value, led by Millennium Pharmaceuticals, which was acquired; Celgene; and Vertex Pharmaceuticals. We added a few biotech names to the portfolio in the first half of the year; we try to stay well diversified to reduce the risks of investing in this industry. Although we underweight pharmaceuticals, we benefited greatly from owning Elan. Shares appreciated briskly because of promising test results for its new Alzheimer’s drug.
Energy stocks produced excellent absolute returns in the last six months, as global demand for energy commodities remained solid. Our stock selection was favorable, and virtually all of our holdings—oil and gas businesses and energy equipment companies—were among the portfolio’s best performers in our reporting period. Given the likelihood of higher inflation and greater demand for hard assets in the period ahead, we decided to raise our energy sector weighting and added a few new names to the portfolio, such as Forest Oil and Newfield Exploration. We have not changed our basic, conservative approach to the sector: We still seek differentiated service companies or exploration companies with good production growth, rather than investing based on a futile attempt to accurately predict commodity price trends.
Consumer discretionary stocks slumped in the last six months, as rising energy and food prices crimped spending on nonessentials. Hotels, restaurants, and gaming companies were among the hardest hit, but we added a few names to the portfolio on weakness, such as Starbucks, Chipotle Mexican Grill, and Las Vegas Sands. Media stocks also fared poorly, but our specialty retailers held up fairly well, led by discounters Ross Stores and TJX.
The beleaguered financials sector detracted the most from the fund’s relative performance, as various commercial banks, brokerages, and insurance companies reported steep losses, wrote down the values of mortgage assets, slashed dividends, or were forced to raise capital to replenish their balance sheets. Few areas within the sector were spared in the maelstrom. Our investments in this sector are in what we believe are strong and sound companies, such as Northern Trust. Many companies are attractively valued, as the selling has been somewhat indiscriminate.
FUND DISTRIBUTIONS
In mid-December 2008, the fund’s Board of Directors could declare—depending on the portfolio’s full-year performance—a distribution of dividends as well as short- and long-term capital gains. These distributions are taxable to investors in nonretirement accounts.
Investors who would like to minimize such taxable events may want to consider the T. Rowe Price Tax-Efficient Multi-Cap Growth Fund as an alternative investment. Like the Diversified Mid-Cap Growth Fund, the Tax-Efficient Multi-Cap Growth Fund focuses primarily on the mid- and small-cap segment and uses a similar investment process, but it is specifically managed to minimize taxable distributions to shareholders, and its objective is to produce the best possible long-term after-tax returns. In the Diversified Mid-Cap Growth Fund, we eliminate investments in good companies when their market capitalizations grow beyond that of a mid-cap company, whereas in the Tax-Efficient Multi-Cap Growth Fund, we will continue to hold such companies as long as they remain a good longer-term investment. Of course, there is no guarantee that the fund’s attempts to manage its portfolio in a tax-efficient manner will be successful. The fund is subject to market risk, including possible loss of principal. (Please remember that an exchange from one fund to another involves the sale of shares. In a nonretirement account, such a transaction could result in the realization of a capital gain.)
For more information on this fund, please visit our Web site, troweprice.com, or call 1-800-225-5132 to request a prospectus or a briefer profile; each includes investment objectives, risks, fees, expenses, and other information that you should read and consider carefully before investing.
OUTLOOK
Our outlook has not changed in the last six months. The era of easy credit, reckless risk taking, and financial excess is over, and we are now in a potentially protracted period in which these “sins” and their consequences must be addressed. Credit standards will be tighter than normal and investors could remain risk averse for some time. As a result, economic and financial market performance in the period ahead will be more challenging than in the last few years.
As our longer-term investors know, we do not make investment decisions predicated on economic forecasts, nor do we attempt to time the markets. We are comfortable with the composition of the fund and, as mentioned earlier, we believe the current risk-averse environment is one in which our investment strategy will do well relative to others. We remain committed to finding, buying, and holding attractively valued, high-quality mid-cap growth companies with good business models, strong managements, and favorable long-term prospects.
Thank you for your confidence in T. Rowe Price.
Respectfully submitted,
Donald J. Peters
Chairman of the fund’s Investment Advisory Committee
July 11, 2008
The committee chairman has day-to-day responsibility for managing the portfolio and works with committee members in developing and executing the fund’s investment program.
RISKS OF INVESTING
As with all equity funds, this fund’s share price can fall because of weakness in the broad market, a particular industry, or specific holdings. The market as a whole can decline for many reasons, including adverse political or economic developments here or abroad, changes in investor psychology, or heavy institutional selling. The prospects for an industry or company may deteriorate because of a variety of factors, including disappointing earnings or changes in the competitive environment. In addition, our assessment of companies held in the fund may prove incorrect, resulting in losses or poor performance even in a rising market. Finally, the fund’s investment approach could fall out of favor with the investing public, resulting in lagging performance versus other types of stock funds.
The stocks of mid-cap companies entail greater risk and are usually more volatile than the shares of large companies. In addition, growth stocks can be volatile for several reasons. Since they usually reinvest a high proportion of earnings in their own businesses, they may lack the dividends usually associated with value stocks that can cushion their decline in a falling market. Also, since investors buy these stocks because of their expected superior earnings growth, earnings disappointments often result in sharp price declines.
Diversification cannot assure a profit or protect against loss in a declining market.
GLOSSARY
Fed funds target rate: An overnight lending rate set by the Federal Reserve and used by banks to meet reserve requirements. Banks also use the fed funds rate as a benchmark for their prime lending rates.
Lipper indexes: Consist of a small number (10 to 30) of the largest mutual funds in a particular category as tracked by Lipper Inc.
Price/earnings (P/E) ratio: A ratio shows the “multiple” of earnings at which a stock is selling. It is calculated by dividing a stock’s current price by its current earnings per share. For example, if a stock’s price is $60 per share and the issuing company earns $2 per share, the P/E ratio is $60/$2, or 30.
Real interest rate: An interest rate that has been adjusted for inflation. It is calculated by subtracting the inflation rate from the nominal interest rate. For example, if a 10-year Treasury note is yielding 5% and inflation is 2%, the real interest rate is 3%.
Russell Midcap Index: Measures the performance of the 800 smallest companies in the Russell 1000 Index.
Russell Midcap Growth Index: Measures the performance of those Russell Midcap companies with higher price-to-book ratios and higher forecasted growth values. The stocks are also members of the Russell 1000 Growth Index.
Russell Midcap Value Index: Measures the performance of those Russell Midcap companies with lower price-to-book ratios and lower forecasted growth values. The stocks are also members of the Russell 1000 Value Index.
S&P MidCap 400 Index: An unmanaged index that tracks the stocks of 400 U.S. mid-cap companies.
Performance and Expenses
| GROWTH OF $10,000 |
This chart shows the value of a hypothetical $10,000 investment in the fund over the past 10 fiscal year periods or since inception (for funds lacking 10-year records). The result is compared with benchmarks, which may include a broad-based market index and a peer group average or index. Market indexes do not include expenses, which are deducted from fund returns as well as mutual fund averages and indexes.
| AVERAGE ANNUAL COMPOUND TOTAL RETURN |
This table shows how the fund would have performed each year if its actual (or cumulative) returns for the periods shown had been earned at a constant rate.
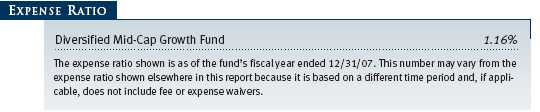
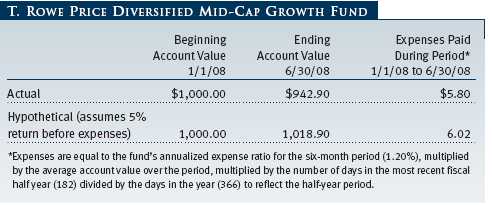
| FUND EXPENSE EXAMPLE |
As a mutual fund shareholder, you may incur two types of costs: (1) transaction costs, such as redemption fees or sales loads, and (2) ongoing costs, including management fees, distribution and service (12b-1) fees, and other fund expenses. The following example is intended to help you understand your ongoing costs (in dollars) of investing in the fund and to compare these costs with the ongoing costs of investing in other mutual funds. The example is based on an investment of $1,000 invested at the beginning of the most recent six-month period and held for the entire period.
Actual Expenses
The first line of the following table (“Actual”) provides information about actual account values and expenses based on the fund’s actual returns. You may use the information in this line, together with your account balance, to estimate the expenses that you paid over the period. Simply divide your account value by $1,000 (for example, an $8,600 account value divided by $1,000 = 8.6), then multiply the result by the number in the first line under the heading “Expenses Paid During Period” to estimate the expenses you paid on your account during this period.
Hypothetical Example for Comparison Purposes
The information on the second line of the table (“Hypothetical”) is based on hypothetical account values and expenses derived from the fund’s actual expense ratio and an assumed 5% per year rate of return before expenses (not the fund’s actual return). You may compare the ongoing costs of investing in the fund with other funds by contrasting this 5% hypothetical example and the 5% hypothetical examples that appear in the shareholder reports of the other funds. The hypothetical account values and expenses may not be used to estimate the actual ending account balance or expenses you paid for the period.
Note: T. Rowe Price charges an annual small-account maintenance fee of $10, generally for accounts with less than $2,000 ($500 for UGMA/UTMA). The fee is waived for any investor whose T. Rowe Price mutual fund accounts total $25,000 or more, accounts employing automatic investing, and IRAs and other retirement plan accounts that utilize a prototype plan sponsored by T. Rowe Price (although a separate custodial or administrative fee may apply to such accounts). This fee is not included in the accompanying table. If you are subject to the fee, keep it in mind when you are estimating the ongoing expenses of investing in the fund and when comparing the expenses of this fund with other funds.
You should also be aware that the expenses shown in the table highlight only your ongoing costs and do not reflect any transaction costs, such as redemption fees or sales loads. Therefore, the second line of the table is useful in comparing ongoing costs only and will not help you determine the relative total costs of owning different funds. To the extent a fund charges transaction costs, however, the total cost of owning that fund is higher.
Unaudited
The accompanying notes are an integral part of these financial statements.
Unaudited
The accompanying notes are an integral part of these financial statements.
Unaudited
The accompanying notes are an integral part of these financial statements.
Unaudited
The accompanying notes are an integral part of these financial statements.
Unaudited
The accompanying notes are an integral part of these financial statements.
Unaudited
| NOTES TO FINANCIAL STATEMENTS |
T. Rowe Price Diversified Mid-Cap Growth Fund, Inc. (the fund), is registered under the Investment Company Act of 1940 (the 1940 Act) as a diversified, open-end management investment company. The fund commenced operations on December 31, 2003. The fund seeks to provide long-term capital growth by investing primarily in the common stocks of mid-cap growth companies.
NOTE 1 - SIGNIFICANT ACCOUNTING POLICIES
Basis of Preparation The accompanying financial statements were prepared in accordance with accounting principles generally accepted in the United States of America, which require the use of estimates made by fund management. Fund management believes that estimates and security valuations are appropriate; however, actual results may differ from those estimates, and the security valuations reflected in the financial statements may differ from the value the fund ultimately realizes upon sale of the securities.
Investment Transactions, Investment Income, and Distributions Income and expenses are recorded on the accrual basis. Dividends received from mutual fund investments are reflected as dividend income; capital gain distributions are reflected as realized gain/loss. Dividend income and capital gain distributions are recorded on the ex-dividend date. Income tax-related interest and penalties, if incurred, would be recorded as income tax expense. Investment transactions are accounted for on the trade date. Realized gains and losses are reported on the identified cost basis. Distributions to shareholders are recorded on the ex-dividend date. Income distributions are declared and paid on an annual basis. Capital gain distributions, if any, are declared and paid by the fund, typically on an annual basis.
Rebates Subject to best execution, the fund may direct certain security trades to brokers who have agreed to rebate a portion of the related brokerage commission to the fund in cash. Commission rebates are reflected as realized gain on securities in the accompanying financial statements.
New Accounting Pronouncements On January 1, 2008, the fund adopted Statement of Financial Accounting Standards No. 157 (FAS 157), Fair Value Measurements. FAS 157 defines fair value, establishes the framework for measuring fair value, and expands the disclosures of fair value measurements in the financial statements. Adoption of FAS 157 did not have a material impact on the fund’s net assets or results of operations.
In March 2008, the Financial Accounting Standards Board issued Statement of Financial Accounting Standards No. 161, Disclosures about Derivative Instruments and Hedging Activities (“FAS 161”), which is effective for fiscal years and interim periods beginning after November 15, 2008. FAS 161 requires enhanced disclosures about derivative and hedging activities, including how such activities are accounted for and their effect on financial position, performance and cash flows. Management is currently evaluating the impact the adoption of FAS 161 will have on the fund’s financial statements and related disclosures.
NOTE 2 - VALUATION
The fund’s investments are reported at fair value as defined under FAS 157. The fund values its investments and computes its net asset value per share at the close of the New York Stock Exchange (NYSE), normally 4 p.m. ET, each day that the NYSE is open for business.
Valuation Methods Equity securities listed or regularly traded on a securities exchange or in the over-the-counter (OTC) market are valued at the last quoted sale price or, for certain markets, the official closing price at the time the valuations are made, except for OTC Bulletin Board securities, which are valued at the mean of the latest bid and asked prices. A security that is listed or traded on more than one exchange is valued at the quotation on the exchange determined to be the primary market for such security. Listed securities not traded on a particular day are valued at the mean of the latest bid and asked prices for domestic securities and the last quoted sale price for international securities.
Investments in mutual funds are valued at the mutual fund’s closing net asset value per share on the day of valuation.
Other investments, including restricted securities, and those for which the above valuation procedures are inappropriate or are deemed not to reflect fair value are stated at fair value as determined in good faith by the T. Rowe Price Valuation Committee, established by the fund’s Board of Directors.
Valuation Inputs Various inputs are used to determine the value of the fund’s investments. These inputs are summarized in the three broad levels listed below:
Level 1 – quoted prices in active markets for identical securities
Level 2 – observable inputs other than Level 1 quoted prices (including, but not limited to, quoted prices for similar securities, interest rates, prepayment speeds, credit risk)
Level 3 – unobservable inputs
Observable inputs are those based on market data obtained from sources independent of the fund, and unobservable inputs reflect the fund’s own assumptions based on the best information available. The input levels are not necessarily an indication of the risk or liquidity associated with investments at that level. The following table summarizes the fund’s investments, based on the inputs used to determine their values on June 30, 2008:
![]()
NOTE 3 - INVESTMENT TRANSACTIONS
Consistent with its investment objective, the fund engages in the following practices to manage exposure to certain risks or to enhance performance. The investment objective, policies, program, and risk factors of the fund are described more fully in the fund’s prospectus and Statement of Additional Information.
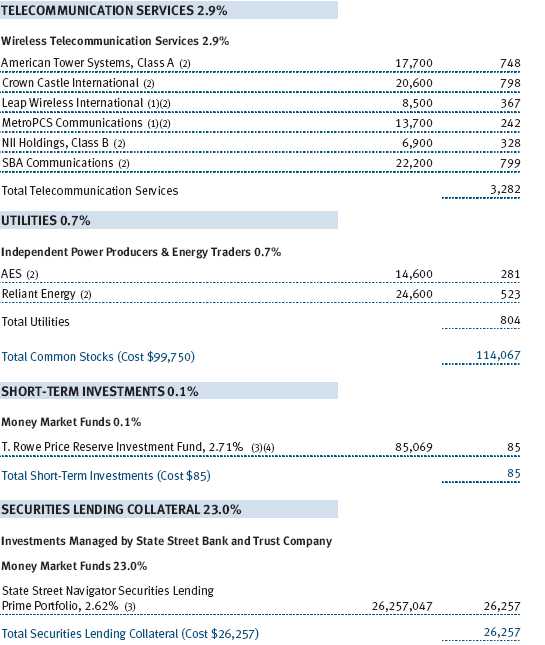
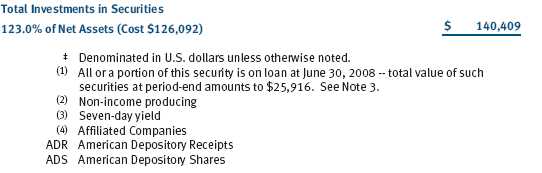
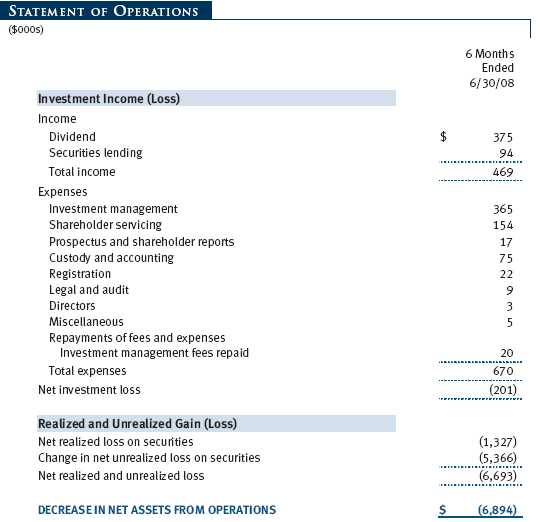
Securities Lending The fund lends its securities to approved brokers to earn additional income. It receives as collateral cash and U.S. government securities valued at 102% to 105% of the value of the securities on loan. Cash collateral is invested by the fund’s lending agent(s) in accordance with investment guidelines approved by fund management. Although risk is mitigated by the collateral, the fund could experience a delay in recovering its securities and a possible loss of income or value if the borrower fails to return the securities or if collateral investments decline in value. Securities lending revenue recognized by the fund consists of earnings on invested collateral and borrowing fees, net of any rebates to the borrower and compensation to the lending agent. On June 30, 2008, the value of loaned securities was $25,916,000; aggregate collateral received included U.S. government securities valued at $429,000.
Other Purchases and sales of portfolio securities, other than short-term securities, aggregated $18,136,000 and $16,311,000, respectively, for the six months ended June 30, 2008.
NOTE 4 - FEDERAL INCOME TAXES
No provision for federal income taxes is required since the fund intends to continue to qualify as a regulated investment company under Subchapter M of the Internal Revenue Code and distribute to shareholders all of its taxable income and gains. Distributions are determined in accordance with Federal income tax regulations, which differ from generally accepted accounting principles, and, therefore, may differ in amount or character from net investment income and realized gains for financial reporting purposes. Financial reporting records are adjusted for permanent book/tax differences to reflect tax character but are not adjusted for temporary differences. The amount and character of tax-basis distributions and composition of net assets are finalized at fiscal year-end; accordingly, tax-basis balances have not been determined as of June 30, 2008.
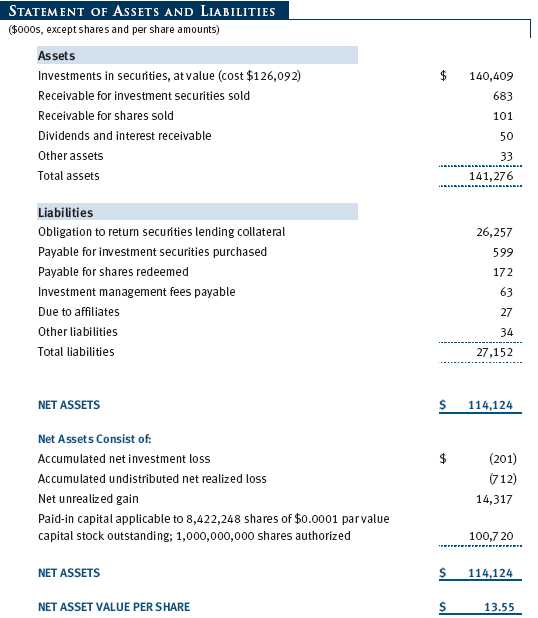
At June 30, 2008, the cost of investments for federal income tax purposes was $126,092,000. Net unrealized gain aggregated $14,318,000 at period-end, of which $24,363,000 related to appreciated investments and $10,045,000 related to depreciated investments.
NOTE 5 - RELATED PARTY TRANSACTIONS
The fund is managed by T. Rowe Price Associates, Inc. (the manager or Price Associates), a wholly owned subsidiary of T. Rowe Price Group, Inc. The investment management agreement between the fund and the manager provides for an annual investment management fee, which is computed daily and paid monthly. The fee consists of an individual fund fee, equal to 0.35% of the fund’s average daily net assets, and a group fee. The group fee rate is calculated based on the combined net assets of certain mutual funds sponsored by Price Associates (the group) applied to a graduated fee schedule, with rates ranging from 0.48% for the first $1 billion of assets to 0.285% for assets in excess of $220 billion. The fund’s group fee is determined by applying the group fee rate to the fund’s average daily net assets. At June 30, 2008, the effective annual group fee rate was 0.30%.
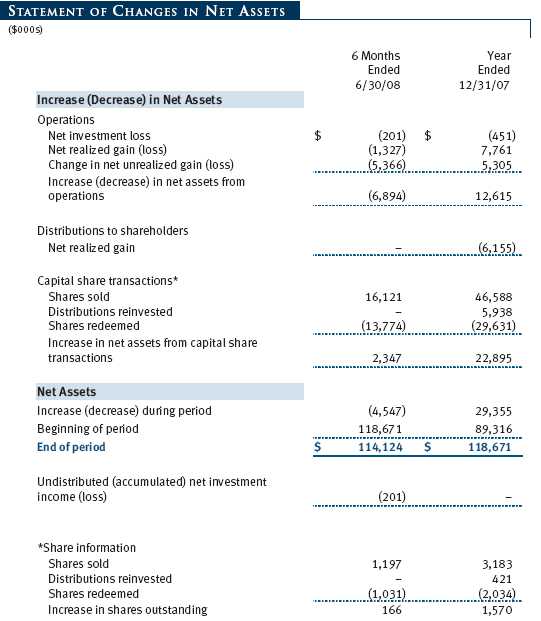
The fund is also subject to a contractual expense limitation through April 30, 2008. During the limitation period, the manager is required to waive its management fee and reimburse the fund for any expenses, excluding interest, taxes, brokerage commissions, and extraordinary expenses, that would otherwise cause the fund’s ratio of annualized total expenses to average net assets (expense ratio) to exceed its expense limitation of 1.25% . For a period of three years after the date of any reimbursement or waiver, the fund is required to repay the manager for expenses previously reimbursed and management fees waived to the extent its net assets have grown or expenses have declined sufficiently to allow repayment without causing the fund’s expense ratio to exceed its expense limitation. Pursuant to this agreement, management fees in the amount of $20,000 were repaid during the six months ended June 30, 2008. At June 30, 2008, there were no amounts subject to repayment by the fund. For the six months ended June 30, 2008, the fund operated below its expense limitation.
In addition, the fund has entered into service agreements with Price Associates and two wholly owned subsidiaries of Price Associates (collectively, Price). Price Associates computes the daily share price and provides certain other administrative services to the fund. T. Rowe Price Services, Inc., provides shareholder and administrative services in its capacity as the fund’s transfer and dividend disbursing agent. T. Rowe Price Retirement Plan Services, Inc., provides subaccounting and recordkeeping services for certain retirement accounts invested in the fund. For the six months ended June 30, 2008, expenses incurred pursuant to these service agreements were $53,000 for Price Associates, $122,000 for T. Rowe Price Services, Inc., and $0 for T. Rowe Price Retirement Plan Services, Inc. The total amount payable at period-end pursuant to these service agreements is reflected as Due to Affiliates in the accompanying financial statements.
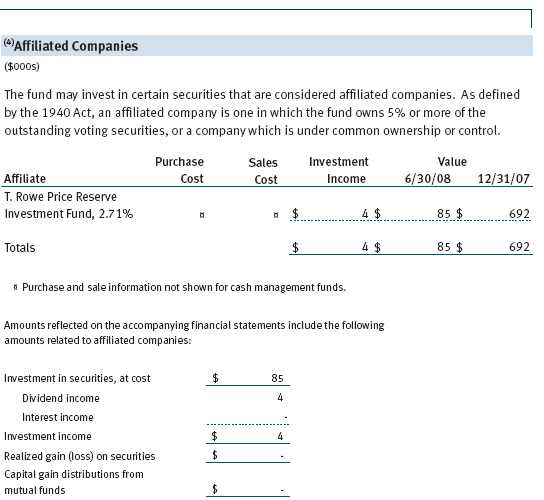
The fund may invest in the T. Rowe Price Reserve Investment Fund and the T. Rowe Price Government Reserve Investment Fund (collectively, the T. Rowe Price Reserve Investment Funds), open-end management investment companies managed by Price Associates and considered affiliates of the fund. The T. Rowe Price Reserve Investment Funds are offered as cash management options to mutual funds, trusts, and other accounts managed by Price Associates and/or its affiliates and are not available for direct purchase by members of the public. The T. Rowe Price Reserve Investment Funds pay no investment management fees.
| INFORMATION ON PROXY VOTING POLICIES, PROCEDURES, AND RECORDS |
A description of the policies and procedures used by T. Rowe Price funds and portfolios to determine how to vote proxies relating to portfolio securities is available in each fund’s Statement of Additional Information, which you may request by calling 1-800-225-5132 or by accessing the SEC’s Web site, www.sec.gov. The description of our proxy voting policies and procedures is also available on our Web site, www.troweprice.com. To access it, click on the words “Company Info” at the top of our homepage for individual investors. Then, in the window that appears, click on the “Proxy Voting Policy” navigation button in the top left corner.
Each fund’s most recent annual proxy voting record is available on our Web site and through the SEC’s Web site. To access it through our Web site, follow the directions above, then click on the words “Proxy Voting Record” at the bottom of the Proxy Voting Policy page.
| HOW TO OBTAIN QUARTERLY PORTFOLIO HOLDINGS |
The fund files a complete schedule of portfolio holdings with the Securities and Exchange Commission for the first and third quarters of each fiscal year on Form N-Q. The fund’s Form N-Q is available electronically on the SEC’s Web site (www.sec.gov); hard copies may be reviewed and copied at the SEC’s Public Reference Room, 450 Fifth St. N.W., Washington, DC 20549. For more information on the Public Reference Room, call 1-800-SEC-0330.
| APPROVAL OF INVESTMENT MANAGEMENT AGREEMENT |
On March 4, 2008, the fund’s Board of Directors (Board) unanimously approved the investment advisory contract (Contract) between the fund and its investment manager, T. Rowe Price Associates, Inc. (Manager). The Board considered a variety of factors in connection with its review of the Contract, also taking into account information provided by the Manager during the course of the year, as discussed below:
Services Provided by the Manager
The Board considered the nature, quality, and extent of the services provided to the fund by the Manager. These services included, but were not limited to, management of the fund’s portfolio and a variety of related activities, as well as financial and administrative services, reporting, and communications. The Board also reviewed the background and experience of the Manager’s senior management team and investment personnel involved in the management of the fund. The Board concluded that it was satisfied with the nature, quality, and extent of the services provided by the Manager.
Investment Performance of the Fund
The Board reviewed the fund’s returns for the one-year, three-year, and since-inception periods as well as the fund’s year-by-year returns and compared these returns with previously agreed upon comparable performance measures and market data, including those supplied by Lipper and Morningstar, which are independent providers of mutual fund data. On the basis of this evaluation and the Board’s ongoing review of investment results, the Board concluded that the fund’s performance was satisfactory.
Costs, Benefits, Profits, and Economies of Scale
The Board reviewed detailed information regarding the revenues received by the Manager under the Contract and other benefits that the Manager (and its affiliates) may have realized from its relationship with the fund, including research received under “soft dollar” agreements. The Board noted that soft dollars were not used to pay for third-party, non-broker research. The Board also received information on the estimated costs incurred and profits realized by the Manager and its affiliates from advising T. Rowe Price mutual funds as well as estimates of the gross profits realized from managing the fund in particular. The Board concluded that the Manager’s profits were reasonable in light of the services provided to the fund. The Board also considered whether the fund or other funds benefit under the fee levels set forth in the Contract from any economies of scale realized by the Manager. Under the Contract, the fund pays a fee to the Manager composed of two components—a group fee rate based on the aggregate assets of certain T. Rowe Price mutual funds (including the fund) that declines at certain asset levels and an individual fund fee rate that is assessed on the assets of the fund. The Board concluded that the advisory fee structure for the fund continued to provide for a reasonable sharing of benefits from any economies of scale with the fund’s investors.
Fees
The Board reviewed the fund’s management fee rate, operating expenses, and total expense ratio and compared them with fees and expenses of other comparable funds based on information and data supplied by Lipper. The information provided to the Board indicated that the fund’s management fee rate was at or above the median for comparable funds and the expense ratio was above the median for certain groups of comparable funds and at or below the median for other groups of comparable funds. The Board also reviewed the fee schedules for comparable privately managed accounts of the Manager and its affiliates. Management informed the Board that the Manager’s responsibilities for privately managed accounts are more limited than its responsibilities for the fund and other T. Rowe Price mutual funds that it or its affiliates advise. On the basis of the information provided, the Board concluded that the fees paid by the fund under the Contract were reasonable.
Approval of the Contract
As noted, the Board approved the continuation of the Contract. No single factor was considered in isolation or to be determinative to the decision. Rather, the Board concluded, in light of a weighting and balancing of all factors considered, that it was in the best interests of the fund to approve the continuation of the Contract, including the fees to be charged for services thereunder.
Item 2. Code of Ethics.
A code of ethics, as defined in Item 2 of Form N-CSR, applicable to its principal executive officer, principal financial officer, principal accounting officer or controller, or persons performing similar functions is filed as an exhibit to the registrant’s annual Form N-CSR. No substantive amendments were approved or waivers were granted to this code of ethics during the registrant’s most recent fiscal half-year.
Item 3. Audit Committee Financial Expert.
Disclosure required in registrant’s annual Form N-CSR.
Item 4. Principal Accountant Fees and Services.
Disclosure required in registrant’s annual Form N-CSR.
Item 5. Audit Committee of Listed Registrants.
Not applicable.
Item 6. Investments.
(a) Not applicable. The complete schedule of investments is included in Item 1 of this Form N-CSR.
(b) Not applicable.
Item 7. Disclosure of Proxy Voting Policies and Procedures for Closed-End Management Investment Companies.
Not applicable.
Item 8. Portfolio Managers of Closed-End Management Investment Companies.
Not applicable.
Item 9. Purchases of Equity Securities by Closed-End Management Investment Company and Affiliated Purchasers.
Not applicable.
Item 10. Submission of Matters to a Vote of Security Holders.
Not applicable.
Item 11. Controls and Procedures.
(a) The registrant’s principal executive officer and principal financial officer have evaluated the registrant’s disclosure controls and procedures within 90 days of this filing and have concluded that the registrant’s disclosure controls and procedures were effective, as of that date, in ensuring that information required to be disclosed by the registrant in this Form N-CSR was recorded, processed, summarized, and reported timely.
(b) The registrant’s principal executive officer and principal financial officer are aware of no change in the registrant’s internal control over financial reporting that occurred during the registrant’s second fiscal quarter covered by this report that has materially affected, or is reasonably likely to materially affect, the registrant’s internal control over financial reporting.
Item 12. Exhibits.
(a)(1) The registrant’s code of ethics pursuant to Item 2 of Form N-CSR is filed with the registrant’s annual Form N-CSR.
(2) Separate certifications by the registrant's principal executive officer and principal financial officer, pursuant to Section 302 of the Sarbanes-Oxley Act of 2002 and required by Rule 30a-2(a) under the Investment Company Act of 1940, are attached.
(3) Written solicitation to repurchase securities issued by closed-end companies: not applicable.
(b) A certification by the registrant's principal executive officer and principal financial officer, pursuant to Section 906 of the Sarbanes-Oxley Act of 2002 and required by Rule 30a-2(b) under the Investment Company Act of 1940, is attached.
SIGNATURES | |
| Pursuant to the requirements of the Securities Exchange Act of 1934 and the Investment | |
| Company Act of 1940, the registrant has duly caused this report to be signed on its behalf by the | |
| undersigned, thereunto duly authorized. | |
| T. Rowe Price Diversified Mid-Cap Growth Fund, Inc. | |
| By | /s/ Edward C. Bernard |
| Edward C. Bernard | |
| Principal Executive Officer | |
| Date | August 20, 2008 |
| Pursuant to the requirements of the Securities Exchange Act of 1934 and the Investment | |
| Company Act of 1940, this report has been signed below by the following persons on behalf of | |
| the registrant and in the capacities and on the dates indicated. | |
| By | /s/ Edward C. Bernard |
| Edward C. Bernard | |
| Principal Executive Officer | |
| Date | August 20, 2008 |
| By | /s/ Gregory K. Hinkle |
| Gregory K. Hinkle | |
| Principal Financial Officer | |
| Date | August 20, 2008 |