UNITED STATES
SECURITIES AND EXCHANGE COMMISSION
Washington, D.C. 20549
FORM N-CSR
CERTIFIED SHAREHOLDER REPORT OF REGISTERED
MANAGEMENT INVESTMENT COMPANIES
Investment Company Act file number 811-21475
Tamarack Funds Trust
(Exact name of registrant as specified in charter)
100 S. Fifth Street, Suite 2300,
Minneapolis, MN | 55402-1240 |
(Address of principal executive offices) | (Zip code) |
BISYS Fund Services Ohio, Inc., 3435 Stelzer Road, Columbus, OH 43219
(Name and address of agent for service)
Registrant’s telephone number, including area code: | (800) 422-2766 |
Date of fiscal year end: | September 30 |
Date of reporting period: | March 31, 2007 |
Form N-CSR is to be used by management investment companies to file reports with the Commission not later than 10 days after the transmission to stockholders of any report that is required to be transmitted to stockholders under Rule 30e-1 under the Investment Company Act of 1940 (17 CFR 270.30e-1). The Commission may use the information provided on Form N-CSR in its regulatory, disclosure review, inspection, and policymaking roles.
A registrant is required to disclose the information specified by Form N-CSR, and the Commission will make this information public. A registrant is not required to respond to the collection of information contained in Form N-CSR unless the Form displays a currently valid Office of Management and Budget (“OMB”) control number. Please direct comments concerning the accuracy of the information collection burden estimate and any suggestions for reducing the burden to Secretary, Securities and Exchange Commission, 450 Fifth Street, NW, Washington, DC 20549-0609. The OMB has reviewed this collection of information under the clearance requirements of 44 U.S.C. § 3507.
Item 1. | Reports to Stockholders. |
Include a copy of the report transmitted to stockholders pursuant to Rule 30e-1 under the Act (17 CFR 270.30e-1).
 | |
 | SEMI-ANNUAL REPORT March 31, 2007 |
Large Cap Growth Fund Mid Cap Growth Fund SMID Cap Growth Fund Enterprise Fund Small Cap Core Fund Value Fund Microcap Value Fund | |
Tamarack Funds
About Your Semi-Annual Report
This semi-annual report includes detailed information regarding your Fund’s performance. This report is provided to help answer your questions as a shareholder. Among these questions may be: How has my Fund performed against its benchmark both in the last year and over the last ten years (or since inception if less than ten years)? What are the annual expenses of my Fund? What are the significant accounting policies and procedures followed by my Fund?
The Tamarack Funds compare their performance against various Russell Equity indices. Each of these indices is a widely recognized measure of return for the underlying category of securities. However, the indices are unmanaged, do not include fees, and cannot be invested in directly.
We hope the financial information presented, as well as the discussion and analysis from your portfolio manager(s), will help you evaluate your investment in the Tamarack Funds. We also encourage you to read your Fund’s prospectus for further detail as to your Fund’s investment policies and risk profile. Tamarack Funds prospectuses and performance information subsequent to the date of this report are available on our website at www.voyageur.net.
A description of the policies and procedures that your Fund uses to determine how to vote proxies relating to portfolio securities is available (i) without charge, upon request, by calling 1 800-422-2766; (ii) on the Fund’s website at www.voyageur.net; and (iii) on the Securities and Exchange Commission’s (the “Commission”) website at http://www.sec.gov.
Information regarding how your Fund voted proxies relating to portfolio securities during the most recent 12-month period ended June 30, 2006 is available (i) on the Fund’s website at www.voyageur.net; and (ii) on the Commission’s website at http://www.sec.gov.
A schedule of each Fund’s portfolio holdings will be filed with the Commission for the first and third quarters of each fiscal year on Form N-Q. This information is available on the Commission’s website at http://www.sec.gov and may be reviewed and copied at the Commission’s Public Reference Room in Washington, D.C. Information on the operation of the Public Reference Room is available by calling 1-800-SEC-0330.
Table of Contents
Table of Contents
LETTER FROM THE CIO OF EQUITIES
A Change in Sentiment?
The U.S. equity markets were generally strong during 2006, with most indices posting double-digit returns. In what has become a common pattern over the past several years, equities rallied strongly in the fourth quarter. Steady interest rates, cheaper energy prices, good inflation readings, decent retail sales and potential signs of a bottoming in the housing market fueled investor optimism. The rally was broad-based, allowing the S&P 500 Index to hit a new multi-year high, rising 6.7% for the fourth quarter and finish up 15.8% for the year.
During the fourth quarter of 2006, small cap stocks (as measured by the Russell 2000 Index) outperformed their large and mid cap counterparts. This has been the case for several years, although there was some evidence in the last half of 2006 that large cap stocks were regaining market leadership. Also during the fourth quarter, value stocks performed significantly better than growth stocks across all capitalization ranges, especially in large cap. In large cap, the Russell 1000 Value Index out-performed the Russell 1000 Growth Index by 210 basis points (8.0% vs. 5.9%) for the quarter and finished ahead of large cap growth by 1310 basis points (22.2% vs. 9.1%) for the year. In mid cap, value finished ahead of growth by 150 basis points (8.5% vs. 7.0%) for the quarter and by 950 basis points (20.2% vs. 10.7%) for the year. In small cap, value beat growth by a narrow 20 basis points (9.0% vs. 8.8%) for the fourth quarter but by a wide 1010 basis points (23.5% vs. 13.4%) for the year.
At the sector level, all ten sectors of the broad market S&P 500 Index posted positive returns in the fourth quarter and the year. Materials 11.4%, Energy 11.2% and Consumer Discretionary 10.3% led all sectors in the fourth quarter while Health Care 1.4% and Consumer Staples 3.5% trailed. For the year, Telecommunications Services 36.8%, Energy 24.2%, and Utilities 21.0% were up most while Health Care 7.5% lagged.
In 2007, investors began where they left off in 2006, namely with a significant appetite for risk. The combination of robust “fundamentals”, including corporate earnings, economic growth, subdued inflation and interest rates together with still-ample liquidity, encouraged continued speculative behavior among investors. However, after months of building a bulletproof conviction in a “Goldilocks” investment environment where slow, steady economic growth would be just right to keep earnings growing and inflation shrinking, risk aversion suddenly returned. After foiling many market strategists who had been calling for a market correction since last summer, the eight-month S&P 500 winning streak was finally broken in February. Tuesday, February 27 was the 16th largest 1-day drop in the S&P 500 since 1990. The pullback began with the Shanghai stock market falling 9%. Investor bullishness shifted toward bearish concerns about global liquidity, sub-prime mortgages, a potential credit crunch, the housing market and a Greenspan warning among others. But underlying it all was concern about future economic growth. This change in investor behavior also caused the VIX, (the Chicago Board Options Exchange Volatility Index - a popular measure of investor sentiment and risk), to almost double. U.S. equity markets remained jittery through end of the first quarter as investors continued to digest the news flow and change in sentiment. At the close on March 30, the broad market S&P 500 eked out a first quarter return of 0.7%, the Dow Jones Industrial Average declined 0.3% and the NASDAQ Composite added 0.5%.
1
Table of Contents
LETTER FROM THE CIO OF EQUITIES
The Opportunities Ahead
We periodically find ourselves in the midst of uncertain economic signals. The current environment presents opportunities for discerning and patient investors to take advantage of clear investment opportunities amid the uncertainty.
Overall, equities remain an attractive asset class. Last year was an above-average year for all equities, with the exception perhaps of growth stocks. Stock prices rose significantly in 2006, but corporate earnings rose in tandem, keeping valuations reasonable. Key equity ratios are close to their long-term averages and nowhere near levels that could be viewed as excessive. Corporations that strengthened their balance sheets, in recent years, are taking advantage to make acquisitions and buy back their stock. In fact, stock buybacks and cash acquisitions have increased 289% since 2004.
More directly tied to stock prices, investors will have to adjust to the fact that they probably just enjoyed the last quarter of double-digit corporate earnings growth for a while. According to First Call estimates, S&P 500 operating profits will only be growing at 6.9% for the calendar year 2007. In the previous four cycles where corporate profit growth decelerated, higher quality stocks have delivered superior investment returns.
Volatile market environments have also favored higher quality stocks. Over the past 20 years, there is a high correlation between an increase in the VIX Index and the outperformance of higher quality stocks. Regardless of why volatility is occurring, we think that it is quite healthy because a pickup in volatility tends to draw assets back toward their “intrinsic value”. Periods of stability, such as we have experienced for the past three years, often spur speculation during which asset valuations sometimes stray far from reasonable levels. Volatility tends to increase investors’ risk aversion and dampen speculation. When that happens, asset prices tend to decline to more reasonable levels, ones that are based more on actual fundamentals than on speculation. This is something that long-term investors (rather that traders or speculators) who take a rational approach to buying securities should welcome.
The recent shift in market leadership, with signs of investors’ attention being drawn to higher quality stocks, is typical of the late stages of an economic cycle. We think this trend is positive for Voyageur’s investment approach. At this advanced stage of an economic expansion, we believe that corporate earnings can continue to grow, but at a reduced rate. So, while some companies may experience difficulty in a low-growth environment we expect that the innovative companies with strong financials will continue to prosper and we remain committed to our diversified, high quality approach to investing.

Nancy M. Scinto
Chief Investment Officer,
Equity Products | |

Nancy M. Scinto
Tamarack Funds Chief Investment Officer
Equity Products |
2
Table of Contents
EQUITY PORTFOLIO MANAGERS
Voyageur Asset Management Inc. (“Voyageur”), the investment advisor to the Tamarack Funds, employs a team approach to the management of the Tamarack Equity Funds, with no individual team member being solely responsible for the investment decisions.
Nancy M. Scinto
Chief Investment Officer Equity Products, Managing Director, Director of Equity Research, Senior Portfolio Manager
Nancy Scinto is responsible for equity portfolio management and directing the Voyageur growth equity research efforts. She joined Voyageur in 1999 from Chicago Trust Company where she managed institutional accounts and was co-manager of the five-star Alleghany / Chicago Growth and Income Fund. Nancy has held various positions including personal trust, equity trader, senior equity analyst and senior portfolio manager. She began her career in the investment industry in 1984. Nancy received a BA from Governors State University and an MBA from DePaul University. She is a member of the CFA Society of Chicago. |
Nancy M. Scinto |
David J. Cox, CFA
Senior Managing Director, Director of Equity Investments, Senior Portfolio Manager
David Cox is responsible for equity portfolio management and directing the Voyageur growth equity efforts. He joined Voyageur in 1999 from Chicago Trust Company where he held positions as director of equity research, portfolio manager and senior equity analyst. While at Chicago Trust, David co-managed the Alleghany/Chicago Trust Balanced Fund, which held a Morningstar five-star rating in the Domestic Hybrid category. Prior to his experience at Voyageur and Chicago Trust, David held analyst positions at Driehaus Securities and at Kirr, Marbach & Company. David began his career in the investment industry in 1984. He received a BS from the University of Illinois and an MBA from the Kelley School of Business at Indiana University. He is a CFA charterholder and member of the CFA Society of Chicago and the CFA Institute. David is also a member of the Reese Fund Advisory Board. | 
David J. Cox, CFA |
Steven A. Rusnak, CFA
Vice President, Senior Portfolio Manager, Senior Equity Analyst
Steven Rusnak is a member of the growth equity team and conducts fundamental equity research for a diverse group of industries, including financials and health care. He joined Voyageur in 1999 from Chicago Trust Company where he was a senior equity analyst and portfolio manager. Previously Steve held positions with Mesirow Financial as senior equity analyst, the State Teachers Retirement System of Ohio as an analyst and at Feldman Securities Corporation as a portfolio analyst. Steve has been in the investment industry since 1985. He earned a BA in Economics and an MBA from The Stephen M. Ross School of Business at the University of Michigan. Steve is CFA charterholder and a member of the CFA Society of Chicago and CFA Institute. | 
Steven A. Rusnak, CFA |
| |
3
Table of Contents
EQUITY PORTFOLIO MANAGERS

Forbes L. Watson | Forbes L. Watson
Vice President, Senior Portfolio Manager
Forbes Watson is responsible for small cap growth and SMID cap growth equity portfolio management. He joined Voyageur in 2002 from RBC Centura Bank where he managed separate accounts and the five-star RBC Mid Cap Equity Fund. Forbes held portfolio management positions with Trustmark National Bank and ParkSouth Corporation, a registered investment advisor, before joining RBC Centura Bank in 1998. He began his career with May, Cullum, Ragland & Brittain, Inc., a Dallas-based investment boutique, and also worked in the Dallas NASDAQ trading office of Shearson/Lehman Brothers. Forbes began his career in the investment industry in 1981. He received a BA in Finance from the University of North Texas and an MBA from Millsaps College. Forbes is a member of the CFA Society of North Carolina and CFA Institute. |

Michael T. Lee, CFA | Michael T. Lee, CFA
President, Chief Investment Officer, Senior Portfolio Manager
Mike Lee is the President of Voyageur and responsible for overseeing the firm’s investment activities. He is also a portfolio manager with Voyageur’s Growth Equity team. Mike began his career with Voyageur in 1993 as an equity analyst. His prior professional experience included seven years with Northwest Airlines in corporate sales and strategic systems development. Mike serves on the board of the Minnesota Children’s Museum and is a mentor and advisor for the Carlson School Funds Enterprise at the University of Minnesota. Mike received a BS in Economics from DePauw University and an MBA in Finance from the University of Minnesota, Carlson School of Management. He is a CFA charterholder and member of the CFA Society of Minnesota. |

Lance F. James | Lance F. James
Managing Director, Senior Portfolio Manager
Lance James is responsible for portfolio management of Voyageur’s Small Cap Core Fund and Enterprise Fund. Prior to joining Voyageur in 2006, Lance was an equity analyst and portfolio manager for OFI Institutional and Babson Capital Management, affiliated companies of Mass Mutual Life Insurance Company. During his tenure he served as head of the firm’s small/mid cap value investment team. Prior to joining Babson Capital in 1986, Lance worked at Rockwell International Corporation, EBF Associates of Boston and Hewitt Associates. Lance began his career in the investment industry in 1980. He received an AB in Economics from Princeton University and an MBA in Finance from the Wharton School of Business at the University of Pennsylvania. |

George Prince | George Prince
Portfolio Manager, Senior Equity Analyst
George Prince serves as the co-portfolio manager for the Enterprise Fund. George also provides research support for Voyageur’s Small Cap Core Fund and mid cap value portfolios. He joined Voyageur in 2006 from Eagle Asset Management, where he was a senior equity analyst. Prior to his experience at Eagle Asset Management, George was an analyst at Babson Capital Management. George also has a great deal of entrepreneurial experience and founded SignStorey, a leader in place-based digital communications in retail stores and co-founded Cutting Edge Inc., a global CAD-CAM technology company. George has over 10 years of investment industry experience. He received a BA from Yale University. |
4
Table of Contents
EQUITY PORTFOLIO MANAGERS
Bruce W. Kaser, CFA
Senior Portfolio Manager
Bruce Kaser is responsible for large cap value portfolio management and is a member of Voyageur’s large cap value and concentrated large cap value team. Bruce joined Voyageur in 2007 from Freedom Capital where he served as a senior large cap value portfolio manager for six years. Prior to his experience at Voyageur and Freedom Capital, Bruce was a portfolio manager for value equity clients at Loomis Sayles. Bruce began his career in the investment industry in 1985. He received a BS from Miami University (Ohio) and an MBA from the University of Chicago’s Graduate School of Business. Bruce is a CFA charterholder and member of the CFA Institute. Bruce is also a member of the Petroleum Analysts of Boston and is the Treasurer for the Boston charity, Strike Out Cancer. | 
Bruce W. Kaser, CFA |
Stuart A. (“Sam”) Lippe
Senior Portfolio Manager
Sam Lippe is responsible for large cap value portfolio management and is a member of Voyageur’s large cap value and concentrated large cap value team. Sam joined Voyageur in 2007 from Freedom Capital where he served as a senior large cap value portfolio manager for over five years. Prior to his experience at Voyageur and Freedom Capital, Sam was a portfolio manager and analyst for the Endowment Fund at Howard Hughes Medical Institute. He also worked as an analyst for value-oriented portfolios at Legg Mason Capital Management. Sam began his career in the investment industry in 1978. He received a BS from Cornell University and an MBA from New York University. Sam is a member of the Association of Insurance and Financial Analysts. | 
Stuart A. Lippe |
5
Table of Contents
PERFORMANCE SUMMARY
Average Annual Total Returns as of March 31, 2007 (Unaudited)
Tamarack Large Cap Growth Fund
| | | 1 Year | | | 3 Year | | | 5 Year | | | 10 Year | | | Since
Inception (a) | |
|---|
| | |
| | |
| | |
| | |
| | |
| |
| Class A (g) | | | | | | | | | | | | | | | | | | | | | | |
| - Including Maximum Sales Charge of 5.75% | | | | | -6.78 | % | | | 1.26 | % | | | -0.11 | % | | | 2.81 | % | | | 6.92 | % |
| - At Net Asset Value | | | | | -1.07 | % | | | 3.29 | % | | | 1.07 | % | | | 3.42 | % | | | 7.31 | % |
| Class C (h) | | | | | | | |
| - Including Contingent Deferred Sales Charge of 1.00% | | | | | -2.78 | % | | | 2.53 | % | | | 0.32 | % | | | 2.65 | % | | | 6.51 | % |
| - At Net Asset Value | | | | | -1.80 | % | | | 2.53 | % | | | 0.32 | % | | | 2.65 | % | | | 6.51 | % |
| Class I (g) | | | | | -0.79 | % | | | 3.53 | % | | | 1.32 | % | | | 3.67 | % | | | 7.67 | % |
| Class R (h) | | | | | -1.34 | % | | | 3.02 | % | | | 0.82 | % | | | 3.16 | % | | | 7.04 | % |
| Class S (i) | | | | | -0.79 | % | | | 3.53 | % | | | 1.32 | % | | | 3.67 | % | | | 7.67 | % |
| Russell 1000 Growth Index* | | | | | 7.06 | % | | | 7.01 | % | | | 3.48 | % | | | 5.51 | % | | | 9.77 | % |
Tamarack Mid Cap Growth Fund
| | | 1 Year | | | 3 Year | | | 5 Year | | | 10 Year | | | Since
Inception (a) | |
|---|
| | |
| | |
| | |
| | |
| | |
| |
| Class A (g) | | | | | | | | | | | | | | | | | | | | | | |
| - Including Maximum Sales Charge of 5.75% | | | | | -9.16 | % | | | 4.85 | % | | | 4.21 | % | | | 9.76 | % | | | 12.59 | % |
| - At Net Asset Value | | | | | -3.61 | % | | | 6.94 | % | | | 5.45 | % | | | 10.41 | % | | | 13.01 | % |
| Class C (h) | | | | | | | | | | | | | | | | | | | | | | |
| - Including Contingent Deferred Sales Charge of 1.00% | | | | | -5.27 | % | | | 6.16 | % | | | 4.67 | % | | | 9.60 | % | | | 12.17 | % |
| - At Net Asset Value | | | | | -4.34 | % | | | 6.16 | % | | | 4.67 | % | | | 9.60 | % | | | 12.17 | % |
| Class I (g) | | | | | -3.36 | % | | | 7.21 | % | | | 5.70 | % | | | 10.72 | % | | | 13.35 | % |
| Class R (h) | | | | | -3.85 | % | | | 6.68 | % | | | 5.19 | % | | | 10.14 | % | | | 12.72 | % |
| Class S (i) | | | | | -3.36 | % | | | 7.23 | % | | | 5.72 | % | | | 10.73 | % | | | 13.36 | % |
| Russell Midcap Growth Index | | | | | 6.90 | % | | | 12.41 | % | | | 9.45 | % | | | 9.44 | % | | | 12.21 | % |
Tamarack SMID Cap Growth Fund
| | | 1 Year | | | 3 Year | | | 5 Year | | | 10 Year | | | Since
Inception (b) | |
|---|
| | |
| | |
| | |
| | |
| | |
| |
| Class A (g) | | | | | | | | | | | | | | | | | | | | | | |
| - Including Maximum Sales Charge of 5.75% | | | | | -11.11 | % | | | 6.18 | % | | | 5.88 | % | | | 9.43 | % | | | 10.78 | % |
| - At Net Asset Value | | | | | -5.68 | % | | | 8.30 | % | | | 7.14 | % | | | 10.08 | % | | | 11.31 | % |
| Class C (h) | | | | | | | | | | | | | | | | | | | | | | |
| - Including Contingent Deferred Sales Charge of 1.00% | | | | | -7.22 | % | | | 7.48 | % | | | 6.33 | % | | | 9.25 | % | | | 10.48 | % |
| - At Net Asset Value | | | | | -6.34 | % | | | 7.48 | % | | | 6.33 | % | | | 9.25 | % | | | 10.48 | % |
| Class I (g) | | | | | -5.41 | % | | | 8.57 | % | | | 7.41 | % | | | 10.34 | % | | | 11.62 | % |
| Class R (h) | | | | | -5.99 | % | | | 7.98 | % | | | 6.85 | % | | | 9.79 | % | | | 11.02 | % |
| Class S (i) | | | | | -5.42 | % | | | 8.55 | % | | | 7.39 | % | | | 10.33 | % | | | 11.62 | % |
| Russell 2500 Growth Index* | | | | | 4.44 | % | | | 11.12 | % | | | 9.13 | % | | | 8.43 | % | | | 9.89 | % |
| Russell 2000 Growth Index* | | | | | 1.56 | % | | | 9.41 | % | | | 7.88 | % | | | 6.31 | % | | | 7.43 | % |
6
Table of Contents
PERFORMANCE SUMMARY
Tamarack Enterprise Fund
| | | 1 Year | | | 3 Year | | | 5 Year | | | 10 Year | | | Since
Inception (c) | |
|---|
| | |
| | |
| | |
| | |
| | |
| |
| Class A (j) | | | | | | | | | | | | | | | | | | | | | | |
| - Including Maximum Sales Charge of 5.75% | | | | | -0.93 | % | | | 8.08 | % | | | 10.56 | % | | | 11.36 | % | | | 12.46 | % |
| - At Net Asset Value | | | | | 5.13 | % | | | 10.23 | % | | | 11.87 | % | | | 12.03 | % | | | 12.75 | % |
| Class C (j) | | | | | | | | | | | | | | | | | | | | | | |
| - Including Contingent Deferred Sales Charge of 1.00% | | | | | 3.31 | % | | | 9.39 | % | | | 11.03 | % | | | 11.19 | % | | | 11.91 | % |
| - At Net Asset Value | | | | | 4.26 | % | | | 9.39 | % | | | 11.03 | % | | | 11.19 | % | | | 11.91 | % |
| Class I (k) | | | | | 5.39 | % | | | 10.52 | % | | | 12.16 | % | | | 12.31 | % | | | 13.03 | % |
| Class R (j) | | | | | 4.85 | % | | | 9.94 | % | | | 11.58 | % | | | 11.74 | % | | | 12.46 | % |
| Class S | | | | | 5.35 | % | | | 10.51 | % | | | 12.15 | % | | | 12.31 | % | | | 13.03 | % |
| Russell 2000 Index * | | | | | 5.91 | % | | | 12.00 | % | | | 10.95 | % | | | 10.23 | % | | | 10.47 | % |
| Russell 2000 Value Index * | | | | | 10.38 | % | | | 14.47 | % | | | 13.61 | % | | | 13.46 | % | | | 13.23 | % |
Tamarack Small Cap Core Fund
| | | 1 Year | | | 3 Year | | | 5 Year | | | 10 Year | | | Since
Inception (d) | |
|---|
| | |
| | |
| | |
| | |
| | |
| |
| Class A (j) | | | | | | | | | | | | | | | | | | | | | | |
| - Including Maximum Sales Charge of 5.75% | | | | | 0.38 | % | | | 9.00 | % | | | 9.98 | % | | | 10.82 | % | | | 11.91 | % |
| - At Net Asset Value | | | | | 6.49 | % | | | 11.17 | % | | | 11.29 | % | | | 11.48 | % | | | 12.33 | % |
| Class C (j) | | | | | | | | | | | | | | | | | | | | | | |
| - Including Contingent Deferred Sales Charge of 1.00% | | | | | 4.76 | % | | | 10.34 | % | | | 10.46 | % | | | 10.65 | % | | | 11.49 | % |
| - At Net Asset Value | | | | | 5.71 | % | | | 10.34 | % | | | 10.46 | % | | | 10.65 | % | | | 11.49 | % |
| Class R (j) | | | | | 6.23 | % | | | 10.87 | % | | | 11.00 | % | | | 11.19 | % | | | 12.05 | % |
| Class S | | | | | 6.75 | % | | | 11.43 | % | | | 11.56 | % | | | 11.75 | % | | | 12.61 | % |
| Russell 2000 Index * | | | | | 5.91 | % | | | 12.00 | % | | | 10.95 | % | | | 10.23 | % | | | 15.08 | % |
Tamarack Value Fund
| | | 1 Year | | | 3 Year | | | 5 Year | | | 10 Year | | | Since
Inception (e) | |
|---|
| | |
| | |
| | |
| | |
| | |
| |
| Class A (j) | | | | | | | | | | | | | | | | | | | | | | |
| - Including Maximum Sales Charge of 5.75% | | | | | 3.82 | % | | | 7.46 | % | | | 4.21 | % | | | 6.43 | % | | | 11.43 | % |
| - At Net Asset Value | | | | | 10.15 | % | | | 9.60 | % | | | 5.45 | % | | | 7.06 | % | | | 11.72 | % |
| Class C (j) | | | | | | | | | | | | | | | | | | | | | | |
| - Including Contingent Deferred Sales Charge of 1.00% | | | | | 8.32 | % | | | 8.77 | % | | | 4.66 | % | | | 6.26 | % | | | 10.89 | % |
| - At Net Asset Value | | | | | 9.32 | % | | | 8.77 | % | | | 4.66 | % | | | 6.26 | % | | | 10.89 | % |
| Class R (j) | | | | | 9.86 | % | | | 9.31 | % | | | 5.18 | % | | | 6.79 | % | | | 11.44 | % |
| Class S | | | | | 10.40 | % | | | 9.86 | % | | | 5.71 | % | | | 7.33 | % | | | 12.00 | % |
| Russell 1000 Value Index * | | | | | 16.83 | % | | | 14.42 | % | | | 10.25 | % | | | 10.85 | % | | | 13.78 | % |
7
Table of Contents
PERFORMANCE SUMMARY
Tamarack Microcap Value Fund
| | | 1 Year | | | 3 Year | | | 5 Year | | | 10 Year | | | Since
Inception (f) | |
|---|
| | |
| | |
| | |
| | |
| | |
| |
| Class A (j) | | | | | | | | | | | | | | | | | | | | | | |
| - Including Maximum Sales Charge of 5.75% | | | | | 2.61 | % | | | 11.56 | % | | | 13.24 | % | | | 13.88 | % | | | 10.91 | % |
| - At Net Asset Value | | | | | 8.86 | % | | | 13.79 | % | | | 14.59 | % | | | 14.56 | % | | | 11.25 | % |
| Class C (j) | | | | | | | | | | | | | | | | | | | | | | |
| - Including Contingent Deferred Sales Charge of 1.00% | | | | | 7.05 | % | | | 12.95 | % | | | 13.75 | % | | | 13.71 | % | | | 10.42 | % |
| - At Net Asset Value | | | | | 8.05 | % | | | 12.95 | % | | | 13.75 | % | | | 13.71 | % | | | 10.42 | % |
| Class R (j) | | | | | 8.56 | % | | | 13.49 | % | | | 14.30 | % | | | 14.27 | % | | | 10.97 | % |
| Class S | | | | | 9.12 | % | | | 14.08 | % | | | 14.88 | % | | | 14.84 | % | | | 11.53 | % |
| Russell 2000 Value Index * | | | | | 10.38 | % | | | 14.47 | % | | | 13.61 | % | | | 13.46 | % | | | 12.35 | % |
Performance data quoted represents past performance. Past performance is no guarantee of future results. Investment return and principal value of an investment will fluctuate so that an investor’s shares, when redeemed, may be worth more or less than their original cost. Current performance may be lower or higher than performance quoted. For performance data current to the most recent month-end go to www.voyageur.net.
*Each of the comparative indices is a widely recognized market value weighted measure of the return of securities. Index returns do not include sales fees or operating expenses. You cannot invest directly in indices.
| (a) | The since inception date (commencement of operations) of the Fund is December 31, 1990. |
| (b) | The since inception date (commencement of operations) of the Fund is January 1, 1995. |
| (c) | The since inception date (commencement of operations) of the Fund is December 2, 1983. |
| (d) | The since inception date (commencement of operations) of the Fund is August 5, 1991. |
| (e) | The since inception date (commencement of operations) of the Fund is September 30, 1984. |
| (f) | The since inception date (commencement of operations) of the Fund is September 10, 1987. |
| (g) | The performance in the table reflects the performance of the former RBC Funds, the predecessors to the Tamarack Funds. The quoted performance of the Funds include the performance of a common trust fund (“CTF”) account advised by the Adviser (including its predecessor) and managed the same as the Fund in all material respects, for periods dating prior to the Fund’s commencement of operations (October 1, 1996 for the Large Cap Growth Fund, June 1, 1994 for the Mid Cap Growth Fund, and May 2, 1997 for the SMID Cap Growth Fund), as adjusted to reflect the full contractual rate of expenses associated with the Fund at its inception. Each CTF account was not registered with the SEC under the 1940 Act and therefore was not subject to the investment restrictions imposed by law on registered mutual funds. If each CTF account had been registered, the CTF account’s performance may have been adversely affected. Fund performance reflects applicable fee waivers/expense reimbursements (which, if excluded, would cause performance to be lower). |
| (h) | The inception date for Class C and Class R shares of the Fund is April 19, 2004. All performance shown for each such class of shares prior to its inception date is based on the performance of the Class A Shares of the Fund, adjusted to reflect the fees and expenses of Class C and Class R shares, as applicable (and where applicable, the maximum sales charges of the Class C shares). |
| (i) | The inception date for Class S of the Fund is April 19, 2004. All performance shown for each such class of shares prior to its inception date is based on the performance of the Class I Shares of the Fund, adjusted to reflect the fees and expenses of Class S. |
| (j) | The inception date for Class A, Class C and Class R shares of the Fund is April 19, 2004. All performance shown for each such class of shares prior to its inception date is based on the performance of the Class S Shares of the Fund, adjusted to reflect the fees and expenses of Class A, Class C and Class R shares, as applicable (and where applicable, the maximum sales charges of the Class A and Class C shares). |
| (k) | The inception date for Class I shares of the Fund is September 30, 2004. All performance shown for each such class of shares prior to its inception date is based on the performance of the Class S Shares of the Fund, adjusted to reflect the fees and expenses of Class I shares, as applicable. |
The Russell Midcap Growth Index is an unmanaged index that measures the performance of U.S. mid cap companies in the Russell 3000 Index, which have higher price-to-book ratios and higher forecasted growth rates.
The Russell 1000 Growth Index is an unmanaged index that measures the performance of U.S. large cap companies in the Russell 3000 Index with higher price-to-book ratios and higher forecasted growth values.
The Russell 1000 Value Index is an unmanaged index that measures the performance of U.S. large cap companies in the Russell 3000 Index, which have lower price-to-book ratios and lower forecasted growth rates.
8
Table of Contents
PERFORMANCE SUMMARY
The Russell 2000 Growth Index is an unmanaged index that measures the performance of U.S. small cap companies in the Russell 2000 Index, which have higher price-to-book ratios and higher forecasted growth rates.
The Russell 2000 Value Index is an unmanaged index that measures the performance of small cap companies in the Russell 3000 Index with lower price-to-book ratios and lower forecasted growth rates.
The Russell 2000 Index is an unmanaged index that measures the performance of U.S. small cap companies in the Russell 3000 Index.
The Russell 2500 Growth Index is an unmanaged index that measures the performance of those Russell 2500 companies with higher price-to-book ratios and higher forecasted growth values.
9
Table of Contents
MANAGEMENT DISCUSSION AND ANALYSIS
Tamarack Large Cap Growth Fund
Investment Objective
Seeks long-term growth by purchasing high-quality, larger capitalization companies that display consistent earnings growth and superior financial characteristics. Utilizing fundamental research, the Fund employs a bottom-up approach and strict risk controls to build a diversified portfolio of stocks that offer above average expected growth with lower than average market risk.
Performance
For the six-month period ending March 31, 2007, the Fund had a total return of 2.67% (Class A, at net asset value). That compares to a total return of 7.19% for the Russell 1000 Growth Index, the Fund’s primary benchmark.
Factors That Made Positive Contributions
| | • | Stryker Corp. (medical technology) was the best performing stock in the portfolio, for the period, returning +33.7% and contributing 78bps to total returns. |
| | • | An overweight allocation to Energy stocks, the second best performing sector in the Russell 1000 Index, added to returns. Smith International (oil well equipment), +23.8%, strongly outperformed both its sector and the Index. |
| | • | An underweight allocation to the Information Technology sector, an underperforming group made a positive contribution. |
Factors That Detracted From Relative Returns
| | • | The six month period continued to be a challenging environment for our investment approach. Consistent growth companies that we own generally lagged as fundamentals diverged from stock prices. |
| | • | In addition, our portfolio returns were hurt by a small number of stocks primarily in the Financials, Health Care and Consumer Staples sectors. |
| | • | Stock selection in Financials was the largest detractor to returns. SLM Corporation, (lending/ financing), stock price declined, - -21.3%, largely due to concerns that the new make-up of Congress, following the mid-term elections, may threaten its margins. |
| | • | Within Health Care, Quest Diagnostics, (clinical laboratories), stock price was negatively impacted by news the company had lost a contract with United Healthcare. We feel the market’s reaction to this news was overdone and continue to hold this stock in the Fund. |
| | • | Among our Consumer Staples picks, Whole Foods Market, (food retailer), declined as investors became increasingly concerned about intensified competition, slowing business growth and reduced profit margins. This stock was sold from the portfolio. |
10
Table of Contents
MANAGEMENT DISCUSSION AND ANALYSIS
Tamarack Large Cap Growth Fund
Investment Objective
Long-term capital appreciation.
Benchmark
Russell 1000 Growth Index
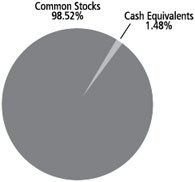
Asset Allocation
(% of fund’s investments excluding securities lending collateral) & Top Five Industries (% of fund’s net assets)
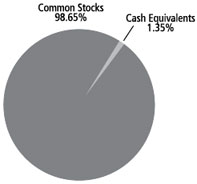
| Top Five Industries | |
|---|
| Information Technology | 22.9% |
| Healthcare | 15.9% |
| Consumer Discretionary | 15.3% |
| Industrials | 14.4% |
| Financials | 12.9% |
Top Ten Holdings
(as of 3/31/07)
(% of fund’s net assets)
| Danaher Corp. | 4.38% | | Procter & Gamble Co. (The) | 3.60% |
| Cisco Systems, Inc. | 4.21% | | Chicago Mercantile Exchange Holdings, Inc. | 3.34% |
| General Electric Co. | 3.80% | | Stryker Corp. | 3.21% |
| Adobe Systems, Inc. | 3.71% | | PepsiCo, Inc. | 3.18% |
| United Technologies Corp. | 3.61% | | Johnson Controls, Inc. | 3.00% |
*A listing of all portfolio holdings can be found on page 60.
Growth of $10,000 Initial Investment Over 10 Years

The graph reflects an initial investment of $10,000 over a 10 year period and is based on Class A shares including the maximum sales charge of 5.75%. The quoted performance of the Fund includes performance of certain collective trust funds (“Commingled Accounts”) advised by Centura Bank prior to the establishment of the Fund on October 1, 1996. On that date, the assets of the Commingled Accounts were equivalent in all material aspects to those of the Fund. During that time, the Commingled Accounts were not registered under the Investment Company Act of 1940 (the “1940 Act”), and therefore were not subject to certain investment restrictions that are imposed under the 1940 Act. If the Commingled Accounts had been registered under the 1940 Act, the Commingled Accounts’ performance may have been adversely affected. Because the Commingled Accounts did not charge any expenses, their performance has been adjusted to reflect the Fund’s estimated expenses at the time of its inception, which was 1.00% of average daily net assets for Class A. The Fund’s total return includes reinvested dividends and capital gains. The Fund’s total return also includes operating expenses that reduce return, while the total return of the index does not. The graph does not reflect the deduction of taxes that a shareholder would pay on fund distributions or redemption of fund shares. Performance of other classes will vary due to differences in fee structures.
11
Table of Contents
MANAGEMENT DISCUSSION AND ANALYSIS
Tamarack Mid Cap Growth Fund
Investment Objective
Seeks long-term growth by primarily investing in high quality, mid-capitalization companies that display consistent earnings growth and superior financial characteristics. Utilizing fundamental research, the Fund employs a bottom-up approach and strict risk controls to build a diversified portfolio of stocks that offer above average expected growth with lower than average market risk.
Performance
For the six-month period ending March 31, 2007, the Fund had a total return of 4.97% (Class A, at net asset value). That compares to a total return of 11.18% for the Russell Midcap Growth Index, the Fund’s primary benchmark.
Factors That Made Positive Contributions
| | • | Overall, including both stock selection and sector weightings, Materials and Information Technology stocks added the most to the Fund’s returns. |
| | • | Among our Materials picks, Florida Rock Industries, (cement and aggregate), was the greatest contributor, adding 124 bps to Fund returns, following an announcement the company is to be acquired by Vulcan Materials. |
| | • | In Information Technology, FactSet Research Systems, (computer software), +29.4%, outperformed both the Russell Midcap Growth Index and the Information Technology sector. |
| | • | An overweight allocation to Industrials, an outperforming sector and an underweight allocation to Consumer Staples, a lagging sector, made a slight positive contribution in the period. |
Factors That Detracted From Relative Returns
| | • | The six month period continued to be a challenging environment for our investment approach. Consistent growth companies that we own generally lagged as fundamentals diverged from stock prices. |
| | • | Overall, including both stock selection and sector weightings, Consumer Discretionary and Health Care detracted the most from Fund returns. |
| | • | Among our Consumer Discretionary holdings, several of our previously strongest performing stocks experienced a pullback. This included Coldwater Creek, (specialty retailer), -29.5% and Pool Corp. (swimming pool supplies), -7.0%. |
| | • | Within the Health Care sector, Quest Diagnostics, (clinical laboratories), -18.5%, was a significant negative. However, we are maintaining this position as we believe investors’ concerns about the United Healthcare contract loss are overdone. |
| | • | Finally, an underweight allocation to Materials, the best performing sector +30.7%, negatively impacted Fund returns. |
12
Table of Contents
MANAGEMENT DISCUSSION AND ANALYSIS
Tamarack Mid Cap Growth Fund
Investment Objective
Long-term capital appreciation.
Benchmark
Russell Midcap Growth Index
Asset Allocation
(% of fund’s investments excluding securities lending collateral) & Top Five Industries (% of fund’s net assets)

| Top Five Industries | |
|---|
| Industrials | 24.6% |
| Consumer Discretionary | 23.4% |
| Information Technology | 19.6% |
| Healthcare | 13.9% |
| Financials | 7.7% |
Top Ten Holdings
(as of 3/31/07)
(% of fund’s net assets)
| Roper Industries, Inc. | 4.44% | | Expeditors International of Washington, Inc. | 2.77% |
| FactSet Research Systems, Inc. | 4.04% | | Cognos, Inc. ADR | 2.70% |
| Varian Medical Systems, Inc. | 3.11% | | VCA Antech, Inc. | 2.68% |
| CDW Corp. | 3.10% | | Dick’s Sporting Goods, Inc. | 2.63% |
| Stericycle, Inc. | 2.90% | | | |
| Pool Corp. | 2.89% | | | |
*A listing of all portfolio holdings can be found on page 62.
Growth of $10,000 Initial Investment Over 10 Years
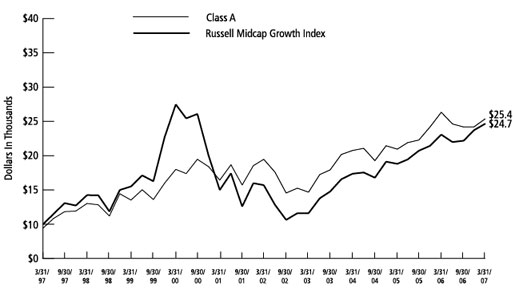
The graph reflects an initial investment of $10,000 over a 10 year period and is based on Class A shares including the maximum sales charge of 5.75%. The Fund’s total return includes reinvested dividends and capital gains. The Fund’s total return also includes operating expenses that reduce return, while the total return of the index does not. The graph does not reflect the deduction of taxes that a shareholder would pay on fund distributions or redemption of fund shares. Performance of other classes will vary due to differences in fee structures.
13
Table of Contents
MANAGEMENT DISCUSSION AND ANALYSIS
Tamarack SMID Cap Growth Fund
Investment Objective
Invests in a diversified portfolio of high-quality, small and mid capitalization companies. Utilizing fundamental research, the Fund seeks to identify profitable companies, selling at reasonable valuations with the most potential for long-term capital appreciation and less than average market risk.
Performance
For the six-month period ending March 31, 2007, the Fund had a total return of 3.95% (Class A, at net asset value). That compares to a total return of 12.61% for the Russell 2500 Growth Index, the Fund’s primary benchmark.
Factors That Made Positive Contributions
| | • | Performance benefited by strong security selection in the Energy sector during the first fiscal quarter. |
| | • | Performance benefited by strong security selection in the Health Care, Financials, and Industrials during the second fiscal quarter. |
| | • | An increasing number of the portfolio companies are subject to takeover activity, as the cash hoards being built up by private equity firms and public corporations start being put to use. |
Factors That Detracted From Relative Returns
| | • | The Fund remained committed to its higher quality growth style while the market placed higher rewards on lower quality, smaller cap stocks. |
| | • | Overweight allocations to the Financial sector and underweight to the Materials sector during the first three months of the period. |
| | • | Security selection in Consumer Discretionary, Information Technology, and Consumer Staples during the second three months of the period. |
14
Table of Contents
MANAGEMENT DISCUSSION AND ANALYSIS
Tamarack SMID Cap Growth Fund
Investment Objective
Long-term capital appreciation.
Benchmark
Russell 2500 Growth Index
Asset Allocation
(% of fund’s investments excluding securities lending collateral) & Top Five Industries (% of fund’s net assets)

| Top Five Industries | |
|---|
| Healthcare | 22.5% |
| Information Technology | 20.1% |
| Consumer Discretionary | 18.0% |
| Industrials | 15.2% |
| Financials | 11.4% |
Top Ten Holdings
(as of 3/31/07)
(% of fund’s net assets)
| Wells Fargo Prime Investment Money Market Fund | 4.01% | | Cymer, Inc. | 2.47% |
| DST Systems, Inc. | 3.07% | | FactSet Research Systems, Inc. | 2.44% |
| Legg Mason, Inc. | 3.01% | | Coldwater Creek, Inc. | 2.41% |
| Valspar Corp. | 2.54% | | Dick’s Sporting Goods, Inc. | 2.38% |
| Roper Industries, Inc. | 2.52% | | PetSmart, Inc. | 2.37% |
*A listing of all portfolio holdings can be found beginning on page 64.
Growth of $10,000 Initial Investment Over 10 Years

The graph reflects an initial investment of $10,000 over a ten year period and is based on Class A shares including the maximum sales charge of 5.75%. The quoted performance of the Fund includes performance of certain collective trust funds (“Commingled Accounts”) advised by Centura Bank prior to the establishment of the Fund on May 2, 1997. On that date, the assets of the Commingled Accounts were equivalent in all material aspects to those of the Fund. During that time, the Commingled Accounts were not registered under the Investment Company Act of 1940 (the “1940 Act”), and therefore were not subject to certain investment restrictions that are imposed under the 1940 Act. If the Commingled Accounts had been registered under the 1940 Act, the Commingled Accounts’ performance may have been adversely affected. Because the Commingled Accounts did not charge any expenses, their performance has been adjusted to reflect the Fund’s estimated expenses at the time of its inception, which was 1.50% of average daily net assets for Class A. The Fund’s total return includes reinvested dividends and capital gains. The Fund’s total return also includes operating expenses that reduce return, while the total return of the index does not. The graph does not reflect the deduction of taxes that a shareholder would pay on fund distributions or redemption of fund shares. Performance of other classes will vary due to differences in fee structures.
15
Table of Contents
MANAGEMENT DISCUSSION AND ANALYSIS
Tamarack Enterprise Fund
Investment Objective
Invests in profitable, established small companies that are dominant in their industries. By selecting undervalued companies with small market capitalizations, this Fund strives to achieve growth with greater price stability than many other small stock funds.
Performance
For the six-month period ending March 31, 2007, the Fund had a total return of 9.44% (Class A, at net asset value). That compares to a total return of 11.02% for the Russell 2000 Index, the Fund’s primary benchmark.
Factors That Made Positive Contributions
| | • | Favorable stock selection in the Technology sector as compared to Russell 2000 index. An example would be Covansys which returned 44%. |
| | • | Favorable stock selection in the Health Care sector. An example would be Adeza Biomedical which returned 46%. |
| | • | Favorable Consumer Discretionary stock selection such as Steinway Musical which returned 25%. |
Factors That Detracted From Relative Returns
| | • | Adverse stock selection compared to the index in the Transportation industry. One of the bigger detractors in the portfolio was the trucking firm SAIA, which declined by -27%. |
| | • | Adverse Producer Durables sector stock selection such as Allied defense Group which declined by -48%. |
| | • | Underweight versus the Russell 2000 index in the top performing Consumer Staples sector. |
16
Table of Contents
MANAGEMENT DISCUSSION AND ANALYSIS
Tamarack Enterprise Fund
Investment Objective
Long-term growth of capital.
Benchmark
Russell 2000 Index
Asset Allocation
(% of fund’s investments excluding securities lending collateral) & Top Five Industries (% of fund’s net assets)
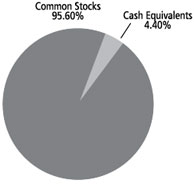
| Top Five Industries | |
|---|
| Industrials | 24.9% |
| Consumer Discretionary | 17.2% |
| Financials | 15.8% |
| Information Technology | 12.4% |
| Materials | 11.1% |
Top Ten Holdings
(as of 3/31/07)
(% of fund’s net assets)
| Movado Group, Inc. | 4.37% | | Universal Stainless & Alloy Products, Inc. | 2.42% |
| Steinway Musical Instruments, Inc. | 3.40% | | Comtech Telecommunications Corp. | 2.41% |
| HMS Holdings Corp. | 3.37% | | Penford Corp. | 2.35% |
| ASTA Funding, Inc. | 2.72% | | Columbus McKinnon Corp. | 2.16% |
| Tetra Technologies, Inc. | 2.52% | | Covansys Corp. | 2.11% |
*A listing of all portfolio holdings can be found beginning on page 65.
Growth of $10,000 Initial Investment Over 10 Years
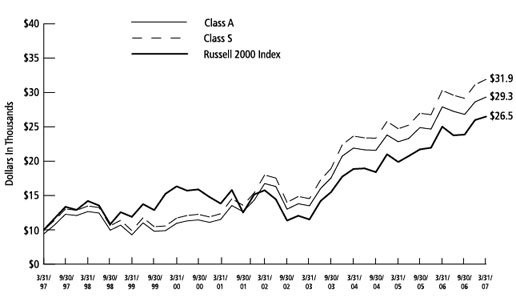
The graph reflects an initial investment of $10,000 over a 10 year period and is based on Class A shares including the maximum sales charge of 5.75%. The inception date for Class A shares of the Fund is April 19, 2004. All performance shown for Class A shares prior to the inception date is based on the performance of the Class S shares of the Fund, adjusted to reflect the fees, expenses and maximum sales charges of Class A shares. The Fund’s total return includes reinvested dividends and capital gains. The Fund’s total return also includes operating expenses that reduce return, while the total return of the index does not. The graph does not reflect the deduction of taxes that a shareholder would pay on fund distributions or redemption of fund shares. Performance of other classes will vary due to differences in fee structures.
17
Table of Contents
MANAGEMENT DISCUSSION AND ANALYSIS
Tamarack Small Cap Core Fund
Investment Objective
Invests in profitable, established small companies that are dominant in their industries. By selecting undervalued growth companies with small to mid-size market capitalizations, this Fund strives to achieve growth with greater price stability than many other small stock funds.
Performance
For the six-month period ending March 31, 2007, the Fund had a total return of 9.67% (Class A, at net asset value). That compares to a total return of 11.02% for the Russell 2000 Index, the Fund’s primary benchmark.
Factors That Made Positive Contributions
| | • | Strong 1st Quarter 2007 performance as compared to the Russell 2000 index (Fund Class A +3.91%, compared to Russell 2000 +1.95%). |
| | • | The Fund was underweight versus the index in the poorly performing Financial Services sector. |
| | • | Favorable stock selection in the Financial Services sector such as S.L. Green Realty (up +25%) and Asta Funding (up +15%). |
| | • | Favorable stock selection in Utilities sector such as Energen (up +22%). |
Factors That Detracted From Relative Returns
| | • | Weak 4th Quarter 2006 performance as compared to the Russell 2000 index. |
| | • | Adverse Basic Materials sector stock selection such as Intertape Polymer Group (down -46%). |
| | • | Adverse Consumer Discretionary stock selection such as Casual male Retail Group (down -14%). |
| | • | Adverse Health Care sector stock selection such as Angiotech Pharmaceutical (down -38%). |
18
Table of Contents
MANAGEMENT DISCUSSION AND ANALYSIS
Tamarack Small Cap Core Fund
Investment Objective
Long-term growth of capital.
Benchmark
Russell 2000 Index
Asset Allocation
(% of fund’s investments excluding securities lending collateral) & Top Five Industries (% of fund’s net assets)

| Top Five Industries | |
|---|
| Industrials | 23.0% |
| Consumer Discretionary | 22.5% |
| Financials | 13.3% |
| Information Technology | 11.3% |
| Healthcare | 8.9% |
Top Ten Holdings
(as of 3/31/07)
(% of fund’s net assets)
| Carlisle Co. | 4.42% | | Steinway Musical Instruments, Inc. | 3.03% |
| Movado Group, Inc. | 3.49% | | Polymedica Corp. | 2.88% |
| Gardner Denver, Inc. | 3.40% | | Men’s Wearhouse, Inc. | 2.50% |
| Interface, Inc. | 3.39% | | Ashford Hospitality Trust, Inc. | 2.47% |
| Inverness Medical Innovations, Inc. | 3.09% | | Manitowoc Co., Inc. (The) | 2.34% |
*A listing of all portfolio holdings can be found beginning on page 67.
Growth of $10,000 Initial Investment Over 10 Years

The graph reflects an initial investment of $10,000 over a 10 year period and is based on Class A shares including the maximum sales charge of 5.75%. The inception date for Class A shares of the Fund is April 19, 2004. All performance shown for Class A shares prior to the inception date is based on the performance of the Class S shares of the Fund, adjusted to reflect the fees, expenses and maximum sales charges of Class A shares. The Fund’s total return includes reinvested dividends and capital gains. The Fund’s total return also includes operating expenses that reduce return, while the total return of the index does not. The graph does not reflect the deduction of taxes that a shareholder would pay on fund distributions or redemption of fund shares. Performance of other classes will vary due to differences in fee structures.
19
Table of Contents
MANAGEMENT DISCUSSION AND ANALYSIS
Tamarack Value Fund
Investment Objective
Seeks long-term growth by purchasing larger capitalization companies that are unpopular and undervalued based on their earnings, assets and/or dividends. The Fund’s goal is to invest in stocks that offer above-average potential for growth in principal and income while assuming less than market risk.
Performance
For the six-month period ending March 31, 2007, the Fund had a total return of 5.65% (Class A, at net asset value). That compares to a total return of 9.34% for the Russell 1000 Value Index, the Fund’s primary benchmark. The style of investment management changed in February of 2007 as the Large Cap Value Team formerly with Freedom Capital Management assumed responsibility for the Fund.
Factors That Made Positive Contributions
| | • | During the six-month period the performance was aided by strong stock selection in the consumer discretionary sector with Johnson Controls, up 32.9%, being the top performer. Subsequent to the investment team change in February, the large cap value portfolio showed strong relative performance in Utilities, Energy and Financials. |
| | • | Utilities was the second strongest sector in the market, up 9.40%. Our stock selection and slight overweight in the electric utilities part of the sector combined to produce 15 basis points of relative outperformance. FPL up 13.18%, and MDU, up 12.67%, were some notable holdings in the sector. |
| | • | Energy produced 14 basis points of excess return. Noble Energy, up 21.7% during the quarter, led the way in this sector. |
| | • | We also gained relative to the market in the Financial sector. Financials, responding to worries in the subprime market, was the weakest sector in the benchmark, down 2.65%. We made a very good trade selling Lehman Brothers during the quarter as the stock gained 8.26% during the time we held it, but ended the quarter down 10.15%. While neutral the sector as a whole, we were underweight commercial banks within the sector which also helped performance. |
Factors That Detracted From Relative Returns
| | • | In Financials, the fund’s holding in SLM Corp hurt performance while in Energy the fund’s Integrated Oil Holdings were unable to match the 14.5% return of that industry within the index. |
| | • | Telecommunication equipment was a weak spot as our holdings in Motorola and Tellabs hurt us in the first quarter. |
| | • | Within the Industrials sector, Machinery was up strongly while our holding in the space, Dover Corporation, was flat in the quarter. |
20
Table of Contents
MANAGEMENT DISCUSSION AND ANALYSIS
Tamarack Value Fund
Investment Objective
Long-term growth of capital and income.
Benchmark
Russell 1000 Value Index
Asset Allocation
(% of fund’s investments excluding securities lending collateral) & Top Five Industries (% of fund’s net assets)
| Top Five Industries | |
|---|
| Financials | 31.0% |
| Energy | 9.0% |
| Healthcare | 8.8% |
| Telecommunication Services | 8.8% |
| Consumer Staples | 8.1% |
Top Ten Holdings
(as of 3/31/07)
(% of fund’s net assets)
| Exxon Mobil Corp. | 5.34% | | Merck & Co., Inc. | 2.93% |
| Citigroup, Inc. | 4.03% | | AT&T, Inc. | 2.62% |
| Verizon Communications, Inc. | 3.64% | | General Electric Co. | 2.54% |
| American International Group, Inc. | 3.46% | | Coca-Cola Co. | 2.48% |
| JPMorgan Chase & Co. | 3.33% | | Bank of America Corp. | 2.42% |
*A listing of all portfolio holdings can be found beginning on page 69.
Growth of $10,000 Initial Investment Over 10 Years
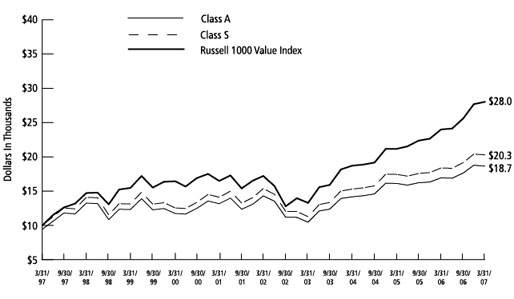
The graph reflects an initial investment of $10,000 over a 10 year period and is based on Class A shares including the maximum sales charge of 5.75%. The inception date for Class A shares of the Fund is April 19, 2004. All performance shown for Class A shares prior to the inception date is based on the performance of the Class S shares of the Fund, adjusted to reflect the fees, expenses and maximum sales charges of Class A shares. The Fund’s total return includes reinvested dividends and capital gains. The Fund’s total return also includes operating expenses that reduce return, while the total return of the index does not. The graph does not reflect the deduction of taxes that a shareholder would pay on fund distributions or redemption of fund shares. Performance of other classes will vary due to differences in fee structures.
21
Table of Contents
MANAGEMENT DISCUSSION AND ANALYSIS
Tamarack Microcap Value Fund
Investment Objective
Invests in a diversified portfolio of the smallest companies that have been neglected by institutional shareholders. Utilizing a quantitative process to identify value-oriented investments, the Fund strives to achieve long-term growth while offering shareholders some protection from market declines and fluctuations.
Performance
For the six-month period ending March 31, 2007, the Fund had a total return of 10.43% (Class A, at net asset value). That compares to a total return of 10.62% for the Russell 2000 Value Index, the Fund’s primary benchmark.
Factors That Made Positive Contributions
| | • | Sector weightings (allocation) contributed strongly to relative performance versus the benchmark with all ten sectors making a positive contribution. The total contribution to relative performance from allocation was roughly 230 basis points. |
| | • | Overall the top three sectors were Financials, Consumer Staples and Utilities. Both allocation and stock selection in each of the sectors made a positive contribution versus the benchmark. |
| | • | Financials, the top sector overall, had the strongest relative contribution from allocation at over 110 basis points. Consumer Staples, the second best sector, had the strongest relative contribution from stock selection at 45 basis points. |
Factors That Detracted From Relative Returns
| | • | Overall stock selection detracted from relative performance versus the benchmark. |
| | • | Consumer Discretionary and Materials had the weakest relative stock selection and were the weakest overall sectors. |
22
Table of Contents
MANAGEMENT DISCUSSION AND ANALYSIS
Tamarack Microcap Value Fund
Investment Objective
Long-term growth of capital.
Benchmark
Russell 2000 Value Index
Asset Allocation
(% of fund’s investments excluding securities lending collateral) & Top Five Industries (% of fund’s net assets)
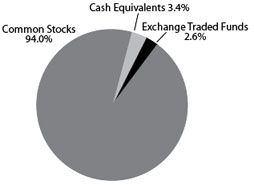
| Top Five Industries | |
|---|
| Consumer Discretionary | 20.4% |
| Financials | 17.3% |
| Industrials | 16.5% |
| Consumer Staples | 8.6% |
| Information Technology | 8.5% |
Top Ten Holdings
(as of 3/31/07)
(% of fund’s net assets)
| iShares Russell Microcap Index Fund | 2.06% | | South Jersey Industries, Inc. | 0.73% |
| Credit Acceptance Corp. | 0.91% | | HEICO Corp. | 0.69% |
| Hub International Ltd. ADR | 0.89% | | HEICO Corp., Class A | 0.69% |
| Consolidated Graphics, Inc. | 0.78% | | Bon-Ton Stores, Inc. | 0.69% |
| Ingles Markets, Inc., Class A | 0.74% | | M & F Worldwide Corp. | 0.68% |
*A listing of all portfolio holdings can be found beginning on page 71.
Growth of $10,000 Initial Investment Over 10 Years
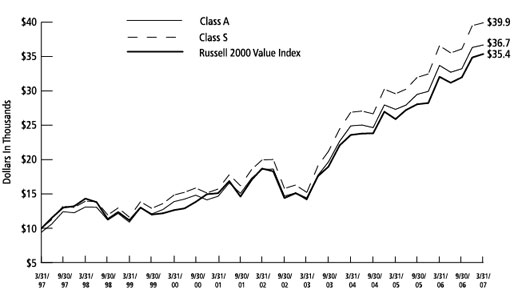
The graph reflects an initial investment of $10,000 over a 10 year period and is based on Class A shares including the maximum sales charge of 5.75%. The inception date for Class A shares of the Fund is April 19, 2004. All performance shown for Class A shares prior to the inception date is based on the performance of the Class S shares of the Fund, adjusted to reflect the fees, expenses and maximum sales charges of Class A shares. The Fund’s total return includes reinvested dividends and capital gains. The Fund’s total return also includes operating expenses that reduce return, while the total return of the index does not. The graph does not reflect the deduction of taxes that a shareholder would pay on fund distributions or redemption of fund shares. Performance of other classes will vary due to differences in fee structures.
23
Table of Contents
FINANCIAL STATEMENTS
Statements of Assets and Liabilities
March 31, 2007
(Unaudited)
| | | Tamarack
Large Cap
Growth Fund | | | Tamarack
Mid Cap
Growth Fund | | | Tamarack
SMID Cap
Growth Fund | | | Tamarack
Enterprise
Fund | |
|---|
| | |
| | |
| | |
| | |
| |
| Assets: | | | | | | | | | | | | | | | | | | |
| Investments, at value (cost $104,750,359; $93,418,412; $8,794,438 and $256,716,251, respectively) | | | | $ | 118,617,232 | | | $ | 115,166,872 | | | $ | 10,050,275 | | | $ | 359,051,248 | |
| Investment of cash collateral for securities on loan, at value (cost $11,210,762; $16,887,814; $-; and $54,531,034, respectively) | | | | | 11,210,762 | | | | 16,887,814 | | | | — | | | | 54,531,034 | |
| | |
| | |
| | |
| | |
| |
| Total Investments | | | | | 129,827,994 | | | | 132,054,686 | | | | 10,050,275 | | | | 413,582,282 | |
| Interest and dividends receivable | | | | | 102,540 | | | | 28,277 | | | | 3,087 | | | | 202,689 | |
| Cash | | | | | — | | | | — | | | | — | | | | 420,647 | |
| Receivable for capital shares issued | | | | | 1,183 | | | | 40,809 | | | | 1,382 | | | | 279,101 | |
| Receivable from advisor | | | | | — | | | | — | | | | 7,102 | | | | — | |
| Prepaid expenses | | | | | 13,050 | | | | 20,333 | | | | 15,787 | | | | 30,969 | |
| | |
| | |
| | |
| | |
| |
| Total Assets | | | | | 129,944,767 | | | | 132,144,105 | | | | 10,077,633 | | | | 414,515,688 | |
| | |
| | |
| | |
| | |
| |
| Liabilities: | | | | | | | | | | | | | | | | | | |
| Cash overdraft | | | | | 53,174 | | | | 2 | | | | — | | | | — | |
| Payable for capital shares redeemed | | | | | 145,778 | | | | 12,369 | | | | 10,461 | | | | 170,305 | |
| Payable for investments purchased | | | | | — | | | | — | | | | — | | | | 393,904 | |
| Payable upon return of securities on loan | | | | | 11,210,762 | | | | 16,887,814 | | | | — | | | | 54,531,034 | |
| Accrued expenses and other payables: | | | | | | | | | | | | | | | | | | |
| Investment advisory fees | | | | | 38,601 | | | | 42,304 | | | | — | | | | 179,039 | |
| Administration fees | | | | | 10,092 | | | | 9,780 | | | | 859 | | | | 30,325 | |
| Distribution fees | | | | | 929 | | | | 10,350 | | | | 1,222 | | | | 6,488 | |
| Other | | | | | 167,315 | | | | 129,063 | | | | 36,795 | | | | 147,503 | |
| | |
| | |
| | |
| | |
| |
| Total Liabilities | | | | | 11,626,651 | | | | 17,091,682 | | | | 49,337 | | | | 55,458,598 | |
| | |
| | |
| | |
| | |
| |
| Net Assets | | | | $ | 118,318,116 | | | $ | 115,052,423 | | | $ | 10,028,296 | | | $ | 359,057,090 | |
| | |
| | |
| | |
| | |
| |
| Net Assets Consist Of: | | | | | | | | | | | | | | | | | | |
| Capital | | | | $ | 135,038,377 | | | $ | 89,829,389 | | | $ | 7,666,892 | | | $ | 238,608,664 | |
| Undistributed net investment income (loss) | | | | | (5,665 | ) | | | (369,328 | ) | | | (63,676 | ) | | | 900,074 | |
| Accumulated net realized gains (losses) from investment transactions | | | | | (30,581,469 | ) | | | 3,843,902 | | | | 1,169,243 | | | | 17,213,355 | |
| Net unrealized appreciation (depreciation) on investments | | | | | 13,866,873 | | | | 21,748,460 | | | | 1,255,837 | | | | 102,334,997 | |
| | |
| | |
| | |
| | |
| |
| Net Assets | | | | $ | 118,318,116 | | | $ | 115,052,423 | | | $ | 10,028,296 | | | $ | 359,057,090 | |
| | |
| | |
| | |
| | |
| |
| Net Assets: | | | | | | | | | | | | | | | | | | |
| Class A | | | | $ | 4,179,388 | | | $ | 40,159,596 | | | $ | 5,275,690 | | | $ | 20,103,882 | |
| Class I | | | | | 1,129,383 | | | | 71,183,226 | | | | 4,399,390 | | | | 43,352,932 | |
| Class C | | | | | 34,775 | | | | 2,020,731 | | | | 30,103 | | | | 2,643,011 | |
| Class R | | | | | 10,195 | | | | 10,768 | | | | 35,788 | | | | 50,306 | |
| Class S | | | | | 112,964,375 | | | | 1,678,102 | | | | 287,325 | | | | 292,906,959 | |
| | |
| | |
| | |
| | |
| |
| Total | | | | $ | 118,318,116 | | | $ | 115,052,423 | | | $ | 10,028,296 | | | $ | 359,057,090 | |
| | |
| | |
| | |
| | |
| |
24
Table of Contents
FINANCIAL STATEMENTS
Statements of Assets and Liabilities (cont.)
| | | Tamarack
Large Cap
Growth Fund | | | Tamarack
Mid Cap
Growth Fund | | | Tamarack
SMID Cap
Growth Fund | | | Tamarack
Enterprise
Fund | |
|---|
| | |
| | |
| | |
| | |
| |
| Shares Outstanding (Unlimited number of shares authorized, no par value): | | | | | | | | | | | | | | | | | | |
| Class A | | | | | 375,040 | | | | 3,153,566 | | | | 522,516 | | | | 798,484 | |
| Class I | | | | | 100,018 | | | | 5,414,802 | | | | 420,321 | | | | 1,707,792 | |
| Class C | | | | | 3,190 | | | | 162,355 | | | | 3,073 | | | | 107,777 | |
| Class R | | | | | 922 | | | | 852 | | | | 3,586 | | | | 2,016 | |
| Class S | | | | | 10,003,341 | | | | 127,535 | | | | 27,482 | | | | 11,542,495 | |
| | |
| | |
| | |
| | |
| |
| Total | | | | | 10,482,511 | | | | 8,859,110 | | | | 976,978 | | | | 14,158,564 | |
| | |
| | |
| | |
| | |
| |
| Net Asset Values and Redemption Price per Share: | | | | | | | | | | | | | | | | | | |
| Class A (a) | | | | $ | 11.14 | | | $ | 12.73 | | | $ | 10.10 | | | $ | 25.18 | |
| | |
| | |
| | |
| | |
| |
| Class I | | | | $ | 11.29 | | | $ | 13.15 | | | $ | 10.47 | | | $ | 25.39 | |
| | |
| | |
| | |
| | |
| |
| Class C (b) | | | | $ | 10.90 | | | $ | 12.45 | | | $ | 9.80 | | | $ | 24.52 | |
| | |
| | |
| | |
| | |
| |
| Class R | | | | $ | 11.05 | (c) | | $ | 12.64 | | | $ | 9.98 | | | $ | 24.95 | |
| | |
| | |
| | |
| | |
| |
| Class S | | | | $ | 11.29 | | | $ | 13.16 | | | $ | 10.46 | | | $ | 25.38 | |
| | |
| | |
| | |
| | |
| |
| Maximum Offering Price Per Share: | | | | | | | | | | | | | | | | | | |
| Class A | | | | $ | 11.82 | | | $ | 13.51 | | | $ | 10.72 | | | $ | 26.72 | |
| | |
| | |
| | |
| | |
| |
| Maximum Sales Charge - Class A | | | | | 5.75 | % | | | 5.75 | % | | | 5.75 | % | | | 5.75 | % |
| | |
| | |
| | |
| | |
| |
| (a) | For Class A shares, redemption price per share is reduced by 1.00% for sales of shares within 12 months of purchase (applicable on purchases of $1 million or more on which no initial sales charge was paid). |
| (b) | For Class C shares, redemption price per share is reduced by 1.00% for sales of shares within 12 months of purchase. |
| (c) | Net asset value is calculated using unrounded net assets of $10,195.21 divided by the unrounded shares of 922.37. |
See notes to financial statements.
25
Table of Contents
FINANCIAL STATEMENTS
Statements of Assets and Liabilities (cont.)
March 31, 2007
(Unaudited)
| | | Tamarack
Small Cap
Core Fund | | | Tamarack
Value Fund | | | Tamarack
Microcap
Value Fund | |
|---|
| | |
| | |
| | |
| |
| Assets: | | | | | | | | | | | | | | |
| Investments, at value (cost $47,007,093; $244,924,653 and $269,284,570, respectively) | | | | $ | 71,045,547 | | | $ | 279,756,016 | | | $ | 367,928,946 | |
| Investment of cash collateral for securities on loan, at value (cost $10,168,057; $13,215,583 and $-, respectively) | | | | | 10,168,057 | | | | 13,215,583 | | | | — | |
| | |
| | |
| | |
| |
| Total Investments | | | | | 81,213,604 | | | | 292,971,599 | | | | 367,928,946 | |
| Interest and dividends receivable | | | | | 55,900 | | | | 510,276 | | | | 274,144 | |
| Receivable for capital shares issued | | | | | 75,527 | | | | 8,323 | | | | 1,648,567 | |
| Receivable for investments sold | | | | | 220,588 | | | | 5,411,899 | | | | — | |
| Prepaid expenses | | | | | 30,861 | | | | 26,694 | | | | 64,488 | |
| | |
| | |
| | |
| |
| Total Assets | | | | | 81,596,480 | | | | 298,928,791 | | | | 369,916,145 | |
| | |
| | |
| | |
| |
| Liabilities: | | | | | | | | | | | | | | |
| Cash overdraft | | | | | 43 | | | | — | | | | 7 | |
| Payable for capital shares redeemed | | | | | 12,035 | | | | 231,358 | | | | 87,421 | |
| Payable for investments purchased | | | | | 542,268 | | | | 8,355,078 | | | | 677,084 | |
| Payable upon return of securities on loan | | | | | 10,168,057 | | | | 13,215,583 | | | | — | |
| Accrued expenses and other payables: | | | | | | | | | | | | | | |
| Investment advisory fees | | | | | 42,170 | | | | 113,775 | | | | 212,926 | |
| Administration fees | | | | | 5,914 | | | | 23,367 | | | | 30,514 | |
| Distribution fees | | | | | 1,052 | | | | 138 | | | | 11,793 | |
| Other | | | | | 65,078 | | | | 197,972 | | | | 78,108 | |
| | |
| | |
| | |
| |
| Total Liabilities | | | | | 10,836,617 | | | | 22,137,271 | | | | 1,097,853 | |
| | |
| | |
| | |
| |
| Net Assets | | | | $ | 70,759,863 | | | $ | 276,791,520 | | | $ | 368,818,292 | |
| | |
| | |
| | |
| |
| Net Assets Consist Of: | | | | | | | | | | | | | | |
| Capital | | | | $ | 42,595,478 | | | $ | 165,190,891 | | | $ | 269,692,013 | |
| Undistributed net investment income (loss) | | | | | 218,411 | | | | 2,110,480 | | | | (285,393 | ) |
| Accumulated net realized gains (losses) from investment transactions | | | | | 3,907,520 | | | | 74,658,786 | | | | 767,296 | |
| Net unrealized appreciation (depreciation) on investments | | | | | 24,038,454 | | | | 34,831,363 | | | | 98,644,376 | |
| | |
| | |
| | |
| |
| Net Assets | | | | $ | 70,759,863 | | | $ | 276,791,520 | | | $ | 368,818,292 | |
| | |
| | |
| | |
| |
| Net Assets: | | | | | | | | | | | | | | |
| Class A | | | | $ | 2,821,029 | | | $ | 554,643 | | | $ | 41,127,770 | |
| Class C | | | | | 572,002 | | | | 25,467 | | | | 3,767,010 | |
| Class R | | | | | 15,510 | | | | 4,223 | | | | 540,086 | |
| Class S | | | | | 67,351,322 | | | | 276,207,187 | | | | 323,383,426 | |
| | |
| | |
| | |
| |
| Total | | | | $ | 70,759,863 | | | $ | 276,791,520 | | | $ | 368,818,292 | |
| | |
| | |
| | |
| |
26
Table of Contents
FINANCIAL STATEMENTS
Statements of Assets and Liabilities (cont.)
| | | Tamarack
Small Cap
Core Fund | | | Tamarack
Value Fund | | | Tamarack
Microcap
Value Fund | |
|---|
| | |
| | |
| | |
| |
| Shares Outstanding (Unlimited number of shares authorized, no par value): | | | | | | | | | | | | | | |
| Class A | | | | | 90,682 | | | | 13,898 | | | | 1,795,230 | |
| Class C | | | | | 18,827 | | | | 645 | | | | 167,754 | |
| Class R | | | | | 502 | | | | 106 | | | | 23,677 | |
| Class S | | | | | 2,152,555 | | | | 6,914,332 | | | | 14,051,898 | |
| | |
| | |
| | |
| |
| Total | | | | | 2,262,566 | | | | 6,928,981 | | | | 16,038,559 | |
| | |
| | |
| | |
| |
| Net Asset Values and Redemption Price per Share: | | | | | | | | | | | | | | |
| Class A (a) | | | | $ | 31.11 | | | $ | 39.91 | | | $ | 22.91 | |
| | |
| | |
| | |
| |
| Class C (b) | | | | $ | 30.38 | | | $ | 39.48 | | | $ | 22.46 | |
| | |
| | |
| | |
| |
| Class R | | | | $ | 30.87 | (c) | | $ | 39.84 | | | $ | 22.81 | |
| | |
| | |
| | |
| |
| Class S | | | | $ | 31.29 | | | $ | 39.95 | | | $ | 23.01 | |
| | |
| | |
| | |
| |
| Maximum Offering Price Per Share: | | | | | | | | | | | | | | |
| Class A | | | | $ | 33.01 | | | $ | 42.34 | | | $ | 24.31 | |
| | |
| | |
| | |
| |
| Maximum Sales Charge - Class A | | | | | 5.75 | % | | | 5.75 | % | | | 5.75 | % |
| | |
| | |
| | |
| |
| (a) | For Class A shares, redemption price per share is reduced by 1.00% for sales of shares within 12 months of purchase (applicable on purchases of $1 million or more on which no initial sales charge was paid). |
| (b) | For Class C shares, redemption price per share is reduced by 1.00% for sales of shares within 12 months of purchase. |
| (c) | Net asset value is calculated using unrounded net assets of $15,509.86 divided by the unrounded shares outstanding of 502.40. |
See notes to financial statements.
27
Table of Contents
FINANCIAL STATEMENTS
Statements of Operations
For the Six Months Ended
March 31, 2007
(Unaudited)
| | | Tamarack
Large Cap
Growth Fund | | | Tamarack
Mid Cap
Growth Fund | | | Tamarack
SMID Cap
Growth Fund | | | Tamarack
Enterprise
Fund | |
|---|
| | |
| | |
| | |
| | |
| |
| Investment Income: | | | | | | | | | | | | | | | | | | |
| Interest income | | | | $ | 27,984 | | | $ | 27,703 | | | $ | 504 | | | $ | 304,589 | |
| Dividend income | | | | | 599,153 | | | | 304,777 | | | | 19,066 | | | | 2,564,879 | |
| Securities lending income (a) | | | | | 8,004 | | | | 11,124 | | | | — | | | | 114,800 | |
| | |
| | |
| | |
| | |
| |
| Total Investment Income | | | | | 635,141 | | | | 343,604 | | | | 19,570 | | | | 2,984,268 | |
| | |
| | |
| | |
| | |
| |
| Expenses: | | | | | | | | | | | | | | | | | | |
| Investment advisory fees | | | | | 444,596 | | | | 413,419 | | | | 37,117 | | | | 1,697,494 | |
| Administration fees | | | | | 63,513 | | | | 59,059 | | | | 5,302 | | | | 180,298 | |
| Distribution fees - Class A | | | | | 12,124 | | | | 105,615 | | | | 14,135 | | | | 48,499 | |
| Distribution fees - Class C | | | | | 155 | | | | 10,434 | | | | 178 | | | | 12,492 | |
| Distribution fees - Class R | | | | | 25 | | | | 26 | | | | 79 | | | | 130 | |
| Accounting fees | | | | | 47,930 | | | | 44,899 | | | | 7,888 | | | | 130,018 | |
| Custodian fees | | | | | 1,863 | | | | 1,519 | | | | 1,562 | | | | 4,863 | |
| Insurance fees | | | | | 4,469 | | | | 4,205 | | | | 385 | | | | 12,610 | |
| Legal and Audit fees | | | | | 20,913 | | | | 16,514 | | | | 9,607 | | | | 28,534 | |
| Registration and filing fees | | | | | 28,295 | | | | 29,280 | | | | 28,778 | | | | 28,027 | |
| Shareholder reports | | | | | 31,894 | | | | 13,182 | | | | 5,022 | | | | 43,756 | |
| Transfer agent fees | | | | | 177,451 | | | | 170,453 | | | | 37,401 | | | | 223,264 | |
| Trustees’ fees | | | | | 9,523 | | | | 9,508 | | | | 9,351 | | | | 9,850 | |
| Other fees | | | | | 1,555 | | | | 1,441 | | | | 257 | | | | 4,079 | |
| | |
| | |
| | |
| | |
| |
| Total expenses before fee reductions | | | | | 844,306 | | | | 879,554 | | | | 157,062 | | | | 2,423,914 | |
| Expenses reduced by: | | | | | | | | | | | | | | | | | | |
| Advisor | | | | | (197,438 | ) | | | (113,814 | ) | | | (66,749 | ) | | | (415,797 | ) |
| Distributor | | | | | (6,062 | ) | | | (52,808 | ) | | | (7,067 | ) | | | (24,249 | ) |
| | |
| | |
| | |
| | |
| |
| Net Expenses | | | | | 640,806 | | | | 712,932 | | | | 83,246 | | | | 1,983,868 | |
| | |
| | |
| | |
| | |
| |
| Net Investment Income (Loss) | | | | | (5,665 | ) | | | (369,328 | ) | | | (63,676 | ) | | | 1,000,400 | |
| | |
| | |
| | |
| | |
| |
| Realized/Unrealized Gains (Losses) from Investments: | | | | | | | | | | | | | | | | | | |
| Net realized gains (losses) from investment transactions | | | | | 3,419,514 | | | | 3,891,002 | | | | 1,315,172 | | | | 19,083,970 | |
| Net change in unrealized appreciation (depreciation) on investments | | | | | 406,377 | | | | 2,314,760 | | | | (824,874 | ) | | | 12,749,117 | |
| | |
| | |
| | |
| | |
| |
| Net realized/unrealized gains (losses) from investments | | | | | 3,825,891 | | | | 6,205,762 | | | | 490,298 | | | | 31,833,087 | |
| | |
| | |
| | |
| | |
| |
| Change in net assets resulting from operations | | | | $ | 3,820,226 | | | $ | 5,836,434 | | | $ | 426,622 | | | $ | 32,833,487 | |
| | |
| | |
| | |
| | |
| |
| (a) | For more information on Securities Lending, please see Footnote 2 in the Notes to Financial Statements. |
See notes to financial statements.
28
Table of Contents
FINANCIAL STATEMENTS
Statements of Operations (cont.)
For the Six Months Ended
March 31, 2007
(Unaudited)
| | | Tamarack
Small Cap
Core Fund | | | Tamarack
Value Fund | | | Tamarack
Microcap
Value Fund | |
|---|
| | |
| | |
| | |
| |
| Investment Income: | | | | | | | | | | | | | | |
| Interest income | | | | $ | 49,255 | | | $ | 167,626 | | | $ | 402,199 | |
| Dividend income | | | | | 1,003,415 | | | | 3,448,952 | | | | 1,961,190 | |
| Securities lending income (a) | | | | | 17,946 | | | | 13,807 | | | | — | |
| | |
| | |
| | |
| |
| Total Investment Income | | | | | 1,070,616 | | | | 3,630,385 | | | | 2,363,389 | |
| | |
| | |
| | |
| |
| Expenses: | | | | | | | | | | | | | | |
| Investment advisory fees | | | | | 387,500 | | | | 1,223,787 | | | | 1,516,195 | |
| Administration fees | | | | | 34,745 | | | | 143,973 | | | | 168,464 | |
| Distribution fees - Class A | | | | | 6,369 | | | | 1,453 | | | | 87,449 | |
| Distribution fees - Class C | | | | | 2,325 | | | | 124 | | | | 14,116 | |
| Distribution fees - Class R | | | | | 39 | | | | 11 | | | | 988 | |
| Accounting fees | | | | | 28,363 | | | | 104,203 | | | | 126,866 | |
| Custodian fees | | | | | 2,690 | | | | 4,365 | | | | 10,878 | |
| Insurance fees | | | | | 2,229 | | | | 9,704 | | | | 7,687 | |
| Legal and Audit fees | | | | | 11,653 | | | | 23,177 | | | | 20,011 | |
| Registration and filing fees | | | | | 26,241 | | | | 23,067 | | | | 27,235 | |
| Shareholder reports | | | | | 10,989 | | | | 55,051 | | | | 25,739 | |
| Transfer agent fees | | | | | 60,565 | | | | 251,764 | | | | 130,414 | |
| Trustees’ fees | | | | | 9,434 | | | | 9,749 | | | | 9,769 | |
| Other fees | | | | | 865 | | | | 3,341 | | | | 3,325 | |
| | |
| | |
| | |
| |
| Total expenses before fee reductions | | | | | 584,007 | | | | 1,853,769 | | | | 2,149,136 | |
| Expenses reduced by: | | | | | | | | | | | | | | |
| Advisor | | | | | (123,571 | ) | | | (370,078 | ) | | | (243,712 | ) |
| Distributor | | | | | (3,184 | ) | | | (727 | ) | | | (43,724 | ) |
| | |
| | |
| | |
| |
| Net Expenses | | | | | 457,252 | | | | 1,482,964 | | | | 1,861,700 | |
| | |
| | |
| | |
| |
| Net Investment Income (Loss) | | | | | 613,364 | | | | 2,147,421 | | | | 501,689 | |
| | |
| | |
| | |
| |
| Realized/Unrealized Gains (Losses) from Investments: | | | | | | | | | | | | | | |
| Net realized gains (losses) from investment transactions | | | | | 4,426,023 | | | | 77,709,774 | | | | 1,216,735 | |
| Net change in unrealized appreciation (depreciation) on investments | | | | | 1,414,635 | | | | (63,370,650 | ) | | | 30,478,840 | |
| | |
| | |
| | |
| |
| Net realized/unrealized gains (losses) from investments | | | | | 5,840,658 | | | | 14,339,124 | | | | 31,695,575 | |
| | |
| | |
| | |
| |
| Change in net assets resulting from operations | | | | $ | 6,454,022 | | | $ | 16,486,545 | | | $ | 32,197,264 | |
| | |
| | |
| | |
| |
| (a) | For more information on Securities Lending, please see Footnote 2 in the Notes to Financial Statements. |
See notes to financial statements.
29
Table of Contents
FINANCIAL STATEMENTS
Statements of Changes in Net Assets
Tamarack Large Cap Growth Fund
| | | For the
Six Months Ended
March 31, 2007 | | | For the
Year Ended
September 30, 2006 | |
|---|
| | |
| | |
| |
| | | (Unaudited) | | |
|---|
| From Investment Activities: | | | | | | | | | | |
| Operations: | | | | | | | | | | |
| Net investment income (loss) | | | | $ | (5,665 | ) | | $ | (43,633 | ) |
| Net realized gains (losses) from investment transactions | | | | | 3,419,514 | | | | 7,321,698 | |
| Net change in unrealized appreciation (depreciation) on investments | | | | | 406,377 | | | | (3,758,766 | ) |
| | |
| | |
| |
| Change in net assets resulting from operations | | | | | 3,820,226 | | | | 3,519,299 | |
| | |
| | |
| |
| Distributions to Class A Shareholders: | | | | | | | | | | |
| From net investment income | | | | | — | | | | — | |
| From net realized gains from investment transactions | | | | | — | | | | — | |
| Distributions to Class I Shareholders: | | | | | | | | | | |
| From net investment income | | | | | — | | | | (928 | ) |
| From net realized gains from investment transactions | | | | | — | | | | — | |
| Distributions to Class C Shareholders: | | | | | | | | | | |
| From net investment income | | | | | — | | | | — | |
| From net realized gains from investment transactions | | | | | — | | | | — | |
| Distributions to Class R Shareholders: | | | | | | | | | | |
| From net investment income | | | | | — | | | | — | |
| From net realized gains from investment transactions | | | | | — | | | | — | |
| Distributions to Class S Shareholders: | | | | | | | | | | |
| From net investment income | | | | | — | | | | (62,129 | ) |
| From net realized gains from investment transactions | | | | | — | | | | — | |
| | |
| | |
| |
| Change in net assets resulting from shareholder distributions | | | | | — | | | | (63,057 | ) |
| | |
| | |
| |
| Capital Transactions: | | | | | | | | | | |
| Proceeds from shares issued | | | | | 735,881 | | | | 1,940,383 | |
| Dividends reinvested | | | | | — | | | | 56,446 | |
| Cost of shares redeemed | | | | | (17,904,844 | ) | | | (29,390,661 | ) |
| | |
| | |
| |
| Change in net assets resulting from capital transactions | | | | | (17,168,963 | ) | | | (27,393,832 | ) |
| | |
| | |
| |
| Net increase (decrease) in net assets | | | | | (13,348,737 | ) | | | (23,937,590 | ) |
| Net Assets: | | | | | | | | | | |
| Beginning of period | | | | | 131,666,853 | | | | 155,604,443 | |
| | |
| | |
| |
| End of period | | | | $ | 118,318,116 | | | $ | 131,666,853 | |
| | |
| | |
| |
| Undistributed net investment income (loss) | | | | $ | (5,665 | ) | | $ | — | |
| | |
| | |
| |
| Share Transactions: | | | | | | | | | | |
| Issued | | | | | 65,524 | | | | 175,817 | |
| Reinvested | | | | | — | | | | 4,982 | |
| Redeemed | | | | | (1,582,801 | ) | | | (2,658,951 | ) |
| | |
| | |
| |
| Change in shares resulting from capital transactions | | | | | (1,517,277 | ) | | | (2,478,152 | ) |
| | |
| | |
| |
See notes to financial statements.
30
Table of Contents
FINANCIAL STATEMENTS
Statements of Changes in Net Assets (cont.)
Tamarack Mid Cap Growth Fund
| | | For the
Six Months Ended
March 31, 2007 | | | For the
Year Ended
September 30, 2006 | |
|---|
| | |
| | |
| |
| | | (Unaudited) | | |
|---|
| From Investment Activities: | | | | | | | | | | |
| Operations: | | | | | | | | | | |
| Net investment income (loss) | | | | $ | (369,328 | ) | | $ | (608,782 | ) |
| Net realized gains (losses) from investment transactions | | | | | 3,891,002 | | | | 4,228,187 | |
| Net change in unrealized appreciation (depreciation) on investments | | | | | 2,314,760 | | | | 4,591,148 | |
| | |
| | |
| |
| Change in net assets resulting from operations | | | | | 5,836,434 | | | | 8,210,553 | |
| | |
| | |
| |
| Distributions to Class A Shareholders: | | | | | | | | | | |
| From net investment income | | | | | — | | | | — | |
| From net realized gains from investment transactions | | | | | (1,156,808 | ) | | | (855,699 | ) |
| Distributions to Class I Shareholders: | | | | | | | | | | |
| From net investment income | | | | | — | | | | — | |
| From net realized gains from investment transactions | | | | | (1,923,501 | ) | | | (1,192,053 | ) |
| Distributions to Class C Shareholders: | | | | | | | | | | |
| From net investment income | | | | | — | | | | — | |
| From net realized gains from investment transactions | | | | | (59,163 | ) | | | (7,302 | ) |
| Distributions to Class R Shareholders: | | | | | | | | | | |
| From net investment income | | | | | — | | | | — | |
| From net realized gains from investment transactions | | | | | (287 | ) | | | (186 | ) |
| Distributions to Class S Shareholders: | | | | | | | | | | |
| From net investment income | | | | | — | | | | — | |
| From net realized gains from investment transactions | | | | | (44,185 | ) | | | (28,062 | ) |
| | |
| | |
| |
| Change in net assets resulting from shareholder distributions | | | | | (3,183,944 | ) | | | (2,083,302 | ) |
| | |
| | |
| |
| Capital Transactions: | | | | | | | | | | |
| Proceeds from shares issued | | | | | 5,871,120 | | | | 27,231,648 | |
| Dividends reinvested | | | | | 3,121,844 | | | | 2,033,557 | |
| Cost of shares redeemed | | | | | (17,196,419 | ) | | | (24,717,145 | ) |
| | |
| | |
| |
| Change in net assets resulting from capital transactions | | | | | (8,203,455 | ) | | | 4,548,060 | |
| | |
| | |
| |
| Net increase (decrease) in net assets | | | | | (5,550,965 | ) | | | 10,675,311 | |
| Net Assets: | | | | | | | | | | |
| Beginning of period | | | | | 120,603,388 | | | | 109,928,077 | |
| | |
| | |
| |
| End of period | | | | $ | 115,052,423 | | | $ | 120,603,388 | |
| | |
| | |
| |
| Undistributed net investment income (loss) | | | | $ | (369,328 | ) | | $ | — | |
| | |
| | |
| |
| Share Transactions: | | | | | | | | | | |
| Issued | | | | | 456,162 | | | | 2,065,479 | |
| Reinvested | | | | | 250,032 | | | | 158,873 | |
| Redeemed | | | | | (1,344,146 | ) | | | (1,970,247 | ) |
| | |
| | |
| |
| Change in shares resulting from capital transactions | | | | | (637,952 | ) | | | 254,105 | |
| | |
| | |
| |
See notes to financial statements.
31
Table of Contents
FINANCIAL STATEMENTS
Statements of Changes in Net Assets (cont.)
Tamarack SMID Cap Growth Fund
| | | For the
Six Months Ended
March 31, 2007 | | | For the
Year Ended
September 30, 2006 | |
|---|
| | |
| | |
| |
| | | (Unaudited) | | | | |
|---|
| From Investment Activities: | | | | | | | | | | |
| Operations: | | | | | | | | | | |
| Net investment income (loss) | | | | $ | (63,676 | ) | | $ | (138,004 | ) |
| Net realized gains (losses) from investment transactions | | | | | 1,315,172 | | | | 767,278 | |
| Net change in unrealized appreciation (depreciation) on investments | | | | | (824,874 | ) | | | (167,322 | ) |
| | |
| | |
| |
| Change in net assets resulting from operations | | | | | 426,622 | | | | 461,952 | |
| | |
| | |
| |
| Distributions to Class A Shareholders: | | | | | | | | | | |
| From net investment income | | | | | — | | | | — | |
| From net realized gains from investment transactions | | | | | (366,850 | ) | | | (1,942,958 | ) |
| Distributions to Class I Shareholders: | | | | | | | | | | |
| From net investment income | | | | | — | | | | — | |
| From net realized gains from investment transactions | | | | | (289,387 | ) | | | (922,615 | ) |
| Distributions to Class C Shareholders: | | | | | | | | | | |
| From net investment income | | | | | — | | | | — | |
| From net realized gains from investment transactions | | | | | (2,627 | ) | | | (14,323 | ) |
| Distributions to Class R Shareholders: | | | | | | | | | | |
| From net investment income | | | | | — | | | | — | |
| From net realized gains from investment transactions | | | | | (2,033 | ) | | | (8,748 | ) |
| Distributions to Class S Shareholders: | | | | | | | | | | |
| From net investment income | | | | | — | | | | — | |
| From net realized gains from investment transactions | | | | | (17,047 | ) | | | (58,989 | ) |
| | |
| | |
| |
| Change in net assets resulting from shareholder distributions | | | | | (677,944 | ) | | | (2,947,633 | ) |
| | |
| | |
| |
| Capital Transactions: | | | | | | | | | | |
| Proceeds from shares issued | | | | | 491,037 | | | | 2,960,531 | |
| Dividends reinvested | | | | | 654,225 | | | | 2,776,551 | |
| Cost of shares redeemed | | | | | (1,582,981 | ) | | | (4,653,751 | ) |
| | |
| | |
| |
| Change in net assets resulting from capital transactions | | | | | (437,719 | ) | | | 1,083,331 | |
| | |
| | |
| |
| Net increase (decrease) in net assets | | | | | (689,041 | ) | | | (1,402,350 | ) |
| Net Assets: | | | | | | | | | | |
| Beginning of period | | | | | 10,717,337 | | | | 12,119,687 | |
| | |
| | |
| |
| End of period | | | | $ | 10,028,296 | | | $ | 10,717,337 | |
| | |
| | |
| |
| Undistributed net investment income (loss) | | | | $ | (63,676 | ) | | $ | — | |
| | |
| | |
| |
| Share Transactions: | | | | | | | | | | |
| Issued | | | | | 46,879 | | | | 263,232 | |
| Reinvested | | | | | 64,053 | | | | 266,407 | |
| Redeemed | | | | | (150,475 | ) | | | (402,959 | ) |
| | |
| | |
| |
| Change in shares resulting from capital transactions | | | | | (39,543 | ) | | | 126,680 | |
| | |
| | |
| |
See notes to financial statements.
32
Table of Contents
FINANCIAL STATEMENTS
Statements of Changes in Net Assets (cont.)
Tamarack Enterprise Fund
| | | For the
Six Months Ended
March 31, 2007 | | | For the
Year Ended
September 30, 2006 | |
|---|
| | |
| | |
| |
| | | (Unaudited) | | | | |
|---|
| From Investment Activities: | | | | | | | | | | |
| Operations: | | | | | | | | | | |
| Net investment income (loss) | | | | $ | 1,000,400 | | | $ | 189,125 | |
| Net realized gains (losses) from investment transactions | | | | | 19,083,970 | | | | 31,052,535 | |
| Net change in unrealized appreciation (depreciation) on investments | | | | | 12,749,117 | | | | (2,900,464 | ) |
| | |
| | |
| |
| Change in net assets resulting from operations | | | | | 32,833,487 | | | | 28,341,196 | |
| | |
| | |
| |
| Distributions to Class A Shareholders: | | | | | | | | | | |
| From net investment income | | | | | — | | | | — | |
| From net realized gains from investment transactions | | | | | (1,650,953 | ) | | | (1,714,562 | ) |
| Distributions to Class I Shareholders: | | | | | | | | | | |
| From net investment income | | | | | (31,267 | ) | | | — | |
| From net realized gains from investment transactions | | | | | (3,012,968 | ) | | | (3,431,576 | ) |
| Distributions to Class C Shareholders: | | | | | | | | | | |
| From net investment income | | | | | — | | | | — | |
| From net realized gains from investment transactions | | | | | (213,776 | ) | | | (106,524 | ) |
| Distributions to Class R Shareholders: | | | | | | | | | | |
| From net investment income | | | | | — | | | | — | |
| From net realized gains from investment transactions | | | | | (4,695 | ) | | | (6,998 | ) |
| Distributions to Class S Shareholders: | | | | | | | | | | |
| From net investment income | | | | | (258,184 | ) | | | — | |
| From net realized gains from investment transactions | | | | | (24,883,698 | ) | | | (37,704,988 | ) |
| | |
| | |
| |
| Change in net assets resulting from shareholder distributions | | | | | (30,055,541 | ) | | | (42,964,648 | ) |
| | |
| | |
| |
| Capital Transactions: | | | | | | | | | | |
| Proceeds from shares issued | | | | | 25,529,312 | | | | 42,750,442 | |
| Dividends reinvested | | | | | 27,256,559 | | | | 38,814,292 | |
| Cost of shares redeemed | | | | | (55,948,351 | ) | | | (78,409,731 | ) |
| | |
| | |
| |
| Change in net assets resulting from capital transactions | | | | | (3,162,480 | ) | | | 3,155,003 | |
| | |
| | |
| |
| Net increase (decrease) in net assets | | | | | (384,534 | ) | | | (11,468,449 | ) |
| Net Assets: | | | | | | | | | | |
| Beginning of period | | | | | 359,441,624 | | | | 370,910,073 | |
| | |
| | |
| |
| End of period | | | | $ | 359,057,090 | | | $ | 359,441,624 | |
| | |
| | |
| |
| Undistributed net investment income (loss) | | | | $ | 900,074 | | | $ | 189,125 | |
| | |
| | |
| |
| Share Transactions: | | | | | | | | | | |
| Issued | | | | | 1,002,888 | | | | 1,687,288 | |
| Reinvested | | | | | 1,111,333 | | | | 1,675,630 | |
| Redeemed | | | | | (2,169,951 | ) | | | (3,113,691 | ) |
| | |
| | |
| |
| Change in shares resulting from capital transactions | | | | | (55,730 | ) | | | 249,227 | |
| | |
| | |
| |
See notes to financial statements.
33
Table of Contents
FINANCIAL STATEMENTS
Statements of Changes in Net Assets (cont.)
Tamarack Small Cap Core Fund
| | | For the
Six Months Ended
March 31, 2007 | | | For the
Year Ended
September 30, 2006 | |
|---|
| | |
| | |
| |
| | | (Unaudited) | | | | |
|---|
| From Investment Activities: | | | | | | | | | | |
| Operations: | | | | | | | | | | |
| Net investment income (loss) | | | | $ | 613,364 | | | $ | (167,598 | ) |
| Net realized gains (losses) from investment transactions | | | | | 4,426,023 | | | | 7,438,440 | |
| Net change in unrealized appreciation (depreciation) on investments | | | | | 1,414,635 | | | | 2,164,571 | |
| | |
| | |
| |
| Change in net assets resulting from operations | | | | | 6,454,022 | | | | 9,435,413 | |
| | |
| | |
| |
| Distributions to Class A Shareholders: | | | | | | | | | | |
| From net investment income | | | | | (8,590 | ) | | | — | |
| From net realized gains from investment transactions | | | | | (258,301 | ) | | | (446,947 | ) |
| Distributions to Class C Shareholders: | | | | | | | | | | |
| From net investment income | | | | | — | | | | — | |
| From net realized gains from investment transactions | | | | | (46,287 | ) | | | (95,246 | ) |
| Distributions to Class R Shareholders: | | | | | | | | | | |
| From net investment income | | | | | (20 | ) | | | — | |
| From net realized gains from investment transactions | | | | | (1,661 | ) | | | (2,727 | ) |
| Distributions to Class S Shareholders: | | | | | | | | | | |
| From net investment income | | | | | (386,343 | ) | | | — | |
| From net realized gains from investment transactions | | | | | (6,777,479 | ) | | | (10,203,874 | ) |
| | |
| | |
| |
| Change in net assets resulting from shareholder distributions | | | | | (7,478,681 | ) | | | (10,748,794 | ) |
| | |
| | |
| |
| Capital Transactions: | | | | | | | | | | |
| Proceeds from shares issued | | | | | 1,700,301 | | | | 3,271,484 | |
| Dividends reinvested | | | | | 6,965,827 | | | | 10,265,969 | |
| Cost of shares redeemed | | | | | (4,394,451 | ) | | | (16,066,758 | ) |
| | |
| | |
| |
| Change in net assets resulting from capital transactions | | | | | 4,271,677 | | | | (2,529,305 | ) |
| | |
| | |
| |
| Net increase (decrease) in net assets | | | | | 3,247,018 | | | | (3,842,686 | ) |
| Net Assets: | | | | | | | | | | |
| Beginning of period | | | | | 67,512,845 | | | | 71,355,531 | |
| | |
| | |
| |
| End of period | | | | $ | 70,759,863 | | | $ | 67,512,845 | |
| | |
| | |
| |
| Undistributed net investment income (loss) | | | | $ | 218,411 | | | $ | — | |
| | |
| | |
| |
| Share Transactions: | | | | | | | | | | |
| Issued | | | | | 53,932 | | | | 104,355 | |
| Reinvested | | | | | 234,154 | | | | 365,085 | |
| Redeemed | | | | | (139,496 | ) | | | (513,998 | ) |
| | |
| | |
| |
| Change in shares resulting from capital transactions | | | | | 148,590 | | | | (44,558 | ) |
| | |
| | |
| |
See notes to financial statements.
34
Table of Contents
FINANCIAL STATEMENTS
Statements of Changes in Net Assets (cont.)
Tamarack Value Fund
| | | For the
Six Months Ended
March 31, 2007 | | | For the
Year Ended
September 30, 2006 | |
|---|
| | |
| | |
| |
| | | (Unaudited) | | | | |
|---|
| From Investment Activities: | | | | | | | | | | |
| Operations: | | | | | | | | | | |
| Net investment income (loss) | | | | $ | 2,147,421 | | | $ | 4,318,258 | |
| Net realized gains (losses) from investment transactions | | | | | 77,709,774 | | | | 32,266,673 | |
| Net change in unrealized appreciation (depreciation) on investments | | | | | (63,370,650 | ) | | | (8,051,450 | ) |
| | |
| | |
| |
| Change in net assets resulting from operations | | | | | 16,486,545 | | | | 28,533,481 | |
| | |
| | |
| |
| Distributions to Class A Shareholders: | | | | | | | | | | |
| From net investment income | | | | | (6,777 | ) | | | (25,171 | ) |
| From net realized gains from investment transactions | | | | | (51,226 | ) | | | (346,127 | ) |
| Distributions to Class C Shareholders: | | | | | | | | | | |
| From net investment income | | | | | (143 | ) | | | (127 | ) |
| From net realized gains from investment transactions | | | | | (2,125 | ) | | | (4,337 | ) |
| Distributions to Class R Shareholders: | | | | | | | | | | |
| From net investment income | | | | | (42 | ) | | | (31 | ) |
| From net realized gains from investment transactions | | | | | (348 | ) | | | (571 | ) |
| Distributions to Class S Shareholders: | | | | | | | | | | |
| From net investment income | | | | | (4,197,693 | ) | | | (4,711,754 | ) |
| From net realized gains from investment transactions | | | | | (24,181,519 | ) | | | (54,587,535 | ) |
| | |
| | |
| |
| Change in net assets resulting from shareholder distributions | | | | | (28,439,873 | ) | | | (59,675,653 | ) |
| | |
| | |
| |
| Capital Transactions: | | | | | | | | | | |
| Proceeds from shares issued | | | | | 2,130,341 | | | | 10,321,320 | |
| Dividends reinvested | | | | | 27,177,009 | | | | 57,708,479 | |
| Cost of shares redeemed | | | | | (32,816,590 | ) | | | (113,751,128 | ) |
| | |
| | |
| |
| Change in net assets resulting from capital transactions | | | | | (3,509,240 | ) | | | (45,721,329 | ) |
| | |
| | |
| |
| Net increase (decrease) in net assets | | | | | (15,462,568 | ) | | | (76,863,501 | ) |
| Net Assets: | | | | | | | | | | |
| Beginning of period | | | | | 292,254,088 | | | | 369,117,589 | |
| | |
| | |
| |
| End of period | | | | $ | 276,791,520 | | | $ | 292,254,088 | |
| | |
| | |
| |
| Undistributed net investment income (loss) | | | | $ | 2,110,480 | | | $ | 4,167,714 | |
| | |
| | |
| |
| Share Transactions: | | | | | | | | | | |
| Issued | | | | | 52,186 | | | | 252,465 | |
| Reinvested | | | | | 674,035 | | | | 1,481,233 | |
| Redeemed | | | | | (799,379 | ) | | | (2,795,287 | ) |
| | |
| | |
| |
| Change in shares resulting from capital transactions | | | | | (73,158 | ) | | | (1,061,589 | ) |
| | |
| | |
| |
See notes to financial statements.
35
Table of Contents
FINANCIAL STATEMENTS
Statements of Changes in Net Assets (cont.)
Tamarack Microcap Value Fund
| | | For the
Six Months Ended
March 31, 2007 | | | For the
Year Ended
September 30, 2006 | |
|---|
| | |
| | |
| |
| | | (Unaudited) | | | | |
|---|
| From Investment Activities: | | | | | | | | | | |
| Operations: | | | | | | | | | | |
| Net investment income (loss) | | | | $ | 501,689 | | | $ | 569,330 | |
| Net realized gains (losses) from investment transactions | | | | | 1,216,735 | | | | 24,703,831 | |
| Net change in unrealized appreciation (depreciation) on investments | | | | | 30,478,840 | | | | 5,136,261 | |
| | |
| | |
| |
| Change in net assets resulting from operations | | | | | 32,197,264 | | | | 30,409,422 | |
| | |
| | |
| |
| Distributions to Class A Shareholders: | | | | | | | | | | |
| From net investment income | | | | | — | | | | (22,835 | ) |
| From net realized gains from investment transactions | | | | | (2,208,456 | ) | | | (998,432 | ) |
| Distributions to Class C Shareholders: | | | | | | | | | | |
| From net investment income | | | | | — | | | | — | |
| From net realized gains from investment transactions | | | | | (170,812 | ) | | | (48,522 | ) |
| Distributions to Class R Shareholders: | | | | | | | | | | |
| From net investment income | | | | | — | | | | — | |
| From net realized gains from investment transactions | | | | | (23,707 | ) | | | (8,965 | ) |
| Distributions to Class S Shareholders: | | | | | | | | | | |
| From net investment income | | | | | (425,045 | ) | | | (815,624 | ) |
| From net realized gains from investment transactions | | | | | (19,181,515 | ) | | | (19,223,939 | ) |
| | |
| | |
| |
| Change in net assets resulting from shareholder distributions | | | | | (22,009,535 | ) | | | (21,118,317 | ) |
| | |
| | |
| |
| Capital Transactions: | | | | | | | | | | |
| Proceeds from shares issued | | | | | 89,477,826 | | | | 77,607,462 | |
| Dividends reinvested | | | | | 20,913,603 | | | | 19,966,985 | |
| Cost of shares redeemed | | | | | (44,778,434 | ) | | | (57,736,917 | ) |
| | |
| | |
| |
| Change in net assets resulting from capital transactions | | | | | 65,612,995 | | | | 39,837,530 | |
| | |
| | |
| |
| Net increase (decrease) in net assets | | | | | 75,800,724 | | | | 49,128,635 | |
| Net Assets: | | | | | | | | | | |
| Beginning of period | | | | | 293,017,568 | | | | 243,888,933 | |
| | |
| | |
| |
| End of period | | | | $ | 368,818,292 | | | $ | 293,017,568 | |
| | |
| | |
| |
| Undistributed net investment income (loss) | | | | $ | (285,393 | ) | | $ | (362,037 | ) |
| | |
| | |
| |
| Share Transactions: | | | | | | | | | | |
| Issued | | | | | 3,894,025 | | | | 3,569,091 | |
| Reinvested | | | | | 929,898 | | | | 993,498 | |
| Redeemed | | | | | (1,950,688 | ) | | | (2,695,012 | ) |
| | |
| | |
| |
| Change in shares resulting from capital transactions | | | | | 2,873,235 | | | | 1,867,577 | |
| | |
| | |
| |
See notes to financial statements.
36
Table of Contents
FINANCIAL HIGHLIGHTS
Tamarack Large Cap Growth Fund
(Selected data for a share outstanding throughout the periods indicated)
| | | | | | Investment Activities | | | Distributions | |
|---|
| | | | | |
| | |
| |
| | | Net Asset
Value,
Beginning
of Period | | | Net
Investment
Income (Loss) | | | Net Realized
and Unrealized
Gains (Losses)
on Investments | | | Redemption
Fees | | | Total from
Investment
Activities | | | Net
Investment
Income | | | Return
of Capital | | | Net
Realized
Gains | | | Total
Distributions | |
|---|
| | |
| | |
| | |
| | |
| | |
| | |
| | |
| | |
| | |
| |
| Class A | | | | | | | | | | | | | | | | | | | | | | | | | | | | | | | | | | | | | | |
| Six Months Ended March 31, 2007 (Unaudited) | | | | $ | 10.85 | | | | (0.02 | ) | | | 0.31 | | | | | (a) | | | 0.29 | | | | — | | | | — | | | | — | | | | — | |
| Year Ended September 30, 2006 | | | | | 10.65 | | | | (0.03 | ) | | | 0.23 | | | | | (a) | | | 0.20 | | | | — | | | | — | | | | — | | | | — | |
| Year Ended September 30, 2005 | | | | | 9.88 | | | | 0.01 | | | | 0.76 | | | | | (a) | | | 0.77 | | | | — | | | | — | | | | — | | | | — | |
| Period Ended September 30, 2004 (e) | | | | | 10.02 | | | | (0.01 | ) | | | (0.13 | ) | | | | (a) | | | (0.14 | ) | | | — | | | | — | | | | — | | | | — | |
| Year Ended April 30, 2004 | | | | | 8.33 | | | | (0.07 | ) | | | 1.76 | | | | — | | | | 1.69 | | | | — | | | | — | | | | — | | | | — | |
| Year Ended April 30, 2003 | | | | | 9.87 | | | | — | | | | (1.53 | ) | | | — | | | | (1.53 | ) | | | (0.01 | ) | | | — | | | | — | | | | (0.01 | ) |
| Year Ended April 30, 2002 | | | | | 12.02 | | | | (0.02 | ) | | | (2.13 | ) | | | — | | | | (2.15 | ) | | | | (a) | | | | (a) | | | — | | | | — | |
| Class I | | | | | | | | | | | | | | | | | | | | | | | | | | | | | | | | | | | | | | |
| Six Months Ended March 31, 2007 (Unaudited) | | | | $ | 10.98 | | | | | (a) | | | 0.31 | | | | | (a) | | | 0.31 | | | | — | | | | — | | | | — | | | | — | |
| Year Ended September 30, 2006 | | | | | 10.75 | | | | (0.01 | ) | | | 0.24 | | | | | (a) | | | 0.23 | | | | | (a) | | | — | | | | — | | | | | (a) |
| Year Ended September 30, 2005 | | | | | 9.97 | | | | 0.05 | | | | 0.75 | | | | | (a) | | | 0.80 | | | | (0.02 | ) | | | — | | | | — | | | | (0.02 | ) |
| Period Ended September 30, 2004 (e) | | | | | 10.11 | | | | | (a) | | | (0.14 | ) | | | | (a) | | | (0.14 | ) | | | — | | | | — | | | | — | | | | — | |
| Year Ended April 30, 2004 | | | | | 8.38 | | | | (0.07 | ) | | | 1.80 | | | | — | | | | 1.73 | | | | — | | | | — | | | | — | | | | — | |
| Year Ended April 30, 2003 | | | | | 9.92 | | | | 0.03 | | | | (1.55 | ) | | | — | | | | (1.52 | ) | | | (0.02 | ) | | | — | | | | — | | | | (0.02 | ) |
| Year Ended April 30, 2002 | | | | | 12.07 | | | | 0.02 | | | | (2.15 | ) | | | — | | | | (2.13 | ) | | | (0.01 | ) | | | (0.01 | ) | | | — | | | | (0.02 | ) |
| Class C | | | | | | | | | | | | | | | | | | | | | | | | | | | | | | | | | | | | | | |
| Six Months Ended March 31, 2007 (Unaudited) | | | | $ | 10.65 | | | | (0.05 | ) | | | 0.30 | | | | | (a) | | | 0.25 | | | | — | | | | — | | | | — | | | | — | |
| Year Ended September 30, 2006 | | | | | 10.53 | | | | (0.10 | ) | | | 0.22 | | | | | (a) | | | 0.12 | | | | — | | | | — | | | | — | | | | — | |
| Year Ended September 30, 2005 | | | | | 9.85 | | | | (0.02 | ) | | | 0.70 | | | | | (a) | | | 0.68 | | | | — | | | | — | | | | — | | | | — | |
| Period Ended September 30, 2004 (e) | | | | | 10.02 | | | | (0.04 | ) | | | (0.13 | ) | | | | (a) | | | (0.17 | ) | | | — | | | | — | | | | — | | | | — | |
| Period Ended April 30, 2004 (f) | | | | | 10.28 | | | | — | | | | (0.26 | ) | | | — | | | | (0.26 | ) | | | — | | | | — | | | | — | | | | — | |
| Class R | | | | | | | | | | | | | | | | | | | | | | | | | | | | | | | | | | | | | | |
| Six Months Ended March 31, 2007 (Unaudited) | | | | $ | 10.78 | | | | (0.03 | ) | | | 0.30 | | | | | (a) | | | 0.27 | | | | — | | | | — | | | | — | | | | — | |
| Year Ended September 30, 2006 | | | | | 10.60 | | | | (0.05 | ) | | | 0.23 | | | | | (a) | | | 0.18 | | | | — | | | | — | | | | — | | | | — | |
| Year Ended September 30, 2005 | | | | | 9.87 | | | | (0.15 | ) | | | 0.89 | | | | | (a) | | | 0.74 | | | | (0.01 | ) | | | — | | | | — | | | | (0.01 | ) |
| Period Ended September 30, 2004 (e) | | | | | 10.02 | | | | — | | | | (0.15 | ) | | | | (a) | | | (0.15 | ) | | | — | | | | — | | | | — | | | | — | |
| Period Ended April 30, 2004 (f) | | | | | 10.28 | | | | — | | | | (0.26 | ) | | | — | | | | (0.26 | ) | | | — | | | | — | | | | — | | | | — | |
| Class S | | | | | | | | | | | | | | | | | | | | | | | | | | | | | | | | | | | | | | |
| Six Months Ended March 31, 2007 (Unaudited) | | | | $ | 10.98 | | | | | (a) | | | 0.31 | | | | | (a) | | | 0.31 | | | | — | | | | — | | | | — | | | | — | |
| Year Ended September 30, 2006 | | | | | 10.75 | | | | | (a) | | | 0.23 | | | | | (a) | | | 0.23 | | | | | (a) | | | — | | | | — | | | | | (a) |
| Year Ended September 30, 2005 | | | | | 9.97 | | | | 0.02 | | | | 0.78 | | | | | (a) | | | 0.80 | | | | (0.02 | ) | | | — | | | | — | | | | (0.02 | ) |
| Period Ended September 30, 2004 (e) | | | | | 10.11 | | | | — | | | | (0.14 | ) | | | | (a) | | | (0.14 | ) | | | — | | | | — | | | | — | | | | — | |
| Period Ended April 30, 2004 (f) | | | | | 10.37 | | | | — | | | | (0.26 | ) | | | — | | | | (0.26 | ) | | | — | | | | — | | | | — | | | | — | |
[TABLE CONTINUES BELOW]
| | | | | | | | | Ratios/Supplemental Data | | |
|---|
| | | | | | | | |
| | |
| | | Net Asset
Value,
End of
Period | | | Total
Return* | | | Net Assets,
End of Period
(000’s) | | | Ratio of Net
Expenses to
Average
Net Assets | | | Ratio of Net
Investment
Income (Loss)
to Average
Net Assets | | | Ratio of
Expenses to
Average
Net Assets** | | | Portfolio
Turnover
Rate *** | |
|---|
| | |
| | |
| | |
| | |
| | |
| | |
| | |
| |
| Class A | | | | | | | | | | | | | | | | | | | | | | | | | | | | | | |
| Six Months Ended March 31, 2007 (Unaudited) | | | | $ | 11.14 | | | | 2.67% | (b) | | $ | 4,179 | | | | 1.25% | (c) | | | (0.25% | )(c) | | | 1.81% | (c) | | | 12% | |
| Year Ended September 30, 2006 | | | | | 10.85 | | | | 1.88% | | | | 5,175 | | | | 1.25% | | | | (0.27% | ) | | | 1.68% | | | | 35% | |
| Year Ended September 30, 2005 | | | | | 10.65 | | | | 7.79% | | | | 6,280 | | | | 1.15% | | | | 0.06% | | | | 1.74% | | | | 28% | |
| Period Ended September 30, 2004 (e) | | | | | 9.88 | | | | (1.40% | )(b) | | | 10,614 | | | | 1.10% | (c) | | | (0.27% | )(c) | | | 1.63% | (c) | | | 16% | |
| Year Ended April 30, 2004 | | | | | 10.02 | | | | 20.29% | | | | 10,864 | | | | 1.54% | | | | (0.85% | ) | | | 1.79% | | | | 264% | |
| Year Ended April 30, 2003 | | | | | 8.33 | | | | (15.53% | ) | | | 7,686 | | | | 1.46% | | | | (0.07% | ) | | | 1.71% | | | | 90% | |
| Year Ended April 30, 2002 | | | | | 9.87 | | | | (17.87% | ) | | | 9,906 | | | | 1.34% | | | | (0.14% | ) | | | 1.59% | | | | 33% | |
| Class I | | | | | | | | | | | | | | | | | | | | | | | | | | | | | | |
| Six Months Ended March 31, 2007 (Unaudited) | | | | $ | 11.29 | | | | 2.82% | (b) | | $ | 1,129 | | | | 1.00% | (c) | | | 0.00% | (c) | | | 1.31% | (c) | | | 12% | |
| Year Ended September 30, 2006 | | | | | 10.98 | | | | 2.18% | | | | 1,204 | | | | 1.00% | | | | (0.08% | ) | | | 1.19% | | | | 35% | |
| Year Ended September 30, 2005 | | | | | 10.75 | | | | 8.04% | | | | 3,636 | | | | 0.89% | | | | 0.35% | | | | 1.22% | | | | 28% | |
| Period Ended September 30, 2004 (e) | | | | | 9.97 | | | | (1.38% | )(b) | | | 19,556 | | | | 0.85% | (c) | | | (0.03% | )(c) | | | 1.11% | (c) | | | 16% | |
| Year Ended April 30, 2004 | | | | | 10.11 | | | | 20.64% | | | | 28,454 | | | | 1.29% | | | | (0.60% | ) | | | 1.29% | | | | 264% | |
| Year Ended April 30, 2003 | | | | | 8.38 | | | | (15.34% | ) | | | 35,379 | | | | 1.21% | | | | 0.20% | | | | | (d) | | | 90% | |
| Year Ended April 30, 2002 | | | | | 9.92 | | | | (17.71% | ) | | | 64,516 | | | | 1.09% | | | | 0.11% | | | | | (d) | | | 33% | |
| Class C | | | | | | | | | | | | | | | | | | | | | | | | | | | | | | |
| Six Months Ended March 31, 2007 (Unaudited) | | | | $ | 10.90 | | | | 2.35% | (b) | | $ | 35 | | | | 2.00% | (c) | | | (0.98% | )(c) | | | 2.31% | (c) | | | 12% | |
| Year Ended September 30, 2006 | | | | | 10.65 | | | | 1.14% | | | | 25 | | | | 2.00% | | | | (1.01% | ) | | | 2.17% | | | | 35% | |
| Year Ended September 30, 2005 | | | | | 10.53 | | | | 6.90% | | | | 25 | | | | 1.93% | | | | (0.88% | ) | | | 2.26% | | | | 28% | |
| Period Ended September 30, 2004 (e) | | | | | 9.85 | | | | (1.70% | )(b) | | | 3 | | | | 1.81% | (c) | | | (0.98% | )(c) | | | 2.13% | (c) | | | 16% | |
| Period Ended April 30, 2004 (f) | | | | | 10.02 | | | | (2.53% | )(b) | | | 3 | | | | 1.88% | (c) | | | (1.15% | )(c) | | | | (d) | | | 264% | |
| Class R | | | | | | | | | | | | | | | | | | | | | | | | | | | | | | |
| Six Months Ended March 31, 2007 (Unaudited) | | | | $ | 11.05 | | | | 2.60% | (b) | | $ | 10 | | | | 1.50% | (c) | | | (0.49% | )(c) | | | 1.78% | (c) | | | 12% | |
| Year Ended September 30, 2006 | | | | | 10.78 | | | | 1.60% | | | | 10 | | | | 1.50% | | | | (0.53% | ) | | | 1.66% | | | | 35% | |
| Year Ended September 30, 2005 | | | | | 10.60 | | | | 7.46% | | | | 15 | | | | 1.41% | | | | (0.27% | ) | | | 1.75% | | | | 28% | |
| Period Ended September 30, 2004 (e) | | | | | 9.87 | | | | (1.50% | )(b) | | | 65 | | | | 1.34% | (c) | | | 0.12% | (c) | | | 2.00% | (c) | | | 16% | |
| Period Ended April 30, 2004 (f) | | | | | 10.02 | | | | (2.53% | )(b) | | | 3 | | | | 1.32% | (c) | | | (0.63% | )(c) | | | | (d) | | | 264% | |
| Class S | | | | | | | | | | | | | | | | | | | | | | | | | | | | | | |
| Six Months Ended March 31, 2007 (Unaudited) | | | | $ | 11.29 | | | | 2.82% | (b) | | $ | 112,964 | | | | 1.00% | (c) | | | 0.00% | (c) | | | 1.30% | (c) | | | 12% | |
| Year Ended September 30, 2006 | | | | | 10.98 | | | | 2.18% | | | | 125,253 | | | | 1.00% | | | | (0.02% | ) | | | 1.18% | | | | 35% | |
| Year Ended September 30, 2005 | | | | | 10.75 | | | | 8.04% | | | | 145,649 | | | | 0.91% | | | | 0.24% | | | | 1.25% | | | | 28% | |
| Period Ended September 30, 2004 (e) | | | | | 9.97 | | | | (1.38% | )(b) | | | 168,756 | | | | 0.85% | (c) | | | (0.02% | )(c) | | | 1.13% | (c) | | | 16% | |
| Period Ended April 30, 2004 (f) | | | | | 10.11 | | | | (2.51% | )(b) | | | 190,737 | | | | 0.85% | (c) | | | (0.27% | )(c) | | | | (d) | | | 264% | |
| ** | During the period, certain fees were contractually or voluntarily reduced. If such contractual/voluntary fee reductions had not occurred, the ratio would have been as indicated. |
| *** | Portfolio turnover rate is calculated on the basis of the fund as a whole without distinguishing between the classes of shares issued. |
| (a) | Less than $0.01 or $(0.01) per share. | | (d) | There were no waivers or reimbursements during the period. |
| (b) | Not annualized. | | (e) | For the period from May 1, 2004 to September 30, 2004. |
| (c) | Annualized. | | (f) | For the period from April 19, 2004 (commencement of operations) to April 30, 2004. |
See notes to financial statements.
37
Table of Contents
FINANCIAL HIGHLIGHTS
Tamarack Mid Cap Growth Fund
(Selected data for a share outstanding throughout the periods indicated)
| | | | | | Investment Activities | | | Distributions |
|---|
| | | | | |
| | |
|
| | | Net Asset
Value,
Beginning
of Period | | | Net
Investment
Income (Loss) | | | Net Realized
and Unrealized
Gains (Losses)
on Investments | | | Redemption
Fees | | | Total from
Investment
Activities | | | Net
Investment
Income | | | Net
Realized
Gains | | | Total
Distributions |
|---|
| | |
| | |
| | |
| | |
| | |
| | |
| | |
| | |
|
| Class A | | | | | | | | | | | | | | | | | | | | | | | | | | | | | | | | | | |
| Six Months Ended March 31, 2007 (Unaudited) | | | | $ | 12.47 | | | | (0.05 | )(a) | | | 0.66 | | | | (g | ) | | | 0.61 | | | | — | | | | (0.35 | ) | | | (0.35 | ) |
| Year Ended September 30, 2006 | | | | | 11.71 | | | | (0.08 | )(a) | | | 1.07 | | | | (g | ) | | | 0.99 | | | | — | | | | (0.23 | ) | | | (0.23 | ) |
| Year Ended September 30, 2005 | | | | | 11.57 | | | | (0.14 | ) | | | 1.86 | | | | (g | ) | | | 1.72 | | | | — | | | | (1.58 | ) | | | (1.58 | ) |
| Period Ended September 30, 2004 (e) | | | | | 12.17 | | | | (0.04 | ) | | | (0.56 | ) | | | (g | ) | | | (0.60 | ) | | | — | | | | — | | | | — | |
| Year Ended April 30, 2004 | | | | | 9.46 | | | | (0.08 | ) | | | 2.79 | | | | — | | | | 2.71 | | | | — | | | | — | | | | — | |
| Year Ended April 30, 2003 | | | | | 11.73 | | | | (0.03 | ) | | | (2.15 | ) | | | — | | | | (2.18 | ) | | | — | | | | (0.09 | ) | | | (0.09 | ) |
| Year Ended April 30, 2002 | | | | | 11.99 | | | | (0.01 | ) | | | 0.67 | | | | — | | | | 0.66 | | | | (0.01 | ) | | | (0.91 | ) | | | (0.92 | ) |
| Class I |
| Six Months Ended March 31, 2007 (Unaudited) | | | | $ | 12.85 | | | | (0.03 | )(a) | | | 0.68 | | | | (g | ) | | | 0.65 | | | | — | | | | (0.35 | ) | | | (0.35 | ) |
| Year Ended September 30, 2006 | | | | | 12.03 | | | | (0.05 | )(a) | | | 1.10 | | | | (g | ) | | | 1.05 | | | | — | | | | (0.23 | ) | | | (0.23 | ) |
| Year Ended September 30, 2005 | | | | | 11.81 | | | | (0.04 | ) | | | 1.84 | | | | (g | ) | | | 1.80 | | | | — | | | | (1.58 | ) | | | (1.58 | ) |
| Period Ended September 30, 2004 (e) | | | | | 12.41 | | | | (0.04 | ) | | | (0.56 | ) | | | (g | ) | | | (0.60 | ) | | | — | | | | — | | | | — | |
| Year Ended April 30, 2004 | | | | | 9.62 | | | | (0.08 | ) | | | 2.87 | | | | — | | | | 2.79 | | | | — | | | | — | | | | — | |
| Year Ended April 30, 2003 | | | | | 11.91 | | | | (0.01 | ) | | | (2.19 | ) | | | — | | | | (2.20 | ) | | | — | | | | (0.09 | ) | | | (0.09 | ) |
| Year Ended April 30, 2002 | | | | | 12.13 | | | | 0.01 | | | | 0.69 | | | | — | | | | 0.70 | | | | (0.01 | ) | | | (0.91 | ) | | | (0.92 | ) |
| Class C |
| Six Months Ended March 31, 2007 (Unaudited) | | | | $ | 12.24 | | | | (0.09 | )(a) | | | 0.65 | | | | (g | ) | | | 0.56 | | | | — | | | | (0.35 | ) | | | (0.35 | ) |
| Year Ended September 30, 2006 | | | | | 11.59 | | | | (0.17 | )(a) | | | 1.05 | | | | (g | ) | | | 0.88 | | | | — | | | | (0.23 | ) | | | (0.23 | ) |
| Year Ended September 30, 2005 | | | | | 11.53 | | | | (0.11 | ) | | | 1.75 | | | | (g | ) | | | 1.64 | | | | — | | | | (1.58 | ) | | | (1.58 | ) |
| Period Ended September 30, 2004 (e) | | | | | 12.16 | | | | (0.05 | ) | | | (0.58 | ) | | | (g | ) | | | (0.63 | ) | | | — | | | | — | | | | — | |
| Period Ended April 30, 2004 (f) | | | | | 12.51 | | | | — | | | | (0.35 | ) | | | — | | | | (0.35 | ) | | | — | | | | — | | | | — | |
| Class R |
| Six Months Ended March 31, 2007 (Unaudited) | | | | $ | 12.39 | | | | (0.06 | )(a) | | | 0.66 | | | | (g | ) | | | 0.60 | | | | — | | | | (0.35 | ) | | | (0.35 | ) |
| Year Ended September 30, 2006 | | | | | 11.67 | | | | (0.12 | )(a) | | | 1.07 | | | | (g | ) | | | 0.95 | | | | — | | | | (0.23 | ) | | | (0.23 | ) |
| Year Ended September 30, 2005 | | | | | 11.55 | | | | (0.30 | ) | | | 2.00 | | | | (g | ) | | | 1.70 | | | | — | | | | (1.58 | ) | | | (1.58 | ) |
| Period Ended September 30, 2004 (e) | | | | | 12.17 | | | | (0.01 | ) | | | (0.61 | ) | | | (g | ) | | | (0.62 | ) | | | — | | | | — | | | | — | |
| Period Ended April 30, 2004 (f) | | | | | 12.51 | | | | — | | | | (0.34 | ) | | | — | | | | (0.34 | ) | | | — | | | | — | | | | — | |
| Class S |
| Six Months Ended March 31, 2007 (Unaudited) | | | | $ | 12.86 | | | | (0.03 | )(a) | | | 0.68 | | | | (g | ) | | | 0.65 | | | | — | | | | (0.35 | ) | | | (0.35 | ) |
| Year Ended September 30, 2006 | | | | | 12.03 | | | | (0.05 | )(a) | | | 1.11 | | | | (g | ) | | | 1.06 | | | | — | | | | (0.23 | ) | | | (0.23 | ) |
| Year Ended September 30, 2005 | | | | | 11.81 | | | | (0.02 | ) | | | 1.82 | | | | (g | ) | | | 1.80 | | | | — | | | | (1.58 | ) | | | (1.58 | ) |
| Period Ended September 30, 2004 (e) | | | | | 12.41 | | | | (0.01 | ) | | | (0.59 | ) | | | (g | ) | | | (0.60 | ) | | | — | | | | — | | | | — | |
| Period Ended April 30, 2004 (f) | | | | | 12.76 | | | | — | | | | (0.35 | ) | | | — | | | | (0.35 | ) | | | — | | | | — | | | | — | |
[TABLE CONTINUED BELOW]
| | | | | | | | | Ratios/Supplemental Data | | |
|---|
| | | | | | | | |
| | |
| | | Net Asset
Value,
End of
Period | | | Total
Return* | | | Net Assets,
End of Period
(000’s) | | | Ratio of Net
Expenses to
Average
Net Assets | | | Ratio of Net
Investment
Income (Loss)
to Average
Net Assets | | | Ratio of
Expenses to
Average
Net Assets** | | | Portfolio
Turnover
Rate *** | |
|---|
| | |
| | |
| | |
| | |
| | |
| | |
| | |
| |
| Class A | | | | | | | | | | | | | | | | | | | | | | | | | | | | | | |
| Six Months Ended March 31, 2007 (Unaudited) | | | | $ | 12.73 | | | | 4.97 | %(b) | | $ | 40,160 | | | | 1.35 | %(c) | | | (0.77 | %)(c) | | | 1.79 | %(c) | | | 14 | % |
| Year Ended September 30, 2006 | | | | | 12.47 | | | | 8.52 | % | | | 43,803 | | | | 1.35 | % | | | (0.66 | %) | | | 1.73 | % | | | 23 | % |
| Year Ended September 30, 2005 | | | | | 11.71 | | | | 15.62 | % | | | 45,359 | | | | 1.32 | % | | | (0.80 | %) | | | 1.75 | % | | | 22 | % |
| Period Ended September 30, 2004 (e) | | | | | 11.57 | | | | (4.93 | %)(b) | | | 69,979 | | | | 1.27 | %(c) | | | (0.88 | %)(c) | | | 1.58 | %(c) | | | 15 | % |
| Year Ended April 30, 2004 | | | | | 12.17 | | | | 28.65 | % | | | 74,150 | | | | 1.38 | % | | | (0.78 | %) | | | 1.64 | % | | | 93 | % |
| Year Ended April 30, 2003 | | | | | 9.46 | | | | (18.58 | %) | | | 48,806 | | | | 1.40 | % | | | (0.37 | %) | | | 1.65 | % | | | 28 | % |
| Year Ended April 30, 2002 | | | | | 11.73 | | | | 5.99 | % | | | 55,143 | | | | 1.37 | % | | | (0.22 | %) | | | 1.62 | % | | | 19 | % |
| Class I |
| Six Months Ended March 31, 2007 (Unaudited) | | | | $ | 13.15 | | | | 5.14 | %(b) | | $ | 71,183 | | | | 1.10 | %(c) | | | (0.52 | %)(c) | | | 1.29 | %(c) | | | 14 | % |
| Year Ended September 30, 2006 | | | | | 12.85 | | | | 8.71 | % | | | 72,866 | | | | 1.10 | % | | | (0.41 | %) | | | 1.23 | % | | | 23 | % |
| Year Ended September 30, 2005 | | | | | 12.03 | | | | 16.02 | % | | | 62,652 | | | | 1.07 | % | | | (0.54 | %) | | | 1.25 | % | | | 22 | % |
| Period Ended September 30, 2004 (e) | | | | | 11.81 | | | | (4.83 | %)(b) | | | 47,778 | | | | 1.02 | %(c) | | | (0.62 | %)(c) | | | 1.07 | %(c) | | | 15 | % |
| Year Ended April 30, 2004 | | | | | 12.41 | | | | 29.00 | % | | | 66,039 | | | | 1.15 | % | | | (0.50 | %) | | | 1.16 | % | | | 93 | % |
| Year Ended April 30, 2003 | | | | | 9.62 | | | | (18.46 | %) | | | 94,472 | | | | 1.15 | % | | | (0.12 | %) | | | (d | ) | | | 28 | % |
| Year Ended April 30, 2002 | | | | | 11.91 | | | | 6.34 | % | | | 115,032 | | | | 1.12 | % | | | 0.10 | % | | | (d | ) | | | 19 | % |
| Class C |
| Six Months Ended March 31, 2007 (Unaudited) | | | | $ | 12.45 | | | | 4.65 | %(b) | | $ | 2,021 | | | | 2.10 | %(c) | | | (1.52 | %)(c) | | | 2.29 | %(c) | | | 14 | % |
| Year Ended September 30, 2006 | | | | | 12.24 | | | | 7.56 | % | | | 2,054 | | | | 2.10 | % | | | (1.40 | %) | | | 2.22 | % | | | 23 | % |
| Year Ended September 30, 2005 | | | | | 11.59 | | | | 14.91 | % | | | 370 | | | | 2.09 | % | | | (1.53 | %) | | | 2.28 | % | | | 22 | % |
| Period Ended September 30, 2004 (e) | | | | | 11.53 | | | | (5.18 | %)(b) | | | 13 | | | | 2.02 | %(c) | | | (1.65 | %)(c) | | | 2.12 | %(c) | | | 15 | % |
| Period Ended April 30, 2004 (f) | | | | | 12.16 | | | | (2.80 | %)(b) | | | 3 | | | | 1.28 | %(c) | | | (1.01 | %)(c) | | | (d | ) | | | 93 | % |
| Class R |
| Six Months Ended March 31, 2007 (Unaudited) | | | | $ | 12.64 | | | | 4.92 | %(b) | | $ | 11 | | | | 1.59 | %(c) | | | (1.01 | %)(c) | | | 1.79 | %(c) | | | 14 | % |
| Year Ended September 30, 2006 | | | | | 12.39 | | | | 8.12 | % | | | 10 | | | | 1.60 | % | | | (0.95 | %) | | | 1.73 | % | | | 23 | % |
| Year Ended September 30, 2005 | | | | | 11.67 | | | | 15.47 | % | | | 32 | | | | 1.57 | % | | | (1.04 | %) | | | 1.76 | % | | | 22 | % |
| Period Ended September 30, 2004 (e) | | | | | 11.55 | | | | (5.09 | %)(b) | | | 72 | | | | 1.52 | %(c) | | | (1.20 | %)(c) | | | 1.78 | %(c) | | | 15 | % |
| Period Ended April 30, 2004 (f) | | | | | 12.17 | | | | (2.72 | %)(b) | | | 3 | | | | 0.79 | %(c) | | | (0.56 | %)(c) | | | (d | ) | | | 93 | % |
| Class S |
| Six Months Ended March 31, 2007 (Unaudited) | | | | $ | 13.16 | | | | 5.13 | %(b) | | $ | 1,678 | | | | 1.10 | %(c) | | | (0.52 | %)(c) | | | 1.29 | %(c) | | | 14 | % |
| Year Ended September 30, 2006 | | | | | 12.86 | | | | 8.79 | % | | | 1,870 | | | | 1.10 | % | | | (0.41 | %) | | | 1.23 | % | | | 23 | % |
| Year Ended September 30, 2005 | | | | | 12.03 | | | | 16.02 | % | | | 1,515 | | | | 1.08 | % | | | (0.52 | %) | | | 1.27 | % | | | 22 | % |
| Period Ended September 30, 2004 (e) | | | | | 11.81 | | | | (4.83 | %)(b) | | | 225 | | | | 1.03 | %(c) | | | (0.71 | %)(c) | | | 1.15 | %(c) | | | 15 | % |
| Period Ended April 30, 2004 (f) | | | | | 12.41 | | | | (2.74 | %)(b) | | | 4 | | | | 0.25 | %(c) | | | (0.06 | %)(c) | | | (d | ) | | | 93 | % |
| ** | During the period, certain fees were contractually or voluntarily reduced. If such contractual/voluntary fee reductions had not occurred, the ratio would have been as indicated. |
| *** | Portfolio turnover rate is calculated on the basis of the fund as a whole without distinguishing between the classes of shares issued. |
| (a) | | Per share net investment income (loss) has been calculated using the | | (d) | | There were no waivers or reimbursements during the period. | |
| | | average daily shares method. | | (e) | | For the period from May 1, 2004 to September 30, 2004. | |
| (b) | | Not annualized. | | (f) | | For the period from April 19, 2004 (commencement of operations) to April 30, 2004. | |
| (c) | | Annualized. | | (g) | | Less than $0.01 or $(0.01) per share. | |
See notes to financial statements.
38
Table of Contents
FINANCIAL HIGHLIGHTS
Tamarack SMID Cap Growth Fund
(Selected data for a share outstanding throughout the periods indicated)
| | | | | | Investment Activities | | | Distributions |
|---|
| | | | | |
| | |
|
| | | Net Asset
Value,
Beginning
of Period | | | Net
Investment
Loss | | | Net Realized
and Unrealized
Gains (Losses)
on Investments | | | Redemption
Fees | | | Total from
Investment
Activities | | | Net
Investment
Income | | | Net
Realized
Gains | | | Total
Distributions |
|---|
| | |
| | |
| | |
| | |
| | |
| | |
| | |
| | |
|
| Class A | | | | | | | | | | | | | | | | | | | | | | | | | | | | | | | | | | |
| Six Months Ended March 31, 2007 (Unaudited) | | | | $ | 10.39 | | | | (0.07 | )(a) | | | 0.48 | | | | | (g) | | | 0.41 | | | | — | | | | (0.70 | ) | | | (0.70 | ) |
| Year Ended September 30, 2006 | | | | | 13.51 | | | | (0.14 | )(a) | | | 0.68 | | | | | (g) | | | 0.54 | | | | — | | | | (3.66 | ) | | | (3.66 | ) |
| Year Ended September 30, 2005 | | | | | 13.78 | | | | (0.19 | ) | | | 2.11 | | | | | (g) | | | 1.92 | | | | — | | | | (2.19 | ) | | | (2.19 | ) |
| Period Ended September 30, 2004 (e) | | | | | 13.19 | | | | (0.07 | ) | | | 0.66 | | | | | (g) | | | 0.59 | | | | — | | | | — | | | | — | |
| Year Ended April 30, 2004 | | | | | 10.11 | | | | (0.15 | ) | | | 3.23 | | | | — | | | | 3.08 | | | | — | | | | — | | | | — | |
| Year Ended April 30, 2003 | | | | | 12.32 | | | | (0.12 | ) | | | (2.09 | ) | | | — | | | | (2.21 | ) | | | — | | | | — | | | | — | |
| Year Ended April 30, 2002 | | | | | 11.56 | | | | (0.11 | ) | | | 1.04 | | | | — | | | | 0.93 | | | | — | | | | (0.17 | ) | | | (0.17 | ) |
| Class I |
| Six Months Ended March 31, 2007 (Unaudited) | | | | $ | 10.73 | | | | (0.06 | )(a) | | | 0.50 | | | | | (g) | | | 0.44 | | | | — | | | | (0.70 | ) | | | (0.70 | ) | |
| Year Ended September 30, 2006 | | | | | 13.81 | | | | (0.12 | )(a) | | | 0.70 | | | | | (g) | | | 0.58 | | | | — | | | | (3.66 | ) | | | (3.66 | ) |
| Year Ended September 30, 2005 | | | | | 14.01 | | | | (0.21 | ) | | | 2.20 | | | | | (g) | | | 1.99 | | | | — | | | | (2.19 | ) | | | (2.19 | ) |
| Period Ended September 30, 2004 (e) | | | | | 13.40 | | | | (0.08 | ) | | | 0.69 | | | | | (g) | | | 0.61 | | | | — | | | | — | | | | — | |
| Year Ended April 30, 2004 | | | | | 10.25 | | | | (0.17 | ) | | | 3.32 | | | | — | | | | 3.15 | | | | — | | | | — | | | | — | |
| Year Ended April 30, 2003 | | | | | 12.45 | | | | (0.09 | ) | | | (2.11 | ) | | | — | | | | (2.20 | ) | | | — | | | | — | | | | — | |
| Year Ended April 30, 2002 | | | | | 11.66 | | | | (0.07 | ) | | | 1.03 | | | | — | | | | 0.96 | | | | — | | | | (0.17 | ) | | | (0.17 | ) |
| Class C |
| Six Months Ended March 31, 2007 (Unaudited) | | | | $ | 10.13 | | | | (0.10 | )(a) | | | 0.47 | | | | | (g) | | | 0.37 | | | | — | | | | (0.70 | ) | | | (0.70 | ) | |
| Year Ended September 30, 2006 | | | | | 13.34 | | | | (0.22 | )(a) | | | 0.67 | | | | | (g) | | | 0.45 | | | | — | | | | (3.66 | ) | | | (3.66 | ) |
| Year Ended September 30, 2005 | | | | | 13.74 | | | | (1.00 | ) | | | 2.79 | | | | | (g) | | | 1.79 | | | | — | | | | (2.19 | ) | | | (2.19 | ) |
| Period Ended September 30, 2004 (e) | | | | | 13.19 | | | | (0.09 | ) | | | 0.64 | | | | | (g) | | | 0.55 | | | | — | | | | — | | | | — | |
| Period Ended April 30, 2004 (f) | | | | | 13.63 | | | | (0.02 | ) | | | (0.42 | ) | | | — | | | | (0.44 | ) | | | — | | | | — | | | | — | |
| Class R |
| Six Months Ended March 31, 2007 (Unaudited) | | | | $ | 10.29 | | | | (0.08 | )(a) | | | 0.47 | | | | | (g) | | | 0.39 | | | | — | | | | (0.70 | ) | | | (0.70 | ) |
| Year Ended September 30, 2006 | | | | | 13.44 | | | | (0.17 | )(a) | | | 0.68 | | | | | (g) | | | 0.51 | | | | — | | | | (3.66 | ) | | | (3.66 | ) |
| Year Ended September 30, 2005 | | | | | 13.76 | | | | (0.17 | ) | | | 2.04 | | | | | (g) | | | 1.87 | | | | — | | | | (2.19 | ) | | | (2.19 | ) |
| Period Ended September 30, 2004 (e) | | | | | 13.19 | | | | (0.02 | ) | | | 0.59 | | | | | (g) | | | 0.57 | | | | — | | | | — | | | | — | |
| Period Ended April 30, 2004 (f) | | | | | 13.63 | | | | (0.02 | ) | | | (0.42 | ) | | | — | | | | (0.44 | ) | | | — | | | | — | | | | — | |
| Class S |
| Six Months Ended March 31, 2007 (Unaudited) | | | | $ | 10.72 | | | | (0.06 | )(a) | | | 0.50 | | | | | (g) | | | 0.44 | | | | — | | | | (0.70 | ) | | | (0.70 | ) |
| Year Ended September 30, 2006 | | | | | 13.80 | | | | (0.12 | )(a) | | | 0.70 | | | | | (g) | | | 0.58 | | | | — | | | | (3.66 | ) | | | (3.66 | ) |
| Year Ended September 30, 2005 | | | | | 14.01 | | | | (0.08 | ) | | | 2.06 | | | | | (g) | | | 1.98 | | | | — | | | | (2.19 | ) | | | (2.19 | ) |
| Period Ended September 30, 2004 (e) | | | | | 13.40 | | | | (0.02 | ) | | | 0.63 | | | | | (g) | | | 0.61 | | | | — | | | | — | | | | — | |
| Period Ended April 30, 2004 (f) | | | | | 13.84 | | | | (0.02 | ) | | | (0.42 | ) | | | — | | | | (0.44 | ) | | | — | | | | — | | | | — | |
[TABLE CONTINUED BELOW]
| | | | | | | | | | Ratios/Supplemental Data | | |
|---|
| | | | | | | | |
| | |
| | | Net Asset
Value,
End of
Period | | | Total
Return* | | | Net Assets,
End of Period
(000’s) | | | Ratio of Net
Expenses to
Average
Net Assets | | | Ratio of Net
Investment
Loss
to Average
Net Assets | | | Ratio of
Expenses to
Average
Net Assets** | | | Portfolio
Turnover
Rate *** | |
|---|
| | |
| | |
| | |
| | |
| | |
| | |
| | |
| |
| Class A | | | | | | | | | | | | | | | | | | | | | | | | | | | | | | |
| Six Months Ended March 31, 2007 (Unaudited) | | | | $ | 10.10 | | | | 3.95% | (b) | | $ | 5,276 | | | | 1.68% | (c) | | | (1.31% | )(c) | | | 3.19% | (c) | | | 66% | |
| Year Ended September 30, 2006 | | | | | 10.39 | | | | 4.12% | | | | 5,728 | | | | 1.68% | | | | (1.28% | ) | | | 3.07% | | | | 23% | |
| Year Ended September 30, 2005 | | | | | 13.51 | | | | 14.56% | | | | 7,476 | | | | 1.68% | | | | (1.34% | ) | | | 2.80% | | | | 23% | |
| Period Ended September 30, 2004 (e) | | | | | 13.78 | | | | 4.47% | (b) | | | 8,140 | | | | 1.68% | (c) | | | (1.28% | )(c) | | | 2.76% | (c) | | | 11% | |
| Year Ended April 30, 2004 | | | | | 13.19 | | | | 30.46% | | | | 7,488 | | | | 1.81% | | | | (1.52% | ) | | | 2.06% | | | | 40% | |
| Year Ended April 30, 2003 | | | | | 10.11 | | | | (17.94% | ) | | | 4,359 | | | | 1.70% | | | | (1.12% | ) | | | 1.95% | | | | 120% | |
| Year Ended April 30, 2002 | | | | | 12.32 | | | | 8.17% | | | | 6,069 | | | | 1.61% | | | | (0.99% | ) | | | 1.86% | | | | 31% | |
| Class I |
| Six Months Ended March 31, 2007 (Unaudited) | | | | $ | 10.47 | | | | 4.11% | (b) | | $ | 4,399 | | | | 1.43% | (c) | | | (1.06% | )(c) | | | 2.69% | (c) | | | 66% | |
| Year Ended September 30, 2006 | | | | | 10.73 | | | | 4.36% | | | | 4,604 | | | | 1.43% | | | | (1.03% | ) | | | 2.58% | | | | 23% | |
| Year Ended September 30, 2005 | | | | | 13.81 | | | | 14.85% | | | | 4,363 | | | | 1.43% | | | | (1.10% | ) | | | 2.26% | | | | 23% | |
| Period Ended September 30, 2004 (e) | | | | | 14.01 | | | | 4.55% | (b) | | | 9,952 | | | | 1.43% | (c) | | | (1.04% | )(c) | | | 2.13% | (c) | | | 11% | |
| Year Ended April 30, 2004 | | | | | 13.40 | | | | 30.73% | | | | 14,094 | | | | 1.55% | | | | (1.23% | ) | | | | (d) | | | 40% | |
| Year Ended April 30, 2003 | | | | | 10.25 | | | | (17.67% | ) | | | 16,621 | | | | 1.45% | | | | (0.87% | ) | | | | (d) | | | 120% | |
| Year Ended April 30, 2002 | | | | | 12.45 | | | | 8.36% | | | | 19,113 | | | | 1.36% | | | | (0.72% | ) | | | | (d) | | | 31% | |
| Class C |
| Six Months Ended March 31, 2007 (Unaudited) | | | | $ | 9.80 | | | | 3.54% | (b) | | $ | 30 | | | | 2.43% | (c) | | | (2.07% | )(c) | | | 3.68% | (c) | | | 66% | |
| Year Ended September 30, 2006 | | | | | 10.13 | | | | 3.41% | | | | 41 | | | | 2.43% | | | | (2.04% | ) | | | 3.59% | | | | 23% | |
| Year Ended September 30, 2005 | | | | | 13.34 | | | | 13.55% | | | | 54 | | | | 2.43% | | | | (2.11% | ) | | | 3.26% | | | | 23% | |
| Period Ended September 30, 2004 (e) | | | | | 13.74 | | | | 4.17% | (b) | | | 214 | | | | 2.43% | (c) | | | (2.01% | )(c) | | | 3.39% | (c) | | | 11% | |
| Period Ended April 30, 2004 (f) | | | | | 13.19 | | | | (3.23% | )(b) | | | 3 | | | | 2.49% | (c) | | | (5.27% | )(c) | | | | (d) | | | 40% | |
| Class R |
| Six Months Ended March 31, 2007 (Unaudited) | | | | $ | 9.98 | | | | 3.78% | (b) | | $ | 36 | | | | 1.93% | (c) | | | (1.56% | )(c) | | | 3.20% | (c) | | | 66% | |
| Year Ended September 30, 2006 | | | | | 10.29 | | | | 3.86% | | | | 28 | | | | 1.93% | | | | (1.50% | ) | | | 3.09% | | | | 23% | |
| Year Ended September 30, 2005 | | | | | 13.44 | | | | 14.18% | | | | 70 | | | | 1.93% | | | | (1.60% | ) | | | 2.89% | | | | 23% | |
| Period Ended September 30, 2004 (e) | | | | | 13.76 | | | | 4.32% | (b) | | | 22 | | | | 1.93% | (c) | | | (1.48% | )(c) | | | 3.22% | (c) | | | 11% | |
| Period Ended April 30, 2004 (f) | | | | | 13.19 | | | | (3.23% | )(b) | | | 5 | | | | 1.94% | (c) | | | (5.14% | )(c) | | | | (d) | | | 40% | |
| Class S |
| Six Months Ended March 31, 2007 (Unaudited) | | | | $ | 10.46 | | | | 4.11% | (b) | | $ | 287 | | | | 1.43% | (c) | | | (1.07% | )(c) | | | 2.69% | (c) | | | 66% | |
| Year Ended September 30, 2006 | | | | | 10.72 | | | | 4.37% | | | | 316 | | | | 1.43% | | | | (1.02% | ) | | | 2.58% | | | | 23% | |
| Year Ended September 30, 2005 | | | | | 13.80 | | | | 14.77% | | | | 156 | | | | 1.43% | | | | (1.07% | ) | | | 2.45% | | | | 23% | |
| Period Ended September 30, 2004 (e) | | | | | 14.01 | | | | 4.55% | (b) | | | 21 | | | | 1.42% | (c) | | | (0.94% | )(c) | | | 3.19% | (c) | | | 11% | |
| Period Ended April 30, 2004 (f) | | | | | 13.40 | | | | (3.18% | )(b) | | | 3 | | | | 1.47% | (c) | | | (4.34% | )(c) | | | | (d) | | | 40% | |
| ** | During the period, certain fees were contractually or voluntarily reduced. If such contractual/voluntary fee reductions had not occurred, the ratio would have been as indicated. |
| *** | Portfolio turnover rate is calculated on the basis of the fund as a whole without distinguishing between the classes of shares issued. |
| (a) | | Per share net investment income (loss) has been calculated using the | | (d) | | There were no waivers or reimbursements during the period. | |
| | | average daily shares method. | | (e) | | For the period from May 1, 2004 to September 30, 2004. | |
| (b) | | Not annualized. | | (f) | | For the period from April 19, 2004 (commencement of operations) to April 30, 2004. | |
| (c) | | Annualized. | | (g) | | Less than $0.01 or $(0.01) per share. | |
See notes to financial statements.
39
Table of Contents
FINANCIAL HIGHLIGHTS
Tamarack Enterprise Fund
(Selected data for a share outstanding throughout the periods indicated)
| | | | | | Investment Activities | | | Distributions |
|---|
| | | | | |
| | |
|
| | | Net Asset
Value,
Beginning
of Period | | | Net
Investment
Income (Loss) | | | Net Realized
and Unrealized
Gains (Losses)
on Investments | | | Redemption
Fees | | | Total from
Investment
Activities | | | Net
Investment
Income | | | Net
Realized
Gains | | | Total
Distributions | |
|---|
| | |
| | |
| | |
| | |
| | |
| | |
| | |
| | |
|
| Class A | | | | | | | | | | | | | | | | | | | | | | | | | | | | | | | | | | |
| Six Months Ended March 31, 2007 (Unaudited) | | | | $ | 25.12 | | | | 0.04 | (a) | | | 2.26 | | | | | (i) | | | 2.30 | | | | — | | | | (2.24 | ) | | | (2.24 | ) | |
| Year Ended September 30, 2006 | | | | | 26.46 | | | | (0.04 | )(a) | | | 1.80 | | | | | (i) | | | 1.76 | | | | — | | | | (3.10 | ) | | | (3.10 | ) |
| Year Ended September 30, 2005 | | | | | 23.81 | | | | (0.06 | ) | | | 3.66 | | | | | (i) | | | 3.60 | | | | — | | | | (0.95 | ) | | | (0.95 | ) | |
| Period Ended September 30, 2004 (e) | | | | | 23.89 | | | | (0.02 | ) | | | (0.06 | ) | | | | (i) | | | (0.08 | ) | | | — | | | | — | | | | — | | |
| Period Ended June 30, 2004 (f) | | | | | 24.01 | | | | — | | | | (0.12 | ) | | | — | | | | (0.12 | ) | | | — | | | | — | | | | — | |
| Class I |
| Six Months Ended March 31, 2007 (Unaudited) | | | | $ | 25.31 | | | | 0.08 | (a) | | | 2.26 | | | | | (i) | | | 2.34 | | | | (0.02 | ) | | | (2.24 | ) | | | (2.26 | ) |
| Year Ended September 30, 2006 | | | | | 26.57 | | | | 0.02 | (a) | | | 1.82 | | | | | (i) | | | 1.84 | | | | — | | | | (3.10 | ) | | | (3.10 | ) |
| Year Ended September 30, 2005 | | | | | 23.85 | | | | (0.02 | ) | | | 3.69 | | | | | (i) | | | 3.67 | | | | — | | | | (0.95 | ) | | | (0.95 | ) |
| Period Ended September 30, 2004 (g) | | | | | 23.85 | | | | — | | | | — | | | | | (i) | | | — | | | | — | | | | — | | | | — | |
| Class C |
| Six Months Ended March 31, 2007 (Unaudited) | | | | $ | 24.62 | | | | (0.05 | )(a) | | | 2.19 | | | | | (i) | | | 2.14 | | | | — | | | | (2.24 | ) | | | (2.24 | ) | |
| Year Ended September 30, 2006 | | | | | 26.17 | | | | (0.21 | )(a) | | | 1.76 | | | | | (i) | | | 1.55 | | | | — | | | | (3.10 | ) | | | (3.10 | ) |
| Year Ended September 30, 2005 | | | | | 23.74 | | | | (0.15 | ) | | | 3.53 | | | | | (i) | | | 3.38 | | | | — | | | | (0.95 | ) | | | (0.95 | ) |
| Period Ended September 30, 2004 (e) | | | | | 23.85 | | | | (0.04 | ) | | | (0.07 | ) | | | | (i) | | | (0.11 | ) | | | — | | | | — | | | | — | |
| Period Ended June 30, 2004 (f) | | | | | 24.01 | | | | (0.01 | ) | | | (0.15 | ) | | | — | | | | (0.16 | ) | | | — | | | | — | | | | — | |
| Class R |
| Six Months Ended March 31, 2007 (Unaudited) | | | | $ | 24.95 | | | | 0.01 | (a) | | | 2.23 | | | | | (i) | | | 2.24 | | | | — | | | | (2.24 | ) | | | (2.24 | ) | |
| Year Ended September 30, 2006 | | | | | 26.35 | | | | (0.11 | )(a) | | | 1.81 | | | | | (i) | | | 1.70 | | | | — | | | | (3.10 | ) | | | (3.10 | ) |
| Year Ended September 30, 2005 | | | | | 23.78 | | | | (0.12 | ) | | | 3.64 | | | | | (i) | | | 3.52 | | | | — | | | | (0.95 | ) | | | (0.95 | ) |
| Period Ended September 30, 2004 (e) | | | | | 23.87 | | | | (0.02 | ) | | | (0.07 | ) | | | | (i) | | | (0.09 | ) | | | — | | | | — | | | | — | |
| Period Ended June 30, 2004 (f) | | | | | 24.01 | | | | (0.02 | ) | | | (0.12 | ) | | | — | | | | (0.14 | ) | | | — | | | | — | | | | — | |
| Class S |
| Six Months Ended March 31, 2007 (Unaudited) | | | | $ | 25.30 | | | | 0.07 | (a) | | | 2.27 | | | | | (i) | | | 2.34 | | | | (0.02 | ) | | | (2.24 | ) | | | (2.26 | ) | |
| Year Ended September 30, 2006 | | | | | 26.56 | | | | 0.02 | (a) | | | 1.82 | | | | | (i) | | | 1.84 | | | | — | | | | (3.10 | ) | | | (3.10 | ) |
| Year Ended September 30, 2005 | | | | | 23.85 | | | | (0.02 | ) | | | 3.68 | | | | | (i) | | | 3.66 | | | | — | | | | (0.95 | ) | | | (0.95 | ) |
| Period Ended September 30, 2004 (e) | | | | | 23.91 | | | | (0.01 | ) | | | (0.05 | ) | | | | (i) | | | (0.06 | ) | | | — | | | | — | | | | — | |
| Year Ended June 30, 2004 (h) | | | | | 17.66 | | | | (0.02 | ) | | | 6.27 | | | | — | | | | 6.25 | | | | — | | | | — | | | | — | |
| Year Ended June 30, 2003 | | | | | 17.98 | | | | 0.04 | | | | (0.31 | ) | | | — | | | | (0.27 | ) | | | (0.03 | ) | | | (0.02 | ) | | | (0.05 | ) |
| Year Ended June 30, 2002 | | | | | 15.24 | | | | 0.02 | | | | 3.08 | | | | — | | | | 3.10 | | | | (0.05 | ) | | | (0.31 | ) | | | (0.36 | ) |
[TABLE CONTINUED BELOW]
| | | | | | | | | Ratios/Supplemental Data | | |
|---|
| | | | | | | | |
| | |
| | | Net Asset
Value,
End of
Period | | | Total
Return* | | | Net Assets,
End of Period
(000’s) | | | Ratio of Net
Expenses to
Average
Net Assets | | | Ratio of Net
Investment
Income (Loss)
to Average
Net Assets | | | Ratio of
Expenses to
Average
Net Assets** | | | Portfolio
Turnover
Rate *** | |
|---|
| | |
| | |
| | |
| | |
| | |
| | |
| | |
|
| Class A | | | | | | | | | | | | | | | | | | | | | | | | | | | | | | | |
| Six Months Ended March 31, 2007 (Unaudited) | | | | $ | 25.18 | | | | 9.44% | (b) | | $ | 20,104 | | | | 1.33% | (c) | | | 0.34% | (c) | | | 1.81% | (c) | | | 10% | |
| Year Ended September 30, 2006 | | | | | 25.12 | | | | 7.72% | | | | 17,586 | | | | 1.33% | | | | (0.17% | ) | | | 1.77% | | | | 27% | |
| Year Ended September 30, 2005 | | | | | 26.46 | | | | 15.34% | | | | 12,856 | | | | 1.33% | | | | (0.29% | ) | | | 1.88% | | | | 33% | |
| Period Ended September 30, 2004 (e) | | | | | 23.81 | | | | (0.33% | )(b) | | | 3,359 | | | | 1.33% | (c) | | | (0.35% | )(c) | | | 1.73% | (c) | | | 7% | |
| Period Ended June 30, 2004 (f) | | | | | 23.89 | | | | (0.50% | )(b) | | | 1,872 | | | | 1.33% | (c) | | | (0.07% | )(c) | | | 1.72% | (c) | | | 28% | |
| Class I |
| Six Months Ended March 31, 2007 (Unaudited) | | | | $ | 25.39 | | | | 9.55% | | | $ | 43,353 | | | | 1.08% | (c) | | | 0.63% | (c) | | | 1.31% | (c) | | | 10% | |
| Year Ended September 30, 2006 | | | | | 25.31 | | | | 8.02% | | | | 34,478 | | | | 1.08% | | | | 0.08% | | | | 1.27% | | | | 27% | |
| Year Ended September 30, 2005 | | | | | 26.57 | | | | 15.61% | | | | 29,554 | | | | 1.08% | | | | (0.08% | ) | | | 1.36% | | | | 33% | |
| Period Ended September 30, 2004 (g) | | | | | 23.85 | | | | 0.00% | (b) | | | 26,707 | | | | 0.00% | (c) | | | 0.00% | (c) | | | 0.00% | (c) | | | 7% | |
| Class C |
| Six Months Ended March 31, 2007 (Unaudited) | | | | $ | 24.52 | | | | 8.96% | | | $ | 2,643 | | | | 2.08% | (c) | | | (0.41% | )(c) | | | 2.31% | (c) | | | 10% | |
| Year Ended September 30, 2006 | | | | | 24.62 | | | | 6.93% | | | | 2,366 | | | | 2.08% | | | | (0.86% | ) | | | 2.26% | | | | 27% | |
| Year Ended September 30, 2005 | | | | | 26.17 | | | | 14.43% | | | | 801 | | | | 2.08% | | | | (1.01% | ) | | | 2.39% | | | | 33% | |
| Period Ended September 30, 2004 (e) | | | | | 23.74 | | | | (0.46% | )(b) | | | 75 | | | | 2.08% | (c) | | | (1.09% | )(c) | | | 2.25% | (c) | | | 7% | |
| Period Ended June 30, 2004 (f) | | | | | 23.85 | | | | (0.67% | )(b) | | | 23 | | | | 2.07% | (c) | | | (0.67% | )(c) | | | 2.22% | (c) | | | 28% | |
| Class R |
| Six Months Ended March 31, 2007 (Unaudited) | | | | $ | 24.95 | | | | 9.26% | | | $ | 50 | | | | 1.58% | (c) | | | 0.05% | (c) | | | 1.81% | (c) | | | 10% | |
| Year Ended September 30, 2006 | | | | | 24.95 | | | | 7.50% | | | | 52 | | | | 1.58% | | | | (0.44% | ) | | | 1.77% | | | | 27% | |
| Year Ended September 30, 2005 | | | | | 26.35 | | | | 15.01% | | | | 59 | | | | 1.58% | | | | (0.54% | ) | | | 1.88% | | | | 33% | |
| Period Ended September 30, 2004 (e) | | | | | 23.78 | | | | (0.38% | )(b) | | | 6 | | | | 1.57% | (c) | | | (0.61% | )(c) | | | 1.77% | (c) | | | 7% | |
| Period Ended June 30, 2004 (f) | | | | | 23.87 | | | | (0.58% | )(b) | | | 3 | | | | 1.54% | (c) | | | (0.38% | )(c) | | | 1.61% | (c) | | | 28% | |
| Class S |
| Six Months Ended March 31, 2007 (Unaudited) | | | | $ | 25.38 | | | | 9.56% | | | $ | 292,907 | | | | 1.08% | (c) | | | 0.57% | (c) | | | 1.31% | (c) | | | 10% | |
| Year Ended September 30, 2006 | | | | | 25.30 | | | | 8.02% | | | | 304,960 | | | | 1.08% | | | | 0.06% | | | | 1.27% | | | | 27% | |
| Year Ended September 30, 2005 | | | | | 26.56 | | | | 15.57% | | | | 327,641 | | | | 1.08% | | | | (0.08% | ) | | | 1.36% | | | | 33% | |
| Period Ended September 30, 2004 (e) | | | | | 23.85 | | | | (0.21% | )(b) | | | 345,451 | | | | 1.08% | (c) | | | (0.12% | )(c) | | | 1.21% | (c) | | | 7% | |
| Year Ended June 30, 2004 (h) | | | | | 23.91 | | | | 35.35% | | | | 365,930 | | | | 1.08% | | | | (0.09% | ) | | | 1.22% | | | | 28% | |
| Year Ended June 30, 2003 | | | | | 17.66 | | | | (1.48% | ) | | | 208,651 | | | | 1.08% | | | | 0.21% | | | | 1.14% | | | | 13% | |
| Year Ended June 30, 2002 | | | | | 17.98 | | | | 20.82% | | | | 370,351 | | | | 1.08% | | | | 0.04% | | | | | (d) | | | 93% | |
| ** | During the period, certain fees were contractually or voluntarily reduced. If such contractual/voluntary fee reductions had not occurred, the ratio would have been as indicated. |
| *** | Portfolio turnover rate is calculated on the basis of the fund as a whole without distinguishing between the classes of shares issued. |
| (a) | | Per share net investment income (loss) has been calculated using | | (f) | | For the period from April 19, 2004 (commencement of operations) to June 30, 2004. | |
| | | the average daily shares method. | | (g) | | For the period from September 30, 2004 (commencement of operations) to | |
| (b) | | Not annualized. | | | | September 30, 2004. | |
| (c) | | Annualized. | | (h) | | The existing class of shares was designated Class S shares as of April 19, 2004. | |
| (d) | | There were no waivers or reimbursements during the period. | | (i) | | Less than $0.01 or $(0.01) per share. | |
| (e) | | For the period from July 1, 2004 to September 30, 2004. | |
See notes to financial statements.
40
Table of Contents
FINANCIAL HIGHLIGHTS
Tamarack Small Cap Core Fund
(Selected data for a share outstanding throughout the periods indicated)
| | | | | | Investment Activities | | | Distributions | |
|---|
| | | | | |
| | |
|
| | | Net Asset
Value,
Beginning
of Period | | | Net
Investment
Income (Loss) | | | Net Realized
and Unrealized
Gains (Losses)
on Investments | | | Redemption
Fees | | | Total from
Investment
Activities | | | Net
Investment
Income | | | Net
Realized
Gains | | | Total
Distributions | | |
|---|
| | |
| | |
| | |
| | |
| | |
| | |
| | |
| | |
|
| Class A | | | | | | | | | | | | | | | | | | | | | | | | | | | | | | | | | | |
| Six Months Ended March 31, 2007 (Unaudited) | | | | $ | 31.74 | | | | 0.24 | (a) | | | 2.65 | | | | | (h) | | | 2.89 | | | | (0.11 | ) | | | (3.41 | ) | | | (3.52 | ) |
| Year Ended September 30, 2006 | | | | | 32.96 | | | | (0.15 | )(a) | | | 4.03 | | | | | (h) | | | 3.88 | | | | — | | | | (5.10 | ) | | | (5.10 | ) |
| Year Ended September 30, 2005 | | | | | 32.59 | | | | (0.24 | ) | | | 3.10 | | | | | (h) | | | 2.86 | | | | — | | | | (2.49 | ) | | | (2.49 | ) |
| Period Ended September 30, 2004 (e) | | | | | 32.69 | | | | (0.05 | ) | | | (0.05 | ) | | | | (h) | | | (0.10 | ) | | | — | | | | — | | | | — | |
| Period Ended June 30, 2004 (f) | | | | | 32.36 | | | | (0.03 | ) | | | 0.36 | | | | — | | | | 0.33 | | | | — | | | | — | | | | — | |
| Class C |
| Six Months Ended March 31, 2007 (Unaudited) | | | | $ | 31.08 | | | | 0.12 | (a) | | | 2.59 | | | | | (h) | | | 2.71 | | | | — | | | | (3.41 | ) | | | (3.41 | ) |
| Year Ended September 30, 2006 | | | | | 32.59 | | | | (0.38 | )(a) | | | 3.97 | | | | | (h) | | | 3.59 | | | | — | | | | (5.10 | ) | | | (5.10 | ) |
| Year Ended September 30, 2005 | | | | | 32.47 | | | | (0.24 | ) | | | 2.85 | | | | | (h) | | | 2.61 | | | | — | | | | (2.49 | ) | | | (2.49 | ) |
| Period Ended September 30, 2004 (e) | | | | | 32.63 | | | | (0.12 | ) | | | (0.04 | ) | | | | (h) | | | (0.16 | ) | | | — | | | | — | | | | — | |
| Period Ended June 30, 2004 (f) | | | | | 32.36 | | | | (0.06 | ) | | | 0.33 | | | | — | | | | 0.27 | | | | — | | | | — | | | | — | |
| Class R |
| Six Months Ended March 31, 2007 (Unaudited) | | | | $ | 31.50 | | | | 0.21 | (a) | | | 2.61 | | | | | (h) | | | 2.82 | | | | (0.04 | ) | | | (3.41 | ) | | | (3.45 | ) |
| Year Ended September 30, 2006 | | | | | 32.81 | | | | (0.23 | )(a) | | | 4.02 | | | | | (h) | | | 3.79 | | | | — | | | | (5.10 | ) | | | (5.10 | ) |
| Year Ended September 30, 2005 | | | | | 32.54 | | | | (0.28 | ) | | | 3.04 | | | | | (h) | | | 2.76 | | | | — | | | | (2.49 | ) | | | (2.49 | ) |
| Period Ended September 30, 2004 (e) | | | | | 32.66 | | | | (0.08 | ) | | | (0.04 | ) | | | | (h) | | | (0.12 | ) | | | — | | | | — | | | | — | |
| Period Ended June 30, 2004 (f) | | | | | 32.36 | | | | (0.06 | ) | | | 0.36 | | | | — | | | | 0.30 | | | | — | | | | — | | | | — | |
| Class S |
| Six Months Ended March 31, 2007 (Unaudited) | | | | $ | 31.95 | | | | 0.28 | (a) | | | 2.66 | | | | | (h) | | | 2.94 | | | | (0.19 | ) | | | (3.41 | ) | | | (3.60 | ) |
| Year Ended September 30, 2006 | | | | | 33.06 | | | | (0.07 | )(a) | | | 4.06 | | | | | (h) | | | 3.99 | | | | — | | | | (5.10 | ) | | | (5.10 | ) |
| Year Ended September 30, 2005 | | | | | 32.62 | | | | (0.19 | ) | | | 3.12 | | | | | (h) | | | 2.93 | | | | — | | | | (2.49 | ) | | | (2.49 | ) |
| Period Ended September 30, 2004 (e) | | | | | 32.70 | | | | (0.05 | ) | | | (0.03 | ) | | | | (h) | | | (0.08 | ) | | | — | | | | — | | | | — | |
| Year Ended June 30, 2004 (g) | | | | | 23.78 | | | | (0.14 | ) | | | 9.06 | | | | — | | | | 8.92 | | | | — | | | | — | | | | — | |
| Year Ended June 30, 2003 | | | | | 25.62 | | | | (0.04 | ) | | | (1.29 | ) | | | — | | | | (1.33 | ) | | | — | | | | (0.51 | ) | | | (0.51 | ) |
| Year Ended June 30, 2002 | | | | | 26.19 | | | | (0.03 | ) | | | 0.73 | | | | — | | | | 0.70 | | | | (0.01 | ) | | | (1.26 | ) | | | (1.27 | ) |
[TABLE CONTINUED BELOW]
| | | | | | | | | Ratios/Supplemental Data | | |
|---|
| | | | | | | | |
| | |
| | | Net Asset
Value,
End of
Period | | | Total
Return* | | | Net Assets,
End of Period
(000’s) | | | Ratio of Net
Expenses to
Average
Net Assets | | | Ratio of Net
Investment
Income (Loss)
to Average
Net Assets | | | Ratio of
Expenses to
Average
Net Assets** | | | Portfolio
Turnover
Rate *** | |
|---|
| | |
| | |
| | |
| | |
| | |
| | |
| | |
| | |
| Class A | | | | | | | | | | | | | | | | | | | | | | | | | | | | | | |
| Six Months Ended March 31, 2007 (Unaudited) | | | | $ | 31.11 | | | | 9.67% | (b) | | $ | 2,821 | | | | 1.55% | (c) | | | 1.51% | (c) | | | 2.16% | (c) | | | 17% | |
| Year Ended September 30, 2006 | | | | | 31.74 | | | | 13.85% | | | | 2,382 | | | | 1.55% | | | | (0.49% | ) | | | 2.15% | | | | 35% | |
| Year Ended September 30, 2005 | | | | | 32.96 | | | | 8.67% | | | | 2,793 | | | | 1.55% | | | | (0.77% | ) | | | 2.13% | | | | 33% | |
| Period Ended September 30, 2004 (e) | | | | | 32.59 | | | | (0.31% | )(b) | | | 1,771 | | | | 1.55% | (c) | | | (0.80% | )(c) | | | 1.94% | (c) | | | 8% | |
| Period Ended June 30, 2004 (f) | | | | | 32.69 | | | | 1.02% | (b) | | | 882 | | | | 1.54% | (c) | | | (1.08% | )(c) | | | 2.64% | (c) | | | 33% | |
| Class C |
| Six Months Ended March 31, 2007 (Unaudited) | | | | $ | 30.38 | | | | 9.24% | (b) | | $ | 572 | | | | 2.30% | (c) | | | 0.79% | (c) | | | 2.66% | (c) | | | 17% | |
| Year Ended September 30, 2006 | | | | | 31.08 | | | | 13.01% | | | | 366 | | | | 2.30% | | | | (1.24% | ) | | | 2.65% | | | | 35% | |
| Year Ended September 30, 2005 | | | | | 32.59 | | | | 7.89% | | | | 473 | | | | 2.30% | | | | (1.47% | ) | | | 2.64% | | | | 33% | |
| Period Ended September 30, 2004 (e) | | | | | 32.47 | | | | (0.49% | )(b) | | | 196 | | | | 2.30% | (c) | | | (1.58% | )(c) | | | 2.52% | (c) | | | 8% | |
| Period Ended June 30, 2004 (f) | | | | | 32.63 | | | | 0.83% | (b) | | | 202 | | | | 2.30% | (c) | | | (1.88% | )(c) | | | 3.18% | (c) | | | 33% | |
| Class R |
| Six Months Ended March 31, 2007 (Unaudited) | | | | $ | 30.87 | | | | 9.50% | (b) | | $ | 16 | | | | 1.80% | (c) | | | 1.32% | (c) | | | 2.15% | (c) | | | 17% | |
| Year Ended September 30, 2006 | | | | | 31.50 | | | | 13.61% | | | | 15 | | | | 1.80% | | | | (0.73% | ) | | | 2.15% | | | | 35% | |
| Year Ended September 30, 2005 | | | | | 32.81 | | | | 8.36% | | | | 18 | | | | 1.80% | | | | (1.01% | ) | | | 2.15% | | | | 33% | |
| Period Ended September 30, 2004 (e) | | | | | 32.54 | | | | (0.37% | )(b) | | | 3 | | | | 1.76% | (c) | | | (1.05% | )(c) | | | 1.95% | (c) | | | 8% | |
| Period Ended June 30, 2004 (f) | | | | | 32.66 | | | | 0.93% | (b) | | | 3 | | | | 1.82% | (c) | | | (0.98% | )(c) | | | 2.38% | (c) | | | 33% | |
| Class S |
| Six Months Ended March 31, 2007 (Unaudited) | | | | $ | 31.29 | | | | 9.79% | (b) | | $ | 67,351 | | | | 1.30% | (c) | | | 1.78% | (c) | | | 1.66% | (c) | | | 17% | |
| Year Ended September 30, 2006 | | | | | 31.95 | | | | 14.18% | | | | 64,750 | | | | 1.30% | | | | (0.22% | ) | | | 1.65% | | | | 35% | |
| Year Ended September 30, 2005 | | | | | 33.06 | | | | 8.89% | | | | 68,071 | | | | 1.30% | | | | (0.53% | ) | | | 1.63% | | | | 33% | |
| Period Ended September 30, 2004 (e) | | | | | 32.62 | | | | (0.24% | )(b) | | | 74,165 | | | | 1.30% | (c) | | | (0.57% | )(c) | | | 1.53% | (c) | | | 8% | |
| Year Ended June 30, 2004 (g) | | | | | 32.70 | | | | 37.57% | | | | 76,036 | | | | 1.30% | | | | (0.48% | ) | | | 1.54% | | | | 33% | |
| Year Ended June 30, 2003 | | | | | 23.78 | | | | (5.22% | ) | | | 53,261 | | | | 1.30% | | | | (0.18% | ) | | | 1.38% | | | | 25% | |
| Year Ended June 30, 2002 | | | | | 25.62 | | | | 2.91% | | | | 61,420 | | | | 1.30% | | | | (0.14% | ) | | | | (d) | | | 37% | |
| ** | During the period, certain fees were contractually or voluntarily reduced. If such contractual/voluntary fee reductions had not occurred, the ratio would have been as indicated. |
| *** | Portfolio turnover rate is calculated on the basis of the fund as a whole without distinguishing between the classes of shares issued. |
| (a) | | Per share net investment income (loss) has been calculated using | | (e) | | For the period from July 1, 2004 to September 30, 2004. | |
| | | the average daily shares method. | | (f) | | For the period from April 19, 2004 (commencement of operations) to | |
| (b) | | Not annualized. | | | | June 30, 2004. | |
| (c) | | Annualized. | | (g) | | The existing class of shares was designated Class S shares as of April 19, 2004. | |
| (d) | | There were no waivers or reimbursements during the period. | | (h) | | Less than $0.01 or $(0.01) per share. | |
See notes to financial statements.
41
Table of Contents
FINANCIAL HIGHLIGHTS
Tamarack Value Fund
(Selected data for a share outstanding throughout the periods indicated)
| | | | | | Investment Activities | | | Distributions | |
|---|
| | | | | |
| | |
| |
| | | Net Asset
Value,
Beginning
of Period | | | Net
Investment
Income (Loss) | | | Net Realized
and Unrealized
Gains (Losses)
on Investments | | | Redemption
Fees | | | Total from
Investment
Activities | | | Net
Investment
Income | | | Return
of Capital | | | Net
Realized
Gains | | | Total
Distributions | |
|---|
| | |
| | |
| | |
| | |
| | |
| | |
| | |
| | |
| | |
| |
| Class A | | | | | | | | | | | | | | | | | | | | | | | | | | | | | | | | | | | | | | |
| Six Months Ended March 31, 2007 (Unaudited) | | | | $ | 41.61 | | | | 0.26 | (a) | | | 2.13 | | | | | (h) | | | 2.39 | | | | (0.48 | ) | | | — | | | | (3.61 | ) | | | (4.09 | ) | |
| Year Ended September 30, 2006 | | | | | 45.66 | | | | 0.41 | (a) | | | 3.10 | | | | | (h) | | | 3.51 | | | | (0.51 | ) | | | — | | | | (7.05 | ) | | | (7.56 | ) |
| Year Ended September 30, 2005 | | | | | 45.01 | | | | 0.43 | | | | 4.53 | | | | | (h) | | | 4.96 | | | | (0.41 | ) | | | — | | | | (3.90 | ) | | | (4.31 | ) |
| Period Ended September 30, 2004 (e) | | | | | 44.18 | | | | (0.01 | ) | | | 0.84 | | | | | (h) | | | 0.83 | | | | — | | | | — | | | | — | | | | — | |
| Period Ended June 30, 2004 (f) | | | | | 44.16 | | | | 0.08 | | | | (0.06 | ) | | | — | | | | 0.02 | | | | — | | | | — | | | | — | | | | — | |
| Class C |
| Six Months Ended March 31, 2007 (Unaudited) | | | | $ | 41.13 | | | | 0.10 | (a) | | | 2.11 | | | | | (h) | | | 2.21 | | | | (0.25 | ) | | | — | | | | (3.61 | ) | | | (3.86 | ) |
| Year Ended September 30, 2006 | | | | | 45.22 | | | | 0.13 | (a) | | | 3.04 | | | | | (h) | | | 3.17 | | | | (0.21 | ) | | | — | | | | (7.05 | ) | | | (7.26 | ) |
| Year Ended September 30, 2005 | | | | | 44.85 | | | | 0.02 | | | | 4.58 | | | | | (h) | | | 4.60 | | | | (0.33 | ) | | | — | | | | (3.90 | ) | | | (4.23 | ) |
| Period Ended September 30, 2004 (e) | | | | | 44.11 | | | | | (h) | | | 0.74 | | | | | (h) | | | 0.74 | | | | — | | | | — | | | | — | | | | — | |
| Period Ended June 30, 2004 (f) | | | | | 44.16 | | | | 0.04 | | | | (0.09 | ) | | | — | | | | (0.05 | ) | | | — | | | | — | | | | — | | | | — | |
| Class R |
| Six Months Ended March 31, 2007 (Unaudited) | | | | $ | 41.56 | | | | 0.20 | (a) | | | 2.13 | | | | | (h) | | | 2.33 | | | | (0.44 | ) | | | — | | | | (3.61 | ) | | | (4.05 | ) |
| Year Ended September 30, 2006 | | | | | 45.59 | | | | 0.35 | (a) | | | 3.05 | | | | | (h) | | | 3.40 | | | | (0.38 | ) | | | — | | | | (7.05 | ) | | | (7.43 | ) |
| Year Ended September 30, 2005 | | | | | 44.95 | | | | 0.44 | | | | 4.40 | | | | | (h) | | | 4.84 | | | | (0.30 | ) | | | — | | | | (3.90 | ) | | | (4.20 | ) |
| Period Ended September 30, 2004 (e) | | | | | 44.16 | | | | 0.08 | | | | 0.71 | | | | | (h) | | | 0.79 | | | | — | | | | — | | | | — | | | | — | |
| Period Ended June 30, 2004 (f) | | | | | 44.16 | | | | 0.09 | | | | (0.09 | ) | | | — | | | | — | | | | — | | | | — | | | | — | | | | — | |
| Class S |
| Six Months Ended March 31, 2007 (Unaudited) | | | | $ | 41.74 | | | | 0.31 | (a) | | | 2.14 | | | | | (h) | | | 2.45 | | | | (0.63 | ) | | | — | | | | (3.61 | ) | | | (4.24 | ) |
| Year Ended September 30, 2006 | | | | | 45.78 | | | | 0.55 | (a) | | | 3.07 | | | | | (h) | | | 3.62 | | | | (0.61 | ) | | | — | | | | (7.05 | ) | | | (7.66 | ) |
| Year Ended September 30, 2005 | | | | | 45.05 | | | | 0.74 | | | | 4.35 | | | | | (h) | | | 5.09 | | | | (0.46 | ) | | | — | | | | (3.90 | ) | | | (4.36 | ) |
| Period Ended September 30, 2004 (e) | | | | | 44.20 | | | | 0.14 | | | | 0.71 | | | | | (h) | | | 0.85 | | | | — | | | | — | | | | — | | | | — | |
| Year Ended June 30, 2004 (g) | | | | | 37.98 | | | | 0.56 | | | | 6.47 | | | | — | | | | 7.03 | | | | (0.41 | ) | | | — | | | | (0.40 | ) | | | (0.81 | ) |
| Year Ended June 30, 2003 | | | | | 42.85 | | | | 0.45 | | | | (4.88 | ) | | | — | | | | (4.43 | ) | | | (0.44 | ) | | | — | | | | — | | | | (0.44 | ) |
| Year Ended June 30, 2002 | | | | | 45.43 | | | | 0.44 | | | | (1.87 | ) | | | — | | | | (1.43 | ) | | | (0.07 | ) | | | (0.41 | ) | | | (0.67 | ) | | | (1.15 | ) |
[TABLE CONTINUED BELOW]
| | | | | | | | | Ratios/Supplemental Data | | |
|---|
| | | | | | | | |
| | |
| | | Net Asset
Value,
End of
Period | | | Total
Return* | | | Net Assets,
End of Period
(000’s) | | | Ratio of Net
Expenses to
Average
Net Assets | | | Ratio of Net
Investment
Income
to Average
Net Assets | | | Ratio of
Expenses to
Average
Net Assets** | | | Portfolio
Turnover
Rate *** | |
|---|
| | |
| | |
| | |
| | |
| | |
| | |
| | |
| |
| Class A | | | | | | | | | | | | | | | | | | | | | | | | | | | | | | |
| Six Months Ended March 31, 2007 (Unaudited) | | | | $ | 39.91 | | | | 5.65% | (b) | | $ | 555 | | | | 1.28% | (c) | | | 1.25% | (c) | | | 1.79% | (c) | | | 73% | |
| Year Ended September 30, 2006 | | | | | 41.61 | | | | 8.84% | | | | 565 | | | | 1.31% | | | | 0.98% | | | | 1.73% | | | | 38% | |
| Year Ended September 30, 2005 | | | | | 45.66 | | | | 11.12% | | | | 2,136 | | | | 1.28% | | | | 1.16% | | | | 1.77% | | | | 35% | |
| Period Ended September 30, 2004 (e) | | | | | 45.01 | | | | 1.88% | (b) | | | 717 | | | | 1.21% | (c) | | | 1.08% | (c) | | | 1.65% | (c) | | | 5% | |
| Period Ended June 30, 2004 (f) | | | | | 44.18 | | | | 0.05% | (b) | | | 295 | | | | 1.21% | (c) | | | 1.43% | (c) | | | 1.72% | (c) | | | 14% | |
| Class C |
| Six Months Ended March 31, 2007 (Unaudited) | | | | $ | 39.48 | | | | 5.22% | (b) | | $ | 25 | | | | 2.03% | (c) | | | 0.50% | (c) | | | 2.28% | (c) | | | 73% | |
| Year Ended September 30, 2006 | | | | | 41.13 | | | | 8.04% | | | | 23 | | | | 2.05% | | | | 0.32% | | | | 2.21% | | | | 38% | |
| Year Ended September 30, 2005 | | | | | 45.22 | | | | 10.29% | | | | 27 | | | | 2.02% | | | | 0.43% | | | | 2.26% | | | | 35% | |
| Period Ended September 30, 2004 (e) | | | | | 44.85 | | | | 1.68% | (b) | | | 5 | | | | 1.96% | (c) | | | 0.21% | (c) | | | 2.17% | (c) | | | 5% | |
| Period Ended June 30, 2004 (f) | | | | | 44.11 | | | | (0.11% | )(b) | | | 5 | | | | 1.97% | (c) | | | 0.57% | (c) | | | 2.20% | (c) | | | 14% | |
| Class R |
| Six Months Ended March 31, 2007 (Unaudited) | | | | $ | 39.84 | | | | 5.50% | (b) | | $ | 4 | | | | 1.56% | (c) | | | 0.97% | (c) | | | 1.84% | (c) | | | 73% | |
| Year Ended September 30, 2006 | | | | | 41.56 | | | | 8.56% | | | | 4 | | | | 1.53% | | | | 0.85% | | | | 1.68% | | | | 38% | |
| Year Ended September 30, 2005 | | | | | 45.59 | | | | 10.85% | | | | 4 | | | | 1.52% | | | | 0.99% | | | | 1.77% | | | | 35% | |
| Period Ended September 30, 2004 (e) | | | | | 44.95 | | | | 1.79% | (b) | | | 3 | | | | 1.44% | (c) | | | 0.74% | (c) | | | 1.65% | (c) | | | 5% | |
| Period Ended June 30, 2004 (f) | | | | | 44.16 | | | | 0.00% | (b) | | | 3 | | | | 1.45% | (c) | | | 1.08% | (c) | | | 1.72% | (c) | | | 14% | |
| Class S |
| Six Months Ended March 31, 2007 (Unaudited) | | | | $ | 39.95 | | | | 5.77% | (b) | | $ | 276,207 | | | | 1.03% | (c) | | | 1.49% | (c) | | | 1.29% | (c) | | | 73% | |
| Year Ended September 30, 2006 | | | | | 41.74 | | | | 9.10% | | | | 291,662 | | | | 1.05% | | | | 1.33% | | | | 1.22% | | | | 38% | |
| Year Ended September 30, 2005 | | | | | 45.78 | | | | 11.42% | | | | 366,952 | | | | 1.01% | | | | 1.52% | | | | 1.25% | | | | 35% | |
| Period Ended September 30, 2004 (e) | | | | | 45.05 | | | | 1.92% | (b) | | | 379,023 | | | | 0.96% | (c) | | | 1.22% | (c) | | | 1.15% | (c) | | | 5% | |
| Year Ended June 30, 2004 (g) | | | | | 44.20 | | | | 18.60% | | | | 386,932 | | | | 0.96% | | | | 1.30% | | | | 1.14% | | | | 14% | |
| Year Ended June 30, 2003 | | | | | 37.98 | | | | (10.26% | ) | | | 373,781 | | | | 0.96% | | | | 1.24% | | | | 0.99% | | | | 78% | |
| Year Ended June 30, 2002 | | | | | 42.85 | | | | (3.02% | ) | | | 436,487 | | | | 0.96% | | | | 1.02% | | | | | (d) | | | 25% | |
| ** | During the period, certain fees were contractually or voluntarily reduced. If such contractual/voluntary fee reductions had not occurred, the ratio would have been as indicated. |
| *** | Portfolio turnover rate is calculated on the basis of the fund as a whole without distinguishing between the classes of shares issued. |
| (a) | | Per share net investment income (loss) has been calculated using | | (e) | | For the period from July 1, 2004 to September 30, 2004. | |
| | | the average daily shares method. | | (f) | | For the period from April 19, 2004 (commencement of operations) to June 30, 2004. | |
| (b) | | Not annualized. | | (g) | | The existing class of shares was designated Class S shares as of April 19, 2004. | |
| (c) | | Annualized. | | (h) | | Less than $0.01 or $(0.01) per share. | |
| (d) | | There were no waivers or reimbursements during the period. | |
See notes to financial statements.
42
Table of Contents
FINANCIAL HIGHLIGHTS
Tamarack Microcap Value Fund
(Selected data for a share outstanding throughout the periods indicated)
| | | | | | Investment Activities | | | Distributions | |
|---|
| | | | | |
| | |
| |
| | | Net Asset
Value,
Beginning
of Period | | | Net
Investment
Income (Loss) | | | Net Realized
and Unrealized
Gains (Losses)
on Investments | | | Redemption
Fees | | | Total from
Investment
Activities | | | Net
Investment
Income | | | Net
Realized
Gains | | | Total
Distributions | |
|---|
| | |
| | |
| | |
| | |
| | |
| | |
| | |
| | |
| |
| Class A | | | | | | | | | | | | | | | | | | | | | | | | | | | | | | | | | | |
| Six Months Ended March 31, 2007 (Unaudited) | | | | $ | 22.17 | | | | 0.01 | (a) | | | 2.27 | | | | | (h) | | | 2.28 | | | | — | | | | (1.54 | ) | | | (1.54 | ) | |
| Year Ended September 30, 2006 | | | | | 21.52 | | | | 0.00 | (a) | | | 2.53 | | | | | (h) | | | 2.53 | | | | (0.04 | ) | | | (1.84 | ) | | | (1.88 | ) |
| Year Ended September 30, 2005 | | | | | 18.83 | | | | 0.07 | | | | 3.57 | | | | | (h) | | | 3.64 | | | | (0.15 | ) | | | (0.80 | ) | | | (0.95 | ) |
| Period Ended September 30, 2004 (e) | | | | | 19.12 | | | | (0.01 | ) | | | (0.28 | ) | | | | (h) | | | (0.29 | ) | | | — | | | | — | | | | — | |
| Period Ended June 30, 2004 (f) | | | | | 19.04 | | | | — | | | | 0.08 | | | | — | | | | 0.08 | | | | — | | | | — | | | | — | |
| Class C |
| Six Months Ended March 31, 2007 (Unaudited) | | | | $ | 21.84 | | | | (0.07 | )(a) | | | 2.23 | | | | | (h) | | | 2.16 | | | | — | | | | (1.54 | ) | | | (1.54 | ) |
| Year Ended September 30, 2006 | | | | | 21.33 | | | | (0.16 | )(a) | | | 2.51 | | | | | (h) | | | 2.35 | | | | — | | | | (1.84 | ) | | | (1.84 | ) |
| Year Ended September 30, 2005 | | | | | 18.77 | | | | (0.08 | ) | | | 3.54 | | | | | (h) | | | 3.46 | | | | (0.10 | ) | | | (0.80 | ) | | | (0.90 | ) |
| Period Ended September 30, 2004 (e) | | | | | 19.09 | | | | (0.02 | ) | | | (0.30 | ) | | | | (h) | | | (0.32 | ) | | | — | | | | — | | | | — | |
| Period Ended June 30, 2004 (f) | | | | | 19.04 | | | | (0.02 | ) | | | 0.07 | | | | — | | | | 0.05 | | | | — | | | | — | | | | — | |
| Class R |
| Six Months Ended March 31, 2007 (Unaudited) | | | | $ | 22.11 | | | | (0.01 | )(a) | | | 2.25 | | | | | (h) | | | 2.24 | | | | — | | | | (1.54 | ) | | | (1.54 | ) |
| Year Ended September 30, 2006 | | | | | 21.47 | | | | (0.06 | )(a) | | | 2.54 | | | | | (h) | | | 2.48 | | | | — | | | | (1.84 | ) | | | (1.84 | ) |
| Year Ended September 30, 2005 | | | | | 18.81 | | | | (0.03 | ) | | | 3.60 | | | | | (h) | | | 3.57 | | | | (0.11 | ) | | | (0.80 | ) | | | (0.91 | ) |
| Period Ended September 30, 2004 (e) | | | | | 19.11 | | | | (0.01 | ) | | | (0.29 | ) | | | | (h) | | | (0.30 | ) | | | — | | | | — | | | | — | |
| Period Ended June 30, 2004 (f) | | | | | 19.04 | | | | — | | | | 0.07 | | | | — | | | | 0.07 | | | | — | | | | — | | | | — | |
| Class S |
| Six Months Ended March 31, 2007 (Unaudited) | | | | $ | 22.27 | | | | 0.04 | (a) | | | 2.27 | | | | | (h) | | | 2.31 | | | | (0.03 | ) | | | (1.54 | ) | | | (1.57 | ) |
| Year Ended September 30, 2006 | | | | | 21.59 | | | | 0.05 | (a) | | | 2.55 | | | | | (h) | | | 2.60 | | | | (0.08 | ) | | | (1.84 | ) | | | (1.92 | ) |
| Year Ended September 30, 2005 | | | | | 18.86 | | | | 0.04 | | | | 3.65 | | | | | (h) | | | 3.69 | | | | (0.16 | ) | | | (0.80 | ) | | | (0.96 | ) |
| Period Ended September 30, 2004 (e) | | | | | 19.14 | | | | 0.01 | | | | (0.29 | ) | | | | (h) | | | (0.28 | ) | | | — | | | | — | | | | — | |
| Year Ended June 30, 2004 (g) | | | | | 13.60 | | | | 0.05 | | | | 5.60 | | | | — | | | | 5.65 | | | | (0.05 | ) | | | (0.06 | ) | | | (0.11 | ) |
| Year Ended June 30, 2003 | | | | | 14.60 | | | | 0.05 | | | | (0.72 | ) | | | — | | | | (0.67 | ) | | | (0.04 | ) | | | (0.29 | ) | | | (0.33 | ) |
| Year Ended June 30, 2002 | | | | | 13.23 | | | | 0.03 | | | | 1.58 | | | | — | | | | 1.61 | | | | (0.02 | ) | | | (0.22 | ) | | | (0.24 | ) |
[TABLE CONTINUED BELOW]
| | | | | | | | | Ratios/Supplemental Data | | |
|---|
| | | | | | | | |
| | |
| | | Net Asset
Value,
End of
Period | | | Total
Return* | | | Net Assets,
End of Period
(000’s) | | | Ratio of Net
Expenses to
Average
Net Assets | | | Ratio of Net
Investment
Income
to Average
Net Assets | | | Ratio of
Expenses to
Average
Net Assets** | | | Portfolio
Turnover
Rate *** | |
|---|
| | |
| | |
| | |
| | |
| | |
| | |
| | |
| |
| Class A | | | | | | | | | | | | | | | | | | | | | | | | | | | | | | |
| Six Months Ended March 31, 2007 (Unaudited) | | | | $ | 22.91 | | | | 10.43% | (b) | | $ | 41,128 | | | | 1.32% | (c) | | | 0.09% | (c) | | | 1.72% | (c) | | | 2% | |
| Year Ended September 30, 2006 | | | | | 22.17 | | | | 12.67% | | | | 29,186 | | | | 1.33% | | | | 0.01% | | | | 1.74% | | | | 20% | |
| Year Ended September 30, 2005 | | | | | 21.52 | | | | 19.62% | | | | 10,328 | | | | 1.33% | | | | (0.04% | ) | | | 1.73% | | | | 8% | |
| Period Ended September 30, 2004 (e) | | | | | 18.83 | | | | (1.52% | )(b) | | | 1,522 | | | | 1.28% | (c) | | | 0.04% | (c) | | | 1.63% | (c) | | | 3% | |
| Period Ended June 30, 2004 (f) | | | | | 19.12 | | | | 0.42% | (b) | | | 405 | | | | 1.26% | (c) | | | 0.00% | (c) | | | 1.91% | (c) | | | 11% | |
| Class C |
| Six Months Ended March 31, 2007 (Unaudited) | | | | $ | 22.46 | | | | 10.03% | (b) | | $ | 3,767 | | | | 2.07% | (c) | | | (0.65% | )(c) | | | 2.22% | (c) | | | 2% | |
| Year Ended September 30, 2006 | | | | | 21.84 | | | | 11.86% | | | | 2,073 | | | | 2.08% | | | | (0.73% | ) | | | 2.25% | | | | 20% | |
| Year Ended September 30, 2005 | | | | | 21.33 | | | | 18.72% | | | | 506 | | | | 2.08% | | | | (0.77% | ) | | | 2.22% | | | | 8% | |
| Period Ended September 30, 2004 (e) | | | | | 18.77 | | | | (1.68% | )(b) | | | 167 | | | | 2.03% | (c) | | | (0.70% | )(c) | | | 2.06% | (c) | | | 3% | |
| Period Ended June 30, 2004 (f) | | | | | 19.09 | | | | 0.26% | (b) | | | 4 | | | | 2.03% | (c) | | | (0.62% | )(c) | | | 2.22% | (c) | | | 11% | |
| Class R |
| Six Months Ended March 31, 2007 (Unaudited) | | | | $ | 22.81 | | | | 10.28% | (b) | | $ | 540 | | | | 1.57% | (c) | | | (0.13% | )(c) | | | 1.72% | (c) | | | 2% | |
| Year Ended September 30, 2006 | | | | | 22.11 | | | | 12.42% | | | | 164 | | | | 1.59% | | | | (0.27% | ) | | | 1.73% | | | | 20% | |
| Year Ended September 30, 2005 | | | | | 21.47 | | | | 19.27% | | | | 143 | | | | 1.57% | | | | (0.27% | ) | | | 1.72% | | | | 8% | |
| Period Ended September 30, 2004 (e) | | | | | 18.81 | | | | (1.57% | )(b) | | | 94 | | | | 1.53% | (c) | | | (0.29% | )(c) | | | 1.67% | (c) | | | 3% | |
| Period Ended June 30, 2004 (f) | | | | | 19.11 | | | | 0.37% | (b) | | | 104 | | | | 1.49% | (c) | | | 0.15% | (c) | | | 2.17% | (c) | | | 11% | |
| Class S |
| Six Months Ended March 31, 2007 (Unaudited) | | | | $ | 23.01 | | | | 10.55% | (b) | | $ | 323,383 | | | | 1.07% | (c) | | | 0.33% | (c) | | | 1.21% | (c) | | | 2% | |
| Year Ended September 30, 2006 | | | | | 22.27 | | | | 12.97% | | | | 261,594 | | | | 1.09% | | | | 0.24% | | | | 1.23% | | | | 20% | |
| Year Ended September 30, 2005 | | | | | 21.59 | | | | 19.89% | | | | 232,912 | | | | 1.07% | | | | 0.23% | | | | 1.22% | | | | 8% | |
| Period Ended September 30, 2004 (e) | | | | | 18.86 | | | | (1.46% | )(b) | | | 218,871 | | | | 1.03% | (c) | | | 0.22% | (c) | | | 1.16% | (c) | | | 3% | |
| Year Ended June 30, 2004 (g) | | | | | 19.14 | | | | 41.63% | | | | 234,956 | | | | 1.03% | | | | 0.31% | | | | 1.20% | | | | 11% | |
| Year Ended June 30, 2003 | | | | | 13.60 | | | | (4.55% | ) | | | 92,202 | | | | 1.03% | | | | 0.36% | | | | 1.08% | | | | 17% | |
| Year Ended June 30, 2002 | | | | | 14.60 | | | | 12.44% | | | | 96,312 | | | | 1.03% | | | | 0.26% | | | | | (d) | | | 34% | |
| ** | During the period, certain fees were contractually or voluntarily reduced. If such contractual/voluntary fee reductions had not occurred, the ratio would have been as indicated. |
| *** | Portfolio turnover rate is calculated on the basis of the fund as a whole without distinguishing between the classes of shares issued. |
| (a) | | Per share net investment income (loss) has been calculated using | | (e) | | For the period from July 1, 2004 to September 30, 2004. | |
| | | the average daily shares method. | | (f) | | For the period from April 19, 2004 (commencement of operations) to June 30, 2004. | |
| (b) | | Not annualized. | | (g) | | The existing class of shares was designated Class S shares as of April 19, 2004. | |
| (c) | | Annualized. | | (h) | | Less than $0.01 or $(0.01) per share. | |
| (d) | | There were no waivers or reimbursements during the period. | |
See notes to financial statements.
43
Table of Contents
NOTES TO FINANCIAL STATEMENTS
March 31, 2007 (Unaudited)
1. Organization
Tamarack Funds Trust (“Tamarack”) is registered under the Investment Company Act of 1940 (as amended) as an open-end management investment company. Tamarack was organized as a Delaware statutory trust on December 16, 2003. Predecessor funds to Tamarack were reorganized as portfolios of Tamarack effective April 16, 2004. This semi-annual report includes the following seven investment portfolios (“Funds”):
- Tamarack Large Cap Growth Fund (“Large Cap Growth Fund”)
- Tamarack Mid Cap Growth Fund (“Mid Cap Growth Fund”)
- Tamarack SMID Cap Growth Fund (“SMID Cap Growth Fund”) (formerly known as the “Tamarack Small Cap Growth Fund”)
- Tamarack Enterprise Fund (“Enterprise Fund”)
- Tamarack Small Cap Core Fund (“Small Cap Core Fund”) (formerly known as the “Tamarack Enterprise Small Cap Fund”)
- Tamarack Value Fund (“Value Fund”)
- Tamarack Microcap Value Fund (“Microcap Value Fund”)
The Large Cap Growth, Mid Cap Growth, SMID Cap Growth, Enterprise and Small Cap Core Funds offer five share classes: Class A, Class C, Class R, Class I and Class S shares. The Value and Microcap Value Funds offer four share classes: Class A, Class C, Class R and Class S shares. Class A shares are offered with a 5.75% maximum front-end sales charge and a 1.00% contingent deferred sales charge (“CDSC”) for redemption within 12 months of a $1 million or greater purchase on which no front-end sales charge was paid. Class C shares are offered at net asset value (i.e. no front-end sales charge), but are subject to a CDSC of 1.00% for redemptions within 12 months of purchase. Class R shares (available to certain 401(k) and other employer-sponsored retirement plans), Class I shares (intended for investors meeting certain investment minimum thresholds) and Class S shares are not subject to either a front-end sales charge or a CDSC.
Voyageur Asset Management Inc. (“Voyageur”) acts as the investment advisor for Tamarack. The officers of Tamarack (“Fund Management”) are also employees of Voyageur or its affiliates.
2. Significant Accounting Policies
Summarized below are the significant accounting policies of the Funds. These policies conform to accounting principles generally accepted in the United States of America (“GAAP”). Fund management follows these policies when preparing financial statements. Management may also be required to make estimates and assumptions that affect the reported amounts of assets and liabilities at the date of the financial statements and the reported amounts of income and expenses for the period. Actual results could differ from those estimates.
New Accounting Standard:
In September 2006, the Financial Accounting Standards Board (FASB) issued Statement on Financial Accounting Standards (SFAS) No. 157, “Fair Value Measurements.” This standard establishes a single authoritative definition of fair value, sets out a framework for measuring fair value and requires additional disclosures about fair value measurements. SFAS No. 157 applies to fair value measurements already required or permitted by existing standards. SFAS No. 157 is effective for financial statements issued for fiscal years beginning after November 15, 2007 and interim periods within those
44
Table of Contents
NOTES TO FINANCIAL STATEMENTS
fiscal years. The changes to current generally accepted accounting principles from the application of this Statement relate to the definition of fair value, the methods used to measure fair value, and the expanded disclosures about fair value measurements. The Funds do not believe the adoption of SFAS No. 157 will impact the financial statement amounts; however, additional disclosures may be required about the inputs used to develop the measurements and the effect of certain of the measurements on changes in net assets for the period.
Security Valuation:
Equity securities traded on one or more U.S. exchanges shall be valued at the last available quoted sale price on the primary trading exchange as of the (“Valuation Time”). Valuation Time is as of the close of regular trading on the New York Stock Exchange (usually 4:00 p.m. Eastern Standard Time). If there was no sale on the primary exchange on the day the net asset value is calculated (“Value Date”), the most recent bid quotation generally will be used. In cases where neither closing prices nor bid prices are available, or where those prices do not accurately reflect the value of the security, a security will be valued in accordance with the Board of Trustees’ approved pricing and valuation procedures that Tamarack has established to estimate a security’s fair value. These procedures are also used to estimate the fair value of a security if a significant event occurs that materially affects the value of the security. Foreign equity securities generally are valued in their national currency at the latest available quoted sale price as of the close of trading on the foreign exchange or other principal market on which the security is traded. In the absence of current trading activity, the securities will be valued at the last bid quotation. The value is then converted into its U.S. dollar equivalent using the latest foreign exchange bid quotation. Investments in open-end investment companies are valued at net asset value. Short-term securities with less than 60 days to maturity at time of purchase are valued at amortized cost.
Repurchase Agreements:
The Funds may enter into repurchase agreements with primary dealers that report to the Federal Reserve Bank of New York or the 100 largest U.S. commercial banks (as measured by domestic deposits) who are deemed creditworthy under guidelines approved by the Board. These repurchase agreements are subject to the seller’s agreement to repurchase such securities at a mutually agreed upon date and price. The repurchase price generally equals the price paid by the Funds plus interest negotiated on the basis of current short-term rates.
Securities pledged as collateral for repurchase agreements are held by the Funds’ custodian bank until maturity of the repurchase agreement. The Funds have procedures to secure additional collateral, if needed, to ensure that the daily market value of the collateral remains in excess of the repurchase agreement in the event of a default.
Investment Transactions and Income:
Investment transactions are recorded on one business day after trade date, except on the last day of each fiscal quarter end, when they are recorded on trade date. Dividend income is recorded on the ex-dividend date. Realized gains and losses from investment transactions are calculated based on the costs of the specific security (also known as identified cost basis). Interest income is recognized on the accrual basis and includes, where applicable, the amortization or accretion of premium or discount using the effective yield method.
45
Table of Contents
NOTES TO FINANCIAL STATEMENTS
Expense, Investment Income and Gain/Loss Allocation:
Each Fund pays the expenses that are directly related to its operations, such as custodian fees or Investment Advisory Fees. Expenses incurred by Tamarack, such as trustee or legal fees, are allocated among each of the Funds either proportionately based upon each Fund’s relative net assets or using another reasonable basis such as equally across all Funds, depending on the nature of the expense. Individual share classes within a Fund are charged expenses specific to that class, such as distribution fees. Within a Fund, expenses other than class specific expenses are allocated daily to each class based upon the proportion of relative net assets. Investment income and realized and unrealized gains or losses are allocated to each class of shares based on relative net assets.
Financial Instruments:
The Funds may enter into futures contracts in an effort to hedge against market risk. A futures contract on a securities index is an agreement obligating one party to pay, and entitling the other party to receive, during the term of the contract, cash payments based on the level of a specified securities index. Futures transactions involve brokerage costs and require a Fund to segregate assets to cover contracts that would require it to purchase securities or currencies. A Fund may lose the expected benefit of futures transactions if interest rates, exchange rates or securities prices change in an unanticipated manner. Such unanticipated changes may also result in lower overall performance than if a Fund had not entered into any futures transactions.
Upon entering into a futures contract, a Fund is required to pledge to the broker an amount of cash, U.S. government securities or other assets equal to a certain percentage of the contract amount. Subsequent payments are made or received by the Fund each day, depending on the daily fluctuations in the fair value of the underlying index. A Fund would recognize an unrealized gain or loss each day equal to these daily payments. The Funds did not enter into futures contracts during the period ended March 31, 2007.
Distributions to Shareholders:
Each Fund pays out any income that it receives, less expenses, in the form of dividends and capital gains to its shareholders. Income dividends and capital gains on each Fund are declared and paid at least annually. Distributions to shareholders are recorded on the ex-dividend date. The amount of dividends and distributions are calculated based on federal income tax regulations, which may differ from GAAP. These “book/tax” differences may be either temporary or permanent in nature. To the extent these differences are determined, as of the end of the tax year, to be permanent (e.g., net operating loss, expiring capital loss carry forward and foreign currency transactions), they are reclassified within a Fund’s capital accounts based on their federal tax basis treatment. Such differences are not reflected in the calculation of the Financial Highlights. The Value Fund utilizes earnings and profits distributed to shareholders on redemption of shares as a part of the dividends paid deduction for income tax purposes.
Securities Lending:
The Funds may lend their portfolio securities to brokers, dealers and financial institutions, provided: (1) the loan is secured continuously by collateral consisting of U.S. Government securities, cash or letters of credit maintained on a daily mark-to-market basis in an amount at least equal to 100% of the current market value of the securities loaned; (2)
46
Table of Contents
NOTES TO FINANCIAL STATEMENTS
the Funds may at any time call the loan and obtain the return of the securities loaned within five business days; (3) the Funds will receive any interest or dividends paid on the loaned securities; and (4) the aggregate market value of securities loaned will not at any time exceed 331/3% of the total assets of a particular Fund. The Funds do not have the right to vote the securities during the existence of the loan but could call the loan in an attempt to permit voting of the securities in certain circumstances.
The Funds will earn income for lending their securities from fees paid by borrowers and from the investment of cash collateral. The Funds will then pay the lending agent (Wells Fargo Bank) a percentage of the lending income. Securities lending income is presented net of such payments to the lending agent in the financial statements. Loans of securities involve a risk that the borrower may fail to return the securities or may fail to provide additional collateral. In the event that a borrower fails to return the lent security, the lending agent will indemnify the Funds based on the difference in value between the closing market value of the security on the date it should have been returned and the value of the cash collateral. The Funds assume all risk of loss from a decline in the value of the collateral investment and any resulting collateral deficiencies. In an effort to reduce these risks, Voyageur and Wells Fargo Bank will monitor the creditworthiness of the borrowers to which the Funds lend securities.
The following summarizes the value of the securities that were on loan and the value of the cash held as collateral for these loans as of March 31, 2007. No securities or letters of credit were held by the Funds as collateral as of March 31, 2007.
| | | Value of
Securities Loaned | | | Value of
Collateral | |
|---|
| | |
| | |
| |
| Large Cap Growth Fund | | | | $ | 10,865,716 | | | $ | 11,210,762 | |
| Mid Cap Growth Fund | | | | | 16,284,034 | | | | 16,887,814 | |
| Enterprise Fund | | | | | 51,657,676 | | | | 54,531,034 | |
| Small Cap Core Fund | | | | | 9,646,709 | | | | 10,168,057 | |
| Value Fund | | | | | 12,662,111 | | | | 13,215,583 | |
See page 78, Notes to Schedules of Portfolio Investments, for a detailed breakdown of the investments purchased with the collateral received.
47
Table of Contents
NOTES TO FINANCIAL STATEMENTS
3. Agreements and Other Transactions with Affiliates
Tamarack has entered into investment advisory agreements with Voyageur, under which Voyageur manages each Fund’s assets and furnishes related office facilities, equipment, research and personnel. The agreement requires each Fund to pay Voyageur a monthly fee based upon average daily net assets. Under the terms of the advisory contracts, Voyageur is entitled to receive fees based on a percentage of the average daily net assets of each of the Funds as follows:
| | | Average Daily Net
Assets of Fund | | | Annual Rate | |
|---|
| | |
| | |
| |
| Large Cap Growth Fund | | | | | All Net Assets | | | | 0.70 | % |
| Mid Cap Growth Fund | | | | | All Net Assets | | | | 0.70 | % |
| SMID Cap Growth Fund | | | | | All Net Assets | | | | 0.70 | % |
| Enterprise Fund | | | | | Up to $30 million | | | | 1.40 | % |
| | | | | Over $30 million | | | | 0.90 | % |
| Small Cap Core Fund | | | | | Up to $30 million | | | | 1.40 | % |
| | | | | Over $30 million | | | | 0.90 | % |
| Value Fund | | | | | All Net Assets | | | | 0.85 | % |
| Microcap Value Fund | | | | | All Net Assets | | | | 0.90 | % |
Effective January 29, 2007, Voyageur has contractually agreed to waive fees and/or make payments in order to keep total operating expenses of the Class S and Class I shares of each fund to the following levels:
| | | Annual Rate | |
|---|
| | |
| |
| Large Cap Growth Fund | | | | | 1.00 | % |
| Mid Cap Growth Fund | | | | | 1.10 | % |
| SMID Cap Growth Fund | | | | | 1.43 | % |
| Enterprise Fund | | | | | 1.08 | % |
| Small Cap Core Fund | | | | | 1.30 | % |
| Value Fund | | | | | 1.03 | % |
| Microcap Value Fund | | | | | 1.07 | % |
Classes A, C, and R vary from these limits only by the addition of class- specific 12b-1 fees. These expense limitation agreements are in place until January 31, 2008. Voyageur may also voluntarily waive and/or reimburse operating expenses of any Fund from time to time. Any such voluntary program may be changed or eliminated at any time without notice.
Voyageur serves as administrator to the Funds and BISYS Fund Services Ohio, Inc. (“BISYS”) serves as sub-administrator. Services provided under the administrative services contract include providing day-to-day administration of matters related to the Funds, maintenance of their records and the preparation of reports. Under the terms of the administrative services contract, Voyageur receives from each Fund a fee, payable monthly, at the annual rate of 0.10% of each Fund’s average daily net assets. For its services as sub-administrator, BISYS receives a fee payable by Voyageur out of Voyageur’s own resources.
Certain Officers and Trustees of the Funds are affiliated with the adviser or the administrator. Such Officers and Trustees receive no compensation from the Funds for serving in their respective roles.
48
Table of Contents
NOTES TO FINANCIAL STATEMENTS
4. Fund Distribution
Each of the Funds has adopted a Master Distribution 12b-1 Plan (the “Plan”) in which Tamarack Distributors Inc. (the “Distributor”) acts as the Funds’ distributor. The Distributor is an affiliate of Voyageur. The Plan permits each Fund to make payments for or to reimburse the Distributor monthly for distribution-related costs and expenses of marketing shares of each share class covered under the Plan; and/or for providing shareholder services. The following chart shows the current Plan fee rate for each class.
| | | Class A | | | Class C | | | Class R | |
|---|
| | |
| | |
| | |
| |
| 12b-1 Plan Fee | | | | | 0.25 | %* | | | 1.00 | % | | | 0.50 | % |
Plan fees are based on average annual daily net assets of the applicable class. The Distributor, subject to applicable legal requirements, may waive a Plan fee voluntarily, in whole or in part.
*The maximum Plan fee rate for Class A shares is 0.50%.The Distributor is contractually waiving 0.25% of the total 0.50% Plan fee for Class A through January 31, 2008.
For the period ended March 31, 2007, the Distributor received commissions of $39,523 from front-end sales charges of Class A shares of the Funds, of which $4,933 was paid to affiliated broker-dealers, the remainder was either paid to unaffiliated broker-dealers or retained by the Distributor. The Distributor also received $2,178 from CDSC fees from Class C shares of the Funds. The Distributor received no CDSC fees from Class A shares of the Funds during the period ended March 31, 2007.
5. Securities Transactions
The cost of securities purchased and proceeds from securities sold (excluding securities maturing less than one year from acquisition) for the period ended March 31, 2007 were as follows:
| | | Purchases | | | Sales | |
|---|
| | |
| | |
| |
| Large Cap Growth Fund | | | | $ | 15,154,201 | | | $ | 31,574,009 | |
| Mid Cap Growth Fund | | | | | 16,423,677 | | | | 28,653,878 | |
| SMID Cap Growth Fund | | | | | 6,923,484 | | | | 8,973,292 | |
| Enterprise Fund | | | | | 33,120,096 | | | | 61,421,175 | |
| Small Cap Core Fund | | | | | 11,363,869 | | | | 12,265,029 | |
| Value Fund | | | | | 207,045,923 | | | | 229,050,607 | |
| Microcap Value Fund | | | | | 49,726,808 | | | | 4,925,565 | |
Within the guidelines, established by the Funds, to always seek best execution when entering into portfolio transactions, certain of the funds use directed brokerage transactions through LJR Recapture Services (“LJR”) and its correspondent brokers. A portion of the commissions paid for portfolio transactions under this program are reimbursed to the Funds and are recorded as realized gains and losses from investment transactions in the financial statements.
6. Capital Share Transactions
Tamarack is authorized to issue an unlimited number of shares of beneficial interest (“shares outstanding”) without par value. Transactions in shares of the Funds are summarized on the following pages:
49
Table of Contents
NOTES TO FINANCIAL STATEMENTS
Tamarack Large Cap Growth Fund
| | | For the
Six Months Ended
March 31,
2007 | | | For the
Year Ended
September 30,
2006 | |
|---|
| | |
| | |
| |
| | | (Unaudited) | | | | |
|---|
| CAPITAL TRANSACTIONS: | | | | | | | | | | |
| Class A | | | | | | | | | | |
| Proceeds from shares issued | | | | $ | 310,334 | | | $ | 428,205 | |
| Dividends reinvested | | | | | — | | | | — | |
| Cost of shares redeemed | | | | | (1,447,612 | ) | | | (1,677,100 | ) |
| | |
| | |
| |
| Change in Class A | | | | $ | (1,137,278 | ) | | $ | (1,248,895 | ) |
| | |
| | |
| |
| Class I | | | | | | | | | | |
| Proceeds from shares issued | | | | $ | 43,786 | | | $ | 74,609 | |
| Dividends reinvested | | | | | — | | | | 751 | |
| Cost of shares redeemed | | | | | (154,747 | ) | | | (2,591,178 | ) |
| | |
| | |
| |
| Change in Class I | | | | $ | (110,961 | ) | | $ | (2,515,818 | ) |
| | |
| | |
| |
| Class C | | | | | | | | | | |
| Proceeds from shares issued | | | | $ | 9,000 | | | $ | — | |
| Dividends reinvested | | | | | — | | | | — | |
| Cost of shares redeemed | | | | | (17 | ) | | | — | |
| | |
| | |
| |
| Change in Class C | | | | $ | 8,983 | | | $ | — | |
| | |
| | |
| |
| Class R | | | | | | | | | | |
| Proceeds from shares issued | | | | $ | — | | | $ | 229 | |
| Dividends reinvested | | | | | — | | | | — | |
| Cost of shares redeemed | | | | | — | | | | (4,988 | ) |
| | |
| | |
| |
| Change in Class R | | | | $ | — | | | $ | (4,759 | ) |
| | |
| | |
| |
| Class S | | | | | | | | | | |
| Proceeds from shares issued | | | | $ | 372,761 | | | $ | 1,437,340 | |
| Dividends reinvested | | | | | — | | | | 55,695 | |
| Cost of shares redeemed | | | | | (16,302,468 | ) | | | (25,117,395 | ) |
| | |
| | |
| |
| Change in Class S | | | | $ | (15,929,707 | ) | | $ | (23,624,360 | ) |
| | |
| | |
| |
| Change in net assets resulting from capital transactions | | | | $ | (17,168,963 | ) | | $ | (27,393,832 | ) |
| | |
| | |
| |
| SHARE TRANSACTIONS: | | | | | | | | | | |
| Class A | | | | | | | | | | |
| Issued | | | | | 27,699 | | | | 39,158 | |
| Reinvested | | | | | — | | | | — | |
| Redeemed | | | | | (129,733 | ) | | | (152,059 | ) |
| | |
| | |
| |
| Change in Class A | | | | | (102,034 | ) | | | (112,901 | ) |
| | |
| | |
| |
| Class I | | | | | | | | | | |
| Issued | | | | | 3,920 | | | | 6,795 | |
| Reinvested | | | | | — | | | | 66 | |
| Redeemed | | | | | (13,614 | ) | | | (235,328 | ) |
| | |
| | |
| |
| Change in Class I | | | | | (9,694 | ) | | | (228,467 | ) |
| | |
| | |
| |
| Class C | | | | | | | | | | |
| Issued | | | | | 819 | | | | — | |
| Reinvested | | | | | — | | | | — | |
| Redeemed | | | | | — | | | | — | |
| | |
| | |
| |
| Change in Class C | | | | | 819 | | | | — | |
| | |
| | |
| |
| Class R | | | | | | | | | | |
| Issued | | | | | — | | | | 21 | |
| Reinvested | | | | | — | | | | — | |
| Redeemed | | | | | — | | | | (483 | ) |
| | |
| | |
| |
| Change in Class R | | | | | — | | | | (462 | ) |
| | |
| | |
| |
| Class S | | | | | | | | | | |
| Issued | | | | | 33,086 | | | | 129,843 | |
| Reinvested | | | | | — | | | | 4,916 | |
| Redeemed | | | | | (1,439,454 | ) | | | (2,271,081 | ) |
| | |
| | |
| |
| Change in Class S | | | | | (1,406,368 | ) | | | (2,136,322 | ) |
| | |
| | |
| |
| Change in shares resulting from capital transactions | | | | | (1,517,277 | ) | | | (2,478,152 | ) |
| | |
| | |
| |
50
Table of Contents
NOTES TO FINANCIAL STATEMENTS
Tamarack Mid Cap Growth Fund
| | | For the
Six Months Ended
March 31,
2007 | | | For the
Year Ended
September 30,
2006 | |
|---|
| | |
| | |
| |
| | | (Unaudited) | | | | |
|---|
| CAPITAL TRANSACTIONS: | | | | | | | | | | |
| Class A | | | | | | | | | | |
| Proceeds from shares issued | | | | $ | 1,607,132 | | | $ | 6,944,468 | |
| Dividends reinvested | | | | | 1,144,886 | | | | 849,667 | |
| Cost of shares redeemed | | | | | (7,275,304 | ) | | | (12,006,567 | ) |
| | |
| | |
| |
| Change in Class A | | | | $ | (4,523,286 | ) | | $ | (4,212,432 | ) |
| | |
| | |
| |
| Class I | | | | | | | | | | |
| Proceeds from shares issued | | | | $ | 4,157,088 | | | $ | 18,030,328 | |
| Dividends reinvested | | | | | 1,874,960 | | | | 1,149,878 | |
| Cost of shares redeemed | | | | | (9,413,692 | ) | | | (12,305,131 | ) |
| | |
| | |
| |
| Change in Class I | | | | $ | (3,381,644 | ) | | $ | 6,875,075 | |
| | |
| | |
| |
| Class C | | | | | | | | | | |
| Proceeds from shares issued | | | | $ | 62,580 | | | $ | 1,661,440 | |
| Dividends reinvested | | | | | 58,278 | | | | 6,280 | |
| Cost of shares redeemed | | | | | (188,342 | ) | | | (40,763 | ) |
| | |
| | |
| |
| Change in Class C | | | | $ | (67,484 | ) | | $ | 1,626,957 | |
| | |
| | |
| |
| Class R | | | | | | | | | | |
| Proceeds from shares issued | | | | $ | — | | | $ | 296 | |
| Dividends reinvested | | | | | 286 | | | | 186 | |
| Cost of shares redeemed | | | | | — | | | | (21,940 | ) |
| | |
| | |
| |
| Change in Class R | | | | $ | 286 | | | $ | (21,458 | ) |
| | |
| | |
| |
| Class S | | | | | | | | | | |
| Proceeds from shares issued | | | | $ | 44,320 | | | $ | 595,116 | |
| Dividends reinvested | | | | | 43,434 | | | | 27,546 | |
| Cost of shares redeemed | | | | | (319,081 | ) | | | (342,744 | ) |
| | |
| | |
| |
| Change in Class S | | | | $ | (231,327 | ) | | $ | 279,918 | |
| | |
| | |
| |
| Change in net assets resulting from capital transactions | | | | $ | (8,203,455 | ) | | $ | 4,548,060 | |
| | |
| | |
| |
| SHARE TRANSACTIONS: | | | | | | | | | | |
| Class A | | | | | | | | | | |
| Issued | | | | | 127,564 | | | | 543,820 | |
| Reinvested | | | | | 93,384 | | | | 67,434 | |
| Redeemed | | | | | (578,750 | ) | | | (972,641 | ) |
| | |
| | |
| |
| Change in Class A | | | | | (357,802 | ) | | | (361,387 | ) |
| | |
| | |
| |
| Class I | | | | | | | | | | |
| Issued | | | | | 320,112 | | | | 1,338,057 | |
| Reinvested | | | | | 148,335 | | | | 88,794 | |
| Redeemed | | | | | (725,349 | ) | | | (964,789 | ) |
| | |
| | |
| |
| Change in Class I | | | | | (256,902 | ) | | | 462,062 | |
| | |
| | |
| |
| Class C | | | | | | | | | | |
| Issued | | | | | 5,063 | | | | 138,416 | |
| Reinvested | | | | | 4,856 | | | | 505 | |
| Redeemed | | | | | (15,320 | ) | | | (3,120 | ) |
| | |
| | |
| |
| Change in Class C | | | | | (5,401 | ) | | | 135,801 | |
| | |
| | |
| |
| Class R | | | | | | | | | | |
| Issued | | | | | — | | | | 25 | |
| Reinvested | | | | | 23 | | | | 15 | |
| Redeemed | | | | | — | | | | (1,918 | ) |
| | |
| | |
| |
| Change in Class R | | | | | 23 | | | | (1,878 | ) |
| | |
| | |
| |
| Class S | | | | | | | | | | |
| Issued | | | | | 3,423 | | | | 45,161 | |
| Reinvested | | | | | 3,434 | | | | 2,125 | |
| Redeemed | | | | | (24,727 | ) | | | (27,779 | ) |
| | |
| | |
| |
| Change in Class S | | | | | (17,870 | ) | | | 19,507 | |
| | |
| | |
| |
| Change in shares resulting from capital transactions | | | | | (637,952 | ) | | | 254,105 | |
| | |
| | |
| |
51
Table of Contents
NOTES TO FINANCIAL STATEMENTS
Tamarack SMID Cap Growth Fund
| | | For the
Six Months Ended
March 31,
2007 | | | For the
Year Ended
September 30,
2006 | |
|---|
| | |
| | |
| |
| | | (Unaudited) | | | | |
|---|
| CAPITAL TRANSACTIONS: | | | | | | | | | | |
| Class A | | | | | | | | | | |
| Proceeds from shares issued | | | | $ | 391,038 | | | $ | 947,992 | |
| Dividends reinvested | | | | | 361,996 | | | | 1,925,396 | |
| Cost of shares redeemed | | | | | (1,061,931 | ) | | | (2,996,628 | ) |
| | |
| | |
| |
| Change in Class A | | | | $ | (308,897 | ) | | $ | (123,240 | ) |
| | |
| | |
| |
| Class I | | | | | | | | | | |
| Proceeds from shares issued | | | | $ | 59,264 | | | $ | 1,799,030 | |
| Dividends reinvested | | | | | 270,792 | | | | 776,912 | |
| Cost of shares redeemed | | | | | (432,200 | ) | | | (1,552,267 | ) |
| | |
| | |
| |
| Change in Class I | | | | $ | (102,144 | ) | | $ | 1,023,675 | |
| | |
| | |
| |
| Class C | | | | | | | | | | |
| Proceeds from shares issued | | | | $ | — | | | $ | 12,650 | |
| Dividends reinvested | | | | | 2,362 | | | | 12,936 | |
| Cost of shares redeemed | | | | | (12,159 | ) | | | (27,027 | ) |
| | |
| | |
| |
| Change in Class C | | | | $ | (9,797 | ) | | $ | (1,441 | ) |
| | |
| | |
| |
| Class R | | | | | | | | | | |
| Proceeds from shares issued | | | | $ | 6,451 | | | $ | 7,840 | |
| Dividends reinvested | | | | | 2,031 | | | | 8,741 | |
| Cost of shares redeemed | | | | | (18 | ) | | | (49,757 | ) |
| | |
| | |
| |
| Change in Class R | | | | $ | 8,464 | | | $ | (33,176 | ) |
| | |
| | |
| |
| Class S | | | | | | | | | | |
| Proceeds from shares issued | | | | $ | 34,284 | | | $ | 193,019 | |
| Dividends reinvested | | | | | 17,044 | | | | 52,566 | |
| Cost of shares redeemed | | | | | (76,673 | ) | | | (28,072 | ) |
| | |
| | |
| |
| Change in Class S | | | | $ | (25,345 | ) | | $ | 217,513 | |
| | |
| | |
| |
| Change in net assets resulting from capital transactions | | | | $ | (437,719 | ) | | $ | 1,083,331 | |
| | |
| | |
| |
| SHARE TRANSACTIONS: | | | | | | | | | | |
| Class A | | | | | | | | | | |
| Issued | | | | | 37,478 | | | | 83,231 | |
| Reinvested | | | | | 35,984 | | | | 186,389 | |
| Redeemed | | | | | (102,214 | ) | | | (271,707 | ) |
| | |
| | |
| |
| Change in Class A | | | | | (28,752 | ) | | | (2,087 | ) |
| | |
| | |
| |
| Class I | | | | | | | | | | |
| Issued | | | | | 5,493 | | | | 162,255 | |
| Reinvested | | | | | 25,988 | | | | 72,949 | |
| Redeemed | | | | | (40,147 | ) | | | (122,090 | ) |
| | |
| | |
| |
| Change in Class I | | | | | (8,666 | ) | | | 113,114 | |
| | |
| | |
| |
| Class C | | | | | | | | | | |
| Issued | | | | | — | | | | 1,227 | |
| Reinvested | | | | | 241 | | | | 1,276 | |
| Redeemed | | | | | (1,217 | ) | | | (2,532 | ) |
| | |
| | |
| |
| Change in Class C | | | | | (976 | ) | | | (29 | ) |
| | |
| | |
| |
| Class R | | | | | | | | | | |
| Issued | | | | | 635 | | | | 732 | |
| Reinvested | | | | | 203 | | | | 853 | |
| Redeemed | | | | | — | | | | (4,062 | ) |
| | |
| | |
| |
| Change in Class R | | | | | 838 | | | | (2,477 | ) |
| | |
| | |
| |
| Class S | | | | | | | | | | |
| Issued | | | | | 3,273 | | | | 15,787 | |
| Reinvested | | | | | 1,637 | | | | 4,940 | |
| Redeemed | | | | | (6,897 | ) | | | (2,568 | ) |
| | |
| | |
| |
| Change in Class S | | | | | (1,987 | ) | | | 18,159 | |
| | |
| | |
| |
| Change in shares resulting from capital transactions | | | | | (39,543 | ) | | | 126,680 | |
| | |
| | |
| |
52
Table of Contents
NOTES TO FINANCIAL STATEMENTS
Tamarack Enterprise Fund
| | | For the
Six Months Ended
March 31,
2007 | | | For the
Year Ended
September 30,
2006 | |
|---|
| | |
| | |
| |
| | | (Unaudited) | | | | |
|---|
| CAPITAL TRANSACTIONS: | | | | | | | | | | |
| Class A | | | | | | | | | | |
| Proceeds from shares issued | | | | $ | 2,751,588 | | | $ | 9,206,486 | |
| Dividends reinvested | | | | | 1,472,750 | | | | 1,539,600 | |
| Cost of shares redeemed | | | | | (1,761,790 | ) | | | (5,419,718 | ) |
| | |
| | |
| |
| Change in Class A | | | | $ | 2,462,548 | | | $ | 5,326,368 | |
| | |
| | |
| |
| Class I | | | | | | | | | | |
| Proceeds from shares issued | | | | $ | 7,959,919 | | | $ | 5,966,827 | |
| Dividends reinvested | | | | | 3,044,157 | | | | 3,431,493 | |
| Cost of shares redeemed | | | | | (2,453,278 | ) | | | (3,325,090 | ) |
| | |
| | |
| |
| Change in Class I | | | | $ | 8,550,798 | | | $ | 6,073,230 | |
| | |
| | |
| |
| Class C | | | | | | | | | | |
| Proceeds from shares issued | | | | $ | 309,849 | | | $ | 1,600,594 | |
| Dividends reinvested | | | | | 204,733 | | | | 103,385 | |
| Cost of shares redeemed | | | | | (234,925 | ) | | | (79,082 | ) |
| | |
| | |
| |
| Change in Class C | | | | $ | 279,657 | | | $ | 1,624,897 | |
| | |
| | |
| |
| Class R | | | | | | | | | | |
| Proceeds from shares issued | | | | $ | 123 | | | $ | 52 | |
| Dividends reinvested | | | | | 366 | | | | 994 | |
| Cost of shares redeemed | | | | | (2,405 | ) | | | (5,067 | ) |
| | |
| | |
| |
| Change in Class R | | | | $ | (1,916 | ) | | $ | (4,021 | ) |
| | |
| | |
| |
| Class S | | | | | | | | | | |
| Proceeds from shares issued | | | | $ | 14,507,833 | | | $ | 25,976,483 | |
| Dividends reinvested | | | | | 22,534,553 | | | | 33,738,820 | |
| Cost of shares redeemed | | | | | (51,495,953 | ) | | | (69,580,774 | ) |
| | |
| | |
| |
| Change in Class S | | | | $ | (14,453,567 | ) | | $ | (9,865,471 | ) |
| | |
| | |
| |
| Change in net assets resulting from capital transactions | | | | $ | (3,162,480 | ) | | $ | 3,155,003 | |
| | |
| | |
| |
| SHARE TRANSACTIONS: | | | | | | | | | | |
| Class A | | | | | | | | | | |
| Issued | | | | | 107,256 | | | | 361,918 | |
| Reinvested | | | | | 60,433 | | | | 66,794 | |
| Redeemed | | | | | (69,167 | ) | | | (214,608 | ) |
| | |
| | |
| |
| Change in Class A | | | | | 98,522 | | | | 214,104 | |
| | |
| | |
| |
| Class I | | | | | | | | | | |
| Issued | | | | | 317,527 | | | | 233,929 | |
| Reinvested | | | | | 123,998 | | | | 148,101 | |
| Redeemed | | | | | (96,209 | ) | | | (131,890 | ) |
| | |
| | |
| |
| Change in Class I | | | | | 345,316 | | | | 250,140 | |
| | |
| | |
| |
| Class C | | | | | | | | | | |
| Issued | | | | | 12,394 | | | | 64,172 | |
| Reinvested | | | | | 8,609 | | | | 4,550 | |
| Redeemed | | | | | (9,337 | ) | | | (3,201 | ) |
| | |
| | |
| |
| Change in Class C | | | | | 11,666 | | | | 65,521 | |
| | |
| | |
| |
| Class R | | | | | | | | | | |
| Issued | | | | | 5 | | | | 2 | |
| Reinvested | | | | | 15 | | | | 43 | |
| Redeemed | | | | | (100 | ) | | | (204 | ) |
| | |
| | |
| |
| Change in Class R | | | | | (80 | ) | | | (159 | ) |
| | |
| | |
| |
| Class S | | | | | | | | | | |
| Issued | | | | | 565,706 | | | | 1,027,267 | |
| Reinvested | | | | | 918,278 | | | | 1,456,142 | |
| Redeemed | | | | | (1,995,138 | ) | | | (2,763,788 | ) |
| | |
| | |
| |
| Change in Class S | | | | | (511,154 | ) | | | (280,379 | ) |
| | |
| | |
| |
| Change in shares resulting from capital transactions | | | | | (55,730 | ) | | | 249,227 | |
| | |
| | |
| |
53
Table of Contents
NOTES TO FINANCIAL STATEMENTS
Tamarack Small Cap Core Fund
| | | For the
Six Months Ended
March 31,
2007 | | | For the
Year Ended
September 30,
2006 | |
|---|
| | |
| | |
| |
| | | (Unaudited) | | | | |
|---|
| CAPITAL TRANSACTIONS: | | | | | | | | | | |
| Class A | | | | | | | | | | |
| Proceeds from shares issued | | | | $ | 441,240 | | | $ | 1,218,562 | |
| Dividends reinvested | | | | | 247,641 | | | | 414,559 | |
| Cost of shares redeemed | | | | | (215,204 | ) | | | (2,010,800 | ) |
| | |
| | |
| |
| Change in Class A | | | | $ | 473,677 | | | $ | (377,679 | ) |
| | |
| | |
| |
| Class C | | | | | | | | | | |
| Proceeds from shares issued | | | | $ | 218,044 | | | $ | 280,542 | |
| Dividends reinvested | | | | | 46,062 | | | | 95,240 | |
| Cost of shares redeemed | | | | | (50,594 | ) | | | (471,242 | ) |
| | |
| | |
| |
| Change in Class C | | | | $ | 213,512 | | | $ | (95,460 | ) |
| | |
| | |
| |
| Class R | | | | | | | | | | |
| Proceeds from shares issued | | | | $ | — | | | $ | — | |
| Dividends reinvested | | | | | 441 | | | | 2,723 | |
| Cost of shares redeemed | | | | | — | | | | (4,157 | ) |
| | |
| | |
| |
| Change in Class R | | | | $ | 441 | | | $ | (1,434 | ) |
| | |
| | |
| |
| Class S | | | | | | | | | | |
| Proceeds from shares issued | | | | $ | 1,041,017 | | | $ | 1,772,380 | |
| Dividends reinvested | | | | | 6,671,683 | | | | 9,753,447 | |
| Cost of shares redeemed | | | | | (4,128,653 | ) | | | (13,580,559 | ) |
| | |
| | |
| |
| Change in Class S | | | | $ | 3,584,047 | | | $ | (2,054,732 | ) |
| | |
| | |
| |
| Change in net assets resulting from capital transactions | | | | $ | 4,271,677 | | | $ | (2,529,305 | ) |
| | |
| | |
| |
| SHARE TRANSACTIONS: | | | | | | | | | | |
| Class A | | | | | | | | | | |
| Issued | | | | | 14,035 | | | | 38,876 | |
| Reinvested | | | | | 8,366 | | | | 14,806 | |
| Redeemed | | | | | (6,765 | ) | | | (63,387 | ) |
| | |
| | |
| |
| Change in Class A | | | | | 15,636 | | | | (9,705 | ) |
| | |
| | |
| |
| Class C | | | | | | | | | | |
| Issued | | | | | 7,122 | | | | 9,228 | |
| Reinvested | | | | | 1,590 | | | | 3,453 | |
| Redeemed | | | | | (1,648 | ) | | | (15,447 | ) |
| | |
| | |
| |
| Change in Class C | | | | | 7,064 | | | | (2,766 | ) |
| | |
| | |
| |
| Class R | | | | | | | | | | |
| Issued | | | | | — | | | | — | |
| Reinvested | | | | | 15 | | | | 98 | |
| Redeemed | | | | | — | | | | (145 | ) |
| | |
| | |
| |
| Change in Class R | | | | | 15 | | | | (47 | ) |
| | |
| | |
| |
| Class S | | | | | | | | | | |
| Issued | | | | | 32,775 | | | | 56,251 | |
| Reinvested | | | | | 224,183 | | | | 346,728 | |
| Redeemed | | | | | (131,083 | ) | | | (435,019 | ) |
| | |
| | |
| |
| Change in Class S | | | | | 125,875 | | | | (32,040 | ) |
| | |
| | |
| |
| Change in shares resulting from capital transactions | | | | | 148,590 | | | | (44,558 | ) |
| | |
| | |
| |
54
Table of Contents
NOTES TO FINANCIAL STATEMENTS
Tamarack Value Fund
| | | For the
Six Months Ended
March 31,
2007 | | | For the
Year Ended
September 30,
2006 | |
|---|
| | |
| | |
| |
| | | (Unaudited) | | | | |
|---|
| CAPITAL TRANSACTIONS: | | | | | | | | | | |
| Class A | | | | | | | | | | |
| Proceeds from shares issued | | | | $ | 94,585 | | | $ | 299,314 | |
| Dividends reinvested | | | | | 43,523 | | | | 337,055 | |
| Cost of shares redeemed | | | | | (120,086 | ) | | | (1,953,944 | ) |
| | |
| | |
| |
| Change in Class A | | | | $ | 18,022 | | | $ | (1,317,575 | ) |
| | |
| | |
| |
| Class C | | | | | | | | | | |
| Proceeds from shares issued | | | | $ | 1,000 | | | $ | 1,200 | |
| Dividends reinvested | | | | | 2,266 | | | | 4,460 | |
| Cost of shares redeemed | | | | | (250 | ) | | | (6,265 | ) |
| | |
| | |
| |
| Change in Class C | | | | $ | 3,016 | | | $ | (605 | ) |
| | |
| | |
| |
| Class R | | | | | | | | | | |
| Proceeds from shares issued | | | | $ | — | | | $ | — | |
| Dividends reinvested | | | | | 388 | | | | 598 | |
| Cost of shares redeemed | | | | | — | | | | — | |
| | |
| | |
| |
| Change in Class R | | | | $ | 388 | | | $ | 598 | |
| | |
| | |
| |
| Class S | | | | | | | | | | |
| Proceeds from shares issued | | | | $ | 2,034,756 | | | $ | 10,020,806 | |
| Dividends reinvested | | | | | 27,130,832 | | | | 57,366,366 | |
| Cost of shares redeemed | | | | | (32,696,254 | ) | | | (111,790,919 | ) |
| | |
| | |
| |
| Change in Class S | | | | $ | (3,530,666 | ) | | $ | (44,403,747 | ) |
| | |
| | |
| |
| Change in net assets resulting from capital transactions | | | | $ | (3,509,240 | ) | | $ | (45,721,329 | ) |
| | |
| | |
| |
| SHARE TRANSACTIONS: | | | | | | | | | | |
| Class A | | | | | | | | | | |
| Issued | | | | | 2,214 | | | | 7,045 | |
| Reinvested | | | | | 1,080 | | | | 8,660 | |
| Redeemed | | | | | (2,965 | ) | | | (48,909 | ) |
| | |
| | |
| |
| Change in Class A | | | | | 329 | | | | (33,204 | ) |
| | |
| | |
| |
| Class C | | | | | | | | | | |
| Issued | | | | | 24 | | | | 27 | |
| Reinvested | | | | | 57 | | | | 115 | |
| Redeemed | | | | | (7 | ) | | | (159 | ) |
| | |
| | |
| |
| Change in Class C | | | | | 74 | | | | (17 | ) |
| | |
| | |
| |
| Class R | | | | | | | | | | |
| Issued | | | | | — | | | | — | |
| Reinvested | | | | | 10 | | | | 15 | |
| Redeemed | | | | | — | | | | — | |
| | |
| | |
| |
| Change in Class R | | | | | 10 | | | | 15 | |
| | |
| | |
| |
| Class S | | | | | | | | | | |
| Issued | | | | | 49,948 | | | | 245,393 | |
| Reinvested | | | | | 672,888 | | | | 1,472,443 | |
| Redeemed | | | | | (796,407 | ) | | | (2,746,219 | ) |
| | |
| | |
| |
| Change in Class S | | | | | (73,571 | ) | | | (1,028,383 | ) |
| | |
| | |
| |
| Change in shares resulting from capital transactions | | | | | (73,158 | ) | | | (1,061,589 | ) |
| | |
| | |
| |
55
Table of Contents
NOTES TO FINANCIAL STATEMENTS
Tamarack Microcap Value Fund
| | | For the
Six Months Ended
March 31,
2007 | | | For the
Year Ended
September 30,
2006 | |
|---|
| | |
| | |
| |
| | | (Unaudited) | | | | |
|---|
| CAPITAL TRANSACTIONS: | | | | | | | | | | |
| Class A | | | | | | | | | | |
| Proceeds from shares issued | | | | $ | 13,403,020 | | | $ | 21,509,388 | |
| Dividends reinvested | | | | | 1,656,596 | | | | 724,313 | |
| Cost of shares redeemed | | | | | (4,112,348 | ) | | | (4,079,726 | ) |
| | |
| | |
| |
| Change in Class A | | | | $ | 10,947,268 | | | $ | 18,153,975 | |
| | |
| | |
| |
| Class C | | | | | | | | | | |
| Proceeds from shares issued | | | | $ | 1,584,151 | | | $ | 1,522,129 | |
| Dividends reinvested | | | | | 138,761 | | | | 40,803 | |
| Cost of shares redeemed | | | | | (95,809 | ) | | | (48,232 | ) |
| | |
| | |
| |
| Change in Class C | | | | $ | 1,627,103 | | | $ | 1,514,700 | |
| | |
| | |
| |
| Class R | | | | | | | | | | |
| Proceeds from shares issued | | | | $ | 355,371 | | | $ | 87,900 | |
| Dividends reinvested | | | | | 23,703 | | | | 8,962 | |
| Cost of shares redeemed | | | | | (9,763 | ) | | | (77,953 | ) |
| | |
| | |
| |
| Change in Class R | | | | $ | 369,311 | | | $ | 18,909 | |
| | |
| | |
| |
| Class S | | | | | | | | | | |
| Proceeds from shares issued | | | | $ | 74,135,284 | | | $ | 54,488,045 | |
| Dividends reinvested | | | | | 19,094,543 | | | | 19,192,907 | |
| Cost of shares redeemed | | | | | (40,560,514 | ) | | | (53,531,006 | ) |
| | |
| | |
| |
| Change in Class S | | | | $ | 52,669,313 | | | $ | 20,149,946 | |
| | |
| | |
| |
| Change in net assets resulting from capital transactions | | | | $ | 65,612,995 | | | $ | 39,837,530 | |
| | |
| | |
| |
| SHARE TRANSACTIONS: | | | | | | | | | | |
| Class A | | | | | | | | | | |
| Issued | | | | | 584,421 | | | | 989,589 | |
| Reinvested | | | | | 73,889 | | | | 36,125 | |
| Redeemed | | | | | (179,428 | ) | | | (189,336 | ) |
| | |
| | |
| |
| Change in Class A | | | | | 478,882 | | | | 836,378 | |
| | |
| | |
| |
| Class C | | | | | | | | | | |
| Issued | | | | | 70,758 | | | | 71,356 | |
| Reinvested | | | | | 6,302 | | | | 2,055 | |
| Redeemed | | | | | (4,241 | ) | | | (2,223 | ) |
| | |
| | |
| |
| Change in Class C | | | | | 72,819 | | | | 71,188 | |
| | |
| | |
| |
| Class R | | | | | | | | | | |
| Issued | | | | | 15,615 | | | | 4,033 | |
| Reinvested | | | | | 1,061 | | | | 447 | |
| Redeemed | | | | | (437 | ) | | | (3,683 | ) |
| | |
| | |
| |
| Change in Class R | | | | | 16,239 | | | | 797 | |
| | |
| | |
| |
| Class S | | | | | | | | | | |
| Issued | | | | | 3,223,231 | | | | 2,504,113 | |
| Reinvested | | | | | 848,646 | | | | 954,871 | |
| Redeemed | | | | | (1,766,582 | ) | | | (2,499,770 | ) |
| | |
| | |
| |
| Change in Class S | | | | | 2,305,295 | | | | 959,214 | |
| | |
| | |
| |
| Change in shares resulting from capital transactions | | | | | 2,873,235 | | | | 1,867,577 | |
| | |
| | |
| |
56
Table of Contents
NOTES TO FINANCIAL STATEMENTS
7. Federal Income Taxes
It is the policy of each Fund to continue to qualify as a regulated investment company by complying with the provisions available to certain investment companies, as defined under Subchapter M of the Internal Revenue Code, and to distribute substantially all of its net investment income and net realized capital gains. Therefore, no federal tax liability is recorded in the financial statements of each Fund.
In June 2006, the Financial Accounting Standards Board (FASB) released FASB Interpretation No. 48 “Accounting for Uncertainty in Income Taxes” (FIN 48). FIN 48 provides guidance for how uncertain tax positions should be recognized, measured, presented and disclosed in the financial statements. FIN 48 requires each evaluation of tax positions taken or expected to be taken in the course of preparing the Fund’s tax return to determine whether the tax positions are “more-likely-than-not” to be sustained by the applicable tax authority. Tax positions not deemed to meet the more-likely-than-not threshold would be recorded as a tax benefit or expense in the current year. Adoption of FIN 48 is required no later than the last business day of the first financial statement reporting period for fiscal years beginning after December 15, 2006 and is to be applied to all open tax years as of the effective date. Management has not completed its analysis on whether the adoption of FIN 48 will have an impact to the financial statements.
The tax cost of securities differ from financial reporting cost by the amount of losses recognized for financial reporting purposes in excess of those allowed to be recognized for federal income tax purposes. As of March 31, 2007, the tax cost of securities and the breakdown of unrealized appreciation (depreciation) for each Fund were as follows:
| | | Tax Cost
of Securities | | | Unrealized
Appreciation | | | Unrealized
Depreciation | | | Net Unrealized
Appreciation
(Depreciation) | |
|---|
| | |
| | |
| | |
| | |
| |
| Large Cap Growth Fund | | | | $ | $120,089,503 | | | $ | 17,669,585 | | | $ | (7,931,094 | ) | | $ | 9,738,491 | |
| Mid Cap Growth Fund | | | | | 110,326,977 | | | | 25,900,278 | | | | (4,172,569 | ) | | | 21,727,709 | |
| SMID Cap Growth Fund | | | | | 8,853,696 | | | | 1,395,368 | | | | (198,789 | ) | | | 1,196,579 | |
| Enterprise Fund | | | | | 311,766,539 | | | | 124,290,751 | | | | (22,475,008 | ) | | | 101,815,743 | |
| Small Cap Core Fund | | | | | 57,362,077 | | | | 27,135,042 | | | | (3,283,515 | ) | | | 23,851,527 | |
| Value Fund | | | | | 258,665,609 | | | | 37,540,438 | | | | (3,234,448 | ) | | | 34,305,990 | |
| Microcap Value Fund | | | | | 269,790,966 | | | | 118,159,003 | | | | (20,021,023 | ) | | | 98,137,980 | |
The tax character of distributions as of the latest fiscal year ended September 30, 2006 were as follows:
| | | Distributions Paid From | | |
|---|
| | |
| | |
| | | Ordinary
Income | | | Net Long Term
Capital Gains | | | Total Taxable
Distributions | | | Tax Exempt
Distributions | | | Total
Distributions
Paid* | |
|---|
| | |
| | |
| | |
| | |
| | |
| |
| Large Cap Growth Fund | | | | $ | 63,057 | | | $ | — | | | $ | 63,057 | | | $ | — | | | $ | 63,057 | |
| Mid Cap Growth Fund | | | | | 461,810 | | | | 1,621,492 | | | | 2,083,302 | | | | — | | | | 2,083,302 | |
| SMID Cap Growth Fund | | | | | 93,040 | | | | 2,854,593 | | | | 2,947,633 | | | | — | | | | 2,947,633 | |
| Enterprise Fund | | | | | — | | | | 42,964,648 | | | | 42,964,648 | | | | — | | | | 42,964,648 | |
| Small Cap Core Fund | | | | | 1,063,554 | | | | 9,685,240 | | | | 10,748,794 | | | | — | | | | 10,748,794 | |
| Value Fund | | | | | 7,474,650 | | | | 52,201,003 | | | | 59,675,653 | | | | — | | | | 59,675,653 | |
| Microcap Value Fund | | | | | 1,700,236 | | | | 19,418,081 | | | | 21,118,317 | | | | — | | | | 21,118,317 | |
* Total Distributions Paid may differ from the Statements of Changes in Net Assets because distributions are recognized when actually paid for tax purposes.
57
Table of Contents
NOTES TO FINANCIAL STATEMENTS
As of September 30, 2006 the components of accumulated earnings/(deficit) on a tax basis were as follows:
| | | Undistributed
Ordinary
Income | | | Undistributed
Long-Term
Capital Gains | | | Accumulated
Earnings | | | Distributions
Payable | | | Accumulated
Capital and
Other
Losses | | | Unrealized
Appreciation/
Depreciation | | | Total
Accumulated
Earnings/
(Deficit) | |
|---|
| | |
| | |
| | |
| | |
| | |
| | |
| | |
| |
| Large Cap Growth Fund | | | | $ | — | | | $ | — | | | $ | — | | | $ | — | | | $ | (29,872,601 | ) | | $ | 9,332,114 | | | $ | (20,540,487 | ) |
| Mid Cap Growth Fund | | | | | 60,768 | | | | 3,096,827 | | | | 3,157,595 | | | | — | | | | — | | | | 19,412,949 | | | | 22,570,544 | |
| SMID Cap Growth Fund | | | | | — | | | | 585,942 | | | | 585,942 | | | | — | | | | — | | | | 2,026,784 | | | | 2,612,726 | |
| Enterprise Fund | | | | | 8,245,250 | | | | 20,358,604 | | | | 28,603,854 | | | | — | | | | — | | | | 89,066,626 | | | | 117,670,480 | |
| Small Cap Core Fund | | | | | 368,679 | | | | 6,243,016 | | | | 6,611,695 | | | | — | | | | — | | | | 22,577,349 | | | | 29,189,044 | |
| Value Fund | | | | | 4,204,657 | | | | 22,701,735 | | | | 26,906,392 | | | | — | | | | — | | | | 97,684,122 | | | | 124,590,514 | |
| Microcap Value Fund | | | | | 1,577,956 | | | | 19,830,450 | | | | 21,408,406 | | | | — | | | | (128,996 | ) | | | 67,659,140 | | | | 88,938,550 | |
As of September 30, 2006, the following Fund had net capital loss carryforwards as successor to a merger and subject to certain limitations on utilization. To the extent that these carryforwards are utilized, it is probable that the realized gains that are offset will not be required to be distributed to shareholders.
| | | Capital Loss
Carryforward | | | Expires | |
|---|
| | |
| | |
| |
| Large Cap Growth Fund | | | | $ | 17,283,662 | | | | 2008 | |
| | | | | 9,673,722 | | | | 2009 | |
| | | | | 2,915,217 | | | | 2010 | |
Under current tax law, capital losses realized after October 31 of a Fund’s fiscal year may be deferred and treated as occurring on the first business day of the following fiscal year for tax purposes. The following Funds had deferred post October capital losses, which will be treated as arising on the first business day of the fiscal year ending September 30, 2007:
| | | Deferred
Post-October
Losses | |
|---|
| | |
| |
| Microcap Value Fund | | | | $ | 128,996 | |
58
Table of Contents
NOTES TO FINANCIAL STATEMENTS
8. Market Timing
Tamarack strongly discourages attempts at market timing by Fund shareholders. Each Fund charges a redemption fee of 2% of the value of the shares redeemed or exchanged within 30 days of purchase, in addition to limiting the number of exchanges that may be made between Funds to five (5) per calendar year. When assessed, the redemption fee is deducted from the redemption proceeds and retained by the Fund, not by Voyageur. This redemption fee is not charged in cases where, for example, the redemption results from an automatic reinvestment or asset re-allocation not specifically directed by the shareholder. Tamarack also reserves the right to reject any Fund purchase order made by persons deemed to be market timers. The Funds’ prospectus contains a full description of Tamarack’s policies on market timing and/or excessive trading. During the period ended March 31, 2007 the redemption fees collected by each Fund were as follows:
| | | Redemption Fees | |
|---|
| | |
| |
| Large Cap Growth Fund | | | | $ | 29 | |
| Mid Cap Growth Fund | | | | | 57 | |
| SMID Cap Growth Fund | | | | | 276 | |
| Enterprise Fund | | | | | 104 | |
| Small Cap Core Fund | | | | | 43 | |
| Value Fund | | | | | 210 | |
| Microcap Value Fund | | | | | 2,186 | |
9. Soft Dollars
The term soft dollars generally refers to arrangements in which services other than trade execution are received from a broker-dealer. Federal securities laws permit a fund advisor to incur commission charges on behalf of a Fund that are higher than another broker dealer would have charged if the advisor believes the charges are reasonable in relation to the brokerage and research services received. Voyageur has a fiduciary duty to the shareholders of the Funds to seek the best execution price for all of the Funds’ securities transactions. Fund management believes that using soft dollars to purchase brokerage and research services may, in certain cases, be in a Fund’s best interest. As of March 31, 2007 certain of the Funds used soft dollar arrangements on a limited basis. Fund management continues to closely monitor its current use of soft dollars, in addition to regulatory developments in this area for any possible impact on Fund policies.
59
Table of Contents
SCHEDULE OF PORTFOLIO INVESTMENTS
Tamarack Large Cap Growth Fund
March 31, 2007 (Unaudited)
Shares or
Principal
Amount | | | | Value | |
|---|
|
| Common Stocks – 98.91% |
| Consumer Discretionary – 15.27% |
| 38,350 | | E.W. Scripps Co. (The), Class A | | $ | 1,713,478 | |
| 37,490 | | Johnson Controls, Inc. | | | 3,547,303 | |
| 35,480 | | Kohl’s Corp. (b) | | | 2,718,123 | |
| 51,500 | | McGraw-Hill Cos., Inc. (The) | | | 3,238,320 | |
| 30,960 | | Omnicom Group, Inc. | | | 3,169,685 | |
| 77,290 | | Staples, Inc. | | | 1,997,174 | |
| 53,570 | | Starbucks Corp. (b) | | | 1,679,955 | |
| | | |
|
| | | | | 18,064,038 | |
| | | |
|
| Consumer Staples – 9.30% |
| 59,200 | | PepsiCo, Inc. | | | 3,762,752 | |
| 67,480 | | Procter & Gamble Co. (The) | | | 4,262,037 | |
| 64,910 | | Walgreen Co. | | | 2,978,720 | |
| | | |
|
| | | | | 11,003,509 | |
| | | |
|
| Energy – 5.62% |
| 29,950 | | Apache Corp. | | | 2,117,465 | |
| 28,930 | | EOG Resources, Inc. | | | 2,063,866 | |
| 51,380 | | Smith International, Inc. (c) | | | 2,468,809 | |
| | | |
|
| | | | | 6,650,140 | |
| | | |
|
| Financials – 12.86% |
| 39,920 | | AFLAC, Inc. | | | 1,878,635 | |
| 48,920 | | American Express Co. | | | 2,759,088 | |
| 7,420 | | Chicago Mercantile Exchange Holdings, Inc. (c) | | | 3,950,853 | |
| 25,900 | | Franklin Resources, Inc. | | | 3,129,497 | |
| 54,070 | | State Street Corp. (c) | | | 3,501,033 | |
| | | |
|
| | | | | 15,219,106 | |
| | | |
|
| Healthcare – 15.88% |
| 34,120 | | Abbott Laboratories | | | 1,903,896 | |
| 37,540 | | Amgen, Inc. (b) | | | 2,097,735 | |
| 23,850 | | Express Scripts, Inc. (b) | | | 1,925,172 | |
| 51,510 | | Genzyme Corp. (b) | | | 3,091,630 | |
| 47,690 | | Medtronic, Inc. | | | 2,339,671 | |
| 35,800 | | Quest Diagnostics, Inc. (c) | | | 1,785,346 | |
| 57,290 | | Stryker Corp. (c) | | | 3,799,474 | |
| 22,640 | | WellPoint, Inc. (b) | | | 1,836,104 | |
| | | |
|
| | | | | 18,779,028 | |
| | | |
|
| Industrials – 14.41% |
| 72,570 | | Danaher Corp. (c) | | | 5,185,126 | |
| 127,070 | | General Electric Co. | | | 4,493,195 | |
| 66,270 | | Thermo Fisher Scientific, Inc. (b) | | | 3,098,123 | |
| 65,790 | | United Technologies Corp. | | | 4,276,350 | |
| | | |
|
| | | | | 17,052,794 | |
| | | |
|
| Information Technology – 22.90% |
| 105,200 | | Adobe Systems, Inc. (b) | | | 4,386,840 | |
| 29,110 | | Apple Computer, Inc. (b) | | | 2,704,610 | |
| 44,500 | | Autodesk, Inc. (b) | | | 1,673,200 | |
| 194,930 | | Cisco Systems, Inc. (b) | | | 4,976,562 | |
| 76,560 | | eBay, Inc. (b) | | | 2,537,964 | |
| 91,680 | | Jabil Circuit, Inc. | | | 1,962,869 | |
| 86,690 | | Paychex, Inc. | | | 3,282,950 | |
| 79,780 | | QUALCOMM, Inc. | | | 3,403,415 | |
| 49,300 | | SanDisk Corp. (b) (c) | | | 2,159,340 | |
| | | |
|
| | | | | 27,087,750 | |
| | | |
|
| Materials – 2.67% |
| 73,420 | | Ecolab, Inc. | | | 3,157,060 | |
| | | |
|
Total Common Stocks
(Cost $103,146,552) | | | 117,013,425 | |
| |
| |
| Investment Companies – 0.34% |
| 403,807 | | Wells Fargo Prime Investment Money Market Fund | | | 403,807 | |
| | | |
|
Total Investment Companies
(Cost $403,807) | | | 403,807 | |
| |
| |
Investment of Cash Collateral for Securities
on Loan – 9.47% |
| 11,210,762 | | Various Securities (see Notes to Schedules of Portfolio Investments for collateral information) | | | 11,210,762 | |
| | | |
|
Total Investment of Cash Collateral for Securities on Loan
(Cost $11,210,762) | | | 11,210,762 | |
| |
| |
| Repurchase Agreements – 1.01% |
| 1,200,000 | | Bank of America dated 3/30/07; due 4/2/07 at 5.38% with maturity value of $1,200,538 (fully collateralized by Federal Home Loan Mortgage Corporation with effective yield of 5.00% and maturity date of 6/1/35) | | | 1,200,000 | |
| | | |
|
Total Repurchase Agreements
(Cost $1,200,000) | | | 1,200,000 | |
| |
| |
60
Table of Contents
SCHEDULE OF PORTFOLIO INVESTMENTS
Tamarack Large Cap Growth Fund (cont.)
Shares or
Principal
Amount | | | | Value | |
|---|
|
Total Investments
(Cost $115,961,121) (a) – 109.44% | | $ | 129,827,994 | |
| Liabilities in excess of other assets – (9.73)% | | | (11,509,878 | ) |
| |
| |
| NET ASSETS – 100.00% | | $ | 118,318,116 | |
| |
| |
(a) See notes to financial statements for the tax cost of securities and the breakdown of unrealized appreciation (depreciation).
(b) Non-income producing security.
(c) All or part of this security has been loaned as of March 31, 2007.
See notes to financial statements.
61
Table of Contents
SCHEDULE OF PORTFOLIO INVESTMENTS
Tamarack Mid Cap Growth Fund
March 31, 2007 (Unaudited)
Shares or
Principal
Amount | | | | Value | |
|---|
|
| Common Stocks – 98.65% |
| Consumer Discretionary – 23.40% |
| 52,000 | | Aeropostale, Inc. (b) (c) | | $ | 2,091,960 | |
| 67,000 | | Chico’s FAS, Inc. (b) (c) | | | 1,636,810 | |
| 126,000 | | Coldwater Creek, Inc. (b) | | | 2,555,280 | |
| 52,000 | | Dick’s Sporting Goods, Inc. (b) | | | 3,029,520 | |
| 48,000 | | E.W. Scripps Co. (The), Class A | | | 2,144,640 | |
| 34,000 | | Guitar Center, Inc. (b) (c) | | | 1,534,080 | |
| 89,000 | | O’Reilly Automotive, Inc. (b) (c) | | | 2,945,900 | |
| 75,000 | | PetSmart, Inc. | | | 2,472,000 | |
| 93,000 | | Pool Corp. (c) | | | 3,329,400 | |
| 46,000 | | Tractor Supply Co. (b) (c) | | | 2,369,000 | |
| 70,000 | | Zumiez, Inc. (b) (c) | | | 2,808,400 | |
| | | |
|
| | | | | 26,916,990 | |
| | | |
|
| Consumer Staples – 1.64% |
| 32,000 | | Chattem, Inc. (b) (c) | | | 1,886,080 | |
| | | |
|
| Energy – 4.25% |
| 77,000 | | BJ Services Co. | | | 2,148,300 | |
| 57,000 | | Smith International, Inc. | | | 2,738,850 | |
| | | |
|
| | | | | 4,887,150 | |
| | | |
|
| Financials – 7.73% |
| 60,000 | | Commerce Bancorp, Inc. (c) | | | 2,002,800 | |
| 79,000 | | East West Bancorp, Inc. | | | 2,904,830 | |
| 14,500 | | Legg Mason, Inc. | | | 1,366,045 | |
| 31,000 | | Zions Bancorp. | | | 2,620,120 | |
| | | |
|
| | | | | 8,893,795 | |
| | | |
|
| Healthcare – 13.91% |
| 22,000 | | Express Scripts, Inc. (b) (c) | | | 1,775,840 | |
| 33,000 | | Henry Schein, Inc. (b) | | | 1,820,940 | |
| 41,000 | | Omnicare, Inc. | | | 1,630,570 | |
| 42,000 | | Quest Diagnostics, Inc. (c) | | | 2,094,540 | |
| 40,000 | | ResMed, Inc. (b) | | | 2,014,800 | |
| 75,000 | | Varian Medical Systems, Inc. (b) | | | 3,576,750 | |
| 85,000 | | VCA Antech, Inc. (b) | | | 3,086,350 | |
| | | |
|
| | | | | 15,999,790 | |
| | | |
|
| Industrials – 24.64% |
| 49,000 | | ChoicePoint, Inc. (b) | | | 1,834,070 | |
| 17,000 | | Corporate Executive Board Co. | | | 1,291,320 | |
| 67,000 | | Donaldson Co., Inc. | | | 2,418,700 | |
| 77,000 | | Expeditors International of Washington, Inc. | | | 3,181,640 | |
| 64,000 | | Fastenal Co. | | | 2,243,200 | |
| 47,000 | | Graco, Inc. | | | 1,840,520 | |
| 128,500 | | Knight Transportation, Inc. (c) | | | 2,289,870 | |
| 21,000 | | Precision Castparts Corp. | | | 2,185,050 | |
| 93,000 | | Roper Industries, Inc. | | | 5,103,840 | |
| 41,000 | | Stericycle, Inc. (b) | | | 3,341,500 | |
| 56,160 | | Thermo Fisher Scientific, Inc. (b) | | | 2,625,480 | |
| | | |
|
| | | | | 28,355,190 | |
| | | |
|
| Information Technology – 19.58% |
| 63,000 | | Amdocs Ltd. ADR (b) | | | 2,298,240 | |
| 47,000 | | ANSYS, Inc. (b) (c) | | | 2,386,190 | |
| 58,000 | | CDW Corp. | | | 3,562,940 | |
| 79,000 | | Cognos, Inc. ADR (b) | | | 3,111,810 | |
| 24,000 | | DST Systems, Inc. (b) (c) | | | 1,804,800 | |
| 74,000 | | FactSet Research Systems, Inc. | | | 4,650,900 | |
| 104,000 | | Jabil Circuit, Inc. | | | 2,226,640 | |
| 70,000 | | Microchip Technology, Inc. | | | 2,487,100 | |
| | | |
|
| | | | | 22,528,620 | |
| | | |
|
| Materials – 3.50% |
| 42,000 | | Albemarle Corp. | | | 1,736,280 | |
| 34,000 | | Florida Rock Industries, Inc. | | | 2,287,860 | |
| | | |
|
| | | | | 4,024,140 | |
| | | |
|
Total Common Stocks
(Cost $91,743,295) | | | 113,491,755 | |
| |
| |
| Investment Companies – 0.41% |
| 475,117 | | Wells Fargo Prime Investment Money Market Fund | | | 475,117 | |
| | | |
|
Total Investment Companies
(Cost $475,117) | | | 475,117 | |
| |
| |
Investment of Cash Collateral for Securities
on Loan – 14.68% |
| 16,887,814 | | Various Securities (see Notes to Schedules of Portfolio Investments for collateral information) | | | 16,887,814 | |
| | | |
|
Total Investment of Cash Collateral for Securities on Loan
(Cost $16,887,814) | | | 16,887,814 | |
| |
| |
62
Table of Contents
SCHEDULE OF PORTFOLIO INVESTMENTS
Tamarack Mid Cap Growth Fund (cont.)
Shares or
Principal
Amount | | | | Value | |
|---|
|
| Repurchase Agreements – 1.04% |
| 1,200,000 | | Bank of America dated 3/30/07; due 4/2/07 at 5.38% with maturity value of $1,200,538 (fully collateralized by Federal Home Loan Mortgage Corporation with effective yield of 5.00% and maturity date of 6/1/35) | | $ | 1,200,000 | |
| | | |
|
Total Repurchase Agreements
(Cost $1,200,000) | | | 1,200,000 | |
| |
| |
Total Investments
(Cost $110,306,226) (a) – 114.78% | | | 132,054,686 | |
| Liabilities in excess of other assets – (14.25)% | | | (17,002,263 | ) |
| |
| |
| NET ASSETS – 100.00% | | $ | 115,052,423 | |
| |
| |
(a) See notes to financial statements for the tax cost of securities and the breakdown of unrealized appreciation (depreciation).
(b) Non-income producing security.
(c) All or part of this security has been loaned as of March 31, 2007.
Abbreviations used are defined below:
ADR – American Depositary Receipt
See notes to financial statements.
63
Table of Contents
SCHEDULE OF PORTFOLIO INVESTMENTS
Tamarack SMID Cap Growth Fund
March 31, 2007 (Unaudited)
Shares or
Principal
Amount | | | | Value | |
|---|
|
| Common Stocks – 96.03% |
| Consumer Discretionary – 17.95% |
| 5,800 | | Aeropostale, Inc. (b) | | $ | 233,334 | |
| 11,900 | | Coldwater Creek, Inc. (b) | | | 241,332 | |
| 4,100 | | Dick’s Sporting Goods, Inc. (b) | | | 238,866 | |
| 6,600 | | O’Reilly Automotive, Inc. (b) | | | 218,460 | |
| 7,200 | | PetSmart, Inc. | | | 237,312 | |
| 6,300 | | Pool Corp. | | | 225,540 | |
| 10,650 | | Shuffle Master, Inc. (b) | | | 194,363 | |
| 4,100 | | Tractor Supply Co. (b) | | | 211,150 | |
| | | |
|
| | | | | 1,800,357 | |
| | | |
|
| Consumer Staples – 2.23% |
| 3,800 | | Chattem, Inc. (b) | | | 223,972 | |
| | | |
|
| Energy – 4.17% |
| 6,750 | | Berry Petroleum Co., Class A | | | 206,955 | |
| 4,400 | | Smith International, Inc. | | | 211,420 | |
| | | |
|
| | | | | 418,375 | |
| | | |
|
| Financials – 11.35% |
| 5,900 | | East West BanCorp, Inc. | | | 216,943 | |
| 7,100 | | HCC Insurance Holdings, Inc. | | | 218,680 | |
| 4,850 | | Investment Technology Group, Inc. (b) | | | 190,120 | |
| 3,200 | | Legg Mason, Inc. | | | 301,472 | |
| 2,500 | | Zions Bancorp. | | | 211,300 | |
| | | |
|
| | | | | 1,138,515 | |
| | | |
|
| Healthcare – 22.51% |
| 4,900 | | ArthroCare Corp. (b) | | | 176,596 | |
| 2,200 | | Express Scripts, Inc. (b) | | | 177,584 | |
| 7,200 | | HealthExtras, Inc. (b) | | | 207,216 | |
| 3,800 | | Henry Schein, Inc. (b) | | | 209,684 | |
| 5,200 | | Kensey Nash Corp. (b) | | | 158,600 | |
| 3,850 | | Kyphon, Inc. (b) | | | 173,789 | |
| 5,500 | | Pharmaceutical Product Development, Inc. | | | 185,295 | |
| 4,600 | | ResMed, Inc. (b) | | | 231,701 | |
| 6,100 | | SonoSite, Inc. (b) | | | 172,386 | |
| 3,800 | | Varian Medical Systems, Inc. (b) | | | 181,222 | |
| 5,400 | | VCA Antech, Inc. (b) | | | 196,074 | |
| 4,000 | | West Pharmaceutical Services, Inc. | | | 185,720 | |
| | | |
|
| | | | | 2,255,867 | |
| | | |
|
| Industrials – 15.15% |
| 3,250 | | DRS Technologies, Inc. | | | 169,553 | |
| 4,300 | | Expeditors International of Washington, Inc. | | | 177,676 | |
| 4,800 | | Fastenal Co. | | | 168,240 | |
| 3,000 | | Huron Consulting Group, Inc. (b) | | | 182,520 | |
| 10,725 | | Knight Transportation, Inc. | | | 191,120 | |
| 6,900 | | NuCo2, Inc. (b) | | | 174,018 | |
| 4,600 | | Roper Industries, Inc. | | | 252,447 | |
| 2,500 | | Stericycle, Inc. (b) | | | 203,750 | |
| | | |
|
| | | | | 1,519,324 | |
| | | |
|
| Information Technology – 20.13% |
| 3,900 | | ANSYS, Inc. (b) | | | 198,003 | |
| 3,300 | | CDW Corp. | | | 202,719 | |
| 5,000 | | Cognos, Inc. ADR (b) | | | 196,950 | |
| 5,950 | | Cymer, Inc. (b) | | | 247,223 | |
| 4,100 | | DST Systems, Inc. (b) | | | 308,319 | |
| 3,900 | | FactSet Research Systems, Inc. | | | 245,115 | |
| 9,100 | | Jabil Circuit, Inc. | | | 194,831 | |
| 6,600 | | Microchip Technology, Inc. | | | 234,498 | |
| 4,950 | | Zebra Technologies Corp., Class A (b) | | | 191,120 | |
| | | |
|
| | | | | 2,018,778 | |
| | | |
|
| Materials – 2.54% |
| 9,150 | | Valspar Corp. | | | 254,645 | |
| | | |
|
Total Common Stocks
(Cost $8,373,996) | | | 9,629,833 | |
| |
| |
| Investment Companies – 4.19% |
| 18,782 | | Wells Fargo Government Institutional Money Market Fund | | | 18,782 | |
| 401,660 | | Wells Fargo Prime Investment Money Market Fund | | | 401,660 | |
| | | |
|
Total Investment Companies
(Cost $420,442) | | | 420,442 | |
| |
| |
Total Investments
(Cost $8,794,438) (a) – 100.22% | | | 10,050,275 | |
| Liabilities in excess of other assets – (0.22)% | | | (21,979 | ) |
| |
| |
| NET ASSETS – 100.00% | | $ | 10,028,296 | |
| |
| |
(a) See notes to financial statements for the tax cost of securities and the breakdown of unrealized appreciation (depreciation).
(b) Non-income producing security.
Abbreviations used are defined below:
ADR – American Depositary Receipt
See notes to financial statements.
64
Table of Contents
SCHEDULE OF PORTFOLIO INVESTMENTS
Tamarack Enterprise Fund
March 31, 2007 (Unaudited)
Shares or
Principal
Amount | | | | Value | |
|---|
|
| Common Stocks – 95.60% |
| Consumer Discretionary – 17.22% |
| 154,250 | | Cache, Inc. (b) | | $ | 2,737,938 | |
| 110,400 | | Carmike Cinemas, Inc. (c) | | | 2,561,280 | |
| 639,000 | | Casual Male Retail Group, Inc. (b) (c) | | | 7,559,370 | |
| 300,000 | | Comstock Homebuilding Cos., Inc., Class A (b) (c) | | | 1,215,000 | |
| 159,971 | | Deb Shops, Inc. | | | 4,332,015 | |
| 295,800 | | Dixie Group, Inc. (The) (b) | | | 3,558,474 | |
| 495,400 | | Hancock Fabrics, Inc. (b) (c) | | | 842,180 | |
| 150,000 | | McCormick & Schmick’s Seafood Restaurants, Inc. (b) | | | 4,021,500 | |
| 532,400 | | Movado Group, Inc. | | | 15,679,180 | |
| 762,900 | | Regent Communications, Inc. (b) | | | 2,456,538 | |
| 378,000 | | Steinway Musical Instruments, Inc. | | | 12,198,060 | |
| 93,380 | | Tefron Ltd. ADR | | | 913,256 | |
| 135,000 | | Universal Electronics, Inc. (b) | | | 3,761,100 | |
| | | |
|
| | | | | 61,835,891 | |
| | | |
|
| Consumer Staples – 1.78% |
| 220,000 | | NutraCea (b) (c) | | | 662,200 | |
| 510,400 | | Topps Co., Inc. (The) | | | 4,961,088 | |
| 24,600 | | United Natural Foods, Inc. (b) (c) | | | 753,744 | |
| | | |
|
| | | | | 6,377,032 | |
| | | |
|
| Energy – 4.53% |
| 79,300 | | Goodrich Petroleum Corp. (b) (c) | | | 2,666,859 | |
| 170,000 | | Gulf Island Fabrication, Inc. | | | 4,545,800 | |
| 366,800 | | Tetra Technologies, Inc. (b) | | | 9,063,628 | |
| | | |
|
| | | | | 16,276,287 | |
| | | |
|
| Financials – 15.76% |
| 226,300 | | ASTA Funding, Inc. (c) | | | 9,771,633 | |
| 33,400 | | Bank of the Ozarks, Inc. (c) | | | 959,248 | |
| 103,100 | | Boston Private Financial Holdings, Inc. (c) | | | 2,878,552 | |
| 91,009 | | Capital Corp. of the West | | | 2,416,289 | |
| 96,259 | | Cobiz, Inc. (c) | | | 1,916,517 | |
| 187,157 | | Dearborn BanCorp, Inc. (b) | | | 3,269,633 | |
| 158,800 | | FirstCity Financial Corp. (b) | | | 1,683,280 | |
| 136,096 | | Hanmi Financial Corp. | | | 2,593,990 | |
| 171,200 | | Harrington West Financial Group, Inc. | | | 2,910,400 | |
| 100,100 | | LaSalle Hotel Properties (c) | | | 4,640,636 | |
| 77,516 | | Mercantile Bank Corp. (c) | | | 2,517,720 | |
| 140,289 | | MetroCorp Bancshares, Inc. | | | 2,974,127 | |
| 119,900 | | National Interstate Corp. (c) | | | 3,088,624 | |
| 92,788 | | Northrim BanCorp, Inc. | | | 2,741,885 | |
| 274,666 | | Sanders Morris Harris Group, Inc. (c) | | | 2,925,193 | |
| 79,554 | | Sterling Financial Corp. | | | 2,481,289 | |
| 274,900 | | SWS Group, Inc. | | | 6,820,269 | |
| | | |
|
| | | | | 56,589,285 | |
| | | |
|
| Healthcare – 3.92% |
| 45,000 | | Kensey Nash Corp. (b) | | | 1,372,500 | |
| 188,000 | | Meridian Bioscience, Inc. | | | 5,218,880 | |
| 345,275 | | Penwest Pharmaceuticals Co. (b) (c) | | | 3,480,372 | |
| 146,624 | | Young Innovations, Inc. | | | 3,991,105 | |
| | | |
|
| | | | | 14,062,857 | |
| | | |
|
| Industrials – 24.90% |
| 230,200 | | ABM Industries, Inc. (c) | | | 6,074,979 | |
| 260,870 | | Allied Defense Group, Inc. (b) (c) | | | 2,230,439 | |
| 480,000 | | C&D Technologies, Inc. (c) | | | 2,414,400 | |
| 161,600 | | CDI Corp. | | | 4,673,472 | |
| 345,725 | | Columbus McKinnon Corp. (b) | | | 7,740,782 | |
| 282,000 | | EDO Corp. (c) | | | 7,388,400 | |
| 281,200 | | Ennis Business Forms, Inc. | | | 7,524,912 | |
| 66,500 | | ESCO Technologies, Inc. (b) | | | 2,980,530 | |
| 181,000 | | Gehl Co. (b) | | | 4,593,780 | |
| 20,500 | | Herley Industries, Inc. (b) | | | 320,210 | |
| 445,500 | | LaBarge, Inc. (b) | | | 5,791,500 | |
| 281,837 | | LSI Industries, Inc. | | | 4,717,951 | |
| 198,000 | | Mac-Gray Corp. (b) | | | 3,100,680 | |
| 111,763 | | Modtech Holdings, Inc. (b) | | | 350,936 | |
| 316,490 | | Nu Horizons Electronics Corp. (b) | | | 3,332,640 | |
| 142,200 | | Old Dominion Freight Line, Inc. (b) | | | 4,096,782 | |
| 193,010 | | Quixote Corp. | | | 3,860,200 | |
| 350,393 | | Rush Enterprises, Inc., Class A (b) | | | 6,731,050 | |
| 152,800 | | Saia, Inc. (b) | | | 3,629,000 | |
65
Table of Contents
SCHEDULE OF PORTFOLIO INVESTMENTS
Tamarack Enterprise Fund (cont.)
Shares or
Principal
Amount | | | | Value | |
|---|
|
| 264,900 | | Spectrum Control, Inc. (b) | | $ | 3,258,270 | |
| 129,789 | | Standard Parking Corp. (b) (c) | | | 4,590,637 | |
| | | |
|
| | | | | 89,401,550 | |
| | | |
|
| Information Technology – 12.35% |
| 223,700 | | Comtech Telecommunications Corp. (b) | | | 8,663,901 | |
| 306,600 | | Covansys Corp. (b) | | | 7,566,888 | |
| 101,715 | | Edgewater Technology, Inc. (b) | | | 858,475 | |
| 552,732 | | HMS Holdings Corp. (b) (c) | | | 12,104,830 | |
| 591,300 | | Hypercom Corp. (b) | | | 3,524,148 | |
| 130,900 | | Landauer, Inc. | | | 6,607,832 | |
| 151,700 | | NIC, Inc. | | | 813,112 | |
| 52,533 | | Printronix, Inc. | | | 727,582 | |
| 274,800 | | Tyler Technologies, Inc. (b) | | | 3,489,960 | |
| | | |
|
| | | | | 44,356,728 | |
| | | |
|
| Materials – 11.11% |
| 839,600 | | Birch Mountain Resources Ltd. ADR (b) (c) | | | 2,510,404 | |
| 819,000 | | Intertape Polymer Group, Inc. ADR (b) | | | 3,374,280 | |
| 140,000 | | Koppers Holdings, Inc. | | | 3,592,400 | |
| 322,300 | | NN, Inc. | | | 4,025,527 | |
| 549,500 | | Omnova Solutions, Inc. (b) | | | 3,000,270 | |
| 418,250 | | Penford Corp. | | | 8,423,555 | |
| 803,300 | | U.S. Concrete, Inc. (b) | | | 6,281,806 | |
| 183,088 | | Universal Stainless & Alloy Products, Inc. (b) | | | 8,691,187 | |
| | | |
|
| | | | | 39,899,429 | |
| | | |
|
| Telecommunication Services – 2.09% |
| 388,500 | | EMS Technologies, Inc. (b) | | | 7,486,395 | |
| | | |
|
| Utilities – 1.94% |
| 142,900 | | Central Vermont Public Service Corp. | | | 4,118,378 | |
| 104,800 | | Unitil Corp. | | | 2,847,416 | |
| | | |
|
| | | | | 6,965,794 | |
| | | |
|
Total Common Stocks
(Cost $240,916,251) | | | 343,251,248 | |
| |
| |
Investment of Cash Collateral for Securities
on Loan – 15.19% |
| 54,531,034 | | Various Securities (see Notes to Schedules of Portfolio Investments for collateral information) | | | 54,531,034 | |
| | | |
|
Total Investment of Cash Collateral for Securities on Loan
(Cost $54,531,034) | | | 54,531,034 | |
| |
| |
| Repurchase Agreement – 4.40% |
| 15,800,000 | | Bank of America dated 3/30/07; due 4/2/07 at 5.38% with maturity value of $15,807,084 (fully collateralized by Federal Home Loan Mortgage Corporation with effective yield of 5.00% and maturity date of 6/1/35) | | | 15,800,000 | |
| | | |
|
Total Repurchase Agreement
(Cost $15,800,000) | | | 15,800,000 | |
| |
| |
Total Investments
(Cost $311,247,285) (a) – 115.19% | | | 413,582,282 | |
| Liabilities in excess of other assets – (15.19)% | | | (54,525,192 | ) |
| |
| |
| NET ASSETS – 100.00% | | $ | 359,057,090 | |
| |
| |
(a) See notes to financial statements for the tax cost of securities and the breakdown of unrealized appreciation (depreciation).
(b) Non-income producing security.
(c) All or part of this security has been loaned as of March 31, 2007.
Abbreviations used defined:
ADR – American Depositary Receipt
See notes to financial statements.
66
Table of Contents
SCHEDULE OF PORTFOLIO INVESTMENTS
Tamarack Small Cap Core Fund
March 31, 2007 (Unaudited)
Shares or
Principal
Amount | | | | Value | |
|---|
|
| Common Stocks – 97.92% |
| Consumer Discretionary – 22.49% |
| 37,700 | | Big 5 Sporting Goods Corp. | | $ | 977,184 | |
| 107,300 | | Casual Male Retail Group, Inc. (b) (c) | | | 1,269,359 | |
| 46,400 | | Hancock Fabrics, Inc. (b) (c) | | | 78,880 | |
| 150,100 | | Interface, Inc. | | | 2,400,099 | |
| 37,550 | | Men’s Wearhouse, Inc. | | | 1,766,728 | |
| 83,900 | | Movado Group, Inc. | | | 2,470,855 | |
| 22,500 | | O’Charley’s, Inc. (b) | | | 434,025 | |
| 33,725 | | Pool Corp. (c) | | | 1,207,355 | |
| 14,700 | | Salem Communications Corp., Class A | | | 183,750 | |
| 59,100 | | Source Interlink Cos., Inc. (b) (c) | | | 396,561 | |
| 71,800 | | Stein Mart, Inc. | | | 1,171,776 | |
| 66,500 | | Steinway Musical Instruments, Inc. | | | 2,145,955 | |
| 12,300 | | Steven Madden Ltd. | | | 359,160 | |
| 68,100 | | Stride Rite Corp. | | | 1,048,059 | |
| | | |
|
| | | | | 15,909,746 | |
| | | |
|
| Consumer Staples – 5.08% |
| 33,900 | | Alberto-Culver Co. | | | 775,632 | |
| 17,200 | | BJ’s Wholesale Club, Inc. (b) | | | 581,876 | |
| 24,000 | | Nash-Finch Co. (c) | | | 827,040 | |
| 33,900 | | Sally Beauty Holdings, Inc. (b) | | | 311,541 | |
| 50,400 | | Smart & Final, Inc. (b) | | | 1,097,208 | |
| | | |
|
| | | | | 3,593,297 | |
| | | |
|
| Energy – 3.12% |
| 57,100 | | Basic Energy Services, Inc. (b) | | | 1,330,430 | |
| 19,000 | | World Fuel Services Corp. (c) | | | 878,940 | |
| | | |
|
| | | | | 2,209,370 | |
| | | |
|
| Financials – 13.28% |
| 26,800 | | Amerisafe, Inc. (b) | | | 505,180 | |
| 146,200 | | Ashford Hospitality Trust, Inc. | | | 1,745,628 | |
| 30,800 | | ASTA Funding, Inc. (c) | | | 1,329,944 | |
| 14,100 | | Cadence Financial Corp. | | | 282,000 | |
| 23,408 | | Cash America International, Inc. | | | 959,728 | |
| 27,525 | | Delphi Financial Group, Inc., Class A | | | 1,107,331 | |
| 12,100 | | GB&T Bancshares, Inc. (c) | | | 219,373 | |
| 17,400 | | Pro-Assurance Corp. (b) | | | 890,010 | |
| 20,400 | | SWS Group, Inc. | | | 506,124 | |
| 33,400 | | Thomas Weisel Partners Group, Inc. (b) (c) | | | 635,268 | |
| 14,072 | | TriCo Bancshares | | | 333,084 | |
| 37,500 | | UCBH Holdings, Inc. | | | 698,250 | |
| 7,200 | | Union Bankshares Corp. | | | 186,768 | |
| | | |
|
| | | | | 9,398,688 | |
| | | |
|
| Healthcare – 8.93% |
| 66,500 | | Angiotech Pharmaceuticals, Inc. ADR (b) | | | 364,420 | |
| 49,900 | | Inverness Medical Innovations, Inc. (b) | | | 2,184,621 | |
| 48,102 | | Polymedica Corp. (c) | | | 2,036,158 | |
| 52,975 | | PSS World Medical, Inc. (b) | | | 1,119,892 | |
| 14,600 | | Respironics, Inc. (b) | | | 613,054 | |
| | | |
|
| | | | | 6,318,145 | |
| | | |
|
| Industrials – 22.98% |
| 13,200 | | Arkansas Best Corp. | | | 469,260 | |
| 49,800 | | Blount International, Inc. (b) | | | 620,010 | |
| 75,600 | | C&D Technologies, Inc. (c) | | | 380,268 | |
| 72,800 | | Carlisle Co. | | | 3,125,304 | |
| 20,700 | | CDI Corp. | | | 598,644 | |
| 41,300 | | Columbus McKinnon Corp. (b) | | | 924,707 | |
| 21,500 | | Franklin Electric Co., Inc. | | | 999,750 | |
| 69,000 | | Gardner Denver, Inc. (b) | | | 2,404,650 | |
| 30,400 | | Gehl Co. (b) | | | 771,552 | |
| 40,400 | | Lamson & Sessions Co. (b) (c) | | | 1,122,716 | |
| 26,100 | | Manitowoc Co., Inc. (The) | | | 1,658,133 | |
| 9,500 | | NCI Building Systems, Inc. (b) | | | 453,530 | |
| 15,600 | | Pacer International, Inc. | | | 420,264 | |
| 32,800 | | Wabtec Corp. | | | 1,131,272 | |
| 30,900 | | Watts Water Technologies, Inc., Class A (c) | | | 1,175,127 | |
| | | |
|
| | | | | 16,255,187 | |
| | | |
|
| Information Technology – 11.25% |
| 75,900 | | Aeroflex, Inc. (b) | | | 998,085 | |
| 17,300 | | Altiris, Inc. (b) | | | 569,343 | |
| 47,100 | | Aspen Technology, Inc. (b) | | | 612,300 | |
| 53,950 | | Benchmark Electronics, Inc. (b) | | | 1,114,607 | |
| 18,600 | | Comtech Telecommunications Corp. (b) | | | 720,378 | |
| 12,400 | | Daktronics, Inc. (c) | | | 340,256 | |
| 21,200 | | Keithley Instruments, Inc. | | | 324,148 | |
| 57,700 | | Paxar Corp. (b) | | | 1,655,990 | |
67
Table of Contents
SCHEDULE OF PORTFOLIO INVESTMENTS
Tamarack Small Cap Core Fund (cont.)
Shares or
Principal
Amount | | | | Value | |
|---|
|
| 8,700 | | ScanSource, Inc. (b) | | $ | 233,508 | |
| 75,300 | | Skyworks Solutions, Inc. (b) | | | 432,975 | |
| 68,100 | | Sonic Solutions (b) | | | 960,210 | |
| | | |
|
| | | | | 7,961,800 | |
| | | |
|
| Materials – 7.76% |
| 153,000 | | Birch Mountain Resources Ltd. ADR (b) (c) | | | 457,470 | |
| 26,500 | | H.B. Fuller Co. | | | 722,655 | |
| 69,300 | | Hercules, Inc. (b) | | | 1,354,122 | |
| 155,300 | | Intertape Polymer Group, Inc. ADR (b) | | | 639,836 | |
| 41,000 | | Koppers Holdings, Inc. | | | 1,052,060 | |
| 43,000 | | Spartech Corp. | | | 1,261,620 | |
| | | |
|
| | | | | 5,487,763 | |
| | | |
|
| Telecommunication Services – 1.84% |
| 116,200 | | Premiere Global Services, Inc. (b) | | | 1,303,764 | |
| | | |
|
| Utilities – 1.19% |
| 16,600 | | Energen Corp. (c) | | | 844,774 | |
| | | |
|
Total Common Stocks
(Cost $45,244,080) | | | 69,282,534 | |
| |
| |
| Investment Companies – 0.65% |
| 463,013 | | Wells Fargo Prime Investment Money Market Fund | | | 463,013 | |
| | | |
|
Total Investment Companies
(Cost $463,013) | | | 463,013 | |
| |
| |
Investment of Cash Collateral for Securities
on Loan – 14.36% |
| 10,168,057 | | Various Securities (see Notes to Schedules of Investments for collateral information) | | | 10,168,057 | |
| | | |
|
Total Investment of Cash Collateral for Securities on Loan
(Cost $10,168,057) | | | 10,168,057 | |
| |
| |
| Repurchase Agreement – 1.84% |
| 1,300,000 | | Bank of America dated 3/30/07; due 4/2/07 at 5.38% with maturity value of $1,300,583 (fully collateralized by Federal Home Loan Mortgage Corporation with effective yield of 5.00% and maturity date of 6/1/35) | | | 1,300,000 | |
| | | |
|
Total Repurchase Agreement
(Cost $1,300,000) | | | 1,300,000 | |
| |
| |
Total Investments
(Cost $57,175,150) (a) – 114.77% | | | 81,213,604 | |
| Liabilities in excess of other assets – (14.77)% | | | (10,453,741 | ) |
| |
| |
| NET ASSETS – 100.00% | | $ | 70,759,863 | |
| |
| |
(a) See notes to financial statements for the tax cost of securities and the breakdown of unrealized appreciation (depreciation).
(b) Non-income producing security.
(c) All or part of this security has been loaned as of March 31, 2007.
Abbreviations used are defined below:
ADR – American Depositary Receipt
See notes to financial statements.
68
Table of Contents
SCHEDULE OF PORTFOLIO INVESTMENTS
Tamarack Value Fund
March 31, 2007 (Unaudited)
Shares or
Principal
Amount | | | | Value | |
|---|
|
| Common Stocks – 99.58% |
| Consumer Discretionary – 7.99% |
| 156,400 | | CBS Corp., Class B (c) | | $ | 4,784,276 | |
| 62,600 | | McDonald’s Corp. | | | 2,820,130 | |
| 169,040 | | Newell Rubbermaid, Inc. | | | 5,255,454 | |
| 99,220 | | Time Warner, Inc. | | | 1,956,618 | |
| 37,740 | | VF Corp. | | | 3,118,079 | |
| 121,160 | | Walt Disney Co. (The) (c) | | | 4,171,539 | |
| | | |
|
| | | | | 22,106,096 | |
| | | |
|
| Consumer Staples – 8.09% |
| 34,320 | | Altria Group, Inc. | | | 3,013,639 | |
| 142,890 | | Coca-Cola Co. (The) | | | 6,858,721 | |
| 48,700 | | General Mills, Inc. | | | 2,835,314 | |
| 81,810 | | Kimberly-Clark Corp. | | | 5,603,167 | |
| 64,740 | | Procter & Gamble Co. | | | 4,088,978 | |
| | | |
|
| | | | | 22,399,819 | |
| | | |
|
| Energy – 14.92% |
| 86,240 | | Anadarko Petroleum Corp. | | | 3,706,595 | |
| 85,680 | | Apache Corp. | | | 6,057,576 | |
| 55,690 | | Chevron Corp. | | | 4,118,832 | |
| 65,430 | | ConocoPhillips | | | 4,472,141 | |
| 195,860 | | Exxon Mobil Corp. | | | 14,777,636 | |
| 26,430 | | Marathon Oil Corp. | | | 2,612,077 | |
| 92,940 | | Noble Energy, Inc. | | | 5,543,871 | |
| | | |
|
| | | | | 41,288,728 | |
| | | |
|
| Financials – 30.96% |
| 35,110 | | AFLAC, Inc. | | | 1,652,277 | |
| 142,300 | | American International Group, Inc. | | | 9,565,406 | |
| 44,420 | | Ameriprise Financial, Inc. | | | 2,538,159 | |
| 131,170 | | Bank of America Corp. | | | 6,692,293 | |
| 57,200 | | CBL & Associates Properties, Inc. | | | 2,564,848 | |
| 50,120 | | Chubb Corp. | | | 2,589,700 | |
| 217,466 | | Citigroup, Inc. | | | 11,164,705 | |
| 55,940 | | Federal National Mortgage Association | | | 3,053,205 | |
| 57,530 | | Hartford Financial Services Group, Inc. | | | 5,498,717 | |
| 56,930 | | Hospitality Properties Trust | | | 2,664,324 | |
| 190,290 | | JPMorgan Chase & Co. | | | 9,206,230 | |
| 82,720 | | Loews Corp. | | | 3,757,970 | |
| 45,390 | | Merrill Lynch & Co., Inc. | | | 3,707,001 | |
| 28,910 | | Morgan Stanley | | | 2,276,952 | |
| 59,660 | | State Street Corp. (c) | | | 3,862,985 | |
| 57,610 | | SunTrust Banks, Inc. | | | 4,783,934 | |
| 118,300 | | U.S. Bancorp | | | 4,136,951 | |
| 49,722 | | Wachovia Corp. | | | 2,737,196 | |
| 93,310 | | Wells Fargo & Co. | | | 3,212,663 | |
| | | |
|
| | | | | 85,665,516 | |
| | | |
|
| Healthcare – 8.82% |
| 31,830 | | Laboratory Corp. of America Holdings (b) | | | 2,311,813 | |
| 71,770 | | McKesson Corp. | | | 4,201,416 | |
| 183,450 | | Merck & Co., Inc. | | | 8,102,986 | |
| 50,530 | | WellPoint, Inc. (b) | | | 4,097,983 | |
| 113,860 | | Wyeth | | | 5,696,416 | |
| | | |
|
| | | | | 24,410,614 | |
| | | |
|
| Industrials – 7.05% |
| 52,490 | | Burlington Northern Santa Fe Corp. | | | 4,221,771 | |
| 57,310 | | Dover Corp. | | | 2,797,301 | |
| 35,160 | | General Dynamics Corp. | | | 2,686,224 | |
| 198,790 | | General Electric Co. | | | 7,029,214 | |
| 37,750 | | Manpower, Inc. | | | 2,784,818 | |
| | | |
|
| | | | | 19,519,328 | |
| | | |
|
| Information Technology – 4.24% |
| 29,240 | | Diebold, Inc. (c) | | | 1,395,040 | |
| 86,190 | | Fidelity National Information Services, Inc. | | | 3,918,198 | |
| 95,400 | | Hewlett-Packard Co. | | | 3,829,356 | |
| 147,370 | | Motorola, Inc. | | | 2,604,028 | |
| | | |
|
| | | | | 11,746,622 | |
| | | |
|
| Materials – 3.28% |
| 162,100 | | Alcoa, Inc. | | | 5,495,190 | |
| 47,610 | | FMC Corp. | | | 3,591,222 | |
| | | |
|
| | | | | 9,086,412 | |
| | | |
|
| Telecommunication Services – 7.02% |
| 184,270 | | AT&T, Inc. | | | 7,265,766 | |
| 109,720 | | Sprint Nextel Corp. (c) | | | 2,080,291 | |
| 265,910 | | Verizon Communications, Inc. | | | 10,083,308 | |
| | | |
|
| | | | | 19,429,365 | |
| | | |
|
| Utilities – 7.21% |
| 40,980 | | Dominion Resources, Inc. | | | 3,637,795 | |
| 125,320 | | Edison International | | | 6,156,971 | |
| 30,980 | | Exelon Corp. | | | 2,128,636 | |
| 42,000 | | FPL Group, Inc. | | | 2,569,140 | |
| 189,950 | | MDU Resources Group, Inc. | | | 5,459,163 | |
| | | |
|
| | | | | 19,951,705 | |
| | | |
|
Total Common Stocks
(Cost $240,772,842) | | | 275,604,205 | |
| |
| |
69
Table of Contents
SCHEDULE OF PORTFOLIO INVESTMENTS
Tamarack Value Fund (cont.)
Shares or
Principal
Amount | | | | Value | |
|---|
|
| Investment Companies – 0.13% |
| 351,811 | | Wells Fargo Prime Investment Money Market Fund | | $ | 351,811 | |
| | | |
|
Total Investment Companies
(Cost $351,811) | | | 351,811 | |
| |
| |
Investment of Cash Collateral for Securities
on Loan – 4.77% |
| 13,215,583 | | Various Securities (see Notes to Schedules of Investments for collateral information) | | | 13,215,583 | |
| | | |
|
Total Investment of Cash Collateral for Securities on Loan
(Cost $13,215,583) | | | 13,215,583 | |
| |
| |
| Repurchase Agreement – 1.37% |
| 3,800,000 | | Bank of America dated 3/30/07; due 4/2/07 at 5.38% with maturity value of $3,801,704 (fully collateralized by Federal Home Loan Mortgage Corporation with effective yield of 5.00% and maturity date of 6/1/35) | | | 3,800,000 | |
| | | |
|
Total Repurchase Agreement
(Cost $3,800,000) | | | 3,800,000 | |
| |
| |
Total Investments
(Cost $258,140,236) (a) – 105.85% | | | 292,971,599 | |
| Liabilities in excess of other assets – (5.85)% | | | (16,180,079 | ) |
| |
| |
| NET ASSETS – 100.00% | | $ | 276,791,520 | |
| |
| |
(a) See notes to financial statements for the tax cost of securities and the breakdown of unrealized appreciation (depreciation).
(b) Non-income producing security.
(c) All or part of this security has been loaned as of March 31, 2007.
See notes to financial statements.
70
Table of Contents
SCHEDULE OF PORTFOLIO INVESTMENTS
Tamarack Microcap Value Fund
March 31, 2007 (Unaudited)
Shares or
Principal
Amount | | | | Value | |
|---|
|
| Common Stocks – 93.79% |
| Consumer Discretionary – 20.35% |
| 70,000 | | Aftermarket Technology Corp. (b) | | $ | 1,699,600 | |
| 29,800 | | Ambassadors International, Inc. | | | 1,374,972 | |
| 34,500 | | America’s Car Mart, Inc. (b) | | | 460,920 | |
| 15,000 | | AMREP Corp. | | | 1,158,750 | |
| 60,000 | | Asbury Automotive Group, Inc. | | | 1,695,000 | |
| 40,000 | | Ashworth, Inc. (b) | | | 302,800 | |
| 65,000 | | Audiovox Corp., Class A (b) | | | 957,450 | |
| 18,000 | | Bandag, Inc., Class A | | | 908,820 | |
| 29,000 | | Bassett Furniture Industries, Inc. | | | 426,880 | |
| 83,300 | | Bell Microproducts, Inc. (b) | | | 533,120 | |
| 25,000 | | Benihana, Inc., Class A (b) | | | 708,500 | |
| 22,000 | | Big Dog Holdings, Inc. (b) | | | 352,000 | |
| 22,040 | | Blair Corp. | | | 925,460 | |
| 69,000 | | Bluegreen Corp. (b) | | | 779,010 | |
| 45,000 | | Bon-Ton Stores, Inc. (The) | | | 2,530,800 | |
| 46,000 | | Books-A-Million, Inc. | | | 655,040 | |
| 15,127 | | Bowl America, Inc., Class A | | | 249,596 | |
| 29,000 | | Building Materials Holding Corp. | | | 525,190 | |
| 23,000 | | Carmike Cinemas, Inc. | | | 533,600 | |
| 37,000 | | Central Parking Corp. | | | 820,660 | |
| 61,000 | | Charlotte Russe Holding, Inc. (b) | | | 1,761,070 | |
| 42,010 | | Chromcraft Revington, Inc. (b) | | | 404,136 | |
| 45,000 | | Cobra Electronics Corp. | | | 466,200 | |
| 40,000 | | CompX International, Inc. | | | 645,200 | |
| 110,000 | | Comstock Homebuilding Cos., Inc., Class A (b) | | | 445,500 | |
| 34,000 | | Cost Plus, Inc. (b) | | | 340,000 | |
| 95,000 | | CSK Auto Corp. (b) | | | 1,634,000 | |
| 32,000 | | Cutter & Buck, Inc. | | | 379,200 | |
| 40,000 | | Deb Shops, Inc. | | | 1,083,200 | |
| 42,000 | | Delta Apparel, Inc. | | | 730,800 | |
| 56,000 | | Dixie Group, Inc. (The) (b) | | | 673,680 | |
| 22,000 | | Dominion Homes, Inc. (b) | | | 98,340 | |
| 40,000 | | Dorman Products, Inc. (b) | | | 462,400 | |
| 17,500 | | Duckwall-ALCO Stores, Inc. (b) | | | 718,375 | |
| 83,000 | | Educate, Inc. (b) | | | 635,780 | |
| 84,000 | | Emmis Communications Corp., Class A | | | 708,960 | |
| 117,000 | | Finish Line, Inc. (The), Class A | | | 1,474,200 | |
| 48,000 | | Finlay Enterprises, Inc. (b) | | | 278,880 | |
| 95,000 | | First Cash Financial Services, Inc. (b) | | | 2,116,600 | |
| 48,000 | | Friedman’s, Inc., Class A (b)(c) (d) | | | 0 | |
| 65,200 | | Golfsmith International Holdings, Inc. (b) | | | 567,240 | |
| 59,000 | | Gottschalks, Inc. (b) | | | 841,930 | |
| 24,000 | | GTSI Corp. (b) | | | 264,000 | |
| 26,000 | | Hampshire Group Ltd. (b) | | | 418,600 | |
| 57,000 | | Handleman Co. | | | 397,290 | |
| 78,300 | | Hartmarx Corp. (b) | | | 579,420 | |
| 89,000 | | Hastings Entertainment, Inc. (b) | | | 542,900 | |
| 34,750 | | Haverty Furniture Cos., Inc. | | | 486,500 | |
| 27,000 | | Helen of Troy Ltd. ADR (b) | | | 613,170 | |
| 31,000 | | Hooker Furniture Corp. | | | 621,550 | |
| 20,000 | | Industrial Distribution Group, Inc. (b) | | | 249,800 | |
| 75,000 | | Isle of Capri Casinos, Inc. (b) | | | 1,921,500 | |
| 15,000 | | J. Alexander’s Corp. | | | 165,750 | |
| 73,000 | | JAKKS Pacific, Inc. (b) | | | 1,744,700 | |
| 29,000 | | Johnson Outdoors, Inc., Class A (b) | | | 529,540 | |
| 102,000 | | Journal Register Co. | | | 607,920 | |
| 93,657 | | K2, Inc. (b) | | | 1,132,313 | |
| 23,310 | | Lakeland Industries, Inc. (b) | | | 326,340 | |
| 22,000 | | Landry’s Restaurants, Inc. | | | 651,200 | |
| 60,270 | | Lazare Kaplan International, Inc. (b) | | | 485,776 | |
| 47,000 | | Lenox Group, Inc. (b) | | | 309,260 | |
| 53,000 | | Levitt Corp., Class A | | | 493,430 | |
| 7,600 | | Liberty Homes, Inc., Class A | | | 31,160 | |
| 31,000 | | Lifetime Brands, Inc. | | | 647,590 | |
| 25,000 | | Lithia Motors, Inc., Class A | | | 685,250 | |
| 37,800 | | M/I Homes, Inc. | | | 1,003,590 | |
| 58,000 | | MAIR Holdings, Inc. (b) | | | 381,060 | |
| 28,000 | | Marcus Corp. | | | 651,280 | |
| 43,000 | | MarineMax, Inc. (b) | | | 996,740 | |
| 21,300 | | Mestek, Inc. (b) | | | 302,460 | |
| 50,000 | | Monaco Coach Corp. | | | 796,500 | |
| 69,400 | | Movado Group, Inc. | | | 2,043,830 | |
| 22,000 | | National R.V. Holdings, Inc. (b) | | | 48,620 | |
| 10,300 | | Nobility Homes, Inc. | | | 245,655 | |
| 32,000 | | O’Charley’s, Inc. (b) | | | 617,280 | |
71
Table of Contents
SCHEDULE OF PORTFOLIO INVESTMENTS
Tamarack Microcap Value Fund (cont.)
Shares or
Principal
Amount | | | | Value | |
|---|
|
| 41,000 | | Orleans Homebuilders, Inc. | | $ | 362,850 | |
| 60,000 | | Palm Harbor Homes, Inc. (b) | | | 860,400 | |
| 82,000 | | PC Connection, Inc. (b) | | | 1,172,600 | |
| 36,750 | | Perry Ellis International, Inc. (b) | | | 1,175,633 | |
| 54,000 | | Prestige Brands Holdings, Inc. (b) | | | 639,900 | |
| 44,000 | | ProQuest Co. (b) | | | 396,000 | |
| 90,600 | | Radio One, Inc., Class D (b) | | | 585,276 | |
| 56,000 | | Red Lion Hotels Corp. (b) | | | 696,640 | |
| 37,550 | | Rex Stores Corp. (b) | | | 614,318 | |
| 40,000 | | Rocky Brands, Inc. (b) | | | 456,000 | |
| 11,300 | | S&K Famous Brands, Inc. | | | 132,888 | |
| 80,000 | | Saga Communications, Inc. (b) | | | 778,400 | |
| 45,150 | | Salem Communications Corp., Class A | | | 564,375 | |
| 36,000 | | Shoe Carnival, Inc. (b) | | | 1,198,800 | |
| 75,000 | | Source Interlink Cos., Inc. (b) | | | 503,250 | |
| 31,500 | | Sport Chalet, Inc., Class A (b) | | | 343,035 | |
| 4,500 | | Sport Chalet, Inc., Class B (b) | | | 48,150 | |
| 46,000 | | StarTek, Inc. | | | 450,340 | |
| 111,000 | | Stein Mart, Inc. | | | 1,811,520 | |
| 26,000 | | Steinway Musical Instruments, Inc. | | | 839,020 | |
| 41,000 | | Superior Uniform Group, Inc. | | | 525,620 | |
| 34,000 | | Supreme Industries, Inc., Class A | | | 198,900 | |
| 43,000 | | Syms Corp. (b) | | | 801,950 | |
| 72,000 | | Systemax, Inc. | | | 1,348,560 | |
| 15,000 | | Tandy Brands Accessories, Inc. | | | 196,950 | |
| 50,000 | | Technical Olympic USA, Inc. | | | 199,500 | |
| 50,000 | | Tuesday Morning Corp. | | | 742,000 | |
| 3,200 | | Vulcan International Corp. | | | 186,400 | |
| 35,900 | | WCI Communities, Inc. (b) | | | 766,106 | |
| 75,080 | | Westwood One, Inc. | | | 515,800 | |
| 33,400 | | Weyco Group, Inc. | | | 867,732 | |
| | | |
|
| | | | | 75,034,746 | |
| | | |
|
| Consumer Staples – 8.64% |
| 31,000 | | Air Methods Corp. (b) | | | 744,620 | |
| 73,000 | | American Italian Pasta Co. (b) | | | 766,500 | |
| 11,000 | | American Shared Hospital Services | | | 64,900 | |
| 42,800 | | Andersons, Inc. (The) | | | 1,900,320 | |
| 92,000 | | BioScrip, Inc. (b) | | | 287,960 | |
| 9,300 | | Cagle’s, Inc., Class A (b) | | | 68,820 | |
| 44,000 | | Carriage Services, Inc. (b) | | | 355,960 | |
| 36,000 | | Chiquita Brands International, Inc. | | | 504,720 | |
| 39,000 | | Consolidated Graphics, Inc. (b) | | | 2,887,949 | |
| 37,000 | | Cornell Cos., Inc. (b) | | | 748,140 | |
| 32,000 | | CSS Industries, Inc. | | | 1,199,360 | |
| 28,000 | | E-Z-EM, Inc. (b) | | | 450,240 | |
| 70,000 | | Electro Rent Corp. (b) | | | 1,008,000 | |
| 83,000 | | Elizabeth Arden, Inc. (b) | | | 1,811,060 | |
| 41,600 | | Exponent, Inc. (b) | | | 829,920 | |
| 42,000 | | Farmer Brothers Co. | | | 953,400 | |
| 2,250 | | FRMO Corp. (b) | | | 17,775 | |
| 36,000 | | Gaiam, Inc. (b) | | | 566,640 | |
| 67,000 | | Ingles Markets, Inc., Class A | | | 2,736,279 | |
| 16,250 | | IntegraMed America, Inc. (b) | | | 242,938 | |
| 7,100 | | Kewaunee Scientific Corp. | | | 75,615 | |
| 30,000 | | Lannett Co., Inc. (b) | | | 154,500 | |
| 53,000 | | M & F Worldwide Corp. (b) | | | 2,523,330 | |
| 7,500 | | McRae Industries, Inc., Class A | | | 90,000 | |
| 44,000 | | MGP Ingredients, Inc. | | | 896,280 | |
| 37,500 | | Monro Muffler Brake, Inc. | | | 1,316,250 | |
| 35,000 | | Nash-Finch Co. | | | 1,206,100 | |
| 70,000 | | National Beverage Corp. (b) | | | 1,227,800 | |
| 18,300 | | Nobel Learning Communities, Inc. (b) | | | 277,062 | |
| 69,000 | | Omega Protein Corp. (b) | | | 481,620 | |
| 42,000 | | PDI, Inc. (b) | | | 399,840 | |
| 33,000 | | Premium Standard Farms, Inc. | | | 694,320 | |
| 52,575 | | Sanderson Farms, Inc. | | | 1,948,430 | |
| 52,000 | | Spartan Stores, Inc. | | | 1,393,600 | |
| 76,450 | | Spectrum Brands, Inc. (b) | | | 483,929 | |
| 6,402 | | Stantec, Inc. ADR (b) | | | 174,839 | |
| 29,000 | | Synovis Life Technologies, Inc. (b) | | | 392,080 | |
| | | |
|
| | | | | 31,881,096 | |
| | | |
|
| Energy – 4.17% |
| 119,000 | | Brigham Exploration Co. (b) | | | 740,180 | |
| 40,000 | | Callon Petroleum Co. (b) | | | 542,800 | |
| 48,000 | | Edge Petroleum Corp. (b) | | | 600,960 | |
| 36,497 | | Enbridge Energy Management, LLC (b) | | | 1,971,203 | |
| 21,000 | | Giant Industries, Inc. (b) | | | 1,588,650 | |
72
Table of Contents
SCHEDULE OF PORTFOLIO INVESTMENTS
Tamarack Microcap Value Fund (cont.)
Shares or
Principal
Amount | | | | Value | |
|---|
|
| 34,000 | | Gulf Island Fabrication, Inc. | | $ | 909,160 | |
| 98,000 | | Harvest Natural Resources, Inc. (b) | | | 954,520 | |
| 40,000 | | Lufkin Industries, Inc. | | | 2,247,200 | |
| 28,980 | | Mariner Energy, Inc. (b) | | | 554,387 | |
| 43,000 | | NATCO Group, Inc., Class A (b) | | | 1,467,160 | |
| 106,000 | | Newpark Resources, Inc. (b) | | | 747,300 | |
| 43,000 | | NGP Capital Resources Co. | | | 679,830 | |
| 20,000 | | PHI, Inc., Non Voting (b) | | | 541,200 | |
| 39,000 | | Prospect Energy Corp. | | | 668,460 | |
| 49,000 | | Resource America, Inc., Class A | | | 1,157,870 | |
| | | |
|
| | | | | 15,370,880 | |
| | | |
|
| Financials – 17.25% |
| 40,000 | | Affirmative Insurance Holdings, Inc. | | | 692,000 | |
| 71,000 | | AmCOMP, Inc. (b) | | | 685,860 | |
| 105,000 | | American Equity Investment Life Holding Co. | | | 1,378,650 | |
| 19,000 | | American Safety Insurance Holdings Ltd. ADR (b) | | | 362,140 | |
| 30,000 | | Ameris Bancorp | | | 734,400 | |
| 21,000 | | Baldwin & Lyons, Inc., Class B | | | 534,450 | |
| 14,500 | | Bancinsurance Corp. (b) | | | 83,375 | |
| 31,000 | | Banner Corp. | | | 1,288,050 | |
| 11,300 | | Brantley Capital Corp. (b) | | | 29,832 | |
| 31,000 | | California First National BanCorp | | | 407,650 | |
| 21,000 | | Camco Financial Corp. | | | 269,640 | |
| 5,200 | | Capital Southwest Corp. | | | 799,084 | |
| 38,000 | | Capitol Bancorp Ltd. | | | 1,400,300 | |
| 25,000 | | Citizens South Banking Corp. | | | 312,250 | |
| 48,150 | | Citizens, Inc. (b) | | | 351,977 | |
| 123,000 | | Credit Acceptance Corp. (b) | | | 3,344,370 | |
| 41,500 | | Deerfield Triarc Capital Corp. | | | 622,085 | |
| 65,777 | | Donegal Group, Inc., Class A | | | 1,116,893 | |
| 12,444 | | Donegal Group, Inc., Class B | | | 212,544 | |
| 75,040 | | Dynex Capital, Inc. (b) | | | 581,560 | |
| 20,000 | | EMC Insurance Group, Inc. | | | 516,000 | |
| 32,725 | | First Albany Cos., Inc. (b) | | | 52,360 | |
| 40,000 | | First Financial Corp. | | | 1,238,000 | |
| 39,181 | | First Indiana Corp. | | | 856,105 | |
| 54,000 | | First Merchants Corp. | | | 1,280,880 | |
| 14,000 | | First PacTrust BanCorp, Inc. | | | 357,000 | |
| 38,000 | | First Place Financial Corp. | | | 815,100 | |
| 42,000 | | First State BanCorp | | | 947,100 | |
| 25,000 | | FirstCity Financial Corp. (b) | | | 265,000 | |
| 27,000 | | FPIC Insurance Group, Inc. (b) | | | 1,206,090 | |
| 45,000 | | Gladstone Investment Corp. | | | 669,150 | |
| 87,220 | | Hanover Capital Mortgage Holdings, Inc. | | | 379,407 | |
| 34,963 | | HF Financial Corp. | | | 638,075 | |
| 13,000 | | Home Federal BanCorp | | | 379,860 | |
| 79,000 | | Hub International Ltd. ADR | | | 3,292,720 | |
| 8,300 | | Investors Title Co. | | | 417,739 | |
| 24,000 | | Jefferson Bancshares, Inc. | | | 306,720 | |
| 11,000 | | Kansas City Life Insurance Co. | | | 495,000 | |
| 77,000 | | KMG America Corp. (b) | | | 356,510 | |
| 56,930 | | LaBranche & Co., Inc. (b) | | | 464,549 | |
| 11,000 | | LSB Corp. | | | 180,950 | |
| 37,000 | | Mass Financial Corp., Class A ADR (b) | | | 103,600 | |
| 69,000 | | Meadowbrook Insurance Group, Inc. (b) | | | 758,310 | |
| 62,000 | | Medallion Financial Corp. | | | 709,280 | |
| 5,000 | | Merchants Group, Inc. | | | 164,750 | |
| 174,000 | | MFA Mortgage Investments, Inc. | | | 1,339,800 | |
| 49,800 | | Midland Co. | | | 2,112,516 | |
| 12,000 | | MutualFirst Financial, Inc. | | | 232,800 | |
| 5,300 | | National Security Group, Inc. (The) | | | 91,054 | |
| 6,000 | | National Western Life Insurance Co., Class A | | | 1,468,800 | |
| 36,400 | | Navigators Group, Inc. (The) (b) | | | 1,826,188 | |
| 16,000 | | NYMAGIC, Inc. | | | 653,600 | |
| 91,000 | | Opteum, Inc., Class A | | | 409,500 | |
| 18,000 | | Pacific Mercantile BanCorp (b) | | | 255,600 | |
| 85,000 | | Partners Trust Financial Group, Inc. | | | 971,550 | |
| 104,830 | | Paulson Capital Corp. (b) | | | 501,087 | |
| 38,000 | | PennFed Financial Services, Inc. | | | 823,460 | |
| 29,000 | | Peoples BanCorp, Inc. | | | 765,890 | |
| 65,000 | | PMA Capital Corp., Class A (b) | | | 610,350 | |
| 37,900 | | PMC Commercial Trust | | | 555,235 | |
| 21,000 | | Presidential Life Corp. | | | 414,120 | |
| 19,000 | | Provident Financial Holdings, Inc. | | | 522,880 | |
73
Table of Contents
SCHEDULE OF PORTFOLIO INVESTMENTS
Tamarack Microcap Value Fund (cont.)
Shares or
Principal
Amount | | | | Value | |
|---|
|
| 38,500 | | PXRE Group Ltd. ADR (b) | | $ | 184,800 | |
| 13,000 | | RTW, Inc. (b) | | | 106,210 | |
| 50,000 | | Sanders Morris Harris Group, Inc. | | | 532,500 | |
| 22,000 | | SCPIE Holdings, Inc. (b) | | | 499,400 | |
| 42,000 | | Seabright Insurance Holdings (b) | | | 772,800 | |
| 37,000 | | Simmons First National Corp., Class A | | | 1,112,590 | |
| 32,000 | | Southern Community Financial Corp. | | | 328,320 | |
| 47,000 | | Stewart Information Services Corp. | | | 1,964,130 | |
| 30,666 | | Stifel Financial Corp. (b) | | | 1,358,504 | |
| 73,500 | | SWS Group, Inc. | | | 1,823,535 | |
| 49,490 | | Tarragon Corp. | | | 513,211 | |
| 54,000 | | TierOne Corp. | | | 1,460,160 | |
| 24,000 | | Triad Guaranty, Inc. (b) | | | 993,840 | |
| 32,381 | | United America Indemnity Ltd., Class A (b) | | | 751,239 | |
| 21,000 | | United Capital Corp. (b) | | | 716,310 | |
| 97,000 | | United Community Financial Corp. | | | 1,071,850 | |
| 56,500 | | United Fire & Casualty Co. | | | 1,984,845 | |
| 19,000 | | United Western Bancorp, Inc. | | | 453,720 | |
| 89,000 | | Wellsford Real Properties, Inc. (b) | | | 694,200 | |
| 4,600 | | Ziegler Cos., Inc. | | | 131,100 | |
| 80,000 | | ZipRealty, Inc. (b) | | | 566,400 | |
| | | |
|
| | | | | 63,631,459 | |
| | | |
|
| Healthcare – 4.77% |
| 54,000 | | Albany Molecular Research (b) | | | 531,900 | |
| 128,000 | | Allied Healthcare International, Inc. (b) | | | 390,400 | |
| 39,000 | | Cholestech Corp. (b) | | | 672,360 | |
| 26,000 | | CONMED Corp. (b) | | | 759,980 | |
| 52,000 | | DJ Orthopedics, Inc. (b) | | | 1,970,800 | |
| 76,970 | | Hanger Orthopedic Group, Inc. (b) | | | 898,240 | |
| 74,250 | | Healthcare Services Group, Inc. | | | 2,127,262 | |
| 82,000 | | HealthTronics Surgical Services, Inc. (b) | | | 441,980 | |
| 28,000 | | Invacare Corp. | | | 488,320 | |
| 43,500 | | Matria Healthcare, Inc. (b) | | | 1,146,660 | |
| 84,000 | | Medical Staffing Network Holdings, Inc. (b) | | | 533,400 | |
| 73,670 | | Merge Technologies, Inc. (b) | | | 358,773 | |
| 42,000 | | National Dentex Corp. (b) | | | 591,360 | |
| 61,000 | | National Home Health Care Corp. | | | 717,360 | |
| 64,000 | | National Medical Health Card Systems, Inc. (b) | | | 990,080 | |
| 90,000 | | Option Care, Inc. | | | 1,197,000 | |
| 44,000 | | Pediatric Services of America, Inc. (b) | | | 621,720 | |
| 78,000 | | Penn Treaty American Corp. (b) | | | 471,900 | |
| 30,000 | | Pharmanet Development Group, Inc. (b) | | | 780,000 | |
| 62,000 | | Res-Care, Inc. (b) | | | 1,085,000 | |
| 103,000 | | Stewart Enterprises, Inc., Class A | | | 830,180 | |
| | | |
|
| | | | | 17,604,675 | |
| | | |
|
| Industrials – 16.53% |
| 24,000 | | Alamo Group, Inc. | | | 557,040 | |
| 7,300 | | American Biltrite, Inc. (b) | | | 67,963 | |
| 21,125 | | Astronics Corp. (b) | | | 371,800 | |
| 14,000 | | AZZ, Inc. (b) | | | 588,000 | |
| 44,000 | | Bronco Drilling Co., Inc. (b) | | | 729,080 | |
| 34,800 | | Cascade Corp. | | | 2,081,388 | |
| 2,800 | | Chicago Rivet & Machine Co. | | | 61,600 | |
| 45,000 | | CIRCOR International, Inc. | | | 1,606,500 | |
| 50,000 | | Covenant Transport, Inc., Class A (b) | | | 551,000 | |
| 18,000 | | Cronos Group (The) ADR | | | 280,260 | |
| 29,000 | | Ducommun, Inc. (b) | | | 746,170 | |
| 50,580 | | DynCorp International, Inc., Class A (b) | | | 763,252 | |
| 14,700 | | Eastern Co. (The) | | | 399,546 | |
| 11,315 | | Ecology and Environment, Inc., Class A | | | 134,422 | |
| 50,400 | | EDO Corp. | | | 1,320,480 | |
| 60,000 | | Encore Wire Corp. | | | 1,519,200 | |
| 62,000 | | Ennis Business Forms, Inc. | | | 1,659,120 | |
| 20,000 | | Enpro Industries, Inc. (b) | | | 721,000 | |
| 39,000 | | Espey Manufacturing & Electronics Corp. | | | 766,350 | |
| 62,000 | | Excel Maritime Carriers Ltd. ADR (b) | | | 1,068,260 | |
| 79,000 | | Frozen Food Express Industries, Inc. | | | 657,280 | |
| 24,900 | | Gehl Co. (b) | | | 631,962 | |
| 25,750 | | Hardinge, Inc. | | | 673,620 | |
| 70,000 | | HEICO Corp. | | | 2,554,300 | |
| 80,900 | | HEICO Corp., Class A | | | 2,536,215 | |
| 43,000 | | Herley Industries, Inc. (b) | | | 671,660 | |
74
Table of Contents
SCHEDULE OF PORTFOLIO INVESTMENTS
Tamarack Microcap Value Fund (cont.)
Shares or
Principal
Amount | | | | Value | |
|---|
|
| 118,000 | | Huttig Building Products, Inc. (b) | | $ | 713,900 | |
| 43,350 | | International Shipholding Corp. (b) | | | 795,906 | |
| 31,900 | | Interpool, Inc. | | | 778,998 | |
| 19,000 | | Jinpan International Ltd. ADR | | | 296,970 | |
| 12,000 | | Key Technology, Inc. (b) | | | 189,600 | |
| 37,000 | | KHD Humboldt Wedag International Ltd. ADR (b) | | | 1,505,900 | |
| 47,000 | | Knightsbridge Tankers Ltd. ADR | | | 1,311,300 | |
| 37,000 | | Ladish Co., Inc. (b) | | | 1,392,680 | |
| 51,750 | | LSI Industries, Inc. | | | 866,295 | |
| 66,000 | | Lydall, Inc. (b) | | | 1,048,740 | |
| 36,000 | | Mac-Gray Corp. (b) | | | 563,760 | |
| 21,000 | | Magal Security Systems Ltd. ADR (b) | | | 231,000 | |
| 58,875 | | Marten Transport Ltd. (b) | | | 934,935 | |
| 72,000 | | Mesa Air Group, Inc. (b) | | | 542,160 | |
| 33,088 | | Met-Pro Corp. | | | 480,769 | |
| 104,000 | | Methode Electronics, Inc. | | | 1,536,080 | |
| 23,800 | | Michael Baker Corp. (b) | | | 578,340 | |
| 10,562 | | MOD-PAC Corp. (b) | | | 115,760 | |
| 41,000 | | Modtech Holdings, Inc. (b) | | | 128,740 | |
| 18,800 | | Northwest Pipe Co. (b) | | | 748,804 | |
| 60,000 | | Nu Horizons Electronics Corp. (b) | | | 631,800 | |
| 10,000 | | P & F Industries, Inc., Class A (b) | | | 125,200 | |
| 33,100 | | P.A.M. Transportation Services, Inc. (b) | | | 682,522 | |
| 43,160 | | Patrick Industries, Inc. (b) | | | 517,488 | |
| 14,600 | | PHI, Inc., Voting (b) | | | 383,688 | |
| 30,000 | | Powell Industries, Inc. (b) | | | 960,000 | |
| 8,000 | | Q.E.P. Co., Inc. (b) | | | 48,080 | |
| 4,600 | | Quipp, Inc. | | | 33,580 | |
| 99,000 | | RCM Technologies, Inc. (b) | | | 705,870 | |
| 42,000 | | Robbins & Myers, Inc. | | | 1,566,180 | |
| 40,000 | | Rofin-Sinar Technologies, Inc. (b) | | | 2,367,200 | |
| 37,000 | | Rush Enterprises, Inc., Class A (b) | | | 710,770 | |
| 13,800 | | SL Industries, Inc. (b) | | | 207,000 | |
| 78,000 | | Spherion Corp. (b) | | | 687,960 | |
| 32,000 | | Standex International Corp. | | | 912,320 | |
| 66,000 | | Stoneridge, Inc. (b) | | | 683,760 | |
| 56,000 | | Sypris Solutions, Inc. | | | 362,320 | |
| 52,000 | | TRC Cos., Inc. (b) | | | 524,680 | |
| 34,000 | | Tredegar Corp. | | | 774,860 | |
| 14,000 | | Triumph Group, Inc. | | | 774,760 | |
| 48,000 | | Tsakos Energy Navigation Ltd. ADR | | | 2,496,000 | |
| 30,000 | | U.S. Xpress Enterprises, Inc., Class A (b) | | | 517,800 | |
| 17,000 | | UniFirst Corp. | | | 652,290 | |
| 28,000 | | USA Truck, Inc. (b) | | | 435,120 | |
| 78,000 | | Velcro Industries NV ADR | | | 1,348,620 | |
| 38,000 | | Vitran Corp., Inc. (b) | | | 746,700 | |
| 3,350 | | VSE Corp. | | | 137,886 | |
| 34,000 | | Waste Industries USA, Inc. | | | 933,980 | |
| 102,000 | | WCA Waste Corp. (b) | | | 775,200 | |
| 68,000 | | Willis Lease Finance Corp. (b) | | | 684,760 | |
| 37,000 | | Wolverine Tube, Inc. (b) | | | 85,840 | |
| | | |
|
| | | | | 60,952,339 | |
| | | |
|
| Information Technology – 8.53% |
| 100,000 | | Advanced Analogic Technologies, Inc. (b) | | | 658,000 | |
| 41,000 | | Agilysys, Inc. | | | 921,270 | |
| 14,000 | | Black Box Corp. | | | 511,560 | |
| 77,025 | | Brocade Communications Systems, Inc. (b) | | | 733,278 | |
| 57,090 | | Catapult Communications Corp. (b) | | | 556,057 | |
| 77,000 | | CIBER, Inc. (b) | | | 605,990 | |
| 77,000 | | Dynamics Research Corp. (b) | | | 877,800 | |
| 85,000 | | Edgewater Technology, Inc. (b) | | | 717,400 | |
| 39,000 | | Exar Corp. (b) | | | 516,360 | |
| 36,000 | | Genesis Microchip, Inc. (b) | | | 334,440 | |
| 64,000 | | GSI Group, Inc. ADR (b) | | | 634,240 | |
| 120,000 | | Hurry! Holding Co., Ltd. ADR (b) | | | 616,800 | |
| 28,000 | | Hutchinson Technology, Inc. (b) | | | 653,800 | |
| 103,000 | | Inforte Corp. (b) | | | 357,410 | |
| 32,000 | | InfoSpace, Inc. (b) | | | 821,440 | |
| 35,000 | | Integral Systems, Inc. | | | 845,950 | |
| 90,000 | | Jupitermedia Corp. (b) | | | 595,800 | |
| 87,000 | | KEMET Corp. (b) | | | 665,550 | |
| 48,000 | | Keynote Systems, Inc. (b) | | | 644,160 | |
| 61,000 | | LeCroy Corp. (b) | | | 509,350 | |
| 65,000 | | MCSI, Inc. (b)(c) (d) | | | 0 | |
| 19,000 | | Mediware Information Systems, Inc. (b) | | | 172,140 | |
| 51,000 | | MedQuist, Inc. (b) | | | 506,940 | |
| 70,000 | | Merix Corp. (b) | | | 575,400 | |
| 67,000 | | Neoware, Inc. (b) | | | 674,690 | |
| 60,000 | | OmniVision Technologies, Inc. (b) | | | 777,600 | |
75
Table of Contents
SCHEDULE OF PORTFOLIO INVESTMENTS
Tamarack Microcap Value Fund (cont.)
Shares or
Principal
Amount | | | | Value | |
|---|
|
| 40,000 | | OPNET Technologies, Inc. (b) | | $ | 540,400 | |
| 123,000 | | Optical Cable Corp. (b) | | | 654,360 | |
| 37,000 | | PDF Solutions, Inc. (b) | | | 417,730 | |
| 76,000 | | Pegasystems, Inc. | | | 703,000 | |
| 140,000 | | Performance Technologies, Inc. (b) | | | 701,400 | |
| 75,000 | | Pericom Semiconductor Corp. (b) | | | 733,500 | |
| 37,930 | | Photronics, Inc. (b) | | | 589,812 | |
| 67,000 | | Planar Systems, Inc. (b) | | | 580,890 | |
| 62,000 | | PLATO Learning, Inc. (b) | | | 260,400 | |
| 71,000 | | Pomeroy IT Solutions, Inc. (b) | | | 640,420 | |
| 28,000 | | Retalix Ltd. ADR (b) | | | 539,560 | |
| 47,000 | | Richardson Electronics Ltd. | | | 438,980 | |
| 29,000 | | Rudolph Technologies, Inc. (b) | | | 505,760 | |
| 30,040 | | SafeNet, Inc. (b) | | | 850,132 | |
| 76,000 | | Semitool, Inc. (b) | | | 987,999 | |
| 70,000 | | Sigmatron International, Inc. (b) | | | 611,100 | |
| 27,000 | | SYNNEX Corp. (b) | | | 573,480 | |
| 70,560 | | TechTeam Global, Inc. (b) | | | 882,000 | |
| 98,000 | | Tier Technologies, Inc., Class B (b) | | | 862,400 | |
| 56,000 | | Tollgrade Communications, Inc. (b) | | | 703,360 | |
| 120,000 | | Ulticom, Inc. (b) | | | 984,000 | |
| 28,000 | | Ultimate Software Group, Inc. (The) (b) | | | 733,320 | |
| 46,000 | | Vignette Corp. (b) | | | 854,220 | |
| 97,000 | | White Electronic Designs Corp. (b) | | | 646,020 | |
| | | |
|
| | | | | 31,477,668 | |
| | | |
|
| Materials – 6.54% |
| 67,839 | | Aceto Corp. | | | 535,928 | |
| 85,000 | | AMCOL International Corp. | | | 2,520,250 | |
| 70,200 | | American Pacific Corp. (b) | | | 814,320 | |
| 54,000 | | Bairnco Corp. | | | 726,300 | |
| 37,000 | | Blue Earth Refineries, Inc. ADR | | | 74,740 | |
| 107,000 | | Buckeye Technologies, Inc. (b) | | | 1,388,860 | |
| 38,000 | | Chesapeake Corp. | | | 573,800 | |
| 92,840 | | CPAC, Inc. | | | 789,140 | |
| 18,000 | | Friedman Industries, Inc. | | | 166,320 | |
| 80,000 | | Gibraltar Industries, Inc. | | | 1,809,600 | |
| 29,000 | | Hawkins, Inc. | | | 429,200 | |
| 35,000 | | Innospec, Inc. | | | 2,017,400 | |
| 60,000 | | Material Sciences Corp. (b) | | | 598,800 | |
| 44,000 | | NewMarket Corp. | | | 1,789,480 | |
| 140,400 | | North American Palladium Ltd. ADR (b) | | | 1,017,900 | |
| 26,000 | | Novamerican Steel, Inc. ADR (b) | | | 1,149,720 | |
| 23,000 | | Olympic Steel, Inc. | | | 712,770 | |
| 38,000 | | Penford Corp. | | | 765,320 | |
| 110,000 | | PolyOne Corp. (b) | | | 671,000 | |
| 28,000 | | Ryerson, Inc. | | | 1,109,360 | |
| 34,000 | | Schulman (A.), Inc. | | | 801,040 | |
| 30,000 | | Schweitzer-Mauduit International, Inc. | | | 745,500 | |
| 26,000 | | Steel Technologies, Inc. | | | 769,080 | |
| 26,000 | | Stepan Co. | | | 682,500 | |
| 88,610 | | U.S. Concrete, Inc. (b) | | | 692,930 | |
| 16,000 | | Universal Stainless & Alloy Products, Inc. (b) | | | 759,520 | |
| | | |
|
| | | | | 24,110,778 | |
| | | |
|
| Telecommunication Services – 2.31% |
| 59,000 | | Anaren, Inc. (b) | | | 1,038,990 | |
| 49,200 | | CalAmp Corp. (b) | | | 424,596 | |
| 23,000 | | Communications Systems, Inc. | | | 238,740 | |
| 45,000 | | CT Communications, Inc. | | | 1,084,500 | |
| 40,000 | | D & E Communications, Inc. | | | 532,800 | |
| 131,000 | | EFJ, Inc. (b) | | | 699,540 | |
| 44,000 | | ePlus, Inc. (b) | | | 468,600 | |
| 76,000 | | Lightbridge, Inc. (b) | | | 1,335,320 | |
| 70,000 | | MIVA, Inc. (b) | | | 268,800 | |
| 10,562 | | OneSource Services, Inc. (b) | | | 129,913 | |
| 41,000 | | SureWest Communications | | | 1,019,670 | |
| 21,000 | | TESSCO Technologies, Inc. (b) | | | 570,990 | |
| 35,000 | | USA Mobility, Inc. | | | 697,550 | |
| | | |
|
| | | | | 8,510,009 | |
| | | |
|
| Utilities – 4.70% |
| 44,000 | | American States Water Co. | | | 1,622,280 | |
| 47,054 | | California Water Service Group | | | 1,803,109 | |
| 31,900 | | Cascade Natural Gas Corp. | | | 840,565 | |
| 29,000 | | Central Vermont Public Service Corp. | | | 835,780 | |
| 15,700 | | Chesapeake Utilities Corp. | | | 485,758 | |
| 23,500 | | Connecticut Water Service, Inc. | | | 565,175 | |
| 9,000 | | Delta Natural Gas Co., Inc. | | | 225,000 | |
76
Table of Contents
SCHEDULE OF PORTFOLIO INVESTMENTS
Tamarack Microcap Value Fund (cont.)
Shares or
Principal
Amount | | | | Value | |
|---|
|
| 71,000 | | Empire District Electric Co. (The) | | $ | 1,760,800 | |
| 24,000 | | EnergySouth, Inc. | | | 1,006,320 | |
| 18,000 | | Florida Public Utilities Co. | | | 223,200 | |
| 14,500 | | Green Mountain Power Corp. | | | 505,615 | |
| 4,900 | | Maine & Maritimes Corp. (b) | | | 93,100 | |
| 30,400 | | Middlesex Water Co. | | | 559,056 | |
| 6,500 | | RGC Resources, Inc. | | | 184,275 | |
| 91,000 | | SEMCO Energy, Inc. (b) | | | 693,420 | |
| 52,800 | | SJW Corp. | | | 2,137,344 | |
| 70,400 | | South Jersey Industries, Inc. | | | 2,678,721 | |
| 45,644 | | Southwest Water Co. | | | 658,186 | |
| 16,476 | | Unitil Corp. | | | 447,653 | |
| | | |
|
| | | | | 17,325,357 | |
| | | |
|
Total Common Stocks
(Cost $247,936,781) | | | 345,899,007 | |
| |
| |
| Exchange Traded Funds – 2.55% |
| 129,000 | | iShares Russell Microcap Index Fund | | | 7,586,490 | |
| 100,000 | | PowerShares Zacks Micro Cap Portfolio | | | 1,820,000 | |
| | | |
|
Total Exchange Traded Funds
(Cost $8,724,933) | | | 9,406,490 | |
| |
| |
| Warrants – 0.00% |
| Healthcare – 0.00% |
| 2,967 | | Del Global Technologies Corp., 3/28/08, $2 (b) | | | 593 | |
| | | |
|
Total Warrants
(Cost $0) | | | 593 | |
| |
| |
| Corporate Bonds – 0.00% |
| 1,947 | | Trenwick America Corp., 0.00%, 9/26/05 (d) | | | 0 | |
| 1,625 | | Trenwick America Corp., 0.00%, 9/26/05 (d) | | | 0 | |
| | | |
|
Total Corporate Bonds
(Cost $0) | | | 0 | |
| |
| |
| Investment Companies – 0.11% |
| 422,856 | | Wells Fargo Government Institutional Money Market Fund | | | 422,856 | |
| | | |
|
Total Investment Companies
(Cost $422,856) | | | 422,856 | |
| |
| |
| Repurchase Agreement – 3.31% |
| 12,200,000 | | Bank of America dated 3/30/07; due 4/2/07 at 5.38% with maturity value of $12,205,470 (fully collateralized by Federal Home Loan Mortgage Corporation with effective yield of 5.00% and maturity date of 6/1/35) | | $ | 12,200,000 | |
| | | |
|
Total Repurchase Agreement
(Cost $12,200,000) | | | 12,200,000 | |
| |
| |
Total Investments
(Cost $269,284,570) (a) – 99.76% | | | 367,928,946 | |
| Other assets in excess of liabilities – 0.24% | | | 889,346 | |
| |
| |
| NET ASSETS – 100.00% | | $ | 368,818,292 | |
| |
| |
(a) See notes to financial statements for the tax cost of securities and the breakdown of unrealized appreciation (depreciation).
(b) Non-income producing security.
(c) Security delisted or issuer in bankruptcy.
(d) Fair valued security.
Abbreviations used are defined below:
ADR – American Depositary Receipt
See notes to financial statements.
77
Table of Contents
NOTES TO SCHEDULES OF PORTFOLIO INVESTMENTS
Collateral Information for Securities on Loan:
The cash collateral received for securities lending, as discussed in Note 2, was pooled and invested into the following:.
| | | Large Cap
Growth Fund | | | Mid Cap
Growth Fund | | | Enterprise | | | Small Cap
Core | | | Value | |
|---|
| | |
| | |
| | |
| | |
| | |
| |
| American General Finance, 5.37%, 3/14/2008 | | | | $ | 520,405 | | | $ | 783,935 | | | $ | 2,531,338 | | | $ | 472,003 | | | $ | 613,469 | |
| Atlas Capital Funding Corp., 4.43%, 4/13/2007 | | | | | 92,472 | | | | 139,299 | | | | 449,799 | | | | 83,871 | | | | 109,009 | |
| Atomium Funding, LLC., 0.00%, 4/2/2007 | | | | | 104,068 | | | | 156,767 | | | | 506,202 | | | | 94,388 | | | | 122,678 | |
| Atomium Funding Corp., 5.11%, 6/21/2007 | | | | | 308,569 | | | | 464,825 | | | | 1,500,929 | | | | 279,869 | | | | 363,750 | |
| Bear Stearns Company, Inc., 3.50%, 8/22/2007 | | | | | 312,203 | | | | 470,300 | | | | 1,518,606 | | | | 283,165 | | | | 368,034 | |
| Bear Stearns Company, Inc., 5.50%, 10/3/2007 | | | | | 286,343 | | | | 431,345 | | | | 1,392,821 | | | | 259,710 | | | | 337,550 | |
| Buckingham COD, LLC., 4.08%, 4/9/2007 | | | | | 103,961 | | | | 156,607 | | | | 505,686 | | | | 94,292 | | | | 122,553 | |
| Cairn High Grade Funding, 4.92%, 5/3/2007 | | | | | 207,196 | | | | 312,119 | | | | 1,007,838 | | | | 187,925 | | | | 244,249 | |
| Cairn High Grade Funding, 5.05%, 5/24/2007 | | | | | 103,280 | | | | 155,580 | | | | 502,370 | | | | 93,674 | | | | 121,749 | |
| Cairn High Grade Funding, 5.11%, 6/21/2007 | | | | | 359,997 | | | | 542,296 | | | | 1,751,084 | | | | 326,514 | | | | 424,375 | |
| Cedar Springs Capital Company, LLC., 4.79%, 4/23/2007 | | | | | 151,889 | | | | 228,804 | | | | 738,812 | | | | 137,762 | | | | 179,051 | |
| Cedar Springs Capital Company, LLC., 5.03%, 5/21/2007 | | | | | 332,605 | | | | 501,034 | | | | 1,617,846 | | | | 301,669 | | | | 392,085 | |
| Charta, LLC., 0.00%, 4/2/2007 | | | | | 312,203 | | | | 470,300 | | | | 1,518,606 | | | | 283,165 | | | | 368,034 | |
| Cheyne Finance, Inc., 5.28%, 2/25/2008 | | | | | 364,131 | | | | 548,524 | | | | 1,771,193 | | | | 330,263 | | | | 429,248 | |
| Cheyne Finance, LLC., 4.98%, 5/10/2007 | | | | | 248,381 | | | | 374,159 | | | | 1,208,166 | | | | 225,279 | | | | 292,799 | |
| Corporate Asset Security, LTD., 4.38%, 4/12/2007 | | | | | 415,662 | | | | 626,151 | | | | 2,021,851 | | | | 377,002 | | | | 489,995 | |
| Corporate Asset Security, LTD., 4.72%, 4/20/2007 | | | | | 197,210 | | | | 297,076 | | | | 959,264 | | | | 178,868 | | | | 232,477 | |
| Crown Point Cap Co., 4.43%, 4/13/2007 | | | | | 103,901 | | | | 156,516 | | | | 505,392 | | | | 94,237 | | | | 122,482 | |
| Deer Valley Funding, LLC., 4/2/2007 | | | | | 156,101 | | | | 235,150 | | | | 759,303 | | | | 141,582 | | | | 184,017 | |
| Five Finance, Inc., 5.11%, 6/22/2007 | | | | | 514,203 | | | | 774,591 | | | | 2,501,169 | | | | 466,377 | | | | 606,158 | |
| Fox Trot, LTD., 4.08%, 4/9/2007 | | | | | 363,865 | | | | 548,123 | | | | 1,769,899 | | | | 330,022 | | | | 428,935 | |
| German Residential Funding, 5.04%, 5/22/2007 | | | | | 206,620 | | | | 311,251 | | | | 1,005,033 | | | | 187,402 | | | | 243,570 | |
| German Residential Funding, 3.50%, 8/22/2007 | | | | | 208,135 | | | | 313,533 | | | | 1,012,404 | | | | 188,777 | | | | 245,356 | |
| Hudson-Thames, LLC., 2.61%, 4/4/2007 | | | | | 156,056 | | | | 235,082 | | | | 759,083 | | | | 141,541 | | | | 183,963 | |
| Jupiter Co., LLC., 0.00%, 4/2/2007 | | | | | 364,236 | | | | 548,683 | | | | 1,771,707 | | | | 330,359 | | | | 429,373 | |
| Kestrel Funding P.L.C., 5.05%, 5/24/2007 | | | | $ | 116,190 | | | $ | 175,027 | | | $ | 565,166 | | | $ | 105,383 | | | $ | 136,968 | |
78
Table of Contents
NOTES TO SCHEDULES OF PORTFOLIO INVESTMENTS
| | | Large Cap
Growth Fund | | | Mid Cap
Growth Fund | | | Enterprise | | | Small Cap
Core | | | Value | |
|---|
| | |
| | |
| | |
| | |
| | |
| |
| Liquid Funding, LTD., 5.06%, 4/12/2007 | | | | | 520,343 | | | | 783,841 | | | | 2,531,035 | | | | 471,946 | | | | 613,396 | |
| Met Life Global Funding, 4.97%, 3/06/2012 | | | | | 520,410 | | | | 783,943 | | | | 2,531,364 | | | | 472,007 | | | | 613,475 | |
| Morgan Stanley, CP, 3.50%, 8/7/2007 | | | | | 312,203 | | | | 470,300 | | | | 1,518,606 | | | | 283,165 | | | | 368,034 | |
| Shiprock Finance, 5.39%, 4/11/2008 | | | | | 260,169 | | | | 391,916 | | | | 1,265,505 | | | | 235,971 | | | | 306,695 | |
| Stanfield Victoria Funding, 4.82%, 4/25/2007 | | | | | 311,157 | | | | 468,724 | | | | 1,513,518 | | | | 282,216 | | | | 366,801 | |
| Tasman Funding, Inc., 2.61%, 4/04/2007 | | | | | 520,187 | | | | 783,606 | | | | 2,530,275 | | | | 471,804 | | | | 613,212 | |
| Unicredito Italia AZ, 4.92%, 5/3/2007 | | | | | 414,393 | | | | 624,238 | | | | 2,015,676 | | | | 375,850 | | | | 488,499 | |
| Whistlejacket Capital, 4.87%, 4/27/2007 | | | | | 487,332 | | | | 734,114 | | | | 2,370,465 | | | | 442,006 | | | | 574,482 | |
| Whistlejacket Capital, 4.90%, 4/30/2007 | | | | | 193,812 | | | | 291,957 | | | | 942,735 | | | | 175,786 | | | | 228,472 | |
| White Pine Finance, LLC., 4.79%, 4/23/2007 | | | | | 103,749 | | | | 156,287 | | | | 504,653 | | | | 94,099 | | | | 122,303 | |
| Windmill Funding Corporation, 4.43%, 4/13/2007 | | | | | 103,901 | | | | 156,516 | | | | 505,392 | | | | 94,237 | | | | 122,482 | |
| Goldman Money Market Repurchase Agreement, 5.39%, 4/2/2007 | | | | | 853,228 | | | | 1,285,297 | | | | 4,150,245 | | | | 773,870 | | | | 1,005,811 | |
| | |
| | |
| | |
| | |
| | |
| |
| | | | $ | 11,210,762 | | | $ | 16,887,814 | | | $ | 54,531,034 | | | $ | 10,168,057 | | | $ | 13,215,583 | |
| | |
| | |
| | |
| | |
| | |
| |
LLC = Limited Liability Company
COD = Certificate of Deposit
CP = Commercial Paper
79
Table of Contents
MANAGEMENT (unaudited)
Independent Trustees(1)
T. Geron Bell (65)
Position Held with Fund: Trustee; Since January, 2004
Principal Occupation(s) During Past 5 Years: President of Twins Sports, Inc. (parent company of the Minnesota Twins) (2002-present); prior thereto President of the Minnesota Twins Baseball Club Incorporated (1987-present); Director, Great Hall Investment Funds, Inc. (1993-2004); Trustee, J&B Funds (2003-2004); Director, Babson Funds (2003-2004).
Number of Portfolios in Fund Complex Overseen: 15
Lucy Hancock Bode (55)
Position Held with Fund: Trustee; Since January, 2004
Principal Occupation(s) During Past 5 Years: Healthcare consultant; Director, RBC Funds (1994-2004).
Number of Portfolios in Fund Complex Overseen: 15
Leslie H. Garner Jr. (56)
Position Held with Fund: Trustee; Since January, 2004
Principal Occupation(s) During Past 5 Years: President, Cornell College; Director, RBC Funds (1994-2004).
Number of Portfolios in Fund Complex Overseen: 15
Ronald James (56)
Position Held with Fund: Trustee; Since January, 2004
Principal Occupation(s) During Past 5 Years: President and Chief Executive Officer, Center for Ethical Business Cultures (2000-present); Director, Great Hall Investment Funds, Inc. (1993-2004); Trustee, J&B Funds (2003-2004); Director, Babson Funds (2003-2004).
Number of Portfolios in Fund Complex Overseen: 15
John A. MacDonald (58)
Position Held with Fund: Trustee; Since January, 2004
Principal Occupation(s) During Past 5 Years: Chief Investment Officer, Hall Family Foundation; Trustee, J&B Funds (2001-2004).
Number of Portfolios in Fund Complex Overseen: 15
H. David Rybolt (64)
Position Held with Fund: Trustee; Since January, 2004
Principal Occupation(s) During Past 5 Years: Consultant, HDR Associates (management consulting); Director, Babson Funds (1992-2004).
Number of Portfolios in Fund Complex Overseen: 15
James R. Seward (54)
Position Held with Fund: Trustee; Since January, 2004
Principal Occupation(s) During Past 5 Years: Private investor (2000-present); Trustee, J&B Funds (2001-2004); CFA.
Number of Portfolios in Fund Complex Overseen: 15
| (1) | Unless otherwise specified, the address of each trustee/officer is 100 South Fifth Street, Suite 2300, Minneapolis, Minnesota 55402. |
80
Table of Contents
MANAGEMENT (unaudited)
Independent Trustees(1)
William B. Taylor (61)
Position Held with Fund: Trustee; Since September, 2005
Principal Occupation(s) During Past 5 Years: Consultant (2003-present); Partner (until 2003) Ernst & Young LLP.
Number of Portfolios in Fund Complex Overseen: 15
Interested Trustees(1)
Erik R. Preus (41)
Position Held with Fund: Trustee; Since September, 2005
Principal Occupation(s) During Past 5 Years: Head of Retail Assets Management (2006-present); Director, President and Chief Executive Officer, Tamarack Distributors Inc. (2005-present); Chief Operating Officer, Voyageur Asset Management (2005-2006); Director, Investment Counseling Services, RBC Dain Rauscher (2004-2005); Director, Voyageur Advisory Services, Voyageur Asset Management (2003-2004); Senior Vice President, Divisional Sales Manager, PIMCO Allianz Investments and its predecessor firm, Nicholas Applegate (2001-2003).
Number of Portfolios in Fund Complex Overseen: 15
Executive Officers(1)
Erik R. Preus (41)
Position Held with Fund: President and Chief Executive Officer; Since September, 2006
Principal Occupation(s) During Past 5 Years: Head of Retail Assets Management (2006-present); Director, President and Chief Executive Officer, Tamarack Distributors Inc. (2005-present); Chief Operating Officer, Voyageur Asset Management (2005-2006); Director, Investment Counseling Services, RBC Dain Rauscher (2004-2005); Director, Voyageur Advisory Services, Voyageur Asset Management (2003-2004); Senior Vice President, Divisional Sales Manager, PIMCO Allianz Investments and its predecessor firm, Nicholas Applegate (2001-2003).
David P. Lux (52)
Position Held with Fund: Chief Financial Officer and Treasurer; Since September, 2005
Principal Occupation(s) During Past 5 Years: Vice President and Director, Mutual Funds (2006-present); Director, Tamarack Distributors Inc. (2006-present); Controller, Tamarack Funds, November, 2004-September, 2005; Vice President and Mutual Funds Finance Manager, Voyageur Asset Management (2004-2006); Senior Financial Analyst, Voyageur Asset Management (2003-2004); Senior Financial Analyst, RBC Dain Rauscher (1995-2003).
Kathleen A. Gorman (43)
Position Held with Fund: Chief Compliance Officer Since April, 2006; and Assistant Secretary Since September, 2006
Principal Occupation(s) During Past 5 Years: Chief Compliance Officer, Voyageur Asset Management (2006-present); Director, Asset Management Compliance, RiverSource Investments (2004-2006); Senior Compliance Officer, U.S. Bancorp Asset Management (1994-2004).
| (1) | Unless otherwise specified, the address of each trustee/officer is 100 South Fifth Street, Suite 2300, Minneapolis, Minnesota 55402. |
81
Table of Contents
MANAGEMENT (unaudited)
Executive Officers(1)
Martin A. Cramer (57)
Position Held with Fund: Vice President, and AML Compliance Officer; Since January, 2004
Principal Occupation(s) During Past 5 Years: Vice President and Mutual Fund Administration Manager, Voyageur Asset Management (2003-present); Vice President, Tamarack Distributors Inc. (2007-present); Senior Compliance Officer, Tamarack Funds (2006-2007); Chief Compliance Officer, Tamarack Funds (2004-2006); Legal and Regulatory Affairs Vice President, Compliance Officer and Secretary, J&B (mutual fund management and distribution company) (1993-2003); Vice President, Assistant Secretary, Compliance Officer and AML Compliance Officer (2003-2004)(2), and formerly, Vice President, Compliance Officer and Secretary, Buffalo Fund Complex (1994-2003) and Secretary, Gold Bank Funds(3) (2001-2003).
Monica P. Ballard (37)
Position Held with Fund: Secretary and Chief Legal Officer; Since September, 2005
Principal Occupation(s) During Past 5 Years: Vice President and Senior Associate General Counsel, RBC Dain Rauscher (2004 to present); Counsel, Allianz Life (2002 to 2004); Associate Counsel, American Express Financial Advisors (1996 to 2002).
Gordon Telfer (41)
Position Held with Fund: Portfolio Strategist; Since March, 2004
Principal Occupation(s) During Past 5 Years: Vice President and Portfolio Manager, Voyageur Asset Management (2003-present); Senior Portfolio Manager, Alliance Capital Management (2000-2003); Senior Vice President, Global Strategist, Scudder Kemper Investments (1997-2000).
Nancy M. Scinto (47)
Position Held with Fund: Chief Investment Officer, Equity Products; Since January, 2004
Principal Occupation(s) During Past 5 Years: Managing Director and Director of Research, Voyageur Asset Management (2003-present).
John M. Huber (38)
Position Held with Fund: Chief Investment Officer, Fixed Income Products; Since February, 2005
Principal Occupation(s) During Past 5 Years: Chief Investment Officer, Fixed Income, Voyageur Asset Management (2004-Present); Principal and Senior Portfolio Manager, Galliard Capital Management (1995-2004).
| (1) | Unless otherwise specified, the address of each trustee/officer is 100 South Fifth Street, Suite 2300, Minneapolis, Minnesota 55402. |
| (2) | Great Hall Investment Funds, Inc., J&B Funds, Babson Enterprise Fund, Inc., Babson Enterprise Fund II, Inc., Babson-Stewart Ivory International Fund, Inc., Babson Value Fund, Inc., David L. Babson Growth Fund, Inc., D.L. Babson Bond Trust, D.L. Babson Money Market Fund, Inc., D.L. Babson Tax-Free Income Fund, Inc., Shadow Stock Fund, Inc., and Investors Mark Series Fund, Inc. |
| (3) | The Buffalo Fund Complex consists of Buffalo Balanced Fund, Inc., Buffalo Large Cap Fund, Inc., Buffalo High Yield Fund, Inc., Buffalo Small Cap Fund, Inc., Buffalo USA Global Fund, Inc., and the Buffalo Funds, which is a series fund consisting of Buffalo Science & Technology Fund and Buffalo Mid Cap Fund. Gold Bank Funds is a series fund consisting of Gold Bank Equity and Gold Bank Money Market Fund. |
The Funds’ Statement of Additional Information includes information about the Funds’ Trustees. To receive your free copy of the Statement of Additional Information, call toll free: 1-800-422-2766.
82
Table of Contents
SHARE CLASS INFORMATION (unaudited)
The Tamarack Equity Funds offer up to five share classes. These five share classes are the A, C, R, I, and S classes.
Class A
Class A shares are available for purchase primarily through investment advisors, broker-dealers, banks and other financial services intermediaries. Class A shares of the Tamarack Equity Funds are currently subject to a maximum up-front sales charge of 5.75% and a 1.00% contingent deferred sales charge (“CDSC”) for redemption within 12 months of a $1 million or greater purchase. Class A shares currently include a 0.25% (25 bps) annual 12b-1 service and distribution fee. (The 12b-1 Plan allows for 50 bps, but the Funds’ distributor is currently contractually waiving 25 bps. The Distributor currently has no plans to discontinue this waiver.) Class A shares have a higher up-front sales charge (load) than Class C shares, but a lower annual expense ratio.
Class C
Class C shares are also available for purchase primarily through investment advisors, broker-dealers, banks and other financial services intermediaries. Class C shares redeemed within 12 months of purchase are subject to a contingent deferred sales charge (CDSC) of 1.00%. (No CDSC will be charged on shares acquired through reinvestment of dividends or capital gains.) C Class shares expenses include a 1.00% (100 bps) annual 12b-1 service and distribution fee. Class C shares have a lower up-front sales charge (load) than Class A shares, but due to the higher service and distribution fee, have higher annual expenses than Class A shares.
Class R
Class R shares are available for purchase through employer-sponsored or 401(k) retirement plans for which omnibus or program-level accounts are held on the books of the Funds. Class R shares have no up-front sales charge (load), but are subject to a 0.50% (50 bps) 12b-1 service and distribution fee. Class R shares currently have annual expenses between Class A and Class C share expenses.
Class S
Class S shares are available to investors purchasing shares directly through the Fund or its agent, BFDS, or through certain fee-based programs of broker-dealers or registered investment advisors. This share class does not have an up-front sales charge (load) or a 12b-1 service and distribution fee.
Class I
Class I shares are available in the Tamarack Enterprise, Large Cap Growth, Mid Cap Growth and Small Cap Growth Funds. This share class is intended for investors meeting certain minimum investment thresholds. This share class does not have an up-front sales charge (load) or a 12b-1 service and distribution fee.
For an investor purchasing Tamarack Funds shares through a financial services intermediary, the question as to which share class, A or C, is the better choice is dependent on many factors, including the amount to be invested and the length of time an investor anticipates holding the shares. An investor should consult with his or her financial advisor about his or her personal financial situation to determine which share class is the best choice for his or her individual situation.
83
Table of Contents
SUPPLEMENTAL INFORMATION (unaudited)
Information for Tamarack Funds Shareholders Regarding the Renewal of Investment Advisory Agreements
The Tamarack Board of Trustees has renewed the Investment Advisory Agreement with Voyageur Asset Management Inc. (“Voyageur” or the “Advisor”) for each of the Funds. After evaluating the services provided by the Advisor and reviewing the performance and relevant expenses of each Fund, the Trustees concluded that it was in the best interests of the Funds and their shareholders to continue the investment advisory agreements (“Agreements”).
As part of their review of the Agreements, the Trustees received and discussed certain information, including information regarding the advisory services performed, qualifications of staffing, and Fund performance and expenses. The Trustees considered information provided in advance of their in-person meeting, as well as supplemental information provided at the meeting. The Trustees met with representatives from the Advisor’s senior management team, as well as senior investment professionals, to discuss this information and Voyageur’s intentions with regard to the ongoing management of the Funds. The Trustees reviewed the quality of the services provided to the Funds by Voyageur, including information prepared by a third-party consultant as to each Fund’s performance relative to an appropriate benchmark as well as compared to the Fund’s appropriate peer group. The Trustees also reviewed the investment management fees payable to Voyageur. In this connection, the Trustees reviewed comparative information prepared by a third-party consultant on investment management fees paid and expenses incurred by similarly situated funds. The Trustees also received reports from Voyageur regarding other investment companies advised by it, including the advisory fees paid. The Trustees took into account profitability data for Voyageur included in the materials. The Trustees received information from Voyageur regarding other benefits derived from its relationships with the funds. In connection with their deliberations, the independent Trustees met separately with their independent legal counsel to review the relevant material and consider their responsibilities under relevant laws and regulations. In addition, the Trustees noted the expected composition of each portfolio management team.
The Board observed that the one-year performance for four of the Funds was in the first quintile of their respective peer groups and only the Value Fund was in the fifth quintile of its peer group. The expense comparisons ranged from first quintile in its peer group (Large Cap Growth Fund) to the fourth quintile in their peer groups (Value Fund and Enterprise Small Cap Fund). With respect to the Value Fund, management noted that Voyageur will be acquiring a new investment team in January with a strong track record who will be taking over management of that Fund and proposed no changes to the Fund’s expense structure in anticipation of the new team’s efforts to improve the Fund’s performance.
The Trustees also reviewed and approved Fund Management’s proposal to continue for an additional year all existing fee waivers in order to maintain total expenses at their current levels. In considering the quality of the services performed for each Fund by Voyageur, the Trustees discussed the strong research capabilities and fundamental analysis performed by the firm and also considered the extensive portfolio management experience of Voyageur staff, the compliance structure and systems established by Voyageur and the financial viability of Voyageur. The Trustees also considered steps that
84
Table of Contents
SUPPLEMENTAL INFORMATION (unaudited)
already had been taken by Voyageur to expand upon existing research capabilities and compliance processes and steps that were expected to be taken to maintain and/or enhance such capabilities and processes.
Based upon their review, the Trustees determined that the advisory fees proposed to be payable to Voyageur were reasonable and fair in light of the nature and quality of services provided under all of the circumstances, and were within the range of what might have been negotiated at arms’ length. The Trustees concluded that it is in the interest of the Funds and their shareholders for the Trustees to approve the Agreements for the Funds. In arriving at their decision to approve the renewal of each of the Agreements, the Trustees did not assign relative weights to the factors discussed above or deem any one or group of them to be controlling in and of themselves.
85
Table of Contents
SUPPLEMENTAL INFORMATION (unaudited)
Shareholder Expense Examples
As a shareholder of the Tamarack Funds, you incur two types of costs: (1) transaction costs, including sales charges (loads) on purchases, reinvested dividends, or other distributions; redemption fees; and exchange fees; (2) ongoing costs, including management fees; 12b-1 distribution and service fees; and other Fund expenses. This example is intended to help you understand your ongoing costs (in dollars) of investing in the Tamarack Funds and to compare these costs with the ongoing costs of investing in other mutual funds.
The Example is based on an investment of $1,000 invested at the beginning of the period and held for the entire period from October 1, 2006 through March 31, 2007.
Actual Expenses and Performance
The table below provides information about actual account values and actual expenses. You may use the information below, together with the amount you invested, to estimate the expenses that you paid over the period. Simply divide your account value by $1,000 (for example, an $8,600 account value divided by $1,000 = 8.6), then multiply the result by the number in the table under the heading entitled “Expenses Paid During Period” to estimate the expenses you paid on your account during this period.
| | | | | | Beginning
Account Value
10/1/06 | | | Ending
Account Value
3/31/07 | | | Expenses Paid
During Period*
10/1/06 - 3/31/07 | | | Annualized
Expense Ratio
During Period
10/1/06 - 3/31/07 | |
|---|
| | | | | |
| | |
| | |
| | |
| |
| Large Cap Growth Fund | | | | | Class A | | | $ | 1,000.00 | | | $ | 1,026.70 | | | $ | 6.32 | | | | 1.25 | % |
| | | | | Class I | | | | 1,000.00 | | | | 1,028.20 | | | | 5.06 | | | | 1.00 | % |
| | | | | Class C | | | | 1,000.00 | | | | 1,023.50 | | | | 10.09 | | | | 2.00 | % |
| | | | | Class R | | | | 1,000.00 | | | | 1,026.00 | | | | 7.58 | | | | 1.50 | % |
| | | | | Class S | | | | 1,000.00 | | | | 1,028.20 | | | | 5.06 | | | | 1.00 | % |
| Mid Cap Growth Fund | | | | | Class A | | | | 1,000.00 | | | | 1,049.70 | | | | 6.90 | | | | 1.35 | % |
| | | | | Class I | | | | 1,000.00 | | | | 1,051.40 | | | | 5.63 | | | | 1.10 | % |
| | | | | Class C | | | | 1,000.00 | | | | 1,046.50 | | | | 10.71 | | | | 2.10 | % |
| | | | | Class R | | | | 1,000.00 | | | | 1,049.20 | | | | 8.12 | | | | 1.59 | % |
| | | | | Class S | | | | 1,000.00 | | | | 1,051.30 | | | | 5.63 | | | | 1.10 | % |
| SMID Cap Growth Fund | | | | | Class A | | | | 1,000.00 | | | | 1,039.50 | | | | 8.54 | | | | 1.68 | % |
| | | | | Class I | | | | 1,000.00 | | | | 1,041.10 | | | | 7.28 | | | | 1.43 | % |
| | | | | Class C | | | | 1,000.00 | | | | 1,035.40 | | | | 12.33 | | | | 2.43 | % |
| | | | | Class R | | | | 1,000.00 | | | | 1,037.80 | | | | 9.81 | | | | 1.93 | % |
| | | | | Class S | | | | 1,000.00 | | | | 1,041.10 | | | | 7.28 | | | | 1.43 | % |
| Enterprise Fund | | | | | Class A | | | | 1,000.00 | | | | 1,094.40 | | | | 6.94 | | | | 1.33 | % |
| | | | | Class I | | | | 1,000.00 | | | | 1,095.50 | | | | 5.64 | | | | 1.08 | % |
| | | | | Class C | | | | 1,000.00 | | | | 1,089.60 | | | | 10.84 | | | | 2.08 | % |
| | | | | Class R | | | | 1,000.00 | | | | 1,092.60 | | | | 8.24 | | | | 1.58 | % |
| | | | | Class S | | | | 1,000.00 | | | | 1,095.60 | | | | 5.64 | | | | 1.08 | % |
| Small Cap Core Fund | | | | | Class A | | | | 1,000.00 | | | | 1,096.70 | | | | 8.10 | | | | 1.55 | % |
| | | | | Class C | | | | 1,000.00 | | | | 1,092.40 | | | | 12.00 | | | | 2.30 | % |
| | | | | Class R | | | | 1,000.00 | | | | 1,095.00 | | | | 9.40 | | | | 1.80 | % |
| | | | | Class S | | | | 1,000.00 | | | | 1,097.90 | | | | 6.80 | | | | 1.30 | % |
| Value Fund | | | | | Class A | | | | 1,000.00 | | | | 1,056.50 | | | | 6.56 | | | | 1.28 | % |
| | | | | Class C | | | | 1,000.00 | | | | 1,052.20 | | | | 10.39 | | | | 2.03 | % |
| | | | | Class R | | | | 1,000.00 | | | | 1,055.00 | | | | 7.99 | | | | 1.56 | % |
| | | | | Class S | | | | 1,000.00 | | | | 1,057.70 | | | | 5.28 | | | | 1.03 | % |
| Microcap Value Fund | | | | | Class A | | | | 1,000.00 | | | | 1,104.30 | | | | 6.93 | | | | 1.32 | % |
| | | | | Class C | | | | 1,000.00 | | | | 1,100.30 | | | | 10.84 | | | | 2.07 | % |
| | | | | Class R | | | | 1,000.00 | | | | 1,102.80 | | | | 8.23 | | | | 1.57 | % |
| | | | | Class S | | | | 1,000.00 | | | | 1,105.50 | | | | 5.62 | | | | 1.07 | % |
* Expenses are equal to the average account value times the Fund’s annualized expense ratio multiplied by the number of days in the most recent fiscal half-year divided by the number of days in the fiscal year( to reflect one-half year period).
86
Table of Contents
SUPPLEMENTAL INFORMATION (unaudited)
Hypothetical Examplefor Comparison Purposes
The table below provides information about hypothetical account values and hypothetical expenses based on each Tamarack Funds’ actual expense ratio and an assumed rate of return of 5% per year before expenses, which is not the Fund’s actual return. The hypothetical account values and expenses may not be used to estimate the actual ending account balance or expenses you paid for the period. You may use this information to compare this 5% hypothetical example with the 5% hypothetical examples that appear in the shareholder reports of other funds.
Please note that the expenses shown in the table are meant to highlight your ongoing costs only and do not reflect any transactional costs, such as sales charges (loads), redemption fees, or exchange fees. Therefore, the table is useful in comparing ongoing costs only, and will not help you determine the relative total costs of owning different funds. In addition, if these transactional costs were included, your costs would have been higher.
| | | | | | Beginning
Account Value
10/1/06 | | | Ending
Account Value
3/31/07 | | | Expenses Paid
During Period*
10/1/06 - 3/31/07 | | | Annualized
Expense Ratio
During Period
10/1/06 - 3/31/07 | |
|---|
| | | | | |
| | |
| | |
| | |
| |
| Large Cap Growth Fund | | | | | Class A | | | $ | 1,000.00 | | | $ | 1,018.70 | | | $ | 6.29 | | | | 1.25 | % |
| | | | | Class I | | | | 1,000.00 | | | | 1,019.95 | | | | 5.04 | | | | 1.00 | % |
| | | | | Class C | | | | 1,000.00 | | | | 1,014.96 | | | | 10.05 | | | | 2.00 | % |
| | | | | Class R | | | | 1,000.00 | | | | 1,017.45 | | | | 7.54 | | | | 1.50 | % |
| | | | | Class S | | | | 1,000.00 | | | | 1,019.95 | | | | 5.04 | | | | 1.00 | % |
| Mid Cap Growth Fund | | | | | Class A | | | | 1,000.00 | | | | 1,018.20 | | | | 6.79 | | | | 1.35 | % |
| | | | | Class I | | | | 1,000.00 | | | | 1,019.45 | | | | 5.54 | | | | 1.10 | % |
| | | | | Class C | | | | 1,000.00 | | | | 1,014.46 | | | | 10.55 | | | | 2.10 | % |
| | | | | Class R | | | | 1,000.00 | | | | 1,017.00 | | | | 8.00 | | | | 1.59 | % |
| | | | | Class S | | | | 1,000.00 | | | | 1,019.45 | | | | 5.54 | | | | 1.10 | % |
| SMID Cap Growth Fund | | | | | Class A | | | | 1,000.00 | | | | 1,016.55 | | | | 8.45 | | | | 1.68 | % |
| | | | | Class I | | | | 1,000.00 | | | | 1,017.80 | | | | 7.19 | | | | 1.43 | % |
| | | | | Class C | | | | 1,000.00 | | | | 1,012.81 | | | | 12.19 | | | | 2.43 | % |
| | | | | Class R | | | | 1,000.00 | | | | 1,015.31 | | | | 9.70 | | | | 1.93 | % |
| | | | | Class S | | | | 1,000.00 | | | | 1,017.80 | | | | 7.19 | | | | 1.43 | % |
| Enterprise Fund | | | | | Class A | | | | 1,000.00 | | | | 1,018.30 | | | | 6.69 | | | | 1.33 | % |
| | | | | Class I | | | | 1,000.00 | | | | 1,019.55 | | | | 5.44 | | | | 1.08 | % |
| | | | | Class C | | | | 1,000.00 | | | | 1,014.56 | | | | 10.45 | | | | 2.08 | % |
| | | | | Class R | | | | 1,000.00 | | | | 1,017.05 | | | | 7.95 | | | | 1.58 | % |
| | | | | Class S | | | | 1,000.00 | | | | 1,019.55 | | | | 5.44 | | | | 1.08 | % |
| Small Cap Core Fund | | | | | Class A | | | | 1,000.00 | | | | 1,017.20 | | | | 7.80 | | | | 1.55 | % |
| | | | | Class C | | | | 1,000.00 | | | | 1,013.46 | | | | 11.55 | | | | 2.30 | % |
| | | | | Class R | | | | 1,000.00 | | | | 1,015.96 | | | | 9.05 | | | | 1.80 | % |
| | | | | Class S | | | | 1,000.00 | | | | 1,018.45 | | | | 6.54 | | | | 1.30 | % |
| Value Fund | | | | | Class A | | | | 1,000.00 | | | | 1,018.55 | | | | 6.44 | | | | 1.28 | % |
| | | | | Class C | | | | 1,000.00 | | | | 1,014.81 | | | | 10.20 | | | | 2.03 | % |
| | | | | Class R | | | | 1,000.00 | | | | 1,017.15 | | | | 7.85 | | | | 1.56 | % |
| | | | | Class S | | | | 1,000.00 | | | | 1,019.80 | | | | 5.19 | | | | 1.03 | % |
| Microcap Value Fund | | | | | Class A | | | | 1,000.00 | | | | 1,018.35 | | | | 6.64 | | | | 1.32 | % |
| | | | | Class C | | | | 1,000.00 | | | | 1,014.61 | | | | 10.40 | | | | 2.07 | % |
| | | | | Class R | | | | 1,000.00 | | | | 1,017.10 | | | | 7.90 | | | | 1.57 | % |
| | | | | Class S | | | | 1,000.00 | | | | 1,019.60 | | | | 5.39 | | | | 1.07 | % |
* Expenses are equal to the average account value times the Fund’s annualized expense ratio multiplied by the number of days in the most recent fiscal half-year divided by the number of days in the fiscal year (to reflect one-half year period).
87
Table of Contents
This Page Intentionally Left Blank
88
Table of Contents
Performance data represents past performance and does not guarantee future results. The principal value of an investment and investment return will fluctuate so that an investor’s shares, when redeemed, may be worth more or less than their original cost.
This report and the financial statements contained herein are provided for the information of Tamarack Funds shareholders. This report is not authorized for distribution to prospective investors unless preceded or accompanied by a current prospectus, which contains information concerning investment objectives, risks, charges and expenses of the funds. Please read the prospectus carefully before investing.
This report and the financial statements contained herein are not intended to be a forecast of future events, a guarantee of future results, or investment advice. There is no assurance that certain securities will remain in or out of each fund’s portfolio. The views expressed in this report reflect those of the portfolio managers through the period ended March 31, 2007. The portfolio managers’ views are subject to change at any time based on market or other conditions.
NOT FDIC INSURED • NO BANK GUARANTEE • MAY LOSE VALUE
Voyageur Asset Management serves as investment adviser for the Tamarack Funds. Tamarack Funds are distributed by Tamarack Distributors Inc., member NASD.
Tamarack Funds
P.O. Box 219757
Kansas City, MO 64121-9757
800-422-2766
www.voyageur.net

The Tamarack Funds are pleased to introduce our first shareholder
reports printed entirely on Forest Stewardship Council certified paper.
FSC certification ensures that the paper used in this report contains
fiber from well-managed and responsibly harvested forests
that meet strict environmental and socioeconomic standards.
TF-EQ SAR3-07
| |
| SEMI-ANNUAL REPORT March 31, 2007 |
Quality Fixed Income Fund Tax-Free Income Fund | |
Tamarack Funds
About Your Semi-Annual Report
This semi-annual report includes detailed information regarding your Fund’s performance. This report is provided to help answer your questions as a shareholder. Among these questions may be: How has my Fund performed against its benchmark both in the last year and over the last ten years (or since inception if less than ten years)? What are the annual expenses of my Fund? What are the significant accounting policies and procedures followed by my Fund?
The Tamarack Funds compare their performance against widely used market indices, depending on the market sector or investment style of the particular fund. Fixed income funds are benchmarked against various Lehman Brothers Bond Indices, which show only the performance of the underlying fixed income securities, rather than of a comparable fund that would be available to an average investor.
We hope the financial information presented, as well as the discussion and analysis from your portfolio manager(s), will help you evaluate your investment in the Tamarack Funds. We also encourage you to read your Fund’s prospectus for further detail as to your Fund’s investment policies and risk profile. Tamarack Funds prospectuses and performance information subsequent to the date of this report are available on our website at www.voyageur.net.
A description of the policies and procedures that your Fund uses to determine how to vote proxies relating to portfolio securities is available (i) without charge, upon request, by calling 1-800-422-2766; (ii) on the Fund’s website at www.voyageur.net; and (iii) on the Securities and Exchange Commission’s (the “Commission”) website at http://www.sec.gov.
Information regarding how your Fund voted proxies relating to portfolio securities during the most recent 12 month period ended June 30, 2006 is available (i) on the Fund’s website at www.voyageur.net; and (ii) on the Commission’s website at http://www.sec.gov.
A schedule of each Fund’s portfolio holdings will be filed with the Commission for the first and third quarters of each fiscal year on Form N-Q. This information is available on the Commission’s website at http://www.sec.gov and may be reviewed and copied at the Commission’s Public Reference Room in Washington, D.C. Information on the operation of the Public Reference Room is available by calling 1-800-SEC-0330.
Table of Contents
Table of Contents
LETTER FROM THE CIO OF FIXED INCOME
Market optimism continued during the first half of the fiscal year throughout the capital markets. U.S. stock and bond indices produced solidly positive returns over the past six months while global equity markets posted double digit returns. These strong returns are even more impressive or worrisome (depending on your perspective) when one considers it occurred during a relatively high inflation, low growth environment. Robust investment demand, tight labor markets, stable consumer confidence, and positive earnings reports combined with stable Fed policy to push the markets higher during this period.
The Federal Reserve finds itself in a difficult position at the moment. Economic growth over the last three quarters has averaged a modest 2.3%. Growth in this range, by itself, would probably be sufficient to encourage the Fed to lower interest rates in order to stimulate future economic activity. However, the Fed is not responsible solely for growth. It also has the responsibility of controlling inflation. Currently, the Fed’s favorite measure of inflation, the core Personal Consumption Expenditure (PCE) indicator, is well above its stated 2% target level. The combination of slow growth and an unacceptably high level of inflation has kept the Fed from changing interest rates for the last ten months. It seems fairly clear that any future change in interest rate policy, up or down, will result from either much lower inflation or much stronger growth.
The housing market has been one of the most important influences on economic performance over the past several years, both positively and most recently negatively. The housing market is one of the predominant factors that transitioned our economy from the 3.5% level of economic growth in 2003-2004 to the current level of just above 2%. In the early part of this decade, the real estate market became a major engine for pulling the economy out of recession. After the 2001 recession, interest rates fell significantly, eventually posting record lows in 2003. At about the same time, mortgage companies were developing new and innovative mortgage products, which allowed more homebuyers to qualify for cheaper financing. The somewhat rare combination of low interest rates and easier financing caused homes to become highly affordable. As the demand for housing increased, so did employment in construction, real estate brokerage and appraisal and mortgage origination. Indirect beneficiaries of housing transactions, such as the furniture and home remodeling companies, also have increased employment.
Ultimately, housing demand became self-feeding, due mostly to the escalation in home prices. People were not simply trading up to the next affordable house; they became investors whose sole purpose was to borrow money cheaply and invest in housing because they believed prices would be higher in the future. Then, after several years of double-digit price gains, investors started to extract profits and spend the money. This, in turn, became an additional source of economic growth along with the employment build-up.
Today, things are markedly different. Housing demand has slowed, builders have finally stopped adding to the new housing stock, and home price increases have slowed. In some areas of the country, prices have started to decline. The current housing malaise is causing weakness in a number of sectors of the economy, most of which are the same sectors that expanded so rapidly in the early part of the decade. One area particularly hard hit has been the sub-prime market, which lends mortgage money to lower credit-quality borrowers. As competition for business tightened in this market over the last several years, lenders began cutting corners on underwriting standards in order to maintain loan volume. Eventually delinquencies began to show up, causing numerous lenders in this sector to shut their doors. The bankruptcy of sub-prime lenders has been
1
Table of Contents
LETTER FROM THE CIO OF FIXED INCOME
well documented, but the sub-prime market is not the only mortgage market that exists. In fact, Lehman Brothers estimates that sub-prime lending makes up approximately 15% of the entire outstanding mortgage market. The rest of the market (approximately 85%) is made up of high quality (prime) borrowers and remains relatively unaffected by the issues in the sub-prime sector.
Given the relative size of the sub-prime market, Voyageur does not expect a broad meltdown in either housing or the economy. Troubles in the sub-prime sector will continue to have an economic impact and the housing downturn will take some time to correct itself. The process of reducing existing home supply, dealing with foreclosures and stabilization of prices will move fairly slowly. The impact could easily be felt through reduced economic growth for the next several years, but most likely the impact will lessen as time progresses. Voyageur has, for the past several years, believed that mortgage origination standards for lower grade borrowers were being relaxed in order to maintain levels of business. We have consistently worked to understand the individual underwriting companies’ business methods as well as the specific collateral pools that we invest in for our clients. This allowed us to avoid virtually all of the pain in the sub-prime market. We also believe the discipline that is currently being brought to bear on the market in terms of fewer originators and tighter lending standards will likely create an opportunity at some point in the future.
Peripheral issues related to consumer spending based on the wealth effect are areas of concern. Over most of this decade, either the stock market or housing has contributed mightily to consumer net wealth and ultimately to consumers’ willingness to spend. The other factor that has affected consumers spending has been the level of employment. Regarding spending, we are watchful for a change in the attitude of business as it relates to both employment and the level of the stock market. A substantial decline in employment and/or the stock market with further declines in home prices could be the catalyst for even weaker growth and an immediate change in the interest rate policy of the Fed. However, Voyageur does not see this as probable. Instead, we believe that economic growth and inflation will remain at current levels with no recession in the forecast until 2008 or beyond.
Voyageur remains cautious on the fixed income markets and these views are reflected in our strategy for the Funds. First, we remain biased toward high quality issuers and cash flows across our fixed income holdings. Spreads in traditional corporate and mortgage backed securities are extremely narrow by almost any measure and seem to have been pushed to extremes by investors hungry for yield. Second, we remain committed to our income based approach to investing even though we are cautious on many sectors and names in the market. Security selection and a consistent investment process will help us provide value added returns to our shareholders. Third, we will not time interest rates as a means of generating excess returns for the Funds. We believe it presents too much risk for our shareholders. Finally, we remain keenly aware of opportunities and developing risks in upcoming quarters as we strive to produce absolute and risk-adjusted returns for all of our shareholders.

John Huber
Chief Investment Officer
Fixed Income Products |

John Huber
Chief Investment Officer, Fixed Income Products
Tamarack Funds |
2
Table of Contents
FIXED INCOME PORTFOLIO MANAGERS
Voyageur Asset Management Inc. (“Voyageur”), the investment advisor to the Tamarack Funds, employs a team approach to the management of each of the fixed income funds. Each Fund’s management team has access to Voyageur’s investment research and other money management resources. The members of Voyageur’s fixed income funds team are:
John M. Huber, CFA
Senior Managing Director, Chief Investment Officer — Fixed Income
John Huber directs Voyageur’s fixed income group. John joined Voyageur in 2004 from Galliard Capital Management where he was a principal and senior portfolio manager, responsible for the firm’s total return fixed income effort. Prior to working for Galliard, John was a portfolio manager for Norwest Investment Management where he began his career in 1990. John received a BA from the University of Iowa and an MBA in Finance from the University of Minnesota, Carlson School of Management. He acts as an advisor to the Carlson Funds Enterprise for the University of Minnesota. John is a CFA charterholder and a member of the CFA Society of Minnesota. He also serves on the Board of the YMCA of Metropolitan Minneapolis. |
John M. Huber, CFA |
|
James A. Norungolo, CFA
Vice President, Credit Team Lead, Senior Portfolio Manager
James Norungolo leads Voyageur’s Credit Team which is responsible for conducting our investment process in cash management, high grade and high yield debt, and municipal bonds. In addition, he acts as primary portfolio manager for many of our core and core plus taxable fixed income clients. James joined Voyageur in 1993 and has held several critical roles within the organization including credit/equity analyst, structured product analyst, trading and portfolio administration. Prior to joining Voyageur, James worked for Westport Bank & Trust, NationsBank and Sovran Capital Management. James began his career in the investment industry in 1987. He received a BA from the University of Virginia. James is a CFA charterholder and member of the CFA Society of Minnesota. | 
James A. Norungolo, CFA |
|
Raye C. Kanzenbach, CFA
Senior Managing Director, Senior Portfolio Manager
Raye Kanzenbach is an active member of the Credit Team. He has extensive experience working with taxable and tax-exempt municipal fixed income securities. Prior to his experience at Voyageur, Raye was employed at First Bank where he managed the municipal and money market trust funds. Raye also supervised the municipal and corporate credit analysis areas for the Trust Department and First Bank’s investment portfolio. Prior to First Bank, Raye was employed as an investment officer with the St. Paul Companies. Raye began his career in the investment industry in 1973 and joined Voyageur in 1983. He received a BA in Economics from Lawrence University and an MBA in Finance from the University of Michigan. Raye is a CFA charterholder and member of the CFA Society of Minnesota. | 
Raye C. Kanzenbach, CFA |
3
Table of Contents
FIXED INCOME PORTFOLIO MANAGERS

Todd Brux, CFA | Todd Brux, CFA
Vice President, Structured Product Team Lead, Senior Portfolio Manager
Todd Brux leads Voyageur’s Structured Product Team which focuses on opportunities in mortgage-backed and asset-backed securities. Prior to his current role, Todd led the firm’s Portfolio Analytics Team. Prior to joining Voyageur in 2004, Todd was head trader at GMAC RFC and a senior investment analyst at Galliard Capital Management. Todd has been in the investment industry since 1994. He received a BA in Economics from the University of Wisconsin-Madison. Todd is a CFA charterholder and member of the CFA Society of Minnesota. |
|

Steven P. Eldredge, CFA | Steven P. Eldredge, CFA
Managing Director, Client Portfolio Management Team Lead, Senior Portfolio Manager
Steven Eldredge leads the Client Portfolio Management Team which is responsible for assisting clients in developing portfolio objectives and keeping them informed about Voyageur’s fixed income strategies and outlook. Prior to his current role, Steve led the firm’s Portfolio Solutions Team. He has an extensive background in both taxable and tax-exempt fixed income securities. Prior to joining Voyageur in 1995, Steve was chief operating officer for the ABT Mutual Fund family. Steve began his career in the investment industry in 1978. He received a BS in Finance from the University of Central Florida. Steve is a CFA charterholder and member of the CFA Society of Minnesota. |
4
Table of Contents
This Page Intentionally Left Blank
5
Table of Contents
PERFORMANCE SUMMARY
Average Annual Total Returns as of March 31, 2007 (Unaudited)
Tamarack Quality Fixed Income Fund
| | | 1 Year | | | 3 Year | | | 5 Year | | | Since
Inception (a) | |
|---|
| | |
| | |
| | |
| | |
| |
| Class A (c) | | | | | | | | | | | | | | | | | | |
| - Including Maximum Sales Charge of 3.75% | | | | | 2.10 | % | | | 1.58 | % | | | 3.80 | % | | | 4.23 | % |
| - At Net Asset Value | | | | | 6.13 | % | | | 2.89 | % | | | 4.59 | % | | | 4.74 | % |
| Class C (d) | | | | | | | | | | | | | | | | | | |
| - Including Contingent Deferred Sales Charge of 1.00% | | | | | 4.35 | % | | | 2.16 | % | | | 3.84 | % | | | 3.97 | % |
| - At Net Asset Value | | | | | 5.35 | % | | | 2.16 | % | | | 3.84 | % | | | 3.97 | % |
| Class I (c) | | | | | 6.51 | % | | | 3.19 | % | | | 4.87 | % | | | 5.00 | % |
| Class R (d) | | | | | 5.98 | % | | | 2.67 | % | | | 4.35 | % | | | 4.49 | % |
| Class S (e) | | | | | 6.40 | % | | | 3.15 | % | | | 4.85 | % | | | 4.98 | % |
| Lehman Brothers U.S. Aggregate Bond Index* | | | | | 6.59 | % | | | 3.31 | % | | | 5.35 | % | | | 5.80 | % |
Tamarack Tax-Free Income Fund
| | | 1 Year | | | 3 Year | | | 5 Year | | | 10 Year | | | Since
Inception (b) | |
|---|
| | |
| | |
| | |
| | |
| | |
| |
| Class A (f) | | | | | | | | | | | | | | | | | | | | | | |
| - Including Maximum Sales Charge of 3.75% | | | | | 0.13 | % | | | 0.58 | % | | | 3.21 | % | | | 4.07 | % | | | 6.04 | % |
| - At Net Asset Value | | | | | 4.05 | % | | | 1.88 | % | | | 4.01 | % | | | 4.46 | % | | | 6.19 | % |
| Class C (f) | | | | | | | | | | | | | | | | | | | | | | |
| - Including Contingent Deferred Sales Charge of 1.00% | | | | | 2.34 | % | | | 1.14 | % | | | 3.25 | % | | | 3.69 | % | | | 5.41 | % |
| - At Net Asset Value | | | | | 3.32 | % | | | 1.14 | % | | | 3.25 | % | | | 3.69 | % | | | 5.41 | % |
| Class R (f) | | | | | 3.79 | % | | | 1.61 | % | | | 3.74 | % | | | 4.20 | % | | | 5.93 | % |
| Class S | | | | | 4.31 | % | | | 2.13 | % | | | 4.26 | % | | | 4.72 | % | | | 6.46 | % |
| Lehman Brothers Municipal 3-15 Year Blend Index * | | | | | 5.02 | % | | | 3.17 | % | | | 4.93 | % | | | 5.48 | % | | | NA | |
Performance data quoted represents past performance. Past performance is no guarantee of future results. Investment return and principal value of an investment will fluctuate so that an investor’s shares, when redeemed, may be worth more or less than their original cost. Current performance may be lower or higher than performance quoted. For performance data current to most recent month-end go to www.voyageur.net.
*Each of the comparative indices is a widely recognized market value weighted measure of the return of securities. Index returns do not include sales fees or operating expenses. You cannot invest directly into indices.
| (a) | The since inception date (commencement of operations) of the Fund is May 10, 1999. |
| (b) | The since inception date (commencement of operations) of the Fund is February 22, 1980. |
| (c) | The performance in the table reflects the performance of the former RBC Funds, the predecessors to the Tamarack Funds. |
| (d) | The inception date for Class C and Class R shares of the Fund is April 19, 2004. All performance shown for each such class of shares prior to its inception date is based on the performance of the Class A Shares of the Fund, adjusted to reflect the fees and expenses of Class C and Class R shares, as applicable (and where applicable, the maximum sales charges of the Class C shares). |
| (e) | The inception date for Class S of the Fund is April 19, 2004. All performance shown for each such class of shares prior to its inception date is based on the performance of the Class I Shares of the Fund, adjusted to reflect the fees and expenses of Class S. |
| (f) | The inception date for Class A, Class C and Class R shares of the Fund is April 19, 2004. All performance shown for each such class of shares prior to its inception date is based on the performance of the Class S Shares of the |
6
Table of Contents
PERFORMANCE SUMMARY
| | Fund, adjusted to reflect the fees and expenses of Class A, Class C and Class R shares, as applicable (and where applicable, the maximum sales charges of the Class A and Class C shares). |
The Lehman Brothers U.S. Aggregate Bond Index is an unmanaged index of U.S. Dollar denominated government, investment grade corporate, mortgage-backed and asset-backed securities.
The Lehman Brothers Municipal 3-15 Year Blend Index is an unmanaged index of investment grade municipal bonds with maturities of 2-17 years.
7
Table of Contents
MANAGEMENT DISCUSSION AND ANALYSIS
Tamarack Quality Fixed Income Fund
Investment Objective
The Fund seeks to provide high current income and appreciation as is consistent with relative stability of principal through active management of portfolio sectors, maturity and security selection.
Performance
For the six-month period ending March 31, 2007, the Fund had a total return of 2.73% (Class A, at net asset value). That compares to a total return of 2.75% for the Lehman Brothers U.S. Aggregate Bond Index, the Fund’s primary benchmark. Returns, both net and gross of expenses, placed the Fund at the 37% and 40%, respectively in its Lipper category for the period.
Factors That Made Positive Contributions
| | • | The Portfolio’s significant nominal yield and option-adjusted spread advantages of 53 and 51 basis points, respectively contributed to the positive outperformance over the semi-annual period. During the previous six months, interest rates were essentially unchanged resulting in little price return performance, making portfolio yield an important differentiator of our return compared to the benchmark. |
| | • | Holdings of fixed-rate mortgage-backed securities (MBS) performed well during the period providing 37 basis points of excess return compared to similar Treasuries. |
| | • | Hybrid adjustable-rate mortgages (ARMs) were added to the Portfolio over the last six months. ARMs performed well during this period as demand grew ahead of their inclusion in the Lehman Indices at the beginning of April. |
| | • | High yield corporate bonds outperformed all other domestic fixed income sectors during four of the last six months. The fund held approximately a 10% weighting in high yield bonds, mostly concentrated in the upper portion of this credit spectrum. |
Factors That Detracted From Relative Returns
| | • | The portfolio maintains a core position in Treasury Inflation Protected Securities which underperformed comparable Treasury securities by more than 1% over the semi-annual period. |
| | • | While the Portfolio held a modest amount of highly-diversified, high yield corporate securities, its overall structure across the yield curve was concentrated at the short-end of the curve and detracted from performance. |
| | • | General credit spread levels are very tight which lead us to carry a very defensive view on credit, even while remaining involved in the market. This defensive bias caused us to avoid specific sectors that have performed well as investors made little distinction among various issuers’ credit quality. |
8
Table of Contents
MANAGEMENT DISCUSSION AND ANALYSIS
Tamarack Quality Fixed Income Fund
Investment Objective
Current income and capital appreciation
Benchmark
Lehman Brothers U.S. Aggregate Bond Index
Asset Allocation
(% of fund’s investments excluding securities lending collateral)
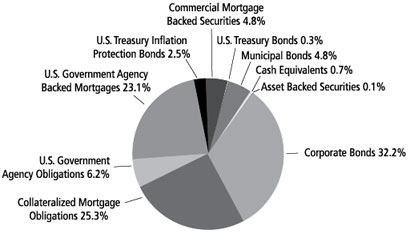
Top Ten Holdings
(as of 3/31/07)
(% of fund’s net assets)
| U.S. Treasury Inflation Protection Bonds, 2.38%, 1/15/17 | | | | 2.56 | % |
| Countrywide Alternative Loan Trust, 5.00%, 7/25/19 | | | | 2.43 | % |
| FNMA, 6.26%, 4/15/37 | | | | 1.91 | % |
| Merrill Lynch Mortgage Investors, Inc., Series 2005-A1 4.54%, 12/25/34 | | | | 1.72 | % |
| Countrywide Alternative Loan Trust, 4.97%, 7/25/35 | | | | 1.57 | % |
| Federal Home Loan Mortgage Corp., 5.50%, 6/1/23 | | | | 1.56 | % |
| Washington Mutual, Inc., Series 2003-S11, 5.00%, 11/25/33 | | | | 1.49 | % |
| Federal Home Loan Mortgage Corp., 6.52%, 7/25/16 | | | | 1.47 | % |
| JP Morgan Commercial Mortgage Finance Corp., Series 1999-C7, 6.51%, 10/15/35 | | | | 1.43 | % |
| Bank of America Funding Corp., 6.06%, 7/30/46 | | | | 1.32 | % |
*A listing of all portfolio holdings can be found on page 28.
Growth of $10,000 Initial Investment Since Inception

The graph reflects an initial investment of $10,000 since inception of 5/10/1999 and is based on Class A shares including the maximum sales charge of 3.75%. The Fund’s total return includes reinvested dividends and capital gains. The Fund’s total return also includes operating expenses that reduce return, while the total return of the index does not. The graph does not reflect the deduction of taxes that a shareholder would pay on fund distributions or redemption of fund shares. Performance of other classes will vary due to differences in fee structures.
9
Table of Contents
MANAGEMENT DISCUSSION AND ANALYSIS
Tamarack Tax-Free Income Fund
Investment Objective
Providing the highest level of regular income exempt from federal income tax consistent with stated quality and maturity standards.
Performance
For the six-month period ending March 31, 2007, the Fund had a total return of 1.19% (Class A, at net asset value). That compares to a total return of 1.69% for the Lehman Brothers Municipal 3-15 Year Blend Index, the Fund’s primary benchmark.
Factors That Made Positive Contributions
| | • | We purchased several higher yielding bonds and transitioned out of some lower yielding bonds in order to increase the Fund’s yield. |
| | • | The Fund is over-weighted in lower investment grade quality bonds relative to the benchmark, which lead to stronger total returns than the general market. |
Factors That Detracted From Relative Returns
| | • | The Fund does not own any bonds secured by tobacco company settlement payments and this sector produced some of the highest returns during the period. |
10
Table of Contents
MANAGEMENT DISCUSSION AND ANALYSIS
Tamarack Tax-Free Income Fund
Investment Objective
Providing the highest level of regular income exempt from federal income tax consistent with stated quality and maturity standards
Benchmark
Lehman Brothers Municipal 3-15 Year Blend Index
Asset Allocation
(% of fund’s investments)

Top Ten Holdings
(as of 3/31/07)
(% of fund’s net assets)
| State Health & Education Facilities Authority (Partners Healthcare), Series C, 5.75%, 7/1/12 | | | | 5.71 | % |
| Seattle Municipal Light and Power, 5.63%, 12/1/16 | | | | 5.57 | % |
| State Construction Loan, Series E, 5.38%, 1/1/17 | | | | 3.41 | % |
| Cook County Township High School District, 5.50%, 12/1/19 | | | | 3.01 | % |
| University of Texas Revenue, Series B, 5.25%, 8/15/19 | | | | 2.94 | % |
| Chicago, Series B, 5.13%, 1/1/22, (AMBAC Insured) | | | | 2.93 | % |
| Santa Rosa Waste Water Revenue, Series B, 6.00%, 9/1/15, (FGIC Insured) | | | | 2.92 | % |
| San Antonio Electric & Gas, 5.38%, 2/1/15 | | | | 2.90 | % |
| Anderson School Building Corp., 5.00%, 7/15/17, (FSA Insured) | | | | 2.86 | % |
| Arkansas River Power Authority Power Revenue, 5.00%, 10/1/14 | | | | 2.82 | % |
*A listing of all portfolio holdings can be found on page 36.
Growth of $10,000 Initial Investment Over 10 Years
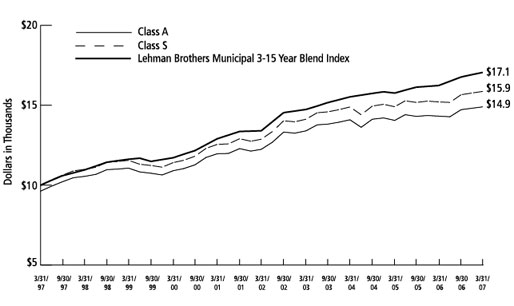
The graph reflects an initial investment of $10,000 over a 10 year period and is based on Class A shares including the maximum sales charge of 3.75%. The inception date for Class A shares of the Fund is April 19, 2004. All performance shown for Class A shares prior to the inception date is based on the performance of the Class S shares of the Fund, adjusted to reflect the fees, expenses and maximum sales charges of Class A shares. The Fund’s total return includes reinvested dividends and capital gains. The Fund’s total return also includes operating expenses that reduce return, while the total return of the index does not. The graph does not reflect the deduction of taxes that a shareholder would pay on fund distributions or redemption of fund shares. Performance of other classes will vary due to differences in fee structures. The Fund has recently added the Lehman Brothers Municipal 3-15 Year Blend Index as its primary benchmark because Fund management has determined that this benchmark more closely reflects the universe of securities in which the Fund invests.
11
Table of Contents
FINANCIAL STATEMENTS
Statements of Assets and Liabilities
March 31, 2007 (Unaudited)
| | | Tamarack
Quality Fixed
Income Fund | | | Tamarack
Tax-Free
Income Fund | |
|---|
| | |
| | |
| |
| Assets: | | | | | | | | | | |
| Investments, at value (cost $56,237,798 and $18,390,764, respectively) | | | | $ | 56,046,172 | | | $ | 18,865,106 | |
| Investment of cash collateral for securities on loan, at value (cost $1,712,611; $-, respectively) | | | | | 1,712,611 | | | | — | |
| | |
| | |
| |
| Total Investments | | | | | 57,758,783 | | | | 18,865,106 | |
| | |
| | |
| |
| Interest and dividends receivable | | | | | 505,905 | | | | 206,251 | |
| Cash | | | | | 9,101 | | | | — | |
| Receivable for investments sold | | | | | 30,148 | | | | — | |
| Receivable from advisor | | | | | 43,260 | | | | 17,470 | |
| Restricted deposits with broker for futures | | | | | 216,018 | | | | — | |
| Prepaid expenses | | | | | 25,469 | | | | 37,061 | |
| | |
| | |
| |
| Total Assets | | | | | 58,588,684 | | | | 19,125,888 | |
| | |
| | |
| |
| Liabilities: | | | | | | | | | | |
| Distributions payable | | | | | 33,264 | | | | 17,530 | |
| Payable for capital shares redeemed | | | | | 16,105 | | | | 1,850 | |
| Payable for investments purchased | | | | | 1,326,437 | | | | — | |
| Net payable for variation margin on futures contracts | | | | | 9,375 | | | | — | |
| Payable upon return of securities on loan | | | | | 1,712,611 | | | | — | |
| Accrued expenses and other payables: | | | | | | | | | | |
| Administration fees | | | | | 4,743 | | | | 1,623 | |
| Distribution fees | | | | | 85 | | | | 20 | |
| Other | | | | | 91,375 | | | | 34,442 | |
| | |
| | |
| |
| Total Liabilities | | | | | 3,193,995 | | | | 55,465 | |
| | |
| | |
| |
| Net Assets | | | | $ | 55,394,689 | | | $ | 19,070,423 | |
| | |
| | |
| |
| Net Assets Consist Of: | | | | | | | | | | |
| Capital | | | | $ | 59,006,868 | | | $ | 18,532,828 | |
| Undistributed (distributions in excess of) net investment income | | | | | (34,053 | ) | | | 11 | |
| Accumulated net realized gains (losses) from investment transactions | | | | | (3,381,428 | ) | | | 63,242 | |
| Net unrealized appreciation (depreciation) on investments | | | | | (196,698 | ) | | | 474,342 | |
| | |
| | |
| |
| Net Assets | | | | $ | 55,394,689 | | | $ | 19,070,423 | |
| | |
| | |
| |
| Net Assets: | | | | | | | | | | |
| Class A | | | | $ | 352,882 | | | $ | 75,142 | |
| Class I | | | | | 487,371 | | | | — | |
| Class C | | | | | 3,560 | | | | 3,450 | |
| Class R | | | | | 7,384 | | | | 3,497 | |
| Class S | | | | | 54,543,492 | | | | 18,988,334 | |
| | |
| | |
| |
| Total | | | | $ | 55,394,689 | | | $ | 19,070,423 | |
| | |
| | |
| |
12
Table of Contents
FINANCIAL STATEMENTS
Statements of Assets and Liabilities (cont.)
March 31, 2007 (Unaudited)
| | | Tamarack
Quality Fixed
Income Fund | | | Tamarack
Tax-Free
Income Fund | |
|---|
| | |
| | |
| |
| Shares Outstanding (Unlimited number of shares authorized, no par value): | | | | | | | | | | |
| Class A | | | | | 37,051 | | | | 8,862 | |
| Class I | | | | | 51,161 | | | | — | |
| Class C | | | | | 374 | | | | 407 | |
| Class R | | | | | 775 | | | | 413 | |
| Class S | | | | | 5,726,934 | | | | 2,239,465 | |
| | |
| | |
| |
| Total | | | | | 5,816,295 | | | | 2,249,147 | |
| | |
| | |
| |
| Net Asset Values and Redemption Price per Share: | | | | | | | | | | |
| Class A (a) | | | | $ | 9.52 | | | $ | 8.48 | |
| | |
| | |
| |
| Class I | | | | $ | 9.53 | | | | — | |
| | |
| | |
| |
| Class C (b) | | | | $ | 9.52 | | | $ | 8.48 | |
| | |
| | |
| |
| Class R | | | | $ | 9.53 | | | $ | 8.48(c | ) |
| | |
| | |
| |
| Class S | | | | $ | 9.52 | | | $ | 8.48 | |
| | |
| | |
| |
| Maximum Offering Price Per Share: | | | | | | | | | | |
| Class A | | | | $ | 9.89 | | | $ | 8.81 | |
| | |
| | |
| |
| Maximum Sales Charge – Class A | | | | | 3.75 | % | | | 3.75 | % |
| | |
| | |
| |
| (a) | For Class A shares, redemption price per share is reduced by 1.00% for sales of shares within 12 months of purchase (only applicable on purchases of $1 million or more on which no initial sales charge was paid). |
| (b) | For Class C shares, redemption price per share is reduced by 1.00% for sales of shares within 12 months of purchase. |
| (c) | Net asset value is calculated unsing the unrounded net assets of $3,497.18 divided by the unrounded shares outstanding of 412.51. |
See notes to financial statements.
13
Table of Contents
FINANCIAL STATEMENTS
Statements of Operations
For the Six Months Ended March 31, 2007 (Unaudited)
| | | Tamarack
Quality Fixed
Income Fund | | | Tamarack
Tax-Free
Income Fund | |
|---|
| | |
| | |
| |
| Investment Income: | | | | | | | | | | |
| Interest income | | | | $ | 1,520,265 | | | $ | 417,604 | |
| Dividend income | | | | | 11,328 | | | | 9,229 | |
| Securities lending income (a) | | | | | 108 | | | | — | |
| | |
| | |
| |
| Total Investment Income | | | | | 1,531,701 | | | | 426,833 | |
| | |
| | |
| |
| Expenses: | | | | | | | | | | |
| Investment advisory fees | | | | | 173,761 | | | | 83,451 | |
| Administration fees | | | | | 28,960 | | | | 9,818 | |
| Distribution fees - Class A | | | | | 982 | | | | 177 | |
| Distribution fees - Class C | | | | | 18 | | | | 16 | |
| Distribution fees - Class R | | | | | 18 | | | | 9 | |
| Accounting fees | | | | | 40,765 | | | | 12,659 | |
| Custodian fees | | | | | 1,280 | | | | 182 | |
| Insurance fees | | | | | 28,950 | | | | 9,140 | |
| Legal and Audit fees | | | | | 18,761 | | | | 11,109 | |
| Registration and filing fees | | | | | 27,073 | | | | 22,632 | |
| Shareholder reports | | | | | 28,264 | | | | 7,955 | |
| Transfer agent fees | | | | | 72,384 | | | | 26,931 | |
| Trustees’ fees | | | | | 9,421 | | | | 9,365 | |
| Other fees | | | | | 798 | | | | 346 | |
| | |
| | |
| |
| Total expenses before fee reductions | | | | | 431,435 | | | | 193,790 | |
| Expenses reduced by: | | | | | | | | | | |
| Advisor | | | | | (233,653 | ) | | | (120,791 | ) |
| Distributor | | | | | (491 | ) | | | (88 | ) |
| | |
| | |
| |
| Net Expenses | | | | | 197,291 | | | | 72,911 | |
| | |
| | |
| |
| Net Investment Income (Loss) | | | | | 1,334,410 | | | | 353,922 | |
| | |
| | |
| |
| Realized/Unrealized Gains (Losses) from Investments: | | | | | | | | | | |
| Net realized gains (losses) from investment transactions | | | | | (36,211 | ) | | | 92,334 | |
| Net realized gains (losses) from futures contracts | | | | | 34,125 | | | | — | |
| Net change in unrealized appreciation (depreciation) on investments | | | | | 328,252 | | | | (180,325 | ) |
| Net change in unrealized appreciation (depreciation) on futures contracts | | | | | (5,072 | ) | | | — | |
| | |
| | |
| |
| Net realized/unrealized gains (losses) from investments | | | | | 321,094 | | | | (87,991 | ) |
| | |
| | |
| |
| Change in net assets resulting from operations | | | | $ | 1,655,504 | | | $ | 265,931 | |
| | |
| | |
| |
| (a) | For more information on Securities Lending, please see Note 2 in the Notes to Financial Statements. |
See notes to financial statements.
14
Table of Contents
FINANCIAL STATEMENTS
Statements of Changes in Net Assets
Tamarack Quality Fixed Income Fund
| | | For the
Six Months Ended
March 31, 2007 | | | For the
Year Ended
September 30, 2006 | |
|---|
| | |
| | |
| |
| | | (Unaudited) | | | | |
|---|
| From Investment Activities: | | | | | | | | | | |
| Operations: | | | | | | | | | | |
| Net investment income (loss) | | | | $ | 1,334,410 | | | $ | 3,128,999 | |
| Net realized gains (losses) from investment transactions and futures contracts | | | | | (2,086 | ) | | | (777,982 | ) |
| Net change in unrealized appreciation (depreciation) on investment transactions and futures contracts | | | | | 323,180 | | | | (317,924 | ) |
| | |
| | |
| |
| Change in net assets resulting from operations | | | | | 1,655,504 | | | | 2,033,093 | |
| | |
| | |
| |
| Distributions to Class A Shareholders: | | | | | | | | | | |
| From net investment income | | | | | (8,550 | ) | | | (40,181 | ) |
| Return of capital | | | | | — | | | | (1,274 | ) |
| Distributions to Class I Shareholders: | | | | | | | | | | |
| From net investment income | | | | | (22,825 | ) | | | (64,107 | ) |
| Return of capital | | | | | — | | | | (2,032 | ) |
| Distributions to Class C Shareholders: | | | | | | | | | | |
| From net investment income | | | | | (62 | ) | | | (124 | ) |
| Return of capital | | | | | — | | | | (4 | ) |
| Distributions to Class R Shareholders: | | | | | | | | | | |
| From net investment income | | | | | (149 | ) | | | (290 | ) |
| Return of capital | | | | | — | | | | (9 | ) |
| Distributions to Class S Shareholders: | | | | | | | | | | |
| From net investment income | | | | | (1,302,696 | ) | | | (2,994,299 | ) |
| Return of capital | | | | | — | | | | (94,908 | ) |
| | |
| | |
| |
| Change in net assets resulting from shareholder distributions | | | | | (1,334,282 | ) | | | (3,197,228 | ) |
| | |
| | |
| |
| Capital Transactions: | | | | | | | | | | |
| Proceeds from shares issued | | | | | 279,531 | | | | 1,160,752 | |
| Dividends reinvested | | | | | 1,130,161 | | | | 2,954,075 | |
| Cost of shares redeemed | | | | | (7,490,578 | ) | | | (18,753,949 | ) |
| | |
| | |
| |
| Change in net assets resulting from capital transactions | | | | | (6,080,886 | ) | | | (14,639,122 | ) |
| | |
| | |
| |
| Net increase (decrease) in net assets | | | | | (5,759,664 | ) | | | (15,803,257 | ) |
| Net Assets: | | | | | | | | | | |
| Beginning of period | | | | | 61,154,353 | | | | 76,957,610 | |
| | |
| | |
| |
| End of period | | | | $ | 55,394,689 | | | $ | 61,154,353 | |
| | |
| | |
| |
| Undistributed (distributions in excess of) net investment income | | | | $ | (34,053 | ) | | $ | (34,181 | ) |
| | |
| | |
| |
| Share Transactions: | | | | | | | | | | |
| Issued | | | | | 29,402 | | | | 122,850 | |
| Reinvested | | | | | 118,848 | | | | 313,026 | |
| Redeemed | | | | | (786,494 | ) | | | (1,988,327 | ) |
| | |
| | |
| |
| Change in shares resulting from capital transactions | | | | | (638,244 | ) | | | (1,552,451 | ) |
| | |
| | |
| |
See notes to financial statements.
15
Table of Contents
FINANCIAL STATEMENTS
Statements of Changes in Net Assets (cont.)
Tamarack Tax-Free Income Fund
| | | For the
Six Months Ended
March 31, 2007 | | | For the
Year Ended
September 30, 2006 | |
|---|
| | |
| | |
| |
| | | (Unaudited) | | | | |
|---|
| From Investment Activities: | | | | | | | | | | |
| Operations: | | | | | | | | | | |
| Net investment income (loss) | | | | $ | 353,922 | | | $ | 818,484 | |
| Net realized gains (losses) from investment transactions | | | | | 92,334 | | | | 587,479 | |
| Net change in unrealized appreciation (depreciation) on investments | | | | | (180,325 | ) | | | (766,866 | ) |
| | |
| | |
| |
| Change in net assets resulting from operations | | | | | 265,931 | | | | 639,097 | |
| | |
| | |
| |
| Distributions to Class A Shareholders: | | | | | | | | | | |
| From net investment income | | | | | (1,183 | ) | | | (3,713 | ) |
| From net realized gains from investment transactions | | | | | (2,079 | ) | | | (1,009 | ) |
| Distributions to Class C Shareholders: | | | | | | | | | | |
| From net investment income | | | | | (46 | ) | | | (92 | ) |
| From net realized gains from investment transactions | | | | | (101 | ) | | | (21 | ) |
| Distributions to Class R Shareholders: | | | | | | | | | | |
| From net investment income | | | | | (54 | ) | | | (109 | ) |
| From net realized gains from investment transactions | | | | | (103 | ) | | | (21 | ) |
| Distributions to Class S Shareholders: | | | | | | | | | | |
| From net investment income | | | | | (352,639 | ) | | | (814,583 | ) |
| From net realized gains from investment transactions | | | | | (590,718 | ) | | | (145,481 | ) |
| | |
| | |
| |
| Change in net assets resulting from shareholder distributions | | | | | (946,923 | ) | | | (965,029 | ) |
| | |
| | |
| |
| Capital Transactions: | | | | | | | | | | |
| Proceeds from shares issued | | | | | 119,889 | | | | 578,362 | |
| Dividends reinvested | | | | | 686,469 | | | | 707,749 | |
| Cost of shares redeemed | | | | | (1,394,405 | ) | | | (4,722,444 | ) |
| | |
| | |
| |
| Change in net assets resulting from capital transactions | | | | | (588,047 | ) | | | (3,436,333 | ) |
| | |
| | |
| |
| Net increase (decrease) in net assets | | | | | (1,269,039 | ) | | | (3,762,265 | ) |
| Net Assets: | | | | | | | | | | |
| Beginning of period | | | | | 20,339,462 | | | | 24,101,727 | |
| | |
| | |
| |
| End of period | | | | $ | 19,070,423 | | | $ | 20,339,462 | |
| | |
| | |
| |
| Undistributed (distributions in excess of) net investment income | | | | $ | 11 | | | $ | 11 | |
| | |
| | |
| |
| Share Transactions: | | | | | | | | | | |
| Issued | | | | | 13,877 | | | | 65,917 | |
| Reinvested | | | | | 80,342 | | | | 80,921 | |
| Redeemed | | | | | (162,640 | ) | | | (539,934 | ) |
| | |
| | |
| |
| Change in shares resulting from capital transactions | | | | | (68,421 | ) | | | (393,096 | ) |
| | |
| | |
| |
See notes to financial statements.
16
Table of Contents
FINANCIAL HIGHLIGHTS
Tamarack Quality Fixed Income Fund
(Selected data for a share outstanding throughout the periods indicated)
| | | | | | Investment Activities | | | Distributions |
|---|
| | | | | |
| | |
|
| | | Net Asset
Value,
Beginning
of Period | | | Net
Investment
Income | | | Net Realized
and Unrealized
Gains (Losses)
on Investments | | | Redemption
Fees | | | Total from
Investment
Activities | | | Net
Investment
Income | | | Net
Realized
Gains | | | Return
Of Capital | | | Total
Distributions |
|---|
| | |
| | |
| | |
| | |
| | |
| | |
| | |
| | |
| | |
|
| Class A | | | | | | | | | | | | | | | | | | | | | | | | | | | | | | | | | | | | | | |
| Six Months Ended March 31, 2007 (Unaudited) | | | | $ | 9.47 | | | | 0.21 | (a) | | | 0.05 | | | | | (g) | | | 0.26 | | | | (0.21 | ) | | | — | | | | — | | | | (0.21 | ) |
| Year Ended September 30, 2006 | | | | | 9.61 | | | | 0.41 | (a) | | | (0.13 | ) | | | | (g) | | | 0.28 | | | | (0.39 | ) | | | — | | | | (0.03 | ) | | | (0.42 | ) |
| Year Ended September 30, 2005 | | | | | 9.77 | | | | 0.39 | | | | (0.15 | ) | | | | (g) | | | 0.24 | | | | (0.40 | ) | | | — | | | | — | | | | (0.40 | ) |
| Period Ended September 30, 2004 (e) | | | | | 9.65 | | | | 0.16 | | | | 0.13 | | | | | (g) | | | 0.29 | | | | (0.17 | ) | | | — | | | | — | | | | (0.17 | ) |
| Year Ended April 30, 2004 | | | | | 10.27 | | | | 0.38 | | | | (0.25 | ) | | | — | | | | 0.13 | | | | (0.41 | ) | | | (0.34 | ) | | | — | | | | (0.75 | ) |
| Year Ended April 30, 2003 | | | | | 9.84 | | | | 0.41 | | | | 0.47 | | | | — | | | | 0.88 | | | | (0.44 | ) | | | (0.01 | ) | | | — | | | | (0.45 | ) |
| Year Ended April 30, 2002 | | | | | 10.06 | | | | 0.51 | | | | (0.15 | ) | | | — | | | | 0.36 | | | | (0.52 | ) | | | (0.06 | ) | | | — | | | | (0.58 | ) |
| Class I |
| Six Months Ended March 31, 2007 (Unaudited) | | | | $ | 9.48 | | | | 0.22 | (a) | | | 0.05 | | | | | (g) | | | 0.27 | | | | (0.22 | ) | | | — | | | | — | | | | (0.22 | ) |
| Year Ended September 30, 2006 | | | | | 9.62 | | | | 0.43 | (a) | | | (0.13 | ) | | | | (g) | �� | | 0.30 | | | | (0.42 | ) | | | | | | | (0.02 | ) | | | (0.44 | ) |
| Year Ended September 30, 2005 | | | | | 9.77 | | | | 0.33 | | | | (0.06 | ) | | | | (g) | | | 0.27 | | | | (0.42 | ) | | | — | | | | — | | | | (0.42 | ) |
| Period Ended September 30, 2004 (e) | | | | | 9.65 | | | | 0.17 | | | | 0.13 | | | | | (g) | | | 0.30 | | | | (0.18 | ) | | | — | | | | — | | | | (0.18 | ) |
| Year Ended April 30, 2004 | | | | | 10.27 | | | | 0.37 | | | | (0.21 | ) | | | — | | | | 0.16 | | | | (0.44 | ) | | | (0.34 | ) | | | — | | | | (0.78 | ) |
| Year Ended April 30, 2003 | | | | | 9.84 | | | | 0.42 | | | | 0.48 | | | | — | | | | 0.90 | | | | (0.46 | ) | | | (0.01 | ) | | | — | | | | (0.47 | ) |
| Year Ended April 30, 2002 | | | | | 10.06 | | | | 0.54 | | | | (0.15 | ) | | | — | | | | 0.39 | | | | (0.55 | ) | | | (0.06 | ) | | | — | | | | (0.61 | ) |
| Class C |
| Six Months Ended March 31, 2007 (Unaudited) | | | | $ | 9.48 | | | | 0.17 | (a) | | | 0.04 | | | | | (g) | | | 0.21 | | | | (0.17 | ) | | | — | | | | — | | | | (0.17 | ) |
| Year Ended September 30, 2006 | | | | | 9.61 | | | | 0.35 | (a) | | | (0.12 | ) | | | | (g) | | | 0.23 | | | | (0.35 | ) | | | — | | | | (0.01 | ) | | | (0.36 | ) |
| Year Ended September 30, 2005 | | | | | 9.77 | | | | 0.32 | | | | (0.15 | ) | | | | (g) | | | 0.17 | | | | (0.33 | ) | | | — | | | | — | | | | (0.33 | ) |
| Period Ended September 30, 2004 (e) | | | | | 9.65 | | | | 0.13 | | | | 0.13 | | | | | (g) | | | 0.26 | | | | (0.14 | ) | | | — | | | | — | | | | (0.14 | ) |
| Period Ended April 30, 2004 (f) | | | | | 9.73 | | | | 0.01 | | | | (0.08 | ) | | | — | | | | (0.07 | ) | | | (0.01 | ) | | | — | | | | — | | | | (0.01 | ) |
| Class R |
| Six Months Ended March 31, 2007 (Unaudited) | | | | $ | 9.47 | | | | 0.19 | (a) | | | 0.06 | | | | | (g) | | | 0.25 | | | | (0.19 | ) | | | — | | | | — | | | | (0.19 | ) |
| Year Ended September 30, 2006 | | | | | 9.61 | | | | 0.39 | (a) | | | (0.13 | ) | | | | (g) | | | 0.26 | | | | (0.39 | ) | | | — | | | | (0.01 | ) | | | (0.40 | ) |
| Year Ended September 30, 2005 | | | | | 9.77 | | | | 0.35 | | | | (0.13 | ) | | | | (g) | | | 0.22 | | | | (0.38 | ) | | | | | | | | | | | (0.38 | ) |
| Period Ended September 30, 2004 (e) | | | | | 9.65 | | | | 0.16 | | | | 0.12 | | | | | (g) | | | 0.28 | | | | (0.16 | ) | | | — | | | | — | | | | (0.16 | ) |
| Period Ended April 30, 2004 (f) | | | | | 9.73 | | | | 0.01 | | | | (0.08 | ) | | | — | | | | (0.07 | ) | | | (0.01 | ) | | | — | | | | — | | | | (0.01 | ) |
| Class S |
| Six Months Ended March 31, 2007 (Unaudited) | | | | $ | 9.47 | | | | 0.22 | (a) | | | 0.05 | | | | | (g) | | | 0.27 | | | | (0.22 | ) | | | — | | | | — | | | | (0.22 | ) |
| Year Ended September 30, 2006 | | | | | 9.61 | | | | 0.43 | (a) | | | (0.13 | ) | | | | (g) | | | 0.30 | | | | (0.42 | ) | | | — | | | | (0.02 | ) | | | (0.44 | ) |
| Year Ended September 30, 2005 | | | | | 9.77 | | | | 0.41 | | | | (0.15 | ) | | | | (g) | | | 0.26 | | | | (0.42 | ) | | | — | | | | — | | | | (0.42 | ) |
| Period Ended September 30, 2004 (e) | | | | | 9.65 | | | | 0.17 | | | | 0.13 | | | | | (g) | | | 0.30 | | | | (0.18 | ) | | | — | | | | — | | | | (0.18 | ) |
| Period Ended April 30, 2004 (f) | | | | | 9.73 | | | | 0.01 | | | | (0.08 | ) | | | — | | | | (0.07 | ) | | | (0.01 | ) | | | — | | | | — | | | | (0.01 | ) |
[TABLE CONTINUES BELOW]
| | | | | | | | | Ratios/Supplemental Data |
|---|
| | | | | | | | | |
|
| | | Net Asset
Value,
End of
Period | | | Total
Return* | | | Net Assets,
End of Period
(000’s) | | | Ratio of Net
Expenses to
Average
Net Assets | | | Ratio of Net
Investment
Income
to Average
Net Assets | | | Ratio of
Expenses to
Average
Net Assets** | | | Portfolio
Turnover
Rate*** | |
|---|
| | |
| | |
| | |
| | |
| | |
| | |
| | |
| |
| Class A | | | | | | | | | | | | | | | | | | | | | | | | | | | | | | |
| Six Months Ended March 31, 2007 (Unaudited) | | | | $ | 9.52 | | | | 2.73% | (b) | | $ | 353 | | | | 0.93% | (c) | | | 4.35% | (c) | | | 1.98% | (c) | | | 26% | |
| Year Ended September 30, 2006 | | | | | 9.47 | | | | 3.04% | | | | 406 | | | | 0.93% | | | | 4.35% | | | | 1.89% | | | | 65% | |
| Year Ended September 30, 2005 | | | | | 9.61 | | | | 2.48% | | | | 1,188 | | | | 0.93% | | | | 4.02% | | | | 1.82% | | | | 116% | |
| Period Ended September 30, 2004 (e) | | | | | 9.77 | | | | 2.96% | (b) | | | 1,257 | | | | 0.93% | (c) | | | 4.07% | (c) | | | 1.64% | (c) | | | 13% | |
| Year Ended April 30, 2004 | | | | | 9.65 | | | | 1.39% | | | | 1,128 | | | | 1.42% | | | | 3.56% | | | | 1.68% | | | | 87% | |
| Year Ended April 30, 2003 | | | | | 10.27 | | | | 9.09% | | | | 501 | | | | 1.31% | | | | 4.03% | | | | 1.56% | | | | 79% | |
| Year Ended April 30, 2002 | | | | | 9.84 | | | | 3.67% | | | | 493 | | | | 1.22% | | | | 5.03% | | | | 1.47% | | | | 88% | |
| Class I |
| Six Months Ended March 31, 2007 (Unaudited) | | | | $ | 9.53 | | | | 2.86% | (b) | | $ | 487 | | | | 0.68% | (c) | | | 4.59% | (c) | | | 1.42% | (c) | | | 26% | |
| Year Ended September 30, 2006 | | | | | 9.48 | | | | 3.30% | | | | 1,091 | | | | 0.68% | | | | 4.57% | | | | 1.39% | | | | 65% | |
| Year Ended September 30, 2005 | | | | | 9.62 | | | | 2.84% | | | | 2,511 | | | | 0.68% | | | | 4.32% | | | | 1.28% | | | | 116% | |
| Period Ended September 30, 2004 (e) | | | | | 9.77 | | | | 3.18% | (b) | | | 18,990 | | | | 0.68% | (c) | | | 4.39% | (c) | | | 1.09% | (c) | | | 13% | |
| Year Ended April 30, 2004 | | | | | 9.65 | | | | 1.54% | | | | 30,990 | | | | 1.18% | | | | 3.83% | | | | | (d) | | | 87% | |
| Year Ended April 30, 2003 | | | | | 10.27 | | | | 9.33% | | | | 47,658 | | | | 1.06% | | | | 4.30% | | | | | (d) | | | 79% | |
| Year Ended April 30, 2002 | | | | | 9.84 | | | | 3.93% | | | | 64,912 | | | | 0.97% | | | | 5.34% | | | | | (d) | | | 88% | |
| Class C |
| Six Months Ended March 31, 2007 (Unaudited) | | | | $ | 9.52 | | | | 2.32% | (b) | | $ | 4 | | | | 1.74% | (c) | | | 3.56% | (c) | | | 2.60% | (c) | | | 26% | |
| Year Ended September 30, 2006 | | | | | 9.48 | | | | 2.30% | | | | 3 | | | | 1.62% | | | | 3.68% | | | | 2.31% | | | | 65% | |
| Year Ended September 30, 2005 | | | | | 9.61 | | | | 1.79% | | | | 3 | | | | 1.62% | | | | 3.33% | | | | 2.24% | | | | 116% | |
| Period Ended September 30, 2004 (e) | | | | | 9.77 | | | | 2.75% | (b) | | | 3 | | | | 1.68% | (c) | | | 3.33% | (c) | | | 2.09% | (c) | | | 13% | |
| Period Ended April 30, 2004 (f) | | | | | 9.65 | | | | (0.72% | )(b) | | | 3 | | | | 1.69% | (c) | | | 3.03% | (c) | | | | (d) | | | 87% | |
| Class R |
| Six Months Ended March 31, 2007 (Unaudited) | | | | $ | 9.53 | | | | 2.60% | (b) | | $ | 7 | | | | 1.19% | (c) | | | 4.10% | (c) | | | 2.08% | (c) | | | 26% | |
| Year Ended September 30, 2006 | | | | | 9.47 | | | | 2.87% | | | | 7 | | | | 1.19% | | | | 4.12% | | | | 1.96% | | | | 65% | |
| Year Ended September 30, 2005 | | | | | 9.61 | | | | 2.23% | | | | 9 | | | | 1.18% | | | | 3.77% | | | | 1.81% | | | | 116% | |
| Period Ended September 30, 2004 (e) | | | | | 9.77 | | | | 2.96% | (b) | | | 20 | | | | 1.16% | (c) | | | 2.92% | (c) | | | 1.73% | (c) | | | 13% | |
| Period Ended April 30, 2004 (f) | | | | | 9.65 | | | | (0.71% | )(b) | | | 3 | | | | 1.13% | (c) | | | 3.54% | (c) | | | | (d) | | | 87% | |
| Class S |
| Six Months Ended March 31, 2007 (Unaudited) | | | | $ | 9.52 | | | | 2.86% | (b) | | $ | 54,543 | | | | 0.68% | (c) | | | 4.61% | (c) | | | 1.49% | (c) | | | 26% | |
| Year Ended September 30, 2006 | | | | | 9.47 | | | | 3.27% | | | | 59,647 | | | | 0.68% | | | | 4.61% | | | | 1.39% | | | | 65% | |
| Year Ended September 30, 2005 | | | | | 9.61 | | | | 2.73% | | | | 73,246 | | | | 0.68% | | | | 4.28% | | | | 1.31% | | | | 116% | |
| Period Ended September 30, 2004 (e) | | | | | 9.77 | | | | 3.07% | (b) | | | 89,278 | | | | 0.68% | (c) | | | 4.34% | (c) | | | 1.13% | (c) | | | 13% | |
| Period Ended April 30, 2004 (f) | | | | | 9.65 | | | | (0.58% | )(b) | | | 97,237 | | | | 0.68% | (c) | | | 4.37% | (c) | | | | (d) | | | 87% | |
| ** | During the period, certain fees were contractually or voluntarily reduced. If such contractual/voluntary fee reductions had not occurred, the ratio would have been as indicated. |
| *** | Portfolio turnover rate is calculated on the basis of the fund as a whole without distinguishing between the classes of shares issued. |
| (a) | | Per share net investment income (loss) has been calculated | | (d) | | There were no waivers or reimbursements during the period. | |
| | | using the average daily shares method. | | (e) | | For the period from May 1, 2004 to September 30, 2004. | |
| (b) | | Not annualized. | | (f) | | For the period from April 19, 2004 (commencement of operations) to April 30, 2004. | |
| (c) | | Annualized. | | (g) | | Less than $0.01 or $(0.01) per share. | |
See notes to financial statements.
17
Table of Contents
FINANCIAL HIGHLIGHTS
Tamarack Tax-Free Income Fund
(Selected data for a share outstanding throughout the periods indicated)
| | | | | | Investment Activities | | | Distributions |
|---|
| | | | | |
| | |
|
|---|
| | | Net Asset
Value,
Beginning
of Period | | | Net
Investment
Income | | | Net Realized
and Unrealized
Gains (Losses)
on Investments | | | Redemption
Fees | | | Total from
Investment
Activities | | | Net
Investment
Income | | | Net
Realized
Gains | | | Total
Distributions | |
|---|
| | |
| | |
| | |
| | |
| | |
| | |
| | |
| | |
|
| Class A | | | | | | | | | | | | | | | | | | | | | | | | | | | | | | | | | | |
| Six Months Ended March 31, 2007 (Unaudited) | | | | $ | 8.78 | | | | 0.14 | | | | (0.04 | ) | | | | (f) | | | 0.10 | | | | (0.14 | ) | | | (0.26 | ) | | | (0.40 | ) | |
| Year Ended September 30, 2006 | | | | | 8.89 | | | | 0.30 | | | | (0.05 | ) | | | | (f) | | | 0.25 | | | | (0.30 | ) | | | (0.06 | ) | | | (0.36 | ) | |
| Year Ended September 30, 2005 | | | | | 9.31 | | | | 0.30 | | | | (0.18 | ) | | | | (f) | | | 0.12 | | | | (0.30 | ) | | | (0.24 | ) | | | (0.54 | ) | |
| Period Ended September 30, 2004 (c) | | | | | 9.05 | | | | 0.07 | | | | 0.26 | | | | | (f) | | | 0.33 | | | | (0.07 | ) | | | — | | | | (0.07 | ) | |
| Period Ended June 30, 2004 (d) | | | | | 9.25 | | | | 0.06 | | | | (0.20 | ) | | | — | | | | (0.14 | ) | | | (0.06 | ) | | | — | | | | (0.06 | ) | |
| Class C |
| Six Months Ended March 31, 2007 (Unaudited) | | | | $ | 8.77 | | | | 0.11 | | | | (0.03 | ) | | | | (f) | | | 0.08 | | | | (0.11 | ) | | | (0.26 | ) | | | (0.37 | ) | |
| Year Ended September 30, 2006 | | | | | 8.89 | | | | 0.24 | | | | (0.06 | ) | | | | (f) | | | 0.18 | | | | (0.24 | ) | | | (0.06 | ) | | | (0.30 | ) | |
| Year Ended September 30, 2005 | | | | | 9.31 | | | | 0.23 | | | | (0.18 | ) | | | | (f) | | | 0.05 | | | | (0.23 | ) | | | (0.24 | ) | | | (0.47 | ) | |
| Period Ended September 30, 2004 (c) | | | | | 9.05 | | | | 0.06 | | | | 0.26 | | | | | (f) | | | 0.32 | | | | (0.06 | ) | | | — | | | | (0.06 | ) | |
| Period Ended June 30, 2004 (d) | | | | | 9.25 | | | | 0.05 | | | | (0.20 | ) | | | — | | | | (0.15 | ) | | | (0.05 | ) | | | — | | | | (0.05 | ) | |
| Class R |
| Six Months Ended March 31, 2007 (Unaudited) | | | | $ | 8.78 | | | | 0.13 | | | | (0.04 | ) | | | | (f) | | | 0.09 | | | | (0.13 | ) | | | (0.26 | ) | | | (0.39 | ) | |
| Year Ended September 30, 2006 | | | | | 8.89 | | | | 0.28 | | | | (0.05 | ) | | | | (f) | | | 0.23 | | | | (0.28 | ) | | | (0.06 | ) | | | (0.34 | ) | |
| Year Ended September 30, 2005 | | | | | 9.31 | | | | 0.27 | | | | (0.18 | ) | | | | (f) | | | 0.09 | | | | (0.27 | ) | | | (0.24 | ) | | | (0.51 | ) | |
| Period Ended September 30, 2004 (c) | | | | | 9.05 | | | | 0.07 | | | | 0.26 | | | | | (f) | | | 0.33 | | | | (0.07 | ) | | | — | | | | (0.07 | ) | |
| Period Ended June 30, 2004 (d) | | | | | 9.25 | | | | 0.06 | | | | (0.20 | ) | | | — | | | | (0.14 | ) | | | (0.06 | ) | | | — | | | | (0.06 | ) | |
| Class S |
| Six Months Ended March 31, 2007 (Unaudited) | | | | $ | 8.78 | | | | 0.15 | | | | (0.04 | ) | | | | (f) | | | 0.11 | | | | (0.15 | ) | | | (0.26 | ) | | | (0.41 | ) | |
| Year Ended September 30, 2006 | | | | | 8.89 | | | | 0.33 | | | | (0.06 | ) | | | | (f) | | | 0.27 | | | | (0.32 | ) | | | (0.06 | ) | | | (0.38 | ) | |
| Year Ended September 30, 2005 | | | | | 9.31 | | | | 0.32 | | | | (0.18 | ) | | | | (f) | | | 0.14 | | | | (0.32 | ) | | | (0.24 | ) | | | (0.56 | ) | |
| Period Ended September 30, 2004 (c) | | | | | 9.05 | | | | 0.08 | | | | 0.26 | | | | | (f) | | | 0.34 | | | | (0.08 | ) | | | — | | | | (0.08 | ) | |
| Year Ended June 30, 2004 (e) | | | | | 9.57 | | | | 0.32 | | | | (0.40 | ) | | | — | | | | (0.08 | ) | | | (0.32 | ) | | | (0.12 | ) | | | (0.44 | ) | |
| Year Ended June 30, 2003 | | | | | 9.14 | | | | 0.35 | | | | 0.44 | | | | — | | | | 0.79 | | | | (0.35 | ) | | | (0.01 | ) | | | (0.36 | ) | |
| Year Ended June 30, 2002 | | | | | 8.96 | | | | 0.36 | | | | 0.18 | | | | — | | | | 0.54 | | | | (0.36 | ) | | | — | | | | (0.36 | ) | |
[TABLE CONTINUES BELOW]
| | | | | | | | | | Ratios/Supplemental Data |
|---|
| | | | | | | | |
|
| | | Net Asset
Value,
End of
Period | | | Total
Return* | | | Net Assets,
End of Period
(000’s) | | | Ratio of Net
Expenses to
Average
Net Assets | | | Ratio of Net
Investment
Income
to Average
Net Assets | | | Ratio of
Expenses to
Average
Net Assets** | | | Portfolio
Turnover
Rate*** | |
|---|
| | |
| | |
| | |
| | |
| | |
| | |
| | |
|
| Class A | | | | | | | | | | | | | | | | | | | | | | | | | | | | | | |
| Six Months Ended March 31, 2007 (Unaudited) | | | | $ | 8.48 | | | | 1.19% | | | $ | 75 | | | | 0.99% | (b) | | | 3.35% | (b) | | | 2.49% | (b) | | | 6% | |
| Year Ended September 30, 2006 | | | | | 8.78 | | | | 2.91% | | | | 71 | | | | 1.12% | | | | 3.48% | | | | 2.41% | | | | 45% | |
| Year Ended September 30, 2005 | | | | | 8.89 | | | | 1.27% | | | | 171 | | | | 1.24% | | | | 3.29% | | | | 2.31% | | | | 8% | |
| Period Ended September 30, 2004 (c) | | | | | 9.31 | | | | 3.71% | (a) | | | 166 | | | | 1.23% | (b) | | | 3.20% | (b) | | | 1.82% | (b) | | | 2% | |
| Period Ended June 30, 2004 (d) | | | | | 9.05 | | | | (1.50% | )(a) | | | 33 | | | | 1.24% | (b) | | | 3.39% | (b) | | | 3.00% | (b) | | | 17% | |
| Class C |
| Six Months Ended March 31, 2007 (Unaudited) | | | | $ | 8.48 | | | | 0.85% | | | $ | 3 | | | | 1.70% | (b) | | | 2.68% | (b) | | | 2.99% | (b) | | | 6% | |
| Year Ended September 30, 2006 | | | | | 8.77 | | | | 2.15% | | | | 3 | | | | 1.81% | | | | 2.74% | | | | 2.95% | | | | 45% | |
| Year Ended September 30, 2005 | | | | | 8.89 | | | | 0.54% | | | | 3 | | | | 1.96% | | | | 2.57% | | | | 2.67% | | | | 8% | |
| Period Ended September 30, 2004 (c) | | | | | 9.31 | | | | 3.53% | (a) | | | 3 | | | | 1.99% | (b) | | | 2.54% | (b) | | | 2.45% | (b) | | | 2% | |
| Period Ended June 30, 2004 (d) | | | | | 9.05 | | | | (1.65% | )(a) | | | 3 | | | | 1.98% | (b) | | | 2.59% | (b) | | | 3.16% | (b) | | | 17% | |
| Class R |
| Six Months Ended March 31, 2007 (Unaudited) | | | | $ | 8.48 | | | | 1.08% | | | $ | 3 | | | | 1.26% | (b) | | | 3.12% | (b) | | | 2.53% | (b) | | | 6% | |
| Year Ended September 30, 2006 | | | | | 8.78 | | | | 2.62% | | | | 3 | | | | 1.37% | | | | 3.20% | | | | 2.49% | | | | 45% | |
| Year Ended September 30, 2005 | | | | | 8.89 | | | | 1.01% | | | | 3 | | | | 1.52% | | | | 3.03% | | | | 2.23% | | | | 8% | |
| Period Ended September 30, 2004 (c) | | | | | 9.31 | | | | 3.66% | (a) | | | 3 | | | | 1.49% | (b) | | | 3.03% | (b) | | | 1.96% | (b) | | | 2% | |
| Period Ended June 30, 2004 (d) | | | | | 9.05 | | | | (1.55% | )(a) | | | 3 | | | | 1.48% | (b) | | | 3.09% | (b) | | | 2.65% | (b) | | | 17% | |
| Class S |
| Six Months Ended March 31, 2007 (Unaudited) | | | | $ | 8.48 | | | | 1.32% | | | $ | 18,988 | | | | 0.74% | (b) | | | 3.61% | (b) | | | 1.97% | (b) | | | 6% | |
| Year Ended September 30, 2006 | | | | | 8.78 | | | | 3.17% | | | | 20,262 | | | | 0.83% | | | | 3.74% | | | | 1.95% | | | | 45% | |
| Year Ended September 30, 2005 | | | | | 8.89 | | | | 1.52% | | | | 23,924 | | | | 0.99% | | | | 3.54% | | | | 1.81% | | | | 8% | |
| Period Ended September 30, 2004 (c) | | | | | 9.31 | | | | 3.78% | (a) | | | 27,329 | | | | 0.99% | (b) | | | 3.48% | (b) | | | 1.43% | (b) | | | 2% | |
| Year Ended June 30, 2004 (e) | | | | | 9.05 | | | | (0.87% | ) | | | 28,186 | | | | 0.99% | | | | 3.47% | | | | 1.35% | | | | 17% | |
| Year Ended June 30, 2003 | | | | | 9.57 | | | | 8.82% | | | | 39,045 | | | | 0.99% | | | | 3.73% | | | | 1.04% | | | | 15% | |
| Year Ended June 30, 2002 | | | | | 9.14 | | | | 6.12% | | | | 36,435 | | | | 0.99% | | | | 3.96% | | | | | (g) | | | 12% | |
| ** | During the period, certain fees were contractually or voluntarily reduced. If such contractual/voluntary fee reductions had not occurred, the ratio would have been as indicated. |
| *** | Portfolio turnover rate is calculated on the basis of the fund as a whole without distinguishing between the classes of shares issued. |
| (a) | | Not annualized. | | (e) | | The existing class of shares was designated Class S shares as of April 19, 2004. |
| (b) | | Annualized. | | (f) | | Less than $0.01 or $(0.01) per share. |
| (c) | | For the period from July 1, 2004 to September 30, 2004. | | (g) | | There were no waivers or reimbursements during the period. |
| (d) | | For the period from April 19, 2004 (commencement of operations) to June 30, 2004. |
See notes to financial statements.
18
Table of Contents
NOTES TO FINANCIAL STATEMENTS
March 31, 2007 (Unaudited)
1. Organization
Tamarack Funds Trust (“Tamarack”) is registered under the Investment Company Act of 1940 (as amended) as an open-end management investment company. Tamarack was organized as a Delaware statutory trust on December 16, 2003. Predecessor funds to Tamarack were reorganized as portfolios of Tamarack effective April 16, 2004. This semi-annual report includes the following two investment portfolios (“Funds”):
- Tamarack Quality Fixed Income Fund (“Quality Fixed Income Fund”)
- Tamarack Tax-Free Income Fund (“Tax-Free Income Fund”)
The Quality Fixed Income Fund offers five share classes: Class A, Class C, Class R, Class I, and Class S shares. The Tax-Free Income Fund offers four share classes: Class A, Class C, Class R and Class S shares. Class A shares are offered with a 3.75% maximum front-end sales charge and a 1.00% contingent deferred sales charge (“CDSC”) for redemption within 12 months of a $1 million or greater purchase on which no front-end sales charge was paid. Class C shares are offered at net asset value (i.e. no front-end sales charge), but are subject to a CDSC of 1.00% for redemptions within 12 months of purchase. Class R shares (available to certain 401(k) and other employer-sponsored retirement plans), Class I shares (intended for investors meeting certain investment minimum thresholds) and Class S shares are not subject to either a front-end sales charge or a CDSC.
Voyageur Asset Management Inc. (“Voyageur”) acts as the investment advisor for Tamarack. The officers of Tamarack (“Fund Management”) are also employees of Voyageur or its affiliates.
2. Significant Accounting Policies
Summarized below are the significant accounting policies of the Funds. These policies conform to accounting principles generally accepted in the United States of America (“GAAP”). Fund management follows these policies when preparing financial statements. Management may also be required to make estimates and assumptions that affect the reported amounts of assets and liabilities at the date of the financial statements and the reported amounts of income and expenses for the period. Actual results could differ from those estimates.
New Accounting Standard:
In September 2006, the Financial Accounting Standards Board (FASB) issued Statement on Financial Accounting Standards (SFAS) No. 157, “Fair Value Measurements.” This standard establishes a single authoritative definition of fair value, sets out a framework for measuring fair value and requires additional disclosures about fair value measurements. SFAS No. 157 applies to fair value measurements already required or permitted by existing standards. SFAS No. 157 is effective for financial statements issued for fiscal years beginning after November 15, 2007 and interim periods within those fiscal years. The changes to current generally accepted accounting principles from the application of this Statement relate to the definition of fair value, the methods used to measure fair value, and the expanded disclosures about fair value measurements. The Funds do not believe the adoption of SFAS No. 157 will impact the financial statement amounts; however, additional disclosures may be required about the inputs used to develop the measurements and the effect of certain of the measurements on changes in net assets for the period.
19
Table of Contents
NOTES TO FINANCIAL STATEMENTS
Security Valuation:
Bonds and other fixed income securities are generally valued on the basis of prices furnished by pricing services approved by Tamarack’s Board of Trustees (the “Board”). The pricing services utilize both dealer-supplied valuations and electronic data processing techniques that take into account appropriate factors such as institutional-size trading in similar groups of securities, yield, quality, coupon rate, maturity, type of issue and trading characteristics other than market data and without exclusive reliance upon quoted prices of exchanges or over-the-counter prices, since these valuations are believed to reflect more accurately the fair value of such securities. Short-term debt obligations with less than 60 days to maturity at time of purchase are valued at amortized cost, which approximates value, unless Fund Management determines that amortized cost no longer approximates market value due to credit or other impairments of the issuer. In such cases where a security price is unavailable, or where Fund Management determines that the value provided by the pricing services or amortized cost does not approximate fair value, from a pricing service, the Board has approved pricing and valuation procedures to determine a security’s fair value. Investments in open-end investment companies are valued at net asset value. Exchange traded financial futures are valued at the settlement price as established by the exchange on which they are traded.
Investment Transactions and Income:
Investment transactions are recorded one business day after trade date, except for on the last day of each fiscal quarter end, when they are recorded on trade date. Dividend income is recorded on the ex-dividend date. Realized gains and losses from investment transactions are calculated based on the costs of the specific security (also known as identified cost basis). Interest income is recognized on the accrual basis and includes, where applicable, the amortization and accretion of premium or discount using the effective yield method. Paydown gains and losses on mortgage- and asset-backed securities are included in the financial statements as interest income. Interest income on U.S. Treasury inflation indexed securities is accrued daily based upon the inflation adjusted principal. Additionally, any increase in the principal or face amount of the securities adjusted for inflation is recorded as interest income.
Expense, Investment Income and Gain/Loss Allocation:
Each Fund pays the expenses that are directly related to its operations, such as custodian fees or portfolio management fees. Expenses incurred by Tamarack, such as trustee or legal fees, are allocated among each of the Funds either proportionately based upon each Fund’s relative net assets or using another reasonable basis such as equally across all Funds, depending on the nature of the expense. Individual share classes within a Fund are charged expenses specific to that class, such as distribution fees. Within a Fund, expenses other than class specific expenses are allocated daily to each class based upon the proportion of relative net assets. Investment income and realized and unrealized gains or losses are allocated to each class of shares based upon the proportion of relative net assets.
Financial Instruments:
The Funds may engage in when-issued transactions. A Fund would record when-issued securities on the trade date and maintain sufficient liquidity so that cash will be available to make payment for the securities purchased. Securities purchased on a when-issued basis are valued daily beginning on the trade date and begin accruing interest on the
20
NOTES TO FINANCIAL STATEMENTS
settlement date. When-issued securities are identified in the Schedule of Portfolio Investments.
The Funds may enter into futures contracts in an effort to manage the duration of the portfolio or to hedge against market risk. A futures contract on a securities index is an agreement obligating one party to pay, and entitling the other party to receive, during the term of the contract, cash payments based on the level of a specified securities index. Futures transactions involve brokerage costs and require a Fund to segregate assets to cover contracts that would require it to purchase securities or currencies. A Fund may lose the expected benefit of futures transactions if interest rates, exchange rates or securities prices change in an unanticipated manner. Such unanticipated changes may also result in lower overall performance than if a Fund had not entered into any futures transactions.
Upon entering into a futures contract, a Fund is required to pledge to the broker an amount of cash, U.S. government securities, or other assets, equal to a certain percentage of the contract amount. Subsequent payments are made or received by the Fund each day, depending on the daily fluctuations in the fair value of the underlying index. A Fund would recognize an unrealized gain or loss each day equal to these daily payments.
The Tamarack Quality Fixed Income Fund had the following open futures contracts at March 31, 2007:
| Type | | | Number
of Contracts | | | Expiration
Date | | | Unrealized
Depreciation | | | Notional
Value | |
|---|
| | |
| | |
| | |
| | |
| |
| U.S. Treasury Long Bond | | | | | 30 | | | | June 2007 | | | $ | (5,072 | ) | | $ | 3,337,500 | |
Distributions to Shareholders:
Each Fund pays out any income that it receives, less expenses, in the form of dividends and capital gains to its shareholders. Income dividends are declared daily and paid monthly. Dividends will also be paid at any time during the month upon total redemption of shares in an account. Capital gain distributions are declared and paid at least annually. Distributions to shareholders are recorded on the ex-dividend date. The amount of dividends and distributions are calculated based on federal income tax regulations, which may differ from GAAP. These “book/tax” differences may be either temporary or permanent in nature. To the extent these differences are determined, as of the end of the tax year, to be permanent (e.g. net operating loss, expiring capital loss carryforward and foreign currency transactions), they are reclassified within a Fund’s capital accounts based on their federal tax basis treatment. Such differences are not reflected in the calculation of the Financial Highlights.
Securities Lending:
The Funds may lend their portfolio securities to brokers, dealers and financial institutions, provided: (1) the loan is secured continuously by collateral consisting of U.S. Government securities, cash or letters of credit maintained on a daily mark-to-market basis in an amount at least equal to 100% of the current market value of the securities loaned; (2) the Funds may at any time call the loan and obtain the return of the securities loaned within five business days; (3) the Funds will receive any interest or dividends paid on the loaned securities; and (4) the aggregate market value of securities loaned will not at any time exceed 331/3% of the total assets of a particular Fund.
21
Table of Contents
NOTES TO FINANCIAL STATEMENTS
The Funds will earn income for lending their securities from fees paid by borrowers and from the investment of cash collateral. The Funds will then pay the lending agent (Wells Fargo Bank) a percentage of the lending income. Securities lending income is presented net of such payments to the lending agent in the financial statements. Loans of securities involve a risk that the borrower may fail to return the securities or may fail to provide additional collateral. In the event that a borrower fails to return the lent security, the lending agent will indemnify the Funds based on the difference in value between the closing market value of the security on the date it should have been returned and the value of the cash collateral. The Funds assume all risk of loss from a decline in the value of the collateral investment and any resulting collateral deficiencies. In an effort to reduce these risks, Voyageur and Wells Fargo Bank will monitor the creditworthiness of the borrowers to which the Funds lend securities.
The following summarizes the value of securities that were on loan and the value of the cash held as collateral for these loans as of March 31, 2007. No securities or letters of credit were held by the Fund as collateral as of March 31, 2007.
| | | Value of
Securities Loaned | | | Value of
Collateral | |
|---|
| | |
| | |
| |
| Quality Fixed Income Fund | | | | $ | 1,672,184 | | | $ | 1,712,611 | |
See page 39, Notes to Schedules of Portfolio Investments for a detailed breakdown of the investments purchased with the collateral received.
Credit Enhancement:
Certain obligations held in the portfolio have credit enhancement or liquidity features that may, under certain circumstances, provide for repayment of principal and interest on the obligation upon demand date, interest rate reset date or final maturity. These enhancements may include: letters of credit; liquidity guarantees; security purchase agreements; tender option purchase agreements; and third party insurance (i.e. AMBAC, FGIC and MBIA).
3. Agreements and Other Transactions with Affiliates
Tamarack has entered into investment advisory agreements with Voyageur under which Voyageur manages each Fund’s assets and furnishes related office facilities, equipment, research and personnel. The agreements require each Fund to pay Voyageur a monthly fee based upon average daily net assets. Under the terms of the advisory contracts, Voyageur is entitled to receive fees based on a percentage of the average daily net assets of each of the Funds as follows:
| | | Annual Rate | |
|---|
| | |
| |
| Quality Fixed Income Fund | | | | | 0.60 | % |
| Tax-Free Income Fund | | | | | 0.85 | % |
Effective January 29, 2007, Voyageur has contractually agreed to waive fees and/or to make payments in order to keep total operating expenses of the Class S and Class I shares of Quality Fixed Income Fund and Tax-Free Income Fund to 0.68% and 0.74%, respectively. Class A, C and R shares vary from these limits only by the addition of class-specific 12b-1 fees. These expense limitation agreements are in place until January 31, 2008. Voyageur may also voluntarily waive and/or reimburse operating expenses of any Fund from time to time. Any such voluntary program may be changed or eliminated at any time without notice. The prior expense limitation agreement for Tax-Free Income
22
Table of Contents
NOTES TO FINANCIAL STATEMENTS
Fund was superseded by a new expense limitation agreement effective on January 29, 2007.
Voyageur serves as administrator to the Funds and BISYS Fund Services Ohio, Inc. (“BISYS”) serves as sub-administrator. Services provided under the administrative services contract includes providing day-to-day administration of matters related to the Funds, maintenance of their records and the preparation of reports. Under terms of the administrative services contract, Voyageur receives from each Fund a fee, payable monthly, at the annual rate of 0.10% of the Funds’ average daily net assets. For its services as sub-administrator, BISYS receives a fee payable by Voyageur out of Voyageur’s own resources.
Certain Officers and Trustees of the Funds are affiliated with the adviser or the administrator. Such Officers and Trustees receive no compensation from the Funds for serving in their respective roles.
4. Fund Distribution
Each of the Funds has adopted a Master Distribution 12b-1 Plan (the “Plan”) in which Tamarack Distributors Inc. (the “Distributor”) acts as the Funds’ distributor. The Distributor is an affiliate of Voyageur. The Plan permits each Fund to make payments for, or to reimburse the Distributor monthly for, distribution-related costs and expenses of marketing shares of each share class covered under the Plan, and/or for providing shareholder services. The following chart shows the current Plan fee rate for each class.
| | | Class A | | | Class C | | | Class R | |
|---|
| | |
| | |
| | |
| |
| 12b-1 Plan Fee | | | | | 0.25 | %* | | | 1.00 | % | | | 0.50 | % |
Plan fees are based on average annual daily net assets of the applicable class. The Distributor, subject to applicable legal requirements, may waive a Plan fee voluntarily, in whole or in part.
*The maximum Plan fee rate for Class A shares is 0.50%. The Distributor is contractually waiving 0.25% of the total 0.50% Plan fee for Class A through January 31, 2008.
For the period ended March 31, 2007, the Distributor received commissions of $152 from front-end sales charges of Class A shares of the Funds, of which $30 was paid to affiliated broker-dealers. The Distributor received no CDSC fees from the Funds during the period ended March 31, 2007.
5. Securities Transactions
The cost of securities purchased and proceeds from securities sold (excluding securities maturing less than one year from acquisition) for the period ended March 31, 2007 were as follows:
| | | Purchases
(Excl. U.S. Govt.) | | | Sales
(Excl. U.S. Govt.) | | | Purchases
of U.S. Govt. | | | Sales of
U.S. Govt. | |
|---|
| | |
| | |
| | |
| | |
| |
| Quality Fixed Income Fund | | | | $ | 8,555,494 | | | $ | 7,373,095 | | | $ | 6,254,248 | | | $ | 12,881,988 | |
| Tax Free Income Fund | | | | | 1,044,737 | | | | 2,156,823 | | | | — | | | | — | |
6. Capital Share Transactions
Tamarack is authorized to issue an unlimited number of shares of beneficial interest (“shares outstanding”) without par value. Transactions in shares of the Funds are summarized on the following pages:
23
Table of Contents
NOTES TO FINANCIAL STATEMENTS
Tamarack Quality Fixed Income Fund
| | | For the
Six Months Ended
March 31,
2007 | | | For the
Year Ended
September 30,
2006 | |
|---|
| | |
| | |
| |
| | | (Unaudited) | | | | |
|---|
| CAPITAL TRANSACTIONS: | | | | | | | | | | |
| Class A | | | | | | | | | | |
| Proceeds from shares issued | | | | $ | 67,012 | | | $ | 148,244 | |
| Dividends reinvested | | | | | 6,505 | | | | 40,049 | |
| Cost of shares redeemed | | | | | (128,088 | ) | | | (940,497 | ) |
| | |
| | |
| |
| Change in Class A | | | | $ | (54,571 | ) | | $ | (752,204 | ) |
| | |
| | |
| |
| Class I | | | | | | | | | | |
| Proceeds from shares issued | | | | $ | — | | | $ | 631 | |
| Dividends reinvested | | | | | 13,335 | | | | 45,915 | |
| Cost of shares redeemed | | | | | (625,031 | ) | | | (1,431,549 | ) |
| | |
| | |
| |
| Change in Class I | | | | $ | (611,696 | ) | | $ | (1,385,003 | ) |
| | |
| | |
| |
| Class C | | | | | | | | | | |
| Proceeds from shares issued | | | | $ | — | | | $ | — | |
| Dividends reinvested | | | | | 62 | | | | 137 | |
| Cost of shares redeemed | | | | | — | | | | — | |
| | |
| | |
| |
| Change in Class C | | | | $ | 62 | | | $ | 137 | |
| | |
| | |
| |
| Class R | | | | | | | | | | |
| Proceeds from shares issued | | | | $ | — | | | $ | 238 | |
| Dividends reinvested | | | | | 148 | | | | 335 | |
| Cost of shares redeemed | | | | | — | | | | (2,083 | ) |
| | |
| | |
| |
| Change in Class R | | | | $ | 148 | | | $ | (1,510 | ) |
| | |
| | |
| |
| Class S | | | | | | | | | | |
| Proceeds from shares issued | | | | $ | 212,519 | | | $ | 1,011,639 | |
| Dividends reinvested | | | | | 1,110,111 | | | | 2,867,639 | |
| Cost of shares redeemed | | | | | (6,737,459 | ) | | | (16,379,820 | ) |
| | |
| | |
| |
| Change in Class S | | | | $ | (5,414,829 | ) | | $ | (12,500,542 | ) |
| | |
| | |
| |
| Change in net assets resulting from capital transactions | | | | $ | (6,080,886 | ) | | $ | (14,639,122 | ) |
| | |
| | |
| |
| SHARE TRANSACTIONS: | | | | | | | | | | |
| Class A | | | | | | | | | | |
| Issued | | | | | 7,048 | | | | 15,718 | |
| Reinvested | | | | | 684 | | | | 4,245 | |
| Redeemed | | | | | (13,490 | ) | | | (100,744 | ) |
| | |
| | |
| |
| Change in Class A | | | | | (5,758 | ) | | | (80,781 | ) |
| | |
| | |
| |
| Class I | | | | | | | | | | |
| Issued | | | | | — | | | | 65 | |
| Reinvested | | | | | 1,402 | | | | 4,852 | |
| Redeemed | | | | | (65,373 | ) | | | (150,958 | ) |
| | |
| | |
| |
| Change in Class I | | | | | (63,971 | ) | | | (146,041 | ) |
| | |
| | |
| |
| Class C | | | | | | | | | | |
| Issued | | | | | — | | | | — | |
| Reinvested | | | | | 7 | | | | 14 | |
| Redeemed | | | | | — | | | | — | |
| | |
| | |
| |
| Change in Class C | | | | | 7 | | | | 14 | |
| | |
| | |
| |
| Class R | | | | | | | | | | |
| Issued | | | | | — | | | | 25 | |
| Reinvested | | | | | 15 | | | | 36 | |
| Redeemed | | | | | — | | | | (219 | ) |
| | |
| | |
| |
| Change in Class R | | | | | 15 | | | | (158 | ) |
| | |
| | |
| |
| Class S | | | | | | | | | | |
| Issued | | | | | 22,354 | | | | 107,042 | |
| Reinvested | | | | | 116,740 | | | | 303,879 | |
| Redeemed | | | | | (707,631 | ) | | | (1,736,406 | ) |
| | |
| | |
| |
| Change in Class S | | | | | (568,537 | ) | | | (1,325,485 | ) |
| | |
| | |
| |
| Change in shares resulting from capital transactions | | | | | (638,244 | ) | | | (1,552,451 | ) |
| | |
| | |
| |
24
Table of Contents
NOTES TO FINANCIAL STATEMENTS
Tamarack Tax-Free Income Fund
| | | For the
Six Months Ended
March 31,
2007 | | | For the
Year Ended
September 30,
2006 | |
|---|
| | |
| | |
| |
| | | (Unaudited) | | | | |
|---|
| CAPITAL TRANSACTIONS: | | | | | | | | | | |
| Class A | | | | | | | | | | |
| Proceeds from shares issued | | | | $ | 4,813 | | | $ | — | |
| Dividends reinvested | | | | | 3,261 | | | | 3,077 | |
| Cost of shares redeemed | | | | | (1,188 | ) | | | (101,052 | ) |
| | |
| | |
| |
| Change in Class A | | | | $ | 6,886 | | | $ | (97,975 | ) |
| | |
| | |
| |
| Class C | | | | | | | | | | |
| Proceeds from shares issued | | | | $ | — | | | $ | — | |
| Dividends reinvested | | | | | 146 | | | | 119 | |
| Cost of shares redeemed | | | | | — | | | | — | |
| | |
| | |
| |
| Change in Class C | | | | $ | 146 | | | $ | 119 | |
| | |
| | |
| |
| Class R | | | | | | | | | | |
| Proceeds from shares issued | | | | $ | — | | | $ | — | |
| Dividends reinvested | | | | | 156 | | | | 137 | |
| Cost of shares redeemed | | | | | — | | | | — | |
| | |
| | |
| |
| Change in Class R | | | | $ | 156 | | | $ | 137 | |
| | |
| | |
| |
| Class S | | | | | | | | | | |
| Proceeds from shares issued | | | | $ | 115,076 | | | $ | 578,362 | |
| Dividends reinvested | | | | | 682,906 | | | | 704,416 | |
| Cost of shares redeemed | | | | | (1,393,217 | ) | | | (4,621,392 | ) |
| | |
| | |
| |
| Change in Class S | | | | $ | (595,235 | ) | | $ | (3,338,614 | ) |
| | |
| | |
| |
| Change in net assets resulting from capital transactions | | | | $ | (588,047 | ) | | $ | (3,436,333 | ) |
| | |
| | |
| |
| SHARE TRANSACTIONS: | | | | | | | | | | |
| Class A | | | | | | | | | | |
| Issued | | | | | 567 | | | | — | |
| Reinvested | | | | | 380 | | | | 352 | |
| Redeemed | | | | | (137 | ) | | | (11,507 | ) |
| | |
| | |
| |
| Change in Class A | | | | | 810 | | | | (11,155 | ) |
| | |
| | |
| |
| Class C | | | | | | | | | | |
| Issued | | | | | — | | | | — | |
| Reinvested | | | | | 17 | | | | 14 | |
| Redeemed | | | | | — | | | | — | |
| | |
| | |
| |
| Change in Class C | | | | | 17 | | | | 14 | |
| | |
| | |
| |
| Class R | | | | | | | | | | |
| Issued | | | | | — | | | | — | |
| Reinvested | | | | | 19 | | | | 15 | |
| Redeemed | | | | | — | | | | — | |
| | |
| | |
| |
| Change in Class R | | | | | 19 | | | | 15 | |
| | |
| | |
| |
| Class S | | | | | | | | | | |
| Issued | | | | | 13,310 | | | | 65,917 | |
| Reinvested | | | | | 79,926 | | | | 80,540 | |
| Redeemed | | | | | (162,503 | ) | | | (528,427 | ) |
| | |
| | |
| |
| Change in Class S | | | | | (69,267 | ) | | | (381,970 | ) |
| | |
| | |
| |
| Change in shares resulting from capital transactions | | | | | (68,421 | ) | | | (393,096 | ) |
| | |
| | |
| |
7. Federal Income Taxes
It is the policy of each Fund to continue to qualify as a regulated investment company by complying with the provisions applicable to certain investment companies, as defined under Subchapter M of the Internal Revenue Code, and to distribute substantially all of its net investment income and net realized capital gains. Therefore, no federal tax liability is recorded in the financial statements of each Fund.
In June 2006, the Financial Accounting Standards Board (FASB) released FASB Interpretation No. 48 “Accounting for Uncertainty in Income Taxes” (FIN 48). FIN 48
25
Table of Contents
NOTES TO FINANCIAL STATEMENTS
provides guidance for how uncertain tax positions should be recognized, measured, presented and disclosed in the financial statements. FIN 48 requires the evaluation of tax positions taken or expected to be taken in the course of preparing each Fund’s tax return to determine whether the tax positions are “more-likely-than-not” to be sustained by the applicable tax authority. Tax positions not deemed to meet the more-likely-than-not threshold would be recorded as a tax benefit or expense in the current year. Adoption of FIN 48 is required no later than the last business day of the first financial statement reporting period for fiscal years beginning after December 15, 2006 and is to be applied to all open tax years as of the effective date. Management has not completed its analysis on whether the adoption of FIN 48 will have an impact to the financial statements.
The tax cost of securities differ from financial reporting cost by the amount of losses recognized for financial reporting purposes in excess of those allowed to be recognized for federal income tax purposes. As of March 31, 2007, the tax cost of securities and the breakdown of unrealized appreciation (depreciation) for each Fund were as follows:
| | | Tax Cost
of Securities | | | Unrealized
Appreciation | | | Unrealized
Depreciation | | | Net Unrealized
Appreciation
(Depreciation) | |
|---|
| | |
| | |
| | |
| | |
| |
| Quality Fixed Income Fund | | | | $ | 57,993,839 | | | $ | 345,442 | | | $ | (546,373 | ) | | $ | (200,931 | ) |
| Tax-Free Income Fund | | | | | 18,390,764 | | | | 476,701 | | | | (2,359 | ) | | | 474,342 | |
The tax character of distributions as of the latest fiscal year ended September 30, 2006 were as follows:
| | | Distribution Paid From | | | | | | | | | | | |
|---|
| | |
| | | | | | | | | | | |
| | | Ordinary
Income | | | Net
Long-Term
Capital Gains | | | Total
Taxable
Distributions | | | Return
of Capital | | | Tax Exempt
Distributions | | | Total
Distributions
Paid* | |
|---|
| | |
| | |
| | |
| | |
| | |
| | |
| |
| Quality Fixed Income Fund | | | | $ | 3,339,851 | | | $ | — | | | $ | 3,339,851 | | | $ | 98,227 | | | $ | — | | | $ | 3,438,078 | |
| Tax-Free Income Fund | | | | | 35,911 | | | | 146,532 | | | | 182,443 | | | | — | | | | 835,188 | | | | 1,017,631 | |
*Total Distributions Paid may differ from the Statements of Changes in Net Assets because distributions are recognized when actually paid for tax purposes.
As of September 30, 2006 the components of accumulated earnings/(deficits) on a tax basis was as follows:
| | | Undistributed
Tax
Exempt
Income | | | Undistributed
Long-Term
Capital
Gains | | | Accumulated
Earnings | | | Distributions
Payable | | | Accumulated
Capital and
Other
Losses | | | Unrealized
Appreciation/
Depreciation | | | Total
Accumulated
Earnings/
(Deficits) | |
|---|
| | |
| | |
| | |
| | |
| | |
| | |
| | |
| |
| Quality Fixed Income Fund | | | | $ | — | | | $ | — | | | $ | — | | | $ | (34,181 | ) | | $ | (3,272,475 | ) | | $ | (626,745 | ) | | $ | (3,933,401 | ) |
| Tax-Free Income Fund | | | | | 19,715 | | | | 563,909 | | | | 583,624 | | | | (19,704 | ) | | | — | | | | 654,667 | | | | 1,218,587 | |
As of September 30, 2006, the following additional information is available regarding capital losses:
26
Table of Contents
NOTES TO FINANCIAL STATEMENTS
The following Funds had net capital loss carryforwards to offset future net capital gains, if any:
| | | Capital Loss
Carryforward | | | Expires | |
|---|
| | |
| | |
| |
| Quality Fixed Income Fund | | | | $ | 672,204 | | | | 2012 | |
| | | | | 70,674 | | | | 2014 | |
As of September 30, 2006, the following Fund had net capital loss carryforwards as successor to a merger and subject to certain limitations on utilization. To the extent that these carryforwards are utilized, it is probable that the realized gains that are offset will not be required to be distributed to shareholders.
| | | Capital Loss
Carryforward | | | Expires | |
|---|
| | |
| | |
| |
| Quality Fixed Income Fund | | | | $ | 1,604 | | | | 2009 | |
| | | | | 702,251 | | | | 2010 | |
| | | | | 1,229,732 | | | | 2011 | |
Under current tax law, capital losses realized after October 31 of a Fund’s fiscal year may be deferred and treated as occurring on the first business day of the following fiscal year for tax purposes. The following Fund had deferred post October capital losses, which will be treated as arising on the first business day of the fiscal year ending September 30, 2007:
| | | Deferred Post-October
Capital Losses | |
|---|
| | |
| |
| Quality Fixed Income Fund | | | | $ | 596,010 | |
8. Market Timing
Tamarack strongly discourages attempts at market timing by Fund shareholders. Each Fund charges a redemption fee of 2% of the value of the shares redeemed or exchanged within 30 days of purchase, in addition to limiting the number of exchanges that may be made between Funds to five (5) per calendar year. When assessed, the redemption fee is deducted from the redemption proceeds and retained by the Fund, not by Voyageur. This redemption fee is not charged in cases where, for example, the redemption results from an automatic reinvestment or asset re-allocation not specifically directed by the shareholder. Tamarack also reserves the right to reject any Fund purchase order made by persons deemed to be market timers. The Funds’ prospectus contains a full description of Tamarack’s policies on market timing and/or excessive trading. During the period ended March 31, 2007 the redemption fees collected by each Fund were as follows:
| | | Amounts | |
|---|
| | |
| |
| Quality Fixed Income Fund | | | | $ | 6 | |
27
Table of Contents
SCHEDULE OF PORTFOLIO INVESTMENTS
Tamarack Quality Fixed Income Fund
March 31, 2007 (Unaudited)
Shares or
Principal
Amount | | | | Value | |
|---|
|
| Municipal Bonds – 4.86% |
| Arizona – 0.36% |
| $100,000 | | Tucson Certificate of Participation, 4.30%, 7/1/10 (Credit Support: MBIA) | | $ | 97,514 | |
| 105,000 | | Tucson Certificate of Participation, 4.55%, 7/1/11 (Credit Support: MBIA) | | | 102,463 | |
| | | |
|
| | | | | 199,977 | |
| | | |
|
| California – 1.44% |
| 370,000 | | Alameda County Pension Obligation, Series B, 4.60%, 12/1/09 (Credit Support: MBIA) (f) | | | 323,891 | |
| 355,000 | | Los Angeles Community Redevelopment Agency, 5.90%, 9/1/35 (Credit Support: RADIAN) | | | 343,590 | |
| 135,000 | | San Diego Metro Transportation Development Board, 3.86%, 12/1/09 (Credit Support: MBIA) | | | 131,468 | |
| | | |
|
| | | | | 798,949 | |
| | | |
|
| Illinois – 0.74% |
| 425,000 | | Bensenville Taxable-Debt Series E, 4.65%, 12/1/11 | | | 407,941 | |
| | | |
|
| Indiana – 0.37% |
| 210,000 | | State Bond Bank Revenue, 5.26%, 7/15/18 (FGIC Insured) | | | 207,173 | |
| | | |
|
| Nebraska – 0.94% |
| 200,000 | | Saunders County School District No. 072, 6.15%, 12/15/16 | | | 200,828 | |
| 320,000 | | Saunders County School District No. 107, 6.15%, 12/15/16 | | | 321,325 | |
| | | |
|
| | | | | 522,153 | |
| | | |
|
| New Jersey – 0.33% |
| 180,000 | | New Jersey Economic Development Authority Revenue, Series B, 5.18%, 11/1/15 | | | 180,272 | |
| | | |
|
| Texas – 0.68% |
| 390,000 | | San Antonio Convention Center Hotel Finance Corp. Contract Revenue, 5.10%, 7/15/20 (Credit Support: AMBAC) | | | 376,884 | |
| | | |
|
Total Municipal Bonds
(Cost $2,730,174) | | | 2,693,349 | |
| |
| |
| Asset Backed Securities – 0.13% |
| Banking & Financial Services – 0.13% |
| 49,401 | | Countrywide Home Equity Loan Trust, Series 2004-G, Class 2A, 5.54%, 12/15/29 (b) | | | 49,469 | |
| 4,377 | | New Century Home Equity Loan Trust, Series 1997-NC5, Class A6, 6.70%, 10/25/28 (b) | | | 4,358 | |
| 20,177 | | Vanderbilt Mortgage Finance, Series 2002-C, Class A2, 4.23%, 2/7/15 | | | 20,156 | |
| | | |
|
Total Asset Backed Securities
(Cost $73,870) | | | 73,983 | |
| |
| |
| Collateralized Mortgage Obligations – 25.47% |
| Banking & Financial Services — 25.47% |
| 673,673 | | Banc of America Funding Corp., Series 2004-F, Class 2A7, 4.15%, 7/25/34 (b) | | | 660,723 | |
| 158,741 | | Banc of America Funding Corp., Series 2005-D, Class B1, 4.11%, 5/25/35 (b) | | | 157,087 | |
| 550,127 | | Banc of America Funding Corp., Series 2006-A, Class 2A1, 5.43%, 2/25/36 (b) | | | 551,915 | |
| 723,511 | | Bank of America Funding Corp., Series 2006-R2, Class A1, 6.06%, 7/30/46 (b)(d) | | | 729,898 | |
| 296,171 | | Bank of America Mortgage Securities, Series 2003-J, Class B2b, 4.56%, 11/25/33 (b) | | | 288,674 | |
| 269,802 | | Bank of America Mortgage Securities, Series 2004-D, Class B1b, 3.96%, 5/25/34 (b) | | | 263,593 | |
| 540,157 | | Bear Stearns Adjustable Rate Mortgage Trust, Series 2003-9, Class 3A2, 4.97%, 2/25/34 (b) | | | 538,669 | |
28
Table of Contents
SCHEDULE OF PORTFOLIO INVESTMENTS
Tamarack Quality Fixed Income Fund (cont.)
Shares or
Principal
Amount | | | | Value | |
|---|
|
| $89,774 | | Citigroup Mortgage Loan Trust, Inc., Series 2005-3, Class 2A2A, 4.70%, 6/25/35 | | $ | 88,883 | |
| 1,363,651 | | Countrywide Alternative Loan Trust, Series 2004-12CB, Class 1A1, 5.00%, 7/25/19 | | | 1,344,430 | |
| 884,000 | | Countrywide Alternative Loan Trust, Series 2005-4, Class 1A5, 4.97%, 7/25/35 (b) | | | 867,898 | |
| 480,434 | | Countrywide Alternative Loan Trust, Series 2005-73CB, Class 1A1, 5.50%, 1/25/36 | | | 482,516 | |
| 338,261 | | Countrywide Alternative Loan Trust, Series 2006-9T1, Class A7, 6.00%, 5/25/36 | | | 341,503 | |
| 388,821 | | Countrywide Home Loans, Series 2003-21, Class B2, 4.71%, 5/25/33 (b) | | | 381,263 | |
| 161,430 | | CS First Boston Mortgage Securities Corp., Series 2004-7, Class 5A1, 5.00%, 10/25/19 | | | 160,076 | |
| 474,552 | | First Horizon Mortgage Pass-Through Trust, Series 2004-AR1, Class B2, 5.15%, 2/25/34 (b) | | | 468,509 | |
| 606,243 | | GSR Mortgage Loan Trust, Series 2005-AR7, Class 2A1, 4.56%, 11/25/35 (b) | | | 601,354 | |
| 480,000 | | Homebanc Mortgage Trust, Series 2006-1, Class 3A2, 5.91%, 4/25/37 (b) | | | 488,185 | |
| 256,696 | | JP Morgan Mortgage Trust, Series 2004-A4, Class 2A2, 4.61%, 9/25/34 (b) | | | 252,210 | |
| 243,464 | | JP Morgan Mortgage Trust, Series 2004-S1, Class 1A7, 5.00%, 8/25/19 | | | 238,824 | |
| 440,290 | | Merrill Lynch Mortgage Investors Trust, Series 2005-A5, Class M1, 4.88%, 6/25/35 (b) | | | 431,299 | |
| 958,185 | | Merrill Lynch Mortgage Investors Trust, Inc., Series 2005-A1, Class 2A1, 4.54%, 12/25/34 (b) | | | 952,151 | |
| 2,762 | | Morgan Stanley Mortgage Loan Trust, Series 2004-2AR, Class 1A, 7.48%, 2/25/34 (b) | | | 2,790 | |
| 427,589 | | Residential Funding Mortgage Securities, Inc., Series 2004-S5, Class 2A1, 4.50%, 5/25/19 | | | 418,328 | |
| 169,300 | | Sequoia Mortgage Trust, Series 2003-4, Class 1B2, 6.64%, 7/20/33 (b) | | | 169,353 | |
| 425,000 | | Sequoia Mortgage Trust, Series 2003-4, Class 2B4, 6.56%, 7/20/33 (b) | | | 417,563 | |
| 60,723 | | Structured Asset Securities Corp., Series 2002-11A, Class 2A1, 5.60%, 6/25/32 | | | 60,501 | |
| 457,460 | | Structured Asset Securities Corp., Series 2003-30, Class 1A1, 5.50%, 10/25/33 | | | 449,097 | |
| 172,942 | | Vendee Mortgage Trust, Series 1992-1, Class 2Z, 7.75%, 5/15/22 | | | 182,793 | |
| 853,471 | | Washington Mutual, Inc., Series 2003-S11, Class 1A, 5.00%, 11/25/33 | | | 824,589 | |
| 585,794 | | Washington Mutual, Inc., Series 2005-8, Class 1A8, 5.50%, 10/25/35 | | | 586,284 | |
| 264,242 | | Washington Mutual, Series 2004-AR7, Class B1, 3.94%, 7/25/34 (b) | | | 257,200 | |
| 346,339 | | Wells Fargo Mortgage Backed Securities Trust, Series 2004-P, Class B1, 4.25%, 9/25/34 (b) | | | 339,372 | |
| 124,564 | | Wells Fargo Mortgage Backed Securities Trust, Series 2006-20, Class B4, 5.50%, 12/25/21 | | | 111,635 | |
| | | |
|
Total Collateralized Mortgage Obligations
(Cost $14,124,068) | | | 14,109,165 | |
| |
| |
| Commercial Mortgage-Backed Securities – 4.89% |
| Banking & Financial Services — 4.89% |
29
Table of Contents
SCHEDULE OF PORTFOLIO INVESTMENTS
Tamarack Quality Fixed Income Fund (cont.)
Shares or
Principal
Amount | | | | Value | |
|---|
|
| $419,923 | | ABN AMRO Mortgage Corp., Series 2003-12, Class 1A, 5.00%, 12/25/33 | | $ | 406,574 | |
| 360,000 | | Flagstar Home Equity Loan Trust, 5.77%, 1/25/35 (d) | | | 359,993 | |
| 782,783 | | JP Morgan Commercial Mortgage Finance Corp., Series 1999-C7, Class A2, 6.51%, 10/15/35 | | | 792,168 | |
| 500,000 | | LB-UBS Commercial Mortgage Trust, Series 2004-C2, Class A4, 4.37%, 3/1/36 | | | 474,170 | |
| 702,024 | | Master Asset Securitization Trust, Series 2003-12, Class 6A1, 5.00%, 12/25/33 | | | 677,939 | |
| | | |
|
Total Commercial Mortgage-Backed Securities
(Cost $2,758,259) | | | 2,710,844 | |
| |
| |
| Corporate Bonds – 32.49% |
| Agriculture – 0.30% |
| 170,000 | | Bunge Limited Finance Co., 4.38%, 12/15/08 | | | 167,279 | |
| | | |
|
| Apparel – 0.12% |
| 65,000 | | Hanes Brands, Inc., 8.74%, 12/15/14 (b)(c)(d) | | | 66,219 | |
| | | |
|
| Auto Parts & Equipment – 0.24% |
| 128,000 | | Titan International, Inc., 8.00%, 1/15/12 (d) | | | 131,680 | |
| | | |
|
| Banks – 5.00% |
| 213,000 | | Barclays Bank PLC, 6.28%, 12/29/49, Perpetual Call 12/15/34 @ 100 | | | 214,027 | |
| 164,000 | | Chase Capital II, Series B, 5.86%, 2/1/27, Callable 6/18/07 @ 100.00 (b) | | | 160,224 | |
| 136,000 | | Chase Capital III, Series C, 5.91%, 3/1/27 (b) | | | 133,027 | |
| 179,000 | | Frist National Bank, 6.88%, 8/1/11 | | | 190,178 | |
| 382,000 | | NB Capital Trust III, 5.91%, 1/15/27 (b) | | | 372,394 | |
| 430,000 | | North Fork Bancorp., 5.00%, 8/15/12 | | | 429,456 | |
| 212,000 | | Popular North America, Inc., MTN, 5.65%, 4/15/09 | | | 213,285 | |
| 435,000 | | Rabobank Capital II, 5.26%, 12/29/49 (d) | | | 423,233 | |
| 268,000 | | RBS Capital Trust III, 5.51%, 9/29/49, Perpetual Call 9/30/14 @ 100 (b) | | | 263,681 | |
| 374,000 | | Wachovia Capital Trust II, 5.86%, 1/15/27 (b) | | | 363,296 | |
| | | |
|
| | | | | 2,762,801 | |
| | | |
|
| Beverages – 0.42% |
| 229,000 | | Diageo Finance, 5.50%, 4/1/13 | | | 230,499 | |
| | | |
|
| Building Materials – 0.20% |
| 110,000 | | Texas Industries, Inc., 7.25%, 7/15/13 | | | 113,300 | |
| | | |
|
| Chemicals – 1.88% |
| 280,000 | | Equistar Chemical LP, 10.13%, 9/1/08 | | | 294,700 | |
| 300,000 | | MacDermid, Inc., 9.13%, 7/15/11 | | | 314,439 | |
| 86,000 | | Methanex Corp., 8.75%, 8/15/12 | | | 95,460 | |
| 160,000 | | Mosaic Co., 7.63%, 12/1/16 (d) | | | 168,800 | |
| 155,000 | | Potash Corp., 7.75%, 5/31/11 | | | 169,169 | |
| | | |
|
| | | | | 1,042,568 | |
| | | |
|
| Coal – 0.20% |
| 114,000 | | Arch Western Finance, 6.75%, 7/1/13 | | | 112,148 | |
| | | |
|
| Commercial Services – 0.36% |
| 128,000 | | Corrections Corporation of America, 6.25%, 3/15/13 | | | 128,000 | |
| 72,000 | | Service Corp. International, 6.75%, 4/1/15 (d) | | | 71,910 | |
| | | |
|
| | | | | 199,910 | |
| | | |
|
| Distribution/Wholesale – 0.33% |
| 183,000 | | Owens & Minor Inc., 6.35%, 4/15/16 | | | 184,494 | |
| Diversified Financial Services – 3.92% |
30
Table of Contents
SCHEDULE OF PORTFOLIO INVESTMENTS
Tamarack Quality Fixed Income Fund (cont.)
Shares or
Principal
Amount | | | | Value | |
|---|
|
| $138,000 | | American General Finance, MTN, 4.88%, 7/15/12 | | $ | 135,655 | |
| 299,000 | | Bear Stearns Co., Inc., 5.59%, 1/31/11 (b) | | | 299,352 | |
| 475,000 | | Fort Knox Military Housing, 5.66%, 2/15/52, Callable 5/14/07 @ 100.00 (b)(d) | | | 467,363 | |
| 300,000 | | Jefferies Group, Inc., 7.50%, 8/15/07 | | | 301,418 | |
| 295,000 | | Morgan Stanley, 5.66%, 1/9/14 (b) | | | 294,648 | |
| 199,000 | | One America Financial Partners, 7.00%, 10/15/33 (d) | | | 205,849 | |
| 206,500 | | Pemex Finance Ltd., 9.69%, 8/15/09 | | | 217,715 | |
| 250,000 | | Preferred Term Securities XXV, Inc., 0.03%, 6/22/37 (d) | | | 247,500 | |
| | | |
|
| | | | | 2,169,500 | |
| | | |
|
| Electric – 1.25% |
| 242,000 | | Energy East Corp., 6.75%, 7/15/36 | | | 255,738 | |
| 129,000 | | Nevada Power Co., Series A, 8.25%, 6/1/11 | | | 141,851 | |
| 132,000 | | New York State Gas & Electric, 4.38%, 11/15/07 | | | 131,134 | |
| 158,000 | | Public Services Co. of Oklahoma, 6.15%, 8/1/16 | | | 162,153 | |
| | | |
|
| | | | | 690,876 | |
| | | |
|
| Electrical Components & Equipment – 0.30% |
| 166,000 | | Ametek, Inc., 7.20%, 7/15/08 | | | 168,807 | |
| | | |
|
| Electronics – 0.41% |
| 244,000 | | Thermo Electron Corp., 5.00%, 6/1/15 | | | 229,169 | |
| | | |
|
| Engineering & Construction – 0.26% |
| 135,000 | | Dycom Industries, Inc., 8.13%, 10/15/15 | | | 141,750 | |
| | | |
|
| Food – 0.36% |
| 198,000 | | Dean Foods Co., 6.63%, 5/15/09 | | | 200,475 | |
| | | |
|
| Healthcare – Products — 0.27% |
| 146,000 | | Baxter International, 5.90%, 9/1/16 | | | 150,669 | |
| | | |
|
| Healthcare – Services – 0.31% |
| 176,000 | | Laboratory Corp. of America, 5.50%, 2/1/13 | | | 172,386 | |
| | | |
|
| Home Builders – 0.66% |
| 116,000 | | KB Home, 5.75%, 2/1/14 | | | 103,696 | |
| 260,000 | | Lennar Corp., 6.10%, 3/19/09 (b) | | | 260,209 | |
| | | |
|
| | | | | 363,905 | |
| | | |
|
| Insurance – 4.14% |
| 226,000 | | American International Group, 6.25%, 3/15/37 | | | 219,970 | |
| 300,000 | | Americo Life, Inc., 7.88%, 5/1/13 (d) | | | 308,361 | |
| 195,000 | | Arch Capital Group Ltd., 7.35%, 5/1/34 | | | 211,475 | |
| 375,000 | | ING Capital Funding Trust III, 8.44%, 12/31/49 | | | 414,015 | |
| 133,000 | | Metlife Inc., 6.40%, 12/15/36, Callable 12/15/31 @ 100.00 | | | 129,860 | |
| 247,000 | | Navigators Group, Inc., 7.00%, 5/1/16 | | | 255,350 | |
| 255,000 | | NLV Financial Corp., 7.50%, 8/15/33 (d) | | | 281,836 | |
| 225,000 | | Selective Insurance Group, 6.70%, 11/1/35 | | | 222,165 | |
| 250,000 | | Unitrin, Inc., 4.88%, 11/1/10 | | | 245,837 | |
| | | |
|
| | | | | 2,288,869 | |
| | | |
|
| Iron/Steel – 0.87% |
| 300,000 | | Steel Dynamics, Inc., 9.50%, 3/15/09 | | | 306,750 | |
| 60,000 | | Steel Dynamics, Inc., 6.75%, 4/1/15, Callable 4/1/11 @ 103.38 (d) | | | 60,075 | |
| 110,000 | | United States Steel Corp., 9.75%, 5/15/10 | | | 115,500 | |
| | | |
|
| | | | | 482,325 | |
| | | |
|
| Leisure Time – 0.23% |
| 116,000 | | Royal Caribbean Cruises, 8.75%, 2/2/11 | | | 127,019 | |
| | | |
|
| Lodging – 0.21% |
| 109,000 | | Starwood Hotels and Resorts, 7.88%, 5/1/12 | | | 117,137 | |
| | | |
|
| Machinery – Diversified — 1.33% |
31
Table of Contents
SCHEDULE OF PORTFOLIO INVESTMENTS
Tamarack Quality Fixed Income Fund (cont.)
Shares or
Principal
Amount | | | | Value | |
|---|
|
| $122,000 | | Baldor Electric Co., 8.63%, 2/15/17, Callable 2/15/12 @ 104.3125 | | $ | 129,015 | |
| 228,000 | | IDEX Corp., 6.88%, 2/15/08 | | | 230,554 | |
| 190,000 | | Joy Global Inc., 6.00%, 11/15/16 | | | 191,363 | |
| 187,000 | | Westinghouse Air Brake Technologies Corp., 6.88%, 7/31/13 | | | 187,000 | |
| | | |
|
| | | | | 737,932 | |
| | | |
|
| Media – 1.73% |
| 128,000 | | Echostar DBS Corp., 5.75%, 10/1/08 | | | 128,160 | |
| 255,000 | | News America Holdings, Inc., 7.70%, 10/30/25 | | | 290,381 | |
| 129,000 | | Rogers Cable, Inc., 7.88%, 5/1/12 | | | 140,288 | |
| 242,000 | | TCI Communications, Inc., 9.80%, 2/1/12 | | | 286,505 | |
| 92,000 | | Time Warner Cos., Inc., 9.15%, 2/1/23 | | | 114,590 | |
| | | |
|
| | | | | 959,924 | |
| | | |
|
| Office Furnishings – 0.37% |
| 198,000 | | Steelcase, Inc., 6.50%, 8/15/11 | | | 203,335 | |
| | | |
|
| Oil & Gas – 1.20% |
| 139,000 | | Anadarko Petroleum Corp., 5.00%, 10/1/12 | | | 135,359 | |
| 113,000 | | Berry Petroleum Co., 8.25%, 11/1/16 | | | 112,435 | |
| 106,000 | | Chesapeake Energy Corp., 7.50%, 9/15/13 | | | 110,770 | |
| 207,000 | | Forest Oil Corp., 8.00%, 6/15/08 | | | 211,398 | |
| 95,000 | | Plains Exploration, Inc., 7.00%, 3/15/17, Callable 3/15/12 @ 103.50 | | | 95,475 | |
| | | |
|
| | | | | 665,437 | |
| | | |
|
| Pharmaceuticals – 0.42% |
| 143,000 | | Mylan Laboratories, Inc., 5.75%, 8/15/10 | | | 142,285 | |
| 92,000 | | NBTY, Inc., 7.13%, 10/1/15 | | | 92,575 | |
| | | |
|
| | | | | 234,860 | |
| | | |
|
| Pipelines – 1.34% |
| 100,000 | | Atlas Pipeline Partners, 8.13%, 12/15/15 | | | 103,000 | |
| 198,000 | | Boardwalk Pipeline LP, 5.88%, 11/15/16 | | | 198,347 | |
| 46,000 | | Duke Capital Corp., 7.50%, 10/1/09 | | | 48,397 | |
| 131,000 | | Kinder Morgan Energy Partners, 6.50%, 2/1/37 | | | 130,641 | |
| 248,000 | | Texas East Transmission Corp., 7.30%, 12/1/10 | | | 263,568 | |
| | | |
|
| | | | | 743,953 | |
| | | |
|
| Real Estate Investment Trusts – 2.64% |
| 205,000 | | CPG Partners LP, 3.50%, 3/15/09 | | | 198,668 | |
| 126,000 | | Duke Realty LP, 5.63%, 8/15/11 | | | 127,461 | |
| 192,000 | | Federal Realty Investment Trust, 8.75%, 12/1/09 | | | 208,954 | |
| 50,000 | | Federal Realty Investment Trust, 5.40%, 12/1/13 | | | 49,801 | |
| 134,000 | | Healthcare Realty Trust, 8.13%, 5/1/11 | | | 145,961 | |
| 250,000 | | Kimco Realty Corp., MTN, 7.86%, 11/1/07 | | | 253,015 | |
| 216,000 | | Liberty Property LP, 5.50%, 12/15/16 | | | 214,496 | |
| 259,000 | | Realty Income Corp., 5.95%, 9/15/16 | | | 265,761 | |
| | | |
|
| | | | | 1,464,117 | |
| | | |
|
| Retail – 0.73% |
| 97,000 | | Dollar General Corp., 8.63%, 6/15/10 | | | 103,184 | |
| 302,000 | | Home Depot, Inc., 5.25%, 12/16/13 | | | 299,910 | |
| | | |
|
| | | | | 403,094 | |
| | | |
|
| Software – 0.25% |
| 138,000 | | Fiserv, Inc., 4.00%, 4/15/08 | | | 135,857 | |
| | | |
|
| Transportation – 0.24% |
| 125,000 | | Navios Maritime Holdings, 9.50%, 12/15/14 (d) | | | 130,156 | |
| | | |
|
Total Corporate Bonds
(Cost $17,956,508) | | | 17,992,450 | |
| |
| |
| U.S. Government Agency Backed Mortgages – 23.38% |
| Federal National Mortgage Association – 6.26% |
| 1,050,000 | | Pool # 45041, 6.00%, 4/15/37 | | | 1,057,547 | |
32
Table of Contents
SCHEDULE OF PORTFOLIO INVESTMENTS
Tamarack Quality Fixed Income Fund (cont.)
Shares or
Principal
Amount | | | | Value | |
|---|
|
| $ 248 | | Pool # 529175, 7.00%, 2/1/30 | | $ | 258 | |
| 685,629 | | Pool # 841068, 4.19%, 11/1/34 (b) | | | 678,927 | |
| 625,206 | | Pool #885632, 6.50%, 9/1/36 | | | 637,789 | |
| 271,563 | | Series 2002-W11, Class AF5, 4.98%, 11/25/32 (b) | | | 269,082 | |
| 445,000 | | Series 2003-T1, Class B, 4.49%, 11/25/12 | | | 433,197 | |
| 405,000 | | Series 2005-W2, Class A8, 5.41%, 5/25/35 | | | 392,898 | |
| | | |
|
| | | | | 3,469,698 | |
| | | |
|
| Federal Home Loan Mortgage Corporation – 11.44% |
| 3,339 | | Pool # 051686, 8.00%, 2/1/09 | | | 3,365 | |
| 305 | | Pool # 072923, 8.25%, 1/1/09 | | | 307 | |
| 9,609 | | Pool # 124425, 9.25%, 10/1/20 | | | 10,351 | |
| 14,410 | | Pool # 170170, 9.00%, 6/1/16 | | | 15,378 | |
| 365,718 | | Pool # 1B0899, 3.93%, 6/1/33 (b) | | | 364,516 | |
| 593,091 | | Pool # 1B2721, 4.38%, 1/1/35 (b) | | | 587,160 | |
| 865,766 | | Pool # 254764, 5.50%, 6/1/23 | | | 863,342 | |
| 9,413 | | Pool # 306588, 8.00%, 10/1/18 | | | 9,831 | |
| 38,001 | | Pool # 380828, 6.42%, 11/1/08 (b) | | | 38,333 | |
| 401 | | Pool # 519217, 7.00%, 2/1/30 | | | 419 | |
| 25,263 | | Pool # 626582, 5.50%, 3/1/17 | | | 25,388 | |
| 136,718 | | Pool # 635169, 5.00%, 8/1/17 | | | 135,249 | |
| 47,778 | | Pool # 644943, 5.50%, 5/1/17 | | | 48,014 | |
| 339,124 | | Pool # 707578, 5.00%, 4/1/33 | | | 328,509 | |
| 454,515 | | Pool # 731252, 5.00%, 8/1/33 | | | 440,289 | |
| 411,249 | | Pool # 740447, 4.50%, 9/1/18 | | | 399,271 | |
| 461,714 | | Pool # 810896, 4.84%, 1/1/35 (b) | | | 460,563 | |
| 50,229 | | Pool # C00921, 7.50%, 2/1/30 | | | 52,541 | |
| 1,322 | | Pool # D09479, 9.00%, 10/1/18 | | | 1,351 | |
| 20,145 | | Pool # G10625, 8.00%, 1/1/12 | | | 20,904 | |
| 474,345 | | Pool # G11771, 6.00%, 6/1/20 | | | 482,966 | |
| 639,422 | | Pool # J03251, 6.00%, 8/1/21 | | | 650,064 | |
| 9,525 | | Series 1988-16, Class B, 9.50%, 6/25/18 | | | 10,288 | |
| 770,000 | | Series 1997-M9, 6.52%, 7/25/16 | | | 811,625 | |
| 505,000 | | Series 2004-32, Class AY, 4.00%, 5/25/19 | | | 456,659 | |
| 117,091 | | Series 2178, Class PB, 7.00%, 8/15/29 | | | 120,308 | |
| | | |
|
| | | | | 6,336,991 | |
| | | |
|
| Government National Mortgage Association – 5.68% |
| 44,205 | | Pool # 003132, 6.00%, 9/20/31 | | | 44,857 | |
| 111,423 | | Pool # 003296, 6.00%, 10/20/32 | | | 113,017 | |
| 278 | | Pool # 015750, 7.50%, 7/15/07 | | | 279 | |
| 3,462 | | Pool # 019081, 8.00%, 10/15/07 | | | 3,481 | |
| 932 | | Pool # 152589, 9.50%, 4/15/16 | | | 1,011 | |
| 16,835 | | Pool # 269020, 9.50%, 1/15/19 | | | 18,409 | |
| 1,103 | | Pool # 275465, 9.50%, 9/15/19 | | | 1,206 | |
| 10,262 | | Pool # 342206, 6.50%, 12/15/23 | | | 10,547 | |
| 7,068 | | Pool # 361064, 6.50%, 8/15/23 | | | 7,264 | |
| 7,018 | | Pool # 363767, 6.50%, 11/15/23 | | | 7,213 | |
| 32,756 | | Pool # 376510, 7.00%, 5/15/24 | | | 34,246 | |
| 284,448 | | Pool # 380866, 7.00%, 3/15/24 | | | 297,385 | |
| 19,982 | | Pool # 398964, 7.50%, 11/15/11 | | | 20,561 | |
| 3,146 | | Pool # 433258, 7.50%, 10/15/11 | | | 3,237 | |
| 15,208 | | Pool # 433263, 7.50%, 10/15/11 | | | 15,649 | |
| 14,511 | | Pool # 441009, 8.00%, 11/15/26 | | | 15,402 | |
| 271,744 | | Pool # 442164, 8.00%, 12/15/26 | | | 288,435 | |
| 209,980 | | Pool # 481547, 6.00%, 1/15/33 | | | 213,270 | |
33
Table of Contents
SCHEDULE OF PORTFOLIO INVESTMENTS
Tamarack Quality Fixed Income Fund (cont.)
Shares or
Principal
Amount | | | | Value | |
|---|
|
| $ 3,485 | | Pool # 485682, 6.50%, 8/15/31 | | $ | 3,586 | |
| 2,011 | | Pool # 549180, 6.00%, 5/15/31 | | | 2,043 | |
| 49,019 | | Pool # 552381, 6.00%, 2/15/32 | | | 49,781 | |
| 36,837 | | Pool # 558945, 6.00%, 4/15/33 | | | 37,398 | |
| 8,541 | | Pool # 565982, 7.00%, 7/15/32 | | | 8,934 | |
| 4,278 | | Pool # 568184, 6.50%, 11/15/31 | | | 4,402 | |
| 66,797 | | Pool # 578345, 6.00%, 8/15/32 | | | 67,837 | |
| 39,503 | | Pool # 584369, 7.00%, 4/15/32 | | | 41,318 | |
| 102,677 | | Pool # 584486, 6.00%, 6/15/32 | | | 104,275 | |
| 21,929 | | Pool # 591571, 7.50%, 7/15/32 | | | 22,868 | |
| 10,319 | | Pool # 591581, 7.00%, 8/15/32 | | | 10,793 | |
| 157,032 | | Pool # 592154, 5.00%, 8/15/33 | | | 153,052 | |
| 198,989 | | Pool # 597857, 5.00%, 8/15/33 | | | 193,945 | |
| 57,768 | | Pool # 598131, 6.00%, 3/15/33 | | | 58,647 | |
| 163,011 | | Pool # 780332, 8.00%, 11/15/09 | | | 166,591 | |
| 185,032 | | Pool # 781124, 7.00%, 12/15/29 | | | 193,569 | |
| 151,776 | | Series 2001-58, Class B, 5.14%, 6/16/23 (b) | | | 152,030 | |
| 490,000 | | Series 2004-12, Class C, 5.15%, 12/16/40 | | | 478,818 | |
| 305,000 | | Series 2004-25, Class BA, 4.93%, 11/16/44 | | | 301,390 | |
| | | |
|
| | | | | 3,146,746 | |
| | | |
|
Total U.S. Government Agency
Backed Mortgages
(Cost $13,030,652) | | | 12,953,435 | |
| |
| |
U.S. Government Agency
Obligations – 6.31% |
| New Valley Generation IV – 0.16% |
| 91,747 | | Pool # 182177, 4.69%, 1/15/22 | | | 90,044 | |
| | | |
|
| Small Business Administration – 6.15% |
| 2,465 | | Series 1988-20G, Class 1, 9.80%, 7/1/08 | | | 2,509 | |
| 781 | | Series 1988-20H, Class 1, 10.05%, 8/1/08 | | | 798 | |
| 1,915 | | Series 1989-20D, Class 1, 10.05%, 4/1/09 | | | 1,963 | |
| 576,546 | | Series 2004-10B, Class 1, 4.68%, 9/10/14 | | | 563,071 | |
| 280,411 | | Series 2004-20K, Class 1, 4.88%, 11/1/24 | | | 276,495 | |
| 607,021 | | Series 2005-10A, Class 1, 5.04%, 3/10/15 | | | 600,501 | |
| 276,415 | | Series 2005-20A, Class 1, 4.86%, 1/1/25 | | | 271,981 | |
| 592,016 | | Series 2005-20D, Class 1, 5.11%, 4/1/25 | | | 590,702 | |
| 572,241 | | Series 2005-20G, Class 1, 4.75%, 7/1/25 | | | 558,247 | |
| 554,218 | | Series 2005-P10A, Class 1, 4.64%, 2/10/15 | | | 539,513 | |
| | | |
|
| | | | | 3,405,780 | |
| | | |
|
Total U.S. Government Agency Obligations
(Cost $3,555,776) | | | 3,495,824 | |
| |
| |
| U.S. Treasury Bonds – 0.33% |
| 174,000 | | 5.38%, 2/15/31 (c) | | | 185,500 | |
| | | |
|
Total U.S. Treasury Bonds
(Cost $187,946) | | | 185,500 | |
| |
| |
| U.S. Treasury Inflation Protection Bonds – 2.56% |
| 1,390,000 | | 2.38%, 1/15/17 (c)(e) | | | 1,415,840 | |
| | | |
|
Total U.S. Treasury Inflation
Protection Bonds
(Cost $1,404,763) | | | 1,415,840 | |
| |
| |
| Investment Companies – 0.75% |
| 415,782 | | Wells Fargo Prime Investment Money Market Fund | | | 415,782 | |
| | | |
|
Total Investment Companies
(Cost $415,782) | | | 415,782 | |
| |
| |
Investment of Cash Collateral for Securities
on Loan – 3.10% |
| 1,712,611 | | Various Securities (see Notes to Schedules of Portfolio Investments for collateral information) | | | 1,712,611 | |
| | | |
|
Total Investment of Cash Collateral
for Securities on Loan
(Cost $1,712,611) | | | 1,712,611 | |
| |
| |
34
Table of Contents
SCHEDULE OF PORTFOLIO INVESTMENTS
Tamarack Quality Fixed Income Fund (cont.)
Shares or
Principal
Amount | | | | Value | |
|---|
|
Total Investments
(Cost $57,950,409) (a) – 104.27% | | $ | 57,758,783 | |
| Liabilities in excess of other assets – (4.27)% | | | (2,364,094 | ) |
| |
| |
| NET ASSETS – 100.00% | | $ | 55,394,689 | |
| |
| |
(a) See notes to financial statements for the tax cost of securities and the breakdown of unrealized appreciation (depreciation).
(b) Variable rate security. The rate reflected in the Schedule of Portfolio Investments is the rate in effect on March 31, 2007. The maturity date represents the actual maturity date.
(c) All or part of this security has been loaned as of March 31, 2007.
(d) Security exempt from registration under Rule 144A of the Securities Act of 1933, as amended. These securities may be resold in transactions exempt from registration, normally to qualified institutional buyers. Security has been deemed to be liquid based on procedures approved by the Board of Trustees.
(e) TIPS Security – par has not been adjusted for inflation.
(f) Rate represents the effective yield at purchase.
Abbreviations used are defined below:
MTN – Medium Term Note
AMBAC – Ambac Assurance Corporation
FGIC – Financial Guaranty Insurance Corporation
MBIA – MBIA Insurance Corporation
RADIAN – RADIAN Group, Inc.
See notes to financial statements.
35
Table of Contents
SCHEDULE OF PORTFOLIO INVESTMENTS
Tamarack Tax-Free Income Fund
March 31, 2007 (Unaudited)
Shares or
Principal
Amount | | | | Value | |
|---|
|
| Municipal Bonds – 96.95% |
| California – 2.92% |
| $500,000 | | Santa Rosa Waste Water Revenue, Series B, 6.00%, 9/1/15, (FGIC Insured) | | $ | 557,765 | |
| | | |
|
| Colorado – 3.35% |
| 500,000 | | Arkansas River Power Authority Power Revenue, 5.00%, 10/1/14, (XLCA Insured) (b) | | | 538,460 | |
| 100,000 | | Denver West Metropolitan District Colorado, Series B, 5.70%, 12/1/17, Callable 12/1/07 @ 100 | | | 100,639 | |
| | | |
|
| | | | | 639,099 | |
| | | |
|
| Florida – 4.54% |
| 500,000 | | Miami-Dade County Special Obligation, 5.91%, 10/1/15, (MBIA Insured), Callable 4/1/08 @ 69.48 (c) | | | 333,410 | |
| 500,000 | | State Board of Education, Series J, 5.00%, 6/1/19, Callable 6/1/13 @ 101 | | | 532,640 | |
| | | |
|
| | | | | 866,050 | |
| | | |
|
| Illinois – 7.83% |
| 500,000 | | Chicago, Series B, 5.13%, 1/1/22, (AMBAC Insured) | | | 558,605 | |
| 500,000 | | Cook County Township High School District, 5.50%, 12/1/19 | | | 573,360 | |
| 350,000 | | State Financial Authority Revenue (Chicago Charter School Foundation), 5.00%, 12/1/21 | | | 361,900 | |
| | | |
|
| | | | | 1,493,865 | |
| | | |
|
| Indiana – 19.19% |
| 380,000 | | Anderson Indiana Economic Development Revenue (Anderson University), 5.00%, 10/1/19 | | | 391,145 | |
| 500,000 | | Anderson School Building Corp., 5.00%, 7/15/17, (FSA Insured) (b) | | | 545,299 | |
| 180,000 | | Boone County Indiana Redevelopment, Series B, 4.80%, 8/1/17, Callable 2/1/16 @ 100 (b) | | | 182,837 | |
| 135,000 | | Boone County Indiana Redevelopment, Series B, 4.85%, 2/1/18, Callable 2/1/16 @ 100 (b) | | | 137,221 | |
| 500,000 | | Hamilton County Optional Income Tax Revenue, 4.25%, 7/10/08, Callable 1/23/08 @ 100 (b) | | | 500,200 | |
| 450,000 | | Indiana Bond Bank Revenue, Series A, 5.00%, 8/1/16, (FSA Insured) (b) | | | 489,465 | |
| 500,000 | | IPS Multi-School Building Corp., 4.00%, 1/15/13, (FSA Insured) (b) | | | 505,640 | |
| 100,000 | | Munster Municipal Center Corp., 4.25%, 7/15/11 (b) | | | 100,813 | |
| 445,000 | | Munster Municipal Center Corp., 4.70%, 7/15/17, Callable 1/15/14 @100 (b) | | | 454,559 | |
| 345,000 | | Noblesville Multi-School Building Corp., 4.00%, 1/15/14, (FGIC Insured) (b) | | | 349,899 | |
| | | |
|
| | | | | 3,657,078 | |
| | | |
|
| Louisiana – 3.05% |
| 400,000 | | Louisiana State Bond Commission, Series B, 5.00%, 7/15/11, (CIFG Insured) (b) | | | 420,389 | |
| 150,000 | | Louisiana State Bond Commission, Series B, 5.00%, 7/15/15, (CIFG Insured) (b) | | | 162,123 | |
| | | |
|
| | | | | 582,512 | |
| | | |
|
| Maryland – 1.98% |
| 350,000 | | Baltimore Convention Center Hotel Revenue, Series A, 5.00%, 9/1/14, (XLCA Insured) (b) | | | 378,294 | |
| | | |
|
| Massachusetts – 9.12% |
| 600,000 | | State Construction Loan, Series E, 5.38%, 1/1/17, Pre-refunded 1/1/13 @ 100 | | | 649,908 | |
36
Table of Contents
SCHEDULE OF PORTFOLIO INVESTMENTS
Tamarack Tax-Free Income Fund (cont.)
Shares or
Principal
Amount | | | | Value | |
|---|
|
| $1,000,000 | | State Health & Education Facilities Authority (Partners Healthcare), Series C, 5.75%, 7/1/12, Callable 7/1/11 @ 100 | | $ | 1,089,520 | |
| | | |
|
| | | | | 1,739,428 | |
| | | |
|
| Michigan – 1.42% |
| 250,000 | | State Building Authority, Series III, 5.38%, 10/15/16, Callable 10/15/12 @ 100 | | | 271,028 | |
| | | |
|
| Missouri – 1.39% |
| 250,000 | | State Development Finance Board, 5.25%, 3/1/15 | | | 265,943 | |
| | | |
|
| New Hampshire – 2.69% |
| 500,000 | | Higher Education & Health Facility (Franklin Pierce Law Center), 5.50%, 7/1/18, Callable 7/1/08 @ 101 | | | 513,355 | |
| | | |
|
| Ohio – 1.18% |
| 225,000 | | Ohio State Higher Educational Facility Revenue, (John Carroll University), 4.00%, 4/1/09 | | | 225,214 | |
| | | |
|
| Oklahoma – 10.69% |
| 225,000 | | Jay Oklahoma Industrial Authority Lease Revenue, (Jay Public Schools), 4.75%, 9/1/10 | | | 228,526 | |
| 500,000 | | McClain County Economic Development Authority (New Castle Public Schools), 5.00%, 9/1/11 | | | 514,910 | |
| 380,000 | | Oklahoma Baptist University Authority, 5.25%, 12/1/14 (b) | | | 402,557 | |
| 300,000 | | Pottawatomie County Facilities Authority Educational Faculty Lease Revenue, (Shawnee Public School), 5.00%, 9/1/10 | | | 308,976 | |
| 230,000 | | Pottawatomie County Facilities Authority Educational Faculty Lease Revenue, (Tecumseh Public Schools), 4.75%, 9/1/13 | | | 234,572 | |
| 100,000 | | Pottawatomie County Facilities Authority Educational Facilities Lease Revenue, (Tecumseh Public Schools), 4.75%, 9/1/14 | | | 102,062 | |
| 245,000 | | Tulsa Industrial Authority Student Housing Revenue, (University of Tulsa), 4.30%, 10/1/12 (b) | | | 247,266 | |
| | | |
|
| | | | | 2,038,869 | |
| | | |
|
| South Carolina – 1.20% |
| 220,000 | | Lexington One School Facilities Corp. Installment Purchase Revenue, (Lexington County School District No.1), 5.00%, 12/1/10 (b) | | | 228,774 | |
| | | |
|
| South Dakota – 1.11% |
| 210,000 | | West Central School District No. 49-7, 4.00%, 8/15/11, (FSA Insured), Callable 4/1/11 @ 100 | | | 212,239 | |
| | | |
|
| Texas – 12.47% |
| 190,000 | | Keller Texas Certificates Obligation, 4.25%, 2/15/08, (CIFG Insured) | | | 191,033 | |
| 100,000 | | Northeast Travis County Utility District, 4.50%, 9/1/13, Callable 9/1/11 @ 100 | | | 101,313 | |
| 65,000 | | Northeast Travis County Utility District, 4.60%, 9/1/14, Callable 9/1/11 @ 100 | | | 65,956 | |
| 90,000 | | Northeast Travis County Utility District, 4.65%, 9/1/15, Callable 9/1/11 @ 100 | | | 91,358 | |
| 170,000 | | Plano Independent School District, 5.38%, 2/15/16, (PSF-GTD Insured), Callable 2/15/11 @ 100 | | | 179,780 | |
| 500,000 | | San Antonio Electric & Gas, 5.38%, 2/1/15 | | | 552,135 | |
| 500,000 | | Socorro Independent School District, Series A, 4.50%, 8/15/32, (PSF-GTD Insured), Callable 8/15/15 @ 100 | | | 498,475 | |
37
Table of Contents
SCHEDULE OF PORTFOLIO INVESTMENTS
Tamarack Tax-Free Income Fund (cont.)
Shares or
Principal
Amount | | | | Value | |
|---|
|
| $135,000 | | State Water Development, Series D, 5.50%, 8/1/07 | | $ | 135,795 | |
| 500,000 | | University of Texas Revenue, Series B, 5.25%, 8/15/19 | | | 560,469 | |
| | | |
|
| | | | | 2,376,314 | |
| | | |
|
| Washington – 6.38% |
| 55,000 | | Adams County Washington Park & Recreation District No.4, 4.13%, 12/1/15 | | | 54,977 | |
| 100,000 | | Adams County Washington Park & Recreation District No.4, 4.13%, 12/1/16 | | | 99,562 | |
| 1,000,000 | | Seattle Municipal Light & Power, 5.63%, 12/1/16, Callable 12/1/10 @ 100 | | | 1,061,380 | |
| | | |
|
| | | | | 1,215,919 | |
| | | |
|
| Wisconsin – 6.44% |
| 500,000 | | Kewaskum Waterworks & Sewer System Revenue, 4.50%, 6/1/07 (b) | | | 500,370 | |
| 300,000 | | Manitowoc Electric Revenue, (Power System), 5.00%, 8/1/10 | | | 309,897 | |
| 400,000 | | State Health & Educational Facilities Authority Revenue (Marshfield Clinic), 5.00%, 2/15/17, Callable 2/15/16 @ 100 | | | 417,140 | |
| | | |
|
| | | | | 1,227,407 | |
| | | |
|
Total Municipal Bonds
(Cost $18,014,811) | | | 18,489,153 | |
| |
| |
| Investment Companies – 1.97% |
| 375,953 | | Wells Fargo National Tax-Free Money Market Fund | | | 375,953 | |
| | | |
|
Total Investment Companies
(Cost $375,953) | | | 375,953 | |
| |
| |
Total Investments
(Cost $18,390,764) (a) – 98.92% | | $ | 18,865,106 | |
| Other assets in excess of liabilities – 1.08% | | | 205,317 | |
| |
| |
| NET ASSETS – 100.00% | | $ | 19,070,423 | |
| |
| |
(a) See notes to financial statements for the tax cost of securities and the breakdown of unrealized appreciation (depreciation).
(b) When-issued security.
(c) Rate represents the effective yield at purchase.
Abbreviations used are defined below:
AMBAC – Ambac Assurance Corporation
CIFG – CIFG Guaranty
FGIC – Financial Guaranty Insurance Corporation
FSA – Financial Security Assurance Inc.
MBIA – MBIA Insurance Corporation
PSF-GTD – Permanent School Fund Guaranteed
XLCA – XL Capital Assurance, Inc.
See notes to financial statements.
38
Table of Contents
NOTES TO SCHEDULES OF PORTFOLIO INVESTMENTS
The cash collateral received for securities lending, as discussed in Note 2, was pooled and invested into the following:
| | | Quality
Income Fund | |
|---|
| | |
| |
| American General Finance, 5.37%, 3/14/2008 | | | | $ | 79,500 | |
| Atlas Capital Funding Corp., 4.43%, 4/13/2007 | | | | | 14,126 | |
| Atomium Funding, LLC., 0.00%, 4/2/2007 | | | | | 15,898 | |
| Atomium Funding Corp., 5.11%, 6/21/2007 | | | | | 47,138 | |
| Bear Stearns Company, Inc., 3.50%, 8/22/2007 | | | | | 47,694 | |
| Bear Stearns Company, Inc., 5.50%, 10/3/2007 | | | | | 43,743 | |
| Buckingham COD, LLC., 4.08%, 4/9/2007 | | | | | 15,882 | |
| Cairn High Grade Funding, 4.92%, 5/3/2007 | | | | | 31,652 | |
| Cairn High Grade Funding, 5.05%, 5/24/2007 | | | | | 15,778 | |
| Cairn High Grade Funding, 5.11%, 6/21/2007 | | | | | 54,995 | |
| Cedar Springs Capital Company, LLC., 4.79%, 4/23/2007 | | | | | 23,203 | |
| Cedar Springs Capital Company, LLC., 5.03%, 5/21/2007 | | | | | 50,810 | |
| Charta, LLC., 0.00%, 4/2/2007 | | | | | 47,694 | |
| Cheyne Finance, Inc., 5.28%, 2/25/2008 | | | | | 55,626 | |
| Cheyne Finance, LLC., 4.98%, 5/10/2007 | | | | | 37,944 | |
| Corporate Asset Security, LTD., 4.38%, 4/12/2007 | | | | | 63,499 | |
| Corporate Asset Security, LTD., 4.72%, 4/20/2007 | | | | | 30,127 | |
| Crown Point Cap Co., 4.43%, 4/13/2007 | | | | | 15,872 | |
| Deer Valley Funding, LLC., 4/2/2007 | | | | | 23,847 | |
| Five Finance, Inc., 5.11%, 6/22/2007 | | | | | 78,552 | |
| Fox Trot, LTD., 4.08%, 4/9/2007 | | | | | 55,586 | |
| German Residential Funding, 5.04%, 5/22/2007 | | | | | 31,564 | |
| German Residential Funding, 3.50%, 8/22/2007 | | | | | 31,796 | |
| Hudson-Thames, LLC., 2.61%, 4/4/2007 | | | | | 23,840 | |
| Jupiter Co., LLC., 0.00%, 4/2/2007 | | | | | 55,643 | |
| Kestrel Funding P.L.C., 5.05%, 5/24/2007 | | | | | 17,750 | |
| Liquid Funding, LTD., 5.06%, 04/12/2007 | | | | | 79,490 | |
| Met Life Global Funding, 4.97%, 3/6/2012 | | | | | 79,500 | |
| Morgan Stanley, CP, 3.50%, 8/7/2007 | | | | | 47,694 | |
| Shiprock Finance, 5.39%, 4/11/2008 | | | | | 39,745 | |
| Stanfield Victoria Funding, 4.82%, 4/25/2007 | | | | | 47,534 | |
| Tasman Funding, Inc., 2.61%, 4/4/2007 | | | | | 79,466 | |
| Unicredito Italia AZ, 4.92%, 5/3/2007 | | | | | 63,305 | |
| Whistlejacket Capital, 4.87%, 4/27/2007 | | | | | 74,447 | |
| Whistlejacket Capital, 4.90%, 4/30/2007 | | | | | 29,608 | |
| White Pine Finance, LLC., 4.79%, 4/23/2007 | | | | | 15,849 | |
| Windmill Funding Corp., 4.43%, 4/13/2007 | | | | | 15,872 | |
| Goldman Money Market Repurchase Agreement, 5.39%, 4/2/2007 | | | | | 130,343 | |
| | |
| |
| | | | $ | 1,712,611 | |
| | |
| |
LLC = Limited Liability Company
COD = Certificate of Deposit
CP = Commercial Paper
39
Table of Contents
MANAGEMENT (unaudited)
Independent Trustees(1)
T. Geron Bell (65)
Position Held with Fund: Trustee; Since January, 2004
Principal Occupation(s) During Past 5 Years: President of Twins Sports, Inc. (parent company of the Minnesota Twins) (2002-present); prior thereto President of the Minnesota Twins Baseball Club Incorporated (1987-present); Director, Great Hall Investment Funds, Inc. (1993-2004); Trustee, J&B Funds (2003-2004); Director, Babson Funds (2003-2004).
Number of Portfolios in Fund Complex Overseen: 15
Lucy Hancock Bode (55)
Position Held with Fund: Trustee; Since January, 2004
Principal Occupation(s) During Past 5 Years: Healthcare consultant; Director, RBC Funds (1994-2004).
Number of Portfolios in Fund Complex Overseen: 15
Leslie H. Garner Jr. (56)
Position Held with Fund: Trustee; Since January, 2004
Principal Occupation(s) During Past 5 Years: President, Cornell College; Director, RBC Funds (1994-2004).
Number of Portfolios in Fund Complex Overseen: 15
Ronald James (56)
Position Held with Fund: Trustee; Since January, 2004
Principal Occupation(s) During Past 5 Years: President and Chief Executive Officer, Center for Ethical Business Cultures (2000-present); Director, Great Hall Investment Funds, Inc. (1993-2004); Trustee, J&B Funds (2003-2004); Director, Babson Funds (2003-2004).
Number of Portfolios in Fund Complex Overseen: 15
John A. MacDonald (58)
Position Held with Fund: Trustee; Since January, 2004
Principal Occupation(s) During Past 5 Years: Chief Investment Officer, Hall Family Foundation; Trustee, J&B Funds (2001-2004).
Number of Portfolios in Fund Complex Overseen: 15
H. David Rybolt (64)
Position Held with Fund: Trustee; Since January, 2004
Principal Occupation(s) During Past 5 Years: Consultant, HDR Associates (management consulting); Director, Babson Funds (1992-2004).
Number of Portfolios in Fund Complex Overseen: 15
James R. Seward (54)
Position Held with Fund: Trustee; Since January, 2004
Principal Occupation(s) During Past 5 Years: Private investor (2000-present); Trustee, J&B Funds (2001-2004); CFA.
Number of Portfolios in Fund Complex Overseen: 15
| (1) | Unless otherwise specified, the address of each trustee/officer is 100 South Fifth Street, Suite 2300, Minneapolis, Minnesota 55402. |
40
Table of Contents
MANAGEMENT (unaudited)
Independent Trustees(1)
William B. Taylor (61)
Position Held with Fund: Trustee; Since September, 2005
Principal Occupation(s) During Past 5 Years: Consultant (2003-present); Partner (until 2003) Ernst & Young LLP.
Number of Portfolios in Fund Complex Overseen: 15
Interested Trustees(1)
Erik R. Preus (41)
Position Held with Fund: Trustee; Since September, 2005
Principal Occupation(s) During Past 5 Years: Head of Retail Asset Management (2006-present); Director, President and Chief Executive Officer, Tamarack Distributors Inc. (2005-present); Chief Operating Officer, Voyageur Asset Management (2005-2006); Director, Investment Counseling Services, RBC Dain Rauscher (2004-2005); Director, Voyageur Advisory Services, Voyageur Asset Management (2003-2004); Senior Vice President, Divisional Sales Manager, PIMCO Allianz Investments and its predecessor firm, Nicholas Applegate (2001-2003).
Number of Portfolios in Fund Complex Overseen: 15
Executive Officers(1)
Erik R. Preus (41)
Position Held with Fund: President and Chief Executive Officer; Since September, 2006
Principal Occupation(s) During Past 5 Years: Head of Retail Asset Management (2006-present); Director, President and Chief Executive Officer, Tamarack Distributors Inc. (2005-present); Chief Operating Officer, Voyageur Asset Management (2005-2006); Director, Investment Counseling Services, RBC Dain Rauscher (2004-2005); Director, Voyageur Advisory Services, Voyageur Asset Management (2003-2004); Senior Vice President, Divisional Sales Manager, PIMCO Allianz Investments and its predecessor firm, Nicholas Applegate (2001-2003).
David P. Lux (52)
Position Held with Fund: Chief Financial Officer and Treasurer; Since September, 2005
Principal Occupation(s) During Past 5 Years: Vice President and Director, Mutual Funds (2006-present); Director, Tamarack Distributors Inc. (2006-present); Controller, Tamarack Funds, November, 2004-September, 2005; Vice President and Mutual Funds Finance Manager, Voyageur Asset Management (2004-2006); Senior Financial Analyst, Voyageur Asset Management (2003-2004); Senior Financial Analyst, RBC Dain Rauscher (1995-2003).
Kathleen A. Gorman (43)
Position Held with Fund: Chief Compliance Officer Since April, 2006 and Assistant Secretary Since September 2006
Principal Occupation(s) During Past 5 Years: Chief Compliance Officer, Voyageur Asset Management (2006-present); Director, Asset Management Compliance, RiverSource Investments (2004-2006); Senior Compliance Officer, U.S. Bancorp Asset Management (1994-2004).
| (1) | Unless otherwise specified, the address of each trustee/officer is 100 South Fifth Street, Suite 2300, Minneapolis, Minnesota 55402. |
41
Table of Contents
MANAGEMENT (unaudited)
Executive Officers(1)
Martin A. Cramer (57)
Position Held with Fund: Vice President and AML Compliance Officer; Since January, 2004
Principal Occupation(s) During Past 5 Years: Vice President and Mutual Fund Administration Manager, Voyageur Asset Management (2003-present); Vice President, Tamarack Distributors Inc. (2007-present); Senior Compliance Officer, Tamarack Funds (2006-2007); Chief Compliance Officer, Tamarack Funds (2004-2006); Legal and Regulatory Affairs Vice President, Compliance Officer and Secretary, J&B (mutual fund management and distribution company) (1993-2003); Vice President, Assistant Secretary, Compliance Officer and AML Compliance Officer (2003-2004)(2), and formerly, Vice President, Compliance Officer and Secretary, Buffalo Fund Complex (1994-2003) and Secretary, Gold Bank Funds(3) (2001-2003).
Monica P. Ballard (37)
Position Held with Fund: Secretary and Chief Legal Officer; Since September, 2005
Principal Occupation(s) During Past 5 Years: Vice President and Senior Associate General Counsel, RBC Dain Rauscher (2004 to present); Counsel, Allianz Life (2002 to 2004); Associate Counsel, American Express Financial Advisors (1996 to 2002).
Gordon Telfer (41)
Position Held with Fund: Portfolio Strategist; Since March, 2004
Principal Occupation(s) During Past 5 Years: Vice President and Portfolio Manager, Voyageur Asset Management (2003-present); Senior Portfolio Manager, Alliance Capital Management (2000-2003); Senior Vice President, Global Strategist, Scudder Kemper Investments (1997-2000).
Nancy M. Scinto (47)
Position Held with Fund: Chief Investment Officer, Equity Products; Since January, 2004
Principal Occupation(s) During Past 5 Years: Managing Director and Director of Research, Voyageur Asset Management (2003-present).
John M. Huber (38)
Position Held with Fund: Chief Investment Officer, Fixed Income Products; Since February, 2005
Principal Occupation(s) During Past 5 Years: Chief Investment Officer, Fixed Income, Voyageur Asset Management (2004-Present); Principal and Senior Portfolio Manager, Galliard Capital Management (1995-2004).
| (1) | Unless otherwise specified, the address of each trustee/officer is 100 South Fifth Street, Suite 2300, Minneapolis, Minnesota 55402. |
| (2) | Great Hall Investment Funds, Inc., J&B Funds, Babson Enterprise Fund, Inc., Babson Enterprise Fund II, Inc., Babson-Stewart Ivory International Fund, Inc., Babson Value Fund, Inc., David L. Babson Growth Fund, Inc., D.L. Babson Bond Trust, D.L. Babson Money Market Fund, Inc., D.L. Babson Tax-Free Income Fund, Inc., Shadow Stock Fund, Inc., and Investors Mark Series Fund, Inc. |
| (3) | The Buffalo Fund Complex consists of Buffalo Balanced Fund, Inc., Buffalo Large Cap Fund, Inc., Buffalo High Yield Fund, Inc., Buffalo Small Cap Fund, Inc., Buffalo USA Global Fund, Inc., and the Buffalo Funds, which is a series fund consisting of Buffalo Science & Technology Fund and Buffalo Mid Cap Fund. Gold Bank Funds is a series fund consisting of Gold Bank Equity and Gold Bank Money Market Fund. |
The Funds’ Statement of Additional Information includes information about the Funds’ Trustees. To receive your free copy of the Statement of Additional Information, call toll free: 1-800-422-2766.
42
Table of Contents
SHARE CLASS INFORMATION (unaudited)
The Tamarack Fixed Income Funds offer five share classes, A, C, R, I, and S.
Class A
Class A shares are available for purchase primarily through investment advisors, broker dealers, banks and other financial services intermediaries. Class A shares of the Tamarack Fixed Income Funds are subject to a maximum up-front sales charge of 3.75% and a 1.00% contingent deferred sales charge (“CDSC”) for redemption within 12 months of a $1 million or greater purchase. Class A shares include a 0.25% (25 bps) annual 12b-1 service and distribution fee. (The 12b-1 Plan allows for 50 bps, but the Funds’ distributor is currently contractually waiving 25 bps of the fee.) Class A shares have a higher up front sales charge (load) than Class C shares, but a lower annual expense ratio.
Class C
Class C shares are also available for purchase primarily through investment advisors, broker-dealers, banks and other financial services intermediaries. Class C shares redeemed within 12 months of purchase are subject to a contingent deferred sales charge (CDSC) of 1.00%. (No CDSC will be charged on shares acquired through reinvestment of dividends or capital gains.) Class C shares expenses include a 1.00% (100 bps) annual 12b-1 service and distribution fee. Class C shares have a lower up-front sales charge (load) than Class A shares, but due to the higher 12b-1 service and distribution fee, have higher annual expenses than Class A shares.
Class R
Class R shares are available for purchase through employer-sponsored or 401(k) retirement plans for which omnibus or program-level accounts are held on the books of the Funds. Class R shares have no upfront sales charge (load), but are subject to a 0.50% (50 bps) 12b-1 service and distribution fee. Class R shares currently have annual expenses between Class A and Class C share expenses.
Class S
Class S shares are available to investors purchasing shares directly through the Fund or its Agent, BFDS, or through certain fee-based programs of broker dealers or registered investment advisors. This share class does not have an upfront sales charge (load) or a 12b-1 service and distribution fee.
Class I
Class I shares are available in the Quality Fixed Income Fund. This share class is intended for investors meeting certain minimum investment thresholds. This share class does not have an up front sales charge (load) or a 12b-1 service and distribution fee.
For an investor purchasing Tamarack Funds shares through a financial services intermediary, the question as to which share class, A or C, is the best choice is dependent on many factors, including the amount to be invested and the length of time an investor anticipates holding the shares. An investor should consult with his or her financial advisor about his or her personal financial situation to determine which share class is the best choice for his or her individual situation.
43
Table of Contents
SUPPLEMENTAL INFORMATION (unaudited)
Information for Tamarack Funds Shareholders Regarding the Renewal of Investment Advisory Agreements
The Tamarack Board of Trustees has renewed the Investment Advisory Agreements with Voyageur Asset Management Inc. (“Voyageur” or the “Advisor”) for both of the Funds. After evaluating the services provided by the Advisor and reviewing the performance and relevant advisory fees and expenses of both Funds, the Trustees concluded that it was in the best interests of the Funds and their shareholders to continue the Investment Advisory Agreements (“Agreements”).
As part of their review of the Agreements, the Trustees received and discussed certain information, including information regarding the advisory services performed, qualifications of staffing, and Fund performance and expenses. The Trustees considered information provided in advance of their in-person meeting, as well as supplemental information provided at the meeting. The Trustees met with representatives from the Advisor’s senior management team, as well as senior investment professionals, to discuss this information and Voyageur’s intentions with regard to the ongoing management of the Funds. The Trustees reviewed the quality of the services provided to the Funds by Voyageur, including information prepared by a third-party consultant as to both Funds’ performance relative to an appropriate benchmark as well as compared to the Fund’s appropriate peer group. The Trustees also reviewed the investment management fees payable to Voyageur. In this connection, the Trustees reviewed comparative information prepared by a third-party consultant on investment management fees paid and expenses incurred by similarly situated funds. The Trustees also received reports from Voyageur regarding other investment companies advised by it, including the advisory fees paid. The Trustees took into account profitability data for Voyageur included in the materials. The Trustees received information from Voyageur regarding other benefits derived from its relationships with the funds. In connection with their deliberations, the independent Trustees met separately with their independent legal counsel to review the relevant material and consider their responsibilities under relevant laws and regulations. In addition, the Trustees noted the expected composition of the portfolio management teams.
When evaluating the investment performance of the Funds, the Trustees generally emphasize three to five year returns, as opposed to shorter time periods, when evaluating the investment performance of the Funds. Nonetheless, the Board observed that the one-year performance of the Quality Fixed Income Fund had improved significantly to move it into the third quintile of its peer group and the Fund’s total expense structure was .10% points lower than its peer group median. The Tax-Free Income Fund performance continued to lag behind its peer group and its expense structure was higher than its peer group median. Management proposed leaving both of these Funds at their current expense caps with a commitment to readdress the Tax-Free Income Fund performance and growth prospects during the fiscal year. In considering the quality of the services performed for each Fund by Voyageur, the Trustees discussed the strong research capabilities and fundamental analysis performed by the firm and also considered the extensive portfolio management experience of Voyageur staff, the compliance structure and systems established by Voyageur and the financial viability of Voyageur. The Trustees also considered steps that already had been taken by Voyageur to expand upon existing research capabilities and compliance processes and steps that were expected to be taken to maintain and/or enhance such capabilities and processes.
44
Table of Contents
SUPPLEMENTAL INFORMATION (unaudited)
The Trustees also reviewed and approved Fund Management’s proposal to continue for an additional year the existing fee waivers for the Tax-Free Income and Quality Fixed Income Funds in order to maintain total expenses at their current levels.
Based upon their review, the Trustees determined that the advisory fees proposed to be payable to Voyageur were reasonable and fair in light of the nature and quality of services provided under all of the circumstances, and were within the range of what might have been negotiated at arms’ length. The Trustees concluded that it is in the interest of the Funds and their shareholders for the Trustees to approve the continuation of the Agreements for the Funds. In arriving at their decision to approve the renewal of both of the Agreements, the Trustees did not assign relative weights to the factors discussed above or deem any one or group of them to be controlling in and of themselves.
45
Table of Contents
SUPPLEMENTAL INFORMATION (unaudited)
Shareholder Expense Examples
As a shareholder of the Tamarack Funds, you incur two types of costs: (1) transaction costs, including sales charges (loads) on purchases, and redemption fees; (2) ongoing costs, including management fees; 12b-1 fees; and other Fund expenses. This example is intended to help you understand your ongoing costs (in dollars) of investing in the Tamarack Funds and to compare these costs with the ongoing costs of investing in other mutual funds.
The Example is based on an investment of $1,000 invested at the beginning of the period and held for the entire period from October 1, 2006 through March 31, 2007.
Actual Expenses and Performance
The table below provides information about actual account values and actual expenses. You may use the information below, together with the amount you invested, to estimate the expenses that you paid over the period. Simply divide your account value by $1,000 (for example, an $8,600 account value divided by $1,000 = 8.6), then multiply the result by the number in the table under the heading entitled “Expenses Paid During Period” to estimate the expenses you paid on your account during this period.
| | | | | | Beginning
Account Value
10/1/06 | | | Ending
Account Value
3/31/07 | | | Expenses Paid
During Period*
10/1/06 – 3/31/07 | | | Annualized
Expense Ratio
During Period
10/1/06 – 3/31/07 | |
|---|
| | | | | |
| | |
| | |
| | |
| |
| Quality Income Fund | | | | | Class A | | | $ | 1,000.00 | | | $ | 1,027.30 | | | $ | 4.70 | | | | 0.93 | % |
| | | | | Class I | | | | 1,000.00 | | | | 1,028.60 | | | | 3.44 | | | | 0.68 | % |
| | | | | Class C | | | | 1,000.00 | | | | 1,023.20 | | | | 8.78 | | | | 1.74 | % |
| | | | | Class R | | | | 1,000.00 | | | | 1,026.00 | | | | 6.01 | | | | 1.19 | % |
| | | | | Class S | | | | 1,000.00 | | | | 1,028.60 | | | | 3.44 | | | | 0.68 | % |
| Tax-Free Income Fund | | | | | Class A | | | | 1,000.00 | | | | 1,011.90 | | | | 4.97 | | | | 0.99 | % |
| | | | | Class C | | | | 1,000.00 | | | | 1,008.50 | | | | 8.51 | | | | 1.70 | % |
| | | | | Class R | | | | 1,000.00 | | | | 1,010.80 | | | | 6.32 | | | | 1.26 | % |
| | | | | Class S | | | | 1,000.00 | | | | 1,013.20 | | | | 3.71 | | | | 0.74 | % |
* Expenses are equal to the average account value times the Fund’s annualized expense ratio multiplied by the number of days in the most recent fiscal half-year divided by the number of days in the fiscal year( to reflect one-half year period).
46
Table of Contents
SUPPLEMENTAL INFORMATION (unaudited)
Hypothetical Example for Comparison Purposes
The table below provides information about hypothetical account values and hypothetical expenses based on each Tamarack Funds’ actual expense ratio and an assumed rate of return of 5% per year before expenses, which is not the Fund’s actual return. The hypothetical account values and expenses may not be used to estimate the actual ending account balance or expenses you paid for the period. You may use this information to compare this 5% hypothetical example with the 5% hypothetical examples that appear in the shareholder reports of other funds.
Please note that the expenses shown in the table are meant to highlight your ongoing costs only and do not reflect any transactional costs, such as sales charges (loads), redemption fees, or exchange fees. Therefore, the table is useful in comparing ongoing costs only, and will not help you determine the relative total costs of owning different funds. In addition, if these transactional costs were included, your costs would have been higher.
| | | | | | Beginning
Account Value
10/1/06 | | | Ending
Account Value
3/31/07 | | | Expenses Paid
During Period*
10/1/06 – 3/31/07 | | | Annualized
Expense Ratio
During Period
10/1/06 – 3/31/07 | |
|---|
| | | | | |
| | |
| | |
| | |
| |
| Quality Income Fund | | | | | Class A | | | $ | 1,000.00 | | | $ | 1,020.29 | | | $ | 4.68 | | | | 0.93 | % |
| | | | | Class I | | | | 1,000.00 | | | | 1,021.54 | | | | 3.43 | | | | 0.68 | % |
| | | | | Class C | | | | 1,000.00 | | | | 1,016.26 | | | | 8.75 | | | | 1.74 | % |
| | | | | Class R | | | | 1,000.00 | | | | 1,019.00 | | | | 5.99 | | | | 1.19 | % |
| | | | | Class S | | | | 1,000.00 | | | | 1,021.54 | | | | 3.43 | | | | 0.68 | % |
| Tax-Free Income Fund | | | | | Class A | | | | 1,000.00 | | | | 1,020.00 | | | | 4.99 | | | | 0.99 | % |
| | | | | Class C | | | | 1,000.00 | | | | 1,016.45 | | | | 8.55 | | | | 1.70 | % |
| | | | | Class R | | | | 1,000.00 | | | | 1,018.65 | | | | 6.34 | | | | 1.26 | % |
| | | | | Class S | | | | 1,000.00 | | | | 1,021.24 | | | | 3.73 | | | | 0.74 | % |
* Expenses are equal to the average account value times the Fund’s annualized expense ratio multiplied by the number of days in the most recent fiscal half-year divided by the number of days in the fiscal year (to reflect one-half year period).
47
Table of Contents
This Page Intentionally Left Blank
48
Table of Contents
Performance data represents past performance and does not guarantee future results. The principal value of an investment and investment return will fluctuate so that an investor’s shares, when redeemed, may be worth more or less than their original cost.
This report and the financial statements contained herein are provided for the information of Tamarack Funds shareholders. This report is not authorized for distribution to prospective investors unless preceded or accompanied by a current prospectus, which contains information concerning investment objectives, risks, charges and expenses of the funds. Please read the prospectus carefully before investing.
This report and the financial statements contained herein are not intended to be a forecast of future events, a guarantee of future results, or investment advice. There is no assurance that certain securities will remain in or out of each fund’s portfolio. The views expressed in this report reflect those of the portfolio managers through the period ended March 31, 2007. The portfolio managers’ views are subject to change at any time based on market or other conditions.
NOT FDIC INSURED • NO BANK GUARANTEE • MAY LOSE VALUE
Voyageur Asset Management serves as investment adviser for the Tamarack Funds. Tamarack Funds are distributed by Tamarack Distributors Inc., member NASD.
Tamarack Funds
P.O. Box 219757
Kansas City, MO 64121-9757
800-422-2766
www.voyageur.net
The Tamarack Funds are pleased to introduce our first shareholder
reports printed entirely on Forest Stewardship Council certified paper.
FSC certification ensures that the paper used in this report contains
fiber from well-managed and responsibly harvested forests that
meet strict environmental and socioeconomic standards.
TF-FI SAR 3-07
| |
| SEMI-ANNUAL REPORT March 31, 2007 |
Prime Money Market Fund U.S. Government Money Market Fund Tax-Free Money Market Fund Institutional Prime Money Market Fund Institutional Tax-Free Money Market Fund Treasury Plus Money Market Fund | |
Tamarack Funds
About Your Semi-Annual Report
This semi-annual report includes detailed information regarding your Fund’s performance. This report is provided to help answer your questions as a shareholder. Among these questions may be: What are the annual expenses of my Fund? What are the significant accounting policies and procedures followed by my Fund?
We hope the financial information presented will help you evaluate your investment in the Tamarack Funds. We also encourage you to read your Fund’s prospectus for further detail as to your Fund’s investment policies and risk profile. Tamarack Funds prospectuses and additional performance information are available on our website at www.voyageur.net.
A description of the policies and procedures that your Fund uses to determine how to vote proxies relating to portfolio securities is available (i) without charge, upon request, by calling 1-800-422-2766; (ii) on the Fund’s website at www.voyageur.net; and (iii) on the Securities and Exchange Commission’s (“Commission”) website at http://www.sec.gov.
Information regarding how your Fund voted proxies relating to portfolio securities during the most recent 12-month period ended June 30, 2006 is available (i) on the Fund’s website at www.voyageur.net; and (ii) on the Commission’s website at http://www.sec.gov.
A schedule of each Fund’s portfolio holdings will be filed with the Commission for the first and third quarters of each fiscal year on Form N-Q. This information is available on the Commission’s website at http://www.sec.gov and may be reviewed and copied at the Commission’s Public Reference Room in Washington, D.C. Information on the operation of the Public Reference Room is available by calling 1-800-SEC-0330.
Table of Contents
Table of Contents
LETTER FROM THE CIO OF FIXED INCOME
Market optimism continued during the first half of the fiscal year throughout the capital markets. U.S. stock and bond indices produced solidly positive returns over the past six months while global equity markets posted double digit returns. These strong returns are even more impressive or worrisome (depending on your perspective) when one considers it occurred during a relatively high inflation, low growth environment. Robust investment demand, tight labor markets, stable consumer confidence, and positive earnings reports combined with stable Fed policy to push the markets higher during this period.
The Federal Reserve finds itself in a difficult position at the moment. Economic growth over the last three quarters has averaged a modest 2.3%. Growth in this range, by itself, would probably be sufficient to encourage the Fed to lower interest rates in order to stimulate future economic activity. However, the Fed is not responsible solely for growth. It also has the responsibility of controlling inflation. Currently, the Fed’s favorite measure of inflation, the core Personal Consumption Expenditure (PCE) indicator, is well above its stated 2% target level. The combination of slow growth and an unacceptably high level of inflation has kept the Fed from changing interest rates for the last ten months. It seems fairly clear that any future change in interest rate policy, up or down, will result from either much lower inflation or much stronger growth.
The housing market has been one of the most important influences on economic performance over the past several years, both positively and most recently negatively. The housing market is one of the predominant factors that transitioned our economy from the 3.5% level of economic growth in 2003-2004 to the current level of just above 2%. In the early part of this decade, the real estate market became a major engine for pulling the economy out of recession. After the 2001 recession, interest rates fell significantly, eventually posting record lows in 2003. At about the same time, mortgage companies were developing new and innovative mortgage products, which allowed more homebuyers to qualify for cheaper financing. The somewhat rare combination of low interest rates and easier financing caused homes to become highly affordable. As the demand for housing increased, so did employment in construction, real estate brokerage and appraisal and mortgage origination. Indirect beneficiaries of housing transactions, such as the furniture and home remodeling companies, also have increased employment.
Ultimately, housing demand became self-feeding, due mostly to the escalation in home prices. People were not simply trading up to the next affordable house; they became investors whose sole purpose was to borrow money cheaply and invest in housing because they believed prices would be higher in the future. Then, after several years of double-digit price gains, investors started to extract profits and spend the money. This, in turn, became an additional source of economic growth along with the employment build-up.
Today, things are markedly different. Housing demand has slowed, builders have finally stopped adding to the new housing stock, and home price increases have slowed. In some areas of the country, prices have started to decline. The current housing malaise is causing weakness in a number of sectors of the economy, most of which are the same sectors that expanded so rapidly in the early part of the decade. One area particularly hard hit has been the sub-prime market, which lends mortgage money to lower credit-quality borrowers. As competition for business tightened in this market over the last several years, lenders began cutting corners on underwriting standards in order to maintain loan volume. Eventually delinquencies began to show up, causing numerous lenders in this sector to shut their doors. The bankruptcy of sub-prime lenders has been
1
Table of Contents
LETTER FROM THE CIO OF FIXED INCOME
well documented, but the sub-prime market is not the only mortgage market that exists. In fact, Lehman Brothers estimates that sub-prime lending makes up approximately 15% of the entire outstanding mortgage market. The rest of the market (approximately 85%) is made up of high quality (prime) borrowers and remains relatively unaffected by the issues in the sub-prime sector.
Given the relative size of the sub-prime market, Voyageur does not expect a broad meltdown in either housing or the economy. Troubles in the sub-prime sector will continue to have an economic impact and the housing downturn will take some time to correct itself. The process of reducing existing home supply, dealing with foreclosures and stabilization of prices will move fairly slowly. The impact could easily be felt through reduced economic growth for the next several years, but most likely the impact will lessen as time progresses. Voyageur has, for the past several years, believed that mortgage origination standards for lower grade borrowers were being relaxed in order to maintain levels of business. We have consistently worked to understand the individual underwriting companies’ business methods as well as the specific collateral pools that we invest in for our clients. This allowed us to avoid virtually all of the pain in the sub-prime market. We also believe the discipline that is currently being brought to bear on the market in terms of fewer originators and tighter lending standards will likely create an opportunity at some point in the future.
Peripheral issues related to consumer spending based on the wealth effect are areas of concern. Over most of this decade, either the stock market or housing has contributed mightily to consumer net wealth and ultimately to consumers’ willingness to spend. The other factor that has affected consumers spending has been the level of employment. Regarding spending, we are watchful for a change in the attitude of business as it relates to both employment and the level of the stock market. A substantial decline in employment and/or the stock market with further declines in home prices could be the catalyst for even weaker growth and an immediate change in the interest rate policy of the Fed. However, Voyageur does not see this as probable. Instead, we believe that economic growth and inflation will remain at current levels with no recession in the forecast until 2008 or beyond.
Voyageur remains cautious on the fixed income markets and these views are reflected in our strategy for the Funds. First, we remain biased toward high quality issuers and cash flows across our fixed income holdings. Spreads in traditional corporate and mortgage backed securities are extremely narrow by almost any measure and seem to have been pushed to extremes by investors hungry for yield. Second, we remain committed to our income based approach to investing even though we are cautious on many sectors and names in the market. Security selection and a consistent investment process will help us provide value added returns to our shareholders. Third, we will not time interest rates as a means of generating excess returns for the Funds. We believe it presents too much risk for our shareholders. Finally, we remain keenly aware of opportunities and developing risks in upcoming quarters as we strive to produce absolute and risk–adjusted returns for all of our shareholders.
John Huber
Chief Investment Officer
Fixed Income Products |
John M. Huber
Chief Investment Officer, Fixed Income Products
Tamarack Funds |
2
Table of Contents
MONEY MARKET PORTFOLIO MANAGERS
Voyageur Asset Management (“Voyageur”), the investment advisor to the Tamarack Funds, employs a team approach to the management of each of the money market funds. Each Fund’s management team has access to Voyageur’s investment research and other money management resources. The members of Voyageur’s money market funds team are:
John M. Huber, CFA
Senior Managing Director, Chief Investment Officer — Fixed Income
John Huber directs Voyageur’s fixed income group. John joined Voyageur in 2004 from Galliard Capital Management where he was a principal and senior portfolio manager, responsible for the firm’s total return fixed income effort. Prior to working for Galliard, John was a portfolio manager for Norwest Investment Management where he began his career in 1990. John received a BA from the University of Iowa and an MBA in Finance from the University of Minnesota, Carlson School of Management. He acts as an advisor to the Carlson Funds Enterprise for the University of Minnesota. John is a CFA charterholder and a member of the CFA Society of Minnesota. He also serves on the Board of the YMCA of Metropolitan Minneapolis. |
John M. Huber, CFA |
|
Raye C. Kanzenbach, CFA
Senior Managing Director, Senior Portfolio Manager
Raye Kanzenbach is an active member of the Credit Team. He has extensive experience working with taxable and tax-exempt municipal fixed income securities. Prior to his experience at Voyageur, Raye was employed at First Bank where he managed the municipal and money market trust funds. Raye also supervised the municipal and corporate credit analysis areas for the Trust Department and First Bank’s investment portfolio. Prior to First Bank, Raye was employed as an investment officer with the St. Paul Companies. Raye began his career in the investment industry in 1973 and joined Voyageur in 1983. He received a BA in Economics from Lawrence University and an MBA in Finance from the University of Michigan. Raye is a CFA charterholder and member of the CFA Society of Minnesota. |
Raye C. Kanzenbach, CFA |
|
Scott Cabalka
Vice President, Senior Portfolio Manager
Scott Cabalka is a member of the Credit Team and oversees trading and portfolio management for the taxable and tax-sensitive portfolios of the Tamarack Money Market Funds, state investment pools and short-term portfolios of Voyageur corporate clients. Prior to joining Voyageur in 1993, Scott was an account executive with Merrill Lynch where he focused on short-term investment strategies for institutional investors. Scott began his career in the investment industry in 1980. He received a BS and an MBA in Finance from the University of Minnesota, Carlson School of Management. | 
Scott Cabalka |
|
3
Table of Contents
MONEY MARKET PORTFOLIO MANAGERS
Steven P. Eldredge, CFA | Steven P. Eldredge, CFA
Managing Director
Client Portfolio Management Team Lead, Senior Portfolio Manager
Steven Eldredge leads the Client Portfolio Management Team which is responsible for assisting clients in developing portfolio objectives and keeping them informed about Voyageur’s fixed income strategies and outlook. Prior to his current role, Steve led the firm’s Portfolio Solutions Team. He has an extensive background in both taxable and tax-exempt fixed income securities. Prior to joining Voyageur in 1995, Steve was chief operating officer for the ABT Mutual Fund family. Steve began his career in the investment industry in 1978. He received a BS in Finance from the University of Central Florida. Steve is a CFA charterholder and member of the CFA Society of Minnesota. |
4
Table of Contents
PERFORMANCE SUMMARY
Tamarack Money Market Funds
Tamarack Money Market Funds
The Tamarack Money Market Funds seek to achieve the highest level of current income as is consistent with prudent investment management, the preservation of capital, and maintenance of liquidity. The Funds invest in a variety of highly-rated money market instruments. In the Tax-Free Money Market Funds, investments are made in highly-rated debt obligations that pay interest exempt from federal income taxes and alternative minimum tax (AMT).
Although the Tamarack Money Market Funds are not benchmarked to industry indices (such as the S&P 500®), we do evaluate performance against each Fund’s respective peer group as reported by Lipper.
Taxable Money Funds
Over the six-month period ended March 31, 2007, the Prime, Institutional Prime, and U.S. Government Money Market Funds provided yields that were comparable to the average reported yields of their respective Lipper peer groups.
Short-term interest rates fluctuated within a fairly narrow range in the first quarter of 2007. The Federal Reserve has kept the benchmark overnight Fed Funds rate at 5.25% where it was last set in June, 2006. The FOMC has provided consistent messages regarding their concern that inflation will not moderate from currently high levels. Nonetheless, market expectations have continued to suggest a rate cut which has helped to push yields for short-term securities slightly lower through out the first quarter of 2007.
In this yield environment, the money market funds maintained a strategy whereby:
| | • | A high percentage of assets were in securities that matured within 90 days, |
| | • | A modest percentage of assets were placed in securities with maturities of longer than 180 days and less than 397 days, |
| | • | The three Funds maintained slightly longer average portfolio maturities than were reported by their respective peer groups. |
We believe that in the coming months the Federal Reserve is likely to be on hold for further rate hikes, with perhaps a slight bias toward an interest rate ease sometime late in 2007, depending on their interpretation of the inflationary climate.
Tax-Exempt Money Funds
Over the six-month period ended March 31, 2007, the Tax-Free Money Market Fund and the Institutional Tax-Free Money Market Fund’s performance was on average with the performance of their respective Lipper peer groups.
During the first quarter of 2007, Tax-free yields have risen in the short portion of the money market yield curve, reflecting the seasonal cash outflows around tax time. This phenomenon generally pushes overall yields higher but in particular has the greatest impact on securities of one month or less.
Both tax-free Funds hold a large percentage of assets that provide either daily or weekly liquidity (in other words, securities with maturities of seven days or less.) However, the Funds also hold a portion of assets in highly-rated notes with maturities of between 180 and 397 days. This has resulted in average portfolio maturities of both Funds that are consistent with those of their peer groups.
5
Table of Contents
PERFORMANCE SUMMARY
Investment Objective
Each of the Tamarack Money Market funds was managed to preserve principal. This means that the share price of each fund held steady at $1. A consistent share price of $1 is expected for a money market mutual fund, but is not guaranteed.
| | | Total Return
for the six
months ended
March 31, 2007
(Unaudited) | | | SEC 7-Day Annualized Yield (1) | | |
|---|
| | |
| | |
| | | March 31, 2007
(Unaudited) | | | September 30,
2006 | | |
|---|
| | |
| | |
| | |
| | |
| Tamarack Prime Money Market Fund | | | | | 2.30 | % | | | 4.68 | % | | | 4.71 | % |
| Tamarack U.S. Government Money Market Fund | | | | | 2.23 | % | | | 4.61 | % | | | 4.62 | % |
| Tamarack Tax-Free Money Market Fund | | | | | 1.45 | % | | | 2.99 | % | | | 3.02 | % |
| Tamarack Institutional Prime Money Market Fund (2) | | | | | 2.56 | % | | | 5.22 | % | | | 5.22 | % |
| Tamarack Institutional Tax-Free Money Market Fund (2) | | | | | 1.66 | % | | | 3.43 | % | | | 3.44 | % |
| Tamarack Treasury Plus Money Market Fund (3) | | | | | 2.57 | % | | | 4.63 | % | | | 4.12 | % |
| (1) | As money market returns respond rapidly to market changes, such as in the Fed Funds rate, the 7-Day yield is a more accurate reflection of current earnings than the total return for the year. Prior year 7-Day yield information is provided for comparative purposes. |
| (2) | The Tamarack Institutional Prime and Institutional Tax-Free Money Market Funds are intended for shareholders investing $1 million or more. |
| (3) | The Treasury Plus Money Market Fund commenced operations on September 1, 2006. |
Asset Allocation
Money Market Maturity Schedules
as a percentage of value of investments
| | | Prime
Money
Market
Fund | | | U.S.
Government
Money
Market Fund | | | Tax-Free
Money
Market Fund | | | Institutional
Prime Money
Market Fund | | | Institutional
Tax-Free
Money
Market Fund | | | Treasury
Plus Money
Market Fund | |
|---|
| | |
| | |
| | |
| | |
| | |
| | |
| |
| Less than 8 days | | | | | 10.5 | % | | | 21.6 | % | | | 80.9 | % | | | 10.8 | % | | | 79.5 | % | | | 100.0 | % |
| 8 to 14 Days | | | | | 9.3 | % | | | 9.2 | % | | | 1.0 | % | | | 12.3 | % | | | 0.0 | % | | | 0.0 | % |
| 15 to 30 Days | | | | | 30.0 | % | | | 19.8 | % | | | 0.0 | % | | | 23.2 | % | | | 0.0 | % | | | 0.0 | % |
| 31 to 180 Days | | | | | 42.6 | % | | | 40.3 | % | | | 14.3 | % | | | 46.4 | % | | | 16.7 | % | | | 0.0 | % |
| 181 to 365 Days | | | | | 7.6 | % | | | 9.1 | % | | | 3.8 | % | | | 7.3 | % | | | 3.0 | % | | | 0.0 | % |
| 366 to 397 Days | | | | | 0.0 | % | | | 0.0 | % | | | 0.0 | % | | | 0.0 | % | | | 0.8 | % | | | 0.0 | % |
An investment in a money market fund is not insured or guaranteed by the Federal Deposit Insurance Corporation or any other government agency. Although the funds seek to preserve the value of your investment at $1.00 per share, it is possible to lose money by investing in the funds.
6
Table of Contents
FINANCIAL STATEMENTS
Statements of Assets and Liabilities
March 31, 2007 (Unaudited)
| | | Tamarack
Prime
Money
Market Fund | | | Tamarack
U.S. Government
Money
Market Fund | | | Tamarack
Tax-Free
Money
Market Fund | | | Tamarack
Inst’l Prime
Money
Market Fund | | | Tamarack
Inst’l Tax-Free
Money
Market Fund | | | Tamarack
Treasury Plus
Money
Market Fund | |
|---|
| | |
| | |
| | |
| | |
| | |
| | |
| |
| Assets: | | | | | | | | | | | | | | | | | | | | | | | | | | |
| Investments, at value (cost $9,995,039,828; $804,159,444; $815,710,173 $1,609,854,245 and $485,212,440 and $2,031,453, respectively) | | | | $ | 9,995,039,828 | | | $ | 804,159,444 | * | | $ | 815,710,173 | | | $ | 1,609,854,245 | | | $ | 485,212,440 | | | $ | 2,031,453 | ** |
| Interest receivable | | | | | 42,959,587 | | | | 2,906,159 | | | | 4,607,628 | | | | 7,933,322 | | | | 2,814,858 | | | | 1,296 | |
| Cash | | | | | 1,181,550 | | | | — | | | | 1,025 | | | | — | | | | — | | | | — | |
| Receivable for capital shares issued | | | | | 1,584 | | | | 3 | | | | — | | | | — | | | | — | | | | — | |
| Receivable for investments sold | | | | | — | | | | — | | | | 34,520,000 | | | | — | | | | 24,000,000 | | | | — | |
| Receivable from advisor | | | | | — | | | | — | | | | — | | | | — | | | | — | | | | 14,837 | |
| Prepaid and other expenses | | | | | 276,380 | | | | 9,868 | | | | 23,987 | | | | 40,711 | | | | 13,704 | | | | 35,550 | |
| | |
| | |
| | |
| | |
| | |
| | |
| |
| Total Assets | | | | | 10,039,458,929 | | | | 807,075,474 | | | | 854,862,813 | | | | 1,617,828,278 | | | | 512,041,002 | | | | 2,083,136 | |
| | |
| | |
| | |
| | |
| | |
| | |
| |
| Liabilities: | | | | | | | | | | | | | | | | | | | | | | | | | | |
| Distributions payable | | | | | 2,450 | | | | — | | | | — | | | | 4 | | | | — | | | | — | |
| Payable for investments purchased | | | | | 293,900,000 | | | | — | | | | 1,665,227 | | | | 46,100,000 | | | | 5,490,074 | | | | — | |
| Accrued expenses and other payables: | | | | | | | | | | | | | | | | | | | | | | | | | | |
| Investment advisory fees | | | | | 2,803,681 | | | | 260,275 | | | | 269,321 | | | | 331,780 | | | | 106,273 | | | | — | |
| Administrative services fees | | | | | 2,075,140 | | | | 170,745 | | | | 186,370 | | | | — | | | | — | | | | — | |
| Other | | | | | 1,469,105 | | | | 112,413 | | | | 81,819 | | | | 55,415 | | | | 27,790 | | | | 23,151 | |
| | |
| | |
| | |
| | |
| | |
| | |
| |
| Total Liabilities | | | | | 300,250,376 | | | | 543,433 | | | | 2,202,737 | | | | 46,487,199 | | | | 5,624,137 | | | | 23,151 | |
| | |
| | |
| | |
| | |
| | |
| | |
| |
| Net Assets | | | | $ | 9,739,208,553 | | | $ | 806,532,041 | | | $ | 852,660,076 | | | $ | 1,571,341,079 | | | $ | 506,416,865 | | | $ | 2,059,985 | |
| | |
| | |
| | |
| | |
| | |
| | |
| |
| Net Assets Consist Of: | | | | | | | | | | | | | | | | | | | | | | | | | | |
| Capital | | | | $ | 9,739,306,892 | | | $ | 806,535,776 | | | $ | 852,663,335 | | | $ | 1,571,440,512 | | | $ | 506,419,264 | | | $ | 2,059,799 | |
| Undistributed (distributions in excess of) net investment income | | | | | — | | | | — | | | | — | | | | — | | | | — | | | | 186 | |
| Accumulated net realized gains (losses) from investment transactions | | | | | (98,339 | ) | | | (3,735 | ) | | | (3,259 | ) | | | (99,433 | ) | | | (2,399 | ) | | | — | |
| | |
| | |
| | |
| | |
| | |
| | |
| |
| Net Assets | | | | $ | 9,739,208,553 | | | $ | 806,532,041 | | | $ | 852,660,076 | | | $ | 1,571,341,079 | | | $ | 506,416,865 | | | $ | 2,059,985 | |
| | |
| | |
| | |
| | |
| | |
| | |
| |
| Shares Outstanding (Unlimited number of shares authorized, no par value): | | | | | 9,739,421,191 | | | | 806,569,919 | | | | 852,711,440 | | | | 1,571,448,929 | | | | 506,419,264 | | | | 2,059,799 | |
| Net Asset Values: | | | | $ | 1.00 | | | $ | 1.00 | | | $ | 1.00 | | | $ | 1.00 | | | $ | 1.00 | | | $ | 1.00 | |
| | |
| | |
| | |
| | |
| | |
| | |
| |
* $225,000,000 of which is repurchase agreements. See the Schedule of Portfolio Investments for details.
** $2,000,000 of which is repurchase agreements. See the Schedule of Portfolio Investments for details.
See notes to financial statements.
7
Table of Contents
FINANCIAL STATEMENTS
Statements of Operations
For the Six Months Ended March 31, 2007 (Unaudited)
| | | Tamarack
Prime Money
Market Fund | | | Tamarack
U.S. Government
Money
Market Fund | | | Tamarack
Tax-Free Money
Market Fund | | | Tamarack
Institutional
Prime Money
Market Fund | | | Tamarack
Institutional
Tax-Free Money
Market Fund | | | Tamarack
Treasury Plus
Money
Market Fund | |
|---|
| | |
| | |
| | |
| | |
| | |
| | |
| |
| Investment Income: | | | | | | | | | | | | | | | | | | | | | | | | | | |
| Interest income | | | | $ | 251,211,295 | | | $ | 20,623,524 | | | $ | 15,177,350 | | | $ | 39,034,221 | | | $ | 8,343,235 | | | $ | 53,584 | |
| Dividend income | | | | | 179,588 | | | | 94,768 | | | | 37,507 | | | | 115,368 | | | | 36,740 | | | | — | |
| Securities lending income (a) | | | | | 276 | | | | — | | | | — | | | | 151 | | | | — | | | | — | |
| | |
| | |
| | |
| | |
| | |
| | |
| |
| Total Investment Income | | | | | 251,391,159 | | | | 20,718,292 | | | | 15,214,857 | | | | 39,149,740 | | | | 8,379,975 | | | | 53,584 | |
| | |
| | |
| | |
| | |
| | |
| | |
| |
| Expenses: | | | | | | | | | | | | | | | | | | | | | | | | | | |
| Investment advisory fees | | | | | 19,707,749 | | | | 1,518,226 | | | | 2,122,348 | | | | 1,825,863 | | | | 583,542 | | | | 1,518 | |
| Administrative services fees | | | | | 11,709,614 | | | | 995,407 | | | | 1,061,174 | | | | — | | | | — | | | | — | |
| Accounting fees | | | | | 68,524 | | | | 8,752 | | | | 11,277 | | | | 13,702 | | | | 8,168 | | | | 2,289 | |
| Custodian fees | | | | | 57,612 | | | | 5,152 | | | | 5,161 | | | | 9,900 | | | | 3,323 | | | | 1,178 | |
| Insurance fees | | | | | 31,178 | | | | 3,176 | | | | 3,108 | | | | 4,798 | | | | 1,679 | | | | 4,005 | |
| Legal and Audit fees | | | | | 245,742 | | | | 34,388 | | | | 34,211 | | | | 45,917 | | | | 20,360 | | | | 21,961 | |
| Registration and filing fees | | | | | 181,975 | | | | 33,368 | | | | 38,961 | | | | 31,003 | | | | 29,042 | | | | 12,143 | |
| Shareholder reports | | | | | 583,290 | | | | 27,843 | | | | 18,792 | | | | 2,597 | | | | 869 | | | | 737 | |
| Transfer agent fees | | | | | 7,526,496 | | | | 352,180 | | | | 232,555 | | | | 29,952 | | | | 10,896 | | | | 1,981 | |
| Trustees’ fees | | | | | 21,833 | | | | 10,405 | | | | 10,472 | | | | 11,164 | | | | 9,916 | | | | 8,991 | |
| Other fees | | | | | 1,679,419 | | | | 100,355 | | | | 57,645 | | | | 24,867 | | | | 8,940 | | | | 10,407 | |
| | |
| | |
| | |
| | |
| | |
| | |
| |
| Total expenses before fee | | | | | | | | | | | | | | | | | | | | | | | | | | |
| reductions | | | | | 41,813,432 | | | | 3,089,252 | | | | 3,595,704 | | | | 1,999,763 | | | | 676,735 | | | | 65,210 | |
| Expenses reduced by: | | | | | | | | | | | | | | | | | | | | | | | | | | |
| Advisor | | | | | (4,341,874 | ) | | | — | | | | (624,306 | ) | | | — | | | | — | | | | (63,196 | ) |
| | |
| | |
| | |
| | |
| | |
| | |
| |
| Net Expenses | | | | | 37,471,558 | | | | 3,089,252 | | | | 2,971,398 | | | | 1,999,763 | | | | 676,735 | | | | 2,014 | |
| | |
| | |
| | |
| | |
| | |
| | |
| |
| Net Investment Income | | | | | 213,919,601 | | | | 17,629,040 | | | | 12,243,459 | | | | 37,149,977 | | | | 7,703,240 | | | | 51,570 | |
| | |
| | |
| | |
| | |
| | |
| | |
| |
| Realized/Unrealized Gains (Losses) from Investments: | | | | | | | | | | | | | | | | | | | | | | | | | | |
| Net realized/unrealized gains (losses) from investment transactions | | | | | (882 | ) | | | 9 | | | | (1,602 | ) | | | (12,058 | ) | | | — | | | | — | |
| | |
| | |
| | |
| | |
| | |
| | |
| |
| Change in net assets resulting from operations | | | | $ | 213,918,719 | | | $ | 17,629,049 | | | $ | 12,241,857 | | | $ | 37,137,919 | | | $ | 7,703,240 | | | $ | 51,570 | |
| | |
| | |
| | |
| | |
| | |
| | |
| |
| (a) | For more information on Securities Lending, please see Note 2 in the Notes to Financial Statements. |
See notes to financial statements.
8
Table of Contents
FINANCIAL STATEMENTS
Statements of Changes in Net Assets
Tamarack Prime Money Market Fund
| | | For the
Six Months Ended
March 31, 2007 | | | For the
Year Ended
September 30, 2006 | |
|---|
| | |
| | |
| |
| | | (Unaudited) | | | | |
|---|
| From Investment Activities: | | | | | | | | | | |
| Operations: | | | | | | | | | | |
| Net investment income (loss) | | | | $ | 213,919,601 | | | $ | 324,673,988 | |
| Net realized gains (losses) from investment transactions | | | | | (882 | ) | | | (54,064 | ) |
| | |
| | |
| |
| Change in net assets resulting from operations | | | | | 213,918,719 | | | | 324,619,924 | |
| | |
| | |
| |
| Distributions to Shareholders: | | | | | | | | | | |
| From net investment income | | | | | (213,919,601 | ) | | | (324,673,988 | ) |
| | |
| | |
| |
| Change in net assets resulting from shareholder distributions | | | | | (213,919,601 | ) | | | (324,673,988 | ) |
| | |
| | |
| |
| Capital Transactions: | | | | | | | | | | |
| Proceeds from shares issued | | | | | 2,757,639,055 | | | | 3,908,947,445 | |
| Dividends reinvested | | | | | 213,902,740 | | | | 343,299,003 | |
| Cost of shares redeemed | | | | | (1,917,791,577 | ) | | | (3,488,432,901 | ) |
| | |
| | |
| |
| Change in net assets resulting from capital transactions | | | | | 1,053,750,218 | | | | 763,813,547 | |
| | |
| | |
| |
| Net increase (decrease) in net assets | | | | | 1,053,749,336 | | | | 763,759,483 | |
| Net Assets: | | | | | | | | | | |
| Beginning of period | | | | | 8,685,459,217 | | | | 7,921,699,734 | |
| | |
| | |
| |
| End of period | | | | $ | 9,739,208,553 | | | $ | 8,685,459,217 | |
| | |
| | |
| |
| Share Transactions: | | | | | | | | | | |
| Issued | | | | | 2,757,640,966 | | | | 3,908,951,713 | |
| Reinvested | | | | | 213,902,740 | | | | 343,299,003 | |
| Redeemed | | | | | (1,917,804,819 | ) | | | (3,488,432,900 | ) |
| | |
| | |
| |
| Change in shares resulting from capital transactions | | | | | 1,053,738,887 | | | | 763,817,816 | |
| | |
| | |
| |
See notes to financial statements.
9
Table of Contents
FINANCIAL STATEMENTS
Statements of Changes in Net Assets (cont.)
Tamarack U.S. Government Money Market Fund
| | | For the
Six Months Ended
March 31, 2007 | | | For the
Year Ended
September 30, 2006 | |
|---|
| | |
| | |
| |
| | | (Unaudited) | | | | |
|---|
| From Investment Activities: | | | | | | | | | | |
| Operations: | | | | | | | | | | |
| Net investment income (loss) | | | | $ | 17,629,040 | | | $ | 30,836,810 | |
| Net realized gains (losses) from investment transactions | | | | | 9 | | | | (463 | ) |
| | |
| | |
| |
| Change in net assets resulting from operations | | | | | 17,629,049 | | | | 30,836,347 | |
| | |
| | |
| |
| Distributions to Shareholders: | | | | | | | | | | |
| From net investment income | | | | | (17,629,041 | ) | | | (30,836,773 | ) |
| | |
| | |
| |
| Change in net assets resulting from shareholder distributions | | | | | (17,629,041 | ) | | | (30,836,773 | ) |
| | |
| | |
| |
| Capital Transactions: | | | | | | | | | | |
| Proceeds from shares issued | | | | | 301,250,335 | | | | 667,724,063 | |
| Dividends reinvested | | | | | 17,630,704 | | | | 32,770,551 | |
| Cost of shares redeemed | | | | | (260,887,762 | ) | | | (765,099,028 | ) |
| | |
| | |
| |
| Change in net assets resulting from capital transactions | | | | | 57,993,277 | | | | (64,604,414 | ) |
| | |
| | |
| |
| Net increase (decrease) in net assets | | | | | 57,993,285 | | | | (64,604,840 | ) |
| Net Assets: | | | | | | | | | | |
| Beginning of period | | | | | 748,538,756 | | | | 813,143,596 | |
| | |
| | |
| |
| End of period | | | | $ | 806,532,041 | | | $ | 748,538,756 | |
| | |
| | |
| |
| Undistributed (distributions in excess of) net investment income | | | | $ | — | | | $ | 1 | |
| | |
| | |
| |
| Share Transactions: | | | | | | | | | | |
| Issued | | | | | 301,250,335 | | | | 667,724,063 | |
| Reinvested | | | | | 17,630,704 | | | | 32,770,551 | |
| Redeemed | | | | | (260,887,762 | ) | | | (765,099,028 | ) |
| | |
| | |
| |
| Change in shares resulting from capital transactions | | | | | 57,993,277 | | | | (64,604,414 | ) |
| | |
| | |
| |
See notes to financial statements.
10
Table of Contents
FINANCIAL STATEMENTS
Statements of Changes in Net Assets (cont.)
Tamarack Tax-Free Money Market Fund
| | | | | |
|---|
| | | For the
Six Months Ended
March 31, 2007 | | | For the
Year Ended
September 30, 2006 | |
|---|
| | |
| | |
| |
| | | (Unaudited) | | | | |
|---|
| From Investment Activities: | | | | | | | | | | |
| Operations: | | | | | | | | | | |
| Net investment income (loss) | | | | $ | 12,243,459 | | | $ | 20,891,888 | |
| Net realized gains (losses) from investment transactions | | | | | (1,602 | ) | | | — | |
| | |
| | |
| |
| Change in net assets resulting from operations | | | | | 12,241,857 | | | | 20,891,888 | |
| | |
| | |
| |
| Distributions to Shareholders: | | | | | | | | | | |
| From net investment income | | | | | (12,243,460 | ) | | | (20,891,888 | ) |
| | |
| | |
| |
| Change in net assets resulting from shareholder distributions | | | | | (12,243,460 | ) | | | (20,891,888 | ) |
| | |
| | |
| |
| Capital Transactions: | | | | | | | | | | |
| Proceeds from shares issued | | | | | 584,560,766 | | | | 889,498,350 | |
| Dividends reinvested | | | | | 12,243,460 | | | | 22,254,085 | |
| Cost of shares redeemed | | | | | (534,884,401 | ) | | | (979,050,888 | ) |
| | |
| | |
| |
| Change in net assets resulting from capital transactions | | | | | 61,919,825 | | | | (67,298,453 | ) |
| | |
| | |
| |
| Net increase (decrease) in net assets | | | | | 61,918,222 | | | | (67,298,453 | ) |
| Net Assets: | | | | | | | | | | |
| Beginning of period | | | | | 790,741,854 | | | | 858,040,307 | |
| | |
| | |
| |
| End of period | | | | $ | 852,660,076 | | | $ | 790,741,854 | |
| | |
| | |
| |
| Undistributed (distributions in excess of) net investment income | | | | $ | — | | | $ | 1 | |
| | |
| | |
| |
| Share Transactions: | | | | | | | | | | |
| Issued | | | | | 584,560,766 | | | | 889,498,114 | |
| Reinvested | | | | | 12,243,460 | | | | 22,254,085 | |
| Redeemed | | | | | (534,884,401 | ) | | | (979,050,888 | ) |
| | |
| | |
| |
| Change in shares resulting from capital transactions | | | | | 61,919,825 | | | | (67,298,689 | ) |
| | |
| | |
| |
See notes to financial statements.
11
Table of Contents
FINANCIAL STATEMENTS
Statements of Changes in Net Assets (cont.)
Tamarack Institutional Prime Money Market Fund
| | | For the
Six Months Ended
March 31, 2007 | | | For the
Year Ended
September 30, 2006 | |
|---|
| | |
| | |
| |
| | | (Unaudited) | | | | |
|---|
| From Investment Activities: | | | | | | | | | | |
| Operations: | | | | | | | | | | |
| Net investment income (loss) | | | | $ | 37,149,977 | | | $ | 46,531,472 | |
| Net realized gains (losses) from investment transactions | | | | | (12,058 | ) | | | (39,584 | ) |
| | |
| | |
| |
| Change in net assets resulting from operations | | | | | 37,137,919 | | | | 46,491,888 | |
| | |
| | |
| |
| Distributions to Shareholders: | | | | | | | | | | |
| From net investment income | | | | | (37,149,976 | ) | | | (46,531,442 | ) |
| | |
| | |
| |
| Change in net assets resulting from shareholder distributions | | | | | (37,149,976 | ) | | | (46,531,442 | ) |
| | |
| | |
| |
| Capital Transactions: | | | | | | | | | | |
| Proceeds from shares issued | | | | | 1,466,047,170 | | | | 2,000,696,237 | |
| Dividends reinvested | | | | | 37,150,064 | | | | 48,677,945 | |
| Cost of shares redeemed | | | | | (1,130,495,592 | ) | | | (1,641,011,524 | ) |
| | |
| | |
| |
| Change in net assets resulting from capital transactions | | | | | 372,701,642 | | | | 408,362,658 | |
| | |
| | |
| |
| Net increase (decrease) in net assets | | | | | 372,689,585 | | | | 408,323,104 | |
| Net Assets: | | | | | | | | | | |
| Beginning of period | | | | | 1,198,651,494 | | | | 790,328,390 | |
| | |
| | |
| |
| End of period | | | | $ | 1,571,341,079 | | | $ | 1,198,651,494 | |
| | |
| | |
| |
| Undistributed (distributions in excess of) net investment income | | | | $ | — | | | $ | (1 | ) |
| | |
| | |
| |
| Share Transactions: | | | | | | | | | | |
| Issued | | | | | 1,466,047,170 | | | | 2,000,696,237 | |
| Reinvested | | | | | 37,150,064 | | | | 48,677,945 | |
| Redeemed | | | | | (1,130,495,592 | ) | | | (1,641,011,524 | ) |
| | |
| | |
| |
| Change in shares resulting from capital transactions | | | | | 372,701,642 | | | | 408,362,658 | |
| | |
| | |
| |
See notes to financial statements.
12
Table of Contents
FINANCIAL STATEMENTS
Statements of Changes in Net Assets (cont.)
Tamarack Institutional Tax-Free Money Market Fund
| | | For the
Six Months Ended
March 31, 2007 | | | For the
Year Ended
September 30, 2006 | |
|---|
| | |
| | |
| |
| | | (Unaudited) | | | | |
|---|
| From Investment Activities: | | | | | | | | | | |
| Operations: | | | | | | | | | | |
| Net investment income (loss) | | | | $ | 7,703,240 | | | $ | 12,324,486 | |
| Net realized gains (losses) from investment transactions | | | | | — | | | | (1,863 | ) |
| | |
| | |
| |
| Change in net assets resulting from operations | | | | | 7,703,240 | | | | 12,322,623 | |
| | |
| | |
| |
| Distributions to Shareholders: | | | | | | | | | | |
| From net investment income | | | | | (7,703,239 | ) | | | (12,324,471 | ) |
| | |
| | |
| |
| Change in net assets resulting from shareholder distributions | | | | | (7,703,239 | ) | | | (12,324,471 | ) |
| | |
| | |
| |
| Capital Transactions: | | | | | | | | | | |
| Proceeds from shares issued | | | | | 454,252,880 | | | | 687,094,998 | |
| Dividends reinvested | | | | | 7,703,450 | | | | 13,014,149 | |
| Cost of shares redeemed | | | | | (361,403,515 | ) | | | (652,320,543 | ) |
| | |
| | |
| |
| Change in net assets resulting from capital transactions | | | | | 100,552,815 | | | | 47,788,604 | |
| | |
| | |
| |
| Net increase (decrease) in net assets | | | | | 100,552,816 | | | | 47,786,756 | |
| Net Assets: | | | | | | | | | | |
| Beginning of period | | | | | 405,864,049 | | | | 358,077,293 | |
| | |
| | |
| |
| End of period | | | | $ | 506,416,865 | | | $ | 405,864,049 | |
| | |
| | |
| |
| Undistributed (distributions in excess of) net investment income | | | | $ | — | | | $ | (1 | ) |
| | |
| | |
| |
| Share Transactions: | | | | | | | | | | |
| Issued | | | | | 454,252,880 | | | | 687,094,998 | |
| Reinvested | | | | | 7,703,450 | | | | 13,014,149 | |
| Redeemed | | | | | (361,403,515 | ) | | | (652,320,543 | ) |
| | |
| | |
| |
| Change in shares resulting from capital transactions | | | | | 100,552,815 | | | | 47,788,604 | |
| | |
| | |
| |
See notes to financial statements.
13
Table of Contents
FINANCIAL STATEMENTS
Statements of Changes in Net Assets (cont.)
Tamarack Treasury Plus Money Market Fund
| | | For the
Six Months Ended
March 31, 2007 | | | For the Period
September 1, 2006
through
September 30, 2006 (a) | |
|---|
| | |
| | |
| |
| | | (Unaudited) | | | | |
|---|
| From Investment Activities: | | | | | | | | | | |
| Operations: | | | | | | | | | | |
| Net investment income (loss) | | | | $ | 51,570 | | | $ | 9,674 | |
| Net realized gains (losses) from investment transactions | | | | | — | | | | — | |
| | |
| | |
| |
| Change in net assets resulting from operations | | | | | 51,570 | | | | 9,674 | |
| | |
| | |
| |
| Distributions to Shareholders: | | | | | | | | | | |
| From net investment income | | | | | (51,384 | ) | | | (9,674 | ) |
| | |
| | |
| |
| Change in net assets resulting from shareholder distributions | | | | | (51,384 | ) | | | (9,674 | ) |
| | |
| | |
| |
| Capital Transactions: | | | | | | | | | | |
| Proceeds from shares issued | | | | | — | | | | 2,000,120 | |
| Dividends reinvested | | | | | 51,384 | | | | 8,396 | |
| Cost of shares redeemed | | | | | (101 | ) | | | — | |
| | |
| | |
| |
| Change in net assets resulting from capital transactions | | | | | 51,283 | | | | 2,008,516 | |
| | |
| | |
| |
| Net increase (decrease) in net assets | | | | | 51,469 | | | | 2,008,516 | |
| Net Assets: | | | | | | | | | | |
| Beginning of period | | | | | 2,008,516 | | | | — | |
| | |
| | |
| |
| End of period | | | | $ | 2,059,985 | | | $ | 2,008,516 | |
| | |
| | |
| |
| Undistributed (distributions in excess of) net investment income | | | | $ | 186 | | | $ | — | |
| | |
| | |
| |
| Share Transactions: | | | | | | | | | | |
| Issued | | | | | — | | | | 2,000,120 | |
| Reinvested | | | | | 51,384 | | | | 8,396 | |
| Redeemed | | | | | (101 | ) | | | — | |
| | |
| | |
| |
| Change in shares resulting from capital transactions | | | | | 51,283 | | | | 2,008,516 | |
| | |
| | |
| |
| (a) | For the period from September 1, 2006 (commencement of operations) to September 30, 2006. |
See notes to financial statements.
14
Table of Contents
FINANCIAL HIGHLIGHTS
Tamarack Prime Money Market Fund
(Selected data for a share outstanding throughout the periods indicated)
| | | | | | Investment Activities | | | Distributions | | | | | | | | | Ratios/Supplemental Data | | |
|---|
| | | | | |
| | |
| | | | | | | | |
| | |
| | | Net Asset
Value,
Beginning
of Period | | | Net
Investment
Income | | | Total from
Investment
Activities | | | Net
Investment
Income | | | Total
Distributions | | | Net Asset
Value,
End of
Period | | | Total
Return | | | Net Assets,
End of Period
(millions) | | | Ratio of Net
Expenses to
Average
Net Assets | | | Ratio of Net
Investment
Income
to Average
Net Assets | | | Ratio of
Expenses to
Average
Net Assets* | | | Ratio of Net
Investment
Income
to Average
Net Assets* | |
|---|
| | |
| | |
| | |
| | |
| | |
| | |
| | |
| | |
| | |
| | |
| | |
| | |
| |
| Six Months Ended March 31, 2007 (Unaudited) | | | | $ | 1.00 | | | | 0.02 | | | | 0.02 | | | | (0.02) | | | | (0.02) | | | $ | 1.00 | | | | 2.30% | (b) | | $ | 9,739 | | | | 0.80% | (c) | | | 4.57% | (c) | | | 0.89% | (c) | | | 4.47% | (c) |
| Year Ended September 30, 2006 | | | | | 1.00 | | | | 0.04 | | | | 0.04 | | | | (0.04) | | | | (0.04) | | | | 1.00 | | | | 3.99% | | | | 8,685 | | | | 0.80% | | | | 3.93% | | | | 0.92% | | | | 3.82% | |
| Year Ended September 30, 2005 | | | | | 1.00 | | | | 0.02 | | | | 0.02 | | | | (0.02) | | | | (0.02) | | | | 1.00 | | | | 2.00% | | | | 7,922 | | | | 0.76% | | | | 1.97% | | | | 0.92% | | | | 1.81% | |
| Period Ended September 30, 2004 (d) | | | | | 1.00 | | | | | (a) | | | | (a) | | | | (a) | | | | (a) | | | 1.00 | | | | 0.14% | (b) | | | 7,885 | | | | 0.71% | (c) | | | 0.83% | (c) | | | 0.93% | (c) | | | 0.61% | (c) |
| Year Ended July 31, 2004 | | | | | 1.00 | | | | | (a) | | | | (a) | | | | (a) | | | | (a) | | | 1.00 | | | | 0.42% | | | | 7,860 | | | | 0.71% | | | | 0.42% | | | | 0.90% | | | | 0.24% | |
| Year Ended July 31, 2003 | | | | | 1.00 | | | | 0.01 | | | | 0.01 | | | | (0.01) | | | | (0.01) | | | | 1.00 | | | | 0.80% | | | | 8,111 | | | | 0.71% | | | | 0.80% | | | | 0.90% | | | | 0.61% | |
| Year Ended July 31, 2002 | | | | | 1.00 | | | | 0.02 | | | | 0.02 | | | | (0.02) | | | | (0.02) | | | | 1.00 | | | | 1.70% | | | | 8,524 | | | | 0.69% | | | | 1.66% | | | | 0.73% | | | | 1.61% | |
* During the period, certain fees were contractually or voluntarily reduced. If such contractual/voluntary fee reductions had not occurred, the ratio would have been as indicated.
| (a) | Less than $0.01 or $(0.01) per share. |
| (b) | Not Annualized. |
| (c) | Annualized. |
| (d) | For the period from August 1, 2004 to September 30, 2004. |
See notes to financial statements.
15
Table of Contents
FINANCIAL HIGHLIGHTS
Tamarack U.S. Government Money Market Fund
(Selected data for a share outstanding throughout the periods indicated)
| | | | | | Investment Activities | | | Distributions | | | | | | | | | Ratios/Supplemental Data | | |
|---|
| | | | | |
| | |
| | | | | | | | |
| | |
| | | Net Asset
Value,
Beginning
of Period | | | Net
Investment
Income | | | Total from
Investment
Activities | | | Net
Investment
Income | | | Total
Distributions | | | Net Asset
Value,
End of
Period | | | Total
Return | | | Net Assets,
End of Period
(millions) | | | Ratio of Net
Expenses to
Average
Net Assets | | | Ratio of Net
Investment
Income
to Average
Net Assets | | | Ratio of
Expenses to
Average
Net Assets* | | | Ratio of
Investment
Income
to Average
Net Assets* | |
|---|
| | |
| | |
| | |
| | |
| | |
| | |
| | |
| | |
| | |
| | |
| | |
| | |
| |
| Six Months Ended March 31, 2007 (Unaudited) | | | | $ | 1.00 | | | | 0.02 | | | | 0.02 | | | | (0.02) | | | | (0.02) | | | $ | 1.00 | | | | 2.23% | (c) | | $ | 807 | | | | 0.78% | (d) | | | 4.43% | (d) | | | | (b) | | | | (b) |
| Year Ended September 30, 2006 | | | | | 1.00 | | | | 0.04 | | | | 0.04 | | | | (0.04) | | | | (0.04) | | | | 1.00 | | | | 3.90% | | | | 749 | | | | 0.78% | | | | 3.82% | | | | | (b) | | | | (b) |
| Year Ended September 30, 2005 | | | | | 1.00 | | | | 0.02 | | | | 0.02 | | | | (0.02) | | | | (0.02) | | | | 1.00 | | | | 1.96% | | | | 813 | | | | 0.74% | | | | 1.92% | | | | 0.77% | | | | 1.89% | |
| Period Ended September 30, 2004 (e) | | | | | 1.00 | | | | | (a) | | | | (a) | | | | (a) | | | | (a) | | | 1.00 | | | | 0.14% | (c) | | | 947 | | | | 0.71% | (d) | | | 0.81% | (d) | | | 0.79% | (d) | | | 0.73% | (d) |
| Year Ended July 31, 2004 | | | | | 1.00 | | | | | (a) | | | | (a) | | | | (a) | | | | (a) | | | 1.00 | | | | 0.38% | | | | 929 | | | | 0.71% | | | | 0.38% | | | | 0.73% | | | | 0.36% | |
| Year Ended July 31, 2003 | | | | | 1.00 | | | | 0.01 | | | | 0.01 | | | | (0.01) | | | | (0.01) | | | | 1.00 | | | | 0.70% | | | | 1,060 | | | | 0.71% | | | | 0.70% | | | | 0.75% | | | | 0.66% | |
| Year Ended July 31, 2002 | | | | | 1.00 | | | | 0.02 | | | | 0.02 | | | | (0.02) | | | | (0.02) | | | | 1.00 | | | | 1.60% | | | | 1,088 | | | | 0.57% | | | | 1.60% | | | | 0.59% | | | | 1.58% | |
* During the period, certain fees were contractually or voluntarily reduced. If such contractual/voluntary fee reductions had not occurred, the ratio would have been as indicated.
| (a) | Less than $0.01 or $(0.01) per share. |
| (b) | There were no waivers or reimbursements during the period. |
| (c) | Not Annualized. |
| (d) | Annualized. |
| (e) | For the period from August 1, 2004 to September 30, 2004. |
See notes to financial statements.
16
Table of Contents
FINANCIAL HIGHLIGHTS
Tamarack Tax-Free Money Market Fund
(Selected data for a share outstanding throughout the periods indicated)
| | | | | | Investment Activities | | | Distributions | | | | | | | | | Ratios/Supplemental Data | | |
|---|
| | | | | |
| | |
| | | | | | | | |
| | |
| | | Net Asset
Value,
Beginning
of Period | | | Net
Investment
Income | | | Total from
Investment
Activities | | | Net
Investment
Income | | | Total
Distributions | | | Net Asset
Value,
End of
Period | | | Total
Return | | | Net Assets,
End of Period
(millions) | | | Ratio of Net
Expenses to
Average
Net Assets | | | Ratio of Net
Investment
Income
to Average
Net Assets | | | Ratio of
Expenses to
Average
Net Assets* | | | Ratio of
Investment
Income
to Average
Net Assets* | |
|---|
| | |
| | |
| | |
| | |
| | |
| | |
| | |
| | |
| | |
| | |
| | |
| | |
| |
| Six Months Ended March 31, 2007 (Unaudited) | | | | $ | 1.00 | | | | 0.01 | | | | 0.01 | | | | (0.01) | | | | (0.01) | | | $ | 1.00 | | | | 1.45% | (b) | | $ | 853 | | | | 0.70% | (c) | | | 2.88% | (c) | | | 0.85% | (c) | | | 2.74% | (c) |
| Year Ended September 30, 2006 | | | | | 1.00 | | | | 0.02 | | | | 0.02 | | | | (0.02) | | | | (0.02) | | | | 1.00 | | | | 2.52% | | | | 791 | | | | 0.70% | | | | 2.49% | | | | 0.85% | | | | 2.33% | |
| Year Ended September 30, 2005 | | | | | 1.00 | | | | 0.01 | | | | 0.01 | | | | (0.01) | | | | (0.01) | | | | 1.00 | | | | 1.44% | | | | 858 | | | | 0.66% | | | | 1.41% | | | | 0.83% | | | | 1.24% | |
| Period Ended September 30, 2004 (d) | | | | | 1.00 | | | | | (a) | | | | (a) | | | | (a) | | | | (a) | | | 1.00 | | | | 0.11% | (b) | | | 965 | | | | 0.62% | (c) | | | 0.64% | (c) | | | 0.83% | (c) | | | 0.43% | (c) |
| Year Ended July 31, 2004 | | | | | 1.00 | | | | | (a) | | | | (a) | | | | (a) | | | | (a) | | | 1.00 | | | | 0.38% | | | | 1,003 | | | | 0.62% | | | | 0.38% | | | | 0.86% | | | | 0.14% | |
| Year Ended July 31, 2003 | | | | | 1.00 | | | | 0.01 | | | | 0.01 | | | | (0.01) | | | | (0.01) | | | | 1.00 | | | | 0.60% | | | | 946 | | | | 0.62% | | | | 0.62% | | | | 0.85% | | | | 0.39% | |
| Year Ended July 31, 2002 | | | | | 1.00 | | | | 0.01 | | | | 0.01 | | | | (0.01) | | | | (0.01) | | | | 1.00 | | | | 1.10% | | | | 909 | | | | 0.59% | | | | 1.08% | | | | 0.65% | | | | 1.03% | |
* During the period, certain fees were contractually or voluntarily reduced. If such contractual/voluntary fee reductions had not occurred, the ratio would have been as indicated.
| (a) | Less than $0.01 or $(0.01) per share. |
| (b) | Not Annualized. |
| (c) | Annualized. |
| (d) | For the period from August 1, 2004 to September 30, 2004. |
See notes to financial statements.
17
Table of Contents
FINANCIAL HIGHLIGHTS
Tamarack Institutional Prime Money Market Fund
(Selected data for a share outstanding throughout the periods indicated)
| | | | | | Investment Activities | | | Distributions | | | | | | | | | Ratios/Supplemental Data | | |
|---|
| | | | | |
| | |
| | | | | | | | |
| | |
| | | Net Asset
Value,
Beginning
of Period | | | Net
Investment
Income | | | Total from
Investment
Activities | | | Net
Investment
Income | | | Total
Distributions | | | Net Asset
Value,
End of
Period | | | Total
Return | | | Net Assets,
End of Period
(millions) | | | Ratio of Net
Expenses to
Average
Net Assets | | | Ratio of Net
Investment
Income
to Average
Net Assets | |
|---|
| | |
| | |
| | |
| | |
| | |
| | |
| | |
| | |
| | |
| | |
| |
| Six Months Ended March 31, 2007 (Unaudited) | | | | $ | 1.00 | | | | 0.03 | | | | 0.03 | | | | (0.03) | | | | (0.03) | | | $ | 1.00 | | | | 2.56% | (b) | | $ | 1,571 | | | | 0.27% | (c) | | | 5.09% | (c) |
| Year Ended September 30, 2006 | | | | | 1.00 | | | | 0.04 | | | | 0.04 | | | | (0.04) | | | | (0.04) | | | | 1.00 | | | | 4.53% | | | | 1,199 | | | | 0.28% | | | | 4.51% | |
| Year Ended September 30, 2005 | | | | | 1.00 | | | | 0.02 | | | | 0.02 | | | | (0.02) | | | | (0.02) | | | | 1.00 | | | | 2.48% | | | | 790 | | | | 0.28% | | | | 2.47% | |
| Period Ended September 30, 2004 (d) | | | | | 1.00 | | | | | (a) | | | | (a) | | | | (a) | | | | (a) | | | 1.00 | | | | 0.21% | (b) | | | 643 | | | | 0.29% | (c) | | | 1.26% | (c) |
| Year Ended July 31, 2004 | | | | | 1.00 | | | | 0.01 | | | | 0.01 | | | | (0.01) | | | | (0.01) | | | | 1.00 | | | | 0.85% | | | | 656 | | | | 0.29% | | | | 0.85% | |
| Year Ended July 31, 2003 | | | | | 1.00 | | | | 0.01 | | | | 0.01 | | | | (0.01) | | | | (0.01) | | | | 1.00 | | | | 1.20% | | | | 503 | | | | 0.30% | | | | 1.20% | |
| Year Ended July 31, 2002 | | | | | 1.00 | | | | 0.02 | | | | 0.02 | | | | (0.02) | | | | (0.02) | | | | 1.00 | | | | 2.20% | | | | 449 | | | | 0.30% | | | | 2.17% | |
| (a) | Less than $0.01 or $(0.01) per share. |
| (b) | Not Annualized. |
| (c) | Annualized. |
| (d) | For the period from August 1, 2004 to September 30, 2004. |
See notes to financial statements.
18
Table of Contents
FINANCIAL HIGHLIGHTS
Tamarack Institutional Tax-Free Money Market Fund
(Selected data for a share outstanding throughout the periods indicated)
| | | | | | Investment Activities | | | Distributions | | | | | | | | | Ratios/Supplemental Data | | |
|---|
| | | | | |
| | |
| | | | | | | | |
| | |
| | | Net Asset
Value,
Beginning
of Period | | | Net
Investment
Income | | | Total from
Investment
Activities | | | Net
Investment
Income | | | Total
Distributions | | | Net Asset
Value,
End of
Period | | | Total
Return | | | Net Assets,
End of Period
(millions) | | | Ratio of Net
Expenses to
Average
Net Assets | | | Ratio of Net
Investment
Income
to Average
Net Assets | |
|---|
| | |
| | |
| | |
| | |
| | |
| | |
| | |
| | |
| | |
| | |
| |
| Six Months Ended March 31, 2007 (Unaudited) | | | | $ | 1.00 | | | | 0.02 | | | | 0.02 | | | | (0.02 | ) | | | (0.02 | ) | | $ | 1.00 | | | | 1.66 | %(b) | | $ | 506 | | | | 0.29 | %(c) | | | 3.30 | %(c) |
| Year Ended September 30, 2006 | | | | | 1.00 | | | | 0.03 | | | | 0.03 | | | | (0.03 | ) | | | (0.03 | ) | | | 1.00 | | | | 2.94 | % | | | 406 | | | | 0.30 | % | | | 2.91 | % |
| Year Ended September 30, 2005 | | | | | 1.00 | | | | 0.02 | | | | 0.02 | | | | (0.02 | ) | | | (0.02 | ) | | | 1.00 | | | | 1.78 | % | | | 358 | | | | 0.28 | % | | | 1.79 | % |
| Period Ended September 30, 2004 (d) | | | | | 1.00 | | | | (a | ) | | | (a | ) | | | (a | ) | | | (a | ) | | | 1.00 | | | | 0.16 | %(b) | | | 387 | | | | 0.30 | %(c) | | | 0.98 | %(c) |
| Year Ended July 31, 2004 | | | | | 1.00 | | | | 0.01 | | | | 0.01 | | | | (0.01 | ) | | | (0.01 | ) | | | 1.00 | | | | 0.72 | % | | | 355 | | | | 0.32 | % | | | 0.72 | % |
| Year Ended July 31, 2003 | | | | | 1.00 | | | | 0.01 | | | | 0.01 | | | | (0.01 | ) | | | (0.01 | ) | | | 1.00 | | | | 0.90 | % | | | 244 | | | | 0.33 | % | | | 0.90 | % |
| Year Ended July 31, 2002 | | | | | 1.00 | | | | 0.01 | | | | 0.01 | | | | (0.01 | ) | | | (0.01 | ) | | | 1.00 | | | | 1.40 | % | | | 193 | | | | 0.36 | % | | | 1.42 | % |
| (a) | Less than $0.01 or $(0.01) per share. |
| (b) | Not Annualized. |
| (c) | Annualized. |
| (d) | For the period from August 1, 2004 to September 30, 2004. |
See notes to financial statements.
19
Table of Contents
FINANCIAL HIGHLIGHTS
Tamarack Treasury Plus Money Market Fund
(Selected data for a share outstanding throughout the periods indicated)
| | | | | | Investment Activities | | | Distributions | | | | | | | | | Ratios/Supplemental Data | | |
|---|
| | | | | |
| | |
| | | | | | | | |
| | |
| | | Net Asset
Value,
Beginning
of Period | | | Net
Investment
Income | | | Total from
Investment
Activities | | | Net
Investment
Income | | | Total
Distributions | | | Net Asset
Value,
End of
Period | | | Total
Return | | | Net Assets,
End of Period
(millions) | | | Ratio of Net
Expenses to
Average
Net Assets | | | Ratio of Net
Investment
Income
to Average
Net Assets | | | Ratio of
Expenses to
Average
Net Assets* | | | Ratio of Net
Investment
Income
to Average
Net Assets* | |
|---|
| | |
| | |
| | |
| | |
| | |
| | |
| | |
| | |
| | |
| | |
| | |
| | |
| |
| Six Months Ended March 31, 2007 (Unaudited) | | | | $ | 1.00 | | | | 0.03 | | | | 0.03 | | | | (0.03) | | | | (0.03) | | | $ | 1.00 | | | | 2.57% | (b) | | $ | 2 | | | | 0.20% | (c) | | | 5.09% | (c) | | | 6.44% | (c) | | | (1.15%)(c) | |
| Year Ended September 30, 2006 (d) | | | | | 1.00 | | | | | (a) | | | | (a) | | | | (a) | | | | (a) | | | 1.00 | | | | 0.50% | (b) | | | 2 | | | | 0.15% | (c) | | | 5.88% | (c) | | | 11.14% | (c) | | | (5.10%)(c) | |
* During the period, certain fees were contractually or voluntarily reduced. If such contractual/voluntary fee reductions had not occurred, the ratio would have been as indicated.
| (a) | Less than $0.01 or $(0.01) per share. |
| (b) | Not Annualized. |
| (c) | Annualized. |
| (d) | For the period from September 1, 2006 (commencement of operations) to September 30, 2006. |
See notes to financial statements.
20
Table of Contents
NOTES TO FINANCIAL STATEMENTS
March 31, 2007 (Unaudited)
1. Organization
Tamarack Funds Trust (“Tamarack”) is registered under the Investment Company Act of 1940 (as amended) as an open-end management investment company. Tamarack was organized as a Delaware statutory trust on December 16, 2003. Predecessor funds to Tamarack were reorganized as portfolios of Tamarack effective April 16, 2004. This semi-annual report includes the following six investment portfolios (“Funds”):
- Tamarack Prime Money Market Fund (“Prime Money Market Fund”)
- Tamarack U.S. Government Money Market Fund (“U.S. Government Money Market Fund”)
- Tamarack Tax-Free Money Market Fund (“Tax-Free Money Market Fund”)
- Tamarack Institutional Prime Money Market Fund (“Institutional Prime Money Market Fund”)
- Tamarack Institutional Tax-Free Money Market Fund (“Institutional Tax-Free Money Market Fund”)
- Tamarack Treasury Plus Money Market Fund (“Treasury Plus Money Market Fund”)
Voyageur Asset Management Inc. (“Voyageur”) acts as the investment advisor for Tamarack. The officers of Tamarack (“Fund Management”) are also employees of Voyageur or its affiliates.
2. Significant Accounting Policies
Summarized below are the significant accounting policies of the Funds. These policies conform to accounting principles generally accepted in the United States of America (“GAAP”). Fund management follows these policies when preparing financial statements. Management may also be required to make estimates and assumptions that affect the reported amounts of assets and liabilities at the date of the financial statements and the reported amounts of income and expenses for the period. Actual results could differ from those estimates.
New Accounting Standard:
In September 2006, the Financial Accounting Standards Board (FASB) issued Statement on Financial Accounting Standards (SFAS) No. 157, “Fair Value Measurements.” This standard establishes a single authoritative definition of fair value, sets out a framework for measuring fair value and requires additional disclosures about fair value measurements. SFAS No. 157 applies to fair value measurements already required or permitted by existing standards. SFAS No. 157 is effective for financial statements issued for fiscal years beginning after November 15, 2007 and interim periods within those fiscal years. The changes to current generally accepted accounting principles from the application of this Statement relate to the definition of fair value, the methods used to measure fair value, and the expanded disclosures about fair value measurements. The Funds do not believe the adoption of SFAS No. 157 will impact the financial statement amounts, however, additional disclosures may be required about the inputs used to develop the measurements and the effect of certain of the measurements on changes in net assets for the period.
Security Valuation:
Securities held by the Funds are valued at amortized cost, which approximates fair market value, in order to maintain a constant net asset value of $1.00 per share. If amortized cost no longer approximates market value due to credit or other impairments
21
Table of Contents
NOTES TO FINANCIAL STATEMENTS
of the issuer, the Fund will use pricing and valuation procedures approved by Tamarack’s Board of Trustees (the “Board”) to determine a security’s fair value.
Money market funds must invest exclusively in high quality securities. To be considered high quality, a security generally must be rated in one of the two highest short-term credit quality categories by a nationally recognized rating organization such as Standard & Poors Corporation or Moody’s Investors Service, Inc. The Funds do not invest in any unrated securities.
Investment Transactions and Income:
Investment transactions are accounted for on the date the security is bought or sold (“trade date”). Dividend income is recorded on the ex-dividend date. Realized gains and losses from investment transactions are calculated based on the costs of the specific security (also known as identified cost basis). Interest income is recognized on the accrual basis and includes, where applicable, the amortization or accretion of premium or discount using the effective yield method.
Financial Instruments:
The Funds may engage in when-issued transactions. The Funds record when-issued securities on trade date and maintain sufficient liquidity so that cash will be available to make payment for the securities purchased. Securities purchased on a when-issued basis are valued daily beginning on trade date and begin earning interest on the settlement date. As of March 31, 2007, the Funds held no when-issued securities.
Repurchase Agreements:
The Funds may enter into repurchase agreements with primary dealers that report to the Federal Reserve Bank of New York or the 100 largest U.S. commercial banks (as measured by domestic deposits) who are deemed creditworthy under guidelines approved by the Board. These repurchase agreements are subject to the seller’s agreement to repurchase such securities at a mutually agreed upon date and price. The repurchase price generally equals the price paid by the Funds plus interest negotiated on the basis of current short-term rates.
Securities pledged as collateral for repurchase agreements are held by the Funds’ custodian bank until maturity of the repurchase agreement. The Funds have procedures to secure additional collateral, if needed, to ensure that the daily market value of the collateral remains in excess of the market value of the repurchase agreement in the event of a default.
Expense, Investment Income and Gain/Loss Allocation:
Each Fund pays the expenses that are directly related to its operations, such as custodian fees or portfolio management fees. Expenses incurred by Tamarack such as trustee or legal fees, are allocated among each of the Funds either proportionately based upon each Fund’s relative net assets or using another reasonable basis such as equally across all Funds, depending on the nature of the expense.
Distributions to Shareholders:
Each Fund pays out any income that it receives, less expenses, in the form of dividends and capital gain distributions to its shareholders. Income dividends are declared daily and paid monthly. Dividends will also be paid at any time during the month upon total
22
Table of Contents
NOTES TO FINANCIAL STATEMENTS
redemption of shares in an account. Capital gains, if any, are declared and paid at least annually. Distributions to shareholders are recorded on the ex-dividend date. The amount of dividends and distributions are calculated based on federal income tax regulations, which may differ from GAAP. These “book/tax” differences may be either temporary or permanent in nature. To the extent these differences are determined, as of the end of the tax year, to be permanent (e.g. net operating loss, expiring capital loss carryforward and foreign currency transactions), they are reclassified within a Fund’s capital accounts based on their federal tax basis treatment. Such differences are not reflected in the calculation of the Financial Highlights.
Securities Lending:
The Funds may lend their portfolio securities to brokers, dealers and financial institutions, provided: (1) the loan is secured continuously by collateral consisting of U.S. Government securities, cash or letters of credit maintained on a daily mark-to-market basis in an amount at least equal to 100% of the current market value of the securities loaned; (2) the Funds may at any time call the loan and obtain the return of the securities loaned within five business days; (3) the Funds will receive any interest or dividends paid on the loaned securities; and (4) the aggregate market value of securities loaned will not at any time exceed 331/3% of the total assets of a particular Fund.
The Funds will earn income for lending their securities from fees paid by borrowers and from the investment of cash collateral. The Funds will then pay the lending agent (“Wells Fargo Bank”) a percentage of the lending income. Securities lending income is presented net of such payments to the lending agent in the financial statements. Loans of securities involve a risk that the borrower may fail to return the securities or may fail to provide additional collateral. In the event that a borrower fails to return the lent security, the lending agent will indemnify the Funds based on the difference in value between the closing market value of the security on the date it should have been returned and the value of the cash collateral. The Funds assume all risk of loss from a decline in the value of the collateral investment and any resulting collateral deficiencies. In an effort to reduce these risks, Voyageur and Wells Fargo Bank will monitor the creditworthiness of the borrowers to which the Funds lend securities. As of March 31, 2007, the Funds had no securities on loan.
Credit Enhancement:
Certain obligations held in the portfolio have credit enhancement or liquidity features that may, under certain circumstances, provide for repayment of principal and interest on the obligation upon demand date, interest rate reset date or final maturity. These enhancements may include: letters of credit; liquidity guarantees; security purchase agreements; tender option purchase agreements; and third party insurance (i.e. AMBAC, FGIC and MBIA).
23
Table of Contents
NOTES TO FINANCIAL STATEMENTS
3. Agreements and Other Transactions with Affiliates
Tamarack has entered into investment advisory agreements with Voyageur under which Voyageur manages the Funds’ assets and furnishes related office facilities, equipment, research and personnel. The agreements require the Funds to pay Voyageur a monthly fee based upon average daily net assets. Under the terms of the advisory contract Voyageur is entitled to receive fees based on a percentage of the average daily net assets as follows:
| | | Average Daily Net
Assets of Fund | | | Annual Rate | |
|---|
| | |
| | |
| |
| Prime Money Market Fund | | | | | Up to $700 million | | | | 0.55 | % |
| | | | | Next $500 million | | | | 0.50 | % |
| | | | | Next $800 million | | | | 0.45 | % |
| | | | | Over $2 billion | | | | 0.40 | % |
| U.S. Government Money Market Fund | | | | | Up to $100 million | | | | 0.50 | % |
| | | | | Next $200 million | | | | 0.40 | % |
| | | | | Over $300 million | | | | 0.35 | % |
| Tax-Free Money Market Fund | | | | | All Net Assets | | | | 0.50 | % |
| Institutional Prime Money Market Fund | | | | | All Net Assets | | | | 0.25 | % |
| Institutional Tax-Free Money Market Fund | | | | | All Net Assets | | | | 0.25 | % |
| Treasury Plus Money Market Fund | | | | | All Net Assets | | | | 0.15 | % |
Effective January 29, 2007, Voyageur contractually agreed to waive fees and/or to make payments in order to keep total operating expenses of Prime Money Market, U.S. Government Money Market ,Tax-Free Money Market and Treasury Plus Money Market Funds to 0.80%, 0.78%, 0.70% and 0.20%, respectively. This expense limitation agreement is in place until January 31, 2008. Voyageur may also voluntarily waive and/or reimburse operating expenses of the Funds from time to time. Any such voluntary program may be changed or eliminated at any time without notice.
Voyageur and RBC Dain Rauscher Inc. (“RBC Dain Rauscher”), the distributor of all of the Tamarack Money Market Funds except for the Treasury Plus Money Market Fund, have entered into a written agreement under which RBC Dain Rauscher provides certain services to Voyageur and is entitled to receive as compensation from Voyageur fees based on a percentage of average daily net assets as follows:
| | | Average Daily
Net Assets | | | Annual Rate | |
|---|
| | |
| | |
| |
| Prime Money Market Fund | | | | | All Net Assets | | | | 0.36 | % |
| U.S. Government Money Market Fund | | | | | Up to $300 million | | | | 0.36 | % |
| | | | | Over $300 million | | | | 0.31 | % |
| Tax-Free Money Market Fund | | | | | All Net Assets | | | | 0.36 | % |
| Institutional Prime Money Market Fund | | | | | All Net Assets | | | | 0.15 | % |
| Institutional Tax-Free Money Market Fund | | | | | All Net Assets | | | | 0.15 | % |
| Treasury Plus Money Market Fund | | | | | All Net Assets | | | | 0.02 | % |
RBC Dain Rauscher is eligible to receive from Voyageur an additional fee of up to 0.25% for the Prime Money Market Fund, U.S. Government Money Market Fund, and the Tax-Free Money Market Fund to the extent that such Fund is operating at an expense level that is below the expense limitation for such Fund as identified in the current Prospectus and Statement of Additional Information of the Trust with respect to such Fund.
24
Table of Contents
NOTES TO FINANCIAL STATEMENTS
Tamarack Distributors Inc. is the distributor for the Treasury Plus Money Market Fund. In addition, as of March 31, 2007, RBC Dain Rauscher was the sole shareholder in the Treasury Plus Money Market Fund.
Voyageur serves as administrator to the Funds and BISYS Fund Services Ohio, Inc. (“BISYS”) serves as sub-administrator. Services provided under the administrative services contract include providing day-to-day administration of matters related to the Funds, maintenance of their records and the preparation of reports. Under terms of the administrative services contract, Voyageur receives from the Prime Money Market Fund, U.S. Government Money Market Fund and Tax-Free Money Market Fund a fee, payable monthly, at the annual rate of 0.25% of the Funds’ average daily net assets. For its services as sub-administrator, BISYS receives a fee payable by Voyageur out of Voyageur’s own resources.
Certain Officers and Trustees of the Funds are affiliated with the adviser or the administrator. Such Officers and Trustees receive no compensation from the Funds for serving in their respective roles.
4. Federal Income Taxes
It is the policy of each Fund to continue to qualify as a regulated investment company by complying with the provisions applicable to certain investment companies, as defined under Subchapter M of the Internal Revenue Code, and to distribute substantially all of its net investment income and net realized capital gains. Therefore, no federal tax liability is recorded in the financial statements of each Fund.
In June 2006, the Financial Accounting Standards Board (FASB) released FASB Interpretation No. 48 “Accounting for Uncertainty in Income Taxes” (FIN 48). FIN 48 provides guidance for how uncertain tax positions should be recognized, measured, presented and disclosed in the financial statements. FIN 48 requires the evaluation of tax positions taken or expected to be taken in the course of preparing each Fund’s tax return to determine whether the tax positions are “more-likely-than-not” to be sustained by the applicable tax authority. Tax positions not deemed to meet the more-likely-than-not threshold would be recorded as a tax benefit or expense in the current year. Adoption of FIN 48 is required no later than the last business day of the first financial statement reporting period for fiscal years beginning after December 15, 2006 and is to be applied to all open tax years as of the effective date. Management has not completed its analysis on whether the adoption of FIN 48 will have an impact to the financial statements.
25
Table of Contents
NOTES TO FINANCIAL STATEMENTS
The tax character of distributions as of the latest fiscal year ended September 30, 2006 were as follows:
| | | Distributions Paid From | | | | | | | | | | | |
|---|
| | |
| | | | | | | | | | | |
| | | Ordinary
Income | | | Net
Long Term
Capital Gains | | | Total Taxable
Distributions | | | Tax Exempt
Distributions | | | Total
Distributions
Paid* | |
|---|
| | |
| | |
| | |
| | |
| | |
| |
| Prime Money Market Fund | | | | $ | 343,274,563 | | | $ | — | | | $ | 343,274,563 | | | $ | — | | | $ | 343,274,563 | |
| U.S. Government Money Market Fund | | | | | 32,770,440 | | | | — | | | | 32,770,440 | | | | — | | | | 32,770,440 | |
| Tax-Free Money Money Market Fund | | | | | 728 | | | | — | | | | 728 | | | | 22,253,354 | | | | 22,254,082 | |
| Institutional Prime Money Market Fund | | | | | 48,677,692 | | | | — | | | | 48,677,692 | | | | — | | | | 48,677,692 | |
| Institutional Tax-Free Money Market Fund | | | | | — | | | | — | | | | — | | | | 13,013,897 | | | | 13,013,897 | |
| Treasury Plus Money Market Fund | | | | | 8,396 | | | | — | | | | 8,396 | | | | — | | | | 8,396 | |
*Total Distributions paid may differ from the Statements of Changes in Net Assets because distributions are recognized when actually paid for tax purposes.
As of September 30, 2006 the components of accumulated earnings/(deficit) on a tax basis were as follows:
| | | Undistributed
Tax
Exempt
Income | | | Taxable
Ordinary
Income | | | Undistributed
Long-
Term
Capital
Gains | | | Accumulated
Earnings | |
|---|
| | |
| | |
| | |
| | |
| |
| Prime Money Market Fund | | | | $ | — | | | $ | — | | | $ | — | | | $ | — | |
| U.S. Government Money Market Fund | | | | | — | | | | 1 | | | | — | | | | 1 | |
| Tax-Free Money Money Market Fund | | | | | 1 | | | | — | | | | — | | | | 1 | |
| Institutional Prime Money Market Fund | | | | | — | | | | — | | | | — | | | | — | |
| Institutional Tax-Free Money Market Fund | | | | | — | | | | — | | | | — | | | | — | |
| Treasury Plus Money Market Fund | | | | | — | | | | 1,278 | | | | — | | | | 1,278 | |
| | | Distributions
Payable | | | Accumulated
Capital
and
Other
Losses | | | Unrealized
Appreciation/
Depreciation | | | Total
Accumulated
Earnings/
(Deficit) | |
|---|
| | |
| | |
| | |
| | |
| |
| Prime Money Market Fund | | | | $ | — | | | $ | (97,457 | ) | | $ | — | | | $ | (97,457 | ) |
| U.S. Government Money Market Fund | | | | | — | | | | (3,744 | ) | | | — | | | | (3,743 | ) |
| Tax-Free Money Money Market Fund | | | | | — | | | | (1,657 | ) | | | — | | | | (1,656 | ) |
| Institutional Prime Money Market Fund | | | | | — | | | | (87,376 | ) | | | — | | | | (87,376 | ) |
| Institutional Tax-Free Money Market Fund | | | | | — | | | | (2,400 | ) | | | — | | | | (2,400 | ) |
| Treasury Plus Money Market Fund | | | | | (1,278 | ) | | | — | | | | — | | | | — | |
26
Table of Contents
NOTES TO FINANCIAL STATEMENTS
As of September 30, 2006, the following Funds had net capital loss carryforwards to offset future net capital gains or net investment income, if any:
| | | Capital Loss
Carryforward | | | Expires | |
|---|
| | |
| | |
| |
| Prime Money Market Fund | | | | $ | 3,069 | | | | 2012 | |
| | | | | 40,324 | | | | 2014 | |
| U.S. Government Money Market Fund | | | | | 97 | | | | 2012 | |
| | | | | 1,086 | | | | 2013 | |
| | | | | 2,129 | | | | 2014 | |
| Tax-Free Money Market Fund | | | | | 1,657 | | | | 2010 | |
| Institutional Prime Money Market Fund | | | | | 21,544 | | | | 2009 | |
| | | | | 279 | | | | 2011 | |
| | | | | 5,669 | | | | 2012 | |
| | | | | 1,579 | | | | 2013 | |
| | | | | 18,923 | | | | 2014 | |
| Institutional Tax-Free Money Market Fund | | | | | 536 | | | | 2009 | |
Under current tax law, capital losses realized after October 31 of a Fund’s fiscal year may be deferred and treated as occurring on the first business day of the following fiscal year for tax purposes. The following Funds had deferred post October capital losses, which will be treated as arising on the first business day of the fiscal year ending September 30, 2007:
| | | Deferred
Post-October
Losses | |
|---|
| | |
| |
| Prime Money Market Fund | | | | $ | 54,064 | |
| U.S. Government Money Market Fund | | | | | 432 | |
| Institutional Prime Money Market Fund | | | | | 39,381 | |
| Institutional Tax-Free Money Market Fund | | | | | 1,863 | |
27
Table of Contents
SCHEDULE OF PORTFOLIO INVESTMENTS
Tamarack Prime Money Market Fund
March 31, 2007 (Unaudited)
Shares or
Principal
Amount | | | | Value | |
|---|
|
| Asset Backed Securities – 12.77% |
| Asset Backed Auto Receivable – 5.56% |
| 41,235,174 | | Americredit Automobile Receivables Trust, Series 2007-AX, Class A1, 5.31%, 2/6/08 (b) | | $ | 41,235,174 | |
| 5,286,626 | | BMW Vehicle Owner Trust, Series 2006-A, Class A1, 5.36%, 9/25/07 (b) | | | 5,286,626 | |
| 58,318,247 | | Capital One Auto Finance Trust, Series 2007-A, Class A1, 5.32%, 2/15/08 (b) | | | 58,318,247 | |
| 1,595,738 | | CNH Equipment Trust, Series 2006-B, Class A1, 5.39%, 10/5/07 (b) | | | 1,595,738 | |
| 72,500,000 | | CNH Equipment Trust, Series 2007-A, Class A1, 5.26%, 4/4/08 (b) | | | 72,499,999 | |
| 18,000,000 | | CPS Auto Trust, Series 2007-A, Class A1, 5.33%, 3/17/08 (b) (c) | | | 18,000,000 | |
| 2,720,505 | | Daimler Chrysler Auto Trust, Series 2006-C, Class A1, 5.33%, 10/8/07 (b) (c) | | | 2,720,505 | |
| 12,490,555 | | Ford Credit Auto Owner Trust, Series 2006-C, Class A1, 5.36%, 12/15/07 (b) | | | 12,490,555 | |
| 12,494,684 | | General Electric Equipment Midticket LLC, Series 2006-1, Class A1, 5.30%, 12/15/07 (b) | | | 12,494,684 | |
| 1,935,054 | | Honda Auto Receivables Owner Trust, Series 2006-2, Class A1, 5.43%, 8/21/07 (b) | | | 1,935,054 | |
| 30,093,458 | | Honda Auto Receivables Owner Trust, Series 2007-1, Class A1, 5.32%, 3/18/08 (b) | | | 30,093,458 | |
| 4,946,854 | | Household Automotive Trust, Series 2006-3, Class A1, 5.36%, 11/19/07 (b) | | | 4,946,854 | |
| 26,703,601 | | Household Automotive Trust, Series 2007-1, Class A1, 5.33%, 2/17/08 (b) | | | 26,703,601 | |
| 323,850 | | John Deere Owner Trust, Series 2006-A, Class A1, 5.36%, 7/13/07 (b) | | | 323,802 | |
| 2,553,748 | | Long Beach Auto Receivables Trust, Series 2006-B, Class A1, 5.37%, 10/15/07 (b) | | | 2,553,748 | |
| 34,500,000 | | Long Beach Auto Receivables Trust, Series 2007-A, Class A1, 5.34%, 4/15/08 (b) | | | 34,500,000 | |
| 2,345,476 | | Nissan Auto Receivables Owner Trust, Series 2006-C, Class A1, 5.49%, 8/15/07 (b) | | | 2,345,476 | |
| 56,243,273 | | Nissan Auto Receivables Owner Trust, Series 2007-A, Class A1, 5.32%, 3/17/08 (b) | | | 56,243,273 | |
| 56,400,000 | | Santander Drive Auto Receivables Trust, Series 2007-1, Class A1, 5.32%, 4/15/08 (b) | | | 56,400,000 | |
| 1,066,094 | | USAA Auto Owner Trust, Series 2006-3, Class A1, 5.40%, 8/15/07 (b) | | | 1,066,094 | |
| 10,943,361 | | USAA Auto Owner Trust, Series 2006-4, Class A1, 5.34%, 12/13/07 (b) | | | 10,943,361 | |
| 2,671,565 | | Volkswagen Auto Lease Trust, Series 2006-A, Class A1, 5.52%, 8/20/07 (b) | | | 2,671,565 | |
| 52,852,659 | | Volkswagen Auto Loan Enhanced Trust, Series 2007-1, Class A1, 5.32%, 2/20/08 | | | 52,852,659 | |
| 3,195,064 | | Wachovia Auto Loan Owner Trust, Series 2006-1, Class A1, 5.39%, 10/19/07 (b) (c) | | | 3,195,064 | |
| 9,904,036 | | World Omni Auto Receivables Trust, Series 2006-B, Class A1, 5.37%, 10/15/07 (b) | | | 9,904,036 | |
| 20,314,853 | | World Omni Auto Receivables Trust, Series 2007-A, Class A1, 5.32%, 2/15/08 (b) | | | 20,314,853 | |
| | | |
|
| | | | | 541,634,426 | |
| | | |
|
28
Table of Contents
SCHEDULE OF PORTFOLIO INVESTMENTS
Tamarack Prime Money Market Fund (cont.)
Shares or
Principal
Amount | | | | Value | |
|---|
|
| Asset Backed Mortgages – 7.21% |
| 65,500,000 | | Arkle Master Issuer PLC, Series 2006-1A, Class A1, 5.30%, 11/19/07 (b) (c) | | $ | 65,500,000 | |
| 177,200,000 | | Brunel Residential Mortgage Securities, Series 2007-1A, Class A3, 5.31%, 1/13/39 (b) (c) | | | 177,200,000 | |
| 7,791,405 | | CIT Equipment Collateral, Series 2006-VT2, Class A1, 5.34%, 11/20/07 (b) | | | 7,791,405 | |
| 22,200,000 | | Granite Master Issuer PLC, Series 2006-3, Class A4, 5.30%, 12/20/54 (b) | | | 22,200,000 | |
| 34,000,000 | | Holmes Financing PLC, Series 10A, Class 1A, 5.29%, 7/15/07 (b) (c) | | | 34,000,000 | |
| 36,100,000 | | Holmes Master Issuer PLC, Series 2006-1A, Class 1A, 5.30%, 1/15/16 (b) (c) | | | 36,100,000 | |
| 63,000,000 | | Holmes Master Issuer PLC, Series 2007-1, Class 1A1, 5.30%, 3/15/08 (b) | | | 63,000,000 | |
| 38,897,289 | | Paragon Mortgages PLC, Series 13A, Class A1, 5.31%, 1/15/39 (b) (c) | | | 38,897,807 | |
| 78,000,000 | | Paragon Mortgages PLC, Series 14A, Class A1, 5.32%, 9/15/39 (b) (c) | | | 78,000,000 | |
| 110,000,000 | | Pendeford Master Issuer PLC, Series 2007-1A, Class 1A, 5.32%, 2/12/08 (b) (c) | | | 110,000,000 | |
| 24,000,000 | | Permanent Master Issuer PLC, Series 2006-1, Class 1A, 5.30%, 10/17/07 (b) | | | 24,000,000 | |
| 45,000,000 | | Permanent Master Issuer PLC, Series 2007-1, Class 1A, 5.31%, 1/15/08 (b) | | | 45,000,000 | |
| | | |
|
| | | | | 701,689,212 | |
| | | |
|
Total Asset Backed Securities
(Cost $1,243,323,638) | | | 1,243,323,638 | |
| |
| |
| Commercial Paper – 33.94% |
| Asset Backed – 12.24% |
| 37,783,000 | | Barton Capital LLC, 5.35%, 4/11/07 (d) | | | 37,727,900 | |
| 15,000,000 | | Ciesco LLC, 5.38%, 4/5/07 (c) (d) | | | 14,991,167 | |
| 15,000,000 | | Ciesco LLC, 5.37%, 4/17/07 (c) (d) | | | 14,965,000 | |
| 35,000,000 | | Ciesco LLC, 5.36%, 4/19/07 (c) (d) | | | 34,908,125 | |
| 35,000,000 | | Ciesco LLC, 5.36%, 5/8/07 (c) (d) | | | 34,811,506 | |
| 65,000,000 | | Fairway Finance Corp. LLC, 5.28%, 6/12/07 (b) (c) | | | 64,999,350 | |
| 100,000,000 | | Fairway Finance Corp. LLC, 5.28%, 6/20/07 (b) (c) | | | 99,998,906 | |
| 12,000,000 | | Fairway Finance Corp. LLC, 5.28%, 6/20/07 (b) (c) | | | 11,999,869 | |
| 85,000,000 | | Fairway Finance Corp. LLC, 5.28%, 7/16/07 (b) (c) | | | 84,998,123 | |
| 80,000,000 | | Grampian Funding LLC, 5.38%, 4/25/07 (d) | | | 79,720,533 | |
| 31,342,000 | | Grampian Funding LLC, 5.38%, 5/25/07 (d) | | | 31,096,592 | |
| 50,000,000 | | Grampian Funding LLC, 5.37%, 6/28/07 (c) (d) | | | 49,361,389 | |
| 85,000,000 | | Grampian Funding LLC, 5.41%, 7/31/07 (d) | | | 83,514,389 | |
| 70,000,000 | | Kitty Hawk, 5.37%, 4/20/07 (c) (d) | | | 69,806,042 | |
| 100,000,000 | | Kitty Hawk, 5.37%, 5/16/07 (d) | | | 99,346,250 | |
| 40,499,000 | | Nieuw Amsterdam Funding, 5.37%, 4/2/07 (c) (d) | | | 40,493,071 | |
| 25,035,000 | | Nieuw Amsterdam Funding, 5.36%, 4/9/07 (c) (d) | | | 25,005,737 | |
| 50,000,000 | | Ranger Funding Co. LLC, 5.37%, 5/18/07 | | | 49,656,639 | |
| 50,000,000 | | Sheffield Receivables, 5.38%, 4/20/07 (c) (d) | | | 49,861,722 | |
| 52,038,000 | | Three Pillars Funding, 5.50%, 4/2/07 (c) (d) | | | 52,030,165 | |
| 30,000,000 | | Windmill Funding Corp., 5.37%, 4/5/07 (c) (d) | | | 29,982,567 | |
| 81,959,000 | | Yorktown Capital Corp., 5.37%, 4/16/07 (d) | | | 81,779,715 | |
29
Table of Contents
SCHEDULE OF PORTFOLIO INVESTMENTS
Tamarack Prime Money Market Fund (cont.)
Shares or
Principal
Amount | | | | Value | |
|---|
|
| 32,000,000 | | Yorktown Capital Corp., 5.37%, 4/17/07 (d) | | $ | 31,925,404 | |
| 18,390,000 | | Yorktown Capital Corp., 5.36%, 5/1/07 (d) | | | 18,309,697 | |
| | | |
|
| | | | | 1,191,289,858 | |
| | | |
|
| Banks – Australia/New Zealand – 1.02% |
| 50,000,000 | | Australia & New Zealand Banking Group, 5.38%, 4/18/07 (d) | | | 49,876,278 | |
| 50,000,000 | | Westpac Banking Corp., 5.41%, 7/12/07 (c) (d) | | | 49,262,625 | |
| | | |
|
| | | | | 99,138,903 | |
| | | |
|
| Banks – Domestic – 3.12% |
| 22,500,000 | | BA Credit Card Trust Emerald Note, 5.38%, 4/4/07 (c) (d) | | | 22,490,175 | |
| 15,000,000 | | BA Credit Card Trust Emerald Note, 5.37%, 6/6/07 (c) (d) | | | 14,856,175 | |
| 55,000,000 | | BA Credit Card Trust Emerald Note, 5.38%, 6/26/07 (c) (d) | | | 54,311,522 | |
| 50,000,000 | | Credit Suisse First Boston USA, Inc., 5.37%, 4/2/07 (d) | | | 49,992,736 | |
| 25,000,000 | | Credit Suisse First Boston USA, Inc., 5.37%, 4/9/07 (d) | | | 24,970,833 | |
| 63,000,000 | | Credit Suisse First Boston USA, Inc., 5.37%, 4/26/07 (d) | | | 62,770,313 | |
| 50,000,000 | | Credit Suisse First Boston USA, Inc., 5.38%, 5/2/07 (d) | | | 49,774,389 | |
| 25,000,000 | | Marshall & Ilsley Corp., 5.38%, 4/12/07 (d) | | | 24,959,972 | |
| | | |
|
| | | | | 304,126,115 | |
| | | |
|
| Banks – Foreign – 8.09% |
| 70,000,000 | | Alliance & Leicester PLC, 5.38%, 5/18/07 (c) (d) | | | 69,525,235 | |
| 25,000,000 | | Alliance & Leicester PLC, 5.36%, 6/7/07 (c) (d) | | | 24,757,125 | |
| 80,000,000 | | Alliance & Leicester PLC, 5.37%, 7/13/07 (c) (d) | | | 78,809,778 | |
| 100,000,000 | | BNP Paribas, 5.46%, 6/6/07 (d) | | | 99,044,467 | |
| 50,000,000 | | Dexia Delaware LLC, 5.34%, 5/4/07 (d) | | | 49,760,521 | |
| 35,000,000 | | Greenwich Capital Holdings, 5.42%, 8/24/07 (d) | | | 34,267,649 | |
| 60,000,000 | | HBOS Treasury Services PLC, 5.38%, 4/26/07 (d) | | | 59,781,667 | |
| 40,000,000 | | HBOS Treasury Services PLC, 5.37%, 5/2/07 (d) | | | 39,819,683 | |
| 100,000,000 | | Rabobank Nederland, 5.18%, 12/20/07 | | | 99,895,183 | |
| 73,000,000 | | Societe Generale North America, 5.37%, 4/3/07 (d) | | | 72,978,789 | |
| 50,000,000 | | Swedbank, 5.37%, 4/4/07 (d) | | | 49,978,208 | |
| 50,000,000 | | Swedbank, 5.38%, 4/13/07 (d) | | | 49,912,750 | |
| 60,000,000 | | Swedbank, 5.36%, 5/16/07 (d) | | | 59,607,750 | |
| | | |
|
| | | | | 788,138,805 | |
| | | |
|
| Chemicals – 1.96% |
| 67,500,000 | | BASF AG, 5.38%, 4/11/07 (c) (d) | | | 67,401,750 | |
| 50,000,000 | | BASF AG, 5.36%, 4/23/07 (d) | | | 49,839,889 | |
| 75,000,000 | | BASF AG, 5.40%, 7/16/07 (c) (d) | | | 73,851,667 | |
| | | |
|
| | | | | 191,093,306 | |
| | | |
|
| Conglomerates – 0.31% |
| 30,000,000 | | Dover Corp., 5.36%, 4/13/07 (c) | | | 29,947,400 | |
| Finance – Diversified Domestic – 1.12% |
| 80,000,000 | | Dexia Delaware LLC, 5.38%, 4/20/07 (d) | | | 79,779,178 | |
| 30,000,000 | | Morgan Stanley, 5.40%, 6/18/07 (d) | | | 29,662,650 | |
| | | |
|
| | | | | 109,441,828 | |
| | | |
|
| Finance – Diversified Foreign – 5.30% |
| 50,000,000 | | ING (US) Funding LLC, 5.34%, 5/11/07 (d) | | | 49,710,000 | |
| 40,061,000 | | ING (US) Funding LLC, 5.38%, 5/15/07 (d) | | | 39,804,676 | |
| 50,000,000 | | ING (US) Funding LLC, 5.37%, 5/21/07 (d) | | | 49,636,805 | |
| 100,000,000 | | Northern Rock PLC, 5.36%, 5/1/07 (c) (d) | | | 99,562,917 | |
| 50,000,000 | | Northern Rock PLC, 5.36%, 5/4/07 (c) (d) | | | 49,759,833 | |
| 32,000,000 | | Northern Rock PLC, 5.31%, 5/23/07 (c) (d) | | | 31,757,796 | |
30
Table of Contents
SCHEDULE OF PORTFOLIO INVESTMENTS
Tamarack Prime Money Market Fund (cont.)
Shares or
Principal
Amount | | | | Value | |
|---|
|
| 20,000,000 | | UBS Finance (DE) LLC, 5.37%, 4/19/07 (d) | | $ | 19,947,700 | |
| 40,000,000 | | UBS Finance (DE) LLC, 5.36%, 4/27/07 (d) | | | 39,848,478 | |
| 47,000,000 | | UBS Finance (DE) LLC, 5.37%, 5/1/07 (d) | | | 46,794,963 | |
| 50,000,000 | | UBS Finance (DE) LLC, 5.36%, 5/4/07 (d) | | | 49,759,833 | |
| 40,000,000 | | UBS Finance (DE) LLC, 5.42%, 8/10/07 (d) | | | 39,243,111 | |
| | | |
|
| | | | | 515,826,112 | |
| | | |
|
| Insurance – 0.78% |
| 26,728,000 | | ING America Insurance, 5.15%, 5/17/07 (d) | | | 26,549,383 | |
| 50,000,000 | | Prudential Funding LLC, 5.36%, 6/6/07 (d) | | | 49,521,958 | |
| | | |
|
| | | | | 76,071,341 | |
| | | |
|
Total Commercial Paper
(Cost $3,305,073,668) | | | 3,305,073,668 | |
| |
| |
| Certificates of Deposit – 33.78% |
| Banks – Australia/New Zealand – 2.95% |
| 42,500,000 | | Australia & New Zealand Banking Group, 5.32%, 4/4/08 (b) (c) | | | 42,500,000 | |
| 25,000,000 | | Australia & New Zealand Banking Group, 5.32%, 6/23/10 (b) (c) | | | 25,000,000 | |
| 100,000,000 | | National Australia Bank, 5.31%, 3/7/11 (b) (c) | | | 100,000,000 | |
| 60,000,000 | | Westpac Banking Corp., 5.29%, 12/7/07 (b) | | | 59,998,431 | |
| 60,000,000 | | Westpac Banking Corp., 5.31%, 2/16/11 (b) (c) | | | 60,000,000 | |
| | | |
|
| | | | | 287,498,431 | |
| | | |
|
| Banks – Canada – 3.47% |
| 85,000,000 | | Bank of Nova Scotia, 5.26%, 10/4/07 (b) | | | 84,989,015 | |
| 42,500,000 | | Bank of Nova Scotia, 5.27%, 12/31/07 (b) | | | 42,491,750 | |
| 70,000,000 | | Canadian Imperial Bank, 5.29%, 6/4/07 | | | 70,000,614 | |
| 65,000,000 | | Canadian Imperial Bank, 5.35%, 11/7/07 | | | 65,001,909 | |
| 75,000,000 | | Toronto Dominion Bank, 5.51%, 6/18/07 | | | 74,976,767 | |
| | | |
|
| | | | | 337,460,055 | |
| | | |
|
| Banks – Domestic – 12.52% |
| 85,000,000 | | AmSouth Bank, NA, 5.44%, 12/27/07 (b) | | | 85,072,596 | |
| 30,000,000 | | Bank of New York Co., Inc., 5.34%, 11/16/07 (b) | | | 30,003,265 | |
| 30,000,000 | | Bank of the West, 5.31%, 11/19/07 (b) | | | 30,003,692 | |
| 55,000,000 | | Comerica Bank, 5.30%, 8/24/07 (b) | | | 55,002,827 | |
| 20,000,000 | | Comerica Bank, 5.30%, 9/27/07 (b) | | | 19,999,020 | |
| 91,000,000 | | Comerica Bank, 5.41%, 11/26/07 | | | 91,069,329 | |
| 80,000,000 | | Credit Suisse First Boston USA, Inc., 5.31%, 5/21/07 | | | 80,000,000 | |
| 42,500,000 | | Marshall & Ilsley Bank, 5.16%, 12/15/16 | | | 42,503,493 | |
| 50,000,000 | | Mercantile Safe Deposit & Trust Co., 5.56%, 7/16/07 | | | 50,000,000 | |
| 50,000,000 | | Mercantile Safe Deposit & Trust Co., 5.72%, 8/7/07 | | | 50,000,000 | |
| 42,500,000 | | Mercantile Safe Deposit & Trust Co., 5.43%, 8/22/07 | | | 42,496,670 | |
| 70,000,000 | | National City Bank, 5.35%, 2/13/08 (b) | | | 70,013,616 | |
| 75,000,000 | | National City Bank, 5.30%, 3/13/08 (b) | | | 75,014,008 | |
| 60,000,000 | | PNC Bank NA, 5.27%, 1/2/08 (b) | | | 59,986,463 | |
| 73,900,000 | | Suntrust Bank, 5.29%, 5/1/07 (b) | | | 73,900,773 | |
| 163,500,000 | | Suntrust Bank, 5.27%, 9/14/07 (b) | | | 163,487,046 | |
| 82,500,000 | | US Bank NA, 5.29%, 12/5/07 (b) | | | 82,504,740 | |
| 20,015,000 | | Wells Fargo & Co., 5.37%, 3/10/08 (b) | | | 20,032,640 | |
| 98,000,000 | | World Savings Bank, 5.32%, 10/19/07 (b) | | | 98,020,654 | |
| | | |
|
| | | | | 1,219,110,832 | |
| | | |
|
| Banks – Foreign – 14.84% |
| 85,000,000 | | Abbey National Treasury Services, 5.36%, 6/29/07 (b) | | | 85,009,027 | |
| 127,500,000 | | Banco Espanol De Credito, 5.33%, 4/18/08 (b) (c) | | | 127,500,000 | |
| 35,000,000 | | Bank of Ireland, 5.30%, 7/19/11, (b) (c) | | | 35,000,000 | |
31
Table of Contents
SCHEDULE OF PORTFOLIO INVESTMENTS
Tamarack Prime Money Market Fund (cont.)
Shares or
Principal
Amount | | | | Value | |
|---|
|
| 29,000,000 | | Barclays Bank PLC, 5.28%, 1/3/08 (b) | | $ | 28,996,672 | |
| 100,000,000 | | BNP Paribas, 5.33%, 4/12/07 | | | 100,000,149 | |
| 50,000,000 | | BNP Paribas, 5.32%, 12/16/07 (b) (c) | | | 50,000,000 | |
| 85,000,000 | | Calyon Bank, 5.35%, 5/7/07 | | | 85,001,263 | |
| 175,000,000 | | Credit Agricole (London), 5.32%, 1/1/49 (b) (c) | | | 174,999,999 | |
| 60,000,000 | | Deustsche Bank, 5.32%, 6/18/07 | | | 60,000,036 | |
| 50,000,000 | | Deutsche Bank, 5.35%, 8/8/07 | | | 50,000,596 | |
| 75,000,000 | | Fortis Bank New York, 5.27%, 10/15/07 (b) | | | 74,991,000 | |
| 42,500,000 | | HBOS Treasury Services PLC, 5.29%, 4/7/08 (b) (c) | | | 42,500,000 | |
| 50,000,000 | | Royal Bank of Scotland Group, 5.29%, 6/8/07 | | | 50,000,000 | |
| 100,000,000 | | Royal Bank of Scotland Group, 5.31%, 4/21/10 (b) (c) | | | 100,000,000 | |
| 75,000,000 | | Santander Totta Ireland PLC, 5.32%, 3/7/08 (b) (c) | | | 75,000,000 | |
| 42,500,000 | | Societe Generale NY, 5.27%, 9/21/07 (b) | | | 42,493,943 | |
| 32,965,000 | | Svenska Handelsbanken, 5.27%, 10/4/07 (b) | | | 32,960,793 | |
| 95,000,000 | | Svenska Handelsbanken, 5.29%, 4/4/08 (b) (c) | | | 95,000,000 | |
| 93,500,000 | | Svenska Handelsbanken, 5.29%, 11/21/11 (b) (c) | | | 93,500,000 | |
| 42,500,000 | | Swedbank, 5.31%, 9/17/07 (b) | | | 42,496,180 | |
| | | |
|
| | | | | 1,445,449,658 | |
| | | |
|
Total Certificates of Deposit
(Cost $3,289,518,976) | | | 3,289,518,976 | |
| |
| |
| Corporate Bonds – 21.00% |
| Banks – Domestic – 2.05% |
| 50,000,000 | | Bank of New York Co., Inc., 5.32%, 3/10/15 (b) (c) | | | 50,000,000 | |
| 100,000,000 | | Credit Suisse First Boston USA, Inc., 5.31%, 5/8/07 (b) | | | 100,001,304 | |
| 50,000,000 | | Wells Fargo & Co., 5.33%, 7/15/09 (b) (c) | | | 50,000,000 | |
| | | |
|
| | | | | 200,001,304 | |
| | | |
|
| Finance – Automotive – 2.83% |
| 50,000,000 | | American Honda Finance Corp., 5.38%, 1/23/08 (b) (c) | | | 50,019,826 | |
| 50,000,000 | | American Honda Finance Corp., 5.32%, 1/28/08 (b) (c) | | | 50,000,000 | |
| 61,000,000 | | American Honda Finance Corp., 4.25%, 3/11/08 (c) | | | 60,453,663 | |
| 50,000,000 | | Toyota Motor Credit Corp., 5.27%, 5/21/07 (b) | | | 50,000,474 | |
| 65,000,000 | | Toyota Motor Credit Corp., 5.32%, 7/2/07 (b) | | | 64,998,741 | |
| | | |
|
| | | | | 275,472,704 | |
| | | |
|
| Finance – Diversified Domestic – 4.30% |
| 38,272,000 | | American General Finance, 5.48%, 1/18/08 (b) | | | 38,318,342 | |
| 50,000,000 | | HSBC Finance Corp., 5.40%, 10/4/07 (b) | | | 50,018,179 | |
| 25,000,000 | | JP Morgan Chase & Co., 5.29%, 7/2/07 (b) | | | 25,000,000 | |
| 110,000,000 | | Merrill Lynch & Co., 5.32%, 7/27/07 (b) | | | 109,999,999 | |
| 50,000,000 | | Merrill Lynch & Co., 5.30%, 4/18/08 (b) | | | 50,000,000 | |
| 10,000,000 | | Morgan Stanley, 5.49%, 7/27/07 (b) | | | 10,004,844 | |
| 50,000,000 | | Morgan Stanley, 5.29%, 9/14/07 (b) | | | 50,000,000 | |
| 85,000,000 | | Morgan Stanley, 5.49%, 1/18/08 (b) | | | 85,102,903 | |
| | | |
|
| | | | | 418,444,267 | |
| | | |
|
| Forest & Paper Products – 0.65% |
| 63,000,000 | | Kimberly-Clark Corp., 5.26%, 12/19/07 (c) | | | 63,000,000 | |
| Information Technology – 1.67% |
| 82,200,000 | | IBM Corp., 5.35%, 6/28/07 (b) | | | 82,207,742 | |
| 80,000,000 | | IBM Corp., 5.33%, 12/8/10 (b) (c) | | | 80,000,000 | |
| | | |
|
| | | | | 162,207,742 | |
| | | |
|
32
Table of Contents
SCHEDULE OF PORTFOLIO INVESTMENTS
Tamarack Prime Money Market Fund (cont.)
Shares or
Principal
Amount | | | | Value | |
|---|
|
| Insurance – 7.75% |
| 50,000,000 | | Allstate Life Global Funding Trust, 5.30%, 5/4/07 (b) | | $ | 50,000,000 | |
| 55,000,000 | | Allstate Life Global Funding Trust, 5.34%, 5/21/07 (b) | | | 55,003,755 | |
| 77,000,000 | | Allstate Life Global Funding Trust, 5.29%, 1/11/08 (b) | | | 77,000,000 | |
| 42,500,000 | | Allstate Life Global Funding Trust, 5.29%, 4/4/08 (b) | | | 42,500,000 | |
| 85,000,000 | | ING Verzekeringen, NV, 5.29%, 1/4/08 (b) (c) | | | 85,000,000 | |
| 40,000,000 | | Metropolitan Life Global Funding I, 5.34%, 11/9/07 (b) (c) | | | 40,011,684 | |
| 125,000,000 | | Metropolitan Life Global Funding I, 5.31%, 2/22/08 (b) (c) | | | 124,999,999 | |
| 60,780,000 | | Monument Global Funding 2007-F, 5.33%, 3/20/08 (b) (c) | | | 60,780,000 | |
| 52,500,000 | | Monumental Global Funding II, 5.44%, 6/29/07 (b) (c) | | | 52,516,013 | |
| 5,750,000 | | Monumental Global Funding II, 5.37%, 9/13/07 (b) (c) | | | 5,751,183 | |
| 42,500,000 | | Monumental Global Funding II, 5.33%, 12/20/07 (b) (c) | | | 42,500,000 | |
| 80,000,000 | | Nationwide Life Global Funding, 5.31%, 12/27/11 (b) (c) | | | 80,000,000 | |
| 40,000,000 | | Pricoa Global Funding I, 5.44%, 1/25/08 (b) (c) | | | 40,037,225 | |
| | | |
|
| | | | | 756,099,859 | |
| | | |
|
| Manufacturing – 0.88% |
| 85,000,000 | | 3M Co., 5.15%, 12/12/10 (c) | | | 85,303,866 | |
| | | |
|
| Retail – 0.87% |
| 85,000,000 | | Wal-Mart Stores, 5.88%, 6/1/18 | | | 85,069,181 | |
| | | |
|
Total Corporate Bonds
(Cost $2,045,598,923) | | | 2,045,598,923 | |
| |
| |
| Taxable Municipal Bonds – 0.87% |
| Florida – 0.87% |
| 85,000,000 | | Florida Hurricane Catastrophe, 5.33%, 4/14/08 (b) | | | 85,000,000 | |
| | | |
|
Total Taxable Municipal Bonds
(Cost $85,000,000) | | | 85,000,000 | |
| |
| |
| Municipal Bonds – 0.23% |
| Virginia – 0.23% |
| 22,700,000 | | Arlington County Industrial Development Authority Economic Development Revenue, 5.35%, 8/1/31 (b) | | | 22,700,000 | |
| | | |
|
Total Municipal Bonds
(Cost $22,700,000) | | | 22,700,000 | |
| |
| |
| Investment Companies – 0.04% |
| 3,824,623 | | Wells Fargo Prime Investment Money Market Fund | | | 3,824,623 | |
| | | |
|
Total Investment Companies
(Cost $3,824,623) | | | 3,824,623 | |
| |
| |
Total Investments
(Cost $9,995,039,828) (a) – 102.63% | | | 9,995,039,828 | |
| Liabilities in excess of other assets – (2.63)% | | | (255,831,275 | ) |
| |
| |
| NET ASSETS – 100.00% | | $ | 9,739,208,553 | |
| |
| |
(a) Tax cost of securities is equal to book cost of securities.
(b) Variable rate security. The rate reflected in the Schedule of Portfolio Investments is the rate in effect on March 31, 2007. The maturity date represents the actual maturity date.
(c) Security exempt from registration under Rule 144A of the Securities Act of 1933, as amended. These securities may be resold in transactions exempt from registration, normally to qualified institutional buyers. Security has been deemed to be liquid based on procedures approved by the Board of Trustees.
(d) Rate represents the effective yield at purchase.
Abbreviations used are defined below:
LOC – Letter of Credit
LLC – Limited Liability
See notes to financial statements.
33
Table of Contents
SCHEDULE OF PORTFOLIO INVESTMENTS
Tamarack U.S. Government Money Market Fund
March 31, 2007 (Unaudited)
Shares or
Principal
Amount | | | | Value | |
|---|
|
| U.S. Government Agency Obligations – 71.35% |
| Federal Farm Credit Bank – 9.33% |
| $30,568,000 | | 5.29%, 6/12/07 (c) | | $ | 30,256,206 | |
| 45,000,000 | | 5.18%, 2/8/08 (b) | | | 44,995,107 | |
| | | |
|
| | | | | 75,251,313 | |
| | | |
|
| Federal Home Loan Bank – 23.05% |
| 50,000,000 | | 5.26%, 5/2/07 (c) | | | 49,779,125 | |
| 31,885,000 | | 3.50%, 5/15/07 | | | 31,812,756 | |
| 47,000,000 | | 5.28%, 5/18/07 (c) | | | 46,684,604 | |
| 25,000,000 | | Series 555, 4.13%, 10/26/07 | | | 24,841,284 | |
| 22,820,000 | | Series 586, 4.25%, 4/16/07 | | | 22,810,911 | |
| 10,000,000 | | Series 605, 5.21%, 6/8/07 | | | 10,000,000 | |
| | | |
|
| | | | | 185,928,680 | |
| | | |
|
| Federal Home Loan Mortgage Corporation – 26.88% |
| 25,058,000 | | 4.25%, 4/5/07 | | | 25,055,218 | |
| 29,000,000 | | 5.30%, 4/11/07 | | | 28,958,796 | |
| 10,000,000 | | 4.50%, 4/18/07 | | | 9,996,342 | |
| 30,000,000 | | 5.25%, 5/16/07 | | | 29,997,559 | |
| 10,000,000 | | 5.21%, 5/22/07 | | | 9,927,608 | |
| 50,000,000 | | 5.28%, 5/31/07 (c) | | | 49,570,000 | |
| 15,000,000 | | 5.22%, 6/22/07 (b) | | | 14,999,492 | |
| 50,000,000 | | 5.22%, 12/7/07 (c) | | | 48,275,694 | |
| | | |
|
| | | | | 216,780,709 | |
| | | |
|
| Federal National Mortgage Association – 12.09% |
| 26,989,000 | | 5.30%, 4/25/07 | | | 26,897,147 | |
| 19,749,000 | | 5.27%, 4/30/07 (c) | | | 19,667,626 | |
| 39,366,000 | | 5.29%, 5/23/07 | | | 39,075,435 | |
| 11,900,000 | | 4.20%, 8/1/07 | | | 11,856,925 | |
| | | |
|
| | | | | 97,497,133 | |
| | | |
|
Total U.S. Government Agency Obligations
(Cost $575,457,835) | | | 575,457,835 | |
| |
| |
| Repurchase Agreements – 27.90% |
| 145,000,000 | | Cantor Fitzgerald dated 3/30/07, due 4/2/07 at 5.37% with a maturity value of $145,064,888 (fully collateralized by Federal National Mortgage Association, 6.00%, 3/1/21) | | | 145,000,000 | |
| 80,000,000 | | Barclays Capital, Inc., dated 3/16/07, due 4/16/07 at 5.26% with a maturity value of $80,362,356 (fully collateralized by Federal Home Loan Mortgage Corp., 6.254%, 7/1/36 and Federal Home Loan Mortgage Corp., 5.943%, 2/1/37) | | | 80,000,000 | |
Total Repurchase Agreements
(Cost $225,000,000) | | | 225,000,000 | |
| |
| |
| Investment Companies – 0.46% |
| 3,701,609 | | Wells Fargo Government Institutional Money Market Fund | | | 3,701,609 | |
| | | |
|
Total Investment Companies
(Cost $3,701,609) | | | 3,701,609 | |
| |
| |
Total Investments
(Cost $804,159,444) (a) – 99.71% | | | 804,159,444 | |
| Other assets in excess of liabilities – 0.29% | | | 2,372,597 | |
| |
| |
| NET ASSETS – 100.00% | | $ | 806,532,041 | |
| |
| |
(a) Tax cost of securities is equal to book cost of securities.
(b) Variable rate security. The rate reflected in the Schedule of Investments is the rate in effect on March 31, 2007. The Maturity date represents the actual maturity date.
(c) Rate represents the effective yield at purchase.
See notes to financial statements.
34
Table of Contents
SCHEDULE OF PORTFOLIO INVESTMENTS
Tamarack Tax-Free Money Market Fund
March 31, 2007 (Unaudited)
Shares or
Principal
Amount | | | | Value | |
|---|
|
| Municipal Bonds – 85.03% |
| Alabama – 3.08% |
| 23,000,000 | | Birmingham Alabama Medical Clinic Board Revenue, 3.66%, 12/1/26, (LOC Suntrust Bank) (b) | | $ | 23,000,000 | |
| 3,265,000 | | Mobile Industrial Development Board Dock & Wharf Revenue, 3.66%, 6/1/32, (LOC Wachovia Bank) (b) | | | 3,265,000 | |
| | | |
|
| | | | | 26,265,000 | |
| | | |
|
| Arizona – 2.88% |
| 13,000,000 | | Apache County IDR, 3.65%, 12/15/18, (LOC Credit Suisse First Boston) (b) | | | 13,000,000 | |
| 1,010,000 | | Glendale IDR, 3.65%, 12/1/14, (LOC Wells Fargo Bank) (b) | | | 1,010,000 | |
| 3,000,000 | | Phoenix IDA, 3.67%, 10/1/29, (FHLMC Insured) (b) | | | 3,000,000 | |
| 1,655,000 | | Phoenix IDA, 3.79%, 1/1/31, (LOC Wells Fargo Bank) | | | 1,655,000 | |
| 4,300,000 | | Scottsdale IDA Hospital Revenue (Scottsdale Healthcare), 3.65%, 9/1/26, (FGIC Insured) (b) | | | 4,300,000 | |
| 1,550,000 | | State Health Facilities Authority Revenue (Community Behavioral Health Property), 3.65%, 8/1/25, (LOC Wells Fargo Bank) (b) | | | 1,550,000 | |
| | | |
|
| | | | | 24,515,000 | |
| | | |
|
| California – 0.08% |
| 650,000 | | Hesperia Public Financing Authority Lease Revenue, 3.72%, 6/1/22, (LOC Bank of America) (b) | | | 650,000 | |
| | | |
|
| Colorado – 7.47% |
| 1,295,000 | | Boulder County Revenue (Mental Health Center), 3.65%, 2/15/25, (LOC Wells Fargo Bank) (b) | | | 1,295,000 | |
| 3,450,000 | | Colorado Educational & Cultural Facilities Authority Revenue (Clayton Foundation Project), 3.65%, 7/1/36, (LOC Wells Fargo Bank) (b) | | | 3,450,000 | |
| 1,190,000 | | Colorado Springs Revenue (Pikes Peak Mental Health), 3.65%, 3/15/23, (LOC Wells Fargo Bank) (b) | | | 1,190,000 | |
| 5,000,000 | | Commerce City Northern Infrastructure General Improvement, 3.66%, 12/1/28, (LOC U.S. Bank) (b) | | | 5,000,000 | |
| 1,940,000 | | Crystal Valley Metropolitan District, 3.65%, 10/1/34, (LOC Wells Fargo Bank) (b) | | | 1,940,000 | |
| 3,900,000 | | Douglas County MFHR (Autumn Chase), 3.67%, 12/1/29, (FHLMC Insured) (b) | | | 3,900,000 | |
| 2,400,000 | | Educational & Cultural Facilities Authority Revenue (Shambhala Mountain Center Project), 3.65%, 6/1/30, (LOC Wells Fargo Bank) (b) | | | 2,400,000 | |
| 695,000 | | Jefferson County Revenue, 3.65%, 6/1/10, (LOC Wells Fargo Bank) (b) | | | 695,000 | |
| 2,310,000 | | NBC Metropolitan District, 3.70%, 12/1/30, (LOC U.S. Bank) (b) | | | 2,310,000 | |
| 7,600,000 | | Pinery West Metropolitan District, 3.70%, 11/1/32, (LOC U.S. Bank) (b) | | | 7,600,000 | |
| 3,725,000 | | State Educational & Cultural Facilities Authority (Denver Art Museum Project), 3.65%, 1/1/34, (LOC Wells Fargo Bank) (b) | | | 3,725,000 | |
| 18,500,000 | | State Educational & Cultural Facilities Authority (National Jewish Building Program C-1), 3.77%, 9/1/35, (LOC U.S. Bank) (b) | | | 18,500,000 | |
35
Table of Contents
SCHEDULE OF PORTFOLIO INVESTMENTS
Tamarack Tax-Free Money Market Fund (cont.)
Shares or
Principal
Amount | | | | Value | |
|---|
|
| 1,900,000 | | State Educational & Cultural Facilities Authority (National Jewish Federal Building Program A-7), 3.77%, 7/1/29, (LOC Bank of America) (b) | | $ | 1,900,000 | |
| 280,000 | | State Educational & Cultural Facilities Authority (Regis Jesuit High School), 3.65%, 12/1/33, (LOC Wells Fargo Bank) (b) | | | 280,000 | |
| 1,250,000 | | State Health Facilities Authority Revenue (Arapahoe House Project), 3.72%, 4/1/24, (LOC Wells Fargo Bank) (b) | | | 1,250,000 | |
| 625,000 | | State Health Facilities Authority Revenue (The Visiting Nurse Corp.), 3.86%, 7/1/22, (LOC Wells Fargo Bank) (b) | | | 625,000 | |
| 5,000,000 | | State Housing & Financial Authority MFHR (Grant A), 3.65%, 5/1/19, (LOC Wells Fargo Bank) (b) | | | 5,000,000 | |
| 2,600,000 | | University of Colorado Hospital Authority Revenue, Series B, 3.66%, 11/15/35, (LOC Wells Fargo Bank) (b) | | | 2,600,000 | |
| | | |
|
| | | | | 63,660,000 | |
| | | |
|
| District of Columbia – 0.45% |
| 3,835,000 | | District Revenue Pooled Loan, 3.66%, 1/1/29, (LOC Bank of America) (b) | | | 3,835,000 | |
| | | |
|
| Florida – 4.32% |
| 5,800,000 | | Collier County Health Facilities Authority (The Moorings, Inc.), 3.67%, 12/1/24, (LOC Wachovia Bank) (b) | | | 5,800,000 | |
| 3,510,000 | | Dade County Water & Sewer Systems Revenue, 3.65%, 10/5/22, (FGIC Insured) (b) | | | 3,510,000 | |
| 3,500,000 | | Palm Beach County Housing Finance Authority, 3.67%, 11/1/07, (LOC Credit Suisse First Boston) (b) | | | 3,500,000 | |
| 5,300,000 | | Palm Beach County School Board, Series B, 3.64%, 8/1/29, (AMBAC Insured) (b) | | | 5,300,000 | |
| 3,345,000 | | Sarasota County Continuing Care Retirement Community Revenue (Glenridge Palmer Project), 3.79%, 6/1/36, (LOC Bank of Scotland) (b) | | | 3,345,000 | |
| 10,415,000 | | Sunshine State Governmental Funding Common Florida Revenue, 3.80%, 7/1/16, (AMBAC Insured) (b) | | | 10,415,000 | |
| 5,000,000 | | West Orange Health District Revenue, 3.67%, 2/1/22, (LOC Suntrust Bank) (b) | | | 5,000,000 | |
| | | |
|
| | | | | 36,870,000 | |
| | | |
|
| Georgia – 5.58% |
| 5,800,000 | | Clayton County MFHR (BS Partners), 3.67%, 9/1/26, (FNMA Insured) (b) | | | 5,800,000 | |
| 900,000 | | DeKalb County Development Authority Revenue, 3.66%, 6/1/20, (LOC Wachovia Bank) (b) | | | 900,000 | |
| 16,475,000 | | DeKalb County Housing Authority Revenue, 3.66%, 1/1/34, (FHLMC Insured) (b) | | | 16,475,000 | |
| 1,500,000 | | DeKalb Private Hospital Authority (Children’s Health Care Project), 3.67%, 12/1/17, (LOC Suntrust Bank) (b) | | | 1,500,000 | |
| 2,000,000 | | DeKalb Private Hospital Authority (Children’s Health Care Project), 3.67%, 12/1/28, (LOC Suntrust Bank) (b) | | | 2,000,000 | |
| 2,100,000 | | DeKalb Private Hospital Authority (Egleston Children’s Hospital), 3.67%, 3/1/24, (LOC Suntrust Bank) (b) | | | 2,100,000 | |
36
Table of Contents
SCHEDULE OF PORTFOLIO INVESTMENTS
Tamarack Tax-Free Money Market Fund (cont.)
Shares or
Principal
Amount | | | | Value | |
|---|
|
| 4,000,000 | | Downtown Savannah Authority Revenue, 3.67%, 10/1/07, (LOC Wachovia Bank) (b) | | $ | 4,000,000 | |
| 5,750,000 | | Marietta MFHR, 3.67%, 5/15/07, (FNMA Insured) (b) | | | 5,750,000 | |
| 9,025,000 | | Marietta MFHR, 3.69%, 7/1/24, (FNMA Insured) (b) | | | 9,025,000 | |
| | | |
|
| | | | | 47,550,000 | |
| | | |
|
| Idaho – 1.76% |
| 3,150,000 | | State Health Facilities Revenue (St. Luke’s Medical Center), 3.79%, 7/1/30, (FSA Insured) (b) | | | 3,150,000 | |
| 8,350,000 | | State Tax Anticipation Notes GO, 4.50%, 6/29/07, (LOC Idaho State) | | | 8,365,712 | |
| 3,455,000 | | State University Foundation, Inc. Revenue, 3.65%, 5/1/21, (LOC Wells Fargo Bank) (b) | | | 3,455,000 | |
| | | |
|
| | | | | 14,970,712 | |
| | | |
|
| Illinois – 9.32% |
| 1,700,000 | | Galesburg Revenue (Knox College), 3.68%, 3/1/31, (LOC LaSalle Bank) (b) | | | 1,700,000 | |
| 4,575,000 | | Health Facilities Authority Revenue (Metropolitan Medical Center), Series C, 3.68%, 1/1/16, (LOC Bank One) (b) | | | 4,575,000 | |
| 26,335,000 | | Illinois Financial Authority Revenue (Alexian Brothers Health Systems), 3.62%, 1/1/18, (FSA Insured) (b) | | | 26,334,999 | |
| 4,000,000 | | State Development Finance Authority PCR, 3.73%, 9/1/08, (LOC JP Morgan Chase Bank) (b) | | | 4,000,000 | |
| 6,800,000 | | State Development Finance Authority Revenue (Provena Health), Series C, 3.65%, 5/1/28, (MBIA Insured) (b) | | | 6,800,000 | |
| 10,500,000 | | State Finance Authority Revenue (Chicago Historical Society), 3.70%, 1/1/36, (LOC JP Morgan Chase Bank) (b) | | | 10,500,000 | |
| 5,100,000 | | State Finance Authority Revenue (Elmhurst College), 3.64%, 4/1/35, (LOC Bank One) (b) | | | 5,100,000 | |
| 10,000,000 | | State Finance Authority Revenue (Resurrection Health), 3.65%, 5/15/35, (LOC LaSalle Bank) (b) | | | 10,000,000 | |
| 3,360,000 | | State Health Facilities Authority Revenue (Loyola University Health System), 3.65%, 7/1/24, (MBIA Insured) (b) | | | 3,360,000 | |
| 7,150,000 | | State Toll Highway Authority Revenue, 3.65%, 1/1/10, (MBIA Insured) (b) | | | 7,150,000 | |
| | | |
|
| | | | | 79,519,999 | |
| | | |
|
| Indiana – 3.86% |
| 10,265,000 | | Eclipse Funding Trust (Solar Eclipse-Middlebury), 3.69%, 1/15/30, (FSA Insured) (b) | | | 10,265,000 | |
| 3,700,000 | | Indianapolis Public Improvement Revenue, 3.66%, 2/1/20, (MBIA Insured) (b) | | | 3,700,000 | |
| 1,870,000 | | State Health Facilities Finance Authority Revenue (Anthony Wayne Rehabilitation Center), 3.65%, 2/1/31, (LOC Wells Fargo Bank) (b) | | | 1,870,000 | |
| 250,000 | | State Health Facilities Finance Authority Revenue (Deaconess Hospital), 3.67%, 1/1/22, (LOC Fifth Third Bank) (b) | | | 250,000 | |
| 2,835,000 | | State Health Facilities Finance Authority Revenue, Series D, 5.00%, 11/1/26, (b) | | | 2,858,409 | |
37
Table of Contents
SCHEDULE OF PORTFOLIO INVESTMENTS
Tamarack Tax-Free Money Market Fund (cont.)
Shares or
Principal
Amount | | | | Value | |
|---|
|
| 4,430,000 | | State Hospital Equipment Financing Authority Revenue, 3.68%, 12/1/15, (MBIA Insured) (b) | | $ | 4,430,000 | |
| 6,165,000 | | Vincennes University Revenue, 3.68%, 10/1/22, (LOC Bank One Indiana) (b) | | | 6,165,000 | |
| 3,405,000 | | Vincennes University Revenue, 3.68%, 10/1/24, (LOC JP Morgan Chase Bank) (b) | | | 3,405,000 | |
| | | |
|
| | | | | 32,943,409 | |
| | | |
|
| Iowa – 4.64% |
| 2,815,000 | | State Finance Authority Revenue (Mississippi Valley Regional Blood Center), 3.65%, 2/1/23, (LOC Wells Fargo Bank) (b) | | | 2,815,000 | |
| 715,000 | | State Finance Authority Revenue (Putnam Museum of History), 3.65%, 5/1/12, (LOC Wells Fargo Bank) (b) | | | 715,000 | |
| 2,385,000 | | State Finance Authority Revenue (YMCA & Rehabilitation Center), 3.71%, 4/1/25, (LOC Bank of America) (b) | | | 2,385,000 | |
| 2,850,000 | | State Higher Education Authority Revenue (Cornell College), 3.65%, 11/1/16, (LOC Wells Fargo Bank) (b) | | | 2,850,000 | |
| 915,000 | | State Higher Education Authority Revenue (Loras College), 3.79%, 11/1/30, (LOC LaSalle Bank) (b) | | | 915,000 | |
| 7,840,000 | | State Higher Education Authority Revenue (Palmer Chiropractic), 3.68%, 4/1/27, (LOC LaSalle Bank) (b) | | | 7,840,000 | |
| 7,000,000 | | State School Cash Anticipation Program, 4.50%, 6/28/07, (FSA Insured) | | | 7,012,843 | |
| 10,000,000 | | State School Cash Anticipation Program, Series B, 4.25%, 1/25/08, (FSA Insured) | | | 10,052,982 | |
| 1,950,000 | | Webster County Educational Facilities Revenue, 3.65%, 7/1/20, (LOC Wells Fargo Bank) (b) | | | 1,950,000 | |
| 2,985,000 | | Woodbury County (Siouxland Regional Cancer Center), 3.65%, 12/1/14, (LOC Wells Fargo Bank) (b) | | | 2,985,000 | |
| | | |
|
| | | | | 39,520,825 | |
| | | |
|
| Kansas – 0.45% |
| 1,500,000 | | Olathe Health Facilities Revenue (Olathe Medical Center), 3.79%, 9/1/32, (AMBAC Insured) (b) | | | 1,500,000 | |
| 2,375,000 | | University of Kansas Hospital Authority Health Facilities Revenue (KU Health Systems), 3.79%, 9/1/34, (LOC Harris Trust) (b) | | | 2,375,000 | |
| | | |
|
| | | | | 3,875,000 | |
| | | |
|
| Kentucky – 0.54% |
| 4,630,000 | | Louisville & Jefferson County Sewer and Drain Systems Revenue, 3.65%, 5/15/23, (FSA Insured) (b) | | | 4,630,000 | |
| Louisiana – 0.95% |
| 4,105,000 | | State Offshore Terminal Authority Deepwater Port Revenue (Loop LLC Project), 3.66%, 10/1/19, (LOC JP Morgan Chase Bank) (b) | | | 4,105,000 | |
| 4,000,000 | | State Public Facilities Authority Revenue (Community Care), 3.67%, 7/1/21, (LOC JP Morgan Chase Bank) (b) | | | 4,000,000 | |
| | | |
|
| | | | | 8,105,000 | |
| | | |
|
| Maryland – 0.35% |
| 3,000,000 | | State Health & Higher Educational Facilities, 3.65%, 4/1/35, (LOC U.S. Bank) (b) | | | 3,000,000 | |
| | | |
|
38
Table of Contents
SCHEDULE OF PORTFOLIO INVESTMENTS
Tamarack Tax-Free Money Market Fund (cont.)
Shares or
Principal
Amount | | | | Value | |
|---|
|
| Massachusetts – 0.36% |
| 500,000 | | State Health & Educational Facilities Authority Revenue (Capital Assets Program), 3.65%, 1/1/19, (MBIA Insured) (b) | | $ | 500,000 | |
| 2,600,000 | | State Water Resource Authority, 3.65%, 11/1/26, (FGIC Insured) (b) | | | 2,600,000 | |
| | | |
|
| | | | | 3,100,000 | |
| | | |
|
| Michigan – 1.19% |
| 3,310,000 | | Eastern Michigan University, 3.79%, 6/1/27, (FGIC Insured) (b) | | | 3,310,000 | |
| 6,860,000 | | State Strategic Fund Limited Obligation Revenue (Henry Ford Museum), 3.72%, 12/1/33, (LOC Comerica Bank) (b) | | | 6,860,000 | |
| | | |
|
| | | | | 10,170,000 | |
| | | |
|
| Minnesota – 4.12% |
| 1,440,000 | | Inver Grove Heights Senior Housing Revenue, 3.68%, 5/15/35, (FNMA Insured) (b) | | | 1,440,000 | |
| 5,980,000 | | Midwest Consortium of Minneapolis Municipal Utilities Revenue, 3.65%, 1/1/25, (LOC U.S. Bank) (b) | | | 5,980,000 | |
| 7,945,000 | | Midwest Consortium of Minneapolis Municipal Utilities Revenue, 3.65%, 10/1/35, (LOC U.S. Bank) (b) | | | 7,945,000 | |
| 2,000,000 | | Minneapolis Health Care Systems Revenue (Fairview Health Services), 3.66%, 11/15/32, (AMBAC Insured) (b) | | | 2,000,000 | |
| 9,010,000 | | Minneapolis Housing Development Revenue (Orchestra Hall Associates), 3.67%, 12/1/14, (FHLMC Insured) (b) | | | 9,010,000 | |
| 895,000 | | Minneapolis Revenue (Catholic Charities Projects), 3.68%, 11/1/16, (LOC Wells Fargo Bank) (b) | | | 895,000 | |
| 3,800,000 | | Oak Park Heights MFHR (Boutwells Landing), 3.68%, 11/1/35, (LOC Freddie Mac) (b) | | | 3,800,000 | |
| 2,340,000 | | St. Paul Housing & Redevelopment Authority Revenue (Science Museum Project), 3.69%, 5/1/27, (LOC U.S. Bank) (b) | | | 2,340,000 | |
| 870,000 | | St. Paul Minnesota Housing & Redevelopment Authority Distribution Heating Revenue, 3.68%, 12/1/12, (LOC Dexia Credit) (b) | | | 870,000 | |
| 820,000 | | State Higher Education Facilities Authority Revenue (St. Olaf College), 3.79%, 10/1/20, (LOC Harris Trust & Savings Bank) (b) | | | 820,000 | |
| | | |
|
| | | | | 35,100,000 | |
| | | |
|
| Mississippi – 1.71% |
| 14,555,000 | | State Development Bank Special Obligation (Desoto County), 3.68%, 11/1/22, (AMBAC Insured) (b) | | | 14,555,000 | |
| | | |
|
| Missouri – 0.89% |
| 3,150,000 | | Independence IDA MFHR (Mansions Project), 3.68%, 8/1/35, (FHLMC Insured) (b) | | | 3,150,000 | |
| 2,000,000 | | St. Charles County IDA, 3.67%, 2/1/29, (FNMA Insured) (b) | | | 2,000,000 | |
| 2,440,000 | | State Health & Educational Facilities Authority, 3.79%, 11/1/32, (LOC Bank of America) (b) | | | 2,440,000 | |
| | | |
|
| | | | | 7,590,000 | |
| | | |
|
39
Table of Contents
SCHEDULE OF PORTFOLIO INVESTMENTS
Tamarack Tax-Free Money Market Fund (cont.)
Shares or
Principal
Amount | | | | Value | |
|---|
|
| Montana – 0.59% |
| 5,050,000 | | State Health Facilities Authority Revenue (Health Care Pooled Loan Program), 3.68%, 12/1/15, (FGIC Insured) (b) | | $ | 5,050,000 | |
| | | |
|
| Nebraska – 0.73% |
| 2,000,000 | | Lancaster County Hospital Authority Revenue (Bryan Leigh Medical Center Project), 3.79%, 6/1/18, (AMBAC Insured) | | | 2,000,000 | |
| 3,225,000 | | Scotts Bluff County Hospital Authority Revenue, 3.81%, 12/1/31, (GNMA Insured) (b) | | | 3,225,000 | |
| 1,000,000 | | State Educational Finance Authority (Creighton University Project), 3.79%, 3/1/33, (AMBAC Insured) (b) | | | 1,000,000 | |
| | | |
|
| | | | | 6,225,000 | |
| | | |
|
| New Hampshire – 0.11% |
| 970,000 | | State Health & Educational Facilities Revenue, 3.65%, 7/1/21, (LOC JP Morgan Chase Bank) (b) | | | 970,000 | |
| | | |
|
| North Carolina – 1.39% |
| 2,665,000 | | Charlotte Airport Revenue, Series A, 3.65%, 7/1/16, (MBIA Insured) (b) | | | 2,665,000 | |
| 7,000,000 | | North Carolina Capital Facilities Finance Agency Recreational Facilities Revenue (YMCA), 3.66%, 4/1/29, (LOC Wachovia Bank) (b) | | | 7,000,000 | |
| 2,165,000 | | State Educational Facilities Agency Revenue, 3.67%, 1/1/19, (LOC Bank of America) (b) | | | 2,165,000 | |
| | | |
|
| | | | | 11,830,000 | |
| | | |
|
| Ohio – 4.01% |
| 5,045,000 | | Franklin County Hospital Revenue (Children’s Hospital), 3.66%, 11/1/25, (AMBAC Insured) (b) | | | 5,045,000 | |
| 1,960,000 | | Franklin County Hospital Revenue (OhioHealth), 3.65%, 12/1/20, (LOC Citigroup) (b) | | | 1,960,000 | |
| 2,465,000 | | Franklin County Hospital Revenue (OhioHealth), 3.65%, 12/1/28, (LOC National City Bank) (b) | | | 2,465,000 | |
| 3,915,000 | | Lucas County Bond Anticipation Notes, 3.60%, 10/10/07 | | | 3,916,586 | |
| 13,700,000 | | Salem Hospital Revenue, 3.70%, 9/1/35, (LOC JP Morgan Chase Bank) (b) | | | 13,700,000 | |
| 7,085,000 | | University of Toledo General Receipts Bonds, 3.79%, 6/1/32, (FGIC Insured) (b) | | | 7,085,000 | |
| | | |
|
| | | | | 34,171,586 | |
| | | |
|
| Oklahoma – 1.08% |
| 9,200,000 | | University of Oklahoma Hospital Trust Revenue, Series A, 3.66%, 8/15/35, (LOC Bank of America) (b) | | | 9,200,000 | |
| | | |
|
| Pennsylvania – 2.83% |
| 2,910,000 | | Montgomery County IDA (Gloria Dei Project), 3.67%, 1/1/23, (LOC Citizens Bank) (b) | | | 2,910,000 | |
| 11,300,000 | | Pennsylvania Intergovernmental Cooperation Authority Split Tax Revenue, 3.67%, 6/15/22, (AMBAC Insured) (b) | | | 11,300,000 | |
| 9,650,000 | | Sayre Health Care Facilities Authority Revenue, 3.67%, 12/1/20, (AMBAC Insured) (b) | | | 9,650,000 | |
40
Table of Contents
SCHEDULE OF PORTFOLIO INVESTMENTS
Tamarack Tax-Free Money Market Fund (cont.)
Shares or
Principal
Amount | | | | Value | |
|---|
|
| 280,000 | | Schuylkill County IDA (Northeast Power Co. Project), Series A, 3.87%, 12/1/22, (LOC Dexia Group) (b) | | $ | 280,000 | |
| | | |
|
| | | | | 24,140,000 | |
| | | |
|
| South Carolina – 1.00% |
| 2,800,000 | | Florence County Hospital Revenue (McLeod Regional Medical Center), 3.67%, 11/1/15, (FGIC Insured) (b) | | | 2,800,000 | |
| 3,300,000 | | State Job Development Authority (Catholic Diocese), 3.71%, 9/1/18, (LOC Bank of America) (b) | | | 3,300,000 | |
| 795,000 | | State Job Development Authority (Orangeburg Regional Medical Center), 3.65%, 2/15/28, (AMBAC Insured) (b) | | | 795,000 | |
| 1,600,000 | | State Jobs Economic Development Authority Revenue (Hammond School Project), 3.65%, 6/1/30, (LOC Wells Fargo Bank) (b) | | | 1,600,000 | |
| | | |
|
| | | | | 8,495,000 | |
| | | |
|
| Tennessee – 1.19% |
| 3,315,000 | | Clarksville Public Building Authority Revenue, 3.66%, 11/1/27, (LOC Bank of America) (b) | | | 3,315,000 | |
| 5,400,000 | | Hamilton County IDR (Aquarium), 3.66%, 3/1/15, (LOC Bank of America) (b) | | | 5,400,000 | |
| 1,410,000 | | Metropolitan Government Nashville & Davidson County, 3.66%, 8/1/18, (LOC Bank of America) (b) | | | 1,410,000 | |
| | | |
|
| | | | | 10,125,000 | |
| | | |
|
| Texas – 5.11% |
| 1,050,000 | | Austin County Industrial Development Corp., 3.67%, 12/1/14, (LOC JP Morgan Chase Bank) (b) | | | 1,050,000 | |
| 1,300,000 | | San Antonio Health Facilities Authority Revenue (Clinical Foundation Project), 3.65%, 6/1/20, (LOC Wells Fargo Bank) (b) | | | 1,300,000 | |
| 2,380,000 | | Splendora Higher Education Facilities Revenue, 3.65%, 12/1/26, (LOC Wells Fargo Bank) (b) | | | 2,380,000 | |
| 35,000,000 | | State Tax & Revenue Anticipation Notes, 4.50%, 8/31/07 | | | 35,133,656 | |
| 3,700,000 | | Tarrant County Housing Finance Corp. Revenue, 3.67%, 2/15/28, (FNMA Insured) (b) | | | 3,700,000 | |
| | | |
|
| | | | | 43,563,656 | |
| | | |
|
| Utah – 1.41% |
| 900,000 | | Duchesne School District Municipal Building Authority Lease Revenue, 3.70%, 6/1/21, (LOC U.S. Bank) (b) | | | 900,000 | |
| 11,105,000 | | Salt Lake City Revenue (Valley Mental Health Project), 3.65%, 12/1/21, (LOC Wells Fargo Bank) (b) | | | 11,105,000 | |
| | | |
|
| | | | | 12,005,000 | |
| | | |
|
| Virginia – 0.70% |
| 2,740,000 | | Alexandria IDA (Pooled Loan Project), 3.66%, 7/1/26, (LOC Bank of America) (b) | | | 2,740,000 | |
| 2,205,000 | | Hampton Redevelopment & Housing Authority MFHR (Shoreline Apartments Project), 3.67%, 12/1/19, (FHLMC Insured) (b) | | | 2,205,000 | |
| 1,000,000 | | Louisa County IDA, 3.66%, 1/1/20, (LOC Bank of America) (b) | | | 1,000,000 | |
| | | |
|
| | | | | 5,945,000 | |
| | | |
|
41
Table of Contents
SCHEDULE OF PORTFOLIO INVESTMENTS
Tamarack Tax-Free Money Market Fund (cont.)
Shares or
Principal
Amount | | | | Value | |
|---|
|
| Washington – 2.97% |
| 2,235,000 | | Richland Golf Enterprise Revenue, 3.68%, 12/1/21, (LOC Bank of America) (b) | | $ | 2,235,000 | |
| 6,000,000 | | Snohomish County Public Utility, 3.65%, 12/1/19, (FSA Insured) (b) | | | 6,000,000 | |
| 5,500,000 | | State Housing & Finance Commission (Evergreen School Project), 3.65%, 7/1/28, (LOC Wells Fargo Bank) (b) | | | 5,500,000 | |
| 1,100,000 | | State Housing & Finance Commission (Riverview Retirement Project), 3.73%, 7/1/22, (LOC U.S. Bank) (b) | | | 1,100,000 | |
| 670,000 | | State Housing & Finance Commission Nonprofit Housing Revenue (Christa Ministries), 3.73%, 7/1/11, (LOC U.S. Bank) (b) | | | 670,000 | |
| 1,800,000 | | State Housing & Finance Commission Nonprofit Revenue (Annie Wright School), 3.70%, 12/1/23, (LOC Bank of America) (b) | | | 1,800,000 | |
| 7,045,000 | | State Housing & Finance Commission Nonprofit Revenue (Overlake School Project), 3.65%, 10/1/29, (LOC Wells Fargo Bank) (b) | | | 7,045,000 | |
| 1,000,000 | | State Housing & Finance Commission Nonprofit Revenue (Wesley Homes Project), 3.66%, 1/1/36, (LOC Bank of America) (b) | | | 1,000,000 | |
| | | |
|
| | | | | 25,350,000 | |
| | | |
|
| Wisconsin – 7.91% |
| 3,000,000 | | Kenosha Unified School District, 3.60%, 9/14/07 | | | 3,001,310 | |
| 7,000,000 | | School District Cash Flow Management Program, Certificate of Participation, Series B, 4.25%, 11/1/07 | | | 7,029,391 | |
| 7,000,000 | | School District Cash Flow Management Program, Series A1, 4.50%, 9/19/07, (LOC U.S. Bank) | | | 7,029,447 | |
| 25,590,000 | | State Health & Educational Facilities Authority Revenue (Aurora Health Care), Series B, 3.64%, 4/1/28, (LOC Marshall & Ilsley) (b) | | | 25,590,000 | |
| 2,000,000 | | State Health & Educational Facilities Authority Revenue (Aurora Health Care), Series C, 3.79%, 4/1/28, (LOC Marshall & Ilsley) (b) | | | 2,000,000 | |
| 3,100,000 | | State Health & Educational Facilities Authority Revenue (Goodwill North Central), 3.65%, 11/1/25, (LOC Wells Fargo Bank) (b) | | | 3,100,000 | |
| 13,265,000 | | State Health & Educational Facilities Authority Revenue (Gundersen Lutheran), 3.79%, 12/1/15, (FSA Insured) (b) | | | 13,265,000 | |
| 650,000 | | State Health & Educational Facilities Authority Revenue (Meriter Hospital), 3.84%, 12/1/32, (LOC Marshall & Ilsley Bank) (b) | | | 650,000 | |
| 2,800,000 | | State Health & Educational Facilities Authority Revenue (ProHealth, Inc.), 3.79%, 8/15/30, (AMBAC Insured) (b) | | | 2,800,000 | |
| 1,025,000 | | State Health & Educational Facilities Authority Revenue (St. John’s United Church), 3.73%, 2/1/30, (LOC U.S. Bank) (b) | | | 1,025,000 | |
42
Table of Contents
SCHEDULE OF PORTFOLIO INVESTMENTS
Tamarack Tax-Free Money Market Fund (cont.)
Shares or
Principal
Amount | | | | Value | |
|---|
|
| 2,000,000 | | State Health & Educational Facilities Authority Revenue (Wheaton Franciscan Services), 3.66%, 8/15/33, (LOC U.S. Bancorp) (b) | | $ | 2,000,000 | |
| | | |
|
| | | | | 67,490,148 | |
| | | |
|
Total Municipal Bonds
(Cost $724,985,335) | | | 724,985,335 | |
| |
| |
| Commercial Paper – 10.36% |
| Florida – 2.76% |
| 7,901,000 | | Cape Coral Florida, 3.70%, 4/12/07, (LOC Bank of America) | | | 7,901,000 | |
| 14,099,000 | | Cape Coral Florida, 3.65%, 6/28/07, (LOC Bank of America) | | | 14,099,000 | |
| 1,500,000 | | Jacksonville Health Authority, 3.56%, 6/4/07, (LOC Bank of America) | | | 1,500,000 | |
| | | |
|
| | | | | 23,500,000 | |
| | | |
|
| Massachusetts – 1.17% |
| 10,000,000 | | Massachusetts School Building Authority, 3.60%, 8/8/07 | | | 10,000,000 | |
| | | |
|
| Minnesota – 3.28% |
| 18,000,000 | | University of Minnesota, 3.54%, 4/5/07 | | | 18,000,000 | |
| 10,000,000 | | University of Minnesota, 3.62%, 5/22/07 | | | 10,000,000 | |
| | | |
|
| | | | | 28,000,000 | |
| | | |
|
| Texas – 2.03% |
| 8,800,000 | | Pinellas County Education, 3.61%, 5/23/07, (LOC Wachovia Bank) | | | 8,800,000 | |
| 2,000,000 | | Plano Texas Health Facilities, 3.61%, 5/22/07, (MBIA Insured) | | | 2,000,000 | |
| 6,500,000 | | Upper Trinity Regional, 3.60%, 4/5/07, (LOC Bank of America) | | | 6,500,000 | |
| | | |
|
| | | | | 17,300,000 | |
| | | |
|
| Wyoming – 1.12% |
| 9,525,000 | | Sweetwater County Wyoming, 3.61%, 7/9/07, (LOC Barclays Bank) | | | 9,525,000 | |
| | | |
|
Total Commercial Paper
(Cost $88,325,000) | | | 88,325,000 | |
| |
| |
| Investment Companies – 0.28% |
| 2,399,838 | | Federated Tax Exempt Money Market Fund | | | 2,399,838 | |
| | | |
|
Total Investment Companies
(Cost $2,399,838) | | | 2,399,838 | |
| |
| |
Total Investments
(Cost $815,710,173) (a) – 95.67% | | | 815,710,173 | |
| Other assets in excess of liabilities – 4.33% | | | 36,949,903 | |
| |
| |
| NET ASSETS – 100.00% | | $ | 852,660,076 | |
| |
| |
(a) Tax cost of securities is equal to book cost of securities.
(b) Variable rate security. The rate reflected in the Schedule of Portfolio Investments is the rate in effect on March 31, 2007. The maturity date represents the actual maturity date.
Abbreviations used are defined below:
AMBAC – Ambac Assurance Corporation
FGIC – Financial Guaranty Insurance Corporation
FHLMC – Federal Home Loan Mortgage Corporation
FNMA – Federal National Mortgage Association
FSA – Financial Security Assurance Inc.
GNMA – Government National Mortgage Association
GO – General Obligation IDA – Industrial Development Authority
IDR – Industrial Development Revenue
LOC – Letter of Credit
MBIA – MBIA Insurance Corporation
MFHR – Multi-Family Housing Revenue
PCR – Pollution Control Revenue
See notes to financial statements.
43
Table of Contents
SCHEDULE OF PORTFOLIO INVESTMENTS
Tamarack Institutional Prime Money Market Fund
March 31, 2007 (Unaudited)
Shares or
Principal
Amount | | | | Value | |
|---|
|
| Asset Backed Securities – 11.53% |
| Asset Backed Auto Receivable – 5.33% |
| 6,747,574 | | Americredit Automobile Receivables Trust, Series 2007-AX, Class A1, 5.31%, 2/6/08 (b) | | $ | 6,747,574 | |
| 614,724 | | BMW Vehicle Owner Trust, Series 2006-A, Class A1, 5.36%, 9/25/07 (b) | | | 614,724 | |
| 6,479,805 | | Capital One Auto Finance Trust, Series 2007-A, Class A1, 5.32%, 2/15/08 (b) | | | 6,479,805 | |
| 9,342,545 | | CNH Equipment Trust, Series 2006-B, Class A1, 5.39%, 10/5/07 (b) | | | 9,342,546 | |
| 7,500,000 | | CNH Equipment Trust, Series 2007-A, Class A1, 5.26%, 4/4/08 (b) | | | 7,500,000 | |
| 2,000,000 | | CPS Auto Trust, Series 2007-A, Class A1, 5.33%, 3/17/08 (b) (c) | | | 2,000,000 | |
| 922,205 | | Daimler Chrysler Auto Trust, Series 2006-C, Class A1, 5.33%, 10/8/07 (b) (c) | | | 922,205 | |
| 2,033,346 | | Ford Credit Auto Owner Trust, Series 2006-C, Class A1, 5.36%, 12/15/07 (b) | | | 2,033,346 | |
| 3,123,671 | | General Electric Equipment Midticket LLC, Series 2006-1, Class A1, 5.30%, 12/15/07 (b) | | | 3,123,671 | |
| 341,480 | | Honda Auto Receivables Owner Trust, Series 2006-2, Class A1, 5.43%, 8/21/07 (b) | | | 341,480 | |
| 5,310,610 | | Honda Auto Receivables Owner Trust, Series 2007-1, Class A1, 5.32%, 3/18/08 (b) | | | 5,310,610 | |
| 1,236,714 | | Household Automotive Trust, Series 2006-3, Class A1, 5.36%, 11/19/07 (b) | | | 1,236,714 | |
| 4,712,400 | | Household Automotive Trust, Series 2007-1, Class A1, 5.33%, 2/17/08 (b) | | | 4,712,400 | |
| 80,962 | | John Deere Owner Trust, Series 2006-A, Class A1, 5.36%, 7/13/07 (b) | | | 80,950 | |
| 348,238 | | Long Beach Auto Receivables Trust, Series 2006-B, Class A1, 5.37%, 10/15/07 (b) | | | 348,238 | |
| 5,500,000 | | Long Beach Auto Receivables Trust, Series 2007-A, Class A1, 5.34%, 4/15/08 (b) | | | 5,500,000 | |
| 586,369 | | Nissan Auto Receivables Owner Trust, Series 2006-C, Class A1, 5.49%, 8/15/07 (b) | | | 586,369 | |
| 6,151,608 | | Nissan Auto Receivables Owner Trust, Series 2007-A, Class A1, 5.32%, 3/17/08 (b) | | | 6,151,608 | |
| 8,600,000 | | Santander Drive Auto Receivables Trust, Series 2007-1, Class A1, 5.32%, 4/15/08 (b) | | | 8,600,000 | |
| 177,682 | | USAA Auto Owner Trust, Series 2006-3, Class A1, 5.40%, 8/15/07 (b) | | | 177,682 | |
| 1,635,215 | | USAA Auto Owner Trust, Series 2006-4, Class A1, 5.34%, 12/13/07 (b) | | | 1,635,215 | |
| 572,478 | | Volkswagen Auto Lease Trust, Series 2006-A, Class A1, 5.52%, 8/20/07 (b) | | | 572,478 | |
| 5,637,617 | | Volkswagen Auto Loan Enhanced Trust, Series 2007-1, Class A1, 5.32%, 2/20/08 | | | 5,637,617 | |
| 456,438 | | Wachovia Auto Loan Owner Trust, Series 2006-1, Class A1, 5.39%, 10/19/07 (b) (c) | | | 456,438 | |
| 1,346,949 | | World Omni Auto Receivables Trust, Series 2006-B, Class A1, 5.37%, 10/15/07 (b) | | | 1,346,949 | |
| 2,257,206 | | World Omni Auto Receivables Trust, Series 2007-A, Class A1, 5.32%, 2/15/08 (b) | | | 2,257,206 | |
| | | |
|
| | | | | 83,715,825 | |
| | | |
|
| Asset Backed Mortgages – 6.20% |
| 9,500,000 | | Arkle Master Issuer PLC, Series 2006-1A, Class A1, 5.30%, 11/19/07 (b) (c) | | | 9,500,000 | |
44
Table of Contents
SCHEDULE OF PORTFOLIO INVESTMENTS
Tamarack Institutional Prime Money Market Fund (cont.)
Shares or
Principal
Amount | | | | Value | |
|---|
|
| 19,500,000 | | Brunel Residential Mortgage Securities, Series 2007-1A, Class A3, 5.31%, 1/13/39 (b) (c) | | $ | 19,499,999 | |
| 1,113,058 | | CIT Equipment Collateral, Series 2006-VT2, Class A1, 5.34%, 11/20/07 (b) | | | 1,113,058 | |
| 2,000,000 | | Granite Master Issuer PLC, Series 2006-3, Class A4, 5.30%, 12/20/54 (b) | | | 2,000,000 | |
| 6,000,000 | | Holmes Financing PLC, Series 10A, Class 1A, 5.29%, 7/15/07 (b) (c) | | | 6,000,000 | |
| 5,900,000 | | Holmes Master Issuer PLC, Series 2006-1A, Class 1A, 5.30%, 1/15/16 (b) (c) | | | 5,900,000 | |
| 12,000,000 | | Holmes Master Issuer PLC, Series 2007-1, Class 1A1, 5.30%, 3/15/08 (b) | | | 12,000,000 | |
| 5,416,078 | | Paragon Mortgages PLC, Series 13A, Class A1, 5.31%, 1/15/39 (b) (c) | | | 5,416,136 | |
| 12,000,000 | | Paragon Mortgages PLC, Series 14A, Class A1, 5.32%, 9/15/39 (b) (c) | | | 12,000,000 | |
| 15,000,000 | | Pendeford Master Issuer PLC, Series 2007-1A, Class 1A, 5.32%, 2/12/08 (b) (c) | | | 15,000,000 | |
| 4,000,000 | | Permanent Master Issuer PLC, Series 2006-1, Class 1A, 5.30%, 10/17/07 (b) | | | 4,000,000 | |
| 5,000,000 | | Permanent Master Issuer PLC, Series 2007-1, Class 1A, 5.31%, 1/15/08 (b) | | | 5,000,000 | |
| | | |
|
| | | | | 97,429,193 | |
| | | |
|
Total Asset Backed Securities
(Cost $181,145,018) | | | 181,145,018 | |
| |
| |
| Commercial Paper – 19.10% |
| Asset Backed – 7.73% |
| 10,000,000 | | Fairway Finance Corp. LLC, 5.28%, 6/12/07 (b) (c) (d) | | | 9,999,900 | |
| 18,000,000 | | Fairway Finance Corp. LLC, 5.28%, 6/20/07 (b) (c) (d) | | | 17,999,803 | |
| 15,000,000 | | Fairway Finance Corp. LLC, 5.28%, 7/16/07 (b) (c) (d) | | | 14,999,669 | |
| 20,000,000 | | Galaxy Funding, Inc., 5.38%, 4/13/07 (d) | | | 19,965,067 | |
| 1,408,000 | | Park Avenue Receivables, 5.35%, 4/25/07 (d) | | | 1,403,081 | |
| 3,000,000 | | Sheffield Receivables, 5.38%, 4/20/07 (c) (d) | | | 2,991,703 | |
| 30,393,000 | | Three Pillars Funding, 5.38%, 6/22/07 (c) (d) | | | 30,030,242 | |
| 15,000,000 | | Yorktown Capital Corp., 5.37%, 4/16/07 (d) | | | 14,967,188 | |
| 9,000,000 | | Yorktown Capital Corp., 5.36%, 5/1/07 (d) | | | 8,960,700 | |
| | | |
|
| | | | | 121,317,353 | |
| | | |
|
| Banks – Domestic – 1.65% |
| 7,000,000 | | BA Credit Card Trust Emerald Note, 5.38%, 4/5/07 (c) (d) | | | 6,995,924 | |
| 19,000,000 | | Marshall & Ilsley Corp., 5.38%, 4/12/07 (d) | | | 18,969,579 | |
| | | |
|
| | | | | 25,965,503 | |
| | | |
|
| Banks – Foreign – 3.17% |
| 25,000,000 | | Dexia Delaware LLC, 5.34%, 5/4/07 (d) | | | 24,880,261 | |
| 5,000,000 | | Greenwich Capital Holdings, 5.42%, 8/24/07 (d) | | | 4,895,378 | |
| 20,000,000 | | Societe Generale North America, 5.37%, 4/3/07 (d) | | | 19,994,144 | |
| | | |
|
| | | | | 49,769,783 | |
| | | |
|
| Finance – Diversified Foreign – 5.66% |
| 25,000,000 | | ING (US) Funding LLC, 5.37%, 5/21/07 (d) | | | 24,818,403 | |
| 30,000,000 | | Northern Rock PLC, 5.36%, 5/4/07 (c) | | | 29,855,900 | |
| 35,000,000 | | UBS Finance (DE) LLC, 5.42%, 8/10/07 (d) | | | 34,337,722 | |
| | | |
|
| | | | | 89,012,025 | |
| | | |
|
| Food Products – 0.09% |
| 1,480,000 | | McCormick & Company, Inc., 5.36%, 5/23/07 (d) | | | 1,468,884 | |
| | | |
|
| Health Care – 0.66% |
| 10,500,000 | | Baystate Health Systems, 5.38%, 6/28/07 | | | 10,365,507 | |
| | | |
|
45
Table of Contents
SCHEDULE OF PORTFOLIO INVESTMENTS
Tamarack Institutional Prime Money Market Fund (cont.)
Shares or
Principal
Amount | | | | Value | |
|---|
|
| Insurance – 0.14% |
| 2,240,000 | | Prudential Funding LLC, 5.33%, 5/25/07 (d) | | $ | 2,222,629 | |
Total Commercial Paper
(Cost $300,121,684) | | | 300,121,684 | |
| |
| |
| Certificates of Deposit – 39.32% |
| Banks – Australia/New Zealand – 3.66% |
| 7,500,000 | | Australia & New Zealand Banking Group, 5.32%, 4/4/08 (b) (c) | | | 7,500,000 | |
| 15,000,000 | | Westpac Banking Corp., 5.29%, 12/7/07 (b) | | | 14,999,608 | |
| 20,000,000 | | Westpac Banking Corp., 5.32%, 1/15/08 (b) | | | 19,999,887 | |
| 15,000,000 | | Westpac Banking Corp., 5.31%, 2/16/11 (b) (c) | | | 15,000,000 | |
| | | |
|
| | | | | 57,499,495 | |
| | | |
|
| Banks – Canada – 4.49% |
| 13,000,000 | | Bank of Nova Scotia, 5.21%, 10/4/07 | | | 12,985,076 | |
| 15,000,000 | | Bank of Nova Scotia, 5.26%, 10/4/07 (b) | | | 14,998,062 | |
| 7,500,000 | | Bank of Nova Scotia, 5.27%, 12/31/07 (b) | | | 7,498,544 | |
| 10,000,000 | | Canadian Imperial Bank, 5.35%, 11/7/07 | | | 10,000,294 | |
| 25,000,000 | | Canadian Imperial Bank, 5.36%, 1/10/08 (b) | | | 25,005,506 | |
| | | |
|
| | | | | 70,487,482 | |
| | | |
|
| Banks – Domestic – 20.79% |
| 15,000,000 | | AmSouth Bank, NA, 5.44%, 12/27/07 (b) | | | 15,012,811 | |
| 5,000,000 | | Bank of Montreal Chicago, 5.42%, 3/18/08 (b) | | | 5,004,941 | |
| 25,000,000 | | Bank of New York Co., Inc., 5.34%, 11/16/07 (b) | | | 25,002,721 | |
| 7,000,000 | | Bank of New York Co., Inc., 5.31%, 11/19/07 (b) | | | 6,998,861 | |
| 25,000,000 | | Branch Banking & Trust, 5.28%, 4/30/07 | | | 25,000,000 | |
| 9,475,000 | | Branch Banking & Trust, 5.42%, 6/4/07 (b) | | | 9,476,962 | |
| 12,000,000 | | Comerica Bank, 5.30%, 8/24/07 (b) | | | 12,000,617 | |
| 16,000,000 | | Comerica Bank, 5.41%, 11/26/07 | | | 16,012,190 | |
| 9,350,000 | | Comerica Bank, 5.32%, 2/8/08 (b) | | | 9,350,739 | |
| 25,000,000 | | Credit Suisse First Boston USA, Inc., 5.29%, 6/13/07 | | | 24,999,961 | |
| 10,000,000 | | Marshall & Ilsley Bank, 3.80%, 2/8/08 | | | 9,878,015 | |
| 7,500,000 | | Marshall & Ilsley Bank, 5.16%, 12/15/16 | | | 7,500,616 | |
| 20,000,000 | | Mercantile Safe Deposit & Trust Co., 5.28%, 6/5/07 (b) | | | 19,999,567 | |
| 7,500,000 | | Mercantile Safe Deposit & Trust Co., 5.43%, 8/22/07 | | | 7,499,412 | |
| 55,000,000 | | National City Bank, 5.35%, 2/13/08 (b) | | | 55,011,006 | |
| 10,000,000 | | PNC Bank NA, 5.27%, 1/2/08 (b) | | | 9,997,744 | |
| 51,500,000 | | Suntrust Bank, 5.27%, 9/14/07 (b) | | | 51,495,837 | |
| 6,510,000 | | US Bank NA, 5.29%, 12/5/07 (b) | | | 6,510,202 | |
| 10,000,000 | | Washington Mutual Bank, 5.30%, 4/24/07 | | | 10,000,000 | |
| | | |
|
| | | | | 326,752,202 | |
| | | |
|
| Banks – Foreign – 9.97% |
| 22,500,000 | | Banco Espanol De Credito, 5.33%, 4/18/08 (b) (c) | | | 22,500,000 | |
| 5,000,000 | | Bank of Ireland, 5.30%, 7/19/11, (b) (c) | | | 5,000,000 | |
| 25,000,000 | | Calyon Bank, 5.35%, 5/7/07 | | | 25,000,372 | |
| 25,000,000 | | Credit Agricole (London), 5.32%, 1/1/49 (b) (c) | | | 25,000,000 | |
| 7,500,000 | | HBOS Treasury Services PLC, 5.29%, 4/7/08 (b) (c) | | | 7,500,000 | |
| 10,200,000 | | Nationwide Building Society, 5.48%, 7/20/07 (b) (c) | | | 10,205,150 | |
| 10,000,000 | | Santander Totta Ireland PLC, 5.32%, 3/7/08 (b) (c) | | | 10,000,000 | |
| 7,500,000 | | Societe Generale NY, 5.27%, 9/21/07 (b) | | | 7,498,931 | |
| 20,000,000 | | Svenska Handelsbanken, 5.29%, 4/4/08 (b) (c) | | | 20,000,000 | |
| 16,500,000 | | Svenska Handelsbanken, 5.29%, 11/21/11 (b) (c) | | | 16,500,000 | |
| 7,500,000 | | Swedbank, 5.31%, 9/17/07 (b) | | | 7,499,326 | |
| | | |
|
| | | | | 156,703,779 | |
| | | |
|
46
Table of Contents
SCHEDULE OF PORTFOLIO INVESTMENTS
Tamarack Institutional Prime Money Market Fund (cont.)
Shares or
Principal
Amount | | | | Value | |
|---|
|
| Household Products – 0.41% |
| 6,500,000 | | Colgate-Palmolive Co., 7.84%, 5/15/07 | | $ | 6,518,865 | |
Total Certificates of Deposit
(Cost $617,961,823) | | | 617,961,823 | |
| |
| |
| Corporate Bonds – 28.29% |
| Banks – Domestic – 0.56% |
| 2,809,000 | | Bank of New York Co., Inc., 3.90%, 9/1/07 | | | 2,792,063 | |
| 2,000,000 | | Credit Suisse First Boston USA, Inc., 5.75%, 4/15/07 (d) | | | 2,000,418 | |
| 4,000,000 | | Wells Fargo & Co., 5.37%, 3/10/08 (b) | | | 4,003,525 | |
| | | |
|
| | | | | 8,796,006 | |
| | | |
|
| Banks – Foreign – 0.95% |
| 15,000,000 | | Abbey National Treasury Services, 5.36%, 6/29/07 (b) | | | 15,001,593 | |
| Finance – Automotive – 3.25% |
| 15,000,000 | | American Honda Finance Corp., 5.32%, 12/6/07 (b) (c) | | | 15,000,000 | |
| 6,000,000 | | American Honda Finance Corp., 5.35%, 12/27/07 (b) (c) | | | 6,001,260 | |
| 20,000,000 | | American Honda Finance Corp., 5.32%, 2/20/08 (b) (c) | | | 20,000,000 | |
| 10,000,000 | | Toyota Motor Credit Corp., 5.32%, 7/2/07 (b) | | | 9,999,806 | |
| | | |
|
| | | | | 51,001,066 | |
| | | |
|
| Finance – Diversified Domestic – 6.57% |
| 8,650,000 | | Citigroup Inc., 5.41%, 6/4/07 (b) | | | 8,651,527 | |
| 40,000,000 | | Merrill Lynch & Co., 5.32%, 7/27/07 (b) | | | 40,000,000 | |
| 6,325,000 | | Merrill Lynch & Co., 5.49%, 7/27/07 (b) | | | 6,328,375 | |
| 10,000,000 | | Morgan Stanley, 5.29%, 9/14/07 (b) | | | 10,000,000 | |
| 5,250,000 | | Morgan Stanley, 5.49%, 11/9/07 (b) | | | 5,254,750 | |
| 15,000,000 | | Morgan Stanley, 5.49%, 1/18/08 (b) | | | 15,018,159 | |
| 18,050,000 | | Wachovia Corp., 5.44%, 7/20/07 (b) | | | 18,056,675 | |
| | | |
|
| | | | | 103,309,486 | |
| | | |
|
| Food Products – 0.10% |
| 1,584,000 | | Watts Brothers Frozen Foods, 5.37%, 7/1/13 (b) | | | 1,584,000 | |
| | | |
|
| Forest & Paper Products – 0.76% |
| 12,000,000 | | Kimberly-Clark Corp., 5.26%, 12/19/07 (c) | | | 12,000,000 | |
| | | |
|
| Information Technology – 1.59% |
| 25,000,000 | | IBM Corp., 5.33%, 12/8/10 (b) (c) | | | 25,000,000 | |
| | | |
|
| Insurance – 12.59% |
| 14,535,000 | | Allstate Life Global Funding II, 5.43%, 4/2/07 (b) (c) | | | 14,535,049 | |
| 10,000,000 | | Allstate Life Global Funding Trust, 5.34%, 5/21/07 (b) | | | 10,000,683 | |
| 13,000,000 | | Allstate Life Global Funding Trust, 5.29%, 1/11/08 (b) | | | 13,000,000 | |
| 7,500,000 | | Allstate Life Global Funding Trust, 5.29%, 4/4/08 (b) | | | 7,500,000 | |
| 15,000,000 | | ING Verzekeringen, NV, 5.29%, 1/4/08 (b) (c) | | | 15,000,000 | |
| 7,090,000 | | John Hancock Global Funding II, 5.00%, 7/27/07 (c) | | | 7,082,368 | |
| 6,500,000 | | Metropolitan Life Global Funding I, 4.75%, 6/20/07 (c) | | | 6,488,263 | |
| 7,100,000 | | Metropolitan Life Global Funding I, 5.43%, 10/5/07 (b) (c) | | | 7,103,313 | |
| 10,000,000 | | Metropolitan Life Global Funding I, 5.34%, 11/9/07 (b) (c) | | | 10,002,921 | |
| 25,000,000 | | Metropolitan Life Global Funding I, 5.31%, 2/22/08 (b) (c) | | | 25,000,000 | |
| 12,000,000 | | Monument Global Funding 2007-F, 5.33%, 3/20/08 (b) (c) | | | 12,000,000 | |
| 42,500,000 | | Monumental Global Funding II, 5.44%, 6/29/07 (b) (c) | | | 42,513,644 | |
| 7,500,000 | | Monumental Global Funding II, 5.33%, 12/20/07 (b) (c) | | | 7,500,000 | |
| 20,000,000 | | Nationwide Life Global Funding, 5.31%, 12/27/11 (b) (c) | | | 20,000,000 | |
| | | |
|
| | | | | 197,726,241 | |
| | | |
|
47
Table of Contents
SCHEDULE OF PORTFOLIO INVESTMENTS
Tamarack Institutional Prime Money Market Fund (cont.)
Shares or
Principal
Amount | | | | Value | |
|---|
|
| Manufacturing – 0.96% |
| 15,000,000 | | 3M Co., 5.15%, 12/12/10 (c) | | $ | 15,053,623 | |
| | | |
|
| Retail – 0.96% |
| 15,000,000 | | Wal-Mart Stores, 5.88%, 6/1/18 | | | 15,012,208 | |
| | | |
|
Total Corporate Bonds
(Cost $444,484,223) | | | 444,484,223 | |
| |
| |
| Taxable Municipal Bonds – 3.89% |
| California – 0.64% |
| 10,000,000 | | Adelanto Public Utility Authorization Revenue, 5.42%, 11/1/34 (AMBAC Insured) (b) | | | 10,000,000 | |
| | | |
|
| Florida – 0.95% |
| 15,000,000 | | Florida Hurricane Catastrophe, 5.33%, 4/14/08 (b) | | | 15,000,000 | |
| | | |
|
| Illinois – 0.53% |
| 8,270,000 | | Illinois Student Assistance Common Student Loan Revenue, 5.33%, 9/1/32 (MBIA Insured) (b) | | | 8,270,000 | |
| | | |
|
| Michigan – 0.38% |
| 5,955,000 | | Oakland County, 5.35%, 4/1/07 | | | 5,955,000 | |
| | | |
|
| Minnesota – 0.17% |
| 1,180,000 | | St. Paul Minnesota Housing & Redevelopment Authority District Cooling Revenue, 5.33%, 3/1/18 (b) | | | 1,180,000 | |
| 1,500,000 | | St. Paul Minnesota Port Authority District Heating Revenue, 5.33%, 12/1/26 (LOC Dexia Credit) (b) | | | 1,500,000 | |
| | | |
|
| | | | | 2,680,000 | |
| | | |
|
| New Mexico – 0.24% |
| 3,800,000 | | Albuquerque Industrial Revenue, 5.40%, 8/1/25 (LOC Wells Fargo Bank) (b) | | | 3,800,000 | |
| | | |
|
| New York – 0.18% |
| 2,900,000 | | State Housing Finance Agency Revenue (Chelsea Apartments), 5.35%, 11/15/36 (b) (c) | | | 2,900,000 | |
| | | |
|
| Oregon – 0.16% |
| 2,565,000 | | Lake Oswego Redevelopment Agency Tax Increment Revenue, 5.40%, 6/1/20 (LOC Wells Fargo Bank) (b) | | | 2,565,000 | |
| | | |
|
| Texas – 0.64% |
| 10,000,000 | | North Texas Higher Education Authority Inc., 5.32%, 12/1/46, (AMBAC Insured) (b) | | | 10,000,000 | |
| | | |
|
Total Taxable Municipal Bonds
(Cost $61,170,000) | | | 61,170,000 | |
| |
| |
| Investment Companies – 0.32% |
| 4,971,497 | | Wells Fargo Prime Investment Money Market Fund | | | 4,971,497 | |
| | | |
|
Total Investment Companies
(Cost $4,971,497) | | | 4,971,497 | |
| |
| |
Total Investments
(Cost $1,609,854,245) (a) – 102.45% | | | 1,609,854,245 | |
| Liabilities in excess of other assets – (2.45)% | | | (38,513,166 | ) |
| |
| |
| NET ASSETS – 100.00% | | $ | 1,571,341,079 | |
| |
| |
(a) Tax cost of securities is equal to book cost of securities.
(b) Variable rate security. The rate reflected in the Schedule of Portfolio Investments is the rate in effect on March 31, 2007. The maturity date represents the actual maturity date.
(c) Security exempt from registration under Rule 144A of the Securities Act of 1933, as amended. These securities may be resold in transactions exempt from registration, normally to qualified institutional buyers. Security has been deemed to be liquid based on procedures approved by the Board of Trustees.
(d) Rate represents the effective yield at purchase.
Abbreviations used are defined below:
AMBAC – Ambac Assurance Corporation
LOC – Letter of Credit
MBIA – MBIA Insurance Corporation
See notes to financial statements.
48
Table of Contents
SCHEDULE OF PORTFOLIO INVESTMENTS
Tamarack Institutional Tax-Free Money Market Fund
March 31, 2007 (Unaudited)
Shares or
Principal
Amount | | | | Value | |
|---|
|
| Municipal Bonds – 86.57% |
| Alabama – 0.59% |
| 3,000,000 | | Mobile Industrial Development Board Dock & Wharf Revenue, 3.66%, 6/1/32, (LOC Wachovia Bank) (b) | | $ | 3,000,000 | |
| | | |
|
| Arizona – 1.19% |
| 1,300,000 | | Apache County IDR, 3.65%, 12/15/18, (LOC Bank of New York) (b) | | | 1,300,000 | |
| 605,000 | | Maricopa County IDA MFHR (Gran Victoria Housing LLC), 3.68%, 4/15/30, (FNMA Insured) (b) | | | 605,000 | |
| 1,500,000 | | Phoenix IDA, 3.65%, 4/1/28, (LOC Wells Fargo Bank) (b) | | | 1,500,000 | |
| 2,610,000 | | State Health Facilities Authority Revenue (Community Behavioral Health Property), 3.65%, 8/1/25, (LOC Wells Fargo Bank) (b) | | | 2,610,000 | |
| | | |
|
| | | | | 6,015,000 | |
| | | |
|
| Colorado – 6.63% |
| 1,000,000 | | Aurora Centretech Metropolitan District, Series A, 3.70%, 12/1/28, (LOC BP Amoco) (b) | | | 1,000,000 | |
| 695,000 | | Colorado Springs Revenue (Pikes Peak Mental Health), 3.65%, 3/15/23, (LOC Wells Fargo Bank) (b) | | | 695,000 | |
| 4,300,000 | | Crystal Valley Metropolitan District, 3.65%, 10/1/34, (LOC Wells Fargo Bank) (b) | | | 4,300,000 | |
| 1,600,000 | | Denver City & County Convention Center, 3.65%, 9/1/25, (FSA Insured) (b) | | | 1,600,000 | |
| 3,000,000 | | Douglas County MFHR (Autumn Chase), 3.67%, 12/1/29, (FHLMC Insured) (b) | | | 3,000,000 | |
| 4,810,000 | | Parker Automotive Metropolitan District, 3.70%, 12/1/34, (LOC U.S. Bank) (b) | | | 4,810,000 | |
| 6,500,000 | | State Educational & Cultural Facilities Authority (Denver Seminary), 3.65%, 7/1/34, (LOC Wells Fargo Bank) (b) | | | 6,500,000 | |
| 1,290,000 | | State Educational & Cultural Facilities Authority (Regis Jesuit High School), 3.65%, 12/1/33, (LOC Wells Fargo Bank) (b) | | | 1,290,000 | |
| 1,700,000 | | State Health Facilities Authority Revenue (Craig Hospital), 3.65%, 12/1/20, (LOC Wells Fargo Bank) (b) | | | 1,700,000 | |
| 300,000 | | State Health Facilities Authority Revenue (The Visiting Nurse Corp.), 3.86%, 7/1/22, (LOC Wells Fargo Bank) (b) | | | 300,000 | |
| 2,700,000 | | University of Colorado Hospital Authority Revenue, Series B, 3.66%, 11/15/35, (LOC Wells Fargo Bank) (b) | | | 2,700,000 | |
| 5,700,000 | | Water Valley Metropolitan District Number 002, 3.65%, 12/1/24, (LOC Wells Fargo Bank) (b) | | | 5,700,000 | |
| | | |
|
| | | | | 33,595,000 | |
| | | |
|
| District of Columbia – 1.75% |
| 4,095,000 | | American Geophysical Union, 3.66%, 9/1/23, (LOC Bank of America) (b) | | | 4,095,000 | |
| 1,700,000 | | District Revenue (Internships & Academic), 3.68%, 7/1/36, (LOC Branch Banking & Trust) (b) | | | 1,700,000 | |
| 3,085,000 | | Galleria Metropolitan District, 3.65%, 12/1/29, (LOC Wells Fargo Bank) (b) | | | 3,085,000 | |
| | | |
|
| | | | | 8,880,000 | |
| | | |
|
| Florida – 6.72% |
| 2,500,000 | | Alachua County Health Facilities Authority Revenue (Santa Fe Health Care Facilities Project), 3.80%, 12/1/12, (LOC Suntrust Bank) (b) | | | 2,500,000 | |
49
Table of Contents
SCHEDULE OF PORTFOLIO INVESTMENTS
Tamarack Institutional Tax-Free Money Market Fund (cont.)
Shares or
Principal
Amount | | | | Value | |
|---|
|
| 2,900,000 | | Brevard County Educational Facilities Authority (Institute of Technology), 3.66%, 7/1/32, (LOC Bank of America) (b) | | $ | 2,900,000 | |
| 900,000 | | Collier County Health Facilities Authority (The Moorings, Inc.), 3.67%, 12/1/24, (LOC Wachovia Bank) (b) | | | 900,000 | |
| 6,185,000 | | Dade County Special Revenue (Youth Fair & Exposition Project), 3.66%, 8/1/15, (LOC Suntrust Bank) (b) | | | 6,185,000 | |
| 1,900,000 | | Indiana River County Revenue (St. Edward’s School), 3.66%, 7/1/27, (LOC Wachovia Bank) (b) | | | 1,900,000 | |
| 18,460,000 | | Sarasota County Continuing Care Retirement Community Revenue (Glenridge Palmer Project), 3.79%, 6/1/36, (LOC Bank of Scotland) (b) | | | 18,460,000 | |
| 1,200,000 | | Sunshine State Government Finance Committee, 3.80%, 7/1/16, (AMBAC Insured) (b) | | | 1,200,000 | |
| | | |
|
| | | | | 34,045,000 | |
| | | |
|
| Georgia – 6.94% |
| 1,415,000 | | Clayton County MFHR (BS Partners), 3.67%, 9/1/26, (FNMA Insured) (b) | | | 1,415,000 | |
| 4,540,000 | | Cobb County Development Authority Revenue (Institute Nuclear Power), 3.66%, 2/1/13, (LOC Suntrust Bank) (b) | | | 4,540,000 | |
| 900,000 | | DeKalb Private Hospital Authority (Children’s Health Care Project), 3.67%, 12/1/28, (LOC Suntrust Bank) (b) | | | 900,000 | |
| 1,700,000 | | DeKalb Private Hospital Authority (Egleston Children’s Hospital), 3.67%, 3/1/24, (LOC Suntrust Bank) (b) | | | 1,700,000 | |
| 5,000,000 | | Fulco Hospital Authority Revenue (Shepherd Center, Inc. Project), 3.67%, 9/1/17, (LOC Wachovia Bank) (b) | | | 5,000,000 | |
| 2,100,000 | | Fulton County Development Authority (St. George Village), 3.66%, 4/1/34, (LOC Bank of America) (b) | | | 2,100,000 | |
| 3,000,000 | | Fulton County Development Authority Revenue (Pace Academy, Inc. Project), 3.66%, 7/1/18, (LOC Bank of America) (b) | | | 3,000,000 | |
| 5,900,000 | | Hall County Gainesville Hospital Authority Revenue (Northeast Health), 3.65%, 5/15/29, (LOC MBIA) (b) | | | 5,900,000 | |
| 7,000,000 | | Macon-Bibb County Hospital Authority Revenue, 3.80%, 5/1/30, (LOC Suntrust Bank) (b) | | | 7,000,000 | |
| 3,600,000 | | Marietta MFHR, 3.67%, 5/15/07, (FNMA Insured) (b) | | | 3,600,000 | |
| | | |
|
| | | | | 35,155,000 | |
| | | |
|
| Idaho – 1.72% |
| 2,675,000 | | State Health Facilities Revenue (St. Luke’s Medical Center), 3.79%, 7/1/30, (FSA Insured) (b) | | | 2,675,000 | |
| 6,000,000 | | State Tax Anticipation Notes GO, 4.50%, 6/29/07, (LOC Idaho State) | | | 6,011,290 | |
| | | |
|
| | | | | 8,686,290 | |
| | | |
|
| Illinois – 12.72% |
| 1,000,000 | | Chicago Waterworks Revenue, 5.25%, 11/1/23, Prerefunded 11/1/07 @ 102 | | | 1,029,277 | |
| 3,000,000 | | Crestwood Tax, Increment Revenue, 3.70%, 12/1/23, (LOC Fifth Third Bank) (b) | | | 3,000,000 | |
| 2,700,000 | | Galesburg Revenue (Knox College), 3.68%, 7/1/24, (LOC LaSalle Bank) (b) | | | 2,700,000 | |
50
Table of Contents
SCHEDULE OF PORTFOLIO INVESTMENTS
Tamarack Institutional Tax-Free Money Market Fund (cont.)
Shares or
Principal
Amount | | | | Value | |
|---|
|
| 4,800,000 | | Galesburg Revenue (Knox College), 3.68%, 3/1/31, (LOC LaSalle Bank) (b) | | $ | 4,800,000 | |
| 925,000 | | Health Facilities Authority Revenue (Metropolitan Medical Center), Series C, 3.68%, 1/1/16, (LOC Bank One) (b) | | | 925,000 | |
| 3,500,000 | | Illinois Finance Authority Revenue (Elmhurst College), 3.66%, 2/1/42, (LOC Bank of America) (b) | | | 3,500,000 | |
| 8,880,000 | | Illinois Financial Authority Revenue (Alexian Brothers Health Systems), 3.62%, 1/1/18, (FSA Insured) (b) | | | 8,880,000 | |
| 2,730,000 | | State Development Finance Authority Revenue (Westside Health), 3.68%, 12/1/29, (LOC LaSalle Bank) (b) | | | 2,730,000 | |
| 6,960,000 | | State Finance Authority Revenue (Proctor Hospital), 3.70%, 1/1/16, (LOC JP Morgan Chase Bank) (b) | | | 6,960,000 | |
| 14,450,000 | | State Finance Authority Revenue (Resurrection Health), 3.65%, 5/15/35, (LOC LaSalle Bank) (b) | | | 14,450,000 | |
| 9,000,000 | | State Health Facilities Authority Revenue (OSF Healthcare System), 3.85%, 11/15/27, (LOC Fifth Third Bank) (b) | | | 9,000,000 | |
| 6,450,000 | | State Health Facilities Authority Revenue (Swediah Covenant Hospital), 3.65%, 8/15/33, (LOC JP Morgan Chase Bank) (b) | | | 6,450,000 | |
| | | |
|
| | | | | 64,424,277 | |
| | | |
|
| Indiana – 3.00% |
| 3,314,000 | | Crawfordsville Economic Development Revenue (Autumn Woods Apartments Project), Series A, 3.68%, 1/1/30, (LOC FHLB) (b) | | | 3,314,000 | |
| 820,000 | | Health & Educational Facilities Finance Authority Hospital Revenue, 3.79%, 2/15/36, (LOC Fifth Third Bank) (b) | | | 820,000 | |
| 1,630,000 | | State Health Facilities Finance Authority Revenue (Anthony Wayne Rehabilitation Center), 3.65%, 2/1/31, (LOC Wells Fargo Bank) (b) | | | 1,630,000 | |
| 2,130,000 | | State Health Facilities Finance Authority Revenue (Deaconess Hospital), 3.67%, 1/1/22, (LOC Fifth Third Bank) (b) | | | 2,130,000 | |
| 800,000 | | State Health Facilities Finance Authority Revenue (Golden Years Homestead), 3.65%, 6/1/12, (LOC Wells Fargo Bank) (b) | | | 800,000 | |
| 6,500,000 | | State Hospital Equipment Financing Authority Revenue, 3.68%, 12/1/15, (MBIA Insured) (b) | | | 6,500,000 | |
| | | |
|
| | | | | 15,194,000 | |
| | | |
|
| Iowa – 5.69% |
| 2,130,000 | | State Finance Authority Revenue (Health Systems), Series A-1, 3.66%, 2/15/35, (FGIC Insured) (b) | | | 2,130,000 | |
| 1,495,000 | | State Finance Authority Revenue (Mississippi Valley Regional Blood Center), 3.65%, 2/1/23, (LOC Wells Fargo Bank) (b) | | | 1,495,000 | |
| 305,000 | | State Finance Authority Revenue (Putnam Museum of History), 3.65%, 5/1/12, (LOC Wells Fargo Bank) (b) | | | 305,000 | |
| 1,830,000 | | State Higher Education Authority Revenue (Palmer Chiropractic), 3.68%, 4/1/27, (LOC LaSalle Bank) (b) | | | 1,830,000 | |
51
Table of Contents
SCHEDULE OF PORTFOLIO INVESTMENTS
Tamarack Institutional Tax-Free Money Market Fund (cont.)
Shares or
Principal
Amount | | | | Value | |
|---|
|
| 1,350,000 | | State Higher Education Loan Authority Revenue (Private Colleges), 3.79%, 11/1/32, (LOC LaSalle Bank) | | $ | 1,350,000 | |
| 12,250,000 | | State School Cash Anticipation Program, 4.50%, 6/28/07, (FSA Insured) | | | 12,272,476 | |
| 5,000,000 | | State School Cash Anticipation Program, Series B, 4.25%, 1/25/08, (FSA Insured) | | | 5,026,491 | |
| 2,250,000 | | Webster County Educational Facilities Revenue, 3.65%, 7/1/20, (LOC Wells Fargo Bank) (b) | | | 2,250,000 | |
| 2,150,000 | | Woodbury County Educational Facilities Revenue, 3.70%, 11/1/16, (LOC U.S. Bank) (b) | | | 2,150,000 | |
| | | |
|
| | | | | 28,808,967 | |
| | | |
|
| Kansas – 1.02% |
| 1,680,000 | | Olathe Health Facilities Revenue (Olathe Medical Center), 3.79%, 9/1/32, (AMBAC Insured) (b) | | | 1,680,000 | |
| 2,170,000 | | State Development Finance Authority Revenue (Village Shalom Obligated Group), 3.65%, 11/15/28, (LOC LaSalle Bank) (b) | | | 2,170,000 | |
| 1,330,000 | | University of Kansas Hospital Authority Health Facilities Revenue (KU Health Systems), 3.79%, 9/1/34, (LOC Harris Trust) (b) | | | 1,330,000 | |
| | | |
|
| | | | | 5,180,000 | |
| | | |
|
| Kentucky – 0.60% |
| 2,040,000 | | Breckinridge County Lease Program Revenue, 3.65%, 12/1/29, (LOC U.S. Bank) (b) | | | 2,040,000 | |
| 1,000,000 | | State Property & Buildings Community Revenue (Project #55), 6.25%, 9/1/07, (MBIA Insured) | | | 1,011,110 | |
| | | |
|
| | | | | 3,051,110 | |
| | | |
|
| Louisiana – 2.28% |
| 6,675,000 | | East Baton Rouge Parish Sales Tax Revenue, Road & Street Improvement, Series B, 3.65%, 8/1/30, (FGIC Insured) (b) | | | 6,675,000 | |
| 1,355,000 | | Kenner Sales Tax Revenue, Series 2003, 5.00%, 6/1/07, (MBIA Insured) | | | 1,358,222 | |
| 3,500,000 | | State Offshore Terminal Authority Deepwater Port Revenue (Loop LLC Project), 3.66%, 10/1/19, (LOC JP Morgan Chase Bank) (b) | | | 3,500,000 | |
| | | |
|
| | | | | 11,533,222 | |
| | | |
|
| Maryland – 5.51% |
| 21,950,000 | | Montgomery County Housing Opportunities MFHR (Oakwood Apartments), 3.67%, 11/1/07, (FHLMC Insured) (b) | | | 21,950,000 | |
| 4,540,000 | | State Economic Development Corporation Revenue (U.S. Pharmacopeial Project), 3.80%, 7/1/34, (AMBAC Insured) (b) | | | 4,540,000 | |
| 1,415,000 | | State Health & Higher Education Facilities Revenue (Pooled Loan Program), 3.64%, 1/1/29, (LOC Bank of America) (b) | | | 1,415,000 | |
| | | |
|
| | | | | 27,905,000 | |
| | | |
|
| Michigan – 0.73% |
| 300,000 | | Kent Hospital Finance Authority Revenue (Spectrum Health), 3.65%, 1/15/26, (MBIA Insured) (b) | | | 300,000 | |
| 2,000,000 | | Kent Hospital Finance Authority Revenue (Spectrum Health), 3.65%, 1/15/26, (MBIA Insured) (b) | | | 2,000,000 | |
| 1,400,000 | | Kent Hospital Finance Authority Revenue (Spectrum Health), 3.65%, 1/15/29, (FGIC Insured) (b) | | | 1,400,000 | |
| | | |
|
| | | | | 3,700,000 | |
| | | |
|
52
Table of Contents
SCHEDULE OF PORTFOLIO INVESTMENTS
Tamarack Institutional Tax-Free Money Market Fund (cont.)
Shares or
Principal
Amount | | | | Value | |
|---|
|
| Minnesota – 5.82% |
| 1,290,000 | | Higher Education Facilities Authority Revenue (Olaf College), 3.79%, 10/1/32, (LOC Harris Trust) (b) | | $ | 1,290,000 | |
| 5,095,000 | | Inver Grove Heights Senior Housing Revenue, 3.68%, 5/15/35, (FNMA Insured) (b) | | | 5,095,000 | |
| 1,215,000 | | Midwest Consortium of Minneapolis Municipal Utilities Revenue, 3.65%, 1/1/25, (LOC U.S. Bank) (b) | | | 1,215,000 | |
| 10,355,000 | | Midwest Consortium of Minneapolis Municipal Utilities Revenue, 3.65%, 10/1/35, (LOC U.S. Bank) (b) | | | 10,355,000 | |
| 2,235,000 | | Minneapolis Health Care Systems Revenue (Fairview Health Services), 3.66%, 11/15/32, (AMBAC Insured) (b) | | | 2,235,000 | |
| 760,000 | | Minneapolis Revenue (Catholic Charities Projects), 3.68%, 11/1/16, (LOC Wells Fargo Bank) (b) | | | 760,000 | |
| 1,200,000 | | Minnetonka MFHR (Minnetonka Hills Apartments), 3.68%, 11/15/31, (FNMA Insured) (b) | | | 1,200,000 | |
| 4,500,000 | | Oak Park Heights MFHR (Boutwells Landing), 3.68%, 11/1/35, (LOC Freddie Mac) (b) | | | 4,500,000 | |
| 1,300,000 | | State Higher Education Facilities Authority Revenue (St. Olaf College), 3.79%, 10/1/30, (LOC Harris Trust & Savings Bank) | | | 1,300,000 | |
| 1,500,000 | | State Higher Education Facilities Authority Revenue (William Mitchell), 3.65%, 10/1/33, (LOC U.S. Bank) | | | 1,500,000 | |
| | | |
|
| | | | | 29,450,000 | |
| | | |
|
| Missouri – 1.91% |
| 4,000,000 | | Independence IDA MFHR (Mansions Project), 3.68%, 8/1/35, (FHLMC Insured) (b) | | | 4,000,000 | |
| 5,665,000 | | Kansas City IDA MFHR (Cloverset Apartments Project), 3.68%, 9/15/32, (FNMA Insured) (b) | | | 5,665,000 | |
| | | |
|
| | | | | 9,665,000 | |
| | | |
|
| Montana – 0.89% |
| 4,530,000 | | State Health Facilities Authority Revenue (Health Care Pooled Loan Program), 3.68%, 12/1/15, (FGIC Insured) (b) | | | 4,530,000 | |
| | | |
|
| Nebraska – 1.01% |
| 5,100,000 | | State Educational Finance Authority (Creighton University Project), 3.79%, 3/1/33, (AMBAC Insured) (b) | | | 5,100,000 | |
| | | |
|
| Nevada – 0.99% |
| 5,000,000 | | Director State Department Business & Industry (Nevada Cancer Institute), 3.66%, 12/1/33, (LOC Bank of America) (b) | | | 5,000,000 | |
| | | |
|
| North Carolina – 2.02% |
| 1,985,000 | | Charlotte Airport Revenue, 3.65%, 7/1/34, (MBIA Insured) (b) | | | 1,985,000 | |
| 2,040,000 | | North Carolina Capital Facilities Finance Agency Educational Facilities Revenue (Brevard College Corp), 3.66%, 5/1/26, (LOC Wachovia Bank) (b) | | | 2,040,000 | |
| 3,750,000 | | North Carolina Capital Facilities Finance Agency Recreational Facilities Revenue (YMCA), 3.66%, 4/1/29, (LOC Wachovia Bank) (b) | | | 3,750,000 | |
| 2,450,000 | | State Medical Care Common Revenue (FlexCap-Lutheran Project), 3.66%, 1/1/39, (LOC Bank of America) (b) | | | 2,450,000 | |
| | | |
|
| | | | | 10,225,000 | |
| | | |
|
53
Table of Contents
SCHEDULE OF PORTFOLIO INVESTMENTS
Tamarack Institutional Tax-Free Money Market Fund (cont.)
Shares or
Principal
Amount | | | | Value | |
|---|
|
| Ohio – 1.25% |
| 4,880,000 | | Franklin County Hospital Revenue (OhioHealth), 3.65%, 12/1/28, (LOC National City Bank) (b) | | $ | 4,880,000 | |
| 1,000,000 | | Lucas County Bond Anticipation Notes, 3.60%, 10/10/07 | | | 1,000,405 | |
| 445,000 | | Warren County Health Care Facilities Revenue (Otterbein Homes Project), 3.68%, 7/1/23, (LOC Fifth Third Bank) (b) | | | 445,000 | |
| | | |
|
| | | | | 6,325,405 | |
| | | |
|
| Pennsylvania – 2.15% |
| 3,000,000 | | Chester County Health & Education Facilities Authority (Jenner’s Pond), 3.67%, 7/1/34, (LOC Citizens Bank) (b) | | | 3,000,000 | |
| 4,000,000 | | Dauphin County General Authority Health Systems Revenue, 3.65%, 8/15/27, (FSA Insured) (b) | | | 4,000,000 | |
| 3,890,000 | | Montgomery County IDA (Gloria Dei Project), 3.67%, 1/1/23, (LOC Citizens Bank) (b) | | | 3,890,000 | |
| | | |
|
| | | | | 10,890,000 | |
| | | |
|
| South Dakota – 0.20% |
| 1,000,000 | | State Health & Educational Facilities Authority Revenue (Rapid City Regional Hospital), 3.79%, 9/1/27, (MBIA Insured) | | | 1,000,000 | |
| | | |
|
| Tennessee – 0.32% |
| 1,600,000 | | Sevier County Public Building Authority, 3.85%, 6/1/27, (LOC JP Morgan Chase Bank) (b) | | | 1,600,000 | |
| | | |
|
| Texas – 4.50% |
| 3,650,000 | | Aldine Independent School District, 3.72%, 6/15/28, (PSF Insured) (b) | | | 3,650,000 | |
| 2,600,000 | | Austin County Industrial Development Corp., 3.67%, 12/1/14, (LOC JP Morgan Chase Bank) (b) | | | 2,600,000 | |
| 3,985,000 | | Crawford Educational Facilities Revenue (Woodlands Academy), 3.73%, 6/1/18, (LOC U.S. Bank) (b) | | | 3,985,000 | |
| 2,525,000 | | Splendora Higher Education Facilities Revenue, 3.65%, 12/1/26, (LOC Wells Fargo Bank) (b) | | | 2,525,000 | |
| 10,000,000 | | State Tax & Revenue Anticipation Notes, 4.50%, 8/31/07 | | | 10,038,187 | |
| | | |
|
| | | | | 22,798,187 | |
| | | |
|
| Utah – 1.66% |
| 2,800,000 | | Duchesne School District Municipal Building Authority Lease Revenue, 3.70%, 6/1/21, (LOC U.S. Bank) (b) | | | 2,800,000 | |
| 2,900,000 | | Ogden City Redevelopment Agency Tax, Increment Revenue, 3.65%, 4/1/25, (LOC Wells Fargo Bank) (b) | | | 2,900,000 | |
| 1,925,000 | | Salt Lake City Revenue (Valley Mental Health Project), 3.65%, 12/1/21, (LOC Wells Fargo Bank) (b) | | | 1,925,000 | |
| 805,000 | | Sanpete County School Facilities Revenue (Wasatch Academy), 3.70%, 8/1/28, (LOC U.S. Bank) (b) | | | 805,000 | |
| | | |
|
| | | | | 8,430,000 | |
| | | |
|
| Virginia – 0.42% |
| 860,000 | | Alexandria IDA (Pooled Loan Project), 3.66%, 7/1/26, (LOC Bank of America) (b) | | | 860,000 | |
| 1,250,000 | | Roanoke County IDA Healthcare Facilities Revenue (Friendship Manor, Inc.), 3.66%, 10/1/15, (LOC Wachovia Bank) (b) | | | 1,250,000 | |
| | | |
|
| | | | | 2,110,000 | |
| | | |
|
| Washington – 2.39% |
| 300,000 | | Richland Golf Enterprise Revenue, 3.68%, 12/1/21, (LOC Bank of America) (b) | | | 300,000 | |
54
Table of Contents
SCHEDULE OF PORTFOLIO INVESTMENTS
Tamarack Institutional Tax-Free Money Market Fund (cont.)
Shares or
Principal
Amount | | | | Value | |
|---|
|
| 2,200,000 | | Snohomish County Public Utility, 3.65%, 12/1/19, (FSA Insured) (b) | | $ | 2,200,000 | |
| 6,285,000 | | State Health Care Facilities Revenue (Empire Health Services), 3.65%, 11/1/23, (LOC U.S. Bank) (b) | | | 6,285,000 | |
| 1,825,000 | | State Housing & Finance Commission Nonprofit Revenue (Annie Wright School), 3.70%, 12/1/23, (LOC Bank of America) (b) | | | 1,825,000 | |
| 500,000 | | State Public Power Supply, 3.66%, 7/1/17, (LOC Bank of America) (b) | | | 500,000 | |
| 1,000,000 | | Washington State Housing Finance Communities, 3.66%, 1/1/36, (LOC Bank of America) (b) | | | 1,000,000 | |
| | | |
|
| | | | | 12,110,000 | |
| | | |
|
| Wisconsin – 3.95% |
| 2,000,000 | | Kenosha Unified School District, 3.60%, 9/14/07 | | | 2,000,873 | |
| 3,880,000 | | Little Chute Area School District, 4.00%, 4/1/08 | | | 3,884,889 | |
| 3,000,000 | | School District Cash Flow Management Program, Certificate of Participation, Series B, 4.25%, 11/1/07 | | | 3,012,596 | |
| 3,775,000 | | School District Cash Flow Management Program, Series A1, 4.50%, 9/19/07, (LOC U.S. Bank) | | | 3,790,880 | |
| 1,125,000 | | State Health & Educational Facilities Authority Revenue (Camillus Health Center), 3.67%, 2/1/35, (LOC U.S. Bank) (b) | | | 1,125,000 | |
| 4,025,000 | | State Health & Educational Facilities Authority Revenue (Gundersen Lutheran), 3.79%, 12/1/15, (FSA Insured) (b) | | | 4,025,000 | |
| 2,175,000 | | State Municipalities Private School Finance Commission Revenue (Fox Valley Lutheran High School), 3.73%, 3/1/23, (LOC U.S. Bank) (b) | | | 2,175,000 | |
| | | |
|
| | | | | 20,014,238 | |
| | | |
|
Total Municipal Bonds
(Cost $438,420,696) | | | 438,420,696 | |
| |
| |
| Commercial Paper – 8.84% |
| Florida – 2.25% |
| 4,347,000 | | Florida Municipal Power Agency, 3.61%, 5/22/07, (LOC Wachovia Bank) | | | 4,347,000 | |
| 7,000,000 | | Jacksonville Health Authority, 3.56%, 6/4/07, (LOC Bank of America) | | | 7,000,000 | |
| | | |
|
| | | | | 11,347,000 | |
| | | |
|
| Illinois – 1.66% |
| 5,995,000 | | Illinois Health Facilities Authority, 3.61%, 5/22/07, (MBIA Insured) | | | 5,995,000 | |
| 2,435,000 | | Illinois Health Facilities Authority, 3.61%, 5/22/07, (MBIA Insured) | | | 2,435,000 | |
| | | |
|
| | | | | 8,430,000 | |
| | | |
|
| Massachusetts – 1.97% |
| 10,000,000 | | Massachusetts School Building Authority, 3.60%, 8/8/07 | | | 10,000,000 | |
| | | |
|
| Texas – 2.15% |
| 5,900,000 | | Plano Texas Health Facilities, 3.61%, 5/22/07, (MBIA Insured) | | | 5,900,000 | |
| 5,000,000 | | Upper Trinity Regional, 3.60%, 4/5/07, (LOC Bank of America) | | | 5,000,000 | |
| | | |
|
| | | | | 10,900,000 | |
| | | |
|
| Wisconsin – 0.81% |
| 4,100,000 | | Wisconsin State Health and Education Facilities, 3.61%, 5/22/07, (LOC JP Morgan Chase Bank) | | | 4,100,000 | |
| | | |
|
Total Commercial Paper
(Cost $44,777,000) | | | 44,777,000 | |
| |
| |
55
Table of Contents
SCHEDULE OF PORTFOLIO INVESTMENTS
Tamarack Institutional Tax-Free Money Market Fund (cont.)
Shares or
Principal
Amount | | | | Value | |
|---|
|
| Investment Companies – 0.40% |
| 2,014,744 | | Federated Tax Exempt Money Market Fund | | $ | 2,014,744 | |
| | | |
|
Total Investment Companies
(Cost $2,014,744) | | | 2,014,744 | |
| |
| |
Total Investments
(Cost $485,212,440) (a) – 95.81% | | | 485,212,440 | |
| Other assets in excess of liabilities – 4.19% | | | 21,204,425 | |
| |
| |
| NET ASSETS – 100.00% | | $ | 506,416,865 | |
| |
| |
(a) Tax cost of securities is equal to book cost of securities.
(b) Variable rate security. The rate reflected in the Schedule of Investments is the rate in effect on March 31, 2007. The maturity date represents the actual maturity date.
Abbreviations used are defined below:
AMBAC – Ambac Assurance Corporation
FGIC – Financial Guaranty Insurance Co.
FHLMC – Federal Home Loan Mortgage Corporation
FHLB – Federal Home Loan Bank
FNMA – Federal National Mortgage Association
FSA – Financial Security Assurance, Inc.
GO – General Obligation
IDA – Industrial Development Authority
IDR – Industrial Development Revenue
LOC – Letter of Credit
MBIA – MBIA Insurance Corporation
MFHR – Multi-Family Housing Revenue
PSF – Permanent School Fund
See notes to financial statements.
56
Table of Contents
SCHEDULE OF PORTFOLIO INVESTMENTS
Tamarack Treasury Plus Money Market Fund
March 31, 2007 (Unaudited)
Principal
Amount | | | | Value | |
|---|
|
| Repurchase Agreements – 97.1% |
| $2,000,000 | | Barclay Capital, Inc. dated 3/28/07, due 4/4/07 at 5.10% with a maturity value of $2,001,983 (fully collateralized by U.S. Treasury Bond, 12.50%, 8/15/14) | | $ | 2,000,000 | |
| | | |
|
Total Repurchase Agreements
(Cost $2,000,000) | | | 2,000,000 | |
| |
| |
| Investment Companies – 1.5% |
| 31,453 | | Wells Fargo Prime Investment Money Market Fund | | | 31,453 | |
Total Investment Companies
(Cost $31,453) | | | 31,453 | |
| |
| |
Total Investments
(Cost $2,031,453) (a) – 98.6% | | | 2,031,453 | |
Other assets in excess of
liabilities – 1.4% | | | 28,532 | |
| |
| |
| NET ASSETS – 100.0% | | $ | 2,059,985 | |
| |
| |
(a) Tax cost of securities is equal to book cost of securities.
See notes to financial statements.
57
Table of Contents
MANAGEMENT (unaudited)
Independent Trustees(1)
T. Geron Bell (65)
Position Held with Fund: Trustee; Since January, 2004
Principal Occupation(s) During Past 5 Years: President of Twins Sports, Inc. (parent company of the Minnesota Twins) (2002-present); prior thereto President of the Minnesota Twins Baseball Club Incorporated (1987-present); Director, Great Hall Investment Funds, Inc. (1993-2004); Trustee, J&B Funds (2003-2004); Director, Babson Funds (2003-2004).
Number of Portfolios in Fund Complex Overseen: 15
Lucy Hancock Bode (55)
Position Held with Fund: Trustee; Since January, 2004
Principal Occupation(s) During Past 5 Years: Healthcare consultant; Director, RBC Funds (1994-2004).
Number of Portfolios in Fund Complex Overseen: 15
Leslie H. Garner Jr. (56)
Position Held with Fund: Trustee; Since January, 2004
Principal Occupation(s) During Past 5 Years: President, Cornell College; Director, RBC Funds (1994-2004).
Number of Portfolios in Fund Complex Overseen: 15
Ronald James (56)
Position Held with Fund: Trustee; Since January, 2004
Principal Occupation(s) During Past 5 Years: President and Chief Executive Officer, Center for Ethical Business Cultures (2000-present); Director, Great Hall Investment Funds, Inc. (1993-2004); Trustee, J&B Funds (2003-2004); Director, Babson Funds (2003-2004).
Number of Portfolios in Fund Complex Overseen: 15
John A. MacDonald (58)
Position Held with Fund: Trustee; Since January, 2004
Principal Occupation(s) During Past 5 Years: Chief Investment Officer, Hall Family Foundation; Trustee, J&B Funds (2001-2004).
Number of Portfolios in Fund Complex Overseen: 15
H. David Rybolt (64)
Position Held with Fund: Trustee; Since January, 2004
Principal Occupation(s) During Past 5 Years: Consultant, HDR Associates (management consulting); Director, Babson Funds (1992-2004).
Number of Portfolios in Fund Complex Overseen: 15
James R. Seward (54)
Position Held with Fund: Trustee; Since January, 2004
Principal Occupation(s) During Past 5 Years: Private investor (2000-present); Trustee, J&B Funds (2001-2004); CFA.
Number of Portfolios in Fund Complex Overseen: 15
| (1) | Unless otherwise specified, the address of each trustee/officer is 100 South Fifth Street, Suite 2300, Minneapolis, Minnesota 55402. |
58
Table of Contents
MANAGEMENT (unaudited)
Independent Trustees(1)
William B. Taylor (61)
Position Held with Fund: Trustee; Since September, 2005
Principal Occupation(s) During Past 5 Years: Consultant (2003-present); Partner (until 2003) Ernst & Young LLP.
Number of Portfolios in Fund Complex Overseen: 15
Interested Trustees(1)
Erik R. Preus (41)
Position Held with Fund: Trustee; Since September, 2005
Principal Occupation(s) During Past 5 Years: Head of Retail Asset Management (2006-present); Director, President and Chief Executive Officer, Tamarack Distributors Inc. (2005-present); Chief Operating Officer, Voyageur Asset Management (2005-2006); Director, Investment Counseling Services, RBC Dain Rauscher (2004-2005); Director, Voyageur Advisory Services, Voyageur Asset Management (2003-2004); Senior Vice President, Divisional Sales Manager, PIMCO Allianz Investments and its predecessor firm, Nicholas Applegate (2001-2003).
Number of Portfolios in Fund Complex Overseen: 15
Executive Officers(1)
Erik R. Preus (41)
Position Held with Fund: President and Chief Executive Officer; Since September, 2006
Principal Occupation(s) During Past 5 Years: Head of Retail Asset Management (2006-present); Director, President and Chief Executive Officer, Tamarack Distributors Inc. (2005-present); Chief Operating Officer, Voyageur Asset Management (2005-2006); Director, Investment Counseling Services, RBC Dain Rauscher (2004-2005); Director, Voyageur Advisory Services, Voyageur Asset Management (2003-2004); Senior Vice President, Divisional Sales Manager, PIMCO Allianz Investments and its predecessor firm, Nicholas Applegate (2001-2003).
David P. Lux (52)
Position Held with Fund: Chief Financial Officer and Treasurer; Since September, 2005
Principal Occupation(s) During Past 5 Years: Vice President and Director, Mutual Funds (2006-present); Director, Tamarack Distributors Inc. (2006-present); Controller, Tamarack Funds, November, 2004-September, 2005; Vice President and Mutual Funds Finance Manager, Voyageur Asset Management (2004-2006); Senior Financial Analyst, Voyageur Asset Management (2003-2004); Senior Financial Analyst, RBC Dain Rauscher (1995-2003).
Kathleen A. Gorman (43)
Position Held with Fund: Chief Compliance Officer Since April, 2006 and Assistant Secretary Since September 2006
Principal Occupation(s) During Past 5 Years: Chief Compliance Officer, Voyageur Asset Management (2006-present); Director, Asset Management Compliance, RiverSource Investments (2004-2006); Senior Compliance Officer, U.S. Bancorp Asset Management (1994-2004).
| (1) | Unless otherwise specified, the address of each trustee/officer is 100 South Fifth Street, Suite 2300, Minneapolis, Minnesota 55402. |
59
Table of Contents
MANAGEMENT (unaudited)
Executive Officers(1)
Martin A. Cramer (57)
Position Held with Fund: Vice President, Senior Compliance Officer, and AML Compliance Officer; Since January, 2004
Principal Occupation(s) During Past 5 Years: Vice President and Mutual Fund Administration Manager, Voyageur Asset Management (2003-present); Vice President, Tamarack Distributors Inc. (2007-present); Senior Compliance Officer, Tamarack Funds (2006-2007); Chief Compliance Officer, Tamarack Funds (2004-2006); Legal and Regulatory Affairs Vice President, Compliance Officer and Secretary, J&B (mutual fund management and distribution company) (1993-2003); Vice President, Assistant Secretary, Compliance Officer and AML Compliance Officer (2003-2004)(2), and formerly, Vice President, Compliance Officer and Secretary, Buffalo Fund Complex (1994-2003) and Secretary, Gold Bank Funds(3) (2001-2003).
Monica P. Ballard (37)
Position Held with Fund: Secretary and Chief Legal Officer; Since September, 2005
Principal Occupation(s) During Past 5 Years: Vice President and Senior Associate General Counsel, RBC Dain Rauscher (2004 to present); Counsel, Allianz Life (2002 to 2004); Associate Counsel, American Express Financial Advisors (1996 to 2002).
Gordon Telfer (41)
Position Held with Fund: Portfolio Strategist; Since March, 2004
Principal Occupation(s) During Past 5 Years: Vice President and Portfolio Manager, Voyageur Asset Management (2003-present); Senior Portfolio Manager, Alliance Capital Management (2000-2003); Senior Vice President, Global Strategist, Scudder Kemper Investments (1997-2000).
Nancy M. Scinto (47)
Position Held with Fund: Chief Investment Officer, Equity Products; Since January, 2004
Principal Occupation(s) During Past 5 Years: Managing Director and Director of Research, Voyageur Asset Management (2003-present).
John M. Huber (38)
Position Held with Fund: Chief Investment Officer, Fixed Income Products; Since February, 2005
Principal Occupation(s) During Past 5 Years: Chief Investment Officer, Fixed Income, Voyageur Asset Management (2004-Present); Principal and Senior Portfolio Manager, Galliard Capital Management (1995-2004).
| (1) | Unless otherwise specified, the address of each trustee/officer is 100 South Fifth Street, Suite 2300, Minneapolis, Minnesota 55402. |
| (2) | Great Hall Investment Funds, Inc., J&B Funds, Babson Enterprise Fund, Inc., Babson Enterprise Fund II, Inc., Babson-Stewart Ivory International Fund, Inc., Babson Value Fund, Inc., David L. Babson Growth Fund, Inc., D.L. Babson Bond Trust, D.L. Babson Money Market Fund, Inc., D.L. Babson Tax-Free Income Fund, Inc., Shadow Stock Fund, Inc., and Investors Mark Series Fund, Inc. |
| (3) | The Buffalo Fund Complex consists of Buffalo Balanced Fund, Inc., Buffalo Large Cap Fund, Inc., Buffalo High Yield Fund, Inc., Buffalo Small Cap Fund, Inc., Buffalo USA Global Fund, Inc., and the Buffalo Funds, which is a series fund consisting of Buffalo Science & Technology Fund and Buffalo Mid Cap Fund. Gold Bank Funds is a series fund consisting of Gold Bank Equity and Gold Bank Money Market Fund. |
The Funds’ Statement of Additional Information includes information about the Fund’s Trustees. To receive your free copy of the Statement of Additional Information, call toll free 1-800-422-2766.
60
Table of Contents
SUPPLEMENTAL INFORMATION (unaudited)
Information for Tamarack Funds Shareholders Regarding the Renewal of Investment Advisory Agreements
The Tamarack Board of Trustees has renewed the Investment Advisory Agreement with Voyageur Asset Management Inc. (“Voyageur” or the “Advisor”) for each of the Funds. After evaluating the services provided by the Advisor and reviewing the performance and relevant advisory fees and expenses of each Fund, the Trustees concluded that it was in the best interests of the Funds and their shareholders to continue the Investment Advisory Agreement.
As part of their review of the Agreement, the Trustees received and discussed certain information, including information regarding the advisory services performed, qualifications of staffing, and Fund performance and expenses. The Trustees considered information provided in advance of their in-person meeting, as well as supplemental information provided at the meeting. The Trustees met with representatives from the Advisor’s senior management team, as well as senior investment professionals, to discuss this information and Voyageur’s intentions with regard to the ongoing management of the Funds. The Trustees reviewed the quality of the services provided to the Funds by Voyageur, including information prepared by a third-party consultant as to each Fund’s performance relative to an appropriate benchmark as well as compared to the Fund’s appropriate peer group. The Trustees also reviewed the investment management fees payable to Voyageur. In this connection, the Trustees reviewed comparative information prepared by a third-party consultant on investment management fees paid and expenses incurred by similarly situated funds. The Trustees also received reports from Voyageur regarding other investment companies advised by it, including the advisory fees paid. The Trustees took into account profitability data for Voyageur included in the materials. The Trustees received information from Voyageur regarding other benefits derived from its relationships with the funds. In connection with their deliberations, the independent Trustees met separately with their independent legal counsel to review the relevant material and consider their responsibilities under relevant laws and regulations. In addition, the Trustees noted the expected composition of each portfolio management team.
When evaluating the investment performance of the Funds, the Trustees observed that each Money Market Fund had one-year net performance that was within a few basis points of each Fund’s peer group median. The variances from peer group median ranged from three basis points higher for the Institutional Prime Fund to 15 basis points lower for the Tax-Free Money Market Fund. It was noted that the Tax-Free Money Market Fund’s yield may be expected to trail its peer group median since none of its income was subject to Alternative Minimum Tax during the entire fiscal year. The expense structure of the Money Market Funds also was within a reasonable range as compared to the relevant peer groups. The variance from peer group medians ranged from five basis points lower for the Institutional Tax-Free Money Market Fund to five basis points higher for the Prime Money Market Fund.
The Trustees also reviewed and approved Fund Management’s proposal to continue for an additional year the existing fee waivers in order to maintain total expenses at their current levels. In considering the quality of the services performed for each Fund by Voyageur, the Trustees discussed the strong research capabilities and fundamental analysis performed by the firm and also considered the extensive portfolio management
61
Table of Contents
SUPPLEMENTAL INFORMATION (unaudited)
experience of Voyageur, the compliance structure and systems established by Voyageur and the financial viability of Voyageur. The Trustees also considered steps that already had been taken by Voyageur to expand upon existing research capabilities and compliance processes and steps that were expected to be taken to maintain and/or enhance such capabilities and processes.
Based upon their review, the Trustees determined that the advisory fees proposed to be payable to Voyageur were reasonable and fair in light of the nature and quality of services provided under all of the circumstances, and were within the range of what might have been negotiated at arms’ length. The Trustees concluded that it is in the interest of the Funds and their shareholders for the Trustees to approve the continuation of the Agreement for the Funds. In arriving at their decision to approve the renewal of the Agreement, the Trustees did not assign relative weights to the factors discussed above or deem any one or group of them to be controlling in and of themselves.
62
Table of Contents
SUPPLEMENTAL INFORMATION (unaudited)
Shareholder Expense Examples
As a shareholder of the Tamarack Funds, you incur ongoing costs, including management fees and other Fund expenses. This example is intended to help you understand your ongoing costs (in dollars) of investing in the Tamarack Funds and to compare these costs with the ongoing costs of investing in other mutual funds.
The Example is based on an investment of $1,000 invested at the beginning of the period and held for the entire period from October 1, 2006 through March 31, 2007.
Actual Expenses and Performance
The table below provides information about actual account values and actual expenses. You may use the information below, together with the amount you invested, to estimate the expenses that you paid over the period. Simply divide your account value by $1,000 (for example, an $8,600 account value divided by $1,000 = 8.6), then multiply the result by the number in the table under the heading entitled “Expenses Paid During Period” to estimate the expenses you paid on your account during this period.
| | | Beginning
Account Value
10/1/06 | | | Ending
Account Value
3/31/07 | | | Expenses Paid
During Period*
10/1/06 - 3/31/07 | | | Annualized
Expense Ratio
During Period
10/1/06 - 3/31/07 | |
|---|
| | |
| | |
| | |
| | |
| |
| Prime Money Market Fund | | | | $ | 1,000.00 | | | $ | 1,023.00 | | | $ | 4.03 | | | | 0.80 | % |
| U.S. Government Money Market Fund | | | | | 1,000.00 | | | | 1,022.30 | | | | 3.93 | | | | 0.78 | % |
| Tax-Free Money Market Fund | | | | | 1,000.00 | | | | 1,014.50 | | | | 3.52 | | | | 0.70 | % |
| Institutional Prime Money Market Fund | | | | | 1,000.00 | | | | 1,025.60 | | | | 1.36 | | | | 0.27 | % |
| Institutional Tax-Free Money Market Fund | | | | | 1,000.00 | | | | 1,016.60 | | | | 1.46 | | | | 0.29 | % |
| Treasury Plus Money Market Fund | | | | | 1,000.00 | | | | 1,025.70 | | | | 1.01 | | | | 0.20 | % |
* Expenses are equal to the average account value times the Fund’s annualized expense ratio multiplied by the number of days in the most recent fiscal half-year divided by the number of days in the fiscal year (to reflect one-half year period).
63
Table of Contents
SUPPLEMENTAL INFORMATION (unaudited)
Hypothetical Example for Comparison Purposes
The table below provides information about hypothetical account values and hypothetical expenses based on each Tamarack Fund’s actual expense ratio and an assumed rate of return of 5% per year before expenses, which is not the Fund’s actual return.
The hypothetical account values and expenses may not be used to estimate the actual ending account balance or expenses you paid for the period. You may use this information to compare this 5% hypothetical example with the 5% hypothetical examples that appear in the shareholder reports of other funds.
| | | Beginning
Account Value
10/1/06 | | | Ending
Account Value
3/31/07 | | | Expenses Paid
During Period*
10/1/06 - 3/31/07 | | | Annualized
Expense Ratio
During Period
10/1/06 - 3/31/07 | |
|---|
| | |
| | |
| | |
| | |
| |
| Prime Money Market Fund | | | | $ | 1,000.00 | | | $ | 1,020.94 | | | $ | 4.03 | | | | 0.80 | % |
| U.S. Government Money Market Fund | | | | | 1,000.00 | | | | 1,021.04 | | | | 3.93 | | | | 0.78 | % |
| Tax-Free Money Market Fund | | | | | 1,000.00 | | | | 1,021.44 | | | | 3.53 | | | | 0.70 | % |
| Institutional Prime Money Market Fund | | | | | 1,000.00 | | | | 1,023.59 | | | | 1.36 | | | | 0.27 | % |
| Institutional Tax-Free Money Market Fund | | | | | 1,000.00 | | | | 1,023.49 | | | | 1.46 | | | | 0.29 | % |
| Treasury Plus Money Market Fund | | | | | 1,000.00 | | | | 1,023.93 | | | | 1.01 | | | | 0.20 | % |
* Expenses are equal to the average account value times the Fund’s annualized expense ratio multiplied by the number of days in the most recent fiscal half-year divided by the number of days in the fiscal year (to reflect one-half year period).
64
Table of Contents
Performance data represents past performance and does not guarantee future results. The principal value of an investment and investment return will fluctuate so that an investor’s shares, when redeemed, may be worth more or less than their original cost.
This report and the financial statements contained herein are provided for the information of Tamarack Funds shareholders. This report is not authorized for distribution to prospective investors unless preceded or accompanied by a current prospectus, which contains information concerning investment objectives, risks, charges and expenses of the funds. Please read the prospectus carefully before investing.
This report and the financial statements contained herein are not intended to be a forecast of future events, a guarantee of future results, or investment advice. There is no assurance that certain securities will remain in or out of each fund’s portfolio. The views expressed in this report reflect those of the portfolio managers through the period ended March 31, 2007. The portfolio managers’ views are subject to change at any time based on market or other conditions.
NOT FDIC INSURED • NO BANK GUARANTEE • MAY LOSE VALUE
Voyageur Asset Management serves as investment adviser for the Tamarack Funds. RBC Dain Rauscher Inc. is the distributor for all of the Tamarack Money Market Funds except for the Treasury Plus Money Market Fund. The Treasury Plus Money Market Fund is distributed by Tamarack Distributors Inc., member NASD.
Tamarack Funds
P.O. Box 219757
Kansas City, MO 64121-9757
800-422-2766
www.voyageur.net
The Tamarack Funds are pleased to introduce our first shareholder
reports printed entirely on Forest Stewardship Council certified paper.
FSC certification ensures that the paper used in this report contains
fiber from well-managed and responsibly harvested forests that
meet strict environmental and socioeconomic standards.
TF-MM SAR 3-07
Item 2. Code of Ethics.
Disclose whether, as of the end of the period covered by the report, the registrant has adopted a code of ethics that applies to the registrant’s principal executive officer, principal financial officer, principal accounting officer or controller, or persons performing similar functions, regardless of whether these individuals are employed by the registrant or a third party. If the registrant has not adopted such a code of ethics, explain why it has not done so.
NOT APPLICABLE – ONLY FOR ANNUAL REPORTS.
The registrant must briefly describe the nature of any amendment, during the period covered by the report, to a provision of its code of ethics that applies to the registrant’s principal executive officer, principal financial officer, principal accounting officer or controller, or persons performing similar functions, regardless of whether these individuals are employed by the registrant or a third party, and that relates to any element of the code of ethics definition enumerated in paragraph (b) of this Item. The registrant must file a copy of any such amendment as an exhibit pursuant to Item 12(a)(1), unless the registrant has elected to satisfy paragraph (f) of this Item by posting its code of ethics on its website pursuant to paragraph (f)(2) of this Item, or by undertaking to provide its code of ethics to any person without charge, upon request, pursuant to paragraph (f)(3) of this Item.
If the registrant has, during the period covered by the report, granted a waiver, including an implicit waiver, from a provision of the code of ethics that applies to the registrant’s principal executive officer, principal financial officer, principal accounting officer or controller, or persons performing similar functions, regardless of whether these individuals are employed by the registrant or a third party, that relates to one or more items set forth in paragraph (b) of this Item, the registrant must briefly describe the nature of the waiver, the name of the person to whom the waiver was granted, and the date of the waiver.
NOT APPLICABLE – ONLY FOR ANNUAL REPORTS.
Item 3. Audit Committee Financial Expert.
| (a) | (1) Disclose that the registrant’s board of directors has determined that the registrant either: |
(i) Has at least one audit committee financial expert serving on its audit committee; or
(ii) Does not have an audit committee financial expert serving on its audit committee.
(2) If the registrant provides the disclosure required by paragraph (a)(1)(i) of this Item, it must disclose the name of the audit committee financial expert and whether that person is “independent.” In order to be considered “independent” for purposes of this Item, a member of an audit committee may not, other than in his or her capacity as a member of the audit committee, the board of directors, or any other board committee:
(i) Accept directly or indirectly any consulting, advisory, or other compensatory fee from the issuer; or
(ii) Be an “interested person” of the investment company as defined in Section 2(a)(19) of the Act (15 U.S.C. 80a-
2(a)(19)).
(3) If the registrant provides the disclosure required by paragraph (a)(1)(ii) of this Item, it must explain why it does not
have an audit committee financial expert.
NOT APPLICABLE – ONLY FOR ANNUAL REPORTS.
Item 4. Principal Accountant Fees and Services.
(a) Disclose, under the caption Audit Fees, the aggregate fees billed for each of the last two fiscal years for professional services rendered by the principal accountant for the audit of the registrant’s annual financial statements or services that are normally provided by the accountant in connection with statutory and regulatory filings or engagements for those fiscal years.
(b) Disclose, under the caption Audit-Related Fees, the aggregate fees billed in each of the last two fiscal years for assurance and related services by the principal accountant that are reasonably related to the performance of the audit of the registrant’s financial statements and are not reported under paragraph (a) of this Item. Registrants shall describe the nature of the services comprising the fees disclosed under this category.
(c) Disclose, under the caption Tax Fees, the aggregate fees billed in each of the last two fiscal years for professional services rendered by the principal accountant for tax compliance, tax advice, and tax planning. Registrants shall describe the nature of the services comprising the fees disclosed under this category.
(d) Disclose, under the caption All Other Fees, the aggregate fees billed in each of the last two fiscal years for products and services provided by the principal accountant, other than the services reported in paragraphs (a) through (c) of this Item. Registrants shall describe the nature of the services comprising the fees disclosed under this category.
(e) (1) Disclose the audit committee’s pre-approval policies and procedures described in paragraph (c)(7) of Rule 2-01 of Regulation S-X.
(2) Disclose the percentage of services described in each of paragraphs (b) through (d) of this Item that were approved by the audit committee pursuant to paragraph (c)(7)(i)(C) of Rule 2-01 of Regulation S-X.
(f) If greater than 50 percent, disclose the percentage of hours expended on the principal accountant’s engagement to audit the registrant’s financial statements for the most recent fiscal year that were attributed to work performed by persons other than the principal accountant’s full-time, permanent employees.
(g) Disclose the aggregate non-audit fees billed by the registrant’s accountant for services rendered to the registrant, and rendered to the registrant’s investment adviser (not including any sub-adviser whose role is primarily portfolio management and is subcontracted with or overseen by another investment adviser), and any entity controlling, controlled by, or under common control with the adviser that provides ongoing services to the registrant for each of the last two fiscal years of the registrant.
(h) Disclose whether the registrant’s audit committee of the board of directors has considered whether the provision of nonaudit services that were rendered to the registrant’s investment adviser (not including any subadviser whose role is primarily portfolio management and is subcontracted with or overseen by another investment adviser), and any entity controlling, controlled by, or under common control with the investment adviser that provides ongoing services to the registrant that were not pre-approved pursuant to paragraph (c)(7)(ii) of Rule 2-01 of Regulation S-X is compatible with maintaining the principal accountant’s independence.
NOT APPLICABLE – ONLY FOR ANNUAL REPORTS.
Item 5. Audit Committee of Listed Registrants.
| (a) | If the registrant is a listed issuer as defined in Rule 10A-3 under the Exchange Act (17CFR 240.10A-3), state whether or not the registrant has a separately-designated standing audit committee established in accordance with Section 3(a)(58)(A) of the Exchange Act (15 U.S.C. 78c(a)(58)(A)). If the registrant has such a committee, however designated, identify each committee member. If the entire board of directors is acting as the registrant’s audit committee as specified in Section 3(a)(58)(B) of the Exchange Act (15 U.S.C. 78c(a)(58)(B)), so state. |
| (b) | If applicable, provide the disclosure required by Rule 10A-3(d) under the Exchange Act (17CFR 240.10A-3(d)) regarding an exemption from the listing standards for all audit committees. |
NOT APPLICABLE.
Item 6. Schedule of Investments.
File Schedule I – Investments in securities of unaffiliated issuers as of the close of the reporting period as set forth in § 210.12-12 of Regulation S-X, unless the schedule is included as part of the report to shareholders filed under Item 1 of this Form.
NOT APPLICABLE.
Item 7. Disclosure of Proxy Voting Policies and Procedures for Closed-End Management Investment Companies.
A closed-end management investment company that is filing an annual report on this Form N-CSR must, unless it invests exclusively in non-voting securities, describe the policies and procedures that it uses to determine how to vote proxies relating to portfolio securities, including the procedures that the company uses when a vote presents a conflict between the interests of its shareholders, on the one hand, and those of the company’s investment adviser; principal underwriter; or any affiliated person (as defined in Section 2(a)(3) of the Investment Company Act of 1940 (15 U.S.C. 80a-2(a)(3)) and the rules thereunder) of the company, its investment adviser, or its principal underwriter, on the other. Include any policies and procedures of the company’s investment adviser, or any other third party, that the company uses, or that are used on the company’s behalf, to determine how to vote proxies relating to portfolio securities.
NOT APPLICABLE.
Item 8. Portfolio Managers of Closed-End Management Investment Companies.
If the registrant is a closed-end management investment company that is filing an annual report on this Form N-CSR, provide the information specified in paragraphs (a) and (b) of this Item with respect to portfolio managers.
NOT APPLICABLE.
Item 9. Purchases of Equity Securities by Closed-End Management Investment Company and Affiliated Purchasers.
If the registrant is a closed-end management investment company, provide the information specified in paragraph (b) of this Item with respect to any purchase made by or on behalf of the registrant or any "affiliated purchaser," as defined in Rule 10b-18(a)(3) under the Exchange Act (17 CFR 240.10b-18(a)(3)), of shares or other units of any class of the registrant's equity securities that is registered by the registrant pursuant to Section 12 of the Exchange Act (15 U.S.C. 781).
NOT APPLICABLE.
Item 10. Submission of Matters to a Vote of Security Holders.
Describe any material changes to the procedures by which shareholders may recommend nominees to the registrant's board of directors, where those changes were implemented after the registrant last provided disclosure in response to the requirements of Item 7(d)(2)(ii)(G) of Schedule 14A (17 CFR 240.14a-101), or this Item.
NOT APPLICABLE.
Item 11. Controls and Procedures.
(a) Disclose the conclusions of the registrant’s principal executive and principal financial officers, or persons performing similar functions, regarding the effectiveness of the registrant’s disclosure controls and procedures (as defined in Rule 30a-3(c) under the Act (17 CFR 270.30a-3(c))) as of a date within 90 days of the filing date of the report that includes the disclosure required by this paragraph, based on the evaluation of these controls and procedures required by Rule 30a-3(b) under the Act (17 CFR 270.30a-3(b)) and Rules 13a-15(b) or 15d-15(b) under the Exchange Act (17 CFR 240.13a-15(b) or 240.15d-15(b)).
The registrant’s principal executive officer and principal financial officer have concluded, based on their evaluation of the registrant's disclosure controls and procedures as conducted within 90 days of the filing date of this report, that these disclosure controls and procedures are adequately designed and are operating effectively to ensure that information required to be disclosed by the registrant on Form N-CSR is recorded, processed, summarized and reported within the time periods specified in the Securities and Exchange Commission's rules and forms.
(b) Disclose any change in the registrant’s internal control over financial reporting (as defined in Rule 30a-3(d) under the Act (17 CFR 270.30a-3(d)) that occurred during the second fiscal quarter of the period covered by this report that has materially affected, or is reasonably likely to materially affect, the registrant's internal control over financial reporting.
There were no changes in the registrant’s internal control over financial reporting that occurred during the second fiscal quarter of the period covered by this report that have materially affected or are reasonably likely to materially affect, the registrant’s internal control over financial reporting.
Item 12. Exhibits.
(a) File the exhibits listed below as part of this Form. Letter or number the exhibits in the sequence indicated.
(a)(1) Any code of ethics, or amendment thereto, that is the subject of the disclosure required by Item 2, to the extent that the
registrant intends to satisfy the Item 2 requirements through filing of an exhibit.
NOT APPLICABLE – ONLY EFFECTIVE FOR ANNUAL REPORTS.
(a)(2) A separate certification for each principal executive officer and principal financial officer of the registrant as required by Rule 30a-2(a) under the Act (17 CFR 270.30a-2).
CERTIFICATIONS PURSUANT TO RULE 30a-2 ( a) ARE ATTACHED HERETO.
(a)(3) Any written solicitation to purchase securities under Rule 23c-1 under the Act (17 CFR 270.23c-1) sent or given during the period covered by the report by or on behalf of the registrant to 10 or more persons.
NOT APPLICABLE.
| (b) | If the report is filed under Section 13(a) or 15(d) of the Exchange Act, provide the certifications required by rule 30a-2(b) under the Act as an exhibit. A certification furnished pursuant to this paragraph will not be deemed “filed” for purposes of Section 18 of the Exchange Act, or otherwise subject to the liability of that section. Such certification will not be deemed to be incorporated by reference into any filing under the Securities Act of 1933 or the Exchange Act, except to the extent that the registrant incorporates it by reference.
CERTIFICATIONS PURSUANT TO RULE 30A-2 (B) ARE FURNISHED HEREWITH. |
SIGNATURES
Pursuant to the requirements of the Securities Exchange Act of 1934 and the Investment Company Act of 1940, the registrant
has duly caused this report to be signed on its behalf by the undersigned, thereunto duly authorized.
(Registrant) | Tamarack Funds Trust |
By (Signature and Title)* | /s/ Erik R. Preus |
| Erik R. Preus, President and Chief Executive Officer |
Pursuant to the requirements of the Securities Exchange Act of 1934 and the Investment Company Act of 1940, this report has been signed below by the following persons on behalf of the registrant and in the capacities and on the dates indicated.
By (Signature and Title)* | /s/ Erik R. Preus |
| Erik R. Preus, President and Chief Executive Officer |
By (Signature and Title)* | /s/ David P. Lux |
| David P. Lux, Chief Financial Officer and Treasurer |
* Print the name and title of each signing officer under his or her signature.