UNITED STATES
SECURITIES AND EXCHANGE COMMISSION
Washington, D.C. 20549
FORM N-CSR
CERTIFIED SHAREHOLDER REPORT OF REGISTERED MANAGEMENT
INVESTMENT COMPANIES
| | |
Investment Company Act file number | | 811-21475 |
Tamarack Funds Trust
|
| (Exact name of registrant as specified in charter) |
|
100 South Fifth Street, Suite 2300 Minneapolis, MN 55402-1240 |
| (Address of principal executive offices) (Zip code) |
Lee Greenhalgh, Esq.
RBC Plaza
60 South Sixth Street
Minneapolis, MN 55402
|
| (Name and address of agent for service) |
Registrant’s telephone number, including area code: (612) 376-7000
Date of fiscal year end: September 30
Date of reporting period: March 31, 2009
Item 1. Reports to Stockholders.
The Report to Shareholders is attached herewith.
| | | | | | | | |
| | | | | | |
| | | | | Tamarack Funds |
About Your Semi-Annual Report | | | | | | This semi-annual report includes detailed information about your Fund including financial statements, performance, and a complete list of its holdings. The Tamarack Funds compare their performance against various Russell equity indices. Each of these indices is a widely recognized measure of return for the underlying category of securities. However, the indices are unmanaged, do not include fees, and cannot be invested in directly. We hope the financial information presented will help you evaluate your investment in the Tamarack Funds. We also encourage you to read your Fund’s prospectus for further detail as to your Fund’s investment policies and risk profile. Tamarack Funds prospectuses and performance information subsequent to the date of this report are available on our website at www.voyageur.net. A description of the policies and procedures that your Fund uses to determine how to vote proxies relating to portfolio securities is available (i) without charge, upon request, by calling 1-800-422-2766; (ii) on the Fund’s website at www.voyageur.net; and (iii) on the Securities and Exchange Commission’s (the “Commission”) website at http://www.sec.gov. Information regarding how your Fund voted proxies relating to portfolio securities during the most recent 12-month period ended June 30 is available (i) on the Fund’s website at www.voyageur.net; and (ii) on the Commission’s website at http://www.sec.gov. A schedule of each Fund’s portfolio holdings will be filed with the Commission for the first and third quarters of each fiscal year on Form N-Q. This information is available on the Commission’s website at http://www.sec.gov and may be reviewed and copied at the Commission’s Public Reference Room in Washington, D.C. Information on the operation of the Public Reference Room is available by calling 1-800-SEC-0330. |
| Table of Contents | | | | | | | | |
| | | | | | Letter from the CIO of Equities | | 1 |
| | | | | | Equity Portfolio Managers | | 4 |
| | | | | | Performance Summary | | 6 |
| | | | | | Mid Cap Growth Fund | | 10 |
| | | | | | Enterprise Fund | | 11 |
| | | | | | Small Cap Core Fund | | 12 |
| | | | | | Microcap Value Fund | | 13 |
| | | | | | Schedules of Portfolio Investments | | 14 |
| | | | | | Financial Statements | | |
| | | | | | - Statements of Assets and Liabilities | | 25 |
| | | | | | - Statements of Operations | | 27 |
| | | | | | - Statements of Changes in Net Assets | | 28 |
| | | | | | Financial Highlights | | 30 |
| | | | | | Notes to Financial Statements | | 34 |
| | | | | | Share Class Information | | 43 |
| | | | | | Supplemental Information | | 44 |
| | | | | | Renewal of Investment Advisory Fees | | 46 |
| | | | | | |
LETTER FROM THE CIO OF EQUITIES | | | | | | |
| | | |
| | | | | | | |
Market Review The last six months proved extremely challenging for equity investors. Cumulatively, equity indices across all capitalization ranges lost on average approximately 35% of their value in one of the three worst bear markets on record. The heavier losses occurred during the fourth quarter of 2008. However, the New Year offered no respite. January 2009 proved the worst opening month on record for the S&P 500, which fell 8.4%. While a number of factors contributed to the market’s fall, the one central area concerning investors was the health of the U.S. and, furthermore, global financial systems. Major market averages put in new lows in November and again in early March as worries regarding the health of U.S. banks peaked. The March S&P 500 bottom equated to a level last experienced in 1996. As financials, especially banks, pulled the market down over these past two quarters, they also sparked a powerful rally in the period’s closing weeks. S&P financials rallied 46% off the March low, helping the broad averages to gains of about 9% for the month. While March ended strongly, the first quarter overall still delivered losses of 10-15% across the market cap spectrum. The late-period rally persisted into the early weeks of April, leading many to wonder whether we’ve seen the worst of this market already. In considering the entire six-month period we observe that large-cap stocks experienced the best relative returns. The lower one went in market cap the worse the relative return experience during this timeframe. Value and growth stocks did equally poorly during the fourth quarter of 2008, but growth stocks emerged as clear leaders in 2009’s first quarter. Not Your Average Recession To be clear, while Voyageur acknowledges the economy is mired in a deep recession with unusual challenges, we do not think comparisons to the Great Depression of the 1930s are valid. Nevertheless, this contraction is somewhat unique in many respects, including the underlying causes, the breadth and depth of economic weakness, and the fact that the entire world has suffered. As mentioned, the global banking system’s poor health was the spark that set our markets aflame. The causes are well-known by now: essentially a combination of extremely poor lending, borrowing, and investing decisions based on the erroneous assumption that home prices would rise without interruption. While the U.S. rightly accepts most of the blame for the consequences of the bursting real estate bubble, it’s clear that similar errors were also made in the U.K. and Europe. What generally differentiates this recession from the Great Depression is the global coordination and rapidity of policy responses to the crisis. Here in the U.S. we’ve seen the Federal Reserve take its policy rate down to essentially zero. They’ve introduced myriad programs aimed at providing or improving liquidity in a number of important corners of the financial system. They’ve embarked on pumping $1.2 trillion of cash into the economy | | | | | | |
| | | |
| | | | | | |
1
| | | | |
| | | | | LETTER FROM THE CIO OF EQUITIES |
| | | | | through asset purchases which also provide the benefit of lower Treasury and mortgage lending rates. The federal government enacted an $800 billion stimulus package – cutting payroll taxes for most workers, providing financial aid to strapped state governments, dedicating funds to various infrastructure projects, and offering an $8,000 tax credit to first time home buyers. The Treasury and Fed are executing a plan to both assure the market’s confidence in the health of our major banks and to (finally) relieve these banks of some of their most troubled assets. The unemployment rate has exploded but is nowhere close to the 25% experienced during the Depression. A broad array of government support programs for the unemployed which did not exist in the ‘30s are in place today. Lastly, while there have been isolated exceptions there appears a strong global consensus to maintain an open trading system as major global leaders recognize the harmful impact protectionist policies would have on the economy. The Promises The administration has referred to early signs of stabilization or improvement in the economy as “green shoots.” The desire is that enough of these hopeful signs sprout and are fed by stimulus and monetary policy to halt and then reverse the economy’s slide. What do we see? The administration’s policy responses in both fiscal and monetary terms have been rapid and unprecedented. True, some of the proposals have seemed scattershot or indecisive, but the amount of intervention has been massive in scale. Coming quarters will begin to reveal the boost these programs should provide to the economy. The hope behind these stimulus efforts is that they spark a recovery that is self-sustaining. Fed policy changes work with variable lags, but if past form is followed a lower cost of capital, increased money supply, and improved access to credit should begin having a positive impact during the second half of this year. Rising unemployment presents a problem, but as we have already discussed, a number of counter-balances are in place: expanded unemployment insurance, a cut in payroll taxes, cash to help states balance their budgets with fewer program cuts and/or tax increases, and a material tax credit to incentivize first-time home buyers. Consumers have also been aided by the sharp drop in gasoline prices and inflation in general. Heavy refinancing of mortgage loans not only help put more cash in consumer pockets but provide a valuable stream of fee income and higher quality loans to banks that desperately need it. Another boon to consumers has been tax refunds, which so far this year are running on average over 10% higher than refunds last year. It’s fair to look at housing as the culprit behind this recession, and it will be necessary for housing markets to stabilize before the economy returns to a growth track. Inventories remain high, and prices appear at risk of some further decline. Still, we see some green shoots in the form of extremely high housing affordability. Sales paces are at depressingly low levels; however, we see promise in the fact that sales seem to have stabilized an even improved slightly from their lows. The months of supply at current sales paces have fallen for both new and existing homes. This is a key barometer for gauging the supply/demand |
| | | |
2
| | | | | | |
LETTER FROM THE CIO OF EQUITIES | | | | | | |
balance in these markets. We are still in a state of excess supply, but we are moving in the right direction. Lastly, the stock market itself may be telling us something important at this very moment. Markets are forward-looking. Despite all the discouraging economic statistics, we’ve witnessed a strong rebound in stock prices that began in early March and continued well into April. Only in hindsight will we be able to say whether March 2009 marked the end of this bear market, but the rally must be taken as a support to the economy for now. Not only has the market risen lately, but volatility is down by over half from its 2008 peak. Volatility remains above long-term averages, and we would prefer to see it lower as another encouraging sign that this rally has legs. For now volatility is moving in the right direction. The Opportunity Emerging from recession and bearish periods stocks typically deliver strong and fast-moving recoveries that can more than offset losses incurred during the market decline. Pinpointing the date when a recession will end or when a sustained market recovery will begin is an impossible task. However, it’s at these moments after the markets have delivered their harshest blows that patient investors can potentially reap their greatest rewards. If you’ve resisted the urge to sell when things seemed darkest then we believe you are on the verge of seeing your portfolios begin to increase in value again. With earnings estimates having come down in response to the current economic environment market valuations appear quite attractive, and we’ve yet to enjoy any boost from the government’s policy prescriptions. Those who have been sidelined through this period or who currently have an allocation to equities below their normal range may wish to consider beginning to put some of their cash back to work. After witnessing the third-worst bear market on record the recovery we experience, when it comes, may be equally breathtaking. 
Nancy M. Scinto Tamarack Funds Chief Investment Officer Equity Products | | | | | | 
|
| | | | | |
3
| | | | | | |
| | | | | | | EQUITY PORTFOLIO MANAGERS |
| | | | | | | |
| | | | | | Voyageur Asset Management Inc. (“Voyageur”), the investment advisor to the Tamarack Funds, employs a team approach to the management of the Tamarack Equity Funds, with no individual team member being solely responsible for the investment decisions. |

| | | | | | Nancy M. Scinto Chief Investment Officer Equity Products, Director of Global Equity Investments, Managing Director, Senior Portfolio Manager Nancy Scinto is responsible for portfolio management of the Mid Cap Growth and Microcap Value Funds and directing the Voyageur growth equity research efforts. She joined Voyageur in 1999 from Chicago Trust Company where she managed institutional accounts and was co-manager of the five-star Alleghany / Chicago Growth and Income Fund. Nancy has held various positions including personal trust, equity trader, senior equity analyst and senior portfolio manager. She began her career in the investment industry in 1984. Nancy received a BA from Governors State University and an MBA from DePaul University. She is a member of the CFA Society of Chicago. |

| | | | | | Gordon Telfer Managing Director, Head of Growth Equities Gordon Telfer is head of Voyageur’s growth equity team and co-manager of the Mid Cap Growth Fund. Fund. He joined Voyageur in 2003 from Alliance Capital Management where he was a senior portfolio manager and a member of Alliance’s Investment Policy Group. Prior to Alliance, he worked for Scudder Kemper Investments as senior vice president and global strategist and spokesperson for Scudder Kemper’s U.S. and International Portfolio Management Group. Gordon began his career in the investment industry in 1986 at Murray Johnstone International in portfolio management. He has spoken at numerous regional and national conferences on portfolio management and been a guest on CNBC. A native of Glasgow, Scotland, Gordon received his Stock Exchange Diploma from the Herriott Watt University, Edinburgh, Scotland. |

| | | | | | Lance F. James Managing Director, Senior Portfolio Manager Lance James is responsible for portfolio management of the Small Cap Core Fund and Enterprise Fund and is a co-manager of the Microcap Value Fund. Prior to joining Voyageur in 2006, Lance was an equity analyst and portfolio manager for OFI Institutional and Babson Capital Management, affiliated companies of Mass Mutual Life Insurance Company. During his tenure he served as head of the firm’s small/mid cap value investment team. Prior to joining Babson Capital in 1986, Lance worked at Rockwell International Corporation, EBF Associates of Boston and Hewitt Associates. Lance began his career in the investment industry in 1980. He received an AB in Economics from Princeton University and an MBA in Finance from the Wharton School of Business at the University of Pennsylvania. |
| | | | | | |
4
| | | | | | | | | | | | | | | | | | | | |
EQUITY PORTFOLIO MANAGERS | | | | | | |
| | | | | | | |
| | | | | | | |
George Prince Portfolio Manager, Senior Equity Analyst George Prince serves as the co-portfolio manager for the Enterprise Fund. George also provides research support for the Small Cap Core Fund. He joined Voyageur in 2006 from Eagle Asset Management, where he was a senior equity analyst. Prior to his experience at Eagle Asset Management, George was an analyst at Babson Capital Management. George also has a great deal of entrepreneurial experience and founded SignStorey, a leader in place-based digital communications in retail stores and co-founded Cutting Edge Inc., a global CAD-CAM technology company. George has over 12 years of investment industry experience. He received a BA from Yale University. | | | | | |  |
| | | | | | | | | | | | | | | | | | | | |
| | | | | | | | | | | | | | | | | | | | |
| | | | | | | PERFORMANCE SUMMARY |
| | | | | | Average Annual Total Returns as of March 31, 2009 (Unaudited) |
| | | | | | Tamarack Mid Cap Growth Fund (a) |
| | | | | | | | | 1 Year | | 3 Year | | 5 Year | | 10 Year | | Since
Inception(b) | | Net
Expense
Ratio*(1)(2) | | Gross
Expense
Ratio*(1)(2) |
| | | | | | Class A | | | | | | | | | | | | | | |
| | | | | | - Including | | | | | | | | | | | | | | |
| | | | | | Maximum Sales | | | | | | | | | | | | | | |
| | | | | | Charge of 5.75% | | (39.67)% | | (17.98)% | | (6.88)% | | 0.72% | | 8.14% | | | | |
| | | | | | - At Net Asset Value | | (35.96)% | | (16.35)% | | (5.77)% | | 1.32% | | 8.49% | | 1.35% | | 1.44% |
| | | | | | | | | | |
| | | | | | Class C (c) | | | | | | | | | | | | | | |
| | | | | | - Including | | | | | | | | | | | | | | |
| | | | | | Contingent | | | | | | | | | | | | | | |
| | | | | | Deferred Sales | | | | | | | | | | | | | | |
| | | | | | Charge of 1.00% | | (37.05)% | | (16.96)% | | (6.46)% | | 0.57% | | 7.69% | | | | |
| | | | | | - At Net Asset Value | | (36.42)% | | (16.96)% | | (6.46)% | | 0.57% | | 7.69% | | 2.10% | | 2.19% |
| | | | | | | | | | |
| | | | | | Class I | | (35.78)% | | (16.12)% | | (5.53)% | | 1.60% | | 8.82% | | 1.10% | | 1.19% |
| | | | | | | | | | |
| | | | | | Class R (c) | | (36.08)% | | (16.53)% | | (5.99)% | | 1.08% | | 8.23% | | 1.60% | | 1.69% |
| | | | | | | | | | |
| | | | | | Class S (d) | | (35.84)% | | (16.14)% | | (5.53)% | | 1.60% | | 8.82% | | 1.10% | | 1.19% |
| | | | | | | | | | |
| | | | | | Russell Midcap | | | | | | | | | | | | | | |
| | | | | | Growth Index** | | (39.58)% | | (14.89)% | | (3.91)% | | (0.86)% | | 7.51% | | | | |
| | | | | | | | | | | | | | | | | | | | |
| | | | | | Tamarack Enterprise Fund (e) |
| | | | | | 1 Year | | 3 Year | | 5 Year | | 10 Year | | Since
Inception(f) | | Net
Expense
Ratio*(1)(2) | | Gross
Expense
Ratio*(1)(2) |
| | | | | | Class A (g) | | | | | | | | | | | | | | |
| | | | | | - Including | | | | | | | | | | | | | | |
| | | | | | Maximum Sales | | | | | | | | | | | | | | |
| | | | | | Charge of 5.75% | | (44.26)% | | (21.74)% | | (9.39)% | | 3.73% | | 8.27% | | | | |
| | | | | | - At Net Asset Value | | (40.86)% | | (20.18)% | | (8.31)% | | 4.35% | | 8.53% | | 1.33% | | 1.56% |
| | | | | | | | | | |
| | | | | | Class C (g) | | | | | | | | | | | | | | |
| | | | | | - Including | | | | | | | | | | | | | | |
| | | | | | Contingent | | | | | | | | | | | | | | |
| | | | | | Deferred Sales | | | | | | | | | | | | | | |
| | | | | | Charge of 1.00% | | (41.79)% | | (20.77)% | | (8.99)% | | 3.58% | | 7.72% | | | | |
| | | | | | - At Net Asset Value | | (41.29)% | | (20.77)% | | (8.99)% | | 3.58% | | 7.72% | | 2.08% | | 2.31% |
| | | | | | | | | | |
| | | | | | Class I (h) | | (40.68)% | | (19.98)% | | (8.07)% | | 4.62% | | 8.80% | | 1.08% | | 1.31% |
| | | | | | | | | | |
| | | | | | Class R (g) | | (40.98)% | | (20.37)% | | (8.54)% | | 4.09% | | 8.26% | | 1.58% | | 1.81% |
| | | | | | | | | | |
| | | | | | Class S | | (40.74)% | | (20.00)% | | (8.09)% | | 4.61% | | 8.80% | | 1.08% | | 1.31% |
| | | | | | | | | | |
| | | | | | Russell 2000 | | | | | | | | | | | | | | |
| | | | | | Index** | | (37.50)% | | (16.80)% | | (5.24)% | | 1.93% | | 7.00% | | | | |
| | | | | | | | | | | | | | | | | | | | |
| | | | | | Performance data quoted represents past performance. Past performance is no guarantee of future results. Investment return and principal value of an investment will fluctuate so that an investor’s shares, when redeemed, may be worth more or less than their original cost. Current performance may be lower or higher than performance quoted. Performance shown reflects contractual fee waivers, without such fee waivers total returns would be reduced. Performance information does not reflect the 2% fee on shares redeemed or exchanged within 30 days of purchase. If such redemption fee was included, performance would be reduced. For performance data current to the most recent month-end go to www.voyageur.net. Please see footnotes on page 8. |
| | | | | | |
6
| | | | | | | | | | | | | | | | | | | | |
PERFORMANCE SUMMARY | | | | | | |
Tamarack Small Cap Core Fund (i) | | | | | |
| | | | | | | | | | |
| | | 1 Year | | 3 Year | | 5 Year | | 10 Year | | Since
Inception(j) | | Net
Expense
Ratio*(1)(2) | | Gross
Expense
Ratio*(1)(2) | | | | | | |
Class A (g) | | | | | | | | | | | | | | | | | | | |
- Including | | | | | | | | | | | | | | | | | | | |
Maximum Sales | | | | | | | | | | | | | | | | | | | |
Charge of 5.75% | | (42.10)% | | (19.87)% | | (7.87)% | | 2.18% | | 6.39% | | | | | | | | | |
- At Net Asset Value | | (38.58)% | | (18.28)% | | (6.77)% | | 2.78% | | 6.74% | | 1.55% | | 2.02% | | | | | |
Class C (g) | | | | | | | | | | | | | | | | | | | |
- Including | | | | | | | | | | | | | | | | | | | |
Contingent | | | | | | | | | | | | | | | | | | | |
Deferred Sales | | | | | | | | | | | | | | | | | | | |
Charge of 1.00% | | (39.58)% | | (18.81)% | | (7.42)% | | 2.05% | | 5.96% | | | | | | | | | |
- At Net Asset Value | | (39.06)% | | (18.81)% | | (7.42)% | | 2.05% | | 5.96% | | 2.30% | | 2.77% | | | | | |
Class I (k) | | (38.39)% | | (17.98)% | | (6.49)% | | 3.07% | | 7.02% | | 1.30% | | 1.77% | | | | | |
Class R (g) | | (38.72)% | | (18.39)% | | (6.96)% | | 2.56% | | 6.49% | | 1.80% | | 2.27% | | | | | |
Class S | | (38.39)% | | (17.98)% | | (6.49)% | | 3.07% | | 7.02% | | 1.30% | | 1.77% | | | | | |
Russell 2000
Index** | | (37.50)% | | (16.80)% | | (5.24)% | | 1.93% | | 7.00% | | | | | | | | | |
| | | | | | | | | | | | | | | | | | | | |
Tamarack Microcap Value Fund (l) | | | | | |
| | | 1 Year | | 3 Year | | 5 Year | | 10 Year | | Since
Inception(m) | | Net
Expense
Ratio*(1)(2) | | Gross
Expense
Ratio*(1)(2) | | | | | |
Class A (g) | | | | | | | | | | | | | | | | | | | |
- Including | | | | | | | | | | | | | | | | | | | |
Maximum Sales | | | | | | | | | | | | | | | | | | | |
Charge of 5.75% | | (47.86)% | | (22.52)% | | (8.84)% | | 3.72% | | 5.89% | | | | | | | | | |
- At Net Asset Value | | (44.68)% | | (20.97)% | | (7.75)% | | 4.33% | | 6.19% | | 1.32% | | 1.51% | | | | | |
Class C (g) | | | | | | | | | | | | | | | | | | | |
- Including | | | | | | | | | | | | | | | | | | | |
Contingent | | | | | | | | | | | | | | | | | | | |
Deferred Sales | | | | | | | | | | | | | | | | | | | |
Charge of 1.00% | | (45.55)% | | (21.56)% | | (8.43)% | | 3.56% | | 5.40% | | | | | | | | | |
- At Net Asset Value | | (45.05)% | | (21.56)% | | (8.43)% | | 3.56% | | 5.40% | | 2.07% | | 2.26% | | | | | |
Class R (g) | | (44.77)% | | (21.17)% | | (7.98)% | | 4.07% | | 5.92% | | 1.57% | | 1.76% | | | | | |
Class S | | (44.50)% | | (20.77)% | | (7.51)% | | 4.59% | | 6.45% | | 1.07% | | 1.26% | | | | | |
Russell 2000 Value
Index** | | (38.89)% | | (17.54)% | | (5.30)% | | 4.87% | | 9.17% | | | | | | | | | |
| | | | | | | | | | | | | | | | | | | | |
Performance data quoted represents past performance. Past performance is no guarantee of future results. Investment return and principal value of an investment will fluctuate so that an investor’s shares, when redeemed, may be worth more or less than their original cost. Current performance may be lower or higher than performance quoted. Performance shown reflects contractual fee waivers, without such fee waivers total returns would be reduced. Performance information does not reflect the 2% fee on shares redeemed or exchanged within 30 days of purchase. If such redemption fee was included, performance would be reduced. For performance data current to the most recent month-end go to www.voyageur.net. Please see footnotes on page 8. | | | | | |
| | | | | |
| | | | | | |
| | | | | PERFORMANCE SUMMARY |
| | | |
| | | | | (1) The Funds expenses reflect the most recent fiscal year-end (September 30, 2008). |
| | | |
| | | | | (2) The Adviser has contractually agreed to waive fees and/or make payments in order to keep total operating expenses of the Fund to the levels listed under net expense ratio until January 31, 2010. |
| | | |
| | | | | *The expense ratios are from the Funds’ prospectus dated January 28, 2009. Additional information pertaining to the Funds’ expense ratios as of March 31, 2009 can be found in the financial highlights. |
| | | |
| | | | | **Each of the comparative indices is a widely recognized market value weighted measure of the return of securities, but do not include sales fees or operating expenses. You cannot invest directly in indices. |
| | | | | (a) | | The performance in the table for the period from June 1, 1994 to April 19, 2004 reflects the performance of RBC Mid Cap Equity Fund, the predecessor to Tamarack Mid Cap Growth Fund. The performance of the Fund also includes the performance of a common trust fund (“CTF”) account advised by the Advisor (including its predecessor) and managed the same as the Fund in all material respects for the period from December 31, 1990 to June 1, 1994, as adjusted to reflect the full contractual rate of expenses associated with the Fund at its inception. The CTF account was not registered with the SEC under the 1940 Act and therefore was not subject to the investment restrictions imposed by law on registered mutual funds. If the CTF account had been registered, the CTF account’s performance may have been adversely affected. Fund performance reflects applicable fee waivers/expense reimbursements (which, if excluded, would cause performance to be lower). |
| | | | | (b) | | The since inception date (commencement of operations) of the Fund is December 31, 1990. |
| | | | | (c) | | The inception date for Class C and Class R Shares of the Fund is April 19, 2004. All performance shown for each such class of shares prior to its inception date is based on the performance of the Class A Shares of the Fund, adjusted to reflect the fees and expenses of Class C and Class R Shares, as applicable (and where applicable, the maximum sales charges of the Class C Shares). |
| | | | | (d) | | The inception date for Class S Shares of the Fund is April 19, 2004. All performance shown for each such class of shares prior to its inception date is based on the performance of the Class I Shares of the Fund, adjusted to reflect the fees and expenses of Class S Shares. |
| | | | | (e) | | The performance in the table for the period from December 2, 1983 to April 19, 2004 reflects the performance of Babson Enterprise Fund, the predecessor to Tamarack Enterprise Fund. Fund performance reflects applicable fee waivers/expense reimbursements (which, if excluded, would cause performance to be lower). |
| | | | | (f) | | The since inception date (commencement of operations) of the Fund is December 2, 1983. The performance of the index since inception of the Fund is calculated from November 30, 1983. |
| | | | | (g) | | The inception date for Class A, Class C and Class R Shares of the Fund is April 19, 2004. All performance shown for each such class of shares prior to its inception date is based on the performance of the Class S Shares of the Fund, adjusted to reflect the fees and expenses of Class A, Class C and Class R Shares, as applicable (and where applicable, the maximum sales charges of the Class A and Class C Shares). |
| | | | | (h) | | The inception date for Class I Shares of the Fund is September 30, 2004. All performance shown for each such class of shares prior to its inception date is based on the performance of the Class S Shares of the Fund, adjusted to reflect the fees and expenses of Class I Shares, as applicable. |
| | | | | (i) | | The performance in the table for the period from August 5, 1991 to April 19, 2004 reflects the performance of Babson Enterprise Fund II, the predecessor to Tamarack Small Cap Core Fund. Fund performance reflects applicable fee waivers/expense reimbursements (which, if excluded, would cause performance to be lower). |
| | | | | (j) | | The since inception date (commencement of operations) of the Fund is August 5, 1991. The performance of the index since inception of the Fund is calculated from July 31, 1991. |
| | | | | (k) | | The inception date for Class I Shares of the Fund is August 2, 2007. All performance shown for each such class of shares prior to its inception date is based on the performance of the Class S Shares of the Fund, adjusted to reflect the fees and expenses of Class I Shares, as applicable. |
| | | | | (l) | | The performance in the table for the period from September 10, 1987 to April 19, 2004 reflects the performance of Shadow Stock Fund, the predecessor to Tamarack Microcap Value Fund. Fund performance reflects applicable fee waivers/expense reimbursements (which, if excluded, would cause performance to be lower). |
| | | | | (m) | | The since inception date (commencement of operations) of the Fund is September 10, 1987. The performance of the index since inception of the Fund is calculated from August 31, 1987. |
| | | | | The Russell Midcap Growth Index is an unmanaged index that measures the performance of U.S. mid cap companies in the Russell 3000 Index, which have higher price-to-book ratios and higher forecasted growth rates. |
| | | | | |
8
| | | | | | |
PERFORMANCE SUMMARY | | | | | | |
The Russell 2000 Value Index is an unmanaged index that measures the performance of small cap companies in the Russell 3000 Index with lower price-to-book ratios and lower forecasted growth rates. The Russell 2000 Index is an unmanaged index that measures the performance of U.S. small cap companies in the Russell 3000 Index. | | | | | | |
| | | | | | |
| | | | | | | | | | | | | | |
| | | | | | | | FUND STATISTICS (UNAUDITED) |
| | | | | | | | Tamarack Mid Cap Growth Fund |
| Investment Objective | | | | | | | | Long-term capital appreciation. |
| Benchmark | | | | | | | | Russell Midcap Growth Index |
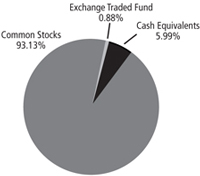
Asset Allocation (as of 3/31/09) (% of fund’s investments) & Top Five Industries (as of 3/31/09) (% of fund’s net assets) | | | | | | | | 
| | | | Top Five Industries Consumer Discretionary Health Care Industrials Information Technology Energy | | 19.56%
18.34% 17.97% 15.84% 10.43% |
| | | | | | | | | | | | | |
| | | | | | | | | | | | | |
| | | | | | | | | | | | | |
| | | | | | | | | | | | | |
| | | | | | | | | | | | | |
| | | | | | | | | | | | | |
Top Ten Holdings (as of 3/31/09) (% of fund’s net assets) | | | | | | | | Stericycle, Inc. | | 4.22% | | Dril-Quip, Inc. | | 2.96% |
| | | | | | | | LKQ Corp. | | 3.56% | | Quest Diagnostics, Inc. | | 2.80% |
| | | | | | | | Core Laboratories NV | | 3.51% | | Microchip Technology, Inc. | | 2.65% |
| | | | | | | | O’Reilly Automotive, Inc. | | 3.12% | | Fastenal Co. | | 2.57% |
| | | | | | | | Roper Industries, Inc. | | 3.07% | | GameStop Corp., Class A | | 2.47% |
| | | | | | | | *A listing of all portfolio holdings can be found on page 14. |
Growth of $10,000 Initial Investment Over 10 Years | | | | | | | | 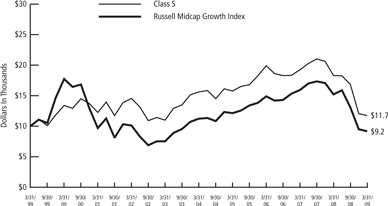
|
| | | | | | | | The graph reflects an initial investment of $10,000 over a 10 year period and is based on Class S shares. The performance of the Fund for the period from March 31, 1999 to April 19, 2004 reflects the performance of RBC Mid Cap Equity Fund, the predecessor to Tamarack Mid Cap Growth Fund. The Fund’s total return includes reinvested dividends and capital gains. The Fund’s total return also includes operating expenses that reduce return, while the total return of the index does not. The graph does not reflect the deduction of taxes that a shareholder would pay on fund distributions or redemption of fund shares. Performance of other classes will vary due to differences in fee structures. |
| | | | | | | | |
10
| | | | | | | | | | | | | | |
FUND STATISTICS (UNAUDITED) | | | | | | | | |
Tamarack Enterprise Fund | | | | | | | | |
Long-term growth of capital. | | | | | | | | Investment Objective |
Russell 2000 Index | | | | | | | | Benchmark |
| | | | Top Five Industries
Information Technology
Industrials Consumer Discretionary Health Care Financials | | 29.67% 22.45% 15.41% 9.38% 8.36% | | | | | | | | Asset Allocation (as of 3/31/09) (% of fund’s investments) & Top Five Industries (as of 3/31/09) (% of fund’s net assets) |
| | | | | | | | | | | | | |
| | | | | | | | | | | | | |
| | | | | | | | | | | | | |
| | | | | | | | | | | | | |
| | | | | | | | | | | | | |
| | | | | | | | | | | | | | |
Universal Electronics, Inc. | | 4.87% | | Comtech Telecommunications Corp. | | 3.71% | | | | | | | | Top Ten Holdings (as of 3/31/09) (% of fund’s net assets) |
| Spectrum Control, Inc. | | 4.74% | | | | | | | | | |
| NIC, Inc. | | 4.64% | | Steinway Musical Instruments | | 3.64% | | | | | | | |
| EMS Technologies, Inc. | | 4.53% | | Landauer, Inc. | | 3.37% | | | | | | | |
| LaBarge, Inc. | | 4.42% | | AZZ, Inc. | | 3.17% | | | | | | | |
| Tyler Technologies, Inc. | | 3.83% | | | | | | | | | | | |
*A listing of all portfolio holdings can be found beginning on page 15. | | | | | | | | |
| �� | | | | | | | Growth of $10,000 Initial Investment Over 10 Years |
The graph reflects an initial investment of $10,000 over a 10 year period and is based on Class S shares. The performance of the Fund for the period from March 31, 1999 to April 19, 2004 reflects the performance of Babson Enterprise Fund, the predecessor to Tamarack Enterprise Fund. The Fund’s total return includes reinvested dividends and capital gains. The Fund’s total return also includes operating expenses that reduce return, while the total return of the index does not. The graph does not reflect the deduction of taxes that a shareholder would pay on fund distributions or redemption of fund shares. Performance of other classes will vary due to differences in fee structures. | | | | | | | |
| | | | |
| | | | | | | | | | | | | | |
| | | | | | | | FUND STATISTICS (UNAUDITED) |
| | | | | | | | Tamarack Small Cap Core Fund |
| Investment Objective | | | | | | | | Long-term growth of capital and income. |
| Benchmark | | | | | | | | Russell 2000 Index |
Asset Allocation (as of 3/31/09) (% of fund’s investments) & Top Five Industries (as of 3/31/09) (% of fund’s net assets) | | | | | | | | 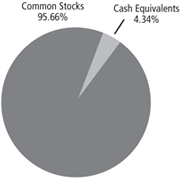
| | | | Top Five Industries Industrials Information Technology Health Care Consumer Discretionary Financials | | 22.68%
19.97% 14.38% 11.85% 10.37% |
| | | | | | | | | | | | | |
| | | | | | | | | | | | | |
| | | | | | | | | | | | | |
| | | | | | | | | | | | | |
| | | | | | | | | | | | | |
| | | | | | | | | | | | | |
Top Ten Holdings (as of 3/31/09) (% of fund’s net assets) | | | | | | | | West Pharmaceutical Services, Inc. | | 4.02% | | Comtech Telecommunications Corp. | | 3.03% |
| | | | | | | | EMS Technologies, Inc. | | 3.33% | | Gardner Denver, Inc. | | 2.97% |
| | | | | | | | AZZ, Inc. | | 3.29% | | Spectrum Control, Inc. | | 2.87% |
| | | | | | | | PSS World Medical, Inc. | | 3.11% | | Powell Industries, Inc. | | 2.69% |
| | | | | | | | Nash Finch Co. | | 3.09% | | Steinway Musical Instruments | | 2.57% |
| | | | | | | | *A listing of all portfolio holdings can be found beginning on page 17. |
Growth of $10,000 Initial Investment Over 10 Years | | | | | | | | 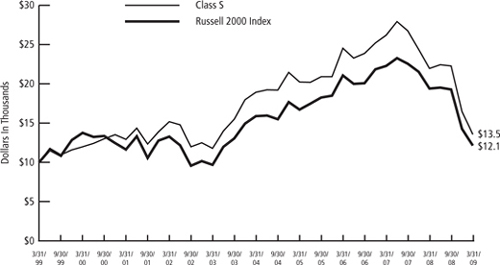
|
| | | | | | | | The graph reflects an initial investment of $10,000 over a 10 year period and is based on Class S shares. The performance of the Fund for the period from March 31, 1999 to April 19, 2004 reflects the performance of Babson Enterprise Fund II, the predecessor to Tamarack Small Cap Core Fund. The Fund’s total return includes reinvested dividends and capital gains. The Fund’s total return also includes operating expenses that reduce return, while the total return of the index does not. The graph does not reflect the deduction of taxes that a shareholder would pay on fund distributions or redemption of fund shares. Performance of other classes will vary due to differences in fee structures. |
| | | | | | | | |
| | | | | | | | | | | | |
FUND STATISTICS (UNAUDITED) | | | | | | |
Tamarack Microcap Value Fund | | | | | | |
Long-term growth of capital. | | | | | | Investment Objective |
Russell 2000 Value Index | | | | | | Benchmark |
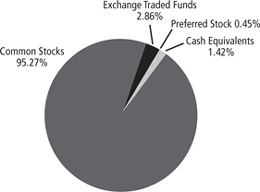
| | | | Top Five Industries Financials Industrials Consumer Discretionary Information Technology Health Care | | 20.18%
19.65% 17.90% 13.03% 6.73% | | | | | | Asset Allocation (as of 3/31/09) (% of fund’s investments) & Top Five Industries (as of 3/31/09) (% of fund’s net assets) |
| | | | | | | | | | | |
| | | | | | | | | | | |
| | | | | | | | | | | |
| | | | | | | | | | | |
| | | | | | | | | | | |
| | | | | | | | | | | |
iShares Russell Microcap Index | | 2.05% | | Empire District Electric Co. (The) | | 0.74% | | | | | | Top Ten Holdings (as of 3/31/09) (% of fund’s net assets) |
Fund | | | | Encore Wire Corp. | | 0.74% | | | | | |
| Enbridge Energy Management | | 0.90% | | CIRCOR International, Inc. | | 0.73% | | | | | |
| LLC | | | | Donegal Group, Inc., Class A | | 0.73% | | | | | |
| PowerShares Zacks Micro Cap | | 0.81% | | Robbins & Myers, Inc. | | 0.73% | | | | | |
| Portfolio | | | | Ingles Markets, Inc., Class A | | 0.72% | | | | | |
| Navigators Group, Inc. | | 0.76% | | | | | | | | | |
*A listing of all portfolio holdings can be found beginning on page 19. | | | | | |
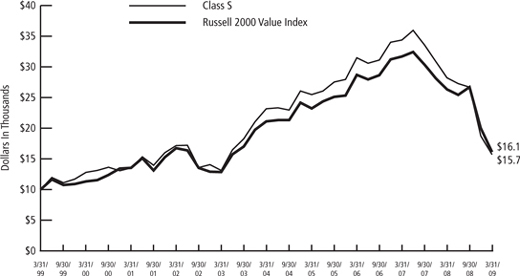
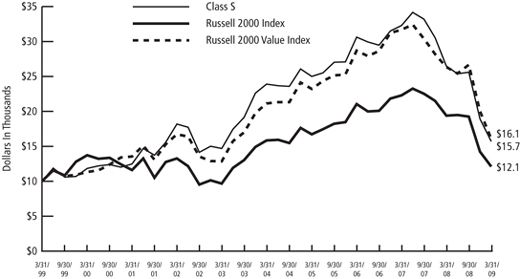
| | | | | | Growth of $10,000 Initial Investment Over 10 Years |
The graph reflects an initial investment of $10,000 over a 10 year period and is based on Class S shares. The performance of the Fund for the period from March 31, 1999 to April 19, 2004 reflects the performance of Shadow Stock Fund, the predecessor to Tamarack Microcap Value Fund. The Fund’s total return includes reinvested dividends and capital gains. The Fund’s total return also includes operating expenses that reduce return, while the total return of the index does not. The graph does not reflect the deduction of taxes that a shareholder would pay on fund distributions or redemption of fund shares. Performance of other classes will vary due to differences in fee structures. | | | | | |
13
|
SCHEDULE OF PORTFOLIO INVESTMENTS |
Tamarack Mid Cap Growth Fund
March 31, 2009 (Unaudited)
| | | | | |
| Shares | | | | Value |
| Common Stocks — 98.63% | | | |
| Consumer Discretionary — 19.56% | | | |
| 40,990 | | Aeropostale, Inc.* | | $ | 1,088,694 |
| 52,320 | | GameStop Corp., Class A* | | | 1,466,006 |
| 25,800 | | John Wiley & Sons, Inc., Class A | | | 768,324 |
| 148,160 | | LKQ Corp.* | | | 2,114,243 |
| 17,000 | | New Oriental Education & Technology Group ADR* | | | 854,250 |
| 52,920 | | O’Reilly Automotive, Inc.* | | | 1,852,729 |
| 46,090 | | PetSmart, Inc. | | | 966,047 |
| 6,680 | | Strayer Education, Inc. | | | 1,201,532 |
| 36,150 | | Tractor Supply Co.* | | | 1,303,569 |
| | | | | |
| | | | | 11,615,394 |
| | | | | |
| Consumer Staples — 6.67% | | | |
| 48,000 | | Alberto-Culver Co. | | | 1,085,280 |
| 19,000 | | Chattem, Inc.* | | | 1,064,950 |
| 16,700 | | Church & Dwight Co., Inc. | | | 872,241 |
| 26,030 | | Hansen Natural Corp.* | | | 937,080 |
| | | | | |
| | | | | 3,959,551 |
| | | | | |
| Energy — 10.43% | | | |
| 28,450 | | Core Laboratories NV | | | 2,081,402 |
| 57,300 | | Dril-Quip, Inc.* | | | 1,759,110 |
| 33,290 | | Oceaneering International, Inc* | | | 1,227,402 |
| 52,420 | | Smith International, Inc. | | | 1,125,982 |
| | | | | |
| | | | | 6,193,896 |
| | | | | |
| Financials — 3.68% | | | |
| 58,000 | | Eaton Vance Corp. | | | 1,325,300 |
| 73,320 | | Hudson City Bancorp, Inc. | | | 857,111 |
| | | | | |
| | | | | 2,182,411 |
| | | | | |
| Health Care — 18.34% | | | |
| 17,050 | | Cephalon, Inc.* | | | 1,161,105 |
| 33,000 | | Charles River Laboratories International, Inc.* | | | 897,930 |
| 15,840 | | Express Scripts, Inc.* | | | 731,333 |
| 23,900 | | Henry Schein, Inc.* | | | 956,239 |
| 53,950 | | Immucor, Inc.* | | | 1,356,842 |
| 33,220 | | Pharmaceutical Product Development, Inc. | | | 787,978 |
| 35,000 | | Quest Diagnostics, Inc. | | | 1,661,800 |
| 36,000 | | ResMed, Inc.* | | | 1,272,240 |
| 23,990 | | Varian Medical Systems, Inc.* | | | 730,256 |
| | | | | | |
| Shares | | | | Value | |
| 59,120 | | VCA Antech, Inc.* | | $ | 1,333,156 | |
| | | | | | |
| | | | | 10,888,879 | |
| | | | | | |
| Industrials — 17.97% | | | | |
| 56,150 | | Barnes Group, Inc. | | | 600,244 | |
| 19,820 | | Donaldson Co., Inc. | | | 531,969 | |
| 37,480 | | Expeditors International of Washington, Inc. | | | 1,060,309 | |
| 47,520 | | Fastenal Co. | | | 1,528,006 | |
| 13,940 | | Huron Consulting Group, Inc.* | | | 591,474 | |
| 34,000 | | IHS, Inc., Class A* | | | 1,400,120 | |
| 20,470 | | Regal-Beloit Corp. | | | 627,201 | |
| 42,990 | | Roper Industries, Inc. | | | 1,824,925 | |
| 52,480 | | Stericycle, Inc.* | | | 2,504,870 | |
| | | | | | |
| | | | | 10,669,118 | |
| | | | | | |
| Information Technology — 15.84% | | | | |
| 65,600 | | Altera Corp. | | | 1,151,280 | |
| 32,000 | | Amdocs Ltd.* | | | 592,640 | |
| 49,220 | | Ansys, Inc.* | | | 1,235,422 | |
| 68,910 | | Autodesk, Inc.* | | | 1,158,377 | |
| 47,000 | | Cognizant Technology Solutions Corp., Class A* | | | 977,130 | |
| 37,140 | | Dolby Laboratories, Inc., Class A* | | | 1,266,845 | |
| 29,000 | | FactSet Research Systems, Inc. | | | 1,449,710 | |
| 74,350 | | Microchip Technology, Inc. | | | 1,575,477 | |
| | | | | | |
| | | | | 9,406,881 | |
| | | | | | |
| Materials — 6.14% | | | | |
| 38,000 | | Airgas, Inc. | | | 1,284,780 | |
| 51,920 | | Albemarle Corp. | | | 1,130,298 | |
| 36,860 | | Greif, Inc., Class A | | | 1,227,070 | |
| | | | | | |
| | | | | 3,642,148 | |
| | | | | | |
| |
| Total Common Stocks | | | | |
| (Cost $69,235,136) | | | 58,558,278 | |
| | | | | | |
| |
| Investment Companies — 6.07% | | | | |
| 3,605,618 | | Wells Fargo Prime Investment Money Market Fund | | | 3,605,618 | |
| | | | | | |
| |
| Total Investment Companies | | | | |
| (Cost $3,605,618) | | | 3,605,618 | |
| | | | | | |
| |
Total Investments
(Cost $72,840,754)(a) — 104.70% | | | 62,163,896 | |
| |
| Liabilities in excess of other assets — (4.70)% | | | (2,789,205 | ) |
| | | | | | |
| |
| NET ASSETS — 100.00% | | $ | 59,374,691 | |
| | | | | | |
|
* Non-income producing security. |
(a) See notes to financial statements for the tax cost of securities and the breakdown of unrealized appreciation (depreciation). |
|
Abbreviations used are defined below: |
ADR - American Depository Receipt |
|
|
| See notes to financial statements. |
|
SCHEDULE OF PORTFOLIO INVESTMENTS |
Tamarack Enterprise Fund
March 31, 2009 (Unaudited)
| | | | | |
| Shares | | | | Value |
| Common Stocks — 97.36% | | | |
| Consumer Discretionary — 15.41% | | | |
| 537,000 | | Benihana, Inc., Class A* | | $ | 1,390,830 |
| 300,250 | | Cache, Inc.* | | | 864,720 |
| 740,800 | | Casual Male Retail Group, Inc.* | | | 362,992 |
| 133,630 | | Mac-Gray Corp.* | | | 698,885 |
| 134,900 | | McCormick & Schmick’s Seafood Restaurants, Inc.* | | | 528,808 |
| 421,291 | | Movado Group, Inc. | | | 3,176,534 |
| 202,900 | | Regent Communications, Inc.* | | | 26,377 |
| 315,512 | | Steinway Musical Instruments* | | | 3,776,679 |
| 27,150 | | Tefron Ltd. | | | 96,382 |
| 279,100 | | Universal Electronics, Inc.* | | | 5,051,710 |
| | | | | |
| | | | | 15,973,917 |
| | | | | |
| Consumer Staples — 0.12% | | | |
| 500,000 | | NutraCea* | | | 120,000 |
| | | | | |
| Energy — 2.42% | | | |
| 73,300 | | Goodrich Petroleum Corp.* | | | 1,419,088 |
| 28,000 | | Gulf Island Fabrication, Inc. | | | 224,280 |
| 40,000 | | OYO Geospace Corp.* | | | 522,400 |
| 44,300 | | Tesco Corp.* | | | 346,426 |
| | | | | |
| | | | | 2,512,194 |
| | | | | |
| Financials — 8.36% | | | |
| 301,300 | | Asta Funding, Inc. | | | 738,185 |
| 71,900 | | Boston Private Financial Holdings, Inc. | | | 252,369 |
| 81,059 | | CoBiz Financial, Inc. | | | 425,560 |
| 165,000 | | Compass Diversified Holdings | | | 1,471,800 |
| 52,157 | | Dearborn Bancorp, Inc.* | | | 94,926 |
| 78,800 | | Firstcity Financial Corp.* | | | 145,780 |
| 131,280 | | Harrington West Financial Group, Inc. | | | 160,161 |
| 70,000 | | LaSalle Hotel Properties | | | 408,800 |
| 84,626 | | Mercantile Bank Corp. | | | 454,442 |
| 115,389 | | MetroCorp Bancshares, Inc. | | | 320,781 |
| 115,160 | | National Interstate Corp. | | | 1,947,356 |
| 65,374 | | Northrim BanCorp, Inc. | | | 651,779 |
| 10,666 | | Sanders Morris Harris Group, Inc. | | | 41,597 |
| 99,900 | | SWS Group, Inc. | | | 1,551,447 |
| | | | | |
| | | | | 8,664,983 |
| | | | | |
| Health Care — 9.38% | | | |
| 31,832 | | HMS Holdings Corp.* | | | 1,047,273 |
| 94,800 | | Kensey Nash Corp.* | | | 2,016,396 |
| 68,900 | | Landauer, Inc. | | | 3,491,852 |
| 175,100 | | Meridian Bioscience, Inc. | | | 3,172,812 |
| | | | | |
| | | | | 9,728,333 |
| | | | | |
| Industrials — 22.45% | | | |
| 410,870 | | Allied Defense Group, Inc. (The)* | | | 1,618,828 |
| 124,700 | | AZZ, Inc.* | | | 3,290,833 |
| 600,000 | | C&D Technologies, Inc.* | | | 1,110,000 |
| 301,725 | | Columbus McKinnon Corp.* | | | 2,631,042 |
| 82,200 | | Ennis, Inc. | | | 728,292 |
| | | | | |
| Shares | | | | Value |
| 58,700 | | Hardinge, Inc. | | $ | 163,773 |
| 18,900 | | Hurco Cos, Inc.* | | | 200,907 |
| 547,894 | | LaBarge, Inc.* | | | 4,585,873 |
| 278,100 | | NN, Inc. | | | 350,406 |
| 44,200 | | Old Dominion Freight Line, Inc.* | | | 1,038,258 |
| 180,000 | | Orion Marine Group, Inc.* | | | 2,358,000 |
| 250,000 | | PGT, Inc.* | | | 347,500 |
| 5,589 | | Rush Enterprises, Inc., Class A* | | | 49,854 |
| 159,578 | | Standard Parking Corp.* | | | 2,617,079 |
| 150,000 | | Sun Hydraulics Corp. | | | 2,191,500 |
| | | | | |
| | | | | 23,282,145 |
| | | | | |
| Information Technology — 29.67% | | | |
| 247,682 | | Aspen Technology, Inc.* | | | 1,731,297 |
| 100,000 | | Computer Task Group, Inc.* | | | 345,000 |
| 155,277 | | Comtech Telecommunications Corp.* | | | 3,846,212 |
| 502,402 | | DivX, Inc.* | | | 2,527,082 |
| 257,691 | | Edgewater Technology, Inc.* | | | 721,535 |
| 269,200 | | EMS Technologies, Inc.* | | | 4,700,232 |
| 221,200 | | Hypercom Corp.* | | | 212,352 |
| 113,000 | | Interactive Intelligence, Inc.* | | | 1,023,780 |
| 574,238 | | Lionbridge Technologies, Inc.* | | | 562,753 |
| 924,500 | | NIC, Inc. | | | 4,807,400 |
| 249,190 | | NU Horizons Electronics Corp.* | | | 498,380 |
| 751,511 | | Sonic Solutions, Inc.* | | | 901,813 |
| 699,300 | | Spectrum Control, Inc.* | | | 4,916,079 |
| 271,300 | | Tyler Technologies, Inc.* | | | 3,969,119 |
| | | | | |
| | | | | 30,763,034 |
| | | | | |
| Materials — 6.21% | | | |
| 624,900 | | Intertape Polymer Group, Inc.* | | | 262,458 |
| 110,000 | | Koppers Holdings, Inc. | | | 1,597,200 |
| 209,800 | | Landec Corp.* | | | 1,168,586 |
| 178,800 | | Omnova Solutions, Inc.* | | | 311,112 |
| 79,442 | | Penford Corp. | | | 288,374 |
| 187,088 | | Universal Stainless & Alloy* | | | 1,809,141 |
| 503,300 | | US Concrete, Inc.* | | | 1,006,600 |
| | | | | |
| | | | | 6,443,471 |
| | | | | |
| Utilities — 3.34% | | | |
| 107,400 | | Central Vermont Public Service Corp. | | | 1,858,020 |
| 79,800 | | Unitil Corp. | | | 1,602,384 |
| | | | | |
| | | | | 3,460,404 |
| | | | | |
| |
| Total Common Stocks | | | |
| (Cost $166,252,871) | | | 100,948,481 |
| | | | | |
| |
| Exchange Traded Fund — 0.93% | | | |
| 50,000 | | SPDR KBW Regional Banking | | | 961,000 |
| | | | | |
| |
| Total Exchange Traded Fund | | | |
| (Cost $1,368,357) | | | 961,000 |
| | | | | |
|
SCHEDULE OF PORTFOLIO INVESTMENTS |
Tamarack Enterprise Fund (cont.)
March 31, 2009 (Unaudited)
| | | | | |
| Shares | | | | Value |
| Investment Companies — 6.26% | | | |
| 47,700 | | First Opportunity Fund, Inc. | | $ | 206,064 |
| 6,282,705 | | Wells Fargo Prime Investment Money Market Fund | | | 6,282,705 |
| | | | | |
| |
Total Investment Companies
(Cost $6,676,620) | | | 6,488,769 |
| | | | | |
| | | | |
| | | Value | |
Total Investments (Cost $174,297,848)(a) — 104.55% | | $ | 108,398,250 | |
| |
Liabilities in excess of other assets — (4.55)% | | | (4,712,729 | ) |
| | | | |
| |
NET ASSETS — 100.00% | | $ | 103,685,521 | |
| | | | |
| * | Non-income producing security. |
| (a) | See notes to financial statements for the tax cost of securities and the breakdown of unrealized appreciation (depreciation). |
See notes to financial statements.
|
SCHEDULE OF PORTFOLIO INVESTMENTS |
Tamarack Small Cap Core Fund
March 31, 2009 (Unaudited)
| | | | | |
| Shares | | | | Value |
| Common Stocks — 96.32% | | | |
| Consumer Discretionary — 11.85% | | | |
| 237,000 | | Casual Male Retail Group, Inc.* | | $ | 116,130 |
| 23,000 | | Dress Barn, Inc.* | | | 282,670 |
| 16,600 | | Drew Industries, Inc.* | | | 144,088 |
| 12,800 | | Jo-Ann Stores, Inc.* | | | 209,152 |
| 62,900 | | Movado Group, Inc. | | | 474,266 |
| 58,900 | | Steinway Musical Instruments* | | | 705,033 |
| 15,300 | | Steven Madden Ltd.* | | | 287,334 |
| 36,600 | | True Religion Apparel, Inc.* | | | 432,246 |
| 32,962 | | Universal Electronics, Inc.* | | | 596,612 |
| | | | | |
| | | | | 3,247,531 |
| | | | | |
| Consumer Staples — 5.33% | | | |
| 22,400 | | Alberto-Culver Co. | | | 506,464 |
| 30,100 | | Nash Finch Co. | | | 845,509 |
| 19,300 | | Sally Beauty Holdings, Inc.* | | | 109,624 |
| | | | | |
| | | | | 1,461,597 |
| | | | | |
| Energy — 3.53% | | | |
| 3,000 | | CARBO Ceramics, Inc. | | | 85,320 |
| 1,800 | | Core Laboratories NV | | | 131,688 |
| 15,200 | | Swift Energy Co.* | | | 110,960 |
| 28,100 | | Tesco Corp.* | | | 219,742 |
| 17,800 | | Willbros Group, Inc.* | | | 172,660 |
| 7,800 | | World Fuel Services Corp. | | | 246,714 |
| | | | | |
| | | | | 967,084 |
| | | | | |
| Financials — 10.37% | | | |
| 21,000 | | Amerisafe, Inc.* | | | 321,720 |
| 67,300 | | Ares Capital Corp. | | | 325,732 |
| 38,600 | | Asta Funding, Inc. | | | 94,570 |
| 72,900 | | Compass Diversified Holdings | | | 650,268 |
| 24,325 | | Delphi Financial Group, Inc., Class A | | | 327,415 |
| 55,400 | | LaSalle Hotel Properties | | | 323,536 |
| 7,200 | | ProAssurance Corp.* | | | 335,664 |
| 9,600 | | SeaBright Insurance Holdings, Inc.* | | | 100,416 |
| 8,800 | | SWS Group, Inc. | | | 136,664 |
| 4,072 | | Trico Bancshares | | | 68,165 |
| 105,300 | | UCBH Holdings, Inc. | | | 159,003 |
| | | | | |
| | | | | 2,843,153 |
| | | | | |
| Health Care — 14.38% | | | |
| 15,400 | | Amedisys, Inc.* | | | 423,346 |
| 13,900 | | Emergency Medical Services Corp., Class A* | | | 436,321 |
| 30,200 | | Invacare Corp. | | | 484,106 |
| 11,700 | | Kinetic Concepts, Inc.* | | | 247,104 |
| 21,900 | | Meridian Bioscience, Inc. | | | 396,828 |
| 59,375 | | PSS World Medical, Inc.* | | | 852,031 |
| 33,600 | | West Pharmaceutical Services, Inc. | | | 1,102,416 |
| | | | | |
| | | | | 3,942,152 |
| | | | | |
| | | | | |
| Shares | | | | Value |
| Industrials — 22.68% | | | |
| 34,200 | | AZZ, Inc.* | | $ | 902,538 |
| 185,800 | | C&D Technologies, Inc.* | | | 343,730 |
| 25,800 | | Chart Industries, Inc.* | | | 203,304 |
| 64,200 | | Columbus McKinnon Corp.* | | | 559,824 |
| 23,900 | | Forward Air Corp. | | | 387,897 |
| 37,500 | | Gardner Denver, Inc.* | | | 815,250 |
| 22,100 | | II-VI, Inc.* | | | 379,678 |
| 31,000 | | Insteel Industries, Inc. | | | 215,760 |
| 142,000 | | Interface, Inc., Class A | | | 424,580 |
| 5,500 | | LB Foster Co., Class A* | | | 136,565 |
| 20,900 | | Powell Industries, Inc.* | | | 737,979 |
| 29,100 | | Sun Hydraulics Corp. | | | 425,151 |
| 6,800 | | Tennant Co. | | | 63,716 |
| 23,500 | | Wabtec Corp. | | | 619,930 |
| | | | | |
| | | | | 6,215,902 |
| | | | | |
| Information Technology — 19.97% | | | |
| 45,000 | | ADC Telecommunications, Inc.* | | | 197,550 |
| 83,300 | | Aspen Technology, Inc.* | | | 582,267 |
| 33,500 | | Comtech Telecommunications Corp.* | | | 829,795 |
| 116,724 | | DivX, Inc.* | | | 587,122 |
| 52,200 | | EMS Technologies, Inc.* | | | 911,412 |
| 119,400 | | NIC, Inc. | | | 620,880 |
| 66,700 | | Skyworks Solutions, Inc.* | | | 537,602 |
| 151,700 | | Sonic Solutions, Inc.* | | | 182,040 |
| 111,900 | | Spectrum Control, Inc.* | | | 786,657 |
| 107,900 | | Xyratex Ltd.* | | | 237,380 |
| | | | | |
| | | | | 5,472,705 |
| | | | | |
| Materials — 2.93% | | | |
| 7,200 | | Arch Chemicals, Inc. | | | 136,512 |
| 59,900 | | Intertape Polymer Group, Inc.* | | | 25,158 |
| 24,200 | | Koppers Holdings, Inc. | | | 351,384 |
| 30,000 | | Universal Stainless & Alloy* | | | 290,100 |
| | | | | |
| | | | | 803,154 |
| | | | | |
| Telecommunication Services — 2.38% | | | |
| 74,100 | | Premiere Global Services, Inc.* | | | 653,562 |
| | | | | |
| Utilities — 2.90% | | | |
| 14,000 | | Energen Corp. | | | 407,820 |
| 13,700 | | Unisource Energy Corp. | | | 386,203 |
| | | | | |
| | | | | 794,023 |
| | | | | |
| |
| Total Common Stocks | | | |
| (Cost $36,729,668) | | | 26,400,863 |
| | | | | |
|
SCHEDULE OF PORTFOLIO INVESTMENTS |
Tamarack Small Cap Core Fund (cont.)
March 31, 2009 (Unaudited)
| | | | | |
| Shares | | | | Value |
| Investment Companies — 4.37% | | | |
| 47,800 | | First Opportunity Fund, Inc. | | $ | 206,496 |
| 991,039 | | Wells Fargo Prime Investment Money Market Fund | | | 991,039 |
| | | | | |
| |
Total Investment Companies
(Cost $1,437,187) | | | 1,197,535 |
| | | | | |
| | | | |
| | | Value | |
Total Investments (Cost $38,166,855)(a) — 100.69% | | $ | 27,598,398 | |
| |
Liabilities in excess of other assets — (0.69)% | | | (190,063 | ) |
| | | | |
| |
NET ASSETS — 100.00% | | $ | 27,408,335 | |
| | | | |
| * | Non-income producing security. |
| (a) | See notes to financial statements for the tax cost of securities and the breakdown of unrealized appreciation (depreciation). |
See notes to financial statements.
|
SCHEDULE OF PORTFOLIO INVESTMENTS |
Tamarack Microcap Value Fund
March 31, 2009 (Unaudited)
| | | | | |
| Shares | | | | Value |
| Common Stocks — 95.38% | | | |
| Consumer Discretionary — 17.90% | | | |
| 96,000 | | Adams Golf, Inc.* | | $ | 230,400 |
| 2,800 | | Allen Organ Co.(a)(b) | | | 0 |
| 29,800 | | Ambassadors International, Inc.* | | | 11,622 |
| 34,500 | | America’s Car-Mart, Inc.* | | | 468,855 |
| 53,000 | | Arctic Cat, Inc. | | | 202,990 |
| 60,000 | | Asbury Automotive Group, Inc. | | | 258,600 |
| 65,000 | | Audiovox Corp., Class A* | | | 222,950 |
| 90,000 | | Bakers Footwear Group, Inc.* | | | 36,000 |
| 29,000 | | Bassett Furniture Industries, Inc. | | | 56,260 |
| 48,000 | | Beazer Homes USA, Inc.* | | | 48,480 |
| 69,000 | | Benihana, Inc., Class A* | | | 178,710 |
| 69,000 | | Bluegreen Corp.* | | | 120,060 |
| 45,000 | | Bon-Ton Stores, Inc. (The) | | | 78,750 |
| 46,000 | | Books-A-Million, Inc. | | | 211,600 |
| 15,127 | | Bowl America, Inc., Class A | | | 148,245 |
| 43,000 | | Brookfield Homes Corp. | | | 148,350 |
| 72,000 | | Build-A-Bear Workshop, Inc.* | | | 437,040 |
| 44,000 | | Carriage Services, Inc.* | | | 67,320 |
| 61,000 | | Charlotte Russe Holding, Inc.* | | | 497,150 |
| 45,000 | | Cobra Electronics Corp. | | | 40,500 |
| 23,000 | | Core-Mark Holding Co., Inc.* | | | 419,060 |
| 84,000 | | Cost Plus, Inc.* | | | 79,800 |
| 99,000 | | Craftmade International, Inc.* | | | 130,680 |
| 32,000 | | CSS Industries, Inc. | | | 544,000 |
| 42,000 | | Delta Apparel, Inc.* | | | 181,860 |
| 43,000 | | Destination Maternity Corp.* | | | 271,330 |
| 56,000 | | Dixie Group, Inc.* | | | 61,600 |
| 40,000 | | Dorman Products, Inc.* | | | 373,200 |
| 17,500 | | Duckwall-ALCO Stores, Inc.* | | | 157,325 |
| 84,000 | | Emmis Communications Corp., Class A* | | | 32,760 |
| 41,000 | | Entercom Communications Corp., Class A | | | 45,100 |
| 117,000 | | Finish Line, Inc. (The), Class A | | | 774,540 |
| 56,000 | | Flexsteel Industries | | | 288,960 |
| 67,000 | | Fred’s, Inc., Class A | | | 755,760 |
| 53,000 | | Furniture Brands International, Inc. | | | 77,910 |
| 36,000 | | Gaiam, Inc., Class A* | | | 118,080 |
| 85,000 | | Golfsmith International Holdings, Inc.* | | | 84,150 |
| 24,000 | | Group 1 Automotive, Inc. | | | 335,280 |
| 26,000 | | Hampshire Group Ltd.* | | | 136,500 |
| 106,000 | | Handleman Co.* | | | 3,604 |
| 78,300 | | Hartmarx Corp.* | | | 3,445 |
| 89,000 | | Hastings Entertainment, Inc.* | | | 224,280 |
| 61,750 | | Haverty Furniture Cos., Inc. | | | 650,228 |
| 27,000 | | Helen of Troy Ltd.* | | | 371,250 |
| 31,000 | | Hooker Furniture Corp. | | | 261,640 |
| 50,000 | | HOT Topic, Inc.* | | | 559,500 |
| 135,000 | | Interstate Hotels & Resorts, Inc.* | | | 59,400 |
| 75,000 | | Isle of Capri Casinos, Inc.* | | | 396,750 |
| 15,000 | | J Alexander’s Corp.* | | | 42,225 |
| | | | | |
| Shares | | | | Value |
| 73,000 | | Jakks Pacific, Inc.* | | $ | 901,550 |
| 29,000 | | Johnson Outdoors, Inc., Class A | | | 146,450 |
| 24,000 | | Jos. A. Bank Clothiers, Inc.* | | | 667,440 |
| 82,000 | | Journal Communications, Inc., Class A | | | 61,500 |
| 102,000 | | Journal Register Co.* | | | 510 |
| 58,310 | | Lakeland Industries, Inc.* | | | 315,457 |
| 22,000 | | Landry’s Restaurants, Inc. | | | 114,840 |
| 95,270 | | Lazare Kaplan International, Inc.* | | | 100,986 |
| 100,000 | | La-Z-Boy, Inc. | | | 125,000 |
| 48,000 | | Lee Enterprises, Inc. | | | 13,440 |
| 31,000 | | Lifetime Brands, Inc. | | | 41,230 |
| 77,000 | | LIN TV Corp., Class A* | | | 86,240 |
| 25,000 | | Lithia Motors, Inc., Class A | | | 56,250 |
| 91,000 | | Luby’s, Inc.* | | | 446,810 |
| 37,800 | | M/I Homes, Inc. | | | 264,222 |
| 36,000 | | Mac-Gray Corp.* | | | 188,280 |
| 28,000 | | Marcus Corp. | | | 238,000 |
| 43,000 | | MarineMax, Inc.* | | | 84,280 |
| 64,000 | | McCormick & Schmick’s Seafood Restaurants, Inc.* | | | 250,880 |
| 7,500 | | McRae Industries, Inc., Class A | | | 95,700 |
| 26,000 | | Media General, Inc., Class A | | | 49,920 |
| 38,000 | | Meritage Homes Corp.* | | | 433,960 |
| 21,300 | | Mestek, Inc.* | | | 133,125 |
| 39,000 | | Modine Manufacturing Co. | | | 97,500 |
| 18,250 | | Monro Muffler Brake, Inc. | | | 498,772 |
| 82,000 | | Morton’s Restaurant Group, Inc.* | | | 218,940 |
| 69,400 | | Movado Group, Inc. | | | 523,276 |
| 18,300 | | Nobel Learning Communities, Inc.* | | | 214,842 |
| 10,300 | | Nobility Homes, Inc. | | | 74,675 |
| 32,000 | | O’Charleys, Inc. | | | 96,320 |
| 41,000 | | Orleans Homebuilders, Inc. | | | 97,990 |
| 29,000 | | Oxford Industries, Inc. | | | 178,930 |
| 60,000 | | Palm Harbor Homes, Inc.* | | | 133,800 |
| 36,750 | | Perry Ellis International, Inc.* | | | 127,155 |
| 135,000 | | Point.360* | | | 166,050 |
| 71,000 | | Pomeroy IT Solutions, Inc.* | | | 265,540 |
| 90,600 | | Radio One, Inc., Class D* | | | 40,770 |
| 34,000 | | RC2 Corp.* | | | 179,180 |
| 56,000 | | Red Lion Hotels Corp.* | | | 164,080 |
| 37,550 | | Rex Stores Corp.* | | | 402,536 |
| 40,000 | | Rocky Brands, Inc.* | | | 140,000 |
| 85,000 | | Ruby Tuesday, Inc.* | | | 248,200 |
| 20,000 | | Saga Communications, Inc., Class A* | | | 75,200 |
| 45,150 | | Salem Communications Corp., Class A* | | | 25,284 |
| 90,000 | | Shiloh Industries, Inc.* | | | 184,500 |
| 36,000 | | Shoe Carnival, Inc.* | | | 372,600 |
| 131,000 | | Source Interlink Cos., Inc.* | | | 24,235 |
| 49,000 | | Stage Stores, Inc. | | | 493,920 |
| 89,000 | | Standard Motor Products, Inc. | | | 244,750 |
| 55,000 | | Steak N Shake Co. (The)* | | | 416,350 |
| 111,000 | | Stein Mart, Inc.* | | | 320,790 |
| 26,000 | | Steinway Musical Instruments* | | | 311,220 |
|
SCHEDULE OF PORTFOLIO INVESTMENTS |
Tamarack Microcap Value Fund (cont.)
March 31, 2009 (Unaudited)
| | | | | |
| Shares | | | | Value |
| 103,000 | | Stewart Enterprises, Inc., Class A | | $ | 333,720 |
| 66,000 | | Stoneridge, Inc.* | | | 139,260 |
| 17,000 | | Strattec Security Corp. | | | 141,780 |
| 30,000 | | Superior Industries International, Inc. | | | 355,500 |
| 43,000 | | Syms Corp.* | | | 263,160 |
| 72,000 | | Systemax, Inc.* | | | 930,240 |
| 150,000 | | Trans World Entertainment Corp.* | | | 91,500 |
| 50,000 | | Tuesday Morning Corp.* | | | 63,500 |
| 22,000 | | Walking Co. Holdings, Inc. (The)* | | | 46,860 |
| 75,080 | | Westwood One, Inc.* | | | 4,505 |
| 13,400 | | Weyco Group, Inc. | | | 347,328 |
| | | | | |
| | | | | 24,774,927 |
| | | | | |
| Consumer Staples — 4.96% | | | |
| 18,307 | | American Italian Pasta Co., Class A* | | | 637,267 |
| 42,800 | | Andersons, Inc. (The) | | | 605,192 |
| 9,300 | | Cagle’s, Inc., Class A* | | | 16,275 |
| 94,000 | | Central Garden and Pet Co.* | | | 715,340 |
| 36,000 | | Chiquita Brands International, Inc.* | | | 238,680 |
| 110,000 | | Craft Brewers Alliance, Inc.* | | | 127,600 |
| 83,000 | | Elizabeth Arden, Inc.* | | | 483,890 |
| 31,000 | | Farmer Bros. Co. | | | 551,800 |
| 67,000 | | Ingles Markets, Inc., Class A | | | 1,000,310 |
| 44,000 | | MGP Ingredients, Inc.* | | | 32,560 |
| 143,000 | | ML Macadamia Orchards LP* | | | 264,550 |
| 10,000 | | Nash Finch Co. | | | 280,900 |
| 35,500 | | National Beverage Corp.* | | | 325,535 |
| 69,000 | | Omega Protein Corp.* | | | 182,160 |
| 54,000 | | Prestige Brands Holdings, Inc.* | | | 279,720 |
| 10,575 | | Sanderson Farms, Inc. | | | 397,091 |
| 22,000 | | Spartan Stores, Inc. | | | 339,020 |
| 76,450 | | Spectrum Brands, Inc.* | | | 9,938 |
| 91,000 | | Tasty Baking Co. | | | 384,020 |
| | | | | |
| | | | | 6,871,848 |
| | | | | |
| Energy — 3.85% | | | |
| 119,000 | | Aventine Renewable Energy Holdings, Inc.* | | | 10,115 |
| 119,000 | | Brigham Exploration Co.* | | | 226,100 |
| 44,000 | | Bronco Drilling Co., Inc.* | | | 231,440 |
| 40,000 | | Callon Petroleum Co.* | | | 43,600 |
| 39,000 | | Calumet Specialty Products Partners LP | | | 425,100 |
| 31,000 | | Constellation Energy Partners LLC | | | 48,670 |
| 43,124 | | Enbridge Energy Management LLC* | | | 1,249,302 |
| 19,000 | | EV Energy Partner LP | | | 275,500 |
| 98,000 | | Harvest Natural Resources, Inc.* | | | 332,220 |
| 61,000 | | HKN, Inc.* | | | 90,280 |
| 47,000 | | Knightsbridge Tankers Ltd. | | | 683,850 |
| 25,000 | | Lufkin Industries, Inc. | | | 947,000 |
| 106,000 | | Newpark Resources, Inc.* | | | 268,180 |
| 14,600 | | PHI, Inc.* | | | 191,844 |
| 20,000 | | PHI, Inc., Non voting* | | | 199,600 |
| | | | | |
| Shares | | | | Value |
| 48,000 | | Trico Marine Services, Inc.* | | $ | 100,800 |
| 78,570 | | VeraSun Energy Corp.* | | | 1,572 |
| | | | | |
| | | | | 5,325,173 |
| | | | | |
| Financials — 20.18% | | | |
| 70,000 | | 21st Century Holding Co. | | | 233,800 |
| 68,000 | | Advanta Corp., Class A | | | 34,680 |
| 40,000 | | Affirmative Insurance Holdings, Inc. | | | 127,200 |
| 105,000 | | American Equity Investment Life Holding Co. | | | 436,800 |
| 75,000 | | American Independence Corp.* | | | 266,250 |
| 19,000 | | American Safety Insurance Holdings Ltd.* | | | 218,690 |
| 30,000 | | Ameris Bancorp | | | 141,300 |
| 92,000 | | Asta Funding, Inc. | | | 225,400 |
| 16,000 | | Avatar Holdings, Inc.* | | | 239,680 |
| 21,000 | | Baldwin & Lyons, Inc., Class B | | | 397,320 |
| 14,500 | | Bancinsurance Corp.* | | | 50,895 |
| 45,000 | | BankUnited Financial Corp., Class A | | | 10,350 |
| 31,000 | | Banner Corp. | | | 90,210 |
| 100,000 | | Beverly Hills Bancorp, Inc.* | | | 12,000 |
| 52,000 | | California First National Bancorp | | | 390,000 |
| 21,000 | | Camco Financial Corp. | | | 35,280 |
| 5,200 | | Capital Southwest Corp. | | | 397,228 |
| 38,000 | | Capitol Bancorp Ltd. | | | 157,700 |
| 44,000 | | Central Pacific Financial Corp. | | | 246,400 |
| 25,000 | | Citizens South Banking Corp. | | | 131,000 |
| 48,150 | | Citizens, Inc.* | | | 350,050 |
| 133,000 | | Consumer Portfolio Services* | | | 67,830 |
| 43,000 | | Cowen Group, Inc.* | | | 209,410 |
| 58,821 | | Crawford & Co., Class B* | | | 395,277 |
| 4,150 | | Deerfield Capital Corp. | | | 4,150 |
| 65,777 | | Donegal Group, Inc., Class A | | | 1,010,992 |
| 12,444 | | Donegal Group, Inc., Class B | | | 188,527 |
| 75,040 | | Dynex Capital, Inc. REIT | | | 526,781 |
| 31,000 | | EMC Insurance Group, Inc. | | | 653,170 |
| 21,000 | | First Cash Financial Services, Inc.* | | | 313,320 |
| 11,000 | | First Financial Corp. | | | 405,900 |
| 58,000 | | First Industrial Realty Trust, Inc. | | | 142,100 |
| 54,000 | | First Merchants Corp. | | | 582,660 |
| 14,000 | | First Pactrust Bancorp, Inc. | | | 94,500 |
| 38,000 | | First Place Financial Corp. | | | 127,680 |
| 42,000 | | First State Bancorp | | | 59,220 |
| 25,000 | | Firstcity Financial Corp.* | | | 46,250 |
| 66,000 | | Flagstar Bancorp, Inc.* | | | 49,500 |
| 60,660 | | FNB Corp. | | | 465,262 |
| 45,000 | | FNB United Corp. | | | 108,900 |
| 22,000 | | FPIC Insurance Group, Inc.* | | | 814,660 |
| 62,000 | | Franklin Bank Corp.*(b) | | | 0 |
| 109,000 | | Fremont General Corp.* | | | 6,649 |
| 2,250 | | FRMO Corp.* | | | 1,688 |
| 45,000 | | Gladstone Investment Corp. | | | 171,900 |
| 108,000 | | Guaranty Bancorp* | | | 189,000 |
| 36,850 | | Hampton Roads Bankshares, Inc. | | | 287,061 |
|
SCHEDULE OF PORTFOLIO INVESTMENTS |
Tamarack Microcap Value Fund (cont.)
March 31, 2009 (Unaudited)
| | | | | |
| Shares | | | | Value |
| 36,180 | | Harleysville National Corp. | | $ | 219,251 |
| 66,529 | | Hercules Technology Growth Capital, Inc. | | | 332,643 |
| 38,000 | | HF Financial Corp. | | | 484,500 |
| 36,000 | | Independence Holding Co. | | | 180,360 |
| 13,000 | | Indiana Community Bancorp | | | 169,000 |
| 13,000 | | Infinity Property & Casualty Corp. | | | 441,090 |
| 31,000 | | Intervest Bancshares Corp., Class A | | | 66,650 |
| 8,300 | | Investors Title Co. | | | 240,617 |
| 24,000 | | Jefferson Bancshares, Inc. | | | 184,560 |
| 17,000 | | Kansas City Life Insurance Co. | | | 609,450 |
| 56,930 | | LaBranche & Co., Inc.* | | | 212,918 |
| 11,000 | | LSB Corp. | | | 98,340 |
| 53,000 | | Marlin Business Services Corp.* | | | 207,760 |
| 41,353 | | Mass Financial Corp., Class A* | | | 184,021 |
| 108,000 | | MCG Capital Corp. | | | 138,240 |
| 138,751 | | Meadowbrook Insurance Group, Inc. | | | 846,379 |
| 62,000 | | Medallion Financial Corp. | | | 459,420 |
| 43,000 | | Mercer Insurance Group, Inc. | | | 614,470 |
| 136,000 | | MicroFinancial, Inc. | | | 272,000 |
| 12,000 | | MutualFirst Financial, Inc. | | | 57,600 |
| 5,300 | | National Security Group, Inc. | | | 37,842 |
| 6,000 | | National Western Life Insurance Co., Class A | | | 678,000 |
| 22,400 | | Navigators Group, Inc.* | | | 1,056,832 |
| 43,000 | | NGP Capital Resources Co. | | | 213,710 |
| 90,000 | | Nicholas Financial, Inc.* | | | 235,800 |
| 16,000 | | NYMAGIC, Inc. | | | 195,200 |
| 18,000 | | Pacific Mercantile Bancorp* | | | 63,540 |
| 19,000 | | Parkway Properties, Inc. | | | 195,700 |
| 50,000 | | Patriot Capital Funding, Inc. | | | 91,500 |
| 104,830 | | Paulson Capital Corp.* | | | 105,878 |
| 29,000 | | Peoples Bancorp, Inc. | | | 376,420 |
| 65,000 | | PMA Capital Corp., Class A* | | | 271,050 |
| 37,900 | | PMC Commercial Trust REIT | | | 210,345 |
| 40,000 | | Presidential Life Corp. | | | 311,600 |
| 39,000 | | Prospect Capital Corp. | | | 332,280 |
| 19,000 | | Provident Financial Holdings, Inc. | | | 99,940 |
| 89,000 | | Reis, Inc.* | | | 289,250 |
| 49,000 | | Resource America, Inc., Class A | | | 195,510 |
| 17,000 | | Safety Insurance Group, Inc. | | | 528,360 |
| 50,000 | | Sanders Morris Harris Group, Inc. | | | 195,000 |
| 42,000 | | SeaBright Insurance Holdings, Inc.* | | | 439,320 |
| 21,000 | | Simmons First National Corp., Class A | | | 528,990 |
| 32,000 | | Southern Community Financial Corp. | | | 113,920 |
| 98,000 | | Specialty Underwriters Alliance, Inc.* | | | 355,740 |
| 47,000 | | Stewart Information Services Corp. | | | 916,500 |
| 8,999 | | Stifel Financial Corp.* | | | 389,747 |
| 72,000 | | Sun Bancorp, Inc.* | | | 373,680 |
| 46,500 | | SWS Group, Inc. | | | 722,145 |
| 54,000 | | TierOne Corp. | | | 115,560 |
| 68,000 | | Unico American Corp.* | | | 510,000 |
| 99,716 | | United Community Financial Corp. | | | 120,656 |
| 128,000 | | United PanAm Financial Corp.* | | | 185,600 |
| | | | | |
| Shares | | | | Value |
| 19,000 | | United Western Bancorp, Inc. | | $ | 92,720 |
| 29,000 | | Winthrop Realty Trust | | | 200,390 |
| 4,600 | | Ziegler Cos., Inc. (The)* | | | 52,900 |
| | | | | |
| | | | | 27,935,514 |
| | | | | |
| Health Care — 6.73% | | | |
| 31,000 | | Air Methods Corp.* | | | 524,210 |
| 54,000 | | Albany Molecular Research, Inc.* | | | 509,220 |
| 128,000 | | Allied Healthcare International, Inc.* | | | 162,560 |
| 131,000 | | Allion Healthcare, Inc.* | | | 602,600 |
| 11,000 | | American Shared Hospital Services* | | | 22,000 |
| 46,000 | | Angiodynamics, Inc.* | | | 517,040 |
| 92,000 | | BioScrip, Inc.* | | | 215,280 |
| 57,000 | | Cantel Medical Corp.* | | | 733,590 |
| 67,000 | | Cardiac Science Corp.* | | | 201,670 |
| 26,000 | | Conmed Corp.* | | | 374,660 |
| 46,000 | | Cross Country Healthcare, Inc.* | | | 301,300 |
| 27,970 | | Hanger Orthopedic Group, Inc.* | | | 370,602 |
| 82,000 | | HealthTronics, Inc.* | | | 111,520 |
| 20,313 | | IntegraMed America, Inc.* | | | 123,706 |
| 28,000 | | Invacare Corp. | | | 448,840 |
| 7,100 | | Kewaunee Scientific Corp. | | | 65,675 |
| 30,000 | | Lannett Co., Inc.* | | | 162,000 |
| 31,000 | | Medcath Corp.* | | | 225,370 |
| 84,000 | | Medical Staffing Network Holdings, Inc.* | | | 12,600 |
| 19,000 | | Mediware Information Systems* | | | 79,800 |
| 51,000 | | MedQuist, Inc. | | | 130,050 |
| 42,000 | | National Dentex Corp.* | | | 163,380 |
| 42,000 | | PDI, Inc.* | | | 127,680 |
| 41,000 | | PharMerica Corp.* | | | 682,240 |
| 49,000 | | RehabCare Group, Inc.* | | | 854,560 |
| 62,000 | | Res-Care, Inc.* | | | 902,720 |
| 13,888 | | SXC Health Solutions Corp.* | | | 299,148 |
| 28,000 | | Synovis Life Technologies, Inc.* | | | 387,520 |
| | | | | |
| | | | | 9,311,541 |
| | | | | |
| Industrials — 19.65% | | | |
| 50,839 | | Aceto Corp. | | | 303,000 |
| 24,000 | | Alamo Group, Inc. | | | 255,840 |
| 125,000 | | Allied Motion Technologies, Inc.* | | | 203,750 |
| 44,000 | | Altra Holdings, Inc.* | | | 170,720 |
| 13,000 | | Amrep Corp.* | | | 204,100 |
| 59,000 | | ATC Technology Corp.* | | | 660,800 |
| 25,000 | | AZZ, Inc.* | | | 659,750 |
| 34,000 | | Beacon Roofing Supply, Inc.* | | | 455,260 |
| 103,000 | | Builders FirstSource, Inc.* | | | 208,060 |
| 28,800 | | Cascade Corp. | | | 507,744 |
| 94,000 | | Celadon Group, Inc.* | | | 521,700 |
| 2,800 | | Chicago Rivet & Machine Co. | | | 33,824 |
| 45,000 | | CIRCOR International, Inc. | | | 1,013,400 |
| 41,000 | | Commercial Vehicle Group, Inc.* | | | 22,550 |
| 40,000 | | Compx International, Inc. | | | 227,200 |
| 39,000 | | Consolidated Graphics, Inc.* | | | 496,080 |
| 37,000 | | Cornell Cos., Inc.* | | | 605,690 |
|
SCHEDULE OF PORTFOLIO INVESTMENTS |
Tamarack Microcap Value Fund (cont.)
March 31, 2009 (Unaudited)
| | | | | |
| Shares | | | | Value |
| 29,000 | | Ducommun, Inc. | | $ | 421,660 |
| 63,000 | | Eagle Bulk Shipping, Inc. | | | 267,750 |
| 14,700 | | Eastern Co. (The) | | | 158,760 |
| 11,880 | | Ecology and Environment, Inc., Class A | | | 149,450 |
| 48,000 | | Encore Wire Corp. | | | 1,028,640 |
| 62,000 | | Ennis, Inc. | | | 549,320 |
| 20,000 | | EnPro Industries, Inc.* | | | 342,000 |
| 39,000 | | Espey Manufacturing & Electronics Corp. | | | 588,900 |
| 62,000 | | Excel Maritime Carriers Ltd. | | | 280,240 |
| 14,600 | | Exponent, Inc.* | | | 369,818 |
| 12,000 | | ExpressJet Holdings, Inc.* | | | 12,960 |
| 79,000 | | Frozen Food Express Industries | | | 237,000 |
| 21,000 | | G&K Services, Inc., Class A | | | 397,110 |
| 80,000 | | Gibraltar Industries, Inc. | | | 377,600 |
| 47,000 | | Griffon Corp.* | | | 352,500 |
| 25,750 | | Hardinge, Inc. | | | 71,843 |
| 43,000 | | Herley Industries, Inc.* | | | 514,280 |
| 31,000 | | Houston Wire & Cable Co. | | | 240,250 |
| 65,000 | | ICT Group, Inc.* | | | 362,050 |
| 31,000 | | Insituform Technologies, Inc., Class A* | | | 484,840 |
| 43,350 | | International Shipholding Corp. | | | 852,695 |
| 19,000 | | Jinpan International Ltd. | | | 320,150 |
| 12,000 | | Key Technology, Inc.* | | | 105,600 |
| 76,000 | | Kforce, Inc.* | | | 534,280 |
| 74,000 | | KHD Humboldt Wedag International | | | |
| | Ltd.* | | | 511,340 |
| 55,000 | | Kimball International, Inc., Class B | | | 360,800 |
| 37,000 | | Ladish Co., Inc.* | | | 268,620 |
| 64,000 | | LECG Corp.* | | | 162,560 |
| 38,000 | | LS Starrett Co., Class A | | | 237,500 |
| 51,750 | | LSI Industries, Inc. | | | 267,548 |
| 66,000 | | Lydall, Inc.* | | | 196,020 |
| 58,000 | | Mair Holdings Escrow Shares(a) | | | 13,920 |
| 26,875 | | Marten Transport Ltd.* | | | 502,025 |
| 72,000 | | Mesa Air Group, Inc.* | | | 9,180 |
| 36,117 | | Met-Pro Corp. | | | 294,356 |
| 13,800 | | Michael Baker Corp.* | | | 358,800 |
| 59,000 | | Miller Industries, Inc.* | | | 383,500 |
| 85,000 | | Nashua Corp.* | | | 85,000 |
| 21,000 | | NCI Building Systems, Inc.* | | | 46,620 |
| 63,000 | | NN, Inc. | | | 79,380 |
| 18,800 | | Northwest Pipe Co.* | | | 535,236 |
| 106,000 | | On Assignment, Inc.* | | | 287,260 |
| 33,100 | | PAM Transportation Services, Inc.* | | | 181,719 |
| 62,000 | | Paragon Shipping, Inc., Class A | | | 216,380 |
| 41,000 | | Park-Ohio Holdings Corp.* | | | 133,660 |
| 43,160 | | Patrick Industries, Inc.* | | | 21,148 |
| 99,000 | | RCM Technologies, Inc.* | | | 101,970 |
| 67,000 | | Robbins & Myers, Inc. | | | 1,016,390 |
| 55,500 | | Rush Enterprises, Inc., Class A* | | | 495,060 |
| 21,000 | | School Specialty, Inc.* | | | 369,390 |
| | | | | |
| Shares | | | | Value |
| 13,800 | | SL Industries, Inc.* | | $ | 63,756 |
| 78,000 | | Spherion Corp.* | | | 162,240 |
| 32,000 | | Standex International Corp. | | | 294,400 |
| 41,000 | | Superior Uniform Group, Inc. | | | 296,020 |
| 68,116 | | Supreme Industries, Inc., Class A | | | 61,304 |
| 34,000 | | Tredegar Corp. | | | 555,220 |
| 11,000 | | Trex Co., Inc.* | | | 83,930 |
| 21,000 | | United Capital Corp.* | | | 362,250 |
| 21,000 | | Universal Forest Products, Inc. | | | 558,810 |
| 28,000 | | USA Truck, Inc.* | | | 362,040 |
| 38,000 | | Vitran Corp., Inc.* | | | 199,880 |
| 44,000 | | Volt Information Sciences, Inc.* | | | 292,600 |
| 85,000 | | Wabash National Corp. | | | 104,550 |
| 102,000 | | WCA Waste Corp.* | | | 168,300 |
| 125,000 | | Willdan Group, Inc.* | | | 208,750 |
| 68,000 | | Willis Lease Finance Corp.* | | | 719,440 |
| | | | | |
| | | | | 27,198,036 |
| | | | | |
| Information Technology — 13.03% | | | |
| 120,000 | | Acorn Energy, Inc.* | | | 294,000 |
| 55,000 | | Actel Corp.* | | | 556,600 |
| 100,000 | | Advanced Analogic Technologies, Inc.* | | | 360,000 |
| 41,000 | | Agilysys, Inc. | | | 176,300 |
| 59,000 | | Anaren, Inc.* | | | 645,460 |
| 125,000 | | Axcelis Technologies, Inc.* | | | 47,500 |
| 83,300 | | Bell Microproducts, Inc.* | | | 39,151 |
| 14,000 | | Black Box Corp. | | | 330,540 |
| 49,200 | | CalAmp Corp.* | | | 27,060 |
| 85,000 | | Cascade Microtech, Inc.* | | | 274,550 |
| 57,090 | | Catapult Communications Corp.* | | | 397,917 |
| 77,000 | | Ciber, Inc.* | | | 210,210 |
| 115,000 | | Comarco, Inc.* | | | 227,700 |
| 23,000 | | Communications Systems, Inc. | | | 176,180 |
| 73,000 | | Cyberoptics Corp.* | | | 357,700 |
| 25,582 | | DG FastChannel, Inc.* | | | 480,174 |
| 75,000 | | Digi International, Inc.* | | | 575,250 |
| 36,000 | | DSP Group, Inc.* | | | 155,520 |
| 77,000 | | Dynamics Research Corp.* | | | 557,480 |
| 85,000 | | Edgewater Technology, Inc.* | | | 238,000 |
| 131,000 | | EF Johnson Technologies, Inc.* | | | 98,250 |
| 46,000 | | Electro Rent Corp. | | | 443,440 |
| 39,000 | | Electro Scientific Industries, Inc.* | | | 230,880 |
| 77,000 | | ePlus, Inc.* | | | 900,130 |
| 39,000 | | Exar Corp.* | | | 243,360 |
| 64,000 | | GSI Group, Inc.* | | | 60,800 |
| 24,000 | | GTSI Corp.* | | | 92,640 |
| 120,000 | | Hurray! Holding Co. Ltd. ADR* | | | 177,600 |
| 28,000 | | Hutchinson Technology, Inc.* | | | 72,800 |
| 123,000 | | InfoGROUP, Inc.* | | | 511,680 |
| 32,000 | | Infospace, Inc.* | | | 166,400 |
| 57,000 | | Insight Enterprises, Inc.* | | | 174,420 |
| 24,000 | | Integral Systems, Inc.* | | | 206,400 |
| 110,375 | | Integrated Silicon Solution, Inc.* | | | 166,666 |
| 87,000 | | KEMET Corp.* | | | 21,315 |
|
SCHEDULE OF PORTFOLIO INVESTMENTS |
Tamarack Microcap Value Fund (cont.)
March 31, 2009 (Unaudited)
| | | | | |
| Shares | | | | Value |
| 48,000 | | Keynote Systems, Inc.* | | $ | 380,640 |
| 61,000 | | LeCroy Corp.* | | | 191,540 |
| 21,000 | | Magal Security Systems Ltd.* | | | 88,620 |
| 35,000 | | Measurement Specialties, Inc.* | | | 143,150 |
| 104,000 | | Methode Electronics, Inc. | | | 372,320 |
| 50,000 | | Newport Corp.* | | | 221,000 |
| 60,000 | | NU Horizons Electronics Corp.* | | | 120,000 |
| 48,000 | | Oplink Communications, Inc.* | | | 369,600 |
| 40,000 | | Opnet Technologies, Inc.* | | | 346,800 |
| 123,000 | | Optical Cable Corp.* | | | 293,970 |
| 82,000 | | PC Connection, Inc.* | | | 311,600 |
| 37,000 | | PDF Solutions, Inc.* | | | 58,460 |
| 40,000 | | Pegasystems, Inc. | | | 742,800 |
| 90,000 | | Perceptron, Inc.* | | | 319,500 |
| 140,000 | | Performance Technologies, Inc.* | | | 362,600 |
| 37,930 | | Photronics, Inc.* | | | 36,413 |
| 28,000 | | Retalix Ltd.* | | | 251,440 |
| 47,000 | | Richardson Electronics Ltd. | | | 158,860 |
| 29,000 | | Rudolph Technologies, Inc.* | | | 87,870 |
| 76,000 | | Semitool, Inc.* | | | 211,280 |
| 70,000 | | Sigmatron International, Inc.* | | | 115,500 |
| 46,000 | | Startek, Inc.* | | | 142,600 |
| 27,000 | | SYNNEX Corp.* | | | 531,090 |
| 70,560 | | TechTeam Global, Inc.* | | | 344,333 |
| 21,000 | | Tessco Technologies, Inc.* | | | 162,960 |
| 98,000 | | Tier Technologies, Inc., Class B* | | | 453,740 |
| 120,000 | | Ulticom, Inc.* | | | 600,000 |
| 46,000 | | Vignette Corp.* | | | 307,280 |
| 90,000 | | WebMediaBrands, Inc.* | | | 36,000 |
| 97,000 | | White Electronic Designs Corp.* | | | 388,970 |
| 100,000 | | WPCS International, Inc.* | | | 192,000 |
| | | | | |
| | | | | 18,037,009 |
| | | | | |
| Materials — 4.00% | | | |
| 70,200 | | American Pacific Corp.* | | | 363,636 |
| 12,000 | | ASA Ltd. | | | 641,400 |
| 37,000 | | Blue Earth Refineries, Inc.* | | | 29,230 |
| 107,000 | | Buckeye Technologies, Inc.* | | | 227,910 |
| 18,000 | | Friedman Industries | | | 89,100 |
| 29,000 | | Hawkins, Inc. | | | 447,470 |
| 50,000 | | Headwaters, Inc.* | | | 157,000 |
| 70,000 | | Innospec, Inc. | | | 263,900 |
| 60,000 | | Material Sciences Corp.* | | | 32,400 |
| 12,000 | | NewMarket Corp. | | | 531,600 |
| 140,400 | | North American Palladium Ltd.* | | | 195,156 |
| 23,000 | | Olympic Steel, Inc. | | | 348,910 |
| 38,000 | | Penford Corp. | | | 137,940 |
| 110,000 | | PolyOne Corp.* | | | 254,100 |
| 34,000 | | Schulman (A), Inc. | | | 460,700 |
| 30,000 | | Schweitzer-Mauduit International, Inc. | | | 553,800 |
| 45,000 | | Spartech Corp. | | | 110,700 |
| 10,000 | | Stepan Co. | | | 273,000 |
| 16,000 | | Universal Stainless & Alloy* | | | 154,720 |
| | | | | |
| Shares | | | | Value |
| 88,610 | | US Concrete, Inc.* | | $ | 177,220 |
| 3,200 | | Vulcan International Corp. | | | 86,400 |
| | | | | |
| | | | | 5,536,292 |
| | | | | |
| Telecommunication Services — 0.59% |
| 40,000 | | D&E Communications, Inc. | | | 214,800 |
| 41,000 | | SureWest Communications | | | 319,800 |
| 30,000 | | USA Mobility, Inc. | | | 276,300 |
| | | | | |
| | | | | 810,900 |
| | | | | |
| Utilities — 4.49% | | | |
| 14,000 | | American States Water Co. | | | 508,480 |
| 9,054 | | California Water Service Group | | | 379,001 |
| 29,000 | | Central Vermont Public Service Corp. | | | 501,700 |
| 17,000 | | CH Energy Group, Inc. | | | 797,300 |
| 15,700 | | Chesapeake Utilities Corp. | | | 478,536 |
| 23,500 | | Connecticut Water Service, Inc. | | | 476,580 |
| 9,000 | | Delta Natural Gas Co., Inc. | | | 192,690 |
| 71,000 | | Empire District Electric Co. (The) | | | 1,025,240 |
| 18,000 | | Florida Public Utilities Co. | | | 175,860 |
| 4,900 | | Maine & Maritimes Corp. | | | 171,500 |
| 30,400 | | Middlesex Water Co. | | | 437,760 |
| 6,500 | | RGC Resources, Inc. | | | 149,175 |
| 15,800 | | SJW Corp. | | | 401,794 |
| 45,644 | | Southwest Water Co. | | | 196,269 |
| 16,476 | | Unitil Corp. | | | 330,838 |
| | | | | |
| | | | | 6,222,723 |
| | | | | |
| |
Total Common Stocks
(Cost $262,822,491) | | | 132,023,963 |
| | | | | |
| |
| Preferred Stock — 0.45% | | | |
| 3,714 | | Inverness Medical Innovations, Inc.* | | | 620,907 |
| | | | | |
| |
Total Preferred Stock
(Cost $643,056) | | | 620,907 |
| | | | | |
| |
| Exchange Traded Funds — 2.86% | | | |
| 106,000 | | iShares Russell Microcap Index Fund | | | 2,837,620 |
| 160,000 | | PowerShares Zacks Micro Cap Portfolio | | | 1,121,600 |
| | | | | |
| |
Total Exchange Traded Funds
(Cost $4,320,517) | | | 3,959,220 |
| | | | | |
| | |
Principal
Amount | | | | |
| Corporate Bonds — 0.00% | | | |
| $1,947 | | Trenwick America Corp.*(a)(b) | | | 0 |
| 1,579 | | Trenwick America Corp.*(a)(b) | | | 0 |
| |
Total Corporate Bonds
(Cost $0) | | | 0 |
|
SCHEDULE OF PORTFOLIO INVESTMENTS |
Tamarack Microcap Value Fund (cont.)
March 31, 2009 (Unaudited)
| | | | | |
| Shares | | | | Value |
| Investment Company — 1.43% | | | |
| 1,974,524 | | Wells Fargo Prime Investment Money Market Fund | | $ | 1,974,524 |
| | | | | |
| |
Total Investment Company
(Cost $1,974,524) | | | 1,974,524 |
| | | | | |
| | | | |
| | | Value | |
| | | | |
Total Investments (Cost $269,760,588)(c) — 100.12% | | $ | 138,578,614 | |
| |
Liabilities in excess of other assets — (0.12)% | | | (165,968 | ) |
| | | | |
| |
NET ASSETS — 100.00% | | $ | 138,412,646 | |
| | | | |
| * | Non-income producing security. |
| (a) | Security delisted or issuer in bankruptcy. |
| (b) | Fair valued security under procedures established by the Fund’s Board of Trustees. |
| (c) | See notes to financial statements for the tax cost of securities and the breakdown of unrealized appreciation (depreciation). |
Abbreviations used are defined below:
ADR - American Depository Receipt
REIT - Real Estate Investment Trust
See notes to financial statements.
Statements of Assets and Liabilities
March 31, 2009 (Unaudited)
| | | | | | | | | | | | | | | | |
| | | Tamarack
Mid Cap
Growth Fund | | | Tamarack
Enterprise
Fund | | | Tamarack
Small Cap
Core Fund | | | Tamarack
Microcap
Value Fund | |
Assets: | | | | | | | | | | | | | | | | |
Investments, at value (cost $72,840,754, $174,297,848, $38,166,855 and $269,760,588, respectively) | | $ | 62,163,896 | | | $ | 108,398,250 | | | $ | 27,598,398 | | | $ | 138,578,614 | |
Interest and dividends receivable | | | 35,458 | | | | 105,533 | | | | 18,626 | | | | 163,632 | |
Receivable for capital shares issued | | | 104 | | | | 4,508 | | | | 175 | | | | 117,262 | |
Receivable for investments sold | | | — | | | | 257,690 | | | | 123,892 | | | | — | |
Prepaid expenses | | | 41,906 | | | | 45,614 | | | | 40,655 | | | | 38,225 | |
| | | | | | | | | | | | | | | | |
Total Assets | | $ | 62,241,364 | | | $ | 108,811,595 | | | $ | 27,781,746 | | | $ | 138,897,733 | |
| | | | | | | | | | | | | | | | |
| | | | |
Liabilities: | | | | | | | | | | | | | | | | |
Payable for capital shares redeemed | | | 2,780,248 | | | | 4,838,481 | | | | 13,266 | | | | 259,823 | |
Payable for investments purchased | | | — | | | | 113,734 | | | | 319,997 | | | | — | |
Accrued expenses and other payables: | | | | | | | | | | | | | | | | |
Investment advisory fees | | | 17,122 | | | | 38,094 | | | | 5,898 | | | | 42,506 | |
Administration fees | | | 3,620 | | | | 6,297 | | | | 1,571 | | | | 8,013 | |
Audit fees | | | 4,221 | | | | 5,277 | | | | 3,864 | | | | 5,823 | |
Trustees’ fees | | | 336 | | | | 903 | | | | 189 | | | | 1,263 | |
Distribution fees | | | 3,442 | | | | 1,028 | | | | 244 | | | | 2,087 | |
Shareholder reports | | | 5,226 | | | | 28,826 | | | | 4,812 | | | | 22,244 | |
Transfer agent fees | | | 50,012 | | | | 88,161 | | | | 21,235 | | | | 136,488 | |
Other | | | 2,446 | | | | 5,273 | | | | 2,335 | | | | 6,840 | |
| | | | | | | | | | | | | | | | |
Total Liabilities | | | 2,866,673 | | | | 5,126,074 | | | | 373,411 | | | | 485,087 | |
| | | | | | | | | | | | | | | | |
Net Assets | | $ | 59,374,691 | | | $ | 103,685,521 | | | $ | 27,408,335 | | | $ | 138,412,646 | |
| | | | | | | | | | | | | | | | |
| | | | |
Net Assets Consist Of: | | | | | | | | | | | | | | | | |
Capital | | $ | 81,600,534 | | | $ | 180,748,545 | | | $ | 41,615,141 | | | $ | 275,931,877 | |
Undistributed net investment income (loss) | | | (68,203 | ) | | | 297,120 | | | | 43,557 | | | | 7,378 | |
Accumulated net realized losses from investment transactions | | | (11,480,782 | ) | | | (11,460,547 | ) | | | (3,681,906 | ) | | | (6,344,635 | ) |
Net unrealized depreciation on investments | | | (10,676,858 | ) | | | (65,899,597 | ) | | | (10,568,457 | ) | | | (131,181,974 | ) |
| | | | | | | | | | | | | | | | |
Net Assets | | $ | 59,374,691 | | | $ | 103,685,521 | | | $ | 27,408,335 | | | $ | 138,412,646 | |
| | | | | | | | | | | | | | | | |
| | | | |
Net Assets: | | | | | | | | | | | | | | | | |
Class A | | $ | 17,404,065 | | | $ | 2,582,400 | | | $ | 423,402 | | | $ | 6,454,150 | |
Class I | | | 40,774,371 | | | | 17,376,691 | | | | 10,498 | | | | N/A | |
Class C | | | 88,312 | | | | 636,980 | | | | 199,462 | | | | 879,101 | |
Class R | | | 14,972 | | | | 27,823 | | | | 14,794 | | | | 331,479 | |
Class S | | | 1,092,971 | | | | 83,061,627 | | | | 26,760,179 | | | | 130,747,916 | |
| | | | | | | | | | | | | | | | |
Total | | $ | 59,374,691 | | | $ | 103,685,521 | | | $ | 27,408,335 | | | $ | 138,412,646 | |
| | | | | | | | | | | | | | | | |
Statements of Assets and Liabilities (cont.)
| | | | | | | | | | | | | | | | |
| | | Tamarack
Mid Cap
Growth Fund | | | Tamarack
Enterprise
Fund | | | Tamarack
Small Cap
Core Fund | | | Tamarack
Microcap
Value Fund | |
Shares Outstanding (Unlimited number of shares authorized, no par value): | | | | | | | | | | | | | | | | |
Class A | | | 2,481,009 | | | | 287,439 | | | | 38,072 | | | | 738,091 | |
Class I | | | 5,586,242 | | | | 1,909,131 | | | | 928 | | | | N/A | |
Class C | | | 13,123 | | | | 74,742 | | | | 18,827 | | | | 104,253 | |
Class R | | | 2,163 | | | | 3,149 | | | | 1,347 | | | | 38,213 | |
Class S | | | 149,567 | | | | 9,137,427 | | | | 2,366,207 | | | | 14,934,325 | |
| | | | | | | | | | | | | | | | |
Total | | | 8,232,104 | | | | 11,411,888 | | | | 2,425,381 | | | | 15,814,882 | |
| | | | | | | | | | | | | | | | |
| | | | |
Net Asset Values and Redemption Price per Share: | | | | | | | | | | | | | | | | |
Class A(a) | | $ | 7.01 | | | $ | 8.98 | | | $ | 11.12 | | | $ | 8.74 | |
| | | | | | | | | | | | | | | | |
Class I | | $ | 7.30 | | | $ | 9.10 | | | $ | 11.31 | | | | N/A | |
| | | | | | | | | | | | | | | | |
Class C(b) | | $ | 6.73 | | | $ | 8.52 | | | $ | 10.59 | | | $ | 8.43 | |
| | | | | | | | | | | | | | | | |
Class R | | $ | 6.92 | | | $ | 8.83 | (c) | | $ | 10.98 | | | $ | 8.67 | |
| | | | | | | | | | | | | | | | |
Class S | | $ | 7.31 | | | $ | 9.09 | | | $ | 11.31 | | | $ | 8.75 | |
| | | | | | | | | | | | | | | | |
| | | | |
Maximum Offering Price Per Share: | | | | | | | | | | | | | | | | |
Class A | | $ | 7.44 | | | $ | 9.53 | | | $ | 11.80 | | | $ | 9.27 | |
| | | | | | | | | | | | | | | | |
Maximum Sales Charge - Class A | | | 5.75 | % | | | 5.75 | % | | | 5.75 | % | | | 5.75 | % |
| | | | | | | | | | | | | | | | |
| (a) | For Class A shares, redemption price per share will be reduced by 1.00% for sales of shares within 12 months of purchase (only applicable on purchases of $1 million or more on which no initial sales charge was paid). Such reduction is not reflected in the net asset value and the redemption price per share. |
| (b) | For Class C shares, redemption price per share will be reduced by 1.00% for sales of shares within 12 months of purchase. Such reduction is not reflected in the net asset value and the redemption price per share. |
| (c) | Net asset value is calculated using unrounded net assets of $27,823.21 divided by the unrounded shares outstanding of 3,149.328. |
See notes to financial statements.
Statements of Operations
For the Six Months Ended March 31, 2009 (Unaudited)
| | | | | | | | | | | | | | | | | | | | | | | | |
| | | Tamarack Mid Cap
Growth Fund | | | Tamarack Enterprise
Fund | | | Tamarack Small Cap
Core Fund | | | Tamarack Microcap
Value Fund | |
Investment Income: | | | | | | | | | | | | | | | | | | | | | | | | |
Interest income | | | | $ | 1,425 | | | | | $ | 3,086 | | | | | $ | 845 | | | | | $ | 2,654 | |
Dividend income | | | | | 295,231 | | | | | | 991,876 | | | | | | 244,552 | | | | | | 1,326,605 | |
Foreign tax withholding | | | | | (780 | ) | | | | | — | | | | | | (33 | ) | | | | | — | |
| | | | | | | | | | | | | | | | | | | | | | | | |
Total Investment Income | | | | | 295,876 | | | | | | 994,962 | | | | | | 245,364 | | | | | | 1,329,259 | |
| | | | | | | | | | | | | | | | | | | | | | | | |
| | | | | | | | |
Expenses: | | | | | | | | | | | | | | | | | | | | | | | | |
Investment advisory fees | | | | | 217,416 | | | | | | 649,263 | | | | | | 210,103 | | | | | | 748,555 | |
Distribution fees - Class A | | | | | 43,905 | | | | | | 9,103 | | | | | | 1,403 | | | | | | 25,681 | |
Distribution fees - Class C | | | | | 454 | | | | | | 3,870 | | | | | | 1,227 | | | | | | 5,455 | |
Distribution fees - Class R | | | | | 18 | | | | | | 58 | | | | | | 20 | | | | | | 946 | |
Accounting fees | | | | | 14,018 | | | | | | 15,657 | | | | | | 13,234 | | | | | | 16,624 | |
Administration fees | | | | | 23,295 | | | | | | 47,872 | | | | | | 11,530 | | | | | | 62,382 | |
Audit fees | | | | | 2,605 | | | | | | 3,612 | | | | | | 2,219 | | | | | | 4,251 | |
Custodian fees | | | | | 1,805 | | | | | | 4,699 | | | | | | 3,790 | | | | | | 3,216 | |
Insurance fees | | | | | 2,583 | | | | | | 3,875 | | | | | | 2,583 | | | | | | 3,875 | |
Legal fees | | | | | 1,445 | | | | | | 3,488 | | | | | | 748 | | | | | | 4,428 | |
Registration and filing fees | | | | | 22,848 | | | | | | 28,393 | | | | | | 22,947 | | | | | | 22,346 | |
Shareholder reports | | | | | 8,542 | | | | | | 29,649 | | | | | | 7,526 | | | | | | 30,273 | |
Transfer agent fees | | | | | 136,398 | | | | | | 201,609 | | | | | | 56,828 | | | | | | 289,655 | |
Trustees’ fees | | | | | 1,000 | | | | | | 2,246 | | | | | | 528 | | | | | | 3,141 | |
Other fees | | | | | 4,393 | | | | | | 6,209 | | | | | | 4,608 | | | | | | 15,387 | |
| | | | | | | | | | | | | | | | | | | | | | | | |
Total expenses before fee waiver/reimbursement | | | | | 480,725 | | | | | | 1,009,603 | | | | | | 339,294 | | | | | | 1,236,215 | |
Expenses waived/reimbursed by: | | | | | | | | | | | | | | | | | | | | | | | | |
Adviser | | | | | (94,693 | ) | | | | | (307,209 | ) | | | | | (136,786 | ) | | | | | (314,146 | ) |
Distributor | | | | | (21,953 | ) | | | | | (4,552 | ) | | | | | (701 | ) | | | | | (12,840 | ) |
| | | | | | | | | | | | | | | | | | | | | | | | |
Net Expenses | | | | | 364,079 | | | | | | 697,842 | | | | | | 201,807 | | | | | | 909,229 | |
| | | | | | | | | | | | | | | | | | | | | | | | |
| | | | | | | | |
Net Investment Income (Loss) | | | | | (68,203 | ) | | | | | 297,120 | | | | | | 43,557 | | | | | | 420,030 | |
| | | | | | | | | | | | | | | | | | | | | | | | |
| | | | | | | | |
Realized/Unrealized Gains (Losses) from Investment Transactions: | | | | | | | | | | | | | | | | | | | | | | | | |
Net realized losses from investment transactions | | | | | (11,454,304 | ) | | | | | (11,307,795 | ) | | | | | (3,502,062 | ) | | | | | (6,286,861 | ) |
Net change in unrealized appreciation/depreciation on investments | | | | | (15,169,361 | ) | | | | | (63,931,647 | ) | | | | | (14,704,803 | ) | | | | | (104,680,144 | ) |
| | | | | | | | | | | | | | | | | | | | | | | | |
Net realized/unrealized losses from investments | | | | | (26,623,665 | ) | | | | | (75,239,442 | ) | | | | | (18,206,865 | ) | | | | | (110,967,005 | ) |
| | | | | | | | | | | | | | | | | | | | | | | | |
Change in net assets resulting from operations | | | | $ | (26,691,868 | ) | | | | $ | (74,942,322 | ) | | | | $ | (18,163,308 | ) | | | | $ | (110,546,975 | ) |
| | | | | | | | | | | | | | | | | | | | | | | | |
See notes to the financial statements.
27
Statements of Changes in Net Assets
| | | | | | | | | | | | | | | | | | | | | | | | |
| | | Tamarack Mid Cap Growth Fund | | | Tamarack Enterprise Fund | |
| | | For the Six Months Ended
March 31, 2009 | | | For the Year Ended
September 30, 2008 | | | For the Six Months Ended
March 31, 2009 | | | For the Year Ended
September 30, 2008 | |
| | | (Unaudited) | | | | | | | | (Unaudited) | | | | | | |
From Investment Activities: | | | | | | | | | | | | | | | | | | | | | | | | |
Operations: | | | | | | | | | | | | | | | | | | | | | | | | |
Net investment income (loss) | | | | $ | (68,203 | ) | | | | $ | (587,430 | ) | | | | $ | 297,120 | | | | | $ | (527,754 | ) |
Net realized gains (losses) from investment transactions | | | | | (11,454,304 | ) | | | | | 1,048,287 | | | | | | (11,307,795 | ) | | | | | 22,026,591 | |
Net change in unrealized appreciation/depreciation on investments | | | | | (15,169,361 | ) | | | | | (23,039,529 | ) | | | | | (63,931,647 | ) | | | | | (92,810,629 | ) |
| | | | | | | | | | | | | | | | | | | | | | | | |
Change in net assets resulting from operations | | | | | (26,691,868 | ) | | | | | (22,578,672 | ) | | | | | (74,942,322 | ) | | | | | (71,311,792 | ) |
| | | | | | | | | | | | | | | | | | | | | | | | |
| | | | | | | | |
Distributions to Class A Shareholders: | | | | | | | | | | | | | | | | | | | | | | | | |
From net investment income | | | | | — | | | | | | — | | | | | | — | | | | | | (10,365 | ) |
From net realized gains | | | | | (203,081 | ) | | | | | (2,669,542 | ) | | | | | (495,155 | ) | | | | | (2,346,496 | ) |
| | | | | | | | |
Distributions to Class I Shareholders: | | | | | | | | | | | | | | | | | | | | | | | | |
From net investment income | | | | | — | | | | | | — | | | | | | — | | | | | | (144,910 | ) |
From net realized gains | | | | | (480,353 | ) | | | | | (5,977,503 | ) | | | | | (2,634,071 | ) | | | | | (5,719,952 | ) |
| | | | | | | | |
Distributions to Class C Shareholders: | | | | | | | | | | | | | | | | | | | | | | | | |
From net realized gains | | | | | (1,093 | ) | | | | | (93,838 | ) | | | | | (107,763 | ) | | | | | (312,649 | ) |
| | | | | | | | |
Distributions to Class R Shareholders: | | | | | | | | | | | | | | | | | | | | | | | | |
From net realized gains | | | | | (77 | ) | | | | | (950 | ) | | | | | (3,157 | ) | | | | | (6,334 | ) |
| | | | | | | | |
Distributions to Class S Shareholders: | | | | | | | | | | | | | | | | | | | | | | | | |
From net investment income | | | | | — | | | | | | — | | | | | | — | | | | | | (890,190 | ) |
From net realized gains | | | | | (11,879 | ) | | | | | (158,103 | ) | | | | | (14,038,037 | ) | | | | | (35,123,251 | ) |
| | | | | | | | | | | | | | | | | | | | | | | | |
Change in net assets resulting from shareholder distributions | | | | | (696,483 | ) | | | | | (8,899,936 | ) | | | | | (17,278,183 | ) | | | | | (44,554,147 | ) |
| | | | | | | | | | | | | | | | | | | | | | | | |
| | | | | | | | |
Capital Transactions: | | | | | | | | | | | | | | | | | | | | | | | | |
Proceeds from shares issued | | | | | 7,596,507 | | | | | | 16,760,254 | | | | | | 4,615,876 | | | | | | 20,372,415 | |
Distributions reinvested | | | | | 693,108 | | | | | | 8,621,750 | | | | | | 16,492,996 | | | | | | 41,674,838 | |
Cost of shares redeemed | | | | | (9,640,757 | ) | | | | | (18,552,168 | ) | | | | | (22,776,923 | ) | | | | | (94,911,761 | ) |
| | | | | | | | | | | | | | | | | | | | | | | | |
Change in net assets resulting from capital transactions | | | | | (1,351,142 | ) | | | | | 6,829,836 | | | | | | (1,668,051 | ) | | | | | (32,864,508 | ) |
| | | | | | | | | | | | | | | | | | | | | | | | |
Net decrease in net assets | | | | | (28,739,493 | ) | | | | | (24,648,772 | ) | | | | | (93,888,556 | ) | | | | | (148,730,447 | ) |
| | | | | | | | |
Net Assets: | | | | | | | | | | | | | | | | | | | | | | | | |
Beginning of period | | | | | 88,114,184 | | | | | | 112,762,956 | | | | | | 197,574,077 | | | | | | 346,304,524 | |
| | | | | | | | | | | | | | | | | | | | | | | | |
End of period | | | | $ | 59,374,691 | | | | | $ | 88,114,184 | | | | | $ | 103,685,521 | | | | | $ | 197,574,077 | |
| | | | | | | | | | | | | | | | | | | | | | | | |
Undistributed net investment income (loss) | | | | $ | (68,203 | ) | | | | $ | — | | | | | $ | 297,120 | | | | | $ | — | |
| | | | | | | | | | | | | | | | | | | | | | | | |
| | | | | | | | |
Share Transactions: | | | | | | | | | | | | | | | | | | | | | | | | |
Issued | | | | | 1,019,267 | | | | | | 1,358,824 | | | | | | 408,494 | | | | | | 1,028,150 | |
Reinvested | | | | | 98,610 | | | | | | 682,843 | | | | | | 1,609,996 | | | | | | 2,045,189 | |
Redeemed | | | | | (1,311,642 | ) | | | | | (1,550,449 | ) | | | | | (2,154,158 | ) | | | | | (4,808,013 | ) |
| | | | | | | | | | | | | | | | | | | | | | | | |
Change in shares resulting from capital transactions | | | | | (193,765 | ) | | | | | 491,218 | | | | | | (135,668 | ) | | | | | (1,734,674 | ) |
| | | | | | | | | | | | | | | | | | | | | | | | |
See notes to financial statements.
28
Statements of Changes in Net Assets (cont.)
| | | | | | | | | | | | | | | | | | | | | | | | |
| | | Tamarack Small Cap Core Fund | | | Tamarack Microcap Value Fund | |
| | | For the Six Months Ended
March 31, 2009 | | | For the Year Ended
September 30, 2008 | | | For the Six Months Ended
March 31, 2009 | | | For the Year Ended
September 30, 2008 | |
| | | (Unaudited) | | | | | | | | (Unaudited) | | | | | | |
From Investment Activities: | | | | | | | | | | | | | | | | | | | | | | | | |
Operations: | | | | | | | | | | | | | | | | | | | | | | | | |
Net investment income (loss) | | | | $ | 43,557 | | | | | $ | (257,391 | ) | | | | $ | 420,030 | | | | | $ | 1,691,187 | |
Net realized gains (losses) from investment transactions | | | | | (3,502,062 | ) | | | | | 5,404,967 | | | | | | (6,286,861 | ) | | | | | 14,845,377 | |
Net change in unrealized appreciation/depreciation on investments | | | | | (14,704,803 | ) | | | | | (15,731,329 | ) | | | | | (104,680,144 | ) | | | | | (91,772,336 | ) |
| | | | | | | | | | | | | | | | | | | | | | | | |
Change in net assets resulting from operations | | | | | (18,163,308 | ) | | | | | (10,583,753 | ) | | | | | (110,546,975 | ) | | | | | (75,235,772 | ) |
| | | | | | | | | | | | | | | | | | | | | | | | |
| | | | | | | | |
Distributions to Class A Shareholders: | | | | | | | | | | | | | | | | | | | | | | | | |
From net investment income | | | | | — | | | | | | — | | | | | | (28,683 | ) | | | | | (26,401 | ) |
From net realized gains | | | | | (74,015 | ) | | | | | (232,299 | ) | | | | | (856,790 | ) | | | | | (2,294,474 | ) |
| | | | | | | | |
Distributions to Class I Shareholders: | | | | | | | | | | | | | | | | | | | | | | | | |
From net investment income | | | | | — | | | | | | (139 | ) | | | | | — | | | | | | — | |
From net realized gains | | | | | (7,995 | ) | | | | | (17,547 | ) | | | | | — | | | | | | — | |
| | | | | | | | |
Distributions to Class C Shareholders: | | | | | | | | | | | | | | | | | | | | | | | | |
From net realized gains | | | | | (36,301 | ) | | | | | (95,888 | ) | | | | | (100,150 | ) | | | | | (252,032 | ) |
| | | | | | | | |
Distributions to Class R Shareholders: | | | | | | | | | | | | | | | | | | | | | | | | |
From net investment income | | | | | — | | | | | | — | | | | | | (643 | ) | | | | | — | |
From net realized gains | | | | | (1,085 | ) | | | | | (2,759 | ) | | | | | (34,563 | ) | | | | | (38,888 | ) |
| | | | | | | | |
Distributions to Class S Shareholders: | | | | | | | | | | | | | | | | | | | | | | | | |
From net investment income | | | | | — | | | | | | (83,916 | ) | | | | | (1,244,104 | ) | | | | | (1,248,605 | ) |
From net realized gains | | | | | (4,126,465 | ) | | | | | (10,649,049 | ) | | | | | (12,830,897 | ) | | | | | (22,588,829 | ) |
| | | | | | | | | | | | | | | | | | | | | | | | |
Change in net assets resulting from shareholder distributions | | | | | (4,245,861 | ) | | | | | (11,081,597 | ) | | | | | (15,095,830 | ) | | | | | (26,449,229 | ) |
| | | | | | | | | | | | | | | | | | | | | | | | |
| | | | | | | | |
Capital Transactions: | | | | | | | | | | | | | | | | | | | | | | | | |
Proceeds from shares issued | | | | | 1,596,249 | | | | | | 2,957,494 | | | | | | 36,620,551 | | | | | | 163,492,450 | |
Distributions reinvested | | | | | 4,099,726 | | | | | | 10,709,260 | | | | | | 14,287,788 | | | | | | 24,817,920 | |
Cost of shares redeemed | | | | | (3,310,142 | ) | | | | | (12,429,543 | ) | | | | | (69,835,990 | ) | | | | | (170,106,121 | ) |
| | | | | | | | | | | | | | | | | | | | | | | | |
Change in net assets resulting from capital transactions | | | | | 2,385,833 | | | | | | 1,237,211 | | | | | | (18,927,651 | ) | | | | | 18,204,249 | |
| | | | | | | | | | | | | | | | | | | | | | | | |
Net decrease in net assets | | | | | (20,023,336 | ) | | | | | (20,428,139 | ) | | | | | (144,570,456 | ) | | | | | (83,480,752 | ) |
| | | | | | | | |
Net Assets: | | | | | | | | | | | | | | | | | | | | | | | | |
Beginning of period | | | | | 47,431,671 | | | | | | 67,859,810 | | | | | | 282,983,102 | | | | | | 366,463,854 | |
| | | | | | | | | | | | | | | | | | | | | | | | |
End of period | | | | $ | 27,408,335 | | | | | $ | 47,431,671 | | | | | $ | 138,412,646 | | | | | $ | 282,983,102 | |
| | | | | | | | | | | | | | | | | | | | | | | | |
Undistributed net investment income | | | | $ | 43,557 | | | | | $ | — | | | | | $ | 7,378 | | | | | $ | 860,778 | |
| | | | | | | | | | | | | | | | | | | | | | | | |
| | | | | | | | |
Share Transactions: | | | | | | | | | | | | | | | | | | | | | | | | |
Issued | | | | | 140,381 | | | | | | 126,394 | | | | | | 3,694,020 | | | | | | 8,656,491 | |
Reinvested | | | | | 319,065 | | | | | | 455,611 | | | | | | 1,445,019 | | | | | | 1,322,173 | |
Redeemed | | | | | (236,593 | ) | | | | | (504,754 | ) | | | | | (6,516,937 | ) | | | | | (9,112,705 | ) |
| | | | | | | | | | | | | | | | | | | | | | | | |
Change in shares resulting from capital transactions | | | | | 222,853 | | | | | | 77,251 | | | | | | (1,377,898 | ) | | | | | 865,959 | |
| | | | | | | | | | | | | | | | | | | | | | | | |
See notes to financial statements.
29
Tamarack Mid Cap Growth Fund
(Selected data for a share outstanding throughout the periods indicated)
| | | | | | | | | | | | | | | | | | | | | | | | | | | | | |
| | | Net Asset
Value,
Beginning
of Period | | Investment Activities | | Distributions | | Net
Asset
Value,
End of
Period | | Total
Return* | | | Ratios/Supplemental Data |
| | | Net
Investment
Loss | | Net
Realized
and
Unrealized
Gains
(Losses) on
Investments | | Redemption
Fees | | Total from
Investment
Activities | | Net
Realized
Gains | | Total
Distributions | | | | Net
Assets,
End of
Period
(000’s) | | Ratio of
Net
Expenses
to
Average
Net
Assets | | Ratio of
Net
Investment
Loss
to Average
Net Assets | | Ratio of
Expenses
to
Average
Net
Assets** | | Portfolio
Turnover
Rate*** |
Class A | | | | | | | | | | | | | | | | | | | | | | | | | | | | | |
Six Months Ended March 31, 2009 (Unaudited) | | $10.18 | | (0.01)(a) | | (3.08) | | (b) | | (3.09) | | (0.08) | | (0.08) | | $ 7.01 | | (30.30%)(c) | | | $ 17,404 | | 1.35%(d) | | (0.40%)(d) | | 1.91%(d) | | 36% |
Year Ended September 30, 2008 | | 13.90 | | (0.09)(a) | | (2.52) | | (b) | | (2.61) | | (1.11) | | (1.11) | | 10.18 | | (20.14%) | | | 25,483 | | 1.32% | | (0.74%) | | 1.68% | | 46% |
Year Ended September 30, 2007 | | 12.47 | | (0.10)(a) | | 1.88 | | (b) | | 1.78 | | (0.35) | | (0.35) | | 13.90 | | 14.52% | | | 33,887 | | 1.35% | | (0.78%) | | 1.72% | | 31% |
Year Ended September 30, 2006 | | 11.71 | | (0.08)(a) | | 1.07 | | (b) | | 0.99 | | (0.23) | | (0.23) | | 12.47 | | 8.52% | | | 43,803 | | 1.35% | | (0.66%) | | 1.73% | | 23% |
Year Ended September 30, 2005 | | 11.57 | | (0.14) | | 1.86 | | (b) | | 1.72 | | (1.58) | | (1.58) | | 11.71 | | 15.62% | | | 45,359 | | 1.32% | | (0.80%) | | 1.75% | | 22% |
Period Ended September 30, 2004(e) | | 12.17 | | (0.04) | | (0.56) | | (b) | | (0.60) | | — | | — | | 11.57 | | (4.93%)(c) | | | 69,979 | | 1.27%(d) | | (0.88%)(d) | | 1.58%(d) | | 15% |
Year Ended April 30, 2004 | | 9.46 | | (0.08) | | 2.79 | | — | | 2.71 | | — | | — | | 12.17 | | 28.65% | | | 74,150 | | 1.38% | | (0.78%) | | 1.64% | | 93% |
Class I | | | | | | | | | | | | | | | | | | | | | | | | | | | | | |
Six Months Ended March 31, 2009 (Unaudited) | | $10.58 | | (0.01)(a) | | (3.19) | | (b) | | (3.20) | | (0.08) | | (0.08) | | $ 7.30 | | (30.19%)(c) | | | $40,774 | | 1.10%(d) | | (0.15%)(d) | | 1.40%(d) | | 36% |
Year Ended September 30, 2008 | | 14.36 | | (0.06)(a) | | (2.61) | | (b) | | (2.67) | | (1.11) | | (1.11) | | 10.58 | | (19.95%) | | | 60,998 | | 1.07% | | (0.48%) | | 1.19% | | 46% |
Year Ended September 30, 2007 | | 12.85 | | (0.07)(a) | | 1.93 | | (b) | | 1.86 | | (0.35) | | (0.35) | | 14.36 | | 14.89% | | | 75,721 | | 1.10% | | (0.53%) | | 1.21% | | 31% |
Year Ended September 30, 2006 | | 12.03 | | (0.05)(a) | | 1.10 | | (b) | | 1.05 | | (0.23) | | (0.23) | | 12.85 | | 8.71% | | | 72,866 | | 1.10% | | (0.41%) | | 1.23% | | 23% |
Year Ended September 30, 2005 | | 11.81 | | (0.04) | | 1.84 | | (b) | | 1.80 | | (1.58) | | (1.58) | | 12.03 | | 16.02% | | | 62,652 | | 1.07% | | (0.54%) | | 1.25% | | 22% |
Period Ended September 30, 2004(e) | | 12.41 | | (0.04) | | (0.56) | | (b) | | (0.60) | | — | | — | | 11.81 | | (4.83%)(c) | | | 47,778 | | 1.02%(d) | | (0.62%)(d) | | 1.07%(d) | | 15% |
Year Ended April 30, 2004 | | 9.62 | | (0.08) | | 2.87 | | — | | 2.79 | | — | | — | | 12.41 | | 29.00 | % | | 66,039 | | 1.15% | | (0.50%) | | 1.16% | | 93% |
Class C | | | | | | | | | | | | | | | | | | | | | | | | | | | | | |
Six Months Ended March 31, 2009 (Unaudited) | | $ 9.81 | | (0.04)(a) | | (2.96) | | (b) | | (3.00) | | (0.08) | | (0.08) | | $6.73 | | (30.53%)(c) | | | $88 | | 2.10%(d) | | (1.14%)(d) | | 2.40%(d) | | 36% |
Year Ended September 30, 2008 | | 13.53 | | (0.18)(a) | | (2.43) | | (b) | | (2.61) | | (1.11) | | (1.11) | | 9.81 | | (20.72%) | | | 129 | | 2.07% | | (1.52%) | | 2.16% | | 46% |
Year Ended September 30, 2007 | | 12.24 | | (0.19)(a) | | 1.83 | | (b) | | 1.64 | | (0.35) | | (0.35) | | 13.53 | | 13.73% | | | 1,265 | | 2.10% | | (1.52%) | | 2.23% | | 31% |
Year Ended September 30, 2006 | | 11.59 | | (0.17)(a) | | 1.05 | | (b) | | 0.88 | | (0.23) | | (0.23) | | 12.24 | | 7.56% | | | 2,054 | | 2.10% | | (1.40%) | | 2.22% | | 23% |
Year Ended September 30, 2005 | | 11.53 | | (0.11) | | 1.75 | | (b) | | 1.64 | | (1.58) | | (1.58) | | 11.59 | | 14.91% | | | 370 | | 2.09% | | (1.53%) | | 2.28% | | 22% |
Period Ended September 30, 2004(e) | | 12.16 | | (0.05) | | (0.58) | | (b) | | (0.63) | | — | | — | | 11.53 | | (5.18%)(c) | | | 13 | | 2.02%(d) | | (1.65%)(d) | | 2.12%(d) | | 15% |
Period Ended April 30, 2004(f) | | 12.51 | | — | | (0.35) | | — | | (0.35) | | — | | — | | 12.16 | | (2.80%)(c) | | | 3 | | 1.28%(d) | | (1.01%)(d) | | (g) | | 93% |
Class R | | | | | | | | | | | | | | | | | | | | | | | | | | | | | |
Six Months Ended March 31, 2009 (Unaudited) | | $ 10.05 | | (0.02)(a) | | (3.03) | | (b) | | (3.05) | | (0.08) | | (0.08) | | $ 6.92 | | (30.30%)(c) | | | $15 | | 1.58%(d) | | (0.64%)(d) | | 1.90%(d) | | 36% |
Year Ended September 30, 2008 | | 13.77 | | (0.12)(a) | | (2.49) | | (b) | | (2.61) | | (1.11) | | (1.11) | | 10.05 | | (20.34%) | | | 9 | | 1.57% | | (0.99%) | | 1.69% | | 46% |
Year Ended September 30, 2007 | | 12.39 | | (0.13)(a) | | 1.86 | | (b) | | 1.73 | | (0.35) | | (0.35) | | 13.77 | | 14.30% | | | 12 | | 1.60% | | (1.03%) | | 1.70% | | 31% |
Year Ended September 30, 2006 | | 11.67 | | (0.12)(a) | | 1.07 | | (b) | | 0.95 | | (0.23) | | (0.23) | | 12.39 | | 8.12% | | | 10 | | 1.60% | | (0.95%) | | 1.73% | | 23% |
Year Ended September 30, 2005 | | 11.55 | | (0.30) | | 2.00 | | (b) | | 1.70 | | (1.58) | | (1.58) | | 11.67 | | 15.47% | | | 32 | | 1.57% | | (1.04%) | | 1.76% | | 22% |
Period Ended September 30, 2004(e) | | 12.17 | | (0.01) | | (0.61) | | (b) | | (0.62) | | — | | — | | 11.55 | | (5.09%)(c) | | | 72 | | 1.52%(d) | | (1.20%)(d) | | 1.78%(d) | | 15% |
Period Ended April 30, 2004(f) | | 12.51 | | — | | (0.34) | | — | | (0.34) | | — | | — | | 12.17 | | (2.72%)(c) | | | 3 | | 0.79%(d) | | (0.56%)(d) | | (g) | | 93% |
Class S | | | | | | | | | | | | | | | | | | | | | | | | | | | | | |
Six Months Ended March 31, 2009 (Unaudited) | | $10.59 | | (0.01)(a) | | (3.19) | | (b) | | (3.20) | | (0.08) | | (0.08) | | $7.31 | | (30.26%)(c) | | | $ 1,093 | | 1.10%(d) | | (0.15%)(d) | | 1.41%(d) | | 36% |
Year Ended September 30, 2008 | | 14.38 | | (0.06)(a) | | (2.62) | | (b) | | (2.68) | | (1.11) | | (1.11) | | 10.59 | | (19.94%) | | | 1,495 | | 1.06% | | (0.49%) | | 1.18% | | 46% |
Year Ended September 30, 2007 | | 12.86 | | (0.07)(a) | | 1.94 | | (b) | | 1.87 | | (0.35) | | (0.35) | | 14.38 | | 14.88% | | | 1,878 | | 1.10% | | (0.53%) | | 1.21% | | 31% |
Year Ended September 30, 2006 | | 12.03 | | (0.05)(a) | | 1.11 | | (b) | | 1.06 | | (0.23) | | (0.23) | | 12.86 | | 8.79% | | | 1,870 | | 1.10% | | (0.41%) | | 1.23% | | 23% |
Year Ended September 30, 2005 | | 11.81 | | (0.02) | | 1.82 | | (b) | | 1.80 | | (1.58) | | (1.58) | | 12.03 | | 16.02% | | | 1,515 | | 1.08% | | (0.52%) | | 1.27% | | 22% |
Period Ended September 30, 2004(e) | | 12.41 | | (0.01) | | (0.59) | | (b) | | (0.60) | | — | | — | | 11.81 | | (4.83%)(c) | | | 225 | | 1.03%(d) | | (0.71%)(d) | | 1.15%(d) | | 15% |
Period Ended April 30, 2004(f) | | 12.76 | | — | | (0.35) | | — | | (0.35) | | — | | — | | 12.41 | | (2.74%)(c) | | | 4 | | 0.25%(d) | | (0.06%)(d) | | (g) | | 93% |
| | | | | | |
* | | Excludes sales charge. |
** | | During the periods, certain fees were contractually or voluntarily reduced. If such contractual/voluntary fee reductions had not occurred, the ratio would have been as indicated. |
*** | | Portfolio turnover rate is calculated on the basis of the fund as a whole without distinguishing between the classes of shares issued. The rate has not been annualized for periods of less than one year. |
| | | |
(a) | | Per share net investment income (loss) has been calculated using the average daily shares method. | | (e) | | For the period from May 1, 2004 to September 30, 2004. |
(b) | | Less than $0.01 or $(0.01) per share. | | (f) | | For the period from April 19, 2004 (commencement of operations) to April 30, 2004. |
(c) | | Not annualized. | | (g) | | There were no waivers or reimbursements during the period. |
(d) | | Annualized. | | | | |
See notes to financial statements.
Tamarack Enterprise Fund
(Selected data for a share outstanding throughout the periods indicated)
| | | | | | | | | | | | | | | | | | | | | | | | | | | | | | |
| | | Net Asset
Value,
Beginning
of Period | | Investment Activities | | Distributions | | Net
Asset
Value,
End
of
Period | | Total
Return* | | Ratios/Supplemental Data |
| | | Net
Investment
Income/(Loss) | | Net
Realized
and
Unrealized
Gains
(Losses) on
Investments | | Redemption
Fees | | Total from
Investment
Activities | | Net
Investment
Income | | Net
Realized
Gains | | Total
Distributions | | | | Net
Assets,
End of
Period
(000’s) | | Ratio of
Net
Expenses
to
Average
Net
Assets | | Ratio of
Net
Investment
Income
(Loss) to
Average
Net Assets | | Ratio of
Expenses
to
Average
Net
Assets** | | Portfolio
Turnover
Rate*** |
Class A | | | | | | | | | | | | | | | | | | | | | | | | | | | | | | |
Six Months Ended March 31, 2009 (Unaudited) | | $16.95 | | 0.01(a) | | (6.40) | | (b) | | (6.39) | | — | | (1.58) | | (1.58) | | $8.98 | | (38.77%)(c) | | $ 2,582 | | 1.33%(d) | | 0.20%(d) | | 2.05%(d) | | 10% |
Year Ended September 30, 2008 | | 25.86 | | (0.08)(a) | | (5.31) | | (b) | | (5.39) | | (0.02) | | (3.50) | | (3.52) | | 16.95 | | (23.07%) | | 6,398 | | 1.33% | | (0.43%) | | 1.80% | | 23% |
Year Ended September 30, 2007 | | 25.12 | | 0.03(a) | | 2.95 | | (b) | | 2.98 | | — | | (2.24) | | (2.24) | | 25.86 | | 12.40% | | 18,933 | | 1.33% | | 0.09% | | 1.80% | | 22% |
Year Ended September 30, 2006 | | 26.46 | | (0.04)(a) | | 1.80 | | (b) | | 1.76 | | — | | (3.10) | | (3.10) | | 25.12 | | 7.72% | | 17,586 | | 1.33% | | (1.17%) | | 1.77% | | 27% |
Year Ended September 30, 2005 | | 23.81 | | (0.06) | | 3.66 | | (b) | | 3.60 | | — | | (0.95) | | (0.95) | | 26.46 | | 15.34% | | 12,856 | | 1.33% | | (0.29%) | | 1.88% | | 33% |
Period Ended September 30, 2004(e) | | 23.89 | | (0.02) | | (0.06) | | (b) | | (0.08) | | — | | — | | — | | 23.81 | | (0.33%)(c) | | 3,359 | | 1.33%(d) | | (0.35%)(d) | | 1.73%(d) | | 7% |
Period Ended June 30, 2004(f) | | 24.01 | | — | | (0.12) | | — | | (0.12) | | — | | — | | — | | 23.89 | | (0.50%)(c) | | 1,872 | | 1.33%(d) | | (0.07%)(d) | | 1.72%(d) | | 28% |
Class I | | | | | | | | | | | | | | | | | | | | | | | | | | | | | | |
Six Months Ended March 31, 2009 (Unaudited) | | $17.13 | | 0.03(a) | | (6.48) | | (b) | | (6.45) | | — | | (1.58) | | (1.58) | | $9.10 | | (38.71%)(c) | | $ 17,377 | | 1.08%(d) | | 0.49%(d) | | 1.56%(d) | | 10% |
Year Ended September 30, 2008 | | 26.10 | | (0.04)(a) | | (5.34) | | (b) | | (5.38) | | (0.09) | | (3.50) | | (3.59) | | 17.13 | | (22.82%) | | 29,388 | | 1.08% | | (0.19%) | | 1.31% | | 23% |
Year Ended September 30, 2007 | | 25.31 | | 0.09(a) | | 2.96 | | (b) | | 3.05 | | (0.02) | | (2.24) | | (2.26) | | 26.10 | | 12.62% | | 43,096 | | 1.08% | | 0.35% | | 1.30% | | 22% |
Year Ended September 30, 2006 | | 26.57 | | 0.02(a) | | 1.82 | | (b) | | 1.84 | | — | | (3.10) | | (3.10) | | 25.31 | | 8.02% | | 34,478 | | 1.08% | | 0.08% | | 1.27% | | 27% |
Year Ended September 30, 2005 | | 23.85 | | (0.02) | | 3.69 | | (b) | | 3.67 | | — | | (0.95) | | (0.95) | | 26.57 | | 15.61% | | 29,554 | | 1.08% | | (0.08%) | | 1.36% | | 33% |
Period Ended September 30, 2004(g) | | 23.85 | | — | | — | | (b) | | — | | — | | — | | — | | 23.85 | | 0.00%(c) | | 26,707 | | 0.00%(d) | | 0.00%(d) | | 0.00%(d) | | 7% |
Class C | | | | | | | | | | | | | | | | | | | | | | | | | | | | | | |
Six Months Ended March 31, 2009 (Unaudited) | | $16.25 | | (0.03)(a) | | (6.12) | | (b) | | (6.15) | | — | | (1.58) | | (1.58) | | $8.52 | | (38.98%)(c) | | $ 637 | | 2.08%(d) | | (0.53%)(d) | | 2.56%(d) | | 10% |
Year Ended September 30, 2008 | | 25.09 | | (0.22)(a) | | (5.12) | | (b) | | (5.34) | | — | | (3.50) | | (3.50) | | 16.25 | | (23.61%) | | 1,269 | | 2.08% | | (1.19%) | | 2.30% | | 23% |
Year Ended September 30, 2007 | | 24.62 | | (0.16)(a) | | 2.87 | | (b) | | 2.71 | | — | | (2.24) | | (2.24) | | 25.09 | | 11.50% | | 2,356 | | 2.08% | | (0.66%) | | 2.30% | | 22% |
Year Ended September 30, 2006 | | 26.17 | | (0.21)(a) | | 1.76 | | (b) | | 1.55 | | — | | (3.10) | | (3.10) | | 24.62 | | 6.93% | | 2,366 | | 2.08% | | (0.86%) | | 2.26% | | 27% |
Year Ended September 30, 2005 | | 23.74 | | (0.15) | | 3.53 | | (b) | | 3.38 | | — | | (0.95) | | (0.95) | | 26.17 | | 14.43% | | 801 | | 2.08% | | (1.01%) | | 2.39% | | 33% |
Period Ended September 30, 2004(e) | | 23.85 | | (0.04) | | (0.07) | | (b) | | (0.11) | | — | | — | | — | | 23.74 | | (0.46%)(c) | | 75 | | 2.08%(d) | | (1.09%)(d) | | 2.25%(d) | | 7% |
Period Ended June 30, 2004(f) | | 24.01 | | (0.01) | | (0.15) | | — | | (0.16) | | — | | — | | — | | 23.85 | | (0.67%)(c) | | 23 | | 2.07%(d) | | (0.67%)(d) | | 2.22%(d) | | 28% |
Class R | | | | | | | | | | | | | | | | | | | | | | | | | | | | | | |
Six Months Ended March 31, 2009 (Unaudited) | | $16.72 | | (a)(b) | | (6.31) | | (b) | | (6.31) | | — | | (1.58) | | (1.58) | | $8.83 | | (38.83%)(c) | | $ 28 | | 1.56%(d) | | (0.04%)(d) | | 2.04%(d) | | 10% |
Year Ended September 30, 2008 | | 25.59 | | (0.13)(a) | | (5.24) | | (b) | | (5.37) | | — | | (3.50) | | (3.50) | | 16.72 | | (23.23%) | | 41 | | 1.57% | | (0.70%) | | 1.81% | | 23% |
Year Ended September 30, 2007 | | 24.95 | | (0.04)(a) | | 2.92 | | (b) | | 2.88 | | — | | (2.24) | | (2.24) | | 25.59 | | 12.06% | | 53 | | 1.58% | | (0.18%) | | 1.80% | | 22% |
Year Ended September 30, 2006 | | 26.35 | | (0.11)(a) | | 1.81 | | (b) | | 1.70 | | — | | (3.10) | | (3.10) | | 24.95 | | 7.50% | | 52 | | 1.58% | | (0.44%) | | 1.77% | | 27% |
Year Ended September 30, 2005 | | 23.78 | | (0.12) | | 3.64 | | (b) | | 3.52 | | — | | (0.95) | | (0.95) | | 26.35 | | 15.01% | | 59 | | 1.58% | | (0.54%) | | 1.88% | | 33% |
Period Ended September 30, 2004(e) | | 23.87 | | (0.02) | | (0.07) | | (b) | | (0.09) | | — | | — | | — | | 23.78 | | (0.38%)(c) | | 6 | | 1.57%(d) | | (0.61%)(d) | | 1.77%(d) | | 7% |
Period Ended June 30, 2004(f) | | 24.01 | | (0.02) | | (0.12) | | — | | (0.14) | | — | | — | | — | | 23.87 | | (0.58%)(c) | | 3 | | 1.54%(d) | | (0.38%)(d) | | 1.61%(d) | | 28% |
Class S | | | | | | | | | | | | | | | | | | | | | | | | | | | | | | |
Six Months Ended March 31, 2009 (Unaudited) | | $17.12 | | 0.03(a) | | (6.48) | | (b) | | (6.45) | | — | | (1.58) | | (1.58) | | $9.09 | | (38.73%)(c) | | $ 83,062 | | 1.08%(d) | | 0.48%(d) | | 1.56%(d) | | 10% |
Year Ended September 30, 2008 | | 26.09 | | (0.04)(a) | | (5.34) | | (b) | | (5.38) | | (0.09) | | (3.50) | | (3.59) | | 17.12 | | (22.83%) | | 160,478 | | 1.08% | | (0.19%) | | 1.31% | | 23% |
Year Ended September 30, 2007 | | 25.30 | | 0.09(a) | | 2.96 | | (b) | | 3.05 | | (0.02) | | (2.24) | | (2.26) | | 26.09 | | 12.62% | | 281,867 | | 1.08% | | 0.33% | | 1.30% | | 22% |
Year Ended September 30, 2006 | | 26.56 | | 0.02(a) | | 1.82 | | (b) | | 1.84 | | — | | (3.10) | | (3.10) | | 25.30 | | 8.02% | | 304,960 | | 1.08% | | 0.06% | | 1.27% | | 27% |
Year Ended September 30, 2005 | | 23.85 | | (0.02) | | 3.68 | | (b) | | 3.66 | | — | | (0.95) | | (0.95) | | 26.56 | | 15.57% | | 327,641 | | 1.08% | | (0.08%) | | 1.36% | | 33% |
Period Ended September 30, 2004(e) | | 23.91 | | (0.01) | | (0.05) | | (b) | | (0.06) | | — | | — | | — | | 23.85 | | (0.21%)(c) | | 345,451 | | 1.08%(d) | | (0.12%)(d) | | 1.21%(d) | | 7% |
Year Ended June 30, 2004(h) | | 17.66 | | (0.02) | | 6.27 | | — | | 6.25 | | — | | — | | — | | 23.91 | | 35.35% | | 365,930 | | 1.08% | | (0.09%) | | 1.22% | | 28% |
| | | | | | |
* | | Excludes sales charge. |
** | | During the periods, certain fees were contractually or voluntarily reduced. If such contractual/voluntary fee reductions had not occurred, the ratio would have been as indicated. |
*** | | Portfolio turnover rate is calculated on the basis of the fund as a whole without distinguishing between the classes of shares issued. The rate has not been annualized for periods of less than one year. |
| | | |
(a) | | Per share net investment income (loss) has been calculated using the average daily shares method. | | (f) | | For the period from April 19, 2004 (commencement of operations) to June 30, 2004. |
(b) | | Less than $0.01 or $(0.01) per share. | | (g) | | For the period from September 30, 2004 (commencement of operations) to September 30, 2004. |
(c) | | Not annualized. | | (h) | | The existing class of shares was designated Class S shares as of April 19, 2004. |
(d) | | Annualized. | | | | |
(e) | | For the period from July 1, 2004 to September 30, 2004. | | | | |
See notes to financial statements.
Tamarack Small Cap Core Fund
(Selected data for a share outstanding throughout the periods indicated)
| | | | | | | | | | | | | | | | | | | | | | | | | | | | | | |
| | | Net Asset
Value,
Beginning
of Period | | Investment Activities | | Distributions | | Net
Asset
Value,
End of
Period | | Total
Return* | | Ratios/Supplemental Data |
| | | Net
Investment
Income
(Loss) | | Net
Realized
and
Unrealized
Gains
(Losses) on
Investments | | Redemption
Fees | | Total from
Investment
Activities | | Net
Investment
Income | | Net
Realized
Gains | | Total
Distributions | | | | Net
Assets,
End of
Period
(000’s) | | Ratio of
Net
Expenses
to
Average
Net
Assets | | Ratio of
Net
Investment
Income
(Loss) to
Average
Net Assets | | Ratio of
Expenses
to
Average
Net
Assets** | | Portfolio
Turnover
Rate*** |
Class A | | | | | | | | | | | | | | | | | | | | | | | | | | | | | | |
Six Months Ended March 31, 2009 (Unaudited) | | $21.27 | | (a)(b) | | (8.12) | | (a) | | (8.12) | | — | | (2.03) | | (2.03) | | $ 11.12 | | (39.35%)(c) | | $ 423 | | 1.55%(d) | | 0.01%(d) | | 2.67%(d) | | 35% |
Year Ended September 30, 2008 | | 31.72 | | (0.17)(b) | | (4.79) | | (a) | | (4.96) | | — | | (5.49) | | (5.49) | | 21.27 | | (17.15%) | | 1,046 | | 1.54% | | (0.71%) | | 2.27% | | 47% |
Year Ended September 30, 2007 | | 31.74 | | 0.16(b) | | 3.34 | | (a) | | 3.50 | | (0.11) | | (3.41) | | (3.52) | | 31.72 | | 11.86% | | 1,401 | | 1.55% | | 0.49% | | 2.13% | | 44% |
Year Ended September 30, 2006 | | 32.96 | | (0.15)(b) | | 4.03 | | (a) | | 3.88 | | — | | (5.10) | | (5.10) | | 31.74 | | 13.85% | | 2,382 | | 1.55% | | (0.49%) | | 2.15% | | 35% |
Year Ended September 30, 2005 | | 32.59 | | (0.24) | | 3.10 | | (a) | | 2.86 | | — | | (2.49) | | (2.49) | | 32.96 | | 8.67% | | 2,793 | | 1.55% | | (0.77%) | | 2.13% | | 33% |
Period Ended September 30, 2004(e) | | 32.69 | | (0.05) | | (0.05) | | (a) | | (0.10) | | — | | — | | — | | 32.59 | | (0.31%)(c) | | 1,771 | | 1.55%(d) | | (0.80%)(d) | | 1.94%(d) | | 8% |
Period Ended June 30, 2004(f) | | 32.36 | | (0.03) | | 0.36 | | — | | 0.33 | | — | | — | | — | | 32.69 | | 1.02%(c) | | 882 | | 1.54%(d) | | (1.08%)(d) | | 2.64%(d) | | 33% |
Class I | | | | | | | | | | | | | | | | | | | | | | | | | | | | | | |
Six Months Ended March 31, 2009 (Unaudited) | | $21.55 | | 0.03(b) | | (8.24) | | (a) | | (8.21) | | — | | (2.03) | | (2.03) | | $ 11.31 | | (39.25%)(c) | | $ 11 | | 1.30%(d) | | 0.39%(d) | | 2.18%(d) | | 35% |
Year Ended September 30, 2008 | | 31.94 | | (0.11)(b) | | (4.75) | | (a) | | (4.86) | | (0.04) | | (5.49) | | (5.53) | | 21.55 | | (16.65%) | | 85 | | 1.29% | | (0.45%) | | 1.77% | | 47% |
Period Ended September 30, 2007(g) | | 31.30 | | (0.02)(b) | | 0.66 | | (a) | | 0.64 | | — | | — | | — | | 31.94 | | 2.04% | | 102 | | 1.30%(d) | | (0.35%)(d) | | 1.46%(d) | | 44% |
Class C | | | | | | | | | | | | | | | | | | | | | | | | | | | | | | |
Six Months Ended March 31, 2009 (Unaudited) | | $ 20.47 | | (0.05)(b) | | (7.80) | | (a) | | (7.85) | | — | | (2.03) | | (2.03) | | $ 10.59 | | (39.59%)(c) | | $ 199 | | 2.30%(d) | | (0.71%)(d) | | 3.19%(d) | | 35% |
Year Ended September 30, 2008 | | 30.86 | | (0.34)(b) | | (4.56) | | (a) | | (4.90) | | — | | (5.49) | | (5.49) | | 20.47 | | (17.52%) | | 384 | | 2.29% | | (1.47%) | | 2.76% | | 47% |
Year Ended September 30, 2007 | | 31.08 | | (0.12)(b) | | 3.31 | | (a) | | 3.19 | | — | | (3.41) | | (3.41) | | 30.86 | | 11.01% | | 570 | | 2.30% | | (0.41%) | | 2.62% | | 44% |
Year Ended September 30, 2006 | | 32.59 | | (0.38)(b) | | 3.97 | | (a) | | 3.59 | | — | | (5.10) | | (5.10) | | 31.08 | | 13.01% | | 366 | | 2.30% | | (1.24%) | | 2.65% | | 35% |
Year Ended September 30, 2005 | | 32.47 | | (0.24) | | 2.85 | | (a) | | 2.61 | | — | | (2.49) | | (2.49) | | 32.59 | | 7.89% | | 473 | | 2.30% | | (1.47%) | | 2.64% | | 33% |
Period Ended September 30, 2004(e) | | 32.63 | | (0.12) | | (0.04) | | (a) | | (0.16) | | — | | — | | — | | 32.47 | | (0.49%)(c) | | 196 | | 2.30%(d) | | (1.58%)(d) | | 2.52%(d) | | 8% |
Period Ended June 30, 2004(f) | | 32.36 | | (0.06) | | 0.33 | | — | | 0.27 | | — | | — | | — | | 32.63 | | 0.83%(c) | | 202 | | 2.30%(d) | | (1.88%)(d) | | 3.18%(d) | | 33% |
Class R | | | | | | | | | | | | | | | | | | | | | | | | | | | | | | |
Six Months Ended March 31, 2009 (Unaudited) | | $ 21.06 | | (0.02)(b) | | (8.03) | | (a) | | (8.05) | | — | | (2.03) | | (2.03) | | $10.98 | | (39.42%)(c) | | $ 15 | | 1.79%(d) | | (0.25%)(d) | | 2.71%(d) | | 35% |
Year Ended September 30, 2008 | | 31.44 | | (0.23)(b) | | (4.66) | | (a) | | (4.89) | | — | | (5.49) | | (5.49) | | 21.06 | | (17.07%) | | 11 | | 1.79% | | (0.96%) | | 2.26% | | 47% |
Year Ended September 30, 2007 | | 31.50 | | 0.07(b) | | 3.32 | | (a) | | 3.39 | | (0.04) | | (3.41) | | (3.45) | | 31.44 | | 11.52% | | 16 | | 1.80% | | 0.21% | | 2.12% | | 44% |
Year Ended September 30, 2006 | | 32.81 | | (0.23)(b) | | 4.02 | | (a) | | 3.79 | | — | | (5.10) | | (5.10) | | 31.50 | | 13.61% | | 15 | | 1.80% | | (0.73%) | | 2.15% | | 35% |
Year Ended September 30, 2005 | | 32.54 | | (0.28) | | 3.04 | | (a) | | 2.76 | | — | | (2.49) | | (2.49) | | 32.81 | | 8.36% | | 18 | | 1.80% | | (1.01%) | | 2.15% | | 33% |
Period Ended September 30, 2004(e) | | 32.66 | | (0.08) | | (0.04) | | (a) | | (0.12) | | — | | — | | — | | 32.54 | | (0.37%)(c) | | 3 | | 1.76%(d) | | (1.05%)(d) | | 1.95%(d) | | 8% |
Period Ended June 30, 2004(f) | | 32.36 | | (0.06) | | 0.36 | | — | | 0.30 | | — | | — | | — | | 32.66 | | 0.93%(c) | | 3 | | 1.82%(d) | | (0.98%)(d) | | 2.38%(d) | | 33% |
Class S | | | | | | | | | | | | | | | | | | | | | | | | | | | | | | |
Six Months Ended March 31, 2009 (Unaudited) | | $ 21.55 | | 0.02(b) | | (8.23) | | (a) | | (8.21) | | — | | (2.03) | | (2.03) | | $ 11.31 | | (39.25%)(c) | | $ 26,760 | | 1.30%(d) | | 0.30%(d) | | 2.19%(d) | | 35% |
Year Ended September 30, 2008 | | 31.94 | | (0.11)(b) | | (4.75) | | (a) | | (4.86) | | (0.04) | | (5.49) | | (5.53) | | 21.55 | | (16.68%) | | 45,905 | | 1.29% | | (0.46%) | | 1.76% | | 47% |
Year Ended September 30, 2007 | | 31.95 | | 0.23(b) | | 3.36 | | (a) | | 3.59 | | (0.19) | | (3.41) | | (3.60) | | 31.94 | | 12.10% | | 65,771 | | 1.30% | | 0.70% | | 1.62% | | 44% |
Year Ended September 30, 2006 | | 33.06 | | (0.07)(b) | | 4.06 | | (a) | | 3.99 | | — | | (5.10) | | (5.10) | | 31.95 | | 14.18% | | 64,750 | | 1.30% | | (0.22%) | | 1.65% | | 35% |
Year Ended September 30, 2005 | | 32.62 | | (0.19) | | 3.12 | | (a) | | 2.93 | | — | | (2.49) | | (2.49) | | 33.06 | | 8.89% | | 68,071 | | 1.30% | | (0.53%) | | 1.63% | | 33% |
Period Ended September 30, 2004(e) | | 32.70 | | (0.05) | | (0.03) | | (a) | | (0.08) | | — | | — | | — | | 32.62 | | (0.24%)(c) | | 74,165 | | 1.30%(d) | | (0.57%)(d) | | 1.53%(d) | | 8% |
Year Ended June 30, 2004(h) | | 23.78 | | (0.14) | | 9.06 | | — | | 8.92 | | — | | — | | — | | 32.70 | | 37.57% | | 76,036 | | 1.30% | | (0.48%) | | 1.54% | | 33% |
| | | | | | |
* | | Excludes sales charge. |
** | | During the periods, certain fees were contractually or voluntarily reduced. If such contractual/voluntary fee reductions had not occurred, the ratio would have been as indicated. |
*** | | Portfolio turnover rate is calculated on the basis of the fund as a whole without distinguishing between the classes of shares issued. The rate has not been annualized for periods of less than one year. |
| | | |
(a) | | Less than $0.01 or $(0.01) per share. | | (f) | | For the period from April 19, 2004 (commencement of operations) to June 30, 2004. |
(b) | | Per share net investment income (loss) has been calculated using the average daily shares method. | | (g) | | For the period August 2, 2007 (commencement of operations) to September 30, 2007. |
(c) | | Not annualized. | | (h) | | The existing class of shares was designated Class S shares as of April 19, 2004. |
(d) | | Annualized. | | | | |
(e) | | For the period from July 1, 2004 to September 30, 2004. | | | | |
See notes to financial statements.
Tamarack Microcap Value Fund
(Selected data for a share outstanding throughout the periods indicated)
| | | | | | | | | | | | | | | | | | | | | | | | | | | | | | |
| | | Net Asset
Value,
Beginning
of Period | | Investment Activities | | Distributions | | Net
Asset
Value,
End of
Period | | Total
Return* | | Ratios/Supplemental Data |
| | | Net
Investment
Income
(Loss) | | Net
Realized
and
Unrealized
Gains
(Losses) on
Investments | | Redemption
Fees | | Total from
Investment
Activities | | Net
Investment
Income | | Net
Realized
Gains | | Total
Distributions | | | | Net Assets,
End of
Period
(000’s) | | Ratio of
Net
Expenses
to
Average
Net
Assets | | Ratio of
Net
Investment
Income
(Loss) to
Average
Net Assets | | Ratio of
Expenses
to
Average
Net
Assets** | | Portfolio
Turnover
Rate*** |
Class A | | | | | | | | | | | | | | | | | | | | | | | | | | | | | | |
Six Months Ended March 31, 2009 (Unaudited) | | $16.38 | | 0.02(a) | | (6.68) | | (b) | | (6.66) | | (0.03) | | (0.95) | | (0.98) | | $ 8.74 | | (41.34%)(c) | | $ 6,454 | | 1.32%(d) | | 0.33%(d) | | 1.93%(d) | | 7% |
Year Ended September 30, 2008 | | 22.34 | | 0.05(a) | | (4.49) | | (b) | | (4.44) | | (0.02) | | (1.50) | | (1.52) | | 16.38 | | (20.74%) | | 19,641 | | 1.31% | | 0.29% | | 1.74% | | 18.0% |
Year Ended September 30, 2007 | | 22.17 | | 0.03(a) | | 1.68 | | (b) | | 1.71 | | — | | (1.54) | | (1.54) | | 22.34 | | 7.68% | | 43,004 | | 1.32% | | 0.14% | | 1.78% | | 17% |
Year Ended September 30, 2006 | | 21.52 | | 0.00(a) | | 2.53 | | (b) | | 2.53 | | (0.04) | | (1.84) | | (1.88) | | 22.17 | | 12.67% | | 29,186 | | 1.33% | | 0.01% | | 1.74% | | 20% |
Year Ended September 30, 2005 | | 18.83 | | 0.07 | | 3.57 | | (b) | | 3.64 | | (0.15) | | (0.80) | | (0.95) | | 21.52 | | 19.62% | | 10,328 | | 1.33% | | (0.04%) | | 1.73% | | 8% |
Period Ended September 30, 2004(e) | | 19.12 | | (0.01) | | (0.28) | | (b) | | (0.29) | | — | | — | | — | | 18.83 | | (1.52%)(c) | | 1,522 | | 1.28%(d) | | 0.04%(d) | | 1.63%(d) | | 3% |
Period Ended June 30, 2004(f) | | 19.04 | | — | | 0.08 | | — | | 0.08 | | — | | — | | — | | 19.12 | | 0.42%(c) | | 405 | | 1.26%(d) | | 0.00%(d) | | 1.91%(d) | | 11% |
Class C | | | | | | | | | | | | | | | | | | | | | | | | | | | | | | |
Six Months Ended March 31, 2009 (Unaudited) | | $ 15.86 | | (0.02)(a) | | (6.46) | | (b) | | (6.48) | | — | | (0.95) | | (0.95) | | $ 8.43 | | (41.55%)(c) | | $ 879 | | 2.07%(d) | | (0.47%)(d) | | 2.45%(d) | | 7% |
Year Ended September 30, 2008 | | 21.82 | | (0.08)(a) | | (4.38) | | (b) | | (4.46) | | — | | (1.50) | | (1.50) | | 15.86 | | (21.34%) | | 1,723 | | 2.06% | | (0.45%) | | 2.23% | | 18% |
Year Ended September 30, 2007 | | 21.84 | | (0.13)(a) | | 1.65 | | (b) | | 1.52 | | — | | (1.54) | | (1.54) | | 21.82 | | 6.89% | | 3,981 | | 2.07% | | (0.60%) | | 2.28% | | 17% |
Year Ended September 30, 2006 | | 21.33 | | (0.16)(a) | | 2.51 | | (b) | | 2.35 | | — | | (1.84) | | (1.84) | | 21.84 | | 11.86% | | 2,073 | | 2.08% | | (0.73%) | | 2.25% | | 20% |
Year Ended September 30, 2005 | | 18.77 | | (0.08) | | 3.54 | | (b) | | 3.46 | | (0.10) | | (0.80) | | (0.90) | | 21.33 | | 18.72% | | 506 | | 2.08% | | (0.77%) | | 2.22% | | 8% |
Period Ended September 30, 2004(e) | | 19.09 | | (0.02) | | (0.30) | | (b) | | (0.32) | | — | | — | | — | | 18.77 | | (1.68%)(c) | | 167 | | 2.03%(d) | | (0.70%)(d) | | 2.06%(d) | | 3% |
Period Ended June 30, 2004(f) | | 19.04 | | (0.02) | | 0.07 | | — | | 0.05 | | — | | — | | — | | 19.09 | | 0.26%(c) | | 4 | | 2.03%(d) | | (0.62%)(d) | | 2.22%(d) | | 11% |
Class R | | | | | | | | | | | | | | | | | | | | | | | | | | | | | | |
Six Months Ended March 31, 2009 (Unaudited) | | $ 16.26 | | —(a)(b) | | (6.62) | | (b) | | (6.62) | | (0.02) | | (0.95) | | (0.97) | | $8.67 | | (41.41%)(c) | | $ 331 | | 1.57%(d) | | 0.05%(d) | | 1.95%(d) | | 7% |
Year Ended September 30, 2008 | | 22.21 | | 0.01(a) | | (4.46) | | (b) | | (4.45) | | — | | (1.50) | | (1.50) | | 16.26 | | (20.93%) | | 578 | | 1.57% | | 0.06% | | 1.77% | | 18% |
Year Ended September 30, 2007 | | 22.11 | | (0.02)(a) | | 1.66 | | (b) | | 1.64 | | — | | (1.54) | | (1.54) | | 22.21 | | 7.42% | | 532 | | 1.57% | | (0.08%) | | 1.78% | | 17% |
Year Ended September 30, 2006 | | 21.47 | | (0.06)(a) | | 2.54 | | (b) | | 2.48 | | — | | (1.84) | | (1.84) | | 22.11 | | 12.42% | | 164 | | 1.59% | | (0.27%) | | 1.73% | | 20% |
Year Ended September 30, 2005 | | 18.81 | | (0.03) | | 3.60 | | (b) | | 3.57 | | (0.11) | | (0.80) | | (0.91) | | 21.47 | | 19.27% | | 143 | | 1.57% | | (0.27%) | | 1.72% | | 8% |
Period Ended September 30, 2004(e) | | 19.11 | | (0.01) | | (0.29) | | (b) | | (0.30) | | — | | — | | — | | 18.81 | | (1.57%)(c) | | 94 | | 1.53%(d) | | (0.29%)(d) | | 1.67%(d) | | 3% |
Period Ended June 30, 2004(f) | | 19.04 | | — | | 0.07 | | — | | 0.07 | | — | | — | | — | | 19.11 | | 0.37%(c) | | 104 | | 1.49%(d) | | 0.15%(d) | | 2.17%(d) | | 11% |
Class S | | | | | | | | | | | | | | | | | | | | | | | | | | | | | | |
Six Months Ended March 31, 2009 (Unaudited) | | $ 16.47 | | 0.03(a) | | (6.71) | | (b) | | (6.68) | | (0.09) | | (0.95) | | (1.04) | | $8.75 | | (41.27%)(c) | | $ 130,748 | | 1.07%(d) | | 0.52%(d) | | 1.45%(d) | | 7% |
Year Ended September 30, 2008 | | 22.47 | | 0.10(a) | | (4.52) | | (b) | | (4.42) | | (0.08) | | (1.50) | | (1.58) | | 16.47 | | (20.53%) | | 261,041 | | 1.07% | | 0.56% | | 1.26% | | 18% |
Year Ended September 30, 2007 | | 22.27 | | 0.09(a) | | 1.68 | | (b) | | 1.77 | | (0.03) | | (1.54) | | (1.57) | | 22.47 | | 7.95% | | 318,947 | | 1.07% | | 0.39% | | 1.27% | | 17% |
Year Ended September 30, 2006 | | 21.59 | | 0.05(a) | | 2.55 | | (b) | | 2.60 | | (0.08) | | (1.84) | | (1.92) | | 22.27 | | 12.97% | | 261,594 | | 1.09% | | 0.24% | | 1.23% | | 20% |
Year Ended September 30, 2005 | | 18.86 | | 0.04 | | 3.65 | | (b) | | 3.69 | | (0.16) | | (0.80) | | (0.96) | | 21.59 | | 19.89% | | 232,912 | | 1.07% | | 0.23% | | 1.22% | | 8% |
Period Ended September 30, 2004(e) | | 19.14 | | 0.01 | | (0.29) | | (b) | | (0.28) | | — | | — | | — | | 18.86 | | (1.46%)(c) | | 218,871 | | 1.03%(d) | | 0.22%(d) | | 1.16%(d) | | 3% |
Year Ended June 30, 2004(g) | | 13.60 | | 0.05 | | 5.60 | | — | | 5.65 | | (0.05) | | (0.06) | | (0.11) | | 19.14 | | 41.63% | | 234,956 | | 1.03% | | 0.31% | | 1.20% | | 11% |
| | | | | | |
* | | Excludes sales charge. |
** | | During the periods, certain fees were contractually or voluntarily reduced. If such contractual/voluntary fee reductions had not occurred, the ratio would have been as indicated. |
*** | | Portfolio turnover rate is calculated on the basis of the fund as a whole without distinguishing between the classes of shares issued. The rate has not been annualized for periods of less than one year. |
| | | |
(a) | | Per share net investment income (loss) has been calculated using the average daily shares method. | | (e) | | For the period from July 1, 2004 to September 30, 2004. |
(b) | | Less than $0.01 or $(0.01) per share. | | (f) | | For the period from April 19, 2004 (commencement of operations) to June 30, 2004. |
(c) | | Not annualized. | | (g) | | The existing class of shares was designated Class S shares as of April 19, 2004. |
(d) | | Annualized. | | | | |
See notes to financial statements.
|
NOTES TO FINANCIAL STATEMENTS |
March 31, 2009 (Unaudited)
1.Organization
Tamarack Funds Trust (“Tamarack”) is registered under the Investment Company Act of 1940 (as amended) as an open-end management investment company. Tamarack was organized as a Delaware statutory trust on December 16, 2003. Predecessor funds to Tamarack were reorganized as portfolios of Tamarack effective April 16, 2004. This semi-annual report includes the following four investment portfolios (“Funds”):
- Tamarack Mid Cap Growth Fund (“Mid Cap Growth Fund”)
- Tamarack Enterprise Fund (“Enterprise Fund”)
- Tamarack Small Cap Core Fund (“Small Cap Core Fund”)
- Tamarack Microcap Value Fund (“Microcap Value Fund”)
The Mid Cap Growth, Enterprise and Small Cap Core Funds offer five share classes: Class A, Class C, Class R, Class I and Class S shares. The Microcap Value Fund offers four share classes: Class A, Class C, Class R and Class S shares. Class A shares are offered with a 5.75% maximum front-end sales charge and a 1.00% contingent deferred sales charge (“CDSC”) for redemption within 12 months of a $1 million or greater purchase on which no front-end sales charge was paid. Class C shares are offered at net asset value (i.e. no front-end sales charge), but are subject to a CDSC of 1.00% for redemptions within 12 months of purchase. Class R shares (available to certain 401(k) and other employer-sponsored retirement plans), Class I shares (intended for investors meeting certain investment minimum thresholds) and Class S shares are not subject to either a front-end sales charge or a CDSC.
Voyageur Asset Management Inc. (“Voyageur”) acts as the investment advisor for Tamarack. The officers of Tamarack (“Fund Management”) are also employees of Voyageur or its affiliates or of PNC Global Investment Servicing (U.S.) Inc. (“PNC”).
2. Significant Accounting Policies
Summarized below are the significant accounting policies of the Funds. These policies conform to accounting principles generally accepted in the United States of America (“GAAP”). Fund Management follows these policies when preparing financial statements. Management may also be required to make estimates and assumptions that affect the reported amounts of assets and liabilities at the date of the financial statements and the reported amounts of income and expenses for the period. Actual results could differ from those estimates. The financial statements are as of the close of regular trading on the New York Stock Exchange.
Security Valuation:
Equity securities are generally valued on the basis of prices furnished by pricing services approved by Tamarack’s Board of Trustees (the “Board”). Equity securities traded on one or more U.S. exchanges shall be valued at the last available quoted sale price on the primary trading exchange as of the valuation time. Valuation time is as of the close of regular trading on the New York Stock Exchange (usually 4:00 p.m. Eastern Standard Time). If there was no sale on the primary exchange on the day the net asset value is calculated, the most recent bid quotation generally will be used. In cases where neither closing prices nor bid prices are available, or where those prices do not accurately reflect the value of the security, a security will be valued in accordance with the Fund’s approved pricing and valuation procedures to determine a security’s fair value. These procedures are also used to determine the fair value of a security if a significant event occurs that materially affects the value of the security. Investments in open-end investment companies are valued at net asset value. Short-term securities with less than 60 days to maturity at time of purchase are valued at amortized cost.
34
|
NOTES TO FINANCIAL STATEMENTS |
Financial Accounting Standards Board (“FASB”) Statement of Financial Accounting Standards No. 157, “Fair Value Measurements” (“SFAS No. 157”):
SFAS No. 157 clarifies the definition of fair value for financial reporting, establishes a framework for measuring fair value and requires additional disclosures about the use of fair value measurements. The three levels of the fair value hierarchy under SFAS No. 157 are described below:
• Level 1 - quoted prices in active markets for identical securities.
• Level 2 - other significant observable inputs (including quoted prices for similar securities, interest rates, prepayment speeds, credit risk, etc.).
• Level 3 - significant unobservable inputs (including the Funds’ own assumptions in determining the fair value of investments).
The inputs or methodology used for valuing investments are not necessarily an indication of the risk associated with investing in those securities.
The summary of inputs used to determine the fair valuation of the Fund’s investments as of March 31, 2009 is as follows:
| | | | | | | | | | |
| Funds | | Level 1 Quoted Prices | | Level 2 Significant Observable Inputs | | Level 3 Significant Unobservable Inputs | | Total |
| | | | |
Mid Cap Growth Fund | | $ | 62,163,896 | | $— | | $— | | $ | 62,163,896 |
Enterprise Fund | | | 108,398,250 | | — | | — | | | 108,398,250 |
Small Cap Core Fund | | | 27,598,398 | | — | | — | | | 27,598,398 |
Microcap Value Fund | | | 138,578,614 | | — | | — | | | 138,578,614 |
Repurchase Agreements:
The Funds may enter into repurchase agreements with primary dealers that report to the Federal Reserve Bank of New York or the 100 largest U.S. commercial banks (as measured by domestic deposits) who are deemed creditworthy under guidelines approved by the Board. These repurchase agreements are subject to the seller’s agreement to repurchase such securities at a mutually agreed upon date and price. The repurchase price generally equals the price paid by the Funds plus interest negotiated on the basis of current short-term rates.
Securities pledged as collateral for repurchase agreements are held by the Funds’ custodian bank until maturity of the repurchase agreement. The Funds have procedures to secure additional collateral, if needed, to ensure that the daily market value of the collateral remains in excess of the repurchase agreement in the event of a default.
Investment Transactions and Income:
Investment transactions are recorded on one business day after trade date, except on the last day of each fiscal quarter end, when they are recorded on trade date. Dividend income is recorded on the ex-dividend date. Realized gains and losses from investment transactions are calculated based on the cost of the specific security (also known as identified cost basis). Interest income is recognized on the accrual basis and includes, where applicable, the amortization or accretion of premium or discount using the effective yield method.
Expense, Investment Income and Gain/Loss Allocation:
Each Fund pays the expenses that are directly related to its operations, such as custodian fees or adviser fees. Expenses incurred by Tamarack, such as trustee or legal fees, are allocated among each of the Funds either proportionately based upon each Fund’s relative net assets or using another reasonable basis such as equally across all Funds, depending on the nature of the expense. Individual share classes within a Fund are charged expenses specific to that class, such as distribution fees. Within
35
|
NOTES TO FINANCIAL STATEMENTS |
a Fund, expenses other than class specific expenses are allocated daily to each class based upon the proportion of relative net assets. Investment income and realized and unrealized gains or losses are allocated to each class of shares based on relative net assets.
Real Estate Investment Trusts:
The Funds may own shares of real estate investment trusts (“REITs”) which report information on the source of their distributions annually. Certain distributions received from REITs during the period, which are known to be a return of capital, are recorded as a reduction to the cost of the individual REIT.
Distributions to Shareholders:
Each Fund pays out any income that it receives, less expenses, in the form of dividends and capital gains to its shareholders. Income dividends and capital gains on each Fund are declared and paid at least annually. Distributions to shareholders are recorded on the ex-dividend date. The amount of dividends and distributions are calculated based on federal income tax regulations, which may differ from GAAP. These “book/tax” differences may be either temporary or permanent in nature. To the extent these differences are determined, as of the end of the tax year, to be permanent (e.g., net operating loss, foreign currency transactions, distribution redisignations and prior year spillbacks ), they are reclassified within a Fund’s capital accounts based on their federal tax basis treatment. Such differences are not reflected in the calculation of the Financial Highlights.
3. Agreements and Other Transactions with Affiliates
Tamarack has entered into investment advisory agreements with Voyageur under which Voyageur manages each Fund’s assets and furnishes related office facilities, equipment, research and personnel. The agreements require each Fund to pay Voyageur a monthly fee based upon average daily net assets. Under the terms of the advisory contracts, Voyageur is entitled to receive fees based on a percentage of the average daily net assets of each of the Funds as follows:
| | | | |
| | | Average Daily Net Assets of Fund | | Annual Rate |
| | |
Mid Cap Growth Fund | | All Net Assets | | 0.70% |
| | |
Enterprise Fund | | Up to $30 million | | 1.40% |
| | Over $30 million | | 0.90% |
| | |
Small Cap Core Fund | | Up to $30 million | | 1.40% |
| | Over $30 million | | 0.90% |
Microcap Value Fund | | All Net Assets | | 0.90% |
Voyageur has contractually agreed to waive fees and/or make payments in order to keep total operating expenses of the Class S shares of each Fund and Class I shares of each Fund (except Microcap Value Fund, which does not offer Class I shares) to the following levels. This expense limitation agreement is in place February 1, 2009 until January 31, 2010.
| | |
| | | Annual Rate |
| |
Mid Cap Growth Fund | | 1.10% |
Enterprise Fund | | 1.08% |
Small Cap Core Fund | | 1.30% |
Microcap Value Fund | | 1.07% |
Classes A, C, and R vary from these limits only by the addition of class-specific 12b-1 fees. Each Fund will carry forward, for a period not to exceed 12 months from the date on which a waiver or reimbursement is made by Voyageur, any expenses in excess of the expense limitation and repay Voyageur such amounts, provided the Fund is able to effect such repayment and remain in compliance with the expense limitation stated above. Voyageur may also voluntarily waive and/or reimburse operating expenses of any Fund from time to time. Any such voluntary program may be changed or eliminated at any time without notice.
36
|
NOTES TO FINANCIAL STATEMENTS |
Voyageur serves as co-administrator to the Funds. PNC serves as co- administrator and fund accounting agent. Services provided under the administrative services contract include providing day-to-day administration of matters related to the Funds, maintenance of their records and the preparation of reports. Under the terms of the administrative services contract, Voyageur receives from each Fund a fee, payable monthly, at the annual rate of 0.075% of each Fund’s average daily net assets. PNC receives a fee for its services payable by the Funds based on the Funds’ average net assets. Voyageur’s fee is listed as “Administration fees” in the Statements of Operations. PNC’s fee is included with “Accounting fees” in the Statements of Operations.
Certain Officers and Trustees of the Funds are affiliated with the adviser or the administrator. Such Officers and Trustees receive no compensation from the Funds for serving in their respective roles.
Independent Trustees (Trustees of Tamarack who are not directors, officers or employees of the adviser, administrator or distributor) receive from the entire Tamarack fund family an annual retainer of $20,000. The Board Chairperson and Audit Committee Chairperson each receive an additional retainer of $2,500 annually, and all other trustees serving as Chair of a Board committee each receive an additional retainer of $1,000 annually. In addition, Independent Trustees receive a quarterly meeting fee of $5,000 for each in-person Board meeting attended, a meeting fee of $1,000 for each telephonic or Special Board meeting attended, and a $1,000 fee for each Board committee meeting attended and are reimbursed for all out-of-pocket expenses relating to attendance at such meetings.
4. Fund Distribution
Each of the Funds has adopted a Master Distribution 12b-1 Plan (the “Plan”) in which Tamarack Distributors Inc. (the “Distributor”) acts as the Funds’ distributor. The Distributor is an affiliate of Voyageur. The Plan permits each Fund to make payments for or to reimburse the Distributor monthly for distribution-related costs and expenses of marketing shares of each share class covered under the Plan; and/or for providing shareholder services. The following chart shows the current Plan fee rate for each class.
| | | | | | |
| | | Class A | | Class C | | Class R |
| | | |
12b-1 Plan Fee | | 0.25%* | | 1.00% | | 0.50% |
*The maximum Plan fee rate for Class A shares is 0.50%.The Distributor is contractually waiving 0.25% of the total 0.50% Plan fee for Class A at least through January 31, 2010.
Plan fees are based on average daily net assets of the applicable class. Up to 0.25% of each Plan fee may be designated as a Service Fee, as defined by the applicable rules of the Financial Industry Regulatory Authority. The Distributor, subject to applicable legal requirements, may waive a Plan fee voluntarily, in whole or in part.
For the six months ended March 31, 2009, the Distributor received commissions of $4,120 from front-end sales charges of Class A shares of the Funds, of which $828 was paid to affiliated broker-dealers, the remainder was either paid to unaffiliated broker-dealers or retained by the Distributor. The Distributor also received $272 from CDSC fees from Class C shares of the Funds. The Distributor received no CDSC fees from Class A shares of the Funds during the six months ended March 31, 2009.
37
|
NOTES TO FINANCIAL STATEMENTS |
5. Securities Transactions
The cost of securities purchased and proceeds from securities sold (excluding securities maturing less than one year from acquisition) for the period ended March 31, 2009 were as follows:
| | | | | | |
| | | Purchases | | Sales |
| | |
Mid Cap Growth Fund | | $ | 23,158,788 | | $ | 25,763,878 |
Enterprise Fund | | | 13,726,876 | | | 31,130,578 |
Small Cap Core Fund | | | 11,337,622 | | | 12,583,170 |
Microcap Value Fund | | | 12,438,517 | | | 34,619,909 |
Within the guidelines established by the Funds to always seek best execution when entering into portfolio transactions, certain of the Funds use directed brokerage transactions through LJR Recapture Services (“LJR”) and its correspondent brokers. A portion of the commissions paid for portfolio transactions under this program are reimbursed to the Funds and are recorded as net realized gains from investment transactions in the financial statements.
6. Capital Share Transactions
Tamarack is authorized to issue an unlimited number of shares of beneficial interest (“shares outstanding”) without par value. Transactions in shares of the Funds are summarized on the following pages:
| | | | | | | | | | | | | | | | | | | | | | | | | | |
| | | Tamarack Mid Cap Growth Fund | | | | | Tamarack Enterprise Fund | |
| | | For the Six Months Ended
March 31, 2009 | | | | | For the
Year Ended
September 30,
2008 | | | | | For the Six Months Ended
March 31, 2009 | | | | | For the
Year Ended
September 30,
2008 | |
| | | (Unaudited) | | | | | | | | | | (Unaudited) | | | | | | |
CAPITAL TRANSACTIONS: | | | | | | | | | | | | | | | | | | | | |
Class A | | | | | | | | | | | | | | | | | | | | |
Proceeds from shares issued | | | | $ | 917,464 | | | | | $ | 2,906,833 | | | | | | | $ | 76,665 | | | | | $ | 756,580 | |
Distributions reinvested | | | | | 200,982 | | | | | | 2,640,566 | | | | | | | | 447,890 | | | | | | 2,151,734 | |
Cost of shares redeemed | | | | | (1,327,462 | ) | | | | | (4,652,827 | ) | | | | | | | (1,526,038 | ) | | | | | (9,459,263 | ) |
| | | | | | | | | | | | | | | | | | | | | | | | | | |
Change in Class A | | | | $ | (209,016 | ) | | | | $ | 894,572 | | | | | | | $ | (1,001,483 | ) | | | | $ | (6,550,949 | ) |
| | | | | | | | | | | | | | | | | | | | | | | | | | |
Class I | | | | | | | | | | | | | | | | | | | | | | | | | | |
Proceeds from shares issued | | | | $ | 6,583,620 | | | | | $ | 13,518,790 | | | | | | | $ | 974,589 | | | | | $ | 2,778,617 | |
Distributions reinvested | | | | | 479,097 | | | | | | 5,730,436 | | | | | | | | 2,634,071 | | | | | | 5,864,860 | |
Cost of shares redeemed | | | | | (8,273,610 | ) | | | | | (12,600,472 | ) | | | | | | | (1,708,432 | ) | | | | | (6,897,094 | ) |
| | | | | | | | | | | | | | | | | | | | | | | | | | |
Change in Class I | | | | $ | (1,210,893 | ) | | | | $ | 6,648,754 | | | | | | | $ | 1,900,228 | | | | | $ | 1,746,383 | |
| | | | | | | | | | | | | | | | | | | | | | | | | | |
Class C | | | | | | | | | | | | | | | | | | | | | | | | | | |
Proceeds from shares issued | | | | $ | 999 | | | | | $ | — | | | | | | | $ | 12,518 | | | | | $ | 145,451 | |
Distributions reinvested | | | | | 1,093 | | | | | | 91,961 | | | | | | | | 104,090 | | | | | | 298,946 | |
Cost of shares redeemed | | | | | (2,020 | ) | | | | | (976,575 | ) | | | | | | | (169,662 | ) | | | | | (717,448 | ) |
| | | | | | | | | | | | | | | | | | | | | | | | | | |
Change in Class C | | | | $ | 72 | | | | | $ | (884,614 | ) | | | | | | $ | (53,054 | ) | | | | $ | (273,051 | ) |
| | | | | | | | | | | | | | | | | | | | | | | | | | |
Class R | | | | | | | | | | | | | | | | | | | | | | | | | | |
Proceeds from shares issued | | | | $ | 10,000 | | | | | $ | — | | | | | | | $ | 11,561 | | | | | $ | 15,119 | |
Distributions reinvested | | | | | 77 | | | | | | 948 | | | | | | | | 694 | | | | | | 868 | |
Cost of shares redeemed | | | | | (2,071 | ) | | | | | (22 | ) | | | | | | | (8,319 | ) | | | | | (11,564 | ) |
| | | | | | | | | | | | | | | | | | | | | | | | | | |
Change in Class R | | | | $ | 8,006 | | | | | $ | 926 | | | | | | | $ | 3,936 | | | | | $ | 4,423 | |
| | | | | | | | | | | | | | | | | | | | | | | | | | |
Class S | | | | | | | | | | | | | | | | | | | | | | | | | | |
Proceeds from shares issued | | | | $ | 84,424 | | | | | $ | 334,631 | | | | | | | $ | 3,540,638 | | | | | $ | 16,676,648 | |
Distributions reinvested | | | | | 11,859 | | | | | | 157,839 | | | | | | | | 13,306,251 | | | | | | 33,358,430 | |
Cost of shares redeemed | | | | | (35,594 | ) | | | | | (322,272 | ) | | | | | | | (19,364,567 | ) | | | | | (77,826,392 | ) |
| | | | | | | | | | | | | | | | | | | | | | | | | | |
Change in Class S | | | | $ | 60,689 | | | | | $ | 170,198 | | | | | | | $ | (2,517,678 | ) | | | | $ | (27,791,314 | ) |
| | | | | | | | | | | | | | | | | | | | | | | | | | |
Change in net assets resulting from capital transactions | | | | $ | (1,351,142 | ) | | | | $ | 6,829,836 | | | | | | | $ | (1,668,051 | ) | | | | $ | (32,864,508 | ) |
| | | | | | | | | | | | | | | | | | | | | | | | | | |
38
|
NOTES TO FINANCIAL STATEMENTS |
| | | | | | | | | | | | | | | | | | | | | | | | | | |
| | | Tamarack Mid Cap
Growth Fund | | | | | Tamarack Enterprise Fund | |
| | | For the
Six Months Ended
March 31,
2009 | | | | | For the
Year Ended
September 30,
2008 | | | | | For the Six Months Ended
March 31, 2009 | | | | | For the Year Ended
September 30, 2008 | |
| | | (Unaudited) | | | | | | | | | | (Unaudited) | | | | | | |
SHARE TRANSACTIONS: | | | | | | | | | | | | | | | | | | | | | | | | | | |
Class A | | | | | | | | | | | | | | | | | | | | | | | | | | |
Issued | | | | 131,912 | | | | | | | 246,121 | | | | | | | 6,528 | | | | | | | 37,961 | |
Reinvested | | | | 29,383 | | | | | | | 214,331 | | | | | | | 44,214 | | | | | | | 106,311 | |
Redeemed | | | | (184,265 | ) | | | | | | (394,814 | ) | | | | | | (140,680 | ) | | | | | | (499,159 | ) |
| | | | | | | | | | | | | | | | | | | | | | | | | | |
Change in Class A | | | | (22,970 | ) | | | | | | 65,638 | | | | | | | (89,938 | ) | | | | | | (354,887 | ) |
| | | | | | | | | | | | | | | | | | | | | | | | | | |
Class I | | | | | | | | | | | | | | | | | | | | | | | | | | |
Issued | | | | 874,358 | | | | | | | 1,087,452 | | | | | | | 94,680 | | | | | | | 141,476 | |
Reinvested | | | | 67,383 | | | | | | | 448,391 | | | | | | | 256,732 | | | | | | | 287,493 | |
Redeemed | | | | (1,122,123 | ) | | | | | | (1,040,588 | ) | | | | | | (158,203 | ) | | | | | | (364,198 | ) |
| | | | | | | | | | | | | | | | | | | | | | | | | | |
Change in Class I | | | | (180,382 | ) | | | | | | 495,255 | | | | | | | 193,209 | | | | | | | 64,771 | |
| | | | | | | | | | | | | | | | | | | | | | | | | | |
Class C | | | | | | | | | | | | | | | | | | | | | | | | | | |
Issued | | | | 151 | | | | | | | — | | | | | | | 1,088 | | | | | | | 7,358 | |
Reinvested | | | | 166 | | | | | | | 7,702 | | | | | | | 10,809 | | | | | | | 15,323 | |
Redeemed | | | | (318 | ) | | | | | | (88,051 | ) | | | | | | (15,215 | ) | | | | | | (38,513 | ) |
| | | | | | | | | | | | | | | | | | | | | | | | | | |
Change in Class C | | | | (1 | ) | | | | | | (80,349 | ) | | | | | | (3,318 | ) | | | | | | (15,832 | ) |
| | | | | | | | | | | | | | | | | | | | | | | | | | |
Class R | | | | | | | | | | | | | | | | | | | | | | | | | | |
Issued | | | | 1,541 | | | | | | | — | | | | | | | 1,381 | | | | | | | 858 | |
Reinvested | | | | 11 | | | | | | | 78 | | | | | | | 69 | | | | | | | 43 | |
Redeemed | | | | (317 | ) | | | | | | (2 | ) | | | | | | (759 | ) | | | | | | (522 | ) |
| | | | | | | | | | | | | | | | | | | | | | | | | | |
Change in Class R | | | | 1,235 | | | | | | | 76 | | | | | | | 691 | | | | | | | 379 | |
| | | | | | | | | | | | | | | | | | | | | | | | | | |
Class S | | | | | | | | | | | | | | | | | | | | | | | | | | |
Issued | | | | 11,306 | | | | | | | 25,251 | | | | | | | 304,817 | | | | | | | 840,497 | |
Reinvested | | | | 1,665 | | | | | | | 12,341 | | | | | | | 1,298,171 | | | | | | | 1,636,019 | |
Redeemed | | | | (4,618 | ) | | | | | | (26,994 | ) | | | | | | (1,839,300 | ) | | | | | | (3,905,621 | ) |
| | | | | | | | | | | | | | | | | | | | | | | | | | |
Change in Class S | | | | 8,353 | | | | | | | 10,598 | | | | | | | (236,312 | ) | | | | | | (1,429,105 | ) |
| | | | | | | | | | | | | | | | | | | | | | | | | | |
Change in shares resulting from capital transactions | | | | (193,765 | ) | | | | | | 491,218 | | | | | | | (135,668 | ) | | | | | | (1,734,674 | ) |
| | | | | | | | | | | | | | | | | | | | | | | | | | |
39
|
NOTES TO FINANCIAL STATEMENTS |
| | | | | | | | | | | | | | | | | | | | | | | | | | |
| | | Tamarack Small Cap Core Fund | | | | | Tamarack Microcap Value Fund | |
| | | For the Six Months Ended
March 31, 2009 | | | | | For the
Year Ended
September 30,
2008 | | | | | For the Six Months Ended
March 31, 2009 | | | | | For the
Year Ended
September 30,
2008 | |
| | | (Unaudited) | | | | | | | | | | (Unaudited) | | | | | | |
CAPITAL TRANSACTIONS: | | | | | | | | | | | | | | | | | | | | | | | | | | |
Class A | | | | | | | | | | | | | | | | | | | | | | | | | | |
Proceeds from shares issued | | | | $ | 31,216 | | | | | $ | 192,481 | | | | | | | $ | 574,402 | | | | | $ | 6,065,076 | |
Distributions reinvested | | | | | 69,291 | | | | | | 225,429 | | | | | | | | 629,432 | | | | | | 1,658,167 | |
Cost of shares redeemed | | | | | (265,082 | ) | | | | | (304,470 | ) | | | | | | | (5,994,873 | ) | | | | | (22,030,260 | ) |
| | | | | | | | | | | | | | | | | | | | | | | | | | |
Change in Class A | | | | $ | (164,575 | ) | | | | $ | 113,440 | | | | | | | $ | (4,791,039 | ) | | | | $ | (14,307,017 | ) |
| | | | | | | | | | | | | | | | | | | | | | | | | | |
Class I | | | | | | | | | | | | | | | | | | | | | | | | | | |
Proceeds from shares issued | | | | $ | 58,343 | | | | | $ | — | | | | | | | $ | — | | | | | $ | — | |
Distributions reinvested | | | | | 7,995 | | | | | | 17,685 | | | | | | | | — | | | | | | — | |
Cost of shares redeemed | | | | | (93,057 | ) | | | | | — | | | | | | | | — | | | | | | — | |
| | | | | | | | | | | | | | | | | | | | | | | | | | |
Change in Class I | | | | $ | (26,719 | ) | | | | $ | 17,685 | | | | | | | $ | — | | | | | $ | — | |
| | | | | | | | | | | | | | | | | | | | | | | | | | |
Class C | | | | | | | | | | | | | | | | | | | | | | | | | | |
Proceeds from shares issued | | | | $ | 944 | | | | | $ | — | | | | | | | $ | 34,307 | | | | | $ | 298,348 | |
Distributions reinvested | | | | | 36,300 | | | | | | 95,884 | | | | | | | | 88,784 | | | | | | 226,017 | |
Cost of shares redeemed | | | | | (36,448 | ) | | | | | (92,187 | ) | | | | | | | (156,935 | ) | | | | | (1,830,778 | ) |
| | | | | | | | | | | | | | | | | | | | | | | | | | |
Change in Class C | | | | $ | 796 | | | | | $ | 3,697 | | | | | | | $ | (33,844 | ) | | | | $ | (1,306,413 | ) |
| | | | | | | | | | | | | | | | | | | | | | | | | | |
Class R | | | | | | | | | | | | | | | | | | | | | | | | | | |
Proceeds from shares issued | | | | $ | 10,001 | | | | | $ | — | | | | | | | $ | 46,467 | | | | | $ | 367,046 | |
Distributions reinvested | | | | | 358 | | | | | | 784 | | | | | | | | 35,127 | | | | | | 38,764 | |
Cost of shares redeemed | | | | | (2,080 | ) | | | | | (16 | ) | | | | | | | (58,998 | ) | | | | | (185,753 | ) |
| | | | | | | | | | | | | | | | | | | | | | | | | | |
Change in Class R | | | | $ | 8,279 | | | | | $ | 768 | | | | | | | $ | 22,596 | | | | | $ | 220,057 | |
| | | | | | | | | | | | | | | | | | | | | | | | | | |
Class S | | | | | | | | | | | | | | | | | | | | | | | | | | |
Proceeds from shares issued | | | | $ | 1,498,172 | | | | | $ | 2,765,013 | | | | | | | $ | 35,965,374 | | | | | $ | 156,761,980 | |
Distributions reinvested | | | | | 3,985,782 | | | | | | 10,369,478 | | | | | | | | 13,534,444 | | | | | | 22,894,972 | |
Cost of shares redeemed | | | | | (2,915,902 | ) | | | | | (12,032,870 | ) | | | | | | | (63,625,182 | ) | | | | | (146,059,330 | ) |
| | | | | | | | | | | | | | | | | | | | | | | | | | |
Change in Class S | | | | $ | 2,568,052 | | | | | $ | 1,101,621 | | | | | | | $ | (14,125,364 | ) | | | | $ | 33,597,622 | |
| | | | | | | | | | | | | | | | | | | | | | | | | | |
Change in net assets resulting from capital transactions | | | | $ | 2,385,833 | | | | | $ | 1,237,211 | | | | | | | $ | (18,927,651 | ) | | | | $ | 18,204,249 | |
| | | | | | | | | | | | | | | | | | | | | | | | | | |
| | | | | | | | | |
SHARE TRANSACTIONS: | | | | | | | | | | | | | | | | | | | | | | | | | | |
Class A | | | | | | | | | | | | | | | | | | | | | | | | | | |
Issued | | | | | 2,506 | | | | | | 8,061 | | | | | | | | 57,409 | | | | | | 328,343 | |
Reinvested | | | | | 5,473 | | | | | | 9,688 | | | | | | | | 63,643 | | | | | | 88,577 | |
Redeemed | | | | | (19,097 | ) | | | | | (12,732 | ) | | | | | | | (581,927 | ) | | | | | (1,142,761 | ) |
| | | | | | | | | | | | | | | | | | | | | | | | | | |
Change in Class A | | | | | (11,118 | ) | | | | | 5,017 | | | | | | | | (460,875 | ) | | | | | (725,841 | ) |
| | | | | | | | | | | | | | | | | | | | | | | | | | |
Class I | | | | | | | | | | | | | | | | | | | | | | | | | | |
Issued | | | | | 5,497 | | | | | | — | | | | | | | | — | | | | | | — | |
Reinvested | | | | | 621 | | | | | | 752 | | | | | | | | — | | | | | | — | |
Redeemed | | | | | (9,137 | ) | | | | | — | | | | | | | | — | | | | | | — | |
| | | | | | | | | | | | | | | | | | | | | | | | | | |
Change in Class I | | | | | (3,019 | ) | | | | | 752 | | | | | | | | — | | | | | | — | |
| | | | | | | | | | | | | | | | | | | | | | | | | | |
Class C | | | | | | | | | | | | | | | | | | | | | | | | | | |
Issued | | | | | 55 | | | | | | — | | | | | | | | 3,246 | | | | | | 15,814 | |
Reinvested | | | | | 3,005 | | | | | | 4,257 | | | | | | | | 9,297 | | | | | | 12,398 | |
Redeemed | | | | | (2,986 | ) | | | | | (3,976 | ) | | | | | | | (16,967 | ) | | | | | (102,018 | ) |
| | | | | | | | | | | | | | | | | | | | | | | | | | |
Change in Class C | | | | | 74 | | | | | | 281 | | | | | | | | (4,424 | ) | | | | | (73,806 | ) |
| | | | | | | | | | | | | | | | | | | | | | | | | | |
Class R | | | | | | | | | | | | | | | | | | | | | | | | | | |
Issued | | | | | 988 | | | | | | — | | | | | | | | 4,616 | | | | | | 19,673 | |
Reinvested | | | | | 29 | | | | | | 35 | | | | | | | | 3,581 | | | | | | 2,083 | |
Redeemed | | | | | (206 | ) | | | | | (1 | ) | | | | | | | (5,539 | ) | | | | | (10,165 | ) |
| | | | | | | | | | | | | | | | | | | | | | | | | | |
Change in Class R | | | | | 811 | | | | | | 34 | | | | | | | | 2,658 | | | | | | 11,591 | |
| | | | | | | | | | | | | | | | | | | | | | | | | | |
Class S | | | | | | | | | | | | | | | | | | | | | | | | | | |
Issued | | | | | 131,336 | | | | | | 118,333 | | | | | | | | 3,628,748 | | | | | | 8,292,661 | |
Reinvested | | | | | 309,936 | | | | | | 440,880 | | | | | | | | 1,368,498 | | | | | | 1,219,115 | |
Redeemed | | | | | (205,167 | ) | | | | | (488,046 | ) | | | | | | | (5,912,503 | ) | | | | | (7,857,761 | ) |
| | | | | | | | | | | | | | | | | | | | | | | | | | |
Change in Class S | | | | | 236,105 | | | | | | 71,167 | | | | | | | | (915,257 | ) | | | | | 1,654,015 | |
| | | | | | | | | | | | | | | | | | | | | | | | | | |
Change in shares resulting from capital transactions | | | | | 222,853 | | | | | | 77,251 | | | | | | | | (1,377,898 | ) | | | | | 865,959 | |
| | | | | | | | | | | | | | | | | | | | | | | | | | |
40
|
NOTES TO FINANCIAL STATEMENTS |
7. Federal Income Taxes
It is the policy of each Fund to continue to qualify as a regulated investment company by complying with the provisions available to certain investment companies, as defined under Subchapter M of the Internal Revenue Code, and to distribute substantially all of its net investment income and net realized capital gains. Therefore, no federal tax liability is recorded in the financial statements of each Fund.
The Funds adopted the provisions of FASB Interpretation No. 48 (“FIN48”), Accounting for Uncertainty in Income Taxes, on March 30, 2008. The implementation of FIN48 resulted in no material liability for unrecognized tax benefits and no material change to the net asset value of the Funds at the beginning of the day. As of March 31, 2009, the Funds did not have a liability for any uncertain tax benefits. The Funds recognize interest and penalties, if any, related to unrecognized tax benefits as income tax expense in the Statements of Operations. During the period, the Funds did not incur any interest or penalties. The Funds are not subject to examination by U.S. federal tax authorities for tax years before 2005 and by state authorities for tax years before 2004.
As of March 31, 2009, the tax cost of securities and the breakdown of unrealized appreciation (depreciation) for each Fund were as follows:
| | | | | | | | | | | | |
| | | Tax Cost of
Securities | | Unrealized
Appreciation | | Unrealized
Depreciation | | Net Unrealized
Appreciation
(Depreciation) |
| | | | |
Mid Cap Growth Fund | | $ | 74,098,367 | | $ | 4,046,821 | | $ | (15,981,293) | | $ | (11,934,472) |
Enterprise Fund | | | 174,940,106 | | | 10,673,969 | | | (77,215,825) | | | (66,541,856) |
Small Cap Core Fund | | | 38,613,430 | | | 2,044,218 | | | (13,059,250) | | | (11,015,032) |
Microcap Value Fund | | | 270,166,405 | | | 16,296,256 | | | (147,884,044) | | | (131,587,788) |
The tax character of distributions during the fiscal year ended September 30, 2008 were as follows:
| | | | | | | | | | | | |
| | | Distributions Paid From |
| | | Ordinary
Income | | Net Long Term
Capital Gains | | Total Taxable
Distributions | | Total
Distributions
Paid* |
| | | | |
Mid Cap Growth Fund | | $ | — | | $ | 8,899,936 | | $ | 8,899,936 | | $ | 8,899,936 |
Enterprise Fund | | | 5,347,268 | | | 39,206,879 | | | 44,554,147 | | | 44,554,147 |
Small Cap Core Fund | | | 612,109 | | | 10,469,488 | | | 11,081,597 | | | 11,081,597 |
Microcap Value Fund | | | 4,259,319 | | | 22,189,910 | | | 26,449,229 | | | 26,449,229 |
*Total distributions paid may differ from the Statements of Changes in Net Assets because distributions are recognized when actually paid for tax purposes.
The tax basis of components of accumulated earnings/(losses) and tax character of distributions are determined at fiscal year end, and will be included in the Annual Report dated September 30, 2009.
8. Market Timing
Tamarack strongly discourages attempts at market timing by Fund shareholders. Each Fund charges a redemption fee of 2% of the value of the shares redeemed or exchanged within 30 days of purchase, in addition to limiting the number of exchanges that may be made between Funds to five (5) per calendar year. When assessed, the redemption fee is deducted from the redemption proceeds and retained by the Fund, not by Voyageur. This redemption fee is not charged in cases where, for example, the redemption results from an automatic reinvestment or asset re-allocation not specifically directed by the shareholder. Tamarack also reserves the right to reject any Fund purchase order made by persons deemed to be market timers. The Funds’ prospectus contains a full description of Tamarack’s policies on market timing and/or excessive trading.
41
|
NOTES TO FINANCIAL STATEMENTS |
During the six months ended March 31, 2009, the redemption fees collected by each Fund were as follows:
| | |
| | | Redemption Fees |
| |
Mid Cap Growth Fund | | $ 19 |
Enterprise Fund | | 396 |
Small Cap Core Fund | | 39 |
Microcap Value Fund | | 186 |
9. Soft Dollars
The term soft dollars generally refers to arrangements in which services other than trade execution are received from a broker-dealer. Federal securities laws permit a fund advisor to incur commission charges on behalf of a Fund that are higher than another broker dealer would have charged if the advisor believes the charges are reasonable in relation to the brokerage and research services received. Voyageur has a fiduciary duty to the shareholders of the Funds to seek the best execution price for all of the Funds’ securities transactions. Fund management believes that using soft dollars to purchase brokerage and research services may, in certain cases, be in a Fund’s best interest. As of March 31, 2009, certain of the Funds used soft dollar arrangements on a limited basis. Fund management continues to closely monitor its current use of soft dollars, in addition to regulatory developments in this area for any possible impact on Fund policies.
42
|
SHARE CLASS INFORMATION (UNAUDITED) |
The Tamarack Equity Funds offer up to five share classes. These five share classes are the A, C, R, I, and S classes.
Class A
Class A shares are available for purchase primarily through investment advisors, broker-dealers, banks and other financial services intermediaries. Class A shares of the Funds are currently subject to a maximum up-front sales charge of 5.75% and a 1.00% CDSC for redemption within 12 months of a $1 million or greater purchase. Class A shares currently include a 0.25% (25 bps) annual 12b-1 service and distribution fee. (The 12b-1 Plan allows for 50 bps, but the Funds’ distributor is currently voluntarily waiving 25 bps. The Distributor currently has no plans to discontinue this waiver.) Class A shares have a higher up-front sales charge (load) than Class C shares, but a lower annual expense ratio.
Class C
Class C shares are also available for purchase primarily through investment advisors, broker-dealers, banks and other financial services intermediaries. Class C shares redeemed within 12 months of purchase are subject to a CDSC of 1.00%. (No CDSC will be charged on shares acquired through reinvestment of dividends or capital gains.) C Class shares expenses include a 1.00% (100 bps) annual 12b-1 service and distribution fee. Class C shares have a lower up-front sales charge (load) than Class A shares, but due to the higher service and distribution fee, have higher annual expenses than A Class shares.
Class R
Class R shares are available for purchase through employer-sponsored or 401(k) retirement plans for which omnibus or program-level accounts are held on the books of the Funds. Class R shares have no up-front sales charge (load), but are subject to a 0.50% (50 bps) 12b-1 service and distribution fee. Class R shares currently have annual expenses between Class A and Class C share expenses.
Class S
Class S shares are available to investors purchasing shares directly through the Fund or its agent, BFDS, or through certain fee-based programs of broker-dealers or registered investment advisors. This share class does not have an up-front sales charge (load) or a 12b-1 service and distribution fee.
Class I
Class I shares are available in the Mid Cap Growth, Enterprise, and Small Cap Core Funds. This share class is intended for investors meeting certain minimum investment thresholds. This share class does not have an up-front sales charge (load) or a 12b-1 service and distribution fee.
For an investor purchasing Tamarack Funds shares through a financial services intermediary, the question as to which share class, A or C, is the better choice is dependent on many factors, including the amount to be invested and the length of time an investor anticipates holding the shares. An investor should consult with his or her financial advisor about his or her personal financial situation to determine which share class is the best choice for his or her individual situation.
43
|
SUPPLEMENTAL INFORMATION (UNAUDITED) |
Shareholder Expense Examples
As a shareholder of the Tamarack Funds, you incur two types of costs: (1) transaction costs, including sales charges (loads) and (2) ongoing costs, including management fees; 12b-1 distribution and service fees; and other Fund expenses. This example is intended to help you understand your ongoing costs (in dollars) of investing in the Tamarack Funds and to compare these costs with the ongoing costs of investing in other mutual funds.
The Example is based on an investment of $1,000 invested at the beginning of the period and held for the entire period from October 1, 2008 through March 31, 2009.
Actual Expenses and Performance
The table below provides information about actual account values and actual expenses. You may use the information below, together with the amount you invested, to estimate the expenses that you paid over the period. Simply divide your account value by $1,000 (for example, an $8,600 account value divided by $1,000 = 8.6), then multiply the result by the number in the table under the heading entitled “Expenses Paid During Period” to estimate the expenses you paid on your account during this period.
| | | | | | | | | | |
| | | | | Beginning
Account Value
10/1/2008 | | Ending
Account Value
3/31/2009 | | Expenses Paid
During Period*
10/1/08-3/31/09 | | Annualized
Expense Ratio
During Period
10/1/08-3/31/09 |
| | | | | |
Mid Cap Growth Fund | | Class A | | $1,000.00 | | $697.00 | | $5.71 | | 1.35% |
| | Class I | | 1,000.00 | | 698.10 | | 4.66 | | 1.10% |
| | Class C | | 1,000.00 | | 694.70 | | 8.87 | | 2.10% |
| | Class R | | 1,000.00 | | 697.00 | | 6.68 | | 1.58% |
| | Class S | | 1,000.00 | | 697.40 | | 4.66 | | 1.10% |
| | | | | |
Enterprise Fund | | Class A | | 1,000.00 | | 612.30 | | 5.35 | | 1.33% |
| | Class I | | 1,000.00 | | 612.90 | | 4.34 | | 1.08% |
| | Class C | | 1,000.00 | | 610.20 | | 8.35 | | 2.08% |
| | Class R | | 1,000.00 | | 611.70 | | 6.27 | | 1.56% |
| | Class S | | 1,000.00 | | 612.70 | | 4.34 | | 1.08% |
| | | | | |
Small Cap Core Fund | | Class A | | 1,000.00 | | 606.50 | | 6.21 | | 1.55% |
| | Class I | | 1,000.00 | | 607.50 | | 5.21 | | 1.30% |
| | Class C | | 1,000.00 | | 604.10 | | 9.20 | | 2.30% |
| | Class R | | 1,000.00 | | 605.80 | | 7.17 | | 1.79% |
| | Class S | | 1,000.00 | | 607.50 | | 5.21 | | 1.30% |
| | | | | |
Microcap Value Fund | | Class A | | 1,000.00 | | 586.60 | | 5.22 | | 1.32% |
| | Class C | | 1,000.00 | | 584.50 | | 8.18 | | 2.07% |
| | Class R | | 1,000.00 | | 585.90 | | 6.21 | | 1.57% |
| | Class S | | 1,000.00 | | 587.30 | | 4.23 | | 1.07% |
*Expenses are equal to the average account value times the Fund’s annualized expense ratio multiplied by the number of days in the most recent fiscal half-year divided by the number of days in the fiscal year (to reflect one-half year period).
44
|
SUPPLEMENTAL INFORMATION (UNAUDITED) |
Hypothetical Example for Comparison Purposes
The table below provides information about hypothetical account values and hypothetical expenses based on each Tamarack Funds’ actual expense ratio and an assumed rate of return of 5% per year before expenses, which is not the Fund’s actual return. The hypothetical account values and expenses may not be used to estimate the actual ending account balance or expenses you paid for the period. You may use this information to compare this 5% hypothetical example with the 5% hypothetical examples that appear in the shareholder reports of other funds.
Please note that the expenses shown in the table are meant to highlight your ongoing costs only and do not reflect any transactional costs, such as sales charges (loads), redemption fees, or exchange fees. Therefore, the table is useful in comparing ongoing costs only, and will not help you determine the relative total costs of owning different funds. In addition, if these transactional costs were included, your costs would have been higher.
| | | | | | | | | | |
| | | | | Beginning
Account Value
10/1/2008 | | Ending
Account Value
3/31/2009 | | Expenses Paid
During Period*
10/1/08-3/31/09 | | Annualized
Expense Ratio
During Period
10/1/08-3/31/09 |
| | | | | |
Mid Cap Growth Fund | | Class A | | $1,000.00 | | $1,018.20 | | $ 6.79 | | 1.35% |
| | Class I | | 1,000.00 | | 1,019.45 | | 5.54 | | 1.10% |
| | Class C | | 1,000.00 | | 1,014.46 | | 10.55 | | 2.10% |
| | Class R | | 1,000.00 | | 1,017.05 | | 7.95 | | 1.58% |
| | Class S | | 1,000.00 | | 1,019.45 | | 5.54 | | 1.10% |
| | | | | |
Enterprise Fund | | Class A | | 1,000.00 | | 1,018.30 | | 6.69 | | 1.33% |
| | Class I | | 1,000.00 | | 1,019.55 | | 5.44 | | 1.08% |
| | Class C | | 1,000.00 | | 1,014.56 | | 10.45 | | 2.08% |
| | Class R | | 1,000.00 | | 1,017.15 | | 7.85 | | 1.56% |
| | Class S | | 1,000.00 | | 1,019.55 | | 5.44 | | 1.08% |
| | | | | |
Small Cap Core Fund | | Class A | | 1,000.00 | | 1,017.20 | | 7.80 | | 1.55% |
| | Class I | | 1,000.00 | | 1,018.45 | | 6.54 | | 1.30% |
| | Class C | | 1,000.00 | | 1,013.46 | | 11.55 | | 2.30% |
| | Class R | | 1,000.00 | | 1,016.01 | | 9.00 | | 1.79% |
| | Class S | | 1,000.00 | | 1,018.45 | | 6.54 | | 1.30% |
| | | | | |
Microcap Value Fund | | Class A | | 1,000.00 | | 1,018.35 | | 6.64 | | 1.32% |
| | Class C | | 1,000.00 | | 1,014.61 | | 10.40 | | 2.07% |
| | Class R | | 1,000.00 | | 1,017.10 | | 7.90 | | 1.57% |
| | Class S | | 1,000.00 | | 1,019.60 | | 5.39 | | 1.07% |
*Expenses are equal to the average account value times the Fund’s annualized expense ratio multiplied by the number of days in the most recent fiscal half-year divided by the number of days in the fiscal year (to reflect one-half year period).
45
|
APPROVAL OF INVESTMENT ADVISORY - SUB-ADVISORY AGREEMENTS (UNAUDITED) |
Information for Tamarack Funds Shareholders Regarding the Renewal of Investment Advisory Agreements
The Tamarack Board of Trustees has renewed the Investment Advisory Agreement with Voyageur Asset Management Inc. (“Voyageur” or the “Advisor”) for each of the Funds. After evaluating the services provided by the Advisor and reviewing the performance and relevant expenses of each Fund, the Trustees concluded that it was in the best interests of the Funds and their shareholders to continue the investment advisory agreements (“Agreements”).
As part of their review of the Agreements, the Trustees received and discussed certain information, including information regarding the advisory services performed, qualifications of staffing, and Fund performance and expenses. The Trustees considered information provided in advance of their in-person meeting, as well as supplemental information provided at the meeting. The Trustees met with representatives from the Advisor’s senior management team, as well as senior investment professionals, to discuss this information and Voyageur’s intentions with regard to the ongoing management of the Funds. The Trustees reviewed the quality of the services provided to the Funds by Voyageur, including information prepared by a third-party consultant as to each Fund’s performance relative to an appropriate benchmark as well as compared to the Fund’s appropriate peer group. The Trustees also reviewed the investment management fees payable to Voyageur. In this connection, the Trustees reviewed comparative information prepared by a third-party consultant on investment management fees paid and expenses incurred by similarly situated funds. The Trustees also received reports from Voyageur regarding other investment companies advised by it, including the advisory fees paid. The Trustees took into account profitability data for Voyageur included in the materials. The Trustees received information from Voyageur regarding other benefits derived from its relationships with the Funds. In connection with their deliberations, the independent Trustees met separately with their independent legal counsel to review the relevant material and consider their responsibilities under relevant laws and regulations. In addition, the Trustees noted the expected composition of each portfolio management team.
While, with the exception of the Small Cap Core Fund, the Funds’ performance generally ranked between the third and fifth quintiles of their respective peer groups for the three and five year periods, the Board observed that the performance of the Mid Cap Growth Fund ranked in the top quintile of its peer group for the one year period. Additionally, the Small Cap Core Fund ranked in the second quintile of its peer group for the one year period and the Enterprise and Micro Cap Value Funds’ performance was in the fourth quintile of their respective peer groups for the one year period. The expense comparisons ranged from first quintile (Enterprise Fund and Mid Cap Growth Fund) to the third quintile (Small Cap Core Fund) in their peer groups. In addition, the total expense structure for the Mid Cap Growth Fund was twenty four basis points lower than its peer group median and the Enterprise Fund was nineteen basis points lower than its peer group median.
The Trustees also reviewed and approved Fund Management’s proposal to continue for an additional year all existing fee waivers in order to maintain total expenses at their current levels. In considering the quality of the services performed for each Fund by Voyageur, the Trustees discussed the strong research capabilities and fundamental analysis performed by the firm and also considered the extensive portfolio management experience of Voyageur staff, the compliance structure and systems established by Voyageur and the financial viability of Voyageur. The Trustees also considered steps that already had been taken by Voyageur to expand upon existing research capabilities and compliance processes and steps that were expected to be taken to maintain and/or enhance such capabilities and processes.
Based upon their review, the Trustees determined that the advisory fees proposed to be payable to Voyageur were reasonable and fair in light of the nature and quality of services provided under all of the circumstances, and were within the range of what might have been negotiated at arms’ length. The Trustees concluded that it is in the interest of the Funds and their shareholders for the Trustees to approve the continuation of the Agreements for the Funds. In arriving at their decision to approve the renewal of both of the Agreements, the Trustees did not assign relative weights to the factors discussed above or deem any one or group of them to be controlling in and of themselves.
46
This Page Intentionally Left Blank
This Page Intentionally Left Blank
Tamarack Funds
P.O. Box 219757
Kansas City, MO 64121-9757
800-422-2766
www.voyageur.net
Performance data represents past performance and does not guarantee future results. The principal value of an investment and investment return will fluctuate so that an investor’s shares, when redeemed, may be worth more or less than their original cost.
This report and the financial statements contained herein are provided for the information of Tamarack Funds shareholders. This report is not authorized for distribution to prospective investors unless preceded or accompanied by a current prospectus, which contains information concerning investment objectives, risks, charges and expenses of the funds. Please read the prospectus carefully before investing.
This report and the financial statements contained herein are not intended to be a forecast of future events, a guarantee of future results, or investment advice. There is no assurance that certain securities will remain in or out of each fund’s portfolio. The views expressed in this report reflect those of the portfolio managers through the period ended March 31, 2009.
NOT FDIC INSURED • NO BANK GUARANTEE • MAY LOSE VALUE
Voyageur Asset Management Inc. serves as investment adviser for the Tamarack Funds. Tamarack Funds are distributed by Tamarack Distributors Inc.

| | |
The Tamarack Funds are pleased to offer shareholder reports printed entirely on Forest Stewardship Council certified paper. FSC certification ensures that the paper used in this report contains fiber from well- managed and responsibly harvested forests that meet strict environmental and socioeconomic standards. | | |
TF-EQ SAR 03-09
| | | | | | | | |
| | | | | | |
| | | | | | Tamarack Funds | | |
About Your Semi-Annual Report | | | | | | This semi-annual report includes detailed information about your Fund including financial statements, performance, and a complete list of holdings. We hope the financial information presented will help you evaluate your investment in the Tamarack Funds. We also encourage you to read your Fund’s prospectus for further detail as to your Fund’s investment policies and risk profile. Tamarack Funds prospectuses and additional performance information are available on our website at www.voyageur.net. A description of the policies and procedures that your Fund uses to determine how to vote proxies relating to portfolio securities is available (i) without charge, upon request, by calling 1-800-422-2766; (ii) on the Fund’s website at www.voyageur.net; and (iii) on the Securities and Exchange Commission’s (“Commission”) website at http://www.sec.gov. Information regarding how your Fund voted proxies relating to portfolio securities during the most recent 12-month period ended June 30 is available (i) on the Fund’s website at www.voyageur.net; and (ii) on the Commission’s website at http://www.sec.gov. A schedule of each Fund’s portfolio holdings will be filed with the Commission for the first and third quarters of each fiscal year on Form N-Q. This information is available on the Commission’s website at http://www.sec.gov and may be reviewed and copied at the Commission’s Public Reference Room in Washington, D.C. Information on the operation of the Public Reference Room is available by calling 1-800-SEC-0330. |
| Table of Contents | | | | | | | | |
| | | | | | Letter from the CIO of Fixed Income | | 1 |
| | | | Money Market Portfolio Managers | | 3 |
| | | | Performance Summary | | 4 |
| | | | Schedules of Portfolio Investments | | 6 |
| | | | Financial Statements | | |
| | | | - Statements of Assets and Liabilities | | 26 |
| | | | - Statements of Operations | | 28 |
| | | | - Statements of Changes in Net Assets | | 29 |
| | | | Financial Highlights | | 32 |
| | | | Notes to Financial Statements | | 37 |
| | | | Supplemental Information | | 46 |
| | | | | | | | |
| | | | | | | | |
| | | | | | | | |
| | | | | | | | |
| | | | | | | | |
| | | | | | | | |
| | | | | | |
LETTER FROM THE CIO OF FIXED INCOME | | | | | | |
| | | | | | |
| | | | | | | |
| | | |
The fixed income market has gradually reopened for business over the past several quarters. While the economy continued to contract at a record pace over the past two quarters, credit availability, as reflected in corporate bond new issue volumes, has certainly improved during this period. Government intervention and the introduction of important new guarantee programs have improved market sentiment. While the current economic environment is clearly daunting, we believe that preliminary signs of a consolidation or bottoming to the market volatility that has roiled the fixed income markets for much of the past two years are increasingly evident. More recently, credit spreads and risk premiums across all market sectors have been narrowing and trading flows are improving. There are extremely good long-term values to be had in nearly every sector of the fixed income market. Income or yield, in stark contrast to the past several years, will increasingly become the key differentiator of relative performance as we move ahead through 2009. That said, new risks will certainly emerge as the economy attempts to gain more permanent footing. Increasing default rates and the eventual pull back of government stimulus are two important areas of concern. The massive amounts of fiscal stimulus being put into the market will have a larger impact on the economy in 2010 and beyond as much of the stimulus will be distributed in future years. We are increasingly concerned with the interconnectedness of the Federal Reserve and the U.S. Treasury. While the combined effects of monetary and fiscal stimulus may have suited the cultural and political will of the day, the Federal Reserve will need to prepare for inevitable inflationary pressures that will present themselves. Pulling back that stimulus will be extremely difficult. Future successes in the fixed income markets will equally be determined by carefully managing these new risks in light of the generational investment opportunities currently available in the marketplace. From an economic perspective, the major growth impediments remain the same: housing, consumers’ secular swing from debt-financed consumption toward saving, and stress in the financial system. The jobs situation will likely continue to worsen in upcoming quarters, further dampening prospects for a quick turnaround in the second half of 2009. While pending home sales, construction and manufacturing have recently exceeded lowered expectations, we continue to believe the key to a sustainable recovery is a real bottoming in the housing and labor markets. The fact remains that new and existing home inventories remain near record levels relative to demand – despite high affordability indices. Wealth destruction continues as equity and housing values have collapsed over the past six months. Consequently, personal savings rates (4.2% in February) skyrocketed as families repaired their balance sheets. In the fourth quarter net non-financial sector (ex-government) borrowing fell for the first time ever year-over-year. Household debt alone fell 2.0%. The consumer shift from debt-fueled consumption to thrift greatly contributes to the downward economic trajectory. Durable goods orders continued falling during the first quarter. Manufacturing capacity utilization rates are at post-war lows. The high durables inventory/sales ratio suggests further production cuts. These developments influence employment. An 8+% unemployment rate is widely expected to reach 10% by year-end. None of this bodes well for bank loan performance. Commercial real estate appears the next big challenge to bank loan quality. On a positive note, there may be early signs of recovery. Core retail sales (ex-building materials, vehicles, and gasoline) rose in January and February. March’s 20%+ recovery in the Dow Jones Industrial Average was the quickest (13 | | | | | | |
| | | | | | |
| | | | | | |
1
| | | | |
| | | | LETTER FROM THE CIO OF FIXED INCOME |

| | | | trading days) since 1938. The Mortgage Application Index increased 58% since late January, and with 78% of those applications being refinancings, those borrowers’ net cash flow situation should improve. Consumers will likely also benefit from higher tax refunds as the IRS reports the average paid is up 9% versus this time last year. That said, the economy and our markets remain at risk to further volatility as we determine whether the fixed income markets have correctly called a bottom in economic activity. Looking ahead, while the Federal Reserve and the U.S. Treasury have successfully employed multiple strategies to avoid a collapse of the U.S. financial system, we are highly skeptical of the use of low interest rates and leverage (PPIP and TALF) to permanently solve the current economic and financial crisis. Excess capacity needs to be driven out of the economy. The current slowdown has been impacted by too many goods chasing the marginal dollar of consumption. Until we can get supply more in balance with normalized demand, the economy will continue to stumble along. Interest rates will likely remain volatile within a relatively well defined range for each maturity for the foreseeable future. We do not expect the Federal Reserve to alter monetary policy in 2009. Treasury supply driven concerns will be offset by the reality of Federal Reserve’s quantitative easing program. Mortgage rates will remain stable and will continue to benefit from government support. Agency debentures and TLGP guaranteed corporate debt should continue to perform well in upcoming quarters. Despite increasing default rates, corporate bonds exhibit some of the strongest potential returns within the fixed income market over the next year. The municipal market also provides significant opportunities. Our strategy will continue to emphasize holding existing risk positions within our funds while at the same time prudently adding quality new issues at attractive valuation levels. We believe the actions we take today will continue to sow the seeds for stable and competitive relative performance in future periods. We appreciate your continued confidence and trust. Ours is a business of trust. As a fiduciary for your assets, professional and ethical behavior is the standard for how we approach our investment discipline. We want to thank you for your trust and ongoing support for the Tamarack Funds. Sincerely, 
John M. Huber, CFA Chief Investment Officer, Fixed Income Tamarack Funds |
| | | | |
| | | | |
| | | | |
| | | | |
| | | | |
| | | | |
2
| | | | | | |
MONEY MARKET PORTFOLIO MANAGERS | | | | | | |
| | | |
| | | | | | | |
| | | |
Voyageur Asset Management (“Voyageur”), the investment advisor to the Tamarack Funds, employs a team approach to the management of each of the money market funds. Each Fund’s management team has access to Voyageur’s investment research and other money management resources. | | | | | | |
| | | |
John M. Huber, CFA Senior Managing Director, Chief Investment Officer — Fixed Income John Huber directs Voyageur’s fixed income group. John joined Voyageur in 2004 from Galliard Capital Management where he was a principal and senior portfolio manager, responsible for the firm’s total return fixed income effort. Prior to working for Galliard, John was a portfolio manager for Norwest Investment Management where he began his career in 1990. John received a BA from the University of Iowa and an MBA in Finance from the University of Minnesota, Carlson School of Management. He acts as an advisor to the Carlson Funds Enterprise for the University of Minnesota. John is a CFA charterholder and a member of the CFA Society of Minnesota. He also serves on the Board of the YMCA of Metropolitan Minneapolis. | | | | | |  |
| | | |
Raye C. Kanzenbach, CFA Senior Managing Director, Senior Portfolio Manager Raye Kanzenbach is an active member of the Credit Team and serves as primary portfolio manager for the Tax-Free and Institutional Tax-Free Money Market Funds. He has extensive experience working with taxable and tax-exempt municipal fixed income securities. Prior to his experience at Voyageur, Raye was employed at First Bank where he managed the municipal and money market trust funds. Raye also supervised the municipal and corporate credit analysis areas for the Trust Department and First Bank’s investment portfolio. Prior to First Bank, Raye was employed as an investment officer with the St. Paul Companies. Raye began his career in the investment industry in 1973 and joined Voyageur in 1983. He received a BA in Economics from Lawrence University and an MBA in Finance from the University of Michigan. Raye is a CFA charterholder and member of the CFA Society of Minnesota. | | | | | |  |
| | | |
Scott Cabalka Vice President, Client Service Portfolio Manager Scott Cabalka is a portfolio manager on Voyageur’s Institutional Portfolio Management Team overseeing portfolio strategy and investment activity for clients. Scott has particular expertise managing short duration mandates, and he co-manages the Tamarack Money Market Funds. Before joining Voyageur in 1993, he was an account executive with Merrill Lynch, where he focused on short-term investment strategies for institutional investors. Scott began his career in the investment industry in 1980. He received a BS and an MBA in Finance from the University of Minnesota Carlson School of Management. | | | | | |  |
| | | |
Brandon T. Swensen, CFA Vice President, Portfolio Manager Brandon Swensen is a portfolio manager on the Spread Management Team and leads the firm’s trading activity in short duration investment services. Brandon also has specific research responsibilities for finance companies, automobile, auto asset backed securities and asset backed commercial paper. He joined Voyageur in 2000 and has held several key roles including senior structured product analyst and credit analyst in the fixed income group. Brandon began his career in the investment industry in 1998. He received a BS in Finance from St. Cloud State University and an MBA in Finance from the University of St. Thomas. Brandon is a CFA charterholder and member of the CFA Society of Minnesota. | | | | | |  |
3
| | | | | | | | | | | | |
| | | | | | | PERFORMANCE SUMMARY |
| Investment Objective | | | | | | |
| | | | | | Each of the Tamarack Money Market Funds was managed to preserve principal. This means that the share price of each fund held steady at $1.00. A consistent share price of $1.00 is expected for a money market mutual fund. An investment in the Fund is not insured or guaranteed by the Federal Deposit Insurance Corporation or any other government agency. Although the Fund seeks to preserve the value of your investment at $1.00 per share, it is possible to lose money by investing in the Fund. These risks are more fully described in the prospectus. |
| | | | | |
| | | | | | | | | | | SEC 7-Day Annualized Yield (1) |
| | | | | | | | | Total Return for the Six Months Ended
March 31, 2009 | | March 31, 2009 (Unaudited) | | September 30, 2008 |
| | | | | | Prime Money Market Fund* | | | | | | |
| | | | | | RBC Institutional Class 1 | | 0.66% | | 0.87% | | 2.29% |
| | | | | | RBC Institutional Class 2 | | 0.63% | | 0.72% | | |
| | | | | | RBC Investor Class | | 0.35% | | 0.02% | | |
| | | | | | RBC Reserve Class | | 0.41% | | 0.15% | | |
| | | | | | RBC Select Class | | 0.44% | | 0.25% | | |
| | | | | | U.S. Government Money Market Fund* | | | | | | |
| | | | | | RBC Institutional Class 1 | | 0.57% | | 0.58% | | 1.50% |
| | | | | | RBC Institutional Class 2 | | 0.54% | | 0.48% | | |
| | | | | | RBC Investor Class | | 0.29% | | 0.01% | | |
| | | | | | RBC Reserve Class | | 0.33% | | 0.01% | | |
| | | | | | RBC Select Class | | 0.36% | | 0.01% | | |
| | | | | | Tax-Free Money Market Fund* | | | | | | |
| | | | | | RBC Institutional Class 1 | | 0.51% | | 0.60% | | 5.94% |
| | | | | | RBC Institutional Class 2 | | 0.48% | | 0.52% | | |
| | | | | | RBC Investor Class | | 0.29% | | 0.01% | | |
| | | | | | RBC Reserve Class | | 0.30% | | 0.01% | | |
| | | | | | RBC Select Class | | 0.34% | | 0.09% | | |
| | | | | | Tamarack Institutional Prime Money Market Fund (2) | | 0.62% | | 0.54% | | 2.85% |
| | | | | | Tamarack Institutional Tax-Free Money Market Fund (2) | | 0.48% | | 0.23% | | 6.50% |
| | | | | | |
| | | | | | | | | | | | |
| | | | | | Performance data quoted represents past performance. Past performance is no guarantee of future results. Investment return and principal value of an investment will fluctuate so that an investor’s shares, when redeemed, may be worth more or less than their original cost. Current performance may be lower or higher than performance quoted. Performance shown reflects contractual fee waivers, without such fee waivers total returns would be reduced. Performance information does not reflect the 2% fee on shares redeemed or exchanged within 30 days of purchase. If such redemption fee was included, performance would be reduced. For performance data current to most recent month-end go to www.voyageur.net. *The inception date for the RBC Institutional Class 2, RBC Select Class, RBC Reserve Class and RBC Investor Class is November 21, 2008. All performance shown for these classes of shares prior to their inception date is based on the performance, fees and expenses of RBC Institutional Class 1 shares of the Fund and its predecessors, and has not been adjusted to reflect the fees and expenses of RBC Institutional Class 2, RBC Select Class, RBC Reserve Class, and RBC Investor Class shares. (1) As money market returns respond rapidly to market changes, such as in the Fed Funds rate, the 7-Day yield is a more accurate reflection of current earnings than the total return for the year. Prior year 7-Day yield information is provided for comparative purposes. (2) The Tamarack Institutional Prime and Institutional Tax-Free Money Market Funds are intended for shareholders investing $1 million or more. |
4
| | | | | | | | | | | | | | | | |
PERFORMANCE SUMMARY | | | | | | |
| | | | | | | |
| | | | | | Asset Allocation |
Money Market Maturity Schedules as a percentage of value of investments based on effective maturity as of March 31, 2009. | | | | | | |
| | | Prime Money Market Fund | | U.S.
Government
Money
Market Fund | | Tax-Free
Money
Market Fund | | Tamarack
Institutional
Prime Money
Market Fund | | Tamarack
Institutional
Tax-Free
Money
Market Fund | | | | | | |
Less than 8 days | | 32.6% | | 29.7% | | 75.5% | | 50.4% | | 99.2% | | | | | | |
8 to 14 Days | | 5.4% | | 7.1% | | 0.0% | | 3.2% | | 0.0% | | | | | | |
15 to 30 Days | | 10.6% | | 20.4% | | 0.5% | | 12.0% | | 0.8% | | | | | | |
31 to 180 Days | | 40.6% | | 35.3% | | 5.8% | | 34.4% | | 0.0% | | | | | | |
181 to 365 Days | | 10.8% | | 7.5% | | 18.2% | | 0.0% | | 0.0% | | | | | | |
5
|
SCHEDULE OF PORTFOLIO INVESTMENTS |
Prime Money Market Fund
March 31, 2009 (Unaudited)
| | | | | | |
Principal Amount | | | | Value |
| | Asset Backed Securities — 0.37% |
| | Asset Backed Auto Receivables — 0.37% |
| $ | 42,000,000 | | Nissan Auto Receivables Owner Trust, Series 2009-A , Class A1, 1.76%, 4/15/10(c) | | $ | 42,000,000 |
| | 4,079,231 | | World Omni Auto Receivables Trust, Series 2008-B, Class A1, 3.00%, 8/17/09 | | | 4,079,231 |
| | | | | | |
| |
| Total Asset Backed Securities
(Cost $46,079,231) | | | 46,079,231 |
| | | | | | |
| | Commercial Paper — 19.77% |
| | Banks - Australia & New Zealand — 2.56% |
| | 50,000,000 | | Australia & New Zealand Banking Group Ltd., 0.81%, 7/6/09(a)(b) | | | 49,892,000 |
| | 65,000,000 | | Australia & New Zealand Banking Group Ltd., 0.86%, 6/25/09(a)(b) | | | 64,868,014 |
| | 100,000,000 | | Westpac Banking Corp., 0.50%, 4/15/09(a)(b) | | | 99,980,555 |
| | 100,000,000 | | Westpac Banking Corp., 0.70%, 7/6/09(a)(b) | | | 99,813,333 |
| | | | | | |
| | | | | | 314,553,902 |
| | | | | | |
| | Chemicals — 1.62% |
| | 100,000,000 | | BASF SE, 0.78%, 4/6/09(a)(b) | | | 99,989,167 |
| | 100,000,000 | | BASF SE, 1.25%, 1/8/10(a)(b) | | | 99,020,833 |
| | | | | | |
| | | | | | 199,010,000 |
| | | | | | |
| | Consumer Staples — 1.83% |
| | 50,000,000 | | The Coca-Cola Co., 0.35%, 5/18/09(a)(b) | | | 49,977,153 |
| | 75,000,000 | | The Coca-Cola Co., 0.55%, 6/22/09(a)(b) | | | 74,906,042 |
| | 50,000,000 | | Kimberly-Clark Worldwide, 0.25%, 4/8/09(a)(b) | | | 49,997,569 |
| | 50,000,000 | | Nestle Capital Corp., 0.72%, 10/5/09(a)(b) | | | 49,813,000 |
| | | | | | |
| | | | | | 224,693,764 |
| | | | | | |
| | Finance - Diversified Domestic — 5.27% |
| | 74,000,000 | | American Honda Finance Corp., 0.65%, 4/9/09(b) | | | 73,989,311 |
| | 100,000,000 | | CBA Delaware Finance, Inc., 0.58%, 4/16/09(b) | | | 99,975,833 |
| | 100,000,000 | | CBA Delaware Finance, Inc., 0.80%, 5/26/09(b) | | | 99,877,778 |
| | 100,000,000 | | Reckitt Benckiser, 1.20%, 5/8/09(a)(b) | | | 99,876,667 |
| | 100,000,000 | | Reckitt Benckiser, 1.21%, 5/18/09(a)(b) | | | 99,842,028 |
| | | | | | |
Principal
Amount | | | | Value |
| $ | 75,000,000 | | Reckitt Benckiser, 1.23%, 6/2/09(a)(b) | | $ | 74,841,125 |
| | 100,000,000 | | Toyota Motor Credit Corp., 0.70%, 6/3/09(b) | | | 99,877,500 |
| | | | | | |
| | | | | | 648,280,242 |
| | | | | | |
| | Health Care — 3.12% |
| | 9,301,000 | | Baystate Health Systems, Inc., 0.60%, 4/27/09, (Credit Support: Bank of America)(b) | | | 9,296,970 |
| | 100,000,000 | | Dean Health Systems, Inc., 0.60%, 4/9/09, (Credit Support: U.S. Bank)(b) | | | 99,986,667 |
| | 35,000,000 | | Eli Lilly & Co., 0.50%, 7/15/09(a)(b) | | | 34,948,958 |
| | 35,000,000 | | Eli Lilly & Co., 0.65%, 10/6/09(a)(b) | | | 34,881,195 |
| | 75,000,000 | | Roche Holdings, Inc., 0.30%, 5/18/09(a)(b) | | | 74,970,625 |
| | 100,000,000 | | Roche Holdings, Inc., 0.30%, 5/19/09(a)(b) | | | 99,960,000 |
| | 29,869,000 | | Society of New York Hospital Fund, 1.35%, 5/12/09(b) | | | 29,823,076 |
| | | | | | |
| | | | | | 383,867,491 |
| | | | | | |
| | Industrials — 0.77% |
| | 45,000,000 | | Illinois Tool Works, Inc., 0.57%, 6/1/09(a)(b) | | | 44,956,538 |
| | 50,000,000 | | Procter & Gamble International Funding SCA, 0.49%, 5/19/09(a)(b) | | | 49,967,333 |
| | | | | | |
| | | | | | 94,923,871 |
| | | | | | |
| | Insurance — 0.89% |
| | 110,000,000 | | Met Life Funding, Inc., 1.35%, 4/30/09(a)(b) | | | 109,880,375 |
| | | | | | |
| | Machinery-Diversified — 1.10% |
| | 50,000,000 | | Caterpillar, Inc., 0.30%, 4/13/09(a)(b) | | | 49,995,000 |
| | 52,000,000 | | Caterpillar, Inc., 0.40%, 4/15/09(a)(b) | | | 51,991,911 |
| | 34,000,000 | | Caterpillar, Inc., 0.45%, 4/6/09(a)(b) | | | 33,997,875 |
| | | | | | |
| | | | | | 135,984,786 |
| | | | | | |
| | Oil & Gas — 2.33% |
| | 100,000,000 | | Chevron Corp., 0.50%, 5/29/09(b) | | | 99,919,444 |
| | 50,000,000 | | Chevron Corp., 0.55%, 5/18/09(b) | | | 49,964,097 |
| | 50,000,000 | | Chevron Corp., 0.55%, 5/26/09(b) | | | 49,957,986 |
| | 37,000,000 | | TransCanada Keystone Pipeline LP, 0.40%, 4/15/09(a)(b) | | | 36,994,247 |
| | 50,000,000 | | TransCanada Keystone Pipeline LP, 0.40%, 4/16/09(a)(b) | | | 49,991,667 |
| | | | | | |
| | | | | | 286,827,441 |
| | | | | | |
|
SCHEDULE OF PORTFOLIO INVESTMENTS |
Prime Money Market Fund (cont.)
March 31, 2009 (Unaudited)
| | | | | | |
Principal
Amount | | | | Value |
| | Utilities — 0.28% |
| $ | 35,000,000 | | National Rural Utilities Co., 0.27%, 4/30/09(b) | | $ | 34,992,387 |
| | | | | | |
| Total Commercial Paper
(Cost $2,433,014,259) | | | 2,433,014,259 |
| | | | | | |
| | Certificates of Deposit — 6.74% |
| | Banks - Canada — 2.03% | | | |
| | 100,000,000 | | Bank of Montreal, 0.55%, 6/22/09 | | | 100,000,000 |
| | 50,000,000 | | Bank of Nova Scotia, 0.70%, 4/23/09 | | | 50,000,000 |
| | 100,000,000 | | Bank of Nova Scotia, 0.71%, 5/20/09 | | | 100,001,359 |
| | | | | | |
| | | | | | 250,001,359 |
| | | | | | |
| | Banks - Domestic — 2.05% |
| | 252,000,000 | | Citibank N.A., 0.25%, 4/1/09 | | | 252,000,000 |
| | | | | | |
| | Banks - Foreign — 2.17% |
| | 167,750,000 | | Rabobank Nederland, 0.65%, 6/24/09 | | | 167,761,694 |
| | 100,000,000 | | Rabobank Nederland, 0.70%, 5/5/09 | | | 100,000,000 |
| | | | | | |
| | | | | | 267,761,694 |
| | | | | | |
| | Banks - United Kingdom — 0.49% |
| | 60,000,000 | | Bank of Scotland PLC, 1.45%, 8/6/09(c)(d) | | | 59,991,540 |
| | | | | | |
| Total Certificates of Deposit
(Cost $829,763,053) | | | 829,754,593 |
| | | | | | |
| | Corporate Bonds — 21.84% |
| | Banks - Australia & New Zealand — 2.15% |
| | 63,750,000 | | Australia & New Zealand National (International) Ltd., 1.53%, 10/9/09(a)(c) | | | 63,750,000 |
| | 19,523,000 | | Commonwealth Bank of Australia, 1.31%, 7/16/09(a)(c) | | | 19,514,557 |
| | 42,500,000 | | Commonwealth Bank of Australia, 1.63%, 10/2/09(a)(c) | | | 42,500,000 |
| | 64,000,000 | | National Australia Bank Ltd., 1.51%, 4/6/09(a)(c)(d) | | | 64,000,192 |
| | 75,000,000 | | National Australia Bank Ltd., 1.51%, 10/6/09(a)(c) | | | 74,996,409 |
| | | | | | |
| | | | | | 264,761,158 |
| | | | | | |
| | Banks - Canada — 0.41% |
| | 50,000,000 | | Bank of Nova Scotia, 1.65%, 8/10/09(a)(c) | | | 50,000,000 |
| | | | | | |
| | Banks - Domestic — 2.58% |
| | 73,000,000 | | Bank of America NA, 1.63%, 11/3/09(c) | | | 73,000,000 |
| | 56,000,000 | | PNC Bank NA, 1.63%, 8/5/09(c) | | | 55,648,002 |
| | 50,000,000 | | Wells Fargo & Co., 0.71%, 7/15/09(a)(c) | | | 50,000,000 |
| | 50,000,000 | | Wells Fargo & Co., 3.55%, 5/1/09 | | | 50,002,083 |
| | 64,000,000 | | Wells Fargo Bank, 1.64%, 5/1/09(c)(d) | | | 64,070,245 |
| | 25,000,000 | | Wells Fargo Bank, 4.13%, 12/15/09 | | | 25,192,662 |
| | | | | | |
| | | | | | 317,912,992 |
| | | | | | |
| | | | | | |
Principal
Amount | | | | Value |
| | Banks - Foreign — 1.10% |
| $ | 85,000,000 | | Deutsche Bank AG (New York), 1.64%, 11/4/09(a)(c) | | $ | 85,000,000 |
| | 50,000,000 | | ING Bank NV, 1.50%, 7/24/09(a)(c) | | | 50,000,000 |
| | | | | | |
| | | | | | 135,000,000 |
| | | | | | |
| | Consumer Staples — 0.86% |
| | 106,000,000 | | Procter & Gamble International Funding SCA, 1.49%, 2/8/10(c) | | | 106,000,000 |
| | | | | | |
| | Finance - Diversified Domestic — 6.95% |
| | 17,800,000 | | American Honda Finance Corp., 1.28%, 5/12/09(a)(g) | | | 17,799,686 |
| | 14,642,000 | | American Honda Finance Corp., 1.29%, 7/14/09(a)(c) | | | 14,611,494 |
| | 15,000,000 | | American Honda Finance Corp., 1.36%, 5/5/09(a)(g) | | | 15,001,123 |
| | 100,000,000 | | American Honda Finance Corp., 2.81%, 12/18/09(a)(c) | | | 100,000,000 |
| | 16,672,000 | | Baldwin County Sewer Service LLC, 2.55%, 7/1/28, (Credit Support: Regions Bank)(c) | | | 16,672,000 |
| | 87,000,000 | | General Electric Capital Corp, 0.57%, 10/9/09(c)(d) | | | 86,998,582 |
| | 100,000,000 | | General Electric Capital Corp., 1.36%, 8/31/09(c) | | | 98,912,995 |
| | 25,000,000 | | General Electric Capital Corp., 1.36%, 3/12/10(c) | | | 24,256,297 |
| | 20,776,000 | | JPMorgan Chase & Co., 1.35%, 7/16/09(c) | | | 20,737,191 |
| | 20,300,000 | | JPMorgan Chase & Co., 1.60%, 11/19/09(c) | | | 20,218,151 |
| | 50,000,000 | | JPMorgan Chase & Co., 1.78%, 3/10/10(c) | | | 49,861,258 |
| | 200,000,000 | | Merrill Lynch & Co., Inc., 3.05%, 5/20/09(d)(g) | | | 200,852,258 |
| | 35,000,000 | | Mortgage Bankers Association of America, 1.30%, 5/1/38, (Credit Support: PNC Bank)(c) | | | 35,000,000 |
| | 19,335,000 | | Racetrac Capital LLC, Series 2000, 2.55%, 9/1/20, (Credit Support: Regions Bank)(c) | | | 19,335,000 |
| | 100,000,000 | | Toyota Motor Credit Corp., 2.23%, 12/23/09(c) | | | 100,000,000 |
| | 35,000,000 | | Twins Ballpark LLC, 3.40%, 10/1/34, (Credit Support: Assured Guaranty, JP Morgan)(a)(c) | | | 35,000,000 |
| | | | | | |
| | | | | | 855,256,035 |
| | | | | | |
| | Finance - Diversified Foreign — 0.43% |
| | 52,500,000 | | BP Capital Markets PLC, 1.43%, 10/9/09(c) | | | 52,500,000 |
| | | | | | |
| | Health Care — 2.03% |
| | 150,000,000 | | Eli Lilly & Co., 2.85%, 5/15/09(a)(c) | | | 150,000,000 |
| | 100,000,000 | | Roche Holdings, Inc., 2.25%, 2/25/10(a)(c) | | | 100,000,000 |
| | | | | | |
| | | | | | 250,000,000 |
| | | | | | |
|
SCHEDULE OF PORTFOLIO INVESTMENTS |
Prime Money Market Fund (cont.)
March 31, 2009 (Unaudited)
| | | | | | |
Principal Amount | | | | Value |
| | Industrials — 0.84% | | | |
| $ | 100,000,000 | | 3M Co., 7.14%, 12/14/09(a) | | $ | 103,047,586 |
| | | | | | |
| | Insurance — 2.55% | | | |
| | 40,000,000 | | Metropolitan Life Global Funding I, 1.65%, 5/11/09(a)(c)(d) | | | 39,786,880 |
| | 50,000,000 | | Metropolitan Life Global Funding I, 1.67%, 8/7/09(a)(c)(d) | | | 50,000,000 |
| | 50,000,000 | | Pacific Life Global Funding, 1.51%, 9/9/09(a)(c) | | | 50,000,000 |
| | 63,000,000 | | Pricoa Global Funding I, 1.52%, 9/11/09(a)(c) | | | 63,000,000 |
| | 56,000,000 | | Principal Life Income Funding Trusts, 1.65%, 6/9/09(c)(d) | | | 55,089,608 |
| | 56,000,000 | | Principal Life Income Funding Trusts, 1.65%, 10/9/09(c)(d) | | | 55,995,645 |
| | | | | | |
| | | | | | 313,872,133 |
| | | | | | |
| | Oil & Gas — 0.93% | | | |
| | 115,000,000 | | BP AMI Leasing, Inc., 1.24%, 6/26/09(a)(g) | | | 115,004,292 |
| | | | | | |
| | Telecommunication Services — 1.01% |
| | 124,000,000 | | BellSouth Corp., 4.97%, 4/26/09(a) | | | 124,245,520 |
| | | | | | |
| Total Corporate Bonds
(Cost $2,687,734,216) | | | 2,687,599,716 |
| | | | | | |
| | Municipal Bonds — 10.78% | | | |
| | Alabama — 0.33% | | | |
| | 40,930,000 | | University of Alabama Revenue, Series B, 1.07%, 9/1/31, (Credit Support: Regions Bank)(c) | | | 40,930,000 |
| | | | | | |
| | Arizona — 0.08% | | | |
| | 10,000,000 | | Yuma Industrial Development Authority Refunding Revenue, 0.35%, 8/1/43, (LOC: JP Morgan Chase Bank)(c) | | | 10,000,000 |
| | | | | | |
| | Arkansas — 0.26% | | | |
| | 31,505,000 | | Northwest Regional Airport Authority Revenue, Series A, 1.09%, 2/1/21, (LOC: Regions Bank)(c) | | | 31,505,000 |
| | | | | | |
| | California — 1.75% | | | |
| | 20,000,000 | | City of Oakland GO, Series B, 3.75%, 7/17/09 | | | 20,019,469 |
| | 23,200,000 | | City of Riverside Refunding Revenue, Series A, 3.18%, 6/1/09 | | | 23,200,000 |
| | 75,000,000 | | County of Los Angeles Revenue, Series C, OID, 3.76%, 6/30/09(b) | | | 74,314,818 |
| | 30,293,000 | | County of San Bernardino Refunding Program COP, Series B, 0.85%, 3/1/17, (LOC: Bank of America NA)(c) | | | 30,293,000 |
| | 22,975,000 | | Los Angeles Unified School District Revenue, Series R-10392, 0.83%, 7/1/30, (Credit Support: FSA), Callable 7/1/16 @ 100(a)(c) | | | 22,975,000 |
| | | | | | |
Principal
Amount | | | | Value |
| $ | 44,240,000 | | The Olympic Club Refunding Revenue, 0.85%, 9/30/32, (LOC: Bank of America NA)(c) | | $ | 44,240,000 |
| | | | | | |
| | | | | | 215,042,287 |
| | | | | | |
| | Florida — 0.24% | | | |
| | 13,000,000 | | City of Tampa Volunteers of America Refunding Revenue, 1.04%, 9/1/32, (LOC: Regions Bank)(c) | | | 13,000,000 |
| | 17,000,000 | | Highlands County Health Facilities Authority Revenue, 0.48%, 11/15/37, (LOC: SunTrust Bank)(c) | | | 17,000,000 |
| | | | | | |
| | | | | | 30,000,000 |
| | | | | | |
| | Georgia — 0.51% | | | |
| | 38,900,000 | | Valdosta-Lowndes County Industrial Development Authority Revenue, Series B, 1.00%, 6/1/28, (LOC: Wachovia Bank NA)(c) | | | 38,900,000 |
| | 23,700,000 | | Walker Dade & Catoosa Counties Hospital Authority Refunding Revenue, 1.04%, 10/1/28, (LOC: Regions Bank)(c) | | | 23,700,000 |
| | | | | | |
| | | | | | 62,600,000 |
| | | | | | |
| | Illinois — 0.13% | | | |
| | 15,340,000 | | Chicago O’Hare International Airport, 0.91%, 1/1/16, (Credit Support: BHAC-CR)(a)(c) | | | 15,340,000 |
| | | | | | |
| | Kentucky — 0.06% | | | |
| | 7,720,000 | | City of Wilmore Industrial Building, Asbury Theological Project Revenue, 1.04%, 8/1/31, (LOC: Regions Bank)(c) | | | 7,720,000 |
| | | | | | |
| | Louisiana — 0.29% | | | |
| | 36,125,000 | | Louisiana Public Facilities Authority, Coco-Cola Bottling Co. Project Revenue, 1.04%, 4/1/23, (LOC: Regions Bank)(c) | | | 36,125,000 |
| | | | | | |
| | Massachusetts — 0.46% | | | |
| | 56,200,000 | | Massachusetts Health & Educational Facilities Authority Revenue, Boston University, Series N, 0.50%, 10/1/34, (LOC: Bank of America NA)(c) | | | 56,200,000 |
| | | | | | |
| | Michigan — 0.34% | | | |
| | 41,630,000 | | Detroit Economic Development Corp. Revenue, Series A, 0.95%, 5/1/09, (LOC: Deutsche Bank Trust Co. of America)(c) | | | 41,630,000 |
| | | | | | |
| | New Jersey — 0.60% | | | |
| | 44,725,000 | | Newark GO, 3.25%, 1/20/10 | | | 45,077,093 |
| | 28,000,000 | | Newark School Promotion GO, Series D, 3.25%, 1/20/10 | | | 28,220,427 |
| | | | | | |
| | | | | | 73,297,520 |
| | | | | | |
|
SCHEDULE OF PORTFOLIO INVESTMENTS |
Prime Money Market Fund (cont.)
March 31, 2009 (Unaudited)
| | | | | | |
Principal
Amount | | | | Value |
| | New York — 1.49% | | | |
| $ | 24,725,000 | | Nassau County GO, Series B, 0.35%, 12/1/24, (LOC: Bank of America NA)(c) | | $ | 24,725,000 |
| | 36,115,000 | | New York City Housing Development Corp. Multi-Family Rental Housing Revenue, Series B, 0.95%, 4/15/36, (Credit Support: Fannie Mae)(c) | | | 36,115,000 |
| | 96,000,000 | | New York State Housing Finance Agency Revenue, 320 West 38 Project, Series B, 0.70%, 5/1/42, (LOC: Wachovia Bank NA)(c) | | | 96,000,000 |
| | 26,500,000 | | New York State Housing Finance Agency Revenue, West 37th Street Project, Series B, 1.00%, 5/1/42, (LOC: Wachovia Bank NA)(c) | | | 26,500,000 |
| | | | | | |
| | | | | | 183,340,000 |
| | | | | | |
| | Pennsylvania — 0.38% | | | |
| | 26,900,000 | | Blair County Industrial Development Authority Revenue, 1.30%, 10/1/28, (LOC: PNC Bank NA)(c) | | | 26,900,000 |
| | 20,000,000 | | City of Philadelphia Refunding Revenue, Series C, 0.55%, 6/15/25, (LOC: TD Bank NA)(c) | | | 20,000,000 |
| | | | | | |
| | | | | | 46,900,000 |
| | | | | | |
| | Rhode Island — 0.18% | | | |
| | 22,330,000 | | Rhode Island Health & Educational Building Corp. Refunding Revenue, Series A, 0.45%, 8/15/34, (LOC: Bank of America NA)(c) | | | 22,330,000 |
| | | | | | |
| | Tennessee — 2.11% | | | |
| | 260,000,000 | | Johnson City Health & Educational Facilities Board Hospital Revenue, Series B, 1.55%, 7/1/33, (LOC: Regions Bank)(c) | | | 260,000,000 |
| | | | | | |
| | Texas — 0.48% | | | |
| | 13,000,000 | | Port of Corpus Christi Industrial Development Corp., Citgo Petroleum Corp. Project Revenue, 0.40%, 8/1/28, (LOC: JP Morgan Chase Bank)(c) | | | 13,000,000 |
| | 46,400,000 | | Port of Corpus Christi Industrial Development Corp., Citgo Petroleum Corp. Project Revenue, Series C, 0.40%, 10/1/36, (LOC: JP Morgan Chase Bank)(c) | | | 46,400,000 |
| | | | | | |
| | | | | | 59,400,000 |
| | | | | | |
| | Virginia — 0.64% | | | |
| | 18,490,000 | | Newport News Economic Development Authority Revenue, Series B, 1.05%, 7/1/31, (LOC: Wachovia Bank NA)(c) | | | 18,490,000 |
| | | | | | |
Principal
Amount | | | | Value |
| $ | 27,075,000 | | Stafford County & Staunton Industrial Development Authority Revenue, Series B1, 0.50%, 3/1/35, (LOC: Bank of America NA)(c) | | $ | 27,075,000 |
| | 33,240,000 | | Stafford County Revenue, 0.60%, 4/6/09(b) | | | 33,240,000 |
| | | | | | |
| | | | | | 78,805,000 |
| | | | | | |
| | Wisconsin — 0.45% | | | |
| | 22,395,000 | | Wisconsin Housing & Economic Development Authority Revenue, Series F, 1.00%, 5/1/30, (Credit Support: GO of Authority)(c) | | | 22,395,000 |
| | 33,315,000 | | Wisconsin Housing & Economic Development Authority Revenue, Series F, 1.00%, 11/1/30, (Credit Support: GO of Authority)(c) | | | 33,315,000 |
| | | | | | |
| | | | | | 55,710,000 |
| | | | | | |
| Total Municipal Bonds
(Cost $1,326,874,807) | | | 1,326,874,807 |
| | | | | | |
| U.S. Government Agency Backed
Mortgages — 2.75% |
| | Fannie Mae — 1.77% | | | |
| | 2,591,274 | | Pool #381612, 6.07%, 5/1/09 | | | 2,590,421 |
| | 1,294,776 | | Pool #381963, 7.33%, 9/1/09 | | | 1,302,183 |
| | 214,000,000 | | Pool #958363, 0.53%, 6/1/09(b) | | | 213,807,817 |
| | | | | | |
| | | | | | 217,700,421 |
| | | | | | |
| | Freddie Mac — 0.98% | | | |
| | 4,644,661 | | Pool #W00065, 7.21%, 8/1/09 | | | 4,668,167 |
| | 115,878,193 | | Series 3427, 0.71%, 3/15/10(c) | | | 115,878,193 |
| | | | | | |
| | | | | | 120,546,360 |
| | | | | | |
| Total U.S. Government Agency
Backed Mortgages
(Cost $338,246,781) | | | 338,246,781 |
| | | | | | |
| | U.S. Government Agency Obligations — 23.12% |
| | Fannie Mae — 9.75% | | | |
| | 240,000,000 | | 2.85%, 5/29/09(b) | | | 238,898,000 |
| | 200,000,000 | | 1.17%, 2/12/10(c) | | | 199,567,041 |
| | 300,000,000 | | 1.18%, 8/5/10(c) | | | 299,952,190 |
| | 50,000,000 | | 1.24%, 7/13/10(c) | | | 50,000,000 |
| | 84,000,000 | | 6.63%, 9/15/09 | | | 86,191,978 |
| | 310,000,000 | | 7.25%, 1/15/10 | | | 325,528,616 |
| | | | | | |
| | | | | | 1,200,137,825 |
| | | | | | |
| | Federal Farm Credit Bank — 1.63% |
| | 100,000,000 | | 0.66%, 4/27/10 | | | 99,989,185 |
| | 100,000,000 | | 0.68%, 6/2/10(c) | | | 100,000,000 |
| | | | | | |
| | | | | | 199,989,185 |
| | | | | | |
| | Federal Home Loan Bank — 6.12% |
| | 220,000,000 | | 0.65%, 1/21/10(c) | | | 220,000,000 |
|
SCHEDULE OF PORTFOLIO INVESTMENTS |
Prime Money Market Fund (cont.)
March 31, 2009 (Unaudited)
| | | | | | |
Principal
Amount | | | | Value |
| $ | 100,000,000 | | 0.80%, 2/26/10(c) | | $ | 100,000,000 |
| | 100,000,000 | | 0.84%, 3/12/10(c) | | | 99,980,845 |
| | 10,000,000 | | 0.88%, 12/23/09 | | | 10,000,000 |
| | 122,500,000 | | 0.93%, 3/25/10 | | | 122,439,760 |
| | 100,000,000 | | 0.98%, 10/30/09(c) | | | 99,929,124 |
| | 100,000,000 | | 2.25%, 10/2/09 | | | 100,670,394 |
| | | | | | |
| | | | | | 753,020,123 |
| | | | | | |
| | Freddie Mac — 5.62% | | | |
| | 90,000,000 | | 0.50%, 9/21/09(c) | | | 89,940,421 |
| | 100,000,000 | | 1.09%, 2/4/10(c) | | | 100,000,000 |
| | 200,000,000 | | 1.23%, 8/24/10(c) | | | 200,000,000 |
| | 202,250,000 | | 3.13%, 2/4/10 | | | 205,715,882 |
| | 90,625,000 | | 7.00%, 3/15/10 | | | 95,864,938 |
| | | | | | |
| | | | | | 691,521,241 |
| | | | | | |
| Total U.S. Government Agency
Obligations
(Cost $2,844,668,374) | | | 2,844,668,374 |
| | | | | | |
|
| | Repurchase Agreements — 13.61% |
| | 250,000,000 | | Barclays Capital, Inc. dated 3/31/09; due 4/1/09 at 0.30% with maturity value of $250,002,083 (fully collateralized by Fannie Mae and Freddie Mac with maturity dates ranging from 9/1/33 to 11/1/38 at rates ranging from 4.50% to 7.50%). | | | 250,000,000 |
| | 1,025,000,000 | | BNP Paribas Securities Corp. dated 3/31/09; due 4/1/09 at 0.20% with maturity value of $1,025,005,694 (fully collateralized by Fannie Mae and Freddie Mac with maturity dates ranging from 3/1/36 to 8/1/38 at rates ranging from 5.00% to 5.50%). | | | 1,025,000,000 |
| | 400,000,000 | | Deutsche Bank AG dated 3/31/09; due 4/1/09 at 0.25% with maturity value of $400,002,778 (fully collateralized by Fannie Mae with maturity dates ranging from 11/1/35 to 1/1/39 at rates ranging from 5.00% to 7.00%). | | | 400,000,000 |
| | | | | | |
| Total Repurchase Agreements
(Cost $1,675,000,000) | | | 1,675,000,000 |
| | | | | | |
| | | | |
| Shares | | | | Value |
| Investment Company — 2.44% |
| 300,559,225 | | Wells Fargo Prime Investment Money Market Fund | | $300,559,225 |
| | | | |
| |
Total Investment Company
(Cost $300,559,225) | | 300,559,225 |
| | | | |
| | | | | |
| | |
Principal Amount | | | | | |
| Capital Support Agreement — 0.00% | |
| $0 | | Voyageur Capital Support Agreement(e) | | 0 | |
| | | | | |
| |
Total Capital Support Agreement (Cost $0) | | 0 | |
| | | | | |
| |
Total Investments (Cost $12,481,939,946)(f) — 101.42% | | 12,481,796,986 | |
| |
| Liabilities in excess of other assets — (1.42)% | | (175,151,063 | ) |
| | | | | |
| NET ASSETS — 100.00% | | $12,306,645,923 | |
| | | | | |
| (a) | Security exempt from registration under Rule 144A of the Securities Act of 1933, as amended. These securities may be resold in transactions exempt from registration, normally to qualified institutional buyers. Security has been deemed to be liquid based on procedures approved by the Board of Trustees. |
| (b) | Represents effective yield to maturity on date of purchase. |
| (c) | Variable rate security. The rate reflected in the Schedule of Portfolio Investments is the rate in effect on March 31, 2009. The maturity date represents the actual maturity date. The security’s effective maturity resets periodically. |
| (d) | Security (“Eligible Note”) is subject to capital support agreement and is stated at fair value. See Note 7. |
| (e) | The Fund has entered into a Capital Support Agreement (“Agreement”) with Voyageur Asset Management Inc. (“Voyageur”) which provides that Voyageur will contribute capital to the Fund, up to a specified maximum amount, in the event that the Fund realizes a loss on any of the Eligible Notes securities and such realized loss causes the Fund’s net asset value as calculated using the market based net asset value to drop below $0.9950. As of March 31, 2009, the fair value of the Agreement was $0. See Note 7. |
|
SCHEDULE OF PORTFOLIO INVESTMENTS |
Prime Money Market Fund (cont.)
March 31, 2009 (Unaudited)
| (f) | Book cost of $12,481,939,946 and depreciation of $142,960 on securities is equal to tax cost and depreciation on securities. |
| (g) | Variable rate security. The rate reflected in the Schedule of Portfolio Investments is the rate in effect on March 31, 2009 |
Abbreviations used are defined below:
BHAC-CR - Berkshire Hathaway Assurance Corp. Custodial Receipts
COP - Certificate of Participation
FSA - Financial Security Assurance, Inc.
GO - General Obligation
LOC - Letter of Credit
OID - Original Issue Discount
See notes to financial statements.
|
SCHEDULE OF PORTFOLIO INVESTMENTS |
U.S. Government Money Market Fund
March 31, 2009 (Unaudited)
| | | | | | |
Principal
Amount | | | | Value |
| | U.S. Government Agency Backed Mortgages — 12.22% |
| | Fannie Mae — 10.68% |
| $ | 421,110 | | Pool #381535, 6.15%, 4/1/09 | | $ | 421,110 |
| | 5,152,261 | | Pool #381687, 6.40%, 6/1/09 | | | 5,162,050 |
| | 8,076,305 | | Pool #381797, 6.79%, 7/1/09 | | | 8,079,508 |
| | 4,719,978 | | Pool #381882, 6.80%, 8/1/09 | | | 4,738,645 |
| | 5,974,310 | | Pool #385362, 5.06%, 8/1/09 | | | 5,968,676 |
| | 1,583,910 | | Pool #725564, 4.47%, 4/1/09 | | | 1,583,910 |
| | 53,115 | | Pool #725929, 6.10%, 4/1/09 | | | 53,115 |
| | 74,284,000 | | Pool #957991, 0.67%, 4/1/09(a) | | | 74,284,000 |
| | 2,500,000 | | Pool #957996, 0.67%, 4/1/09(a) | | | 2,500,000 |
| | 10,250,000 | | Pool #957997, 0.67%, 4/1/09(a) | | | 10,250,000 |
| | 10,000,000 | | Pool #957998, 0.67%, 4/1/09(a) | | | 10,000,000 |
| | 16,938,000 | | Pool #958252, 0.40%, 5/1/09(a) | | | 16,932,354 |
| | 67,632,000 | | Pool #958255, 0.39%, 5/1/09(a) | | | 67,610,020 |
| | 7,061,000 | | Pool #958306, 0.54%, 5/1/09(a) | | | 7,057,823 |
| | 51,000,000 | | Pool #958355, 0.53%, 6/1/09(a) | | | 50,954,199 |
| | 74,284,000 | | Pool #958477, 0.46%, 7/1/09(a) | | | 74,197,624 |
| | 3,300,000 | | Pool #958479, 0.42%, 7/1/09(a) | | | 3,296,496 |
| | 10,250,000 | | Pool #958480, 0.42%, 7/1/09(a) | | | 10,239,118 |
| | 10,000,000 | | Pool #958481, 0.42%, 7/1/09(a) | | | 9,989,383 |
| | 10,500,000 | | Pool #958482, 3.27%, 7/1/09 | | | 10,491,321 |
| | 152,362,500 | | Pool #958544, 0.28%, 5/1/09(a) | | | 152,326,949 |
| | 19,537,000 | | Pool #958547, 0.45%, 7/1/09(a) | | | 19,514,777 |
| | 11,500,000 | | Pool #958573, 0.45%, 7/1/09(a) | | | 11,486,919 |
| | | | | | |
| | | | | | 557,137,997 |
| | | | | | |
| | Freddie Mac — 1.54% | | | |
| | 7,609,376 | | Pool #M80792, 4.50%, 1/1/10 | | | 7,724,776 |
| | 594,880 | | Pool #M90912, 4.00%, 4/1/09 | | | 594,880 |
| | 4,062,535 | | Pool #W00065, 7.21%, 8/1/09 | | | 4,082,902 |
| | 68,163,643 | | Series 3427, 0.71%, 3/15/10(b) | | | 68,163,643 |
| | | | | | |
| | | | | | 80,566,201 |
| | | | | | |
| Total U.S. Government Agency
Backed Mortgages
(Cost $637,704,198) | | | 637,704,198 |
| | | | | | |
| | U.S. Government Agency Obligations — 72.83% |
| | Fannie Mae — 21.90% |
| | 250,000,000 | | 0.36%, 8/3/09(a) | | | 249,690,000 |
| | 31,250,000 | | 0.45%, 7/1/09(a) | | | 31,214,453 |
| | 113,819,600 | | 0.82%, 1/4/10(a) | | | 113,103,264 |
| | 130,000,000 | | 1.02%, 7/28/09(b) | | | 129,993,192 |
| | 150,000,000 | | 1.05%, 4/27/09(a) | | | 149,886,250 |
| | 75,000,000 | | 1.08%, 1/21/10(b) | | | 75,000,000 |
| | 100,000,000 | | 1.17%, 2/12/10(b) | | | 99,783,521 |
| | 100,000,000 | | 1.24%, 7/13/10(b) | | | 100,000,000 |
| | 100,000,000 | | 1.52%, 4/13/09(a) | | | 99,949,333 |
| | 57,977,000 | | 2.50%, 4/9/10 | | | 58,783,799 |
| | 30,000,000 | | 6.38%, 6/15/09 | | | 30,223,316 |
| | | | | | |
Principal
Amount | | | | Value |
| $ | 5,000,000 | | 7.25%, 1/15/10 | | $ | 5,249,118 |
| | | | | | |
| | | | | | 1,142,876,246 |
| | | | | | |
| | Federal Farm Credit Bank — 4.88% |
| | 100,000,000 | | 0.37%, 8/4/09(b) | | | 100,000,000 |
| | 50,000,000 | | 0.39%, 8/5/09(b) | | | 50,000,000 |
| | 75,000,000 | | 1.06%, 5/28/10(b) | | | 75,000,000 |
| | 30,000,000 | | 1.09%, 8/11/09(b) | | | 30,000,000 |
| | | | | | |
| | | | | | 255,000,000 |
| | | | | | |
| | Federal Home Loan Bank — 23.95% |
| | 50,000,000 | | 0.46%, 8/27/09(b) | | | 50,000,000 |
| | 50,000,000 | | 0.47%, 9/4/09(b) | | | 50,000,000 |
| | 100,000,000 | | 0.61%, 1/14/10(b) | | | 100,000,000 |
| | 100,000,000 | | 0.65%, 1/21/10(b) | | | 100,000,000 |
| | 50,000,000 | | 0.80%, 2/26/10(b) | | | 50,000,000 |
| | 100,000,000 | | 0.84%, 3/12/10(b) | | | 99,980,845 |
| | 75,000,000 | | 0.98%, 10/30/09(b) | | | 74,946,843 |
| | 50,000,000 | | 0.99%, 4/30/09(d) | | | 50,000,000 |
| | 50,000,000 | | 1.04%, 5/20/09(d) | | | 49,998,315 |
| | 100,000,000 | | 1.05%, 5/13/09(d) | | | 100,000,000 |
| | 125,000,000 | | 1.21%, 2/19/10(b) | | | 125,150,768 |
| | 100,000,000 | | 1.25%, 7/9/10(b) | | | 99,974,480 |
| | 39,500,000 | | 1.37%, 11/18/09(b) | | | 39,500,000 |
| | 100,000,000 | | 1.72%, 5/28/09(a) | | | 99,727,667 |
| | 10,000,000 | | 3.75%, 1/8/10 | | | 10,198,350 |
| | 25,000,000 | | 4.25%, 11/20/09 | | | 25,504,027 |
| | 50,000,000 | | 4.38%, 3/17/10 | | | 51,541,582 |
| | 40,900,000 | | 5.00%, 12/11/09 | | | 42,061,666 |
| | 31,060,000 | | 5.38%, 7/17/09 | | | 31,506,052 |
| | | | | | |
| | | | | | 1,250,090,595 |
| | | | | | |
| | Freddie Mac — 21.83% |
| | 101,700,000 | | 0.28%, 6/15/09(a) | | | 101,641,735 |
| | 150,000,000 | | 0.42%, 9/1/09(a) | | | 149,732,250 |
| | 100,000,000 | | 0.43%, 12/23/09(b) | | | 99,978,196 |
| | 25,000,000 | | 0.45%, 6/22/09(a) | | | 24,974,375 |
| | 154,000,000 | | 0.50%, 9/21/09(b) | | | 153,904,256 |
| | 200,000,000 | | 0.53%, 9/18/09(b) | | | 199,961,495 |
| | 125,000,000 | | 1.09%, 2/4/10(b) | | | 125,000,000 |
| | 100,000,000 | | 1.19%, 9/24/10(b) | | | 99,970,437 |
| | 106,000,000 | | 4.13%, 11/30/09 | | | 108,142,516 |
| | 75,930,000 | | 5.00%, 6/11/09 | | | 76,335,395 |
| | | | | | |
| | | | | | 1,139,640,655 |
| | | | | | |
| | Overseas Private Investment Corp. — 0.27% |
| | 12,545,590 | | 0.40%, 11/15/13(b) | | | 12,545,590 |
|
SCHEDULE OF PORTFOLIO INVESTMENTS |
U.S. Government Money Market Fund (cont.)
March 31, 2009 (Unaudited)
| | | | | | |
Principal
Amount | | | | Value |
| $ | 1,400,000 | | 0.40%, 3/15/15(b) | | $ | 1,400,000 |
| | | | | | |
| | | | | | 13,945,590 |
| | | | | | |
| Total U.S. Government Agency
Obligations
(Cost$3,801,553,086) | | | 3,801,553,086 |
| | | | | | |
| | Repurchase Agreement — 18.68% |
| | 975,000,000 | | BNP Paribas Securities Corp. dated 3/31/09; due 4/1/09 at 0.20% with maturity value of $975,005,417 (fully collateralized by Fannie Mae and Freddie Mac with maturity dates ranging from 8/1/35 to 10/1/38 at rates ranging from 5.00% to 7.00%). | | | 975,000,000 |
| | | | | | |
| Total Repurchase Agreement
(Cost $975,000,000) | | | 975,000,000 |
| | | | | | |
| | |
| Shares | | | | |
| | Investment Company — 4.51% |
| | 235,510,154 | | Wells Fargo Government Institutional Money Market Fund | | | 235,510,154 |
| | | | | | |
| Total Investment Company
(Cost $235,510,154) | | | 235,510,154 |
| | | | | | |
| | | | | | |
| | | | | Value | |
Total Investments
(Cost$5,649,767,438)(c) — 108.24% | | $ | 5,649,767,438 | |
Liabilities in excess of other
assets — (8.24)% | | | (430,304,415 | ) |
| | | | | | |
| NET ASSETS — 100.00% | | $ | 5,219,463,023 | |
| | | | | | |
| (a) | Represents effective yield to maturity on date of purchase. |
| (b) | Variable rate security. The rate reflected in the Schedule of Portfolio Investments is the rate in effect on March 31, 2009. The maturity date represents the actual maturity date. The security’s effective maturity resets periodically. |
| (c) | Tax cost of securities is equal to book cost of securities. |
| (d) | Variable rate security. The rate reflected in the Schedule of Portfolio Investments is the rate in effect on March 31, 2009. |
See notes to financial statements.
|
SCHEDULE OF PORTFOLIO INVESTMENTS |
Tax-Free Money Market Fund
March 31, 2009 (Unaudited)
| | | | | | |
Principal
Amount | | | | Value |
| | Municipal Bonds — 96.96% | | | |
| | Alabama — 1.65% | | | |
| $ | 16,500,000 | | Washington County Industrial Development Authority Revenue, 1.00%, 8/1/37, (LOC: Regions Bank)(a) | | $ | 16,500,000 |
| | | | | | |
| | Arizona — 0.30% | | | |
| | 3,000,000 | | Arizona State Transportation Board Revenue, 6.00%, 7/1/12(d) | | | 3,035,041 |
| | | | | | |
| | California — 2.06% | | | |
| | 590,000 | | Hesperia Public Financing Authority Refunding Revenue, Series B, 0.60%, 6/1/22, (LOC: Bank of America NA)(a) | | | 590,000 |
| | 20,000,000 | | Los Angeles Unified School District Revenue, Series R-10392, 0.83%, 7/1/30, (Credit Support: FSA), Callable 7/1/16 @ 100(a)(b) | | | 20,000,000 |
| | | | | | |
| | | | | | 20,590,000 |
| | | | | | |
| | Colorado — 3.96% | | | |
| | 3,170,000 | | Aurora Centretech Metropolitan District GO, Series C, 0.54%, 12/1/28, (LOC: U.S. Bank NA)(a) | | | 3,170,000 |
| | 1,250,000 | | Colorado Health Facilities Authority Revenue, Series A, 0.61%, 4/1/24, (LOC: Wells Fargo Bank NA)(a) | | | 1,250,000 |
| | 3,000,000 | | Colorado Housing & Finance Authority Refunding Revenue, 0.55%, 2/15/28, (Credit Support: Fannie Mae)(a) | | | 3,000,000 |
| | 5,000,000 | | Commerce City Northern Infrastructure General Improvement District GO, 0.54%, 12/1/28, (LOC: U.S. Bank NA)(a) | | | 5,000,000 |
| | 16,610,000 | | Crystal Valley Metropolitan District No. 1 Revenue, 0.47%, 10/1/34, (LOC: Wells Fargo Bank NA)(a) | | | 16,610,000 |
| | 5,200,000 | | Gateway Regional Metropolitan District Refunding GO, 0.47%, 12/1/37, (LOC: Wells Fargo Bank NA)(a) | | | 5,200,000 |
| | 5,290,000 | | Water Valley Metropolitan District No. 2 GO, 0.47%, 12/1/24, (LOC: Wells Fargo Bank NA)(a) | | | 5,290,000 |
| | | | | | |
| | | | | | 39,520,000 |
| | | | | | |
| | District Of Columbia — 2.47% | | | |
| | 7,150,000 | | District of Columbia Revenue, Association American Medical Colleges, Series B, 0.56%, 2/1/27, (LOC: Bank of America NA)(a) | | | 7,150,000 |
| | 8,100,000 | | District of Columbia Revenue, Foundation Jewish Campus Life, 0.58%, 5/1/27, (LOC: SunTrust Bank)(a) | | | 8,100,000 |
| | | | | | |
Principal
Amount | | | | Value |
| $ | 9,360,000 | | District of Columbia Water & Sewer Authority Revenue, 0.76%, 10/1/34, (Credit Support: Assured GTY), Callable 10/1/18 @ 100(a)(b) | | $ | 9,360,000 |
| | | | | | |
| | | | | | 24,610,000 |
| | | | | | |
| | Florida — 8.26% | | | |
| | 3,715,000 | | City of Eustis Revenue, Series A, 0.83%, 12/1/27, (LOC: SunTrust Bank)(a) | | | 3,715,000 |
| | 2,100,000 | | City of Jacksonville Revenue, 0.50%, 7/1/19, (LOC:Bank of America NA)(a) | | | 2,100,000 |
| | 5,490,000 | | City of Port St. Joe Revenue, 1.04%, 12/1/38, (LOC: Regions Bank)(a) | | | 5,490,000 |
| | 4,995,000 | | City of Tallahassee Revenue, Series 2069Z, 0.84%, 4/1/15, (Credit Support: MBIA)(a) | | | 4,995,000 |
| | 2,660,000 | | Collier County Industrial Development Authority Revenue, 0.60%, 12/1/26, (LOC: Bank of America NA)(a) | | | 2,660,000 |
| | 1,280,000 | | Florida Housing Finance Corp. Refunding Revenue, Series I, 0.55%, 11/1/32, (Credit Support: Freddie Mac)(a) | | | 1,280,000 |
| | 5,835,000 | | Marion County Industrial Development Authority Refunding Revenue, 0.55%, 11/15/32, (Credit Support: Fannie Mae)(a) | | | 5,835,000 |
| | 5,355,000 | | Miami-Dade County Industrial Development Authority Revenue, 0.57%, 9/1/29, (LOC: Bank of America NA)(a) | | | 5,355,000 |
| | 8,000,000 | | Miami-Dade County Industrial Development Authority Revenue, 1.04%, 6/1/31, (LOC: Regions Bank)(a) | | | 8,000,000 |
| | 15,000,000 | | Miami-Dade County School District Revenue, 1.50%, 1/28/10 | | | 15,108,521 |
| | 9,015,000 | | Orange County Housing Finance Authority Refunding Revenue, 0.50%, 6/1/25, (Credit Support: Fannie Mae)(a) | | | 9,015,000 |
| | 18,810,000 | | Peace River Manasota Regional Water Supply Authority Revenue,Series R-10408, 0.83%, 10/1/35, (Credit Support:BHAC-CR, FSA), Callable 10/1/15 @ 100(a)(b) | | | 18,810,000 |
| | | | | | |
| | | | | | 82,363,521 |
| | | | | | |
| | Georgia — 5.65% | | | |
| | 11,500,000 | | Camden County Public Service Authority Revenue, 0.55%, 12/1/32, (Credit Support: Assured GTY)(a) | | | 11,500,000 |
| | 4,755,000 | | Cobb County Housing Authority Refunding Revenue, 0.55%, 3/1/24, (Credit Support: Freddie Mac)(a) | | | 4,755,000 |
| | 7,590,000 | | Fulton County Development Authority Revenue, 0.55%, 4/1/34, (LOC: Bank of America NA)(a) | | | 7,590,000 |
|
SCHEDULE OF PORTFOLIO INVESTMENTS |
Tax-Free Money Market Fund (cont.)
March 31, 2009 (Unaudited)
| | | | | | |
Principal
Amount | | | | Value |
| $ | 10,620,000 | | Fulton County Development Authority Revenue, 0.58%, 11/1/28, (LOC: SunTrust Bank)(a) | | $ | 10,620,000 |
| | 3,400,000 | | Fulton County Development Authority Revenue, 0.83%, 4/1/17, (LOC: SunTrust Bank)(a) | | | 3,400,000 |
| | 5,495,000 | | Lowndes County Board of Education GO, 4.25%, 2/1/10, (Credit Support: State Aid Withholding) | | | 5,650,263 |
| | 8,725,000 | | Marietta Housing Authority Refunding Revenue, 0.54%, 7/1/24, (Credit Support: Fannie Mae)(a) | | | 8,725,000 |
| | 1,050,000 | | State of Georgia GO, Series F, 4.50%, 12/1/09 | | | 1,076,573 |
| | 3,100,000 | | Thomasville Hospital Authority Revenue, 0.58%, 11/1/23, (LOC: SunTrust Bank)(a) | | | 3,100,000 |
| | | | | | |
| | | | | | 56,416,836 |
| | | | | | |
| | Hawaii — 0.11% |
| | 1,000,000 | | City & County of Honolulu GO, Pre-Refunded, Series A, 6.00%, 1/1/10 | | | 1,040,634 |
| | | | | | |
| | Illinois — 2.41% |
| | 6,500,000 | | Galesburg Revenue, 0.55%, 3/1/31, (LOC: Bank of America)(a) | | | 6,500,000 |
| | 1,680,000 | | Illinois Finance Authority Revenue, 0.50%, 6/1/17, (LOC: Bank One NA)(a) | | | 1,680,000 |
| | 6,900,000 | | Illinois Health Facilities Authority Revenue, Series C, 0.53%, 1/1/16, (LOC: JP Morgan Chase)(a) | | | 6,900,000 |
| | 7,800,000 | | Kane County School District No. 129, Aurora West Side GO, 3.00%, 6/30/09 | | | 7,824,169 |
| | 1,175,000 | | Lake County Community Consolidated School District No 73-Hawthorn GO, Series 329, 0.84%, 12/1/14, (Credit Support: FGIC)(a)(b) | | | 1,175,000 |
| | | | | | |
| | | | | | 24,079,169 |
| | | | | | |
| | Indiana — 6.40% |
| | 16,931,000 | | Elkhart Community Schools GO, 2.00%, 12/31/09, (Credit Support: State Aid Withholding) | | | 17,047,921 |
| | 23,445,000 | | Indiana Bond Bank Revenue, Series A, 2.00%, 1/5/10 | | | 23,604,405 |
| | 17,800,000 | | Indiana Finance Authority Revenue, Series A, 1.50%, 7/1/35, (LOC: Regions Bank)(a) | | | 17,800,000 |
| | 5,390,000 | | Vincennes University Revenue, Series F, 0.53%, 10/1/22, (LOC: JP Morgan Chase)(a) | | | 5,390,000 |
| | | | | | |
| | | | | | 63,842,326 |
| | | | | | |
| | Iowa — 6.04% |
| | 1,985,000 | | Iowa Finance Authority Revenue, 0.60%, 4/1/25, (LOC: Bank of America NA)(a) | | | 1,985,000 |
| | | | | | |
Principal
Amount | | | | Value |
| $ | 6,605,000 | | Iowa Finance Authority Revenue, Series A1, 0.50%, 2/15/35, (Credit Support: Assured GTY)(a) | | $ | 6,602,798 |
| | 20,545,000 | | Iowa Finance Authority Revenue, Series A3, 0.47%, 2/15/35, (Credit Support: Assured GTY)(a) | | | 20,545,000 |
| | 7,870,000 | | Iowa Higher Education Loan Authority Revenue, 0.47%, 5/1/20, (LOC: Wells Fargo Bank NA)(a) | | | 7,870,000 |
| | 9,020,000 | | Iowa Higher Education Loan Authority Revenue, 0.55%, 4/1/27, (LOC: Bank of America)(a) | | | 9,020,000 |
| | 14,000,000 | | Iowa State School Cash Anticipation Program Revenue, Series B, 3.00%, 1/21/10, (Credit Support: State Aid Withholding), (LOC: U.S. Bank NA) | | | 14,246,895 |
| | | | | | |
| | | | | | 60,269,693 |
| | | | | | |
| | Kansas — 3.29% |
| | 4,455,000 | | Sedgwick County Unified School District No. 259 GO, 5.00%, 10/1/09 | | | 4,543,634 |
| | 2,510,000 | | University of Kansas Hospital Authority Revenue, 0.40%, 9/1/34, (Credit Support: GO of Authority), (LOC: U.S. Bank)(a) | | | 2,510,000 |
| | 25,770,000 | | Wyandotte County-Kansas City Unified Government, GO, Series II, 2.00%, 3/1/10 | | | 25,770,000 |
| | | | | | |
| | | | | | 32,823,634 |
| | | | | | |
| | Louisiana — 3.71% |
| | 9,900,000 | | Louisiana Local Government Environmental Facilities & Community Development Authority Revenue, 1.04%, 7/1/33, (LOC: Regions Bank)(a) | | | 9,900,000 |
| | 16,000,000 | | Louisiana Public Facilities Authority Revenue, Series B, 0.80%, 7/1/16, (LOC: Regions Bank)(a) | | | 16,000,000 |
| | 4,070,000 | | Shreveport Home Mortgage Authority Refunding Revenue, 0.64%, 2/15/23, (Credit Support: Fannie Mae)(a) | | | 4,070,000 |
| | 7,000,000 | | St. Tammany Parish Development District Revenue, 0.58%, 7/1/38, (LOC: SunTrust Bank)(a) | | | 7,000,000 |
| | | | | | |
| | | | | | 36,970,000 |
| | | | | | |
| | Maryland — 2.00% |
| | 5,610,000 | | Maryland Health & Higher Educational Facilities Authority Revenue, 0.49%, 7/1/33, (LOC: PNC Bank NA)(a) | | | 5,610,000 |
| | 5,000,000 | | Maryland Health & Higher Educational Facilities Authority Revenue, 0.58%, 7/1/36, (Credit Support: P&I, Radian), (LOC: SunTrust Bank)(a) | | | 5,000,000 |
|
SCHEDULE OF PORTFOLIO INVESTMENTS |
Tax-Free Money Market Fund (cont.)
March 31, 2009 (Unaudited)
| | | | | | |
Principal
Amount | | | | Value |
| $ | 9,000,000 | | State of Maryland GO, Series A, 5.25%, 2/15/10 | | $ | 9,371,848 |
| | | | | | |
| | | | | | 19,981,848 |
| | | | | | |
| | Massachusetts — 1.00% | | | |
| | 10,000,000 | | Massachusetts School Building Authority Revenue, Series R-10391, 0.87%, 8/15/30, (Credit Support: FSA), Callable 8/15/15 @ 100(a)(b) | | | 10,000,000 |
| | | | | | |
| | Michigan — 1.02% | | | |
| | 4,975,000 | | L’Anse Creuse Public Schools GO, Putters Series 2719, 0.84%, 11/1/13, (Credit Support: FSA,Q-SBLF)(a) | | | 4,975,000 |
| | 5,230,000 | | Michigan Strategic Fund Revenue, 0.55%, 9/1/40, (LOC: Bank of America)(a) | | | 5,230,000 |
| | | | | | |
| | | | | | 10,205,000 |
| | | | | | |
| | Minnesota — 3.48% | | | |
| | 1,825,000 | | City of Bloomington Revenue, Series A1, 0.66%, 11/15/32, (Credit Support: Fannie Mae)(a) | | | 1,825,000 |
| | 7,240,000 | | Inver Grove Heights Refunding Revenue, 0.50%, 5/15/35, (Credit Support: Fannie Mae)(a) | | | 7,240,000 |
| | 8,150,000 | | Oak Park Heights Refunding Revenue, 0.50%, 11/1/35, (Credit Support: Freddie Mac)(a) | | | 8,150,000 |
| | 2,140,000 | | St. Paul Housing & Redevelopment Authority Revenue, Series A, 0.52%, 5/1/27, (LOC: U.S. Bank NA)(a) | | | 2,140,000 |
| | 6,000,000 | | State of Minnesota GO, 5.00%, 10/1/09 | | | 6,130,121 |
| | 9,000,000 | | State of Minnesota GO, 5.00%, 11/1/09 | | | 9,227,771 |
| | | | | | |
| | | | | | 34,712,892 |
| | | | | | |
| | Mississippi — 3.37% | | | |
| | 6,500,000 | | Mississippi Business Finance Commission Revenue, 0.58%, 5/1/32, (LOC: SunTrust Bank)(a) | | | 6,500,000 |
| | 20,000,000 | | Mississippi Business Finance Commission Revenue, Series B, 0.70%, 12/1/30(a) | | | 20,000,000 |
| | 7,100,000 | | Mississippi Development Bank Special Obligation Refunding Revenue, 1.04%, 11/1/28, (LOC: Regions Bank)(a) | | | 7,100,000 |
| | | | | | |
| | | | | | 33,600,000 |
| | | | | | |
| | Missouri — 0.45% | | | |
| | 2,500,000 | | Missouri State Health & Educational Facilities Authority Revenue, 0.63%, 7/1/18, (LOC: SunTrust Bank)(a) | | | 2,500,000 |
| | | | | | |
Principal
Amount | | | | Value |
| $ | 2,000,000 | | St. Charles County Industrial Development Authority Refunding Revenue, 0.57%, 2/1/29, (Credit Support: Fannie Mae)(a) | | $ | 2,000,000 |
| | | | | | |
| | | | | | 4,500,000 |
| | | | | | |
| | Montana — 2.21% | | | |
| | 17,970,000 | | Montana Board of Investment Revenue, 2.15%, 3/1/29, Callable 3/1/10 @ 100(a) | | | 17,970,000 |
| | 4,045,000 | | Montana Board of Investment Revenue, 3.25%, 3/1/10(a) | | | 4,045,000 |
| | | | | | |
| | | | | | 22,015,000 |
| | | | | | |
| | Nebraska — 0.30% | | | |
| | 2,975,000 | | Scotts Bluff County Hospital Authority Refunding Revenue, 0.52%, 12/1/31, (Credit Support: Ginnie Mae), (LOC: U.S. Bank NA)(a) | | | 2,975,000 |
| | | | | | |
| | New Hampshire — 0.90% | | | |
| | 9,000,000 | | New Hampshire Health & Education Facilities Authority Revenue, 0.57%, 7/1/28, (LOC: Wells Fargo Bank)(a) | | | 9,000,000 |
| | | | | | |
| | New Jersey — 2.13% | | | |
| | 4,915,000 | | Austin Trust Various States Revenue, Series 2008-353, 0.64%, 7/1/13, (LOC: Bank of America NA)(a) | | | 4,915,000 |
| | 5,215,700 | | City of Trenton Water Utility GO, 3.50%, 2/19/10 | | | 5,254,001 |
| | 2,300,000 | | New Jersey Health Care Facilities Financing Authority Revenue, 0.74%, 7/1/38, (Credit Support: Assured GTY), Callable 7/1/18 @ 100(a) | | | 2,300,000 |
| | 8,700,000 | | Newark GO, 3.25%, 1/20/10 | | | 8,768,490 |
| | | | | | |
| | | | | | 21,237,491 |
| | | | | | |
| | New York — 3.48% | | | |
| | 10,780,000 | | New York State Dormitory Authority Revenue, 0.74%, 7/1/37, (Credit Support: Assured GTY), Callable 7/1/17 @ 100(a)(b) | | | 10,780,000 |
| | 5,595,000 | | Triborough Bridge & Tunnel Authority Revenue, 0.65%, 11/15/24, (Credit Support: BHAC-CR), Callable 11/15/18 @ 100(a)(b) | | | 5,595,000 |
| | 18,000,000 | | TSASC, Inc. Revenue, Series 1, OID, 6.25%, 7/15/09 | | | 18,383,385 |
| | | | | | |
| | | | | | 34,758,385 |
| | | | | | |
| | North Carolina — 4.08% | | | |
| | 10,000,000 | | North Carolina Capital Facilities Finance Agency Revenue, 0.57%, 8/1/33, (LOC: Wells Fargo Bank)(a) | | | 10,000,000 |
| | 17,700,000 | | North Carolina Capital Facilities Finance Agency Revenue, Series B, 0.50%, 6/1/38, (LOC: Wells Fargo Bank)(a) | | | 17,700,000 |
|
SCHEDULE OF PORTFOLIO INVESTMENTS |
Tax-Free Money Market Fund (cont.)
March 31, 2009 (Unaudited)
| | | | | | |
Principal
Amount | | | | Value |
| $ | 12,995,000 | | North Carolina Municipal Power Agency No. 1 Catawba Revenue, 0.83%, 1/1/20, (Credit Support: BHAC-CR, MBIA), Callable 1/1/13 @ 100(a) | | $ | 12,995,000 |
| | | | | | |
| | | | | | 40,695,000 |
| | | | | | |
| | Oklahoma — 0.10% | | | |
| | 1,000,000 | | Oklahoma Development Finance Authority Revenue, Series A, OID, 5.63%, 8/15/09 | | | 1,024,423 |
| | | | | | |
| | Oregon — 0.60% | | | |
| | 6,000,000 | | Confederated Tribes of the Umatilla Indian Reservation Revenue, 0.55%, 12/1/28, (LOC: Bank of America NA)(a) | | | 6,000,000 |
| | | | | | |
| | Pennsylvania — 8.76% | | | |
| | 9,000,000 | | Allegheny County Higher Education Building Authority Revenue, Series A, 0.49%, 3/1/38, (LOC: PNC Bank NA)(a) | | | 9,000,000 |
| | 18,345,000 | | Eclipse Funding Trust Revenue, Series 2007-93, 0.50%, 6/1/31, (Credit Support: FSA, State Aid Withholding), (LOC: U.S. Bank NA), Callable 12/1/16 @ 100(a) | | | 18,345,000 |
| | 8,220,000 | | Luzerne County Convention Center Authority Revenue, Series A, 0.49%, 9/1/28, (LOC: PNC Bank NA)(a) | | | 8,220,000 |
| | 2,000,000 | | Pennsylvania Higher Educational Facilities Authority Revenue, Series J4, 3.30%, 5/1/32, (LOC: PNC Bank NA)(a) | | | 2,005,981 |
| | 16,000,000 | | Pennsylvania Turnpike Commission Refunding Revenue, Series A1, 0.58%, 12/1/22(a) | | | 16,000,000 |
| | 7,480,000 | | Pennsylvania Turnpike Commission Revenue, Series A, 4.00%, 10/15/09, (Credit Support: AMBAC) | | | 7,495,013 |
| | 14,200,000 | | Southeastern Pennsylvania Transportation Authority Refunding Revenue, 0.49%, 3/1/22, (LOC: PNC Bank NA)(a) | | | 14,200,000 |
| | 12,105,000 | | Westmoreland County Industrial Development Authority Revenue, Series A, 0.49%, 7/1/27, (LOC: Wachovia Bank NA )(a) | | | 12,105,000 |
| | | | | | |
| | | | | | 87,370,994 |
| | | | | | |
| | Rhode Island — 2.62% | | | |
| | 22,955,000 | | JPMorgan Chase Putters/Drivers Trust GO, Series 3273, 1.10%, 3/1/11, (Credit Support: MBIA-RE)(a)(b) | | | 22,955,000 |
| | 3,200,000 | | Rhode Island Health & Educational Building Corp. Revenue, 0.60%, 6/1/37, (LOC: Bank of America NA)(a) | | | 3,200,000 |
| | | | | | |
| | | | | | 26,155,000 |
| | | | | | |
| | | | | | |
Principal
Amount | | | | Value |
| | South Carolina — 0.62% | | | |
| $ | 6,169,000 | | Austin Trust Various States Revenue, Series 10002, 0.79%, 1/1/43, (LOC: Bank of America NA), Callable 1/1/18 @ 100(a) | | $ | 6,169,000 |
| | | | | | |
| | Tennessee — 4.06% | | | |
| | 6,240,000 | | Dayton Industrial Development Board Revenue, 1.04%, 7/1/36, (LOC: Regions Bank)(a) | | | 6,240,000 |
| | 2,800,000 | | Dickson County Industrial Development Board Revenue, 0.63%, 11/1/12, (LOC: SunTrust Bank)(a) | | | 2,800,000 |
| | 2,000,000 | | Hendersonville Industrial Development Board Refunding Revenue, 0.55%, 2/15/28, (Credit Support: Fannie Mae)(a) | | | 2,000,000 |
| | 8,500,000 | | Memphis Health Educational & Housing Facility Board Revenue, 1.04%, 10/1/33, (LOC: Regions Bank)(a) | | | 8,500,000 |
| | 5,340,000 | | Memphis-Shelby County Industrial Development Board Revenue, Series A, 0.63%, 1/1/28, (LOC: SunTrust Bank)(a) | | | 5,340,000 |
| | 11,160,000 | | Metropolitan Government Nashville & Davidson County Industrial Development Board Revenue, 0.58%, 11/1/27, (LOC: SunTrust Bank)(a) | | | 11,160,000 |
| | 4,500,000 | | Shelby County Health Educational & Housing Facilities Board Revenue, 1.04%, 5/1/33, (LOC: Regions Bank)(a) | | | 4,500,000 |
| | | | | | |
| | | | | | 40,540,000 |
| | | | | | |
| | Texas — 0.82% | | | |
| | 5,545,000 | | Splendora Higher Education Facilities Corp. Revenue, Series A, 0.47%, 12/1/26, (LOC: Wells Fargo Bank NA)(a) | | | 5,545,000 |
| | 2,630,000 | | Tarrant County Housing Finance Corp. Revenue, 0.55%, 2/15/36, (Credit Support: Fannie Mae)(a) | | | 2,630,000 |
| | | | | | |
| | | | | | 8,175,000 |
| | | | | | |
| | Utah — 1.32% | | | |
| | 3,700,000 | | Duchesne County School District Revenue, 0.52%, 6/1/21, (LOC: U.S. Bank NA)(a) | | | 3,700,000 |
| | 5,000,000 | | Emery County Revenue, 0.54%, 11/1/24, (LOC: Wells Fargo Bank NA)(a) | | | 5,000,000 |
| | 4,435,000 | | Salt Lake County Housing Authority Refunding Revenue, 0.50%, 2/15/31, (Credit Support: Fannie Mae)(a) | | | 4,435,000 |
| | | | | | |
| | | | | | 13,135,000 |
| | | | | | |
|
SCHEDULE OF PORTFOLIO INVESTMENTS |
Tax-Free Money Market Fund (cont.)
March 31, 2009 (Unaudited)
| | | | | | |
Principal
Amount | | | | Value |
| | Virginia — 4.65% | | | |
| $ | 14,360,000 | | Fairfax County Economic Development Authority Revenue, 0.58%, 2/1/29, (LOC: SunTrust Bank)(a) | | $ | 14,360,000 |
| | 6,735,000 | | JP Morgan Chase Putters/Drivers Trust Revenue, Series 3313Z, 0.69%, 1/1/31, (Credit Support: MBIA-RE, GO of Authority), Callable 7/1/11 @ 100(a) | | | 6,735,000 |
| | 9,050,000 | | Lewistown Commerce Center Community Development Authority Special Tax, Series 2115, 0.54%, 3/1/27, Callable 3/1/18 @ 100(a) | | | 9,050,000 |
| | 16,250,000 | | Virginia Small Business Financing Authority Revenue, Series A, 0.49%, 12/1/38, (LOC: PNC Bank NA)(a) | | | 16,250,000 |
| | | | | | |
| | | | | | 46,395,000 |
| | | | | | |
| | Washington — 0.15% | | | |
| | 430,000 | | Washington State Housing Finance Commission Refunding Revenue, Series B, 0.55%, 7/1/11, (LOC: U.S. Bank NA)(a) | | | 430,000 |
| | 1,100,000 | | Washington State Housing Finance Commission Revenue, 0.55%, 7/1/22, (LOC: U.S. Bank NA)(a) | | | 1,100,000 |
| | | | | | |
| | | | | | 1,530,000 |
| | | | | | |
| | West Virginia — 0.51% | | | |
| | 5,000,000 | | State of West Virginia GO, OID, 5.25%, 6/1/09, (Credit Support: FSA) | | | 5,074,204 |
| | | | | | |
| | Wisconsin — 2.02% | | | |
| | 600,000 | | Beloit School District GO, 3.00%, 2/1/10 | | | 602,672 |
| | 5,000,000 | | Pleasant Prairie Refunding Revenue, 0.50%, 9/1/30, (LOC: Wells Fargo Bank NA)(a) | | | 5,000,000 |
| | | | | | |
Principal
Amount | | | | Value |
| $ | 3,875,000 | | Watertown Unified School District GO, 2.50%, 2/1/10 | | $ | 3,882,654 |
| | 5,135,000 | | Wisconsin Health & Educational Facilities Authority Revenue, 0.47%, 11/1/25, (LOC: Wells Fargo Bank NA)(a) | | | 5,135,000 |
| | 5,500,000 | | Wisconsin Health & Educational Facilities Authority Revenue, 1.68%, 11/15/30(a) | | | 5,500,000 |
| | | | | | |
| | | | | | 20,120,326 |
| | | | | | |
| Total Municipal Bonds
(Cost $967,430,417) | | | 967,430,417 |
| | | | | | |
| | |
| Shares | | | | |
| | Investment Companies — 2.85% | | | |
| | 14,149,404 | | Goldman Sachs Tax-Free Institutional Money Market Fund | | | 14,149,404 |
| | 14,303,997 | | Wells Fargo Advantage National Tax-Free Institutional Money Market Fund | | | 14,303,997 |
| | | | | | |
| Total Investment Companies
(Cost $28,453,401) | | | 28,453,401 |
| | | | | | |
| Total Investments
(Cost $995,883,818)(c) — 99.81% | | | 995,883,818 |
| Other assets in excess
of liabilities — 0.19% | | | 1,913,660 |
| | | | | | |
| | NET ASSETS — 100.00% | | $ | 997,797,478 |
| | | | | | |
| (a) | Variable rate security. The rate reflected in the Schedule of Portfolio Investments is the rate in effect on March 31, 2009. The maturity date represents the actual maturity date. The security’s effective maturity resets periodically. |
| (b) | Security exempt from registration under Rule 144A of the Securities Act of 1933, as amended. These securities may be resold in transactions exempt from registration, normally to qualified institutional buyers. Security has been deemed to be liquid based on procedures approved by the Board of Trustees. |
| (c) | Tax cost of securities is equal to book cost of securities. |
| (d) | Variable rate security. The rate reflected in the Schedule of Portfolio Investments is the rate in effect on March 31, 2009. |
Abbreviations used are defined below:
AMBAC – American Municipal Bond Assurance Corp.
BHAC-CR – Berkshire Hathaway Assurance Corp. Custodial Receipts
FGIC – Financial Guaranty Insurance Co.
FSA – Financial Security Assurance, Inc.
GO – General Obligation
GTY – Guaranty
LOC – Letter of Credit
MBIA – Municipal Bond Insurance Association
Q-SBLF – Qualified School Board Loan Fund
RADIAN – Radian Group, Inc.
OID – Original Issue Discount
See notes to financial statements.
|
SCHEDULE OF PORTFOLIO INVESTMENTS |
Tamarack Institutional Prime Money Market Fund
March 31, 2009 (Unaudited)
| | | | | | |
Principal
Amount | | | | Value |
| | Commercial Paper — 22.42% | | | |
| | Banks - Australia & New Zealand — 2.34% |
| $ | 10,000,000 | | Australia & New Zealand Banking Group Ltd., 0.86%, 6/25/09(a)(b) | | $ | 9,979,695 |
| | 25,000,000 | | Westpac Banking Corp., 0.70%, 7/6/09(a)(b) | | | 24,953,333 |
| | | | | | |
| | | | | | 34,933,028 |
| | | | | | |
| | Consumer Staples — 1.67% | | | |
| | 25,000,000 | | The Coca-Cola Co., 0.43%, 5/7/09(a)(b) | | | 24,989,250 |
| | | | | | |
| | Finance - Diversified Domestic — 6.69% |
| | 25,000,000 | | American Honda Finance Corp., 0.65%, 4/22/09(b) | | | 24,990,521 |
| | 25,000,000 | | Reckitt Benckiser, 1.23%, 6/2/09(a)(b) | | | 24,947,042 |
| | 50,000,000 | | Toyota Motor Credit Corp., 0.70%, 6/3/09(b) | | | 49,938,750 |
| | | | | | |
| | | | | | 99,876,313 |
| | | | | | |
| | Health Care — 1.67% | | | |
| | 25,000,000 | | Roche Holdings, Inc., 0.30%, 5/18/09(a)(b) | | | 24,990,208 |
| | | | | | |
| | Household Products & Ware — 1.67% |
| | 25,000,000 | | Procter & Gamble International Funding SCA, 0.40%, 5/26/09(a)(b) | | | 24,984,722 |
| | | | | | |
| | Insurance — 2.68% | | | |
| | 40,000,000 | | Met Life Funding, Inc., 1.35%, 4/30/09(a)(b) | | | 39,956,500 |
| | | | | | |
| | Oil & Gas — 3.35% | | | |
| | 25,000,000 | | Chevron Corp., 0.55%, 5/26/09(b) | | | 24,978,993 |
| | 25,000,000 | | TransCanada Keystone Pipeline LP, 0.40%, 4/15/09(a)(b) | | | 24,996,112 |
| | | | | | |
| | | | | | 49,975,105 |
| | | | | | |
| | Utilities — 2.35% | | | |
| | 10,000,000 | | Florida Power and Light Capital Co., 0.40%, 4/1/09(a)(b) | | | 10,000,000 |
| | 25,000,000 | | National Rural Utilities Co., 0.27%, 4/13/09(b) | | | 24,997,750 |
| | | | | | |
| | | | | | 34,997,750 |
| | | | | | |
| Total Commercial Paper
(Cost $334,702,876) | | | 334,702,876 |
| | | | | | |
| | Certificates of Deposit — 5.02% | | | |
| | Banks - Canada — 1.67% | | | |
| | 25,000,000 | | Bank of Montreal, 0.55%, 6/22/09(b) | | | 25,000,000 |
| | | | | | |
| | Banks - Domestic — 1.68% | | | |
| | 5,000,000 | | The Bank of New York Mellon, 5.41%, 5/15/09 | | | 5,012,026 |
| | | | | | |
Principal
Amount | | | | Value |
| $ | 20,000,000 | | Branch Banking & Trust Co., 1.67%, 9/4/09(c)(d) | | $ | 19,997,960 |
| | | | | | |
| | | | | | 25,009,986 |
| | | | | | |
| | Banks - Foreign — 1.00% | | | |
| | 15,000,000 | | Deutsche Bank AG (New York), 1.40%, 8/4/09(c)(d) | | | 15,000,000 |
| | | | | | |
| | Banks - United Kingdom — 0.67% | | | |
| | 10,000,000 | | Bank of Scotland PLC, 1.45%, 5/6/09(d)(g) | | | 9,997,710 |
| | | | | | |
| Total Certificates of Deposit
(Cost $75,012,026) | | | 75,007,696 |
| | | | | | |
| | Corporate Bonds — 17.38% | | | |
| | Banks - Australia & New Zealand — 1.99% |
| | 11,250,000 | | Australia & New Zealand National (International) Ltd., 0.79%, 4/10/09(a)(c) | | | 11,250,000 |
| | 7,500,000 | | Commonwealth Bank of Australia, 1.39%, 5/1/09(a)(c) | | | 7,500,000 |
| | 11,000,000 | | National Australia Bank Ltd., 1.51%, 4/6/09(a)(c)(d) | | | 11,000,033 |
| | | | | | |
| | | | | | 29,750,033 |
| | | | | | |
| | Banks - Domestic — 3.94% | | | |
| | 12,000,000 | | Bank of America NA, 1.39%, 6/3/09(a)(c) | | | 12,000,000 |
| | 9,600,000 | | First Family Church, 2.52%, 4/1/30, (Credit Support: Regions Bank)(c) | | | 9,600,000 |
| | 26,205,000 | | US Bancorp, 5.30%, 4/28/09 | | | 26,249,308 |
| | 11,000,000 | | Wachovia Bank NA, 1.64%, 5/1/09(c)(d) | | | 11,012,073 |
| | | | | | |
| | | | | | 58,861,381 |
| | | | | | |
| | Finance - Diversified Domestic — 4.18% |
| | 13,000,000 | | General Electric Capital Corp., 0.57%, 6/9/09(c)(d) | | | 12,987,810 |
| | 13,800,000 | | Ring-Missouri LP, 0.85%, 9/1/18, (Credit Support: Regions Bank)(c) | | | 13,800,000 |
| | 15,655,000 | | SF Tarns LLC, 0.85%, 1/1/28, (Credit Support: Bank of America)(c) | | | 15,655,000 |
| | 20,000,000 | | Twins Ballpark LLC, 3.40%, 10/1/34, (Credit Support: Assured Guaranty, JP Morgan)(a)(c) | | | 20,000,000 |
| | | | | | |
| | | | | | 62,442,810 |
| | | | | | |
| | Finance - Diversified Foreign — 0.50% |
| | 7,500,000 | | BP Capital Markets PLC, 1.43%, 7/10/09(c) | | | 7,500,000 |
| | | | | | |
| | Health Care — 0.80% | | | |
| | 12,000,000 | | The Portland Clinic LLP, 1.90%, 11/20/33, (Credit Support: U.S. Bank)(c) | | | 12,000,000 |
| | | | | | |
| | Insurance — 1.47% | | | |
| | 10,000,000 | | Metropolitan Life Global Funding I, 1.65%, 5/11/09(a)(c)(d) | | | 9,946,720 |
|
SCHEDULE OF PORTFOLIO INVESTMENTS |
Tamarack Institutional Prime Money Market Fund (cont.)
March 31, 2009 (Unaudited)
| | | | | | |
Principal
Amount | | | | Value |
| $ | 12,000,000 | | Pricoa Global Funding I, 1.52%, 6/12/09(a)(c) | | $ | 12,000,000 |
| | | | | | |
| | | | | | 21,946,720 |
| | | | | | |
| | Oil & Gas — 1.81% | | | |
| | 27,000,000 | | BP AMI Leasing, Inc., 1.24%, 6/26/09(a)(g) | | | 27,000,973 |
| | | | | | |
| | Telecommunication Services — 2.69% |
| | 40,000,000 | | BellSouth Corp., 4.97%, 4/26/09(a) | | | 40,079,200 |
| | | | | | |
| Total Corporate Bonds
(Cost $259,634,243) | | | 259,581,117 |
| | | | | | |
| | Municipal Bonds — 24.61% | | | |
| | California — 1.92% | | | |
| | 20,000,000 | | The Olympic Club Refunding Revenue, 0.85%, 9/30/32, (LOC: Bank of America NA)(c) | | | 20,000,000 |
| | 8,610,000 | | San Francisco City & County Housing Authority, 0.70%, 9/1/49, (LOC: Citibank NA)(c) | | | 8,610,000 |
| | | | | | |
| | | | | | 28,610,000 |
| | | | | | |
| | Colorado — 1.07% | | | |
| | 16,000,000 | | University of Colorado Hospital Authority Revenue, 0.47%, 11/15/31, (LOC: Wells Fargo)(c) | | | 16,000,000 |
| | | | | | |
| | Florida — 0.46% | | | |
| | 6,950,000 | | Highlands County Industrial Development Authority Revenue, 0.83%, 5/1/16, (LOC: SunTrust Bank)(c) | | | 6,950,000 |
| | | | | | |
| | Kentucky — 0.30% | | | |
| | 4,445,000 | | Lexington-Fayette Urban County Airport Board Refunding Revenue, Series C, 0.55%, 7/1/33, (LOC: JP Morgan Chase Bank)(c) | | | 4,445,000 |
| | | | | | |
| | Massachusetts — 3.29% | | | |
| | 15,215,000 | | Massachusetts Development Finance Agency Revenue, Series B, 0.80%, 7/1/28, (LOC: Wells Fargo)(c) | | | 15,215,000 |
| | 20,835,000 | | Massachusetts Educational Financing Authority Revenue, Series R-11649, 0.82%, 1/1/30, (Credit Support: Assured GTY), Callable 1/1/18 @ 100(a)(c) | | | 20,835,000 |
| | 13,135,000 | | Massachusetts School Building Authority Revenue, Series R-10391, 0.87%, 8/15/30, (Credit Support: FSA), Callable 8/15/15 @ 100(a)(c) | | | 13,135,000 |
| | | | | | |
| | | | | | 49,185,000 |
| | | | | | |
| | | | | | |
Principal
Amount | | | | Value |
| | Mississippi — 1.45% | | | |
| $ | 21,710,000 | | Mississippi Business Finance Corp, 200 Renaissance LLC Project Revenue, 1.04%, 1/1/37, (LOC: Regions Bank)(c) | | $ | 21,710,000 |
| | | | | | |
| | New Jersey — 1.68% | | | |
| | 6,675,000 | | New Jersey Economic Development Authority Revenue, Series A, 0.75%, 9/1/21, (LOC: Wells Fargo)(c) | | | 6,675,000 |
| | 18,350,000 | | New Jersey Health Care Facilities Finance Authority Revenue, Series B, 0.85%, 7/1/37, (Credit Support: Assured GTY)(c) | | | 18,350,000 |
| | | | | | |
| | | | | | 25,025,000 |
| | | | | | |
| | New York — 5.56% | | | |
| | 7,945,000 | | Nassau County Industrial Development Agency Revenue, Series D, 0.75%, 1/1/28, (LOC: LaSalle Bank NA)(c) | | | 7,945,000 |
| | 7,045,000 | | New York City Housing Development Corp. Multi-Family Rental Housing Revenue, Series B, 0.95%, 4/15/36, (Credit Support: Fannie Mae)(c) | | | 7,045,000 |
| | 22,150,000 | | New York City Housing Development Corp. Revenue, Series A, 1.20%, 6/1/13, (LOC: JP Morgan)(c) | | | 22,150,000 |
| | 22,150,000 | | New York City Housing Development Corp. Revenue, The Plaza Series A, 0.70%, 7/1/39, (LOC: Citibank NA)(c) | | | 22,150,000 |
| | 8,700,000 | | New York City Industrial Development Agency Revenue, Series A, 0.40%, 7/1/36, (LOC: JP Morgan Chase Bank)(c) | | | 8,700,000 |
| | 15,100,000 | | New York State Housing Finance Agency Revenue, Series B, 1.00%, 11/1/36, (LOC: Bank of America NA)(c) | | | 15,100,000 |
| | | | | | |
| | | | | | 83,090,000 |
| | | | | | |
| | Ohio — 0.84% | | | |
| | 12,500,000 | | Ohio State Higher Educational Facilities Refunding Revenue, Series B, 0.75%, 5/1/42, (LOC: U.S. Bank NA)(c) | | | 12,500,000 |
| | | | | | |
| | Pennsylvania — 1.41% | | | |
| | 21,015,000 | | City of Reading Revenue, Series D, 1.00%, 11/1/32, (LOC: Wells Fargo)(c) | | | 21,015,000 |
| | | | | | |
| | South Dakota — 2.79% | | | |
| | 3,400,000 | | South Dakota Housing Development Authority Revenue, Series C, 0.60%, 5/1/37(c) | | | 3,400,000 |
|
SCHEDULE OF PORTFOLIO INVESTMENTS |
Tamarack Institutional Prime Money Market Fund (cont.)
March 31, 2009 (Unaudited)
| | | | | | |
Principal
Amount | | | | Value |
| $ | 25,000,000 | | South Dakota Housing Development Authority Revenue, Series G, 0.60%, 5/1/35(c) | | $ | 25,000,000 |
| | 13,200,000 | | South Dakota Housing Development Authority Revenue, Series I, 0.60%, 5/1/38(c) | | | 13,200,000 |
| | | | | | |
| | | | | | 41,600,000 |
| | | | | | |
| | Tennessee — 2.68% | | | |
| | 40,000,000 | | Johnson City Health & Educational Facilities Board Hospital Revenue, Series B, 1.55%, 7/1/33, (LOC: Regions Bank)(c) | | | 40,000,000 |
| | | | | | |
| | Texas — 0.30% | | | |
| | 4,500,000 | | Dallas Performing Arts Cultural Facilities Corp. Revenue, Series B, 0.40%, 9/1/41, (LOC: JP Morgan Chase Bank)(c) | | | 4,500,000 |
| | | | | | |
| | Utah — 0.86% | | | |
| | 12,805,000 | | Utah Housing Corp. Revenue, Series C-2, Class 1, 1.40%, 1/1/38(c) | | | 12,805,000 |
| | | | | | |
| Total Municipal Bonds
(Cost $367,435,000) | | | 367,435,000 |
| | | | | | |
| U.S. Government Agency Backed
Mortgages — 12.68% | | | |
| | Fannie Mae — 11.26% | | | |
| | 12,624,000 | | Pool #958354, 0.53%, 6/1/09(b) | | | 12,612,663 |
| | 155,600,000 | | Pool #958356, 0.53%, 6/1/09(b) | | | 155,460,263 |
| | | | | | |
| | | | | | 168,072,926 |
| | | | | | |
| | Freddie Mac — 1.42% | | | |
| | 812,507 | | Pool #W00065, 7.21%, 8/1/09 | | | 816,619 |
| | 20,449,093 | | Series 3427, 0.71%, 3/15/10(c) | | | 20,449,093 |
| | | | | | |
| | | | | | 21,265,712 |
| | | | | | |
| Total U.S. Government Agency
Backed Mortgages
(Cost $189,338,638) | | | 189,338,638 |
| | | | | | |
| | | | | | |
Principal
Amount | | | | Value |
| | Repurchase Agreement — 6.70% | | | |
| $ | 100,000,000 | | BNP Paribas Securities Corp. dated 3/31/09; due 4/1/09 at 0.20% with maturity value of $100,000,556 (fully collateralized by Fannie Mae with maturity dates ranging from 5/1/18 to 1/1/39 at rates ranging from 4.50% to 6.00%). | | $ | 100,000,000 |
| | | | | | |
| Total Repurchase Agreement
(Cost $100,000,000) | | | 100,000,000 |
| | | | | | |
| | |
| Shares | | | | |
| | Investment Company — 10.08% | | | |
| | 150,544,181 | | Wells Fargo Prime Investment Money Market Fund | | | 150,544,181 |
| | | | | | |
| Total Investment Company
(Cost $150,544,181) | | | 150,544,181 |
| | | | | | |
| | |
Principal
Amount | | | | |
| | Capital Support Agreement — 0.00% |
| | $0 | | Voyageur Capital Support Agreement(e) | | | 0 |
| | | | | | |
| Total Capital Support Agreement
(Cost $0) | | | 0 |
| | | | | | |
| Total Investments
(Cost $1,476,666,964)(f) — 98.89% | | | 1,476,609,508 |
| Other assets in excess of
liabilities — 1.11% | | | 16,508,007 |
| | | | | | |
| | NET ASSETS — 100.00% | | $ | 1,493,117,515 |
| | | | | | |
| (a) | Security exempt from registration under Rule 144A of the Securities Act of 1933, as amended. These securities may be resold in transactions exempt from registration, normally to qualified institutional buyers. Security has been deemed to be liquid based on procedures approved by the Board of Trustees. |
| (b) | Represents effective yield to maturity on date of purchase. |
| (c) | Variable rate security. The rate reflected in the Schedule of Portfolio Investments is the rate in effect on March 31, 2009. The maturity date represents the actual maturity date. The security’s effective maturity resets periodically. |
| (d) | Security (“Eligible Note”) is subject to capital support agreement and is stated at fair value. See Note 7. |
| (e) | The Fund has entered into a Capital Support Agreement (“Agreement”) with Voyageur Asset Management Inc. (“Voyageur”) which provides that Voyageur will contribute capital to the Fund, up to a specified maximum amount, in the |
event that the Fund realizes a loss on any of the Eligible Notes securities and such realized loss causes the Fund’s net asset value as calculated using the market based net asset value to drop below $0.9950. As of March 31, 2009, the fair value of the Agreement was $0. See Note 7.
| (f) | Book cost of $1,476,666,964 and depreciation of $57,456 on securities is equal to tax cost and depreciation on securities. |
| (g) | Variable rate security. The rate reflected in the Schedule of Portfolio Investments is the rate in effect on March 31, 2009. |
Abbreviations used are defined below:
FSA – Financial Security Assurance, Inc.
GTY – Guaranty
LOC – Letter of Credit
See notes to financial statements.
|
SCHEDULE OF PORTFOLIO INVESTMENTS |
Tamarack Institutional Tax-Free Money Market Fund
March 31, 2009 (Unaudited)
| | | | | | |
Principal
Amount | | | | Value |
| | Municipal Bonds — 96.89% | | | |
| | Alabama — 6.76% | | | |
| $ | 3,495,000 | | City of Birmingham GO, Series A, 1.04%, 6/1/11, (LOC: Regions Bank)(a) | | $ | 3,495,000 |
| | 1,400,000 | | County of Jefferson Revenue, 1.54%, 9/1/25, (LOC: AmSouth Bank)(a) | | | 1,400,000 |
| | 12,140,000 | | County of Taladega Revenue, 1.04%, 2/1/31, (LOC: Regions Bank)(a) | | | 12,140,000 |
| | 8,000,000 | | Mobile Industrial Development Board Refunding Revenue, Series B, 0.45%, 6/1/32, (LOC: Wachovia Bank NA)(a) | | | 8,000,000 |
| | 6,000,000 | | Washington County Industrial Development Authority Revenue, 1.00%, 8/1/37, (LOC: Regions Bank)(a) | | | 6,000,000 |
| | | | | | |
| | | | | | 31,035,000 |
| | | | | | |
| | Arizona — 3.24% | | | |
| | 5,500,000 | | Glendale Industrial Development Authority Revenue, 0.47%, 1/1/27, (LOC: Wells Fargo Bank NA)(a) | | | 5,500,000 |
| | 3,360,000 | | Maricopa County Industrial Development Authority Revenue, Series A, 0.50%, 4/15/30, (Credit Support: Fannie Mae)(a) | | | 3,360,000 |
| | 6,000,000 | | Pima County Industrial Development Authority Revenue, 0.49%, 9/1/38, (LOC: PNC Bank NA)(a) | | | 6,000,000 |
| | | | | | |
| | | | | | 14,860,000 |
| | | | | | |
| | California — 3.51% | | | |
| | 9,000,000 | | Los Angeles Unified School District Revenue, Series R-10392, 0.83%, 7/1/30, (Credit Support: FSA), Callable 7/1/16 @ 100(a)(b) | | | 9,000,000 |
| | 7,110,000 | | Poway Unified School District GO, 0.78%, 8/1/30, (Credit Support: BHAC-CR, FSA), Callable 8/1/16 @ 100(a) | | | 7,110,000 |
| | | | | | |
| | | | | | 16,110,000 |
| | | | | | |
| | Colorado — 3.14% | | | |
| | 3,825,000 | | City of Colorado Springs Revenue, 0.47%, 3/15/23, (LOC: Wells Fargo Bank NA)(a) | | | 3,825,000 |
| | 3,625,000 | | Colorado Educational & Cultural Facilities Authority Revenue, 1.04%, 7/1/31, (LOC: Regions Bank)(a) | | | 3,625,000 |
| | 3,475,000 | | County of Pitkin Refunding Revenue, Series A, 0.55%, 12/1/24, (LOC: U.S. Bank NA)(a) | | | 3,475,000 |
| | 1,630,000 | | Meridian Ranch Metropolitan District GO, 0.54%, 12/1/38, (LOC: U.S. Bank NA)(a) | | | 1,630,000 |
| | | | | | |
Principal
Amount | | | | Value |
| $ | 1,830,000 | | Parker Automotive Metropolitan District GO, 0.54%, 12/1/34, (LOC: U.S. Bank NA)(a) | | $ | 1,830,000 |
| | | | | | |
| | | | | | 14,385,000 |
| | | | | | |
| | District Of Columbia — 3.33% | | | |
| | 1,700,000 | | District of Columbia Revenue, 0.55%, 7/1/36, (LOC: BB&T Bank)(a) | | | 1,700,000 |
| | 4,700,000 | | District of Columbia Revenue,, 0.49%, 10/1/37, (LOC: PNC Bank NA)(a) | | | 4,700,000 |
| | 4,900,000 | | District of Columbia Revenue, Children’s Defense Fund, 0.57%, 4/1/22, (LOC: Wachovia Bank NA)(a) | | | 4,900,000 |
| | 3,980,000 | | District of Columbia Water & Sewer Authority Revenue, Series 3022, 0.69%, 4/1/16, (Credit Support: Assured GTY)(a) | | | 3,980,000 |
| | | | | | |
| | | | | | 15,280,000 |
| | | | | | |
| | Florida — 3.26% | | | |
| | 5,053,000 | | Austin Trust Various States Revenue, Series 10003, 0.79%, 12/1/31, (LOC: Bank of America NA)(a) | | | 5,053,000 |
| | 5,910,000 | | County of Miami-Dade Revenue, 0.58%, 8/1/15, (LOC: SunTrust Bank)(a) | | | 5,910,000 |
| | 4,000,000 | | Highlands County Health Facilities Authority Revenue, 0.48%, 11/15/37, (LOC: SunTrust Bank)(a) | | | 4,000,000 |
| | | | | | |
| | | | | | 14,963,000 |
| | | | | | |
| | Georgia — 5.38% | | | |
| | 3,900,000 | | Bibb County Development Authority Revenue, 0.78%, 11/1/23, (LOC: SunTrust Bank)(a) | | | 3,900,000 |
| | 7,215,000 | | Clayton County Housing Authority Refunding Revenue, 0.49%, 9/1/26, (Credit Support: Fannie Mae)(a) | | | 7,215,000 |
| | 9,255,000 | | Columbus Hospital Authority Revenue, 0.58%, 1/1/18, (LOC: SunTrust Bank)(a) | | | 9,255,000 |
| | 4,300,000 | | Macon-Bibb County Hospital Authority Revenue, 0.58%, 12/1/18, (LOC: SunTrust Bank)(a) | | | 4,300,000 |
| | | | | | |
| | | | | | 24,670,000 |
| | | | | | |
| | Illinois — 6.21% | | | |
| | 3,095,000 | | Channahon Revenue, Series D, 0.45%, 12/1/32, (LOC: U.S. Bank NA)(a) | | | 3,095,000 |
| | 2,700,000 | | Galesburg Revenue, 0.50%, 7/1/24, (LOC: Bank of America)(a) | | | 2,700,000 |
| | 4,100,000 | | Illinois Educational Facilities Authority Revenue, 0.53%, 12/1/25, (LOC: JPMorgan Chase Bank)(a) | | | 4,100,000 |
|
SCHEDULE OF PORTFOLIO INVESTMENTS |
Tamarack Institutional Tax-Free Money Market Fund (cont.)
March 31, 2009 (Unaudited)
| | | | | | |
Principal
Amount | | | | Value |
| $ | 16,100,000 | | Illinois Finance Authority Revenue, 0.75%, 8/15/47, (Credit Support: Assured GTY), Callable 8/15/18 @ 100(a)(b) | | $ | 16,100,000 |
| | 2,500,000 | | State of Illinois GO, Series 687, 0.84%, 11/1/12, (Credit Support: AMBAC)(a) | | | 2,500,000 |
| | | | | | |
| | | | | | 28,495,000 |
| | | | | | |
| | Indiana — 2.84% | | | |
| | 4,500,000 | | Indiana Finance Authority Refunding Revenue, 0.40%, 3/1/36, (LOC: BB&T Bank)(a) | | | 4,500,000 |
| | 8,540,000 | | Indiana Health Facility Financing Authority Revenue, Series A, 0.55%, 7/1/28, (LOC: Bank of America NA)(a) | | | 8,540,000 |
| | | | | | |
| | | | | | 13,040,000 |
| | | | | | |
| | Iowa — 3.68% | | | |
| | 3,305,000 | | Iowa Finance Authority Revenue, 0.47%, 2/1/23, (LOC: Wells Fargo Bank NA)(a) | | | 3,305,000 |
| | 11,445,000 | | Iowa Finance Authority Revenue, Series A3, 0.47%, 2/15/35, (Credit Support: Assured GTY)(a) | | | 11,445,000 |
| | 2,150,000 | | Woodbury County Revenue, 0.52%, 11/1/16, (LOC: U.S. Bank NA)(a) | | | 2,150,000 |
| | | | | | |
| | | | | | 16,900,000 |
| | | | | | |
| | Kansas — 0.70% | | | |
| | 3,215,000 | | City of Olathe Revenue, Series B, 0.60%, 11/1/18, (LOC: Bank of America NA)(a) | | | 3,215,000 |
| | | | | | |
| | Louisiana — 1.11% | | | |
| | 5,080,000 | | South Louisiana Port Commission Refunding Revenue, 0.43%, 7/1/18, (LOC: Bank of New York)(a) | | | 5,080,000 |
| | | | | | |
| | Maryland — 1.07% | | | |
| | 4,900,000 | | Maryland Health & Higher Educational Facilities Authority Revenue, 0.58%, 7/1/28, (LOC: SunTrust Bank)(a) | | | 4,900,000 |
| | | | | | |
| | Massachusetts — 1.96% | | | |
| | 9,000,000 | | Massachusetts School Building Authority Revenue, Series R-10391, 0.87%, 8/15/30, (Credit Support: FSA), Callable 8/15/15 @ 100(a)(b) | | | 9,000,000 |
| | | | | | |
| | Michigan — 0.22% | | | |
| | 1,000,000 | | Michigan State Hospital Finance Authority Revenue, 0.56%, 6/1/22, (Credit Support: Assured GTY)(a) | | | 1,000,000 |
| | | | | | |
| | Minnesota — 7.11% | | | |
| | 8,035,000 | | Burnsville Refunding Revenue, 0.50%, 1/1/35, (Credit Support: Freddie Mac)(a) | | | 8,035,000 |
| | 4,995,000 | | Inver Grove Heights Refunding Revenue, 0.50%, 5/15/35, (Credit Support: Fannie Mae)(a) | | | 4,995,000 |
| | | | | | |
Principal
Amount | | | | Value |
| $ | 7,280,000 | | JPMorgan Chase Putters/Drivers Trust GO, Series 3265, 0.47%, 11/1/10(a)(b) | | $ | 7,280,000 |
| | 4,195,000 | | Midwest Consortium of Municipal Utilities Revenue, Series B, 0.47%, 10/1/35, (LOC: U.S. Bank NA)(a) | | | 4,195,000 |
| | 1,200,000 | | Minnetonka Refunding Revenue, 0.50%, 11/15/31, (Credit Support: Fannie Mae)(a) | | | 1,200,000 |
| | 5,615,000 | | Oak Park Heights Refunding Revenue, 0.50%, 11/1/35, (Credit Support: Freddie Mac)(a) | | | 5,615,000 |
| | 1,290,000 | | Spring Lake Park Refunding Revenue, 0.50%, 2/15/33, (Credit Support: Fannie Mae)(a) | | | 1,290,000 |
| | | | | | |
| | | | | | 32,610,000 |
| | | | | | |
| | Mississippi — 2.88% | | | |
| | 6,660,000 | | Mississippi Business Finance Corp. Revenue, 1.04%, 8/1/25, (LOC: Regions Bank)(a) | | | 6,660,000 |
| | 6,560,000 | | Mississippi Business Finance Corp. Revenue, 1.04%, 9/1/33, (LOC: Regions Bank)(a) | | | 6,560,000 |
| | | | | | |
| | | | | | 13,220,000 |
| | | | | | |
| | Missouri — 1.09% | | | |
| | 5,000,000 | | St. Louis Industrial Development Authority Refunding Revenue, 0.49%, 5/1/09, (LOC: PNC Bank NA)(a) | | | 5,000,000 |
| | | | | | |
| | Nebraska — 1.31% | | | |
| | 6,000,000 | | Madison County Hospital Authority No. 1 Revenue, Series B, 0.52%, 7/1/33, (LOC: U.S. Bank NA)(a) | | | 6,000,000 |
| | | | | | |
| | Nevada — 2.33% | | | |
| | 5,550,000 | | Reno Revenue, Series A, 0.50%, 6/1/32, (LOC: Bank of America NA)(a) | | | 5,550,000 |
| | 5,145,000 | | Township of Fernley GO, 0.76%, 2/1/38, (Credit Support: Assured GTY), Callable 2/1/18 @ 100(a) | | | 5,145,000 |
| | | | | | |
| | | | | | 10,695,000 |
| | | | | | |
| | New York — 0.81% | | | |
| | 3,700,000 | | New York City Trust For Cultural Resources Revenue, Series SGA91, 0.55%, 7/1/29, (Credit Support: AMBAC, GO of Museum)(a)(b) | | | 3,700,000 |
| | | | | | |
| | Pennsylvania — 12.67% | | | |
| | 4,010,000 | | Allegheny County Industrial Development Authority Revenue, 0.49%, 6/1/38, (LOC: PNC Bank NA)(a) | | | 4,010,000 |
| | 10,000,000 | | Delaware County Industrial Development Authority Refunding Revenue, Series G, 0.50%, 12/1/31(a) | | | 10,000,000 |
|
SCHEDULE OF PORTFOLIO INVESTMENTS |
Tamarack Institutional Tax-Free Money Market Fund (cont.)
March 31, 2009 (Unaudited)
| | | | | | |
Principal
Amount | | | | Value |
| $ | 4,800,000 | | Doylestown Hospital Authority Revenue, Series B, 0.49%, 7/1/37, (LOC: PNC Bank NA)(a) | | $ | 4,800,000 |
| | 4,700,000 | | Emmaus General Authority Revenue, Series F, 0.42%, 3/1/24, (LOC: U.S. Bank NA)(a) | | | 4,700,000 |
| | 5,000,000 | | Montgomery County Industrial Development Authority Revenue, Archdiocese Philadelphia, 0.49%, 11/1/38, (LOC: PNC Bank NA)(a) | | | 5,000,000 |
| | 8,000,000 | | Philadelphia Authority for Industrial Development Revenue, 0.57%, 12/1/37, (LOC: Wells Fargo Bank)(a) | | | 8,000,000 |
| | 4,375,000 | | Philadelphia School District Refunding, GO, Sub-series D2, 0.49%, 9/1/11, (Credit Support: State Aid Withholding), (LOC: PNC Bank NA)(a) | | | 4,375,000 |
| | 6,620,000 | | Westmoreland County Industrial Development Authority Revenue, Series B, 0.49%, 7/1/27, (LOC: Wachovia Bank NA)(a) | | | 6,620,000 |
| | 10,625,000 | | York County Industrial Development Authority Revenue, 0.49%, 7/1/37, (LOC: PNC Bank NA)(a) | | | 10,625,000 |
| | | | | | |
| | | | | | 58,130,000 |
| | | | | | |
| | Rhode Island — 2.69% | | | |
| | 12,330,000 | | JPMorgan Chase Putters/Drivers Trust GO, Series 3273, 1.10%, 3/1/11, (Credit Support: MBIA-RE)(a)(b) | | | 12,330,000 |
| | | | | | |
| | South Carolina — 3.36% | | | |
| | 6,500,000 | | Cherokee County Revenue, 0.55%, 12/1/15, (LOC: LaSalle Bank NA)(a) | | | 6,500,000 |
| | 8,895,000 | | South Carolina Jobs-Economic Development Authority Revenue, 0.57%, 5/1/29, (LOC: Wachovia Bank NA)(a) | | | 8,895,000 |
| | | | | | |
| | | | | | 15,395,000 |
| | | | | | |
| | South Dakota — 2.75% | | | |
| | 12,640,000 | | Sioux Falls Revenue, Putters Series 2057, 0.84%, 5/15/15, (Credit Support: MBIA-RE)(a) | | | 12,640,000 |
| | | | | | |
| | Tennessee — 3.92% | | | |
| | 7,000,000 | | Clarksville Public Building Authority, 0.58%, 7/1/24, (LOC: SunTrust Bank)(a) | | | 7,000,000 |
| | 6,000,000 | | Pulaski & Giles County Industrial Development Board Revenue, 1.04%, 1/1/24, (LOC: Regions Bank)(a) | | | 6,000,000 |
| | | | | | |
Principal
Amount | | | | Value |
| $ | 5,000,000 | | Shelby County Health Educational & Housing Facilities Board Revenue, Series A, 0.40%, 6/1/42, (Credit Support: Assured GTY)(a) | | $ | 5,000,000 |
| | | | | | |
| | | | | | 18,000,000 |
| | | | | | |
| | Texas — 1.95% | | | |
| | 3,445,000 | | Crawford Education Facilities Corp. Revenue, 0.55%, 6/1/18, (LOC: U.S. Bank NA)(a) | | | 3,445,000 |
| | 5,510,000 | | Dallas Performing Arts Cultural Facilities Corp. Revenue, Series A, 0.30%, 9/1/41, (LOC: Bank of America NA)(a) | | | 5,510,000 |
| | | | | | |
| | | | | | 8,955,000 |
| | | | | | |
| | Utah — 2.29% | | | |
| | 5,680,000 | | Jordanelle Special Service District Revenue, 0.47%, 9/1/25, (LOC: Wells Fargo Bank NA)(a) | | | 5,680,000 |
| | 4,045,000 | | Ogden City Redevelopment Agency Tax Allocation, Series A, 0.47%, 4/1/25, (LOC: Wells Fargo Bank NA)(a) | | | 4,045,000 |
| | 805,000 | | Sanpete County Revenue, 0.52%, 8/1/28, (LOC: U.S. Bank NA)(a) | | | 805,000 |
| | | | | | |
| | | | | | 10,530,000 |
| | | | | | |
| | Virginia — 0.98% | | | |
| | 4,500,000 | | Chesapeake Hospital Authority Revenue, Series A, 0.58%, 7/1/31, (LOC: SunTrust Bank)(a) | | | 4,500,000 |
| | | | | | |
| | Washington — 2.23% | | | |
| | 7,220,000 | | Washington Health Care Facilities Authority Revenue, 0.60%, 8/1/26, (LOC: Bank of America NA)(a) | | | 7,220,000 |
| | 3,000,000 | | Washington State Housing Finance Commission Revenue, The Overlake School Project, 0.47%, 10/1/29, (LOC: Wells Fargo Bank NA)(a) | | | 3,000,000 |
| | | | | | |
| | | | | | 10,220,000 |
| | | | | | |
| | Wisconsin — 2.11% | | | |
| | 3,700,000 | | Wisconsin Health & Educational Facilities Authority Revenue, 1.68%, 11/15/30(a) | | | 3,700,000 |
| | 4,100,000 | | Wisconsin Health & Educational Facilities Authority Revenue, Series B3, 0.54%, 10/1/33, (LOC: JPMorgan Chase Bank)(a) | | | 4,100,000 |
| | 1,880,000 | | Wisconsin Municipalities Private School Finance Commission Revenue, 0.55%, 3/1/23, (LOC: U.S. Bank NA)(a) | | | 1,880,000 |
| | | | | | |
| | | | | | 9,680,000 |
| | | | | | |
| Total Municipal Bonds
(Cost $444,538,000) | | | 444,538,000 |
| | | | | | |
|
SCHEDULE OF PORTFOLIO INVESTMENTS |
Tamarack Institutional Tax-Free Money Market Fund (cont.)
March 31, 2009 (Unaudited)
| | | | | |
| Shares | | | | Value |
| Investment Companies — 3.03% | | | |
| 6,904,156 | | Goldman Sachs Tax-Free Institutional Money Market Fund | | $ | 6,904,156 |
| 7,000,208 | | Wells Fargo Advantage National Tax-Free Institutional Money Market Fund | | | 7,000,208 |
| | | | | |
Total Investment Companies
(Cost $13,904,364) | | | 13,904,364 |
| | | | | |
| | | | | |
| | | | | Value |
Total Investments
(Cost $458,442,364)(c) — 99.92% | | $ | 458,442,364 |
| Other assets in excess of liabilities — 0.08% | | | 364,609 |
| | | | | |
| NET ASSETS — 100.00% | | $ | 458,806,973 |
| | | | | |
| (a) | Variable rate security. The rate reflected in the Schedule of Portfolio Investments is the rate in effect on March 31, 2009. The maturity date represents the actual maturity date. The security’s effective maturity resets periodically. |
| (b) | Security exempt from registration under Rule 144A of the Securities Act of 1933, as amended. These securities may be resold in transactions exempt from registration, normally to qualified institutional buyers. Security has been deemed to be liquid based on procedures approved by the Board of Trustees. |
| (c) | Tax cost of securities is equal to book cost of securities. |
Abbreviations used are defined below:
AMBAC - American Municipal Bond Assurance Corp.
BHAC-CR - Berkshire Hathaway Assurance Corp. Custodial Receipts
FSA - Financial Security Assurance
GO - General Obligation
GTY - Guaranty
MBIA-RE - Municipal Bond Insurance Association
LOC - Letter of Credit
See notes to financial statements.
25
Statements of Assets and Liabilities
March 31, 2009 (Unaudited)
| | | | | | | | | | | | | | | | | | | | |
| | | Prime
Money
Market Fund | | | U.S. Government
Money
Market Fund | | | Tax-Free
Money
Market Fund | | | Tamarack
Institutional
Prime Money
Market Fund | | | Tamarack
Institutional
Tax-Free Money
Market Fund | |
Assets: | | | | | | | | | | | | | | | | | | | | |
Investments, at value (cost $12,481,939,946; $5,649,767,438; $995,883,818; $1,476,666,964 and $458,442,364, respectively) | | $ | 12,481,796,986* | | | $ | 5,649,767,438** | | | $ | 995,883,818 | | | $ | 1,476,609,508*** | | | $ | 458,442,364 | |
Securities of Affiliates - Capital Support Agreement (Note 7) | | | — | | | | — | | | | — | | | | — | | | | — | |
Cash | | | — | | | | — | | | | 389 | | | | — | | | | 172 | |
Interest and dividends receivable | | | 28,564,801 | | | | 8,147,026 | | | | 2,391,577 | | | | 3,471,255 | | | | 410,198 | |
Receivable for investments sold | | | — | | | | — | | | | — | | | | 13,301,822 | | | | — | |
Prepaid expenses and other assets | | | 1,029,238 | | | | 294,416 | | | | 133,790 | | | | 126,402 | | | | 80,095 | |
| | | | | | | | | | | | | | | | | | | | |
Total Assets | | | 12,511,391,025 | | | | 5,658,208,880 | | | | 998,409,574 | | | | 1,493,508,987 | | | | 458,932,829 | |
| | | | | | | | | | | | | | | | | | | | |
| | | | | |
Liabilities: | | | | | | | | | | | | | | | | | | | | |
Distributions payable | | | 319 | | | | 699 | | | | — | | | | — | | | | — | |
Payable for investments purchased | | | 196,146,882 | | | | 435,860,304 | | | | — | | | | — | | | | — | |
Accrued expenses and other payables: | | | | | | | | | | | | | | | | | | | | |
Investment advisory fees | | | 962,191 | | | | 377,907 | | | | 83,655 | | | | 303,231 | | | | 98,241 | |
Audit fees | | | 116,175 | | | | 35,115 | | | | 14,239 | | | | 18,979 | | | | 9,333 | |
Trustee fees | | | 6,554 | | | | — | | | | — | | | | 5,085 | | | | 1,640 | |
Distribution fees | | | 7,479,373 | | | | 2,471,384 | | | | 504,691 | | | | — | | | | — | |
Shareholder reports | | | — | | | | — | | | | 4,213 | | | | — | | | | — | |
Shareholder servicing fees | | | 20,428 | | | | 448 | | | | 2,077 | | | | — | | | | — | |
Transfer Agent fees | | | 13,180 | | | | — | | | | — | | | | 15,172 | | | | 5,657 | |
Other | | | — | | | | — | | | | 3,221 | | | | 49,005 | | | | 10,985 | |
| | | | | | | | | | | | | | | | | | | | |
Total Liabilities | | | 204,745,102 | | | | 438,745,857 | | | | 612,096 | | | | 391,472 | | | | 125,856 | |
| | | | | | | | | | | | | | | | | | | | |
Net Assets | | $ | 12,306,645,923 | | | $ | 5,219,463,023 | | | $ | 997,797,478 | | | $ | 1,493,117,515 | | | $ | 458,806,973 | |
| | | | | | | | | | | | | | | | | | | | |
| | | | | |
Net Assets Consist Of: | | | | | | | | | | | | | | | | | | | | |
Capital | | $ | 12,311,677,902 | | | $ | 5,219,477,436 | | | $ | 997,945,602 | | | $ | 1,493,229,176 | | | $ | 459,048,466 | |
Distributions in excess of net investment income | | | (77,568 | ) | | | — | | | | (413,929 | ) | | | (10,590 | ) | | | (292,306 | ) |
Accumulated net realized gains (losses) from investment transactions | | | (4,811,451 | ) | | | (14,413 | ) | | | 265,805 | | | | (43,615 | ) | | | 50,813 | |
Net unrealized depreciation on investments | | | (142,960 | ) | | | — | | | | — | | | | (57,456 | ) | | | — | |
| | | | | | | | | | | | | | | | | | | | |
Net Assets | | $ | 12,306,645,923 | | | $ | 5,219,463,023 | | | $ | 997,797,478 | | | $ | 1,493,117,515 | | | $ | 458,806,973 | |
| | | | | | | | | | | | | | | | | | | | |
| | | | | |
Net Assets: | | | | | | | | | | | | | | | | | | | | |
Fund Level | | | | | | | | | | | | | | $ | 1,493,117,515 | | | $ | 458,806,973 | |
RBC Institutional Class 1 | | $ | 1,111,417,257 | | | $ | 50,933,128 | | | $ | 50,564,566 | | | | — | | | | — | |
RBC Institutional Class 2 | | | 10,037 | | | | 67,387,760 | | | | 10,022 | | | | — | | | | — | |
RBC Investor Class | | | 4,831,875,337 | | | | 2,100,900,653 | | | | 234,187,788 | | | | — | | | | — | |
RBC Reserve Class | | | 5,018,658,664 | | | | 1,742,019,221 | | | | 475,609,266 | | | | — | | | | — | |
RBC Select Class | | | 1,344,684,628 | | | | 1,258,222,261 | | | | 237,425,836 | | | | — | | | | — | |
| | | | | | | | | | | | | | | | | | | | |
Total | | $ | 12,306,645,923 | | | $ | 5,219,463,023 | | | $ | 997,797,478 | | | $ | 1,493,117,515 | | | $ | 458,806,973 | |
| | | | | | | | | | | | | | | | | | | | |
26
Statements of Assets and Liabilities
| | | | | | | | | | | | | | | |
| | | Prime
Money
Market Fund | | U.S. Government
Money
Market Fund | | Tax-Free
Money
Market Fund | | Tamarack
Institutional
Prime Money
Market Fund | | Tamarack
Institutional
Tax-Free Money
Market Fund |
Shares Outstanding (Unlimited number of shares authorized, no par value): | | | | | | | | | | | | | | | |
Fund Level | | | — | | | — | | | — | | | 1,493,242,814 | | | 459,048,466 |
RBC Institutional Class 1 | | | 1,111,440,965 | | | 50,933,663 | | | 50,580,705 | | | — | | | — |
RBC Institutional Class 2 | | | 10,042 | | | 67,387,872 | | | 10,024 | | | — | | | — |
RBC Investor Class | | | 4,834,082,667 | | | 2,100,910,910 | | | 234,231,997 | | | — | | | — |
RBC Reserve Class | | | 5,020,951,608 | | | 1,742,041,437 | | | 475,700,648 | | | — | | | — |
RBC Select Class S | | | 1,345,312,587 | | | 1,258,237,941 | | | 237,470,333 | | | — | | | — |
| | | | | | | | | | | | | | | |
Total | | | 12,311,797,869 | | | 5,219,511,823 | | | 997,993,707 | | | 1,493,242,814 | | | 459,048,466 |
| | | | | | | | | | | | | | | |
| | | | | |
Net Asset Values and Redemption Price per Share: | | | | | | | | | | | | | | | |
Fund Level | | | | | | | | | | | $ | 1.00 | | $ | 1.00 |
| | | | | | | | | | | | | | | |
RBC Institutional Class 1 | | $ | 1.00 | | $ | 1.00 | | $ | 1.00 | | | | | | |
| | | | | | | | | | | | | | | |
RBC Institutional Class 2 | | $ | 1.00 | | $ | 1.00 | | $ | 1.00 | | | | | | |
| | | | | | | | | | | | | | | |
RBC Investor Class | | $ | 1.00 | | $ | 1.00 | | $ | 1.00 | | | | | | |
| | | | | | | | | | | | | | | |
RBC Reserve Class | | $ | 1.00 | | $ | 1.00 | | $ | 1.00 | | | | | | |
| | | | | | | | | | | | | | | |
RBC Select Class S | | $ | 1.00 | | $ | 1.00 | | $ | 1.00 | | | | | | |
| | | | | | | | | | | | | | | |
| * | $1,675,000,000 of which are repurchase agreements. See Schedule of Portfolio Investments for details. |
| ** | $975,000,000 of which are repurchase agreements. See Schedule of Portfolio Investments for details. |
| *** | $100,000,000 of which are repurchase agreements. See Schedule of Portfolio Investments for details. |
See notes to financial statements.
27
Statements of Operations
For the Six Months Ended March 31, 2009 (Unaudited)
| | | | | | | | | | | | | | | | | | | |
| | | Prime
Money
Market Fund | | | U.S. Government
Money
Market Fund | | | Tax-Free
Money
Market Fund | | | Tamarack
Institutional
Prime Money
Market Fund | | | Tamarack
Institutional
Tax-Free Money
Market Fund |
Investment Income: | | | | | | | | | | | | | | | | | | | |
Interest income | | $ | 93,125,522 | | | $ | 27,246,082 | | | $ | 6,117,718 | | | $ | 11,585,677 | | | $ | 3,057,365 |
Dividend income | | | 592,589 | | | | 165,103 | | | | 819,970 | | | | 304,708 | | | | 196,235 |
| | | | | | | | | | | | | | | | | | | |
Total Investment Income | | | 93,718,111 | | | | 27,411,185 | | | | 6,937,688 | | | | 11,890,385 | | | | 3,253,600 |
| | | | | | | | | | | | | | | | | | | |
| | | | | |
Expenses: | | | | | | | | | | | | | | | | | | | |
Investment advisory fees | | | 10,035,751 | | | | 3,127,446 | | | | 1,077,464 | | | | 1,878,599 | | | | 638,790 |
Distribution fees-RBC Institutional Class 2 | | | 5 | | | | 16,231 | | | | 5 | | | | — | | | | — |
Distribution fees-RBC Investor Class | | | 16,215,263 | | | | 3,363,580 | | | | 816,931 | | | | — | | | | — |
Distribution fees-RBC Reserve Class | | | 15,416,056 | | | | 5,408,711 | | | | 1,587,786 | | | | — | | | | — |
Distribution fees-RBC Select Class | | | 3,769,188 | | | | 3,630,381 | | | | 730,225 | | | | — | | | | — |
Shareholder servicing fee | | | 92,252 | | | | 15,459 | | | | 11,814 | | | | — | | | | — |
Accounting fees | | | 271,670 | | | | 95,352 | | | | 25,689 | | | | 37,578 | | | | 12,776 |
Administration fees | | | 3,608,254 | | | | 1,185,466 | | | | 352,219 | | | | — | | | | — |
Audit fees | | | 127,838 | | | | 38,073 | | | | 13,756 | | | | 19,827 | | | | 8,838 |
Custodian fees | | | 68,663 | | | | 18,861 | | | | 7,745 | | | | 15,175 | | | | 5,579 |
Federal insurance fee | | | 2,354,953 | | | | 584,024 | | | | 212,681 | | | | 413,932 | | | | 150,508 |
Insurance fees | | | 64,575 | | | | 15,497 | | | | 6,457 | | | | 10,332 | | | | 5,165 |
Legal fees | | | 300,305 | | | | 54,762 | | | | 26,313 | | | | 54,160 | | | | 17,713 |
Registration and filing fees | | | 120,615 | | | | 69,580 | | | | 64,071 | | | | 41,976 | | | | 41,387 |
Shareholder reports | | | 1,310,017 | | | | 93,933 | | | | 31,190 | | | | 10,260 | | | | 3,114 |
Transfer agent fees | | | 2,035,441 | | | | 212,522 | | | | 65,969 | | | | 37,050 | | | | 12,949 |
Trustees’ fees | | | 121,018 | | | | 28,230 | | | | 11,202 | | | | 21,158 | | | | 7,349 |
Other fees | | | 90,376 | | | | 36,678 | | | | 14,059 | | | | 17,760 | | | | 10,633 |
| | | | | | | | | | | | | | | | | | | |
Total expenses before fee reductions | | | 56,002,240 | | | | 17,994,786 | | | | 5,055,576 | | | | 2,557,807 | | | | 914,801 |
Expenses reduced by: | | | | | | | | | | | | | | | | | | | |
Shareholder Servicing Agent | | | (3,085 | ) | | | (14 | ) | | | — | | | | — | | | | — |
Distributor | | | (4,593,044 | ) | | | (2,602,563 | ) | | | (981,811 | ) | | | — | | | | — |
| | | | | | | | | | | | | | | | | | | |
Net Expenses | | | 51,406,111 | | | | 15,392,209 | | | | 4,073,765 | | | | 2,557,807 | | | | 914,801 |
| | | | | | | | | | | | | | | | | | | |
| | | | | |
Net Investment Income | | | 42,312,000 | | | | 12,018,976 | | | | 2,863,923 | | | | 9,332,578 | | | | 2,338,799 |
| | | | | | | | | | | | | | | | | | | |
| | | | | |
Realized/Unrealized Gains (Losses) from Investment Transactions: | | | | | | | | | | | | | | | | | | | |
Net realized gains (losses) from investment transactions | | | (722 | ) | | | (16,693 | ) | | | 112,264 | | | | (111 | ) | | | 14,759 |
Net change in unrealized appreciation/depreciation on investments | | | 14,701,287 | | | | — | | | | — | | | | 1,401,158 | | | | — |
| | | | | | | | | | | | | | | | | | | |
Net realized/unrealized gains (losses) from investments | | | 14,700,565 | | | | (16,693 | ) | | | 112,264 | | | | 1,401,047 | | | | 14,759 |
| | | | | | | | | | | | | | | | | | | |
Change in net assets resulting from operations | | $ | 57,012,565 | | | $ | 12,002,283 | | | $ | 2,976,187 | | | $ | 10,733,625 | | | $ | 2,353,558 |
| | | | | | | | | | | | | | | | | | | |
See notes to financial statements.
28
Statements of Changes in Net Assets
| | | | | | | | | | | | | | | | |
| | | Prime
Money Market Fund | | | U.S. Government
Money Market Fund | |
| | | For the
Six Months Ended
March 31, 2009 | | | For the
Year Ended
September 30, 2008 | | | For the
Six Months Ended
March 31, 2009 | | | For the
Year Ended
September 30, 2008 | |
| | | (Unaudited) | | | | | | (Unaudited) | | | | |
From Investment Activities: | | | | | | | | | | | | | | | | |
Operations: | | | | | | | | | | | | | | | | |
Net investment income | | $ | 42,312,000 | | | $ | 317,782,495 | | | $ | 12,018,976 | | | $ | 46,333,075 | |
Net realized gains (losses) from investment transactions | | | (722 | ) | | | (4,674,165 | ) | | | (16,693 | ) | | | 6,015 | |
Net change in unrealized appreciation/depreciation on investments | | | 14,701,287 | | | | (14,844,247 | ) | | | — | | | | — | |
| | | | | | | | | | | | | | | | |
Change in net assets resulting from operations | | | 57,012,565 | | | | 298,264,083 | | | | 12,002,283 | | | | 46,339,090 | |
| | | | | | | | | | | | | | | | |
Distributions from Net Investment Income | | | | | | | | | | | | | | | | |
RBC Institutional Class 1 Shareholders | | | (24,417,970 | ) | | | (317,789,080 | ) | | | (7,057,154 | ) | | | (46,333,075 | ) |
RBC Institutional Class 2 Shareholders | | | (41 | ) | | | — | | | | (95,022 | ) | | | — | |
RBC Investor Class Shareholders | | | (6,089,393 | ) | | | — | | | | (733,173 | ) | | | — | |
RBC Reserve Class Shareholders | | | (8,942,811 | ) | | | — | | | | (2,187,681 | ) | | | — | |
RBC Select Class Shareholders | | | (2,938,435 | ) | | | — | | | | (1,945,946 | ) | | | — | |
| | | | | | | | | | | | | | | | |
Change in net assets resulting from shareholder distributions | | | (42,388,650 | ) | | | (317,789,080 | ) | | | (12,018,976 | ) | | | (46,333,075 | ) |
| | | | | | | | | | | | | | | | |
| | | | |
Capital Transactions: | | | | | | | | | | | | | | | | |
Proceeds from shares issued | | | 19,014,697,246 | | | | 5,514,316,481 | | | | 7,347,790,599 | | | | 2,818,896,723 | |
Distributions reinvested | | | 42,383,409 | | | | 317,761,781 | | | | 11,999,133 | | | | 46,337,501 | |
Cost of shares redeemed | | | (17,355,926,694 | ) | | | (4,883,761,002 | ) | | | (5,406,494,836 | ) | | | (992,408,623 | ) |
| | | | | | | | | | | | | | | | |
Change in net assets resulting from capital transactions | | | 1,701,153,961 | | | | 948,317,260 | | | | 1,953,294,896 | | | | 1,872,825,601 | |
| | | | | | | | | | | | | | | | |
Net increase in net assets | | | 1,715,777,876 | | | | 928,792,263 | | | | 1,953,278,203 | | | | 1,872,831,616 | |
| | | | |
Net Assets: | | | | | | | | | | | | | | | | |
Beginning of period | | | 10,590,868,047 | | | | 9,662,075,784 | | | | 3,266,184,820 | | | | 1,393,353,204 | |
| | | | | | | | | | | | | | | | |
End of period | | $ | 12,306,645,923 | | | $ | 10,590,868,047 | | | $ | 5,219,463,023 | | | $ | 3,266,184,820 | |
| | | | | | | | | | | | | | | | |
Distributions in excess of net investment income | | $ | (77,568 | ) | | $ | (918 | ) | | $ | — | | | $ | — | |
| | | | | | | | | | | | | | | | |
| | | | |
Share Transactions: | | | | | | | | | | | | | | | | |
Issued | | | 19,014,697,246 | | | | 5,514,316,481 | | | | 7,347,790,599 | | | | 2,818,896,723 | |
Reinvested | | | 42,383,409 | | | | 317,761,781 | | | | 11,999,133 | | | | 46,337,501 | |
Redeemed | | | (17,355,926,694 | ) | | | (4,883,761,002 | ) | | | (5,406,494,836 | ) | | | (992,408,623 | ) |
| | | | | | | | | | | | | | | | |
Change in shares resulting from capital transactions | | | 1,701,153,961 | | | | 948,317,260 | | | | 1,953,294,896 | | | | 1,872,825,601 | |
| | | | | | | | | | | | | | | | |
See notes to financial statements.
29
Statements of Changes in Net Assets (cont.)
| | | | | | | | |
| | | Tax-Free
Money Market Fund | |
| | | For the
Six Months Ended
March 31, 2009 | | | For the
Year Ended
September 30, 2008 | |
| | | (Unaudited) | | | | |
From Investment Activities: | | | | | | | | |
Operations: | | | | | | | | |
Net investment income | | $ | 2,863,923 | | | $ | 18,753,469 | |
Net realized gains from investment transactions | | | 112,264 | | | | 166,368 | |
| | | | | | | | |
Change in net assets resulting from operations | | | 2,976,187 | | | | 18,919,837 | |
| | | | | | | | |
| | |
Distributions from Net Investment Income | | | | | | | | |
RBC Institutional Class 1 Shareholders | | | (2,700,988 | ) | | | (18,772,192 | ) |
RBC Institutional Class 2 Shareholders | | | (23 | ) | | | — | |
RBC Investor Class Shareholders | | | (87,247 | ) | | | — | |
RBC Reserve Class Shareholders | | | (268,589 | ) | | | — | |
RBC Select Class Shareholders | | | (221,005 | ) | | | — | |
| | | | | | | | |
Change in net assets resulting from shareholder distributions | | | (3,277,852 | ) | | | (18,772,192 | ) |
| | | | | | | | |
| | |
Capital Transactions: | | | | | | | | |
Proceeds from shares issued | | | 1,664,027,045 | | | | 1,157,984,109 | |
Distributions reinvested | | | 3,277,854 | | | | 18,772,192 | |
Cost of shares redeemed | | | (1,572,914,046 | ) | | | (1,114,363,283 | ) |
| | | | | | | | |
Change in net assets resulting from capital transactions | | | 94,390,853 | | | | 62,393,018 | |
| | | | | | | | |
Net increase in net assets | | | 94,089,188 | | | | 62,540,663 | |
| | |
Net Assets: | | | | | | | | |
Beginning of period | | | 903,708,290 | | | | 841,167,627 | |
| | | | | | | | |
End of period | | $ | 997,797,478 | | | $ | 903,708,290 | |
| | | | | | | | |
Distributions in excess of net investment income | | $ | (413,929 | ) | | $ | — | |
| | | | | | | | |
| | |
Share Transactions: | | | | | | | | |
Issued | | | 1,664,027,045 | | | | 1,157,984,109 | |
Reinvested | | | 3,277,854 | | | | 18,772,192 | |
Redeemed | | | (1,572,914,046 | ) | | | (1,114,363,283 | ) |
| | | | | | | | |
Change in shares resulting from capital transactions | | | 94,390,853 | | | | 62,393,018 | |
| | | | | | | | |
See notes to financial statements.
30
Statements of Changes in Net Assets (cont.)
| | | | | | | | | | | | | | | | |
| | | Tamarack Institutional Prime
Money Market Fund | | | Tamarack Institutional Tax-Free
Money Market Fund | |
| | | For the
Six Months Ended
March 31, 2009 | | | For the
Year Ended
September 30, 2008 | | | For the
Six Months Ended
March 31, 2009 | | | For the
Year Ended
September 30, 2008 | |
| | | (Unaudited) | | | | | | (Unaudited) | | | | |
From Investment Activities: | | | | | | | | | | | | | | | | |
Operations: | | | | | | | | | | | | | | | | |
Net investment income | | $ | 9,332,578 | | | $ | 67,800,853 | | | $ | 2,338,799 | | | $ | 16,427,946 | |
Net realized gains (losses) from investment transactions | | | (111 | ) | | | 90,200 | | | | 14,759 | | | | 54,050 | |
Net change in unrealized appreciation/depreciation on investments | | | 1,401,158 | | | | (1,458,614 | ) | | | — | | | | — | |
| | | | | | | | | | | | | | | | |
Change in net assets resulting from operations | | | 10,733,625 | | | | 66,432,439 | | | | 2,353,558 | | | | 16,481,996 | |
| | | | | | | | | | | | | | | | |
| | | | |
Distributions from Net Investment Income | | | (9,343,167 | ) | | | (67,806,075 | ) | | | (2,631,105 | ) | | | (16,442,240 | ) |
| | | | | | | | | | | | | | | | |
Change in net assets resulting from shareholder distributions | | | (9,343,167 | ) | | | (67,806,075 | ) | | | (2,631,105 | ) | | | (16,442,240 | ) |
| | | | | | | | | | | | | | | | |
| | | | |
Capital Transactions: | | | | | | | | | | | | | | | | |
Proceeds from shares issued | | | 858,603,767 | | | | 9,045,055,732 | | | | 392,142,555 | | | | 1,266,057,850 | |
Distributions reinvested | | | 9,340,795 | | | | 67,806,074 | | | | 2,624,761 | | | | 16,442,240 | |
Cost of shares redeemed | | | (1,264,791,715 | ) | | | (8,643,146,226 | ) | | | (475,977,846 | ) | | | (1,311,362,487 | ) |
| | | | | | | | | | | | | | | | |
Change in net assets resulting from capital transactions | | | (396,847,153 | ) | | | 469,715,580 | | | | (81,210,530 | ) | | | (28,862,397 | ) |
| | | | | | | | | | | | | | | | |
Net increase (decrease) in net assets | | | (395,456,695 | ) | | | 468,341,944 | | | | (81,488,077 | ) | | | (28,822,641 | ) |
| | | | |
Net Assets: | | | | | | | | | | | | | | | | |
Beginning of period | | | 1,888,574,210 | | | | 1,420,232,266 | | | | 540,295,050 | | | | 569,117,691 | |
| | | | | | | | | | | | | | | | |
End of period | | $ | 1,493,117,515 | | | $ | 1,888,574,210 | | | $ | 458,806,973 | | | $ | 540,295,050 | |
| | | | | | | | | | | | | | | | |
Distributions in excess of net investment income | | $ | (10,590 | ) | | $ | (1 | ) | | $ | (292,306 | ) | | $ | — | |
| | | | | | | | | | | | | | | | |
| | | | |
Share Transactions: | | | | | | | | | | | | | | | | |
Issued | | | 858,603,767 | | | | 9,045,055,731 | | | | 392,142,555 | | | | 1,266,057,849 | |
Reinvested | | | 9,340,795 | | | | 67,806,074 | | | | 2,624,761 | | | | 16,442,240 | |
Redeemed | | | (1,264,791,715 | ) | | | (8,643,146,226 | ) | | | (475,977,846 | ) | | | (1,311,362,487 | ) |
| | | | | | | | | | | | | | | | |
Change in shares resulting from capital transactions | | | (396,847,153 | ) | | | 469,715,579 | | | | (81,210,530 | ) | | | (28,862,398 | ) |
| | | | | | | | | | | | | | | | |
See notes to financial statements.
31
Prime Money Market Fund
(Selected data for a share outstanding throughout the periods indicated)
| | | | | | | | | | | | | | | | | | | | | | | | |
| | | | | Investment Activities | | Distributions | | | | | | Ratios/Supplemental Data |
| | | Net Asset
Value,
Beginning
of Period | | Net
Investment
Income | | Net Realized/
Unrealized
Gain (Loss) on
Investments | | Total from
Investment
Activities | | Net
Investment
Income | | Total
Distributions | | Net Asset
Value,
End of
Period | | Total
Return | | Net Assets,
End of Period
(millions) | | Ratio of Net
Expenses to
Average
Net Assets | | Ratio of Net
Investment
Income
to Average
Net Assets | | Ratio of
Expenses to
Average
Net Assets* |
RBC Institutional Class 1 | | | | | | | | | | | | | | | | | | | | | | | | |
Six Months Ended March 31, 2009 (Unaudited) | | $1.00 | | 0.01(a) | | (b) | | 0.01 | | (0.01) | | (0.01) | | $1.00 | | 0.66%(c) | | $1,111 | | 0.84%(d)(e)(f) | | 1.50%(d) | | 0.84%(d) |
Year Ended September 30, 2008 | | 1.00 | | 0.03(a) | | (b) | | 0.03 | | (0.03) | | (0.03) | | 1.00 | | 3.02% | | 10,591 | | 0.84% | | 2.94% | | 0.87% |
Year Ended September 30, 2007 | | 1.00 | | 0.05 | | (b) | | 0.05 | | (0.05) | | (0.05) | | 1.00 | | 4.69% | | 9,662 | | 0.80% | | 4.59% | | 0.89% |
Year Ended September 30, 2006 | | 1.00 | | 0.04 | | (b) | | 0.04 | | (0.04) | | (0.04) | | 1.00 | | 3.99% | | 8,685 | | 0.80% | | 3.93% | | 0.92% |
Year Ended September 30, 2005 | | 1.00 | | 0.02 | | (b) | | 0.02 | | (0.02) | | (0.02) | | 1.00 | | 2.00% | | 7,922 | | 0.76% | | 1.97% | | 0.92% |
Period Ended September 30, 2004 (g) | | 1.00 | | (b) | | (b) | | (b) | | (b) | | (b) | | 1.00 | | 0.14%(c) | | 7,885 | | 0.71%(d) | | 0.83%(d) | | 0.93%(d) |
Year Ended July 31, 2004 | | 1.00 | | (b) | | — | | (b) | | (b) | | (b) | | 1.00 | | 0.42% | | 7,860 | | 0.71% | | 0.42% | | 0.90% |
| | | | | | | | | | | | |
RBC Institutional Class 2 | | | | | | | | | | | | | | | | | | | | | | | | |
Period Ended March 31, 2009 (Unaudited)(h) | | $1.00 | | (a)(b) | | (b) | | (b) | | (b) | | (b) | | $1.00 | | 0.63%(c) | | (i) | | 0.33%(d)(e) | | 1.15%(d) | | 0.33%(d) |
| | | | | | | | | | | | |
RBC Investor Class | | | | | | | | | | | | | | | | | | | | | | | | |
Period Ended March 31, 2009 (Unaudited)(h) | | $1.00 | | (a)(b) | | (b) | | (b) | | (b) | | (b) | | $1.00 | | 0.35%(c) | | $4,832 | | 1.09%(d)(e) | | 0.37%(d) | | 1.18%(d) |
| | | | | | | | | | | | |
RBC Reserve Class | | | | | | | | | | | | | | | | | | | | | | | | |
Period Ended March 31, 2009 (Unaudited)(h) | | $1.00 | | (a)(b) | | (b) | | (b) | | (b) | | (b) | | $1.00 | | 0.41%(c) | | $5,019 | | 0.94%(d)(e) | | 0.52%(d) | | 1.08%(d) |
| | | | | | | | | | | | |
RBC Select Class | | | | | | | | | | | | | | | | | | | | | | | | |
Period Ended March 31, 2009 (Unaudited)(h) | | $1.00 | | (a)(b) | | (b) | | (b) | | (b) | | (b) | | $1.00 | | 0.44%(c) | | $1,345 | | 0.84%(d)(e) | | 0.62%(d) | | 0.98%(d) |
* During the periods, certain fees were contractually or voluntarily reduced. If such contractual/voluntary fee reductions had not occurred, the ratio would have been as indicated.
| (a) | Per share net investment income has been calculated using the average daily shares method. |
| (b) | Less than $0.01 or $(0.01) per share. |
| (e) | Includes expenses not covered by the contractual agreement to limit operating expenses. |
| (f) | On November 21, 2008, the net operating expenses were contractually limited to 0.20% of average daily net assets. The ratio of net expenses to average net assets represents a blended percentage for the six months ended March 31, 2009. |
| (g) | For the period from August 1, 2004 to September 30, 2004. |
| (h) | For the period from November 21, 2008 (commencement of operations) to March 31, 2009. |
See notes to financial statements.
32
U.S. Government Money Market Fund
(Selected data for a share outstanding throughout the periods indicated)
| | | | | | | | | | | | | | | | | | | | | | | | |
| | | | | Investment Activities | | Distributions | | | | | | Ratios/Supplemental Data |
| | | Net Asset
Value,
Beginning
of Period | | Net
Investment
Income | | Net Realized/
Unrealized
Gain (Loss) on
Investments | | Total from
Investment
Activities | | Net
Investment
Income | | Total
Distributions | | Net Asset
Value,
End of
Period | | Total
Return | | Net Assets,
End of Period
(millions) | | Ratio of Net
Expenses to
Average
Net Assets | | Ratio of Net
Investment
Income
to Average
Net Assets | | Ratio of
Expenses to
Average
Net Assets* |
RBC Institutional Class 1 | | | | | | | | | | | | | | | | | | | | | | | | |
Six Months Ended March 31, 2009 (Unaudited) | | $1.00 | | 0.01(a) | | (b) | | 0.01 | | (0.01) | | (0.01) | | $1.00 | | 0.57%(c) | | $51 | | 0.67%(d)(e)(f) | | 1.40%(d) | | 0.67%(d) |
Year Ended September 30, 2008 | | 1.00 | | 0.03(a) | | (b) | | 0.03 | | (0.03) | | (0.03) | | 1.00 | | 2.70% | | 3,266 | | 0.72% | | 2.51% | | (g) |
Year Ended September 30, 2007 | | 1.00 | | 0.04 | | (b) | | 0.04 | | (0.04) | | (0.04) | | 1.00 | | 4.56% | | 1,393 | | 0.76% | | 4.47% | | (g) |
Year Ended September 30, 2006 | | 1.00 | | 0.04 | | (b) | | 0.04 | | (0.04) | | (0.04) | | 1.00 | | 3.90% | | 749 | | 0.78% | | 3.82% | | (g) |
Year Ended September 30, 2005 | | 1.00 | | 0.02 | | (b) | | 0.02 | | (0.02) | | (0.02) | | 1.00 | | 1.96% | | 813 | | 0.74% | | 1.92% | | 0.77% |
Period Ended September 30, 2004 (h) | | 1.00 | | (b) | | (b) | | (b) | | (b) | | (b) | | 1.00 | | 0.14%(c) | | 947 | | 0.71%(c) | | 0.81%(d) | | 0.79%(d) |
Year Ended July 31, 2004 | | 1.00 | | (b) | | — | | (b) | | (b) | | (b) | | 1.00 | | 0.38% | | 929 | | 0.71% | | 0.38% | | 0.73% |
| | | | | | | | | | | | |
RBC Institutional Class 2 | | | | | | | | | | | | | | | | | | | | | | | | |
Period Ended March 31, 2009 (Unaudited)(i) | | $1.00 | | (a)(b) | | (b) | | (b) | | (b) | | (b) | | $1.00 | | 0.54%(c) | | $67 | | 0.31%(d)(e) | | 0.88%(d) | | 0.31%(d) |
| | | | | | | | | | | | |
RBC Investor Class | | | | | | | | | | | | | | | | | | | | | | | | |
Period Ended March 31, 2009 (Unaudited)(i) | | $1.00 | | (a)(b) | | (b) | | (b) | | (b) | | (b) | | $1.00 | | 0.29%(c) | | $2,101 | | 0.94%(d)(e) | | 0.22%(d) | | 1.16%(d) |
| | | | | | | | | | | | |
RBC Reserve Class | | | | | | | | | | | | | | | | | | | | | | | | |
Period Ended March 31, 2009 (Unaudited)(i) | | $1.00 | | (a)(b) | | (b) | | (b) | | (b) | | (b) | | $1.00 | | 0.33%(c) | | $1,742 | | 0.87%(d)(e) | | 0.36%(d) | | 1.06%(d) |
| | | | | | | | | | | | |
RBC Select Class | | | | | | | | | | | | | | | | | | | | | | | | |
Period Ended March 31, 2009 (Unaudited)(i) | | $1.00 | | (a)(b) | | (b) | | (b) | | (b) | | (b) | | $1.00 | | 0.36%(c) | | $1,258 | | 0.80%(d)(e) | | 0.43%(d) | | 0.96%(d) |
| * | During the periods, certain fees were contractually or voluntarily reduced. If such contractual/voluntary fee reductions had not occurred, the ratio would have been as indicated. |
| (a) | Per share net investment income has been calculated using the average daily shares method. |
| (b) | Less than $0.01 or $(0.01) per share. |
| (e) | Includes expenses not covered by the contractual agreement to limit operating expenses. |
| (f) | On November 21, 2008, the net operating expenses were contractually limited to 0.20% of average daily net assets. The ratio of net expenses to average net assets represents a blended percentage for the six months ended March 31, 2009. |
| (g) | There were no waivers or reimbursements during the period. |
| (h) | For the period from August 1, 2004 to September 30, 2004. |
| (i) | For the period from November 21, 2008 (commencement of operations) to March 31, 2009. |
See notes to financial statements.
33
Tax-Free Money Market Fund
(Selected data for a share outstanding throughout the periods indicated)
| | | | | | | | | | | | | | | | | | | | | | | | |
| | | | | Investment Activities | | Distributions | | | | | | Ratios/Supplemental Data |
| | | Net Asset
Value,
Beginning
of Period | | Net
Investment
Income | | Net Realized/
Unrealized
Gain (Loss) on
Investments | | Total from
Investment
Activities | | Net
Investment
Income | | Total
Distributions | | Net Asset
Value,
End of
Period | | Total
Return | | Net Assets,
End of Period
(millions) | | Ratio of Net
Expenses to
Average
Net Assets | | Ratio of Net
Investment
Income (Loss)
to Average
Net Assets | | Ratio of
Expenses to
Average
Net Assets* |
RBC Institutional Class 1 | | | | | | | | | | | | | | | | | | | | | | | | |
Six Months Ended March 31, 2009 (Unaudited) | | $1.00 | | 0.01(a) | | (b) | | 0.01 | | (0.01) | | (0.01) | | $1.00 | | 0.51%(c) | | $51 | | 0.79%(d)(e)(f) | | 1.64%(d) | | 0.79%(d) |
Year Ended September 30, 2008 | | 1.00 | | 0.02(a) | | (b) | | 0.02 | | (0.02) | | (0.02) | | 1.00 | | 1.95% | | 904 | | 0.80% | | 1.90% | | 0.84% |
Year Ended September 30, 2007 | | 1.00 | | 0.03 | | (b) | | 0.03 | | (0.03) | | (0.03) | | 1.00 | | 3.00% | | 841 | | 0.70% | | 2.96% | | 0.84% |
Year Ended September 30, 2006 | | 1.00 | | 0.02 | | — | | 0.02 | | (0.02) | | (0.02) | | 1.00 | | 2.52% | | 791 | | 0.70% | | 2.49% | | 0.85% |
Year Ended September 30, 2005 | | 1.00 | | 0.01 | | — | | 0.01 | | (0.01) | | (0.01) | | 1.00 | | 1.44% | | 858 | | 0.66% | | 1.41% | | 0.83% |
Period Ended September 30, 2004 (g) | | 1.00 | | (b) | | — | | (b) | | (b) | | (b) | | 1.00 | | 0.11%(c) | | 965 | | 0.62%(d) | | 0.64%(d) | | 0.83%(d) |
Year Ended July 31, 2004 | | 1.00 | | (b) | | — | | (b) | | (b) | | (b) | | 1.00 | | 0.38% | | 1,003 | | 0.62% | | 0.38% | | 0.86% |
| | | | | | | | | | | | |
RBC Institutional Class 2 | | | | | | | | | | | | | | | | | | | | | | | | |
Period Ended March 31, 2009 (Unaudited)(h) | | $1.00 | | (a)(b) | | (b) | | (b) | | (b) | | (b) | | $1.00 | | 0.48%(c) | | (i) | | 0.32%(d)(e) | | 0.53%(d) | | 0.32%(d) |
| | | | | | | | | | | | |
RBC Investor Class | | | | | | | | | | | | | | | | | | | | | | | | |
Period Ended March 31, 2009 (Unaudited)(h) | | $1.00 | | (a)(b) | | (b) | | (b) | | (b) | | (b) | | $1.00 | | 0.29%(c) | | $234 | | 0.86%(d)(e) | | (0.01)%(d) | | 1.18%(d) |
| | | | | | | | | | | | |
RBC Reserve Class | | | | | | | | | | | | | | | | | | | | | | | | |
Period Ended March 31, 2009 (Unaudited)(h) | | $1.00 | | (a)(b) | | (b) | | (b) | | (b) | | (b) | | $1.00 | | 0.30%(c) | | $476 | | 0.81%(d)(e) | | 0.04%(d) | | 1.08%(d) |
| | | | | | | | | | | | |
RBC Select Class | | | | | | | | | | | | | | | | | | | | | | | | |
Period Ended March 31, 2009 (Unaudited)(h) | | $1.00 | | (a)(b) | | (b) | | (b) | | (b) | | (b) | | $1.00 | | 0.34%(c) | | $237 | | 0.71%(d)(e) | | 0.13%(d) | | 0.98%(d) |
| * | During the periods, certain fees were contractually or voluntarily reduced. If such contractual/voluntary fee reductions had not occurred, the ratio would have been as indicated. |
| (a) | Per share net investment income has been calculated using the average daily shares method. |
| (b) | Less than $0.01 or $(0.01) per share. |
| (e) | Includes expenses not covered by the contractual agreement to limit operating expenses. |
| (f) | On November 21, 2008, the net operating expenses were contractually limited to 0.20% of average daily net assets. The ratio of net expenses to average net assets represents a blended percentage for the six months ended March 31, 2009. |
| (g) | For the period from August 1, 2004 to September 30, 2004. |
| (h) | For the period from November 21, 2008 (commencement of operations) to March 31, 2009. |
See notes to financial statements.
34
Tamarack Institutional Prime Money Market Fund
(Selected data for a share outstanding throughout the periods indicated)
| | | | | | | | | | | | | | | | | | | | | | |
| | | | | Investment Activities | | Distributions | | | | | | Ratios/Supplemental Data |
| | | Net Asset
Value,
Beginning
of Period | | Net
Investment
Income | | Net Realized/
Unrealized
Gain (Loss) on
Investments | | Total from
Investment
Activities | | Net
Investment
Income | | Total
Distributions | | Net Asset
Value,
End of
Period | | Total
Return | | Net Assets,
End of Period
(millions) | | Ratio of Net
Expenses to
Average
Net Assets | | Ratio of Net
Investment
Income to
Average
Net Assets |
Six Months Ended March 31, 2009 (Unaudited) | | $1.00 | | 0.01(a) | | (b) | | 0.01 | | (0.01) | | (0.01) | | $1.00 | | 0.62%(c) | | $1,493 | | 0.34%(d) | | 1.24%(d) |
Year Ended September 30, 2008 | | 1.00 | | 0.03(a) | | (b) | | 0.03 | | (0.03) | | (0.03) | | 1.00 | | 3.52% | | 1,889 | | 0.28% | | 3.39% |
Year Ended September 30, 2007 | | 1.00 | | 0.05 | | (b) | | 0.05 | | (0.05) | | (0.05) | | 1.00 | | 5.23% | | 1,420 | | 0.27% | | 5.11% |
Year Ended September 30, 2006 | | 1.00 | | 0.04 | | — | | 0.04 | | (0.04) | | (0.04) | | 1.00 | | 4.53% | | 1,199 | | 0.28% | | 4.51% |
Year Ended September 30, 2005 | | 1.00 | | 0.02 | | (b) | | 0.02 | | (0.02) | | (0.02) | | 1.00 | | 2.48% | | 790 | | 0.28% | | 2.47% |
Period Ended September 30, 2004 (e) | | 1.00 | | (b) | | (b) | | (b) | | (b) | | (b) | | 1.00 | | 0.21%(c) | | 643 | | 0.29%(d) | | 1.26%(d) |
Year Ended July 31, 2004 | | 1.00 | | 0.01 | | (b) | | 0.01 | | (0.01) | | (0.01) | | 1.00 | | 0.85% | | 656 | | 0.29% | | 0.85% |
| (a) | Per share net investment income has been calculated using the average daily shares method. |
| (b) | Less than $0.01 or $(0.01) per share. |
| (e) | For the period from August 1, 2004 to September 30, 2004. |
See notes to financial statements.
35
Tamarack Institutional Tax-Free Money Market Fund
(Selected data for a share outstanding throughout the periods indicated)
| | | | | | | | | | | | | | | | | | | | | | |
| | | | | Investment Activities | | Distributions | | | | | | Ratios/Supplemental Data |
| | | Net Asset
Value,
Beginning
of Period | | Net
Investment
Income | | Net Realized/
Unrealized
Gain (Loss) on
Investments | | Total from
Investment
Activities | | Net
Investment
Income | | Total
Distributions | | Net Asset
Value,
End of
Period | | Total
Return | | Net Assets,
End of Period
(millions) | | Ratio of Net
Expenses to
Average
Net Assets | | Ratio of Net
Investment
Income to
Average
Net Assets |
Six Months Ended March 31, 2009 (Unaudited) | | $1.00 | | 0.01(a) | | (b) | | 0.01 | | (0.01) | | (0.01) | | $1.00 | | 0.48%(c) | | $459 | | 0.36%(d) | | 0.92%(d) |
Year Ended September 30, 2008 | | 1.00 | | 0.02(a) | | (b) | | 0.02 | | (0.02) | | (0.02) | | 1.00 | | 2.45% | | 540 | | 0.28% | | 2.41% |
Year Ended September 30, 2007 | | 1.00 | | 0.03 | | (b) | | 0.03 | | (0.03) | | (0.03) | | 1.00 | | 3.43% | | 569 | | 0.29% | | 3.38% |
Year Ended September 30, 2006 | | 1.00 | | 0.03 | | — | | 0.03 | | (0.03) | | (0.03) | | 1.00 | | 2.94% | | 406 | | 0.30% | | 2.91% |
Year Ended September 30, 2005 | | 1.00 | | 0.02 | | — | | 0.02 | | (0.02) | | (0.02) | | 1.00 | | 1.78% | | 358 | | 0.28% | | 1.79% |
Period Ended September 30, 2004 (e) | | 1.00 | | (b) | | (b) | | (b) | | (b) | | (b) | | 1.00 | | 0.16%(c) | | 387 | | 0.30%(d) | | 0.98%(d) |
Year Ended July 31, 2004 | | 1.00 | | 0.01 | | — | | 0.01 | | (0.01) | | (0.01) | | 1.00 | | 0.72% | | 355 | | 0.32% | | 0.72% |
| (a) | Per share net investment income has been calculated using the average daily shares method. |
| (b) | Less than $0.01 or $(0.01) per share. |
| (e) | For the period from August 1, 2004 to September 30, 2004. |
See notes to financial statements.
36
|
NOTES TO FINANCIAL STATEMENTS |
March 31, 2009 (Unaudited)
1. Organization
Tamarack Funds Trust (“Tamarack”) is registered under the Investment Company Act of 1940 (as amended) as an open-end management investment company. Tamarack was organized as a Delaware statutory trust on December 16, 2003. Predecessor funds to Tamarack were reorganized as portfolios of Tamarack effective April 16, 2004. This semi-annual report includes the following five investment portfolios (“Funds”):
- Prime Money Market Fund (“Prime Money Market Fund”), formerly known as Tamarack Prime Money Market Fund
- U.S. Government Money Market Fund (“U.S. Government Money Market Fund”), formerly known as Tamarack U.S. Government Money Market Fund
- Tax-Free Money Market Fund (“Tax-Free Money Market Fund”), formerly known as Tamarack Tax-Free Money Market Fund
- Tamarack Institutional Prime Money Market Fund (“Institutional Prime Money Market Fund”)
- Tamarack Institutional Tax-Free Money Market Fund (“Institutional Tax-Free Money Market Fund”)
Prior to November 21, 2008, each Fund offered a single class of shares. Effective November 21, 2008, the Prime Money Market Fund, U.S. Government Money Market Fund and Tax-Free Money Market Fund offer five share classes: RBC Institutional Class 1, RBC Institutional Class 2, RBC Investor Class, RBC Reserve Class and RBC Select Class. The Institutional Prime Money Market Fund and Institutional Tax-Free Money Market Fund continue to offer only one class of shares. Effective January 28, 2009, the Prime Money Market Fund, U.S. Government Money Market Fund and Tax-Free Money Market Fund were renamed as noted above.
Voyageur Asset Management Inc. (“Voyageur”) acts as the investment adviser for Tamarack. The officers of Tamarack (“Fund Management”) are also employees of Voyageur or its affiliates or PNC Global Investment Servicing (U.S.) Inc. (“PNC”).
2. Significant Accounting Policies
Summarized below are the significant accounting policies of the Funds. These policies conform to accounting principles generally accepted in the United States of America (“GAAP”). Fund management follows these policies when preparing financial statements. Management may also be required to make estimates and assumptions that affect the reported amounts of assets and liabilities at the date of the financial statements and the reported amounts of income and expenses for the period. Actual results could differ from those estimates. The financial statements are as of the close of regular trading on the New York Stock Exchange.
Security Valuation:
Securities held by the Funds are valued at amortized cost, which approximates fair market value, in order to maintain a constant net asset value of $1.00 per share. If amortized cost no longer approximates market value due to credit or other impairments of an issuer, the Fund will use pricing and valuation procedures approved by Tamarack’s Board of Trustees (the “Board”) to determine a security’s fair value. See Note 7 for a listing of all securities that have been valued in the financial statements at fair value.
Money market funds must invest exclusively in high quality securities. To be considered high quality, a security must be rated in one of the two highest short-term credit quality categories by a nationally recognized rating organization such as Standard & Poors Corporation or Moody’s Investors Service.
37
|
NOTES TO FINANCIAL STATEMENTS |
Financial Accounting Standards Board (“FASB”) Statement of Financial Accounting Standards No. 157, “Fair Value Measurements” (“SFAS No. 157”) :
SFAS No. 157 clarifies the definition of fair value for financial reporting, establishes a framework for measuring fair value and requires additional disclosures about the use of fair value measurements. The three levels of the fair value hierarchy under SFAS No. 157 are described below:
• Level 1 - quoted prices in active markets for identical securities.
• Level 2 - other significant observable inputs (including quoted prices for similar securities, interest rates, prepayment speeds, credit risk, etc.).
• Level 3 - significant unobservable inputs (including the Funds’ own assumptions in determining the fair value of investments).
The inputs or methodology used for valuing securities are not necessarily an indication of the risk associated with investing in those securities.
The summary of inputs used to determine the fair valuation of the Fund’s investments as of March 31, 2009 is as follows:
| | | | | | | | | | | |
Funds | | Level 1
Quoted Prices | | Level 2
Significant
Observable
Inputs | | Level 3
Significant
Unobservable
Inputs | | Total |
Prime Money Market Fund | | $ | 300,559,225 | | $ | 12,181,237,761 | | $— | | $ | 12,481,796,986 |
U.S. Government Money Market Fund | | | 235,510,154 | | | 5,414,257,284 | | — | | | 5,649,767,438 |
Tax Free Money Market Fund | | | 28,453,401 | | | 967,430,417 | | — | | | 995,883,818 |
Institutional Prime Money Market Fund | | | 150,544,181 | | | 1,326,065,327 | | — | | | 1,476,609,508 |
Institutional Tax Free Money Market Fund | | | 13,904,364 | | | 444,538,000 | | — | | | 458,442,364 |
Investment Transactions and Income:
Investment transactions are accounted for on the date the security is bought or sold (“trade date”). Dividend income is recorded on the ex-dividend date. Realized gains and losses from investment transactions are calculated based on the costs of the specific security (also known as identified cost basis). Interest income is recognized on the accrual basis and includes, where applicable, the amortization or accretion of premium or discount using the effective yield method.
Financial Instruments:
The Funds may engage in when-issued transactions. The Funds record when-issued securities on the trade date and maintain sufficient liquidity so that cash will be available to make payment for the securities purchased. Securities purchased on a when-issued basis are valued daily beginning on trade date and begin earning interest on the settlement date. As of March 31, 2009, the Funds held no when-issued securities.
Repurchase Agreements:
The Funds may enter into repurchase agreements with primary dealers that report to the Federal Reserve Bank of New York or the 100 largest U.S. commercial banks (as measured by domestic deposits) who are deemed creditworthy under guidelines approved by the Board. These repurchase agreements are subject to the seller’s agreement to repurchase such securities at a mutually agreed upon date and price. The repurchase price generally equals the price paid by the Funds plus interest negotiated on the basis of current short-term rates.
Securities pledged by the dealers as collateral for repurchase agreements are held by the Funds’ custodian bank until maturity of the repurchase agreement. The Funds have procedures to secure additional collateral, if needed, to ensure that the daily market value of the collateral remains in excess of the market value of the repurchase agreement in the event of a default.
38
|
NOTES TO FINANCIAL STATEMENTS |
Expense, Investment Income and Gain/Loss Allocation:
Each Fund pays the expenses that are directly related to its operations, such as custodian fees or investment advisory fees. Expenses incurred by Tamarack, such as trustee or legal fees, are allocated among each of the Funds either proportionately based upon each Fund’s relative net assets or using another reasonable basis such as equally across all Funds, depending on the nature of the expense. Individual share classes within a Fund are charged expenses specific to that class, such as distribution fees. Within a Fund, expenses other that class specific expenses are allocated daily to each class based upon the proportion of relative net assets. Investment income and realized and unrealized gains or losses are allocated to each class of shares based on relative net assets.
Distributions to Shareholders:
Each Fund pays out any income that it receives, less expenses, in the form of dividends and capital gain distributions to its shareholders. Income dividends are declared daily and paid monthly. Dividends will also be paid at any time during the month upon total redemption of shares in an account. Capital gains, if any, are declared and paid at least annually. Distributions to shareholders are recorded on the ex-dividend date. The amount of dividends and distributions are calculated based on federal income tax regulations, which may differ from GAAP. These “book/tax” differences may be either temporary or permanent in nature. To the extent these differences are determined, as of the end of the tax year, to be permanent (e.g. expiring capital loss carryforward), they are reclassified within a Fund’s capital accounts based on their federal tax basis treatment. Such differences are not reflected in the calculation of the Financial Highlights.
Credit Enhancement:
Certain obligations held in the Funds have credit enhancement or liquidity features that may, under certain circumstances, provide for repayment of principal and interest on the obligation upon demand date, interest rate reset date or final maturity. These enhancements may include: letters of credit; liquidity guarantees; security purchase agreements; tender option purchase agreements; and third party insurance (i.e., AMBAC and MBIA).
3. Agreements and Other Transactions with Affiliates
Tamarack has entered into investment advisory agreements with Voyageur under which Voyageur manages the Funds’ assets and furnishes related office facilities, equipment, research and personnel. The agreements require the Funds to pay Voyageur a monthly fee based upon average daily net assets. Prior to November 21, 2008, (and for the entire period for Institutional Prime Money Market Fund and Institutional Tax Free Money Market Fund) under the terms of the advisory contract Voyageur was entitled to receive fees based on a percentage of the average daily net assets as follows:
| | | | | | |
| | | Average Daily Net
Assets of Fund | | | | Annual Rate |
Prime Money Market Fund | | Up to $700 million | | | | 0.55% |
| | Next $500 million | | | | 0.50% |
| | Next $800 million | | | | 0.45% |
| | Over $2 billion | | | | 0.40% |
U.S. Government Money Market Fund | | Up to $100 million | | | | 0.50% |
| | Next $200 million | | | | 0.40% |
| | Over $300 million | | | | 0.35% |
Tax-Free Money Market Fund | | All Net Assets | | | | 0.50% |
Institutional Prime Money Market Fund | | All Net Assets | | | | 0.25% |
Institutional Tax-Free Money Market Fund | | All Net Assets | | | | 0.25% |
39
|
NOTES TO FINANCIAL STATEMENTS |
Effective November 21, 2008, under the terms of the advisory contract Voyageur is entitled to receive fees based on a percentage of the average daily net assets as follows:
| | | | | | |
| | | Average Daily Net
Assets of Fund | | | | Annual Rate |
Prime Money Market Fund | | All Net Assets | | | | 0.10% |
U.S. Government Money Market Fund | | All Net Assets | | | | 0.10% |
Tax Free Money Market Fund | | All Net Assets | | | | 0.10% |
RBC Capital Markets Corporation (“RBC”), an affiliate of Voyageur, receives fees for services it provides for the Funds pursuant to a Shareholder Account Services Agreement. Effective November 21, 2008, this agreement was terminated with respect to Prime Money Market Fund, U.S. Government Money Market Fund and Tax Free Money Market Fund. For the six months ended March 31, 2009, RBC received fees of $34,585 and $9,874 from Institutional Prime Money Market Fund and Institutional Tax-Free Money Market Fund, respectively. For the period October 1, 2008 through November 21, 2008, RBC received fees of $4,036,113, $359,504 and $125,393 from Prime Money Market Fund, U.S. Government Money Market Fund and Tax-Free Money Market Fund, respectively. These amounts are included in shareholder reports expense and transfer agent fees on the Statement of Operations.
RBC Institutional Class 1 of Prime Money Market Fund, U.S. Government Money Market Fund and Tax-Free Money Market Fund pays an annual shareholder services administration fee of 0.05% of the average daily net assets attributable to RBC Institutional Class 1 shares of a Fund that is used to compensate financial intermediaries or the Distributor for providing services to shareholders and maintaining shareholder accounts. This shareholder services administration fee is not paid pursuant to Rule 12b-1. During the six months ended March 31, 2009, Voyageur voluntarily waived shareholder servicing fees of $3,085 and $14 for Prime Money Market Fund and U.S. Government Money Market Fund, respectively.
Voyageur and PNC serve as co-administrators to the Funds. Services provided under the administrative services contract include providing day-to-day administration of matters related to the Funds, maintenance of their records and the preparation of reports. Under the terms of the administrative services contract, prior to November 21, 2008 Voyageur received a fee from Prime Money Market Fund, U.S. Government Money Market Fund and Tax-Free Money Market Fund, payable monthly, at the annual rate of 0.25% of each Fund’s average daily net assets. Effective November 21, 2008, Voyageur no longer receives an administration services fee. PNC receives a fee for its services payable by the Funds based on the Fund’s average net assets. Fees previously paid to Voyageur are listed as “Administration fees” in the Statements of Operations. PNC’s fee is included with “Accounting fees” in the Statements of Operations.
Certain Officers and Trustees of the Funds are affiliated with the adviser or the administrator. Such Officers and Trustees receive no compensation from the Funds for serving in their respective roles.
Independent Trustees (Trustees of Tamarack who are not directors, officers or employees of the adviser, administrator or distributor) receive from the entire Tamarack fund family an annual retainer of $20,000. The Board Chairperson and Audit Committee Chairperson each receive an additional retainer of $2,500 annually, and all other trustees serving as Chair of a Board committee each receive an additional retainer of $1,000 annually. In addition, Independent Trustees receive a quarterly meeting fee of $5,000 for each in-person Board meeting attended, a meeting fee of $1,000 for each telephonic or Special Board meeting attended, and a $1,000 fee for each Board committee meeting attended and are reimbursed for all out-of-pocket expenses relating to attendance at such meetings.
40
|
NOTES TO FINANCIAL STATEMENTS |
4. Fund Distribution
The Prime Money Market, U. S. Government Money Market and Tax -Free Money Market Funds have adopted a Master Distribution 12b-1 Plan (the “Plan”) with respect to RBC Institutional Class 2, RBC Investor Class, RBC Reserve Class and the RBC Select Class, in which Tamarack Distributors Inc. (the “Distributor”) acts as the Funds’ distributor. The Distributor is an affiliate of Voyageur. The Plan permits each Fund to make payments for or to reimburse the Distributor monthly for distribution-related costs and expenses of marketing shares of each share class covered under the Plan; and/or for providing shareholder services. The following chart shows the current Plan fee rate for each class:
| | | | | | | | |
| | | RBC Institutional Class 2 | | RBC Investor Class | | RBC Reserve Class | | RBC Select Class |
12b-1 Plan Fee | | 0.15% | | 1.00% | | 0.90% | | 0.80% |
Plan fees are based on average daily net asset of the applicable class. Up to 0.25% of each Plan fee may be designated as a Service Fee, as defined by the applicable rules of the Financial Industry Regulatory Authority.
Effective November 21, 2008, the Distributor has contractually agreed to waive fees and/or reimburse expenses under an Expense Limitation Agreement in order to maintain the net annual fund operating expenses for each class of each Fund to the following amounts:
| | |
Fund | | Operating Expense Limit |
Prime Money Market Fund | | |
RBC Institutional Class 1 | | 0.20% |
RBC Institutional Class 2 | | 0.30% |
RBC Investor Class | | 1.05% |
RBC Reserve Class | | 0.90% |
RBC Select Class | | 0.80% |
| |
U.S. Government Money Market Fund | | |
RBC Institutional Class 1 | | 0.20% |
RBC Institutional Class 2 | | 0.30% |
RBC Investor Class | | 1.00% |
RBC Reserve Class | | 0.85% |
RBC Select Class | | 0.77% |
| |
Tax-Free Money Market Fund | | |
RBC Institutional Class 1 | | 0.20% |
RBC Institutional Class 2 | | 0.30% |
RBC Investor Class | | 1.00% |
RBC Reserve Class | | 0.85% |
RBC Select Class | | 0.70% |
This Expense Limitation Agreement is in place until January 31, 2010 and shall continue for additional one-year terms unless terminated by either party at any time. Each Fund will carry forward, for a period not to exceed 12 months from the date on which a waiver or reimbursement is made by the Distributor, any expenses in excess of the Expense Limitation and repay the Distributor such amounts, provided the Fund is able to effect such repayment and remain in compliance with the Expense Limitation. The Distributor may voluntarily waive and/or reimburse additional fund operating expenses from time to time. Any such voluntary program may be modified or discontinued at any time without notice.
41
|
NOTES TO FINANCIAL STATEMENTS |
5. Capital Share Transactions
The number of shares sold, reinvested and redeemed correspond to the net proceeds from sale of shares. reinvestments of dividends and cost of shares redeemed, respectively, since shares are redeemed at $1.00 per share.
Share transactions for the period for Funds with multiple classes were as follows:
| | | | | | | | | | | | |
| | | Prime
Money Market Fund | | | U.S. Government
Money Market Fund | | | Tax-Free
Money Market Fund | |
| | | |
| | | For the Period
Ended
March 31,
2009* | | | For the Period
Ended
March 31,
2009* | | | For the Period
Ended
March 31,
2009* | |
| | | (Unaudited) | | | (Unaudited) | | | (Unaudited) | |
CAPITAL TRANSACTIONS: | | | | | | | | | | | | |
RBC Institutional Class 1 | | | | | | | | | | | | |
Proceeds from shares issued | | $ | 5,876,423,363 | | | $ | 550,170,200 | | | $ | 293,818,947 | |
Distributions reinvested | | | 24,412,748 | | | | 7,051,468 | | | | 2,700,988 | |
Cost of shares redeemed | | | (15,400,039,054 | ) | | | (3,772,504,932 | ) | | | (1,149,542,084 | ) |
| | | | | | | | | | | | |
Change in RBC Institutional Class 1 | | $ | (9,499,202,943 | ) | | $ | (3,215,283,264 | ) | | $ | (853,022,149 | ) |
| | | | | | | | | | | | |
RBC Institutional Class 2 | | | | | | | | | | | | |
Proceeds from shares issued | | $ | 10,001 | | | $ | 118,410,001 | | | $ | 10,001 | |
Distributions reinvested | | | 41 | | | | 80,871 | | | | 23 | |
Cost of shares redeemed | | | — | | | | (51,103,000) | | | | — | |
| | | | | | | | | | | | |
Change in RBC Institutional Class 2 | | $ | 10,042 | | | $ | 67,387,872 | | | $ | 10,024 | |
| | | | | | | | | | | | |
RBC Investor Class | | | | | | | | | | | | |
Proceeds from shares issued | | $ | 5,571,267,006 | | | $ | 2,613,494,530 | | | $ | 314,287,304 | |
Distributions reinvested | | | 6,089,397 | | | | 733,173 | | | | 87,248 | |
Cost of shares redeemed | | | (743,273,736) | | | | (513,316,793) | | | | (80,142,555) | |
| | | | | | | | | | | | |
Change in RBC Investor Class | | $ | 4,834,082,667 | | | $ | 2,100,910,910 | | | $ | 234,231,997 | |
| | | | | | | | | | | | |
RBC Reserve Class | | | | | | | | | | | | |
Proceeds from shares issued | | $ | 5,720,432,357 | | | $ | 2,174,445,727 | | | $ | 634,096,521 | |
Distributions reinvested | | | 8,942,791 | | | | 2,187,679 | | | | 268,590 | |
Cost of shares redeemed | | | (708,423,540) | | | | (434,591,969) | | | | (158,664,463) | |
| | | | | | | | | | | | |
Change in RBC Reserve Class | | $ | 5,020,951,608 | | | $ | 1,742,041,437 | | | $ | 475,700,648 | |
| | | | | | | | | | | | |
RBC Select Class | | | | | | | | | | | | |
Proceeds from shares issued | | $ | 1,846,564,519 | | | $ | 1,891,270,141 | | | $ | 421,814,272 | |
Distributions reinvested | | | 2,938,432 | | | | 1,945,942 | | | | 221,005 | |
Cost of shares redeemed | | | (504,190,364) | | | | (634,978,142) | | | | (184,564,944) | |
| | | | | | | | | | | | |
Change in RBC Select Class | | $ | 1,345,312,587 | | | $ | 1,258,237,941 | | | $ | 237,470,333 | |
| | | | | | | | | | | | |
Change in net assets resulting from capital transactions | | $ | 1,701,153,961 | | | $ | 1,953,294,896 | | | $ | 94,390,853 | |
| | | | | | | | | | | | |
* For the six month period ended March 31, 2009 for RBC Institutional Class 1 and from November 21, 2008 (commencement of operations) through March 31, 2009 for RBC Institutional Class 2, RBC Investor Class, RBC Reserve Class and RBC Select Class.
6. Federal Income Taxes
It is the policy of each Fund to continue to qualify as a regulated investment company by complying with the provisions applicable to certain investment companies, as defined under Subchapter M of the Internal Revenue Code, and to distribute substantially all of its net investment income and net realized capital gains. Therefore, no federal tax liability is recorded in the financial statements of each Fund.
The Funds adopted the provisions of FASB Interpretation No. 48 (“FIN48”), Accounting for Uncertainty in Income Taxes, on March 31, 2008. The implementation of FIN48 resulted in no material liability for unrecognized tax benefits and no material change to the net asset value of the Funds at the beginning of the day. As of March 31, 2009, the Funds did not have a liability for any certain tax benefits. The Funds recognize interest and penalties, if any, related to unrecognized tax benefits as
42
|
NOTES TO FINANCIAL STATEMENTS |
income tax expense in the Statements of Operations. During the period, the Funds did not incur any interest or penalties. The Funds are not subject to examination by U.S. federal tax authorities for tax years before 2005 and by state authorities for tax years before 2004.
The tax character of distributions during the fiscal year ended September 30, 2008 were as follows:
| | | | | | | | | | | | |
| | | Distributions Paid From | | | | |
| | | Ordinary
Income | | Total Taxable
Distributions | | Tax Exempt
Distributions | | Total
Distributions
Paid* |
Prime Money Market Fund | | $ | 317,791,122 | | $ | 317,791,122 | | $ | — | | $ | 317,791,122 |
U.S. Government Money Market Fund | | | 46,333,071 | | | 46,333,071 | | | — | | | 46,333,071 |
Tax-Free Money Market Fund | | | 18,723 | | | 18,723 | | | 18,753,469 | | | 18,772,192 |
Institutional Prime Money Market Fund | | | 67,806,074 | | | 67,806,074 | | | — | | | 67,806,074 |
Institutional Tax-Free Money Market Fund | | | 14,293 | | | 14,293 | | | 16,427,948 | | | 16,442,241 |
* Total distributions paid may differ from the Statements of Changes in Net Assets because distributions are recognized when actually paid for tax purposes.
The tax basis of components of accumulated earnings/(losses) and the tax character of distributions paid are determined at fiscal year end, and will be included in the Annual Report dated September 30, 2009.
As of September 30, 2008, the following Funds had net capital loss carryforwards to offset future net capital gains, if any:
| | | | | |
| | | Capital Loss
Carryforward | | Expires |
Prime Money Market Fund | | $ | 3,069 | | 2013 |
| | | 40,324 | | 2014 |
| | | 52,797 | | 2015 |
| | | 38,902 | | 2016 |
Institutional Prime Money Market Fund | | | 4,329 | | 2014 |
| | | 39,175 | | 2015 |
Under current tax law, capital losses realized after October 31 of a Fund’s fiscal year may be deferred and treated as occurring on the first business day of the following fiscal year for tax purposes. The following Fund had deferred post October capital losses, which will be treated as arising on the first business day of the fiscal year ending September 30, 2009 and as such are included in current year earnings.
| | | |
| | | Deferred
Post-October
Losses |
Prime Money Market Fund | | $ | 4,675,637 |
7. Capital Support Agreement
On September 23, 2008, Prime Money Market and Institutional Prime Money Market Funds each entered into a Capital Support Agreement (“Agreement”) with Voyageur to maintain each Fund’s net asset value at no less than $0.9950 or such greater amount as required by any national recognized statistical rating organization (“NRSRO”). The Agreements require Voyageur to commit capital to the Funds, subject to the aggregate limit of $150 million and $50 million for the Prime Money Market Fund and Institutional Prime Money Market Fund, respectively, if a Fund realizes a loss on payments or sales proceeds from specified securities (“Eligible Notes”) held by the Funds which are less than the amortized cost of such securities and such loss causes the Fund’s mark-to-market net asset value to drop below $0.9950. The mark-to-market net asset value is calculated using the market value of all securities in the Prime Money Market and Institutional Prime Money Market Funds. The
43
|
NOTES TO FINANCIAL STATEMENTS |
net asset value in the financial statements is calculated using the amortized cost for all securities except the Eligible Notes. The Eligible Notes held in the Funds on March 31, 2009 are footnoted on the respective Schedule of Portfolio Investments. Upon the sale or other disposition of an Eligible Note, the amount of required capital commitment would be the least of the following amounts: (i) the amount, if any, by which the amortized cost of the Eligible Note exceeds the amount realized from the sale or other disposition of the security; (ii) the amount, if any, necessary to restore the net asset value per share of the Fund to $0.9950, or (iii) the remaining amount of the aggregate limit of the Agreement, taking into account all prior contributions. Voyageur’s obligations under the Agreements are supported by a Letter of Credit issued by Royal Bank of Canada, an indirect parent company of Voyageur, having a First Tier credit rating. The Funds will draw on the Letter of Credit in the event that Voyageur fails to make a cash contribution when due under the Agreement.
The Funds will sell the Eligible Notes (i) within thirty (30) calendar days following any change in the Letter of Credit provider’s short term credit ratings such that the Letter of Credit provider’s obligations no longer qualify as First Tier Securities as defined in paragraph (a)(12) of Rule 2a-7, or (ii) on the business day immediately prior to the termination date of the Agreement; provided that the Funds are not required to complete any such sale if the amount the Funds expect to receive would not result in the payment of a Capital Contribution, or, with respect to an event described in (i) above, if Voyageur substitutes an obligation or credit support that satisfies the requirement of a First Tier Security within fifteen (15) calendar days from the occurrence of such event and, during such 15 day period, the Letter of Credit provider’s obligations continue to qualify as Second Tier Securities under paragraph (a)(22) of Rule 2a-7. The termination date of the Agreement is October 9, 2009 for the Prime Money Market Fund and September 4, 2009 for the Institutional Prime Money Market Fund.
In the event that the Fund receives a capital contribution from Voyageur with respect to an Eligible Note and subsequently receives additional payments from or on behalf of the issuer of the Eligible Note, the Fund shall repay Voyageur the lesser of the amount of capital contribution or the amount of such subsequent payments, provided than in no event the effect of such repayment to Voyageur causes the Fund’s net asset value per share to fall below $0.995 or such greater amount required by NRSRO.
The following tables show the Eligible Notes and their amortized cost and fair value as of March 31, 2009:
| | | | | | | | | | | | |
| Prime Money Market Fund | | Face
Amount | | Amortized
Cost | | Fair
Value | | Unrealized
Appreciation/
(Depreciation) |
Bank of Scotland PLC, 1.45%, 8/6/09 | | $ | 60,000,000 | | $ | 60,000,000 | | $ | 59,991,540 | | $ | (8,460) |
General Electric Capital Corp., 0.57%, 10/9/09 | | | 87,000,000 | | | 86,998,582 | | | 86,998,582 | | | — |
Merrill Lynch & Co., Inc., 3.05%, 5/20/09 | | | 200,000,000 | | | 199,933,682 | | | 200,852,258 | | | 918,576 |
Metropolitan Life Global Funding I, 1.65%, 5/11/09 | | | 40,000,000 | | | 40,000,000 | | | 39,786,880 | | | (213,120) |
Metropolitan Life Global Funding I, 1.67%, 8/7/09 | | | 50,000,000 | | | 50,000,000 | | | 50,000,000 | | | — |
National Australia Bank Ltd., 1.51%, 4/6/09 | | | 64,000,000 | | | 64,000,000 | | | 64,000,192 | | | 192 |
Principal Life Income Funding Trusts, 1.65%, 10/9/09 | | | 56,000,000 | | | 55,995,645 | | | 55,995,645 | | | — |
Principal Life Income Funding Trusts, 1.65%, 6/9/09 | | | 56,000,000 | | | 56,000,000 | | | 55,089,608 | | | (910,392) |
Wachovia Bank NA, 1.64%, 5/1/09 | | | 64,000,000 | | | 64,000,000 | | | 64,070,245 | | | 70,245 |
| | | | | | | | | | | | |
Total | | | | | $ | 676,927,909 | | $ | 676,784,950 | | $ | (142,959) |
| | | | | | | | | | | | |
44
|
NOTES TO FINANCIAL STATEMENTS |
| | | | | | | | | | | |
| Institutional Prime Money Market Fund | | Face
Amount | | Amortized
Cost | | Fair
Value | | Unrealized
Appreciation/
(Depreciation) |
Bank of Scotland PLC, 1.45%, 5/6/09 | | $ | 10,000,000 | | $ | 10,000,000 | | $ | 9,997,710 | | $ (2,290) |
Branch Banking & Trust Co., 1.67%, 9/4/09 | | | 20,000,000 | | | 20,000,000 | | | 19,997,960 | | (2,040) |
Deutsche Bank AG (New York), 1.40%, 8/4/09 | | | 15,000,000 | | | 15,000,000 | | | 15,000,000 | | — |
General Electric Capital Corp., 0.57%, 6/09/09 | | | 13,000,000 | | | 12,999,762 | | | 12,987,810 | | (11,952) |
Metropolitan Life Global Funding I, 1.65%, 5/11/09 | | | 10,000,000 | | | 10,000,000 | | | 9,946,720 | | (53,280) |
National Australia Bank Ltd., 1.51%, 4/6/09 | | | 11,000,000 | | | 11,000,000 | | | 11,000,033 | | 33 |
Wachovia Bank NA, 1.64%, 5/1/09 | | | 11,000,000 | | | 11,000,000 | | | 11,012,073 | | 12,073 |
| | | | | | | | | | | |
Total | | | | | $ | 89,999,762 | | $ | 89,942,306 | | $(57,456) |
| | | | | | | | | | | |
8. Federal Insurance:
The Prime Money Market, U.S. Government Money Market, Tax-Free Money Market, Institutional Prime Money Market and Institutional Tax-Free Money Market Funds (the “Participating Funds”), participate in the U.S. Department of the Treasury’s Temporary Guarantee Program for Money Market Funds (the”Program”) which expires September 18, 2009. Subject to certain conditions and limitations, in the event that the per share value of a Participating Fund falls below $0.995 and the Participating Fund liquidates its holdings, the Program will provide coverage to shareholders in the Participating Fund for up to $1.00 per share for the lesser of either the number of shares the investor held in the Fund at the close of business on September 19, 2008 or the number of shares the investor held the date the per share value fell below $0.995. Shares acquired by investors after September 19, 2008 generally are not eligible for protection under the Program. The participation fee for the period September 19, 2008 to March 31, 2009 is included in federal insurance on the Statement of Operations. The fees to participate in the Program are borne by each Fund without regard to any expense limitation currently in effect for the Fund.
45
|
SUPPLEMENTAL INFORMATION (Unaudited) |
Information for Tamarack Funds Shareholders Regarding the Renewal of Investment Advisory Agreements
The Tamarack Board of Trustees has renewed the Investment Advisory Agreement with Voyageur Asset Management Inc. (“Voyageur” or the “Advisor”) for each of the Funds. After evaluating the services provided by the Advisor and reviewing the performance and relevant expenses of each Fund, the Trustees concluded that it was in the best interests of the Funds and their shareholders to continue the investment advisory agreements (“Agreements”).
As part of their review of the Agreements, the Trustees received and discussed certain information, including information regarding the advisory services performed, qualifications of staffing, and Fund performance and expenses. The Trustees considered information provided in advance of their in-person meeting, as well as supplemental information provided at the meeting. The Trustees met with representatives from the Advisor’s senior management team, as well as senior investment professionals, to discuss this information and Voyageur’s intentions with regard to the ongoing management of the Funds. The Trustees reviewed the quality of the services provided to the Funds by Voyageur, including information prepared by a third-party consultant as to each Fund’s performance relative to an appropriate benchmark as well as compared to the Fund’s appropriate peer group. The Trustees also reviewed the investment management fees payable to Voyageur. In this connection, the Trustees reviewed comparative information prepared by a third-party consultant on investment management fees paid and expenses incurred by similarly situated funds. The Trustees also received reports from Voyageur regarding other investment companies advised by it, including the advisory fees paid. The Trustees took into account profitability data for Voyageur included in the materials. The Trustees received information from Voyageur regarding other benefits derived from its relationships with the Funds. In connection with their deliberations, the independent Trustees met separately with their independent legal counsel to review the relevant material and consider their responsibilities under relevant laws and regulations. In addition, the Trustees noted the expected composition of each portfolio management team.
The Trustees observed that the Funds, except the Institutional Prime and Institutional Tax-Free Funds, ranked in the fifth quintile of their peer groups for the one, three and five year periods. The Institutional Prime Fund ranked in the second quintile of its peer group and peer universe for the same time periods. The Board also noted that the Funds’ expense comparisons ranged from the third quintile (Institutional Prime Fund) to the fifth quintile (Prime and Tax-Free Funds) in their peer groups. In considering the quality of the services performed for each Fund by Voyageur, the Trustees discussed the strong research capabilities and fundamental analysis performed by the firm and also considered the extensive portfolio management experience of Voyageur staff, the compliance structure and systems established by Voyageur and the financial viability of Voyageur. The Trustees also considered steps that already had been taken by Voyageur to expand upon existing research capabilities and compliance processes and steps that were expected to be taken to maintain and/or enhance such capabilities and processes.
Based upon their review, the Trustees determined that the advisory fees proposed to be payable to Voyageur were reasonable and fair in light of the nature and quality of services provided under all of the circumstances, and were within the range of what might have been negotiated at arms’ length. The Trustees concluded that it is in the interest of the Funds and their shareholders for the Trustees to approve the continuation of the Agreements for the Funds. In arriving at their decision to approve the renewal of the Agreements, the Trustees did not assign relative weights to the factors discussed above or deem any one or group of them to be controlling in and of themselves.
46
|
SUPPLEMENTAL INFORMATION (Unaudited) |
Shareholder Expense Examples
As a shareholder of the Tamarack Funds, you incur two types of costs: (1) transaction costs, including sales charges (loads) and (2) ongoing costs, including management fees; 12b-1 distribution and service fees; and other Fund expenses. This example is intended to help you understand your ongoing costs (in dollars) of investing in the Tamarack Funds and to compare these costs with the ongoing costs of investing in other mutual funds.
The Example is based on an investment of $1,000 invested at the beginning of the period and held for the entire period from October 1, 2008 through March 31, 2009.
Actual Expenses and Performance
The table below provides information about actual account values and actual expenses. You may use the information below, together with the amount you invested, to estimate the expenses that you paid over the period. Simply divide your account value by $1,000 (for example, an $8,600 account value divided by $1,000 = 8.6), then multiply the result by the number in the table under the heading entitled “Expenses Paid During Period” to estimate the expenses you paid on your account during this period.
| | | | | | | | | | |
| | | Beginning
Account Value
10/1/2008 | | Ending
Account Value
3/31/2009 | | Expenses Paid
During Period*
10/1/08-3/31/09 | | Annualized
Expense Ratio
During Period
10/1/08-3/31/09 |
Prime Money Market Fund | | | | | | | | | | |
| | | | |
RBC Institutional Class 1 | | $ | 1,000.00 | | $ | 1,006.60 | | $4.20 | | 0.84% |
RBC Institutional Class 2(a) | | | 1,000.00 | | | 1,004.53 | | 1.19 | | 0.33% |
RBC Investor Class(a) | | | 1,000.00 | | | 1,002.52 | | 3.92 | | 1.09% |
RBC Reserve Class(a) | | | 1,000.00 | | | 1,002.95 | | 3.38 | | 0.94% |
RBC Select Class(a) | | | 1,000.00 | | | 1,003.17 | | 3.02 | | 0.84% |
| | | | |
U.S. Government Money Market Fund | | | | | | | | | | |
| | | | |
RBC Institutional Class 1 | | | 1,000.00 | | | 1,005.70 | | 3.35 | | 0.67% |
RBC Institutional Class 2(a) | | | 1,000.00 | | | 1,003.89 | | 1.11 | | 0.31% |
RBC Investor Class(a) | | | 1,000.00 | | | 1,002.09 | | 3.38 | | 0.94% |
RBC Reserve Class(a) | | | 1,000.00 | | | 1,002.38 | | 3.13 | | 0.87% |
RBC Select Class(a) | | | 1,000.00 | | | 1,002.59 | | 2.87 | | 0.80% |
| | | | |
Tax-Free Money Market Fund | | | | | | | | | | |
| | | | |
RBC Institutional Class 1 | | | 1,000.00 | | | 1,005.10 | | 3.95 | | 0.79% |
RBC Institutional Class 2(a) | | | 1,000.00 | | | 1,003.45 | | 1.15 | | 0.32% |
RBC Investor Class(a) | | | 1,000.00 | | | 1,002.09 | | 3.09 | | 0.86% |
RBC Reserve Class(a) | | | 1,000.00 | | | 1,002.16 | | 2.91 | | 0.81% |
RBC Select Class(a) | | | 1,000.00 | | | 1,002.45 | | 2.55 | | 0.71% |
| | | | |
Institutional Prime Money Market Fund | | | 1,000.00 | | | 1,006.20 | | 1.70 | | 0.34% |
| | | | |
Institutional Tax-Free Money Market Fund | | | 1,000.00 | | | 1,004.80 | | 1.80 | | 0.36% |
| (a) | For the period from November 21, 2008 (commencement of operations) to March 31, 2009. |
| * | Expenses are equal to the average account value times the Fund’s annualized expense ratio multiplied by the number of days in the most recent fiscal half-year divided by the number of days in the fiscal year (to reflect one-half year period). |
47
|
SUPPLEMENTAL INFORMATION (Unaudited) |
Hypothetical Example for Comparison Purposes
The table below provides information about hypothetical account values and hypothetical expenses based on each Tamarack Funds’ actual expense ratio and an assumed rate of return of 5% per year before expenses, which is not the Fund’s actual return. The hypothetical account values and expenses may not be used to estimate the actual ending account balance or expenses you paid for the period. You may use this information to compare this 5% hypothetical example with the 5% hypothetical examples that appear in the shareholder reports of other funds.
Please note that the expenses shown in the table are meant to highlight your ongoing costs only and do not reflect any transactional costs, such as sales charges (loads), redemption fees, or exchange fees. Therefore, the table is useful in comparing ongoing costs only, and will not help you determine the relative total costs of owning different funds. In addition, if these transactional costs were included, your costs would have been higher.
| | | | | | | | |
| | | Beginning
Account Value
10/1/2008 | | Ending
Account Value
3/31/2009 | | Expenses Paid
During Period*
10/1/08-3/31/09 | | Annualized
Expense Ratio
During Period
10/1/08-3/31/09 |
Prime Money Market Fund | | | | | | | | |
| | | | |
RBC Institutional Class 1 | | $1,000.00 | | $1,020.74 | | $4.23 | | 0.84% |
RBC Institutional Class 2(a) | | 1,000.00 | | 1,016.76 | | 1.19 | | 0.33% |
RBC Investor Class(a) | | 1,000.00 | | 1,014.03 | | 3.94 | | 1.09% |
RBC Reserve Class(a) | | 1,000.00 | | 1,014.57 | | 3.40 | | 0.94% |
RBC Select Class(a) | | 1,000.00 | | 1,014.93 | | 3.04 | | 0.84% |
| | | | |
U.S. Government Money Market Fund | | | | | | | | |
| | | | |
RBC Institutional Class 1 | | 1,000.00 | | 1,021.59 | | 3.38 | | 0.67% |
RBC Institutional Class 2(a) | | 1,000.00 | | 1,016.83 | | 1.12 | | 0.31% |
RBC Investor Class(a) | | 1,000.00 | | 1,014.57 | | 3.40 | | 0.94% |
RBC Reserve Class(a) | | 1,000.00 | | 1,014.82 | | 3.15 | | 0.87% |
RBC Select Class(a) | | 1,000.00 | | 1,015.07 | | 2.89 | | 0.80% |
| | | | |
Tax-Free Money Market Fund | | | | | | | | |
| | | | |
RBC Institutional Class 1 | | 1,000.00 | | 1,020.99 | | 3.98 | | 0.79% |
RBC Institutional Class 2(a) | | 1,000.00 | | 1,016.80 | | 1.16 | | 0.32% |
RBC Investor Class(a) | | 1,000.00 | | 1,014.86 | | 3.11 | | 0.86% |
RBC Reserve Class(a) | | 1,000.00 | | 1,015.04 | | 2.93 | | 0.81% |
RBC Select Class(a) | | 1,000.00 | | 1,015.40 | | 2.57 | | 0.71% |
| | | | |
Institutional Prime Money Market Fund | | 1,000.00 | | 1,023.24 | | 1.72 | | 0.34% |
| | | | |
Institutional Tax-Free Money Market Fund | | 1,000.00 | | 1,023.14 | | 1.82 | | 0.36% |
| (a) | For the period from November 21, 2008 (commencement of operations) to March 31, 2009. |
| * | Expenses are equal to the average account value times the Fund’s annualized expense ratio multiplied by the number of days in the most recent fiscal half-year divided by the number of days in the fiscal year (to reflect one-half year period). |
48
Tamarack Funds
P.O. Box 219757
Kansas City, MO 64121-9757
800-422-2766
www.voyageur.net
Performance data represents past performance and does not guarantee future results. The principal value of an investment and investment return will fluctuate so that an investor’s shares, when redeemed, may be worth more or less than their original cost.
This report and the financial statements contained herein are provided for the information of Tamarack Funds shareholders. This report is not authorized for distribution to prospective investors unless preceded or accompanied by a current prospectus, which contains information concerning investment objectives, risks, charges and expenses of the funds. Please read the prospectus carefully before investing.
This report and the financial statements contained herein are not intended to be a forecast of future events, a guarantee of future results, or investment advice. There is no assurance that certain securities will remain in or out of each fund’s portfolio. The views expressed in this report reflect those of the portfolio managers through the period ended March 31, 2009.
NOT FDIC INSURED • NO BANK GUARANTEE • MAY LOSE VALUE
Voyageur Asset Management Inc. serves as investment adviser for the Tamarack Funds. Tamarack Funds are distributed by Tamarack Distributors Inc.

| | |
The Tamarack Funds are pleased to offer shareholder reports printed entirely on Forest Stewardship Council certified paper. FSC certification ensures that the paper used in this report contains fiber from well-managed and responsibly harvested forests that meet strict environmental and socioeconomic standards. | | |
TF-MM SAR 03-09

| | | | | | | | | | |
| | | | | | . |
| | | | Tamarack Funds |
About Your Semi-Annual Report | | | | | | | | This semi-annual report includes detailed information about your Fund including financial statements, performance, and a complete list of holdings. The Tamarack Funds compare their performance against widely used market indices, depending on the market sector or investment style of the particular fund. Fixed income funds are benchmarked against various Barclays Capital Bond Indices, which show only the performance of the underlying fixed income securities, rather than of a comparable fund that would be available to an individual investor. We hope the financial information presented will help you evaluate your investment in the Tamarack Funds. We also encourage you to read your Fund’s prospectus for further detail as to your Fund’s investment policies and risk profile. Tamarack Funds prospectuses and performance information subsequent to the date of this report are available on our website at www.voyageur.net. A description of the policies and procedures that your Fund uses to determine how to vote proxies relating to portfolio securities is available (i) without charge, upon request, by calling 1-800-422-2766; (ii) on the Fund’s website at www.voyageur.net; and (iii) on the Securities and Exchange Commission’s (the “Commission”) website at http://www.sec.gov. Information regarding how your Fund voted proxies relating to portfolio securities during the most recent 12 month period ended June 30 is available (i) on the Fund’s website at www.voyageur.net; and (ii) on the Commission’s website at http://www.sec.gov. A schedule of each Fund’s portfolio holdings will be filed with the Commission for the first and third quarters of each fiscal year on Form N-Q. This information is available on the Commission’s website at http://www.sec.gov and may be reviewed and copied at the Commission’s Public Reference Room in Washington, D.C. Information on the operation of the Public Reference Room is available by calling 1-800-SEC-0330. |
| Table of Contents | | | | | | |
| | | | | | | | Letter from the CIO of Fixed Income | | 1 |
| | | | | | | | Fixed Income Portfolio Managers | | 3 |
| | | | | | | | Performance Summary | | 4 |
| | | | | | | | Fund Statistics: | | |
| | | | | | | | Quality Fixed Income Fund | | 6 |
| | | | | | | | Tax-Free Income Fund | | 7 |
| | | | | | | | Schedules of Portfolio Investments | | 8 |
| | | | | | | | Financial Statements | | |
| | | | | | | | - Statements of Assets and Liabilities | | 17 |
| | | | | | | | - Statements of Operations | | 19 |
| | | | | | | | - Statements of Changes in Net Assets | | 20 |
| | | | | | | | Financial Highlights | | 21 |
| | | | | | | | Notes to Financial Statements | | 23 |
| | | | | | | | Share Class Information | | 30 |
| | | | | | | | Supplemental Information | | 31 |
| | | | | | | | Renewal of Investment Advisory Fees | | 32 |
| | | | | | |
LETTER FROM THE CIO OF FIXED INCOME | | | | | | |
| | | |
| | | | | | | |
The fixed income market has gradually reopened for business over the past several quarters. While the economy continued to contract at a record pace over the past two quarters, credit availability, as reflected in corporate bond new issue volumes, has certainly improved during this period. Government intervention and the introduction of important new guarantee programs have improved market sentiment. While the current economic environment is clearly daunting, we believe that preliminary signs of a consolidation or bottoming to the market volatility that has roiled the fixed income markets for much of the past two years are increasingly evident. More recently, credit spreads and risk premiums across all market sectors have been narrowing and trading flows are improving. There are extremely good long-term values to be had in nearly every sector of the fixed income market. Income or yield, in stark contrast to the past several years, will increasingly become the key differentiator of relative performance as we move ahead through 2009. That said, new risks will certainly emerge as the economy attempts to gain more permanent footing. Increasing default rates and the eventual pull back of government stimulus are two important areas of concern. The massive amounts of fiscal stimulus being put into the market will have a larger impact on the economy in 2010 and beyond as much of the stimulus will be distributed in future years. We are increasingly concerned with the interconnectedness of the Federal Reserve and the U.S. Treasury. While the combined effects of monetary and fiscal stimulus may have suited the cultural and political will of the day, the Federal Reserve will need to prepare for inevitable inflationary pressures that will present themselves. Pulling back that stimulus will be extremely difficult. Future successes in the fixed income markets will equally be determined by carefully managing these new risks in light of the generational investment opportunities currently available in the marketplace | | | | | | |
| | | |
From an economic perspective, the major growth impediments remain the same: housing, consumers’ secular swing from debt-financed consumption toward saving, and stress in the financial system. The jobs situation will likely continue to worsen in upcoming quarters, further dampening prospects for a quick turnaround in the second half of 2009. While pending home sales, construction and manufacturing have recently exceeded lowered expectations, we continue to believe the key to a sustainable recovery is a real bottoming in the housing and labor markets. The fact remains that new and existing home inventories remain near record levels relative to demand – despite high affordability indices. Wealth destruction continues as equity and housing values have collapsed over the past six months. Consequently, personal savings rates (4.2% in February) skyrocketed as families repaired their balance sheets. In the fourth quarter net non-financial sector (ex-government) borrowing fell for the first time ever year-over-year. Household debt alone fell 2.0%. The consumer shift from debt-fueled consumption to thrift greatly contributes to the downward economic trajectory. Durable goods orders continued falling during the first quarter. Manufacturing capacity utilization rates are at post-war lows. The high durables inventory/sales ratio suggests further production cuts. These developments influence employment. An 8+% unemployment rate is widely expected to reach 10% by year-end. None of this bodes well for bank loan performance. Commercial real estate appears the next big challenge to bank loan quality. On a positive note, there may be early signs of recovery. Core retail sales (ex-building materials, vehicles, and gasoline) rose in January and February. March’s 20%+ recovery in the Dow Jones Industrial Average was the quickest (13 | | | | | | |
1
| | | | | | |
| | | | | | LETTER FROM THE CIO OF FIXED INCOME |
| | | | | | trading days) since 1938. The Mortgage Application Index increased 58% since late January, and with 78% of those applications being refinancings, those borrowers’ net cash flow situation should improve. Consumers will likely also benefit from higher tax refunds as the IRS reports the average paid is up 9% versus this time last year. That said, the economy and our markets remain at risk to further volatility as we determine whether the fixed income markets have correctly called a bottom in economic activity |
| | | |

| | | | | | Looking ahead, while the Federal Reserve and the U.S. Treasury have successfully employed multiple strategies to avoid a collapse of the U.S. financial system, we are highly skeptical of the use of low interest rates and leverage (PPIP and TALF) to permanently solve the current economic and financial crisis. Excess capacity needs to be driven out of the economy. The current slowdown has been impacted by too many goods chasing the marginal dollar of consumption. Until we can get supply more in balance with normalized demand, the economy will continue to stumble along. Interest rates will likely remain volatile within a relatively well defined range for each maturity for the foreseeable future. We do not expect the Federal Reserve to alter monetary policy in 2009. Treasury supply driven concerns will be offset by the reality of Federal Reserve’s quantitative easing program. Mortgage rates will remain stable and will continue to benefit from government support. Agency debentures and TLGP guaranteed corporate debt should continue to perform well in upcoming quarters. Despite increasing default rates, corporate bonds exhibit some of the strongest potential returns within the fixed income market over the next year. The municipal market also provides significant opportunities. Our strategy will continue to emphasize holding existing risk positions within our funds while at the same time prudently adding quality new issues at attractive valuation levels. We believe the actions we take today will continue to sow the seeds for stable and competitive relative performance in future periods. We appreciate your continued confidence and trust. Sincerely, 
John M. Huber, CFA Chief Investment Officer, Fixed Income Tamarack Funds |
2
| | | | | | |
FIXED INCOME PORTFOLIO MANAGERS | | | | | | |
| | | | | | |
| | | | |
Voyageur Asset Management Inc. (“Voyageur”), the investment advisor to the Tamarack Funds, employs a team approach to the management of each of the fixed income funds. Each Fund’s management team has access to Voyageur’s investment research and other money management resources. | | | | | | |
| | | | |
John M. Huber, CFA Senior Managing Director, Chief Investment Officer — Fixed Income John Huber directs Voyageur’s fixed income group. John joined Voyageur in 2004 from Galliard Capital Management where he was a principal and senior portfolio manager, responsible for the firm’s total return fixed income effort. Prior to working for Galliard, John was a portfolio manager for Norwest Investment Management where he began his career in 1990. John received a BA from the University of Iowa and an MBA in Finance from the University of Minnesota, Carlson School of Management. He acts as an advisor to the Carlson Funds Enterprise for the University of Minnesota. John is a CFA charterholder and a member of the CFA Society of Minnesota. He also serves on the Board of the YMCA of Metropolitan Minneapolis. | | | | | |  |
| | | | |
Raye C. Kanzenbach, CFA Senior Managing Director, Senior Portfolio Manager Raye Kanzenbach is an active member of the Credit Team and serves as primary portfolio manager for the Tax-Free Income Fund. He has extensive experience working with taxable and tax-exempt municipal fixed income securities. Prior to his experience at Voyageur, Raye was employed at First Bank where he managed the municipal and money market trust funds. Raye also supervised the municipal and corporate credit analysis areas for the Trust Department and First Bank’s investment portfolio. Prior to First Bank, Raye was employed as an investment officer with the St. Paul Companies. Raye began his career in the investment industry in 1973 and joined Voyageur in 1983. He received a BA in Economics from Lawrence University and an MBA in Finance from the University of Michigan. Raye is a CFA charterholder and member of the CFA Society of Minnesota. | | | | | |  |
3
| | | | | | | | | | | | | | | | | | | | | | | | | |
| | | | | | PERFORMANCE SUMMARY |
| | | | | | | Average Annual Total Returns as of March 31, 2009 (Unaudited) |
| | | | | | Tamarack Quality Fixed Income Fund (a) |
| | | | | | | | | | | 1 Year | | | 3 Year | | | 5 Year | | | Since
Inception (b) | | | Net
Expense
Ratio*(1)(2) | | Gross
Expense
Ratio*(1)(2) |
| | | | | | Class A | | | | | | | | | | | | | | | | | | | |
| | | | | | - Including | | | | | | | | | | | | | | | | | | | |
| | | | | | Maximum Sales | | | | | | | | | | | | | | | | | | | |
| | | | | | Charge of 3.75% | | | | | (12.41 | )% | | (1.65)% | | | (0.47)% | | | 2.62% | | | | | |
| | | | | | - At Net Asset Value | | | | | (9.01 | )% | | (0.38)% | | | 0.30% | | | 3.02% | | | 0.93% | | 1.57% |
| | | | | | Class I | | | | | (8.69 | )% | | (0.13)% | | | 0.55% | | | 3.27% | | | 0.68% | | 1.32% |
| | | | | | Class R (c) | | | | | (9.19 | )% | | (0.60)% | | | 0.06% | | | 2.77% | | | 1.18% | | 1.82% |
| | | | | | Class S (d) | | | | | (8.69 | )% | | (0.13)% | | | 0.55% | | | 3.27% | | | 0.68% | | 1.32% |
| | | | | | Barclays Capital U.S. | | | | | | | | | | | | | | | | | | | |
| | | | | | Aggregate Bond | | | | | | | | | | | | | | | | | | | |
| | | | | | Index** | | | | | 3.13 | % | | 5.78 | % | | 4.13 | % | | 5.71 | % | | | | |
| | | | | | Tamarack Tax-Free Income Fund (e) |
| | | | | | | | 1 Year | | | 3 Year | | | 5 Year | | | 10 Year | | | Since
Inception (f) | | | Net
Expense
Ratio*(1)(2) | | Gross
Expense
Ratio*(1)(2) |
| | | | | | Class A (g) | | | | | | | | | | | | | | | | | | | |
| | | | | | - Including | | | | | | | | | | | | | | | | | | | |
| | | | | | Maximum Sales | | | | | | | | | | | | | | | | | | | |
| | | | | | Charge of 3.75% | | (3.61 | )% | | 1.17% | | | 1.03% | | | 2.97% | | | 5.74% | | | | | |
| | | | | | - At Net Asset Value | | 0.18 | % | | 2.48% | | | 1.81% | | | 3.37% | | | 5.88% | | | 0.99% | | 2.23% |
| | | | | | Class C (g) | | | | | | | | | | | | | | | | | | | |
| | | | | | - Including | | | | | | | | | | | | | | | | | | | |
| | | | | | Contingent | | | | | | | | | | | | | | | | | | | |
| | | | | | Deferred Sales | | | | | | | | | | | | | | | | | | | |
| | | | | | Charge of 1.00% | | (1.54 | )% | | 1.74% | | | 1.07% | | | 2.61% | | | 5.10% | | | | | |
| | | | | | - At Net Asset Value | | (0.58 | )% | | 1.74% | | | 1.07% | | | 2.61% | | | 5.10% | | | 1.74% | | 2.98% |
| | | | | | Class S | | 0.42 | % | | 2.73% | | | 2.06% | | | 3.62% | | | 6.14% | | | 0.74% | | 1.98% |
| | | | | | Barclays Capital | | | | | | | | | | | | | | | | | | | |
| | | | | | Municipal 3-15 Year | | | | | | | | | | | | | | | | | | | |
| | | | | | Blend Index** | | 4.81 | % | | 4.74% | | | 3.74% | | | 4.84% | | | 5.14% | | | | | |
| | | | | | Performance data quoted represents past performance. Past performance is no guarantee of future results. Investment return and principal value of an investment will fluctuate so that an investor’s shares, when redeemed, may be worth more or less than their original cost. Current performance may be lower or higher than performance quoted. Performance shown reflects contractual fee waivers, without such fee waivers total returns would be reduced. Performance information does not reflect the 2% fee on shares redeemed or exchanged within 30 days of purchase. If such redemption fee was included, performance would be reduced. For performance data current to most recent month-end go to www.voyageur.net. |
| | | |
| | | | | | Current and future portfolio holdings are subject to change at any time, and are subject to various risks such as interest rate risk and issuer/credit risk, as further described in the prospectus. |
4
| | | | | | |
PERFORMANCE SUMMARY | | | | | | |
(1). The Fund expenses reflect the most recent fiscal year-end (September 30, 2008). | | | | | | |
(2). The Adviser has contractually agreed to waive fees and/or make payments in order to keep total operating expenses of the Fund to the levels listed under net expense ratio until January 31, 2010. | | | | | | |
*The expense ratios are from the Funds’ prospectus dated January 28, 2009. Additional information pertaining to the Funds’ expense ratios as of March 31, 2009 can be found in the financial highlights. | | | | | | |
**Each of the comparative indices is a widely recognized market value weighted measure of the return of securities, but do not include sales fees or operating expenses. You cannot invest directly into indices. | | | | | | |
(a)The performance in the table for the period from May 10,1999 to April 19, 2004 reflects the performance of RBC Quality Income Fund, the predecessor to the Tamarack Quality Fixed Income Fund. | | | | | | |
(b)The inception date (commencement of operations) of the Fund is May 10, 1999. The performance of Barclays Capital U.S. Aggregate Bond Index since inception is calculated from April 30, 1999. | | | | | | |
(c)The inception date for Class R Shares of the Fund is April 19, 2004. All performance shown for each such class of shares prior to its inception date is based on the performance of the Class A Shares of the Fund, adjusted to reflect the fees and expenses of Class R Shares, as applicable (and where applicable, the maximum sales charge of Class R Shares). | | | | | | |
(d)The inception date for Class S Shares of the Fund is April 19, 2004. All performance shown for each such class of shares prior to its inception date is based on the performance of the Class I Shares of the Fund, adjusted to reflect the fees and expenses of Class S Shares. | | | | | | |
(e)The performance for the period from February 22, 1980 to April 19, 2004 reflects the performance of D.L. Babson Tax-Free Income Fund, the predecessor to Tamarack Tax-Free Income Fund. | | | | | | |
(f) The since inception date (commencement of operations) of the Fund is February 22, 1980. The performance of the Barclays Capital Municipal 3-15 Year Blend Index since inception is calculated from July1, 1993. | | | | | | |
(g)The inception date for Class A and Class C Shares of the Fund is April 19, 2004. All performance shown for each such class of shares prior to its inception date is based on the performance of the Class S Shares of the Fund, adjusted to reflect the fees and expenses of Class A and Class C , as applicable (and where applicable, the maximum sales charges of the Class A and Class C Shares). | | | | | | |
The Barclays Capital U.S. Aggregate Bond Index is an unmanaged index of U.S. Dollar denominated government, investment grade corporate, mortgage-backed and asset-backed securities. | | | | | | |
The Barclays Capital Municipal 3-15 Year Blend Index is an unmanaged index of investment grade municipal bonds with maturities of 2-17 years. | | | | | | |
5
| | | | | | | | | | | | | | | | |
| | | | | | | | FUND STATISTICS (UNAUDITED) | |
| | | | | | | | Tamarack Quality Fixed Income Fund | |
Investment Objective | | | | | | | | Current income and capital appreciation | |
Benchmark | | | | | | | | Barclays Capital U.S. Aggregate Bond Index . | |
Asset Allocation (as of 3/31/09) (% of fund’s investments) | | | | | | | | 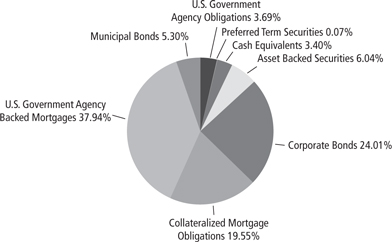
| |
Top Ten Holdings (as of 3/31/09) (% of fund’s net assets) | | | | | | | | Fannie Mae TBA, 4.50%, 4/15/39 | | 6.86 | % | | Fannie Mae, Series 1997-M9, Class C,6.52%, 7/25/16 | | 2.14 | % |
| | | | | | | | Fannie Mae, Pool #986937, 5.50%, 9/1/38 | | 5.17 | % | | Countrywide Alternative Loan Trust, Series 2005-J4, Class 1A5, 4.97%, 7/25/35 | | 1.86 | % |
| | | | | | | | Fannie Mae, Pool #AA3409, 5.00%, 3/1/39 | | 3.63 | % | | WaMu Mortgage Pass-Through Certificates, Series 2003-S11, Class 1A, 5.00%, 11/25/33 | | 1.81 | % |
| | | | | | | | Fannie Mae, 3.88%, 7/12/13 | | 2.58 | % | | Fannie Mae, Pool #254764, 5.50%, 6/1/23 | | 1.71 | % |
| | | | | | | | Fannie Mae, Pool #961560, 6.00%,2/1/38 | | 2.22 | % | | | | | |
| | | | | | | | Fannie Mae, Pool #796610, 5.50%, 10/1/34 | | 2.18 | % | | | | | |
| | | | | | | | *A listing of all portfolio holdings can be found on page 8. | |
Growth of $10,000 Initial Investment Since Inception | | | | | | | | 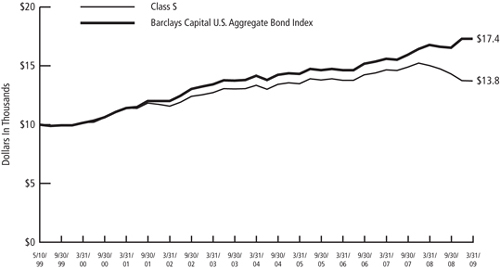
| |
| | | | | | | | The graph reflects an initial investment of $10,000 since inception of 5/10/1999 and is based on Class S shares. The performance of the Fund for the period from May 10, 1999 to April 19, 2004 reflects the performance of RBC Quality Income Fund, the predecessor to Tamarack Quality Fixed Income Fund. The Fund’s total return includes reinvested dividends and capital gains. The Fund’s total return also includes operating expenses that reduce return, while the total return of the index does not. The graph does not reflect the deduction of taxes that a shareholder would pay on fund distributions or redemption of fund shares. Performance of other classes will vary due to differences in fee structures. | |
6
| | | | | | | | | | | | | | | |
| FUND STATISTICS (UNAUDITED) | | | | | | | | | |
Tamarack Tax-Free Income Fund | | | | | | | | | |
Providing the highest level of regular income exempt from federal income tax consistent with stated quality and maturity standards. | | | | | | Investment Objective |
Barclays Capital Municipal 3-15 Year Bond Index. | | | | | | Benchmark |
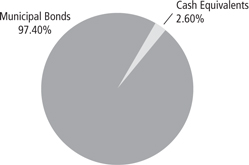
| | | | | | Asset Allocation (as of 3/31/09) (% of fund’s investments) |
Massachusetts Health & Educational Facilities Authority Revenue, Series C, 5.75%, 7/1/12 | | 6.81% | | City of Seattle Refunding Revenue, 5.63%, 12/1/16 | | 3.36 | % | | | | | | | | Top Ten Holdings (as of 3/31/09) (% of fund’s net assets) |
University of Texas Refunding Revenue, Series B, 5.25%, 8/15/19 | | 3.71% | | McClain County Economic Development Authority Revenue, 5.00%, 9/1/11 | | 3.35 | % | | | | | | | | |
City of Santa Rosa Refunding Revenue, Series B, 6.00%, 9/1/15 | | 3.63% | | Indiana Bond Bank Refunding Revenue, Series A, 5.00%, 8/1/16 | | 3.32 | % | | | | | | | | |
Minnesota Higher Education Facilities Authority Revenue, Bethel University Project, Series 6R, 5.50%, 5/1/22 | | 3.51% | | Arkansas River Power Authority Revenue, 5.00%, 10/1/14 | | 3.28 | % | | | | | | | | |
Florida State Board of Education, GO, Series J, 5.00%, 6/1/19 | | 3.37% | | Putnam County Development Authority, Refunding Revenue, 5.35%, 3/15/42 | | 3.22 | % | | | | | | | | |
*A listing of all portfolio holdings can be found on page 15. | | | | | | | | | | | |
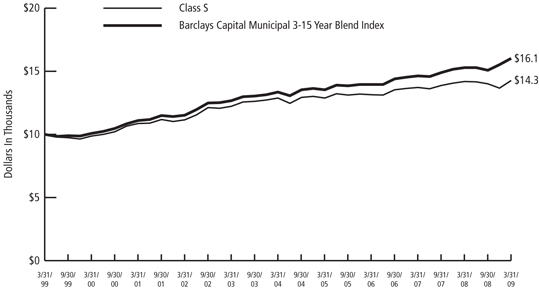 | | | | | | Growth of $10,000 Initial Investment Over Ten Years |
The graph reflects an initial investment of $10,000 over a 10 year period and is based on Class S shares. The performance of the Fund for the period from March 31, 1999 to April 19, 2004 reflects the performance of D.L Babson Tax-Free Income Fund, the predecessor to Tamarack Tax-Free Income Fund. The Fund’s total return includes reinvested dividends and capital gains. The Fund’s total return also includes operating expenses that reduce return, while the total return of the index does not. The graph does not reflect the deduction of taxes that a shareholder would pay on fund distributions or redemption of fund shares. Performance of other classes will vary due to differences in fee structures. | | | | | | |
7
|
| SCHEDULE OF PORTFOLIO INVESTMENTS |
Tamarack Quality Fixed Income Fund
March 31, 2009 (Unaudited)
| | | | | | |
Principal
Amount | | | | Value |
| | Municipal Bonds — 5.61% |
| | California — 0.95% |
| $ | 355,000 | | Los Angeles Community Redevelopment Agency Tax Allocation, Series B, OID, 5.90%, 9/1/35, (Credit Support: RADIAN), Callable 9/1/15 @ 100 | | $ | 232,521 |
| | 135,000 | | San Diego Metropolitan Transportation Development Board Revenue, Series A, 3.86%, 12/1/09, (Credit Support: MBIA-RE) | | | 136,238 |
| | | | | | |
| | | | | | 368,759 |
| | �� | | | | |
| | Illinois — 1.35% |
| | 425,000 | | Bensenville GO, Series E, 4.65%, 12/1/11, Callable 5/14/09 @ 100 | | | 394,587 |
| | 165,000 | | Village of Riverdale GO, 9.62%, 1/1/27 | | | 128,992 |
| | | | | | |
| | | | | | 523,579 |
| | | | | | |
| | Michigan — 0.29% |
| | 160,000 | | Township of Buena Vista GO, 8.00%, 4/1/32, Callable 4/1/18 @ 100 | | | 112,914 |
| | | | | | |
| | Missouri — 0.62% |
| | 270,000 | | Missouri Development Finance Board Revenue, Series A, OID, 6.00%, 3/1/24, Callable 3/1/16 @ 100 | | | 240,214 |
| | | | | | |
| | Nebraska — 1.16% |
| | 320,000 | | Saunders County School District No. 107 GO, 6.15%, 12/15/16, Callable 12/15/10 @ 100 | | | 268,960 |
| | 200,000 | | Saunders County School District No. 72 GO, 6.15%, 12/15/16, Callable 12/15/10 @ 100 | | | 181,674 |
| | | | | | |
| | | | | | 450,634 |
| | | | | | |
| | North Carolina — 0.36% |
| | 155,000 | | North Carolina Housing Finance Agency Revenue, Series A, 3.70%, 7/1/31, (Credit Support: FSA), Callable 7/1/12 @ 100(a) | | | 140,574 |
| | | | | | |
| | Texas — 0.88% |
| | 390,000 | | San Antonio Convention Hotel Finance Corp. Revenue, Series B, 5.10%, 7/15/20, (Credit Support: AMBAC) | | | 338,563 |
| | | | | | |
| Total Municipal Bonds
(Cost $2,531,513) | | | 2,175,237 |
| | | | | | |
| | Asset Backed Securities — 6.40% |
| | Banking & Financial Services — 6.40% |
| | 367,000 | | Asset Backed Securities Corp. Home Equity Series 2004-HE8, Class M1 1.22%, 12/25/34, Callable 12/25/09 @ 100(a) | | | 195,772 |
| | | | | | |
Principal
Amount | | | | Value |
| $ | 105,298 | | Bayview Financial Acquisition Trust Series 2005-D, Class AF2 5.40%, 12/28/35(a) | | $ | 92,185 |
| | 335,486 | | Countrywide Asset-Backed Certificates, Series 2007-A1, Class 2A1, 0.81%, 5/25/47, Callable 3/25/25 @ 100(a)(c) | | | 172,461 |
| | 163,100 | | Countrywide Home Equity Loan Trust, Series 2002-G, Class A, 0.93%, 12/15/28(a) | | | 123,681 |
| | 87,657 | | Countrywide Home Equity Loan Trust, Series 2002-H, Class A, 0.96%, 1/15/29(a) | | | 60,684 |
| | 72,669 | | Countrywide Home Equity Loan Trust, Series 2003-BA, Class A 0.87%, 4/15/29(a) | | | 34,182 |
| | 267,871 | | Countrywide Home Equity Loan Trust, Series 2003-C, Class A, 0.83%, 5/15/29(a) | | | 149,278 |
| | 169,925 | | Countrywide Home Equity Loan Trust, Series 2003-D, Class A, 0.82%, 6/15/29(a) | | | 93,978 |
| | 179,096 | | Countrywide Home Equity Loan Trust, Series 2004-A, Class A, 0.78%, 4/15/30(a) | | | 85,790 |
| | 111,933 | | Countrywide Home Equity Loan Trust, Series 2004-E, Class 2A, 0.82%, 6/15/29, Callable 4/15/09 @ 100(a) | | | 53,435 |
| | 185,027 | | Countrywide Home Equity Loan Trust, Series 2004-F, Class 2A, 0.82%, 5/15/34(a) | | | 80,614 |
| | 88,691 | | Countrywide Home Equity Loan Trust, Series 2004-I, Class A, 0.85%, 2/15/34, Callable 11/15/09 @ 100(a) | | | 35,947 |
| | 27,526 | | Countrywide Home Equity Loan Trust, Series 2004-K, Class 2A, 0.86%, 2/15/34(a) | | | 10,320 |
| | 41,225 | | Countrywide Home Equity Loan Trust, Series 2004-T, Class 2A, 0.80%, 1/15/30(a) | | | 20,192 |
| | 554,615 | | Countrywide Home Equity Loan Trust, Series 2005-D, Class 2A 0.75%, 11/15/35(a) | | | 304,391 |
| | 39,463 | | First Horizon Asset Back Trust, Series 2004-HE4, Class A2, 4.07%, 7/25/19 | | | 35,355 |
| | 360,000 | | Flagstar Home Equity Loan Trust, Series 2007-1A, Class AF2 (STEP), 5.77%, 1/25/35(b) | | | 236,089 |
| | 230,000 | | GSAA Home Equity Trust, Series 2004-10, Class AF3 4.88%, 8/25/34(a) | | | 207,211 |
| | 228,501 | | Master Asset Backed Securities Trust Series 2006-WMC1, Class A2 0.63%, 2/25/36(a) | | | 218,859 |
|
SCHEDULE OF PORTFOLIO INVESTMENTS |
Tamarack Quality Fixed Income Fund (cont.)
March 31, 2009 (Unaudited)
| | | | | | |
Principal
Amount | | | | Value |
| $ | 1,554 | | New Century Home Equity Loan Trust, Series 1997-NC5, Class A6 (STEP), 7.20%, 10/25/28, Callable 4/25/09 @ 100 | | $ | 1,549 |
| | 217,356 | | Structured Asset Securities Corp., Series 2007-RM1, Class A1, 0.80%, 5/25/47(a)(b) | | | 123,519 |
| | 173,818 | | WaMu Asset-Backed Certificates, Series 2007-HE2, Class 2A1, 0.63%, 4/25/37(a) | | | 144,166 |
| | | | | | |
| Total Asset Backed Securities
(Cost $2,809,967) | | | 2,479,658 |
| | | | | | |
| | Collateralized Mortgage Obligations — 20.72% |
| | Banking & Financial Services — 20.72% |
| | 339,965 | | ABN AMRO Mortgage Corp., Series 2003-12, Class 1A, 5.00%, 12/25/33, Callable 6/25/18 @ 100 | | | 299,701 |
| | 157,116 | | Banc of America Funding Corp., Series 2005-D, Class B1, 4.11%, 5/25/35, Callable 9/25/28 @ 100(a) | | | 61,961 |
| | 156,660 | | Banc of America Funding Corp., Series 2007-4, Class SB2, 5.42%, 11/25/34, Callable 9/25/34 @ 100(a) | | | 53,708 |
| | 135,084 | | Banc of America Funding Corp., Series 2007-4, Class SB3, 5.42%, 11/25/34, Callable 9/25/34 @ 100(a) | | | 37,309 |
| | 149,987 | | Banc of America Mortgage Securities, Inc., Series 2003-J, Class B2, 5.10%, 11/25/33, Callable 11/25/10 @ 100(a) | | | 41,478 |
| | 188,191 | | Banc of America Mortgage Securities, Inc., Series 2004-D, Class B1, 4.21%, 5/25/34, Callable 7/25/12 @ 100(a) | | | 111,437 |
| | 464,450 | | Banc of America Mortgage Securities, Inc., Series 2004-F, Class 2A7, 4.15%, 7/25/34(a) | | | 457,124 |
| | 406,868 | | Banc of America Mortgage Securities, Inc., Series 2006-A, Class 2A1, 5.43%, 2/25/36, Callable 1/25/20 @ 100(a) | | | 246,354 |
| | 411,380 | | Bear Stearns Adjustable Rate Mortgage Trust, Series 2003-9, Class 3A2, 4.95%, 2/25/34, Callable 12/25/18 @ 100(a) | | | 349,455 |
| | 70,182 | | Citigroup Mortgage Loan Trust, Inc., Series 2005-3, Class 2A2A, 4.68%, 8/25/35, Callable 10/25/20 @ 100(a) | | | 43,439 |
| | 358,957 | | Countrywide Alternative Loan Trust, Series 2004-J8, Class 2A1 7.00%, 8/25/34, Callable 5/25/12 @ 100 | | | 256,205 |
| | 328,880 | | Countrywide Alternative Loan Trust, Series 2005-73CB, Class 1A1, 5.50%, 1/25/36 | | | 287,399 |
| | 814,061 | | Countrywide Alternative Loan Trust, Series 2005-J4, Class 1A5 (STEP), 4.97%, 7/25/35, Callable 5/25/18 @ 100 | | | 721,611 |
| | | | | | |
Principal
Amount | | | | Value |
| $ | 284,190 | | Countrywide Alternative Loan Trust, Series 2007-16CB, Class 3A1, 6.75%, 8/25/37, Callable 10/25/30 @ 100 | | $ | 160,212 |
| | 192,263 | | Countrywide Home Loan Mortgage Pass Through Trust, Series 2003-21, Class B2, 4.77%, 5/25/33, Callable 4/25/09 @ 100(a) | | | 38,570 |
| | 125,751 | | Credit Suisse First Boston Mortgage Securities Corp., Series 2004-7, Class 5A1, 5.00%, 10/25/19 | | | 112,709 |
| | 287,718 | | First Horizon Asset Securities, Inc., Series 2004-AR1, Class B2, 4.39%, 2/25/34, Callable 12/25/11 @ 100(a)(d) | | | 83,167 |
| | 480,000 | | Homebanc Mortgage Trust, Series 2006-1, Class 3A2, 5.87%, 4/25/37, Callable 4/25/24 @ 100(a)(d) | | | 262,130 |
| | 205,313 | | JPMorgan Mortgage Trust, Series 2004-A4, Class 2A2, 4.62%, 9/25/34, Callable 4/25/17 @ 100(a) | | | 168,265 |
| | 487,974 | | Master Alternative Loans Trust, Series 2005-2, Class 3A1 6.00%, 3/25/35, Callable 5/25/24 @ 100 | | | 372,290 |
| | 577,673 | | Master Asset Securitization Trust, Series 2003-12, Class 6A1, 5.00%, 12/25/33, Callable 5/25/21 @ 100 | | | 509,255 |
| | 680,003 | | Merrill Lynch Mortgage Investors, Inc., Series 2005-A1, Class 2A1, 4.50%, 12/25/34, Callable 9/25/16 @ 100(a) | | | 495,155 |
| | 439,368 | | Merrill Lynch Mortgage Investors, Inc., Series 2005-A5, Class M1 4.87%, 6/25/35, Callable 4/25/22 @ 100(a) | | | 120,354 |
| | 411 | | Morgan Stanley Mortgage Loan Trust, Series 2004-2AR, Class 1A, 5.43%, 2/25/34, Callable 12/25/14 @ 100(a) | | | 249 |
| | 414,527 | | Morgan Stanley Mortgage Loan Trust, Series 2007-13, Class 6A1, 6.00%, 10/25/37, Callable 4/25/37 @ 100 | | | 224,314 |
| | 132,335 | | Residential Accredit Loans, Inc., Series 2004-QS4, Class A1 4.35%, 3/25/34, Callable 11/25/21 @ 100 | | | 117,001 |
| | 363,281 | | Residential Asset Mortgage Products, Inc., Series 2005-SL2, Class A3 7.00%, 2/25/32, Callable 6/25/27 @ 100 | | | 313,784 |
| | 104,815 | | Sequoia Mortgage Trust, Series 2003-4, Class 1B2, 3.47%, 7/20/33, Callable 4/20/09 @ 100(a)(d) | | | 25,316 |
| | 199,722 | | Sequoia Mortgage Trust, Series 2003-4, Class 2B4, 1.55%, 7/20/33, Callable 11/20/09 @ 100(a) | | | 56,359 |
|
SCHEDULE OF PORTFOLIO INVESTMENTS |
Tamarack Quality Fixed Income Fund (cont.)
March 31, 2009 (Unaudited)
| | | | | | |
Principal
Amount | | | | Value |
| $ | 27,062 | | Structured Asset Securities Corp., Series 2002-11A, Class 2A1, 5.48%, 6/25/32, Callable 4/25/09 @ 100(a) | | $ | 19,638 |
| | 405,614 | | Structured Asset Securities Corp., Series 2003-30, Class 1A1, 5.50%, 10/25/33, Callable 6/25/26 @ 100 | | | 360,110 |
| | 275,280 | | SunTrust Acquisition Closed-end Seconds Trust, Series 2007-1, Class A, 0.84%, 4/25/37, Callable 10/25/12 @ 100(a) | | | 120,423 |
| | 126,071 | | Vendee Mortgage Trust, Series 1992-1, Class 2Z, 7.75%, 5/15/22, Callable 10/15/18 @ 100 | | | 134,011 |
| | 738,195 | | WaMu Mortgage Pass-Through Certificates, Series 2003-S11, Class 1A, 5.00%, 11/25/33, Callable 7/25/28 @ 100 | | | 702,440 |
| | 239,027 | | WaMu Mortgage Pass-Through Certificates, Series 2004-AR14, Class B2, 4.26%, 1/25/35, Callable 12/25/19 @ 100(a)(d) | | | 28,834 |
| | 328,496 | | WaMu Mortgage Pass-Through Certificates, Series 2004-AR7, Class B1, 3.94%, 7/25/34, Callable 7/25/19 @ 100(a) | | | 177,174 |
| | 389,612 | | Washington Mutual Alternative Mortgage Pass-Through Certificates, Series 2005-8, Class 1A8, 5.50%, 10/25/35 | | | 286,699 |
| | 335,530 | | Wells Fargo Mortgage Backed Securities Trust, Series 2004-P, Class B1, 4.25%, 9/25/34, Callable 4/25/15 @ 100(a) | | | 162,220 |
| | 111,295 | | Wells Fargo Mortgage Backed Securities Trust, Series 2006-20, Class B4, 5.50%, 12/25/21, Callable 5/25/14 @ 100 | | | 8,636 |
| | | | | | |
| Total Collateralized Mortgage Obligations
(Cost $11,508,766) | | | 8,026,496 |
| | | | | | |
| | Corporate Bonds — 25.45% |
| | Aerospace & Defense — 0.36% |
| | 145,000 | | L-3 Communications Corp., 6.13%, 7/15/13, Callable 5/14/09 @ 103 | | | 139,200 |
| | | | | | |
| | Agriculture — 0.75% |
| | 290,000 | | Archer-Daniels-Midland Co., 5.45%, 3/15/18 | | | 290,194 |
| | | | | | |
| | Apparel — 0.39% |
| | 156,000 | | Phillips-Van Heusen, 7.25%, 2/15/11, Callable 5/14/09 @ 102 | | | 150,150 |
| | | | | | |
| | Banks — 3.54% |
| | 213,000 | | Barclays Bank PLC, 6.28%, 12/15/34, Callable 12/15/34 @ 100(a)(d) | | | 69,747 |
| | 200,000 | | BB&T Capital Trust IV, 6.82%, 6/12/48, Callable 6/12/37 @ 100(a) | | | 84,642 |
| | 171,000 | | CBA Capital Trust I, 5.81%, 6/30/15, Callable 6/30/15 @ 100(b) | | | 99,514 |
| | | | | | |
Principal
Amount | | | | Value |
| $ | 164,000 | | Chase Capital II, 1.67%, 2/1/27, Callable 5/14/09 @ 100(a) | | $ | 65,053 |
| | 136,000 | | Chase Capital III, 1.81%, 3/1/27, Callable 5/14/09 @ 100(a) | | | 54,000 |
| | 179,000 | | Frost National Bank, 6.88%, 8/1/11 | | | 172,446 |
| | 382,000 | | Nationsbank Capital Trust III, 1.64%, 1/15/27, Callable 5/14/09 @ 100(a) | | | 129,637 |
| | 225,000 | | Northgroup Preferred Capital Corp. 6.38%, 12/29/49, Callable 10/15/17 @ 100(a)(b) | | | 76,770 |
| | 250,000 | | People’s United Bank, 9.88%, 11/15/10 | | | 242,171 |
| | 235,000 | | Rabobank Capital Funding II, 5.26%, 12/31/13, Callable 12/31/13 @ 100(a)(b) | | | 105,750 |
| | 222,000 | | Regions Financing Trust II, 6.63%, 5/15/47, Callable 5/15/27 @ 100(a) | | | 80,414 |
| | 374,000 | | Wachovia Capital Trust II 1.59%, 1/15/27, Callable 5/14/09 @ 100(a) | | | 189,531 |
| | | | | | |
| | | | | | 1,369,675 |
| | | | | | |
| | Building Materials — 0.21% |
| | 110,000 | | Texas Industries, Inc., 7.25%, 7/15/13, Callable 7/15/09 @ 104 | | | 83,050 |
| | | | | | |
| | Chemicals — 0.94% |
| | 148,000 | | Methanex Corp. 8.75%, 8/15/12(d) | | | 138,698 |
| | 160,000 | | Mosaic Co. (The) 7.63%, 12/1/16, Callable 12/1/11 @ 104(b) | | | 156,800 |
| | 76,000 | | Valspar Corp. 5.63%, 5/1/12 | | | 70,491 |
| | | | | | |
| | | | | | 365,989 |
| | | | | | |
| | Coal — 0.27% |
| | 114,000 | | Arch Western Finance LLC 6.75%, 7/1/13, Callable 5/14/09 @ 103 | | | 104,310 |
| | | | | | |
| | Commercial Services — 0.47% |
| | 152,000 | | Equifax, Inc. 6.30%, 7/1/17 | | | 120,470 |
| | 72,000 | | Service Corp. International 6.75%, 4/1/15 | | | 63,360 |
| | | | | | |
| | | | | | 183,830 |
| | | | | | |
| | Consumer Cyclical — 0.52% |
| | 207,000 | | CVS Caremark Corp. 5.75%, 6/1/17 | | | 201,858 |
| | | | | | |
| | Diversified Financial Services — 3.05% |
| | 286,000 | | Citigroup Capital XXI 8.30%, 12/21/37, Callable 12/21/37 @ 100(a) | | | 137,708 |
| | 475,000 | | Fort Knox Military Housing Privatization Project 0.90%, 2/15/49, (Credit Support: AMBAC)(a)(c)(d) | | | 271,264 |
| | 180,000 | | General Electric Capital Corp. 6.88%, 1/10/39 | | | 146,806 |
| | 268,000 | | General Electric Capital Corp., 6.00%, 6/15/12 | | | 264,228 |
| | 112,000 | | Morgan Stanley, 1.70%, 1/9/14(a) | | | 83,055 |
|
SCHEDULE OF PORTFOLIO INVESTMENTS |
Tamarack Quality Fixed Income Fund (cont.)
March 31, 2009 (Unaudited)
| | | | | | |
Principal
Amount | | | | Value |
| $ | 41,300 | | Pemex Finance Ltd., 9.69%, 8/15/09, (Credit Support: MBIA )(d) | | $ | 41,515 |
| | 110,000 | | Sovereign Bancorp, Inc. 4.90%, 9/23/10 | | | 103,467 |
| | 250,000 | | Travelers Cos., Inc. (The) 6.25%, 3/15/37, Callable 3/15/17 @ 100(a) | | | 132,665 |
| | | | | | |
| | | | | | 1,180,708 |
| | | | | | |
| | Electric — 1.07% | | | |
| | 242,000 | | Energy East Corp., 6.75%, 7/15/36 | | | 163,611 |
| | 154,000 | | Potomac Electric Power Co., 6.50%, 11/15/37 | | | 146,891 |
| | 203,000 | | Puget Sound Energy, Inc., 6.97%, 6/1/49, Callable 6/1/17 @ 100(a) | | | 105,560 |
| | | | | | |
| | | | | | 416,062 |
| | | | | | |
| | Engineering & Construction — 0.36% |
| | 176,000 | | Dycom Industries, Inc., 8.13%, 10/15/15, Callable 10/15/10 @ 104 | | | 139,040 |
| | | | | | |
| | Food — 0.22% | | | |
| | 90,000 | | Corn Products International, Inc., 6.00%, 4/15/17 | | | 84,590 |
| | | | | | |
| | Government - Other — 0.23% |
| | 82,085 | | New Valley Generation III, 4.69%, 1/15/22 | | | 90,150 |
| | | | | | |
| | Healthcare - Services — 0.44% |
| | 176,000 | | Laboratory Corp. of America Holdings, 5.50%, 2/1/13 | | | 169,241 |
| | | | | | |
| | Insurance — 3.24% | | | |
| | 300,000 | | Americo Life, Inc., 7.88%, 5/1/13(b) | | | 195,001 |
| | 375,000 | | ING Capital Funding Trust III, 8.44%, 12/31/10, Callable 12/31/10 @ 100(a) | | | 109,369 |
| | 225,000 | | MetLife, Inc., 6.40%, 12/15/36, Callable 12/15/31 @ 100 | | | 94,500 |
| | 247,000 | | Navigators Group, Inc., 7.00%, 5/1/16 | | | 165,842 |
| | 255,000 | | NLV Financial Corp., 7.50%, 8/15/33(b) | | | 205,579 |
| | 199,000 | | OneAmerica Financial Partners, Inc., 7.00%, 10/15/33(b) | | | 167,187 |
| | 225,000 | | Selective Insurance Group, 6.70%, 11/1/35 | | | 181,161 |
| | 197,000 | | Willis North America, Inc., 6.20%, 3/28/17 | | | 138,082 |
| | | | | | |
| | | | | | 1,256,721 |
| | | | | | |
| | Iron/Steel — 0.63% | | | |
| | 199,000 | | Nucor Corp. 5.75%, 12/1/17 | | | 199,117 |
| | 60,000 | | Steel Dynamics, Inc., 7.38%, 11/1/12 | | | 46,800 |
| | | | | | |
| | | | | | 245,917 |
| | | | | | |
| | Machinery-Diversified — 1.42% |
| | 190,000 | | Joy Global, Inc., 6.00%, 11/15/16 | | | 159,015 |
| | | | | | |
Principal
Amount | | | | Value |
| $ | 195,000 | | Rockwell Automation, Inc., 5.65%, 12/1/17 | | $ | 198,456 |
| | 202,000 | | Westinghouse Air Brake 6.88%, 7/31/13 | | | 191,900 |
| | | | | | |
| | | | | | 549,371 |
| | | | | | |
| | Media — 1.25% | | | |
| | 242,000 | | Comcast Cable Holdings LLC, 9.80%, 2/1/12 | | | 259,407 |
| | 255,000 | | News America Holdings, Inc., 7.70%, 10/30/25 | | | 223,521 |
| | | | | | |
| | | | | | 482,928 |
| | | | | | |
| | Metal Fabricate/Hardware — 0.17% |
| | 70,000 | | Valmont Industries, Inc., 6.88%, 5/1/14, Callable 5/1/09 @ 103 | | | 64,400 |
| | | | | | |
| | Office Furnishings — 0.51% |
| | 198,000 | | Steelcase, Inc., 6.50%, 8/15/11 | | | 196,118 |
| | | | | | |
| | Pharmaceuticals — 0.75% | | | |
| | 178,000 | | GlaxoSmithKline Capital, Inc. 5.65%, 5/15/18 | | | 182,576 |
| | 131,000 | | NBTY, Inc., 7.13%, 10/1/15, Callable 10/1/10 @ 104 | | | 106,765 |
| | | | | | |
| | | | | | 289,341 |
| | | | | | |
| | Pipelines — 1.08% | | | |
| | 198,000 | | Boardwalk Pipelines LP, 5.88%, 11/15/16 | | | 167,763 |
| | 130,000 | | Sonat, Inc., 7.63%, 7/15/11 | | | 125,589 |
| | 150,000 | | Trans-Canada Pipelines Ltd., 6.20%, 10/15/37 | | | 127,022 |
| | | | | | |
| | | | | | 420,374 |
| | | | | | |
| | REITS — 0.27% | | | |
| | 126,000 | | Duke Realty LP, 5.63%, 8/15/11 | | | 105,858 |
| | | | | | |
| | Software — 0.69% | | | |
| | 272,000 | | Fiserv, Inc., 6.13%, 11/20/12 | | | 269,102 |
| | | | | | |
| | Telecommunication Services — 0.95% |
| | 176,000 | | AT&T, Inc., 6.40%, 5/15/38 | | | 156,589 |
| | 184,000 | | Verizon Communications, Inc., 8.75%, 11/1/18 | | | 210,529 |
| | | | | | |
| | | | | | 367,118 |
| | | | | | |
| | Transportation — 1.12% |
| | 182,000 | | CSX Corp., 6.75%, 3/15/11 | | | 183,163 |
| | 125,000 | | Navios Maritime Holdings, Inc., 9.50%, 12/15/14, Callable 12/15/10 @ 105 | | | 71,250 |
| | 174,000 | | Union Pacific Corp., 6.13%, 1/15/12 | | | 180,596 |
| | | | | | |
| | | | | | 435,009 |
| | | | | | |
|
SCHEDULE OF PORTFOLIO INVESTMENTS |
Tamarack Quality Fixed Income Fund (cont.)
March 31, 2009 (Unaudited)
| | | | | | |
Principal
Amount | | | | Value |
| | Utilities — 0.55% | | | |
| $ | 215,000 | | Alabama Power Co. 6.00%, 3/1/39 | | $ | 211,465 |
| | | | | | |
| Total Corporate Bonds
(Cost $13,008,300) | | | 9,861,769 |
| | | | | | |
| | Preferred Term Securities — 0.08% | | | |
| | 125,000 | | Preferred Term Securities XIV, Inc., 0.76%, 6/24/34(c)(d) | | | 6,500 |
| | 150,000 | | Preferred Term Securities XIX, Inc., 0.57%, 12/22/35(c)(d) | | | 2,220 |
| | 125,000 | | Preferred Term Securities XVI, Inc., 0.40%, 3/23/35(c)(d) | | | 625 |
| | 175,000 | | Preferred Term Securities XVIII, Inc., 0.63%, 6/24/34(c)(d) | | | 6,020 |
| | 150,000 | | Preferred Term Securities XXIV, Inc., 0.02%, 9/25/35(c)(d) | | | 4,950 |
| | 250,000 | | Preferred Term Securities XXV, Inc., 0.03%, 6/22/37(c)(d) | | | 6,200 |
| | 150,000 | | Preferred Term Securities XXVI, Inc., 0.03%, 9/22/37(c)(d) | | | 3,015 |
| | | | | | |
| Total Preferred Term Securities
(Cost $996,193) | | | 29,530 |
| | | | | | |
| | U.S. Government Agency Backed Mortgages — 40.21% |
| | Fannie Mae — 33.49% | | | |
| | 2,600,000 | | (TBA), 4.50%, 4/15/39 | | | 2,656,875 |
| | 8,197 | | Pool #124425, 9.25%, 10/1/20 | | | 9,030 |
| | 635,449 | | Pool #254764, 5.50%, 6/1/23 | | | 663,785 |
| | 384 | | Pool #519217, 7.00%, 2/1/30 | | | 414 |
| | 238 | | Pool #529175, 7.00%, 2/1/30 | | | 258 |
| | 17,053 | | Pool #626582, 5.50%, 3/1/17 | | | 17,904 |
| | 97,458 | | Pool #635169, 5.00%, 8/1/17 | | | 101,943 |
| | 33,610 | | Pool #644943, 5.50%, 5/1/17 | | | 35,287 |
| | 292,954 | | Pool #740447, 4.50%, 9/1/18 | | | 302,850 |
| | 813,135 | | Pool #796610, 5.50%, 10/1/34 | | | 846,486 |
| | 30,660 | | Pool #898644, 6.50%, 1/1/37 | | | 32,335 |
| | 21,275 | | Pool #898682, 6.50%, 2/1/37 | | | 22,437 |
| | 23,515 | | Pool #898684, 6.50%, 2/1/37 | | | 24,799 |
| | 73,237 | | Pool #907600, 6.50%, 12/1/36 | | | 77,242 |
| | 248,561 | | Pool #913327, 6.50%, 4/1/22 | | | 260,647 |
| | 24,470 | | Pool #916843, 6.50%, 4/1/37 | | | 25,807 |
| | 84,120 | | Pool #922123, 6.50%, 4/1/37 | | | 88,714 |
| | 366,462 | | Pool #933554, 6.00%, 3/1/38 | | | 383,142 |
| | 181,613 | | Pool #936193, 6.50%, 5/1/37 | | | 191,533 |
| | 272,413 | | Pool #960143, 6.00%, 11/1/37 | | | 284,840 |
| | 822,609 | | Pool #961560, 6.00%, 2/1/38 | | | 860,135 |
| | 1,927,045 | | Pool #986937, 5.50%, 9/1/38 | | | 2,002,061 |
| | 463,391 | | Pool #987036, 6.00%, 8/1/38 | | | 484,529 |
| | 329,379 | | Pool #991101, 5.00%, 12/1/38 | | | 340,245 |
| | 1,362,273 | | Pool #AA3409 5.00%, 3/1/39 | | | 1,407,215 |
| | | | | | |
Principal Amount | | | | Value |
| $ | 6,429 | | Series 1988-16, Class B, 9.50%, 6/25/18 | | $ | 7,203 |
| | 770,000 | | Series 1997-M9, Class C, 6.52%, 7/25/16 | | | 830,935 |
| | 127,451 | | Series 2002-W11, Class AF5 (STEP), 5.48%, 11/25/32, Callable 5/25/09 @ 100 | | | 127,308 |
| | 505,000 | | Series 2004-32, Class AY, 4.00%, 5/25/19 | | | 518,776 |
| | 405,000 | | Series 2005-W2, Class A8, 5.41%, 5/25/35, Callable 6/25/20 @ 100 | | | 370,224 |
| | | | | | |
| | | | | | 12,974,959 |
| | | | | | |
| | Freddie Mac — 2.65% | | | |
| | 9,728 | | Pool #170170, 9.00%, 6/1/16 | | | 10,648 |
| | 359,972 | | Pool #1B2721, 4.38%, 1/1/35(a) | | | 367,303 |
| | 7,122 | | Pool #306588, 8.00%, 10/1/18 | | | 7,557 |
| | 478,808 | | Pool #A70902, 6.00%, 1/1/38 | | | 501,126 |
| | 37,586 | | Pool #C00921, 7.50%, 2/1/30 | | | 40,752 |
| | 8,732 | | Pool #G10625, 8.00%, 1/1/12 | | | 9,197 |
| | 85,133 | | Series 2178-PB, 7.00%, 8/15/29, Callable 2/15/12 @ 100 | | | 91,169 |
| | | | | | |
| | | | | | 1,027,752 |
| | | | | | |
| | Ginnie Mae — 4.07% | | | |
| | 30,437 | | Pool #003132, 6.00%, 9/20/31 | | | 31,906 |
| | 79,233 | | Pool #003296, 6.00%, 10/20/32 | | | 82,979 |
| | 736 | | Pool #152589, 9.50%, 4/15/16 | | | 805 |
| | 6,503 | | Pool #269020, 9.50%, 1/15/19 | | | 7,137 |
| | 9,438 | | Pool #342206, 6.50%, 12/15/23 | | | 9,930 |
| | 5,724 | | Pool #361064, 6.50%, 8/15/23 | | | 6,023 |
| | 5,914 | | Pool #363767, 6.50%, 11/15/23 | | | 6,223 |
| | 22,317 | | Pool #376510, 7.00%, 5/15/24 | | | 23,874 |
| | 189,698 | | Pool #380866, 7.00%, 3/15/24 | | | 202,936 |
| | 7,364 | | Pool #398964, 7.50%, 11/15/11 | | | 7,708 |
| | 1,231 | | Pool #433258, 7.50%, 10/15/11 | | | 1,289 |
| | 5,449 | | Pool #433263, 7.50%, 10/15/11 | | | 5,703 |
| | 9,513 | | Pool #441009, 8.00%, 11/15/26 | | | 10,330 |
| | 214,071 | | Pool #442164, 8.00%, 12/15/26 | | | 232,455 |
| | 2,240 | | Pool #485682, 6.50%, 8/15/31 | | | 2,385 |
| | 1,561 | | Pool #549180, 6.00%, 5/15/31 | | | 1,643 |
| | 36,868 | | Pool #552381, 6.00%, 2/15/32 | | | 38,802 |
| | 31,733 | | Pool #558945, 6.00%, 4/15/33 | | | 33,378 |
| | 8,296 | | Pool #565982, 7.00%, 7/15/32 | | | 8,865 |
| | 4,137 | | Pool #568184, 6.50%, 11/15/31 | | | 4,405 |
| | 47,932 | | Pool #578345, 6.00%, 8/15/32 | | | 50,446 |
| | 32,864 | | Pool #584369, 7.00%, 4/15/32 | | | 35,120 |
| | 80,492 | | Pool #584486, 6.00%, 6/15/32 | | | 84,714 |
| | 21,329 | | Pool #591571, 7.50%, 7/15/32 | | | 22,849 |
| | 6,147 | | Pool #591581, 7.00%, 8/15/32 | | | 6,569 |
| | 125,876 | | Pool #592154, 5.00%, 8/15/33 | | | 131,095 |
| | 147,976 | | Pool #597857, 5.00%, 8/15/33 | | | 154,111 |
|
SCHEDULE OF PORTFOLIO INVESTMENTS |
Tamarack Quality Fixed Income Fund (cont.)
March 31, 2009 (Unaudited)
| | | | | | |
Principal
Amount | | | | Value |
| $ | 20,055 | | Pool #598131, 6.00%, 3/15/33 | | $ | 21,094 |
| | 5,207 | | Pool #780332, 8.00%, 11/15/09 | | | 5,239 |
| | 133,489 | | Pool #781124, 7.00%, 12/15/29 | | | 143,370 |
| | 157,280 | | Pool #781547, 6.00%, 1/15/33 | | | 164,951 |
| | 39,183 | | Series 2001-58, Class B, 5.14%, 6/16/23(a) | | | 39,630 |
| | | | | | |
| | | | | | 1,577,964 |
| | | | | | |
| |
| Total U.S. Government Agency Backed
Mortgages
(Cost $15,212,051) | | | 15,580,675 |
| | | | | | |
| | U.S. Government Agency Obligations — 3.91% |
| | Fannie Mae — 2.58% |
| | 935,000 | | 3.88%, 7/12/13 | | | 997,772 |
| | | | | | |
| | Freddie Mac — 1.33% |
| | 460,000 | | 5.00%, 7/15/14 | | | 515,879 |
| | | | | | |
| | Small Business Administration — 0.00% |
| | 421 | | 10.05%, 4/1/09 | | | 421 |
| | | | | | |
| |
| Total U.S. Government Agency Obligations
(Cost $1,426,006) | | | 1,514,072 |
| | | | | | |
| | | | | | |
| Shares | | | | Value | |
| Investment Company — 3.61% | |
| 1,397,762 | | Wells Fargo Prime Investment Money Market Fund | | | $1,397,762 | |
| | | | | | |
| |
Total Investment Company
(Cost $1,397,762) | | | 1,397,762 | |
| | | | | | |
| |
Total Investments
(Cost $48,890,559)(e) — 105.99% | | | 41,065,199 | |
| |
| Liabilities in excess of other assets — (5.99)% | | | (2,320,873 | ) |
| | | | | | |
| NET ASSETS — 100.00% | | $ | 38,744,326 | |
| | | | | | |
| | | | | | | | | | |
(a) Variable rate security. The rate reflected in the Schedule of Portfolio Investments is the rate in effect on March 31, 2009. |
(b) Security exempt from registration under Rule 144A of the Securities Act of 1933, as amended. These securities may be resold in transactions exempt from registration, normally to qualified institutional buyers. Security has been deemed to be liquid based on procedures approved by the Board of Trustees. |
(c) This security is restricted and illiquid as the security may not be offered or sold within the United States or to U.S. persons except to qualified purchasers who are also either qualified institutional buyers or “accredited investors” (as defined in Rule 501 (a) of Regulation D under the Securities Act of 1933). |
|
The total investment in restricted and illiquid securities representing $473,255 or 1.22% of net assets was as follows: |
| | | | |
Acquisition Principal Amount | | Issuer | | Acquisition
Date | | Acquisition
Cost | | 3/31/2009
Carrying
Value
Per Unit |
| $335,486 | | Countrywide Asset-Backed Certificates Series 2007-A1 Class 2A1 | | 7/18/2007 | | $ | 327,759 | | $ | 0.5141 |
| | | | | | | | | | |
Acquisition
Principal
Amount | | Issuer | | Acquisition
Date | | Acquisition
Cost | | 3/31/2009
Carrying
Value
Per Unit |
| | | | |
| $475,000 | | Fort Knox Military Housing Privatization Project | | 1/29/2007 | | $ | 475,000 | | $ | 0.5711 |
| 125,000 | | Preferred Term Securities XIV, Inc. | | 6/7/2007 | | | 95,950 | | | 0.0520 |
| 125,000 | | Preferred Term Securities XVI, Inc. | | 4/13/2007 | | | 109,695 | | | 0.0050 |
| 175,000 | | Preferred Term Securities XVIII, Inc. | | 5/14/2007 | | | 134,499 | | | 0.0344 |
| 150,000 | | Preferred Term Securities XXIV, Inc. | | 5/16/2007 | | | 142,740 | | | 0.0330 |
| 150,000 | | Preferred Term Securities XIX, Inc. | | 5/11/2007 | | | 121,868 | | | 0.0148 |
| 250,000 | | Preferred Term Securities XXV, Inc. | | 3/16/2007 | | | 246,955 | | | 0.0248 |
| 150,000 | | Preferred Term Securities XXVI, Inc. | | 6/15/2007 | | | 144,486 | | | 0.0201 |
|
SCHEDULE OF PORTFOLIO INVESTMENTS |
Tamarack Quality Fixed Income Fund (cont.)
March 31, 2009 (Unaudited)
| (d) | Fair valued security under procedures established by the Fund’s Board of Trustees. |
| (e) | See notes to financial statements for the tax cost of securities and the breakdown of unrealized appreciation (depreciation). |
Abbreviations used are defined below:
AMBAC – Insured by American Municipal Bond Insurance Assurance Corp.
FSA – Insured by Financial Security Assurance, Inc.
GO – General Obligation
MBIA – Insured by MBIA
OID – Original Issue Discount
RADIAN – RADIAN Group, Inc.
REIT – Real Estate Investment Trust
STEP – Step Coupon Bond
TBA – To Be Announced
See notes to financial statements.
14
|
SCHEDULE OF PORTFOLIO INVESTMENTS |
Tamarack Tax-Free Income Fund
March 31, 2009 (Unaudited)
| | | | | |
Principal Amount | | | | Value |
| Municipal Bonds — 96.15% |
| Arizona — 1.44% |
| $250,000 | | Surprise Municipal Property Corp. Revenue, 4.50%, 4/1/17, Callable 4/1/11 @ 100 | | $ | 224,573 |
| | | | | |
| California — 3.63% |
| 500,000 | | City of Santa Rosa Refunding Revenue, Series B, 6.00%, 9/1/15, (Credit Support: MBIA-RE, FGIC) | | | 564,820 |
| | | | | |
| Colorado — 5.60% |
| 500,000 | | Arkansas River Power Authority Revenue, 5.00%, 10/1/14, (Credit Support: XLCA) | | | 511,315 |
| 290,000 | | Colorado Educational & Cultural Facilities Authority Revenue, American Academy Project, 6.25%, 12/1/18 | | | 278,211 |
| 100,000 | | Denver West Metropolitan District, GO, Series B, 5.70%, 12/1/17, Callable 5/1/09 @ 100 | | | 82,742 |
| | | | | |
| | | | | 872,268 |
| | | | | |
| Florida — 8.92% |
| 500,000 | | County of Miami-Dade Refunding Revenue, Series A, 5.44%, 10/1/15, (Credit Support: MBIA-RE), Callable 5/1/09 @ 73(a) | | | 363,040 |
| 500,000 | | Florida State Board of Education, GO, Series J, 5.00%, 6/1/19, Callable 6/1/13 @ 101 | | | 525,565 |
| 500,000 | | Putnam County Development Authority, Refunding Revenue, 5.35%, 3/15/42, (Credit Support: AMBAC)(b) | | | 501,405 |
| | | | | |
| | | | | 1,390,010 |
| | | | | |
| Illinois — 12.31% |
| 500,000 | | Cook County School District No. 148, Dolton, GO, Series E, 4.75%, 12/1/23, (Credit Support: FSA), Callable 12/1/18 @ 100 | | | 442,470 |
| 350,000 | | Illinois Finance Authority Refunding Revenue, 5.00%, 12/1/21, Callable 12/1/16 @ 100 | | | 266,634 |
| 380,000 | | Illinois Finance Authority Refunding Revenue, 5.13%, 4/1/19, Callable 4/1/17 @ 100 | | | 348,046 |
| 200,000 | | Illinois Finance Authority Refunding Revenue, Series A, 4.95%, 7/1/15, (Credit Support: GO of Participants), Callable 7/1/14 @ 101 | | | 175,824 |
| 300,000 | | Illinois Finance Authority Refunding Revenue, Series A, 5.05%, 7/1/17, (Credit Support: GO of Participants), Callable 7/1/14 @ 101 | | | 252,912 |
| 440,000 | | Markham, GO, Series B, 5.75%, 2/1/21, Callable 2/1/18 @ 100 | | | 431,829 |
| | | | | |
| | | | | 1,917,715 |
| | | | | |
| | | | | | |
Principal
Amount | | | | Value |
| | Indiana — 13.02% |
| $ | 180,000 | | Boone County Redevelopment Commission Tax Allocation, Series B, 4.80%, 8/1/17, Callable 2/1/16 @ 100 | | $ | 172,868 |
| | 135,000 | | Boone County Redevelopment Commission Tax Allocation, Series B, 4.85%, 2/1/18, Callable 2/1/16 @ 100 | | | 127,603 |
| | 380,000 | | City of Anderson Refunding Revenue, 5.00%, 10/1/19, Callable 4/1/17 @ 100 | | | 291,711 |
| | 450,000 | | Indiana Bond Bank Refunding Revenue, Series A, 5.00%, 8/1/16, (Credit Support: FSA) | | | 517,410 |
| | 100,000 | | Munster Municipal Center Corp. Revenue, 4.25%, 7/15/11 | | | 104,470 |
| | 445,000 | | Munster Municipal Center Corp. Revenue, 4.70%, 7/15/17, Callable 1/15/14 @ 100 | | | 453,366 |
| | 345,000 | | Noblesville Multi School Building Corp. Revenue, 4.00%, 1/15/14, (Credit Support: MBIA-RE, FGIC, State Aid Withholding) | | | 359,942 |
| | | | | | |
| | | | | | 2,027,370 |
| | | | | | |
| | Louisiana — 1.06% |
| | 150,000 | | State of Louisiana Refunding GO, Series B, 5.00%, 7/15/15, (Credit Support: CIFG) | | | 165,251 |
| | | | | | |
| | Maryland — 1.86% |
| | 350,000 | | City of Baltimore Revenue, Series A, 5.00%, 9/1/14, (Credit Support: XLCA) | | | 289,968 |
| | | | | | |
| | Massachusetts — 6.81% |
| | 1,000,000 | | Massachusetts Health & Educational Facilities Authority Revenue, Series C, 5.75%, 7/1/12, Callable 7/1/11 @ 101 | | | 1,061,370 |
| | | | | | |
| | Michigan — 1.81% |
| | 250,000 | | Michigan State Building Authority Revenue, Series III, Pre-Refunded, 5.38%, 10/15/16, Callable 10/15/12 @ 100 | | | 282,570 |
| | | | | | |
| | Minnesota — 3.51% |
| | 600,000 | | Minnesota Higher Education Facilities Authority Revenue, Bethel University Project, Series 6R, 5.50%, 5/1/22, Callable 5/1/17 @ 100 | | | 546,168 |
| | | | | | |
| | Missouri — 4.10% |
| | 250,000 | | Missouri Development Finance Board Revenue, Series A, 5.25%, 3/1/15 | | | 269,022 |
| | 385,000 | | St. Louis Park Revenue, Series C, 5.50%, 7/1/23, Callable 7/1/18 @ 100 | | | 369,989 |
| | | | | | |
| | | | | | 639,011 |
| | | | | | |
|
SCHEDULE OF PORTFOLIO INVESTMENTS |
Tamarack Tax-Free Income Fund (cont.)
March 31, 2009 (Unaudited)
| | | | | | |
Principal
Amount | | | | Value |
| | Ohio — 1.45% |
| $ | 225,000 | | State of Ohio Revenue, 4.00%, 4/1/09 | | $ | 225,000 |
| | | | | | |
| | Oklahoma — 13.07% |
| | 225,000 | | Jay Industrial Authority Revenue, 4.75%, 9/1/10 | | | 233,116 |
| | 500,000 | | McClain County Economic Development Authority Revenue, 5.00%, 9/1/11 | | | 521,540 |
| | 380,000 | | Oklahoma Baptist University Authority Revenue, 5.25%, 12/1/14 | | | 358,279 |
| | 300,000 | | Pottawatomie County Facilities Authority Revenue, 5.00%, 9/1/10 | | | 311,391 |
| | 230,000 | | Pottawatomie County Facilities Authority Revenue, 4.75%, 9/1/13 | | | 247,791 |
| | 100,000 | | Pottawatomie County Facilities Authority Revenue, 4.75%, 9/1/14 | | | 107,437 |
| | 245,000 | | Tulsa Industrial Authority Revenue, 4.30%, 10/1/12 | | | 256,652 |
| | | | | | |
| | | | | | 2,036,206 |
| | | | | | |
| | Texas — 8.89% |
| | 100,000 | | Northeast Travis County Utility District, GO, 4.50%, 9/1/13, Callable 9/1/11 @ 100 | | | 104,961 |
| | 65,000 | | Northeast Travis County Utility District, GO, 4.60%, 9/1/14, Callable 9/1/11 @ 100 | | | 68,095 |
| | 90,000 | | Northeast Travis County Utility District, GO, 4.65%, 9/1/15, Callable 9/1/11 @ 100 | | | 93,854 |
| | 405,000 | | San Leanna Educational Facilities Corp. Refunding Revenue, 5.00%, 6/1/18, Callable 6/1/17 @ 100 | | | 340,633 |
| | 500,000 | | University of Texas Refunding Revenue, Series B, 5.25%, 8/15/19 | | | 577,390 |
| | 250,000 | | Varner Creek Utility District GO, 5.50%, 8/15/22, Callable 8/15/18 @ 100 | | | 199,055 |
| | | | | | |
| | | | | | 1,383,988 |
| | | | | | |
| | Washington — 4.43% |
| | 55,000 | | Adams County Park & Recreation District No. 4, Refunding GO, 4.13%, 12/1/15 | | | 59,364 |
| | | | |
Principal
Amount | | | | Value |
| $100,000 | | Adams County Park & Recreation District No. 4, Refunding GO, 4.13%, 12/1/16 | | $ 107,362 |
| 500,000 | | City of Seattle Refunding Revenue, 5.63%, 12/1/16, Callable 12/1/10 @ 100 | | 523,750 |
| | | | |
| | | | 690,476 |
| | | | |
| Wisconsin — 4.24% |
| 300,000 | | Manitowoc Refunding Revenue, 5.00%, 8/1/10 | | 310,884 |
| 400,000 | | Wisconsin Health & Educational Facilities Authority Refunding Revenue, Series A, 5.00%, 2/15/17, Callable 2/15/16 @ 100 | | 349,776 |
| | | | |
| | | | 660,660 |
| | | | |
| |
Total Municipal Bonds
(Cost $15,317,744) | | 14,977,424 |
| | | | |
| | |
| Shares | | | | |
|
| Investment Company — 2.57% |
| 400,211 | | Wells Fargo Advantage National Tax-Free Institutional Money Market Fund | | 400,211 |
| | | | |
| |
Total Investment Company
(Cost $400,211) | | 400,211 |
| | | | |
| |
Total Investments
(Cost $15,717,955)(c) — 98.72% | | 15,377,635 |
| |
| Other assets in excess of liabilities — 1.28% | | 198,740 |
| | | | |
| NET ASSETS — 100.00% | | $15,576,375 |
| | | | |
| (a) | Represents effective yield to maturity on date of purchase. |
| (b) | Variable rate security. The rate reflected in the Schedule of Portfolio Investments is the rate in effect on March 31, 2009. |
| (c) | See notes to financial statements for the tax cost of securities and the breakdown of unrealized appreciation (depreciation). |
Abbreviations used are defined below:
AMBAC – Insured by American Municipal Bond Insurance Assurance Corp.
CIFG – IXIS Financial Guaranty
FGIC – Federal Guaranty Insurance Corp.
FSA – Financial Security Assurance Inc.
GO – General Obligation
MBIA – Insured by MBIA
MBIA-RE – MBIA re-insure FGIC
XLCA – XL Capital Assurance
See notes to financial statements.
Statements of Assets and Liabilities
March 31, 2009 (Unaudited)
| | | | | | | | |
| | | Tamarack
Quality Fixed
Income Fund | | | Tamarack
Tax-Free
Income Fund | |
Assets: | | | | | | | | |
Investments, at value (cost $48,890,559 and $15,717,955, respectively) | | $ | 41,065,199 | | | $ | 15,377,635 | |
Interest and dividends receivable | | | 389,683 | | | | 200,657 | |
Receivable from adviser | | | 3,991 | | | | 4,438 | |
Receivable for capital shares issued | | | 373 | | | | — | |
Receivable for open maturities | | | 7,014 | | | | — | |
Prepaid expenses | | | 43,761 | | | | 34,145 | |
| | | | | | | | |
Total Assets | | | 41,510,021 | | | | 15,616,875 | |
| | | | | | | | |
| | |
Liabilities: | | | | | | | | |
Distributions payable | | | 25,338 | | | | 16,620 | |
Payable for capital shares redeemed | | | 72,302 | | | | 4,036 | |
Payable for investments purchased | | | 2,612,025 | | | | — | |
Accrued expenses and other payables: | | | | | | | | |
Administration fees | | | 2,454 | | | | 988 | |
Audit fees | | | 3,929 | | | | 3,639 | |
Trustee fees | | | 50 | | | | 14 | |
Distribution fees | | | 94 | | | | 98 | |
Shareholder reports | | | 7,954 | | | | 520 | |
Transfer agent fees | | | 24,680 | | | | 10,897 | |
Other | | | 16,869 | | | | 3,688 | |
| | | | | | | | |
Total Liabilities | | | 2,765,695 | | | | 40,500 | |
| | | | | | | | |
Net Assets | | $ | 38,744,326 | | | $ | 15,576,375 | |
| | | | | | | | |
| | |
Net Assets Consist Of: | | | | | | | | |
Capital | | $ | 50,152,459 | | | $ | 15,889,790 | |
Undistributed (distributions in excess) of net investment income | | | (29,865 | ) | | | 175 | |
Accumulated net realized gains (losses) from investment transactions | | | (3,552,908 | ) | | | 26,730 | |
Net unrealized depreciation on investments | | | (7,825,360 | ) | | | (340,320 | ) |
| | | | | | | | |
Net Assets | | $ | 38,744,326 | | | $ | 15,576,375 | |
| | | | | | | | |
| | |
Net Assets: | | | | | | | | |
Class A | | $ | 429,541 | | | $ | 231,966 | |
Class I | | | 192,847 | | | | — | |
Class C | | | — | | | | 54,526 | |
Class R | | | 2,626 | | | | — | |
Class S | | | 38,119,312 | | | | 15,289,883 | |
| | | | | | | | |
Total | | $ | 38,744,326 | | | $ | 15,576,375 | |
| | | | | | | | |
17
Statements of Assets and Liabilities (cont.)
| | | | | | | | |
| | | Tamarack
Quality Fixed
Income Fund | | | Tamarack
Tax-Free
Income Fund | |
Shares Outstanding (Unlimited number of shares authorized, no par value): | | | | | | | | |
Class A | | | 53,606 | | | | 28,755 | |
Class I | | | 24,081 | | | | — | |
Class C | | | — | | | | 6,758 | |
Class R | | | 328 | | | | — | |
Class S | | | 4,759,972 | | | | 1,895,018 | |
| | | | | | | | |
Total | | | 4,837,987 | | | | 1,930,531 | |
| | | | | | | | |
| | |
Net Asset Values and Redemption Price per Share: | | | | | | | | |
Class A(a) | | $ | 8.01 | | | $ | 8.07 | |
| | | | | | | | |
Class I | | $ | 8.01 | | | | — | |
| | | | | | | | |
Class C(b) | | $ | — | | | $ | 8.07 | |
| | | | | | | | |
Class R | | $ | 8.01 | | | $ | — | |
| | | | | | | | |
Class S | | $ | 8.01 | | | $ | 8.07 | |
| | | | | | | | |
| | |
Maximum Offering Price Per Share: | | | | | | | | |
Class A | | $ | 8.32 | | | $ | 8.38 | |
| | | | | | | | |
Maximum Sales Charge - Class A | | | 3.75 | % | | | 3.75 | % |
| | | | | | | | |
| (a) | For Class A shares, redemption price per share will be reduced by 1.00% for sales of shares within 12 months of purchase (only applicable on purchases of $1 million or more on which no initial sales charge was paid). Such reduction is not reflected in the net asset value and the redemption price per share. |
| (b) | For Class C shares, redemption price per share will be reduced by 1.00% for sales of shares within 12 months of purchase. Such reduction is not reflected in the net asset value and the redemption price per share. |
See notes to financial statements.
18
Statements of Operations
For the Six Months Ended March 31, 2009 (Unaudited)
| | | | | | | | |
| | | Tamarack
Quality Fixed
Income Fund | | | Tamarack
Tax-Free
Income Fund | |
Investment Income: | | | | | | | | |
Interest income | | $ | 1,244,861 | | | $ | 370,460 | |
Dividend income | | | 10,821 | | | | 2,720 | |
| | | | | | | | |
Total Investment Income | | | 1,255,682 | | | | 373,180 | |
| | | | | | | | |
| | |
Expenses: | | | | | | | | |
Investment advisory fees | | | 119,468 | | | | 65,612 | |
Distribution fees - Class A | | | 1,079 | | | | 590 | |
Distribution fees - Class C | | | 15 | | | | 285 | |
Distribution fees - Class R | | | 14 | | | | 8 | |
Accounting fees | | | 13,461 | | | | 12,851 | |
Administration fees | | | 14,933 | | | | 5,789 | |
Audit fees | | | 2,322 | | | | 2,001 | |
Custodian fees | | | 1,011 | | | | 202 | |
Insurance fees | | | 2,583 | | | | 2,583 | |
Legal fees | | | 7,049 | | | | 1,549 | |
Registration and filing fees | | | 27,268 | | | | 18,457 | |
Shareholder reports | | | 11,899 | | | | 2,391 | |
Transfer agent fees | | | 57,544 | | | | 28,688 | |
Trustees’ fees | | | 473 | | | | 178 | |
Other fees | | | 20,259 | | | | 6,582 | |
| | | | | | | | |
Total expenses before fee reductions | | | 279,378 | | | | 147,766 | |
Expenses reduced/waived by: | | | | | | | | |
Adviser | | | (142,873 | ) | | | (89,762 | ) |
Distributor | | | (540 | ) | | | (295 | ) |
| | | | | | | | |
Net Expenses | | | 135,965 | | | | 57,709 | |
| | | | | | | | |
| | |
Net Investment Income | | | 1,119,717 | | | | 315,471 | |
| | | | | | | | |
| | |
Realized/Unrealized Gains (Losses) from Investment Transactions: | | | | | | | | |
Net realized gains (losses) from investment transactions | | | (610,226 | ) | | | 32,036 | |
Net realized gains (losses) from futures contracts | | | (15,455 | ) | | | — | |
Net change in unrealized appreciation/depreciation on investments | | | (2,260,491 | ) | | | (95,557 | ) |
Net change in unrealized appreciation/depreciation on futures contracts | | | 13,695 | | | | — | |
| | | | | | | | |
Net realized/unrealized losses from investments | | | (2,872,477 | ) | | | (63,521 | ) |
| | | | | | | | |
Change in net assets resulting from operations | | $ | (1,752,760 | ) | | $ | 251,950 | |
| | | | | | | | |
See notes to financial statements.
19
Statements of Changes in Net Assets
| | | | | | | | | | | | | | | | |
| | | Tamarack Quality Fixed
Income Fund | | | Tamarack Tax-Free
Income Fund | |
| | | For the
Six Months Ended
March 31, 2009 | | | For the
Year Ended
September 30, 2008 | | | For the
Six Months Ended
March 31, 2009 | | | For the
Year Ended
September 30, 2008 | |
| | | (Unaudited) | | | | | | (Unaudited) | | | | |
From Investment Activities: | | | | | | | | | | | | | | | | |
Operations: | | | | | | | | | | | | | | | | |
Net investment income | | $ | 1,119,717 | | | $ | 2,677,373 | | | $ | 315,471 | | | $ | 640,035 | |
Net realized gains (losses) from investments and futures contracts | | | (625,681 | ) | | | 525,763 | | | | 32,036 | | | | 113,806 | |
Net change in unrealized appreciation/depreciation on investments and futures contracts | | | (2,246,796 | ) | | | (5,061,005 | ) | | | (95,557 | ) | | | (573,136 | ) |
| | | | | | | | | | | | | | | | |
Change in net assets resulting from operations | | | (1,752,760 | ) | | | (1,857,869 | ) | | | 251,950 | | | | 180,705 | |
| | | | | | | | | | | | | | | | |
| | | | |
Distributions to Class A Shareholders: | | | | | | | | | | | | | | | | |
From net investment income | | | (11,641 | ) | | | (22,213 | ) | | | (4,501 | ) | | | (2,781 | ) |
From net realized gains | | | — | | | | — | | | | (1,837 | ) | | | (307 | ) |
| | | | |
Distributions to Class I Shareholders: | | | | | | | | | | | | | | | | |
From net investment income | | | (6,015 | ) | | | (12,884 | ) | | | — | | | | — | |
| | | | |
Distributions to Class C Shareholders: | | | | | | | | | | | | | | | | |
From net investment income | | | (69 | ) | | | (152 | ) | | | (880 | ) | | | (1,291 | ) |
From net realized gains | | | — | | | | — | | | | (444 | ) | | | (15 | ) |
| | | | |
Distributions to Class R Shareholders: | | | | | | | | | | | | | | | | |
From net investment income | | | (147 | ) | | | (327 | ) | | | (57 | ) | | | (117 | ) |
From net realized gains | | | — | | | | — | | | | (27 | ) | | | (16 | ) |
| | | | |
Distributions to Class S Shareholders: | | | | | | | | | | | | | | | | |
From net investment income | | | (1,104,392 | ) | | | (2,497,762 | ) | | | (309,856 | ) | | | (636,022 | ) |
From net realized gains | | | — | | | | — | | | | (116,614 | ) | | | (77,331 | ) |
| | | | | | | | | | | | | | | | |
Change in net assets resulting from shareholder distributions | | | (1,122,264 | ) | | | (2,533,338 | ) | | | (434,216 | ) | | | (717,880 | ) |
| | | | | | | | | | | | | | | | |
| | | | |
Capital Transactions: | | | | | | | | | | | | | | | | |
Proceeds from shares issued | | | 630,520 | | | | 1,782,917 | | | | 379,798 | | | | 269,376 | |
Distributions reinvested | | | 961,741 | | | | 2,168,905 | | | | 307,925 | | | | 504,531 | |
Cost of shares redeemed | | | (2,993,397 | ) | | | (8,893,066 | ) | | | (1,187,372 | ) | | | (2,296,379 | ) |
| | | | | | | | | | | | | | | | |
Change in net assets resulting from capital transactions | | | (1,401,136 | ) | | | (4,941,244 | ) | | | (499,649 | ) | | | (1,522,472 | ) |
| | | | | | | | | | | | | | | | |
Net decrease in net assets | | | (4,276,160 | ) | | | (9,332,451 | ) | | | (681,915 | ) | | | (2,059,647 | ) |
| | | | |
Net Assets: | | | | | | | | | | | | | | | | |
Beginning of period | | | 43,020,486 | | | | 52,352,937 | | | | 16,258,290 | | | | 18,317,937 | |
| | | | | | | | | | | | | | | | |
End of period | | $ | 38,744,326 | | | $ | 43,020,486 | | | $ | 15,576,375 | | | $ | 16,258,290 | |
| | | | | | | | | | | | | | | | |
Undistributed (distributions in excess of) net investment income | | $ | (29,865 | ) | | $ | (27,318 | ) | | $ | 175 | | | $ | (2 | ) |
| | | | | | | | | | | | | | | | |
| | | | |
Share Transactions: | | | | | | | | | | | | | | | | |
Issued | | | 73,523 | | | | 189,583 | | | | 47,993 | | | | 31,861 | |
Reinvested | | | 119,225 | | | | 236,332 | | | | 38,892 | | | | 60,119 | |
Redeemed | | | (363,811 | ) | | | (966,434 | ) | | | (150,947 | ) | | | (272,559 | ) |
| | | | | | | | | | | | | | | | |
Change in shares resulting from capital transactions | | | (171,063 | ) | | | (540,519 | ) | | | (64,062 | ) | | | (180,579 | ) |
| | | | | | | | | | | | | | | | |
See notes to financial statements.
20
Tamarack Quality Fixed Income Fund
(Selected data for a share outstanding throughout the periods indicated)
| | | | | | | | | | | | | | | | | | | | | | | | | | | | | | | | |
| | | | | Investment Activities | | Distributions | | | | | | Ratios/Supplemental Data |
| | | Net Asset
Value,
Beginning
of Period | | Net
Investment
Income | | Net
Realized
and
Unrealized
Gains
(Losses) on
Investments | | Redemption
Fees | | Total from
Investment
Activities | | Net
Investment
Income | | Net
Realized
Gains | | Return
of
Capital | | Total
Distributions | | Net
Asset
Value,
End
of
Period | | Total
Return* | | Net
Assets,
End of
Period
(000’s) | | Ratio of
Net
Expenses
to
Average
Net
Assets | | Ratio of
Net
Investment
Income
to Average
Net Assets | | Ratio of
Expenses
to
Average
Net
Assets** | | Portfolio
Turnover
Rate*** |
Class A | | | | | | | | | | | | | | | | | | | | | | | | | | | | | | | | |
Six Months Ended March 31, 2009 (Unaudited) | | $8.59 | | 0.22(a) | | (0.58) | | (b) | | (0.36) | | (0.22) | | — | | — | | (0.22) | | $8.01 | | (4.20%)(c) | | $430 | | 0.93%(d) | | 5.38%(d) | | 1.90%(d) | | 82% |
Year Ended September 30, 2008 | | 9.44 | | 0.45(a) | | (0.84) | | (b) | | (0.39) | | (0.46) | | — | | — | | (0.46) | | 8.59 | | (4.36%) | | 454 | | 0.92% | | 4.90% | | 1.82% | | 80% |
Year Ended September 30, 2007 | | 9.47 | | 0.44(a) | | (0.03) | | (b) | | 0.41 | | (0.44) | | — | | — | | (0.44) | | 9.44 | | 4.45% | | 441 | | 0.93% | | 4.70% | | 1.85% | | 59% |
Year Ended September 30, 2006 | | 9.61 | | 0.41(a) | | (0.13) | | (b) | | 0.28 | | (0.39) | | — | | (0.03) | | (0.42) | | 9.47 | | 3.04% | | 406 | | 0.93% | | 4.35% | | 1.89% | | 65% |
Year Ended September 30, 2005 | | 9.77 | | 0.39 | | (0.15) | | (b) | | 0.24 | | (0.40) | | — | | — | | (0.40) | | 9.61 | | 2.48% | | 1,188 | | 0.93% | | 4.02% | | 1.82% | | 116% |
Period Ended September 30, 2004(e) | | 9.65 | | 0.16 | | 0.13 | | (b) | | 0.29 | | (0.17) | | — | | — | | (0.17) | | 9.77 | | 2.96%(c) | | 1,257 | | 0.93%(d) | | 4.07%(d) | | 1.64%(d) | | 13% |
Year Ended April 30, 2004 | | 10.27 | | 0.38 | | (0.25) | | — | | 0.13 | | (0.41) | | (0.34) | | — | | (0.75) | | 9.65 | | 1.39% | | 1,128 | | 1.42% | | 3.56% | | 1.68% | | 87% |
Class I | | | | | | | | | | | | | | | | | | | | | | | | | | | | | | | | |
Six Months Ended March 31, 2009 (Unaudited) | | $8.59 | | 0.23(a) | | (0.58) | | (b) | | (0.35) | | (0.23) | | — | | — | | (0.23) | | $8.01 | | (4.08%)(c) | | $193 | | 0.68%(d) | | 5.62%(d) | | 1.40%(d) | | 82% |
Year Ended September 30, 2008 | | 9.43 | | 0.51(a) | | (0.87) | | (b) | | (0.36) | | (0.48) | | — | | — | | (0.48) | | 8.59 | | (4.05%) | | 229 | | 0.68% | | 5.51% | | 1.31% | | 80% |
Year Ended September 30, 2007 | | 9.48 | | 0.45(a) | | (0.03) | | (b) | | 0.42 | | (0.47) | | — | | — | | (0.47) | | 9.43 | | 4.49% | | 311 | | 0.68% | | 4.76% | | 1.38% | | 59% |
Year Ended September 30, 2006 | | 9.62 | | 0.43(a) | | (0.13) | | (b) | | 0.30 | | (0.42) | | — | | (0.02) | | (0.44) | | 9.48 | | 3.30% | | 1,091 | | 0.68% | | 4.57% | | 1.39% | | 65% |
Year Ended September 30, 2005 | | 9.77 | | 0.33 | | (0.06) | | (b) | | 0.27 | | (0.42) | | — | | — | | (0.42) | | 9.62 | | 2.84% | | 2,511 | | 0.68% | | 4.32% | | 1.28% | | 116% |
Period Ended September 30, 2004(e) | | 9.65 | | 0.17 | | 0.13 | | (b) | | 0.30 | | (0.18) | | — | | — | | (0.18) | | 9.77 | | 3.18%(c) | | 18,990 | | 0.68%(d) | | 4.39%(d) | | 1.09%(d) | | 13% |
Year Ended April 30, 2004 | | 10.27 | | 0.37 | | (0.21) | | — | | 0.16 | | (0.44) | | (0.34) | | — | | (0.78) | | 9.65 | | 1.54% | | 30,990 | | 1.18% | | 3.83% | | (f) | | 87% |
Class R | | | | | | | | | | | | | | | | | | | | | | | | | | | | | | | | |
Six Months Ended March 31, 2009 (Unaudited) | | $8.59 | | 0.21(a) | | (0.58) | | (b) | | (0.37) | | (0.21) | | — | | — | | (0.21) | | $8.01 | | (4.29%)(c) | | $3 | | 1.11%(d) | | 5.18%(d) | | 1.82%(d) | | 82% |
Year Ended September 30, 2008 | | 9.43 | | 0.46(a) | | (0.86) | | (b) | | (0.40) | | (0.44) | | — | | — | | (0.44) | | 8.59 | | (4.45%) | | 6 | | 1.18% | | 5.03% | | 1.81% | | 80% |
Year Ended September 30, 2007 | | 9.47 | | 0.42(a) | | (0.04) | | (b) | | 0.38 | | (0.42) | | — | | — | | (0.42) | | 9.43 | | 3.96% | | 7 | | 1.19% | | 4.44% | | 1.90% | | 59% |
Year Ended September 30, 2006 | | 9.61 | | 0.39(a) | | (0.13) | | (b) | | 0.26 | | (0.39) | | — | | (0.01) | | (0.40) | | 9.47 | | 2.87% | | 7 | | 1.19% | | 4.12% | | 1.96% | | 65% |
Year Ended September 30, 2005 | | 9.77 | | 0.35 | | (0.13) | | (b) | | 0.22 | | (0.38) | | — | | — | | (0.38) | | 9.61 | | 2.23% | | 9 | | 1.18% | | 3.77% | | 1.81% | | 116% |
Period Ended September 30, 2004(e) | | 9.65 | | 0.16 | | 0.12 | | (b) | | 0.28 | | (0.16) | | — | | — | | (0.16) | | 9.77 | | 2.96%(c) | | 20 | | 1.16%(d) | | 2.92%(d) | | 1.73%(d) | | 13% |
Period Ended April 30, 2004(g) | | 9.73 | | 0.01 | | (0.08) | | — | | (0.07) | | (0.01) | | — | | — | | (0.01) | | 9.65 | | (0.71%)(c) | | 3 | | 1.13%(d) | | 3.54%(d) | | (d)(f) | | 87% |
Class S | | | | | | | | | | | | | | | | | | | | | | | | | | | | | | | | |
Six Months Ended March 31, 2009 (Unaudited) | | $8.59 | | 0.23(a) | | (0.58) | | (b) | | (0.35) | | (0.23) | | — | | — | | (0.23) | | $8.01 | | (4.08%)(c) | | $38,119 | | 0.68%(d) | | 5.63%(d) | | 1.40%(d) | | 82% |
Year Ended September 30, 2008 | | 9.43 | | 0.51(a) | | (0.87) | | (b) | | (0.36) | | (0.48) | | — | | — | | (0.48) | | 8.59 | | (4.16%) | | 42,329 | | 0.68% | | 5.52% | | 1.31% | | 80% |
Year Ended September 30, 2007 | | 9.47 | | 0.47(a) | | (0.04) | | (b) | | 0.43 | | (0.47) | | — | | — | | (0.47) | | 9.43 | | 4.60% | | 51,590 | | 0.68% | | 4.93% | | 1.38% | | 59% |
Year Ended September 30, 2006 | | 9.61 | | 0.43(a) | | (0.13) | | (b) | | 0.30 | | (0.42) | | — | | (0.02) | | (0.44) | | 9.47 | | 3.27% | | 59,647 | | 0.68% | | 4.61% | | 1.39% | | 65% |
Year Ended September 30, 2005 | | 9.77 | | 0.41 | | (0.15) | | (b) | | 0.26 | | (0.42) | | — | | — | | (0.42) | | 9.61 | | 2.73% | | 73,246 | | 0.68% | | 4.28% | | 1.31% | | 116% |
Period Ended September 30, 2004(e) | | 9.65 | | 0.17 | | 0.13 | | (b) | | 0.30 | | (0.18) | | — | | — | | (0.18) | | 9.77 | | 3.07%(c) | | 89,278 | | 0.68%(d) | | 4.34%(d) | | 1.13%(d) | | 13% |
Period Ended April 30, 2004(g) | | 9.73 | | 0.01 | | (0.08) | | — | | (0.07) | | (0.01) | | — | | — | | (0.01) | | 9.65 | | (0.58%)(c) | | 97,237 | | 0.68%(d) | | 4.37%(d) | | (d)(f) | | 87% |
| ** | During the periods, certain fees were contractually or voluntarily reduced. If such contractual/voluntary fee reductions had not occurred, the ratio would have been as indicated. |
| *** | Portfolio turnover rate is calculated on the basis of the fund as a whole without distinguishing between the classes of shares issued. The rate has not been annualized for periods of less than one year. |
| (a) | Per share net investment income (loss) has been calculated using the average daily shares method. |
| (b) | Less than $0.01 or $(0.01) per share. |
See notes to financial statements.
| (e) | For the period from May 1, 2004 to September 30, 2004. |
| (f) | There were no waivers or reimbursements during the period. |
| (g) | For the period from April 19, 2004 (commencement of operations) to April 30, 2004. |
21
Tamarack Tax-Free Income Fund
(Selected data for a share outstanding throughout the periods indicated)
| | | | | | | | | | | | | | | | | | | | | | | | | | | | | | |
| | | | | Investment Activities | | Distributions | | | | | | Ratios/Supplemental Data |
| | | Net Asset
Value,
Beginning
of Period | | Net
Investment
Income | | Net
Realized
and
Unrealized
Gains
(Losses) on
Investments | | Redemption
Fees | | Total from
Investment
Activities | | Net
Investment
Income | | Net
Realized
Gains | | Total
Distributions | | Net
Asset
Value,
End
of
Period | | Total
Return* | | Net
Assets,
End of
Period
(000’s) | | Ratio of
Net
Expenses
to
Average
Net
Assets | | Ratio of
Net
Investment
Income
to Average
Net Assets | | Ratio of
Expenses
to
Average
Net
Assets** | | Portfolio
Turnover
Rate*** |
Class A | | | | | | | | | | | | | | | | | | | | | | | | | | | | | | |
Six Months Ended March, 31 2009 (Unaudited) | | $8.16 | | 0.15(a) | | (0.03) | | — | | 0.12 | | (0.15) | | (0.06) | | (0.21) | | $8.07 | | 1.74%(b) | | $232 | | 0.99%(c) | | 3.82%(c) | | 2.40%(c) | | 5% |
Year Ended September 30, 2008 | | 8.42 | | 0.29(a) | | (0.22) | | — | | 0.07 | | (0.29) | | (0.04) | | (0.33) | | 8.16 | | 0.65% | | 87 | | 0.99% | | 3.45% | | 2.52% | | 44% |
Year Ended September 30, 2007 | | 8.78 | | 0.29 | | (0.10) | | (d) | | 0.19 | | (0.29) | | (0.26) | | (0.55) | | 8.42 | | 2.21% | | 70 | | 0.99% | | 3.38% | | 2.54% | | 12% |
Year Ended September 30, 2006 | | 8.89 | | 0.30 | | (0.05) | | (d) | | 0.25 | | (0.30) | | (0.06) | | (0.36) | | 8.78 | | 2.91% | | 71 | | 1.12% | | 3.48% | | 2.41% | | 45% |
Year Ended September 30, 2005 | | 9.31 | | 0.30 | | (0.18) | | (d) | | 0.12 | | (0.30) | | (0.24) | | (0.54) | | 8.89 | | 1.27% | | 171 | | 1.24% | | 3.29% | | 2.31% | | 8% |
Period Ended September 30, 2004(e) | | 9.05 | | 0.07 | | 0.26 | | (d) | | 0.33 | | (0.07) | | — | | (0.07) | | 9.31 | | 3.71%(b) | | 166 | | 1.23%(c) | | 3.20%(c) | | 1.82%(c) | | 2% |
Period Ended June 30, 2004(f) | | 9.25 | | 0.06 | | (0.20) | | — | | (0.14) | | (0.06) | | — | | (0.06) | | 9.05 | | (1.50%)(b) | | 33 | | 1.24%(c) | | 3.39%(c) | | 3.00%(c) | | 17% |
Class C | | | | | | | | | | | | | | | | | | | | | | | | | | | | | | |
Six Months Ended March, 31 2009 (Unaudited) | | $8.15 | | 0.12(a) | | (0.02) | | — | | 0.10 | | (0.12) | | (0.06) | | (0.18) | | $8.07 | | 1.36%(b) | | $54 | | 1.73%(c) | | 3.09%(c) | | 2.89%(c) | | 5% |
Year Ended September 30, 2008 | | 8.42 | | 0.23(a) | | (0.23) | | — | | — | | (0.23) | | (0.04) | | (0.27) | | 8.15 | | (0.09%) | | 94 | | 1.74% | | 2.72% | | 3.14% | | 44% |
Year Ended September 30, 2007 | | 8.77 | | 0.23 | | (0.09) | | (d) | | 0.14 | | (0.23) | | (0.26) | | (0.49) | | 8.42 | | 1.52% | | 3 | | 1.71% | | 2.70% | | 3.06% | | 12% |
Year Ended September 30, 2006 | | 8.89 | | 0.24 | | (0.06) | | (d) | | 0.18 | | (0.24) | | (0.06) | | (0.30) | | 8.77 | | 2.15% | | 3 | | 1.81% | | 2.74% | | 2.95% | | 45% |
Year Ended September 30, 2005 | | 9.31 | | 0.23 | | (0.18) | | (d) | | 0.05 | | (0.23) | | (0.24) | | (0.47) | | 8.89 | | 0.54% | | 3 | | 1.96% | | 2.57% | | 2.67% | | 8% |
Period Ended September 30, 2004(e) | | 9.05 | | 0.06 | | 0.26 | | (d) | | 0.32 | | (0.06) | | — | | (0.06) | | 9.31 | | 3.53%(b) | | 3 | | 1.99%(c) | | 2.54%(c) | | 2.45%(c) | | 2% |
Period Ended June 30, 2004(f) | | 9.25 | | 0.05 | | (0.20) | | — | | (0.15) | | (0.05) | | — | | (0.05) | | 9.05 | | (1.65%)(b) | | 3 | | 1.98%(c) | | 2.59%(c) | | 3.16%(c) | | 17% |
Class S | | | | | | | | | | | | | | | | | | | | | | | | | | | | | | |
Six Months Ended March, 31 2009 (Unaudited) | | $8.15 | | 0.16(a) | | (0.02) | | — | | 0.14 | | (0.16) | | (0.06) | | (0.22) | | $8.07 | | 1.86%(b) | | $15,290 | | 0.74%(c) | | 4.10%(c) | | 1.90%(c) | | 5% |
Year Ended September 30, 2008 | | 8.42 | | 0.31(a) | | (0.23) | | — | | 0.08 | | (0.31) | | (0.04) | | (0.35) | | 8.15 | | 0.90% | | 16,074 | | 0.74% | | 3.70% | | 1.98% | | 44% |
Year Ended September 30, 2007 | | 8.78 | | 0.31 | | (0.10) | | (d) | | 0.21 | | (0.31) | | (0.26) | | (0.57) | | 8.42 | | 2.47% | | 18,241 | | 0.74% | | 3.64% | | 2.04% | | 12% |
Year Ended September 30, 2006 | | 8.89 | | 0.33 | | (0.06) | | (d) | | 0.27 | | (0.32) | | (0.06) | | (0.38) | | 8.78 | | 3.17% | | 20,262 | | 0.83% | | 3.74% | | 1.95% | | 45% |
Year Ended September 30, 2005 | | 9.31 | | 0.32 | | (0.18) | | (d) | | 0.14 | | (0.32) | | (0.24) | | (0.56) | | 8.89 | | 1.52% | | 23,924 | | 0.99% | | 3.54% | | 1.81% | | 8% |
Period Ended September 30, 2004(e) | | 9.05 | | 0.08 | | 0.26 | | (d) | | 0.34 | | (0.08) | | — | | (0.08) | | 9.31 | | 3.78%(b) | | 27,329 | | 0.99%(c) | | 3.48%(c) | | 1.43%(c) | | 2% |
Year Ended June 30, 2004(g) | | 9.57 | | 0.32 | | (0.40) | | — | | (0.08) | | (0.32) | | (0.12) | | (0.44) | | 9.05 | | (0.87%) | | 28,186 | | 0.99% | | 3.47% | | 1.35% | | 17% |
| ** | During the periods, certain fees were contractually or voluntarily reduced. If such contractual/voluntary fee reductions had not occurred, the ratio would have been as indicated. |
| *** | Portfolio turnover rate is calculated on the basis of the fund as a whole without distinguishing between the classes of shares issued. The rate has not been annualized for periods of less than one year. |
| (a) | Per share net investment income has been calculated using the average daily shares method. |
| (d) | Less than $0.01 or $(0.01) per share. |
See notes to financial statements.
| (e) | For the period from July 1, 2004 to September 30, 2004. |
| (f) | For the period from April 19, 2004 (commencement of operations) to June 30, 2004. |
| (g) | The existing class of shares was designated Class S shares as of April 19, 2004. |
22
|
NOTES TO FINANCIAL STATEMENTS |
March 31, 2009 (Unaudited)
1. Organization
Tamarack Funds Trust (“Tamarack”) is registered under the Investment Company Act of 1940 (as amended) as an open-end management investment company. Tamarack was organized as a Delaware statutory trust on December 16, 2003. Predecessor funds to Tamarack were reorganized as portfolios of Tamarack effective April 16, 2004. This semi-annual report includes the following two investment portfolios (“Funds”):
- Tamarack Quality Fixed Income Fund (“Quality Fixed Income Fund”)
- Tamarack Tax-Free Income Fund (“Tax-Free Income Fund”)
The Quality Fixed Income Fund offers four share classes: Class A, Class R, Class I, and Class S shares. The Tax-Free Income Fund offers three share classes: Class A, Class C, and Class S shares. Class A shares are offered with a 3.75% maximum front-end sales charge and a 1.00% contingent deferred sales charge (“CDSC”) for redemption within 12 months of a $1 million or greater purchase on which no front-end sales charge was paid. Class C shares are offered at net asset value (i.e. no front-end sales charge), but are subject to a CDSC of 1.00% for redemptions within 12 months of purchase. Class R shares (available to certain 401(k) and other employer-sponsored retirement plans), Class I shares (intended for investors meeting certain investment minimum thresholds) and Class S shares are not subject to either a front-end sales charge or a CDSC.
Voyageur Asset Management Inc. (“Voyageur”) acts as the investment adviser for Tamarack. The officers of Tamarack (“Fund Management”) are also employees of Voyageur or its affiliates or PNC Global Investment Servicing (U.S.) Inc. (“PNC”).
2. Significant Accounting Policies
Summarized below are the significant accounting policies of the Funds. These policies conform to accounting principles generally accepted in the United States of America (“GAAP”). Fund Management follows these policies when preparing financial statements. Management may also be required to make estimates and assumptions that affect the reported amounts of assets and liabilities at the date of the financial statements and the reported amounts of income and expenses for the period. Actual results could differ from those estimates. The financial statements are as of the close of regular trading on the New York Stock Exchange.
Security Valuation:
Bonds and other fixed income securities are generally valued on the basis of prices furnished by pricing services approved by Tamarack’s Board of Trustees (the “Board”). The pricing services utilize both dealer-supplied valuations and electronic data processing techniques that take into account appropriate factors such as institutional-size trading in similar groups of securities, yield, quality, coupon rate, maturity, type of issue and trading characteristics other than market data and without exclusive reliance upon quoted prices of exchanges or over-the-counter prices, since these valuations are believed to reflect more accurately the fair value of such securities. Short-term debt obligations with less than 60 days to maturity at time of purchase are valued at amortized cost, which approximates value, unless Fund Management determines that amortized cost no longer approximates market value due to credit or other impairments of the issuer. In such cases where a security price is unavailable, or where Fund Management determines that the value provided by the pricing services or amortized cost does not approximate fair value, the Board has approved pricing and valuation procedures to determine a security’s fair value. Investments in open-end investment companies are valued at net asset value. Exchange traded financial futures are valued at the settlement price as established by the exchange on which they are traded.
23
|
NOTES TO FINANCIAL STATEMENTS |
Financial Accounting Standards Board (“FASB”) Statement of Financial Accounting Standards No. 157, “Fair Value Measurements” (“SFAS No. 157”) :
SFAS No. 157 clarifies the definition of fair value for financial reporting, establishes a framework for measuring fair value and requires additional disclosures about the use of fair value measurements. The three levels of the fair value hierarchy under SFAS No. 157 are described below:
• Level 1 - quoted prices in active markets for identical securities
• Level 2 - other significant observable inputs (including quoted prices for similar securities, interest rates, prepayment speeds, credit risk, etc.).
• Level 3 - significant unobservable inputs (including the Funds’ own assumptions in determining the fair value of investments).
The inputs or methodologies used for valuing investments are not necessarily an indication of the risk associated with investing in those securities
The summary of inputs used to determine the fair valuation of the Fund’s investments as of March 31, 2009 is as follows:
| | | | | | | | |
Funds | | Level 1
Quoted Prices | | Level 2
Significant
Observable
Inputs | | Level 3
Significant
Unobservable
Inputs | | Total |
Assets: | | | | | | | | |
Investments in Securities | | | | | | | | |
Quality Fixed Income Fund | | $1,397,762 | | $39,637,907 | | $29,530 | | $41,065,199 |
Tax Free Income Fund | | 400,211 | | 14,977,424 | | — | | 15,377,635 |
Following is a reconciliation of Level 3 investments for which significant unobservable inputs were used to determine fair value:
| | | |
| | | Quality Fixed
Income Fund |
| |
Balance as of 10/01/08 (market value) | | $ | 454,840 |
Change in unrealized (depreciation) * | | | (425,310) |
| | | |
Balance as of 3/31/09 (market value) | | $ | 29,530 |
* Net change in unrealized appreciation/(depreciation) in level 3 securities still held at March 31, 2009.
Recent Accounting Standards:
In March 2008, FASB issued Statement of Financial Accounting Standards No. 161, “Disclosures about Derivative Instruments and Hedging Activities” (“SFAS 161”) and is effective for fiscal years beginning after November 15, 2008. SFAS 161 is intended to improve financial reporting for derivative instruments by requiring enhanced disclosure that enables investors to understand how and why an entity uses derivatives, how derivatives are accounted for, and how derivative instruments affect an entity’s results of operations and financial position. Management is currently evaluating the implications of SFAS 161. The impact on the Funds’ financial statement disclosures, if any, is currently being assessed.
Investment Transactions and Income:
Investment transactions are recorded one business day after trade date, except for on the last day of each fiscal quarter end, when they are recorded on trade date. Dividend income is recorded on the ex-dividend date. Realized gains and losses from investment transactions are calculated based on the costs of the specific security (also known as identified cost basis). Interest income is recognized on the accrual basis and includes, where applicable, the amortization and accretion of premium or discount using the effective yield method. Paydown gains and losses on mortgage and asset-backed securities are included in
24
|
NOTES TO FINANCIAL STATEMENTS |
the financial statements as interest income. Interest income on U.S. Treasury inflation indexed securities is accrued daily based upon the inflation adjusted principal. Additionally, any increase in the principal or face amount of the securities adjusted for inflation is recorded as interest income.
Expense, Investment Income and Gain/Loss Allocation:
Each Fund pays the expenses that are directly related to its operations, such as custodian fees or adviser fees. Expenses incurred by Tamarack, such as trustee or legal fees, are allocated among each of the Funds either proportionately based upon each Fund’s relative net assets or using another reasonable basis such as equally across all Funds, depending on the nature of the expense. Individual share classes within a Fund are charged expenses specific to that class, such as distribution fees. Within a Fund, expenses other than class specific expenses are allocated daily to each class based upon the proportion of relative net assets. Investment income and realized and unrealized gains or losses are allocated to each class of shares based upon the proportion of relative net assets.
Financial Instruments:
The Funds may engage in when-issued transactions. A Fund would record when-issued securities one business day after trade date and maintain sufficient liquidity so that cash will be available to make payment for the securities purchased. Securities purchased on a when-issued basis are valued daily beginning on the trade date and begin accruing interest on the settlement date. When-issued securities, if any, would be identified in the Schedule of Portfolio Investments.
The Funds may enter into futures contracts in an effort to manage the duration of the portfolio or to hedge against market risk. A futures contract on a securities index is an agreement obligating one party to pay, and entitling the other party to receive, during the term of the contract, cash payments based on the level of a specified securities index. Futures transactions involve brokerage costs and require a Fund to segregate assets to cover contracts that would require it to purchase securities or currencies. A Fund may lose the expected benefit of futures transactions if interest rates, exchange rates or securities prices change in an unanticipated manner. Such unanticipated changes may also result in lower overall performance than if a Fund had not entered into any futures transactions.
Upon entering into a futures contract, a Fund is required to pledge to the broker an amount of cash, U.S. government securities, or other assets, equal to a certain percentage of the contract amount. Subsequent payments are made or received by the Fund each day, depending on the daily fluctuations in the fair value of the underlying index. A Fund recognizes an unrealized gain or loss each day equal to these daily payments.
Distributions to Shareholders:
Each Fund pays out any income that it receives, less expenses, in the form of dividends and capital gains to its shareholders. Income dividends are declared daily and paid monthly. Dividends will also be paid at any time during the month upon total redemption of shares in an account. Capital gain distributions are declared and paid at least annually. Distributions to shareholders are recorded on the ex-dividend date. The amount of dividends and distributions are calculated based on federal income tax regulations, which may differ from GAAP. These “book/tax” differences may be either temporary or permanent in nature. To the extent these differences are determined, as of the end of the tax year, to be permanent (e.g. reclassification of paydown gains and losses and re-designation of distributions), they are reclassified within a Fund’s capital accounts based on their federal tax basis treatment. Such differences are not reflected in the calculation of the Financial Highlights.
Credit Enhancement:
Certain obligations held in the Funds have credit enhancement or liquidity features that may, under certain circumstances, provide for repayment of principal and interest on the obligation upon demand date, interest rate reset date or final maturity. These enhancements may include: letters of credit; liquidity guarantees; security purchase agreements; tender option purchase agreements; and third party insurance (i.e., AMBAC, FGIC and MBIA).
25
|
NOTES TO FINANCIAL STATEMENTS |
3. Agreements and Other Transactions with Affiliates
Tamarack has entered into investment advisory agreements with Voyageur under which Voyageur manages each Fund’s assets and furnishes related office facilities, equipment, research and personnel. The agreements require each Fund to pay Voyageur a monthly fee based upon average daily net assets. Under the terms of the advisory contracts, Voyageur is entitled to receive fees based on a percentage of the average daily net assets of each of the Funds as follows:
| | |
| | | Annual Rate |
Quality Fixed Income Fund | | 0.60% |
Tax-Free Income Fund | | 0.85% |
Voyageur has contractually agreed to waive fees and/or to make payments in order to keep total operating expenses of the Class S and Class I shares of Quality Fixed Income to 0.68% and Class S Shares of Tax-Free Income to 0.74%. Class A, C and R shares vary from these limits only by the addition of class specific 12b-1 fees. These expense limitation agreements are in place until January 31, 2010. Each Fund will carry forward, for a period not to exceed 12 months from the date on which a waiver or reimbursement is made by Voyageur, any expenses in excess of the expense limitation and repay Voyageur such amounts, provided the Fund is able to effect such repayment and remain in compliance with the expense limitation stated above. Voyageur may also voluntarily waive and/or reimburse additional fund operating expenses of any Fund from time to time. Any such voluntary program may be changed or eliminated at any time without notice.
Voyageur serves as co-administrator to the Funds. PNC serves as co- administrator and fund accounting agent. Services provided under the administrative services contract include providing day-to-day administration of matters related to the Funds, maintenance of their records and the preparation of reports. Under the terms of the administrative services contract, Voyageur receives from each Fund a fee, payable monthly, at the annual rate of 0.075% of each Fund’s average daily net assets. PNC receives a fee for its services payable by the Funds based on the Funds’ average net assets. Voyageur’s fee is listed as “Administration fees” in the Statements of Operations. PNC’s fee is included with “Accounting fees” in the Statements of Operations.
Certain Officers and Trustees of the Funds are affiliated with the adviser or the administrator. Such Officers and Trustees receive no compensation from the Funds for serving in their respective roles.
Independent Trustees (Trustees of Tamarack who are not directors, officers or employees of the adviser, administrator or distributor) receive from the entire Tamarack fund family an annual retainer of $20,000. The Board Chairperson and Audit Committee Chairperson each receive an additional retainer of $2,500 annually, and all other trustees serving as Chair of a Board committee each receive an additional retainer of $1,000 annually. In addition, Independent Trustees receive a quarterly meeting fee of $5,000 for each in-person Board meeting attended, a meeting fee of $1,000 for each telephonic or Special Board meeting attended, and a $1,000 fee for each Board committee meeting attended and are reimbursed for all out-of-pocket expenses relating to attendance at such meetings.
4. Fund Distribution
Each of the Funds has adopted a Master Distribution 12b-1 Plan (the “Plan”) in which Tamarack Distributors Inc. (the “Distributor”) acts as the Funds’ distributor. The Distributor is an affiliate of Voyageur. The Plan permits each Fund to make payments for, or to reimburse the Distributor monthly for, distribution-related costs and expenses of marketing shares of each share class covered under the Plan, and/or for providing shareholder services. The following chart shows the current Plan fee rate for each class.
| | | | | | |
| | | Class A | | Class C | | Class R |
12b-1 Plan Fee | | 0.25%* | | 1.00% | | 0.50% |
26
|
NOTES TO FINANCIAL STATEMENTS |
*The maximum Plan fee rate for Class A shares is 0.50%. The Distributor is contractually waiving 0.25% of the total 0.50% Plan fee for Class A through January 31, 2010.
Plan fees are based on average annual daily net assets of the applicable class. The Distributor, subject to applicable legal requirements, may waive a Plan fee voluntarily, in whole or in part.
For the six months ended March 31, 2009, the Distributor received no commissions from front-end sales charges of Class A shares of the Funds. The Distributor received no CDSC fees from the Funds during the six months ended March 31, 2009.
5. Securities Transactions
The cost of securities purchased and proceeds from securities sold (excluding securities maturing less than one year from acquisition) for the six months ended March 31, 2009 were as follows:
| | | | | | |
| | | Purchases | | Sales |
Quality Fixed Income Fund | | $ | 34,938,891 | | $ | 38,486,742 |
Tax-Free Income Fund | | | 809,092 | | | 1,780,895 |
6. Capital Share Transactions
| | | | | | | | | | | | | | | | |
| | | Tamarack Quality Fixed Income Fund | | | Tamarack Tax-Free Income Fund | |
| | | For the
Six Months Ended
March 31,
2009 | | | For the
Year Ended
September 30,
2008 | | | For the
Six Months Ended
March 31,
2009 | | | For the
Year Ended
September 30,
2008 | |
| | | (Unaudited) | | | | | | (Unaudited) | | | | |
| | | | |
CAPITAL TRANSACTIONS: | | | | | | | | | | | | | | | | |
Class A | | | | | | | | | | | | | | | | |
Proceeds from shares issued | | $ | 15,087 | | | $ | 101,058 | | | $ | 243,543 | | | $ | 32,840 | |
Distributions reinvested | | | 11,587 | | | | 22,047 | | | | 6,219 | | | | 3,047 | |
Cost of shares redeemed | | | (19,827 | ) | | | (66,393 | ) | | | (106,949 | ) | | | (15,884 | ) |
| | | | | | | | | | | | | | | | |
Change in Class A | | $ | 6,847 | | | $ | 56,712 | | | $ | 142,813 | | | $ | 20,003 | |
| | | | | | | | | | | | | | | | |
Class I | | | | | | | | | | | | | | | | |
Distributions reinvested | | $ | 5,442 | | | $ | 12,637 | | | | | | | | | |
Cost of shares redeemed | | | (25,617 | ) | | | (73,052 | ) | | | | | | | | |
| | | | | | | | | | | | | | | | |
Change in Class I | | $ | (20,175 | ) | | $ | (60,415 | ) | | | | | | | | |
| | | | | | | | | | | | | | | | |
Class C | | | | | | | | | | | | | | | | |
Proceeds from shares issued | | $ | — | | | $ | — | | | $ | — | | | $ | 93,352 | |
Distributions reinvested | | | 63 | | | | 152 | | | | 430 | | | | 1,103 | |
Cost of shares redeemed | | | (3,188 | ) | | | (22 | ) | | | (39,408 | ) | | | (22 | ) |
| | | | | | | | | | | | | | | | |
Change in Class C | | $ | (3,125 | ) | | $ | 130 | | | $ | (38,978 | ) | | $ | 94,433 | |
| | | | | | | | | | | | | | | | |
Class R | | | | | | | | | | | | | | | | |
Distributions reinvested | | $ | 140 | | | $ | 327 | | | $ | 78 | | | $ | 133 | |
Cost of shares redeemed | | | (3,264 | ) | | | (997 | ) | | | (3,542 | ) | | | (22 | ) |
| | | | | | | | | | | | | | | | |
Change in Class R | | $ | (3,124 | ) | | $ | (670 | ) | | $ | (3,464 | ) | | $ | 111 | |
| | | | | | | | | | | | | | | | |
Class S | | | | | | | | | | | | | | | | |
Proceeds from shares issued | | $ | 615,433 | | | $ | 1,681,839 | | | $ | 136,255 | | | $ | 143,184 | |
Distributions reinvested | | | 944,509 | | | | 2,133,762 | | | | 301,198 | | | | 500,248 | |
Cost of shares redeemed | | | (2,941,501 | ) | | | (8,752,602 | ) | | | (1,037,473 | ) | | | (2,280,451 | ) |
| | | | | | | | | | | | | | | | |
Change in Class S | | $ | (1,381,559 | ) | | $ | (4,937,001 | ) | | $ | (600,020 | ) | | $ | (1,637,019 | ) |
| | | | | | | | | | | | | | | | |
Change in net assets resulting from capital transactions | | $ | (1,401,136 | ) | | $ | (4,941,244 | ) | | $ | (499,649 | ) | | $ | (1,522,472 | ) |
| | | | | | | | | | | | | | | | |
| | | | |
SHARE TRANSACTIONS: | | | | | | | | | | | | | | | | |
Class A | | | | | | | | | | | | | | | | |
Issued | | | 1,859 | | | | 10,678 | | | | 31,050 | | | | 3,912 | |
Reinvested | | | 1,436 | | | | 2,410 | | | | 786 | | | | 363 | |
Redeemed | | | (2,470 | ) | | | (7,080 | ) | | | (13,720 | ) | | | (1,939 | ) |
| | | | | | | | | | | | | | | | |
Change in Class A | | | 825 | | | | 6,008 | | | | 18,116 | | | | 2,336 | |
| | | | | | | | | | | | | | | | |
27
|
NOTES TO FINANCIAL STATEMENTS |
| | | | | | | | | | | | |
| | | Tamarack Quality Fixed Income Fund | | | Tamarack Tax-Free Income Fund | |
| | | For the
Six Months Ended
March 31,
2009 | | | For the
Year Ended
September 30,
2008 | | | For the
Six Months Ended
March 31,
2009 | | | For the
Year Ended
September 30,
2008 | |
| | | (Unaudited) | | | | | | (Unaudited) | | | | |
Class I | | | | | | | | | | | | |
Issued | | — | | | — | | | | | | | |
Reinvested | | 676 | | | 1,376 | | | | | | | |
Redeemed | | (3,202 | ) | | (7,715 | ) | | | | | | |
| | | | | | | | | | | | |
Change in Class I | | (2,526 | ) | | (6,339 | ) | | | | | | |
| | | | | | | | | | | | |
Class C | | | | | | | | | | | | |
Issued | | — | | | — | | | — | | | 11,016 | |
Reinvested | | 8 | | | 17 | | | 54 | | | 132 | |
Redeemed | | (404 | ) | | (3 | ) | | (4,854 | ) | | (3 | ) |
| | | | | | | | | | | | |
Change in Class C | | (396 | ) | | 14 | | | (4,800 | ) | | 11,145 | |
| | | | | | | | | | | | |
Class R | | | | | | | | | | | | |
Reinvested | | 17 | | | 36 | | | 10 | | | 16 | |
Redeemed | | (413 | ) | | (106 | ) | | (442 | ) | | (3 | ) |
| | | | | | | | | | | | |
Change in Class R | | (396 | ) | | (70 | ) | | (432 | ) | | 13 | |
| | | | | | | | | | | | |
Class S | | | | | | | | | | | | |
Issued | | 71,665 | | | 178,905 | | | 16,943 | | | 16,933 | |
Reinvested | | 117,088 | | | 232,494 | | | 38,042 | | | 59,608 | |
Redeemed | | (357,323 | ) | | (951,590 | ) | | (131,931 | ) | | (270,614 | ) |
| | | | | | | | | | | | |
Change in Class S | | (168,570 | ) | | (540,191 | ) | | (76,946 | ) | | (194,073 | ) |
| | | | | | | | | | | | |
Change in shares resulting from capital transactions | | (171,063 | ) | | (540,578 | ) | | (64,062 | ) | | (180,579 | ) |
| | | | | | | | | | | | |
7. Federal Income Taxes
It is the policy of each Fund to continue to qualify as a regulated investment company by complying with the provisions applicable to certain investment companies, as defined under Subchapter M of the Internal Revenue Code, and to distribute substantially all of its net investment income and net realized capital gains. Therefore, no federal tax liability is recorded in the financial statements of each Fund.
The Funds adopted the provisions of FASB Interpretation No. 48 (“FIN48”), Accounting for Uncertainty in Income Taxes, on March 31, 2008. The implementation of FIN48 resulted in no material liability for unrecognized tax benefits and no material change to the net asset value of the Funds at the beginning of the day. As of March 31, 2009, the Funds did not have a liability for any uncertain tax benefits. The Funds recognize interest and penalties, if any, related to unrecognized tax benefits as income tax expense in the Statements of Operations. During the period, the Funds did not incur any interest or penalties. The Funds are not subject to examination by U.S. federal tax authorities for tax years before 2005 and by state authorities for tax years before 2004.
As of March 31, 2009, the tax cost of securities and the breakdown of unrealized appreciation (depreciation) for each Fund were as follows:
| | | | | | | | | | | | |
| | | Cost of
Securities | | Unrealized
Appreciation | | Unrealized
Depreciation | | Net Unrealized
Depreciation |
Quality Fixed Income Fund | | $ | 48,890,559 | | $ | 776,186 | | $ | (8,601,546) | | $ | (7,825,360) |
Tax-Free Income Fund | | | 15,717,954 | | | 414,660 | | | (754,979) | | | (340,319) |
28
|
NOTES TO FINANCIAL STATEMENTS |
The tax character of distributions during the fiscal year ended September 30, 2008 were as follows:
| | | | | | | | | | | | |
| | | Distributions Paid From | | | | | | |
| | | Ordinary
Income | | Net
Long Term
Capital Gains | | Total
Taxable
Distributions | | Tax-Exempt
Distributions | | Total
Distributions
Paid* |
Quality Fixed Income Fund | | $ | 2,766,826 | | $ — | | $2,766,826 | | $ — | | $ | 2,766,826 |
Tax-Free Income Fund | | | 3,225 | | 77,418 | | 80,643 | | 676,277 | | | 756,920 |
*Total Distributions Paid may differ from the Statements of Changes in Net Assets because distributions are recognized when actually paid for tax purposes.
The tax basis of components of accumulated earnings/(losses) and the tax character of distributions paid are determined at fiscal year end, and will be included in the Annual Report dated September 30, 2009.
As of September 30, 2008, the following Fund had net capital loss carryforwards to offset future net capital gains, if any:
| | | | |
| | | Capital Loss
Carryforward | | Expires |
Quality Fixed Income Fund | | $835,813 | | 2012 |
| | 70,674 | | 2014 |
| | 659,449 | | 2015 |
As of September 30, 2008, the following Fund had net capital loss carryforwards as successor to a merger and subject to certain limitations on utilization. To the extent that these carryforwards are utilized, it is probable that the realized gains that are offset will not be required to be distributed to shareholders.
| | | | |
| | | Capital Loss
Carryforward | | Expires |
Quality Fixed Income Fund | | $ 129,938 | | 2010 |
| | 1,229,732 | | 2011 |
8. Market Timing
Tamarack strongly discourages attempts at market timing by Fund shareholders. Each Fund charges a redemption fee of 2% of the value of the shares redeemed or exchanged within 30 days of purchase, in addition to limiting the number of exchanges that may be made between Funds to five (5) per calendar year. When assessed, the redemption fee is deducted from the redemption proceeds and retained by the Fund, not by Voyageur. This redemption fee is not charged in cases where, for example, the redemption results from an automatic reinvestment or asset re-allocation not specifically directed by the shareholder. Tamarack also reserves the right to reject any Fund purchase order made by persons deemed to be market timers. The Funds’ prospectus contains a full description of Tamarack’s policies on market timing and/or excessive trading. During the six months ended March 31, 2009, there were no redemption fees collected by the Funds.
9. Subsequent Event
On May 11, 2009, the Board unanimously voted to liquidate the Tax-Free Income Fund. This decision was made after careful consideration of the Fund’s operations, asset size and current expenses. Effective on or about May 13, 2009, the Fund will suspend all purchases and exchanges into the Fund other than purchases through dividend reinvestment, in order to facilitate an orderly liquidation on or after June 30, 2009. As disclosed in the Prospectus, the Tax-Free Income Fund is permitted to depart from its stated investment objective and policies and hold cash and cash equivalent positions as a temporary defensive measure to preserve value. In anticipation of the liquidation, the Tax-Free Income Fund intends to begin to sell its portfolio holdings in exchange for cash, U.S. government securities and/or other short-term debt instruments.
29
|
SHARE CLASS INFORMATION (Unaudited) |
The Tamarack Fixed Income Funds offer five share classes, A, C, R, I, and S.
Class A
Class A shares are available for purchase primarily through investment advisors, broker dealers, banks and other financial services intermediaries. Class A shares of the Funds are subject to a maximum up-front sales charge of 3.75% and a 1.00% “CDSC” for redemption within 12 months of a $1 million or greater purchase. Class A shares include a 0.25% (25 bps) annual 12b-1 service and distribution fee. (The 12b-1 Plan allows for 50 bps, but the Funds’ distributor is currently contractually waiving 25 bps of the fee.) Class A shares have a higher up front sales charge (load) than Class C shares, but a lower annual expense ratio.
Class C
Class C shares are also available for purchase primarily through investment advisors, broker-dealers, banks and other financial services intermediaries. Class C shares redeemed within 12 months of purchase are subject to a CDSC of 1.00%. (No CDSC will be charged on shares acquired through reinvestment of dividends or capital gains.) Class C shares expenses include a 1.00% (100 bps) annual 12b-1 service and distribution fee. Class C shares have a lower up-front sales charge (load) than Class A shares, but due to the higher 12b-1 service and distribution fee, have higher annual expenses than Class A shares.
Class R
Class R shares are available for purchase through employer-sponsored or 401(k) retirement plans for which omnibus or program-level accounts are held on the books of the Funds. Class R shares have no upfront sales charge (load), but are subject to a 0.50% (50 bps) 12b-1 service and distribution fee. Class R shares currently have annual expenses between Class A and Class C share expenses.
Class S
Class S shares are available to investors purchasing shares directly through the Fund or its agent, BFDS, or through certain fee-based programs of broker dealers or registered investment advisors. This share class does not have an upfront sales charge (load) or a 12b-1 service and distribution fee.
Class I
Class I shares are available in the Quality Fixed Income Fund. This share class is intended for investors meeting certain minimum investment thresholds. This share class does not have an up front sales charge (load) or a 12b-1 service and distribution fee.
For an investor purchasing Tamarack Funds shares through a financial services intermediary, the question as to which share class, A or C, is the best choice is dependent on many factors, including the amount to be invested and the length of time an investor anticipates holding the shares. An investor should consult with his or her financial advisor about his or her personal financial situation to determine which share class is the best choice for his or her individual situation.
30
|
SUPPLEMENTAL INFORMATION (Unaudited) |
Shareholder Expense Examples
As a shareholder of the Tamarack Funds, you incur two types of costs: (1) transaction costs, including sales charges (loads) and (2) ongoing costs, including management fees; 12b-1 distribution and service fees; and other Fund expenses. This example is intended to help you understand your ongoing costs (in dollars) of investing in the Tamarack Funds and to compare these costs with the ongoing costs of investing in other mutual funds.
The Example is based on an investment of $1,000 invested at the beginning of the period and held for the entire period from October 1, 2008 through March 31, 2009.
Actual Expenses
The table below provides information about actual account values and actual expenses. You may use the information below, together with the amount you invested, to estimate the expenses that you paid over the period. Simply divide your account value by $1,000 (for example, an $8,600 account value divided by $1,000 = 8.6), then multiply the result by the number in the table under the heading entitled “Expenses Paid During Period” to estimate the expenses you paid on your account during this period.
| | | | | | | | | | | |
| | | | | Beginning
Account Value
10/1/2008 | | Ending
Account Value
3/31/2009 | | Expenses Paid
During Period*
10/1/08-3/31/09 | | Annualized
Expense Ratio
During Period
10/1/08-3/31/09 |
Quality Fixed Income Fund | | Class A | | $ | 1,000.00 | | $ 958.00 | | $4.54 | | 0.93% |
| | Class I | | | 1,000.00 | | 959.20 | | 3.32 | | 0.68% |
| | Class R | | | 1,000.00 | | 957.10 | | 5.42 | | 1.11% |
| | Class S | | | 1,000.00 | | 959.20 | | 3.32 | | 0.68% |
| | | | | |
Tax Free Income Fund | | Class A | | | 1,000.00 | | 1,017.40 | | 4.98 | | 0.99% |
| | Class C | | | 1,000.00 | | 1,013.60 | | 8.68 | | 1.73% |
| | Class S | | | 1,000.00 | | 1,018.60 | | 3.72 | | 0.74% |
Hypothetical Example for Comparison Purposes The table below provides information about hypothetical account values and hypothetical expenses based on each Tamarack Funds’ actual expense ratio and an assumed rate of return of 5% per year before expenses, which is not the Fund’s actual return. The hypothetical account values and expenses may not be used to estimate the actual ending account balance or expenses you paid for the period. You may use this information to compare this 5% hypothetical example with the 5% hypothetical examples that appear in the shareholder reports of other funds. Please note that the expenses shown in the table are meant to highlight your ongoing costs only and do not reflect any transactional costs, such as sales charges (loads), redemption fees, or exchange fees. Therefore, the table is useful in comparing ongoing costs only, and will not help you determine the relative total costs of owning different funds. In addition, if these transactional costs were included, your costs would have been higher. |
| | | | | |
| | | | | Beginning
Account Value
10/1/2008 | | Ending
Account Value
3/31/2009 | | Expenses Paid
During Period*
10/1/08-3/31/09 | | Annualized
Expense Ratio
During Period
10/1/08-3/31/09 |
Quality Fixed Income Fund | | Class A | | $ | 1,000.00 | | $1,020.29 | | $4.68 | | 0.93% |
| | Class I | | | 1,000.00 | | 1,021.54 | | 3.43 | | 0.68% |
| | Class R | | | 1,000.00 | | 1,019.40 | | 5.59 | | 1.11% |
| | Class S | | | 1,000.00 | | 1,021.54 | | 3.43 | | 0.68% |
| | | | | |
Tax Free Income Fund | | Class A | | | 1,000.00 | | 1,020.00 | | 4.99 | | 0.99% |
| | Class C | | | 1,000.00 | | 1,016.31 | | 8.70 | | 1.73% |
| | Class S | | | 1,000.00 | | 1,021.24 | | 3.73 | | 0.74% |
*Expenses are equal to the average account value times the Fund’s annualized expense ratio multiplied by the number of days in the most recent fiscal half-year divided by the number of days in the fiscal year (to reflect one-half year period).
31
|
APPROVAL OF INVESTMENT ADVISORY - SUB-ADVISORY AGREEMENTS (UNAUDITED) |
Information for Tamarack Funds Shareholders Regarding the Renewal of Investment Advisory Agreements
The Tamarack Board of Trustees has renewed the Investment Advisory Agreement with Voyageur Asset Management Inc. (“Voyageur” or the “Advisor”) for both of the Funds. After evaluating the services provided by the Advisor and reviewing the performance and relevant expenses of each Fund, the Trustees concluded that it was in the best interests of the Funds and their shareholders to continue the investment advisory agreements (“Agreements”).
As part of their review of the Agreements, the Trustees received and discussed certain information, including information regarding the advisory services performed, qualifications of staffing, and Fund performance and expenses. The Trustees considered information provided in advance of their in-person meeting, as well as supplemental information provided at the meeting. The Trustees met with representatives from the Advisor’s senior management team, as well as senior investment professionals, to discuss this information and Voyageur’s intentions with regard to the ongoing management of the Funds. The Trustees reviewed the quality of the services provided to the Funds by Voyageur, including information prepared by a third-party consultant as to both Funds’ performance relative to an appropriate benchmark as well as compared to the Fund’s appropriate peer group. The Trustees also reviewed the investment management fees payable to Voyageur. In this connection, the Trustees reviewed comparative information prepared by a third-party consultant on investment management fees paid and expenses incurred by similarly situated funds. The Trustees also received reports from Voyageur regarding other investment companies advised by it, including the advisory fees paid. The Trustees took into account profitability data for Voyageur included in the materials. The Trustees received information from Voyageur regarding other benefits derived from its relationships with the Funds. In connection with their deliberations, the independent Trustees met separately with their independent legal counsel to review the relevant material and consider their responsibilities under relevant laws and regulations. In addition, the Trustees noted the expected composition of the portfolio management teams.
The Board observed that the Quality Fixed Income Fund ranked in the fifth quintile of its peer group for the one and three year periods and the Fund’s total expense structure was twenty-three basis points lower than its peer group median. The Tax-Free Income Fund ranked in the second quintile for the one and three year periods, the fifth quintile for the five year period and its one-year performance was in the top quintile of its peer universe. In addition, the total expense structure of the Tax-Free Income Fund was two basis points lower than the median of its peer group. In considering the quality of the services performed for each Fund by Voyageur, the Trustees discussed the strong research capabilities and fundamental analysis performed by the firm and also considered the extensive portfolio management experience of Voyageur staff, the compliance structure and systems established by Voyageur and the financial viability of Voyageur. The Trustees also considered steps that already had been taken by Voyageur to expand upon existing research capabilities and compliance processes and steps that were expected to be taken to maintain and/or enhance such capabilities and processes.
The Trustees also reviewed and approved Fund Management’s proposal to continue for an additional year the existing fee waivers for the Tax-Free Income and Quality Fixed Income Funds in order to maintain total expenses at their current levels.
Based upon their review, the Trustees determined that the advisory fees proposed to be payable to Voyageur were reasonable and fair in light of the nature and quality of services provided under all of the circumstances, and were within the range of what might have been negotiated at arms’ length. The Trustees concluded that it is in the interest of the Funds and their shareholders for the Trustees to approve the continuation of the Agreements for the Funds. In arriving at their decision to approve the renewal of both of the Agreements, the Trustees did not assign relative weights to the factors discussed above or deem any one or group of them to be controlling in and of themselves.
32
Tamarack Funds
P.O. Box 219757
Kansas City, MO 64121-9757
800-422-2766
www.voyageur.net
Performance data represents past performance and does not guarantee future results. The principal value of an investment and investment return will fluctuate so that an investor’s shares, when redeemed, may be worth more or less than their original cost.
This report and the financial statements contained herein are provided for the information of Tamarack Funds shareholders. This report is not authorized for distribution to prospective investors unless preceded or accompanied by a current prospectus, which contains information concerning investment objectives, risks, charges and expenses of the funds. Please read the prospectus carefully before investing.
This report and the financial statements contained herein are not intended to be a forecast of future events, a guarantee of future results, or investment advice. There is no assurance that certain securities will remain in or out of each fund’s portfolio. The views expressed in this report reflect those of the portfolio managers through the period ended March 31, 2009.
NOT FDIC INSURED • NO BANK GUARANTEE • MAY LOSE VALUE
Voyageur Asset Management Inc. serves as investment adviser for the Tamarack Funds. Tamarack Funds are distributed by Tamarack Distributors Inc.
| | |
 | | |
| |
The Tamarack Funds are pleased to offer shareholder reports printed entirely on Forest Stewardship Council certified paper. FSC certification ensures that the paper used in this report contains fiber from well-managed and responsibly harvested forests that meet strict environmental and socioeconomic standards. | | |
| | TF-FI SAR 03-09 |
| | | | | | | | |
| | | | | | |
| | | | Tamarack Funds |
About Your Semi-Annual Report | | | | | | This semi-annual report includes detailed information about the Access Capital Community Investment Fund (the” Fund”) including financial statements, performance, and a complete list of holdings. The Fund compares its performance against the Barclays Capital U.S. Securitized Index, the Barclays Capital U.S. Aggregate Bond Index and the 80% Merrill Lynch Conventional 30-Year Mortgage Backed Securities Index and 20% Merrill Lynch 1-10 Year U.S. Treasury Index (“80/20 Composite Index”) which are widely used market indices. We hope the financial information presented will help you evaluate your investment in the Fund. We also encourage you to read your Fund’s prospectus for further detail as to the Fund’s investment policies and risk profile. Fund prospectuses and performance information subsequent to the date of this report are available on our website at www.voyageur.net. A description of the policies and procedures that your Fund uses to determine how to vote proxies relating to portfolio securities is available (i) without charge, upon request, by calling 1-800-973-0073; (ii) on the Fund’s website at www.voyageur.net; and (iii) on the Securities and Exchange Commission’s (the “Commission”) website at http://www.sec.gov. Information regarding how your Fund voted proxies relating to portfolio securities during the most recent 12 month period ended June 30 is available (i) on the Fund’s website at www.voyageur.net; and (ii) on the Commission’s website at http://www.sec.gov. A schedule of the Fund’s portfolio holdings will be filed with the Commission for the first and third quarters of each fiscal year on Form N-Q. This information is available on the Commission’s website at http://www.sec.gov and may be reviewed and copied at the Commission’s Public Reference Room in Washington, D.C. Information on the operation of the Public Reference Room is available by calling 1-800-SEC-0330. |
| Table of Contents | | | | | | |
| | | | | | Letter from the CIO | | 1 |
| | | | | | Portfolio Managers | | 3 |
| | | | | | Performance Summary | | 4 |
| | | | | | Fund Statistics | | 5 |
| | | | | | Schedule of Portfolio Investments | | 6 |
| | | | | | Financial Statements | | |
| | | | | | - Statement of Assets and Liabilities | | 17 |
| | | | | | - Statement of Operations | | 18 |
| | | | | | - Statements of Changes in Net Assets | | 19 |
| | | | | | - Statement of Cash Flows | | 20 |
| | | | | | Financial Highlights | | 21 |
| | | | | | Notes to Financial Statements | | 22 |
| | | | | | Share Class Information | | 30 |
| | | | | | Supplemental Information | | 31 |
| | | | |
| | | | | | | | |
| | | | | | |
LETTER FROM THE CIO | | | | | | |
| | | |
| | | | | | | |
Dear Shareholder: The mission of the Access Capital Community Investment Fund (the “Fund”) is to provide double bottom line returns, both economically and to the community, through investments in debt securities that support community development activities serving low and moderate income individuals and communities in the United States. These activities include investments in homeownership, affordable housing, education, community health centers and small businesses. The Fund invests in securities with the highest credit ratings or that are issued by the U.S. Government, government agencies and government-sponsored enterprises such as Fannie Mae or Freddie Mac. This report covers the six month period from the end of the Fund’s last fiscal year, September 30, 2008, through March 31, 2009. The Fund is now in its eleventh year of operation. Portfolio Management Report For the six months ended March 31, 2009, Class I Shares of the Fund had a net total return of 4.61%, based upon the net asset value of $9.59 per share on March 31, up from $9.41 at September 30, 2008 and unchanged from March 31, 2008, and assuming reinvestment of $0.25 per share ordinary income dividends. For the year ended March 31, 2009, Class I Shares of the Fund had a net total return of 5.37%, assuming reinvestment of $0.49 per share ordinary income dividends. The Class I Shares of the Fund’s six month net total return of 4.61% exceeded that of the Barclay’s Capital U.S. Securitized Index which was 4.33%. The one year net total return for the Class I Shares of 5.37% compares favorably with a total return of 4.44% for the Barclay’s Capital U. S. Securitized Index. We remain in a historic time for the capital markets. In our last report we spoke of the positive impact that the placement of Fannie Mae and Freddie Mac into Federal Conservatorship had on our portfolio holdings. In the most recent six month period we have experienced massive buying of Agency Mortgage-Backed Securities (MBS) by the U.S. Government as part of a concerted effort to make mortgage refinancing more attractive. These purchases have brought support to the entire MBS sector and have contributed to the Fund’s strong performance. We are positive on the prospects for the sectors we invest in and continue to feel that our form of community investment offers a win-win for you, our shareholders, and for the citizens and communities across the country who benefit from the investments we make. | | | | | | |
| | | |
| | | | | | |
1
| | | | | | |
| | | | | | LETTER FROM THE CIO |
| | | | Community Impact For the six months ended March 31, 2009, the Fund’s net assets grew from $543 million to $549 million. For the year ended March 31, 2009 the Fund’s net assets grew from $510 million to $549 million. Total number of shareholders remained constant at 133. Designated Target Regions selected by shareholders now call for investment in 46 states and U.S. Territories. Since inception, the Fund has owned more than 9,800 mortgages for low and moderate income individuals and over 6,400 units of affordable rental units. Total small business loans total more than 250. We are proud of these results and thank you, our shareholders, for allowing us to work on your behalf over the years. Shareholder Dividends For the six month period ended March 31, 2009, the Class I Shares of the Fund paid dividends of 25 cents per share. At the end of the period, the Class I Shares’ 30-day current yield, calculated by our portfolio administrator using the methodology recommended by the SEC, was 5.02%. Other Items We have completed all of the transitions associated with our merger in August 2008 with Voyageur Asset Management and the Tamarack Funds and are happy to report that all has gone smoothly. |
| | | | Sincerely, |
 | | | | 
|
| | | David F. Sand |
| | | Chief Investment Officer, Access Capital Community Investment Fund |
| | |
| | | | |
2
| | | | | | |
PORTFOLIO MANAGERS | | | | | | |
| | | | | | |
| | | | | | | |
Voyageur Asset Management Inc. (“Voyageur”), the investment advisor to the Access Capital Community Investment Fund, employs a team approach to the management of each of the fixed income funds. The Fund’s management team has access to Voyageur’s investment research and other money management resources. | | | | | | |
John M. Huber, CFA Senior Managing Director, Chief Investment Officer — Fixed Income John Huber directs Voyageur’s fixed income group. John joined Voyageur in 2004 from Galliard Capital Management where he was a principal and senior portfolio manager, responsible for the firm’s total return fixed income effort. Prior to working for Galliard, John was a portfolio manager for Norwest Investment Management where he began his career in 1990. John received a BA from the University of Iowa and an MBA in Finance from the University of Minnesota, Carlson School of Management. He acts as an advisor to the Carlson Funds Enterprise for the University of Minnesota. John is a CFA charterholder and a member of the CFA Society of Minnesota. He also serves on the Board of the YMCA of Metropolitan Minneapolis. | | | | | |  |
David F. Sand Managing Director, Chief Investment Officer David Sand is responsible for the strategic direction of Access Capital Community Investment Fund. In July 2008, Voyageur acquired Access Capital where he served as the firm’s president, chief investment officer and co-founder. Prior to joining Access Capital, David co-founded Commonwealth Capital Partners, Inc., and Commonwealth Capital Strategies, Inc., Cambridge and New York. The latter was a consulting and investment banking firm that specialized in housing, enterprise development, job training and the environment and was involved in a $100 million affordable housing program in Pennsylvania. David also served as a vice president at Shearson Lehman Brothers, New York, where he helped build a successful pioneering partnership in socially responsible investment management. He did extensive research and public speaking on issues including investments in companies involved in South Africa, nuclear energy, defense, and environmental issues. David began his career in the financial services industry in 1980. He received a BA from Princeton University and a MPA at the John F. Kennedy School of Government, Harvard University. David is on the board for the Social Investment Forum. | | | | | |  |
Brian Svendahl Managing Director, Senior Portfolio Manager Brian Svendahl is a senior portfolio manager leading Voyageur’s Risk Management Team which monitors various risks within our fixed income products. Brian also has specific research responsibilities for government and agency loans including small business administration and U.S.D.A. programs. Brian joined Voyageur in 2005 from Wells Fargo Brokerage Services, where he served as senior vice president and risk manager. Prior to that, Brian’s experiences include developing VAR analysis and off balance sheet hedging strategies for Wells Fargo’s Treasury group. Brian has worked in the investment industry since 1992. Brian received a BS in Economics from the University of Minnesota. He also received a BBA in Finance and an MBA from the University of Minnesota, Carlson School of Management. Brian is a CFA charterholder and member of the CFA Society of Minnesota. | | | | | |  |
| | | |
| | | | | | |
| | | | | | | | | | | | | | | | | | |
| | | | | | PERFORMANCE SUMMARY |
| | | | | | Average Annual Total Returns as of March 31, 2009 (Unaudited). |
| | | | | | Access Capital Community Investment Fund |
| | | | | | | 1 Year | | 3 Year | | 5 Year | | 10 Year | | Since
Inception | | Expense
Ratio* |
| | | | Class A (a) | | | | | | | | | | | | |
| | | | - Including Maximum Sales Charge of 3.75% | | 1.91% | | 4.39% | | 3.35% | | 4.51% | | 4.52% | | |
| | | | - At Net Asset Value Class I (b) | | 5.84% | | 5.75% | | 4.14% | | 4.91% | | 4.89% | | 1.78% |
| | | | - At Net Asset Value | | 5.37% | | 5.68% | | 4.18% | | 5.10% | | 5.14% | | 1.53% |
| | | | Barclays Capital U. S. Securitized Index (c) | | 4.86% | | 6.19% | | 4.68% | | 5.79% | | 5.80% | | |
| | | | Barclays Capital U. S. Aggregate Bond Index (c) | | 3.13% | | 5.78% | | 4.13% | | 5.70% | | 5.68% | | |
| | | | 80/20 Composite Index (c) | | 7.85% | | 7.81% | | 5.62% | | 6.22% | | 6.21% | | |
| | | | | | | | | | | | | | | | | | |
| | | | | | Performance data quoted represents past performance. Past performance is no guarantee of future results. Investment return and principal value of an investment will fluctuate so that an investor’s shares, when redeemed, may be worth more or less than their original cost. Current performance may be lower or higher than performance quoted. For performance data current to most recent month-end go to www.voyageur.net The Barclays Capital U.S. Securitized Index is an unmanaged index that tracks the performance of mortgage-backed pass-through securities issued by Ginnie Mae, Fannie Mae, and Freddie Mac, investment-grade bonds and asset-backed securities. The Barclays Capital U.S. Aggregate Bond Index is an unmanaged index that tracks the performance of a representative list of government, corporate, asset-backed and mortgage-backed securities. The 80/20 Composite Index is an unmanaged index weighted 80% to the Merrill Lynch Conventional 30-Year Mortgage Backed Securities Index and 20% to the Merrill Lynch 1-10 Year U.S. Treasury Index. The Merrill Lynch Conventional 30-Year Mortgage Backed Securities Index is an unmanaged index that tracks the performance of 30-Year fixed-rate residential mortgage pass-through securities issued by Fannie Mae, and Freddie Mac with at least one year remaining term to final maturity. The Merrill Lynch 1-10 Year U.S. Treasury Index is an unmanaged index that tracks the performance of direct obligations of the U.S. Treasury with between one and ten years remaining to final maturity. (a) The inception date for Class A shares of the Fund is January 29, 2009. All performance shown for such class of shares prior to its inception date is based on the performance of the Class I shares of the Fund, adjusted to reflect the fees and expenses of Class A shares, as applicable. (b) Class I commenced operations on July 28, 2008. The performance in the table reflects the performance of Access Capital Strategies Community Investment Fund, Inc., the predecessor to the Fund. From its inception, June 23, 1998, until May 30, 2006, the predecessor fund elected status as a business development company. From May 31, 2006 until July 27, 2008, the predecessor fund operated as a continuously offered closed-end interval management company. If the predecessor fund had operated as an open-end management company, performance may have been adversely affected. Fund performance reflects applicable fee waivers/expense reimbursements which, if excluded, would cause performance to be lower. (c) You cannot invest directly into the index. * The expense ratios are from the Fund’s prospectus dated January 28, 2009. Additional information pertaining to the Fund’s expense ratios as of March 31, 2009 can be found in the financial highlights. |
| | | | | | | | | | | | | | | | | | |
| | | | | | | | | | | | | | | | | | |
4
| | | | | | | | | | | | | | |
FUND STATISTICS (UNAUDITED) | | | | | | | | |
Access Capital Community Investment Fund | | | | | | | | | | |
Current income and capital appreciation | | | | | | | | | | Investment Objective |
| | | | | | | | | | | | | | Benchmarks |
Barclays Capital U.S. Securitized Index | | | | | | | | | | |
Barclays Capital U.S. Aggregate Bond Index | | | | | | | | | | |
80/20 Composite Index | | | | | | | | | | | | | | |
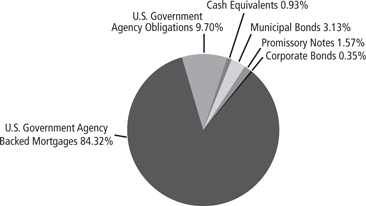
| | | | | | | | Asset Allocation (as of 3/31/09) (% of fund’s investments) |
| | | | | | | | | | | | | | | |
Fannie Mae 5.12%, 7/25/41 | | 2.17% | | Massachusetts Housing Finance Agency Revenue, Series B, 6.53%, 12/1/27 | | 1.14% | | | | | | | | Top Ten Holdings (as of 3/31/09) (% of fund’s net assets) |
Massachusetts Housing Investment Corp. Term Loan, 6.67%, 4/1/35 | | 1.92% | | Fannie Mae, Pool #806761, 5.50%, 9/1/34 | | 1.14% | | | | | | | |
Fannie Mae, Pool #387590, 4.90%, 9/1/15 | | 1.83% | | Fannie Mae, Pool #663159, 5.00%, 7/1/32 | | 1.06% | | | | | | | |
Fannie Mae, Pool #AA0527, 5.50%, 12/1/38 | | 1.52% | | Fannie Mae, Pool #874136, 5.57%, 12/1/16 | | 1.03% | | | | | | | |
New York City Housing Development Corp. Revenue, Series B, 4.95%, 5/15/36 | | 1.33% | | | | | | | | | | | |
Community Reinvestment Revenue Notes, 3.198%, 8/1/35 | | 1.21% | | | | | | | | | | | |
*A listing of all portfolio holdings can be found on page 6. | | | | | | | | | |
| | | | | | | | | | | | | | |
| | | | | | | | | | | | | |
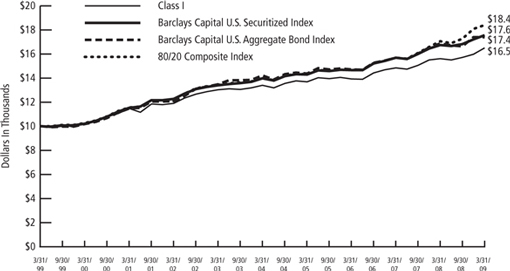
The graph reflects an initial investment of $10,000 over a 10 year period and is based on Class I Shares. The Fund’s total return includes reinvested dividends and capital gains. The Fund’s total return also includes operating expenses that reduce return, while the total return of the indices do not. The graph does not reflect the deduction of taxes that a shareholder would pay on fund distributions or redemption of fund shares. Performance of other classes will vary due to differences in fee structures. | | | | | | Growth of $10,000 Initial Investment Over Ten Years |
|
SCHEDULE OF PORTFOLIO INVESTMENTS |
Access Capital Community Investment Fund
March 31, 2009 (Unaudited)
| | | | | | |
Principal
Amount | | | | Value |
| | Municipal Bonds — 3.81% | | | |
| | California — 0.43% | | | |
| $ | 285,000 | | California Rural Home Mortgage Finance Authority Revenue, Series A, 4.20%, 2/1/27, (Credit Support: Ginnie Mae, Fannie Mae, Freddie Mac), Callable 2/1/17 @ 104 | | $ | 278,736 |
| | |
| | 995,000 | | California Rural Home Mortgage Finance Authority Revenue, Series C, 5.40%, 8/1/35, (Credit Support: Ginnie Mae, Fannie Mae, Freddie Mac), Callable 2/1/17 @ 104 | | | 977,100 |
| | |
| | 490,000 | | Camarillo California Community Development, Community Tax Allocation (Housing Set-Aside), Series A-T, 5.26%, 9/1/16, (Credit Support: AMBAC) | | | 464,633 |
| | |
| | 750,000 | | Sacramento County Housing Authority Revenue, 5.00%, 1/20/48, (Credit Support: Ginnie Mae) | | | 629,527 |
| | | | | | |
| | | | | | 2,349,996 |
| | | | | | |
| |
| | Guam — 0.02% | | | |
| | 140,000 | | Guam Power Authority Revenue, Series A, 5.00%, 10/1/24, (Credit Support: AMBAC), Callable 10/1/09 @ 101 | | | 108,133 |
| | | | | | |
| |
| | Massachusetts — 1.14% | | | |
| | 6,790,000 | | Massachusetts Housing Finance Agency Revenue, Series B, 6.53%, 12/1/27, (Credit Support:MBIA-IBC), Callable 6/1/17 @ 100 | | | 6,287,472 |
| | | | | | |
| |
| | New York — 1.33% | | | |
| | 7,750,000 | | New York City Housing Development Corp. Revenue, Series B, 4.95%, 5/15/36, (Credit Support: Fannie Mae), Callable 11/1/15 @ 100 | | | 7,316,310 |
| | | | | | |
| |
| | Ohio — 0.15% | | | |
| | 860,000 | | Ohio Housing Finance Agency Refunding Revenue, 5.32%, 9/1/38, (Credit Support: Ginnie Mae, Fannie Mae), Callable 9/1/16 @ 100 | | | 828,653 |
| | | | | | |
| |
| | Utah — 0.74% | | | |
| | 1,425,000 | | Utah Housing Corporation, Single Family Mortgage Revenue, Series B-2, Class 1, 4.33%, 1/1/18, Callable 1/1/17 @ 100 | | | 1,393,964 |
| | | | | | |
Principal
Amount | | | | Value |
| $ | 2,695,000 | | Utah Housing Corporation, Single Family Mortgage Revenue, Series C-2, Class 1, 4.85%, 1/1/18, Callable 1/1/17 @ 100 | | $ | 2,654,332 |
| | | | | | |
| | | | | | 4,048,296 |
| | | | | | |
| |
| Total Municipal Bonds
(Cost $19,707,831) | | | 20,938,860 |
| | | | | | |
| | Corporate Bonds — 0.42% | | | |
| | Diversified Financials — 0.42% | | | |
| | 575,000 | | Atlantic Marine Corps Communities LLC 5.34%, 12/1/49 (Credit Support: MBIA)(a) | | | 364,406 |
| | |
| | 1,395,000 | | Fort Knox Military Housing Privatization Project 0.90%, 2/15/49 (Credit Support: AMBAC)(a)(b)(c)(e) | | | 796,660 |
| | |
| | 2,000,000 | | Pacific Beacon LLC 1.49%, 7/15/49 (Credit Support: MBIA)(a)(b) | | | 1,158,195 |
| | | | | | |
| |
| Total Corporate Bonds
(Cost $3,860,996) | | | 2,319,261 |
| | | | | | |
| | U.S. Government Agency Backed Mortgages — 102.02% |
| | Fannie Mae — 71.47% | | | |
| | 400,000 | | 5.07%, , 1/1/39 | | | 417,650 |
| | 11,389,550 | | 5.12%, , 7/25/41 | | | 11,902,749 |
| | 62,179 | | Pool #253173, 7.50%, 1/1/30 | | | 67,636 |
| | 27,371 | | Pool #253174, 7.25%, 12/1/29 | | | 29,605 |
| | 145,762 | | Pool #253212, 7.50%, 1/1/30 | | | 158,759 |
| | 51,447 | | Pool #253214, 7.00%, 1/1/15 | | | 54,028 |
| | 312,706 | | Pool #257611, 5.50%, 5/1/38 | | | 326,443 |
| | 53,437 | | Pool #257612, 5.00%, 5/1/38 | | | 55,467 |
| | 399,295 | | Pool #257613, 5.50%, 6/1/38 | | | 418,832 |
| | 368,324 | | Pool #257631, 6.00%, 7/1/38 | | | 386,968 |
| | 514,925 | | Pool #257632, 5.50%, 7/1/38 | | | 537,545 |
| | 245,179 | | Pool #257645, 6.00%, 7/1/38 | | | 258,816 |
| | 301,194 | | Pool #257649, 5.50%, 7/1/38 | | | 314,425 |
| | 231,206 | | Pool #257656, 6.00%, 8/1/38 | | | 242,909 |
| | 478,607 | | Pool #257663, 5.50%, 8/1/38 | | | 499,632 |
| | 935,327 | | Pool #257857, 6.00%, 12/1/37 | | | 982,671 |
| | 192,953 | | Pool #257868, 6.50%, 11/1/37 | | | 204,457 |
| | 192,551 | | Pool #257869, 5.50%, 12/1/37 | | | 201,972 |
| | 252,341 | | Pool #257875, 5.50%, 12/1/37 | | | 263,425 |
| | 610,016 | | Pool #257890, 5.50%, 2/1/38 | | | 636,813 |
| | 3,654,243 | | Pool #257892, 5.50%, 2/1/38 | | | 3,814,766 |
| | 1,074,314 | | Pool #257893, 6.00%, 2/1/38 | | | 1,128,693 |
| | 351,936 | | Pool #257897, 5.50%, 2/1/38 | | | 367,396 |
| | 235,042 | | Pool #257898, 6.00%, 2/1/38 | | | 246,940 |
| | 102,513 | | Pool #257899, 5.00%, 2/1/38 | | | 106,408 |
| | 224,882 | | Pool #257900, 5.00%, 1/1/38 | | | 234,549 |
| | 432,586 | | Pool #257901, 5.50%, 2/1/38 | | | 453,751 |
|
SCHEDULE OF PORTFOLIO INVESTMENTS |
Access Capital Community Investment Fund (cont.)
March 31, 2009 (Unaudited)
| | | | | | |
Principal
Amount | | | | Value |
| $ | 56,340 | | Pool #257902, 6.00%, 2/1/38 | | $ | 59,474 |
| | 449,540 | | Pool #257903, 5.50%, 2/1/38 | | | 469,288 |
| | 371,329 | | Pool #257904, 6.00%, 2/1/38 | | | 390,124 |
| | 193,175 | | Pool #257913, 5.50%, 1/1/38 | | | 201,661 |
| | 132,245 | | Pool #257914, 6.00%, 1/1/38 | | | 138,939 |
| | 117,113 | | Pool #257919, 6.00%, 2/1/38 | | | 123,041 |
| | 99,208 | | Pool #257925, 6.00%, 11/1/37 | | | 104,229 |
| | 222,466 | | Pool #257926, 5.50%, 3/1/38 | | | 232,238 |
| | 158,976 | | Pool #257927, 5.50%, 3/1/38 | | | 165,960 |
| | 166,031 | | Pool #257928, 6.00%, 3/1/38 | | | 174,435 |
| | 309,976 | | Pool #257942, 5.50%, 4/1/38 | | | 323,593 |
| | 107,417 | | Pool #257943, 6.00%, 4/1/38 | | | 112,855 |
| | 101,874 | | Pool #257973, 5.00%, 5/1/38 | | | 105,744 |
| | 910,745 | | Pool #257974, 5.50%, 4/1/38 | | | 950,753 |
| | 87,183 | | Pool #257995, 6.00%, 7/1/38 | | | 91,596 |
| | 974,571 | | Pool #258000, 5.00%, 4/1/34 | | | 1,012,868 |
| | 170,754 | | Pool #258001, 5.00%, 3/1/34 | | | 177,464 |
| | 448,285 | | Pool #258002, 5.00%, 4/1/34 | | | 465,901 |
| | 116,318 | | Pool #258005, 5.50%, 3/1/34 | | | 121,670 |
| | 75,576 | | Pool #258022, 5.50%, 5/1/34 | | | 79,054 |
| | 1,034,922 | | Pool #258024, 5.00%, 6/1/34 | | | 1,075,591 |
| | 310,166 | | Pool #258027, 5.00%, 5/1/34 | | | 322,354 |
| | 28,330 | | Pool #258028, 5.00%, 5/1/34 | | | 29,443 |
| | 120,283 | | Pool #258030, 5.00%, 5/1/34 | | | 125,010 |
| | 77,555 | | Pool #258031, 5.00%, 5/1/34 | | | 80,603 |
| | 406,627 | | Pool #258049, 5.00%, 5/1/34 | | | 422,606 |
| | 59,230 | | Pool #258050, 5.50%, 5/1/34 | | | 61,956 |
| | 49,939 | | Pool #258051, 5.00%, 5/1/34 | | | 51,901 |
| | 537,848 | | Pool #258070, 5.00%, 6/1/34 | | | 558,984 |
| | 185,615 | | Pool #258090, 5.00%, 6/1/34 | | | 192,909 |
| | 340,624 | | Pool #258092, 5.50%, 6/1/34 | | | 356,298 |
| | 176,238 | | Pool #258093, 5.50%, 6/1/34 | | | 184,347 |
| | 83,696 | | Pool #258094, 5.00%, 6/1/34 | | | 86,985 |
| | 63,576 | | Pool #258095, 5.50%, 7/1/34 | | | 66,501 |
| | 82,098 | | Pool #258097, 5.50%, 6/1/34 | | | 85,876 |
| | 51,729 | | Pool #258121, 5.50%, 6/1/34 | | | 54,110 |
| | 324,281 | | Pool #258152, 5.50%, 8/1/34 | | | 339,203 |
| | 473,836 | | Pool #258157, 5.00%, 8/1/34 | | | 492,457 |
| | 142,495 | | Pool #258159, 5.50%, 8/1/34 | | | 149,052 |
| | 197,881 | | Pool #258163, 5.50%, 8/1/34 | | | 206,987 |
| | 131,870 | | Pool #258165, 5.50%, 8/1/34 | | | 137,938 |
| | 141,777 | | Pool #258166, 5.50%, 9/1/34 | | | 148,301 |
| | 229,226 | | Pool #258171, 5.50%, 10/1/34 | | | 239,774 |
| | 447,118 | | Pool #258173, 5.50%, 10/1/34 | | | 467,692 |
| | 168,925 | | Pool #258174, 5.50%, 10/1/34 | | | 176,698 |
| | 200,327 | | Pool #258175, 5.50%, 9/1/34 | | | 209,545 |
| | 450,977 | | Pool #258180, 5.00%, 10/1/34 | | | 468,699 |
| | 165,451 | | Pool #258182, 5.00%, 10/1/34 | | | 171,953 |
| | 87,393 | | Pool #258185, 5.50%, 10/1/34 | | | 91,415 |
| | 172,545 | | Pool #258186, 5.50%, 11/1/34 | | | 180,485 |
| | 151,578 | | Pool #258187, 5.50%, 11/1/34 | | | 158,553 |
| | 891,982 | | Pool #258188, 5.50%, 11/1/34 | | | 933,027 |
| | 240,567 | | Pool #258198, 5.50%, 10/1/34 | | | 251,637 |
| | 99,416 | | Pool #258199, 5.50%, 9/1/34 | | | 103,990 |
| | | | | | |
Principal
Amount | | | | Value |
| $ | 124,971 | | Pool #258200, 5.50%, 11/1/34 | | $ | 130,722 |
| | 239,858 | | Pool #258203, 5.50%, 10/1/34 | | | 250,896 |
| | 182,468 | | Pool #258208, 5.50%, 11/1/34 | | | 190,865 |
| | 161,048 | | Pool #258210, 5.50%, 11/1/34 | | | 168,459 |
| | 113,014 | | Pool #258221, 5.50%, 11/1/34 | | | 118,214 |
| | 49,489 | | Pool #258222, 5.00%, 11/1/34 | | | 51,434 |
| | 141,342 | | Pool #258224, 5.50%, 12/1/34 | | | 147,846 |
| | 146,991 | | Pool #258225, 5.50%, 11/1/34 | | | 153,755 |
| | 293,670 | | Pool #258236, 5.00%, 12/1/34 | | | 305,210 |
| | 179,166 | | Pool #258237, 5.50%, 1/1/35 | | | 187,242 |
| | 1,124,697 | | Pool #258238, 5.00%, 1/1/35 | | | 1,168,894 |
| | 46,054 | | Pool #258245, 5.50%, 12/1/34 | | | 48,174 |
| | 117,321 | | Pool #258249, 5.00%, 12/1/34 | | | 121,932 |
| | 103,004 | | Pool #258250, 5.50%, 11/1/34 | | | 108,259 |
| | 156,623 | | Pool #258251, 5.50%, 1/1/35 | | | 163,830 |
| | 82,702 | | Pool #258252, 5.50%, 12/1/34 | | | 86,508 |
| | 432,942 | | Pool #258254, 5.50%, 12/1/34 | | | 452,864 |
| | 618,541 | | Pool #258255, 5.50%, 1/1/35 | | | 647,003 |
| | 143,863 | | Pool #258258, 5.00%, 1/1/35 | | | 149,494 |
| | 616,394 | | Pool #258300, 5.00%, 3/1/35 | | | 640,520 |
| | 141,732 | | Pool #258301, 5.50%, 2/1/35 | | | 148,121 |
| | 198,172 | | Pool #258302, 5.00%, 3/1/35 | | | 205,928 |
| | 298,069 | | Pool #258303, 5.00%, 2/1/35 | | | 311,226 |
| | 282,273 | | Pool #258304, 5.00%, 2/1/35 | | | 293,321 |
| | 420,722 | | Pool #258305, 5.00%, 3/1/35 | | | 437,189 |
| | 68,823 | | Pool #258311, 5.00%, 2/1/35 | | | 71,517 |
| | 84,437 | | Pool #258312, 5.50%, 2/1/35 | | | 88,243 |
| | 327,291 | | Pool #258324, 5.50%, 4/1/35 | | | 342,045 |
| | 336,011 | | Pool #258325, 5.50%, 4/1/35 | | | 351,158 |
| | 627,845 | | Pool #258333, 5.00%, 4/1/35 | | | 652,419 |
| | 352,649 | | Pool #258336, 5.00%, 4/1/35 | | | 366,452 |
| | 138,717 | | Pool #258337, 5.00%, 4/1/35 | | | 144,146 |
| | 317,000 | | Pool #258338, 5.00%, 4/1/35 | | | 329,407 |
| | 263,915 | | Pool #258339, 5.00%, 4/1/35 | | | 274,244 |
| | 77,684 | | Pool #258340, 5.00%, 3/1/35 | | | 80,725 |
| | 94,011 | | Pool #258341, 5.00%, 4/1/35 | | | 97,691 |
| | 103,432 | | Pool #258342, 5.00%, 4/1/35 | | | 107,997 |
| | 520,676 | | Pool #258343, 5.00%, 4/1/35 | | | 541,055 |
| | 128,184 | | Pool #258344, 5.00%, 3/1/35 | | | 133,201 |
| | 85,100 | | Pool #258345, 5.00%, 3/1/35 | | | 88,431 |
| | 242,794 | | Pool #258346, 5.00%, 3/1/35 | | | 252,298 |
| | 1,114,378 | | Pool #258347, 5.00%, 4/1/35 | | | 1,157,995 |
| | 91,667 | | Pool #258348, 5.00%, 4/1/35 | | | 95,255 |
| | 251,490 | | Pool #258388, 5.50%, 6/1/35 | | | 262,827 |
| | 502,710 | | Pool #258392, 5.00%, 6/1/35 | | | 522,387 |
| | 625,242 | | Pool #258393, 5.00%, 5/1/35 | | | 649,714 |
| | 286,313 | | Pool #258394, 5.00%, 5/1/35 | | | 297,519 |
| | 405,802 | | Pool #258395, 5.50%, 6/1/35 | | | 424,095 |
| | 214,115 | | Pool #258400, 5.00%, 6/1/35 | | | 222,496 |
| | 535,124 | | Pool #258402, 5.00%, 6/1/35 | | | 556,069 |
| | 75,816 | | Pool #258403, 5.00%, 6/1/35 | | | 78,784 |
| | 102,061 | | Pool #258404, 5.00%, 6/1/35 | | | 106,056 |
| | 87,754 | | Pool #258406, 5.50%, 5/1/35 | | | 91,710 |
| | 178,409 | | Pool #258407, 5.00%, 5/1/35 | | | 185,392 |
|
SCHEDULE OF PORTFOLIO INVESTMENTS |
Access Capital Community Investment Fund (cont.)
March 31, 2009 (Unaudited)
| | | | | | |
Principal
Amount | | | | Value |
| $ | 59,410 | | Pool #258408, 5.00%, 5/1/34 | | $ | 61,745 |
| | 206,857 | | Pool #258409, 5.00%, 5/1/35 | | | 214,954 |
| | 112,244 | | Pool #258410, 5.00%, 4/1/35 | | | 116,638 |
| | 121,682 | | Pool #258411, 5.50%, 5/1/35 | | | 127,167 |
| | 161,298 | | Pool #258422, 5.00%, 6/1/35 | | | 167,611 |
| | 141,373 | | Pool #258427, 5.00%, 7/1/35 | | | 146,906 |
| | 168,511 | | Pool #258428, 5.00%, 7/1/35 | | | 175,107 |
| | 92,964 | | Pool #258439, 5.50%, 6/1/35 | | | 97,154 |
| | 420,520 | | Pool #258448, 5.00%, 8/1/35 | | | 436,979 |
| | 138,846 | | Pool #258449, 5.50%, 7/1/35 | | | 145,105 |
| | 952,031 | | Pool #258450, 5.50%, 8/1/35 | | | 994,947 |
| | 57,085 | | Pool #258451, 5.50%, 7/1/35 | | | 59,658 |
| | 165,171 | | Pool #258454, 5.50%, 7/1/35 | | | 172,616 |
| | 346,198 | | Pool #258456, 5.00%, 8/1/35 | | | 359,748 |
| | 130,090 | | Pool #258457, 5.00%, 8/1/35 | | | 135,182 |
| | 575,726 | | Pool #258460, 5.00%, 8/1/35 | | | 598,261 |
| | 167,022 | | Pool #258470, 5.00%, 7/1/35 | | | 173,559 |
| | 226,615 | | Pool #258479, 5.50%, 7/1/35 | | | 236,830 |
| | 546,700 | | Pool #258480, 5.00%, 8/1/35 | | | 568,098 |
| | 160,803 | | Pool #258551, 5.50%, 11/1/35 | | | 168,052 |
| | 349,452 | | Pool #258552, 5.00%, 11/1/35 | | | 363,130 |
| | 61,017 | | Pool #258555, 5.00%, 10/1/35 | | | 63,405 |
| | 115,086 | | Pool #258556, 5.50%, 11/1/35 | | | 120,274 |
| | 94,200 | | Pool #258561, 5.50%, 11/1/35 | | | 98,446 |
| | 127,296 | | Pool #258562, 5.50%, 11/1/35 | | | 133,035 |
| | 116,244 | | Pool #258569, 5.00%, 10/1/35 | | | 120,794 |
| | 1,470,743 | | Pool #258571, 5.50%, 11/1/35 | | | 1,537,041 |
| | 164,383 | | Pool #258595, 5.50%, 12/1/35 | | | 171,793 |
| | 492,241 | | Pool #258596, 6.00%, 12/1/35 | | | 517,723 |
| | 124,623 | | Pool #258598, 5.00%, 12/1/35 | | | 129,501 |
| | 187,055 | | Pool #258599, 5.50%, 1/1/36 | | | 195,312 |
| | 385,752 | | Pool #258600, 6.00%, 1/1/36 | | | 405,541 |
| | 114,388 | | Pool #258610, 5.50%, 8/1/35 | | | 119,544 |
| | 169,173 | | Pool #258621, 5.50%, 1/1/36 | | | 176,641 |
| | 1,728,394 | | Pool #258627, 5.50%, 2/1/36 | | | 1,806,307 |
| | 178,708 | | Pool #258633, 5.50%, 12/1/35 | | | 186,763 |
| | 400,802 | | Pool #258634, 5.50%, 2/1/36 | | | 418,494 |
| | 618,990 | | Pool #258643, 5.50%, 1/1/36 | | | 646,893 |
| | 810,915 | | Pool #258644, 5.50%, 2/1/36 | | | 846,710 |
| | 99,410 | | Pool #258650, 5.50%, 1/1/36 | | | 103,798 |
| | 129,598 | | Pool #258651, 5.00%, 1/1/36 | | | 134,550 |
| | 908,085 | | Pool #258658, 5.50%, 3/1/36 | | | 948,168 |
| | 117,380 | | Pool #258663, 5.50%, 2/1/36 | | | 122,561 |
| | 205,767 | | Pool #258721, 5.50%, 4/1/36 | | | 214,850 |
| | 151,195 | | Pool #258736, 5.00%, 3/1/36 | | | 156,971 |
| | 146,802 | | Pool #258737, 5.50%, 12/1/35 | | | 153,741 |
| | 90,908 | | Pool #258763, 6.00%, 5/1/36 | | | 95,571 |
| | 249,827 | | Pool #258765, 6.00%, 5/1/36 | | | 262,643 |
| | 182,275 | | Pool #258766, 5.50%, 5/1/36 | | | 190,321 |
| | 519,606 | | Pool #258767, 6.00%, 6/1/36 | | | 546,261 |
| | 158,648 | | Pool #258773, 5.50%, 6/1/36 | | | 165,651 |
| | 226,900 | | Pool #258779, 6.00%, 5/1/36 | | | 238,540 |
| | 55,054 | | Pool #259004, 8.00%, 2/1/30 | | | 60,123 |
| | 38,151 | | Pool #259011, 8.00%, 3/1/30 | | | 41,663 |
| | | | | | |
Principal
Amount | | | | Value |
| $ | 65,875 | | Pool #259030, 8.00%, 4/1/30 | | $ | 71,941 |
| | 22,618 | | Pool #259178, 6.50%, 3/1/31 | | | 24,148 |
| | 343,291 | | Pool #259181, 6.50%, 3/1/31 | | | 366,513 |
| | 182,551 | | Pool #259187, 6.50%, 4/1/31 | | | 194,900 |
| | 93,380 | | Pool #259190, 6.50%, 4/1/31 | | | 99,697 |
| | 170,795 | | Pool #259191, 6.50%, 4/1/31 | | | 182,349 |
| | 147,618 | | Pool #259201, 6.50%, 4/1/31 | | | 157,604 |
| | 43,984 | | Pool #259213, 6.50%, 5/1/31 | | | 46,987 |
| | 147,945 | | Pool #259256, 6.50%, 8/1/31 | | | 157,953 |
| | 40,486 | | Pool #259284, 6.50%, 8/1/31 | | | 43,224 |
| | 46,512 | | Pool #259306, 6.50%, 9/1/31 | | | 49,658 |
| | 89,343 | | Pool #259309, 6.50%, 10/1/31 | | | 95,387 |
| | 385,827 | | Pool #259316, 6.50%, 11/1/31 | | | 411,927 |
| | 180,313 | | Pool #259327, 6.00%, 11/1/31 | | | 190,549 |
| | 103,064 | | Pool #259331, 6.00%, 11/1/31 | | | 108,915 |
| | 68,391 | | Pool #259333, 6.50%, 10/1/31 | | | 73,018 |
| | 125,223 | | Pool #259369, 6.00%, 1/1/32 | | | 132,331 |
| | 81,928 | | Pool #259372, 6.00%, 1/1/32 | | | 86,579 |
| | 79,960 | | Pool #259376, 6.00%, 1/1/32 | | | 84,399 |
| | 84,219 | | Pool #259377, 6.50%, 12/1/31 | | | 89,916 |
| | 41,331 | | Pool #259378, 6.00%, 12/1/31 | | | 43,677 |
| | 303,554 | | Pool #259390, 6.00%, 1/1/32 | | | 320,407 |
| | 90,774 | | Pool #259391, 6.00%, 1/1/32 | | | 95,927 |
| | 100,056 | | Pool #259392, 6.50%, 1/1/32 | | | 106,700 |
| | 115,471 | | Pool #259393, 6.00%, 1/1/32 | | | 121,882 |
| | 148,436 | | Pool #259397, 6.00%, 2/1/32 | | | 156,677 |
| | 54,492 | | Pool #259398, 6.50%, 2/1/32 | | | 58,110 |
| | 77,081 | | Pool #259412, 6.50%, 3/1/32 | | | 82,584 |
| | 89,439 | | Pool #259440, 6.50%, 4/1/32 | | | 95,824 |
| | 111,821 | | Pool #259522, 6.50%, 7/1/32 | | | 119,245 |
| | 250,299 | | Pool #259559, 6.00%, 9/1/32 | | | 264,195 |
| | 100,710 | | Pool #259560, 6.00%, 9/1/32 | | | 106,301 |
| | 228,131 | | Pool #259590, 5.50%, 11/1/32 | | | 238,985 |
| | 86,566 | | Pool #259592, 5.50%, 10/1/32 | | | 90,685 |
| | 114,238 | | Pool #259593, 6.00%, 10/1/32 | | | 120,581 |
| | 174,862 | | Pool #259598, 6.00%, 10/1/32 | | | 184,570 |
| | 54,256 | | Pool #259599, 6.00%, 10/1/32 | | | 57,268 |
| | 125,798 | | Pool #259601, 5.50%, 11/1/32 | | | 131,783 |
| | 104,593 | | Pool #259607, 5.50%, 11/1/32 | | | 109,569 |
| | 162,071 | | Pool #259610, 5.50%, 11/1/32 | | | 169,782 |
| | 354,673 | | Pool #259611, 5.50%, 11/1/32 | | | 371,548 |
| | 85,156 | | Pool #259612, 5.50%, 11/1/32 | | | 89,208 |
| | 231,857 | | Pool #259614, 6.00%, 11/1/32 | | | 244,729 |
| | 117,131 | | Pool #259623, 5.50%, 12/1/32 | | | 122,704 |
| | 111,730 | | Pool #259625, 6.00%, 11/1/32 | | | 117,933 |
| | 103,465 | | Pool #259634, 5.50%, 12/1/32 | | | 108,388 |
| | 149,663 | | Pool #259636, 5.50%, 12/1/32 | | | 156,784 |
| | 280,278 | | Pool #259650, 5.50%, 2/1/33 | | | 293,526 |
| | 77,053 | | Pool #259655, 5.50%, 2/1/33 | | | 80,695 |
| | 136,598 | | Pool #259656, 5.50%, 2/1/33 | | | 143,054 |
| | 126,215 | | Pool #259658, 5.50%, 2/1/33 | | | 132,181 |
| | 676,685 | | Pool #259659, 5.50%, 2/1/33 | | | 708,669 |
| | 160,298 | | Pool #259660, 5.50%, 2/1/33 | | | 167,874 |
| | 207,329 | | Pool #259665, 5.50%, 1/1/33 | | | 217,129 |
|
SCHEDULE OF PORTFOLIO INVESTMENTS |
Access Capital Community Investment Fund (cont.)
March 31, 2009 (Unaudited)
| | | | | | |
Principal
Amount | | | | Value |
| $ | 235,029 | | Pool #259667, 5.50%, 2/1/33 | | $ | 246,138 |
| | 42,738 | | Pool #259671, 5.50%, 2/1/33 | | | 44,758 |
| | 183,968 | | Pool #259686, 5.50%, 3/1/33 | | | 192,664 |
| | 180,772 | | Pool #259688, 5.50%, 3/1/33 | | | 189,316 |
| | 73,235 | | Pool #259689, 5.50%, 3/1/33 | | | 76,696 |
| | 53,218 | | Pool #259722, 5.00%, 5/1/33 | | | 55,359 |
| | 157,285 | | Pool #259723, 5.00%, 5/1/33 | | | 163,613 |
| | 63,915 | | Pool #259724, 5.00%, 5/1/33 | | | 66,848 |
| | 527,474 | | Pool #259725, 5.00%, 5/1/33 | | | 548,696 |
| | 80,380 | | Pool #259726, 5.00%, 5/1/33 | | | 83,614 |
| | 223,033 | | Pool #259728, 5.00%, 6/1/33 | | | 232,007 |
| | 137,482 | | Pool #259729, 5.00%, 6/1/33 | | | 143,014 |
| | 179,480 | | Pool #259731, 5.00%, 6/1/33 | | | 186,702 |
| | 50,424 | | Pool #259732, 5.50%, 5/1/33 | | | 52,807 |
| | 144,856 | | Pool #259733, 5.50%, 6/1/33 | | | 151,703 |
| | 87,066 | | Pool #259734, 5.50%, 5/1/33 | | | 91,181 |
| | 127,619 | | Pool #259735, 5.50%, 6/1/33 | | | 133,651 |
| | 408,211 | | Pool #259743, 5.00%, 6/1/33 | | | 424,635 |
| | 392,869 | | Pool #259748, 5.00%, 6/1/33 | | | 408,676 |
| | 230,648 | | Pool #259753, 5.00%, 7/1/33 | | | 239,928 |
| | 82,959 | | Pool #259757, 5.00%, 6/1/33 | | | 86,297 |
| | 676,598 | | Pool #259761, 5.00%, 6/1/33 | | | 703,821 |
| | 310,298 | | Pool #259764, 5.00%, 7/1/33 | | | 322,783 |
| | 277,725 | | Pool #259765, 5.00%, 7/1/33 | | | 288,900 |
| | 206,306 | | Pool #259776, 5.00%, 6/1/33 | | | 214,607 |
| | 158,401 | | Pool #259777, 5.00%, 7/1/33 | | | 164,774 |
| | 176,592 | | Pool #259779, 5.00%, 7/1/33 | | | 183,697 |
| | 116,728 | | Pool #259780, 5.00%, 7/1/33 | | | 121,425 |
| | 106,368 | | Pool #259781, 5.00%, 7/1/33 | | | 110,647 |
| | 115,025 | | Pool #259782, 5.00%, 7/1/33 | | | 119,653 |
| | 230,521 | | Pool #259783, 5.00%, 7/1/33 | | | 239,796 |
| | 65,269 | | Pool #259789, 5.00%, 7/1/33 | | | 67,895 |
| | 119,933 | | Pool #259807, 5.00%, 8/1/33 | | | 124,759 |
| | 233,829 | | Pool #259808, 5.00%, 8/1/33 | | | 243,237 |
| | 155,974 | | Pool #259809, 5.00%, 8/1/33 | | | 162,249 |
| | 692,053 | | Pool #259816, 5.00%, 8/1/33 | | | 719,897 |
| | 87,781 | | Pool #259818, 5.00%, 8/1/33 | | | 91,313 |
| | 36,267 | | Pool #259819, 5.00%, 8/1/33 | | | 37,726 |
| | 94,181 | | Pool #259820, 5.00%, 8/1/33 | | | 97,971 |
| | 261,791 | | Pool #259821, 5.00%, 7/1/33 | | | 273,633 |
| | 473,880 | | Pool #259830, 5.00%, 8/1/33 | | | 495,316 |
| | 789,744 | | Pool #259848, 5.00%, 9/1/33 | | | 821,518 |
| | 139,791 | | Pool #259862, 5.50%, 9/1/33 | | | 146,398 |
| | 272,246 | | Pool #259863, 5.50%, 10/1/33 | | | 285,114 |
| | 188,565 | | Pool #259867, 5.50%, 10/1/33 | | | 197,477 |
| | 348,211 | | Pool #259869, 5.50%, 10/1/33 | | | 364,669 |
| | 119,612 | | Pool #259871, 5.50%, 9/1/33 | | | 125,266 |
| | 322,450 | | Pool #259872, 5.50%, 11/1/33 | | | 337,691 |
| | 207,575 | | Pool #259873, 5.50%, 10/1/33 | | | 217,386 |
| | 154,566 | | Pool #259875, 5.50%, 10/1/33 | | | 161,871 |
| | 274,454 | | Pool #259876, 5.50%, 10/1/33 | | | 287,426 |
| | 99,072 | | Pool #259877, 5.50%, 9/1/33 | | | 103,754 |
| | 231,736 | | Pool #259879, 5.50%, 10/1/33 | | | 242,690 |
| | 134,802 | | Pool #259884, 5.50%, 11/1/33 | | | 141,173 |
| | | | | | |
Principal
Amount | | | | Value |
| $ | 48,109 | | Pool #259886, 5.50%, 10/1/33 | | $ | 50,383 |
| | 110,642 | | Pool #259889, 5.50%, 11/1/33 | | | 115,872 |
| | 283,998 | | Pool #259903, 5.50%, 11/1/33 | | | 297,421 |
| | 42,040 | | Pool #259904, 5.50%, 11/1/33 | | | 44,027 |
| | 328,407 | | Pool #259906, 5.50%, 11/1/33 | | | 343,930 |
| | 240,274 | | Pool #259908, 5.50%, 11/1/33 | | | 251,631 |
| | 150,775 | | Pool #259926, 5.50%, 12/1/33 | | | 157,901 |
| | 65,019 | | Pool #259928, 5.50%, 12/1/33 | | | 68,092 |
| | 321,092 | | Pool #259930, 5.00%, 11/1/33 | | | 334,011 |
| | 175,139 | | Pool #259936, 5.50%, 11/1/33 | | | 183,417 |
| | 232,826 | | Pool #259938, 5.50%, 12/1/33 | | | 243,830 |
| | 25,675 | | Pool #259939, 5.50%, 11/1/33 | | | 26,889 |
| | 142,412 | | Pool #259944, 5.50%, 1/1/34 | | | 148,965 |
| | 110,997 | | Pool #259946, 5.50%, 12/1/33 | | | 116,243 |
| | 288,847 | | Pool #259961, 5.50%, 3/1/34 | | | 302,139 |
| | 258,585 | | Pool #259962, 5.50%, 3/1/34 | | | 270,484 |
| | 431,384 | | Pool #259976, 5.00%, 3/1/34 | | | 448,336 |
| | 148,066 | | Pool #259977, 5.00%, 3/1/34 | | | 153,885 |
| | 49,460 | | Pool #259998, 5.00%, 3/1/34 | | | 51,403 |
| | 763,305 | | Pool #380307, 6.53%, 6/1/16 | | | 832,750 |
| | 656,528 | | Pool #381985, 7.97%, 9/1/17 | | | 762,152 |
| | 575,723 | | Pool #382373, 7.58%, 5/1/18 | | | 671,676 |
| | 621,433 | | Pool #383765, 6.70%, 6/1/19 | | | 701,447 |
| | 1,129,565 | | Pool #383783, 6.38%, 5/1/11 | | | 1,191,900 |
| | 1,001,369 | | Pool #385869, 5.41%, 2/1/21 | | | 1,050,262 |
| | 2,403,159 | | Pool #386129, 5.43%, 5/1/21 | | | 2,519,534 |
| | 2,446,044 | | Pool #386602, 4.66%, 10/1/13 | | | 2,547,382 |
| | 4,755,859 | | Pool #386608, 5.37%, 11/1/21 | | | 4,965,968 |
| | 2,756,986 | | Pool #386641, 5.80%, 12/1/33 | | | 2,907,888 |
| | 725,980 | | Pool #386674, 5.51%, 11/1/21 | | | 765,294 |
| | 463,733 | | Pool #386862, 4.78%, 5/1/14 | | | 482,661 |
| | 3,708,550 | | Pool #387374, 5.60%, 5/1/23 | | | 4,008,498 |
| | 928,550 | | Pool #387446, 5.22%, 6/1/20 | | | 972,356 |
| | 948,063 | | Pool #387472, 4.89%, 6/1/15 | | | 996,168 |
| | 9,549,406 | | Pool #387590, 4.90%, 9/1/15 | | | 10,042,242 |
| | 366,074 | | Pool #557295, 7.00%, 12/1/29 | | | 397,211 |
| | 31,564 | | Pool #572424, 6.50%, 3/1/31 | | | 33,699 |
| | 56,708 | | Pool #575886, 7.50%, 1/1/31 | | | 61,686 |
| | 106,391 | | Pool #576445, 6.00%, 1/1/31 | | | 112,431 |
| | 62,389 | | Pool #576520, 5.50%, 3/1/16 | | | 65,893 |
| | 57,961 | | Pool #577906, 6.50%, 4/1/31 | | | 61,882 |
| | 244,762 | | Pool #579402, 6.50%, 4/1/31 | | | 261,472 |
| | 386,065 | | Pool #583728, 6.50%, 6/1/31 | | | 412,181 |
| | 240,856 | | Pool #585148, 6.50%, 7/1/31 | | | 257,149 |
| | 2,254 | | Pool #586115, 7.00%, 10/1/30 | | | 2,440 |
| | 232,747 | | Pool #590931, 6.50%, 7/1/31 | | | 248,637 |
| | 171,741 | | Pool #590932, 6.50%, 7/1/31 | | | 183,359 |
| | 273,375 | | Pool #590933, 6.50%, 7/1/31 | | | 292,039 |
| | 62,523 | | Pool #591063, 6.50%, 7/1/31 | | | 66,752 |
| | 316,960 | | Pool #601865, 6.50%, 4/1/31 | | | 339,590 |
| | 194,720 | | Pool #601868, 6.00%, 7/1/29 | | | 206,261 |
| | 279,649 | | Pool #607611, 6.50%, 11/1/31 | | | 298,566 |
| | 135,812 | | Pool #613125, 6.50%, 10/1/31 | | | 144,999 |
| | 95,824 | | Pool #624103, 6.00%, 2/1/32 | | | 101,264 |
|
SCHEDULE OF PORTFOLIO INVESTMENTS |
Access Capital Community Investment Fund (cont.)
March 31, 2009 (Unaudited)
| | | | | |
Principal
Amount | | | | Value |
| $ | 1,055,930 | | Pool #634271, 6.50%, 5/1/32 | | $1,126,041 |
| | 350,219 | | Pool #640146, 5.00%, 12/1/17 | | 368,088 |
| | 160,673 | | Pool #644232, 6.50%, 6/1/32 | | 171,542 |
| | 158,344 | | Pool #644250, 6.00%, 8/1/32 | | 167,135 |
| | 228,308 | | Pool #644432, 6.50%, 7/1/32 | | 244,609 |
| | 54,728 | | Pool #644437, 6.50%, 6/1/32 | | 58,361 |
| | 333,630 | | Pool #644444, 6.50%, 6/1/32 | | 355,782 |
| | 235,892 | | Pool #647461, 6.00%, 6/1/32 | | 248,989 |
| | 410,639 | | Pool #656797, 6.00%, 10/1/32 | | 435,490 |
| | 484,655 | | Pool #656835, 5.50%, 11/1/32 | | 510,138 |
| | 124,777 | | Pool #657250, 6.00%, 10/1/32 | | 131,704 |
| | 5,550,452 | | Pool #663159, 5.00%, 7/1/32 | | 5,799,615 |
| | 109,294 | | Pool #666206, 5.50%, 9/1/32 | | 114,494 |
| | 302,850 | | Pool #670278, 5.50%, 11/1/32 | | 317,259 |
| | 154,622 | | Pool #670285, 5.50%, 12/1/32 | | 161,978 |
| | 260,034 | | Pool #676702, 5.50%, 11/1/32 | | 272,406 |
| | 288,038 | | Pool #677591, 5.50%, 12/1/32 | | 301,743 |
| | 1,072,111 | | Pool #679004, 5.00%, 9/1/32 | | 1,116,085 |
| | 869,705 | | Pool #679006, 6.00%, 8/1/32 | | 917,988 |
| | 212,806 | | Pool #681752, 5.50%, 12/1/32 | | 223,994 |
| | 317,479 | | Pool #681819, 5.50%, 1/1/33 | | 332,485 |
| | 1,423,660 | | Pool #681883, 6.00%, 3/1/33 | | 1,501,808 |
| | 487,455 | | Pool #683087, 5.00%, 1/1/18 | | 512,325 |
| | 489,773 | | Pool #684570, 5.00%, 12/1/32 | | 509,862 |
| | 418,509 | | Pool #684644, 4.50%, 6/1/18 | | 436,069 |
| | 474,986 | | Pool #686542, 5.50%, 3/1/33 | | 498,574 |
| | 218,990 | | Pool #686544, 5.50%, 2/1/33 | | 229,409 |
| | 603,412 | | Pool #686565, 5.50%, 4/1/33 | | 631,933 |
| | 357,009 | | Pool #688972, 5.50%, 4/1/33 | | 373,883 |
| | 588,457 | | Pool #689034, 5.00%, 5/1/33 | | 612,134 |
| | 481,608 | | Pool #689667, 5.50%, 4/1/33 | | 504,522 |
| | 508,046 | | Pool #695960, 5.00%, 1/1/33 | | 528,884 |
| | 883,913 | | Pool #695961, 5.50%, 1/1/33 | | 925,968 |
| | 338,329 | | Pool #695962, 6.00%, 11/1/32 | | 357,112 |
| | 111,972 | | Pool #695963, 6.50%, 11/1/32 | | 119,407 |
| | 932,653 | | Pool #696407, 5.50%, 4/1/33 | | 976,736 |
| | 3,099,327 | | Pool #702478, 5.50%, 6/1/33 | | 3,245,818 |
| | 872,689 | | Pool #702479, 5.00%, 6/1/33 | | 907,801 |
| | 498,628 | | Pool #703210, 5.50%, 9/1/32 | | 523,390 |
| | 1,027,556 | | Pool #703851, 5.50%, 4/1/33 | | 1,076,124 |
| | 228,360 | | Pool #705576, 5.50%, 5/1/33 | | 239,153 |
| | 1,405,666 | | Pool #720025, 5.00%, 8/1/33 | | 1,462,222 |
| | 1,534,511 | | Pool #723066, 5.00%, 4/1/33 | | 1,596,251 |
| | 1,069,855 | | Pool #723067, 5.50%, 5/1/33 | | 1,120,423 |
| | 821,742 | | Pool #723068, 4.50%, 5/1/33 | | 848,874 |
| | 863,299 | | Pool #723070, 4.50%, 5/1/33 | | 889,240 |
| | 813,330 | | Pool #723074, 4.50%, 5/1/33 | | 837,769 |
| | 863,445 | | Pool #723328, 5.00%, 9/1/33 | | 898,185 |
| | 206,906 | | Pool #723728, 5.00%, 7/1/33 | | 215,231 |
| | 237,004 | | Pool #723730, 5.50%, 7/1/33 | | 248,207 |
| | 797,755 | | Pool #727311, 4.50%, 9/1/33 | | 821,726 |
| | 3,841,801 | | Pool #727312, 5.00%, 9/1/33 | | 3,996,373 |
| | 593,957 | | Pool #727315, 6.00%, 10/1/33 | | 627,333 |
| | 710,483 | | Pool #728648, 5.00%, 7/1/33 | | 739,069 |
| | | | | | |
Principal
Amount | | | | Value |
| $ | 1,822,048 | | Pool #737198, 5.00%, 8/1/33 | | $ | 1,895,356 |
| | 1,809,184 | | Pool #737250, 5.00%, 8/1/33 | | | 1,881,975 |
| | 1,521,160 | | Pool #738589, 5.00%, 9/1/33 | | | 1,582,363 |
| | 452,746 | | Pool #738683, 5.00%, 9/1/33 | | | 470,962 |
| | 1,648,752 | | Pool #739269, 5.00%, 9/1/33 | | | 1,715,088 |
| | 488,625 | | Pool #743593, 5.50%, 10/1/33 | | | 511,720 |
| | 547,297 | | Pool #743595, 5.50%, 10/1/33 | | | 573,166 |
| | 318,514 | | Pool #748041, 4.50%, 10/1/33 | | | 328,658 |
| | 1,227,585 | | Pool #749891, 5.00%, 9/1/33 | | | 1,276,976 |
| | 867,460 | | Pool #749897, 4.50%, 9/1/33 | | | 893,527 |
| | 607,154 | | Pool #750984, 5.00%, 12/1/18 | | | 637,562 |
| | 570,749 | | Pool #751008, 5.00%, 12/1/18 | | | 599,334 |
| | 664,342 | | Pool #753533, 5.00%, 11/1/33 | | | 691,071 |
| | 1,408,695 | | Pool #755510, 4.00%, 12/1/18 | | | 1,451,748 |
| | 318,590 | | Pool #755679, 6.00%, 1/1/34 | | | 336,078 |
| | 523,957 | | Pool #755745, 5.00%, 1/1/34 | | | 545,038 |
| | 552,712 | | Pool #755746, 5.50%, 12/1/33 | | | 578,837 |
| | 403,376 | | Pool #755780, 5.50%, 2/1/34 | | | 421,937 |
| | 560,010 | | Pool #763551, 5.50%, 3/1/34 | | | 586,227 |
| | 1,358,016 | | Pool #763820, 5.50%, 1/1/34 | | | 1,420,506 |
| | 695,679 | | Pool #763824, 5.00%, 3/1/34 | | | 723,017 |
| | 678,009 | | Pool #765216, 5.00%, 1/1/19 | | | 710,271 |
| | 819,108 | | Pool #765217, 4.50%, 1/1/19 | | | 852,452 |
| | 467,918 | | Pool #765296, 5.00%, 2/1/34 | | | 486,305 |
| | 573,451 | | Pool #765306, 5.00%, 2/1/19 | | | 601,311 |
| | 131,272 | | Pool #770099, 5.50%, 2/1/34 | | | 137,312 |
| | 478,657 | | Pool #773084, 4.50%, 3/1/19 | | | 498,142 |
| | 449,190 | | Pool #773091, 4.00%, 3/1/19 | | | 461,514 |
| | 454,833 | | Pool #773096, 4.50%, 3/1/19 | | | 473,348 |
| | 842,236 | | Pool #773175, 5.00%, 5/1/34 | | | 875,333 |
| | 343,090 | | Pool #773188, 6.00%, 7/1/34 | | | 361,494 |
| | 740,488 | | Pool #773476, 5.50%, 7/1/19 | | | 779,302 |
| | 796,219 | | Pool #773547, 5.00%, 5/1/34 | | | 827,508 |
| | 857,504 | | Pool #773553, 5.00%, 4/1/34 | | | 891,202 |
| | 1,135,164 | | Pool #773568, 5.50%, 5/1/34 | | | 1,187,399 |
| | 487,258 | | Pool #773575, 6.00%, 7/1/34 | | | 513,396 |
| | 783,134 | | Pool #776849, 5.00%, 11/1/34 | | | 813,908 |
| | 970,735 | | Pool #776850, 5.50%, 11/1/34 | | | 1,015,404 |
| | 397,847 | | Pool #776851, 6.00%, 10/1/34 | | | 419,188 |
| | 975,925 | | Pool #777444, 5.50%, 5/1/34 | | | 1,020,833 |
| | 3,073,011 | | Pool #777621, 5.00%, 2/1/34 | | | 3,196,652 |
| | 1,216,541 | | Pool #777622, 5.00%, 1/1/34 | | | 1,265,488 |
| | 874,346 | | Pool #777627, 5.00%, 2/1/34 | | | 909,525 |
| | 438,018 | | Pool #779124, 5.00%, 5/1/34 | | | 455,230 |
| | 477,964 | | Pool #781437, 6.00%, 8/1/34 | | | 503,603 |
| | 760,671 | | Pool #781741, 6.00%, 9/1/34 | | | 801,476 |
| | 757,888 | | Pool #781907, 5.00%, 2/1/21 | | | 791,583 |
| | 1,170,116 | | Pool #781954, 5.00%, 6/1/34 | | | 1,216,098 |
| | 958,482 | | Pool #781959, 5.50%, 6/1/34 | | | 1,002,587 |
| | 684,919 | | Pool #781960, 5.50%, 6/1/34 | | | 716,436 |
| | 758,720 | | Pool #783893, 5.50%, 12/1/34 | | | 793,633 |
| | 986,737 | | Pool #783929, 5.50%, 10/1/34 | | | 1,032,142 |
| | 401,589 | | Pool #788329, 6.50%, 8/1/34 | | | 426,998 |
| | 185,911 | | Pool #790282, 6.00%, 7/1/34 | | | 195,884 |
|
SCHEDULE OF PORTFOLIO INVESTMENTS |
Access Capital Community Investment Fund (cont.)
March 31, 2009 (Unaudited)
| | | | | | |
Principal
Amount | | | | Value |
| $ | 401,628 | | Pool #797623, 5.00%, 7/1/35 | | $ | 417,348 |
| | 175,794 | | Pool #797626, 5.50%, 7/1/35 | | | 183,718 |
| | 208,638 | | Pool #797627, 5.00%, 7/1/35 | | | 216,804 |
| | 266,302 | | Pool #797674, 5.50%, 9/1/35 | | | 278,307 |
| | 1,468,525 | | Pool #798725, 5.50%, 11/1/34 | | | 1,536,100 |
| | 475,084 | | Pool #799547, 5.50%, 9/1/34 | | | 496,945 |
| | 353,414 | | Pool #799548, 6.00%, 9/1/34 | | | 372,814 |
| | 3,820,741 | | Pool #806754, 4.50%, 9/1/34 | | | 3,931,968 |
| | 1,269,461 | | Pool #806757, 6.00%, 9/1/34 | | | 1,337,558 |
| | 4,054,189 | | Pool #806759, 4.50%, 9/1/34 | | | 4,175,050 |
| | 5,988,882 | | Pool #806761, 5.50%, 9/1/34 | | | 6,264,465 |
| | 591,658 | | Pool #808185, 5.50%, 3/1/35 | | | 618,329 |
| | 1,157,803 | | Pool #808205, 5.00%, 1/1/35 | | | 1,203,120 |
| | 96,449 | | Pool #813941, 4.50%, 11/1/20 | | | 100,134 |
| | 116,460 | | Pool #813942, 5.00%, 11/1/20 | | | 121,783 |
| | 2,332,748 | | Pool #815009, 5.00%, 4/1/35 | | | 2,424,054 |
| | 1,276,736 | | Pool #817641, 5.00%, 11/1/35 | | | 1,326,708 |
| | 1,342,262 | | Pool #820334, 5.00%, 9/1/35 | | | 1,394,799 |
| | 1,219,479 | | Pool #820335, 5.00%, 9/1/35 | | | 1,267,210 |
| | 752,470 | | Pool #820336, 5.00%, 9/1/35 | | | 782,862 |
| | 1,429,565 | | Pool #822008, 5.00%, 5/1/35 | | | 1,485,519 |
| | 859,456 | | Pool #822891, 6.00%, 1/1/36 | | | 903,545 |
| | 1,939,414 | | Pool #829005, 5.00%, 8/1/35 | | | 2,015,323 |
| | 226,374 | | Pool #829006, 5.50%, 9/1/35 | | | 236,579 |
| | 492,683 | | Pool #829007, 4.50%, 8/1/35 | | | 506,641 |
| | 190,014 | | Pool #829117, 5.50%, 9/1/35 | | | 198,579 |
| | 90,669 | | Pool #829118, 5.50%, 9/1/35 | | | 94,756 |
| | 1,085,985 | | Pool #829274, 5.00%, 8/1/35 | | | 1,128,491 |
| | 1,467,402 | | Pool #829275, 5.00%, 8/1/35 | | | 1,524,837 |
| | 1,488,679 | | Pool #829276, 5.00%, 8/1/35 | | | 1,546,947 |
| | 1,277,388 | | Pool #829277, 5.00%, 8/1/35 | | | 1,327,385 |
| | 216,808 | | Pool #829356, 5.00%, 9/1/35 | | | 225,294 |
| | 3,629,800 | | Pool #829649, 5.50%, 3/1/35 | | | 3,796,827 |
| | 1,732,594 | | Pool #835287, 5.00%, 8/1/35 | | | 1,800,409 |
| | 265,646 | | Pool #843586, 5.50%, 11/1/35 | | | 277,621 |
| | 279,574 | | Pool #843587, 6.00%, 12/1/35 | | | 294,046 |
| | 5,063,887 | | Pool #844361, 5.50%, 11/1/35 | | | 5,292,158 |
| | 1,108,854 | | Pool #845245, 5.50%, 11/1/35 | | | 1,158,839 |
| | 660,167 | | Pool #845246, 5.00%, 11/1/35 | | | 686,006 |
| | 2,602,081 | | Pool #866969, 6.00%, 2/1/36 | | | 2,735,565 |
| | 830,803 | | Pool #867410, 5.50%, 4/1/36 | | | 867,475 |
| | 365,492 | | Pool #867569, 6.00%, 2/1/36 | | | 384,241 |
| | 512,225 | | Pool #867574, 5.50%, 2/1/36 | | | 534,835 |
| | 915,296 | | Pool #868849, 6.00%, 4/1/36 | | | 962,249 |
| | 983,800 | | Pool #870599, 6.00%, 6/1/36 | | | 1,034,267 |
| | 817,796 | | Pool #870684, 6.00%, 7/1/36 | | | 859,748 |
| | 1,105,856 | | Pool #871072, 5.50%, 2/1/37 | | | 1,154,434 |
| | 776,029 | | Pool #873819, 6.39%, 8/1/24 | | | 880,212 |
| | 5,208,918 | | Pool #874136, 5.57%, 12/1/16 | | | 5,670,986 |
| | 3,305,486 | | Pool #874900, 5.45%, 10/1/17 | | | 3,572,427 |
| | 1,055,417 | | Pool #881425, 6.00%, 7/1/36 | | | 1,109,559 |
| | 872,386 | | Pool #882044, 6.00%, 5/1/36 | | | 917,548 |
| | 549,337 | | Pool #883589, 6.00%, 4/1/36 | | | 577,517 |
| | 748,339 | | Pool #884693, 5.50%, 4/1/36 | | | 781,371 |
| | | | | |
Principal
Amount | | | | Value |
| $4,296,935 | | Pool #885724, 5.50%, 6/1/36 | | $ | 4,486,604 |
| 921,085 | | Pool #899800, 6.00%, 8/1/37 | | | 968,296 |
| 907,176 | | Pool #901412, 6.00%, 8/1/36 | | | 953,714 |
| 1,218,513 | | Pool #905438, 6.00%, 11/1/36 | | | 1,281,021 |
| 838,956 | | Pool #907646, 6.00%, 1/1/37 | | | 881,994 |
| 1,074,844 | | Pool #908671, 6.00%, 1/1/37 | | | 1,129,982 |
| 1,660,613 | | Pool #908672, 5.50%, 1/1/37 | | | 1,733,913 |
| 1,629,338 | | Pool #911730, 5.50%, 12/1/21 | | | 1,709,651 |
| 1,217,609 | | Pool #913995, 6.01%, 2/1/37(b) | | | 1,268,639 |
| 1,282,968 | | Pool #914428, 5.50%, 2/1/37 | | | 1,339,326 |
| 919,842 | | Pool #915944, 5.50%, 3/1/37 | | | 960,249 |
| 1,052,763 | | Pool #919368, 5.50%, 4/1/37 | | | 1,099,009 |
| 1,055,530 | | Pool #920972, 5.95%, 1/1/37(b) | | | 1,098,115 |
| 1,503,015 | | Pool #922582, 6.00%, 12/1/36 | | | 1,580,118 |
| 1,003,345 | | Pool #939465, 5.50%, 6/1/37 | | | 1,047,420 |
| 2,293,219 | | Pool #941204, 5.50%, 6/1/37 | | | 2,393,956 |
| 1,151,448 | | Pool #941205, 5.00%, 5/1/37 | | | 1,195,437 |
| 1,350,763 | | Pool #941206, 5.50%, 5/1/37 | | | 1,410,099 |
| 802,548 | | Pool #941487, 6.00%, 8/1/37 | | | 843,171 |
| 942,429 | | Pool #943394, 5.50%, 6/1/37 | | | 983,828 |
| 1,738,437 | | Pool #944502, 6.00%, 6/1/37 | | | 1,827,616 |
| 911,013 | | Pool #945853, 6.00%, 7/1/37 | | | 957,127 |
| 1,043,082 | | Pool #948600, 6.00%, 8/1/37 | | | 1,095,880 |
| 1,080,148 | | Pool #948672, 5.50%, 8/1/37 | | | 1,128,353 |
| 2,420,172 | | Pool #952598, 6.00%, 7/1/37 | | | 2,544,324 |
| 1,310,664 | | Pool #952623, 6.00%, 8/1/37 | | | 1,377,006 |
| 2,392,694 | | Pool #952632, 6.00%, 7/1/37 | | | 2,513,807 |
| 985,966 | | Pool #952649, 6.00%, 7/1/37 | | | 1,036,545 |
| 1,336,778 | | Pool #952659, 6.00%, 8/1/37 | | | 1,405,353 |
| 943,729 | | Pool #952665, 6.00%, 8/1/37 | | | 991,498 |
| 934,945 | | Pool #952678, 6.50%, 8/1/37 | | | 990,687 |
| 649,927 | | Pool #952693, 6.50%, 8/1/37 | | | 688,677 |
| 1,408,296 | | Pool #956050, 6.00%, 12/1/37 | | | 1,482,257 |
| 2,674,317 | | Pool #957324, 5.43%, 5/1/18 | | | 2,823,394 |
| 1,001,918 | | Pool #960919, 5.00%, 2/1/38 | | | 1,039,981 |
| 638,586 | | Pool #965239, 5.84%, 9/1/38 | | | 669,458 |
| 866,667 | | Pool #972648, 5.50%, 2/1/38 | | | 904,738 |
| 1,146,845 | | Pool #975137, 5.00%, 5/1/38 | | | 1,191,745 |
| 1,102,540 | | Pool #975769, 5.50%, 3/1/38 | | | 1,151,739 |
| 1,158,107 | | Pool #982656, 5.50%, 6/1/38 | | | 1,208,981 |
| 1,121,344 | | Pool #982898, 5.00%, 5/1/38 | | | 1,163,945 |
| 1,142,848 | | Pool #983033, 5.00%, 5/1/38 | | | 1,186,265 |
| 1,403,541 | | Pool #984842, 5.50%, 6/1/38 | | | 1,465,196 |
| 1,014,864 | | Pool #986230, 5.00%, 7/1/38 | | | 1,053,634 |
| 2,271,443 | | Pool #986957, 5.50%, 7/1/38 | | | 2,377,373 |
| 1,629,508 | | Pool #986958, 5.50%, 7/1/38 | | | 1,701,089 |
| 689,069 | | Pool #986985, 5.00%, 7/1/23 | | | 719,256 |
| 2,190,052 | | Pool #990510, 5.50%, 8/1/38 | | | 2,286,257 |
| 1,756,408 | | Pool #990511, 6.00%, 8/1/38 | | | 1,845,314 |
| 1,375,781 | | Pool #990617, 5.50%, 9/1/38 | | | 1,439,243 |
| 1,451,821 | | Pool #AA0525, 5.50%, 12/1/38 | | | 1,522,855 |
| 2,794,688 | | Pool #AA0526, 5.00%, 12/1/38 | | | 2,900,860 |
| 8,011,388 | | Pool #AA0527, 5.50%, 12/1/38 | | | 8,363,313 |
| 1,030,554 | | Pool #AA0643, 4.00%, 3/1/39 | | | 1,042,965 |
|
SCHEDULE OF PORTFOLIO INVESTMENTS |
Access Capital Community Investment Fund (cont.)
March 31, 2009 (Unaudited)
| | | | | |
Principal
Amount | | | | Value |
| $1,216,875 | | Pool #AA0644, 4.50%, 3/1/39 | | $ | 1,251,091 |
| 1,350,982 | | Pool #AA0645, 4.50%, 3/1/39 | | | 1,388,833 |
| 2,876,263 | | Pool #AA0814, 5.50%, 12/1/38 | | | 3,002,612 |
| 2,070,473 | | Pool #AA3142, 4.50%, 3/1/39 | | | 2,128,483 |
| 1,121,099 | | Pool #AA3143, 4.00%, 3/1/39 | | | 1,134,197 |
| 1,745,406 | | Pool #MC0007, 5.50%, 12/1/38 | | | 1,813,352 |
| 281,957 | | Pool #MC0013, 5.50%, 12/1/38 | | | 292,933 |
| 133,593 | | Pool #MC0014, 5.50%, 12/1/38 | | | 138,793 |
| 70,953 | | Pool #MC0015, 6.00%, 11/1/38 | | | 74,189 |
| 86,152 | | Pool #MC0016, 5.50%, 11/1/38 | | | 89,506 |
| 607,300 | | Pool #MC0038, 4.50%, 3/1/39 | | | 624,315 |
| 255,469 | | Pool #MC3344, 5.00%, 12/1/38 | | | 263,897 |
| | | | | |
| | | | | 392,709,564 |
| | | | | |
Freddie Mac — 27.45% |
| 431,454 | | Pool #A10124, 5.00%, 6/1/33 | | | 448,936 |
| 562,579 | | Pool #A10548, 5.00%, 6/1/33 | | | 585,374 |
| 1,668,551 | | Pool #A12237, 5.00%, 8/1/33 | | | 1,736,157 |
| 587,752 | | Pool #A12969, 4.50%, 8/1/33 | | | 604,753 |
| 934,070 | | Pool #A12985, 5.00%, 8/1/33 | | | 971,917 |
| 669,974 | | Pool #A12986, 5.00%, 8/1/33 | | | 697,120 |
| 954,838 | | Pool #A12987, 5.00%, 8/1/33 | | | 993,525 |
| 1,001,651 | | Pool #A14028, 4.50%, 9/1/33 | | | 1,030,625 |
| 1,623,276 | | Pool #A14325, 5.00%, 9/1/33 | | | 1,689,047 |
| 392,366 | | Pool #A15268, 6.00%, 10/1/33 | | | 414,026 |
| 1,510,389 | | Pool #A15579, 5.50%, 11/1/33 | | | 1,581,498 |
| 709,892 | | Pool #A17393, 5.50%, 12/1/33 | | | 743,313 |
| 806,173 | | Pool #A17397, 5.50%, 1/1/34 | | | 843,120 |
| 1,245,346 | | Pool #A18617, 5.50%, 1/1/34 | | | 1,302,420 |
| 568,320 | | Pool #A19019, 5.50%, 2/1/34 | | | 594,367 |
| 493,668 | | Pool #A19362, 5.50%, 2/1/34 | | | 516,293 |
| 500,421 | | Pool #A20069, 5.00%, 3/1/34 | | | 520,228 |
| 1,117,696 | | Pool #A20070, 5.50%, 3/1/34 | | | 1,168,920 |
| 1,459,049 | | Pool #A20540, 5.50%, 4/1/34 | | | 1,525,917 |
| 569,478 | | Pool #A20541, 5.50%, 4/1/34 | | | 595,578 |
| 855,661 | | Pool #A21679, 5.50%, 4/1/34 | | | 894,876 |
| 1,410,383 | | Pool #A21681, 5.00%, 4/1/34 | | | 1,466,206 |
| 777,324 | | Pool #A23192, 5.00%, 5/1/34 | | | 808,091 |
| 2,205,354 | | Pool #A25310, 5.00%, 6/1/34 | | | 2,292,642 |
| 750,658 | | Pool #A25311, 5.00%, 6/1/34 | | | 780,369 |
| 681,338 | | Pool #A25600, 5.50%, 8/1/34 | | | 712,564 |
| 174,703 | | Pool #A26269, 5.50%, 8/1/34 | | | 182,710 |
| 90,244 | | Pool #A26270, 6.00%, 8/1/34 | | | 95,176 |
| 56,504 | | Pool #A26386, 6.00%, 9/1/34 | | | 59,552 |
| 810,653 | | Pool #A26395, 6.00%, 9/1/34 | | | 854,391 |
| 949,960 | | Pool #A26396, 5.50%, 9/1/34 | | | 993,497 |
| 1,880,054 | | Pool #A28241, 5.50%, 10/1/34 | | | 1,966,217 |
| 1,138,864 | | Pool #A30055, 5.00%, 11/1/34 | | | 1,183,941 |
| 1,716,996 | | Pool #A30056, 5.50%, 12/1/34 | | | 1,795,686 |
| 747,151 | | Pool #A30591, 6.00%, 12/1/34 | | | 787,463 |
| 772,211 | | Pool #A31135, 5.50%, 12/1/34 | | | 807,602 |
| 569,643 | | Pool #A32976, 5.50%, 8/1/35 | | | 595,216 |
| 992,660 | | Pool #A33167, 5.00%, 1/1/35 | | | 1,031,950 |
| 2,318,849 | | Pool #A34999, 5.50%, 4/1/35 | | | 2,422,948 |
| | | | | | |
Principal
Amount | | | | Value |
| $ | 742,170 | | Pool #A35628, 5.50%, 6/1/35 | | $ | 775,488 |
| | 2,133,527 | | Pool #A37185, 5.00%, 9/1/35 | | | 2,216,639 |
| | 2,087,884 | | Pool #A38830, 5.00%, 5/1/35 | | | 2,169,218 |
| | 763,420 | | Pool #A39561, 5.50%, 11/1/35 | | | 797,692 |
| | 2,245,021 | | Pool #A40538, 5.00%, 12/1/35 | | | 2,332,476 |
| | 489,151 | | Pool #A41442, 5.50%, 12/1/35 | | | 511,399 |
| | 993,681 | | Pool #A42095, 5.50%, 1/1/36 | | | 1,038,290 |
| | 1,550,533 | | Pool #A42097, 5.00%, 1/1/36 | | | 1,611,155 |
| | 554,639 | | Pool #A42098, 5.50%, 1/1/36 | | | 579,539 |
| | 549,497 | | Pool #A42099, 6.00%, 1/1/36 | | | 578,115 |
| | 874,979 | | Pool #A42802, 5.00%, 2/1/36 | | | 909,064 |
| | 2,055,968 | | Pool #A42803, 5.50%, 2/1/36 | | | 2,148,265 |
| | 1,130,471 | | Pool #A42804, 6.00%, 2/1/36 | | | 1,189,346 |
| | 1,262,398 | | Pool #A42805, 6.00%, 2/1/36 | | | 1,328,144 |
| | 638,575 | | Pool #A44637, 5.50%, 4/1/36 | | | 667,182 |
| | 811,662 | | Pool #A44638, 6.00%, 4/1/36 | | | 853,680 |
| | 1,161,421 | | Pool #A45396, 5.00%, 6/1/35 | | | 1,207,390 |
| | 1,001,024 | | Pool #A46321, 5.50%, 7/1/35 | | | 1,045,963 |
| | 1,801,648 | | Pool #A46735, 5.00%, 8/1/35 | | | 1,871,831 |
| | 1,223,800 | | Pool #A46746, 5.50%, 8/1/35 | | | 1,278,740 |
| | 781,794 | | Pool #A46747, 5.50%, 8/1/35 | | | 816,891 |
| | 1,049,827 | | Pool #A46748, 5.50%, 8/1/35 | | | 1,096,957 |
| | 556,167 | | Pool #A46996, 5.50%, 9/1/35 | | | 581,135 |
| | 1,061,251 | | Pool #A46997, 5.50%, 9/1/35 | | | 1,109,888 |
| | 1,471,346 | | Pool #A47552, 5.00%, 11/1/35 | | | 1,528,662 |
| | 1,062,877 | | Pool #A47553, 5.00%, 11/1/35 | | | 1,104,281 |
| | 827,052 | | Pool #A47554, 5.50%, 11/1/35 | | | 864,180 |
| | 838,699 | | Pool #A48788, 5.50%, 5/1/36 | | | 875,433 |
| | 1,105,340 | | Pool #A48789, 6.00%, 5/1/36 | | | 1,162,561 |
| | 1,246,476 | | Pool #A49013, 6.00%, 5/1/36 | | | 1,311,003 |
| | 911,539 | | Pool #A49526, 6.00%, 5/1/36 | | | 958,727 |
| | 753,479 | | Pool #A49843, 6.00%, 6/1/36 | | | 792,485 |
| | 1,178,404 | | Pool #A49844, 6.00%, 6/1/36 | | | 1,241,248 |
| | 545,098 | | Pool #A49845, 6.50%, 6/1/36 | | | 578,070 |
| | 1,105,967 | | Pool #A50128, 6.00%, 6/1/36 | | | 1,163,221 |
| | 1,769,411 | | Pool #A59530, 5.50%, 4/1/37 | | | 1,846,810 |
| | 965,154 | | Pool #A59964, 5.50%, 4/1/37 | | | 1,007,372 |
| | 2,350,027 | | Pool #A60751, 5.50%, 5/1/37 | | | 2,452,823 |
| | 1,297,564 | | Pool #A61754, 5.50%, 5/1/37 | | | 1,354,323 |
| | 990,903 | | Pool #A61779, 5.50%, 5/1/37 | | | 1,034,248 |
| | 1,133,374 | | Pool #A61915, 5.50%, 6/1/37 | | | 1,183,518 |
| | 4,157,232 | | Pool #A61916, 6.00%, 6/1/37 | | | 4,371,792 |
| | 4,170,672 | | Pool #A63456, 5.50%, 6/1/37 | | | 4,353,108 |
| | 1,199,691 | | Pool #A64002, 5.50%, 7/1/37 | | | 1,252,169 |
| | 1,449,640 | | Pool #A64012, 5.50%, 7/1/37 | | | 1,513,195 |
| | 1,024,694 | | Pool #A64015, 6.00%, 7/1/37 | | | 1,077,580 |
| | 944,079 | | Pool #A64016, 6.50%, 7/1/37 | | | 1,001,131 |
| | 1,381,174 | | Pool #A64447, 6.00%, 8/1/37 | | | 1,452,458 |
| | 1,626,925 | | Pool #A64450, 6.00%, 8/1/37 | | | 1,710,893 |
| | 289,656 | | Pool #A65713, 6.00%, 9/1/37 | | | 304,606 |
| | 892,313 | | Pool #A65837, 6.00%, 9/1/37 | | | 940,418 |
| | 1,166,999 | | Pool #A66043, 5.50%, 7/1/37 | | | 1,218,112 |
|
SCHEDULE OF PORTFOLIO INVESTMENTS |
Access Capital Community Investment Fund (cont.)
March 31, 2009 (Unaudited)
| | | | | | | | |
Principal
Amount | | | | Value | | |
| $ | 2,598,297 | | Pool #A66061, 5.50%, 8/1/37 | | $ | 2,711,954 | | |
| | 2,154,404 | | Pool #A66116, 6.00%, 9/1/37 | | | 2,265,595 | | |
| | 1,233,917 | | Pool #A66122, 6.00%, 8/1/37 | | | 1,297,601 | | |
| | 1,617,476 | | Pool #A66133, 6.00%, 6/1/37 | | | 1,700,956 | | |
| | 2,399,190 | | Pool #A66156, 6.50%, 9/1/37 | | | 2,544,178 | | |
| | 2,294,773 | | Pool #A67630, 6.00%, 11/1/37 | | | 2,413,209 | | |
| | 1,267,663 | | Pool #A68766, 6.00%, 10/1/37 | | | 1,333,089 | | |
| | 1,008,444 | | Pool #A70292, 5.50%, 7/1/37 | | | 1,052,613 | | |
| | 1,246,847 | | Pool #A73038, 5.50%, 1/1/38 | | | 1,301,387 | | |
| | 1,313,611 | | Pool #A73816, 6.00%, 3/1/38 | | | 1,381,334 | | |
| | 1,171,615 | | Pool #A75113, 5.00%, 3/1/38 | | | 1,215,541 | | |
| | 1,047,327 | | Pool #A76187, 5.00%, 4/1/38 | | | 1,086,594 | | |
| | 854,994 | | Pool #A78354, 5.50%, 11/1/37 | | | 894,658 | | |
| | 1,350,005 | | Pool #A79561, 5.50%, 7/1/38 | | | 1,412,163 | | |
| | 21,484 | | Pool #B31069, 6.50%, 3/1/31 | | | 22,941 | | |
| | 63,785 | | Pool #B31081, 7.00%, 3/1/31 | | | 69,067 | | |
| | 92,870 | | Pool #B31082, 6.00%, 3/1/31 | | | 98,171 | | |
| | 117,344 | | Pool #B31128, 6.00%, 9/1/31 | | | 124,042 | | |
| | 92,945 | | Pool #B31139, 6.50%, 10/1/31 | | | 99,250 | | |
| | 259,632 | | Pool #B31140, 6.50%, 10/1/31 | | | 277,243 | | |
| | 89,292 | | Pool #B31141, 6.50%, 10/1/31 | | | 95,795 | | |
| | 61,753 | | Pool #B31146, 6.50%, 10/1/31 | | | 65,942 | | |
| | 79,887 | | Pool #B31150, 6.50%, 11/1/31 | | | 85,306 | | |
| | 322,461 | | Pool #B31188, 6.00%, 1/1/32 | | | 340,464 | | |
| | 29,614 | | Pool #B31206, 6.00%, 3/1/32 | | | 31,304 | | |
| | 135,684 | | Pool #B31277, 6.50%, 8/1/32 | | | 144,803 | | |
| | 116,838 | | Pool #B31292, 6.00%, 9/1/32 | | | 123,507 | | |
| | 233,461 | | Pool #B31493, 5.00%, 2/1/34 | | | 242,702 | | |
| | 523,087 | | Pool #B31516, 5.00%, 4/1/34 | | | 543,791 | | |
| | 475,237 | | Pool #B31517, 5.00%, 4/1/34 | | | 494,475 | | |
| | 425,512 | | Pool #B31532, 5.00%, 5/1/34 | | | 442,354 | | |
| | 487,697 | | Pool #B31545, 5.00%, 5/1/34 | | | 507,000 | | |
| | 243,059 | | Pool #B31546, 5.50%, 5/1/34 | | | 254,199 | | |
| | 452,892 | | Pool #B31547, 5.50%, 5/1/34 | | | 473,649 | | |
| | 381,601 | | Pool #B31550, 5.00%, 6/1/34 | | | 396,705 | | |
| | 366,245 | | Pool #B31551, 5.50%, 6/1/34 | | | 383,602 | | |
| | 407,764 | | Pool #B31587, 5.00%, 11/1/34 | | | 423,903 | | |
| | 450,022 | | Pool #B31588, 5.50%, 11/1/34 | | | 470,647 | | |
| | 579,816 | | Pool #B31642, 5.50%, 5/1/35 | | | 605,845 | | |
| | 158,894 | | Pool #B50443, 5.00%, 11/1/18 | | | 166,802 | | |
| | 300,484 | | Pool #B50450, 4.50%, 1/1/19 | | | 312,340 | | |
| | 119,422 | | Pool #B50451, 5.00%, 1/1/19 | | | 125,142 | | |
| | 181,953 | | Pool #B50458, 4.50%, 3/1/19 | | | 189,133 | | |
| | 59,874 | | Pool #B50470, 4.50%, 4/1/19 | | | 62,237 | | |
| | 229,053 | | Pool #B50496, 5.50%, 9/1/19 | | | 240,744 | | |
| | 504,011 | | Pool #B50499, 5.00%, 11/1/19 | | | 528,151 | | |
| | 110,953 | | Pool #B50500, 5.50%, 10/1/19 | | | 116,560 | | |
| | 283,104 | | Pool #B50501, 4.50%, 11/1/19 | | | 294,275 | | |
| | 250,571 | | Pool #B50504, 5.50%, 11/1/19 | | | 263,436 | | |
| | 477,868 | | Pool #B50506, 5.00%, 11/1/19 | | | 501,043 | | |
| | | | | | | | | |
Principal
Amount | | | | Value | | | |
| $ | 313,956 | | Pool #C35457, 7.50%, 1/1/30 | | $ | 341,843 | | | |
| | 55,692 | | Pool #C37233, 7.50%, 2/1/30 | | | 60,638 | | | |
| | 92,230 | | Pool #C48137, 7.00%, 1/1/31 | | | 99,868 | | | |
| | 216,070 | | Pool #C48138, 7.00%, 2/1/31 | | | 233,964 | | | |
| | 44,852 | | Pool #C49785, 6.50%, 3/1/31 | | | 47,922 | | | |
| | 102,292 | | Pool #C50288, 6.50%, 4/1/31 | | | 109,295 | | | |
| | 56,360 | | Pool #C50753, 6.00%, 3/1/31 | | | 59,577 | | | |
| | 399,112 | | Pool #C51686, 6.50%, 5/1/31 | | | 426,185 | | | |
| | 199,589 | | Pool #C53210, 6.50%, 6/1/31 | | | 213,128 | | | |
| | 67,361 | | Pool #C53914, 6.50%, 6/1/31 | | | 71,930 | | | |
| | 159,200 | | Pool #C60020, 6.50%, 11/1/31 | | | 169,999 | | | |
| | 358,389 | | Pool #C60804, 6.00%, 11/1/31 | | | 380,279 | | | |
| | 31,239 | | Pool #C62574, 6.50%, 12/1/31 | | | 33,358 | | | |
| | 84,577 | | Pool #C65200, 6.50%, 3/1/32 | | | 90,261 | | | |
| | 138,671 | | Pool #C65616, 6.50%, 3/1/32 | | | 148,077 | | | |
| | 63,923 | | Pool #C68324, 6.50%, 6/1/32 | | | 68,219 | | | |
| | 800,743 | | Pool #C73273, 6.00%, 11/1/32 | | | 845,449 | | | |
| | 553,174 | | Pool #C73525, 6.00%, 11/1/32 | | | 584,335 | | | |
| | 985,348 | | Pool #C74672, 5.50%, 11/1/32 | | | 1,032,046 | | | |
| | 1,034,121 | | Pool #C77844, 5.50%, 3/1/33 | | | 1,082,807 | | | |
| | 171,337 | | Pool #C77845, 5.50%, 3/1/33 | | | 179,403 | | | |
| | 905,730 | | Pool #C78252, 5.50%, 3/1/33 | | | 948,372 | | | |
| | 757,396 | | Pool #C78380, 5.50%, 3/1/33 | | | 793,054 | | | |
| | 434,437 | | Pool #C79177, 5.50%, 5/1/33 | | | 454,890 | | | |
| | 232,128 | | Pool #C79178, 5.50%, 4/1/33 | | | 243,057 | | | |
| | 899,040 | | Pool #J00980, 5.00%, 1/1/21 | | | 939,853 | | | |
| | 865,298 | | Pool #J05466, 5.50%, 6/1/22 | | | 907,496 | | | |
| | 1,338,011 | | Pool #N31468, 6.00%, 11/1/37 | | | 1,392,479 | | | |
| | | | | | | | | |
| | | | | | 150,848,371 | | | |
| | | | | | | | | |
| | Ginnie Mae — 3.10% | | | |
| | 1,055,246 | | Pool #409117, 5.50%, 6/20/38 | | | 1,104,325 | | | |
| | 1,106,866 | | Pool #487643, 5.00%, 2/15/39 | | | 1,155,522 | | | |
| | 1,384,834 | | Pool #514702, 8.25%, 12/15/32 | | | 1,395,541 | | | |
| | 299,636 | | Pool #552186, 6.00%, 12/15/31 | | | 316,944 | | | |
| | 493,810 | | Pool #588448, 6.25%, 9/15/32 | | | 510,409 | | | |
| | 1,923,840 | | Pool #616936, 5.50%, 1/15/36 | | | 2,015,132 | | | |
| | 642,472 | | Pool #617904, 5.75%, 9/15/23 | | | 666,893 | | | |
| | 589,942 | | Pool #624106, 5.13%, 3/15/34 | | | 600,939 | | | |
| | 464,863 | | Pool #664269, 5.85%, 6/15/38 | | | 485,628 | | | |
| | 2,344,293 | | Pool #675509, 5.50%, 6/15/38 | | | 2,454,803 | | | |
| | 881,669 | | Pool #685140, 5.90%, 4/15/38 | | | 928,230 | | | |
| | 1,613,171 | | Pool #697672, 5.50%, 12/15/38 | | | 1,689,217 | | | |
| | 1,195,849 | | Pool #697814, 5.00%, 2/15/39 | | | 1,248,416 | | | |
| | 1,212,669 | | Pool #697885, 4.50%, 3/15/39 | | | 1,248,693 | | | |
| | 1,186,061 | | Pool #699294, 5.63%, 9/20/38 | | | 1,237,468 | | | |
| | | | | | | | | |
| | | | | | 17,058,160 | | | |
| | | | | | | | | |
| Total U.S. Government Agency Backed
Mortgages
(Cost $536,494,257) | | | 560,616,095 | | | |
| | | | | | | | | |
|
SCHEDULE OF PORTFOLIO INVESTMENTS |
Access Capital Community Investment Fund (cont.)
March 31, 2009 (Unaudited)
| | | | | | |
Principal
Amount | | | | Value |
| | U.S. Government Agency Obligations — 11.80% |
| | Community Reinvestment Revenue Notes — 1.48% |
| $ | 1,661,475 | | 3.39%, 8/1/35(a) | | $ | 1,504,278 |
| | 7,250,000 | | 3.98%, 8/1/35(a) | | | 6,630,051 |
| | | | | | |
| | | | | | 8,134,329 |
| | | | | | |
| | Small Business Administration — 6.19% |
| | 286,521 | | 0.55%, 4/25/28(b) | | | 277,582 |
| | 706,959 | | 0.55%, 3/25/29(b) | | | 684,644 |
| | 2,135,529 | | 0.55%, 9/25/30(b) | | | 2,076,974 |
| | 301,766 | | 0.60%, 3/25/28(b) | | | 292,891 |
| | 573,800 | | 0.60%, 11/25/29(b) | | | 556,565 |
| | 454,563 | | 0.63%, 6/25/18(b) | | | 444,031 |
| | 1,196,720 | | 0.63%, 4/15/32(c) | | | 1,182,658 |
| | 100,474 | | 0.65%, 10/25/10(b) | | | 99,761 |
| | 976,361 | | 0.65%, 3/25/14(b) | | | 961,014 |
| | 462,264 | | 0.66%, 7/15/32(c) | | | 459,830 |
| | 216,347 | | 0.66%, 4/15/26(c) | | | 214,673 |
| | 1,225,823 | | 0.66%, 12/15/24(c) | | | 1,219,367 |
| | 1,031,206 | | 0.80%, 11/15/26(c) | | | 1,010,133 |
| | 1,369,213 | | 0.80%, 4/15/33(c) | | | 1,341,231 |
| | 179,955 | | 0.80%, 9/15/32(c) | | | 179,007 |
| | 482,619 | | 0.80%, 3/15/33(c) | | | 480,077 |
| | 259,084 | | 0.80%, 2/21/33(c) | | | 253,789 |
| | 336,981 | | 0.85%, 9/14/29(c) | | | 329,878 |
| | 811,198 | | 0.88%, 2/15/32(c) | | | 794,620 |
| | 1,443,988 | | 0.88%, 9/15/32(c) | | | 1,414,478 |
| | 23,999,553 | | 1.26%, 10/19/29(c)(d) | | | 476,563 |
| | 1,280,797 | | 2.41%, 11/15/30(c) | | | 1,254,622 |
| | 632,019 | | 2.50%, 11/29/32(c) | | | 622,420 |
| | 266,917 | | 2.55%, 9/27/30(c) | | | 261,274 |
| | 195,461 | | 2.55%, 6/15/18(c) | | | 191,523 |
| | 138,474 | | 2.63%, 1/1/32(c) | | | 136,774 |
| | 1,388,101 | | 2.65%, 3/14/18(c) | | | 1,376,636 |
| | 1,111,946 | | 3.13%, 10/25/15(b) | | | 1,131,215 |
| | 1,314,940 | | 3.38%, 10/25/15(b) | | | 1,339,140 |
| | 436,227 | | 3.38%, 5/25/16(b) | | | 439,378 |
| | 898,061 | | 3.58%, 12/25/15(b) | | | 921,624 |
| | 1,137,911 | | 3.58%, 7/15/14(c) | | | 1,122,137 |
| | 100,429 | | 5.70%, 8/15/17(c) | | | 100,882 |
| | 396,744 | | 5.85%, 12/15/27(c) | | | 393,836 |
| | 348,429 | | 5.85%, 9/27/13(c) | | | 352,298 |
| | 119,535 | | 5.86%, 11/15/22(c) | | | 119,090 |
| | 357,289 | | 5.98%, 6/9/26(c) | | | 357,768 |
| | 206,350 | | 6.00%, 4/15/22(c) | | | 207,386 |
| | 549,338 | | 6.03%, 10/31/32(c) | | | 539,897 |
| | 431,327 | | 6.10%, 10/15/27(c) | | | 434,085 |
| | 1,350,917 | | 6.13%, 4/15/31(c) | | | 1,338,054 |
| | 256,881 | | 6.15%, 1/10/32(c) | | | 254,468 |
| | 40,306 | | 6.20%, 8/4/14(c) | | | 41,084 |
| | 175,876 | | 6.25%, 9/15/27(c) | | | 178,352 |
| | 1,051,588 | | 6.28%, 8/15/17(c) | | | 1,076,508 |
| | | | | | |
Principal
Amount | | | | Value |
| $ | 226,626 | | 6.30%, 4/15/18(c) | | $ | 231,133 |
| | 76,208 | | 6.33%, 3/15/27(c) | | | 77,740 |
| | 623,932 | | 6.35%, 8/13/26(c) | | | 637,123 |
| | 1,096,243 | | 6.45%, 2/19/32(c) | | | 1,105,074 |
| | 264,462 | | 6.50%, 3/30/32(c) | | | 267,356 |
| | 53,650 | | 6.51%, 7/6/27(c) | | | 55,163 |
| | 91,592 | | 6.53%, 1/2/27(c) | | | 94,406 |
| | 66,405 | | 6.69%, 5/28/24(c) | | | 69,129 |
| | 426,591 | | 6.71%, 3/15/27(c) | | | 443,387 |
| | 91,415 | | 7.08%, 9/1/13(c) | | | 93,484 |
| | 203,755 | | 7.08%, 1/19/14(c) | | | 208,580 |
| | 93,157 | | 7.27%, 8/1/14(c) | | | 95,867 |
| | 124,979 | | 7.33%, 7/1/16(c) | | | 130,051 |
| | 261,792 | | 7.33%, 7/1/16(c) | | | 272,416 |
| | 268,059 | | 7.33%, 7/1/16(c) | | | 278,938 |
| | 208,752 | | 7.33%, 2/23/16(c) | | | 217,141 |
| | 204,325 | | 7.38%, 4/1/15(c) | | | 211,016 |
| | 68,113 | | 7.38%, 1/1/15(c) | | | 70,323 |
| | 84,077 | | 7.58%, 8/1/16(c) | | | 87,489 |
| | 259,721 | | 7.83%, 10/3/16(c) | | | 270,256 |
| | 28,609 | | 7.83%, 11/1/13(c) | | | 29,691 |
| | 25,810 | | 8.08%, 2/15/14(c) | | | 26,856 |
| | 55,726 | | 8.08%, 10/1/16(c) | | | 57,987 |
| | 6,884 | | 8.33%, 11/1/11(c) | | | 7,037 |
| | 6,080 | | 9.58%, 2/15/12(c) | | | 6,284 |
| | 8,745 | | 9.58%, 2/15/12(c) | | | 9,039 |
| | 16,926 | | 9.83%, 1/10/32(c) | | | 17,498 |
| | | | | | |
| | | | | | 34,010,681 |
| | | | | | |
| | United States Department of Agriculture — 4.13% |
| | 25,767 | | 3.85%, 6/25/10(c) | | | 26,797 |
| | 299,981 | | 4.45%, 4/2/18(c) | | | 291,629 |
| | 211,941 | | 5.09%, 3/1/20(c) | | | 206,530 |
| | 365,917 | | 5.25%, 10/26/22(c) | | | 355,838 |
| | 76,395 | | 5.33%, 12/4/14(c) | | | 76,695 |
| | 360,000 | | 5.55%, 10/20/32(c) | | | 343,870 |
| | 342,000 | | 5.55%, 10/20/32(c) | | | 326,732 |
| | 172,891 | | 5.59%, 1/20/38(c) | | | 164,061 |
| | 540,441 | | 5.60%, 11/29/30(c) | | | 520,276 |
| | 238,639 | | 5.63%, 6/1/20(c) | | | 236,586 |
| | 375,108 | | 5.63%, 4/15/27(c) | | | 368,338 |
| | 420,401 | | 5.63%, 4/1/27(c) | | | 412,424 |
| | 71,707 | | 5.64%, 1/20/38(c) | | | 68,274 |
| | 285,739 | | 5.64%, 1/20/33(c) | | | 274,400 |
| | 769,790 | | 5.64%, 1/20/38(c) | | | 731,856 |
| | 106,723 | | 5.66%, 1/20/38(c) | | | 101,782 |
| | 106,090 | | 5.66%, 10/20/32(c) | | | 102,602 |
| | 284,759 | | 5.70%, 1/20/38(c) | | | 272,471 |
| | 223,200 | | 5.73%, 4/20/37(c) | | | 215,023 |
| | 484,538 | | 5.73%, 2/1/30(c) | | | 476,782 |
| | 785,942 | | 5.75%, 1/20/33(c) | | | 760,975 |
| | 196,045 | | 5.80%, 8/1/20(c) | | | 196,194 |
| | 104,211 | | 5.83%, 11/1/20(c) | | | 104,544 |
|
SCHEDULE OF PORTFOLIO INVESTMENTS |
Access Capital Community Investment Fund (cont.)
March 31, 2009 (Unaudited)
| | | | | | |
Principal
Amount | | | | Value |
| $ | 15,962 | | 5.88%, 1/31/11(c) | | $ | 15,911 |
| | 142,221 | | 5.91%, 12/4/37(c) | | | 138,592 |
| | 87,127 | | 5.92%, 10/20/37(c) | | | 84,476 |
| | 225,000 | | 5.93%, 2/20/33(c) | | | 221,034 |
| | 130,131 | | 5.98%, 12/20/37(c) | | | 127,419 |
| | 410,256 | | 5.98%, 12/31/26(c) | | | 410,519 |
| | 207,406 | | 5.99%, 11/1/32(c) | | | 204,568 |
| | 135,383 | | 6.00%, 10/20/37(c) | | | 132,727 |
| | 69,274 | | 6.00%, 10/20/37(c) | | | 67,915 |
| | 192,252 | | 6.00%, 10/20/37(c) | | | 188,480 |
| | 309,792 | | 6.00%, 1/10/37(c) | | | 302,820 |
| | 223,501 | | 6.01%, 1/20/38(c) | | | 219,011 |
| | 179,757 | | 6.01%, 7/20/36(c) | | | 176,213 |
| | 132,116 | | 6.01%, 11/8/32(c) | | | 130,481 |
| | 357,163 | | 6.02%, 10/20/37(c) | | | 350,671 |
| | 161,661 | | 6.04%, 2/1/27(c) | | | 162,295 |
| | 386,976 | | 6.05%, 1/1/37(c) | | | 380,875 |
| | 189,058 | | 6.05%, 1/5/26(c) | | | 190,364 |
| | 512,554 | | 6.07%, 4/20/37(c) | | | 502,036 |
| | 148,409 | | 6.08%, 7/1/32(c) | | | 147,202 |
| | 106,661 | | 6.09%, 5/17/22(c) | | | 107,015 |
| | 109,360 | | 6.10%, 1/1/13(c) | | | 110,803 |
| | 99,565 | | 6.10%, 3/15/11(c) | | | 99,535 |
| | 202,817 | | 6.10%, 8/25/37(c) | | | 198,909 |
| | 350,591 | | 6.11%, 7/20/32(c) | | | 348,431 |
| | 110,554 | | 6.11%, 1/15/29(c) | | | 109,818 |
| | 638,116 | | 6.11%, 2/2/37(c) | | | 672,416 |
| | 829,245 | | 6.12%, 7/20/37(c) | | | 819,451 |
| | 217,356 | | 6.12%, 4/20/37(c) | | | 214,842 |
| | 303,356 | | 6.12%, 1/26/37(c) | | | 298,964 |
| | 141,587 | | 6.13%, 11/1/26(c) | | | 142,954 |
| | 136,931 | | 6.13%, 4/16/27(c) | | | 136,551 |
| | 703,693 | | 6.13%, 4/4/27(c) | | | 701,848 |
| | 302,900 | | 6.13%, 4/19/27(c) | | | 302,059 |
| | 684,737 | | 6.13%, 5/15/14(c) | | | 699,452 |
| | 135,068 | | 6.13%, 8/1/19(c) | | | 137,203 |
| | 283,065 | | 6.13%, 7/29/19(c) | | | 287,583 |
| | 565,143 | | 6.13%, 5/31/14(c) | | | 574,030 |
| | 108,900 | | 6.13%, 7/20/22(c) | | | 110,306 |
| | 99,841 | | 6.18%, 1/20/38(c) | | | 98,879 |
| | 254,677 | | 6.20%, 1/20/37(c) | | | 252,879 |
| | 115,516 | | 6.22%, 6/1/37(c) | | | 114,887 |
| | 61,912 | | 6.23%, 2/1/27(c) | | | 62,833 |
| | 406,296 | | 6.23%, 3/14/32(c) | | | 405,143 |
| | 613,127 | | 6.25%, 1/1/37(c) | | | 607,926 |
| | 113,591 | | 6.28%, 3/1/14(c) | | | 115,905 |
| | 88,163 | | 6.28%, 2/1/28(c) | | | 89,581 |
| | 82,581 | | 6.33%, 3/2/27(c) | | | 87,020 |
| | | | | | | |
Principal
Amount | | | | Value | |
| $ | 212,768 | | 6.38%, 1/31/37(c) | | $ | 212,498 | |
| | 241,736 | | 6.38%, 2/16/37(c) | | | 241,634 | |
| | 56,285 | | 6.38%, 3/1/27(c) | | | 57,543 | |
| | 782,051 | | 6.51%, 4/20/37(c) | | | 791,784 | |
| | 864,769 | | 6.63%, 12/15/23(c) | | | 891,394 | |
| | 201,722 | | 6.64%, 4/20/37(c) | | | 205,915 | |
| | 211,119 | | 6.88%, 2/3/17(c) | | | 219,689 | |
| | 439,558 | | 6.88%, 2/3/22(c) | | | 457,566 | |
| | 646,198 | | 7.00%, 6/3/22(c) | | | 663,342 | |
| | 242,497 | | 7.13%, 12/10/16(c) | | | 250,901 | |
| | | | | | 22,687,777 | |
| | | | | | | |
| |
| Total U.S. Government Agency
Obligations
(Cost $66,725,729) | | | 64,832,787 | |
| | | | | | | |
| | Promissory Notes — 1.92% | | | | |
| | 9,375,000 | | Massachusetts Housing Investment Corp. Term Loan, 6.67%, 4/1/35(c)(e) | | | 10,524,298 | |
| | | | | | | |
| |
| Total Promissory Notes
(Cost $9,375,000) | | | 10,524,298 | |
| | | | | | | |
| Shares | |
| | Investment Company — 1.14% | | | | |
| | 6,237,877 | | Wells Fargo Prime Investment Money Market Fund | | | 6,237,877 | |
| | | | | | | |
| |
| Total Investment Company
(Cost $6,237,877) | | | 6,237,877 | |
| | | | | | | |
| | Short-Term Investment — 0.54% | | | | |
| | |
| | $3,000,000 | | Freddie Mac, 0.70%, 9/14/09(f) | | | 2,995,713 | |
| | | | | | | |
| |
| Total Short-Term Investment
(Cost $2,990,317) | | | 2,995,713 | |
| |
| Total Investments
(Cost $645,392,007)(g) — 121.65% | | | 668,464,891 | |
| |
| Liabilities in excess of other
assets — (21.65)% | | | (118,968,386 | ) |
| | | | | | | |
| |
| | NET ASSETS — 100.00% | | $ | 549,496,505 | |
| | | | | | | |
| (a) | Security exempt from registration under Rule 144A of the Securities Act of 1933, as amended. These securities may be resold in transactions exempt from registration, normally to qualified institutional buyers. Security has been deemed to be liquid based on procedures approved by the Board of Trustees. |
| (b) | Floating rate note. Rate shown is as of report date. |
| (c) | Fair valued security under procedures established by the Fund’s Board of Trustees. |
| (d) | Interest Only represents the right to receive the monthly interest payment on an underlying pool of mortgage loans. The principal amount shown represents the par value on the underlying pool. |
|
SCHEDULE OF PORTFOLIO INVESTMENTS |
Access Capital Community Investment Fund (cont.)
March 31, 2009 (Unaudited)
| (e) | This security is restricted and illiquid as the security may not be offered or sold within the United States or to U.S. persons except to qualified purchasers who are also either qualified institutional buyers or “accredited investors” (as defined in Rule 501 (a) of Regulation D under the Securities Act of 1933). The total investment in restricted and illiquid securities representing $11,320,958 or 2.06% of net assets was as follows: |
| | | | | | | | | |
Acquisition
Principal
Amount | | Issuer | | Acquisition
Date | | Acquisition
Cost | | 03/31/2009
Carrying
Value Per
Unit |
| | Fort Knox Military Housing | | | | | | | |
| $1,395,000 | | Privatization Project | | 1/29/2007 | | $ | 1,328,900 | | $0.57 |
| | Massachusetts Housing | | | | | | | |
| $9,375,000 | | Investment Corp. | | 3/29/2005 | | $ | 9,375,000 | | $1.12 |
| (f) | The rate represents the annualized yield at time of purchase. |
| (g) | Tax cost of securities is equal to book cost of securities. |
Abbreviations used are defined below:
AMBAC – Insured by American Municipal Bond Insurance Assurance Corp.
MBIA – Insured by MBIA
IBC—Insured by International Bancshares Corp.
See notes to financial statements.
Statement of Assets and Liabilities
March 31, 2009 (Unaudited)
| | | | |
Assets: | | | | |
Investments, at value (cost $645,392,007) | | $ | 668,464,891 | |
Segregated cash collateral for reverse repurchase agreement | | | 7,663,601 | |
Interest and dividends receivable | | | 3,778,734 | |
Receivable for open maturities | | | 231,258 | |
Receivable for fund shares sold | | | 6,259 | |
Receivable for investments sold | | | 108,865 | |
Deposits at broker for futures contracts | | | 488,641 | |
Prepaid expenses and other assets | | | 77,925 | |
| | | | |
Total Assets | | | 680,820,174 | |
| | | | |
| |
Liabilities: | | | | |
Distributions payable | | | 1,612,424 | |
Payable for investments purchased | | | 408,539 | |
Reverse repurchase agreements (including interest of $36,024) | | | 128,974,507 | |
Accrued expenses and other payables: | | | | |
Investment advisory fees | | | 277,777 | |
Accounting fees | | | 4,279 | |
Distribution fees | | | 113 | |
Trustee fees | | | 5 | |
Audit fees | | | 37,888 | |
Transfer Agent fees | | | 8,137 | |
| | | | |
Total Liabilities | | | 131,323,669 | |
| | | | |
Net Assets | | $ | 549,496,505 | |
| | | | |
| |
Net Assets Consist Of: | | | | |
Capital | | $ | 562,719,261 | |
Distributions in excess of net investment income | | | (1,333,133 | ) |
Accumulated net realized losses from investment transactions
and futures contracts | | | (31,454,383 | ) |
Net unrealized appreciation on investments
and futures contracts | | | 19,564,760 | |
| | | | |
Net Assets | | $ | 549,496,505 | |
| | | | |
| |
Net Assets: | | | | |
Class A | | $ | 908,246 | |
Class I | | | 548,588,259 | |
| | | | |
Total | | $ | 549,496,505 | |
| | | | |
| |
Shares Outstanding (1,000,000,000 shares authorized, 100,000,000 shares registered at $.0000001 par value): | | | | |
Class A | | | 94,656 | |
Class I | | | 57,221,922 | |
| | | | |
Total | | | 57,316,578 | |
| | | | |
| |
Net Asset Values and Redemption Price Per Share: | | | | |
Class A(a) | | $ | 9.60 | |
| | | | |
Class I | | $ | 9.59 | |
| | | | |
| |
Maximum Offering Price Per Share: | | | | |
Class A | | $ | 9.97 | |
| | | | |
Maximum Sales Charge - Class A | | | 3.75 | % |
| | | | |
| (a) | For Class A shares, redemption price per share will be reduced by 1.00% for sales of shares within 12 months of purchase (only applicable on purchases of $1 million or more on which no initial sales charge was paid). Such reduction is not reflected in the net asset value and the redemption price per share. |
See notes to financial statements.
Statement of Operations
For the Six Months Ended March 31, 2009 (Unaudited)
| | | | |
Investment Income: | | | | |
Interest income | | $ | 17,323,104 | |
Other income | | | 54,661 | |
| | | | |
Total Investment Income | | | 17,377,765 | |
| | | | |
| |
Expenses: | | | | |
Interest expense | | | 1,438,010 | |
Management fees | | | 1,688,677 | |
Distribution fees - Class A | | | 243 | |
Professional fees | | | 40,874 | |
Accounting services | | | 25,873 | |
Custodian fees | | | 44,738 | |
Insurance fees | | | 15,343 | |
Directors’ fees and expenses | | | 6,170 | |
Transfer agent fees | | | 35,302 | |
Printing and shareholder reports | | | 10,828 | |
Registration fees | | | 17,189 | |
Other fees | | | 56,147 | |
| | | | |
| |
Total expenses | | | 3,379,394 | |
Expenses reduced/waived by: | | | | |
Distributor | | | (122 | ) |
| | | | |
Net Expenses | | | 3,379,272 | |
| | | | |
Net Investment Income | | | 13,998,493 | |
| | | | |
| |
Realized/Unrealized Gains (Losses) from Investment Transactions
and Futures Contracts: | | | | |
Net realized gains from investment transactions | | | 90,272 | |
Net realized losses from futures contracts | | | (12,300,195 | ) |
Net change in unrealized appreciation/depreciation on investments | | | 26,158,697 | |
Net change in unrealized appreciation/depreciation on futures contracts | | | (4,126,305 | ) |
| | | | |
Net realized/unrealized gains from investments
and futures contracts | | | 9,822,469 | |
| | | | |
Change in net assets resulting from operations | | $ | 23,820,962 | |
| | | | |
See notes to financial statements.
Statements of Changes in Net Assets
| | | | | | | | | | | | |
| | | For the
Six Months
Ended
March 31, 2009 | | | Period
June 1, 2008
to
September 30, 2008 | | | For the
Year Ended
May 31,
2008 | |
| | | (Unaudited) | | | | | | | |
From Investment Activities: | | | | | | | | | | | | |
Operations: | | | | | | | | | | | | |
Net investment income (loss) | | $ | 13,998,493 | | | $ | 9,055,586 | | | $ | 23,775,831 | |
Net realized losses from investments and futures contracts | | | (12,209,923 | ) | | | (2,647,818 | ) | | | (6,779,602 | ) |
Net change in unrealized appreciation/depreciation on
investments and futures contracts | | | 22,032,392 | | | | (787,050 | ) | | | 7,236,536 | |
| | | | | | | | | | | | |
Change in net assets resulting from operations | | | 23,820,962 | | | | 5,620,718 | | | | 24,232,765 | |
| | | | | | | | | | | | |
| | | |
Distributions to Class A Shareholders: | | | | | | | | | | | | |
From net investment income | | | (2,568 | ) | | | — | | | | — | |
| | | |
Distributions to Class I Shareholders: | | | | | | | | | | | | |
From net investment income | | | (14,004,496 | ) | | | (9,105,665 | ) | | | (23,953,132 | ) |
| | | | | | | | | | | | |
Change in net assets resulting from shareholder distributions | | | (14,007,064 | ) | | | (9,105,665 | ) | | | (23,953,132 | ) |
| | | | | | | | | | | | |
| | | |
Capital Transactions: | | | | | | | | | | | | |
Proceeds from shares issued | | | 9,860,667 | | | | 32,501,000 | | | | 68,500,203 | |
Distributions reinvested | | | 4,606,325 | | | | 2,839,116 | | | | 7,529,607 | |
Cost of shares redeemed | | | (18,188,044 | ) | | | (5,174,612 | ) | | | (34,306,024 | ) |
| | | | | | | | | | | | |
Change in net assets resulting from capital transactions | | | (3,721,052 | ) | | | 30,165,504 | | | | 41,723,786 | |
| | | | | | | | | | | | |
Net increase in net assets | | | 6,092,846 | | | | 26,680,557 | | | | 42,003,419 | |
| | | |
Net Assets: | | | | | | | | | | | | |
Beginning of period | | | 543,403,659 | | | | 516,723,102 | | | | 474,719,683 | |
| | | | | | | | | | | | |
End of period | | $ | 549,496,505 | | | $ | 543,403,659 | | | $ | 516,723,102 | |
| | | | | | | | | | | | |
Distributions in excess of net investment income | | $ | (1,333,133 | ) | | $ | (1,324,562 | ) | | $ | (1,310,504 | ) |
| | | | | | | | | | | | |
| | | |
Share Transactions: | | | | | | | | | | | | |
Issued | | | 1,034,675 | | | | 3,481,488 | | | | 7,180,712 | |
Reinvested | | | 488,479 | | | | 302,684 | | | | 790,074 | |
Redeemed | | | (1,955,552 | ) | | | (558,810 | ) | | | (3,615,736 | ) |
| | | | | | | | | | | | |
Change in shares resulting from capital transactions | | | (432,398 | ) | | | 3,225,362 | | | | 4,355,050 | |
| | | | | | | | | | | | |
See notes to financial statements.
Statement of Cash Flows
For the Six Months Ended March 31, 2009 (Unaudited)
| | | | |
Cash Used for Operating Activities: | | | | |
Net increase in net assets resulting from operations | | $ | 23,820,962 | |
Adjustments to reconcile net increase in net assets resulting from operations to net cash
used for operating activities: | | | | |
Decrease in interest and dividend receivable | | | 69,126 | |
Decrease in deposits at broker for futures contracts | | | 2,323,143 | |
Increase in prepaid expenses and other assets | | | (6,264 | ) |
Increase in collateral for reverse repurchase agreements | | | (4,178,601 | ) |
Decrease in receivables/payables for TBA sales commitment | | | 10,160,486 | |
Decrease in receivables for open maturity | | | 397,919 | |
Increase in interest due on reverse repurchase agreements | | | (283,461 | ) |
Increase in payable to investment adviser | | | 5,071 | |
Decrease in accrued expenses and other liabilities | | | (108,638 | ) |
Proceeds from sales and paydowns of long-term securities | | | 73,899,511 | |
Proceeds from short sales | | | 19,780,312 | |
Purchases of long-term securities | | | (46,666,382 | ) |
Purchases of short sales | | | (30,015,865 | ) |
Net proceeds from short-term securities | | | 12,396,552 | |
Amortization of premium and discount - net | | | (35,010 | ) |
Realized and unrealized gain/(loss) on investments - net | | | (26,248,969 | ) |
| | | | |
| | | 35,309,892 | |
| | | | |
| |
Cash provided by Financing Activities: | | | | |
Proceeds from issuance of shares | | | 9,854,408 | |
Cash payments on shares redeemed | | | (18,188,044 | ) |
Cash receipts from reverse repurchase agreements | | | 661,445,754 | |
Cash payments on reverse repurchase agreements | | | (679,086,271 | ) |
Distributions paid to shareholders | | | (9,366,873 | ) |
| | | | |
| | | (35,341,026 | ) |
| | | | |
Cash: | | | | |
Net decrease in cash | | | (31,134 | ) |
Cash at beginning of period | | | 31,134 | |
| | | | |
Cash paid for interest | | | 1,721,471 | |
| | | | |
Noncash Financing Activities: | | | | |
Capital shares issued in reinvestment of distributions paid to shareholders | | | 4,606,325 | |
| | | | |
See notes to financial statements.
Access Capital Community Investment Fund
(Selected data for a share outstanding throughout the periods indicated)
| | | | | | | | | | | | | | | | | | | | | | | | | | | | | | | | |
| | | Period Ended
March 31, | | | For the
Six Months
Ended
March 31, | | | Period
June 1, 2008
to
September 30, | | | For the Year Ended May 31, | |
| | | 2009 | | | 2008(a) | | | 2008 | | | 2007 | | | 2006 | | | 2005 | | | 2004 | |
| | | (Unaudited) | | | (Unaudited) | | | | | | | | | | | | | | | | | | | |
| | | Class A(b) | | | Class I(c) | | | | | | | | | | | | | | | | | | | |
Per Share Operating Performance: | | | | | | | | | | | | | | | | | | | | | | | | | | | | | | | | |
Net asset value, beginning of period | | $ | 9.47 | | | $ | 9.41 | | | $ | 9.48 | | | $ | 9.46 | | | $ | 9.29 | | | $ | 9.82 | | | $ | 9.62 | | | $ | 10.21 | |
| | | | | | | | | | | | | | | | | | | | | | | | | | | | | | | | |
Net investment income(d) | | | 0.09 | | | | 0.25 | | | | 0.16 | | | | 0.46 | | | | 0.44 | | | | 0.45 | | | | 0.48 | | | | 0.54 | |
Realized and unrealized gain (loss) | | | 0.13 | | | | 0.18 | | | | (0.07 | ) | | | 0.02 | | | | 0.17 | | | | (0.53 | ) | | | 0.20 | | | | (0.59 | ) |
| | | | | | | | | | | | | | | | | | | | | | | | | | | | | | | | |
Total from investment operations | | | 0.22 | | | | 0.43 | | | | 0.09 | | | | 0.48 | | | | 0.61 | | | | (0.08 | ) | | | 0.68 | | | | (0.05 | ) |
| | | | | | | | | | | | | | | | | | | | | | | | | | | | | | | | |
Less dividends from net investment
income | | | (0.09 | ) | | | (0.25 | ) | | | (0.16 | ) | | | (0.46 | ) | | | (0.44 | ) | | | (0.45 | ) | | | (0.48 | ) | | �� | (0.54 | ) |
| | | | | | | | | | | | | | | | | | | | | | | | | | | | | | | | |
Net asset value, end of period | | $ | 9.60 | | | $ | 9.59 | | | $ | 9.41 | | | $ | 9.48 | | | $ | 9.46 | | | $ | 9.29 | | | $ | 9.82 | | | $ | 9.62 | |
| | | | | | | | | | | | | | | | | | | | | | | | | | | | | | | | |
Total Investment Return:(e) | | | | | | | | | | | | | | | | | | | | | | | | | | | | | | | | |
Based on net asset value per share | | | 2.40 | % | | | 4.61 | % | | | 1.02 | % | | | 5.19 | % | | | 6.65 | % | | | (0.83 | )% | | | 7.14 | % | | | (0.56 | )% |
Ratios to Average Net Assets:(f) | | | | | | | | | | | | | | | | | | | | | | | | | | | | | | | | |
Total expenses, net of
reimbursement and excluding
interest expense and investment
structuring fees(g) | | | 1.01 | % | | | 0.73 | % | | | 0.86 | % | | | 0.93 | % | | | 0.79 | % | | | 0.74 | % | | | 0.85 | % | | | 0.87 | % |
Total expenses, excluding interest
expense | | | 1.26 | % | | | 0.73 | % | | | 0.86 | % | | | 0.93 | % | | | 0.83 | % | | | 0.73 | % | | | 0.74 | % | | | 0.78 | % |
Net expenses | | | 1.19 | % | | | 1.28 | % | | | 1.61 | % | | | 1.99 | % | | | 1.48 | % | | | 1.32 | % | | | 1.13 | % | | | 1.04 | % |
Investment income-net | | | 5.25 | % | | | 5.29 | % | | | 5.17 | % | | | 4.83 | % | | | 4.55 | % | | | 4.72 | % | | | 4.87 | % | | | 5.43 | % |
Ratios to Average Net Assets,
Plus Average Borrowings:(f)(h) | | | | | | | | | | | | | | | | | | | | | | | | | | | | | | | | |
Total expenses, net of
reimbursement and excluding
interest expense and investment
structuring fees(g) | | | 0.81 | % | | | 0.57 | % | | | 0.67 | % | | | 0.75 | % | | | 0.70 | % | | | 0.65 | % | | | 0.72 | % | | | 0.71 | % |
Total expenses, excluding interest
expense | | | 1.01 | % | | | 0.57 | % | | | 0.67 | % | | | 0.75 | % | | | 0.74 | % | | | 0.64 | % | | | 0.63 | % | | | 0.64 | % |
Net expenses | | | 0.95 | % | | | 1.00 | % | | | 1.25 | % | | | 1.60 | % | | | 1.31 | % | | | 1.16 | % | | | 0.96 | % | | | 0.85 | % |
Investment income-net | | | 4.22 | % | | | 4.15 | % | | | 4.00 | % | | | 3.88 | % | | | 4.03 | % | | | 4.13 | % | | | 4.13 | % | | | 4.44 | % |
Supplemental Data: | | | | | | | | | | | | | | | | | | | | | | | | | | | | | | | | |
Net assets, end of period (in
thousands) | | $ | 908 | | | $ | 548,588 | | | | $543,404 | | | $ | 513,723 | | | $ | 474,720 | | | $ | 449,324 | | | $ | 388,299 | | | $ | 346,567 | |
Portfolio turnover | | | 6 | % | | | 6 | % | | | 1 | % | | | 19 | % | | | 23 | % | | | 21 | % | | | 33 | % | | | 46 | % |
| (a) | Effective September 30, 2008, the Fund’s fiscal year end changed from May 31 to September 30. |
| (b) | For the period January 29, 2009 (commencement of operations) to March 31, 2009. |
| (c) | Fund level Shares were renamed Class I Shares with the commencement of Class A Shares on January 29, 2009. |
| (d) | Based on average shares outstanding. |
| (e) | Total investment returns exclude the effect of sales charge. |
| (f) | Annualized for those periods that are less than one year. |
| (g) | During the fiscal years ended May 31, 2006, 2005 and 2004, to the extent that the Fund’s operating expenses (exclusive of management fees and interest expense) were less then 0.25% of the Fund’s monthly average net assets, the Fund repaid the Fund’s investment adviser and sub-adviser for operating expenses previously borne or reimbursed. |
| (h) | These ratios are calculated based upon the average net assets plus average borrowings. |
See notes to financial statements.
|
NOTES TO FINANCIAL STATEMENTS |
March 31, 2009 (Unaudited)
1. Organization
Tamarack Funds Trust (“Tamarack”) was organized as a Delaware statutory trust on December 16, 2003. Overall responsibility for the management of Tamarack is vested in its Board of Trustees (the “Board”). This semi-annual report includes the Access Capital Community Investment Fund (the “Fund”). At its inception in 1998, the Access Capital Strategies Community Investment Fund, Inc. the Fund’s predecessor, elected status as a business development company under the Investment Company Act of 1940 (the “1940 Act”), but withdrew its election on May 30, 2006, and registered as a continuously offered, closed-end interval management company under the 1940 Act. The predecessor fund was reorganized into a series of Tamarack, a registered open-end management company under the 1940 Act, effective July 28, 2008.
The Fund offers two share classes: Class A and Class I shares. Class A shares are offered with a 3.75% maximum front-end sales charge and a 1.00% contingent deferred sales charge (“CDSC”) for redemption within 12 months of a $1 million or greater purchase on which no front-end sales charge was paid. Class I shares (intended for investors meeting certain investment minimum thresholds) are not subject to either a front-end sales charge or a CDSC.
Voyageur Asset Management Inc. (“Voyageur”or the “Advisor”) acts as the investment advisor for Tamarack. The officers of Tamarack (“Fund Management”) are also employees of Voyageur or its affiliates and PNC Global Investment Servicing (U.S.) Inc. (“PNC”).
The Fund’s investment objective is to invest in geographically specific debt securities located in portions of the United States designated by Fund investors. The Fund seeks to achieve its investment objective by investing primarily in debt securities specifically designed to support underlying economic activities such as affordable housing, education, small business lending, and job-creating activities in areas of the United States designated by Fund investors.
2. Significant Accounting Policies
Security Valuation:
Summarized below are the significant accounting policies of the Fund. The policies conform to accounting principles generally accepted in the United States of America (“GAAP”). Fund Management follows these policies when preparing financial statements. Management may also be required to make estimates and assumptions that affect the reported amounts of assets and liabilities at the date of the financial statements and the reported amounts of income and expenses for the period. Actual results could differ from those estimates. The financial statements are as of the close of regular trading on the New York Stock Exchange.
Bonds and other fixed income securities are generally valued on the basis of prices furnished by pricing services approved by Tamarack’s Board. The pricing services utilize both dealer-supplied valuations and electronic data processing techniques that take into account appropriate factors such as institutional-size trading in similar groups of securities, yield, quality, coupon rate, maturity and type of issue. Valuations of mortgage backed securities that qualify under the Community Reinvestment Act (“CRA”) may also include adjustments to reflect the CRA premium indicated by the independent pricing agent to reflect the higher valuations accorded these securities in the market for their geographically or other targeted nature. Short-term debt obligations, with less than 60 days to maturity at time of purchase, are valued at amortized cost unless Fund Management determines that amortized cost no longer approximates market value. In such cases where a security price is unavailable, or where Fund Management determines that the value provided by the pricing services or amortized cost does not approximate fair value, the Board has approved pricing and valuation procedures to determine a security’s fair value. Investments in open-end investment companies are valued at net asset value. Exchange traded financial futures are valued at the settlement price as established by the exchange on which they are traded.
22
|
NOTES TO FINANCIAL STATEMENTS |
Financial Instruments:
Reverse Repurchase Agreements — To obtain short-term financing, the Fund may enter into reverse repurchase agreements with primary dealers that report to the Federal Reserve Bank of New York or the 100 largest U.S. commercial banks, who are deemed creditworthy under guidelines approved by the Board. Interest on the value of the reverse repurchase agreements is based upon competitive market rates at the time of issuance. At the time the Fund enters into a reverse repurchase agreement, it will establish and maintain a segregated account with the custodian containing qualifying assets having a value not less than the repurchase price, including accrued interest. Based on requirements with certain exchanges and third party brokers-dealers, the Fund may also be required to deliver or deposit securities or cash as collateral. If the counterparty to the transaction is rendered insolvent, the ultimate realization of the securities to be repurchased by the Fund may be delayed or limited. For the six months ended March 31, 2009, the average amount borrowed was approximately $146,614,301 and the daily weighted average interest rate was 1.96%.
Details of open reverse repurchase agreements at March 31, 2009 were as follows:
| | | | | | | | | | | | | | |
| | | Rate | | Trade
Date | | Maturity
Date | | Net Closing
Amount | | | Par | |
Goldman Sachs | | 0.65% | | 3/11/09 | | 04/09/09 | | $ | (23,610,711 | ) | | $ | (23,598,355 | ) |
Goldman Sachs | | 0.65% | | 3/11/09 | | 04/16/09 | | | (23,910,012 | ) | | | (23,894,481 | ) |
Goldman Sachs | | 0.75% | | 3/17/09 | | 06/16/09 | | | (31,242,118 | ) | | | (31,183,000 | ) |
Goldman Sachs | | 0.75% | | 3/19/09 | | 06/18/09 | | | (17,427,375 | ) | | | (17,394,398 | ) |
Goldman Sachs | | 0.65% | | 3/26/09 | | 05/13/09 | | | (32,896,735 | ) | | | (32,868,249 | ) |
Details of underlying collateral pledged for open reverse repurchase agreements at March 31, 2009 were as follows:
| | | | | | | | | | | | |
| | | Description | | Rate | | Maturity
Date | | Par | | Market
Value |
Goldman Sachs 3/11/09 to 4/9/09 | | | | | | | | | | | | |
| | Fannie Mae Pool #806754 | | 4.50% | | 9/01/34 | | $ | 3,820,741 | | $ | 3,931,968 |
| | Fannie Mae Pool #806759 | | 4.50% | | 9/01/34 | | | 4,054,189 | | | 4,175,050 |
| | Fannie Mae Pool #777621 | | 5.00% | | 2/01/34 | | | 3,073,011 | | | 3,196,652 |
| | Freddie Mac Pool #A25310 | | 5.00% | | 6/01/34 | | | 2,205,354 | | | 2,292,642 |
| | Freddie Mac Pool #A37185 | | 5.00% | | 9/01/35 | | | 2,133,527 | | | 2,216,639 |
| | Freddie Mac Pool #A66061 | | 5.50% | | 8/01/37 | | | 2,598,297 | | | 2,711,954 |
| | Freddie Mac Pool #A66116 | | 6.00% | | 9/01/37 | | | 2,154,404 | | | 2,265,595 |
| | Freddie Mac Pool #A67630 | | 6.00% | | 11/01/37 | | | 2,294,773 | | | 2,413,209 |
| | Freddie Mac Pool #A66156 | | 6.50% | | 9/01/37 | | | 2,399,190 | | | 2,544,178 |
| | | | | | | | | | | | |
| | | | | | | | | | | $ | 25,747,887 |
| | | | | | | | | | | | |
Goldman Sachs
3/11/09 to 4/16/09 | | | | | | | | | | | | |
| | Fannie Mae Pool #835287 | | 5.00% | | 8/01/35 | | $ | 1,732,594 | | $ | 1,800,409 |
| | Freddie Mac Pool #A21681 | | 5.00% | | 4/01/34 | | | 1,410,383 | | | 1,466,206 |
| | Fannie Mae Pool #258627 | | 5.50% | | 2/01/36 | | | 1,728,394 | | | 1,806,307 |
| | Fannie Mae Pool #806761 | | 5.50% | | 9/01/34 | | | 5,988,882 | | | 6,264,465 |
| | Freddie Mac Pool #A30056 | | 5.50% | | 12/01/34 | | | 1,716,996 | | | 1,795,686 |
| | Freddie Mac Pool #A34999 | | 5.50% | | 4/01/35 | | | 2,318,849 | | | 2,422,948 |
| | Freddie Mac Pool #A59530 | | 5.50% | | 4/01/37 | | | 1,769,411 | | | 1,846,810 |
| | Freddie Mac Pool #A60751 | | 5.50% | | 5/01/37 | | | 2,350,027 | | | 2,452,823 |
| | Fannie Mae Pool #944502 | | 6.00% | | 6/01/37 | | | 1,738,437 | | | 1,827,616 |
| | Freddie Mac Pool #A61916 | | 6.00% | | 6/01/37 | | | 4,157,232 | | | 4,371,792 |
| | | | | | | | | | | | |
| | | | | | | | | | | $ | 26,055,062 |
| | | | | | | | | | | | |
23
|
NOTES TO FINANCIAL STATEMENTS |
| | | | | | | | | | | | |
| | | Description | | Rate | | Maturity
Date | | Par | | Market
Value |
Goldman Sachs 3/17/09 to 6/16/09 | | | | | | | | | | | | |
| | Freddie Mac Pool #A42097 | | 5.00% | | 1/01/36 | | $ | 1,550,533 | | $ | 1,611,155 |
| | Freddie Mac Pool #A47552 | | 5.00% | | 11/01/35 | | | 1,471,346 | | | 1,528,662 |
| | Freddie Mac Pool #A76187 | | 5.00% | | 4/01/38 | | | 1,047,327 | | | 1,086,594 |
| | Freddie Mac Pool #A12237 | | 5.00% | | 8/01/33 | | | 1,668,551 | | | 1,736,157 |
| | Freddie Mac Pool #A40538 | | 5.00% | | 12/01/35 | | | 2,245,021 | | | 2,332,476 |
| | Freddie Mac Pool #A46735 | | 5.00% | | 8/01/35 | | | 1,801,648 | | | 1,871,831 |
| | Freddie Mac Pool #A45396 | | 5.00% | | 6/01/35 | | | 1,161,421 | | | 1,207,390 |
| | Freddie Mac Pool #A61915 | | 5.50% | | 6/01/37 | | | 1,133,374 | | | 1,183,518 |
| | Freddie Mac Pool #C77844 | | 5.50% | | 3/01/33 | | | 1,034,121 | | | 1,082,807 |
| | Freddie Mac Pool #A42803 | | 5.50% | | 2/01/36 | | | 2,055,968 | | | 2,148,265 |
| | Fannie Mae Pool #914428 | | 5.50% | | 2/01/37 | | | 1,282,968 | | | 1,339,326 |
| | Freddie Mac Pool #A61754 | | 5.50% | | 5/01/37 | | | 1,297,564 | | | 1,354,323 |
| | Freddie Mac Pool #A46746 | | 5.50% | | 8/01/35 | | | 1,223,800 | | | 1,278,740 |
| | Freddie Mac Pool #A18617 | | 5.50% | | 1/01/34 | | | 1,245,346 | | | 1,302,420 |
| | Freddie Mac Pool #A63456 | | 5.50% | | 6/01/37 | | | 4,170,672 | | | 4,353,108 |
| | Freddie Mac Pool #A20540 | | 5.50% | | 4/01/34 | | | 1,459,049 | | | 1,525,917 |
| | Freddie Mac Pool #A42805 | | 6.00% | | 2/01/36 | | | 1,262,398 | | | 1,328,144 |
| | Freddie Mac Pool #A48789 | | 6.00% | | 5/01/36 | | | 1,105,340 | | | 1,162,561 |
| | Freddie Mac Pool #A64447 | | 6.00% | | 8/01/37 | | | 1,381,174 | | | 1,452,458 |
| | Freddie Mac Pool #A68766 | | 6.00% | | 10/01/37 | | | 1,267,663 | | | 1,333,089 |
| | Freddie Mac Pool #A42804 | | 6.00% | | 2/01/36 | | | 1,130,471 | | | 1,189,346 |
| | Freddie Mac Pool #A49013 | | 6.00% | | 5/01/36 | | | 1,246,476 | | | 1,311,003 |
| | | | | | | | | | | | |
| | | | | | | | | | | $ | 34,719,290 |
| | | | | | | | | | | | |
Goldman Sachs 3/19/09 to 6/18/09 | | | | | | | | | | | | |
| | Fannie Mae Pool #815009 | | 5.00% | | 4/01/35 | | $ | 2,332,748 | | $ | 2,424,054 |
| | Fannie Mae Pool #829005 | | 5.00% | | 8/01/35 | | | 1,939,414 | | | 2,015,323 |
| | Freddie Mac Pool #A38830 | | 5.00% | | 5/01/35 | | | 2,087,884 | | | 2,169,218 |
| | Freddie Mac Pool #A14325 | | 5.00% | | 9/01/33 | | | 1,623,276 | | | 1,689,047 |
| | Ginnie Mae Pool #675509 | | 5.50% | | 6/15/38 | | | 2,344,293 | | | 2,454,803 |
| | Freddie Mac Pool #A46321 | | 5.50% | | 7/01/35 | | | 1,001,024 | | | 1,045,963 |
| | Fannie Mae Pool #990510 | | 5.50% | | 8/01/38 | | | 2,190,052 | | | 2,286,257 |
| | Freddie Mac Pool #A73038 | | 5.50% | | 1/01/38 | | | 1,246,847 | | | 1,301,387 |
| | Freddie Mac Pool #A64015 | | 6.00% | | 7/01/37 | | | 1,024,694 | | | 1,077,580 |
| | Fannie Mae Pool #866969 | | 6.00% | | 2/01/36 | | | 2,602,081 | | | 2,735,565 |
| | | | | | | | | | | | |
| | | | | | | | | | | $ | 19,199,197 |
| | | | | | | | | | | | |
Goldman Sachs 3/26/09 to 5/13/09 | | | | | | | | | | | | |
| | Fannie Mae Pool #663159 | | 5.00% | | 7/01/32 | | $ | 5,550,452 | | $ | 5,799,615 |
| | Fannie Mae Pool #727312 | | 5.00% | | 9/01/33 | | | 3,841,801 | | | 3,996,373 |
| | Fannie Mae Pool #844361 | | 5.50% | | 11/01/35 | | | 5,063,887 | | | 5,292,158 |
| | Fannie Mae Pool #829649 | | 5.50% | | 3/01/35 | | | 3,629,800 | | | 3,796,827 |
| | Fannie Mae Pool #885724 | | 5.50% | | 6/01/36 | | | 4,296,935 | | | 4,486,604 |
| | Fannie Mae Pool #702478 | | 5.50% | | 6/01/33 | | | 3,099,327 | | | 3,245,818 |
| | Fannie Mae Pool #257892 | | 5.50% | | 2/01/38 | | | 3,654,243 | | | 3,814,766 |
| | Fannie Mae Pool #952632 | | 6.00% | | 7/01/37 | | | 2,392,694 | | | 2,513,807 |
| | Fannie Mae Pool #952598 | | 6.00% | | 7/01/37 | | | 2,420,172 | | | 2,544,324 |
| | | | | | | | | | | | |
| | | | | | | | | | | $ | 35,490,292 |
| | | | | | | | | | | | |
24
|
NOTES TO FINANCIAL STATEMENTS |
Derivatives — The Fund may use derivative instruments, including futures, forwards, options, indexed securities, swaps and inverse securities for hedging purposes only. During the six month period ended March 31, 2009, the Fund entered into only futures contracts as described below. Derivatives allow the Fund to increase or decrease its risk exposure more quickly and efficiently than other types of instruments. While hedging can reduce losses, it can also reduce or eliminate gains if the market moves in a different manner than anticipated by the Fund or if the cost of the derivative outweighs the benefit of the hedge. Hedging also involves the risk that changes in the value of the derivative will not match those of the holdings being hedged as expected by the Fund, in which case any losses on the holdings being hedged may not be reduced and may be increased. Losses may also arise due to changes in the value of the contract or if the counterparty does not perform under the contract. There can be no assurance that the Fund’s hedging strategy will reduce risk or that hedging transactions will be available or cost effective.
Financial Futures Contracts — The Fund may purchase or sell financial futures contracts and options on such futures contracts. Futures contracts are contracts for delayed delivery of securities at a specific future date and at a specific price or yield. Upon entering into a contract, the Fund deposits and maintains as collateral such initial margin as required by the exchange on which the transaction is effected. Pursuant to the contract, the Fund agrees to receive from or pay to the broker an amount of cash equal to the daily fluctuation in value of the contract. Such receipts or payments are known as variation margin and are recorded by the Fund as unrealized gains or losses. When the contract is closed, the Fund records a realized gain or loss equal to the difference between the value of the contract at the time it was opened and the value at the time it was closed. The Fund had the following open futures contracts at March 31, 2009:
| | | | | | | | | | | | |
| | | Number of
Contracts | | Expiration
Date | | Unrealized
Depreciation | | Notional
Value | | Counterparty |
Short contracts: | | | | | | | | | | | | |
Ten Year Swap | | 500 | | June, 2009 | | $ | (1,843,750) | | $ | 61,375,000 | | Barclays Capital |
Ten Year Swap | | 145 | | June, 2009 | | $ | (512,031) | | $ | 17,821,406 | | Barclays Capital |
U.S. Treasury Long Bond | | 250 | | June, 2009 | | $ | (1,152,343) | | $ | 31,273,438 | | Barclays Capital |
TBA Commitments — The Fund may enter into to be announced (“TBA”) commitments to purchase or sell securities for a fixed price at a future date. TBA commitments are considered securities in themselves, and involve a risk of loss if the value of the security to be purchased/sold declines/increases prior to settlement date, which is in addition to the risk of decline in the value of a Fund’s other assets. Unsettled TBA commitments are valued at the current market value of the underlying securities, according to the procedures described under “Valuation of Securities”.
Mortgage Backed Securities — Because the Fund will focus on community development investments, such as securities backed by commercial and/or residential mortgage loans, it will be affected by risks not typically associated with funds that do not specialize in community development investments. These risks include credit and prepayment risk due to default on underlying loans within a security. Changes in economic conditions, including delinquencies and/or defaults or assets underlying these securities, can affect the value, income and/or liquidity of such positions.
In addition, the Fund invests in certain mortgage backed securities that qualify under the CRA in which it may pay a premium for the geographically or other targeted nature of the securities. There can be no guarantee, however, that a similar premium will be received if the security is sold by the Fund.
Credit Enhancement — Certain obligations held in the Fund have credit enhancement or liquidity features that may, under certain circumstances, provide for repayment of principal and interest on the obligation upon demand date, interest rate reset date or final maturity. These enhancements may include: letters of credit; liquidity guarantees; security purchase agreements; tender option purchase agreements; and third party insurance (i.e., AMBAC and MBIA).
25
|
NOTES TO FINANCIAL STATEMENTS |
Recent Accounting Standard:
In March 2008, FASB issued Statement of Financial Accounting Standards No. 161, “Disclosures about Derivative Instruments and Hedging Activities” (“SFAS 161”) and is effective for fiscal years beginning after November 15, 2008. SFAS 161 is intended to improve financial reporting for derivative instruments by requiring enhanced disclosure that enables investors to understand how and why an entity uses derivatives, how derivatives are accounted for, and how derivative instruments affect an entity’s results of operations and financial position. Management is currently evaluating the implications of SFAS 161. The impact on the Funds’ financial statement disclosures, if any, is currently being assessed.
Financial Accounting Standards Board (“FASB”) Statement of Financial Accounting Standards No. 157 “Fair Value Measurements” (“SFAS 157”) —
SFAS 157 clarifies the definition of fair value for financial reporting, establishes a framework for measuring fair value and requires additional disclosures about the use of fair value measurements.
The three levels of the fair value hierarchy under SFAS 157 are described below:
• Level 1 - quoted prices in active markets for identical securities.
• Level 2 - other significant observable inputs (including quoted prices for similar securities, interest rates, prepayment speeds, credit risk, etc.).
• Level 3 - significant unobservable inputs (including the Fund’s own assumptions in determining the fair value of investments).
The inputs or methodology used for valuing securities are not necessarily an indication of the risk associated with investing in those securities.
The summary of inputs used to determine the fair valuation of the Fund’s investments as of March 31, 2009 is as follows:
| | | | | | | | | | | | | | | | | | | | |
Funds | | | | Level 1
Quoted Prices | | | | Level 2
Significant
Observable
Inputs | | | | Level 3
Significant
Unobservable
Inputs | | | | Total | |
| | | | | | | | |
Assets: | | | | | | | | | | | | | | | | | | | | |
Investments in Securities | | | | $ | 6,237,877 | | | | $ | 662,227,014 | | | | $— | | | | $ | 668,464,891 | |
| | | | | | | | |
Liabilities: | | | | | | | | | | | | | | | | | | | | |
Other * | | | | $ | (3,508,124) | | | | $ | — | | | | $— | | | | $ | (3,508,124 | ) |
* Other financial instruments are instruments not reflected in the Schedule of Investments, such as futures contracts which are valued at the unrealized appreciation/(depreciation) on the investment.
Investment Transactions and Income:
Investment transactions are recorded one business day after trade date, except for on the last day of each fiscal quarter end, when they are recorded on trade date. Dividend income is recorded on the ex-dividend date. Realized gains and losses from investment transactions are calculated based on the costs of the specific security (also known as identified cost basis). Interest income is recognized on the accrual basis and includes, where applicable, the amortization and accretion of premium or discount using the effective yield method. Paydown gains and losses on mortgage and asset-backed securities are included in the financial statements as interest income.
Distributions to Shareholders:
The Fund pays out any income that it receives, less expenses, in the form of dividends and capital gains to its shareholders. Income dividends are declared daily and paid monthly. Dividends will also be paid at any time during the month upon total redemption of shares in an account. Capital gain distributions are declared and paid at least annually. Distributions to shareholders are recorded on the ex-dividend date. The amount of dividends and distributions are calculated based on federal income tax regulations, which may differ from GAAP. These “book/tax” differences may be either temporary or permanent in nature. To the extent these differences are determined, as of the end of the tax year, to be permanent (e.g., reclassification of paydown gains and losses, and expiring capital loss carryforward), they are reclassified within a Fund’s capital account based on their federal tax basis treatment. Such differences are not reflected in the calculation of the Financial Highlights.
26
|
NOTES TO FINANCIAL STATEMENTS |
3. Agreements and Other Transactions with Affiliates
Voyageur serves as investment advisor to the Fund. The Advisor has agreed to waive or limit fees through January 31, 2010, to maintain expenses, (excluding interest expense, management fees and distribution fees) at 0.20% of the Fund’s average monthly gross assets less liabilities, other than indebtness for borrowing. The Fund will carry forward, for a period not to exceed 12 months from the date on which a waiver or reimbursement is made by the Advisor, any expenses in excess of the expense limitation and repay the Advisor such amounts, provided the Fund is able to effect such repayment and remain in compliance with the expense limitation disclosed in the effective prospectus. During the six month period ended March 31, 2009, no reimbursements were made to the Advisor.
Under the terms of the Fund’s management agreement, the Advisor receives from the Fund an annual management fee, paid monthly, of 50 basis points (0.50%) of the Fund’s average daily total assets less liabilities, other than indebtedness for borrowing. For purposes of calculating the management fee, assets purchased with borrowed monies are included in the total that is subject to the management fee. As a result, the Advisor has an incentive to use leverage so as to increase the amount of assets upon which it may charge a fee. As of March 31, 2009, the impact of leverage raised the management fee to approximately 64 basis points (0.64%) of the Funds average net assets.
Independent Trustees (Trustees of Tamarack who are not directors, officers or employees of the adviser, administrator or distributor) receive from the entire Tamarack fund family an annual retainer of $20,000. The Board Chairperson and Audit Committee Chairperson each receive an additional retainer of $2,500 annually, and all other trustees serving as Chair of a Board committee each receive an additional retainer of $1,000 annually. In addition, Independent Trustees receive a quarterly meeting fee of $5,000 for each in-person Board meeting attended, a meeting fee of $1,000 for each telephonic or Special Board meeting attended, and a $1,000 fee for each Board committee meeting attended and are reimbursed for all out-of-pocket expenses relating to attendance at such meetings.
Expense, Investment Income and Gain/Loss Allocation:
The Fund pays the expenses that are directly related to its operations, such as custodian fees or adviser fees. Expenses incurred by Tamarack, such as trustee or legal fees, are allocated to the Fund either proportionately based upon the Fund’s relative net assets or using another reasonable basis such as equally across all funds in Tamarack Trust, depending on the nature of the expense. Individual share classes within the Fund are charged expenses specific to that class, such as distribution fees. Within the Fund, expenses other than class specific expenses are allocated daily to each class based upon the proportion of relative net assets. Investment income and realized and unrealized gains or losses are allocated to each class of shares based upon the proportion of relative net assets.
4. Fund Distribution:
The Fund has adopted a Master Distribution 12b-1 Plan (the “Plan”) in which Tamarack Distributors, Inc. (the “Distributor”) acts as the Fund’s distributor. The Distributor is an affiliate of Voyageur. The Plan permits the Fund to make payments for, or to reimburse the Distributor monthly for, distribution-related costs and expenses of marketing shares of each share class covered under the Plan, and/or for providing shareholder services. The following chart shows the current Plan fee rate for each class.
| | |
| | | Class A |
12b-1 Plan Fee | | 0.25%* |
* The maximum Plan fee rate for Class A shares is 0.50%. The Distributor is currently waiving 0.25% of the 0.50% Plan fee for Class A.
27
|
NOTES TO FINANCIAL STATEMENTS |
Plan fees are based on average daily net assets of the applicable class. The Distributor, subject to applicable legal requirements, may waive a Plan fee voluntarily, in whole or in part. For the six months ended March 31, 2009, the Distributor waived $122 of Plan fees.
For the six months ended March 31, 2009, the Distributor received no commissions from front-end sales charges of Class A shares of the Fund. The Distributor received no CDSC fees from the Funds during the same six month period.
5. Securities Transactions:
The cost of securities purchased and proceeds from securities sold (excluding securities maturing less than one year from acquisition) for the six month period ended March 31, 2009 were as follows:
| | | |
Purchases | | Sales |
$ 41,871,448 | | $ | 37,818,960 |
6. Capital Share Transactions:
Tamarack is authorized to issue 1,000,000,000 shares of beneficial interest (“shares outstanding”) with par value of $.0000001. Transactions in shares of the Fund are summarized below:
| | | | |
| | | For the
Period Ended
March 31,
2009* | |
| |
CAPITAL TRANSACTIONS: | | | | |
Class A | | | | |
Proceeds from shares issued | | $ | 901,526 | |
Distributions reinvested | | | 1,308 | |
| | | | |
Change in Class A | | $ | 902,834 | |
| | | | |
Class I | | | | |
Proceeds from shares issued | | $ | 8,959,141 | |
Distributions reinvested | | | 4,605,017 | |
Cost of shares redeemed | | | (18,188,044 | ) |
| | | | |
Change in Class I | | $ | (4,623,886) | |
| | | | |
Change in net assets resulting from capital transactions | | $ | (3,721,052) | |
| | | | |
| |
SHARE TRANSACTIONS: | | | | |
Class A | | | | |
Issued | | | 94,519 | |
Reinvested | | | 137 | |
| | | | |
Change in Class A | | | 94,656 | |
| | | | |
Class I | | | | |
Issued | | | 940,156 | |
Reinvested | | | 488,342 | |
Redeemed | | | (1,955,552 | ) |
| | | | |
Change in Class I | | | (527,054 | ) |
| | | | |
Change in shares resulting from capital transactions | | | (432,398 | ) |
| | | | |
* January 29, 2009 (commencement of operations) through March 31, 2009 for Class A and six month period ended March 31, 2009 for Class I
7. Federal Income Taxes:
It is the policy of the Fund to continue to qualify as a regulated investment company by complying with the provisions available to certain investment companies, as defined under Subchapter M of the Internal Revenue Code, and to distribute substantially all of its net investment income and net realized capital gains. Therefore, no federal tax liability is recorded in the financial statements of the Fund.
|
NOTES TO FINANCIAL STATEMENTS |
As of March 31, 2009 the tax cost of securities and the breakdown of unrealized appreciation (depreciation) was as follows:
| | | | | | | | | | | | | | | | | | | | | | | |
Tax
Cost of
Securities | | Unrealized
Appreciation | | Unrealized
Depreciation | | | Net Unrealized
Appreciation | | |
| $ | 645,392,007 | | $ | 27,514,703 | | $ | (4,441,819 | ) | | $ | 23,072,884 | |
The tax character of distributions were as follows:
| | | | | | |
| | | Distributions Paid From |
| | | Ordinary
Income | | Total
Distributions
Paid |
For the period June 1, 2008 to September 30, 2008 | | $ | 9,137,073 | | $ | 9,137,073 |
For the year ended May 31, 2008 | | | 23,953,132 | | | 23,953,132 |
The tax basis of components of accumulated earnings/(losses) and the tax character of distributions paid are determined at fiscal year end, and will be included in the Annual Report dated September 30, 2009.
As of September 30, 2008, the Fund had capital loss carryforwards for federal income tax purposes as follows:
| | | | | | | | | | | | | | | | | | | | | | | | | | | | | | | | | | | | | | | | | | | | | | | | | | | | |
Capital Loss
Carryforward | | | | Expires | | |
| $ 310,646 | | | | 2009 | |
| 1,093,937 | | | | 2010 | |
| 2,026,076 | | | | 2011 | |
| 3,756,334 | | | | 2012 | |
| 659,184 | | | | 2013 | |
| 27,743 | | | | 2014 | |
| 2,484,167 | | | | 2015 | |
| 8,197,543 | | | | 2016 | |
The Fund adopted the provisions of FASB Interpretation No. 48 (“FIN48”), Accounting for Uncertainty in Income Taxes, on November 29, 2007. The implementation of FIN48 resulted in no material liability for unrecognized tax benefits and no material change to the net asset value of the Fund at the beginning of the day. As of September 30, 2008, the Fund did not have a liability for any uncertain tax benefits. The Fund recognizes interest and penalties, if any, related to unrecognized tax benefits as income tax expense in the Statements of Operations. During the period, the Fund did not incur any interest or penalties. The Fund is not subject to examination by U.S. federal tax authorities for tax years before 2005 and by state authorities for tax years before 2004.
|
SHARE CLASS INFORMATION (UNAUDITED) |
The Access Capital Community Investment Fund offers two share classes. These share classes are the A and I classes.
Class A
Class A shares are available for purchase primarily through investment advisors, broker-dealers, banks and other financial services intermediaries. Class A shares of the Fund are currently subject to a maximum up-front sales charge of 3.75% and a 1.00% CDSC for redemption within 12 months of a $1 million or greater purchase. Class A shares currently include a 0.25% annual 12b-1 service and distribution fee. (The 12b-1 Plan allows for 0.50%, but the Funds’ Distributor is currently voluntarily waiving 0.25%. The Distributor currently has no plans to discontinue this waiver.)
Class I
Class I shares are intended for investors meeting certain minimum investment thresholds. This share class does not have an up-front sales charge (load) or a 12b-1 service and distribution fee.
30
|
SUPPLEMENTAL INFORMATION (UNAUDITED) |
Information for Tamarack Funds Shareholders Regarding Advisory Agreements
The Tamarack Board of Trustees has renewed the Investment Advisory Agreement with Voyageur Asset Management Inc. (“Voyageur” or the “Advisor”) for the Fund. After evaluating the services provided by the Advisor and reviewing the performance and relevant expenses of the Fund, the Trustees concluded that it was in the best interests of the Fund and its shareholders to continue the investment advisory agreement (“Agreement”).
As part of their review of the Agreement, the Trustees received and discussed certain information, including information regarding the advisory services performed, qualifications of staffing, and Fund performance and expenses. The Trustees considered information provided in advance of their in-person meeting, as well as supplemental information provided at the meeting. The Trustees met with representatives from the Advisor’s senior management team, as well as senior investment professionals, to discuss this information and Voyageur’s intentions with regard to the ongoing management of the Fund. The Trustees reviewed the quality of the services provided to the Fund by Voyageur, including information prepared by a third-party consultant as to the Fund’s performance relative to an appropriate benchmark as well as compared to the Fund’s appropriate peer group. The Trustees also reviewed the investment management fees payable to Voyageur. In this connection, the Trustees reviewed comparative information prepared by a third-party consultant on investment management fees paid and expenses incurred by similarly situated funds. The Trustees also received reports from Voyageur regarding other investment companies advised by it, including the advisory fees paid. The Trustees took into account profitability data for Voyageur included in the materials. The Trustees received information from Voyageur regarding other benefits derived from its relationship with the Fund. In connection with their deliberations, the independent Trustees met separately with their independent legal counsel to review the relevant material and consider their responsibilities under relevant laws and regulations. In addition, the Trustees noted the expected composition of each portfolio management team.
The Trustees observed that the Fund was ranked in the top quintile for its peer group for the one and three year periods, and in the top quintile of its peer universe for the one year period. The Board also noted that the Fund’s expense comparison was in the fifth quintile for both its peer group and peer universe. In considering the quality of services be provided by Voyageur, the Trustees discussed the strong research, credit and fundamental analysis capabilities, the specialized expertise in the area of fixed income investments eligible for regulatory credit under the Community Reinvestment Act of 1977 and the extensive portfolio management experience of Voyageur staff, as well as Voyageur’s operational and compliance structure and systems and Voyageur’s financial strength. The Trustees also considered steps that already had been taken by Voyageur to expand upon existing research capabilities and compliance processes and steps that were expected to be taken to maintain and/or enhance such capabilities and processes.
Based upon their review, the Trustees determined that the advisory fee proposed to be payable to Voyageur was reasonable and fair in light of the nature and quality of services provided under all of the circumstances, and was within the range of what might have been negotiated at arms’ length. The Trustees concluded that it is in the interest of the Fund and its shareholders for the Trustees to approve the continuation of the Agreement for the Fund. In arriving at their decision to approve the renewal of the Agreement, the Trustees did not assign relative weights to the factors discussed above or deem any one or group of them to be controlling in and of themselves.
31
|
SUPPLEMENTAL INFORMATION (UNAUDITED) |
Shareholder Expense Examples
As a shareholder of the Access Capital Community Investment Fund, you incur two types of costs: (1) transaction costs, and (2) ongoing costs, including management fees and other Fund expenses. This example is intended to help you understand your ongoing costs (in dollars) of investing in the Fund and to compare these costs with the ongoing costs of investing in other mutual funds.
The Example is based on an investment of $1,000 invested at the beginning of the period and held for the entire period from October 1, 2008 through March 31, 2009.
Actual Expenses
The table below provides information about actual account values and actual expenses. You may use the information below, together with the amount you invested, to estimate the expenses that you paid over the period. Simply divide your account value by $1,000 (for example, an $8,600 account value divided by $1,000 = 8.6), then multiply the result by the number in the table under the heading entitled “Expenses Paid During Period” to estimate the expenses you paid on your account during this period.
| | | | | | | | |
| | | Beginning
Account Value
10/1/2008 | | Ending
Account Value
3/31/09 | | Expenses Paid
During Period*
10/1/08-3/31/09 | | Annualized
Expense Ratio
During Period
10/1/08-3/31/09 |
Class A | | $ 1,000.00 | | $1,017.54 | | $2.04 | | 1.19% |
Class I | | $ 1,000.00 | | $1,046.10 | | $6.53 | | 1.28% |
Hypothetical Example for Comparison Purposes
The table below provides information about hypothetical account values and hypothetical expenses based on the Funds’ actual expense ratio and an assumed rate of return of 5% per year before expenses, which is not the Fund’s actual return. The hypothetical account values and expenses may not be used to estimate the actual ending account balance or expenses you paid for the period. You may use this information to compare this 5% hypothetical example with the 5% hypothetical examples that appear in the shareholder reports of other funds.
Please note that the expenses shown in the table are meant to highlight your ongoing costs only and do not reflect any transactional costs, such as sales charges (loads), redemption fees, or exchange fees. Therefore, the table is useful in comparing ongoing costs only, and will not help you determine the relative total costs of owning different funds. In addition, if these transactional costs were included, your costs would have been higher.
| | | | | | | | |
| | | Beginning
Account Value
10/1/2008 | | Ending
Account Value
3/31/2009 | | Expenses Paid
During Period*
10/1/08-3/31/09 | | Annualized
Expense Ratio
During Period
10/1/08-3/31/09 |
Class A | | $ 1,000.00 | | $1,006.47 | | $2.03 | | 1.19% |
Class I | | $ 1,000.00 | | $1,018.55 | | $6.44 | | 1.28% |
* Expenses are equal to the average account value times the Fund’s annualized expense ratio multiplied by the number of days in the most recent fiscal half-year divided by the number of days in the fiscal year (to reflect one half-year period).
32
This Page Intentionally Left Blank
33
|
Tamarack Funds P.O. Box 219757 Kansas City, MO 64121-9757 800-422-2766 www.voyageur.net Performance data represents past performance and does not guarantee future results. The principal value of an investment and investment return will fluctuate so that an investor’s shares, when redeemed, may be worth more or less than their original cost. This report and the financial statements contained herein are provided for the information of Tamarack Funds shareholders. This report is not authorized for distribution to prospective investors unless preceded or accompanied by a current prospectus, which contains information concerning investment objectives, risks, charges and expenses of the funds. Please read the prospectus carefully before investing. This report and the financial statements contained herein are not intended to be a forecast of future events, a guarantee of future results, or investment advice. There is no assurance that certain securities will remain in or out of each fund’s portfolio. The views expressed in this report reflect those of the portfolio managers through the period ended March 31, 2009. NOT FDIC INSURED • NO BANK GUARANTEE • MAY LOSE VALUE Voyageur Asset Management Inc. serves as investment adviser to the Access Capital Community Investment Fund (the” Fund”). The Fund is distributed by Tamarack Distributors Inc. |

The Tamarack Funds are pleased to offer shareholder reports printed
entirely on Forest Stewardship Council certified paper. FSC certification
ensures that the paper used in this report contains fiber from well-
managed and responsibly harvested forests that meet strict
environmental and socioeconomic standards.
TF-AC SAR 03-09
Item 2. Code of Ethics.
Not applicable.
Item 3. Audit Committee Financial Expert.
Not applicable.
Item 4. Principal Accountant Fees and Services.
Not applicable.
Item 5. Audit Committee of Listed registrants.
Not applicable.
Item 6. Investments.
| (a) | Schedule of Investments in securities of unaffiliated issuers as of the close of the reporting period is included as part of the report to shareholders filed under Item 1 of this form. |
| | |
Item 7. | | Disclosure of Proxy Voting Policies and Procedures for Closed-End Management Investment Companies. |
Not applicable.
Item 8. Portfolio Managers of Closed-End Management Investment Companies.
Not applicable.
| | |
Item 9. | | Purchases of Equity Securities by Closed-End Management Investment Company and Affiliated Purchasers. |
Not applicable.
Item 10. Submission of Matters to a Vote of Security Holders.
There have been no material changes to the procedures by which the shareholders may recommend nominees to the registrant’s board of directors, where those changes were implemented after the registrant last provided disclosure in response to the requirements of Item 407(c)(2)(iv) of Regulation S-K (17 CFR 229.407) (as required by Item 22(b)(15) of Schedule 14A (17 CFR 240.14a-101)), or this Item.
Item 11. Controls and Procedures.
| | (a) | The registrant’s principal executive and principal financial officers, or persons performing similar functions, have concluded that the registrant’s disclosure controls and procedures (as defined in Rule 30a-3(c) under the Investment Company Act of 1940, as amended (the “1940 Act”) (17 CFR 270.30a-3(c))) are effective, as of a date within 90 days of the filing date of the report that includes the disclosure required by this paragraph, based on their evaluation of these controls and procedures required by Rule 30a-3(b) under the 1940 Act (17 CFR 270.30a-3(b)) and Rules 13a-15(b) or 15d-15(b) under the Securities Exchange Act of 1934, as amended (17 CFR 240.13a-15(b) or 240.15d-15(b)). |
| | (b) | There were no changes in the registrant’s internal control over financial reporting (as defined in Rule 30a-3(d) under the 1940 Act (17 CFR 270.30a-3(d)) that occurred during the registrant’s second fiscal quarter of the period covered by this report that has materially affected, or is reasonably likely to materially affect, the registrant’s internal control over financial reporting. |
Item 12. Exhibits.
| | (a)(2) | Certifications pursuant to Rule 30a-2(a) under the 1940 Act and Section 302 of the Sarbanes-Oxley Act of 2002 are attached hereto. |
| | (b) | Certifications pursuant to Rule 30a-2(b) under the 1940 Act and Section 906 of the Sarbanes- Oxley Act of 2002 are attached hereto. |
SIGNATURES
Pursuant to the requirements of the Securities Exchange Act of 1934 and the Investment Company Act of 1940, the registrant has duly caused this report to be signed on its behalf by the undersigned, thereunto duly authorized.
| | | | |
(registrant) | | Tamarack Funds Trust | | |
| | | | |
| | |
By (Signature and Title)* | | /s/ Erik R. Preus | | |
| | Erik R. Preus, President and Chief Executive Officer (principal executive officer) | | |
Pursuant to the requirements of the Securities Exchange Act of 1934 and the Investment Company Act of 1940, this report has been signed below by the following persons on behalf of the registrant and in the capacities and on the dates indicated.
| | | | |
By (Signature and Title)* | | /s/ Erik R. Preus | | |
| | Erik R. Preus, President and Chief Executive Officer (principal executive officer) | | |
| | | | |
By (Signature and Title)* | | /s/ Kathleen A. Hegna | | |
| | Kathleen A. Hegna, Chief Financial Officer (principal financial officer) | | |
* Print the name and title of each signing officer under his or her signature.