UNITED STATES
SECURITIES AND EXCHANGE COMMISSION
Washington, D.C. 20549
FORM N-CSR
CERTIFIED SHAREHOLDER REPORT OF REGISTERED MANAGEMENT
INVESTMENT COMPANIES
Investment Company Act file number 811-21475
RBC Funds Trust
(Exact name of registrant as specified in charter)
100 South Fifth Street, Suite 2300
Minneapolis, MN 55402-1240
(Address of principal executive offices) (Zip code)
Lee Thoresen, Esq.
RBC Plaza
60 South Sixth Street
Minneapolis, MN 55402
(Name and address of agent for service)
Registrant’s telephone number, including area code: (612) 313-1341
Date of fiscal year end: September 30
Date of reporting period: March 31, 2012
Item 1. Reports to Stockholders.
The Report to Shareholders is attached herewith.
| | | | | | | | | | | | | | | | |
| | | | | | | | | |
| | | | | | | | RBC Funds | |
About Your Semi Annual Report | | | | | | | | This semi annual report includes detailed information about your Fund including financial statements, performance, and a complete list of its holdings. The RBC Funds compare their performance against various Russell equity indices. Each of these indices is a widely recognized measure of return for the underlying category of securities. However, the indices are unmanaged, do not include fees, and cannot be invested in directly. We hope the financial information presented will help you evaluate your investment in the RBC Funds. We also encourage you to read your Funds’ prospectus for further detail as to your Funds’ investment policies and risk profile. RBC Funds prospectuses and performance information subsequent to the date of this report are available on our website at www.rbcgam.us. A description of the policies and procedures that your Fund uses to determine how to vote proxies relating to portfolio securities is available (i) without charge, upon request, by calling 1-800-422-2766; (ii) on the Fund’s website at www.rbcgam.us; and (iii) on the Securities and Exchange Commission’s (the “Commission”) website at http://www.sec.gov. Information regarding how your Fund voted proxies relating to portfolio securities during the most recent 12-month period ended June 30 is available (i) on the Fund’s website at www.rbcgam.us; and (ii) on the Commission’s website at http://www.sec.gov. A schedule of each Fund’s portfolio holdings will be filed with the Commission for the first and third quarters of each fiscal year on Form N-Q. This information is available on the Commission’s website at http://www.sec.gov and may be reviewed and copied at the Commission’s Public Reference Room in Washington, D.C. Information on the operation of the Public Reference Room is available by calling 1-202-551-8090. | |
| Table of | | | | | | | | | | | | | | | | |
| Contents | | | | | | | | Equity Portfolio Managers | | | 1 | |
| | | | | | | | Performance Summary | | | 3 | |
| | | | | | | | RBC SMID Cap Growth Fund | | | 8 | |
| | | | | | | | RBC Enterprise Fund | | | 9 | |
| | | | | | | | RBC Small Cap Core Fund | | | 10 | |
| | | | | | | | RBC Microcap Value Fund | | | 11 | |
| | | | | | | | RBC Mid Cap Value Fund | | | 12 | |
| | | | | | | | Schedules of Portfolio Investments | | | 13 | |
| | | | | | | | Financial Statements | | | | |
| | | | | | | | - Statements of Assets and Liabilities | | | 36 | |
| | | | | | | | - Statements of Operations | | | 38 | |
| | | | | | | | - Statements of Changes in Net Assets | | | 39 | |
| | | | | | | | Financial Highlights | | | 44 | |
| | | | | | | | Notes to Financial Statements | | | 54 | |
| | | | | | | | Share Class Information | | | 64 | |
| | | | | | | | Supplemental Information | | | 65 | |
| | | | | | | | | | | | |
| | | | | | | | | | | | |
| | | | | | |
EQUITY PORTFOLIO MANAGERS | | | | | | |
| | | | | | | |
RBC Global Asset Management (U.S.) Inc. (“RBC GAM (US)”) serves as the investment advisor to the RBC Funds. RBC GAM (US) employs a team approach to the management of the RBC Equity Funds, with no individual team member being solely responsible for the investment decisions. | | | | | | |
Lance F. James Managing Director, Senior Portfolio Manager Lance James is responsible for portfolio management of the RBC Small Cap Core Fund, RBC Enterprise Fund, and RBC Microcap Value Fund. He is also co-manager of RBC Mid Cap Value Fund. Prior to joining RBC GAM (US) in 2006, Lance was an equity analyst and portfolio manager for OFI Institutional and Babson Capital Management, affiliated companies of Mass Mutual Life Insurance Company. During his tenure he served as head of the firm’s small/mid cap value investment team. Prior to joining Babson Capital in 1986, Lance worked at Rockwell International Corporation, EBF Associates of Boston and Hewitt Associates. Lance began his career in the investment industry in 1980. He received an AB in Economics from Princeton University and an MBA in Finance from the Wharton School of Business at the University of Pennsylvania. | | | | | | 
Lance F. James |
George Prince Vice President, Portfolio Manager, Senior Equity Analyst George Prince serves as the co-portfolio manager for the RBC Enterprise Fund. George also provides research support for the RBC Small Cap Core Fund. He joined RBC GAM (US) in 2006 from Eagle Asset Management, where he was a senior equity analyst. Prior to his experience at Eagle Asset Management, George was an analyst at Babson Capital Management. George also has a great deal of entrepreneurial experience and founded SignStorey, a leader in place-based digital communications in retail stores and co-founded Cutting Edge Inc., a global CAD-CAM technology company. George has over 12 years of investment industry experience. He received a BA from Yale University. | | | | | | 
George Prince |
Kenneth A. Tyszko, CPA, CFA Managing Director, Senior Portfolio Manager Ken Tyszko is responsible for portfolio management of the RBC SMID Cap Growth Fund, and is responsible for Small Cap Growth and SMID Cap Growth research and portfolio management at RBC GAM (US). Ken has been in the investment industry since 1984 and has been managing small cap growth and SMID cap growth portfolios since 1988. He joined RBC GAM (US) in 2001. Ken previously served as a portfolio manager for Oberweis Asset Management, ABN AMRO Asset Management (USA) Inc., ABN AMRO Incorporated, and Sears Investment Management Company. His background also includes experience at Main Hurdman, an international accounting and consulting firm. Ken earned a BS in Accountancy from the University of Illinois. He is a CFA charterholder. Ken is a member of the Illinois CPA Society, the CFA Society of Chicago, and the CFA Institute. He has been a guest on Bloomberg Television, Bloomberg Radio, CNBC, and WebFN. | | | | | | 
Kenneth A. Tyszko, CPA, CFA |
1
| | | | | | |
| | | | | | EQUITY PORTFOLIO MANAGERS |
| | | | | | |

Stephen E. Kylander | | | | | | Stephen E. Kylander Vice President, Senior Portfolio Manager Steve Kylander is responsible for portfolio management of the RBC Mid Cap Value Fund. Prior to joining RBC GAM (US) in 2006, he was a portfolio manager and research analyst for Babson Capital Management. Steve’s previous experience also includes strategy consulting, mergers and acquisitions work and investment banking for L.E.K. Consulting, The Yarmouth Group, and First Boston Corporation. He began working in the investment industry in 1986. Steve earned a BA from Dartmouth College and an MBA from Harvard Business School. |
| | | | | | |
| | | | | | |
| | | | | | |
| | | | | | |
| | | | | | |
| | | | | | |
| | | | | | |
2
Average Annual Total Returns as of March 31, 2012 (Unaudited)
RBC SMID Cap Growth Fund (a)
| | | | | | | | | | | | | | | | | | | | | | | | | | | | |
| | | 1 Year | | | 3 Year | | | 5 Year | | | 10 Year | | | Since
Inception(b) | | | Net
Expense
Ratio(1)(2) | | | Gross
Expense
Ratio(1)(2) | |
| | | | | | | |
Class A | | | | | | | | | | | | | | | | | | | | | | | | | | | | |
- Including Maximum Sales Charge of 5.75% | | | 1.12% | | | | 24.82% | | | | 3.39% | | | | 4.42% | | | | 10.66% | | | | | | | | | |
- At Net Asset Value | | | 7.27% | | | | 27.33% | | | | 4.62% | | | | 5.04% | | | | 10.97% | | | | 1.35% | | | | 1.61% | |
| | | | | | | |
Class C (c) | | | | | | | | | | | | | | | | | | | | | | | | | | | | |
- Including Contingent Deferred Sales Charge of 1.00% | | | 5.52% | | | | 26.33% | | | | 3.83% | | | | 4.25% | | | | 10.15% | | | | | | | | | |
- At Net Asset Value | | | 6.52% | | | | 26.33% | | | | 3.83% | | | | 4.25% | | | | 10.15% | | | | 2.09% | | | | 2.36% | |
| | | | | | | |
Class I | | | 7.51% | | | | 27.64% | | | | 4.89% | | | | 5.30% | | | | 11.30% | | | | 1.10% | | | | 1.35% | |
| | | | | | | |
Class S (d) | | | 7.51% | | | | 27.64% | | | | 4.88% | | | | 5.30% | | | | 11.30% | | | | 1.10% | | | | 1.35% | |
| | | | | | | |
Russell 2500 | | | | | | | | | | | | | | | | | | | | | | | | | | | | |
Growth Index* | | | 2.70% | | | | 29.86% | | | | 4.90% | | | | 6.99% | | | | 9.82% | | | | | | | | | |
| | | | | | | |
Russell Midcap | | | | | | | | | | | | | | | | | | | | | | | | | | | | |
Growth Index* | | | 4.43% | | | | 29.16% | | | | 4.44% | | | | 6.92% | | | | 10.33% | | | | | | | | | |
| | | | | | | |
| | | | | | | | | | | | | | | | | | | | | | | | | | | | | |
| | | | | | | |
| RBC Enterprise Fund (e) | | | | | | | | | | | | | | | | | | | | | | | | | | | | |
| | | | | | | |
| | | 1 Year | | | 3 Year | | | 5 Year | | | 10 Year | | | Since
Inception(f) | | | Net
Expense
Ratio(1)(2) | | | Gross
Expense
Ratio(1)(2) | |
| | | | | | | |
Class A (g) | | | | | | | | | | | | | | | | | | | | | | | | | | | | |
- Including Maximum Sales Charge of 5.75% | | | (2.11)% | | | | 24.93% | | | | (1.16)% | | | | 5.16% | | | | 10.16% | | | | | | | | | |
- At Net Asset Value | | | 3.86% | | | | 27.43% | | | | 0.02% | | | | 5.78% | | | | 10.39% | | | | 1.33% | | | | 1.57% | |
| | | | | | | |
Class C (g) | | | | | | | | | | | | | | | | | | | | | | | | | | | | |
- Including Contingent Deferred Sales Charge of 1.00% | | | 2.05% | | | | 26.43% | | | | (0.73)% | | | | 4.98% | | | | 9.56% | | | | | | | | | |
- At Net Asset Value | | | 3.05% | | | | 26.43% | | | | (0.73)% | | | | 4.98% | | | | 9.56% | | | | 2.08% | | | | 2.32% | |
| | | | | | | |
Class I (h) | | | 4.06% | | | | 27.70% | | | | 0.25% | | | | 6.04% | | | | 10.66% | | | | 1.08% | | | | 1.29% | |
| | | | | | | |
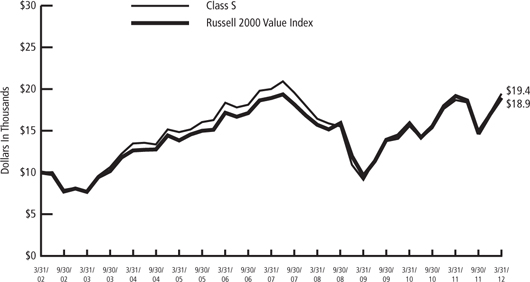
Class S | | | 4.12% | | | | 27.75% | | | | 0.26% | | | | 6.04% | | | | 10.66% | | | | 1.08% | | | | 1.32% | |
| | | | | | | |
Russell 2000 Index* | | | (0.18)% | | | | 26.90% | | | | 2.13% | | | | 6.45% | | | | 8.95% | | | | | | | | | |
Performance data quoted represents past performance. Past performance is no guarantee of future results. Investment return and principal value of an investment will fluctuate so that an investor’s shares, when redeemed, may be worth more or less than their original cost. Current performance may be lower or higher than performance quoted. Performance shown reflects contractual fee waivers, without such fee waivers total returns would be reduced. Performance information does not reflect the 2% fee on shares redeemed or exchanged within 30 days of purchase. If such redemption fee was included, performance would be reduced. For performance data current to the most recent month-end go to www.rbcgam.us. Please see footnotes beginning on page 5.
3
RBC Small Cap Core Fund (i)
| | | | | | | | | | | | | | | | | | | | | | | | | | | | |
| | | 1 Year | | | 3 Year | | | 5 Year | | | 10 Year | | | Since
Inception(j) | | | Net
Expense
Ratio(1)(2) | | | Gross
Expense
Ratio(1)(2) | |
| | | | | | | |
Class A (g) | | | | | | | | | | | | | | | | | | | | | | | | | | | | |
- Including Maximum Sales Charge of 5.75% | | | (3.88 | )% | | | 30.27 | % | | | 2.53 | % | | | 6.82 | % | | | 9.88 | % | | | | | | | | |
- At Net Asset Value | | | 1.98 | % | | | 32.87 | % | | | 3.75 | % | | | 7.46 | % | | | 10.19 | % | | | 1.30 | % | | | 1.80 | % |
| | | | | | | |
Class C (g) | | | | | | | | | | | | | | | | | | | | | | | | | | | | |
- Including Contingent Deferred Sales Charge of 1.00% | | | 0.32 | % | | | 31.90 | % | | | 3.05 | % | | | 6.69 | % | | | 9.39 | % | | | | | | | | |
- At Net Asset Value | | | 1.27 | % | | | 31.90 | % | | | 3.05 | % | | | 6.69 | % | | | 9.39 | % | | | 2.05 | % | | | 2.56 | % |
| | | | | | | |
Class S | | | 2.25 | % | | | 33.20 | % | | | 4.08 | % | | | 7.75 | % | | | 10.48 | % | | | 1.05 | % | | | 1.54 | % |
| | | | | | | |
Russell 2000 | | | | | | | | | | | | | | | | | | | | | | | | | | | | |
Index* | | | (0.18 | )% | | | 26.90 | % | | | 2.13 | % | | | 6.45 | % | | | 9.38 | % | | | | | | | | |
| | | | | | | |
| | | | | | | | | | | | | | | | | | | | | | | | | | | | | |
| | | | | | | |
| RBC Microcap Value Fund (k) | | | | | | | | | | | | | | | | | | | | | | | | | | | | |
| | | | | | | |
| | | 1 Year | | | 3 Year | | | 5 Year | | | 10 Year | | | Since
Inception(l) | | | Net
Expense
Ratio(1)(2) | | | Gross
Expense
Ratio(1)(2) | |
| | | | | | | |
Class A (g) | | | | | | | | | | | | | | | | | | | | | | | | | | | | |
- Including Maximum Sales Charge of 5.75% | | | (2.21 | )% | | | 25.83 | % | | | (2.02 | )% | | | 5.96 | % | | | 8.41 | % | | | | | | | | |
- At Net Asset Value | | | 3.74 | % | | | 28.32 | % | | | (0.85 | )% | | | 6.59 | % | | | 8.67 | % | | | 1.32 | % | | | 1.60 | % |
| | | | | | | |
Class C (g) | | | | | | | | | | | | | | | | | | | | | | | | | | | | |
- Including Contingent Deferred Sales Charge of 1.00% | | | 1.96 | % | | | 27.35 | % | | | (1.60 | )% | | | 5.80 | % | | | 7.86 | % | | | | | | | | |
- At Net Asset Value | | | 2.96 | % | | | 27.35 | % | | | (1.60 | )% | | | 5.80 | % | | | 7.86 | % | | | 2.07 | % | | | 2.35 | % |
| | | | | | | |
Class S | | | 4.00 | % | | | 28.64 | % | | | (0.60 | )% | | | 6.86 | % | | | 8.94 | % | | | 1.07 | % | | | 1.35 | % |
| | | | | | | |
Russell 2000 | | | | | | | | | | | | | | | | | | | | | | | | | | | | |
Value Index* | | | (1.07 | )% | | | 25.36 | % | | | 0.01 | % | | | 6.59 | % | | | 9.72 | % | | | | | | | | |
| | | | | | | |
| | | | | | | | | | | | | | | | | | | | | | | | | | | | | |
Performance data quoted represents past performance. Past performance is no guarantee of future results. Investment return and principal value of an investment will fluctuate so that an investor’s shares, when redeemed, may be worth more or less than their original cost. Current performance may be lower or higher than performance quoted. Performance shown reflects contractual fee waivers, without such fee waivers total returns would be reduced. Performance information does not reflect the 2% fee on shares redeemed or exchanged within 30 days of purchase. If such redemption fee was included, performance would be reduced. For performance data current to the most recent month-end go to www.rbcgam.us. Please see footnotes beginning on page 5.
4
RBC Mid Cap Value Fund
| | | | | | | | |
| | | 1 Year | | Since Inception(m) | | Net Expense Ratio(1)(2) | | Gross Expense Ratio(1)(2) |
Class I | | | | | | | | |
- At Net Asset Value | | 3.28% | | 16.34% | | 0.90% | | 5.59% |
| | | | |
Russell MidCap Value Index* | | 2.28% | | 15.09% | | | | |
Performance data quoted represents past performance. Past performance is no guarantee of future results. Investment return and principal value of an investment will fluctuate so that an investor’s shares, when redeemed, may be worth more or less than their original cost. Current performance may be lower or higher than performance quoted. Performance shown reflects contractual fee waivers, without such fee waivers total returns would be reduced. Performance information does not reflect the 2% fee on shares redeemed or exchanged within 30 days of purchase. If such redemption fee was included, performance would be reduced. For performance data current to the most recent month-end go to www.rbcgam.us. Please see footnotes below.
(1) The Funds’ expenses reflect the most recent fiscal year-end (September 30, 2011).
(2) The Adviser has contractually agreed to waive fees and/or make payments in order to keep total operating expenses of the Fund to the levels listed under net expense ratio until January 31, 2013.
*Each of the comparative indices is a widely recognized market value weighted measure of the return of securities, but do not include sales fees or operating expenses. You cannot invest directly in indices.
| (a) | The performance in the table for the period from June 1, 1994 to April 19, 2004 reflects the performance of RBC Mid Cap Equity Fund, the predecessor to RBC SMID Cap Growth Fund. The performance of the Fund also includes the performance of a common trust fund (“CTF”) account advised by RBC GAM (US) (including its predecessor) and managed the same as the Fund in all material respects for the period from December 31, 1990 to June 1, 1994, as adjusted to reflect the full contractual rate of expenses associated with the Fund at its inception. The CTF account was not registered with the SEC under the 1940 Act and therefore was not subject to the investment restrictions imposed by law on registered mutual funds. If the CTF account had been registered, the CTF account’s performance may have been adversely affected. Fund performance reflects applicable fee waivers/expense reimbursements (which, if excluded, would cause performance to be lower). |
| (b) | The since inception date (commencement of operations) of the Fund is December 31, 1990. |
| (c) | The inception date for Class C Shares of the Fund is April 19, 2004. All performance shown for each such class of shares prior to its inception date is based on the performance of the Class A Shares of the Fund, adjusted to reflect the fees and expenses of Class C Shares, as applicable (and where applicable, the maximum sales charges of the Class C Shares). |
| (d) | The inception date for Class S Shares of the Fund is April 19, 2004. All performance shown for each such class of shares prior to its inception date is based on the performance of the Class I Shares of the Fund, adjusted to reflect the fees and expenses of Class S Shares. |
| (e) | The performance in the table for the period from December 2, 1983 to April 19, 2004 reflects the performance of Babson Enterprise Fund, the predecessor to RBC Enterprise Fund. Fund performance reflects applicable fee waivers/expense reimbursements (which, if excluded, would cause performance to be lower). |
| (f) | The since inception date (commencement of operations) of the Fund is December 2, 1983. The performance of the index since inception of the Fund is calculated from November 30, 1983. |
| (g) | The inception date for Class A and Class C Shares of the Fund is April 19, 2004. All performance shown for each such class of shares prior to its inception date is based on the performance of the Class S Shares of the Fund, adjusted to reflect the fees and expenses of Class A and Class C Shares, as applicable (and where applicable, the maximum sales charges of the Class A and Class C Shares). |
5
| (h) | The inception date for Class I Shares of the Fund is September 30, 2004. All performance shown for each such class of shares prior to its inception date is based on the performance of the Class S Shares of the Fund, adjusted to reflect the fees and expenses of Class I Shares, as applicable. |
| (i) | The performance in the table for the period from August 5, 1991 to April 19, 2004 reflects the performance of Babson Enterprise Fund II, the predecessor to RBC Small Cap Core Fund. Fund performance reflects applicable fee waivers/expense reimbursements (which, if excluded, would cause performance to be lower). |
| (j) | The since inception date (commencement of operations) of the Fund is August 5, 1991. The performance of the index since inception of the Fund is calculated from July 31, 1991. |
| (k) | The performance in the table for the period from September 10, 1987 to April 19, 2004 reflects the performance of Shadow Stock Fund, the predecessor to RBC Microcap Value Fund. Fund performance reflects applicable fee waivers/expense reimbursements (which, if excluded, would cause performance to be lower). |
| (l) | The since inception date (commencement of operations) of the Fund is September 10, 1987. The performance of the index since inception of the Fund is calculated from August 31, 1987. |
| (m) | The since inception date (commencement of operations) of the Fund is December 31, 2009. The performance of the index since inception of the Fund is calculated from December 31, 2009. |
The Russell 2500 Growth Index is an unmanaged index that measures the performance of those Russell 2500 companies with higher price-to-book ratios and higher forecasted growth values.
The Russell 2000 Value Index is an unmanaged index that measures the performance of those Russell 2000 companies with lower price-to-book ratios and lower forecasted growth values.
The Russell 2000 Index is an unmanaged index that measures the performance of approximately 2,000 of the smallest securities in the Russell 3000 Index based on a combination of their market cap and current index membership.
The Russell Midcap Value Index is an unmanaged, market-weighted total return index that tracks the performance of those Russell Midcap companies with lower price-to-book ratios and lower forecasted growth rates.
The Russell Midcap Growth Index is an unmanaged index that measures the performance of those Russell Midcap Index companies with higher price-to-book ratios and higher forecasted growth values.
The Russell Microcap Index is an unmanaged index that measures the performance of 1000 of the smallest securities in the Russell 2000 Index based on a combination of their market cap and current index membership.
6
This Page Intentionally Left Blank
7
| | | | | | | | | | | | | | |
| | | | | | FUND STATISTICS (UNAUDITED) |
| | | |
| | | | | | RBC SMID Cap Growth Fund |
Investment Objective | | | | | | Long-term capital appreciation. |
| Benchmark | | | | | | Russell Midcap Growth Index and Russell 2500 Growth Index |
Asset Allocation (as of 3/31/12) (% of fund’s investments) & Top Five Industries (as of 3/31/12) (% of fund’s net assets) | | | | | | 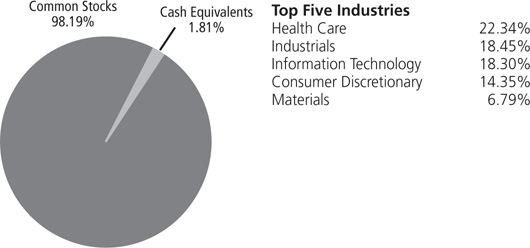
|
| | | | | |
| | | | | |
| | | | | |
| | | | | |
| | | | | |
| | | | | |
Top Ten Holdings (as of 3/31/12) (% of fund’s net assets) | | | | | | Tractor Supply Co. | | 3.50% | | | | Fossil, Inc. | | 2.24% |
| | | | | | Ross Stores, Inc. | | 2.59% | | | | LKQ Corp. | | 2.02% |
| | | | | | Pricesmart, Inc. | | 2.48% | | | | AMETEK, Inc. | | 1.90% |
| | | | | | Catalyst Health Solutions, Inc. | | 2.32% | | | | Cerner Corp. | | 1.83% |
| | | | | | Airgas, Inc. | | 2.32% | | | | Roper Industries, Inc. | | 1.76% |
| | | | | | *A listing of all portfolio holdings can be found beginning on page 13. |
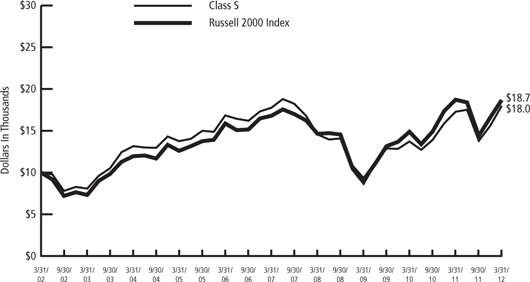
Growth of $10,000 Initial Investment Over 10 Years | | | | | | 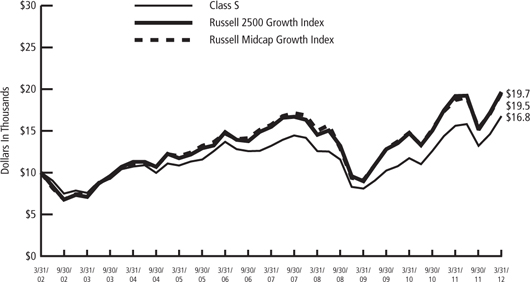
|
| | | | | |
| | | | | |
| | | | | |
| | | | | | The graph reflects an initial investment of $10,000 over a 10 year period and is based on Class S shares. The performance of the Fund for the period from September 30, 2001 to April 19, 2004 reflects the performance of RBC Mid Cap Equity Fund, the predecessor to RBC SMID Cap Growth Fund. The Fund’s total return includes reinvested dividends and capital gains. The Fund’s total return also includes operating expenses that reduce return, while the total return of the index does not. The graph does not reflect the deduction of taxes that a shareholder would pay on fund distributions or redemption of fund shares. Performance of other classes will vary due to differences in fee structures. |
| | | | | | |
| | | | | | |
8
| | | | | | | | | | | | | | |
FUND STATISTICS (UNAUDITED) | | | | | | |
| | | |
RBC Enterprise Fund | | | | | | |
Long-term growth of capital. | | | | | | Investment Objective |
Russell 2000 Index | | | | | | Benchmark |
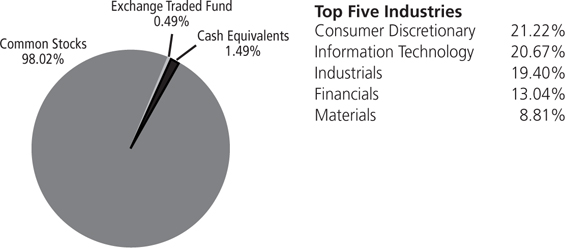
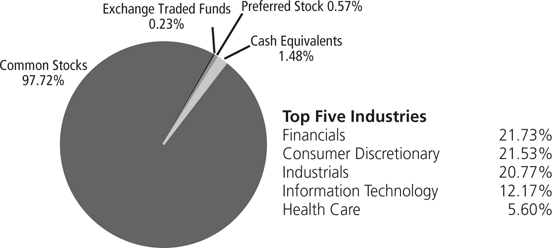
| | | | | | Asset Allocation (as of 3/31/12) (% of fund’s investments) & Top Five Industries (as of 3/31/12) (% of fund’s net assets) |
| | | | | |
| | | | | |
| | | | | |
| | | | | |
| | | | | |
| | | | | |
Universal Electronics, Inc. | | 3.99% | | | | Acacia Research Corp. | | 3.60% | | | | | | Top Ten Holdings (as of 3/31/12) (% of fund’s net assets) |
| Benihana, Inc. | | 3.97% | | | | Tyler Technologies, Inc. | | 3.31% | | | | | |
| Universal Stainless & Alloy | | 3.92% | | | | Columbus McKinnon Corp. | | 2.97% | | | | | |
| AZZ, Inc. | | 3.72% | | | | Tessco Technologies, Inc. | | 2.93% | | | | | |
| Steinway Musical Instruments, Inc. | | 3.71% | | | | Compass Diversified Holdings | | 2.90% | | | | | |
| *A listing of all portfolio holdings can be found beginning on page 16. | | | | | |
| | | | | | Growth of $10,000 Initial Investment Over 10 Years |
| | | | | |
| | | | | |
| | | | | |
| The graph reflects an initial investment of $10,000 over a 10 year period and is based on Class S shares. The performance of the Fund for the period from September 30, 2001 to April 19, 2004 reflects the performance of Babson Enterprise Fund, the predecessor to RBC Enterprise Fund. The Fund’s total return includes reinvested dividends and capital gains. The Fund’s total return also includes operating expenses that reduce return, while the total return of the index does not. The graph does not reflect the deduction of taxes that a shareholder would pay on fund distributions or redemption of fund shares. Performance of other classes will vary due to differences in fee structures. | | | | |
| | | | | |
| | | | | |
9
| | | | | | | | | | | | | | | | | | |
| | | |
| | | | | | FUND STATISTICS (UNAUDITED) |
| | | |
| | | | | | RBC Small Cap Core Fund |
Investment Objective | | | | | | Long-term growth of capital and income. |
| Benchmark | | | | | | Russell 2000 Index |
Asset Allocation (as of 3/31/12) (% of fund’s investments) & Top Five Industries (as of 3/31/12) (% of fund’s net assets) | | | | | | 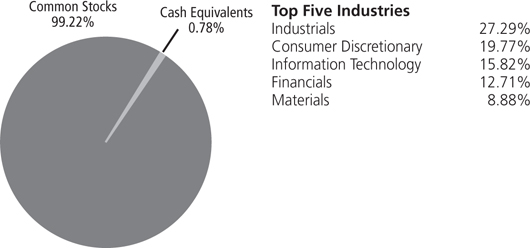
|
| | | | | |
| | | | | |
| | | | | |
| | | | | |
| | | | | |
| | | | | |
Top Ten Holdings (as of 3/31/12) (% of fund’s net assets) | | | | | | Universal Stainless & Alloy | | | 3.70 | % | | | | Compass Diversified Holdings | | 2.48% | | |
| | | | | | Gardner Denver, Inc. | | | 2.77 | % | | | | Universal Electronics, Inc. | | 2.34% | | |
| | | | | | Acacia Research Corp. | | | 2.73 | % | | | | ACCO Brands Corp. | | 2.26% | | |
| | | | | | Steinway Musical Instruments, Inc. | | | 2.61 | % | | | | Xyratex Ltd. | | 2.24% | | |
| | | | | | AZZ, Inc. | | | 2.49 | % | | | | Ares Capital Corp. | | 2.16% | | |
| | | | | | *A listing of all portfolio holdings can be found beginning on page 19. |
| Growth of $10,000 Initial Investment Over 10 Years | | | | | | 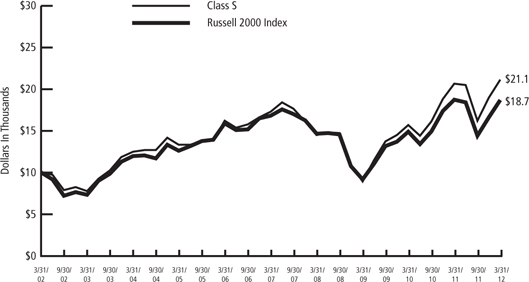
|
| | | | | | The graph reflects an initial investment of $10,000 over a 10 year period and is based on Class S shares. The performance of the Fund for the period from September 30, 2001 to April 19, 2004 reflects the performance of Babson Enterprise Fund II, the predecessor to RBC Small Cap Core Fund. The Fund’s total return includes reinvested dividends and capital gains. The Fund’s total return also includes operating expenses that reduce return, while the total return of the index does not. The graph does not reflect the deduction of taxes that a shareholder would pay on fund distributions or redemption of fund shares. Performance of other classes will vary due to differences in fee structures. |
| | | | | | |
| | | | | | |
10
| | | | | | | | | | | | | | |
FUND STATISTICS (UNAUDITED) | | | | | | |
| | | |
RBC Microcap Value Fund | | | | | | |
Long-term growth of capital. | | | | | | Investment Objective |
Russell 2000 Value Index | | | | | | Benchmark |
| | | | | | Asset Allocation (as of 3/31/12) (% of fund’s investments) & Top Five Industries (as of 3/31/12) (% of fund’s net assets) |
| | | | | |
| | | | | |
| | | | | |
| | | | | |
| | | | | |
| Cantel Medical Corp. | | 0.81% | | | | Adams Golf, Inc. | | 0.66% | | | | | | Top Ten Holdings (as of 3/31/12) (% of fund’s net assets) |
| On Assignment, Inc. | | 0.75% | | | | Benihana, Inc. | | 0.64% | | | | | |
| SureWest Communications | | 0.71% | | | | Tessco Technologies, Inc. | | 0.61% | | | | | |
| Arctic Cat, Inc. | | 0.69% | | | | Alere, Inc. | | 0.57% | | | | | |
| Insight Enterprises, Inc. | | 0.69% | | | | Allied Motion Technologies, Inc. | | 0.56% | | | | | |
| *A listing of all portfolio holdings can be found beginning on page 22. | | | | | | |
The graph reflects an initial investment of $10,000 over a 10 year period and is based on Class S shares. The performance of the Fund for the period from September 30, 2001 to April 19, 2004 reflects the performance of Shadow Stock Fund, the predecessor to RBC Microcap Value Fund. The Fund’s total return includes reinvested dividends and capital gains. The Fund’s total return also includes operating expenses that reduce return, while the total return of the index does not. The graph does not reflect the deduction of taxes that a shareholder would pay on fund distributions or redemption of fund shares. Performance of other classes will vary due to differences in fee structures. | | | | | | Growth of $10,000 Initial Investment Over 10 Years |
| | | | | | | | | | | | | | |
| | | | | | | | | | | | | | |
| | | | | | | | | | | | | | |
11
| | | | | | | | | | | | | | | | | | |
| | | | | | | | FUND STATISTICS (UNAUDITED) |
| | | | | | | | RBC Mid Cap Value Fund |
Investment Objective | | | | | | | | Long-term capital appreciation. |
| Benchmark | | | | | | | | Russell Midcap Value Index |
Asset Allocation (as of 3/31/12) (% of fund’s investments) & Top Five Industries (as of 3/31/12) (% of fund’s net assets) | | | | | | | | 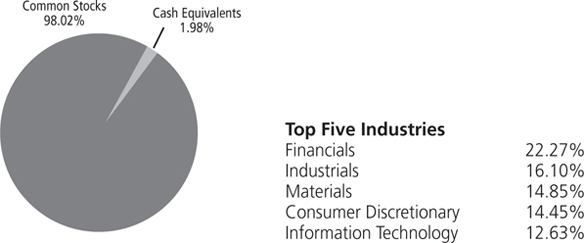
|
| | | | |
| | | | |
| | | | |
| | | | |
| | | | |
| | | | |
| | | | |
| | | | |
Top Ten Holdings (as of 3/31/12) (% of fund’s net assets) | | | | | | | | Dana Holding Corp. | | 3.93% | | | | Crown Holdings, Inc. | | 2.53% | | |
| | | | | KKR Financial Holdings LLC | | 3.77% | | | | Gardner Denver, Inc. | | 2.46% | | |
| | | | | Jarden Corp. | | 3.08% | | | | Mylan, Inc. | | 2.42% | | |
| | | | | Schweitzer-Mauduit | | 3.00% | | | | Edison International | | 2.41% | | |
| | | | | | | | International, Inc. | | | | | | Fifth Third Bancorp | | 2.37% | | |
| | | | | | | | Ashland, Inc. | | 2.87% | | | | | | | | |
| | | | | | | | *A listing of all portfolio holdings can be found beginning on page 33. |
Growth of $10,000 Initial Investment Since Inception (12/30/09) | | | | | | | | 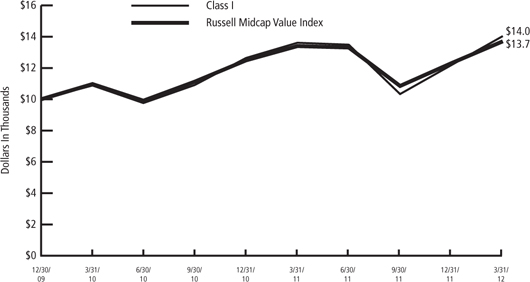
|
| | | | | | | |
| | | | | | | |
| | | | | | | |
| | | | | | | | The graph reflects an initial investment of $10,000 over the period from December 30, 2009 to March 31, 2012 and is based on Class I shares. The Fund’s total return includes reinvested dividends and capital gains. The Fund’s total return also includes operating expenses that reduce return, while the total return of the index does not. The graph does not reflect the deduction of taxes that a shareholder would pay on fund distributions or redemption of fund shares. |
12
|
SCHEDULE OF PORTFOLIO INVESTMENTS |
RBC SMID Cap Growth Fund
March 31, 2012 (Unaudited)
| | | | | | |
| Shares | | | | Value | |
Common Stocks — 98.49% | | | | |
Consumer Discretionary — 14.35% | | | | |
| 11,700 | | Fossil, Inc.* | | | $ 1,544,166 | |
| 16,000 | | Guess?, Inc. | | | 500,000 | |
| 44,660 | | LKQ Corp.* | | | 1,392,052 | |
| 18,000 | | Monro Muffler Brake, Inc. | | | 746,820 | |
| 7,100 | | Panera Bread Co., Class A* | | | 1,142,532 | |
| 30,800 | | Ross Stores, Inc. | | | 1,789,480 | |
| 26,700 | | Tractor Supply Co. | | | 2,417,952 | |
| 16,000 | | WMS Industries, Inc.* | | | 379,680 | |
| | |
| | | | | | |
| | | | | 9,912,682 | |
| | | | | | |
Consumer Staples — 6.06% | | | | |
| 16,000 | | Church & Dwight Co., Inc. | | | 787,040 | |
| 23,500 | | Pricesmart, Inc. | | | 1,711,035 | |
| 8,000 | | Ralcorp Holdings, Inc.* | | | 592,720 | |
| 23,500 | | United Natural Foods, Inc.* | | | 1,096,510 | |
| | |
| | | | | | |
| | | | | 4,187,305 | |
| | | | | | |
Energy — 6.22% | | | | |
| 12,100 | | Dril-Quip, Inc.* | | | 786,742 | |
| 17,600 | | Gulfport Energy Corp.* | | | 512,512 | |
| 22,580 | | Oceaneering International, Inc. | | | 1,216,836 | |
| 13,700 | | Oil States International, Inc.* | | | 1,069,422 | |
| 16,600 | | Unit Corp.* | | | 709,816 | |
| | |
| | | | | | |
| | | | | 4,295,328 | |
| | | | | | |
Financials — 5.98% | | | | |
| 17,300 | | Eaton Vance Corp. | | | 494,434 | |
| 14,400 | | Federated Investors, Inc., Class B | | | 322,704 | |
| 18,700 | | First Cash Financial Services, Inc.* | | | 802,043 | |
| 26,400 | | HCC Insurance Holdings, Inc. | | | 822,888 | |
| 27,000 | | Raymond James Financial, Inc. | | | 986,310 | |
| 31,500 | | Tower Group, Inc. | | | 706,545 | |
| | |
| | | | | | |
| | | | | 4,134,924 | |
| | | | | | |
Health Care — 22.34% | | | | |
| 44,300 | | Bruker Corp.* | | | 678,233 | |
| 25,200 | | Catalyst Health Solutions, Inc.* | | | 1,605,996 | |
| 20,600 | | Cepheid, Inc.* | | | 861,698 | |
| 16,600 | | Cerner Corp.* | | | 1,264,256 | |
| 9,700 | | Charles River Laboratories International, Inc.* | | | 350,073 | |
| 8,000 | | Edwards Lifesciences Corp.* | | | 581,840 | |
| 10,300 | | Gen-Probe, Inc.* | | | 684,023 | |
| 14,600 | | Henry Schein, Inc.* | | | 1,104,928 | |
| 11,800 | | IDEXX Laboratories, Inc.* | | | 1,031,910 | |
13
|
SCHEDULE OF PORTFOLIO INVESTMENTS |
RBC SMID Cap Growth Fund (cont.)
March 31, 2012 (Unaudited)
| | | | | | |
| Shares | | | | Value | |
| 12,400 | | Integra LifeSciences Holdings Corp.* | | | $ 430,156 | |
| 6,200 | | Laboratory Corp of America Holdings* | | | 567,548 | |
| 5,500 | | Mettler-Toledo International, Inc.* | | | 1,016,125 | |
| 10,600 | | MWI Veterinary Supply, Inc.* | | | 932,800 | |
| 17,000 | | NuVasive, Inc.* | | | 286,280 | |
| 22,600 | | PAREXEL International Corp.* | | | 609,522 | |
| 8,900 | | Perrigo Co. | | | 919,459 | |
| 8,000 | | Varian Medical Systems, Inc.* | | | 551,680 | |
| 21,800 | | Volcano Corp.* | | | 618,030 | |
| 9,700 | | Waters Corp.* | | | 898,802 | |
| 10,300 | | West Pharmaceutical Services, Inc. | | | 438,059 | |
| | | | | | |
| | | | | 15,431,418 | |
| | | | | | |
Industrials — 18.45% | | | | |
| 8,000 | | Alliant Techsystems, Inc. | | | 400,960 | |
| 27,000 | | AMETEK, Inc. | | | 1,309,770 | |
| 26,040 | | Donaldson Co., Inc. | | | 930,409 | |
| 12,080 | | Expeditors International of Washington, Inc. | | | 561,841 | |
| 6,400 | | Flowserve Corp. | | | 739,264 | |
| 9,340 | | Huron Consulting Group, Inc.* | | | 350,811 | |
| 13,400 | | Jacobs Engineering Group, Inc.* | | | 594,558 | |
| 12,500 | | Landstar System, Inc. | | | 721,500 | |
| 14,300 | | MSC Industrial Direct Co., Class A | | | 1,190,904 | |
| 14,600 | | Polypore International, Inc.* | | | 513,336 | |
| 12,290 | | Roper Industries, Inc. | | | 1,218,676 | |
| 11,100 | | Stericycle, Inc.* | | | 928,404 | |
| 12,200 | | Teledyne Technologies, Inc.* | | | 769,210 | |
| 14,200 | | Towers Watson & Co., Class A | | | 938,194 | |
| 18,500 | | Waste Connections, Inc. | | | 601,805 | |
| 22,900 | | Woodward, Inc. | | | 980,807 | |
| | | | | | |
| | | | | 12,750,449 | |
| | | | | | |
Information Technology — 18.30% | | | | |
| 12,520 | | ANSYS, Inc.* | | | 814,051 | |
| 22,010 | | Autodesk, Inc.* | | | 931,463 | |
| 11,800 | | Comtech Telecommunications Corp. | | | 384,444 | |
| 20,000 | | Digital River, Inc.* | | | 374,200 | |
| 11,840 | | Dolby Laboratories, Inc., Class A* | | | 450,631 | |
| 8,700 | | F5 Networks, Inc.* | | | 1,174,152 | |
| 18,700 | | Global Payments, Inc.(a) | | | 888,250 | |
| 17,400 | | Informatica Corp.* | | | 920,460 | |
| 8,100 | | Mantech International Corp., Class A | | | 279,126 | |
| 20,050 | | Microchip Technology, Inc. | | | 745,860 | |
| 20,700 | | MICROS Systems, Inc.* | | | 1,144,503 | |
| 21,750 | | National Instruments Corp. | | | 620,310 | |
| 14,300 | | Open Text Corp.* | | | 874,445 | |
| 20,000 | | Plexus Corp.* | | | 699,800 | |
| 26,600 | | Riverbed Technology, Inc.* | | | 746,928 | |
14
|
SCHEDULE OF PORTFOLIO INVESTMENTS |
RBC SMID Cap Growth Fund (cont.)
March 31, 2012 (Unaudited)
| | | | | | |
| | |
| Shares | | | | Value | |
| 20,000 | | Synopsys, Inc.* | | | $ 613,200 | |
| 13,400 | | Ultimate Software Group, Inc.* | | | 981,952 | |
| | | | | | |
| | | | | 12,643,775 | |
| | | | | | |
Materials — 6.79% | | | | |
| 18,000 | | Airgas, Inc. | | | 1,601,460 | |
| 17,500 | | AptarGroup, Inc. | | | 958,475 | |
| 19,700 | | Balchem Corp. | | | 595,925 | |
| 12,200 | | Reliance Steel & Aluminum Co. | | | 689,056 | |
| 11,600 | | Sigma-Aldrich Corp. | | | 847,496 | |
| | | | | | |
| | | | | 4,692,412 | |
| | | | | | |
| |
Total Common Stocks | | | 68,048,293 | |
| | | | | | |
(Cost $44,441,065) | | | | |
Investment Company — 1.81% | | | | |
| 1,251,315 | | JPMorgan Prime Money Market Fund | | | 1,251,315 | |
| | | | | | |
| |
Total Investment Company | | | 1,251,315 | |
| | | | | | |
(Cost $1,251,315) | | | | |
| |
Total Investments | | | $ 69,299,608 | |
(Cost $45,692,380)(b) — 100.30% | | | | |
| |
Liabilities in excess of other assets — (0.30)% | | | (210,307 | ) |
| | | | | | |
| |
NET ASSETS — 100.00% | | | $ 69,089,301 | |
| | | | | | |
| | | | | | |
| | | | | | | |
| * | Non-income producing security. |
| (a) | Fair valued security under procedures established by the Fund’s Board of Trustees. |
| (b) | See notes to financial statements for the tax cost of securities and the breakdown of unrealized appreciation (depreciation). |
See notes to financial statements.
15
|
SCHEDULE OF PORTFOLIO INVESTMENTS |
RBC Enterprise Fund
March 31, 2012 (Unaudited)
| | | | | | |
| | | | | | |
| Shares | | | | Value | |
Common Stocks — 98.53% | | | | |
Consumer Discretionary — 21.22% | | | | |
| 330,878 | | Benihana, Inc. | | | $ 4,317,958 | |
| 41,400 | | Books-A-Million, Inc. | | | 132,480 | |
| 917,773 | | Casual Male Retail Group, Inc.* | | | 3,083,717 | |
| 122,438 | | Delta Apparel, Inc.* | | | 2,011,656 | |
| 72,700 | | Grand Canyon Education, Inc.* | | | 1,291,152 | |
| 52,530 | | Mac-Gray Corp. | | | 794,779 | |
| 250,900 | | RG Barry Corp. | | | 3,060,980 | |
| 161,233 | | Steinway Musical Instruments, Inc.* | | | 4,030,825 | |
| 216,700 | | Universal Electronics, Inc.* | | | 4,329,666 | |
| | | | | | |
| | | | | 23,053,213 | |
| | | | | | |
Energy — 6.04% | |
| 44,000 | | GeoResources, Inc.* | | | 1,440,560 | |
| 102,400 | | Gulfport Energy Corp.* | | | 2,981,888 | |
| 20,254 | | OYO Geospace Corp.* | | | 2,133,354 | |
| | | | | | |
| | | | | 6,555,802 | |
| | | | | | |
Financials — 13.04% | |
| 205,300 | | Asta Funding, Inc. | | | 1,677,301 | |
| 96,100 | | Boston Private Financial Holdings, Inc. | | | 952,351 | |
| 91,059 | | CoBiz Financial, Inc. | | | 643,787 | |
| 212,900 | | Compass Diversified Holdings | | | 3,148,791 | |
| 50,800 | | Firstcity Financial Corp.* | | | 443,992 | |
| 56,400 | | LaSalle Hotel Properties REIT | | | 1,587,096 | |
| 27,626 | | Mercantile Bank Corp.* | | | 393,118 | |
| 84,489 | | MetroCorp Bancshares, Inc.* | | | 844,890 | |
| 80,000 | | National Interstate Corp. | | | 2,046,400 | |
| 71,174 | | Northrim BanCorp, Inc. | | | 1,531,665 | |
| 65,000 | | Washington Banking Co. | | | 897,650 | |
| | | | | | |
| | | | | 14,167,041 | |
| | | | | | |
Health Care — 7.41% | |
| 235,600 | | BioScrip, Inc.* | | | 1,599,724 | |
| 85,900 | | Exactech, Inc.* | | | 1,361,515 | |
| 60,600 | | Kensey Nash Corp. | | | 1,773,156 | |
| 58,700 | | Meridian Bioscience, Inc. | | | 1,137,606 | |
| 94,700 | | US Physical Therapy, Inc. | | | 2,182,835 | |
| | | | | | |
| | | | | 8,054,836 | |
| | | | | | |
Industrials — 19.40% | |
| 93,800 | | Acacia Research Corp.* | | | 3,915,212 | |
| 263,700 | | Air Transport Services Group, Inc.* | | | 1,526,823 | |
| 111,456 | | Allied Defense Group, Inc. (The)*(a)(b) | | | 601,862 | |
| 78,200 | | AZZ, Inc. | | | 4,038,248 | |
| 198,325 | | Columbus McKinnon Corp.* | | | 3,230,714 | |
| 59,900 | | Ducommun, Inc.* | | | 712,810 | |
| 81,600 | | Ennis, Inc. | | | 1,290,912 | |
16
|
SCHEDULE OF PORTFOLIO INVESTMENTS |
RBC Enterprise Fund (cont.)
March 31, 2012 (Unaudited)
| | | | | | |
| Shares | | | | Value | |
| 67,800 | | Greenbrier Cos., Inc.* | | | $ 1,341,762 | |
| 13,500 | | Hurco Cos, Inc.* | | | 381,375 | |
| 13,500 | | Marten Transport Ltd. | | | 297,945 | |
| 52,400 | | NN, Inc.* | | | 427,584 | |
| 17,250 | | Old Dominion Freight Line, Inc.* | | | 822,308 | |
| 50,900 | | Orion Marine Group, Inc.* | | | 368,007 | |
| 376,000 | | PGT, Inc.* | | | 680,560 | |
| 54,950 | | Sun Hydraulics Corp. | | | 1,437,492 | |
| | | | | | |
| | | | | 21,073,614 | |
| | | | | | |
Information Technology — 20.67% | | | | |
| 80,982 | | Aspen Technology, Inc.* | | | 1,662,561 | |
| 78,000 | | Authentec, Inc.* | | | 245,700 | |
| 147,674 | | Computer Task Group, Inc.* | | | 2,262,366 | |
| 30,000 | | comScore, Inc.* | | | 641,700 | |
| 102,200 | | Interactive Intelligence Group, Inc.* | | | 3,118,122 | |
| 99,400 | | KEYW Holding Corp. (The)* | | | 770,350 | |
| 62,238 | | Lionbridge Technologies, Inc.* | | | 179,245 | |
| 178,800 | | NIC, Inc. | | | 2,168,844 | |
| 47,500 | | Rubicon Technology, Inc.* | | | 495,425 | |
| 47,400 | | STEC, Inc.* | | | 447,456 | |
| 124,951 | | Tessco Technologies, Inc. | | | 3,182,502 | |
| 53,000 | | TNS, Inc.* | | | 1,151,690 | |
| 93,700 | | Tyler Technologies, Inc.* | | | 3,599,017 | |
| 159,100 | | Xyratex Ltd. | | | 2,531,281 | |
| | | | | | |
| | | | | 22,456,259 | |
| | | | | | |
Materials — 8.81% | | | | |
| 172,116 | | Intertape Polymer Group, Inc.* | | | 800,339 | |
| 63,700 | | Koppers Holdings, Inc. | | | 2,456,272 | |
| 57,300 | | Landec Corp.* | | | 374,169 | |
| 249,900 | | Omnova Solutions, Inc.* | | | 1,686,825 | |
| 99,588 | | Universal Stainless & Alloy* | | | 4,254,399 | |
| | | | | | |
| | | | | 9,572,004 | |
| | | | | | |
Telecommunication Services — 0.56% | | | | |
| 128,300 | | Towerstream Corp.* | | | 609,425 | |
| | | | | | |
Utilities — 1.38% | | | | |
| 55,800 | | Unitil Corp. | | | 1,497,114 | |
| | | | | | |
| |
Total Common Stocks (Cost $74,835,951) | | | 107,039,308 | |
| | | | | | |
Rights/Warrants — 0.00% | |
| 6,203 | | US Concrete, Inc. Warrants, Expire 8/31/17*(a)(b)(c) | | | 0 | |
17
|
SCHEDULE OF PORTFOLIO INVESTMENTS |
RBC Enterprise Fund (cont.)
| | | | | | |
| March 31, 2012 (Unaudited) | |
| | |
| Shares | | | | Value | |
| 6,203 | | US Concrete, Inc. Warrants, Expire 8/31/17*(a)(b)(c) | | $ | 0 | |
| | | | | | |
| |
Total Rights/Warrants | | | 0 | |
| | | | | | |
(Cost $0) | | | | |
|
Exchange Traded Funds — 0.49% | |
| 18,800 | | SPDR KBW Regional Banking | | | 535,236 | |
| | | | | | |
| |
Total Exchange Traded Funds | | | 535,236 | |
| | | | | | |
(Cost $373,522) | | | | |
Investment Company — 1.50% | | | | |
| 1,629,150 | | JPMorgan Prime Money Market Fund | | | 1,629,150 | |
| | | | | | |
| |
Total Investment Company | | | 1,629,150 | |
| | | | | | |
(Cost $1,629,150) | | | | |
| |
Total Investments | | $ | 109,203,694 | |
(Cost $76,838,623)(d) — 100.52% | | | | |
| |
Liabilities in excess of other assets — (0.52)% | | | (563,755 | ) |
| | | | | | |
| |
NET ASSETS — 100.00% | | $ | 108,639,939 | |
| | | | | | |
| * | Non-income producing security. |
| (a) | Fair valued security under procedures established by the Fund’s Board of Trustees. |
| (b) | This security is restricted and illiquid as the security may not be offered or sold within the United States or to U.S. persons except to qualified purchasers who are also either qualified institutional buyers or “accredited investors” (as defined in Rule 501 (a) of Regulation D under the Securities Act of 1933). |
The total investment in restricted and illiquid securities representing $601,862 or 0.55% of net assets was as follows:
| | | | | | | | | | | | | | | | | | |
Acquisition
Shares | | | | Issuer | | | | Acquisition
Date | | | Acquisition
Cost | | | 3/31/12
Carrying
Value
Per Unit | |
| 111,456 | | | | Allied Defense Group, Inc. (The) | | | | | 12/21/2007 | | | $ | 667,484 | | | $ | 5.40 | |
| 6,203 | | | | U.S. Concrete, Inc., Warrants | | | | | 09/09/2010 | | | $ | — | | | $ | — | |
| 6,203 | | | | U.S. Concrete, Inc., Warrants | | | | | 09/09/2010 | | | $ | — | | | $ | — | |
| (c) | Security delisted or issuer in bankruptcy. |
| (d) | See notes to financial statements for the tax cost of securities and the breakdown of unrealized appreciation (depreciation). |
Abbreviations used are defined below:
REIT - Real Estate Investment Trust
See notes to financial statements.
18
|
SCHEDULE OF PORTFOLIO INVESTMENTS |
RBC Small Cap Core Fund
| | | | | | |
| March 31, 2012 (Unaudited) | |
| | |
| Shares | | | | Value | |
Common Stocks — 99.00% | |
Consumer Discretionary — 19.77% | |
| 20,500 | | Ascena Retail Group, Inc.* | | $ | 908,560 | |
| 81,219 | | Benihana, Inc. | | | 1,059,908 | |
| 354,500 | | Casual Male Retail Group, Inc.* | | | 1,191,120 | |
| 22,200 | | Drew Industries, Inc.* | | | 606,282 | |
| 38,500 | | Grand Canyon Education, Inc.* | | | 683,760 | |
| 19,500 | | Maidenform Brands, Inc.* | | | 438,945 | |
| 66,623 | | RG Barry Corp. | | | 812,801 | |
| 46,900 | | Sally Beauty Holdings, Inc.* | | | 1,163,120 | |
| 58,907 | | Steinway Musical Instruments, Inc.* | | | 1,472,675 | |
| 18,675 | | Steven Madden Ltd.* | | | 798,356 | |
| 26,000 | | True Religion Apparel, Inc.* | | | 712,400 | |
| 66,323 | | Universal Electronics, Inc.* | | | 1,325,133 | |
| | | | | | |
| | | | | 11,173,060 | |
| | | | | | |
Consumer Staples — 1.04% | |
| 20,700 | | Nash Finch Co. | | | 588,294 | |
| | | | | | |
Energy — 6.84% | |
| 6,700 | | CARBO Ceramics, Inc. | | | 706,515 | |
| 21,100 | | GeoResources, Inc.* | | | 690,814 | |
| 29,400 | | Gulfport Energy Corp.* | | | 856,128 | |
| 6,700 | | OYO Geospace Corp.* | | | 705,711 | |
| 22,100 | | World Fuel Services Corp. | | | 906,100 | |
| | | | | | |
| | | | | 3,865,268 | |
| | | | | | |
Financials — 12.71% | |
| 29,400 | | AMERISAFE, Inc.* | | | 727,356 | |
| 74,600 | | Ares Capital Corp. | | | 1,219,710 | |
| 43,327 | | Asta Funding, Inc. | | | 353,982 | |
| 9,200 | | Community Bank System, Inc. | | | 264,776 | |
| 94,700 | | Compass Diversified Holdings | | | 1,400,613 | |
| 81,500 | | KKR Financial Holdings LLC | | | 750,615 | |
| 27,500 | | LaSalle Hotel Properties REIT | | | 773,850 | |
| 25,400 | | Netspend Holdings, Inc.* | | | 197,104 | |
| 11,400 | | ProAssurance Corp. | | | 1,004,454 | |
| 13,100 | | Safeguard Scientifics, Inc.* | | | 225,320 | |
| 21,500 | | SeaBright Holdings, Inc. | | | 195,435 | |
| 4,072 | | TriCo Bancshares | | | 70,934 | |
| | | | | | |
| | | | | 7,184,149 | |
| | | | | | |
Health Care — 5.91% | |
| 91,900 | | BioScrip, Inc.* | | | 624,001 | |
| 23,700 | | Masimo Corp.* | | | 554,106 | |
| 17,600 | | Meridian Bioscience, Inc. | | | 341,088 | |
| 19,875 | | PSS World Medical, Inc.* | | | 503,633 | |
| 6,900 | | Thoratec Corp.* | | | 232,599 | |
19
|
SCHEDULE OF PORTFOLIO INVESTMENTS |
RBC Small Cap Core Fund (cont.)
| | | | | | |
| March 31, 2012 (Unaudited) | |
| | |
| Shares | | | | Value | |
| 25,500 | | West Pharmaceutical Services, Inc. | | $ | 1,084,515 | |
| | | | | | |
| | | | | 3,339,942 | |
| | | | | | |
Industrials — 27.29% | |
| 36,914 | | Acacia Research Corp.* | | | 1,540,790 | |
| 102,900 | | ACCO Brands Corp.* | | | 1,276,989 | |
| 16,900 | | Astronics Corp.* | | | 590,824 | |
| 860 | | Astronics Corp., Class B* | | | 29,464 | |
| 14,400 | | Atlas Air Worldwide Holdings, Inc.* | | | 708,624 | |
| 27,208 | | AZZ, Inc. | | | 1,405,021 | |
| 10,700 | | Chart Industries, Inc.* | | | 784,631 | |
| 62,400 | | Columbus McKinnon Corp.* | | | 1,016,496 | |
| 26,900 | | Ducommun, Inc.* | | | 320,110 | |
| 24,700 | | EnerSys* | | | 855,855 | |
| 24,800 | | Gardner Denver, Inc. | | | 1,562,896 | |
| 34,700 | | Greenbrier Cos., Inc.* | | | 686,713 | |
| 44,000 | | II-VI, Inc.* | | | 1,040,600 | |
| 32,000 | | Insteel Industries, Inc. | | | 388,800 | |
| 55,300 | | Interface, Inc., Class A | | | 771,435 | |
| 6,400 | | Knoll, Inc. | | | 106,496 | |
| 59,100 | | Meritor, Inc.* | | | 476,937 | |
| 4,100 | | Old Dominion Freight Line, Inc.* | | | 195,447 | |
| 28,600 | | Sun Hydraulics Corp. | | | 748,176 | |
| 12,100 | | Wabtec Corp. | | | 911,977 | |
| | | | | | |
| | | | | 15,418,281 | |
| | | | | | |
Information Technology — 15.82% | |
| 43,400 | | Aspen Technology, Inc.* | | | 891,002 | |
| 23,800 | | Checkpoint Systems, Inc.* | | | 268,464 | |
| 37,139 | | Computer Task Group, Inc.* | | | 568,969 | |
| 24,158 | | Interactive Intelligence Group, Inc.* | | | 737,061 | |
| 23,900 | | InterDigital, Inc. | | | 833,154 | |
| 19,000 | | Measurement Specialties, Inc.* | | | 640,300 | |
| 60,300 | | NIC, Inc. | | | 731,439 | |
| 29,200 | | Skyworks Solutions, Inc.* | | | 807,380 | |
| 27,400 | | STEC, Inc.* | | | 258,656 | |
| 51,400 | | Take-Two Interactive Software, Inc.* | | | 790,789 | |
| 29,900 | | Tyler Technologies, Inc.* | | | 1,148,459 | |
| 79,600 | | Xyratex Ltd. | | | 1,266,436 | |
| | | | | | |
| | | | | 8,942,109 | |
| | | | | | |
Materials — 8.88% | |
| 6,100 | | Kaiser Aluminum, Corp. | | | 288,286 | |
| 28,600 | | Koppers Holdings, Inc. | | | 1,102,816 | |
| 105,100 | | Omnova Solutions, Inc.* | | | 709,425 | |
| 8,700 | | Rockwood Holdings, Inc.* | | | 453,705 | |
| 5,400 | | Schweitzer-Mauduit International, Inc. | | | 372,924 | |
20
|
SCHEDULE OF PORTFOLIO INVESTMENTS |
RBC Small Cap Core Fund (cont.)
| | | | | | |
| March 31, 2012 (Unaudited) | |
| | |
| Shares | | | | Value | |
| 48,991 | | Universal Stainless & Alloy* | | $ | 2,092,895 | |
| | | | | | |
| | | | | 5,020,051 | |
| | | | | | |
Utilities — 0.74% | |
| 11,400 | | Unisource Energy Corp. | | | 416,898 | |
| | | | | | |
| |
Total Common Stocks | | | 55,948,052 | |
| | | | | | |
(Cost $39,070,771) | | | | |
Investment Company — 0.78% | | | | |
| 440,126 | | JPMorgan Prime Money Market Fund | | | 440,126 | |
| | | | | | |
| |
Total Investment Company | | | 440,126 | |
| | | | | | |
(Cost $440,126) | | | | |
| |
Total Investments | | $ | 56,388,178 | |
(Cost $39,510,897)(a) — 99.78% | | | | |
| |
Other assets in excess of liabilities — 0.22% | | | 122,759 | |
| | | | | | |
| |
NET ASSETS — 100.00% | | $ | 56,510,937 | |
| | | | | | |
| * | Non-income producing security. |
| (a) | See notes to financial statements for the tax cost of securities and the breakdown of unrealized appreciation (depreciation). |
Abbreviations used are defined below:
REIT - Real Estate Investment Trust
See notes to financial statements.
21
|
SCHEDULE OF PORTFOLIO INVESTMENTS |
RBC Microcap Value Fund
| | | | | | |
| March 31, 2012 (Unaudited) | |
| | |
| Shares | | | | Value | |
Common Stocks — 97.69% | |
Consumer Discretionary — 21.53% | |
| 81,000 | | Adams Golf, Inc.* | | | $869,130 | |
| 3,725 | | Ambassadors International, Inc.* | | | 56 | |
| 18,000 | | Ambow Education Holding Ltd. ADR* | | | 132,480 | |
| 13,500 | | America’s Car-Mart, Inc.* | | | 593,730 | |
| 21,000 | | Arctic Cat, Inc.* | | | 899,430 | |
| 25,000 | | Asbury Automotive Group, Inc.* | | | 675,000 | |
| 64,000 | | Benihana, Inc. | | | 835,200 | |
| 800 | | Biglari Holdings, Inc.* | | | 322,280 | |
| 54,000 | | Bluegreen Corp.* | | | 232,740 | |
| 5,000 | | Blyth, Inc. | | | 374,150 | |
| 46,000 | | Books-A-Million, Inc. | | | 147,200 | |
| 15,127 | | Bowl America, Inc., Class A | | | 204,215 | |
| 14,000 | | Brown Shoe Co., Inc. | | | 129,220 | |
| 47,500 | | Build-A-Bear Workshop, Inc.* | | | 249,375 | |
| 44,000 | | Carriage Services, Inc. | | | 332,200 | |
| 35,000 | | Christopher & Banks Corp. | | | 65,100 | |
| 12,000 | | Core-Mark Holding Co., Inc. | | | 491,280 | |
| 24,000 | | CSS Industries, Inc. | | | 467,040 | |
| 34,000 | | Delta Apparel, Inc.* | | | 558,620 | |
| 82 | | Digital Generation, Inc.* | | | 837 | |
| 11,700 | | Dorman Products, Inc.* | | | 592,020 | |
| 17,500 | | Duckwall-ALCO Stores, Inc.* | | | 156,450 | |
| 15,000 | | E.W. Scripps Co. (The), Class A* | | | 148,050 | |
| 23,000 | | Entercom Communications Corp., Class A* | | | 149,270 | |
| 28,000 | | Flexsteel Industries | | | 506,800 | |
| 36,000 | | Fred’s, Inc., Class A | | | 525,960 | |
| 70,000 | | Golfsmith International Holdings, Inc.* | | | 303,800 | |
| 58,000 | | Hastings Entertainment, Inc.* | | | 161,240 | |
| 10,000 | | Haverty Furniture Cos., Inc. | | | 111,000 | |
| 15,000 | | Helen of Troy Ltd.* | | | 510,150 | |
| 31,000 | | Hooker Furniture Corp. | | | 423,150 | |
| 52,800 | | Isle of Capri Casinos, Inc.* | | | 372,768 | |
| 26,800 | | Jakks Pacific, Inc. | | | 467,660 | |
| 24,000 | | Johnson Outdoors, Inc., Class A* | | | 458,400 | |
| 82,000 | | Journal Communications, Inc., Class A* | | | 461,660 | |
| 36,000 | | Kid Brands, Inc.* | | | 97,200 | |
| 50,310 | | Lakeland Industries, Inc.* | | | 506,118 | |
| 95,270 | | Lazare Kaplan International, Inc.* | | | 242,939 | |
| 42,000 | | La-Z-Boy, Inc.* | | | 628,320 | |
| 31,000 | | Lifetime Brands, Inc. | | | 348,440 | |
| 24,000 | | Lithia Motors, Inc., Class A | | | 628,800 | |
| 46,000 | | Luby’s, Inc.* | | | 279,220 | |
| 33,000 | | Mac-Gray Corp. | | | 499,290 | |
| 33,000 | | Marcus Corp. | | | 414,150 | |
| 19,000 | | MarineMax, Inc.* | | | 156,370 | |
| 7,500 | | McRae Industries, Inc., Class A | | | 115,125 | |
22
|
SCHEDULE OF PORTFOLIO INVESTMENTS |
RBC Microcap Value Fund (cont.)
| | | | | | |
March 31, 2012 (Unaudited) | |
| | |
| Shares | | | | Value | |
| 26,000 | | Media General, Inc., Class A* | | | $ 133,640 | |
| 13,800 | | Meritage Homes Corp.* | | | 373,428 | |
| 21,300 | | Mestek, Inc.* | | | 244,950 | |
| 20,000 | | Modine Manufacturing Co.* | | | 176,600 | |
| 23,400 | | Movado Group, Inc. | | | 574,470 | |
| 10,300 | | Nobility Homes, Inc.* | | | 79,825 | |
| 32,000 | | O’Charleys, Inc.* | | | 314,880 | |
| 24,000 | | Officemax, Inc.* | | | 137,280 | |
| 41,000 | | Orleans Homebuilders, Inc.*(a)(b)(c) | | | 0 | |
| 18,350 | | Perry Ellis International, Inc.* | | | 342,595 | |
| 135,000 | | Point.360* | | | 101,250 | |
| 90,600 | | Radio One, Inc., Class D* | | | 87,891 | |
| 56,000 | | Red Lion Hotels Corp.* | | | 459,760 | |
| 23,550 | | REX American Resources Corp.* | | | 722,985 | |
| 40,000 | | Rocky Brands, Inc.* | | | 544,400 | |
| 34,000 | | Ruby Tuesday, Inc.* | | | 310,420 | |
| 16,000 | | Saga Communications, Inc., Class A* | | | 572,800 | |
| 45,150 | | Salem Communications Corp., Class A | | | 212,657 | |
| 45,000 | | Shiloh Industries, Inc. | | | 428,850 | |
| 30,000 | | Stage Stores, Inc. | | | 487,200 | |
| 31,000 | | Standard Motor Products, Inc. | | | 549,940 | |
| 33,000 | | Stein Mart, Inc.* | | | 217,800 | |
| 25,000 | | Steinway Musical Instruments, Inc.* | | | 625,000 | |
| 80,000 | | Stewart Enterprises, Inc., Class A | | | 485,600 | |
| 17,000 | | Strattec Security Corp. | | | 397,800 | |
| 3,000 | | Sturm Ruger & Co, Inc. | | | 147,300 | |
| 24,000 | | Superior Industries International, Inc. | | | 468,960 | |
| 33,000 | | Systemax, Inc.* | | | 556,380 | |
| 75,000 | | Trans World Entertainment Corp.* | | | 159,000 | |
| 38,000 | | Tuesday Morning Corp.* | | | 145,920 | |
| 16,000 | | Unifi, Inc.* | | | 154,560 | |
| 30,000 | | Universal Travel Group*(a)(c) | | | 0 | |
| 54,000 | | VOXX International Corp.* | | | 732,240 | |
| 20,000 | | Walking Co. Holdings, Inc. (The) | | | 122,000 | |
| 12,400 | | Weyco Group, Inc. | | | 293,880 | |
| | | | | | |
| | | | | 28,205,894 | |
| | | | | | |
Consumer Staples — 3.36% | |
| 13,600 | | Andersons, Inc. (The) | | | 662,184 | |
| 61,000 | | Central Garden and Pet Co.* | | | 574,010 | |
| 36,000 | | Chiquita Brands International, Inc.* | | | 316,440 | |
| 30,000 | | Ingles Markets, Inc., Class A | | | 529,200 | |
| 73,000 | | ML Macadamia Orchards LP* | | | 204,400 | |
| 10,000 | | Nash Finch Co. | | | 284,200 | |
| 12,000 | | Oil-Dri Corp. of America | | | 255,480 | |
| 63,000 | | Omega Protein Corp.* | | | 479,430 | |
| 40,000 | | Prestige Brands Holdings, Inc.* | | | 699,200 | |
23
|
SCHEDULE OF PORTFOLIO INVESTMENTS |
RBC Microcap Value Fund (cont.)
| | | | | | |
March 31, 2012 (Unaudited) | |
| Shares | | | | | Value | |
| 22,000 | | Spartan Stores, Inc. | | | $ 398,640 | |
| | | | | | |
| | | | | 4,403,184 | |
| | | | | | |
Energy — 3.21% | | | | | | |
| 23,000 | | Calumet Specialty Products Partners LP | | | 607,660 | |
| 31,000 | | Constellation Energy Partners LLC* | | | 79,360 | |
| 17,000 | | Endeavour International Corp.* | | | 201,450 | |
| 9,000 | | Global Partners LP | | | 209,070 | |
| 27,000 | | Harvest Natural Resources, Inc.* | | | 191,160 | |
| 17,000 | | Hornbeck Offshore Services, Inc.* | | | 714,510 | |
| 34,000 | | Knightsbridge Tankers Ltd. | | | 488,920 | |
| 19,000 | | Natural Gas Services Group, Inc.* | | | 250,800 | |
| 30,000 | | Newpark Resources, Inc.* | | | 245,700 | |
| 11,000 | | Niska Gas Storage Partners LLC | | | 104,940 | |
| 30,000 | | North American Energy Partners, Inc.* | | | 147,000 | |
| 14,600 | | PHI, Inc.* | | | 326,456 | |
| 13,000 | | PHI, Inc., Non voting* | | | 300,950 | |
| 25,000 | | Teekay Tankers, Ltd., Class A | | | 151,750 | |
| 110,300 | | Trico Marine Services, Inc.*(a)(c) | | | 0 | |
| 21,000 | | Tsakos Energy Navigation Ltd. | | | 182,280 | |
| | | | | | |
| | | | | 4,202,006 | |
| | | | | | |
Financials — 21.73% | |
| 70,000 | | 21st Century Holding Co.* | | | 310,800 | |
| 40,000 | | Affirmative Insurance Holdings, Inc.* | | | 21,200 | |
| 9,000 | | Agree Realty Corp. REIT | | | 203,220 | |
| 28,000 | | American Equity Investment Life Holding Co. | | | 357,560 | |
| 75,000 | | American Independence Corp.* | | | 322,500 | |
| 23,000 | | American Safety Insurance Holdings Ltd.* | | | 433,550 | |
| 34,190 | | Ameris Bancorp* | | | 449,256 | |
| 9,000 | | Apollo Commercial Real Estate Finance, Inc. REIT | | | 140,850 | |
| 6,000 | | Arlington Asset Investment Corp., Class A | | | 133,200 | |
| 68,000 | | Asta Funding, Inc. | | | 555,560 | |
| 20,000 | | Baldwin & Lyons, Inc., Class B | | | 447,600 | |
| 14,000 | | Banco Latinoamericano de Comercio Exterior SA | | | 295,540 | |
| 63,600 | | Bancorp, Inc.* | | | 638,544 | |
| 8,228 | | Banner Corp. | | | 181,263 | |
| 100,000 | | Beverly Hills Bancorp, Inc.* | | | 1,400 | |
| 34,000 | | California First National Bancorp | | | 521,560 | |
| 21,000 | | Camco Financial Corp.* | | | 58,800 | |
| 5,200 | | Capital Southwest Corp. | | | 491,660 | |
| 38,000 | | Capitol Bancorp Ltd.* | | | 12,920 | |
| 15,750 | | Citizens South Banking Corp. | | | 71,663 | |
| 48,150 | | Citizens, Inc.* | | | 475,722 | |
| 133,000 | | Consumer Portfolio Services* | | | 166,250 | |
| 18,856 | | Cowen Group, Inc., Class A* | | | 51,100 | |
| 35,777 | | Donegal Group, Inc., Class A | | | 489,071 | |
| 8,444 | | Donegal Group, Inc., Class B | | | 139,073 | |
24
|
SCHEDULE OF PORTFOLIO INVESTMENTS |
RBC Microcap Value Fund (cont.)
March 31, 2012 (Unaudited)
| | | | | | |
| Shares | | | | | Value | |
| 3,000 | | Duff & Phelps Corp., Class A | | | $ 46,620 | |
| 58,040 | | Dynex Capital, Inc. REIT | | | 554,282 | |
| 37,000 | | Edelman Financial Group, Inc. | | | 244,570 | |
| 27,000 | | EMC Insurance Group, Inc. | | | 542,430 | |
| 20,000 | | Federal Agricultural Mortgage Corp., Class C | | | 454,000 | |
| 34,300 | | First Defiance Financial Corp. | | | 578,298 | |
| 11,000 | | First Financial Corp. | | | 349,250 | |
| 45,400 | | First Financial Holdings, Inc. | | | 499,400 | |
| 27,000 | | First Industrial Realty Trust, Inc. REIT* | | | 333,450 | |
| 54,000 | | First Merchants Corp. | | | 666,360 | |
| 47,200 | | First Pactrust Bancorp, Inc. | | | 562,624 | |
| 38,000 | | First Place Financial Corp.* | | | 28,120 | |
| 42,000 | | First State Bancorporation* | | | 67 | |
| 25,000 | | Firstcity Financial Corp.* | | | 218,500 | |
| 6,600 | | Flagstar Bancorp, Inc.* | | | 6,072 | |
| 2,250 | | FRMO Corp.* | | | 6,075 | |
| 45,000 | | Gladstone Investment Corp. | | | 340,650 | |
| 50,400 | | Green Bankshares, Inc.* | | | 85,176 | |
| 43,000 | | Guaranty Bancorp* | | | 85,570 | |
| 52,528 | | Hercules Technology Growth Capital, Inc. | | | 582,010 | |
| 38,000 | | HF Financial Corp. | | | 455,620 | |
| 6,059 | | Hudson Valley Holding Corp. | | | 97,731 | |
| 39,600 | | Independence Holding Co. | | | 394,416 | |
| 13,000 | | Indiana Community Bancorp | | | 305,500 | |
| 9,000 | | Infinity Property & Casualty Corp. | | | 470,970 | |
| 31,000 | | Intervest Bancshares Corp., Class A* | | | 118,420 | |
| 8,300 | | Investors Title Co. | | | 387,776 | |
| 24,000 | | Jefferson Bancshares, Inc.* | | | 54,960 | |
| 24,000 | | JMP Group, Inc. | | | 177,120 | |
| 17,000 | | Kansas City Life Insurance Co. | | | 547,400 | |
| 7,000 | | Main Street Capital Corp. | | | 172,410 | |
| 44,000 | | Marlin Business Services Corp. | | | 662,640 | |
| 48,000 | | MCG Capital Corp. | | | 204,000 | |
| 54,750 | | Meadowbrook Insurance Group, Inc. | | | 510,817 | |
| 53,000 | | Medallion Financial Corp. | | | 591,480 | |
| 103,000 | | MicroFinancial, Inc. | | | 705,550 | |
| 15,000 | | Monmouth Real Estate Investment Corp. REIT, Class A | | | 146,100 | |
| 52,100 | | MutualFirst Financial, Inc. | | | 508,496 | |
| 5,300 | | National Security Group, Inc. | | | 46,057 | |
| 4,000 | | National Western Life Insurance Co., Class A | | | 547,480 | |
| 11,400 | | Navigators Group, Inc.* | | | 538,536 | |
| 43,000 | | NGP Capital Resources Co. | | | 281,650 | |
| 44,000 | | Nicholas Financial, Inc. | | | 580,360 | |
| 13,000 | | One Liberty Properties, Inc. REIT | | | 237,900 | |
| 13,000 | | Onebeacon Insurance Group, Ltd., Class A | | | 200,330 | |
| 6,000 | | Oppenheimer Holdings, Inc., Class A | | | 104,100 | |
| 18,000 | | Pacific Mercantile Bancorp* | | | 98,640 | |
| 8,000 | | Parkway Properties, Inc. REIT | | | 83,840 | |
25
|
SCHEDULE OF PORTFOLIO INVESTMENTS |
RBC Microcap Value Fund (cont.)
March 31, 2012 (Unaudited)
| | | | | | |
| Shares | | | | | Value | |
| 29,000 | | Peoples Bancorp, Inc. | | | $ 508,660 | |
| 6,000 | | Piper Jaffray Cos.* | | | 159,720 | |
| 37,900 | | PMC Commercial Trust REIT | | | 324,424 | |
| 40,000 | | Presidential Life Corp. | | | 457,200 | |
| 19,000 | | Provident Financial Holdings, Inc. | | | 207,670 | |
| 20,000 | | Ramco-Gershenson Properties Trust REIT | | | 244,400 | |
| 59,000 | | Reis, Inc.* | | | 525,690 | |
| 23,000 | | Resource Capital Corp. REIT | | | 123,970 | |
| 11,000 | | Safety Insurance Group, Inc. | | | 458,040 | |
| 42,000 | | SeaBright Holdings, Inc. | | | 381,780 | |
| 109,000 | | Signature Group Holdings, Inc.* | | | 27,795 | |
| 14,000 | | Simmons First National Corp., Class A | | | 361,620 | |
| 32,000 | | Southern Community Financial Corp.* | | | 83,840 | |
| 38,300 | | Southwest Bancorp, Inc.* | | | 353,126 | |
| 25,000 | | Sterling Bancorp NY | | | 239,750 | |
| 35,600 | | Sun Bancorp, Inc.* | | | 125,668 | |
| 46,500 | | SWS Group, Inc. | | | 265,980 | |
| 54,000 | | TierOne Corp.* | | | 189 | |
| 52,000 | | Unico American Corp.* | | | 582,400 | |
| 99,716 | | United Community Financial Corp.* | | | 229,347 | |
| 19,000 | | United Western Bancorp, Inc.* | | | 2,850 | |
| 29,000 | | Winthrop Realty Trust REIT | | | 336,110 | |
| 4,600 | | Ziegler Cos., Inc. (The)* | | | 87,400 | |
| | | | | | |
| | | | | 28,471,314 | |
| | | | | | |
Health Care — 5.60% | |
| 4,000 | | Air Methods Corp.* | | | 349,000 | |
| 34,000 | | Albany Molecular Research, Inc.* | | | 91,800 | |
| 11,000 | | American Shared Hospital Services* | | | 37,400 | |
| 40,000 | | Angiodynamics, Inc.* | | | 490,000 | |
| 16,000 | | Assisted Living Concepts, Inc., Class A | | | 265,760 | |
| 77,000 | | BioScrip, Inc.* | | | 522,830 | |
| 22,000 | | Cambrex Corp.* | | | 153,780 | |
| 42,500 | | Cantel Medical Corp. | | | 1,066,325 | |
| 45,000 | | Capital Senior Living Corp.* | | | 415,800 | |
| 22,000 | | CONMED Corp. | | | 657,140 | |
| 46,000 | | Cross Country Healthcare, Inc.* | | | 230,460 | |
| 40,000 | | CryoLife, Inc.* | | | 210,800 | |
| 27,970 | | Hanger Orthopedic Group, Inc.* | | | 611,424 | |
| 20,313 | | IntegraMed America, Inc.* | | | 245,889 | |
| 20,000 | | Invacare Corp. | | | 331,400 | |
| 7,100 | | Kewaunee Scientific Corp. | | | 61,770 | |
| 10,362 | | Kindred Healthcare, Inc.* | | | 89,528 | |
| 30,000 | | Lannett Co., Inc.* | | | 125,100 | |
| 15,000 | | Medcath Corp.* | | | 117,900 | |
| 19,000 | | Mediware Information Systems* | | | 279,110 | |
| 41,000 | | PharMerica Corp.* | | | 509,630 | |
| 25,000 | | Symmetry Medical, Inc.* | | | 176,750 | |
26
|
SCHEDULE OF PORTFOLIO INVESTMENTS |
RBC Microcap Value Fund (cont.)
March 31, 2012 (Unaudited)
| | | | | | |
| Shares | | | | | Value | |
13,000 | | Triple-S Management Corp., Class B* | | | $ 300,300 | |
| | | | | | |
| | | | | 7,339,896 | |
| | | | | | |
Industrials — 20.77% | |
| 45,839 | | Aceto Corp. | | | 435,012 | |
| 24,000 | | Aegean Marine Petroleum Network, Inc. | | | 165,840 | |
| 3,000 | | Aegion Corp.* | | | 53,490 | |
| 21,000 | | Alamo Group, Inc. | | | 631,260 | |
| 102,000 | | Allied Motion Technologies, Inc. | | | 739,500 | |
| 8,000 | | Altra Holdings, Inc.* | | | 153,600 | |
| 8,000 | | Ampco-Pittsburgh Corp. | | | 161,040 | |
| 10,000 | | AMREP Corp.* | | | 87,400 | |
| 22,000 | | Baltic Trading Ltd. | | | 91,300 | |
| 24,000 | | Beacon Roofing Supply, Inc.* | | | 618,240 | |
| 17,000 | | CAI International, Inc.* | | | 309,060 | |
| 10,800 | | Cascade Corp. | | | 541,296 | |
| 30,000 | | CBIZ, Inc.* | | | 189,600 | |
| 42,000 | | Celadon Group, Inc. | | | 653,100 | |
| 93,525 | | Cenveo, Inc.* | | | 316,115 | |
| 2,800 | | Chicago Rivet & Machine Co. | | | 55,468 | |
| 14,400 | | CIRCOR International, Inc. | | | 479,088 | |
| 12,000 | | Comfort Systems USA, Inc. | | | 130,920 | |
| 36,178 | | Compx International, Inc. | | | 503,236 | |
| 12,000 | | Consolidated Graphics, Inc.* | | | 543,000 | |
| 58,000 | | Contra Mair Holdings, Inc.*(a)(b)(c) | | | 0 | |
| 20,000 | | Dolan Co. (The)* | | | 182,200 | |
| 24,000 | | Ducommun, Inc.* | | | 285,600 | |
| 43,000 | | Eagle Bulk Shipping, Inc.* | | | 83,420 | |
| 14,700 | | Eastern Co. (The) | | | 294,000 | |
| 9,880 | | Ecology and Environment, Inc., Class A | | | 149,682 | |
| 21,000 | | Encore Wire Corp. | | | 624,330 | |
| 35,000 | | Ennis, Inc. | | | 553,700 | |
| 10,000 | | EnPro Industries, Inc.* | | | 411,000 | |
| 24,000 | | Espey Manufacturing & Electronics Corp. | | | 592,560 | |
| 56,000 | | Excel Maritime Carriers Ltd.* | | | 112,000 | |
| 30,000 | | Federal Signal Corp.* | | | 166,800 | |
| 10,000 | | FLY Leasing Ltd. ADR | | | 122,100 | |
| 69,000 | | Frozen Food Express Industries* | | | 84,180 | |
| 20,000 | | G&K Services, Inc., Class A | | | 684,000 | |
| 15,000 | | Genco Shipping & Trading Ltd.* | | | 95,400 | |
| 25,000 | | GenCorp, Inc.* | | | 177,500 | |
| 40,000 | | Gibraltar Industries, Inc.* | | | 606,000 | |
| 10,300 | | GP Strategies Corp.* | | | 180,250 | |
| 35,000 | | Griffon Corp. | | | 374,500 | |
| 25,750 | | Hardinge, Inc. | | | 243,595 | |
| 22,000 | | Hill International, Inc.* | | | 86,460 | |
| 23,350 | | International Shipholding Corp. | | | 539,151 | |
| 26,000 | | Jinpan International Ltd. | | | 226,980 | |
27
|
SCHEDULE OF PORTFOLIO INVESTMENTS |
RBC Microcap Value Fund (cont.)
March 31, 2012 (Unaudited)
| | | | | | |
| Shares | | | | | Value | |
| 6,000 | | Kadant, Inc.* | | | $ 142,920 | |
| 12,000 | | Key Technology, Inc.* | | | 158,640 | |
| 33,000 | | Kforce, Inc.* | | | 491,700 | |
| 40,000 | | Kimball International, Inc., Class B | | | 276,400 | |
| 9,408 | | Kratos Defense & Security Solutions, Inc.* | | | 50,239 | |
| 64,000 | | LECG Corp.* | | | 640 | |
| 38,000 | | LS Starrett Co. (The), Class A | | | 492,100 | |
| 51,750 | | LSI Industries, Inc. | | | 379,327 | |
| 52,000 | | Lydall, Inc.* | | | 529,880 | |
| 22,875 | | Marten Transport Ltd. | | | 504,851 | |
| 72,000 | | Mesa Air Group, Inc.*(a)(b)(c) | | | 0 | |
| 38,117 | | Met-Pro Corp. | | | 402,515 | |
| 89,294 | | MFC Industrial Ltd. | | | 686,671 | |
| 34,000 | | Miller Industries, Inc. | | | 575,280 | |
| 34,000 | | NN, Inc.* | | | 277,440 | |
| 18,800 | | Northwest Pipe Co.* | | | 399,312 | |
| 56,000 | | On Assignment, Inc.* | | | 978,320 | |
| 20,000 | | Orion Marine Group, Inc.* | | | 144,600 | |
| 53,600 | | PAM Transportation Services, Inc. | | | 599,784 | |
| 52,000 | | Paragon Shipping, Inc., Class A | | | 42,640 | |
| 43,160 | | Patrick Industries, Inc.* | | | 524,394 | |
| 16,000 | | Pike Electric Corp.* | | | 131,680 | |
| 29,000 | | RCM Technologies, Inc.* | | | 161,530 | |
| 33,500 | | Rush Enterprises, Inc., Class A* | | | 710,870 | |
| 13,000 | | Schawk, Inc. | | | 162,630 | |
| 10,000 | | SeaCube Container Leasing Ltd. | | | 172,000 | |
| 13,800 | | SL Industries, Inc.* | | | 270,066 | |
| 16,000 | | Standex International Corp. | | | 659,040 | |
| 41,000 | | Superior Uniform Group, Inc. | | | 481,340 | |
| 58,115 | | Supreme Industries, Inc., Class A* | | | 180,737 | |
| 5,269 | | SYKES Enterprises, Inc.* | | | 83,250 | |
| 26,000 | | Tredegar Corp. | | | 509,340 | |
| 3,000 | | Trex Co., Inc.* | | | 96,240 | |
| 17,000 | | Universal Forest Products, Inc. | | | 586,160 | |
| 16,000 | | USA Truck, Inc.* | | | 124,000 | |
| 6,000 | | Viad Corp. | | | 116,580 | |
| 38,000 | | Vitran Corp., Inc.* | | | 303,240 | |
| 43,200 | | Volt Information Sciences, Inc.* | | | 269,568 | |
| 75,000 | | Willdan Group, Inc.* | | | 273,750 | |
| 41,000 | | Willis Lease Finance Corp.* | | | 533,410 | |
| | | | | | |
| | | | | 27,216,057 | |
| | | | | | |
Information Technology — 12.17% | |
| 67,300 | | Acorn Energy, Inc. | | | 731,551 | |
| 31,000 | | Agilysys, Inc.* | | | 278,690 | |
| 31,000 | | Anaren, Inc.* | | | 568,850 | |
| 12,000 | | Black Box Corp. | | | 306,120 | |
| 70,000 | | CIBER, Inc.* | | | 296,800 | |
28
|
SCHEDULE OF PORTFOLIO INVESTMENTS |
RBC Microcap Value Fund (cont.)
March 31, 2012 (Unaudited)
| | | | | | |
| Shares | | | | | Value | |
| 50,000 | | Comarco, Inc.* | | | $ 10,000 | |
| 21,000 | | Communications Systems, Inc. | | | 275,730 | |
| 13,000 | | CTS Corp. | | | 136,760 | |
| 30,000 | | Digi International, Inc.* | | | 329,700 | |
| 49,598 | | Dynamics Research Corp.* | | | 478,125 | |
| 30,000 | | Edgewater Technology, Inc.* | | | 117,600 | |
| 35,000 | | Electro Rent Corp. | | | 644,350 | |
| 33,000 | | Electro Scientific Industries, Inc. | | | 495,330 | |
| 22,400 | | ePlus, Inc.* | | | 716,128 | |
| 9,000 | | Fabrinet* | | | 159,390 | |
| 21,332 | | GSI Group, Inc.* | | | 257,264 | |
| 19,000 | | GTSI Corp.* | | | 94,620 | |
| 32,000 | | Infospace, Inc.* | | | 409,920 | |
| 41,000 | | Insight Enterprises, Inc.* | | | 899,130 | |
| 63,375 | | Integrated Silicon Solution, Inc.* | | | 707,265 | |
| 15,000 | | JinkoSolar Holding Co. Ltd. ADR* | | | 91,500 | |
| 13,000 | | Kemet Corp.* | | | 121,680 | |
| 25,000 | | Keynote Systems, Inc. | | | 494,000 | |
| 21,000 | | Magal Security Systems Ltd.* | | | 97,440 | |
| 20,000 | | Measurement Specialties, Inc.* | | | 674,000 | |
| 56,000 | | Methode Electronics, Inc. | | | 519,680 | |
| 39,000 | | Newport Corp.* | | | 691,080 | |
| 29,000 | | Oplink Communications, Inc.* | | | 495,900 | |
| 83,000 | | Optical Cable Corp. | | | 291,330 | |
| 66,000 | | PC Connection, Inc. | | | 542,520 | |
| 67,000 | | Perceptron, Inc.* | | | 391,280 | |
| 120,000 | | Performance Technologies, Inc.* | | | 309,600 | |
| 37,930 | | Photronics, Inc.* | | | 252,235 | |
| 28,000 | | Retalix Ltd.* | | | 510,720 | |
| 47,000 | | Richardson Electronics Ltd. | | | 563,060 | |
| 9,000 | | Rosetta Stone, Inc.* | | | 92,880 | |
| 29,000 | | Rudolph Technologies, Inc.* | | | 322,190 | |
| 70,000 | | Sigmatron International, Inc.* | | | 291,200 | |
| 13,000 | | STR Holdings, Inc.* | | | 62,920 | |
| 31,500 | | Tessco Technologies, Inc. | | | 802,305 | |
| 8,000 | | Vishay Precision Group, Inc.* | | | 118,640 | |
| 30,000 | | WebMediaBrands, Inc.* | | | 31,200 | |
| 100,000 | | WPCS International, Inc.* | | | 127,000 | |
| 15,000 | | XO Group, Inc.* | | | 140,850 | |
| | | | | | |
| | | | | 15,948,533 | |
| | | | | | |
Materials — 4.60% | |
| 68,200 | | American Pacific Corp.* | | | 512,864 | |
| 37,000 | | Blue Earth Refineries, Inc.* | | | 5,920 | |
| 20,000 | | China Green Agriculture, Inc.* | | | 86,000 | |
| 18,000 | | Friedman Industries, Inc. | | | 196,200 | |
| 5,000 | | Hawkins, Inc. | | | 186,000 | |
| 50,000 | | Headwaters, Inc.* | | | 209,000 | |
29
|
SCHEDULE OF PORTFOLIO INVESTMENTS |
RBC Microcap Value Fund (cont.)
March 31, 2012 (Unaudited)
| | | | | | |
| Shares | | | | | Value | |
| 23,000 | | Innospec, Inc.* | | | $ 698,740 | |
| 25,000 | | Myers Industries, Inc. | | | 368,750 | |
| 8,000 | | Neenah Paper, Inc. | | | 237,920 | |
| 10,400 | | North American Palladium Ltd.* | | | 27,248 | |
| 21,000 | | Olympic Steel, Inc. | | | 504,000 | |
| 38,000 | | Penford Corp.* | | | 256,880 | |
| 6,000 | | Quaker Chemical Corp. | | | 236,700 | |
| 27,000 | | Schulman (A), Inc. | | | 729,540 | |
| 45,000 | | Spartech Corp.* | | | 219,600 | |
| 6,000 | | Stepan Co. | | | 526,800 | |
| 16,000 | | Universal Stainless & Alloy* | | | 683,520 | |
| 3,200 | | Vulcan International Corp. | | | 106,240 | |
| 25,000 | | Wausau Paper Corp. | | | 234,500 | |
| | | | | | |
| | | | | 6,026,422 | |
| | | | | | |
Telecommunication Services — 1.23% | |
| 30,000 | | Premiere Global Services, Inc.* | | | 271,200 | |
| 41,000 | | SureWest Communications | | | 924,550 | |
| 30,000 | | USA Mobility, Inc. | | | 417,900 | |
| | | | | | |
| | | | | 1,613,650 | |
| | | | | | |
Utilities — 3.49% | |
| 9,000 | | American States Water Co. | | | 325,260 | |
| 6,108 | | California Water Service Group | | | 111,227 | |
| 11,000 | | CH Energy Group, Inc. | | | 734,030 | |
| 14,990 | | Chesapeake Utilities Corp. | | | 616,389 | |
| 21,500 | | Connecticut Water Service, Inc. | | | 608,235 | |
| 9,000 | | Delta Natural Gas Co., Inc. | | | 342,000 | |
| 18,600 | | Empire District Electric Co. (The) | | | 378,510 | |
| 28,400 | | Middlesex Water Co. | | | 536,476 | |
| 17,800 | | SJW Corp. | | | 429,336 | |
| 18,476 | | Unitil Corp. | | | 495,711 | |
| | | | | | |
| | | | | 4,577,174 | |
| | | | | | |
Total Common Stocks (Cost $135,756,573) | | | 128,004,130 | |
| | | | | | |
Preferred Stock — 0.57% | |
| 3,122 | | Alere, Inc. | | | 752,402 | |
| | | | | | |
Total Preferred Stock (Cost $504,723) | | | 752,402 | |
| | | | | | |
Exchange Traded Funds — 0.23% | |
| 2,700 | | iShares Russell Microcap Index Fund | | | 138,780 | |
30
|
SCHEDULE OF PORTFOLIO INVESTMENTS |
RBC Microcap Value Fund (cont.)
March 31, 2012 (Unaudited)
| | | | | | |
| Shares | | | | | Value | |
| 13,400 | | PowerShares Zacks Micro Cap Portfolio | | | $ 155,172 | |
| | | | | | |
Total Exchange Traded Funds (Cost $210,668) | | | 293,952 | |
| | | | | | |
Rights/Warrants — 0.00% | | | | |
| 1,232 | | Aventine Renewable Energy Holdings, Inc. Warrants, Expire 3/15/15*(a)(c) | | | 0 | |
| 3,585 | | US Concrete, Inc. Warrants, Expire 8/31/17*(a)(b)(c) | | | 0 | |
| 3,585 | | US Concrete, Inc. Warrants, Expire 8/31/17*(a)(b)(c) | | | 0 | |
| | | | | | |
Total Rights/Warrants | | | 0 | |
| | | | | | |
| (Cost $0) | | | | | | |
Principal Amount | | | | | | |
Corporate Bonds — 0.00% | | | | |
| $1,947 | | Trenwick America Corp.*(a)(b)(c) | | | 0 | |
| 1,625 | | Trenwick America Corp.*(a)(b)(c) | | | 0 | |
| | | | | | |
Total Corporate Bonds | | | 0 | |
| | | | | | |
| (Cost $0) | | | | | | |
| | |
Shares | | | | | |
Investment Company — 1.48% | | | | |
| 1,942,782 | | JPMorgan Prime Money Market Fund | | | 1,942,782 | |
| | | | | | |
Total Investment Company | | | 1,942,782 | |
| | | | | | |
| (Cost $1,942,782) | | | | | | |
Total Investments | | | $130,993,266 | |
| (Cost $138,414,746)(d) — 99.97% | | | | |
Other assets in excess of liabilities — 0.03% | | | 40,469 | |
| | | | | | |
| |
NET ASSETS — 100.00% | | | $131,033,735 | |
| | | | | | |
31
|
SCHEDULE OF PORTFOLIO INVESTMENTS |
RBC Microcap Value Fund (cont.)
March 31, 2012 (Unaudited)
| * | Non-income producing security. |
| (a) | This security is restricted and illiquid as the security may not be offered or sold within the United States or to U.S. persons except to qualified purchasers who are also either qualified institutional buyers or “accredited investors” (as defined in Rule 501 (a) of Regulation D under the Securities Act of 1933). The total investment in restricted and illiquid securities representing $0 or 0.00% of net assets was as follows: |
| | | | | | | | |
Acquisition Shares | | Issuer | | Acquisition
Date | | Acquisition Cost | | 3/31/12
Carrying Value Per Unit |
| | Aventine Renewable | | | | | | |
1,232 | | Energy Holdings,Inc., Warrants | | 04/14/2010 | | $ — | | $— |
58,000 | | Contra Mair Holdings, Inc. | | 09/04/2008 | | $ 6,960 | | $— |
72,000 | | Mesa Air Group, Inc. | | 11/01/2006 | | $635,933 | | $— |
41,000 | | Orleans Homebuilders, Inc. | | 12/12/2006 | | $685,227 | | $— |
110,300 | | Trico Marine Services, Inc. | | 02/03/2009 | | $518,857 | | $— |
3,585 | | U.S. Concrete, Inc., Warrants | | 09/09/2010 | | $ — | | $— |
3,585 | | U.S. Concrete, Inc., Warrants | | 09/09/2010 | | $ — | | $— |
30,000 | | Universal Travel Group | | 09/13/2010 | | $157,113 | | $— |
| | | | |
Acquisition Principal Amount | | | | | | | | |
$1,947 | | Trenwick America Corp. | | 05/18/2006 | | $ — | | $— |
$1,625 | | Trenwick America Corp. | | 05/18/2006 | | $ — | | $— |
| (b) | Security delisted or issuer in bankruptcy. |
| (c) | Fair valued security under procedures established by the Fund’s Board of Trustees. |
| (d) | See notes to financial statements for the tax cost of securities and the breakdown of unrealized appreciation (depreciation). |
Abbreviations used are defined below:
ADR - American Depositary Receipt
REIT - Real Estate Investment Trust
See notes to financial statements.
32
|
SCHEDULE OF PORTFOLIO INVESTMENTS |
RBC Mid Cap Value Fund
| | | | | | |
March 31, 2012 (Unaudited) | | | | |
| Shares | | | | | Value | |
Common Stocks — 99.83% | |
Consumer Discretionary — 14.45% | |
| 320 | | ANN INC.* | | $ | 9,165 | |
| 460 | | Ascena Retail Group, Inc.* | | | 20,387 | |
| 5,720 | | Dana Holding Corp. | | | 88,660 | |
| 1,730 | | Jarden Corp. | | | 69,598 | |
| 1,130 | | Mattel, Inc. | | | 38,036 | |
| 1,570 | | Newell Rubbermaid, Inc. | | | 27,962 | |
| 821 | | Tenneco, Inc.* | | | 30,500 | |
| 900 | | TRW Automotive Holdings Corp.* | | | 41,805 | |
| | | | | | |
| | | | | 326,113 | |
| | | | | | |
Consumer Staples — 0.62% | |
| 190 | | Energizer Holdings, Inc.* | | | 14,094 | |
| | | | | | |
Energy — 6.84% | |
| 310 | | Berry Petroleum Co., Class A | | | 14,610 | |
| 1,060 | | C&J Energy Services, Inc.* | | | 18,857 | |
| 780 | | Cameron International Corp.* | | | 41,207 | |
| 1,300 | | Key Energy Services, Inc.* | | | 20,085 | |
| 1,060 | | Noble Corp. | | | 39,718 | |
| 370 | | QEP Resources, Inc. | | | 11,285 | |
| 210 | | World Fuel Services Corp. | | | 8,610 | |
| | | | | | |
| | | | | 154,372 | |
| | | | | | |
Financials — 22.27% | |
| 350 | | American Financial Group, Inc. | | | 13,503 | |
| 150 | | Ameriprise Financial, Inc. | | | 8,569 | |
| 3,260 | | Ares Capital Corp. | | | 53,301 | |
| 60 | | Comerica, Inc. | | | 1,942 | |
| 570 | | Discover Financial Services | | | 19,004 | |
| 3,810 | | Fifth Third Bancorp | | | 53,531 | |
| 880 | | Hartford Financial Services Group, Inc. | | | 18,550 | |
| 1,230 | | HCC Insurance Holdings, Inc. | | | 38,339 | |
| 2,770 | | Huntington Bancshares, Inc. | | | 17,867 | |
| 9,240 | | KKR Financial Holdings LLC | | | 85,100 | |
| 1,500 | | New York Community Bancorp, Inc. | | | 20,865 | |
| 2,960 | | People’s United Financial, Inc. | | | 39,190 | |
| 410 | | Principal Financial Group, Inc. | | | 12,099 | |
| 880 | | Reinsurance Group of America, Inc. | | | 52,334 | |
| 1,820 | | Tower Group, Inc. | | | 40,822 | |
| 1,130 | | Unum Group | | | 27,662 | |
| | | | | | |
| | | | | 502,678 | |
| | | | | | |
Health Care — 5.30% | |
| 550 | | Humana, Inc. | | | 50,864 | |
| 2,330 | | Mylan, Inc.* | | | 54,639 | |
| 340 | | Universal Health Services, Inc., Class B | | | 14,249 | |
| | | | | | |
| | | | | 119,752 | |
| | | | | | |
33
|
SCHEDULE OF PORTFOLIO INVESTMENTS |
RBC Mid Cap Value Fund (cont.)
| | | | | | |
March 31, 2012 (Unaudited) | |
| | |
| Shares | | | | Value | |
Industrials — 16.10% | |
| 870 | | Fluor Corp. | | $ | 52,235 | |
| 880 | | Gardner Denver, Inc. | | | 55,458 | |
| 590 | | KBR, Inc. | | | 20,975 | |
| 230 | | Kirby Corp.* | | | 15,132 | |
| 700 | | Old Dominion Freight Line, Inc.* | | | 33,369 | |
| 200 | | Regal-Beloit Corp. | | | 13,110 | |
| 1,660 | | Republic Services, Inc. | | | 50,730 | |
| 440 | | SPX Corp. | | | 34,113 | |
| 3,765 | | Swift Transporation Co.* | | | 43,448 | |
| 1,810 | | Werner Enterprises, Inc. | | | 44,996 | |
| | | | | | |
| | | | | 363,566 | |
| | | | | | |
Information Technology — 12.63% | |
| 940 | | Arrow Electronics, Inc.* | | | 39,452 | |
| 1,450 | | Avnet, Inc.* | | | 52,765 | |
| 160 | | CACI International, Inc., Class A* | | | 9,966 | |
| 1,430 | | Fairchild Semiconductor International, Inc.* | | | 21,021 | |
| 410 | | Harris Corp. | | | 18,483 | |
| 590 | | Ingram Micro, Inc., Class A* | | | 10,950 | |
| 400 | | SanDisk Corp.* | | | 19,836 | |
| 1,960 | | Seagate Technology Plc | | | 52,822 | |
| 1,440 | | Skyworks Solutions, Inc.* | | | 39,816 | |
| 1,140 | | Western Union Co. (The) | | | 20,064 | |
| | | | | | |
| | | | | 285,175 | |
| | | | | | |
Materials — 14.85% | |
| 420 | | Allegheny Technologies, Inc. | | | 17,291 | |
| 1,060 | | Ashland, Inc. | | | 64,724 | |
| 190 | | Celanese Corp., Class A | | | 8,774 | |
| 1,550 | | Crown Holdings, Inc.* | | | 57,087 | |
| 514 | | Cytec Industries, Inc. | | | 31,246 | |
| 630 | | International Paper Co. | | | 22,113 | |
| 2,090 | | Owens-Illinois, Inc.* | | | 48,781 | |
| 310 | | Reliance Steel & Aluminum Co. | | | 17,509 | |
| 980 | | Schweitzer-Mauduit International, Inc. | | | 67,679 | |
| | | | | | |
| | | | | 335,204 | |
| | | | | | |
Telecommunication Services — 0.87% | |
| 1,670 | | Windstream Corp. | | | 19,556 | |
| | | | | | |
34
|
SCHEDULE OF PORTFOLIO INVESTMENTS |
RBC Mid Cap Value Fund (cont.)
| | | | | | |
| March 31, 2012 (Unaudited) | |
| | |
| Shares | | | | Value | |
Utilities — 5.90% | |
| 610 | | Cleco Corp. | | $ | 24,187 | |
| 1,850 | | CMS Energy Corp. | | | 40,700 | |
| 1,280 | | Edison International | | | 54,413 | |
| 90 | | EQT Corp. | | | 4,339 | |
| 260 | | Northeast Utilities | | | 9,651 | |
| | | | | | |
| | | | | 133,290 | |
| | | | | | |
| |
Total Common Stocks | | | 2,253,800 | |
| | | | | | |
| (Cost $2,021,717) | | | | | | |
| |
Investment Company — 2.01% | | | | |
| 45,440 | | JPMorgan Prime Money Market Fund | | | 45,440 | |
| | | | | | |
| |
Total Investment Company | | | 45,440 | |
| | | | | | |
| (Cost $45,440) | | | | | | |
| |
Total Investments
(Cost $2,067,157)(a) — 101.84% | | $ | 2,299,240 | |
| |
Liabilities in excess of other assets — (1.84)% | | | (41,518 | ) |
| | | | | | |
| |
NET ASSETS — 100.00% | | $ | 2,257,722 | |
| | | | | | |
| * | Non-income producing security. |
| (a) | See notes to financial statements for the tax cost of securities and the breakdown of unrealized appreciation (depreciation). |
See notes to financial statements.
35
Statements of Assets and Liabilities
March 31, 2012 (Unaudited)
| | | | | | | | | | | | | | | | | | | | |
| | | RBC
SMID Cap
Growth Fund | | | RBC
Enterprise
Fund | | | RBC
Small Cap
Core Fund | | | RBC
Microcap
Value Fund | | | RBC
Mid Cap
Value Fund | |
Assets: | | | | | | | | | | | | | | | | | | | | |
Investments, at value (cost $45,692,380, $76,838,623, $39,510,897, $138,414,746 and $2,067,157, respectively) | | $ | 69,299,608 | | | $ | 109,203,694 | | | $ | 56,388,178 | | | $ | 130,993,266 | | | $ | 2,299,240 | |
Interest and dividends receivable | | | 14,798 | | | | 40,032 | | | | 51,267 | | | | 173,914 | | | | 2,428 | |
Receivable from advisor | | | — | | | | — | | | | — | | | | — | | | | 6,856 | |
Receivable for capital shares issued | | | 2,173 | | | | 2,316 | | | | 34,554 | | | | 112,000 | | | | — | |
Receivable for investments sold | | | 1,276,251 | | | | — | | | | 878,997 | | | | — | | | | 16,800 | |
Prepaid expenses | | | 37,721 | | | | 38,117 | | | | 27,305 | | | | 36,237 | | | | 4,536 | |
| | | | | | | | | | | | | | | | | | | | |
Total Assets | | | 70,630,551 | | | | 109,284,159 | | | | 57,380,301 | | | | 131,315,417 | | | | 2,329,860 | |
| | | | | | | | | | | | | | | | | | | | |
Liabilities: | | | | | | | | | | | | | | | | | | | | |
Cash overdraft | | | — | | | | — | | | | 2,894 | | | | — | | | | — | |
Payable for capital shares redeemed | | | 1,439,232 | | | | 99,136 | | | | 91,712 | | | | 104,165 | | | | — | |
Payable for investments purchased | | | — | | | | 406,732 | | | | 712,001 | | | | — | | | | 43,141 | |
Accrued expenses and other payables: | | | | | | | | | | | | | | | | | | | | |
Investment advisory fees | | | 29,117 | | | | 66,175 | | | | 23,526 | | | | 73,570 | | | | — | |
Administration fees | | | 4,674 | | | | 7,019 | | | | 3,706 | | | | 8,464 | | | | 148 | |
Audit fees | | | 22,407 | | | | 22,433 | | | | 22,398 | | | | 22,435 | | | | 22,372 | |
Trustees’ fees | | | 55 | | | | 301 | | | | 16 | | | | 222 | | | | 29 | |
Distribution fees | | | 19,500 | | | | 2,516 | | | | 2,148 | | | | 7,958 | | | | — | |
Shareholder reports | | | — | | | | 137 | | | | — | | | | — | | | | 2,872 | |
Transfer agent fees | | | 26,265 | | | | 35,935 | | | | 10,421 | | | | 59,198 | | | | 652 | |
Other | | | — | | | | 3,836 | | | | 542 | | | | 5,670 | | | | 2,924 | |
| | | | | | | | | | | | | | | | | | | | |
Total Liabilities | | | 1,541,250 | | | | 644,220 | | | | 869,364 | | | | 281,682 | | | | 72,138 | |
| | | | | | | | | | | | | | | | | | | | |
Net Assets | | $ | 69,089,301 | | | $ | 108,639,939 | | | $ | 56,510,937 | | | $ | 131,033,735 | | | $ | 2,257,722 | |
| | | | | | | | | | | | | | | | | | | | |
Net Assets Consist Of: | | | | | | | | | | | | | | | | | | | | |
Capital | | $ | 43,322,207 | | | $ | 88,815,728 | | | $ | 37,792,318 | | | $ | 155,630,356 | | | $ | 2,056,633 | |
Undistributed net investment income (loss) | | | (220,773 | ) | | | 72,466 | | | | 3,253 | | | | 408,825 | | | | 10,802 | |
Accumulated net realized gains (losses) from investment transactions and foreign currency | | | 2,380,639 | | | | (12,613,326 | ) | | | 1,838,085 | | | | (17,583,966 | ) | | | (41,796 | ) |
Net unrealized appreciation (depreciation) on investments and foreign currency | | | 23,607,228 | | | | 32,365,071 | | | | 16,877,281 | | | | (7,421,480 | ) | | | 232,083 | |
| | | | | | | | | | | | | | | | | | | | |
Net Assets | | $ | 69,089,301 | | | $ | 108,639,939 | | | $ | 56,510,937 | | | $ | 131,033,735 | | | $ | 2,257,722 | |
| | | | | | | | | | | | | | | | | | | | |
Net Assets: | | | | | | | | | | | | | | | | | | | | |
Class A | | $ | 30,637,198 | | | $ | 1,458,250 | | | $ | 2,745,135 | | | $ | 4,420,859 | | | | N/A | |
Class I | | | 36,715,869 | | | | 22,326 | | | | N/A | | | | N/A | | | $ | 2,257,722 | |
Class C | | | 50,311 | | | | 468,223 | | | | 116,992 | | | | 696,728 | | | | N/A | |
Class S | | | 1,685,923 | | | | 106,691,140 | | | | 53,648,810 | | | | 125,916,148 | | | | N/A | |
| | | | | | | | | | | | | | | | | | | | |
Total | | $ | 69,089,301 | | | $ | 108,639,939 | | | $ | 56,510,937 | | | $ | 131,033,735 | | | $ | 2,257,722 | |
| | | | | | | | | | | | | | | | | | | | |
36
Statements of Assets and Liabilities (cont.)
| | | | | | | | | | | | | | | | | | | | |
| | | RBC
SMID Cap
Growth Fund | | | RBC
Enterprise
Fund | | | RBC
Small Cap
Core Fund | | | RBC
Microcap
Value Fund | | | RBC
Mid Cap
Value Fund | |
Shares Outstanding (Unlimited number of shares authorized, no par value): | | | | | | | | | | | | | | | | | | | | |
Class A | | | 2,117,502 | | | | 78,481 | | | | 111,856 | | | | 240,786 | | | | N/A | |
Class I | | | 2,418,425 | | | | 1,178 | | | | N/A | | | | N/A | | | | 211,328 | |
Class C | | | 3,708 | | | | 27,189 | | | | 5,141 | | | | 40,015 | | | | N/A | |
Class S | | | 111,035 | | | | 5,629,959 | | | | 2,130,743 | | | | 6,860,345 | | | | N/A | |
| | | | | | | | | | | | | | | | | | | | |
Total | | | 4,650,670 | | | | 5,736,807 | | | | 2,247,740 | | | | 7,141,146 | | | | 211,328 | |
| | | | | | | | | | | | | | | | | | | | |
| | | | | |
Net Asset Values and Redemption Prices per Share: | | | | | | | | | | | | | | | | | | | | |
Class A(a) | | $ | 14.47 | | | $ | 18.58 | | | $ | 24.54 | | | $ | 18.36 | | | | N/A | |
| | | | | | | | | | | | | | | | | | | | |
Class I | | $ | 15.18 | | | $ | 18.95 | | | | N/A | | | | N/A | | | $ | 10.68 | |
| | | | | | | | | | | | | | | | | | | | |
Class C(b) | | $ | 13.57 | | | $ | 17.22 | | | $ | 22.76 | | | $ | 17.41 | | | | N/A | |
| | | | | | | | | | | | | | | | | | | | |
Class S | | $ | 15.18 | | | $ | 18.95 | | | $ | 25.18 | | | $ | 18.35 | | | | N/A | |
| | | | | | | | | | | | | | | | | | | | |
| | | | | |
Maximum Offering Price Per Share: | | | | | | | | | | | | | | | | | | | | |
Class A | | $ | 15.35 | | | $ | 19.71 | | | $ | 26.04 | | | $ | 19.48 | | | | N/A | |
| | | | | | | | | | | | | | | | | | | | |
Maximum Sales Charge - Class A | | | 5.75 | % | | | 5.75 | % | | | 5.75 | % | | | 5.75 | % | | | N/A | |
| | | | | | | | | | | | | | | | | | | | |
| (a) | For Class A shares, redemption price per share will be reduced by 1.00% for sales of shares within 12 months of purchase (only applicable on purchases of $1 million or more on which no initial sales charge was paid). Such reduction is not reflected in the net asset value and the redemption price per share. |
| (b) | For Class C shares, redemption price per share will be reduced by 1.00% for sales of shares within 12 months of purchase. Such reduction is not reflected in the net asset value and the redemption price per share. |
See notes to financial statements.
37
Statements of Operations
| | | | | | | | | | | | | | | | | | | | |
| For the Six Months Ended March 31, 2012 (Unaudited) | | | | | | | | | | | | | | | | | | | | |
| | | | | |
| | | RBC SMID Cap
Growth Fund | | | RBC Enterprise
Fund | | | RBC Small Cap
Core Fund | | | RBC Microcap
Value Fund | | | RBC Mid Cap
Value Fund | |
| | | | | |
Investment Income: | | | | | | | | | | | | | | | | | | | | |
Dividend income | | $ | 177,735 | | | $ | 623,261 | | | $ | 293,383 | | | $ | 1,151,428 | | | $ | 19,888 | |
Foreign tax withholding | | | — | | | | — | | | | — | | | | (2,689 | ) | | | — | |
| | | | | | | | | | | | | | | | | | | | |
Total Investment Income | | | 177,735 | | | | 623,261 | | | | 293,383 | | | | 1,148,739 | | | | 19,888 | |
| | | | | | | | | | | | | | | | | | | | |
| | | | | |
Expenses: | | | | | | | | | | | | | | | | | | | | |
Investment advisory fees | | | 231,595 | | | | 470,527 | | | | 262,001 | | | | 547,589 | | | | 7,065 | |
Distribution fees - Class A | | | 34,345 | | | | 1,771 | | | | 2,629 | | | | 5,219 | | | | — | |
Distribution fees - Class C | | | 228 | | | | 2,293 | | | | 364 | | | | 3,429 | | | | — | |
Accounting fees | | | 14,143 | | | | 15,020 | | | | 13,862 | | | | 15,531 | | | | 12,539 | |
Administration fees | | | 24,814 | | | | 37,968 | | | | 20,590 | | | | 45,633 | | | | 757 | |
Audit fees | | | 18,098 | | | | 18,101 | | | | 18,097 | | | | 18,103 | | | | 18,094 | |
Custodian fees | | | 1,531 | | | | 2,040 | | | | 2,046 | | | | 2,664 | | | | 4,413 | |
Insurance fees | | | 4,239 | | | | 4,239 | | | | 4,239 | | | | 4,239 | | | | 4,239 | |
Legal fees | | | 927 | | | | 1,295 | | | | 606 | | | | 2,433 | | | | 87 | |
Registration and filing fees | | | 47,125 | | | | 45,560 | | | | 38,946 | | | | 37,950 | | | | 4,497 | |
Shareholder reports | | | 4,095 | | | | 7,923 | | | | 3,815 | | | | 10,885 | | | | 12 | |
Transfer agent fees | | | 100,840 | | | | 79,353 | | | | 45,394 | | | | 145,058 | | | | 1,888 | |
Trustees’ fees | | | 814 | | | | 1,447 | | | | 630 | | | | 1,570 | | | | 14 | |
Other fees | | | 4,844 | | | | 5,253 | | | | 4,482 | | | | 11,865 | | | | 3,497 | |
| | | | | | | | | | | | | | | | | | | | |
Total expenses before fee waiver/reimbursement | | | 487,638 | | | | 692,790 | | | | 417,701 | | | | 852,168 | | | | 57,102 | |
Expenses waived/reimbursed by: | | | | | | | | | | | | | | | | | | | | |
Adviser | | | (89,130 | ) | | | (141,995 | ) | | | (126,444 | ) | | | (192,497 | ) | | | (48,019 | ) |
| | | | | | | | | | | | | | | | | | | | |
Net Expenses | | | 398,508 | | | | 550,795 | | | | 291,257 | | | | 659,671 | | | | 9,083 | |
| | | | | | | | | | | | | | | | | | | | |
| | | | | |
Net Investment Income (Loss) | | | (220,773 | ) | | | 72,466 | | | | 2,126 | | | | 489,068 | | | | 10,805 | |
| | | | | | | | | | | | | | | | | | | | |
| | | | | |
Realized/Unrealized Gains (Losses) from Investment Transactions: | | | | | | | | | | | | | | | | | | | | |
Net realized gains (losses) from investment transactions | | | 2,863,532 | | | | (955,500 | ) | | | 2,044,633 | | | | 2,814,750 | | | | 16,824 | |
Net change in unrealized appreciation/depreciation on investments and foreign currency | | | 12,951,285 | | | | 27,787,122 | | | | 11,668,591 | | | | 27,291,427 | | | | 570,998 | |
| | | | | | | | | | | | | | | | | | | | |
Net realized/unrealized gains from investments | | | 15,814,817 | | | | 26,831,622 | | | | 13,713,224 | | | | 30,106,177 | | | | 587,822 | |
| | | | | | | | | | | | | | | | | | | | |
Change in net assets resulting from operations | | $ | 15,594,044 | | | $ | 26,904,088 | | | $ | 13,715,350 | | | $ | 30,595,245 | | | $ | 598,627 | |
| | | | | | | | | | | | | | | | | | | | |
| | | |
| See notes to the financial statements. | | | | | | | | | | | | | |
38
Statements of Changes in Net Assets
| | | | | | | | |
| | | RBC SMID Cap
Growth Fund | |
| | | For the
Six Months Ended
March 31, 2012 | | | For the
Year Ended
September 30, 2011 | |
| | | (Unaudited) | | | | |
| | |
From Investment Activities: | | | | | | | | |
Operations: | | | | | | | | |
Net investment loss | | $ | (220,773 | ) | | $ | (428,118 | ) |
Net realized gains from investment transactions | | | 2,863,532 | | | | 5,801,079 | |
Net change in unrealized appreciation/depreciation on investments | | | 12,951,285 | | | | (1,409,826 | ) |
| | | | | | | | |
Change in net assets resulting from operations | | | 15,594,044 | | | | 3,963,135 | |
| | | | | | | | |
| | |
Capital Transactions: | | | | | | | | |
Proceeds from shares issued | | | 3,563,004 | | | | 7,396,063 | |
Cost of shares redeemed | | | (8,762,485 | ) | | | (17,614,910 | ) |
| | | | | | | | |
Change in net assets resulting from capital transactions | | | (5,199,481 | ) | | | (10,218,847 | ) |
| | | | | | | | |
Net increase (decrease) in net assets | | | 10,394,563 | | | | (6,255,712 | ) |
| | |
Net Assets: | | | | | | | | |
Beginning of period | | | 58,694,738 | | | | 64,950,450 | |
| | | | | | | | |
End of period | | $ | 69,089,301 | | | $ | 58,694,738 | |
| | | | | | | | |
Distributions in excess of net investment income | | $ | (220,773 | ) | | $ | — | |
| | | | | | | | |
| | |
Share Transactions: | | | | | | | | |
Issued | | | 277,851 | | | | 601,446 | |
Redeemed | | | (633,774 | ) | | | (1,363,886 | ) |
| | | | | | | | |
Change in shares resulting from capital transactions | | | (355,923 | ) | | | (762,440 | ) |
| | | | | | | | |
See notes to financial statements.
39
Statements of Changes in Net Assets (cont.)
| | | | | | | | |
| | | RBC Enterprise Fund | |
| | | For the
Six Months Ended
March 31, 2012 | | | For the
Year Ended
September 30, 2011 | |
| | | (Unaudited) | | | | |
| | |
From Investment Activities: | | | | | | | | |
Operations: | | | | | | | | |
Net investment income (loss) | | $ | 72,466 | | | $ | (324,292 | ) |
Net realized gains (losses) from investment transactions | | | (955,500 | ) | | | 17,004,371 | |
Net change in unrealized appreciation/depreciation on investments | | | 27,787,122 | | | | (8,347,648 | ) |
| | | | | | | | |
Change in net assets resulting from operations | | | 26,904,088 | | | | 8,332,431 | |
| | | | | | | | |
| | |
Capital Transactions: | | | | | | | | |
Proceeds from shares issued | | | 302,964 | | | | 3,414,432 | |
Cost of shares redeemed | | | (11,752,921 | ) | | | (57,801,141 | ) |
| | | | | | | | |
Change in net assets resulting from capital transactions | | | (11,449,957 | ) | | | (54,386,709 | ) |
| | | | | | | | |
Net increase (decrease) in net assets | | | 15,454,131 | | | | (46,054,278 | ) |
| | |
Net Assets: | | | | | | | | |
Beginning of period | | | 93,185,808 | | | | 139,240,086 | |
| | | | | | | | |
End of period | | $ | 108,639,939 | | | $ | 93,185,808 | |
| | | | | | | | |
Undistributed net investment income | | $ | 72,466 | | | $ | — | |
| | | | | | | | |
| | |
Share Transactions: | | | | | | | | |
Issued | | | 17,790 | | | | 203,048 | |
Redeemed | | | (696,913 | ) | | | (3,289,647 | ) |
| | | | | | | | |
Change in shares resulting from capital transactions | | | (679,123 | ) | | | (3,086,599 | ) |
| | | | | | | | |
See notes to financial statements.
40
Statements of Changes in Net Assets (cont.)
| | | | | | | | |
| | | RBC Small Cap
Core Fund | |
| | | For the
Six Months Ended
March 31, 2012 | | | For the
Year Ended
September 30, 2011 | |
| | | (Unaudited) | | | | |
| | |
From Investment Activities: | | | | | | | | |
Operations: | | | | | | | | |
Net investment income (loss) | | $ | 2,126 | | | $ | (48,889 | ) |
Net realized gains from investment transactions | | | 2,044,633 | | | | 6,052,352 | |
Net change in unrealized appreciation/depreciation on investments | | | 11,668,591 | | | | (5,687,024 | ) |
| | | | | | | | |
Change in net assets resulting from operations | | | 13,715,350 | | | | 316,439 | |
| | | | | | | | |
| | |
Distributions to Class A Shareholders: | | | | | | | | |
From net realized gains | | | (114,102 | ) | | | — | |
| | |
Distributions to Class C Shareholders: | | | | | | | | |
From net realized gains | | | (2,164 | ) | | | — | |
| | |
Distributions to Class S Shareholders: | | | | | | | | |
From net realized gains | | | (3,133,890 | ) | | | — | |
| | | | | | | | |
Change in net assets resulting from shareholder distributions | | | (3,250,156 | ) | | | — | |
| | | | | | | | |
| | |
Capital Transactions: | | | | | | | | |
Proceeds from shares issued | | | 7,815,915 | | | | 9,631,033 | |
Distributions reinvested | | | 3,156,260 | | | | — | |
Cost of shares redeemed | | | (9,025,512 | ) | | | (9,893,792 | ) |
| | | | | | | | |
Change in net assets resulting from capital transactions | | | 1,946,663 | | | | (262,759 | ) |
| | | | | | | | |
Net increase in net assets | | | 12,411,857 | | | | 53,680 | |
| | |
Net Assets: | | | | | | | | |
Beginning of period | | | 44,099,080 | | | | 44,045,400 | |
| | | | | | | | |
End of period | | $ | 56,510,937 | | | $ | 44,099,080 | |
| | | | | | | | |
Undistributed net investment income | | $ | 3,253 | | | $ | 1,127 | |
| | | | | | | | |
| | |
Share Transactions: | | | | | | | | |
Issued | | | 326,381 | | | | 416,277 | |
Reinvested | | | 138,809 | | | | — | |
Redeemed | | | (371,131 | ) | | | (421,570 | ) |
| | | | | | | | |
Change in shares resulting from capital transactions | | | 94,059 | | | | (5,293 | ) |
| | | | | | | | |
| | |
| See notes to financial statements. | | | | | | | | |
41
Statements of Changes in Net Assets (cont.)
| | | | | | | | |
| | | RBC Microcap Value Fund | |
| | | For the
Six Months Ended
March 31, 2012 | | | For the
Year Ended
September 30, 2011 | |
| | | (Unaudited) | | | | |
| | |
From Investment Activities: | | | | | | | | |
Operations: | | | | | | | | |
Net investment income | | $ | 489,068 | | | $ | 717,120 | |
Net realized gains from investment transactions and foreign currency | | | 2,814,750 | | | | 6,596,169 | |
Net change in unrealized appreciation/depreciation on investments | | | 27,291,427 | | | | (4,828,920 | ) |
| | | | | | | | |
Change in net assets resulting from operations | | | 30,595,245 | | | | 2,484,369 | |
| | | | | | | | |
| | |
Distributions to Class A Shareholders: | | | | | | | | |
From net investment income | | | (11,983 | ) | | | (10,208 | ) |
| | |
Distributions to Class S Shareholders: | | | | | | | | |
From net investment income | | | (747,692 | ) | | | (587,562 | ) |
| | | | | | | | |
Change in net assets resulting from shareholder distributions | | | (759,675 | ) | | | (597,770 | ) |
| | | | | | | | |
| | |
Capital Transactions: | | | | | | | | |
Proceeds from shares issued | | | 3,864,407 | | | | 19,768,305 | |
Distributions reinvested | | | 730,943 | | | | 578,852 | |
Cost of shares redeemed | | | (13,853,134 | ) | | | (65,574,944 | ) |
| | | | | | | | |
Change in net assets resulting from capital transactions | | | (9,257,784 | ) | | | (45,227,787 | ) |
| | | | | | | | |
Net increase (decrease) in net assets | | | 20,577,786 | | | | (43,341,188 | ) |
| | |
Net Assets: | | | | | | | | |
Beginning of period | | | 110,455,949 | | | | 153,797,137 | |
| | | | | | | | |
End of period | | $ | 131,033,735 | | | $ | 110,455,949 | |
| | | | | | | | |
Undistributed net investment income | | $ | 408,825 | | | $ | 679,432 | |
| | | | | | | | |
| | |
Share Transactions: | | | | | | | | |
Issued | | | 225,615 | | | | 1,190,604 | |
Reinvested | | | 44,897 | | | | 34,292 | |
Redeemed | | | (841,996 | ) | | | (4,038,145 | ) |
| | | | | | | | |
Change in shares resulting from capital transactions | | | (571,484 | ) | | | (2,813,249 | ) |
| | | | | | | | |
See notes to financial statements.
42
Statements of Changes in Net Assets (cont.)
| | | | | | | | |
| | | RBC Mid Cap
Value Fund | |
| | | For the
Six Months Ended
March 31, 2012 | | | For the
Year Ended
September 30, 2011 | |
| | | (Unaudited) | | | | |
From Investment Activities: | | | | | | | | |
Operations: | | | | | | | | |
Net investment income | | $ | 10,805 | | | $ | 22,780 | |
Net realized gains from investment transactions | | | 16,824 | | | | 307,140 | |
Net change in unrealized appreciation/depreciation on investments | | | 570,998 | | | | (423,886 | ) |
| | | | | | | | |
Change in net assets resulting from operations | | | 598,627 | | | | (93,966 | ) |
| | | | | | | | |
| | |
Distributions to Class I Shareholders: | | | | | | | | |
From net investment income | | | (16,837 | ) | | | (76,421 | ) |
From net realized gains | | | (310,191 | ) | | | (83,847 | ) |
| | | | | | | | |
Change in net assets resulting from shareholder distributions | | | (327,028 | ) | | | (160,268 | ) |
| | | | | | | | |
| | |
Capital Transactions: | | | | | | | | |
Proceeds from shares issued | | | 75 | | | | — | |
Distributions reinvested | | | 327,014 | | | | 160,268 | |
Cost of shares redeemed | | | (66 | ) | | | — | |
| | | | | | | | |
Change in net assets resulting from capital transactions | | | 327,023 | | | | 160,268 | |
| | | | | | | | |
Net increase (decrease) in net assets | | | 598,622 | | | | (93,966 | ) |
| | | | | | | | |
| | |
Net Assets | | | | | | | | |
Beginning of period | | | 1,659,100 | | | | 1,753,066 | |
| | | | | | | | |
End of period | | $ | 2,257,722 | | | $ | 1,659,100 | |
| | | | | | | | |
Undistributed net investment income | | $ | 10,802 | | | $ | 16,834 | |
| | | | | | | | |
| | |
Share Transactions: | | | | | | | | |
Issued | | | 7 | | | | — | |
Reinvested | | | 35,238 | | | | 13,816 | |
Redeemed | | | (7 | ) | | | — | |
| | | | | | | | |
Change in shares resulting from capital transactions | | | 35,238 | | | | 13,816 | |
| | | | | | | | |
See notes to financial statements.
43
| | |
| RBC SMID Cap Growth Fund | | (Selected data for a share outstanding throughout the periods indicated) |
| | | | | | | | | | | | | | | | | | | | | | | | | | | | | | | | |
| | | | | | Investment Activities | | | Distributions | | | | |
| | | Net Asset Value,
Beginning
of Period | | | Net
Investment
Loss | | | Net Realized and
Unrealized Gains (Losses)
on Investments | | | Redemption
Fees | | | Total from
Investment
Activities | | | Net
Realized
Gains | | | Total
Distributions | | | Net Asset Value,
End of Period | |
Class A | | | | | | | | | | | | | | | | | | | | | | | | | | | | | | | | |
Six Months Ended March 31, 2012 (Unaudited) | | | $11.41 | | | | (0.05)(a) | | | | 3.11 | | | | (b) | | | | 3.06 | | | | — | | | | — | | | | $14.47 | |
Year Ended September 30, 2011 | | | 10.94 | | | | (0.10)(a) | | | | 0.57 | | | | (b) | | | | 0.47 | | | | — | | | | — | | | | 11.41 | |
Year Ended September 30, 2010 | | | 8.89 | | | | (0.08)(a) | | | | 2.13 | | | | (b) | | | | 2.05 | | | | — | | | | — | | | | 10.94 | |
Year Ended September 30, 2009 | | | 10.18 | | | | (0.04)(a) | | | | (1.17) | | | | (b) | | | | (1.21) | | | | (0.08) | | | | (0.08) | | | | 8.89 | |
Year Ended September 30, 2008 | | | 13.90 | | | | (0.09)(a) | | | | (2.52) | | | | (b) | | | | (2.61) | | | | (1.11) | | | | (1.11) | | | | 10.18 | |
Year Ended September 30, 2007 | | | 12.47 | | | | (0.10)(a) | | | | 1.88 | | | | (b) | | | | 1.78 | | | | (0.35) | | | | (0.35) | | | | 13.90 | |
Class I | | | | | | | | | | | | | | | | | | | | | | | | | | | | | | | | |
Six Months Ended March 31, 2012 (Unaudited) | | | $11.95 | | | | (0.04)(a) | | | | 3.27 | | | | (b) | | | | 3.23 | | | | — | | | | — | | | | $15.18 | |
Year Ended September 30, 2011 | | | 11.43 | | | | (0.07)(a) | | | | 0.59 | | | | (b) | | | | 0.52 | | | | — | | | | — | | | | 11.95 | |
Year Ended September 30, 2010 | | | 9.27 | | | | (0.06)(a) | | | | 2.22 | | | | (b) | | | | 2.16 | | | | — | | | | — | | | | 11.43 | |
Year Ended September 30, 2009 | | | 10.58 | | | | (0.02)(a) | | | | (1.21) | | | | (b) | | | | (1.23) | | | | (0.08) | | | | (0.08) | | | | 9.27 | |
Year Ended September 30, 2008 | | | 14.36 | | | | (0.06)(a) | | | | (2.61) | | | | (b) | | | | (2.67) | | | | (1.11) | | | | (1.11) | | | | 10.58 | |
Year Ended September 30, 2007 | | | 12.85 | | | | (0.07)(a) | | | | 1.93 | | | | (b) | | | | 1.86 | | | | (0.35) | | | | (0.35) | | | | 14.36 | |
Class C | | | | | | | | | | | | | | | | | | | | | | | | | | | | | | | | |
Six Months Ended March 31, 2012 (Unaudited) | | | $10.73 | | | | (0.10)(a) | | | | 2.94 | | | | (b) | | | | 2.84 | | | | — | | | | — | | | | $13.57 | |
Year Ended September 30, 2011 | | | 10.38 | | | | (0.18)(a) | | | | 0.53 | | | | (b) | | | | 0.35 | | | | — | | | | — | | | | 10.73 | |
Year Ended September 30, 2010 | | | 8.50 | | | | (0.14)(a) | | | | 2.02 | | | | (b) | | | | 1.88 | | | | — | | | | — | | | | 10.38 | |
Year Ended September 30, 2009 | | | 9.81 | | | | (0.09)(a) | | | | (1.14) | | | | (b) | | | | (1.23) | | | | (0.08) | | | | (0.08) | | | | 8.50 | |
Year Ended September 30, 2008 | | | 13.53 | | | | (0.18)(a) | | | | (2.43) | | | | (b) | | | | (2.61) | | | | (1.11) | | | | (1.11) | | | | 9.81 | |
Year Ended September 30, 2007 | | | 12.24 | | | | (0.19)(a) | | | | 1.83 | | | | (b) | | | | 1.64 | | | | (0.35) | | | | (0.35) | | | | 13.53 | |
Class S | | | | | | | | | | | | | | | | | | | | | | | | | | | | | | | | |
Six Months Ended March 31, 2012 (Unaudited) | | | $11.95 | | | | (0.04)(a) | | | | 3.27 | | | | (b) | | | | 3.23 | | | | — | | | | — | | | | $15.18 | |
Year Ended September 30, 2011 | | | 11.43 | | | | (0.07)(a) | | | | 0.59 | | | | (b) | | | | 0.52 | | | | — | | | | — | | | | 11.95 | |
Year Ended September 30, 2010 | | | 9.28 | | | | (0.06)(a) | | | | 2.21 | | | | (b) | | | | 2.15 | | | | — | | | | — | | | | 11.43 | |
Year Ended September 30, 2009 | | | 10.59 | | | | (0.02)(a) | | | | (1.21) | | | | (b) | | | | (1.23) | | | | (0.08) | | | | (0.08) | | | | 9.28 | |
Year Ended September 30, 2008 | | | 14.38 | | | | (0.06)(a) | | | | (2.62) | | | | (b) | | | | (2.68) | | | | (1.11) | | | | (1.11) | | | | 10.59 | |
Year Ended September 30, 2007 | | | 12.86 | | | | (0.07)(a) | | | | 1.94 | | | | (b) | | | | 1.87 | | | | (0.35) | | | | (0.35) | | | | 14.38 | |
| | | | |
(a) Per share net investment income (loss) has been calculated using the average daily shares method. | | | | (b) Less than $0.01 or $(0.01) per share. |
See notes to financial statements.
44
| | |
| RBC SMID Cap Growth Fund (cont.) | | (Selected data for a share outstanding throughout the periods indicated) |
| | | | | | | | | | | | | | | | | | | | | | | | |
| | | | | | Ratios/Supplemental Data | |
| | | Total
Return* | | | Net Assets,
End of Period (000’s) | | | Ratio of Net Expenses
to Average Net Assets | | | Ratio of Net Investment Loss to
Average Net Assets | | | Ratio of Expenses
to Average Net Assets** | | | Portfolio
Turnover Rate*** | |
Class A | | | | | | | | | | | | | | | | | | | | | | | | |
Six Months Ended March 31, 2012 (Unaudited) | | | 26.93%(a) | | | | $30,637 | | | | 1.35%(b) | | | | (0.81%)(b) | | | | 1.62%(b) | | | | 4% | |
Year Ended September 30, 2011 | | | 4.21% | | | | 23,593 | | | | 1.35% | | | | (0.75%) | | | | 1.61% | | | | 13% | |
Year Ended September 30, 2010 | | | 23.06% | | | | 21,940 | | | | 1.35% | | | | (0.81%) | | | | 1.79% | | | | 89% | |
Year Ended September 30, 2009 | | | (11.61%) | | | | 19,421 | | | | 1.35% | | | | (0.47%) | | | | 1.88% | | | | 62% | |
Year Ended September 30, 2008 | | | (20.14%) | | | | 25,483 | | | | 1.32% | | | | (0.74%) | | | | 1.68% | | | | 46% | |
Year Ended September 30, 2007 | | | 14.52% | | | | 33,887 | | | | 1.35% | | | | (0.78%) | | | | 1.72% | | | | 31% | |
Class I | | | | | | | | | | | | | | | | | | | | | | | | |
Six Months Ended March 31, 2012 (Unaudited) | | | 27.03%(a) | | | | $36,716 | | | | 1.10%(b) | | | | (0.56%)(b) | | | | 1.37%(b) | | | | 4% | |
Year Ended September 30, 2011 | | | 4.55% | | | | 33,835 | | | | 1.10% | | | | (0.49%) | | | | 1.35% | | | | 13% | |
Year Ended September 30, 2010 | | | 23.30% | | | | 41,121 | | | | 1.10% | | | | (0.57%) | | | | 1.54% | | | | 89% | |
Year Ended September 30, 2009 | | | (11.36%) | | | | 40,098 | | | | 1.10% | | | | (0.21%) | | | | 1.38% | | | | 62% | |
Year Ended September 30, 2008 | | | (19.95%) | | | | 60,998 | | | | 1.07% | | | | (0.48%) | | | | 1.19% | | | | 46% | |
Year Ended September 30, 2007 | | | 14.89% | | | | 75,721 | | | | 1.10% | | | | (0.53%) | | | | 1.21% | | | | 31% | |
Class C | | | | | | | | | | | | | | | | | | | | | | | | |
Six Months Ended March 31, 2012 (Unaudited) | | | 26.47%(a) | | | | $50 | | | | 2.10%(b) | | | | (1.57%)(b) | | | | 2.37%(b) | | | | 4% | |
Year Ended September 30, 2011 | | | 3.37% | | | | 40 | | | | 2.09% | | | | (1.49%) | | | | 2.36% | | | | 13% | |
Year Ended September 30, 2010 | | | 22.12% | | | | 67 | | | | 2.09% | | | | (1.57%) | | | | 2.53% | | | | 89% | |
Year Ended September 30, 2009 | | | (12.26%) | | | | 98 | | | | 2.10% | | | | (1.21%) | | | | 2.38% | | | | 62% | |
Year Ended September 30, 2008 | | | (20.72%) | | | | 129 | | | | 2.07% | | | | (1.52%) | | | | 2.16% | | | | 46% | |
Year Ended September 30, 2007 | | | 13.73% | | | | 1,265 | | | | 2.10% | | | | (1.52%) | | | | 2.23% | | | | 31% | |
Class S | | | | | | | | | | | | | | | | | | | | | | | | |
Six Months Ended March 31, 2012 (Unaudited) | | | 27.03%(a) | | | | $1,686 | | | | 1.10%(b) | | | | (0.56%)(b) | | | | 1.37%(b) | | | | 4% | |
Year Ended September 30, 2011 | | | 4.55% | | | | 1,227 | | | | 1.10% | | | | (0.52%) | | | | 1.35% | | | | 13% | |
Year Ended September 30, 2010 | | | 23.17% | | | | 1,822 | | | | 1.10% | | | | (0.56%) | | | | 1.54% | | | | 89% | |
Year Ended September 30, 2009 | | | (11.35%) | | | | 1,501 | | | | 1.10% | | | | (0.22%) | | | | 1.38% | | | | 62% | |
Year Ended September 30, 2008 | | | (19.94%) | | | | 1,495 | | | | 1.06% | | | | (0.49%) | | | | 1.18% | | | | 46% | |
Year Ended September 30, 2007 | | | 14.88% | | | | 1,878 | | | | 1.10% | | | | (0.53%) | | | | 1.21% | | | | 31% | |
| ** | During the period, certain fees were contractually or voluntarily reduced and/or reimbursed. If such contractual/voluntary fee reductions and reimbursements had not occurred, the ratio would have been as indicated. |
| *** | Portfolio turnover rate is calculated on the basis of the fund as a whole without distinguishing between the classes of shares issued. |
| | | | |
(a) Not Annualized. | | | | (b) Annualized. |
See notes to financial statements.
45
| | |
| RBC Enterprise Fund | | (Selected data for a share outstanding throughout the periods indicated) |
| | | | | | | | | | | | | | | | | | | | | | | | | | | | | | | | | | | | |
| | | | | | Investment Activities | | | Distributions | | | | |
| | | Net Asset Value,
Beginning of
Period | | | Net
Investment
Income/(Loss) | | | Net Realized and
Unrealized Gains (Losses)
on Investments | | | Redemption
Fees | | | Total from
Investment
Activities | | | Net
Investment
Income | | | Net
Realized
Gains | | | Total
Distributions | | | Net Asset Value,
End of Period | |
Class A | | | | | | | | | | | | | | | | | | | | | | | | | | | | | | | | | | | | |
Six Months Ended March 31, 2012 (Unaudited) | | | $14.27 | | | | (0.01)(a) | | | | 4.32 | | | | (b) | | | | 4.31 | | | | — | | | | — | | | | — | | | | $18.58 | |
Year Ended September 30, 2011 | | | 14.43 | | | | (0.07)(a) | | | | (0.09) | | | | (b) | | | | (0.16) | | | | — | | | | — | | | | — | | | | 14.27 | |
Year Ended September 30, 2010 | | | 13.37 | | | | (0.05)(a) | | | | 1.11 | | | | (b) | | | | 1.06 | | | | — | | | | — | | | | — | | | | 14.43 | |
Year Ended September 30, 2009 | | | 16.95 | | | | (0.02)(a) | | | | (1.98) | | | | (b) | | | | (2.00) | | | | — | | | | (1.58) | | | | (1.58) | | | | 13.37 | |
Year Ended September 30, 2008 | | | 25.86 | | | | (0.08)(a) | | | | (5.31) | | | | (b) | | | | (5.39) | | | | (0.02) | | | | (3.50) | | | | (3.52) | | | | 16.95 | |
Year Ended September 30, 2007 | | | 25.12 | | | | 0.03(a) | | | | 2.95 | | | | (b) | | | | 2.98 | | | | — | | | | (2.24) | | | | (2.24) | | | | 25.86 | |
Class I | | | | | | | | | | | | | | | | | | | | | | | | | | | | | | | | | | | | |
Six Months Ended March 31, 2012 (Unaudited) | | | $14.53 | | | | 0.06(a) | | | | 4.36 | | | | (b) | | | | 4.42 | | | | — | | | | — | | | | — | | | | $18.95 | |
Year Ended September 30, 2011 | | | 14.67 | | | | (0.04)(a) | | | | (0.10) | | | | (b) | | | | (0.14) | | | | — | | | | — | | | | — | | | | 14.53 | |
Year Ended September 30, 2010 | | | 13.57 | | | | (0.01)(a) | | | | 1.11 | | | | (b) | | | | 1.10 | | | | — | | | | — | | | | — | | | | 14.67 | |
Year Ended September 30, 2009 | | | 17.13 | | | | 0.01(a) | | | | (1.99) | | | | (b) | | | | (1.98) | | | | — | | | | (1.58) | | | | (1.58) | | | | 13.57 | |
Year Ended September 30, 2008 | | | 26.10 | | | | (0.04)(a) | | | | (5.34) | | | | (b) | | | | (5.38) | | | | (0.09) | | | | (3.50) | | | | (3.59) | | | | 17.13 | |
Year Ended September 30, 2007 | | | 25.31 | | | | 0.09(a) | | | | 2.96 | | | | (b) | | | | 3.05 | | | | (0.02) | | | | (2.24) | | | | (2.26) | | | | 26.10 | |
Class C | | | | | | | | | | | | | | | | | | | | | | | | | | | | | | | | | | | | |
Six Months Ended March 31, 2012 (Unaudited) | | | $13.28 | | | | (0.07)(a) | | | | 4.01 | | | | (b) | | | | 3.94 | | | | — | | | | — | | | | — | | | | $17.22 | |
Year Ended September 30, 2011 | | | 13.53 | | | | (0.19)(a) | | | | (0.06) | | | | (b) | | | | (0.25) | | | | — | | | | — | | | | — | | | | 13.28 | |
Year Ended September 30, 2010 | | | 12.64 | | | | (0.14)(a) | | | | 1.03 | | | | (b) | | | | 0.89 | | | | — | | | | — | | | | — | | | | 13.53 | |
Year Ended September 30, 2009 | | | 16.25 | | | | (0.10)(a) | | | | (1.93) | | | | (b) | | | | (2.03) | | | | — | | | | (1.58) | | | | (1.58) | | | | 12.64 | |
Year Ended September 30, 2008 | | | 25.09 | | | | (0.22)(a) | | | | (5.12) | | | | (b) | | | | (5.34) | | | | — | | | | (3.50) | | | | (3.50) | | | | 16.25 | |
Year Ended September 30, 2007 | | | 24.62 | | | | (0.16)(a) | | | | 2.87 | | | | (b) | | | | 2.71 | | | | — | | | | (2.24) | | | | (2.24) | | | | 25.09 | |
Class S | | | | | | | | | | | | | | | | | | | | | | | | | | | | | | | | | | | | |
Six Months Ended March 31, 2012 (Unaudited) | | | $14.53 | | | | 0.01(a) | | | | 4.41 | | | | (b) | | | | 4.42 | | | | — | | | | — | | | | — | | | | $18.95 | |
Year Ended September 30, 2011 | | | 14.66 | | | | (0.04)(a) | | | | (0.09) | | | | (b) | | | | (0.13) | | | | — | | | | — | | | | — | | | | 14.53 | |
Year Ended September 30, 2010 | | | 13.56 | | | | (0.01)(a) | | | | 1.11 | | | | (b) | | | | 1.10 | | | | — | | | | — | | | | — | | | | 14.66 | |
Year Ended September 30, 2009 | | | 17.12 | | | | 0.01(a) | | | | (1.99) | | | | (b) | | | | (1.98) | | | | — | | | | (1.58) | | | | (1.58) | | | | 13.56 | |
Year Ended September 30, 2008 | | | 26.09 | | | | (0.04)(a) | | | | (5.34) | | | | (b) | | | | (5.38) | | | | (0.09) | | | | (3.50) | | | | (3.59) | | | | 17.12 | |
Year Ended September 30, 2007 | | | 25.30 | | | | 0.09(a) | | | | 2.96 | | | | (b) | | | | 3.05 | | | | (0.02) | | | | (2.24) | | | | (2.26) | | | | 26.09 | |
| | | | |
(a) Per share net investment income (loss) has been calculated using the average daily shares method. | | | | (b) Less than $0.01 or $(0.01) per share. |
See notes to financial statements.
46
| | |
| RBC Enterprise Fund (cont.) | | (Selected data for a share outstanding throughout the periods indicated) |
| | | | | | | | | | | | | | | | | | | | | | | | |
| | | | | | Ratios/Supplemental Data | |
| | | Total
Return* | | | Net Assets,
End of Period (000’s) | | | Ratio of Net Expenses
to Average Net Assets | | | Ratio of Net Investment Income (Loss)
to Average Net Assets | | | Ratio of Expenses
to Average Net Assets** | | | Portfolio
Turnover Rate*** | |
Class A | | | | | | | | | | | | | | | | | | | | | | | | |
Six Months Ended March 31, 2012 (Unaudited) | | | 30.20%(a) | | | | $1,458 | | | | 1.33%(b) | | | | (0.10%)(b) | | | | 1.61%(b) | | | | 4% | |
Year Ended September 30, 2011 | | | (1.11%) | | | | 1,320 | | | | 1.33% | | | | (0.44%) | | | | 1.57% | | | | 27% | |
Year Ended September 30, 2010 | | | 7.93% | | | | 2,426 | | | | 1.33% | | | | (0.35%) | | | | 1.76% | | | | 22% | |
Year Ended September 30, 2009 | | | (8.83%) | | | | 3,320 | | | | 1.33% | | | | (0.15%) | | | | 2.01% | | | | 20% | |
Year Ended September 30, 2008 | | | (23.07%) | | | | 6,398 | | | | 1.33% | | | | (0.43%) | | | | 1.80% | | | | 23% | |
Year Ended September 30, 2007 | | | 12.40% | | | | 18,933 | | | | 1.33% | | | | 0.09% | | | | 1.80% | | | | 22% | |
Class I | | | | | | | | | | | | | | | | | | | | | | | | |
Six Months Ended March 31, 2012 (Unaudited) | | | 30.42%(a) | | | | $22 | | | | 0.98%(b) | | | | 0.68%(b) | | | | 1.26%(b) | | | | 4% | |
Year Ended September 30, 2011 | | | (0.96%) | | | | 3,378 | | | | 1.08% | | | | (0.25%) | | | | 1.29% | | | | 27% | |
Year Ended September 30, 2010 | | | 8.11% | | | | 25,999 | | | | 1.08% | | | | (0.10%) | | | | 1.51% | | | | 22% | |
Year Ended September 30, 2009 | | | (8.60%) | | | | 25,543 | | | | 1.08% | | | | 0.06% | | | | 1.50% | | | | 20% | |
Year Ended September 30, 2008 | | | (22.82%) | | | | 29,388 | | | | 1.08% | | | | (0.19%) | | | | 1.31% | | | | 23% | |
Year Ended September 30, 2007 | | | 12.62% | | | | 43,096 | | | | 1.08% | | | | 0.35% | | | | 1.30% | | | | 22% | |
Class C | | | | | | | | | | | | | | | | | | | | | | | | |
Six Months Ended March 31, 2012 (Unaudited) | | | 29.67%(a) | | | | $468 | | | | 2.08%(b) | | | | (0.84%)(b) | | | | 2.36%(b) | | | | 4% | |
Year Ended September 30, 2011 | | | (1.85%) | | | | 424 | | | | 2.08% | | | | (1.21%) | | | | 2.32% | | | | 27% | |
Year Ended September 30, 2010 | | | 7.04% | | | | 568 | | | | 2.08% | | | | (1.10%) | | | | 2.51% | | | | 22% | |
Year Ended September 30, 2009 | | | (9.47%) | | | | 778 | | | | 2.08% | | | | (0.92%) | | | | 2.50% | | | | 20% | |
Year Ended September 30, 2008 | | | (23.61%) | | | | 1,269 | | | | 2.08% | | | | (1.19%) | | | | 2.30% | | | | 23% | |
Year Ended September 30, 2007 | | | 11.50% | | | | 2,356 | | | | 2.08% | | | | (0.66%) | | | | 2.30% | | | | 22% | |
Class S | | | | | | | | | | | | | | | | | | | | | | | | |
Six Months Ended March 31, 2012 (Unaudited) | | | 30.42%(a) | | | | $106,691 | | | | 1.08%(b) | | | | 0.15%(b) | | | | 1.36%(b) | | | | 4% | |
Year Ended September 30, 2011 | | | (0.89%) | | | | 88,064 | | | | 1.08% | | | | (0.21%) | | | | 1.32% | | | | 27% | |
Year Ended September 30, 2010 | | | 8.11% | | | | 110,248 | | | | 1.08% | | | | (0.10%) | | | | 1.51% | | | | 22% | |
Year Ended September 30, 2009 | | | (8.60%) | | | | 117,009 | | | | 1.08% | | | | 0.08% | | | | 1.51% | | | | 20% | |
Year Ended September 30, 2008 | | | (22.83%) | | | | 160,478 | | | | 1.08% | | | | (0.19%) | | | | 1.31% | | | | 23% | |
Year Ended September 30, 2007 | | | 12.62% | | | | 281,867 | | | | 1.08% | | | | 0.33% | | | | 1.30% | | | | 22% | |
| ** | During the period, certain fees were contractually or voluntarily reduced and/or reimbursed. If such contractual/voluntary fee reductions and reimbursements had not occurred, the ratio would have been as indicated. |
| *** | Portfolio turnover rate is calculated on the basis of the fund as a whole without distinguishing between the classes of shares issued. |
| | | | |
(a) Not Annualized. | | | | (b) Annualized. |
See notes to financial statements.
47
| | |
| RBC Small Cap Core Fund | | (Selected data for a share outstanding throughout the periods indicated) |
| | | | | | | | | | | | | | | | | | | | | | | | | | | | | | | | | | | | |
| | | | | | Investment Activities | | | Distributions | | | | |
| | | Net Asset Value,
Beginning of
Period | | | Net
Investment
Income (Loss) | | | Net Realized and
Unrealized Gains (Losses)
on Investments | | | Redemption
Fees | | | Total from
Investment
Activities | | | Net
Investment
Income | | | Net
Realized
Gains | | | Total
Distributions | | | Net Asset Value,
End of Period | |
Class A | | | | | | | | | | | | | | | | | | | | | | | | | | | | | | | | | | | | |
Six Months Ended March 31, 2012 (Unaudited) | | | $20.02 | | | | (0.03)(a) | | | | 5.95 | | | | (b) | | | | 5.92 | | | | — | | | | (1.40) | | | | (1.40) | | | | $24.54 | |
Year Ended September 30, 2011 | | | 19.99 | | | | (0.09)(a) | | | | 0.12 | | | | (b) | | | | 0.03 | | | | — | | | | — | | | | — | | | | 20.02 | |
Year Ended September 30, 2010 | | | 17.04 | | | | (0.09)(a) | | | | 3.04 | | | | (b) | | | | 2.95 | | | | — | | | | — | | | | — | | | | 19.99 | |
Year Ended September 30, 2009 | | | 21.27 | | | | (0.03)(a) | | | | (2.17) | | | | (b) | | | | (2.20) | | | | — | | | | (2.03) | | | | (2.03) | | | | 17.04 | |
Year Ended September 30, 2008 | | | 31.72 | | | | (0.17)(a) | | | | (4.79) | | | | (b) | | | | (4.96) | | | | — | | | | (5.49) | | | | (5.49) | | | | 21.27 | |
Year Ended September 30, 2007 | | | 31.74 | | | | 0.16(a) | | | | 3.34 | | | | (b) | | | | 3.50 | | | | (0.11) | | | | (3.41) | | | | (3.52) | | | | 31.72 | |
Class C | | | | | | | | | | | | | | | | | | | | | | | | | | | | | | | | | | | | |
Six Months Ended March 31, 2012 (Unaudited) | | | $18.72 | | | | (0.10)(a) | | | | 5.54 | | | | (b) | | | | 5.44 | | | | — | | | | (1.40) | | | | (1.40) | | | | $22.76 | |
Year Ended September 30, 2011 | | | 18.83 | | | | (0.22)(a) | | | | 0.11 | | | | (b) | | | | (0.11) | | | | — | | | | — | | | | — | | | | 18.72 | |
Year Ended September 30, 2010 | | | 16.18 | | | | (0.22)(a) | | | | 2.87 | | | | (b) | | | | 2.65 | | | | — | | | | — | | | | — | | | | 18.83 | |
Year Ended September 30, 2009 | | | 20.47 | | | | (0.13)(a) | | | | (2.13) | | | | (b) | | | | (2.26) | | | | — | | | | (2.03) | | | | (2.03) | | | | 16.18 | |
Year Ended September 30, 2008 | | | 30.86 | | | | (0.34)(a) | | | | (4.56) | | | | (b) | | | | (4.90) | | | | — | | | | (5.49) | | | | (5.49) | | | | 20.47 | |
Year Ended September 30, 2007 | | | 31.08 | | | | (0.12)(a) | | | | 3.31 | | | | (b) | | | | 3.19 | | | | — | | | | (3.41) | | | | (3.41) | | | | 30.86 | |
Class S | | | | | | | | | | | | | | | | | | | | | | | | | | | | | | | | | | | | |
Six Months Ended March 31, 2012 (Unaudited) | | | $20.49 | | | | —(a)(b) | | | | 6.09 | | | | (b) | | | | 6.09 | | | | — | | | | (1.40) | | | | (1.40) | | | | $25.18 | |
Year Ended September 30, 2011 | | | 20.41 | | | | (0.02)(a) | | | | 0.10 | | | | (b) | | | | 0.08 | | | | — | | | | — | | | | — | | | | 20.49 | |
Year Ended September 30, 2010 | | | 17.35 | | | | (0.04)(a) | | | | 3.10 | | | | (b) | | | | 3.06 | | | | — | | | | — | | | | — | | | | 20.41 | |
Year Ended September 30, 2009 | | | 21.55 | | | | 0.01(a) | | | | (2.18) | | | | (b) | | | | (2.17) | | | | — | | | | (2.03) | | | | (2.03) | | | | 17.35 | |
Year Ended September 30, 2008 | | | 31.94 | | | | (0.11)(a) | | | | (4.75) | | | | (b) | | | | (4.86) | | | | (0.04) | | | | (5.49) | | | | (5.53) | | | | 21.55 | |
Year Ended September 30, 2007 | | | 31.95 | | | | 0.23(a) | | | | 3.36 | | | | (b) | | | | 3.59 | | | | (0.19) | | | | (3.41) | | | | (3.60) | | | | 31.94 | |
| | | | |
(a) Per share net investment income (loss) has been calculated using the average daily shares method. | | | | (b) Less than $0.01 or $(0.01) per share. |
See notes to financial statements.
48
| | |
| RBC Small Cap Core Fund (cont.) | | (Selected data for a share outstanding throughout the periods indicated) |
| | | | | | | | | | | | | | | | | | | | | | | | |
| | | | | | Ratios/Supplemental Data | |
| | | Total
Return* | | | Net Assets,
End of Period (000’s) | | | Ratio of Net Expenses
to Average Net Assets | | | Ratio of Net Investment Income (Loss)
to Average Net Assets | | | Ratio of Expenses
to Average Net Assets** | | | Portfolio
Turnover Rate*** | |
Class A | | | | | | | | | | | | | | | | | | | | | | | | |
Six Months Ended March 31, 2012 (Unaudited) | | | 30.24%(a) | | | | $2,745 | | | | 1.30%(b) | | | | (0.22%)(b) | | | | 1.77%(b) | | | | 19% | |
Year Ended September 30, 2011 | | | 0.20% | | | | 1,420 | | | | 1.30% | | | | (0.37%) | | | | 1.80% | | | | 40% | |
Year Ended September 30, 2010 | | | 17.31% | | | | 519 | | | | 1.47%† | | | | (0.48%) | | | | 2.28% | | | | 31% | |
Year Ended September 30, 2009 | | | (7.07%) | | | | 656 | | | | 1.55% | | | | (0.20%) | | | | 2.65% | | | | 47% | |
Year Ended September 30, 2008 | | | (17.15%) | | �� | | 1,046 | | | | 1.54% | | | | (0.71%) | | | | 2.27% | | | | 47% | |
Year Ended September 30, 2007 | | | 11.86% | | | | 1,401 | | | | 1.55% | | | | 0.49% | | | | 2.13% | | | | 44% | |
Class C | | | | | | | | | | | | | | | | | | | | | | | | |
Six Months Ended March 31, 2012 (Unaudited) | | | 29.83%(a) | | | | $117 | | | | 2.06%(b) | | | | (0.95%)(b) | | | | 2.52%(b) | | | | 19% | |
Year Ended September 30, 2011 | | | (0.58%) | | | | 32 | | | | 2.05% | | | | (1.02%) | | | | 2.56% | | | | 40% | |
Year Ended September 30, 2010 | | | 16.38% | | | | 86 | | | | 2.23%† | | | | (1.26%) | | | | 2.99% | | | | 31% | |
Year Ended September 30, 2009 | | | (7.70%) | | | | 297 | | | | 2.30% | | | | (0.96%) | | | | 3.16% | | | | 47% | |
Year Ended September 30, 2008 | | | (17.52%) | | | | 384 | | | | 2.29% | | | | (1.47%) | | | | 2.76% | | | | 47% | |
Year Ended September 30, 2007 | | | 11.01% | | | | 570 | | | | 2.30% | | | | (0.41%) | | | | 2.62% | | | | 44% | |
Class S | | | | | | | | | | | | | | | | | | | | | | | | |
Six Months Ended March 31, 2012 (Unaudited) | | | 30.44%(a) | | | | $53,649 | | | | 1.05%(b) | | | | 0.02%(b) | | | | 1.51%(b) | | | | 19% | |
Year Ended September 30, 2011 | | | 0.39% | | | | 42,647 | | | | 1.05% | | | | (0.09%) | | | | 1.54% | | | | 40% | |
Year Ended September 30, 2010 | | | 17.64% | | | | 43,441 | | | | 1.22%† | | | | (0.21%) | | | | 2.04% | | | | 31% | |
Year Ended September 30, 2009 | | | (6.81%) | | | | 40,205 | | | | 1.30% | | | | 0.04% | | | | 2.16% | | | | 47% | |
Year Ended September 30, 2008 | | | (16.68%) | | | | 45,905 | | | | 1.29% | | | | (0.46%) | | | | 1.76% | | | | 47% | |
Year Ended September 30, 2007 | | | 12.10% | | | | 65,771 | | | | 1.30% | | | | 0.70% | | | | 1.62% | | | | 44% | |
| ** | During the period, certain fees were contractually or voluntarily reduced and/or reimbursed. If such contractual/voluntary fee reductions and reimbursements had not occurred, the ratio would have been as indicated. |
| *** | Portfolio turnover rate is calculated on the basis of the fund as a whole without distinguishing between the classes of shares issued. |
| † | Beginning May 26, 2010, the net operating expenses were contractually limited to 1.30%, 2.05% and 1.05% of average daily net assets for Class A, Class C, and Class S respectively. The ratio of net expenses to average net assets represents a blended percentage for the year ended September 30, 2010. |
| | | | |
(a) Not Annualized. | | | | (b) Annualized. |
See notes to financial statements.
49
| | |
| RBC Microcap Value Fund | | (Selected data for a share outstanding throughout the periods indicated) |
| | | | | | | | | | | | | | | | | | | | | | | | | | | | | | | | | | | | |
| | | | | | Investment Activities | | | Distributions | | | | |
| | | Net Asset Value,
Beginning
of Period | | | Net
Investment
Income (Loss) | | | Net Realized and
Unrealized Gains (Losses)
on Investments | | | Redemption
Fees | | | Total from
Investment
Activities | | | Net
Investment
Income | | | Net
Realized
Gains | | | Total
Distributions | | | Net Asset Value,
End of Period | |
Class A | | | | | | | | | | | | | | | | | | | | | | | | | | | | | | | | | | | | |
Six Months Ended March 31, 2012 (Unaudited) | | | $14.30 | | | | 0.05(a) | | | | 4.06 | | | | (b) | | | | 4.11 | | | | (0.05) | | | | — | | | | (0.05) | | | | $18.36 | |
Year Ended September 30, 2011 | | | 14.59 | | | | 0.05(a) | | | | (0.32) | | | | (b) | | | | (0.27) | | | | (0.02) | | | | — | | | | (0.02) | | | | 14.30 | |
Year Ended September 30, 2010 | | | 13.15 | | | | 0.02(a) | | | | 1.44 | | | | (b) | | | | 1.46 | | | | (0.02) | | | | — | | | | (0.02) | | | | 14.59 | |
Year Ended September 30, 2009 | | | 16.38 | | | | 0.05(a) | | | | (2.30) | | | | (b) | | | | (2.25) | | | | (0.03) | | | | (0.95) | | | | (0.98) | | | | 13.15 | |
Year Ended September 30, 2008 | | | 22.34 | | | | 0.05(a) | | | | (4.49) | | | | (b) | | | | (4.44) | | | | (0.02) | | | | (1.50) | | | | (1.52) | | | | 16.38 | |
Year Ended September 30, 2007 | | | 22.17 | | | | 0.03(a) | | | | 1.68 | | | | (b) | | | | 1.71 | | | | — | | | | (1.54) | | | | (1.54) | | | | 22.34 | |
Class C | | | | | | | | | | | | | | | | | | | | | | | | | | | | | | | | | | | | |
Six Months Ended March 31, 2012 (Unaudited) | | | $13.57 | | | | (0.01)(a) | | | | 3.85 | | | | (b) | | | | 3.84 | | | | — | | | | — | | | | — | | | | $17.41 | |
Year Ended September 30, 2011 | | | 13.93 | | | | (0.08)(a) | | | | (0.28) | | | | (b) | | | | (0.36) | | | | — | | | | — | | | | — | | | | 13.57 | |
Year Ended September 30, 2010 | | | 12.64 | | | | (0.08)(a) | | | | 1.37 | | | | (b) | | | | 1.29 | | | | — | | | | — | | | | — | | | | 13.93 | |
Year Ended September 30, 2009 | | | 15.86 | | | | (0.03)(a) | | | | (2.24) | | | | (b) | | | | (2.27) | | | | — | | | | (0.95) | | | | (0.95) | | | | 12.64 | |
Year Ended September 30, 2008 | | | 21.82 | | | | (0.08)(a) | | | | (4.38) | | | | (b) | | | | (4.46) | | | | — | | | | (1.50) | | | | (1.50) | | | | 15.86 | |
Year Ended September 30, 2007 | | | 21.84 | | | | (0.13)(a) | | | | 1.65 | | | | (b) | | | | 1.52 | | | | — | | | | (1.54) | | | | (1.54) | | | | 21.82 | |
Class S | | | | | | | | | | | | | | | | | | | | | | | | | | | | | | | | | | | | |
Six Months Ended March 31, 2012 (Unaudited) | | | $14.33 | | | | 0.07(a) | | | | 4.06 | | | | (b) | | | | 4.13 | | | | (0.11) | | | | — | | | | (0.11) | | | | $18.35 | |
Year Ended September 30, 2011 | | | 14.62 | | | | 0.08(a) | | | | (0.30) | | | | (b) | | | | (0.22) | | | | (0.07) | | | | — | | | | (0.07) | | | | 14.33 | |
Year Ended September 30, 2010 | | | 13.19 | | | | 0.05(a) | | | | 1.44 | | | | (b) | | | | 1.49 | | | | (0.06) | | | | — | | | | (0.06) | | | | 14.62 | |
Year Ended September 30, 2009 | | | 16.47 | | | | 0.08(a) | | | | (2.32) | | | | (b) | | | | (2.24) | | | | (0.09) | | | | (0.95) | | | | (1.04) | | | | 13.19 | |
Year Ended September 30, 2008 | | | 22.47 | | | | 0.10(a) | | | | (4.52) | | | | (b) | | | | (4.42) | | | | (0.08) | | | | (1.50) | | | | (1.58) | | | | 16.47 | |
Year Ended September 30, 2007 | | | 22.27 | | | | 0.09(a) | | | | 1.68 | | | | (b) | | | | 1.77 | | | | (0.03) | | | | (1.54) | | | | (1.57) | | | | 22.47 | |
| | | | |
(a) Per share net investment income (loss) has been calculated using the average daily shares method. | | | | (b) Less than $0.01 or $(0.01) per share. |
See notes to financial statements.
50
| | |
| RBC Microcap Value Fund (cont.) | | (Selected data for a share outstanding throughout the periods indicated) |
| | | | | | | | | | | | | | | | | | | | | | | | |
| | | | | | Ratios/Supplemental Data | |
| | | Total
Return* | | | Net Assets,
End of Period (000’s) | | | Ratio of Net Expenses
to Average Net Assets | | | Ratio of Net Investment Income (Loss)
to Average Net Assets | | | Ratio of Expenses
to Average Net Assets** | | | Portfolio
Turnover Rate*** | |
Class A | | | | | | | | | | | | | | | | | | | | | | | | |
Six Months Ended March 31, 2012 (Unaudited) | | | 28.77%(a) | | | | $4,421 | | | | 1.32%(b) | | | | 0.57%(b) | | | | 1.64%(b) | | | | 4% | |
Year Ended September 30, 2011 | | | (1.85%) | | | | 3,852 | | | | 1.32% | | | | 0.28% | | | | 1.60% | | | | 2% | |
Year Ended September 30, 2010 | | | 11.12% | | | | 6,968 | | | | 1.32% | | | | 0.12% | | | | 1.64% | | | | 9% | |
Year Ended September 30, 2009 | | | (11.74%) | | | | 8,358 | | | | 1.32% | | | | 0.50% | | | | 1.87% | | | | 17% | |
Year Ended September 30, 2008 | | | (20.74%) | | | | 19,641 | | | | 1.31% | | | | 0.29% | | | | 1.74% | | | | 18% | |
Year Ended September 30, 2007 | | | 7.68% | | | | 43,004 | | | | 1.32% | | | | 0.14% | | | | 1.78% | | | | 17% | |
Class C | | | | | | | | | | | | | | | | | | | | | | | | |
Six Months Ended March 31, 2012 (Unaudited) | | | 28.30%(a) | | | | $697 | | | | 2.07%(b) | | | | (0.18%)(b) | | | | 2.39%(b) | | | | 4% | |
Year Ended September 30, 2011 | | | (2.58%) | | | | 613 | | | | 2.07% | | | | (0.51%) | | | | 2.35% | | | | 2% | |
Year Ended September 30, 2010 | | | 10.21% | | | | 850 | | | | 2.07% | | | | (0.63%) | | | | 2.39% | | | | 9% | |
Year Ended September 30, 2009 | | | (12.36%) | | | | 1,124 | | | | 2.07% | | | | (0.25%) | | | | 2.37% | | | | 17% | |
Year Ended September 30, 2008 | | | (21.34%) | | | | 1,723 | | | | 2.06% | | | | (0.45%) | | | | 2.23% | | | | 18% | |
Year Ended September 30, 2007 | | | 6.89% | | | | 3,981 | | | | 2.07% | | | | (0.60%) | | | | 2.28% | | | | 17% | |
Class S | | | | | | | | | | | | | | | | | | | | | | | | |
Six Months Ended March 31, 2012 (Unaudited) | | | 28.89%(a) | | | | $125,916 | | | | 1.07%(b) | | | | 0.82%(b) | | | | 1.39%(b) | | | | 4% | |
Year Ended September 30, 2011 | | | (1.59%) | | | | 105,991 | | | | 1.07% | | | | 0.51% | | | | 1.35% | | | | 2% | |
Year Ended September 30, 2010 | | | 11.33% | | | | 145,979 | | | | 1.07% | | | | 0.37% | | | | 1.39% | | | | 9% | |
Year Ended September 30, 2009 | | | (11.47%) | | | | 162,465 | | | | 1.07% | | | | 0.76% | | | | 1.37% | | | | 17% | |
Year Ended September 30, 2008 | | | (20.53%) | | | | 261,041 | | | | 1.07% | | | | 0.56% | | | | 1.26% | | | | 18% | |
Year Ended September 30, 2007 | | | 7.95% | | | | 318,947 | | | | 1.07% | | | | 0.39% | | | | 1.27% | | | | 17% | |
| ** | During the period, certain fees were contractually or voluntarily reduced and/or reimbursed. If such contractual/voluntary fee reductions and reimbursements had not occurred, the ratio would have been as indicated. |
| *** | Portfolio turnover rate is calculated on the basis of the fund as a whole without distinguishing between the classes of shares issued. |
See notes to financial statements.
51
| | |
| RBC Mid Cap Value Fund | | (Selected data for a share outstanding throughout the periods indicated) |
| | | | | | | | | | | | | | | | | | | | | | | | | | | | | | | | | | | | |
| | | | | | Investment Activities | | | Distributions | | | | |
| | | Net Asset Value,
Beginning
of Period | | | Net
Investment
Income/(Loss) | | | Net Realized and
Unrealized Gains (Losses)
on Investments | | | Redemption
Fees | | | Total from
Investment
Activities | | | Net
Investment
Income | | | Net
Realized
Gains | | | Total
Distributions | | | Net Asset Value,
End of Period | |
Class I | | | | | | | | | | | | | | | | | | | | | | | | | | | | | | | | | | | | |
Six Months Ended March 31, 2012 (Unaudited) | | | $9.42 | | | | 0.06(a) | | | | 3.06 | | | | — | | | | 3.12 | | | | (0.10 | ) | | | (1.76 | ) | | | (1.86 | ) | | | $10.68 | |
Year Ended September 30, 2011 | | | 10.80 | | | | 0.13(a) | | | | (0.52 | ) | | | — | | | | (0.39 | ) | | | (0.47 | ) | | | (0.52 | ) | | | (0.99 | ) | | | 9.42 | |
Period Ended September 30, 2010(b) | | | 10.00 | | | | 0.02(a) | | | | 0.78 | | | | — | | | | 0.80 | | | | — | | | | — | | | | — | | | | 10.80 | |
| (a) | Per share net investment income (loss) has been calculated using the average daily shares method. |
| (b) | For the period from December 31, 2009 (commencement of operations) to September 30, 2010. |
See notes to financial statements.
52
| | |
| RBC Mid Cap Value Fund (cont.) | | (Selected data for a share outstanding throughout the periods indicated) |
| | | | | | | | | | | | | | | | | | | | | | | | |
| | | | | | Ratios/Supplemental Data | |
| | | Total
Return* | | | Net Assets,
End of Period (000’s) | | | Ratio of Net Expenses
to Average Net Assets | | | Ratio of Net Investment Income (Loss)
to Average Net Assets | | | Ratio of Expenses
to Average Net Assets** | | | Portfolio
Turnover Rate | |
Class I | | | | | | | | | | | | | | | | | | | | | | | | |
Six Months Ended March 31, 2012 (Unaudited) | | | 36.06%(a) | | | | $2,258 | | | | 0.90%(b) | | | | 1.07%(b) | | | | 5.66%(b) | | | | 86% | |
Year Ended September 30, 2011 | | | (5.35%) | | | | 1,659 | | | | 0.90% | | | | 1.12% | | | | 5.59% | | | | 174% | |
Period Ended September 30, 2010(c) | | | 8.00%(a) | | | | 1,753 | | | | 0.90%(b) | | | | 0.26%(b) | | | | 12.64%(b) | | | | 161% | |
| ** | During the period, certain fees were contractually or voluntarily reduced and/or reimbursed. If such contractual/voluntary fee reductions and reimbursements had not occurred, the ratio would have been as indicated. |
| | | | |
(a) Not Annualized | | | | (c) For the period from December 31, 2009 (commencement of operations) to September 30, 2010. |
See notes to financial statements.
53
|
NOTES TO FINANCIAL STATEMENTS |
March 31, 2012 (Unaudited)
1.Organization
RBC Funds Trust (“the Trust”) is registered under the Investment Company Act of 1940 (as amended) as an open-end management investment company. The Trust was organized as a Delaware statutory trust on December 16, 2003. Predecessor funds to the Trust were reorganized as portfolios of the Trust effective April 16, 2004. This annual report includes the following five investment portfolios (“Funds”):
- RBC SMID Cap Growth Fund (“SMID Cap Growth Fund”)
- RBC Enterprise Fund (“Enterprise Fund”)
- RBC Small Cap Core Fund (“Small Cap Core Fund”)
- RBC Microcap Value Fund (“Microcap Value Fund”)
- RBC Mid Cap Value Fund (“Mid Cap Value Fund”)
The SMID Cap Growth and Enterprise Funds offer four share classes: Class A, Class C, Class I and Class S shares. The Small Cap Core and Microcap Value Funds offer three share classes: Class A, Class C, and Class S shares. The Mid Cap Value Fund offers Class I shares. Class A shares are offered with a 5.75% maximum front-end sales charge and a 1.00% contingent deferred sales charge (“CDSC”) for redemption within 12 months of a $1 million or greater purchase on which no front-end sales charge was paid. Class C shares are offered at net asset value (i.e. no front-end sales charge), but are subject to a CDSC of 1.00% for redemptions within 12 months of purchase. Class I shares (intended for investors meeting certain investment minimum thresholds) and Class S shares (available to investors purchasing shares directly from the Funds’ transfer agent) are not subject to either a front-end sales charge or a CDSC.
RBC Global Asset Management (U.S.) Inc. (“RBC GAM (US)”) acts as the investment advisor for the Funds. The officers of the Trust (“Fund Management”) are also employees of RBC GAM (US) or its affiliates or of BNY Mellon Investment Servicing (US) Inc. (“BNY Mellon”), the co-administrator.
2. Significant Accounting Policies
Summarized below are the significant accounting policies of the Funds. These policies conform to accounting principles generally accepted in the United States of America (“U.S. GAAP”). Fund Management follows these policies when preparing financial statements. Management may also be required to make estimates and assumptions that affect the reported amounts of assets and liabilities at the date of the financial statements and the reported amounts of income and expenses for the period. Actual results could differ from those estimates. The financial statements are as of the close of regular trading on the New York Stock Exchange.
Security Valuation:
Equity securities are generally valued on the basis of prices furnished by pricing services approved by the Trust’s Board of Trustees (the “Board”). Equity securities traded on one or more U.S. exchanges shall be valued at the last available quoted sale price on the primary trading exchange as of the valuation time. Valuation time is as of the close of regular trading on the New York Stock Exchange (usually 4:00 p.m. Eastern Standard Time). If there was no sale on the primary exchange on the day the net asset value is calculated, the most recent bid quotation generally will be used. In cases where neither closing prices nor bid prices are available, or where those prices do not accurately reflect the value of the security, a security will be valued in accordance with the Funds’ approved pricing and valuation procedures to determine a security’s fair value. These procedures are also used to determine the fair value of a security if a significant event occurs that materially affects the value of the security. Bonds and other fixed income securities, including TBA commitments, are generally valued on the basis of prices furnished by pricing services approved by the Trust’s Board. The pricing services utilize both dealer-supplied valuations and electronic data processing techniques that take into account appropriate
54
|
NOTES TO FINANCIAL STATEMENTS |
March 31, 2012 (Unaudited)
factors such as institutional-size trading in similar groups of securities yield, quality, coupon rate, maturity and type of issue. Investments in open-end investment companies are valued at net asset value. Short-term securities with less than 60 days to maturity at time of purchase are valued at amortized cost.
Fair Value Measurements:
Various input levels are used in determining the fair value of investments which are as follows:
• Level 1 - Inputs that reflect unadjusted quoted prices in active markets for identical assets or liabilities that the Funds have the ability to access at the measurement date.
• Level 2 - Inputs other than quoted prices that are observable for the asset or liability either directly or indirectly, including inputs in markets that are not considered to be active.
• Level 3 - Unobservable inputs based on the best information available in the circumstances, to the extent observable inputs are not available (including the Fund’s own assumptions in determining the fair value of investments).
The inputs or methodology used for valuing investments are not necessarily an indication of the risk associated with investing in those securities.
The summary of inputs used to determine the fair value of the Fund’s investments as of March 31, 2012 is as follows:
| | | | | | | | | | | | | | | | |
Funds | | Level 1
Quoted Prices | | | Level 2
Significant
Observable
Inputs | | | Level 3
Significant
Unobservable
Inputs | | | Total | |
Investments in Securities | | | | | | | | | | | | |
SMID Cap Growth Fund | | $ | 68,411,358 | (a) | | | $— | | | | $888,250 | | | $ | 69,299,608 | |
Enterprise Fund | | | 108,601,832 | (a) | | | — | | | | 601,862 | | | | 109,203,694 | |
Small Cap Core Fund | | | 56,388,178 | (a) | | | — | | | | — | | | | 56,388,178 | |
Microcap Value Fund | | | 130,993,266 | (a) | | | — | | | | — | | | | 130,993,266 | |
Mid Cap Value Fund | | | 2,299,240 | (a) | | | — | | | | — | | | | 2,299,240 | |
(a) The breakdown of the Funds’ investments into major categories is disclosed in the Schedules of Portfolio Investments.
The Funds did not have any liabilities that were measured at fair value on a recurring basis at March 31, 2012.
Following is a reconciliation of Level 3 investments for which significant unobservable inputs were used to determine fair value:
| | | | | | | | | | | | |
| | | SMID Cap
Growth Fund | | Enterprise Fund | | Microcap Value Fund |
| | | (Common Stocks
Information Technology) | | (Common Stocks
Industrials) | | (Common Stocks
Energy) |
Balance as of 09/30/11 (value) | | | | $ — | | | | $601,862 | | | | $ — |
Transfers in | | | | 840,112 | | | | — | | | | 6,287 |
Net sales | | | | (102,542) | | | | — | | | | — |
Realized gain (loss) | | | | (89) | | | | — | | | | — |
Change in unrealized appreciation (depreciation) * | | | | 150,769 | | | | — | | | | (6,287) |
| | | | | | | | | | | | |
Balance as of 03/31/12 (value) | | | | $ 888,250 | | | | $601,862 | | | | $ — |
| | | | | | | | | | | | |
55
|
NOTES TO FINANCIAL STATEMENTS |
* Net change in unrealized appreciation/(depreciation) in level 3 securities still held at March 31, 2012.
During the six months ended March 31, 2012, the Funds recognized no transfers to/from level 1 or 2. The Fund’s policy is to recognize transfers between level 1, level 2 and level 3 at the end of the year utilizing fair value at the beginning of the year.
In May 2011, the Financial Accounting Standards Board (“FASB”) issued Accounting Standards Update (“ASU”) No. 2011-04 “Amendments to Achieve Common Fair Value Measurement and Disclosure Requirements” in U.S. GAAP and International Financial Reporting Standards (“IFRSs”). ASU 2011-04 includes common requirements for measurement of and disclosure about fair value between U.S. GAAP and IFRS. ASU 2011-04 will require reporting entities to disclose the following information for fair value measurements categorized within Level 3 of the fair value hierarchy: quantitative information about the unobservable inputs used in the fair value measurement, the valuation processes used by the reporting entity and a narrative description of the sensitivity of the fair value measurement to changes in unobservable inputs and the interrelationships between those unobservable inputs. In addition, ASU 2011-04 will require reporting entities to make disclosures about amounts and reasons for all transfers in and out of Level 1 and Level 2 fair value measurements. The new and revised disclosures are effective for interim and annual reporting periods beginning after December 15, 2011. Management is currently evaluating the implications of ASU No. 2011-04 and its impact on the financial statements.
Repurchase Agreements:
The Funds may enter into repurchase agreements with counterparties whom the Adviser has deemed creditworthy, including primary dealers that report to the Federal Reserve Bank of New York or other large U.S. commercial banks or broker-dealers. These repurchase agreements are subject to the seller’s agreement to repurchase such securities at a mutually agreed upon date and price. The repurchase price generally equals the price paid by the Funds plus interest negotiated on the basis of current short-term rates.
Securities pledged as collateral for repurchase agreements are held by a custodian bank until maturity of the repurchase agreement. The Funds have procedures to secure additional collateral, if needed, to ensure that the daily market value of the collateral remains in excess of the repurchase agreement in the event of a default. There were no Repurchase Agreements held at March 31, 2012.
Investment Transactions and Income:
Investment transactions are recorded on one business day after trade date, except on the last day of each fiscal quarter end, when they are recorded on trade date. Dividend income is recorded on the ex-dividend date. Realized gains and losses from investment transactions are calculated based on the cost of the specific security (also known as identified cost basis). Interest income is recognized on the accrual basis and includes, where applicable, the amortization or accretion of premium or discount using the effective yield method.
Expense, Investment Income and Gain/Loss Allocation:
Each Fund pays the expenses that are directly related to its operations, such as custodian fees or adviser fees. Expenses incurred by the Trust, such as trustee or legal fees, are allocated among each of the Funds either proportionately based upon each Fund’s relative net assets or using another reasonable basis such as equally across all Funds, depending on the nature of the expense. Individual share classes within a Fund are charged expenses specific to that class, such as distribution fees. Within a Fund, expenses other than class specific expenses are allocated daily to each class based upon the proportion of relative net assets. Investment income and realized and unrealized gains or losses are allocated to each class of shares based on relative net assets.
Real Estate Investment Trusts:
The Funds may own shares of real estate investment trusts (“REITs”) which report information on the source of their distributions annually. Dividends paid by a REIT, other than capital gain distributions, will be taxable as ordinary income up to the amount of the REIT’s current and accumulated earnings and profits. Capital gain dividends paid by a REIT to a fund will be treated as long term capital gains by the fund and, in turn, may be distributed by the fund to its shareholders as a capital gain distribution.
56
|
NOTES TO FINANCIAL STATEMENTS |
Distributions received from a REIT in excess of its income are recorded as a return of capital and a reduction to the cost basis of the REIT.
Distributions to Shareholders:
Each Fund pays out any income that it receives, less expenses, in the form of dividends and capital gain distributions to its shareholders. Income dividends and capital gain distributions for each Fund are declared and paid at least annually. Distributions to shareholders are recorded on the ex-dividend date. The amount of dividends and distributions are calculated based on federal income tax regulations, which may differ from GAAP. These “book/tax” differences may be either temporary or permanent in nature. To the extent these differences are determined, as of the end of the tax year, to be permanent (e.g., net operating loss, foreign currency transactions, distribution redesignations and prior year spillbacks ), they are reclassified within a Fund’s capital accounts based on their federal tax basis treatment.
3. Agreements and Other Transactions with Affiliates
The Trust has entered into investment advisory agreements with RBC GAM (US) under which RBC GAM (US) manages each Fund’s assets and furnishes related office facilities, equipment, research and personnel. The agreements require each Fund to pay RBC GAM (US) a monthly fee based upon average daily net assets. Under the terms of the advisory contracts, RBC GAM (US) is entitled to receive fees based on a percentage of the average daily net assets of each of the Funds as follows:
| | | | | | |
| | | Average Daily Net Assets of Fund | | Annual Rate | |
SMID Cap Growth Fund | | All Net Assets | | | 0.70% | |
Enterprise Fund | | Up to $30 million | | | 1.00% | |
| | Over $30 million | | | 0.90% | |
Small Cap Core Fund | | Up to $30 million | | | 1.00% | |
| | Over $30 million | | | 0.90% | |
Microcap Value Fund | | All Net Assets | | | 0.90% | |
Mid Cap Value Fund | | All Net Assets | | | 0.70% | |
RBC GAM (US) has contractually agreed to waive fees and/or make payments in order to keep total operating expenses of the Class S shares of each Fund and Class I shares of each Fund (except Small Cap Core Fund and Microcap Value Fund, which do not offer Class I shares) to the following levels. This expense limitation agreement is in place until January 31, 2013.
| | | | |
| | | Annual Rate | |
SMID Cap Growth Fund | | | 1.10% | |
Enterprise Fund | | | 1.08% | |
Small Cap Core Fund | | | 1.05% | |
Microcap Value Fund | | | 1.07% | |
Mid Cap Value Fund | | | 0.90% | |
Classes A and C vary from these limits only by the addition of class-specific 12b-1 fees. Each Fund will carry forward, for a period not to exceed 12 months from the date on which a waiver or reimbursement is made by RBC GAM (US), any expenses in excess of the expense limitation and repay RBC GAM (US) such amounts, provided the Fund is able to effect such repayment and remain in compliance with the expense limitation stated above. At March 31, 2012, the amounts subject to possible recoupment under the expense limitation agreement are $193,109, $293,013, $245,994, $369,225 and $103,009 for SMID Cap Growth Fund, Enterprise Fund, Small Cap Core Fund, Microcap Value Fund and Mid Cap Value Fund, respectively.
RBC GAM (US) may also voluntarily waive and/or reimburse operating expenses of any Fund from time to time. Any such voluntary program may be changed or eliminated at any time without notice.
57
|
NOTES TO FINANCIAL STATEMENTS |
RBC GAM (US) serves as co-administrator to the Funds. BNY Mellon serves as co-administrator and fund accounting agent. Services provided under the administrative services contract include providing day-to-day administration of matters related to the Funds, maintenance of their records and the preparation of reports. Under the terms of the administrative services contract, RBC GAM (US) receives from each Fund a fee, payable monthly, at the annual rate of 0.075% of each Fund’s average daily net assets. BNY Mellon receives a fee for its services payable by the Funds based on the Funds’ average net assets. RBC GAM (US)’s fee is listed as “Administration fees” in the Statements of Operations. BNY Mellon’s fee is included with “Accounting fees” in the Statements of Operations.
Certain Officers and Trustees of the Trust are affiliated with the adviser or the co-administrator. Such Officers and Trustees receive no compensation from the Funds for serving in their respective roles.
The RBC Funds currently pay the independent Trustees (Trustees of the Trust who are not directors, officers or employees of the adviser, administrator or distributor) an annual retainer of $32,500. The Board Chairperson and Audit Committee Chairperson each receive an additional retainer of $2,500 annually, and all other trustees serving as Chair of a Board committee each receive an additional retainer of $1,000 annually. In addition, Independent Trustees receive a quarterly meeting fee of $5,000 for each in-person Board meeting attended, a meeting fee of $1,000 for each telephonic or Special Board meeting attended, and a $1,500 fee for each Board committee meeting attended and are reimbursed for all out-of-pocket expenses relating to attendance at such meetings.
4. Fund Distribution
Each of the Funds has adopted a Master Distribution 12b-1 Plan (the “Plan”) in which Quasar Distributors LLC (the “Distributor”) acts as the Funds’ distributor. The Plan permits each Fund to make payments for or to reimburse the Distributor monthly for distribution-related costs and expenses of marketing shares of each share class covered under the Plan; and/or for providing shareholder services. The following chart shows the current Plan fee rate for each class.
| | | | |
| | | Class A | | Class C |
12b-1 Plan Fee | | 0.25%* | | 1.00% |
* Under the 12b-1 plan, the maximum fee rate for Class A shares is 0.50%. Currently the Board of Trustees has approved an annual limit of 0.25%.
Plan fees are based on average daily net assets of the applicable class. Up to 0.25% of each Plan fee may be designated as a Service Fee, as defined by the applicable rules of the Financial Industry Regulatory Authority. The Distributor, subject to applicable legal requirements, may waive a Plan fee voluntarily, in whole or in part.
For the six months ended March 31, 2012, the Distributor received commissions of $992 from front-end sales charges of Class A and Class C shares of the Funds, of which $25 was paid to affiliated broker-dealers, and the remainder was either paid to unaffiliated broker-dealers or retained by the Distributor.
The Distributor received no CDSC fees from Class A and Class C shares of the Funds during the six months ended March 31, 2012.
5. Securities Transactions
The cost of securities purchased and proceeds from securities sold (excluding securities maturing less than one year from acquisition) for the six months ended March 31, 2012 were as follows:
58
|
NOTES TO FINANCIAL STATEMENTS |
| | | | | | | | | | |
| | | Purchases | | | | | Sales | |
SMID Cap Growth Fund | | $ | 2,281,492 | | | | | $ | 8,744,126 | |
Enterprise Fund | | | 3,614,695 | | | | | | 14,733,607 | |
Small Cap Core Fund | | | 10,048,928 | | | | | | 11,463,568 | |
Microcap Value Fund | | | 4,852,812 | | | | | | 14,200,368 | |
Mid Cap Value Fund | | | 1,720,459 | | | | | | 1,725,959 | |
Within the guidelines established by the Funds to always seek best execution when entering into portfolio transactions, certain of the Funds use directed brokerage transactions through LJR Recapture Services (“LJR”) and its correspondent brokers. A portion of the commissions paid for portfolio transactions under this program are reimbursed to the Funds and are recorded as net realized gains from investment transactions in the financial statements.
6. Capital Share Transactions
The Trust is authorized to issue an unlimited number of shares of beneficial interest (“shares outstanding”) without par value. Transactions in capital stock of the Funds are summarized on the following pages:
| | | | | | | | | | | | | | | | |
| | | SMID Cap Growth Fund | | | Enterprise Fund | |
| | | For the
Six Months Ended
March 31, 2012 | | | For the
Year Ended
September 30, 2011 | | | For the
Six Months Ended
March 31, 2012 | | | For the
Year Ended
September 30, 2011 | |
| | | (Unaudited) | | | | | | (Unaudited) | | | | |
CAPITAL TRANSACTIONS: | | | | | | | | | | | | | | | | |
Class A | | | | | | | | | | | | | | | | |
Proceeds from shares issued | | $ | 3,333,432 | | | $ | 4,677,538 | | | $ | 2,730 | | | $ | 18,460 | |
Cost of shares redeemed | | | (2,674,692 | ) | | | (3,948,963 | ) | | | (240,539 | ) | | | (1,258,647 | ) |
| | | | | | | | | | | | | | | | |
Change in Class A | | $ | 658,740 | | | $ | 728,575 | | | $ | (237,809 | ) | | $ | (1,240,187 | ) |
| | | | | | | | | | | | | | | | |
Class I | | | | | | | | | | | | | | | | |
Proceeds from shares issued | | $ | 45,560 | | | $ | 2,566,987 | | | $ | 2,389 | | | $ | 2,471,463 | |
Cost of shares redeemed | | | (6,013,661 | ) | | | (12,819,670 | ) | | | (4,030,278 | ) | | | (31,448,360 | ) |
| | | | | | | | | | | | | | | | |
Change in Class I | | $ | (5,968,101 | ) | | $ | (10,252,683 | ) | | $ | (4,027,889 | ) | | $ | (28,976,897 | ) |
| | | | | | | | | | | | | | | | |
Class C | | | | | | | | | | | | | | | | |
Proceeds from shares issued | | $ | — | | | $ | — | | | $ | 600 | | | $ | 3,534 | |
Cost of shares redeemed | | | — | | | | (30,520 | ) | | | (73,551 | ) | | | (163,037 | ) |
| | | | | | | | | | | | | | | | |
Change in Class C | | $ | — | | | $ | (30,520 | ) | | $ | (72,951 | ) | | $ | (159,503 | ) |
| | | | | | | | | | | | | | | | |
Class S | | | | | | | | | | | | | | | | |
Proceeds from shares issued | | $ | 184,012 | | | $ | 151,538 | | | $ | 297,245 | | | $ | 920,975 | |
Cost of shares redeemed | | | (74,132 | ) | | | (815,757 | ) | | | (7,408,553 | ) | | | (24,931,097 | ) |
| | | | | | | | | | | | | | | | |
Change in Class S | | $ | 109,880 | | | $ | (664,219 | ) | | $ | (7,111,308 | ) | | $ | (24,010,122 | ) |
| | | | | | | | | | | | | | | | |
Change in net assets resulting from capital transactions | | $ | (5,199,481 | ) | | $ | (10,218,847 | ) | | $ | (11,449,957 | ) | | $ | (54,386,709 | ) |
| | | | | | | | | | | | | | | | |
SHARE TRANSACTIONS: | | | | | | | | | | | | | | | | |
Class A | | | | | | | | | | | | | | | | |
Issued | | | 261,269 | | | | 380,703 | | | | 160 | | | | 1,143 | |
Redeemed | | | (211,662 | ) | | | (318,977 | ) | | | (14,195 | ) | | | (76,730 | ) |
| | | | | | | | | | | | | | | | |
Change in Class A | | | 49,607 | | | | 61,726 | | | | (14,035 | ) | | | (75,587 | ) |
| | | | | | | | | | | | | | | | |
Class I | | | | | | | | | | | | | | | | |
Issued | | | 3,201 | | | | 209,055 | | | | 99 | | | | 147,155 | |
Redeemed | | | (417,030 | ) | | | (973,857 | ) | | | (231,358 | ) | | | (1,687,334 | ) |
| | | | | | | | | | | | | | | | |
Change in Class I | | | (413,829 | ) | | | (764,802 | ) | | | (231,259 | ) | | | (1,540,179 | ) |
| | | | | | | | | | | | | | | | |
59
|
NOTES TO FINANCIAL STATEMENTS |
| | | | | | | | | | | | | | | | |
| | | SMID Cap
Growth Fund | | | Enterprise Fund | |
| | | For the
Six Months Ended
March 31,
2012 | | | For the
Year Ended
September 30,
2011 | | | For the
Six Months Ended
March 31,
2012 | | | For the
Year Ended
September 30,
2011 | |
| | | (Unaudited) | | | | | | (Unaudited) | | | | |
| | | | |
(cont.) | | | | | | | | | | | | | | | | |
Class C | | | | | | | | | | | | | | | | |
Issued | | | — | | | | — | | | | 39 | | | | 230 | |
Redeemed | | | — | | | | (2,724 | ) | | | (4,763 | ) | | | (10,321 | ) |
| | | | | | | | | | | | | | | | |
Change in Class C | | | — | | | | (2,724 | ) | | | (4,724 | ) | | | (10,091 | ) |
| | | | | | | | | | | | | | | | |
Class S | | | | | | | | | | | | | | | | |
Issued | | | 13,381 | | | | 11,688 | | | | 17,492 | | | | 54,520 | |
Redeemed | | | (5,082 | ) | | | (68,328 | ) | | | (446,597 | ) | | | (1,515,262 | ) |
| | | | | | | | | | | | | | | | |
Change in Class S | | | 8,299 | | | | (56,640 | ) | | | (429,105 | ) | | | (1,460,742 | ) |
| | | | | | | | | | | | | | | | |
Change in shares resulting from capital transactions | | | (355,923 | ) | | | (762,440 | ) | | | (679,123 | ) | | | (3,086,599 | ) |
| | | | | | | | | | | | | | | | |
| | |
| | | Small Cap
Core Fund | | | Microcap Value Fund | |
| | | For the
Six Months Ended
March 31,
2012 | | | For the
Year Ended
September 30,
2011 | | | For the
Six Months Ended
March 31,
2012 | | | For the
Year Ended
September 30,
2011 | |
| | | (Unaudited) | | | | | | (Unaudited) | | | | |
| | | | |
CAPITAL TRANSACTIONS: | | | | | | | | | | | | | | | | |
Class A | | | | | | | | | | | | | | | | |
Proceeds from shares issued | | $ | 1,016,961 | | | $ | 1,186,176 | | | $ | 127,590 | | | $ | 407,665 | |
Distributions reinvested | | | 111,284 | | | | — | | | | 10,572 | | | | 8,348 | |
Cost of shares redeemed | | | (189,061 | ) | | | (163,399 | ) | | | (603,886 | ) | | | (3,901,379 | ) |
| | | | | | | | | | | | | | | | |
Change in Class A | | $ | 939,184 | | | $ | 1,022,777 | | | $ | (465,724 | ) | | $ | (3,485,366 | ) |
| | | | | | | | | | | | | | | | |
Class C | | | | | | | | | | | | | | | | |
Proceeds from shares issued | | $ | 75,000 | | | $ | — | | | $ | 10,568 | | | $ | 21,358 | |
Distributions reinvested | | | 2,164 | | | | — | | | | — | | | | — | |
Cost of shares redeemed | | | (6,609 | ) | | | (62,360 | ) | | | (95,823 | ) | | | (270,146 | ) |
| | | | | | | | | | | | | | | | |
Change in Class C | | $ | 70,555 | | | $ | (62,360 | ) | | $ | (85,255 | ) | | $ | (248,788 | ) |
| | | | | | | | | | | | | | | | |
Class S | | | | | | | | | | | | | | | | |
Proceeds from shares issued | | $ | 6,723,954 | | | $ | 8,444,857 | | | $ | 3,726,249 | | | $ | 19,339,282 | |
Distributions reinvested | | | 3,042,812 | | | | — | | | | 720,371 | | | | 570,504 | |
Cost of shares redeemed | | | (8,829,842 | ) | | | (9,668,033 | ) | | | (13,153,425 | ) | | | (61,403,419 | ) |
| | | | | | | | | | | | | | | | |
Change in Class S | | $ | 936,924 | | | $ | (1,223,176 | ) | | $ | (8,706,805 | ) | | $ | (41,493,633 | ) |
| | | | | | | | | | | | | | | | |
Change in net assets resulting from capital transactions | | $ | 1,946,663 | | | $ | (262,759) | | | $ | (9,257,784 | ) | | $ | (45,227,787 | ) |
| | | | | | | | | | | | | | | | |
60
|
NOTES TO FINANCIAL STATEMENTS |
|
| | | | | | | | | | | | | | | | |
| | | Small Cap Core Fund | | | Microcap Value Fund | |
| | | For the
Six Months Ended
March 31, 2012 | | | For the
Year Ended
September 30, 2011 | | | For the
Six Months Ended
March 31, 2012 | | | For the
Year Ended
September 30, 2011 | |
| | | (Unaudited) | | | | | | (Unaudited) | | | | |
| | | | |
(cont.) | | | | | | | | | | | | | | | | |
SHARE TRANSACTIONS: | | | | | | | | | | | | | | | | |
Class A | | | | | | | | | | | | | | | | |
Issued | | | 43,905 | | | | 52,269 | | | | 7,466 | | | | 24,731 | |
Reinvested | | | 5,013 | | | | — | | | | 648 | | | | 494 | |
Redeemed | | | (7,989 | ) | | | (7,296 | ) | | | (36,650 | ) | | | (233,524 | ) |
| | | | | | | | | | | | | | | | |
Change in Class A | | | 40,929 | | | | 44,973 | | | | (28,536 | ) | | | (208,299 | ) |
| | | | | | | | | | | | | | | | |
Class C | | | | | | | | | | | | | | | | |
Issued | | | 3,630 | | | | — | | | | 657 | | | | 1,344 | |
Reinvested | | | 105 | | | | — | | | | — | | | | — | |
Redeemed | | | (314 | ) | | | (2,827 | ) | | | (5,822 | ) | | | (17,148 | ) |
| | | | | | | | | | | | | | | | |
Change in Class C | | | 3,421 | | | | (2,827 | ) | | | (5,165 | ) | | | (15,804 | ) |
| | | | | | | | | | | | | | | | |
Class S | | | | | | | | | | | | | | | | |
Issued | | | 278,846 | | | | 364,008 | | | | 217,492 | | | | 1,164,529 | |
Reinvested | | | 133,691 | | | | — | | | | 44,249 | | | | 33,798 | |
Redeemed | | | (362,828 | ) | | | (411,447 | ) | | | (799,524 | ) | | | (3,787,473 | ) |
| | | | | | | | | | | | | | | | |
Change in Class S | | | 49,709 | | | | (47,439 | ) | | | (537,783 | ) | | | (2,589,146 | ) |
| | | | | | | | | | | | | | | | |
Change in shares resulting from capital transactions | | | 94,059 | | | | (5,293 | ) | | | (571,484 | ) | | | (2,813,249 | ) |
| | | | | | | | | | | | | | | | |
| | | | | | | | |
| | | Mid Cap Value Fund | |
| | | For the
Six Months Ended
March 31, 2012 | | | For the
Year Ended
September 30, 2011 | |
| | | (Unaudited) | | | | |
CAPITAL TRANSACTIONS: | | | | | | | | |
Class I | | | | | | | | |
Proceeds from shares issued | | $ | 75 | | | $ | — | |
Distributions reinvested | | | 327,014 | | | | 160,268 | |
Cost of shares redeemed | | | (66 | ) | | | — | |
| | | | | | | | |
Change in net assets resulting from capital transactions | | $ | 327,023 | | | $ | 160,268 | |
| | | | | | | | |
SHARE TRANSACTIONS: | | | | | | | | |
Class I | | | | | | | | |
Issued | | | 7 | | | | — | |
Reinvested | | | 35,238 | | | | 13,816 | |
Redeemed | | | (7 | ) | | | — | |
| | | | | | | | |
Change in shares resulting from capital transactions | | | 35,238 | | | | 13,816 | |
| | | | | | | | |
7. Federal Income Taxes
It is the policy of each Fund to continue to qualify as a regulated investment company by complying with the provisions available to certain investment companies, as defined under Subchapter M of the Internal Revenue Code, and to distribute substantially all of its net investment income and net realized capital gains. Therefore, no federal tax liability is recorded in the financial statements of each Fund.
61
|
NOTES TO FINANCIAL STATEMENTS |
Management has analyzed the Funds’ tax positions taken or expected to be taken on federal income tax returns for all open tax years (for the tax years ended September 30 of the years 2008, 2009, 2010 and 2011), and has concluded that no provision for federal income tax is required in the Funds’ financial statements. The Funds’ federal and state income and federal excise tax returns for tax years for which the applicable statutes of limitations have not expired are subject to examination by the Internal Revenue Service and state departments of revenue.
As of March 31, 2012, the tax cost of securities and the breakdown of unrealized appreciation (depreciation) for each Fund were as follows:
| | | | | | | | | | | | | | | | |
| | | Tax Cost of
Securities | | | Unrealized
Appreciation | | | Unrealized
Depreciation | | | Net
Unrealized
Appreciation
(Depreciation) | |
SMID Cap Growth Fund | | $ | 46,103,370 | | | $ | 25,367,223 | | | $ | (2,170,985 | ) | | $ | 23,196,238 | |
Enterprise Fund | | | 77,741,407 | | | | 39,232,758 | | | | (7,770,471 | ) | | | 31,462,287 | |
Small Cap Core Fund | | | 39,969,110 | | | | 18,787,991 | | | | (2,368,923 | ) | | | 16,419,068 | |
Microcap Value Fund | | | 138,486,532 | | | | 34,102,957 | | | | (41,596,223 | ) | | | (7,493,266 | ) |
Mid Cap Value Fund | | | 2,123,461 | | | | 245,140 | | | | (69,361 | ) | | | 175,779 | |
The tax character of distributions during the fiscal year ended September 31, 2011 was as follows:
| | | | | | | | | | | | | | | | |
| | | Distributions Paid From | |
| | | Ordinary
Income | | | Net Long Term
Capital Gains | | | Total Taxable
Distributions | | | Total
Distributions
Paid | |
SMID Cap Growth Fund | | $ | — | | | | $— | | | | $ — | | | | $ — | |
Enterprise Fund | | | — | | | | — | | | | — | | | | — | |
Small Cap Core Fund | | | — | | | | — | | | | — | | | | — | |
Microcap Value Fund | | | 597,770 | | | | — | | | | 597,770 | | | | 597,770 | |
Mid Cap Value Fund | | | 160,268 | | | | — | | | | 160,268 | | | | 160,268 | |
The tax basis of components of accumulated earnings/(losses) and tax character of distributions are determined at fiscal year end, and will be included in the Annual Report dated September 30, 2012.
As of September 30, 2011, the Funds had capital loss carryforwards for federal income tax purposes as follows:
| | | | | | | | |
| | | Capital Loss
Carryforward | | | Expires | |
SMID Cap Growth Fund | | $ | 43,316 | | | | 2018 | |
| | |
Enterprise Fund | | | 11,423,141 | | | | 2018 | |
| | |
Microcap Value Fund | | | 20,379,007 | | | | 2018 | |
The Regulated Investment Company Modernization Act of 2010 (The “Act”) was enacted on December 22, 2010. The Act makes changes to several tax rules impacting the Funds. In general, the provisions of the Act will be effective for the Funds’ fiscal year beginning after September 30, 2011. Although the Act provides several benefits, including the unlimited carryover of future capital losses, there may be a greater likelihood that all or a portion of each Fund’s pre-enactment capital loss carryovers may expire without being utilized due to the fact that post-enactment capital losses get utilized before pre-enactment capital loss carryovers. Relevant information regarding the impact of the Act on the Funds will be contained within this section of the Funds’ fiscal year ending September 30, 2012 financial statements.
62
|
NOTES TO FINANCIAL STATEMENTS |
8. Market Timing
The Trust strongly discourages attempts at market timing by Fund shareholders. Each Fund charges a redemption fee of 2% of the value of the shares redeemed or exchanged within 30 days of purchase, and may also limit the number of exchanges that may be made between Funds to five (5) per calendar year. When assessed, the redemption fee is deducted from the redemption proceeds and retained by the Fund, not by the Adviser. This redemption fee is not charged in certain situations, such as where the redemption results from an automatic reinvestment or asset re-allocation not specifically directed by the shareholder. The Trust also reserves the right to reject any Fund purchase order made by persons deemed to be market timers. The Funds’ prospectus contains a full description of the Trust’s policies on market timing and/or excessive trading. The redemption fee is recorded as a credit to capital and is included in the capital transactions on the statements of changes in net assets.
During the six months ended March 31, 2012, the redemption fees collected by the Funds which are included in the cost of shares redeemed on the statement of changes in net assets are as follows:
| | | | |
| | | Redemption Fees | |
SMID Cap Growth Fund | | | $ 3 | |
Enterprise Fund | | | 5 | |
Small Cap Core Fund | | | 39 | |
Microcap Value Fund | | | 33,791 | |
Mid Cap Value Fund | | | — | |
9. Soft Dollars
The term soft dollars generally refers to arrangements in which services other than trade execution are received from a broker-dealer. Federal securities laws permit a fund advisor to incur commission charges on behalf of a Fund that are higher than another broker dealer would have charged if the advisor believes the charges are reasonable in relation to the brokerage and research services received. RBC GAM (US) has a fiduciary duty to the shareholders of the Funds to seek the best execution price for all of the Funds’ securities transactions. Fund management believes that using soft dollars to purchase brokerage and research services may, in certain cases, be in a Fund’s best interest. As of March 31, 2012, certain of the Funds used soft dollar arrangements on a limited basis. Fund management continues to closely monitor its current use of soft dollars, in addition to regulatory developments in this area for any possible impact on Fund policies.
10. Subsequent Events
Management has evaluated the impact of subsequent events of the Funds and has determined that there are no subsequent events that require recognition or disclosure in the financial statements.
63
|
SHARE CLASS INFORMATION (UNAUDITED) |
The RBC Equity Funds offer up to four share classes. These four share classes are the A, C, I, and S classes.
For an investor purchasing RBC Funds shares through a financial services intermediary, the question as to which share class, A or C, is the better choice is dependent on many factors, including the amount to be invested and the length of time an investor anticipates holding the shares. An investor should consult with his or her financial advisor about his or her personal financial situation to determine which share class is the best choice for his or her individual situation.
Class A
Class A shares of all Funds except Mid Cap Value are available for purchase primarily through investment advisors, broker-dealers, banks and other financial services intermediaries. Class A shares of the Funds are currently subject to a maximum up-front sales charge of 5.75% and a 1.00% CDSC for redemption within 12 months of a $1 million or greater purchase. Class A shares currently include a 0.25% (25 bps) annual 12b-1 service and distribution fee. Class A shares have a higher up-front sales charge (load) than Class C shares, but a lower annual expense ratio.
Class C
Class C shares of all Funds except Mid Cap Value are also available for purchase primarily through investment advisors, broker-dealers, banks and other financial services intermediaries. Class C shares redeemed within 12 months of purchase are subject to a CDSC of 1.00%. (No CDSC will be charged on shares acquired through reinvestment of dividends or capital gains.) C Class shares expenses include a 1.00% (100 bps) annual 12b-1 service and distribution fee. Class C shares have a lower up-front sales charge (load) than Class A shares, but due to the higher service and distribution fee, have higher annual expenses than A Class shares.
Class S
Class S shares of all Funds except Mid Cap Value are available to investors purchasing shares directly through the Fund or its agent, U.S. Bancorp Fund Services LLC, or through certain fee-based programs of broker-dealers or registered investment advisors. This share class does not have an up-front sales charge (load) or a 12b-1 service and distribution fee.
Class I
Class I shares are available in the SMID Cap Growth, Enterprise and Mid Cap Value Funds. This share class is intended for investors meeting certain minimum investment thresholds. This share class does not have an up-front sales charge (load) or a 12b-1 service and distribution fee.
64
|
SUPPLEMENTAL INFORMATION (UNAUDITED) |
Shareholder Expense Examples
As a shareholder of the RBC Funds, you incur two types of costs: (1) transaction costs, including sales charges (loads) and (2) ongoing costs, including management fees; 12b-1 distribution and service fees; and other Fund expenses. This example is intended to help you understand your ongoing costs (in dollars) of investing in the RBC Funds and to compare these costs with the ongoing costs of investing in other mutual funds.
The example is based on an investment of $1,000 invested at the beginning of the period and held for the entire period from October 1, 2011 through March 31, 2012.
Actual Expenses and Performance
The table below provides information about actual account values and actual expenses. You may use the information below, together with the amount you invested, to estimate the expenses that you paid over the period. Simply divide your account value by $1,000 (for example, an $8,600 account value divided by $1,000 = 8.6), then multiply the result by the number in the table under the heading entitled “Expenses Paid During Period” to estimate the expenses you paid on your account during this period.
| | | | | | | | | | | | | | | | | | | | |
| | | | | | Beginning
Account Value
10/1/2011 | | | Ending
Account Value
3/31/2012 | | | Expenses Paid
During Period*
10/1/11-3/31/12 | | | Annualized
Expense Ratio
During Period
10/1/11-3/31/12 | |
| | | | | |
SMID Cap Growth Fund | | | Class A | | | | $1,000.00 | | | | $1,269.30 | | | | $ 7.62 | | | | 1.35 | % |
| | | Class I | | | | 1,000.00 | | | | 1,270.30 | | | | 6.21 | | | | 1.10 | % |
| | | Class C | | | | 1,000.00 | | | | 1,264.70 | | | | 11.82 | | | | 2.10 | % |
| | | Class S | | | | 1,000.00 | | | | 1,270.30 | | | | 6.21 | | | | 1.10 | % |
| | | | | |
Enterprise Fund | | | Class A | | | | 1,000.00 | | | | 1,302.00 | | | | 7.61 | | | | 1.33 | % |
| | | Class I | | | | 1,000.00 | | | | 1,304.20 | | | | 5.61 | | | | 0.98 | % |
| | | Class C | | | | 1,000.00 | | | | 1,296.70 | | | | 11.88 | | | | 2.08 | % |
| | | Class S | | | | 1,000.00 | | | | 1,304.20 | | | | 6.19 | | | | 1.08 | % |
| | | | | |
Small Cap Core Fund | | | Class A | | | | 1,000.00 | | | | 1,302.40 | | | | 7.44 | | | | 1.30 | % |
| | | Class C | | | | 1,000.00 | | | | 1,298.30 | | | | 11.77 | | | | 2.06 | % |
| | | Class S | | | | 1,000.00 | | | | 1,304.40 | | | | 6.02 | | | | 1.05 | % |
| | | | | |
Microcap Value Fund | | | Class A | | | | 1,000.00 | | | | 1,287.70 | | | | 7.51 | | | | 1.32 | % |
| | | Class C | | | | 1,000.00 | | | | 1,283.00 | | | | 11.75 | | | | 2.07 | % |
| | | Class S | | | | 1,000.00 | | | | 1,288.90 | | | | 6.09 | | | | 1.07 | % |
| | | | | |
Mid Cap Value Fund | | | Class I | | | | 1,000.00 | | | | 1,360.60 | | | | 5.28 | | | | 0.90 | % |
*Expenses are equal to the average account value times the Fund’s annualized expense ratio multiplied by 182/366 (to reflect one-half year period).
65
|
SUPPLEMENTAL INFORMATION (UNAUDITED) |
Hypothetical Example for Comparison Purposes
The table below provides information about hypothetical account values and hypothetical expenses based on each RBC Funds’ actual expense ratio and an assumed rate of return of 5% per year before expenses, which is not the Fund’s actual return. The hypothetical account values and expenses may not be used to estimate the actual ending account balance or expenses you paid for the period. You may use this information to compare this 5% hypothetical example with the 5% hypothetical examples that appear in the shareholder reports of other funds.
Please note that the expenses shown in the table are meant to highlight your ongoing costs only and do not reflect any transactional costs, such as sales charges (loads), redemption fees, or exchange fees. Therefore, the table is useful in comparing ongoing costs only, and will not help you determine the relative total costs of owning different funds. In addition, if these transactional costs were included, your costs would have been higher.
| | | | | | | | | | | | | | | | | | |
| | | | | Beginning
Account Value
10/1/2011 | | | Ending
Account Value
3/31/2012 | | | Expenses Paid
During Period*
10/1/11-3/31/12 | | | Annualized
Expense Ratio
During Period
10/1/11-3/31/12 | |
| | | | | |
SMID Cap Growth Fund | | Class A | | | $1,000.00 | | | | $1,018.15 | | | | $6.77 | | | | 1.35 | % |
| | Class I | | | 1,000.00 | | | | 1,019.39 | | | | 5.52 | | | | 1.10 | % |
| | Class C | | | 1,000.00 | | | | 1,014.42 | | | | 10.52 | | | | 2.10 | % |
| | Class S | | | 1,000.00 | | | | 1,019.39 | | | | 5.52 | | | | 1.10 | % |
| | | | | |
Enterprise Fund | | Class A | | | 1,000.00 | | | | 1,018.25 | | | | 6.67 | | | | 1.33 | % |
| | Class I | | | 1,000.00 | | | | 1,019.99 | | | | 4.92 | | | | 0.98 | % |
| | Class C | | | 1,000.00 | | | | 1,014.52 | | | | 10.42 | | | | 2.08 | % |
| | Class S | | | 1,000.00 | | | | 1,019.49 | | | | 5.42 | | | | 1.08 | % |
| | | | | |
Small Cap Core Fund | | Class A | | | 1,000.00 | | | | 1,018.40 | | | | 6.52 | | | | 1.30 | % |
| | Class C | | | 1,000.00 | | | | 1,014.62 | | | | 10.32 | | | | 2.06 | % |
| | Class S | | | 1,000.00 | | | | 1,019.64 | | | | 5.27 | | | | 1.05 | % |
| | | | | |
Microcap Value Fund | | Class A | | | 1,000.00 | | | | 1,018.30 | | | | 6.62 | | | | 1.32 | % |
| | Class C | | | 1,000.00 | | | | 1,014.57 | | | | 10.37 | | | | 2.07 | % |
| | Class S | | | 1,000.00 | | | | 1,019.54 | | | | 5.37 | | | | 1.07 | % |
| | | | | |
Mid Cap Value Fund | | Class I | | | 1,000.00 | | | | 1,020.39 | | | | 4.52 | | | | 0.90 | % |
*Expenses are equal to the average account value times the Fund’s annualized expense ratio multiplied by 182/366 (to reflect one-half year period).
66
This Page Intentionally Left Blank
67
This Page Intentionally Left Blank
��
68
This Page Intentionally Left Blank
69
This Page Intentionally Left Blank
70
This Page Intentionally Left Blank
71
This Page Intentionally Left Blank
72
RBC Funds
P.O. Box 701
Milwaukee, WI 53201-0701
800-422-2766
www.rbcgam.us
Performance data represents past performance and does not guarantee future results. The principal value of an investment and investment return will fluctuate so that an investor’s shares, when redeemed, may be worth more or less than their original cost.
This report and the financial statements contained herein are provided for the information of RBC Funds shareholders. This report is not authorized for distribution to prospective investors unless preceded or accompanied by a current prospectus, which contains information concerning investment objectives, risks, charges and expenses of the funds. Please read the prospectus carefully before investing.
This report and the financial statements contained herein are not intended to be a forecast of future events, a guarantee of future results, or investment advice. There is no assurance that certain securities will remain in or out of each fund’s portfolio. The views expressed in this report reflect those of the portfolio managers through the period ended March 31, 2012.
NOT FDIC INSURED — NO BANK GUARANTEE — MAY LOSE VALUE
RBC Global Asset Management, Inc. serves as investment adviser for the RBC Funds. RBC Funds are distributed by Quasar Distributors LLC.

| | |
| The RBC Funds are pleased to offer shareholder reports printed entirely on Forest Stewardship Council certified paper. FSC® certification ensures that the paper used in this report contains fiber from well-managed and responsibly harvested forests that meet strict environmental and socioeconomic standards. | | |
RBCF-EQ SAR 03-12
| | | | | | | | |
| | | | | | | | | |
| | | | | | RBC Funds | | |
About Your Semi Annual Report | | | | | | This semi annual report includes detailed information about your Fund including financial statements, performance, and a complete list of holdings. We hope the financial information presented will help you evaluate your investment in the RBC Funds. We also encourage you to read your Fund’s prospectus for further detail as to your Fund’s investment policies and risk profile. RBC Funds prospectuses and additional performance information are available on our website at www.rbcgam.us. A description of the policies and procedures that your Fund uses to determine how to vote proxies relating to portfolio securities is available (i) without charge, upon request, by calling 1-800-422-2766; (ii) on the Fund’s website at www.rbcgam.us; and (iii) on the Securities and Exchange Commission’s (“Commission”) website at http://www.sec.gov. Information regarding how your Fund voted proxies relating to portfolio securities during the most recent 12-month period ended June 30 is available (i) on the Fund’s website at www.rbcgam.us; and (ii) on the Commission’s website at http://www.sec.gov. A schedule of each Fund’s portfolio holdings will be filed with the Commission for the first and third quarters of each fiscal year on Form N-Q. This information is available on the Commission’s website at http://www.sec.gov and may be reviewed and copied at the Commission’s Public Reference Room in Washington, D.C. Information on the operation of the Public Reference Room is available by calling 1-202-551-8090. |
Table of Contents | | | | | | Money Market Portfolio Managers | | 1 |
| | | | |
| | | | Performance Summary | | 3 |
| | | | Schedules of Portfolio Investments | | 5 |
| | | | Financial Statements | | |
| | | | - Statements of Assets and Liabilities | | 36 |
| | | | - Statements of Operations | | 38 |
| | | | - Statements of Changes in Net Assets | | 39 |
| | | | Financial Highlights | | 42 |
| | | | Notes to Financial Statements | | 48 |
| | | | Supplemental Information | | 58 |
| | | | | | | | |
| | | | | | | | |
| | | | | | | | |
| | | | | | | | |
| | | | | | | | |
| | | | | | | | |
| | | | | | |
MONEY MARKET PORTFOLIO MANAGERS | | | | | | |
| | | | | | |
| RBC Global Asset Management (U.S.) Inc. (“RBC GAM (US)”), serves as the investment advisor to the RBC Funds. RBC GAM (US) employs a team approach to the management of each of the Money Market Funds, with no individual team member being solely responsible for the investment decisions. Each Fund’s management team has access to RBC GAM (US)’s investment research and other money management resources. | | | | | | |
John M. Huber, CFA Senior Managing Director, Chief Investment Officer — Fixed Income John Huber oversees RBC GAM (US)’s fixed income research and portfolio management efforts. He is a member of the firm’s Executive Committee. John joined RBC GAM (US) in 2001 from Galliard Capital Management where he was a founding member and principal. Before that, John was a portfolio manager at Norwest Investment Management, where he began his career in the capital markets group in 1990. He earned a BA from the University of Iowa and an MBA in Finance from the University of Minnesota Carlson School of Management. John acts as an advisor to the Carlson Funds Enterprise for the University of Minnesota. He is also a board member of the Minneapolis Downtown YMCA. John is a CFA charterholder and a member of the CFA Society of Minnesota. | | | | | | 
John M. Huber, CFA |
Raye C. Kanzenbach, CFA Senior Managing Director, Senior Portfolio Manager Raye Kanzenbach leads the Municipal Research Team within RBC GAM (US)’s fixed income group. Raye has extensive experience researching and investing in municipal securities. His research responsibilities include tax-exempt money market securities, general obligations, and revenue bonds. Before joining RBC GAM (US) in 1983, Raye worked at First Bank, where he managed the firm’s municipal and money market trust funds. He was also previously an investment officer at The St. Paul Companies. Raye began his career in the investment industry in 1973. He earned a BA in Economics from Lawrence University and an MBA in Finance from the University of Michigan. Raye is a CFA charterholder. | | | | | | 
Raye C. Kanzenbach, CFA |
Brandon T. Swensen, CFA Vice President, Portfolio Manager Brandon Swensen leads the Short Term Research Team within RBC GAM (US)’s fixed income group. Brandon researches asset-backed commercial paper and consumer asset-backed securities. He joined RBC GAM (US) in 2000, and has held several key positions in the firm’s fixed income group, including structured product analyst and credit analyst. Brandon began his career in the investment industry in 1998. He earned a BS in Finance from St. Cloud State University and an MBA in Finance from the University of St. Thomas. Brandon is a CFA charterholder and member of the CFA Society of Minnesota. | | | | | | 
Brandon T. Swensen, CFA |
| | | | | | | |
| | | | | | |
| | | | | | |
| | | | | | |
| | | | | | |
| | | | | | |
| | | | | | |
| | | | | | |
1
| | | | | | |
| | | | | | MONEY MARKET PORTFOLIO MANAGERS |

Chad Rice, CFA | | | | | | Chad Rice, CFA Vice President, Portfolio Manager Chad Rice is a member of the Municipal Research Team and is a portfolio manager for the Tax-Free Money Market Fund. His research responsibilities include tax-exempt money market securities and taxable and tax-exempt general obligations and revenue bonds. Chad joined RBC GAM (US) in 2011 from Sentry Insurance, where he was a senior portfolio manager responsible for municipal portfolio management for the firm’s property and casualty and life insurance businesses. He joined Sentry in 2003 after completing his MS in Finance, Investments, and Banking at the University of Wisconsin- Madison School of Business. While attending the Applied Security Analysis Program at Wisconsin, Chad was selected to co-manage a fixed-income portfolio, which spurred his interest in investment research. He earned a BS from the University of Wisconsin-Stevens Point and began his professional career as a medical technologist doing immunohematological testing for Marshfield Clinic Laboratory. Chad is a CFA charterholder and member of the National Federation of Municipal Analysts. |
| | | | | | | |
| | | | | | |
| | | | | | |
| | | | | | |
| | | | | | |
| | | | | | |
2
| | | | | | | | | | | | |
PERFORMANCE SUMMARY | | | | | | |
| | | |
Each of the RBC Money Market Funds was managed to preserve principal. This means that the share price of each fund held steady at $1.00. A consistent share price of $1.00 is expected for a money market mutual fund. An investment in the Fund is not insured or guaranteed by the Federal Deposit Insurance Corporation or any other government agency. Although the Fund seeks to preserve the value of your investment at $1.00 per share, it is possible to lose money by investing in the Fund. These risks are more fully described in the prospectus. | | | | | | Investment Objective |
| | | Total Return
for the | | SEC 7-Day Annualized Yield (1) | | | | | | |
| | Six Months Ended
March 31, 2012
(Unaudited) | | March 31,
2012
(Unaudited) | | September 30,
2011 | | | | | | |
Prime Money Market
Fund | | | | | | | | | | | | |
RBC Institutional Class 1 | | 0.04% | | 0.08% | | 0.07% | | | | | | |
RBC Institutional Class 2 | | 0.01% | | 0.01% | | 0.01% | | | | | | |
RBC Investor Class | | 0.01% | | 0.01% | | 0.01% | | | | | | |
RBC Reserve Class | | 0.01% | | 0.01% | | 0.01% | | | | | | |
RBC Select Class | | 0.01% | | 0.01% | | 0.01% | | | | | | |
U.S. Government
Money Market Fund | | | | | | | | | | | | |
RBC Institutional Class 1 | | 0.01% | | 0.01% | | 0.01% | | | | | | |
RBC Institutional Class 2 | | 0.01% | | 0.01% | | 0.01% | | | | | | |
RBC Investor Class | | 0.01% | | 0.01% | | 0.01% | | | | | | |
RBC Reserve Class | | 0.01% | | 0.01% | | 0.01% | | | | | | |
RBC Select Class | | 0.01% | | 0.01% | | 0.01% | | | | | | |
Tax-Free Money
Market Fund | | | | | | | | | | | | |
RBC Institutional Class 1 | | 0.01% | | 0.01% | | 0.05% | | | | | | |
RBC Institutional Class 2 | | 0.01% | | 0.01% | | 0.01% | | | | | | |
RBC Investor Class | | 0.01% | | 0.01% | | 0.01% | | | | | | |
RBC Reserve Class | | 0.01% | | 0.01% | | 0.01% | | | | | | |
RBC Select Class | | 0.01% | | 0.01% | | 0.01% | | | | | | |
| | | | | | | | | | | | | |
| Performance data quoted represents past performance. Past performance is no guarantee of future results. Investment return and principal value of an investment will fluctuate so that an investor’s shares, when redeemed, may be worth more or less than their original cost. Current performance may be lower or higher than performance quoted. Performance shown reflects contractual fee waivers, without such fee waivers total returns would be reduced. For performance data current to most recent month-end go to www.rbcgam.us. | | | | | | |
| | | | | | | | | | | | |
| | | | | | | | |
| | | | | | | | |
| | | | | | | | |
| | | | | | | | |
| | | | | | | | |
| | | | | | | | |
| | | | | | | | |
3
| | | | | | | | | | | | |
| | | | | | PERFORMANCE SUMMARY | | | | | | |
| | | |
| | | | | | (1) As money market returns respond rapidly to market changes, such as in the Fed Funds rate, the 7-Day yield is a more accurate reflection of current earnings than the total return for the year. Prior year 7-Day yield information is provided for comparative purposes. |
Asset Allocation | | | | | | | | | | | | |
| | | | | | Money Market Maturity Schedules as a percentage of value of investments based on effective maturity as of March 31, 2012. |
| | | | | | | | | Prime
Money
Market
Fund | | U.S.
Government
Money
Market Fund | | Tax-Free
Money
Market Fund |
| | | | | | Less than 8 days | | 41.9% | | 38.1% | | 18.8% |
| | | | | | 8 to 14 Days | | 13.7% | | 16.9% | | 64.1% |
| | | | | | 15 to 30 Days | | 11.4% | | 10.1% | | 0.4% |
| | | | | | 31 to 180 Days | | 26.6% | | 26.3% | | 13.3% |
| | | | | | 181 to 365 Days | | 6.4% | | 8.6% | | 3.4% |
| | | | | | | | | | | | |
| | | | | | | | | | | | |
| | | | | | | | | | | | |
| | | | | | | | | | | | |
| | | | | | | | | | | | |
| | | | | | | | | | | | |
4
|
SCHEDULE OF PORTFOLIO INVESTMENTS |
Prime Money Market Fund
| | | | | | |
March 31, 2012 (Unaudited) | |
| | |
Principal Amount | | | | Value | |
Asset Backed Securities — 1.27% | |
Asset Backed Auto Receivables — 0.39% | |
| $ 7,948,908 | | Ford Credit Auto Owner Trust, 0.45%, 2/15/13(a) | | $ | 7,948,908 | |
| 23,876,176 | | Honda Auto Receivables Owner Trust Series 2012-1 Class A1, 0.41%, 3/15/13 | | | 23,876,176 | |
| 15,214,312 | | Volkswagen Auto Loan Enhanced Trust, 0.44%, 1/22/13 | | | 15,214,312 | |
| 6,009,594 | | World Omni Auto Receivables Trust, 0.41%, 11/15/12 | | | 6,009,594 | |
| | | | | | |
| | | | | 53,048,990 | |
| | | | | | |
Finance - Diversified Domestic — 0.88% | |
| 45,000,000 | | CNH Equipment Trust Series 2012-A Class A1, 0.43%, 4/12/13 | | | 45,000,000 | |
| 2,278,045 | | Enterprise Fleet Financing LLC, 0.38%, 7/20/12(a) | | | 2,278,045 | |
| 23,000,000 | | Great America Leasing Receivables Series 2012-1 Class A1, 0.51%, 4/15/13(a) | | | 23,000,000 | |
| 48,000,000 | | Volvo Financial Equipment LLC Series 2012-1A Class A1, 0.35%, 3/15/13(a) | | | 48,000,000 | |
| | | | | | |
| | | | | 118,278,045 | |
| | | | | | |
| |
Total Asset Backed Securities | | | 171,327,035 | |
| | | | | | |
(Cost $171,327,035) | | | | |
Commercial Paper — 30.14% | | | | |
Banks - Australia & New Zealand — 2.96% | |
| 50,000,000 | | Australia & New Zealand Banking Group Ltd., 0.35%, 8/16/12(a)(b) | | | 49,933,889 | |
| 50,000,000 | | Commonwealth Bank Australia, 0.19%, 5/24/12(a)(b) | | | 49,986,278 | |
| 50,000,000 | | Commonwealth Bank Australia, 0.19%, 5/29/12(a)(b) | | | 49,984,958 | |
| 50,000,000 | | Commonwealth Bank Australia, 0.24%, 4/10/12(a)(b) | | | 49,997,333 | |
| 50,000,000 | | Commonwealth Bank Australia, 0.49%, 5/7/12(a)(b) | | | 49,976,181 | |
| 100,000,000 | | Commonwealth Bank Australia, 0.55%, 4/30/12(a)(b) | | | 100,000,000 | |
| 50,000,000 | | National Australia Funding Delaware, Inc., 0.35%, 9/12/12(a)(b) | | | 49,921,896 | |
| | | | | | |
| | | | | 399,800,535 | |
| | | | | | |
Banks - Canadian — 1.41% | |
| 90,000,000 | | Bank of Nova Scotia NY, 0.10%, 4/5/12(b) | | | 89,999,250 | |
| 100,000,000 | | Toronto-Dominion Holdings USA, 0.20%, 5/3/12(a)(b) | | | 99,982,778 | |
| | | | | | |
| | | | | 189,982,028 | |
| | | | | | |
Banks - Domestic — 2.01% | |
| 62,000,000 | | John Deere Bank SA, 0.11%, 4/3/12(a)(b) | | | 61,999,811 | |
| 40,000,000 | | John Deere Bank SA, 0.14%, 4/4/12(a)(b) | | | 39,999,689 | |
| 43,000,000 | | John Deere Bank SA, 0.15%, 4/13/12(a)(b) | | | 42,998,029 | |
| 26,000,000 | | John Deere Bank SA, 0.16%, 4/20/12(a)(b) | | | 25,997,920 | |
| 100,000,000 | | Union Bank NA, 0.40%, 4/2/12(b) | | | 100,000,000 | |
| | | | | | |
| | | | | 270,995,449 | |
| | | | | | |
Banks - Foreign — 3.23% | |
| 50,000,000 | | Credit Suisse New York, 0.28%, 6/8/12(b) | | | 49,973,945 | |
5
|
SCHEDULE OF PORTFOLIO INVESTMENTS |
Prime Money Market Fund (cont.)
March 31, 2012 (Unaudited)
| | | | | | |
Principal Amount | | | | Value | |
| $ 50,000,000 | | Credit Suisse New York, 0.30%, 6/12/12(b) | | $ | 49,970,417 | |
| 50,000,000 | | DnB NOR Bank ASA, 0.28%, 6/11/12(a)(b) | | | 49,972,778 | |
| 25,000,000 | | DnB NOR Bank ASA, 0.28%, 6/13/12(a)(b) | | | 24,986,000 | |
| 50,000,000 | | DnB NOR Bank ASA, 0.30%, 7/2/12(a)(b) | | | 49,962,083 | |
| 50,000,000 | | DnB NOR Bank ASA, 0.32%, 5/18/12(a)(b) | | | 50,000,000 | |
| 50,000,000 | | Rabobank USA Finance Corp., 0.28%, 7/2/12(b) | | | 49,964,611 | |
| 45,000,000 | | Rabobank USA Finance Corp., 0.36%, 6/8/12(b) | | | 44,969,850 | |
| 50,000,000 | | Sumitomo Mitsui Banking Corp., 0.37%, 6/21/12(a)(b) | | | 49,959,444 | |
| 16,000,000 | | Svenska Handelsbanken, Inc., 0.24%, 6/4/12(a)(b) | | | 15,993,280 | |
| | | | | | |
| | | | | 435,752,408 | |
| | | | | | |
Banks - United Kingdom — 0.37% | |
| 50,000,000 | | Barclays US Funding LLC, 0.38%, 6/8/12(b) | | | 49,964,639 | |
| | | | | | |
Consumer Discretionary — 2.22% | |
| 40,000,000 | | Coca-Cola Co., 0.12%, 4/19/12(a)(b) | | | 39,997,733 | |
| 60,000,000 | | Coca-Cola Co., 0.15%, 5/15/12(a)(b) | | | 59,989,250 | |
| 52,000,000 | | Coca-Cola Co., 0.16%, 6/4/12(a)(b) | | | 51,985,440 | |
| 48,000,000 | | Coca-Cola Co., 0.17%, 7/16/12(a)(b) | | | 47,976,200 | |
| 100,000,000 | | Coca-Cola Co., 0.37%, 7/26/12(a)(b) | | | 99,881,809 | |
| | | | | | |
| | | | | 299,830,432 | |
| | | | | | |
Consumer Staples — 1.48% | |
| 50,000,000 | | Procter & Gamble Co., 0.08%, 4/27/12(a)(b) | | | 49,997,222 | |
| 70,000,000 | | Procter & Gamble Co., 0.12%, 5/31/12(a)(b) | | | 69,986,233 | |
| 80,000,000 | | Procter & Gamble Co., 0.12%, 6/1/12(a)(b) | | | 79,984,000 | |
| | | | | | |
| | | | | 199,967,455 | |
| | | | | | |
Finance - Diversified Domestic — 8.39% | |
| 35,000,000 | | American Honda Finance Corp., 0.20%, 4/3/12(b) | | | 34,999,806 | |
| 41,000,000 | | American Honda Finance Corp., 0.20%, 4/17/12(b) | | | 40,996,583 | |
| 39,000,000 | | American Honda Finance Corp., 0.22%, 4/3/12(b) | | | 38,999,762 | |
| 100,000,000 | | BHP Billiton Finance USA Ltd., 0.15%, 4/17/12(a)(b) | | | 99,993,750 | |
| 50,000,000 | | BHP Billiton Finance USA Ltd., 0.15%, 4/18/12(a)(b) | | | 49,996,667 | |
| 50,000,000 | | BHP Billiton Finance USA Ltd., 0.17%, 5/15/12(a)(b) | | | 49,989,847 | |
| 50,000,000 | | BHP Billiton Finance USA Ltd., 0.20%, 5/16/12(a)(b) | | | 49,987,778 | |
| 75,000,000 | | Nestle Capital Corp., 0.25%, 7/30/12(a)(b) | | | 74,938,021 | |
| 50,000,000 | | Nestle Capital Corp., 0.27%, 10/16/12(a)(b) | | | 49,926,125 | |
| 75,000,000 | | Nestle Finance International Ltd., 0.18%, 6/11/12(b) | | | 74,974,479 | |
| 18,000,000 | | PACCAR Financial Corp., 0.15%, 4/2/12(b) | | | 18,000,000 | |
| 23,000,000 | | PACCAR Financial Corp., 0.15%, 4/12/12(b) | | | 22,999,042 | |
| 63,200,000 | | PACCAR Financial Corp., 0.15%, 6/7/12(b) | | | 63,182,620 | |
| 42,100,000 | | PACCAR Financial Corp., 0.17%, 5/15/12(b) | | | 42,091,451 | |
| 15,000,000 | | Reckitt Benckiser Treasury Services Plc, 0.73%, 4/13/12(a)(b) | | | 14,996,654 | |
| 25,000,000 | | Toyota Motor Credit Corp., 0.26%, 5/9/12(b) | | | 24,993,319 | |
| 25,000,000 | | Toyota Motor Credit Corp., 0.28%, 6/20/12(b) | | | 24,984,639 | |
| 30,000,000 | | Toyota Motor Credit Corp., 0.29%, 5/21/12(b) | | | 29,988,158 | |
| 25,000,000 | | Toyota Motor Credit Corp., 0.29%, 7/5/12(b) | | | 24,981,069 | |
6
|
SCHEDULE OF PORTFOLIO INVESTMENTS |
Prime Money Market Fund (cont.)
March 31, 2012 (Unaudited)
| | | | | | |
Principal Amount | | | | | Value | |
| $ 25,000,000 | | Toyota Motor Credit Corp., 0.30%, 7/6/12(b) | | | $ 24,980,208 | |
| 25,000,000 | | Toyota Motor Credit Corp., 0.42%, 8/21/12(b) | | | 24,958,875 | |
| 48,000,000 | | Unilever Capital Corp., 0.10%, 4/12/12(a)(b) | | | 47,998,667 | |
| 130,000,000 | | Unilever Capital Corp., 0.24%, 9/7/12(a)(b) | | | 129,863,067 | |
| 75,000,000 | | Unilever Capital Corp., 0.45%, 1/17/13(a)(b) | | | 74,728,125 | |
| | | | | | |
| | | | | 1,133,548,712 | |
| | | | | | |
Health Care — 0.85% | |
| 30,000,000 | | Dean Health Systems, Inc., 0.22%, 5/10/12(b) | | | 29,993,033 | |
| 50,000,000 | | Novartis Finance Corp., 0.12%, 4/2/12(a)(b) | | | 50,000,000 | |
| 35,000,000 | | Novartis Finance Corp., 0.12%, 4/5/12(a)(b) | | | 34,999,650 | |
| | | | | | |
| | | | | 114,992,683 | |
| | | | | | |
Industrials — 1.97% | |
| 71,000,000 | | Danaher Corp., 0.12%, 4/5/12(a)(b) | | | 70,999,290 | |
| 45,000,000 | | Danaher Corp., 0.15%, 4/5/12(a)(b) | | | 44,999,437 | |
| 35,700,000 | | Danaher Corp., 0.16%, 4/4/12(a)(b) | | | 35,699,683 | |
| 25,000,000 | | Honeywell International, Inc., 0.25%, 9/26/12(a)(b) | | | 24,969,271 | |
| 40,000,000 | | Honeywell International, Inc., 0.26%, 9/25/12(a)(b) | | | 39,949,156 | |
| 50,000,000 | | Honeywell International, Inc., 0.26%, 9/28/12(a)(b) | | | 49,935,361 | |
| | | | | | |
| | | | | 266,552,198 | |
| | | | | | |
Information Technology — 1.86% | |
| 25,000,000 | | Texas Instruments, Inc., 0.15%, 4/2/12(a)(b) | | | 25,000,000 | |
| 65,000,000 | | Texas Instruments, Inc., 0.20%, 4/3/12(a)(b) | | | 64,999,639 | |
| 87,000,000 | | Texas Instruments, Inc., 0.20%, 4/9/12(a)(b) | | | 86,996,617 | |
| 74,175,000 | | Texas Instruments, Inc., 0.43%, 7/6/12(a)(b) | | | 74,091,811 | |
| | | | | | |
| | | | | 251,088,067 | |
| | | | | | |
Insurance — 0.95% | |
| 21,000,000 | | Massachusetts Mutual Life Insurance Co., 0.12%, 4/12/12(a)(b) | | | 20,999,300 | |
| 23,000,000 | | Massachusetts Mutual Life Insurance Co., 0.15%, 4/17/12(a)(b) | | | 22,998,562 | |
| 25,000,000 | | Massachusetts Mutual Life Insurance Co., 0.16%, 4/9/12(a)(b) | | | 24,999,222 | |
| 25,000,000 | | Metlife Short Term Funding LLC, 0.31%, 4/16/12(a)(b) | | | 24,996,986 | |
| 35,000,000 | | Metlife Short Term Funding LLC, 0.37%, 5/15/12(a)(b) | | | 34,984,532 | |
| | | | | | |
| | | | | 128,978,602 | |
| | | | | | |
Manufacturing — 2.44% | |
| 38,000,000 | | Illinois Tool Works, Inc., 0.14%, 4/2/12(a)(b) | | | 38,000,000 | |
| 50,000,000 | | Siemens Capital Co. LLC, 0.14%, 4/10/12(a)(b) | | | 49,998,444 | |
| 50,000,000 | | Siemens Capital Co. LLC, 0.15%, 4/11/12(a)(b) | | | 49,998,125 | |
| 141,476,000 | | Siemens Capital Co. LLC, 0.15%, 4/12/12(a)(b) | | | 141,470,105 | |
| 50,000,000 | | Siemens Capital Co. LLC, 0.16%, 4/10/12(a)(b) | | | 49,998,222 | |
| | | | | | |
| | | | | 329,464,896 | |
| | | | | | |
| |
Total Commercial Paper | | | 4,070,918,104 | |
| | | | | | |
| (Cost $4,070,918,104) | | | | |
7
|
SCHEDULE OF PORTFOLIO INVESTMENTS |
Prime Money Market Fund (cont.)
March 31, 2012 (Unaudited)
| | | | | | |
Principal Amount | | | | | Value | |
Certificates of Deposit, Domestic — 3.70% | | | | |
Banks - Domestic — 3.70% | | | | |
| $300,000,000 | | Citibank NA, 0.11%, 4/2/12 | | | $ 300,000,000 | |
| 200,000,000 | | Union Bank NA, 0.07%, 4/2/12 | | | 200,000,000 | |
| | | | | | |
| |
Total Certificates of Deposit, Domestic | | | 500,000,000 | |
| | | | | | |
(Cost $500,000,000) | | | | |
Certificates of Deposit, Yankee(c) — 10.90% | |
Banks - Australia & New Zealand — 1.04% | |
| 15,000,000 | | Westpac Banking Corp., 0.33%, 6/11/12 | | | 15,003,239 | |
| 50,000,000 | | Westpac Banking Corp., 0.33%, 6/15/12 | | | 50,000,000 | |
| 40,000,000 | | Westpac Banking Corp., 0.34%, 7/17/12 | | | 40,000,000 | |
| 36,000,000 | | Westpac Banking Corp., 0.40%, 5/10/12 | | | 36,006,471 | |
| | | | | | |
| | | | | 141,009,710 | |
| | | | | | |
Banks - Canadian — 5.64% | |
| 100,000,000 | | Bank of Montreal Chicago, 0.14%, 4/2/12 | | | 100,000,000 | |
| 100,000,000 | | Bank of Montreal Chicago, 0.14%, 4/4/12 | | | 100,000,000 | |
| 100,000,000 | | Bank of Montreal Chicago, 0.14%, 4/5/12 | | | 100,000,000 | |
| 150,000,000 | | Bank of Nova Scotia, 0.08%, 4/2/12 | | | 150,000,000 | |
| 100,000,000 | | Bank of Nova Scotia, 0.55%, 4/11/13 | | | 100,000,000 | |
| 63,000,000 | | Bank of Nova Scotia, 0.67%, 6/11/12 | | | 63,021,635 | |
| 23,500,000 | | Bank of Nova Scotia, 0.76%, 7/27/12 | | | 23,503,661 | |
| 25,000,000 | | Bank of Nova Scotia, 0.77%, 8/9/12 | | | 25,033,045 | |
| 100,000,000 | | Toronto Dominion Bank NY, 0.40%, 4/30/12 | | | 100,000,000 | |
| | | | | | |
| | | | | 761,558,341 | |
| | | | | | |
Banks - Foreign — 3.85% | |
| 50,000,000 | | Credit Suisse New York, 0.28%, 6/6/12 | | | 50,000,000 | |
| 50,000,000 | | DnB NOR Bank ASA, 0.27%, 6/6/12 | | | 50,000,000 | |
| 75,000,000 | | DnB NOR Bank ASA, 0.32%, 4/11/12 | | | 75,000,000 | |
| 29,275,000 | | Nordea Bank Finland NY, 0.88%, 4/13/12 | | | 29,277,253 | |
| 35,000,000 | | Nordea Bank Finland NY, 0.95%, 7/12/12 | | | 35,033,941 | |
| 50,000,000 | | Rabobank Nederland NY, 0.34%, 4/2/12 | | | 50,000,000 | |
| 100,000,000 | | Rabobank Nederland NY, 0.34%, 4/2/12 | | | 100,000,000 | |
| 40,000,000 | | Rabobank Nederland NY, 0.36%, 6/11/12 | | | 40,000,000 | |
| 40,000,000 | | Svenska Handelsbanken NY, 0.29%, 6/7/12 | | | 40,000,000 | |
| 50,000,000 | | Svenska Handelsbanken NY, 0.29%, 6/12/12 | | | 50,000,493 | |
| | | | | | |
| | | | | 519,311,687 | |
| | | | | | |
Banks - United Kingdom — 0.37% | |
| 50,000,000 | | Barclays Capital, Inc., 0.09%, 4/2/12 | | | 50,000,000 | |
| | | | | | |
| |
Total Certificates of Deposit, Yankee | | | 1,471,879,738 | |
| | | | | | |
| (Cost $1,471,879,738) | | | | |
Corporate Bonds — 15.71% | |
Agriculture — 0.42% | |
| 57,170,000 | | Archer-Daniels-Midland Co., 0.67%, 8/13/12(d) | | | 57,214,280 | |
| | | | | | |
8
|
SCHEDULE OF PORTFOLIO INVESTMENTS |
Prime Money Market Fund (cont.)
March 31, 2012 (Unaudited)
| | | | | | |
Principal Amount | | | | | Value | |
Banks - Australia & New Zealand — 1.74% | | | | |
| $ 75,000,000 | | Australia & New Zealand Banking Group Ltd, 0.39%, 6/1/12(a)(d) | | | $ 75,000,000 | |
| 100,000,000 | | Westpac Banking Corp., 0.54%, 9/7/12(a)(d) | | | 99,996,163 | |
| 60,000,000 | | Westpac Banking Corp., 0.62%, 4/3/12(a)(d) | | | 60,000,527 | |
| | | | | | |
| | | | | 234,996,690 | |
| | | | | | |
Banks - Domestic — 3.64% | |
| 42,745,000 | | Bank of America Corp. (FDIC Insured under TLGP), 0.85%, 4/30/12(d) | | | 42,757,892 | |
| 15,000,000 | | Bank of New York Mellon Corp., 4.50%, 4/1/13 | | | 15,599,850 | |
| 50,000,000 | | JPMorgan Chase Bank NA, 0.36%, 5/21/12(d) | | | 50,002,287 | |
| 100,000,000 | | JPMorgan Chase Bank NA, 0.36%, 4/19/13(d) | | | 99,881,060 | |
| 75,000,000 | | JPMorgan Chase Bank NA, 0.59%, 4/19/13(d) | | | 74,979,928 | |
| 85,995,000 | | Wells Fargo & Co., 0.69%, 4/23/12(d) | | | 86,012,474 | |
| 75,537,000 | | Wells Fargo & Co., 5.25%, 10/23/12 | | | 77,504,594 | |
| 10,000,000 | | Wells Fargo & Co., 5.50%, 5/1/13 | | | 10,502,176 | |
| 34,100,000 | | Wells Fargo Financial, Inc., 5.50%, 8/1/12 | | | 34,656,081 | |
| | | | | | |
| | | | | 491,896,342 | |
| | | | | | |
Banks - Foreign — 0.83% | |
| 12,033,000 | | Credit Suisse New York, 3.45%, 7/2/12 | | | 12,123,422 | |
| 100,000,000 | | Svenska Handelsbanken NY, 0.51%, 9/7/12(a)(d) | | | 100,000,000 | |
| | | | | | |
| | | | | 112,123,422 | |
| | | | | | |
Consumer Discretionary — 0.19% | |
| 25,000,000 | | Target Corp., 0.61%, 1/11/13(d) | | | 25,000,000 | |
| | | | | | |
Consumer Staples — 1.97% | |
| 263,800,000 | | Wal-Mart Stores, Inc. STEP, 5.23%, 6/1/12(d) | | | 265,938,576 | |
| | | | | | |
Finance - Diversified Domestic — 3.54% | |
| 11,050,000 | | ETC Holdings LLC, 0.21%, 4/1/28(d) | | | 11,050,000 | |
| 3,705,000 | | GBG LLC, 0.21%, 9/1/27(a)(d) | | | 3,705,000 | |
| 14,310,000 | | General Electric Capital Corp., 0.73%, 7/27/12(d) | | | 14,316,254 | |
| 45,000,000 | | General Electric Capital Corp., 2.80%, 1/8/13 | | | 45,717,718 | |
| 20,000,000 | | General Electric Capital Corp., 3.50%, 8/13/12 | | | 20,213,202 | |
| 29,835,000 | | General Electric Capital Corp., 5.00%, 4/10/12 | | | 29,863,990 | |
| 48,465,000 | | General Electric Capital Corp., 5.00%, 2/1/13 | | | 50,228,263 | |
| 4,000,000 | | General Electric Capital Corp., 5.25%, 10/19/12 | | | 4,094,278 | |
| 9,605,000 | | General Electric Capital Corp., 5.45%, 1/15/13 | | | 9,961,379 | |
| 70,946,000 | | General Electric Capital Corp., 6.00%, 6/15/12 | | | 71,727,002 | |
| 50,000,000 | | JPMorgan Chase & Co., 5.38%, 10/1/12 | | | 51,225,303 | |
| 31,321,000 | | JPMorgan Chase & Co., 6.95%, 8/10/12 | | | 32,019,348 | |
| 50,000,000 | | NGSP, Inc., 0.31%, 6/1/46(d) | | | 50,000,000 | |
| 9,660,000 | | Ring-Missouri LP, 1.32%, 9/1/18(d) | | | 9,660,000 | |
| 75,000,000 | | Twins Ballpark LLC, 0.24%, 10/1/34(a)(d) | | | 75,000,000 | |
| | | | | | |
| | | | | 478,781,737 | |
| | | | | | |
9
|
SCHEDULE OF PORTFOLIO INVESTMENTS |
Prime Money Market Fund (cont.)
March 31, 2012 (Unaudited)
| | | | | | |
Principal Amount | | | | Value | |
Health Care — 0.31% | |
| $ 30,000,000 | | AstraZeneca Plc, 5.40%, 9/15/12 | | | $ 30,670,590 | |
| 11,330,000 | | The Portland Clinic LLP, 0.25%, 11/20/33(d) | | | 11,330,000 | |
| | | | | | |
| | | | | 42,000,590 | |
| | | | | | |
Information Technology — 0.53% | |
| 55,625,000 | | IBM International Group Capital LLC, 5.05%, 10/22/12 | | | 57,060,428 | |
| 14,400,000 | | International Business Machines Corp., 4.75%, 11/29/12 | | | 14,802,295 | |
| | | | | | |
| | | | | 71,862,723 | |
| | | | | | |
Insurance — 2.54% | |
| 58,000,000 | | Berkshire Hathaway Finance Corp., 4.50%, 1/15/13 | | | 59,860,452 | |
| 25,000,000 | | MetLife Institutional Funding, Series II, 0.72%, 4/3/13(a)(d) | | | 25,000,000 | |
| 200,000,000 | | Metropolitan Life Global Funding, Series I, 0.71%, 7/6/12(a)(d) | | | 200,000,000 | |
| 15,865,000 | | Metropolitan Life Global Funding, Series I, 2.50%, 1/11/13(a) | | | 16,080,915 | |
| 25,000,000 | | New York Life Global Funding, 0.63%, 4/4/12(a)(d) | | | 25,000,241 | |
| 16,350,000 | | New York Life Global Funding, 5.25%, 10/16/12(a) | | | 16,765,452 | |
| | | | | | |
| | | | | 342,707,060 | |
| | | | | | |
| |
Total Corporate Bonds | | | 2,122,521,420 | |
| | | | | | |
(Cost $2,122,521,420) | | | | |
Municipal Bonds — 12.54% | |
California — 3.75% | |
| 55,450,000 | | Abag Finance Authority For Nonprofit Corps. Revenue, Series A, 0.18%, 12/15/37, (Credit Support: Fannie Mae)(d) | | | 55,450,000 | |
| 77,330,000 | | California Housing Finance Agency Revenue, Series F, 0.15%, 2/1/38, (LOC: Freddie Mac, Fannie Mae)(d) | | | 77,330,000 | |
| 5,000,000 | | California Statewide Communities Development Authority Revenue, Floaters Series 2114, 0.26%, 9/1/46(d) | | | 5,000,000 | |
| 27,297,000 | | County of San Bernardino Refunding Program COP, Series B, 0.30%, 3/1/17, (LOC: Bank of America NA)(d) | | | 27,297,000 | |
| 38,080,000 | | Los Angeles Department of Water & Power Revenue, Series RR-11625, 0.21%, 7/1/36, (Credit Support: BHAC, FGIC), Callable 7/1/12 @ 100(a)(d) | | | 38,080,000 | |
| 7,755,000 | | San Francisco City & County Housing Authority Refunding Revenue, 0.19%, 9/1/49, (LOC: Citibank NA)(d) | | | 7,755,000 | |
| 30,000,000 | | University of California Pension Funding Revenue, Series Y1, 0.32%, 7/1/12(d) | | | 30,000,000 | |
| 71,000,000 | | University of California TECP, 0.13%, 4/4/12(b) | | | 70,999,487 | |
| 71,000,000 | | University of California TECP, 0.13%, 4/5/12(b) | | | 70,999,231 | |
| 44,831,000 | | University of California TECP, 0.14%, 4/4/12(b) | | | 44,830,651 | |
| 48,300,000 | | University of California TECP, 0.15%, 4/5/12(b) | | | 48,299,396 | |
| 30,000,000 | | University of California TECP, 0.28%, 7/9/12(b) | | | 29,977,133 | |
| | | | | | |
| | | | | 506,017,898 | |
| | | | | | |
Connecticut — 0.30% | |
| 40,775,000 | | Connecticut Housing Finance Authority Revenue, 0.19%, 5/1/41(d) | | | 40,775,000 | |
| | | | | | |
10
|
SCHEDULE OF PORTFOLIO INVESTMENTS |
Prime Money Market Fund (cont.)
March 31, 2012 (Unaudited)
| | | | | | |
Principal Amount | | | | | Value | |
Georgia — 0.25% | |
| $34,440,000 | | Valdosta-Lowndes County Industrial Development Authority Revenue, Series B, 0.19%, 6/1/28, (LOC: Wells Fargo Bank)(d) | | | $ 34,440,000 | |
| | | | | | |
Kentucky — 0.56% | |
| 74,995,000 | | JPMorgan Chase Putters Drivers Trust Refunding Revenue, Series 4012, 0.19%, 12/12/12, (LOC: JPMorgan Chase Bank NA)(a)(d) | | | 74,995,000 | |
| 660,000 | | Lexington-Fayette Urban County Airport Board Refunding Revenue, Series C, 0.62%, 7/1/33, (LOC: JP Morgan Chase Bank)(d) | | | 660,000 | |
| | | | | | |
| | | | | 75,655,000 | |
| | | | | | |
Maryland — 0.08% | |
| 10,475,000 | | Montgomery County Housing Opportunites Commission Refunding Revenue, Series D, 0.18%, 7/1/39, (LOC: Fannie Mae, Freddie Mac)(d) | | | 10,475,000 | |
| | | | | | |
Michigan — 0.19% | |
| 25,000,000 | | Michigan Finance Authority Taxable School Loan Refunding Revenue, 0.17%, 9/1/50, (LOC: PNC Bank NA)(d) | | | 25,000,000 | |
| | | | | | |
Nebraska — 0.07% | |
| 10,000,000 | | Nebraska Investment Finance Authority Multi Family Housing Revenue, Series A, 0.22%, 10/1/42, (LOC: Citibank NA)(d) | | | 10,000,000 | |
| | | | | | |
New Jersey — 0.16% | |
| 21,495,000 | | New Jersey Health Care Facilities Financing Authority Barnabas Health Refunding Revenue, 0.21%, 7/1/38, (LOC: JPMorgan Chase Bank NA)(d) | | | 21,495,000 | |
| | | | | | |
New York — 0.76% | |
| 12,450,000 | | JPMorgan Chase Putters Drivers Trust Public Improvement Revenue, Series 4043, 0.20%, 4/1/14(a)(d) | | | 12,450,000 | |
| 9,895,000 | | New York City Capital Resources Corp. Nursing Home Revenue, Series B, 0.28%, 1/1/37, (LOC: Bank of America NA)(d) | | | 9,895,000 | |
| 23,375,000 | | New York City Capital Resources Corp. Nursing Home Revenue, Series B-1, 0.28%, 7/1/37, (LOC: Bank of America NA)(d) | | | 23,375,000 | |
| 40,305,000 | | New York City Housing Development Corp. Multi Family Housing Revenue, Series B, 0.17%, 4/15/36, (Credit Support: Fannie Mae)(d) | | | 40,305,000 | |
| 16,400,000 | | New York State Housing Finance Agency Revenue, West 37th St. Project, Series B, 0.27%, 5/1/42, (LOC: Wells Fargo Bank)(d) | | | 16,400,000 | |
| | | | | | |
| | | | | 102,425,000 | |
| | | | | | |
Ohio — 0.29% | |
| 9,680,000 | | City of Grove Multi Family Housing Regency Arms Apartment Revenue, 0.22%, 6/15/30, (Credit Support: Fannie Mae)(d) | | | 9,680,000 | |
| 29,000,000 | | Cleveland Apartment System Revenue, Series F, 0.19%, 1/1/33(d) | | | 29,000,000 | |
| | | | | | |
| | | | | 38,680,000 | |
| | | | | | |
11
|
SCHEDULE OF PORTFOLIO INVESTMENTS |
Prime Money Market Fund (cont.)
March 31, 2012 (Unaudited)
| | | | | | |
Principal Amount | | | | | Value | |
Pennsylvania — 0.70% | | | | |
| $ 40,900,000 | | Blair County Industrial Development Authority Refunding Revenue, 0.17%, 10/1/28, (LOC: PNC Bank NA)(d) | | | $ 40,900,000 | |
| 19,725,000 | | Derry Township Industrial & Commercial Development Authority Revenue, 0.17%, 11/1/30, (LOC: PNC Bank NA)(d) | | | 19,725,000 | |
| 33,400,000 | | Pennsylvania Economic Development Financing Authority Revenue, 0.27%, 11/1/28, (LOC: Bank of America NA)(d) | | | 33,400,000 | |
| | | | | | |
| | | | | 94,025,000 | |
| | | | | | |
South Dakota — 0.30% | | | | |
| 22,200,000 | | South Dakota Housing Development Authority Home Ownership Mortgage Revenue, Series C, 0.20%, 5/1/37(d) | | | 22,200,000 | |
| 18,600,000 | | South Dakota Housing Development Authority Home Ownership Mortgage Revenue, Series I, 0.20%, 5/1/38(d) | | | 18,600,000 | |
| | | | | | |
| | | | | 40,800,000 | |
| | | | | | |
Tennessee — 0.23% | | | | |
| 19,600,000 | | Johnson City Health & Educational Facilities Board Revenue, Series B2, 0.17%, 7/1/33, (LOC: PNC Bank NA)(d) | | | 19,600,000 | |
| 11,425,000 | | Metropolitan Government Nashville & Davidson County Health & Educational Facilities Board Revenue, 0.22%, 6/1/42, (LOC: Citibank NA)(d) | | | 11,425,000 | |
| | | | | | |
| | | | | 31,025,000 | |
| | | | | | |
Texas — 3.01% | | | | |
| 44,010,000 | | City of Houston Utilities System Refunding Revenue, Series D-1, 0.19%, 5/15/34, (Credit Support: AGM), (LOC: JP Morgan Chase Bank)(d) | | | 44,010,000 | |
| 200,000,000 | | JPMorgan Chase Putters Drivers Trust Cash Flow Management Revenue, Series 3944, 0.20%, 8/30/12(a)(d) | | | 200,000,000 | |
| 40,000,000 | | JPMorgan Chase Putters Drivers Trust Cash Flow Management Revenue, Series 3964, 0.20%, 8/30/12(a)(d) | | | 40,000,000 | |
| 60,000,000 | | JPMorgan Chase Putters Drivers Trust Cash Flow Management Revenue, Series 3984, 0.20%, 8/30/12(a)(d) | | | 60,000,000 | |
| 6,455,000 | | Texas State Veteran’s Fund Refunding GO, Series I-C, 0.20%, 12/1/25(d) | | | 6,455,000 | |
| 6,250,000 | | Texas State Veteran’s Fund Refunding GO, Series I-D, 0.20%, 6/1/20(d) | | | 6,250,000 | |
| 17,505,000 | | Texas State Veteran’s Fund Refunding GO, Series II-C, 0.20%, 6/1/29(d) | | | 17,505,000 | |
| 20,000,000 | | Texas State Veteran’s Housing GO, Series A-2, 0.16%, 12/1/29(d) | | | 20,000,000 | |
| 12,110,000 | | Texas State Veteran’s Housing Refunding GO, 0.20%, 6/1/31, (LOC: JP Morgan Chase Bank)(d) | | | 12,110,000 | |
| | | | | | |
| | | | | 406,330,000 | |
| | | | | | |
Utah — 0.06% | | | | |
| 8,175,000 | | Ogden City Redevelopment Agency Refunding Revenue, Series A, 0.19%, 6/1/31, (LOC: Wells Fargo Bank)(d) | | | 8,175,000 | |
| | | | | | |
12
|
SCHEDULE OF PORTFOLIO INVESTMENTS |
Prime Money Market Fund (cont.)
March 31, 2012 (Unaudited)
| | | | | | |
Principal Amount | | | | | Value | |
Virginia — 1.64% | | | | |
| $ 180,823,000 | | Federal Home Loan Mortgage Corp., Multi Family Housing Revenue, Series M017, Class A, 0.24%, 9/15/50, (Credit Support: Freddie Mac)(d) | | | $ 180,823,000 | |
| 15,905,000 | | Newport News Industrial Development Authority Industrial Improvement Revenue, Series B, 0.19%, 7/1/31, (LOC: Wells Fargo Bank)(d) | | | 15,905,000 | |
| 24,745,000 | | Stafford County & Staunton Industrial Development Authority Revenue, Series B1, 0.26%, 12/1/28, (LOC: Bank of America NA)(d) | | | 24,745,000 | |
| | | | | | |
| | | | | 221,473,000 | |
| | | | | | |
Washington — 0.19% | | | | |
| 26,300,000 | | Washington State Housing Finance Commission YMCA Greater Seattle Recreational Facility Revenue, 0.22%, 9/1/37, (LOC: Bank of America NA)(d) | | | 26,300,000 | |
| | | | | | |
Total Municipal Bonds | | | 1,693,090,898 | |
| | | | | | |
(Cost $1,693,090,898) | | | | |
| |
U.S. Government Agency Obligations — 9.39% | | | | |
Fannie Mae — 2.66% | | | | |
| 25,000,000 | | 0.23%, 1/2/13(b) | | | 24,956,554 | |
| 150,000,000 | | 0.21%, 11/14/13(d) | | | 149,927,145 | |
| 50,000,000 | | 0.33%, 12/3/12(d) | | | 50,027,123 | |
| 100,000,000 | | 0.08%, 4/2/12(b) | | | 100,000,000 | |
| 33,950,000 | | 0.35%, 5/1/12(d) | | | 33,940,428 | |
| | | | | | |
| | | | | 358,851,250 | |
| | | | | | |
Federal Farm Credit Bank — 1.69% | | | | |
| 18,080,000 | | 0.23%, 8/8/12(d) | | | 18,078,715 | |
| 16,265,000 | | 0.23%, 8/20/12(d) | | | 16,263,740 | |
| 88,525,000 | | 0.23%, 8/13/12(d) | | | 88,538,196 | |
| 44,000,000 | | 0.28%, 7/23/12(d) | | | 44,009,569 | |
| 62,020,000 | | 0.32%, 7/13/12(d) | | | 62,039,315 | |
| | | | | | |
| | | | | 228,929,535 | |
| | | | | | |
Federal Home Loan Bank — 1.99% | | | | |
| 27,000,000 | | 0.14%, 4/18/12(b) | | | 26,998,320 | |
| 100,000,000 | | 0.18%, 7/25/12(d) | | | 100,000,000 | |
| 50,000,000 | | 0.21%, 7/25/12(d) | | | 50,000,000 | |
| 91,000,000 | | 0.88%, 8/22/12 | | | 91,205,637 | |
| | | | | | |
| | | | | 268,203,957 | |
| | | | | | |
Freddie Mac — 3.05% | | | | |
| 187,000,000 | | 0.19%, 5/16/13(d) | | | 187,016,745 | |
13
|
SCHEDULE OF PORTFOLIO INVESTMENTS |
Prime Money Market Fund (cont.)
March 31, 2012 (Unaudited)
| | | | | | |
Principal Amount | | | | | Value | |
| $ 100,000,000 | | 0.19%, 6/17/13(d) | | | $ 99,976,575 | |
| 125,000,000 | | 0.20%, 3/21/13(d) | | | 125,061,134 | |
| | | | | | |
| | | | | 412,054,454 | |
| | | | | | |
Total U.S. Government Agency Obligations | | | 1,268,039,196 | |
| | | | | | |
(Cost $1,268,039,196) | | | | |
| |
U.S. Treasury Obligations — 1.30% | | | | |
U.S. Treasury Bills — 0.74% | | | | |
| 100,000,000 | | 0.10%, 4/19/12 | | | 99,995,278 | |
| | | | | | |
U.S. Treasury Notes — 0.56% | | | | |
| 75,000,000 | | 1.38%, 2/15/13 | | | 75,776,086 | |
| | | | | | |
Total U.S. Treasury Obligations | | | 175,771,364 | |
| | | | | | |
(Cost $175,771,364) | | | | |
| |
Repurchase Agreements — 15.77% | | | | |
| 215,000,000 | | Barclays Capital Inc. dated 3/30/12; due 4/2/12 at 0.08% with maturity value of $215,001,433 (fully collateralized by a US Treasury Note with a maturity date of 11/30/14 at a rate of 2.125%) | | | 215,000,000 | |
| 80,000,000 | | BNP Paribas Securities Corp. dated 3/30/12; due 4/2/12 at 0.05% with maturity value of $80,000,333 (fully collateralized by a US Treasury Bill with a maturity date of 8/30/12 at a rate of 0.00%) | | | 80,000,000 | |
| 80,000,000 | | BNP Paribas Securities Corp. dated 3/30/12; due 4/2/12 at 0.09% with maturity value of $80,000,600 (fully collateralized by Federal Home Loan Bank and Freddie Mac securities with maturity dates ranging from 10/26/12 to 5/27/16 at rates ranging from 0.19% to 2.50%) | | | 80,000,000 | |
| 105,000,000 | | BNP Paribas Securities Corp. dated 3/30/12; due 4/2/12 at 0.13% with maturity value of $105,001,137 (fully collateralized by Fannie Mae and Freddie Mac securities with maturity dates ranging from 9/1/26 to 3/1/42 at rates ranging from 3.50% to 6.50%) | | | 105,000,000 | |
| 100,000,000 | | BNP Paribas Securities Corp. dated 3/30/12; due 4/2/12 at 0.15% with maturity value of $100,001,250 (fully collateralized by Fannie Mae and Freddie Mac securities with maturity dates ranging from 11/1/36 to 3/1/42 at rates ranging from 4.00% to 6.50%) | | | 100,000,000 | |
| 200,000,000 | | Citibank N.A., dated 3/30/12; due 4/2/12 at 0.15% with maturity value of $200,002,500 (fully collateralized by Freddie Mac and Fannie Mae securities with maturity dates ranging from 9/1/25 to 10/1/41 at rates ranging from 3.50% to 5.50%) | | | 200,000,000 | |
| 20,000,000 | | Deutsche Bank Securities, dated 3/30/12; due 4/2/12 at 0.05% with maturity value of $20,000,083 (fully collateralized by a US Treasury Note with a maturity date of 5/15/14 at a rate of 4.75%) | | | 20,000,000 | |
14
|
SCHEDULE OF PORTFOLIO INVESTMENTS |
Prime Money Market Fund (cont.)
March 31, 2012 (Unaudited)
| | | | | | |
Principal Amount | | | | | Value | |
| $ 300,000,000 | | Goldman Sachs & Co. dated 3/28/12; due 4/2/12 at 0.20% with maturity value of $300,011,667 (fully collateralized by Fannie Mae and Freddie Mac securities with maturity dates ranging from 9/1/24 to 3/1/42 at rates ranging from 2.50% to 6.50%) | | | $ 300,000,000 | |
| 70,000,000 | | Goldman Sachs & Co. dated 3/30/12; due 4/2/12 at 0.08% with maturity value of $70,000,466 (fully collateralized by Fannie Mae and Freddie Mac securities with maturity dates ranging from 4/15/13 to 9/6/16 at rates ranging from 1.625% to 3.63%) | | | 70,000,000 | |
| 270,000,000 | | Goldman Sachs & Co. dated 3/30/12; due 4/2/12 at 0.15% with maturity value of $270,003,375 (fully collateralized by Fannie Mae and Freddie Mac securities with maturity dates ranging from 11/1/31 to 5/1/39 at rates ranging from 3.50% to 4.50%) | | | 270,000,000 | |
| 150,000,000 | | JP Morgan Securities dated 3/30/12; due 4/2/12 at 0.14% with maturity value of $150,001,750 (fully collateralized by Fannie Mae securities with maturity dates ranging from 3/1/16 to 4/1/42 at rates ranging from 3.00% to 6.50%) | | | 150,000,000 | |
| 40,000,000 | | Merrill Lynch, Pierce, Fenner, Smith. dated 3/30/12; due 4/2/12 at 0.03% with maturity value of $40,000,100 (fully collateralized by a US Treasury Bill with a maturity date of 2/07/13 at a rate of 0.000%) | | | 40,000,000 | |
| 200,000,000 | | Merrill Lynch, Pierce, Fenner, Smith. dated 3/30/12; due 4/2/12 at 0.14% with maturity value of $200,002,333 (fully collateralized by Fannie Mae securities with maturity dates ranging from 1/1/31 to 2/1/41 at rates ranging from 4.00% to 4.50%) | | | 200,000,000 | |
| 100,000,000 | | TD Securities (USA) LLC. dated 3/29/12; due 4/5/12 at 0.12% with maturity value of $100,002,333 (fully collateralized by US Treasury Notes with maturity dates ranging from 9/20/12 to 8/15/40 at rates ranging from 0.00% to 3.25%) | | | 100,000,000 | |
| 200,000,000 | | TD Securities (USA) LLC. dated 3/30/12; due 4/2/12 at 0.05% with maturity value of $200,000,833 (fully collateralized by US Treasury Notes with maturity dates ranging from 3/31/12 to 11/15/40 at rates ranging from 0.50% to 5.25%) | | | 200,000,000 | |
| | | | | | |
Total Repurchase Agreements | | | 2,130,000,000 | |
| | | | | | |
(Cost $2,130,000,000) | | | | |
| |
Total Investments | | | $13,603,547,755 | |
(Cost $13,603,547,755)(e) — 100.72% | | | | |
Liabilities in excess of other assets — (0.72)% | | | (97,717,734) | |
| | | | | | |
NET ASSETS — 100.00% | | | $13,505,830,021 | |
| | | | | | |
| (a) | Security exempt from registration under Rule 144A or Section 4(2) of the Securities Act of 1933, as amended. These securities may be resold in transactions exempt from registration, normally to qualified institutional buyers. Security has been deemed to be liquid based on procedures approved by the Board of Trustees. |
| (b) | Represents effective yield to maturity on date of purchase. |
| (c) | Issuer is a U.S. branch of a foreign domiciled bank. |
15
|
SCHEDULE OF PORTFOLIO INVESTMENTS |
Prime Money Market Fund (cont.)
March 31, 2012 (Unaudited)
| (d) | Variable rate security. The rate reflected in the Schedule of Portfolio Investments is the rate in effect on March 31, 2012. The maturity date represents the actual maturity date. The security’s effective maturity resets periodically. |
| (e) | Tax cost of securities is equal to book cost of securities. |
Abbreviations used are defined below:
AGM - Assured Guaranty Municipal
BHAC - Berkshire Hathaway Assurance Corp.
COP - Certificate of Participation
FDIC - Federal Deposit Insurance Corp.
FGIC - Insured by Federal Guaranty Insurance Corp.
GO - General Obligation
LOC - Letter of Credit
STEP - Step Coupon Bond
TECP - Tax Exempt Commercial Paper
TLGP - Temporary Liquidity Guarantee Program
See notes to financial statements.
16
|
SCHEDULE OF PORTFOLIO INVESTMENTS |
U.S. Government Money Market Fund
March 31, 2012 (Unaudited)
| | | | | | |
Principal Amount | | | | | Value | |
FDIC-TLGP Backed Corporate Bonds — 14.09% | | | | |
Banks - Domestic — 4.78% | | | | |
| $ 2,740,000 | | Bank of America Corp., 0.67%, 6/22/12(a) | | | $ 2,741,621 | |
| 25,000,000 | | Bank of America Corp., 0.85%, 6/22/12(a) | | | 25,026,331 | |
| 26,015,000 | | Bank of America Corp., 2.10%, 4/30/12 | | | 26,053,337 | |
| 25,000,000 | | Bank of America Corp., 2.38%, 6/22/12 | | | 25,120,093 | |
| 43,096,000 | | Bank of America Corp., 3.13%, 6/15/12 | | | 43,342,837 | |
| 15,990,000 | | Citibank NA, 0.45%, 6/4/12(a) | | | 15,998,386 | |
| 20,280,000 | | Citibank NA, 0.56%, 5/7/12(a) | | | 20,282,206 | |
| 106,110,000 | | Citibank NA, 1.88%, 5/7/12 | | | 106,279,891 | |
| 3,890,000 | | Citibank NA, 1.88%, 6/4/12 | | | 3,900,798 | |
| 8,535,000 | | Wells Fargo & Co., 2.13%, 6/15/12 | | | 8,568,910 | |
| | | | | | |
| | | | | 277,314,410 | |
| | | | | | |
Finance - Diversified Domestic — 9.31% | | | | |
| 46,435,000 | | Citigroup Funding, Inc., 0.88%, 4/30/12(a) | | | 46,456,144 | |
| 15,519,000 | | Citigroup Funding, Inc., 1.88%, 11/15/12 | | | 15,675,812 | |
| 72,024,000 | | Citigroup Funding, Inc., 2.13%, 4/30/12 | | | 72,129,786 | |
| 59,052,000 | | Citigroup Funding, Inc., 2.13%, 7/12/12 | | | 59,379,176 | |
| 6,780,000 | | General Electric Capital Corp., 0.47%, 5/8/12(a) | | | 6,780,231 | |
| 25,000,000 | | General Electric Capital Corp., 2.20%, 6/8/12 | | | 25,087,838 | |
| 120,000,000 | | Goldman Sachs Group, Inc., 3.25%, 6/15/12 | | | 120,734,913 | |
| 55,650,000 | | JPMorgan Chase & Co., 0.70%, 6/15/12(a) | | | 55,686,119 | |
| 2,400,000 | | JPMorgan Chase & Co., 0.85%, 6/22/12(a) | | | 2,402,391 | |
| 71,365,000 | | JPMorgan Chase & Co., 2.13%, 6/22/12 | | | 71,658,582 | |
| 16,715,000 | | JPMorgan Chase & Co., 2.20%, 6/15/12 | | | 16,779,903 | |
| 3,435,000 | | Morgan Stanley, 0.82%, 6/20/12(a) | | | 3,438,109 | |
| 7,500,000 | | PNC Funding Corp., 0.78%, 4/1/12(a) | | | 7,500,000 | |
| 27,341,000 | | PNC Funding Corp., 2.30%, 6/22/12 | | | 27,468,079 | |
| 9,500,000 | | State Street Corp., 2.15%, 4/30/12 | | | 9,514,431 | |
| | | | | | |
| | | | | 540,691,514 | |
| | | | | | |
Total FDIC-TLGP Backed Corporate Bonds | | | 818,005,924 | |
| | | | | | |
(Cost $818,005,924) | | | | |
U.S. Government Agency Backed Municipal Bonds — 12.83% | | | | |
California — 6.31% | | | | |
| 36,000,000 | | Abag Finance Authority For Nonprofit Corps. Lakeside Village Apartments Revenue, 0.16%, 10/1/46, (Credit Support: Freddie Mac)(a) | | | 36,000,000 | |
| 6,700,000 | | California Housing Finance Agency Revenue, Series B, 0.14%, 8/1/36, (LOC: Fannie Mae, Freddie Mac)(a) | | | 6,700,000 | |
| 64,400,000 | | California Housing Finance Agency Revenue, Series B, 0.15%, 2/1/35, (LOC: Freddie Mac, Fannie Mae)(a) | | | 64,400,000 | |
| 39,230,000 | | California Housing Finance Agency Revenue, Series D, 0.17%, 8/1/33, (LOC: Fannie Mae, Freddie Mac)(a) | | | 39,230,000 | |
| 55,685,000 | | California Housing Finance Agency Revenue, Series F, 0.15%, 2/1/37, (LOC: Freddie Mac, Fannie Mae)(a) | | | 55,685,000 | |
17
|
SCHEDULE OF PORTFOLIO INVESTMENTS |
U.S. Government Money Market Fund (cont.)
March 31, 2012 (Unaudited)
| | | | | | |
Principal Amount | | | | | Value | |
| $ 27,420,000 | | California Housing Finance Agency Revenue, Series J, 0.17%, 2/1/32, (LOC: Fannie Mae, Freddie Mac)(a) | | | $ 27,420,000 | |
| 14,860,000 | | California Housing Finance Agency Revenue, Series K, 0.15%, 8/1/34, (LOC: Freddie Mac, Fannie Mae)(a) | | | 14,860,000 | |
| 14,600,000 | | California Statewide Communities Development Agency Multi Family Revenue, Series DD, 0.18%, 10/15/36, (Credit Support: Fannie Mae)(a) | | | 14,600,000 | |
| 10,750,000 | | California Statewide Communities Development Authority Multi Family Revenue, Series E, 0.19%, 12/15/35, (Credit Support: Fannie Mae)(a) | | | 10,750,000 | |
| 29,320,000 | | California Statewide Communities Development Authority Single Family Revenue, Series NN-1, 0.18%, 11/15/37, (Credit Support: Fannie Mae)(a) | | | 29,320,000 | |
| 8,600,000 | | City of San Jose Cinnabar Commons Revenue, Series C, 0.18%, 2/1/37, (Credit Support: Freddie Mac)(a) | | | 8,600,000 | |
| 12,595,000 | | San Diego Housing Authority Hillside Garden Apartment Revenue, Series B, 0.18%, 1/15/35, (Credit Support: Fannie Mae)(a) | | | 12,595,000 | |
| 20,800,000 | | San Francisco City & County Housing Authority City Heights Apartments Refunding Revenue, Series A, 0.18%, 6/15/25, (Credit Support: Fannie Mae)(a) | | | 20,800,000 | |
| 25,200,000 | | San Francisco City and County Redevelopment Agency Revenue, Series C, 0.15%, 6/15/34, (Credit Support: Fannie Mae)(a) | | | 25,200,000 | |
| | | | | | |
| | | | | 366,160,000 | |
| | | | | | |
Colorado — 0.84% | | | | |
| 10,100,000 | | Colorado Housing & Finance Authority Refunding Revenue, Class I, Series A2, 0.14%, 5/1/38, (LOC: Fannie Mae, Freddie Mac)(a) | | | 10,100,000 | |
| 14,700,000 | | Colorado Housing & Finance Authority Refunding Revenue, Class I, Series B1, 0.17%, 5/1/38, (LOC: Fannie Mae, Freddie Mac)(a) | | | 14,700,000 | |
| 9,535,000 | | Colorado Housing & Finance Authority Refunding Revenue, Class I, Series C1, 0.17%, 11/1/32, (LOC: Fannie Mae, Freddie Mac)(a) | | | 9,535,000 | |
| 2,500,000 | | Colorado Housing & Finance Authority Taxable Revenue, Class 1, Series A1, 0.14%, 11/1/37, (Credit Support: GO of Authority), (LOC: Fannie Mae, Freddie Mac)(a) | | | 2,500,000 | |
| 1,000,000 | | Colorado Housing & Finance Authority Taxable Revenue, Class 1, Series B1, 0.14%, 11/1/36, (LOC: Fannie Mae, Freddie Mac)(a) | | | 1,000,000 | |
| 1,000,000 | | Colorado Housing & Finance Authority Taxable Revenue, Class 1, Series C1, 0.14%, 11/1/36, (LOC: Fannie Mae, Freddie Mac)(a) | | | 1,000,000 | |
| 9,775,000 | | Colorado Housing & Finance Authority Taxable Revenue, Series B-1, 0.14%, 11/1/33, (LOC: Fannie Mae, Freddie Mac)(a) | | | 9,775,000 | |
| | | | | | |
| | | | | 48,610,000 | |
| | | | | | |
Indiana — 0.48% | | | | |
| 27,700,000 | | City of Indianapolis Lakeside Pointe & Fox Club Refunding Revenue, 0.19%, 11/15/37, (Credit Support: Fannie Mae)(a) | | | 27,700,000 | |
| | | | | | |
18
|
SCHEDULE OF PORTFOLIO INVESTMENTS |
U.S. Government Money Market Fund (cont.)
March 31, 2012 (Unaudited)
| | | | | | |
Principal Amount | | | | | Value | |
Louisiana — 0.21% | | | | |
| $ 12,600,000 | | Louisiana Public Facilities Authority Refunding Revenue, 0.19%, 4/1/36, (Credit Support: Freddie Mac)(a) | | | $ 12,600,000 | |
| | | | | | |
Michigan — 0.31% | | | | |
| 9,435,000 | | Lansing Economic Development Corp. Parking Facility Improvement Revenue, 0.24%, 3/1/42, (LOC: Federal Home Loan Bank)(a) | | | 9,435,000 | |
| 8,400,000 | | Michigan State Housing Development Authority Refunding Revenue, Series C, 0.17%, 6/1/39, (LOC: Fannie Mae, Freddie Mac)(a) | | | 8,400,000 | |
| | | | | | |
| | | | | 17,835,000 | |
| | | | | | |
New York — 3.04% | | | | |
| 14,205,000 | | New York City Housing Development Corp. First Avenue Development Revenue, Series A, 0.18%, 10/15/35, (Credit Support: Fannie Mae)(a) | | | 14,205,000 | |
| 22,370,000 | | New York City Housing Development Corp. Related-Monterey Revenue, Series A, 0.15%, 11/15/19, (Credit Support: Fannie Mae)(a) | | | 22,370,000 | |
| 37,500,000 | | New York City Housing Development Corp. West 61st. Street Apartments Revenue, Series A, 0.17%, 12/15/37, (Credit Support: Fannie Mae)(a) | | | 37,500,000 | |
| 20,000,000 | | New York State Housing Finance Agency 150 East 44th Street Revenue, Series A, 0.19%, 5/15/32, (Credit Support: Fannie Mae)(a) | | | 20,000,000 | |
| 7,500,000 | | New York State Housing Finance Agency 38 Street Revenue, Series B, 0.14%, 5/15/33, (Credit Support: Fannie Mae)(a) | | | 7,500,000 | |
| 25,000,000 | | New York State Housing Finance Agency Clinton Green North Revenue, Series A, 0.17%, 11/1/38, (Credit Support: Freddie Mac)(a) | | | 25,000,000 | |
| 41,750,000 | | New York State Housing Finance Agency North End Revenue, Series A, 0.17%, 11/15/36, (Credit Support: Fannie Mae)(a) | | | 41,750,000 | |
| 8,000,000 | | New York State Housing Finance Agency W. 23 Street Revenue, Series B, 0.14%, 5/15/33, (Credit Support: Fannie Mae)(a) | | | 8,000,000 | |
| | | | | | |
| | | | | 176,325,000 | |
| | | | | | |
Tennessee — 0.14% | | | | |
| 8,210,000 | | Shelby County Health Educational & Housing Facilities Board Revenue, 0.18%, 12/15/37, (Credit Support: Fannie Mae)(a) | | | 8,210,000 | |
| | | | | | |
Virginia — 1.50% | | | | |
| 53,870,000 | | Federal Home Loan Mortgage Corp. Multi Family Housing Revenue, Series MO15, Class A, 0.24%, 5/15/46, (Credit Support: Freddie Mac)(a) | | | 53,870,000 | |
19
|
SCHEDULE OF PORTFOLIO INVESTMENTS |
U.S. Government Money Market Fund (cont.)
March 31, 2012 (Unaudited)
| | | | | | |
Principal Amount | | | | | Value | |
| $ 33,280,000 | | Federal Home Loan Mortgage Corp. Multi Family Housing Revenue, Series MO21, Class A, 0.24%, 6/15/36, (Credit Support: Freddie Mac)(a) | | | $ 33,280,000 | |
| | | | | | |
| | | | | 87,150,000 | |
| | | | | | |
Total U.S. Government Agency Backed Municipal Bonds | | | 744,590,000 | |
| | | | | | |
(Cost $744,590,000) | | | | |
U.S. Government Agency Obligations — 53.48% | | | | |
Fannie Mae — 24.19% | | | | |
| 89,000,000 | | 0.06%, 4/2/12(b) | | | 89,000,000 | |
| 15,000,000 | | 0.06%, 4/2/12(b) | | | 15,000,000 | |
| 125,000,000 | | 0.06%, 4/2/12(b) | | | 125,000,000 | |
| 67,380,707 | | 0.07%, 4/2/12(b) | | | 67,380,707 | |
| 31,053,000 | | 0.07%, 4/2/12(b) | | | 31,053,000 | |
| 42,800,000 | | 0.07%, 5/1/12(b) | | | 42,797,500 | |
| 180,000,000 | | 0.08%, 4/2/12(b) | | | 180,000,000 | |
| 35,326,000 | | 0.08%, 5/1/12(b) | | | 35,323,866 | |
| 55,000,000 | | 0.10%, 7/11/12(b) | | | 54,985,486 | |
| 66,624,000 | | 0.15%, 7/2/12(b) | | | 66,599,159 | |
| 41,000,000 | | 0.15%, 10/1/12(b) | | | 40,968,908 | |
| 25,000,000 | | 0.19%, 10/1/12(b) | | | 24,975,986 | |
| 10,000,000 | | 0.19%, 1/3/13(b) | | | 9,985,433 | |
| 12,710,000 | | 0.19%, 1/8/13(b) | | | 12,691,150 | |
| 39,200,000 | | 0.19%, 1/4/13(b) | | | 39,142,692 | |
| 25,000,000 | | 0.21%, 11/14/13(a) | | | 24,987,858 | |
| 87,381,600 | | 0.23%, 1/2/13(b) | | | 87,229,744 | |
| 52,080,000 | | 0.23%, 7/26/12(a) | | | 52,086,677 | |
| 25,000,000 | | 0.23%, 8/12/13(a) | | | 25,003,572 | |
| 113,030,700 | | 0.25%, 4/2/12(b) | | | 113,030,700 | |
| 100,143,000 | | 0.26%, 8/23/12(a) | | | 100,166,966 | |
| 122,420,000 | | 0.33%, 12/3/12(a) | | | 122,486,398 | |
| 5,151,000 | | 0.38%, 12/28/12 | | | 5,157,520 | |
| 38,000,000 | | 3.63%, 2/12/13 | | | 39,126,569 | |
| | | | | | |
| | | | | 1,404,179,891 | |
| | | | | | |
Federal Farm Credit Bank — 5.72% | | | | |
| 75,000,000 | | 0.18%, 8/1/12(a) | | | 74,997,641 | |
| 17,750,000 | | 0.21%, 7/24/13(a) | | | 17,760,791 | |
| 11,000,000 | | 0.23%, 2/22/13(a) | | | 11,005,036 | |
| 80,000,000 | | 0.25%, 7/9/12(a) | | | 80,008,714 | |
| 101,000,000 | | 0.26%, 5/14/12(a) | | | 101,009,528 | |
| 47,000,000 | | 0.39%, 8/15/12(a) | | | 46,994,742 | |
| | | | | | |
| | | | | 331,776,452 | |
| | | | | | |
Federal Home Loan Bank — 12.32% | | | | |
| 100,000,000 | | 0.08%, 5/30/12(b) | | | 99,987,917 | |
| 140,000,000 | | 0.09%, 4/13/12(b) | | | 139,996,364 | |
| 15,000,000 | | 0.14%, 4/18/12(b) | | | 14,999,067 | |
20
|
SCHEDULE OF PORTFOLIO INVESTMENTS |
U.S. Government Money Market Fund (cont.)
March 31, 2012 (Unaudited)
| | | | | | |
Principal Amount | | | | Value | |
| $ 50,000,000 | | 0.15%, 5/1/12 | | $ | 49,997,918 | |
| 10,000,000 | | 0.17%, 12/27/12(a) | | | 10,001,878 | |
| 115,000,000 | | 0.18%, 7/25/12(a) | | | 115,000,000 | |
| 75,000,000 | | 0.21%, 7/25/12(a) | | | 75,000,000 | |
| 210,350,000 | | 0.25%, 7/25/12 | | | 210,429,305 | |
| | | | | | |
| | | | | 715,412,449 | |
| | | | | | |
Freddie Mac — 11.15% | | | | |
| 70,000,000 | | 0.07%, 6/4/12(b) | | | 69,991,425 | |
| 22,950,000 | | 0.18%, 11/2/12(a) | | | 22,955,625 | |
| 100,000,000 | | 0.19%, 5/16/13(a) | | | 100,005,922 | |
| 40,000,000 | | 0.19%, 6/17/13(a) | | | 39,990,630 | |
| 14,700,000 | | 0.19%, 1/7/13(b) | | | 14,678,277 | |
| 75,000,000 | | 0.20%, 3/21/13(a) | | | 75,036,680 | |
| 75,000,000 | | 0.21%, 4/3/12(a) | | | 75,000,322 | |
| 95,175,000 | | 0.22%, 5/11/12(a) | | | 95,179,754 | |
| 5,395,000 | | 0.38%, 11/30/12 | | | 5,401,467 | |
| 8,456,000 | | 0.75%, 12/28/12 | | | 8,490,069 | |
| 95,000,000 | | 4.50%, 1/15/13 | | | 98,196,857 | |
| 41,717,000 | | 5.13%, 7/15/12 | | | 42,299,873 | |
| | | | | | |
| | | | | 647,226,901 | |
| | | | | | |
Overseas Private Investment Corp. — 0.10% | | | | |
| 1,400,000 | | 0.12%, 3/15/15(a) | | | 1,400,000 | |
| 4,622,061 | | 0.12%, 11/15/13(a) | | | 4,622,061 | |
| | | | | | |
| | | | | 6,022,061 | |
| | | | | | |
Total U.S. Government Agency Obligations | | | 3,104,617,754 | |
| | | | | | |
(Cost $3,104,617,754) | | | | |
| |
U.S. Treasury Obligations — 4.17% | | | | |
U.S. Treasury Bills — 2.34% | | | | |
| 44,000,000 | | 0.07%, 4/5/12(b) | | | 43,999,762 | |
| 50,000,000 | | 0.10%, 4/19/12(b) | | | 49,997,639 | |
| 42,000,000 | | 0.11%, 7/12/12(b) | | | 41,987,569 | |
| | | | | | |
U.S. Treasury Notes — 1.83% | | | | |
| 75,000,000 | | 1.38%, 2/15/13 | | | 75,770,865 | |
| 30,000,000 | | 1.75%, 4/15/13 | | | 30,462,081 | |
| | | | | | |
Total U.S. Treasury Obligations | | | 242,217,916 | |
| | | | | | |
(Cost $242,217,916) | | | | |
| |
Repurchase Agreements — 17.43% | | | | |
| 70,000,000 | | Barclays Capital, Inc. dated 3/30/12; due 4/2/12 at 0.08% with maturity value of $70,000,467 (fully collateralized by a US Treasury Note with a maturity date of 11/30/13 at a rate of 0.25%) | | | 70,000,000 | |
21
|
SCHEDULE OF PORTFOLIO INVESTMENTS |
U.S. Government Money Market Fund (cont.)
March 31, 2012 (Unaudited)
| | | | | | |
Principal Amount | | | | Value | |
| $ 55,000,000 | | BNP Paribas Securities Corp. dated 3/30/12; due 4/2/12 at 0.05% with maturity value of $55,000,229 (fully collateralized by a US Treasury Bill with a maturity date of 8/30/12 at a rate of 0.00%) | | | $ 55,000,000 | |
| 100,000,000 | | BNP Paribas Securities Corp. dated 3/30/12; due 4/2/12 at 0.13% with maturity value of $100,001,083 (fully collateralized by Fannie Mae and Freddie Mac securities with maturity dates ranging from 2/1/23 to 3/1/42 at rates ranging from 3.50% to 6.00%) | | | 100,000,000 | |
| 200,000,000 | | Citibank N.A., dated 3/30/12; due 4/2/12 at 0.15% with maturity value of $200,002,500 (fully collateralized by Fannie Mae, Ginnie Mae and Freddie Mac securities with maturity dates ranging from 10/1/24 to 7/1/41 at rates ranging from 3.50% to 6.00%) | | | 200,000,000 | |
| 12,000,000 | | Deutsche Bank Securities, dated 3/30/12; due 4/2/12 at 0.10% with maturity value of $12,000,100 (fully collateralized by a US Treasury Bill with a maturity date of 4/26/12 at a rate of 0.00%) | | | 12,000,000 | |
| 150,000,000 | | Goldman Sachs & Co. dated 3/28/12; due 4/4/12 at 0.20% with maturity value of $150,005,833 (fully collateralized by Fannie Mae and Freddie Mac securities with maturity dates ranging from 2/1/26 to 9/1/41 at rates ranging from 3.50% to 5.00%) | | | 150,000,000 | |
| 100,000,000 | | Goldman Sachs & Co. dated 3/30/12; due 4/2/12 at 0.15% with maturity value of $100,001,250 (fully collateralized by Fannie Mae and Freddie Mac securities with maturity dates ranging from 4/1/38 to 8/1/39 at a rate of 5.00%) | | | 100,000,000 | |
| 50,000,000 | | JP Morgan Securities dated 3/30/12; due 4/2/12 at 0.14% with maturity value of $50,000,583 (fully collateralized by Fannie Mae securities with maturity dates ranging from 2/1/22 to 4/1/42 at rates ranging from 2.50% to 4.50%) | | | 50,000,000 | |
| 25,000,000 | | Merrill Lynch, Pierce, Fenner, Smith. dated 3/30/12; due 4/2/12 at 0.03% with maturity value of $25,000,062 (fully collateralized by a US Treasury Bill with a maturity date of 9/27/12 at a rate of 0.000%) | | | 25,000,000 | |
| 150,000,000 | | Merrill Lynch, Pierce, Fenner, Smith. dated 3/30/12; due 4/2/12 at 0.14% with maturity value of $150,001,750 (fully collateralized by a Fannie Mae security with a maturity date of 7/1/40 at a rate of 4.00%) | | | 150,000,000 | |
| 50,000,000 | | TD Securities (USA) LLC. dated 3/29/12; due 4/5/12 at 0.12% with maturity value of $50,001,167 (fully collateralized by US Treasury Notes with maturity dates ranging from 7/15/17 to 11/15/39 at rates ranging from 0.00% to 2.625%) | | | 50,000,000 | |
| 50,000,000 | | TD Securities (USA) LLC. dated 3/30/12; due 4/2/12 at 0.05% with maturity value of $50,000,208 (fully collateralized by a US Treasury Note with a maturity date of 11/15/15 at a rate of 4.50%) | | | 50,000,000 | |
| | | | | | |
Total Repurchase Agreements | | | 1,012,000,000 | |
| | | | | | |
(Cost $1,012,000,000) | | | | |
22
|
SCHEDULE OF PORTFOLIO INVESTMENTS |
U.S. Government Money Market Fund (cont.)
March 31, 2012 (Unaudited)
| | | | |
Total Investments | | $ | 5,921,431,594 | |
(Cost $5,921,431,594)(c) — 102.00% | | | | |
Liabilities in excess of other assets — (2.00)% | | | (116,209,990 | ) |
| | | | |
NET ASSETS — 100.00% | | $ | 5,805,221,604 | |
| | | | |
| (a) | Variable rate security. The rate reflected in the Schedule of Portfolio Investments is the rate in effect on March 31, 2012. The maturity date represents the actual maturity date. The security’s effective maturity resets periodically. |
| (b) | Represents effective yield to maturity on date of purchase. |
| (c) | Tax cost of securities is equal to book cost of securities. |
Abbreviations used are defined below:
FDIC - Federal Deposit Insurance Corp.
GO - General Obligation
LOC - Letter of Credit
TLGP - Temporary Liquidity Guaranty Program
See notes to financial statements.
23
|
SCHEDULE OF PORTFOLIO INVESTMENTS |
Tax-Free Money Market Fund
March 31, 2012 (Unaudited)
| | | | | | |
Principal Amount | | | | Value | |
Municipal Bonds — 99.47% | | | | |
Alaska — 0.72% | | | | |
| $ 10,000,000 | | Alaska International Airports System Refunding Revenue, Series A, 0.16%, 10/1/30, (LOC: State Street Bank & Trust Co.)(a) | | | $ 10,000,000 | |
| | | | | | |
Arizona — 0.83% | | | | |
| 3,000,000 | | Arizona Health Facilities Authority, Banner Health Refunding Revenue, Series B, 0.16%, 1/1/35, (LOC: Scotia Bank)(a) | | | 3,000,000 | |
| 2,960,000 | | Maricopa County Industrial Development Authority Gran Victoria Housing Revenue, Series A, 0.18%, 4/15/30, (Credit Support: Fannie Mae)(a) | | | 2,960,000 | |
| 5,700,000 | | Pima County Industrial Development Authority Delaware Military Academy Revenue, 0.18%, 9/1/38, (LOC: PNC Bank NA)(a) | | | 5,700,000 | |
| | | | | | |
| | | | | 11,660,000 | |
| | | | | | |
California — 5.69% | | | | |
| 10,000,000 | | California Affordable Housing Agency Revenue, Series A, 0.18%, 9/15/33, (Credit Support: Fannie Mae)(a) | | | 10,000,000 | |
| 6,725,000 | | California Health Facilities Financing Authority Revenue, 0.17%, 3/1/47, (LOC: Bank of Montreal)(a) | | | 6,725,000 | |
| 14,695,000 | | California Infrastructure & Economic Development Bank, J. Paul Getty Trust Refunding Revenue, Series A-4, 0.17%, 10/1/47(a) | | | 14,695,000 | |
| 6,500,000 | | City of Ontario Housing Authority, Park Centre Apartments Refunding Revenue, 0.18%, 12/1/35, (Credit Support: Freddie Mac)(a) | | | 6,500,000 | |
| 17,695,000 | | City of Simi Valley Refunding Revenue, Series A, 0.19%, 7/1/23, (Credit Support: Freddie Mac)(a) | | | 17,695,000 | |
| 7,900,000 | | City of Tracy Sycamores Apartments Refunding Revenue, Series A, 0.17%, 5/1/15, (LOC: Freddie Mac)(a) | | | 7,900,000 | |
| 5,675,000 | | City of Vacaville Sycamores Apartments Refunding Revenue, Series A, 0.18%, 5/15/29, (Credit Support: Fannie Mae)(a) | | | 5,675,000 | |
| 5,600,000 | | County of San Bernardino Sycamore Terrace Refunding Revenue, Series A, 0.17%, 5/15/29, (Credit Support: Fannie Mae)(a) | | | 5,600,000 | |
| 4,900,000 | | Sacramento County Housing Authority Refunding Revenue, Series C, 0.17%, 7/15/29, (Credit Support: Fannie Mae)(a) | | | 4,900,000 | |
| | | | | | |
| | | | | 79,690,000 | |
| | | | | | |
Colorado — 2.29% | | | | |
| 3,170,000 | | Aurora Centretech Metropolitan District Refunding GO, Series C, 0.21%, 12/1/28, (LOC: U.S. Bank NA)(a) | | | 3,170,000 | |
| 1,250,000 | | Colorado Health Facilities Authority Arapahoe Housing Project Revenue, Series A, 0.30%, 4/1/24, (LOC: Wells Fargo Bank)(a) | | | 1,250,000 | |
| 5,700,000 | | Colorado Health Facilities Authority Crossroads Maranatha Project Refunding Revenue, 0.19%, 12/1/43, (LOC: U.S Bank NA)(a) | | | 5,700,000 | |
| 5,000,000 | | Commerce City Northern Infrastructure General Improvement District GO, 0.21%, 12/1/28, (LOC: U.S. Bank NA)(a) | | | 5,000,000 | |
| 3,475,000 | | County of Pitkin Refunding Revenue, Series A, 0.20%, 12/1/24, (LOC: U.S. Bank NA)(a) | | | 3,475,000 | |
24
|
SCHEDULE OF PORTFOLIO INVESTMENTS |
Tax-Free Money Market Fund (cont.)
March 31, 2012 (Unaudited)
| | | | | | |
Principal Amount | | | | Value | |
| $ 5,035,000 | | Gateway Regional Metropolitan District Refunding GO, 0.30%, 12/1/37, (LOC: Wells Fargo Bank)(a) | | | $ 5,035,000 | |
| 5,100,000 | | Jefferson County School District R1 Cash Flow Management GO, Series A, 1.50%, 6/29/12 | | | 5,115,340 | |
| 2,795,000 | | Meridian Ranch Metropolitan District Refunding GO, 0.21%, 12/1/38, (LOC: U.S. Bank NA)(a) | | | 2,795,000 | |
| 485,000 | | Parker Automotive Metropolitan District GO, 0.21%, 12/1/34, (LOC: U.S. Bank NA)(a) | | | 485,000 | |
| | | | | | |
| | | | | 32,025,340 | |
| | | | | | |
District Of Columbia — 1.01% | | | | |
| 4,195,000 | | District of Columbia Children’s Defense Fund Refunding Revenue, 0.29%, 4/1/22, (LOC: Wells Fargo Bank)(a) | | | 4,195,000 | |
| 1,600,000 | | District of Columbia Internships and Academic Revenue, 0.18%, 7/1/36, (LOC: Branch Banking & Trust)(a) | | | 1,600,000 | |
| 4,400,000 | | District of Columbia Jesuit Conference Revenue, 0.19%, 10/1/37, (LOC: PNC Bank NA)(a) | | | 4,400,000 | |
| 3,980,000 | | District of Columbia Water & Sewer Authority Refunding Revenue, Putters Series 3022, 0.21%, 4/1/16, (Credit Support: Assured GTY)(a) | | | 3,980,000 | |
| | | | | | |
| | | | | 14,175,000 | |
| | | | | | |
Florida — 4.85% | | | | |
| 2,525,000 | | Collier County Industrial Development Authority Revenue, 0.47%, 12/1/26, (LOC: Bank of America NA)(a) | | | 2,525,000 | |
| 15,000,000 | | County of Palm Beach Pine Crest Preparatory Refunding Revenue, 0.29%, 6/1/38, (LOC: Bank of America NA)(a) | | | 15,000,000 | |
| 4,925,000 | | Florida State Housing Finance Corp. South Pointe Project Refunding Revenue, Series J, 0.20%, 2/15/28, (Credit Support: Fannie Mae)(a) | | | 4,925,000 | |
| 4,000,000 | | Hillsborough County TECP, 0.10%, 4/5/12, (LOC: State Street Bank & Trust)(b) | | | 4,000,000 | |
| 4,000,000 | | Hillsborough County TECP, 0.11%, 4/5/12, (LOC: State Street Bank & Trust)(b) | | | 4,000,000 | |
| 5,245,000 | | JP Morgan Chase Putters/Drivers Trust Seminole County Sales Tax Refunding Revenue, Series 3438Z, 0.21%, 4/1/27(a)(c) | | | 5,245,000 | |
| 2,225,000 | | JP Morgan Chase Putters/Drivers Trust Tampa Water Revenue, Series 3617, 0.21%, 10/1/25(a)(c) | | | 2,225,000 | |
| 6,835,000 | | Marion County Industrial Development Authority Refunding Revenue, 0.19%, 11/15/32, (Credit Support: Fannie Mae)(a) | | | 6,835,000 | |
| 4,955,000 | | Miami-Dade County Industrial Development Authority Revenue, 0.32%, 9/1/29, (LOC: Bank of America NA)(a) | | | 4,955,000 | |
| 4,500,000 | | Orange County Health Facilities Authority Refunding Revenue, Series E, 0.17%, 10/1/26, (LOC: Branch Banking & Trust)(a) | | | 4,500,000 | |
| 8,615,000 | | Orange County Housing Finance Authority Refunding Revenue, 0.18%, 6/1/25, (Credit Support: Fannie Mae)(a) | | | 8,615,000 | |
| 4,995,000 | | Tallahassee Energy System Revenue, Putters Series 2069Z, 0.21%, 4/1/15(a) | | | 4,995,000 | |
| | | | | | |
| | | | | 67,820,000 | |
| | | | | | |
25
|
SCHEDULE OF PORTFOLIO INVESTMENTS |
Tax-Free Money Market Fund (cont.)
March 31, 2012 (Unaudited)
| | | | | | |
Principal Amount | | | | Value | |
Georgia — 2.34% | | | | |
| $ 7,215,000 | | Clayton County Housing Authority Refunding Revenue, 0.19%, 9/1/26, (Credit Support: Fannie Mae)(a) | | | $ 7,215,000 | |
| 7,985,000 | | Cobb County Development Authority Refunding Revenue, Series B, 0.17%, 7/1/34, (LOC: Branch Banking & Trust)(a) | | | 7,985,000 | |
| 4,755,000 | | Cobb County Housing Authority Refunding Revenue, 0.15%, 3/1/24, (Credit Support: Freddie Mac)(a) | | | 4,755,000 | |
| 4,915,000 | | Fulton County Development Authority School Improvement Revenue, 0.18%, 8/1/35, (LOC: Branch Banking & Trust)(a) | | | 4,915,000 | |
| 7,825,000 | | Marietta Housing Authority Refunding Revenue, 0.18%, 7/1/24, (Credit Support: Fannie Mae)(a) | | | 7,825,000 | |
| | | | | | |
| | | | | 32,695,000 | |
| | | | | | |
Illinois — 5.59% | | | | |
| 3,155,000 | | City of Chicago Waterworks Refunding Revenue, Sub Series, 04-3, 0.18%, 11/1/31, (LOC: State Street Bank & Trust)(a) | | | 3,155,000 | |
| 7,400,000 | | Illinois Development Finance Authority YMCA Metro Chicago Project Refunding Revenue, 0.20%, 6/1/29, (LOC: JP Morgan Chase Bank)(a) | | | 7,400,000 | |
| 2,600,000 | | Illinois Finance Authority Cultural Pool Revenue, 0.19%, 12/1/25, (LOC: JP Morgan Chase Bank)(a) | | | 2,600,000 | |
| 9,645,000 | | Illinois Finance Authority Dominican University Revenue, 0.20%, 3/1/36, (LOC: JP Morgan Chase Bank)(a) | | | 9,645,000 | |
| 3,930,000 | | Illinois Finance Authority Garrett Evangelical Project Refunding Revenue, 0.19%, 6/1/40, (LOC: First Midwest Trust Co., Federal Home Loan Bank)(a) | | | 3,930,000 | |
| 13,800,000 | | Illinois Finance Authority Ingalls Memorial Hospital Revenue, Series C, 0.17%, 1/1/16, (LOC: JP Morgan Chase Bank)(a) | | | 13,800,000 | |
| 4,995,000 | | Illinois Finance Authority Revenue, Putters Series 2967, 0.21%, 2/15/16, (Credit Support: Assured GTY)(a) | | | 4,995,000 | |
| 16,100,000 | | Illinois Finance Authority Revenue, Series R-11624, 0.31%, 8/15/39, (Credit Support: Assured GTY), Callable 8/15/18 @ 100(a)(c) | | | 16,100,000 | |
| 10,000,000 | | Joliet Regional Port District Exxon Project Refunding Revenue, 0.15%, 10/1/24(a) | | | 10,000,000 | |
| 6,645,000 | | Village of Channahon Morris Hospital Refunding Revenue, Series A, 0.19%, 12/1/23, (LOC: U.S. Bank NA)(a) | | | 6,645,000 | |
| | | | | | |
| | | | | 78,270,000 | |
| | | | | | |
Indiana — 5.08% | | | | |
| 19,000,000 | | Indiana Bond Bank Advance Funding Program Cash Flow Management Revenue, Series A, 1.25%, 1/3/13, (Credit Support: GO of Bond Bank) | | | 19,128,272 | |
| 23,600,000 | | Indiana Finance Authority Ascension Health Refunding Revenue, Series E7, 0.17%, 11/15/33(a) | | | 23,600,000 | |
| 14,370,000 | | Indiana Finance Authority Refunding Revenue, 0.21%, 3/1/36, (LOC: Branch Banking & Trust)(a) | | | 14,370,000 | |
| 14,015,000 | | Indiana State Authority Indiana University Healthcare Revenue, Series C, 0.14%, 3/1/33, (LOC: Northern Trust Co.)(a) | | | 14,015,000 | |
| | | | | | |
| | | | | 71,113,272 | |
| | | | | | |
26
|
SCHEDULE OF PORTFOLIO INVESTMENTS |
Tax-Free Money Market Fund (cont.)
March 31, 2012 (Unaudited)
| | | | | | |
Principal Amount | | | | Value | |
Iowa — 1.16% | |
| $ 5,700,000 | | City of Urbandale Interstate Acres LP Refunding Revenue, 0.21%, 12/1/14, (LOC: Bankers Trust Co., Federal Home Loan Bank)(a) | | | $ 5,700,000 | |
| 1,100,000 | | Iowa Higher Education Loan Authority Cash Flow Management Revenue, 2.00%, 5/18/12, (LOC: U.S. Bank NA) | | | 1,102,063 | |
| 7,270,000 | | Iowa Higher Education Loan Authority University & College Revenue, 0.30%, 5/1/20, (LOC: Wells Fargo Bank)(a) | | | 7,270,000 | |
| 2,150,000 | | Woodbury County Revenue, 0.30%, 11/1/16, (LOC: U.S. Bank NA)(a) | | | 2,150,000 | |
| | | | | | |
| | | | | 16,222,063 | |
| | | | | | |
Kentucky — 0.56% | |
| 7,855,000 | | County of Warren Refunding Revenue, 0.29%, 4/1/37, (Credit Support: Assured GTY)(a) | | | 7,855,000 | |
| | | | | | |
Louisiana — 2.21% | |
| 8,000,000 | | East Baton Rouge Parish Industrial Development Board Inc. Exxon Mobil Project Revenue, Series B, 0.15%, 12/1/40(a) | | | 8,000,000 | |
| 9,055,000 | | Louisiana Local Government Environmental Facilities & Community Development Authority Revenue, Series A, 0.18%, 10/1/37, (LOC: First NBC Bank, Federal Home Loan Bank)(a) | | | 9,055,000 | |
| 10,000,000 | | Parish of Saint James Texaco Project Refunding Revenue, Series B, 0.19%, 7/1/12(a) | | | 10,000,000 | |
| 3,850,000 | | Shreveport Home Mortgage Authority Refunding Revenue, 0.19%, 2/15/23, (Credit Support: Fannie Mae)(a) | | | 3,850,000 | |
| | | | | | |
| | | | | 30,905,000 | |
| | | | | | |
Massachusetts — 2.15% | |
| 11,180,000 | | City of Worcester Cash Flow Management GO, 2.00%, 11/8/12 | | | 11,294,071 | |
| 14,850,000 | | Commonwealth of Massachusetts Central Artery Highway Improvements GO, Series B, 0.17%, 12/1/30(a) | | | 14,850,000 | |
| 4,000,000 | | Massachusetts Industrial Finance Agency Refunding Revenue, 0.17%, 12/1/24, (LOC: TD Bank NA)(a) | | | 4,000,000 | |
| | | | | | |
| | | | | 30,144,071 | |
| | | | | | |
Michigan — 3.85% | |
| 12,475,000 | | Michigan Finance Authority Cash Flow Management Revenue, Series C-1, 2.00%, 8/20/12, (Credit Support: State Appropriation) | | | 12,544,473 | |
| 18,400,000 | | Michigan State Hospital Finance Authority Trinity Health Group Revenue TECP, 0.13%, 5/15/12(b) | | | 18,400,000 | |
| 23,000,000 | | Michigan State Hospital Finance Authority Trinity Health Group Revenue TECP, 0.13%, 6/5/12(b) | | | 23,000,000 | |
| | | | | | |
| | | | | 53,944,473 | |
| | | | | | |
Minnesota — 9.77% | |
| 1,825,000 | | City of Bloomington Refunding Revenue, Series A1, 0.20%, 11/15/32, (Credit Support: Fannie Mae)(a) | | | 1,825,000 | |
| 4,860,000 | | City of Burnsville Berkshire Project Refunding Revenue, Series A, 0.18%, 7/15/30, (Credit Support: Fannie Mae)(a) | | | 4,860,000 | |
27
|
SCHEDULE OF PORTFOLIO INVESTMENTS |
Tax-Free Money Market Fund (cont.)
March 31, 2012 (Unaudited)
| | | | | | |
Principal Amount | | | | Value | |
| $ 8,350,000 | | City of Burnsville Southwind Apartments Project Refunding Revenue, 0.18%, 1/1/35, (Credit Support: Freddie Mac)(a) | | | $ 8,350,000 | |
| 12,235,000 | | City of Inver Grove Heights Refunding Revenue, 0.18%, 5/15/35, (Credit Support: Fannie Mae)(a) | | | 12,235,000 | |
| 6,025,000 | | City of Minnetonka Beacon Hill Refunding Revenue, 0.18%, 5/15/34, (Credit Support: Fannie Mae)(a) | | | 6,025,000 | |
| 3,865,000 | | City of Minnetonka, Minnetonka Hills Apartments Refunding Revenue, 0.18%, 11/15/31, (Credit Support: Fannie Mae)(a) | | | 3,865,000 | |
| 13,165,000 | | City of Oak Park Heights Boutwells Landing Refunding Revenue, 0.18%, 11/1/35, (Credit Support: Freddie Mac)(a) | | | 13,165,000 | |
| 15,000,000 | | City of Rochester Mayo Foundation Refunding Revenue, Series B, 0.21%, 8/15/32(a) | | | 15,000,000 | |
| 5,565,000 | | City of Saint Louis Park Westwind Apartments Project Refunding Revenue, 0.18%, 9/15/33, (Credit Support: Fannie Mae)(a) | | | 5,565,000 | |
| 1,195,000 | | City of Spring Lake Park Oak Crest Apartments Project Refunding Revenue, 0.18%, 2/15/33, (Credit Support: Fannie Mae)(a) | | | 1,195,000 | |
| 8,705,000 | | Midwest Consortium of Municipal Utilities Refunding Revenue, Series B, 0.20%, 10/1/35, (LOC: U.S. Bank NA)(a) | | | 8,705,000 | |
| 19,000,000 | | Rochester Health Care Facilities TECP, 0.14%, 6/5/12, (Credit Support: Mayo Clinic Foundation)(b) | | | 19,000,000 | |
| 6,400,000 | | Rochester Health Care Facilities TECP, 0.15%, 4/3/12, (Credit Support: Mayo Clinic Foundation)(b) | | | 6,400,000 | |
| 9,000,000 | | Roseville Independent School District No 623 Cash Flow Management GO, 1.50%, 9/28/12, (Credit Support: School District Credit Program) | | | 9,057,305 | |
| 11,000,000 | | Saint Francis Independent School District No 15 Cash Flow Management GO, Series 2011A, 1.00%, 9/12/12, (Credit Support: School District Credit Program) | | | 11,031,696 | |
| 3,300,000 | | Saint Paul Housing & Redevelopment Authority Highland Ridge Project Refunding Revenue, 0.18%, 10/1/33, (Credit Support: Freddie Mac)(a) | | | 3,300,000 | |
| 7,255,000 | | Saint Paul Port Authority Sibley Project Refunding Revenue, 0.18%, 2/1/34, (Credit Support: Freddie Mac)(a) | | | 7,255,000 | |
| | | | | | |
| | | | | 136,834,001 | |
| | | | | | |
Mississippi — 4.26% | |
| 30,000,000 | | County of Jackson Chevron USA Inc. Project Refunding Revenue, 0.17%, 6/1/23(a) | | | 30,000,000 | |
| 3,100,000 | | Mississippi Business Finance Corp., Chevron USA Inc. Project Revenue, Series B, 0.18%, 12/1/30(a) | | | 3,100,000 | |
| 8,260,000 | | Mississippi Business Finance Corp., Chevron USA Inc. Project Revenue, Series A, 0.17%, 12/1/30(a) | | | 8,260,000 | |
| 2,500,000 | | Mississippi Business Finance Corp., Chevron USA Inc. Project Revenue, Series D, 0.20%, 11/1/35(a) | | | 2,500,000 | |
| 8,585,000 | | Mississippi Business Finance Corp., Chevron USA Inc. Project Revenue, Series F, 0.17%, 11/1/35(a) | | | 8,585,000 | |
28
|
SCHEDULE OF PORTFOLIO INVESTMENTS |
Tax-Free Money Market Fund (cont.)
March 31, 2012 (Unaudited)
| | | | | | |
Principal Amount | | | | | Value | |
| $ 7,140,000 | | Mississippi Business Finance Corp., King Edward Hotel Project Revenue, 0.19%, 5/1/39, (LOC: Capital One NA, Federal Home Loan Bank)(a) | | | $ 7,140,000 | |
| | | | | | |
| | | | | 59,585,000 | |
| | | | | | |
Missouri — 1.50% | |
| 4,000,000 | | Curators University of Missouri TECP, 0.13%, 4/2/12(b) | | | 4,000,000 | |
| 10,000,000 | | Curators University of Missouri TECP, 0.13%, 5/7/12(b) | | | 10,000,000 | |
| 5,000,000 | | North Kansas City, North Kansas Hospital Refunding Revenue, 0.26%, 11/1/33, (LOC: Bank of America NA)(a) | | | 5,000,000 | |
| 2,000,000 | | St. Charles County Industrial Development Authority Refunding Revenue, 0.19%, 2/1/29, (Credit Support: Fannie Mae)(a) | | | 2,000,000 | |
| | | | | | |
| | | | | 21,000,000 | |
| | | | | | |
Montana — 0.55% | |
| 1,700,000 | | Montana Board of Investment Public Improvements Revenue,, 0.22%, 3/1/29(a) | | | 1,700,000 | |
| 6,000,000 | | Montana Board of Investments Public Improvements Revenue, 0.22%, 3/1/35(a) | | | 6,000,000 | |
| | | | | | |
| | | | | 7,700,000 | |
| | | | | | |
Nebraska — 0.43% | |
| 6,000,000 | | Madison County Hospital Authority No. 1 Revenue, Series B, 0.20%, 7/1/33, (LOC: U.S. Bank NA)(a) | | | 6,000,000 | |
| | | | | | |
New Jersey — 2.24% | |
| 18,500,000 | | New Jersey Economic Development Authority Diocese of Metuchen Project Refunding Revenue, 0.28%, 9/1/30, (LOC: Bank of America NA)(a) | | | 18,500,000 | |
| 12,895,000 | | New Jersey Health Care Facilities Financing Authority Refunding Revenue, 0.16%, 7/1/33, (LOC: TD Bank NA)(a) | | | 12,895,000 | |
| | | | | | |
| | | | | 31,395,000 | |
| | | | | | |
New York — 13.10% | |
| 14,000,000 | | City of New York GO, Sub-Series A-4, 0.14%, 8/1/31, (LOC: Bank of Nova Scotia)(a) | | | 14,000,000 | |
| 25,000,000 | | City of New York Refunding GO, Sub-Series C-5, 0.16%, 8/1/20, (LOC: BNY Mellon)(a) | | | 25,000,000 | |
| 2,900,000 | | Erie County Industrial Development Agency Revenue, Putters Series 2090, 0.20%, 5/1/15, (Credit Support: AGM)(a) | | | 2,900,000 | |
| 5,325,000 | | Nassau Health Care Corp. Refunding Revenue, Sub Series D2, 0.13%, 8/1/29, (Credit Support: County GTY), (LOC: JP Morgan Chase Bank)(a) | | | 5,325,000 | |
| 6,700,000 | | New York City Industrial Development Agency College Improvement Revenue, Series B, 0.17%, 6/1/36, (LOC: TD Bank NA)(a) | | | 6,700,000 | |
| 50,000,000 | | New York City Transitional Finance Authority Refunding Revenue, 0.18%, 11/1/29(a) | | | 50,000,000 | |
| 13,000,000 | | New York City, Transitional Finance Authority Revenue, Series A2, 0.17%, 11/15/27(a) | | | 13,000,000 | |
29
|
SCHEDULE OF PORTFOLIO INVESTMENTS |
Tax-Free Money Market Fund (cont.)
March 31, 2012 (Unaudited)
| | | | | | |
Principal Amount | | | | | Value | |
| $ 9,000,000 | | New York Liberty Development Corp., 3 World Trade Center Project Revenue, 0.30%, 11/8/12(a) | | | $ 9,000,208 | |
| 22,900,000 | | New York State Dormitory Authority Refunding Revenue, Series D, 0.17%, 7/1/31, (LOC: TD Bank NA)(a) | | | 22,900,000 | |
| 3,765,000 | | New York State Dormitory Authority Wagner College Revenue, 0.16%, 7/1/38, (LOC: TD Bank NA)(a) | | | 3,765,000 | |
| 27,400,000 | | New York State Energy Research & Development Authority Refunding Revenue, Series A, 0.29%, 8/1/15, (LOC: Wells Fargo Bank)(a) | | | 27,400,000 | |
| 3,400,000 | | Triborough Bridge & Tunnel Authority Refunding Revenue, Series B, 0.16%, 1/1/32, (LOC: State Street Bank & Trust Co.)(a) | | | 3,400,000 | |
| | | | | | |
| | | | | 183,390,208 | |
| | | | | | |
North Carolina — 0.81% | |
| 3,200,000 | | Guilford County Industrial Facilities & Pollution Control Financing Authority Revenue, 0.18%, 9/1/29, (LOC: Branch Banking & Trust)(a) | | | 3,200,000 | |
| 2,100,000 | | North Carolina Capital Facilities Finance Agency Refunding Revenue, 0.18%, 7/1/19, (LOC: Branch Banking & Trust)(a) | | | 2,100,000 | |
| 2,800,000 | | North Carolina Medical Care Commission Lower Cape Fear Hospice Revenue, 0.18%, 11/1/27, (LOC: Branch Banking & Trust)(a) | | | 2,800,000 | |
| 3,245,000 | | North Carolina Medical Care Commission Sisters of Mercy Services Corp. Revenue, 0.18%, 3/1/28, (LOC: Branch Banking & Trust)(a) | | | 3,245,000 | |
| | | | | | |
| | | | | 11,345,000 | |
| | | | | | |
Ohio — 0.17% | |
| 2,400,000 | | County of Lucas Cash Flow Management GO, Series 1, 1.00%, 7/19/12 | | | 2,403,167 | |
| | | | | | |
Pennsylvania — 8.45% | |
| 8,900,000 | | Allegheny County Higher Education Building Authority Refunding Revenue, Series A, 0.19%, 3/1/38, (LOC: PNC Bank NA)(a) | | | 8,900,000 | |
| 7,500,000 | | Allegheny County Hospital Development Authority Revenue, Series A, 0.19%, 6/1/30, (LOC: PNC Bank NA)(a) | | | 7,500,000 | |
| 4,635,000 | | Allegheny County Industrial Development Authority Revenue, 0.19%, 6/1/38, (LOC: PNC Bank NA)(a) | | | 4,635,000 | |
| 12,575,000 | | Butler County General Authority Iroquois School District Project Refunding Revenue, 0.36%, 8/1/31, (Credit Support: AGM)(a) | | | 12,575,000 | |
| 10,425,000 | | Butler County General Authority South Park School District Project Refunding Revenue, 0.36%, 8/1/27, (Credit Support: AGM)(a) | | | 10,425,000 | |
| 5,000,000 | | Delaware County Industrial Development Authority General Electric Capital Refunding Revenue, Series G, 0.14%, 12/1/31(a) | | | 5,000,000 | |
| 5,000,000 | | Delaware County Industrial Development Authority General Electric Capital Refunding Revenue, Series G, 0.14%, 12/1/31(a) | | | 5,000,000 | |
| 15,920,000 | | Delaware County Industrial Development Authority, United Parcel Service Project, 0.16%, 12/1/15(a) | | | 15,920,000 | |
| 3,100,000 | | Emmaus General Authority Revenue, Series A11, 0.20%, 3/1/24, (LOC: U.S. Bank NA)(a) | | | 3,100,000 | |
30
|
SCHEDULE OF PORTFOLIO INVESTMENTS |
Tax-Free Money Market Fund (cont.)
March 31, 2012 (Unaudited)
| | | | | | |
Principal Amount | | | | | Value | |
| $ 4,700,000 | | Emmaus General Authority Revenue, Series F, 0.20%, 3/1/24, (LOC: U.S. Bank NA)(a) | | | $ 4,700,000 | |
| 8,155,000 | | JP Morgan Chase Putters/Drivers Trust Refunding GO, Series 3405, 0.20%, 11/15/14, (Credit Support: AGM, State Aid Withholding)(a)(c) | | | 8,155,000 | |
| 7,740,000 | | Luzerne County Convention Center Authority Revenue, Series A, 0.19%, 9/1/28, (LOC: PNC Bank NA)(a) | | | 7,740,000 | |
| 10,680,000 | | Montgomery County Industrial Development Authority Refunding Revenue, 0.16%, 6/1/33, (LOC: TD Bank NA)(a) | | | 10,680,000 | |
| 3,730,000 | | Pennsylvania Economic Development Financing Authority Revenue, 0.19%, 12/1/31, (LOC: PNC Bank NA)(a) | | | 3,730,000 | |
| 3,100,000 | | Pennsylvania Higher Educational Facilties Authority Gannon University Refunding Revenue, 0.19%, 5/1/15, (LOC: PNC Bank NA)(a) | | | 3,100,000 | |
| 7,200,000 | | Pennsylvania Higher Educational Facilties Authority Holy Family College Refunding Revenue, Series B, 0.18%, 12/1/32, (LOC: TD Bank NA)(a) | | | 7,200,000 | |
| | | | | | |
| | | | | 118,360,000 | |
| | | | | | |
Rhode Island — 0.22% | |
| 3,075,000 | | Rhode Island Health & Educational Building Corp. Refunding Revenue, 0.51%, 6/1/37, (LOC: Bank of America NA)(a) | | | 3,075,000 | |
| | | | | | |
South Carolina — 1.01% | |
| 6,500,000 | | County of Cherokee Revenue, 0.62%, 12/1/15, (LOC: Bank of America NA)(a) | | | 6,500,000 | |
| 3,400,000 | | South Carolina Jobs-Economic Development Authority Revenue, 0.21%, 5/1/29, (LOC: Branch Banking & Trust)(a) | | | 3,400,000 | |
| 4,250,000 | | South Carolina Jobs-Economic Development Authority Revenue, 0.30%, 5/1/29, (LOC: Wells Fargo Bank)(a) | | | 4,250,000 | |
| | | | | | |
| | | | | 14,150,000 | |
| | | | | | |
South Dakota — 1.26% | |
| 12,640,000 | | City of Sioux Falls Sales Tax Revenue, Series 2057, 0.21%, 5/15/15(a) | | | 12,640,000 | |
| 5,000,000 | | South Dakota Housing Development Authority Revenue, Series C, 0.18%, 5/1/39(a) | | | 5,000,000 | |
| | | | | | |
| | | | | 17,640,000 | |
| | | | | | |
Tennessee — 2.79% | |
| 14,000,000 | | Clarksville Public Building Authority Public Improvements Revenue, 0.30%, 2/1/38, (LOC: Bank of America NA)(a) | | | 14,000,000 | |
| 25,000,000 | | Vanderbilt University TECP, 0.15%, 6/8/12(b) | | | 25,000,000 | |
| | | | | | |
| | | | | 39,000,000 | |
| | | | | | |
Texas — 6.64% | |
| 2,525,000 | | Crawford Education Facilities Corp. Revenue, 0.20%, 6/1/18, (LOC: U.S. Bank NA)(a) | | | 2,525,000 | |
| 7,050,000 | | DeSoto Industrial Development Authority Caterpillar Refunding Revenue, 0.29%, 12/1/16(a) | | | 7,050,000 | |
31
|
SCHEDULE OF PORTFOLIO INVESTMENTS |
Tax-Free Money Market Fund (cont.)
March 31, 2012 (Unaudited)
| | | | | | |
Principal Amount | | | | | Value | |
| $ 9,000,000 | | Harris County Cultural Educational Facilities TECP, 0.28%, 5/3/12, (Credit Support: Methodist Hospital)(b) | | | $ 9,000,000 | |
| 8,000,000 | | Harris County Cultural Educational Facilities TECP, 0.28%, 8/6/12, (Credit Support: Methodist Hospital)(b) | | | 8,000,000 | |
| 18,000,000 | | Harris County Cultural Educational Facilities TECP, 0.28%, 8/6/12, (Credit Support: Methodist Hospital)(b) | | | 18,000,000 | |
| 11,095,000 | | Lake Travis Independent School District Putters GO, Series 1882, 0.19%, 2/15/14, (Credit Support: PSF-GTD)(a)(c) | | | 11,095,000 | |
| 5,050,000 | | Splendora Higher Education Facilities Corp. Revenue, Series A, 0.30%, 12/1/26, (LOC: Wells Fargo Bank)(a) | | | 5,050,000 | |
| 15,000,000 | | University of Texas TECP, 0.09%, 6/6/12(b) | | | 15,000,000 | |
| 17,300,000 | | University of Texas, Financing System Refunding Revenue, Series B, 0.14%, 8/1/34(a) | | | 17,300,000 | |
| | | | | | |
| | | | | 93,020,000 | |
| | | | | | |
Utah — 1.22% | |
| 5,000,000 | | County of Emery Refunding Revenue, 0.19%, 11/1/24, (LOC: Wells Fargo Bank)(a) | | | 5,000,000 | |
| 635,000 | | County of Sanpete Private Primary Schools Revenue, 0.30%, 8/1/28, (LOC: U.S. Bank NA)(a) | | | 635,000 | |
| 3,700,000 | | Duchesne County School District Revenue, 0.30%, 6/1/21, (LOC: U.S. Bank NA)(a) | | | 3,700,000 | |
| 3,310,000 | | Ogden City Redevelopment Agency Tax Allocation Revenue, Series A, 0.30%, 4/1/25, (LOC: Wells Fargo Bank)(a) | | | 3,310,000 | |
| 4,435,000 | | Salt Lake County Housing Authority Refunding Revenue, 0.19%, 2/15/31, (Credit Support: Fannie Mae)(a) | | | 4,435,000 | |
| | | | | | |
| | | | | 17,080,000 | |
| | | | | | |
Vermont — 0.24% | |
| 3,400,000 | | Vermont Educational & Health Buildings Financing Agency Springfield Project Refunding Revenue, Series A, 0.18%, 9/1/31, (LOC: TD Bank NA)(a) | | | 3,400,000 | |
| | | | | | |
Virginia — 1.98% | |
| 11,100,000 | | Arlington County Ballston Public Parking Revenue, 0.17%, 8/1/17, (LOC: PNC Bank NA)(a) | | | 11,100,000 | |
| 10,000,000 | | Russell County Industrial Development Authority Revenue, Series B, 0.17%, 7/1/38, (LOC: U.S. Bank NA)(a) | | | 10,000,000 | |
| 6,560,000 | | Virginia Beach Development Authority Refunding Revenue, 0.31%, 7/1/33, (LOC: Bank of America NA)(a) | | | 6,560,000 | |
| | | | | | |
| | | | | 27,660,000 | |
| | | | | | |
Washington — 1.11% | |
| 5,000,000 | | Everett Public Facilities District Refunding Revenue, 0.15%, 4/1/36, (LOC: BNY Mellon Bank)(a) | | | 5,000,000 | |
| 4,995,000 | | JP Morgan Chase Putters/Drivers Trust Snohomish County School District No. 15 GO, Series 3542Z, 0.21%, 12/1/14, (Credit Support: School Board GTY)(a)(c) | | | 4,995,000 | |
| 4,680,000 | | Washington State Housing Finance Commission Retirement Facilities Revenue, Series A, 0.23%, 8/1/44, (LOC: East West Bank, Federal Home Loan Bank)(a) | | | 4,680,000 | |
32
|
SCHEDULE OF PORTFOLIO INVESTMENTS |
Tax-Free Money Market Fund (cont.)
March 31, 2012 (Unaudited)
| | | | | | |
Principal Amount | | | | | Value | |
| $ 900,000 | | Washington State Housing Finance Commission Revenue, 0.20%, 7/1/22, (LOC: U.S. Bank NA)(a) | | | $ 900,000 | |
| | | | | | |
| | | | | 15,575,000 | |
| | | | | | |
Wisconsin — 1.74% | |
| 7,840,000 | | Wisconsin Health & Educational Facilities Authority Revenue, 0.30%, 6/1/28, (LOC: Wells Fargo Bank)(a) | | | 7,840,000 | |
| 6,907,000 | | Wisconsin Health & Educational Facilities Authority Revenue, Series A, 0.20%, 9/1/19, (LOC: JP Morgan Chase Bank)(a) | | | 6,907,000 | |
| 7,500,000 | | Wisconsin Health & Educational Facilities Authority, Aurora Health Care Refunding Revenue, Series C, 0.19%, 7/15/28, (LOC: Bank of Montreal)(a) | | | 7,500,000 | |
| 2,100,000 | | Wisconsin Municipalities Private School Finance Commission Revenue, 0.20%, 3/1/23, (LOC: U.S. Bank NA)(a) | | | 2,100,000 | |
| | | | | | |
| | | | | 24,347,000 | |
| | | | | | |
Wyoming — 1.65% | |
| 14,185,000 | | County of Lincoln Exxon Project Pollution Control Revenue, Series A, 0.15%, 11/1/14(a) | | | 14,185,000 | |
| 8,915,000 | | County of Lincoln Exxon Project Pollution Control Revenue, Series C, 0.15%, 11/1/14(a) | | | 8,914,998 | |
| | | | | | |
| | | | | 23,099,998 | |
| | | | | | |
Total Municipal Bonds (Cost $1,392,578,593) | | | 1,392,578,593 | |
| | | | | | |
| | |
Shares | | | | | |
Investment Company — 0.36% | | | | |
| 5,000,000 | | Goldman Sachs Financial Square Tax Free Money Market Fund | | | 5,000,000 | |
| | | | | | |
Total Investment Company (Cost $5,000,000) | | | 5,000,000 | |
| | | | | | |
Total Investments (Cost $1,397,578,593)(d) — 99.83% | | | $1,397,578,593 | |
Other assets in excess of liabilities — 0.17% | | | 2,448,877 | |
| | | | | | |
NET ASSETS — 100.00% | | | $1,400,027,470 | |
| | | | | | |
| (a) | Variable rate demand security. The rate reflected in the Schedule of Portfolio Investments is the rate in effect on March 31, 2012. The maturity date represents the actual maturity date. The security’s effective maturity resets periodically. |
| (b) | Represents effective yield to maturity on date of purchase. |
| (c) | Security exempt from registration under Rule 144A or Section 4(2) of the Securities Act of 1933, as amended. These securities may be resold in transactions exempt from registration, normally to qualified institutional buyers. Security has been deemed to be liquid based on procedures approved by the Board of Trustees. |
33
|
SCHEDULE OF PORTFOLIO INVESTMENTS |
Tax-Free Money Market Fund (cont.)
March 31, 2012 (Unaudited)
| (d) | Tax cost of securities is equal to book cost of securities. |
Abbreviations used are defined below:
AGM – Assured Guaranty Municipal
GO – General Obligation
GTY – Guaranty
LOC – Letter of Credit
PSF-GTD – Permanent School Fund Guarantee
TECP – Tax Exempt Commercial Paper
See notes to financial statements.
34
This Page Intentionally Left Blank
35
Statements of Assets and Liabilities
March 31, 2012 (Unaudited)
| | | | | | | | | | | | |
| | | Prime
Money
Market Fund | | | U.S. Government
Money
Market Fund | | | Tax-Free
Money
Market Fund | |
Assets: | | | | | | | | | | | | |
Investments, at value (cost $13,603,547,755; $5,921,431,594; $1,397,578,593 respectively) | | $ | 13,603,547,755* | | | $ | 5,921,431,594** | | | $ | 1,397,578,593 | |
Cash | | | 27,158,387 | | | | 30,870,682 | | | | 1,910,072 | |
Interest and dividends receivable | | | 24,216,966 | | | | 7,482,077 | | | | 622,795 | |
Prepaid expenses and other assets | | | 218,751 | | | | 187,523 | | | | 124,224 | |
| | | | | | | | | | | | |
Total Assets | | | 13,655,141,859 | | | | 5,959,971,876 | | | | 1,400,235,684 | |
| | | | | | | | | | | | |
| | | |
Liabilities: | | | | | | | | | | | | |
Distributions payable | | | 45,518 | | | | 50,981 | | | | 12,271 | |
Payable for investments purchased | | | 146,278,980 | | | | 153,828,903 | | | | — | |
Accrued expenses and other payables: | | | | | | | | | | | | |
Investment advisory fees | | | 1,146,481 | | | | 518,136 | | | | 122,296 | |
Audit fees | | | 28,517 | | | | 24,613 | | | | 19,890 | |
Trustee fees | | | 27,412 | | | | 1,133 | | | | 1,565 | |
Distribution fees | | | 1,182,333 | | | | 147,946 | | | | 28,992 | |
Shareholder reports | | | 409,280 | | | | 131,243 | | | | 21,900 | |
Shareholder servicing fees | | | 105,671 | | | | 47,317 | | | | 468 | |
Transfer Agent fees | | | 4,482 | | | | — | | | | 832 | |
Other | | | 83,164 | | | | — | | | | — | |
| | | | | | | | | | | | |
Total Liabilities | | | 149,311,838 | | | | 154,750,272 | | | | 208,214 | |
| | | | | | | | | | | | |
Net Assets | | $ | 13,505,830,021 | | | $ | 5,805,221,604 | | | $ | 1,400,027,470 | |
| | | | | | | | | | | | |
| | | |
Net Assets Consist Of: | | | | | | | | | | | | |
Capital | | $ | 13,510,081,908 | | | $ | 5,805,201,635 | | | $ | 1,400,044,628 | |
Undistributed (distributions in excess of) net investment income | | | (1,031 | ) | | | 3,719 | | | | (371 | ) |
Accumulated net realized gains (losses) from investment transactions | | | (4,250,856 | ) | | | 16,250 | | | | (16,787 | ) |
| | | | | | | | | | | | |
Net Assets | | $ | 13,505,830,021 | | | $ | 5,805,221,604 | | | $ | 1,400,027,470 | |
| | | | | | | | | | | | |
Net Assets: | | | | | | | | | | | | |
RBC Institutional Class 1 | | $ | 2,820,323,161 | | | $ | 1,425,244,654 | | | $ | 25,806,674 | |
RBC Institutional Class 2 | | | 652,696,131 | | | | 171,643,470 | | | | 227,425,158 | |
RBC Investor Class | | | 2,965,816,730 | | | | 889,275,709 | | | | 164,973,331 | |
RBC Reserve Class | | | 5,402,860,440 | | | | 1,945,861,512 | | | | 599,234,145 | |
RBC Select Class | | | 1,664,133,559 | | | | 1,373,196,259 | | | | 382,588,162 | |
| | | | | | | | | | | | |
Total | | $ | 13,505,830,021 | | | $ | 5,805,221,604 | | | $ | 1,400,027,470 | |
| | | | | | | | | | | | |
36
Statements of Assets and Liabilities (cont.)
| | | | | | | | | | | | |
| | | Prime
Money
Market Fund | | | U.S. Government
Money
Market Fund | | | Tax-Free
Money
Market Fund | |
Shares Outstanding (Unlimited number of shares authorized, no par value): | | | | | | | | | | | | |
RBC Institutional Class 1 | | | 2,820,192,508 | | | | 1,425,222,136 | | | | 25,820,487 | |
RBC Institutional Class 2 | | | 652,664,913 | | | | 171,640,031 | | | | 227,499,214 | |
RBC Investor Class | | | 2,967,798,638 | | | | 889,285,396 | | | | 164,966,453 | |
RBC Reserve Class | | | 5,404,872,851 | | | | 1,945,879,652 | | | | 599,225,078 | |
RBC Select Class | | | 1,664,672,965 | | | | 1,373,208,807 | | | | 382,580,225 | |
| | | | | | | | | | | | |
Total | | | 13,510,201,875 | | | | 5,805,236,022 | | | | 1,400,091,457 | |
| | | | | | | | | | | | |
| | | |
Net Asset Values and Redemption Price per Share: | | | | | | | | | | | | |
RBC Institutional Class 1 | | $ | 1.00 | | | $ | 1.00 | | | $ | 1.00 | |
| | | | | | | | | | | | |
RBC Institutional Class 2 | | $ | 1.00 | | | $ | 1.00 | | | $ | 1.00 | |
| | | | | | | | | | | | |
RBC Investor Class | | $ | 1.00 | | | $ | 1.00 | | | $ | 1.00 | |
| | | | | | | | | | | | |
RBC Reserve Class | | $ | 1.00 | | | $ | 1.00 | | | $ | 1.00 | |
| | | | | | | | | | | | |
RBC Select Class | | $ | 1.00 | | | $ | 1.00 | | | $ | 1.00 | |
| | | | | | | | | | | | |
| * | $2,130,000,000 of which are repurchase agreements. See Schedule of Portfolio Investments for details. |
| ** | $1,012,000,000 of which are repurchase agreements. See Schedule of Portfolio Investments for details. |
See notes to financial statements.
37
Statements of Operations
For the Six Months Ended March 31, 2012 (Unaudited)
| | | | | | | | | | | | |
| | | Prime
Money
Market Fund | | | U.S. Government
Money
Market Fund | | | Tax-Free
Money
Market Fund | |
Investment Income: | | | | | | | | | | | | |
Interest income | | $ | 15,758,634 | | | $ | 4,641,237 | | | $ | 1,042,271 | |
Dividend income | | | — | | | | — | | | | 1,224 | |
| | | | | | | | | | | | |
Total Investment Income | | | 15,758,634 | | | | 4,641,237 | | | | 1,043,495 | |
| | | | | | | | | | | | |
| | | |
Expenses: | | | | | | | | | | | | |
Investment advisory fees | | | 6,318,737 | | | | 2,930,409 | | | | 661,642 | |
Distribution fees-RBC Institutional Class 2 | | | 493,116 | | | | 123,615 | | | | 160,780 | |
Distribution fees-RBC Investor Class | | | 15,349,406 | | | | 4,664,935 | | | | 860,675 | |
Distribution fees-RBC Reserve Class | | | 23,047,532 | | | | 8,373,368 | | | | 2,539,466 | |
Distribution fees-RBC Select Class | | | 6,504,569 | | | | 5,402,800 | | | | 1,366,466 | |
Shareholder servicing fee-RBC Institutional Class 1 | | | 540,572 | | | | 387,891 | | | | 7,708 | |
Accounting fees | | | 315,937 | | | | 146,520 | | | | 33,082 | |
Audit fees | | | 19,820 | | | | 19,220 | | | | 19,799 | |
Custodian fees | | | 86,723 | | | | 43,380 | | | | 7,946 | |
Insurance fees | | | 63,589 | | | | 21,197 | | | | 7,067 | |
Legal fees | | | 155,926 | | | | 56,259 | | | | 18,511 | |
Registration and filing fees | | | 156,591 | | | | 103,622 | | | | 87,976 | |
Shareholder reports | | | 269,865 | | | | 57,872 | | | | 12,481 | |
Transfer agent fees | | | 43,365 | | | | 13,945 | | | | 11,679 | |
Trustees’ fees | | | 164,333 | | | | 66,598 | | | | 16,403 | |
Other fees | | | 228,337 | | | | 100,583 | | | | 32,023 | |
| | | | | | | | | | | | |
Total expenses before fee reductions | | | 53,758,418 | | | | 22,512,214 | | | | 5,843,704 | |
Expenses reduced by: | | | | | | | | | | | | |
Shareholder Servicing Agent - Class Specific | | | — | | | | (190,986 | ) | | | (5,942 | ) |
Distributor - Class Specific | | | (39,330,510 | ) | | | (17,974,708 | ) | | | (4,860,650 | ) |
| | | | | | | | | | | | |
Net Expenses | | | 14,427,908 | | | | 4,346,520 | | | | 977,112 | |
| | | | | | | | | | | | |
| | | |
Net Investment Income | | | 1,330,726 | | | | 294,717 | | | | 66,383 | |
| | | | | | | | | | | | |
| | | |
Realized/Unrealized Gains (Losses) from Investment Transactions: | | | | | | | | | | | | |
Net realized gains from investment transactions | | | 98,033 | | | | 16,250 | | | | 1,570 | |
| | | | | | | | | | | | |
Change in net assets resulting from operations | | $ | 1,428,759 | | | $ | 310,967 | | | $ | 67,953 | |
| | | | | | | | | | | | |
See notes to financial statements.
38
Statements of Changes in Net Assets
| | | | | | | | |
| | | Prime
Money Market Fund | |
| | | For the
Six Months Ended
March 31, 2012 | | | For the
Year Ended
September 30, 2011 | |
| | | (Unaudited) | | | | |
| | |
From Investment Activities: | | | | | | | | |
Operations: | | | | | | | | |
Net investment income | | $ | 1,330,726 | | | $ | 6,158,942 | |
Net realized gains from investment transactions | | | 98,033 | | | | 364,928 | |
| | | | | | | | |
Change in net assets resulting from operations | | | 1,428,759 | | | | 6,523,870 | |
| | | | | | | | |
Distributions from Net Investment Income | | | | | | | | |
RBC Institutional Class 1 Shareholders | | | (805,246 | ) | | | (4,715,323 | ) |
RBC Institutional Class 2 Shareholders | | | (32,963 | ) | | | (371,207 | ) |
RBC Investor Class Shareholders | | | (154,031 | ) | | | (367,403 | ) |
RBC Reserve Class Shareholders | | | (256,918 | ) | | | (529,673 | ) |
RBC Select Class Shareholders | | | (81,568 | ) | | | (175,336 | ) |
| | | | | | | | |
Change in net assets resulting from shareholder distributions | | | (1,330,726 | ) | | | (6,158,942 | ) |
| | | | | | | | |
| | |
Capital Transactions: | | | | | | | | |
Proceeds from shares issued | | | 17,333,319,444 | | | | 55,383,518,080 | |
Distributions reinvested | | | 1,136,726 | | | | 4,223,143 | |
Cost of shares redeemed | | | (16,320,600,611 | ) | | | (58,508,859,963 | ) |
| | | | | | | | |
Change in net assets resulting from capital transactions | | | 1,013,855,559 | | | | (3,121,118,740 | ) |
| | | | | | | | |
Net increase (decrease) in net assets | | | 1,013,953,592 | | | | (3,120,753,812 | ) |
| | |
Net Assets: | | | | | | | | |
Beginning of period | | | 12,491,876,429 | | | | 15,612,630,241 | |
| | | | | | | | |
End of period | | $ | 13,505,830,021 | | | $ | 12,491,876,429 | |
| | | | | | | | |
Distributions in excess of net investment income | | $ | (1,031 | ) | | $ | (1,031 | ) |
| | | | | | | | |
| | |
Share Transactions: | | | | | | | | |
Issued | | | 17,333,319,444 | | | | 55,383,518,080 | |
Reinvested | | | 1,136,726 | | | | 4,223,143 | |
Redeemed | | | (16,320,600,611 | ) | | | (58,508,859,963 | ) |
| | | | | | | | |
Change in shares resulting from capital transactions | | | 1,013,855,559 | | | | (3,121,118,740 | ) |
| | | | | | | | |
See notes to financial statements.
39
Statements of Changes in Net Assets (cont.)
| | | | | | | | |
| | | U.S. Government
Money Market Fund | |
| | | For the
Six Months Ended
March 31, 2012 | | | For the
Year Ended
September 30, 2011 | |
| | | (Unaudited) | | | | |
| | |
From Investment Activities: | | | | | | | | |
Operations: | | | | | | | | |
Net investment income | | $ | 294,717 | | | $ | 1,007,107 | |
Net realized gains from investment transactions | | | 16,250 | | | | 78,276 | |
| | | | | | | | |
Change in net assets resulting from operations | | | 310,967 | | | | 1,085,383 | |
| | | | | | | | |
Distributions from Net Investment Income | | | | | | | | |
RBC Institutional Class 1 Shareholders | | | (78,626 | ) | | | (591,712 | ) |
RBC Institutional Class 2 Shareholders | | | (8,263 | ) | | | (15,108 | ) |
RBC Investor Class Shareholders | | | (46,788 | ) | | | (108,071 | ) |
RBC Reserve Class Shareholders | | | (93,311 | ) | | | (175,362 | ) |
RBC Select Class Shareholders | | | (67,729 | ) | | | (116,852 | ) |
| | | | | | | | |
Change in net assets resulting from Distributions of Net Investment Income | | | (294,717 | ) | | | (1,007,105 | ) |
| | | | | | | | |
Distributions from Net Realized Gains | | | | | | | | |
RBC Institutional Class 1 Shareholders | | | (12,707 | ) | | | — | |
RBC Institutional Class 2 Shareholders | | | (1,173 | ) | | | — | |
RBC Investor Class Shareholders | | | (7,136 | ) | | | — | |
RBC Reserve Class Shareholders | | | (14,189 | ) | | | — | |
RBC Select Class Shareholders | | | (10,464 | ) | | | — | |
| | | | | | | | |
Change in net assets resulting from Distributions of Net Realized Gains | | | (45,669 | ) | | | — | |
| | | | | | | | |
| | |
Capital Transactions: | | | | | | | | |
Proceeds from shares issued | | | 4,131,410,882 | | | | 11,731,772,486 | |
Distributions reinvested | | | 272,000 | | | | 750,750 | |
Cost of shares redeemed | | | (4,038,874,260 | ) | | | (10,957,608,972 | ) |
| | | | | | | | |
Change in net assets resulting from capital transactions | | | 92,808,622 | | | | 774,914,264 | |
Net increase in net assets | | | 92,779,203 | | | | 774,992,542 | |
| | |
Net Assets: | | | | | | | | |
Beginning of period | | | 5,712,442,401 | | | | 4,937,449,859 | |
| | | | | | | | |
End of period | | $ | 5,805,221,604 | | | $ | 5,712,442,401 | |
| | | | | | | | |
Undistributed net investment income | | $ | 3,719 | | | $ | 3,719 | |
| | | | | | | | |
| | |
Share Transactions: | | | | | | | | |
Issued | | | 4,131,410,882 | | | | 11,731,772,486 | |
Reinvested | | | 272,000 | | | | 750,750 | |
Redeemed | | | (4,038,874,260 | ) | | | (10,957,608,972 | ) |
| | | | | | | | |
Change in shares resulting from capital transactions | | | 92,808,622 | | | | 774,914,264 | |
| | | | | | | | |
See notes to financial statements.
40
Statements of Changes in Net Assets (cont.)
| | | | | | | | |
| | | Tax-Free
Money Market Fund | |
| | | For the
Six Months Ended
March 31, 2012 | | | For the
Year Ended
September 30, 2011 | |
| | | (Unaudited) | | | | |
From Investment Activities: | | | | | | | | |
Operations: | | | | | | | | |
Net investment income | | $ | 66,383 | | | $ | 209,626 | |
Net realized gains (losses) from investment transactions | | | 1,570 | | | | (18,807 | ) |
| | | | | | | | |
Change in net assets resulting from operations | | | 67,953 | | | | 190,819 | |
| | | | | | | | |
Distributions from Net Investment Income | | | | | | | | |
RBC Institutional Class 1 Shareholders | | | (1,581 | ) | | | (44,510 | ) |
RBC Institutional Class 2 Shareholders | | | (10,752 | ) | | | (53,846 | ) |
RBC Investor Class Shareholders | | | (8,630 | ) | | | (19,149 | ) |
RBC Reserve Class Shareholders | | | (28,293 | ) | | | (60,382 | ) |
RBC Select Class Shareholders | | | (17,127 | ) | | | (31,739 | ) |
| | | | | | | | |
Change in net assets resulting from Distributions of Net Investment Income | | | (66,383 | ) | | | (209,626 | ) |
| | | | | | | | |
Distributions from Net Realized Gains | | | | | | | | |
RBC Institutional Class 1 Shareholders | | | — | | | | (2,490 | ) |
RBC Institutional Class 2 Shareholders | | | — | | | | (15,077 | ) |
RBC Investor Class Shareholders | | | — | | | | (9,193 | ) |
RBC Reserve Class Shareholders | | | — | | | | (30,785 | ) |
RBC Select Class Shareholders | | | — | | | | (14,254 | ) |
| | | | | | | | |
Change in net assets resulting from Distributions of Net Realized Gains | | | — | | | | (71,799 | ) |
| | | | | | | | |
| | |
Capital Transactions: | | | | | | | | |
Proceeds from shares issued | | | 796,591,209 | | | | 1,612,678,587 | |
Distributions reinvested | | | 53,836 | | | | 280,174 | |
Cost of shares redeemed | | | (635,357,470 | ) | | | (1,834,297,551 | ) |
| | | | | | | | |
Change in net assets resulting from capital transactions | | | 161,287,575 | | | | (221,338,790 | ) |
| | | | | | | | |
Net increase (decrease) in net assets | | | 161,289,145 | | | | (221,429,396 | ) |
| | |
Net Assets: | | | | | | | | |
Beginning of period | | | 1,238,738,325 | | | | 1,460,167,721 | |
| | | | | | | | |
End of period | | $ | 1,400,027,470 | | | $ | 1,238,738,325 | |
| | | | | | | | |
Distributions in excess of net investment income | | $ | (371 | ) | | $ | (371 | ) |
| | | | | | | | |
| | |
Share Transactions: | | | | | | | | |
Issued | | | 796,591,209 | | | | 1,612,678,587 | |
Reinvested | | | 53,836 | | | | 280,174 | |
Redeemed | | | (635,357,470 | ) | | | (1,834,297,551 | ) |
| | | | | | | | |
Change in shares resulting from capital transactions | | | 161,287,575 | | | | (221,338,790 | ) |
| | | | | | | | |
See notes to financial statements.
41
| | |
| Prime Money Market Fund | | (Selected data for a share outstanding throughout the periods indicated) |
| | | | | | | | | | | | | | | | | | | | | | | | | | | | |
| | | | | | Investment Activities | | | Distributions | | | | |
| | | Net
Asset
Value,
Beginning
of Period | | | Net
Investment
Income | | | Net
Realized /
Unrealized
Gain/(Loss) on
Investments | | | Total from
Investment
Activities | | | Net
Investment
Income | | | Total
Distributions | | | Net
Asset
Value,
End of
Period | |
RBC Institutional Class 1 | | | | | | | | | | | | | | | | | | | | | | | | | | | | |
Six Months Ended March 31, 2012 (Unaudited) | | | $1.00 | | | | (a)(b) | | | | (b) | | | | (b) | | | | (b) | | | | (b) | | | | $1.00 | |
Year Ended September 30, 2011 | | | 1.00 | | | | (a)(b) | | | | (b) | | | | (b) | | | | (b) | | | | (b) | | | | 1.00 | |
Year Ended September 30, 2010 | | | 1.00 | | | | (a)(b) | | | | (b) | | | | (b) | | | | (b) | | | | (b) | | | | 1.00 | |
Year Ended September 30, 2009 | | | 1.00 | | | | 0.01(a) | | | | (b) | | | | 0.01 | | | | (0.01) | | | | (0.01) | | | | 1.00 | |
Year Ended September 30, 2008 | | | 1.00 | | | | 0.03(a) | | | | (b) | | | | 0.03 | | | | (0.03) | | | | (0.03) | | | | 1.00 | |
Year Ended September 30, 2007 | | | 1.00 | | | | 0.05 | | | | (b) | | | | 0.05 | | | | (0.05) | | | | (0.05) | | | | 1.00 | |
RBC Institutional Class 2 | | | | | | | | | | | | | | | | | | | | | | | | | | | | |
Six Months Ended March 31, 2012 (Unaudited) | | | $1.00 | | | | (a)(b) | | | | (b) | | | | (b) | | | | (b) | | | | (b) | | | | $1.00 | |
Year Ended September 30, 2011 | | | 1.00 | | | | (a)(b) | | | | (b) | | | | (b) | | | | (b) | | �� | | (b) | | | | 1.00 | |
Year Ended September 30, 2010 | | | 1.00 | | | | (a)(b) | | | | (b) | | | | (b) | | | | (b) | | | | (b) | | | | 1.00 | |
Period Ended September 30, 2009(c) | | | 1.00 | | | | (a)(b) | | | | (b) | | | | (b) | | | | (b) | | | | (b) | | | | 1.00 | |
RBC Investor Class | | | | | | | | | | | | | | | | | | | | | | | | | | | | |
Six Months Ended March 31, 2012 (Unaudited) | | | $1.00 | | | | (a)(b) | | | | (b) | | | | (b) | | | | (b) | | | | (b) | | | | $1.00 | |
Year Ended September 30, 2011 | | | 1.00 | | | | (a)(b) | | | | (b) | | | | (b) | | | | (b) | | | | (b) | | | | 1.00 | |
Year Ended September 30, 2010 | | | 1.00 | | | | (a)(b) | | | | (b) | | | | (b) | | | | (b) | | | | (b) | | | | 1.00 | |
Period Ended September 30, 2009(c) | | | 1.00 | | | | (a)(b) | | | | (b) | | | | (b) | | | | (b) | | | | (b) | | | | 1.00 | |
RBC Reserve Class | | | | | | | | | | | | | | | | | | | | | | | | | | | | |
Six Months Ended March 31, 2012 (Unaudited) | | | $1.00 | | | | (a)(b) | | | | (b) | | | | (b) | | | | (b) | | | | (b) | | | | $1.00 | |
Year Ended September 30, 2011 | | | 1.00 | | | | (a)(b) | | | | (b) | | | | (b) | | | | (b) | | | | (b) | | | | 1.00 | |
Year Ended September 30, 2010 | | | 1.00 | | | | (a)(b) | | | | (b) | | | | (b) | | | | (b) | | | | (b) | | | | 1.00 | |
Period Ended September 30, 2009(c) | | | 1.00 | | | | (a)(b) | | | | (b) | | | | (b) | | | | (b) | | | | (b) | | | | 1.00 | |
RBC Select Class | | | | | | | | | | | | | | | | | | | | | | | | | | | | |
Six Months Ended March 31, 2012 (Unaudited) | | | $1.00 | | | | (a)(b) | | | | (b) | | | | (b) | | | | (b) | | | | (b) | | | | $1.00 | |
Year Ended September 30, 2011 | | | 1.00 | | | | (a)(b) | | | | (b) | | | | (b) | | | | (b) | | | | (b) | | | | 1.00 | |
Year Ended September 30, 2010 | | | 1.00 | | | | (a)(b) | | | | (b) | | | | (b) | | | | (b) | | | | (b) | | | | 1.00 | |
Period Ended September 30, 2009(c) | | | 1.00 | | | | (a)(b) | | | | (b) | | | | (b) | | | | (b) | | | | (b) | | | | 1.00 | |
| | | | | | |
(a) (b) | | Per share net investment income has been calculated using the average daily shares method. Less than $0.01 or $(0.01) per share. | | (c) | | For the period from November 21, 2008 (commencement of operations) to September 30, 2009. |
See notes to financial statements.
42
| | |
| Prime Money Market Fund (cont.) | | (Selected data for a share outstanding throughout the periods indicated) |
| | | | | | | | | | | | | | | | | | | | |
| | | | | | Ratios/Supplemental Data | |
| | Total
Return | | | Net
Assets,
End of
Period
(millions) | | | Ratio of Net
Expenses
to Average
Net Assets | | | Ratio of
Net
Investment
Income to
Average
Net Assets | | | Ratio of
Expenses
to Average
Net
Assets* | |
RBC Institutional Class 1 | | | | | | | | | | | | | | | | | | | | |
Six Months Ended March 31, 2012 (Unaudited) | | | 0.04%(d) | | | | $2,820 | | | | 0.17%(e) | | | | 0.07%(e) | | | | 0.17%(g) | |
Year Ended September 30, 2011 | | | 0.13% | | | | 1,978 | | | | 0.17% | | | | 0.14% | | | | 0.17%(g) | |
Year Ended September 30, 2010 | | | 0.19% | | | | 4,051 | | | | 0.17% | | | | 0.19% | | | | 0.17%(g) | |
Year Ended September 30, 2009 | | | 0.95% | | | | 4,426 | | | | 0.55%(f) | | | | 1.03% | | | | 0.55% | |
Year Ended September 30, 2008 | | | 3.02% | | | | 10,591 | | | | 0.84% | | | | 2.94% | | | | 0.87% | |
Year Ended September 30, 2007 | | | 4.69% | | | | 9,662 | | | | 0.80% | | | | 4.59% | | | | 0.89% | |
RBC Institutional Class 2 | | | | | | | | | | | | | | | | | | | | |
Six Months Ended March 31, 2012 (Unaudited) | | | 0.01%(d) | | | | $653 | | | | 0.24%(e) | | | | 0.01%(e) | | | | 0.27%(e) | |
Year Ended September 30, 2011 | | | 0.04% | | | | 687 | | | | 0.26% | | | | 0.04% | | | | 0.27% | |
Year Ended September 30, 2010 | | | 0.09% | | | | 830 | | | | 0.27% | | | | 0.07% | | | | 0.27% | |
Period Ended September 30, 2009(c) | | | 0.62%(d) | | | | 19 | | | | 0.31%(e) | | | | 0.45%(e) | | | | 0.32%(e) | |
RBC Investor Class | | | | | | | | | | | | | | | | | | | | |
Six Months Ended March 31, 2012 (Unaudited) | | | 0.01%(d) | | | | $2,966 | | | | 0.24%(e) | | | | 0.01%(e) | | | | 1.12%(e) | |
Year Ended September 30, 2011 | | | 0.01% | | | | 3,199 | | | | 0.30% | | | | 0.01% | | | | 1.12% | |
Year Ended September 30, 2010 | | | 0.01% | | | | 3,995 | | | | 0.35% | | | | 0.01% | | | | 1.13% | |
Period Ended September 30, 2009(c) | | | 0.15%(d) | | | | 4,659 | | | | 0.91%(e) | | | | 0.16%(e) | | | | 1.19%(e) | |
RBC Reserve Class | | | | | | | | | | | | | | | | | | | | |
Six Months Ended March 31, 2012 (Unaudited) | | | 0.01%(d) | | | | $5,403 | | | | 0.24%(e) | | | | 0.01%(e) | | | | 1.02%(e) | |
Year Ended September 30, 2011 | | | 0.01% | | | | 5,032 | | | | 0.29% | | | | 0.01% | | | | 1.01% | |
Year Ended September 30, 2010 | | | 0.01% | | | | 5,165 | | | | 0.35% | | | | 0.01% | | | | 1.03% | |
Period Ended September 30, 2009(c) | | | 0.22%(d) | | | | 4,870 | | | | 0.83%(e) | | | | 0.24%(e) | | | | 1.08%(e) | |
RBC Select Class | | | | | | | | | | | | | | | | | | | | |
Six Months Ended March 31, 2012 (Unaudited) | | | 0.01%(d) | | | | $1,664 | | | | 0.24%(e) | | | | 0.01%(e) | | | | 0.92%(e) | |
Year Ended September 30, 2011 | | | 0.01% | | | | 1,595 | | | | 0.29% | | | | 0.01% | | | | 0.92% | |
Year Ended September 30, 2010 | | | 0.01% | | | | 1,572 | | | | 0.35% | | | | 0.01% | | | | 0.92% | |
Period Ended September 30, 2009(c) | | | 0.27%(d) | | | | 1,383 | | | | 0.77%(e) | | | | 0.29%(e) | | | | 0.97%(e) | |
| | | | | | |
* | | During the period, certain fees were contractually or voluntarily reduced and/or reimbursed. If such contractual/voluntary fee reductions and reimbursements had not occurred, the ratio would have been as indicated. |
(c) (d) (e) | | For the period from November 21, 2008 (commencement of operations) to September 30, 2009. Not annualized. Annualized. | | (f) | | Beginning November 21, 2008, the net operating expenses were contractually limited to 0.20% of average daily net assets. The ratio of net expenses to average net assets represents a blended percentage for the year ended September 30, 2009. |
| | | | (g) | | There were no waivers or reimbursements during the period. |
See notes to financial statements.
43
| | |
| U.S. Government Money Market Fund | | (Selected data for a share outstanding throughout the periods indicated) |
| | | | | | | | | | | | | | | | | | | | | | | | | | | | |
| | | | | | Investment Activities | | | Distributions | | | | |
| | | Net
Asset
Value,
Beginning
of Period | | | Net
Investment
Income | | | Net
Realized/
Unrealized
Gain/(Loss)
on
Investments | | | Total from
Investment
Activities | | | Net
Investment
Income | | | Total
Distributions | | | Net
Asset
Value,
End of
Period | |
RBC Institutional Class 1 | | | | | | | | | | | | | | | | | | | | | | | | | | | | |
Six Months Ended March 31, 2012 (Unaudited) | | | $1.00 | | | | (a)(b) | | | | (b) | | | | (b) | | | | (b) | | | | (b) | | | | $1.00 | |
Year Ended September 30, 2011 | | | 1.00 | | | | (a)(b) | | | | (b) | | | | (b) | | | | (b) | | | | (b) | | | | 1.00 | |
Year Ended September 30, 2010 | | | 1.00 | | | | (a)(b) | | | | (b) | | | | (b) | | | | (b) | | | | (b) | | | | 1.00 | |
Year Ended September 30, 2009 | | | 1.00 | | | | 0.01(a) | | | | (b) | | | | 0.01 | | | | (0.01) | | | | (0.01) | | | | 1.00 | |
Year Ended September 30, 2008 | | | 1.00 | | | | 0.03(a) | | | | (b) | | | | 0.03 | | | | (0.03) | | | | (0.03) | | | | 1.00 | |
Year Ended September 30, 2007 | | | 1.00 | | | | 0.04 | | | | (b) | | | | 0.04 | | | | (0.04) | | | | (0.04) | | | | 1.00 | |
RBC Institutional Class 2 | | | | | | | | | | | | | | | | | | | | | | | | | | | | |
Six Months Ended March 31, 2012 (Unaudited) | | | $1.00 | | | | (a)(b) | | | | (b) | | | | (b) | | | | (b) | | | | (b) | | | | $1.00 | |
Year Ended September 30, 2011 | | | 1.00 | | | | (a)(b) | | | | (b) | | | | (b) | | | | (b) | | | | (b) | | | | 1.00 | |
Year Ended September 30, 2010 | | | 1.00 | | | | (a)(b) | | | | (b) | | | | (b) | | | | (b) | | | | (b) | | | | 1.00 | |
Period Ended September 30, 2009(c) | | | 1.00 | | | | (a)(b) | | | | (b) | | | | (b) | | | | (b) | | | | (b) | | | | 1.00 | |
RBC Investor Class | | | | | | | | | | | | | | | | | | | | | | | | | | | | |
Six Months Ended March 31, 2012 (Unaudited) | | | $1.00 | | | | (a)(b) | | | | (b) | | | | (b) | | | | (b) | | | | (b) | | | | $1.00 | |
Year Ended September 30, 2011 | | | 1.00 | | | | (a)(b) | | | | (b) | | | | (b) | | | | (b) | | | | (b) | | | | 1.00 | |
Year Ended September 30, 2010 | | | 1.00 | | | | (a)(b) | | | | (b) | | | | (b) | | | | (b) | | | | (b) | | | | 1.00 | |
Period Ended September 30, 2009(c) | | | 1.00 | | | | (a)(b) | | | | (b) | | | | (b) | | | | (b) | | | | (b) | | | | 1.00 | |
RBC Reserve Class | | | | | | | | | | | | | | | | | | | | | | | | | | | | |
Six Months Ended March 31, 2012 (Unaudited) | | | $1.00 | | | | (a)(b) | | | | (b) | | | | (b) | | | | (b) | | | | (b) | | | | $1.00 | |
Year Ended September 30, 2011 | | | 1.00 | | | | (a)(b) | | | | (b) | | | | (b) | | | | (b) | | | | (b) | | | | 1.00 | |
Year Ended September 30, 2010 | | | 1.00 | | | | (a)(b) | | | | (b) | | | | (b) | | | | (b) | | | | (b) | | | | 1.00 | |
Period Ended September 30, 2009(c) | | | 1.00 | | | | (a)(b) | | | | (b) | | | | (b) | | | | (b) | | | | (b) | | | | 1.00 | |
RBC Select Class | | | | | | | | | | | | | | | | | | | | | | | | | | | | |
Six Months Ended March 31, 2012 (Unaudited) | | | $1.00 | | | | (a)(b) | | | | (b) | | | | (b) | | | | (b) | | | | (b) | | | | $1.00 | |
Year Ended September 30, 2011 | | | 1.00 | | | | (a)(b) | | | | (b) | | | | (b) | | | | (b) | | | | (b) | | | | 1.00 | |
Year Ended September 30, 2010 | | | 1.00 | | | | (a)(b) | | | | (b) | | | | (b) | | | | (b) | | | | (b) | | | | 1.00 | |
Period Ended September 30, 2009(c) | | | 1.00 | | | | (a)(b) | | | | (b) | | | | (b) | | | | (b) | | | | (b) | | | | 1.00 | |
| | | | | | |
| (a) | | Per share net investment income has been calculated using the average daily shares method. Less than $0.01 or $(0.01) per share. | | (c) | | For the period from November 21, 2008 (commencement of operations) to September 30, 2009. |
| (b) | | | | |
See notes to financial statements.
44
| | |
| U.S. Government Money Market Fund (cont.) | | (Selected data for a share outstanding throughout the periods indicated) |
| | | | | | | | | | | | | | | | | | | | |
| | | | | | Ratios/Supplemental Data | |
| | | Total
Return | | | Net
Assets,
End of
Period
(millions) | | | Ratio of Net
Expenses
to Average
Net Assets | | | Ratio of
Net
Investment
Income to
Average
Net Assets | | | Ratio of
Expenses
to Average
Net
Assets* | |
RBC Institutional Class 1 | | | | | | | | | | | | | | | | | | | | |
Six Months Ended March 31, 2012 (Unaudited) | | | 0.01%(d) | | | | $1,425 | | | | 0.15%(e) | | | | 0.01%(e) | | | | 0.17%(e) | |
Year Ended September 30, 2011 | | | 0.05% | | | | 1,580 | | | | 0.17% | | | | 0.05% | | | | 0.17% | |
Year Ended September 30, 2010 | | | 0.11% | | | | 662 | | | | 0.17% | | | | 0.11% | | | | 0.17%(g) | |
Year Ended September 30, 2009 | | | 0.73% | | | | 848 | | | | 0.49%(f) | | | | 0.98% | | | | 0.49%(g) | |
Year Ended September 30, 2008 | | | 2.70% | | | | 3,266 | | | | 0.72% | | | | 2.51% | | | | 0.72%(g) | |
Year Ended September 30, 2007 | | | 4.56% | | | | 1,393 | | | | 0.76% | | | | 4.47% | | | | 0.76%(g) | |
RBC Institutional Class 2 | | | | | | | | | | | | | | | | | | | | |
Six Months Ended March 31, 2012 (Unaudited) | | | 0.01%(d) | | | | $172 | | | | 0.15%(e) | | | | 0.01%(e) | | | | 0.27%(e) | |
Year Ended September 30, 2011 | | | 0.01% | | | | 142 | | | | 0.20% | | | | 0.01% | | | | 0.27% | |
Year Ended September 30, 2010 | | | 0.02% | | | | 124 | | | | 0.27% | | | | 0.02% | | | | 0.27% | |
Period Ended September 30, 2009(c) | | | 0.44%(d) | | | | 14 | | | | 0.30%(e) | | | | 0.56%(e) | | | | 0.30%(e) | |
RBC Investor Class | | | | | | | | | | | | | | | | | | | | |
Six Months Ended March 31, 2012 (Unaudited) | | | 0.01%(d) | | | | $889 | | | | 0.15%(e) | | | | 0.01%(e) | | | | 1.12%(e) | |
Year Ended September 30, 2011 | | | 0.01% | | | | 981 | | | | 0.21% | | | | 0.01% | | | | 1.12% | |
Year Ended September 30, 2010 | | | 0.01% | | | | 1,260 | | | | 0.27% | | | | 0.01% | | | | 1.13% | |
Period Ended September 30, 2009(c) | | | 0.11%(d) | | | | 1,372 | | | | 0.65%(e) | | | | 0.07%(e) | | | | 1.17%(e) | |
RBC Reserve Class | | | | | | | | | | | | | | | | | | | | |
Six Months Ended March 31, 2012 (Unaudited) | | | 0.01%(d) | | | | $1,946 | | | | 0.15%(e) | | | | 0.01%(e) | | | | 1.02%(e) | |
Year Ended September 30, 2011 | | | 0.01% | | | | 1,748 | | | | 0.21% | | | | 0.01% | | | | 1.02% | |
Year Ended September 30, 2010 | | | 0.01% | | | | 1,752 | | | | 0.27% | | | | 0.01% | | | | 1.03% | |
Period Ended September 30, 2009(c) | | | 0.14%(d) | | | | 1,714 | | | | 0.65%(e) | | | | 0.15%(e) | | | | 1.06%(e) | |
RBC Select Class | | | | | | | | | | | | | | | | | | | | |
Six Months Ended March 31, 2012 (Unaudited) | | | 0.01%(d) | | | | $1,373 | | | | 0.15%(e) | | | | 0.01%(e) | | | | 0.92%(e) | |
Year Ended September 30, 2011 | | | 0.01% | | | | 1,262 | | | | 0.21% | | | | 0.01% | | | | 0.92% | |
Year Ended September 30, 2010 | | | 0.01% | | | | 1,139 | | | | 0.27% | | | | 0.01% | | | | 0.93% | |
Period Ended September 30, 2009(c) | | | 0.17%(d) | | | | 1,233 | | | | 0.63%(e) | | | | 0.18%(e) | | | | 0.95%(e) | |
| | | | | | |
* | | During the period, certain fees were contractually or voluntarily reduced and/or reimbursed. If such contractual/voluntary fee reductions and reimbursements had not occurred, the ratio would have been as indicated. |
(c) (d) (e) | | For the period from November 21, 2008 (commencement of operations) to September 30, 2009. Not annualized. Annualized. | | (f) | | Beginning November 21, 2008, the net operating expenses were contractually limited to 0.20% of average daily net assets. The ratio of net expenses to average net assets represents a blended percentage for the year ended September 30, 2009. |
| | | |
| | | (g) | | There were no waivers or reimbursements during the period. |
See notes to financial statements.
45
| | |
| Tax-Free Money Market Fund | | (Selected data for a share outstanding throughout the periods indicated) |
| | | | | | | | | | | | | | | | | | | | | | | | | | | | |
| | | | | | Investment Activities | | | Distributions | | | | |
| | | Net
Asset
Value,
Beginning
of Period | | | Net
Investment
Income | | | Net
Realized/
Unrealized
Gain/(Loss)
on
Investments | | | Total from
Investment
Activities | | | Net
Investment
Income | | | Net
Realized
Gains | | | Net
Asset
Value,
End of
Period | |
RBC Institutional Class 1 | | | | | | | | | | | | | | | | | | | | | | | | | | | | |
Six Months Ended March 31, 2012 (Unaudited) | | $ | 1.00 | | | | (a)(b) | | | | (b) | | | | (b) | | | | (b) | | | | (b) | | | | $1.00 | |
Year Ended September 30, 2011 | | | 1.00 | | | | (a)(b) | | | | (b) | | | | (b) | | | | (b) | | | | (b) | | | | 1.00 | |
Year Ended September 30, 2010 | | | 1.00 | | | | (a)(b) | | | | (b) | | | | (b) | | | | (b) | | | | (b) | | | | 1.00 | |
Year Ended September 30, 2009 | | | 1.00 | | | | 0.01(a) | | | | (b) | | | | 0.01 | | | | (0.01) | | | | — | | | | 1.00 | |
Year Ended September 30, 2008 | | | 1.00 | | | | 0.02(a) | | | | (b) | | | | 0.02 | | | | (0.02) | | | | — | | | | 1.00 | |
Year Ended September 30, 2007 | | | 1.00 | | | | 0.03 | | | | (b) | | | | 0.03 | | | | (0.03) | | | | — | | | | 1.00 | |
RBC Institutional Class 2 | | | | | | | | | | | | | | | | | | | | | | | | | | | | |
Six Months Ended March 31, 2012 (Unaudited) | | $ | 1.00 | | | | (a)(b) | | | | (b) | | | | (b) | | | | (b) | | | | (b) | | | | $1.00 | |
Year Ended September 30, 2011 | | | 1.00 | | | | (a)(b) | | | | (b) | | | | (b) | | | | (b) | | | | (b) | | | | 1.00 | |
Year Ended September 30, 2010 | | | 1.00 | | | | (a)(b) | | | | (b) | | | | (b) | | | | (b) | | | | (b) | | | | 1.00 | |
Period Ended September 30, 2009(c) | | | 1.00 | | | | (a)(b) | | | | (b) | | | | (b) | | | | (b) | | | | — | | | | 1.00 | |
RBC Investor Class | | | | | | | | | | | | | | | | | | | | | | | | | | | | |
Six Months Ended March 31, 2012 (Unaudited) | | $ | 1.00 | | | | (a)(b) | | | | (b) | | | | (b) | | | | (b) | | | | (b) | | | | $1.00 | |
Year Ended September 30, 2011 | | | 1.00 | | | | (a)(b) | | | | (b) | | | | (b) | | | | (b) | | | | (b) | | | | 1.00 | |
Year Ended September 30, 2010 | | | 1.00 | | | | (a)(b) | | | | (b) | | | | (b) | | | | (b) | | | | (b) | | | | 1.00 | |
Period Ended September 30, 2009(c) | | | 1.00 | | | | (a)(b) | | | | (b) | | | | (b) | | | | (b) | | | | — | | | | 1.00 | |
RBC Reserve Class | | | | | | | | | | | | | | | | | | | | | | | | | | | | |
Six Months Ended March 31, 2012 (Unaudited) | | $ | 1.00 | | | | (a)(b) | | | | (b) | | | | (b) | | | | (b) | | | | (b) | | | | $1.00 | |
Year Ended September 30, 2011 | | | 1.00 | | | | (a)(b) | | | | (b) | | | | (b) | | | | (b) | | | | (b) | | | | 1.00 | |
Year Ended September 30, 2010 | | | 1.00 | | | | (a)(b) | | | | (b) | | | | (b) | | | | (b) | | | | (b) | | | | 1.00 | |
Period Ended September 30, 2009(c) | | | 1.00 | | | | (a)(b) | | | | (b) | | | | (b) | | | | (b) | | | | — | | | | 1.00 | |
RBC Select Class | | | | | | | | | | | | | | | | | | | | | | | | | | | | |
Six Months Ended March 31, 2012 (Unaudited) | | $ | 1.00 | | | | (a)(b) | | | | (b) | | | | (b) | | | | (b) | | | | (b) | | | | $1.00 | |
Year Ended September 30, 2011 | | | 1.00 | | | | (a)(b) | | | | (b) | | | | (b) | | | | (b) | | | | (b) | | | | 1.00 | |
Year Ended September 30, 2010 | | | 1.00 | | | | (a)(b) | | | | (b) | | | | (b) | | | | (b) | | | | (b) | | | | 1.00 | |
Period Ended September 30, 2009(c) | | | 1.00 | | | | (a)(b) | | | | (b) | | | | (b) | | | | (b) | | | | — | | | | 1.00 | |
| | | | | | |
(a) (b) | | Per share net investment income has been calculated using the average daily shares method. Less than $0.01 or $(0.01) per share. | | (c) | | For the period from November 21, 2008 (commencement of operations) to September 30, 2009. |
| | | |
See notes to financial statements.
46
| | |
| Tax-Free Money Market Fund (cont.) | | (Selected data for a share outstanding throughout the periods indicated) |
| | | | | | | | | | | | | | | | | | | | |
| | | | | | Ratios/Supplemental Data | |
| | | Total
Return | | | Net
Assets,
End of
Period
(millions) | | | Ratio of Net
Expenses to
Average Net
Assets | | | Ratio of
Net
Investment
Income
to Average
Net Assets | | | Ratio of
Expenses to
Average Net
Assets* | |
RBC Institutional Class 1 | | | | | | | | | | | | | | | | | | | | |
Six Months Ended March 31, 2012 (Unaudited) | | | 0.01%(d) | | | | $26 | | | | 0.15%(e) | | | | 0.01%(e) | | | | 0.19%(e) | |
Year Ended September 30, 2011 | | | 0.09% | | | | 37 | | | | 0.18% | | | | 0.10% | | | | 0.19% | |
Year Ended September 30, 2010 | | | 0.25% | | | | 71 | | | | 0.18% | | | | 0.22% | | | | 0.18%(g) | |
Year Ended September 30, 2009 | | | 0.74% | | | | 51 | | | | 0.71%(f) | | | | 1.49% | | | | 0.71% | |
Year Ended September 30, 2008 | | | 1.95% | | | | 904 | | | | 0.80% | | | | 1.90% | | | | 0.84% | |
Year Ended September 30, 2007 | | | 3.00% | | | | 841 | | | | 0.70% | | | | 2.96% | | | | 0.84% | |
RBC Institutional Class 2 | | | | | | | | | | | | | | | | | | | | |
Six Months Ended March 31, 2012 (Unaudited) | | | 0.01%(d) | | | | $227 | | | | 0.15%(e) | | | | 0.01%(e) | | | | 0.29%(e) | |
Year Ended September 30, 2011 | | | 0.02% | | | | 214 | | | | 0.26% | | | | 0.02% | | | | 0.29% | |
Year Ended September 30, 2010 | | | 0.15% | | | | 282 | | | | 0.28% | | | | 0.09% | | | | 0.28% | |
Period Ended September 30, 2009(c) | | | 0.41%(d) | | | | (h) | | | | 0.34%(e) | | | | 0.45%(e) | | | | 0.34%(e) | |
RBC Investor Class | | | | | | | | | | | | | | | | | | | | |
Six Months Ended March 31, 2012 (Unaudited) | | | 0.01%(d) | | | | $165 | | | | 0.15%(e) | | | | 0.01%(e) | | | | 1.13%(e) | |
Year Ended September 30, 2011 | | | 0.02% | | | | 167 | | | | 0.26% | | | | 0.01% | | | | 1.14% | |
Year Ended September 30, 2010 | | | 0.02% | | | | 210 | | | | 0.42% | | | | 0.01% | | | | 1.15% | |
Period Ended September 30, 2009(c) | | | 0.04%(d) | | | | 202 | | | | 0.76%(e) | | | | 0.03%(e) | | | | 1.19%(e) | |
RBC Reserve Class | | | | | | | | | | | | | | | | | | | | |
Six Months Ended March 31, 2012 (Unaudited) | | | 0.01%(d) | | | | $599 | | | | 0.15%(e) | | | | 0.01%(e) | | | | 1.04%(e) | |
Year Ended September 30, 2011 | | | 0.02% | | | | 520 | | | | 0.26% | | | | 0.01% | | | | 1.04% | |
Year Ended September 30, 2010 | | | 0.02% | | | | 612 | | | | 0.40% | | | | 0.01% | | | | 1.04% | |
Period Ended September 30, 2009(c) | | | 0.06%(d) | | | | 432 | | | | 0.74%(e) | | | | 0.05%(e) | | | | 1.09%(e) | |
RBC Select Class | | | | | | | | | | | | | | | | | | | | |
Six Months Ended March 31, 2012 (Unaudited) | | | 0.01%(d) | | | | $383 | | | | 0.15%(e) | | | | 0.01%(e) | | | | 0.94%(e) | |
Year Ended September 30, 2011 | | | 0.02% | | | | 300 | | | | 0.26% | | | | 0.01% | | | | 0.93% | |
Year Ended September 30, 2010 | | | 0.02% | | | | 286 | | | | 0.40% | | | | 0.01% | | | | 0.94% | |
Period Ended September 30, 2009(c) | | | 0.11%(d) | | | | 242 | | | | 0.68%(e) | | | | 0.10%(e) | | | | 0.99%(e) | |
| | | | | | |
* | | During the period, certain fees were contractually or voluntarily reduced and/or reimbursed. If such contractual/voluntary fee reductions and reimbursements had not occurred, the ratio would have been as indicated. |
(c) (d) (e) | | For the period from November 21, 2008 (commencement of operations) to September 30, 2009. Not annualized. Annualized. | | (f) (g) (h) | | Beginning November 21, 2008, the net operating expenses were contractually limited to 0.20% of average daily net assets. The ratio of net expenses to average net assets represents a blended percentage for the year ended September 30, 2009. There were no waivers or reimbursements during the period. Less than $1,000,000. |
| | | |
| | | |
| | | |
See notes to financial statements.
47
|
NOTES TO FINANCIAL STATEMENTS |
March 31, 2012 (Unaudited)
1. Organization
RBC Funds Trust (“the Trust”), is registered under the Investment Company Act of 1940 (as amended) as an open-end management investment company. The Trust was organized as a Delaware statutory trust on December 16, 2003. Predecessor funds to the Trust were reorganized as portfolios of the Trust effective April 16, 2004. This semi annual report includes the following three investment portfolios (“Funds”):
- Prime Money Market Fund
- U.S. Government Money Market Fund
- Tax-Free Money Market Fund
The Prime Money Market Fund, U.S. Government Money Market Fund and Tax-Free Money Market Fund offer five share classes: RBC Institutional Class 1, RBC Institutional Class 2, RBC Investor Class, RBC Reserve Class and RBC Select Class.
RBC Global Asset Management (U.S.) Inc (“RBC GAM (US)”) acts as the investment adviser for the Funds. The officers of the Trust (“Fund Management”) are also employees of RBC GAM (US) or its affiliates or BNY Mellon Investment Servicing (US) Inc. (“BNY Mellon”), the co-administrator.
2. Significant Accounting Policies
Summarized below are the significant accounting policies of the Funds. These policies conform to accounting principles generally accepted in the United States of America (“U.S. GAAP”). Fund management follows these policies when preparing financial statements. Management may also be required to make estimates and assumptions that affect the reported amounts of assets and liabilities at the date of the financial statements and the reported amounts of income and expenses for the period. Actual results could differ from those estimates.
Security Valuation:
Securities held by the Funds are valued at amortized cost, which approximates fair value, in order to maintain a constant net asset value of $1.00 per share. If amortized cost no longer approximates fair value due to credit or other impairments of an issuer, the Fund will use pricing and valuation procedures approved by the Trust’s Board of Trustees (the “Board”) to determine a security’s fair value. Investments in open-end investment companies are valued at net asset value.
Money market funds must invest exclusively in high quality securities. To be considered high quality, a security generally must be rated in one of the two highest short-term credit quality categories by at least two nationally recognized rating organizations such as Standard & Poors Corporation, Moody’s Investors Service or Fitch Investors Service. If unrated, a security must be determined by the Adviser to be of comparable quality.
Fair Value Measurements:
Various inputs are used in determining the fair value of investments which are as follows:
• Level 1 - Inputs that reflect unadjusted quoted prices in active markets for identical assets or liabilities that the Funds have the ability to access at the measurement date.
• Level 2 - Inputs other than quoted prices that are observable for the asset or liability either directly or indirectly, including inputs in markets that are not considered to be active. Generally, the types of securities included in Level 2 for the Funds are U.S. Treasury bills and certain money market instruments, including those valued at amortized cost under Rule 2a-7. Amortized cost approximates the current fair value of a security, but is not obtained from a quoted price in an active market.
48
|
NOTES TO FINANCIAL STATEMENTS |
• Level 3 - Unobservable inputs based on the best information available in the circumstances, to the extent observable inputs are not available (including the Fund’s own assumptions in determining the fair value of investments).
The inputs or methodology used for valuing securities are not necessarily an indication of the risk associated with investing in those securities.
The summary of inputs used to determine the fair value of the Fund’s investments as of March 31, 2012 is as follows:
| | | | | | | | | | | | | | | | |
Funds | | Level 1
Quoted Prices | | | Level 2
Significant
Observable
Inputs | | | Level 3
Significant
Unobservable
Inputs | | | Total | |
Prime Money Market | | $ | — | | | $ | 13,603,547,755(b)(c) | | | | $— | | | $ | 13,603,547,755 | |
U.S. Government Money Market | | | — | | | | 5,921,431,594(b)(c) | | | | — | | | | 5,921,431,594 | |
Tax-Free Money Market | | | 5,000,000(a) | | | | 1,392,578,593(c) | | | | — | | | | 1,397,578,593 | |
(a) Level 1 investments consist of Investment Companies.
(b) The breakdown of the Fund’s investments by security type is disclosed in the Schedules of Portfolio Investments.
(c) The breakdown of the Fund’s investments by state classification or political subdivision is disclosed in the Schedules of Portfolio Investments.
During the six months ended March 31, 2012, the Funds recognized no transfers to/from level 1 or 2. The Fund’s policy is to recognize transfers between level 1, level 2 and level 3 at the end of the year utilizing fair value at the beginning of the year.
In May 2011, the Financial Accounting Standards Board (“FASB”) issued Accounting Standards Update (“ASU”) No. 2011-04 “Amendments to Achieve Common Fair Value Measurement and Disclosure Requirements” in U.S. GAAP and International Financial Reporting Standards (“IFRSs”). ASU 2011-04 includes common requirements for measurement of and disclosure about fair value between U.S. GAAP and IFRS. ASU 2011-04 will require reporting entities to disclose the following information for fair value measurements categorized within Level 3 of the fair value hierarchy: quantitative information about the unobservable inputs used in the fair value measurement, the valuation processes used by the reporting entity and a narrative description of the sensitivity of the fair value measurement to changes in unobservable inputs and the interrelationships between those unobservable inputs. In addition, ASU 2011-04 will require reporting entities to make disclosures about amounts and reasons for all transfers in and out of Level 1 and Level 2 fair value measurements. The new and revised disclosures are effective for interim and annual reporting periods beginning after December 15,2011. Management is currently evaluating the implications of ASU No. 2011-04 and its impact on the financial statements.
Investment Transactions and Income:
Investment transactions are accounted for on the date the security is bought or sold (“trade date”). Dividend income is recorded on the ex-dividend date. Realized gains and losses from investment transactions are calculated based on the costs of the specific security (also known as identified cost basis). Interest income is recognized on the accrual basis. The Funds amortize all premiums and discounts on debt securities.
When Issued Transactions:
The Funds may engage in when-issued transactions. The Funds record when-issued securities on the trade date and maintain sufficient liquidity so that cash will be available to make payment for the securities purchased. Securities purchased on a when-issued basis are valued daily beginning on trade date and begin earning interest on the settlement date. As of March 31, 2012, the Funds held no when-issued securities.
49
|
NOTES TO FINANCIAL STATEMENTS |
Repurchase Agreements:
The Funds may enter into repurchase agreements with counterparties whom the Adviser has deemed creditworthy, including primary dealers that report to the Federal Reserve Bank of New York or other large U.S. commercial banks or broker-dealers. These repurchase agreements are subject to the seller’s agreement to repurchase such securities at a mutually agreed upon date and price. The repurchase price generally equals the price paid by the Funds plus interest negotiated on the basis of current short-term rates.
Securities pledged by the dealers as collateral for repurchase agreements are held by a custodian bank until maturity of the repurchase agreement. The Funds have procedures to secure additional collateral, if needed, to ensure that the daily market value of the collateral remains in excess of the market value of the repurchase agreement in the event of a default.
Expense, Investment Income and Gain/Loss Allocation:
Each Fund pays the expenses that are directly related to its operations, such as custodian fees or investment advisory fees. Expenses incurred by the Trust, such as trustee or legal fees, are allocated among each of the Funds either proportionately based upon each Fund’s relative net assets or using another reasonable basis such as equally across all Funds, depending on the nature of the expense. Individual share classes within a Fund are charged expenses specific to that class, such as distribution fees. Within a Fund, expenses other than class specific expenses are allocated daily to each class based upon the proportion of relative net assets. Investment income and realized and unrealized gains or losses are allocated to each class of shares based on the proportion of relative net assets.
Distributions to Shareholders:
Each Fund pays out any income that it receives, less expenses, in the form of dividends and capital gain distributions to its shareholders. Income dividends are declared daily and paid monthly. Dividends will also be paid at any time during the month upon total redemption of shares in an account. Capital gains, if any, are declared and paid at least annually. Distributions to shareholders are recorded on the ex-dividend date. The amount of dividends and distributions are calculated based on federal income tax regulations, which may differ from GAAP. These “book/tax” differences may be either temporary or permanent in nature. To the extent these differences are determined, as of the end of the tax year, to be permanent (e.g. expiring capital loss carryforward), they are reclassified within a Fund’s capital accounts based on their federal tax basis treatment.
Credit Enhancement:
Certain obligations held in the Funds have credit enhancement or liquidity features that may, under certain circumstances, provide for repayment of principal and interest on the obligation upon demand date, interest rate reset date or final maturity. These enhancements may include: letters of credit; liquidity guarantees; security purchase agreements; tender option purchase agreements; and third party insurance (i.e., AMBAC and MBIA).
3. Agreements and Other Transactions with Affiliates
The Trust has entered into investment advisory agreements with RBC GAM (US) under which RBC GAM (US) manages the Funds’ assets and furnishes related office facilities, equipment, research and personnel. The agreements require the Funds to pay RBC GAM (US) a monthly fee based upon average daily net assets. Under the terms of the advisory contract RBC GAM (US) is entitled to receive fees based on a percentage of the average daily net assets as follows:
| | | | | | |
| | | Average Daily Net Assets of Fund | | Annual Rate | |
Prime Money Market Fund | | All Net Assets | | | 0.10% | |
U.S. Government Money Market Fund | | All Net Assets | | | 0.10% | |
Tax-Free Money Market Fund | | All Net Assets | | | 0.10% | |
50
|
NOTES TO FINANCIAL STATEMENTS |
RBC Institutional Class 1 of Prime Money Market Fund, U.S. Government Money Market Fund and Tax-Free Money Market Fund pays an annual shareholder services administration fee of 0.05% of the average daily net assets attributable to RBC Institutional Class 1 shares of a Fund that is used to compensate financial intermediaries for providing services to shareholders and maintaining shareholder accounts. This shareholder services administration fee is not paid pursuant to Rule 12b-1.
RBC GAM (US) has contractually agreed to waive fees and/or reimburse expenses under an Expense Limitation Agreement in order to maintain the net annual fund operating expenses at 0.20% for RBC Institutional Class 1 of the Prime Money Market Fund, U.S. Government Money Market Fund and Tax-Free Money Market Fund. During the six months ended March 31, 2012, there were no fees waived under this agreement.
RBC GAM (US) and BNY Mellon serve as co-administrators to the Funds. Services provided under the administrative services contract include providing day-to-day administration of matters related to the Funds, maintenance of their records and the preparation of reports. RBC GAM (US) does not receive an administration services fee. BNY Mellon receives a fee for its services payable by the Funds based on the Fund’s average net assets. BNY Mellon’s fee is included with “Accounting fees” in the Statements of Operations.
Certain Officers and Trustees of the Trust are affiliated with the adviser or the co-administrator. Such Officers and Trustees receive no compensation from the Funds for serving in their respective roles.
The RBC Funds currently pay the independent Trustees (Trustees of the Trust who are not directors, officers or employees of the adviser, administrator or distributor) an annual retainer of $32,500. The Board Chairperson and Audit Committee Chairperson each receive an additional retainer of $2,500 annually, and all other trustees serving as Chair of a Board committee each receive an additional retainer of $1,000 annually. In addition, Independent Trustees receive a quarterly meeting fee of $5,000 for each in-person Board meeting attended, a meeting fee of $1,000 for each telephonic or Special Board meeting attended, and a $1,500 fee for each Board committee meeting attended and are reimbursed for all out-of-pocket expenses relating to attendance at such meetings.
Security Transactions with Affiliated Funds
During the six months ended March 31, 2012, the Prime Money Market Fund, U.S. Government Money Market Fund and Tax-Free Money Market Fund engaged in security purchase and sale transactions with other RBC Funds or investment advisory clients managed by RBC GAM (US). These purchase and sale transactions complied with Rule 17a-7 under the Investment Company Act of 1940 (as amended) and amounted to $0 and $148,725,000 for Prime Money Market Fund, respectively, $96,225,000 and $0 for U.S. Government Money Market Fund, respectively, and $42,225,000 and $0 for Tax-Free Money Market Fund, respectively.
51
|
NOTES TO FINANCIAL STATEMENTS |
4. Fund Distribution
The Prime Money Market, U. S. Government Money Market and Tax-Free Money Market Funds have adopted a Shareholder Account and Distribution Services (12b-1) Plan (the ”Plan”) with respect to RBC Institutional Class 2, RBC Investor Class, RBC Reserve Class and the RBC Select Class, in which Quasar Distributors LLC (the “Distributor”) acts as the Funds’ distributor. The Plan permits each Fund to make payments for or to reimburse the Distributor or others, including RBC Capital Markets, LLC monthly for distribution-related costs and expenses of marketing shares of each share class covered under the Plan, and/or for providing shareholder services. The following chart shows the current Plan fee rate for each class:
| | | | | | | | | | | | | | | | |
| | | RBC Institutional Class 2 | | | RBC Investor Class | | | RBC Reserve Class | | | RBC Select Class | |
12b-1 Plan Fee | | | 0.15% | | | | 1.00% | | | | 0.90% | | | | 0.80% | |
Plan fees are based on average daily net assets of the applicable class. Up to 0.25% of each Plan fee may be designated as a Service Fee, as defined by the applicable rules of the Financial Industry Regulatory Authority.
Pursuant to a Shareholder Account and Distribution Services Agreement between the Distributor and RBC Capital Markets, LLC, the Distributor has agreed to compensate RBC Capital Markets for certain shareholder account servicing support provided to the Funds. RBC Capital Markets has agreed to waive fees and/or reimburse expenses in order to maintain the net annual fund operating expenses for each class listed below for each Fund to the following amounts:
| | | | |
Fund | | | | Operating Expense Limit |
Prime Money Market Fund | | | | |
RBC Institutional Class 2 | | | | 0.30% |
RBC Investor Class | | | | 1.05% |
RBC Reserve Class | | | | 0.90% |
RBC Select Class | | | | 0.80% |
| | |
U.S. Government Money Market Fund | | | | |
RBC Institutional Class 2 | | | | 0.30% |
RBC Investor Class | | | | 1.00% |
RBC Reserve Class | | | | 0.85% |
RBC Select Class | | | | 0.77% |
| | |
Tax-Free Money Market Fund | | | | |
RBC Institutional Class 2 | | | | 0.30% |
RBC Investor Class | | | | 1.00% |
RBC Reserve Class | | | | 0.85% |
RBC Select Class | | | | 0.70% |
This Expense Limitation Agreement is in place until January 31, 2013 and shall continue for additional one-year terms unless terminated by either party at any time. Each Fund will carry forward, for a period not to exceed 12 months from the date on which a waiver or reimbursement is made by RBC Capital Markets, any expenses in excess of the Expense Limitation and repay RBC Capital Markets such amounts, provided the Fund is able to effect such repayment and remain in compliance with the Expense Limitation. At March 31, 2012, the amounts subject to possible recoupment under the expense limitation agreement are $10,646,203, $6,040,107 and $2,053,186 for the Prime Money Market Fund, U.S. Government Money Market Fund and Tax-Free Money Market Fund, respectively.
RBC Capital Markets may voluntarily waive and/or reimburse additional fund operating expenses at any time, such as to maintain a minimum yield in a fund. Any such voluntary program may be modified or discontinued at any time without notice.
52
|
NOTES TO FINANCIAL STATEMENTS |
For the six months ended March 31, 2012, the following distribution fees were waived:
| | | | | | |
Fund | | | | Distribution Fees Waived | |
Prime Money Market Fund | | | | | | |
RBC Institutional Class 2 | | | | | $ 117,565 | |
RBC Investor Class | | | | | 13,561,295 | |
RBC Reserve Class | | | | | 20,082,995 | |
RBC Select Class | | | | | 5,568,655 | |
| | |
U.S. Government Money Market Fund | | | | | | |
RBC Institutional Class 2 | | | | | $ 101,661 | |
RBC Investor Class | | | | | 4,529,460 | |
RBC Reserve Class | | | | | 8,119,290 | |
RBC Select Class | | | | | 5,224,297 | |
| | |
Tax-Free Money Market Fund | | | | | | |
RBC Institutional Class 2 | | | | | $ 150,083 | |
RBC Investor Class | | | | | 849,743 | |
RBC Reserve Class | | | | | 2,510,379 | |
RBC Select Class | | | | | 1,350,445 | |
For the six months ended March 31, 2012, shareholder servicing fees were voluntarily waived for the RBC Institutional Class 1 in the amount of $190,986 and $5,942 for the U.S. Government Money Market Fund and the Tax-Free Money Market Fund, respectively.
53
|
NOTES TO FINANCIAL STATEMENTS |
5. Capital Share Transactions
The number of shares sold, reinvested and redeemed correspond to the net proceeds from sale of shares, reinvestments of dividends and cost of shares redeemed, respectively, since shares are redeemed at $1.00 per share.
Transactions for the period were as follows:
| | | | | | | | | | | | | | | | |
| | | Prime
Money Market Fund | | | U.S. Government
Money Market Fund | |
| | | | |
| | | For the Six Months
Ended
March 31,
2012 | | | For the Year
Ended
September 30,
2011 | | | For the Six Months
Ended
March 31,
2012 | | | For the Year
Ended
September 30,
2011 | |
| | | (Unaudited) | | | | | | (Unaudited) | | | | |
CAPITAL TRANSACTIONS: | | | | | | | | | | | | | | | | |
RBC Institutional Class 1 | | | | | | | | | | | | | | | | |
Proceeds from shares issued | | $ | 14,273,915,782 | | | $ | 47,958,836,084 | | | $ | 2,369,173,259 | | | $ | 8,471,837,355 | |
Distributions reinvested | | | 611,233 | | | | 2,779,850 | | | | 61,476 | | | | 335,353 | |
Cost of shares redeemed | | | (13,432,669,948 | ) | | | (50,033,766,650 | ) | | | (2,524,097,649 | ) | | | (7,553,849,882 | ) |
| | | | | | | | | | | | | | | | |
Change in RBC Institutional
Class 1 | | $ | 841,857,067 | | | $ | (2,072,150,716 | ) | | $ | (154,862,914 | ) | | $ | 918,322,826 | |
| | | | | | | | | | | | | | | | |
RBC Institutional Class 2 | | | | | | | | | | | | | | | | |
Proceeds from shares issued | | $ | 376,902,467 | | | $ | 1,537,763,049 | | | $ | 234,974,532 | | | $ | 664,679,726 | |
Distributions reinvested | | | 32,967 | | | | 370,876 | | | | 7,966 | | | | 15,107 | |
Cost of shares redeemed | | | (411,638,579 | ) | | | (1,680,872,073 | ) | | | (205,546,550 | ) | | | (646,731,961 | ) |
| | | | | | | | | | | | | | | | |
Change in RBC Institutional
Class 2 | | $ | (34,703,145 | ) | | $ | (142,738,148 | ) | | $ | 29,435,948 | | | $ | 17,962,872 | |
| | | | | | | | | | | | | | | | |
RBC Investor Class | | | | | | | | | | | | | | | | |
Proceeds from shares issued | | $ | 568,458,103 | | | $ | 1,487,557,623 | | | $ | 254,670,998 | | | $ | 470,599,974 | |
Distributions reinvested | | | 154,036 | | | | 367,405 | | | | 46,072 | | | | 108,072 | |
Cost of shares redeemed | | | (802,230,040 | ) | | | (2,283,435,059 | ) | | | (346,268,375 | ) | | | (750,374,803 | ) |
| | | | | | | | | | | | | | | | |
Change in RBC Investor Class | | $ | (233,617,901 | ) | | $ | (795,510,031 | ) | | $ | (91,551,305 | ) | | $ | (279,666,757 | ) |
| | | | | | | | | | | | | | | | |
RBC Reserve Class | | | | | | | | | | | | | | | | |
Proceeds from shares issued | | $ | 1,326,315,628 | | | $ | 2,563,297,367 | | | $ | 596,941,914 | | | $ | 1,052,547,577 | |
Distributions reinvested | | | 256,922 | | | | 529,679 | | | | 90,329 | | | | 175,364 | |
Cost of shares redeemed | | | (955,857,498 | ) | | | (2,696,929,651 | ) | | | (398,918,512 | ) | | | (1,056,632,356 | ) |
| | | | | | | | | | | | | | | | |
Change in RBC Reserve Class | | $ | 370,715,052 | | | $ | (133,102,605 | ) | | $ | 198,113,731 | | | $ | (3,909,415 | ) |
| | | | | | | | | | | | | | | | |
RBC Select Class | | | | | | | | | | | | | | | | |
Proceeds from shares issued | | $ | 787,727,464 | | | $ | 1,836,063,957 | | | $ | 675,650,179 | | | $ | 1,072,107,854 | |
Distributions reinvested | | | 81,568 | | | | 175,333 | | | | 66,157 | | | | 116,854 | |
Cost of shares redeemed | | | (718,204,546 | ) | | | (1,813,856,530 | ) | | | (564,043,174 | ) | | | (950,019,970 | ) |
| | | | | | | | | | | | | | | | |
Change in RBC Select Class | | $ | 69,604,486 | | | $ | 22,382,760 | | | $ | 111,673,162 | | | $ | 122,204,738 | |
| | | | | | | | | | | | | | | | |
Change in net assets
resulting from capital transactions | | $ | 1,013,855,559 | | | $ | (3,121,118,740 | ) | | $ | 92,808,622 | | | $ | 774,914,264 | |
| | | | | | | | | | | | | | | | |
54
|
NOTES TO FINANCIAL STATEMENTS |
| | | | | | | | |
| | | Tax-Free
Money Market Fund | |
| | |
| | | For the Six Months
Ended
March 31,
2012 | | | For the Year
Ended
September 30,
2011 | |
| | | (Unaudited) | | | | |
CAPITAL TRANSACTIONS: | | | | | | | | |
RBC Institutional Class 1 | | | | | | | | |
Proceeds from shares issued | | $ | 565 | | | $ | 47,748,219 | |
Distributions reinvested | | | 1,064 | | | | 45,747 | |
Cost of shares redeemed | | | (11,001,070 | ) | | | (81,866,423 | ) |
| | | | | | | | |
Change in RBC Institutional Class 1 | | $ | (10,999,441 | ) | | $ | (34,072,457 | ) |
| | | | | | | | |
RBC Institutional Class 2 | | | | | | | | |
Proceeds from shares issued | | $ | 127,917,177 | | | $ | 310,679,168 | |
Distributions reinvested | | | 8,764 | | | | 68,926 | |
Cost of shares redeemed | | | (114,922,975 | ) | | | (378,104,024 | ) |
| | | | | | | | |
Change in RBC Institutional Class 2 | | $ | 13,002,966 | | | $ | (67,355,930 | ) |
| | | | | | | | |
RBC Investor Class | | | | | | | | |
Proceeds from shares issued | | $ | 132,036,826 | | | $ | 201,253,242 | |
Distributions reinvested | | | 7,142 | | | | 28,344 | |
Cost of shares redeemed | | | (134,451,264 | ) | | | (243,457,745 | ) |
| | | | | | | | |
Change in RBC Investor Class | | $ | (2,407,296 | ) | | $ | (42,176,159 | ) |
| | | | | | | | |
RBC Reserve Class | | | | | | | | |
Proceeds from shares issued | | $ | 247,742,023 | | | $ | 530,161,442 | |
Distributions reinvested | | | 23,085 | | | | 91,163 | |
Cost of shares redeemed | | | (168,936,557 | ) | | | (622,044,607 | ) |
| | | | | | | | |
Change in RBC Reserve Class | | $ | 78,828,551 | | | $ | (91,792,002 | ) |
| | | | | | | | |
RBC Select Class | | | | | | | | |
Proceeds from shares issued | | $ | 288,894,618 | | | $ | 522,836,516 | |
Distributions reinvested | | | 13,781 | | | | 45,994 | |
Cost of shares redeemed | | | (206,045,604 | ) | | | (508,824,752 | ) |
| | | | | | | | |
Change in RBC Select Class | | $ | 82,862,795 | | | $ | 14,057,758 | |
| | | | | | | | |
Change in net assets resulting from capital transactions | | $ | 161,287,575 | | | $ | (221,338,790 | ) |
| | | | | | | | |
6. Federal Income Taxes
It is the policy of each Fund to continue to qualify as a regulated investment company by complying with the provisions applicable to certain investment companies, as defined under Subchapter M of the Internal Revenue Code, and to distribute substantially all of its net investment income and net realized capital gains. Therefore, no federal tax liability is recorded in the financial statements of each Fund.
Management has analyzed the Funds’ tax positions taken or expected to be taken on federal income tax returns for all open tax years (current and prior three tax years) and has concluded that no provision for federal income tax is required in the Funds’ financial statements. The Funds’ federal and state income and federal excise tax returns for tax years for which the applicable statutes of limitations have not expired are subject to examination by the Internal Revenue Service and state departments of revenue.
55
|
NOTES TO FINANCIAL STATEMENTS |
The tax character of distributions during the fiscal year ended September 30, 2011 were as follows:
| | | | | | | | | | | | | | | | | | | | | | | | |
| | | Distributions Paid From | | | | | | | | | | |
| | | Ordinary
Income | | | Net
Long Term
Capital Gains | | | Net
Short Term
Capital Gains | | | Total Taxable
Distributions | | | Tax Exempt
Distributions | | | Total
Distributions
Paid* | |
Prime Money Market Fund | | | $6,289,029 | | | | $ — | | | | $ — | | | | $6,289,029 | | | | $ — | | | | $6,289,029 | |
U.S. Government Money Market Fund | | | 1,024,577 | | | | — | | | | — | | | | 1,024,577 | | | | — | | | | 1,024,577 | |
Tax-Free Money Market Fund | | | 841 | | | | 50,212 | | | | 21,587 | | | | 72,640 | | | | 208,414 | | | | 281,054 | |
*Total distributions paid may differ from the Statements of Changes in Net Assets because distributions are recognized when actually paid for tax purposes.
The tax basis of components of accumulated earnings/(losses) and the tax character of distributions paid are determined at fiscal year end, and will be included in the Annual Report dated September 30, 2012.
As of September 30, 2011, the following Funds had net capital loss carryforwards to offset future net capital gains, if any:
| | | | | | | | |
| | | Capital Loss
Carryforward | | | Expires | |
Prime Money Market Fund | | | $4,346,878 | | | | 2017 | |
| | |
Tax-Free Money Market Fund | | | 12,260 | | | | 2019 | |
The Regulated Investment Company Modernization Act of 2010 (The “Act”) was enacted on December 22, 2010. The Act makes changes to several tax rules impacting the Funds. In general, the provisions of the Act will be effective for the Funds’ fiscal year beginning after September 30, 2011. Although the Act provides several benefits, including the unlimited carryover of future capital losses, there may be a greater likelihood that all or a portion of each Funds’s pre-enactment capital loss carryovers may expire without being utilized due to the fact that post-enactment capital losses get utilized before pre-enactment capital loss carryovers. Relevant information regarding the impact of the Act on the Funds will be contained within this section of the Funds’ fiscal year ending September 30, 2012 financial statements.
Under current tax law, capital losses realized after October 31 of a Fund’s fiscal year may be deferred and treated as occurring on the first business day of the following fiscal year for tax purposes. The following Fund had deferred post October capital losses, which were treated as arising on the first business day of the fiscal year ending September 30, 2012 and as such are included in current year earnings.
| | | | |
| | | Deferred
Post-October
Losses | |
Prime Money Market Fund | | | $2,011 | |
Tax-Free Money Market Fund | | | 6,097 | |
56
|
NOTES TO FINANCIAL STATEMENTS |
7. Line of Credit
Tax-Free Money Market Fund is the sole participant in an uncommitted, unsecured $150,000,000 line of credit with U.S. Bank N.A. (the “Bank”), the Fund’s custodian, to be used only for liquidity and other purposes. Interest is charged on borrowings under this line of credit at the Bank’s prime lending rate – 1/2% per annum. There were no loans outstanding pursuant to this line of credit at March 31, 2012. During the six months ended March 31, 2012, the Tax-Free Money Market Fund did not utilize this line of credit.
8. Subsequent Events
Management has evaluated the impact of subsequent events of the Funds and has determined that there are no subsequent events that require recognition or disclosure in the financial statements.
57
|
SUPPLEMENTAL INFORMATION (Unaudited) |
Shareholder Expense Examples
As a shareholder of the RBC Funds, you incur two types of costs: (1) transaction costs, including sales charges (loads) and (2) ongoing costs, including management fees; 12b-1 distribution and service fees; and other Fund expenses. This example is intended to help you understand your ongoing costs (in dollars) of investing in the RBC Funds and to compare these costs with the ongoing costs of investing in other mutual funds.
The Example is based on an investment of $1,000 invested at the beginning of the period and held for the entire period from October 1, 2011 through March 31, 2012.
Actual Expenses and Performance
The table below provides information about actual account values and actual expenses. You may use the information below, together with the amount you invested, to estimate the expenses that you paid over the period. Simply divide your account value by $1,000 (for example, an $8,600 account value divided by $1,000 = 8.6), then multiply the result by the number in the table under the heading entitled “Expenses Paid During Period” to estimate the expenses you paid on your account during this period.
| | | | | | | | |
| | | Beginning
Account Value 10/1/11 | | Ending
Account Value 3/31/12 | | Expenses Paid During Period* 10/1/11-3/31/12 | | Annualized
Expense Ratio During Period 10/1/11-3/31/12 |
Prime Money Market Fund | | | | | | | | |
RBC Institutional Class 1 | | $1,000.00 | | $1,000.40 | | $0.85 | | 0.17% |
RBC Institutional Class 2 | | 1,000.00 | | 1,000.10 | | 1.19 | | 0.24% |
RBC Investor Class | | 1,000.00 | | 1,000.10 | | 1.19 | | 0.24% |
RBC Reserve Class | | 1,000.00 | | 1,000.10 | | 1.19 | | 0.24% |
RBC Select Class | | 1,000.00 | | 1,000.10 | | 1.19 | | 0.24% |
| | | | |
U.S. Government | | | | | | | | |
Money Market Fund | | | | | | | | |
RBC Institutional Class 1 | | 1,000.00 | | 1,000.10 | | 0.75 | | 0.15% |
RBC Institutional Class 2 | | 1,000.00 | | 1,000.10 | | 0.75 | | 0.15% |
RBC Investor Class | | 1,000.00 | | 1,000.10 | | 0.75 | | 0.15% |
RBC Reserve Class | | 1,000.00 | | 1,000.10 | | 0.75 | | 0.15% |
RBC Select Class | | 1,000.00 | | 1,000.10 | | 0.75 | | 0.15% |
| | | | |
Tax-Free Money Market Fund | | | | | | | | |
RBC Institutional Class 1 | | 1,000.00 | | 1,000.10 | | 0.75 | | 0.15% |
RBC Institutional Class 2 | | 1,000.00 | | 1,000.10 | | 0.75 | | 0.15% |
RBC Investor Class | | 1,000.00 | | 1,000.10 | | 0.75 | | 0.15% |
RBC Reserve Class | | 1,000.00 | | 1,000.10 | | 0.75 | | 0.15% |
RBC Select Class | | 1,000.00 | | 1,000.10 | | 0.75 | | 0.15% |
| * | Expenses are equal to the average account value times the Fund’s annualized expense ratio multiplied by 182/366 (to reflect one-half year period). |
58
|
SUPPLEMENTAL INFORMATION (Unaudited) |
Hypothetical Example for Comparison Purposes
The table below provides information about hypothetical account values and hypothetical expenses based on each RBC Funds’ actual expense ratio and an assumed rate of return of 5% per year before expenses, which is not the Fund’s actual return. The hypothetical account values and expenses may not be used to estimate the actual ending account balance or expenses you paid for the period. You may use this information to compare this 5% hypothetical example with the 5% hypothetical examples that appear in the shareholder reports of other funds.
Please note that the expenses shown in the table are meant to highlight your ongoing costs only and do not reflect any transactional costs, such as sales charges (loads), redemption fees, or exchange fees. Therefore, the table is useful in comparing ongoing costs only, and will not help you determine the relative total costs of owning different funds. In addition, if these transactional costs were included, your costs would have been higher.
| | | | | | | | |
| | | Beginning
Account Value
10/1/11 | | Ending
Account Value
3/31/12 | | Expenses Paid
During Period*
10/1/11-3/31/12 | | Annualized
Expense Ratio
During Period 10/1/11-3/31/12 |
Prime Money Market Fund | | | | | | | | |
RBC Institutional Class 1 | | $1,000.00 | | $1,024.02 | | $0.86 | | 0.17% |
RBC Institutional Class 2 | | 1,000.00 | | 1,023.67 | | 1.21 | | 0.24% |
RBC Investor Class | | 1,000.00 | | 1,023.67 | | 1.21 | | 0.24% |
RBC Reserve Class | | 1,000.00 | | 1,023.67 | | 1.21 | | 0.24% |
RBC Select Class | | 1,000.00 | | 1,023.67 | | 1.21 | | 0.24% |
| | | | |
U.S. Government | | | | | | | | |
Money Market Fund | | | | | | | | |
RBC Institutional Class 1 | | 1,000.00 | | 1,024.12 | | 0.75 | | 0.15% |
RBC Institutional Class 2 | | 1,000.00 | | 1,024.12 | | 0.75 | | 0.15% |
RBC Investor Class | | 1,000.00 | | 1,024.12 | | 0.75 | | 0.15% |
RBC Reserve Class | | 1,000.00 | | 1,024.12 | | 0.75 | | 0.15% |
RBC Select Class | | 1,000.00 | | 1,024.12 | | 0.75 | | 0.15% |
| | | | |
Tax-Free Money Market Fund | | | | | | | | |
RBC Institutional Class 1 | | 1,000.00 | | 1,024.12 | | 0.75 | | 0.15% |
RBC Institutional Class 2 | | 1,000.00 | | 1,024.12 | | 0.75 | | 0.15% |
RBC Investor Class | | 1,000.00 | | 1,024.12 | | 0.75 | | 0.15% |
RBC Reserve Class | | 1,000.00 | | 1,024.12 | | 0.75 | | 0.15% |
RBC Select Class | | 1,000.00 | | 1,024.12 | | 0.75 | | 0.15% |
| * | Expenses are equal to the average account value times the Fund’s annualized expense ratio multiplied by 182/366 (to reflect one-half year period). |
59
This Page Intentionally Left Blank
60
This Page Intentionally Left Blank
61
This Page Intentionally Left Blank
62
This Page Intentionally Left Blank
63
This Page Intentionally Left Blank
64
RBC Funds
P.O. Box 701
Milwaukee, WI 53201-0701
800-422-2766
www.rbcgam.us
Performance data represents past performance and does not guarantee future results. The principal value of an investment and investment return will fluctuate so that an investor’s shares, when redeemed, may be worth more or less than their original cost.
This report and the financial statements contained herein are provided for the information of RBC Funds shareholders. This report is not authorized for distribution to prospective investors unless preceded or accompanied by a current prospectus, which contains information concerning investment objectives, risks, charges and expenses of the funds. Please read the prospectus carefully before investing.
This report and the financial statements contained herein are not intended to be a forecast of future events, a guarantee of future results, or investment advice. There is no assurance that certain securities will remain in or out of each fund’s portfolio. The views expressed in this report reflect those of the portfolio managers through the period ended March 31, 2012.
NOT FDIC INSURED • NO BANK GUARANTEE • MAY LOSE VALUE
RBC Global Asset Management (U.S.), Inc. serves as investment adviser for the RBC Funds. RBC Funds are distributed by Quasar Distributors LLC.

| | |
| The RBC Funds are pleased to offer shareholder reports printed entirely on Forest Stewardship Council certified paper. FSC® certification ensures that the paper used in this report contains fiber from well-managed and responsibly harvested forests that meet strict environmental and socioeconomic standards. | | |
RBCF-MM SAR 03-12
| | | | | | | | | | | | | | | | |
| | | | | | | | | |
| | | | | | | | RBC Funds | |
About Your Semi Annual Report | | | | | | | | This semi annual report includes detailed information about the Access Capital Community Investment Fund (the” Fund”) including financial statements, performance, and a complete list of holdings. The Fund compares its performance against the Barclays U.S. Securitized Index and the Barclays U.S. Aggregate Bond Index which are widely used market indices. We hope the financial information presented will help you evaluate your investment in the Fund. We also encourage you to read your Fund’s prospectus for further detail as to the Fund’s investment policies and risk profile. Fund prospectuses and performance information subsequent to the date of this report are available on our website at www.rbcgam.us. A description of the policies and procedures that your Fund uses to determine how to vote proxies relating to portfolio securities is available (i) without charge, upon request, by calling 1-800-422-2766; (ii) on the Fund’s website at www.rbcgam.us; and (iii) on the Securities and Exchange Commission’s (the “Commission”) website at http://www.sec.gov. Information regarding how your Fund voted proxies relating to portfolio securities during the most recent 12 month period ended June 30 is available (i) on the Fund’s website at www.rbcgam.us; and (ii) on the Commission’s website at http://www.sec.gov. A schedule of the Fund’s portfolio holdings will be filed with the Commission for the first and third quarters of each fiscal year on Form N-Q. This information is available on the Commission’s website at http://www.sec.gov and may be reviewed and copied at the Commission’s Public Reference Room in Washington, D.C. Information on the operation of the Public Reference Room is available by calling 1-202-551-8090. | |
| Table of | | | | | | | | | | | | | | | | |
| Contents | | | | | | | | Portfolio Managers | | | 1 | |
| | | | | | | | Performance Summary | | | 2 | |
| | | | | | | | Fund Statistics | | | 3 | |
| | | | | | | | Schedule of Portfolio Investments | | | 5 | |
| | | | | | | | Financial Statements | | | | |
| | | | | | | | - Statement of Assets and Liabilities | | | 26 | |
| | | | | | | | - Statement of Operations | | | 28 | |
| | | | | | | | - Statements of Changes in Net Assets | | | 29 | |
| | | | | | | | - Statement of Cash Flows | | | 30 | |
| | | | | | | | Financial Highlights | | | 32 | |
| | | | | | | | Notes to Financial Statements | | | 34 | |
| | | | | | | | Share Class Information | | | 45 | |
| | | | | | | | Supplemental Information | | | 46 | |
| | | | | | | | | | | | |
| | | | | | | | | | | | |
| | | | | | | | | | | | |
| | | | | | | | | | | | |
| | | | | | | | | | | | |
| | | | | | | | | | | | |
| | | | | | | | | | | | |
| | | | | | |
| PORTFOLIO MANAGERS | | | | | | |
| | | | | | | |
RBC Global Asset Management (U.S.) Inc.(“RBC GAM (US)”) serves as the investment advisor to the Access Capital Community Investment Fund. RBC GAM (US) employs a team approach to the management of the Access Capital Community Investment Fund, with no individual team member being solely responsible for the investment decisions. The Fund’s management team has access to RBC GAM (US)’s investment research and other money management resources. | | | | | | |
John M. Huber, CFA Senior Managing Director, Chief Investment Officer — Fixed Income John Huber oversees RBC GAM (US)’s fixed income research and portfolio management efforts. He is a member of the firm’s Executive Committee. John joined RBC GAM (US) in 2001 from Galliard Capital Management where he was a founding member and principal. Before that, John was a portfolio manager at Norwest Investment Management, where he began his career in the capital markets group in 1990. He earned a BA from the University of Iowa and an MBA in Finance from the University of Minnesota Carlson School of Management. John acts as an advisor to the Carlson Funds Enterprise for the University of Minnesota. He is also a board member of the Minneapolis Downtown YMCA. John is a CFA charterholder and a member of the CFA Society of Minnesota. | | | | | | 
John M. Huber, CFA |
Brian Svendahl, CFA Managing Director, Senior Portfolio Manager Brian Svendahl is a senior portfolio manager leading RBC GAM (US)’s Risk Management Team which monitors various risks within our fixed income products. Brian also has specific research responsibilities for government and agency loans including small business administration and U.S.D.A. programs. Brian joined RBC GAM (US) in 2005 from Wells Fargo Brokerage Services, where he served as senior vice president and risk manager. Prior to that, Brian’s experiences include developing VAR analysis and off balance sheet hedging strategies for Wells Fargo’s Treasury group. Brian has worked in the investment industry since 1992. Brian received a BS in Economics from the University of Minnesota. He also received a BBA in Finance and an MBA from the University of Minnesota, Carlson School of Management. Brian is a CFA charterholder and member of the CFA Society of Minnesota. | | | | | | 
Brian Svendahl, CFA |
Todd Brux, CFA Managing Director, Senior Portfolio Manager Todd Brux co-leads the Rates Research Team in RBC GAM (US)’s fixed income group. Todd has extensive fixed income industry experience and is currently responsible for researching Agency and whole-loan residential mortgage-backed securities as well as commercial mortgage- and asset-backed securities. He also has portfolio management responsibilities for our community investing, mortgage, and opportunistic high income mandates. Before joining RBC GAM (US) in 2004, Todd held senior positions at GMAC-RFC, and was previously a senior investment analyst at Galliard Capital Management. He began his career in the investment industry in 1994. Todd earned a BA in Economics from the University of Wisconsin-Madison. He is a CFA charterholder and a member of the CFA Society of Minnesota. | | | | | | 
Todd Brux, CFA |
| | | | | | |
| | | | | | |
| | | | | | |
1
| | | | | | | | | | | | | | | | | | | | |
| | | | | | PERFORMANCE SUMMARY |
| | | | | | Average Annual Total Returns as of March 31, 2012 | | | | | | |
| | | | | | Access Capital Community Investment Fund | | | | | | | | | | | | | | |
| | | | | | | | | 1 Year | | 3 Year | | 5 Year | | 10 Year | | Since
Inception | | Expense
Ratio* | | |
| | | | | | Class A (a) | | | | | | | | | | | | | | |
| | | | | | - Including Maximum Sales Charge of 3.75% | | 1.75% | | 3.81% | | 4.40% | | 4.40% | | 4.65% | | | | |
| | | | | | - At Net Asset Value | | 5.67% | | 5.12% | | 5.19% | | 4.80% | | 4.95% | | 1.03% | | |
| | | | | | Class I (b) | | | | | | | | | | | | | | |
| | | | | | - At Net Asset Value | | 5.83% | | 5.39% | | 5.36% | | 4.99% | | 5.23% | | 0.79% | | |
| | | | | | | | | | |
| | | | | | Barclays U. S. Securitized Index (c) | | 6.28% | | 6.42% | | 6.18% | | 5.60% | | 5.94% | | | | |
| | | | | | Barclays U. S. Aggregate Bond Index (c) | | 7.71% | | 6.83% | | 6.25% | | 5.80% | | 5.93% | | | | |
| | | | | | Performance data quoted represents past performance. Past performance is no guarantee of future results. Investment return and principal value of an investment will fluctuate so that an investor’s shares, when redeemed, may be worth more or less than their original cost. Current performance may be lower or higher than performance quoted. For performance data current to most recent month-end go to www.rbcgam.us. The Barclays U.S. Securitized Index is an unmanaged index that tracks the performance of mortgage-backed pass-through securities issued by Ginnie Mae, Fannie Mae, and Freddie Mac, investment-grade bonds and asset-backed securities. The Barclays U.S. Aggregate Bond Index is an unmanaged index that tracks the performance of a representative list of government, corporate, asset-backed and mortgage-backed securities. (a) The inception date for Class A shares of the Fund is January 29, 2009. All performance shown for such class of shares prior to its inception date is based on the performance of the Class I shares of the Fund, adjusted to reflect the fees and expenses of Class A shares, as applicable. (b) Class I commenced operations on July 28, 2008. The performance in the table reflects the performance of Access Capital Strategies Community Investment Fund, Inc., the predecessor to the Fund. From its inception, June 23, 1998, until May 30, 2006, the predecessor fund elected status as a business development company. From May 31, 2006 until July 27, 2008, the predecessor fund operated as a continuously offered closed-end interval management company. If the predecessor fund had operated as an open-end management company, performance may have been adversely affected. Fund performance reflects applicable fee waivers/expense reimbursements which, if excluded, would cause performance to be lower. (c) You cannot invest directly into the index. * The Fund’s expenses reflect the most recent year end (September 30, 2011). |
| | | | | | |
| | | | | | |
2
| | | | | | | | | | | | | | | | |
FUND STATISTICS (UNAUDITED) | | | | | | | | |
Access Capital Community Investment Fund | | | | | | | | |
Current income and capital appreciation | | | | | | | | | | | | | | Investment
Objective | | |
Barclays U.S. Securitized Index Barclays U.S. Aggregate Bond Index | | | | | | | | | | | | | | Benchmark | | |
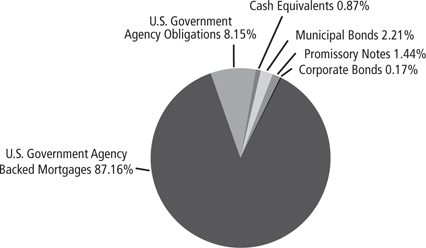
| | | | | | | | Asset Allocation
(as of 3/31/12)
(% of fund’s
investments) | | |
Fannie Mae Pool #AK2386, | | 2.94% | | | | Fannie Mae Pool #387590, | | 1.70% | | | | | | Top Ten Holdings
(as of 3/31/12)
(% of fund’s net
assets) | | |
3.50%, 2/1/42 | | | | | | 4.90%, 9/1/15 | | | | | | | | |
| Small Business Administration, | | 2.91% | | | | Fannie Mae Pool #465537, | | 1.41% | | | | | | |
1.45%, 3/25/36 | | | | | | 4.20%, 7/1/20 | | | | | | | | |
| Fannie Mae Pool #466934, | | 2.02% | | | | Fannie Mae Pool #466303, | | 1.35% | | | | | | |
4.10%, 1/1/21 | | | | | | 3.54%, 11/1/20 | | | | | | | | |
| Fannie Mae Pool #463212, | | 1.91% | | | | Fannie Mae Pool #AK6715, | | 1.30% | | | | | | |
4.68%, 8/1/19 | | | | | | 3.50%, 3/1/42 | | | | | | | | |
| Fannie Mae Series 2004-T7, | | 1.86% | | | | | | | | | | | | |
Class A, 5.12%, 7/25/41 | | | | | | | | | | | | | | |
| Massachusetts Housing | | 1.78% | | | | | | | | | | | | | | |
Investment Corp. Term Loan, | | | | | | | | | | | | | | | | |
6.67%, 4/1/35 | | | | | | | | | | | | | | | | |
| | | | |
*A listing of all portfolio holdings can be found beginning on page 5. | | | | | | | | |
| | | | | | | | |
| | | | | | | | | | | | | | | | |
| | | | | | | | |
| | | | | | | | | | | | | | | | |
| | | | | | | | |
| | | | | | | | | | | | | | | | |
| | | | | | | | |
| | | | | | | | | | | | | | | | |
| | | | | | | | |
| | | | | | | | | | | | | | | | |
| | | | | | | | |
| | | | | | | | | | | | | | | | |
| | | | | | | | |
| | | | | | | | | | | | | | | | |
3
| | | | | | | | |
| | | | | | FUND STATISTICS (UNAUDITED) |
| | | | | | | Access Capital Community Investment Fund |
Growth of $10,000 Initial
Investment Over
10 Years | | | | | | 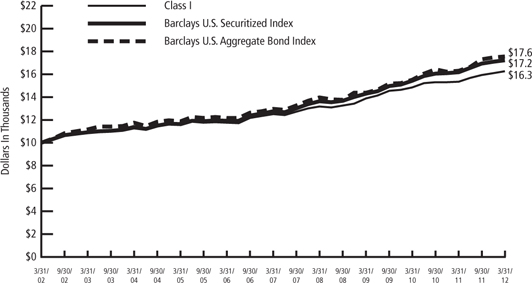
|
| | | |
| | | | | | The graph reflects an initial investment of $10,000 over a 10 year period and is based on Class I shares. The Fund’s total return includes reinvested dividends and capital gains. The Fund’s total return also includes operating expenses that reduce return, while the total return of the index do not. The graph does not reflect the deduction of taxes that a shareholder would pay on fund distributions or redemption of fund shares. Performance of other classes will vary due to differences in fee structures. |
| | | | | | | | |
| | | | | | | | |
| | | | | | | | |
| | | | | | | | |
| | | | | | | | |
| | | | | | | | |
| | | | | | | | |
| | | | | | | | |
4
|
SCHEDULE OF PORTFOLIO INVESTMENTS |
Access Capital Community Investment Fund
March 31, 2012 (Unaudited)
| | | | | | |
Principal Amount | | | | Value | |
Municipal Bonds — 2.75% | | | | |
California — 0.28% | | | | |
| $ 290,000 | | California Rural Home Mortgage Finance Authority Revenue, Series C, 5.40%, 8/1/35, (Credit Support: Ginnie Mae, Fannie Mae, Freddie Mac), Callable 2/1/17 @ 104 | | | $ 308,693 | |
| | |
| 975,000 | | California Statewide Communities Development Authority Revenue, Series B, 5.25%, 10/20/42, (Credit Support: Ginnie Mae), Callable 10/20/17 @ 102 | | | 978,705 | |
| | |
| 330,000 | | Camarillo California Community Development, Community Tax Allocation (Housing Set-Aside), Series A-T, 5.26%, 9/1/16, (Credit Support: AMBAC) | | | 335,650 | |
| | | | | | |
| | | | | 1,623,048 | |
| | | | | | |
| |
Delaware — 0.25% | | | | |
| 730,000 | | Delaware State Housing Authority Revenue, Series 2, 0.95%, 1/1/14, (Credit Support: Ginnie Mae, Fannie Mae, Freddie Mac) | | | 731,891 | |
| 745,000 | | Delaware State Housing Authority Revenue, Series 2, 1.50%, 1/1/15, (Credit Support: Ginnie Mae, Fannie Mae, Freddie Mac) | | | 749,597 | |
| | | | | | |
| | | | | 1,481,488 | |
| | | | | | |
| |
Guam — 0.02% | | | | |
| 140,000 | | Guam Power Authority Revenue OID, Series A, 5.00%, 10/1/24, (Credit Support: AMBAC), Callable 4/30/12 @ 100 | | | 139,678 | |
| | | | | | |
| |
Massachusetts — 1.23% | | | | |
| 6,790,000 | | Massachusetts Housing Finance Agency Revenue, Series B, 6.53%, 12/1/27, (Credit Support: NATL-RE,IBC), Callable 6/1/17 @ 100 | | | 7,239,023 | |
| | | | | | |
| |
Mississippi — 0.02% | | | | |
| 100,000 | | Mississippi Home Corp. Multi Family Revenue OID, 5.35%, 8/20/48, (Credit Support: Ginnie Mae, FHA), Callable 9/1/18 @ 105 | | | 99,866 | |
| | | | | | |
| |
New York — 0.69% | | | | |
| 665,000 | | New York City Housing Development Corp. Revenue, Series A, 4.15%, 7/15/15, (Credit Support: Fannie Mae) | | | 690,489 | |
| | |
| 700,000 | | New York State Housing Finance Agency Revenue, 4.50%, 11/15/27, (Credit Support: Fannie Mae), Callable 11/15/16 @ 100 | | | 708,043 | |
5
|
SCHEDULE OF PORTFOLIO INVESTMENTS |
Access Capital Community Investment Fund (cont.)
March 31, 2012 (Unaudited)
| | | | | | |
Principal Amount | | | | Value | |
| $1,000,000 | | New York State Housing Finance Agency Revenue, Series A, 4.65%, 11/15/38, (Credit Support: Fannie Mae), Callable 11/15/16 @ 100 | | | $ 1,005,280 | |
| | |
| 1,620,000 | | Suffolk County Industrial Development Agency Revenue, 5.70%, 12/1/26, (LOC: Bank of New York), Callable 4/30/12 @ 102 | | | 1,664,663 | |
| | | | | | |
| | | | | 4,068,475 | |
| | | | | | |
| |
Texas — 0.19% | | | | |
| 1,085,000 | | Texas Department of Housing & Community Affairs Revenue, 5.13%, 12/1/38, (Credit Support: Fannie Mae), Callable 6/01/21 @ 102(a) | | | 1,148,885 | |
| | | | | | |
| |
Utah — 0.07% | | | | |
| 387,000 | | Utah Housing Corp. Multi Family Mortgage Revenue, 7.25%, 1/20/26, (Credit Support: Ginnie Mae), Callable 4/30/12 @ 102 | | | 395,344 | |
| | | | | | |
Total Municipal Bonds (Cost $15,485,820) | | | 16,195,807 | |
| | | | | | |
Corporate Bonds — 0.21% | | | | |
Diversified Financials — 0.21% | | | | |
| 1,987,097 | | Pacific Beacon LLC 0.97%, 7/15/51(Credit Support: MBIA)(a)(b)(c) | | | 1,237,782 | |
| | | | | | |
Total Corporate Bonds (Cost $1,987,097) | | | 1,237,782 | |
| | | | | | |
U.S. Government Agency Backed Mortgages — 108.11% | | | | |
Fannie Mae — 77.89% | | | | |
| 1,907,000 | | (TBA), 3.26%, 4/1/22(b) | | | 1,948,913 | |
| 24,926 | | Pool #253174, 7.25%, 12/1/29 | | | 28,610 | |
| 26,972 | | Pool #253214, 7.00%, 1/1/15 | | | 28,474 | |
| 109,915 | | Pool #257611, 5.50%, 5/1/38 | | | 120,541 | |
| 51,156 | | Pool #257612, 5.00%, 5/1/38 | | | 56,242 | |
| 382,265 | | Pool #257613, 5.50%, 6/1/38 | | | 418,027 | |
| 179,393 | | Pool #257631, 6.00%, 7/1/38 | | | 199,547 | |
| 396,651 | | Pool #257632, 5.50%, 7/1/38 | | | 431,777 | |
| 288,421 | | Pool #257649, 5.50%, 7/1/38 | | | 315,133 | |
| 85,998 | | Pool #257656, 6.00%, 8/1/38 | | | 95,659 | |
| 297,776 | | Pool #257663, 5.50%, 8/1/38 | | | 325,355 | |
| 524,626 | | Pool #257857, 6.00%, 12/1/37 | | | 577,006 | |
| 185,773 | | Pool #257868, 6.50%, 11/1/37 | | | 208,705 | |
| 69,401 | | Pool #257869, 5.50%, 12/1/37 | | | 76,914 | |
| 375,649 | | Pool #257890, 5.50%, 2/1/38 | | | 411,028 | |
| 1,263,653 | | Pool #257892, 5.50%, 2/1/38 | | | 1,379,504 | |
| 282,185 | | Pool #257893, 6.00%, 2/1/38 | | | 311,417 | |
6
|
SCHEDULE OF PORTFOLIO INVESTMENTS |
Access Capital Community Investment Fund (cont.)
March 31, 2012 (Unaudited)
| | | | | | |
Principal Amount | | | | Value | |
| $ 53,492 | | Pool #257897, 5.50%, 2/1/38 | | | $ 58,997 | |
| 110,110 | | Pool #257898, 6.00%, 2/1/38 | | | 123,787 | |
| 97,892 | | Pool #257899, 5.00%, 2/1/38 | | | 107,256 | |
| 121,073 | | Pool #257901, 5.50%, 2/1/38 | | | 132,476 | |
| 54,240 | | Pool #257902, 6.00%, 2/1/38 | | | 60,978 | |
| 287,128 | | Pool #257903, 5.50%, 2/1/38 | | | 313,003 | |
| 200,267 | | Pool #257904, 6.00%, 2/1/38 | | | 223,517 | |
| 86,812 | | Pool #257913, 5.50%, 1/1/38 | | | 95,585 | |
| 112,230 | | Pool #257919, 6.00%, 2/1/38 | | | 125,260 | |
| 211,600 | | Pool #257926, 5.50%, 3/1/38 | | | 231,528 | |
| 167,453 | | Pool #257942, 5.50%, 4/1/38 | | | 183,642 | |
| 103,361 | | Pool #257943, 6.00%, 4/1/38 | | | 115,748 | |
| 83,265 | | Pool #257995, 6.00%, 7/1/38 | | | 92,619 | |
| 71,338 | | Pool #258022, 5.50%, 5/1/34 | | | 78,636 | |
| 96,180 | | Pool #258027, 5.00%, 5/1/34 | | | 104,554 | |
| 112,932 | | Pool #258030, 5.00%, 5/1/34 | | | 122,624 | |
| 259,988 | | Pool #258070, 5.00%, 6/1/34 | | | 282,626 | |
| 159,893 | | Pool #258090, 5.00%, 6/1/34 | | | 174,165 | |
| 57,180 | | Pool #258093, 5.50%, 6/1/34 | | | 63,029 | |
| 48,393 | | Pool #258121, 5.50%, 6/1/34 | | | 53,344 | |
| 160,624 | | Pool #258152, 5.50%, 8/1/34 | | | 176,805 | |
| 443,468 | | Pool #258157, 5.00%, 8/1/34 | | | 479,864 | |
| 187,065 | | Pool #258163, 5.50%, 8/1/34 | | | 205,735 | |
| 133,728 | | Pool #258166, 5.50%, 9/1/34 | | | 146,698 | |
| 83,596 | | Pool #258171, 5.50%, 10/1/34 | | | 91,992 | |
| 170,020 | | Pool #258173, 5.50%, 10/1/34 | | | 186,351 | |
| 156,045 | | Pool #258180, 5.00%, 10/1/34 | | | 168,827 | |
| 82,649 | | Pool #258185, 5.50%, 10/1/34 | | | 90,949 | |
| 82,547 | | Pool #258187, 5.50%, 11/1/34 | | | 90,837 | |
| 421,441 | | Pool #258188, 5.50%, 11/1/34 | | | 462,317 | |
| 132,918 | | Pool #258198, 5.50%, 10/1/34 | | | 145,976 | |
| 90,309 | | Pool #258199, 5.50%, 9/1/34 | | | 99,294 | |
| 226,587 | | Pool #258203, 5.50%, 10/1/34 | | | 248,847 | |
| 106,917 | | Pool #258221, 5.50%, 11/1/34 | | | 117,554 | |
| 46,562 | | Pool #258222, 5.00%, 11/1/34 | | | 50,783 | |
| 128,564 | | Pool #258224, 5.50%, 12/1/34 | | | 141,034 | |
| 138,751 | | Pool #258225, 5.50%, 11/1/34 | | | 152,208 | |
| 106,830 | | Pool #258236, 5.00%, 12/1/34 | | | 115,982 | |
| 523,290 | | Pool #258238, 5.00%, 1/1/35 | | | 566,155 | |
| 109,538 | | Pool #258249, 5.00%, 12/1/34 | | | 119,059 | |
| 148,182 | | Pool #258251, 5.50%, 1/1/35 | | | 162,925 | |
| 51,358 | | Pool #258252, 5.50%, 12/1/34 | | | 56,596 | |
| 126,165 | | Pool #258254, 5.50%, 12/1/34 | | | 138,402 | |
| 130,910 | | Pool #258258, 5.00%, 1/1/35 | | | 141,797 | |
| 134,232 | | Pool #258301, 5.50%, 2/1/35 | | | 147,356 | |
| 187,358 | | Pool #258302, 5.00%, 3/1/35 | | | 204,345 | |
| 79,113 | | Pool #258303, 5.00%, 2/1/35 | | | 86,162 | |
| 391,930 | | Pool #258305, 5.00%, 3/1/35 | | | 424,402 | |
7
|
SCHEDULE OF PORTFOLIO INVESTMENTS |
Access Capital Community Investment Fund (cont.)
March 31, 2012 (Unaudited)
| | | | | | |
Principal Amount | | | | Value | |
| $ 79,868 | | Pool #258312, 5.50%, 2/1/35 | | | $ 87,877 | |
| 309,444 | | Pool #258324, 5.50%, 4/1/35 | | | 339,313 | |
| 376,053 | | Pool #258333, 5.00%, 4/1/35 | | | 406,622 | |
| 331,322 | | Pool #258336, 5.00%, 4/1/35 | | | 358,773 | |
| 249,050 | | Pool #258339, 5.00%, 4/1/35 | | | 269,295 | |
| 72,908 | | Pool #258340, 5.00%, 3/1/35 | | | 79,541 | |
| 97,406 | | Pool #258342, 5.00%, 4/1/35 | | | 106,085 | |
| 132,977 | | Pool #258346, 5.00%, 3/1/35 | | | 143,995 | |
| 607,586 | | Pool #258347, 5.00%, 4/1/35 | | | 656,976 | |
| 121,139 | | Pool #258388, 5.50%, 6/1/35 | | | 132,983 | |
| 66,495 | | Pool #258392, 5.00%, 6/1/35 | | | 72,545 | |
| 393,777 | | Pool #258393, 5.00%, 5/1/35 | | | 428,863 | |
| 141,656 | | Pool #258394, 5.00%, 5/1/35 | | | 154,543 | |
| 385,234 | | Pool #258395, 5.50%, 6/1/35 | | | 421,937 | |
| 73,818 | | Pool #258402, 5.00%, 6/1/35 | | | 80,534 | |
| 71,635 | | Pool #258403, 5.00%, 6/1/35 | | | 78,152 | |
| 96,431 | | Pool #258404, 5.00%, 6/1/35 | | | 105,023 | |
| 83,172 | | Pool #258406, 5.50%, 5/1/35 | | | 91,512 | |
| 37,145 | | Pool #258408, 5.00%, 5/1/34 | | | 40,327 | |
| 92,753 | | Pool #258409, 5.00%, 5/1/35 | | | 101,017 | |
| 55,745 | | Pool #258410, 5.00%, 4/1/35 | | | 60,816 | |
| 115,573 | | Pool #258411, 5.50%, 5/1/35 | | | 127,378 | |
| 152,820 | | Pool #258422, 5.00%, 6/1/35 | | | 165,481 | |
| 383,635 | | Pool #258448, 5.00%, 8/1/35 | | | 414,580 | |
| 390,165 | | Pool #258450, 5.50%, 8/1/35 | | | 427,520 | |
| 54,009 | | Pool #258451, 5.50%, 7/1/35 | | | 59,551 | |
| 156,283 | | Pool #258454, 5.50%, 7/1/35 | | | 171,245 | |
| 107,096 | | Pool #258456, 5.00%, 8/1/35 | | | 116,337 | |
| 422,975 | | Pool #258460, 5.00%, 8/1/35 | | | 457,094 | |
| 158,135 | | Pool #258470, 5.00%, 7/1/35 | | | 170,891 | |
| 92,196 | | Pool #258479, 5.50%, 7/1/35 | | | 101,340 | |
| 258,553 | | Pool #258552, 5.00%, 11/1/35 | | | 280,863 | |
| 76,671 | | Pool #258562, 5.50%, 11/1/35 | | | 84,539 | |
| 110,172 | | Pool #258569, 5.00%, 10/1/35 | | | 119,678 | |
| 746,360 | | Pool #258571, 5.50%, 11/1/35 | | | 817,818 | |
| 156,277 | | Pool #258595, 5.50%, 12/1/35 | | | 170,971 | |
| 255,959 | | Pool #258600, 6.00%, 1/1/36 | | | 286,914 | |
| 633,642 | | Pool #258627, 5.50%, 2/1/36 | | | 692,229 | |
| 212,907 | | Pool #258634, 5.50%, 2/1/36 | | | 235,055 | |
| 522,193 | | Pool #258644, 5.50%, 2/1/36 | | | 570,801 | |
| 93,943 | | Pool #258650, 5.50%, 1/1/36 | | | 104,390 | |
| 456,841 | | Pool #258658, 5.50%, 3/1/36 | | | 499,081 | |
| 63,830 | | Pool #258721, 5.50%, 4/1/36 | | | 71,028 | |
| 143,452 | | Pool #258736, 5.00%, 3/1/36 | | | 155,247 | |
| 129,414 | | Pool #258737, 5.50%, 12/1/35 | | | 143,807 | |
| 86,937 | | Pool #258763, 6.00%, 5/1/36 | | | 97,682 | |
| 216,207 | | Pool #258779, 6.00%, 5/1/36 | | | 241,611 | |
| 51,790 | | Pool #259004, 8.00%, 2/1/30 | | | 61,962 | |
8
|
SCHEDULE OF PORTFOLIO INVESTMENTS |
Access Capital Community Investment Fund (cont.)
March 31, 2012 (Unaudited)
| | | | | | |
Principal Amount | | | | Value | |
| $ 35,850 | | Pool #259011, 8.00%, 3/1/30 | | | $ 42,891 | |
| 60,574 | | Pool #259030, 8.00%, 4/1/30 | | | 72,142 | |
| 104,292 | | Pool #259181, 6.50%, 3/1/31 | | | 117,719 | |
| 22,303 | | Pool #259187, 6.50%, 4/1/31 | | | 24,921 | |
| 87,720 | | Pool #259190, 6.50%, 4/1/31 | | | 99,162 | |
| 138,259 | | Pool #259201, 6.50%, 4/1/31 | | | 156,284 | |
| 38,067 | | Pool #259284, 6.50%, 8/1/31 | | | 42,980 | |
| 43,009 | | Pool #259306, 6.50%, 9/1/31 | | | 48,495 | |
| 83,906 | | Pool #259309, 6.50%, 10/1/31 | | | 94,730 | |
| 211,255 | | Pool #259316, 6.50%, 11/1/31 | | | 238,480 | |
| 167,791 | | Pool #259327, 6.00%, 11/1/31 | | | 187,175 | |
| 114,212 | | Pool #259369, 6.00%, 1/1/32 | | | 127,137 | |
| 76,745 | | Pool #259372, 6.00%, 1/1/32 | | | 85,649 | |
| 38,311 | | Pool #259378, 6.00%, 12/1/31 | | | 42,727 | |
| 85,121 | | Pool #259391, 6.00%, 1/1/32 | | | 95,006 | |
| 107,991 | | Pool #259393, 6.00%, 1/1/32 | | | 120,516 | |
| 51,246 | | Pool #259398, 6.50%, 2/1/32 | | | 57,869 | |
| 79,153 | | Pool #259440, 6.50%, 4/1/32 | | | 88,927 | |
| 52,433 | | Pool #259590, 5.50%, 11/1/32 | | | 57,765 | |
| 40,005 | | Pool #259599, 6.00%, 10/1/32 | | | 44,000 | |
| 97,985 | | Pool #259607, 5.50%, 11/1/32 | | | 107,764 | |
| 63,315 | | Pool #259610, 5.50%, 11/1/32 | | | 69,753 | |
| 270,736 | | Pool #259611, 5.50%, 11/1/32 | | | 297,757 | |
| 74,656 | | Pool #259612, 5.50%, 11/1/32 | | | 82,154 | |
| 117,852 | | Pool #259614, 6.00%, 11/1/32 | | | 131,476 | |
| 96,680 | | Pool #259634, 5.50%, 12/1/32 | | | 106,329 | |
| 72,216 | | Pool #259655, 5.50%, 2/1/33 | | | 79,604 | |
| 167,839 | | Pool #259659, 5.50%, 2/1/33 | | | 184,643 | |
| 162,218 | | Pool #259667, 5.50%, 2/1/33 | | | 178,002 | |
| 40,056 | | Pool #259671, 5.50%, 2/1/33 | | | 44,129 | |
| 167,509 | | Pool #259686, 5.50%, 3/1/33 | | | 184,280 | |
| 48,667 | | Pool #259722, 5.00%, 5/1/33 | | | 53,049 | |
| 146,944 | | Pool #259723, 5.00%, 5/1/33 | | | 159,210 | |
| 59,903 | | Pool #259724, 5.00%, 5/1/33 | | | 65,296 | |
| 273,900 | | Pool #259725, 5.00%, 5/1/33 | | | 297,278 | |
| 75,348 | | Pool #259726, 5.00%, 5/1/33 | | | 82,014 | |
| 129,071 | | Pool #259729, 5.00%, 6/1/33 | | | 140,068 | |
| 63,770 | | Pool #259731, 5.00%, 6/1/33 | | | 69,502 | |
| 136,066 | | Pool #259733, 5.50%, 6/1/33 | | | 149,390 | |
| 75,524 | | Pool #259734, 5.50%, 5/1/33 | | | 83,157 | |
| 126,085 | | Pool #259748, 5.00%, 6/1/33 | | | 136,610 | |
| 70,059 | | Pool #259753, 5.00%, 7/1/33 | | | 75,918 | |
| 77,529 | | Pool #259757, 5.00%, 6/1/33 | | | 84,376 | |
| 431,617 | | Pool #259761, 5.00%, 6/1/33 | | | 469,602 | |
| 160,695 | | Pool #259764, 5.00%, 7/1/33 | | | 174,385 | |
| 123,147 | | Pool #259765, 5.00%, 7/1/33 | | | 133,638 | |
| 82,997 | | Pool #259776, 5.00%, 6/1/33 | | | 90,068 | |
| 147,591 | | Pool #259777, 5.00%, 7/1/33 | | | 159,935 | |
9
|
SCHEDULE OF PORTFOLIO INVESTMENTS |
Access Capital Community Investment Fund (cont.)
March 31, 2012 (Unaudited)
| | | | | | |
Principal Amount | | | | Value | |
| $ 114,988 | | Pool #259779, 5.00%, 7/1/33 | | | $ 124,785 | |
| 99,873 | | Pool #259781, 5.00%, 7/1/33 | | | 108,506 | |
| 60,973 | | Pool #259789, 5.00%, 7/1/33 | | | 66,454 | |
| 112,055 | | Pool #259807, 5.00%, 8/1/33 | | | 121,601 | |
| 517,326 | | Pool #259816, 5.00%, 8/1/33 | | | 559,945 | |
| 33,840 | | Pool #259819, 5.00%, 8/1/33 | | | 36,882 | |
| 88,021 | | Pool #259820, 5.00%, 8/1/33 | | | 95,795 | |
| 243,566 | | Pool #259821, 5.00%, 7/1/33 | | | 263,937 | |
| 317,215 | | Pool #259830, 5.00%, 8/1/33 | | | 344,241 | |
| 136,064 | | Pool #259848, 5.00%, 9/1/33 | | | 147,826 | |
| 131,368 | | Pool #259862, 5.50%, 9/1/33 | | | 144,233 | |
| 86,807 | | Pool #259867, 5.50%, 10/1/33 | | | 95,552 | |
| 267,836 | | Pool #259869, 5.50%, 10/1/33 | | | 294,065 | |
| 96,825 | | Pool #259872, 5.50%, 11/1/33 | | | 106,489 | |
| 139,305 | | Pool #259875, 5.50%, 10/1/33 | | | 153,339 | |
| 83,517 | | Pool #259876, 5.50%, 10/1/33 | | | 91,931 | |
| 150,812 | | Pool #259879, 5.50%, 10/1/33 | | | 165,581 | |
| 125,276 | | Pool #259884, 5.50%, 11/1/33 | | | 137,662 | |
| 39,549 | | Pool #259904, 5.50%, 11/1/33 | | | 43,607 | |
| 153,102 | | Pool #259906, 5.50%, 11/1/33 | | | 168,382 | |
| 61,190 | | Pool #259928, 5.50%, 12/1/33 | | | 67,469 | |
| 225,083 | | Pool #259930, 5.00%, 11/1/33 | | | 243,873 | |
| 91,568 | | Pool #259936, 5.50%, 11/1/33 | | | 100,821 | |
| 219,071 | | Pool #259938, 5.50%, 12/1/33 | | | 240,730 | |
| 14,422 | | Pool #259939, 5.50%, 11/1/33 | | | 15,902 | |
| 104,116 | | Pool #259946, 5.50%, 12/1/33 | | | 114,540 | |
| 184,975 | | Pool #259961, 5.50%, 3/1/34 | | | 203,032 | |
| 212,026 | | Pool #259976, 5.00%, 3/1/34 | | | 230,256 | |
| 138,943 | | Pool #259977, 5.00%, 3/1/34 | | | 150,542 | |
| 46,365 | | Pool #259998, 5.00%, 3/1/34 | | | 50,583 | |
| 705,911 | | Pool #380307, 6.53%, 6/1/16 | | | 734,142 | |
| 588,182 | | Pool #381985, 7.97%, 9/1/17 | | | 643,509 | |
| 542,948 | | Pool #382373, 7.58%, 5/1/18 | | | 635,189 | |
| 589,234 | | Pool #383765, 6.70%, 6/1/19 | | | 681,389 | |
| 2,607,708 | | Pool #386602, 4.66%, 10/1/13 | | | 2,676,669 | |
| 4,487,076 | | Pool #386608, 5.37%, 11/1/21 | | | 4,910,115 | |
| 2,612,193 | | Pool #386641, 5.80%, 12/1/33 | | | 2,966,487 | |
| 689,813 | | Pool #386674, 5.51%, 11/1/21 | | | 755,615 | |
| 3,523,263 | | Pool #387374, 5.60%, 5/1/23 | | | 4,086,311 | |
| 858,368 | | Pool #387446, 5.22%, 6/1/20 | | | 972,451 | |
| 897,605 | | Pool #387472, 4.89%, 6/1/15 | | | 985,543 | |
| 9,084,820 | | Pool #387590, 4.90%, 9/1/15 | | | 10,017,780 | |
| 630,821 | | Pool #462834, 4.70%, 2/1/17 | | | 683,411 | |
| 10,176,036 | | Pool #463212, 4.68%, 8/1/19 | | | 11,254,492 | |
| 7,560,854 | | Pool #465537, 4.20%, 7/1/20 | | | 8,296,299 | |
| 744,354 | | Pool #465946, 3.61%, 9/1/20 | | | 795,770 | |
| 7,457,390 | | Pool #466303, 3.54%, 11/1/20 | | | 7,933,758 | |
| 10,887,200 | | Pool #466934, 4.10%, 1/1/21 | | | 11,937,327 | |
10
|
SCHEDULE OF PORTFOLIO INVESTMENTS |
Access Capital Community Investment Fund (cont.)
March 31, 2012 (Unaudited)
| | | | | | |
Principal Amount | | | | Value | |
| $3,441,445 | | Pool #467882, 4.24%, 6/1/21 | | | $3,779,054 | |
| 2,475,322 | | Pool #468104, 3.93%, 5/1/18 | | | 2,706,576 | |
| 3,538,255 | | Pool #470561, 2.94%, 2/1/22 | | | 3,582,381 | |
| 247,996 | | Pool #557295, 7.00%, 12/1/29 | | | 282,545 | |
| 34,069 | | Pool #575886, 7.50%, 1/1/31 | | | 40,140 | |
| 92,532 | | Pool #576445, 6.00%, 1/1/31 | | | 102,730 | |
| 21,339 | | Pool #576520, 5.50%, 3/1/16 | | | 23,231 | |
| 195,736 | | Pool #579402, 6.50%, 4/1/31 | | | 220,961 | |
| 169,402 | | Pool #583728, 6.50%, 6/1/31 | | | 191,104 | |
| 220,214 | | Pool #585148, 6.50%, 7/1/31 | | | 248,292 | |
| 42,556 | | Pool #590931, 6.50%, 7/1/31 | | | 48,021 | |
| 79,193 | | Pool #590932, 6.50%, 7/1/31 | | | 89,379 | |
| 58,815 | | Pool #591063, 6.50%, 7/1/31 | | | 66,406 | |
| 279,644 | | Pool #601865, 6.50%, 4/1/31 | | | 315,079 | |
| 153,223 | | Pool #601868, 6.00%, 7/1/29 | | | 170,975 | |
| 258,517 | | Pool #607611, 6.50%, 11/1/31 | | | 291,709 | |
| 127,332 | | Pool #613125, 6.50%, 10/1/31 | | | 143,722 | |
| 320,722 | | Pool #634271, 6.50%, 5/1/32 | | | 362,026 | |
| 131,026 | | Pool #640146, 5.00%, 12/1/17 | | | 141,441 | |
| 151,299 | | Pool #644232, 6.50%, 6/1/32 | | | 170,894 | |
| 31,953 | | Pool #644432, 6.50%, 7/1/32 | | | 36,048 | |
| 51,515 | | Pool #644437, 6.50%, 6/1/32 | | | 58,185 | |
| 116,987 | | Pool #657250, 6.00%, 10/1/32 | | | 130,615 | |
| 4,120,375 | | Pool #663159, 5.00%, 7/1/32 | | | 4,463,396 | |
| 191,633 | | Pool #670278, 5.50%, 11/1/32 | | | 211,119 | |
| 57,073 | | Pool #676702, 5.50%, 11/1/32 | | | 62,877 | |
| 62,841 | | Pool #677591, 5.50%, 12/1/32 | | | 69,112 | |
| 717,560 | | Pool #681883, 6.00%, 3/1/33 | | | 802,207 | |
| 233,347 | | Pool #683087, 5.00%, 1/1/18 | | | 251,896 | |
| 200,586 | | Pool #684570, 5.00%, 12/1/32 | | | 217,173 | |
| 102,010 | | Pool #684644, 4.50%, 6/1/18 | | | 109,150 | |
| 333,082 | | Pool #686542, 5.50%, 3/1/33 | | | 365,493 | |
| 126,247 | | Pool #686565, 5.50%, 4/1/33 | | | 138,610 | |
| 177,120 | | Pool #689034, 5.00%, 5/1/33 | | | 191,739 | |
| 169,517 | | Pool #689667, 5.50%, 4/1/33 | | | 186,648 | |
| 723,490 | | Pool #695961, 5.50%, 1/1/33 | | | 793,889 | |
| 155,551 | | Pool #695962, 6.00%, 11/1/32 | | | 173,622 | |
| 471,016 | | Pool #696407, 5.50%, 4/1/33 | | | 518,615 | |
| 1,154,756 | | Pool #702478, 5.50%, 6/1/33 | | | 1,267,119 | |
| 445,425 | | Pool #702479, 5.00%, 6/1/33 | | | 482,190 | |
| 380,179 | | Pool #703210, 5.50%, 9/1/32 | | | 415,426 | |
| 168,106 | | Pool #705576, 5.50%, 5/1/33 | | | 184,463 | |
| 712,970 | | Pool #720025, 5.00%, 8/1/33 | | | 771,707 | |
| 777,023 | | Pool #723066, 5.00%, 4/1/33 | | | 841,158 | |
| 407,596 | | Pool #723067, 5.50%, 5/1/33 | | | 447,257 | |
| 469,964 | | Pool #723068, 4.50%, 5/1/33 | | | 500,511 | |
| 412,924 | | Pool #723070, 4.50%, 5/1/33 | | | 439,506 | |
| 382,984 | | Pool #723328, 5.00%, 9/1/33 | | | 414,535 | |
11
|
SCHEDULE OF PORTFOLIO INVESTMENTS |
Access Capital Community Investment Fund (cont.)
March 31, 2012 (Unaudited)
| | | | | | |
Principal Amount | | | | Value | |
| $ 683,679 | | Pool #727311, 4.50%, 9/1/33 | | | $ 727,478 | |
| 2,159,436 | | Pool #727312, 5.00%, 9/1/33 | | | 2,346,109 | |
| 428,117 | | Pool #727315, 6.00%, 10/1/33 | | | 479,004 | |
| 970,665 | | Pool #738589, 5.00%, 9/1/33 | | | 1,050,631 | |
| 418,669 | | Pool #738683, 5.00%, 9/1/33 | | | 453,160 | |
| 656,912 | | Pool #739269, 5.00%, 9/1/33 | | | 711,030 | |
| 282,872 | | Pool #743595, 5.50%, 10/1/33 | | | 310,574 | |
| 291,394 | | Pool #748041, 4.50%, 10/1/33 | | | 310,061 | |
| 714,175 | | Pool #749891, 5.00%, 9/1/33 | | | 775,020 | |
| 441,294 | | Pool #749897, 4.50%, 9/1/33 | | | 469,564 | |
| 260,143 | | Pool #750984, 5.00%, 12/1/18 | | | 280,823 | |
| 320,805 | | Pool #751008, 5.00%, 12/1/18 | | | 346,307 | |
| 313,531 | | Pool #753533, 5.00%, 11/1/33 | | | 340,243 | |
| 195,034 | | Pool #755679, 6.00%, 1/1/34 | | | 217,981 | |
| 216,923 | | Pool #755745, 5.00%, 1/1/34 | | | 235,573 | |
| 188,467 | | Pool #755746, 5.50%, 12/1/33 | | | 207,807 | |
| 280,275 | | Pool #763551, 5.50%, 3/1/34 | | | 307,371 | |
| 844,318 | | Pool #763820, 5.50%, 1/1/34 | | | 925,947 | |
| 345,230 | | Pool #763824, 5.00%, 3/1/34 | | | 374,911 | |
| 381,724 | | Pool #765216, 5.00%, 1/1/19 | | | 412,541 | |
| 263,043 | | Pool #765217, 4.50%, 1/1/19 | | | 281,456 | |
| 303,673 | | Pool #765306, 5.00%, 2/1/19 | | | 327,813 | |
| 123,912 | | Pool #773084, 4.50%, 3/1/19 | | | 132,586 | |
| 150,796 | | Pool #773091, 4.00%, 3/1/19 | | | 159,952 | |
| 191,635 | | Pool #773096, 4.50%, 3/1/19 | | | 205,050 | |
| 615,104 | | Pool #773175, 5.00%, 5/1/34 | | | 665,585 | |
| 421,094 | | Pool #773476, 5.50%, 7/1/19 | | | 460,838 | |
| 274,780 | | Pool #773547, 5.00%, 5/1/34 | | | 297,331 | |
| 651,041 | | Pool #773553, 5.00%, 4/1/34 | | | 704,473 | |
| 932,386 | | Pool #773568, 5.50%, 5/1/34 | | | 1,022,238 | |
| 247,541 | | Pool #773575, 6.00%, 7/1/34 | | | 275,544 | |
| 264,249 | | Pool #776849, 5.00%, 11/1/34 | | | 285,895 | |
| 464,875 | | Pool #776850, 5.50%, 11/1/34 | | | 509,528 | |
| 54,640 | | Pool #776851, 6.00%, 10/1/34 | | | 60,847 | |
| 476,065 | | Pool #777444, 5.50%, 5/1/34 | | | 521,942 | |
| 2,606,264 | | Pool #777621, 5.00%, 2/1/34 | | | 2,820,569 | |
| 451,428 | | Pool #781437, 6.00%, 8/1/34 | | | 502,496 | |
| 398,330 | | Pool #781741, 6.00%, 9/1/34 | | | 443,391 | |
| 458,492 | | Pool #781907, 5.00%, 2/1/21 | | | 497,016 | |
| 496,085 | | Pool #781954, 5.00%, 6/1/34 | | | 536,799 | |
| 552,831 | | Pool #781959, 5.50%, 6/1/34 | | | 606,106 | |
| 443,016 | | Pool #781960, 5.50%, 6/1/34 | | | 485,708 | |
| 519,404 | | Pool #783893, 5.50%, 12/1/34 | | | 570,432 | |
| 626,259 | | Pool #783929, 5.50%, 10/1/34 | | | 686,414 | |
| 192,620 | | Pool #788329, 6.50%, 8/1/34 | | | 216,397 | |
| 173,465 | | Pool #790282, 6.00%, 7/1/34 | | | 193,467 | |
| 378,685 | | Pool #797623, 5.00%, 7/1/35 | | | 409,232 | |
| 166,739 | | Pool #797626, 5.50%, 7/1/35 | | | 182,494 | |
12
|
SCHEDULE OF PORTFOLIO INVESTMENTS |
Access Capital Community Investment Fund (cont.)
March 31, 2012 (Unaudited)
| | | | | | |
Principal Amount | | | | Value | |
| $ 144,160 | | Pool #797627, 5.00%, 7/1/35 | | | $ 156,059 | |
| 135,797 | | Pool #797674, 5.50%, 9/1/35 | | | 149,053 | |
| 691,473 | | Pool #798725, 5.50%, 11/1/34 | | | 757,892 | |
| 442,325 | | Pool #799547, 5.50%, 9/1/34 | | | 486,333 | |
| 125,019 | | Pool #799548, 6.00%, 9/1/34 | | | 139,220 | |
| 2,506,441 | | Pool #806754, 4.50%, 9/1/34 | | | 2,665,835 | |
| 658,642 | | Pool #806757, 6.00%, 9/1/34 | | | 733,151 | |
| 2,818,740 | | Pool #806761, 5.50%, 9/1/34 | | | 3,090,374 | |
| 362,185 | | Pool #808185, 5.50%, 3/1/35 | | | 396,691 | |
| 693,506 | | Pool #808205, 5.00%, 1/1/35 | | | 750,314 | |
| 91,551 | | Pool #813942, 5.00%, 11/1/20 | | | 99,372 | |
| 875,294 | | Pool #815009, 5.00%, 4/1/35 | | | 946,446 | |
| 1,009,558 | | Pool #817641, 5.00%, 11/1/35 | | | 1,096,041 | |
| 336,500 | | Pool #820334, 5.00%, 9/1/35 | | | 364,275 | |
| 622,906 | | Pool #820335, 5.00%, 9/1/35 | | | 673,153 | |
| 657,885 | | Pool #820336, 5.00%, 9/1/35 | | | 714,242 | |
| 585,308 | | Pool #822008, 5.00%, 5/1/35 | | | 632,887 | |
| 1,589,287 | | Pool #829005, 5.00%, 8/1/35 | | | 1,717,485 | |
| 214,381 | | Pool #829006, 5.50%, 9/1/35 | | | 234,806 | |
| 125,548 | | Pool #829007, 4.50%, 8/1/35 | | | 133,395 | |
| 96,180 | | Pool #829117, 5.50%, 9/1/35 | | | 105,839 | |
| 560,171 | | Pool #829274, 5.00%, 8/1/35 | | | 605,357 | |
| 1,242,773 | | Pool #829275, 5.00%, 8/1/35 | | | 1,343,020 | |
| 775,212 | | Pool #829276, 5.00%, 8/1/35 | | | 837,744 | |
| 587,707 | | Pool #829277, 5.00%, 8/1/35 | | | 635,114 | |
| 112,687 | | Pool #829356, 5.00%, 9/1/35 | | | 122,411 | |
| 1,391,994 | | Pool #829649, 5.50%, 3/1/35 | | | 1,525,702 | |
| 242,728 | | Pool #835287, 5.00%, 8/1/35 | | | 262,307 | |
| 90,452 | | Pool #843586, 5.50%, 11/1/35 | | | 99,536 | |
| 1,707,408 | | Pool #844361, 5.50%, 11/1/35 | | | 1,868,745 | |
| 785,373 | | Pool #845245, 5.50%, 11/1/35 | | | 859,585 | |
| 627,379 | | Pool #866969, 6.00%, 2/1/36 | | | 693,646 | |
| 348,461 | | Pool #867569, 6.00%, 2/1/36 | | | 384,832 | |
| 349,202 | | Pool #867574, 5.50%, 2/1/36 | | | 382,035 | |
| 344,193 | | Pool #868788, 6.00%, 3/1/36 | | | 380,118 | |
| 126,763 | | Pool #868849, 6.00%, 4/1/36 | | | 140,153 | |
| 315,794 | | Pool #870599, 6.00%, 6/1/36 | | | 352,456 | |
| 174,383 | | Pool #870684, 6.00%, 7/1/36 | | | 192,339 | |
| 736,448 | | Pool #871072, 5.50%, 2/1/37 | | | 802,354 | |
| 746,183 | | Pool #873819, 6.39%, 8/1/24 | | | 869,880 | |
| 693,801 | | Pool #874253, 5.29%, 8/1/17 | | | 779,763 | |
| 3,173,864 | | Pool #874900, 5.45%, 10/1/17 | | | 3,616,248 | |
| 438,470 | | Pool #881425, 6.00%, 7/1/36 | | | 483,618 | |
| 575,325 | | Pool #882044, 6.00%, 5/1/36 | | | 635,375 | |
| 340,229 | | Pool #883589, 6.00%, 4/1/36 | | | 375,740 | |
| 288,171 | | Pool #884693, 5.50%, 4/1/36 | | | 319,138 | |
| 2,452,403 | | Pool #885724, 5.50%, 6/1/36 | | | 2,679,154 | |
| 518,448 | | Pool #899800, 6.00%, 8/1/37 | | | 571,022 | |
13
|
SCHEDULE OF PORTFOLIO INVESTMENTS |
Access Capital Community Investment Fund (cont.)
March 31, 2012 (Unaudited)
| | | | | | |
Principal Amount | | | | Value | |
| $ 162,275 | | Pool #901412, 6.00%, 8/1/36 | | | $ 179,187 | |
| 258,086 | | Pool #905438, 6.00%, 11/1/36 | | | 284,459 | |
| 492,956 | | Pool #907646, 6.00%, 1/1/37 | | | 543,330 | |
| 294,829 | | Pool #908671, 6.00%, 1/1/37 | | | 329,010 | |
| 951,599 | | Pool #908672, 5.50%, 1/1/37 | | | 1,036,760 | |
| 776,885 | | Pool #911730, 5.50%, 12/1/21 | | | 850,477 | |
| 311,572 | | Pool #919368, 5.50%, 4/1/37 | | | 345,005 | |
| 818,574 | | Pool #922582, 6.00%, 12/1/36 | | | 902,989 | |
| 1,833,117 | | Pool #934941, 5.00%, 8/1/39 | | | 1,987,285 | |
| 1,108,493 | | Pool #934942, 5.00%, 9/1/39 | | | 1,196,177 | |
| 747,367 | | Pool #941204, 5.50%, 6/1/37 | | | 815,185 | |
| 301,766 | | Pool #941205, 5.00%, 5/1/37 | | | 326,768 | |
| 343,197 | | Pool #941206, 5.50%, 5/1/37 | | | 374,339 | |
| 260,424 | | Pool #941487, 6.00%, 8/1/37 | | | 290,169 | |
| 556,156 | | Pool #943394, 5.50%, 6/1/37 | | | 613,227 | |
| 1,240,109 | | Pool #944502, 6.00%, 6/1/37 | | | 1,365,864 | |
| 284,177 | | Pool #945853, 6.00%, 7/1/37 | | | 313,438 | |
| 714,843 | | Pool #948600, 6.00%, 8/1/37 | | | 786,215 | |
| 703,404 | | Pool #948672, 5.50%, 8/1/37 | | | 765,694 | |
| 1,165,469 | | Pool #952598, 6.00%, 7/1/37 | | | 1,298,587 | |
| 591,243 | | Pool #952623, 6.00%, 8/1/37 | | | 651,199 | |
| 1,659,729 | | Pool #952632, 6.00%, 7/1/37 | | | 1,828,036 | |
| 299,926 | | Pool #952649, 6.00%, 7/1/37 | | | 330,340 | |
| 1,002,022 | | Pool #952659, 6.00%, 8/1/37 | | | 1,103,633 | |
| 220,301 | | Pool #952665, 6.00%, 8/1/37 | | | 242,985 | |
| 661,893 | | Pool #952678, 6.50%, 8/1/37 | | | 739,975 | |
| 287,845 | | Pool #952693, 6.50%, 8/1/37 | | | 321,217 | |
| 491,792 | | Pool #956050, 6.00%, 12/1/37 | | | 540,894 | |
| 2,571,057 | | Pool #957324, 5.43%, 5/1/18 | | | 2,930,583 | |
| 385,733 | | Pool #958502, 5.07%, 5/1/19 | | | 435,856 | |
| 540,662 | | Pool #959093, 5.50%, 11/1/37 | | | 591,244 | |
| 538,643 | | Pool #960919, 5.00%, 2/1/38 | | | 583,270 | |
| 296,910 | | Pool #965239, 5.84%, 9/1/38 | | | 328,557 | |
| 228,239 | | Pool #975137, 5.00%, 5/1/38 | | | 248,433 | |
| 589,029 | | Pool #975769, 5.50%, 3/1/38 | | | 640,822 | |
| 562,075 | | Pool #982656, 5.50%, 6/1/38 | | | 613,606 | |
| 515,133 | | Pool #982898, 5.00%, 5/1/38 | | | 558,457 | |
| 163,040 | | Pool #983033, 5.00%, 5/1/38 | | | 176,752 | |
| 370,850 | | Pool #984842, 5.50%, 6/1/38 | | | 404,269 | |
| 276,181 | | Pool #986230, 5.00%, 7/1/38 | | | 302,601 | |
| 168,091 | | Pool #986233, 5.00%, 6/1/38 | | | 181,387 | |
| 538,125 | | Pool #986239, 6.00%, 7/1/38 | | | 593,031 | |
| 929,330 | | Pool #986957, 5.50%, 7/1/38 | | | 1,011,045 | |
| 486,215 | | Pool #986958, 5.50%, 7/1/38 | | | 530,184 | |
| 149,905 | | Pool #986985, 5.00%, 7/1/23 | | | 162,758 | |
| 450,330 | | Pool #990510, 5.50%, 8/1/38 | | | 492,038 | |
| 638,354 | | Pool #990511, 6.00%, 8/1/38 | | | 702,090 | |
| 368,273 | | Pool #990617, 5.50%, 9/1/38 | | | 400,655 | |
14
|
SCHEDULE OF PORTFOLIO INVESTMENTS |
Access Capital Community Investment Fund (cont.)
March 31, 2012 (Unaudited)
| | | | | | |
Principal Amount | | | | Value | |
| $ 133,656 | | Pool #AA0525, 5.50%, 12/1/38 | | | $ 146,077 | |
| 1,027,316 | | Pool #AA0526, 5.00%, 12/1/38 | | | 1,115,641 | |
| 1,560,094 | | Pool #AA0527, 5.50%, 12/1/38 | | | 1,708,974 | |
| 863,661 | | Pool #AA0643, 4.00%, 3/1/39 | | | 905,258 | |
| 1,155,225 | | Pool #AA0644, 4.50%, 3/1/39 | | | 1,227,065 | |
| 1,057,216 | | Pool #AA0645, 4.50%, 3/1/39 | | | 1,135,846 | |
| 370,404 | | Pool #AA0814, 5.50%, 12/1/38 | | | 403,899 | |
| 676,194 | | Pool #AA2243, 4.50%, 5/1/39 | | | 724,796 | |
| 1,894,028 | | Pool #AA3142, 4.50%, 3/1/39 | | | 2,026,018 | |
| 1,039,534 | | Pool #AA3143, 4.00%, 3/1/39 | | | 1,089,602 | |
| 1,056,109 | | Pool #AA3206, 4.00%, 4/1/39 | | | 1,106,976 | |
| 1,137,254 | | Pool #AA3207, 4.50%, 3/1/39 | | | 1,207,977 | |
| 585,901 | | Pool #AA4468, 4.00%, 4/1/39 | | | 616,501 | |
| 1,023,211 | | Pool #AA7042, 4.50%, 6/1/39 | | | 1,090,679 | |
| 851,665 | | Pool #AA7658, 4.00%, 6/1/39 | | | 898,540 | |
| 1,285,286 | | Pool #AA7659, 4.50%, 6/1/39 | | | 1,383,691 | |
| 724,355 | | Pool #AA7741, 4.50%, 6/1/24 | | | 780,945 | |
| 902,635 | | Pool #AA8455, 4.50%, 6/1/39 | | | 971,743 | |
| 1,627,606 | | Pool #AC1463, 5.00%, 8/1/39 | | | 1,769,577 | |
| 817,937 | | Pool #AC1464, 5.00%, 8/1/39 | | | 885,704 | |
| 2,050,365 | | Pool #AC2109, 4.50%, 7/1/39 | | | 2,177,872 | |
| 613,940 | | Pool #AC4394, 5.00%, 9/1/39 | | | 662,504 | |
| 1,228,988 | | Pool #AC4395, 5.00%, 9/1/39 | | | 1,346,558 | |
| 1,009,270 | | Pool #AC5328, 5.00%, 10/1/39 | | | 1,107,398 | |
| 1,301,012 | | Pool #AC5329, 5.00%, 10/1/39 | | | 1,410,429 | |
| 1,421,060 | | Pool #AC6304, 5.00%, 11/1/39 | | | 1,540,573 | |
| 792,142 | | Pool #AC6305, 5.00%, 11/1/39 | | | 862,228 | |
| 1,473,701 | | Pool #AC6307, 5.00%, 12/1/39 | | | 1,597,641 | |
| 1,145,557 | | Pool #AC6790, 5.00%, 12/1/39 | | | 1,256,936 | |
| 4,493,116 | | Pool #AC7199, 5.00%, 12/1/39 | | | 4,870,994 | |
| 2,577,162 | | Pool #AD1470, 5.00%, 2/1/40 | | | 2,790,684 | |
| 2,832,694 | | Pool #AD1471, 4.50%, 2/1/40 | | | 3,019,475 | |
| 1,734,012 | | Pool #AD1560, 5.00%, 3/1/40 | | | 1,879,845 | |
| 3,466,947 | | Pool #AD1585, 4.50%, 2/1/40 | | | 3,695,549 | |
| 1,259,028 | | Pool #AD1586, 5.00%, 1/1/40 | | | 1,363,341 | |
| 725,900 | | Pool #AD1638, 4.50%, 2/1/40 | | | 771,042 | |
| 1,158,191 | | Pool #AD1640, 4.50%, 3/1/40 | | | 1,236,007 | |
| 2,901,894 | | Pool #AD1942, 4.50%, 1/1/40 | | | 3,093,238 | |
| 1,140,140 | | Pool #AD1943, 5.00%, 1/1/40 | | | 1,234,602 | |
| 4,424,873 | | Pool #AD1988, 4.50%, 2/1/40 | | | 4,716,638 | |
| 830,335 | | Pool #AD2896, 5.00%, 3/1/40 | | | 911,066 | |
| 2,814,037 | | Pool #AD4456, 4.50%, 4/1/40 | | | 3,003,105 | |
| 732,116 | | Pool #AD4457, 4.50%, 4/1/40 | | | 780,390 | |
| 2,340,441 | | Pool #AD4458, 4.50%, 4/1/40 | | | 2,485,987 | |
| 1,154,871 | | Pool #AD4940, 4.50%, 6/1/40 | | | 1,246,178 | |
| 1,075,294 | | Pool #AD4946, 4.50%, 6/1/40 | | | 1,142,164 | |
| 1,155,262 | | Pool #AD5728, 5.00%, 4/1/40 | | | 1,267,584 | |
| 1,518,234 | | Pool #AD7239, 4.50%, 7/1/40 | | | 1,638,269 | |
15
|
SCHEDULE OF PORTFOLIO INVESTMENTS |
Access Capital Community Investment Fund (cont.)
March 31, 2012 (Unaudited)
| | | | | | |
Principal Amount | | | | Value | |
| $1,283,174 | | Pool #AD7242, 4.50%, 7/1/40 | | | $1,369,387 | |
| 1,230,352 | | Pool #AD7256, 4.50%, 7/1/40 | | | 1,327,627 | |
| 2,373,318 | | Pool #AD7271, 4.50%, 7/1/40 | | | 2,532,775 | |
| 1,345,044 | | Pool #AD7272, 4.50%, 7/1/40 | | | 1,451,387 | |
| 1,422,192 | | Pool #AD8960, 5.00%, 6/1/40 | | | 1,548,023 | |
| 2,220,822 | | Pool #AD9613, 4.50%, 8/1/40 | | | 2,358,930 | |
| 2,073,551 | | Pool #AD9614, 4.50%, 8/1/40 | | | 2,202,500 | |
| 1,194,418 | | Pool #AE2011, 4.00%, 9/1/40 | | | 1,256,426 | |
| 3,411,802 | | Pool #AE2012, 4.00%, 9/1/40 | | | 3,576,129 | |
| 1,603,994 | | Pool #AE2023, 4.00%, 9/1/40 | | | 1,681,249 | |
| 2,152,945 | | Pool #AE5432, 4.00%, 10/1/40 | | | 2,256,640 | |
| 1,013,915 | | Pool #AE5435, 4.50%, 9/1/40 | | | 1,076,968 | |
| 1,055,818 | | Pool #AE5806, 4.50%, 9/1/40 | | | 1,139,294 | |
| 1,595,637 | | Pool #AE5861, 4.00%, 10/1/40 | | | 1,672,489 | |
| 2,210,729 | | Pool #AE5862, 4.00%, 10/1/40 | | | 2,325,497 | |
| 2,025,583 | | Pool #AE5863, 4.00%, 10/1/40 | | | 2,130,739 | |
| 1,256,209 | | Pool #AE6850, 4.00%, 10/1/40 | | | 1,316,713 | |
| 1,408,672 | | Pool #AE6851, 4.00%, 10/1/40 | | | 1,476,520 | |
| 1,356,260 | | Pool #AE7699, 4.00%, 11/1/40 | | | 1,421,583 | |
| 1,176,235 | | Pool #AE7703, 4.00%, 10/1/40 | | | 1,232,887 | |
| 1,897,208 | | Pool #AE7707, 4.00%, 11/1/40 | | | 1,988,585 | |
| 943,588 | | Pool #AH0300, 4.00%, 11/1/40 | | | 989,035 | |
| 1,356,882 | | Pool #AH0301, 3.50%, 11/1/40 | | | 1,394,514 | |
| 854,592 | | Pool #AH0302, 4.00%, 11/1/40 | | | 895,753 | |
| 1,221,838 | | Pool #AH0306, 4.00%, 12/1/40 | | | 1,290,614 | |
| 1,880,959 | | Pool #AH0508, 4.00%, 11/1/40 | | | 1,971,553 | |
| 1,924,413 | | Pool #AH0537, 4.00%, 12/1/40 | | | 2,027,925 | |
| 1,272,257 | | Pool #AH0914, 4.50%, 11/1/40 | | | 1,351,375 | |
| 1,626,467 | | Pool #AH0917, 4.00%, 12/1/40 | | | 1,704,804 | |
| 1,320,371 | | Pool #AH1077, 4.00%, 1/1/41 | | | 1,400,057 | |
| 1,855,946 | | Pool #AH2973, 4.00%, 12/1/40 | | | 1,945,336 | |
| 2,386,665 | | Pool #AH2980, 4.00%, 1/1/41 | | | 2,501,617 | |
| 1,650,803 | | Pool #AH5656, 4.00%, 1/1/41 | | | 1,739,599 | |
| 1,229,488 | | Pool #AH5657, 4.00%, 2/1/41 | | | 1,288,705 | |
| 2,567,837 | | Pool #AH5658, 4.00%, 2/1/41 | | | 2,691,514 | |
| 1,091,307 | | Pool #AH5662, 4.00%, 2/1/41 | | | 1,143,869 | |
| 2,082,962 | | Pool #AH5882, 4.00%, 2/1/26 | | | 2,205,255 | |
| 1,453,271 | | Pool #AH6764, 4.00%, 3/1/41 | | | 1,523,267 | |
| 3,663,665 | | Pool #AH6768, 4.00%, 3/1/41 | | | 3,840,122 | |
| 1,292,597 | | Pool #AH7277, 4.00%, 3/1/41 | | | 1,359,701 | |
| 2,301,683 | | Pool #AH7281, 4.00%, 3/1/41 | | | 2,421,173 | |
| 1,113,036 | | Pool #AH7526, 4.50%, 3/1/41 | | | 1,194,775 | |
| 3,107,882 | | Pool #AH7537, 4.00%, 3/1/41 | | | 3,269,224 | |
| 1,037,962 | | Pool #AH7576, 4.00%, 3/1/41 | | | 1,087,955 | |
| 2,154,889 | | Pool #AH8878, 4.50%, 4/1/41 | | | 2,288,896 | |
| 1,261,123 | | Pool #AH8885, 4.50%, 4/1/41 | | | 1,339,549 | |
| 1,561,577 | | Pool #AH9050, 3.50%, 2/1/26 | | | 1,637,643 | |
| 1,284,568 | | Pool #AI0114, 4.00%, 3/1/41 | | | 1,351,255 | |
16
|
SCHEDULE OF PORTFOLIO INVESTMENTS |
Access Capital Community Investment Fund (cont.)
March 31, 2012 (Unaudited)
| | | | | | |
Principal Amount | | | | Value | |
| $ 2,379,929 | | Pool #AI1846, 4.50%, 5/1/41 | | | $ 2,527,930 | |
| 1,261,885 | | Pool #AI1847, 4.50%, 5/1/41 | | | 1,340,358 | |
| 2,748,077 | | Pool #AI1848, 4.50%, 5/1/41 | | | 2,918,973 | |
| 1,659,663 | | Pool #AI1849, 4.50%, 5/1/41 | | | 1,779,989 | |
| 1,008,097 | | Pool #AJ0651, 4.00%, 8/1/41 | | | 1,056,651 | |
| 1,256,213 | | Pool #AJ7667, 3.50%, 12/1/41 | | | 1,291,053 | |
| 1,525,784 | | Pool #AJ7668, 4.00%, 11/1/41 | | | 1,601,656 | |
| 1,664,857 | | Pool #AJ9133, 4.00%, 1/1/42 | | | 1,749,726 | |
| 16,887,461 | | Pool #AK2386, 3.50%, 2/1/42 | | | 17,355,825 | |
| 7,466,121 | | Pool #AK6715, 3.50%, 3/1/42 | | | 7,673,189 | |
| 2,414,697 | | Pool #AK6716, 3.50%, 3/1/42 | | | 2,481,667 | |
| 1,607,495 | | Pool #AK6717, 3.50%, 3/1/42 | | | 1,652,078 | |
| 1,103,032 | | Pool #AK6718, 3.50%, 2/1/42 | | | 1,133,624 | |
| 475,148 | | Pool #MC0007, 5.50%, 12/1/38 | | | 520,492 | |
| 61,742 | | Pool #MC0013, 5.50%, 12/1/38 | | | 68,136 | |
| 128,146 | | Pool #MC0014, 5.50%, 12/1/38 | | | 140,856 | |
| 82,691 | | Pool #MC0016, 5.50%, 11/1/38 | | | 90,892 | |
| 470,360 | | Pool #MC0038, 4.50%, 3/1/39 | | | 505,343 | |
| 137,660 | | Pool #MC0046, 4.00%, 4/1/39 | | | 144,936 | |
| 292,429 | | Pool #MC0047, 4.50%, 4/1/39 | | | 310,615 | |
| 57,374 | | Pool #MC0059, 4.00%, 4/1/39 | | | 60,890 | |
| 397,301 | | Pool #MC0081, 4.00%, 5/1/39 | | | 420,037 | |
| 387,988 | | Pool #MC0082, 4.50%, 5/1/39 | | | 417,694 | |
| 504,961 | | Pool #MC0111, 4.00%, 6/1/39 | | | 532,438 | |
| 311,639 | | Pool #MC0112, 4.50%, 6/1/39 | | | 336,473 | |
| 369,282 | | Pool #MC0127, 4.50%, 7/1/39 | | | 395,824 | |
| 76,923 | | Pool #MC0135, 4.50%, 6/1/39 | | | 83,317 | |
| 1,246,732 | | Pool #MC0137, 4.50%, 7/1/39 | | | 1,328,939 | |
| 1,680,708 | | Pool #MC0154, 4.50%, 8/1/39 | | | 1,791,530 | |
| 104,196 | | Pool #MC0155, 5.00%, 8/1/39 | | | 114,815 | |
| 645,202 | | Pool #MC0160, 4.50%, 8/1/39 | | | 685,325 | |
| 1,118,389 | | Pool #MC0171, 4.50%, 9/1/39 | | | 1,192,132 | |
| 609,514 | | Pool #MC0177, 4.50%, 9/1/39 | | | 656,179 | |
| 427,418 | | Pool #MC0270, 4.50%, 3/1/40 | | | 455,601 | |
| 883,909 | | Pool #MC0325, 4.50%, 7/1/40 | | | 947,992 | |
| 285,683 | | Pool #MC0422, 4.00%, 2/1/41 | | | 301,050 | |
| 105,664 | | Pool #MC0426, 4.50%, 1/1/41 | | | 112,235 | |
| 994,540 | | Pool #MC0584, 4.00%, 1/1/42 | | | 1,045,239 | |
| 1,247,927 | | Pool #MC0585, 4.00%, 1/1/42 | | �� | 1,311,542 | |
| 74,395 | | Pool #MC3344, 5.00%, 12/1/38 | | | 82,139 | |
| 9,673,318 | | Series 2004-T7, Class A, 5.12%, 7/25/41 | | | 10,958,960 | |
| | | | | | |
| | | | | 459,396,662 | |
| | | | | | |
Federal Agricultural Mortgage Corp. — 0.14% | | | | |
| 808,493 | | Series #S0282, 5.63%, 6/10/36(b) | | | 843,728 | |
| | | | | | |
Freddie Mac — 14.59% | | | | |
| 100,925 | | Pool #A10124, 5.00%, 6/1/33 | | | 109,555 | |
17
|
SCHEDULE OF PORTFOLIO INVESTMENTS |
Access Capital Community Investment Fund (cont.)
March 31, 2012 (Unaudited)
| | | | | | |
Principal Amount | | | | Value | |
| $ 258,508 | | Pool #A10548, 5.00%, 6/1/33 | | | $ 280,370 | |
| 1,063,401 | | Pool #A12237, 5.00%, 8/1/33 | | | 1,149,345 | |
| 429,167 | | Pool #A12969, 4.50%, 8/1/33 | | | 455,269 | |
| 206,254 | | Pool #A12985, 5.00%, 8/1/33 | | | 223,697 | |
| 282,112 | | Pool #A12986, 5.00%, 8/1/33 | | | 306,235 | |
| 206,485 | | Pool #A14028, 4.50%, 9/1/33 | | | 219,043 | |
| 776,460 | | Pool #A14325, 5.00%, 9/1/33 | | | 839,214 | |
| 169,745 | | Pool #A15268, 6.00%, 10/1/33 | | | 189,625 | |
| 775,242 | | Pool #A15579, 5.50%, 11/1/33 | | | 850,253 | |
| 464,593 | | Pool #A17393, 5.50%, 12/1/33 | | | 510,272 | |
| 551,847 | | Pool #A17397, 5.50%, 1/1/34 | | | 606,622 | |
| 476,491 | | Pool #A18617, 5.50%, 1/1/34 | | | 523,786 | |
| 335,312 | | Pool #A19019, 5.50%, 2/1/34 | | | 369,537 | |
| 168,034 | | Pool #A19362, 5.50%, 2/1/34 | | | 184,713 | |
| 380,492 | | Pool #A20069, 5.00%, 3/1/34 | | | 412,967 | |
| 1,043,329 | | Pool #A20070, 5.50%, 3/1/34 | | | 1,143,953 | |
| 770,772 | | Pool #A20540, 5.50%, 4/1/34 | | | 844,869 | |
| 229,688 | | Pool #A20541, 5.50%, 4/1/34 | | | 252,271 | |
| 241,103 | | Pool #A21679, 5.50%, 4/1/34 | | | 264,357 | |
| 527,176 | | Pool #A21681, 5.00%, 4/1/34 | | | 569,617 | |
| 495,132 | | Pool #A23192, 5.00%, 5/1/34 | | | 534,994 | |
| 1,849,807 | | Pool #A25310, 5.00%, 6/1/34 | | | 1,998,731 | |
| 407,792 | | Pool #A25311, 5.00%, 6/1/34 | | | 441,260 | |
| 562,090 | | Pool #A25600, 5.50%, 8/1/34 | | | 616,125 | |
| 85,541 | | Pool #A26270, 6.00%, 8/1/34 | | | 95,469 | |
| 50,652 | | Pool #A26386, 6.00%, 9/1/34 | | | 56,594 | |
| 332,153 | | Pool #A26395, 6.00%, 9/1/34 | | | 370,700 | |
| 317,614 | | Pool #A26396, 5.50%, 9/1/34 | | | 349,040 | |
| 1,389,226 | | Pool #A28241, 5.50%, 10/1/34 | | | 1,522,342 | |
| 383,398 | | Pool #A30055, 5.00%, 11/1/34 | | | 414,804 | |
| 585,451 | | Pool #A30591, 6.00%, 12/1/34 | | | 651,017 | |
| 509,106 | | Pool #A31135, 5.50%, 12/1/34 | | | 558,843 | |
| 283,058 | | Pool #A32976, 5.50%, 8/1/35 | | | 310,446 | |
| 763,141 | | Pool #A33167, 5.00%, 1/1/35 | | | 825,653 | |
| 1,075,124 | | Pool #A34999, 5.50%, 4/1/35 | | | 1,177,303 | |
| 589,252 | | Pool #A35628, 5.50%, 6/1/35 | | | 645,254 | |
| 963,275 | | Pool #A37185, 5.00%, 9/1/35 | | | 1,039,471 | |
| 938,633 | | Pool #A38830, 5.00%, 5/1/35 | | | 1,015,080 | |
| 123,261 | | Pool #A39561, 5.50%, 11/1/35 | | | 135,303 | |
| 996,669 | | Pool #A40538, 5.00%, 12/1/35 | | | 1,075,507 | |
| 531,045 | | Pool #A42095, 5.50%, 1/1/36 | | | 581,017 | |
| 971,403 | | Pool #A42097, 5.00%, 1/1/36 | | | 1,050,064 | |
| 284,088 | | Pool #A42098, 5.50%, 1/1/36 | | | 310,111 | |
| 115,312 | | Pool #A42099, 6.00%, 1/1/36 | | | 129,091 | |
| 533,024 | | Pool #A42802, 5.00%, 2/1/36 | | | 574,688 | |
| 864,689 | | Pool #A42803, 5.50%, 2/1/36 | | | 943,896 | |
| 277,192 | | Pool #A42804, 6.00%, 2/1/36 | | | 306,330 | |
| 570,568 | | Pool #A42805, 6.00%, 2/1/36 | | | 630,544 | |
18
|
SCHEDULE OF PORTFOLIO INVESTMENTS |
Access Capital Community Investment Fund (cont.)
March 31, 2012 (Unaudited)
| | | | | | |
Principal Amount | | | | Value | |
| $ 95,918 | | Pool #A44637, 5.50%, 4/1/36 | | | $ 106,653 | |
| 356,997 | | Pool #A44638, 6.00%, 4/1/36 | | | 401,440 | |
| 614,828 | | Pool #A44639, 5.50%, 3/1/36 | | | 671,147 | |
| 858,992 | | Pool #A45396, 5.00%, 6/1/35 | | | 927,477 | |
| 495,150 | | Pool #A46321, 5.50%, 7/1/35 | | | 543,292 | |
| 556,410 | | Pool #A46735, 5.00%, 8/1/35 | | | 600,423 | |
| 762,607 | | Pool #A46746, 5.50%, 8/1/35 | | | 834,489 | |
| 286,104 | | Pool #A46747, 5.50%, 8/1/35 | | | 313,787 | |
| 337,128 | | Pool #A46748, 5.50%, 8/1/35 | | | 370,063 | |
| 105,301 | | Pool #A46996, 5.50%, 9/1/35 | | | 115,818 | |
| 622,304 | | Pool #A46997, 5.50%, 9/1/35 | | | 682,516 | |
| 790,116 | | Pool #A47552, 5.00%, 11/1/35 | | | 852,616 | |
| 482,630 | | Pool #A47553, 5.00%, 11/1/35 | | | 523,673 | |
| 442,176 | | Pool #A47554, 5.50%, 11/1/35 | | | 484,960 | |
| 477,259 | | Pool #A48788, 5.50%, 5/1/36 | | | 520,977 | |
| 616,627 | | Pool #A48789, 6.00%, 5/1/36 | | | 680,482 | |
| 236,332 | | Pool #A49013, 6.00%, 5/1/36 | | | 261,543 | |
| 415,035 | | Pool #A49526, 6.00%, 5/1/36 | | | 458,014 | |
| 315,446 | | Pool #A49843, 6.00%, 6/1/36 | | | 354,421 | |
| 572,107 | | Pool #A49844, 6.00%, 6/1/36 | | | 631,352 | |
| 36,599 | | Pool #A49845, 6.50%, 6/1/36 | | | 41,029 | |
| 415,142 | | Pool #A50128, 6.00%, 6/1/36 | | | 458,392 | |
| 908,834 | | Pool #A59530, 5.50%, 4/1/37 | | | 987,683 | |
| 318,421 | | Pool #A59964, 5.50%, 4/1/37 | | | 352,216 | |
| 474,589 | | Pool #A61754, 5.50%, 5/1/37 | | | 517,246 | |
| 243,160 | | Pool #A61779, 5.50%, 5/1/37 | | | 265,016 | |
| 576,074 | | Pool #A61915, 5.50%, 6/1/37 | | | 626,053 | |
| 1,753,829 | | Pool #A61916, 6.00%, 6/1/37 | | | 1,932,157 | |
| 1,300,233 | | Pool #A63456, 5.50%, 6/1/37 | | | 1,421,165 | |
| 854,292 | | Pool #A64012, 5.50%, 7/1/37 | | | 928,408 | |
| 389,992 | | Pool #A64015, 6.00%, 7/1/37 | | | 429,646 | |
| 355,732 | | Pool #A64016, 6.50%, 7/1/37 | | | 397,239 | |
| 202,051 | | Pool #A64447, 6.00%, 8/1/37 | | | 223,354 | |
| 581,843 | | Pool #A64450, 6.00%, 8/1/37 | | | 641,005 | |
| 95,206 | | Pool #A65713, 6.00%, 9/1/37 | | | 106,523 | |
| 412,311 | | Pool #A65837, 6.00%, 9/1/37 | | | 454,235 | |
| 754,718 | | Pool #A66043, 5.50%, 7/1/37 | | | 820,196 | |
| 1,489,830 | | Pool #A66061, 5.50%, 8/1/37 | | | 1,619,084 | |
| 1,061,887 | | Pool #A66116, 6.00%, 9/1/37 | | | 1,169,860 | |
| 639,357 | | Pool #A66122, 6.00%, 8/1/37 | | | 705,765 | |
| 550,456 | | Pool #A66133, 6.00%, 6/1/37 | | | 606,426 | |
| 1,394,531 | | Pool #A66156, 6.50%, 9/1/37 | | | 1,552,886 | |
| 640,585 | | Pool #A67630, 6.00%, 11/1/37 | | | 708,121 | |
| 834,010 | | Pool #A68766, 6.00%, 10/1/37 | | | 920,897 | |
| 372,704 | | Pool #A70292, 5.50%, 7/1/37 | | | 406,611 | |
| 122,029 | | Pool #A73816, 6.00%, 3/1/38 | | | 135,772 | |
| 784,075 | | Pool #A75113, 5.00%, 3/1/38 | | | 846,342 | |
| 647,524 | | Pool #A76187, 5.00%, 4/1/38 | | | 696,518 | |
19
|
SCHEDULE OF PORTFOLIO INVESTMENTS |
Access Capital Community Investment Fund (cont.)
March 31, 2012 (Unaudited)
| | | | | | |
Principal Amount | | | | Value | |
| $ 577,193 | | Pool #A78354, 5.50%, 11/1/37 | | | $ 628,532 | |
| 509,972 | | Pool #A79561, 5.50%, 7/1/38 | | | 553,579 | |
| 1,080,076 | | Pool #A91887, 5.00%, 4/1/40 | | | 1,171,925 | |
| 1,013,387 | | Pool #A92388, 4.50%, 5/1/40 | | | 1,085,314 | |
| 1,020,133 | | Pool #A93962, 4.50%, 9/1/40 | | | 1,099,871 | |
| 1,098,914 | | Pool #A95573, 4.00%, 12/1/40 | | | 1,157,165 | |
| 993,506 | | Pool #A96339, 4.00%, 12/1/40 | | | 1,046,170 | |
| 1,507,516 | | Pool #A97099, 4.00%, 1/1/41 | | | 1,591,195 | |
| 1,239,730 | | Pool #A97715, 4.00%, 3/1/41 | | | 1,295,760 | |
| 864,059 | | Pool #A97716, 4.50%, 3/1/41 | | | 925,387 | |
| 86,626 | | Pool #B31082, 6.00%, 3/1/31 | | | 96,415 | |
| 110,123 | | Pool #B31128, 6.00%, 9/1/31 | | | 122,638 | |
| 185,421 | | Pool #B31140, 6.50%, 10/1/31 | | | 208,758 | |
| 74,996 | | Pool #B31150, 6.50%, 11/1/31 | | | 84,523 | |
| 150,030 | | Pool #B31188, 6.00%, 1/1/32 | | | 166,845 | |
| 27,681 | | Pool #B31206, 6.00%, 3/1/32 | | | 30,821 | |
| 109,492 | | Pool #B31292, 6.00%, 9/1/32 | | | 121,964 | |
| 79,734 | | Pool #B31493, 5.00%, 2/1/34 | | | 85,792 | |
| 490,273 | | Pool #B31516, 5.00%, 4/1/34 | | | 527,556 | |
| 80,224 | | Pool #B31517, 5.00%, 4/1/34 | | | 86,298 | |
| 240,717 | | Pool #B31532, 5.00%, 5/1/34 | | | 258,970 | |
| 98,345 | | Pool #B31546, 5.50%, 5/1/34 | | | 106,623 | |
| 295,801 | | Pool #B31547, 5.50%, 5/1/34 | | | 320,702 | |
| 227,698 | | Pool #B31550, 5.00%, 6/1/34 | | | 244,956 | |
| 192,805 | | Pool #B31551, 5.50%, 6/1/34 | | | 209,033 | |
| 197,360 | | Pool #B31587, 5.00%, 11/1/34 | | | 212,293 | |
| 133,346 | | Pool #B31588, 5.50%, 11/1/34 | | | 144,546 | |
| 139,688 | | Pool #B31642, 5.50%, 5/1/35 | | | 151,358 | |
| 116,704 | | Pool #B50443, 5.00%, 11/1/18 | | | 126,847 | |
| 168,299 | | Pool #B50450, 4.50%, 1/1/19 | | | 181,522 | |
| 84,917 | | Pool #B50451, 5.00%, 1/1/19 | | | 92,042 | |
| 13,610 | | Pool #B50470, 4.50%, 4/1/19 | | | 14,685 | |
| 159,069 | | Pool #B50496, 5.50%, 9/1/19 | | | 174,902 | |
| 238,836 | | Pool #B50499, 5.00%, 11/1/19 | | | 259,631 | |
| 50,507 | | Pool #B50500, 5.50%, 10/1/19 | | | 55,642 | |
| 115,695 | | Pool #B50501, 4.50%, 11/1/19 | | | 124,692 | |
| 165,367 | | Pool #B50504, 5.50%, 11/1/19 | | | 181,941 | |
| 320,416 | | Pool #B50506, 5.00%, 11/1/19 | | | 351,029 | |
| 87,883 | | Pool #C35457, 7.50%, 1/1/30 | | | 101,827 | |
| 50,267 | | Pool #C37233, 7.50%, 2/1/30 | | | 58,685 | |
| 86,212 | | Pool #C48137, 7.00%, 1/1/31 | | | 98,711 | |
| 36,439 | | Pool #C48138, 7.00%, 2/1/31 | | | 41,651 | |
| 371,870 | | Pool #C51686, 6.50%, 5/1/31 | | | 419,720 | |
| 186,483 | | Pool #C53210, 6.50%, 6/1/31 | | | 210,227 | |
| 63,118 | | Pool #C53914, 6.50%, 6/1/31 | | | 71,182 | |
| 147,886 | | Pool #C60020, 6.50%, 11/1/31 | | | 166,735 | |
| 64,364 | | Pool #C60804, 6.00%, 11/1/31 | | | 71,773 | |
| 65,586 | | Pool #C65616, 6.50%, 3/1/32 | | | 73,977 | |
20
|
SCHEDULE OF PORTFOLIO INVESTMENTS |
Access Capital Community Investment Fund (cont.)
March 31, 2012 (Unaudited)
| | | | | | |
Principal Amount | | | | Value | |
| $ 60,003 | | Pool #C68324, 6.50%, 6/1/32 | | | $ 67,719 | |
| 480,041 | | Pool #C73273, 6.00%, 11/1/32 | | | 534,581 | |
| 289,284 | | Pool #C73525, 6.00%, 11/1/32 | | | 322,674 | |
| 378,642 | | Pool #C74672, 5.50%, 11/1/32 | | | 416,936 | |
| 570,109 | | Pool #C77844, 5.50%, 3/1/33 | | | 625,449 | |
| 160,951 | | Pool #C77845, 5.50%, 3/1/33 | | | 177,329 | |
| 408,963 | | Pool #C78252, 5.50%, 3/1/33 | | | 449,555 | |
| 107,248 | | Pool #C78380, 5.50%, 3/1/33 | | | 117,894 | |
| 146,103 | | Pool #C79178, 5.50%, 4/1/33 | | | 160,970 | |
| 449,056 | | Pool #J00980, 5.00%, 1/1/21 | | | 485,437 | |
| 165,535 | | Pool #J05466, 5.50%, 6/1/22 | | | 180,012 | |
| 656,459 | | Pool #N31468, 6.00%, 11/1/37 | | | 713,771 | |
| 1,326,927 | | Pool #Q00462, 4.00%, 3/1/41 | | | 1,391,874 | |
| 1,247,397 | | Pool #Q00465, 4.50%, 4/1/41 | | | 1,323,069 | |
| 1,060,748 | | Pool #Q05867, 3.50%, 12/1/41 | | | 1,087,557 | |
| 1,053,068 | | Pool #Q06239, 3.50%, 1/1/42 | | | 1,079,682 | |
| 1,233,837 | | Pool #Q06406, 4.00%, 2/1/42 | | | 1,294,227 | |
| | | | | | |
| | | | | 86,011,381 | |
| | | | | | |
Ginnie Mae — 15.49% | | | | |
| 3,618,100 | | (TBA), 3.50%, 4/1/22(b) | | | 3,790,803 | |
| 513,897 | | Pool #409117, 5.50%, 6/20/38 | | | 570,446 | |
| 554,830 | | Pool #487643, 5.00%, 2/15/39 | | | 612,740 | |
| 465,212 | | Pool #588448, 6.25%, 9/15/32 | | | 471,685 | |
| 1,150,200 | | Pool #616936, 5.50%, 1/15/36 | | | 1,284,989 | |
| 552,546 | | Pool #617904, 5.75%, 9/15/23 | | | 560,784 | |
| 3,193,928 | | Pool #618363, 4.00%, 9/20/41 | | | 3,428,857 | |
| 554,676 | | Pool #624106, 5.13%, 3/15/34 | | | 565,111 | |
| 1,368,916 | | Pool #654705, 4.00%, 9/20/41 | | | 1,469,606 | |
| 448,708 | | Pool #664269, 5.85%, 6/15/38 | | | 474,931 | |
| 1,190,927 | | Pool #675509, 5.50%, 6/15/38 | | | 1,329,186 | |
| 845,709 | | Pool #685140, 5.90%, 4/15/38 | | | 895,192 | |
| 715,867 | | Pool #697672, 5.50%, 12/15/38 | | | 799,310 | |
| 738,474 | | Pool #697814, 5.00%, 2/15/39 | | | 818,322 | |
| 748,428 | | Pool #697885, 4.50%, 3/15/39 | | | 814,588 | |
| 1,035,097 | | Pool #698112, 4.50%, 5/15/39 | | | 1,126,598 | |
| 2,400,896 | | Pool #698113, 4.50%, 5/15/39 | | | 2,628,137 | |
| 790,342 | | Pool #699294, 5.63%, 9/20/38 | | | 879,541 | |
| 4,172,129 | | Pool #713519, 6.00%, 7/15/39 | | | 4,712,224 | |
| 970,738 | | Pool #714561, 4.50%, 6/15/39 | | | 1,062,616 | |
| 1,229,470 | | Pool #716822, 4.50%, 4/15/39 | | | 1,338,153 | |
| 1,179,668 | | Pool #716823, 4.50%, 4/15/39 | | | 1,291,322 | |
| 1,103,961 | | Pool #717132, 4.50%, 5/15/39 | | | 1,209,829 | |
| 1,329,348 | | Pool #717133, 4.50%, 5/15/39 | | | 1,446,860 | |
| 1,350,645 | | Pool #720080, 4.50%, 6/15/39 | | | 1,483,968 | |
| 1,119,910 | | Pool #720521, 5.00%, 8/15/39 | | | 1,241,000 | |
| 2,823,310 | | Pool #726550, 5.00%, 9/15/39 | | | 3,128,580 | |
21
|
SCHEDULE OF PORTFOLIO INVESTMENTS |
Access Capital Community Investment Fund (cont.)
March 31, 2012 (Unaudited)
| | | | | | |
Principal Amount | | | | Value | |
| $1,744,943 | | Pool #729018, 4.50%, 2/15/40 | | | $ 1,905,737 | |
| 1,011,789 | | Pool #729019, 5.00%, 2/15/40 | | | 1,121,188 | |
| 889,037 | | Pool #729346, 4.50%, 7/15/41 | | | 974,572 | |
| 1,455,545 | | Pool #737574, 4.00%, 11/15/40 | | | 1,564,427 | |
| 993,465 | | Pool #738844, 3.50%, 10/15/41 | | | 1,036,696 | |
| 1,209,046 | | Pool #738845, 3.50%, 10/15/41 | | | 1,261,658 | |
| 2,352,942 | | Pool #738862, 4.00%, 10/15/41 | | | 2,526,747 | |
| 1,060,946 | | Pool #747241, 5.00%, 9/20/40 | | | 1,168,450 | |
| 1,355,402 | | Pool #748654, 3.50%, 9/15/40 | | | 1,414,383 | |
| 1,007,586 | | Pool #748846, 4.50%, 9/20/40 | | | 1,108,463 | |
| 1,100,680 | | Pool #757016, 3.50%, 11/15/40 | | | 1,148,576 | |
| 1,073,745 | | Pool #757017, 4.00%, 12/15/40 | | | 1,154,066 | |
| 1,478,530 | | Pool #759196, 3.50%, 1/15/41 | | | 1,542,869 | |
| 997,324 | | Pool #762877, 4.00%, 4/15/41 | | | 1,074,733 | |
| 1,127,834 | | Pool #763564, 4.50%, 5/15/41 | | | 1,236,344 | |
| 1,642,624 | | Pool #770391, 4.50%, 6/15/41 | | | 1,800,662 | |
| 1,775,837 | | Pool #770481, 4.00%, 8/15/41 | | | 1,907,845 | |
| 1,065,159 | | Pool #770482, 4.50%, 8/15/41 | | | 1,160,316 | |
| 2,504,301 | | Pool #770517, 4.00%, 8/15/41 | | | 2,689,286 | |
| 1,153,368 | | Pool #770529, 4.00%, 8/15/41 | | | 1,238,564 | |
| 2,233,946 | | Pool #770537, 4.00%, 8/15/41 | | | 2,400,008 | |
| 1,040,924 | | Pool #770738, 4.50%, 6/20/41 | | | 1,133,428 | |
| 2,109,633 | | Pool #779592, 4.00%, 11/20/41 | | | 2,264,807 | |
| 1,488,598 | | Pool #779593, 4.00%, 11/20/41 | | | 1,598,091 | |
| 6,000,000 | | Series 2012-33 Class B, 2.89%, 3/16/46(b) | | | 5,992,427 | |
| 3,000,000 | | Series 2012-35 Class C, 3.25%, 11/16/52(b) | | | 2,967,325 | |
| 6,400,000 | | Series 2012-44 Class A, 2.17%, 7/16/41(b) | | | 6,537,393 | |
| | | | | | |
| | | | | 91,364,439 | |
| | | | | | |
Total U.S. Government Agency Backed Mortgages (Cost $600,040,216) | | | 637,616,210 | |
| | | | | | |
U.S. Government Agency Obligations — 10.11% | | | | |
Community Reinvestment Revenue Notes — 0.50% | | | | |
| 2,944,429 | | 3.98%, 8/1/35(b)(c) | | | 2,959,152 | |
| | | | | | |
Federal Home Loan Bank — 0.34% | | | | |
| 2,000,000 | | 0.09%, 4/9/12(d)(e) | | | 1,999,984 | |
| | | | | | |
Small Business Administration — 8.44% | | | | |
| 305,801 | | 0.53%, 4/30/35(b) | | | 305,807 | |
| 164,853 | | 0.53%, 10/14/20(b) | | | 165,013 | |
| 4,689,143 | | 0.53%, 3/25/21(a) | | | 4,654,022 | |
| 243,446 | | 0.55%, 4/25/28(a) | | | 241,296 | |
| 198,520 | | 0.55%, 3/25/29(a) | | | 196,730 | |
| 1,205,655 | | 0.55%, 9/25/30(a) | | | 1,194,455 | |
| 256,375 | | 0.60%, 3/25/28(a) | | | 254,607 | |
| 404,476 | | 0.60%, 11/25/29(a) | | | 401,587 | |
| 223,611 | | 0.63%, 6/25/18(a) | | | 222,742 | |
22
|
SCHEDULE OF PORTFOLIO INVESTMENTS |
Access Capital Community Investment Fund (cont.)
March 31, 2012 (Unaudited)
| | | | | | |
Principal Amount | | | | | Value | |
| $ 1,071,293 | | 0.63%, 3/19/32(b) | | | $ 1,073,436 | |
| 87,946 | | 0.65%, 3/25/14(a) | | | 87,774 | |
| 192,687 | | 0.66%, 3/8/26(b) | | | 193,560 | |
| 425,941 | | 0.66%, 6/8/32(b) | | | 427,513 | |
| 247,264 | | 0.70%, 3/30/20(b) | | | 248,312 | |
| 80,896 | | 0.70%, 2/13/20(b) | | | 81,234 | |
| 192,142 | | 0.70%, 2/17/20(b) | | | 192,920 | |
| 249,405 | | 0.70%, 8/6/19(b) | | | 250,205 | |
| 590,367 | | 0.75%, 11/29/32(b) | | | 593,029 | |
| 164,783 | | 0.80%, 8/8/32(b) | | | 165,710 | |
| 1,271,964 | | 0.80%, 3/27/33(b) | | | 1,278,515 | |
| 241,685 | | 0.80%, 2/21/33(b) | | | 242,949 | |
| 739,909 | | 0.88%, 1/26/32(b) | | | 745,872 | |
| 559,699 | | 0.88%, 11/17/19(b) | | | 563,706 | |
| 30,164 | | 0.88%, 6/4/14(b) | | | 30,181 | |
| 171,532 | | 0.88%, 12/1/19(b) | | | 172,793 | |
| 1,316,260 | | 0.88%, 8/1/32(b) | | | 1,325,855 | |
| 1,407,799 | | 0.89%, 4/21/34(b) | | | 1,417,302 | |
| 983,072 | | 0.90%, 3/14/18(b) | | | 987,329 | |
| 150,548 | | 0.91%, 4/16/20(b) | | | 151,737 | |
| 2,357,665 | | 1.00%, 1/25/22(b) | | | 2,398,358 | |
| 3,200,000 | | 1.00%, 3/1/37(b) | | | 3,232,320 | |
| 90,777 | | 1.13%, 7/30/17(a)(b) | | | 91,415 | |
| 1,015,143 | | 1.14%, 11/4/34(b) | | | 1,031,426 | |
| 16,265,546 | | 1.26%, 7/18/30*(b) | | | 437,381 | |
| 16,683,864 | | 1.45%, 3/25/36(a) | | | 17,155,836 | |
| 526,861 | | 2.00%, 6/20/14(b) | | | 528,663 | |
| 452,982 | | 3.13%, 10/25/15(a) | | | 466,780 | |
| 751,754 | | 3.38%, 10/25/15(a) | | | 766,487 | |
| 266,343 | | 3.38%, 5/25/16(a) | | | 272,377 | |
| 389,355 | | 3.58%, 12/25/15(a) | | | 397,875 | |
| 64,694 | | 5.70%, 7/30/17(b) | | | 65,643 | |
| 367,125 | | 5.85%, 11/27/27(b) | | | 383,311 | |
| 103,605 | | 5.86%, 11/15/22(b) | | | 107,087 | |
| 175,427 | | 6.00%, 3/9/22(b) | | | 180,572 | |
| 523,528 | | 6.03%, 10/31/32(b) | | | 548,264 | |
| 1,306,348 | | 6.13%, 3/31/31(b) | | | 1,368,974 | |
| 162,720 | | 6.25%, 8/30/27(b) | | | 170,353 | |
| 92,476 | | 6.30%, 4/15/18(b) | | | 94,077 | |
| 552,965 | | 6.35%, 8/13/26(b) | | | 577,318 | |
| 971,910 | | 6.45%, 2/19/32(b) | | | 1,021,370 | |
| 54,865 | | 6.69%, 5/28/24(b) | | | 57,014 | |
| 35,044 | | 7.08%, 9/1/13(b) | | | 35,803 | |
| 179,173 | | 7.33%, 6/29/16(b) | | | 182,975 | |
| 125,541 | | 7.33%, 2/23/16(b) | | | 128,293 | |
| 38,228 | | 7.38%, 1/1/15(b) | | | 39,127 | |
23
|
SCHEDULE OF PORTFOLIO INVESTMENTS |
Access Capital Community Investment Fund (cont.)
March 31, 2012 (Unaudited)
| | | | | | |
Principal Amount | | | | | Value | |
| $ 181,178 | | 7.83%, 9/28/16(b) | | | $ 186,908 | |
| 325 | | 8.08%, 2/15/14(b) | | | 335 | |
| | | | | | |
| | | | | 49,792,533 | |
| | | | | | |
United States Department of Agriculture — 0.83% | | | | |
| 261,152 | | 1.13%, 5/31/14(b) | | | 265,574 | |
| 172,405 | | 5.09%, 3/1/20(b) | | | 175,374 | |
| 311,311 | | 5.38%, 10/26/22(b) | | | 321,727 | |
| 177,790 | | 5.59%, 1/20/38(b) | | | 184,469 | |
| 218,300 | | 5.73%, 4/20/37(b) | | | 226,532 | |
| 745,237 | | 5.75%, 1/20/33(b) | | | 778,125 | |
| 216,177 | | 6.01%, 1/20/38(b) | | | 225,302 | |
| 125,555 | | 6.01%, 11/8/32(b) | | | 131,388 | |
| 171,931 | | 6.05%, 1/5/26(b) | | | 179,056 | |
| 507,066 | | 6.07%, 4/20/37(b) | | | 529,722 | |
| 140,332 | | 6.08%, 7/1/32(b) | | | 147,007 | |
| 90,976 | | 6.09%, 5/17/22(b) | | | 93,740 | |
| 31,117 | | 6.10%, 1/1/13(b) | | | 31,483 | |
| 197,101 | | 6.10%, 8/25/37(b) | | | 205,760 | |
| 217,356 | | 6.12%, 4/20/37(b) | | | 227,365 | |
| 88,794 | | 6.13%, 7/20/22(b) | | | 91,565 | |
| 222,803 | | 6.22%, 1/20/37(b) | | | 233,825 | |
| 377,930 | | 6.23%, 3/14/32(b) | | | 396,550 | |
| 226,116 | | 6.38%, 2/16/37(b) | | | 237,679 | |
| 197,468 | | 6.64%, 4/20/37(b) | | | 208,499 | |
| | | | | | |
| | | | | 4,890,742 | |
| | | | | | |
| |
Total U.S. Government Agency Obligations | | | 59,642,411 | |
| | | | | | |
(Cost $59,996,597) | | | | |
Promissory Notes — 1.78% | | | | |
| 9,375,000 | | Massachusetts Housing Investment Corp. Term Loan, 6.67%, 4/1/35(b)(c) | | | 10,490,250 | |
| | | | | | |
| |
Total Promissory Notes | | | 10,490,250 | |
| | | | | | |
(Cost $9,375,000) | | | | |
| | | | | | |
| Shares | | | | | Value | |
Investment Company — 1.08% | | | | |
| 6,387,769 | | JPMorgan Prime Money Market Fund | | | $ 6,387,769 | |
| | | | | | |
| |
Total Investment Company | | | 6,387,769 | |
| | | | | | |
(Cost $6,387,769) | | | | |
24
|
SCHEDULE OF PORTFOLIO INVESTMENTS |
Access Capital Community Investment Fund (cont.)
March 31, 2012 (Unaudited)
| | | | |
| | | | Value | |
| |
Total Investments | | $ | 731,570,229 | |
(Cost $693,272,499)(f) — 124.04% | | | | |
| |
Liabilities in excess of other assets — (24.04)% | | | (141,767,717 | ) |
| | | | |
NET ASSETS — 100.00% | | $ | 589,802,512 | |
| | | | |
| * | Interest Only security represents the right to receive the monthly interest payment on an underlying pool of mortgage loans. The principal amount shown represents the par value on the underlying pool. |
| (a) | Floating rate note. Rate shown is as of report date. |
| (b) | Fair valued security under procedures established by the Fund’s Board of Trustees. |
| (c) | This security is restricted and illiquid as the security may not be offered or sold within the United States or to U.S. persons except to qualified purchasers who are also either qualified institutional buyers or “accredited investors” (as defined in Rule 501 (a) of Regulation D under the Securities Act of 1933). |
The total investment in restricted and illiquid securities representing $14,687,184 or 2.49% of net assets are as follows:
| | | | | | | | |
Acquisition Principal Amount | | Issuer | | Acquisition Date | | Acquisition Cost | | 3/31/2012 Carrying Value Per Unit |
$1,987,097 | | Pacific Beacon LLC | | 12/18/2006 | | $1,987,097 | | $0.62 |
| | Community Reinvestment | | | | | | |
$2,944,429 | | Revenue Note | | 3/24/2008 | | $2,910,490 | | $1.00 |
| | Massachusetts Housing | | | | | | |
$9,375,000 | | Investment Corp. | | 3/29/2005 | | $9,375,000 | | $1.12 |
| (d) | This security is pledged as collateral for financial futures contracts. |
| (e) | The rate represents the annualized yield at time of purchase. |
| (f) | See notes to financial statements for the tax cost of securities and the breakdown of unrealized appreciation (depreciation). |
Abbreviations used are defined below:
AMBAC – Insured by American Municipal Bond Insurance Assurance Corp.
IBC - Insured by International Bancshares Corp.
LOC - Letter of Credit
MBIA – Insured by MBIA
NATL-RE - Insured by National Public Guarantee Corp.
OID - Original Issue Discount
See notes to financial statements.
25
Statement of Assets and Liabilities
March 31, 2012 (Unaudited)
| | | | |
Assets: | | | | |
Investments in securities, at value (cost $693,272,499) | | $ | 731,570,229 | |
Segregated cash collateral for reverse repurchase agreements | | | 670,291 | |
Interest and dividends receivable | | | 3,035,600 | |
Receivable for Fund shares sold | | | 310,689 | |
Deposits at broker for futures contracts | | | 2,546,981 | |
Prepaid expenses and other assets | | | 13,112 | |
| | | | |
Total Assets | | | 738,146,902 | |
| | | | |
Liabilities: | | | | |
Distributions payable | | | 1,243,553 | |
Payable for capital shares redeemed | | | 36,626 | |
Payable for investments purchased | | | 17,985,229 | |
Reverse repurchase agreements (including interest of $36,408) | | | 128,675,709 | |
Accrued expenses and other payables: | | | | |
Investment advisory fees | | | 312,291 | |
Accounting fees | | | 4,770 | |
Distribution fees | | | 19,741 | |
Trustee fees | | | 278 | |
Audit fees | | | 33,408 | |
Transfer Agent fees | | | 16,086 | |
Other | | | 16,699 | |
| | | | |
Total Liabilities | | | 148,344,390 | |
| | | | |
Net Assets | | $ | 589,802,512 | |
| | | | |
| |
Net Assets Consist Of: | | | | |
Capital | | $ | 596,374,453 | |
Distributions in excess of net investment income | | | (1,942,573 | ) |
Accumulated net realized losses from investment transactions, futures contracts and sale commitments | | | (43,443,303 | ) |
Net unrealized appreciation on investments, futures contracts, and sale commitments | | | 38,813,935 | |
| | | | |
Net Assets | | $ | 589,802,512 | |
| | | | |
26
Statement of Assets and Liabilities (cont.)
| | | | |
Net Assets: | | | | |
Class A | | $ | 16,010,189 | |
Class I | | | 573,792,323 | |
| | | | |
Total | | $ | 589,802,512 | |
| | | | |
| |
Shares Outstanding (1,000,000,000 shares authorized, 100,000,000 shares registered at $.0000001 par value): | | | | |
Class A | | | 1,649,062 | |
Class I | | | 59,136,335 | |
| | | | |
Total | | | 60,785,397 | |
| | | | |
| |
Net Asset Values and Redemption Price Per Share: | | | | |
Class A(a) | | $ | 9.71 | |
Class I | | $ | 9.70 | |
Maximum Offering Price Per Share: | | | | |
Class A | | $ | 10.07 | |
Maximum Sales Charge - Class A | | | 3.75 | % |
| (a) | For Class A shares, redemption price per share will be reduced by 1.00% for sales of shares within 12 months of purchase (only applicable on purchases of $1 million or more on which no initial sales charge was paid). Such reduction is not reflected in the net asset value and the redemption price per share. |
See notes to financial statements.
27
Statement of Operations
For the Six Months Ended March 31, 2012 (Unaudited)
| | | | |
Investment Income: | | | | |
Interest income | | $ | 14,682,705 | |
Dividend income | | | 4,959 | |
| | | | |
Total Investment Income | | | 14,687,664 | |
| | | | |
| |
Expenses: | | | | |
Management fees | | | 1,752,608 | |
Interest expense | | | 225,754 | |
Distribution fees - Class A | | | 13,387 | |
Accounting services | | | 26,453 | |
Audit fees | | | 24,831 | |
Legal fees | | | 15,906 | |
Custodian fees | | | 25,826 | |
Insurance fees | | | 4,239 | |
Trustees’ fees and expenses | | | 6,555 | |
Transfer agent fees | | | 22,849 | |
Printing and shareholder reports | | | 5,265 | |
Registration fees | | | 24,459 | |
Other fees and expenses | | | 64,433 | |
| | | | |
Total expenses | | | 2,212,565 | |
| | | | |
| |
Net Investment Income | | | 12,475,099 | |
| | | | |
| |
Realized/Unrealized Gains (Losses) from Investment Transactions and Futures Contracts: | | | | |
Net realized losses from investment transactions | | | (489,014 | ) |
Net realized losses from futures contracts | | | (2,712,753 | ) |
Net change in unrealized appreciation/depreciation on investments | | | (2,625,958 | ) |
Net change in unrealized appreciation/depreciation on futures contracts | | | 3,494,849 | |
| | | | |
Net realized/unrealized losses from investments and futures contracts | | | (2,332,876 | ) |
| | | | |
Change in net assets resulting from operations | | $ | 10,142,223 | |
| | | | |
See notes to financial statements.
28
Statements of Changes in Net Assets
| | | | | | | | |
| | | For the
Six Months
Ended
March 31, 2012 | | | For the
Year
Ended
September 30, 2011 | |
| | | (Unaudited) | | | | |
| | |
From Investment Activities: | | | | | | | | |
Operations: | | | | | | | | |
Net investment income | | $ | 12,475,099 | | | $ | 25,463,089 | |
Net realized losses from investments and futures contracts | | | (3,201,767 | ) | | | (7,812,804 | ) |
Net change in unrealized appreciation/depreciation on investments and futures contracts | | | 868,891 | | | | 4,973,653 | |
| | | | | | | | |
Change in net assets resulting from operations | | | 10,142,223 | | | | 22,623,938 | |
| | | | | | | | |
| | |
Distributions to Class A Shareholders: | | | | | | | | |
From net investment income | | | (223,738 | ) | | | (447,645 | ) |
| | |
Distributions to Class I Shareholders: | | | | | | | | |
From net investment income | | | (12,250,637 | ) | | | (25,633,188 | ) |
| | | | | | | | |
Change in net assets resulting from shareholder distributions | | | (12,474,375 | ) | | | (26,080,833 | ) |
| | | | | | | | |
| | |
Capital Transactions: | | | | | | | | |
Proceeds from shares issued | | | 46,010,178 | | | | 26,082,537 | |
Distributions reinvested | | | 5,310,518 | | | | 10,549,800 | |
Cost of shares redeemed | | | (4,717,013 | ) | | | (35,983,586 | ) |
| | | | | | | | |
Change in net assets resulting from capital transactions | | | 46,603,683 | | | | 648,751 | |
| | | | | | | | |
Net increase/(decrease) in net assets | | | 44,271,531 | | | | (2,808,144 | ) |
| | |
Net Assets: | | | | | | | | |
Beginning of period | | | 545,530,981 | | | | 548,339,125 | |
| | | | | | | | |
End of period | | $ | 589,802,512 | | | $ | 545,530,981 | |
| | | | | | | | |
Distributions in excess of net investment income | | $ | (1,942,573 | ) | | $ | (1,324,828 | ) |
| | | | | | | | |
| | |
Share Transactions: | | | | | | | | |
Issued | | | 4,735,860 | | | | 2,688,679 | |
Reinvested | | | 547,000 | | | | 1,086,063 | |
Redeemed | | | (485,707 | ) | | | (3,717,395 | ) |
| | | | | | | | |
Change in shares resulting from capital transactions | | | 4,797,153 | | | | 57,347 | |
| | | | | | | | |
See notes to financial statements.
29
Statement of Cash Flows
| | | | |
For the Six Months Ended March 31, 2012 (Unaudited) | | | | |
| |
Cash Provided by Operating Activities: | | | | |
Net increase in net assets resulting from operations | | $ | 10,142,223 | |
Adjustments to reconcile net increase in net assets
resulting from operations to net cash provided by
operating activities: | | | | |
Purchases of long-term securities | | | (69,302,470 | ) |
Proceeds from sales and paydowns of long-term securities | | | 60,817,985 | |
Purchases/proceeds from sales of short-term securities | | | (158,590 | ) |
Net change in unrealized (appreciation)/depreciation on investment securities | | | 2,625,958 | |
Net realized losses from investment transactions | | | 489,014 | |
Amortization of premium and discount - net | | | 196,730 | |
Decrease in interest and dividends receivable | | | 190,256 | |
Increase in interest due on reverse repurchase agreements | | | 3,605 | |
Increase in deposits at brokers for futures contracts | | | (782,011 | ) |
Decrease in prepaid expenses and other net assets | | | 9,404 | |
Decrease in payable to investment adviser | | | (187 | ) |
Decrease in accrued expenses and other liabilities | | | (18,158 | ) |
| | | | |
Net Cash Provided by Operating Activities | | | 4,213,759 | |
| | | | |
| |
Cash Provided by Financing Activities: | | | | |
Cash receipts/payments from reverse repurchase agreements | | | (37,937,837 | ) |
Proceeds from issuance of shares | | | 45,722,166 | |
Cash payments on shares redeemed | | | (4,694,528 | ) |
Distributions paid to shareholders | | | (7,303,560 | ) |
| | | | |
Net Cash Used in Financing Activities | | | (4,213,759 | ) |
| | | | |
Cash: | | | | |
Net change in cash | | | — | |
Cash at beginning of period | | | — | |
| | | | |
Cash at end of period | | $ | — | |
| | | | |
Cash Flow Information: | | | | |
Cash paid for interest | | | 222,149 | |
| | | | |
Noncash Financing Activities: | | | | |
Capital shares issued in reinvestment of distributions paid to shareholders | | | 5,310,518 | |
| | | | |
See notes to financial statements.
30
This Page Intentionally Left Blank
31
| | |
| Access Capital Community Investment Fund | | (Selected data for a share outstanding throughout the years indicated) |
| | | | | | | | | | | | | | | | | | | | | | | | |
| | | | | | Investment Activities | | | Distributions | | | | |
| | | Net Asset Value,
Beginning
of Period | | | Net
Investment
Income(a) | | | Net Realized and
Unrealized Gains (Losses)
on Investments | | | Total from
Investment
Activities | | | Net
Investment
Income | | | Net Asset Value,
End of Period | |
Class A | | | | | | | | | | | | | | | | | | | | | | | | |
Six Months Ended March 31, 2012 (Unaudited) | | | $9.75 | | | | 0.20 | | | | (0.03) | | | | 0.17 | | | | (0.21) | | | | $9.71 | |
Year Ended September 30, 2011 | | | 9.81 | | | | 0.43 | | | | (0.05) | | | | 0.38 | | | | (0.44) | | | | 9.75 | |
Year Ended September 30, 2010 | | | 9.80 | | | | 0.46 | | | | 0.02 | | | | 0.48 | | | | (0.47) | | | | 9.81 | |
Period Ended September 30, 2009(b) | | | 9.47 | | | | 0.31 | | | | 0.34 | | | | 0.65 | | | | (0.32) | | | | 9.80 | |
Class I(c) | | | | | | | | | | | | | | | | | | | | | | | | |
Six Months Ended March 31, 2012 (Unaudited) | | | $9.74 | | | | 0.22 | | | | (0.04) | | | | 0.18 | | | | (0.22) | | | | $9.70 | |
Year Ended September 30, 2011 | | | 9.80 | | | | 0.45 | | | | (0.05) | | | | 0.40 | | | | (0.46) | | | | 9.74 | |
Year Ended September 30, 2010 | | | 9.79 | | | | 0.49 | | | | 0.02 | | | | 0.51 | | | | (0.50) | | | | 9.80 | |
Year Ended September 30, 2009 | | | 9.41 | | | | 0.50 | | | | 0.38 | | | | 0.88 | | | | (0.50) | | | | 9.79 | |
Period Ended September 30, 2008(d) | | | 9.48 | | | | 0.16 | | | | (0.07) | | | | 0.09 | | | | (0.16) | | | | 9.41 | |
Year Ended May 31, 2008 | | | 9.46 | | | | 0.46 | | | | 0.02 | | | | 0.48 | | | | (0.46) | | | | 9.48 | |
Year Ended May 31, 2007 | | | 9.29 | | | | 0.44 | | | | 0.17 | | | | 0.61 | | | | (0.44) | | | | 9.46 | |
| | | | |
(a) Per share net investment income has been calculated using the average daily shares method. | | | | (c) The existing share class was renamed Class I Shares with the commencement of Class A Shares on January 29, 2009. |
(b) For the period January 29, 2009 (commencement of operations) to September 30, 2009. | | | | (d) Effective September 30, 2008, the Fund’s fiscal year end changed from May 31 to September 30. |
See notes to financial statements.
32
| | |
| Access Capital Community Investment Fund (cont.) | | (Selected data for a share outstanding throughout the years indicated) |
| | | | | | | | | | | | | | | | | | | | | | | | | | | | | | | | | | | | | | | | | | | | |
| | | | | | Ratios to Average Net Assets(a) | | | Ratios to Average Net Assets
Plus Average Borrowings(a)(b) | | | Supplemental
Data | |
| | | Total
Return(c) | | | Total Expenses
Net of
Reimbursement
and Excluding
Interest Expense | | | Total Expenses
Excluding
Interest
Expense | | | Net
Expenses | | | Net
Investment
Income | | | Total Expenses
Net of
Reimbursement
and Excluding
Interest Expense
and Investment
Structuring Fees | | | Total Expenses
Excluding
Interest
Expense | | | Net
Expenses | | | Net
Investment
Income | | | Net Assets,
End of
Period (000’s) | | | Portfolio
Turnover
Rate | |
Class A | | | | | | | | | | | | | | | | | | | | | | | | | | | | | | | | | | | | | | | | | | | | |
Six Months Ended March 31, 2012 (Unaudited)(d) | | | 1.72% | | | | 0.95% | | | | 0.95% | | | | 1.03% | | | | 4.18% | | | | 0.76% | | | | 0.76% | | | | 0.82% | | | | 3.35% | | | | $16,010 | | | | 9% | |
Year Ended September 30, 2011(d) | | | 3.98% | | | | 0.96% | | | | 0.96% | | | | 1.03% | | | | 4.40% | | | | 0.77% | | | | 0.77% | | | | 0.82% | | | | 3.51% | | | | 8,212 | | | | 17% | |
Year Ended September 30, 2010(d) | | | 5.02% | | | | 0.97% | | | | 0.97% | | | | 1.04% | | | | 4.67% | | | | 0.78% | | | | 0.78% | | | | 0.84% | | | | 3.76% | | | | 12,141 | | | | 9% | |
Period Ended September 30, 2009(d) | | | 7.11% | | | | 1.00% | | | | 1.25% | | | | 1.11% | | | | 4.77% | | | | 0.81% | | | | 1.02% | | | | 0.90% | | | | 3.89% | | | | 8,662 | | | | 10% | |
Class I | | | | | | | | | | | | | | | | | | | | | | | | | | | | | | | | | | | | | | | | | | | | |
Six Months Ended March 31, 2012 (Unaudited)(d) | | | 1.84% | | | | 0.70% | | | | 0.70% | | | | 0.79% | | | | 4.47% | | | | 0.56% | | | | 0.56% | | | | 0.63% | | | | 3.56% | | | | $573,792 | | | | 9% | |
Year Ended September 30, 2011(d) | | | 4.23% | | | | 0.72% | | | | 0.72% | | | | 0.79% | | | | 4.66% | | | | 0.57% | | | | 0.57% | | | | 0.62% | | | | 3.69% | | | | 537,319 | | | | 17% | |
Year Ended September 30, 2010(d) | | | 5.28% | | | | 0.72% | | | | 0.72% | | | | 0.79% | | | | 4.94% | | | | 0.58% | | | | 0.58% | | | | 0.64% | | | | 3.98% | | | | 536,198 | | | | 9% | |
Year Ended September 30, 2009(d) | | | 9.59% | | | | 0.74% | | | | 0.74% | | | | 1.06% | | | | 5.16% | | | | 0.59% | | | | 0.59% | | | | 0.85% | | | | 4.12% | | | | 561,148 | | | | 10% | |
Period Ended September 30, 2008 | | | 1.02% | | | | 0.86% | | | | 0.86% | | | | 1.61% | | | | 5.17% | | | | 0.67% | | | | 0.67% | | | | 1.25% | | | | 4.00% | | | | 543,404 | | | | 1% | |
Year Ended May 31, 2008 | | | 5.19% | | | | 0.93%(e) | | | | 0.93% | | | | 1.99% | | | | 4.83% | | | | 0.75%(e) | | | | 0.75% | | | | 1.60% | | | | 3.88% | | | | 513,723 | | | | 19% | |
Year Ended May 31, 2007 | | | 6.65% | | | | 0.79% | | | | 0.83% | | | | 1.48% | | | | 4.55% | | | | 0.70% | | | | 0.74% | | | | 1.31% | | | | 4.03% | | | | 474,720 | | | | 23% | |
| | |
(a) Annualized for those periods that are less than one year. | | (e) To the extent that the Fund’s operating expenses (exclusive of management fees, distribution fees and interest expense) were less than 0.25% of the Fund’s monthly average net assets, the Fund repaid the Fund’s investment adviser and sub-adviser for operating expenses previously borne or reimbursed. |
(b) These ratios are calculated based upon the average net assets plus average borrowings. | |
(c) Total investment returns exclude the effect of sales charge. | |
(d) Total expenses of the Fund for the period ended September 30, 2009 is 1.36% and 1.09% for the Class A and Class I shares, respectively. Total expenses for all other periods would be the same as shown in the financial highlights as net expenses because there were no fee waivers during these periods. | |
See notes to financial statements.
33
|
NOTES TO FINANCIAL STATEMENTS |
March 31, 2012 (Unaudited)
1. Organization
RBC Funds Trust (the “Trust”) was organized as a Delaware statutory trust on December 16, 2003. Overall responsibility for the management of the Trust is vested in its Board of Trustees (the “Board”). This annual report includes the Access Capital Community Investment Fund (the “Fund”). At its inception in 1998, the Access Capital Strategies Community Investment Fund, Inc., the Fund’s predecessor, elected status as a business development company under the Investment Company Act of 1940 (the “1940 Act”), but withdrew its election on May 30, 2006, and registered as a continuously offered, closed-end interval management company under the 1940 Act. The predecessor fund was reorganized into a series of the Trust, a registered open-end management company under the 1940 Act, effective July 28, 2008.
The Fund offers two share classes: Class A and Class I shares. Class A shares are offered with a 3.75% maximum front-end sales charge and a 1.00% contingent deferred sales charge (“CDSC”) for redemption within 12 months of a $1 million or greater purchase on which no front-end sales charge was paid. Class I shares (intended for investors meeting certain investment minimum thresholds) are not subject to either a front-end sales charge or a CDSC.
RBC Global Asset Management (U.S.) Inc. (“RBC GAM (US)”) acts as the investment advisor for the Trust. The officers of the Trust (“Fund Management”) are also employees of RBC GAM (US) or its affiliates and BNY Mellon Investment Servicing (US) Inc. (“BNY Mellon”).
The Fund’s investment objective is to invest in geographically specific debt securities located in portions of the United States designated by Fund investors. The Fund seeks to achieve its investment objective by investing primarily in debt securities specifically designed to support underlying economic activities such as affordable housing, education, small business lending, and job-creating activities in areas of the United States designated by Fund investors.
2. Significant Accounting Policies
Summarized below are the significant accounting policies of the Fund. The policies conform to accounting principles generally accepted in the United States of America (“U.S. GAAP”). Fund Management follows these policies when preparing financial statements. Management may also be required to make estimates and assumptions that affect the reported amounts of assets and liabilities at the date of the financial statements and the reported amounts of income and expenses for the period. Actual results could differ from those estimates.
Security Valuation:
Bonds and other fixed income securities, including TBA commitments, are generally valued on the basis of prices furnished by pricing services approved by the Trust’s Board. The pricing services utilize both dealer-supplied valuations and electronic data processing techniques that take into account appropriate factors such as institutional-size trading in similar groups of securities, yield, quality, coupon rate, maturity and type of issue. Swaptions are fair valued using methodologies approved by the Trust’s Board. These valuation techniques take into account mutiple factors, including fundamental security analytical data, information from broker-dealers, market spreads and interest rates. Short-term debt obligations, with less than 60 days to maturity at time of purchase, are valued at amortized cost unless Fund Management determines that amortized cost no longer approximates market value.
In such cases where a security price is unavailable, or where Fund Management determines that the value provided by the pricing services or amortized cost does not approximate fair value, the Board has approved pricing and valuation procedures to determine a security’s fair value. Some of the factors which may be considered in determining fair value are fundamental analytical data relating to the security, the issuer and the market, such as duration, prepayment and default rates; general level of interest rates and changes in interest rates; information from broker-dealers; and trading in similar
34
|
NOTES TO FINANCIAL STATEMENTS |
securities. Investments in open-end investment companies are valued at net asset value. Exchange traded financial futures are valued at the settlement price as established by the exchange on which they are traded.
Financial Instruments:
Reverse Repurchase Agreements
To obtain short-term financing, the Fund entered into reverse repurchase agreements with primary dealers that report to the Federal Reserve Bank of New York or the 100 largest U.S. commercial banks, who are deemed creditworthy under guidelines approved by the Board. Interest on the value of the reverse repurchase agreements is based upon competitive market rates at the time of issuance. At the time the Fund enters into a reverse repurchase agreement, it will establish and maintain a segregated account with the custodian containing qualifying assets having a value, including accrued interest, not less than the repurchase price. Based on requirements with certain exchanges and third party broker-dealers, the Fund may also be required to deliver or deposit securities or cash as collateral. If the counterparty to the transaction is rendered insolvent, the ultimate realization of the securities to be repurchased by the Fund may be delayed or limited. For the six months ended March 31, 2012, the average amount borrowed was approximately $143,251,904 and the daily weighted average interest rate was 0.32%.
Details of open reverse repurchase agreements at March 31, 2012 were as follows:
| | | | | | | | | | | | | | | | | | |
| | | Rate | | Trade
Date | | | Maturity
Date | | | Net Closing
Amount | | | Par | |
Goldman Sachs | | 0.30% | | | 2/13/12 | | | | 4/02/12 | | | $ | (15,920,605) | | | $ | (15,914,106) | |
Goldman Sachs | | 0.32% | | | 2/15/12 | | | | 4/02/12 | | | | (29,056,328) | | | | (29,044,194) | |
Deutsche Bank Securities | | 0.27% | | | 2/27/12 | | | | 4/16/12 | | | | (20,227,431) | | | | (20,220,000) | |
Goldman Sachs | | 0.30% | | | 3/02/12 | | | | 4/25/12 | | | | (21,405,628) | | | | (21,396,000) | |
Goldman Sachs | | 0.33% | | | 3/15/12 | | | | 5/02/12 | | | | (42,083,509) | | | | (42,065,000) | |
Details of underlying collateral pledged for open reverse repurchase agreements in addition to the segregated cash collateral shown on the Statement of Assets and Liabilities at March 31, 2012 were as follows:
| | | | | | | | | | | | | | | | |
| | | Description | | Rate | | Maturity Date | | | Par | | | Value | |
Goldman Sachs 2/13/12 to 4/02/12 | | | | | | | | | | | | | | | | |
| | Ginnie Mae Pool #748654 | | 3.50% | | | 9/15/40 | | | $ | 1,355,402 | | | $ | 1,414,383 | |
| | Ginnie Mae Pool #759196 | | 3.50% | | | 1/15/41 | | | | 1,478,530 | | | | 1,542,869 | |
| | Ginnie Mae Pool #737574 | | 4.00% | | | 11/15/40 | | | | 1,455,545 | | | | 1,564,427 | |
| | Ginnie Mae Pool #717133 | | 4.50% | | | 5/15/39 | | | | 1,329,348 | | | | 1,446,860 | |
| | Ginnie Mae Pool #720080 | | 4.50% | | | 6/15/39 | | | | 1,350,645 | | | | 1,483,968 | |
| | Ginnie Mae Pool #729018 | | 4.50% | | | 2/15/40 | | | | 1,744,943 | | | | 1,905,737 | |
| | Ginnie Mae Pool #698113 | | 4.50% | | | 5/15/39 | | | | 2,400,896 | | | | 2,628,137 | |
| | Ginnie Mae Pool #713519 | | 6.00% | | | 7/15/39 | | | | 4,172,129 | | | | 4,712,224 | |
| | | | | | | | | | | | | | | | |
| | | | | | | | | | | | | | $ | 16,698,605 | |
| | | | | | | | | | | | | | | | |
Goldman Sachs 2/15/12 to 4/02/12 | | | | | | | | | | | | | | | | |
| | Fannie Mae Pool #AH5657 | | 4.00% | | | 2/01/41 | | | $ | 1,229,488 | | | $ | 1,288,705 | |
| | Fannie Mae Pool #AE2012 | | 4.00% | | | 9/01/40 | | | | 3,411,802 | | | | 3,576,129 | |
35
|
| NOTES TO FINANCIAL STATEMENTS |
| | | | | | | | | | | | | | | | |
| | | Description | | Rate | | Maturity
Date | | | Par | | | Value | |
| | Fannie Mae Pool #AE5862 | | 4.00% | | | 10/01/40 | | | $ | 2,210,729 | | | $ | 2,325,497 | |
| | Fannie Mae Pool #AE5863 | | 4.00% | | | 10/01/40 | | | | 2,025,583 | | | | 2,130,739 | |
| | Fannie Mae Pool #AE7703 | | 4.00% | | | 10/01/40 | | | | 1,176,235 | | | | 1,232,887 | |
| | Fannie Mae Pool #AD1585 | | 4.50% | | | 2/01/40 | | | | 3,466,947 | | | | 3,695,549 | |
| | Fannie Mae Pool #AD1988 | | 4.50% | | | 2/01/40 | | | | 4,424,873 | | | | 4,716,638 | |
| | Fannie Mae Pool #AD7271 | | 4.50% | | | 7/01/40 | | | | 2,373,318 | | | | 2,532,775 | |
| | Fannie Mae Pool #AD9613 | | 4.50% | | | 8/01/40 | | | | 2,220,822 | | | | 2,358,930 | |
| | Fannie Mae Pool #AD1560 | | 5.00% | | | 3/01/40 | | | | 1,734,012 | | | | 1,879,845 | |
| | Fannie Mae Pool #885724 | | 5.50% | | | 6/01/36 | | | | 2,452,403 | | | | 2,679,154 | |
| | Fannie Mae Pool #AA0527 | | 5.50% | | | 12/01/38 | | | | 1,560,094 | | | | 1,708,974 | |
| | | | | | | | | | | | | | | | |
| | | | | | | | | | | | | | $ | 30,125,822 | |
| | | | | | | | | | | | | | | | |
Deutsche Bank Securities 2/27/12 to 4/16/12 | | | | | | | | | | | | | | | | |
| | Fannie Mae Pool #AH2980 | | 4.00% | | | 1/01/41 | | | $ | 2,386,665 | | | $ | 2,501,617 | |
| | Fannie Mae Pool #AH5658 | | 4.00% | | | 2/01/41 | | | | 2,567,837 | | | | 2,691,514 | |
| | Fannie Mae Pool #AH6768 | | 4.00% | | | 3/01/41 | | | | 3,663,665 | | | | 3,840,122 | |
| | Fannie Mae Pool #AH7537 | | 4.00% | | | 3/01/41 | | | | 3,107,882 | | | | 3,269,224 | |
| | Fannie Mae Pool #AA0644 | | 4.50% | | | 3/01/39 | | | | 1,155,225 | | | | 1,227,065 | |
| | Fannie Mae Pool #AA3207 | | 4.50% | | | 3/01/39 | | | | 1,137,254 | | | | 1,207,977 | |
| | Fannie Mae Pool #AA7659 | | 4.50% | | | 6/01/39 | | | | 1,285,286 | | | | 1,383,691 | |
| | Fannie Mae Pool #AC7199 | | 5.00% | | | 12/01/39 | | | | 4,493,116 | | | | 4,870,994 | |
| | | | | | | | | | | | | | | | |
| | | | | | | | | | | | | | $ | 20,992,204 | |
| | | | | | | | | | | | | | | | |
Goldman Sachs 3/02/12 to 4/25/12 | | | | | | | | | | | | | | | | |
| | Fannie Mae Pool #806754 | | 4.50% | | | 9/01/34 | | | $ | 2,506,441 | | | $ | 2,665,835 | |
| | Fannie Mae Pool #AC2109 | | 4.50% | | | 7/01/39 | | | | 2,050,365 | | | | 2,177,872 | |
| | Fannie Mae Pool #AD1942 | | 4.50% | | | 1/01/40 | | | | 2,901,894 | | | | 3,093,238 | |
| | Fannie Mae Pool #AD9614 | | 4.50% | | | 8/01/40 | | | | 2,073,551 | | | | 2,202,500 | |
| | Fannie Mae Pool #663159 | | 5.00% | | | 7/01/32 | | | | 4,120,375 | | | | 4,463,396 | |
| | Fannie Mae Pool #777621 | | 5.00% | | | 2/01/34 | | | | 2,606,264 | | | | 2,820,569 | |
| | Fannie Mae Pool #806761 | | 5.50% | | | 9/01/34 | | | | 2,818,740 | | | | 3,090,374 | |
| | Fannie Mae Pool #844361 | | 5.50% | | | 11/01/35 | | | | 1,707,408 | | | | 1,868,745 | |
| | | | | | | | | | | | | | | | |
| | | | | | | | | | | | | | $ | 22,382,529 | |
| | | | | | | | | | | | | | | | |
Goldman Sachs 3/15/12 to 5/02/12 | | | | | | | | | | | | | | | | |
| | Fannie Mae Pool #AE5432 | | 4.00% | | | 10/01/40 | | | $ | 2,152,945 | | | $ | 2,256,640 | |
| | Fannie Mae Pool #AE2023 | | 4.00% | | | 9/01/40 | | | | 1,603,994 | | | | 1,681,249 | |
| | Fannie Mae Pool #AE5861 | | 4.00% | | | 10/01/40 | | | | 1,595,637 | | | | 1,672,489 | |
| | Fannie Mae Pool #AE6851 | | 4.00% | | | 10/01/40 | | | | 1,408,672 | | | | 1,476,520 | |
| | Fannie Mae Pool #AE6850 | | 4.00% | | | 10/01/40 | | | | 1,256,209 | �� | | | 1,316,713 | |
36
|
| NOTES TO FINANCIAL STATEMENTS |
| | | | | | | | | | | | | | | | |
| | | Description | | Rate | | Maturity Date | | | Par | | | Value | |
| | Fannie Mae Pool #AE7707 | | 4.00% | | | 11/01/40 | | | $ | 1,897,208 | | | $ | 1,988,585 | |
| | Fannie Mae Pool #AD7256 | | 4.50% | | | 7/01/40 | | | | 1,230,352 | | | | 1,327,627 | |
| | Fannie Mae Pool #AA3142 | | 4.50% | | | 3/01/39 | | | | 1,894,028 | | | | 2,026,018 | |
| | Fannie Mae Pool #MC0154 | | 4.50% | | | 8/01/39 | | | | 1,680,708 | | | | 1,791,530 | |
| | Fannie Mae Pool #MC0171 | | 4.50% | | | 9/01/39 | | | | 1,118,389 | | | | 1,192,132 | |
| | Fannie Mae Pool #AD7239 | | 4.50% | | | 7/01/40 | | | | 1,518,234 | | | | 1,638,269 | |
| | Fannie Mae Pool #AD4458 | | 4.50% | | | 4/01/40 | | | | 2,340,441 | | | | 2,485,987 | |
| | Fannie Mae Pool #AD4940 | | 4.50% | | | 6/01/40 | | | | 1,154,871 | | | | 1,246,178 | |
| | Fannie Mae Pool #AD7272 | | 4.50% | | | 7/01/40 | | | | 1,345,044 | | | | 1,451,387 | |
| | Fannie Mae Pool #AD1470 | | 5.00% | | | 2/01/40 | | | | 2,577,162 | | | | 2,790,684 | |
| | Fannie Mae Pool #727312 | | 5.00% | | | 9/01/33 | | | | 2,159,436 | | | | 2,346,109 | |
| | Fannie Mae Pool #934941 | | 5.00% | | | 8/01/39 | | | | 1,833,117 | | | | 1,987,285 | |
| | Fannie Mae Pool #829005 | | 5.00% | | | 8/01/35 | | | | 1,589,287 | | | | 1,717,485 | |
| | Fannie Mae Pool #AC6307 | | 5.00% | | | 12/01/39 | | | | 1,473,701 | | | | 1,597,641 | |
| | Fannie Mae Pool #AC6304 | | 5.00% | | | 11/01/39 | | | | 1,421,060 | | | | 1,540,573 | |
| | Fannie Mae Pool #AC5329 | | 5.00% | | | 10/01/39 | | | | 1,301,012 | | | | 1,410,429 | |
| | Fannie Mae Pool #AD8960 | | 5.00% | | | 6/01/40 | | | | 1,422,192 | | | | 1,548,023 | |
| | Fannie Mae Pool #257892 | | 5.50% | | | 2/01/38 | | | | 1,263,653 | | | | 1,379,504 | |
| | Fannie Mae Pool #829649 | | 5.50% | | | 3/01/35 | | | | 1,391,994 | | | | 1,525,702 | |
| | Fannie Mae Pool #702478 | | 5.50% | | | 6/01/33 | | | | 1,154,756 | | | | 1,267,119 | |
| | Fannie Mae Pool #952632 | | 6.00% | | | 7/01/37 | | | | 1,659,729 | | | | 1,828,036 | |
| | | | | | | | | | | | | | | | |
| | | | | | | | | | | | | | $ | 44,489,914 | |
| | | | | | | | | | | | | | | | |
Derivatives
The Fund may use derivative instruments, including futures, forwards, options, indexed securities, swaps and inverse securities for hedging purposes only. Derivatives allow the Fund to increase or decrease its risk exposure more quickly and efficiently than other types of instruments. Use of derivative contracts may give rise to losses. To the extent amounts due to the Fund from counterparties are not fully collateralized, contractually or otherwise, the Fund bears the risk of loss from counterparty non-performance. The Fund’s maximum risk of loss from counterparty credit risk on over-the-counter derivatives is generally the aggregate unrealized gain in excess of any collateral pledged by the counterparty to the Fund. For over-the-counter purchased options, the Fund bears the risk of loss in the amount of the premiums paid and change in value of the options should the counterparty not perform under the contracts. Written options by the Fund do not give rise to counterparty credit risk, as written options obligate the Fund to perform and not the counterparty. Counterparty risk related to exchange traded financial futures contracts and options is minimal because of the protection against defaults provided by the exchange on which they trade. Hedging also involves the risk that changes in the value of the derivative will not match those of the holdings being hedged as expected by the Fund, in which case any losses on the holdings being hedged may not be reduced and may be increased. There can be no assurance that the Fund’s hedging strategy will reduce risk or that hedging transactions will be available or cost effective. The Fund is subject to interest rate risk in the normal course of pursuing its investment objectives by investing in various derivative instruments, as described below. For open derivative instruments as of March 31, 2012, see the following section for financial futures contracts.
Financial Futures Contracts
The Fund entered into futures contracts in an effort to manage both the duration of the portfolio and hedge against certain market risk. A futures contract on a securities index is an agreement obligating one party to pay, and entitling the other party to receive, during the term of the contract, cash
37
|
| NOTES TO FINANCIAL STATEMENTS |
payments based on the level of a specified securities index. Futures transactions involve brokerage costs and require a Fund to segregate assets to cover contracts that would require it to purchase securities or currencies. A Fund may lose the expected benefit of futures transactions if interest rates, exchange rates or securities prices change in an unanticipated manner. Such unanticipated changes may also result in lower overall performance than if a Fund had not entered into any futures transactions.
Upon entering into a futures contract, a Fund is required to pledge to the broker an amount of cash, U.S. government securities, or other assets equal to a certain percentage of the contract amount. Subsequent payments are made or received by the Fund each day, depending on the daily fluctuations in the fair value of the underlying instrument. A Fund would record an unrealized gain or loss each day equal to these daily payments.
The Fund had the following open futures contracts at March 31, 2012:
| | | | | | | | | | | | | | | | |
| | | Number of
Contracts | | | Expiration Date | | Unrealized
Appreciation
(Depreciation) | | | Notional
Value | | | Counterparty |
Short Position: | | | | | | | | | | | | | | | | |
| | | | | |
90 Day Euro Dollar | | | 25 | | | March, 2013 | | | (60,937 | ) | | | 6,154,688 | | | Barclays Capital |
| | | 25 | | | March, 2014 | | | (113,125 | ) | | | 6,081,875 | | | Barclays Capital |
| | | 25 | | | June, 2012 | | | (33,750 | ) | | | 6,186,875 | | | Barclays Capital |
| | | 25 | | | June, 2013 | | | (69,687 | ) | | | 6,142,500 | | | Barclays Capital |
| | | 25 | | | June, 2014 | | | (120,313 | ) | | | 6,066,562 | | | Barclays Capital |
| | | 25 | | | September, 2012 | | | (42,812 | ) | | | 6,176,563 | | | Barclays Capital |
| | | 25 | | | September, 2013 | | | (77,188 | ) | | | 6,130,313 | | | Barclays Capital |
| | | 25 | | | September, 2014 | | | (126,250 | ) | | | 6,051,563 | | | Barclays Capital |
| | | 25 | | | December, 2012 | | | (52,813 | ) | | | 6,164,688 | | | Barclays Capital |
| | | 25 | | | December, 2013 | | | (105,000 | ) | | | 6,096,250 | | | Barclays Capital |
Ten Year | | | | | | | | | | | | | | | | |
U.S. Treasury Notes | | | 310 | | | June, 2012 | | | 447,578 | | | | 40,587,734 | | | Barclays Capital |
Thirty Year | | | | | | | | | | | | | | | | |
U.S. Treasury Bonds | | | 270 | | | June, 2012 | | | 870,000 | | | | 38,062,500 | | | Barclays Capital |
Details of underlying collateral pledged for open futures contracts in addition to the deposit at brokers shown on the Statement of Assets and Liabilities at March 31, 2012 is as follows:
| | | | | | | | | | | | | | | | |
Description | | Yield | | | Maturity
Date | | | Par | | | Market
Value | |
| Federal Home Loan Bank | | | | | | | | | | | | | | | | |
| Discount Note | | | 0.09 | % | | | 04/09/12 | | | $ | 2,000,000 | | | $ | 1,999,984 | |
Options
The Fund may write (or sell) put and call options on the securities that the Fund is authorized to buy or already holds in its portfolio. A Fund may also purchase put and call options. A call option gives the purchaser the right to buy, and the writer the obligation to sell, the underlying security at the agreed-upon exercise (or “strike”) price during the option period. A put option gives the purchaser the right to sell, and the writer the obligation to buy, the underlying security at the strike price during the option period. Purchasers of options pay an amount, known as a premium, to the option writer in exchange for the right under the option contract. The Fund does not have any outstanding options as of March 31, 2012.
38
|
NOTES TO FINANCIAL STATEMENTS |
Swaptions
The Fund may purchase or write swaptions in an attempt to gain additional protection against the effects of interest rate fluctuations. Swap options (swaptions) are similar to options on securities except that instead of selling or purchasing the right to buy or sell a security, the writer or purchaser of the swap option is granting or buying the right to enter into a previously agreed upon interest rate swap agreement at any time before the expiration of the option (interest rate risk). In purchasing and writing swaptions, the Fund bears the risk of an unfavorable change in the price of the underlying interest rate swap or the risk that the Fund may not be able to enter into a closing transaction due to an illiquid market. The Fund executes transactions in over-the-counter swaptions. Transactions in over-the-counter swaptions may expose the Fund to the risk of default by the counterparty to the transaction. In the event of default by the counterparty, the Fund’s maximum amount of loss is the premium paid (as purchaser) or the unrealized loss of the contract (as writer).The Fund does not have any outstanding call swaptions as of March 31, 2012.
The effect of Derivative Instruments on the Statement of Operations during the six months ended March 31, 2012 is as follows:
| | | | | | | | |
Derivative Instruments Categorized by Risk Exposure | | Net Realized Losses
from
Futures Contracts | | | Net Change in Unrealized
Appreciation/Depreciation
on Futures Contracts | |
Interest Rate Risk | | | $(2,712,753) | | | | $3,494,849 | |
For the six months ended March 31, 2012, the average volume of derivative activities are as follows:
| | | | | | |
| | | Futures Short Positions (Contracts) | | | |
| | | 840 | | | |
TBA Commitments
The Fund may enter into to be announced (“TBA”) commitments to purchase or sell securities for a fixed price at a future date. TBA commitments are considered securities in themselves, and involve a risk of loss if the value of the security to be purchased/sold declines/increases prior to settlement date, which is in addition to the risk of decline in the value of a Fund’s other assets. Unsettled TBA commitments are valued at the current value of the underlying securities, according to the procedures described under “Security Valuation”.
Mortgage Backed Securities
Because the Fund will focus on community development investments, such as securities backed by commercial and/or residential mortgage loans, it will be affected by risks not typically associated with funds that do not specialize in community development investments. These risks include credit and prepayment risk and risk due to default on underlying loans within a security. Changes in economic conditions, including delinquencies and/or defaults or assets underlying these securities, can affect the value, income and/or liquidity of such positions.
In addition, the Fund invests in certain mortgage backed securities that qualify under the CRA in which the Fund may pay a premium for the geographically or other targeted nature of the securities. There can be no guarantee, however, that a similar premium will be received if the security is sold by the Fund.
Credit Enhancement
Certain obligations held in the Fund have credit enhancement or liquidity features that may, under certain circumstances, provide for repayment of principal and interest on the obligation upon demand date, interest rate reset date or final maturity. These enhancements may include: letters of credit; liquidity guarantees; security purchase agreements; tender option purchase agreements; and third party insurance (i.e., AMBAC and MBIA).
Fair Value Measurements:
Various inputs are used in determining the fair value of investments which are as follows:
· Level 1 - Inputs that reflect unadjusted quoted prices in active markets for identical assets or liabilities that the Funds have the ability to access at the measurement date.
39
|
NOTES TO FINANCIAL STATEMENTS |
· Level 2 - Inputs other than quoted prices that are observable for the asset or liability either directly or indirectly, including inputs in markets that are not considered to be active.
· Level 3 - Unobservable inputs based on the best information available in the circumstances, to the extent observable inputs are not available (including the Fund’s own assumptions in determining the fair value of investments).
The inputs or methodology used for valuing securities are not necessarily an indication of the risk associated with investing in those securities.
The summary of inputs used to determine the fair valuation of the Fund’s investments as of March 31, 2012 is as follows:
| | | | | | | | | | | | | | | | |
| | | Level 1
Quoted Prices | | | Level 2
Significant Observable Inputs | | | Level 3 Significant Unobservable Inputs | | | Total | |
Assets: | | | | | | | | | | | | | | | | |
Investments in Securities | | | | | | | | | | | | | | | | |
Investment Company | | $ | 6,387,769 | | | $ | — | | | $ | — | | | $ | 6,387,769 | |
Municipal Bonds | | | — | | | | 16,195,807 | | | | — | | | | 16,195,807 | |
Corporate Bonds | | | — | | | | 1,237,782 | | | | — | | | | 1,237,782 | |
U.S. Government Agency Backed Mortgages | | | — | | | | 637,616,210 | | | | — | | | | 637,616,210 | |
U.S. Government Agency Obligations | | | — | | | | 59,642,411 | | | | — | | | | 59,642,411 | |
Promissory Notes | | | — | | | | 10,490,250 | | | | — | | | | 10,490,250 | |
| | | | | | | | | | | | | | | | |
| | $ | 6,387,769 | | | $ | 725,182,460 | | | $ | — | | | $ | 731,570,229 | |
| | | | | | | | | | | | | | | | |
Other Financial Instruments(*) | | | | | | | | | | | | | | | | |
Interest Rate Contracts | | $ | 1,317,578 | | | $ | — | | | $ | — | | | $ | 1,317,578 | |
| | | | | | | | | | | | | | | | |
Total Assets | | $ | 7,705,347 | | | $ | 725,182,460 | | | $ | — | | | $ | 732,887,807 | |
| | | | | | | | | | | | | | | | |
| | | | |
Liabilities: | | | | | | | | | | | | | | | | |
Other Financial Instruments(*) | | | | | | | | | | | | | | | | |
Interest Rate Contracts | | $ | (801,875) | | | $ | — | | | $ | — | | | $ | (801,875) | |
| | | | | | | | | | | | | | | | |
* Other financial instruments are futures contracts which are not reflected in the Schedule of Portfolio Investments and are shown at the unrealized appreciation/(depreciation) on the investment.
During the six months ended March 31, 2012, the Fund recognized no transfers to/from level 1 or 2. The Fund’s policy is to recognize transfers to/from level 1, level 2 and level 3 at the end of the year utilizing fair value at the beginning of the year.
In May 2011, the Financial Accounting Standards Board (“FASB”) issued Accounting Standards Update (“ASU”) No. 2011-04 “Amendments to Achieve Common Fair Value Measurement and Disclosure Requirements” in U.S. GAAP and International Financial Reporting Standards (“IFRSs”). ASU 2011-04 includes common requirements for measurement of and disclosure about fair value between U.S. GAAP and IFRS. ASU 2011-04 will require reporting entities to disclose the following information for fair value measurements categorized within Level 3 of the fair value hierarchy: quantitative information about the unobservable inputs used in the fair value measurement, the valuation processes used by the reporting entity and a narrative description of the sensitivity of the fair value measurement to changes in unobservable inputs and the interrelationships between those unobservable inputs. In addition, ASU 2011-04 will require reporting entities to make disclosures about amounts and reasons for all transfers in and out of Level 1 and Level 2 fair value measurements. The new and revised disclosures are effective for interim and annual reporting periods beginning after December 15, 2011. Management is currently evaluating the implications of ASU No. 2011-04 and its impact on the financial statements.
40
|
NOTES TO FINANCIAL STATEMENTS |
Investment Transactions and Income:
Investment transactions are recorded one business day after trade date, except on the last day of each fiscal quarter end, when they are recorded on trade date. Dividend income is recorded on the ex-dividend date. Realized gains and losses from investment transactions are calculated based on the costs of the specific security (also known as identified cost basis). Interest income is recognized on the accrual basis and includes, where applicable, the amortization and accretion of premium or discount using the effective yield method. Paydown gains and losses on mortgage and asset-backed securities are included in the financial statements as interest income.
Expense, Investment Income and Gain/Loss Allocation:
The Fund pays the expenses that are directly related to its operations, such as custodian fees or adviser fees. Expenses incurred by the Trust, such as trustee or legal fees, are allocated to the Fund either proportionately based upon the Fund’s relative net assets or using another reasonable basis such as equally across all Funds in the Trust, depending on the nature of the expense. Individual share classes within the Fund are charged expenses specific to that class, such as distribution fees. Within the Fund, expenses other than class specific expenses are allocated daily to each class based upon the proportion of relative net assets. Investment income and realized and unrealized gains or losses are allocated to each class of shares based upon the proportion of relative net assets.
Distributions to Shareholders:
The Fund pays out any income that it receives, less expenses, in the form of dividends and capital gains to its shareholders. Income dividends are declared daily and paid monthly. Dividends will also be paid at any time during the month upon total redemption of shares in an account. Capital gain distributions are declared and paid at least annually. Distributions to shareholders are recorded on the ex-dividend date. The amount of dividends and distributions are calculated based on federal income tax regulations, which may differ from GAAP. These “book/tax” differences may be either temporary or permanent in nature. To the extent these differences are determined, as of the end of the tax year, to be permanent (e.g., reclassification of paydown gains and losses, and expiring capital loss carryforward), they are reclassified within a Fund’s capital account based on their federal tax basis treatment.
3. Agreements and Other Transactions with Affiliates
RBC GAM (US) serves as investment advisor to the Fund. The Advisor has agreed to waive or limit fees through January 31, 2013, to maintain expenses (excluding interest expense, management fees and distribution fees) at 0.20% of the Fund’s average monthly gross assets less liabilities, other than indebtness for borrowing. The Fund will carry forward, for a period not to exceed 12 months from the date on which a waiver or reimbursement is made by the Advisor, any expenses in excess of the expense limitation and repay the Advisor such amounts, provided the Fund is able to effect such repayment and remain in compliance with the expense limitation disclosed in the effective prospectus. During the six months ended March 31, 2012, no reimbursements were made to the Advisor.
Under the terms of the Fund’s management agreement, the Advisor receives from the Fund an annual management fee, paid monthly, of 50 basis points (0.50%) of the Fund’s average daily total assets less liabilities, other than indebtedness for borrowing. For purposes of calculating the management fee, assets purchased with borrowed monies are included in the total that is subject to the management fee. As a result, the Advisor has an incentive to use leverage so as to increase the amount of assets upon which it may charge a fee. As of March 31, 2012, the impact of leverage raised the management fee to approximately 63 basis points (0.63%) of the Fund’s average net assets.
The RBC Funds currently pay the independent Trustees (Trustees of the Trust who are not directors, officers or employees of the adviser, administrator or distributor) an annual retainer of $32,500. The Board Chairperson and Audit Committee Chairperson each receive an additional retainer of $2,500 annually, and all other trustees serving as Chair of a Board committee each receive an additional retainer of $1,000 annually. In addition, Independent Trustees receive a quarterly meeting fee of $5,000 for each in-person Board meeting attended, a meeting fee of $1,000 for each telephonic or Special Board meeting attended, and a $1,500 fee for each Board committee meeting attended and are reimbursed for all out-of-pocket expenses relating to attendance at such meetings.
41
|
NOTES TO FINANCIAL STATEMENTS |
4. Fund Distribution:
The Fund has adopted a Master Distribution 12b-1 Plan (the “Plan”) in which Quasar Distributors LLC (the “Distributor”) acts as the Fund’s distributor. The Plan permits the Fund to make payments for, or to reimburse the Distributor monthly for, distribution-related costs and expenses of marketing shares of Class A covered under the Plan, and/or for providing shareholder services. The Plan does not apply to Class I. The following chart shows the current Plan fee rate for Class A.
| | | | |
| | | Class A | |
12b-1 Plan Fee | | | 0.25% | |
Plan fees are based on average daily net assets of Class A. The Distributor, subject to applicable legal requirements, may waive the Plan fee voluntarily, in whole or in part. For the six months ended March 31, 2012, there were no fees waived by the Distributor.
5. Securities Transactions:
The cost of securities purchased and proceeds from securities sold (excluding securities maturing less than one year from acquisition) for the period ended March 31, 2012 were as follows:
| | | | | | |
Purchases(Excl. U.S. Gov’t.) | | Sales(Excl. U.S. Gov’t.) | | Purchases of U.S. Gov’t. | | Sales of U.S. Gov’t. |
$ 86,068,948 | | $61,077,022 | | $— | | $— |
6. Capital Share Transactions:
The Trust is authorized to issue 1,000,000,000 shares of beneficial interest (“shares outstanding”) with par value of $.0000001. Transactions in shares of the Fund are summarized below:
| | | | | | | | |
| | | For the
Six Months Ended
March 31,
2012 | | | For the
Year Ended
September 30,
2011 | |
| | | (Unaudited) | | | | |
CAPITAL TRANSACTIONS: | | | | | | | | |
Class A | | | | | | | | |
Proceeds from shares issued | | $ | 10,528,259 | | | $ | 4,360,376 | |
Distributions reinvested | | | 155,639 | | | | 205,393 | |
Cost of shares redeemed | | | (2,830,163 | ) | | | (8,377,225 | ) |
| | | | | | | | |
Change in Class A | | $ | 7,853,735 | | | $ | (3,811,456 | ) |
| | | | | | | | |
| | |
Class I | | | | | | | | |
Proceeds from shares issued | | $ | 35,481,919 | | | $ | 21,722,161 | |
Distributions reinvested | | | 5,154,879 | | | | 10,344,407 | |
Cost of shares redeemed | | | (1,886,850 | ) | | | (27,606,361 | ) |
| | | | | | | | |
Change in Class I | | $ | 38,749,948 | | | $ | 4,460,207 | |
| | | | | | | | |
Change in net assets resulting from capital transactions | | $ | 46,603,683 | | | $ | 648,751 | |
| | | | | | | | |
42
|
NOTES TO FINANCIAL STATEMENTS |
| | | | | | | | |
| | | For the
Six Months Ended
March 31,
2012 | | | For the
Year Ended
September 30,
2011 | |
| | | (Unaudited) | | | | |
SHARE TRANSACTIONS: | | | | | | | | |
Class A | | | | | | | | |
Issued | | | 1,082,311 | | | | 450,086 | |
Reinvested | | | 16,019 | | | | 21,131 | |
Redeemed | | | (291,451 | ) | | | (866,187 | ) |
| | | | | | | | |
Change in Class A | | | 806,879 | | | | (394,970 | ) |
| | | | | | | | |
Class I | | | | | | | | |
Issued | | | 3,653,549 | | | | 2,238,593 | |
Reinvested | | | 530,981 | | | | 1,064,932 | |
Redeemed | | | (194,256 | ) | | | (2,851,208 | ) |
| | | | | | | | |
Change in Class I | | | 3,990,274 | | | | 452,317 | |
| | | | | | | | |
Change in shares resulting from capital transactions | | | 4,797,153 | | | | 57,347 | |
| | | | | | | | |
7. Federal Income Taxes:
It is the policy of the Fund to continue to qualify as a regulated investment company by complying with the provisions available to certain investment companies, as defined under Subchapter M of the Internal Revenue Code, and to distribute substantially all of its net investment income and net realized capital gains. Therefore, no federal tax liability is recorded in the financial statements of the Fund. As of March 31, 2012, the tax cost of securities and the breakdown of unrealized appreciation (depreciation) was as follows:
| | | | | | |
Tax Cost of Securities | | Unrealized Appreciation | | Unrealized Depreciation | | Net Unrealized Appreciation |
$ 693,272,499 | | $40,472,027 | | $(2,174,297) | | $38,297,730 |
The tax character of distributions were as follows:
| | | | | | | | |
| | | Distributions Paid From | |
| | | Ordinary
Income | | | Total
Distributions
Paid | |
For the year ended September 30, 2011 | | $ | 26,023,509 | | | $ | 26,023,509 | |
43
|
NOTES TO FINANCIAL STATEMENTS |
The tax basis of components of accumulated earnings/(losses) and the tax character of distributions paid are determined at fiscal year end, and will be included the the Annual Report dated September 30, 2012.
As of September 30, 2011, the Fund had capital loss carryforwards for federal income tax purposes as follows:
| | | | | | | | |
| | | Capital Loss
Carryforward | | | Expires | | |
| | | $ 3,756,334 | | | 2012 | |
| | | 659,184 | | | 2013 | |
| | | 27,743 | | | 2014 | |
| | | 2,484,167 | | | 2015 | |
| | | 8,197,543 | | | 2016 | |
| | | 11,587,282 | | | 2018 | |
| | | 4,011,206 | | | 2019 | |
The Regulated Investment Company Modernization Act of 2010 (The “Act”) was enacted on December 22, 2010. The Act makes changes to several tax rules impacting the Fund. In general, the provisions of the Act will be effective for the Fund’s fiscal year beginning after September 30, 2011. Although the Act provides several benefits, including the unlimited carryover of future capital losses, there may be a greater likelihood that all or a portion of the Fund’s pre-enactment capital loss carryovers may expire without being utilized due to the fact that post-enactment capital losses get utilized before pre-enactment capital loss carryovers. Relevant information regarding the impact of the Act on the Fund will be contained within this section of the Fund’s fiscal year ending September 30, 2012 financial statements.
Under current tax law, capital losses realized after October 31 of a Fund’s fiscal year may be deferred and treated as occurring on the first business day of the following fiscal year for tax purposes. The Fund had deferred post October capital losses of $11,203,794 which were treated as arising on the first business day of the fiscal year ending September 30, 2012.
Management has analyzed the Fund’s tax positions taken or expected to be taken on federal income tax returns for all open tax years (for the tax years ended September 30 of the years 2008, 2009, 2010, 2011 and the tax year ended May 31 of 2008), and has concluded that no provision for federal income tax is required in the Fund’s financial statements. The Fund’s federal and state income and federal excise tax returns for tax years for which the applicable statutes of limitations have not expired are subject to examination by the Internal Revenue Service and state departments of revenue.
8. Subsequent Events.
Management has evaluated the impact of all subsequent events on the Fund and has determined that there were no subsequent events requiring recognition or disclosure in the financial statements.
44
|
SHARE CLASS INFORMATION (UNAUDITED) |
The Access Capital Community Investment Fund offers Class A and Class I shares.
Class A
Class A shares are available for purchase primarily through investment advisors, broker-dealers, banks and other financial services intermediaries. Class A shares of the Fund are currently subject to a maximum up-front sales charge of 3.75% and a 1.00% CDSC for redemption within 12 months of a $1 million or greater purchase. Class A shares currently include a 0.25% annual 12b-1 service and distribution fee.
Class I
Class I shares are intended for investors meeting certain minimum investment thresholds. This share class does not have an up-front sales charge (load) or a 12b-1 service and distribution fee.
45
|
SUPPLEMENTAL INFORMATION (UNAUDITED) |
Shareholder Expense Examples
As a shareholder of the Access Capital Community Investment Fund, you incur two types of costs: (1) transaction costs, and (2) ongoing costs, including management fees and other Fund expenses. This example is intended to help you understand your ongoing costs (in dollars) of investing in the Fund and to compare these costs with the ongoing costs of investing in other mutual funds.
The Example is based on an investment of $1,000 invested at the beginning of the period and held for the entire period from October 1, 2011 through March 31, 2012.
Actual Expenses
The table below provides information about actual account values and actual expenses. You may use the information below, together with the amount you invested, to estimate the expenses that you paid over the period. Simply divide your account value by $1,000 (for example, an $8,600 account value divided by $1,000 = 8.6), then multiply the result by the number in the table under the heading entitled “Expenses Paid During Period” to estimate the expenses you paid on your account during this period.
| | | | | | | | |
| | | Beginning
Account Value
10/1/11 | | Ending
Account Value
3/31/12 | | Expenses Paid
During Period*
10/1/11-3/31/12 | | Annualized
Expense Ratio
During Period
10/1/11-3/31/12 |
Class A | | $ 1,000.00 | | $1,017.20 | | $5.17 | | 1.03% |
Class I | | $ 1,000.00 | | $1,018.40 | | $3.96 | | 0.79% |
Hypothetical Example for Comparison Purposes
The table below provides information about hypothetical account values and hypothetical expenses based on the Fund’s actual expense ratio and an assumed rate of return of 5% per year before expenses, which is not the Fund’s actual return. The hypothetical account values and expenses may not be used to estimate the actual ending account balance or expenses you paid for the period. You may use this information to compare this 5% hypothetical example with the 5% hypothetical examples that appear in the shareholder reports of other funds.
Please note that the expenses shown in the table are meant to highlight your ongoing costs only and do not reflect any transactional costs, such as sales charges (loads), redemption fees, or exchange fees. Therefore, the table is useful in comparing ongoing costs only, and will not help you determine the relative total costs of owning different funds. In addition, if these transactional costs were included, your costs would have been higher.
| | | | | | | | |
| | | Beginning Account Value 10/1/11 | | Ending
Account Value
3/31/12 | | Expenses Paid
During Period*
10/1/11-3/31/12 | | Annualized
Expense Ratio
During Period
10/1/11-3/31/12 |
Class A | | $ 1,000.00 | | $1,019.74 | | $5.17 | | 1.03% |
Class I | | $ 1,000.00 | | $1,020.93 | | $3.97 | | 0.79% |
*Expenses are equal to the average account value times the Fund’s annualized expense ratio multiplied by 182/366 (to reflect one half-year period).
46
This Page Intentionally Left Blank
47
This Page Intentionally Left Blank
48
This Page Intentionally Left Blank
49
This Page Intentionally Left Blank
50
This Page Intentionally Left Blank
51
This Page Intentionally Left Blank
52
Access Capital
P.O. Box 701
Milwaukee, WI 53201-0701
800-422-2766
www.rbcgam.us
Performance data represents past performance and does not guarantee future results. The principal value of an investment and investment return will fluctuate so that an investor’s shares, when redeemed, may be worth more or less than their original cost.
This report and the financial statements contained herein are provided for the information of RBC Funds shareholders. This report is not authorized for distribution to prospective investors unless preceded or accompanied by a current prospectus, which contains information concerning investment objectives, risks, charges and expenses of the Fund. Please read the prospectus carefully before investing.
This report and the financial statements contained herein are not intended to be a forecast of future events, a guarantee of future results, or investment advice. There is no assurance that certain securities will remain in or out of the Fund’s portfolio. The views expressed in this report reflect those of the portfolio managers through the period ended March 31, 2012.
NOT FDIC INSURED • NO BANK GUARANTEE • MAY LOSE VALUE
RBC Global Asset Management U.S., Inc. serves as investment adviser to the Access Capital Community Investment Fund. The Fund is distributed by Quasar Distributors LLC.

The RBC Funds are pleased to offer shareholder reports printed entirely on Forest Stewardship Council certified paper. FSC® certification ensures that the paper used in this report contains fiber from well-managed and responsibly harvested forests that meet strict environmental and socioeconomic standards.
RBCF-AC SAR 03-12
| | | | | | | | | | | | | | | | |
| | | | | | | | | |
| | | | | | | | RBC Funds | |
About Your Semi Annual Report | | | | | | | | This semi annual report includes detailed information about the RBC U.S. Long Corporate Fund (the” Fund”) including financial statements, performance, and a complete list of holdings. The Fund compares its performance against the Barclays Long U.S. Corporate Index which is a widely used market index. We hope the financial information presented will help you evaluate your investment in the Fund. We also encourage you to read your Fund’s prospectus for further detail as to the Fund’s investment policies and risk profile. Fund prospectuses and performance information subsequent to the date of this report are available on our website at www.rbcgam.us. A description of the policies and procedures that your Fund uses to determine how to vote proxies relating to portfolio securities is available (i) without charge, upon request, by calling 1-800-422-2766; (ii) on the Fund’s website at www.rbcgam.us; and (iii) on the Securities and Exchange Commission’s (the “Commission”) website at http://www.sec.gov. Information regarding how your Fund voted proxies relating to portfolio securities during the most recent 12 month period ended June 30 is available (i) on the Fund’s website at www.rbcgam.us; and (ii) on the Commission’s website at http://www.sec.gov. A schedule of the Fund’s portfolio holdings will be filed with the Commission for the first and third quarters of each fiscal year on Form N-Q. This information is available on the Commission’s website at http://www.sec.gov and may be reviewed and copied at the Commission’s Public Reference Room in Washington, D.C. Information on the operation of the Public Reference Room is available by calling 1-202-551-8090. | |
| Table of | | | | | | | | | | | | | | | | |
| Contents | | | | | | | | Portfolio Managers | | | 1 | |
| | | | | | | | Performance Summary | | | 2 | |
| | | | | | | | Fund Statistics | | | 3 | |
| | | | | | | | Schedule of Portfolio Investments | | | 4 | |
| | | | | | | | Financial Statements | | | | |
| | | | | | | | - Statement of Assets and Liabilities | | | 7 | |
| | | | | | | | - Statement of Operations | | | 8 | |
| | | | | | | | - Statement of Changes in Net Assets | | | 9 | |
| | | | | | | | Financial Highlights | | | 10 | |
| | | | | | | | Notes to Financial Statements | | | 11 | |
| | | | | | | | Supplemental Information | | | 16 | |
| | | | | | | | | | | | |
| | | | | | | | | | | | |
| | | | | | | | | | | | |
| | | | | | | | | | | | |
| | | | | | | | | | | | |
| | | | | | | | | | | | |
| | | | | | | | | | | | |
| | | | | | | | | | | | |
| | | | | | | | | | | | |
| | | | | | | | | | | | |
| | | | | | | | | | | | |
| | | | | | |
PORTFOLIO MANAGERS | | | | | | |
| | | | | | | |
RBC Global Asset Management (U.S.) Inc. (“RBC GAM (US)”) serves as the investment advisor to the RBC U.S. Long Corporate Fund. RBC GAM (US) employs a team approach to the management of the RBC U.S. Long Corporate Fund, with no individual team member being solely responsible for the investment decisions. The Fund’s management team has access to RBC GAM (US)’s investment research and other money management resources. | | | | | | |
John M. Huber, CFA Senior Managing Director, Chief Investment Officer — Fixed Income John Huber oversees RBC GAM (US)’s fixed income research and portfolio management efforts. He is a member of the firm’s Executive Committee. John joined RBC GAM (US) in 2001 from Galliard Capital Management where he was a founding member and principal. Before that, John was a portfolio manager at Norwest Investment Management, where he began his career in the capital markets group in 1990. He earned a BA from the University of Iowa and an MBA in Finance from the University of Minnesota Carlson School of Management. John acts as an advisor to the Carlson Funds Enterprise for the University of Minnesota. He is also a board member of the Minneapolis Downtown YMCA. John is a CFA charterholder and a member of the CFA Society of Minnesota. | | | | | |
John M. Huber, CFA |
| | | | | |
Susanna Gibbons, CFA Vice President, Portfolio Manager Susanna Gibbons leads our fixed income group’s Credit Research Team. Susanna has extensive fixed income industry experience and is currently responsible for researching the banking, energy, and utilities sectors of the credit markets. She also has considerable expertise in portfolio management, with current responsibilities for our core, investment grade, and high yield mandates. Susanna joined RBC GAM (US) in 2007 from Jeffrey Slocum & Associates, where she was the director of fixed income research. She previously held several senior credit and portfolio management positions at The St. Paul Companies. Susanna began her career in the investment industry in 1985 and has also worked for J.P. Morgan Investment Management and MetLife. She earned a BA from Bryn Mawr College and an MBA from the New York University Stern School of Business. Susanna is a CFA charterholder. | | | | | | 
Susanna Gibbons, CFA |
| | | | | |
| | | | | | |
| | | | | | |
| | | | | | |
| | | | | | |
| | | | | | |
| | | | | | |
| | | | | | |
| | | | | | |
1
| | | | | | | | | | | | |
| | | | | | | PERFORMANCE SUMMARY | | | | | | |
| | | | |
| | | | | | Aggregate Total Returns as of March 31, 2012 (Unaudited) | | |
| | | | | | RBC U.S. Long Corporate Fund | | |
| | | | | | | | | Since Inception | | Expense Ratio* | | Gross Expense Ratio* |
| | | | | | RBC U.S. Long Corporate Fund (a) - At Net Asset Value | | 9.52% | | 0.00% | | 2.40% |
| | | | | | |
| | | | | | Barclays Long U. S. Corporate Index (b) | | 10.55% | | | | |
| | | | | | Performance data quoted represents past performance. Past performance is no guarantee of future results. Investment return and principal value of an investment will fluctuate so that an investor’s shares, when redeemed, may be worth more or less than their original cost. Current performance may be lower or higher than performance quoted. For performance data current to most recent month-end go to www.rbcgam.us. |
| | | |
| | | | | | The Barclays Long U.S. Corporate Index is an unmanaged index that is composed of U.S. dollar-denominated investment grade,
SEC-registered corporate bonds issued by industrial, utility, and financial companies that have at least 10 years to maturity. |
| | | |
| | | | | | (a) The inception date for the RBC U.S. Long Corporate Fund is May 31, 2011. (b) You cannot invest directly into the index. * The Funds’s expenses reflect the most recent period end (September 30, 2011). The advisor has contractually agreed to waive all expenses for this period. |
| | | |
| | | | | | |
| | | |
| | | | | | |
| | | |
| | | | | | |
| | | |
| | | | | | |
2
| | | | | | | | | | | | | | |
FUND STATISTICS (UNAUDITED) | | | | | | |
RBC Long U.S. Corporate Fund | | | | | | |
Long-term total return. | | | | | | Investment Objective |
Barclays U.S. Long Corporate Index | | | | | | Benchmark |
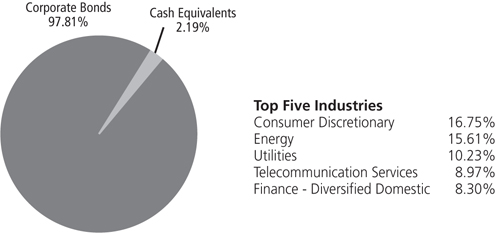
| | | | | | Asset Allocation (as of 3/31/12) (% of fund’s investments) & Top Five Industries (as of 3/31/12) (% of fund’s net assets) |
| | | | | |
| | | | | |
| | | | | |
| | | | | |
| | | | | |
| | | | | |
| | | | | |
| | | | | |
AT&T, Inc. | | 3.35% | | | | ONEOK Partners LP | | 2.13% | | | | | | Top Ten Holdings (as of 3/31/12) (% of fund’s net assets) |
| Wal-Mart Stores, Inc. | | 2.50% | | | | GlaxoSmithKline Capital, Inc. | | 2.11% | | | | | |
| Norfolk Southern Corp. | | 2.32% | | | | Pacific Gas & Electric Co. | | 2.09% | | | | | |
| Florida Power & Light Co. | | 2.16% | | | | Anheuser-Busch Cos., LLC | | 2.08% | | | | | |
| Estee Lauder Cos., Inc. (The) | | 2.14% | | | | Boeing Co. (The) | | 2.06% | | | | | | |
*A listing of all portfolio holdings can be found beginning on page 4. | | | | | | |
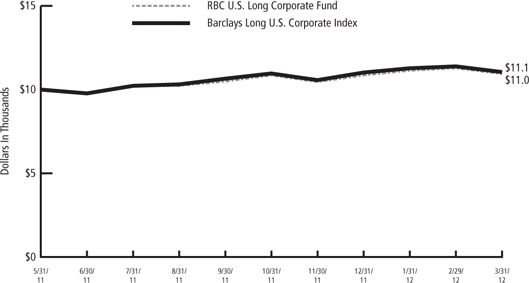
| | | | | | Growth of $10,000 Initial Investment Since Inception (5/31/11) |
| | | | | | |
| | | | | | |
| | | | | | |
| The graph reflects an initial investment of $10,000 over the period from May 31, 2011 to March 31, 2012. The Fund’s total return includes reinvested dividends and capital gains. The Fund’s total return also includes operating expenses that reduce return while the total return of the index does not. The graph does not reflect the deduction of taxes that a shareholder would pay on fund distributions or redemption of fund shares. | | | | | | |
| | | | | | |
| | | | | | |
| | | | | | |
| | | | | | |
| | | | | | |
| | | | | | |
3
|
SCHEDULE OF PORTFOLIO INVESTMENTS |
RBC U.S. Long Corporate Fund
March 31, 2012 (Unaudited)
| | | | | | |
Principal Amount | | | | Value | |
Corporate Bonds — 96.24% | |
Banks - Domestic — 4.21% | |
$ 70,000 | | Citigroup, Inc., 6.00%, 10/31/33 | | | $ 67,036 | |
25,000 | | Fifth Third Bancorp, 8.25%, 3/1/38 | | | 33,186 | |
70,000 | | Wachovia Corp., 5.50%, 8/1/35 | | | 71,262 | |
| | | | | | |
| | | | | 171,484 | |
| | | | | | |
Banks - Foreign — 1.19% | | | | |
50,000 | | Rabobank Nederland NY, 3.88%, 2/8/22 | | | 48,354 | |
| | | | | | |
Consumer Discretionary — 16.75% | | | | |
65,000 | | Anheuser-Busch Cos., LLC, 6.80%, 8/20/32 | | | 84,565 | |
40,000 | | CBS Corp., 7.88%, 7/30/30 | | | 51,737 | |
70,000 | | Comcast Corp., 6.40%, 5/15/38 | | | 83,471 | |
60,000 | | Directv Holdings LLC/Directv Financing Co., Inc., 6.35%, 3/15/40 | | | 66,380 | |
70,000 | | Estee Lauder Cos., Inc. (The), 6.00%, 5/15/37 | | | 87,004 | |
30,000 | | McDonald’s Corp., 6.30%, 10/15/37 | | | 40,021 | |
70,000 | | News America, Inc., 6.20%, 12/15/34 | | | 77,631 | |
60,000 | | Time Warner Cable, Inc., 7.30%, 7/1/38 | | | 75,660 | |
60,000 | | Time Warner, Inc., 7.70%, 5/1/32 | | | 78,254 | |
30,000 | | Viacom, Inc., 6.88%, 4/30/36 | | | 37,709 | |
| | | | | | |
| | | | | 682,432 | |
| | | | | | |
Consumer Staples — 8.14% | | | | |
50,000 | | Archer-Daniels-Midland Co., 7.50%, 3/15/27 | | | 66,298 | |
70,000 | | CVS Caremark Corp., 6.13%, 9/15/39 | | | 81,768 | |
65,000 | | Kraft Foods, Inc., 6.88%, 2/1/38 | | | 81,641 | |
80,000 | | Wal-Mart Stores, Inc., 6.20%, 4/15/38 | | | 101,994 | |
| | | | | | |
| | | | | 331,701 | |
| | | | | | |
Energy — 15.61% | | | | |
70,000 | | Anadarko Petroleum Corp., 6.45%, 9/15/36 | | | 81,032 | |
65,000 | | Apache Corp., 6.00%, 1/15/37 | | | 79,214 | |
30,000 | | Cameron International Corp., 7.00%, 7/15/38 | | | 37,977 | |
50,000 | | ConocoPhillips Holding Co., 6.95%, 4/15/29 | | | 67,173 | |
25,000 | | Devon Financing Corp. ULC, 7.88%, 9/30/31 | | | 34,492 | |
40,000 | | Enterprise Products Operating LLC, 6.88%, 3/1/33 | | | 48,229 | |
30,000 | | Hess Corp., 5.60%, 2/15/41 | | | 32,621 | |
43,000 | | Kinder Morgan Energy Partners LP, 7.40%, 3/15/31 | | | 50,227 | |
70,000 | | MidAmerican Energy Holdings Co., 6.13%, 4/1/36 | | | 83,209 | |
75,000 | | ONEOK Partners LP, 6.65%, 10/1/36 | | | 86,607 | |
30,000 | | Williams Partners LP, 6.30%, 4/15/40 | | | 34,875 | |
| | | | | | |
| | | | | 635,656 | |
| | | | | | |
Finance - Diversified Domestic — 8.30% | | | | |
30,000 | | Credit Suisse USA, Inc., 7.13%, 7/15/32 | | | 36,147 | |
50,000 | | General Electric Capital Corp, 5.88%, 1/14/38 | | | 54,962 | |
50,000 | | General Electric Capital Corp., 6.88%, 1/10/39 | | | 61,747 | |
4
|
SCHEDULE OF PORTFOLIO INVESTMENTS |
RBC U.S. Long Corporate Fund (cont.)
March 31, 2012 (Unaudited)
| | | | | | |
Principal
Amount | | | | Value | |
| $ 50,000 | | Goldman Sachs Group, Inc., 6.75%, 10/1/37 | | | $ 48,854 | |
| 60,000 | | HSBC Holdings Plc, 7.63%, 5/17/32 | | | 66,982 | |
| 40,000 | | JPMorgan Chase & Co., 6.40%, 5/15/38 | | | 47,567 | |
| 20,000 | | Morgan Stanley, 7.25%, 4/1/32 | | | 21,682 | |
| | | | | | |
| | | | | 337,941 | |
| | | | | | |
Health Care — 3.44% | | | | |
| 65,000 | | GlaxoSmithKline Capital, Inc., 6.38%, 5/15/38 | | | 85,875 | |
| 40,000 | | Roche Holdings, Inc., 7.00%, 3/1/39(a) | | | 54,398 | |
| | | | | | |
| | | | | 140,273 | |
| | | | | | |
Industrials — 6.19% | | | | |
| 60,000 | | Boeing Co. (The), 6.88%, 3/15/39 | | | 83,747 | |
| 70,000 | | Norfolk Southern Corp., 7.05%, 5/1/37 | | | 94,421 | |
| 30,000 | | United Technologies Corp., 6.13%, 7/15/38 | | | 37,505 | |
| 30,000 | | Waste Management, Inc., 6.13%, 11/30/39 | | | 36,507 | |
| | | | | | |
| | | | | 252,180 | |
| | | | | | |
Insurance — 5.97% | | | | |
| 50,000 | | AXA SA, 8.60%, 12/15/30 | | | 55,214 | |
| 35,000 | | Hartford Financial Services Group Inc., 6.10%, 10/1/41 | | | 33,871 | |
| 35,000 | | Massachusetts Mutual Life Insurance Co., 5.38%, 12/1/41(a) | | | 36,228 | |
| 30,000 | | New York Life Insurance Co., 6.75%, 11/15/39(a) | | | 37,586 | |
| 35,000 | | Prudential Financial, Inc., 5.70%, 12/14/36 | | | 37,299 | |
| 35,000 | | Travelers Cos., Inc., 6.25%, 6/15/37 | | | 43,001 | |
| | | | | | |
| | | | | 243,199 | |
| | | | | | |
Materials — 5.51% | | | | |
| 30,000 | | ArcelorMittal, 7.00%, 10/15/39 | | | 28,654 | |
| 35,000 | | Dow Chemical Co. (The), 7.38%, 11/1/29 | | | 45,209 | |
| 35,000 | | Ecolab, Inc., 5.50%, 12/8/41 | | | 37,958 | |
| 25,000 | | Georgia-Pacific LLC, 7.75%, 11/15/29 | | | 31,152 | |
| 35,000 | | Rio Tinto Alcan, Inc., 6.13%, 12/15/33 | | | 40,981 | |
| 35,000 | | Vale Overseas Ltd., 6.88%, 11/21/36 | | | 40,594 | |
| | | | | | |
| | | | | 224,548 | |
| | | | | | |
Real Estate — 1.73% | | | | |
| 60,000 | | HCP, Inc. REIT, 6.75%, 2/1/41 | | | 70,260 | |
| | | | | | |
Telecommunication Services — 8.97% | | | | |
| 30,000 | | Alltel Corp., 7.88%, 7/1/32 | | | 42,884 | |
| 115,000 | | AT&T, Inc., 6.40%, 5/15/38 | | | 136,567 | |
| 65,000 | | Cisco Systems, Inc., 5.90%, 2/15/39 | | | 78,949 | |
| 35,000 | | Telefonica Emisiones SAU, 7.05%, 6/20/36 | | | 34,405 | |
| 60,000 | | Verizon Communications, Inc., 6.40%, 2/15/38 | | | 72,679 | |
| | | | | | |
| | | | | 365,484 | |
| | | | | | |
Utilities — 10.23% | | | | |
| 30,000 | | Appalachian Power Co., 7.00%, 4/1/38 | | | 39,241 | |
5
|
SCHEDULE OF PORTFOLIO INVESTMENTS |
RBC U.S. Long Corporate Fund (cont.)
March 31, 2012 (Unaudited)
| | | | | | |
Principal Amount | | | | | Value | |
| $30,000 | | Consolidated Edison Co. of New York, Inc., 5.50%, 12/1/39 | | | $ 35,393 | |
| 70,000 | | Florida Power & Light Co., 5.95%, 2/1/38 | | | 87,992 | |
| 70,000 | | Pacific Gas & Electric Co., 6.05%, 3/1/34 | | | 85,090 | |
| 42,000 | | Sempra Energy, 6.00%, 10/15/39 | | | 50,434 | |
| 50,000 | | South Carolina Electric & Gas Co., 5.50%, 12/15/39 | | | 55,798 | |
| 50,000 | | Virginia Electric & Power Co., 6.00%, 5/15/37 | | | 62,589 | |
| | | | | | |
| | | | | 416,537 | |
| | | | | | |
| |
Total Corporate Bonds (Cost $3,725,223) | | | 3,920,049 | |
| | | | | | |
| | |
Shares | | | | | |
Investment Company — 2.16% | | | | |
| 87,803 | | JPMorgan Prime Money Market Fund | | | 87,803 | |
| | | | | | |
Total Investment Company (Cost $87,803) | | | 87,803 | |
| | | | | | |
| |
Total Investments (Cost $3,813,026)(b) — 98.40% | | | $4,007,852 | |
| |
Other assets in excess of liabilities — 1.60% | | | 65,312 | |
| | | | | | |
NET ASSETS — 100.00% | | | $4,073,164 | |
| | | | | | |
| (a) | Security exempt from registration under Rule 144A or Section 4(2) of the Securities Act of 1933, as amended. These securities may be resold in transactions exempt from registration, normally to qualified institutional buyers. Security has been deemed to be liquid based on procedures approved by the Board of Trustees. |
| (b) | See notes to financial statements for the tax cost of securities and the breakdown of unrealized appreciation (depreciation). |
Abbreviations used are defined below:
REIT - Real Estate Investment Trust
See notes to financial statements.
6
Statement of Assets and Liabilities
March 31, 2012 (Unaudited)
| | | | |
Assets: | | | | |
Investments in securities, at value (cost $3,813,026) | | $ | 4,007,852 | |
Interest and dividends receivable | | | 59,933 | |
Receivable from the advisor | | | 11,371 | |
Prepaid expenses and other assets | | | 20,355 | |
| | | | |
Total Assets | | | 4,099,511 | |
| | | | |
| |
Liabilities: | | | | |
Accrued expenses and other payables: | | | | |
Accounting fees | | | 2,216 | |
Audit fees | | | 22,414 | |
Other | | | 1,717 | |
| | | | |
Total Liabilities | | | 26,347 | |
| | | | |
Net Assets | | $ | 4,073,164 | |
| | | | |
| |
Net Assets Consist Of: | | | | |
Capital | | $ | 3,895,728 | |
Accumulated net realized losses from investment transactions | | | (17,390 | ) |
Net unrealized appreciation on investments | | | 194,826 | |
| | | | |
Net Assets | | $ | 4,073,164 | |
| | | | |
| |
Shares Outstanding (Unlimited number of shares authorized, no par value): | | | 388,820 | |
| | | | |
| |
Net Asset Value and Redemption Price Per Share: | | $ | 10.48 | |
See notes to financial statements.
7
Statement of Operations
For the Six Months Ended March 31, 2012 (Unaudited)
| | | | |
Investment Income: | | | | |
Interest income | | $ | 102,956 | |
Dividend income | | | 34 | |
| | | | |
Total Investment Income | | | 102,990 | |
| | | | |
| |
Expenses: | | | | |
Accounting services | | | 12,588 | |
Audit fees | | | 19,458 | |
Legal fees | | | 2,166 | |
Custodian fees | | | 107 | |
Insurance fees | | | 4,579 | |
Trustees’ fees and expenses | | | 23 | |
Transfer agent fees | | | 1,282 | |
Printing and shareholder reports | | | 1,910 | |
Other fees and expenses | | | 4,913 | |
| | | | |
Total expenses | | | 47,026 | |
| | | | |
Expenses reduced/waived by: | | | | |
Advisor | | | (47,026 | ) |
| | | | |
Net Expenses | | | — | |
| | | | |
| |
Net Investment Income | | | 102,990 | |
| | | | |
| |
Net realized losses from investment transactions | | | (17,390 | ) |
Net change in unrealized appreciation on investments | | | 90,483 | |
| | | | |
Net realized/unrealized gains from investments | | | 73,093 | |
| | | | |
Change in net assets resulting from operations | | $ | 176,083 | |
| | | | |
See notes to financial statements.
8
Statement of Changes in Net Assets
| | | | | | | | |
| | | For the
Six Months
Ended
March 31, 2012 | | | For the
Period
Ended
September 30, 2011(a) | |
| | | (Unaudited) | | | | |
| From Investment Activities: | | | | | | | | |
Operations: | | | | | | | | |
Net investment income | | $ | 102,990 | | | $ | 69,231 | |
Net realized losses from investments | | | (17,390 | ) | | | — | |
Net change in unrealized appreciation on investments | | | 90,483 | | | | 104,343 | |
| | | | | | | | |
Change in net assets resulting from operations | | | 176,083 | | | | 173,574 | |
| | | | | | | | |
| | |
Distributions to Shareholders: | | | | | | | | |
From net investment income | | | (102,990 | ) | | | (69,231 | ) |
| | | | | | | | |
Change in net assets resulting from shareholder distributions | | | (102,990 | ) | | | (69,231 | ) |
| | | | | | | | |
| | |
Capital Transactions: | | | | | | | | |
Proceeds from shares issued in-kind (Note 5) | | | — | | | | 3,598,672 | |
Proceeds from shares issued | | | — | | | | 144,833 | |
Distributions reinvested | | | 104,128 | | | | 68,095 | |
Cost of shares redeemed | | | (10,000 | ) | | | (10,000 | ) |
| | | | | | | | |
Change in net assets resulting from capital transactions | | | 94,128 | | | | 3,801,600 | |
| | | | | | | | |
Net increase in net assets | | | 167,221 | | | | 3,905,943 | |
| | |
Net Assets: | | | | | | | | |
Beginning of period | | | 3,905,943 | | | | — | |
| | | | | | | | |
End of period | | $ | 4,073,164 | | | $ | 3,905,943 | |
| | | | | | | | |
| | |
Share Transactions: | | | | | | | | |
Issued in-kind | | | — | | | | 359,867 | |
Issued | | | — | | | | 14,331 | |
Reinvested | | | 9,864 | | | | 6,773 | |
Redeemed | | | (986 | ) | | | (1,029 | ) |
| | | | | | | | |
Change in shares resulting from capital transactions | | | 8,878 | | | | 379,942 | |
| | | | | | | | |
| (a) | For the period from May 31, 2011 (commencement of operations) to September 30, 2011. |
See notes to financial statements.
9
RBC U.S. Long Corporate Fund
(Selected data for a share outstanding throughout the periods indicated)
| | | | | | | | |
| | | For the Six Months
Ended
March 31, 2012 | | | For the Period
Ended
September 30, 2011(a) | |
| | | (Unaudited) | | | | |
Per Share Operating Performance: | | | | | | | | |
Net asset value, beginning of period | | | $10.28 | | | | $10.00 | |
| | | | | | | | |
Net investment income(b) | | | 0.27 | | | | 0.19 | |
Realized and unrealized gain | | | 0.20 | | | | 0.28 | |
| | | | | | | | |
Total from investment operations | | | 0.47 | | | | 0.47 | |
| | | | | | | | |
Less dividends from net investment income | | | (0.27 | ) | | | (0.19 | ) |
| | | | | | | | |
Net asset value, end of period | | | $10.48 | | | | $10.28 | |
| | | | | | | | |
Total Investment Return: | | | 4.59 | % | | | 4.71 | % |
Based on net asset value per share | | | | | | | | |
Ratios to Average Net Assets:(c) | | | | | | | | |
Ratio of Net Expenses to Average Net Assets | | | 0.00 | % | | | 0.00 | % |
Ratio of Net Investment Income to Average Net Assets | | | 5.16 | % | | | 5.52 | % |
Ratio of Expenses to Average Net Assets* | | | 2.36 | % | | | 2.40 | % |
| | |
Net assets, end of period (in thousands) | | | $4,073 | | | | $3,906 | |
Portfolio turnover | | | 12 | % | | | 0 | % |
| * | During the period, certain fees were contractually or voluntarily reduced and/or reimbursed. If such contractual/voluntary fee reductions and reimbursements had not occurred, the ratio would have been as indicated. |
| (a) | For the period from May 31, 2011 (commencement of operations) to September 30, 2011. |
| (b) | Per share net investment income has been calculated using the average daily shares method. |
| (c) | Annualized for those periods that are less than one year. |
See notes to financial statements.
10
|
NOTES TO FINANCIAL STATEMENTS |
March 31, 2012 (Unaudited)
1. Organization
RBC Funds Trust (the “Trust”) is registered under the Investment Company Act of 1940 (as amended) as an open-end management Investment Company. The Trust was organized as a Delaware statutory trust on December 16, 2003. Overall responsibility for the management of the Trust is vested in its Board of Trustees (the “Board”). This semi annual report is for the RBC U.S. Long Corporate Fund (the “Fund”), which offers one share class.
RBC Global Asset Management (U.S.) Inc. (“RBC GAM (US)”) acts as the investment advisor for the Trust. The officers of the Trust (“Fund Management”) are also employees of RBC GAM (US) or its affiliates and BNY Mellon Investment Servicing (US) Inc. (“BNY Mellon”).
2. Significant Accounting Policies
Summarized below are the significant accounting policies of the Fund. The policies conform to accounting principles generally accepted in the United States of America (“U.S. GAAP”). Fund Management follows these policies when preparing financial statements. Management may also be required to make estimates and assumptions that affect the reported amounts of assets and liabilities at the date of the financial statements and the reported amounts of income and expenses for the period. Actual results could differ from those estimates.
Security Valuation:
Bonds and other fixed income securities, including TBA commitments, are generally valued on the basis of prices furnished by pricing services approved by the Trust’s Board. The pricing services utilize both dealer-supplied valuations and electronic data processing techniques that take into account appropriate factors such as institutional-size trading in similar groups of securities, yield, quality, coupon rate, maturity and type of issue. These valuation techniques take into account mutiple factors, including fundamental security analytical data, information from broker-dealers, market spreads and interest rates. Short-term debt obligations, with less than 60 days to maturity at time of purchase, are valued at amortized cost unless Fund Management determines that amortized cost no longer approximates market value. In such cases where a security price is unavailable, or where Fund Management determines that the value provided by the pricing services or amortized cost does not approximate fair value, the Board has approved pricing and valuation procedures to determine a security’s fair value. Some of the factors which may be considered in determining fair value are fundamental analytical data relating to the security, the issuer and the market, such as duration, prepayment and default rates; general level of interest rates and changes in interest rates; information from broker-dealers; and trading in similar securities. Investments in open-end investment companies are valued at net asset value.
Financial Instruments:
TBA Commitments
The Fund may enter into to be announced (“TBA”) commitments to purchase or sell securities for a fixed price at a future date. TBA commitments are considered securities in themselves, and involve a risk of loss if the value of the security to be purchased/sold declines/increases prior to settlement date, which is in addition to the risk of decline in the value of a Fund’s other assets. Unsettled TBA commitments are valued at the current value of the underlying securities, according to the procedures described under “Security Valuation”. There were no outstanding TBA commitments for the six months ended March 31, 2012.
Credit Enhancement
Certain obligations held in the Fund have credit enhancement or liquidity features that may, under certain circumstances, provide for repayment of principal and interest on the obligation upon demand date, interest rate reset date or final maturity. These enhancements may include: letters of credit; liquidity guarantees; security purchase agreements; tender option purchase agreements; and third party insurance (i.e., AMBAC and MBIA). For the six months ended March 31, 2012, there are no obligations with credit enhancement or liquidity features.
11
|
| NOTES TO FINANCIAL STATEMENTS |
Fair Value Measurements:
Various inputs are used in determining the fair value of investments which are as follows:
• Level 1 - Inputs that reflect unadjusted quoted prices in active markets for identical assets or liabilities that the Fund has the ability to access at the measurement date.
• Level 2 - Inputs other than quoted prices that are observable for the asset or liability either directly or indirectly, including inputs in markets that are not considered to be active.
• Level 3 - Unobservable inputs based on the best information available in the circumstances, to the extent observable inputs are not available (including the Fund’s own assumptions in determining the fair value of investments).
The inputs or methodology used for valuing securities are not necessarily an indication of the risk associated with investing in those securities.
The summary of inputs used to determine the fair valuation of the Fund’s investments as of March 31, 2012 is as follows:
| | | | | | | | | | | | | | | | |
| | | Level 1
Quoted Prices | | | Level 2
Significant
Observable
Inputs | | | Level 3
Significant
Unobservable
Inputs | | | Total | |
Assets: | | | | | | | | | | | | | | | | |
Investments in Securities | | | | | | | | | | | | | | | | |
Corporate Bonds | | $ | — | | | $ | 3,920,049 | | | $ | — | | | $ | 3,920,049 | |
Investment Company | | | 87,803 | | | | — | | | | — | | | | 87,803 | |
| | | | | | | | | | | | | | | | |
| | $ | 87,803 | | | $ | 3,920,049 | | | $ | — | | | $ | 4,007,852 | |
| | | | | | | | | | | | | | | | |
During the six months ended March 31, 2012, the Fund recognized no transfers to/from level 1 or 2. The Fund’s policy is to recognize transfers between level 1, level 2 and level 3 at the end of the year utilizing fair value at the beginning of the year.
In May 2011, the Financial Accounting Standards Board (“FASB”) issued Accounting Standards Update (“ASU”) No. 2011-04 “Amendments to Achieve Common Fair Value Measurement and Disclosure Requirements” in U.S. GAAP and International Financial Reporting Standards (“IFRSs”). ASU 2011-04 includes common requirements for measurement of and disclosure about fair value between U.S. GAAP and IFRS. ASU 2011-04 will require reporting entities to disclose the following information for fair value measurements categorized within Level 3 of the fair value hierarchy: quantitative information about the unobservable inputs used in the fair value measurement, the valuation processes used by the reporting entity and a narrative description of the sensitivity of the fair value measurement to changes in unobservable inputs and the interrelationships between those unobservable inputs. In addition, ASU 2011-04 will require reporting entities to make disclosures about amounts and reasons for all transfers in and out of Level 1 and Level 2 fair value measurements. The new and revised disclosures are effective for interim and annual reporting periods beginning after December 15,2011. Management is currently evaluating the implications of ASU No. 2011-04 and its impact on the financial statements.
Investment Transactions and Income:
Investment transactions are recorded one business day after trade date, except for on the last day of each fiscal quarter end, when they are recorded on trade date. Dividend income is recorded on the ex-dividend date. Realized gains and losses from investment transactions are calculated based on the costs of the specific security (also known as identified cost basis). Interest income is recognized on the accrual basis and includes the amortization and accretion of premium or discount using the effective yield method.
12
|
NOTES TO FINANCIAL STATEMENTS |
Distributions to Shareholders:
The Fund pays out any income that it receives, less expenses, in the form of dividends and capital gains to its shareholders. Income dividends are declared daily and paid monthly. Dividends will also be paid at any time during the month upon total redemption of shares in an account. Capital gain distributions are declared and paid at least annually. Distributions to shareholders are recorded on the ex-dividend date. The amount of dividends and distributions are calculated based on federal income tax regulations, which may differ from GAAP. These “book/tax” differences may be either temporary or permanent in nature. To the extent these differences are determined, as of the end of the tax year, to be permanent (e.g., reclassification of paydown gains and losses, and expiring capital loss carryforward), they are reclassified within a Fund’s capital account based on their federal tax basis treatment.
3. Agreements and Other Transactions with Affiliates
RBC GAM (US) serves as investment advisor to the Fund. The Advisor has contractually agreed to waive fees and/or pay Fund operating expenses in order to limit the “Total Annual Fund Operating Expenses” of the Fund to 0.00% of the Fund’s average daily net assets (excluding interest, taxes, brokerage commissions, or non-routine expenses such as litigation). The expense limitation agreement is in place until January 31, 2013 and may not be terminated by the Advisor prior to that date. The Fund will not pay the Advisor directly for advisory services.
The Fund is designed to be a component of separately managed accounts for clients of RBC GAM (US), and for other pooled investment strategies managed by RBC GAM (US) and is not available for direct investment by the general public.
The RBC Funds currently pay the independent Trustees (Trustees of the Trust who are not directors, officers or employees of the adviser, administrator or distributor) an annual retainer of $32,500. The Board Chairperson and Audit Committee Chairperson each receive an additional retainer of $2,500 annually, and all other trustees serving as Chair of a Board committee each receive an additional retainer of $1,000 annually. In addition, Independent Trustees receive a quarterly meeting fee of $5,000 for each in-person Board meeting attended, a meeting fee of $1,000 for each telephonic or Special Board meeting attended, and a $1,500 fee for each Board committee meeting attended and are reimbursed for all out-of-pocket expenses relating to attendance at such meetings.
Expense Allocation:
The Fund pays the expenses that are directly related to its operations, such as custodian fees or administrative services fees. Expenses incurred by the Trust, such as trustee or legal fees, are allocated to the Fund either proportionately based upon the Fund’s relative net assets or using another reasonable basis such as equally across all Funds in the Trust, depending on the nature of the expense.
4. Securities Transactions:
The cost of securities purchased and proceeds from securities sold (excluding securities maturing less than one year from acquisition) for the period ended March 31, 2012 were as follows:
| | | | | | |
Purchases(Excl. US. Gov’t.) | | Sales(Excl. US. Gov’t.) | | Purchases of US. Gov’t. | | Sales of US. Gov’t. |
| $ 476,599 | | $(467,959) | | $— | | $— |
13
|
NOTES TO FINANCIAL STATEMENTS |
5. Capital Share Transactions:
The Trust is authorized to issue an unlimited number of shares of beneficial interest (“shares outstanding”) without par value. Transactions in shares of the Fund are summarized below:
| | | | | | | | |
| | | For the
Six Months Ended
March 31,
2012 | | | For the
Period Ended
September 30,
2011(a) | |
| | | (Unaudited) | | | | |
| | |
CAPITAL TRANSACTIONS: | | | | | | | | |
Proceeds from shares issued in-kind | | $ | — | | | $ | 3,598,672 | |
Proceeds from shares issued | | | — | | | | 144,833 | |
Distributions reinvested | | | 104,128 | | | | 68,095 | |
Cost of shares redeemed | | | (10,000 | ) | | | (10,000 | ) |
| | | | | | | | |
Change in net assets resulting from capital transactions | | $ | 94,128 | | | $ | 3,801,600 | |
| | | | | | | | |
| | |
SHARE TRANSACTIONS: | | | | | | | | |
Issued in-kind | | | — | | | | 359,867 | |
Issued | | | — | | | | 14,331 | |
Reinvested | | | 9,864 | | | | 6,773 | |
Redeemed | | | (986 | ) | | | (1,029 | ) |
| | | | | | | | |
Change in shares resulting from capital transactions | | | 8,878 | | | | 379,942 | |
| | | | | | | | |
| (a) | For the period from May 31, 2011 (commencement of operations) to September 30, 2011. |
During the period ended September 30, 2011, the Fund had in kind contributions of $3,598,672 which were contributed from RBC GAM (US), the Fund’s advisor.
6. Federal Income Taxes:
It is the policy of the Fund to continue to qualify as a regulated investment company by complying with the provisions available to certain investment companies, as defined under Subchapter M of the Internal Revenue Code, and to distribute substantially all of its net investment income and net realized capital gains. Therefore, no federal tax liability is recorded in the financial statements of the Fund.
As of March 31, 2012, the tax cost of securities and the breakdown of unrealized appreciation (depreciation) was as follows:
| | | | | | | | | | | | |
Tax
Cost of
Securities | | Unrealized
Appreciation | | | Unrealized
Depreciation | | | Net Unrealized
Appreciation | |
| $3,813,026 | | | $228,418 | | | | $(33,592) | | | | $194,826 | |
The tax character of distributions were as follows:
| | | | | | | | |
| | | Distributions Paid From | |
| | | Ordinary
Income | | | Total
Distributions
Paid | |
For the period ended September 30, 2011 | | $ | 68,095 | | | $ | 68,095 | |
14
|
NOTES TO FINANCIAL STATEMENTS |
The tax basis of components of accumulated earnings/(losses) and tax character of distributions are determined at fiscal year end, and will be included in the Annual Report dated September 30, 2012.
As of September 30, 2011, the Fund did not have any capital loss carryforwards for federal income tax purposes.
Management has analyzed the Fund’s tax positions taken or expected to be taken on federal income tax returns for all open tax years (for the tax year ended September 30 of the year 2011), and has concluded that no provision for federal income tax is required in the Fund’s financial statements. The Fund’s federal and state income and federal excise tax returns for tax years for which the applicable statutes of limitations have not expired are subject to examination by the Internal Revenue Service and state departments of revenue.
8. Subsequent Events.
Management has evaluated the impact of all subsequent events on the Fund and has determined that there were no subsequent events requiring recognition or disclosure in the financial statements.
15
|
SUPPLEMENTAL INFORMATION (UNAUDITED) |
Shareholder Expense Examples
As a shareholder of the RBC U.S. Long Corporate Fund, you incur two types of costs: (1) transaction costs, and (2) ongoing costs, including management fees and other Fund expenses. This example is intended to help you understand your ongoing costs (in dollars) of investing in the Fund and to compare these costs with the ongoing costs of investing in other mutual funds.
The Example is based on an investment of $1,000 invested at the beginning of the period and held for the entire period from October 1, 2011 through March 31, 2012.
Actual Expenses
The table below provides information about actual account values and actual expenses. You may use the information below, together with the amount you invested, to estimate the expenses that you paid over the period. Simply divide your account value by $1,000 (for example, an $8,600 account value divided by $1,000 = 8.6), then multiply the result by the number in the table under the heading entitled “Expenses Paid During Period” to estimate the expenses you paid on your account during this period.
| | | | | | |
Beginning Account Value 10/1/11 | | Ending Account Value 3/31/12 | | Expenses Paid During Period* 10/1/11-3/31/12 | | Annualized Expense Ratio During Period 10/1/11-3/31/12 |
$ 1,000.00 | | $1,045.90 | | $— | | 0.00% |
Hypothetical Example for Comparison Purposes
The table below provides information about hypothetical account values and hypothetical expenses based on the Fund’s actual expense ratio and an assumed rate of return of 5% per year before expenses, which is not the Fund’s actual return. The hypothetical account values and expenses may not be used to estimate the actual ending account balance or expenses you paid for the period. You may use this information to compare this 5% hypothetical example with the 5% hypothetical examples that appear in the shareholder reports of other funds.
Please note that the expenses shown in the table are meant to highlight your ongoing costs only and do not reflect any transactional costs, such as sales charges (loads), redemption fees, or exchange fees. Therefore, the table is useful in comparing ongoing costs only, and will not help you determine the relative total costs of owning different funds. In addition, if these transactional costs were included, your costs would have been higher.
| | | | | | |
Beginning Account Value 10/1/11 | | Ending Account Value 3/31/12 | | Expenses Paid During Period* 10/1/11-3/31/12 | | Annualized Expense Ratio During Period 10/1/11-3/31/12 |
$ 1,000.00 | | $1,024.86 | | $— | | 0.00% |
*Expenses are equal to the average account value times the Fund’s annualized expense ratio multiplied by 182/366 (to reflect one half-year period).
16
This Page Intentionally Left Blank
17
This Page Intentionally Left Blank
18
This Page Intentionally Left Blank
19
This Page Intentionally Left Blank
20
RBC Funds
P.O. Box 701
Milwaukee, WI 53201-0701
800-422-2766
www.rbcgam.us
Performance data represents past performance and does not guarantee future results. The principal value of an investment and investment return will fluctuate so that an investor’s shares, when redeemed, may be worth more or less than their original cost.
This report and the financial statements contained herein are provided for the information of RBC Funds shareholders. This report is not authorized for distribution to prospective investors unless preceded or accompanied by a current prospectus, which contains information concerning investment objectives, risks, charges and expenses of the Fund. Please read the prospectus carefully before investing.
This report and the financial statements contained herein are not intended to be a forecast of future events, a guarantee of future results, or investment advice. There is no assurance that certain securities will remain in or out of the Fund’s portfolio. The views expressed in this report reflect those of the portfolio managers through the period ended March 31, 2012.
NOT FDIC INSURED • NO BANK GUARANTEE • MAY LOSE VALUE
RBC Global Asset Management U.S., Inc. serves as investment adviser to the RBC Funds. The Fund is distributed by Quasar Distributors LLC.
| | |
The RBC Funds are pleased to offer shareholder reports printed entirely on Forest Stewardship Council certified paper. FSC® certification ensures that the paper used in this report contains fiber from well-managed and responsibly harvested forests that meet strict environmental and socioeconomic standards. | | |
RBCF-LC SAR 03-12
| | | | | | |
PORTFOLIO MANAGERS | | | | | | |
| | | | | | | |
| | | | | | |
| RBC Global Asset Management (U.S.) Inc. (“RBC GAM (US)”) serves as the investment advisor and BlueBay Asset Management Ltd. (“BlueBay”) serves as the investment sub-advisor to the RBC BlueBay Funds and is responsible for the overall management of the Funds’ portfolios. The individuals primarily responsible for the day-to-day management of the Funds’ portfolios are set forth below. | | | | | | |
David Dowsett | | | | | | |
Senior Portfolio Manager | | | | | | |
| David Dowsett is responsible for portfolio management of the RBC BlueBay Emerging Market Select Bond Fund. David joined BlueBay in April 2002. Previously he spent seven years at Deutsche Asset Management (formerly Morgan Grenfell Asset Management) where he was a Board Director with responsibility for emerging markets and a member of the Investment Policy Committee for all fixed income. David has a BA (Hons) degree in Politics and Economics from Durham University. | | | | | | |
Nick Shearn Portfolio Manager | | | | | | |
| Nick Shearn is responsible for portfolio management of the RBC BlueBay Emerging Market Select Bond Fund. Nick joined BlueBay in June 2011 from The Royal Bank of Scotland, where he was Head of Local Markets Rates Trading for the CEEMEA region. Prior to this he spent ten years at Deutsche Bank in Johannesburg (1998-2002) and London (2002-2008) trading local markets products. Before trading emerging markets products, Nick focused on the Eurobond markets and was Head of Liquid Credit Trading at JP Morgan before joining DKB International as Head of Trading in 1995. He has a BSc Econ (Hons) from Queen Mary College, London University. | | | | | | |
Polina Kurdyavko Senior Portfolio Manager | | | | | | |
| Polina Kurdyavko is head of the Emerging Market Corporate Debt team at BlueBay and is responsible for portfolio management of the RBC BlueBay Emerging Market Corporate Bond Fund. Polina joined BlueBay in July 2005 from UBS where she worked as a Credit Analyst in EMEA corporate research. Her role involved secondary coverage of CEEMEA issuers and research support for primary issuance of select corporates. Prior to this, Polina was with Alliance Capital where she started as an emerging markets equity analyst and then moved on to pioneer emerging markets quantitative research at Alliance. Polina holds an MSc (Hons) in Finance from the People’s Friendship University of Russia, Moscow and is a CFA charterholder. | | | | | | |
Adam Borneleit Portfolio Manager | | | | | | |
Adam Borneleit is responsible for portfolio management of the RBC BlueBay Emerging Market Corporate Bond Fund. Adam joined BlueBay in June 2008 from Pacific Investment Management Company (PIMCO) where he worked since 2000. He was part of the Emerging Markets Portfolio Management team with a focus on corporate bonds. Prior to that, he was a Credit Analyst in SunAmerica’s high-yield bond group, a manager at PriceWaterhouse Moscow’s corporate finance group in Russia, and an Analyst in Prudential’s private-placement group. Adam holds bachelor’s degrees in both economics and French from the University of Pennsylvania’s Wharton School and College of Arts and Sciences, and an MBA from Stanford University’s Graduate School of Business. | | | | | | |
1
| | | | | | |
| | | | | | PORTFOLIO MANAGERS |
| | | | | | |
| | | | | | Anthony Robertson |
| | | | | | Head of Global Leveraged Finance Group Senior Portfolio Manager |
| | | | | | Anthony Robertson is responsible for portfolio management of the RBC BlueBay Global High Yield Bond Fund. Anthony joined BlueBay in August 2004 from Putnam Investments (formerly New Flag Asset Management) where he was a Senior Portfolio Manager responsible for European high yield portfolios. Prior to Putnam, Anthony held similar roles at Standard Asset Management, London & Capital Asset Management, and the West Merchant Bank (West LB). Anthony received his Bachelor of Commerce (Honours) from the University of Natal. |
| | | | | | Peter Higgins |
| | | | | | Head of Leveraged Loans Senior Portfolio Manager |
| | | | | | Peter Higgins is responsible for portfolio management of the RBC BlueBay Global High Yield Bond Fund. Peter joined BlueBay in January 2008 as a Portfolio Manager with the High Yield team. Previously, he was Director of proprietary trading at Deutsche Bank within the Principal Strategies Group. Peter also spent four years at Goldman Sachs where he was a Desk Analyst in high yield trading. Prior to this, he was at Credit Suisse in high yield capital markets after beginning his career as an investment banker with Prudential Securities. Peter holds a BA from Columbia University. |
| | | | | | Michael Reed |
| | | | | | Senior Portfolio Manager |
| | | | | | Michael Reed is responsible for portfolio management of the RBC BlueBay Global Convertible Bond Fund. Michael joined BlueBay in October 2007 from Pendragon, where, as a Partner, he ran the company’s convertible arbitrage strategies. Prior to that, he was a Managing Director of Salomon Brothers, responsible for international convertible bond trading between 1994 and 2002. Michael joined the Japanese Warrant Arbitrage desk at Salomon in 1989 and spent two years trading Japanese Warrant Arbitrage in Tokyo. Michael holds a Bachelor of Engineering from Southampton University. |
| | | | | | Alessandro Esposito Portfolio Manager |
| | | | | | Alessandro Esposito is responsible for portfolio management of the RBC BlueBay Global Convertible Bond Fund. Alessandro joined BlueBay in December 2007 as a portfolio manager on the convertible arbitrage team. He began his career in 1998 at JP Morgan before moving to Intesa in 2000. He began trading hybrids and equity derivatives at Morgan Stanley in 2003 and ran the convertible arbitrage strategy at Peloton Partners since 2006. He has an MSc in Mathematical Trading and Finance and is a CFA charterholder. |
2
Aggregate Total Returns as of March 31, 2012 (Unaudited)
| | | | | | |
| | | | | Net | | Gross |
| | | Since | | Expense | | Expense |
| | | Inception(a) | | Ratio(1)(2)(3)(4) | | Ratio(1)(2)(3)(4) |
| | | |
RBC BlueBay Emerging Market Select Bond Fund | | | | | | |
Class I | | | | | | |
- At Net Asset Value | | 5.84% | | 1.00% | | 2.41% |
50% JPMorgan EMBI Global Diversified/50% JPMorgan | | | | | | |
GBI-EM Broad Diversified Index(b) | | 6.09% | | | | |
| | | |
RBC BlueBay Emerging Market Corporate Bond Fund | | | | | | |
Class I | | | | | | |
- At Net Asset Value | | 6.33% | | 1.15% | | 3.71% |
JPMorgan CEMBI Diversified Index(b) | | 6.74% | | | | |
| | | |
RBC BlueBay Global High Yield Bond Fund | | | | | | |
Class I | | | | | | |
| | | |
- At Net Asset Value | | 6.46% | | 0.95% | | 2.69% |
BofA Merrill Lynch Global High Yield | | | | | | |
Constrained Index(b) | | 9.54% | | | | |
| | | |
RBC BlueBay Global Convertible Bond Fund | | | | | | |
Class I | | | | | | |
| | | |
- At Net Asset Value | | 7.59% | | 1.01%(c) | | 3.37% |
UBS Global Focus Convertible Index(b) | | 6.04% | | | | |
| | | |
| | | | | | | |
Performance data quoted represents past performance. Past performance is no guarantee of future results. Investment return and principal value of an investment will fluctuate so that an investor’s shares, when redeemed, may be worth more or less than their original cost. Current performance may be lower or higher than performance quoted. Performance shown reflects contractual fee waivers, without such fee waivers total returns would be reduced. Performance information does not reflect the 2% fee on shares redeemed or exchanged within 30 days of purchase. If such redemption fee was included, performance would be reduced. For performance data current to the most recent month-end go to www.rbcgam.us. Please see footnotes below.
(1) The Funds’ expenses reflect actual expenses from November 30, 2011 to March 31,2012.
(2) The Adviser has contractually agreed to waive fees and/or make payments in order to keep total operating expenses of the Fund to the levels listed under net expense ratio until January 31, 2013.
| (3) | For the period from November 30, 2011 (commencement of operations) to March 31, 2012. |
| (a) | The inception date (commencement of operations) of the Fund is November 30, 2011. |
| (b) | Each of the comparative indices is a widely recognized market value weighted measure of the return of securities, but do not include sales fees or operating expenses. You cannot invest directly in indices. |
| (c) | The ratio for this period excluding interest expense was 1.00%. |
JPMorgan Emerging Markets Bond Index (“EMBI”) Global tracks total returns for US Dollar denominated debt instruments issued by emerging market sovereign and quasi-sovereign entities: Brady bonds, loans, Eurobonds and local market instruments.
3
JPMorgan Government Bond Index - Emerging Markets (“GBI-EM”) Global Diversified Index (Unhedged) is a comprehensive global local emerging markets index, and consists of regularly traded, liquid fixed-rate, domestic currency government bonds to which international investors can gain exposure.
The J.P. Morgan Corporate Emerging Markets Bond Index (“CEMBI”) Diversified limits the weights of those index countries with larger corporate debt stocks by only including a specified portion of these countries’ eligible current face amounts of debt outstanding. The CEMBI Diversified results in well-distributed, more balanced weightings for countries included in the index. The countries covered in the CEMBI Diversified are identical to those covered by the CEMBI.
The BofA Merrill Lynch Global High Yield Constrained Index tracks the performance of below investment grade bonds of corporate issuers domiciled in countries having an investment grade foreign currency long term debt rating.
The UBS Global Focus Convertible Index measures the size and performance of the most liquid convertible issues.
4
| | | | | | | | | | | | | | |
| FUND STATISTICS (UNAUDITED) | | | | | | |
| | | |
RBC BlueBay Emerging Market Select Bond Fund | | | | | | |
Current income and capital appreciation. | | | | | | Investment Objective |
50% JPMorgan EMBI Global Diversified/50% JPMorgan GBI-EM Broad Diversified Index | | | | | | Benchmark |
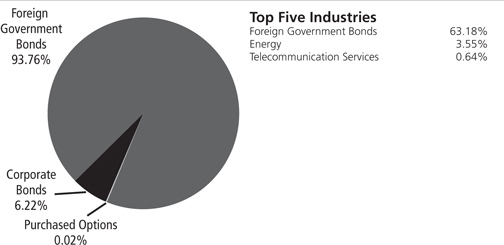
| | | | | | Asset Allocation (as of 3/31/12) (% of fund’s investments) & Top Five Industries (as of 3/31/12) (% of fund’s net assets) |
| | | | | |
| | | | | |
| | | | | |
| | | | | |
| | | | | |
| | | | | |
Wakala Global Sukuk Bhd, 4.65%,
7/6/21 | | 5.31% | | | | South Africa Government Bond,
13.50%, 9/15/15 | | 2.31% | | | | | | |
| | | | | | | | | | | |
Poland Government Bond, 5.75%,
10/25/21 | | 3.10% | | | | Chile Government International Bond,
3.25%, 9/14/21 | | 2.19% | | | | | | |
| | | | | | | | | | | |
Panama Government International Bond,
6.70%, 1/26/36 | | 2.94% | | | | Turkey Government International Bond,
6.25%, 9/26/22 | | 2.14% | | | | | | |
| | | | | | | | | | | |
Colombia Government International Bond,
6.13%, 1/18/41 | | 2.60% | | | | Russian Foreign Bond - Eurobond,
7.50%, 3/31/30 | | 2.11% | | | | | | |
| | | | | | | | | | | |
Mexico Government International Bond,
5.13%, 1/15/20 | | 2.49% | | | | Brazilian Government International
Bond, 5.63%, 1/7/41 | | 1.95% | | | | | | |
| | | | | | | | | | | |
| *A listing of all portfolio holdings can be found beginning on page 9. | | | | | | |
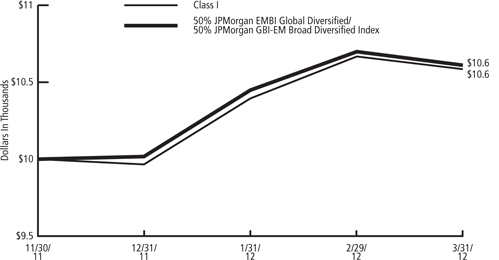
| | | | | | Growth of $10,000 Initial Investment Since Inception(11/30/11) |
| | | | | |
| | | | | |
| | | | | |
| The graph reflects an initial investment of $10,000 over the period from November 30, 2011 to March 31, 2012 and is based on Class I shares. The Fund’s total return includes reinvested dividends and capital gains. The Fund’s total return also includes operating expenses that reduce return, while the total return of the index does not. The graph does not reflect the deduction of taxes that a shareholder would pay on fund distributions or redemption of fund shares. | | | | |
| | | | | |
| | | | | |
5
| | | | | | | | | | | | | | | | | | | | |
| | | | | | | | | FUND STATISTICS (UNAUDITED) | |
| | | | | | | | RBC BlueBay Emerging Market Corporate Bond Fund | |
Investment Objective | | | | | | | | Current income and capital appreciation. | | | | | | | | | | | | |
Benchmark | | | | | | | | JPMorgan CEMBI Diversified Index | | | | | | | | | | | | |
Asset Allocation
(as of 3/31/12)
(% of fund’s
investments)
& Top Five
Industries
(as of 3/31/12)
(% of fund’s
net assets) | | | | | | | | 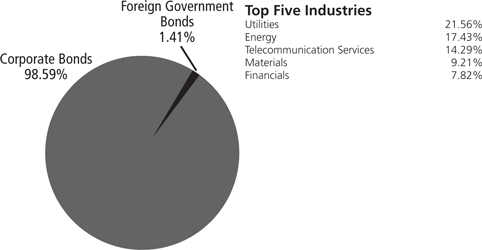
| |
Top Ten Holdings
| | | | | | | | Empresa de Energia de Bogota SA,
6.13%, 11/10/21 | | | 3.31 | % | | | | QGOG Atlantic/Alaskan Rigs Ltd.,
5.25%, 7/30/18 | | | 2.10 | % |
(as of 3/31/12) | | | | | | | | Indosat Palapa Co. BV, 7.38%, 7/29/20 | | | 2.74 | % | | | | Petroleos de Venezuela SA, 4.90%, 10/28/14 | | | 2.09 | % |
(% of fund’s net assets) | | | | | | | | Sable International Finance Ltd., 8.75%,
2/1/20 | | | 2.65 | % | | | | Myriad International Holding BV, 6.38%,
7/28/17 | | | 2.05 | % |
| | | | | | | | Cencosud SA, 5.50%, 1/20/21 | | | 2.47 | % | | | | Petroleos Mexicanos, 7.65%, 11/24/21 | | | 2.01 | % |
| | | | | | | | NET Servicos de Comunicacao SA,
7.50%, 1/27/20 | | | 2.18 | % | | | | E.CL SA, 5.63%, 1/15/21 | | | 2.01 | % |
| | | | | | | | *A listing of all portfolio holdings can be found beginning on page 17. | |
Growth of
$10,000 Initial
Investment Since
Inception (11/30/11) | | | | | | | | 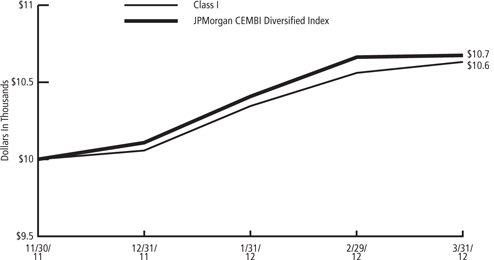
| |
| | | | | | | | The graph reflects an initial investment of $10,000 over the period from November 30, 2011 to March 31, 2012 and is based on Class I shares. The Fund’s total return includes reinvested dividends and capital gains. The Fund’s total return also includes operating expenses that reduce return, while the total return of the index does not. The graph does not reflect the deduction of taxes that a shareholder would pay on fund distributions or redemption of fund shares. | |
| | | | | | | | | |
| | | | | | | | | |
| | | | | | | | | |
| | | | | | | | | |
| | | | | | | | | |
| | | | | | | | | |
| | | | | | | | | |
6
| | | | | | | | | | | | | | |
FUND STATISTICS (UNAUDITED) | | | | | | |
| | | |
RBC BlueBay Global High Yield Bond Fund | | | | | | |
Current income and capital appreciation. | | | | | | Investment Objective |
BofA Merrill Lynch Global High Yield Constrained Index | | | | | | Benchmark |
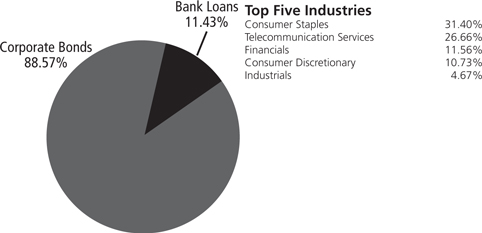
| | | | | | Asset Allocation (as of 3/31/12) (% of fund’s investments) & Top Five Industries (as of 3/31/12) (% of fund’s net assets) |
| | | | | |
| | | | | |
| | | | | |
| | | | | |
| | | | | |
| | | | | |
Priory Group No. 3 Plc, 7.00%, 2/15/18 | | 3.24% | | | | WMG Acquisition Corp., 9.50%,
6/15/16 | | 2.54% | | | | | | Top Ten Holdings (as of 3/31/12) (% of fund’s net assets) |
Tenet Healthcare Corp., 8.00%, 8/1/20 | | 3.14% | | | | National Mentor Holdings, Inc., 12.50%,
2/15/18 | | 2.51% | | | | | |
Ontex IV SA, 7.50%, 4/15/18 | | 2.62% | | | | MU Finance Plc, 8.75%, 2/1/17 | | 2.39% | | | | | |
Wind Acquisition Finance SA, 7.38%, 2/15/18 | | 2.61% | | | | Columbus International, Inc., 11.50%,
11/20/14 | | 2.34% | | | | | |
CEVA Group Plc, 8.38%, 12/1/17 | | 2.56% | | | | Unitymedia Hessen GmbH & Co.
KG/Unitymedia NRW GmbH, 8.13%,
12/1/17 | | 2.32% | | | | | |
| *A listing of all portfolio holdings can be found beginning on page 22. | | | | | |
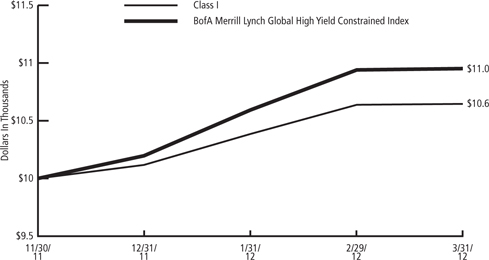
| | | | | | Growth of $10,000 Initial Investment Since Inception(11/30/11) |
| | | | | |
| | | | | |
| | | | | |
| The graph reflects an initial investment of $10,000 over the period from November 30, 2011 to March 31, 2012 and is based on Class I shares. The Fund’s total return includes reinvested dividends and capital gains. The Fund’s total return also includes operating expenses that reduce return, while the total return of the index does not. The graph does not reflect the deduction of taxes that a shareholder would pay on fund distributions or redemption of fund shares. | | | | |
| | | | | |
| | | | | |
7
| | | | | | | | | | | | | | | | |
| | | | | | | | | FUND STATISTICS (UNAUDITED) |
| | | | | | | | RBC BlueBay Global Convertible Bond Fund |
Investment Objective | | | | | | | | Current income and capital appreciation. | | | | | | | | |
Benchmark | | | | | | | | UBS Global Focus Convertible Index | | | | | | | | |
Asset Allocation
(as of 3/31/12)
(% of fund’s
investments)
& Top Five
Industries
(as of 3/31/12)
(% of fund’s
net assets) | | | | | | | | 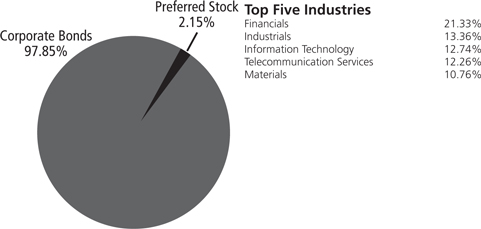
|
Top Ten Holdings
(as of 3/31/12) (% of fund’s net assets) | | | | | | | | Intel Corp., 3.25%, 8/1/39 | | 3.43% | | | | NetApp, Inc., 1.75%, 6/1/13 | | 3.09% |
| | | | | | | | Western Areas NL, 6.40%, 7/2/15 | | 3.37% | | | | AU Optronics Corp., 10.19%, 10/13/15 | | 3.07% |
| | | | | | | | International Power Finance Jersey II
Ltd., 3.25%, 7/20/13 | | 3.23% | | | | Seadrill Ltd., 3.38%, 10/27/17 Gilead Sciences, Inc., 1.00%, 5/1/14 Liberty Interactive LLC, 3.13%, 3/30/23 | | 3.05%
2.98% 2.94% |
| | | | | | | | Aabar Investments PJSC, 4.00%,
5/27/16 | | 3.14% | | | | |
| | | | | | | | VeriSign, Inc., 3.25%, 8/15/37 | | 3.11% | | | | |
| | | | | | | | *A listing of all portfolio holdings can be found beginning on page 26. |
Growth of
$10,000 Initial
Investment Since
Inception (11/30/11) | | | | | | | | 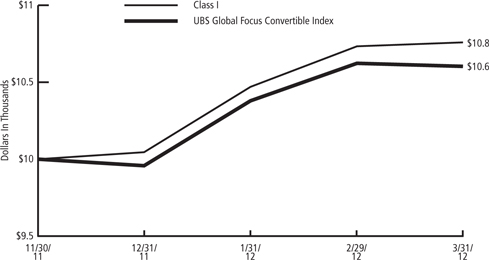
|
| | | | | | | | The graph reflects an initial investment of $10,000 over the period from November 30, 2011 to March 31, 2012 and is based on Class I shares. The Fund’s total return includes reinvested dividends and capital gains. The Fund’s total return also includes operating expenses that reduce return, while the total return of the index does not. The graph does not reflect the deduction of taxes that a shareholder would pay on fund distributions or redemption of fund shares. |
| | | | | | | | |
| | | | | | | | |
| | | | | | | | |
| | | | | | | | |
| | | | | | | | |
| | | | | | | | |
| | | | | | | | |
8
|
SCHEDULE OF PORTFOLIO INVESTMENTS |
RBC BlueBay Emerging Market Select Bond Fund
March 31, 2012 (Unaudited)
| | | | | | |
Principal Amount | | | | | Value | |
Corporate Bonds — 4.19% | |
Cayman Islands — 1.73% | |
$ 280,000 | | Petrobras International Finance Co., 3.50%, 2/6/17 | | $ | 286,991 | |
500,000 | | Petrobras International Finance Co., 6.75%, 1/27/41 | | | 579,883 | |
| | | | | | |
| | | | | 866,874 | |
| | | | | | |
Netherlands — 0.64% | | | | |
330,000 | | VimpelCom Holdings BV, 7.50%, 3/1/22 | | | 320,100 | |
United States — 0.45% | | | | |
250,000 | | Reliance Holdings USA, Inc., 6.25%, 10/19/40 | | | 228,020 | |
Venezuela — 1.37% | | | | |
775,000 | | Petroleos de Venezuela SA, 8.50%, 11/2/17 | | | 688,975 | |
| | | | | | |
Total Corporate Bonds | | | 2,103,969 | |
| | | | | | |
(Cost $2,039,582) | | | | |
Foreign Government Bonds — 63.18% | | | | |
Argentina — 0.91% | | | | |
1,278,000 | | Argentine Republic Government International Bond, 2.50%, 12/31/38(a) | | | 456,885 | |
Brazil — 1.95% | | | | |
850,000 | | Brazilian Government International Bond, 5.63%, 1/7/41 | | | 979,625 | |
Chile — 2.19% | | | | |
1,080,000 | | Chile Government International Bond, 3.25%, 9/14/21 | | | 1,096,200 | |
Columbia — 3.16% | | | | |
1,060,000 | | Colombia Government International Bond, 6.13%, 1/18/41 | | | 1,303,800 | |
128,000,000(b) | | Colombia Government International Bond, 7.75%, 4/14/21 | | | 85,357 | |
277,000,000(b) | | Colombia Government International Bond, 12.00%, 10/22/15 | | | 194,345 | |
| | | | | | |
| | | | | 1,583,502 | |
| | | | | | |
Dominican Republic — 0.88% | | | | |
430,000 | | Dominican Republic International Bond, 7.50%, 5/6/21 | | | 442,900 | |
Hungary — 2.76% | | | | |
6,050,000(b) | | Hungary Government Bond, 6.50%, 6/24/19 | | | 23,820 | |
109,280,000(b) | | Hungary Government Bond, 6.75%, 8/22/14 | | | 479,842 | |
12,980,000(b) | | Hungary Government Bond, 6.75%, 11/24/17 | | | 53,206 | |
3,020,000(b) | | Hungary Government Bond, 7.00%, 6/24/22 | | | 11,848 | |
6,050,000(b) | | Hungary Government Bond, 7.50%, 11/12/20 | | | 24,828 | |
225,000(c) | | Hungary Government International Bond, 4.38%, 7/4/17 | | | 250,150 | |
119,000(c) | | Hungary Government International Bond, 5.75%, 6/11/18 | | | 137,226 | |
440,000 | | Hungary Government International Bond, 6.38%, 3/29/21 | | | 402,600 | |
| | | | | | |
| | | | | 1,383,520 | |
| | | | | | |
9
|
SCHEDULE OF PORTFOLIO INVESTMENTS |
RBC BlueBay Emerging Market Select Bond Fund (cont.)
March 31, 2012 (Unaudited)
| | | | | | |
Principal Amount | | | | | Value | |
Indonesia — 0.79% | |
| $ 1,161,000,000(b) | | Indonesia Treasury Bond, 9.50%, 7/15/31(d) | | $ | 162,381 | |
| 793,000,000(b) | | Indonesia Treasury Bond, 11.50%, 9/15/19(d) | | | 115,822 | |
| 725,000,000(b) | | Indonesia Treasury Bond, 12.80%, 6/15/21(d) | | | 117,216 | |
| | | | | | |
| | | | | 395,419 | |
| | | | | | |
Israel — 0.39% | |
| 200,000 | | Israel Government International Bond, 4.00%, 6/30/22 | | | 197,793 | |
Lithuania — 0.44% | |
| 200,000 | | Lithuania Government International Bond, 6.63%, 2/1/22 | | | 221,500 | |
Malaysia — 8.16% | |
| 260,000(b) | | Malaysia Government Bond, 3.58%, 9/28/18 | | | 84,975 | |
| 2,265,000(b) | | Malaysia Government Bond, 4.26%, 9/15/16 | | | 767,164 | |
| 1,712,000(b) | | Malaysia Government Bond, 5.09%, 4/30/14 | | | 580,796 | |
| 2,460,000 | | Wakala Global Sukuk Bhd, 4.65%, 7/6/21 | | | 2,661,275 | |
| | | | | | |
| | | | | 4,094,210 | |
| | | | | | |
Mexico — 10.09% | |
| 11,700,000(b) | | Mexican Bonos, 6.25%, 6/16/16 | | | 948,488 | |
| 3,230,000(b) | | Mexican Bonos, 6.50%, 6/10/21 | | | 257,503 | |
| 1,060,000(b) | | Mexican Bonos, 6.50%, 6/9/22 | | | 84,012 | |
| 450,000(b) | | Mexican Bonos, 7.50%, 6/3/27 | | | 37,236 | |
| 7,990,000(b) | | Mexican Bonos, 9.50%, 12/18/14 | | | 696,406 | |
| 360,000(b) | | Mexican Bonos, 10.00%, 11/20/36 | | | 36,060 | |
| 450,000 | | Mexico Government International Bond, 3.63%, 3/15/22 | | | 460,125 | |
| 500,000 | | Mexico Government International Bond, 4.75%, 3/8/44 | | | 490,000 | |
| 1,090,000 | | Mexico Government International Bond, 5.13%, 1/15/20 | | | 1,250,775 | |
| 780,000 | | Mexico Government International Bond, 5.75%, 10/12/10 | | | 801,450 | |
| | | | | | |
| | | | | 5,062,055 | |
| | | | | | |
Panama — 2.94% | |
| 1,121,000 | | Panama Government International Bond, 6.70%, 1/26/36 | | | 1,474,115 | |
Peru — 0.18% | |
| 213,000(b) | | Peruvian Government International Bond, 7.84%, 8/12/20 | | | 92,556 | |
Poland — 5.56% | |
| 540,000(b) | | Poland Government Bond, 4.75%, 10/25/16 | | | 172,441 | |
| 1,614,000(b) | | Poland Government Bond, 5.00%, 4/25/16 | | | 521,740 | |
| 240,000(b) | | Poland Government Bond, 5.25%, 10/25/20 | | | 76,301 | |
| 70,000(b) | | Poland Government Bond, 5.50%, 10/25/19 | | | 22,806 | |
| 4,746,000(b) | | Poland Government Bond, 5.75%, 10/25/21 | | | 1,554,188 | |
| 140,000(b) | | Poland Government Bond, 5.75%, 9/23/22 | | | 45,824 | |
| 290,000(c) | | Poland Government International Bond, 4.20%, 4/15/20 | | | 397,257 | |
| | | | | | |
| | | | | 2,790,557 | |
| | | | | | |
Russia — 4.02% | |
| 10,780,000(b) | | Russian Federal Bond - OFZ, 7.35%, 1/20/16(d) | | | 370,346 | |
10
|
SCHEDULE OF PORTFOLIO INVESTMENTS |
RBC BlueBay Emerging Market Select Bond Fund (cont.)
March 31, 2012 (Unaudited)
| | | | | | |
Principal Amount | | | | | Value | |
| $ 600,000 | | Russian Foreign Bond - Eurobond, 5.63%, 4/4/42(e) | | $ | 585,318 | |
| 885,100 | | Russian Foreign Bond - Eurobond, 7.50%, 3/31/30(a) | | | 1,058,801 | |
| | | | | | |
| | | | | 2,014,465 | |
| | | | | | |
South Africa — 5.05% | |
| 390,000(b) | | South Africa Government Bond, 6.25%, 3/31/36 | | | 37,576 | |
| 5,985,000(b) | | South Africa Government Bond, 7.25%, 1/15/20 | | | 755,947 | |
| 3,760,000(b) | | South Africa Government Bond, 10.50%, 12/21/26 | | | 577,994 | |
| 7,372,429(b) | | South Africa Government Bond, 13.50%, 9/15/15 | | | 1,159,156 | |
| | | | | | |
| | | | | 2,530,673 | |
| | | | | | |
South Korea — 0.74% | |
| 300,000 | | Republic of Korea, 7.13%, 4/16/19 | | | 371,115 | |
Sri Lanka — 0.56% | |
| 280,000 | | Sri Lanka Government International Bond, 6.25%, 7/27/21 | | | 278,676 | |
Thailand — 3.14% | |
| 4,500,000(b) | | Thailand Government Bond, 1.20%, 7/14/21(f) | | | 149,856 | |
| 22,000,000(b) | | Thailand Government Bond, 3.13%, 12/11/15 | | | 701,530 | |
| 760,000(b) | | Thailand Government Bond, 4.25%, 3/13/13 | | | 24,886 | |
| 20,760,000(b) | | Thailand Government Bond, 5.25%, 5/12/14 | | | 697,223 | |
| | | | | | |
| | | | | 1,573,495 | |
| | | | | | |
Turkey — 6.74% | |
| 700,000(b) | | Turkey Government Bond, 9.00%, 3/8/17 | | | 387,842 | |
| 1,260,000(b) | | Turkey Government Bond, 9.50%, 1/12/22 | | | 705,891 | |
| 315,000(b) | | Turkey Government Bond, 10.15%, 2/20/13(g) | | | 162,701 | |
| 700,000(b) | | Turkey Government Bond, 10.33%, 5/15/13(g) | | | 354,579 | |
| 100,000(b) | | Turkey Government Bond, 10.50%, 1/15/20 | | | 59,558 | |
| 340,000(b) | | Turkey Government Bond, 11.01%, 7/17/13(g) | | | 169,599 | |
| 300,000 | | Turkey Government International Bond, 5.13%, 3/25/22 | | | 297,750 | |
| 1,000,000 | | Turkey Government International Bond, 6.25%, 9/26/22 | | | 1,075,000 | |
| 150,000 | | Turkey Government International Bond, 7.25%, 3/15/15 | | | 166,500 | |
| | | | | | |
| | | | | 3,379,420 | |
| | | | | | |
Ukraine — 0.70% | |
| 410,000 | | Ukraine Government International Bond, 7.75%, 9/23/20 | | | 350,550 | |
Uruguay — 0.36% | |
| 3,190,000(b) | | Uruguay Government International Bond, 4.38%, 12/15/28(f) | | | 182,985 | |
Venezuela — 1.47% | |
| 700,000 | | Venezuela Government International Bond, 12.75%, 8/23/22 | | | 735,000 | |
| | | | | | |
| |
Total Foreign Government Bonds | | | 31,687,216 | |
| | | | | | |
(Cost $31,396,684) | | | | |
11
|
SCHEDULE OF PORTFOLIO INVESTMENTS |
RBC BlueBay Emerging Market Select Bond Fund (cont.)
| | | | | | |
| March 31, 2012 (Unaudited) | |
| | |
| Contracts | | | | Value | |
Put Options Purchased — 0.01% | | | | |
| 150 | | EUR Currency, Strike Price MXN 17.58, Expires 4/04/12 | | $ | 5,792 | |
| 180 | | EUR Currency, Strike Price ZAR 9.928, Expires 5/01/12 | | | 689 | |
| | | | | | |
| |
Total Put Options Purchased | | | 6,481 | |
| | | | | | |
(Cost $5,242) | | | | |
| |
Total Investments | | $ | 33,797,666 | |
(Cost 33,441,508)(h) — 67.38% | | | | |
| |
Other assets in excess of liabilities — 32.62% | | | 16,360,050 | |
| | | | | | |
| |
NET ASSETS — 100.00% | | $ | 50,157,716 | |
| | | | | | |
| (a) | Represents a step-up bond that pays an initial coupon rate for the first period and then a higher coupon rate for the following periods. Rate shown is as of report date. |
| (b) | Investment in non-U.S. Dollars. Principal amount reflects local currency. |
| (c) | Principal amount denoted in Euros. |
| (d) | Security is a fully principal/notional funded Total Return swap with Morgan Stanley Capital Services, Inc. where upon maturity of this bond the Fund will receive the fully funded obligation principal amount from the broker. |
| (e) | Fair valued security under procedures established by the Fund’s Board of Trustees. |
| (f) | Inflation protected security. Principal amount reflects original security face amount. |
| (g) | Zero coupon bond. The rate represents the yield at time of purchase. |
| (h) | See notes to financial statements for the tax cost of securities and the breakdown of unrealized appreciation (depreciation). |
Options written as of March 31, 2012:
| | | | | | |
Contracts | | Call Options | | Value | |
| (150) | | EUR Currency, Strike Price MXN 19.00, Expires 4/04/12 | | $ | — | |
| (180) | | EUR Currency, Strike Price ZAR 10.872, Expires 5/01/12 | | | (154) | |
| | | | | | |
Total (Premiums received $(5,243)) | | $ | (154) | |
| | | | | | |
Foreign currency exchange contracts as of March 31, 2012:
| | | | | | | | | | | | | | | | | | |
Currency Purchased | | Currency Sold | | | Counterparty | | Settlement
Date | | Unrealized
Appreciation/
(Depreciation) | |
BRL | | 2,515,575 | | | USD | | | | 1,459,955 | | | Goldman Sachs Bank USA | | 04/03/12 | | $ | (83,159 | ) |
BRL | | 1,213,450 | | | USD | | | | 700,000 | | | Deutsche Bank AG | | 04/03/12 | | | (35,869 | ) |
BRL | | 341,240 | | | USD | | | | 190,000 | | | HSBC Securities, Inc. | | 04/03/12 | | | (3,236 | ) |
BRL | | 742,920 | | | USD | | | | 410,000 | | | BNP Paribas SA | | 04/03/12 | | | (3,394 | ) |
BRL | | 1,513,720 | | | USD | | | | 825,951 | | | HSBC Securities, Inc. | | 05/03/12 | | | (3,053 | ) |
BRL | | 1,513,720 | | | USD | | | | 825,545 | | | RBS Securities, Inc. | | 05/03/12 | | | (2,648 | ) |
BRL | | 1,513,720 | | | USD | | | | 825,523 | | | Goldman Sachs Bank USA | | 05/03/12 | | | (2,625 | ) |
CLP | | 166,517,500 | | | USD | | | | 341,715 | | | Goldman Sachs Bank USA | | 04/25/12 | | | (2,030 | ) |
CNY | | 2,834,100 | | | USD | | | | 448,185 | | | HSBC Securities, Inc. | | 04/25/12 | | | 976 | |
CNY | | 5,539,362 | | | USD | | | | 880,424 | | | HSBC Securities, Inc. | | 05/25/12 | | | (3,635 | ) |
COP | | 176,300,000 | | | USD | | | | 100,000 | | | HSBC Securities, Inc. | | 04/25/12 | | | (1,808 | ) |
12
|
SCHEDULE OF PORTFOLIO INVESTMENTS |
RBC BlueBay Emerging Market Select Bond Fund (cont.)
March 31, 2012 (Unaudited)
| | | | | | | | | | | | | | | | | | |
Currency Purchased | | Currency Sold | | | Counterparty | | Settlement
Date | | Unrealized
Appreciation/
(Depreciation) | |
COP | | 928,542,867 | | | USD | | | | 525,491 | | | Morgan Stanley Capital Services, Inc. | | 04/25/12 | | $ | (8,332 | ) |
COP | | 928,542,867 | | | USD | | | | 524,897 | | | Goldman Sachs Bank USA | | 04/25/12 | | | (7,737 | ) |
CZK | | 53,299 | | | USD | | | | 2,883 | | | RBS Securities, Inc. | | 04/25/12 | | | (16 | ) |
CZK | | 1,510,276 | | | USD | | | | 80,225 | | | HSBC Securities, Inc. | | 04/25/12 | | | 1,026 | |
EUR | | 75,000 | | | USD | | | | 98,549 | | | RBS Securities, Inc. | | 04/10/12 | | | 1,483 | |
EUR | | 200,000 | | | USD | | | | 266,180 | | | Merrill Lynch & Co., Inc. | | 04/25/12 | | | 591 | |
EUR | | 200,000 | | | USD | | | | 266,169 | | | Merrill Lynch & Co., Inc. | | 04/25/12 | | | 602 | |
EUR | | 200,000 | | | USD | | | | 265,930 | | | JPMorgan Chase Bank, N.A. | | 04/25/12 | | | 841 | |
EUR | | 200,000 | | | USD | | | | 265,137 | | | JPMorgan Chase Bank, N.A. | | 04/25/12 | | | 1,634 | |
EUR | | 200,000 | | | USD | | | | 264,092 | | | JPMorgan Chase Bank, N.A. | | 04/25/12 | | | 2,679 | |
EUR | | 200,000 | | | USD | | | | 264,012 | | | Merrill Lynch & Co., Inc. | | 04/25/12 | | | 2,759 | |
EUR | | 2,149 | | | USD | | | | 2,835 | | | HSBC Securities, Inc. | | 04/25/12 | | | 31 | |
EUR | | 400,000 | | | USD | | | | 527,356 | | | JPMorgan Chase Bank, N.A. | | 04/25/12 | | | 6,185 | |
EUR | | 200,000 | | | USD | | | | 262,832 | | | Merrill Lynch & Co., Inc. | | 04/25/12 | | | 3,939 | |
HUF | | 41,714,713 | | | USD | | | | 189,371 | | | RBS Securities, Inc. | | 04/25/12 | | | (1,118 | ) |
INR | | 75,514,900 | | | USD | | | | 1,486,806 | | | HSBC Securities, Inc. | | 04/25/12 | | | (8,342 | ) |
INR | | 10,263,500 | | | USD | | | | 200,000 | | | Deutsche Bank AG | | 04/25/12 | | | 943 | |
INR | | 10,274,800 | | | USD | | | | 200,000 | | | RBS Securities, Inc. | | 04/25/12 | | | 1,165 | |
IDR | | 8,158,355,890 | | | USD | | | | 885,430 | | | HSBC Securities, Inc. | | 04/25/12 | | | 4,490 | |
JPY | | 33,327,520 | | | USD | | | | 398,817 | | | Deutsche Bank AG | | 04/25/12 | | | 3,933 | |
JPY | | 16,800,700 | | | USD | | | | 200,000 | | | Merrill Lynch & Co., Inc. | | 04/25/12 | | | 3,030 | |
MYR | | 309,200 | | | USD | | | | 100,000 | | | HSBC Securities, Inc. | | 04/25/12 | | | 863 | |
MXN | | 2,544,400 | | | USD | | | | 200,000 | | | Morgan Stanley Capital Services, Inc. | | 04/25/12 | | | (1,623 | ) |
MXN | | 4,744,537 | | | USD | | | | 372,822 | | | Deutsche Bank AG | | 04/25/12 | | | (2,909 | ) |
MXN | | 1,909,725 | | | USD | | | | 150,000 | | | HSBC Securities, Inc. | | 04/25/12 | | | (1,106 | ) |
PLN | | 1,283,645 | | | USD | | | | 411,016 | | | RBS Securities, Inc. | | 04/25/12 | | | 709 | |
PLN | | 1,283,645 | | | USD | | | | 410,451 | | | Deutsche Bank AG | | 04/25/12 | | | 1,274 | |
PLN | | 1,283,645 | | | USD | | | | 410,209 | | | HSBC Securities, Inc. | | 04/25/12 | | | 1,516 | |
PLN | | 788,275 | | | USD | | | | 250,000 | | | HSBC Securities, Inc. | | 04/25/12 | | | 2,837 | |
RUB | | 15,806,340 | | | USD | | | | 538,895 | | | RBS Securities, Inc. | | 04/25/12 | | | (1,925 | ) |
ZAR | | 529,544 | | | USD | | | | 69,444 | | | RBS Securities, Inc. | | 04/25/12 | | | (673 | ) |
ZAR | | 1,222,143 | | | USD | | | | 160,191 | | | HSBC Securities, Inc. | | 04/25/12 | | | (1,474 | ) |
ZAR | | 766,570 | | | USD | | | | 100,000 | | | BNP Paribas SA | | 04/25/12 | | | (448 | ) |
ZAR | | 774,325 | | | USD | | | | 100,000 | | | HSBC Securities, Inc. | | 04/25/12 | | | 560 | |
ZAR | | 1,941,175 | | | USD | | | | 250,000 | | | HSBC Securities, Inc. | | 04/25/12 | | | 2,095 | |
ZAR | | 496,147 | | | USD | | | | 63,860 | | | HSBC Securities, Inc. | | 04/25/12 | | | 573 | |
ZAR | | 1,554,260 | | | USD | | | | 200,000 | | | BNP Paribas SA | | 04/25/12 | | | 1,848 | |
ZAR | | 242,023 | | | USD | | | | 31,111 | | | HSBC Securities, Inc. | | 04/25/12 | | | 319 | |
KRW | | 375,841,900 | | | USD | | | | 332,515 | | | HSBC Securities, Inc. | | 04/25/12 | | | (911 | ) |
KRW | | 226,740,000 | | | USD | | | | 200,000 | | | Deutsche Bank AG | | 04/25/12 | | | 52 | |
TRY | | 183,770 | | | USD | | | | 100,000 | | | HSBC Securities, Inc. | | 04/25/12 | | | 2,492 | |
USD | | 150,000 | | | BRL | | | | 272,025 | | | HSBC Securities, Inc. | | 04/03/12 | | | 1,118 | |
USD | | 831,258 | | | BRL | | | | 1,513,720 | | | HSBC Securities, Inc. | | 04/03/12 | | | 2,786 | |
USD | | 830,801 | | | BRL | | | | 1,513,720 | | | Goldman Sachs Bank USA | | 04/03/12 | | | 2,330 | |
USD | | 830,801 | | | BRL | | | | 1,513,720 | | | RBS Securities, Inc. | | 04/03/12 | | | 2,330 | |
USD | | 410,000 | | | BRL | | | | 752,965 | | | BNP Paribas SA | | 05/03/12 | | | 669 | |
USD | | 100,000 | | | CLP | | | | 49,105,000 | | | Goldman Sachs Bank USA | | 04/25/12 | | | (171 | ) |
13
|
SCHEDULE OF PORTFOLIO INVESTMENTS |
RBC BlueBay Emerging Market Select Bond Fund (cont.)
March 31, 2012 (Unaudited)
| | | | | | | | | | | | | | | | | | |
Currency Purchased | | Currency Sold | | | Counterparty | | Settlement
Date | | Unrealized
Appreciation/
(Depreciation) | |
USD | | 100,000 | | | CLP | | | | 49,180,000 | | | Goldman Sachs Bank USA | | 04/25/12 | | $ | (324 | ) |
USD | | 100,000 | | | CLP | | | | 49,190,000 | | | Morgan Stanley Capital Services, Inc. | | 04/25/12 | | | (344 | ) |
USD | | 81,719 | | | CZK | | | | 1,510,276 | | | HSBC Securities, Inc. | | 04/25/12 | | | 468 | |
USD | | 2,835 | | | CZK | | | | 53,299 | | | HSBC Securities, Inc. | | 04/25/12 | | | (33 | ) |
USD | | 280,595 | | | EUR | | | | 211,000 | | | Credit Suisse International | | 04/12/12 | | | (833 | ) |
USD | | 279,695 | | | EUR | | | | 210,000 | | | Merrill Lynch & Co., Inc. | | 04/12/12 | | | (399 | ) |
USD | | 247,083 | | | EUR | | | | 188,000 | | | Merrill Lynch & Co., Inc. | | 04/12/12 | | | (3,668 | ) |
USD | | 547,580 | | | EUR | | | | 410,000 | | | Deutsche Bank AG | | 04/25/12 | | | 700 | |
USD | | 267,092 | | | EUR | | | | 200,000 | | | JPMorgan Chase Bank, N.A. | | 04/25/12 | | | 321 | |
USD | | 279,827 | | | EUR | | | | 210,000 | | | JPMorgan Chase Bank, N.A. | | 04/25/12 | | | (282 | ) |
USD | | 265,461 | | | EUR | | | | 200,000 | | | Goldman Sachs Bank USA | | 04/25/12 | | | (1,310 | ) |
USD | | 265,324 | | | EUR | | | | 200,000 | | | Nomura Securities International, Inc. | | 04/25/12 | | | (1,447 | ) |
USD | | 529,608 | | | EUR | | | | 400,000 | | | Merrill Lynch & Co., Inc. | | 04/25/12 | | | (3,933 | ) |
USD | | 2,883 | | | EUR | | | | 2,180 | | | RBS Securities, Inc. | | 04/25/12 | | | (24 | ) |
USD | | 80,000 | | | HUF | | | | 17,630,400 | | | Merrill Lynch & Co., Inc. | | 04/25/12 | | | 436 | |
USD | | 100,000 | | | HUF | | | | 22,079,500 | | | Deutsche Bank AG | | 04/25/12 | | | 358 | |
USD | | 100,000 | | | HUF | | | | 22,210,800 | | | JPMorgan Chase Bank, N.A. | | 04/25/12 | | | (234 | ) |
USD | | 100,000 | | | HUF | | | | 22,277,000 | | | HSBC Securities, Inc. | | 04/25/12 | | | (533 | ) |
USD | | 100,000 | | | HUF | | | | 22,371,500 | | | Goldman Sachs Bank USA | | 04/25/12 | | | (960 | ) |
USD | | 410,000 | | | JPY | | | | 33,774,488 | | | UBS AG | | 04/25/12 | | | 1,849 | |
USD | | 201,321 | | | JPY | | | | 16,731,340 | | | JPMorgan Chase Bank, N.A. | | 04/25/12 | | | (871 | ) |
USD | | 200,000 | | | JPY | | | | 16,689,600 | | | JPMorgan Chase Bank, N.A. | | 04/25/12 | | | (1,687 | ) |
USD | | 200,000 | | | JPY | | | | 16,707,280 | | | HSBC Securities, Inc. | | 04/25/12 | | | (1,901 | ) |
USD | | 37,725 | | | MYR | | | | 116,452 | | | HSBC Securities, Inc. | | 04/25/12 | | | (263 | ) |
USD | | 98,549 | | | MXN | | | | 1,245,562 | | | RBS Securities, Inc. | | 04/10/12 | | | 1,296 | |
USD | | 200,000 | | | MXN | | | | 2,539,900 | | | RBS Securities, Inc. | | 04/25/12 | | | 1,974 | |
USD | | 100,000 | | | MXN | | | | 1,274,600 | | | HSBC Securities, Inc. | | 04/25/12 | | | 624 | |
USD | | 100,000 | | | MXN | | | | 1,274,800 | | | Merrill Lynch & Co., Inc. | | 04/25/12 | | | 609 | |
USD | | 200,000 | | | MXN | | | | 2,558,100 | | | Morgan Stanley Capital Services, Inc. | | 04/25/12 | | | 555 | |
USD | | 133,708 | | | PLN | | | | 416,460 | | | Merrill Lynch & Co., Inc. | | 04/25/12 | | | 130 | |
USD | | 200,000 | | | PLN | | | | 629,440 | | | Deutsche Bank AG | | 04/25/12 | | | (1,891 | ) |
USD | | 200,527 | | | PLN | | | | 633,528 | | | JPMorgan Chase Bank, N.A. | | 04/25/12 | | | (2,675 | ) |
USD | | 200,000 | | | RUB | | | | 5,924,280 | | | HSBC Securities, Inc. | | 04/25/12 | | | (1,259 | ) |
USD | | 100,000 | | | ZAR | | | | 765,840 | | | HSBC Securities, Inc. | | 04/25/12 | | | 542 | |
USD | | 100,000 | | | ZAR | | | | 767,980 | | | HSBC Securities, Inc. | | 04/25/12 | | | 264 | |
USD | | 200,000 | | | ZAR | | | | 1,555,000 | | | BNP Paribas SA | | 04/25/12 | | | (1,944 | ) |
USD | | 100,000 | | | KRW | | | | 113,170,000 | | | Deutsche Bank AG | | 04/25/12 | | | 150 | |
USD | | 100,000 | | | KRW | | | | 113,186,000 | | | HSBC Securities, Inc. | | 04/25/12 | | | 136 | |
USD | | 80,000 | | | THB | | | | 2,463,360 | | | Goldman Sachs Bank USA | | 04/25/12 | | | 191 | |
USD | | 379,830 | | | THB | | | | 11,701,604 | | | Goldman Sachs Bank USA | | 04/25/12 | | | 717 | |
USD | | 379,768 | | | THB | | | | 11,701,604 | | | HSBC Securities, Inc. | | 04/25/12 | | | 656 | |
USD | | 379,737 | | | THB | | | | 11,701,604 | | | RBS Securities, Inc. | | 04/25/12 | | | 625 | |
USD | | 200,000 | | | TRY | | | | 359,998 | | | HSBC Securities, Inc. | | 04/25/12 | | | (778 | ) |
USD | | 159,659 | | | TRY | | | | 291,295 | | | HSBC Securities, Inc. | | 04/25/12 | | | (2,801 | ) |
USD | | 159,605 | | | TRY | | | | 291,295 | | | Deutsche Bank AG | | 04/25/12 | | | (2,856 | ) |
USD | | 100,000 | | | TRY | | | | 182,590 | | | HSBC Securities, Inc. | | 04/25/12 | | | (1,834 | ) |
USD | | 159,484 | | | TRY | | | | 291,295 | | | HSBC Securities, Inc. | | 04/25/12 | | | (2,976 | ) |
14
|
SCHEDULE OF PORTFOLIO INVESTMENTS |
RBC BlueBay Emerging Market Select Bond Fund (cont.)
March 31, 2012 (Unaudited)
| | | | | | | | | | | | | | | | | | |
Currency Purchased | | Currency Sold | | | Counterparty | | Settlement
Date | | | Unrealized
Appreciation/
(Depreciation) | |
USD | | 159,404 | | TRY | | | 291,295 | | | RBS Securities, Inc. | | | 04/25/12 | | | $ | (3,057 | ) |
USD | | 64,060 | | ZAR | | | 496,147 | | | HSBC Securities, Inc. | | | 04/03/12 | | | | (580 | ) |
USD | | 31,209 | | ZAR | | | 242,023 | | | HSBC Securities, Inc. | | | 04/03/12 | | | | (323 | ) |
| | | | | | | | | | | | | | | | | | |
Total | | | | | | | | | | | | | | | | $ | (146,983 | ) |
| | | | | | | | | | | | | | | | | | |
Interest rate swaps as of March 31, 2012:
| | | | | | | | | | | | | | | | |
Fixed
Rate | | Floating Rate | | Counterparty | | Expiration
Date | | | Notional
Amount
(000) | | | Unrealized
Appreciation
(Depreciation) | |
9.80% | | BRL-CDI | | Morgan Stanley Capital Services, Inc. | | | 01/02/14 | | | | BRL 3,500 | | | $ | 2,773 | |
5.07% | | CLP-ICP-CAMARA | | Morgan Stanley Capital Services, Inc. | | | 03/05/14 | | | | CLP 194,640 | | | | (6,058 | ) |
7.71% | | INR-MIBOR-OIS-COMPOUND | | JPMorgan Chase Bank, N.A. | | | 03/30/14 | | | | INR 390,000 | | | | 8,572 | |
| | | | | | | | | | | | | | | | |
Total | | | | | | | | | | | | | | $ | 5,287 | |
| | | | | | | | | | | | | | | | |
Abbreviations used are defined below:
BRL - Brazilian Real
BRL-CDI - Brazil Cetip Interbank Deposit Rate
CLP - Chilean Peso
CLP-ICP-CAMARA - Indice Camara Promedia Rate for Chilean Pesos
CNY - Chinese Yuan
COP - Colombian Peso
CZK - Czech Koruna
EUR - Euro
HUF - Hungarian Forint
IDR - Indonesian Rupiah
INR - Indian Rupee
INR-MIBOR-OIS-COMPOUND - Mumbai Interbank Offered Rate - Overnight Index Swap
JPY - Japanese Yen
KRW - South Korean Won
MXN - Mexican Peso
MYR - Malaysian Ringgit
PLN - Polish Zloty
RUB - Russian Ruble
THB - Thai Baht
TRY - Turkish Lira
USD - United States Dollar
ZAR - South African Rand
15
|
SCHEDULE OF PORTFOLIO INVESTMENTS |
RBC BlueBay Emerging Market Select Bond Fund (cont.)
March 31, 2012 (Unaudited)
Portfolio Diversification (Unaudited)
| | | | |
| Industries | | Percentage
of Net Assets | |
Foreign Government Bonds | | | 63.18% | |
Energy | | | 3.55% | |
Telecommunication Services | | | 0.64% | |
Other* | | | 32.63% | |
| | | | |
| | | 100.00% | |
| | | | |
| * | Includes cash, options, futures, interest and dividend receivable, pending trades and Fund share transactions, interest rate swaps, foreign currency exchange contracts and accrued expenses payable. |
See notes to financial statements.
16
|
SCHEDULE OF PORTFOLIO INVESTMENTS |
RBC BlueBay Emerging Market Corporate Bond Fund
March 31, 2012 (Unaudited)
| | | | | | |
Principal Amount | | | | | Value | |
Corporate Bonds — 90.50% | | | | |
Austria — 1.26% | |
| $200,000 | | OGX Austria GmbH, 8.38%, 4/1/22 | | $ | 202,580 | |
Bermuda — 1.22% | |
| 200,000 | | China Resources Gas Group Ltd., 4.50%, 4/5/22 | | | 195,660 | |
Brazil — 9.00% | |
| 200,000 | | Banco Santander Brasil SABrazil, 4.63%, 2/13/17 | | | 201,250 | |
| 200,000 | | Centrais Eletricas Brasileiras SA, 5.75%, 10/27/21 | | | 218,900 | |
| 150,000 | | Cosan Overseas Ltd., 8.25%, 11/29/49 | | | 156,675 | |
| 300,000 | | NET Servicos de Comunicacao SA, 7.50%, 1/27/20 | | | 349,950 | |
| 200,000 | | OGX Austria GmbH, 8.50%, 6/1/18 | | | 207,800 | |
| 300,000 | | Telemar Norte Leste SA, 5.50%, 10/23/20 | | | 308,400 | |
| | | | | | |
| | | | | 1,442,975 | |
| | | | | | |
British Virgin Islands — 4.06% | |
| 100,000 | | GTL Trade Finance, Inc., 7.25%, 10/20/17 | | | 114,700 | |
| 200,000 | | Howes Capital Ltd., 4.75%, 4/10/17(a) | | | 199,876 | |
| 335,090 | | QGOG Atlantic/Alaskan Rigs Ltd., 5.25%, 7/30/18 | | | 336,765 | |
| | | | | | |
| | | | | 651,341 | |
| | | | | | |
Cayman Islands — 11.31% | |
| 100,000 | | Cosan Finance Ltd., 7.00%, 2/1/17 | | | 109,500 | |
| 200,000 | | ENN Energy Holdings Ltd., 6.00%, 5/13/21 | | | 192,114 | |
| 300,000 | | Hutchison Whampoa International 10 Ltd., 6.00%, 6/12/49(b) | | | 305,250 | |
| 250,000 | | MCE Finance Ltd., 10.25%, 5/15/18 | | | 280,625 | |
| 400,000 | | Sable International Finance Ltd., 8.75%, 2/1/20 | | | 424,520 | |
| 200,000 | | Schahin II Finance Co. SPV Ltd., 5.88%, 9/25/22 | | | 201,100 | |
| 200,000 | | Swire Pacific MTN Financing Ltd., 4.50%, 2/28/22 | | | 199,670 | |
| 100,000 | | Vale Overseas Ltd., 4.38%, 1/11/22 | | | 100,444 | |
| | | | | | |
| | | | | 1,813,223 | |
| | | | | | |
Chile — 5.96% | |
| 225,000 | | AES Gener SA, 5.25%, 8/15/21 | | | 237,375 | |
| 375,000 | | Cencosud SA, 5.50%, 1/20/21 | | | 395,881 | |
| 300,000 | | E.CL SA, 5.63%, 1/15/21 | | | 321,582 | |
| | | | | | |
| | | | | 954,838 | |
| | | | | | |
Columbia — 5.88% | |
| 200,000 | | Banco de Bogota SA, 5.00%, 1/15/17 | | | 207,500 | |
| 500,000 | | Empresa de Energia de Bogota SA, 6.13%, 11/10/21 | | | 530,000 | |
| 200,000 | | Transportadora de Gas Internacional SA ESP, 5.70%, 3/20/22 | | | 205,580 | |
| | | | | | |
| | | | | 943,080 | |
| | | | | | |
17
|
SCHEDULE OF PORTFOLIO INVESTMENTS |
RBC BlueBay Emerging Market Corporate Bond Fund (cont.)
March 31, 2012 (Unaudited)
| | | | | | |
Principal Amount | | | | | Value | |
Hong Kong — 3.24% | |
| $200,000 | | LS Finance 2017 Ltd., 5.25%, 1/26/17 | | $ | 205,935 | |
| 300,000 | | Wharf Finance Ltd., 4.63%, 2/8/17 | | | 312,750 | |
| | | | | | |
| | | | | 518,685 | |
| | | | | | |
India — 2.58% | |
| 225,000 | | NTPC Ltd., 5.63%, 7/14/21 | | | 225,523 | |
| 200,000 | | Sesa Goa Ltd., 5.00%, 10/31/14 | | | 188,700 | |
| | | | | | |
| | | | | 414,223 | |
| | | | | | |
Indonesia — 2.22% | |
| 100,000 | | Adaro Indonesia PT, 7.63%, 10/22/19 | | | 108,500 | |
| 225,000 | | Star Energy Geothermal Wayang Windu Ltd., 11.50%, 2/12/15 | | | 248,063 | |
| | | | | | |
| | | | | 356,563 | |
| | | | | | |
Ireland — 2.78% | |
| 200,000 | | RZD Capital Ltd., 5.70%, 4/5/22(a) | | | 200,000 | |
| 225,000 | | Vimpel Communications Via VIP Finance Ireland Ltd. OJSC, 9.13%, 4/30/18 | | | 245,813 | |
| | | | | | |
| | | | | 445,813 | |
| | | | | | |
Kazakhstan — 0.40% | |
| 200,000 | | BTA Bank JSC, 10.75%, 7/1/18(c) | | | 43,000 | |
| 300,000 | | BTA Bank JSC, 36.82%, 6/30/20(d) | | | 21,189 | |
| | | | | | |
| | | | | 64,189 | |
| | | | | | |
Luxembourg — 4.28% | |
| 300,000 | | ALROSA Finance SA, 7.75%, 11/3/20 | | | 320,250 | |
| 200,000 | | Russian Agricultural Bank OJSC Via RSHB Capital SA, 6.00%, 6/3/21(b) | | | 196,760 | |
| 150,000 | | TNK-BP Finance SA, 7.50%, 7/18/16 | | | 169,125 | |
| | | | | | |
| | | | | 686,135 | |
| | | | | | |
Mexico — 6.68% | |
| 100,000 | | Petroleos Mexicanos, 6.50%, 6/2/41 | | | 112,500 | |
| 4,050,000(e) | | Petroleos Mexicanos, 7.65%, 11/24/21 | | | 322,606 | |
| 300,000 | | Sigma Alimentos SA de CV, 5.63%, 4/14/18 | | | 317,250 | |
| 300,000 | | Urbi Desarrollos Urbanos SAB de CV, 9.75%, 2/3/22 | | | 317,640 | |
| | | | | | |
| | | | | 1,069,996 | |
| | | | | | |
Netherlands — 7.29% | |
| 400,000 | | Indosat Palapa Co. BV, 7.38%, 7/29/20 | | | 440,000 | |
| 300,000 | | Myriad International Holding BV, 6.38%, 7/28/17 | | | 328,500 | |
| 200,000 | | OSX 3 Leasing BV, 9.25%, 3/20/15 | | | 206,500 | |
18
|
SCHEDULE OF PORTFOLIO INVESTMENTS |
RBC BlueBay Emerging Market Corporate Bond Fund (cont.)
March 31, 2012 (Unaudited)
| | | | | | |
Principal Amount | | | | | Value | |
| $200,000 | | VimpelCom Holdings BV, 7.50%, 3/1/22 | | $ | 194,000 | |
| | | | | | |
| | | | | 1,169,000 | |
| | | | | | |
Peru — 1.14% | |
| 169,000 | | Banco de Credito del Peru/Panama, 6.88%, 9/16/26(b) | | | 183,365 | |
Philippines — 1.97% | |
| 300,000 | | Energy Development Corp., 6.50%, 1/20/21 | | | 315,529 | |
Qatar — 1.77% | |
| 264,360 | | Ras Laffan Liquefied Natural Gas Co. Ltd. II, 5.30%, 9/30/20 | | | 282,865 | |
Saudi Arabia — 2.52% | |
| 200,000 | | Saudi Electricity Global Sukuk Co., 2.67%, 4/3/17 | | | 201,960 | |
| 200,000 | | Saudi Electricity Global Sukuk Co., 4.21%, 4/3/22 | | | 201,780 | |
| | | | | | |
| | | | | 403,740 | |
| | | | | | |
Singapore — 1.43% | |
| 225,000 | | STATS ChipPAC Ltd., 5.38%, 3/31/16 | | | 229,500 | |
South Korea — 1.91% | |
| 300,000 | | Korea Hydro & Nuclear Power Co. Ltd., 3.13%, 9/16/15 | | | 305,381 | |
United Arab Emirates — 1.63% | |
| 225,000 | | Abu Dhabi National Energy Co., 7.25%, 8/1/18 | | | 261,563 | |
United Kingdom — 4.35% | |
| 200,000 | | Afren Plc, 10.25%, 4/8/19 | | | 209,980 | |
| 200,000 | | Ferrexpo Finance Plc, 7.88%, 4/7/16 | | | 185,000 | |
| 300,000 | | Vedanta Resources Plc, 9.50%, 7/18/18 | | | 303,000 | |
| | | | | | |
| | | | | 697,980 | |
| | | | | | |
United States — 1.65% | |
| 225,000 | | Southern Copper Corp., 7.50%, 7/27/35 | | | 263,793 | |
Venezuela — 3.97% | |
| 375,000 | | Petroleos de Venezuela SA, 4.90%, 10/28/14 | | | 335,625 | |
| 300,000 | | Petroleos de Venezuela SA, 12.75%, 2/17/22 | | | 300,000 | |
| | | | | | |
| | | | | 635,625 | |
| | | | | | |
Total Corporate Bonds | | | 14,507,642 | |
| | | | | | |
(Cost $14,074,099) | | | | |
19
|
SCHEDULE OF PORTFOLIO INVESTMENTS |
RBC BlueBay Emerging Market Corporate Bond Fund (cont.)
March 31, 2012 (Unaudited)
| | | | | | |
Principal Amount | | | | | Value | |
Foreign Government Bonds — 1.29% | | | | |
South Korea — 1.29% | | | | |
| $200,000 | | Korea Development Bank (The), 3.88%, 5/4/17 | | $ | 207,024 | |
| | | | | | |
| |
Total Foreign Government Bonds | | | 207,024 | |
| | | | | | |
(Cost $197,053) | | | | |
| |
Total Investments | | $ | 14,714,666 | |
(Cost 14,271,152)(f) — 91.79% | | | | |
| |
Other assets in excess of liabilities — 8.21% | | | 1,315,683 | |
| | | | | | |
| |
NET ASSETS — 100.00% | | $ | 16,030,349 | |
| | | | | | |
| (a) | Fair valued security under procedures established by the Fund’s Board of Trustees. |
| (b) | Variable rate security. The rate reflected in the Schedule of Portfolio Investments is the rate in effect on March 31, 2012. |
| (c) | Issuer filed for bankruptcy and/or is in default of interest payments. |
| (d) | Zero coupon bond. The rate represents the yield at time of purchase. |
| (e) | Investment in non-U.S. Dollars. Principal amount reflects local currency. |
| (f) | See notes to financial statements for the tax cost of securities and the breakdown of unrealized appreciation (depreciation). |
Foreign currency exchange contracts as of March 31, 2012:
| | | | | | | | | | | | | | | | | | |
Currency Purchased | | Currency Sold | | | Counterparty | | Settlement
Date | | Unrealized
Appreciation
(Depreciation) | |
EUR | | 290,000 | | | USD | | | | 383,668 | | | Merrill Lynch & Co., Inc. | | 04/12/12 | | $ | 3,128 | |
USD | | 270,446 | | | EUR | | | | 280,000 | | | Merrill Lynch & Co., Inc. | | 04/12/12 | | | (3,012 | ) |
| | | | | | |
| | | | | | | | | | | | | | | | | | |
Total | | | | | | | | | | | | | | | | $ | 116 | |
| | | | | | | | | | | | | | | | | | |
Abbreviations used are defined below:
EUR - Euro
USD - United States Dollar
20
|
SCHEDULE OF PORTFOLIO INVESTMENTS |
RBC BlueBay Emerging Market Corporate Bond Fund (cont.)
March 31, 2012 (Unaudited)
Portfolio Diversification (Unaudited)
| | | | |
Industries | | Percentage
of Net Assets | |
Utilities | | | 21.56 | % |
Energy | | | 17.43 | % |
Telecommunication Services | | | 14.29 | % |
Materials | | | 9.21 | % |
Financials | | | 7.82 | % |
Consumer Staples | | | 6.11 | % |
Diversified | | | 5.10 | % |
Industrials | | | 4.52 | % |
Consumer Discretionary | | | 3.03 | % |
Information Technology | | | 1.43 | % |
Foreign Government Bonds | | | 1.29 | % |
Other* | | | 8.21 | % |
| | | | |
| | | 100.00 | % |
| | | | |
| * | Includes cash, interest and dividend receivable, pending trades and Fund share transactions, foreign currency exchange contracts and accrued expenses payable. |
See notes to financial statements.
21
|
SCHEDULE OF PORTFOLIO INVESTMENTS |
RBC BlueBay Global High Yield Bond Fund
March 31, 2012 (Unaudited)
| | | | | | |
Principal Amount | | | | | Value | |
Bank Loan — 10.31% | |
Denmark — 2.57% | |
| $ 250,000(a) | | ISS Holdings LLC Term Loan, 0.00%, 6/30/15 | | $ | 315,005 | |
| 100,000(a) | | Lavena Holdings Term Loan B1, 0.00%, 3/2/15 | | | 115,732 | |
| 100,000(a) | | Lavena Holdings Term Loan C1, 0.00%, 3/2/16 | | | 115,732 | |
| | | | | | |
| | | | | 546,469 | |
| | | | | | |
France — 1.25% | |
| 95,853(a) | | Oberthur Term Loan B1, 0.00%, 8/30/18(b) | | | 127,839 | |
| 104,147(a) | | Oberthur Term Loan B2, 0.00%, 8/3/18(b) | | | 138,902 | |
| | | | | | |
| | | | | 266,741 | |
| | | | | | |
United States — 6.49% | |
| 196,853 | | Clear Channel Communications, Inc. Term Loan, 0.00%, 1/29/16 | | | 159,183 | |
| 250,000 | | Crown Castle Term Loan, 0.00%, 1/31/17 | | | 248,923 | |
| 250,000 | | Protection One Term Loan, 0.00%, 6/4/16 | | | 245,763 | |
| 250,000 | | Roundy’s Supermarket, Inc. Term Loan, 0.00%, 2/13/19 | | | 251,485 | |
| 498,871 | | US Telepacific Holdings Corp. Term Loan, 0.00%, 2/23/17 | | | 475,798 | |
| | | | | | |
| | | | | 1,381,152 | |
| | | | | | |
| |
Total Bank Loan | | | 2,194,362 | |
| | | | | | |
(Cost $2,161,573) | | | | |
Corporate Bonds — 79.85% | |
Australia — 1.37% | |
| 277,000 | | FMG Resources (August 2006) Ltd., 8.25%, 11/1/19(c) | | | 290,850 | |
Barbados — 2.34% | |
| 450,000 | | Columbus International, Inc., 11.50%, 11/20/14 | | | 499,275 | |
Belgium — 3.63% | |
| 450,000(a) | | Ontex IV SA, 7.50%, 4/15/18 | | | 558,156 | |
| 210,000(a) | | Ontex IV SA, 9.00%, 4/15/19 | | | 214,260 | |
| | | | | | |
| | | | | 772,416 | |
| | | | | | |
Cayman Islands — 1.84% | |
| 200,000 | | Sable International Finance Ltd., 8.75%, 2/1/20(c) | | | 212,000 | |
| 175,000 | | UPCB Finance VI Ltd., 6.88%, 1/15/22(c) | | | 180,687 | |
| | | | | | |
| | | | | 392,687 | |
| | | | | | |
Croatia (Hrvatska) — 1.14% | |
| 174,000(a) | | Agrokor DD, 10.00%, 12/7/16 | | | 242,508 | |
Denmark — 6.30% | |
| 120,000(a) | | ISS A/S, 8.88%, 5/15/16 | | | 163,246 | |
| 300,000(a) | | Kabel BW Musketeer GmbH, 9.50%, 3/15/21 | | | 433,121 | |
| 350,000(a) | | Unitymedia Hessen GmbH & Co. KG/Unitymedia NRW GmbH, 8.13%, 12/1/17 | | | 494,805 | |
22
|
SCHEDULE OF PORTFOLIO INVESTMENTS |
RBC BlueBay Global High Yield Bond Fund (cont.)
March 31, 2012 (Unaudited)
| | | | | | |
Principal Amount | | | | | Value | |
| $ 260,000 | | Welltec A/S, 8.00%, 2/1/19(c) | | $ | 249,600 | |
| | | | | | |
| | | | | 1,340,772 | |
| | | | | | |
Ireland — 0.62% | |
| 100,000(a) | | Allied Irish Banks Plc, 1.35%, 4/11/12(d) | | | 133,037 | |
Italy — 0.76% | |
| 180,000(a) | | Seat Pagine Gialle SpA, 10.50%, 1/31/17(e) | | | 162,045 | |
Jersey Channel Island — 1.29% | |
| 210,000(f) | | Aston Martin Capital Ltd., 9.25%, 7/15/18 | | | 273,752 | |
Luxembourg — 5.52% | |
| 190,000 | | Intelsat Jackson Holdings SA, 7.50%, 4/1/21 | | | 199,738 | |
| 250,000 | | Intelsat Jackson Holdings SA, 11.25%, 6/15/16 | | | 263,125 | |
| 150,000 | | Intelsat Luxembourg SA, 11.25%, 2/4/17 | | | 156,000 | |
| 450,000(a) | | Wind Acquisition Finance SA, 7.38%, 2/15/18 | | | 556,656 | |
| | | | | | |
| | | | | 1,175,519 | |
| | | | | | |
Netherlands — 0.59% | |
| 115,000(a) | | Magyar Telecom BV, 9.50%, 12/15/16 | | | 125,769 | |
South Africa — 0.77% | |
| 140,000(a) | | Edcon Proprietary Ltd., 4.13%, 6/15/14(d) | | | 164,313 | |
Sweden — 1.36% | |
| 200,000 | | Eileme 2 AB, 11.63%, 1/31/20(c) | | | 208,500 | |
| 62,000(a) | | TVN Finance Corp. III AB, 7.88%, 11/15/18 | | | 81,036 | |
| | | | | | |
| | | | | 289,536 | |
| | | | | | |
United Kingdom — 13.15% | |
| 550,000 | | CEVA Group Plc, 8.38%, 12/1/17(c) | | | 544,500 | |
| 150,000 | | Jaguar Land Rover Plc, 8.13%, 5/15/21(c) | | | 153,750 | |
| 100,000(g) | | Jaguar Land Rover Plc, 8.25%, 3/15/20 | | | 160,413 | |
| 140,000(a) | | Kerling Plc, 10.63%, 2/1/17 | | | 185,785 | |
| 100,000(g) | | Matalan Finance Plc, 8.88%, 4/29/16 | | | 133,557 | |
| 100,000(g) | | Moto Finance Plc, 10.25%, 3/15/17 | | | 139,155 | |
| 300,000(g) | | MU Finance Plc, 8.75%, 2/1/17 | | | 508,637 | |
| 450,000(g) | | Priory Group No. 3 Plc, 7.00%, 2/15/18 | | | 689,179 | |
| 200,000(g) | | Priory Group No. 3 Plc, 8.88%, 2/15/19 | | | 284,709 | |
| | | | | | |
| | | | | 2,799,685 | |
| | | | | | |
United States — 39.17% | |
| 320,000 | | BakerCorp International, Inc., 8.25%, 6/1/19(c) | | | 329,600 | |
| 200,000 | | BI-LO LLC/BI-LO Finance Corp., 9.25%, 2/15/19(c) | | | 212,000 | |
| 450,000 | | Biomet, Inc., 10.00%, 10/15/17 | | | 484,313 | |
| 200,000 | | CCO Holdings LLC/CCO Holdings Capital Corp., 7.38%, 6/1/20 | | | 217,000 | |
| 290,000 | | Cequel Communications Holdings I LLC and Cequel Capital Corp., 8.63%, 11/15/17(c) | | | 311,388 | |
| 210,000 | | DJO Finance LLC/DJO Finance Corp., 8.75%, 3/15/18(c) | | | 212,100 | |
| 100,000 | | Emergency Medical Services Corp., 8.13%, 6/1/19 | | | 102,750 | |
23
|
SCHEDULE OF PORTFOLIO INVESTMENTS |
RBC BlueBay Global High Yield Bond Fund (cont.)
March 31, 2012 (Unaudited)
| | | | | | |
Principal Amount | | | | | Value | |
| $ 270,000 | | Epicor Software Corp., 8.63%, 5/1/19 | | $ | 276,075 | |
| 210,000 | | Foresight Energy LLC/Foresight Energy Corp., 9.63%, 8/15/17(c) | | | 220,500 | |
| 200,000 | | GCI, Inc., 6.75%, 6/1/21 | | | 201,250 | |
| 150,000 | | Gentiva Health Services, Inc., 11.50%, 9/1/18 | | | 139,875 | |
| 410,000 | | HCA, Inc., 6.50%, 2/15/20 | | | 430,500 | |
| 250,000 | | Integra Telecom Holdings, Inc., 10.75%, 4/15/16(c) | | | 230,000 | |
380,000
| | Iron Mountain, Inc., 7.75%, 10/1/19 | | | 415,150 | |
| 120,000 | | Lawson Software, 9.38%, 4/1/19(c) | | | 120,000 | |
| 100,000 | | Level 3 Communications, Inc., 11.88%, 2/1/19 | | | 114,000 | |
| 210,000 | | Level 3 Financing, Inc., 8.13%, 7/1/19(c) | | | 216,825 | |
| 100,000 | | Level 3 Financing, Inc., 8.63%, 7/15/20(c) | | | 105,000 | |
| 260,000 | | MetroPCS Wireless, Inc., 6.63%, 11/15/20 | | | 258,375 | |
| 550,000 | | National Mentor Holdings, Inc., 12.50%, 2/15/18(c) | | | 533,500 | |
| 210,000 | | Palace Entertainment Holdings LLC/Palace Entertainment Holdings Corp., 8.88%, 4/15/17(c) | | | 218,138 | |
| 100,000 | | Pinnacle Entertainment, Inc., 7.75%, 4/1/22 | | | 104,750 | |
| 47,778(a) | | Pregis Corp., 6.25%, 4/15/13(d) | | | 61,810 | |
| 120,000 | | Spectrum Brands, Inc., 6.75%, 3/15/20(c) | | | 121,200 | |
| 160,000 | | Taylor Morrison Communities, Inc./Monarch Communities, Inc., 7.75%, 4/15/20(c) | | | 160,000 | |
| 650,000 | | Tenet Healthcare Corp., 8.00%, 8/1/20 | | | 669,500 | |
| 220,000 | | USPI Finance Corp., 9.00%, 4/1/20(c) | | | 226,600 | |
| 375,000 | | Valeant Pharmaceuticals International, 6.75%, 10/1/17(c) | | | 379,688 | |
| 275,000 | | Valeant Pharmaceuticals International, 6.88%, 12/1/18(c) | | | 277,063 | |
| 430,000 | | Windstream Corp., 7.50%, 6/1/22(c) | | | 449,350 | |
| 496,000 | | WMG Acquisition Corp., 9.50%, 6/15/16(c) | | | 540,640 | |
| | | | | | |
| | | | | 8,338,940 | |
| | | | | | |
| |
Total Corporate Bonds | | | 17,001,104 | |
| | | | | | |
(Cost $16,283,242) | | | | |
| |
Total Investments | | $ | 19,195,466 | |
(Cost $18,444,815)(h) — 90.16% | | | | |
| |
Other assets in excess of liabilities — 9.84% | | | 2,095,914 | |
| | | | | | |
| |
NET ASSETS — 100.00% | | $ | 21,291,380 | |
| | | | | | |
| (a) | Principal amount denoted in Euros. |
| (b) | Fair valued security under procedures established by the Fund’s Board of Trustees. |
| (c) | Security exempt from registration under Rule 144A or Section 4(2) of the Securities Act of 1933, as amended. These securities may be resold in transactions exempt from registration, normally to qualified institutional buyers. Security has been deemed to be liquid based on procedures approved by the Board of Trustees. |
| (d) | Floating rate note. Rate shown is as of report date. |
| (e) | Issuer filed for bankruptcy and/or is in default of interest payments. |
| (f) | Principal amount denoted in British Pounds. |
24
|
SCHEDULE OF PORTFOLIO INVESTMENTS |
RBC BlueBay Global High Yield Bond Fund (cont.)
March 31, 2012 (Unaudited)
| (g) | Investment in non-U.S. Dollars. Principal amount reflects local currency. |
| (h) | See notes to financial statements for the tax cost of securities and the breakdown of unrealized appreciation (depreciation). |
Foreign currency exchange contracts as of March 31, 2012:
| | | | | | | | | | | | | | | | | | |
Currency Purchased | | Currency Sold | | | Counterparty | | Settlement
Date | | Unrealized
Appreciation | |
USD | | 2,023,999 | | | GBP | | | | 1,292,000 | | | UBS AG | | 04/12/12 | | $ | (42,382 | ) |
USD | | 318,501 | | | GBP | | | | 200,000 | | | Citigroup Global Markets | | 04/12/12 | | | (1,372 | ) |
USD | | 4,672,460 | | | EUR | | | | 3,529,000 | | | Citigroup Global Markets | | 04/12/12 | | | (34,448 | ) |
| | | | | | | | | | | | | | | | | | |
Total | | | | | | | | | | | | | | | | $ | (78,202 | ) |
| | | | | | | | | | | | | | | | | | |
Abbreviations used are defined below:
EUR - Euro
GBP - British Pound
USD - United States Dollar
Portfolio Diversification (Unaudited)
| | | | |
Industries | | Percentage
of Net Assets | |
| |
Consumer Staples | | | 31.40% | |
Telecommunication Services | | | 26.66% | |
Financials | | | 11.56% | |
Consumer Discretionary | | | 10.73% | |
Industrials | | | 4.67% | |
Materials | | | 2.24% | |
Technology | | | 1.86% | |
Energy | | | 1.04% | |
Other* | | | 9.84% | |
| | | | |
| | | 100.00% | |
| | | | |
| * | Includes cash, interest and dividend receivable, pending trades and Fund share transactions, foreign currency exchange contracts and accrued expenses payable. |
See notes to financial statements.
25
|
SCHEDULE OF PORTFOLIO INVESTMENTS |
RBC BlueBay Global Convertible Bond Fund
March 31, 2012 (Unaudited)
| | | | | | |
Principal Amount | | | | | Value | |
Corporate Bonds — 90.18% | |
Australia — 7.69% | |
| $ 300,000(a) | | Commonwealth Property Office Fund, 5.25%, 12/11/16 | | $ | 320,907 | |
| 400,000 | | Paladin Energy Ltd., 5.00%, 3/11/13 | | | 387,000 | |
| 500,000(a) | | Western Areas NL, 6.40%, 7/2/15 | | | 553,797 | |
| | | | | | |
| | | | | 1,261,704 | |
| | | | | | |
Bermuda — 6.56% | |
| 300,000 | | Aquarius Platinum Ltd., 4.00%, 12/18/15 | | | 251,700 | |
| 2,000,000(b) | | GOME Electrical Appliances Holding Ltd., 3.00%, 9/25/14 | | | 324,905 | |
| 400,000 | | Seadrill Ltd., 3.38%, 10/27/17 | | | 500,400 | |
| | | | | | |
| | | | | 1,077,005 | |
| | | | | | |
British Virgin Islands — 2.60% | |
| 400,000 | | Billion Express Investments Ltd., 0.75%, 10/18/15 | | | 426,200 | |
Cayman Islands — 2.28% | |
| 400,000 | | BES Finance Ltd., 1.63%, 4/15/13 | | | 374,000 | |
Isle of Man — 1.33% | |
| 200,000 | | AngloGold Ashanti Holdings Finance Plc, 3.50%, 5/22/14 | | | 219,000 | |
Japan — 2.36% | |
| 30,000,000(a) | | KDDI Corp., 1.00%, 12/14/15(c) | | | 387,097 | |
Jersey Channel Island — 5.03% | |
| 300,000(d) | | International Power Finance Jersey II Ltd., 3.25%, 7/20/13 | | | 529,748 | |
| 250,000 | | Shire Plc, 2.75%, 5/9/14 | | | 295,375 | |
| | | | | | |
| | | | | 825,123 | |
| | | | | | |
Malaysia — 2.65% | |
| 400,000 | | YTL Corp. Finance Labuan Ltd., 1.88%, 3/18/15 | | | 434,200 | |
Netherlands — 4.91% | |
| 250,000(d) | | Portugal Telecom International Finance BV, 4.13%, 8/28/14 | | | 305,085 | |
| 250,000 | | Siemens Financieringsmaatschappij NV, 1.05%, 8/16/17 | | | 250,675 | |
| 250,000 | | Siemens Financieringsmaatschappij NV, 1.65%, 8/16/19 | | | 250,250 | |
| | | | | | |
| | | | | 806,010 | |
| | | | | | |
Philippines — 2.54% | |
| 400,000 | | San Miguel Corp., 2.00%, 5/5/14 | | | 417,500 | |
Singapore — 8.31% | |
| 250,000(a) | | CapitaLand Ltd., 2.88%, 9/3/16 | | | 193,293 | |
| 500,000(a) | | CapitaMall Trust, 2.13%, 4/19/14 | | | 391,293 | |
| 500,000(a) | | Temasek Financial III Pte Ltd., 0.12%, 10/24/14(c) | | | 421,622 | |
| 300,000 | | Wilmar International Ltd., 0.89%, 12/18/12(c) | | | 357,750 | |
| | | | | | |
| | | | | 1,363,958 | |
| | | | | | |
Spain — 2.11% | |
| 187,000(e) | | International Consolidated Airlines Group SA, 5.80%, 8/13/14 | | | 346,662 | |
26
|
SCHEDULE OF PORTFOLIO INVESTMENTS |
RBC BlueBay Global Convertible Bond Fund (cont.)
March 31, 2012 (Unaudited)
| | | | | | |
Principal Amount | | | | | Value | |
Taiwan — 4.74% | | | | |
| $ 600,000 | | AU Optronics Corp., 10.19%, 10/13/15(c) | | $ | 504,000 | |
| 300,000 | | Tatung Co. Ltd., 4.19%, 3/25/14(c) | | | 274,125 | |
| | | | | | |
| | | | | 778,125 | |
| | | | | | |
Thailand — 2.92% | |
| 15,000,000(a) | | BTS Group Holdings PCL, 1.00%, 1/25/16 | | | 478,930 | |
United Arab Emirates — 3.14% | |
| 400,000(d) | | Aabar Investments PJSC, 4.00%, 5/27/16 | | | 515,344 | |
United States — 31.01% | |
| 300,000 | | Boston Properties LP, 3.63%, 2/15/14(f) | | | 328,125 | |
| 500,000 | | Chesapeake Energy Corp., 2.50%, 5/15/37 | | | 460,625 | |
| 400,000 | | Gilead Sciences, Inc., 1.00%, 5/1/14 | | | 489,000 | |
| 400,000 | | Intel Corp., 3.25%, 8/1/39 | | | 562,500 | |
| 400,000 | | Liberty Interactive LLC, 3.13%, 3/30/23 | | | 483,000 | |
| 350,000 | | MGM Resorts International, 4.25%, 4/15/15 | | | 370,563 | |
| 250,000 | | Microchip Technology, Inc., 2.13%, 12/15/37 | | | 345,000 | |
| 350,000 | | NetApp, Inc., 1.75%, 6/1/13 | | | 507,063 | |
| 250,000 | | SanDisk Corp., 1.50%, 8/15/17 | | | 295,937 | |
| 300,000 | | United States Steel Corp., 4.00%, 5/15/14 | | | 354,750 | |
| 400,000 | | VeriSign, Inc., 3.25%, 8/15/37 | | | 511,000 | |
| 300,000 | | Xilinx, Inc., 3.13%, 3/15/37 | | | 381,000 | |
| | | | | | |
| | | | | 5,088,563 | |
| | | | | | |
| |
Total Corporate Bonds | | | 14,799,421 | |
| | | | | | |
(Cost $13,972,506) | | | | |
| | |
| Shares | | | | | | |
Preferred Stock — 1.98% | | | | |
France — 1.98% | | | | |
| 6,000 | | Publicis Groupe SA | | | 325,451 | |
| | | | | | |
| |
Total Preferred Stock | | | 325,451 | |
| | | | | | |
(Cost $294,807) | | | | |
| |
Total Investments | | $ | 15,124,872 | |
(Cost $14,267,313)(g) — 92.16% | | | | |
| |
Other assets in excess of liabilities — 7.84% | | | 1,285,957 | |
| | | | | | |
| |
NET ASSETS — 100.00% | | $ | 16,410,829 | |
| | | | | | |
27
|
SCHEDULE OF PORTFOLIO INVESTMENTS |
RBC BlueBay Global Convertible Bond Fund (cont.)
March 31, 2012 (Unaudited)
| (a) | Investment in non-U.S. Dollars. Principal amount reflects local currency. |
| (b) | Principal amount denoted in Chinese Yuans. |
| (c) | Zero coupon bond. The rate represents the yield at time of purchase. |
| (d) | Principal amount denoted in Euros. |
| (e) | Principal amount denoted in British Pounds. |
| (f) | Security exempt from registration under Rule 144A or Section 4(2) of the Securities Act of 1933, as amended. These securities may be resold in transactions exempt from registration, normally to qualified institutional buyers. Security has been deemed to be liquid based on procedures approved by the Board of Trustees. |
| (g) | See notes to financial statements for the tax cost of securities and the breakdown of unrealized appreciation (depreciation). |
| | | | | | | | | | | | | | | | |
| Foreign currency exchange contracts as of March 31, 2012: | | | | | |
Currency Purchased | | Currency Sold | | | Counterparty | | Settlement
Date | | Unrealized
Appreciation/
(Depreciation) | |
USD | | 903,743 | | AUD | | | 856,000 | | | Credit Suisse International | | 04/12/12 | | $ | 18,356 | |
USD | | 330,498 | | GBP | | | 211,000 | | | UBS AG | | 04/12/12 | | | (6,969 | ) |
USD | | 1,596,740 | | EUR | | | 1,207,000 | | | Merrill Lynch & Co., Inc. | | 04/12/12 | | | (13,131 | ) |
USD | | 395,280 | | JPY | | | 31,748,000 | | | Merrill Lynch & Co., Inc. | | 04/12/12 | | | 11,665 | |
USD | | 1,020,509 | | SGD | | | 1,285,000 | | | UBS AG | | 04/12/12 | | | (1,737 | ) |
USD | | 449,073 | | THB | | | 13,800,000 | | | Merrill Lynch & Co., Inc. | | 05/09/12 | | | 2,379 | |
| | | | | | | | | | | | | | | | |
Total | | | | | | | | | | | | | | $ | 10,563 | |
| | | | | | | | | | | | | | | | |
Abbreviations used are defined below:
AUD - Australian Dollar
EUR - Euro
GBP - British Pound
JPY - Japanese Yen
SGD - Singapore Dollar
THB - Thai Baht
USD - United States Dollar
28
|
SCHEDULE OF PORTFOLIO INVESTMENTS |
RBC BlueBay Global Convertible Bond Fund (cont.)
| | | | |
| March 31, 2012 (Unaudited) | | | |
| |
| Portfolio Diversification (Unaudited) | | | |
Industries | | Percentage
of Net Assets | |
Financials | | | 21.33% | |
Industrials | | | 13.36% | |
Information Technology | | | 12.74% | |
Telecommunication Services | | | 12.26% | |
Materials | | | 10.76% | |
Consumer Staples | | | 6.96% | |
Consumer Discretionary | | | 6.35% | |
Energy | | | 5.86% | |
Diversified | | | 2.54% | |
Other* | | | 7.84% | |
| | | | |
| | | 100.00% | |
| | | | |
| * | Includes cash, interest and dividend receivable, pending trades and Fund share transactions, foreign currency exchange contracts and accrued expenses payable. |
See notes to financial statements.
29
Statements of Assets and Liabilities
| | | | | | | | | | | | | | | | |
| March 31, 2012 (Unaudited) | | | | | | | | | | | | |
| | | RBC
BlueBay
Emerging Market
Select
Bond Fund | | | RBC
BlueBay
Emerging Market
Corporate
Bond Fund | | | RBC
BlueBay
Global
High Yield
Bond Fund | | | RBC
BlueBay
Global
Convertible
Bond Fund | |
Assets: | | | | | | | | | | | | | | | | |
Investments, at value (cost $33,441,508, $14,271,152, $18,444,815 and $14,267,313, respectively) | | $ | 33,797,666 | | | $ | 14,714,666 | | | $ | 19,195,466 | | | $ | 15,124,872 | |
Cash | | | 14,045,164 | | | | 1,783,472 | | | | 2,484,315 | | | | 1,192,818 | |
Deposits at broker for futures contracts | | | 124,595 | | | | — | | | | — | | | | — | |
Foreign currency, at value (cost $4,407, $0, $1,275,513 and $9,774, respectively) | | | 4,428 | | | | — | | | | 1,279,248 | | | | 9,731 | |
Interest and dividends receivable | | | 512,364 | | | | 221,591 | | | | 382,208 | | | | 84,834 | |
Receivable from advisor | | | — | | | | 22,194 | | | | 18,670 | | | | 21,892 | |
Receivable for capital shares issued | | | 2,593,887 | | | | — | | | | — | | | | — | |
Receivable for investments sold | | | 95,216 | | | | 530,071 | | | | — | | | | — | |
Unrealized appreciation on swap contracts | | | 11,345 | | | | — | | | | — | | | | — | |
Unrealized appreciation on forward foreign exchange contracts | | | 73,279 | | | | 3,128 | | | | — | | | | 32,400 | |
Prepaid expenses and other assets | | | — | | | | — | | | | 51 | | | | — | |
| | | | | | | | | | | | | | | | |
Total Assets | | | 51,257,944 | | | | 17,275,122 | | | | 23,359,958 | | | | 16,466,547 | |
| | | | | | | | | | | | | | | | |
Liabilities: | | | | | | | | | | | | | | | | |
Payable for investments purchased | | | 836,095 | | | | 1,202,209 | | | | 1,961,104 | | | | — | |
Distributions payable | | | 7,695 | | | | 3 | | | | — | | | | 2 | |
Written options, at value (Premiums received $5,243) | | | 154 | | | | — | | | | — | | | | — | |
Unrealized depreciation on forward foreign currency exchange contracts | | | 220,262 | | | | 3,012 | | | | 78,202 | | | | 21,837 | |
Unrealized depreciation on swap contracts | | | 6,058 | | | | — | | | | — | | | | — | |
Foreign withholding tax payable | | | — | | | | — | | | | 3,024 | | | | — | |
Accrued expenses and other payables: | | | | | | | | | | | | | | | | |
Investment advisory fees | | | 1,029 | | | | — | | | | — | | | | — | |
Accounting fees | | | 3,955 | | | | 3,829 | | | | 3,853 | | | | 3,831 | |
Audit fees | | | 19,559 | | | | 19,559 | | | | 19,559 | | | | 19,559 | |
Trustee fees | | | 742 | | | | 812 | | | | 783 | | | | 809 | |
Shareholder reports | | | 1,634 | | | | 1,635 | | | | 1,635 | | | | 1,635 | |
Transfer agent fees | | | 330 | | | | 408 | | | | 418 | | | | 415 | |
Other | | | 2,715 | | | | 13,306 | | | | — | | | | 7,630 | |
| | | | | | | | | | | | | | | | |
Total Liabilities | | | 1,100,228 | | | | 1,244,773 | | | | 2,068,578 | | | | 55,718 | |
| | | | | | | | | | | | | | | | |
Net Assets | | $ | 50,157,716 | | | $ | 16,030,349 | | | $ | 21,291,380 | | | $ | 16,410,829 | |
| | | | | | | | | | | | | | | | |
Net Assets Consist Of: | | | | | | | | | | | | | | | | |
Capital | | $ | 49,481,961 | | | $ | 15,307,848 | | | $ | 20,372,200 | | | $ | 15,407,829 | |
Undistributed net investment income and distributions in excess of net investment income | | | (8,087 | ) | | | 5,573 | | | | (10,351 | ) | | | (813 | ) |
Accumulated net realized gains from investment transactions, futures contracts, swap contracts, written options and foreign currency | | | 456,653 | | | | 273,094 | | | | 266,788 | | | | 135,727 | |
Net unrealized appreciation (depreciation) on investments, futures contracts, swap contracts, written options and foreign currency | | | 227,189 | | | | 443,834 | | | | 662,743 | | | | 868,086 | |
| | | | | | | | | | | | | | | | |
Net Assets | | $ | 50,157,716 | | | $ | 16,030,349 | | | $ | 21,291,380 | | | $ | 16,410,829 | |
| | | | | | | | | | | | | | | | |
Shares Outstanding (Unlimited number of shares authorized, no par value): | | | | | | | | | | | | | | | | |
Class I | | | 4,791,823 | | | | 1,529,978 | | | | 2,035,906 | | | | 1,538,828 | |
| | | | | | | | | | | | | | | | |
Net Asset Values and Redemption Prices Per Share: | | | | | | | | | | | | | | | | |
Class I | | $ | 10.47 | | | $ | 10.48 | | | $ | 10.46 | | | $ | 10.66 | |
| | | | | | | | | | | | | | | | |
| | |
| See notes to financial statements. | | | | | | | | | |
30
Statements of Operations
| | | | | | | | | | | | | | | | |
| For the Period Ended March 31, 2012(a) (Unaudited) | | | | | | | | | | | | |
| | | RBC
BlueBay
Emerging Market
Select
Bond Fund | | | RBC
BlueBay
Emerging Market
Corporate
Bond Fund | | | RBC
BlueBay
Global
High Yield
Bond Fund | | | RBC
BlueBay
Global
Convertible
Bond Fund | |
Investment Income: | | | | | | | | | | | | | | | | |
Interest income | | $ | 369,635 | | | $ | 293,603 | | | $ | 431,887 | | | $ | 194,095 | |
Dividend income | | | — | | | | — | | | | — | | | | 6,131 | |
Foreign tax withholding | | | — | | | | — | | | | (5,054 | ) | | | — | |
| | | | | | | | | | | | | | | | |
Total Investment Income | | | 369,635 | | | | 293,603 | | | | 426,833 | | | | 200,226 | |
| | | | | | | | | | | | | | | | |
Expenses: | | | | | | | | | | | | | | | | |
Investment advisory fees | | | 70,422 | | | | 49,460 | | | | 52,110 | | | | 42,338 | |
Accounting fees | | | 14,892 | | | | 14,712 | | | | 14,799 | | | | 14,716 | |
Audit fees | | | 19,559 | | | | 19,559 | | | | 19,559 | | | | 19,559 | |
Custodian fees | | | 20,030 | | | | 22,033 | | | | 12,018 | | | | 14,021 | |
Interest expense | | | 3 | | | | — | | | | — | | | | 286 | |
Insurance fees | | | 2,419 | | | | 2,419 | | | | 2,419 | | | | 2,419 | |
Legal fees | | | 27,852 | | | | 27,737 | | | | 28,409 | | | | 27,755 | |
Registration and filing fees | | | 10,093 | | | | 10,093 | | | | 10,095 | | | | 10,142 | |
Shareholder reports | | | 3,005 | | | | 3,005 | | | | 3,005 | | | | 3,005 | |
Transfer agent fees | | | 2,520 | | | | 2,520 | | | | 2,520 | | | | 2,520 | |
Organization expense | | | 32,088 | | | | 32,088 | | | | 32,088 | | | | 32,088 | |
Trustees’ fees | | | 900 | | | | 900 | | | | 900 | | | | 900 | |
Other fees | | | 8,676 | | | | 8,676 | | | | 8,676 | | | | 8,676 | |
| | | | | | | | | | | | | | | | |
Total expenses before fee waiver/reimbursement | | | 212,459 | | | | 193,202 | | | | 186,598 | | | | 178,425 | |
Expenses waived/reimbursed by: | | | | | | | | | | | | | | | | |
Adviser | | | (124,429 | ) | | | (133,330 | ) | | | (120,592 | ) | | | (125,217 | ) |
| | | | | | | | | | | | | | | | |
Net Expenses | | | 88,030 | | | | 59,872 | | | | 66,006 | | | | 53,208 | |
| | | | | | | | | | | | | | | | |
| | | | |
Net Investment Income | | | 281,605 | | | | 233,731 | | | | 360,827 | | | | 147,018 | |
| | | | | | | | | | | | | | | | |
Realized/Unrealized Gains (Losses) from Investment Transactions: | | | | | | | | | | | | | | | | |
Net realized gains/(losses) on: | | | | | | | | | | | | | | | | |
Investment transactions | | | 217,685 | | | | 273,600 | | | | 251,243 | | | | 151,802 | |
Foreign currency transactions | | | 224,126 | | | | (506 | ) | | | 15,545 | | | | (16,075 | ) |
Written options | | | 2,121 | | | | — | | | | — | | | | — | |
Futures contracts | | | 12,721 | | | | — | | | | — | | | | — | |
Net change in unrealized appreciation/depreciation on: | | | | | | | | | | | | | | | | |
Investment transactions | | | 356,158 | | | | 443,514 | | | | 750,651 | | | | 857,559 | |
Foreign currency transactions | | | (145,799 | ) | | | 320 | | | | (87,908 | ) | | | 10,527 | |
Written options | | | 5,089 | | | | — | | | | — | | | | — | |
Futures contracts | | | 1,828 | | | | — | | | | — | | | | — | |
Swap contracts | | | 9,913 | | | | — | | | | — | | | | — | |
| | | | | | | | | | | | | | | | |
Net unrealized gains from investments | | | 683,842 | | | | 716,928 | | | | 929,531 | | | | 1,003,813 | |
| | | | | | | | | | | | | | | | |
Change in net assets resulting from operations | | $ | 965,447 | | | $ | 950,659 | | | $ | 1,290,358 | | | $ | 1,150,831 | |
| | | | | | | | | | | | | | | | |
|
| (a) For the period from November 30, 2011 (commencement of operations) to March 31, 2012. | |
| | | | |
| See notes to the financial statements. | | | | | | | | | | | | |
31
Statements of Changes in Net Assets
For the Period Ended March 31, 2012(a) (Unaudited)
| | | | | | | | | | | | | | | | |
| | | RBC
BlueBay
Emerging Market
Select
Bond Fund | | | RBC
BlueBay
Emerging Market
Corporate
Bond Fund | | | RBC
BlueBay
Global
High Yield
Bond Fund | | | RBC
BlueBay
Global
Convertible
Bond Fund | |
| | | | |
From Investment Activities: | | | | | | | | | | | | | | | | |
Operations: | | | | | | | | | | | | | | | | |
Net investment income | | $ | 281,605 | | | $ | 233,731 | | | $ | 360,827 | | | $ | 147,018 | |
Net realized gains from investment transactions | | | 456,653 | | | | 273,094 | | | | 266,788 | | | | 135,727 | |
Net change in unrealized appreciation/depreciation on investments | | | 227,189 | | | | 443,834 | | | | 662,743 | | | | 868,086 | |
| | | | | | | | | | | | | | | | |
Change in net assets resulting from operations | | | 965,447 | | | | 950,659 | | | | 1,290,358 | | | | 1,150,831 | |
| | | | | | | | | | | | | | | | |
| | | | |
Distributions to Class I Shareholders: | | | | | | | | | | | | | | | | |
From net investment income | | | (289,692 | ) | | | (228,158 | ) | | | (371,178 | ) | | | (147,831 | ) |
| | | | | | | | | | | | | | | | |
Change in net assets resulting from shareholder distributions | | | (289,692 | ) | | | (228,158 | ) | | | (371,178 | ) | | | (147,831 | ) |
| | | | | | | | | | | | | | | | |
Capital Transactions: | | | | | | | | | | | | | | | | |
Proceeds from shares issued | | | 49,199,964 | | | | 15,079,693 | | | | 20,001,000 | | | | 15,260,000 | |
Distributions reinvested | | | 281,997 | | | | 228,155 | | | | 371,200 | | | | 147,829 | |
| | | | | | | | | | | | | | | | |
Change in net assets resulting from capital transactions | | | 49,481,961 | | | | 15,307,848 | | | | 20,372,200 | | | | 15,407,829 | |
| | | | | | | | | | | | | | | | |
Net increase in net assets | | | 50,157,716 | | | | 16,030,349 | | | | 21,291,380 | | | | 16,410,829 | |
| | | | |
Net Assets: | | | | | | | | | | | | | | | | |
Beginning of period | | | — | | | | — | | | | — | | | | — | |
| | | | | | | | | | | | | | | | |
End of period | | $ | 50,157,716 | | | $ | 16,030,349 | | | $ | 21,291,380 | | | $ | 16,410,829 | |
| | | | | | | | | | | | | | | | |
Undistributed net investment income and distributions in excess of net investment income | | $ | (8,087 | ) | | $ | 5,573 | | | $ | (10,351 | ) | | $ | (813 | ) |
| | | | | | | | | | | | | | | | |
| | | | |
Share Transactions: | | | | | | | | | | | | | | | | |
Issued | | | 4,764,708 | | | | 1,507,839 | | | | 2,000,099 | | | | 1,524,659 | |
Reinvested | | | 27,115 | | | | 22,139 | | | | 35,807 | | | | 14,169 | |
| | | | | | | | | | | | | | | | |
Change in shares resulting from capital transactions | | | 4,791,823 | | | | 1,529,978 | | | | 2,035,906 | | | | 1,538,828 | |
| | | | | | | | | | | | | | | | |
| (a) | For the period from November 30, 2011 (commencement of operations) to March 31, 2012. |
See notes to financial statements.
32
RBC BlueBay Emerging Market Select Bond Fund
| | | | |
| (Selected data for a share outstanding throughout the period indicated) | | | |
| | | For the Period
Ended
March 31, 2012(a)
(Unaudited) | |
Per Share Operating Performance: | | | | |
Net asset value, beginning of period | | $ | 10.00 | |
| | | | |
Net investment income(b) | | | 0.11 | |
Realized and unrealized gains (losses) | | | 0.47 | |
| | | | |
Total from investment activities | | | 0.58 | |
| | | | |
Less distributions from net investment income | | | (0.11 | ) |
| | | | |
Net asset value, end of period | | $ | 10.47 | |
| | | | |
Total Return:(c) | | | 5.84 | % |
| |
Ratios to Average Net Assets:(d) | | | | |
Ratio of Net Expenses to Average Net Assets | | | 1.00 | % |
Ratio of Net Investment Income to Average Net Assets | | | 3.20 | % |
Ratio of Expenses to Average Net Assets* | | | 2.41 | % |
| |
Net assets, end of period (in thousands) | | $ | 50,158 | |
Portfolio turnover | | | 44 | % |
| * | During the period, certain fees were contractually or voluntarily reduced and/or reimbursed. If such contractual/voluntary fee reductions and reimbursements had not occurred, the ratio would have been as indicated. |
| (a) | For the period from November 30, 2011 (commencement of operations) to March 31, 2012. |
| (b) | Per share net investment income (loss) has been calculated using the average daily shares method. |
See notes to financial statements.
33
RBC BlueBay Emerging Market Corporate Bond Fund
| | | | |
| (Selected data for a share outstanding throughout the period indicated) | | | |
| | | For the Period | |
| | | Ended | |
| | | March 31, 2012(a) | |
| | | (Unaudited) | |
Per Share Operating Performance: | | | | |
Net asset value, beginning of period | | $ | 10.00 | |
| | | | |
Net investment income(b) | | | 0.15 | |
Realized and unrealized gains (losses) | | | 0.48 | |
| | | | |
Total from investment activities | | | 0.63 | |
| | | | |
Less distributions from net investment income | | | (0.15 | ) |
| | | | |
Net asset value, end of period | | $ | 10.48 | |
| | | | |
Total Return:(c) | | | 6.33 | % |
| |
Ratios to Average Net Assets:(d) | | | | |
Ratio of Net Expenses to Average Net Assets | | | 1.15 | % |
Ratio of Net Investment Income to Average Net Assets | | | 4.49 | % |
Ratio of Expenses to Average Net Assets* | | | 3.71 | % |
| |
Net assets, end of period (in thousands) | | $ | 16,030 | |
Portfolio turnover | | | 52 | % |
| * | During the period, certain fees were contractually or voluntarily reduced and/or reimbursed. If such contractual/voluntary fee reductions and reimbursements had not occurred, the ratio would have been as indicated. |
| (a) | For the period from November 30, 2011 (commencement of operations) to March 31, 2012. |
| (b) | Per share net investment income (loss) has been calculated using the average daily shares method. |
See notes to financial statements.
34
RBC BlueBay Global High Yield Bond Fund
(Selected data for a share outstanding throughout the period indicated)
| | | | |
| | | For the Period
Ended
March 31, 2012(a)
(Unaudited) | |
Per Share Operating Performance: | | | | |
Net asset value, beginning of period | | $ | 10.00 | |
| | | | |
Net investment income(b) | | | 0.18 | |
Realized and unrealized gains (losses) | | | 0.46 | |
| | | | |
Total from investment activities | | | 0.64 | |
| | | | |
Less distributions from net investment income | | | (0.18 | ) |
| | | | |
Net asset value, end of period | | $ | 10.46 | |
| | | | |
Total Return:(c) | | | 6.46 | % |
| |
Ratios to Average Net Assets:(d) | | | | |
Ratio of Net Expenses to Average Net Assets | | | 0.95 | % |
Ratio of Net Investment Income to Average Net Assets | | | 5.19 | % |
Ratio of Expenses to Average Net Assets* | | | 2.69 | % |
| |
Net assets, end of period (in thousands) | | $ | 21,291 | |
Portfolio turnover | | | 33 | % |
| * | During the period, certain fees were contractually or voluntarily reduced and/or reimbursed. If such contractual/voluntary fee reductions and reimbursements had not occurred, the ratio would have been as indicated. |
| (a) | For the period from November 30, 2011 (commencement of operations) to March 31, 2012. |
| (b) | Per share net investment income (loss) has been calculated using the average daily shares method. |
See notes to financial statements.
35
RBC BlueBay Global Convertible Bond Fund
(Selected data for a share outstanding throughout the period indicated)
| | | | |
| | | For the Period
Ended
March 31, 2012(a)
(Unaudited) | |
Per Share Operating Performance: | | | | |
Net asset value, beginning of period | | $ | 10.00 | |
| | | | |
Net investment income(b) | | | 0.10 | |
Realized and unrealized gains (losses) | | | 0.66 | |
| | | | |
Total from investment activities | | | 0.76 | |
| | | | |
Less distributions from net investment income | | | (0.10 | ) |
| | | | |
Net asset value, end of period | | $ | 10.66 | |
| | | | |
Total Return:(c) | | | 7.59 | % |
| |
Ratios to Average Net Assets:(d) | | | | |
Ratio of Net Expenses to Average Net Assets(e) | | | 1.01 | % |
Ratio of Net Investment Income to Average Net Assets | | | 2.78 | % |
Ratio of Expenses to Average Net Assets* | | | 3.37 | % |
| |
Net assets, end of period (in thousands) | | $ | 16,411 | |
Portfolio turnover | | | 9 | % |
| * | During the period, certain fees were contractually or voluntarily reduced and/or reimbursed. If such contractual/voluntary fee reductions and reimbursements had not occurred, the ratio would have been as indicated. |
| (a) | For the period from November 30, 2011 (commencement of operations) to March 31, 2012. |
| (b) | Per share net investment income (loss) has been calculated using the average daily shares method. |
| (e) | The ratio for this period excluding interest expense was 1.00% |
See notes to financial statements.
36
|
NOTES TO FINANCIAL STATEMENTS |
March 31, 2012 (Unaudited)
1. Organization
RBC Funds Trust (“the Trust”) is registered under the Investment Company Act of 1940 (as amended) as an open-end management investment company. The Trust was organized as a Delaware statutory trust on December 16, 2003. This annual report includes the following four investment portfolios (“Funds”):
- RBC BlueBay Emerging Market Select Bond Fund (“Emerging Market Select Bond Fund”)
- RBC BlueBay Emerging Market Corporate Bond Fund (“Emerging Market Corporate Bond Fund”)
- RBC Blue Bay Global High Yield Bond Fund (“Global High Yield Bond Fund”)
- RBC BlueBay Global Convertible Bond Fund (“Global Convertible Bond Fund”)
The Funds offer Class I shares. Class I shares (intended for investors meeting certain investment minimum thresholds) are not subject to either a front-end sales charge or a contingent deferred sales charge (“CDSC”).
RBC Global Asset Management (U.S.) Inc. (“RBC GAM (US)”) acts as the investment advisor for the Funds and BlueBay Asset Management Ltd. (“BlueBay”) acts as the sub-advisor. The officers of the Trust (“Fund Management”) are also employees of RBC GAM (US) or its affiliates, BlueBay or of BNY Mellon Investment Servicing (US) Inc. (“BNY Mellon”), the co-administrator.
2. Significant Accounting Policies
Summarized below are the significant accounting policies of the Funds. These policies conform to accounting principles generally accepted in the United States of America (“U.S. GAAP”). Fund Management follows these policies when preparing financial statements. Management may also be required to make estimates and assumptions that affect the reported amounts of assets and liabilities at the date of the financial statements and the reported amounts of income and expenses for the period. Actual results could differ from those estimates.
Security Valuation:
Bonds and other fixed income securities are generally valued on the basis of prices furnished by pricing services approved by the Trust’s Board. The pricing services utilize both dealer-supplied valuations and electronic data processing techniques that take into account appropriate factors such as institutional-size trading in similar groups of securities, yield, quality, coupon rate, maturity and type of issue. Derivative contracts and agreements are fair valued using methodologies approved by the Trust’s Board. These valuation techniques take into account multiple factors, including fundamental security analytical data, counterparty valuation quotations, information from broker-dealers, market spreads and interest rates. Short-term debt obligations, with less than 60 days to maturity at time of purchase, are valued at amortized cost unless Fund Management determines that amortized cost no longer approximates market value.
In such cases where a security price is unavailable, or where Fund Management determines that the value provided by the pricing services or amortized cost does not approximate fair value, the Board has approved pricing and valuation procedures to determine a security’s fair value. Fair valuation may also be used when a significant valuation event is determined to have occurred. Significant valuation events may include, but are not limited to, the following: an event affecting the value of a security traded on a foreign market occurs between the close of that market and the close of regular trading on the New York Stock Exchange; an extraordinary event like a natural disaster or terrorist act occurs; or an adverse development arises with respect to a specific issuer, such as a bankruptcy filing. Some of the factors which may be considered in determining fair value are fundamental analytical data relating to the security, the issuer and the market, such as duration, prepayment and default rates; general level of interest rates and changes in interest rates; information from broker-dealers; and trading in similar securities. Exchange traded options, futures, and options on futures are valued at their most recent sale price on the exchange on which they are primarily traded.
37
|
NOTES TO FINANCIAL STATEMENTS |
Forward foreign currency exchange contracts are marked-to market daily based upon foreign currency exchange rates provided by an independent pricing service.
Swaps are valued by an independent pricing service using an industry standard pricing model. If a price is not available from a pricing service or is deemed unreliable or not reflective of current market value, the swap may be priced at fair value using procedures approved by the Board.
Investments initially valued in currencies other than the U.S. dollar are converted to the U.S. dollar using foreign exchange rate quotations received from a pricing vendor as of 4:00 p.m. Eastern time. The value of securities traded in markets outside the United States may be affected on a day that the NYSE is closed and an investor is not able to purchase, exchange or redeem shares of the Funds.
Foreign Currency Transactions:
The values of foreign securities, foreign currencies and other assets and liabilities denominated in foreign currencies are translated into U.S. dollars using current exchange rates each business day. Fluctuations in the value of foreign currency holdings and other assets and liabilities resulting from movements in currency exchange rates are recorded as unrealized foreign currency gains or losses. The effects of changes in foreign currency exchange rates on investments in securities are not segregated from the effects of changes in market prices of those securities on the Statements of Operations. Such fluctuations are included with the net realized gains or losses and net change in unrealized appreciation/depreciation on investment transactions.
Financial Instruments:
Derivatives
The Funds may use derivative instruments, including futures, forwards, options, indexed securities, swaps and inverse securities for hedging purposes only. Derivatives allow a Fund to increase or decrease its risk exposure more quickly and efficiently than other types of instruments. Derivatives may be riskier than other types of investments and could result in losses that significantly exceed a Fund’s original investment. Derivatives are subject to the risk that changes in the value of a derivative may not correlate perfectly with the underlying asset, rate or index. The use of derivatives may not be successful, resulting in losses to a Fund, and the cost of such strategies may reduce the Fund’s returns. Derivatives may also expose a Fund to counterparty risk (the risk that the derivative counterparty will not fulfill its contractual obligations). To the extent amounts due to the Funds from their counterparties are not fully collateralized contractually or otherwise, the Funds bear the risk of loss from counterparty non-performance. A Fund’s maximum risk of loss from counterparty credit risk on over-the-counter derivatives is generally the aggregate unrealized gain in excess of any collateral pledged by the counterparty to the Funds. For over-the-counter purchased options, the Funds bear the risk of loss in the amount of the premiums paid and change in market value of the options should the counterparty not perform under the contracts. Written options by the Funds do not give rise to counterparty credit risk, as written options obligate the Funds to perform and not the counterparty. Counterparty risk related to exchange traded financial futures contracts and options is minimal because of the protection against defaults provided by the exchange on which they trade. Hedging also involves the risk that changes in the value of the derivative will not match those of the holdings being hedged as expected by the Funds, in which case any losses on the holdings being hedged may not be reduced and may be increased. There can be no assurance that a Fund’s hedging strategy will reduce risk or that hedging transactions will be available or cost effective. The Funds are subject to interest rate risk and foreign currency exchange risk in the normal course of pursuing its investment objectives by investing in various derivative financial instruments, as described below. In addition to the risks associated with derivatives in general, the Funds will also be subject to risks related to swap agreement. Because swap agreement are not exchange-traded, but are private contracts into which a Fund and a swap counterparty enter as principals, a Fund may experience a loss or delay in recovering assets if the counterparty defaults on its obligations. Each Fund will segregate or earmark liquid assets in an amount sufficient to cover its obligations under swap agreements.
38
|
NOTES TO FINANCIAL STATEMENTS |
The Funds may mitigate counterparty risk on derivatives through master netting agreements included within an International Swaps and Derivatives Association, Inc. (“ISDA”) Master Agreement between a Fund and each of its counterparties. The ISDA Master Agreement allows each Fund to offset with its counterparty certain derivative financial instruments’ payables and/or receivables with collateral held with each counterparty. The amount of collateral moved to/from applicable counterparties is based upon minimum transfer amounts of up to $1,000,000. To the extent amounts due to the Funds from their counterparties are not fully collateralized contractually or otherwise, the Funds bear the risk of loss from counterparty non-performance.
Financial Futures Contracts
The Funds may enter into futures contracts in an effort to manage the duration of the portfolio and hedge against certain market risk. A futures contract on a securities index is an agreement obligating one party to pay, and entitling the other party to receive, during the term of the contract, cash payments based on the level of a specified securities index. Futures transactions involve brokerage costs and require a Fund to segregate assets to cover contracts that would require it to purchase securities or currencies. A Fund may lose the expected benefit of futures transactions if interest rates, exchange rates or securities prices change in an unanticipated manner. Such unanticipated changes may also result in lower overall performance than if a Fund had not entered into any futures transactions.
Upon entering into a futures contract, a Fund is required to pledge to the broker an amount of cash, U.S. government securities, or other assets equal to a certain percentage of the contract amount. Subsequent payments are made or received by the Funds each day, depending on the daily fluctuations in the fair value of the underlying instrument. A Fund would record an unrealized gain or loss each day equal to these daily payments.
The Emerging Market Select Bond Fund had the following open futures contracts at March 31, 2012:
| | | | | | | | | | | | | | | | |
Short Position | | Number of
Contracts | | | Expiration
Date | | Unrealized
Appreciation | | | Notional
Value | | | Counterparty |
Ten Year U.S. Treasury Bond | | | 4 | | | June, 2012 | | $ | 1,828 | | | $ | 519,766 | | | Citigroup Global Markets, Inc. |
Collateral pledged for open futures contracts is the deposit at brokers shown on the Statement of Assets and Liabilities at March 31, 2012.
Options
The Funds may write (or sell) put and call options on the securities that the Funds are authorized to buy or already hold in their portfolio. The Funds may also purchase put and call options. The Emerging Market Select Bond Fund has outstanding options as of March 31, 2012.
A call option gives the purchaser of the option the right (but not the obligation) to buy, and obligates the seller to sell (when the option is exercised), the underlying instrument at the exercise price at any time or at a specified time during the option period. A put option gives the holder the right to sell and obligates the writer to buy the underlying instrument at the exercise price at any time or at a specified time during the option period. When a Fund purchases (writes) an option, an amount equal to the premium paid (received) by a Fund is reflected as an asset (liability). The amount of the asset (liability) is subsequently marked-to-market to reflect the current market value of the option purchased (written). When an instrument is purchased or sold through an exercise of an option, the related premium paid (or received) is added to (or deducted from) the basis of the instrument acquired or deducted from (or added to) the proceeds of the instrument sold. When an option expires (or a Fund enters into a closing transaction), a Fund realizes a gain or loss on the option to the extent of the premiums received or paid (or gain or loss to the extent the cost of the closing transaction exceeds the premium received or paid). When a Fund writes a call option, such option is “covered,” meaning that a Fund holds the underlying instrument subject to being called by the option counterparty, or cash in an amount sufficient to cover the obligation. When a Fund writes a put option, such option is covered by cash in an amount sufficient to cover the obligation.
39
|
NOTES TO FINANCIAL STATEMENTS |
In purchasing and writing options, a Fund bears the market risk of an unfavorable change in the price of the underlying instrument or the risk that a Fund may not be able to enter into a closing transaction due to an illiquid market. Exercise of a written option could result in a Fund purchasing or selling a security at a price different from the current market value.
A Fund may execute transactions in both listed and over-the-counter options. Listed options involve minimal counterparty risk since listed options are guaranteed against default by the exchange on which they trade. Transactions in certain over-the-counter options may expose a Fund to the risk of default by the counterparty to the transaction. In the event of default by the counterparty to the over-the-counter option transaction, a Fund’s maximum amount of loss is the premium paid (as purchaser) or the unrealized gain of the contract (as writer).
A summary of the Emerging Market Select Bond Fund written option transactions for the year is as follows:
| | | | | | | | |
| | | Number of
Options
Contracts | | | Premiums
Received | |
Contracts outstanding at November 30, 2011* | | | — | | | $ | — | |
Options written | | | 630 | | | | 7,363 | |
Options terminated in closing purchase transactions | | | — | | | | — | |
Options exercised | | | — | | | | — | |
Options expired | | | (300 | ) | | | (2,120 | ) |
| | | | | | | | |
Contracts outstanding at March 31, 2012 | | | 330 | | | $ | 5,243 | |
| | | | | | | | |
* commencement of operations.
Forward Foreign Currency Exchange Contracts
The Funds entered into forward foreign currency contracts (“Forward”) to hedge their exposure to changes in foreign currency exchange rates on foreign portfolio holdings (foreign currency exchange risk). In addition, certain Funds may use a Forward to provide exposure to the foreign currency market. A Forward is an agreement between two parties to purchase or sell a foreign currency at a future date at a negotiated forward rate. A Forward is marked-to-market daily and the change in market value is recorded by the Funds as unrealized appreciation or depreciation until the contract settlement date. The market value of the Forward is determined using the forward rate for the remainder of the outstanding period of the contract, through the delivery date. When a Forward is closed or settled, the Funds record a realized gain or loss equal to the fluctuation in rates during the period a Forward was open. Risks may arise upon entering into these contracts from the potential inability of the counterparties to meet the terms of their contracts, or if the foreign currency rates change unfavorably.
In the event of default by the counterparty to the transaction, the Funds’ maximum amount of loss, as either the buyer or seller, is the unrealized gain of the contract.
Details of forward contracts at period end are included in the Portfolio of Investments under the caption “Foreign currency exchange contracts.”
Swap Agreements
The Funds may enter into swap agreements, which are agreements involving two parties to exchange the return generated by a security, currency, commodity, interest rate, index, or other measures for the return generated by another instrument, for example, the agreement to pay interest in exchange for a market-linked return based on a notional amount. The Funds entered into total return, interest rate and other swap agreements. Interest rate swap agreements generally involve the agreement by the Funds to pay a counterparty a fixed or floating rate on a fixed notional amount and to receive a fixed or floating rate on a fixed notional amount, but may also involve the agreement to pay or receive payments derived from changes in interest rates. Periodic payments are generally made during the life
40
|
NOTES TO FINANCIAL STATEMENTS |
of the swap agreement according to the terms and conditions of the agreement and at termination or maturity. Total return swap agreements involve the commitments to pay or receive an amount generally determined by reference to a security, index or other measure in exchange for a specific market linked return, based on notional amounts. To the extent that the total return of the security, index or other measure underlying the transaction exceeds or falls short of the offsetting interest rate-based obligation, the Funds receive or make a payment to the counterparty. Interim payments or receipts are recorded as interest expense and interest income in the Statements of Operations. Payments received or made by a Fund at the expiration or other termination of the swap agreements are recorded in the Statements of Operations as realized gains or losses, respectively. Swap agreements are marked-to-market daily based on dealer-supplied valuations, and changes in value, including the periodic amounts of interest to be paid or received on swaps, are recorded as unrealized appreciation/(depreciation). Risks may exceed amounts recognized on the Statements of Assets and Liabilities. These risks include changes in the returns of the underlying instruments, failure of the counterparties to perform under the contracts’ terms and the possible lack of liquidity with respect to the swap agreements. Details of swap agreements open at period end are included in the Portfolios of Investments under the caption “Interest Rate Swaps” and Total Return Swaps are footnoted on the Portfolio of Investments.
Fair Values of Derivative Instruments as of March 31, 2012 are as follows*:
Fair Values of Derivative Financial Instruments as of March 31, 2012
Statement of Assets and Liabilities Location
Asset Derivatives
| | | | | | | | | | | | | | | | | | |
| | | | | Emerging
Market Select
Bond Fund | | | Emerging
Market Corporate
Bond Fund | | | Global
High Yield
Bond Fund | | | Global
Convertible
Bond Fund | |
Foreign currency exchange contracts | | Net unrealized appreciation on forward foreign currency exchange contracts | | $ | 73,279 | | | $ | 3,128 | | | $ | — | | | $ | 32,400 | |
Foreign currency contracts | | Investments, at value (put options purchased) | | | 6,481 | | | | — | | | | — | | | | — | |
Interest rate contracts | | Unrealized appreciation on swap contracts | | | 11,345 | | | | — | | | | — | | | | — | |
| | | | | | | | | | | | | | | | | | |
Total | | | | $ | 91,105 | | | $ | 3,128 | | | $ | — | | | $ | 32,400 | |
| | | | | | | | | | | | | | | | | | |
| | | | | | | | | | | | | | | | | | |
Liability Derivatives | |
| | | | | |
| | | | | Emerging
Market Select
Bond Fund | | | Emerging
Market Corporate
Bond Fund | | | Global
High Yield
Bond Fund | | | Global
Convertible
Bond Fund | |
Interest rate contracts | | Unrealized depreciation on swap contracts | | $ | 6,058 | | | $ | — | | | $ | — | | | $ | — | |
Foreign currency contracts | | Written options, at value | | | 154 | | | | — | | | | — | | | | — | |
Foreign currency exchange contracts | | Net unrealized depreciation on forward foreign currency exchange contracts | | | 220,262 | | | | 3,012 | | | | 78,202 | | | | 21,837 | |
| | | | | | | | | | | | | | | | | | |
| Total | | | | $ | 226,474 | | | $ | 3,012 | | | $ | 78,202 | | | $ | 21,837 | |
| | | | | | | | | | | | | | | | | | |
41
|
NOTES TO FINANCIAL STATEMENTS |
The effect of Derivative Instruments on the Statement of Operations during the period ended March 31, 2012 is as follows:
| | | | | | | | | | | | | | | | |
Derivative Instruments Categorized by Risk Exposure | | Emerging
Market Select
Bond Fund | | | Emerging
Market Corporate
Bond Fund | | | Global
High Yield
Bond Fund | | | Global
Convertible
Bond Fund | |
Net realized Gain (Loss) From: | | | | | | | | | | | | | | | | |
Interest Rate Risk: | | | | | | | | | | | | | | | | |
Financial futures contracts | | $ | 12,721 | | | $ | — | | | $ | — | | | $ | — | |
Interest rate swaps | | | — | | | | — | | | | — | | | | — | |
Foreign currency exchange risk: | | | | | | | | | | | | | | | | |
Forward foreign currency exchange contracts | | | 224,126 | | | | (506 | ) | | | 15,545 | | | | (16,075 | ) |
Written options | | | 2,121 | | | | — | | | | — | | | | — | |
Purchased options | | | 3,724 | | | | — | | | | — | | | | — | |
| | | | | | | | | | | | | | | | |
| | $ | 242,692 | | | $ | (506 | ) | | $ | 15,545 | | | $ | (16,075 | ) |
| | | | | | | | | | | | | | | | |
Net Change in Unrealized Appreciation/Depreciation | | | | | | | | | | | | | | | | |
From: | | | | | | | | | | | | | | | | |
Interest Rate Risk: | | | | | | | | | | | | | | | | |
Financial futures contracts | | | 1,828 | | | | — | | | | — | | | | — | |
Interest rate swaps | | | 9,913 | | | | — | | | | — | | | | — | |
Foreign currency exchange risk: | | | | | | | | | | | | | | | | |
Forward foreign currency exchange contracts | | | (145,799 | ) | | | 320 | | | | (87,908 | ) | | | 10,527 | |
Written options | | | 5,089 | | | | — | | | | — | | | | — | |
Purchased options | | | 1,239 | | | | — | | | | — | | | | — | |
| | | | | | | | | | | | | | | | |
| | $ | (127,730 | ) | | $ | 320 | | | $ | (87,908 | ) | | $ | 10,527 | |
| | | | | | | | | | | | | | | | |
| * | For open derivative instruments as of March 31, 2012, see the preceding tables on the Schedule of Portfolio Investments for foreign currency exchange contracts and interest rate contracts and the following section for financial futures contracts. |
For the period ended March 31, 2012, the average volume of derivative activities are as follows:
| | | | | | | | | | | | | | | | |
| | | Emerging
Market Select
Bond Fund | | | Emerging
Market Corporate
Bond Fund | | | Global
High Yield
Bond Fund | | | Global
Convertible
Bond Fund | |
Futures short position (contracts) | | | 2 | | | | — | | | | — | | | | — | |
Forward foreign currency exchange contracts purchased (U.S. dollar amounts) | | $ | 7,321,547 | | | $ | 513,169 | | | $ | 5,963,725 | | | $ | 4,708,015 | |
Forward foreign currency exchange contracts sold (U.S. dollar amounts) | | | 11,741,965 | | | | 191,834 | | | | — | | | | — | |
Purchased options (Cost $) | | | 2,621 | | | | — | | | | — | | | | — | |
Written Options (Premium received $) | | | 2,621 | | | | — | | | | — | | | | — | |
Interest rate swaps | | | | | | | | | | | | | | | | |
(Notional Amount in U.S. Dollars) | | | 5,946,720 | | | | — | | | | — | | | | — | |
Credit Enhancement
Certain obligations held by the Funds have credit enhancement or liquidity features that may, under certain circumstances, provide for repayment of principal and interest on the obligation upon demand date, interest rate reset date or final maturity. These enhancements may include: letters of credit; liquidity guarantees; security purchase agreements; tender option purchase agreements and third party insurance (i.e., AMBAC and MBIA).
Organization Expense
Upon commencement of operations, organization expense associated with the establishment of the Funds were paid by the Funds. Organization expense is amortized and included in expenses over a 12-month period beginning with the commencement of operations and are included in the Statement of Operations.
42
|
NOTES TO FINANCIAL STATEMENTS |
Fair Value Measurements:
Various input levels are used in determining the fair value of investments which are as follows:
• Level 1 - Inputs that reflect unadjusted quoted prices in active markets for identical assets or liabilities that the Funds have the ability to access at the measurement date.
• Level 2 - Inputs other than quoted prices that are observable for the asset or liability either directly or indirectly, including inputs in markets that are not considered to be active.
• Level 3 - Unobservable inputs based on the best information available in the circumstances, to the extent observable inputs are not available (including the Fund’s own assumptions in determining the fair value of investments).
The inputs or methodology used for valuing investments are not necessarily an indication of the risk associated with investing in those securities.
The summary of inputs used to determine the fair value of the Funds’ investments as of March 31, 2012 is as follows:
| | | | | | | | | | | | | | | | |
| Emerging Market Select Bond Fund | | Level 1
Quoted Prices | | | Level 2
Significant
Observable
Inputs | | | Level 3
Significant
Unobservable
Inputs | | | Total | |
Assets: | | | | | | | | | | | | |
Investments in Securities | | | | | | | | | | | | | | | | |
Corporate Bonds | | $ | — | | | $ | 2,103,969 | (a) | | $ | — | | | $ | 2,103,969 | |
Foreign Government Bonds | | | — | | | | 31,101,898 | (a) | | | 585,318 | | | | 31,687,216 | |
Put Options Purchased | | | — | | | | 6,481 | (a) | | | — | | | | 6,481 | |
Other Financial Instruments* | | | | | | | | | | | | | | | | |
Interest rate contracts | | | 1,828 | | | | 11,345 | | | | — | | | | 13,173 | |
Foreign currency exchange contracts | | | — | | | | 73,279 | | | | — | | | | 73,279 | |
| | | | | | | | | | | | | | | | |
Total Assets | | $ | 1,828 | | | $ | 33,296,972 | | | $ | 585,318 | | | $ | 33,884,118 | |
| | | | | | | | | | | | | | | | |
Liabilities: | | | | | | | | | | | | |
Other Financial Instruments* | | | | | | | | | | | | | | | | |
Interest rate contracts | | $ | — | | | $ | (6,058 | ) | | $ | — | | | $ | (6,058 | ) |
Foreign currency exchange contracts | | | — | | | | (220,416 | ) | | | — | | | | (220,416 | ) |
| | | | | | | | | | | | | | | | |
Total Liabilities | | $ | — | | | $ | (226,474 | ) | | $ | — | | | $ | (226,474 | ) |
| | | | | | | | | | | | | | | | |
| | | | |
Emerging Market Corporate Bond Fund | | Level 1
Quoted Prices | | | Level 2
Significant
Observable
Inputs | | | Level 3
Significant
Unobservable
Inputs | | | Total | |
| | | | |
| | | | |
| | | | |
Assets: | | | | | | | | | | | | |
Investments in Securities | | | | | | | | | | | | | | | | |
Corporate Bonds | | $ | — | | | $ | 14,107,766 | (a) | | $ | 399,876 | | | $ | 14,507,642 | |
Foreign Government Bonds | | | — | | | | 207,024 | (a) | | | — | | | | 207,024 | |
Other Financial Instruments* | | | | | �� | | | | | | | | | | | |
Foreign currency exchange contracts | | | — | | | | 3,128 | | | | — | | | | 3,128 | |
| | | | | | | | | | | | | | | | |
Total Assets | | $ | — | | | $ | 14,317,918 | | | $ | 399,876 | | | $ | 14,717,794 | |
| | | | | | | | | | | | | | | | |
Liabilities: | | | | | | | | | | | | |
Other Financial Instruments* | | | | | | | | | | | | | | | | |
Foreign currency exchange contracts | | $ | — | | | $ | (3,012 | ) | | $ | — | | | $ | (3,012 | ) |
| | | | | | | | | | | | | | | | |
Total Liabilities | | $ | — | | | $ | (3,012 | ) | | $ | — | | | $ | (3,012 | ) |
| | | | | | | | | | | | | | | | |
43
|
NOTES TO FINANCIAL STATEMENTS |
| | | | | | | | | | | | | | | | |
Global High Yield Bond Fund | | Level 1
Quoted Prices | | | Level 2
Significant
Observable
Inputs | | | Level 3
Significant
Unobservable
Inputs | | | Total | |
| | | | |
| | | | |
| | | | |
Assets: | | | | | | | | | | | | |
Investments in Securities | | | | | | | | | | | | | | | | |
Bank Loans | | $ | — | | | $ | 1,927,621 | (a) | | $ | 266,741 | | | $ | 2,194,362 | |
Corporate Bonds | | | — | | | | 17,001,104 | (a) | | | — | | | | 17,001,104 | |
Other Financial Instruments* | | | | | | | | | | | | | | | | |
Foreign currency exchange contracts | | | — | | | | — | | | | — | | | | — | |
| | | | | | | | | | | | | | | | |
Total Assets | | $ | — | | | $ | 18,928,725 | | | $ | 266,741 | | | $ | 19,195,466 | |
| | | | | | | | | | | | | | | | |
Liabilities: | | | | | | | | | | | | |
Other Financial Instruments* | | | | | | | | | | | | | | | | |
Foreign currency exchange contracts | | $ | — | | | $ | (78,202 | ) | | $ | — | | | $ | (78,202 | ) |
| | | | | | | | | | | | | | | | |
Total Liabilities | | $ | — | | | $ | (78,202 | ) | | $ | — | | | $ | (78,202 | ) |
| | | | | | | | | | | | | | | | |
| | | | |
Global Convertible Bond Fund | | Level 1
Quoted Prices | | | Level 2
Significant
Observable
Inputs | | | Level 3
Significant
Unobservable
Inputs | | | Total | |
| | | | |
| | | | |
| | | | |
Assets: | | | | | | | | | | | | |
Investments in Securities | | | | | | | | | | | | | | | | |
Corporate Bonds | | $ | — | | | $ | 14,799,421 | (a) | | $ | — | | | $ | 14,799,421 | |
Preferred Stock | | | 325,451 | | | | — | | | | — | | | | 325,451 | |
Other Financial Instruments* | | | | | | | | | | | | | | | | |
Foreign currency exchange contracts | | | — | | | | 32,400 | | | | — | | | | 32,400 | |
| | | | | | | | | | | | | | | | |
Total Assets | | $ | 325,451 | | | $ | 14,831,821 | | | $ | — | | | $ | 15,157,272 | |
| | | | | | | | | | | | | | | | |
Liabilities: | | | | | | | | | | | | |
Other Financial Instruments* | | | | | | | | | | | | | | | | |
Foreign currency exchange contracts | | $ | — | | | $ | (21,837 | ) | | $ | — | | | $ | (21,837 | ) |
| | | | | | | | | | | | | | | | |
Total Liabilities | | $ | — | | | $ | (21,837 | ) | | $ | — | | | $ | (21,837 | ) |
| | | | | | | | | | | | | | | | |
| (a) | The breakdown of the Fund’s investments by country is disclosed in the Schedules of Portfolio Investments. |
| * | Other financial instruments are instruments not reflected in the Schedule of Portfolio Investments, such as futures contracts, options, swaps and foreign currency exchange contracts which are valued at the unrealized appreciation/(depreciation) on the investment. |
During the period ended March 31, 2012, the Funds recognized no transfers to/from level 1 or level 2. The Fund’s policy is to recognize transfers to/from level 1, level 2 and level 3 at the end of the year utilizing fair value at the beginning of the year.
In May 2011, the Financial Accounting Standards Board (“FASB”) issued Accounting Standards Update (“ASU”) No. 2011-04 “Amendments to Achieve Common Fair Value Measurement and Disclosure Requirements” in U.S. GAAP and International Financial Reporting Standards (“IFRSs”). ASU 2011-04 includes common requirements for measurement of and disclosure about fair value between U.S. GAAP and IFRS. ASU 2011-04 will require reporting entities to disclose the following information for fair value measurements categorized within Level 3 of the fair value hierarchy: quantitative information about the unobservable inputs used in the fair value measurement, the valuation processes used by the reporting entity and a narrative description of the sensitivity of the fair value measurement to changes in unobservable inputs and the interrelationships between those unobservable inputs. In addition, ASU 2011-04 will require reporting entities to make disclosures about amounts and reasons for all transfers in and out of Level 1 and Level 2 fair value measurements. The new and revised disclosures are effective for interim and annual reporting periods beginning after December 15, 2011. Management is currently evaluating the implications of ASU No. 2011-04 and its impact on the financial statements.
44
|
NOTES TO FINANCIAL STATEMENTS |
Following is a reconciliation of Level 3 investments for which significant unobservable inputs were used to determine fair value:
| | | | | | | | | | | | |
| | | Emerging
Market Select
Bond Fund
(Foreign
Government
Bonds-Russia) | | | Emerging
Market Corporate
Bond Fund
(Corporate
Bonds-British
Virgin Islands,
Ireland) | | | Global
High Yield
Bond Fund
(Bank Loans-
France) | |
| | | |
| | | |
| | | |
| | | |
| | | |
| | | |
| Balance as of 11/30/11*(value) | | $ | — | | | $ | — | | | $ | — | |
| Purchases | | | 585,318 | | | | 399,876 | | | | 264,410 | |
| | | | | | | | | | | | |
Change in unrealized appreciation/depreciation | | | — | | | | — | | | | 2,331 | |
| | | | | | | | | | | | |
| Balance as of 03/31/12(value) | | $ | 585,318 | | | $ | 399,876 | | | $ | 266,741 | |
| | | | | | | | | | | | |
* commencement of operations. | | | | | | | | | | | | |
Investment Transactions and Income:
Investment transactions are recorded on one business day after trade date, except on the last day of each fiscal quarter end, when they are recorded on trade date. Dividend income is recorded on the ex-dividend date. Realized gains and losses from investment transactions are calculated based on the cost of the specific security (also known as identified cost basis). Interest income is recognized on the accrual basis and includes, where applicable, the amortization or accretion of premium or discount using the effective yield method.
Expense, Investment Income and Gain/Loss Allocation:
Each Fund pays the expenses that are directly related to its operations, such as custodian fees or adviser fees. Expenses incurred by the Trust, such as trustee or legal fees, are allocated among each of the Funds either proportionately based upon each Fund’s relative net assets or using another reasonable basis such as equally across all Funds, depending on the nature of the expense. Individual share classes within a Fund are charged expenses specific to that class, such as distribution fees. Within a Fund, expenses other than class specific expenses are allocated daily to each class based upon the proportion of relative net assets. Investment income and realized and unrealized gains or losses are allocated to each class of shares based on relative net assets.
Distributions to Shareholders:
Each Fund pays out any income that it receives, less expenses, in the form of dividends and capital gains to its shareholders. Income dividends are declared daily and paid monthly. Dividends will also be paid at any time during the month upon total redemption of shares in an account. Capital gain distributions are declared and paid at least annually. Distributions to shareholders are recorded on the ex-dividend date. The amount of dividends and distributions are calculated based on federal income tax regulations, which may differ from GAAP. These “book/tax” differences may be either temporary or permanent in nature. To the extent these differences are determined, as of the end of the tax year, to be permanent (e.g., expiring capital loss carryforward), they are reclassified within a Fund’s capital accounts based on their federal tax basis treatment.
3. Agreements and Other Transactions with Affiliates
The Trust has entered into investment advisory agreements with RBC GAM (US) under which RBC GAM (US) manages each Fund’s assets and furnishes related office facilities, equipment, research and personnel. The agreements require each Fund to pay RBC GAM (US) a monthly fee based upon average daily net assets. Under the terms of the advisory contracts, RBC GAM (US) is entitled
45
|
NOTES TO FINANCIAL STATEMENTS |
to receive fees based on a percentage of the average daily net assets of each of the Funds as follows:
| | | | | | |
| | | Average Daily Net Assets of Fund | | Annual Rate | |
| Emerging Market Select Bond Fund | | All Net Assets | | | 0.80% | |
| Emerging Market Corporate Bond Fund | | All Net Assets | | | 0.95% | |
| Global High Yield Bond Fund | | All Net Assets | | | 0.75% | |
| Global Convertible Bond Fund | | All Net Assets | | | 0.80% | |
RBC GAM (US) has contractually agreed to waive fees and/or make payments in order to keep total operating expenses of the Funds to the following levels. This expense limitation agreement is in place until January 31, 2013.
| | | | |
| | | Annual Rate | |
| Emerging Market Select Bond Fund | | | 1.00% | |
| Emerging Market Corporate Bond Fund | | | 1.15% | |
| Global High Yield Bond Fund | | | 0.95% | |
| Global Convertible Bond Fund | | | 1.00% | |
The Funds are sub-advised by BlueBay, which is a wholly-owned subsidiary of Royal Bank of Canada, which is a parent company of the Advisor. The Sub-Advisor is paid by the Advisor out of the advisory fee paid by the Funds to the Advisor.
RBC GAM (US) serves as co-administrator to the Funds. BNY Mellon serves as co-administrator and fund accounting agent. Services provided under the administrative services contract include providing day-to-day administration of matters related to the Funds, maintenance of their records and the preparation of reports. Under the terms of the administrative services contract, RBC GAM (US) does not receive a fee for it’s role as co-administrator. BNY Mellon receives a fee for its services payable by the Funds based on the Funds’ average net assets. BNY Mellon’s fee is included with “Accounting fees” in the Statements of Operations.
Certain Officers and Trustees of the Trust are affiliated with the adviser or the co-administrator. Such Officers and Trustees receive no compensation from the Funds for serving in their respective roles.
The RBC Funds currently pay the independent Trustees (Trustees of the Trust who are not directors, officers or employees of the adviser, administrator or distributor) an annual retainer of $32,500. The Board Chairperson and Audit Committee Chairperson each receive an additional retainer of $2,500 annually, and all other trustees serving as Chair of a Board committee each receive an additional retainer of $1,000 annually. In addition, Independent Trustees receive a quarterly meeting fee of $5,000 for each in-person Board meeting attended, a meeting fee of $1,000 for each telephonic or Special Board meeting attended, and a $1,500 fee for each Board committee meeting attended and are reimbursed for all out-of-pocket expenses relating to attendance at such meetings.
4. Securities Transactions
The cost of securities purchased and proceeds from securities sold (excluding securities maturing less than one year from acquisition) for the period from November 30, 2011 (commencement of operations) to March 31, 2012 were as follows:
| | | | | | | | |
| | | Purchases | | | Sales | |
| Emerging Market Select Bond Fund | | $ | 52,704,993 | | | $ | 9,575,312 | |
| Emerging Market Corporate Bond Fund | | | 21,442,706 | | | | 7,422,349 | |
| Global High Yield Bond Fund | | | 22,675,748 | | | | 4,505,923 | |
| Global Convertible Bond Fund | | | 15,419,113 | | | | 1,376,330 | |
46
|
NOTES TO FINANCIAL STATEMENTS |
5. Capital Share Transactions
The Trust is authorized to issue an unlimited number of shares of beneficial interest (“shares outstanding”) without par value. Transactions in shares of the Funds are summarized below:
| | | | | | | | |
| | | Emerging Market
Select Bond Fund | | | Emerging Market
Corporate Bond Fund | |
| | | For the
Period Ended
March 31,
2012(a) | | | For the
Period Ended
March 31,
2012(a) | |
| | | (Unaudited) | | | (Unaudited) | |
CAPITAL TRANSACTIONS: Class I | | | | | | | | |
Proceeds from shares issued | | $ | 49,199,964 | | | $ | 15,079,693 | |
Distributions reinvested | | | 281,997 | | | | 228,155 | |
| | | | | | | | |
Change in net assets resulting from capital transactions | | $ | 49,481,961 | | | $ | 15,307,848 | |
| | | | | | | | |
SHARE TRANSACTIONS: | | | | | | | | |
Class I | | | | | | | | |
Issued | | | 4,764,708 | | | | 1,507,839 | |
Reinvested | | | 27,115 | | | | 22,139 | |
| | | | | | | | |
Change in shares resulting from capital transactions | | | 4,791,823 | | | | 1,529,978 | |
| | | | | | | | |
| | |
| | | Global High Yield
Bond Fund | | | Global Convertible
Bond Fund | |
| | | For the
Period Ended
March 31,
2012(a) | | | For the
Period Ended
March 31,
2012(a) | |
| | | (Unaudited) | | | (Unaudited) | |
CAPITAL TRANSACTIONS: | | | | | | | | |
Class I | | | | | | | | |
Proceeds from shares issued | | $ | 20,001,000 | | | $ | 15,260,000 | |
Distributions reinvested | | | 371,200 | | | | 147,829 | |
| | | | | | | | |
Change in net assets resulting from capital transactions | | $ | 20,372,200 | | | $ | 15,407,829 | |
| | | | | | | | |
SHARE TRANSACTIONS: | | | | | | | | |
Class I | | | | | | | | |
Issued | | | 2,000,099 | | | | 1,524,659 | |
Reinvested | | | 35,807 | | | | 14,169 | |
| | | | | | | | |
Change in shares resulting from capital transactions | | | 2,035,906 | | | | 1,538,828 | |
| | | | | | | | |
| (a) | For the period from November 30, 2011 (commencement of operations) to March 31, 2012. |
6. Federal Income Taxes
It is the policy of each Fund to continue to qualify as a regulated investment company by complying with the provisions available to certain investment companies, as defined under Subchapter M of the Internal Revenue Code, and to distribute substantially all of its net investment income and net realized capital gains. Therefore, no federal tax liability is recorded in the financial statements of each Fund.
47
|
NOTES TO FINANCIAL STATEMENTS |
As of March 31, 2012, the tax cost of securities and the breakdown of unrealized appreciation (depreciation) for each Fund were as follows:
| | | | | | | | | | | | | | | | |
| | | Tax Cost of
Securities | | | Unrealized
Appreciation | | | Unrealized
Depreciation | | | Net
Unrealized
Appreciation
(Depreciation) | |
Emerging Market Select Bond Fund | | | $33,447,658 | | | | $584,498 | | | | $(234,490 | ) | | | $350,008 | |
Emerging Market Corporate Bond Fund | | | 14,271,152 | | | | 457,254 | | | | (13,740 | ) | | | 443,514 | |
Global High Yield Bond Fund | | | 18,444,815 | | | | 769,100 | | | | (18,449 | ) | | | 750,651 | |
Global Convertible Bond Fund | | | 14,267,313 | | | | 947,022 | | | | (89,463 | ) | | | 857,559 | |
The tax basis of components of accumulated earnings/(losses) and tax character of distributions are determined at fiscal year end, and will be included in the Annual Report dated September 30, 2012.
The Regulated Investment Company Modernization Act of 2010 (The “Act”) was enacted on December 22, 2010. The Act makes changes to several tax rules impacting the Funds. In general, the provisions of the Act will be effective for the Funds’ fiscal year beginning upon commencement of operations of the Funds on November 30, 2011. Although the Act provides several benefits, including the unlimited carryover of future capital losses, there may be a greater likelihood that all or a portion of each Funds’ pre-enactment capital loss carryovers may expire without being utilized due to the fact that post-enactment capital losses get utilized before pre-enactment capital loss carryovers. Relevant information regarding the impact of the Act on the Funds will be contained within this section of the Funds’ fiscal year ending September 30, 2012 financial statements.
7. Market Timing
The Trust strongly discourages attempts at market timing by Fund shareholders. Each Fund charges a redemption fee of 2% of the value of the shares redeemed or exchanged within 30 days of purchase, in addition to limiting the number of exchanges that may be made between Funds to five (5) per calendar year. When assessed, the redemption fee is deducted from the redemption proceeds and retained by the Fund, not by the Adviser. This redemption fee is not charged in cases where, for example, the redemption results from an automatic reinvestment or asset re-allocation not specifically directed by the shareholder. The Trust also reserves the right to reject any Fund purchase order made by persons deemed to be market timers. The Funds’ prospectus contains a full description of the Trust’s policies on market timing and/or excessive trading. The redemption fee is recorded as a credit to capital and is included in the capital transactions on the statement of changes in net assets.
During the period ended March 31, 2012, there were no redemption fees collected by the Funds.
8. Subsequent Events
Management has evaluated the impact of subsequent events of the Funds and has determined that there are no subsequent events that require recognition or disclosure in the financial statements except for the following:
Effective April 3, 2012, each Fund is a participant in a single committed, unsecured $4,000,000 line of credit with Bank of New York Mellon, the Funds’ custodian, to be used only for liquidity and other purposes. Interest is charged on borrowings made under this line of credit at the higher of (a) the Federal Funds Effective Rate plus 1.25% per annum, and (b) the Overnight Eurodollar Rate plus 1.25% per annum. A commitment fee of 0.12% per annum of the available line of credit is charged, of which each Fund shall pay its pro rata share based on the ratio of its individual net assets to the aggregate net assets of the Funds at the time the fee is due and payable. Accrued and unpaid commitment fees shall be payable on the last business day of each calendar quarter. An upfront fee equal to 0.02% of the commitment amount was paid by the Funds upon the effectiveness of the line of credit. Several funds participate in the line of credit. As a result, there is no assurance that an individual Fund will have access to all or any part of the $4,000,000 at any particular time.
48
|
SHARE CLASS INFORMATION (UNAUDITED) |
The Funds offer Class I shares.
Class I
This share class is intended for investors meeting certain minimum investment thresholds. This share class does not have an up-front sales charge (load) or a 12b-1 service and distribution fee.
49
|
SUPPLEMENTAL INFORMATION (UNAUDITED) |
Shareholder Expense Examples
As a shareholder of the RBC Funds, you incur two types of costs: (1) transaction costs and (2) ongoing costs, including management fees; and other Fund expenses. This example is intended to help you understand your ongoing costs (in dollars) of investing in the RBC Funds and to compare these costs with the ongoing costs of investing in other mutual funds.
The example is based on an investment of $1,000 invested at the beginning of the period and held for the entire period from November 30, 2011 (commencement of operations) through March 31, 2012.
Actual Expenses
The table below provides information about actual account values and actual expenses. You may use the information below, together with the amount you invested, to estimate the expenses that you paid over the period. Simply divide your account value by $1,000 (for example, an $8,600 account value divided by $1,000 = 8.6), then multiply the result by the number in the table under the heading entitled “Expenses Paid During Period” to estimate the expenses you paid on your account during this period.
| | | | | | | | | | |
| | | | | Beginning
Account Value
11/30/2011 | | Ending
Account Value
3/31/2012 | | Expenses Paid
During Period*
11/30/11-3/31/12 | | Annualized
Expense Ratio
During Period
11/30/11-3/31/12 |
Emerging Market Select Bond Fund | | Class I | | $1,000.00 | | $1,058.40 | | $3.46 | | 1.00% |
Emerging Market Corporate Bond Fund | | Class I | | 1,000.00 | | 1,063.30 | | 3.99 | | 1.15% |
Global High Yield Bond Fund | | Class I | | 1,000.00 | | 1,064.60 | | 3.30 | | 0.95% |
Global Convertible Bond Fund | | Class I | | 1,000.00 | | 1,075.90 | | 3.52 | | 1.01%** |
Hypothetical Example for Comparison Purposes
The table below provides information about hypothetical account values and hypothetical expenses based on each RBC Funds’ actual expense ratio and an assumed rate of return of 5% per year before expenses, which is not the Fund’s actual return. The hypothetical account values and expenses may not be used to estimate the actual ending account balance or expenses you paid for the period. You may use this information to compare this 5% hypothetical example with the 5% hypothetical examples that appear in the shareholder reports of other funds.
Please note that the expenses shown in the table are meant to highlight your ongoing costs only and do not reflect any transactional costs, such as sales charges (loads), redemption fees, or exchange fees. Therefore, the table is useful in comparing ongoing costs only, and will not help you determine the relative total costs of owning different funds. In addition, if these transactional costs were included, your costs would have been higher.
| | | | | | | | | | |
| | | | | Beginning
Account Value
11/30/2011 | | Ending
Account Value
3/31/12 | | Expenses Paid
During Period*
11/30/11-3/31/12 | | Annualized
Expense Ratio
During Period
11/30/11-3/31/12 |
Emerging Market Select Bond Fund | | Class I | | $1,000.00 | | $1,013.44 | | $3.38 | | 1.00% |
Emerging Market Corporate Bond Fund | | Class I | | 1,000.00 | | 1,012.94 | | 3.89 | | 1.15% |
Global High Yield Bond Fund | | Class I | | 1,000.00 | | 1,013.61 | | 3.21 | | 0.95% |
Global Convertible Bond Fund | | Class I | | 1,000.00 | | 1,013.41 | | 3.42 | | 1.01%** |
*Expenses are equal to the average account value times the Fund’s annualized expense ratio multiplied by 123/366 (to reflect period since inception).
**Expense ratio for Global Convertible Bond Fund is higher due to interest expense. The ratio for this period excluding interest expense was 1.00%.
50
|
APPROVAL OF INVESTMENT ADVISORY AND SUB-ADVISORY AGREEMENTS (UNAUDITED) |
Information Regarding the Approval of Investment Advisory and Sub-Advisory Agreements
This section provides information regarding the approval of the Investment Advisory Agreement and Sub-Advisory Agreement (together, the “Advisory Agreements”) for the RBC BlueBay Emerging Markets/Global Fixed Income Funds (the “Funds”). RBC Global Asset Management (U.S.) Inc. (the “Advisor”) serves as investment advisor for the Funds and BlueBay Asset Management LLP (“BlueBay”) serves as the Funds’ sub-advisor.
In December 2010, RBC acquired BlueBay Asset Management Ltd. (the predecessor to BlueBay as discussed below), a leading European asset manager based in London. During the following year, the Board of Trustees of the RBC Funds authorized the creation of the four new Funds to be sub-advised by BlueBay: the RBC BlueBay Emerging Market Select Bond Fund; RBC BlueBay Emerging Market Corporate Bond Fund; RBC BlueBay Global Convertible Bond Fund; and RBC BlueBay Global High Yield Bond Fund. The Funds commenced operations on November 30, 2011.
During the year following the BlueBay acquisition, the Trustees discussed at their meetings the strategic integration of BlueBay and its products into RBC’s global asset management business, the organization’s commitment to BlueBay and its products, the benefits to investors of access to the global/emerging markets fixed income asset classes, and BlueBay’s significant capabilities in that respect. In June 2011, the Trustees met twice with representatives of the Advisor and BlueBay (together, the “Advisors”) specifically to consider approval of the then-proposed Advisory Agreements for the Funds. With regard to each Fund, the Trustees determined to approve the Advisory Agreements for an initial term.
As part of their review of the Advisory Agreements, the Trustees requested and considered information regarding the advisory services to be performed by the Advisors for the Funds, the staffing and qualifications of the personnel responsible for operating and managing the Funds, the relevant experience of the Advisors, and the performance record of BlueBay in managing client assets according to similar investment strategies. The Trustees also reviewed information regarding the anticipated expense structure of the Funds and considered fees and expenses as compared to third-party sources, as well as the Advisor’s contractual agreement to subsidize Fund expenses at competitive levels. Additionally, the Trustees considered information provided at Board and Committee meetings throughout the year, including those meetings mentioned above, during which the Trustees reviewed materials related to the Funds and the then-proposed Agreements.
The Trustees focused their consideration of the Agreements mainly on reviewing the nature, quality, and extent of the services to be provided under the Agreements and, with respect to BlueBay, its experiences managing portfolios of securities similar to those held by the Funds. In connection with their deliberations, the independent Trustees were advised by their independent legal counsel with regard to the information and materials considered, the Trustees’ responsibilities with regard to the information and materials, and the Trustees’ responsibilities under relevant laws and regulations.
Based upon their review, the Trustees determined that the nature and quality of the services provided by both the Advisor and BlueBay were of a high quality and it is in the interest of the Funds and their shareholders for the Trustees to approve both the Investment Advisory Agreement and the Sub-Advisory Agreement for each Fund.
Also, during the period of this report, the Trustees met to address a then-pending corporate restructuring within the RBC organization under which the investment advisory business and operations of BlueBay Asset Management Ltd. would be transferred to a new limited liability partnership entity called BlueBay Asset Management LLP (previously defined as “BlueBay”). After evaluating the factors discussed below, the Trustees, including a majority of the Trustees who are not interested persons of the Trust, determined to approve a new investment sub-advisory agreement (the “New Agreement”) between the Advisor and BlueBay following the reorganization.
51
|
APPROVAL OF INVESTMENT ADVISORY AND SUB-ADVISORY AGREEMENTS (UNAUDITED) |
As part of their review of the New Agreement, the Trustees requested and considered that the New Agreement contained conditions substantially identical to the original Sub-Advisory Agreement. The Trustees noted that BlueBay — following the restructuring — would have substantially identical management personnel, investment and non-investment personnel, facilities, operations, and systems as its predecessor firm prior to the restructuring. The Trustees also reviewed information prepared by the independent Trustees’ independent legal counsel that indicated the internal restructuring would not involve any change of actual control or management. In the restructuring, RBC would retain ownership and voting control of BlueBay while senior BlueBay professionals — who would continue to operate the business — would receive non-controlling ownership interests.
The Trustees also considered the information that they received when they approved the original Sub-Advisory Agreement, along with information that they received and reviewed during subsequent periodic board meetings and otherwise since the launch of the Funds. Upon review, the Trustees were satisfied with the nature and quality of services being provided by BlueBay as sub-advisor and the related fee and other provisions of the New Agreement. In connection with their deliberations, the independent Trustees were advised by their independent legal counsel with regard to the information and materials considered, the Trustees’ responsibilities with regard to the information and materials, and the Trustees’ responsibilities under relevant laws and regulations.
Based upon their review of the above-mentioned information, the terms of and compensation payable under the New Agreement, and in light of the nature and quality of the services provided for the Funds by BlueBay, the Trustees concluded that it is in the interest of the Funds and their shareholders for the Trustees to approve the New Agreement. The reorganization took place — and the New Agreement became effective — on April 2, 2012.
52
RBC Funds
P.O. Box 701
Milwaukee, WI 53201-0701
800-422-2766
www.rbcgam.us
Performance data represents past performance and does not guarantee future results. The principal value of an investment and investment return will fluctuate so that an investor’s shares, when redeemed, may be worth more or less than their original cost.
This report and the financial statements contained herein are provided for the information of RBC Funds shareholders. This report is not authorized for distribution to prospective investors unless preceded or accompanied by a current prospectus, which contains information concerning investment objectives, risks, charges and expenses of the funds. Please read the prospectus carefully before investing.
This report and the financial statements contained herein are not intended to be a forecast of future events, a guarantee of future results, or investment advice. There is no assurance that certain securities will remain in or out of each fund’s portfolio. The views expressed in this report reflect those of the portfolio managers through the period ended March 31, 2012.
NOT FDIC INSURED — NO BANK GUARANTEE — MAY LOSE VALUE
RBC Global Asset Management, Inc. serves as investment adviser for the RBC Funds. RBC Funds are distributed by Quasar Distributors LLC.

| | |
The RBC Funds are pleased to offer shareholder reports printed entirely on Forest Stewardship Council certified paper. FSC® certification ensures that the paper used in this report contains fiber from well-managed and responsibly harvested forests that meet strict environmental and socioeconomic standards. | | |
RBCF-BB SAR 03-12
Item 2. Code of Ethics.
Not applicable.
Item 3. Audit Committee Financial Expert.
Not applicable.
Item 4. Principal Accountant Fees and Services.
Not applicable.
Item 5. Audit Committee of Listed registrants.
Not applicable.
Item 6. Investments.
| | (a) | Schedule of Investments in securities of unaffiliated issuers as of the close of the reporting period is included as part of the report to shareholders filed under Item 1 of this form. |
Item 7. Disclosure of Proxy Voting Policies and Procedures for Closed-End Management Investment
Companies.
Not applicable.
Item 8. Portfolio Managers of Closed-End Management Investment Companies.
Not applicable.
Item 9. Purchases of Equity Securities by Closed-End Management Investment Company and Affiliated
Purchasers.
Not applicable.
Item 10. Submission of Matters to a Vote of Security Holders.
There have been no material changes to the procedures by which the shareholders may recommend nominees to the registrant’s board of directors, where those changes were implemented after the registrant last provided disclosure in response to the requirements of Item 407(c)(2)(iv) of Regulation S-K (17 CFR 229.407) (as required by Item 22(b)(15) of Schedule 14A (17 CFR 240.14a-101)), or this Item.
Item 11. Controls and Procedures.
| | (a) | The registrant’s principal executive and principal financial officers, or persons performing similar functions, have concluded that the registrant’s disclosure controls and procedures (as defined in Rule 30a-3(c) under the Investment Company Act of 1940, as amended (the “1940 Act”) (17 CFR 270.30a-3(c))) are effective, as of a date within 90 days of the filing date of the report that includes the disclosure required by this paragraph, based on their evaluation of these controls and procedures required by Rule 30a-3(b) under the 1940 Act (17 CFR 270.30a-3(b)) and Rules 13a-15(b) or 15d-15(b) under the Securities Exchange Act of 1934, as amended (17 CFR 240.13a-15(b) or 240.15d-15(b)). |
| | (b) | There were no changes in the registrant’s internal control over financial reporting (as defined in Rule 30a-3(d) under the 1940 Act (17 CFR 270.30a-3(d)) that occurred during the registrant’s second fiscal quarter of the period covered by this report that has materially affected, or is reasonably likely to materially affect, the registrant’s internal control over financial reporting. |
Item 12. Exhibits.
| | | | |
| (a)(1) | | | | Not applicable. |
| | |
| (a)(2) | | | | Certifications pursuant to Rule 30a-2(a) under the 1940 Act and Section 302 of the Sarbanes-Oxley Act of 2002 are attached hereto. |
| | |
| (a)(3) | | | | Not applicable. |
| | |
(b) | | | | Certifications pursuant to Rule 30a-2(b) under the 1940 Act and Section 906 of the Sarbanes- Oxley Act of 2002 are attached hereto. |
SIGNATURES
Pursuant to the requirements of the Securities Exchange Act of 1934 and the Investment Company Act of 1940, the registrant has duly caused this report to be signed on its behalf by the undersigned, thereunto duly authorized.
| | |
| (registrant) | | RBC Funds Trust |
| | |
| By (Signature and Title)* | | /s/ Erik R. Preus |
| | Erik R. Preus, President and Chief Executive Officer |
| | (principal executive officer) |
Pursuant to the requirements of the Securities Exchange Act of 1934 and the Investment Company Act of 1940, this report has been signed below by the following persons on behalf of the registrant and in the capacities and on the dates indicated.
| | |
| By (Signature and Title)* | | /s/ Erik R. Preus |
| | Erik R. Preus, President and Chief Executive Officer |
| | (principal executive officer) |
| | |
| By (Signature and Title)* | | /s/ Kathleen A. Hegna |
| | Kathleen A. Hegna, Chief Financial Officer |
| | (principal financial officer) |
* Print the name and title of each signing officer under his or her signature.