UNITED STATES
SECURITIES AND EXCHANGE COMMISSION
Washington, D.C. 20549
FORM N-CSR
CERTIFIED SHAREHOLDER REPORT OF REGISTERED
MANAGEMENT INVESTMENT COMPANIES
Investment Company Act file number 811-21475
RBC Funds Trust
(Exact name of registrant as specified in charter)
100 South Fifth Street, Suite 2300
Minneapolis, MN 55402-1240
(Address of principal executive offices) (Zip code)
Lee Greenhalgh, Esq.
RBC Plaza
60 South Sixth Street
Minneapolis, MN 55402
(Name and address of agent for service)
Registrant’s telephone number, including area code: (612) 313-1341
Date of fiscal year end: September 30
Date of reporting period: March 31, 2010
| Item 1. | Reports to Stockholders. |
The Report to Shareholders is attached herewith.
Semi-Annual Report
For the period ended March 31, 2010
RBC Mid Cap Growth Fund
RBC Enterprise Fund
RBC Small Cap Core Fund
RBC Microcap Value Fund
RBC Mid Cap Value Fund

| | | | |
| | RBC Funds | | |
| | |
About Your Semi-Annual Report | | | | |
| | This semi-annual report includes detailed information about your Fund including financial statements, performance, and a complete list of its holdings. |
| |
| | The RBC Funds compare their performance against various Russell equity indices. Each of these indices is a widely recognized measure of return for the underlying category of securities. However, the indices are unmanaged, do not include fees, and cannot be invested in directly. |
| |
| | We hope the financial information presented will help you evaluate your investment in the RBC Funds. We also encourage you to read your Funds’ prospectus for further detail as to your Funds’ investment policies and risk profile. RBC Funds prospectuses and performance information subsequent to the date of this report are available on our website at www.rbcgam.us. |
| |
| | A description of the policies and procedures that your Fund uses to determine how to vote proxies relating to portfolio securities is available (i) without charge, upon request, by calling 1-800-422-2766; (ii) on the Fund’s website at www.rbcgam.us; and (iii) on the Securities and Exchange Commission’s (the “Commission”) website at http://www.sec.gov. |
| |
| | Information regarding how your Fund voted proxies relating to portfolio securities during the most recent 12-month period ended June 30 is available (i) on the Fund’s website at www.rbcgam.us; and (ii) on the Commission’s website at http://www.sec.gov. |
| |
| | A schedule of each Fund’s portfolio holdings will be filed with the Commission for the first and third quarters of each fiscal year on Form N-Q. This information is available on the Commission’s website at http://www.sec.gov and may be reviewed and copied at the Commission’s Public Reference Room in Washington, D.C. Information on the operation of the Public Reference Room is available by calling 1-800-SEC-0330. |
| | |
Table of Contents | | | | |
| | | | |
| | |
| | Letter from the CIO of Equities | | 1 |
| | Equity Portfolio Managers | | 3 |
| | Performance Summary | | 5 |
| | RBC Mid Cap Growth Fund | | 9 |
| | RBC Enterprise Fund | | 10 |
| | RBC Small Cap Core Fund | | 11 |
| | RBC Microcap Value Fund | | 12 |
| | RBC Mid Cap Value Fund | | 13 |
| | Schedules of Portfolio Investments | | 14 |
| | Financial Statements | | |
| | - Statements of Assets and Liabilities | | 36 |
| | - Statements of Operations | | 38 |
| | - Statements of Changes in Net Assets | | 39 |
| | Financial Highlights | | 44 |
| | Notes to Financial Statements | | 54 |
| | Share Class Information | | 65 |
| | Supplemental Information | | 66 |
| | Approval of Investment Advisory Fees | | 68 |
| | |
| | LETTER FROM THE CIO OF EQUITIES A Strong Year Continues In retrospect, 2009 will be recorded in the history books as a remarkable year. In the span of 12 months, the stock market experienced both the depths of the credit-crisis-driven decline and the relief of a surprisingly strong-though still incomplete recovery. The broad market S&P 500 Index returned 26.5% for the 2009 calendar year, its best showing since 2003. Investors who had the fortitude to maintain their long-term strategies were able to regain a sizable portion of what they had lost during the downturn, although they had to endure a nerve testing ride along the way. The upward trend for U.S. equity markets continued in a volatile fashion for the first three months of 2010. For the quarter, the S&P 500 rose 5.4%. Early January saw the benchmark rise 3.2% to January 19th. From there to February 8th, the market declined 8%, as worries about China slowing down, and about Greece defaulting on its debt, weighed upon investors. Subsequently strong economic data across the world, and a belief that the Greek situation would be worked out, helped fuel a rally of 11% from February 8th to the end of the first quarter. Going Forward As has been the case for more than a year, investors remain inclined toward skepticism over the health and longevity of the current economic recovery. To a certain extent, such doubts are normal at this relatively youthful point in the business cycle. However, current levels of concern are somewhat higher than have been observed at previous similar cyclical junctures, suggesting that the severity of the 2008-09 recessions continues to exact a toll on sentiment. Such distrust is perfectly natural and reflects the severe beatings taken by stock market investors back in 2000-02 and more recently in 2007-09 when such allegedly once in a lifetime hits became a twice in a decade phenomenon. The actual economic outlook is biased toward a continued strengthening of economic growth. It is therefore likely that accumulating evidence of economic strength may erode investor skepticism regarding the robustness of the recovery, potentially producing a continuation of the rally in cyclical assets. Investors should also be prepared for some positive surprises illuminating the near-universal gloom surrounding fiscal prospects. Currently, many investors are worried about a potential economic slowdown and stock market correction once the inventory re-stocking phase has finished. These concerns appear to be centered on the simple observation that sensitive cyclical indicators, such as the Purchasing Managers Index new order series, have often been highly correlated with stock market returns. But the data looking out over the next few quarters should provide proof to investors that the approximately 70% rebound in equities is appropriate given the likely earnings trend. As we have highlighted in the past, equity markets do trade with quarterly earnings and earnings have a strong relationship with industrial activity. Given that credit conditions generally lead industrial activity by nine months, one can feel reasonably good about the balance of the year in terms of economic data. As far as equities are concerned, stronger-than-expected growth should bolster confidence in the durability of the current expansion. Although equities appear to be fairly valued on this year’s earnings, it is harder to make that statement about longer forward valuations, in particular with developed markets. These longer forward valuations are definitively cheap. The discount |
1
| | |
| | LETTER FROM THE CIO OF EQUITIES |
| | |
| | for longer forward equity valuations is larger than usual, suggesting a higher-than-normal level of skepticism regarding the persistence and durability of this business cycle. This discount can be thought of as a barometer of confidence in the longer-term outlook for corporate profits and economic growth. Understandably, strong growth boosts confidence in the longer run economic outlook and reduces the discount placed on longer forward valuations. |
| |
| | Stay the Course |
| |
| | Once the details of the financial crisis have faded, history will show that it created an opportunity for equity investors to profit from a strong year of returns. 2008, one of the worst years ever for stocks was followed by 2009- one of the best. A potent reminder of how important it is to stay invested, even through very challenging times. Many equity investors suffered steep losses in the extended downturn that started in October 2007, and they have yet to regain all the ground lost. The S&P 500 Index’s 69.4% return from its bottom on March 6, 2009 through March 31, 2010 has allowed many investors to recoup losses in stocks. Investors who had faith in the market’s ability to recover kept their money at work instead of abandoning their long-term strategy. Those investors should be better off today than 12 months ago. |
| |
| | Many pieces for the potential continuation of the equity rally are in place. An unscientific reading of the press reveals a great deal of disbelief that the rally can continue. In addition, individuals, at least based on mutual fund data, have not yet returned to the stock market. Manufacturing and capital spending surveys around the world are showing a high degree of strength. The leg of the economy that needs to follow a rebound in manufacturing, consumer spending, may be turning as the employment report for March showed significant job growth. |
| |
| | However, based on what moved the market in the first quarter, much will depend upon economic growth and risks to sovereign debt outside of the U.S. While the picture on growth is constructive, the picture on debt is less so. That risk bears watching. So the way forward will not be without ups and downs. While the long-term path of equity markets has been upward, the journey has frequently been interrupted by bear market declines-sometimes substantial ones. As long as stock markets exist, there will be exhilarating rallies and harrowing sell-offs. That is why it is so important to consider your portfolio asset allocation carefully. And once a strategy is in place, check in regularly to ensure that the portfolio is still appropriate. |
| |

Gordon Telfer Chief Investment Officer, Equity Products | |  |
| | Gordon Telfer |
| | RBC Funds Chief Investment Officer |
| | Equity Products |
| | Past performance is not a guarantee of future results. |
| | Opinions expressed are subject to change, are not guaranteed, and should not be considered a recommendation to buy or sell any security. |
| | Mutual fund investing involves risk. Principal loss is possible. |
| | The S&P 500 Index is a broad based unmanaged index of 500 stocks, which is widely recognized as representative of the equity market in general. You cannot invest directly in an index. |
2
EQUITY PORTFOLIO MANAGERS
| | |
| RBC Global Asset Management (U.S.) Inc. (“RBC GAM (US)”) (formerly known as Voyageur Asset Management, Inc.), serves as the investment advisor to the RBC Funds. RBC GAM (US) employs a team approach to the management of the RBC Equity Funds, with no individual team member being solely responsible for the investment decisions. | | |
| |
| Gordon Telfer | | |
| Chief Investment Officer, Equity Products, Managing Director, Head of | | |
| Growth Equities US. | | 
Gordon Telfer |
Gordon Telfer is Chief Investment Officer, Equity Products and is responsible for directing RBC GAM (US)’s U.S. equities research efforts. He joined RBC GAM (US) in 2003 from Alliance Capital Management where he was a senior portfolio manager and a member of Alliance’s Investment Policy Group. Prior to Alliance, he worked for Scudder Kemper Investments as senior vice president and global strategist and spokesperson for Scudder Kemper’s U.S. and International Portfolio Management Group. Gordon began his career in the investment industry in 1986 at Murray Johnstone International in portfolio management. He has spoken at numerous regional and national conferences on portfolio management and been a guest on CNBC. A native of Glasglow, Scotland, Gordon received his Stock Exchange Diploma from the Herriott Watt University, Edinburgh, Scotland | |
| |
| Lance F. James | | |
| Managing Director, Senior Portfolio Manager | | 
Lance F. James |
Lance James is responsible for portfolio management of the RBC Small Cap Core Fund, RBC Enterprise Fund, and RBC Microcap Value Fund. He is also co-manager of RBC Mid Cap Value Fund. Prior to joining RBC GAM (US) in 2006, Lance was an equity analyst and portfolio manager for OFI Institutional and Babson Capital Management, affiliated companies of Mass Mutual Life Insurance Company. During his tenure he served as head of the firm’s small/mid cap value investment team. Prior to joining Babson Capital in 1986, Lance worked at Rockwell International Corporation, EBF Associates of Boston and Hewitt Associates. Lance began his career in the investment industry in 1980. He received an AB in Economics from Princeton University and an MBA in Finance from the Wharton School of Business at the University of Pennsylvania. | |
| |
| George Prince | | |
| Portfolio Manager, Senior Equity Analyst | | 
George Prince |
George Prince serves as the co-portfolio manager for the RBC Enterprise Fund. George also provides research support for the RBC Small Cap Core Fund. He joined RBC GAM (US) in 2006 from Eagle Asset Management, where he was a senior equity analyst. Prior to his experience at Eagle Asset Management, George was an analyst at Babson Capital Management. George also has a great deal of entrepreneurial experience and founded SignStorey, a leader in place-based digital communications in retail stores and co-founded Cutting Edge Inc., a global CAD-CAM technology company. George has over 12 years of investment industry experience. He received a BA from Yale University. | |
3
| | |
| | EQUITY PORTFOLIO MANAGERS |
| |
| | Kenneth A. Tyszko, CPA, CFA |

Kenneth A. Tyszko | | Vice President, Senior Portfolio Manager |
| | Ken Tyszko is responsible for portfolio management of the RBC Mid Cap Growth Fund. He joined RBC GAM (US) in 2001 from Oberweis Asset Management Inc., where he served as a portfolio manager. From 1996 to 1999, he managed small cap growth assets for ABN AMRO Asset Management (USA) Inc. and ABN AMRO Incorporated. Before working at ABN AMRO, Ken was a portfolio manager with Sears Investment Management Co. (SIMCO). His background also includes experience at Main Hurdman, an international accounting and consulting firm. Ken began his career in the investment industry in 1984. He received a BS in Accountancy from the University of Illinois. Ken is both a CFA charterholder and a Certified Public Accountant. He is a member of the Illinois CPA Society, the CFA Society of Chicago and the CFA Institute. Ken has been a guest on Bloomberg Television and WebFN. |
| | |
| | |
| | |
| |
| | Stephen E. Kylander |

Stephen E. Kylander | | Vice President, Senior Portfolio Manager |
| | Steve Kylander is responsible for portfolio management of the RBC Mid Cap Value Fund. Prior to joining RBC GAM (US) in 2006, he was a portfolio manager and research analyst for Babson Capital Management. Steve’s previous experience also includes strategy consulting, mergers and acquisitions work and investment banking for L.E.K. Consulting, The Yarmouth Group, and First Boston Corporation. He began working in the investment industry in 1986. Steve earned a BA from Dartmouth College and an MBA from Harvard Business School. |
| | |
| | |
| | |
| | |
| | |
| | |
4
PERFORMANCE SUMMARY
Average Annual Total Returns as of March 31, 2010 (Unaudited)
RBC Mid Cap Growth Fund (a)
| | | | | | | | | | | | | | | | | | | | | |
| | | 1 Year | | | 3 Year | | | 5 Year | | | 10 Year | | | Since
Inception(b) | | | Net
Expense
Ratio(1)(2) | | | Gross
Expense
Ratio(1)(2) | |
Class A | | | | | | | | | | | | | | | | | | | | | |
- Including Maximum Sales Charge of 5.75% | | 36.56 | % | | (6.04 | )% | | 0.10 | % | | 1.58 | % | | 9.80 | % | | | | | | |
- At Net Asset Value | | 44.94 | % | | (4.16 | )% | | 1.29 | % | | 2.18 | % | | 10.14 | % | | 1.35 | % | | 1.88 | % |
| | | | | | | |
Class C (c) | | | | | | | | | | | | | | | | | | | | | |
- Including Contingent Deferred Sales Charge of 1.00% | | 42.69 | % | | (4.90 | )% | | 0.52 | % | | 1.42 | % | | 9.32 | % | | | | | | |
- At Net Asset Value | | 43.69 | % | | (4.90 | )% | | 0.52 | % | | 1.42 | % | | 9.32 | % | | 2.10 | % | | 2.38 | % |
| | | | | | | |
Class I | | 45.34 | % | | (3.90 | )% | | 1.57 | % | | 2.45 | % | | 10.47 | % | | 1.10 | % | | 1.38 | % |
| | | | | | | |
Class R (c) | | 44.51 | % | | (4.38 | )% | | 1.06 | % | | 1.94 | % | | 9.87 | % | | 1.59 | % | | 1.86 | % |
| | | | | | | |
Class S (d) | | 45.34 | % | | (3.93 | )% | | 1.57 | % | | 2.45 | % | | 10.47 | % | | 1.10 | % | | 1.38 | % |
| | | | | | | |
Russell Midcap Growth Index* | | 63.00 | % | | (2.04 | )% | | 4.27 | % | | (1.69 | )% | | 9.86 | % | | | | | | |
RBC Enterprise Fund (e)
| | | | | | | | | | | | | | | | | | | | | |
| | | 1 Year | | | 3 Year | | | 5 Year | | | 10 Year | | | Since
Inception(f) | | | Net
Expense
Ratio(1)(2) | | | Gross
Expense
Ratio(1)(2) | |
Class A (g) | | | | | | | | | | | | | | | | | | | | | |
- Including Maximum Sales Charge of 5.75% | | 49.21 | % | | (10.29 | )% | | (1.48 | )% | | 6.81 | % | | 9.85 | % | | | | | | |
- At Net Asset Value | | 58.35 | % | | (8.50 | )% | | (0.31 | )% | | 7.45 | % | | 10.10 | % | | 1.33 | % | | 2.01 | % |
| | | | | | | |
Class C (g) | | | | | | | | | | | | | | | | | | | | | |
- Including Contingent Deferred Sales Charge of 1.00% | | 56.16 | % | | (9.16 | )% | | (1.05 | )% | | 6.65 | % | | 9.28 | % | | | | | | |
- At Net Asset Value | | 57.16 | % | | (9.16 | )% | | (1.05 | )% | | 6.65 | % | | 9.28 | % | | 2.08 | % | | 2.50 | % |
| | | | | | | |
Class I (h) | | 58.68 | % | | (8.28 | )% | | (0.06 | )% | | 7.72 | % | | 10.37 | % | | 1.08 | % | | 1.50 | % |
| | | | | | | |
Class R (g) | | 57.98 | % | | (8.70 | )% | | (0.55 | )% | | 7.18 | % | | 9.82 | % | | 1.57 | % | | 1.98 | % |
| | | | | | | |
Class S | | 58.86 | % | | (8.26 | )% | | (0.06 | )% | | 7.72 | % | | 10.37 | % | | 1.08 | % | | 1.51 | % |
| | | | | | | |
Russell 2000 Index* | | 62.76 | % | | (3.99 | )% | | 3.36 | % | | 3.68 | % | | 8.71 | % | | | | | | |
Performance data quoted represents past performance. Past performance is no guarantee of future results. Investment return and principal value of an investment will fluctuate so that an investor’s shares, when redeemed, may be worth more or less than their original cost. Current performance may be lower or higher than performance quoted. Performance shown reflects contractual fee waivers, without such fee waivers total returns would be reduced. Performance information does not reflect the 2% fee on shares redeemed or exchanged within 30 days of purchase. If such redemption fee was included, performance would be reduced. For performance data current to the most recent month-end go to www.rbcgam.us. Please see footnotes on page 7.
5
PERFORMANCE SUMMARY
RBC Small Cap Core Fund (i)
| | | | | | | | | | | | | | | | | | | | | |
| | | 1 Year | | | 3 Year | | | 5 Year | | | 10 Year | | | Since
Inception(j) | | | Net
Expense
Ratio(1)(2) | | | Gross
Expense
Ratio(1)(2) | |
Class A (g) | | | | | | | | | | | | | | | | | | | | | |
- Including Maximum Sales Charge of 5.75% | | 64.92 | % | | (5.45 | )% | | 1.74 | % | | 6.18 | % | | 9.26 | % | | | | | | |
- At Net Asset Value | | 75.00 | % | | (3.56 | )% | | 2.95 | % | | 6.81 | % | | 9.61 | % | | 1.55 | % | | 2.65 | % |
| | | | | | | |
Class C (g) | | | | | | | | | | | | | | | | | | | | | |
- Including Contingent Deferred Sales Charge of 1.00% | | 72.84 | % | | (4.17 | )% | | 2.27 | % | | 6.05 | % | | 8.81 | % | | | | | | |
- At Net Asset Value | | 73.84 | % | | (4.17 | )% | | 2.27 | % | | 6.05 | % | | 8.81 | % | | 2.30 | % | | 3.16 | % |
| | | | | | | |
Class R (g) | | 74.68 | % | | (3.67 | )% | | 2.78 | % | | 6.58 | % | | 9.35 | % | | 1.79 | % | | 2.65 | % |
| | | | | | | |
Class S | | 75.42 | % | | (3.21 | )% | | 3.28 | % | | 7.11 | % | | 9.90 | % | | 1.30 | % | | 2.16 | % |
| | | | | | | |
Russell 2000 Index* | | 62.76 | % | | (3.99 | )% | | 3.36 | % | | 3.68 | % | | 9.10 | % | | | | | | |
RBC Microcap Value Fund (k)
| | | | | | | | | | | | | | | | | | | | | |
| | | 1 Year | | | 3 Year | | | 5 Year | | | 10 Year | | | Since
Inception(l) | | | Net
Expense
Ratio(1)(2) | | | Gross
Expense
Ratio(1)(2) | |
Class A (g) | | | | | | | | | | | | | | | | | | | | | |
- Including Maximum Sales Charge of 5.75% | | 60.22 | % | | (10.12 | )% | | (0.50 | )% | | 6.74 | % | | 8.14 | % | | | | | | |
- At Net Asset Value | | 69.93 | % | | (8.32 | )% | | 0.69 | % | | 7.37 | % | | 8.42 | % | | 1.32 | % | | 1.87 | % |
| | | | | | | |
Class C (g) | | | | | | | | | | | | | | | | | | | | | |
- Including Contingent Deferred Sales Charge of 1.00% | | 67.68 | % | | (9.00 | )% | | (0.05 | )% | | 6.57 | % | | 7.62 | % | | | | | | |
- At Net Asset Value | | 68.68 | % | | (9.00 | )% | | (0.05 | )% | | 6.57 | % | | 7.62 | % | | 2.07 | % | | 2.37 | % |
| | | | | | | |
Class R (g) | | 69.55 | % | | (8.54 | )% | | 0.44 | % | | 7.10 | % | | 8.15 | % | | 1.56 | % | | 1.88 | % |
| | | | | | | |
Class S | | 70.35 | % | | (8.09 | )% | | 0.94 | % | | 7.64 | % | | 8.69 | % | | 1.07 | % | | 1.37 | % |
| | | | | | | |
Russell 2000 Value Index* | | 65.07 | % | | (5.71 | )% | | 2.75 | % | | 8.90 | % | | 9.76 | % | | | | | | |
Performance data quoted represents past performance. Past performance is no guarantee of future results. Investment return and principal value of an investment will fluctuate so that an investor’s shares, when redeemed, may be worth more or less than their original cost. Current performance may be lower or higher than performance quoted. Performance shown reflects contractual fee waivers, without such fee waivers total returns would be reduced. Performance information does not reflect the 2% fee on shares redeemed or exchanged within 30 days of purchase. If such redemption fee was included, performance would be reduced. For performance data current to the most recent month-end go to www.rbcgam.us. Please see footnotes on page 7.
6
PERFORMANCE SUMMARY
RBC Mid Cap Value Fund
| | | | | | | | | |
| | | Since
Inception(m) | | | Net
Expense
Ratio(1)(2) | | | Gross
Expense
Ratio(1)(2) | |
Class I | | | | | | | | | |
- At Net Asset Value | | 7.60 | % | | 0.90 | % | | 3.54 | % |
| | | |
Russell MidCap Value Index* | | 9.61 | % | | | | | | |
Performance data quoted represents past performance. Past performance is no guarantee of future results. Investment return and principal value of an investment will fluctuate so that an investor’s shares, when redeemed, may be worth more or less than their original cost. Current performance may be lower or higher than performance quoted. Performance shown reflects contractual fee waivers, without such fee waivers total returns would be reduced. Performance information does not reflect the 2% fee on shares redeemed or exchanged within 30 days of purchase. If such redemption fee was included, performance would be reduced. For performance data current to the most recent month-end go to www.rbcgam.us. Please see footnotes below.
| (1) | The Funds’ expenses reflect the most recent fiscal year-end (September 30, 2009). For the RBC Mid Cap Value Fund, the expenses reflected are from the Fund’s current prospectus. |
| (2) | The Adviser has contractually agreed to waive fees and/or make payments in order to keep total operating expenses of the Fund to the levels listed under net expense ratio until January 31, 2011. |
| * | Each of the comparative indices is a widely recognized market value weighted measure of the return of securities, but do not include sales fees or operating expenses. You cannot invest directly in indices. (a) The performance in the table for the period from June 1, 1994 to April 19, 2004 reflects the performance of RBC Mid Cap Equity Fund, the predecessor to RBC Mid Cap Growth Fund. The performance of the Fund also includes the performance of a common trust fund (“CTF”) account advised by RBC GAM (US) (including its predecessor) and managed the same as the Fund in all material respects for the period from December 31, 1990 to June 1, 1994, as adjusted to reflect the full contractual rate of expenses associated with the Fund at its inception. The CTF account was not registered with the SEC under the 1940 Act and therefore was not subject to the investment restrictions imposed by law on registered mutual funds. If the CTF account had been registered, the CTF account’s performance may have been adversely affected. Fund performance reflects applicable fee waivers/expense reimbursements (which, if excluded, would cause performance to be lower). |
| (b) | The since inception date (commencement of operations) of the Fund is December 31, 1990. |
| (c) | The inception date for Class C and Class R Shares of the Fund is April 19, 2004. All performance shown for each such class of shares prior to its inception date is based on the performance of the Class A Shares of the Fund, adjusted to reflect the fees and expenses of Class C and Class R Shares, as applicable (and where applicable, the maximum sales charges of the Class C Shares). |
| (d) | The inception date for Class S Shares of the Fund is April 19, 2004. All performance shown for each such class of shares prior to its inception date is based on the performance of the Class I Shares of the Fund, adjusted to reflect the fees and expenses of Class S Shares. |
| (e) | The performance in the table for the period from December 2, 1983 to April 19, 2004 reflects the performance of Babson Enterprise Fund, the predecessor to RBC Enterprise Fund. Fund performance reflects applicable fee waivers/expense reimbursements (which, if excluded, would cause performance to be lower). |
| (f) | The since inception date (commencement of operations) of the Fund is December 2, 1983. The performance of the index since inception of the Fund is calculated from November 30, 1983. |
| (g) | The inception date for Class A, Class C and Class R Shares of the Fund is April 19, 2004. All performance shown for each such class of shares prior to its inception date is based on the performance of the Class S Shares of the Fund, adjusted to reflect the fees and expenses of Class A, Class C and Class R Shares, as applicable (and where applicable, the maximum sales charges of the Class A and Class C Shares). |
7
PERFORMANCE SUMMARY
| (h) | The inception date for Class I Shares of the Fund is September 30, 2004. All performance shown for each such class of shares prior to its inception date is based on the performance of the Class S Shares of the Fund, adjusted to reflect the fees and expenses of Class I Shares, as applicable. |
| (i) | The performance in the table for the period from August 5, 1991 to April 19, 2004 reflects the performance of Babson Enterprise Fund II, the predecessor to RBC Small Cap Core Fund. Fund performance reflects applicable fee waivers/expense reimbursements (which, if excluded, would cause performance to be lower). |
| (j) | The since inception date (commencement of operations) of the Fund is August 5, 1991. The performance of the index since inception of the Fund is calculated from July 31, 1991. |
| (k) | The performance in the table for the period from September 10, 1987 to April 19, 2004 reflects the performance of Shadow Stock Fund, the predecessor to RBC Microcap Value Fund. Fund performance reflects applicable fee waivers/expense reimbursements (which, if excluded, would cause performance to be lower). |
| (l) | The since inception date (commencement of operations) of the Fund is September 10, 1987. The performance of the index since inception of the Fund is calculated from August 31, 1987. |
| (m) | The since inception date (commencement of operations) of the Fund is December 31, 2009. The performance of the index since inception of the Fund is calculated from December 31, 2009. |
The Russell Midcap Growth Index is an unmanaged index that measures the performance of those Russell Midcap Index companies with higher price-to-book ratios and higher forecasted growth values.
The Russell 2000 Value Index is an unmanaged index that measures the performance of those Russell 2000 companies with lower price-to-book ratios and lower forecasted growth values.
The Russell 2000 Index is an unmanaged index that measures the performance of approximately 2,000 of the smallest securities in the Russell 3000 Index based on a combination of their market cap and current index membership.
The Russell Midcap Value Index is an unmanaged, market-weighted total return index that tracks the performance of those Russell Midcap companies with lower price-to-book ratios and lower forecasted growth rates.
8
| | | | | | | | | | |
| | FUND STATISTICS (UNAUDITED) RBC Mid Cap Growth Fund | |
| | | | |
| Investment Objective | | Long-term capital appreciation. | | | | | | | | |
Benchmark | | Russell Midcap Growth Index | | | | | | | | |
Asset Allocation (as of 3/31/10) (% of fund’s investments) & Top Five Industries (as of 3/31/10) (% of fund’s net assets) | | 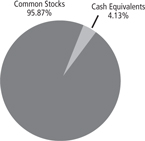
| | | | | Top Five Industries | | | |
| | | | | | Health Care | | 24.08 | % |
| | | | | | Information Technology | | 22.77 | % |
| | | | | | Industrials | | 16.67 | % |
| | | | | | Consumer Discretionary | | 13.64 | % |
| | | | | | Financials | | 7.34 | % |
| | | | | | | | | |
| | | | | | | | | |
| | | | | | | | | |
| | | | | | | | | |
| | | | | | | | | |
| | | | | | | | | |
| | | | | | | | | |
| | | | | | | | | |
| | | | | | | | | |
| | | | | | | | | |
| | | | |
Top Ten Holdings (as of 3/31/10) (% of fund’s net assets) | | F5 Networks, Inc. | | 2.47 | % | | LKQ Corp. | | 1.88 | % |
| | Catalyst Health Solutions, Inc. | | 2.30 | % | | Tractor Supply Co. | | 1.85 | % |
| | Riverbed Technology, Inc. | | 2.21 | % | | Edwards Lifesciences Corp. | | 1.84 | % |
| | Ross Stores, Inc. | | 2.00 | % | | Fossil, Inc. | | 1.83 | % |
| | Akamai Technologies, Inc. | | 1.94 | % | | Henry Schein, Inc. | | 1.81 | % |
| |
| | * A listing of all portfolio holdings can be found beginning on page 15. | |
Growth of $10,000 Initial Investment Over 10 Years | | 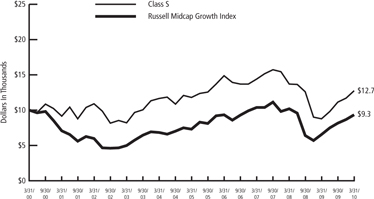
The graph reflects an initial investment of $10,000 over a 10 year period and is based on Class S shares. The performance of the Fund for the period from March 31, 2000 to April 19, 2004 reflects the performance of RBC Mid Cap Equity Fund, the predecessor to RBC Mid Cap Growth Fund. The Fund’s total return includes reinvested dividends and capital gains. The Fund’s total return also includes operating expenses that reduce return, while the total return of the index does not. The graph does not reflect the deduction of taxes that a shareholder would pay on fund distributions or redemption of fund shares. Performance of other classes will vary due to differences in fee structures. | |
9
FUND STATISTICS (UNAUDITED)
RBC Enterprise Fund
| | | | | | | | | | |
Long-term growth of capital. | | | | | | | | | | Investment Objective |
| | | | |
Russell 2000 Index | | | | | | | | | | Benchmark |
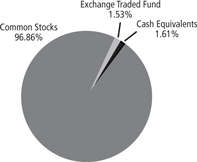
| | | | | Top Five Industries | | | | | Asset Allocation (as of 3/31/10) (% of fund’s investments) & Top Five Industries (as of 3/31/10) (% of fund’s net assets) |
| | | | | Information Technology | | 27.30 | % | |
| | | | | Industrials | | 20.59 | % | |
| | | | | Consumer Discretionary | | 17.16 | % | |
| | | | | Health Care | | 9.44 | % | |
| | | | | Financials | | 9.15 | % | |
| | | | | | | | | | |
| | | | | | | | | | |
| | | | | | | | | | |
| | | | | | | | | | |
| | | | | | | | | | |
| | | | | | | | | | |
| | | | | | | | | | |
| | | | | | | | | | |
| | | | |
Spectrum Control, Inc. | | 4.54 | % | | Columbus McKinnon Corp. | | 3.18 | % | | Top Ten Holdings (as of 3/31/10) (% of fund’s net assets) |
Universal Electronics, Inc. | | 4.13 | % | | Universal Stainless & Alloy | | 3.10 | % | |
Steinway Musical Instruments | | 3.81 | % | | Sonic Solutions, Inc. | | 3.00 | % | |
LaBarge, Inc. | | 3.53 | % | | NIC, Inc. | | 2.82 | % | |
AZZ, Inc. | | 3.24 | % | | EMS Technologies, Inc. | | 2.47 | % | |
| |
* A listing of all portfolio holdings can be found beginning on page 18. | | | |
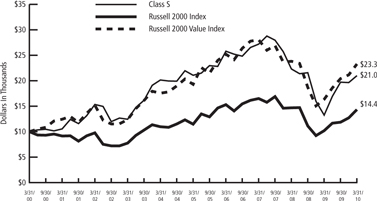
The graph reflects an initial investment of $10,000 over a 10 year period and is based on Class S shares. The performance of the Fund for the period from March 31, 2000 to April 19, 2004 reflects the performance of Babson Enterprise Fund, the predecessor to RBC Enterprise Fund. The Fund’s total return includes reinvested dividends and capital gains. The Fund’s total return also includes operating expenses that reduce return, while the total return of the index does not. The graph does not reflect the deduction of taxes that a shareholder would pay on fund distributions or redemption of fund shares. Performance of other classes will vary due to differences in fee structures. | | | Growth of $10,000 Initial Investment Over 10 Years |
10
| | | | | | | | | | |
| | FUND STATISTICS (UNAUDITED) RBC Small Cap Core Fund | |
| | | | |
| Investment Objective | | Long-term growth of capital and income. | | | | | | | | |
| | | | |
| Benchmark | | Russell 1000 Value Index | | | | | | | | |
Asset Allocation (as of 3/31/10) (% of fund’s investments) & Top Five Industries (as of 3/31/10) (% of fund’s net assets) | | 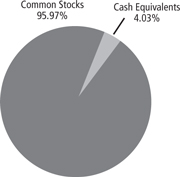
| | | | | Top Five Industries | | | |
| | | | | | Industrials | | 23.27 | % |
| | | | | | Information Technology | | 19.10 | % |
| | | | | | Consumer Discretionary | | 14.60 | % |
| | | | | | Health Care | | 11.77 | % |
| | | | | | Financials | | 11.15 | % |
| | | | | | | | | |
| | | | | | | | | |
| | | | | | | | | |
| | | | | | | | | |
| | | | | | | | | |
| | | | | | | | | |
| | | | | | | | | |
| | | | | | | | | |
| | | | | | | | | |
| | | | | | | | | |
| | | | | | | | | |
Top Ten Holdings (as of 3/31/10) (% of fund’s net assets) | | PSS World Medical, Inc. | | 2.98 | % | | Steinway Musical Instruments | | 2.41 | % |
| | Gardner Denver, Inc. | | 2.96 | % | | Casual Male Retail Group, Inc. | | 2.34 | % |
| | AZZ, Inc. | | 2.57 | % | | Ares Capital Corp. | | 2.30 | % |
| | True Religion Apparel, Inc. | | 2.54 | % | | Universal Electronics, Inc. | | 2.29 | % |
| | Spectrum Control, Inc. | | 2.46 | % | | Xyratex Ltd. | | 2.28 | % |
| |
| | * A listing of all portfolio holdings can be found beginning on page 21. | |
Growth of $10,000 Initial Investment Over 10 Years | | 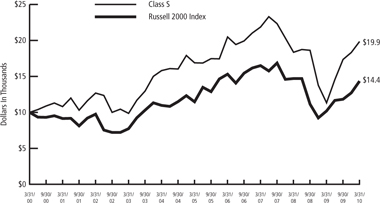
The graph reflects an initial investment of $10,000 over a 10 year period and is based on Class S shares. The performance of the Fund for the period from March 31, 2000 to April 19, 2004 reflects the performance of Babson Enterprise Fund II, the predecessor to RBC Small Cap Core Fund. The Fund’s total return includes reinvested dividends and capital gains. The Fund’s total return also includes operating expenses that reduce return, while the total return of the index does not. The graph does not reflect the deduction of taxes that a shareholder would pay on fund distributions or redemption of fund shares. Performance of other classes will vary due to differences in fee structures. | |
11
FUND STATISTICS (UNAUDITED)
RBC Microcap Value Fund
| | | | | | | | | | |
| |
| Long-term growth of capital. | | | Investment Objective |
| |
| Russell 2000 Value Index | | | Benchmark |
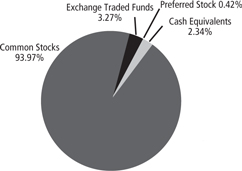
| | | | | Top Five Industries | | | | | Asset Allocation (as of 3/31/10) (% of fund’s investments) & Top Five Industries (as of 3/31/10) (% of fund’s net assets) |
| | | | | Consumer Discretionary | | 20.77 | % | |
| | | | | Industrials | | 20.54 | % | |
| | | | | Financials | | 19.20 | % | |
| | | | | Information Technology | | 12.49 | % | |
| | | | | Health Care | | 5.74 | % | |
| | | | | | | | | | |
| | | | | | | | | | |
| | | | | | | | | | |
| | | | | | | | | | |
| | | | | | | | | | |
| | | | | | | | | | |
| | | | | | | | | | |
| | | | | | | | | | |
| | | | | | | | | | |
| | | | | | | | | | |
| | | | | | | | | | |
Consolidated Graphics, Inc. | | 0.75 | % | | PAM Transportation Services, Inc. | | 0.59 | % | | Top Ten Holdings (as of 3/31/10) (% of fund’s net assets) |
Integrated Silicon Solution, Inc. | | 0.64 | % | | Celadon Group, Inc. | | 0.57 | % | |
Systemax, Inc. | | 0.61 | % | | Elizabeth Arden, Inc. | | 0.55 | % | |
Buckeye Technologies, Inc. | | 0.60 | % | | Perry Ellis International, Inc. | | 0.53 | % | |
American Equity Investment Life Holding Co. | | 0.59 | % | | Kforce, Inc. | | 0.53 | % | |
| |
* A listing of all portfolio holdings can be found beginning on page 24. | | | |
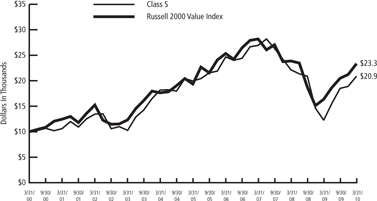
The graph reflects an initial investment of $10,000 over a 10 year period and is based on Class S shares. The performance of the Fund for the period from March 31, 2000 to April 19, 2004 reflects the performance of Shadow Stock Fund, the predecessor to RBC Microcap Value Fund. The Fund’s total return includes reinvested dividends and capital gains. The Fund’s total return also includes operating expenses that reduce return, while the total return of the index does not. The graph does not reflect the deduction of taxes that a shareholder would pay on fund distributions or redemption of fund shares. Performance of other classes will vary due to differences in fee structures. | | | Growth of $10,000 Initial Investment Over 10 Years |
12
| | | | | | | | | | |
| | FUND STATISTICS (UNAUDITED) RBC Mid Cap Value Fund | |
| | | | |
| Investment Objective | | Long-term capital appreciation. | | | | | | | | |
| | | | |
| Benchmark | | Russell Midcap Value Index | | | | | | | | |
Asset Allocation (as of 03/31/10) (% of fund’s investments) & Top Five Industries (as of 03/31/10) (% of fund’s net assets) | | 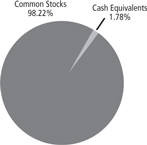
| | | | | Top Five Industries | | | |
| | | | | | | Financials | | 18.88 | % |
| | | | | | | Materials | | 17.44 | % |
| | | | | | | Information Technology | | 15.28 | % |
| | | | | | | Industrials | | 14.02 | % |
| | | | | | | Consumer Discretionary | | 9.75 | % |
| | | | |
| Top Ten Holdings (as of 03/31/10) (% of fund’s net assets) | | Harris Corp. | | 4.29 | % | | Owens-Illinois, Inc. | | 2.25 | % |
| | Crown Holdings, Inc. | | 3.82 | % | | Reinsurance Group of America, Inc. | | 2.22 | % |
| | Pactiv Corp. | | 3.66 | % | | First Horizon National Corp. | | 2.20 | % |
| | Kohl’s Corp. | | 2.45 | % | | FMC Corp. | | 2.19 | % |
| | CACI International, Inc., Class A | | 2.43 | % | | | | | |
| | Comtech Telecommunications Corp. | | 2.32 | % | | | | | |
| | |
| | * A listing of all portfolio holdings can be found beginning on page 34. | | | |
| |
| Growth of $10,000 Initial Investment Since Inception (12/30/09) | | 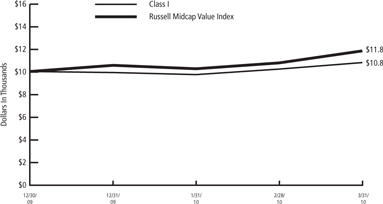
The graph reflects an initial investment of $10,000 over the period from December 30,2009 to March 31, 2010 and is based on Class I shares. The Fund’s total return includes reinvested dividends and capital gains. The Fund’s total return also includes operating expenses that reduce return, while the total return of the index does not. The graph does not reflect the deduction of taxes that a shareholder would pay on fund distributions or redemption of fund shares. | |
13
SCHEDULE OF PORTFOLIO INVESTMENTS
RBC Mid Cap Growth Fund
March 31, 2010 (Unaudited)
| | | | | | | |
Shares | | | | Value |
Common Stocks — 96.27% | | | |
Consumer Discretionary — 13.64% | | | |
| | 10,400 | | Capella Education Co.* | | $ | 965,536 |
| | 29,400 | | Fossil, Inc.* | | | 1,109,556 |
| | 20,100 | | Guess?, Inc. | | | 944,298 |
| | 56,160 | | LKQ Corp.* | | | 1,140,048 |
| | 12,200 | | Panera Bread Co., Class A* | | | 933,178 |
| | 22,700 | | Ross Stores, Inc. | | | 1,213,769 |
| | 19,350 | | Tractor Supply Co. | | | 1,123,267 |
| | 20,100 | | WMS Industries, Inc.* | | | 842,994 |
| | | | | | | |
| | | | | | | 8,272,646 |
| | | | | | | |
Consumer Staples — 3.65% | | | |
| | 10,100 | | Church & Dwight Co., Inc. | | | 676,195 |
| | 10,400 | | Ralcorp Holdings, Inc.* | | | 704,912 |
| | 29,700 | | United Natural Foods, Inc.* | | | 835,461 |
| | | | | | | |
| | | | | | | 2,216,568 |
| | | | | | | |
Energy — 5.08% | | | |
| | 15,100 | | Dril-Quip, Inc.* | | | 918,684 |
| | 12,390 | | Oceaneering International, Inc.* | | | 786,641 |
| | 17,400 | | Oil States International, Inc.* | | | 788,916 |
| | 13,900 | | Unit Corp.* | | | 587,692 |
| | | | | | | |
| | | | | | | 3,081,933 |
| | | | | | | |
Financials — 7.34% | | | |
| | 16,500 | | Eaton Vance Corp. | | | 553,410 |
| | 18,300 | | Federated Investors, Inc., Class B | | | 482,754 |
| | 33,200 | | HCC Insurance Holdings, Inc. | | | 916,320 |
| | 16,500 | | Investment Technology Group, Inc.* | | | 275,385 |
| | 28,800 | | Knight Capital Group, Inc., Class A* | | | 439,200 |
| | 34,100 | | Raymond James Financial, Inc. | | | 911,834 |
| | 39,300 | | Tower Group, Inc. | | | 871,281 |
| | | | | | | |
| | | | | | | 4,450,184 |
| | | | | | | |
Health Care — 24.08% | | | |
| | 55,100 | | Bruker Corp.* | | | 807,215 |
| | 33,700 | | Catalyst Health Solutions, Inc.* | | | 1,394,506 |
| | 10,400 | | Cerner Corp.* | | | 884,624 |
| | 12,200 | | Charles River Laboratories International, Inc.* | | | 479,582 |
| | 11,300 | | Edwards Lifesciences Corp.* | | | 1,117,344 |
| | 13,000 | | Gen-Probe, Inc.* | | | 650,000 |
| | 18,600 | | Henry Schein, Inc.* | | | 1,095,540 |
| | 14,800 | | IDEXX Laboratories, Inc.* | | | 851,740 |
| | 15,600 | | Integra LifeSciences Holdings Corp.* | | | 683,748 |
| | 7,800 | | Laboratory Corp of America Holdings* | | | 590,538 |
| | 18,300 | | Meridian Bioscience, Inc. | | | 372,771 |
14
SCHEDULE OF PORTFOLIO INVESTMENTS
RBC Mid Cap Growth Fund (cont.)
March 31, 2010 (Unaudited)
| | | | | | | |
Shares | | | | Value |
| | 6,900 | | Mettler-Toledo International, Inc.* | | $ | 753,480 |
| | 16,900 | | MWI Veterinary Supply, Inc.* | | | 682,760 |
| | 14,800 | | NuVasive, Inc.* | | | 668,960 |
| | 19,200 | | Parexel International Corp.* | | | 447,552 |
| | 11,300 | | Perrigo Co. | | | 663,536 |
| | 21,800 | | Pharmaceutical Product Development, Inc. | | | 517,750 |
| | 10,400 | | Varian Medical Systems, Inc.* | | | 575,432 |
| | 12,200 | | Waters Corp.* | | | 823,988 |
| | 13,000 | | West Pharmaceutical Services, Inc. | | | 545,350 |
| | | | | | | |
| | | | | | | 14,606,416 |
| | | | | | | |
Industrials — 16.67% | | | |
| | 10,400 | | Alliant Techsystems, Inc.* | | | 845,520 |
| | 22,700 | | AMETEK, Inc. | | | 941,142 |
| | 16,520 | | Donaldson Co., Inc. | | | 745,382 |
| | 10,380 | | Expeditors International of Washington, Inc. | | | 383,230 |
| | 6,900 | | Flowserve Corp. | | | 760,863 |
| | 11,740 | | Huron Consulting Group, Inc.* | | | 238,322 |
| | 12,200 | | Jacobs Engineering Group, Inc.* | | | 551,318 |
| | 13,000 | | Landstar System, Inc. | | | 545,740 |
| | 18,300 | | MSC Industrial Direct Co., Class A | | | 928,176 |
| | 15,490 | | Roper Industries, Inc. | | | 895,942 |
| | 14,000 | | Stericycle, Inc.* | | | 763,000 |
| | 13,000 | | Teledyne Technologies, Inc.* | | | 536,510 |
| | 15,700 | | Towers Watson & Co., Class A | | | 745,750 |
| | 15,600 | | Waste Connections, Inc.* | | | 529,776 |
| | 21,800 | | Woodward Governor Co. | | | 697,164 |
| | | | | | | |
| | | | | | | 10,107,835 |
| | | | | | | |
Information Technology — 22.77% | | | |
| | 37,500 | | Akamai Technologies, Inc.* | | | 1,177,875 |
| | 32,800 | | Altera Corp. | | | 797,368 |
| | 15,820 | | ANSYS, Inc.* | | | 682,475 |
| | 27,810 | | Autodesk, Inc.* | | | 818,170 |
| | 14,800 | | Comtech Telecommunications Corp.* | | | 473,452 |
| | 47,700 | | Cybersource Corp.* | | | 841,428 |
| | 14,840 | | Dolby Laboratories, Inc., Class A* | | | 870,663 |
| | 24,400 | | F5 Networks, Inc.* | | | 1,500,844 |
| | 18,300 | | Global Payments, Inc. | | | 833,565 |
| | 30,700 | | Logitech International SA* | | | 501,638 |
| | 10,400 | | Mantech International Corp., Class A* | | | 507,832 |
| | 19,850 | | Microchip Technology, Inc. | | | 558,976 |
| | 26,100 | | MICROS Systems, Inc.* | | | 858,168 |
| | 18,300 | | National Instruments Corp. | | | 610,305 |
| | 18,300 | | Open Text Corp.* | | | 868,701 |
| | 47,200 | | Riverbed Technology, Inc.* | | | 1,340,480 |
15
SCHEDULE OF PORTFOLIO INVESTMENTS
RBC Mid Cap Growth Fund (cont.)
March 31, 2010 (Unaudited)
| | | | | | | | |
Shares | | | | Value | |
| | 25,300 | | Synopsys, Inc.* | | $ | 565,961 | |
| | | | | | | | |
| | | | | | | 13,807,901 | |
| | | | | | | | |
Materials — 3.04% | | | | |
| | 13,900 | | AptarGroup, Inc. | | | 546,965 | |
| | 12,200 | | Reliance Steel & Aluminum Co. | | | 600,606 | |
| | 13,000 | | Sigma-Aldrich Corp. | | | 697,580 | |
| | | | | | | | |
| | | | | | | 1,845,151 | |
| | | | | | | | |
| |
Total Common Stocks (Cost $50,095,593) | | | 58,388,634 | |
| | | | | | | | |
Investment Company — 4.15% | | | | |
| | 2,518,330 | | JPMorgan Prime Money Market Fund | | | 2,518,330 | |
| | | | | | | | |
| |
Total Investment Company (Cost $2,518,330) | | | 2,518,330 | |
| | | | | | | | |
| |
Total Investments (Cost $52,613,923)(a) — 100.42% | | $ | 60,906,964 | |
| |
Liabilities in excess of other assets — (0.42)% | | | (252,578 | ) |
| | | | | | | | |
| |
NET ASSETS — 100.00% | | $ | 60,654,386 | |
| | | | | | | | |
| * | Non-income producing security. |
| (a) | See notes to financial statements for the tax cost of securities and the breakdown of unrealized appreciation (depreciation). |
See notes to financial statements.
16
SCHEDULE OF PORTFOLIO INVESTMENTS
RBC Enterprise Fund
March 31, 2010 (Unaudited)
| | | | | | | |
Shares | | | | Value |
Common Stocks — 97.00% | | | |
Consumer Discretionary — 17.16% | | | |
| | 441,378 | | Benihana, Inc., Class A* | | $ | 2,868,957 |
| | 160,250 | | Cache, Inc.* | | | 882,977 |
| | 854,973 | | Casual Male Retail Group, Inc.* | | | 3,295,921 |
| | 90,000 | | CKE Restaurants, Inc. | | | 996,300 |
| | 13,100 | | Delta Apparel, Inc.* | | | 204,360 |
| | 93,630 | | Mac-Gray Corp.* | | | 1,057,083 |
| | 221,191 | | Movado Group, Inc.* | | | 2,495,034 |
| | 143,300 | | RG Barry Corp. | | | 1,461,660 |
| | 292,956 | | Steinway Musical Instruments* | | | 5,516,361 |
| | 27,150 | | Tefron Ltd.* | | | 103,442 |
| | 267,700 | | Universal Electronics, Inc.* | | | 5,980,418 |
| | | | | | | |
| | | | | | | 24,862,513 |
| | | | | | | �� |
Energy — 2.25% | | | |
| | 27,200 | | Goodrich Petroleum Corp.* | | | 425,408 |
| | 28,000 | | Gulf Island Fabrication, Inc. | | | 609,000 |
| | 56,400 | | Gulfport Energy Corp.* | | | 633,936 |
| | 19,954 | | OYO Geospace Corp.* | | | 954,001 |
| | 54,300 | | Tesco Corp.* | | | 633,681 |
| | | | | | | |
| | | | | | | 3,256,026 |
| | | | | | | |
Financials — 9.15% | | | |
| | 301,300 | | Asta Funding, Inc. | | | 2,121,152 |
| | 51,900 | | Boston Private Financial Holdings, Inc. | | | 382,503 |
| | 91,059 | | CoBiz Financial, Inc. | | | 567,298 |
| | 175,000 | | Compass Diversified Holdings | | | 2,670,500 |
| | 65,000 | | Cypress Sharpridge Investments, Inc. REIT | | | 869,700 |
| | 68,800 | | Firstcity Financial Corp.* | | | 481,600 |
| | 32,000 | | LaSalle Hotel Properties REIT | | | 745,600 |
| | 34,626 | | Mercantile Bank Corp. | | | 136,080 |
| | 95,389 | | MetroCorp Bancshares, Inc.* | | | 281,397 |
| | 100,700 | | National Interstate Corp. | | | 2,085,497 |
| | 60,374 | | Northrim BanCorp, Inc. | | | 1,031,188 |
| | 108,900 | | SWS Group, Inc. | | | 1,255,617 |
| | 50,000 | | Washington Banking Co. | | | 629,500 |
| | | | | | | |
| | | | | | | 13,257,632 |
| | | | | | | |
Health Care — 9.44% | | | |
| | 92,000 | | Exactech, Inc. | | | 1,929,240 |
| | 15,832 | | HMS Holdings Corp.* | | | 807,274 |
| | 134,800 | | Kensey Nash Corp.* | | | 3,179,932 |
| | 36,900 | | Landauer, Inc. | | | 2,406,618 |
| | 51,200 | | LHC Group, Inc.* | | | 1,716,736 |
| | 102,700 | | Meridian Bioscience, Inc. | | | 2,091,999 |
| | 66,500 | | Symmetry Medical, Inc.* | | | 667,660 |
17
SCHEDULE OF PORTFOLIO INVESTMENTS
RBC Enterprise Fund (cont.)
March 31, 2010 (Unaudited)
| | | | | | | |
Shares | | | | Value |
| | 50,800 | | US Physical Therapy, Inc.* | | $ | 883,920 |
| | | | | | | |
| | | | | | | 13,683,379 |
| | | | | | | |
Industrials — 20.59% | | | |
| | 41,656 | | Allied Defense Group, Inc. (The)* | | | 300,340 |
| | 138,700 | | AZZ, Inc. | | | 4,694,995 |
| | 613,000 | | C&D Technologies, Inc.* | | | 980,800 |
| | 290,225 | | Columbus McKinnon Corp.* | | | 4,605,871 |
| | 175,000 | | Eagle Bulk Shipping, Inc.* | | | 929,250 |
| | 69,200 | | Ennis, Inc. | | | 1,125,884 |
| | 26,900 | | Hurco Cos, Inc.* | | | 452,727 |
| | 462,894 | | LaBarge, Inc.* | | | 5,114,979 |
| | 157,300 | | NN, Inc.* | | | 865,150 |
| | 214,952 | | North American Galvanizing & Coating, Inc.* | | | 1,195,133 |
| | 400,000 | | OceanFreight, Inc.* | | | 300,800 |
| | 31,200 | | Old Dominion Freight Line, Inc.* | | | 1,041,768 |
| | 135,600 | | Orion Marine Group, Inc.* | | | 2,447,580 |
| | 337,639 | | PGT, Inc.* | | | 611,126 |
| | 48,073 | | Powell Industries, Inc.* | | | 1,563,814 |
| | 129,578 | | Standard Parking Corp.* | | | 2,127,671 |
| | 22,100 | | Sun Hydraulics Corp. | | | 574,158 |
| | 125,000 | | TBS International PLC* | | | 912,500 |
| | | | | | | |
| | | | | | | 29,844,546 |
| | | | | | | |
Information Technology — 27.30% | | | |
| | 197,182 | | Aspen Technology, Inc.* | | | 2,021,116 |
| | 100,000 | | Computer Task Group, Inc.* | | | 725,000 |
| | 98,577 | | Comtech Telecommunications Corp.* | | | 3,153,478 |
| | 418,502 | | DivX, Inc.* | | | 2,996,474 |
| | 215,200 | | EMS Technologies, Inc.* | | | 3,572,320 |
| | 124,000 | | Interactive Intelligence, Inc.* | | | 2,317,560 |
| | 524,238 | | Lionbridge Technologies, Inc.* | | | 1,902,984 |
| | 519,500 | | NIC, Inc.* | | | 4,088,465 |
| | 27,900 | | NU Horizons Electronics Corp.* | | | 89,559 |
| | 144,087 | | SkillSoft PLC - ADR* | | | 1,486,978 |
| | 463,411 | | Sonic Solutions, Inc.* | | | 4,342,161 |
| | 562,810 | | Spectrum Control, Inc.* | | | 6,579,249 |
| | 70,000 | | StarTek, Inc.* | | | 486,500 |
| | 129,300 | | Tyler Technologies, Inc.* | | | 2,423,082 |
| | 200,000 | | Xyratex Ltd.* | | | 3,386,000 |
| | | | | | | |
| | | | | | | 39,570,926 |
| | | | | | | |
Materials — 8.46% | | | |
| | 467,116 | | Intertape Polymer Group, Inc.* | | | 1,546,154 |
| | 97,000 | | Koppers Holdings, Inc. | | | 2,747,040 |
| | 194,600 | | Landec Corp.* | | | 1,290,198 |
| | 257,500 | | Omnova Solutions, Inc.* | | | 2,021,375 |
| | 187,088 | | Universal Stainless & Alloy* | | | 4,488,241 |
18
SCHEDULE OF PORTFOLIO INVESTMENTS
RBC Enterprise Fund (cont.)
March 31, 2010 (Unaudited)
| | | | | | | | |
Shares | | | | Value | |
| | 453,300 | | US Concrete, Inc.* | | $ | 172,254 | |
| | | | | | | | |
| | | | | | | 12,265,262 | |
| | | | | | | | |
Utilities — 2.65% | | | | |
| | 107,400 | | Central Vermont Public Service Corp. | | | 2,166,258 | |
| | 71,800 | | Unitil Corp. | | | 1,669,350 | |
| | | | | | | | |
| | | | | | | 3,835,608 | |
| | | | | | | | |
| |
Total Common Stocks (Cost $128,877,821) | | | 140,575,892 | |
| | | | | | | | |
Exchange Traded Fund — 1.54% | | | | |
| | 85,000 | | SPDR KBW Regional Banking | | | 2,228,700 | |
| | | | | | | | |
| |
Total Exchange Traded Fund (Cost $2,108,292) | | | 2,228,700 | |
| | | | | | | | |
Investment Company — 1.61% | | | | |
| | 2,335,005 | | JPMorgan Prime Money Market Fund | | | 2,335,005 | |
| | | | | | | | |
| |
Total Investment Company (Cost $2,335,005) | | | 2,335,005 | |
| | | | | | | | |
| |
Total Investments (Cost $133,321,118)(a) — 100.15% | | $ | 145,139,597 | |
| |
Liabilities in excess of other assets — (0.15)% | | | (215,535 | ) |
| | | | | | | | |
| |
NET ASSETS — 100.00% | | $ | 144,924,062 | |
| | | | | | | | |
| * | Non-income producing security. |
| (a) | See notes to financial statements for the tax cost of securities and the breakdown of unrealized appreciation (depreciation). |
Abbreviations used are defined below:
REIT - Real Estate Investment Trust
See notes to financial statements.
19
SCHEDULE OF PORTFOLIO INVESTMENTS
RBC Small Cap Core Fund
March 31, 2010 (Unaudited)
| | | | | | | |
Shares | | | | Value |
Common Stocks — 96.57% | | | |
Consumer Discretionary — 14.60% | | | |
| | 67,719 | | Benihana, Inc., Class A* | | $ | 440,174 |
| | 296,800 | | Casual Male Retail Group, Inc.* | | | 1,144,164 |
| | 25,300 | | Dress Barn, Inc.* | | | 661,848 |
| | 9,800 | | Drew Industries, Inc.* | | | 215,796 |
| | 5,600 | | Jo-Ann Stores, Inc.* | | | 235,088 |
| | 43,000 | | Movado Group, Inc.* | | | 485,040 |
| | 62,707 | | Steinway Musical Instruments* | | | 1,180,773 |
| | 8,500 | | Steven Madden Ltd.* | | | 414,800 |
| | 40,900 | | True Religion Apparel, Inc.* | | | 1,241,724 |
| | 50,198 | | Universal Electronics, Inc.* | | | 1,121,423 |
| | | | | | | |
| | | | | | | 7,140,830 |
| | | | | | | |
Consumer Staples — 3.89% | | | |
| | 20,400 | | Alberto-Culver Co. | | | 533,460 |
| | 31,600 | | Nash Finch Co. | | | 1,063,340 |
| | 34,300 | | Sally Beauty Holdings, Inc.* | | | 305,956 |
| | | | | | | |
| | | | | | | 1,902,756 |
| | | | | | | |
Energy — 4.59% | | | |
| | 2,500 | | CARBO Ceramics, Inc. | | | 155,850 |
| | 1,100 | | Core Laboratories NV | | | 143,880 |
| | 30,200 | | Georesources, Inc.* | | | 461,154 |
| | 16,300 | | Tesco Corp.* | | | 190,221 |
| | 20,700 | | Willbros Group, Inc.* | | | 248,607 |
| | 39,200 | | World Fuel Services Corp. | | | 1,044,288 |
| | | | | | | |
| | | | | | | 2,244,000 |
| | | | | | | |
Financials — 11.15% | | | |
| | 34,100 | | Amerisafe, Inc.* | | | 558,217 |
| | 75,700 | | Ares Capital Corp. | | | 1,123,388 |
| | 55,027 | | Asta Funding, Inc. | | | 387,390 |
| | 70,900 | | Compass Diversified Holdings | | | 1,081,934 |
| | 19,900 | | Cypress Sharpridge Investments, Inc. REIT | | | 266,262 |
| | 27,325 | | Delphi Financial Group, Inc., Class A | | | 687,497 |
| | 10,200 | | LaSalle Hotel Properties REIT | | | 237,660 |
| | 8,500 | | ProAssurance Corp.* | | | 497,590 |
| | 23,500 | | SeaBright Insurance Holdings, Inc. | | | 258,735 |
| | 23,700 | | SWS Group, Inc. | | | 273,261 |
| | 4,072 | | Trico Bancshares | | | 81,033 |
| | | | | | | |
| | | | | | | 5,452,967 |
| | | | | | | |
Health Care — 11.77% | | | |
| | 14,800 | | Amedisys, Inc.* | | | 817,256 |
| | 12,000 | | Emergency Medical Services Corp., Class A* | | | 678,600 |
| | 22,500 | | Invacare Corp. | | | 597,150 |
| | 11,700 | | Kinetic Concepts, Inc.* | | | 559,377 |
20
SCHEDULE OF PORTFOLIO INVESTMENTS
RBC Small Cap Core Fund (cont.)
March 31, 2010 (Unaudited)
| | | | | | | |
Shares | | | | Value |
| | 17,800 | | Meridian Bioscience, Inc. | | $ | 362,586 |
| | 61,975 | | PSS World Medical, Inc.* | | | 1,457,032 |
| | 34,500 | | Symmetry Medical, Inc.* | | | 346,380 |
| | 22,300 | | West Pharmaceutical Services, Inc. | | | 935,485 |
| | | | | | | |
| | | | | | | 5,753,866 |
| | | | | | | |
Industrials — 23.27% | | | |
| | 89,600 | | ACCO Brands Corp.* | | | 686,336 |
| | 2,800 | | American Science & Engineering, Inc. | | | 209,776 |
| | 17,900 | | Atlas Air Worldwide Holdings, Inc.* | | | 949,595 |
| | 37,100 | | AZZ, Inc. | | | 1,255,835 |
| | 202,500 | | C&D Technologies, Inc.* | | | 324,000 |
| | 15,700 | | Chart Industries, Inc.* | | | 314,000 |
| | 61,200 | | Columbus McKinnon Corp.* | | | 971,244 |
| | 18,700 | | Forward Air Corp. | | | 491,810 |
| | 32,900 | | Gardner Denver, Inc. | | | 1,448,916 |
| | 26,700 | | II-VI, Inc.* | | | 903,528 |
| | 43,600 | | Insteel Industries, Inc. | | | 466,084 |
| | 80,200 | | Interface, Inc., Class A | | | 928,716 |
| | 34,000 | | Knoll, Inc. | | | 382,500 |
| | 13,900 | | LB Foster Co., Class A* | | | 401,571 |
| | 15,400 | | Old Dominion Freight Line, Inc.* | | | 514,206 |
| | 11,578 | | Powell Industries, Inc.* | | | 376,632 |
| | 5,500 | | Sun Hydraulics Corp. | | | 142,890 |
| | 14,500 | | Wabtec Corp. | | | 610,740 |
| | | | | | | |
| | | | | | | 11,378,379 |
| | | | | | | |
Information Technology — 19.10% | | | |
| | 43,900 | | ADC Telecommunications, Inc.* | | | 320,909 |
| | 58,500 | | Aspen Technology, Inc.* | | | 599,625 |
| | 21,100 | | Comtech Telecommunications Corp.* | | | 674,989 |
| | 123,324 | | DivX, Inc.* | | | 883,000 |
| | 36,300 | | EMS Technologies, Inc.* | | | 602,580 |
| | 20,200 | | InterDigital, Inc.* | | | 562,772 |
| | 78,200 | | NIC, Inc. | | | 615,434 |
| | 54,200 | | Skyworks Solutions, Inc.* | | | 845,520 |
| | 111,542 | | Sonic Solutions, Inc.* | | | 1,045,148 |
| | 102,945 | | Spectrum Control, Inc.* | | | 1,203,427 |
| | 30,900 | | STEC, Inc.* | | | 370,182 |
| | 26,700 | | Tyler Technologies, Inc.* | | | 500,358 |
| | 65,900 | | Xyratex Ltd.* | | | 1,115,687 |
| | | | | | | |
| | | | | | | 9,339,631 |
| | | | | | | |
Materials — 5.25% | | | |
| | 59,900 | | Intertape Polymer Group, Inc.* | | | 198,269 |
| | 26,900 | | Koppers Holdings, Inc. | | | 761,808 |
| | 20,500 | | Rockwood Holdings, Inc.* | | | 545,710 |
21
SCHEDULE OF PORTFOLIO INVESTMENTS
RBC Small Cap Core Fund (cont.)
March 31, 2010 (Unaudited)
| | | | | | | | |
Shares | | | | Value | |
| | 44,351 | | Universal Stainless & Alloy* | | $ | 1,063,981 | |
| | | | | | | | |
| | | | | | | 2,569,768 | |
| | | | | | | | |
Telecommunication Services — 0.92% | | | | |
| | 54,700 | | Premiere Global Services, Inc.* | | | 451,822 | |
| | | | | | | | |
Utilities — 2.03% | | | | |
| | 11,900 | | Energen Corp. | | | 553,707 | |
| | 13,900 | | Unisource Energy Corp. | | | 437,016 | |
| | | | | | | | |
| | | | | | | 990,723 | |
| | | | | | | | |
| |
Total Common Stocks (Cost $35,643,550) | | | 47,224,742 | |
| | | | | | | | |
Investment Company — 4.06% | | | | |
| | 1,982,933 | | JPMorgan Prime Money Market Fund | | | 1,982,933 | |
| | | | | | | | |
| |
Total Investment Company (Cost $1,982,933) | | | 1,982,933 | |
| | | | | | | | |
| |
Total Investments (Cost $37,626,483)(a) — 100.63% | | $ | 49,207,675 | |
| |
Liabilities in excess of other assets — (0.63)% | | | (305,751 | ) |
| | | | | | | | |
| |
NET ASSETS — 100.00% | | $ | 48,901,924 | |
| | | | | | | | |
| * | Non-income producing security. |
| (a) | See notes to financial statements for the tax cost of securities and the breakdown of unrealized appreciation (depreciation). |
Abbreviations used are defined below:
REIT - Real Estate Investment Trust
See notes to financial statements.
22
SCHEDULE OF PORTFOLIO INVESTMENTS
RBC Microcap Value Fund
March 31, 2010 (Unaudited)
| | | | | | | |
Shares | | | | Value |
Common Stocks — 94.09% | | | |
Consumer Discretionary — 20.77% | | | |
| | 96,000 | | Adams Golf, Inc.* | | $ | 313,920 |
| | 2,800 | | Allen Organ Co.(a)(b) | | | 0 |
| | 29,800 | | Ambassadors International, Inc.* | | | 15,496 |
| | 27,500 | | America’s Car-Mart, Inc.* | | | 663,300 |
| | 53,000 | | Arctic Cat, Inc.* | | | 575,050 |
| | 50,000 | | Asbury Automotive Group, Inc.* | | | 665,000 |
| | 86,000 | | Audiovox Corp., Class A* | | | 669,080 |
| | 90,000 | | Bakers Footwear Group, Inc.* | | | 207,900 |
| | 69,000 | | Benihana, Inc., Class A* | | | 448,500 |
| | 69,000 | | Bluegreen Corp.* | | | 225,630 |
| | 46,000 | | Books-A-Million, Inc. | | | 333,040 |
| | 15,127 | | Bowl America, Inc., Class A | | | 196,651 |
| | 43,000 | | Brookfield Homes Corp.* | | | 375,820 |
| | 72,000 | | Build-A-Bear Workshop, Inc.* | | | 512,640 |
| | 44,000 | | Carriage Services, Inc.* | | | 201,960 |
| | 45,000 | | Cobra Electronics Corp.* | | | 112,950 |
| | 21,000 | | Core-Mark Holding Co., Inc.* | | | 642,810 |
| | 99,000 | | Craftmade International, Inc.* | | | 495,000 |
| | 32,000 | | CSS Industries, Inc. | | | 643,200 |
| | 42,000 | | Delta Apparel, Inc.* | | | 655,200 |
| | 56,000 | | Dixie Group, Inc.* | | | 277,200 |
| | 36,000 | | Dorman Products, Inc.* | | | 683,640 |
| | 17,500 | | Duckwall-ALCO Stores, Inc.* | | | 253,575 |
| | 84,000 | | Emmis Communications Corp., Class A* | | | 95,760 |
| | 21,000 | | Entercom Communications Corp., Class A* | | | 249,690 |
| | 56,000 | | Finish Line, Inc. (The), Class A | | | 913,920 |
| | 56,000 | | Flexsteel Industries | | | 761,040 |
| | 57,000 | | Fred’s, Inc., Class A | | | 682,860 |
| | 31,000 | | Gaiam, Inc., Class A | | | 257,300 |
| | 85,000 | | Golfsmith International Holdings, Inc.* | | | 342,550 |
| | 22,000 | | Group 1 Automotive, Inc.* | | | 700,920 |
| | 26,000 | | Hampshire Group Ltd.* | | | 109,200 |
| | 89,000 | | Hastings Entertainment, Inc.* | | | 392,490 |
| | 27,000 | | Helen of Troy Ltd.* | | | 703,620 |
| | 31,000 | | Hooker Furniture Corp. | | | 498,480 |
| | 50,000 | | HOT Topic, Inc.* | | | 325,000 |
| | 65,000 | | Isle of Capri Casinos, Inc.* | | | 505,700 |
| | 15,000 | | J Alexander’s Corp.* | | | 62,700 |
| | 52,000 | | Jakks Pacific, Inc.* | | | 678,600 |
| | 29,000 | | Johnson Outdoors, Inc., Class A* | | | 329,150 |
| | 11,000 | | Jos. A. Bank Clothiers, Inc.* | | | 601,150 |
| | 82,000 | | Journal Communications, Inc., Class A* | | | 344,400 |
| | 58,310 | | Lakeland Industries, Inc.* | | | 495,635 |
| | 22,000 | | Landry’s Restaurants, Inc.* | | | 394,240 |
| | 95,270 | | Lazare Kaplan International, Inc.*(b) | | | 238,175 |
23
SCHEDULE OF PORTFOLIO INVESTMENTS
RBC Microcap Value Fund (cont.)
March 31, 2010 (Unaudited)
| | | | | | | |
Shares | | | | Value |
| | 70,000 | | La-Z-Boy, Inc.* | | $ | 877,800 |
| | 31,000 | | Lifetime Brands, Inc.* | | | 365,800 |
| | 25,000 | | Lithia Motors, Inc., Class A* | | | 160,000 |
| | 91,000 | | Luby’s, Inc.* | | | 358,540 |
| | 36,000 | | Mac-Gray Corp. | | | 406,440 |
| | 28,000 | | Marcus Corp. | | | 363,720 |
| | 43,000 | | MarineMax, Inc.* | | | 462,680 |
| | 64,000 | | McCormick & Schmick’s Seafood Restaurants, Inc.* | | | 644,480 |
| | 7,500 | | McRae Industries, Inc., Class A | | | 79,725 |
| | 26,000 | | Media General, Inc., Class A* | | | 215,540 |
| | 31,000 | | Meritage Homes Corp.* | | | 651,000 |
| | 21,300 | | Mestek, Inc.* | | | 166,140 |
| | 39,000 | | Modine Manufacturing Co.* | | | 438,360 |
| | 82,000 | | Morton’s Restaurant Group, Inc.* | | | 501,020 |
| | 59,400 | | Movado Group, Inc.* | | | 670,032 |
| | 18,300 | | Nobel Learning Communities, Inc.* | | | 143,472 |
| | 10,300 | | Nobility Homes, Inc. | | | 100,837 |
| | 32,000 | | O’Charleys, Inc.* | | | 286,080 |
| | 41,000 | | Orleans Homebuilders, Inc.* | | | 5,740 |
| | 42,350 | | Perry Ellis International, Inc.* | | | 959,227 |
| | 135,000 | | Point.360* | | | 195,750 |
| | 90,600 | | Radio One, Inc., Class D* | | | 276,330 |
| | 34,000 | | RC2 Corp.* | | | 508,980 |
| | 56,000 | | Red Lion Hotels Corp.* | | | 404,320 |
| | 37,550 | | Rex Stores Corp.* | | | 608,310 |
| | 40,000 | | Rocky Brands, Inc.* | | | 381,600 |
| | 85,000 | | Ruby Tuesday, Inc.* | | | 898,450 |
| | 20,000 | | Saga Communications, Inc., Class A* | | | 449,600 |
| | 45,150 | | Salem Communications Corp., Class A* | | | 161,637 |
| | 90,000 | | Shiloh Industries, Inc.* | | | 508,500 |
| | 49,000 | | Stage Stores, Inc. | | | 754,110 |
| | 75,000 | | Standard Motor Products, Inc.* | | | 744,000 |
| | 44,000 | | Stein Mart, Inc.* | | | 397,320 |
| | 26,000 | | Steinway Musical Instruments* | | | 489,580 |
| | 103,000 | | Stewart Enterprises, Inc., Class A | | | 643,750 |
| | 16,000 | | Stoneridge, Inc.* | | | 158,240 |
| | 17,000 | | Strattec Security Corp.* | | | 345,440 |
| | 30,000 | | Superior Industries International, Inc. | | | 482,400 |
| | 43,000 | | Syms Corp.* | | | 428,280 |
| | 51,000 | | Systemax, Inc. | | | 1,108,740 |
| | 150,000 | | Trans World Entertainment Corp.* | | | 270,000 |
| | 50,000 | | Tuesday Morning Corp.* | | | 329,500 |
| | 22,000 | | Walking Co. Holdings, Inc. (The)* | | | 50,600 |
| | 13,400 | | Weyco Group, Inc. | | | 315,168 |
| | | | | | | |
| | | | | | | 37,617,380 |
| | | | | | | |
Consumer Staples — 3.49% | | | |
| | 19,600 | | Andersons, Inc. (The) | | | 656,208 |
24
SCHEDULE OF PORTFOLIO INVESTMENTS
RBC Microcap Value Fund (cont.)
March 31, 2010 (Unaudited)
| | | | | | | |
Shares | | | | Value |
| | 80,000 | | Central Garden and Pet Co.* | | $ | 789,600 |
| | 36,000 | | Chiquita Brands International, Inc.* | | | 566,280 |
| | 55,000 | | Elizabeth Arden, Inc.* | | | 990,000 |
| | 52,000 | | Ingles Markets, Inc., Class A | | | 781,560 |
| | 143,000 | | ML Macadamia Orchards LP* | | | 343,200 |
| | 10,000 | | Nash Finch Co. | | | 336,500 |
| | 69,000 | | Omega Protein Corp.* | | | 396,750 |
| | 54,000 | | Prestige Brands Holdings, Inc.* | | | 486,000 |
| | 22,000 | | Spartan Stores, Inc. | | | 317,240 |
| | 91,000 | | Tasty Baking Co. | | | 657,020 |
| | | | | | | |
| | | | | | | 6,320,358 |
| | | | | | | |
Energy — 3.50% | | | |
| | 119,000 | | Aventine Renewable Energy Holdings, Inc.*(a)(b) | | | 0 |
| | 44,000 | | Bronco Drilling Co., Inc.* | | | 206,800 |
| | 36,000 | | Calumet Specialty Products Partners LP | | | 750,600 |
| | 31,000 | | Constellation Energy Partners LLC | | | 108,500 |
| | 16,966 | | Enbridge Energy Management LLC* | | | 866,114 |
| | 19,000 | | EV Energy Partner LP | | | 606,480 |
| | 98,000 | | Harvest Natural Resources, Inc.* | | | 737,940 |
| | 47,000 | | Knightsbridge Tankers Ltd. | | | 796,180 |
| | 9,000 | | Lufkin Industries, Inc. | | | 712,350 |
| | 106,000 | | Newpark Resources, Inc.* | | | 556,500 |
| | 14,600 | | PHI, Inc.* | | | 323,828 |
| | 20,000 | | PHI, Inc., Non voting* | | | 423,600 |
| | 110,300 | | Trico Marine Services, Inc.* | | | 255,896 |
| | 78,570 | | VeraSun Energy Corp.* | | | 951 |
| | | | | | | |
| | | | | | | 6,345,739 |
| | | | | | | |
Financials — 19.20% | | | |
| | 70,000 | | 21st Century Holding Co. | | | 285,600 |
| | 40,000 | | Affirmative Insurance Holdings, Inc.* | | | 188,000 |
| | 100,000 | | American Equity Investment Life Holding Co. | | | 1,065,000 |
| | 75,000 | | American Independence Corp.* | | | 468,750 |
| | 19,000 | | American Safety Insurance Holdings Ltd.* | | | 315,210 |
| | 68,864 | | Ameris Bancorp | | | 621,838 |
| | 92,000 | | Asta Funding, Inc. | | | 647,680 |
| | 21,000 | | Baldwin & Lyons, Inc., Class B | | | 505,890 |
| | 14,500 | | Bancinsurance Corp.* | | | 76,850 |
| | 70,600 | | Bancorp, Inc.* | | | 628,340 |
| | 65,600 | | Banner Corp. | | | 251,904 |
| | 100,000 | | Beverly Hills Bancorp, Inc.* | | | 3,000 |
| | 50,000 | | California First National Bancorp | | | 667,500 |
| | 21,000 | | Camco Financial Corp. | | | 61,740 |
| | 5,200 | | Capital Southwest Corp. | | | 472,576 |
| | 38,000 | | Capitol Bancorp Ltd.* | | | 91,960 |
| | 44,000 | | Central Pacific Financial Corp.* | | | 73,920 |
25
SCHEDULE OF PORTFOLIO INVESTMENTS
RBC Microcap Value Fund (cont.)
March 31, 2010 (Unaudited)
| | | | | | | |
Shares | | | | Value |
| | 25,000 | | Citizens South Banking Corp. | | $ | 154,000 |
| | 48,150 | | Citizens, Inc.* | | | 332,716 |
| | 133,000 | | Consumer Portfolio Services* | | | 297,920 |
| | 41,037 | | Crawford & Co., Class B* | | | 167,021 |
| | 43,777 | | Donegal Group, Inc., Class A | | | 635,204 |
| | 12,444 | | Donegal Group, Inc., Class B | | | 204,828 |
| | 75,040 | | Dynex Capital, Inc. REIT | | | 675,360 |
| | 31,000 | | EMC Insurance Group, Inc. | | | 698,120 |
| | 34,300 | | First Defiance Financial Corp. | | | 347,116 |
| | 11,000 | | First Financial Corp. | | | 318,560 |
| | 45,400 | | First Financial Holdings, Inc. | | | 683,724 |
| | 58,000 | | First Industrial Realty Trust, Inc. REIT* | | | 450,080 |
| | 54,000 | | First Merchants Corp. | | | 375,840 |
| | 47,200 | | First Pactrust Bancorp, Inc. | | | 366,744 |
| | 38,000 | | First Place Financial Corp.* | | | 151,620 |
| | 42,000 | | First State Bancorp* | | | 23,100 |
| | 25,000 | | Firstcity Financial Corp.* | | | 175,000 |
| | 66,000 | | Flagstar Bancorp, Inc.* | | | 39,600 |
| | 45,660 | | FNB Corp. | | | 370,303 |
| | 45,000 | | FNB United Corp. | | | 54,450 |
| | 25,500 | | FPIC Insurance Group, Inc.* | | | 691,305 |
| | 62,000 | | Franklin Bank Corp.* | | | 310 |
| | 109,000 | | Fremont General Corp.* | | | 105,730 |
| | 2,250 | | FRMO Corp.* | | | 5,625 |
| | 45,000 | | Gladstone Investment Corp. | | | 269,100 |
| | 50,400 | | Green Bankshares, Inc. | | | 411,264 |
| | 108,000 | | Guaranty Bancorp* | | | 171,720 |
| | 36,850 | | Hampton Roads Bankshares, Inc. | | | 57,486 |
| | 21,180 | | Harleysville National Corp. | | | 141,906 |
| | 63,528 | | Hercules Technology Growth Capital, Inc. | | | 672,761 |
| | 38,000 | | HF Financial Corp. | | | 383,800 |
| | 36,000 | | Independence Holding Co. | | | 341,640 |
| | 13,000 | | Indiana Community Bancorp | | | 118,950 |
| | 13,000 | | Infinity Property & Casualty Corp. | | | 590,720 |
| | 31,000 | | Intervest Bancshares Corp., Class A | | | 122,450 |
| | 8,300 | | Investors Title Co. | | | 282,864 |
| | 24,000 | | Jefferson Bancshares, Inc. | | | 109,680 |
| | 17,000 | | Kansas City Life Insurance Co. | | | 536,860 |
| | 56,930 | | LaBranche & Co., Inc.* | | | 299,452 |
| | 11,000 | | LSB Corp. | | | 136,400 |
| | 53,000 | | Marlin Business Services Corp.* | | | 537,950 |
| | 23,294 | | Mass Financial Corp., Class A* | | | 216,168 |
| | 108,000 | | MCG Capital Corp.* | | | 562,680 |
| | 113,750 | | Meadowbrook Insurance Group, Inc. | | | 898,625 |
| | 62,000 | | Medallion Financial Corp. | | | 493,520 |
| | 43,000 | | Mercer Insurance Group, Inc. | | | 774,000 |
| | 136,000 | | MicroFinancial, Inc. | | | 524,960 |
| | 52,100 | | MutualFirst Financial, Inc. | | | 346,465 |
26
SCHEDULE OF PORTFOLIO INVESTMENTS
RBC Microcap Value Fund (cont.)
March 31, 2010 (Unaudited)
| | | | | | | |
Shares | | | | Value |
| | 5,300 | | National Security Group, Inc. | | $ | 64,501 |
| | 5,100 | | National Western Life Insurance Co., Class A | | | 940,185 |
| | 17,400 | | Navigators Group, Inc.* | | | 684,342 |
| | 43,000 | | NGP Capital Resources Co. | | | 366,360 |
| | 44,000 | | Nicholas Financial, Inc.* | | | 333,080 |
| | 16,000 | | NYMAGIC, Inc. | | | 339,680 |
| | 67,400 | | Old Second Bancorp, Inc. | | | 444,166 |
| | 18,000 | | Pacific Mercantile Bancorp* | | | 49,500 |
| | 19,000 | | Parkway Properties, Inc. REIT | | | 356,820 |
| | 29,000 | | Peoples Bancorp, Inc. | | | 477,920 |
| | 65,000 | | PMA Capital Corp., Class A* | | | 399,100 |
| | 37,900 | | PMC Commercial Trust REIT | | | 277,428 |
| | 40,000 | | Presidential Life Corp. | | | 398,800 |
| | 58,705 | | Prospect Capital Corp. | | | 713,266 |
| | 19,000 | | Provident Financial Holdings, Inc. | | | 66,120 |
| | 89,000 | | Reis, Inc.* | | | 508,190 |
| | 49,000 | | Resource America, Inc., Class A | | | 235,200 |
| | 17,000 | | Safety Insurance Group, Inc. | | | 640,390 |
| | 50,000 | | Sanders Morris Harris Group, Inc. | | | 309,500 |
| | 42,000 | | SeaBright Insurance Holdings, Inc. | | | 462,420 |
| | 21,000 | | Simmons First National Corp., Class A | | | 578,970 |
| | 32,000 | | Southern Community Financial Corp. | | | 71,040 |
| | 52,300 | | Southwest Bancorp, Inc. | | | 432,521 |
| | 2,999 | | Stifel Financial Corp.* | | | 161,196 |
| | 75,600 | | Sun Bancorp, Inc.* | | | 297,864 |
| | 46,500 | | SWS Group, Inc. | | | 536,145 |
| | 54,000 | | TierOne Corp.* | | | 17,280 |
| | 27,440 | | Tower Group, Inc. | | | 608,345 |
| | 68,000 | | Unico American Corp. | | | 652,800 |
| | 99,716 | | United Community Financial Corp.* | | | 150,571 |
| | 19,000 | | United Western Bancorp, Inc. | | | 29,070 |
| | 29,000 | | Winthrop Realty Trust REIT | | | 349,160 |
| | 4,600 | | Ziegler Cos., Inc. (The)* | | | 73,600 |
| | | | | | | |
| | | | | | | 34,776,985 |
| | | | | | | |
Health Care — 5.74% | | | |
| | 19,000 | | Air Methods Corp.* | | | 646,000 |
| | 54,000 | | Albany Molecular Research, Inc.* | | | 450,900 |
| | 128,000 | | Allied Healthcare International, Inc.* | | | 348,160 |
| | 11,000 | | American Shared Hospital Services* | | | 31,240 |
| | 46,000 | | Angiodynamics, Inc.* | | | 718,520 |
| | 77,000 | | BioScrip, Inc.* | | | 614,460 |
| | 45,000 | | Cantel Medical Corp. | | | 893,250 |
| | 67,000 | | Cardiac Science Corp.* | | | 125,290 |
| | 26,000 | | Conmed Corp.* | | | 619,060 |
| | 46,000 | | Cross Country Healthcare, Inc.* | | | 465,060 |
| | 27,970 | | Hanger Orthopedic Group, Inc.* | | | 508,495 |
27
SCHEDULE OF PORTFOLIO INVESTMENTS
RBC Microcap Value Fund (cont.)
March 31, 2010 (Unaudited)
| | | | | | | |
Shares | | | | Value |
| | 82,000 | | HealthTronics, Inc.* | | $ | 293,560 |
| | 20,313 | | IntegraMed America, Inc.* | | | 178,958 |
| | 28,000 | | Invacare Corp. | | | 743,120 |
| | 7,100 | | Kewaunee Scientific Corp. | | | 99,435 |
| | 30,000 | | Lannett Co., Inc.* | | | 127,500 |
| | 31,000 | | Medcath Corp.* | | | 324,570 |
| | 19,000 | | Mediware Information Systems* | | | 170,240 |
| | 51,000 | | MedQuist, Inc.* | | | 398,310 |
| | 56,800 | | National Dentex Corp.* | | | 553,800 |
| | 41,000 | | PharMerica Corp.* | | | 747,020 |
| | 22,000 | | RehabCare Group, Inc.* | | | 599,940 |
| | 62,000 | | Res-Care, Inc.* | | | 743,380 |
| | | | | | | |
| | | | | | | 10,400,268 |
| | | | | | | |
Industrials — 20.54% | | | |
| | 50,839 | | Aceto Corp. | | | 307,067 |
| | 24,000 | | Alamo Group, Inc. | | | 479,760 |
| | 125,000 | | Allied Motion Technologies, Inc.* | | | 450,000 |
| | 34,000 | | Altra Holdings, Inc.* | | | 466,820 |
| | 13,000 | | Amrep Corp.* | | | 188,890 |
| | 32,000 | | ATC Technology Corp.* | | | 549,120 |
| | 34,000 | | Beacon Roofing Supply, Inc.* | | | 650,420 |
| | 27,800 | | Cascade Corp. | | | 895,438 |
| | 74,000 | | Celadon Group, Inc.* | | | 1,031,560 |
| | 93,525 | | Cenveo, Inc.* | | | 809,926 |
| | 2,800 | | Chicago Rivet & Machine Co. | | | 42,700 |
| | 23,400 | | CIRCOR International, Inc. | | | 777,114 |
| | 40,000 | | Compx International, Inc. | | | 359,600 |
| | 33,000 | | Consolidated Graphics, Inc.* | | | 1,366,530 |
| | 35,000 | | Cornell Cos., Inc.* | | | 640,850 |
| | 29,000 | | Ducommun, Inc. | | | 609,290 |
| | 63,000 | | Eagle Bulk Shipping, Inc.* | | | 334,530 |
| | 14,700 | | Eastern Co. (The) | | | 199,038 |
| | 11,880 | | Ecology and Environment, Inc., Class A | | | 166,558 |
| | 35,000 | | Encore Wire Corp. | | | 728,000 |
| | 49,000 | | Ennis, Inc. | | | 797,230 |
| | 20,000 | | EnPro Industries, Inc.* | | | 581,600 |
| | 39,000 | | Espey Manufacturing & Electronics Corp. | | | 781,950 |
| | 62,000 | | Excel Maritime Carriers Ltd.* | | | 373,860 |
| | 79,000 | | Frozen Food Express Industries* | | | 308,100 |
| | 21,000 | | G&K Services, Inc., Class A | | | 543,480 |
| | 55,000 | | Gibraltar Industries, Inc.* | | | 693,550 |
| | 47,000 | | Griffon Corp.* | | | 585,620 |
| | 25,750 | | Hardinge, Inc. | | | 231,750 |
| | 43,000 | | Herley Industries, Inc.* | | | 630,380 |
| | 31,000 | | Insituform Technologies, Inc., Class A* | | | 824,910 |
| | 28,350 | | International Shipholding Corp. | | | 833,206 |
| | 26,000 | | Jinpan International Ltd. | | | 540,800 |
28
SCHEDULE OF PORTFOLIO INVESTMENTS
RBC Microcap Value Fund (cont.)
March 31, 2010 (Unaudited)
| | | | | | | |
Shares | | | | Value |
| | 12,000 | | Key Technology, Inc.* | | $ | 165,000 |
| | 63,000 | | Kforce, Inc.* | | | 958,230 |
| | 18,857 | | KHD Humboldt Wedag International AG | | | 161,732 |
| | 55,000 | | Kimball International, Inc., Class B | | | 382,250 |
| | 37,000 | | Ladish Co., Inc.* | | | 745,920 |
| | 64,000 | | LECG Corp.* | | | 190,720 |
| | 38,000 | | LS Starrett Co., Class A | | | 393,300 |
| | 51,750 | | LSI Industries, Inc. | | | 352,935 |
| | 66,000 | | Lydall, Inc.* | | | 518,100 |
| | 58,000 | | Mair Holdings Escrow Shares(a)(b) | | | 0 |
| | 26,875 | | Marten Transport Ltd.* | | | 529,706 |
| | 72,000 | | Mesa Air Group, Inc.* | | | 7,560 |
| | 36,117 | | Met-Pro Corp. | | | 353,947 |
| | 59,000 | | Miller Industries, Inc. | | | 733,370 |
| | 63,000 | | NN, Inc.* | | | 346,500 |
| | 18,800 | | Northwest Pipe Co.* | | | 410,780 |
| | 106,000 | | On Assignment, Inc.* | | | 755,780 |
| | 78,600 | | PAM Transportation Services, Inc.* | | | 1,076,820 |
| | 62,000 | | Paragon Shipping, Inc., Class A | | | 288,920 |
| | 43,160 | | Patrick Industries, Inc.* | | | 125,164 |
| | 99,000 | | RCM Technologies, Inc.* | | | 311,850 |
| | 34,100 | | Robbins & Myers, Inc. | | | 812,262 |
| | 55,500 | | Rush Enterprises, Inc., Class A* | | | 733,155 |
| | 21,000 | | School Specialty, Inc.* | | | 476,910 |
| | 78,000 | | SFN Group, Inc.* | | | 624,780 |
| | 13,800 | | SL Industries, Inc.* | | | 124,890 |
| | 32,000 | | Standex International Corp. | | | 824,640 |
| | 41,000 | | Superior Uniform Group, Inc. | | | 389,500 |
| | 68,115 | | Supreme Industries, Inc., Class A* | | | 179,824 |
| | 10,269 | | Sykes Enterprises, Inc.* | | | 234,544 |
| | 34,000 | | Tredegar Corp. | | | 580,720 |
| | 11,000 | | Trex Co., Inc.* | | | 234,190 |
| | 21,000 | | United Capital Corp.* | | | 498,120 |
| | 17,000 | | Universal Forest Products, Inc. | | | 654,840 |
| | 28,000 | | USA Truck, Inc.* | | | 452,480 |
| | 38,000 | | Vitran Corp., Inc.* | | | 459,800 |
| | 58,200 | | Volt Information Sciences, Inc.* | | | 594,222 |
| | 102,000 | | WCA Waste Corp.* | | | 519,180 |
| | 125,000 | | Willdan Group, Inc.* | | | 271,250 |
| | 60,000 | | Willis Lease Finance Corp.* | | | 946,800 |
| | | | | | | |
| | | | | | | 37,200,338 |
| | | | | | | |
Information Technology — 12.49% | | | |
| | 115,000 | | Acorn Energy, Inc.* | | | 680,800 |
| | 55,000 | | Actel Corp.* | | | 761,750 |
| | 41,000 | | Agilysys, Inc. | | | 457,970 |
| | 53,000 | | Anaren, Inc.* | | | 754,720 |
| | 53,300 | | Bell Microproducts, Inc.* | | | 372,034 |
29
SCHEDULE OF PORTFOLIO INVESTMENTS
RBC Microcap Value Fund (cont.)
March 31, 2010 (Unaudited)
| | | | | | | |
| | | Shares | | | | Value |
| | 14,000 | | Black Box Corp. | | $ | 430,640 |
| | 77,000 | | Ciber, Inc.* | | | 287,980 |
| | 115,000 | | Comarco, Inc.* | | | 349,600 |
| | 23,000 | | Communications Systems, Inc. | | | 297,390 |
| | 20,582 | | DG FastChannel, Inc.* | | | 657,595 |
| | 75,000 | | Digi International, Inc.* | | | 798,000 |
| | 74,598 | | Dynamics Research Corp.* | | | 840,720 |
| | 85,000 | | Edgewater Technology, Inc.* | | | 272,000 |
| | 131,000 | | EF Johnson Technologies, Inc.* | | | 122,131 |
| | 46,000 | | Electro Rent Corp. | | | 603,980 |
| | 39,000 | | Electro Scientific Industries, Inc.* | | | 499,590 |
| | 39,400 | | ePlus, Inc.* | | | 691,470 |
| | 64,000 | | GSI Group, Inc.* | | | 126,720 |
| | 24,000 | | GTSI Corp.* | | | 133,200 |
| | 47,000 | | InfoGROUP, Inc.* | | | 366,600 |
| | 32,000 | | Infospace, Inc.* | | | 353,600 |
| | 57,000 | | Insight Enterprises, Inc.* | | | 818,520 |
| | 24,000 | | Integral Systems, Inc.* | | | 231,120 |
| | 110,375 | | Integrated Silicon Solution, Inc.* | | | 1,164,456 |
| | 48,000 | | Keynote Systems, Inc. | | | 546,720 |
| | 21,000 | | Magal Security Systems Ltd.* | | | 81,480 |
| | 35,000 | | Measurement Specialties, Inc.* | | | 514,850 |
| | 94,000 | | Methode Electronics, Inc. | | | 930,600 |
| | 50,000 | | Newport Corp.* | | | 625,000 |
| | 60,000 | | NU Horizons Electronics Corp.* | | | 192,600 |
| | 45,000 | | Oplink Communications, Inc.* | | | 834,300 |
| | 40,000 | | Opnet Technologies, Inc. | | | 644,800 |
| | 123,000 | | Optical Cable Corp.* | | | 410,820 |
| | 82,000 | | PC Connection, Inc.* | | | 508,400 |
| | 90,000 | | Perceptron, Inc.* | | | 391,500 |
| | 140,000 | | Performance Technologies, Inc.* | | | 372,400 |
| | 37,930 | | Photronics, Inc.* | | | 193,064 |
| | 28,000 | | Retalix Ltd.* | | | 393,680 |
| | 47,000 | | Richardson Electronics Ltd. | | | 373,650 |
| | 29,000 | | Rudolph Technologies, Inc.* | | | 248,530 |
| | 70,000 | | Sigmatron International, Inc.* | | | 375,200 |
| | 20,000 | | SYNNEX Corp.* | | | 591,200 |
| | 70,560 | | TechTeam Global, Inc.* | | | 477,691 |
| | 21,000 | | Tessco Technologies, Inc. | | | 493,710 |
| | 30,000 | | Ulticom, Inc. | | | 277,500 |
| | 90,000 | | WebMediaBrands, Inc.* | | | 89,100 |
| | 97,000 | | White Electronic Designs Corp.* | | | 679,000 |
| | 100,000 | | WPCS International, Inc.* | | | 309,000 |
| | | | | | | |
| | | | | | | 22,627,381 |
| | | | | | | |
Materials — 4.94% |
| | 70,200 | | American Pacific Corp.* | | | 478,764 |
30
SCHEDULE OF PORTFOLIO INVESTMENTS
RBC Microcap Value Fund (cont.)
March 31, 2010 (Unaudited)
| | | | | | | |
| | | Shares | | | | Value |
| | 37,000 | | Blue Earth Refineries, Inc.* | | $ | 40,330 |
| | 83,000 | | Buckeye Technologies, Inc.* | | | 1,085,640 |
| | 18,000 | | Friedman Industries | | | 102,960 |
| | 29,000 | | Hawkins, Inc. | | | 701,800 |
| | 50,000 | | Headwaters, Inc.* | | | 229,500 |
| | 63,000 | | Innospec, Inc. | | | 715,680 |
| | 110,400 | | North American Palladium Ltd.* | | | 450,432 |
| | 23,000 | | Olympic Steel, Inc. | | | 750,950 |
| | 38,000 | | Penford Corp.* | | | 389,500 |
| | 65,000 | | PolyOne Corp.* | | | 665,600 |
| | 29,000 | | Schulman (A), Inc. | | | 709,630 |
| | 3,000 | | Schweitzer-Mauduit International, Inc. | | | 142,680 |
| | 45,000 | | Spartech Corp.* | | | 526,500 |
| | 10,000 | | Stepan Co. | | | 558,900 |
| | 66,000 | | Terra Nova Royalty Corp.* | | | 867,900 |
| | 16,000 | | Universal Stainless & Alloy* | | | 383,840 |
| | 88,610 | | US Concrete, Inc.* | | | 33,672 |
| | 3,200 | | Vulcan International Corp. | | | 113,600 |
| | | | | | | |
| | | | | | | 8,947,878 |
| | | | | | | |
Telecommunication Services — 0.40% |
| | 41,000 | | SureWest Communications* | | | 352,190 |
| | 30,000 | | USA Mobility, Inc.* | | | 380,100 |
| | | | | | | |
| | | | | | | 732,290 |
| | | | | | | |
Utilities — 3.02% |
| | 9,000 | | American States Water Co. | | | 312,300 |
| | 4,054 | | California Water Service Group | | | 152,471 |
| | 29,000 | | Central Vermont Public Service Corp. | | | 584,930 |
| | 13,000 | | CH Energy Group, Inc. | | | 530,920 |
| | 21,990 | | Chesapeake Utilities Corp. | | | 655,302 |
| | 23,500 | | Connecticut Water Service, Inc. | | | 546,845 |
| | 9,000 | | Delta Natural Gas Co., Inc. | | | 267,120 |
| | 38,600 | | Empire District Electric Co. (The) | | | 695,572 |
| | 4,900 | | Maine & Maritimes Corp. | | | 215,110 |
| | 30,400 | | Middlesex Water Co. | | | 518,320 |
| | 6,500 | | RGC Resources, Inc. | | | 206,635 |
| | 15,800 | | SJW Corp. | | | 401,636 |
| | 16,476 | | Unitil Corp. | | | 383,067 |
| | | | | | | |
| | | | | | | 5,470,228 |
| | | | | | | |
Total Common Stocks (Cost $201,435,567) | | | 170,438,845 |
| | | | | | | |
31
SCHEDULE OF PORTFOLIO INVESTMENTS
RBC Microcap Value Fund (cont.)
March 31, 2010 (Unaudited)
| | | | | | | | | |
Shares | | | | Value | |
Preferred Stock — 0.42% | | | | |
| | | 2,899 | | Inverness Medical Innovations, Inc.* | | $ | 766,786 | |
| | | | | | | | | |
| |
Total Preferred Stock (Cost $488,120) | | | 766,786 | |
| | | | | | | | | |
Exchange Traded Funds — 3.27% | | | | |
| | | 134,700 | | iShares Russell Microcap Index Fund | | | 5,782,671 | |
| | | 13,400 | | PowerShares Zacks Micro Cap Portfolio | | | 143,916 | |
| | | | | | | | | |
| |
Total Exchange Traded Funds (Cost $5,906,716) | | | 5,926,587 | |
| | | | | | | | | |
| | |
Principal
Amount | | | | | |
Corporate Bonds — 0.00% | | | | |
| | $ | 1,947 | | Trenwick America Corp.*(a)(b) | | $ | 0 | |
| | | 1,578 | | Trenwick America Corp.*(a)(b) | | | 0 | |
| | | | | | | | | |
| |
Total Corporate Bonds (Cost $0) | | | 0 | |
| | | | | | | | | |
| | |
Shares | | | | | |
Investment Company — 2.35% | | | | |
| | | 4,249,398 | | JPMorgan Prime Money Market Fund | | | 4,249,398 | |
| | | | | | | | | |
| |
Total Investment Company (Cost $4,249,398) | | | 4,249,398 | |
| | | | | | | | | |
| |
Total Investments (Cost $212,079,801)(c) — 100.13% | | $ | 181,381,616 | |
| |
Liabilities in excess of other assets — (0.13)% | | | (233,262 | ) |
| | | | | | | | | |
| |
NET ASSETS — 100.00% | | $ | 181,148,354 | |
| | | | | | | | | |
| * | Non-income producing security. |
| (a) | Security delisted or issuer in bankruptcy. |
| (b) | Fair valued security under procedures established by the Fund’s Board of Trustees. |
| (c) | See notes to financial statements for the tax cost of securities and the breakdown of unrealized appreciation (depreciation). |
Abbreviations used are defined below:
REIT - Real Estate Investment Trust
See notes to financial statements.
32
SCHEDULE OF PORTFOLIO INVESTMENTS
RBC Mid Cap Value Fund
March 31, 2010 (Unaudited)
| | | | | | | |
Shares | | | | Value |
Common Stocks — 96.10% | | | |
Consumer Discretionary — 9.75% | | | |
| | 600 | | American Eagle Outfitters, Inc. | | $ | 11,112 |
| | 1,050 | | Dress Barn, Inc.* | | | 27,468 |
| | 730 | | Kohl’s Corp.* | | | 39,989 |
| | 3,280 | | Service Corp. International | | | 30,110 |
| | 860 | | True Religion Apparel, Inc.* | | | 26,110 |
| | 300 | | VF Corp. | | | 24,045 |
| | | | | | | |
| | | | | | | 158,834 |
| | | | | | | |
Consumer Staples — 1.72% | | | |
| | 540 | | BJ’s Wholesale Club, Inc.* | | | 19,974 |
| | 890 | | Sally Beauty Holdings, Inc.* | | | 7,939 |
| | | | | | | |
| | | | | | | 27,913 |
| | | | | | | |
Energy — 7.91% | | | |
| | 400 | | Berry Petroleum Co., Class A | | | 11,264 |
| | 330 | | Cameron International Corp.* | | | 14,144 |
| | 850 | | Dresser-Rand Group, Inc.* | | | 26,707 |
| | 960 | | Forest Oil Corp.* | | | 24,787 |
| | 1,750 | | Key Energy Services, Inc.* | | | 16,713 |
| | 250 | | Peabody Energy Corp. | | | 11,425 |
| | 310 | | Ultra Petroleum Corp.* | | | 14,455 |
| | 350 | | World Fuel Services Corp. | | | 9,324 |
| | | | | | | |
| | | | | | | 128,819 |
| | | | | | | |
Financials — 18.88% | | | |
| | 570 | | Ameriprise Financial, Inc. | | | 25,855 |
| | 160 | | Apollo Investment Corp. | | | 2,037 |
| | 100 | | Arch Capital Group Ltd.* | | | 7,625 |
| | 2,140 | | Ares Capital Corp. | | | 31,758 |
| | 380 | | Delphi Financial Group, Inc., Class A | | | 9,561 |
| | 2,557 | | First Horizon National Corp.* | | | 35,922 |
| | 870 | | HCC Insurance Holdings, Inc. | | | 24,012 |
| | 4,030 | | KKR Financial Holdings LLC REIT | | | 33,086 |
| | 2,200 | | MFA Financial Inc., REIT | | | 16,192 |
| | 780 | | New York Community Bancorp, Inc. | | | 12,901 |
| | 1,310 | | People’s United Financial, Inc. | | | 20,488 |
| | 350 | | Principal Financial Group, Inc. | | | 10,223 |
| | 520 | | ProAssurance Corp.* | | | 30,441 |
| | 690 | | Reinsurance Group of America, Inc. | | | 36,239 |
| | 430 | | WR Berkley Corp. | | | 11,219 |
| | | | | | | |
| | | | | | | 307,559 |
| | | | | | | |
Health Care — 7.65% | | | |
| | 580 | | Amedisys, Inc.* | | | 32,028 |
| | 850 | | AmerisourceBergen Corp. | | | 24,582 |
| | 320 | | DaVita, Inc.* | | | 20,288 |
| | 420 | | Forest Laboratories, Inc.* | | | 13,171 |
33
SCHEDULE OF PORTFOLIO INVESTMENTS
RBC Mid Cap Value Fund (cont.)
March 31, 2010 (Unaudited)
| | | | | | | |
Shares | | | | Value |
| | 990 | | Omnicare, Inc. | | $ | 28,007 |
| | 1,150 | | Tenet Healthcare Corp.* | | | 6,578 |
| | | | | | | |
| | | | | | | 124,654 |
| | | | | | | |
Industrials — 14.02% | | | |
| | 270 | | Actuant Corp., Class A | | | 5,278 |
| | 610 | | Fluor Corp. | | | 28,371 |
| | 600 | | FTI Consulting, Inc.* | | | 23,592 |
| | 740 | | Gardner Denver, Inc. | | | 32,590 |
| | 290 | | Harsco Corp. | | | 9,263 |
| | 360 | | JB Hunt Transport Services, Inc. | | | 12,917 |
| | 200 | | Kaydon Corp. | | | 7,520 |
| | 150 | | Manpower, Inc. | | | 8,568 |
| | 550 | | Navistar International Corp.* | | | 24,601 |
| | 400 | | Old Dominion Freight Line, Inc.* | | | 13,356 |
| | 1,150 | | Republic Services, Inc. | | | 33,373 |
| | 90 | | SPX Corp. | | | 5,969 |
| | 140 | | Teledyne Technologies, Inc.* | | | 5,778 |
| | 350 | | Terex Corp.* | | | 7,948 |
| | 400 | | Werner Enterprises, Inc. | | | 9,268 |
| | | | | | | |
| | | | | | | 228,392 |
| | | | | | | |
Information Technology — 15.28% | | | |
| | 810 | | CACI International, Inc., Class A* | | | 39,569 |
| | 440 | | CommScope, Inc.* | | | 12,329 |
| | 1,180 | | Comtech Telecommunications Corp.* | | | 37,748 |
| | 2,280 | | Fairchild Semiconductor International, Inc.* | | | 24,282 |
| | 1,470 | | Harris Corp. | | | 69,810 |
| | 1,170 | | InterDigital, Inc.* | | | 32,596 |
| | 2,090 | | Skyworks Solutions, Inc.* | | | 32,604 |
| | | | | | | |
| | | | | | | 248,938 |
| | | | | | | |
Materials — 17.44% | | | |
| | 220 | | Air Products & Chemicals, Inc. | | | 16,269 |
| | 530 | | Celanese Corp., Class A | | | 16,880 |
| | 2,310 | | Crown Holdings, Inc.* | | | 62,278 |
| | 184 | | Cytec Industries, Inc. | | | 8,600 |
| | 590 | | FMC Corp. | | | 35,719 |
| | 750 | | International Paper Co. | | | 18,458 |
| | 1,030 | | Owens-Illinois, Inc.* | | | 36,606 |
| | 2,370 | | Pactiv Corp.* | | | 59,677 |
| | 370 | | Reliance Steel & Aluminum Co. | | | 18,215 |
| | 250 | | Rock-Tenn Co., Class A | | | 11,392 |
| | | | | | | |
| | | | | | | 284,094 |
| | | | | | | |
Utilities — 3.45% | | | |
| | 680 | | EQT Corp. | | | 27,880 |
| | 810 | | NRG Energy, Inc.* | | | 16,929 |
34
SCHEDULE OF PORTFOLIO INVESTMENTS
RBC Mid Cap Value Fund (cont.)
March 31, 2010 (Unaudited)
| | | | | | | |
Shares | | | | Value |
| | 360 | | Unisource Energy Corp. | | $ | 11,318 |
| | | | | | | |
| | | | | | | 56,127 |
| | | | | | | |
Total Common Stocks (Cost $1,478,071) | | | 1,565,330 |
| | | | | | | |
Investment Company — 1.74% | | | |
| | 28,354 | | JPMorgan Prime Money Market Fund | | | 28,354 |
| | | | | | | |
| |
Total Investment Company (Cost $28,354) | | | 28,354 |
| | | | | | | |
| |
Total Investments (Cost $1,506,425)(a) — 97.84% | | $ | 1,593,684 |
| |
Other assets in excess of liabilities — 2.16% | | | 35,244 |
| | | | | | | |
| |
NET ASSETS — 100.00% | | $ | 1,628,928 |
| | | | | | | |
| * | Non-income producing security. |
| (a) | See notes to financial statements for the tax cost of securities and the breakdown of unrealized appreciation (depreciation). |
Abbreviations used are defined below:
REIT - Real Estate Investment Trust
See notes to financial statements.
35
FINANCIAL STATEMENTS
Statements of Assets and Liabilities
March 31, 2010 (Unaudited)
| | | | | | | | | | | | | | | | | | | |
| | | RBC
Mid Cap
Growth Fund | | | RBC
Enterprise
Fund | | | RBC
Small Cap
Core Fund | | | RBC
Microcap
Value Fund | | | RBC
Mid Cap
Value Fund |
Assets: | | | | | | | | | | | | | | | | | | | |
Investments, at value (cost $52,613,923, $133,321,118, $37,626,483, $212,079,801 and $1,506,425, respectively) | | $ | 60,906,964 | | | $ | 145,139,597 | | | $ | 49,207,675 | | | $ | 181,381,616 | | | $ | 1,593,684 |
Interest and dividends receivable | | | 14,430 | | | | 64,172 | | | | 13,517 | | | | 136,069 | | | | 798 |
Receivable from advisor | | | — | | | | — | | | | — | | | | — | | | | 17,235 |
Receivable for capital shares issued | | | 115,015 | | | | 4,587 | | | | 2,761 | | | | 54,098 | | | | — |
Receivable for investments sold | | | — | | | | 58,988 | | | | 58,371 | | | | — | | | | 23,550 |
Prepaid expenses | | | 52,850 | | | | 48,101 | | | | 45,558 | | | | 42,679 | | | | 52,250 |
| | | | | | | | | | | | | | | | | | | |
Total Assets | | | 61,089,259 | | | | 145,315,445 | | | | 49,327,882 | | | | 181,614,462 | | | | 1,687,517 |
| | | | | | | | | | | | | | | | | | | |
| | | | | |
Liabilities: | | | | | | | | | | | | | | | | | | | |
Payable for capital shares redeemed | | | 4,477 | | | | 46,678 | | | | 665 | | | | 246,001 | | | | — |
Payable for investments purchased | | | 347,457 | | | | 192,552 | | | | 369,392 | | | | — | | | | 9,763 |
Accrued expenses and other payables: | | | | | | | | | | | | | | | | | | | |
Investment advisory fees | | | 13,264 | | | | 73,905 | | | | 25,266 | | | | 99,866 | | | | — |
Administration fees | | | 3,808 | | | | 9,223 | | | | 3,072 | | | | 11,182 | | | | 102 |
Audit fees | | | 12,521 | | | | 12,499 | | | | 12,409 | | | | 12,584 | | | | 10,280 |
Trustees’ fees | | | 211 | | | | 393 | | | | 55 | | | | 542 | | | | 150 |
Distribution fees | | | 12,355 | | | | 3,337 | | | | 756 | | | | 7,434 | | | | — |
Shareholder reports | | | 5,249 | | | | 10,490 | | | | 2,977 | | | | 14,928 | | | | — |
Transfer agent fees | | | 35,187 | | | | 40,207 | | | | 9,800 | | | | 66,336 | | | | 38,294 |
Other | | | 344 | | | | 2,099 | | | | 1,566 | | | | 7,235 | | | | — |
| | | | | | | | | | | | | | | | | | | |
Total Liabilities | | | 434,873 | | | | 391,383 | | | | 425,958 | | | | 466,108 | | | | 58,589 |
| | | | | | | | | | | | | | | | | | | |
Net Assets | | $ | 60,654,386 | | | $ | 144,924,062 | | | $ | 48,901,924 | | | $ | 181,148,354 | | | $ | 1,628,928 |
| | | | | | | | | | | | | | | | | | | |
| | | | | |
Net Assets Consist Of: | | | | | | | | | | | | | | | | | | | |
Capital | | $ | 59,828,569 | | | $ | 163,432,135 | | | $ | 42,556,436 | | | $ | 234,169,398 | | | $ | 1,515,000 |
Undistributed net investment income (loss) | | | (207,378 | ) | | | (57,953 | ) | | | (60,800 | ) | | | 104,630 | | | | 151 |
Accumulated net realized gains (losses) from investment transactions | | | (7,259,846 | ) | | | (30,268,599 | ) | | | (5,174,905 | ) | | | (22,427,489 | ) | | | 26,518 |
Net unrealized appreciation (depreciation) on investments | | | 8,293,041 | | | | 11,818,479 | | | | 11,581,193 | | | | (30,698,185 | ) | | | 87,259 |
| | | | | | | | | | | | | | | | | | | |
Net Assets | | $ | 60,654,386 | | | $ | 144,924,062 | | | $ | 48,901,924 | | | $ | 181,148,354 | | | $ | 1,628,928 |
| | | | | | | | | | | | | | | | | | | |
| | | | | |
Net Assets: | | | | | | | | | | | | | | | | | | | |
Class A | | $ | 21,667,762 | | | $ | 2,749,547 | | | $ | 502,375 | | | $ | 7,749,887 | | | | N/A |
Class I | | | 37,140,002 | | | | 26,113,583 | | | | N/A | | | | N/A | | | $ | 1,628,928 |
Class C | | | 62,225 | | | | 662,723 | | | | 160,800 | | | | 1,040,607 | | | | N/A |
Class R | | | 22,439 | | | | 41,459 | | | | 38,871 | | | | 434,233 | | | | N/A |
Class S | | | 1,761,958 | | | | 115,356,750 | | | | 48,199,878 | | | | 171,923,627 | | | | N/A |
| | | | | | | | | | | | | | | | | | | |
Total | | $ | 60,654,386 | | | $ | 144,924,062 | | | $ | 48,901,924 | | | $ | 181,148,354 | | | $ | 1,628,928 |
| | | | | | | | | | | | | | | | | | | |
36
FINANCIAL STATEMENTS
Statements of Assets and Liabilities (cont.)
| | | | | | | | | | | | | | | | | | | |
| | | RBC
Mid Cap
Growth Fund | | | RBC
Enterprise
Fund | | | RBC
Small Cap
Core Fund | | | RBC
Microcap
Value Fund | | | RBC
Mid Cap
Value Fund |
Shares Outstanding (Unlimited number of shares authorized, no par value): | | | | | | | | | | | | | | | | | | | |
Class A | | | 2,132,790 | | | | 193,327 | | | | 25,813 | | | | 522,494 | | | | N/A |
Class I | | | 3,501,796 | | | | 1,808,062 | | | | N/A | | | | N/A | | | | 151,438 |
Class C | | | 6,432 | | | | 49,510 | | | | 8,737 | | | | 73,197 | | | | N/A |
Class R | | | 2,244 | | | | 2,973 | | | | 2,027 | | | | 29,535 | | | | N/A |
Class S | | | 166,086 | | | | 7,990,906 | | | | 2,429,002 | | | | 11,583,668 | | | | N/A |
| | | | | | | | | | | | | | | | | | | |
Total | | | 5,809,348 | | | | 10,044,778 | | | | 2,465,579 | | | | 12,208,894 | | | | 151,438 |
| | | | | | | | | | | | | | | | | | | |
| | | | | |
Net Asset Values and Redemption Prices per Share: | | | | | | | | | | | | | | | | | | | |
Class A(a) | | $ | 10.16 | | | $ | 14.22 | | | $ | 19.46 | | | $ | 14.83 | | | | N/A |
| | | | | | | | | | | | | | | | | | | |
Class I | | $ | 10.61 | | | $ | 14.44 | | | | N/A | | | | N/A | | | $ | 10.76 |
| | | | | | | | | | | | | | | | | | | |
Class C(b) | | $ | 9.67 | | | $ | 13.39 | | | $ | 18.41 | (c) | | $ | 14.22 | | | | N/A |
| | | | | | | | | | | | | | | | | | | |
Class R | | $ | 10.00 | | | $ | 13.95 | | | $ | 19.18 | | | $ | 14.70 | | | | N/A |
| | | | | | | | | | | | | | | | | | | |
Class S | | $ | 10.61 | | | $ | 14.44 | | | $ | 19.84 | | | $ | 14.84 | | | | N/A |
| | | | | | | | | | | | | | | | | | | |
| | | | | |
Maximum Offering Price Per Share: | | | | | | | | | | | | | | | | | | | |
Class A | | $ | 10.78 | | | $ | 15.09 | | | $ | 20.65 | | | $ | 15.73 | | | $ | 10.76 |
| | | | | | | | | | | | | | | | | | | |
| | | | | |
Maximum Sales Charge - Class A | | | 5.75 | % | | | 5.75 | % | | | 5.75 | % | | | 5.75 | % | | | N/A |
| | | | | | | | | | | | | | | | | | | |
| (a) | For Class A shares, redemption price per share will be reduced by 1.00% for sales of shares within 12 months of purchase (only applicable on purchases of $1 million or more on which no initial sales charge was paid). Such reduction is not reflected in the net asset value and the redemption price per share. |
| (b) | For Class C shares, redemption price per share will be reduced by 1.00% for sales of shares within 12 months of purchase. Such reduction is not reflected in the net asset value and the redemption price per share. |
| (c) | Net asset value is calculated using unrounded net assets of $160,800.21 divided by the unrounded shares outstanding of 8,736.755. |
See notes to financial statements.
37
FINANCIAL STATEMENTS
Statements of Operations
For the Period Ended March 31, 2010 (Unaudited)
| | | | | | | | | | | | | | | | | | | | |
| | | RBC Mid Cap
Growth Fund | | | RBC Enterprise
Fund | | | RBC Small Cap
Core Fund | | | RBC Microcap
Value Fund | | | RBC Mid Cap
Value Fund(a) | |
Investment Income: | | | | | | | | | | | | | | | | | | | | |
Dividend income | | $ | 147,932 | | | $ | 704,844 | | | $ | 222,253 | | | $ | 1,123,725 | | | $ | 3,604 | |
Foreign tax withholding | | | — | | | | — | | | | (47 | ) | | | — | | | | — | |
| | | | | | | | | | | | | | | | | | | | |
Total Investment Income | | | 147,932 | | | | 704,844 | | | | 222,206 | | | | 1,123,725 | | | | 3,604 | |
| | | | | | | | | | | | | | | | | | | | |
| | | | | |
Expenses: | | | | | | | | | | | | | | | | | | | | |
Investment advisory fees | | | 210,021 | | | | 704,356 | | | | 269,534 | | | | 741,244 | | | | 2,686 | |
Distribution fees - Class A | | | 24,871 | | | | 3,737 | | | | 727 | | | | 9,631 | | | | — | |
Distribution fees - Class C | | | 355 | | | | 3,488 | | | | 912 | | | | 5,258 | | | | — | |
Distribution fees - Class R | | | 51 | | | | 97 | | | | 77 | | | | 594 | | | | — | |
Accounting fees | | | 13,965 | | | | 15,963 | | | | 13,547 | | | | 16,583 | | | | 6,207 | |
Administration fees | | | 22,502 | | | | 52,464 | | | | 16,228 | | | | 61,770 | | | | 288 | |
Audit fees | | | 10,769 | | | | 10,977 | | | | 10,733 | | | | 11,067 | | | | 10,280 | |
Custodian fees | | | 2,042 | | | | 3,099 | | | | 2,006 | | | | 1,952 | | | | 764 | |
Insurance fees | | | 2,974 | | | | 2,974 | | | | 2,974 | | | | 2,974 | | | | — | |
Legal fees | | | 3,998 | | | | 2,178 | | | | 556 | | | | 4,860 | | | | 5,660 | |
Registration and filing fees | | | 34,426 | | | | 38,187 | | | | 33,437 | | | | 31,234 | | | | 2,699 | |
Shareholder reports | | | 5,613 | | | | 13,932 | | | | 4,525 | | | | 16,100 | | | | 1,867 | |
Transfer agent fees | | | 126,772 | | | | 183,989 | | | | 60,269 | | | | 224,251 | | | | 38,304 | |
Trustees’ fees | | | 590 | | | | 1,300 | | | | 349 | | | | 1,587 | | | | 156 | |
Other fees | | | 4,482 | | | | 5,373 | | | | 4,553 | | | | 13,319 | | | | 972 | |
| | | | | | | | | | | | | | | | | | | | |
Total expenses before fee waiver/reimbursement | | | 463,431 | | | | 1,042,114 | | | | 420,427 | | | | 1,142,424 | | | | 69,883 | |
Expenses waived/reimbursed by: | | | | | | | | | | | | | | | | | | | | |
Adviser | | | (108,121 | ) | | | (279,317 | ) | | | (137,421 | ) | | | (245,685 | ) | | | (66,430 | ) |
| | | | | | | | | | | | | | | | | | | | |
Net Expenses | | | 355,310 | | | | 762,797 | | | | 283,006 | | | | 896,739 | | | | 3,453 | |
| | | | | | | | | | | | | | | | | | | | |
Net Investment Income (Loss) | | | (207,378 | ) | | | (57,953 | ) | | | (60,800 | ) | | | 226,986 | | | | 151 | |
| | | | | | | | | | | | | | | | | | | | |
| | | | | |
Realized/Unrealized Gains (Losses) from
Investment Transactions: | | | | | | | | | | | | | | | | | | | | |
Net realized gains (losses) from investment transactions | | | 8,030,235 | | | | (11,775,191 | ) | | | (208,056 | ) | | | 2,452,201 | | | | 26,518 | |
Net change in unrealized appreciation/depreciation on investments | | | (136,918 | ) | | | 20,520,344 | | | | 6,195,392 | | | | 17,493,445 | | | | 87,259 | |
| | | | | | | | | | | | | | | | | | | | |
Net realized/unrealized gains from investments | | | 7,893,317 | | | | 8,745,153 | | | | 5,987,336 | | | | 19,945,646 | | | | 113,777 | |
| | | | | | | | | | | | | | | | | | | | |
Change in net assets resulting from operations | | $ | 7,685,939 | | | $ | 8,687,200 | | | $ | 5,926,536 | | | $ | 20,172,632 | | | $ | 113,928 | |
| | | | | | | | | | | | | | | | | | | | |
| (a) | For the period from December 31, 2009 (commencement of operations) to March 31, 2010. |
See notes to the financial statements.
38
FINANCIAL STATEMENTS
Statements of Changes in Net Assets
| | | | | | | | |
| | | RBC Mid Cap
Growth Fund | |
| | | For the
Six Months Ended
March 31, 2010 | | | For the
Year Ended
September 30, 2009 | |
| | | (Unaudited) | | | | |
From Investment Activities: | | | | | | | | |
Operations: | | | | | | | | |
Net investment loss | | $ | (207,378 | ) | | $ | (182,103 | ) |
Net realized gains (losses) from investment transactions | | | 8,030,235 | | | | (15,263,614 | ) |
Net change in unrealized appreciation/depreciation on investments | | | (136,918 | ) | | | 3,937,456 | |
| | | | | | | | |
Change in net assets resulting from operations | | | 7,685,939 | | | | (11,508,261 | ) |
| | | | | | | | |
| | |
Distributions to Class A Shareholders: | | | | | | | | |
From net realized gains | | | — | | | | (203,081 | ) |
| | |
Distributions to Class I Shareholders: | | | | | | | | |
From net realized gains | | | — | | | | (480,353 | ) |
| | |
Distributions to Class C Shareholders: | | | | | | | | |
From net realized gains | | | — | | | | (1,093 | ) |
| | |
Distributions to Class R Shareholders: | | | | | | | | |
From net realized gains | | | — | | | | (77 | ) |
| | |
Distributions to Class S Shareholders: | | | | | | | | |
From net realized gains | | | — | | | | (11,879 | ) |
| | | | | | | | |
| | |
Change in net assets resulting from shareholder distributions | | | — | | | | (696,483 | ) |
| | | | | | | | |
| | |
Capital Transactions: | | | | | | | | |
Proceeds from shares issued | | | 2,969,273 | | | | 12,364,104 | |
Distributions reinvested | | | — | | | | 693,108 | |
Cost of shares redeemed | | | (11,136,753 | ) | | | (27,830,725 | ) |
| | | | | | | | |
| | |
Change in net assets resulting from capital transactions | | | (8,167,480 | ) | | | (14,773,513 | ) |
| | | | | | | | |
Net decrease in net assets | | | (481,541 | ) | | | (26,978,257 | ) |
Net Assets: | | | | | | | | |
Beginning of period | | | 61,135,927 | | | | 88,114,184 | |
| | | | | | | | |
End of period | | $ | 60,654,386 | | | $ | 61,135,927 | |
| | | | | | | | |
| | |
Undistributed net investment loss | | $ | (207,378 | ) | | $ | — | |
| | | | | | | | |
| | |
Share Transactions: | | | | | | | | |
Issued | | | 301,079 | | | | 1,594,665 | |
Reinvested | | | — | | | | 98,610 | |
Redeemed | | | (1,174,869 | ) | | | (3,436,006 | ) |
| | | | | | | | |
Change in shares resulting from capital transactions | | | (873,790 | ) | | | (1,742,731 | ) |
| | | | | | | | |
See notes to financial statements.
39
FINANCIAL STATEMENTS
Statements of Changes in Net Assets (cont.)
| | | | | | | | |
| | | RBC Enterprise Fund | |
| | | For the
Six Months Ended
March 31, 2010 | | | For the
Year Ended
September 30, 2009 | |
| | | (Unaudited) | | | | |
From Investment Activities: | | | | | | | | |
Operations: | | | | | | | | |
Net investment income (loss) | | $ | (57,953 | ) | | $ | 84,024 | |
Net realized losses from investment transactions | | | (11,775,191 | ) | | | (18,529,991 | ) |
Net change in unrealized appreciation/depreciation on investments | | | 20,520,344 | | | | (6,733,915 | ) |
| | | | | | | | |
Change in net assets resulting from operations | | | 8,687,200 | | | | (25,179,882 | ) |
| | | | | | | | |
| | |
Distributions to Class A Shareholders: | | | | | | | | |
From net realized gains | | | — | | | | (495,155 | ) |
| | |
Distributions to Class I Shareholders: | | | | | | | | |
From net realized gains | | | — | | | | (2,634,071 | ) |
| | |
Distributions to Class C Shareholders: | | | | | | | | |
From net realized gains | | | — | | | | (107,763 | ) |
| | |
Distributions to Class R Shareholders: | | | | | | | | |
From net realized gains | | | — | | | | (3,157 | ) |
| | |
Distributions to Class S Shareholders: | | | | | | | | |
From net realized gains | | | — | | | | (14,038,037 | ) |
| | | | | | | | |
Change in net assets resulting from shareholder distributions | | | — | | | | (17,278,183 | ) |
| | | | | | | | |
| | |
Capital Transactions: | | | | | | | | |
Proceeds from shares issued | | | 1,411,193 | | | | 6,901,058 | |
Distributions reinvested | | | — | | | | 16,492,996 | |
Cost of shares redeemed | | | (11,866,223 | ) | | | (31,818,174 | ) |
| | | | | | | | |
Change in net assets resulting from capital transactions | | | (10,455,030 | ) | | | (8,424,120 | ) |
| | | | | | | | |
| | |
Net decrease in net assets | | | (1,767,830 | ) | | | (50,882,185 | ) |
| | |
Net Assets: | | | | | | | | |
Beginning of period | | | 146,691,892 | | | | 197,574,077 | |
| | | | | | | | |
End of period | | $ | 144,924,062 | | | $ | 146,691,892 | |
| | | | | | | | |
Undistributed net investment loss | | $ | (57,953 | ) | | $ | — | |
| | | | | | | | |
| | |
Share Transactions: | | | | | | | | |
Issued | | | 104,407 | | | | 601,047 | |
Reinvested | | | — | | | | 1,609,996 | |
Redeemed | | | (884,823 | ) | | | (2,933,405 | ) |
| | | | | | | | |
Change in shares resulting from capital transactions | | | (780,416 | ) | | | (722,362 | ) |
| | | | | | | | |
See notes to financial statements.
40
FINANCIAL STATEMENTS
Statements of Changes in Net Assets (cont.)
| | | | | | | | |
| | | RBC Small Cap
Core Fund | |
| | | For the
Six Months Ended
March 31, 2010 | | | For the
Year Ended
September 30, 2009 | |
| | | (Unaudited) | | | | |
From Investment Activities: | | | | | | | | |
Operations: | | | | | | | | |
Net investment income (loss) | | $ | (60,800 | ) | | $ | 10,473 | |
Net realized losses from investment transactions | | | (208,056 | ) | | | (4,927,057 | ) |
Net change in unrealized appreciation/depreciation on investments | | | 6,195,392 | | | | 1,249,455 | |
| | | | | | | | |
Change in net assets resulting from operations | | | 5,926,536 | | | | (3,667,129 | ) |
| | | | | | | | |
| | |
Distributions to Class A Shareholders: | | | | | | | | |
From net realized gains | | | — | | | | (74,015 | ) |
| | |
Distributions to Class I Shareholders: | | | | | | | | |
From net realized gains | | | — | | | | (7,995 | ) |
| | |
Distributions to Class C Shareholders: | | | | | | | | |
From net realized gains | | | — | | | | (36,301 | ) |
| | |
Distributions to Class R Shareholders: | | | | | | | | |
From net realized gains | | | — | | | | (1,085 | ) |
| | |
Distributions to Class S Shareholders: | | | | | | | | |
From net realized gains | | | — | | | | (4,126,465 | ) |
| | | | | | | | |
Change in net assets resulting from shareholder distributions | | | — | | | | (4,245,861 | ) |
| | | | | | | | |
| | |
Capital Transactions: | | | | | | | | |
Proceeds from shares issued | | | 4,537,020 | | | | 2,327,325 | |
Distributions reinvested | | | — | | | | 4,099,727 | |
Cost of shares redeemed | | | (2,746,470 | ) | | | (4,760,895 | ) |
| | | | | | | | |
Change in net assets resulting from capital transactions | | | 1,790,550 | | | | 1,666,157 | |
| | | | | | | | |
Net increase (decrease) in net assets | | | 7,717,086 | | | | (6,246,833 | ) |
Net Assets: | | | | | | | | |
Beginning of period | | | 41,184,838 | | | | 47,431,671 | |
| | | | | | | | |
End of period | | $ | 48,901,924 | | | $ | 41,184,838 | |
| | | | | | | | |
Undistributed net investment loss | | $ | (60,800 | ) | | $ | — | |
| | | | | | | | |
Share Transactions: | | | | | | | | |
Issued | | | 242,636 | | | | 188,844 | |
Reinvested | | | — | | | | 319,064 | |
Redeemed | | | (152,178 | ) | | | (335,315 | ) |
| | | | | | | | |
Change in shares resulting from capital transactions | | | 90,458 | | | | 172,593 | |
| | | | | | | | |
See notes to financial statements.
41
FINANCIAL STATEMENTS
Statements of Changes in Net Assets (cont.)
| | | | | | | | |
| | | RBC Microcap Value Fund | |
| | | For the
Six Months Ended
March 31, 2010 | | | For the
Year Ended
September 30, 2009 | |
| | | (Unaudited) | | | | |
From Investment Activities: | | | | | | | | |
Operations: | | | | | | | | |
Net investment income | | $ | 226,986 | | | $ | 1,219,652 | |
Net realized gains (losses) from investment transactions | | | 2,452,201 | | | | (25,066,826 | ) |
Net change in unrealized appreciation/depreciation on investments | | | 17,493,445 | | | | (21,689,800 | ) |
| | | | | | | | |
Change in net assets resulting from operations | | | 20,172,632 | | | | (45,536,974 | ) |
| | | | | | | | |
| | |
Distributions to Class A Shareholders: | | | | | | | | |
From net investment income | | | (11,456 | ) | | | (28,683 | ) |
From net realized gains | | | — | | | | (856,790 | ) |
Distributions to Class C Shareholders: | | | | | | | | |
From net realized gains | | | — | | | | (100,150 | ) |
Distributions to Class R Shareholders: | | | | | | | | |
From net investment income | | | — | | | | (643 | ) |
From net realized gains | | | — | | | | (34,563 | ) |
Distributions to Class S Shareholders: | | | | | | | | |
From net investment income | | | (675,364 | ) | | | (1,244,104 | ) |
From net realized gains | | | — | | | | (12,830,897 | ) |
| | | | | | | | |
Change in net assets resulting from shareholder distributions | | | (686,820 | ) | | | (15,095,830 | ) |
| | | | | | | | |
| | |
Capital Transactions: | | | | | | | | |
Proceeds from shares issued | | | 18,070,827 | | | | 63,361,145 | |
Distributions reinvested | | | 655,145 | | | | 14,287,787 | |
Cost of shares redeemed | | | (29,097,455 | ) | | | (127,965,205 | ) |
| | | | | | | | |
Change in net assets resulting from capital transactions | | | (10,371,483 | ) | | | (50,316,273 | ) |
| | | | | | | | |
Net increase (decrease) in net assets | | | 9,114,329 | | | | (110,949,077 | ) |
| | |
Net Assets: | | | | | | | | |
Beginning of period | | | 172,034,025 | | | | 282,983,102 | |
| | | | | | | | |
End of period | | $ | 181,148,354 | | | $ | 172,034,025 | |
| | | | | | | | |
Undistributed net investment income | | $ | 104,630 | | | $ | 564,464 | |
| | | | | | | | |
| | |
Share Transactions: | | | | | | | | |
Issued | | | 1,274,451 | | | | 6,040,956 | |
Reinvested | | | 49,595 | | | | 1,445,020 | |
Redeemed | | | (2,166,720 | ) | | | (11,627,188 | ) |
| | | | | | | | |
Change in shares resulting from capital transactions | | | (842,674 | ) | | | (4,141,212 | ) |
| | | | | | | | |
See notes to financial statements.
42
FINANCIAL STATEMENTS
Statements of Changes in Net Assets (cont.)
| | | |
| | | RBC Mid Cap Value Fund |
| | | For the
Period Ended
March 31, 2010(a) |
| | | (Unaudited) |
From Investment Activities: | | | |
Operations: | | | |
Net investment income | | $ | 151 |
Net realized gains from investment transactions | | | 26,518 |
Net change in unrealized appreciation/depreciation on investments | | | 87,259 |
| | | |
Change in net assets resulting from operations | | | 113,928 |
| | | |
| |
Capital Transactions: | | | |
Proceeds from shares issued | | | 1,515,000 |
| | | |
Change in net assets resulting from capital transactions | | | 1,515,000 |
| | | |
Net increase in net assets | | | 1,628,928 |
Net Assets: | | | |
Beginning of period | | | — |
| | | |
End of period | | $ | 1,628,928 |
| | | |
Undistributed net investment income | | $ | 151 |
| | | |
| |
Share Transactions: | | | |
Issued | | | 151,438 |
| | | |
Change in shares resulting from capital transactions | | | 151,438 |
| | | |
| (a) | For the period from December 31, 2009 (commencement of operations) to March 31, 2010. |
See notes to financial statements.
43
FINANCIAL HIGHLIGHTS
RBC Mid Cap Growth Fund
(Selected data for a share outstanding throughout the years indicated)
| | | | | | | | | | | | | | | | | | | | | | | | |
| | | Net Asset Value,
Beginning
of Period | | Investment Activities | | | Distributions | | | Net Asset Value,
End of Period |
| | | | Net
Investment
Loss | | | Net Realized and
Unrealized Gains (Losses)
on Investments | | | Redemption
Fees | | | Total from
Investment
Activities | | | Net
Realized
Gains | | | Total
Distributions | | |
Class A | | | | | | | | | | | | | | | | | | | | | | | | |
Six Months Ended March 31, 2010 (Unaudited) | | $ | 8.89 | | (0.04 | )(a) | | 1.31 | | | (b | ) | | 1.27 | | | — | | | — | | | $ | 10.16 |
Year Ended September 30, 2009 | | | 10.18 | | (0.04 | )(a) | | (1.17 | ) | | (b | ) | | (1.21 | ) | | (0.08 | ) | | (0.08 | ) | | | 8.89 |
Year Ended September 30, 2008 | | | 13.90 | | (0.09 | )(a) | | (2.52 | ) | | (b | ) | | (2.61 | ) | | (1.11 | ) | | (1.11 | ) | | | 10.18 |
Year Ended September 30, 2007 | | | 12.47 | | (0.10 | )(a) | | 1.88 | | | (b | ) | | 1.78 | | | (0.35 | ) | | (0.35 | ) | | | 13.90 |
Year Ended September 30, 2006 | | | 11.71 | | (0.08 | )(a) | | 1.07 | | | (b | ) | | 0.99 | | | (0.23 | ) | | (0.23 | ) | | | 12.47 |
Year Ended September 30, 2005 | | | 11.57 | | (0.14 | ) | | 1.86 | | | (b | ) | | 1.72 | | | (1.58 | ) | | (1.58 | ) | | | 11.71 |
Class I | | | | | | | | | | | | | | | | | | | | | | | | |
Six Months Ended March 31, 2010 (Unaudited) | | $ | 9.27 | | (0.03 | )(a) | | 1.37 | | | (b | ) | | 1.34 | | | — | | | — | | | $ | 10.61 |
Year Ended September 30, 2009 | | | 10.58 | | (0.02 | )(a) | | (1.21 | ) | | (b | ) | | (1.23 | ) | | (0.08 | ) | | (0.08 | ) | | | 9.27 |
Year Ended September 30, 2008 | | | 14.36 | | (0.06 | )(a) | | (2.61 | ) | | (b | ) | | (2.67 | ) | | (1.11 | ) | | (1.11 | ) | | | 10.58 |
Year Ended September 30, 2007 | | | 12.85 | | (0.07 | )(a) | | 1.93 | | | (b | ) | | 1.86 | | | (0.35 | ) | | (0.35 | ) | | | 14.36 |
Year Ended September 30, 2006 | | | 12.03 | | (0.05 | )(a) | | 1.10 | | | (b | ) | | 1.05 | | | (0.23 | ) | | (0.23 | ) | | | 12.85 |
Year Ended September 30, 2005 | | | 11.81 | | (0.04 | ) | | 1.84 | | | (b | ) | | 1.80 | | | (1.58 | ) | | (1.58 | ) | | | 12.03 |
Class C | | | | | | | | | | | | | | | | | | | | | | | | |
Six Months Ended March 31, 2010 (Unaudited) | | $ | 8.50 | | (0.07 | )(a) | | 1.24 | | | (b | ) | | 1.17 | | | — | | | — | | | $ | 9.67 |
Year Ended September 30, 2009 | | | 9.81 | | (0.09 | )(a) | | (1.14 | ) | | (b | ) | | (1.23 | ) | | (0.08 | ) | | (0.08 | ) | | | 8.50 |
Year Ended September 30, 2008 | | | 13.53 | | (0.18 | )(a) | | (2.43 | ) | | (b | ) | | (2.61 | ) | | (1.11 | ) | | (1.11 | ) | | | 9.81 |
Year Ended September 30, 2007 | | | 12.24 | | (0.19 | )(a) | | 1.83 | | | (b | ) | | 1.64 | | | (0.35 | ) | | (0.35 | ) | | | 13.53 |
Year Ended September 30, 2006 | | | 11.59 | | (0.17 | )(a) | | 1.05 | | | (b | ) | | 0.88 | | | (0.23 | ) | | (0.23 | ) | | | 12.24 |
Year Ended September 30, 2005 | | | 11.53 | | (0.11 | ) | | 1.75 | | | (b | ) | | 1.64 | | | (1.58 | ) | | (1.58 | ) | | | 11.59 |
Class R | | | | | | | | | | | | | | | | | | | | | | | | |
Six Months Ended March 31, 2010 (Unaudited) | | $ | 8.76 | | (0.05 | )(a) | | 1.29 | | | (b | ) | | 1.24 | | | — | | | — | | | $ | 10.00 |
Year Ended September 30, 2009 | | | 10.05 | | (0.06 | )(a) | | (1.15 | ) | | (b | ) | | (1.21 | ) | | (0.08 | ) | | (0.08 | ) | | | 8.76 |
Year Ended September 30, 2008 | | | 13.77 | | (0.12 | )(a) | | (2.49 | ) | | (b | ) | | (2.61 | ) | | (1.11 | ) | | (1.11 | ) | | | 10.05 |
Year Ended September 30, 2007 | | | 12.39 | | (0.13 | )(a) | | 1.86 | | | (b | ) | | 1.73 | | | (0.35 | ) | | (0.35 | ) | | | 13.77 |
Year Ended September 30, 2006 | | | 11.67 | | (0.12 | )(a) | | 1.07 | | | (b | ) | | 0.95 | | | (0.23 | ) | | (0.23 | ) | | | 12.39 |
Year Ended September 30, 2005 | | | 11.55 | | (0.30 | ) | | 2.00 | | | (b | ) | | 1.70 | | | (1.58 | ) | | (1.58 | ) | | | 11.67 |
Class S | | | | | | | | | | | | | | | | | | | | | | | | |
Six Months Ended March 31, 2010 (Unaudited) | | $ | 9.28 | | (0.03 | )(a) | | 1.36 | | | (b | ) | | 1.33 | | | — | | | — | | | $ | 10.61 |
Year Ended September 30, 2009 | | | 10.59 | | (0.02 | )(a) | | (1.21 | ) | | (b | ) | | (1.23 | ) | | (0.08 | ) | | (0.08 | ) | | | 9.28 |
Year Ended September 30, 2008 | | | 14.38 | | (0.06 | )(a) | | (2.62 | ) | | (b | ) | | (2.68 | ) | | (1.11 | ) | | (1.11 | ) | | | 10.59 |
Year Ended September 30, 2007 | | | 12.86 | | (0.07 | )(a) | | 1.94 | | | (b | ) | | 1.87 | | | (0.35 | ) | | (0.35 | ) | | | 14.38 |
Year Ended September 30, 2006 | | | 12.03 | | (0.05 | )(a) | | 1.11 | | | (b | ) | | 1.06 | | | (0.23 | ) | | (0.23 | ) | | | 12.86 |
Year Ended September 30, 2005 | | | 11.81 | | (0.02 | ) | | 1.82 | | | (b | ) | | 1.80 | | | (1.58 | ) | | (1.58 | ) | | | 12.03 |
| (a) | Per share net investment income (loss) has been calculated using the average daily shares method. |
| (b) | Less than $0.01 or $(0.01) per share. |
See notes to financial statements.
44
FINANCIAL STATEMENTS
RBC Mid Cap Growth Fund (cont.)
(Selected data for a share outstanding throughout the years indicated)
| | | | | | | | | | | | | | | | | | |
| | | Total
Return* | | | Ratios/Supplemental Data | |
| | | Net Assets,
End of Period (000’s) | | Ratio of Net Expenses
to Average Net Assets | | | Ratio of Net Investment Loss to
Average Net Assets | | | Ratio of Expenses to
Average Net Assets** | | | Portfolio
Turnover Rate*** | |
Class A | | | | | | | | | | | | | | | | | | |
Six Months Ended March 31, 2010 (Unaudited) | | 14.29 | %(c) | | $ | 21,668 | | 1.35 | %(d) | | (0.85 | %)(d) | | 1.71 | %(d) | | 84 | % |
Year Ended September 30, 2009 | | (11.61 | %) | | | 19,421 | | 1.35 | % | | (0.47 | %) | | 1.88 | % | | 62 | % |
Year Ended September 30, 2008 | | (20.14 | %) | | | 25,483 | | 1.32 | % | | (0.74 | %) | | 1.68 | % | | 46 | % |
Year Ended September 30, 2007 | | 14.52 | % | | | 33,887 | | 1.35 | % | | (0.78 | %) | | 1.72 | % | | 31 | % |
Year Ended September 30, 2006 | | 8.52 | % | | | 43,803 | | 1.35 | % | | (0.66 | %) | | 1.73 | % | | 23 | % |
Year Ended September 30, 2005 | | 15.62 | % | | | 45,359 | | 1.32 | % | | (0.80 | %) | | 1.75 | % | | 22 | % |
Class I | | | | | | | | | | | | | | | | | | |
Six Months Ended March 31, 2010 (Unaudited) | | 14.46 | %(c) | | $ | 37,140 | | 1.10 | %(d) | | (0.61 | %)(d) | | 1.46 | %(d) | | 84 | % |
Year Ended September 30, 2009 | | (11.36 | %) | | | 40,098 | | 1.10 | % | | (0.21 | %) | | 1.38 | % | | 62 | % |
Year Ended September 30, 2008 | | (19.95 | %) | | | 60,998 | | 1.07 | % | | (0.48 | %) | | 1.19 | % | | 46 | % |
Year Ended September 30, 2007 | | 14.89 | % | | | 75,721 | | 1.10 | % | | (0.53 | %) | | 1.21 | % | | 31 | % |
Year Ended September 30, 2006 | | 8.71 | % | | | 72,866 | | 1.10 | % | | (0.41 | %) | | 1.23 | % | | 23 | % |
Year Ended September 30, 2005 | | 16.02 | % | | | 62,652 | | 1.07 | % | | (0.54 | %) | | 1.25 | % | | 22 | % |
Class C | | | | | | | | | | | | | | | | | | |
Six Months Ended March 31, 2010 (Unaudited) | | 13.77 | %(c) | | $ | 62 | | 2.09 | %(d) | | (1.61 | %)(d) | | 2.45 | %(d) | | 84 | % |
Year Ended September 30, 2009 | | (12.26 | %) | | | 98 | | 2.10 | % | | (1.21 | %) | | 2.38 | % | | 62 | % |
Year Ended September 30, 2008 | | (20.72 | %) | | | 129 | | 2.07 | % | | (1.52 | %) | | 2.16 | % | | 46 | % |
Year Ended September 30, 2007 | | 13.73 | % | | | 1,265 | | 2.10 | % | | (1.52 | %) | | 2.23 | % | | 31 | % |
Year Ended September 30, 2006 | | 7.56 | % | | | 2,054 | | 2.10 | % | | (1.40 | %) | | 2.22 | % | | 23 | % |
Year Ended September 30, 2005 | | 14.91 | % | | | 370 | | 2.09 | % | | (1.53 | %) | | 2.28 | % | | 22 | % |
Class R | | | | | | | | | | | | | | | | | | |
Six Months Ended March 31, 2010 (Unaudited) | | 14.16 | %(c) | | $ | 22 | | 1.59 | %(d) | | (1.09 | %)(d) | | 1.95 | %(d) | | 84 | % |
Year Ended September 30, 2009 | | (11.76 | %) | | | 20 | | 1.59 | % | | (0.73 | %) | | 1.86 | % | | 62 | % |
Year Ended September 30, 2008 | | (20.34 | %) | | | 9 | | 1.57 | % | | (0.99 | %) | | 1.69 | % | | 46 | % |
Year Ended September 30, 2007 | | 14.30 | % | | | 12 | | 1.60 | % | | (1.03 | %) | | 1.70 | % | | 31 | % |
Year Ended September 30, 2006 | | 8.12 | % | | | 10 | | 1.60 | % | | (0.95 | %) | | 1.73 | % | | 23 | % |
Year Ended September 30, 2005 | | 15.47 | % | | | 32 | | 1.57 | % | | (1.04 | %) | | 1.76 | % | | 22 | % |
Class S | | | | | | | | | | | | | | | | | | |
Six Months Ended March 31, 2010 (Unaudited) | | 14.33 | %(c) | | $ | 1,762 | | 1.10 | %(d) | | (0.60 | %)(d) | | 1.47 | %(d) | | 84 | % |
Year Ended September 30, 2009 | | (11.35 | %) | | | 1,501 | | 1.10 | % | | (0.22 | %) | | 1.38 | % | | 62 | % |
Year Ended September 30, 2008 | | (19.94 | %) | | | 1,495 | | 1.06 | % | | (0.49 | %) | | 1.18 | % | | 46 | % |
Year Ended September 30, 2007 | | 14.88 | % | | | 1,878 | | 1.10 | % | | (0.53 | %) | | 1.21 | % | | 31 | % |
Year Ended September 30, 2006 | | 8.79 | % | | | 1,870 | | 1.10 | % | | (0.41 | %) | | 1.23 | % | | 23 | % |
Year Ended September 30, 2005 | | 16.02 | % | | | 1,515 | | 1.08 | % | | (0.52 | %) | | 1.27 | % | | 22 | % |
| ** | During the periods, certain fees were contractually or voluntarily reduced and/or reimbursed. If such contractual/voluntary fee reductions and reimbursements had not occurred, the ratio would have been as indicated. |
| *** | Portfolio turnover rate is calculated on the basis of the fund as a whole without distinguishing between the classes of shares issued. |
See notes to financial statements.
45
FINANCIAL HIGHLIGHTS
RBC Enterprise Fund
(Selected data for a share outstanding throughout the years indicated)
| | | | | | | | | | | | | | | | | | | | | | | | | | | |
| | | Net Asset Value,
Beginning
of Period | | Investment Activities | | | Distributions | | | Net Asset Value,
End of Period |
| | | Net
Investment
Income/(Loss) | | | Net Realized and
Unrealized Gains (Losses)
on Investments | | | Redemption
Fees | | | Total from
Investment
Activities | | | Net
Investment
Income | | | Net
Realized
Gains | | | Total
Distributions | | |
Class A | | | | | | | | | | | | | | | | | | | | | | | | | | | |
Six Months Ended March 31, 2010 (Unaudited) | | $ | 13.37 | | (0.02 | )(a) | | 0.87 | | | (b | ) | | 0.85 | | | — | | | — | | | — | | | $ | 14.22 |
Year Ended September 30, 2009 | | | 16.95 | | (0.02 | )(a) | | (1.98 | ) | | (b | ) | | (2.00 | ) | | — | | | (1.58 | ) | | (1.58 | ) | | | 13.37 |
Year Ended September 30, 2008 | | | 25.86 | | (0.08 | )(a) | | (5.31 | ) | | (b | ) | | (5.39 | ) | | (0.02 | ) | | (3.50 | ) | | (3.52 | ) | | | 16.95 |
Year Ended September 30, 2007 | | | 25.12 | | 0.03 | (a) | | 2.95 | | | (b | ) | | 2.98 | | | — | | | (2.24 | ) | | (2.24 | ) | | | 25.86 |
Year Ended September 30, 2006 | | | 26.46 | | (0.04 | )(a) | | 1.80 | | | (b | ) | | 1.76 | | | — | | | (3.10 | ) | | (3.10 | ) | | | 25.12 |
Year Ended September 30, 2005 | | | 23.81 | | (0.06 | ) | | 3.66 | | | (b | ) | | 3.60 | | | — | | | (0.95 | ) | | (0.95 | ) | | | 26.46 |
Class I | | | | | | | | | | | | | | | | | | | | | | | | | | | |
Six Months Ended March 31, 2010 (Unaudited) | | $ | 13.57 | | (a | )(b) | | 0.87 | | | (b | ) | | 0.87 | | | — | | | — | | | — | | | $ | 14.44 |
Year Ended September 30, 2009 | | | 17.13 | | 0.01 | (a) | | (1.99 | ) | | (b | ) | | (1.98 | ) | | — | | | (1.58 | ) | | (1.58 | ) | | | 13.57 |
Year Ended September 30, 2008 | | | 26.10 | | (0.04 | )(a) | | (5.34 | ) | | (b | ) | | (5.38 | ) | | (0.09 | ) | | (3.50 | ) | | (3.59 | ) | | | 17.13 |
Year Ended September 30, 2007 | | | 25.31 | | 0.09 | (a) | | 2.96 | | | (b | ) | | 3.05 | | | (0.02 | ) | | (2.24 | ) | | (2.26 | ) | | | 26.10 |
Year Ended September 30, 2006 | | | 26.57 | | 0.02 | (a) | | 1.82 | | | (b | ) | | 1.84 | | | — | | | (3.10 | ) | | (3.10 | ) | | | 25.31 |
Year Ended September 30, 2005 | | | 23.85 | | (0.02 | ) | | 3.69 | | | (b | ) | | 3.67 | | | — | | | (0.95 | ) | | (0.95 | ) | | | 26.57 |
Class C | | | | | | | | | | | | | | | | | | | | | | | | | | | |
Six Months Ended March 31, 2010 (Unaudited) | | $ | 12.64 | | (0.07 | )(a) | | 0.82 | | | (b | ) | | 0.75 | | | — | | | — | | | — | | | $ | 13.39 |
Year Ended September 30, 2009 | | | 16.25 | | (0.10 | )(a) | | (1.93 | ) | | (b | ) | | (2.03 | ) | | — | | | (1.58 | ) | | (1.58 | ) | | | 12.64 |
Year Ended September 30, 2008 | | | 25.09 | | (0.22 | )(a) | | (5.12 | ) | | (b | ) | | (5.34 | ) | | — | | | (3.50 | ) | | (3.50 | ) | | | 16.25 |
Year Ended September 30, 2007 | | | 24.62 | | (0.16 | )(a) | | 2.87 | | | (b | ) | | 2.71 | | | — | | | (2.24 | ) | | (2.24 | ) | | | 25.09 |
Year Ended September 30, 2006 | | | 26.17 | | (0.21 | )(a) | | 1.76 | | | (b | ) | | 1.55 | | | — | | | (3.10 | ) | | (3.10 | ) | | | 24.62 |
Year Ended September 30, 2005 | | | 23.74 | | (0.15 | ) | | 3.53 | | | (b | ) | | 3.38 | | | — | | | (0.95 | ) | | (0.95 | ) | | | 26.17 |
Class R | | | | | | | | | | | | | | | | | | | | | | | | | | | |
Six Months Ended March 31, 2010 (Unaudited) | | $ | 13.13 | | (0.04 | )(a) | | 0.86 | | | (b | ) | | 0.82 | | | — | | | — | | | — | | | $ | 13.95 |
Year Ended September 30, 2009 | | | 16.72 | | (0.06 | )(a) | | (1.95 | ) | | (b | ) | | (2.01 | ) | | — | | | (1.58 | ) | | (1.58 | ) | | | 13.13 |
Year Ended September 30, 2008 | | | 25.59 | | (0.13 | )(a) | | (5.24 | ) | | (b | ) | | (5.37 | ) | | — | | | (3.50 | ) | | (3.50 | ) | | | 16.72 |
Year Ended September 30, 2007 | | | 24.95 | | (0.04 | )(a) | | 2.92 | | | (b | ) | | 2.88 | | | — | | | (2.24 | ) | | (2.24 | ) | | | 25.59 |
Year Ended September 30, 2006 | | | 26.35 | | (0.11 | )(a) | | 1.81 | | | (b | ) | | 1.70 | | | — | | | (3.10 | ) | | (3.10 | ) | | | 24.95 |
Year Ended September 30, 2005 | | | 23.78 | | (0.12 | ) | | 3.64 | | | (b | ) | | 3.52 | | | — | | | (0.95 | ) | | (0.95 | ) | | | 26.35 |
Class S | | | | | | | | | | | | | | | | | | | | | | | | | | | |
Six Months Ended March 31, 2010 (Unaudited) | | $ | 13.56 | | (a | )(b) | | 0.88 | | | (b | ) | | 0.88 | | | — | | | — | | | — | | | $ | 14.44 |
Year Ended September 30, 2009 | | | 17.12 | | 0.01 | (a) | | (1.99 | ) | | (b | ) | | (1.98 | ) | | — | | | (1.58 | ) | | (1.58 | ) | | | 13.56 |
Year Ended September 30, 2008 | | | 26.09 | | (0.04 | )(a) | | (5.34 | ) | | (b | ) | | (5.38 | ) | | (0.09 | ) | | (3.50 | ) | | (3.59 | ) | | | 17.12 |
Year Ended September 30, 2007 | | | 25.30 | | 0.09 | (a) | | 2.96 | | | (b | ) | | 3.05 | | | (0.02 | ) | | (2.24 | ) | | (2.26 | ) | | | 26.09 |
Year Ended September 30, 2006 | | | 26.56 | | 0.02 | (a) | | 1.82 | | | (b | ) | | 1.84 | | | — | | | (3.10 | ) | | (3.10 | ) | | | 25.30 |
Year Ended September 30, 2005 | | | 23.85 | | (0.02 | ) | | 3.68 | | | (b | ) | | 3.66 | | | — | | | (0.95 | ) | | (0.95 | ) | | | 26.56 |
| (a) | Per share net investment income (loss) has been calculated using the average daily shares method. |
| (b) | Less than $0.01 or $(0.01) per share. |
See notes to financial statements.
46
FINANCIAL HIGHLIGHTS
RBC Enterprise Fund (cont.)
(Selected data for a share outstanding throughout the years indicated)
| | | | | | | | | | | | | | | | | | |
| | | Total
Return* | | | Ratios/Supplemental Data | |
| | | Net Assets,
End of Period (000’s) | | Ratio of Net Expenses
to Average Net Assets | | | Ratio of Net Investment Income (Loss)
to Average Net Assets | �� | | Ratio of Expenses to
Average Net Assets** | | | Portfolio
Turnover Rate*** | |
Class A | | | | | | | | | | | | | | | | | | |
Six Months Ended March 31, 2010 (Unaudited) | | 6.36 | %(c) | | $ | 2,750 | | 1.33 | %(d) | | (0.32 | %)(d) | | 1.73 | %(d) | | 11 | % |
Year Ended September 30, 2009 | | (8.83 | %) | | | 3,320 | | 1.33 | % | | (0.15 | %) | | 2.01 | % | | 20 | % |
Year Ended September 30, 2008 | | (23.07 | %) | | | 6,398 | | 1.33 | % | | (0.43 | %) | | 1.80 | % | | 23 | % |
Year Ended September 30, 2007 | | 12.40 | % | | | 18,933 | | 1.33 | % | | 0.09 | % | | 1.80 | % | | 22 | % |
Year Ended September 30, 2006 | | 7.72 | % | | | 17,586 | | 1.33 | % | | (1.17 | %) | | 1.77 | % | | 27 | % |
Year Ended September 30, 2005 | | 15.34 | % | | | 12,856 | | 1.33 | % | | (0.29 | %) | | 1.88 | % | | 33 | % |
Class I | | | | | | | | | | | | | | | | | | |
Six Months Ended March 31, 2010 (Unaudited) | | 6.41 | %(c) | | $ | 26,114 | | 1.08 | %(d) | | (0.07 | %)(d) | | 1.48 | %(d) | | 11 | % |
Year Ended September 30, 2009 | | (8.60 | %) | | | 25,543 | | 1.08 | % | | 0.06 | % | | 1.50 | % | | 20 | % |
Year Ended September 30, 2008 | | (22.82 | %) | | | 29,388 | | 1.08 | % | | (0.19 | %) | | 1.31 | % | | 23 | % |
Year Ended September 30, 2007 | | 12.62 | % | | | 43,096 | | 1.08 | % | | 0.35 | % | | 1.30 | % | | 22 | % |
Year Ended September 30, 2006 | | 8.02 | % | | | 34,478 | | 1.08 | % | | 0.08 | % | | 1.27 | % | | 27 | % |
Year Ended September 30, 2005 | | 15.61 | % | | | 29,554 | | 1.08 | % | | (0.08 | %) | | 1.36 | % | | 33 | % |
Class C | | | | | | | | | | | | | | | | | | |
Six Months Ended March 31, 2010 (Unaudited) | | 5.93 | %(c) | | $ | 663 | | 2.08 | %(d) | | (1.08 | %)(d) | | 2.48 | %(d) | | 11 | % |
Year Ended September 30, 2009 | | (9.47 | %) | | | 778 | | 2.08 | % | | (0.92 | %) | | 2.50 | % | | 20 | % |
Year Ended September 30, 2008 | | (23.61 | %) | | | 1,269 | | 2.08 | % | | (1.19 | %) | | 2.30 | % | | 23 | % |
Year Ended September 30, 2007 | | 11.50 | % | | | 2,356 | | 2.08 | % | | (0.66 | %) | | 2.30 | % | | 22 | % |
Year Ended September 30, 2006 | | 6.93 | % | | | 2,366 | | 2.08 | % | | (0.86 | %) | | 2.26 | % | | 27 | % |
Year Ended September 30, 2005 | | 14.43 | % | | | 801 | | 2.08 | % | | (1.01 | %) | | 2.39 | % | | 33 | % |
Class R | | | | | | | | | | | | | | | | | | |
Six Months Ended March 31, 2010 (Unaudited) | | 6.25 | %(c) | | $ | 41 | | 1.57 | %(d) | | (0.57 | %)(d) | | 1.97 | %(d) | | 11 | % |
Year Ended September 30, 2009 | | (9.04 | %) | | | 42 | | 1.57 | % | | (0.51 | %) | | 1.98 | % | | 20 | % |
Year Ended September 30, 2008 | | (23.23 | %) | | | 41 | | 1.57 | % | | (0.70 | %) | | 1.81 | % | | 23 | % |
Year Ended September 30, 2007 | | 12.06 | % | | | 53 | | 1.58 | % | | (0.18 | %) | | 1.80 | % | | 22 | % |
Year Ended September 30, 2006 | | 7.50 | % | | | 52 | | 1.58 | % | | (0.44 | %) | | 1.77 | % | | 27 | % |
Year Ended September 30, 2005 | | 15.01 | % | | | 59 | | 1.58 | % | | (0.54 | %) | | 1.88 | % | | 33 | % |
Class S | | | | | | | | | | | | | | | | | | |
Six Months Ended March 31, 2010 (Unaudited) | | 6.49 | %(c) | | $ | 115,357 | | 1.08 | %(d) | | (0.07 | %)(d) | | 1.48 | %(d) | | 11 | % |
Year Ended September 30, 2009 | | (8.60 | %) | | | 117,009 | | 1.08 | % | | 0.08 | % | | 1.51 | % | | 20 | % |
Year Ended September 30, 2008 | | (22.83 | %) | | | 160,478 | | 1.08 | % | | (0.19 | %) | | 1.31 | % | | 23 | % |
Year Ended September 30, 2007 | | 12.62 | % | | | 281,867 | | 1.08 | % | | 0.33 | % | | 1.30 | % | | 22 | % |
Year Ended September 30, 2006 | | 8.02 | % | | | 304,960 | | 1.08 | % | | 0.06 | % | | 1.27 | % | | 27 | % |
Year Ended September 30, 2005 | | 15.57 | % | | | 327,641 | | 1.08 | % | | (0.08 | %) | | 1.36 | % | | 33 | % |
| ** | During the periods, certain fees were contractually or voluntarily reduced and/or reimbursed. If such contractual/voluntary fee reductions and reimbursements had not occurred, the ratio would have been as indicated. |
| *** | Portfolio turnover rate is calculated on the basis of the fund as a whole without distinguishing between the classes of shares issued. |
See notes to financial statements.
47
FINANCIAL HIGHLIGHTS
RBC Small Cap Core Fund
(Selected data for a share outstanding throughout the years indicated)
| | | | | | | | | | | | | | | | | | | | | | | | | | | |
| | | Net Asset Value,
Beginning
of Period | | Investment Activities | | | Distributions | | | Net Asset Value,
End of Period |
| | | Net
Investment
Income (Loss) | | | Net Realized and
Unrealized Gains (Losses)
on Investments | | | Redemption
Fees | | | Total from
Investment
Activities | | | Net
Investment
Income | | | Net
Realized
Gains | | | Total
Distributions | | |
Class A | | | | | | | | | | | | | | | | | | | | | | | | | | | |
Six Months Ended March 31, 2010 (Unaudited) | | $ | 17.04 | | (0.05 | )(a) | | 2.47 | | | (b | ) | | 2.42 | | | — | | | — | | | — | | | $ | 19.46 |
Year Ended September 30, 2009 | | | 21.27 | | (0.03 | )(a) | | (2.17 | ) | | (b | ) | | (2.20 | ) | | — | | | (2.03 | ) | | (2.03 | ) | | | 17.04 |
Year Ended September 30, 2008 | | | 31.72 | | (0.17 | )(a) | | (4.79 | ) | | (b | ) | | (4.96 | ) | | — | | | (5.49 | ) | | (5.49 | ) | | | 21.27 |
Year Ended September 30, 2007 | | | 31.74 | | 0.16 | (a) | | 3.34 | | | (b | ) | | 3.50 | | | (0.11 | ) | | (3.41 | ) | | (3.52 | ) | | | 31.72 |
Year Ended September 30, 2006 | | | 32.96 | | (0.15 | )(a) | | 4.03 | | | (b | ) | | 3.88 | | | — | | | (5.10 | ) | | (5.10 | ) | | | 31.74 |
Year Ended September 30, 2005 | | | 32.59 | | (0.24 | ) | | 3.10 | | | (b | ) | | 2.86 | | | — | | | (2.49 | ) | | (2.49 | ) | | | 32.96 |
Class C | | | | | | | | | | | | | | | | | | | | | | | | | | | |
Six Months Ended March 31, 2010 (Unaudited) | | $ | 16.18 | | (0.11 | )(a) | | 2.34 | | | (b | ) | | 2.23 | | | — | | | — | | | — | | | $ | 18.41 |
Year Ended September 30, 2009 | | | 20.47 | | (0.13 | )(a) | | (2.13 | ) | | (b | ) | | (2.26 | ) | | — | | | (2.03 | ) | | (2.03 | ) | | | 16.18 |
Year Ended September 30, 2008 | | | 30.86 | | (0.34 | )(a) | | (4.56 | ) | | (b | ) | | (4.90 | ) | | — | | | (5.49 | ) | | (5.49 | ) | | | 20.47 |
Year Ended September 30, 2007 | | | 31.08 | | (0.12 | )(a) | | 3.31 | | | (b | ) | | 3.19 | | | — | | | (3.41 | ) | | (3.41 | ) | | | 30.86 |
Year Ended September 30, 2006 | | | 32.59 | | (0.38 | )(a) | | 3.97 | | | (b | ) | | 3.59 | | | — | | | (5.10 | ) | | (5.10 | ) | | | 31.08 |
Year Ended September 30, 2005 | | | 32.47 | | (0.24 | ) | | 2.85 | | | (b | ) | | 2.61 | | | — | | | (2.49 | ) | | (2.49 | ) | | | 32.59 |
Class R | | | | | | | | | | | | | | | | | | | | | | | | | | | |
Six Months Ended March 31, 2010 (Unaudited) | | $ | 16.81 | | (0.07 | )(a) | | 2.44 | | | (b | ) | | 2.37 | | | — | | | — | | | — | | | $ | 19.18 |
Year Ended September 30, 2009 | | | 21.06 | | (0.08 | )(a) | | (2.14 | ) | | (b | ) | | (2.22 | ) | | — | | | (2.03 | ) | | (2.03 | ) | | | 16.81 |
Year Ended September 30, 2008 | | | 31.44 | | (0.23 | )(a) | | (4.66 | ) | | (b | ) | | (4.89 | ) | | — | | | (5.49 | ) | | (5.49 | ) | | | 21.06 |
Year Ended September 30, 2007 | | | 31.50 | | 0.07 | (a) | | 3.32 | | | (b | ) | | 3.39 | | | (0.04 | ) | | (3.41 | ) | | (3.45 | ) | | | 31.44 |
Year Ended September 30, 2006 | | | 32.81 | | (0.23 | )(a) | | 4.02 | | | (b | ) | | 3.79 | | | — | | | (5.10 | ) | | (5.10 | ) | | | 31.50 |
Year Ended September 30, 2005 | | | 32.54 | | (0.28 | ) | | 3.04 | | | (b | ) | | 2.76 | | | — | | | (2.49 | ) | | (2.49 | ) | | | 32.81 |
Class S | | | | | | | | | | | | | | | | | | | | | | | | | | | |
Six Months Ended March 31, 2010 (Unaudited) | | $ | 17.35 | | (0.02 | )(a) | | 2.51 | | | (b | ) | | 2.49 | | | — | | | — | | | — | | | $ | 19.84 |
Year Ended September 30, 2009 | | | 21.55 | | 0.01 | (a) | | (2.18 | ) | | (b | ) | | (2.17 | ) | | — | | | (2.03 | ) | | (2.03 | ) | | | 17.35 |
Year Ended September 30, 2008 | | | 31.94 | | (0.11 | )(a) | | (4.75 | ) | | (b | ) | | (4.86 | ) | | (0.04 | ) | | (5.49 | ) | | (5.53 | ) | | | 21.55 |
Year Ended September 30, 2007 | | | 31.95 | | 0.23 | (a) | | 3.36 | | | (b | ) | | 3.59 | | | (0.19 | ) | | (3.41 | ) | | (3.60 | ) | | | 31.94 |
Year Ended September 30, 2006 | | | 33.06 | | (0.07 | )(a) | | 4.06 | | | (b | ) | | 3.99 | | | — | | | (5.10 | ) | | (5.10 | ) | | | 31.95 |
Year Ended September 30, 2005 | | | 32.62 | | (0.19 | ) | | 3.12 | | | (b | ) | | 2.93 | | | — | | | (2.49 | ) | | (2.49 | ) | | | 33.06 |
| (a) | Per share net investment income (loss) has been calculated using the average daily shares method. |
| (b) | Less than $0.01 or $(0.01) per share. |
See notes to financial statements.
48
FINANCIAL HIGHLIGHTS
RBC Small Cap Core Fund (cont.)
(Selected data for a share outstanding throughout the years indicated)
| | | | | | | | | | | | | | | | | | |
| | | Total
Return* | | | Ratios/Supplemental Data | | | Portfolio
Turnover Rate*** | |
| | | Net Assets,
End of Period (000’s) | | Ratio of Net Expenses
to Average Net Assets | | | Ratio of Net Investment Income (Loss)
to Average Net Assets | | | Ratio of Expenses to
Average Net Assets** | | |
Class A | | | | | | | | | | | | | | | | | | |
Six Months Ended March 31, 2010 (Unaudited) | | 14.20 | %(c) | | $ | 502 | | 1.54 | %(d) | | (0.54 | %)(d) | | 2.18 | %(d) | | 14 | % |
Year Ended September 30, 2009 | | (7.07 | %) | | | 656 | | 1.55 | % | | (0.20 | %) | | 2.65 | % | | 47 | % |
Year Ended September 30, 2008 | | (17.15 | %) | | | 1,046 | | 1.54 | % | | (0.71 | %) | | 2.27 | % | | 47 | % |
Year Ended September 30, 2007 | | 11.86 | % | | | 1,401 | | 1.55 | % | | 0.49 | % | | 2.13 | % | | 44 | % |
Year Ended September 30, 2006 | | 13.85 | % | | | 2,382 | | 1.55 | % | | (0.49 | %) | | 2.15 | % | | 35 | % |
Year Ended September 30, 2005 | | 8.67 | % | | | 2,793 | | 1.55 | % | | (0.77 | %) | | 2.13 | % | | 33 | % |
Class C | | | | | | | | | | | | | | | | | | |
Six Months Ended March 31, 2010 (Unaudited) | | 13.78 | %(c) | | $ | 161 | | 2.28 | %(d) | | (1.32 | %)(d) | | 2.91 | %(d) | | 14 | % |
Year Ended September 30, 2009 | | (7.70 | %) | | | 297 | | 2.30 | % | | (0.96 | %) | | 3.16 | % | | 47 | % |
Year Ended September 30, 2008 | | (17.52 | %) | | | 384 | | 2.29 | % | | (1.47 | %) | | 2.76 | % | | 47 | % |
Year Ended September 30, 2007 | | 11.01 | % | | | 570 | | 2.30 | % | | (0.41 | %) | | 2.62 | % | | 44 | % |
Year Ended September 30, 2006 | | 13.01 | % | | | 366 | | 2.30 | % | | (1.24 | %) | | 2.65 | % | | 35 | % |
Year Ended September 30, 2005 | | 7.89 | % | | | 473 | | 2.30 | % | | (1.47 | %) | | 2.64 | % | | 33 | % |
Class R | | | | | | | | | | | | | | | | | | |
Six Months Ended March 31, 2010 (Unaudited) | | 14.10 | %(c) | | $ | 39 | | 1.80 | %(d) | | (0.77 | %)(d) | | 2.43 | %(d) | | 14 | % |
Year Ended September 30, 2009 | | (7.25 | %) | | | 26 | | 1.79 | % | | (0.56 | %) | | 2.65 | % | | 47 | % |
Year Ended September 30, 2008 | | (17.07 | %) | | | 11 | | 1.79 | % | | (0.96 | %) | | 2.26 | % | | 47 | % |
Year Ended September 30, 2007 | | 11.52 | % | | | 16 | | 1.80 | % | | 0.21 | % | | 2.12 | % | | 44 | % |
Year Ended September 30, 2006 | | 13.61 | % | | | 15 | | 1.80 | % | | (0.73 | %) | | 2.15 | % | | 35 | % |
Year Ended September 30, 2005 | | 8.36 | % | | | 18 | | 1.80 | % | | (1.01 | %) | | 2.15 | % | | 33 | % |
Class S | | | | | | | | | | | | | | | | | | |
Six Months Ended March 31, 2010 (Unaudited) | | 14.35 | %(c) | | $ | 48,200 | | 1.30 | %(d) | | (0.27 | %)(d) | | 1.94 | %(d) | | 14 | % |
Year Ended September 30, 2009 | | (6.81 | %) | | | 40,205 | | 1.30 | % | | 0.04 | % | | 2.16 | % | | 47 | % |
Year Ended September 30, 2008 | | (16.68 | %) | | | 45,905 | | 1.29 | % | | (0.46 | %) | | 1.76 | % | | 47 | % |
Year Ended September 30, 2007 | | 12.10 | % | | | 65,771 | | 1.30 | % | | 0.70 | % | | 1.62 | % | | 44 | % |
Year Ended September 30, 2006 | | 14.18 | % | | | 64,750 | | 1.30 | % | | (0.22 | %) | | 1.65 | % | | 35 | % |
Year Ended September 30, 2005 | | 8.89 | % | | | 68,071 | | 1.30 | % | | (0.53 | %) | | 1.63 | % | | 33 | % |
| ** | During the periods, certain fees were contractually or voluntarily reduced and/or reimbursed. If such contractual/voluntary fee reductions and reimbursements had not occurred, the ratio would have been as indicated. |
| *** | Portfolio turnover rate is calculated on the basis of the fund as a whole without distinguishing between the classes of shares issued. |
See notes to financial statements.
49
FINANCIAL HIGHLIGHTS
RBC Microcap Value Fund
(Selected data for a share outstanding throughout the years indicated)
| | | | | | | | | | | | | | | | | | | | | | | | | | | |
| | | Net Asset Value,
Beginning
of Period | | Investment Activities | | | Distributions | | | Net Asset Value,
End of Period |
| | | Net
Investment
Income (Loss) | | | Net Realized and
Unrealized Gains (Losses)
on Investments | | | Redemption
Fees | | | Total from
Investment
Activities | | | Net
Investment
Income | | | Net
Realized
Gains | | | Total
Distributions | | |
Class A | | | | | | | | | | | | | | | | | | | | | | | | | | | |
Six Months Ended March 31, 2010 (Unaudited) | | $ | 13.15 | | (a | )(b) | | 1.70 | | | (b | ) | | 1.70 | | | (0.02 | ) | | — | | | (0.02 | ) | | $ | 14.83 |
Year Ended September 30, 2009 | | | 16.38 | | 0.05 | (a) | | (2.30 | ) | | (b | ) | | (2.25 | ) | | (0.03 | ) | | (0.95 | ) | | (0.98 | ) | | | 13.15 |
Year Ended September 30, 2008 | | | 22.34 | | 0.05 | (a) | | (4.49 | ) | | (b | ) | | (4.44 | ) | | (0.02 | ) | | (1.50 | ) | | (1.52 | ) | | | 16.38 |
Year Ended September 30, 2007 | | | 22.17 | | 0.03 | (a) | | 1.68 | | | (b | ) | | 1.71 | | | — | | | (1.54 | ) | | (1.54 | ) | | | 22.34 |
Year Ended September 30, 2006 | | | 21.52 | | 0.00 | (a) | | 2.53 | | | (b | ) | | 2.53 | | | (0.04 | ) | | (1.84 | ) | | (1.88 | ) | | | 22.17 |
Year Ended September 30, 2005 | | | 18.83 | | 0.07 | | | 3.57 | | | (b | ) | | 3.64 | | | (0.15 | ) | | (0.80 | ) | | (0.95 | ) | | | 21.52 |
Class C | | | | | | | | | | | | | | | | | | | | | | | | | | | |
Six Months Ended March 31, 2010 (Unaudited) | | $ | 12.64 | | (0.04 | )(a) | | 1.62 | | | (b | ) | | 1.58 | | | — | | | — | | | — | | | $ | 14.22 |
Year Ended September 30, 2009 | | | 15.86 | | (0.03 | )(a) | | (2.24 | ) | | (b | ) | | (2.27 | ) | | — | | | (0.95 | ) | | (0.95 | ) | | | 12.64 |
Year Ended September 30, 2008 | | | 21.82 | | (0.08 | )(a) | | (4.38 | ) | | (b | ) | | (4.46 | ) | | — | | | (1.50 | ) | | (1.50 | ) | | | 15.86 |
Year Ended September 30, 2007 | | | 21.84 | | (0.13 | )(a) | | 1.65 | | | (b | ) | | 1.52 | | | — | | | (1.54 | ) | | (1.54 | ) | | | 21.82 |
Year Ended September 30, 2006 | | | 21.33 | | (0.16 | )(a) | | 2.51 | | | (b | ) | | 2.35 | | | — | | | (1.84 | ) | | (1.84 | ) | | | 21.84 |
Year Ended September 30, 2005 | | | 18.77 | | (0.08 | ) | | 3.54 | | | (b | ) | | 3.46 | | | (0.10 | ) | | (0.80 | ) | | (0.90 | ) | | | 21.33 |
Class R | | | | | | | | | | | | | | | | | | | | | | | | | | | |
Six Months Ended March 31, 2010 (Unaudited) | | $ | 13.03 | | (0.03 | )(a) | | 1.70 | | | (b | ) | | 1.67 | | | — | | | — | | | — | | | $ | 14.70 |
Year Ended September 30, 2009 | | | 16.26 | | 0.04 | (a) | | (2.30 | ) | | (b | ) | | (2.26 | ) | | (0.02 | ) | | (0.95 | ) | | (0.97 | ) | | | 13.03 |
Year Ended September 30, 2008 | | | 22.21 | | 0.01 | (a) | | (4.46 | ) | | (b | ) | | (4.45 | ) | | — | | | (1.50 | ) | | (1.50 | ) | | | 16.26 |
Year Ended September 30, 2007 | | | 22.11 | | (0.02 | )(a) | | 1.66 | | | (b | ) | | 1.64 | | | — | | | (1.54 | ) | | (1.54 | ) | | | 22.21 |
Year Ended September 30, 2006 | | | 21.47 | | (0.06 | )(a) | | 2.54 | | | (b | ) | | 2.48 | | | — | | | (1.84 | ) | | (1.84 | ) | | | 22.11 |
Year Ended September 30, 2005 | | | 18.81 | | (0.03 | ) | | 3.60 | | | (b | ) | | 3.57 | | | (0.11 | ) | | (0.80 | ) | | (0.91 | ) | | | 21.47 |
Class S | | | | | | | | | | | | | | | | | | | | | | | | | | | |
Six Months Ended March 31, 2010 (Unaudited) | | $ | 13.19 | | 0.02 | (a) | | 1.69 | | | (b | ) | | 1.71 | | | (0.06 | ) | | — | | | (0.06 | ) | | $ | 14.84 |
Year Ended September 30, 2009 | | | 16.47 | | 0.08 | (a) | | (2.32 | ) | | (b | ) | | (2.24 | ) | | (0.09 | ) | | (0.95 | ) | | (1.04 | ) | | | 13.19 |
Year Ended September 30, 2008 | | | 22.47 | | 0.10 | (a) | | (4.52 | ) | | (b | ) | | (4.42 | ) | | (0.08 | ) | | (1.50 | ) | | (1.58 | ) | | | 16.47 |
Year Ended September 30, 2007 | | | 22.27 | | 0.09 | (a) | | 1.68 | | | (b | ) | | 1.77 | | | (0.03 | ) | | (1.54 | ) | | (1.57 | ) | | | 22.47 |
Year Ended September 30, 2006 | | | 21.59 | | 0.05 | (a) | | 2.55 | | | (b | ) | | 2.60 | | | (0.08 | ) | | (1.84 | ) | | (1.92 | ) | | | 22.27 |
Year Ended September 30, 2005 | | | 18.86 | | 0.04 | | | 3.65 | | | (b | ) | | 3.69 | | | (0.16 | ) | | (0.80 | ) | | (0.96 | ) | | | 21.59 |
| (a) | Per share net investment income (loss) has been calculated using the average daily shares method. |
| (b) | Less than $0.01 or $(0.01) per share. |
See notes to financial statements.
50
FINANCIAL HIGHLIGHTS
RBC Microcap Value Fund (cont.)
(Selected data for a share outstanding throughout the years indicated)
| | | | | | | | | | | | | | | | | | |
| | | Total
Return* | | | Ratios/Supplemental Data | |
| | | Net Assets,
End of Period (000’s) | | Ratio of Net Expenses
to Average Net Assets | | | Ratio of Net Investment Income (Loss)
to Average Net Assets | | | Ratio of Expenses to
Average Net Assets** | | | Portfolio
Turnover Rate*** | |
Class A | | | | | | | | | | | | | | | | | | |
Six Months Ended March 31, 2010 (Unaudited) | | 12.95 | %(c) | | $ | 7,750 | | 1.32 | %(d) | | 0.05 | %(d) | | 1.62 | %(d) | | 3 | % |
Year Ended September 30, 2009 | | (11.74 | %) | | | 8,358 | | 1.32 | % | | 0.50 | % | | 1.87 | % | | 17 | % |
Year Ended September 30, 2008 | | (20.74 | %) | | | 19,641 | | 1.31 | % | | 0.29 | % | | 1.74 | % | | 18 | % |
Year Ended September 30, 2007 | | 7.68 | % | | | 43,004 | | 1.32 | % | | 0.14 | % | | 1.78 | % | | 17 | % |
Year Ended September 30, 2006 | | 12.67 | % | | | 29,186 | | 1.33 | % | | 0.01 | % | | 1.74 | % | | 20 | % |
Year Ended September 30, 2005 | | 19.62 | % | | | 10,328 | | 1.33 | % | | (0.04 | %) | | 1.73 | % | | 8 | % |
Class C | | | | | | | | | | | | | | | | | | |
Six Months Ended March 31, 2010 (Unaudited) | | 12.50 | %(c) | | $ | 1,041 | | 2.07 | %(d) | | (0.70 | %)(d) | | 2.37 | %(d) | | 3 | % |
Year Ended September 30, 2009 | | (12.36 | %) | | | 1,124 | | 2.07 | % | | (0.25 | %) | | 2.37 | % | | 17 | % |
Year Ended September 30, 2008 | | (21.34 | %) | | | 1,723 | | 2.06 | % | | (0.45 | %) | | 2.23 | % | | 18 | % |
Year Ended September 30, 2007 | | 6.89 | % | | | 3,981 | | 2.07 | % | | (0.60 | %) | | 2.28 | % | | 17 | % |
Year Ended September 30, 2006 | | 11.86 | % | | | 2,073 | | 2.08 | % | | (0.73 | %) | | 2.25 | % | | 20 | % |
Year Ended September 30, 2005 | | 18.72 | % | | | 506 | | 2.08 | % | | (0.77 | %) | | 2.22 | % | | 8 | % |
Class R | | | | | | | | | | | | | | | | | | |
Six Months Ended March 31, 2010 (Unaudited) | | 12.82 | %(c) | | $ | 434 | | 1.58 | %(d) | | (0.42 | %)(d) | | 1.88 | %(d) | | 3 | % |
Year Ended September 30, 2009 | | (11.95 | %) | | | 87 | | 1.56 | % | | 0.38 | % | | 1.88 | % | | 17 | % |
Year Ended September 30, 2008 | | (20.93 | %) | | | 578 | | 1.57 | % | | 0.06 | % | | 1.77 | % | | 18 | % |
Year Ended September 30, 2007 | | 7.42 | % | | | 532 | | 1.57 | % | | (0.08 | %) | | 1.78 | % | | 17 | % |
Year Ended September 30, 2006 | | 12.42 | % | | | 164 | | 1.59 | % | | (0.27 | %) | | 1.73 | % | | 20 | % |
Year Ended September 30, 2005 | | 19.27 | % | | | 143 | | 1.57 | % | | (0.27 | %) | | 1.72 | % | | 8 | % |
Class S | | | | | | | | | | | | | | | | | | |
Six Months Ended March 31, 2010 (Unaudited) | | 13.01 | %(c) | | $ | 171,924 | | 1.07 | %(d) | | 0.29 | %(d) | | 1.37 | %(d) | | 3 | % |
Year Ended September 30, 2009 | | (11.47 | %) | | | 162,465 | | 1.07 | % | | 0.76 | % | | 1.37 | % | | 17 | % |
Year Ended September 30, 2008 | | (20.53 | %) | | | 261,041 | | 1.07 | % | | 0.56 | % | | 1.26 | % | | 18 | % |
Year Ended September 30, 2007 | | 7.95 | % | | | 318,947 | | 1.07 | % | | 0.39 | % | | 1.27 | % | | 17 | % |
Year Ended September 30, 2006 | | 12.97 | % | | | 261,594 | | 1.09 | % | | 0.24 | % | | 1.23 | % | | 20 | % |
Year Ended September 30, 2005 | | 19.89 | % | | | 232,912 | | 1.07 | % | | 0.23 | % | | 1.22 | % | | 8 | % |
| ** | During the periods, certain fees were contractually or voluntarily reduced and/or reimbursed. If such contractual/voluntary fee reductions and reimbursements had not occurred, the ratio would have been as indicated. |
| *** | Portfolio turnover rate is calculated on the basis of the fund as a whole without distinguishing between the classes of shares issued. |
See notes to financial statements.
51
FINANCIAL HIGHLIGHTS
RBC Mid Cap Value Fund
(Selected data for a share outstanding throughout the years indicated)
| | | | | | | | | | | | | | | | | | | | | | |
| | | Net Asset Value,
Beginning of
Period | | Investment Activities | | Distributions | | Net Asset Value,
End of Period |
| | | Net
Investment
Income/(Loss) | | | Net Realized and
Unrealized Gains (Losses)
on Investments | | Redemption
Fees | | | Total from
Investment
Activities | | Net
Investment
Income | | Net
Realized
Gains | | Total
Distributions | |
Class I | | | | | | | | | | | | | | | | | | | | | | |
Period Ended March 31, 2010 (Unaudited)(a) | | $ | 10.00 | | (b | )(c) | | 0.76 | | (c | ) | | 0.76 | | — | | — | | — | | $ | 10.76 |
| (a) | For the period from December 31, 2009 (commencement of operations) to March 31, 2010. |
| (b) | Per share net investment income (loss) has been calculated using the average daily shares method. |
| (c) | Less than $0.01 or $(0.01) per share. |
See notes to financial statements.
52
FINANCIAL HIGHLIGHTS
RBC Mid Cap Value Fund (cont.)
(Selected data for a share outstanding throughout the years indicated)
| | | | | | | | | | | | | | | | | | |
| | | Total
Return* | | | Ratios/Supplemental Data | |
| | | Net Assets,
End of Period (000’s) | | Ratio of Net Expenses
to Average Net Assets | | | Ratio of Net Investment Income (Loss)
to Average Net Assets | | | Ratio of Expenses to
Average Net Assets** | | | Portfolio
Turnover Rate*** | |
| | | | | | |
Class I | | | | | | | | | | | | | | | | | | |
Period Ended March 31, 2010 (Unaudited)(a) | | 8.69 | %(d) | | $ | 1,629 | | 0.90 | %(e) | | 0.04 | %(e) | | 18.21 | %(e) | | 73 | % |
| ** | During the periods, certain fees were contractually or voluntarily reduced and/or reimbursed. If such contractual/voluntary fee reductions and reimbursements had not occurred, the ratio would have been as indicated. |
| *** | Portfolio turnover rate is calculated on the basis of the fund as a whole without distinguishing between the classes of shares issued. |
| (a) | For the period from December 31, 2009 (commencement of operations) to March 31, 2010. |
See notes to financial statements.
53
NOTES TO FINANCIAL STATEMENTS
March 31, 2010
1.Organization
RBC Funds Trust (“the Trust”) is registered under the Investment Company Act of 1940 (as amended) as an open-end management investment company. The Trust was organized as a Delaware statutory trust on December 16, 2003. Predecessor funds to the Trust were reorganized as portfolios of the Trust effective April 16, 2004. This semi-annual report includes the following five investment portfolios (“Funds”):
| - | RBC Mid Cap Growth Fund (“Mid Cap Growth Fund”) |
| - | RBC Enterprise Fund (“Enterprise Fund”) |
| - | RBC Small Cap Core Fund (“Small Cap Core Fund”) |
| - | RBC Microcap Value Fund (“Microcap Value Fund”) |
| - | RBC Mid Cap Value Fund (“Mid Cap Value Fund”) |
The Mid Cap Growth and Enterprise Funds offer five share classes: Class A, Class C, Class R, Class I and Class S shares. The Small Cap Core and Microcap Value Funds offer four share classes: Class A, Class C, Class R and Class S shares. The Mid Cap Value Fund offers Class I shares. Class A shares are offered with a 5.75% maximum front-end sales charge and a 1.00% contingent deferred sales charge (“CDSC”) for redemption within 12 months of a $1 million or greater purchase on which no front-end sales charge was paid. Class C shares are offered at net asset value (i.e. no front-end sales charge), but are subject to a CDSC of 1.00% for redemptions within 12 months of purchase. Class R shares (available to certain 401(k) and other employer-sponsored retirement plans), Class I shares (intended for investors meeting certain investment minimum thresholds) and Class S shares are not subject to either a front-end sales charge or a CDSC.
RBC Global Asset Management (U.S.) Inc. (“RBC GAM (US)”) (formerly known as Voyageur Asset Management Inc.) acts as the investment advisor for the Funds. The officers of the Trust (“Fund Management”) are also employees of RBC GAM (US) or its affiliates or of PNC Global Investment Servicing (U.S.) Inc. (“PNC”).
2. Significant Accounting Policies
Summarized below are the significant accounting policies of the Funds. These policies conform to accounting principles generally accepted in the United States of America (“GAAP”). Fund Management follows these policies when preparing financial statements. Management may also be required to make estimates and assumptions that affect the reported amounts of assets and liabilities at the date of the financial statements and the reported amounts of income and expenses for the period. Actual results could differ from those estimates. The financial statements are as of the close of regular trading on the New York Stock Exchange.
Security Valuation:
Equity securities are generally valued on the basis of prices furnished by pricing services approved by the Trust’s Board of Trustees (the “Board”). Equity securities traded on one or more U.S. exchanges shall be valued at the last available quoted sale price on the primary trading exchange as of the valuation time. Valuation time is as of the close of regular trading on the New York Stock Exchange (usually 4:00 p.m. Eastern Standard Time). If there was no sale on the primary exchange on the day the net asset value is calculated, the most recent bid quotation generally will be used. In cases where neither closing prices nor bid prices are available, or where those prices do not accurately reflect the value of the security, a security will be valued in accordance with the Funds’ approved pricing and valuation procedures to determine a security’s fair value. These procedures are also used to determine the fair value of a security if a significant event occurs that materially affects the value of the security. Investments in open-end investment companies are valued at net asset value. Short-term securities with less than 60 days to maturity at time of purchase are valued at amortized cost.
54
NOTES TO FINANCIAL STATEMENTS
Fair Value Measurements:
Various input levels are used in determining the fair value of investments which are as follows:
| • | | Level 1 - Inputs that reflect unadjusted quoted prices in active markets for identical assets or liabilities that the Funds have the ability to access at the measurement date. |
| • | | Level 2 - Inputs other than quoted prices that are observable for the asset or liability either directly or indirectly, including inputs in markets that are not considered to be active. |
| • | | Level 3 - Unobservable inputs based on the best information available in the circumstances, to the extent observable inputs are not available (including the Fund’s own assumptions in determining the fair value of investments). |
The inputs or methodology used for valuing investments are not necessarily an indication of the risk associated with investing in those securities.
The summary of inputs used to determine the fair value of the Fund’s investments as of March 31, 2010 is as follows:
| | | | | | | | | | | | | | |
Funds | | Level 1
Quoted Prices | | | Level 2
Significant
Observable
Inputs | | | Level 3
Significant
Unobservable
Inputs | | Total |
Investments in Securities | | | | | | | | | | | | | | |
Mid Cap Growth Fund | | $ | 60,906,964 | (a) | | $ | — | | | $ | — | | $ | 60,906,964 |
Enterprise Fund | | | 145,139,597 | (a) | | | — | | | | — | | | 145,139,597 |
Small Cap Core Fund | | | 49,207,675 | (a) | | | — | | | | — | | | 49,207,675 |
Microcap Value Fund | | | 181,143,441 | (a) | | | 238,175 | (b) | | | — | | | 181,381,616 |
Mid Cap Value Fund | | | 1,593,684 | (a) | | | — | | | | — | | | 1,593,684 |
| (a) | The breakdown of the Fund’s investments into major categories is disclosed in the Schedules of Portfolio Investments. |
| (b) | Represents a security held in the consumer discretionary category of the Schedule of Portfolio Investments. |
Following is a reconciliation of Level 3 investments for which significant unobservable inputs were used to determine fair value:
| | | | |
| | | Microcap
Value Fund
(Common Stocks-Energy) | |
Balance as of 09/30/09 (value) | | $ | — | |
Transfers in | | | 34,510 | |
Change in unrealized (depreciation) * | | | (34,510 | ) |
| | | | |
Balance as of 3/31/10 (value) | | $ | — | |
| | | | |
| * | Net change in unrealized appreciation/(depreciation) in level 3 securities still held at March 31, 2010. |
The Funds did not have any liabilities that were measured at fair value on a recurring basis at March 31, 2010.
In January 2010, the Financial Accounting Standards Board (“FASB”) issued Accounting Standards Update “Improving Disclosures about Fair Value Measurements” that requires additional disclosures regarding fair value measurements. Certain required disclosures are effective for interim and annual reporting periods beginning after December 15, 2009, and other required disclosures are effective for fiscal years beginning after December 15, 2010, and for interim periods within those fiscal years. Management is currently evaluating the impact it will have on its financial statement disclosures.
55
NOTES TO FINANCIAL STATEMENTS
Repurchase Agreements:
The Funds may enter into repurchase agreements with primary dealers that report to the Federal Reserve Bank of New York or the 100 largest U.S. commercial banks (as measured by domestic deposits) who are deemed creditworthy under guidelines approved by the Board. These repurchase agreements are subject to the seller’s agreement to repurchase such securities at a mutually agreed upon date and price. The repurchase price generally equals the price paid by the Funds plus interest negotiated on the basis of current short-term rates.
Securities pledged as collateral for repurchase agreements are held by U.S. Bank N.A. the Funds’ custodian bank until maturity of the repurchase agreement. The Funds have procedures to secure additional collateral, if needed, to ensure that the daily market value of the collateral remains in excess of the repurchase agreement in the event of a default. There were no Repurchase Agreements held at March 31, 2010.
Investment Transactions and Income:
Investment transactions are recorded on one business day after trade date, except on the last day of each fiscal quarter end, when they are recorded on trade date. Dividend income is recorded on the ex-dividend date. Realized gains and losses from investment transactions are calculated based on the cost of the specific security (also known as identified cost basis). Interest income is recognized on the accrual basis and includes, where applicable, the amortization or accretion of premium or discount using the effective yield method.
Expense, Investment Income and Gain/Loss Allocation:
Each Fund pays the expenses that are directly related to its operations, such as custodian fees or adviser fees. Expenses incurred by the Trust, such as trustee or legal fees, are allocated among each of the Funds either proportionately based upon each Fund’s relative net assets or using another reasonable basis such as equally across all Funds, depending on the nature of the expense. Individual share classes within a Fund are charged expenses specific to that class, such as distribution fees. Within a Fund, expenses other than class specific expenses are allocated daily to each class based upon the proportion of relative net assets. Investment income and realized and unrealized gains or losses are allocated to each class of shares based on relative net assets.
Real Estate Investment Trusts:
The Funds may own shares of real estate investment trusts (“REITs”) which report information on the source of their distributions annually. Certain distributions received from REITs during the period, which are known to be a return of capital, are recorded as a reduction to the cost of the individual REIT.
Distributions to Shareholders:
Each Fund pays out any income that it receives, less expenses, in the form of dividends and capital gains to its shareholders. Income dividends and capital gains on each Fund are declared and paid at least annually. Distributions to shareholders are recorded on the ex-dividend date. The amount of dividends and distributions are calculated based on federal income tax regulations, which may differ from GAAP. These “book/tax” differences may be either temporary or permanent in nature. To the extent these differences are determined, as of the end of the tax year, to be permanent (e.g., net operating loss, foreign currency transactions, distribution redesignations and prior year spillbacks), they are reclassified within a Fund’s capital accounts based on their federal tax basis treatment. Such differences are not reflected in the calculation of the Financial Highlights.
56
NOTES TO FINANCIAL STATEMENTS
3. Agreements and Other Transactions with Affiliates
The Trust has entered into investment advisory agreements with RBC GAM (US) under which RBC GAM (US) manages each Fund’s assets and furnishes related office facilities, equipment, research and personnel. The agreements require each Fund to pay RBC GAM (US) a monthly fee based upon average daily net assets. Under the terms of the advisory contracts, RBC GAM (US) is entitled to receive fees based on a percentage of the average daily net assets of each of the Funds as follows:
| | | | | |
| | | Average Daily Net Assets of Fund | | Annual Rate | |
Mid Cap Growth Fund | | All Net Assets | | 0.70 | % |
| | |
Enterprise Fund | | Up to $30 million | | 1.40 | % |
| | Over $30 million | | 0.90 | % |
| | |
Small Cap Core Fund | | Up to $30 million | | 1.40 | % |
| | Over $30 million | | 0.90 | % |
Microcap Value Fund | | All Net Assets | | 0.90 | % |
Mid Cap Value Fund | | All Net Assets | | 0.70 | % |
RBC GAM (US) has contractually agreed to waive fees and/or make payments in order to keep total operating expenses of the Class S shares of each Fund and Class I shares of each Fund (except Small Cap Core Fund and Microcap Value Fund, which do not offer Class I shares) to the following levels. This expense limitation agreement is in place until January 31, 2011.
| | | |
| | | Annual Rate | |
Mid Cap Growth Fund | | 1.10 | % |
Enterprise Fund | | 1.08 | % |
Small Cap Core Fund | | 1.30 | % |
Microcap Value Fund | | 1.07 | % |
Mid Cap Value Fund | | 0.90 | % |
Classes A, C, and R vary from these limits only by the addition of class-specific 12b-1 fees. Each Fund will carry forward, for a period not to exceed 12 months from the date on which a waiver or reimbursement is made by RBC GAM (US), any expenses in excess of the expense limitation and repay RBC GAM (US) such amounts, provided the Fund is able to effect such repayment and remain in compliance with the expense limitation stated above. At March 31, 2010, the amounts subject to possible recoupment under the expense limitation agreement are $189,775, $517,119, $285,158, $419,623 and $66,430 for Mid Cap Growth Fund, Enterprise Fund, Small Cap Core Fund, Microcap Value Fund and Mid Cap Value Fund respectively.
RBC GAM (US) may also voluntarily waive and/or reimburse operating expenses of any Fund from time to time. Any such voluntary program may be changed or eliminated at any time without notice.
RBC GAM (US) serves as co-administrator to the Funds. PNC serves as co-administrator and fund accounting agent. Services provided under the administrative services contract include providing day-to-day administration of matters related to the Funds, maintenance of their records and the preparation of reports. Under the terms of the administrative services contract, RBC GAM (US) receives from each Fund a fee, payable monthly, at the annual rate of 0.075% of each Fund’s average daily net assets. PNC receives a fee for its services payable by the Funds based on the Funds’ average net assets. RBC GAM (US)’s fee is listed as “Administration fees” in the Statements of Operations. PNC’s fee is included with “Accounting fees” in the Statements of Operations.
Certain Officers and Trustees of the Trust are affiliated with the adviser or the administrator. Such Officers and Trustees receive no compensation from the Funds for serving in their respective roles.
The RBC Funds currently pay the independent Trustees (Trustees of the Trust who are not directors, officers or employees of the adviser, administrator or distributor) an annual retainer of $30,000. The Board Chairperson and Audit Committee Chairperson each receive an additional retainer of $2,500 annually, and all other trustees serving as Chair of a Board committee each receive an additional retainer of $1,000 annually. In addition, Independent Trustees receive a quarterly meeting fee of $5,000 for each in-person Board meeting attended, a meeting fee of $1,000 for each telephonic or Special Board meeting attended, and a $1,000 fee for each Board committee meeting attended and are reimbursed for all out-of-pocket expenses relating to attendance at such meetings.
57
NOTES TO FINANCIAL STATEMENTS
4. Fund Distribution
Each of the Funds has adopted a Master Distribution 12b-1 Plan (the “Plan”) in which Tamarack Distributors Inc. (through February 15, 2010), and Quasar Distributors LLC (effective February 16, 2010) (the “Distributor”) acts as the Funds’ distributor. Tamarack Distributors, Inc. was an affiliate of RBC GAM (US). Quasar Distributors LLC is unaffiliated. The Plan permits each Fund to make payments for or to reimburse the Distributor monthly for distribution-related costs and expenses of marketing shares of each share class covered under the Plan; and/or for providing shareholder services. The following chart shows the current Plan fee rate for each class.
| | | | | | | | | |
| | | Class A | | | Class C | | | Class R | |
12b-1 Plan Fee | | 0.25 | % | | 1.00 | % | | 0.50 | % |
Plan fees are based on average daily net assets of the applicable class. Up to 0.25% of each Plan fee may be designated as a Service Fee, as defined by the applicable rules of the Financial Industry Regulatory Authority. The Distributor, subject to applicable legal requirements, may waive a Plan fee voluntarily, in whole or in part.
For the six months ended March 31, 2010, Tamarack Distributors, Inc. received commissions of $557 from front-end sales charges of Class A shares of the Funds, of which $180 was paid to affiliated broker-dealers, and Quasar Distributors LLC received commissions of $327 from front-end sales charges of Class A shares of the Funds, of which $130 was paid to affiliated broker-dealers, and the remainder was either paid to unaffiliated broker-dealers or retained by the Distributors.
Quasar Distributors LLC also received $12 from CDSC fees from Class C shares of the Funds. The Distributors received no CDSC fees from Class A shares of the Funds during the six months ended March 31, 2010.
5. Securities Transactions
The cost of securities purchased and proceeds from securities sold (excluding securities maturing less than one year from acquisition) for the six months ended March 31, 2010 were as follows:
| | | | | | |
| | | Purchases | | Sales |
Mid Cap Growth Fund | | $ | 48,940,940 | | $ | 58,389,508 |
Enterprise Fund | | | 14,824,668 | | | 24,695,937 |
Small Cap Core Fund | | | 7,554,817 | | | 5,607,979 |
Microcap Value Fund | | | 5,623,251 | | | 16,315,015 |
Mid Cap Value Fund | | | 2,272,137 | | | 820,507 |
Within the guidelines established by the Funds to always seek best execution when entering into portfolio transactions, certain of the Funds use directed brokerage transactions through LJR Recapture Services (“LJR”) and its correspondent brokers. A portion of the commissions paid for portfolio transactions under this program are reimbursed to the Funds and are recorded as net realized gains from investment transactions in the financial statements.
58
NOTES TO FINANCIAL STATEMENTS
6. Capital Share Transactions
The Trust is authorized to issue an unlimited number of shares of beneficial interest (“shares outstanding”) without par value. Transactions in shares of the Funds are summarized on the following pages:
| | | | | | | | | | | | | | | | |
| | | Mid Cap
Growth Fund | | | Enterprise Fund | |
| | | For the
Six Months
Ended
March 31,
2010 | | | For the
Year Ended
September 30,
2009 | | | For the
Six Months
Ended
March 31,
2010 | | | For the
Year Ended
September 30,
2009 | |
| | | (Unaudited) | | | | | | (Unaudited) | | | | |
CAPITAL TRANSACTIONS: | | | | | | | | | | | | | | | | |
Class A | | | | | | | | | | | | | | | | |
Proceeds from shares issued | | $ | 475,687 | | | $ | 1,124,337 | | | $ | 61,001 | | | $ | 129,212 | |
Distributions reinvested | | | — | | | | 200,982 | | | | — | | | | 447,890 | |
Cost of shares redeemed | | | (925,229 | ) | | | (3,925,430 | ) | | | (795,298 | ) | | | (2,033,733 | ) |
| | | | | | | | | | | | | | | | |
Change in Class A | | $ | (449,542 | ) | | $ | (2,600,111 | ) | | $ | (734,297 | ) | | $ | (1,456,631 | ) |
| | | | | | | | | | | | | | | | |
Class I | | | | | | | | | | | | | | | | |
Proceeds from shares issued | | $ | 2,444,853 | | | $ | 10,903,862 | | | $ | 1,046,968 | | | $ | 2,115,474 | |
Distributions reinvested | | | — | | | | 479,097 | | | | — | | | | 2,634,071 | |
Cost of shares redeemed | | | (10,161,496 | ) | | | (23,718,249 | ) | | | (2,039,578 | ) | | | (3,145,900 | ) |
| | | | | | | | | | | | | | | | |
Change in Class I | | $ | (7,716,643 | ) | | $ | (12,335,290 | ) | | $ | (992,610 | ) | | $ | 1,603,645 | |
| | | | | | | | | | | | | | | | |
Class C | | | | | | | | | | | | | | | | |
Proceeds from shares issued | | $ | — | | | $ | 999 | | | $ | 2,467 | | | $ | 73,450 | |
Distributions reinvested | | | — | | | | 1,093 | | | | — | | | | 104,090 | |
Cost of shares redeemed | | | (44,116 | ) | | | (15,169 | ) | | | (151,475 | ) | | | (393,832 | ) |
| | | | | | | | | | | | | | | | |
Change in Class C | | $ | (44,116 | ) | | $ | (13,077 | ) | | $ | (149,008 | ) | | $ | (216,292 | ) |
| | | | | | | | | | | | | | | | |
Class R | | | | | | | | | | | | | | | | |
Proceeds from shares issued | | $ | 85 | | | $ | 11,802 | | | $ | 434 | | | $ | 13,878 | |
Distributions reinvested | | | — | | | | 77 | | | | — | | | | 694 | |
Cost of shares redeemed | | | (1 | ) | | | (3,271 | ) | | | (2,981 | ) | | | (10,625 | ) |
| | | | | | | | | | | | | | | | |
Change in Class R | | $ | 84 | | | $ | 8,608 | | | $ | (2,547 | ) | | $ | 3,947 | |
| | | | | | | | | | | | | | | | |
Class S | | | | | | | | | | | | | | | | |
Proceeds from shares issued | | $ | 48,647 | | | $ | 323,104 | | | $ | 300,323 | | | $ | 4,569,044 | |
Distributions reinvested | | | | | | | 11,859 | | | | — | | | | 13,306,251 | |
Cost of shares redeemed | | | (5,910 | ) | | | (168,606 | ) | | | (8,876,891 | ) | | | (26,234,084 | ) |
| | | | | | | | | | | | | | | | |
Change in Class S | | $ | 42,737 | | | $ | 166,357 | | | $ | (8,576,568 | ) | | $ | (8,358,789 | ) |
| | | | | | | | | | | | | | | | |
Change in net assets resulting from capital transactions | | $ | (8,167,480 | ) | | $ | (14,773,513 | ) | | $ | (10,455,030 | ) | | $ | (8,424,120 | ) |
| | | | | | | | | | | | | | | | |
| | | | |
SHARE TRANSACTIONS: | | | | | | | | | | | | | | | | |
Class A | | | | | | | | | | | | | | | | |
Issued | | | 49,535 | | | | 157,679 | | | | 4,544 | | | | 10,991 | |
Reinvested | | | — | | | | 29,383 | | | | — | | | | 44,214 | |
Redeemed | | | (100,370 | ) | | | (507,416 | ) | | | (59,472 | ) | | | (184,327 | ) |
| | | | | | | | | | | | | | | | |
Change in Class A | | | (50,835 | ) | | | (320,354 | ) | | | (54,928 | ) | | | (129,122 | ) |
| | | | | | | | | | | | | | | | |
Class I | | | | | | | | | | | | | | | | |
Issued | | | 246,619 | | | | 1,396,055 | | | | 77,530 | | | | 193,198 | |
Reinvested | | | — | | | | 67,384 | | | | — | | | | 256,732 | |
Redeemed | | | (1,068,836 | ) | | | (2,906,050 | ) | | | (152,437 | ) | | | (282,883 | ) |
| | | | | | | | | | | | | | | | |
Change in Class I | | | (822,217 | ) | | | (1,442,611 | ) | | | (74,907 | ) | | | 167,047 | |
| | | | | | | | | | | | | | | | |
59
NOTES TO FINANCIAL STATEMENTS
| | | | | | | | | | | | | | | | |
| | | Mid Cap
Growth Fund | | | Enterprise Fund | |
| | | For the
Six Months
Ended
March 31,
2010 | | | For the
Year Ended
September 30,
2009 | | | For the
Six Months
Ended
March 31,
2010 | | | For the
Year Ended
September 30,
2009 | |
| | | (Unaudited) | | | | | | (Unaudited) | | | | |
(cont) | | | | | | | | | | | | | | | | |
Class C | | | | | | | | | | | | | | | | |
Issued | | | — | | | | 151 | | | | 199 | | | | 7,560 | |
Reinvested | | | — | | | | 166 | | | | — | | | | 10,809 | |
Redeemed | | | (5,044 | ) | | | (1,965 | ) | | | (12,256 | ) | | | (34,862 | ) |
| | | | | | | | | | | | | | | | |
Change in Class C | | | (5,044 | ) | | | (1,648 | ) | | | (12,057 | ) | | | (16,493 | ) |
| | | | | | | | | | | | | | | | |
Class R | | | | | | | | | | | | | | | | |
Issued | | | 9 | | | | 1,757 | | | | 34 | | | | 1,576 | |
Reinvested | | | — | | | | 11 | | | | — | | | | 70 | |
Redeemed | | | — | | | | (461 | ) | | | (225 | ) | | | (940 | ) |
| | | | | | | | | | | | | | | | |
Change in Class R | | | 9 | | | | 1,307 | | | | (191 | ) | | | 706 | |
| | | | | | | | | | | | | | | | |
Class S | | | | | | | | | | | | | | | | |
Issued | | | 4,916 | | | | 39,023 | | | | 22,100 | | | | 387,721 | |
Reinvested | | | | | | | 1,666 | | | | — | | | | 1,298,171 | |
Redeemed | | | (619 | ) | | | (20,114 | ) | | | (660,433 | ) | | | (2,430,392 | ) |
| | | | | | | | | | | | | | | | |
Change in Class S | | | 4,297 | | | | 20,575 | | | | (638,333 | ) | | | (744,500 | ) |
| | | | | | | | | | | | | | | | |
Change in shares resulting from capital transactions | | | (873,790 | ) | | | (1,742,731 | ) | | | (780,416 | ) | | | (722,362 | ) |
| | | | | | | | | | | | | | | | |
| | |
| | | Small Cap
Core Fund | | | Microcap Value Fund | |
| | | For the
Six Months
Ended
March 31,
2010 | | | For the
Year Ended
September 30,
2009 | | | For the
Six Months
Ended
March 31,
2010 | | | For the
Year Ended
September 30,
2009 | |
| | | (Unaudited) | | | | | | (Unaudited) | | | | |
CAPITAL TRANSACTIONS: | | | | | | | | | | | | | | | | |
Class A | | | | | | | | | | | | | | | | |
Proceeds from shares issued | | $ | 12,706 | | | $ | 90,664 | | | $ | 154,883 | | | $ | 905,750 | |
Distributions reinvested | | | — | | | | 69,291 | | | | 8,407 | | | | 629,432 | |
Cost of shares redeemed | | | (234,854 | ) | | | (314,173 | ) | | | (1,667,977 | ) | | | (7,457,672 | ) |
| | | | | | | | | | | | | | | | |
Change in Class A | | $ | (222,148 | ) | | $ | (154,218 | ) | | $ | (1,504,687 | ) | | $ | (5,922,490 | ) |
| | | | | | | | | | | | | | | | |
Class I | | | | | | | | | | | | | | | | |
Proceeds from shares issued | | $ | — | | | $ | 12,932 | | | $ | — | | | $ | — | |
Distributions reinvested | | | — | | | | 7,995 | | | | — | | | | — | |
Cost of shares redeemed | | | — | | | | (62,528 | ) | | | — | | | | — | |
| | | | | | | | | | | | | | | | |
Change in Class I | | $ | — | | | $ | (41,601 | ) | | $ | — | | | $ | — | |
| | | | | | | | | | | | | | | | |
Class C | | | | | | | | | | | | | | | | |
Proceeds from shares issued | | $ | — | | | $ | 18,057 | | | $ | 27,149 | | | $ | 61,996 | |
Distributions reinvested | | | — | | | | 36,301 | | | | — | | | | 88,784 | |
Cost of shares redeemed | | | (160,974 | ) | | | (65,101 | ) | | | (227,574 | ) | | | (355,759 | ) |
| | | | | | | | | | | | | | | | |
Change in Class C | | $ | (160,974 | ) | | $ | (10,743 | ) | | $ | (200,425 | ) | | $ | (204,979 | ) |
| | | | | | | | | | | | | | | | |
Class R | | | | | | | | | | | | | | | | |
Proceeds from shares issued | | $ | 9,719 | | | $ | 12,880 | | | $ | 313,934 | | | $ | 136,538 | |
Distributions reinvested | | | — | | | | 358 | | | | — | | | | 35,127 | |
Cost of shares redeemed | | | (1,033 | ) | | | (2,080 | ) | | | (7,221 | ) | | | (514,658 | ) |
| | | | | | | | | | | | | | | | |
Change in Class R | | $ | 8,686 | | | $ | 11,158 | | | $ | 306,713 | | | $ | (342,993 | ) |
| | | | | | | | | | | | | | | | |
60
NOTES TO FINANCIAL STATEMENTS
| | | | | | | | | | | | | | | | |
| | | Small Cap
Core Fund | | | Microcap Value Fund | |
| | | For the
Six Months
Ended
March 31,
2010 | | | For the
Year Ended
September 30,
2009 | | | For the
Six Months
Ended
March 31,
2010 | | | For the
Year Ended
September 30,
2009 | |
| | | (Unaudited) | | | | | | (Unaudited) | | | | |
(cont) | | | | | | | | | | | | | | | | |
Class S | | | | | | | | | | | | | | | | |
Proceeds from shares issued | | $ | 4,514,595 | | | $ | 2,192,792 | | | $ | 17,574,861 | | | $ | 62,256,861 | |
Distributions reinvested | | | — | | | | 3,985,782 | | | | 646,738 | | | | 13,534,444 | |
Cost of shares redeemed | | | (2,349,609 | ) | | | (4,317,013 | ) | | | (27,194,683 | ) | | | (119,637,116 | ) |
| | | | | | | | | | | | | | | | |
Change in Class S | | $ | 2,164,986 | | | $ | 1,861,561 | | | $ | (8,973,084 | ) | | $ | (43,845,811 | ) |
| | | | | | | | | | | | | | | | |
Change in net assets resulting from capital transactions | | $ | 1,790,550 | | | $ | 1,666,157 | | | $ | (10,371,483 | ) | | $ | (50,316,273 | ) |
| | | | | | | | | | | | | | | | |
| | | | |
SHARE TRANSACTIONS: | | | | | | | | | | | | | | | | |
Class A | | | | | | | | | | | | | | | | |
Issued | | | 732 | | | | 6,602 | | | | 11,664 | | | | 86,004 | |
Reinvested | | | — | | | | 5,473 | | | | 636 | | | | 63,644 | |
Redeemed | | | (13,423 | ) | | | (22,761 | ) | | | (125,138 | ) | | | (713,282 | ) |
| | | | | | | | | | | | | | | | |
Change in Class A | | | (12,691 | ) | | | (10,686 | ) | | | (112,838 | ) | | | (563,634 | ) |
| | | | | | | | | | | | | | | | |
Class I | | | | | | | | | | | | | | | | |
Issued | | | — | | | | 928 | | | | — | | | | — | |
Reinvested | | | — | | | | 622 | | | | — | | | | — | |
Redeemed | | | — | | | | (5,497 | ) | | | — | | | | — | |
| | | | | | | | | | | | | | | | |
Change in Class I | | | — | | | | (3,947 | ) | | | — | | | | — | |
| | | | | | | | | | | | | | | | |
Class C | | | | | | | | | | | | | | | | |
Issued | | | — | | | | 1,421 | | | | 2,023 | | | | 5,751 | |
Reinvested | | | — | | | | 3,005 | | | | — | | | | 9,297 | |
Redeemed | | | (9,649 | ) | | | (4,793 | ) | | | (17,760 | ) | | | (34,791 | ) |
| | | | | | | | | | | | | | | | |
Change in Class C | | | (9,649 | ) | | | (367 | ) | | | (15,737 | ) | | | (19,743 | ) |
| | | | | | | | | | | | | | | | |
Class R | | | | | | | | | | | | | | | | |
Issued | | | 536 | | | | 1,194 | | | | 23,369 | | | | 13,272 | |
Reinvested | | | — | | | | 28 | | | | — | | | | 3,581 | |
Redeemed | | | (62 | ) | | | (205 | ) | | | (539 | ) | | | (45,703 | ) |
| | | | | | | | | | | | | | | | |
Change in Class R | | | 474 | | | | 1,017 | | | | 22,830 | | | | (28,850 | ) |
| | | | | | | | | | | | | | | | |
Class S | | | | | | | | | | | | | | | | |
Issued | | | 241,369 | | | | 178,699 | | | | 1,237,396 | | | | 5,935,929 | |
Reinvested | | | — | | | | 309,936 | | | | 48,958 | | | | 1,368,498 | |
Redeemed | | | (129,045 | ) | | | (302,059 | ) | | | (2,023,283 | ) | | | (10,833,412 | ) |
| | | | | | | | | | | | | | | | |
Change in Class S | | | 112,324 | | | | 186,576 | | | | (736,929 | ) | | | (3,528,985 | ) |
| | | | | | | | | | | | | | | | |
Change in shares resulting from capital transactions | | | 90,458 | | | | 172,593 | | | | (842,674 | ) | | | (4,141,212 | ) |
| | | | | | | | | | | | | | | | |
61
NOTES TO FINANCIAL STATEMENTS
| | | |
| | | Mid Cap Value Fund |
| | | For the Period Ended
March 31, 2010(a) |
CAPITAL TRANSACTIONS: | | | |
Class I | | | |
Proceeds from shares issued | | $ | 1,515,000 |
Distributions reinvested | | | — |
Cost of shares redeemed | | | — |
| | | |
Change in net assets resulting from capital transactions | | $ | 1,515,000 |
| | | |
| |
SHARE TRANSACTIONS: | | | |
Class I | | | |
Issued | | | 151,438 |
Redeemed | | | — |
| | | |
Change in shares resulting from capital transactions | | | 151,438 |
| | | |
| (a) | For the period from December 31, 2009 (commencement of operations) to March 31, 2010. |
7. Federal Income Taxes
It is the policy of each Fund to continue to qualify as a regulated investment company by complying with the provisions available to certain investment companies, as defined under Subchapter M of the Internal Revenue Code, and to distribute substantially all of its net investment income and net realized capital gains. Therefore, no federal tax liability is recorded in the financial statements of each Fund.
Management has analyzed the Funds’ tax positions taken on federal income tax returns for all open tax years (current and prior three tax years), and has concluded that no provision for federal income tax is required in the Funds’ financial statements. The Funds’ federal and state income and federal excise tax returns for tax years for which the applicable statutes of limitations have not expired are subject to examination by the Internal Revenue Service and state departments of revenue.
As of March 31, 2010, the tax cost of securities and the breakdown of unrealized appreciation (depreciation) which have been adjusted to reflect wash sales for each Fund were as follows:
| | | | | | | | | | | | | | |
| | | Tax Cost of
Securities | | Unrealized
Appreciation | | Unrealized
Depreciation | | | Net Unrealized
Appreciation
(Depreciation) | |
Mid Cap Growth Fund | | $ | 53,101,433 | | $ | 9,710,097 | | $ | (1,904,566 | ) | | $ | 7,805,531 | |
Enterprise Fund | | | 134,491,429 | | | 34,782,296 | | | (24,134,127 | ) | | | 10,648,169 | |
Small Cap Core Fund | | | 38,214,840 | | | 14,326,856 | | | (3,334,020 | ) | | | 10,992,836 | |
Microcap Value Fund | | | 212,139,956 | | | 32,260,941 | | | (63,019,281 | ) | | | (30,758,340 | ) |
Mid Cap Value Fund | | | 1,516,134 | | | 98,613 | | | (21,063 | ) | | | 77,550 | |
62
NOTES TO FINANCIAL STATEMENTS
The tax character of distributions during the fiscal year ended September 30, 2009 was as follows:
| | | | | | | | | | | | |
| | | Distributions Paid From |
| | | Ordinary
Income | | Net Long Term
Capital Gains | | Total Taxable
Distributions | | Total
Distributions
Paid |
Mid Cap Growth Fund | | $ | — | | $ | 696,483 | | $ | 696,483 | | $ | 696,483 |
Enterprise Fund | | | — | | | 17,278,183 | | | 17,278,183 | | | 17,278,183 |
Small Cap Core Fund | | | — | | | 4,245,861 | | | 4,245,861 | | | 4,245,861 |
Microcap Value Fund | | | 1,990,394 | | | 13,105,436 | | | 15,095,830 | | | 15,095,830 |
The tax basis of components of accumulated earnings/(losses) and tax character of distributions are determined at fiscal year end, and will be included in the Annual Report dated September 30, 2010.
As of September 30, 2009, the Funds had capital loss carryforwards for federal income tax purposes as follows:
| | | | | |
| | | Capital Loss
Carryforward | | Expires |
Mid Cap Growth Fund | | $ | 1,284,433 | | 2017 |
Enterprise Fund | | | 81,333 | | 2017 |
Small Cap Core Fund | | | 547,840 | | 2017 |
Microcap Value Fund | | | 1,092,919 | | 2017 |
8. Market Timing
The Trust strongly discourages attempts at market timing by Fund shareholders. Each Fund charges a redemption fee of 2% of the value of the shares redeemed or exchanged within 30 days of purchase, in addition to limiting the number of exchanges that may be made between Funds to five (5) per calendar year. When assessed, the redemption fee is deducted from the redemption proceeds and retained by the Fund, not by the Adviser. This redemption fee is not charged in cases where, for example, the redemption results from an automatic reinvestment or asset re-allocation not specifically directed by the shareholder. The Trust also reserves the right to reject any Fund purchase order made by persons deemed to be market timers. The Funds’ prospectus contains a full description of the Trust’s policies on market timing and/or excessive trading. The redemption fee is recorded as a credit to capital and is included in the capital transactions on the statement of changes in net assets.
During the six months ended March 31, 2010, the redemption fees collected by each Fund were as follows:
| | | |
| | | Redemption Fees |
Mid Cap Growth Fund | | $ | 448 |
Enterprise Fund | | | 12 |
Microcap Value Fund | | | 83 |
9. Soft Dollars
The term soft dollars generally refers to arrangements in which services other than trade execution are received from a broker-dealer. Federal securities laws permit a fund advisor to incur commission charges on behalf of a Fund that are higher than another broker dealer would have charged if the advisor believes the charges are reasonable in relation to the brokerage and research services received. RBC GAM (US) has a fiduciary duty to the shareholders of the Funds to seek the best execution price for all of the Funds’ securities transactions. Fund management believes that using soft dollars to purchase brokerage and research services may, in certain cases, be in a Fund’s best interest. As of March 31, 2010, certain of the Funds used soft dollar arrangements on a limited basis. Fund management continues to closely monitor its current use of soft dollars, in addition to regulatory developments in this area for any possible impact on Fund policies.
63
NOTES TO FINANCIAL STATEMENTS
10. Subsequent Events
Management has evaluated the impact of subsequent events of the Funds and has determined that there are no subsequent events that require recognition or disclosure in the financial statements.
64
SHARE CLASS INFORMATION (UNAUDITED)
The RBC Equity Funds offer up to five share classes. These five share classes are the A, C, R, I, and S classes.
Class A
Class A shares are available for purchase primarily through investment advisors, broker-dealers, banks and other financial services intermediaries. Class A shares of the Funds are currently subject to a maximum up-front sales charge of 5.75% and a 1.00% CDSC for redemption within 12 months of a $1 million or greater purchase. Class A shares currently include a 0.25% (25 bps) annual 12b-1 service and distribution fee. Class A shares have a higher up-front sales charge (load) than Class C shares, but a lower annual expense ratio.
Class C
Class C shares are also available for purchase primarily through investment advisors, broker-dealers, banks and other financial services intermediaries. Class C shares redeemed within 12 months of purchase are subject to a CDSC of 1.00%. (No CDSC will be charged on shares acquired through reinvestment of dividends or capital gains.) C Class shares expenses include a 1.00% (100 bps) annual 12b-1 service and distribution fee. Class C shares have a lower up-front sales charge (load) than Class A shares, but due to the higher service and distribution fee, have higher annual expenses than A Class shares.
Class R
Class R shares are available for purchase through employer-sponsored or 401(k) retirement plans for which omnibus or program-level accounts are held on the books of the Funds. Class R shares have no up-front sales charge (load), but are subject to a 0.50% (50 bps) 12b-1 service and distribution fee. Class R shares currently have annual expenses between Class A and Class C share expenses.
Class S
Class S shares are available to investors purchasing shares directly through the Fund or its agent, BFDS, or through certain fee-based programs of broker-dealers or registered investment advisors. This share class does not have an up-front sales charge (load) or a 12b-1 service and distribution fee.
Class I
Class I shares are available in the Mid Cap Growth, Enterprise and Mid Cap Value Funds. This share class is intended for investors meeting certain minimum investment thresholds. This share class does not have an up-front sales charge (load) or a 12b-1 service and distribution fee.
For an investor purchasing RBC Funds shares through a financial services intermediary, the question as to which share class, A or C, is the better choice is dependent on many factors, including the amount to be invested and the length of time an investor anticipates holding the shares. An investor should consult with his or her financial advisor about his or her personal financial situation to determine which share class is the best choice for his or her individual situation.
65
SUPPLEMENTAL INFORMATION (UNAUDITED)
Shareholder Expense Examples
As a shareholder of the RBC Funds, you incur two types of costs: (1) transaction costs, including sales charges (loads) and (2) ongoing costs, including management fees; 12b-1 distribution and service fees; and other Fund expenses. This example is intended to help you understand your ongoing costs (in dollars) of investing in the RBC Funds and to compare these costs with the ongoing costs of investing in other mutual funds.
The example is based on an investment of $1,000 invested at the beginning of the period and held for the entire period from October 1, 2009 through March 31, 2010.
Actual Expenses and Performance
The table below provides information about actual account values and actual expenses. You may use the information below, together with the amount you invested, to estimate the expenses that you paid over the period. Simply divide your account value by $1,000 (for example, an $8,600 account value divided by $1,000 = 8.6), then multiply the result by the number in the table under the heading entitled “Expenses Paid During Period” to estimate the expenses you paid on your account during this period.
| | | | | | | | | | | | | | |
| | | | | Beginning
Account Value
10/1/2009 | | Ending
Account Value
3/31/2010 | | Expenses Paid
During Period*
10/1/09-3/31/10 | | Annualized
Expense Ratio
During Period
10/1/09-3/31/10 | |
Mid Cap Growth Fund | | Class A | | $ | 1,000.00 | | $ | 1,142.90 | | $ | 7.21 | | 1.35 | % |
| | Class I | | | 1,000.00 | | | 1,144.60 | | | 5.88 | | 1.10 | % |
| | Class C | | | 1,000.00 | | | 1,137.70 | | | 11.14 | | 2.09 | % |
| | Class R | | | 1,000.00 | | | 1,141.60 | | | 8.49 | | 1.59 | % |
| | Class S | | | 1,000.00 | | | 1,143.30 | | | 5.88 | | 1.10 | % |
| | | | | |
Enterprise Fund | | Class A | | | 1,000.00 | | | 1,063.60 | | | 6.84 | | 1.33 | % |
| | Class I | | | 1,000.00 | | | 1,064.10 | | | 5.56 | | 1.08 | % |
| | Class C | | | 1,000.00 | | | 1,059.30 | | | 10.68 | | 2.08 | % |
| | Class R | | | 1,000.00 | | | 1,062.50 | | | 8.07 | | 1.57 | % |
| | Class S | | | 1,000.00 | | | 1,064.90 | | | 5.56 | | 1.08 | % |
| | | | | |
Small Cap Core Fund | | Class A | | | 1,000.00 | | | 1,142.00 | | | 8.22 | | 1.54 | % |
| | Class C | | | 1,000.00 | | | 1,137.80 | | | 12.15 | | 2.28 | % |
| | Class R | | | 1,000.00 | | | 1,141.00 | | | 9.61 | | 1.80 | % |
| | Class S | | | 1,000.00 | | | 1,143.50 | | | 6.95 | | 1.30 | % |
| | | | | |
Microcap Value Fund | | Class A | | | 1,000.00 | | | 1,129.50 | | | 7.01 | | 1.32 | % |
| | Class C | | | 1,000.00 | | | 1,125.00 | | | 10.97 | | 2.07 | % |
| | Class R | | | 1,000.00 | | | 1,128.20 | | | 8.38 | | 1.58 | % |
| | Class S | | | 1,000.00 | | | 1,130.10 | | | 5.68 | | 1.07 | % |
| | | | | |
Mid Cap Value Fund** | | Class I | | | 1,000.00 | | | 1,076.00 | | | 2.33 | | 0.90 | % |
| * | Expenses are equal to the average account value times the Fund’s annualized expense ratio multiplied by 182/365 (to reflect one-half year period). |
| ** | For the period from December 31, 2009 (date of inception) to March 31, 2010 |
66
SUPPLEMENTAL INFORMATION (UNAUDITED)
Hypothetical Example for Comparison Purposes
The table below provides information about hypothetical account values and hypothetical expenses based on each RBC Funds’ actual expense ratio and an assumed rate of return of 5% per year before expenses, which is not the Fund’s actual return. The hypothetical account values and expenses may not be used to estimate the actual ending account balance or expenses you paid for the period. You may use this information to compare this 5% hypothetical example with the 5% hypothetical examples that appear in the shareholder reports of other funds.
Please note that the expenses shown in the table are meant to highlight your ongoing costs only and do not reflect any transactional costs, such as sales charges (loads), redemption fees, or exchange fees. Therefore, the table is useful in comparing ongoing costs only, and will not help you determine the relative total costs of owning different funds. In addition, if these transactional costs were included, your costs would have been higher.
| | | | | | | | | | | | | | |
| | | | | Beginning
Account Value
10/1/2009 | | Ending
Account Value
3/31/2010 | | Expenses Paid
During Period*
10/1/09-3/31/10 | | Annualized
Expense Ratio
During Period
10/1/09-3/31/10 | |
Mid Cap Growth Fund | | Class A | | $ | 1,000.00 | | $ | 1,018.20 | | $ | 6.79 | | 1.35 | % |
| | Class I | | | 1,000.00 | | | 1,019.45 | | | 5.54 | | 1.10 | % |
| | Class C | | | 1,000.00 | | | 1,014.51 | | | 10.50 | | 2.09 | % |
| | Class R | | | 1,000.00 | | | 1,017.00 | | | 8.00 | | 1.59 | % |
| | Class S | | | 1,000.00 | | | 1,019.45 | | | 5.54 | | 1.10 | % |
| | | | | |
Enterprise Fund | | Class A | | | 1,000.00 | | | 1,018.30 | | | 6.69 | | 1.33 | % |
| | Class I | | | 1,000.00 | | | 1,019.55 | | | 5.44 | | 1.08 | % |
| | Class C | | | 1,000.00 | | | 1,014.56 | | | 10.45 | | 2.08 | % |
| | Class R | | | 1,000.00 | | | 1,017.10 | | | 7.90 | | 1.57 | % |
| | Class S | | | 1,000.00 | | | 1,019.55 | | | 5.44 | | 1.08 | % |
| | | | | |
Small Cap Core Fund | | Class A | | | 1,000.00 | | | 1,017.25 | | | 7.75 | | 1.54 | % |
| | Class C | | | 1,000.00 | | | 1,013.56 | | | 11.45 | | 2.28 | % |
| | Class R | | | 1,000.00 | | | 1,015.96 | | | 9.05 | | 1.80 | % |
| | Class S | | | 1,000.00 | | | 1,018.45 | | | 6.54 | | 1.30 | % |
| | | | | |
Microcap Value Fund | | Class A | | | 1,000.00 | | | 1,018.35 | | | 6.64 | | 1.32 | % |
| | Class C | | | 1,000.00 | | | 1,014.61 | | | 10.40 | | 2.07 | % |
| | Class R | | | 1,000.00 | | | 1,017.05 | | | 7.95 | | 1.58 | % |
| | Class S | | | 1,000.00 | | | 1,019.60 | | | 5.39 | | 1.07 | % |
| | | | | |
Mid Cap Value Fund** | | Class I | | | 1,000.00 | | | 1,010.22 | | | 2.26 | | 0.90 | % |
| * | Expenses are equal to the average account value times the Fund’s annualized expense ratio multiplied by 182/365 (to reflect one-half year period). |
| ** | For the period from December 31, 2009 (date of inception) to March 31, 2010 |
67
APPROVAL OF INVESTMENT ADVISORY AGREEMENTS (UNAUDITED)
Information for RBC Mid Cap Value Fund Shareholders Regarding Approval of Investment Advisory Agreement
In December, 2009, the Board of Trustees of RBC Funds Trust (the “Trust”) approved the investment advisory agreement (“Agreement”) between the Trust and the Advisor for the new RBC Mid Cap Value Fund for an initial period of one year.
As part of their consideration of the Agreement, the Trustees requested and considered information regarding the investment strategy of the Fund, the advisory services to be performed by the Advisor, the staffing, qualifications and experience of the personnel responsible for operating and managing the Fund, and the Fund’s fees and expenses. The Trustees met with representatives from the Advisor’s senior management team to discuss the new Fund, and also met with senior investment professionals, to discuss the information and the Advisor’s proposed management of the Fund. The Trustees also reviewed information regarding the portfolio managers’ historical management of other investment advisory clients accounts in a substantially similar investment strategy as compared to the performance of applicable benchmarks. The Trustees considered information regarding other benefits the Advisor and its affiliates derived from its relationship with the Fund. In connection with their deliberations, the independent Trustees were advised by their own independent legal counsel with regard to the materials and their responsibilities under relevant laws and regulations.
In considering the quality of the services to be performed for the Fund by the Advisor, the Trustees discussed the research capabilities and fundamental analysis to be performed for the Fund, and recognized the expertise and experience of the portfolio management team that would manage the Fund. The Trustees were also satisfied with the capabilities of the Advisor’s staff, its compliance structure and systems and financial strength. Finally, the Trustees considered the manner in which the Fund will fit within the fund group’s other fund offerings and the strategic initiatives of the fund group.
With regard to the Fund’s advisory fee and expenses, the Trustees compared the advisory fee to be payable to the Advisor with comparative fee and expense information for similarly situated funds prepared by a third party consultant. The Trustees also considered the Advisor’s proposal to implement a fee waiver and expense limitation arrangement in order to maintain total expenses at a specified level.
Based upon their review, the Trustees determined that the advisory fee proposed to be payable to the Advisor was fair and reasonable in light of the nature and quality of services provided under all of the circumstances, and was within the range of what might have been negotiated at arms’ length. The Trustees concluded that it is in the interest of the Fund and its shareholders for the Trustees to approve the Agreement and expense limitation arrangement for the Fund. In arriving at their decision to approve the Agreement, the Trustees did not assign relative weights to the factors discussed above or deem any one or group of them to be controlling in and of themselves
68
RBC Funds
P.O. Box 701
Milwaukee, WI 53201-0701
800-422-2766
www.rbcgam.us
Performance data represents past performance and does not guarantee future results. The principal value of an investment and investment return will fluctuate so that an investor’s shares, when redeemed, may be worth more or less than their original cost.
This report and the financial statements contained herein are provided for the information of RBC Funds shareholders. This report is not authorized for distribution to prospective investors unless preceded or accompanied by a current prospectus, which contains information concerning investment objectives, risks, charges and expenses of the funds. Please read the prospectus carefully before investing.
This report and the financial statements contained herein are not intended to be a forecast of future events, a guarantee of future results, or investment advice. There is no assurance that certain securities will remain in or out of each fund’s portfolio. The views expressed in this report reflect those of the portfolio managers through the period ended March 31, 2010.
NOT FDIC INSURED • NO BANK GUARANTEE • MAY LOSE VALUE
RBC Global Asset Management, Inc. serves as investment adviser for the RBC Funds. RBC Funds are distributed by Quasar Distributors LLC.

| | | | |
The RBC Funds are pleased to offer shareholder reports printed entirely on Forest Stewardship Council certified paper. FSC certification ensures that the paper used in this report contains fiber from well-managed and responsibly harvested forests that meet strict environmental and socioeconomic standards. | | |
| | | | RBCF-EQ SAR 03-10 |
Semi-Annual Report
For the period ended March 31, 2010
Prime Money Market Fund
U.S. Government Money Market Fund
Tax-Free Money Market Fund

| | | | |
| | RBC Funds | | |
| | |
About Your Semi-Annual Report | | | | |
| | This semi-annual report includes detailed information about your Fund including financial statements, performance, and a complete list of holdings. |
| |
| | We hope the financial information presented will help you evaluate your investment in the RBC Funds. We also encourage you to read your Fund’s prospectus for further detail as to your Fund’s investment policies and risk profile. RBC Funds prospectuses and additional performance information are available on our website at www.rbcgam.us. |
| |
| | A description of the policies and procedures that your Fund uses to determine how to vote proxies relating to portfolio securities is available (i) without charge, upon request, by calling 1-800-422-2766; (ii) on the Fund’s website at www.rbcgam.us; and (iii) on the Securities and Exchange Commission’s (“Commission”) website at http://www.sec.gov. |
| |
| | Information regarding how your Fund voted proxies relating to portfolio securities during the most recent 12-month period ended June 30 is available (i) on the Fund’s website at www.rbcgam.us; and (ii) on the Commission’s website at http://www.sec.gov. |
| |
| | A schedule of each Fund’s portfolio holdings will be filed with the Commission for the first and third quarters of each fiscal year on Form N-Q. This information is available on the Commission’s website at http://www.sec.gov and may be reviewed and copied at the Commission’s Public Reference Room in Washington, D.C. Information on the operation of the Public Reference Room is available by calling 1-800-SEC-0330. |
| | |
Table of Contents | | | | |
| | | | |
| | |
| | Letter from the CIO of Fixed Income | | 1 |
| | Money Market Portfolio Managers | | 3 |
| | Performance Summary | | 5 |
| | Schedules of Portfolio Investments | | 7 |
| | Financial Statements | | |
| | - Statements of Assets and Liabilities | | 42 |
| | - Statements of Operations | | 44 |
| | - Statements of Changes in Net Assets | | 45 |
| | Financial Highlights | | 49 |
| | Notes to Financial Statements | | 52 |
| | Supplemental Information | | 59 |
| | |
| | LETTER FROM THE CIO OF FIXED INCOME |
| |
| | RBC Funds enjoyed another solid period of providing solutions for our shareholders. We understand the important role our funds play in helping you to build and achieve your financial goals. From a financial perspective, we are pleased to report that all of our Funds continued to perform as expected during the first six months of our fiscal year. In some instances, we performed beyond our expectations. The RBC U.S. Government Money Market Fund earned two awards from Crane Research and iMoney Net for outstanding performance for the calendar year ending 2009. The RBC U.S. Government Money Market Fund – Institutional Class 1 shares received the 2009 iMoneyNet Money Fund Report™ Award for Institutional Government Fund Performance (out of 340 funds) and the 2009 Money Fund Intelligence Award winner for Institutional Government Performance (out of 110 funds) for the 12-month period ended 12/31/09. More important than being recognized with annual awards, we are proud of the long term performance we have provided for our shareholders and we are very pleased with the performance of our Prime, Government and Tax-Free Funds throughout the recent market crisis. Although economic activity has shown signs of sustainable improvement, we remain concerned that growth will remain below potential until the housing market and employment picture materially improve. We remain wary to judge independently the health prospects for the US economy given the large amounts of stimulus still working their way through the system. We continue to believe that the most likely scenario for the US economy in 2010-2011 is a ‘half-speed’ recovery. Our forecast remains cautious as we feel that an accelerating economy will depend on final demand as opposed to government stimulus and inventory accumulation. Inflation remains well under control and is not a significant concern presently. Treasury note and bond issuance has been very heavy, and is likely to continue so, which could result in increased market volatility in the months ahead. The Treasury yield curve remains solidly anchored in the short end. The U.S. Federal Reserve (“the Fed”), has clearly signaled its intention to keep the Fed Funds rate at an exceptionally low level for an extended period of time. The slope of the Treasury yield curve remains very positive and may become more so as we believe the Fed is on hold for the balance of 2010, helping the banks achieve profitability and re-build their capital base. It is becoming apparent that the Fed is nearing an inflection point in its conduct of monetary policy. Nascent signs of tightening have appeared, including an increase in the Fed discount rate from .5% to .75%, and termination of special liquidity facilities in place since 2008. Both are designed to push lenders back into the private credit markets. Still under consideration is how to most effectively unwind the Fed’s quantitative easing activities by reversing the recently ended $1.7 trillion acquisition of Treasury and mortgage backed securities. Financial regulatory reform appears increasingly likely to get passed in some form, and it should. It would be troubling if Rule 2a-7 (the rule that governs the operations of money market funds) regulatory changes were the only material reform to follow this great recession. That said, the market remains anxious to understand the nature and impact of proposed reforms as they are debated in Washington D.C. |
1
| | |
| | LETTER FROM THE CIO OF FIXED INCOME |
| | |
| | Finally, newly enacted revisions to Rule 2a-7 will begin to be implemented in the coming quarter. Two important areas we will be working on in the quarter ahead will be formally instituting know your customer procedures as well as regular stress testing for our money market funds. The RBC Money Market Funds have always managed to tighter weighted average maturity and quality restrictions than those which were historically required. As always, we will remain steadfast in our goal of principal preservation of our shareholders assets while striving to provide the necessary liquidity and income generation they deserve and expect. Thank you for your continued confidence and trust in the RBC Funds. |
| |

John Huber Chief Investment Officer Fixed Income | | Sincerely, |
| |  |
| | John M. Huber, CFA Chief Investment Officer, Fixed Income RBC Funds |
| | Past performance is not a guarantee of future results. |
| | Opinions expressed are subject to change, are not guaranteed, and should not be considered a recommendation to buy or sell any security. |
| | An investment in a Money Market Fund is not insured or guaranteed by the Federal Deposit Insurance Corporation or any other government agency. Although Money Market Funds seek to preserve the value of your investment at $1.00 per share, it is possible to lose money by investing in them. These risks are more fully described in the prospectus. |
| | The 2009 iMoneyNet Money Fund Report™ Award is based on the fund’s total return for the 12 months ending December 31, 2009. Return figures are tracked daily, weekly, and monthly by iMoneyNet’s editors and statisticians. The Government Institutional fund universe consisted of 340 unrestricted funds that had assets of at least $100 million for the year ended December 31, 2009. Winners were chosen in each of six fund categories: Institutional Government, Prime and National and Retail Government, Prime and National. |
| | The 2009 Money Fund Intelligence Award Award is based on the fund’s total return for the 12 months ending December 31, 2009. Return figures are tracked daily, weekly, and monthly by Crane Data LLC editors and statisticians. The Government Institutional fund universe consisted of 110 funds for the year ended December 31, 2009. Winners were chosen in the following categories: Government Institutional , Prime Institutional, Government Retail, and Prime Retail for 1-year, 5-year and 10-year total returns. |
2
MONEY MARKET PORTFOLIO MANAGERS
| | |
| RBC Global Asset Management (U.S.) Inc. (“RBC GAM (US)”), serves as the investment advisor to the RBC Funds. RBC GAM (US) employs a team approach to the management of each of the Money Market Funds, with no individual team member being solely responsible for the investment decisions. Each Fund’s management team has access to RBC GAM (US)’s investment research and other money management resources. | | |
| |
| John M. Huber, CFA | | |
| Senior Managing Director, Chief Investment Officer — Fixed Income | | 
John M. Huber, CFA |
John Huber directs RBC GAM (US)’s fixed income group. John joined RBC GAM (US) in 2004 from Galliard Capital Management where he was a principal and senior portfolio manager, responsible for the firm’s total return fixed income effort. Prior to working for Galliard, John was a portfolio manager for Norwest Investment Management where he began his career in 1990. John received a BA from the University of Iowa and an MBA in Finance from the University of Minnesota, Carlson School of Management. He acts as an advisor to the Carlson Funds Enterprise for the University of Minnesota. John is a CFA charterholder and a member of the CFA Society of Minnesota. He also serves on the Board of the YMCA of Metropolitan Minneapolis. | |
| |
| Raye C. Kanzenbach, CFA | | |
| Senior Managing Director, Senior Portfolio Manager | | 
Raye C. Kanzenbach, CFA |
Raye Kanzenbach is an active member of the Credit Team and serves as primary portfolio manager for the Tax-Free Money Market Fund. He has extensive experience working with taxable and tax-exempt municipal fixed income securities. Prior to his experience at RBC GAM (US), Raye was employed at First Bank where he managed the municipal and money market trust funds. Raye also supervised the municipal and corporate credit analysis areas for the Trust Department and First Bank’s investment portfolio. Prior to First Bank, Raye was employed as an investment officer with the St. Paul Companies. Raye began his career in the investment industry in 1973 and joined RBC GAM (US) in 1983. He received a BA in Economics from Lawrence University and an MBA in Finance from the University of Michigan. Raye is a CFA charterholder and member of the CFA Society of Minnesota. | |
| |
| Scott Cabalka | | |
| Vice President, Client Service Portfolio Manager | | 
Scott Cabalka |
Scott Cabalka is a portfolio manager on RBC GAM (US)’s Institutional Portfolio Management Team overseeing portfolio strategy and investment activity for clients. Scott has particular expertise managing short duration mandates, and he co-manages the Money Market Funds. Before joining RBC GAM (US) in 1993, he was an account executive with Merrill Lynch, where he focused on short-term investment strategies for institutional investors. Scott began his career in the investment industry in 1980. He received a BS and an MBA in Finance from the University of Minnesota Carlson School of Management. | |
3
| | |
| | MONEY MARKET PORTFOLIO MANAGERS |
| | |
| | Brandon T. Swensen, CFA |

Brandon T. Swensen | | Vice President, Portfolio Manager |
| | Brandon Swensen is a portfolio manager on the Spread Management Team and leads the firm’s trading activity in short duration investment services. Brandon also has specific research responsibilities for finance companies, automobile, auto asset backed securities and asset backed commercial paper. He joined RBC GAM (US) in 2000 and has held several key roles including senior structured product analyst and credit analyst in the fixed income group. Brandon began his career in the investment industry in 1998. He received a BS in Finance from St. Cloud State University and an MBA in Finance from the University of St. Thomas. Brandon is a CFA charterholder and member of the CFA Society of Minnesota. |
| | |
| | |
| | |
| | |
| | |
| | |
4
PERFORMANCE SUMMARY
| | |
| Each of the RBC Money Market Funds was managed to preserve principal. This means that the share price of each fund held steady at $1.00. A consistent share price of $1.00 is expected for a money market mutual fund. An investment in the Fund is not insured or guaranteed by the Federal Deposit Insurance Corporation or any other government agency. Although the Fund seeks to preserve the value of your investment at $1.00 per share, it is possible to lose money by investing in the Fund. These risks are more fully described in the prospectus. | | Investment Objective |
| | | | | | | | | |
| | | Total Return
for the
Six Months Ended
March 31, 2010 | | | SEC 7-Day Annualized Yield (1) | |
| | | | March 31,
2010
(Unaudited) | | | September 30,
2009 | |
Prime Money Market Fund* | | | | | | | | | |
RBC Institutional Class 1 | | 0.09 | % | | 0.14 | % | | 0.34 | % |
RBC Institutional Class 2 | | 0.05 | % | | 0.04 | % | | 0.24 | % |
RBC Investor Class | | 0.01 | % | | 0.01 | % | | 0.01 | % |
RBC Reserve Class | | 0.01 | % | | 0.01 | % | | 0.01 | % |
RBC Select Class | | 0.01 | % | | 0.01 | % | | 0.01 | % |
| | | |
U.S. Government Money Market Fund* | | | | | | | | | |
RBC Institutional Class 1 | | 0.05 | % | | 0.09 | % | | 0.12 | % |
RBC Institutional Class 2 | | 0.01 | % | | 0.01 | % | | 0.02 | % |
RBC Investor Class | | 0.01 | % | | 0.01 | % | | 0.01 | % |
RBC Reserve Class | | 0.01 | % | | 0.01 | % | | 0.01 | % |
RBC Select Class | | 0.01 | % | | 0.01 | % | | 0.01 | % |
| | | |
Tax-Free Money Market Fund* | | | | | | | | | |
RBC Institutional Class 1 | | 0.16 | % | | 0.24 | % | | 0.52 | % |
RBC Institutional Class 2 | | 0.11 | % | | 0.14 | % | | 0.41 | % |
RBC Investor Class | | 0.02 | % | | 0.01 | % | | 0.01 | % |
RBC Reserve Class | | 0.02 | % | | 0.01 | % | | 0.01 | % |
RBC Select Class | | 0.02 | % | | 0.01 | % | | 0.02 | % |
| | |
| Performance data quoted represents past performance. Past performance is no guarantee of future results. Investment return and principal value of an investment will fluctuate so that an investor’s shares, when redeemed, may be worth more or less than their original cost. Current performance may be lower or higher than performance quoted. Performance shown reflects contractual fee waivers, without such fee waivers total returns would be reduced. For performance data current to most recent month-end go to www.rbcgam.us. | | |
5
| | |
| | * The inception date for the RBC Institutional Class 2, RBC Select Class, RBC Reserve Class and RBC Investor Class is November 21, 2008. All performance shown for these classes of shares prior to their inception date is based on the performance, fees and expenses of RBC Institutional Class 1 shares of the Fund and its predecessors, and has not been adjusted to reflect the fees and expenses of RBC Institutional Class 2, RBC Select Class, RBC Reserve Class, and RBC Investor Class shares. (1) As money market returns respond rapidly to market changes, such as in the Fed Funds rate, the 7-Day yield is a more accurate reflection of current earnings than the total return for the year. Prior year 7-Day yield information is provided for comparative purposes. |
| Asset Allocation | | |
| | Money Market Maturity Schedules as a percentage of value of investments based on effective maturity as of March 31, 2010. |
| | | | | | | | | |
| | | Prime
Money
Market
Fund | | | U.S.
Government
Money
Market Fund | | | Tax-Free
Money
Market Fund | |
Less than 8 days | | 45.2 | % | | 56.3 | % | | 73.6 | % |
8 to 14 Days | | 8.9 | % | | 10.1 | % | | 1.1 | % |
15 to 30 Days | | 15.0 | % | | 4.2 | % | | 1.0 | % |
31 to 180 Days | | 21.3 | % | | 14.9 | % | | 18.1 | % |
181 to 365 Days | | 9.6 | % | | 14.5 | % | | 6.2 | % |
6
SCHEDULE OF PORTFOLIO INVESTMENTS
Prime Money Market Fund
March 31, 2010 (Unaudited)
| | | | | | | | |
Principal Amount | | | | Value |
Asset Backed Securities — 1.98% | | | |
Asset Backed Auto Receivables — 1.98% | | | |
| | $ | 31,196,240 | | Bank of America Auto Trust, Series 2010-1A, Class A1, 0.26%, 2/15/11(a) | | $ | 31,196,240 |
| | | 21,559,744 | | Harley-Davidson Motorcycle Trust, Series 2009-4, Class A1, 0.29%, 12/15/10 | | | 21,559,744 |
| | | 8,370,667 | | Honda Auto Receivables Owner Trust, Series 2009-3, Class A1, 0.75%, 7/15/10 | | | 8,370,667 |
| | | 125,086,426 | | Honda Auto Receivables Owner Trust, Series 2010-1, Class A1, 0.27%, 2/22/11 | | | 125,086,426 |
| | | 7,183,661 | | Nissan Auto Lease Trust, Series 2009-B, Class A1, 0.41%, 9/15/10 | | | 7,183,661 |
| | | 84,651,710 | | Volkswagen Auto Loan Enhanced Trust, Series 2010-1, Class A1, 0.26%, 2/21/11 | | | 84,651,710 |
| | | 58,391,057 | | World Omni Auto Receivables Trust Series 2010-A, Class A1, 0.23%, 2/15/11 | | | 58,391,058 |
| | | 28,913,224 | | World Omni Automobile Lease Securitization Trust, Series 2009-A, Class A1, 0.40%, 11/15/10 | | | 28,913,224 |
| | | | | | | | |
| |
Total Asset Backed Securities (Cost $365,352,730) | | | 365,352,730 |
| | | | | | | | |
Commercial Paper — 24.40% | | | |
Banks - Australia & New Zealand — 3.12% | | | |
| | | 50,000,000 | | Australia & New Zealand Banking Group Ltd., 0.15%, 4/15/10(a)(b) | | | 49,997,083 |
| | | 25,000,000 | | Australia & New Zealand Banking Group Ltd., 0.18%, 5/4/10(a)(b) | | | 24,995,875 |
| | | 50,000,000 | | Australia & New Zealand Banking Group Ltd., 0.25%, 12/16/10(a)(b) | | | 49,996,744 |
| | | 50,000,000 | | Australia & New Zealand Banking Group Ltd., 0.25%, 1/28/11(a)(b) | | | 50,000,000 |
| | | 50,000,000 | | Australia & New Zealand Banking Group Ltd., 0.30%, 4/7/10(a)(b) | | | 49,997,500 |
| | | 50,000,000 | | Australia & New Zealand Banking Group Ltd., 0.62%, 10/19/10(a)(b) | | | 49,826,917 |
| | | 50,000,000 | | Commonwealth Bank of Australia, 0.16%, 4/22/10(a)(b) | | | 49,995,334 |
| | | 50,000,000 | | Commonwealth Bank of Australia, 0.19%, 5/12/10(a)(b) | | | 49,989,181 |
| | | 25,000,000 | | Commonwealth Bank of Australia, 0.24%, 6/7/10(a)(b) | | | 24,988,833 |
| | | 50,000,000 | | Westpac Banking Corp., 0.29%, 4/7/10(a)(b) | | | 49,997,583 |
| | | 25,000,000 | | Westpac Banking Corp., 0.33%, 5/24/10(a)(b) | | | 24,987,854 |
| | | 50,000,000 | | Westpac Banking Corp., 0.34%, 5/20/10(a)(b) | | | 49,976,861 |
| | | 50,000,000 | | Westpac Banking Corp., 0.81%, 7/2/10(a)(b) | | | 49,897,778 |
| | | | | | | | |
| | | | | | | | 574,647,543 |
| | | | | | | | |
Banks - Canadian — 0.54% | | | |
| | | 50,000,000 | | Bank of Nova Scotia, 0.29%, 4/21/10(b) | | | 49,991,944 |
| | | 50,000,000 | | Scotiabanc, Inc., 0.19%, 4/26/10(a)(b) | | | 49,993,403 |
| | | | | | | | |
| | | | | | | | 99,985,347 |
| | | | | | | | |
7
SCHEDULE OF PORTFOLIO INVESTMENTS
Prime Money Market Fund (cont.)
March 31, 2010 (Unaudited)
| | | | | | | | |
Principal Amount | | | | Value |
Banks - Domestic — 3.62% | | | |
| | $ | 300,000,000 | | BB&T Corp., 0.01%, 4/1/10 | | $ | 300,000,000 |
| | | 300,000,000 | | Citibank, 0.12%, 4/1/10 | | | 300,000,000 |
| | | 67,000,000 | | JPMorgan Chase & Co., 0.03%, 4/1/10(b) | | | 67,000,000 |
| | | | | | | | |
| | | | | | | | 667,000,000 |
| | | | | | | | |
Banks - Foreign — 2.95% | | | |
| | | 300,000,000 | | BNP Paribas, 0.08%, 4/1/10 | | | 300,000,000 |
| | | 60,000,000 | | Nordea North America, Inc., 0.17%, 4/20/10(b) | | | 59,994,617 |
| | | 35,000,000 | | Nordea North America, Inc., 0.18%, 4/19/10(b) | | | 34,996,850 |
| | | 100,000,000 | | Nordea North America, Inc., 0.18%, 4/23/10(b) | | | 99,989,000 |
| | | 50,000,000 | | Rabobank USA Financial Corp., 0.28%, 5/17/10(b) | | | 49,982,111 |
| | | | | | | | |
| | | | | | | | 544,962,578 |
| | | | | | | | |
Consumer Discretionary — 1.00% | | | |
| | | 85,000,000 | | Johnson & Johnson, 0.22%, 7/12/10(a)(b) | | | 84,947,017 |
| | | 100,000,000 | | Johnson & Johnson, 0.22%, 7/19/10(a)(b) | | | 99,933,389 |
| | | | | | | | |
| | | | | | | | 184,880,406 |
| | | | | | | | |
Consumer Staples — 0.55% | | | |
| | | 50,000,000 | | Campbell Soup Co., 0.70%, 7/27/10(a)(b) | | | 49,886,250 |
| | | 10,000,000 | | The Coca-Cola Co., 0.22%, 5/28/10(a)(b) | | | 9,996,517 |
| | | 42,450,000 | | The Coca-Cola Co., 0.76%, 5/28/10(a)(b) | | | 42,399,590 |
| | | | | | | | |
| | | | | | | | 102,282,357 |
| | | | | | | | |
Finance - Diversified Domestic — 3.36% | | | |
| | | 50,000,000 | | Bank of America Corp., 0.17%, 4/1/10(b) | | | 50,000,000 |
| | | 50,000,000 | | Bank of America Corp., 0.17%, 4/5/10(b) | | | 49,999,056 |
| | | 100,000,000 | | Bank of America Corp., 0.18%, 4/23/10(b) | | | 99,989,000 |
| | | 44,460,000 | | Bank of America Corp., 0.24%, 6/4/10(b) | | | 44,441,030 |
| | | 25,000,000 | | General Electric Capital Corp., 0.21%, 4/26/10(b) | | | 24,996,354 |
| | | 100,000,000 | | KFW, 0.14%, 4/12/10(a)(b) | | | 99,995,722 |
| | | 50,000,000 | | KFW, 0.14%, 4/14/10(a)(b) | | | 49,997,472 |
| | | 100,000,000 | | KFW, 0.19%, 4/30/10(a)(b) | | | 99,984,694 |
| | | 100,000,000 | | Toyota Motor Credit Corp., 0.16%, 4/13/10(b) | | | 99,994,667 |
| | | | | | | | |
| | | | | | | | 619,397,995 |
| | | | | | | | |
Health Care — 1.67% | | | |
| | | 30,000,000 | | Dean Health Systems, Inc., 0.20%, 4/27/10(b) | | | 29,995,667 |
| | | 100,000,000 | | Pfizer, Inc., 0.81%, 7/7/10(a)(b) | | | 99,784,444 |
| | | 150,000,000 | | Roche Holdings, Inc., 0.19%, 4/16/10(a)(b) | | | 149,988,125 |
| | | 27,869,000 | | Society of New York Hospital Fund, 0.30%, 7/1/10(b) | | | 27,847,866 |
| | | | | | | | |
| | | | | | | | 307,616,102 |
| | | | | | | | |
Insurance — 3.93% | | | |
| | | 50,000,000 | | AXA Financial, Inc., 0.16%, 4/6/10(a)(b) | | | 49,998,889 |
| | | 50,000,000 | | AXA Financial, Inc., 0.17%, 4/1/10(a)(b) | | | 50,000,000 |
| | | 100,000,000 | | AXA Financial, Inc., 0.20%, 4/9/10(a)(b) | | | 99,995,556 |
8
SCHEDULE OF PORTFOLIO INVESTMENTS
Prime Money Market Fund (cont.)
March 31, 2010 (Unaudited)
| | | | | | | | |
Principal Amount | | | | Value |
| | $ | 25,000,000 | | AXA Financial, Inc., 0.22%, 4/21/10(a)(b) | | $ | 24,996,944 |
| | | 50,000,000 | | AXA Financial, Inc., 0.23%, 4/19/10(a)(b) | | | 49,994,250 |
| | | 25,000,000 | | Mass Mutual Life, 0.22%, 4/8/10(a)(b) | | | 24,998,931 |
| | | 50,000,000 | | Metlife Short Term Funding LLC, 0.19%, 4/19/10(a)(b) | | | 49,995,250 |
| | | 50,000,000 | | Metlife Short Term Funding LLC, 0.20%, 4/12/10(a)(b) | | | 49,996,944 |
| | | 33,235,000 | | New York Life Capital Corp, 0.17%, 5/3/10(a)(b) | | | 33,229,978 |
| | | 68,000,000 | | New York Life Capital Corp., 0.15%, 4/14/10(a)(b) | | | 67,996,317 |
| | | 73,838,000 | | New York Life Capital Corp., 0.16%, 4/14/10(a)(b) | | | 73,833,734 |
| | | 50,000,000 | | Swiss Re Treasury US Corp., 0.37%, 7/12/10(a)(b) | | | 49,947,583 |
| | | 100,000,000 | | Swiss Re Treasury US Corp., 0.65%, 10/5/10(a)(b) | | | 99,662,361 |
| | | | | | | | |
| | | | | | | | 724,646,737 |
| | | | | | | | |
Manufacturing — 0.41% | | | |
| | | 26,500,000 | | Dover Corp., 0.12%, 4/1/10(b) | | | 26,500,000 |
| | | 50,000,000 | | Honeywell International, 0.70%, 6/30/10(a)(b) | | | 49,912,500 |
| | | | | | | | |
| | | | | | | | 76,412,500 |
| | | | | | | | |
Utilities — 3.25% | | | |
| | | 45,000,000 | | E.ON AG, 0.17%, 4/19/10(a)(b) | | | 44,996,175 |
| | | 55,000,000 | | E.ON AG, 0.19%, 4/19/10(a)(b) | | | 54,994,775 |
| | | 50,000,000 | | E.ON AG, 0.20%, 5/11/10(a)(b) | | | 49,988,889 |
| | | 100,000,000 | | E.ON AG, 0.23%, 5/20/10(a)(b) | | | 99,968,695 |
| | | 50,000,000 | | E.ON AG, 0.23%, 6/11/10(a)(b) | | | 49,977,319 |
| | | 5,000,000 | | GDF Suez, 0.15%, 4/7/10(a)(b) | | | 4,999,875 |
| | | 25,000,000 | | GDF Suez, 0.15%, 4/8/10(a)(b) | | | 24,999,271 |
| | | 20,000,000 | | GDF Suez, 0.16%, 4/1/10(a)(b) | | | 20,000,000 |
| | | 25,000,000 | | GDF Suez, 0.16%, 4/9/10(a)(b) | | | 24,999,111 |
| | | 55,000,000 | | GDF Suez, 0.17%, 4/1/10(a)(b) | | | 55,000,000 |
| | | 50,000,000 | | GDF Suez, 0.17%, 4/7/10(a)(b) | | | 49,998,583 |
| | | 50,000,000 | | GDF Suez, 0.17%, 4/8/10(a)(b) | | | 49,998,347 |
| | | 70,000,000 | | GDF Suez, 0.18%, 4/16/10(a)(b) | | | 69,994,750 |
| | | | | | | | |
| | | | | | | | 599,915,790 |
| | | | | | | | |
| |
Total Commercial Paper
(Cost $4,501,747,355) | | | 4,501,747,355 |
| | | | | | | | |
Certificates of Deposit — 7.17% | | | |
Banks - Canadian — 3.63% | | | |
| | | 100,000,000 | | Bank of Montreal Chicago, 0.16%, 4/1/10 | | | 100,000,000 |
| | | 100,000,000 | | Bank of Montreal Chicago, 0.18%, 4/19/10 | | | 100,000,000 |
| | | 70,000,000 | | Bank of Montreal Chicago, 0.20%, 4/26/10 | | | 70,000,000 |
| | | 30,000,000 | | Bank of Montreal Chicago, 0.20%, 4/27/10 | | | 30,000,000 |
| | | 50,000,000 | | Bank of Nova Scotia, 0.25%, 10/1/10 | | | 50,000,000 |
| | | 100,000,000 | | Bank of Nova Scotia, 0.29%, 4/6/10 | | | 100,000,000 |
| | | 50,000,000 | | Bank of Nova Scotia, 0.52%, 11/10/10 | | | 50,000,000 |
9
SCHEDULE OF PORTFOLIO INVESTMENTS
Prime Money Market Fund (cont.)
March 31, 2010 (Unaudited)
| | | | | | | | |
Principal Amount | | | | Value |
| | $ | 170,000,000 | | Toronto Dominion Bank NY, 0.33%, 4/21/10 | | $ | 170,002,826 |
| | | | | | | | |
| | | | | | | | 670,002,826 |
| | | | | | | | |
Banks - Domestic — 0.81% | | | |
| | | 50,000,000 | | Bank of America NA, 0.18%, 4/7/10(a) | | | 50,000,167 |
| | | 100,000,000 | | US Bank NA, 0.82%, 6/8/10 | | | 100,000,000 |
| | | | | | | | |
| | | | | | | | 150,000,167 |
| | | | | | | | |
Banks - Foreign — 1.10% | | | |
| | | 103,000,000 | | Nordea Bank AB, 1.78%, 5/3/10 | | | 103,146,195 |
| | | 50,000,000 | | Rabobank Nederland NV, 0.26%, 12/17/10(c) | | | 50,000,000 |
| | | 50,000,000 | | Rabobank Nederland NY, 0.52%, 9/20/10 | | | 50,000,000 |
| | | | | | | | |
| | | | | | | | 203,146,195 |
| | | | | | | | |
Banks - United Kingdom — 1.63% | | | |
| | | 100,000,000 | | Abbey National Treasury, 0.15%, 4/1/10 | | | 100,000,000 |
| | | 100,000,000 | | Abbey National Treasury, 0.16%, 4/5/10 | | | 100,000,000 |
| | | 100,000,000 | | Abbey National Treasury, 0.18%, 4/12/10 | | | 100,000,000 |
| | | | | | | | |
| | | | | | | | 300,000,000 |
| | | | | | | | |
| |
Total Certificates of Deposit (Cost $1,323,149,188) | | | 1,323,149,188 |
| | | | | | | | |
Corporate Bonds — 10.79% | | | |
Banks - Domestic — 2.85% | | | |
| | | 33,625,000 | | Bank of America NA, 1.70%, 12/23/10 | | | 33,929,820 |
| | | 120,731,000 | | Regions Bank, 2.75%, 12/10/10 | | | 122,648,695 |
| | | 100,000,000 | | Toronto Dominion Bank NY, 0.23%, 3/10/11(c) | | | 100,000,000 |
| | | 44,374,000 | | US Bancorp., 0.30%, 5/28/10(c) | | | 44,363,650 |
| | | 4,750,000 | | US Bancorp., 4.50%, 7/29/10 | | | 4,799,686 |
| | | 41,300,000 | | Wachovia Bank NA, 0.31%, 5/25/10(c) | | | 41,170,295 |
| | | 38,870,000 | | Wachovia Bank NA, 1.15%, 5/14/10(c) | | | 38,810,137 |
| | | 77,269,000 | | Wachovia Corp., 0.40%, 6/1/10(c) | | | 77,118,794 |
| | | 17,832,000 | | Wachovia Corp., 4.38%, 6/1/10 | | | 17,917,791 |
| | | 20,000,000 | | Wells Fargo & Co., 3.98%, 10/29/10 | | | 20,408,898 |
| | | 23,426,000 | | Wells Fargo & Co., 4.63%, 8/9/10 | | | 23,765,245 |
| | | | | | | | |
| | | | | | | | 524,933,011 |
| | | | | | | | |
Banks - Foreign — 0.81% | | | |
| | | 50,000,000 | | Rabobank Nederland NV, 0.22%, 12/21/10(c) | | | 50,000,000 |
| | | 50,000,000 | | Rabobank Nederland NV, 0.23%, 3/11/11(c) | | | 50,000,000 |
| | | 50,000,000 | | Westpac Banking Corp., 0.27%, 3/4/11(a)(c) | | | 50,000,000 |
| | | | | | | | |
| | | | | | | | 150,000,000 |
| | | | | | | | |
Consumer Discretionary — 0.02% | | | |
| | | 3,000,000 | | Lowe’s Cos., Inc., 8.25%, 6/1/10 | | | 3,038,492 |
| | | | | | | | |
Consumer Staples — 0.54% | | | |
| | | 50,000,000 | | Procter & Gamble International Funding SCA, 0.26%, 5/7/10(c) | | | 50,000,000 |
10
SCHEDULE OF PORTFOLIO INVESTMENTS
Prime Money Market Fund (cont.)
March 31, 2010 (Unaudited)
| | | | | | | | |
Principal
Amount | | | | Value |
| | $ | 50,000,000 | | Wal-Mart Stores, Inc. STEP, 5.32%, 6/1/10(c) | | $ | 50,386,982 |
| | | | | | | | |
| | | | | | | | 100,386,982 |
| | | | | | | | |
Energy — 0.22% | | | |
| | | 40,777,000 | | ConocoPhillips, 8.75%, 5/25/10 | | | 41,258,777 |
| | | | | | | | |
Finance - Diversified Domestic — 2.88% | | | |
| | | 12,590,000 | | ETC Holdings LLC, 0.32%, 4/1/28(c) | | | 12,590,000 |
| | | 3,790,000 | | GBG LLC, 0.35%, 9/1/27(a)(c) | | | 3,790,000 |
| | | 50,000,000 | | General Electric Capital Corp., 0.31%, 5/10/10(c) | | | 49,991,308 |
| | | 8,662,000 | | General Electric Capital Corp., 0.70%, 2/1/11(c) | | | 8,693,059 |
| | | 59,947,000 | | General Electric Capital Corp., 5.20%, 2/1/11 | | | 62,208,048 |
| | | 11,948,000 | | General Electric Capital Corp., Series A, 4.25%, 12/1/10 | | | 12,241,446 |
| | | 60,225,000 | | JPMorgan Chase & Co., 0.28%, 5/7/10(c) | | | 60,167,101 |
| | | 31,079,000 | | JPMorgan Chase & Co., 0.29%, 5/7/10(c) | | | 31,058,818 |
| | | 62,740,000 | �� | JPMorgan Chase & Co., 0.37%, 5/18/10(c) | | | 62,716,477 |
| | | 11,000,000 | | JPMorgan Chase & Co., 0.42%, 1/17/11(c) | | | 11,013,235 |
| | | 52,166,000 | | JPMorgan Chase & Co., 4.55%, 6/23/10 | | | 52,633,506 |
| | | 15,000,000 | | JPMorgan Chase & Co., 5.85%, 7/19/10 | | | 15,247,456 |
| | | 55,750,000 | | NGSP, Inc., 0.29%, 6/1/46(c) | | | 55,750,000 |
| | | 12,420,000 | | Ring-Missouri LP, 0.30%, 9/1/18(c) | | | 12,420,000 |
| | | 11,345,000 | | Schlitz Park Associates II LP, 0.32%, 12/1/21(c) | | | 11,345,000 |
| | | 15,425,000 | | SF Tarns LLC, 0.30%, 1/1/28(c) | | | 15,425,000 |
| | | 55,000,000 | | Twins Ballpark LLC, 0.73%, 10/1/34(a)(c) | | | 55,000,000 |
| | | | | | | | |
| | | | | | | | 532,290,454 |
| | | | | | | | |
Finance - Diversified Foreign — 0.41% | | | |
| | | 75,000,000 | | Finance For Danish Industries, 0.65%, 9/29/10(a) | | | 75,000,000 |
| | | | | | | | |
Health Care — 0.28% | | | |
| | | 38,960,000 | | GlaxoSmithKline Capital, Inc., 0.88%, 5/13/10(c) | | | 38,995,938 |
| | | 11,790,000 | | The Portland Clinic LLP, 0.31%, 11/20/33(c) | | | 11,790,000 |
| | | | | | | | |
| | | | | | | | 50,785,938 |
| | | | | | | | |
Industrials — 0.62% | | | |
| | | 110,000,000 | | 3M Co., 5.61%, 12/12/10(a) | | | 114,003,205 |
| | | | | | | | |
Insurance — 2.00% | | | |
| | | 40,000,000 | | AARP, 0.30%, 5/1/31(c) | | | 40,000,000 |
| | | 39,700,000 | | Berkshire Hathaway, Inc., 0.23%, 2/10/11(c) | | | 39,701,963 |
| | | 200,000,000 | | Metropolitan Life Global Funding, Series I, 1.25%, 4/14/11(a)(c) | | | 200,000,000 |
| | | 90,000,000 | | New York Life Global Funding, 0.25%, 4/1/11(a) | | | 90,000,000 |
| | | | | | | | |
| | | | | | | | 369,701,963 |
| | | | | | | | |
Materials — 0.16% | | | |
| | | 30,000,000 | | Praxair, Inc., 0.34%, 5/26/10(c) | | | 30,000,000 |
| | | | | | | | |
| |
Total Corporate Bonds (Cost $1,991,398,822) | | | 1,991,398,822 |
| | | | | | | | |
11
SCHEDULE OF PORTFOLIO INVESTMENTS
Prime Money Market Fund (cont.)
March 31, 2010 (Unaudited)
| | | | | | | | |
Principal
Amount | | | | Value |
Municipal Bonds — 17.88% | | | |
Arizona — 0.05% | | | |
| | $ | 9,900,000 | | Yuma Industrial Development Authority Refunding Revenue, 0.27%, 8/1/43, (LOC: JP Morgan Chase Bank)(c) | | $ | 9,900,000 |
| | | | | | | | |
California — 4.22% | | | |
| | | 99,365,000 | | Abag Finance Authority For Nonprofit Corps. Revenue, 0.28%, 6/1/37(c) | | | 99,365,000 |
| | | 55,450,000 | | Abag Finance Authority For Nonprofit Corps. Revenue, 0.29%, 12/15/37, (Credit Support: Fannie Mae)(c) | | | 55,450,000 |
| | | 67,220,000 | | California Housing Finance Agency Revenue, Series B, 0.29%, 2/1/35, (LOC: Freddie Mac, Fannie Mae)(c) | | | 67,220,000 |
| | | 40,400,000 | | California Housing Finance Agency Revenue, Series F, 0.29%, 2/1/37, (LOC: Freddie Mac, Fannie Mae)(c) | | | 40,400,000 |
| | | 58,125,000 | | California Housing Finance Agency Revenue, Series F, 0.29%, 2/1/38, (LOC: Freddie Mac, Fannie Mae)(c) | | | 58,125,000 |
| | | 24,250,000 | | California Pollution Control Revenue, 0.29%, 4/7/10 | | | 24,250,000 |
| | | 48,080,000 | | California State Department of Water Resources Revenue, Series C15, 0.24%, 5/1/22, (LOC: Bank of Nova Scotia)(c) | | | 48,079,987 |
| | | 5,000,000 | | California Statewide Communities Development Authority Revenue, Series 2114, 0.34%, 9/1/46, Callable 3/1/12 @ 100(c) | | | 5,000,000 |
| | | 41,360,000 | | City of Los Angeles Refunding Revenue, Sub Series F1, 0.27%, 6/1/28, (LOC: Bank of America NA)(c) | | | 41,360,000 |
| | | 32,000,000 | | City of Oakland GO, Series B, 2.25%, 7/16/10 | | | 32,023,017 |
| | | 25,000,000 | | City of Riverside Refunding Revenue, Series A, 1.50%, 6/1/10 | | | 25,000,000 |
| | | 43,600,000 | | City of Whittier Refunding Revenue, Series A, 0.26%, 6/1/36, (LOC: U.S. Bank NA)(c) | | | 43,600,000 |
| | | 27,417,000 | | County of San Bernardino Refunding Program COP, Series B, 0.27%, 3/1/17, (LOC: Bank of America NA)(c) | | | 27,417,000 |
| | | 18,700,000 | | Gilroy Public Facilities Financing Authority Refunding Revenue, 2.00%, 9/1/10 | | | 18,758,070 |
| | | 62,920,000 | | The Olympic Club Refunding Revenue, 0.27%, 9/30/32, (LOC: Bank of America NA)(c) | | | 62,920,000 |
| | | 42,300,000 | | Sacramento Municipal Utility District Refunding Revenue, Series J, 0.27%, 8/15/28, (LOC: Bank of America NA) | | | 42,300,000 |
| | | 8,410,000 | | San Francisco City & County Housing Authority Refunding Revenue, 0.26%, 9/1/49, (LOC: Citibank NA)(c) | | | 8,410,000 |
| | | 79,400,000 | | Southern California Public Power Authority Refunding Revenue, 0.28%, 7/1/36, (LOC: Bank of America NA)(c) | | | 79,400,000 |
| | | | | | | | |
| | | | | | | | 779,078,074 |
| | | | | | | | |
Colorado — 0.35% | | | |
| | | 27,885,000 | | Colorado Educational & Cultural Facilities Authority Refunding Revenue, Floaters Series 1557, 0.26%, 3/1/35, (Credit Support: FGIC)(c) | | | 27,885,000 |
12
SCHEDULE OF PORTFOLIO INVESTMENTS
Prime Money Market Fund (cont.)
March 31, 2010 (Unaudited)
| | | | | | | | |
Principal Amount | | | | Value |
| | $ | 16,610,000 | | Crystal Valley Metropolitan District No. 1 Revenue, 0.28%, 10/1/34, (LOC: Wells Fargo Bank)(c) | | $ | 16,610,000 |
| | | 20,840,000 | | East Cherry Creek Valley Water & Sanitation District Arapahoe County Refunding Revenue, Series A, 0.28%, 11/15/34, (LOC: Wells Fargo Bank)(c) | | | 20,840,000 |
| | | | | | | | |
| | | | | | | | 65,335,000 |
| | | | | | | | |
Florida — 0.25% | | | |
| | | 45,360,000 | | Orange County School Board Refunding COP, Series C, 0.29%, 8/1/25, (LOC: Bank of America NA)(c) | | | 45,360,000 |
| | | | | | | | |
Georgia — 0.23% | | | |
| | | 41,160,000 | | Valdosta-Lowndes County Industrial Development Authority Revenue, Series B, 0.23%, 6/1/28, (LOC: Wells Fargo Bank)(c) | | | 41,160,000 |
| | | 1,800,000 | | Walton County Industrial Building Authority Revenue, 0.63%, 10/1/17, (LOC: Wells Fargo Bank)(c) | | | 1,800,000 |
| | | | | | | | |
| | | | | | | | 42,960,000 |
| | | | | | | | |
Illinois — 0.09% | | | |
| | | 15,775,000 | | Illinois Finance Authority, Beloit Memorial Hospital, Inc. Revenue, Series A, 0.32%, 4/1/36, (LOC: JP Morgan Chase Bank)(c) | | | 15,775,000 |
| | | 1,000,000 | | Upper Illinois River Valley Development Authority Revenue, 1.25%, 1/1/11, (LOC: JP Morgan Chase Bank)(c) | | | 1,000,000 |
| | | | | | | | |
| | | | | | | | 16,775,000 |
| | | | | | | | |
Indiana — 0.23% | | | |
| | | 42,500,000 | | Indiana Finance Authority Refunding Revenue, Series D, 0.28%, 11/1/39, (LOC: Citibank NA)(c) | | | 42,500,000 |
| | | | | | | | |
Kentucky — 0.52% | | | |
| | | 1,395,000 | | Lexington-Fayette Urban County Airport Board Refunding Revenue, Series C, 0.30%, 7/1/33, (LOC: JP Morgan Chase Bank)(c) | | | 1,395,000 |
| | | 94,000,000 | | Louisville & Jefferson County Metropolitan Sewer District Revenue, Series A, 3.00%, 8/19/10 | | | 94,623,027 |
| | | | | | | | |
| | | | | | | | 96,018,027 |
| | | | | | | | |
Maryland — 0.37% | | | |
| | | 58,016,000 | | Maryland Health & Higher Educational Facilities Authority Refunding Revenue, Series D, 0.32%, 1/1/29, (LOC: Bank of America NA)(c) | | | 58,016,000 |
| | | 10,275,000 | | Montgomery County Housing Opportunites Commission Refunding Revenue, Series D, 0.32%, 7/1/39, (LOC: Fannie Mae, Freddie Mac)(c) | | | 10,275,000 |
| | | | | | | | |
| | | | | | | | 68,291,000 |
| | | | | | | | |
Massachusetts — 0.86% | | | |
| | | 16,810,000 | | Massachusetts Educational Financing Authority Refunding Revenue, Series R-11649, 0.35%, 7/1/22, (Credit Support: Assured GTY), Callable 1/1/18 @ 100(a)(c) | | | 16,810,000 |
13
SCHEDULE OF PORTFOLIO INVESTMENTS
Prime Money Market Fund (cont.)
March 31, 2010 (Unaudited)
| | | | | | | | |
Principal
Amount | | | | Value |
| | $ | 43,800,000 | | Massachusetts Health & Educational Facilities Authority Capital Asset Program Revenue, Series M-2, 0.30%, 7/1/31, (LOC: Bank of America)(c) | | $ | 43,800,000 |
| | | 27,415,000 | | Massachusetts Health & Educational Facilities Authority Capital Asset Program Revenue, Series M-4A, 0.30%, 7/1/39, (LOC: Bank of America)(c) | | | 27,415,000 |
| | | 14,505,000 | | Massachusetts Health & Educational Facilities Authority Northeastern University Revenue, Series V, 0.25%, 10/1/30, (LOC: JP Morgan Chase Bank)(c) | | | 14,505,000 |
| | | 55,900,000 | | Massachusetts Health & Educational Facilities Authority Revenue, Boston University, Series N, 0.30%, 10/1/34, (LOC: Bank of America NA)(c) | | | 55,900,000 |
| | | | | | | | |
| | | | | | | | 158,430,000 |
| | | | | | | | |
Michigan — 0.57% | | | |
| | | 34,600,000 | | Michigan Municipal Bond Authority, Student Aid Notes Revenue, Series C-1, 3.00%, 8/20/10 | | | 34,810,782 |
| | | 69,300,000 | | Michigan Strategic Fund Van Andel Research Refunding Revenue, 0.26%, 4/1/43, (LOC: Bank of America NA)(c) | | | 69,300,000 |
| | | | | | | | |
| | | | | | | | 104,110,782 |
| | | | | | | | |
Minnesota — 0.68% | | | |
| | | 69,500,000 | | City of Rochester Mayo Foundation Refunding Revenue, Series A, 0.25%, 8/15/32(c) | | | 69,500,000 |
| | | 51,500,000 | | City of Rochester Mayo Foundation Refunding Revenue, Series B, 0.25%, 8/15/32(c) | | | 51,500,000 |
| | | 3,500,000 | | St. Paul Port Authority Refunding Revenue, Series 10-CC, 0.30%, 3/1/29, (LOC: Deutsche Bank AG)(c) | | | 3,500,000 |
| | | | | | | | |
| | | | | | | | 124,500,000 |
| | | | | | | | |
Mississippi — 0.09% | | | |
| | | 15,935,000 | | Mississippi Development Bank Special Obligation Refunding Revenue, Series B, 0.30%, 10/1/31, (LOC: Bank of America NA)(c) | | | 15,935,000 |
| | | | | | | | |
Nebraska — 0.05% | | | |
| | | 10,000,000 | | Nebraska Investment Finance Authority Multi Family Housing Revenue, Series A, 0.34%, 10/1/42, (LOC: Citibank NA)(c) | | | 10,000,000 |
| | | | | | | | |
New Jersey — 0.14% | | | |
| | | 6,675,000 | | New Jersey Economic Development Authority Revenue, Series A, 0.30%, 9/1/21, (LOC: Wells Fargo Bank)(c) | | | 6,675,000 |
| | | 18,225,000 | | New Jersey Health Care Facilities Finance Authority Revenue, Series B, 0.25%, 7/1/37, (Credit Support: Assured GTY)(c) | | | 18,225,000 |
| | | | | | | | |
| | | | | | | | 24,900,000 |
| | | | | | | | |
New York — 3.16% | | | |
| | | 27,300,000 | | City of New York Public Improvement GO, Series F-6, 0.30%, 2/15/18, (LOC: Morgan Guaranty Trust)(c) | | | 27,300,000 |
14
SCHEDULE OF PORTFOLIO INVESTMENTS
Prime Money Market Fund (cont.)
March 31, 2010 (Unaudited)
| | | | | | | | |
Principal
Amount | | | | Value |
| | $ | 29,000,000 | | City of New York Public Improvement GO, Sub-Series H-2, 0.26%, 3/1/34, (LOC: Bank of New York)(c) | | $ | 29,000,000 |
| | | 45,085,000 | | City of New York Refunding GO, Sub-Series C-5, 0.26%, 8/1/20, (LOC: Bank of New York)(c) | | | 45,085,000 |
| | | 7,945,000 | | Nassau County Industrial Development Agency Nursing Home Improvement Revenue, Series D, 0.30%, 1/1/28, (LOC: Bank of America NA)(c) | | | 7,945,000 |
| | | 25,875,000 | | New York City Capital Resources Corp. Nursing Home Revenue, Series B, 0.28%, 1/1/37, (LOC: Bank of America NA)(c) | | | 25,875,000 |
| | | 23,820,000 | | New York City Capital Resources Corp. Nursing Home Revenue, Series B-1, 0.28%, 7/1/37, (LOC: Bank of America NA)(c) | | | 23,820,000 |
| | | 22,150,000 | | New York City Housing Development Corp. Multi Family Housing Revenue, East Harlem Series A, 0.33%, 6/1/13, (LOC: Fannie Mae)(c) | | | 22,150,000 |
| | | 44,700,000 | | New York City Housing Development Corp. Multi Family Housing Revenue, Royal Properties Series A, 0.25%, 4/15/35, (Credit Support: Fannie Mae)(c) | | | 44,700,000 |
| | | 22,400,000 | | New York City Housing Development Corp. Multi Family Housing Revenue, Series A, 0.26%, 11/1/48, (LOC: Bank of America NA)(c) | | | 22,400,000 |
| | | 42,340,000 | | New York City Housing Development Corp. Multi Family Housing Revenue, Series B, 0.22%, 4/15/36, (Credit Support: Fannie Mae)(c) | | | 42,340,000 |
| | | 56,990,000 | | New York State Dormitory Authority Revenue, Series A, 0.25%, 11/15/36, (Credit Support: Fannie Mae)(c) | | | 56,990,000 |
| | | 13,000,000 | | New York State Energy Research & Development Authority Refunding Revenue, Series A, 0.33%, 8/1/15, (Credit Support: AMBAC), (LOC: Wells Fargo Bank)(c) | | | 13,000,000 |
| | | 29,300,000 | | New York State Energy Research & Development Authority Refunding Revenue, Series D-2, 0.24%, 10/1/29, (LOC: JP Morgan Chase Bank)(c) | | | 29,300,000 |
| | | 23,390,000 | | New York State Housing Finance Agency 320 West 38th St. Refunding Revenue, Series A, 0.30%, 5/1/42, (LOC: Wells Fargo Bank)(c) | | | 23,390,000 |
| | | 40,500,000 | | New York State Housing Finance Agency 320 West 38th St. Refunding Revenue, Series B, 0.30%, 5/1/42, (LOC: Wells Fargo Bank)(c) | | | 40,500,000 |
| | | 15,100,000 | | New York State Housing Finance Agency Multi Family Housing Revenue, Series B, 0.25%, 11/1/36, (LOC: Bank of America NA)(c) | | | 15,100,000 |
| | | 39,000,000 | | New York State Housing Finance Agency Multi Family Housing Worth St. Revenue, Series A, 0.25%, 5/15/33, (Credit Support: Fannie Mae)(c) | | | 39,000,000 |
| | | 16,400,000 | | New York State Housing Finance Agency Revenue, West 37th St. Project, Series B, 0.26%, 5/1/42, (LOC: Wachovia Bank)(c) | | | 16,400,000 |
| | | 58,585,000 | | New York State Urban Development Corp. Public Improvement Revenue, 0.56%, 12/15/10 | | | 58,585,000 |
| | | | | | | | |
| | | | | | | | 582,880,000 |
| | | | | | | | |
15
SCHEDULE OF PORTFOLIO INVESTMENTS
Prime Money Market Fund (cont.)
March 31, 2010 (Unaudited)
| | | | | | | | |
Principal
Amount | | | | Value |
North Carolina — 0.15% | | | |
| | $ | 26,665,000 | | Roman Catholic Diocese of Raleigh Revenue, Series A, 0.35%, 6/1/18, (LOC: Bank of America NA)(c) | | $ | 26,665,000 |
| | | | | | | | |
Ohio — 0.27% | | | |
| | | 6,000,000 | | City of Cuyahoga Falls Refunding GO, 2.13%, 8/19/10 | | | 6,013,026 |
| | | 10,670,000 | | City of Grove Multi Family Housing Regency Arms Apartment Revenue, 0.35%, 6/15/30, (Credit Support: Fannie Mae)(c) | | | 10,670,000 |
| | | 21,000,000 | | County of Lucas GO, 1.75%, 7/22/10 | | | 21,015,852 |
| | | 12,500,000 | | Ohio State Higher Educational Facilities Refunding Revenue, Series B, 0.28%, 5/1/42, (LOC: U.S. Bank NA)(c) | | | 12,500,000 |
| | | | | | | | |
| | | | | | | | 50,198,878 |
| | | | | | | | |
Pennsylvania — 1.23% | | | |
| | | 51,200,000 | | Allegheny County Industrial Development Authority Children’s Hospital Revenue, Series A, 0.30%, 10/1/32, (LOC: Bank of America NA)(c) | | | 51,200,000 |
| | | 26,900,000 | | Blair County Industrial Development Authority Refunding Revenue, 0.30%, 10/1/28, (LOC: PNC Bank NA)(c) | | | 26,900,000 |
| | | 19,500,000 | | City of Philadelphia Refunding Revenue, Series C, 0.27%, 6/15/25, (LOC: TD Bank NA)(c) | | | 19,500,000 |
| | | 20,900,000 | | City of Reading Refunding GO, Series D, 0.23%, 11/1/32, (LOC: Wachovia Bank)(c) | | | 20,900,000 |
| | | 26,995,000 | | Lehigh County General Purpose Authority Refunding Revenue, Series B, 0.27%, 11/1/27, (Credit Support: Assured GTY)(c) | | | 26,995,000 |
| | | 33,400,000 | | Pennsylvania Economic Development Financial Authority Revenue, 0.33%, 11/1/28, (LOC: Bank of America NA)(c) | | | 33,400,000 |
| | | 30,000,000 | | Pennsylvania Higher Educational Facilities Authority Drexel University Revenue, Series B, 0.28%, 5/1/37, (LOC: Wells Fargo Bank)(c) | | | 30,000,000 |
| | | 12,040,000 | | Westmoreland County Industrial Development Authority Cash Flow Management Revenue, Series A, 0.29%, 7/1/27, (LOC: Wells Fargo Bank)(c) | | | 12,040,000 |
| | | 6,570,000 | | Westmoreland County Industrial Development Authority Refunding Revenue, Series B, 0.29%, 7/1/27, (LOC: Wells Fargo Bank)(c) | | | 6,570,000 |
| | | | | | | | |
| | | | | | | | 227,505,000 |
| | | | | | | | |
Rhode Island — 0.12% | | | |
| | | 21,620,000 | | Rhode Island Health & Educational Building Corp. Refunding Revenue, Series A, 0.28%, 8/15/34, (LOC: Bank of America NA)(c) | | | 21,620,000 |
| | | | | | | | |
South Carolina — 0.16% | | | |
| | | 30,180,000 | | South Carolina Transportation Infrastructure Bank Refunding Revenue, Series B-1, 0.27%, 10/1/31, (LOC: Bank of America NA)(c) | | | 30,180,000 |
| | | | | | | | |
South Dakota — 0.29% | | | |
| | | 15,700,000 | | South Dakota Housing Development Authority Revenue, Series C, 0.31%, 5/1/37(c) | | | 15,700,000 |
16
SCHEDULE OF PORTFOLIO INVESTMENTS
Prime Money Market Fund (cont.)
March 31, 2010 (Unaudited)
| | | | | | | | |
Principal
Amount | | | | Value |
| | $ | 25,000,000 | | South Dakota Housing Development Authority Revenue, Series G, 0.30%, 5/1/35(c) | | $ | 25,000,000 |
| | | 13,200,000 | | South Dakota Housing Development Authority Revenue, Series I, 0.31%, 5/1/38(c) | | | 13,200,000 |
| | | | | | | | |
| | | | | | | | 53,900,000 |
| | | | | | | | |
Tennessee — 0.06% | | | |
| | | 11,500,000 | | Metropolitan Government Nashville & Davidson County Health & Educational Facilities Board Revenue, 0.34%, 6/1/42, (LOC: Citibank NA)(c) | | | 11,500,000 |
| | | | | | | | |
Texas — 0.81% | | | |
| | | 51,000,000 | | North Central Texas Health Facility Development Corp. Revenue, Series B, 0.27%, 8/15/30, (Credit Support: AGM)(c) | | | 51,000,000 |
| | | 13,000,000 | | Port of Corpus Christi Industrial Development Corp., Citgo Petroleum Corp. Project Revenue, 0.35%, 8/1/28, (LOC: JP Morgan Chase Bank)(c) | | | 13,000,000 |
| | | 46,400,000 | | Port of Corpus Christi Industrial Development Corp., Citgo Petroleum Corp. Project Revenue, Series C, 0.35%, 10/1/36, (LOC: JP Morgan Chase Bank)(c) | | | 46,400,000 |
| | | 6,845,000 | | Texas State Veteran’s Fund Refunding GO, Series I-C, 0.25%, 12/1/25(c) | | | 6,845,000 |
| | | 12,595,000 | | Texas State Veteran’s Housing Refunding GO, 0.25%, 6/1/31, (LOC: JP Morgan Chase Bank)(c) | | | 12,595,000 |
| | | 20,000,000 | | Texas State Veteran’s Housing Revenue, Series A-2, 0.24%, 12/1/29(c) | | | 20,000,000 |
| | | | | | | | |
| | | | | | | | 149,840,000 |
| | | | | | | | |
Utah — 0.12% | | | |
| | �� | 8,780,000 | | Ogden City Redevelopment Agency Refunding Revenue, Series A, 0.23%, 6/1/31, (LOC: Wells Fargo Bank)(c) | | | 8,780,000 |
| | | 12,805,000 | | Utah Housing Corp. Single Family Mortgage Revenue, Series C-2, Class I, 0.25%, 1/1/38(c) | | | 12,805,000 |
| | | | | | | | |
| | | | | | | | 21,585,000 |
| | | | | | | | |
Virginia — 1.72% | | | |
| | | 159,404,000 | | Federal Home Loan Mortgage Corp., Multi Family Housing Revenue, Series M017, Class A, 0.29%, 9/15/49(c) | | | 159,404,000 |
| | | 51,610,000 | | Montgomery County Industrial Development Authority Refunding Revenue, Series A, 0.30%, 2/1/39(c) | | | 51,610,000 |
| | | 31,960,000 | | Montgomery County Industrial Development Authority Refunding Revenue, Series B, 0.30%, 2/1/39(c) | | | 31,960,000 |
| | | 17,705,000 | | Newport News Industrial Development Authority Industrial Improvement Revenue, Series B, 0.23%, 7/1/31, (LOC: Wachovia Bank)(c) | | | 17,705,000 |
| | | 13,750,000 | | Stafford County & Staunton Industrial Development Authority Revenue, 0.18%, 4/6/10 | | | 13,750,000 |
17
SCHEDULE OF PORTFOLIO INVESTMENTS
Prime Money Market Fund (cont.)
March 31, 2010 (Unaudited)
| | | | | | | | |
Principal Amount | | | | Value |
| | $ | 26,515,000 | | Stafford County & Staunton Industrial Development Authority Revenue, Series B1, 0.29%, 12/1/28, (LOC: Bank of America NA)(c) | | $ | 26,515,000 |
| | | 16,250,000 | | Virginia Small Business Financing Authority Hampton University Revenue, Series A, 0.27%, 12/1/38, (LOC: PNC Bank NA)(c) | | | 16,250,000 |
| | | | | | | | |
| | | | | | | | 317,194,000 |
| | | | | | | | |
Washington — 0.12% | | | |
| | | 6,700,000 | | Port Seattle Industrial Development Corp. Crowley Marine Services Project Revenue, 0.34%, 12/31/21, (LOC: Citibank NA)(c) | | | 6,700,000 |
| | | 15,000,000 | | Port Seattle Revenue, 0.30%, 5/4/10 | | | 15,000,000 |
| | | | | | | | |
| | | | | | | | 21,700,000 |
| | | | | | | | |
Wisconsin — 0.97% | | | |
| | | 51,000,000 | | Wisconsin Health & Educational Facilities Authority Refunding Revenue, 0.29%, 8/15/36, (LOC: JP Morgan Chase Bank)(c) | | | 51,000,000 |
| | | 73,840,000 | | Wisconsin Housing & Economic Development Authority Refunding Revenue, Series A, 0.28%, 9/1/38, (Credit Support: GO of Authority) | | | 73,840,000 |
| | | 22,165,000 | | Wisconsin Housing & Economic Development Authority Refunding Revenue, Series F, 0.25%, 5/1/30, (Credit Support: GO of Authority)(c) | | | 22,165,000 |
| | | 32,550,000 | | Wisconsin Housing & Economic Development Authority Refunding Revenue, Series F, 0.25%, 11/1/30, (Credit Support: GO of Authority)(c) | | | 32,550,000 |
| | | | | | | | |
| | | | | | | | 179,555,000 |
| | | | | | | | |
| |
Total Municipal Bonds (Cost $3,298,415,761) | | | 3,298,415,761 |
| | | | | | | | |
U.S. Government Agency Backed Mortgages — 1.70% | | | |
Fannie Mae — 1.70% | | | |
| | | 69,432,000 | | Pool #463831, 0.37%, 8/2/10(b) | | | 69,344,227 |
| | | 66,020,000 | | Pool #463890, 0.55%, 11/1/10(b) | | | 65,804,151 |
| | | 19,537,000 | | Pool #464165, 0.18%, 4/1/10(b) | | | 19,537,000 |
| | | 60,000,000 | | Pool #464168, 0.41%, 10/1/10(b) | | | 59,874,950 |
| | | 74,284,000 | | Pool #464195, 0.44%, 10/1/10(b) | | | 74,117,851 |
| | | 24,476,000 | | Pool #464242, 0.18%, 4/1/10(b) | | | 24,476,000 |
| | | | | | | | |
| | | | | | | | 313,154,179 |
| | | | | | | | |
| |
Total U.S. Government Agency Backed Mortgages (Cost $313,154,179) | | | 313,154,179 |
| | | | | | | | |
U.S. Government Agency Obligations — 18.25% | | | |
Fannie Mae — 3.93% | | | |
| | | 69,205,000 | | 0.14%, 7/13/10(c) | | | 69,205,000 |
| | | 180,000,000 | | 0.20%, 6/9/10(b) | | | 179,931,000 |
| | | 300,000,000 | | 0.20%, 8/5/10(c) | | | 299,987,731 |
18
SCHEDULE OF PORTFOLIO INVESTMENTS
Prime Money Market Fund (cont.)
March 31, 2010 (Unaudited)
| | | | | | | | |
Principal
Amount | | | | Value |
| | $ | 58,266,000 | | 7.13%, 6/15/10 | | $ | 59,075,170 |
| | | 116,955,000 | | 0.44%, 12/1/10(b) | | | 116,606,214 |
| | | | | | | | |
| | | | | | | | 724,805,115 |
| | | | | | | | |
Federal Farm Credit Bank — 1.08% | | | |
| | | 100,000,000 | | 0.39%, 4/27/10(c) | | | 99,999,281 |
| | | 100,000,000 | | 0.39%, 6/2/10(c) | | | 100,000,000 |
| | | | | | | | |
| | | | | | | | 199,999,281 |
| | | | | | | | |
Federal Home Loan Bank — 9.62% | | | |
| | | 132,000,000 | | 0.00%, 4/13/10(c) | | | 131,992,961 |
| | | 200,000,000 | | 0.12%, 4/5/10(b) | | | 199,997,333 |
| | | 450,000,000 | | 0.15%, 11/18/10(c) | | | 449,985,475 |
| | | 182,000,000 | | 0.30%, 5/28/10(c) | | | 182,000,000 |
| | | 50,000,000 | | 0.56%, 6/18/10 | | | 50,019,903 |
| | | 170,075,000 | | 0.75%, 3/18/11 | | | 170,425,355 |
| | | 10,555,000 | | 1.12%, 6/30/10 | | | 10,574,443 |
| | | 21,280,000 | | 2.75%, 6/18/10 | | | 21,388,114 |
| | | 198,685,000 | | 3.00%, 6/11/10 | | | 199,695,267 |
| | | 77,990,000 | | 4.25%, 6/11/10 | | | 78,578,584 |
| | | 22,380,000 | | 5.25%, 6/11/10 | | | 22,592,332 |
| | | 200,000,000 | | 0.15%, 4/16/10(b) | | | 199,987,916 |
| | | 58,000,000 | | 0.33%, 12/10/10 | | | 57,953,767 |
| | | | | | | | |
| | | | | | | | 1,775,191,450 |
| | | | | | | | |
Freddie Mac — 3.62% | | | |
| | | 200,000,000 | | 0.23%, 8/24/10(c) | | | 200,000,000 |
| | | 70,035,000 | | 0.30%, 11/16/10(b) | | | 69,901,350 |
| | | 300,000,000 | | 1.45%, 9/10/10 | | | 301,292,306 |
| | | 96,500,000 | | 0.25%, 9/15/10(b) | | | 96,387,192 |
| | | | | | | | |
| | | | | | | | 667,580,848 |
| | | | | | | | |
| |
Total U.S. Government Agency Obligations (Cost $3,367,576,694) | | | 3,367,576,694 |
| | | | | | | | |
| |
U.S. Treasury Obligations — 0.63% | | | |
U.S. Treasury Notes — 0.63% | | | |
| | | 112,500,000 | | 4.25%, 1/15/11 | | | 115,772,368 |
| | | | | | | | |
| |
Total U.S. Treasury Obligations (Cost $115,772,368) | | | 115,772,368 |
| | | | | | | | |
| |
Repurchase Agreements — 15.24% | | | |
| | | 240,000,000 | | Bank of America Securities LLC dated 3/31/10; due 4/1/10 at 0.02% with maturity value of $240,100,133 (fully collateralized by Fannie Mae and Freddie Mac securities with maturity dates ranging from 7/1/24 to 3/1/40 at rates ranging from 4.50% to 6.00%). | | | 240,000,000 |
19
SCHEDULE OF PORTFOLIO INVESTMENTS
Prime Money Market Fund (cont.)
March 31, 2010 (Unaudited)
| | | | | | | | |
Principal Amount | | | | Value |
| | $ | 300,000,000 | | Barclays Capital Inc. dated 1/12/10; due 4/13/10 at 0.13% with maturity value of $300,098,583 (fully collateralized by Freddie Mac and Fannie Mae securities with maturity dates ranging from 4/1/18 to 2/1/40 at rates ranging from 4.50% to 6.50%).(d) | | $ | 300,000,000 |
| | | 82,000,000 | | Barclays Capital Inc. dated 3/31/10; due 4/1/10 at 0.01% with maturity value of $82,000,023 (fully collateralized by US Treasury Inflation Notes with maturity dates ranging from 5/15/10 to 12/15/12 at rates ranging from 1.13% to 3.88%). | | | 82,000,000 |
| | | 519,000,000 | | BNP Paribas Securities Corp. dated 3/31/10; due 4/1/10 at 0.01% with maturity value of $519,000,072 (fully collateralized by Fannie Mae and Freddie Mac securities with maturity dates ranging from 7/1/22 to 4/1/40 at rates ranging from 4.00% to 7.00%). | | | 519,000,000 |
| | | 400,000,000 | | Citigroup Global dated 3/31/10; due 4/1/10 at 0.02% with maturity value of $400,000,222 (fully collateralized by Freddie Mac and Fannie Mae securities with maturity dates ranging from 10/1/13 to 10/1/48 at rates ranging from 4.00% to 7.00%) | | | 400,000,000 |
| | | 150,000,000 | | Deutsche Bank AG dated 3/31/10; due 4/1/10 at 0.03% with maturity value of $150,000,125 (fully collateralized by Freddie Mac securities with maturity dates ranging from 1/1/17 to 1/1/40 at rates ranging from 4.50% to 7.00%). | | | 150,000,000 |
| | | 370,000,000 | | Deutsche Bank AG dated 3/31/10; due 4/1/10 at 0.03% with maturity value of $370,000,308 (fully collateralized by Freddie Mac securities with maturity dates ranging from 11/1/17 to 12/1/39 at rates ranging from 3.50% to 7.00%). | | | 370,000,000 |
| | | 300,000,000 | | Goldman Sachs & Co. dated 1/22/10; due 4/15/10 at 0.15% with maturity value of $300,103,750 (fully collateralized by Ginnie Mae securities with maturity dates ranging from 12/15/33 to 12/15/39 at rates ranging from 4.50% to 6.50%).(d) | | | 300,000,000 |
| | | 450,000,000 | | Morgan Stanley & Co. dated 3/31/10; due 4/1/10 at 0.02% with maturity value of $450,000,250 (fully collateralized by Freddie Mac and Fannie Mae securities with maturity dates ranging from 1/1/21 to 2/1/40 at rates ranging from 2.68% to 6.50%). | | | 450,000,000 |
| | | | | | | | |
| |
Total Repurchase Agreements (Cost $2,811,000,000) | | | 2,811,000,000 |
| | | | | | | | |
| | |
Shares | | | | |
Investment Company — 1.08% | | | |
| | | 200,000,000 | | JPMorgan Prime Money Market Fund | | | 200,000,000 |
| | | | | | | | |
| |
Total Investment Company (Cost $200,000,000) | | | 200,000,000 |
| | | | | | | | |
20
SCHEDULE OF PORTFOLIO INVESTMENTS
Prime Money Market Fund (cont.)
March 31, 2010 (Unaudited)
| | | |
| | | Value |
Total Investments (Cost $18,287,567,097)(e) — 99.12% | | $ | 18,287,567,097 |
| |
Other assets in excess of liabilities — 0.88% | | | 162,652,557 |
| | | |
| |
NET ASSETS — 100.00% | | $ | 18,450,219,654 |
| | | |
| (a) | Security exempt from registration under Rule 144A of the Securities Act of 1933, as amended. These securities may be resold in transactions exempt from registration, normally to qualified institutional buyers. Security has been deemed to be liquid based on procedures approved by the Board of Trustees. |
| (b) | Represents effective yield to maturity on date of purchase. |
| (c) | Variable rate security. The rate reflected in the Schedule of Portfolio Investments is the rate in effect on March 31, 2010. The maturity date represents the actual maturity date. The security’s effective maturity resets periodically. |
| (d) | This security is restricted and illiquid as the securities may not be offered or sold within the United States or to U.S. persons except to qualified purchasers who are also either qualified institutional buyers or “accredited investors” (as defined in Rule 501 (a) of Regulation D under the Securities Act of 1933). The total investment in restricted and illiquid securities representing $600,000,000 or 3.25% of net assets was as follows: |
| | | | | | | | | | | |
Acquisition
Principal
Amount | | Issuer | | Acquisition Date | | Acquisition
Cost | | 3/31/2010
Carrying
Value
Per Unit |
| $ | 300,000,000 | | Barclays Capital Inc. | | 1/12/2010 | | $ | 300,000,000 | | $ | 100.00 |
| $ | 300,000,000 | | Goldman Sachs & Co. | | 1/22/2010 | | $ | 300,000,000 | | $ | 100.00 |
| (e) | Tax cost of securities is equal to book cost of securities. |
Abbreviations used are defined below:
AGM – Assured Guaranty Municipal
COP – Certificate of Participation
FGIC – Insured by Financial Guaranty Insurance Corp.
GO – General Obligation
GTY – Guaranty
LOC – Letter of Credit
STEP – Step Coupon Bond
See notes to financial statements.
21
SCHEDULE OF PORTFOLIO INVESTMENTS
U.S. Government Money Market Fund
March 31, 2010 (Unaudited)
| | | | | | | | |
Principal
Amount | | | | Value |
| FDIC-TLGP Backed Corporate Bonds — 7.42% | | | |
| Banks - Domestic — 1.85% | | | |
| | $ | 52,425,000 | | Bank of America NA, 0.29%, 9/13/10(a) | | $ | 52,443,261 |
| | | 21,941,000 | | Bank of America NA, 1.70%, 12/23/10 | | | 22,125,735 |
| | | 36,430,000 | | Citibank NA, 0.44%, 3/30/11(a) | | | 36,503,455 |
| | | | | | | | |
| | | | | | | | 111,072,451 |
| | | | | | | | |
| Finance - Diversified Domestic — 5.57% | | | |
| | | 54,565,000 | | Citigroup Funding, Inc., 0.35%, 7/30/10(a) | | | 54,599,157 |
| | | 34,100,000 | | General Electric Capital Corp., 0.34%, 3/11/11(a) | | | 34,142,403 |
| | | 15,675,000 | | General Electric Capital Corp., 0.30%, 7/8/10(a) | | | 15,679,564 |
| | | 26,000,000 | | General Electric Capital Corp., 1.63%, 1/7/11 | | | 26,237,106 |
| | | 43,500,000 | | General Electric Capital Corp., 1.80%, 3/11/11 | | | 44,057,818 |
| | | 34,724,000 | | Goldman Sachs Group, Inc., 0.75%, 12/3/10(a) | | | 34,853,639 |
| | | 51,435,000 | | JPMorgan Chase & Co., 0.42%, 4/1/11(a) | | | 51,529,597 |
| | | 34,350,000 | | JPMorgan Chase & Co., 0.75%, 12/2/10(a) | | | 34,477,893 |
| | | 10,175,000 | | JPMorgan Chase & Co., 2.63%, 12/1/10 | | | 10,326,461 |
| | | 14,410,000 | | Morgan Stanley, 0.83%, 3/4/11(a) | | | 14,494,422 |
| | | 14,826,000 | | Morgan Stanley, 2.90%, 12/1/10 | | | 15,064,446 |
| | | | | | | | |
| | | | | | | | 335,462,506 |
| | | | | | | | |
| |
Total FDIC-TLGP Backed Corporate Bonds (Cost $446,534,957) | | | 446,534,957 |
| | | | | | | | |
| FHLB Backed Corporate Bonds — 0.31% | | | |
| Finance - Diversified Domestic — 0.31% | | | |
| | | 14,655,000 | | GFRE Holdings LLC, 0.29%, 12/1/49(b) | | | 14,655,000 |
| | | 4,160,000 | | Herman & Kittle Capital LLC, 0.29%, 2/1/37(b) | | | 4,160,000 |
| | | | | | | | |
| | | | | | | | 18,815,000 |
| | | | | | | | |
Total FHLB Backed Corporate Bonds (Cost $18,815,000) | | | 18,815,000 |
| | | | | | | | |
| U.S. Government Agency Backed Municipal Bonds — 22.59% | | | |
| California — 4.78% | | | |
| | | 46,590,000 | | California Housing Finance Agency Revenue, Series A, 0.27%, 8/1/35, (LOC: Fannie Mae)(b) | | | 46,590,000 |
| | | 10,500,000 | | California Housing Finance Agency Revenue, Series A, 0.29%, 8/1/36, (Credit Support: GO of Agency), (LOC: Fannie Mae)(b) | | | 10,500,000 |
| | | 10,000,000 | | California Housing Finance Agency Revenue, Series B, 0.23%, 8/1/36, (LOC: Fannie Mae)(b) | | | 10,000,000 |
| | | 81,445,000 | | California Housing Finance Agency Revenue, Series C, 0.27%, 8/1/37, (LOC: Fannie Mae)(b) | | | 81,445,000 |
| | | 36,520,000 | | California Housing Finance Agency Revenue, Series D, 0.27%, 8/1/22, (LOC: Fannie Mae)(b) | | | 36,520,000 |
| | | 4,764,000 | | City of Los Angeles Multifamily Housing-Fountain Park Project Revenue, Series A, 0.30%, 3/15/34, (Credit Support: Fannie Mae)(b) | | | 4,764,000 |
22
SCHEDULE OF PORTFOLIO INVESTMENTS
U.S. Government Money Market Fund (cont.)
March 31, 2010 (Unaudited)
| | | | | | | | |
Principal
Amount | | | | Value |
| | $ | 27,700,000 | | Orange County Apartment Development, Riverbend Apartments Refunding Revenue, Series B, 0.27%, 12/1/29, (Credit Support: Freddie Mac)(b) | | $ | 27,700,000 |
| | | 17,140,000 | | Santa Rosa Housing Authority, Apple Creek Apartments Revenue, Series E, 0.26%, 3/1/12, (Credit Support: Freddie Mac)(b) | | | 17,140,000 |
| | | 10,400,000 | | Simi Valley Lincoln Wood Ranch Refunding Revenue, 0.27%, 6/1/10, (Credit Support: Freddie Mac)(b) | | | 10,400,000 |
| | | 20,000,000 | | Southern California Home Financing Authority Revenue, Series A, 0.29%, 8/1/33, (LOC: Freddie Mac)(b) | | | 20,000,000 |
| | | 22,715,000 | | Southern California Home Financing Authority Revenue, Series B, 0.29%, 2/1/35, (LOC: Fannie Mae)(b) | | | 22,715,000 |
| | | | | | | | |
| | | | | | | | 287,774,000 |
| | | | | | | | |
Colorado — 2.85% | | | |
| | | 7,000,000 | | Colorado Housing & Finance Authority Insured Mortgage Revenue, Series AA, 0.29%, 10/1/30, (LOC: Fannie Mae)(b) | | | 7,000,000 |
| | | 38,000,000 | | Colorado Housing & Finance Authority Refunding Revenue, Class I, Series B1, 0.22%, 5/1/38, (LOC: Fannie Mae)(b) | | | 38,000,000 |
| | | 23,470,000 | | Colorado Housing & Finance Authority Refunding Revenue, Class I, Series C1, 0.22%, 11/1/32, (LOC: Fannie Mae)(b) | | | 23,470,000 |
| | | 6,425,000 | | Colorado Housing & Finance Authority Revenue, Class I Series SF-1, 0.25%, 11/1/36, (LOC: Fannie Mae)(b) | | | 6,425,000 |
| | | 27,900,000 | | Colorado Housing & Finance Authority Revenue, Class I, Series A2, 0.25%, 5/1/38, (LOC: Fannie Mae)(b) | | | 27,900,000 |
| | | 6,500,000 | | Colorado Housing & Finance Authority Revenue, Class I, Series A3, 0.28%, 5/1/38, (LOC: Fannie Mae)(b) | | | 6,500,000 |
| | | 22,000,000 | | Colorado Housing & Finance Authority Taxable Revenue, Class 1, Series A1, 0.25%, 11/1/37, (LOC: Fannie Mae)(b) | | | 22,000,000 |
| | | 14,000,000 | | Colorado Housing & Finance Authority Taxable Revenue, Class 1, Series B1, 0.25%, 11/1/36, (LOC: Fannie Mae)(b) | | | 14,000,000 |
| | | 14,000,000 | | Colorado Housing & Finance Authority Taxable Revenue, Class 1, Series C1, 0.25%, 11/1/36, (LOC: Fannie Mae)(b) | | | 14,000,000 |
| | | 12,000,000 | | Colorado Housing & Finance Authority Taxable Revenue, Series B-1, 0.25%, 11/1/33, (LOC: Fannie Mae)(b) | | | 12,000,000 |
| | | | | | | | |
| | | | | | | | 171,295,000 |
| | | | | | | | |
Florida — 1.50% | | | |
| | | 22,840,000 | | Highlands County Health Facilities Authority Refunding Revenue, Series B, 0.28%, 11/15/26, (LOC: Federal Home Loan Bank)(b) | | | 22,840,000 |
| | | 26,500,000 | | Highlands County Health Facilities Authority Refunding Revenue, Series C, 0.28%, 11/15/26, (LOC: Federal Home Loan Bank)(b) | | | 26,500,000 |
| | | 27,500,000 | | Highlands County Health Facilities Authority Refunding Revenue, Series D, 0.28%, 11/15/26, (LOC: Federal Home Loan Bank)(b) | | | 27,500,000 |
23
SCHEDULE OF PORTFOLIO INVESTMENTS
U.S. Government Money Market Fund (cont.)
March 31, 2010 (Unaudited)
| | | | | | | | |
Principal
Amount | | | | Value |
| | $ | 13,400,000 | | West Orange Healthcare District Refunding Revenue, 0.29%, 2/1/22, (LOC: Federal Home Loan Bank)(b) | | $ | 13,400,000 |
| | | | | | | | |
| | | | | | | | 90,240,000 |
| | | | | | | | |
Idaho — 0.50% | | | |
| | | 30,000,000 | | Idaho Housing & Finance Association Revenue, Class I, Series J1, 0.34%, 1/1/39, (LOC: Fannie Mae)(b) | | | 30,000,000 |
| | | | | | | | |
Indiana — 0.49% | | | |
| | | 29,700,000 | | City of Indianapolis Lakeside Pointe & Fox Club Refunding Revenue, 0.29%, 11/15/37, (Credit Support: Fannie Mae)(b) | | | 29,700,000 |
| | | | | | | | |
Louisiana — 0.21% | | | |
| | | 12,600,000 | | Louisiana Public Facilities Authority Refunding Revenue, 0.32%, 4/1/36, (Credit Support: Freddie Mac)(b) | | | 12,600,000 |
| | | | | | | | |
Michigan — 0.66% | | | |
| | | 10,250,000 | | Lansing Economic Developement Corp. Revenue, 0.29%, 3/1/42, (LOC: Federal Home Loan Bank)(b) | | | 10,250,000 |
| | | 20,000,000 | | Michigan State Housing Development Authority Refunding Revenue, Series B, 0.34%, 6/1/38, (LOC: Fannie Mae)(b) | | | 20,000,000 |
| | | 9,500,000 | | Michigan State Housing Development Authority Refunding Revenue, Series C, 0.25%, 6/1/39, (LOC: Fannie Mae)(b) | | | 9,500,000 |
| | | | | | | | |
| | | | | | | | 39,750,000 |
| | | | | | | | |
Mississippi — 0.20% | | | |
| | | 12,000,000 | | Mississippi Business Finance Corp. Gulf Opportunity Zone Resources LLC Refunding Revenue, 0.29%, 5/1/32, (LOC: Federal Home Loan Bank)(b) | | | 12,000,000 |
| | | | | | | | |
New York — 9.28% | | | |
| | | 38,600,000 | | New York City Housing Development Corp. 2 Gold Street Revenue, Series A, 0.25%, 4/15/36, (Credit Support: Fannie Mae)(b) | | | 38,600,000 |
| | | 23,100,000 | | New York City Housing Development Corp. 201 Pearl Street Development Revenue, Series A, 0.27%, 10/15/41, (Credit Support: Fannie Mae)(b) | | | 23,100,000 |
| | | 14,205,000 | | New York City Housing Development Corp. First Avenue Development Revenue, Series A, 0.30%, 10/15/35, (Credit Support: Fannie Mae)(b) | | | 14,205,000 |
| | | 21,900,000 | | New York City Housing Development Corp. Multi Family Housing Revenue, Royal Properties Series A, 0.25%, 4/15/35, (Credit Support: Fannie Mae)(b) | | | 21,900,000 |
| | | 36,770,000 | | New York City Housing Development Corp. Multifamily Rental Housing Revenue, Series A, 0.28%, 11/15/19, (Credit Support: Fannie Mae)(b) | | | 36,770,000 |
| | | 39,000,000 | | New York City Housing Development Corp. W. 61 St. Apartments Revenue, Series A, 0.25%, 12/15/37, (Credit Support: Fannie Mae)(b) | | | 39,000,000 |
| | | 16,000,000 | | New York Liberty Development Corp. World Trade Center Project Revenue, Series A, 0.50%, 12/1/49(b) | | | 16,000,000 |
| | | 62,500,000 | | New York State Dormitory Authority Revenue, Series A, 0.25%, 11/15/36, (Credit Support: Fannie Mae)(b) | | | 62,500,000 |
24
SCHEDULE OF PORTFOLIO INVESTMENTS
U.S. Government Money Market Fund (cont.)
March 31, 2010 (Unaudited)
| | | | | | | | |
Principal
Amount | | | | Value |
| | $ | 27,000,000 | | New York State Housing Finance Agency 316 11th Ave. Revenue, Series A, 0.27%, 5/15/41, (Credit Support: Fannie Mae)(b) | | $ | 27,000,000 |
| | | 8,000,000 | | New York State Housing Finance Agency 38 St. Revenue, Series B, 0.23%, 5/15/33, (Credit Support: Fannie Mae)(b) | | | 8,000,000 |
| | | 41,750,000 | | New York State Housing Finance Agency North End Revenue, Series A, 0.25%, 11/15/36, (Credit Support: Fannie Mae)(b) | | | 41,750,000 |
| | | 17,400,000 | | New York State Housing Finance Agency Revenue, Series A, 0.25%, 11/15/29, (Credit Support: Fannie Mae)(b) | | | 17,400,000 |
| | | 60,100,000 | | New York State Housing Finance Agency Revenue, Series A, 0.26%, 5/15/35, (Credit Support: Fannie Mae)(b) | | | 60,100,000 |
| | | 43,785,000 | | New York State Housing Finance Agency Revenue, Series A, 0.28%, 5/1/35, (Credit Support: Freddie Mac)(b) | | | 43,785,000 |
| | | 8,000,000 | | New York State Housing Finance Agency W. 23 St. Revenue, Series B, 0.23%, 5/15/33, (Credit Support: Fannie Mae)(b) | | | 8,000,000 |
| | | 50,000,000 | | New York State Housing Finance Agency, 125 West 31st. Revenue, Series A, 0.25%, 5/15/38, (Credit Support: Fannie Mae)(b) | | | 50,000,000 |
| | | 10,400,000 | | New York State Housing Finance Agency, 360 W. 43rd. St. Revenue, Series A, 0.25%, 11/15/33, (Credit Support: Fannie Mae)(b) | | | 10,400,000 |
| | | 40,000,000 | | New York State Housing Finance Agency, Clinton Green South Revenue, Series A, 0.25%, 11/1/38, (Credit Support: Freddie Mac)(b) | | | 40,000,000 |
| | | | | | | | |
| | | | | | | | 558,510,000 |
| | | | | | | | |
Pennsylvania — 1.02% | | | |
| | | 16,660,000 | | Pennsylvania Housing Finance Agency Single Family Mortgage Refunding Revenue, Series 84D, 0.33%, 10/1/34, (Credit Support: GO of Agency), (LOC: Freddie Mac)(b) | | | 16,660,000 |
| | | 10,000,000 | | Pennsylvania Housing Finance Agency Single Family Mortgage Revenue, Series 83B, 0.26%, 4/1/35, (LOC: Freddie Mac)(b) | | | 10,000,000 |
| | | 13,370,000 | | Pennsylvania Housing Finance Agency Single Family Mortgage Revenue, Series 85B, 0.26%, 4/1/35, (Credit Support: GO of Agency)(b) | | | 13,370,000 |
| | | 10,000,000 | | Pennsylvania Housing Finance Agency Single Family Mortgage Revenue, Series 87B, 0.25%, 4/1/35, (LOC: Fannie Mae)(b) | | | 10,000,000 |
| | | 11,500,000 | | Pennsylvania Housing Finance Agency Single Family Refunding Revenue, Series 91B, 0.33%, 10/1/36, (Credit Support: GO of Agency), (LOC: Freddie Mac)(b) | | | 11,500,000 |
| | | | | | | | |
| | | | | | | | 61,530,000 |
| | | | | | | | |
Virginia — 0.29% | | | |
| | | 17,500,000 | | Lynchburg Industrial Development Authority, Hospital Central Health Refunding Revenue , Series A, 0.29%, 1/1/28, (Credit Support: NATL-RE), (LOC: Federal Home Loan Bank)(b) | | | 17,500,000 |
| | | | | | | | |
Wyoming — 0.81% | | | |
| | | 12,000,000 | | Wyoming Community Development Authority Housing Revenue, Series 11, 0.36%, 12/1/38, (Credit Support: Fannie Mae, Freddie Mac)(b) | | | 12,000,000 |
25
SCHEDULE OF PORTFOLIO INVESTMENTS
U.S. Government Money Market Fund (cont.)
March 31, 2010 (Unaudited)
| | | | | | | | |
Principal Amount | | | | Value |
| | $ | 10,000,000 | | Wyoming Community Development Authority Housing Revenue, Series 7, 0.36%, 6/1/37, (Credit Support: Fannie Mae, Freddie Mac)(b) | | $ | 10,000,000 |
| | | 10,000,000 | | Wyoming Community Development Authority Housing Revenue, Series 9, 0.36%, 6/1/37, (Credit Support: Fannie Mae, Freddie Mac)(b) | | | 10,000,000 |
| | | 17,000,000 | | Wyoming Community Development Authority Revenue, Series A, 0.30%, 12/1/32, (Credit Support: Fannie Mae, Freddie Mac)(b) | | | 17,000,000 |
| | | | | | | | |
| | | | | | | | 49,000,000 |
| | | | | | | | |
| |
Total U.S. Government Agency Backed Municipal Bonds (Cost $1,359,899,000) | | | 1,359,899,000 |
| | | | | | | | |
U.S. Government Agency Backed Mortgages — 5.07% | | | |
Fannie Mae — 4.96% | | | |
| | | 2,126,216 | | Pool #254808, 4.00%, 6/1/10 | | | 2,132,164 |
| | | 66,020,000 | | Pool #463889, 0.38%, 8/2/10(c) | | | 65,934,284 |
| | | 53,572,400 | | Pool #464168, 0.41%, 10/1/10(c) | | | 53,460,746 |
| | | 27,942,000 | | Pool #464241, 0.17%, 4/1/10(c) | | | 27,942,000 |
| | | 68,177,000 | | Pool #464318, 0.17%, 4/1/10(c) | | | 68,177,000 |
| | | 81,000,000 | | Pool #464754, 0.27%, 9/1/10(c) | | | 80,908,774 |
| | | | | | | | |
| | | | | | | | 298,554,968 |
| | | | | | | | |
Freddie Mac — 0.11% | | | |
| | | 6,662,055 | | Pool #M80835, 3.50%, 7/1/10 | | | 6,689,317 |
| | | | | | | | |
| |
Total U.S. Government Agency Backed Mortgages (Cost $305,244,285) | | | 305,244,285 |
| | | | | | | | |
U.S. Government Agency Obligations — 38.34% | | | |
Fannie Mae — 7.07% | | | |
| | | 100,000,000 | | 0.14%, 7/13/10(b) | | | 100,000,000 |
| | | 48,203,000 | | 0.14%, 4/1/10(c) | | | 48,203,000 |
| | | 62,500,000 | | 0.20%, 6/9/10(c) | | | 62,476,042 |
| | | 38,985,000 | | 0.44%, 12/1/10(c) | | | 38,868,738 |
| | | 74,636,000 | | 0.45%, 12/1/10(c) | | | 74,410,890 |
| | | 57,977,000 | | 2.50%, 4/9/10 | | | 57,994,304 |
| | | 43,550,000 | | 4.13%, 5/15/10 | | | 43,738,979 |
| | | | | | | | |
| | | | | | | | 425,691,953 |
| | | | | | | | |
Federal Farm Credit Bank — 1.25% | | | |
| | | 75,000,000 | | 0.07%, 5/28/10(b) | | | 75,000,000 |
| | | | | | | | |
Federal Home Loan Bank — 24.29% | | | |
| | | 56,750,000 | | 0.00%, 4/5/10(b) | | | 56,749,123 |
| | | 72,000,000 | | 0.00%, 4/9/10(b) | | | 72,000,389 |
| | | 128,000,000 | | 0.00%, 4/13/10(b) | | | 127,993,174 |
| | | 61,350,000 | | 0.00%, 4/16/10(b) | | | 61,346,389 |
| | | 83,500,000 | | 0.12%, 4/5/10(c) | | | 83,498,887 |
26
SCHEDULE OF PORTFOLIO INVESTMENTS
U.S. Government Money Market Fund (cont.)
March 31, 2010 (Unaudited)
| | | | | | | | |
| | | Principal Amount | | | | Value |
| | $ | 67,300,000 | | 0.12%, 4/7/10(c) | | $ | 67,298,710 |
| | | 157,000,000 | | 0.13%, 4/14/10(c) | | | 156,992,913 |
| | | 50,000,000 | | 0.13%, 4/16/10(c) | | | 49,997,292 |
| | | 47,270,000 | | 0.16%, 1/14/11(b) | | | 47,270,000 |
| | | 100,000,000 | | 0.30%, 5/28/10(b) | | | 100,000,000 |
| | | 100,000,000 | | 0.33%, 6/2/10(b) | | | 100,000,000 |
| | | 18,600,000 | | 0.33%, 12/10/10 | | | 18,585,173 |
| | | 25,000,000 | | 0.36%, 6/1/10(b) | | | 25,000,000 |
| | | 30,000,000 | | 0.40%, 5/12/10(b) | | | 30,000,000 |
| | | 167,260,000 | | 0.44%, 10/7/10 | | | 167,275,627 |
| | | 50,000,000 | | 0.48%, 10/25/10 | | | 50,056,186 |
| | | 100,000,000 | | 0.50%, 10/25/10 | | | 100,030,968 |
| | | 49,000,000 | | 0.52%, 6/1/10 | | | 48,995,742 |
| | | 25,000,000 | | 0.80%, 4/30/10 | | | 25,001,808 |
| | | 23,050,000 | | 3.00%, 6/11/10 | | | 23,159,789 |
| | | 50,000,000 | | 3.50%, 7/16/10 | | | 50,413,981 |
| | | | | | | | |
| | | | | | | | 1,461,666,151 |
| | | | | | | | |
Freddie Mac — 5.54% | | | |
| | | 50,000,000 | | 0.05%, 11/10/10(b) | | | 49,967,126 |
| | | 100,000,000 | | 0.25%, 9/24/10(b) | | | 99,990,382 |
| | | 55,000,000 | | 0.30%, 11/16/10(c) | | | 54,895,042 |
| | | 9,000,000 | | 0.30%, 4/7/11 | | | 9,009,299 |
| | | 10,100,000 | | 0.31%, 11/18/10(c) | | | 10,079,909 |
| | | 4,900,000 | | 0.35%, 4/1/11(b) | | | 4,904,722 |
| | | 18,750,000 | | 1.45%, 9/10/10 | | | 18,845,659 |
| | | 17,650,000 | | 2.88%, 6/28/10 | | | 17,760,749 |
| | | 37,700,000 | | 4.75%, 12/8/10 | | | 38,846,773 |
| | | 28,502,000 | | 6.88%, 9/15/10 | | | 29,356,156 |
| | | | | | | | |
| | | | | | | | 333,655,817 |
| | | | | | | | |
Overseas Private Investment Corp. — 0.19% | | | |
| | | 1,400,000 | | 0.16%, 3/15/15(b) | | | 1,400,000 |
| | | 9,904,414 | | 0.16%, 11/15/13(b) | | | 9,904,414 |
| | | | | | | | |
| | | | | | | | 11,304,414 |
| | | | | | | | |
| |
Total U.S. Government Agency Obligations (Cost $2,307,318,335) | | | 2,307,318,335 |
| | | | | | | | |
U.S. Treasury Obligations — 1.49% | | | |
U.S. Treasury Notes — 1.49% | | | |
| | | 37,500,000 | | 4.25%, 1/15/11 | | | 38,590,789 |
| | | 50,000,000 | | 4.50%, 11/15/10 | | | 51,267,655 |
| | | | | | | | |
| |
Total U.S. Treasury Obligations (Cost $89,858,444) | | | 89,858,444 |
| | | | | | | | |
27
SCHEDULE OF PORTFOLIO INVESTMENTS
U.S. Government Money Market Fund (cont.)
March 31, 2010 (Unaudited)
| | | | | | | | |
Principal Amount | | | | Value |
Repurchase Agreements — 19.86% | | | |
| | $ | 400,000,000 | | BNP Paribas Securities Corp. dated 3/31/10; due 4/1/10 at 0.01% with maturity value of $400,000,056 (fully collateralized by Fannie Mae and Freddie Mac securities with maturity dates ranging from 2/1/13 to 3/1/40 at rates ranging from 4.00% to 6.50%). | | $ | 400,000,000 |
| | | 200,000,000 | | Citigroup Global, dated 3/31/10; due 4/1/10 at 0.02% with maturity value of $200,000,111 (fully collateralized by Freddie Mac and Fannie Mae securities with maturity dates ranging from 7/1/11 to 12/1/39 at rates ranging from 3.50% to 7.00%) | | | 200,000,000 |
| | | 100,000,000 | | Deutsche Bank AG dated 3/31/10; due 4/1/10 at 0.03% with maturity value of $100,000,083 (fully collateralized by Freddie Mac securities with maturity dates ranging from 3/1/22 to 1/1/40 at rates ranging from 4.50% to 8.00%). | | | 100,000,000 |
| | | 195,000,000 | | Deutsche Bank AG dated 3/31/10; due 4/1/10 at 0.03% with maturity value of $195,000,163 (fully collateralized by Freddie Mac securities with maturity dates ranging from 8/1/16 to 12/1/39 at rates ranging from 4.00% to 7.00%). | | | 195,000,000 |
| | | 300,000,000 | | Morgan Stanley & Co, dated 3/31/10; due 4/1/10 at 0.02% with maturity value of $300,000,167 (fully collateralized by Freddie Mac and Fannie Mae securities with maturity dates ranging from 1/1/15 to 3/1/40 at rates ranging from 4.00% to 6.50%). | | | 300,000,000 |
| | | | | | | | |
| |
Total Repurchase Agreements (Cost $1,195,000,000) | | | 1,195,000,000 |
| | | | | | | | |
| | |
| Shares | | | | |
Investment Company — 0.33% | | | |
| | | 20,000,000 | | First American Government Obligations Fund | | | 20,000,000 |
| | | | | | | | |
| |
Total Investment Company (Cost $20,000,000) | | | 20,000,000 |
| | | | | | | | |
| |
Total Investments (Cost $5,742,670,021)(d) — 95.41% | | $ | 5,742,670,021 |
| |
Other assets in excess of liabilities — 4.59% | | | 276,323,253 |
| | | | | | | | |
NET ASSETS — 100.00% | | $ | 6,018,993,274 |
| | | | | | | | |
| (a) | Variable rate security. The rate reflected in the Schedule of Portfolio Investments is the rate in effect on March 30, 2010. |
| (b) | Variable rate security. The rate reflected in the Schedule of Portfolio Investments is the rate in effect on March 31, 2010. The maturity date represents the actual maturity date. The security’s effective maturity resets periodically. |
| (c) | Represents effective yield to maturity on date of purchase. |
| (d) | Tax cost of securities is equal to book cost of securities. |
28
SCHEDULE OF PORTFOLIO INVESTMENTS
U.S. Government Money Market Fund (cont.)
March 31, 2010 (Unaudited)
Abbreviations used are defined below:
FDIC – Federal Deposit Insurance Corp.
GO – General Obligation
LOC – Letter of Credit
NATL – RE -Insured by National Public Finance Guarantee Corp.
TLGP – Temporary Liquidity Guaranty Program
See notes to financial statements.
29
SCHEDULE OF PORTFOLIO INVESTMENTS
Tax-Free Money Market Fund
March 31, 2010 (Unaudited)
| | | | | | | | |
Principal Amount | | | | Value |
Municipal Bonds — 94.96% | | | |
Alabama — 0.73% | | | |
| | $ | 10,890,000 | | Birmingham Waterworks Board Revenue, Series R-10412, 0.30%, 7/1/14, (Credit Support: BHAC-CR, AGM)(a)(b) | | $ | 10,890,000 |
| | | | | | | | |
Arizona — 1.47% | | | |
| | | 3,260,000 | | Maricopa County Industrial Development Authority Gran Victoria Housing Revenue, Series A, 0.30%, 4/15/30, (Credit Support: Fannie Mae)(b) | | | 3,260,000 |
| | | 5,300,000 | | Maricopa County Industrial Development Authority Valley of the Sun YMCA Revenue, 0.32%, 12/1/37, (LOC: U.S. Bank NA)(b) | | | 5,300,000 |
| | | 5,900,000 | | Pima County Industrial Development Authority Delaware Military Academy Revenue, 0.29%, 9/1/38, (LOC: PNC Bank NA)(b) | | | 5,900,000 |
| | | 7,500,000 | | Tempe Industrial Development Authority Revenue, Series C, 0.27%, 12/1/27, (LOC: Sovereign Bank FSB)(b) | | | 7,500,000 |
| | | | | | | | |
| | | | | | | | 21,960,000 |
| | | | | | | | |
California — 5.83% | | | |
| | | 4,500,000 | | California Communities Note Program Revenue, Series A7, 2.50%, 6/30/10 | | | 4,514,841 |
| | | 5,000,000 | | California Health Facilities Financing Authority Revenue, Series C, 0.25%, 10/1/40, (LOC: Barclays Bank PLC)(b) | | | 5,000,000 |
| | | 5,405,000 | | California Statewide Communities Development Authority Revenue, Series A, 0.27%, 8/1/35, (LOC: Citibank NA)(b) | | | 5,405,000 |
| | | 11,000,000 | | City of Oakland GO, Series A, 2.50%, 7/16/10 | | | 11,053,963 |
| | | 12,475,000 | | Eclipse Funding Trust Tax Allocation Revenue, 0.30%, 2/1/15, (LOC: U.S. Bank NA)(b) | | | 12,475,000 |
| | | 5,000,000 | | Gilroy Public Facilities Financing Authority Refunding Revenue, 2.00%, 9/1/10 | | | 5,015,527 |
| | | 590,000 | | Hesperia Public Financing Authority Refunding Revenue, Series B, 0.45%, 6/1/22, (LOC: Bank of America NA)(b) | | | 590,000 |
| | | 15,500,000 | | Oxnard Financing Authority Revenue, 2.50%, 8/25/10 | | | 15,545,670 |
| | | 5,800,000 | | Padre Dam Municipal Water District COP, Series R-11792, 0.29%, 4/1/17(a)(b) | | | 5,800,000 |
| | | 3,200,000 | | Rocklin Unified School District GO, 3.00%, 9/15/10 | | | 3,221,626 |
| | | 11,915,000 | | San Diego Housing Authority, Hillside Garden Apartments Revenue, Series C, 0.28%, 1/15/35, (Credit Support: Fannie Mae)(b) | | | 11,915,000 |
| | | 2,500,000 | | State of California Floaters GO, Series 1707, 0.39%, 8/1/32, (Credit Support: AGM)(b) | | | 2,500,000 |
| | | 4,000,000 | | State of California Pre-refunded GO, OID, 5.63%, 5/1/10, (Credit Support: AMBAC,TCRS-BNY) | | | 4,057,186 |
| | | | | | | | |
| | | | | | | | 87,093,813 |
| | | | | | | | |
Colorado — 3.91% | | | |
| | | 3,170,000 | | Aurora Centretech Metropolitan District Refunding GO, Series C, 0.30%, 12/1/28, (LOC: U.S. Bank NA)(b) | | | 3,170,000 |
| | | 6,510,000 | | Base Village Metropolitan District No. 2 GO, Series B, 0.30%, 12/1/38, (LOC: US Bank NA)(b) | | | 6,510,000 |
30
SCHEDULE OF PORTFOLIO INVESTMENTS
Tax-Free Money Market Fund (cont.)
March 31, 2010 (Unaudited)
| | | | | | | | |
Principal
Amount | | | | Value |
| | $ | 1,250,000 | | Colorado Health Facilities Authority Revenue, Series A, 0.38%, 4/1/24, (LOC: Wells Fargo Bank)(b) | | $ | 1,250,000 |
| | | 3,000,000 | | Colorado Housing & Finance Authority Refunding Revenue, 0.31%, 2/15/28, (Credit Support: Fannie Mae)(b) | | | 3,000,000 |
| | | 20,000,000 | | Colorado State Education Loan Program Revenue, 1.50%, 8/12/10, (Credit Support: State Aid Withholding) | | | 20,089,047 |
| | | 5,000,000 | | Commerce City Northern Infrastructure General Improvement District GO, 0.30%, 12/1/28, (LOC: US Bank NA)(b) | | | 5,000,000 |
| | | 3,475,000 | | County of Pitkin Refunding Revenue, Series A, 0.30%, 12/1/24, (LOC: US Bank NA)(b) | | | 3,475,000 |
| | | 5,200,000 | | Gateway Regional Metropolitan District Refunding GO, 0.38%, 12/1/37, (LOC: Wells Fargo Bank)(b) | | | 5,200,000 |
| | | 2,580,000 | | Meridian Ranch Metropolitan District Refunding GO, 0.30%, 12/1/38, (LOC: US Bank NA)(b) | | | 2,580,000 |
| | | 1,685,000 | | Parker Automotive Metropolitan District GO, 0.30%, 12/1/34, (LOC: US Bank NA)(b) | | | 1,685,000 |
| | | 1,370,000 | | University of Colorado Hospital Authority Revenue, Series A, 0.32%, 11/15/33, (Credit Support: AGM)(b) | | | 1,370,000 |
| | | 5,180,000 | | Water Valley Metropolitan District No. 2 GO, 0.38%, 12/1/24, (LOC: Wells Fargo Bank)(b) | | | 5,180,000 |
| | | | | | | | |
| | | | | | | | 58,509,047 |
| | | | | | | | |
Connecticut — 0.22% | | | |
| | | 3,245,000 | | Northeast Tax-Exempt Bond Grantor Trust Revenue, 0.36%, 4/1/19, (LOC: PNC Bank NA)(b) | | | 3,245,000 |
| | | | | | | | |
District Of Columbia — 1.62% | | | |
| | | 4,630,000 | | District of Columbia Children’s Defense Fund Revenue, 0.37%, 4/1/22, (LOC: Wells Fargo Bank)(b) | | | 4,630,000 |
| | | 1,700,000 | | District of Columbia Internships and Academic Revenue, 0.28%, 7/1/36, (LOC: Branch Banking & Trust)(b) | | | 1,700,000 |
| | | 4,600,000 | | District of Columbia Jesuit Conference Revenue, 0.29%, 10/1/37, (LOC: PNC Bank NA)(b) | | | 4,600,000 |
| | | 3,980,000 | | District of Columbia Water & Sewer Authority Revenue, Putters Series 3022, 0.34%, 4/1/16, (Credit Support: Assured GTY)(b) | | | 3,980,000 |
| | | 9,360,000 | | District of Columbia Water & Sewer Authority Revenue, Series R-11623, 0.31%, 4/1/29, (Credit Support: Assured GTY), Callable 10/01/18 @ 100(a)(b) | | | 9,360,000 |
| | | | | | | | |
| | | | | | | | 24,270,000 |
| | | | | | | | |
Florida — 3.50% | | | |
| | | 4,995,000 | | City of Tallahassee Revenue, Putters Series 2069Z, 0.34%, 4/1/15, (Credit Support: NATL-RE)(b) | | | 4,995,000 |
| | | 2,635,000 | | Collier County Industrial Development Authority Revenue, 0.45%, 12/1/26, (LOC: Bank of America NA)(b) | | | 2,635,000 |
| | | 15,000,000 | | County of Palm Beach Pine Crest Preparatory Refunding Revenue, 0.32%, 6/1/38, (LOC: Bank of America NA)(b) | | | 15,000,000 |
| | | 1,280,000 | | Florida Housing Finance Corp. Refunding Revenue, Series I, 0.33%, 11/1/32, (Credit Support: Freddie Mac)(b) | | | 1,280,000 |
| | | 5,245,000 | | JP Morgan Chase Putters/Drivers Trust Revenue, Series 3438Z, 0.34%, 4/1/27, (Credit Support: NATL-RE)(a)(b) | | | 5,245,000 |
31
SCHEDULE OF PORTFOLIO INVESTMENTS
Tax-Free Money Market Fund (cont.)
March 31, 2010 (Unaudited)
| | | | | | | | |
Principal Amount | | | | Value |
| | $ | 2,225,000 | | JP Morgan Chase Putters/Drivers Trust Revenue, Series 3617, 0.39%, 10/1/25(a)(b) | | $ | 2,225,000 |
| | | 6,835,000 | | Marion County Industrial Development Authority Refunding Revenue, 0.30%, 11/15/32, (Credit Support: Fannie Mae)(b) | | | 6,835,000 |
| | | 5,255,000 | | Miami-Dade County Industrial Development Authority Revenue, 0.34%, 9/1/29, (LOC: Bank of America NA)(b) | | | 5,255,000 |
| | | 8,815,000 | | Orange County Housing Finance Authority Refunding Revenue, 0.29%, 6/1/25, (Credit Support: Fannie Mae)(b) | | | 8,815,000 |
| | | | | | | | |
| | | | | | | | 52,285,000 |
| | | | | | | | |
Georgia — 2.80% | | | |
| | | 11,200,000 | | Camden County Public Service Authority Revenue, 0.32%, 12/1/32, (Credit Support: Assured GTY)(b) | | | 11,200,000 |
| | | 7,215,000 | | Clayton County Housing Authority Refunding Revenue, 0.30%, 9/1/26, (Credit Support: Fannie Mae)(b) | | | 7,215,000 |
| | | 4,755,000 | | Cobb County Housing Authority Refunding Revenue, 0.32%, 3/1/24, (Credit Support: Freddie Mac)(b) | | | 4,755,000 |
| | | 7,490,000 | | Fulton County Development Authority Revenue, 0.32%, 4/1/34, (LOC: Bank of America NA)(b) | | | 7,490,000 |
| | | 2,800,000 | | Gainesville & Hall County Development Authority Refunding Revenue, 0.32%, 4/1/27, (Credit Support: County GTY), (LOC: Bank of America NA)(b) | | | 2,800,000 |
| | | 8,425,000 | | Marietta Housing Authority Refunding Revenue, 0.27%, 7/1/24, (Credit Support: Fannie Mae)(b) | | | 8,425,000 |
| | | | | | | | |
| | | | | | | | 41,885,000 |
| | | | | | | | |
Idaho — 1.58% | | | |
| | | 23,680,000 | | Idaho Health Facilities Authority Revenue, 0.33%, 7/1/30, (Credit Support: AGM)(b) | | | 23,680,000 |
| | | | | | | | |
Illinois — 5.24% | | | |
| | | 20,625,000 | | City of Chicago GO, Series R-11270, 0.30%, 7/1/15, (Credit Support: NATL-RE)(b) | | | 20,625,000 |
| | | 2,700,000 | | City of Galesburg Revenue, 0.30%, 7/1/24, (LOC: Bank of America)(b) | | | 2,700,000 |
| | | 11,500,000 | | City of Galesburg Revenue, 0.32%, 3/1/31, (LOC: Bank of America)(b) | | | 11,500,000 |
| | | 4,100,000 | | Illinois Finance Authority Cultural Pool Revenue, 0.29%, 12/1/25, (LOC: JP Morgan Chase Bank)(b) | | | 4,100,000 |
| | | 1,480,000 | | Illinois Finance Authority Radiological Society Project Revenue, 0.33%, 6/1/17, (LOC: JP Morgan Chase Bank)(b) | | | 1,480,000 |
| | | 4,995,000 | | Illinois Finance Authority Revenue, Putters Series 2967, 0.34%, 2/15/16, (Credit Support: Assured GTY)(b) | | | 4,995,000 |
| | | 16,100,000 | | Illinois Finance Authority Revenue, Series R-11624, 0.31%, 8/15/39, (Credit Support: Assured GTY), Callable 8/15/18 @ 100(a)(b) | | | 16,100,000 |
| | | 6,900,000 | | Illinois Finance Authority, Beloit Memorial Hospital, Inc. Revenue , Series A, 0.32%, 4/1/36, (LOC: JP Morgan Chase Bank)(b) | | | 6,900,000 |
| | | 4,000,000 | | Illinois Health Facilities Authority Revenue, Series C, 0.30%, 1/1/16, (LOC:JP Morgan Chase Bank)(b) | | | 4,000,000 |
32
SCHEDULE OF PORTFOLIO INVESTMENTS
Tax-Free Money Market Fund (cont.)
March 31, 2010 (Unaudited)
| | | | | | | | |
Principal Amount | | | | Value |
| | $ | 2,780,000 | | Village of Channahon Revenue, Series A, 0.29%, 12/1/34, (LOC: US Bank NA)(b) | | $ | 2,780,000 |
| | | 3,085,000 | | Village of Channahon Revenue, Series D, 0.29%, 12/1/32, (LOC: US Bank NA)(b) | | | 3,085,000 |
| | | | | | | | |
| | | | | | | | 78,265,000 |
| | | | | | | | |
Indiana — 5.63% | | | |
| | | 7,040,000 | | City of Fort Wayne Waterworks Revenue, 0.60%, 2/10/11 | | | 7,040,000 |
| | | 36,000,000 | | City of Whiting, TECP, 0.23%, 6/9/10(c) | | | 36,000,000 |
| | | 20,420,000 | | Indiana Bond Bank Revenue, Series A, 2.00%, 1/6/11, (LOC: JP Morgan Chase Bank) | | | 20,664,707 |
| | | 7,500,000 | | Indiana Development Finance Authority Revenue, 0.29%, 11/1/35, (LOC: JP Morgan Chase Bank)(b) | | | 7,500,000 |
| | | 4,400,000 | | Indiana Finance Authority Refunding Revenue, 0.32%, 3/1/36, (LOC: Branch Banking & Trust)(b) | | | 4,400,000 |
| | | 8,540,000 | | Indiana Health Facility Financing Authority Revenue, Series A, 0.32%, 7/1/28, (LOC: Bank of America NA)(b) | | | 8,540,000 |
| | | | | | | | |
| | | | | | | | 84,144,707 |
| | | | | | | | |
Iowa — 1.98% | | | |
| | | 6,000,000 | | City of Urbandale Interstate Acres LP Refunding Revenue, 0.30%, 12/1/14, (LOC: Bankers Trust Company)(b) | | | 6,000,000 |
| | | 3,070,000 | | Iowa Finance Authority Revenue, 0.28%, 2/1/23, (LOC: Wells Fargo Bank)(b) | | | 3,070,000 |
| | | 1,885,000 | | Iowa Finance Authority Revenue, 0.40%, 4/1/25, (LOC: Bank of America NA)(b) | | | 1,885,000 |
| | | 8,680,000 | | Iowa Higher Education Loan Authority Revenue, 0.32%, 4/1/27, (LOC: Bank of America NA)(b) | | | 8,680,000 |
| | | 7,870,000 | | Iowa Higher Education Loan Authority Revenue, 0.38%, 5/1/20, (LOC: Wells Fargo Bank)(b) | | | 7,870,000 |
| | | 2,150,000 | | Woodbury County Revenue, 0.38%, 11/1/16, (LOC: US Bank NA)(b) | | | 2,150,000 |
| | | | | | | | |
| | | | | | | | 29,655,000 |
| | | | | | | | |
Kansas — 0.21% | | | |
| | | 3,215,000 | | City of Olathe Revenue, Series B, 0.40%, 11/1/18, (LOC: Bank of America NA)(b) | | | 3,215,000 |
| | | | | | | | |
Kentucky — 1.38% | | | |
| | | 8,350,000 | | County of Warren Refunding Revenue, 0.30%, 4/1/37, (Credit Support: Assured GTY)(b) | | | 8,350,000 |
| | | 6,500,000 | | Kentucky Economic Development Finance Authority Revenue, Series R-11810, 0.33%, 6/1/16, (Credit Support: Assured GTY)(a)(b) | | | 6,500,000 |
| | | 5,700,000 | | Louisville & Jefferson County Metropolitan Sewer District Revenue, Series A, 3.00%, 8/19/10 | | | 5,737,779 |
| | | | | | | | |
| | | | | | | | 20,587,779 |
| | | | | | | | |
33
SCHEDULE OF PORTFOLIO INVESTMENTS
Tax-Free Money Market Fund (cont.)
March 31, 2010 (Unaudited)
| | | | | | | | |
Principal Amount | | | | Value |
Louisiana — 0.87% | | | |
| | $ | 9,055,000 | | Louisiana Local Government Environmental Facilities & Community Development Authority Revenue, Series A, 0.30%, 10/1/37, (LOC: First NBC Bank )(b) | | $ | 9,055,000 |
| | | 4,010,000 | | Shreveport Home Mortgage Authority Refunding Revenue, 0.29%, 2/15/23, (Credit Support: Fannie Mae)(b) | | | 4,010,000 |
| | | | | | | | |
| | | | | | | | 13,065,000 |
| | | | | | | | |
Maryland — 0.56% | | | |
| | | 8,300,000 | | Maryland Health & Higher Educational Facilities Authority Revenue, Series D, 0.27%, 7/1/41, (LOC: TD Bank NA)(b) | | | 8,300,000 |
| | | | | | | | |
Massachusetts — 0.68% | | | |
| | | 10,000,000 | | City of New Bedford GO, Series A, 1.75%, 2/11/11 | | | 10,094,540 |
| | | | | | | | |
Michigan — 2.83% | | | |
| | | 5,000,000 | | Detroit City School District GO, Putters Series 2954, 0.34%, 11/1/24, (Credit Support: AGM, Q-SBLF)(b) | | | 5,000,000 |
| | | 5,000,000 | | Michigan Municipal Bond Authority, Student Aid Notes Revenue, Series C-1, 3.00%, 8/20/10 | | | 5,030,460 |
| | | 15,000,000 | | Michigan State Hospital Finance Authority Revenue, 0.30%, 6/1/22, (Credit Support: Assured GTY)(b) | | | 15,000,000 |
| | | 5,010,000 | | Michigan Strategic Fund Revenue, 0.40%, 9/1/40, (LOC: Bank of America)(b) | | | 5,010,000 |
| | | 12,200,000 | | State of Michigan GO, Series A, 2.00%, 9/30/10 | | | 12,289,042 |
| | | | | | | | |
| | | | | | | | 42,329,502 |
| | | | | | | | |
Minnesota — 4.80% | | | |
| | | 1,825,000 | | City of Bloomington Refunding Revenue, Series A1, 0.36%, 11/15/32, (Credit Support: Fannie Mae)(b) | | | 1,825,000 |
| | | 8,035,000 | | City of Burnsville Refunding Revenue, 0.30%, 1/1/35, (Credit Support: Freddie Mac)(b) | | | 8,035,000 |
| | | 12,235,000 | | City of Inver Grove Heights Refunding Revenue, 0.30%, 5/15/35, (Credit Support: Fannie Mae)(b) | | | 12,235,000 |
| | | 1,200,000 | | City of Minnetonka Refunding Revenue, 0.30%, 11/15/31, (Credit Support: Fannie Mae)(b) | | | 1,200,000 |
| | | 13,580,000 | | City of Oak Park Heights Refunding Revenue, 0.30%, 11/1/35, (Credit Support: Freddie Mac)(b) | | | 13,580,000 |
| | | 1,255,000 | | City of Spring Lake Park Refunding Revenue, 0.30%, 2/15/33, (Credit Support: Fannie Mae)(b) | | | 1,255,000 |
| | | 10,420,000 | | Midwest Consortium of Municipal Utilities Revenue, Series B, 0.28%, 10/1/35, (LOC: US Bank NA)(b) | | | 10,420,000 |
| | | 15,000,000 | | Rochester Health Care Facilities, TECP, 0.30%, 6/10/10(c) | | | 15,000,000 |
| | | 2,140,000 | | St. Paul Housing & Redevelopment Authority Revenue, Series A, 0.33%, 5/1/27, (LOC: US Bank NA)(b) | | | 2,140,000 |
| | | 3,000,000 | | St. Paul Port Authority Revenue, Series 5-O, 0.30%, 12/1/28, (LOC: Deutsche Bank AG)(b) | | | 3,000,000 |
| | | 3,000,000 | | St. Paul Port Authority Revenue, Series 9-BB, 0.30%, 3/1/29, (LOC: Deutsche Bank AG)(b) | | | 3,000,000 |
| | | | | | | | |
| | | | | | | | 71,690,000 |
| | | | | | | | |
34
SCHEDULE OF PORTFOLIO INVESTMENTS
Tax-Free Money Market Fund (cont.)
March 31, 2010 (Unaudited)
| | | | | | | | |
Principal
Amount | | | | Value |
Mississippi — 1.74% | | | |
| | $ | 20,000,000 | | County of Jackson Port Facilities Refunding Revenue, 0.28%, 6/1/23(b) | | $ | 20,000,000 |
| | | 6,040,000 | | Mississippi Business Finance Corp. Revenue, 0.34%, 5/1/39, (LOC: Capital One NA)(b) | | | 6,040,000 |
| | | | | | | | |
| | | | | | | | 26,040,000 |
| | | | | | | | |
Missouri — 1.82% | | | |
| | | 4,200,000 | | Cape Girardeau County Industrial Development Authority Revenue, Series B, 0.30%, 6/1/39, (LOC: Wells Fargo Bank)(b) | | | 4,200,000 |
| | | 13,600,000 | | Missouri State Health & Educational Facilities Authority Revenue, Series C-4, 0.30%, 6/1/33, (Credit Support: AGM)(b) | | | 13,600,000 |
| | | 7,420,000 | | Nodaway County Industrial Development Authority Revenue, 0.30%, 11/1/28, (LOC: US Bank NA)(b) | | | 7,420,000 |
| | | 2,000,000 | | St. Charles County Industrial Development Authority Refunding Revenue, 0.29%, 2/1/29, (Credit Support: Fannie Mae)(b) | | | 2,000,000 |
| | | | | | | | |
| | | | | | | | 27,220,000 |
| | | | | | | | |
Nebraska — 0.96% | | | |
| | | 6,000,000 | | Madison County Hospital Authority No. 1 Revenue, Series B, 0.28%, 7/1/33, (LOC: US Bank NA)(b) | | | 6,000,000 |
| | | 5,570,000 | | Saline County Hospital Authority No. 1 Refunding Revenue, Series C, 0.30%, 6/1/31, (LOC: US Bank NA)(b) | | | 5,570,000 |
| | | 2,825,000 | | Scotts Bluff County Hospital Authority Refunding Revenue, 0.33%, 12/1/31, (Credit Support: Ginnie Mae), (LOC: US Bank NA)(b) | | | 2,825,000 |
| | | | | | | | |
| | | | | | | | 14,395,000 |
| | | | | | | | |
Nevada — 0.71% | | | |
| | | 5,145,000 | | City of Fernley GO, Series R-11458, 0.31%, 2/1/16, (Credit Support: Assured GTY)(b) | | | 5,145,000 |
| | | 5,515,000 | | City of Reno Refunding Revenue, Series A, 0.30%, 6/1/32, (LOC: Bank of America NA)(b) | | | 5,515,000 |
| | | | | | | | |
| | | | | | | | 10,660,000 |
| | | | | | | | |
New Hampshire — 2.05% | | | |
| | | 22,000,000 | | New Hampshire Business Finance Authority Revenue, 0.36%, 10/1/37, (LOC: TD Bank NA)(b) | | | 22,000,000 |
| | | 8,700,000 | | New Hampshire Health & Education Facilities Authority Revenue, 0.38%, 7/1/28, (LOC: Wells Fargo Bank)(b) | | | 8,700,000 |
| | | | | | | | |
| | | | | | | | 30,700,000 |
| | | | | | | | |
New Jersey — 2.65% | | | |
| | | 4,915,000 | | Austin Trust Various States Revenue, Series 2008-353, 0.39%, 7/1/13, (LOC: Bank of America NA)(b) | | | 4,915,000 |
| | | 2,185,000 | | City of Newark GO, Series D, 1.25%, 6/17/10 | | | 2,187,751 |
| | | 4,000,000 | | City of Newark GO, Series A, 1.25%, 6/17/10 | | | 4,003,912 |
| | | 16,300,000 | | City of Newark GO, Series E, 3.25%, 4/14/10 | | | 16,305,676 |
35
SCHEDULE OF PORTFOLIO INVESTMENTS
Tax-Free Money Market Fund (cont.)
March 31, 2010 (Unaudited)
| | | | | | | | |
Principal Amount | | | | Value |
| | $ | 12,185,000 | | New Jersey Health Care Facilities Financing Authority Revenue, 0.27%, 7/1/24, (LOC: TD Bank NA)(b) | | $ | 12,185,000 |
| | | | | | | | |
| | | | | | | | 39,597,339 |
| | | | | | | | |
New York — 4.79% | | | |
| | | 11,200,000 | | Addison Central School District GO, 1.75%, 1/21/11, (Credit Support: State Aid Withholding) | | | 11,298,848 |
| | | 2,900,000 | | Erie County Industrial Development Agency Revenue, Putters Series 2090, 0.32%, 5/1/15, (Credit Support: AGM)(b) | | | 2,900,000 |
| | | 15,000,000 | | New York Liberty Development Corp. World Trade Center Project Revenue, Series A, 0.50%, 12/1/49(b) | | | 15,000,000 |
| | | 6,500,000 | | New York State Dormitory Authority Revenue, Series D, 0.26%, 7/1/31, (LOC: TD Bank NA)(b) | | | 6,500,000 |
| | | 2,500,000 | | New York State Dormitory Authority Wagner College Revenue, 0.25%, 7/1/38, (LOC: TD Bank NA)(b) | | | 2,500,000 |
| | | 27,400,000 | | New York State Energy Research & Development Authority Refunding Revenue, Series A, 0.33%, 8/1/15, (Credit Support: AMBAC), (LOC: Wells Fargo Bank)(b) | | | 27,400,000 |
| | | 5,964,000 | | Oppenheim-Ephratah Central School District GO, 2.50%, 6/30/10, (Credit Support: State Aid Withholding) | | | 5,980,286 |
| | | | | | | | |
| | | | | | | | 71,579,134 |
| | | | | | | | |
North Carolina — 2.71% | | | |
| | | 9,770,000 | | North Carolina Capital Facilities Finance Agency Revenue, 0.28%, 8/1/33, (LOC: Wells Fargo Bank)(b) | | | 9,770,000 |
| | | 17,700,000 | | North Carolina Capital Facilities Finance Agency Revenue, Series B, 0.28%, 6/1/38, (LOC: Wells Fargo Bank)(b) | | | 17,700,000 |
| | | 12,995,000 | | North Carolina Municipal Power Agency No. 1 Catawba Revenue, Series R-211, 0.30%, 1/1/11, (Credit Support: BHAC-CR, MBIA)(b) | | | 12,995,000 |
| | | | | | | | |
| | | | | | | | 40,465,000 |
| | | | | | | | |
Ohio — 1.47% | | | |
| | | 10,200,000 | | County of Lucas GO, 1.00%, 7/22/10 | | | 10,209,296 |
| | | 11,690,000 | | Xenia Community School District GO, 1.70%, 7/29/10 | | | 11,744,008 |
| | | | | | | | |
| | | | | | | | 21,953,304 |
| | | | | | | | |
Oregon — 1.44% | | | |
| | | 1,000,000 | | City of Portland Revenue, Series A, 0.27%, 12/1/11, (LOC: Harris Trust & Savings Bank)(b) | | | 1,000,000 |
| | | 5,300,000 | | Clackamas County Hospital Facility Authority Refunding Revenue, Series A-1, 0.27%, 11/1/29, (LOC: Sovereign Bank FSB)(b) | | | 5,300,000 |
| | | 6,000,000 | | Confederated Tribes of the Umatilla Indian Reservation Revenue, 0.32%, 12/1/28, (LOC: Bank of America NA)(b) | | | 6,000,000 |
| | | 4,500,000 | | Oregon State Department of Administrative Services COP, Series A, OID, 6.00%, 5/1/10, (Credit Support: AMBAC) | | | 4,565,271 |
| | | 4,600,000 | | Yamhill County Hospital Authority Refunding Revenue, 0.32%, 12/1/34, (LOC: US Bank NA)(b) | | | 4,600,000 |
| | | | | | | | |
| | | | | | | | 21,465,271 |
| | | | | | | | |
36
SCHEDULE OF PORTFOLIO INVESTMENTS
Tax-Free Money Market Fund (cont.)
March 31, 2010 (Unaudited)
| | | | | | | | |
Principal Amount | | | | Value |
Pennsylvania — 7.99% | | | |
| | $ | 8,900,000 | | Allegheny County Higher Education Building Authority Revenue, Series A, 0.29%, 3/1/38, (LOC: PNC Bank NA)(b) | | $ | 8,900,000 |
| | | 8,000,000 | | Allegheny County Hospital Development Authority Revenue, Series A, 0.29%, 6/1/30, (LOC: PNC Bank NA)(b) | | | 8,000,000 |
| | | 3,630,000 | | Allegheny County Hospital Development Authority Revenue, Series A, 1.85%, 5/1/14, (LOC: PNC Bank NA)(b) | | | 3,630,000 |
| | | 5,135,000 | | Allegheny County Industrial Development Authority Revenue, 0.29%, 6/1/38, (LOC: PNC Bank NA)(b) | | | 5,135,000 |
| | | 1,875,000 | | Butler County General Authority Revenue, 0.33%, 11/15/21, (Credit Support: AGM)(b) | | | 1,875,000 |
| | | 1,375,000 | | County of Somerset GO, 0.35%, 10/15/27, (Credit Support: AGM)(b) | | | 1,375,000 |
| | | 3,255,000 | | Cumberland County Municipal Authority Revenue, Series C, 0.28%, 1/1/33, (LOC: Wells Fargo Bank)(b) | | | 3,255,000 |
| | | 5,000,000 | | Delaware County Industrial Development Authority Refunding Revenue, Series G, 0.28%, 12/1/31(b) | | | 5,000,000 |
| | | 5,000,000 | | Delaware County Industrial Development Authority Refunding Revenue, Series G, 0.28%, 12/1/31(b) | | | 5,000,000 |
| | | 4,700,000 | | Emmaus General Authority Revenue, Series F, 0.32%, 3/1/24, (LOC: US Bank NA)(b) | | | 4,700,000 |
| | | 8,155,000 | | JP Morgan Chase Putters/Drivers Trust GO, Series 3405, 0.32%, 11/15/14, (Credit Support: AGM, State Aid Withholding)(a)(b) | | | 8,155,000 |
| | | 7,500,000 | | Lancaster Industrial Development Authority Revenue, Series B, 0.27%, 12/1/39, (LOC: PNC Bank NA)(b) | | | 7,500,000 |
| | | 8,050,000 | | Luzerne County Convention Center Authority Revenue, Series A, 0.29%, 9/1/28, (LOC: PNC Bank NA)(b) | | | 8,050,000 |
| | | 15,000,000 | | Pennsylvania Economic Development Finance Authority Revenue, 0.62%, 12/1/38, (LOC: Wells Fargo Bank)(b) | | | 15,000,000 |
| | | 2,100,000 | | Pennsylvania Higher Educational Facilities Authority Revenue, Series F2, 2.05%, 5/1/25, (LOC: PNC Bank NA)(b) | | | 2,100,000 |
| | | 4,500,000 | | Pennsylvania Higher Educational Facilities Authority Revenue, Series J4, 1.85%, 5/1/32, (LOC: PNC Bank NA)(b) | | | 4,500,000 |
| | | 2,970,000 | | Pennsylvania State Public School Building Authority Revenue, Putters-Series 1970, 0.32%, 12/1/14, (Credit Support: AGM, State Aid Withholding)(b) | | | 2,970,000 |
| | | 7,800,000 | | Philadelphia Authority for Industrial Development Revenue, 0.38%, 12/1/37, (LOC: Wells Fargo Bank)(b) | | | 7,800,000 |
| | | 2,490,000 | | Shaler Area School District Refunding GO, 0.38%, 9/1/25, (Credit Support: AGM, State Aid Withholding)(b) | | | 2,490,000 |
| | | 4,000,000 | | Washington County Hospital Authority Revenue, Series A, 1.25%, 7/1/37, (LOC: Wells Fargo Bank)(b) | | | 4,000,000 |
| | | 9,925,000 | | York County Industrial Development Authority Revenue, 0.29%, 7/1/37, (LOC: PNC Bank NA)(b) | | | 9,925,000 |
| | | | | | | | |
| | | | | | | | 119,360,000 |
| | | | | | | | |
Rhode Island — 0.58% | | | |
| | | 3,200,000 | | Rhode Island Health & Educational Building Corp. Revenue, 0.45%, 6/1/37, (LOC: Bank of America NA)(b) | | | 3,200,000 |
37
SCHEDULE OF PORTFOLIO INVESTMENTS
Tax-Free Money Market Fund (cont.)
March 31, 2010 (Unaudited)
| | | | | | | | |
Principal Amount | | | | Value |
| | $ | 5,500,000 | | Rhode Island Health & Educational Building Corp. Revenue, Series R-11811, 0.31%, 5/15/17, (Credit Support: Assured GTY)(a)(b) | | $ | 5,500,000 |
| | | | | | | | |
| | | | | | | | 8,700,000 |
| | | | | | | | |
South Carolina — 2.74% | | | |
| | | 6,500,000 | | County of Cherokee Revenue, 0.40%, 12/1/15, (LOC: Bank of America NA)(b) | | | 6,500,000 |
| | | 6,770,000 | | South Carolina Jobs-Economic Development Authority Revenue, 0.38%, 5/1/29, (LOC: Wells Fargo Bank)(b) | | | 6,770,000 |
| | | 6,735,000 | | St Peters Parish-Jasper County Public Facilities Corp. Revenue, Series A, 0.75%, 2/1/11 | | | 6,735,000 |
| | | 6,000,000 | | St Peters Parish-Jasper County Public Facilities Corp. Revenue, Series B, 1.50%, 7/1/10 | | | 6,000,000 |
| | | 15,000,000 | | Town of Lexington Water Works & Sewer Systems Revenue, 1.25%, 4/15/10 | | | 14,998,579 |
| | | | | | | | |
| | | | | | | | 41,003,579 |
| | | | | | | | |
South Dakota — 0.85% | | | |
| | | 12,640,000 | | City of Sioux Falls Revenue, Series 2057, 0.34%, 5/15/15, (Credit Support: NATL-RE)(b) | | | 12,640,000 |
| | | | | | | | |
Tennessee — 0.13% | | | |
| | | 2,000,000 | | Hendersonville Industrial Development Board Refunding Revenue, 0.31%, 2/15/28, (Credit Support: Fannie Mae)(b) | | | 2,000,000 |
| | | | | | | | |
Texas — 5.92% | | | |
| | | 3,150,000 | | Crawford Education Facilities Corp. Revenue, 0.30%, 6/1/18, (LOC: US Bank NA)(b) | | | 3,150,000 |
| | | 5,530,000 | | DeSoto Industrial Development Authority Refunding Revenue, 0.33%, 12/1/16(b) | | | 5,530,000 |
| | | 1,745,000 | | El Paso County Hospital District GO, Putters Series 2747, 0.34%, 2/15/16, (Credit Support: Assured GTY)(b) | | | 1,745,000 |
| | | 9,000,000 | | Harris County Cultural Educational Facilities TECP, 0.36%, 10/20/10(c) | | | 9,000,000 |
| | | 4,075,000 | | Harris County Hospital District Revenue, Series R-12075, 0.30%, 8/15/10, (Credit Support: BHAC-CR, NATL-RE)(b) | | | 4,075,000 |
| | | 8,000,000 | | Harris County TECP, 0.40%, 6/15/10(c) | | | 8,000,000 |
| | | 3,505,000 | | JP Morgan Chase Putters/Drivers Trust GO, Series 3356, 0.34%, 2/15/12, (Credit Support: AMBAC)(a)(b) | | | 3,505,000 |
| | | 4,300,000 | | JP Morgan Chase Putters/Drivers Trust GO, Series 3563, 0.29%, 4/1/15, (Credit Support: AGM)(a)(b) | | | 4,300,000 |
| | | 5,000,000 | | North Texas Tollway Authority Revenue, Series R-11392, 0.30%, 1/1/16, (Credit Support: BHAC-CR)(b) | | | 5,000,000 |
| | | 5,415,000 | | Splendora Higher Education Facilities Corp. Revenue, Series A, 0.38%, 12/1/26, (LOC: Wells Fargo Bank)(b) | | | 5,415,000 |
| | | 2,675,000 | | Tarrant County Health Facilities Development Corp. Revenue OID, 6.00%, 9/1/10 | | | 2,736,893 |
| | | 5,750,000 | | Texas Public Finance Authority TECP, 0.25%, 6/11/10(c) | | | 5,750,000 |
| | | 30,000,000 | | Texas State Revenue, 2.50%, 8/31/10 | | | 30,280,334 |
| | | | | | | | |
| | | | | | | | 88,487,227 |
| | | | | | | | |
38
SCHEDULE OF PORTFOLIO INVESTMENTS
Tax-Free Money Market Fund (cont.)
March 31, 2010 (Unaudited)
| | | | | | | | |
Principal Amount | | | | Value |
Utah — 1.72% | | | |
| | $ | 5,000,000 | | County of Emery Revenue, 0.27%, 11/1/24, (LOC: Wells Fargo Bank)(b) | | $ | 5,000,000 |
| | | 805,000 | | County of Sanpete Revenue, 0.38%, 8/1/28, (LOC: US Bank NA)(b) | | | 805,000 |
| | | 3,700,000 | | Duchesne County School District Revenue, 0.38%, 6/1/21, (LOC: US Bank NA)(b) | | | 3,700,000 |
| | | 4,922,000 | | Jordanelle Special Service District Revenue, 0.28%, 9/1/25, (LOC: Wells Fargo Bank)(b) | | | 4,922,000 |
| | | 3,870,000 | | Ogden City Redevelopment Agency Tax Allocation, Series A, 0.38%, 4/1/25, (LOC: Wells Fargo Bank)(b) | | | 3,870,000 |
| | | 4,435,000 | | Salt Lake County Housing Authority Refunding Revenue, 0.31%, 2/15/31, (Credit Support: Fannie Mae)(b) | | | 4,435,000 |
| | | 2,980,000 | | Utah Transit Authority Revenue, Series R-11800, 0.30%, 12/15/29, (Credit Support: BHAC-CR, MBIA)(a)(b) | | | 2,980,000 |
| | | | | | | | |
| | | | | | | | 25,712,000 |
| | | | | | | | |
Virginia — 2.15% | | | |
| | | 6,735,000 | | JP Morgan Chase Putters/Drivers Trust Revenue, Series 3313Z, 0.34%, 1/1/31, (Credit Support: NATL-RE, GO of Authority), Callable 7/01/11 @ 100(b) | | | 6,735,000 |
| | | 18,420,000 | | Montgomery County Industrial Development Authority Revenue, Series A, 0.30%, 2/1/39(b) | | | 18,420,000 |
| | | 6,940,000 | | Virginia Beach Development Authority Refunding Revenue, 0.32%, 7/1/33, (LOC: Bank of America NA)(b) | | | 6,940,000 |
| | | | | | | | |
| | | | | | | | 32,095,000 |
| | | | | | | | |
Washington — 2.16% | | | |
| | | 10,000,000 | | City of Seattle Revenue, Series R-47, 0.30%, 3/2/21, (Credit Support: AGM)(b) | | | 10,000,000 |
| | | 5,995,000 | | City of Seattle Revenue, Series R-48, 0.30%, 9/2/20, (Credit Support: AGM)(b) | | | 5,995,000 |
| | | 4,995,000 | | JP Morgan Chase Putters/Drivers Trust GO, Series 3542Z, 0.34%, 12/1/14, (Credit Support: NATL-RE, FGIC, School Board GTY)(a)(b) | | | 4,995,000 |
| | | 6,930,000 | | Washington Health Care Facilities Authority Revenue, 0.40%, 8/1/26, (LOC: Bank of America NA)(b) | | | 6,930,000 |
| | | 280,000 | | Washington State Housing Finance Commission Refunding Revenue, Series B, 0.30%, 7/1/11, (LOC: US Bank NA)(b) | | | 280,000 |
| | | 3,000,000 | | Washington State Housing Finance Commission Revenue, 0.28%, 10/1/29, (LOC: Wells Fargo Bank)(b) | | | 3,000,000 |
| | | 1,100,000 | | Washington State Housing Finance Commission Revenue, 0.30%, 7/1/22, (LOC: US Bank NA)(b) | | | 1,100,000 |
| | | | | | | | |
| | | | | | | | 32,300,000 |
| | | | | | | | |
Wisconsin — 4.54% | | | |
| | | 4,295,000 | | Badger TOB Asset Securitization Corp. Revenue, 5.50%, 6/1/10 | | | 4,328,828 |
| | | 15,020,000 | | City of Marshfield Revenue, Series C, 4.00%, 12/1/10 | | | 15,371,490 |
| | | 5,000,000 | | City of Middleton Revenue, 1.75%, 7/1/10 | | | 5,009,760 |
| | | 2,645,000 | | Milwaukee Redevelopment Authority Revenue, 0.29%, 9/1/40, | | | |
| | | | | (LOC: US Bank NA)(b) | | | 2,645,000 |
39
SCHEDULE OF PORTFOLIO INVESTMENTS
Tax-Free Money Market Fund (cont.)
March 31, 2010 (Unaudited)
| | | | | | | | |
Principal Amount | | | | Value |
| | $ | 6,000,000 | | Wisconsin Health & Educational Facilities Authority Revenue, Series A, 0.32%, 8/1/30, (LOC: US Bank NA)(b) | | $ | 6,000,000 |
| | | 10,375,000 | | Wisconsin Health & Educational Facilities Authority Revenue, Series B, 0.32%, 12/1/26, (LOC: US Bank NA)(b) | | | 10,375,000 |
| | | 13,800,000 | | Wisconsin Health & Educational Facilities Authority Revenue, Series C, 0.32%, 4/1/28, (LOC: US Bank NA)(b) | | | 13,800,000 |
| | | 1,760,000 | | Wisconsin Municipalities Private School Finance Commission Revenue, 0.30%, 3/1/23, (LOC: US Bank NA)(b) | | | 1,760,000 |
| | | 8,630,000 | | Wisconsin State Health & Educational Facilities Authority Revenue, 0.38%, 6/1/28, (LOC: Wells Fargo Bank)(b) | | | 8,630,000 |
| | | | | | | | |
| | | | | | | | 67,920,078 |
| | | | | | | | |
| |
Total Municipal Bonds (Cost $1,419,457,320) | | | 1,419,457,320 |
| | | | | | | | |
| |
Repurchase Agreements — 1.34% | | | |
| | | 20,000,000 | | Deutsche Bank AG dated 3/31/10; due 4/1/10 at 0.03% with maturity value of $20,000,017 (fully collateralized by a Fannie Mae security with a maturity date of 12/1/37 at a rate of 6.50%). | | | 20,000,000 |
| | | | | | | | |
| |
Total Repurchase Agreements (Cost $20,000,000) | | | 20,000,000 |
| | | | | | | | |
| | |
| Shares | | | | |
Investment Company — 3.41% | | | |
| | | 51,000,000 | | Goldman Sachs Financial Square Tax Free Money Market Fund | | | 51,000,000 |
| | | | | | | | |
| |
Total Investment Company (Cost $51,000,000) | | | 51,000,000 |
| | | | | | | | |
| |
Total Investments (Cost $1,490,457,320)(d) — 99.71% | | $ | 1,490,457,320 |
| |
Other assets in excess of liabilities — 0.29% | | | 4,297,615 |
| | | | | | | | |
| |
NET ASSETS — 100.00% | | $ | 1,494,754,935 |
| | | | | | | | |
| (a) | Security exempt from registration under Rule 144A of the Securities Act of 1933, as amended. These securities may be resold in transactions exempt from registration, normally to qualified institutional buyers. Security has been deemed to be liquid based on procedures approved by the Board of Trustees. |
| (b) | Variable rate security. The rate reflected in the Schedule of Portfolio Investments is the rate in effect on March 31, 2010. The maturity date represents the actual maturity date. The security’s effective maturity resets periodically. |
| (c) | Represents effective yield to maturity on date of purchase. |
| (d) | Tax cost of securities is equal to book cost of securities. |
40
SCHEDULE OF PORTFOLIO INVESTMENTS
Tax-Free Money Market Fund (cont.)
March 31, 2010 (Unaudited)
Abbreviations used are defined below:
AGM – Assured Guaranty Municipal
AMBAC – American Municipal Bond Assurance Corp.
BHAC-CR – Berkshire Hathaway Assurance Corp. Custodial Receipts
COP – Certificate of Participation
FGIC – Financial Guaranty Insurance Co.
GO – General Obligation
GTY – Guaranty
LOC – Letter of Credit
MBIA – Municipal Bond Insurance Association
NATL-RE – National Public Finance Guaranty Corp.
OID – Original Issue Discount
Q-SBLF – Qualified School Board Loan Fund
TECP – Tax Exempt Commercial Paper
TCRS-BNY – Tennessee Consolidated Retirement System Bank of New York
See notes to financial statements.
41
FINANCIAL STATEMENTS
Statements of Assets and Liabilities
March 31, 2010 (Unaudited)
| | | | | | | | | | | | |
| | | Prime
Money
Market Fund | | | U.S. Government
Money
Market Fund | | | Tax-Free
Money
Market Fund | |
Assets: | | | | | | | | | | | | |
Investments, at value (cost $18,287,567,097; $5,742,670,021; $1,490,457,320 respectively) | | $ | 18,287,567,097 | * | | $ | 5,742,670,021 | ** | | $ | 1,490,457,320 | *** |
Cash | | | 363,110,005 | | | | 271,502,259 | | | | 1,137,600 | |
Interest and dividends receivable | | | 23,783,574 | | | | 5,857,016 | | | | 3,466,015 | |
Prepaid expenses and other assets | | | 384,213 | | | | 185,856 | | | | 113,203 | |
| | | | | | | | | | | | |
Total Assets | | | 18,674,844,889 | | | | 6,020,215,152 | | | | 1,495,174,138 | |
| | | | | | | | | | | | |
| | | |
Liabilities: | | | | | | | | | | | | |
Distributions payable | | | 343,751 | | | | 86,960 | | | | — | |
Payable for investments purchased | | | 220,471,416 | | | | — | | | | — | |
Accrued expenses and other payables: | | | | | | | | | | | | |
Investment advisory fees | | | 1,530,486 | | | | 482,958 | | | | 127,919 | |
Audit fees | | | 32,842 | | | | 28,637 | | | | 18,637 | |
Trustee fees | | | 6,637 | | | | 3,359 | | | | 397 | |
Distribution fees | | | 1,663,961 | | | | 428,205 | | | | 228,631 | |
Shareholder reports | | | 302,693 | | | | 129,847 | | | | 17,702 | |
Shareholder servicing fees | | | 273,449 | | | | 61,912 | | | | 7,269 | |
Transfer Agent fees | | | — | | | | — | | | | 3,906 | |
Other | | | — | | | | — | | | | 14,742 | |
| | | | | | | | | | | | |
Total Liabilities | | | 224,625,235 | | | | 1,221,878 | | | | 419,203 | |
| | | | | | | | | | | | |
Net Assets | | $ | 18,450,219,654 | | | $ | 6,018,993,274 | | | $ | 1,494,754,935 | |
| | | | | | | | | | | | |
| | | |
Net Assets Consist Of: | | | | | | | | | | | | |
Capital | | $ | 18,454,948,562 | | | $ | 6,019,032,047 | | | $ | 1,494,675,380 | |
Undistributed (distributions in excess of) net investment income | | | (918 | ) | | | 3,719 | | | | — | |
Accumulated net realized gains (losses) from investment transactions | | | (4,727,990 | ) | | | (42,492 | ) | | | 79,555 | |
| | | | | | | | | | | | |
Net Assets | | $ | 18,450,219,654 | | | $ | 6,018,993,274 | | | $ | 1,494,754,935 | |
| | | | | | | | | | | | |
| | | |
Net Assets: | | | | | | | | | | | | |
Fund Level | | | | | | | | | | | | |
RBC Institutional Class 1 | | $ | 6,938,578,716 | | | $ | 1,884,716,840 | | | $ | 175,065,335 | |
RBC Institutional Class 2 | | | 923,377,047 | | | | 15,812,268 | | | | 352,407,394 | |
RBC Investor Class | | | 4,175,325,103 | | | | 1,391,747,361 | | | | 220,890,486 | |
RBC Reserve Class | | | 4,927,024,126 | | | | 1,636,765,979 | | | | 454,989,287 | |
RBC Select Class | | | 1,485,914,662 | | | | 1,089,950,826 | | | | 291,402,433 | |
| | | | | | | | | | | | |
Total | | $ | 18,450,219,654 | | | $ | 6,018,993,274 | | | $ | 1,494,754,935 | |
| | | | | | | | | | | | |
42
FINANCIAL STATEMENTS
Statements of Assets and Liabilities (cont.)
| | | | | | | | | |
| | | Prime
Money
Market Fund | | U.S. Government
Money
Market Fund | | Tax-Free
Money
Market Fund |
Shares Outstanding (Unlimited number of shares authorized, no par value): | | | | | | | | | |
RBC Institutional Class 1 | | | 6,938,557,351 | | | 1,884,703,288 | | | 175,063,447 |
RBC Institutional Class 2 | | | 923,372,552 | | | 15,811,418 | | | 352,422,583 |
RBC Investor Class | | | 4,177,422,988 | | | 1,391,770,646 | | | 220,883,671 |
RBC Reserve Class | | | 4,929,205,529 | | | 1,636,804,511 | | | 454,970,424 |
RBC Select Class S | | | 1,486,510,109 | | | 1,089,976,571 | | | 291,383,360 |
| | | | | | | | | |
Total | | | 18,455,068,529 | | | 6,019,066,434 | | | 1,494,723,485 |
| | | | | | | | | |
| | | |
Net Asset Values and Redemption Price per Share: | | | | | | | | | |
RBC Institutional Class 1 | | $ | 1.00 | | $ | 1.00 | | $ | 1.00 |
| | | | | | | | | |
RBC Institutional Class 2 | | $ | 1.00 | | $ | 1.00 | | $ | 1.00 |
| | | | | | | | | |
RBC Investor Class | | $ | 1.00 | | $ | 1.00 | | $ | 1.00 |
| | | | | | | | | |
RBC Reserve Class | | $ | 1.00 | | $ | 1.00 | | $ | 1.00 |
| | | | | | | | | |
RBC Select Class S | | $ | 1.00 | | $ | 1.00 | | $ | 1.00 |
| | | | | | | | | |
| * | $2,811,000,000 of which are repurchase agreements. See Schedule of Portfolio Investments for details. |
| ** | $1,195,000,000 of which are repurchase agreements. See Schedule of Portfolio Investments for details. |
| *** | $20,000,000 of which are repurchase agreements. See Schedule of Portfolio Investments for details. |
See notes to financial statements.
43
FINANCIAL STATEMENTS
Statements of Operations
For the Six Months Ended March 31, 2010 (Unaudited)
| | | | | | | | | | | | |
| | | Prime
Money
Market Fund | | | U.S. Government
Money
Market Fund | | | Tax-Free
Money
Market Fund | |
Investment Income: | | | | | | | | | | | | |
Interest income | | $ | 32,334,592 | | | $ | 7,535,472 | | | $ | 3,059,448 | |
Dividend income | | | 418,170 | | | | 10,449 | | | | 34,014 | |
| | | | | | | | | | | | |
Total Investment Income | | | 32,752,762 | | | | 7,545,921 | | | | 3,093,462 | |
| | | | | | | | | | | | |
| | | |
Expenses: | | | | | | | | | | | | |
Investment advisory fees | | | 9,062,793 | | | | 2,816,474 | | | | 660,886 | |
Distribution fees-RBC Institutional Class 2 | | | 454,322 | | | | 30,219 | | | | 142,000 | |
Distribution fees-RBC Investor Class | | | 21,851,225 | | | | 7,087,769 | | | | 1,174,279 | |
Distribution fees-RBC Reserve Class | | | 22,522,251 | | | | 7,764,151 | | | | 2,106,263 | |
Distribution fees-RBC Select Class | | | 6,249,873 | | | | 4,889,736 | | | | 1,117,891 | |
Shareholder servicing fee-RBC Institutional Class 1 | | | 1,645,542 | | | | 306,825 | | | | 37,513 | |
Accounting fees | | | 453,140 | | | | 140,824 | | | | 33,044 | |
Audit fees | | | 52,628 | | | | 23,937 | | | | 14,273 | |
Custodian fees | | | 108,409 | | | | 38,725 | | | | 7,669 | |
Insurance fees | | | 80,318 | | | | 31,235 | | | | 5,950 | |
Legal fees | | | 202,214 | | | | 70,693 | | | | 16,207 | |
Registration and filing fees | | | 159,009 | | | | 92,531 | | | | 84,030 | |
Shareholder reports | | | 841,030 | | | | 239,559 | | | | 35,958 | |
Transfer agent fees | | | 74,905 | | | | 21,540 | | | | 14,867 | |
Trustees’ fees | | | 139,484 | | | | 45,441 | | | | 9,898 | |
Other fees | | | 108,161 | | | | 49,537 | | | | 14,714 | |
| | | | | | | | | | | | |
Total expenses before fee reductions | | | 64,005,304 | | | | 23,649,196 | | | | 5,475,442 | |
Expenses reduced by: | | | | | | | | | | | | |
Shareholder Servicing Agent - Class Specific | | | — | | | | — | | | | (57 | ) |
Distributor - Class Specific | | | (38,209,219 | ) | | | (16,887,384 | ) | | | (2,743,857 | ) |
| | | | | | | | | | | | |
Net Expenses | | | 25,796,085 | | | | 6,761,812 | | | | 2,731,528 | |
| | | | | | | | | | | | |
| | | |
Net Investment Income | | | 6,956,677 | | | | 784,109 | | | | 361,934 | |
| | | | | | | | | | | | |
| | | |
Realized/Unrealized Gains (Losses) from Investment Transactions: | | | | | | | | | | | | |
Net realized gains (losses) from investment transactions | | | 13,730 | | | | (34,042 | ) | | | 89,776 | |
| | | | | | | | | | | | |
Net realized/unrealized gains (losses) from investments | | | 13,730 | | | | (34,042 | ) | | | 89,776 | |
| | | | | | | | | | | | |
Change in net assets resulting from operations | | $ | 6,970,407 | | | $ | 750,067 | | | $ | 451,710 | |
| | | | | | | | | | | | |
See notes to financial statements.
44
FINANCIAL STATEMENTS
Statements of Changes in Net Assets
| | | | | | | | |
| | | Prime
Money Market Fund | |
| | | For the
Six Months Ended
March 31, 2010 | | | For the
Year Ended
September 30, 2009 | |
| | | (Unaudited) | | | | |
From Investment Activities: | | | | | | | | |
Operations: | | | | | | | | |
Net investment income | | $ | 6,956,677 | | | $ | 50,859,576 | |
Net realized gains from investment transactions | | | 13,730 | | | | 69,009 | |
Net change in unrealized appreciation on investments | | | — | | | | 14,844,247 | |
| | | | | | | | |
Change in net assets resulting from operations | | | 6,970,407 | | | | 65,772,832 | |
| | | | | | | | |
Distributions from Net Investment Income | | | | | | | | |
RBC Institutional Class 1 Shareholders | | | (6,230,641 | ) | | | (30,891,053 | ) |
RBC Institutional Class 2 Shareholders | | | (178,887 | ) | | | (23,212 | ) |
RBC Investor Class Shareholders | | | (218,628 | ) | | | (6,340,573 | ) |
RBC Reserve Class Shareholders | | | (250,368 | ) | | | (10,119,679 | ) |
RBC Select Class Shareholders | | | (78,153 | ) | | | (3,485,059 | ) |
| | | | | | | | |
Change in net assets resulting from shareholder distributions | | | (6,956,677 | ) | | | (50,859,576 | ) |
| | | | | | | | |
| | |
Capital Transactions: | | | | | | | | |
Proceeds from shares issued | | | 45,133,559,060 | | | | 45,303,434,752 | |
Distributions reinvested | | | 3,726,674 | | | | 48,514,598 | |
Cost of shares redeemed | | | (42,044,200,751 | ) | | | (40,600,609,712 | ) |
| | | | | | | | |
Change in net assets resulting from capital transactions | | | 3,093,084,983 | | | | 4,751,339,638 | |
| | | | | | | | |
Net increase in net assets | | | 3,093,098,713 | | | | 4,766,252,894 | |
| | |
Net Assets: | | | | | | | | |
Beginning of period | | | 15,357,120,941 | | | | 10,590,868,047 | |
| | | | | | | | |
End of period | | $ | 18,450,219,654 | | | $ | 15,357,120,941 | |
| | | | | | | | |
Distributions in excess of net investment income | | $ | (918 | ) | | $ | (918 | ) |
| | | | | | | | |
| | |
Share Transactions: | | | | | | | | |
Issued | | | 45,133,559,060 | | | | 45,303,434,752 | |
Reinvested | | | 3,726,674 | | | | 48,514,598 | |
Redeemed | | | (42,044,200,751 | ) | | | (40,600,609,712 | ) |
| | | | | | | | |
Change in shares resulting from capital transactions | | | 3,093,084,983 | | | | 4,751,339,638 | |
| | | | | | | | |
See notes to financial statements.
45
FINANCIAL STATEMENTS
Statements of Changes in Net Assets (cont.)
| | | | | | | | |
| | | U.S. Government
Money Market Fund | |
| | | For the
Six Months Ended
March 31, 2010 | | | For the
Year Ended
September 30, 2009 | |
| | | (Unaudited) | | | | |
From Investment Activities: | | | | | | | | |
Operations: | | | | | | | | |
Net investment income | | $ | 784,109 | | | $ | 13,093,151 | |
Net realized losses from investment transactions | | | (34,042 | ) | | | (7,011 | ) |
| | | | | | | | |
Change in net assets resulting from operations | | | 750,067 | | | | 13,086,140 | |
| | | | | | | | |
Distributions from Net Investment Income | | | | | | | | |
RBC Institutional Class 1 Shareholders | | | (563,586 | ) | | | (7,864,168 | ) |
RBC Institutional Class 2 Shareholders | | | (2,251 | ) | | | (123,498 | ) |
RBC Investor Class Shareholders | | | (70,879 | ) | | | (812,604 | ) |
RBC Reserve Class Shareholders | | | (86,270 | ) | | | (2,280,321 | ) |
RBC Select Class Shareholders | | | (61,123 | ) | | | (2,012,560 | ) |
| | | | | | | | |
Change in net assets resulting from shareholder distributions | | | (784,109 | ) | | | (13,093,151 | ) |
| | | | | | | | |
| | |
Capital Transactions: | | | | | | | | |
Proceeds from shares issued | | | 9,231,731,091 | | | | 13,869,654,342 | |
Distributions reinvested | | | 289,297 | | | | 12,324,595 | |
Cost of shares redeemed | | | (8,394,683,394 | ) | | | (11,966,466,424 | ) |
| | | | | | | | |
Change in net assets resulting from capital transactions | | | 837,336,994 | | | | 1,915,512,513 | |
| | | | | | | | |
Net increase in net assets | | | 837,302,952 | | | | 1,915,505,502 | |
| | |
Net Assets: | | | | | | | | |
Beginning of period | | | 5,181,690,322 | | | | 3,266,184,820 | |
| | | | | | | | |
End of period | | $ | 6,018,993,274 | | | $ | 5,181,690,322 | |
| | | | | | | | |
Undistributed net investment income | | $ | 3,719 | | | $ | 3,719 | |
| | | | | | | | |
| | |
Share Transactions: | | | | | | | | |
Issued | | | 9,231,731,091 | | | | 13,869,654,342 | |
Reinvested | | | 289,297 | | | | 12,324,595 | |
Redeemed | | | (8,394,683,394 | ) | | | (11,966,466,424 | ) |
| | | | | | | | |
Change in shares resulting from capital transactions | | | 837,336,994 | | | | 1,915,512,513 | |
| | | | | | | | |
See notes to financial statements.
46
FINANCIAL STATEMENTS
Statements of Changes in Net Assets (cont.)
| | | | | | | | |
| | | Tax-Free
Money Market Fund | |
| | | For the
Six Months Ended
March 31, 2010 | | | For the
Year Ended
September 30, 2009 | |
| | | (Unaudited) | | | | |
From Investment Activities: | | | | | | | | |
Operations: | | | | | | | | |
Net investment income | | $ | 361,934 | | | $ | 3,318,466 | |
Net realized gains from investment transactions | | | 89,776 | | | | 160,623 | |
| | | | | | | | |
Change in net assets resulting from operations | | | 451,710 | | | | 3,479,089 | |
| | | | | | | | |
| | |
Distributions from Net Investment Income | | | | | | | | |
RBC Institutional Class 1 Shareholders | | | (208,668 | ) | | | (2,817,040 | ) |
RBC Institutional Class 2 Shareholders | | | (152,070 | ) | | | (41 | ) |
RBC Investor Class Shareholders | | | (37,908 | ) | | | (97,915 | ) |
RBC Reserve Class Shareholders | | | (76,297 | ) | | | (299,976 | ) |
RBC Select Class Shareholders | | | (45,057 | ) | | | (269,813 | ) |
| | | | | | | | |
Change in net assets resulting from shareholder distributions | | | (520,000 | ) | | | (3,484,785 | ) |
| | | | | | | | |
| | |
Capital Transactions: | | | | | | | | |
Proceeds from shares issued | | | 1,607,674,779 | | | | 2,278,391,724 | |
Distributions reinvested | | | 494,230 | | | | 3,484,785 | |
Cost of shares redeemed | | | (1,039,297,299 | ) | | | (2,259,627,588 | ) |
| | | | | | | | |
Change in net assets resulting from capital transactions | | | 568,871,710 | | | | 22,248,921 | |
| | | | | | | | |
Net increase in net assets | | | 568,803,420 | | | | 22,243,225 | |
| | |
Net Assets: | | | | | | | | |
Beginning of period | | | 925,951,515 | | | | 903,708,290 | |
| | | | | | | | |
End of period | | $ | 1,494,754,935 | | | $ | 925,951,515 | |
| | | | | | | | |
Undistributed net investment income | | $ | — | | | $ | — | |
| | | | | | | | |
| | |
Share Transactions: | | | | | | | | |
Issued | | | 1,607,674,779 | | | | 2,278,391,724 | |
Reinvested | | | 494,230 | | | | 3,484,785 | |
Redeemed | | | (1,039,297,299 | ) | | | (2,259,627,588 | ) |
| | | | | | | | |
Change in shares resulting from capital transactions | | | 568,871,710 | | | | 22,248,921 | |
| | | | | | | | |
See notes to financial statements.
47
FINANCIAL HIGHLIGHTS
| | |
| Prime Money Market Fund | | (Selected data for a share outstanding throughout the periods indicated |
| | | | | | | | | | | | | | | | | | | | | | | | | | | | | | | | | | | | |
| | | | | Investment Activities | | | Distributions | | | | | | | | Ratios/Supplemental Data | |
| | | Net Asset
Value,
Beginning
of Period | | Net
Investment
Income | | | Net
Realized/
Unrealized
Gain (Loss)
on
Investments | | | Total from
Investment
Activities | | | Net
Investment
Income | | | Total
Distributions | | | Net
Asset
Value,
End
of
Period | | Total
Return | | | Net
Assets,
End of
Period
(millions) | | Ratio of
Net
Expenses
to
Average
Net
Assets | | | Ratio of
Net
Investment
Income to
Average
Net Assets | | | Ratio of
Expenses
to
Average
Net
Assets* | |
RBC Institutional Class 1 | | | | | | | | | | | | | | | | | | | | | | | | | | | | | | | | | | | | |
Six Months Ended March 31, 2010 (Unaudited) | | $ | 1.00 | | (a | )(b) | | (b | ) | | (b | ) | | (b | ) | | (b | ) | | $ | 1.00 | | 0.09 | %(c) | | $ | 6,939 | | 0.17 | %(d) | | 0.19 | %(d) | | 0.17 | %(d)(g) |
Year Ended September 30, 2009 | | | 1.00 | | 0.01 | (a) | | (b | ) | | 0.01 | | | (0.01 | ) | | (0.01 | ) | | | 1.00 | | 0.95 | % | | | 4,426 | | 0.55 | %(f) | | 1.03 | % | | 0.55 | % |
Year Ended September 30, 2008 | | | 1.00 | | 0.03 | (a) | | (b | ) | | 0.03 | | | (0.03 | ) | | (0.03 | ) | | | 1.00 | | 3.02 | % | | | 10,591 | | 0.84 | % | | 2.94 | % | | 0.87 | % |
Year Ended September 30, 2007 | | | 1.00 | | 0.05 | | | (b | ) | | 0.05 | | | (0.05 | ) | | (0.05 | ) | | | 1.00 | | 4.69 | % | | | 9,662 | | 0.80 | % | | 4.59 | % | | 0.89 | % |
Year Ended September 30, 2006 | | | 1.00 | | 0.04 | | | (b | ) | | 0.04 | | | (0.04 | ) | | (0.04 | ) | | | 1.00 | | 3.99 | % | | | 8,685 | | 0.80 | % | | 3.93 | % | | 0.92 | % |
Year Ended September 30, 2005 | | | 1.00 | | 0.02 | | | (b | ) | | 0.02 | | | (0.02 | ) | | (0.02 | ) | | | 1.00 | | 2.00 | % | | | 7,922 | | 0.76 | % | | 1.97 | % | | 0.92 | % |
RBC Institutional Class 2 | | | | | | | | | | | | | | | | | | | | | | | | | | | | | | | | | | | | |
Six Months Ended March 31, 2010 (Unaudited) | | $ | 1.00 | | (a | )(b) | | (b | ) | | (b | ) | | (b | ) | | (b | ) | | $ | 1.00 | | 0.05 | %(c) | | $ | 923 | | 0.27 | %(d) | | 0.06 | %(d) | | 0.27 | %(d)(g) |
Period Ended September 30, 2009(e) | | | 1.00 | | (a | )(b) | | (b | ) | | (b | ) | | (b | ) | | (b | ) | | | 1.00 | | 0.62 | %(c) | | | 19 | | 0.31 | %(d) | | 0.45 | %(d) | | 0.32 | %(d) |
RBC Investor Class | | | | | | | | | | | | | | | | | | | | | | | | | | | | | | | | | | | | |
Six Months Ended March 31, 2010 (Unaudited) | | $ | 1.00 | | (a | )(b) | | (b | ) | | (b | ) | | (b | ) | | (b | ) | | $ | 1.00 | | 0.01 | %(c) | | $ | 4,175 | | 0.35 | %(d) | | 0.01 | %(d) | | 1.13 | %(d) |
Period Ended September 30, 2009(e) | | | 1.00 | | (a | )(b) | | (b | ) | | (b | ) | | (b | ) | | (b | ) | | | 1.00 | | 0.15 | %(c) | | | 4,659 | | 0.91 | %(d) | | 0.16 | %(d) | | 1.19 | %(d) |
RBC Reserve Class | | | | | | | | | | | | | | | | | | | | | | | | | | | | | | | | | | | | |
Six Months Ended March 31, 2010 (Unaudited) | | $ | 1.00 | | (a | )(b) | | (b | ) | | (b | ) | | (b | ) | | (b | ) | | $ | 1.00 | | 0.01 | %(c) | | $ | 4,927 | | 0.35 | %(d) | | 0.01 | %(d) | | 1.03 | %(d) |
Period Ended September 30, 2009(e) | | | 1.00 | | (a | )(b) | | (b | ) | | (b | ) | | (b | ) | | (b | ) | | | 1.00 | | 0.22 | %(c) | | | 4,870 | | 0.83 | %(d) | | 0.24 | %(d) | | 1.08 | %(d) |
RBC Select Class | | | | | | | | | | | | | | | | | | | | | | | | | | | | | | | | | | | | |
Six Months Ended March 31, 2010 (Unaudited) | | $ | 1.00 | | (a | )(b) | | (b | ) | | (b | ) | | (b | ) | | (b | ) | | $ | 1.00 | | 0.01 | %(c) | | $ | 1,486 | | 0.35 | %(d) | | 0.01 | %(d) | | 0.92 | %(d) |
Period Ended September 30, 2009(e) | | | 1.00 | | (a | )(b) | | (b | ) | | (b | ) | | (b | ) | | (b | ) | | | 1.00 | | 0.27 | %(c) | | | 1,383 | | 0.77 | %(d) | | 0.29 | %(d) | | 0.97 | %(d) |
| * | During the periods, certain fees were contractually or voluntarily reduced and/or reimbursed. If such contractual/voluntary fee reductions and reimbursements had not occurred, the ratio would have been as indicated. |
| (a) | Per share net investment income has been calculated using the average daily shares method. |
| (b) | Less than $0.01 or $(0.01) per share. |
| (e) | For the period from November 21, 2008 (commencement of operations) to September 30, 2009. |
| (f) | Beginning November 21, 2008, the net operating expenses were contractually limited to 0.20% of average daily net assets. The ratio of net expenses to average net assets represents a blended percentage for the year ended September 30, 2009. |
| (g) | There were no waivers or reimbursements during the period. |
See notes to financial statements.
48
FINANCIAL HIGHLIGHTS
| | |
| U.S. Government Money Market Fund | | (Selected data for a share outstanding throughout the periods indicated |
| | | | | | | | | | | | | | | | | | | | | | | | | | | | | | | | | | | | |
| | | | | Investment Activities | | | Distributions | | | | | | | | Ratios/Supplemental Data | |
| | | Net Asset
Value,
Beginning
of Period | | Net
Investment
Income | | | Net
Realized/
Unrealized
Gain (Loss)
on
Investments | | | Total from
Investment
Activities | | | Net
Investment
Income | | | Total
Distributions | | | Net
Asset
Value,
End
of
Period | | Total
Return | | | Net
Assets,
End of
Period
(millions) | | Ratio of
Net
Expenses
to
Average
Net
Assets | | | Ratio of
Net
Investment
Income to
Average
Net Assets | | | Ratio of
Expenses
to
Average
Net
Assets* | |
RBC Institutional Class 1 | | | | | | | | | | | | | | | | | | | | | | | | | | | | | | | | | | | | |
Six Months Ended March 31, 2010 (Unaudited) | | $ | 1.00 | | (a | )(b) | | (b | ) | | (b | ) | | (b | ) | | (b | ) | | $ | 1.00 | | 0.05 | %(c) | | $ | 1,885 | | 0.17 | %(d) | | 0.09 | %(d) | | 0.17 | %(d)(g) |
Year Ended September 30, 2009 | | | 1.00 | | 0.01 | (a) | | (b | ) | | 0.01 | | | (0.01 | ) | | (0.01 | ) | | | 1.00 | | 0.73 | % | | | 848 | | 0.49 | %(f) | | 0.98 | % | | (g | ) |
Year Ended September 30, 2008 | | | 1.00 | | 0.03 | (a) | | (b | ) | | 0.03 | | | (0.03 | ) | | (0.03 | ) | | | 1.00 | | 2.70 | % | | | 3,266 | | 0.72 | % | | 2.51 | % | | (g | ) |
Year Ended September 30, 2007 | | | 1.00 | | 0.04 | | | (b | ) | | 0.04 | | | (0.04 | ) | | (0.04 | ) | | | 1.00 | | 4.56 | % | | | 1,393 | | 0.76 | % | | 4.47 | % | | (g | ) |
Year Ended September 30, 2006 | | | 1.00 | | 0.04 | | | (b | ) | | 0.04 | | | (0.04 | ) | | (0.04 | ) | | | 1.00 | | 3.90 | % | | | 749 | | 0.78 | % | | 3.82 | % | | (g | ) |
Year Ended September 30, 2005 | | | 1.00 | | 0.02 | | | (b | ) | | 0.02 | | | (0.02 | ) | | (0.02 | ) | | | 1.00 | | 1.96 | % | | | 813 | | 0.74 | % | | 1.92 | % | | 0.77 | % |
RBC Institutional Class 2 | | | | | | | | | | | | | | | | | | | | | | | | | | | | | | | | | | | | |
Six Months Ended March 31, 2010 (Unaudited) | | $ | 1.00 | | (a | )(b) | | (b | ) | | (b | ) | | (b | ) | | (b | ) | | $ | 1.00 | | 0.01 | %(c) | | $ | 16 | | 0.25 | %(d) | | 0.01 | %(d) | | 0.27 | %(d) |
Period Ended September 30, 2009(e) | | | 1.00 | | (a | )(b) | | (b | ) | | (b | ) | | (b | ) | | (b | ) | | | 1.00 | | 0.44 | %(c) | | | 14 | | 0.30 | %(d) | | 0.56 | %(d) | | 0.30 | %(d) |
RBC Investor Class | | | | | | | | | | | | | | | | | | | | | | | | | | | | | | | | | | | | |
Six Months Ended March 31, 2010 (Unaudited) | | $ | 1.00 | | (a | )(b) | | (b | ) | | (b | ) | | (b | ) | | (b | ) | | $ | 1.00 | | 0.01 | %(c) | | $ | 1,392 | | 0.26 | %(d) | | 0.01 | %(d) | | 1.13 | %(d) |
Period Ended September 30, 2009(e) | | | 1.00 | | (a | )(b) | | (b | ) | | (b | ) | | (b | ) | | (b | ) | | | 1.00 | | 0.11 | %(c) | | | 1,372 | | 0.65 | %(d) | | 0.07 | %(d) | | 1.17 | %(d) |
RBC Reserve Class | | | | | | | | | | | | | | | | | | | | | | | | | | | | | | | | | | | | |
Six Months Ended March 31, 2010 (Unaudited) | | $ | 1.00 | | (a | )(b) | | (b | ) | | (b | ) | | (b | ) | | (b | ) | | $ | 1.00 | | 0.01 | %(c) | | $ | 1,637 | | 0.26 | %(d) | | 0.01 | %(d) | | 1.03 | %(d) |
Period Ended September 30, 2009(e) | | | 1.00 | | (a | )(b) | | (b | ) | | (b | ) | | (b | ) | | (b | ) | | | 1.00 | | 0.14 | %(c) | | | 1,714 | | 0.65 | %(d) | | 0.15 | %(d) | | 1.06 | %(d) |
RBC Select Class | | | | | | | | | | | | | | | | | | | | | | | | | | | | | | | | | | | | |
Six Months Ended March 31, 2010 (Unaudited) | | $ | 1.00 | | (a | )(b) | | (b | ) | | (b | ) | | (b | ) | | (b | ) | | $ | 1.00 | | 0.01 | %(c) | | $ | 1,090 | | 0.26 | %(d) | | 0.01 | %(d) | | 0.92 | %(d) |
Period Ended September 30, 2009(e) | | | 1.00 | | (a | )(b) | | (b | ) | | (b | ) | | (b | ) | | (b | ) | | | 1.00 | | 0.17 | %(c) | | | 1,233 | | 0.63 | %(d) | | 0.18 | %(d) | | 0.95 | %(d) |
| * | During the periods, certain fees were contractually or voluntarily reduced and/or reimbursed. If such contractual/voluntary fee reductions and reimbursements had not occurred, the ratio would have been as indicated. |
| (a) | Per share net investment income has been calculated using the average daily shares method. |
| (b) | Less than $0.01 or $(0.01) per share. |
| (e) | For the period from November 21, 2008 (commencement of operations) to September 30, 2009. |
| (f) | Beginning November 21, 2008, the net operating expenses were contractually limited to 0.20% of average daily net assets. The ratio of net expenses to average net assets represents a blended percentage for the year ended September 30, 2009. |
| (g) | There were no waivers or reimbursements during the period. |
See notes to financial statements.
49
FINANCIAL HIGHLIGHTS
| | |
| Tax-Free Money Market Fund | | (Selected data for a share outstanding throughout the periods indicated |
| | | | | | | | | | | | | | | | | | | | | | | | | | | | | | | | | | | | | |
| | | | | Investment Activities | | | Distributions | | | | | | | | Ratios/Supplemental Data | |
| | | Net Asset
Value,
Beginning
of Period | | Net
Investment
Income | | | Net
Realized/
Unrealized
Gain
(Loss) on
Investment | | | Total from
Investments
Activities | | | Net
Investment
Income | | | Total
Distributions | | | Net
Asset
Value,
End
of
Period | | Total
Return | | | Net
Assets,
End of
Period
(millions) | | | Ratio of
Net
Expenses
to
Average
Net
Assets | | | Ratio of Net
Investment
Income(Loss)
to Average
Net Assets | | | Ratio of
Expenses
to
Average
Net
Assets* | |
RBC Institutional Class 1 | | | | | | | | | | �� | | | | | | | | | | | | | | | | | | | | | | | | | | | |
Six Months Ended March 31, 2010 (Unaudited) | | $ | 1.00 | | (a | )(b) | | (b | ) | | (b | ) | | (b | ) | | (b | ) | | $ | 1.00 | | 0.16 | %(c) | | $ | 175 | | | 0.18 | %(d) | | 0.26 | %(d) | | 0.18 | %(d) |
Year Ended September 30, 2009 | | | 1.00 | | 0.01 | (a) | | (b | ) | | 0.01 | | | (0.01 | ) | | (0.01 | ) | | | 1.00 | | 0.74 | % | | | 51 | | | 0.71 | %(f) | | 1.49 | % | | 0.71 | % |
Year Ended September 30, 2008 | | | 1.00 | | 0.02 | (a) | | (b | ) | | 0.02 | | | (0.02 | ) | | (0.02 | ) | | | 1.00 | | 1.95 | % | | | 904 | | | 0.80 | % | | 1.90 | % | | 0.84 | % |
Year Ended September 30, 2007 | | | 1.00 | | 0.03 | | | (b | ) | | 0.03 | | | (0.03 | ) | | (0.03 | ) | | | 1.00 | | 3.00 | % | | | 841 | | | 0.70 | % | | 2.96 | % | | 0.84 | % |
Year Ended September 30, 2006 | | | 1.00 | | 0.02 | | | — | | | 0.02 | | | (0.02 | ) | | (0.02 | ) | | | 1.00 | | 2.52 | % | | | 791 | | | 0.70 | % | | 2.49 | % | | 0.85 | % |
Year Ended September 30, 2005 | | | 1.00 | | 0.01 | | | — | | | 0.01 | | | (0.01 | ) | | (0.01 | ) | | | 1.00 | | 1.44 | % | | | 858 | | | 0.66 | % | | 1.41 | % | | 0.83 | % |
RBC Institutional Class 2 | | | | | | | | | | | | | | | | | | | | | | | | | | | | | | | | | | | | | |
Six Months Ended March 31, 2010 (Unaudited) | | $ | 1.00 | | (a | )(b) | | (b | ) | | (b | ) | | (b | ) | | (b | ) | | $ | 1.00 | | 0.11 | %(c) | | $ | 352 | | | 0.28 | %(d) | | 0.13 | %(d) | | 0.28 | %(d) |
Period Ended September 30, 2009(e) | | | 1.00 | | (a | )(b) | | (b | ) | | (b | ) | | (b | ) | | (b | ) | | | 1.00 | | 0.41 | %(c) | | | (h | ) | | 0.34 | %(d) | | 0.45 | %(d) | | 0.34 | %(d) |
RBC Investor Class | | | | | | | | | | | | | | | | | | | | | | | | | | | | | | | | | | | | | |
Six Months Ended March 31, 2010 (Unaudited) | | $ | 1.00 | | (a | )(b) | | (b | ) | | (b | ) | | (b | ) | | (b | ) | | $ | 1.00 | | 0.02 | %(c) | | $ | 221 | | | 0.48 | %(d) | | 0.01 | %(d) | | 1.14 | %(d) |
Period Ended September 30, 2009(e) | | | 1.00 | | (a | )(b) | | (b | ) | | (b | ) | | (b | ) | | (b | ) | | | 1.00 | | 0.04 | %(c) | | | 202 | | | 0.76 | %(d) | | 0.03 | %(d) | | 1.19 | %(d) |
RBC Reserve Class | | | | | | | | | | | | | | | | | | | | | | | | | | | | | | | | | | | | | |
Six Months Ended March 31, 2010 (Unaudited) | | $ | 1.00 | | (a | )(b) | | (b | ) | | (b | ) | | (b | ) | | (b | ) | | $ | 1.00 | | 0.02 | %(c) | | $ | 455 | | | 0.47 | %(d) | | 0.01 | %(d) | | 1.04 | %(d) |
Period Ended Sepember 30, 2009(e) | | | 1.00 | | (a | )(b) | | (b | ) | | (b | ) | | (b | ) | | (b | ) | | | 1.00 | | 0.06 | %(c) | | | 432 | | | 0.74 | %(d) | | 0.05 | %(d) | | 1.09 | %(d) |
RBC Select Class | | | | | | | | | | | | | | | | | | | | | | | | | | | | | | | | | | | | | |
Six Months Ended March 31, 2010 (Unaudited) | | $ | 1.00 | | (a | )(b) | | (b | ) | | (b | ) | | (b | ) | | (b | ) | | $ | 1.00 | | 0.02 | %(c) | | $ | 291 | | | 0.47 | %(d) | | 0.01 | %(d) | | 0.94 | %(d) |
Period Ended September 30, 2009(e) | | | 1.00 | | (a | )(b) | | (b | ) | | (b | ) | | (b | ) | | (b | ) | | | 1.00 | | 0.11 | %(c) | | | 242 | | | 0.68 | %(d) | | 0.10 | %(d) | | 0.99 | %(d) |
| * | During the periods, certain fees were contractually or voluntarily reduced and/or reimbursed. If such contractual/voluntary fee reductions and reimbursements had not occurred, the ratio would have been as indicated. |
| (a) | Per share net investment income has been calculated using the average daily shares method. |
| (b) | Less than $0.01 or $(0.01) per share. |
| (e) | For the period from November 21, 2008 (commencement of operations) to September 30, 2009. |
| (f) | Beginning November 21, 2008, the net operating expenses were contractually limited to 0.20% of average daily net assets. The ratio of net expenses to average net assets represents a blended percentage for the year ended September 30, 2009. |
See notes to financial statements.
50
NOTES TO FINANCIAL STATEMENTS
March 31, 2010 (Unaudited)
1. Organization
RBC Funds Trust (“the Trust”), is registered under the Investment Company Act of 1940 (as amended) as an open-end management investment company. The Trust was organized as a Delaware statutory trust on December 16, 2003. Predecessor funds to the Trust were reorganized as portfolios of the Trust effective April 16, 2004. This semi-annual report includes the following three investment portfolios (“Funds”):
| • | | Prime Money Market Fund (“Prime Money Market Fund”) |
| • | | U.S. Government Money Market Fund (“U.S. Government Money Market Fund”) |
| • | | Tax-Free Money Market Fund (“Tax-Free Money Market Fund”) |
The Prime Money Market Fund, U.S. Government Money Market Fund and Tax-Free Money Market Fund offer five share classes: RBC Institutional Class 1, RBC Institutional Class 2, RBC Investor Class, RBC Reserve Class and RBC Select Class.
RBC Global Asset Management (U.S.) Inc (“RBC GAM (US)”) formerly known as Voyageur Asset Management Inc., acts as the investment adviser for the Funds. The officers of the Trust (“Fund Management”) are also employees of RBC GAM (US) or its affiliates or PNC Global Investment Servicing (U.S.) Inc. (“PNC”), the co-administrator.
2. Significant Accounting Policies
Summarized below are the significant accounting policies of the Funds. These policies conform to accounting principles generally accepted in the United States of America (“GAAP”). Fund management follows these policies when preparing financial statements. Management may also be required to make estimates and assumptions that affect the reported amounts of assets and liabilities at the date of the financial statements and the reported amounts of income and expenses for the period. Actual results could differ from those estimates. The financial statements are as of the close of regular trading on the New York Stock Exchange.
Security Valuation:
Securities held by the Funds are valued at amortized cost, which approximates fair market value, in order to maintain a constant net asset value of $1.00 per share. If amortized cost no longer approximates market value due to credit or other impairments of an issuer, the Fund will use pricing and valuation procedures approved by the Trust’s Board of Trustees (the “Board”) to determine a security’s fair value. Investments in open-end companies are valued at net asset value.
Money market funds must invest exclusively in high quality securities. To be considered high quality, a security must be rated in one of the two highest short-term credit quality categories by a nationally recognized rating organization such as Standard & Poors Corporation or Moody’s Investors Service.
Fair Value Measurements:
Various inputs are used in determining the fair value of investments which are as follows:
| • | | Level 1 – Inputs that reflect unadjusted quoted prices in active markets for identical assets or liabilities that the Funds have the ability to access at the measurement date. |
| • | | Level 2 – Inputs other than quoted prices that are observable for the asset or liability either directly or indirectly, including inputs in markets that are not considered to be active. Generally, the types of securities included in Level 2 for the Funds are U.S. Treasury bills and certain money market instruments, including those valued at amortized cost under Rule 2a-7. Amortized cost approximates the current fair value of a security, but is not obtained from a quoted price in an active market. |
51
NOTES TO FINANCIAL STATEMENTS
| • | | Level 3 – Unobservable inputs based on the best information available in the circumstances, to the extent observable inputs are not available (including the Fund’s own assumptions in determining the fair value of investments. |
The inputs or methodology used for valuing securities are not necessarily an indication of the risk associated with investing in those securities.
The summary of inputs used to determine the fair value of the Fund’s investments as of March 31, 2010 is as follows:
| | | | | | | | | | | | | | |
| Funds | | Level 1
Quoted Prices | | | Level 2
Significant
Observable
Inputs | | | Level 3
Significant
Unobservable
Inputs | | Total |
Prime Money Market | | $ | 200,000,000 | (a) | | $ | 18,087,567,097 | (b) | | $ | — | | $ | 18,287,567,097 |
U.S. Government Money Market | | | 20,000,000 | (a) | | | 5,722,670,021 | (b)(c) | | | — | | | 5,742,670,021 |
Tax Free Money Market | | | 51,000,000 | (a) | | | 1,439,457,320 | (c) | | | — | | | 1,490,457,320 |
| (a) | Level 1 investments consist of Investment Companies. |
| (b) | The breakdown of the Fund’s investments by security type is disclosed in the Schedules of Portfolio Investments. |
| (c) | The breakdown of the Fund’s investments by state classification is disclosed in the Schedules of Portfolio Investments. |
In January 2010, the Financial Accounting Standards Board (“FASB”) issued Accounting Standards Update “Improving Disclosures about Fair Value Measurements” that requires additional disclosures regarding fair value measurements. Certain required disclosures are effective for interim and annual reporting periods beginning after December 15, 2009, and other required disclosures are effective for fiscal years beginning after December 15, 2010, and for interim periods within those fiscal years. Management is currently evaluating the impact it will have on its financial statement disclosures.
Investment Transactions and Income:
Investment transactions are accounted for on the date the security is bought or sold (“trade date”). Dividend income is recorded on the ex-dividend date. Realized gains and losses from investment transactions are calculated based on the costs of the specific security (also known as identified cost basis). Interest income is recognized on the accrual basis. The Funds amortize all premiums and discounts on debt securities.
Financial Instruments:
The Funds may engage in when-issued transactions. The Funds record when-issued securities on the trade date and maintain sufficient liquidity so that cash will be available to make payment for the securities purchased. Securities purchased on a when-issued basis are valued daily beginning on trade date and begin earning interest on the settlement date. As of March 31, 2010, the Funds held no when-issued securities.
Repurchase Agreements:
The Funds may enter into repurchase agreements with primary dealers that report to the Federal Reserve Bank of New York or the 100 largest U.S. commercial banks (as measured by domestic deposits) who are deemed creditworthy under guidelines approved by the Board. These repurchase agreements are subject to the seller’s agreement to repurchase such securities at a mutually agreed upon date and price. The repurchase price generally equals the price paid by the Funds plus interest negotiated on the basis of current short-term rates.
Securities pledged by the dealers as collateral for repurchase agreements are held by U.S. Bank N.A., the Funds’ custodian bank, until maturity of the repurchase agreement. The Funds have procedures to secure additional collateral, if needed, to ensure that the daily market value of the collateral remains in excess of the market value of the repurchase agreement in the event of a default.
52
NOTES TO FINANCIAL STATEMENTS
Expense, Investment Income and Gain/Loss Allocation:
Each Fund pays the expenses that are directly related to its operations, such as custodian fees or investment advisory fees. Expenses incurred by the Trust, such as trustee or legal fees, are allocated among each of the Funds either proportionately based upon each Fund’s relative net assets or using another reasonable basis such as equally across all Funds, depending on the nature of the expense. Individual share classes within a Fund are charged expenses specific to that class, such as distribution fees. Within a Fund, expenses other than class specific expenses are allocated daily to each class based upon the proportion of relative net assets. Investment income and realized and unrealized gains or losses are allocated to each class of shares based on the proportion of relative net assets.
Distributions to Shareholders:
Each Fund pays out any income that it receives, less expenses, in the form of dividends and capital gain distributions to its shareholders. Income dividends are declared daily and paid monthly. Dividends will also be paid at any time during the month upon total redemption of shares in an account. Capital gains, if any, are declared and paid at least annually. Distributions to shareholders are recorded on the ex-dividend date. The amount of dividends and distributions are calculated based on federal income tax regulations, which may differ from GAAP. These “book/tax” differences may be either temporary or permanent in nature. To the extent these differences are determined, as of the end of the tax year, to be permanent (e.g. expiring capital loss carryforward), they are reclassified within a Fund’s capital accounts based on their federal tax basis treatment. Such differences are not reflected in the calculation of the Financial Highlights.
Credit Enhancement:
Certain obligations held in the Funds have credit enhancement or liquidity features that may, under certain circumstances, provide for repayment of principal and interest on the obligation upon demand date, interest rate reset date or final maturity. These enhancements may include: letters of credit; liquidity guarantees; security purchase agreements; tender option purchase agreements; and third party insurance (i.e., AMBAC and MBIA).
3. Agreements and Other Transactions with Affiliates
The Trust has entered into investment advisory agreements with RBC GAM (US) under which RBC GAM (US) manages the Funds’ assets and furnishes related office facilities, equipment, research and personnel. The agreements require the Funds to pay RBC GAM (US) a monthly fee based upon average daily net assets. Under the terms of the advisory contract RBC GAM (US) is entitled to receive fees based on a percentage of the average daily net assets as follows:
| | | | | |
| | | Average Daily Net
Assets of Fund | | Annual Rate | |
Prime Money Market Fund | | All Net Assets | | 0.10 | % |
U.S. Government Money Market Fund | | All Net Assets | | 0.10 | % |
Tax Free Money Market Fund | | All Net Assets | | 0.10 | % |
RBC Institutional Class 1 of Prime Money Market Fund, U.S. Government Money Market Fund and Tax-Free Money Market Fund pays an annual shareholder services administration fee of 0.05% of the average daily net assets attributable to RBC Institutional Class 1 shares of a Fund that is used to compensate financial intermediaries for providing services to shareholders and maintaining shareholder accounts. This shareholder services administration fee is not paid pursuant to Rule 12b-1. RBC GAM (US) has contractually agreed to waive fees and/or reimburse expenses under an Expense Limitation Agreement in order to maintain the net annual fund operating expenses at 0.20% for RBC Institutional Class 1 of the Prime Money Market Fund, U.S. Government Money Market Fund and Tax-Free Money Market Fund. During the six months ended March 31, 2010, RBC GAM (US) voluntarily waived shareholder servicing fees of $57 for Tax-Free Money Market Fund.
RBC GAM (US) and PNC serve as co-administrators to the Funds. Services provided under the administrative services contract include providing day-to-day administration of matters related to the
53
NOTES TO FINANCIAL STATEMENTS
Funds, maintenance of their records and the preparation of reports. RBC GAM (US) does not receive an administration services fee. PNC receives a fee for its services payable by the Funds based on the Fund’s average net assets. PNC’s fee is included with “Accounting fees” in the Statements of Operations.
Certain Officers and Trustees of the Trust are affiliated with the adviser or the administrator. Such Officers and Trustees receive no compensation from the Funds for serving in their respective roles.
The RBC Funds currently pay the independent Trustees (Trustees of the Trust who are not directors, officers or employees of the adviser, administrator or distributor) an annual retainer of $30,000. The Board Chairperson and Audit Committee Chairperson each receive an additional retainer of $2,500 annually, and all other trustees serving as Chair of a Board committee each receive an additional retainer of $1,000 annually. In addition, Independent Trustees receive a quarterly meeting fee of $5,000 for each in-person Board meeting attended, a meeting fee of $1,000 for each telephonic or Special Board meeting attended, and a $1,000 fee for each Board committee meeting attended and are reimbursed for all out-of-pocket expenses relating to attendance at such meetings.
Security Transactions with Affiliated Funds
During the six months ended March 31, 2010, the Prime Money Market Fund and Tax-Free Money Market Fund engaged in security purchase and sale transactions with other RBC Funds or investment advisory clients managed by RBC GAM (US). These purchase and sale transactions complied with Rule 17a-7 under the Investment Company Act of 1940 (as amended) and amounted to $187,860,000 and $0 for Prime Money Market Fund, respectively, and $298,863,000 and $50,575,000 for Tax-Free Money Market Fund, respectively.
4. Fund Distribution
The Prime Money Market, U. S. Government Money Market and Tax-Free Money Market Funds have adopted a Master Distribution 12b-1 Plan (the”Plan”) with respect to RBC Institutional Class 2, RBC Investor Class, RBC Reserve Class and the RBC Select Class, in which Tamarack Distributors Inc. (through February 15, 2010) acted, and Quasar Distributors LLC (effective February 16, 2010) (the “Distributor”) acts as the Funds’ distributor. Tamarack Distributors, Inc. was an affiliate of RBC GAM (US), Quasar Distributors LLC is unaffiliated. The Plan permits each Fund to make payments for or to reimburse the Distributor monthly for distribution-related costs and expenses of marketing shares of each share class covered under the Plan, and/or for providing shareholder services. The following chart shows the current Plan fee rate for each class:
| | | | | | | | | | | | |
| | | RBC Institutional Class 2 | | | RBC Investor Class | | | RBC Reserve Class | | | RBC Select Class | |
12b-1 Plan Fee | | 0.15 | % | | 1.00 | % | | 0.90 | % | | 0.80 | % |
Plan fees are based on average daily net assets of the applicable class. Up to 0.25% of each Plan fee may be designated as a Service Fee, as defined by the applicable rules of the Financial Industry Regulatory Authority.
54
NOTES TO FINANCIAL STATEMENTS
RBC Capital Markets Corporation, in its role as shareholder servicing agent to the Funds, has agreed to waive fees and/or reimburse expenses in order to maintain the net annual fund operating expenses for each class listed below for each Fund to the following amounts:
| | | |
Fund | | Operating Expense Limit | |
Prime Money Market Fund | | | |
RBC Institutional Class 2 | | 0.30 | % |
RBC Investor Class | | 1.05 | % |
RBC Reserve Class | | 0.90 | % |
RBC Select Class | | 0.80 | % |
| |
U.S. Government Money Market Fund | | | |
RBC Institutional Class 2 | | 0.30 | % |
RBC Investor Class | | 1.00 | % |
RBC Reserve Class | | 0.85 | % |
RBC Select Class | | 0.77 | % |
| |
Tax-Free Money Market Fund | | | |
RBC Institutional Class 2 | | 0.30 | % |
RBC Investor Class | | 1.00 | % |
RBC Reserve Class | | 0.85 | % |
RBC Select Class | | 0.70 | % |
This Expense Limitation Agreement is in place until January 31, 2011 and shall continue for additional one-year terms unless terminated by either party at any time. Each Fund will carry forward, for a period not to exceed 12 months from the date on which a waiver or reimbursement is made by the Distributor, any expenses in excess of the Expense Limitation and repay the Distributor such amounts, provided the Fund is able to effect such repayment and remain in compliance with the Expense Limitation. At March 31, 2010, the amounts subject to possible recoupment under the expense limitation agreement are $57,884,368, $30,023,030 and $4,646,293 for the Prime Money Market Fund, U.S. Government Money Market Fund and Tax Free Money Market Fund, respectively.
The Distributor may voluntarily waive and/or reimburse additional fund operating expenses from time to time. Any such voluntary program may be modified or discontinued at any time without notice.
For the six months ended March 31, 2010, the following distribution fees were waived:
| | | |
Fund | | Distribution Fees Waived |
Prime Money Market Fund | | | |
RBC Investor Class | | $ | 16,913,447 |
RBC Reserve Class | | | 16,839,728 |
RBC Select Class | | | 4,456,044 |
| |
U.S. Government Money Market Fund | | | |
RBC Institutional Class 2 | | $ | 4,235 |
RBC Investor Class | | | 6,194,233 |
RBC Reserve Class | | | 6,620,843 |
RBC Select Class | | | 4,068,073 |
| |
Tax-Free Money Market Fund | | | |
RBC Investor Class | | $ | 775,680 |
RBC Reserve Class | | | 1,317,043 |
RBC Select Class | | | 651,134 |
55
NOTES TO FINANCIAL STATEMENTS
5. Capital Share Transactions
The number of shares sold, reinvested and redeemed correspond to the net proceeds from sale of shares, reinvestments of dividends and cost of shares redeemed, respectively, since shares are redeemed at $1.00 per share.
Share transactions for the period were as follows:
| | | | | | | | | | | | | | | | |
| | | Prime
Money Market Fund | | | Prime
Money Market Fund | | | U.S. Government
Money Market Fund | | | U.S. Government
Money Market Fund | |
| | | For the Six Months
Ended
March 31,
2010 | | | For the Period
Ended
September 30,
2009* | | | For the Six Months
Ended
March 31,
2010 | | | For the Period
Ended
September 30,
2009* | |
| | | (Unaudited) | | | | | | (Unaudited) | | | | |
| | | | |
CAPITAL TRANSACTIONS: | | | | | | | | | | | | | | | | |
RBC Institutional Class 1 | | | | | | | | | | | | | | | | |
Proceeds from shares issued | | $ | 40,088,656,356 | | | $ | 28,816,601,968 | | | $ | 6,971,637,176 | | | $ | 4,009,468,601 | |
Distributions reinvested | | | 3,002,811 | | | | 28,549,543 | | | | 69,051 | | | | 7,117,794 | |
Cost of shares redeemed | | | (37,579,390,789 | ) | | | (35,029,506,446 | ) | | | (5,935,356,662 | ) | | | (6,434,449,599 | ) |
| | | | | | | | | | | | | | | | |
| | | | |
Change in RBC Institutional Class 1 | | $ | 2,512,268,378 | | | $ | (6,184,354,935 | ) | | $ | 1,036,349,565 | | | $ | (2,417,863,204 | ) |
| | | | | | | | | | | | | | | | |
| | | | |
RBC Institutional Class 2 | | | | | | | | | | | | | | | | |
Proceeds from shares issued | | $ | 1,544,766,394 | | | $ | 142,095,726 | | | $ | 132,581,242 | | | $ | 238,100,001 | |
Distributions reinvested | | | 176,681 | | | | 19,764 | | | | 1,959 | | | | 101,299 | |
Cost of shares redeemed | | | (640,685,013 | ) | | | (123,001,000 | ) | | | (130,868,434 | ) | | | (224,104,649 | ) |
| | | | | | | | | | | | | | | | |
| | | | |
Change in RBC Institutional Class 2 | | $ | 904,258,062 | | | $ | 19,114,490 | | | $ | 1,714,767 | | | $ | 14,096,651 | |
| | | | | | | | | | | | | | | | |
| | | | |
RBC Investor Class | | | | | | | | | | | | | | | | |
Proceeds from shares issued | | $ | 953,216,829 | | | $ | 6,804,530,025 | | | $ | 718,823,092 | | | $ | 3,386,163,324 | |
Distributions reinvested | | | 218,639 | | | | 6,340,574 | | | | 70,886 | | | | 812,612 | |
Cost of shares redeemed | | | (1,436,778,022 | ) | | | (2,150,105,057 | ) | | | (698,801,613 | ) | | | (2,015,297,655 | ) |
| | | | | | | | | | | | | | | | |
| | | | |
Change in RBC Investor Class | | $ | (483,342,554 | ) | | $ | 4,660,765,542 | | | $ | 20,092,365 | | | $ | 1,371,678,281 | |
| | | | | | | | | | | | | | | | |
| | | | |
RBC Reserve Class | | | | | | | | | | | | | | | | |
Proceeds from shares issued | | $ | 1,519,073,988 | | | $ | 6,965,218,353 | | | $ | 615,505,431 | | | $ | 2,901,934,135 | |
Distributions reinvested | | | 250,381 | | | | 10,119,658 | | | | 86,272 | | | | 2,280,328 | |
Cost of shares redeemed | | | (1,462,097,971 | ) | | | (2,103,358,880 | ) | | | (692,994,791 | ) | | | (1,190,006,864 | ) |
| | | | | | | | | | | | | | | | |
| | | | |
Change in RBC Reserve Class | | $ | 57,226,398 | | | $ | 4,871,979,131 | | | $ | (77,403,088 | ) | | $ | 1,714,207,599 | |
| | | | | | | | | | | | | | | | |
| | | | |
RBC Select Class | | | | | | | | | | | | | | | | |
Proceeds from shares issued | | $ | 1,027,845,494 | | | $ | 2,574,988,680 | | | $ | 793,184,150 | | | $ | 3,333,988,281 | |
Distributions reinvested | | | 78,161 | | | | 3,485,059 | | | | 61,129 | | | | 2,012,562 | |
Cost of shares redeemed | | | (925,248,956 | ) | | | (1,194,638,329 | ) | | | (936,661,894 | ) | | | (2,102,607,657 | ) |
| | | | | | | | | | | | | | | | |
| | | | |
Change in RBC Select Class | | $ | 102,674,699 | | | $ | 1,383,835,410 | | | $ | (143,416,615 | ) | | $ | 1,233,393,186 | |
| | | | | | | | | | | | | | | | |
| | | | |
Change in net assets resulting from capital transactions | | $ | 3,093,084,983 | | | $ | 4,751,339,638 | | | $ | 837,336,994 | | | $ | 1,915,512,513 | |
| | | | | | | | | | | | | | | | |
56
NOTES TO FINANCIAL STATEMENTS
| | | | | | | | |
| | | Tax-Free
Money Market Fund | | | Tax-Free
Money Market Fund | |
| | | For the Six Months
Ended
March 31,
2010 | | | For the Period
Ended
September 30,
2009* | |
| | | (Unaudited) | | | | |
| | |
CAPITAL TRANSACTIONS: | | | | | | | | |
RBC Institutional Class 1 | | | | | | | | |
Proceeds from shares issued | | $ | 371,193,808 | | | $ | 293,818,956 | |
Distributions reinvested | | | 182,898 | | | | 2,817,032 | |
Cost of shares redeemed | | | (247,010,017 | ) | | | (1,149,542,084 | ) |
| | | | | | | | |
| | |
Change in RBC Institutional Class 1 | | $ | 124,366,689 | | | $ | (852,906,096 | ) |
| | | | | | | | |
| | |
RBC Institutional Class 2 | | | | | | | | |
Proceeds from shares issued | | $ | 455,181,136 | | | $ | 10,001 | |
Distributions reinvested | | | 152,070 | | | | 41 | |
Cost of shares redeemed | | | (102,920,665 | ) | | | — | |
| | | | | | | | |
| | |
Change in RBC Institutional Class 2 | | $ | 352,412,541 | | | $ | 10,042 | |
| | | | | | | | |
| | |
RBC Investor Class | | | | | | | | |
Proceeds from shares issued | | $ | 233,465,963 | | | $ | 430,651,538 | |
Distributions reinvested | | | 37,910 | | | | 97,917 | |
Cost of shares redeemed | | | (214,167,071 | ) | | | (229,202,586 | ) |
| | | | | | | | |
| | |
Change in RBC Investor Class | | $ | 19,336,802 | | | $ | 201,546,869 | |
| | | | | | | | |
| | |
RBC Reserve Class | | | | | | | | |
Proceeds from shares issued | | $ | 243,952,136 | | | $ | 821,914,742 | |
Distributions reinvested | | | 76,295 | | | | 299,980 | |
Cost of shares redeemed | | | (220,761,748 | ) | | | (390,510,981 | ) |
| | | | | | | | |
| | |
Change in RBC Reserve Class | | $ | 23,266,683 | | | $ | 431,703,741 | |
| | | | | | | | |
| | |
RBC Select Class | | | | | | | | |
Proceeds from shares issued | | $ | 303,881,736 | | | $ | 731,996,487 | |
Distributions reinvested | | | 45,057 | | | | 269,815 | |
Cost of shares redeemed | | | (254,437,798 | ) | | | (490,371,937 | ) |
| | | | | | | | |
| | |
Change in RBC Select Class | | $ | 49,488,995 | | | $ | 241,894,365 | |
| | | | | | | | |
| | |
Change in net assets resulting from capital transactions | | $ | 568,871,710 | | | $ | 22,248,921 | |
| | | | | | | | |
| * | For the year ended September 30, 2009 for the RBC Institutional Class 1 and from November 21, 2008 (commencement of operations) through September 30, 2009 for RBC Institutional Class 2, RBC Investor Class, RBC Reserve Class and RBC Select Class. |
6. Federal Income Taxes
It is the policy of each Fund to continue to qualify as a regulated investment company by complying with the provisions applicable to certain investment companies, as defined under Subchapter M of the Internal Revenue Code, and to distribute substantially all of its net investment income and net realized capital gains. Therefore, no federal tax liability is recorded in the financial statements of each Fund.
Management has analyzed the Funds’ tax positions taken on federal income tax returns for all open tax years (current and prior three tax years) and has concluded that no provision for federal income tax is required in the Funds’ financial statements. The Funds’ federal and state income and federal excise tax returns for tax years for which the applicable statutes of limitations have not expired are subject to examination by the Internal Revenue Service and state departments of revenue.
57
NOTES TO FINANCIAL STATEMENTS
The tax character of distributions during the fiscal year ended September 30, 2009 were as follows:
| | | | | | | | | | | | | | | | | | |
| | | Distributions Paid From | | | | | | |
| | | Ordinary
Income | | Net
Long Term
Capital Gains | | Net
Short Term
Capital Gains | | Total Taxable
Distributions | | Tax Exempt
Distributions | | Total
Distributions
Paid* |
Prime Money Market Fund | | $ | 50,227,912 | | $ | — | | $ | — | | $ | 50,227,912 | | $ | — | | $ | 50,227,912 |
U.S. Government Money Market Fund | | | 13,072,069 | | | — | | | 3,719 | | | 13,075,788 | | | — | | | 13,075,788 |
Tax-Free Money Market Fund | | | 60,960 | | | 582 | | | 165,737 | | | 227,279 | | | 3,257,506 | | | 3,484,785 |
| * | Total distributions paid may differ from the Statements of Changes in Net Assets because distributions are recognized when actually paid for tax purposes. |
The tax basis of components of accumulated earnings/(losses) and the tax character of distributions paid are determined at fiscal year end, and will be included in the Annual Report dated September 30, 2010.
As of September 30, 2009, the following Funds had net capital loss carryforwards to offset future net capital gains, if any:
| | | | | |
| | | Capital Loss
Carryforward | | Expires |
Prime Money Market Fund | | $ | 3,069 | | 2013 |
| | | 40,324 | | 2014 |
| | | 52,797 | | 2015 |
| | | 38,902 | | 2016 |
| | | 4,606,628 | | 2017 |
Under current tax law, capital losses realized after October 31 of a Fund’s fiscal year may be deferred and treated as occurring on the first business day of the following fiscal year for tax purposes. The following Fund had deferred post October capital losses, which will be treated as arising on the first business day of the fiscal year ending September 30, 2010 and as such are included in current year earnings.
| | | |
| | | Deferred
Post-October
Losses |
U.S. Government Money Market Fund | | $ | 8,450 |
7. Subsequent Events
Management has evaluated the impact of subsequent events of the Funds and has determined that there are no subsequent events that require recognition or disclosure in the financial statements.
58
SUPPLEMENTAL INFORMATION (Unaudited)
Shareholder Expense Examples
As a shareholder of the RBC Funds, you incur two types of costs: (1) transaction costs, including sales charges (loads) and (2) ongoing costs, including management fees; 12b-1 distribution and service fees; and other Fund expenses. This example is intended to help you understand your ongoing costs (in dollars) of investing in the RBC Funds and to compare these costs with the ongoing costs of investing in other mutual funds.
The Example is based on an investment of $1,000 invested at the beginning of the period and held for the entire period from October 1, 2009 through March 31, 2010.
Actual Expenses and Performance
The table below provides information about actual account values and actual expenses. You may use the information below, together with the amount you invested, to estimate the expenses that you paid over the period. Simply divide your account value by $1,000 (for example, an $8,600 account value divided by $1,000 = 8.6), then multiply the result by the number in the table under the heading entitled “Expenses Paid During Period” to estimate the expenses you paid on your account during this period.
| | | | | | | | | | | | |
| | | Beginning
Account Value
10/1/2009 | | Ending
Account Value
3/31/2010 | | Expenses Paid
During Period*
10/1/09-3/31/10 | | Annualized
Expense Ratio
During Period
10/1/09-3/31/10 | |
Prime Money Market Fund | | | | | | | | | | | | |
RBC Institutional Class 1 | | $ | 1,000.00 | | $ | 1,000.90 | | $ | 0.85 | | 0.17 | % |
RBC Institutional Class 2 | | | 1,000.00 | | | 1,000.50 | | | 1.35 | | 0.27 | % |
RBC Investor Class | | | 1,000.00 | | | 1,000.10 | | | 1.75 | | 0.35 | % |
RBC Reserve Class | | | 1,000.00 | | | 1,000.10 | | | 1.75 | | 0.35 | % |
RBC Select Class | | | 1,000.00 | | | 1,000.10 | | | 1.75 | | 0.35 | % |
| | | | |
U.S. Government | | | | | | | | | | | | |
Money Market Fund | | | | | | | | | | | | |
RBC Institutional Class 1 | | | 1,000.00 | | | 1,000.50 | | | 0.85 | | 0.17 | % |
RBC Institutional Class 2 | | | 1,000.00 | | | 1,000.10 | | | 1.25 | | 0.25 | % |
RBC Investor Class | | | 1,000.00 | | | 1,000.10 | | | 1.30 | | 0.26 | % |
RBC Reserve Class | | | 1,000.00 | | | 1,000.10 | | | 1.30 | | 0.26 | % |
RBC Select Class | | | 1,000.00 | | | 1,000.10 | | | 1.30 | | 0.26 | % |
| | | | |
Tax-Free Money Market Fund | | | | | | | | | | | | |
RBC Institutional Class 1 | | | 1,000.00 | | | 1,001.60 | | | 0.90 | | 0.18 | % |
RBC Institutional Class 2 | | | 1,000.00 | | | 1,001.10 | | | 1.40 | | 0.28 | % |
RBC Investor Class | | | 1,000.00 | | | 1,000.20 | | | 2.39 | | 0.48 | % |
RBC Reserve Class | | | 1,000.00 | | | 1,000.20 | | | 2.34 | | 0.47 | % |
RBC Select Class | | | 1,000.00 | | | 1,000.20 | | | 2.34 | | 0.47 | % |
| * | Expenses are equal to the average account value times the Fund’s annualized expense ratio multiplied by 182/365 (to reflect one-half year period). |
59
SUPPLEMENTAL INFORMATION (Unaudited)
Hypothetical Example for Comparison Purposes
The table below provides information about hypothetical account values and hypothetical expenses based on each RBC Funds’ actual expense ratio and an assumed rate of return of 5% per year before expenses, which is not the Fund’s actual return. The hypothetical account values and expenses may not be used to estimate the actual ending account balance or expenses you paid for the period. You may use this information to compare this 5% hypothetical example with the 5% hypothetical examples that appear in the shareholder reports of other funds.
Please note that the expenses shown in the table are meant to highlight your ongoing costs only and do not reflect any transactional costs, such as sales charges (loads), redemption fees, or exchange fees. Therefore, the table is useful in comparing ongoing costs only, and will not help you determine the relative total costs of owning different funds. In addition, if these transactional costs were included, your costs would have been higher.
| | | | | | | | | | | | |
| | | Beginning
Account Value
10/1/09 | | Ending
Account Value
3/31/10 | | Expenses Paid
During Period*
10/1/09-3/31/10 | | Annualized
Expense Ratio
During Period
10/1/09-3/31/10 | |
Prime Money Market Fund | | | | | | | | | | | | |
RBC Institutional Class 1 | | $ | 1,000.00 | | $ | 1,024.08 | | $ | 0.86 | | 0.17 | % |
RBC Institutional Class 2 | | | 1,000.00 | | | 1,023.59 | | | 1.36 | | 0.27 | % |
RBC Investor Class | | | 1,000.00 | | | 1,023.19 | | | 1.77 | | 0.35 | % |
RBC Reserve Class | | | 1,000.00 | | | 1,023.19 | | | 1.77 | | 0.35 | % |
RBC Select Class | | | 1,000.00 | | | 1,023.19 | | | 1.77 | | 0.35 | % |
| | | | |
U.S. Government | | | | | | | | | | | | |
Money Market Fund | | | | | | | | | | | | |
RBC Institutional Class 1 | | | 1,000.00 | | | 1,024.08 | | | 0.86 | | 0.17 | % |
RBC Institutional Class 2 | | | 1,000.00 | | | 1,023.68 | | | 1.26 | | 0.25 | % |
RBC Investor Class | | | 1,000.00 | | | 1,023.64 | | | 1.31 | | 0.26 | % |
RBC Reserve Class | | | 1,000.00 | | | 1,023.64 | | | 1.31 | | 0.26 | % |
RBC Select Class | | | 1,000.00 | | | 1,023.64 | | | 1.31 | | 0.26 | % |
| | | | |
Tax-Free Money Market Fund | | | | | | | | | | | | |
RBC Institutional Class 1 | | | 1,000.00 | | | 1,024.03 | | | 0.91 | | 0.18 | % |
RBC Institutional Class 2 | | | 1,000.00 | | | 1,023.54 | | | 1.41 | | 0.28 | % |
RBC Investor Class | | | 1,000.00 | | | 1,022.54 | | | 2.42 | | 0.48 | % |
RBC Reserve Class | | | 1,000.00 | | | 1,022.59 | | | 2.37 | | 0.47 | % |
RBC Select Class | | | 1,000.00 | | | 1,022.59 | | | 2.37 | | 0.47 | % |
| * | Expenses are equal to the average account value times the Fund’s annualized expense ratio multiplied by 182/365 (to reflect one-half year period). |
60
RBC Funds
P.O. Box 701
Milwaukee, WI 53201-0701
800-422-2766
www.rbcgam.us
Performance data represents past performance and does not guarantee future results. The principal value of an investment and investment return will fluctuate so that an investor’s shares, when redeemed, may be worth more or less than their original cost.
This report and the financial statements contained herein are provided for the information of RBC Funds shareholders. This report is not authorized for distribution to prospective investors unless preceded or accompanied by a current prospectus, which contains information concerning investment objectives, risks, charges and expenses of the funds. Please read the prospectus carefully before investing.
This report and the financial statements contained herein are not intended to be a forecast of future events, a guarantee of future results, or investment advice. There is no assurance that certain securities will remain in or out of each fund’s portfolio. The views expressed in this report reflect those of the portfolio managers through the period ended March 31, 2010.
NOT FDIC INSURED • NO BANK GUARANTEE • MAY LOSE VALUE
RBC Global Asset Management (U.S.), Inc. serves as investment adviser for the RBC Funds. RBC Funds are distributed by Quasar Distributors LLC.

| | | | |
| The RBC Funds are pleased to offer shareholder reports printed entirely on Forest Stewardship Council certified paper. FSC certification ensures that the paper used in this report contains fiber from well-managed and responsibly harvested forests that meet strict environmental and socioeconomic standards. | | |
| | |
| | | | RBCF-MM SAR 03-10 |
Semi-Annual Report
For the period ended March 31, 2010
Access Capital Community Investment Fund

| | | | |
| | | RBC Funds | | |
About Your Semi-Annual Report | | | | |
| | This semi-annual report includes detailed information about the Access Capital Community Investment Fund (the “Fund”) including financial statements, performance, and a complete list of holdings. |
| |
| | The Fund compares its performance against the Barclays Capital U.S. Securitized Index and the Barclays Capital U.S. Aggregate Bond Index which are widely used market indices. |
| |
| | We hope the financial information presented will help you evaluate your investment in the Fund. We also encourage you to read your Fund’s prospectus for further detail as to the Fund’s investment policies and risk profile. Fund prospectuses and performance information subsequent to the date of this report are available on our website at www.rbcgam.us. |
| |
| | A description of the policies and procedures that your Fund uses to determine how to vote proxies relating to portfolio securities is available (i) without charge, upon request, by calling 1-800-973-0073; (ii) on the Fund’s website at www.rbcgam.us; and (iii) on the Securities and Exchange Commission’s (the “Commission”) website at http://www.sec.gov. |
| |
| | Information regarding how your Fund voted proxies relating to portfolio securities during the most recent 12 month period ended June 30 is available (i) on the Fund’s website at www.rbcgam.us; and (ii) on the Commission’s website at http://www.sec.gov. |
| |
| | A schedule of the Fund’s portfolio holdings will be filed with the Commission for the first and third quarters of each fiscal year on Form N-Q. This information is available on the Commission’s website at http://www.sec.gov and may be reviewed and copied at the Commission’s Public Reference Room in Washington, D.C. Information on the operation of the Public Reference Room is available by calling 1-800-SEC-0330. |
| | |
Table of Contents | | | | |
| | | | |
| | Letter from the CIO | | 1 |
| | Portfolio Managers | | 4 |
| | Performance Summary | | 5 |
| | Fund Statistics | | 6 |
| | Schedule of Portfolio Investments | | 8 |
| | Financial Statements | | |
| | - Statement of Assets and Liabilities | | 32 |
| | - Statement of Operations | | 34 |
| | - Statements of Changes in Net Assets | | 35 |
| | - Statement of Cash Flows | | 36 |
| | Financial Highlights | | 37 |
| | Notes to Financial Statements | | 39 |
| | Share Class Information | | 50 |
| | Supplemental Information | | 51 |
| | |
LETTER FROM THE CIO Dear Shareholder: RBC Funds enjoyed another solid six month period of providing solutions for our shareholders. We understand the important role our funds play in helping you to build and achieve your financial goals. From a financial perspective, we are pleased to report that all of our Funds continued to perform as expected during the first six months of our fiscal year. In some instances, we performed beyond our expectations. The Access Capital Community Investment Fund continues to have a positive impact by filling capital gaps in underserved communities. The Fund enters into its twelfth year of operations providing returns to shareholders that include both an economic bottom line and a social bottom line. The Fund invests in debt securities that support community development activities serving low and moderate income individuals and neighborhoods in the United States. The Fund’s investments promote home ownership, affordable rental housing, education, community health centers and small businesses. The Fund has also provided solid financial performance for our shareholders as reflected in the highest overall Lipper Leader ranking we can achieve for principal preservation and consistent returns. The Access Capital Community Investment Fund was designated a Lipper Leader in the Preservation category among 4153 US Mortgage funds as well as a Lipper Leader in the Consistent Return category among 85 US Mortgage funds for the Overall period ending 3/31/2010. Lipper ratings for preservation reflect a fund’s historical loss avoidance relative to other funds within the same asset class, as of 3/31/2010. Preservation ratings are relative, rather than absolute measures, and funds named Lipper Leaders for Preservation may still experience losses periodically; those losses may be larger for equity and mixed equity funds than for fixed income funds. Lipper Ratings for Consistent Return reflect funds’ historical risk-adjusted returns, adjusted for volatility, relative to peers as of 3/31/2010. (Complete performance data for the Fund can be found on page 5 of this report). Although overall economic activity has shown signs of sustainable improvement, we remain concerned that growth will remain below potential until the housing market and employment picture materially improve. We remain wary to judge independently the health prospects for the US economy given the large amounts of stimulus still working their way through the system. We continue to believe that the most likely scenario for the US economy in 2010-2011 is a ‘half-speed’ recovery. Our forecast remains cautious as we feel that an accelerating economy will depend on final demand as opposed to government stimulus and inventory accumulation. Inflation remains well under control and is not a significant concern presently. Treasury note and bond issuance has been very heavy, and is likely to continue so, which could result in increased market volatility in the months ahead. The Treasury yield curve remains solidly anchored in the short end. The U.S. Federal Reserve (“the Fed”) has clearly signaled its intention to keep the Fed Funds rate at an exceptionally low level for an extended period of time. The slope of the Treasury yield curve remains very positive and may become more | | |
1
| | |

John Huber Chief Investment Officer Fixed Income | | LETTER FROM THE CIO |
| | so as we believe the Fed is on hold for the balance of 2010, helping the banks achieve profitability and re-build their capital base. It is becoming apparent that the Fed is nearing an inflection point in its conduct of monetary policy. Nascent signs of tightening have appeared, including an increase in the Fed discount rate from .5% to .75%, and termination of special liquidity facilities in place since 2008. Both are designed to push lenders back into the private credit markets. Still under consideration is how to most effectively unwind the Fed’s quantitative easing activities by reversing the recently ended $1.7 trillion acquisition of Treasury and mortgage backed securities. Financial regulatory reform appears increasingly likely to get passed in some form, and it should. That said, the market remains anxious to understand the nature and impact of proposed reforms as they are debated in Washington D.C. |
| | As always, we will remain steadfast in our goal of principal preservation of our shareholders assets while striving to provide the necessary liquidity and income generation they deserve and expect. Thank you for your continued confidence and trust in the RBC Funds. |
| | Sincerely, |
| | 
|
| | John M. Huber, CFA |
| | Chief Investment Officer, Fixed Income RBC Funds |
| | Past performance is not a guarantee of future results |
| | Opinions expressed are subject to change, are not guaranteed, and should not be considered a recommendation to buy or sell any security. |
| | Mutual fund investing involves risk. Principal loss is possible. Bond investments are subject to interest-rate risk such that when interest rates rise, the prices of the bonds, and thus the value of the bond fund, can decline and the investor can lose principal value. In general, the risk of price fluctuation increases with the length of the bond’s maturity. Investment in the Fund involves risks including, but not limited to: the effects of leveraging the Fund’s portfolio; concentration in the affordable housing market and related mortgage backed securities; competition for investments; interest rate risk; and use of derivatives. |
| | Lipper Leader scores are subject to change every month and are calculated for the following time periods: 3-year, 5-year, 10-year, and overall. The overall calculation is based on an equal-weighted average of percentile rank for each category metric over three-, five-, and ten-year periods (if applicable). The top 20% of funds in each classification are rated 5 and are named Lipper Leaders, the next 20% are rated 4, the middle 20% are rated 3, the next 20% are rated 2, and the lowest 20% are rated 1. The Access Capital Community Investment Fund, in Lipper’s US Mortgage Fund category, received the following ratings for the three-, five-, and 10 year periods respectively, for the period ending 3/31/2010: Preservation: 5 out of 4153 funds, 5 out of 3615 funds, and 4 out of 2460 funds; Consistent Returns: 5 out of 82 funds and 5 out of 79 funds (no rating for 10 year period). |
2
| | |
LETTER FROM THE CIO Each Lipper peer group represents a universe of Funds with similar investment objectives Lipper Analytical Services, Inc. is an independent mutual fund research and rating service. Lipper ratings are not intended to predict future results, and Lipper does not guarantee the accuracy of this information. Lipper Leader © 2010, Reuters, All Rights Reserved | | |
3
| | |
| | PORTFOLIO MANAGERS |
| | RBC Global Asset Management (U.S.) Inc.(“RBC GAM (US)”) serves as the investment advisor to the Access Capital Community Investment Fund. RBC GAM (US) employs a team approach to the management of the Access Capital Community Investment Fund, with no individual team member being solely responsible for the investment decisions. The Fund’s management team has access to RBC GAM (US)’s investment research and other money management resources. |

John M. Huber, CFA | | John M. Huber, CFA |
| | Senior Managing Director, Chief Investment Officer — Fixed Income |
| | John Huber directs RBC GAM (US)’s fixed income group. John joined RBC GAM (US) in 2004 from Galliard Capital Management where he was a principal and senior portfolio manager, responsible for the firm’s total return fixed income effort. Prior to working for Galliard, John was a portfolio manager for Norwest Investment Management where he began his career in 1990. John received a BA from the University of Iowa and an MBA in Finance from the University of Minnesota, Carlson School of Management. He acts as an advisor to the Carlson Funds Enterprise for the University of Minnesota. John is a CFA charterholder and a member of the CFA Society of Minnesota. He also serves on the Board of the YMCA of Metropolitan Minneapolis. |
| | |
| | |
| | |
| | |
| | |

Brian Svendahl | | Brian Svendahl, CFA |
| | Managing Director, Senior Portfolio Manager |
| | Brian Svendahl is a senior portfolio manager leading RBC GAM (US)’s Risk Management Team which monitors various risks within our fixed income products. Brian also has specific research responsibilities for government and agency loans including small business administration and U.S.D.A. programs. Brian joined RBC GAM (US) in 2005 from Wells Fargo Brokerage Services, where he served as senior vice president and risk manager. Prior to that, Brian’s experiences include developing VAR analysis and off balance sheet hedging strategies for Wells Fargo’s Treasury group. Brian has worked in the investment industry since 1992. Brian received a BS in Economics from the University of Minnesota. He also received a BBA in Finance and an MBA from the University of Minnesota, Carlson School of Management. Brian is a CFA charterholder and member of the CFA Society of Minnesota. |
| | |
| | |
| | |
4
PERFORMANCE SUMMARY
Average Annual Total Returns as of March 31, 2010
Access Capital Community Investment Fund
| | | | | | | | | | | | | | | | | | |
| | | 1 Year | | | 3 Year | | | 5 Year | | | 10 Year | | | Since
Inception | | | Expense
Ratio* | |
Class A (a) | | | | | | | | | | | | | | | | | | |
- Including | | | | | | | | | | | | | | | | | | |
Maximum Sales | | | | | | | | | | | | | | | | | | |
Charge of 3.75% | | 2.74 | % | | 4.43 | % | | 4.20 | % | | 4.99 | % | | 4.71 | % | | | |
- At Net Asset Value | | 6.70 | % | | 5.76 | % | | 5.01 | % | | 5.39 | % | | 5.05 | % | | 1.11 | % |
Class I (b) | | | | | | | | | | | | | | | | | | |
- At Net Asset Value | | 6.97 | % | | 5.87 | % | | 5.16 | % | | 5.60 | % | | 5.34 | % | | 1.06 | % |
| | | | | | |
Barclays Capital U. S. Securitized Index (c) | | 7.99 | % | | 6.55 | % | | 5.82 | % | | 6.37 | % | | 5.99 | % | | | |
Barclays Capital U. S. Aggregate Bond Index (c) | | 7.69 | % | | 6.14 | % | | 5.44 | % | | 6.29 | % | | 5.85 | % | | | |
| | | | | | | | | | | | | | |
Performance data quoted represents past performance. Past performance is no guarantee of future results. Investment return and principal value of an investment will fluctuate so that an investor’s shares, when redeemed, may be worth more or less than their original cost. Current performance may be lower or higher than performance quoted. For performance data current to most recent month-end go to www.rbcgam.us. The Barclays Capital U.S. Securitized Index is an unmanaged index that tracks the performance of mortgage-backed pass-through securities issued by Ginnie Mae, Fannie Mae, and Freddie Mac, investment-grade bonds and asset-backed securities. The Barclays Capital U.S. Aggregate Bond Index is an unmanaged index that tracks the performance of a representative list of government, corporate, asset-backed and mortgage-backed securities. (a) The inception date for Class A shares of the Fund is January 29, 2009. All performance shown for such class of shares prior to its inception date is based on the performance of the Class I shares of the Fund, adjusted to reflect the fees and expenses of Class A shares, as applicable. (b) Class I commenced operations on July 28, 2008. The performance in the table reflects the performance of Access Capital Strategies Community Investment Fund, Inc., the predecessor to the Fund. From its inception, June 23, 1998, until May 30, 2006, the predecessor fund elected status as a business development company. From May 31, 2006 until July 27, 2008, the predecessor fund operated as a continuously offered closed-end interval management company. If the predecessor fund had operated as an open-end management company, performance may have been adversely affected. Fund performance reflects applicable fee waivers/expense reimbursements which, if excluded, would cause performance to be lower. (c) You cannot invest directly into the index. * The Fund’s expenses reflect the most recent year end (September 30, 2009). | | |
5
| | | | | | | | | | |
| | FUND STATISTICS (UNAUDITED) | | | | | | | | |
| | |
| | Access Capital Community Investment Fund | | | |
| | | | |
| Investment | | Current income and capital appreciation | | | | | | | | |
| Objective | | | | | | | | | | |
| Benchmark | | Barclays Capital U.S. Securitized Index | | | | | | | | |
| | |
| | Barclays Capital U.S. Aggregate Bond Index | | | |
| |
| Asset Allocation (as of 3/31/10) (% of fund’s investments) | | 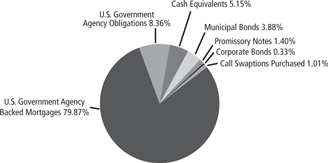 | |
| | | | |
| Top Ten Holdings | | Fannie Mae, Series 2004-T7, | | 1.97 | % | | Community Reinvestment | | 1.19 | % |
| (as of 3/31/10) | | Class A, 5.12%, 7/25/41 | | | | | Revenue Notes, 3.98%, 8/1/35 | | | |
| (% of fund’s net | | Fannie Mae Pool #463212, | | 1.85 | % | | Massachusetts Housing Finance | | 1.14 | % |
| assets) | | 4.68%, 8/1/19 | | | | | Agency Revenue, Series B, | | | |
| | Fannie Mae Pool #387590, | | 1.71 | % | | 6.53%, 12/1/27 | | | |
| | 4.90%, 9/1/15 | | | | | Fannie Mae Pool #AA0527, | | 1.06 | % |
| | Massachusetts Housing | | 1.68 | % | | 5.50%, 12/1/38 | | | |
| | Investment Corp. Term Loan , | | | | | Fannie Mae Pool #874136, | | 0.96 | % |
| | 6.67%, 4/1/35 | | | | | 5.57%, 12/1/16 | | | |
| | New York City Housing | | 1.30 | % | | Ginnie Mae Pool #713519, | | 0.94 | % |
| | Development Corp. Revenue, | | | | | 6.00%, 7/1/39 | | | |
| | Series B, 4.95%, 5/15/36 | | | | | | | | |
| | |
| | * A listing of all portfolio holdings can be found beginning on page 8. | | | |
6
FUND STATISTICS (UNAUDITED)
| | |
| |
Access Capital Community Investment Fund | | |
| |
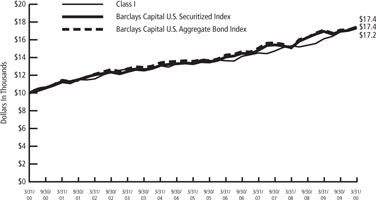 | | Growth of $10,000 Initial Investment Since Inception |
| |
| The graph reflects an initial investment of $10,000 over a 10 year period and is based on Class I shares. The Fund’s total return includes reinvested dividends and capital gains. The Fund’s total return also includes operating expenses that reduce return, while the total return of the index do not. The graph does not reflect the deduction of taxes that a shareholder would pay on fund distributions or redemption of fund shares. Performance of other classes will vary due to differences in fee structures. | | |
7
SCHEDULE OF PORTFOLIO INVESTMENTS
Access Capital Community Investment Fund
March 31, 2010 (Unaudited)
| | | | | | | | |
Principal
Amount | | | | Value |
Municipal Bonds — 4.65% | | | |
Arizona — 0.13% | | | |
| | $ | 752,645 | | Phoenix & Pima County Industrial Development Authority Revenue, Series 2A, 5.45%, 3/1/39, (Credit Support: Ginnie Mae, Fannie Mae, Freddie Mac), Callable 9/1/16 @ 103 | | $ | 780,741 |
| | | | | | | | |
| |
California — 0.49% | | | |
| | | 130,000 | | California Rural Home Mortgage Finance Authority Refunding Revenue, Series A, 4.20%, 2/1/27, (Credit Support: Ginnie Mae, Fannie Mae, Freddie Mac), Callable 2/1/17 @ 104 | | | 125,986 |
| | | |
| | | 655,000 | | California Rural Home Mortgage Finance Authority Revenue, Series C, 5.40%, 8/1/35, (Credit Support: Ginnie Mae, Fannie Mae, Freddie Mac), Callable 2/1/17 @ 104 | | | 666,685 |
| | | |
| | | 975,000 | | California Statewide Communities Development Authority Revenue, Series B, 5.25%, 10/20/42, (Credit Support: Ginnie Mae), Callable 10/20/17 @ 102 | | | 981,523 |
| | | |
| | | 440,000 | | Camarillo California Community Development, Community Tax Allocation (Housing Set-Aside), Series A-T, 5.26%, 9/1/16, (Credit Support: AMBAC) | | | 429,286 |
| | | |
| | | 740,000 | | Sacramento County Housing Authority Revenue, Series B-1, 5.00%, 1/20/48, (Credit Support: Ginnie Mae), Callable 7/20/17 @ 102 | | | 694,704 |
| | | | | | | | |
| | | | | | | | 2,898,184 |
| | | | | | | | |
| |
Guam — 0.02% | | | |
| | | 140,000 | | Guam Power Authority Revenue OID, Series A, 5.00%, 10/1/24, (Credit Support: AMBAC), Callable 5/3/10 @ 101 | | | 132,066 |
| | | | | | | | |
| |
Massachusetts — 1.14% | | | |
| | | 6,790,000 | | Massachusetts Housing Finance Agency Revenue, Series B, 6.53%, 12/1/27, (Credit Support: NATL-RE, IBC), Callable 6/1/17 @ 100 | | | 6,720,538 |
| | | | | | | | |
| |
Mississippi — 0.02% | | | |
| | | 100,000 | | Mississippi Home Corp. Multi Family Revenue OID, 5.35%, 8/20/48, (Credit Support: Ginnie Mae, Fannie Mae), Callable 9/1/18 @ 105 | | | 99,412 |
| | | | | | | | |
| |
New York — 1.98% | | | |
| | | 665,000 | | New York City Housing Development Corp. Revenue, Series A, 4.15%, 7/15/15, (Credit Support: Fannie Mae) | | | 665,060 |
8
SCHEDULE OF PORTFOLIO INVESTMENTS
Access Capital Community Investment Fund (cont.)
March 31, 2010 (Unaudited)
| | | | | | | |
Principal
Amount | | | | Value |
| | $7,750,000 | | New York City Housing Development Corp. Revenue, Series B, 4.95%, 5/15/36, (Credit Support: Fannie Mae), Callable 11/1/15 @ 100 | | $ | 7,671,105 |
| | | |
| | 700,000 | | New York State Housing Finance Agency Revenue, 4.50%, 11/15/27, (Credit Support: Fannie Mae), Callable 11/15/16 @ 100 | | | 671,174 |
| | | |
| | 1,000,000 | | New York State Housing Finance Agency Revenue, Series A, 4.65%, 11/15/38, (Credit Support: Fannie Mae), Callable 11/15/16 @ 100 | | | 962,140 |
| | | |
| | 1,620,000 | | Suffolk County Industrial Development Agency Revenue, 5.70%, 12/1/26, (LOC: Bank of New York), Callable 12/1/11 @ 102 | | | 1,667,434 |
| | | | | | | |
| | | | | | | 11,636,913 |
| | | | | | | |
| |
Ohio — 0.11% | | | |
| | 670,000 | | Ohio Housing Finance Agency Refunding Revenue, 5.32%, 9/1/38, (Credit Support: Ginnie Mae, Fannie Mae), Callable 9/1/16 @ 100 | | | 668,627 |
| | | | | | | |
| |
Texas — 0.19% | | | |
| | 1,085,000 | | Texas Department of Housing & Community Affairs Revenue, 5.13%, 12/1/38, (Credit Support: Fannie Mae)(a) | | | 1,118,548 |
| | | | | | | |
| |
Utah — 0.57% | | | |
| | 810,000 | | Utah Housing Corp. Single Family Mortgage Revenue, Series B-2, Class 1, 4.33%, 1/1/18, Callable 1/1/17 @ 100 | | | 809,020 |
| | | |
| | 2,555,000 | | Utah Housing Corp. Single Family Mortgage Revenue, Series C-2, Class 1, 4.85%, 1/1/18, Callable 1/1/17 @ 100 | | | 2,515,806 |
| | | | | | | |
| | | | | | | 3,324,826 |
| | | | | | | |
Total Municipal Bonds | | | 27,379,855 |
| | | | | | | |
(Cost $25,090,156) | | | |
Corporate Bonds — 0.39% | | | |
Diversified Financials — 0.39% | | | |
| | 575,000 | | Atlantic Marine Corps Communities LLC 5.34%, 12/1/49(Credit Support: MBIA)(b) | | | 458,540 |
9
SCHEDULE OF PORTFOLIO INVESTMENTS
Access Capital Community Investment Fund (cont.)
March 31, 2010 (Unaudited)
| | | | | | | | |
Principal
Amount | | | | Value |
| | $ | 1,395,000 | | Fort Knox Military Housing Privatization Project 0.57%, 2/15/49(Credit Support: AMBAC)(a)(b)(c) | | $ | 763,691 |
| | | 2,000,000 | | Pacific Beacon LLC 0.65%, 7/15/49(Credit Support: MBIA)(a)(b)(c) | | | 1,099,981 |
| | | | | | | | |
| |
Total Corporate Bonds | | | 2,322,212 |
| | | | | | | | |
(Cost $3,862,573) | | | |
U.S. Government Agency Backed Mortgages — 95.87% | | | |
Fannie Mae — 69.27% | | | |
| | | 26,348 | | Pool #253174, 7.25%, 12/1/29 | | | 29,658 |
| | | 139,157 | | Pool #253212, 7.50%, 1/1/30 | | | 157,465 |
| | | 43,900 | | Pool #253214, 7.00%, 1/1/15 | | | 47,451 |
| | | 113,260 | | Pool #257611, 5.50%, 5/1/38 | | | 120,068 |
| | | 52,724 | | Pool #257612, 5.00%, 5/1/38 | | | 54,727 |
| | | 393,952 | | Pool #257613, 5.50%, 6/1/38 | | | 419,605 |
| | | 291,064 | | Pool #257631, 6.00%, 7/1/38 | | | 310,988 |
| | | 457,818 | | Pool #257632, 5.50%, 7/1/38 | | | 485,339 |
| | | 297,137 | | Pool #257649, 5.50%, 7/1/38 | | | 315,000 |
| | | 225,857 | | Pool #257656, 6.00%, 8/1/38 | | | 241,318 |
| | | 469,200 | | Pool #257663, 5.50%, 8/1/38 | | | 497,406 |
| | | 807,410 | | Pool #257857, 6.00%, 12/1/37 | | | 863,058 |
| | | 190,722 | | Pool #257868, 6.50%, 11/1/37 | | | 207,920 |
| | | 189,943 | | Pool #257869, 5.50%, 12/1/37 | | | 202,311 |
| | | 150,602 | | Pool #257875, 5.50%, 12/1/37 | | | 159,655 |
| | | 477,611 | | Pool #257890, 5.50%, 2/1/38 | | | 506,322 |
| | | 2,901,581 | | Pool #257892, 5.50%, 2/1/38 | | | 3,076,009 |
| | | 1,013,590 | | Pool #257893, 6.00%, 2/1/38 | | | 1,082,972 |
| | | 139,230 | | Pool #257897, 5.50%, 2/1/38 | | | 147,599 |
| | | 232,285 | | Pool #257898, 6.00%, 2/1/38 | | | 248,186 |
| | | 101,058 | | Pool #257899, 5.00%, 2/1/38 | | | 104,898 |
| | | 221,741 | | Pool #257900, 5.00%, 1/1/38 | | | 231,275 |
| | | 298,678 | | Pool #257901, 5.50%, 2/1/38 | | | 318,126 |
| | | 55,687 | | Pool #257902, 6.00%, 2/1/38 | | | 59,777 |
| | | 443,541 | | Pool #257903, 5.50%, 2/1/38 | | | 470,204 |
| | | 206,049 | | Pool #257904, 6.00%, 2/1/38 | | | 220,153 |
| | | 190,563 | | Pool #257913, 5.50%, 1/1/38 | | | 202,018 |
| | | 130,445 | | Pool #257914, 6.00%, 1/1/38 | | | 139,375 |
| | | 115,586 | | Pool #257919, 6.00%, 2/1/38 | | | 123,498 |
| | | 219,279 | | Pool #257926, 5.50%, 3/1/38 | | | 232,461 |
| | | 156,768 | | Pool #257927, 5.50%, 3/1/38 | | | 166,192 |
| | | 163,936 | | Pool #257928, 6.00%, 3/1/38 | | | 175,158 |
| | | 305,984 | | Pool #257942, 5.50%, 4/1/38 | | | 324,378 |
| | | 106,159 | | Pool #257943, 6.00%, 4/1/38 | | | 113,426 |
| | | 100,453 | | Pool #257973, 5.00%, 5/1/38 | | | 104,270 |
| | | 898,602 | | Pool #257974, 5.50%, 4/1/38 | | | 952,622 |
| | | 86,205 | | Pool #257995, 6.00%, 7/1/38 | | | 92,105 |
10
SCHEDULE OF PORTFOLIO INVESTMENTS
Access Capital Community Investment Fund (cont.)
March 31, 2010 (Unaudited)
| | | | | | | | |
Principal
Amount | | | | Value |
| | $ | 745,200 | | Pool #258000, 5.00%, 4/1/34 | | $ | 772,040 |
| | | 167,419 | | Pool #258001, 5.00%, 3/1/34 | | | 173,450 |
| | | 114,214 | | Pool #258005, 5.50%, 3/1/34 | | | 120,961 |
| | | 74,247 | | Pool #258022, 5.50%, 5/1/34 | | | 78,633 |
| | | 632,400 | | Pool #258024, 5.00%, 6/1/34 | | | 655,178 |
| | | 100,460 | | Pool #258027, 5.00%, 5/1/34 | | | 104,079 |
| | | 27,533 | | Pool #258028, 5.00%, 5/1/34 | | | 28,525 |
| | | 117,963 | | Pool #258030, 5.00%, 5/1/34 | | | 122,212 |
| | | 76,086 | | Pool #258031, 5.00%, 5/1/34 | | | 78,827 |
| | | 308,453 | | Pool #258049, 5.00%, 5/1/34 | | | 319,563 |
| | | 57,784 | | Pool #258050, 5.50%, 5/1/34 | | | 61,198 |
| | | 48,991 | | Pool #258051, 5.00%, 5/1/34 | | | 50,756 |
| | | 527,559 | | Pool #258070, 5.00%, 6/1/34 | | | 546,560 |
| | | 167,171 | | Pool #258090, 5.00%, 6/1/34 | | | 173,192 |
| | | 332,099 | | Pool #258092, 5.50%, 6/1/34 | | | 351,719 |
| | | 173,196 | | Pool #258093, 5.50%, 6/1/34 | | | 183,428 |
| | | 82,121 | | Pool #258094, 5.00%, 6/1/34 | | | 85,078 |
| | | 61,070 | | Pool #258095, 5.50%, 7/1/34 | | | 64,678 |
| | | 79,765 | | Pool #258097, 5.50%, 6/1/34 | | | 84,477 |
| | | 50,757 | | Pool #258121, 5.50%, 6/1/34 | | | 53,756 |
| | | 259,209 | | Pool #258152, 5.50%, 8/1/34 | | | 274,522 |
| | | 464,654 | | Pool #258157, 5.00%, 8/1/34 | | | 481,390 |
| | | 194,494 | | Pool #258163, 5.50%, 8/1/34 | | | 205,984 |
| | | 129,460 | | Pool #258165, 5.50%, 8/1/34 | | | 137,108 |
| | | 139,250 | | Pool #258166, 5.50%, 9/1/34 | | | 147,476 |
| | | 225,180 | | Pool #258171, 5.50%, 10/1/34 | | | 238,483 |
| | | 438,802 | | Pool #258173, 5.50%, 10/1/34 | | | 464,726 |
| | | 303,020 | | Pool #258180, 5.00%, 10/1/34 | | | 313,935 |
| | | 162,454 | | Pool #258182, 5.00%, 10/1/34 | | | 168,305 |
| | | 85,905 | | Pool #258185, 5.50%, 10/1/34 | | | 90,980 |
| | | 169,254 | | Pool #258186, 5.50%, 11/1/34 | | | 179,254 |
| | | 147,983 | | Pool #258187, 5.50%, 11/1/34 | | | 156,726 |
| | | 767,359 | | Pool #258188, 5.50%, 11/1/34 | | | 812,692 |
| | | 236,199 | | Pool #258198, 5.50%, 10/1/34 | | | 250,153 |
| | | 96,008 | | Pool #258199, 5.50%, 9/1/34 | | | 101,679 |
| | | 235,656 | | Pool #258203, 5.50%, 10/1/34 | | | 249,578 |
| | | 156,735 | | Pool #258210, 5.50%, 11/1/34 | | | 165,994 |
| | | 111,102 | | Pool #258221, 5.50%, 11/1/34 | | | 117,665 |
| | | 48,565 | | Pool #258222, 5.00%, 11/1/34 | | | 50,557 |
| | | 137,256 | | Pool #258224, 5.50%, 12/1/34 | | | 145,364 |
| | | 144,402 | | Pool #258225, 5.50%, 11/1/34 | | | 152,933 |
| | | 287,034 | | Pool #258236, 5.00%, 12/1/34 | | | 297,373 |
| | | 176,096 | | Pool #258237, 5.50%, 1/1/35 | | | 186,169 |
| | | 1,027,769 | | Pool #258238, 5.00%, 1/1/35 | | | 1,069,926 |
| | | 45,280 | | Pool #258245, 5.50%, 12/1/34 | | | 47,956 |
| | | 115,232 | | Pool #258249, 5.00%, 12/1/34 | | | 119,383 |
| | | 99,389 | | Pool #258250, 5.50%, 11/1/34 | | | 105,261 |
| | | 153,977 | | Pool #258251, 5.50%, 1/1/35 | | | 163,844 |
11
SCHEDULE OF PORTFOLIO INVESTMENTS
Access Capital Community Investment Fund (cont.)
March 31, 2010 (Unaudited)
| | | | | | | | |
Principal
Amount | | | | Value |
| | $ | 81,303 | | Pool #258252, 5.50%, 12/1/34 | | $ | 86,106 |
| | | 233,551 | | Pool #258254, 5.50%, 12/1/34 | | | 247,349 |
| | | 140,030 | | Pool #258258, 5.00%, 1/1/35 | | | 145,555 |
| | | 425,473 | | Pool #258300, 5.00%, 3/1/35 | | | 442,261 |
| | | 139,380 | | Pool #258301, 5.50%, 2/1/35 | | | 148,050 |
| | | 194,772 | | Pool #258302, 5.00%, 3/1/35 | | | 202,457 |
| | | 196,159 | | Pool #258303, 5.00%, 2/1/35 | | | 203,899 |
| | | 276,900 | | Pool #258304, 5.00%, 2/1/35 | | | 287,825 |
| | | 411,395 | | Pool #258305, 5.00%, 3/1/35 | | | 427,627 |
| | | 13,099 | | Pool #258311, 5.00%, 2/1/35 | | | 13,616 |
| | | 83,007 | | Pool #258312, 5.50%, 2/1/35 | | | 88,170 |
| | | 321,388 | | Pool #258324, 5.50%, 4/1/35 | | | 341,379 |
| | | 330,073 | | Pool #258325, 5.50%, 4/1/35 | | | 350,604 |
| | | 391,832 | | Pool #258333, 5.00%, 4/1/35 | | | 407,292 |
| | | 346,060 | | Pool #258336, 5.00%, 4/1/35 | | | 359,714 |
| | | 310,186 | | Pool #258338, 5.00%, 4/1/35 | | | 322,424 |
| | | 259,235 | | Pool #258339, 5.00%, 4/1/35 | | | 269,464 |
| | | 76,147 | | Pool #258340, 5.00%, 3/1/35 | | | 79,152 |
| | | 92,278 | | Pool #258341, 5.00%, 4/1/35 | | | 95,919 |
| | | 101,527 | | Pool #258342, 5.00%, 4/1/35 | | | 105,533 |
| | | 411,543 | | Pool #258343, 5.00%, 4/1/35 | | | 427,780 |
| | | 236,314 | | Pool #258346, 5.00%, 3/1/35 | | | 245,638 |
| | | 1,090,415 | | Pool #258347, 5.00%, 4/1/35 | | | 1,133,438 |
| | | 247,330 | | Pool #258388, 5.50%, 6/1/35 | | | 262,715 |
| | | 493,739 | | Pool #258392, 5.00%, 6/1/35 | | | 513,220 |
| | | 550,561 | | Pool #258393, 5.00%, 5/1/35 | | | 572,284 |
| | | 278,734 | | Pool #258394, 5.00%, 5/1/35 | | | 289,732 |
| | | 399,347 | | Pool #258395, 5.50%, 6/1/35 | | | 424,187 |
| | | 55,736 | | Pool #258400, 5.00%, 6/1/35 | | | 57,936 |
| | | 417,804 | | Pool #258402, 5.00%, 6/1/35 | | | 434,288 |
| | | 74,431 | | Pool #258403, 5.00%, 6/1/35 | | | 77,368 |
| | | 100,198 | | Pool #258404, 5.00%, 6/1/35 | | | 104,151 |
| | | 86,341 | | Pool #258406, 5.50%, 5/1/35 | | | 91,712 |
| | | 175,349 | | Pool #258407, 5.00%, 5/1/35 | | | 182,268 |
| | | 52,968 | | Pool #258408, 5.00%, 5/1/34 | | | 54,876 |
| | | 202,963 | | Pool #258409, 5.00%, 5/1/35 | | | 210,972 |
| | | 110,368 | | Pool #258410, 5.00%, 4/1/35 | | | 114,723 |
| | | 119,775 | | Pool #258411, 5.50%, 5/1/35 | | | 127,225 |
| | | 158,636 | | Pool #258422, 5.00%, 6/1/35 | | | 164,895 |
| | | 139,039 | | Pool #258427, 5.00%, 7/1/35 | | | 144,525 |
| | | 165,618 | | Pool #258428, 5.00%, 7/1/35 | | | 172,153 |
| | | 91,511 | | Pool #258439, 5.50%, 6/1/35 | | | 97,204 |
| | | 407,341 | | Pool #258448, 5.00%, 8/1/35 | | | 423,412 |
| | | 136,069 | | Pool #258449, 5.50%, 7/1/35 | | | 144,532 |
| | | 746,513 | | Pool #258450, 5.50%, 8/1/35 | | | 792,949 |
| | | 56,067 | | Pool #258451, 5.50%, 7/1/35 | | | 59,555 |
| | | 162,230 | | Pool #258454, 5.50%, 7/1/35 | | | 172,321 |
| | | 339,977 | | Pool #258456, 5.00%, 8/1/35 | | | 353,391 |
12
SCHEDULE OF PORTFOLIO INVESTMENTS
Access Capital Community Investment Fund (cont.)
March 31, 2010 (Unaudited)
| | | | | | | | |
Principal
Amount | | | | Value |
| | $ | 565,702 | | Pool #258460, 5.00%, 8/1/35 | | $ | 588,022 |
| | | 164,228 | | Pool #258470, 5.00%, 7/1/35 | | | 170,708 |
| | | 103,506 | | Pool #258479, 5.50%, 7/1/35 | | | 109,944 |
| | | 537,068 | | Pool #258480, 5.00%, 8/1/35 | | | 558,258 |
| | | 158,111 | | Pool #258551, 5.50%, 11/1/35 | | | 167,946 |
| | | 343,003 | | Pool #258552, 5.00%, 11/1/35 | | | 356,536 |
| | | 60,023 | | Pool #258555, 5.00%, 10/1/35 | | | 62,391 |
| | | 113,245 | | Pool #258556, 5.50%, 11/1/35 | | | 120,289 |
| | | 124,859 | | Pool #258562, 5.50%, 11/1/35 | | | 132,625 |
| | | 114,335 | | Pool #258569, 5.00%, 10/1/35 | | | 118,846 |
| | | 1,192,626 | | Pool #258571, 5.50%, 11/1/35 | | | 1,266,811 |
| | | 161,587 | | Pool #258595, 5.50%, 12/1/35 | | | 171,638 |
| | | 332,568 | | Pool #258596, 6.00%, 12/1/35 | | | 355,904 |
| | | 120,035 | | Pool #258598, 5.00%, 12/1/35 | | | 124,772 |
| | | 182,870 | | Pool #258599, 5.50%, 1/1/36 | | | 193,959 |
| | | 264,561 | | Pool #258600, 6.00%, 1/1/36 | | | 282,381 |
| | | 112,309 | | Pool #258610, 5.50%, 8/1/35 | | | 119,295 |
| | | 166,498 | | Pool #258621, 5.50%, 1/1/36 | | | 176,595 |
| | | 1,530,910 | | Pool #258627, 5.50%, 2/1/36 | | | 1,626,136 |
| | | 174,775 | | Pool #258633, 5.50%, 12/1/35 | | | 185,646 |
| | | 393,026 | | Pool #258634, 5.50%, 2/1/36 | | | 416,859 |
| | | 608,975 | | Pool #258643, 5.50%, 1/1/36 | | | 646,855 |
| | | 654,104 | | Pool #258644, 5.50%, 2/1/36 | | | 693,769 |
| | | 97,479 | | Pool #258650, 5.50%, 1/1/36 | | | 103,390 |
| | | 677,063 | | Pool #258658, 5.50%, 3/1/36 | | | 718,120 |
| | | 114,589 | | Pool #258663, 5.50%, 2/1/36 | | | 121,538 |
| | | 199,457 | | Pool #258721, 5.50%, 4/1/36 | | | 211,552 |
| | | 148,633 | | Pool #258736, 5.00%, 3/1/36 | | | 154,312 |
| | | 142,834 | | Pool #258737, 5.50%, 12/1/35 | | | 152,299 |
| | | 89,670 | | Pool #258763, 6.00%, 5/1/36 | | | 95,711 |
| | | 246,066 | | Pool #258765, 6.00%, 5/1/36 | | | 262,640 |
| | | 178,398 | | Pool #258766, 5.50%, 5/1/36 | | | 189,216 |
| | | 230,451 | | Pool #258767, 6.00%, 6/1/36 | | | 245,974 |
| | | 156,191 | | Pool #258773, 5.50%, 6/1/36 | | | 165,663 |
| | | 223,335 | | Pool #258779, 6.00%, 5/1/36 | | | 238,378 |
| | | 54,057 | | Pool #259004, 8.00%, 2/1/30 | | | 62,655 |
| | | 37,438 | | Pool #259011, 8.00%, 3/1/30 | | | 43,392 |
| | | 64,210 | | Pool #259030, 8.00%, 4/1/30 | | | 74,423 |
| | | 8,087 | | Pool #259178, 6.50%, 3/1/31 | | | 8,935 |
| | | 218,704 | | Pool #259181, 6.50%, 3/1/31 | | | 241,637 |
| | | 174,090 | | Pool #259187, 6.50%, 4/1/31 | | | 192,345 |
| | | 91,630 | | Pool #259190, 6.50%, 4/1/31 | | | 101,238 |
| | | 167,325 | | Pool #259191, 6.50%, 4/1/31 | | | 184,871 |
| | | 144,567 | | Pool #259201, 6.50%, 4/1/31 | | | 159,726 |
| | | 38,709 | | Pool #259213, 6.50%, 5/1/31 | | | 42,769 |
| | | 142,929 | | Pool #259256, 6.50%, 8/1/31 | | | 157,916 |
| | | 39,737 | | Pool #259284, 6.50%, 8/1/31 | | | 43,904 |
| | | 45,169 | | Pool #259306, 6.50%, 9/1/31 | | | 49,906 |
13
SCHEDULE OF PORTFOLIO INVESTMENTS
Access Capital Community Investment Fund (cont.)
March 31, 2010 (Unaudited)
| | | | | | | | |
Principal
Amount | | | | Value |
| | $ | 87,656 | | Pool #259309, 6.50%, 10/1/31 | | $ | 96,847 |
| | | 220,887 | | Pool #259316, 6.50%, 11/1/31 | | | 244,049 |
| | | 176,594 | | Pool #259327, 6.00%, 11/1/31 | | | 192,187 |
| | | 26,411 | | Pool #259331, 6.00%, 11/1/31 | | | 28,743 |
| | | 121,789 | | Pool #259369, 6.00%, 1/1/32 | | | 132,543 |
| | | 80,311 | | Pool #259372, 6.00%, 1/1/32 | | | 87,402 |
| | | 78,283 | | Pool #259376, 6.00%, 1/1/32 | | | 85,048 |
| | | 82,629 | | Pool #259377, 6.50%, 12/1/31 | | | 91,293 |
| | | 40,467 | | Pool #259378, 6.00%, 12/1/31 | | | 44,040 |
| | | 88,667 | | Pool #259390, 6.00%, 1/1/32 | | | 96,329 |
| | | 89,013 | | Pool #259391, 6.00%, 1/1/32 | | | 96,872 |
| | | 98,106 | | Pool #259392, 6.50%, 1/1/32 | | | 108,394 |
| | | 113,137 | | Pool #259393, 6.00%, 1/1/32 | | | 122,914 |
| | | 145,604 | | Pool #259397, 6.00%, 2/1/32 | | | 158,187 |
| | | 53,485 | | Pool #259398, 6.50%, 2/1/32 | | | 59,093 |
| | | 86,250 | | Pool #259440, 6.50%, 4/1/32 | | | 95,294 |
| | | 98,893 | | Pool #259560, 6.00%, 9/1/32 | | | 107,439 |
| | | 133,048 | | Pool #259590, 5.50%, 11/1/32 | | | 141,241 |
| | | 84,724 | | Pool #259592, 5.50%, 10/1/32 | | | 89,941 |
| | | 68,555 | | Pool #259598, 6.00%, 10/1/32 | | | 74,480 |
| | | 51,876 | | Pool #259599, 6.00%, 10/1/32 | | | 56,359 |
| | | 102,558 | | Pool #259607, 5.50%, 11/1/32 | | | 108,873 |
| | | 158,523 | | Pool #259610, 5.50%, 11/1/32 | | | 168,284 |
| | | 284,897 | | Pool #259611, 5.50%, 11/1/32 | | | 302,440 |
| | | 81,859 | | Pool #259612, 5.50%, 11/1/32 | | | 86,900 |
| | | 226,327 | | Pool #259614, 6.00%, 11/1/32 | | | 245,887 |
| | | 114,406 | | Pool #259623, 5.50%, 12/1/32 | | | 121,451 |
| | | 109,379 | | Pool #259625, 6.00%, 11/1/32 | | | 118,831 |
| | | 101,396 | | Pool #259634, 5.50%, 12/1/32 | | | 107,640 |
| | | 274,631 | | Pool #259650, 5.50%, 2/1/33 | | | 291,456 |
| | | 75,535 | | Pool #259655, 5.50%, 2/1/33 | | | 80,162 |
| | | 123,636 | | Pool #259658, 5.50%, 2/1/33 | | | 131,211 |
| | | 381,558 | | Pool #259659, 5.50%, 2/1/33 | | | 404,934 |
| | | 170,897 | | Pool #259667, 5.50%, 2/1/33 | | | 181,368 |
| | | 41,859 | | Pool #259671, 5.50%, 2/1/33 | | | 44,423 |
| | | 179,611 | | Pool #259686, 5.50%, 3/1/33 | | | 190,615 |
| | | 71,730 | | Pool #259689, 5.50%, 3/1/33 | | | 76,124 |
| | | 51,780 | | Pool #259722, 5.00%, 5/1/33 | | | 53,726 |
| | | 154,021 | | Pool #259723, 5.00%, 5/1/33 | | | 159,809 |
| | | 62,655 | | Pool #259724, 5.00%, 5/1/33 | | | 65,217 |
| | | 364,783 | | Pool #259725, 5.00%, 5/1/33 | | | 378,492 |
| | | 78,798 | | Pool #259726, 5.00%, 5/1/33 | | | 81,759 |
| | | 218,667 | | Pool #259728, 5.00%, 6/1/33 | | | 226,885 |
| | | 134,841 | | Pool #259729, 5.00%, 6/1/33 | | | 139,909 |
| | | 173,524 | | Pool #259731, 5.00%, 6/1/33 | | | 180,045 |
| | | 142,093 | | Pool #259733, 5.50%, 6/1/33 | | | 150,799 |
| | | 83,445 | | Pool #259734, 5.50%, 5/1/33 | | | 88,557 |
| | | 380,786 | | Pool #259748, 5.00%, 6/1/33 | | | 395,096 |
14
SCHEDULE OF PORTFOLIO INVESTMENTS
Access Capital Community Investment Fund (cont.)
March 31, 2010 (Unaudited)
| | | | | | | | |
Principal
Amount | | | | Value |
| | $ | 217,939 | | Pool #259753, 5.00%, 7/1/33 | | $ | 226,130 |
| | | 81,248 | | Pool #259757, 5.00%, 6/1/33 | | | 84,302 |
| | | 563,417 | | Pool #259761, 5.00%, 6/1/33 | | | 584,591 |
| | | 297,300 | | Pool #259764, 5.00%, 7/1/33 | | | 308,473 |
| | | 129,059 | | Pool #259765, 5.00%, 7/1/33 | | | 133,909 |
| | | 197,749 | | Pool #259776, 5.00%, 6/1/33 | | | 205,181 |
| | | 154,794 | | Pool #259777, 5.00%, 7/1/33 | | | 160,611 |
| | | 172,761 | | Pool #259779, 5.00%, 7/1/33 | | | 179,254 |
| | | 114,445 | | Pool #259780, 5.00%, 7/1/33 | | | 118,746 |
| | | 104,328 | | Pool #259781, 5.00%, 7/1/33 | | | 108,249 |
| | | 112,511 | | Pool #259782, 5.00%, 7/1/33 | | | 116,739 |
| | | 63,842 | | Pool #259789, 5.00%, 7/1/33 | | | 66,241 |
| | | 117,443 | | Pool #259807, 5.00%, 8/1/33 | | | 121,857 |
| | | 227,410 | | Pool #259808, 5.00%, 8/1/33 | | | 235,956 |
| | | 152,765 | | Pool #259809, 5.00%, 8/1/33 | | | 158,506 |
| | | 677,105 | | Pool #259816, 5.00%, 8/1/33 | | | 702,551 |
| | | 35,453 | | Pool #259819, 5.00%, 8/1/33 | | | 36,785 |
| | | 92,135 | | Pool #259820, 5.00%, 8/1/33 | | | 95,598 |
| | | 255,734 | | Pool #259821, 5.00%, 7/1/33 | | | 265,344 |
| | | 464,097 | | Pool #259830, 5.00%, 8/1/33 | | | 481,538 |
| | | 568,204 | | Pool #259848, 5.00%, 9/1/33 | | | 589,558 |
| | | 137,137 | | Pool #259862, 5.50%, 9/1/33 | | | 145,539 |
| | | 90,628 | | Pool #259867, 5.50%, 10/1/33 | | | 96,180 |
| | | 340,299 | | Pool #259869, 5.50%, 10/1/33 | | | 361,147 |
| | | 102,744 | | Pool #259871, 5.50%, 9/1/33 | | | 109,038 |
| | | 316,749 | | Pool #259872, 5.50%, 11/1/33 | | | 336,155 |
| | | 151,708 | | Pool #259873, 5.50%, 10/1/33 | | | 161,002 |
| | | 149,508 | | Pool #259875, 5.50%, 10/1/33 | | | 158,668 |
| | | 87,946 | | Pool #259876, 5.50%, 10/1/33 | | | 93,334 |
| | | 97,274 | | Pool #259877, 5.50%, 9/1/33 | | | 103,234 |
| | | 223,488 | | Pool #259879, 5.50%, 10/1/33 | | | 237,180 |
| | | 131,634 | | Pool #259884, 5.50%, 11/1/33 | | | 139,699 |
| | | 41,257 | | Pool #259904, 5.50%, 11/1/33 | | | 43,785 |
| | | 320,385 | | Pool #259906, 5.50%, 11/1/33 | | | 340,014 |
| | | 233,281 | | Pool #259908, 5.50%, 11/1/33 | | | 247,573 |
| | | 145,850 | | Pool #259926, 5.50%, 12/1/33 | | | 154,786 |
| | | 63,817 | | Pool #259928, 5.50%, 12/1/33 | | | 67,727 |
| | | 312,975 | | Pool #259930, 5.00%, 11/1/33 | | | 324,736 |
| | | 97,337 | | Pool #259936, 5.50%, 11/1/33 | | | 103,301 |
| | | 228,507 | | Pool #259938, 5.50%, 12/1/33 | | | 242,506 |
| | | 22,424 | | Pool #259939, 5.50%, 11/1/33 | | | 23,797 |
| | | 137,736 | | Pool #259944, 5.50%, 1/1/34 | | | 145,873 |
| | | 108,637 | | Pool #259946, 5.50%, 12/1/33 | | | 115,293 |
| | | 192,696 | | Pool #259961, 5.50%, 3/1/34 | | | 204,080 |
| | | 251,449 | | Pool #259962, 5.50%, 3/1/34 | | | 266,304 |
| | | 336,465 | | Pool #259976, 5.00%, 3/1/34 | | | 348,584 |
| | | 145,040 | | Pool #259977, 5.00%, 3/1/34 | | | 150,264 |
| | | 48,484 | | Pool #259998, 5.00%, 3/1/34 | | | 50,230 |
15
SCHEDULE OF PORTFOLIO INVESTMENTS
Access Capital Community Investment Fund (cont.)
March 31, 2010 (Unaudited)
| | | | | | | | |
Principal Amount | | | | Value |
| | $ | 745,654 | | Pool #380307, 6.53%, 6/1/16 | | $ | 812,849 |
| | | 635,710 | | Pool #381985, 7.97%, 9/1/17 | | | 735,365 |
| | | 565,722 | | Pool #382373, 7.58%, 5/1/18 | | | 656,009 |
| | | 611,595 | | Pool #383765, 6.70%, 6/1/19 | | | 690,438 |
| | | 1,108,574 | | Pool #383783, 6.38%, 5/1/11 | | | 1,148,312 |
| | | 984,870 | | Pool #385869, 5.41%, 2/1/21 | | | 1,045,781 |
| | | 2,361,245 | | Pool #386129, 5.43%, 5/1/21 | | | 2,509,478 |
| | | 2,401,055 | | Pool #386602, 4.66%, 10/1/13 | | | 2,556,528 |
| | | 4,671,762 | | Pool #386608, 5.37%, 11/1/21 | | | 4,937,388 |
| | | 2,711,908 | | Pool #386641, 5.80%, 12/1/33 | | | 2,830,329 |
| | | 714,770 | | Pool #386674, 5.51%, 11/1/21 | | | 760,801 |
| | | 454,952 | | Pool #386862, 4.78%, 5/1/14 | | | 483,222 |
| | | 3,650,601 | | Pool #387374, 5.60%, 5/1/23 | | | 3,956,252 |
| | | 906,569 | | Pool #387446, 5.22%, 6/1/20 | | | 960,167 |
| | | 932,205 | | Pool #387472, 4.89%, 6/1/15 | | | 998,998 |
| | | 9,403,074 | | Pool #387590, 4.90%, 9/1/15 | | | 10,065,538 |
| | | 645,456 | | Pool #462834, 4.70%, 2/1/17(c) | | | 690,560 |
| | | 10,429,632 | | Pool #463212, 4.68%, 8/1/19(c) | | | 10,862,671 |
| | | 266,003 | | Pool #557295, 7.00%, 12/1/29 | | | 298,371 |
| | | 30,905 | | Pool #572424, 6.50%, 3/1/31 | | | 34,146 |
| | | 35,625 | | Pool #575886, 7.50%, 1/1/31 | | | 40,334 |
| | | 103,180 | | Pool #576445, 6.00%, 1/1/31 | | | 112,291 |
| | | 49,532 | | Pool #576520, 5.50%, 3/1/16 | | | 53,254 |
| | | 56,174 | | Pool #577906, 6.50%, 4/1/31 | | | 62,064 |
| | | 239,319 | | Pool #579402, 6.50%, 4/1/31 | | | 264,413 |
| | | 292,206 | | Pool #583728, 6.50%, 6/1/31 | | | 322,846 |
| | | 234,481 | | Pool #585148, 6.50%, 7/1/31 | | | 259,068 |
| | | 227,997 | | Pool #590931, 6.50%, 7/1/31 | | | 251,904 |
| | | 82,918 | | Pool #590932, 6.50%, 7/1/31 | | | 91,612 |
| | | 61,376 | | Pool #591063, 6.50%, 7/1/31 | | | 67,812 |
| | | 305,448 | | Pool #601865, 6.50%, 4/1/31 | | | 337,477 |
| | | 162,722 | | Pool #601868, 6.00%, 7/1/29 | | | 177,090 |
| | | 273,581 | | Pool #607611, 6.50%, 11/1/31 | | | 302,269 |
| | | 133,180 | | Pool #613125, 6.50%, 10/1/31 | | | 147,145 |
| | | 93,504 | | Pool #624103, 6.00%, 2/1/32 | | | 101,760 |
| | | 560,440 | | Pool #634271, 6.50%, 5/1/32 | | | 619,207 |
| | | 275,062 | | Pool #640146, 5.00%, 12/1/17 | | | 293,707 |
| | | 157,761 | | Pool #644232, 6.50%, 6/1/32 | | | 174,304 |
| | | 182,764 | | Pool #644432, 6.50%, 7/1/32 | | | 201,928 |
| | | 53,729 | | Pool #644437, 6.50%, 6/1/32 | | | 59,363 |
| | | 231,380 | | Pool #647461, 6.00%, 6/1/32 | | | 251,376 |
| | | 378,950 | | Pool #656835, 5.50%, 11/1/32 | | | 402,285 |
| | | 122,406 | | Pool #657250, 6.00%, 10/1/32 | | | 132,985 |
| | | 5,150,517 | | Pool #663159, 5.00%, 7/1/32 | | | 5,355,988 |
| | | 107,217 | | Pool #666206, 5.50%, 9/1/32 | | | 113,820 |
| | | 201,597 | | Pool #670278, 5.50%, 11/1/32 | | | 214,010 |
| | | 151,586 | | Pool #670285, 5.50%, 12/1/32 | | | 160,920 |
| | | 254,280 | | Pool #676702, 5.50%, 11/1/32 | | | 269,938 |
16
SCHEDULE OF PORTFOLIO INVESTMENTS
Access Capital Community Investment Fund (cont.)
March 31, 2010 (Unaudited)
| | | | | | | | |
Principal
Amount | | | | Value |
| | $ | 237,943 | | Pool #677591, 5.50%, 12/1/32 | | $ | 252,595 |
| | | 308,223 | | Pool #681819, 5.50%, 1/1/33 | | | 327,106 |
| | | 1,034,577 | | Pool #681883, 6.00%, 3/1/33 | | | 1,122,694 |
| | | 380,939 | | Pool #683087, 5.00%, 1/1/18 | | | 406,761 |
| | | 479,024 | | Pool #684570, 5.00%, 12/1/32 | | | 496,652 |
| | | 291,878 | | Pool #684644, 4.50%, 6/1/18 | | | 307,295 |
| | | 456,741 | | Pool #686542, 5.50%, 3/1/33 | | | 484,437 |
| | | 134,232 | | Pool #686544, 5.50%, 2/1/33 | | | 142,497 |
| | | 395,525 | | Pool #686565, 5.50%, 4/1/33 | | | 419,757 |
| | | 82,694 | | Pool #688972, 5.50%, 4/1/33 | | | 87,760 |
| | | 398,025 | | Pool #689034, 5.00%, 5/1/33 | | | 412,983 |
| | | 250,084 | | Pool #689667, 5.50%, 4/1/33 | | | 265,484 |
| | | 327,502 | | Pool #695960, 5.00%, 1/1/33 | | | 339,554 |
| | | 859,316 | | Pool #695961, 5.50%, 1/1/33 | | | 912,231 |
| | | 234,688 | | Pool #695962, 6.00%, 11/1/32 | | | 254,970 |
| | | 109,849 | | Pool #695963, 6.50%, 11/1/32 | | | 121,368 |
| | | 740,937 | | Pool #696407, 5.50%, 4/1/33 | | | 786,331 |
| | | 2,715,327 | | Pool #702478, 5.50%, 6/1/33 | | | 2,881,682 |
| | | 761,839 | | Pool #702479, 5.00%, 6/1/33 | | | 790,469 |
| | | 480,036 | | Pool #703210, 5.50%, 9/1/32 | | | 509,146 |
| | | 836,840 | | Pool #703851, 5.50%, 4/1/33 | | | 888,109 |
| | | 223,898 | | Pool #705576, 5.50%, 5/1/33 | | | 237,615 |
| | | 1,213,818 | | Pool #720025, 5.00%, 8/1/33 | | | 1,259,434 |
| | | 1,394,616 | | Pool #723066, 5.00%, 4/1/33 | | | 1,447,027 |
| | | 767,185 | | Pool #723067, 5.50%, 5/1/33 | | | 814,187 |
| | | 799,406 | | Pool #723068, 4.50%, 5/1/33 | | | 806,127 |
| | | 843,370 | | Pool #723070, 4.50%, 5/1/33 | | | 854,151 |
| | | 622,877 | | Pool #723074, 4.50%, 5/1/33 | | | 630,839 |
| | | 844,141 | | Pool #723328, 5.00%, 9/1/33 | | | 875,865 |
| | | 777,802 | | Pool #727311, 4.50%, 9/1/33 | | | 787,744 |
| | | 3,038,313 | | Pool #727312, 5.00%, 9/1/33 | | | 3,152,495 |
| | | 583,450 | | Pool #727315, 6.00%, 10/1/33 | | | 633,143 |
| | | 1,484,355 | | Pool #738589, 5.00%, 9/1/33 | | | 1,540,138 |
| | | 441,708 | | Pool #738683, 5.00%, 9/1/33 | | | 458,307 |
| | | 1,434,231 | | Pool #739269, 5.00%, 9/1/33 | | | 1,488,131 |
| | | 479,416 | | Pool #743593, 5.50%, 10/1/33 | | | 508,788 |
| | | 446,474 | | Pool #743595, 5.50%, 10/1/33 | | | 473,828 |
| | | 310,295 | | Pool #748041, 4.50%, 10/1/33 | | | 314,262 |
| | | 985,428 | | Pool #749891, 5.00%, 9/1/33 | | | 1,022,461 |
| | | 693,357 | | Pool #749897, 4.50%, 9/1/33 | | | 702,220 |
| | | 437,759 | | Pool #750984, 5.00%, 12/1/18 | | | 467,158 |
| | | 501,492 | | Pool #751008, 5.00%, 12/1/18 | | | 535,172 |
| | | 648,832 | | Pool #753533, 5.00%, 11/1/33 | | | 673,216 |
| | | 203,152 | | Pool #755679, 6.00%, 1/1/34 | | | 220,455 |
| | | 366,791 | | Pool #755745, 5.00%, 1/1/34 | | | 380,575 |
| | | 539,532 | | Pool #755746, 5.50%, 12/1/33 | | | 572,586 |
| | | 391,704 | | Pool #755780, 5.50%, 2/1/34 | | | 414,845 |
| | | 446,414 | | Pool #763551, 5.50%, 3/1/34 | | | 472,787 |
17
SCHEDULE OF PORTFOLIO INVESTMENTS
Access Capital Community Investment Fund (cont.)
March 31, 2010 (Unaudited)
| | | | | | | | |
Principal
Amount | | | | Value |
| | $ | 1,316,038 | | Pool #763820, 5.50%, 1/1/34 | | $ | 1,393,786 |
| | | 586,824 | | Pool #763824, 5.00%, 3/1/34 | | | 607,960 |
| | | 617,739 | | Pool #765216, 5.00%, 1/1/19 | | | 658,068 |
| | | 661,334 | | Pool #765217, 4.50%, 1/1/19 | | | 695,233 |
| | | 490,334 | | Pool #765306, 5.00%, 2/1/19 | | | 522,345 |
| | | 128,876 | | Pool #770099, 5.50%, 2/1/34 | | | 136,490 |
| | | 241,997 | | Pool #773084, 4.50%, 3/1/19 | | | 254,401 |
| | | 412,916 | | Pool #773091, 4.00%, 3/1/19 | | | 427,831 |
| | | 418,968 | | Pool #773096, 4.50%, 3/1/19 | | | 440,444 |
| | | 823,546 | | Pool #773175, 5.00%, 5/1/34 | | | 853,209 |
| | | 608,055 | | Pool #773476, 5.50%, 7/1/19 | | | 656,397 |
| | | 776,422 | | Pool #773547, 5.00%, 5/1/34 | | | 804,388 |
| | | 757,117 | | Pool #773553, 5.00%, 4/1/34 | | | 784,387 |
| | | 1,111,348 | | Pool #773568, 5.50%, 5/1/34 | | | 1,177,004 |
| | | 478,405 | | Pool #773575, 6.00%, 7/1/34 | | | 516,161 |
| | | 766,950 | | Pool #776849, 5.00%, 11/1/34 | | | 794,574 |
| | | 953,713 | | Pool #776850, 5.50%, 11/1/34 | | | 1,010,056 |
| | | 391,250 | | Pool #776851, 6.00%, 10/1/34 | | | 422,127 |
| | | 863,207 | | Pool #777444, 5.50%, 5/1/34 | | | 914,203 |
| | | 2,993,687 | | Pool #777621, 5.00%, 2/1/34 | | | 3,106,192 |
| | | 469,328 | | Pool #781437, 6.00%, 8/1/34 | | | 506,368 |
| | | 539,664 | | Pool #781741, 6.00%, 9/1/34 | | | 582,255 |
| | | 707,205 | | Pool #781907, 5.00%, 2/1/21 | | | 749,176 |
| | | 934,928 | | Pool #781954, 5.00%, 6/1/34 | | | 968,603 |
| | | 933,215 | | Pool #781959, 5.50%, 6/1/34 | | | 988,347 |
| | | 671,230 | | Pool #781960, 5.50%, 6/1/34 | | | 710,884 |
| | | 743,831 | | Pool #783893, 5.50%, 12/1/34 | | | 787,774 |
| | | 737,872 | | Pool #783929, 5.50%, 10/1/34 | | | 781,464 |
| | | 335,761 | | Pool #788329, 6.50%, 8/1/34 | | | 368,870 |
| | | 182,059 | | Pool #790282, 6.00%, 7/1/34 | | | 196,427 |
| | | 394,509 | | Pool #797623, 5.00%, 7/1/35 | | | 410,074 |
| | | 172,954 | | Pool #797626, 5.50%, 7/1/35 | | | 183,712 |
| | | 205,029 | | Pool #797627, 5.00%, 7/1/35 | | | 212,093 |
| | | 262,150 | | Pool #797674, 5.50%, 9/1/35 | | | 277,146 |
| | | 996,233 | | Pool #798725, 5.50%, 11/1/34 | | | 1,055,088 |
| | | 464,682 | | Pool #799547, 5.50%, 9/1/34 | | | 492,135 |
| | | 217,133 | | Pool #799548, 6.00%, 9/1/34 | | | 235,627 |
| | | 3,371,682 | | Pool #806754, 4.50%, 9/1/34 | | | 3,408,458 |
| | | 985,173 | | Pool #806757, 6.00%, 9/1/34 | | | 1,062,924 |
| | | 4,869,306 | | Pool #806761, 5.50%, 9/1/34 | | | 5,156,973 |
| | | 576,805 | | Pool #808185, 5.50%, 3/1/35 | | | 609,800 |
| | | 1,016,958 | | Pool #808205, 5.00%, 1/1/35 | | | 1,051,998 |
| | | 90,176 | | Pool #813941, 4.50%, 11/1/20 | | | 94,545 |
| | | 108,140 | | Pool #813942, 5.00%, 11/1/20 | | | 115,064 |
| | | 2,236,567 | | Pool #815009, 5.00%, 4/1/35 | | | 2,324,812 |
| | | 1,192,297 | | Pool #817641, 5.00%, 11/1/35 | | | 1,239,340 |
| | | 1,158,308 | | Pool #820334, 5.00%, 9/1/35 | | | 1,198,218 |
| | | 881,449 | | Pool #820335, 5.00%, 9/1/35 | | | 911,820 |
18
SCHEDULE OF PORTFOLIO INVESTMENTS
Access Capital Community Investment Fund (cont.)
March 31, 2010 (Unaudited)
| | | | | | | | |
Principal
Amount | | | | Value |
| | $ | 725,746 | | Pool #820336, 5.00%, 9/1/35 | | $ | 750,752 |
| | | 1,031,028 | | Pool #822008, 5.00%, 5/1/35 | | | 1,066,552 |
| | | 1,896,742 | | Pool #829005, 5.00%, 8/1/35 | | | 1,962,095 |
| | | 222,617 | | Pool #829006, 5.50%, 9/1/35 | | | 235,351 |
| | | 327,815 | | Pool #829007, 4.50%, 8/1/35 | | | 330,981 |
| | | 186,648 | | Pool #829117, 5.50%, 9/1/35 | | | 197,325 |
| | | 89,114 | | Pool #829118, 5.50%, 9/1/35 | | | 94,657 |
| | | 978,572 | | Pool #829274, 5.00%, 8/1/35 | | | 1,017,182 |
| | | 1,331,276 | | Pool #829275, 5.00%, 8/1/35 | | | 1,383,802 |
| | | 1,462,376 | | Pool #829276, 5.00%, 8/1/35 | | | 1,520,075 |
| | | 976,648 | | Pool #829277, 5.00%, 8/1/35 | | | 1,015,182 |
| | | 213,214 | | Pool #829356, 5.00%, 9/1/35 | | | 221,626 |
| | | 2,573,889 | | Pool #829649, 5.50%, 3/1/35 | | | 2,738,818 |
| | | 1,417,471 | | Pool #835287, 5.00%, 8/1/35 | | | 1,473,398 |
| | | 260,902 | | Pool #843586, 5.50%, 11/1/35 | | | 277,131 |
| | | 273,802 | | Pool #843587, 6.00%, 12/1/35 | | | 293,015 |
| | | 3,807,317 | | Pool #844361, 5.50%, 11/1/35 | | | 4,044,142 |
| | | 982,079 | | Pool #845245, 5.50%, 11/1/35 | | | 1,038,257 |
| | | 2,106,199 | | Pool #866969, 6.00%, 2/1/36 | | | 2,248,071 |
| | | 621,767 | | Pool #867410, 5.50%, 4/1/36 | | | 659,471 |
| | | 360,230 | | Pool #867569, 6.00%, 2/1/36 | | | 384,494 |
| | | 361,925 | | Pool #867574, 5.50%, 2/1/36 | | | 382,063 |
| | | 1,176,311 | | Pool #868788, 6.00%, 3/1/36 | | | 1,255,546 |
| | | 738,338 | | Pool #868849, 6.00%, 4/1/36 | | | 788,072 |
| | | 589,215 | | Pool #870599, 6.00%, 6/1/36 | | | 628,904 |
| | | 479,677 | | Pool #870684, 6.00%, 7/1/36 | | | 511,988 |
| | | 935,473 | | Pool #871072, 5.50%, 2/1/37 | | | 991,709 |
| | | 766,794 | | Pool #873819, 6.39%, 8/1/24 | | | 867,241 |
| | | 5,139,825 | | Pool #874136, 5.57%, 12/1/16 | | | 5,664,627 |
| | | 3,264,100 | | Pool #874900, 5.45%, 10/1/17 | | | 3,571,657 |
| | | 928,350 | | Pool #881425, 6.00%, 7/1/36 | | | 990,883 |
| | | 859,969 | | Pool #882044, 6.00%, 5/1/36 | | | 920,314 |
| | | 540,522 | | Pool #883589, 6.00%, 4/1/36 | | | 576,931 |
| | | 736,649 | | Pool #884693, 5.50%, 4/1/36 | | | 777,636 |
| | | 3,099,588 | | Pool #885724, 5.50%, 6/1/36 | | | 3,272,050 |
| | | 774,631 | | Pool #899800, 6.00%, 8/1/37 | | | 824,147 |
| | | 706,674 | | Pool #901412, 6.00%, 8/1/36 | | | 754,275 |
| | | 690,120 | | Pool #905438, 6.00%, 11/1/36 | | | 736,605 |
| | | 824,521 | | Pool #907646, 6.00%, 1/1/37 | | | 880,060 |
| | | 719,336 | | Pool #908671, 6.00%, 1/1/37 | | | 767,789 |
| | | 1,468,137 | | Pool #908672, 5.50%, 1/1/37 | | | 1,549,824 |
| | | 1,113,309 | | Pool #911730, 5.50%, 12/1/21 | | | 1,194,863 |
| | | 853,648 | | Pool #919368, 5.50%, 4/1/37 | | | 904,965 |
| | | 1,366,814 | | Pool #922582, 6.00%, 12/1/36 | | | 1,458,881 |
| | | 2,843,547 | | Pool #934941, 5.00%, 8/1/39 | | | 2,951,298 |
| | | 1,142,068 | | Pool #934942, 5.00%, 9/1/39 | | | 1,179,635 |
| | | 742,967 | | Pool #939465, 5.50%, 6/1/37 | | | 787,631 |
| | | 1,544,345 | | Pool #941204, 5.50%, 6/1/37 | | | 1,637,184 |
19
SCHEDULE OF PORTFOLIO INVESTMENTS
Access Capital Community Investment Fund (cont.)
March 31, 2010 (Unaudited)
| | | | | | | | |
Principal
Amount | | | | Value |
| | $ | 1,035,548 | | Pool #941205, 5.00%, 5/1/37 | | $ | 1,075,112 |
| | | 1,040,579 | | Pool #941206, 5.50%, 5/1/37 | | | 1,103,134 |
| | | 435,434 | | Pool #941487, 6.00%, 8/1/37 | | | 465,445 |
| | | 841,943 | | Pool #943394, 5.50%, 6/1/37 | | | 892,557 |
| | | 1,713,178 | | Pool #944502, 6.00%, 6/1/37 | | | 1,828,576 |
| | | 786,444 | | Pool #945853, 6.00%, 7/1/37 | | | 836,715 |
| | | 1,027,930 | | Pool #948600, 6.00%, 8/1/37 | | | 1,098,776 |
| | | 936,341 | | Pool #948672, 5.50%, 8/1/37 | | | 987,947 |
| | | 1,846,531 | | Pool #952598, 6.00%, 7/1/37 | | | 1,970,912 |
| | | 981,911 | | Pool #952623, 6.00%, 8/1/37 | | | 1,044,676 |
| | | 2,218,672 | | Pool #952632, 6.00%, 7/1/37 | | | 2,371,586 |
| | | 567,296 | | Pool #952649, 6.00%, 7/1/37 | | | 608,345 |
| | | 1,319,272 | | Pool #952659, 6.00%, 8/1/37 | | | 1,408,137 |
| | | 813,890 | | Pool #952665, 6.00%, 8/1/37 | | | 865,915 |
| | | 729,670 | | Pool #952678, 6.50%, 8/1/37 | | | 791,817 |
| | | 451,550 | | Pool #952693, 6.50%, 8/1/37 | | | 490,009 |
| | | 916,476 | | Pool #956050, 6.00%, 12/1/37 | | | 975,059 |
| | | 2,641,825 | | Pool #957324, 5.43%, 5/1/18(c) | | | 2,888,182 |
| | | 396,022 | | Pool #958502, 5.07%, 1/1/39(c) | | | 422,654 |
| | | 893,222 | | Pool #959093, 5.50%, 11/1/37 | | | 951,384 |
| | | 986,824 | | Pool #960919, 5.00%, 2/1/38 | | | 1,024,317 |
| | | 527,709 | | Pool #965239, 5.84%, 9/1/38 | | | 562,336 |
| | | 194,738 | | Pool #972648, 5.50%, 2/1/38 | | | 206,445 |
| | | 1,128,795 | | Pool #975137, 5.00%, 5/1/38 | | | 1,166,038 |
| | | 1,087,983 | | Pool #975769, 5.50%, 3/1/38 | | | 1,147,947 |
| | | 983,243 | | Pool #982656, 5.50%, 6/1/38 | | | 1,042,350 |
| | | 971,445 | | Pool #982898, 5.00%, 5/1/38 | | | 1,003,496 |
| | | 980,663 | | Pool #983033, 5.00%, 5/1/38 | | | 1,017,922 |
| | | 1,154,917 | | Pool #984842, 5.50%, 6/1/38 | | | 1,218,571 |
| | | 886,907 | | Pool #986230, 5.00%, 7/1/38 | | | 920,792 |
| | | 642,155 | | Pool #986233, 5.00%, 6/1/38 | | | 666,552 |
| | | 736,637 | | Pool #986239, 6.00%, 7/1/38 | | | 787,407 |
| | | 1,948,702 | | Pool #986957, 5.50%, 7/1/38 | | | 2,056,104 |
| | | 1,138,622 | | Pool #986958, 5.50%, 7/1/38 | | | 1,201,377 |
| | | 567,659 | | Pool #986985, 5.00%, 7/1/23 | | | 599,453 |
| | | 1,730,090 | | Pool #990510, 5.50%, 8/1/38 | | | 1,825,444 |
| | | 1,444,276 | | Pool #990511, 6.00%, 8/1/38 | | | 1,535,919 |
| | | 1,017,836 | | Pool #990617, 5.50%, 9/1/38 | | | 1,073,934 |
| | | 886,560 | | Pool #AA0525, 5.50%, 12/1/38 | | | 944,289 |
| | | 2,374,913 | | Pool #AA0526, 5.00%, 12/1/38 | | | 2,465,144 |
| | | 5,888,169 | | Pool #AA0527, 5.50%, 12/1/38 | | | 6,242,137 |
| | | 1,010,679 | | Pool #AA0643, 4.00%, 3/1/39 | | | 980,949 |
| | | 1,197,652 | | Pool #AA0644, 4.50%, 3/1/39 | | | 1,201,853 |
| | | 1,220,815 | | Pool #AA0645, 4.50%, 3/1/39 | | | 1,224,975 |
| | | 1,905,828 | | Pool #AA0814, 5.50%, 12/1/38 | | | 2,020,397 |
| | | 1,039,491 | | Pool #AA2243, 4.50%, 5/1/39 | | | 1,048,230 |
| | | 1,959,536 | | Pool #AA3142, 4.50%, 3/1/39 | | | 1,976,010 |
| | | 1,095,385 | | Pool #AA3143, 4.00%, 3/1/39 | | | 1,063,053 |
20
SCHEDULE OF PORTFOLIO INVESTMENTS
Access Capital Community Investment Fund (cont.)
March 31, 2010 (Unaudited)
| | | | | | | | |
Principal
Amount | | | | Value |
| | $ | 1,324,113 | | Pool #AA3206, 4.00%, 4/1/39 | | $ | 1,291,651 |
| | | 1,188,903 | | Pool #AA3207, 4.50%, 3/1/39 | | | 1,198,898 |
| | | 1,084,554 | | Pool #AA4468, 4.00%, 4/1/39 | | | 1,057,965 |
| | | 1,061,565 | | Pool #AA7042, 4.50%, 6/1/39 | | | 1,070,490 |
| | | 1,128,586 | | Pool #AA7658, 4.00%, 6/1/39 | | | 1,100,917 |
| | | 1,611,802 | | Pool #AA7659, 4.50%, 6/1/39 | | | 1,625,353 |
| | | 1,014,278 | | Pool #AA7741, 4.50%, 6/1/24 | | | 1,053,590 |
| | | 1,206,699 | | Pool #AA8455, 4.50%, 6/1/39 | | | 1,216,844 |
| | | 2,353,934 | | Pool #AC1463, 5.00%, 8/1/39 | | | 2,431,362 |
| | | 1,091,281 | | Pool #AC1464, 5.00%, 8/1/39 | | | 1,132,633 |
| | | 2,249,304 | | Pool #AC2109, 4.50%, 7/1/39 | | | 2,257,193 |
| | | 1,026,748 | | Pool #AC4394, 5.00%, 9/1/39 | | | 1,060,521 |
| | | 1,333,393 | | Pool #AC4395, 5.00%, 9/1/39 | | | 1,377,252 |
| | | 1,041,488 | | Pool #AC5328, 5.00%, 10/1/39 | | | 1,075,745 |
| | | 1,891,790 | | Pool #AC5329, 5.00%, 10/1/39 | | | 1,963,476 |
| | | 1,736,750 | | Pool #AC6304, 5.00%, 12/1/39 | | | 1,802,561 |
| | | 1,097,998 | | Pool #AC6305, 5.00%, 11/1/39 | | | 1,134,115 |
| | | 2,280,589 | | Pool #AC6307, 5.00%, 12/1/39 | | | 2,367,008 |
| | | 1,189,988 | | Pool #AC6790, 5.00%, 12/1/39 | | | 1,229,131 |
| | | 4,873,842 | | Pool #AC7199, 5.00%, 12/1/39 | | | 5,058,527 |
| | | 3,030,675 | | Pool #AD1470, 5.00%, 2/1/40 | | | 3,145,517 |
| | | 2,952,375 | | Pool #AD1471, 4.50%, 2/1/40 | | | 2,977,196 |
| | | 3,725,573 | | Pool #AD1560, 5.00%, 3/1/40 | | | 3,848,118 |
| | | 4,073,752 | | Pool #AD1585, 4.50%, 2/1/40 | | | 4,108,000 |
| | | 1,507,631 | | Pool #AD1586, 5.00%, 1/1/40 | | | 1,564,760 |
| | | 1,047,250 | | Pool #AD1638, 4.50%, 2/1/40 | | | 1,050,818 |
| | | 1,849,415 | | Pool #AD1640, 4.50%, 3/1/40 | | | 1,855,716 |
| | | 3,456,175 | | Pool #AD1942, 4.50%, 1/1/40 | | | 3,485,232 |
| | | 1,291,552 | | Pool #AD1943, 5.00%, 1/1/40 | | | 1,340,493 |
| | | 4,965,599 | | Pool #AD1988, 4.50%, 2/1/40 | | | 4,982,517 |
| | | 1,328,426 | | Pool #AD2896, 5.00%, 3/1/40 | | | 1,372,122 |
| | | 1,024,667 | | Pool #MC0007, 5.50%, 12/1/38 | | | 1,081,141 |
| | | 129,855 | | Pool #MC0013, 5.50%, 12/1/38 | | | 137,012 |
| | | 131,854 | | Pool #MC0014, 5.50%, 12/1/38 | | | 139,121 |
| | | 70,136 | | Pool #MC0015, 6.00%, 11/1/38 | | | 74,586 |
| | | 85,067 | | Pool #MC0016, 5.50%, 11/1/38 | | | 89,755 |
| | | 582,641 | | Pool #MC0038, 4.50%, 3/1/39 | | | 587,539 |
| | | 151,059 | | Pool #MC0046, 4.00%, 4/1/39 | | | 147,356 |
| | | 303,226 | | Pool #MC0047, 4.50%, 4/1/39 | | | 305,775 |
| | | 59,526 | | Pool #MC0059, 4.00%, 4/1/39 | | | 58,066 |
| | | 416,940 | | Pool #MC0081, 4.00%, 5/1/39 | | | 406,718 |
| | | 531,236 | | Pool #MC0082, 4.50%, 5/1/39 | | | 535,702 |
| | | 524,466 | | Pool #MC0111, 4.00%, 6/1/39 | | | 511,608 |
| | | 336,599 | | Pool #MC0112, 4.50%, 6/1/39 | | | 339,429 |
| | | 423,884 | | Pool #MC0127, 4.50%, 7/1/39 | | | 427,448 |
| | | 89,404 | | Pool #MC0135, 4.50%, 7/1/39 | | | 90,156 |
| | | 1,439,753 | | Pool #MC0137, 4.50%, 7/1/39 | | | 1,451,857 |
| | | 2,053,162 | | Pool #MC0154, 4.50%, 8/1/39 | | | 2,070,423 |
21
SCHEDULE OF PORTFOLIO INVESTMENTS
Access Capital Community Investment Fund (cont.)
March 31, 2010 (Unaudited)
| | | | | | | | |
Principal
Amount | | | | Value |
| | $ | 107,104 | | Pool #MC0155, 5.00%, 8/1/39 | | $ | 111,162 |
| | | 670,468 | | Pool #MC0160, 4.50%, 8/1/39 | | | 676,105 |
| | | 1,949,113 | | Pool #MC0171, 4.50%, 9/1/39 | | | 1,965,499 |
| | | 631,960 | | Pool #MC0177, 4.50%, 9/1/39 | | | 637,273 |
| | | 251,919 | | Pool #MC3344, 5.00%, 12/1/38 | | | 260,231 |
| | | 10,995,788 | | Series 2004-T7, Class A, 5.12%, 7/25/41 | | | 11,567,098 |
| | | | | | | | |
| | | | | | | | 407,558,372 |
| | | | | | | | |
Freddie Mac — 19.84% | | | |
| | | 371,800 | | Pool #A10124, 5.00%, 6/1/33 | | | 386,470 |
| | | 355,950 | | Pool #A10548, 5.00%, 6/1/33 | | | 369,994 |
| | | 1,363,571 | | Pool #A12237, 5.00%, 8/1/33 | | | 1,417,371 |
| | | 570,964 | | Pool #A12969, 4.50%, 8/1/33 | | | 577,905 |
| | | 323,593 | | Pool #A12985, 5.00%, 8/1/33 | | | 336,360 |
| | | 554,985 | | Pool #A12986, 5.00%, 8/1/33 | | | 576,882 |
| | | 926,112 | | Pool #A12987, 5.00%, 8/1/33 | | | 962,653 |
| | | 811,154 | | Pool #A14028, 4.50%, 9/1/33 | | | 821,016 |
| | | 1,466,299 | | Pool #A14325, 5.00%, 9/1/33 | | | 1,524,152 |
| | | 179,145 | | Pool #A15268, 6.00%, 10/1/33 | | | 194,543 |
| | | 1,094,103 | | Pool #A15579, 5.50%, 11/1/33 | | | 1,161,304 |
| | | 586,108 | | Pool #A17393, 5.50%, 12/1/33 | | | 622,108 |
| | | 645,130 | | Pool #A17397, 5.50%, 1/1/34 | | | 683,747 |
| | | 732,737 | | Pool #A18617, 5.50%, 1/1/34 | | | 776,597 |
| | | 551,163 | | Pool #A19019, 5.50%, 2/1/34 | | | 584,155 |
| | | 352,987 | | Pool #A19362, 5.50%, 2/1/34 | | | 374,116 |
| | | 489,577 | | Pool #A20069, 5.00%, 3/1/34 | | | 508,435 |
| | | 1,094,617 | | Pool #A20070, 5.50%, 3/1/34 | | | 1,160,139 |
| | | 1,319,865 | | Pool #A20540, 5.50%, 4/1/34 | | | 1,398,871 |
| | | 403,902 | | Pool #A20541, 5.50%, 4/1/34 | | | 428,079 |
| | | 745,365 | | Pool #A21679, 5.50%, 4/1/34 | | | 789,981 |
| | | 889,465 | | Pool #A21681, 5.00%, 4/1/34 | | | 923,726 |
| | | 624,751 | | Pool #A23192, 5.00%, 5/1/34 | | | 648,815 |
| | | 2,009,473 | | Pool #A25310, 5.00%, 6/1/34 | | | 2,086,874 |
| | | 568,550 | | Pool #A25311, 5.00%, 6/1/34 | | | 590,450 |
| | | 667,923 | | Pool #A25600, 5.50%, 8/1/34 | | | 707,904 |
| | | 88,775 | | Pool #A26270, 6.00%, 8/1/34 | | | 96,183 |
| | | 55,343 | | Pool #A26386, 6.00%, 9/1/34 | | | 59,962 |
| | | 673,743 | | Pool #A26395, 6.00%, 9/1/34 | | | 729,968 |
| | | 807,489 | | Pool #A26396, 5.50%, 9/1/34 | | | 855,824 |
| | | 1,605,381 | | Pool #A28241, 5.50%, 10/1/34 | | | 1,701,477 |
| | | 658,507 | | Pool #A30055, 5.00%, 11/1/34 | | | 683,871 |
| | | 1,227,968 | | Pool #A30056, 5.50%, 12/1/34 | | | 1,301,473 |
| | | 653,280 | | Pool #A30591, 6.00%, 12/1/34 | | | 707,798 |
| | | 642,883 | | Pool #A31135, 5.50%, 12/1/34 | | | 684,580 |
| | | 355,686 | | Pool #A32976, 5.50%, 8/1/35 | | | 376,532 |
| | | 973,556 | | Pool #A33167, 5.00%, 1/1/35 | | | 1,011,055 |
| | | 2,083,545 | | Pool #A34999, 5.50%, 4/1/35 | | | 2,205,660 |
| | | 612,760 | | Pool #A35628, 5.50%, 6/1/35 | | | 648,674 |
22
SCHEDULE OF PORTFOLIO INVESTMENTS
Access Capital Community Investment Fund (cont.)
March 31, 2010 (Unaudited)
| | | | | | | | |
Principal
Amount | | | | Value |
| | $ | 1,308,777 | | Pool #A37185, 5.00%, 9/1/35 | | $ | 1,361,643 |
| | | 1,936,108 | | Pool #A38830, 5.00%, 5/1/35 | | | 2,004,633 |
| | | 452,910 | | Pool #A39561, 5.50%, 11/1/35 | | | 479,454 |
| | | 2,054,173 | | Pool #A40538, 5.00%, 12/1/35 | | | 2,137,148 |
| | | 252,108 | | Pool #A41442, 5.50%, 12/1/35 | | | 266,884 |
| | | 966,378 | | Pool #A42095, 5.50%, 1/1/36 | | | 1,023,016 |
| | | 1,356,477 | | Pool #A42097, 5.00%, 1/1/36 | | | 1,404,487 |
| | | 443,458 | | Pool #A42098, 5.50%, 1/1/36 | | | 469,448 |
| | | 378,215 | | Pool #A42099, 6.00%, 1/1/36 | | | 408,359 |
| | | 557,751 | | Pool #A42802, 5.00%, 2/1/36 | | | 577,491 |
| | | 1,867,863 | | Pool #A42803, 5.50%, 2/1/36 | | | 1,977,337 |
| | | 924,466 | | Pool #A42804, 6.00%, 2/1/36 | | | 998,148 |
| | | 1,035,252 | | Pool #A42805, 6.00%, 2/1/36 | | | 1,117,764 |
| | | 250,408 | | Pool #A44637, 5.50%, 4/1/36 | | | 264,927 |
| | | 797,784 | | Pool #A44638, 6.00%, 4/1/36 | | | 858,128 |
| | | 973,998 | | Pool #A44639, 5.50%, 3/1/36 | | | 1,035,344 |
| | | 931,881 | | Pool #A45396, 5.00%, 6/1/35 | | | 967,775 |
| | | 824,318 | | Pool #A46321, 5.50%, 7/1/35 | | | 872,630 |
| | | 1,626,664 | | Pool #A46735, 5.00%, 8/1/35 | | | 1,684,237 |
| | | 1,085,525 | | Pool #A46746, 5.50%, 8/1/35 | | | 1,149,146 |
| | | 592,630 | | Pool #A46747, 5.50%, 8/1/35 | | | 627,364 |
| | | 892,347 | | Pool #A46748, 5.50%, 8/1/35 | | | 944,646 |
| | | 262,841 | | Pool #A46996, 5.50%, 9/1/35 | | | 278,246 |
| | | 812,386 | | Pool #A46997, 5.50%, 9/1/35 | | | 861,015 |
| | | 1,195,633 | | Pool #A47552, 5.00%, 11/1/35 | | | 1,237,951 |
| | | 851,534 | | Pool #A47553, 5.00%, 11/1/35 | | | 881,673 |
| | | 701,451 | | Pool #A47554, 5.50%, 11/1/35 | | | 742,562 |
| | | 683,659 | | Pool #A48788, 5.50%, 5/1/36 | | | 726,719 |
| | | 962,618 | | Pool #A48789, 6.00%, 5/1/36 | | | 1,040,243 |
| | | 727,489 | | Pool #A49013, 6.00%, 5/1/36 | | | 782,516 |
| | | 429,412 | | Pool #A49526, 6.00%, 5/1/36 | | | 464,040 |
| | | 626,661 | | Pool #A49843, 6.00%, 6/1/36 | | | 674,062 |
| | | 785,580 | | Pool #A49844, 6.00%, 6/1/36 | | | 848,193 |
| | | 136,996 | | Pool #A49845, 6.50%, 6/1/36 | | | 149,328 |
| | | 924,496 | | Pool #A50128, 6.00%, 6/1/36 | | | 999,047 |
| | | 1,442,715 | | Pool #A59530, 5.50%, 4/1/37 | | | 1,525,161 |
| | | 806,130 | | Pool #A59964, 5.50%, 4/1/37 | | | 852,198 |
| | | 1,598,140 | | Pool #A60751, 5.50%, 5/1/37 | | | 1,689,468 |
| | | 1,279,716 | | Pool #A61754, 5.50%, 5/1/37 | | | 1,352,847 |
| | | 533,927 | | Pool #A61779, 5.50%, 5/1/37 | | | 567,109 |
| | | 1,116,980 | | Pool #A61915, 5.50%, 6/1/37 | | | 1,180,812 |
| | | 3,321,449 | | Pool #A61916, 6.00%, 6/1/37 | | | 3,569,570 |
| | | 3,042,932 | | Pool #A63456, 5.50%, 6/1/37 | | | 3,232,040 |
| | | 1,073,976 | | Pool #A64012, 5.50%, 7/1/37 | | | 1,135,350 |
| | | 533,590 | | Pool #A64015, 6.00%, 7/1/37 | | | 573,451 |
| | | 670,273 | | Pool #A64016, 6.50%, 7/1/37 | | | 729,769 |
| | | 944,963 | | Pool #A64447, 6.00%, 8/1/37 | | | 1,020,279 |
| | | 903,305 | | Pool #A64450, 6.00%, 8/1/37 | | | 975,301 |
23
SCHEDULE OF PORTFOLIO INVESTMENTS
Access Capital Community Investment Fund (cont.)
March 31, 2010 (Unaudited)
| | | | | | | | |
Principal
Amount | | | | Value |
| | $ | 97,833 | | Pool #A65713, 6.00%, 9/1/37 | | $ | 105,631 |
| | | 881,546 | | Pool #A65837, 6.00%, 9/1/37 | | | 947,400 |
| | | 778,327 | | Pool #A66043, 5.50%, 7/1/37 | | | 827,349 |
| | | 2,388,939 | | Pool #A66061, 5.50%, 8/1/37 | | | 2,525,458 |
| | | 1,532,846 | | Pool #A66116, 6.00%, 9/1/37 | | | 1,647,353 |
| | | 980,166 | | Pool #A66122, 6.00%, 8/1/37 | | | 1,053,387 |
| | | 864,868 | | Pool #A66133, 6.00%, 6/1/37 | | | 929,476 |
| | | 1,757,730 | | Pool #A66156, 6.50%, 9/1/37 | | | 1,922,543 |
| | | 1,642,860 | | Pool #A67630, 6.00%, 11/1/37 | | | 1,773,800 |
| | | 1,251,715 | | Pool #A68766, 6.00%, 10/1/37 | | | 1,351,480 |
| | | 782,216 | | Pool #A70292, 5.50%, 7/1/37 | | | 831,483 |
| | | 627,904 | | Pool #A73816, 6.00%, 3/1/38 | | | 677,620 |
| | | 994,494 | | Pool #A75113, 5.00%, 3/1/38 | | | 1,033,210 |
| | | 817,790 | | Pool #A76187, 5.00%, 4/1/38 | | | 845,538 |
| | | 699,410 | | Pool #A78354, 5.50%, 11/1/37 | | | 739,965 |
| | | 1,069,983 | | Pool #A79561, 5.50%, 7/1/38 | | | 1,131,128 |
| | | 90,935 | | Pool #B31082, 6.00%, 3/1/31 | | | 98,978 |
| | | 115,116 | | Pool #B31128, 6.00%, 9/1/31 | | | 125,299 |
| | | 91,164 | | Pool #B31139, 6.50%, 10/1/31 | | | 100,567 |
| | | 254,176 | | Pool #B31140, 6.50%, 10/1/31 | | | 280,392 |
| | | 60,569 | | Pool #B31146, 6.50%, 10/1/31 | | | 66,817 |
| | | 78,367 | | Pool #B31150, 6.50%, 11/1/31 | | | 86,450 |
| | | 198,871 | | Pool #B31188, 6.00%, 1/1/32 | | | 216,213 |
| | | 29,009 | | Pool #B31206, 6.00%, 3/1/32 | | | 31,575 |
| | | 114,590 | | Pool #B31292, 6.00%, 9/1/32 | | | 124,726 |
| | | 228,984 | | Pool #B31493, 5.00%, 2/1/34 | | | 237,804 |
| | | 512,717 | | Pool #B31516, 5.00%, 4/1/34 | | | 532,466 |
| | | 335,454 | | Pool #B31517, 5.00%, 4/1/34 | | | 348,375 |
| | | 251,398 | | Pool #B31532, 5.00%, 5/1/34 | | | 261,081 |
| | | 422,268 | | Pool #B31545, 5.00%, 5/1/34 | | | 438,533 |
| | | 238,620 | | Pool #B31546, 5.50%, 5/1/34 | | | 252,903 |
| | | 308,534 | | Pool #B31547, 5.50%, 5/1/34 | | | 327,003 |
| | | 374,301 | | Pool #B31550, 5.00%, 6/1/34 | | | 388,719 |
| | | 201,158 | | Pool #B31551, 5.50%, 6/1/34 | | | 213,640 |
| | | 331,466 | | Pool #B31587, 5.00%, 11/1/34 | | | 344,233 |
| | | 245,215 | | Pool #B31588, 5.50%, 11/1/34 | | | 259,893 |
| | | 319,125 | | Pool #B31642, 5.50%, 5/1/35 | | | 337,828 |
| | | 145,561 | | Pool #B50443, 5.00%, 11/1/18 | | | 155,473 |
| | | 272,640 | | Pool #B50450, 4.50%, 1/1/19 | | | 286,573 |
| | | 108,902 | | Pool #B50451, 5.00%, 1/1/19 | | | 116,114 |
| | | 61,632 | | Pool #B50458, 4.50%, 3/1/19 | | | 64,782 |
| | | 51,539 | | Pool #B50470, 4.50%, 4/1/19 | | | 54,173 |
| | | 205,715 | | Pool #B50496, 5.50%, 9/1/19 | | | 221,781 |
| | | 464,087 | | Pool #B50499, 5.00%, 11/1/19 | | | 494,819 |
| | | 102,386 | | Pool #B50500, 5.50%, 10/1/19 | | | 110,382 |
| | | 257,792 | | Pool #B50501, 4.50%, 11/1/19 | | | 270,966 |
| | | 231,819 | | Pool #B50504, 5.50%, 11/1/19 | | | 249,924 |
| | | 442,770 | | Pool #B50506, 5.00%, 11/1/19 | | | 472,091 |
24
SCHEDULE OF PORTFOLIO INVESTMENTS
Access Capital Community Investment Fund (cont.)
March 31, 2010 (Unaudited)
| | | | | | | | |
Principal Amount | | | | Value |
| | $ | 97,308 | | Pool #C35457, 7.50%, 1/1/30 | | $ | 111,113 |
| | | 54,276 | | Pool #C37233, 7.50%, 2/1/30 | | | 61,976 |
| | | 90,332 | | Pool #C48137, 7.00%, 1/1/31 | | | 101,268 |
| | | 38,416 | | Pool #C48138, 7.00%, 2/1/31 | | | 43,067 |
| | | 44,032 | | Pool #C49785, 6.50%, 3/1/31 | | | 48,601 |
| | | 59,142 | | Pool #C50288, 6.50%, 4/1/31 | | | 65,279 |
| | | 390,684 | | Pool #C51686, 6.50%, 5/1/31 | | | 430,980 |
| | | 195,484 | | Pool #C53210, 6.50%, 6/1/31 | | | 215,646 |
| | | 66,044 | | Pool #C53914, 6.50%, 6/1/31 | | | 72,856 |
| | | 155,165 | | Pool #C60020, 6.50%, 11/1/31 | | | 171,169 |
| | | 135,356 | | Pool #C60804, 6.00%, 11/1/31 | | | 147,328 |
| | | 30,191 | | Pool #C62574, 6.50%, 12/1/31 | | | 33,305 |
| | | 81,350 | | Pool #C65200, 6.50%, 3/1/32 | | | 89,690 |
| | | 135,192 | | Pool #C65616, 6.50%, 3/1/32 | | | 149,135 |
| | | 62,729 | | Pool #C68324, 6.50%, 6/1/32 | | | 69,160 |
| | | 782,622 | | Pool #C73273, 6.00%, 11/1/32 | | | 850,868 |
| | | 451,282 | | Pool #C73525, 6.00%, 11/1/32 | | | 490,634 |
| | | 622,293 | | Pool #C74672, 5.50%, 11/1/32 | | | 660,904 |
| | | 823,632 | | Pool #C77844, 5.50%, 3/1/33 | | | 874,220 |
| | | 168,085 | | Pool #C77845, 5.50%, 3/1/33 | | | 178,409 |
| | | 635,474 | | Pool #C78252, 5.50%, 3/1/33 | | | 674,505 |
| | | 371,874 | | Pool #C78380, 5.50%, 3/1/33 | | | 394,715 |
| | | 225,010 | | Pool #C79178, 5.50%, 4/1/33 | | | 238,831 |
| | | 724,417 | | Pool #J00980, 5.00%, 1/1/21 | | | 771,485 |
| | | 494,551 | | Pool #J05466, 5.50%, 6/1/22 | | | 532,296 |
| | | 868,191 | | Pool #N31468, 6.00%, 11/1/37 | | | 927,620 |
| | | | | | | | |
| | | | | | | | 116,713,117 |
| | | | | | | | |
Ginnie Mae — 6.76% | | | |
| | | 701,399 | | Pool #409117, 5.50%, 6/20/38 | | | 742,570 |
| | | 844,200 | | Pool #487643, 5.00%, 2/15/39 | | | 879,432 |
| | | 1,365,931 | | Pool #514702, 8.25%, 12/15/32 | | | 1,363,325 |
| | | 484,911 | | Pool #588448, 6.25%, 9/15/32 | | | 499,481 |
| | | 1,691,908 | | Pool #616936, 5.50%, 1/15/36 | | | 1,796,800 |
| | | 614,344 | | Pool #617904, 5.75%, 9/15/23 | | | 633,175 |
| | | 578,840 | | Pool #624106, 5.13%, 3/15/34 | | | 593,797 |
| | | 459,849 | | Pool #664269, 5.85%, 6/15/38 | | | 484,838 |
| | | 1,600,416 | | Pool #675509, 5.50%, 6/15/38 | | | 1,703,887 |
| | | 870,409 | | Pool #685140, 5.90%, 4/15/38 | | | 922,714 |
| | | 1,256,533 | | Pool #697672, 5.50%, 12/15/38 | | | 1,337,770 |
| | | 996,938 | | Pool #697814, 5.00%, 2/15/39 | | | 1,043,528 |
| | | 963,212 | | Pool #697885, 4.50%, 3/15/39 | | | 976,597 |
| | | 1,576,570 | | Pool #698112, 4.50%, 5/15/39 | | | 1,606,361 |
| | | 2,602,543 | | Pool #698113, 4.50%, 5/15/39 | | | 2,638,708 |
| | | 1,014,718 | | Pool #699294, 5.63%, 9/20/38 | | | 1,084,570 |
| | | 5,133,376 | | Pool #713519, 6.00%, 7/1/39 | | | 5,517,137 |
| | | 1,005,248 | | Pool #714561, 4.50%, 6/15/39 | | | 1,019,217 |
| | | 1,465,957 | | Pool #716822, 4.50%, 4/15/39 | | | 1,493,658 |
25
SCHEDULE OF PORTFOLIO INVESTMENTS
Access Capital Community Investment Fund (cont.)
March 31, 2010 (Unaudited)
| | | | | | | | |
Principal Amount | | | | Value |
| | $ | 1,220,089 | | Pool #716823, 4.50%, 4/15/39 | | $ | 1,237,044 |
| | | 1,289,649 | | Pool #717132, 4.50%, 5/15/39 | | | 1,314,018 |
| | | 1,712,166 | | Pool #717133, 4.50%, 5/15/39 | | | 1,735,959 |
| | | 1,399,281 | | Pool #720080, 4.50%, 6/15/39 | | | 1,425,722 |
| | | 1,154,999 | | Pool #720521, 5.00%, 8/15/39 | | | 1,203,202 |
| | | 3,037,043 | | Pool #726550, 5.00%, 10/1/39 | | | 3,163,791 |
| | | 2,051,653 | | Pool #729018, 4.50%, 2/15/40 | | | 2,090,421 |
| | | 1,199,867 | | Pool #729019, 5.00%, 2/15/40 | | | 1,255,941 |
| | | | | | | | |
| | | | | | | | 39,763,663 |
| | | | | | | | |
| |
Total U.S. Government Agency Backed Mortgages (Cost $540,312,707) | | | 564,035,152 |
| | | | | | | | |
U.S. Government Agency Obligations — 10.04% | | | |
Community Reinvestment Revenue Notes — 1.34% | | | |
| | | 852,973 | | 3.39%, 8/1/35(b)(c) | | | 838,092 |
| | | 7,250,000 | | 3.98%, 8/1/35(b)(c) | | | 7,023,285 |
| | | | | | | | |
| | | | | | | | 7,861,377 |
| | | | | | | | |
Small Business Administration — 5.38% | | | |
| | | 273,435 | | 0.55%, 4/25/28(a) | | | 268,501 |
| | | 676,229 | | 0.55%, 3/25/29(a) | | | 664,022 |
| | | 2,049,539 | | 0.55%, 9/25/30(a) | | | 2,012,599 |
| | | 449,410 | | 0.60%, 11/25/29(a) | | | 442,151 |
| | | 287,983 | | 0.60%, 3/25/28(a) | | | 283,312 |
| | | 296,228 | | 0.63%, 6/25/18(a) | | | 292,543 |
| | | 1,166,718 | | 0.63%, 4/15/32(c) | | | 1,161,190 |
| | | 616,916 | | 0.65%, 3/25/14(a) | | | 611,790 |
| | | 450,914 | | 0.66%, 7/15/32(c) | | | 448,780 |
| | | 210,174 | | 0.66%, 4/15/26(c) | | | 210,237 |
| | | 994,487 | | 0.66%, 11/15/26(c) | | | 989,807 |
| | | 618,896 | | 0.75%, 11/29/32(c) | | | 619,072 |
| | | 254,321 | | 0.80%, 2/21/33(c) | | | 254,387 |
| | | 1,345,487 | | 0.80%, 4/15/33(c) | | | 1,345,842 |
| | | 175,219 | | 0.80%, 9/15/32(c) | | | 175,265 |
| | | 327,317 | | 0.85%, 9/14/29(c) | | | 327,407 |
| | | 1,486,761 | | 0.87%, 4/21/34(a) | | | 1,487,176 |
| | | 791,641 | | 0.88%, 2/15/32(c) | | | 791,850 |
| | | 1,407,073 | | 0.88%, 9/15/32(c) | | | 1,407,452 |
| | | 1,247,761 | | 0.90%, 3/14/18(c) | | | 1,248,070 |
| | | 1,075,584 | | 1.12%, 11/4/34(a) | | | 1,086,229 |
| | | 21,739,277 | | 1.26%, 10/19/29*(c) | | | 352,220 |
| | | 813,929 | | 3.13%, 10/25/15(a) | | | 830,013 |
| | | 1,148,856 | | 3.38%, 10/25/15(a) | | | 1,175,074 |
| | | 386,128 | | 3.38%, 5/25/16(a) | | | 392,045 |
| | | 726,178 | | 3.58%, 12/25/15(a) | | | 745,246 |
| | | 945,012 | | 3.58%, 7/15/14(c) | | | 954,736 |
26
SCHEDULE OF PORTFOLIO INVESTMENTS
Access Capital Community Investment Fund (cont.)
March 31, 2010 (Unaudited)
| | | | | | | | |
Principal Amount | | | | Value |
| | $ | 53,863 | | 4.08%, 6/4/14(a) | | $ | 53,858 |
| | | 670,835 | | 4.33%, 11/17/19(a) | | | 670,770 |
| | | 205,870 | | 4.33%, 12/1/19(a) | | | 205,851 |
| | | 94,892 | | 5.70%, 8/15/17(c) | | | 99,432 |
| | | 388,214 | | 5.85%, 12/15/27(c) | | | 407,323 |
| | | 285,830 | | 5.85%, 9/27/13(c) | | | 298,099 |
| | | 114,643 | | 5.86%, 11/15/22(c) | | | 120,503 |
| | | 335,227 | | 5.98%, 6/9/26(c) | | | 352,675 |
| | | 197,821 | | 6.00%, 4/15/22(c) | | | 207,018 |
| | | 541,410 | | 6.03%, 10/31/32(c) | | | 557,128 |
| | | 421,974 | | 6.10%, 10/15/27(c) | | | 438,087 |
| | | 1,338,845 | | 6.13%, 4/15/31(c) | | | 1,387,015 |
| | | 253,427 | | 6.15%, 1/10/32(c) | | | 262,749 |
| | | 171,793 | | 6.25%, 9/15/27(c) | | | 179,698 |
| | | 962,346 | | 6.28%, 8/15/17(c) | | | 1,008,539 |
| | | 185,411 | | 6.30%, 4/15/18(c) | | | 193,435 |
| | | 73,138 | | 6.33%, 3/15/27(c) | | | 76,833 |
| | | 607,329 | | 6.35%, 8/13/26(c) | | | 638,881 |
| | | 1,080,573 | | 6.45%, 2/19/32(c) | | | 1,137,639 |
| | | 260,706 | | 6.50%, 3/30/32(c) | | | 274,492 |
| | | 52,123 | | 6.51%, 7/6/27(c) | | | 54,841 |
| | | 89,446 | | 6.53%, 1/2/27(c) | | | 94,112 |
| | | 62,882 | | 6.69%, 5/28/24(c) | | | 66,116 |
| | | 416,330 | | 6.71%, 3/15/27(c) | | | 438,056 |
| | | 73,169 | | 7.08%, 9/1/13(c) | | | 76,313 |
| | | 169,782 | | 7.08%, 1/19/14(c) | | | 177,166 |
| | | 241,842 | | 7.33%, 7/1/16(c) | | | 253,169 |
| | | 181,637 | | 7.33%, 2/23/16(c) | | | 190,055 |
| | | 236,182 | | 7.33%, 7/1/16(c) | | | 247,232 |
| | | 112,914 | | 7.33%, 7/1/16(c) | | | 118,206 |
| | | 172,433 | | 7.38%, 4/1/15(c) | | | 180,236 |
| | | 58,560 | | 7.38%, 1/1/15(c) | | | 61,186 |
| | | 76,139 | | 7.58%, 8/1/16(c) | | | 79,714 |
| | | 235,974 | | 7.83%, 10/3/16(c) | | | 247,087 |
| | | 23,714 | | 7.83%, 11/1/13(c) | | | 24,741 |
| | | 16,091 | | 8.08%, 2/15/14(c) | | | 16,793 |
| | | 50,720 | | 8.08%, 10/1/16(c) | | | 53,110 |
| | | 4,581 | | 8.33%, 11/1/11(c) | | | 4,767 |
| | | 4,267 | | 9.58%, 2/15/12(c) | | | 4,441 |
| | | 6,232 | | 9.58%, 2/15/12(c) | | | 6,486 |
| | | 11,824 | | 9.83%, 1/10/32(c) | | | 12,303 |
| | | 120,793 | | 1.13%, 7/30/17(a) | | | 120,781 |
| | | | | | | | |
| | | | | | | | 31,673,952 |
| | | | | | | | |
United States Department of Agriculture — 3.32% | | | |
| | | 467,578 | | 1.13%, 5/31/14(c) | | | 488,260 |
| | | 275,243 | | 4.45%, 4/2/18(c) | | | 284,685 |
| | | 199,706 | | 5.09%, 3/1/20(c) | | | 205,628 |
27
SCHEDULE OF PORTFOLIO INVESTMENTS
Access Capital Community Investment Fund (cont.)
March 31, 2010 (Unaudited)
| | | | | | | | |
Principal
Amount | | | | Value |
| | $ | 348,882 | | 5.25%, 10/26/22(c) | | $ | 360,200 |
| | | 355,957 | | 5.55%, 10/20/32(c) | | | 365,470 |
| | | 333,974 | | 5.55%, 10/20/32(c) | | | 342,899 |
| | | 171,076 | | 5.59%, 1/20/38(c) | | | 175,432 |
| | | 530,447 | | 5.60%, 11/29/30(c) | | | 547,334 |
| | | 224,929 | | 5.63%, 6/1/20(c) | | | 236,227 |
| | | 365,580 | | 5.63%, 4/15/27(c) | | | 379,323 |
| | | 409,723 | | 5.63%, 4/1/27(c) | | | 425,071 |
| | | 66,266 | | 5.64%, 1/20/38(c) | | | 68,167 |
| | | 281,776 | | 5.64%, 1/20/33(c) | | | 290,797 |
| | | 763,764 | | 5.64%, 1/20/38(c) | | | 785,664 |
| | | 105,503 | | 5.66%, 1/20/38(c) | | | 108,654 |
| | | 104,287 | | 5.66%, 10/20/32(c) | | | 107,781 |
| | | 280,213 | | 5.70%, 1/20/38(c) | | | 289,354 |
| | | 223,166 | | 5.73%, 4/20/37(c) | | | 230,878 |
| | | 475,929 | | 5.73%, 2/1/30(c) | | | 494,989 |
| | | 772,927 | | 5.75%, 1/20/33(c) | | | 803,158 |
| | | 185,673 | | 5.80%, 8/1/20(c) | | | 194,965 |
| | | 98,870 | | 5.83%, 11/1/20(c) | | | 103,838 |
| | | 140,738 | | 5.91%, 12/4/37(c) | | | 147,252 |
| | | 87,127 | | 5.92%, 10/20/37(c) | | | 91,242 |
| | | 123,287 | | 5.98%, 12/20/37(c) | | | 129,591 |
| | | 351,894 | | 5.98%, 12/31/26(c) | | | 370,243 |
| | | 203,710 | | 5.99%, 11/1/32(c) | | | 214,448 |
| | | 130,073 | | 6.01%, 11/8/32(c) | | | 133,660 |
| | | 221,233 | | 6.01%, 1/20/38(c) | | | 226,483 |
| | | 74,419 | | 6.01%, 7/20/36(c) | | | 76,217 |
| | | 155,467 | | 6.04%, 2/1/27(c) | | | 160,969 |
| | | 183,809 | | 6.05%, 1/5/26(c) | | | 190,726 |
| | | 360,880 | | 6.05%, 1/1/37(c) | | | 370,586 |
| | | 512,554 | | 6.07%, 4/20/37(c) | | | 526,901 |
| | | 145,860 | | 6.08%, 7/1/32(c) | | | 150,786 |
| | | 101,818 | | 6.09%, 5/17/22(c) | | | 106,884 |
| | | 85,580 | | 6.10%, 1/1/13(c) | | | 89,145 |
| | | 201,066 | | 6.10%, 8/25/37(c) | | | 207,027 |
| | | 343,477 | | 6.11%, 7/20/32(c) | | | 355,001 |
| | | 217,356 | | 6.12%, 4/20/37(c) | | | 224,363 |
| | | 300,115 | | 6.12%, 1/26/37(c) | | | 309,535 |
| | | 137,551 | | 6.13%, 11/1/26(c) | | | 143,125 |
| | | 133,222 | | 6.13%, 4/16/27(c) | | | 138,558 |
| | | 684,522 | | 6.13%, 4/4/27(c) | | | 711,911 |
| | | 294,716 | | 6.13%, 4/19/27(c) | | | 306,523 |
| | | 572,542 | | 6.13%, 5/15/14(c) | | | 597,853 |
| | | 91,065 | | 6.13%, 8/1/19(c) | | | 95,571 |
| | | 99,272 | | 6.13%, 7/20/22(c) | | | 104,332 |
| | | 266,587 | | 6.13%, 7/29/19(c) | | | 279,763 |
| | | 97,619 | | 6.18%, 1/20/38(c) | | | 101,007 |
| | | 222,803 | | 6.20%, 1/20/37(c) | | | 231,141 |
28
SCHEDULE OF PORTFOLIO INVESTMENTS
Access Capital Community Investment Fund (cont.)
March 31, 2010 (Unaudited)
| | | | | | | | |
Principal Amount | | | | Value |
| | $ | 114,187 | | 6.22%, 6/1/37(c) | | $ | 118,503 |
| | | 59,469 | | 6.23%, 2/1/27(c) | | | 62,170 |
| | | 398,974 | | 6.23%, 3/14/32(c) | | | 415,370 |
| | | 606,804 | | 6.25%, 1/1/37(c) | | | 630,847 |
| | | 92,003 | | 6.28%, 3/1/14(c) | | | 96,024 |
| | | 86,011 | | 6.28%, 2/1/28(c) | | | 90,105 |
| | | 80,352 | | 6.33%, 3/2/27(c) | | | 84,412 |
| | | 210,483 | | 6.38%, 1/31/37(c) | | | 220,566 |
| | | 238,897 | | 6.38%, 2/16/37(c) | | | 250,337 |
| | | 54,773 | | 6.38%, 3/1/27(c) | | | 57,631 |
| | | 773,670 | | 6.51%, 4/20/37(c) | | | 814,760 |
| | | 831,346 | | 6.63%, 12/15/23(c) | | | 874,037 |
| | | 199,612 | | 6.64%, 4/20/37(c) | | | 210,272 |
| | | 192,098 | | 6.88%, 2/3/17(c) | | | 201,211 |
| | | 419,357 | | 6.88%, 2/3/22(c) | | | 440,668 |
| | | 617,447 | | 7.00%, 6/3/22(c) | | | 648,903 |
| | | 219,403 | | 7.13%, 12/10/16(c) | | | 229,771 |
| | | | | | | | |
| | | | | | | | 19,525,204 |
| | | | | | | | |
| |
Total U.S. Government Agency Obligations (Cost $59,109,907) | | | 59,060,533 |
| | | | | | | | |
U.S. Treasury Obligations — 0.34% | | | |
U.S. Treasury Bills — 0.34% | | | |
| | | 2,000,000 | | 0.45%, 6/17/10(d) | | | 1,999,380 |
| | | | | | | | |
| |
Total U.S. Treasury Obligations (Cost $1,998,623) | | | 1,999,380 |
| | | | | | | | |
Promissory Notes — 1.68% | | | |
| | | 9,375,000 | | Massachusetts Housing Investment Corp. Term Loan, 6.67%, 4/1/35(b)(c) | | | 9,873,676 |
| | | | | | | | |
| |
Total Promissory Notes (Cost $9,375,000) | | | 9,873,676 |
| | | | | | | | |
| | |
Shares | | | | |
Investment Company — 5.84% | | | |
| | | 34,342,578 | | JPMorgan Prime Money Market Fund | | | 34,342,578 |
| | | | | | | | |
| |
Total Investment Company (Cost $34,342,578) | | | 34,342,578 |
| | | | | | | | |
29
SCHEDULE OF PORTFOLIO INVESTMENTS
Access Capital Community Investment Fund (cont.)
March 31, 2010 (Unaudited)
| | | | | | | | |
| Contracts | | | | Value | |
Call Swaptions Purchased — 1.21% | | | | |
| | 500,000 | | Pay a fixed rate of 5.35% and receive a floating rate based on 3-Month LIBOR, expiring May 23, 2024, Broker, UBS AG(c) | | $ | 3,170,384 | |
| | 500,000 | | Pay a fixed rate of 5.75% and receive a floating rate based on 3-Month LIBOR, expiring June 28, 2029, Broker, UBS AG(c) | | | 2,678,318 | |
| | 500,000 | | Pay a fixed rate of 6.00% and receive a floating rate based on 3-Month LIBOR, expiring June 18, 2019, Broker, Goldman Sachs International(c) | | | 1,285,512 | |
| | | | | | | | |
| |
Total Call Swaptions Purchased (Cost $5,503,750) | | | 7,134,214 | |
| | | | | | | | |
| |
Total Investments (Cost $679,595,294)(e) — 120.02% | | $ | 706,147,600 | |
| |
Liabilities in excess of other assets — (20.02)% | | | (117,783,574 | ) |
| | | | | | | | |
| |
NET ASSETS — 100.00% | | $ | 588,364,026 | |
| | | | | | | | |
| * | Interest Only represents the right to receive the monthly interest payment on an underlying pool of mortgage loans. The principal amount shown represents the par value on the underlying pool. |
| (a) | Floating rate note. Rate shown is as of report date. |
| (b) | This security is restricted and illiquid as the security may not be offered or sold within the United States or to U.S. persons except to qualified purchasers who are also either qualified institutional buyers or “accredited investors” (as defined in Rule 501 (a) of Regulation D under the Securities Act of 1933). |
The total investment in restricted and illiquid securities representing $20,057,265 or 3.41% of net assets was as follows:
| | | | | | | | | | | |
Acquisition
Principal
Amount | | Issuer | | Acquisition
Date | | Acquisition
Cost | | 3/31/2010
Carrying
Value
Per Unit |
| $ | 570,000 | | Atlantic Marine Corps Communities LLC | | 7/31/2007 | | $ | 509,772 | | $ | 0.80 |
| $ | 2,000,000 | | Pacific Beacon LLC | | 12/18/2006 | | $ | 2,000,000 | | $ | 0.55 |
| $ | 852,973 | | Community Reinvestment Revenue Note | | 3/24/2008 | | $ | 847,949 | | $ | 0.98 |
| $ | 7,250,000 | | Community Reinvestment Revenue Note | | 3/24/2008 | | $ | 7,157,925 | | $ | 0.97 |
| $ | 1,395,000 | | Fort Knox Military Housing Privatization Project | | 1/29/2007 | | $ | 1,328,900 | | $ | 0.55 |
| $ | 9,375,000 | | Massachusetts Housing Investment Corp. | | 3/29/2005 | | $ | 9,375,000 | | $ | 1.05 |
| (c) | Fair valued security under procedures established by the Fund’s Board of Trustees. |
| (d) | The rate represents the annualized yield at time of purchase. |
| (e) | See notes to financial statements for the tax cost of securities and the breakdown of unrealized appreciation (depreciation). |
30
SCHEDULE OF PORTFOLIO INVESTMENTS
Access Capital Community Investment Fund (cont.)
March 31, 2010 (Unaudited)
Abbreviations used are defined below:
AMBAC - Insured by American Municipal Bond Insurance Assurance Corp.
IBC - Insured by International Bancshares Corp.
MBIA - Insured by MBIA
NATL-RE - National Reinsurance Corp.
OID - Original Issue Discount
See notes to financial statements.
31
FINANCIAL STATEMENTS
Statement of Assets and Liabilities
March 31, 2010 (Unaudited)
| | | | |
Assets: | | | | |
Investments in securities, at value (cost $679,595,294) | | $ | 706,147,600 | |
Segregated cash collateral for reverse repurchase agreements | | | 6,169,786 | |
Interest and dividends receivable | | | 3,639,372 | |
Receivable for open maturities | | | 184,188 | |
Receivable for Fund shares sold | | | 1,015,901 | |
Deposits at broker for futures contracts | | | 2,393,787 | |
Prepaid expenses and other assets | | | 26,444 | |
| | | | |
Total Assets | | | 719,577,078 | |
| | | | |
Liabilities: | | | | |
Distributions payable | | | 1,535,551 | |
Payable for capital shares redeemed | | | 15,897 | |
Payable for investments purchased | | | 785,008 | |
Margin variation payable | | | 127,151 | |
Reverse repurchase agreements (including interest of $48,370) | | | 127,910,331 | |
Payable for short sale commitment | | | 453,516 | |
Accrued expenses and other payables: | | | | |
Investment advisory fees | | | 305,336 | |
Accounting fees | | | 4,602 | |
Distribution fees | | | 6,039 | |
Trustee fees | | | 1,049 | |
Audit fees | | | 26,286 | |
Transfer Agent fees | | | 4,168 | |
Other | | | 38,118 | |
| | | | |
Total Liabilities | | | 131,213,052 | |
| | | | |
Net Assets | | $ | 588,364,026 | |
| | | | |
Net Assets Consist Of: | | | | |
Capital | | $ | 592,067,267 | |
Distributions in excess of net investment income | | | (1,315,963 | ) |
Accumulated net realized losses from investment transactions, futures contracts and sale commitments | | | (28,908,161 | ) |
Net unrealized appreciation on investments, futures contracts, and sale commitments | | | 26,520,883 | |
| | | | |
Net Assets | | $ | 588,364,026 | |
| | | | |
32
FINANCIAL STATEMENTS
Statement of Assets and Liabilities (cont.)
| | | | |
Net Assets: | | | | |
Class A | | $ | 10,629,698 | |
Class I | | | 577,734,328 | |
| | | | |
Total | | $ | 588,364,026 | |
| | | | |
Shares Outstanding (1,000,000,000 shares authorized, 100,000,000 shares registered at $.0000001 par value): | | | | |
Class A | | | 1,088,561 | |
Class I | | | 59,225,278 | |
| | | | |
Total | | | 60,313,839 | |
| | | | |
Net Asset Values and Redemption Price Per Share: | | | | |
Class A(a) | | $ | 9.76 | |
Class I | | $ | 9.75 | |
Maximum Offering Price Per Share: | | | | |
Class A | | $ | 10.14 | |
Maximum Sales Charge - Class A | | | 3.75 | % |
| (a) | For Class A shares, redemption price per share will be reduced by 1.00% for sales of shares within 12 months of purchase (only applicable on purchases of $1 million or more on which no initial sales charge was paid). Such reduction is not reflected in the net asset value and the redemption price per share. |
See notes to financial statements.
33
FINANCIAL STATEMENTS
Statement of Operations
For the Six Months Ended March 31, 2010 (Unaudited)
| | | | |
Investment Income: | | | | |
Interest income | | $ | 16,712,663 | |
Dividend income | | | 6,083 | |
| | | | |
Total Investment Income | | | 16,718,746 | |
| | | | |
| |
Expenses: | | | | |
Management fees | | | 1,744,911 | |
Interest expense | | | 201,952 | |
Distribution fees - Class A | | | 11,898 | |
Accounting services | | | 26,795 | |
Audit fees | | | 17,035 | |
Legal fees | | | 49,147 | |
Custodian fees | | | 24,283 | |
Insurance fees | | | 4,463 | |
Trustees’ fees and expenses | | | 5,198 | |
Transfer agent fees | | | 34,452 | |
Printing and shareholder reports | | | 7,398 | |
Registration fees | | | 25,515 | |
Other fees and expenses | | | 63,818 | |
| | | | |
Net expenses | | | 2,216,865 | |
| | | | |
| |
Net Investment Income | | | 14,501,881 | |
| | | | |
| |
Realized/Unrealized Gains (Losses) from Investment Transactions and Futures Contracts: | | | | |
Net realized gains from investment transactions | | | 423,813 | |
Net realized losses from sale commitments | | | (881,817 | ) |
Net realized losses from futures contracts | | | (357,036 | ) |
Net change in unrealized appreciation/depreciation on investments | | | (1,858,857 | ) |
Net change in unrealized appreciation/depreciation on sale commitments | | | 2,672 | |
Net change in unrealized appreciation/depreciation on futures contracts | | | 759,202 | |
| | | | |
Net realized/unrealized losses from investments, sales commitments and futures contracts | | | (1,912,023 | ) |
| | | | |
Change in net assets resulting from operations | | $ | 12,589,858 | |
| | | | |
See notes to financial statements.
34
FINANCIAL STATEMENTS
Statements of Changes in Net Assets
| | | | | | | | |
| | | For the
Six Months
Ended
March 31, 2010 | | | For the
Year
Ended
September 30, 2009 | |
| | | (Unaudited) | | | | |
From Investment Activities: | | | | | | | | |
Operations: | | | | | | | | |
Net investment income (loss) | | $ | 14,501,881 | | | $ | 28,079,284 | |
Net realized losses from investments, futures contracts and sale commitments | | | (815,040 | ) | | | (8,591,215 | ) |
Net change in unrealized appreciation/depreciation on investments, futures contracts and sale commitments | | | (1,096,983 | ) | | | 30,085,498 | |
| | | | | | | | |
Change in net assets resulting from operations | | | 12,589,858 | | | | 49,573,567 | |
| | | | | | | | |
| | |
Distributions to Class A Shareholders: | | | | | | | | |
From net investment income | | | (228,922 | ) | | | (157,849 | ) |
| | |
Distributions to Class I Shareholders: | | | | | | | | |
From net investment income | | | (14,263,635 | ) | | | (28,179,606 | ) |
| | | | | | | | |
Change in net assets resulting from shareholder distributions | | | (14,492,557 | ) | | | (28,337,455 | ) |
| | | | | | | | |
| | |
Capital Transactions: | | | | | | | | |
Proceeds from shares issued | | | 29,749,519 | | | | 36,928,806 | |
Distributions reinvested | | | 5,217,568 | | | | 9,642,647 | |
Cost of shares redeemed | | | (14,510,054 | ) | | | (41,401,532 | ) |
| | | | | | | | |
Change in net assets resulting from capital transactions | | | 20,457,033 | | | | 5,169,921 | |
| | | | | | | | |
Net increase in net assets | | | 18,554,334 | | | | 26,406,033 | |
| | |
Net Assets: | | | | | | | | |
Beginning of period | | | 569,809,692 | | | | 543,403,659 | |
| | | | | | | | |
End of period | | $ | 588,364,026 | | | $ | 569,809,692 | |
| | | | | | | | |
Distributions in excess of net investment income | | $ | (1,315,963 | ) | | $ | (1,325,287 | ) |
| | | | | | | | |
| | |
Share Transactions: | | | | | | | | |
Issued | | | 3,033,180 | | | | 3,816,303 | |
Reinvested | | | 532,539 | | | | 1,008,944 | |
Redeemed | | | (1,480,956 | ) | | | (4,345,147 | ) |
| | | | | | | | |
Change in shares resulting from capital transactions | | | 2,084,763 | | | | 480,100 | |
| | | | | | | | |
See notes to financial statements.
35
FINANCIAL STATEMENTS
Statement of Cash Flows
For the Six Months Ended March 31, 2010 (Unaudited)
| | | | |
Cash Used for Operating Activities: | | | | |
Net increase in net assets resulting from operations | | $ | 12,589,858 | |
Adjustments to reconcile net increase in net assets resulting from operations to net cash used for operating activities: | | | | |
Decrease in interest and dividend receivable | | | 69,626 | |
Increase in deposits at broker for futures contracts | | | (524,904 | ) |
Decrease in prepaid expenses and other assets | | | 4,216 | |
Increase in margins variation payable | | | 127,151 | |
Increase in segregated cash collateral for reverse repurchase agreements | | | (3,826,299 | ) |
Decrease in receivables for open maturities | | | 10,970 | |
Decrease in interest due on reverse repurchase agreements | | | (32,267 | ) |
Increase in payable to investment adviser | | | 20,767 | |
Increase in accrued expenses and other liabilities | | | 2,122 | |
Proceeds from sales and paydowns of long-term securities | | | 69,349,185 | |
Opening of TBA sales commitments | | | 6,023,178 | |
Purchases of short-term securities | | | (1,193,393,451 | ) |
Purchases of long-term securities | | | (62,119,262 | ) |
Proceeds from sales of short-term securities | | | 1,167,099,854 | |
Closing of TBA sales commitments | | | (6,439,129 | ) |
Amortization of premium and discount - net | | | 11,772 | |
Net realized losses from investment transactions | | | (423,813 | ) |
Net realized losses from sales commitments | | | 881,817 | |
Net change in unrealized appreciation/(depreciation) on investment securities and sale commitments | | | 1,856,185 | |
| | | | |
Net Cash Used for Operating Activities | | | (8,712,424 | ) |
| | | | |
| |
Cash Provided by Financing Activities: | | | | |
Proceeds from issuance of shares | | | 41,733,618 | |
Cash payments on shares redeemed | | | (14,497,656 | ) |
Cash receipts from reverse repurchase agreements | | | 283,545,112 | |
Cash payments on reverse repurchase agreements | | | (293,124,395 | ) |
Distributions paid to shareholders | | | (9,281,534 | ) |
| | | | |
Net Cash Provided by Financing Activities | | | 8,375,145 | |
| | | | |
Cash: | | | | |
Net decrease in cash | | | (337,280 | ) |
Cash at beginning of period | | | 337,280 | |
| | | | |
Cash at end of period | | $ | — | |
| | | | |
Cash Flow Information: | | | | |
Cash paid for interest | | | 234,219 | |
| | | | |
Noncash Financing Activities: | | | | |
Capital shares issued in reinvestment of distributions paid to shareholders | | | 5,217,568 | |
| | | | |
See notes to financial statements.
36
FINANCIAL HIGHLIGHTS
Access Capital Community Investment Fund
(Selected data for a share outstanding throughout the periods indicated)
| | | | | | | | |
| | | Period Ended
March 31 | | | Period Ended
March 31, | |
| | | 2010 | |
| | | Class A | | | Class I | |
Per Share Operating Performance: | | | | | | | | |
Net asset value, beginning of period | | $ | 9.80 | | | $ | 9.79 | |
| | | | | | | | |
Net investment income(d) | | | 0.24 | | | | 0.25 | |
Realized and unrealized gain (loss) | | | (0.04 | ) | | | (0.04 | ) |
| | | | | | | | |
Total from investment operations | | | 0.20 | | | | 0.21 | |
| | | | | | | | |
Less dividends from net investment income | | | (0.24 | ) | | | (0.25 | ) |
| | | | | | | | |
Net asset value, end of period | | $ | 9.76 | | | $ | 9.75 | |
| | | | | | | | |
Total Investment Return:(e) | | | | | | | | |
Based on net asset value per share | | | 2.01 | % | | | 2.13 | % |
Ratios to Average Net Assets:(f) | | | | | | | | |
Total expenses, net of reimbursement and excluding interest expense and investment structuring fees(g) | | | 0.95 | % | | | 0.70 | % |
Total expenses, excluding interest expense | | | 0.95 | % | | | 0.70 | % |
Net expenses | | | 1.02 | % | | | 0.77 | % |
Investment income-net | | | 4.81 | % | | | 5.06 | % |
Ratios to Average Net Assets, Plus Average Borrowings:(f)(h) | | | | | | | | |
Total expenses, net of reimbursement and excluding interest expense and investment structuring fees(g) | | | 0.78 | % | | | 0.57 | % |
Total expenses, excluding interest expense(i) | | | 0.78 | % | | | 0.57 | % |
Net expenses | | | 0.84 | % | | | 0.63 | % |
Investment income-net | | | 3.95 | % | | | 4.16 | % |
Supplemental Data: | | | | | | | | |
Net assets, end of period (in thousands) | | $ | 10,630 | | | $ | 577,734 | |
Portfolio turnover | | | 3 | % | | | 3 | % |
| (a) | Effective September 30, 2008, the Fund’s fiscal year end changed from May 31 to September 30. |
| (b) | For the period January 29, 2009 (commencement of operations) to September 30, 2009. |
| (c) | The existing share class was renamed Class I Shares with the commencement of Class A Shares on January 29, 2009. |
| (d) | Based on average shares outstanding. |
| (e) | Total investment returns exclude the effect of sales charge. |
| (f) | Annualized for those periods that are less than one year. |
| (g) | During the fiscal years ended May 31, 2006 and 2005, to the extent that the Fund’s operating expenses (exclusive of management fees and interest expense) were less then 0.25% of the Fund’s monthly average net assets, the Fund repaid the Fund’s investment adviser and sub-adviser for operating expenses previously borne or reimbursed. |
| (h) | These ratios are calculated based upon the average net assets plus average borrowings. |
| (i) | Total expenses of the Fund for the period ended September 30, 2009 is 1.36% and 1.09% for the Class A and Class I shares, respectively. |
37
FINANCIAL HIGHLIGHTS
Access Capital Community Investment Fund
| | | | | | | | | | | | | | | | | | | | | | | | | | |
Period Ended
September 30, | | | For the
Year Ended
September 30, | | | Period
June 1, 2008
to September 30, | | | For the Year Ended May 31, | |
| | | |
| | | |
| 2009 | | | 2008(a) | | | 2008 | | | 2007 | | | 2006 | | | 2005 | |
| Class A(b) | | | Class I(c) | | | | | | | | | | | | | | | | |
| | | | | | |
| $ | 9.47 | | | $ | 9.41 | | | $ | 9.48 | | | $ | 9.46 | | | $ | 9.29 | | | $ | 9.82 | | | $ | 9.62 | |
| | | | | | | | | | | | | | | | | | | | | | | | | | | |
| | 0.31 | | | | 0.50 | | | | 0.16 | | | | 0.46 | | | | 0.44 | | | | 0.45 | | | | 0.48 | |
| | 0.34 | | | | 0.38 | | | | (0.07 | ) | | | 0.02 | | | | 0.17 | | | | (0.53 | ) | | | 0.20 | |
| | | | | | | | | | | | | | | | | | | | | | | | | | | |
| | 0.65 | | | | 0.88 | | | | 0.09 | | | | 0.48 | | | | 0.61 | | | | (0.08 | ) | | | 0.68 | |
| | | | | | | | | | | | | | | | | | | | | | | | | | | |
| | (0.32 | ) | | | (0.50 | ) | | | (0.16 | ) | | | (0.46 | ) | | | (0.44 | ) | | | (0.45 | ) | | | (0.48 | ) |
| | | | | | | | | | | | | | | | | | | | | | | | | | | |
| $ | 9.80 | | | $ | 9.79 | | | $ | 9.41 | | | $ | 9.48 | | | $ | 9.46 | | | $ | 9.29 | | | $ | 9.82 | |
| | | | | | | | | | | | | | | | | | | | | | | | | | | |
| | | | | | |
| | 7.11 | % | | | 9.59 | % | | | 1.02 | % | | | 5.19 | % | | | 6.65 | % | | | (0.83 | )% | | | 7.14 | % |
| | | | | | |
| | 1.00 | % | | | 0.74 | % | | | 0.86 | % | | | 0.93 | % | | | 0.79 | % | | | 0.74 | % | | | 0.85 | % |
| | 1.25 | % | | | 0.74 | % | | | 0.86 | % | | | 0.93 | % | | | 0.83 | % | | | 0.73 | % | | | 0.74 | % |
| | 1.11 | % | | | 1.06 | % | | | 1.61 | % | | | 1.99 | % | | | 1.48 | % | | | 1.32 | % | | | 1.13 | % |
| | 4.77 | % | | | 5.16 | % | | | 5.17 | % | | | 4.83 | % | | | 4.55 | % | | | 4.72 | % | | | 4.87 | % |
| | | | | | |
| | 0.81 | % | | | 0.59 | % | | | 0.67 | % | | | 0.75 | % | | | 0.70 | % | | | 0.65 | % | | | 0.72 | % |
| | 1.02 | % | | | 0.59 | % | | | 0.67 | % | | | 0.75 | % | | | 0.74 | % | | | 0.64 | % | | | 0.63 | % |
| | 0.90 | % | | | 0.85 | % | | | 1.25 | % | | | 1.60 | % | | | 1.31 | % | | | 1.16 | % | | | 0.96 | % |
| | 3.89 | % | | | 4.12 | % | | | 4.00 | % | | | 3.88 | % | | | 4.03 | % | | | 4.13 | % | | | 4.13 | % |
| | | | | | |
| $ | 8,662 | | | $ | 561,148 | | | $ | 543,404 | | | $ | 513,723 | | | $ | 474,720 | | | $ | 449,324 | | | $ | 388,299 | |
| | 10 | % | | | 10 | % | | | 1 | % | | | 19 | % | | | 23 | % | | | 21 | % | | | 33 | % |
See notes to financial statements.
38
NOTES TO FINANCIAL STATEMENTS
March 31, 2010
1. Organization
RBC Funds Trust (the “Trust”) was organized as a Delaware statutory trust on December 16, 2003. Overall responsibility for the management of the Trust is vested in its Board of Trustees (the “Board”). This semi-annual report includes the Access Capital Community Investment Fund (the “Fund”). At its inception in 1998, the Access Capital Strategies Community Investment Fund, Inc. the Fund’s predecessor, elected status as a business development company under the Investment Company Act of 1940 (the “1940 Act”), but withdrew its election on May 30, 2006, and registered as a continuously offered, closed-end interval management company under the 1940 Act. The predecessor fund was reorganized into a series of the Trust, a registered open-end management company under the 1940 Act, effective July 28, 2008.
The Fund offers two share classes: Class A and Class I shares. Class A shares are offered with a 3.75% maximum front-end sales charge and a 1.00% contingent deferred sales charge (“CDSC”) for redemption within 12 months of a $1 million or greater purchase on which no front-end sales charge was paid. Class I shares (intended for investors meeting certain investment minimum thresholds) are not subject to either a front-end sales charge or a CDSC.
RBC Global Asset Management (U.S.) Inc. (“RBC GAM (US)”) (formerly known as Voyageur Asset Management Inc), acts as the investment advisor for the Trust. The officers of the Trust (“Fund Management”) are also employees of RBC GAM (US) or its affiliates and PNC Global Investment Servicing (U.S.) Inc. (“PNC”).
The Fund’s investment objective is to invest in geographically specific debt securities located in portions of the United States designated by Fund investors. The Fund seeks to achieve its investment objective by investing primarily in debt securities specifically designed to support underlying economic activities such as affordable housing, education, small business lending, and job-creating activities in areas of the United States designated by Fund investors.
2. Significant Accounting Policies
Summarized below are the significant accounting policies of the Fund. The policies conform to accounting principles generally accepted in the United States of America (“GAAP”). Fund Management follows these policies when preparing financial statements. Management may also be required to make estimates and assumptions that affect the reported amounts of assets and liabilities at the date of the financial statements and the reported amounts of income and expenses for the period. Actual results could differ from those estimates. The financial statements are as of the close of regular trading on the New York Stock Exchange.
Security Valuation:
Bonds and other fixed income securities, including TBA commitments, are generally valued on the basis of prices furnished by pricing services approved by the Trust’s Board. The pricing services utilize both dealer-supplied valuations and electronic data processing techniques that take into account appropriate factors such as institutional-size trading in similar groups of securities, yield, quality, coupon rate, maturity and type of issue. Valuations of certain mortgage backed securities that qualify under the Community Reinvestment Act (“CRA”) may also include adjustments to reflect the CRA premium indicated by the independent pricing agent to reflect the higher valuations accorded these securities in the market for their geographically or other targeted nature. Swaptions are fair valued using methodologies approved by the Trust’s Board. These valuation techniques take into account multiple factors, including fundamental security analytical data, information from broker-dealers, market spreads and interest rates. Short-term debt obligations, with less than 60 days to maturity at time of purchase, are valued at amortized cost unless Fund Management determines that amortized cost no longer approximates market value. In such cases where a security price is unavailable, or where Fund Management determines that the value provided by the pricing services or amortized cost does not approximate fair value, the Board has approved pricing and valuation procedures to determine a security’s fair value. Some of the factors which may be considered in determining fair value are
39
NOTES TO FINANCIAL STATEMENTS
fundamental analytical data relating to the security, the issuer and the market, such as duration, prepayment and default rates; general level of interest rates and changes in interest rates; information from broker-dealers; and trading in similar securities. Investments in open-end investment companies are valued at net asset value. Exchange traded financial futures are valued at the settlement price as established by the exchange on which they are traded.
Financial Instruments:
Reverse Repurchase Agreements
To obtain short-term financing, the Fund may enter into reverse repurchase agreements with primary dealers that report to the Federal Reserve Bank of New York or the 100 largest U.S. commercial banks, who are deemed creditworthy under guidelines approved by the Board. Interest on the value of the reverse repurchase agreements is based upon competitive market rates at the time of issuance. At the time the Fund enters into a reverse repurchase agreement, it will establish and maintain a segregated account with the custodian containing qualifying assets having a value, including accrued interest, not less than the repurchase price. Based on requirements with certain exchanges and third party brokers-dealers, the Fund may also be required to deliver or deposit securities or cash as collateral. If the counterparty to the transaction is rendered insolvent, the ultimate realization of the securities to be repurchased by the Fund may be delayed or limited. For the six months ended March 31, 2010, the average amount borrowed was approximately $125,131,292 and the daily weighted average interest rate was 0.32%.
Details of open reverse repurchase agreements at March 31, 2010 were as follows:
| | | | | | | | | | | | | | | |
| | | Rate | | | Trade
Date | | Maturity
Date | | Net Closing
Amount | | | Par | |
Goldman Sachs | | 0.21 | % | | 1/06/10 | | 4/06/10 | | $ | (34,786,251 | ) | | $ | (34,767,998 | ) |
Mizuho Securities | | 0.24 | % | | 1/13/10 | | 4/13/10 | | | (14,452,666 | ) | | | (14,444,000 | ) |
Goldman Sachs | | 0.22 | % | | 1/20/10 | | 5/05/10 | | | (13,655,814 | ) | | | (13,647,057 | ) |
Goldman Sachs | | 0.21 | % | | 2/03/10 | | 5/05/10 | | | (7,572,923 | ) | | | (7,568,905 | ) |
Mizuho Securities | | 0.24 | % | | 2/10/10 | | 5/12/10 | | | (36,901,373 | ) | | | (36,879,000 | ) |
Goldman Sachs | | 0.23 | % | | 3/10/10 | | 5/12/10 | | | (20,563,273 | ) | | | (20,555,000 | ) |
Details of underlying collateral pledged for open reverse repurchase agreements in addition to the segregated cash collateral shown on the Statement of Assets and Liabilities at March 31, 2010 were as follows:
| | | | | | | | | | | | | |
| | | Description | | Rate | | | Maturity
Date | | Par | | Value |
Goldman Sachs | | | | | | | | | | | | | |
1/6/10 to 4/6/10 | | | | | | | | | | | | | |
| | Freddie Mac Pool #A40538 | | 5.00 | % | | 12/01/35 | | $ | 2,054,173 | | $ | 2,137,148 |
| | Freddie Mac Pool #A46735 | | 5.00 | % | | 8/01/35 | | | 1,626,664 | | | 1,684,237 |
| | Freddie Mac Pool #A42097 | | 5.00 | % | | 1/01/36 | | | 1,356,477 | | | 1,404,487 |
| | Freddie Mac Pool #A47552 | | 5.00 | % | | 11/01/35 | | | 1,195,633 | | | 1,237,951 |
| | Fannie Mae Pool #835287 | | 5.00 | % | | 8/01/35 | | | 1,417,471 | | | 1,473,398 |
| | Freddie Mac Pool #A45396 | | 5.00 | % | | 6/01/35 | | | 931,881 | | | 967,775 |
| | Freddie Mac Pool #A63456 | | 5.50 | % | | 6/01/37 | | | 3,042,932 | | | 3,232,040 |
| | Freddie Mac Pool #A42803 | | 5.50 | % | | 2/01/36 | | | 1,867,863 | | | 1,977,337 |
| | Freddie Mac Pool #A20540 | | 5.50 | % | | 4/01/34 | | | 1,319,865 | | | 1,398,871 |
| | Freddie Mac Pool #A46746 | | 5.50 | % | | 8/01/35 | | | 1,085,525 | | | 1,149,146 |
| | Freddie Mac Pool #A61754 | | 5.50 | % | | 5/01/37 | | | 1,279,716 | | | 1,352,847 |
| | Freddie Mac Pool #A18617 | | 5.50 | % | | 1/01/34 | | | 732,737 | | | 776,597 |
| | Freddie Mac Pool #A64012 | | 5.50 | % | | 7/01/37 | | | 1,073,976 | | | 1,135,350 |
40
NOTES TO FINANCIAL STATEMENTS
| | | | | | | | | | | | | |
| | | Description | | Rate | | | Maturity
Date | | Par | | Value |
| | Fannie Mae Pool #258627 | | 5.50 | % | | 2/01/36 | | $ | 1,530,910 | | $ | 1,626,136 |
| | Fannie Mae Pool #702478 | | 5.50 | % | | 6/01/33 | | | 2,715,327 | | | 2,881,682 |
| | Freddie Mac Pool #A61915 | | 5.50 | % | | 6/01/37 | | | 1,116,980 | | | 1,180,812 |
| | Freddie Mac Pool #A42099 | | 6.00 | % | | 1/01/36 | | | 378,215 | | | 408,359 |
| | Freddie Mac Pool #A64447 | | 6.00 | % | | 8/01/37 | | | 944,963 | | | 1,020,279 |
| | Freddie Mac Pool #A68766 | | 6.00 | % | | 10/01/37 | | | 1,251,715 | | | 1,351,480 |
| | Freddie Mac Pool #A42805 | | 6.00 | % | | 2/01/36 | | | 1,035,252 | | | 1,117,764 |
| | Freddie Mac Pool #A49013 | | 6.00 | % | | 5/01/36 | | | 727,489 | | | 782,516 |
| | Fannie Mae Pool #952632 | | 6.00 | % | | 7/01/37 | | | 2,218,672 | | | 2,371,586 |
| | Fannie Mae Pool #952598 | | 6.00 | % | | 7/01/37 | | | 1,846,531 | | | 1,970,912 |
| | | | | | | | | | | | | |
| | | | | | | | | | | | $ | 34,638,710 |
| | | | | | | | | | | | | |
Mizuho Securities | | | | | | | | | | | | | |
1/13/10 to 4/13/10 | | | | | | | | | | | | | |
| | Fannie Mae Pool #387590 | | 4.90 | % | | 9/01/15 | | $ | 9,403,074 | | $ | 10,065,538 |
| | Fannie Mae Pool #386608 | | 5.37 | % | | 11/01/21 | | | 4,671,762 | | | 4,937,388 |
| | | | | | | | | | | | | |
| | | | | | | | | | | | $ | 15,002,926 |
| | | | | | | | | | | | | |
Goldman Sachs | | | | | | | | | | | | | |
1/20/10 to 5/5/10 | | | | | | | | | | | | | |
| | Fannie Mae Pool #829005 | | 5.00 | % | | 8/01/35 | | $ | 1,896,742 | | $ | 1,962,095 |
| | Fannie Mae Pool #815009 | | 5.00 | % | | 4/01/35 | | | 2,236,567 | | | 2,324,812 |
| | Freddie Mac Pool #A38830 | | 5.00 | % | | 5/01/35 | | | 1,936,108 | | | 2,004,633 |
| | Fannie Mae Pool #908672 | | 5.50 | % | | 1/01/37 | | | 1,468,137 | | | 1,549,824 |
| | Fannie Mae Pool #941204 | | 5.50 | % | | 6/1/37 | | | 1,544,345 | | | 1,637,184 |
| | Ginnie Mae Pool #675509 | | 5.50 | % | | 6/15/38 | | | 1,600,416 | | | 1,703,887 |
| | Fannie Mae Pool #866969 | | 6.00 | % | | 2/01/36 | | | 2,106,199 | | | 2,248,071 |
| | | | | | | | | | | | | |
| | | | | | | | | | | | $ | 13,430,506 |
| | | | | | | | | | | | | |
Goldman Sachs | | | | | | | | | | | | | |
2/3/10 to 5/5/10 | | | | | | | | | | | | | |
| | Fannie Mae Pool #777621 | | 5.00 | % | | 2/01/34 | | $ | 2,993,687 | | $ | 3,106,192 |
| | Freddie Mac Pool #A66061 | | 5.50 | % | | 8/01/37 | | | 2,388,939 | | | 2,525,458 |
| | Freddie Mac Pool #A34999 | | 5.50 | % | | 4/01/35 | | | 2,083,545 | | | 2,205,660 |
| | | | | | | | | | | | | |
| | | | | | | | | | | | $ | 7,837,310 |
| | | | | | | | | | | | | |
Mizuho Securities | | | | | | | | | | | | | |
2/10/10 to 5/12/10 | | | | | | | | | | | | | |
| | Fannie Mae Pool #806754 | | 4.50 | % | | 9/01/34 | | $ | 3,371,682 | | $ | 3,408,458 |
| | Freddie Mac Pool #A25310 | | 5.00 | % | | 6/01/34 | | | 2,009,473 | | | 2,086,874 |
| | Freddie Mac Pool #A37185 | | 5.00 | % | | 9/01/35 | | | 1,308,777 | | | 1,361,643 |
| | Freddie Mac Pool #A14325 | | 5.00 | % | | 9/01/33 | | | 1,466,299 | | | 1,524,152 |
| | Fannie Mae Pool #806761 | | 5.50 | % | | 9/01/34 | | | 4,869,306 | | | 5,156,973 |
| | Freddie Mac Pool #A30056 | | 5.50 | % | | 12/01/34 | | | 1,227,968 | | | 1,301,473 |
41
NOTES TO FINANCIAL STATEMENTS
| | | | | | | | | | | | | |
| | | Description | | Rate | | | Maturity
Date | | Par | | Value |
| | Freddie Mac Pool #A60751 | | 5.50 | % | | 5/01/37 | | $ | 1,598,140 | | $ | 1,689,468 |
| | Fannie Mae Pool #986957 | | 5.50 | % | | 7/01/38 | | | 1,948,702 | | | 2,056,104 |
| | Freddie Mac Pool #A28241 | | 5.50 | % | | 10/01/34 | | | 1,605,381 | | | 1,701,477 |
| | Fannie Mae Pool #990510 | | 5.50 | % | | 8/01/38 | | | 1,730,090 | | | 1,825,444 |
| | Freddie Mac Pool #A59530 | | 5.50 | % | | 4/01/37 | | | 1,442,715 | | | 1,525,161 |
| | Freddie Mac Pool #A61916 | | 6.00 | % | | 6/01/37 | | | 3,321,449 | | | 3,569,570 |
| | Freddie Mac Pool #A42804 | | 6.00 | % | | 2/01/36 | | | 924,466 | | | 998,148 |
| | Fannie Mae Pool #944502 | | 6.00 | % | | 6/01/37 | | | 1,713,178 | | | 1,828,576 |
| | Freddie Mac Pool #A67630 | | 6.00 | % | | 11/01/37 | | | 1,642,860 | | | 1,773,800 |
| | Freddie Mac Pool #A66116 | | 6.00 | % | | 9/01/37 | | | 1,532,846 | | | 1,647,353 |
| | Freddie Mac Pool #A66133 | | 6.00 | % | | 6/01/37 | | | 864,868 | | | 929,476 |
| | Freddie Mac Pool #A66156 | | 6.50 | % | | 9/01/37 | | | 1,757,730 | | | 1,922,543 |
| | | | | | | | | | | | | |
| | | | | | | | | | | | $ | 36,306,693 |
| | | | | | | | | | | | | |
Goldman Sachs | | | | | | | | | | | | | |
3/10/10 to 5/12/10 | | | | | | | | | | | | | |
| | Fannie Mae Pool #663159 | | 5.00 | % | | 7/01/32 | | $ | 5,150,517 | | $ | 5,355,988 |
| | Fannie Mae Pool #727312 | | 5.00 | % | | 9/01/33 | | | 3,038,313 | | | 3,152,495 |
| | Fannie Mae Pool #844361 | | 5.50 | % | | 11/01/35 | | | 3,807,317 | | | 4,044,142 |
| | Fannie Mae Pool #829649 | | 5.50 | % | | 3/01/35 | | | 2,573,889 | | | 2,738,818 |
| | Fannie Mae Pool #885724 | | 5.50 | % | | 6/01/36 | | | 3,099,588 | | | 3,272,050 |
| | Fannie Mae Pool #257892 | | 5.50 | % | | 2/01/38 | | | 2,901,581 | | | 3,076,009 |
| | | | | | | | | | | | | |
| | | | | | | | | | | | $ | 21,639,502 |
| | | | | | | | | | | | | |
Derivatives
The Fund may use derivative instruments, including futures, forwards, options, indexed securities, swaps and inverse securities for hedging purposes only. Derivatives allow the Fund to increase or decrease its risk exposure more quickly and efficiently than other types of instruments. Losses may arise if the price of the contract decreases due to an unfavorable change in the price of the underlying instrument or if the counterparty does not perform under the contract. To the extent amounts due to the Fund from their counterparties are not fully collateralized contractually or otherwise, the Fund bears the risk of loss from counterparty non-performance. The Fund’s maximum risk of loss from counterparty credit risk on over-the-counter derivatives is generally the aggregate unrealized gain in excess of any collateral pledged by the counterparty to the Fund. For over-the-counter purchased options, the Fund bears the risk of loss in the amount of the premiums paid and change in value of the options should the counterparty not perform under the contracts. Written options by the Fund do not give rise to counterparty credit risk, as written options obligate the Fund to perform and not the counterparty. Counterparty risk related to exchange traded financial futures contracts and options is minimal because of the protection against defaults provided by the exchange on which they trade. Hedging also involves the risk that changes in the value of the derivative will not match those of the holdings being hedged as expected by the Fund, in which case any losses on the holdings being hedged may not be reduced and may be increased. There can be no assurance that the Fund’s hedging strategy will reduce risk or that hedging transactions will be available or cost effective. The Fund is subject to interest rate risk in the normal course of pursuing its investment objectives by investing in various derivative financial instruments, as described below.
42
NOTES TO FINANCIAL STATEMENTS
Fair Values of Derivative Instruments as of March 31, 2010*:
| | | | | | |
Derivative Instruments Categorized by Risk Exposure | | Statement of Assets and Liabilities Location | | Fair Value | |
| | Asset Derivatives | | | | |
Interest Rate Contracts | | Assets - Investments at Value (Call Swaptions) | | $ | 7,134,214 | |
| | |
| | Liability Derivatives | | | | |
Interest Rate Contracts | | Liabilities - Margin Variation Payable | | | (127,151 | ) |
| | | | | | |
Total | | | | $ | 7,007,063 | |
| | | | | | |
| * | For open derivative instruments as of March 31,2010, see the preceding tables on the Schedule of Portfolio Investments and the following section for financial futures contracts. |
The effect of Derivative Instruments on the Statement of Operations during the six months ended March 31, 2010 is as follows:
| | | | | | | | | | | |
Derivative Instruments Categorized by Risk Exposure | | Net Realized Losses
from
Futures Contracts | | | Net Change in Unrealized
Appreciation/Depreciation
on Futures Contracts | | | Net Change in Unrealized
Appreciation/Depreciation
on Investments
(Call Swaptions) |
Interest Rate Contracts | | $ | (357,036 | ) | | $ | 759,202 | * | | | — |
Interest Rate Contracts | | | — | | | | — | | | $ | 1,014,458 |
| * | Amount includes cumulative appreciation/depreciation, amount shown on statement of assets and liabilities includes only the daily variation margin. |
For the six months ended March 31, 2010, the average volume of derivative activities are as follows:
| | | |
Purchased Options
(Cost) | | Futures Short Positions
(Contracts |
| $ | 5,503,750 | | 388 |
Financial Futures Contracts
The Fund entered into futures contracts in an effort to manage the duration of the portfolio or to hedge against market risk. A futures contract on a securities index is an agreement obligating one party to pay, and entitling the other party to receive, during the term of the contract, cash payments based on the level of a specified securities index. Futures transactions involve brokerage costs and require a Fund to segregate assets to cover contracts that would require it to purchase securities or currencies. A Fund may lose the expected benefit of futures transactions if interest rates, exchange rates or securities prices change in an unanticipated manner. Such unanticipated changes may also result in lower overall performance than if a Fund had not entered into any futures transactions.
Upon entering into a futures contract, a Fund is required to pledge to the broker an amount of cash, U.S. government securities, or other assets equal to a certain percentage of the contract amount. Subsequent payments are made or received by the Fund each day, depending on the daily fluctuations in the fair value of the underlying index. A Fund would record an unrealized gain or loss each day equal to these daily payments.
Financial futures contracts involve minimal counterparty risk since financial futures contracts are guaranteed against default by the exchange on which they trade.
43
NOTES TO FINANCIAL STATEMENTS
The Fund had the following open futures contracts at March 31, 2010:
| | | | | | | | | | | | | |
| | | Number of
Contracts | | Expiration
Date | | Unrealized
Appreciation
(Depreciation) | | | Notional
Value | | Counterparty |
Short contracts: | | | | | | | | | | | | | |
Ten Year Swap | | 100 | | June, 2010 | | $ | 7,812 | | | $ | 10,075,000 | | Barclays Capital |
Five Year | | | | | | | | | | | | | |
U.S. Treasury Bond | | 425 | | June, 2010 | | | (73,047 | ) | | | 48,728,906 | | Barclays Capital |
U.S. Treasury Long Bond | | 50 | | June, 2010 | | | 34,375 | | | | 5,840,625 | | Barclays Capital |
Details of underlying collateral pledged for open futures contracts in addition to the deposit at brokers shown on the Statement of Assets and Liabilities at March 31, 2010 were as follows:
| | | | | | | | | | | |
Description | | Yield | | | Maturity
Date | | Par | | Market
Value |
U.S. Treasury Bill | | 0.45 | % | | 06/17/10 | | $ | 2,000,000 | | $ | 1,999,380 |
Options
The Fund may write (or sell) put and call options on the securities that the Fund is authorized to buy or already holds in its portfolio. A Fund may also purchase put and call options. A call option gives the purchaser the right to buy, and the writer the obligation to sell, the underlying security at the agreed-upon exercise (or “strike”) price during the option period. A put option gives the purchaser the right to sell, and the writer the obligation to buy, the underlying security at the strike price during the option period. Purchasers of options pay an amount, known as a premium, to the option writer in exchange for the right under the option contract.
Swaptions
The Fund may purchase or write swaptions in an attempt to gain additional protection against the effects of interest rate fluctuations. Swap options (swaptions) are similar to options on securities except that instead of selling or purchasing the right to buy or sell a security, the writer or purchaser of the swap option is granting or buying the right to enter into a previously agreed upon interest rate swap agreement at any time before the expiration of the option (interest rate risk). In purchasing and writing swaptions, the Fund bears the risk of an unfavorable change in the price of the underlying interest rate swap or the risk that the Fund may not be able to enter into a closing transaction due to an illiquid market. The Fund executes transactions in over-the-counter swaptions. Transactions in over-the-counter swaptions may expose the Fund to the risk of default by the counterparty to the transaction. In the event of default by the counterparty, the Fund’s maximum amount of loss is the premium paid (as purchaser) or the unrealized loss of the contract (as writer). The call swaptions purchased listed on the Schedule of Portfolio Investments that are outstanding as of March 31, 2010 represent the only activity for the six months ended March 31, 2010.
TBA Commitments
The Fund may enter into to be announced (“TBA”) commitments to purchase or sell securities for a fixed price at a future date. TBA commitments are considered securities in themselves, and involve a risk of loss if the value of the security to be purchased/sold declines/increases prior to settlement date, which is in addition to the risk of decline in the value of a Fund’s other assets. Unsettled TBA commitments are valued at the current value of the underlying securities, according to the procedures described under “Security Valuation”. There are no TBA commitments outstanding as of March 31, 2010.
Mortgage Backed Securities
Because the Fund will focus on community development investments, such as securities backed by commercial and/or residential mortgage loans, it will be affected by risks not typically associated with funds that do not specialize in community development investments. These risks include credit and
44
NOTES TO FINANCIAL STATEMENTS
prepayment risk due to default on underlying loans within a security. Changes in economic conditions, including delinquencies and/or defaults or assets underlying these securities, can affect the value, income and/or liquidity of such positions.
In addition, the Fund invests in certain mortgage backed securities that qualify under the CRA in which the Fund may pay a premium for the geographically or other targeted nature of the securities. There can be no guarantee, however, that a similar premium will be received if the security is sold by the Fund.
Credit Enhancement
Certain obligations held in the Fund have credit enhancement or liquidity features that may, under certain circumstances, provide for repayment of principal and interest on the obligation upon demand date, interest rate reset date or final maturity. These enhancements may include: letters of credit; liquidity guarantees; security purchase agreements; tender option purchase agreements; and third party insurance (i.e., AMBAC and MBIA).
Fair Value Measurements:
Various inputs are used in determining the fair value of investments which are as follows:
| • | | Level 1 - Inputs that reflect unadjusted quoted prices in active markets for identical assets or liabilities that the Funds have the ability to access at the measurement date. |
| • | | Level 2 - Inputs other than quoted prices that are observable for the asset or liability either directly or indirectly, including inputs in markets that are not considered to be active. |
| • | | Level 3 - Unobservable inputs based on the best information available in the circumstances, to the extent observable inputs are not available (including the Fund’s own assumptions in determining the fair value of investments). |
The inputs or methodology used for valuing securities are not necessarily an indication of the risk associated with investing in those securities.
The summary of inputs used to determine the fair valuation of the Fund’s investments as of March 31, 2010 is as follows:
| | | | | | | | | | | | | | |
| | | Level 1
Quoted Prices | | | Level 2
Significant
Observable
Inputs | | Level 3
Significant
Unobservable
Inputs | | Total | |
Assets: | | | | | | | | | | | | | | |
Investments in Securities | | | | | | | | | | | | | | |
Investment Company | | $ | 34,342,578 | | | $ | — | | $ | — | | $ | 34,342,578 | |
Municipal Bonds | | | — | | | | 27,379,855 | | | — | | | 27,379,855 | |
Corporate Bonds | | | — | | | | 2,322,212 | | | — | | | 2,322,212 | |
U.S. Government Agency Backed Mortgages | | | — | | | | 564,035,152 | | | — | | | 564,035,152 | |
U.S. Government Agency Obligations | | | — | | | | 59,060,533 | | | — | | | 59,060,533 | |
Short-Term Investment | | | — | | | | 1,999,380 | | | — | | | 1,999,380 | |
Promissory Notes | | | — | | | | 9,873,676 | | | — | | | 9,873,676 | |
Call Swaptions Purchased | | | — | | | | 7,134,214 | | | — | | | 7,134,214 | |
| | | | | | | | | | | | | | |
| | $ | 34,342,578 | | | $ | 671,805,022 | | $ | — | | $ | 706,147,600 | |
| | | | | | | | | | | | | | |
Other Financial Instruments(*) | | | 42,187 | | | | — | | | — | | | 42,187 | |
| | | | | | | | | | | | | | |
Total Assets | | $ | 34,384,765 | | | $ | 671,805,022 | | $ | — | | $ | 706,189,787 | |
| | | | | | | | | | | | | | |
| | | | |
Liabilities: | | | | | | | | | | | | | | |
Other Financial Instruments(*) | | $ | (73,047 | ) | | $ | — | | $ | — | | $ | (73,047 | ) |
| | | | | | | | | | | | | | |
45
NOTES TO FINANCIAL STATEMENTS
| * | Other financial instruments are instruments not reflected in the Schedule of Portfolio Investments, such as futures contracts which are shown at the unrealized appreciation/(depreciation) on the investment. |
In January 2010, the Financial Accounting Standards Board (“FASB”) issued Accounting Standards Update “Improving Disclosures about Fair Value Measurements” that requires additional disclosures regarding fair value measurements. Certain required disclosures are effective for interim and annual reporting periods beginning after December 15, 2009, and other required disclosures are effective for fiscal years beginning after December 15, 2010, and for interim periods within those fiscal years. Management is currently evaluating the impact it will have on its financial statement disclosures.
Investment Transactions and Income:
Investment transactions are recorded one business day after trade date, except for on the last day of each fiscal quarter end, when they are recorded on trade date. Dividend income is recorded on the ex-dividend date. Realized gains and losses from investment transactions are calculated based on the costs of the specific security (also known as identified cost basis). Interest income is recognized on the accrual basis and includes, where applicable, the amortization and accretion of premium or discount using the effective yield method. Paydown gains and losses on mortgage and asset-backed securities are included in the financial statements as interest income.
Distributions to Shareholders:
The Fund pays out any income that it receives, less expenses, in the form of dividends and capital gains to its shareholders. Income dividends are declared daily and paid monthly. Dividends will also be paid at any time during the month upon total redemption of shares in an account. Capital gain distributions are declared and paid at least annually. Distributions to shareholders are recorded on the ex-dividend date. The amount of dividends and distributions are calculated based on federal income tax regulations, which may differ from GAAP. These “book/tax” differences may be either temporary or permanent in nature. To the extent these differences are determined, as of the end of the tax year, to be permanent (e.g., reclassification of paydown gains and losses, and expiring capital loss carryforward), they are reclassified within a Fund’s capital account based on their federal tax basis treatment. Such differences are not reflected in the calculation of the Financial Highlights.
3. Agreements and Other Transactions with Affiliates
RBC GAM (US) serves as investment advisor to the Fund. The Advisor has agreed to waive or limit fees through January 31, 2011, to maintain expenses (excluding interest expense, management fees and distribution fees) at 0.20% of the Fund’s average monthly gross assets less liabilities, other than indebtness for borrowing. The Fund will carry forward, for a period not to exceed 12 months from the date on which a waiver or reimbursement is made by the Advisor, any expenses in excess of the expense limitation and repay the Advisor such amounts, provided the Fund is able to effect such repayment and remain in compliance with the expense limitation disclosed in the effective prospectus. During the six month period ended March 31, 2010, no reimbursements were made to the Advisor.
Under the terms of the Fund’s management agreement, the Advisor receives from the Fund an annual management fee, paid monthly, of 50 basis points (0.50%) of the Fund’s average daily total assets less liabilities, other than indebtedness for borrowing. For purposes of calculating the management fee, assets purchased with borrowed monies are included in the total that is subject to the management fee. As a result, the Advisor has an incentive to use leverage so as to increase the amount of assets upon which it may charge a fee. As of March 31, 2010, the impact of leverage raised the management fee to approximately 61 basis points (0.61%) of the Fund’s average net assets.
The RBC Funds currently pay the independent Trustees (Trustees of the Trust who are not directors, officers or employees of the adviser, administrator or distributor) an annual retainer of $30,000. The Board Chairperson and Audit Committee Chairperson each receive an additional retainer of $2,500 annually, and all other trustees serving as Chair of a Board committee each receive an additional retainer of $1,000 annually. In addition, Independent Trustees receive a quarterly meeting fee of $5,000 for each in-person Board meeting attended, a meeting fee of $1,000 for each telephonic or Special Board meeting attended, and a $1,000 fee for each Board committee meeting attended and are reimbursed for all out-of-pocket expenses relating to attendance at such meetings.
46
NOTES TO FINANCIAL STATEMENTS
Expense, Investment Income and Gain/Loss Allocation:
The Fund pays the expenses that are directly related to its operations, such as custodian fees or adviser fees. Expenses incurred by the Trust, such as trustee or legal fees, are allocated to the Fund either proportionately based upon the Fund’s relative net assets or using another reasonable basis such as equally across all Funds in the Trust, depending on the nature of the expense. Individual share classes within the Fund are charged expenses specific to that class, such as distribution fees. Within the Fund, expenses other than class specific expenses are allocated daily to each class based upon the proportion of relative net assets. Investment income and realized and unrealized gains or losses are allocated to each class of shares based upon the proportion of relative net assets.
4. Fund Distribution:
The Fund has adopted a Master Distribution 12b-1 Plan (the “Plan”) in which Tamarack Distributors, Inc. (through February 15, 2010), and Quasar Distributors LLC (effective February 16, 2010) (the “Distributor”) acts as the Fund’s distributor. Tamarack Distributors Inc. was an affiliate of RBC GAM (US) and Quasar Distributors LLC is not affiliated, The Plan permits the Fund to make payments for, or to reimburse the Distributor monthly for, distribution-related costs and expenses of marketing shares of Class A covered under the Plan, and/or for providing shareholder services. The Plan does not apply to Class I. The following chart shows the current Plan fee rate for Class A.
| | | |
| | | Class A | |
12b-1 Plan Fee | | 0.25 | % |
Plan fees are based on average daily net assets of Class A. The Distributor, subject to applicable legal requirements, may waive the Plan fee voluntarily, in whole or in part.
For the six months ended March 31, 2010, Quasar Distributors LLC received commissions of $3 from front-end sales charges of Class A shares of the Fund. Neither Distributor received any CDSC fees from the Fund during the same period.
5. Securities Transactions:
The cost of securities purchased and proceeds from securities sold (excluding securities maturing less than one year from acquisition) for the six months ended March 31, 2010 were as follows:
| | | | | | | | | | |
Purchases(Excl. U.S. Gov’t.) | | Sales(Excl. U.S. Gov’t.) | | Purchases of U.S. Gov’t. | | Sales of U.S. Gov’t. |
| $ | 58,643,447 | | $ | 19,024,528 | | $ | — | | $ | — |
6. Capital Share Transactions:
The Trust is authorized to issue 1,000,000,000 shares of beneficial interest (“shares outstanding”) with par value of $.0000001. Transactions in shares of the Fund are summarized below:
| | | | | | | | |
| | | For the
Six Months Ended
March 31,
2010 | | | For the
Period Ended
September 30,
2009* | |
| | |
CAPITAL TRANSACTIONS: | | | | | | | | |
Class A | | | | | | | | |
Proceeds from shares issued | | $ | 2,720,178 | | | $ | 8,519,665 | |
Distributions reinvested | | | 41,915 | | | | 65,802 | |
Cost of shares redeemed | | | (755,968 | ) | | | (76,189 | ) |
| | | | | | | | |
Change in Class A | | $ | 2,006,125 | | | $ | 8,509,278 | |
| | | | | | | | |
47
NOTES TO FINANCIAL STATEMENTS
| | | | | | | | |
| | | For the
Six Months Ended
March 31,
2010 | | | For the
Period Ended
September 30,
2009* | |
| | |
Class I | | | | | | | | |
Proceeds from shares issued | | $ | 27,029,341 | | | $ | 28,409,141 | |
Distributions reinvested | | | 5,175,653 | | | | 9,576,845 | |
Cost of shares redeemed | | | (13,754,086 | ) | | | (41,325,343 | ) |
| | | | | | | | |
Change in Class I | | $ | 18,450,908 | | | $ | (3,339,357 | ) |
| | | | | | | | |
Change in net assets resulting from capital transactions | | $ | 20,457,033 | | | $ | 5,169,921 | |
| | | | | | | | |
| | |
SHARE TRANSACTIONS: | | | | | | | | |
Class A | | | | | | | | |
Issued | | | 277,107 | | | | 885,359 | |
Reinvested | | | 4,274 | | | | 6,815 | |
Redeemed | | | (77,105 | ) | | | (7,889 | ) |
| | | | | | | | |
Change in Class A | | | 204,276 | | | | 884,285 | |
| | | | | | | | |
Class I | | | | | | | | |
Issued | | | 2,756,073 | | | | 2,930,944 | |
Reinvested | | | 528,265 | | | | 1,002,129 | |
Redeemed | | | (1,403,851 | ) | | | (4,337,258 | ) |
| | | | | | | | |
Change in Class I | | | 1,880,487 | | | | (404,185 | ) |
| | | | | | | | |
Change in shares resulting from capital transactions | | | 2,084,763 | | | | 480,100 | |
| | | | | | | | |
| * | January 29, 2009 (commencement of operations) through September 30, 2009 for Class A and year ended September 30, 2009 for Class I. |
7. Federal Income Taxes:
It is the policy of the Fund to continue to qualify as a regulated investment company by complying with the provisions available to certain investment companies, as defined under Subchapter M of the Internal Revenue Code, and to distribute substantially all of its net investment income and net realized capital gains. Therefore, no federal tax liability is recorded in the financial statements of the Fund. As of March 31, 2010 the tax cost of securities and the breakdown of unrealized appreciation (depreciation) was as follows:
| | | | | | | | | | | |
Tax
Cost of
Securities | | Unrealized
Appreciation | | Unrealized
Depreciation | | | Net
Unrealized
Appreciation |
| $ | 679,595,294 | | $ | 30,306,110 | | $ | (3,753,804 | ) | | $ | 26,552,306 |
The tax character of distributions were as follows:
| | | | | | |
| | | Distributions Paid From |
| | | Ordinary
Income | | Total
Distributions
Paid |
For the year ended September 30, 2009 | | $ | 28,373,918 | | $ | 28,373,918 |
48
NOTES TO FINANCIAL STATEMENTS
The tax basis of components of accumulated earnings/(losses) and the tax character of distributions paid are determined at fiscal year end, and will be included in the Annual Report dated September 30, 2010.
As of September 30, 2009, the Fund had capital loss carryforwards for federal income tax purposes as follows:
| | | | | |
| | | Capital Loss Carryforward | | Expires |
| | $ | 1,911,397 | | 2011 |
| | | 3,756,334 | | 2012 |
| | | 659,184 | | 2013 |
| | | 27,743 | | 2014 |
| | | 2,484,167 | | 2015 |
| | | 8,197,543 | | 2016 |
Management has analyzed the Fund’s tax positions taken on federal income tax returns for all open tax years (current and prior three tax years), and has concluded that no provision for federal income tax is required in the Fund’s financial statements. The Fund’s federal and state income and federal excise tax returns for tax years for which the applicable statutes of limitations have not expired are subject to examination by the Internal Revenue Service and state departments of revenue.
8. Subsequent Events.
Management has evaluated the impact of all subsequent events on the Fund and has determined that there were no subsequent events requiring recognition or disclosure in the financial statements.
49
SHARE CLASS INFORMATION (UNAUDITED)
The Access Capital Community Investment Fund offers Class A and Class I shares.
Class A
Class A shares are available for purchase primarily through investment advisors, broker-dealers, banks and other financial services intermediaries. Class A shares of the Fund are currently subject to a maximum up-front sales charge of 3.75% and a 1.00% CDSC for redemption within 12 months of a $1 million or greater purchase. Class A shares currently include a 0.25% annual 12b-1 service and distribution fee.
Class I
Class I shares are intended for investors meeting certain minimum investment thresholds. This share class does not have an up-front sales charge (load) or a 12b-1 service and distribution fee.
50
SUPPLEMENTAL INFORMATION (UNAUDITED)
Shareholder Expense Examples
As a shareholder of the Access Capital Community Investment Fund, you incur two types of costs: (1) transaction costs, and (2) ongoing costs, including management fees and other Fund expenses. This example is intended to help you understand your ongoing costs (in dollars) of investing in the Fund and to compare these costs with the ongoing costs of investing in other mutual funds.
The Example is based on an investment of $1,000 invested at the beginning of the period and held for the entire period from October 1, 2009 through March 31, 2010.
Actual Expenses
The table below provides information about actual account values and actual expenses. You may use the information below, together with the amount you invested, to estimate the expenses that you paid over the period. Simply divide your account value by $1,000 (for example, an $8,600 account value divided by $1,000 = 8.6), then multiply the result by the number in the table under the heading entitled “Expenses Paid During Period” to estimate the expenses you paid on your account during this period.
| | | | | | | | | | | | |
| | | Beginning
Account Value
10/1/09 | | Ending
Account Value
3/31/10 | | Expenses Paid
During Period*
10/1/09-3/31/10 | | Annualized
Expense Ratio
During Period
10/1/09-3/31/10 | |
Class A | | $ | 1,000.00 | | $ | 1,020.10 | | $ | 5.14 | | 1.02 | % |
Class I | | $ | 1,000.00 | | $ | 1,021.30 | | $ | 3.88 | | 0.77 | % |
Hypothetical Example for Comparison Purposes
The table below provides information about hypothetical account values and hypothetical expenses based on the Fund’s actual expense ratio and an assumed rate of return of 5% per year before expenses, which is not the Fund’s actual return. The hypothetical account values and expenses may not be used to estimate the actual ending account balance or expenses you paid for the period. You may use this information to compare this 5% hypothetical example with the 5% hypothetical examples that appear in the shareholder reports of other funds.
Please note that the expenses shown in the table are meant to highlight your ongoing costs only and do not reflect any transactional costs, such as sales charges (loads), redemption fees, or exchange fees. Therefore, the table is useful in comparing ongoing costs only, and will not help you determine the relative total costs of owning different funds. In addition, if these transactional costs were included, your costs would have been higher.
| | | | | | | | | | | | |
| | | Beginning
Account Value
10/1/09 | | Ending
Account Value
3/31/10 | | Expenses Paid
During Period*
10/1/09-3/31/10 | | Annualized
Expense Ratio
During Period
10/1/09-3/31/10 | |
Class A | | $ | 1,000.00 | | $ | 1,019.85 | | $ | 5.14 | | 1.02 | % |
Class I | | $ | 1,000.00 | | $ | 1,021.09 | | $ | 3.88 | | 0.77 | % |
| * | Expenses are equal to the average account value times the Fund’s annualized expense ratio multiplied by 182/365 (to reflect one half-year period). |
51
Access Capital
P.O. Box 701
Milwaukee, WI 53201-0701
800-973-0073
www.rbcgam.us
Performance data represents past performance and does not guarantee future results. The principal value of an investment and investment return will fluctuate so that an investor’s shares, when redeemed, may be worth more or less than their original cost.
This report and the financial statements contained herein are provided for the information of RBC Funds shareholders. This report is not authorized for distribution to prospective investors unless preceded or accompanied by a current prospectus, which contains information concerning investment objectives, risks, charges and expenses of the Fund. Please read the prospectus carefully before investing.
This report and the financial statements contained herein are not intended to be a forecast of future events, a guarantee of future results, or investment advice. There is no assurance that certain securities will remain in or out of the Fund’s portfolio. The views expressed in this report reflect those of the portfolio managers through the period ended March 31, 2010.
NOT FDIC INSURED • NO BANK GUARANTEE • MAY LOSE VALUE
RBC Global Asset Management U.S., Inc. serves as investment adviser to the Access Capital Community Investment Fund. The Fund is distributed by Quasar Distributors LLC.

| | | | |
| The RBC Funds are pleased to offer shareholder reports printed entirely on Forest Stewardship Council certified paper. FSC certification ensures that the paper used in this report contains fiber from well-managed and responsibly harvested forests that meet strict environmental and socioeconomic standards. | | |
RBCF-AC SAR03-10
Not applicable.
| Item 3. | Audit Committee Financial Expert. |
Not applicable.
| Item 4. | Principal Accountant Fees and Services. |
Not applicable.
| Item 5. | Audit Committee of Listed registrants. |
Not applicable.
| (a) | Schedule of Investments in securities of unaffiliated issuers as of the close of the reporting period is included as part of the report to shareholders filed under Item 1 of this form. |
| Item 7. | Disclosure of Proxy Voting Policies and Procedures for Closed-End Management Investment Companies. |
Not applicable.
| Item 8. | Portfolio Managers of Closed-End Management Investment Companies. |
Not applicable.
| Item 9. | Purchases of Equity Securities by Closed-End Management Investment Company and Affiliated Purchasers. |
Not applicable.
| Item 10. | Submission of Matters to a Vote of Security Holders. |
There have been no material changes to the procedures by which the shareholders may recommend nominees to the registrant’s board of directors, where those changes were implemented after the registrant last provided disclosure in response to the requirements of Item 407(c)(2)(iv) of Regulation S-K (17 CFR 229.407) (as required by Item 22(b)(15) of Schedule 14A (17 CFR 240.14a-101)), or this Item.
| Item 11. | Controls and Procedures. |
| (a) | The registrant’s principal executive and principal financial officers, or persons performing similar functions, have concluded that the registrant’s disclosure controls and procedures (as defined in Rule 30a-3(c) under the Investment Company Act of 1940, as amended (the “1940 Act”) (17 CFR 270.30a-3(c))) are effective, as of a date within 90 days of the filing date of the report that includes the disclosure required by this paragraph, based on their evaluation of these controls and procedures required by Rule 30a-3(b) under the 1940 Act (17 CFR 270.30a-3(b)) and Rules 13a-15(b) or 15d-15(b) under the Securities Exchange Act of 1934, as amended (17 CFR 240.13a-15(b) or 240.15d-15(b)). |
| (b) | There were no changes in the registrant’s internal control over financial reporting (as defined in Rule 30a-3(d) under the 1940 Act (17 CFR 270.30a-3(d)) that occurred during the registrant’s second fiscal quarter of the period covered by this report that has materially affected, or is reasonably likely to materially affect, the registrant’s internal control over financial reporting. |
| | |
| |
(a)(1) | | Not applicable. |
| |
(a)(2) | | Certifications pursuant to Rule 30a-2(a) under the 1940 Act and Section 302 of the Sarbanes-Oxley Act of 2002 are attached hereto. |
| |
(a)(3) | | Not applicable. |
| |
(b) | | Certifications pursuant to Rule 30a-2(b) under the 1940 Act and Section 906 of the Sarbanes- Oxley Act of 2002 are attached hereto. |
SIGNATURES
Pursuant to the requirements of the Securities Exchange Act of 1934 and the Investment Company Act of 1940, the registrant has duly caused this report to be signed on its behalf by the undersigned, thereunto duly authorized.
| | |
| (registrant) RBC Funds Trust |
| |
| By (Signature and Title)* | | /s/ Erik R. Preus |
| | Erik R. Preus, President and Chief Executive Officer |
| | (principal executive officer) |
Date 5/26/10
Pursuant to the requirements of the Securities Exchange Act of 1934 and the Investment Company Act of 1940, this report has been signed below by the following persons on behalf of the registrant and in the capacities and on the dates indicated.
| | |
| By (Signature and Title)* | | /s/ Erik R. Preus |
| | Erik R. Preus, President and Chief Executive Officer |
| | (principal executive officer) |
Date 5/26/10
| | |
| By (Signature and Title)* | | /s/ Kathleen A. Hegna |
| | Kathleen A. Hegna, Chief Financial Officer |
| | (principal financial officer) |
Date 5/26/10
| * | Print the name and title of each signing officer under his or her signature. |