UNITED STATES
SECURITIES AND EXCHANGE COMMISSION
Washington, D.C. 20549
FORM N-CSR
CERTIFIED SHAREHOLDER REPORT OF REGISTERED MANAGEMENT
INVESTMENT COMPANIES
Investment Company Act file number 811-21475
RBC Funds Trust
(Exact name of registrant as specified in charter)
50 South Sixth Street, Suite 2350
Minneapolis, MN 55402
(Address of principal executive offices) (Zip code)
Tara Tilbury
50 South Sixth Street, Suite 2350
Minneapolis, MN 55402
(Name and address of agent for service)
Registrant’s telephone number, including area code: (612) 376-7132
Date of fiscal year end: September 30
Date of reporting period: September 30, 2023
Item 1. Reports to Stockholders.
| (a) | The Report to Shareholders is attached herewith. |

Annual Report
For the year ended September 30, 2023
RBC BlueBay Access Capital Community Investment Fund (formerly, Access Capital Community Investment Fund)
RBC BlueBay Impact Bond Fund (formerly, RBC Impact Bond Fund)
1
| LETTER FROM THE PORTFOLIO MANAGERS | ||||||||||
| September 30, 2023, the Access Fund has supported the following across all 50 states, Puerto Rico, and the District of Columbia: | ||||||||||
| 17,115 Low- to moderate-income homebuyers | ||||||||||
| 62,825 Affordable rental units | ||||||||||
| 6,071 Nursing home facility beds | ||||||||||
| 27 Rural housing | ||||||||||
| 88 Rural Enterprise | ||||||||||
| 638 SBA loans | ||||||||||
| 85 Community Economic development | ||||||||||
| 16 Community-based not-for-profit organizations | ||||||||||
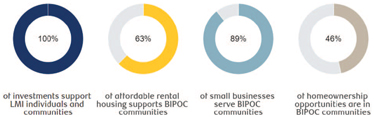
All of the Fund’s investments support low- to moderate-income communities and families. In addition, a substantial percentage of the Fund’s investments support BIPOC communities as of September 30, 2023:
| ||||||||||
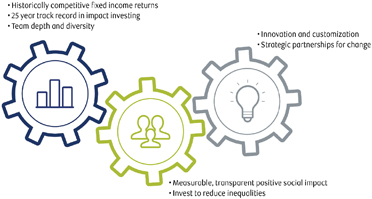
The RBC BlueBay Impact Bond Fund (“Impact Bond”) strives to maximize positive social and environmental impact within the context of a competitive fixed income portfolio, presenting a distinct value proposition for investors:
| ||||||||||
| ||||||||||

2
LETTER FROM THE PORTFOLIO MANAGERS | ||||
We implement the team’s expertise in impact investing in social justice themes, and combine it with a lens on creating meaningful progress toward climate change solutions. In doing so, we seek not just to avoid investments that harm the environment, but also strive to invest in those that explicitly align with advancing climate change solutions. This results in a portfolio that produces positive social and environmental outcomes. The negative impacts of climate change continue to take a toll on our planet and on people, with a disproportionately negative impact on already disadvantaged and lower-income populations. We continue to examine investments with a critical eye toward understanding the social and environmental impact of each project, with a goal to maximize the positive and minimize the negative.
Impact Bond’s core holdings must also have meaningful alignment with the United Nations Sustainable Development Goals (“SDGs)”—a global agenda to end poverty, protect the planet, and ensure prosperity for all people.
For the fiscal year ended September 30, 2023, Impact Bond generated a net-of-fees return of 0.44% (Class I shares; gross-of-fees return of 0.89%) versus the Bloomberg US Aggregate Bond Index that returned 0.64%. The effective duration of Impact Bond as of September 30 was 6.10 years, in line with the benchmark’s 5.99 years, and the subsidized 30-day SEC yield of Impact Bond was 4.36% (Class I shares; 4.31% unsubsidized).
Impact Bond outperformed on a gross-of-fees basis during the year and ended in positive absolute territory on a net-of-fees basis despite significant increases in rates. Impact Bond was positioned relatively neutral to the benchmark duration for the period, resulting in little impact to performance on a relative basis. Impact Bond’s asset-backed security (“ABS”) and municipal holdings lagged in the final quarter of 2022 when the banking sector gapped tighter. These sectors rebounded strongly in 2023 as spreads tightened, leading to a positive impact on performance. Agency MBS holdings were also additive as higher coupons outperformed. Impact Bond produced a notable yield advantage versus the benchmark over the past year based on wider spreads.
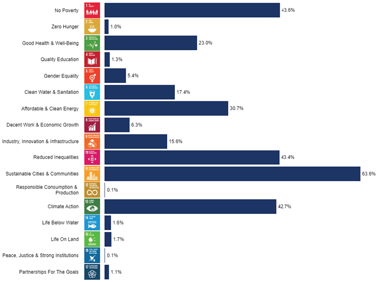
Impact Bond has made measurable progress toward demonstrating the positive social and environmental impacts of investing in the Fund. The holdings of Impact Bond as of September 30, 2023, were invested to support the following themes (totals may exceed 100%, as projects may impact multiple themes/SDGs)::
| ||||
| ||||
| ||||
3
| LETTER FROM THE PORTFOLIO MANAGERS | ||||
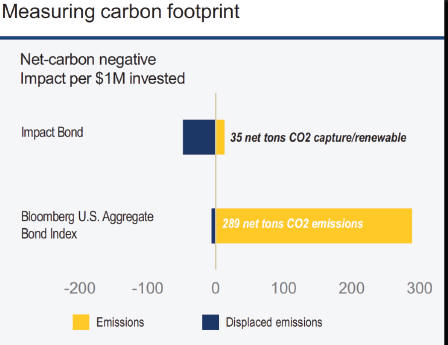
In addition to these meaningful contributions to advancing the SDGs, the Impact Bond also has a low carbon footprint relative to the benchmark, financing significantly less carbon emissions and more carbon capture equivalents than securities held in the benchmark. This is illustrated below, and is calculated using our internally developed, proprietary impact measurement framework:
| ||||
| The above graphic illustrates a comparison of the carbon footprint for the Bloomberg US Aggregate Bond Index versus Impact Bond, per $1 million (“M”) invested. We define net carbon negative as occurring when the Fund’s avoided greenhouse gas (“GHG”) emissions exceed the Fund’s GHG emissions produced, calculated per million dollars invested (unit = tons CO2 equivalent/$1M invested). Calculations are inclusive of all fund assets, excluding Treasuries. GHG emissions (tons CO2 equivalent) are inclusive of Scope 1 and 2 emissions, and may consider Scope 3 emissions when applicable and available. Multiple sources are used for GHG emissions data and include: reports from issuers, reports and estimates from third-party vendors, and sector- and industry-level data from government and academic entities. Gaps in data may exist as climate data and disclosures continue to evolve. Our calculation methodology considers relevant standards and practices, and is proprietary to the investment team. | ||||
| Continued investment in our impact measurement capabilities is a key focus for the team. We believe the ability to accurately and transparently measure the environmental and social impact of the Funds will continue to be important to clients and consultants. In September 2023, RBC Global Asset Management (“RBC GAM”) became a signatory to the Operating Principles for Impact Management (“the Impact Principles”) by the Global Impact Investing Network (“GIIN”), a step that continues to demonstrate our commitment to impact investing. This commitment applies to both the Access Fund and Impact Bond, and our framework was independently verified by an external auditor. The Impact Principles were designed to promote transparency | ||||
4
| LETTER FROM THE PORTFOLIO MANAGERS | ||||||
| within the growing impact investment space. They have become the market standard for impact investors, deepening rigor and driving credibility within the financial services industry since the framework’s launch in 2019. In accordance with this commitment, RBC GAM has adopted the nine Impact Principles for the Access Fund and Impact Bond that are an industry leading investor framework for ensuring that impact considerations are integrated throughout the full lifecycle of an investment. We believe this further demonstrates our proficiency in impact measurement, and seek to maintain and expand our competitive edge. | ||||||
| The need for investment strategies that address the widespread economic disparities that persist across the United States has never been greater, and our distinct approach of seeking double-bottom line that results in a high-quality investment vehicle is one way to help move the dial toward reducing inequalities. We remain committed to investing in positive change for the future while also delivering competitive returns for our shareholders. Thank you for your continued confidence and trust in our impact investing capabilities. | ||||||
| Sincerely, | ||||||
| Brian Svendahl, CFA | ||||||
| Senior Portfolio Manager, U.S. Fixed Income | ||||||
| RBC Global Asset Management (U.S.) Inc. | ||||||
| Past performance does not guarantee of future results. | ||||||
| Mutual fund investing involves risk. Principal loss is possible. | ||||||
| The Bloomberg US Securitized Index represents the securitized portion (mortgage-backed, asset-backed and commercial mortgage-backed securities) of the Bloomberg US Aggregate Bond Index, which measures the investment grade, U.S. dollar-denominated, fixed-rate taxable bond market and includes Treasuries, government-related and corporate securities, mortgage-backed securities (agency fixed-rate and hybrid adjustable-rate mortgage pass-throughs), asset-backed securities, and commercial mortgage-backed securities (agency and non-agency). You cannot invest directly in an index. | ||||||
| Effective duration is a weighted average duration calculation for bonds with embedded options. It takes into account that expected cash flows will fluctuate as interest rates change. Duration measures the sensitivity of a bond’s price to changes in interest rates. | ||||||
| Spread measures the difference between two rates or yields. | ||||||
| Fund holdings and/or sector allocations are subject to change at any time and are not recommendations to buy or sell any security. | ||||||
| RBC Global Asset Management (RBC GAM) is the asset management division of Royal Bank of Canada (RBC) which includes RBC Global Asset Management Inc., RBC Global Asset Management (U.S.) Inc., RBC Global Asset Management (UK) Limited and RBC Global Asset Management (Asia) Limited which are separate, but affiliated subsidiaries of RBC. | ||||||
| ||||||
5
RBC Global Asset Management (U.S.) Inc.(“RBC GAM-US”) serves as the investment advisor to the Funds. RBC GAM-US employs a team approach to the management of the Funds, with no individual team member being solely responsible for the investment decisions. The Funds’ management team has access to RBC GAM-US’s investment research and other money management resources.
| ||||||
Brian Svendahl, CFA
|
Brian Svendahl, CFA
BlueBay Senior Portfolio Manager
Brian is a BlueBay senior portfolio manager on the BlueBay Fixed Income team at RBC Global Asset Management (U.S.) Inc. He has had a leadership role within the Minneapolis-based fixed income group since 2012 and has been the lead portfolio manager for the firm’s impact investing strategies since 2006. He also managed many government and mortgage strategies. Brian joined the organization in 2005, having held risk management, research, and trading positions with a large American multinational financial services company since 1992. Brian holds an MBA, a BBA in Finance and a Bachelor of Science in Economics from the University of Minnesota. He is also a CFA® charterholder and a Financial Risk Manager (FRM®).
| |||||

6
PERFORMANCE SUMMARY (UNAUDITED)
|
| 1 Year | 5 Year | 10 Year | Since Inception | Net Expense Ratio(a)(b) | Gross Expense Ratio(a)(b) | |||||||||||||||||||
Average Annual Total Returns as of September 30, 2023 (Unaudited) |
| |||||||||||||||||||||||
RBC BlueBay Access Capital Community Investment Fund |
| |||||||||||||||||||||||
Class A(c) | ||||||||||||||||||||||||
- Including Max Sales Charge of | ||||||||||||||||||||||||
3.75% | (4.85 | )% | (2.02 | )% | (0.39 | )% | 2.53 | % | ||||||||||||||||
- At Net Asset Value | (1.20 | )% | (1.26 | )% | (0.01 | )% | 2.68 | % | 0.80 | % | 0.84 | % | ||||||||||||
Class I(e) | ||||||||||||||||||||||||
- At Net Asset Value | (0.85 | )% | (0.91 | )% | 0.35 | % | 3.00 | % | 0.45 | % | 0.51 | % | ||||||||||||
Class IS(f) | ||||||||||||||||||||||||
- At Net Asset Value | (0.80 | )% | (0.85 | )% | 0.48 | % | 3.23 | % | 0.40 | % | 0.50 | % | ||||||||||||
Bloomberg US Securitized Index(h) | (0.04 | )% | (0.63 | )% | 0.69 | % | 3.52 | % | ||||||||||||||||
RBC BlueBay Impact Bond Fund | ||||||||||||||||||||||||
Class A(d) | ||||||||||||||||||||||||
- Including Max Sales Charge of | ||||||||||||||||||||||||
3.75% | (3.59 | )% | (1.28 | )% | N/A | (1.52 | )% | |||||||||||||||||
- At Net Asset Value | 0.18 | % | (0.54 | )% | N/A | (0.87 | )% | 0.70 | % | 0.70 | % | |||||||||||||
Class I | ||||||||||||||||||||||||
- At Net Asset Value | 0.44 | % | (0.24 | )% | N/A | (0.58 | )% | 0.45 | % | 0.65 | % | |||||||||||||
Class R6 | ||||||||||||||||||||||||
- At Net Asset Value | 0.49 | % | (0.19 | )% | N/A | (0.53 | )% | 0.40 | % | 0.52 | % | |||||||||||||
Class Y(g) | ||||||||||||||||||||||||
- At Net Asset Value | 0.49 | % | (0.24 | )% | N/A | (0.57 | )% | 0.40 | % | 0.50 | % | |||||||||||||
Bloomberg US Aggregate Bond Index(h) | 0.64 | % | 0.10 | % | N/A | (0.18 | )% | |||||||||||||||||
Parentheses indicate negative performance returns.
Performance data quoted represents past performance. Past performance is no guarantee of future results. Investment return and principal value of an investment will fluctuate so that an investor’s shares, when redeemed, may be worth more or less than their original cost. Current performance may be lower or higher than performance quoted. Performance shown reflects contractual fee waivers, without such fee waivers total returns would be reduced. For performance data current to the most recent month-end go to www.rbcgam.com. Please see footnotes below.
The names of the funds were changed from Access Capital Community Investment Fund and RBC Impact Bond Fund to RBC BlueBay Access Capital Community Investment Fund and RBC BlueBay Impact Bond Fund, respectively, on July 26, 2023.
| (a) | The Funds’ expenses are from the Funds’ most recent prospectus dated January 27, 2023. For current expense ratio information, please see the Financial Highlights starting on page 61. |
| (b) | The advisor has contractually agreed to waive fees and/or pay operating expenses to keep total operating expenses at 0.80% for Class A shares, 0.45% for Class I shares and 0.40% for Class IS shares of the RBC BlueBay Access Capital Community Investment Fund (formerly, RBC BlueBay Access Capital Community Investment Fund) and at 0.70% for Class A shares, 0.45% for Class I shares, 0.40% for Class R6 shares and 0.40% for Class Y shares of the RBC BlueBay Impact Bond Fund (formerly, RBC BlueBay Impact Bond Fund) until January 31, 2025. |
7
PERFORMANCE SUMMARY (UNAUDITED)
|
| (c) | The inception date for Class A shares of the Fund is January 29, 2009. All performance shown for such class of shares prior to its inception date is based on the performance of the Class I shares of the Fund, adjusted to reflect the fees and expenses of Class A shares, as applicable. |
| (d) | The inception date for Class A shares of the Fund is January 28, 2020. All performance shown for such class of shares prior to its inception date is based on the performance of the Class I shares of the Fund, which has an inception date of December 18, 2017, adjusted to reflect the fees and expenses of Class A shares, as applicable. |
| (e) | Class I shares commenced operations on July 28, 2008. The performance in the table prior to that date reflects the performance of Access Capital Strategies Community Investment Fund, Inc., the predecessor to the Fund. From its inception, June 23, 1998, until May 30, 2006, the predecessor fund elected status as a business development company. From May 31, 2006 until July 27, 2008, the predecessor fund operated as a continuously offered closed-end interval management company. If the predecessor fund had operated as an open-end management company, performance may have been adversely affected. Fund performance reflects applicable fee waivers/expense reimbursements which, if excluded, would cause performance to be lower. |
| (f) | The inception date for Class IS shares of the Fund is March 11, 2019. All performance shown for such class of shares prior to its inception date is based on the performance of the Class I shares of the Fund, adjusted to reflect the fees and expenses of Class IS shares, as applicable. |
| (g) | The inception date for Class Y shares of the Fund is April 12, 2021. All performance shown for such class of shares prior to its inception date is based on the Class I shares, which has an inception date of December 18, 2017, adjusted to reflect the fees and expenses of Class Y shares, as applicable. |
| (h) | Each of the comparative indices is a widely recognized market value weighted measure of the return of securities, but do not include sales fees or operating expenses. You cannot invest directly in indices. |
The Bloomberg US Securitized Index represents the securitized portion (mortgage-backed, asset-backed and commercial mortgage-backed securities) of the Bloomberg US Aggregate Bond Index.
The Bloomberg US Aggregate Bond Index measures the investment grade, U.S. dollar-denominated, fixed-rate taxable bond market. It includes Treasuries, government-related and corporate securities, mortgage-backed securities (agency fixed-rate and hybrid adjustable-rate mortgage pass-throughs), asset-backed securities, and commercial mortgage-backed securities (agency and non-agency).
8
|
This Page Intentionally Left Blank
9
10
| MANAGEMENT DISCUSSION AND ANALYSIS (UNAUDITED) | ||||
| RBC BlueBay Access Capital Community Investment Fund | ||||
| The Bloomberg US Securitized Index represents the securitized portion (mortgage-backed, asset-backed and commercial mortgage-backed securities) of the Bloomberg US Aggregate Bond Index. The Bloomberg US Aggregate Bond Index measures the investment grade, U.S. dollar-denominated, fixed-rate taxable bond market and includes Treasuries, government-related and corporate securities, mortgage-backed securities (agency fixed-rate and hybrid adjustable-rate mortgage pass-throughs), asset-backed securities, and commercial mortgage-backed securities (agency and non-agency). You cannot invest directly in an index. | ||||
| Fund holdings and/or sector allocations are subject to change and should not be considered a recommendation to buy or sell any security. Current and future holdings are subject to risk. | ||||
| Past performance does not guarantee future results. | ||||
| ||||
11
MANAGEMENT DISCUSSION AND ANALYSIS (UNAUDITED)
| ||||||||||||||
RBC BlueBay Access Capital Community Investment Fund
|
| |||||||||||||
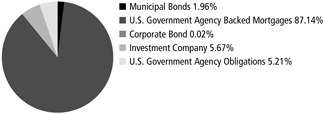
Investment Objective | The Fund’s investment objective is to provide current income consistent with the preservation of capital by investing primarily in high quality debt securities and other debt instruments supporting community development, including investments deemed to be qualified under the Community Reinvestment Act of 1977, as amended (the “CRA”).
|
| ||||||||||||
Benchmark | Bloomberg US Securitized Index
|
| ||||||||||||
Asset Allocation as of 9/30/23 (% of Fund’s investments) |
|
| ||||||||||||
Top Ten Holdings (excluding investment companies) (as of 9/30/23) (% of Fund’s net assets)
| Fannie Mae, Pool #CB4463, 4.50%, 8/1/52 Fannie Mae, Pool #CB5037, 5.50%, 11/1/52 Fannie Mae, Pool #CB4314, 4.50%, 8/1/52 Freddie Mac, Pool #RA7503, 4.50%, 7/1/52 Fannie Mae, Pool #BL4650, 2.30%, 10/1/31 | 1.71% 1.50% 1.32% 1.24% 1.10% | Fannie Mae, Pool #CB3797, 4.00%, 6/1/52 Freddie Mac, Pool #RA5427, 2.50%, 6/1/51 Freddie Mac, Pool #RA5020, 2.00%, 4/1/51 Fannie Mae, Pool #CB5166, 6.00%, 11/1/52 Fannie Mae, Pool #CB4767, 5.00%, 9/1/52 | | 1.01% 0.92% 0.89% 0.87% 0.87% | | ||||||||
*A listing of all portfolio holdings can be found beginning on page 17
|
| |||||||||||||
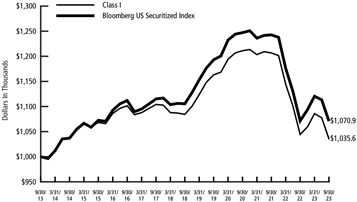
Growth of $1,000,000 Initial Investment Over 10 Years |
|
| ||||||||||||
The graph reflects an initial hypothetical investment of $1,000,000 over a 10 year period and is based on Class I shares. The Fund’s total return includes reinvested dividends and capital gains. The Fund’s total return also includes operating expenses that reduce return, while the total return of the index does not. The graph does not reflect the deduction of taxes that a shareholder would pay on fund distributions or redemption of fund shares. Performance of other classes will vary due to differences in fee structures. This chart does not imply any future performance. |
| |||||||||||||
12
|
This Page Intentionally Left Blank
13
14
MANAGEMENT DISCUSSION AND ANALYSIS (UNAUDITED)
| ||||||||||||||||
RBC BlueBay Impact Bond Fund
| ||||||||||||||||
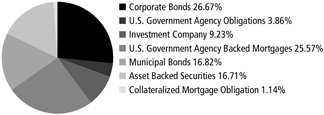
The Fund seeks to achieve a high level of current income consistent with preservation of capital.
|
Investment Objective | |||||||||||||||
Bloomberg US Aggregate Bond Index
|
Benchmark | |||||||||||||||
| Asset Allocation as of 9/30/23 (% of Fund’s investments)
| |||||||||||||||
Tesla Auto Lease Trust, Series 2023-A, Class B, Becton Dickinson & Co., 4.69%, 2/13/28 Hertz Vehicle Financing III LLC, 5.49%, 6/25/27 Amgen, Inc., 5.25%, 3/2/33 Sunnova Sol IV Issuer LLC, Series 2022-A, Class C, Tesla Auto Lease Trust, Series 2021-B, Class C, |
| 2.23%
1.69% 1.63% 1.39% 1.28%
1.27% |
| Tesla Auto Lease Trust, Series 2021-A, Class D, American Water Capital Corp., 4.45%, 6/1/32 Luminace Issuer LLC, Series 2022-1, Class B, BX Commercial Mortgage Trust, Series 2022-AHP, |
| 1.22%
1.20% 1.18%
1.14% |
| Top Ten Holdings (excluding investment companies) (as of 9/30/23) (% of Fund’s net assets) | ||||||||
*A listing of all portfolio holdings can be found beginning on page 40
|
| |||||||||||||||
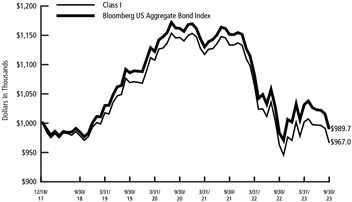 | Growth of $1,000,000 Initial (12/18/17) | |||||||||||||||
15
| MANAGEMENT DISCUSSION AND ANALYSIS (UNAUDITED) | ||||||
| RBC BlueBay Impact Bond Fund | ||||||
| The graph reflects an initial hypothetical investment of $1,000,000 over the period from December 18, 2017 (commencement of operations) to September 30, 2023 and is based on Class I shares. The Fund’s total return includes reinvested dividends and capital gains. The Fund’s total return also includes operating expenses that reduce return while the total return of the index does not. The graph does not reflect the deduction of taxes that a shareholder would pay on fund distributions or redemption of fund shares. Classes will vary due to differences in fee structures. This chart does not imply any future performance. | ||||||
| ||||||
16
SCHEDULE OF PORTFOLIO INVESTMENTS
|
RBC BlueBay Access Capital Community Investment Fund
September 30, 2023
| Principal Amount | Value | |||||||
U.S. Government Agency Backed Mortgages — 88.15% | ||||||||
Fannie Mae — 51.10% | ||||||||
| $643,948 | 6.00%, 10/1/53 | $ | 635,496 | |||||
| 45,448 | Pool #258022, 5.50%, 5/1/34 | 45,255 | ||||||
| 41,192 | Pool #258070, 5.00%, 6/1/34 | 40,307 | ||||||
| 47,956 | Pool #258157, 5.00%, 8/1/34 | 46,924 | ||||||
| 48,214 | Pool #258163, 5.50%, 8/1/34 | 48,009 | ||||||
| 10,836 | Pool #258224, 5.50%, 12/1/34 | 10,790 | ||||||
| 70,249 | Pool #258251, 5.50%, 1/1/35 | 69,950 | ||||||
| 83,253 | Pool #258305, 5.00%, 3/1/35 | 81,492 | ||||||
| 49,667 | Pool #258394, 5.00%, 5/1/35 | 48,619 | ||||||
| 37,048 | Pool #258410, 5.00%, 4/1/35 | 36,265 | ||||||
| 55,359 | Pool #258448, 5.00%, 8/1/35 | 54,185 | ||||||
| 79,006 | Pool #258450, 5.50%, 8/1/35 | 78,708 | ||||||
| 145,854 | Pool #258627, 5.50%, 2/1/36 | 145,304 | ||||||
| 32,976 | Pool #258737, 5.50%, 12/1/35 | 32,969 | ||||||
| 20,089 | Pool #259378, 6.00%, 12/1/31 | 20,226 | ||||||
| 18,148 | Pool #259393, 6.00%, 1/1/32 | 18,272 | ||||||
| 30,876 | Pool #259590, 5.50%, 11/1/32 | 30,736 | ||||||
| 75,905 | Pool #259611, 5.50%, 11/1/32 | 75,560 | ||||||
| 9,358 | Pool #259634, 5.50%, 12/1/32 | 9,315 | ||||||
| 56,744 | Pool #259659, 5.50%, 2/1/33 | 56,486 | ||||||
| 24,051 | Pool #259671, 5.50%, 2/1/33 | 23,942 | ||||||
| 58,036 | Pool #259686, 5.50%, 3/1/33 | 57,802 | ||||||
| 59,959 | Pool #259725, 5.00%, 5/1/33 | 58,678 | ||||||
| 44,836 | Pool #259761, 5.00%, 6/1/33 | 43,878 | ||||||
| 69,869 | Pool #259777, 5.00%, 7/1/33 | 68,373 | ||||||
| 36,748 | Pool #259789, 5.00%, 7/1/33 | 35,964 | ||||||
| 37,620 | Pool #259830, 5.00%, 8/1/33 | 36,816 | ||||||
| 24,906 | Pool #259848, 5.00%, 9/1/33 | 24,375 | ||||||
| 53,616 | Pool #259867, 5.50%, 10/1/33 | 53,400 | ||||||
| 34,595 | Pool #259869, 5.50%, 10/1/33 | 34,456 | ||||||
| 27,338 | Pool #259998, 5.00%, 3/1/34 | 26,751 | ||||||
| 238,180 | Pool #469101, 3.75%, 2/1/27 | 227,808 | ||||||
| 254,121 | Pool #470828, 3.53%, 3/1/32 | 228,375 | ||||||
| 6,463 | Pool #576445, 6.00%, 1/1/31 | 6,459 | ||||||
| 23,299 | Pool #579402, 6.50%, 4/1/31 | 23,957 | ||||||
| 23,028 | Pool #583728, 6.50%, 6/1/31 | 23,679 | ||||||
| 10,413 | Pool #590931, 6.50%, 7/1/31 | 10,706 | ||||||
| 2,479 | Pool #601865, 6.50%, 4/1/31 | 2,469 | ||||||
| 33,314 | Pool #607611, 6.50%, 11/1/31 | 34,255 | ||||||
| 28,790 | Pool #644437, 6.50%, 6/1/32 | 29,682 | ||||||
| 688,540 | Pool #663159, 5.00%, 7/1/32 | 673,529 | ||||||
| 27,169 | Pool #670278, 5.50%, 11/1/32 | 27,046 | ||||||
| 12,145 | Pool #676702, 5.50%, 11/1/32 | 12,090 | ||||||
| 37,695 | Pool #677591, 5.50%, 12/1/32 | 37,524 | ||||||
| 28,758 | Pool #681883, 6.00%, 3/1/33 | 29,175 | ||||||
17
SCHEDULE OF PORTFOLIO INVESTMENTS
|
RBC BlueBay Access Capital Community Investment Fund (cont.)
September 30, 2023
| Principal Amount | Value | |||||||
| $ 26,774 | Pool #686542, 5.50%, 3/1/33 | $ | 26,666 | |||||
| 157,667 | Pool #695961, 5.50%, 1/1/33 | 156,951 | ||||||
| 96,597 | Pool #696407, 5.50%, 4/1/33 | 96,207 | ||||||
| 297,806 | Pool #702478, 5.50%, 6/1/33 | 296,603 | ||||||
| 85,061 | Pool #702479, 5.00%, 6/1/33 | 83,244 | ||||||
| 32,384 | Pool #723066, 5.00%, 4/1/33 | 31,692 | ||||||
| 133,402 | Pool #723067, 5.50%, 5/1/33 | 132,863 | ||||||
| 112,481 | Pool #723070, 4.50%, 5/1/33 | 108,142 | ||||||
| 182,812 | Pool #727311, 4.50%, 9/1/33 | 175,833 | ||||||
| 98,650 | Pool #727312, 5.00%, 9/1/33 | 96,542 | ||||||
| 115,453 | Pool #727315, 6.00%, 10/1/33 | 117,120 | ||||||
| 28,982 | Pool #738589, 5.00%, 9/1/33 | 28,363 | ||||||
| 36,124 | Pool #739269, 5.00%, 9/1/33 | 35,354 | ||||||
| 70,282 | Pool #748041, 4.50%, 10/1/33 | 67,583 | ||||||
| 66,391 | Pool #749891, 5.00%, 9/1/33 | 64,969 | ||||||
| 99,000 | Pool #753533, 5.00%, 11/1/33 | 96,879 | ||||||
| 32,000 | Pool #755679, 6.00%, 1/1/34 | 32,464 | ||||||
| 292,053 | Pool #777621, 5.00%, 2/1/34 | 285,798 | ||||||
| 63,586 | Pool #781741, 6.00%, 9/1/34 | 64,518 | ||||||
| 55,131 | Pool #781959, 5.50%, 6/1/34 | 54,897 | ||||||
| 27,204 | Pool #783893, 5.50%, 12/1/34 | 27,089 | ||||||
| 56,946 | Pool #783929, 5.50%, 10/1/34 | 56,704 | ||||||
| 2,109 | Pool #788329, 6.50%, 8/1/34 | 2,189 | ||||||
| 10,557 | Pool #798725, 5.50%, 11/1/34 | 10,513 | ||||||
| 48,438 | Pool #799548, 6.00%, 9/1/34 | 49,149 | ||||||
| 550,642 | Pool #806754, 4.50%, 9/1/34 | 529,413 | ||||||
| 234,030 | Pool #806757, 6.00%, 9/1/34 | 237,482 | ||||||
| 282,724 | Pool #806761, 5.50%, 9/1/34 | 281,522 | ||||||
| 88,920 | Pool #808205, 5.00%, 1/1/35 | 87,001 | ||||||
| 152,742 | Pool #815009, 5.00%, 4/1/35 | 149,501 | ||||||
| 88,139 | Pool #820336, 5.00%, 9/1/35 | 86,278 | ||||||
| 81,260 | Pool #822008, 5.00%, 5/1/35 | 79,542 | ||||||
| 122,684 | Pool #829276, 5.00%, 8/1/35 | 120,081 | ||||||
| 110,452 | Pool #829649, 5.50%, 3/1/35 | 109,983 | ||||||
| 130,598 | Pool #844361, 5.50%, 11/1/35 | 130,105 | ||||||
| 24,775 | Pool #845245, 5.50%, 11/1/35 | 24,682 | ||||||
| 21,392 | Pool #866969, 6.00%, 2/1/36 | 21,898 | ||||||
| 65,622 | Pool #884693, 5.50%, 4/1/36 | 65,611 | ||||||
| 196,320 | Pool #885724, 5.50%, 6/1/36 | 196,288 | ||||||
| 59,487 | Pool #919368, 5.50%, 4/1/37 | 59,521 | ||||||
| 234,483 | Pool #922582, 6.00%, 12/1/36 | 242,225 | ||||||
| 84,240 | Pool #934941, 5.00%, 8/1/39 | 82,076 | ||||||
| 254,648 | Pool #934942, 5.00%, 9/1/39 | 248,085 | ||||||
| 50,542 | Pool #943394, 5.50%, 6/1/37 | 50,570 | ||||||
| 170,841 | Pool #948600, 6.00%, 8/1/37 | 176,508 | ||||||
| 62,926 | Pool #952678, 6.50%, 8/1/37 | 65,607 | ||||||
| 87,476 | Pool #986239, 6.00%, 7/1/38 | 90,371 | ||||||
| 106,282 | Pool #986957, 5.50%, 7/1/38 | 106,507 | ||||||
18
SCHEDULE OF PORTFOLIO INVESTMENTS
|
RBC BlueBay Access Capital Community Investment Fund (cont.)
September 30, 2023
| Principal Amount | Value | |||||||
| $ 141,534 | Pool #990617, 5.50%, 9/1/38 | $ | 141,838 | |||||
| 140,017 | Pool #AA0645, 4.50%, 3/1/39 | 132,585 | ||||||
| 111,071 | Pool #AA2243, 4.50%, 5/1/39 | 105,183 | ||||||
| 75,265 | Pool #AA3206, 4.00%, 4/1/39 | 69,031 | ||||||
| 242,081 | Pool #AA3207, 4.50%, 3/1/39 | 229,212 | ||||||
| 196,758 | Pool #AA7042, 4.50%, 6/1/39 | 186,340 | ||||||
| 233,944 | Pool #AA7658, 4.00%, 6/1/39 | 214,642 | ||||||
| 16,099 | Pool #AA7741, 4.50%, 6/1/24 | 15,946 | ||||||
| 619,661 | Pool #AB7798, 3.00%, 1/1/43 | 530,194 | ||||||
| 814,761 | Pool #AB9204, 3.00%, 4/1/43 | 696,536 | ||||||
| 69,784 | Pool #AC1463, 5.00%, 8/1/39 | 67,991 | ||||||
| 235,671 | Pool #AC2109, 4.50%, 7/1/39 | 223,163 | ||||||
| 229,884 | Pool #AC4395, 5.00%, 9/1/39 | 223,979 | ||||||
| 86,177 | Pool #AC5329, 5.00%, 10/1/39 | 83,963 | ||||||
| 177,978 | Pool #AC6305, 5.00%, 11/1/39 | 173,390 | ||||||
| 123,472 | Pool #AC6307, 5.00%, 12/1/39 | 120,299 | ||||||
| 263,684 | Pool #AC6790, 5.00%, 12/1/39 | 256,888 | ||||||
| 274,207 | Pool #AC7199, 5.00%, 12/1/39 | 267,178 | ||||||
| 258,491 | Pool #AD1470, 5.00%, 2/1/40 | 251,518 | ||||||
| 536,129 | Pool #AD1471, 4.50%, 2/1/40 | 507,586 | ||||||
| 498,538 | Pool #AD1585, 4.50%, 2/1/40 | 471,996 | ||||||
| 309,003 | Pool #AD1586, 5.00%, 1/1/40 | 301,017 | ||||||
| 199,843 | Pool #AD1638, 4.50%, 2/1/40 | 188,706 | ||||||
| 126,490 | Pool #AD1640, 4.50%, 3/1/40 | 119,441 | ||||||
| 621,731 | Pool #AD1942, 4.50%, 1/1/40 | 588,630 | ||||||
| 144,301 | Pool #AD1988, 4.50%, 2/1/40 | 136,618 | ||||||
| 163,791 | Pool #AD2896, 5.00%, 3/1/40 | 159,396 | ||||||
| 16,608 | Pool #AD4456, 4.50%, 4/1/40 | 15,684 | ||||||
| 382,433 | Pool #AD4458, 4.50%, 4/1/40 | 361,187 | ||||||
| 168,684 | Pool #AD4940, 4.50%, 6/1/40 | 159,283 | ||||||
| 69,141 | Pool #AD4946, 4.50%, 6/1/40 | 65,287 | ||||||
| 106,151 | Pool #AD5728, 5.00%, 4/1/40 | 103,303 | ||||||
| 108,663 | Pool #AD7239, 4.50%, 7/1/40 | 102,607 | ||||||
| 47,119 | Pool #AD7242, 4.50%, 7/1/40 | 44,499 | ||||||
| 81,316 | Pool #AD7256, 4.50%, 7/1/40 | 76,799 | ||||||
| 215,949 | Pool #AD7271, 4.50%, 7/1/40 | 203,940 | ||||||
| 235,199 | Pool #AD7272, 4.50%, 7/1/40 | 222,132 | ||||||
| 78,592 | Pool #AD8960, 5.00%, 6/1/40 | 76,486 | ||||||
| 295,985 | Pool #AD9614, 4.50%, 8/1/40 | 279,489 | ||||||
| 11,820 | Pool #AE2011, 4.00%, 9/1/40 | 10,840 | ||||||
| 823,477 | Pool #AE2012, 4.00%, 9/1/40 | 755,185 | ||||||
| 104,839 | Pool #AE2023, 4.00%, 9/1/40 | 96,158 | ||||||
| 219,872 | Pool #AE5432, 4.00%, 10/1/40 | 201,638 | ||||||
| 295,173 | Pool #AE5435, 4.50%, 9/1/40 | 278,746 | ||||||
| 114,827 | Pool #AE5806, 4.50%, 9/1/40 | 108,441 | ||||||
| 264,787 | Pool #AE5861, 4.00%, 10/1/40 | 242,828 | ||||||
| 116,455 | Pool #AE5862, 4.00%, 10/1/40 | 106,803 | ||||||
19
SCHEDULE OF PORTFOLIO INVESTMENTS
|
RBC BlueBay Access Capital Community Investment Fund (cont.)
September 30, 2023
| Principal Amount | Value | |||||||
| $ 246,462 | Pool #AE6850, 4.00%, 10/1/40 | $ | 226,022 | |||||
| 137,493 | Pool #AE7699, 4.00%, 11/1/40 | 126,146 | ||||||
| 369,004 | Pool #AE7703, 4.00%, 10/1/40 | 338,550 | ||||||
| 140,431 | Pool #AE7707, 4.00%, 11/1/40 | 128,785 | ||||||
| 112,802 | Pool #AH0300, 4.00%, 11/1/40 | 103,453 | ||||||
| 170,328 | Pool #AH0301, 3.50%, 11/1/40 | 150,861 | ||||||
| 10,767 | Pool #AH0302, 4.00%, 11/1/40 | 9,875 | ||||||
| 213,446 | Pool #AH0306, 4.00%, 12/1/40 | 195,772 | ||||||
| 329,046 | Pool #AH0508, 4.00%, 11/1/40 | 301,758 | ||||||
| 518,450 | Pool #AH0537, 4.00%, 12/1/40 | 475,479 | ||||||
| 493,464 | Pool #AH0914, 4.50%, 11/1/40 | 465,963 | ||||||
| 240,173 | Pool #AH0917, 4.00%, 12/1/40 | 220,255 | ||||||
| 198,526 | Pool #AH1077, 4.00%, 1/1/41 | 182,289 | ||||||
| 176,680 | Pool #AH2973, 4.00%, 12/1/40 | 162,050 | ||||||
| 206,787 | Pool #AH2980, 4.00%, 1/1/41 | 189,648 | ||||||
| 556,386 | Pool #AH5656, 4.00%, 1/1/41 | 510,272 | ||||||
| 308,837 | Pool #AH5658, 4.00%, 2/1/41 | 283,224 | ||||||
| 221,797 | Pool #AH5662, 4.00%, 2/1/41 | 203,431 | ||||||
| 142,013 | Pool #AH5882, 4.00%, 2/1/26 | 138,742 | ||||||
| 145,151 | Pool #AH6764, 4.00%, 3/1/41 | 133,114 | ||||||
| 586,975 | Pool #AH6768, 4.00%, 3/1/41 | 537,663 | ||||||
| 285,915 | Pool #AH7281, 4.00%, 3/1/41 | 261,895 | ||||||
| 101,536 | Pool #AH7526, 4.50%, 3/1/41 | 95,842 | ||||||
| 386,174 | Pool #AH7537, 4.00%, 3/1/41 | 353,731 | ||||||
| 130,021 | Pool #AH8878, 4.50%, 4/1/41 | 122,731 | ||||||
| 134,139 | Pool #AH8885, 4.50%, 4/1/41 | 126,626 | ||||||
| 47,290 | Pool #AH9050, 3.50%, 2/1/26 | 45,891 | ||||||
| 330,231 | Pool #AI0114, 4.00%, 3/1/41 | 302,488 | ||||||
| 231,596 | Pool #AI1846, 4.50%, 5/1/41 | 218,584 | ||||||
| 258,468 | Pool #AI1847, 4.50%, 5/1/41 | 243,972 | ||||||
| 490,814 | Pool #AI1848, 4.50%, 5/1/41 | 463,239 | ||||||
| 314,851 | Pool #AI1849, 4.50%, 5/1/41 | 297,245 | ||||||
| 160,769 | Pool #AJ0651, 4.00%, 8/1/41 | 147,271 | ||||||
| 534,085 | Pool #AJ9133, 4.00%, 1/1/42 | 489,216 | ||||||
| 199,616 | Pool #AK6715, 3.50%, 3/1/42 | 176,779 | ||||||
| 322,903 | Pool #AK6716, 3.50%, 3/1/42 | 285,961 | ||||||
| 228,827 | Pool #AK6718, 3.50%, 2/1/42 | 202,648 | ||||||
| 212,843 | Pool #AM6907, 3.68%, 10/1/32 | 186,739 | ||||||
| 350,000 | Pool #AN0360, 3.95%, 12/1/45 | 262,285 | ||||||
| 864,369 | Pool #AN2066, 2.75%, 7/1/26 | 804,128 | ||||||
| 879,931 | Pool #AN2746, 2.30%, 9/1/26 | 812,392 | ||||||
| 437,752 | Pool #AN3919, 2.82%, 12/1/26 | 408,239 | ||||||
| 793,524 | Pool #AN5053, 3.34%, 4/1/27 | 747,869 | ||||||
| 194,909 | Pool #AN6580, 3.36%, 9/1/29 | 177,449 | ||||||
| 892,862 | Pool #AN7154, 3.21%, 10/1/32 | 774,165 | ||||||
| 2,000,000 | Pool #AN8055, 3.05%, 1/1/30 | 1,781,047 | ||||||
| 1,500,000 | Pool #AN8121, 3.16%, 1/1/35 | 1,210,724 | ||||||
| 491,846 | Pool #AN8915, 3.48%, 4/1/30 | 446,210 | ||||||
20
SCHEDULE OF PORTFOLIO INVESTMENTS
|
RBC BlueBay Access Capital Community Investment Fund (cont.)
September 30, 2023
| Principal Amount | Value | |||||||
| $ 184,708 | Pool #AO2923, 3.50%, 5/1/42 | $ | 163,606 | |||||
| 545,060 | Pool #AO8029, 3.50%, 7/1/42 | 482,702 | ||||||
| 126,582 | Pool #AP7483, 3.50%, 9/1/42 | 112,100 | ||||||
| 126,492 | Pool #AQ6710, 2.50%, 10/1/27 | 119,447 | ||||||
| 571,497 | Pool #AQ7193, 3.50%, 7/1/43 | 505,577 | ||||||
| 147,095 | Pool #AR6928, 3.00%, 3/1/43 | 125,783 | ||||||
| 661,792 | Pool #AS1916, 4.00%, 3/1/44 | 603,007 | ||||||
| 135,104 | Pool #AS1917, 4.00%, 3/1/44 | 123,445 | ||||||
| 401,152 | Pool #AS2439, 4.00%, 5/1/44 | 366,534 | ||||||
| 751,120 | Pool #AS3494, 4.00%, 10/1/44 | 684,401 | ||||||
| 178,638 | Pool #AS3726, 4.00%, 11/1/44 | 160,138 | ||||||
| 182,172 | Pool #AS3929, 4.00%, 12/1/44 | 163,306 | ||||||
| 217,496 | Pool #AS4070, 4.00%, 12/1/44 | 194,142 | ||||||
| 142,379 | Pool #AS4390, 3.50%, 2/1/45 | 125,445 | ||||||
| 164,189 | Pool #AS4732, 3.50%, 4/1/45 | 144,353 | ||||||
| 640,423 | Pool #AS4905, 3.50%, 4/1/45 | 563,436 | ||||||
| 915,077 | Pool #AS5341, 3.50%, 7/1/45 | 804,296 | ||||||
| 542,618 | Pool #AS5576, 4.00%, 8/1/45 | 494,182 | ||||||
| 401,772 | Pool #AS5919, 3.50%, 9/1/45 | 353,718 | ||||||
| 208,218 | Pool #AS6303, 4.00%, 11/1/45 | 189,632 | ||||||
| 228,569 | Pool #AS6607, 4.00%, 1/1/46 | 208,258 | ||||||
| 575,748 | Pool #AS6778, 3.50%, 3/1/46 | 505,658 | ||||||
| 259,072 | Pool #AS6958, 3.50%, 4/1/46 | 227,674 | ||||||
| 713,792 | Pool #AS7138, 3.50%, 5/1/46 | 624,576 | ||||||
| 370,941 | Pool #AS7139, 3.50%, 5/1/46 | 324,577 | ||||||
| 674,894 | Pool #AS7334, 3.00%, 6/1/46 | 570,161 | ||||||
| 799,652 | Pool #AS7335, 3.00%, 5/1/46 | 675,559 | ||||||
| 321,527 | Pool #AS7336, 3.00%, 6/1/46 | 271,552 | ||||||
| 1,420,571 | Pool #AS7504, 3.00%, 7/1/46 | 1,200,121 | ||||||
| 437,205 | Pool #AS7516, 3.00%, 7/1/46 | 369,358 | ||||||
| 320,312 | Pool #AS7517, 3.00%, 6/1/46 | 271,441 | ||||||
| 118,259 | Pool #AS7518, 3.00%, 7/1/46 | 100,416 | ||||||
| 147,421 | Pool #AS7674, 3.00%, 8/1/46 | 124,544 | ||||||
| 983,330 | Pool #AS7676, 3.00%, 8/1/46 | 830,733 | ||||||
| 617,247 | Pool #AS8077, 3.00%, 10/1/46 | 521,460 | ||||||
| 458,514 | Pool #AS8289, 3.00%, 10/1/46 | 387,360 | ||||||
| 469,492 | Pool #AS8441, 3.00%, 11/1/46 | 396,634 | ||||||
| 729,378 | Pool #AS8633, 3.50%, 1/1/47 | 638,213 | ||||||
| 304,161 | Pool #AS8776, 3.50%, 2/1/47 | 266,145 | ||||||
| 331,374 | Pool #AS9381, 4.00%, 4/1/47 | 300,214 | ||||||
| 156,590 | Pool #AS9549, 4.00%, 5/1/47 | 142,228 | ||||||
| 579,479 | Pool #AS9550, 4.00%, 5/1/47 | 524,760 | ||||||
| 186,696 | Pool #AS9825, 4.00%, 6/1/47 | 169,140 | ||||||
| 417,567 | Pool #AT2688, 3.00%, 5/1/43 | 356,801 | ||||||
| 212,675 | Pool #AT3963, 2.50%, 3/1/28 | 199,401 | ||||||
| 83,048 | Pool #AT7873, 2.50%, 6/1/28 | 77,860 | ||||||
| 270,493 | Pool #AU0971, 3.50%, 8/1/43 | 239,292 | ||||||
21
SCHEDULE OF PORTFOLIO INVESTMENTS
|
RBC BlueBay Access Capital Community Investment Fund (cont.)
September 30, 2023
| Principal Amount | Value | |||||||
| $ 353,412 | Pool #AU2165, 3.50%, 7/1/43 | $ | 312,647 | |||||
| 320,257 | Pool #AU2188, 3.50%, 8/1/43 | 283,317 | ||||||
| 24,689 | Pool #AU6054, 4.00%, 9/1/43 | 22,641 | ||||||
| 178,683 | Pool #AU6718, 4.00%, 10/1/43 | 163,861 | ||||||
| 271,282 | Pool #AU7003, 4.00%, 11/1/43 | 249,070 | ||||||
| 190,318 | Pool #AU7005, 4.00%, 11/1/43 | 174,305 | ||||||
| 185,959 | Pool #AV0679, 4.00%, 12/1/43 | 170,941 | ||||||
| 255,240 | Pool #AV9282, 4.00%, 2/1/44 | 229,661 | ||||||
| 190,776 | Pool #AW0993, 4.00%, 5/1/44 | 174,954 | ||||||
| 128,175 | Pool #AW1565, 4.00%, 4/1/44 | 115,453 | ||||||
| 536,306 | Pool #AW5046, 4.00%, 7/1/44 | 489,436 | ||||||
| 77,933 | Pool #AW5047, 4.00%, 7/1/44 | 71,470 | ||||||
| 102,083 | Pool #AW7040, 4.00%, 6/1/44 | 92,210 | ||||||
| 60,655 | Pool #AW8629, 3.50%, 5/1/44 | 53,417 | ||||||
| 646,784 | Pool #AX2884, 3.50%, 11/1/44 | 569,558 | ||||||
| 445,908 | Pool #AX4860, 3.50%, 12/1/44 | 393,113 | ||||||
| 543,679 | Pool #AY1389, 3.50%, 4/1/45 | 477,860 | ||||||
| 165,406 | Pool #AY3435, 3.50%, 5/1/45 | 145,623 | ||||||
| 499,754 | Pool #AY5571, 3.50%, 6/1/45 | 439,253 | ||||||
| 264,417 | Pool #BC0802, 3.50%, 4/1/46 | 232,228 | ||||||
| 233,602 | Pool #BC0804, 3.50%, 4/1/46 | 204,404 | ||||||
| 356,676 | Pool #BC1135, 3.00%, 6/1/46 | 302,256 | ||||||
| 688,316 | Pool #BD5021, 3.50%, 2/1/47 | 603,280 | ||||||
| 906,370 | Pool #BD7140, 4.00%, 4/1/47 | 820,783 | ||||||
| 1,020,116 | Pool #BE4232, 3.00%, 12/1/46 | 861,810 | ||||||
| 174,740 | Pool #BE9743, 3.50%, 4/1/47 | 153,210 | ||||||
| 471,639 | Pool #BH2665, 3.50%, 9/1/47 | 412,171 | ||||||
| 103,085 | Pool #BH4659, 4.00%, 6/1/47 | 93,972 | ||||||
| 255,980 | Pool #BJ0657, 4.00%, 2/1/48 | 231,502 | ||||||
| 331,705 | Pool #BJ2670, 4.00%, 4/1/48 | 299,919 | ||||||
| 733,111 | Pool #BJ5158, 4.00%, 4/1/48 | 662,861 | ||||||
| 296,440 | Pool #BK7685, 4.00%, 10/1/48 | 268,033 | ||||||
| 416,854 | Pool #BK7924, 4.00%, 11/1/48 | 377,917 | ||||||
| 8,920,000 | Pool #BL4650, 2.30%, 10/1/31 | 7,266,016 | ||||||
| 438,835 | Pool #BL5454, 2.77%, 1/1/35 | 354,243 | ||||||
| 99,922 | Pool #BO1263, 3.50%, 6/1/49 | 86,989 | ||||||
| 433,234 | Pool #BO3599, 3.00%, 9/1/49 | 362,685 | ||||||
| 558,225 | Pool #BO5263, 3.00%, 9/1/49 | 467,323 | ||||||
| 2,206,849 | Pool #BO6771, 2.50%, 5/1/51 | 1,758,165 | ||||||
| 642,962 | Pool #BP3417, 2.50%, 5/1/51 | 512,239 | ||||||
| 671,716 | Pool #BP8731, 2.50%, 6/1/50 | 539,820 | ||||||
| 877,591 | Pool #BP8741, 2.50%, 6/1/50 | 700,034 | ||||||
| 1,594,011 | Pool #BQ4469, 2.00%, 2/1/51 | 1,217,491 | ||||||
| 482,783 | Pool #BQ4493, 1.50%, 2/1/51 | 348,515 | ||||||
| 366,695 | Pool #BQ5723, 2.00%, 10/1/50 | 280,419 | ||||||
| 1,325,609 | Pool #BQ7523, 2.00%, 11/1/50 | 1,013,720 | ||||||
| 793,230 | Pool #BQ7524, 2.50%, 10/1/50 | 636,737 | ||||||
| 4,488,297 | Pool #BR0940, 2.00%, 4/1/51 | 3,426,442 | ||||||
22
SCHEDULE OF PORTFOLIO INVESTMENTS
|
RBC BlueBay Access Capital Community Investment Fund (cont.)
September 30, 2023
| Principal Amount | Value | |||||||
| $ 843,927 | Pool #BR1037, 2.50%, 5/1/51 | $ | 672,188 | |||||
| 2,010,053 | Pool #BR1113, 2.00%, 11/1/50 | 1,536,506 | ||||||
| 832,426 | Pool #BR1114, 1.50%, 11/1/50 | 601,239 | ||||||
| 320,389 | Pool #BR1115, 2.50%, 12/1/50 | 255,269 | ||||||
| 1,193,179 | Pool #BR2051, 2.50%, 6/1/51 | 950,367 | ||||||
| 2,623,907 | Pool #BR2234, 2.50%, 8/1/51 | 2,088,965 | ||||||
| 905,779 | Pool #BR3565, 2.00%, 1/1/51 | 692,107 | ||||||
| 775,802 | Pool #BR3566, 2.50%, 12/1/50 | 622,386 | ||||||
| 217,468 | Pool #BR7088, 2.00%, 3/1/51 | 166,073 | ||||||
| 3,000,000 | Pool #BS0046, 1.23%, 12/1/27 | 2,517,727 | ||||||
| 1,036,192 | Pool #BS0345, 1.61%, 1/1/36 | 741,771 | ||||||
| 2,545,000 | Pool #BS0391, 1.63%, 1/1/33 | 1,912,491 | ||||||
| 500,000 | Pool #BS0915, 1.62%, 3/1/31 | 379,387 | ||||||
| 1,000,000 | Pool #BS1281, 1.59%, 3/1/31 | 775,494 | ||||||
| 188,260 | Pool #BS1326, 1.19%, 3/1/26 | 170,933 | ||||||
| 1,895,403 | Pool #BS1482, 1.61%, 3/1/31 | 1,510,372 | ||||||
| 700,000 | Pool #BS1524, 2.01%, 3/1/33 | 540,864 | ||||||
| 1,500,000 | Pool #BS1560, 2.03%, 4/1/31 | 1,182,182 | ||||||
| 974,287 | Pool #BS4422, 2.59%, 3/1/32 | 807,611 | ||||||
| 1,000,000 | Pool #BS5203, 2.41%, 4/1/32 | 815,009 | ||||||
| 243,813 | Pool #BS5840, 3.78%, 7/1/32 | 214,735 | ||||||
| 669,000 | Pool #BS6083, 4.38%, 7/1/32 | 627,576 | ||||||
| 400,000 | Pool #BS6178, 3.41%, 7/1/29 | 357,552 | ||||||
| 884,000 | Pool #BS8032, 5.00%, 3/1/28 | 863,722 | ||||||
| 1,000,000 | Pool #BS8302, 4.61%, 4/1/28 | 975,233 | ||||||
| 1,000,000 | Pool #BS8303, 4.61%, 4/1/28 | 975,217 | ||||||
| 2,735,000 | Pool #BS8483, 4.81%, 5/1/28 | 2,648,938 | ||||||
| 537,907 | Pool #BS8518, 4.30%, 5/1/28 | 517,772 | ||||||
| 2,800,000 | Pool #BS8572, 4.23%, 5/1/28 | 2,688,959 | ||||||
| 2,112,000 | Pool #BS8592, 3.98%, 5/1/28 | 2,004,229 | ||||||
| 1,776,243 | Pool #BT6821, 2.50%, 10/1/51 | 1,413,456 | ||||||
| 1,284,803 | Pool #BT8237, 4.00%, 6/1/52 | 1,145,249 | ||||||
| 242,677 | Pool #BT8243, 4.00%, 6/1/52 | 216,280 | ||||||
| 1,852,047 | Pool #BT9419, 2.50%, 11/1/51 | 1,473,433 | ||||||
| 1,400,292 | Pool #BU1334, 2.50%, 2/1/52 | 1,113,249 | ||||||
| 1,794,571 | Pool #BU1337, 3.00%, 2/1/52 | 1,488,552 | ||||||
| 216,293 | Pool #BV4205, 3.00%, 2/1/52 | 179,357 | ||||||
| 1,293,143 | Pool #BV6760, 3.50%, 3/1/52 | 1,113,225 | ||||||
| 3,064,434 | Pool #BV8876, 3.50%, 4/1/52 | 2,637,598 | ||||||
| 560,295 | Pool #CA0114, 3.50%, 8/1/47 | 489,649 | ||||||
| 566,050 | Pool #CA0334, 3.50%, 9/1/47 | 494,872 | ||||||
| 168,326 | Pool #CA0536, 3.50%, 10/1/47 | 147,160 | ||||||
| 587,061 | Pool #CA0551, 4.00%, 10/1/47 | 531,626 | ||||||
| 477,470 | Pool #CA0565, 3.50%, 10/1/47 | 416,917 | ||||||
| 242,055 | Pool #CA0743, 3.50%, 11/1/47 | 212,232 | ||||||
| 642,614 | Pool #CA0825, 3.50%, 12/1/47 | 561,588 | ||||||
| 640,107 | Pool #CA0981, 3.50%, 12/1/47 | 559,397 | ||||||
23
SCHEDULE OF PORTFOLIO INVESTMENTS
|
RBC BlueBay Access Capital Community Investment Fund (cont.)
September 30, 2023
| Principal Amount | Value | |||||||
| $ 185,295 | Pool #CA1070, 3.50%, 1/1/48 | $ | 161,995 | |||||
| 472,944 | Pool #CA1115, 3.50%, 1/1/48 | 413,312 | ||||||
| 969,548 | Pool #CA1130, 3.50%, 1/1/48 | 847,300 | ||||||
| 182,533 | Pool #CA1131, 3.50%, 2/1/48 | 159,580 | ||||||
| 288,215 | Pool #CA1132, 3.50%, 1/1/48 | 251,875 | ||||||
| 426,833 | Pool #CA1144, 3.50%, 2/1/48 | 373,014 | ||||||
| 104,727 | Pool #CA1152, 3.50%, 2/1/48 | 91,523 | ||||||
| 392,023 | Pool #CA1160, 3.50%, 2/1/48 | 343,723 | ||||||
| 487,239 | Pool #CA1161, 3.50%, 2/1/48 | 425,723 | ||||||
| 272,717 | Pool #CA1338, 4.00%, 3/1/48 | 246,638 | ||||||
| 549,372 | Pool #CA1339, 3.50%, 3/1/48 | 480,011 | ||||||
| 182,300 | Pool #CA1418, 4.00%, 3/1/48 | 164,867 | ||||||
| 236,298 | Pool #CA1420, 4.00%, 3/1/48 | 213,654 | ||||||
| 183,635 | Pool #CA1468, 4.00%, 3/1/48 | 166,007 | ||||||
| 468,638 | Pool #CA1469, 4.00%, 3/1/48 | 423,824 | ||||||
| 176,174 | Pool #CA1471, 4.00%, 3/1/48 | 159,718 | ||||||
| 1,069,175 | Pool #CA1507, 4.00%, 4/1/48 | 966,721 | ||||||
| 398,528 | Pool #CA1610, 3.50%, 3/1/48 | 348,212 | ||||||
| 420,038 | Pool #CA1611, 4.00%, 4/1/48 | 379,788 | ||||||
| 412,120 | Pool #CA1612, 3.50%, 4/1/48 | 360,012 | ||||||
| 496,366 | Pool #CA1613, 4.00%, 4/1/48 | 448,802 | ||||||
| 191,891 | Pool #CA2381, 4.00%, 9/1/48 | 173,470 | ||||||
| 210,468 | Pool #CA2440, 4.00%, 9/1/48 | 190,342 | ||||||
| 168,205 | Pool #CA2441, 4.00%, 10/1/48 | 150,747 | ||||||
| 162,367 | Pool #CA2442, 4.00%, 10/1/48 | 147,201 | ||||||
| 358,495 | Pool #CA2443, 4.00%, 10/1/48 | 324,080 | ||||||
| 190,520 | Pool #CA2468, 4.00%, 10/1/48 | 172,230 | ||||||
| 580,788 | Pool #CA2594, 4.00%, 11/1/48 | 527,166 | ||||||
| 243,976 | Pool #CA2913, 4.00%, 1/1/49 | 220,597 | ||||||
| 305,537 | Pool #CA3042, 4.00%, 1/1/49 | 276,216 | ||||||
| 349,702 | Pool #CA3043, 4.00%, 2/1/49 | 316,131 | ||||||
| 168,956 | Pool #CA3045, 4.50%, 1/1/49 | 157,992 | ||||||
| 27,337 | Pool #CA3132, 4.00%, 2/1/49 | 24,785 | ||||||
| 157,368 | Pool #CA3557, 3.50%, 5/1/49 | 137,518 | ||||||
| 352,815 | Pool #CA3628, 3.50%, 6/1/49 | 307,302 | ||||||
| 194,116 | Pool #CA3793, 3.50%, 6/1/49 | 169,060 | ||||||
| 136,461 | Pool #CA3936, 3.50%, 7/1/49 | 118,847 | ||||||
| 417,539 | Pool #CA4043, 3.00%, 8/1/49 | 349,546 | ||||||
| 493,659 | Pool #CA4320, 3.00%, 9/1/49 | 413,270 | ||||||
| 317,102 | Pool #CA5106, 3.00%, 1/1/50 | 265,464 | ||||||
| 418,010 | Pool #CA5132, 3.00%, 2/1/50 | 349,941 | ||||||
| 955,460 | Pool #CA5309, 3.00%, 3/1/50 | 798,762 | ||||||
| 534,285 | Pool #CA5312, 3.00%, 3/1/50 | 446,661 | ||||||
| 1,143,049 | Pool #CA6151, 2.50%, 6/1/50 | 911,996 | ||||||
| 282,785 | Pool #CA6251, 3.00%, 6/1/50 | 236,348 | ||||||
| 1,274,137 | Pool #CA6263, 2.50%, 7/1/50 | 1,016,350 | ||||||
| 1,260,921 | Pool #CA6966, 2.00%, 9/1/50 | 964,644 | ||||||
| 2,261,146 | Pool #CA6967, 2.00%, 9/1/50 | 1,730,547 | ||||||
24
SCHEDULE OF PORTFOLIO INVESTMENTS
|
RBC BlueBay Access Capital Community Investment Fund (cont.)
September 30, 2023
| Principal Amount | Value | |||||||
| $1,357,696 | Pool #CA6968, 2.00%, 9/1/50 | $ | 1,038,679 | |||||
| 1,059,193 | Pool #CA6969, 2.00%, 9/1/50 | 810,644 | ||||||
| 1,275,893 | Pool #CA6971, 2.50%, 9/1/50 | 1,017,039 | ||||||
| 1,380,713 | Pool #CA6972, 2.50%, 8/1/50 | 1,100,849 | ||||||
| 987,772 | Pool #CA6973, 2.50%, 9/1/50 | 787,556 | ||||||
| 1,109,005 | Pool #CA7258, 2.50%, 9/1/50 | 884,009 | ||||||
| 1,164,504 | Pool #CA7259, 2.50%, 9/1/50 | 928,249 | ||||||
| 1,611,170 | Pool #CA7317, 2.00%, 10/1/50 | 1,232,095 | ||||||
| 1,783,237 | Pool #CA7549, 2.00%, 10/1/50 | 1,363,678 | ||||||
| 1,682,708 | Pool #CA7917, 2.00%, 11/1/50 | 1,291,467 | ||||||
| 879,281 | Pool #CA8069, 1.50%, 12/1/50 | 634,912 | ||||||
| 1,070,260 | Pool #CA8070, 2.00%, 12/1/50 | 818,118 | ||||||
| 3,685,968 | Pool #CA8077, 2.00%, 12/1/50 | 2,817,593 | ||||||
| 636,260 | Pool #CA8425, 1.50%, 12/1/50 | 462,084 | ||||||
| 1,034,425 | Pool #CA8432, 2.00%, 12/1/50 | 790,405 | ||||||
| 1,347,492 | Pool #CA8685, 1.50%, 1/1/51 | 972,998 | ||||||
| 3,924,165 | Pool #CA8811, 2.00%, 1/1/51 | 2,997,240 | ||||||
| 4,445,566 | Pool #CA9048, 2.00%, 2/1/51 | 3,395,482 | ||||||
| 282,970 | Pool #CB0245, 2.50%, 4/1/51 | 225,438 | ||||||
| 770,969 | Pool #CB0437, 2.50%, 5/1/51 | 614,220 | ||||||
| 621,064 | Pool #CB0480, 2.50%, 5/1/51 | 494,677 | ||||||
| 144,813 | Pool #CB0576, 2.50%, 5/1/51 | 115,344 | ||||||
| 262,603 | Pool #CB0582, 2.50%, 5/1/51 | 209,163 | ||||||
| 1,934,940 | Pool #CB0688, 2.50%, 6/1/51 | 1,541,640 | ||||||
| 425,738 | Pool #CB0689, 2.50%, 6/1/51 | 339,100 | ||||||
| 956,471 | Pool #CB0972, 2.50%, 6/1/51 | 761,651 | ||||||
| 480,152 | Pool #CB1003, 2.50%, 7/1/51 | 382,351 | ||||||
| 303,994 | Pool #CB1010, 2.50%, 7/1/51 | 242,074 | ||||||
| 1,367,610 | Pool #CB1060, 2.00%, 7/1/51 | 1,042,699 | ||||||
| 1,919,349 | Pool #CB1311, 2.50%, 8/1/51 | 1,528,047 | ||||||
| 1,715,843 | Pool #CB1444, 2.50%, 8/1/51 | 1,365,711 | ||||||
| 980,394 | Pool #CB1515, 2.50%, 8/1/51 | 780,336 | ||||||
| 1,721,680 | Pool #CB1532, 2.50%, 9/1/51 | 1,370,357 | ||||||
| 1,635,385 | Pool #CB1809, 2.50%, 10/1/51 | 1,301,367 | ||||||
| 1,045,075 | Pool #CB1956, 2.50%, 10/1/51 | 831,679 | ||||||
| 888,279 | Pool #CB2029, 2.50%, 11/1/51 | 706,688 | ||||||
| 1,755,667 | Pool #CB2205, 2.50%, 11/1/51 | 1,396,429 | ||||||
| 715,479 | Pool #CB2268, 2.50%, 12/1/51 | 569,080 | ||||||
| 497,019 | Pool #CB2467, 2.50%, 12/1/51 | 395,229 | ||||||
| 1,813,674 | Pool #CB2515, 2.50%, 12/1/51 | 1,442,230 | ||||||
| 2,854,757 | Pool #CB2761, 3.00%, 2/1/52 | 2,367,949 | ||||||
| 5,914,686 | Pool #CB2797, 3.00%, 2/1/52 | 4,906,083 | ||||||
| 5,779,500 | Pool #CB2938, 3.00%, 2/1/52 | 4,788,639 | ||||||
| 1,171,726 | Pool #CB3052, 3.00%, 2/1/52 | 970,840 | ||||||
| 1,251,556 | Pool #CB3249, 3.00%, 4/1/52 | 1,037,022 | ||||||
| 1,974,252 | Pool #CB3281, 3.50%, 4/1/52 | 1,699,264 | ||||||
| 427,883 | Pool #CB3413, 3.50%, 4/1/52 | 369,388 | ||||||
25
SCHEDULE OF PORTFOLIO INVESTMENTS
|
RBC BlueBay Access Capital Community Investment Fund (cont.)
September 30, 2023
| Principal Amount | Value | |||||||
| $ 817,513 | Pool #CB3489, 2.50%, 4/1/52 | $ | 648,978 | |||||
| 646,870 | Pool #CB3490, 3.00%, 4/1/52 | 535,817 | ||||||
| 7,473,790 | Pool #CB3797, 4.00%, 6/1/52 | 6,661,996 | ||||||
| 5,479,271 | Pool #CB4056, 4.50%, 7/1/52 | 5,029,599 | ||||||
| 2,915,448 | Pool #CB4208, 4.50%, 7/1/52 | 2,676,184 | ||||||
| 2,381,449 | Pool #CB4272, 4.50%, 7/1/52 | 2,186,009 | ||||||
| 9,483,791 | Pool #CB4314, 4.50%, 8/1/52 | 8,705,476 | ||||||
| 12,301,441 | Pool #CB4463, 4.50%, 8/1/52 | 11,291,888 | ||||||
| 361,398 | Pool #CB4473, 4.50%, 8/1/52 | 332,158 | ||||||
| 4,805,777 | Pool #CB4539, 4.50%, 9/1/52 | 4,411,377 | ||||||
| 4,609,022 | Pool #CB4595, 4.00%, 9/1/52 | 4,106,251 | ||||||
| 6,089,962 | Pool #CB4767, 5.00%, 9/1/52 | 5,745,222 | ||||||
| 2,901,448 | Pool #CB4966, 5.50%, 10/1/52 | 2,806,348 | ||||||
| 1,626,770 | Pool #CB4967, 5.50%, 10/1/52 | 1,573,580 | ||||||
| 10,215,653 | Pool #CB5037, 5.50%, 11/1/52 | 9,877,656 | ||||||
| 4,271,422 | Pool #CB5048, 6.00%, 11/1/52 | 4,217,537 | ||||||
| 5,843,710 | Pool #CB5166, 6.00%, 11/1/52 | 5,769,992 | ||||||
| 2,989,509 | Pool #CB5199, 6.00%, 11/1/52 | 2,951,796 | ||||||
| 5,603,831 | Pool #CB5202, 6.50%, 11/1/52 | 5,629,760 | ||||||
| 444,687 | Pool #CB5220, 6.50%, 12/1/52 | 446,744 | ||||||
| 3,199,522 | Pool #CB5343, 6.00%, 12/1/52 | 3,159,160 | ||||||
| 332,104 | Pool #CB5344, 6.50%, 12/1/52 | 336,917 | ||||||
| 1,725,984 | Pool #CB5385, 6.00%, 12/1/52 | 1,703,369 | ||||||
| 2,390,379 | Pool #CB5392, 6.00%, 12/1/52 | 2,359,058 | ||||||
| 2,740,915 | Pool #CB5549, 6.00%, 1/1/53 | 2,705,001 | ||||||
| 1,091,841 | Pool #CB5586, 6.00%, 1/1/53 | 1,077,534 | ||||||
| 4,709,588 | Pool #CB5728, 5.50%, 2/1/53 | 4,554,015 | ||||||
| 1,442,546 | Pool #CB5732, 5.50%, 2/1/53 | 1,394,460 | ||||||
| 4,581,322 | Pool #CB5797, 5.50%, 3/1/53 | 4,426,482 | ||||||
| 2,087,711 | Pool #CB5804, 6.00%, 2/1/53 | 2,061,406 | ||||||
| 2,867,589 | Pool #CB5946, 5.50%, 3/1/53 | 2,770,670 | ||||||
| 2,180,039 | Pool #CB5980, 5.50%, 3/1/53 | 2,107,066 | ||||||
| 184,833 | Pool #CB6005, 5.50%, 4/1/53 | 178,646 | ||||||
| 1,923,103 | Pool #CB6126, 5.00%, 4/1/53 | 1,813,842 | ||||||
| 511,599 | Pool #CB6138, 5.00%, 4/1/53 | 482,625 | ||||||
| 617,373 | Pool #CB6208, 5.50%, 5/1/53 | 596,708 | ||||||
| 420,736 | Pool #CB6368, 5.00%, 5/1/53 | 396,832 | ||||||
| 1,351,793 | Pool #CB6400, 5.00%, 5/1/53 | 1,274,991 | ||||||
| 1,442,889 | Pool #CB6564, 5.50%, 6/1/53 | 1,408,547 | ||||||
| 336,081 | Pool #CB6607, 5.50%, 7/1/53 | 324,933 | ||||||
| 350,808 | Pool #CB6783, 5.00%, 7/1/53 | 331,049 | ||||||
| 249,540 | Pool #CB6826, 5.50%, 7/1/53 | 243,079 | ||||||
| 1,861,782 | Pool #CB6953, 5.50%, 8/1/53 | 1,812,549 | ||||||
| 2,397,911 | Pool #CB6955, 6.00%, 8/1/53 | 2,391,548 | ||||||
| 2,976,942 | Pool #CB7160, 6.50%, 9/1/53 | 3,015,166 | ||||||
| 348,000 | Pool #CB7202, 6.50%, 10/1/53 | 352,713 | ||||||
| 3,377,129 | Pool #CB7222, 5.50%, 10/1/53 | 3,262,988 | ||||||
| 1,562,917 | Pool #CB7223, 6.00%, 10/1/53 | 1,542,418 | ||||||
26
SCHEDULE OF PORTFOLIO INVESTMENTS
|
RBC BlueBay Access Capital Community Investment Fund (cont.)
September 30, 2023
| Principal Amount | Value | |||||||
| $ 45,613 | Pool #MC0013, 5.50%, 12/1/38 | $ | 45,708 | |||||
| 74,529 | Pool #MC0014, 5.50%, 12/1/38 | 74,685 | ||||||
| 61,836 | Pool #MC0016, 5.50%, 11/1/38 | 61,966 | ||||||
| 59,084 | Pool #MC0038, 4.50%, 3/1/39 | 55,952 | ||||||
| 40,437 | Pool #MC0059, 4.00%, 4/1/39 | 37,108 | ||||||
| 71,930 | Pool #MC0081, 4.00%, 5/1/39 | 65,973 | ||||||
| 77,393 | Pool #MC0127, 4.50%, 7/1/39 | 73,284 | ||||||
| 330,499 | Pool #MC0154, 4.50%, 8/1/39 | 312,929 | ||||||
| 77,811 | Pool #MC0160, 4.50%, 8/1/39 | 73,680 | ||||||
| 169,518 | Pool #MC0177, 4.50%, 9/1/39 | 160,520 | ||||||
| 106,672 | Pool #MC0270, 4.50%, 3/1/40 | 98,856 | ||||||
| 211,989 | Pool #MC0325, 4.50%, 7/1/40 | 200,212 | ||||||
| 135,460 | Pool #MC0584, 4.00%, 1/1/42 | 124,080 | ||||||
|
| |||||||
| 337,027,036 | ||||||||
|
| |||||||
FNMA, TBA — 0.66% | ||||||||
| 4,374,000 | 5.21%, 10/1/28(a) | 4,351,959 | ||||||
|
| |||||||
Freddie Mac — 32.09% | ||||||||
| 416,601 | Pool #Q63813, 3.50%, 4/1/49 | 363,329 | ||||||
| 735,848 | Pool #QB5148, 2.00%, 11/1/50 | 562,490 | ||||||
| 1,206,170 | Pool #QB5731, 2.00%, 11/1/50 | 922,383 | ||||||
| 1,852,348 | Pool #QB5732, 2.50%, 11/1/50 | 1,476,198 | ||||||
| 1,683,496 | Pool #QB6982, 2.00%, 11/1/50 | 1,286,883 | ||||||
| 476,155 | Pool #QB6992, 1.50%, 12/1/50 | 343,914 | ||||||
| 1,141,319 | Pool #QC4676, 2.50%, 7/1/51 | 908,848 | ||||||
| 769,569 | Pool #QC6090, 2.50%, 8/1/51 | 612,675 | ||||||
| 1,686,102 | Pool #QC6108, 2.50%, 8/1/51 | 1,342,039 | ||||||
| 1,022,082 | Pool #QC6643, 2.50%, 8/1/51 | 813,518 | ||||||
| 1,076,293 | Pool #QC9175, 2.50%, 10/1/51 | 856,466 | ||||||
| 1,724,662 | Pool #QD0152, 2.50%, 10/1/51 | 1,372,089 | ||||||
| 266,501 | Pool #QD1762, 2.00%, 11/1/51 | 202,989 | ||||||
| 2,576,918 | Pool #QD4183, 2.50%, 12/1/51 | 2,049,639 | ||||||
| 827,298 | Pool #QD7419, 3.00%, 2/1/52 | 686,019 | ||||||
| 384,357 | Pool #QE0994, 3.50%, 4/1/52 | 330,881 | ||||||
| 3,205,699 | Pool #QE2342, 4.00%, 5/1/52 | 2,857,997 | ||||||
| 4,811,055 | Pool #QE7866, 4.00%, 8/1/52 | 4,286,991 | ||||||
| 1,177,135 | Pool #QE9025, 4.00%, 8/1/52 | 1,048,911 | ||||||
| 598,471 | Pool #QE9026, 5.00%, 8/1/52 | 564,542 | ||||||
| 1,045,019 | Pool #QE9027, 4.50%, 8/1/52 | 959,257 | ||||||
| 1,401,422 | Pool #QF0539, 4.00%, 9/1/52 | 1,248,549 | ||||||
| 2,020,445 | Pool #QF3474, 6.00%, 11/1/52 | 1,994,266 | ||||||
| 245,761 | Pool #QG5944, 5.00%, 6/1/53 | 231,798 | ||||||
| 241,850 | Pool #RA1234, 3.50%, 8/1/49 | 210,598 | ||||||
| 256,588 | Pool #RA1382, 3.00%, 9/1/49 | 214,805 | ||||||
| 1,332,020 | Pool #RA1383, 3.00%, 9/1/49 | 1,115,111 | ||||||
| 252,545 | Pool #RA1470, 3.00%, 10/1/49 | 211,420 | ||||||
| 269,509 | Pool #RA1713, 3.00%, 11/1/49 | 225,622 | ||||||
27
SCHEDULE OF PORTFOLIO INVESTMENTS
|
RBC BlueBay Access Capital Community Investment Fund (cont.)
September 30, 2023
Principal Amount | Value | |||||||||||
| $ 468,387 | Pool #RA1714, 3.00%, 11/1/49 | $ | 392,114 | |||||||||
| 625,484 | Pool #RA1716, 3.00%, 11/1/49 | 523,629 | ||||||||||
| 467,753 | Pool #RA1724, 2.50%, 10/1/49 | 375,743 | ||||||||||
| 373,264 | Pool #RA1979, 3.00%, 12/1/49 | 312,361 | ||||||||||
| 898,072 | Pool #RA1987, 3.00%, 12/1/49 | 751,828 | ||||||||||
| 1,387,719 | Pool #RA1988, 3.00%, 1/1/50 | 1,161,740 | ||||||||||
| 753,637 | Pool #RA2158, 3.00%, 2/1/50 | 630,126 | ||||||||||
| 733,069 | Pool #RA2162, 3.00%, 2/1/50 | 612,928 | ||||||||||
| 728,599 | Pool #RA2255, 3.00%, 3/1/50 | 609,191 | ||||||||||
| 1,067,918 | Pool #RA2256, 3.00%, 3/1/50 | 892,900 | ||||||||||
| 723,295 | Pool #RA2340, 3.00%, 3/1/50 | 604,673 | ||||||||||
| 291,918 | Pool #RA2395, 2.50%, 4/1/50 | 233,019 | ||||||||||
| 1,361,138 | Pool #RA3207, 2.50%, 7/1/50 | 1,085,495 | ||||||||||
| 2,815,312 | Pool #RA3208, 2.50%, 7/1/50 | 2,245,186 | ||||||||||
| 816,846 | Pool #RA3339, 2.00%, 8/1/50 | 625,166 | ||||||||||
| 1,314,012 | Pool #RA3552, 2.00%, 9/1/50 | 1,005,667 | ||||||||||
| 1,139,741 | Pool #RA3553, 2.50%, 8/1/50 | 908,721 | ||||||||||
| 3,399,854 | Pool #RA3679, 2.00%, 9/1/50 | 2,600,993 | ||||||||||
| 1,644,340 | Pool #RA3680, 2.50%, 9/1/50 | 1,311,040 | ||||||||||
| 483,742 | Pool #RA3733, 2.00%, 10/1/50 | 370,077 | ||||||||||
| 708,495 | Pool #RA3734, 2.50%, 10/1/50 | 564,755 | ||||||||||
| 799,059 | Pool #RA3747, 2.00%, 9/1/50 | 611,552 | ||||||||||
| 1,652,553 | Pool #RA3751, 2.00%, 10/1/50 | 1,268,738 | ||||||||||
| 2,494,359 | Pool #RA3803, 1.50%, 12/1/50 | 1,801,128 | ||||||||||
| 389,618 | Pool #RA3861, 1.50%, 10/1/50 | 281,485 | ||||||||||
| 1,563,993 | Pool #RA3862, 2.00%, 10/1/50 | 1,196,503 | ||||||||||
| 1,592,180 | Pool #RA3917, 1.50%, 10/1/50 | 1,150,295 | ||||||||||
| 3,453,194 | Pool #RA3918, 2.00%, 10/1/50 | 2,640,729 | ||||||||||
| 794,626 | Pool #RA3928, 1.50%, 11/1/50 | 573,937 | ||||||||||
| 198,155 | Pool #RA3929, 2.00%, 10/1/50 | 152,475 | ||||||||||
| 549,972 | Pool #RA4018, 2.00%, 1/1/51 | 420,064 | ||||||||||
| 507,092 | Pool #RA4055, 2.00%, 11/1/50 | 387,784 | ||||||||||
| 698,316 | Pool #RA4056, 1.50%, 11/1/50 | 504,375 | ||||||||||
| 6,973,674 | Pool #RA4195, 2.00%, 12/1/50 | 5,330,751 | ||||||||||
| 4,654,447 | Pool #RA4254, 2.00%, 12/1/50 | 3,556,466 | ||||||||||
| 830,394 | Pool #RA4274, 1.50%, 12/1/50 | 599,771 | ||||||||||
| 1,020,669 | Pool #RA4357, 2.00%, 1/1/51 | 779,894 | ||||||||||
| 1,509,727 | Pool #RA4377, 2.00%, 2/1/51 | 1,158,383 | ||||||||||
| 2,186,464 | Pool #RA4420, 2.00%, 1/1/51 | 1,670,001 | ||||||||||
| 3,104,003 | Pool #RA4503, 2.00%, 2/1/51 | 2,370,808 | ||||||||||
| 860,058 | Pool #RA4548, 2.00%, 2/1/51 | 656,904 | ||||||||||
| 1,850,094 | Pool #RA4578, 2.00%, 2/1/51 | 1,412,852 | ||||||||||
| 296,234 | Pool #RA4590, 2.00%, 2/1/51 | 226,223 | ||||||||||
| 277,232 | Pool #RA4597, 2.00%, 2/1/51 | 211,747 | ||||||||||
| 243,837 | Pool #RA4618, 2.00%, 2/1/51 | 186,240 | ||||||||||
| 804,833 | Pool #RA4621, 2.00%, 2/1/51 | 614,623 | ||||||||||
| 1,353,813 | Pool #RA4738, 2.00%, 3/1/51 | 1,033,859 | ||||||||||
| 3,730,076 | Pool #RA4745, 2.00%, 3/1/51 | 2,848,529 | ||||||||||
28
SCHEDULE OF PORTFOLIO INVESTMENTS
|
RBC BlueBay Access Capital Community Investment Fund (cont.)
September 30, 2023
Principal Amount | Value | |||||||||||
| $1,385,544 | Pool #RA4775, 2.00%, 3/1/51 | $ | 1,058,092 | |||||||||
| 1,102,992 | Pool #RA4835, 2.50%, 3/1/51 | 878,943 | ||||||||||
| 2,115,984 | Pool #RA4872, 2.50%, 4/1/51 | 1,686,167 | ||||||||||
| 7,706,365 | Pool #RA5020, 2.00%, 4/1/51 | 5,883,170 | ||||||||||
| 3,234,341 | Pool #RA5021, 1.50%, 4/1/51 | 2,329,946 | ||||||||||
| 401,631 | Pool #RA5043, 2.50%, 4/1/51 | 319,974 | ||||||||||
| 639,910 | Pool #RA5045, 2.50%, 5/1/51 | 509,807 | ||||||||||
| 2,947,837 | Pool #RA5068, 2.00%, 4/1/51 | 2,249,697 | ||||||||||
| 1,646,352 | Pool #RA5173, 2.50%, 4/1/51 | 1,311,625 | ||||||||||
| 960,644 | Pool #RA5195, 2.50%, 5/1/51 | 762,592 | ||||||||||
| 761,252 | Pool #RA5197, 2.50%, 5/1/51 | 606,478 | ||||||||||
| 1,307,013 | Pool #RA5217, 2.50%, 5/1/51 | 1,051,708 | ||||||||||
| 1,103,854 | Pool #RA5237, 2.50%, 5/1/51 | 879,424 | ||||||||||
| 2,054,171 | Pool #RA5350, 2.50%, 6/1/51 | 1,636,146 | ||||||||||
| 1,588,491 | Pool #RA5387, 2.50%, 6/1/51 | 1,274,830 | ||||||||||
| 236,021 | Pool #RA5404, 2.50%, 6/1/51 | 187,947 | ||||||||||
| 7,637,453 | Pool #RA5427, 2.50%, 6/1/51 | 6,081,808 | ||||||||||
| 1,114,199 | Pool #RA5509, 2.50%, 7/1/51 | 887,252 | ||||||||||
| 465,943 | Pool #RA5525, 2.50%, 7/1/51 | 371,037 | ||||||||||
| 706,875 | Pool #RA5541, 2.50%, 7/1/51 | 562,894 | ||||||||||
| 1,978,670 | Pool #RA5621, 2.50%, 8/1/51 | 1,575,274 | ||||||||||
| 237,966 | Pool #RA5686, 2.50%, 7/1/51 | 189,508 | ||||||||||
| 1,691,996 | Pool #RA5701, 2.00%, 8/1/51 | 1,289,599 | ||||||||||
| 1,552,311 | Pool #RA5719, 2.50%, 10/1/51 | 1,234,972 | ||||||||||
| 3,186,392 | Pool #RA5726, 2.50%, 8/1/51 | 2,536,183 | ||||||||||
| 1,757,370 | Pool #RA5796, 2.50%, 8/1/51 | 1,398,764 | ||||||||||
| 1,873,797 | Pool #RA5873, 2.50%, 9/1/51 | 1,491,433 | ||||||||||
| 703,850 | Pool #RA5874, 2.50%, 9/1/51 | 560,093 | ||||||||||
| 2,588,167 | Pool #RA5948, 2.50%, 12/1/51 | 2,058,721 | ||||||||||
| 157,077 | Pool #RA5951, 2.50%, 9/1/51 | 124,995 | ||||||||||
| 3,725,511 | Pool #RA6030, 2.50%, 10/1/51 | 2,964,597 | ||||||||||
| 65,073 | Pool #RA6108, 3.50%, 3/1/52 | 56,029 | ||||||||||
| 1,283,903 | Pool #RA6117, 2.50%, 10/1/51 | 1,021,435 | ||||||||||
| 1,305,959 | Pool #RA6276, 2.50%, 11/1/51 | 1,038,981 | ||||||||||
| 386,232 | Pool #RA6305, 2.50%, 11/1/51 | 307,275 | ||||||||||
| 1,238,139 | Pool #RA6317, 2.50%, 11/1/51 | 985,026 | ||||||||||
| 86,418 | Pool #RA6389, 2.50%, 11/1/51 | 69,285 | ||||||||||
| 1,883,235 | Pool #RA6516, 2.50%, 12/1/51 | 1,497,545 | ||||||||||
| 1,398,206 | Pool #RA6687, 3.00%, 1/1/52 | 1,159,777 | ||||||||||
| 2,886,658 | Pool #RA6743, 2.50%, 1/1/52 | 2,295,465 | ||||||||||
| 2,014,536 | Pool #RA6760, 3.00%, 2/1/52 | 1,671,007 | ||||||||||
| 938,458 | Pool #RA6782, 3.00%, 2/1/52 | 781,244 | ||||||||||
| 2,402,723 | Pool #RA6801, 3.00%, 2/1/52 | 1,998,152 | ||||||||||
| 3,810,352 | Pool #RA6858, 3.00%, 3/1/52 | 3,157,090 | ||||||||||
| 1,495,163 | Pool #RA6930, 3.50%, 3/1/52 | 1,287,369 | ||||||||||
| 1,072,773 | Pool #RA6978, 3.50%, 3/1/52 | 929,284 | ||||||||||
| 1,763,679 | Pool #RA6983, 2.50%, 3/1/52 | 1,400,576 | ||||||||||
29
SCHEDULE OF PORTFOLIO INVESTMENTS
|
RBC BlueBay Access Capital Community Investment Fund (cont.)
September 30, 2023
| Principal Amount | Value | |||||||||||
| $ 478,258 | Pool #RA7098, 3.50%, 3/1/52 | $ | 411,717 | |||||||||
| 170,513 | Pool #RA7146, 3.50%, 4/1/52 | 146,762 | ||||||||||
| 2,092,442 | Pool #RA7162, 3.50%, 4/1/52 | 1,800,992 | ||||||||||
| 209,517 | Pool #RA7284, 3.50%, 4/1/52 | 180,874 | ||||||||||
| 109,906 | Pool #RA7344, 4.00%, 4/1/52 | 98,334 | ||||||||||
| 6,329,896 | Pool #RA7454, 4.00%, 6/1/52 | 5,641,368 | ||||||||||
| 4,239,814 | Pool #RA7469, 4.00%, 5/1/52 | 3,779,291 | ||||||||||
| 8,926,443 | Pool #RA7503, 4.50%, 7/1/52 | 8,193,869 | ||||||||||
| 2,926,382 | Pool #RA7714, 4.50%, 7/1/52 | 2,686,220 | ||||||||||
| 2,644,611 | Pool #RA7872, 4.50%, 9/1/52 | 2,427,573 | ||||||||||
| 4,918,383 | Pool #RA7897, 4.50%, 9/1/52 | 4,514,742 | ||||||||||
| 3,280,590 | Pool #RA8627, 5.50%, 3/1/53 | 3,172,463 | ||||||||||
| 1,914,465 | Pool #RA8684, 5.00%, 3/1/53 | 1,806,049 | ||||||||||
| 332,554 | Pool #RA9790, 6.00%, 9/1/53 | 328,623 | ||||||||||
| 1,016,750 | Pool #RA9975, 6.00%, 10/1/53 | 1,003,939 | ||||||||||
| 970,268 | Pool #WA3211, 1.91%, 9/1/35 | 687,333 | ||||||||||
| 1,064,608 | Pool #WA3305, 1.75%, 6/1/37 | 690,413 | ||||||||||
| 932,811 | Pool #WA5002, 2.62%, 11/1/31 | 783,741 | ||||||||||
| 250,000 | Pool #WN2304, 4.45%, 12/1/32 | 229,199 | ||||||||||
| 1,000,000 | Pool #WN3049, 2.39%, 9/1/31 | 816,934 | ||||||||||
| 424,143 | Pool #ZA4828, 4.00%, 3/1/47 | 384,092 | ||||||||||
| 58,422 | Pool #ZA4891, 3.50%, 3/1/47 | 51,356 | ||||||||||
| 427,924 | Pool #ZA4892, 4.00%, 5/1/47 | 387,597 | ||||||||||
| 462,357 | Pool #ZA4893, 3.50%, 4/1/47 | 405,685 | ||||||||||
| 647,060 | Pool #ZA4912, 3.50%, 5/1/47 | 565,474 | ||||||||||
| 610,903 | Pool #ZA4913, 4.00%, 5/1/47 | 553,216 | ||||||||||
| 910,660 | Pool #ZA5070, 3.50%, 11/1/47 | 796,149 | ||||||||||
| 155,222 | Pool #ZA5090, 3.50%, 11/1/47 | 136,097 | ||||||||||
| 647,267 | Pool #ZA5174, 3.50%, 12/1/47 | 565,654 | ||||||||||
| 1,402,742 | Pool #ZA5238, 3.50%, 2/1/48 | 1,225,873 | ||||||||||
| 408,562 | Pool #ZA5245, 3.50%, 1/1/48 | 357,047 | ||||||||||
| 954,570 | Pool #ZA5253, 3.50%, 1/1/48 | 834,537 | ||||||||||
| 380,731 | Pool #ZA5254, 4.00%, 1/1/48 | 345,811 | ||||||||||
| 582,552 | Pool #ZA5308, 4.00%, 1/1/48 | 527,542 | ||||||||||
| 756,227 | Pool #ZA5575, 4.00%, 7/1/48 | 683,761 | ||||||||||
| 616,960 | Pool #ZA5637, 4.50%, 8/1/48 | 576,434 | ||||||||||
| 515,042 | Pool #ZA5645, 4.00%, 8/1/48 | 465,598 | ||||||||||
| 58,578 | Pool #ZA6576, 3.50%, 4/1/49 | 51,258 | ||||||||||
| 81,207 | Pool #ZI0238, 5.00%, 6/1/33 | 79,467 | ||||||||||
| 144,721 | Pool #ZI0412, 5.00%, 8/1/33 | 141,622 | ||||||||||
| 60,444 | Pool #ZI0543, 4.50%, 8/1/33 | 58,127 | ||||||||||
| 42,890 | Pool #ZI0549, 5.00%, 8/1/33 | 41,975 | ||||||||||
| 103,558 | Pool #ZI1023, 5.50%, 11/1/33 | 103,140 | ||||||||||
| 81,066 | Pool #ZI1353, 5.50%, 1/1/34 | 80,738 | ||||||||||
| 122,370 | Pool #ZI1493, 5.50%, 1/1/34 | 121,875 | ||||||||||
| 97,194 | Pool #ZI1524, 5.50%, 2/1/34 | 96,802 | ||||||||||
| 141,280 | Pool #ZI1689, 5.50%, 4/1/34 | 140,680 | ||||||||||
| 56,434 | Pool #ZI1802, 5.50%, 4/1/34 | 56,194 | ||||||||||
30
SCHEDULE OF PORTFOLIO INVESTMENTS
|
RBC BlueBay Access Capital Community Investment Fund (cont.)
September 30, 2023
Principal Amount | Value | |||||||||||
| $124,403 | Pool #ZI1991, 5.00%, 5/1/34 | $ | 121,726 | |||||||||
| 96,090 | Pool #ZI2332, 5.00%, 6/1/34 | 94,023 | ||||||||||
| 132,977 | Pool #ZI2939, 5.50%, 12/1/34 | 132,411 | ||||||||||
| 79,814 | Pool #ZI3102, 5.00%, 1/1/35 | 78,097 | ||||||||||
| 76,214 | Pool #ZI3254, 5.50%, 4/1/35 | 75,927 | ||||||||||
| 161,959 | Pool #ZI3507, 5.00%, 9/1/35 | 158,524 | ||||||||||
| 89,646 | Pool #ZI3713, 5.00%, 5/1/35 | 87,749 | ||||||||||
| 74,356 | Pool #ZI4118, 5.50%, 1/1/36 | 74,076 | ||||||||||
| 132,853 | Pool #ZI4120, 5.50%, 1/1/36 | 132,351 | ||||||||||
| 181,510 | Pool #ZI4200, 5.50%, 2/1/36 | 180,825 | ||||||||||
| 77,517 | Pool #ZI4201, 6.00%, 2/1/36 | 79,363 | ||||||||||
| 60,227 | Pool #ZI4429, 5.00%, 6/1/35 | 58,952 | ||||||||||
| 53,819 | Pool #ZI4521, 5.50%, 7/1/35 | 53,616 | ||||||||||
| 151,857 | Pool #ZI4572, 5.50%, 8/1/35 | 151,284 | ||||||||||
| 59,690 | Pool #ZI4605, 5.50%, 9/1/35 | 59,465 | ||||||||||
| 6,859 | Pool #ZI4606, 5.50%, 9/1/35 | 6,833 | ||||||||||
| 37,661 | Pool #ZI4704, 5.00%, 11/1/35 | 36,865 | ||||||||||
| 110,858 | Pool #ZI4705, 5.00%, 11/1/35 | 108,512 | ||||||||||
| 46,824 | Pool #ZI4706, 5.50%, 11/1/35 | 46,648 | ||||||||||
| 194,387 | Pool #ZI4979, 6.00%, 6/1/36 | 200,779 | ||||||||||
| 31,345 | Pool #ZI5006, 6.00%, 6/1/36 | 32,363 | ||||||||||
| 162,245 | Pool #ZI5912, 5.50%, 4/1/37 | 162,332 | ||||||||||
| 83,979 | Pool #ZI6311, 5.50%, 6/1/37 | 84,024 | ||||||||||
| 56,646 | Pool #ZI6814, 6.00%, 10/1/37 | 58,513 | ||||||||||
| 50,751 | Pool #ZI6976, 5.50%, 7/1/37 | 50,779 | ||||||||||
| 197,334 | Pool #ZI9925, 5.00%, 4/1/40 | 192,011 | ||||||||||
| 65,813 | Pool #ZJ0038, 4.50%, 5/1/40 | 62,153 | ||||||||||
| 204,593 | Pool #ZJ0482, 4.50%, 9/1/40 | 193,215 | ||||||||||
| 214,656 | Pool #ZJ0844, 4.00%, 12/1/40 | 196,865 | ||||||||||
| 116,413 | Pool #ZJ1058, 4.00%, 12/1/40 | 106,765 | ||||||||||
| 86,630 | Pool #ZJ1264, 4.00%, 1/1/41 | 79,450 | ||||||||||
| 228,648 | Pool #ZJ1444, 4.00%, 3/1/41 | 209,443 | ||||||||||
| 96,392 | Pool #ZJ1445, 4.50%, 3/1/41 | 90,986 | ||||||||||
| 45,698 | Pool #ZJ5032, 6.50%, 5/1/31 | 46,983 | ||||||||||
| 27,828 | Pool #ZJ5458, 6.50%, 11/1/31 | 28,614 | ||||||||||
| 23,743 | Pool #ZJ5928, 6.50%, 3/1/32 | 24,478 | ||||||||||
| 71,064 | Pool #ZJ6638, 6.00%, 11/1/32 | 72,080 | ||||||||||
| 58,103 | Pool #ZJ6955, 5.50%, 3/1/33 | 57,868 | ||||||||||
| 41,925 | Pool #ZJ6956, 5.50%, 3/1/33 | 41,755 | ||||||||||
| 45,970 | Pool #ZK4661, 2.50%, 11/1/27 | 43,417 | ||||||||||
| 285,802 | Pool #ZL2630, 3.50%, 12/1/41 | 253,139 | ||||||||||
| 317,876 | Pool #ZL2708, 3.50%, 1/1/42 | 281,547 | ||||||||||
| 839,332 | Pool #ZL5676, 3.00%, 4/1/43 | 717,542 | ||||||||||
| 386,353 | Pool #ZL6090, 3.00%, 6/1/43 | 330,291 | ||||||||||
| 181,759 | Pool #ZL6097, 3.00%, 6/1/43 | 155,406 | ||||||||||
| 534,485 | Pool #ZL9372, 3.00%, 4/1/45 | 453,525 | ||||||||||
| 344,083 | Pool #ZL9669, 3.50%, 6/1/45 | 302,427 | ||||||||||
31
SCHEDULE OF PORTFOLIO INVESTMENTS
|
RBC BlueBay Access Capital Community Investment Fund (cont.)
September 30, 2023
Principal Amount | Value | |||||||||||
| $ 196,564 | Pool #ZM1422, 3.50%, 7/1/46 | $ | 171,996 | |||||||||
| 213,802 | Pool #ZM1423, 3.50%, 7/1/46 | 187,079 | ||||||||||
| 156,113 | Pool #ZM1736, 3.00%, 9/1/46 | 132,294 | ||||||||||
| 866,661 | Pool #ZM1738, 3.00%, 9/1/46 | 732,169 | ||||||||||
| 522,094 | Pool #ZM8750, 4.00%, 9/1/48 | 472,064 | ||||||||||
| 283,236 | Pool #ZN1022, 4.00%, 11/1/48 | 256,095 | ||||||||||
| 10,643 | Pool #ZN5269, 6.50%, 10/1/31 | 10,943 | ||||||||||
| 62,263 | Pool #ZN5321, 5.50%, 5/1/34 | 61,998 | ||||||||||
| 38,112 | Pool #ZN5322, 5.50%, 5/1/34 | 37,950 | ||||||||||
| �� | 45,149 | Pool #ZN5332, 5.00%, 11/1/34 | 44,179 | |||||||||
| 599,962 | Series 2017-SB42, Class A10F, 2.96%, 10/25/27(b) | 554,005 | ||||||||||
| 342,335 | Series 2018-SB52, Class A10F, 3.48%, 6/25/28(b) | 320,146 | ||||||||||
| 706,041 | Series 2018-SB53, Class A10F, 3.66%, 6/25/28(b) | 660,099 | ||||||||||
| 271,985 | Series 2018-SB56, Class A10F, 3.70%, 10/25/28(b) | 254,890 | ||||||||||
| 479,376 | Series 2019-SB64, Class A10F, 2.71%, 5/25/29(b) | 433,037 | ||||||||||
| 597,211 | Series 2019-SB66, Class A5H, 2.32%, 6/25/39(b) | 582,242 | ||||||||||
| 1,356,090 | Series 2020-SB81, Class A10H, 1.26%, 10/25/40(b) | 1,086,630 | ||||||||||
| 986,263 | Series 2022-SB100, Class A10F, 2.01%, 5/25/32(b) | 799,798 | ||||||||||
| 759,823 | Series 2022-SB96, Class A7F, 1.88%, 1/25/29(b) | 649,452 | ||||||||||
| 2,884,739 | Series Q014, Class A1, 1.56%, 1/25/36 | 2,216,470 | ||||||||||
|
| |||||||||||
| 211,536,681 | ||||||||||||
|
| |||||||||||
Ginnie Mae — 4.05% | ||||||||||||
| 183,849 | Pool #442423, 4.00%, 9/20/41 | 170,039 | ||||||||||
| 110,873 | Pool #616936, 5.50%, 1/15/36 | 112,683 | ||||||||||
| 691,404 | Pool #618363, 4.00%, 9/20/41 | 636,210 | ||||||||||
| 343,403 | Pool #664269, 5.85%, 6/15/38 | 343,403 | ||||||||||
| 20,752 | Pool #675509, 5.50%, 6/15/38 | 20,834 | ||||||||||
| 136,920 | Pool #697672, 5.50%, 12/15/38 | 138,352 | ||||||||||
| 60,179 | Pool #697814, 5.00%, 2/15/39 | 58,954 | ||||||||||
| 302,602 | Pool #697885, 4.50%, 3/15/39 | 286,452 | ||||||||||
| 93,102 | Pool #698112, 4.50%, 5/15/39 | 86,262 | ||||||||||
| 433,933 | Pool #698113, 4.50%, 5/15/39 | 402,051 | ||||||||||
| 686,646 | Pool #713519, 6.00%, 7/15/39 | 712,690 | ||||||||||
| 159,574 | Pool #716822, 4.50%, 4/15/39 | 151,058 | ||||||||||
| 57,135 | Pool #716823, 4.50%, 4/15/39 | 54,086 | ||||||||||
| 214,439 | Pool #720080, 4.50%, 6/15/39 | 202,995 | ||||||||||
| 242,190 | Pool #724629, 5.00%, 7/20/40 | 237,028 | ||||||||||
| 309,825 | Pool #726550, 5.00%, 9/15/39 | 303,922 | ||||||||||
| 142,041 | Pool #729346, 4.50%, 7/15/41 | 134,450 | ||||||||||
| 210,324 | Pool #738844, 3.50%, 10/15/41 | 186,604 | ||||||||||
| 139,991 | Pool #738845, 3.50%, 10/15/41 | 123,558 | ||||||||||
| 201,391 | Pool #738862, 4.00%, 10/15/41 | 185,410 | ||||||||||
| 171,956 | Pool #747241, 5.00%, 9/20/40 | 168,291 | ||||||||||
| 527,321 | Pool #748654, 3.50%, 9/15/40 | 463,839 | ||||||||||
| 96,239 | Pool #748846, 4.50%, 9/20/40 | 91,333 | ||||||||||
| 254,229 | Pool #757016, 3.50%, 11/15/40 | 227,410 | ||||||||||
| 160,074 | Pool #757017, 4.00%, 12/15/40 | 147,696 | ||||||||||
32
SCHEDULE OF PORTFOLIO INVESTMENTS
|
RBC BlueBay Access Capital Community Investment Fund (cont.)
September 30, 2023
| Principal Amount | Value | |||||||||||
| $ 251,140 | Pool #759297, 4.00%, 1/20/41 | $ | 232,260 | |||||||||
| 143,309 | Pool #759298, 4.00%, 2/20/41 | 132,535 | ||||||||||
| 140,430 | Pool #762877, 4.00%, 4/15/41 | 128,883 | ||||||||||
| 78,329 | Pool #763564, 4.50%, 5/15/41 | 74,143 | ||||||||||
| 170,538 | Pool #770481, 4.00%, 8/15/41 | 157,319 | ||||||||||
| 39,149 | Pool #770482, 4.50%, 8/15/41 | 37,057 | ||||||||||
| 151,405 | Pool #770517, 4.00%, 8/15/41 | 139,391 | ||||||||||
| 114,369 | Pool #770529, 4.00%, 8/15/41 | 105,208 | ||||||||||
| 44,723 | Pool #770537, 4.00%, 8/15/41 | 41,257 | ||||||||||
| 134,808 | Pool #770738, 4.50%, 6/20/41 | 127,982 | ||||||||||
| 153,714 | Pool #779592, 4.00%, 11/20/41 | 142,168 | ||||||||||
| 101,048 | Pool #779593, 4.00%, 11/20/41 | 93,196 | ||||||||||
| 244,565 | Pool #AA6312, 3.00%, 4/15/43 | 211,311 | ||||||||||
| 327,029 | Pool #AA6424, 3.00%, 5/15/43 | 279,837 | ||||||||||
| 586,535 | Pool #AB2733, 3.50%, 8/15/42 | 520,243 | ||||||||||
| 286,619 | Pool #AB2745, 3.00%, 8/15/42 | 245,266 | ||||||||||
| 645,955 | Pool #AB2841, 3.00%, 9/15/42 | 552,758 | ||||||||||
| 42,843 | Pool #AB2843, 3.00%, 9/15/42 | 37,043 | ||||||||||
| 105,325 | Pool #AB2852, 3.50%, 9/15/42 | 93,643 | ||||||||||
| 383,293 | Pool #AE6946, 3.00%, 6/15/43 | 331,176 | ||||||||||
| 70,396 | Pool #AG8915, 4.00%, 2/20/44 | 64,711 | ||||||||||
| 313,680 | Pool #AK6446, 3.00%, 1/15/45 | 267,639 | ||||||||||
| 381,117 | Pool #AK7036, 3.00%, 4/15/45 | 322,803 | ||||||||||
| 285,163 | Pool #AO3594, 3.50%, 8/20/45 | 254,652 | ||||||||||
| 148,276 | Pool #AP3887, 3.50%, 9/20/45 | 130,921 | ||||||||||
| 317,447 | Pool #AR4919, 3.50%, 3/20/46 | 282,620 | ||||||||||
| 464,292 | Pool #AR4970, 3.50%, 4/20/46 | 407,533 | ||||||||||
| 428,289 | Pool #AS2921, 3.50%, 4/20/46 | 377,103 | ||||||||||
| 351,062 | Pool #AS4332, 3.00%, 6/20/46 | 298,516 | ||||||||||
| 406,201 | Pool #AS5511, 3.50%, 3/20/46 | 357,046 | ||||||||||
| 697,992 | Pool #AX7237, 3.50%, 11/20/46 | 616,590 | ||||||||||
| 550,654 | Pool #BO2104, 3.00%, 8/20/49 | 463,334 | ||||||||||
| 1,471,231 | Pool #BR3787, 3.00%, 12/20/49 | 1,237,931 | ||||||||||
| 700,000 | Series 2012-100, Class B, 2.31%, 11/16/51(b) | 618,371 | ||||||||||
| 302,013 | Series 2012-107, Class A, 1.15%, 1/16/45 | 277,206 | ||||||||||
| 870,169 | Series 2012-115, Class A, 2.13%, 4/16/45 | 750,060 | ||||||||||
| 880,652 | Series 2012-120, Class A, 1.90%, 2/16/53 | 751,871 | ||||||||||
| 379,802 | Series 2012-131, Class A, 1.90%, 2/16/53 | 325,100 | ||||||||||
| 139,686 | Series 2012-144, Class AD, 1.77%, 1/16/53 | 122,940 | ||||||||||
| 111,269 | Series 2013-105, Class A, 1.71%, 2/16/37 | 108,931 | ||||||||||
| 85,010 | Series 2013-126, Class BK, 2.45%, 10/16/47(b) | 74,482 | ||||||||||
| 180,023 | Series 2013-29, Class AB, 1.77%, 10/16/45 | 165,112 | ||||||||||
| 142,229 | Series 2013-63, Class AB, 1.38%, 3/16/45 | 137,585 | ||||||||||
| 290,266 | Series 2013-97, Class AC, 2.00%, 6/16/45 | 260,713 | ||||||||||
| 32,869 | Series 2015-107, Class AB, 2.50%, 11/16/49 | 29,247 | ||||||||||
| 347,411 | Series 2015-114, Class AD, 2.50%, 11/15/51 | 326,568 | ||||||||||
| 171,216 | Series 2015-128, Class AD, 2.50%, 12/16/50 | 158,651 | ||||||||||
33
SCHEDULE OF PORTFOLIO INVESTMENTS
|
RBC BlueBay Access Capital Community Investment Fund (cont.)
September 30, 2023
Principal Amount | Value | |||||||||||
| $146,490 | Series 2015-130, Class AH, 2.90%, 8/16/47(b) | $ | 140,110 | |||||||||
| 879,088 | Series 2015-135, Class AC, 2.35%, 4/16/49 | 767,470 | ||||||||||
| 350,324 | Series 2015-136, Class AC, 2.50%, 3/16/47 | 317,043 | ||||||||||
| 130,256 | Series 2015-15, Class A, 2.00%, 11/16/48 | 116,531 | ||||||||||
| 388,230 | Series 2015-154, Class AD, 2.50%, 5/16/54 | 336,931 | ||||||||||
| 320,718 | Series 2015-171, Class DA, 2.37%, 3/16/46 | 282,436 | ||||||||||
| 286,598 | Series 2015-22, Class A, 2.40%, 8/16/47 | 265,194 | ||||||||||
| 425,056 | Series 2015-70, Class AB, 2.30%, 11/16/48 | 375,660 | ||||||||||
| 19,355 | Series 2015-98, Class AB, 2.20%, 11/16/43 | 18,856 | ||||||||||
| 88,790 | Series 2016-11, Class AD, 2.25%, 11/16/43 | 84,975 | ||||||||||
| 155,454 | Series 2016-14, Class AB, 2.15%, 8/16/42 | 145,958 | ||||||||||
| 893,849 | Series 2016-152, Class EA, 2.20%, 8/15/58 | 719,649 | ||||||||||
| 951,865 | Series 2016-157, Class AC, 2.00%, 11/16/50 | 803,107 | ||||||||||
| 21,090 | Series 2016-26, Class A, 2.25%, 12/16/55 | 20,812 | ||||||||||
| 270,836 | Series 2016-39, Class AH, 2.50%, 9/16/44 | 250,117 | ||||||||||
| 97,944 | Series 2016-50, Class A, 2.30%, 7/16/52 | 93,033 | ||||||||||
| 389,901 | Series 2016-64, Class CA, 2.30%, 3/16/45 | 362,901 | ||||||||||
| 24,193 | Series 2016-67, Class A, 2.30%, 7/16/56 | 23,920 | ||||||||||
| 175,431 | Series 2016-94, Class AC, 2.20%, 8/16/57 | 146,875 | ||||||||||
| 118,334 | Series 2016-96, Class BA, 1.95%, 3/16/43 | 111,914 | ||||||||||
| 497,487 | Series 2017-127, Class AB, 2.50%, 2/16/59 | 405,879 | ||||||||||
| 831,328 | Series 2017-135, Class AE, 2.60%, 10/16/58 | 688,762 | ||||||||||
| 296,592 | Series 2017-140, Class A, 2.50%, 2/16/59 | 240,345 | ||||||||||
| 79,355 | Series 2017-157, Class AH, 2.55%, 2/16/53 | 71,767 | ||||||||||
| 225,885 | Series 2017-41, Class AC, 2.25%, 3/16/57 | 211,085 | ||||||||||
| 384,283 | Series 2017-46, Class A, 2.50%, 11/16/57 | 311,084 | ||||||||||
| 276,318 | Series 2017-71, Class AS, 2.70%, 4/16/57 | 248,959 | ||||||||||
| 173,133 | Series 2017-9, Class AE, 2.40%, 9/16/50 | 154,989 | ||||||||||
| 413,684 | Series 2018-2, Class AD, 2.40%, 3/16/59 | 363,845 | ||||||||||
| 215,233 | Series 2018-26, Class AD, 2.50%, 3/16/52 | 198,927 | ||||||||||
|
| |||||||||||
| 26,795,656 | ||||||||||||
|
| |||||||||||
Small Business Administration — 0.25% | ||||||||||||
| 88,040 | Pool #510751, (Prime Index + 0.325%), 8.58%, 6/25/30(c) | 92,060 | ||||||||||
| 105,240 | Pool #530222, (Prime Index + 0.635%), 8.89%, 7/25/32(c) | 111,846 | ||||||||||
| 79,604 | Pool #530390, (Prime Index - 1.000%), 7.25%, 11/25/33(c) | 82,668 | ||||||||||
| 274,312 | Pool #530413, (Prime Index + 0.825%), 9.08%, 1/25/34(c) | 300,208 | ||||||||||
| 124,383 | Pool #540104, (Prime Index + 2.599%), 10.85%, 3/25/33(c) | 139,526 | ||||||||||
| 712,419 | Pool #540109, (Prime Index + 1.176%), 9.43%, 5/25/33(c) | 780,910 | ||||||||||
| 109,472 | Pool #540110, (Prime Index + 2.502%), 10.75%, 7/25/33(c) | 122,765 | ||||||||||
|
| |||||||||||
| 1,629,983 | ||||||||||||
|
| |||||||||||
| Total U.S. Government Agency Backed Mortgages | 581,341,315 | |||||||||||
|
| |||||||||||
| (Cost $686,682,609) | ||||||||||||
U.S. Government Agency Obligations — 5.27% | ||||||||||||
Small Business Administration — 5.27% | ||||||||||||
| 135,965 | Certificate of Originator’s Fee, 0.23%, 4/15/31(a),(c) | 632 | ||||||||||
34
SCHEDULE OF PORTFOLIO INVESTMENTS
|
RBC BlueBay Access Capital Community Investment Fund (cont.)
September 30, 2023
Principal Amount | Value | |||||||||||
| $200,734 | Certificate of Originator’s Fee, 0.70%, 4/23/32(a),(c) | $ | 779 | |||||||||
| 560,469 | Certificate of Originator’s Fee, 0.98%, 4/15/31(a),(c) | 11,097 | ||||||||||
| 304,864 | Certificate of Originator’s Fee, 1.23%, 3/15/31(a),(c) | 7,576 | ||||||||||
| 749,754 | Certificate of Originator’s Fee, 1.23%, 4/15/31(a),(c) | 18,631 | ||||||||||
| 404,145 | Certificate of Originator’s Fee, 1.23%, 5/15/31(a),(c) | 10,043 | ||||||||||
| 243,399 | Certificate of Originator’s Fee, 1.23%, 5/15/31(a),(c) | 6,048 | ||||||||||
| 373,275 | Certificate of Originator’s Fee, 1.68%, 9/11/32(a),(c) | 3,463 | ||||||||||
| 531,055 | Certificate of Originator’s Fee, 1.93%, 5/4/32(a),(c) | 5,660 | ||||||||||
| 339,564 | Certificate of Originator’s Fee, 2.22%, 2/20/29(a),(c) | 4,154 | ||||||||||
| 179,714 | 3.36%, 7/8/24(a),(b) | 190,677 | ||||||||||
| 276,598 | 3.85%, 9/16/34(a),(b) | 303,728 | ||||||||||
| 54,973 | 4.33%, 12/15/30(a),(c) | 62,094 | ||||||||||
| 311,037 | (Prime Index - 2.600%), 5.65%, 9/25/41(c) | 310,276 | ||||||||||
| 173,718 | (Prime Index - 2.600%), 5.65%, 9/25/41(c) | 173,318 | ||||||||||
| 233,968 | (Prime Index - 2.600%),5.65%, 7/25/42(c) | 233,483 | ||||||||||
| 555,052 | (Prime Index - 2.550%), 5.70%, 7/25/42(c) | 554,266 | ||||||||||
| 144,299 | (Prime Index - 2.525%), 5.73%, 11/25/41(c) | 144,200 | ||||||||||
| 243,456 | (Prime Index - 2.500%), 5.75%, 2/25/28(c) | 243,679 | ||||||||||
| 101,368 | 6.08%, 12/19/29(a),(b) | 115,283 | ||||||||||
| 127,375 | 6.58%, 4/8/29(a),(c) | 145,313 | ||||||||||
| 433,104 | (Prime Index - 1.400%), 6.85%, 7/25/41(c) | 441,409 | ||||||||||
| 226,433 | 7.08%, 7/25/30 | 221,383 | ||||||||||
| 976,925 | (Prime Index - 0.675%), 7.58%, 9/25/43(c) | 1,017,186 | ||||||||||
| 3,804,828 | (Prime Index - 0.675%), 7.58%, 11/25/45(c) | 3,985,819 | ||||||||||
| 2,314,957 | (Prime Index - 0.675%), 7.58%, 1/25/46(c) | 2,416,079 | ||||||||||
| 107,338 | (Prime Index - 0.412%), 7.84%, 11/25/27(c) | 109,096 | ||||||||||
| 913,598 | (Prime Index - 0.342%), 7.91%, 12/25/45(c) | 961,921 | ||||||||||
| 139,825 | (Prime Index - 0.187%), 8.06%, 2/25/40(c) | 143,537 | ||||||||||
| 221,944 | (Prime Index - 0.095%), 8.16%, 7/25/29(c) | 228,014 | ||||||||||
| 54,404 | (Prime Index + 0.071%), 8.32%, 12/25/40(c) | 56,929 | ||||||||||
| 205,708 | (Prime Index + 0.092%), 8.34%, 6/25/29(c) | 212,071 | ||||||||||
| 273,105 | (Prime Index + 0.099%), 8.35%, 8/25/29(c) | 281,753 | ||||||||||
| 506,928 | (Prime Index + 0.118%), 8.37%, 1/25/46(c) | 541,479 | ||||||||||
| 245,557 | (Prime Index + 0.188%), 8.44%, 11/25/28(c) | 252,295 | ||||||||||
| 76,705 | (Prime Index + 0.325%), 8.58%, 10/25/30(c) | 80,385 | ||||||||||
| 2,236,404 | (Prime Index + 0.325%), 8.58%, 11/25/30(c) | 2,339,144 | ||||||||||
| 1,081,926 | (Prime Index + 0.325%), 8.58%, 6/25/31(c) | 1,134,532 | ||||||||||
| 1,366,385 | (Prime Index + 0.325%), 8.58%, 7/25/31(c) | 1,437,302 | ||||||||||
| 455,510 | (Prime Index + 0.325%), 8.58%, 2/25/45(c) | 486,463 | ||||||||||
| 928,998 | (Prime Index + 0.325%), 8.58%, 8/25/46(c) | 994,947 | ||||||||||
| 38,640 | (Prime Index + 0.355%), 8.61%, 2/25/26(c) | 39,013 | ||||||||||
| 2,024,183 | (Prime Index + 0.375%), 8.63%, 5/25/31(c) | 2,126,032 | ||||||||||
| 229,945 | (Prime Index + 0.375%), 8.63%, 10/25/31(c) | 241,186 | ||||||||||
| 927,789 | (Prime Index + 0.375%), 8.63%, 8/25/46(c) | 988,748 | ||||||||||
| 2,185,982 | (Prime Index + 0.535%), 8.79%, 12/25/45(c) | 2,375,384 | ||||||||||
| 1,134,692 | (Prime Index + 0.575%), 8.83%, 4/25/31(c) | 1,195,012 | ||||||||||
| 536,672 | (Prime Index + 0.644%), 8.89%, 11/25/30(c) | 565,438 | ||||||||||
35
SCHEDULE OF PORTFOLIO INVESTMENTS
|
RBC BlueBay Access Capital Community Investment Fund (cont.)
September 30, 2023
Principal Amount | Value | |||||||||||
| $ 36,868 | (Prime Index + 0.700%), 8.95%, 2/25/28(c) | $ | 38,076 | |||||||||
| 338,291 | (Prime Index + 0.724%), 8.97%, 5/25/29(c) | 351,531 | ||||||||||
| 263,062 | (Prime Index + 0.759%), 9.01%, 3/25/30(c) | 273,932 | ||||||||||
| 128,356 | (Prime Index + 0.781%), 9.03%, 3/25/29(c) | 133,171 | ||||||||||
| 169,116 | (Prime Index + 0.796%), 9.05%, 2/25/28(c) | 174,801 | ||||||||||
| 102,901 | (Prime Index + 0.818%), 9.07%, 9/25/28(c) | 106,208 | ||||||||||
| 305,809 | (Prime Index + 0.820%), 9.07%, 6/25/29(c) | 317,176 | ||||||||||
| 250,344 | (Prime Index + 0.828%), 9.08%, 2/25/29(c) | 259,242 | ||||||||||
| 46,197 | 9.08%, 9/25/29 | 47,198 | ||||||||||
| 1,311,283 | (Prime Index + 0.825%), 9.08%, 9/25/31(c) | 1,392,922 | ||||||||||
| 47,337 | (Prime Index + 0.860%), 9.11%, 6/25/28(c) | 48,865 | ||||||||||
| 103,512 | (Prime Index + 0.864%), 9.11%, 3/25/31(c) | 109,418 | ||||||||||
| 184,827 | (Prime Index + 0.879%), 9.13%, 8/25/30(c) | 194,853 | ||||||||||
| 87,661 | (Prime Index + 0.886%), 9.14%, 2/25/30(c) | 91,413 | ||||||||||
| 237,869 | (Prime Index + 0.901%), 9.15%, 7/25/30(c) | 249,170 | ||||||||||
| 756,688 | (Prime Index + 0.908%), 9.16%, 12/25/30(c) | 798,552 | ||||||||||
| 28,568 | (Prime Index + 0.673%), 9.17%, 8/25/27(c) | 29,319 | ||||||||||
| 51,216 | (Prime Index + 0.931%), 9.18%, 1/25/29(c) | 53,069 | ||||||||||
| 127,727 | (Prime Index + 0.941%), 9.19%, 5/25/29(c) | 133,811 | ||||||||||
| 53,284 | (Prime Index + 0.937%), 9.19%, 7/25/29(c) | 55,933 | ||||||||||
| 140,456 | (Prime Index + 0.971%), 9.22%, 7/25/29(c) | 145,606 | ||||||||||
| 134,418 | (Prime Index + 0.992%), 9.24%, 1/25/31(c) | 142,011 | ||||||||||
| 34,360 | (Prime Index + 1.013%), 9.26%, 11/25/28(c) | 35,804 | ||||||||||
| 220,094 | (Prime Index + 1.031%), 9.28%, 2/25/31(c) | 233,008 | ||||||||||
| 108,111 | (Prime Index + 1.050%), 9.30%, 9/25/29(c) | 113,645 | ||||||||||
| 189,571 | (Prime Index + 1.062%), 9.31%, 12/25/29(c) | 199,606 | ||||||||||
| 116,833 | (Prime Index + 1.069%), 9.32%, 6/25/30(c) | 123,397 | ||||||||||
| 237,158 | (Prime Index + 1.164%), 9.41%, 9/25/28(c) | 246,099 | ||||||||||
| 21,190 | (Prime Index + 1.199%), 9.45%, 11/25/26(c) | 21,799 | ||||||||||
| 145,956 | (Prime Index + 1.217%), 9.47%, 5/25/29(c) | 152,280 | ||||||||||
| 80,742 | (Prime Index + 1.219%), 9.47%, 6/25/29(c) | 84,845 | ||||||||||
| 387,967 | (Prime Index + 1.284%), 9.53%, 6/25/31(c) | 415,692 | ||||||||||
| 64,812 | (Prime Index + 1.309%), 9.56%, 10/25/31(c) | 69,859 | ||||||||||
| 153,625 | (Prime Index + 1.575%), 9.83%, 7/25/30(c) | 162,848 | ||||||||||
| 20,459 | (Prime Index + 1.604%), 9.85%, 7/25/28(c) | 21,133 | ||||||||||
| 76,439 | 9.88%, 6/7/29(a) | 76,606 | ||||||||||
| 51,083 | (Prime Index + 2.325%), 10.58%, 10/25/30(c) | 54,943 | ||||||||||
| 174,122 | (Prime Index + 2.325%), 10.58%, 1/25/31(c) | 189,904 | ||||||||||
|
| |||||||||||
| 34,764,702 | ||||||||||||
|
| |||||||||||
| Total U.S. Government Agency Obligations | 34,764,702 | |||||||||||
|
| |||||||||||
| (Cost $35,926,570) | ||||||||||||
Municipal Bonds — 1.99% | ||||||||||||
California — 0.85% | ||||||||||||
| 2,000,000 | California Health Facilities Financing Authority Revenue, 2.93%, 6/1/32, Callable 6/1/29 @ 100 | 1,643,382 | ||||||||||
36
SCHEDULE OF PORTFOLIO INVESTMENTS
|
RBC BlueBay Access Capital Community Investment Fund (cont.)
September 30, 2023
Principal Amount | Value | |||||||||||
| $820,000 | California Statewide Communities Development Authority Revenue, Series B, 5.25%, 10/20/42, (Credit Support: Ginnie Mae), Callable 10/30/23 @ 100 | $ | 769,006 | |||||||||
| 200,000 | City & County of San Francisco GO, 1.95%, 6/15/27 | 178,393 | ||||||||||
| 1,790,000 | City & County of San Francisco GO, Series A, 1.78%, 6/15/29 | 1,485,272 | ||||||||||
| 1,675,000 | City of Los Angeles Housing GO, Series A, 2.95%, 9/1/28, Callable 9/1/27 @ 100 | 1,532,111 | ||||||||||
|
| |||||||||||
| 5,608,164 | ||||||||||||
|
| |||||||||||
Colorado — 0.02% | ||||||||||||
| 125,530 | Colorado Housing & Finance Authority Revenue, Series V, 3.40%, 11/1/45, (Credit Support: FHA) | 102,164 | ||||||||||
|
| |||||||||||
District of Columbia — 0.07% | ||||||||||||
| 545,578 | District of Columbia Housing Finance Agency Series 2017 Revenue, Series A, 3.24%, 3/1/49, (Credit Support: FHA), Callable 1/1/70 @ 100 | 483,196 | ||||||||||
|
| |||||||||||
Illinois — 0.03% | ||||||||||||
| 200,000 | City of Chicago Multi Family Revenue, Mercy Preservation Project, 4.55%, 8/1/26, (Credit Support: Freddie Mac), Callable 10/30/23 @ 100 | 200,050 | ||||||||||
|
| |||||||||||
Minnesota — 0.06% | ||||||||||||
| 460,396 | City of Minnetonka Housing Revenue, Series A, 3.00%, 11/1/34, (Credit Support: Fannie Mae) | 390,527 | ||||||||||
|
| |||||||||||
Missouri — 0.09% | ||||||||||||
| 788,827 | Missouri Housing Development Commission Revenue, Series 1, 3.75%, 3/1/42, (Credit Support: FHA), Callable 3/1/25 @ 100 | 588,830 | ||||||||||
|
| |||||||||||
New York — 0.74% | ||||||||||||
| 200,000 | New York City Housing Development Corp. Revenue, Series G, 2.37%, 5/1/24 | 196,128 | ||||||||||
| 40,000 | New York City Housing Development Corp. Revenue, Series G, 2.47%, 11/1/24 | 38,637 | ||||||||||
| 300,000 | New York City Housing Development Corp. Revenue, Series B, 1.02%, 5/1/26 | 268,180 | ||||||||||
| 300,000 | New York City Housing Development Corp. Revenue, Series G, 2.62%, 5/1/26, Callable 11/1/25 @ 100 | 279,507 | ||||||||||
| 200,000 | New York City Housing Development Corp. Revenue, Series B, 1.12%, 11/1/26 | 175,841 | ||||||||||
| 500,000 | New York City Housing Development Corp. Revenue, Series B, 3.56%, 11/1/26, Callable 2/1/26 @ 100 | 473,708 | ||||||||||
| 160,000 | New York City Housing Development Corp. Revenue, Series B, 1.38%, 5/1/27 | 139,260 | ||||||||||
| 250,000 | New York City Housing Development Corp. Revenue, Series B, 1.48%, 11/1/27 | 214,614 | ||||||||||
37
SCHEDULE OF PORTFOLIO INVESTMENTS
|
RBC BlueBay Access Capital Community Investment Fund (cont.)
September 30, 2023
| ||||||
Principal Amount | Value | |||||
| ||||||
$1,000,000 | New York City Housing Development Corp. Revenue, Series B, 3.61%, 11/1/27, Callable 2/1/26 @ 100 | $ | 935,582 | |||
500,000 | New York City Housing Development Corp. Revenue, State of New York Mortgage Agency, 3.33%, 2/1/28, (Credit Support: SONYMA), Callable 8/1/25 @ 100 | 457,495 | ||||
500,000 | New York City Housing Development Corp. Revenue, Series B, 3.81%, 11/1/29, Callable 2/1/26 @ 100 | 456,500 | ||||
330,000 | New York State Housing Finance Agency Revenue, Series A, 4.50%, 11/15/27, Callable 10/30/23 @ 100 | 321,337 | ||||
1,000,000 | New York State Housing Finance Agency Revenue, Series A, 4.65%, 11/15/38, Callable 10/30/23 @ 100 | 926,154 | ||||
|
| |||||
| 4,882,943 | ||||||
|
| |||||
Vermont — 0.02% | ||||||
100,000 | Vermont Housing Finance Agency Revenue, 3.45%, 11/1/29 | 88,990 | ||||
|
| |||||
Washington — 0.11% | ||||||
800,000 | City of Seattle WA GO, Series B, 3.38%, 12/1/28, Callable 12/1/27 @ 100 | 734,862 | ||||
|
| |||||
Total Municipal Bonds | 13,079,726 | |||||
|
| |||||
(Cost $14,668,978) | ||||||
Corporate Bond — 0.03% | ||||||
Consumer, Non-cyclical — 0.03% | ||||||
185,000 | Montefiore Medical Center, 2.15%, 10/20/26 | 174,211 | ||||
|
| |||||
Total Corporate Bond | 174,211 | |||||
|
| |||||
(Cost $185,000) | ||||||
Shares | ||||||
Investment Company — 5.73% | ||||||
37,795,609 | RBC BlueBay U.S. Goverment Money Market Fund, Institutional Class 1(d) | 37,795,609 | ||||
|
| |||||
Total Investment Company | 37,795,609 | |||||
|
| |||||
(Cost $37,795,609) | ||||||
Total Investments | $ | 667,155,563 | ||||
(Cost $775,258,766)(e) — 101.17% | ||||||
Liabilities in excess of other assets — (1.17)% | (7,688,707 | ) | ||||
|
| |||||
NET ASSETS — 100.00% | $ | 659,466,856 | ||||
|
| |||||
38
SCHEDULE OF PORTFOLIO INVESTMENTS
|
RBC BlueBay Access Capital Community Investment Fund (cont.)
September 30, 2023
| (a) | The Pricing Committee has fair valued this security under procedures established by the Fund’s Board of Trustees. |
| (b) | Variable or floating rate security, which interest rate adjusts periodically based on changes in current interest rates and prepayments on the underlying pool of assets. Rate shown is the rate in effect as of period end. |
| (c) | Floating rate note. Rate shown is as of report date. (d) Affiliated investment. |
| (e) | See Notes to Schedules of Portfolio Investments for the tax cost of securities and the breakdown of unrealized appreciation (depreciation). |
Financial futures contracts as of September 30, 2023:
Long Position | Number of Contracts | Expiration Date | Value/Unrealized Depreciation | Notional Value | Clearinghouse | |||||||||||||||||||||||
10 Year U.S. Ultra Treasury Bond | 185 | December 2023 | $ (464,948 | ) | USD | $20,639,063 | Barclays Capital Group | |||||||||||||||||||||
2 Year U.S. Treasury Note | 100 | December 2023 | (69,591 | ) | USD | 20,271,094 | Barclays Capital Group | |||||||||||||||||||||
30 Year U.S. Treasury Bond | 60 | December 2023 | (292,688 | ) | USD | 6,826,875 | Barclays Capital Group | |||||||||||||||||||||
5 Year U.S. Treasury Note | 295 | December 2023 | (211,212 | ) | USD | 31,081,017 | Barclays Capital Group | |||||||||||||||||||||
|
| |||||||||||||||||||||||||||
Total | $(1,038,439) | |||||||||||||||||||||||||||
|
| |||||||||||||||||||||||||||
Abbreviations used are defined below:
FHA - Insured by Federal Housing Administration
GO - General Obligations
SONYMA - State of New York Mortgage Agency
TBA - To-be-announced
USD - United States Dollar
See Notes to the Financial Statements.
39
SCHEDULE OF PORTFOLIO INVESTMENTS
|
RBC BlueBay Impact Bond Fund
September 30, 2023
Principal Amount | Value | |||||||
|
| |||||||
Corporate Bonds — 26.56% | ||||||||
Communications — 0.85% | ||||||||
| $2,670,000 | Vodafone Group Plc, 4.38%, 2/19/43 | $ | 2,057,390 | |||||
|
| |||||||
Consumer, Non-cyclical — 15.88% | ||||||||
| 545,000 | AbbVie, Inc., 3.60%, 5/14/25 | 526,852 | ||||||
| 2,030,000 | AbbVie, Inc., 3.80%, 3/15/25 | 1,973,374 | ||||||
| 1,525,000 | Amgen, Inc., 4.20%, 2/22/52 | 1,138,499 | ||||||
| 3,500,000 | Amgen, Inc., 5.25%, 3/2/33 | 3,344,806 | ||||||
| 2,892,000 | Astrazeneca Finance LLC, 1.75%, 5/28/28 | 2,472,796 | ||||||
| 490,000 | Astrazeneca Finance LLC, 2.25%, 5/28/31 | 393,932 | ||||||
| 2,500,000 | Baxalta, Inc., 4.00%, 6/23/25 | 2,424,905 | ||||||
| 1,089,000 | Becton Dickinson & Co., 4.67%, 6/6/47 | 904,849 | ||||||
| 4,200,000 | Becton Dickinson & Co., 4.69%, 2/13/28 | 4,068,971 | ||||||
| 995,000 | DH Europe Finance II Sarl, 2.60%, 11/15/29 | 853,450 | ||||||
| 100,000 | Doris Duke Charitable Foundation (The), Series 2020, 2.35%, 7/1/50 | 53,820 | ||||||
| 1,850,000 | EMD Finance LLC, 3.25%, 3/19/25(a) | 1,783,161 | ||||||
| 1,500,000 | Gilead Sciences, Inc., 3.65%, 3/1/26 | 1,435,687 | ||||||
| 2,114,000 | Haleon US Capital LLC, 3.63%, 3/24/32 | 1,814,095 | ||||||
| 400,000 | John D and Catherine T MacArthur Foundation, 1.30%, 12/1/30 | 293,870 | ||||||
| 2,500,000 | Kenvue, Inc., 5.05%, 3/22/53(a) | 2,265,123 | ||||||
| 1,200,000 | Mary Free Bed Rehabilitation Hospital, Series 2021, 3.79%, 4/1/51 | 849,844 | ||||||
| 150,000 | Mass General Brigham, Inc., Series 2020, 3.19%, 7/1/49 | 97,919 | ||||||
| 250,000 | Medtronic, Inc., 4.38%, 3/15/35 | 226,221 | ||||||
| 2,600,000 | Pfizer Investment Enterprises Pte Ltd., 5.11%, 5/19/43 | 2,387,367 | ||||||
| 2,500,000 | Reckitt Benckiser Treasury Services Plc, 3.00%, 6/26/27(a) | 2,297,056 | ||||||
| 2,000,000 | Revvity, Inc., 3.63%, 3/15/51 | 1,280,908 | ||||||
| 2,000,000 | Southeast Alaska Regional Health Consortium, 2.26%, 7/1/31 | 1,485,381 | ||||||
| 2,250,000 | Thermo Fisher Scientific, Inc., 2.00%, 10/15/31 | 1,742,394 | ||||||
| 100,000 | Trinity Health Corp., 4.13%, 12/1/45 | 78,613 | ||||||
| 2,350,000 | UnitedHealth Group, Inc., 5.05%, 4/15/53 | 2,103,422 | ||||||
|
| |||||||
| 38,297,315 | ||||||||
|
| |||||||
Financial — 5.46% | ||||||||
| 350,000 | Andrew W Mellon Foundation (The), Series 2020, 0.95%, 8/1/27 | 299,180 | ||||||
| 250,000 | BlueHub Loan Fund, Inc., Series 2020, 2.89%, 1/1/27 | 230,139 | ||||||
| 2,375,000 | BlueHub Loan Fund, Inc., Series 2020, 3.10%, 1/1/30 | 1,946,188 | ||||||
| 1,600,000 | Bridge Housing Corp., 3.25%, 7/15/30 | 1,361,948 | ||||||
| 250,000 | Community Preservation Corp. (The), Series 2020, 2.87%, 2/1/30 | 208,805 | ||||||
| 2,100,000 | Healthcare Realty Holdings LP, REIT, 2.40%, 3/15/30 | 1,613,222 | ||||||
| 590,000 | Low Income Investment Fund, Series 2019, 3.39%, 7/1/26 | 544,856 | ||||||
| 1,300,000 | Low Income Investment Fund, Series 2019, 3.71%, 7/1/29 | 1,143,854 | ||||||
| 2,000,000 | National Community Renaissance of California, Series 2022, 3.27%, 12/1/32 | 1,613,645 | ||||||
40
SCHEDULE OF PORTFOLIO INVESTMENTS
|
RBC BlueBay Impact Bond Fund (cont.)
September 30, 2023
Principal Amount | Value | |||||||
|
| |||||||
| $2,160,000 | Preservation of Affordable Housing, Inc., 4.48%, 12/1/32 | $ | 1,973,220 | |||||
| 2,500,000 | Reinvestment Fund, Inc. (The), 3.93%, 2/15/28 | 2,230,292 | ||||||
|
| |||||||
| 13,165,349 | ||||||||
|
| |||||||
Industrial — 1.68% | ||||||||
| 2,600,000 | Agilent Technologies, Inc., 2.75%, 9/15/29 | 2,218,703 | ||||||
| 1,000,000 | Nature Conservancy (The), Series A, 0.94%, 7/1/26 | 881,128 | ||||||
| 1,000,000 | Nature Conservancy (The), Series A, 1.15%, 7/1/27 | 852,936 | ||||||
| 70,000 | Nature Conservancy (The), Series A, 1.51%, 7/1/29 | 56,098 | ||||||
| 53,000 | Nature Conservancy (The), Series A, 1.86%, 7/1/33 | 36,164 | ||||||
|
| |||||||
| 4,045,029 | ||||||||
|
| |||||||
Utilities — 2.69% | ||||||||
| 3,150,000 | American Water Capital Corp., 4.45%, 6/1/32 | 2,904,903 | ||||||
| 1,534,000 | Avangrid, Inc., 3.15%, 12/1/24 | 1,478,111 | ||||||
| 1,350,000 | Avangrid, Inc., 3.80%, 6/1/29 | 1,199,005 | ||||||
| 1,060,000 | Essential Utilities, Inc., 5.30%, 5/1/52 | 909,613 | ||||||
|
| |||||||
| 6,491,632 | ||||||||
|
| |||||||
Total Corporate Bonds | 64,056,715 | |||||||
|
| |||||||
(Cost $73,336,764) | ||||||||
U.S. Government Agency Backed Mortgages — 25.46% | ||||||||
Fannie Mae — 15.35% | ||||||||
| 50,000 | Pool #AN0360, 3.95%, 12/1/45 | 37,469 | ||||||
| 90,042 | Pool #AN7868, 3.06%, 12/1/27 | 83,027 | ||||||
| 9,526 | Pool #BJ0657, 4.00%, 2/1/48 | 8,615 | ||||||
| 30,377 | Pool #BJ2670, 4.00%, 4/1/48 | 27,466 | ||||||
| 53,636 | Pool #BJ3178, 4.00%, 11/1/47 | 48,835 | ||||||
| 36,765 | Pool #BJ5158, 4.00%, 4/1/48 | 33,242 | ||||||
| 42,162 | Pool #BJ9439, 4.00%, 2/1/48 | 38,224 | ||||||
| 48,714 | Pool #BJ9477, 4.00%, 4/1/48 | 44,164 | ||||||
| 47,171 | Pool #BK7924, 4.00%, 11/1/48 | 42,765 | ||||||
| 21,428 | Pool #BO1263, 3.50%, 6/1/49 | 18,654 | ||||||
| 685,413 | Pool #BP3417, 2.50%, 5/1/51 | 546,058 | ||||||
| 150,218 | Pool #BP8741, 2.50%, 6/1/50 | 119,826 | ||||||
| 278,728 | Pool #BQ7523, 2.00%, 11/1/50 | 213,149 | ||||||
| 337,194 | Pool #BQ7524, 2.50%, 10/1/50 | 270,670 | ||||||
| 1,502,115 | Pool #BR2051, 2.50%, 6/1/51 | 1,196,434 | ||||||
| 300,000 | Pool #BS0915, 1.62%, 3/1/31 | 227,632 | ||||||
| 1,542,878 | Pool #BT8237, 4.00%, 6/1/52 | 1,375,292 | ||||||
| 43,643 | Pool #CA1066, 4.00%, 1/1/48 | 39,522 | ||||||
| 21,725 | Pool #CA1068, 3.50%, 1/1/48 | 18,986 | ||||||
| 35,245 | Pool #CA2595, 4.50%, 11/1/48 | 32,930 | ||||||
| 65,885 | Pool #CA2912, 4.00%, 12/1/48 | 59,802 | ||||||
| 44,486 | Pool #CA3132, 4.00%, 2/1/49 | 40,334 | ||||||
| 44,125 | Pool #CA3174, 4.00%, 2/1/49 | 40,003 | ||||||
| 263,777 | Pool #CA3451, 3.50%, 5/1/49 | 229,750 | ||||||
41
SCHEDULE OF PORTFOLIO INVESTMENTS
|
RBC BlueBay Impact Bond Fund (cont.)
September 30, 2023
Principal Amount | Value | |||||
| ||||||
$ 190,514 | Pool #CA3456, 3.50%, 5/1/49 | $ | 165,922 | |||
345,428 | Pool #CA9048, 2.00%, 2/1/51 | 263,835 | ||||
1,001,454 | Pool #CB0480, 2.50%, 5/1/51 | 797,657 | ||||
578,554 | Pool #CB0576, 2.50%, 5/1/51 | 460,818 | ||||
1,511,791 | Pool #CB2761, 3.00%, 2/1/52 | 1,253,993 | ||||
2,281,554 | Pool #CB3227, 3.50%, 3/1/52 | 1,964,116 | ||||
2,787,281 | Pool #CB3764, 4.00%, 6/1/52 | 2,484,530 | ||||
1,969,939 | Pool #CB3797, 4.00%, 6/1/52 | 1,755,967 | ||||
2,130,381 | Pool #CB4272, 4.50%, 7/1/52 | 1,955,545 | ||||
1,996,260 | Pool #CB4314, 4.50%, 8/1/52 | 1,832,431 | ||||
1,965,918 | Pool #CB4463, 4.50%, 8/1/52 | 1,804,579 | ||||
2,071,092 | Pool #CB4767, 5.00%, 9/1/52 | 1,953,852 | ||||
2,203,004 | Pool #CB4967, 5.50%, 10/1/52 | 2,130,973 | ||||
1,547,722 | Pool #CB5166, 6.00%, 11/1/52 | 1,528,198 | ||||
551,263 | Pool #CB5202, 6.50%, 11/1/52 | 553,814 | ||||
1,224,549 | Pool #CB5220, 6.50%, 12/1/52 | 1,230,214 | ||||
1,371,620 | Pool #CB6607, 5.50%, 7/1/53 | 1,326,119 | ||||
1,978,434 | Pool #CB6783, 5.00%, 7/1/53 | 1,866,998 | ||||
2,246,379 | Pool #CB6784, 5.50%, 7/1/53 | 2,171,185 | ||||
2,228,758 | Pool #CB6826, 5.50%, 7/1/53 | 2,171,049 | ||||
2,511,615 | Pool #CB7160, 6.50%, 9/1/53 | 2,543,864 | ||||
|
| |||||
| 37,008,508 | ||||||
|
| |||||
FNMA, TBA — 0.65% | ||||||
1,575,000 | 5.21%, 10/1/28(b) | 1,567,064 | ||||
|
| |||||
Freddie Mac — 9.36% | ||||||
38,731 | Pool #Q59453, 4.00%, 11/1/48 | 35,067 | ||||
197,555 | Pool #QB5731, 2.00%, 11/1/50 | 151,074 | ||||
196,261 | Pool #QB5732, 2.50%, 11/1/50 | 156,407 | ||||
881,830 | Pool #QC3844, 2.00%, 6/1/51 | 672,548 | ||||
253,224 | Pool #QC3845, 2.50%, 6/1/51 | 201,646 | ||||
980,385 | Pool #QC7895, 2.00%, 9/1/51 | 747,227 | ||||
782,026 | Pool #QE4428, 4.00%, 6/1/52 | 697,083 | ||||
1,966,379 | Pool #QE6510, 4.50%, 7/1/52 | 1,805,003 | ||||
2,109,022 | Pool #QG5944, 5.00%, 6/1/53 | 1,989,198 | ||||
51,233 | Pool #RA1713, 3.00%, 11/1/49 | 42,890 | ||||
79,887 | Pool #RA1714, 3.00%, 11/1/49 | 66,878 | ||||
135,458 | Pool #RA2256, 3.00%, 3/1/50 | 113,258 | ||||
177,781 | Pool #RA2340, 3.00%, 3/1/50 | 148,624 | ||||
167,881 | Pool #RA2395, 2.50%, 4/1/50 | 134,008 | ||||
396,613 | Pool #RA2575, 2.50%, 5/1/50 | 316,517 | ||||
138,892 | Pool #RA2727, 2.00%, 5/1/50 | 106,429 | ||||
137,789 | Pool #RA2728, 2.50%, 5/1/50 | 109,937 | ||||
351,544 | Pool #RA2740, 2.50%, 6/1/50 | 282,597 | ||||
295,564 | Pool #RA3680, 2.50%, 9/1/50 | 235,655 | ||||
204,605 | Pool #RA3751, 2.00%, 10/1/50 | 157,084 | ||||
337,811 | Pool #RA4503, 2.00%, 2/1/51 | 258,017 | ||||
312,373 | Pool #RA4927, 2.00%, 3/1/51 | 238,548 | ||||
42
SCHEDULE OF PORTFOLIO INVESTMENTS |
RBC BlueBay Impact Bond Fund (cont.)
September 30, 2023
| Principal Amount | Value | |||||||||
| $ | 463,630 | Pool #RA5020, 2.00%, 4/1/51 | $ | 353,943 | ||||||
| 1,254,395 | Pool #RA5195, 2.50%, 5/1/51 | 995,781 | ||||||||
| 884,060 | Pool #RA5197, 2.50%, 5/1/51 | 704,318 | |||||||
| 462,550 | Pool #RA5237, 2.50%, 5/1/51 | 368,507 | ||||||||
| 1,464,054 | Pool #RA5571, 2.50%, 7/1/51 | 1,165,574 | ||||||||
| 218,033 | Pool #RA5621, 2.50%, 8/1/51 | 173,582 | ||||||||
| 706,410 | Pool #RA5701, 2.00%, 8/1/51 | 538,409 | ||||||||
| 190,274 | Pool #RA5874, 2.50%, 9/1/51 | 151,412 | ||||||||
| 2,308,889 | Pool #RA6108, 3.50%, 3/1/52 | 1,988,007 | ||||||||
| 1,958,552 | Pool #RA6760, 3.00%, 2/1/52 | 1,624,569 | ||||||||
| 2,258,046 | Pool #RA7454, 4.00%, 6/1/52 | 2,012,429 | ||||||||
| 1,897,645 | Pool #RA7714, 4.50%, 7/1/52 | 1,741,909 | ||||||||
| 53,483 | Pool #V84506, 4.00%, 7/1/48 | 48,424 | ||||||||
| 42,149 | Pool #V84836, 4.00%, 11/1/48 | 38,159 | ||||||||
| 61,177 | Pool #V85365, 3.50%, 4/1/49 | 53,565 | ||||||||
| 177,728 | Pool #V85381, 3.50%, 4/1/49 | 154,976 | ||||||||
| 38,902 | Series 2018-SB45, Class A10F, 3.16%, 11/25/27(c) | 36,412 | ||||||||
| 54,888 | Series 2018-SB47, Class A10F, 3.35%, 1/25/28(c) | 50,811 | ||||||||
| 51,472 | Series 2018-SB48, Class A10F, 3.37%, 2/25/28(c) | 47,432 | ||||||||
| 143,011 | Series 2019-SB59, Class A10F, 3.47%, 1/25/29(c) | 132,709 | ||||||||
| 1,341,838 | Series 2021-SB87, Class A5H, 0.78%, 4/25/41(c) | 1,206,027 | ||||||||
| 66,313 | Series KF57, Class A, (SOFR30A + 0.654%), 5.97%, 12/25/28(d) | 65,944 | ||||||||
| 317,403 | Series Q014, Class A1, 1.56%, 1/25/36(d) | 243,874 | ||||||||
|
| |||||||||
| 22,562,468 | ||||||||||
|
| |||||||||
Ginnie Mae — 0.10% | ||||||||||
| 128,679 | Pool #AC3667, 1.66%, 8/15/26 | 128,679 | ||||||||
| 32,728 | Pool #BB3740, 4.00%, 11/15/47 | 29,822 | ||||||||
| 56,719 | Pool #BE3008, 4.00%, 4/20/48 | 51,616 | ||||||||
| 29,549 | Series 2018-2, Class AD, 2.40%, 3/16/59 | 25,989 | ||||||||
| 21,523 | Series 2018-26, Class AD, 2.50%, 3/16/52 | 19,893 | ||||||||
|
| |||||||||
| 255,999 | ||||||||||
|
| |||||||||
Total U.S. Government Agency Backed Mortgages | 61,394,039 | |||||||||
|
| |||||||||
(Cost $69,985,815) | ||||||||||
Municipal Bonds — 16.75% | ||||||||||
Alabama — 0.37% | ||||||||||
| 150,000 | Water Works Board of the City of Birmingham Revenue, 2.60%, 1/1/27 | 138,623 | ||||||||
| 1,000,000 | Water Works Board of the City of Birmingham Revenue, 2.39%, 1/1/35, Callable 7/1/31 @ 100 | 746,419 | ||||||||
|
| |||||||||
| 885,042 | ||||||||||
|
| |||||||||
43
SCHEDULE OF PORTFOLIO INVESTMENTS |
RBC BlueBay Impact Bond Fund (cont.)
September 30, 2023
| Principal Amount | Value | |||||||||||
Arizona — 0.35% | ||||||||||||
| $ | 750,000 | City of Phoenix Civic Improvement Corp. Revenue, Series C, 1.38%, 7/1/27 | $ | 654,566 | ||||||||
| 250,000 | City of Tucson Water System Revenue, 1.88%, 7/1/30 | 199,145 | ||||||||||
|
| |||||||||||
| 853,711 | ||||||||||||
|
| |||||||||||
Arkansas — 0.04% | ||||||||||||
| 100,000 | City of Russellville Water & Sewer Revenue, Series B, 1.23%, 7/1/26, (Credit Support: BAM) | 89,430 | ||||||||||
|
| |||||||||||
California — 5.16% | ||||||||||||
| 150,000 | California Health Facilities. Financing Authority Revenue, 2.02%, 6/1/24 | 146,393 | ||||||||||
| 250,000 | California Health Facilities. Financing Authority Revenue, 1.68%, 6/1/28 | 213,151 | ||||||||||
| 815,000 | California Health Facilities. Financing Authority Revenue, 1.98%, 6/1/30 | 659,594 | ||||||||||
| 990,000 | California Health Facilities. Financing Authority Revenue, 2.53%, 6/1/35 | 736,021 | ||||||||||
| 460,000 | Calleguas Municipal Water District Revenue, Series A, 2.52%, 7/1/36 | 331,903 | ||||||||||
| 135,000 | City & County of San Francisco GO, Series A, 2.82%, 6/15/24 | 132,210 | ||||||||||
| 100,000 | City & County of San Francisco GO, 1.95%, 6/15/27 | 89,196 | ||||||||||
| 100,000 | City of Los Angeles Housing GO, Series A, 2.95%, 9/1/28, Callable 9/1/27 @ 100 | 91,469 | ||||||||||
| 350,000 | City of San Buenaventura Revenue, 1.17%, 1/1/26 | 319,847 | ||||||||||
| 750,000 | City of Santa Rosa Wastewater Revenue, Series B, 2.12%, 9/1/31 | 590,698 | ||||||||||
| 300,000 | City of Santa Rosa Wastewater Revenue, Series B, 2.32%, 9/1/33 | 227,856 | ||||||||||
| 100,000 | City of Sunnyvale Wastewater Revenue, Series A, 3.20%, 4/1/26 | 94,990 | ||||||||||
| 210,000 | Cucamonga Valley Water District Financing Authority Revenue, Series A, 1.54%, 9/1/27 | 182,806 | ||||||||||
| 1,500,000 | Cucamonga Valley Water District Financing Authority Revenue, Series B, 3.60%, 9/1/27 | 1,413,723 | ||||||||||
| 150,000 | Escondido Joint Powers Financing Authority Revenue, Series B, 2.44%, 9/1/25 | 141,739 | ||||||||||
| 150,000 | Kern Community College District GO, 2.54%, 11/1/26 | 138,343 | ||||||||||
| 240,000 | Lancaster Power Authority Revenue, 1.67%, 11/1/27, (Credit Support: AGM) | 204,987 | ||||||||||
| 285,000 | Lancaster Power Authority Revenue, 1.92%, 11/1/28, (Credit Support: AGM) | 237,402 | ||||||||||
| 525,000 | Lancaster Power Authority Revenue, 2.56%, 11/1/33, (Credit Support: AGM), Callable 11/1/31 @ 100 | 392,105 | ||||||||||
| 525,000 | Lancaster Power Authority Revenue, 2.68%, 11/1/34, (Credit Support: AGM), Callable 11/1/31 @ 100 | 386,367 | ||||||||||
| 755,000 | Lancaster Power Authority Revenue, 2.79%, 11/1/35, (Credit Support: AGM), Callable 11/1/31 @ 100 | 547,774 | ||||||||||
| 200,000 | Rosemead School District GO, Series A, 2.17%, 8/1/25 | 188,069 | ||||||||||
| 250,000 | Rowland Water District Revenue, Series A, 1.61%, 12/1/29 | 200,743 | ||||||||||
44
SCHEDULE OF PORTFOLIO INVESTMENTS
|
RBC BlueBay Impact Bond Fund (cont.)
September 30, 2023
| Principal Amount | Value | |||||||||
| $ | 1,000,000 | Rowland Water District Revenue, Series A, 1.91%, 12/1/31 | $ | 764,473 | ||||||
| 800,000 | Rowland Water District Revenue, Series A, 2.56%, 12/1/36, Callable 12/1/31 @ 100 | 571,434 | ||||||||
| 125,000 | San Diego County Water Authority Revenue, Series A, 1.17%, 5/1/27 | 109,247 | |||||||
| 100,000 | San Francisco City & County Public Utilities Commission Wastewater Revenue, 5.40%, 10/1/28 | 100,026 | ||||||||
| 400,000 | Santa Clara Valley Water District Certificate Participation, Series D, 1.78%, 6/1/31, Callable 6/1/30 @ 100 | 306,013 | ||||||||
| 1,060,000 | Santa Clara Valley Water District Certificate Participation, Series D, 1.88%, 6/1/32, Callable 6/1/30 @ 100 | 791,010 | ||||||||
| 950,000 | Santa Clara Valley Water District Certificate Participation, Series D, 2.08%, 6/1/34, Callable 6/1/30 @ 100 | 681,639 | ||||||||
| 600,000 | Sonoma-Marin Area Rail Transit District Revenue, Series A, 2.02%, 3/1/28 | 526,769 | ||||||||
| 100,000 | State of California Department of Water Resources Revenue, 0.92%, 12/1/26 | 87,762 | ||||||||
| 315,000 | Walnut Valley Water District Revenue, Series A, 0.96%, 6/1/26 | 281,169 | ||||||||
| 320,000 | Walnut Valley Water District Revenue, Series A, 1.17%, 6/1/27 | 276,968 | ||||||||
| 325,000 | Walnut Valley Water District Revenue, Series A, 1.37%, 6/1/28 | 272,920 | ||||||||
|
| |||||||||
| 12,436,816 | ||||||||||
|
| |||||||||
Colorado — 0.12% | ||||||||||
| 50,000 | Denver City & County School District No 1 GO, Series B, 2.99%, 12/1/24, (Credit Support: State Aid Withholding) | 48,430 | ||||||||
| 275,000 | Parker Water & Sanitation District GO, 2.10%, 8/1/29 | 233,306 | ||||||||
|
| |||||||||
| 281,736 | ||||||||||
|
| |||||||||
Connecticut — 0.17% | ||||||||||
| 325,000 | Connecticut Green Bank Revenue, 1.95%, 11/15/28 | 275,040 | ||||||||
| 150,000 | South Central Connecticut Regional Water Authority Revenue, Series B, 2.86%, 8/1/30, Callable 8/1/29 @ 100 | 127,630 | ||||||||
|
| |||||||||
| 402,670 | ||||||||||
|
| |||||||||
District of Columbia — 0.82% | ||||||||||
| 340,000 | District of Columbia Housing Finance Agency Revenue, Series A, 1.05%, 3/1/25, (Credit Support: FHA) | 318,834 | ||||||||
| 155,000 | District of Columbia Housing Finance Agency Revenue, Series A, 1.15%, 9/1/25, (Credit Support: FHA) | 142,673 | ||||||||
| 350,000 | District of Columbia Housing Finance Agency Revenue, Series A, 1.20%, 3/1/26, (Credit Support: FHA) | 316,175 | ||||||||
| 195,000 | District of Columbia Housing Finance Agency Revenue, Series A, 1.50%, 3/1/27, (Credit Support: FHA) | 171,212 | ||||||||
| 195,000 | District of Columbia Housing Finance Agency Revenue, Series A, 1.60%, 9/1/27, (Credit Support: FHA) | 168,828 | ||||||||
| 200,000 | District of Columbia Housing Finance Agency Revenue, Series A, 1.70%, 3/1/28, (Credit Support: FHA) | 170,674 | ||||||||
| 135,000 | District of Columbia Housing Finance Agency Revenue, Series A, 1.75%, 9/1/28, (Credit Support: FHA) | 113,334 | ||||||||
45
SCHEDULE OF PORTFOLIO INVESTMENTS
|
RBC BlueBay Impact Bond Fund (cont.)
September 30, 2023
| Principal Amount | Value | |||||||||
| $ | 140,000 | District of Columbia Housing Finance Agency Revenue, Series A, 1.95%, 9/1/29, (Credit Support: FHA) | $ | 114,565 | |||||
| 590,000 | District of Columbia Housing Finance Agency Revenue, Series A, 2.15%, 3/1/31, (Credit Support: FHA), Callable 3/1/30 @ 100 | 465,390 | ||||||||
|
| |||||||||
| 1,981,685 | ||||||||||
|
| |||||||||
Florida — 0.69% | ||||||||||
| 2,000,000 | City of Palm Coast Utility Revenue, 1.44%, 10/1/28 | 1,667,435 | ||||||||
|
| |||||||||
Georgia — 0.29% | ||||||||||
| 285,000 | Carroll County Water Authority Revenue, Series B, 1.51%, 7/1/27 | 249,349 | ||||||||
| 75,000 | Macon-Bibb County Urban Development Authority Revenue, Series A, 3.00%, 12/1/24, (Credit Support: County Guaranteed) | 72,714 | ||||||||
| 425,000 | Tift County Hospital Authority Revenue, 1.05%, 12/1/25, (Credit Support: County Guaranteed) | 386,016 | ||||||||
|
| |||||||||
| 708,079 | ||||||||||
|
| |||||||||
Hawaii — 0.34% | ||||||||||
| 695,000 | City & County of Honolulu GO, Series C, 1.47%, 7/1/28 | 590,738 | ||||||||
| 250,000 | Honolulu City & County Board of Water Supply Revenue, Series B, 1.98%, 7/1/27 | 224,243 | ||||||||
|
| |||||||||
| 814,981 | ||||||||||
|
| |||||||||
Idaho — 0.13% | ||||||||||
| 500,000 | Idaho Energy Resources Authority Revenue, 2.86%, 9/1/46 | 324,463 | ||||||||
|
| |||||||||
Iowa — 0.04% | ||||||||||
| 100,000 | Northeast Iowa Community College GO, Series 1, 3.45%, 6/1/26, Callable 6/1/24 @ 100 | 95,620 | ||||||||
|
| |||||||||
Maryland — 0.08% | ||||||||||
| 225,000 | City of Baltimore Revenue, Series B, 1.58%, 7/1/28 | 190,405 | ||||||||
|
| |||||||||
Massachusetts — 0.56% | ||||||||||
| 600,000 | Boston Water & Sewer Commission Revenue, 1.37%, 11/1/27 | 519,800 | ||||||||
| 1,040,000 | Massachusetts Bay Transportation Authority Sales Tax Revenue, Series B, 2.49%, 7/1/33, Callable 7/1/31 @ 100 | 827,600 | ||||||||
|
| |||||||||
| 1,347,400 | ||||||||||
|
| |||||||||
Michigan — 0.78% | ||||||||||
| 750,000 | City of Grand Rapids Sanitary Sewer System Revenue, 1.86%, 1/1/31 | 589,710 | ||||||||
| 1,330,000 | City of Grand Rapids Sanitary Sewer System Revenue, 2.01%, 1/1/32, Callable 1/1/31 @ 100 | 1,023,846 | ||||||||
46
SCHEDULE OF PORTFOLIO INVESTMENTS
|
RBC BlueBay Impact Bond Fund (cont.)
September 30, 2023
| Principal Amount | Value | |||||||||||
| $ | 95,000 | Marquette Brownfield Redevelopment Authority Revenue, 3.05%, 5/1/27, (Credit Support: Municipal Government Guaranteed), Callable 5/1/26 @ 100 | $ | 88,807 | ||||||||
| 225,000 | State of Michigan GO, Series B, 1.54%, 5/15/30 | 178,384 | ||||||||||
|
| |||||||||||
| 1,880,747 | ||||||||||||
|
| |||||||||||
| Nebraska — 0.13% | |||||||||||
| 100,000 | City of Omaha Sewer Revenue, Series B, 1.04%, 4/1/26 | 90,109 | ||||||||||
| 250,000 | Papio-Missouri River Natural Resource District Special Tax, 2.20%, 12/15/25, Callable 6/15/24 @ 100 | 229,102 | ||||||||||
|
| |||||||||||
| 319,211 | ||||||||||||
|
| |||||||||||
| Nevada — 0.09% | |||||||||||
| 250,000 | City of Henderson GO, Series A, 2.23%, 6/1/28 | 220,349 | ||||||||||
|
| |||||||||||
New York — 0.56% | ||||||||||||
| 570,000 | New York State Housing Finance Agency Revenue, 1.13%, 11/1/25, (Credit Support: SONYMA), Callable 10/20/23 @ 100 | 520,922 | ||||||||||
| 600,000 | Western Nassau County Water Authority Revenue, Series B, 2.50%, 4/1/34 | 458,159 | ||||||||||
| 500,000 | Western Nassau County Water Authority Revenue, Series B, 2.58%, 4/1/35 | 374,970 | ||||||||||
|
| |||||||||||
| 1,354,051 | ||||||||||||
|
| |||||||||||
Ohio — 0.07% | ||||||||||||
| 130,000 | City of Cincinnati Revenue, Series C, 3.95%, 11/1/28 | 123,022 | ||||||||||
| 100,000 | County of Franklin Revenue, 2.88%, 11/1/50, Callable 5/1/50 @ 100 | 59,242 | ||||||||||
|
| |||||||||||
| 182,264 | ||||||||||||
|
| |||||||||||
Oklahoma — 0.53% | ||||||||||||
| 715,000 | Oklahoma Capitol Improvement Authority Revenue, Series A, 2.58%, 7/1/28 | 634,314 | ||||||||||
| 745,000 | Oklahoma Capitol Improvement Authority Revenue, Series A, 2.63%, 7/1/29 | 645,691 | ||||||||||
|
| |||||||||||
| 1,280,005 | ||||||||||||
|
| |||||||||||
| Oregon — 0.63% | |||||||||||
| 350,000 | City of Portland GO, Series B, 1.51%, 6/15/28 | 300,079 | ||||||||||
| 300,000 | City of Tigard Water Revenue, 2.00%, 8/1/28, (Credit Support: BAM) | 254,501 | ||||||||||
| 345,000 | State of Oregon GO, Series F, 1.32%, 6/1/27 | 302,699 | ||||||||||
| 700,000 | State of Oregon GO, Series B, 3.89%, 5/1/30 | 652,464 | ||||||||||
|
| |||||||||||
| 1,509,743 | ||||||||||||
|
| |||||||||||
Pennsylvania — 1.22% | ||||||||||||
| 1,750,000 | City of Philadelphia Water & Wastewater Revenue, Series B, 1.49%, 7/1/27 | 1,524,300 | ||||||||||
| 185,000 | City of Philadelphia Water & Wastewater Revenue, Series A, 3.55%, 10/1/28 | 174,194 | ||||||||||
47
SCHEDULE OF PORTFOLIO INVESTMENTS
|
RBC BlueBay Impact Bond Fund (cont.)
September 30, 2023
Principal Amount | Value | |||||||
| $ 825,000 | Economy Borough Municipal Authority Revenue, Series A, 1.65%, 12/15/28, (Credit Support: BAM) | $ | 688,162 | |||||
| 500,000 | Redevelopment Authority of the City of Philadelphia Revenue, Series A, 1.38%, 9/1/25 | 461,948 | ||||||
| 100,000 | Redevelopment Authority of the City of Philadelphia Revenue, 4.50%, 11/1/31, Callable 11/1/28 @ 100 | 92,763 | ||||||
|
| |||||||
| 2,941,367 | ||||||||
|
| |||||||
Rhode Island — 0.97% | ||||||||
| 1,295,000 | Narragansett Bay Commission Revenue, 2.09%, 9/1/30 | 1,052,339 | ||||||
| 400,000 | Narragansett Bay Commission Revenue, 2.26%, 9/1/32, Callable 9/1/30 @ 100 | 310,906 | ||||||
| 150,000 | Rhode Island Infrastructure Bank Revenue, 2.70%, 10/1/28 | 133,937 | ||||||
| 1,000,000 | Rhode Island Infrastructure Bank State Revolving Fund Revenue, Series A, 1.40%, 10/1/28 | 841,651 | ||||||
|
| |||||||
| 2,338,833 | ||||||||
|
| |||||||
Tennessee — 0.06% | ||||||||
| 160,000 | Metropolitan Government of Nashville & Davidson County Water & Sewer Revenue, Series B, 1.47%, 7/1/27 | 138,616 | ||||||
|
| |||||||
Texas — 1.22% | ||||||||
| 250,000 | City of Houston Combined Utility System Revenue, Series C, 2.05%, 11/15/26 | 227,383 | ||||||
| 170,000 | City of Temple Utility System Revenue, 1.11%, 8/1/25 | 157,464 | ||||||
| 300,000 | City of Temple Utility System Revenue, 1.53%, 8/1/27 | 262,176 | ||||||
| 690,000 | City of Temple Utility System Revenue, 1.80%, 8/1/29 | 569,144 | ||||||
| 800,000 | Dallas Area Rapid Transit Revenue, 2.18%, 12/1/32 | 619,832 | ||||||
| 335,000 | Hidalgo County Drain District No 1 GO, Series A, 0.96%, 9/1/25 | 307,540 | ||||||
| 275,000 | Hidalgo County Drain District No 1 GO, Series A, 1.11%, 9/1/26 | 244,144 | ||||||
| 225,000 | Hidalgo County Drain District No 1 GO, Series A, 1.35%, 9/1/27 | 194,585 | ||||||
| 130,000 | Hidalgo County Drain District No 1 GO, Series A, 1.50%, 9/1/28 | 109,127 | ||||||
| 300,000 | Hidalgo County Drain District No 1 GO, Series A, 1.67%, 9/1/29 | 245,092 | ||||||
|
| |||||||
| 2,936,487 | ||||||||
|
| |||||||
Utah — 0.18% | ||||||||
| 520,000 | Metropolitan Water District of Salt Lake & Sandy Revenue, Series B, 1.52%, 7/1/28 | 440,245 | ||||||
|
| |||||||
Vermont — 0.04% | ||||||||
| 100,000 | Vermont Housing Finance Agency Revenue, 3.45%, 11/1/29 | 88,990 | ||||||
|
| |||||||
48
SCHEDULE OF PORTFOLIO INVESTMENTS
|
RBC BlueBay Impact Bond Fund (cont.)
September 30, 2023
| Principal Amount | Value | |||||||
Washington — 1.11% | ||||||||
| $2,400,000 | City of Tacoma Electric System Revenue, Series C, 5.64%, 1/1/27 | $ | 2,420,759 | |||||
| 300,000 | Grant County Public Utility District No 2 Priest Rapids Hydroelectric Project Revenue, 1.90%, 1/1/27 | 268,763 | ||||||
|
| |||||||
| 2,689,522 | ||||||||
|
| |||||||
Total Municipal Bonds | 40,399,903 | |||||||
|
| |||||||
(Cost $48,804,221) | ||||||||
Asset Backed Securities — 16.63% | ||||||||
| 2,065,000 | DEXT ABS 2023-1 LLC, 7.13%, 9/15/32(a) | 2,079,868 | ||||||
| 1,430,000 | DEXT ABS 2023-1 LLC, 8.82%, 3/15/33(a) | 1,443,517 | ||||||
| 1,258,605 | Dext ABS LLC, Series 2020-1, Class B, 1.92%, 11/15/27(a) | 1,248,286 | ||||||
| 1,550,000 | Dext ABS LLC, Series 2021-1, Class D, 2.81%, 3/15/29(a) | 1,330,627 | ||||||
| 764,042 | GoodLeap Sustainable Home Solutions Trust, Series 2021-3CS, Class A, 2.10%, 5/20/48(a) | 556,943 | ||||||
| 1,907,729 | GoodLeap Sustainable Home Solutions Trust, Series 2021-5CS, Class B, 2.56%, 10/20/48(a) | 1,303,995 | ||||||
| 1,441,761 | GoodLeap Sustainable Home Solutions Trust, Series 2022-1GS, Class B, 2.94%, 1/20/49(a) | 989,067 | ||||||
| 4,000,000 | Hertz Vehicle Financing III LLC, 5.49%, 6/25/27(a) | 3,933,400 | ||||||
| 684,651 | Loanpal Solar Loan Ltd., Series 2021-2GS, Class A, 2.22%, 3/20/48(a) | 493,328 | ||||||
| 3,352,191 | Luminace Issuer LLC, Series 2022-1, Class B, 5.91%, 7/31/62(a) | 2,845,749 | ||||||
| 993,423 | Sunnova Helios II Issuer LLC, Series 2019-AA, Class A, 3.75%, 6/20/46(a) | 875,668 | ||||||
| 955,302 | Sunnova Helios II Issuer LLC, Series 2021-B, Class A, 1.62%, 7/20/48(a) | 774,224 | ||||||
| 1,430,508 | Sunnova Helios V Issuer LLC, Series 2021-A, Class A, 1.80%, 2/20/48(a) | 1,091,180 | ||||||
| 869,248 | Sunnova Helios VII Issuer LLC, Series 2021-C, Class A, 2.03%, 10/20/48(a) | 720,801 | ||||||
| 217,312 | Sunnova Helios VII Issuer LLC, Series 2021-C, Class C, 2.63%, 10/20/48(a) | 165,543 | ||||||
| 2,031,578 | Sunnova Helios XI Issuer LLC, Series 2023-A, Class B, 5.60%, 5/20/50(a) | 1,925,864 | ||||||
| 492,642 | Sunnova Helios XII Issuer LLC, Series 2023-B, Class C, 6.00%, 8/22/50(a),(c) | 430,372 | ||||||
| 3,952,234 | Sunnova Sol IV Issuer LLC, Series 2022-A, Class C, 3.53%, 2/22/49(a) | 3,092,573 | ||||||
| 796,433 | Sunrun Iris Issuer LLC, Series 2023-1A, Class A, 5.75%, 1/30/59(a) | 749,768 | ||||||
| 800,000 | Tesla Auto Lease Trust, 1.02%, 3/20/25(a) | 794,255 | ||||||
| 3,000,000 | Tesla Auto Lease Trust, Series 2021-A, Class D, 1.34%, 3/20/25(a) | 2,947,261 | ||||||
| 3,200,000 | Tesla Auto Lease Trust, Series 2021-B, Class C, 1.12%, 9/22/25(a) | 3,054,900 | ||||||
49
SCHEDULE OF PORTFOLIO INVESTMENTS
|
RBC BlueBay Impact Bond Fund (cont.)
September 30, 2023
| Principal Amount | Value | |||||||
| $ 2,000,000 | Tesla Auto Lease Trust, Series 2021-B, Class D, 1.32%, 9/22/25(a) | $ | 1,900,899 | |||||
| 5,400,000 | Tesla Auto Lease Trust, Series 2023-A, Class B, 6.41%, 7/20/27(a) | 5,370,268 | ||||||
|
| |||||||
Total Asset Backed Securities | 40,118,356 | |||||||
|
| |||||||
(Cost $43,283,119) | ||||||||
U.S. Government Agency Obligations — 3.85% | ||||||||
Small Business Administration — 2.40% | ||||||||
| 244,717 | Certificate of Originator’s Fee, 0.03%, 4/15/31(b),(d) | 126 | ||||||
| 143,106 | Certificate of Originator’s Fee, 0.23%, 12/15/30(b),(d) | 567 | ||||||
| 447,502 | Certificate of Originator’s Fee, 0.23%, 3/15/31(b),(d) | 1,774 | ||||||
| 344,250 | Certificate of Originator’s Fee, 0.23%, 5/15/31(b),(d) | 1,364 | ||||||
| 389,700 | Certificate of Originator’s Fee, 0.28%, 5/17/46(b),(d) | 2,982 | ||||||
| 450,000 | Certificate of Originator’s Fee, 0.48%, 9/1/31(b) | 4,039 | ||||||
| 443,934 | Certificate of Originator’s Fee, 0.53%, 6/15/31(b),(d) | 4,055 | ||||||
| 222,833 | Certificate of Originator’s Fee, 0.78%, 4/15/31(b),(d) | 2,995 | ||||||
| 1,350,000 | Certificate of Originator’s Fee, 0.78%, 7/15/31(b),(d) | 18,147 | ||||||
| 495,000 | Certificate of Originator’s Fee, 0.78%, 8/15/31(b),(d) | 6,654 | ||||||
| 315,000 | Certificate of Originator’s Fee, 0.78%, 8/15/31(b),(d) | 4,234 | ||||||
| 103,500 | Certificate of Originator’s Fee, 0.78%, 8/15/31(b),(d) | 1,391 | ||||||
| 494,802 | Certificate of Originator’s Fee, 0.98%, 4/15/31(b),(d) | 9,797 | ||||||
| 404,563 | Certificate of Originator’s Fee, 1.03%, 4/15/46(b),(d) | 11,389 | ||||||
| 346,986 | Certificate of Originator’s Fee, 1.23%, 5/10/31(b) | 7,981 | ||||||
| 270,000 | Certificate of Originator’s Fee, 1.23%, 8/2/31(b) | 6,210 | ||||||
| 180,000 | Certificate of Originator’s Fee, 1.23%, 9/10/31(b) | 4,140 | ||||||
| 139,500 | Certificate of Originator’s Fee, 1.23%, 9/16/31(b) | 3,208 | ||||||
| 940,950 | Certificate of Originator’s Fee, 1.28%, 4/7/46(b),(d) | 32,917 | ||||||
| 437,400 | Certificate of Originator’s Fee, 1.28%, 6/23/46(b),(d) | 15,302 | ||||||
| 1,226,700 | Certificate of Originator’s Fee, 1.28%, 6/30/46(b),(d) | 42,914 | ||||||
| 31,845 | (TBA), 5.27%, 3/30/28(b),(d) | 35,345 | ||||||
| 19,751 | (TBA), 5.58%, 9/23/25(b),(d) | 21,693 | ||||||
| 24,346 | (Prime Index - 2.500%), 5.75%, 2/25/28(d) | 24,368 | ||||||
| 69,393 | (Prime Index - 2.500%), 5.75%, 4/25/44(d) | 69,363 | ||||||
| 83,086 | 7.08%, 7/25/30(d) | 81,233 | ||||||
| 40,705 | (Prime Index - 0.675%), 7.58%, 9/25/43(d) | 42,383 | ||||||
| 171,228 | (Prime Index - 0.675%), 7.58%, 11/25/45(d) | 179,373 | ||||||
| 190,098 | (Prime Index + 0.118%), 8.37%, 1/25/46(d) | 203,055 | ||||||
| 321,600 | (Prime Index + 0.325%), 8.58%, 6/25/31(d) | 337,237 | ||||||
| 324,557 | (Prime Index + 0.325%), 8.58%, 7/25/31(d) | 341,402 | ||||||
| 401,326 | (Prime Index + 0.325%), 8.58%, 2/25/32(d) | 423,311 | ||||||
| 86,591 | (Prime Index + 0.325%), 8.58%, 9/25/44(d) | 92,460 | ||||||
| 800,311 | (Prime Index + 0.325%), 8.58%, 8/25/46(d) | 857,125 | ||||||
| 531,969 | (Prime Index + 0.375%), 8.63%, 10/25/31(d) | 557,975 | ||||||
| 606,732 | (Prime Index + 0.375%), 8.63%, 8/25/46(d) | 646,597 | ||||||
| 238,345 | (Prime Index + 0.575%), 8.83%, 4/25/31(d) | 251,016 | ||||||
| 25,068 | (Prime Index + 0.609%), 8.86%, 3/25/43(d) | 26,642 | ||||||
50
SCHEDULE OF PORTFOLIO INVESTMENTS
|
RBC BlueBay Impact Bond Fund (cont.)
September 30, 2023
| Principal Amount | Value | |||||||
| $ 21,367 | (Prime Index + 0.700%), 8.95%, 2/25/28(d) | $ | 22,067 | |||||
| 46,197 | 9.08%, 9/25/29 | 47,198 | ||||||
| 656,739 | (Prime Index + 0.825%), 9.08%, 9/25/31(d) | 697,627 | ||||||
| 321,215 | (Prime Index + 0.875%), 9.13%, 1/25/32(d) | 342,735 | ||||||
| 22,907 | (Prime Index + 1.013%), 9.26%, 11/25/28(d) | 23,870 | ||||||
| 46,194 | (Prime Index + 1.219%), 9.47%, 6/25/29(d) | 48,541 | ||||||
| 51,701 | (Prime Index + 1.575%), 9.83%, 7/25/30(d) | 54,805 | ||||||
| 59,257 | (Prime Index + 2.325%), 10.58%, 10/25/30(d) | 63,734 | ||||||
| 78,062 | (Prime Index + 2.325%), 10.58%, 1/25/31(d) | 85,138 | ||||||
|
| |||||||
| 5,758,479 | ||||||||
|
| |||||||
U.S. International Development Finance Corp. — 1.45% | ||||||||
| 1,000,000 | 1.44%, 4/15/28 | 875,830 | ||||||
| 500,000 | 1.65%, 4/15/28 | 441,736 | ||||||
| 2,198,593 | (US Treasury Bill Yield 3-Month + 0.000%), 5.55%, 7/7/40(d) | 2,198,592 | ||||||
|
| |||||||
| 3,516,158 | ||||||||
|
| |||||||
Total U.S. Government Agency Obligations | 9,274,637 | |||||||
|
| |||||||
(Cost $9,769,304) | ||||||||
Collateralized Mortgage Obligation — 1.14% | ||||||||
| 2,800,000 | BX Commercial Mortgage Trust, Series 2022-AHP, Class C, (Term SOFR 1M + 2.090%), 7.42%, 1/17/39(a),(d) | 2,739,573 | ||||||
|
| |||||||
Total Collateralized Mortgage Obligation | 2,739,573 | |||||||
|
| |||||||
(Cost $2,786,997) | ||||||||
Shares | ||||||||
Investment Company — 9.19% | ||||||||
| 22,167,440 | RBC BlueBay U.S. Goverment Money Market Fund, Institutional Class 1(e) | 22,167,440 | ||||||
|
| |||||||
Total Investment Company | 22,167,440 | |||||||
|
| |||||||
(Cost $22,167,440) | ||||||||
Total Investments | $ | 240,150,663 | ||||||
(Cost $270,133,660)(f) — 99.58% | ||||||||
Other assets in excess of liabilities — 0.42% | 1,019,610 | |||||||
|
| |||||||
NET ASSETS — 100.00% | $ | 241,170,273 | ||||||
|
| |||||||
51
SCHEDULE OF PORTFOLIO INVESTMENTS
|
RBC BlueBay Impact Bond Fund (cont.)
September 30, 2023
| (a) | Security exempt from registration under Rule 144A or Section 4(2) of the Securities Act of 1933, as amended. These securities may be resold in transactions exempt from registration, normally to qualified institutional buyers. |
| (b) | The Pricing Committee has fair valued this security under procedures established by the Fund’s Board of Trustees. |
| (c) | Variable or floating rate security, which interest rate adjusts periodically based on changes in current interest rates and prepayments on the underlying pool of assets. Rate shown is the rate in effect as of period end. |
| (d) | Floating rate note. Rate shown is as of report date. |
| (e) | Affiliated investment. |
| (f) | See Notes to Schedules of Portfolio Investments for the tax cost of securities and the breakdown of unrealized appreciation (depreciation). |
Financial futures contracts as of September 30, 2023:
Long Position | Number of Contracts | Expiration Date | Value/Unrealized | Notional Value | Clearinghouse | |||||||||||||||||
| 10 Year U.S. Ultra Treasury Bond | 5 | December 2023 | $ (13,218) | USD | $ | 557,813 | Barclays Capital Group | |||||||||||||||
| 2 Year U.S. Treasury Note | 100 | December 2023 | (73,467) | USD | 20,271,094 | Barclays Capital Group | ||||||||||||||||
| 30 Year U.S. Treasury Bond | 50 | December 2023 | (332,966) | USD | 5,689,063 | Barclays Capital Group | ||||||||||||||||
| 30 Year U.S. Ultra Treasury Bond | 96 | December 2023 | (886,268) | USD | 11,394,000 | Barclays Capital Group | ||||||||||||||||
| 5 Year U.S. Treasury Note | 175 | December 2023 | (168,870) | USD | 18,437,892 | Barclays Capital Group | ||||||||||||||||
| ||||||||||||||||||||||
Total | $(1,474,789) | |||||||||||||||||||||
| ||||||||||||||||||||||
52
SCHEDULE OF PORTFOLIO INVESTMENTS
|
RBC BlueBay Impact Bond Fund (cont.)
September 30, 2023
Abbreviations used are defined below:
AGM - Assured Guaranty Municipal Corp.
BAM - Bank of America
FHA - Insured by Federal Housing Administration
GO - General Obligations
REIT - Real Estate Investment Trust
SOFR - Secured Overnight Financing Rate
SOFR30A - Secured Overnight Financing Rate 30 Day Average
SONYMA - State of New York Mortgage Agency
TBA - To-be-announced
USD - United States Dollar
See Notes to the Financial Statements.
53
|
Statements of Assets and Liabilities
| September 30, 2023 | ||||||||
| RBC BlueBay Access Capital Community Investment Fund | RBC BlueBay Impact Bond Fund | |||||||
Assets: | ||||||||
Investments in securities, at value: | ||||||||
Unaffiliated investments (cost $737,463,157 and $247,966,220, respectively) | $ | 629,359,954 | $ | 217,983,223 | ||||
Affiliated investments (cost $37,795,609 and $22,167,440, respectively) | 37,795,609 | 22,167,440 | ||||||
Cash | 702 | 415 | ||||||
Cash at broker for financial futures contracts | 2,587,209 | 2,880,856 | ||||||
Interest and dividend receivable | 2,549,109 | 1,389,274 | ||||||
Receivable for capital shares issued | 565,914 | 35,026 | ||||||
Receivable for investments sold | 68,003,776 | 6,429,882 | ||||||
Prepaid expenses and other assets | 21,028 | 6,754 | ||||||
|
|
|
| |||||
Total Assets | 740,883,301 | 250,892,870 | ||||||
|
|
|
| |||||
Liabilities: | ||||||||
Professional fees payable | 4,929 | 4,929 | ||||||
Distributions payable | 553,520 | 23,528 | ||||||
Payable for capital shares redeemed | 594,088 | 190,313 | ||||||
Payable for investments purchased | 78,863,757 | 7,858,387 | ||||||
Unrealized depreciation on futures contracts | 1,038,439 | 1,474,789 | ||||||
Accrued expenses and other payables: | ||||||||
Investment advisory fees | 134,754 | 67,926 | ||||||
Accounting fees | 14,322 | 9,031 | ||||||
Audit fees | 40,189 | 39,018 | ||||||
Trustees’ fees | 1,489 | 120 | ||||||
Distribution fees | 3,582 | 278 | ||||||
Custodian fees | 8,604 | 1,520 | ||||||
Shareholder reports | 27,540 | 10,615 | ||||||
Shareholder servicing fees | 24,172 | — | ||||||
Transfer agent fees | 48,866 | 16,634 | ||||||
Other | 58,194 | 25,509 | ||||||
|
|
|
| |||||
Total Liabilities | 81,416,445 | 9,722,597 | ||||||
|
|
|
| |||||
Net Assets | $ | 659,466,856 | $ | 241,170,273 | ||||
|
|
|
| |||||
Net Assets Consists of: | ||||||||
Capital | $ | 834,411,354 | $ | 289,609,763 | ||||
Accumulated earnings | (174,944,498 | ) | (48,439,490 | ) | ||||
|
|
|
| |||||
Net Assets | $ | 659,466,856 | $ | 241,170,273 | ||||
|
|
|
| |||||
54
FINANCIAL STATEMENTS
|
Statements of Assets and Liabilities (cont.)
| September 30, 2023 | ||||||||||||
| RBC BlueBay Access Capital Community Investment Fund | RBC BlueBay Impact Bond Fund | |||||||||||
Net Assets | ||||||||||||
Class A | $ | 6,963,161 | $ | 974,337 | ||||||||
Class I | 600,100,456 | 108,268,405 | ||||||||||
Class IS | 52,403,239 | N/A | ||||||||||
Class R6 | N/A | 80,372,226 | ||||||||||
Class Y | N/A | 51,555,305 | ||||||||||
|
|
|
| |||||||||
Total | $ | 659,466,856 | $ | 241,170,273 | ||||||||
|
|
|
| |||||||||
Shares Outstanding (Unlimited number of shares authorized, no par value): | ||||||||||||
Class A | 958,944 | 118,962 | ||||||||||
Class I | 82,668,346 | 13,182,454 | ||||||||||
Class IS | 7,222,118 | N/A | ||||||||||
Class R6 | N/A | 9,788,811 | ||||||||||
Class Y | N/A | 6,284,266 | ||||||||||
|
|
|
| |||||||||
Total | 90,849,408 | 29,374,493 | ||||||||||
|
|
|
| |||||||||
Net Asset Values and Redemption Prices Per Share: | ||||||||||||
Class A | $ | 7.26 | $ | 8.19 | ||||||||
|
|
|
| |||||||||
Class I | $ | 7.26 | $ | 8.21 | ||||||||
|
|
|
| |||||||||
Class IS | $ | 7.26 | $ | N/A | ||||||||
|
|
|
| |||||||||
Class R6 | $ | N/A | $ | 8.21 | ||||||||
|
|
|
| |||||||||
Class Y | $ | N/A | $ | 8.20 | ||||||||
|
|
|
| |||||||||
Maximum Offering Price Per Share: | ||||||||||||
Class A | $ | 7.54 | $ | 8.51 | ||||||||
|
|
|
| |||||||||
Maximum Sales Charge - Class A | 3.75 | % | 3.75 | % | ||||||||
|
|
|
| |||||||||
See Notes to the Financial Statements.
55
FINANCIAL STATEMENTS
|
| For the Year Ended September 30, 2023 | ||||||||||||
| RBC BlueBay Access Capital Community Investment Fund | RBC BlueBay Impact Bond Fund | |||||||||||
Investment Income: | ||||||||||||
Interest income | $ | 23,427,551 | $ | 7,474,862 | ||||||||
Dividend income - affiliated | 454,526 | 803,207 | ||||||||||
|
|
|
| |||||||||
Total Investment Income | 23,882,077 | 8,278,069 | ||||||||||
Expenses: | ||||||||||||
Investment advisory fees | 2,440,954 | 807,842 | ||||||||||
Distribution fees–Class A | 20,083 | 2,468 | ||||||||||
Accounting fees | 195,024 | 87,618 | ||||||||||
Audit fees | 39,076 | 37,633 | ||||||||||
Custodian fees | 52,997 | 9,502 | ||||||||||
Insurance fees | 3,538 | 3,509 | ||||||||||
Legal fees | 39,286 | 17,842 | ||||||||||
Registrations and filing fees | 78,027 | 69,721 | ||||||||||
Shareholder reports | 111,942 | 41,112 | ||||||||||
Transfer agent fees–Class A | 29,503 | 3,574 | ||||||||||
Transfer agent fees–Class I | 323,826 | 154,601 | ||||||||||
Transfer agent fees–Class IS | 51,396 | — | ||||||||||
Transfer agent fees–Class R6 | — | 4,278 | ||||||||||
Transfer agent fees–Class Y | — | 3,516 | ||||||||||
Trustees’ fees and expenses | 42,402 | 13,383 | ||||||||||
Shareholder services administration fees–Class I | 317,823 | — | ||||||||||
Tax expense | 5,455 | 4,505 | ||||||||||
Other fees | 14,794 | 8,506 | ||||||||||
|
|
|
| |||||||||
Total expenses before fee waiver/reimbursement | 3,766,126 | 1,269,610 | ||||||||||
Expenses waived/reimbursed by: | ||||||||||||
Advisor | (642,967 | ) | (318,708 | ) | ||||||||
|
|
|
| |||||||||
Net expenses | 3,123,159 | 950,902 | ||||||||||
|
|
|
| |||||||||
Net Investment Income | 20,758,918 | 7,327,167 | ||||||||||
|
|
|
| |||||||||
Realized/Unrealized Gains/(Losses): | ||||||||||||
Net realized gains/(losses) on: | ||||||||||||
Investment transactions | (22,831,029 | ) | (7,531,917 | ) | ||||||||
Futures contracts | (1,671,663 | ) | (2,581,196 | ) | ||||||||
|
|
|
| |||||||||
Net realized losses | (24,502,692 | ) | (10,113,113 | ) | ||||||||
Net change in unrealized appreciation/(depreciation) on: | ||||||||||||
Investments | (2,226,368 | ) | 3,907,157 | |||||||||
Futures contracts | 718,791 | (808,832 | ) | |||||||||
|
|
|
| |||||||||
Net unrealized gains/(losses) | (1,507,577 | ) | 3,098,325 | |||||||||
|
|
|
| |||||||||
Change in net assets resulting from operations | $ | (5,251,351 | ) | $ | 312,379 | |||||||
|
|
|
| |||||||||
See Notes to the Financial Statements.
56
FINANCIAL STATEMENTS
|
Statements of Changes in Net Assets
| RBC BlueBay Access Capital Community Investment Fund | ||||||||||||||||
| For the Year Ended September 30, 2023 | For the Year Ended September 30, 2022 | |||||||||||||||
From Investment Activities | ||||||||||||||||
Operations: | ||||||||||||||||
Net investment income | $ | 20,758,918 | $ | 12,765,081 | ||||||||||||
Net realized losses from investments and futures contracts | (24,502,692 | ) | (3,173,420 | ) | ||||||||||||
Net change in unrealized depreciation on investments and futures contracts | (1,507,577 | ) | (115,901,452 | ) | ||||||||||||
|
|
|
| |||||||||||||
Change in net assets resulting from operations | (5,251,351 | ) | (106,309,791 | ) | ||||||||||||
|
|
|
| |||||||||||||
Distributions to Shareholders: | ||||||||||||||||
Class A | (226,861 | ) | (212,562 | ) | ||||||||||||
Class I | (20,261,352 | ) | (14,190,687 | ) | ||||||||||||
Class IS | (1,742,538 | ) | (882,785 | ) | ||||||||||||
|
|
|
| |||||||||||||
Change in net assets resulting from shareholder distributions | (22,230,751 | ) | (15,286,034 | ) | ||||||||||||
|
|
|
| |||||||||||||
Capital Transactions: | ||||||||||||||||
Proceeds from shares issued | 121,474,790 | 228,138,737 | ||||||||||||||
Distributions reinvested | 14,581,994 | 9,868,662 | ||||||||||||||
Cost of shares redeemed | (153,251,128 | ) | (159,505,905 | ) | ||||||||||||
|
|
|
| |||||||||||||
Change in net assets resulting from capital transactions | (17,194,344 | ) | 78,501,494 | |||||||||||||
|
|
|
| |||||||||||||
Net decrease in net assets | (44,676,446 | ) | (43,094,331 | ) | ||||||||||||
Net Assets: | ||||||||||||||||
Beginning of year | 704,143,302 | 747,237,633 | ||||||||||||||
|
|
|
| |||||||||||||
End of year | $ | 659,466,856 | $ | 704,143,302 | ||||||||||||
|
|
|
| |||||||||||||
Share Transactions: | ||||||||||||||||
Issued | 16,040,760 | 27,428,434 | ||||||||||||||
Reinvested | 1,918,222 | 1,191,228 | ||||||||||||||
Redeemed | (20,260,166 | ) | (19,203,225 | ) | ||||||||||||
|
|
|
| |||||||||||||
Change in shares resulting from capital transactions | (2,301,184 | ) | 9,416,437 | |||||||||||||
|
|
|
| |||||||||||||
See Notes to the Financial Statements.
57
FINANCIAL STATEMENTS
|
Statements of Changes in Net Assets
| RBC BlueBay Impact Bond Fund | ||||||||||||||||
| For the Year Ended September 30, 2023 | For the Year Ended September 30, 2022 | |||||||||||||||
From Investment Activities | ||||||||||||||||
Operations: | ||||||||||||||||
Net investment income | $ | 7,327,167 | $ | 3,760,899 | ||||||||||||
Net realized losses from investments and futures contracts | (10,113,113 | ) | (6,039,559 | ) | ||||||||||||
Net change in unrealized appreciation/(depreciation) on investments and futures contracts | 3,098,325 | (33,707,845 | ) | |||||||||||||
|
|
|
| |||||||||||||
Change in net assets resulting from operations | 312,379 | (35,986,505 | ) | |||||||||||||
|
|
|
| |||||||||||||
Distributions to Shareholders: | ||||||||||||||||
Class A | (29,225 | ) | (7,379 | ) | ||||||||||||
Class I | (3,371,710 | ) | (2,186,798 | ) | ||||||||||||
Class R6 | (2,376,728 | ) | (1,977,070 | ) | ||||||||||||
Class Y | (1,708,221 | ) | (1,470,292 | ) | ||||||||||||
|
|
|
| |||||||||||||
Change in net assets resulting from shareholder distributions | (7,485,884 | ) | (5,641,539 | ) | ||||||||||||
|
|
|
| |||||||||||||
Capital Transactions: | ||||||||||||||||
Proceeds from shares issued | 46,839,383 | 50,109,379 | ||||||||||||||
Distributions reinvested | 7,260,946 | 5,661,624 | ||||||||||||||
Cost of shares redeemed | (19,401,797 | ) | (20,446,633 | ) | ||||||||||||
|
|
|
| |||||||||||||
Change in net assets resulting from capital transactions | 34,698,532 | 35,324,370 | ||||||||||||||
|
|
|
| |||||||||||||
Net increase/(decrease) in net assets | 27,525,027 | (6,303,674 | ) | |||||||||||||
Net Assets: | ||||||||||||||||
Beginning of year | 213,645,246 | 219,948,920 | ||||||||||||||
|
|
|
| |||||||||||||
End of year | $ | 241,170,273 | $ | 213,645,246 | ||||||||||||
|
|
|
| |||||||||||||
Share Transactions: | ||||||||||||||||
Issued | 5,487,959 | 5,352,276 | ||||||||||||||
Reinvested | 854,695 | 598,137 | ||||||||||||||
Redeemed | (2,280,281 | ) | (2,222,132 | ) | ||||||||||||
|
|
|
| |||||||||||||
Change in shares resulting from capital transactions | 4,062,373 | 3,728,281 | ||||||||||||||
|
|
|
| |||||||||||||
See Notes to the Financial Statements.
58
|
RBC BlueBay Access Capital Community Investment Fund
(Selected data for a share outstanding throughout the periods indicated)
| Investment Activities | Distributions | |||||||||||||||||||||||||||
| Net Asset Value, Beginning of Year | Net Investment Income(a) | Net Realized and Unrealized Gains (Losses) on Investments | Total from Investment Activities | Net Investment Income | Total Distributions | Net Asset Value, End of Year | ||||||||||||||||||||||
Class A | ||||||||||||||||||||||||||||
Year Ended 9/30/23 | $7.56 | 0.20 | (0.28 | ) | (0.08 | ) | (0.22 | ) | (0.22 | ) | $7.26 | |||||||||||||||||
Year Ended 9/30/22 | 8.93 | 0.11 | (1.33 | ) | (1.22 | ) | (0.15 | ) | (0.15 | ) | 7.56 | |||||||||||||||||
Year Ended 9/30/21 | 9.13 | 0.10 | (0.15 | ) | (0.05 | ) | (0.15 | ) | (0.15 | ) | 8.93 | |||||||||||||||||
Year Ended 9/30/20 | 9.00 | 0.16 | 0.17 | 0.33 | (0.20 | ) | (0.20 | ) | 9.13 | |||||||||||||||||||
Year Ended 9/30/19 | 8.62 | 0.19 | 0.41 | 0.60 | (0.22 | ) | (0.22 | ) | 9.00 | |||||||||||||||||||
Class I | ||||||||||||||||||||||||||||
Year Ended 9/30/23 | $7.56 | 0.23 | (0.29 | ) | (0.06 | ) | (0.24 | ) | (0.24 | ) | $7.26 | |||||||||||||||||
Year Ended 9/30/22 | 8.92 | 0.15 | (1.33 | ) | (1.18 | ) | (0.18 | ) | (0.18 | ) | 7.56 | |||||||||||||||||
Year Ended 9/30/21 | 9.13 | 0.13 | (0.16 | ) | (0.03 | ) | (0.18 | ) | (0.18 | ) | 8.92 | |||||||||||||||||
Year Ended 9/30/20 | 8.99 | 0.19 | 0.18 | 0.37 | (0.23 | ) | (0.23 | ) | 9.13 | |||||||||||||||||||
Year Ended 9/30/19 | 8.62 | 0.22 | 0.40 | 0.62 | (0.25 | ) | (0.25 | ) | 8.99 | |||||||||||||||||||
Class IS | ||||||||||||||||||||||||||||
Year Ended 9/30/23 | $7.56 | 0.23 | (0.28 | ) | (0.05 | ) | (0.25 | ) | (0.25 | ) | $7.26 | |||||||||||||||||
Year Ended 9/30/22 | 8.92 | 0.15 | (1.33 | ) | (1.18 | ) | (0.18 | ) | (0.18 | ) | 7.56 | |||||||||||||||||
Year Ended 9/30/21 | 9.12 | 0.13 | (0.15 | ) | (0.02 | ) | (0.18 | ) | (0.18 | ) | 8.92 | |||||||||||||||||
Year Ended 9/30/20 | 8.98 | �� | 0.19 | 0.18 | 0.37 | (0.23 | ) | (0.23 | ) | 9.12 | ||||||||||||||||||
Period Ended 9/30/19(b) | 8.73 | 0.13 | 0.26 | 0.39 | (0.14 | ) | (0.14 | ) | 8.98 | |||||||||||||||||||
| (a) | Per share net investment income (loss) has been calculated using the average daily shares method. |
| (b) | For the period from March 11, 2019, (commencement of operations) to September 30, 2019. |
59
FINANCIAL HIGHLIGHTS
|
RBC BlueBay Access Capital Community Investment Fund
(Selected data for a share outstanding throughout the periods indicated)
| Ratios/Supplemental Data | |||||||||||||||||||||||||||||||||||
| Total Return(a)(b) | Net Assets, End of Year (000’s) | Ratio of Net Expenses to Average Net Assets | Ratio of Expenses to Average Net Assets After Fees Waived/ Reimbursed and Excluding Interest Expense | Ratio of Net Investment Income (Loss) to Average Net Assets | Ratio of Expenses to Average Net Assets* | Portfolio Turnover Rate** | |||||||||||||||||||||||||||||
Class A | |||||||||||||||||||||||||||||||||||
Year Ended 9/30/23 | (1.20)% | $ | 6,963 | 0.80% | 0.80% | 2.61% | 1.05% | 74% | |||||||||||||||||||||||||||
Year Ended 9/30/22 | (13.84)% | 9,515 | 0.80% | 0.80% | 1.36% | 0.84% | 21% | ||||||||||||||||||||||||||||
Year Ended 9/30/21 | (0.61)% | 14,233 | 0.80% | 0.80% | 1.07% | 0.86% | 25% | ||||||||||||||||||||||||||||
Year Ended 9/30/20 | 3.65% | 16,662 | 0.80% | 0.80% | 1.71% | 0.90% | 23% | ||||||||||||||||||||||||||||
Year Ended 9/30/19 | 7.03% | 17,583 | 0.95% | (c) | 0.87% | 2.18% | 1.11% | 12% | |||||||||||||||||||||||||||
Class I | |||||||||||||||||||||||||||||||||||
Year Ended 9/30/23 | (0.85)% | $ | 600,100 | 0.45% | 0.45% | 2.98% | 0.53% | 74% | |||||||||||||||||||||||||||
Year Ended 9/30/22 | (13.44)% | 643,252 | 0.45% | 0.45% | 1.74% | 0.51% | 21% | ||||||||||||||||||||||||||||
Year Ended 9/30/21 | (0.37)% | 701,768 | 0.45% | 0.45% | 1.42% | 0.52% | 25% | ||||||||||||||||||||||||||||
Year Ended 9/30/20 | 4.13% | 562,573 | 0.45% | 0.45% | 2.06% | 0.51% | 23% | ||||||||||||||||||||||||||||
Year Ended 9/30/19 | 7.27% | 550,213 | 0.60% | (c) | 0.53% | 2.53% | 0.66% | 12% | |||||||||||||||||||||||||||
Class IS | |||||||||||||||||||||||||||||||||||
Year Ended 9/30/23 | (0.80)% | $ | 52,403 | 0.40% | 0.40% | 3.03% | 0.53% | 74% | |||||||||||||||||||||||||||
Year Ended 9/30/22 | (13.40)% | 51,376 | 0.40% | 0.40% | 1.87% | 0.50% | 21% | ||||||||||||||||||||||||||||
Year Ended 9/30/21 | (0.21)% | 31,237 | 0.40% | 0.40% | 1.47% | 0.55% | 25% | ||||||||||||||||||||||||||||
Year Ended 9/30/20 | 4.19% | 15,566 | 0.40% | 0.40% | 2.06% | 0.59% | 23% | ||||||||||||||||||||||||||||
Period Ended 9/30/19(d) | 4.33%(e) | 5,916 | 0.40% | (f) | 0.40% | (f) | 2.61% | (f) | 0.73% | (f) | 12% | ||||||||||||||||||||||||
| * | During the period, certain fees were contractually or voluntarily reduced and/or reimbursed. If such contractual/voluntary fee reductions and reimbursements had not occurred, the ratio would have been as indicated. |
| ** | Portfolio turnover rate is calculated on the basis of the Fund as a whole without distinguishing between the classes of shares issued. |
| (a) | Excludes sales charge. |
| (b) | Assumes investment at net asset value at the beginning of the period, reinvestment of all dividends and distributions, and a complete redemption of the investment at net asset value at the end of the period. |
60
FINANCIAL HIGHLIGHTS
|
RBC BlueBay Access Capital Community Investment Fund
(Selected data for a share outstanding throughout the periods indicated)
| (c) | Beginning March 11, 2019, the net operating expenses were contractually limited to 0.80% and 0.45% for Class A and Class I respectively. The ratio of net expenses to average net assets represents a blended percentage for the period ended September 30, 2019. |
| (d) | For the period from March 11, 2019, (commencement of operations) to September 30, 2019. |
| (e) | Not annualized. |
| (f) | Annualized. |
See Notes to the Financial Statements.
61
FINANCIAL HIGHLIGHTS
|
RBC BlueBay Impact Bond Fund
(Selected data for a share outstanding throughout the periods indicated)
| Investment Activities | Distributions | |||||||||||||||||||||||||||||||
| Net Asset Value, Beginning of Period | Net Investment Income(a) | Net Realized and Unrealized Gains (Losses) on Investments | Total from Investment Activities | Net Investment Income | Net Realized Gains | Total Distributions | Net Asset Value, End of Year | |||||||||||||||||||||||||
Class A | ||||||||||||||||||||||||||||||||
Year Ended 9/30/23 | $ 8.42 | 0.25 | (0.23) | 0.02 | (0.25) | — | (0.25) | $ 8.19 | ||||||||||||||||||||||||
Year Ended 9/30/22 | 10.17 | 0.17 | (1.71) | (1.54) | (0.14) | (0.07) | (0.21) | 8.42 | ||||||||||||||||||||||||
Year Ended 9/30/21 | 10.58 | 0.09 | (0.24) | (0.15) | (0.12) | (0.14) | (0.26) | 10.17 | ||||||||||||||||||||||||
Period Ended 9/30/20(b) | 10.15 | 0.11 | 0.44 | 0.55 | (0.12) | — | (0.12) | 10.58 | ||||||||||||||||||||||||
Class I | ||||||||||||||||||||||||||||||||
Year Ended 9/30/23 | $ 8.44 | 0.27 | (0.23) | 0.04 | (0.27) | — | (0.27) | $ 8.21 | ||||||||||||||||||||||||
Year Ended 9/30/22 | 10.19 | 0.16 | (1.67) | (1.51) | (0.17) | (0.07) | (0.24) | 8.44 | ||||||||||||||||||||||||
Year Ended 9/30/21 | 10.59 | 0.12 | (0.23) | (0.11) | (0.15) | (0.14) | (0.29) | 10.19 | ||||||||||||||||||||||||
Year Ended 9/30/20 | 10.22 | 0.20 | 0.52 | 0.72 | (0.23) | (0.12) | (0.35) | 10.59 | ||||||||||||||||||||||||
Year Ended 9/30/19 | 9.61 | 0.26 | 0.62 | 0.88 | (0.27) | — | (0.27) | 10.22 | ||||||||||||||||||||||||
Class R6 | ||||||||||||||||||||||||||||||||
Year Ended 9/30/23 | $ 8.44 | 0.27 | (0.22) | 0.05 | (0.28) | — | (0.28) | $ 8.21 | ||||||||||||||||||||||||
Year Ended 9/30/22 | 10.19 | 0.16 | (1.67) | (1.51) | (0.17) | (0.07) | (0.24) | 8.44 | ||||||||||||||||||||||||
Year Ended 9/30/21 | 10.60 | 0.12 | (0.24) | (0.12) | (0.15) | (0.14) | (0.29) | 10.19 | ||||||||||||||||||||||||
Year Ended 9/30/20 | 10.22 | 0.21 | 0.52 | 0.73 | (0.23) | (0.12) | (0.35) | 10.60 | ||||||||||||||||||||||||
Year Ended 9/30/19 | 9.61 | 0.27 | 0.61 | 0.88 | (0.27) | — | (0.27) | 10.22 | ||||||||||||||||||||||||
Class Y | ||||||||||||||||||||||||||||||||
Year Ended 9/30/23 | $ 8.43 | 0.27 | (0.22) | 0.05 | (0.28) | — | (0.28) | $ 8.20 | ||||||||||||||||||||||||
Year Ended 9/30/22 | 10.19 | 0.16 | (1.68) | (1.52) | (0.17) | (0.07) | (0.24) | 8.43 | ||||||||||||||||||||||||
Period Ended 9/30/21(c) | 10.15 | 0.05 | 0.04 | 0.09 | (0.05) | — | (0.05) | 10.19 | ||||||||||||||||||||||||
(a) Per share net investment income (loss) has been calculated using the average daily shares method.
(b) For the period from January 28, 2020 (commencement of operations) to September 30, 2020.
(c) For the period from April 12, 2021 (commencement of operations) to September 30, 2021.
62
FINANCIAL HIGHLIGHTS
|
RBC BlueBay Impact Bond Fund
(Selected data for a share outstanding throughout the periods indicated)
| Ratios/Supplemental Data | ||||||||||||||||||||||||||||||
| Total Return(a) | Net Assets, End of Year (000’s) | Ratio of Net Expenses to Average Net Assets | Ratio of Net Investment Income (Loss) to Average Net Assets | Ratio of Expenses to Average Net Assets* | Portfolio Turnover Rate** | |||||||||||||||||||||||||
Class A | ||||||||||||||||||||||||||||||
Year Ended 9/30/23 | 0.18 | % | $ | 974 | 0.70% | 2.89% | 1.09% | 79% | ||||||||||||||||||||||
Year Ended 9/30/22 | (15.30 | )% | 941 | 0.70% | 1.91% | 0.70% | 33% | |||||||||||||||||||||||
Year Ended 9/30/21 | (1.47 | )% | 21 | 0.70% | 0.91% | 54.43% | 36% | |||||||||||||||||||||||
Period Ended 9/30/20(b) | 5.48 | %(c) | 11 | 0.70% | (d) | 1.56% | (d) | 85.65% | (d) | 31% | ||||||||||||||||||||
Class I | ||||||||||||||||||||||||||||||
Year Ended 9/30/23 | 0.44 | % | $ | 108,268 | 0.45% | 3.15% | 0.62% | 79% | ||||||||||||||||||||||
Year Ended 9/30/22 | (15.05 | )% | 95,006 | 0.45% | 1.70% | 0.65% | 33% | |||||||||||||||||||||||
Year Ended 9/30/21 | (1.13 | )% | 77,793 | 0.45% | 1.14% | 0.73% | 36% | |||||||||||||||||||||||
Year Ended 9/30/20 | 7.18 | % | 21,661 | 0.45% | 1.94% | 1.08% | 31% | |||||||||||||||||||||||
Year Ended 9/30/19 | 9.27 | % | 6,467 | 0.45% | 2.67% | 1.62% | 175% | |||||||||||||||||||||||
Class R6 | ||||||||||||||||||||||||||||||
Year Ended 9/30/23 | 0.49 | % | $ | 80,372 | 0.40% | 3.21% | 0.48% | 79% | ||||||||||||||||||||||
Year Ended 9/30/22 | (15.01 | )% | 66,391 | 0.40% | 1.69% | 0.52% | 33% | |||||||||||||||||||||||
Year Ended 9/30/21 | (1.17 | )% | 81,762 | 0.40% | 1.14% | 0.62% | 36% | |||||||||||||||||||||||
Year Ended 9/30/20 | 7.33 | % | 16,113 | 0.40% | 2.06% | 0.97% | 31% | |||||||||||||||||||||||
Year Ended 9/30/19 | 9.33 | % | 17,158 | 0.40% | 2.73% | 1.52% | 175% | |||||||||||||||||||||||
Class Y | ||||||||||||||||||||||||||||||
Year Ended 9/30/23 | 0.49 | % | $ | 51,555 | 0.40% | 3.19% | 0.49% | 79% | ||||||||||||||||||||||
Year Ended 9/30/22 | (15.11 | )% | 51,307 | 0.40% | 1.70% | 0.50% | 33% | |||||||||||||||||||||||
Period Ended 9/30/21(e) | 0.90 | %(c) | 60,373 | 0.40% | (d) | 0.99% | (d) | 0.59% | (d) | 36% | ||||||||||||||||||||
| * | During the period, certain fees were contractually or voluntarily reduced and/or reimbursed. If such contractual/voluntary fee reductions and reimbursements had not occurred, the ratio would have been as indicated. |
| ** | Portfolio turnover rate is calculated on the basis of the Fund as a whole without distinguishing between the classes of shares issued. |
| (a) | Assumes investment at net asset value at the beginning of the period, reinvestment of all dividends and distributions, and a complete redemption of the investment at net asset value at the end of the period. |
| (b) | For the period from January 28, 2020 (commencement of operations) to September 30, 2020. |
63
FINANCIAL HIGHLIGHTS
|
RBC BlueBay Impact Bond Fund
(Selected data for a share outstanding throughout the periods indicated)
| (c) | Not annualized. |
| (d) | Annualized. |
| (e) | For the period from April 12, 2021 (commencement of operations) to September 30, 2021. |
See Notes to the Financial Statements.
64
|
September 30, 2023
1. Organization:
RBC Funds Trust (the “Trust”) is registered under the Investment Company Act of 1940 (as amended) as an open-end management investment company. The Trust was organized as a Delaware statutory trust on December 16, 2003 and currently consists of 24 portfolios. Overall responsibility for the management of the Trust is vested in its Board of Trustees (the “Board”). The predecessor fund for the RBC BlueBay Access Capital Fund (formerly, Access Capital Community Investment Fund) was reorganized into a series of the Trust, effective July 28, 2008.This report includes the following two investment portfolios (each a “Fund” and collectively, the “Funds”):
-RBC BlueBay Access Capital Community Investment Fund (“Access Capital Community Investment Fund”)
-RBC BlueBay Impact Bond Fund (“Impact Bond Fund”)
The Access Capital Community Investment Fund offers three share classes: Class A, Class I and Class IS shares. The Impact Bond Fund offers four share classes: Class A, Class I, Class R6, and Class Y shares. Class A shares are offered with a 3.75% maximum front-end sales charge and a 1.00% contingent deferred sales charge (“CDSC”) for redemption within 12 months of a $1 million or greater purchase on which no front-end sales charge was paid. Class I, Class IS, Class R6 and Class Y shares (intended for investors meeting certain investment minimum thresholds) are not subject to either a front-end sales charge or a CDSC.
RBC Global Asset Management (U.S.) Inc. (“RBC GAM-US” or “Advisor” or “Co-Administrator”) acts as the investment advisor for the Funds. The officers of the Trust (“Fund Management”) are also employees of RBC GAM-US or its affiliates.
2. Significant Accounting Policies
Each Fund is an investment company that follows accounting and reporting guidance under the Financial Accounting Standards Board. Summarized below are the significant accounting policies of the Funds. These policies conform to accounting principles generally accepted in the United States of America (“U.S. GAAP”). Fund Management follows these policies when preparing financial statements. Fund Management may also be required to make estimates and assumptions that affect the reported amounts of assets and liabilities at the date of the financial statements and the reported amounts of income and expenses for the period. Actual results could differ from those estimates. The financial statements are as of the close of regular trading on the New York Stock Exchange (“NYSE”).
Security Valuation:
The Board has approved pricing and valuation procedures of the Advisor for determining the fair value of each Fund’s investments. Fair value of a security is considered to be the price that a fund might reasonably expect to receive upon its current sale in an orderly transaction between market participants.
Fixed income securities, including to-be-announced (“TBA”) commitments and municipal bonds, are generally valued based on evaluated prices received from third-party pricing services or from broker-dealers who make markets in the securities and are generally categorized as Level 2 in the fair value hierarchy (see “Fair Value Measurements” below for additional information). The pricing services utilize both dealer-supplied valuations and electronic data processing techniques that take into account multiple appropriate factors such as institutional-size trading in similar groups of securities, market spreads, interest rates, and fundamental security analytical data including yield, quality, coupon rate, maturity and type of issue.
Mortgage-related securities represent direct or indirect participation in, or are secured by and payable from, mortgage loans secured by real property and include pass-through securities and collateralized mortgage obligations. These securities may be issued or guaranteed by U.S. Government agencies or instrumentalities, or private issuers, including commercial banks, savings and loan institutions, private mortgage insurance bankers and other secondary market issuers. These mortgage-related securities are
65
NOTES TO FINANCIAL STATEMENTS
|
generally valued by pricing services that use broker-dealer quotations or valuation estimates from their internal pricing models. These pricing models generally consider such factors as current market data, estimated cash flows, market-based yield spreads, and estimated prepayment rates. Securities valued using such techniques and inputs are generally categorized as Level 2 in the fair value hierarchy. To the extent significant inputs are unobservable, the securities will be categorized as Level 3.
Exchange-traded futures are valued at the last sale price at the close of the market on the principal exchange on which they are traded and are categorized as Level 1 in the fair value hierarchy. Investments in open-end investment companies (mutual funds) are valued at net asset value and are categorized as Level 1 in the fair value hierarchy.
The Board has designated the Advisor with the responsibility for implementing the pricing and valuation procedures, including responsibility for determining the fair value of the Funds’ securities or other assets and liabilities, and has established a Pricing Committee to assist in carrying out supervisory functions related to such responsibilities. The Pricing Committee includes representatives of the Funds’ Advisor, and Co-Administrator, including personnel from accounting and operations, trading, risk management and compliance. The Pricing Committee meets at least quarterly to review and approve Fund valuation matters, including a review of the Funds’ pricing activity and operations, fair value measurements, pricing vendors, policies and procedures, and related controls. At least a quorum of the Pricing Committee shall meet more frequently, as needed, to consider and approve time-sensitive fair valuation matters. The Pricing Committee provides periodic reports to the Valuation, Portfolio Management and Performance Committee (“Valuation Committee”) of the Board regarding pricing and valuation matters. Members of the Pricing Committee meet with the Valuation Committee and the Board at each of their regularly scheduled meetings to discuss valuation matters and actions taken during the period.
The Advisor has procedures to determine the fair value of a security when a price is not available from a pricing service or broker- dealer or the Advisor has determined that a price provided by a pricing service or broker-dealer does not approximate fair value. Fair valuation may also be used when a significant valuation event affecting the value of a security or market sector is determined to have occurred between the time when a security’s market closes and the time the Fund’s net asset value is calculated. The fair value of the security will be determined in good faith by the Advisor in accordance with procedures and methodologies approved by the Board. General factors used in determining the fair value of securities include, but are not limited to, fundamental analytical data relating to the security, the issuer and the market, such as duration, prepayment and default rates; general level of interest rates and changes in interest rates; information from broker-dealers; trading in similar securities; any restrictions on disposition of the security; and an evaluation of the forces that influence the market in which the investments are traded. These securities are either categorized as Level 2 or 3 in the fair value hierarchy, depending on the relevant inputs used.
When the Funds utilize fair valuation methods that use significant unobservable inputs to determine a security’s value, such securities will be categorized as Level 3 of the fair value hierarchy. These methods may require subjective determinations about the value of a security. While the Funds’ policy is intended to result in a calculation of a Fund’s net asset value that fairly reflects security values as of the time of pricing, the Funds cannot guarantee that values determined by the Advisor or persons acting at their direction would accurately reflect the price that the Funds could obtain for a security if they were to dispose of it as of the time of pricing (for instance, in a forced or distressed sale). The prices used by the Funds may differ from the value that would be realized if the securities were sold.
The Advisor employs various methods for calibrating the valuation approach related to securities categorized within Level 2 and Level 3 of the fair value hierarchy. These methods may include regular due diligence of the Funds’ pricing vendors, a regular review of key inputs and assumptions, transaction back-testing or disposition analysis to compare unrealized gains and losses to realized gains and losses, reviews of missing and stale prices and large movements in market value, and reviews of any market related activities. Additionally, the pricing of all fair value holdings is subsequently reported to the Valuation Committee and Board.
66
NOTES TO FINANCIAL STATEMENTS
|
Foreign Taxes:
The Funds may be subject to foreign taxes on income, gains on investments or currency repatriation, a portion of which may be recoverable. The Funds will accrue such taxes and recoveries, as applicable, based upon its current interpretation of tax rules and regulations that exist in the markets in which it invests.
Realized gains in certain countries may be subject to foreign taxes at the Fund level, based on statutory rates. The Funds accrue for such foreign taxes on realized and unrealized gains at the appropriate rate for each jurisdiction, as applicable. The amount, if any, is disclosed as a liability in the Statement of Assets and Liabilities.
Fair Value Measurements:
The Funds disclose the fair value of their investments in a hierarchy that categorizes investments based on the inputs to valuation techniques used to measure fair value. The three levels of the fair value hierarchy are as follows:
• Level 1 - Inputs that reflect unadjusted quoted prices in active markets for identical assets or liabilities that the Funds have the ability to access at the measurement date.
• Level 2 - Significant inputs other than quoted prices that are observable for the asset or liability either directly or indirectly, including inputs in markets that are not considered to be active. Observable inputs may include quoted prices for similar securities, interest rates, spreads, prepayment spreads, etc.
• Level 3 - Significant unobservable inputs based on the best information available in the circumstances, to the extent observable inputs are not available (including the Fund’s own assumptions in determining the fair value of investments).
The inputs or methodology used for valuing investments are not necessarily an indication of the risk associated with investing in those securities.
Inputs used in determining fair value of an investment may include, but are not limited to, price information, volatility statistics, credit and market data, and other factors, all of which may be either observable or unobservable. Inputs can vary among investments and will be impacted by the investment type and volume of activity for the particular security or similar securities in the market. Investments in the Level 2 category are generally supported by transactions and quoted prices from dealers participating in the market for those investments. Investments may be included in the Level 3 category due to a lack of market activity or transparency. Internal valuation models may also be used as a pricing source for Level 3 investments. Internal valuation models may rely on one or more unobservable inputs, such as estimated cash flows, financial statement analysis and discount rates.
67
NOTES TO FINANCIAL STATEMENTS
|
The summary of inputs used to determine the fair value of the Funds’ investments as of September 30, 2023 is as follows:
| Level 1 Quoted Prices | Level 2 Significant Observable Inputs | Level 3 Significant Unobservable Inputs | Total | ||||||||||||||||||||||
RBC BlueBay Access Capital Community Investment Fund | |||||||||||||||||||||||||
Assets: | |||||||||||||||||||||||||
Investments in Securities | |||||||||||||||||||||||||
Municipal Bonds | $ | — | $ | 13,079,726 | $ | — | $ | 13,079,726 | |||||||||||||||||
U.S. Government Agency Backed Mortgages | — | 581,341,315 | — | 581,341,315 | |||||||||||||||||||||
U.S. Government Agency Obligations | — | 34,764,702 | — | 34,764,702 | |||||||||||||||||||||
Investment Company | 37,795,609 | — | — | 37,795,609 | |||||||||||||||||||||
Corporate Bond | — | 174,211 | — | 174,211 | |||||||||||||||||||||
|
|
|
|
|
|
|
| ||||||||||||||||||
Total Assets | $ | 37,795,609 | $ | 629,359,954 | $ | — | $ | 667,155,563 | |||||||||||||||||
|
|
|
|
|
|
|
| ||||||||||||||||||
Liabilities: | |||||||||||||||||||||||||
Other Financial Instruments* | |||||||||||||||||||||||||
Financial futures contracts | $ | (1,038,439 | ) | $ | — | $ | — | $ | (1,038,439 | ) | |||||||||||||||
|
|
|
|
|
|
|
| ||||||||||||||||||
RBC BlueBay Impact Bond Fund | |||||||||||||||||||||||||
Assets: | |||||||||||||||||||||||||
Investments in Securities | |||||||||||||||||||||||||
Municipal Bonds | — | 40,399,903 | — | 40,399,903 | |||||||||||||||||||||
U.S. Government Agency Obligations | — | 9,274,637 | — | 9,274,637 | |||||||||||||||||||||
U.S. Government Agency Backed Mortgages | — | 61,394,039 | — | 61,394,039 | |||||||||||||||||||||
Asset Backed Securities | — | 40,118,356 | — | 40,118,356 | |||||||||||||||||||||
Collateralized Mortgage Obligation | — | 2,739,573 | — | 2,739,573 | |||||||||||||||||||||
Investment Company | 22,167,440 | — | — | 22,167,440 | |||||||||||||||||||||
Corporate Bonds | — | 64,056,715 | — | 64,056,715 | |||||||||||||||||||||
|
|
|
|
|
|
|
| ||||||||||||||||||
Total Assets | $ | 22,167,440 | $ | 217,983,223 | $ | — | $ | 240,150,663 | |||||||||||||||||
|
|
|
|
|
|
|
| ||||||||||||||||||
Liabilities: | |||||||||||||||||||||||||
Other Financial Instruments* | |||||||||||||||||||||||||
Financial futures contracts | $ | (1,474,789 | ) | $ | — | $ | — | $ | (1,474,789 | ) | |||||||||||||||
|
|
|
|
|
|
|
| ||||||||||||||||||
*Other financial instruments are instruments shown on the Schedule of Portfolio Investments, such as futures contracts which are valued at fair value.
Reverse Repurchase Agreements:
To obtain short-term financing, the Access Capital Community Investment Fund may enter into reverse repurchase agreements with primary dealers that report to the Federal Reserve Bank of New York or the 100 largest U.S. commercial banks, who are deemed creditworthy under guidelines approved by the Board. Interest on the value of the reverse repurchase agreements is based upon competitive market rates at the time of issuance. At the time the Fund enters into a reverse repurchase agreement, it will establish and maintain a segregated account with the custodian containing qualifying assets having a value, including accrued interest, not less than the repurchase price. Based on requirements with certain exchanges and third party broker-dealers, the Fund may also be required to deliver or deposit securities or cash as collateral.
68
NOTES TO FINANCIAL STATEMENTS
|
As of September 30, 2023 there were no open reverse Repurchase Agreements.
Reverse repurchase transactions are entered into by the Fund under Master Repurchase Agreements (“MRA”), which permit the Fund, under certain circumstances, including an event of default (such as bankruptcy or insolvency), to offset payables and/or receivables under the MRA with collateral held and/or posted to the counterparty and create one single net payment due to or from the Fund. With reverse repurchase transactions, typically the Fund and the counterparties are permitted to sell, repledge, or use the collateral associated with the transaction. However, bankruptcy or insolvency laws of a particular jurisdiction may impose restrictions on or prohibitions against such a right of offset in the event of the MRA counterparty’s bankruptcy or insolvency. Pursuant to the terms of the MRA, the Fund receives or posts securities as collateral with a market value in excess of the repurchase price to be received or paid by the Fund upon the maturity of the transaction. Upon a bankruptcy or insolvency of the MRA counterparty, the Fund is considered an unsecured creditor with respect to excess collateral and, as such, the return of excess collateral may be delayed.
In the event the buyer of securities under a MRA files for bankruptcy or becomes insolvent, the Fund’s use of the proceeds of the agreement may be restricted while the other party, or its trustee or receiver, determines whether or not to enforce the Fund’s obligation to repurchase the securities.
TBA Commitments:
The Funds may enter into TBA commitments to purchase or sell securities for a fixed price at a future date. TBA commitments are considered securities in themselves, and involve a risk of loss if the value of the security to be purchased/sold declines/increases prior to settlement date, which is in addition to the risk of decline in the value of a Fund’s other assets. Unsettled TBA commitments are valued at the current value of the underlying securities, according to the procedures described under “Security Valuation”.
Mortgage Backed Securities:
Because the Funds will focus on community development investments, such as securities backed by commercial and/or residential mortgage loans, it will be affected by risks not typically associated with funds that do not specialize in community development investments. These risks include credit and prepayment risk and risk due to default on underlying loans within a security. Changes in economic conditions, including delinquencies and/or defaults or assets underlying these securities, can affect the value, income and/or liquidity of such positions.
In addition, the RBC BlueBay Access Capital Fund invests in certain mortgage backed securities that qualify under the Community Reinvestment Act of 1977 (“CRA”) in which the Fund may pay a premium for the geographically or other targeted nature of the securities. There can be no guarantee, however, that a similar premium will be received if the security is sold by the Fund.
Derivatives:
The Funds may use derivative instruments, including futures, forwards, options, indexed securities, swaps and inverse securities as tools in the management of portfolio assets. The Funds may use such derivatives through either the creation of long or short positions to hedge various investments, for investment purposes, for risk management and/or to increase income or gain to the Funds. Derivatives allow the Funds to manage their risk exposure more quickly and efficiently than other types of instruments. Derivatives may be riskier than other types of investments and could result in losses that significantly exceed a Fund’s original investment. Derivatives are subject to the risk that changes in the value of a derivative may not correlate perfectly with the underlying asset, rate or index. The use of derivatives may not be successful, resulting in losses to a Fund, and the cost of such strategies may reduce the Fund’s returns.
Hedging also involves the risk that changes in the value of the derivative will not match those of the holdings being hedged as expected by the Funds, in which case any losses on the holdings being hedged may not be reduced and may be increased. There can be no assurance that a Fund’s hedging strategy will reduce risk or that hedging transactions will be available or cost effective. The Funds are subject to interest rate risk in the normal course of pursuing their investment objectives by investing in various derivative financial instruments, as described below.
69
NOTES TO FINANCIAL STATEMENTS
|
Financial Futures Contracts:
The Funds may enter into futures contracts in an effort to manage the duration of the portfolio and hedge against certain market risk. A futures contract on a securities index is an agreement obligating one party to pay, and entitling the other party to receive, during the term of the contract, cash payments based on the level of a specified securities index. Futures transactions involve brokerage costs and require a Fund to segregate assets to cover contracts that would require it to purchase securities or currencies. A Fund may lose the expected benefit of futures transactions if interest rates, exchange rates or securities prices change in an unanticipated manner. Such unanticipated changes may also result in lower overall performance than if a Fund had not entered into any futures transactions.
The Funds entered into U.S. Treasury Bond futures and U.S. Treasury Notes futures during the year ended September 30, 2023.
Upon entering into a futures contract, a Fund is required to pledge to the broker an amount of cash, U.S. government securities, or other assets equal to a certain percentage of the contract amount. Subsequent payments are made or received by the Funds each day, depending on the daily fluctuations in the fair value of the underlying instrument. A Fund would record an unrealized gain or loss each day equal to these daily payments.
Open futures contracts are shown on the Schedules of Portfolio Investments. Underlying collateral pledged for open futures contracts is the cash at brokers for financial futures contracts shown on the Statements of Assets and Liabilities at September 30, 2023.
Fair Values of Derivative Financial Instrument as of September 30, 2023(1) | ||||||||
Statement of Assets and Liabilities Location | ||||||||
| ||||||||
Liability Derivatives | ||||||||
| RBC BlueBay Access Capital | ||||||||
| Community | RBC BlueBay Impact | |||||||
| Investment Fund | Bond Fund | |||||||
Interest Rate Risk: | ||||||||
Unrealized depreciation on futures contracts | $1,038,439 | $1,474,789 | ||||||
Total | $1,038,439 | $1,474,789 | ||||||
| The effect of derivative instruments on the Statement of Operations during the year ended September 30, 2023 is as follows: |
| |||||||
| RBC BlueBay Access Capital | ||||||||
| Derivative Instruments | Community | RBC BlueBay Impact | ||||||
Categorized by Risk Exposure | Investment Fund | Bond Fund | ||||||
Net realized Gain/(Loss) From: | ||||||||
Interest Rate Risk: | ||||||||
Financial futures contracts | $(1,671,663) | $(2,581,196) | ||||||
Total | $(1,671,663) | $(2,581,196) | ||||||
70
NOTES TO FINANCIAL STATEMENTS
|
| RBC BlueBay Access Capital | ||||||||
| Derivative Instruments | Community | RBC BlueBay Impact | ||||||
Categorized by Risk Exposure | Investment Fund | Bond Fund | ||||||
Net Change in Unrealized | ||||||||
Appreciation/(Depreciation) From: | ||||||||
Interest Rate Risk: | ||||||||
Financial futures contracts | $718,791 | $(808,832) | ||||||
Total | $718,791 | $(808,832) | ||||||
(1) Not considered to be hedging instruments for accounting disclosure purposes. |
| |||||||
| For the year ended September 30, 2023, the average volume of derivative activities based on ending quarterly outstanding amounts are as follows: |
| |||||||
| RBC BlueBay Access Capital | ||||||||
| Community | RBC BlueBay Impact | |||||||
| Investment Fund | Bond Fund | |||||||
Futures long position (contracts) | 335 | 326 | ||||||
Futures short position (contracts) | 46 | 42 | ||||||
Counterparty Credit Risk:
Derivatives may also expose a Fund to counterparty risk (the risk that the derivative counterparty will not fulfill its contractual obligations). To the extent amounts due to the Funds from their counterparties are not fully collateralized contractually or otherwise, the Funds bear the risk of loss from counterparty non-performance. A Fund’s maximum risk of loss from counterparty credit risk on over-the-counter (“OTC”) derivatives is generally the aggregate unrealized gain in excess of any collateral pledged by the counterparty to the Funds.
With exchange-traded futures, the exchange or clearinghouse, as counterparty to such instruments, guarantees against a possible default. The clearinghouse stands between the buyer and the seller of the contract; therefore, credit risk is limited to failure of the clearinghouse. While offset rights may exist under applicable law, the Fund does not have a contractual right of offset against a clearing broker or clearinghouse in the event of a default (including the bankruptcy or insolvency) of the clearing broker or clearinghouse. Additionally, credit risk exists in exchange-traded futures with respect to initial and variation margin that is held in a clearing broker’s customer accounts. While clearing brokers are required to segregate customer margin from their own assets, in the event that a clearing broker becomes insolvent or goes into bankruptcy and at that time there is a shortfall in the aggregate amount of margin held by the clearing broker for all its clients, typically the shortfall would be allocated on a pro rata basis across all the clearing broker’s customers, potentially resulting in losses to the Funds.
Affiliated Investments:
The Funds invest in another Fund of the Trust (an “Affiliated Fund”), RBC BlueBay U.S. Government Money Market Fund-RBC Institutional Class 1, as a cash sweep vehicle. The income earned by the Funds from the Affiliated Fund for the period is disclosed in the Statement of Operations. The table below details the transactions of the Funds in the Affiliated Fund. As the affiliated investment is a money market fund in which shares are issued and redeemed at $1.00 per share, the number of shares purchased and sold equal the dollar amount shown as purchased and sold, and no gain or loss was realized on the sale of shares of the money market fund.
71
NOTES TO FINANCIAL STATEMENTS
|
| Value | Value | |||||||||||||||||||
| September 30, 2022 | Purchases | Sales | September 30, 2023 | Dividends | ||||||||||||||||
Investments in RBC BlueBay U.S. Government Money Market Fund —RBC Institutional Class 1 | ||||||||||||||||||||
RBC BlueBay Access Capital Community Investment Fund | $1,836,898 | $199,214,327 | $(163,255,616 | ) | $37,795,609 | $454,526 | ||||||||||||||
RBC BlueBay Impact Bond Fund | 3,439,191 | 97,034,859 | (78,306,610 | ) | 22,167,440 | 803,207 | ||||||||||||||
Credit Enhancement:
Certain obligations held by the Funds have credit enhancement or liquidity features that may, under certain circumstances, provide for repayment of principal and interest on the obligation upon demand date, interest rate reset date or final maturity. These enhancements may include: letters of credit; liquidity guarantees; security purchase agreements; tender option purchase agreements and third party insurance.
Investment Transactions and Income:
Investment transactions are recorded on trade date. Dividend income is recorded on the ex-dividend date. Non-cash dividends, if any, are recorded on the ex-dividend date at fair value. Realized gains and losses from investment transactions are calculated based on the cost of the specific security (also known as identified cost basis). Interest income is recognized on the accrual basis and includes, where applicable, the amortization or accretion of premium or discount using the effective yield method. Paydown gains and losses on mortgage- and asset-backed securities are included in the financial statements as interest income.
Expense, Investment Income and Gain/Loss Allocation:
Each Fund pays the expenses that are directly related to its operations, such as custodian fees or advisory fees. Expenses incurred by the Trust, such as trustee or legal fees, are allocated among each of the Funds in the Trust either proportionately based upon each Fund’s relative net assets or using another reasonable basis such as equally across all Funds in the Trust, depending on the nature of the expense. Individual share classes within a Fund are charged expenses specific to that class, such as distribution fees and transfer agent fees. Within a Fund, expenses other than class specific expenses are allocated daily to each class based upon the proportion of relative net assets. Investment income and realized and unrealized gains or losses are allocated to each class of shares based on relative net assets.
Distributions to Shareholders:
Each Fund pays out any income that it receives, less expenses, in the form of dividends and capital gains to its shareholders. Income dividends are declared daily and paid monthly. Capital gain distributions are declared and paid at least annually. Distributions to shareholders are recorded on the ex-dividend date. The amount of dividends and distributions are calculated based on federal income tax regulations, which may differ from US GAAP. These “book/tax” differences may be either temporary or permanent in nature. To the extent these differences are determined, as of the end of the tax year, to be permanent (e.g., reclassification of paydown gains and losses ), they are reclassified within a Fund’s capital account based on their federal tax basis treatment.
Indemnifications:
Under the Trust’s organizational documents, each Trustee, officer, employee or other agent of the Trust is indemnified against certain liabilities that may arise out of their duties to the Funds. Additionally, in
72
NOTES TO FINANCIAL STATEMENTS
|
the normal course of business, the Funds enter into contracts, including the Funds’ servicing agreements, that contain a variety of indemnification clauses. The Funds’ maximum exposure under these arrangements is unknown as this would involve future claims that may be made against the Funds that have not yet occurred.
3. Agreements and Other Transactions with Affiliates:
The Trust has entered into an investment advisory agreement with RBC GAM-US under which RBC GAM-US manages each Fund’s assets and furnishes related office facilities, equipment, research and personnel. The agreement requires each Fund to pay RBC GAM-US a monthly fee based upon average daily net assets. Under the terms of the agreement, RBC GAM-US is entitled to receive fees based on a percentage of the average daily net assets of each of the Funds as follows:
| Annual Rate | ||||
RBC BlueBay Access Capital Community Investment Fund | 0.35% | |||
RBC BlueBay Impact Bond Fund | 0.35% | |||
RBC GAM-US has contractually agreed to waive fees and/or make payments in order to keep total operating expenses (excluding certain fees such as interest, taxes and acquired fund fees and expenses) of the Funds to the following levels pursuant to an expense limitation agreement.
| Class A | Class I | Class IS | Class R6 | Class Y | ||||||||||||||||
| Annual Rate | Annual Rate | Annual Rate | Annual Rate | Annual Rate | ||||||||||||||||
RBC BlueBay Access Capital Community Investment Fund | 0.80% | 0.45% | 0.40% | N/A | N/A | |||||||||||||||
RBC BlueBay Impact Bond Fund | 0.70% | 0.45% | N/A | 0.40% | 0.40% | |||||||||||||||
This expense limitation agreement is in place until January 31, 2025, and shall continue for additional one-year terms unless terminated by either party at any time. The Advisor is entitled to recoup from the Fund or class the fees and/or operating expenses waived or reimbursed during any of the previous 12 months (3 years for the Impact Bond Fund), provided the Fund is able to do so and remain in compliance with the expense limitation in place at the time the fees were waived or expenses paid.
As of September 30, 2023, the amounts subject to possible recoupment under the expense limitation agreement were:
| FYE 9/30/21 | FYE 9/30/22 | FYE 9/30/23 | Total | |||||||||||||
RBC BlueBay Access Capital Community Investment Fund | $ N/A | $ N/A | $626,508 | $ | 626,508 | |||||||||||
RBC BlueBay Impact Bond Fund | 243,047 | 308,395 | 291,003 | 842,445 | ||||||||||||
There was no recoupment of expense reimbursements/waivers during the year. Amounts from years prior to those shown are no longer subject to recoupment.
RBC GAM-US may also voluntarily waive and/or reimburse operating expenses of any Fund from time to time. Any such voluntary program may be changed or eliminated at any time without notice, and expenses waived under such programs are not subject to recoupment.
RBC GAM-US voluntarily agreed to waive its investment advisory fees by the amount of investment advisory fees the Funds pay to RBC GAM-US indirectly through its investment in an affiliated money market fund. For the year ended September 30, 2023, the amount waived was $16,459 and $27,705 for RBC BlueBay Access Capital Community Investment Fund and RBC BlueBay Impact Bond Fund, respectively, and is included in expenses waived/reimbursed by Advisor in the Statement of Operations.
RBC GAM-US serves as co-administrator to the Funds. Bank of New York Mellon (“BNY Mellon”) serves as co-administrator and fund accounting agent. Services provided under the administrative services contract include providing day-to-day administration of matters related to the Funds,
73
NOTES TO FINANCIAL STATEMENTS
|
maintenance of their records and the preparation of reports. Under the terms of the administrative services contract, RBC GAM-US does not receive a fee for its role as co-administrator. BNY Mellon receives a fee for its services payable by each Fund based in part on each Fund’s average net assets. BNY Mellon’s fee is included with “Accounting fees” in the Statement of Operation.
RBC GAM-US also provides certain CRA-related administrative services to Class I shareholders of Access Capital Community Investment Fund pursuant to a Special Administrative Services Agreement with the Trust. In consideration for such services and the assumption of related expenses, RBC GAM-US receives a fee of 0.05% of the average daily net assets of Class I shares of the Fund.
Certain Officers and Trustees of the Trust are affiliated with the Advisor. Such Officers and Trustees receive no compensation from the Funds for serving their respective roles.
The Trust currently pays each of the independent Trustees (Trustees of the Trust who are not directors, officers or employees of the Advisor, either Co-Administrator or Distributor) an annual retainer of $84,000. The Board Chairperson and Audit Committee Chairperson each receive an additional retainer of $2,500 annually, and all other trustees serving as Chair of a Board committee each receive an additional retainer of $1,000 annually. In addition, Independent Trustees receive a quarterly meeting fee of $6,500 for each in-person Board meeting attended, a meeting fee of $1,500 for each telephonic or Special Board meeting attended, a $1,500 fee for each Board committee meeting attended, and are reimbursed for all out-of -pocket expenses relating to attendance at such meetings. These amounts are included in the Statements of Operations in “Trustee’ fees”.
In conjunction with the initial launch of the Impact Bond Fund and the subsequent launch of Class A and Class Y shares, the Advisor invested seed capital in the Fund to provide the Fund or share class with its initial investment assets. The table below shows, as of September 30, 2023, the Fund’s net assets, the shares held by the Advisor, and the percent of total net assets represented by the Advisor’s investment.
| Shares held | % of Fund | |||||||||||
| Net Assets | by Advisor | Net Assets | ||||||||||
RBC BlueBay Impact Bond Fund | $ | 241,170,273 | 6,875,141 | 23.4% | ||||||||
4. Fund Distribution:
Each of the Funds that offers Class A shares has adopted a Master Distribution 12b-1 Plan (the “Plan”) in which Quasar Distributors LLC (the “Distributor”) acts as the Funds’ distributor. The Plan permits each Fund to make payments for, or to reimburse the Distributor for, distribution-related costs and expenses of marketing shares of Class A covered under the Plan, and/or for providing shareholder services. The Plan does not apply to Class I and Class R6. The following chart shows the current Plan fee rate for Class A.
| Class A | ||||
12b-1 Plan Fee | 0.25%* | |||
* Under the 12b-1 plan, the maximum fee rate for Class A shares is 0.50%. Currently the Board has approved an annual limit of 0.25%.
Plan fees are based on average daily net assets of Class A. Up to 0.25% of each Plan fee may be designated as a service fee, as defined by the applicable rules of the Financial Industry Regulatory Authority. The Distributor, subject to applicable legal requirements, may waive the Plan fee voluntarily, in whole or in part. For the year ended September 30, 2023, there were no fees waived by the Distributor.
For the year ended September 30, 2023, the Distributor received commissions of $1,901 in front-end sales charges of Class A shares of the Funds, of which $1,733 was paid to affiliated broker-dealers, and the remainder was either paid to unaffiliated broker-dealers or retained by the Distributor.
74
NOTES TO FINANCIAL STATEMENTS
|
The Distributor did not receive any CDSC fees from Class A shares of the Funds during the year ended September 30, 2023.
5. Securities Transactions:
The cost of securities purchased and proceeds from securities sold (excluding securities maturing less than one year from acquisition) for the year ended September 30, 2023 were as follows:
| Purchases | Sales | Purchases | Sales | |||||||||||||
| (Excl. U.S. Gov’t) | (Excl. U.S. Gov’t) | of U.S. Gov’t. | of U.S. Gov’t. | |||||||||||||
RBC BlueBay Access Capital Community Investment Fund | $ 4,351,959 | $ 9,484,072 | $517,397,665 | $550,849,138 | ||||||||||||
RBC BlueBay Impact Bond Fund | 78,635,772 | 62,805,179 | 103,815,554 | 107,631,337 | ||||||||||||
6. Capital Share Transactions:
The Trust is authorized to issue an unlimited number of shares of beneficial interest (“Shares Outstanding”) without par value. Transactions in capital stock of the Funds are summarized on the following pages:
| RBC BlueBay Access Capital Community Investment Fund | RBC BlueBay Impact Bond Fund | |||||||||||||||||||||||||||||||
| For the Year Ended September 30, 2023 | For the Year Ended September 30, 2022 | For the Year Ended September 30, 2023 | For the Year Ended September 30, 2022 | |||||||||||||||||||||||||||||
CAPITAL TRANSACTIONS: | ||||||||||||||||||||||||||||||||
Class A | ||||||||||||||||||||||||||||||||
Proceeds from shares issued | $ | 408,295 | $ | 968,891 | $ | 60,793 | $ | 1,000,000 | ||||||||||||||||||||||||
Distributions reinvested | 223,108 | 213,449 | 29,194 | 7,501 | ||||||||||||||||||||||||||||
Cost of shares redeemed | (2,904,215 | ) | (3,939,878 | ) | (28,543 | ) | (16,171 | ) | ||||||||||||||||||||||||
|
|
|
|
|
|
|
| |||||||||||||||||||||||||
Change in Class A | $ | (2,272,812 | ) | $ | (2,757,538 | ) | $ | 61,444 | $ | 991,330 | ||||||||||||||||||||||
|
|
|
|
|
|
|
| |||||||||||||||||||||||||
Class I | ||||||||||||||||||||||||||||||||
Proceeds from shares issued | $ | 103,160,902 | $ | 182,842,481 | $ | 31,047,111 | $ | 45,194,667 | ||||||||||||||||||||||||
Distributions reinvested | 12,620,383 | 8,763,619 | 3,313,753 | 2,193,306 | ||||||||||||||||||||||||||||
Cost of shares redeemed | (134,043,813 | ) | (137,545,454 | ) | (17,880,242 | ) | (13,421,769 | ) | ||||||||||||||||||||||||
|
|
|
|
|
|
|
| |||||||||||||||||||||||||
Change in Class I | $ | (18,262,528 | ) | $ | 54,060,646 | $ | 16,480,622 | $ | 33,966,204 | |||||||||||||||||||||||
|
|
|
|
|
|
|
| |||||||||||||||||||||||||
75
NOTES TO FINANCIAL STATEMENTS
|
| RBC BlueBay Access Capital Community Investment Fund | RBC BlueBay Impact Bond Fund | |||||||||||||||||||||||||||||||
| For the Year Ended September 30, 2023 | For the Year Ended September 30, 2022 | For the Year Ended September 30, 2023 | For the Year Ended September 30, 2022 | |||||||||||||||||||||||||||||
Class IS | ||||||||||||||||||||||||||||||||
Proceeds from shares issued | $ | 17,905,593 | $ | 44,327,365 | $ | — | $ | — | ||||||||||||||||||||||||
Distributions reinvested | 1,738,503 | 891,594 | — | — | ||||||||||||||||||||||||||||
Cost of shares redeemed | (16,303,100 | ) | (18,020,573 | ) | — | — | ||||||||||||||||||||||||||
|
|
|
|
|
|
|
| |||||||||||||||||||||||||
Change in Class IS | $ | 3,340,996 | $ | 27,198,386 | $ | — | $ | — | ||||||||||||||||||||||||
|
|
|
|
|
|
|
| |||||||||||||||||||||||||
Class R6 | ||||||||||||||||||||||||||||||||
Proceeds from shares issued | $ | — | $ | — | $ | 15,731,479 | $ | 3,914,712 | ||||||||||||||||||||||||
Distributions reinvested | — | — | 2,212,031 | 1,982,680 | ||||||||||||||||||||||||||||
Cost of shares redeemed | — | — | (1,493,012 | ) | (7,008,693 | ) | ||||||||||||||||||||||||||
|
|
|
|
|
|
|
| |||||||||||||||||||||||||
Change in Class R6 | $ | — | $ | — | $ | 16,450,498 | $ | (1,111,301 | ) | |||||||||||||||||||||||
|
|
|
|
|
|
|
| |||||||||||||||||||||||||
Class Y | ||||||||||||||||||||||||||||||||
Distributions reinvested | $ | — | $ | — | $ | 1,705,968 | $ | 1,478,137 | ||||||||||||||||||||||||
|
|
|
|
|
|
|
| |||||||||||||||||||||||||
Change in Class Y | $ | — | $ | — | $ | 1,705,968 | $ | 1,478,137 | ||||||||||||||||||||||||
|
|
|
|
|
|
|
| |||||||||||||||||||||||||
Change in net assets resulting from capital transactions | $ | (17,194,344 | ) | $ | 78,501,494 | $ | 34,698,532 | $ | 35,324,370 | |||||||||||||||||||||||
|
|
|
|
|
|
|
| |||||||||||||||||||||||||
76
NOTES TO FINANCIAL STATEMENTS
|
| RBC BlueBay Access Capital Community Investment Fund | RBC BlueBay Impact Bond Fund | |||||||||||||||||||||||||||||||
| For the Year Ended September 30, 2023 | For the Year Ended September 30, 2022 | For the Year Ended September 30, 2023 | For the Year Ended September 30, 2022 | |||||||||||||||||||||||||||||
SHARE TRANSACTIONS: | ||||||||||||||||||||||||||||||||
Class A | ||||||||||||||||||||||||||||||||
Issued | 53,280 | 113,890 | 7,118 | 110,619 | ||||||||||||||||||||||||||||
Reinvested | 29,342 | 25,648 | 3,444 | 850 | ||||||||||||||||||||||||||||
Redeemed | (381,958 | ) | (475,290 | ) | (3,367 | ) | (1,815 | ) | ||||||||||||||||||||||||
|
|
|
|
|
|
|
| |||||||||||||||||||||||||
Change in Class A | (299,336 | ) | (335,752 | ) | 7,195 | 109,654 | ||||||||||||||||||||||||||
|
|
|
|
|
|
|
| |||||||||||||||||||||||||
Class I | ||||||||||||||||||||||||||||||||
Issued | 13,648,609 | 21,919,539 | 3,638,268 | 4,828,785 | ||||||||||||||||||||||||||||
Reinvested | 1,660,052 | 1,056,934 | 389,941 | 232,926 | ||||||||||||||||||||||||||||
Redeemed | (17,732,669 | ) | (16,520,924 | ) | (2,097,983 | ) | (1,442,934 | ) | ||||||||||||||||||||||||
|
|
|
|
|
|
|
| |||||||||||||||||||||||||
Change in Class I | (2,424,008 | ) | 6,455,549 | 1,930,226 | 3,618,777 | |||||||||||||||||||||||||||
|
|
|
|
|
|
|
| |||||||||||||||||||||||||
Class IS | ||||||||||||||||||||||||||||||||
Issued | 2,338,871 | 5,395,005 | — | — | ||||||||||||||||||||||||||||
Reinvested | 228,828 | 108,646 | — | — | ||||||||||||||||||||||||||||
Redeemed | (2,145,539 | ) | (2,207,011 | ) | — | — | ||||||||||||||||||||||||||
|
|
|
|
|
|
|
| |||||||||||||||||||||||||
Change in Class IS | 422,160 | 3,296,640 | — | — | ||||||||||||||||||||||||||||
|
|
|
|
|
|
|
| |||||||||||||||||||||||||
Class R6 | ||||||||||||||||||||||||||||||||
Issued | — | — | 1,842,573 | 412,872 | ||||||||||||||||||||||||||||
Reinvested | — | — | 260,326 | 208,613 | ||||||||||||||||||||||||||||
Redeemed | — | — | (178,931 | ) | (777,383 | ) | ||||||||||||||||||||||||||
|
|
|
|
|
|
|
| |||||||||||||||||||||||||
Change in Class R6 | — | — | 1,923,968 | (155,898 | ) | |||||||||||||||||||||||||||
|
|
|
|
|
|
|
| |||||||||||||||||||||||||
Class Y | ||||||||||||||||||||||||||||||||
Reinvested | — | — | 200,984 | 155,748 | ||||||||||||||||||||||||||||
|
|
|
|
|
|
|
| |||||||||||||||||||||||||
Change in Class Y | — | — | 200,984 | 155,748 | ||||||||||||||||||||||||||||
|
|
|
|
|
|
|
| |||||||||||||||||||||||||
Change in shares resulting from capital transactions | (2,301,184 | ) | 9,416,437 | 4,062,373 | 3,728,281 | |||||||||||||||||||||||||||
|
|
|
|
|
|
|
| |||||||||||||||||||||||||
7. Federal Income Taxes:
It is the policy of each Fund to continue to qualify as a regulated investment company by complying with the provisions available to certain investment companies, as defined under Subchapter M of the Internal Revenue Code, and to distribute substantially all of its net investment income and net realized capital gains. Therefore, no federal tax liability is recorded in the financial statements of each Fund.
77
NOTES TO FINANCIAL STATEMENTS
|
For all open tax years and all major taxing jurisdictions, management of the Funds has concluded that there are no significant uncertain tax positions that would require recognition in the financial statements. Open tax years are those that are open for examination by taxing authorities (i.e., generally the last three tax year ends and the interim tax period since then). Furthermore, management of the Funds is also not aware of any tax positions for which it is reasonably possible that the total amounts of unrecognized tax benefits will significantly change in the next twelve months.
As of September 30, 2023, the tax cost of investments and the breakdown of unrealized appreciation (depreciation) for each Fund was as follows:
| Net Unrealized | ||||||||||||||||
| Tax Cost Of | Unrealized | Unrealized | Appreciation/ | |||||||||||||
| Investments | Appreciation | Depreciation | (Depreciation) | |||||||||||||
RBC BlueBay Access Capital Community Investment Fund | $774,220,327 | $147,872 | $(108,251,075) | $(108,103,203) | ||||||||||||
RBC BlueBay Impact Bond Fund | 268,664,196 | 73,329 | (30,061,651) | (29,988,322) | ||||||||||||
The difference between book basis and tax basis unrealized appreciation/depreciation is attributable primarily to the tax mark-to-market of derivatives.
The tax character of distributions during the year ended September 30, 2023 were as follows:
| Distributions Paid From | ||||||||||||||||
| Total | ||||||||||||||||
| Ordinary | Total Taxable | Distributions | ||||||||||||||
| Income | Distributions | Paid | ||||||||||||||
RBC BlueBay Access Capital Community Investment Fund | $ | 23,287,093 | $23,287,093 | $ | 23,287,093 | |||||||||||
RBC BlueBay Impact Bond Fund | 7,490,077 | 7,490,077 | 7,490,077 | |||||||||||||
The tax character of distributions during the year ended September 30, 2022 were as follows:
|
| |||||||||||||||
| Distributions Paid From | ||||||||||||||||
| Total | ||||||||||||||||
| Ordinary | Net Long Term | Total Taxable | Distributions | |||||||||||||
| Income | Capital Gains | Distributions | Paid | |||||||||||||
RBC BlueBay Access Capital Community Investment Fund | $ | 14,770,525 | $ | — | $ | 14,770,525 | $ | 14,770,525 | ||||||||
RBC BlueBay Impact Bond Fund | 4,504,459 | 1,115,095 | 5,619,554 | 5,619,554 | ||||||||||||
Total distributions paid may differ from the Statements of Changes in Net Assets because distributions are recognized when actually paid for tax purposes.
78
NOTES TO FINANCIAL STATEMENTS
|
As of September 30, 2023, the components of accumulated earnings/(losses) on a tax basis were as follows:
| RBC BlueBay Access Capital Community Investment Fund | RBC BlueBay Impact Bond Fund | |||||||
Undistributed ordinary income | $ | — | $ | 23,326 | ||||
Undistributed long term gain | — | — | ||||||
|
|
|
| |||||
Accumulated earnings | — | 23,326 | ||||||
Accumulated capital loss carryforwards | (66,287,775) | (18,450,965) | ||||||
Unrealized depreciation | (108,103,203) | (29,988,322) | ||||||
Other temporary differences | (553,520) | (23,529) | ||||||
|
|
|
| |||||
Total Accumulated Losses | $ | (174,944,498) | $ | (48,439,490) | ||||
|
|
|
| |||||
As of September 30, 2023, the Access Capital Community Investment Fund and the Impact Bond Fund had a short-term capital loss carryforward of $18,805,807 and $5,902,256 and a long-term capital loss carryforward of $47,481,968 and $12,538,709 respectively, available to offset future realized capital gains in accordance with the Regulated Investment Company Modernization Act of 2010. These capital loss carryforwards are not subject to expiration and must first be utilized to offset future realized gains of the same character.
Under current tax law, Post-October Capital Losses and Late-Year Ordinary Losses may be deferred and treated as occurring on the first business day of the following fiscal year for tax purposes.
8. Line of Credit
The Funds are participants in an uncommitted, secured $500,000,000 line of credit with U.S. Bank, N.A. (the “Bank”), the Funds’ custodian, to be used to fund shareholder redemption requests and for other short-term temporary or emergency general business purposes. The line of credit has a scheduled termination date of July 27, 2024. Interest is charged on borrowings under this line of credit at the Bank’s prime lending rate per annum. Since each Fund participates in this line of credit, there is no assurance that an individual fund will have access to all or any part of the $500,000,000 at any particular time. There were no loans outstanding pursuant to this line of credit at September 30, 2023. There were no borrowings made by the Funds under the line of credit during the year ended September 30, 2023.
9. Significant Risks:
Shareholder concentration risk
As of September 30, 2023, the Funds had broker-dealer omnibus accounts which each owned more than 10% of a Fund’s outstanding shares as shown below:
| # of Omnibus Accounts | % of Fund | |||||||
RBC BlueBay Access Capital Community Investment Fund | 1 | 19.1% | ||||||
RBC BlueBay Impact Bond Fund | 1 | 20.3% | ||||||
79
NOTES TO FINANCIAL STATEMENTS
|
In addition, an unaffiliated shareholder owned 21.3% of the Impact Bond Fund as of September 30, 2023. Significant transactions by these shareholders may impact the Funds’ performance.
10. Subsequent Events:
Fund Management has evaluated the impact of all subsequent events on the Funds and has determined that there were no subsequent events requiring recognition or disclosure in the financial statements.
80
REPORT OF INDEPENDENT REGISTERED PUBLIC ACCOUNTING FIRM
|
To the Board of Trustees of RBC Funds Trust and Shareholders of RBC BlueBay Access Capital Community Investment Fund and RBC BlueBay Impact Bond Fund
Opinions on the Financial Statements
We have audited the accompanying statements of assets and liabilities, including the schedules of portfolio investments, of RBC BlueBay Access Capital Community Investment Fund and RBC BlueBay Impact Bond Fund (two of the funds constituting RBC Funds Trust, hereafter collectively referred to as the “Funds”) as of September 30, 2023, the related statements of operations for the year ended September 30, 2023, the statements of changes in net assets for each of the two years in the period ended September 30, 2023, including the related notes, and the financial highlights for each of the periods indicated therein (collectively referred to as the “financial statements”). In our opinion, the financial statements present fairly, in all material respects, the financial position of each of the Funds as of September 30, 2023, the results of each of their operations for the year then ended, the changes in each of their net assets for each of the two years in the period ended September 30, 2023 and each of the financial highlights for each of the periods indicated therein in conformity with accounting principles generally accepted in the United States of America.
Basis for Opinions
These financial statements are the responsibility of the Funds’ management. Our responsibility is to express an opinion on the Funds’ financial statements based on our audits. We are a public accounting firm registered with the Public Company Accounting Oversight Board (United States) (PCAOB) and are required to be independent with respect to the Funds in accordance with the U.S. federal securities laws and the applicable rules and regulations of the Securities and Exchange Commission and the PCAOB.
We conducted our audits of these financial statements in accordance with the standards of the PCAOB. Those standards require that we plan and perform the audit to obtain reasonable assurance about whether the financial statements are free of material misstatement, whether due to error or fraud.
Our audits included performing procedures to assess the risks of material misstatement of the financial statements, whether due to error or fraud, and performing procedures that respond to those risks. Such procedures included examining, on a test basis, evidence regarding the amounts and disclosures in the financial statements. Our audits also included evaluating the accounting principles used and significant estimates made by management, as well as evaluating the overall presentation of the financial statements. Our procedures included confirmation of securities owned as of September 30, 2023 by correspondence with the custodian and brokers; when replies were not received from brokers, we performed other auditing procedures. We believe that our audits provide a reasonable basis for our opinions.
/s/PricewaterhouseCoopers LLP
Minneapolis, Minnesota
November 21, 2023
We have served as the auditor of one or more investment companies in the RBC Funds since 2016.
81
OTHER FEDERAL INCOME TAX INFORMATION (UNAUDITED)
|
For the year ended September 30, 2023, the following Funds had a qualified interest income percentage of:
| Qualified Interest Income | ||||
RBC BlueBay Access Capital Community Investment Fund | 99.81% | |||
RBC BlueBay Impact Bond Fund | 99.06% | |||
All reportings are based on financial information available as of the date of this annual report and, accordingly, are subject to change. For each item above, it is the intention of the Funds to report the maximum amount permitted under the Internal Revenue Code and the regulations thereunder.
82
|
Independent Trustees(1)(2)
Lucy Hancock Bode (72)
Position, Term of Office and Length of Time Served with the Trust: Trustee since January 2004
Principal Occupation(s) During Past 5 Years: Healthcare consultant (self-employed) (1986 to present)
Number of Portfolios in Fund Complex Overseen by Trustee: 24
Other Director/Trustee Positions Held by Trustee During Past 5 Years: Franklin Street Partners (2014 to 2018 and 2019 to present)
Leslie H. Garner Jr. (73)
Position, Term of Office and Length of Time Served with the Trust: Trustee since January 2004
Principal Occupation(s) During Past 5 Years: President and Chief Executive Officer, The Greater Cedar Rapids Community Foundation (2010 to 2023); President, Cornell College (1994 to 2010)
Number of Portfolios in Fund Complex Overseen by Trustee: 24
Other Director/Trustee Positions Held by Trustee During Past 5 Years: None
Phillip G. Goff (59)
Position, Term of Office and Length of Time Served with the Trust: Trustee since January 2020
Principal Occupation(s) During Past 5 Years: Senior Vice President/Corporate Controller and Funds Treasurer, TIAA (2006 - 2017)
Number of Portfolios in Fund Complex Overseen by Trustee: 24
Other Director/Trustee Positions Held by Trustee During Past 5 Years: None
Ronald James (72)
Position, Term of Office and Length of Time Served with the Trust: Trustee since January 2004
Principal Occupation(s) During Past 5 Years: Faculty member (part time), University of St. Thomas (2004 to present), President and Chief Executive Officer, Center for Ethical Business Cultures (2000 to January 2017)
Number of Portfolios in Fund Complex Overseen by Trustee: 24
Other Director/Trustee Positions Held by Trustee During Past 5 Years: Bremer Financial Corporation (2004 to present); Greater Twin Cities United Way (2012 to 2020); Best Buy Co. Inc. (2004 to 2013)
John A. MacDonald (74)
Position, Term of Office and Length of Time Served with the Trust: Trustee since January 2004
Principal Occupation(s) During Past 5 Years: Retired. Independent Consultant (2020 to present); Vice President and Treasurer, Hall Family Foundation (1988 to 2020); Chief Investment Officer, Chinquapin Trust Company (1999 to 2020)
Number of Portfolios in Fund Complex Overseen by Trustee: 24
Other Director/Trustee Positions Held by Trustee During Past 5 Years: None
83
MANAGEMENT (UNAUDITED)
|
Independent Trustees(1)(2)
James R. Seward, CFA (70)
Position, Term of Office and Length of Time Served with the Trust: Chairman of the Board and Trustee since January 2004
Principal Occupation(s) During Past 5 Years: Private investor (2000 to present); CFA (1987 to present)
Number of Portfolios in Fund Complex Overseen by Trustee: 24
Other Director/Trustee Positions Held by Trustee During Past 5 Years: Brookdale Senior Living Inc. (2008 to 2019)
Christie Zarkovich (49)
Position, Term of Office and Length of Time Served with the Trust: Trustee since March 2023
Principal Occupation(s) During Past 5 Years: Chief Administrative, Financial and Investment Officer, Health Forward Foundation (2021 to present); Investment Director, Chinquapin Trust Company (2019 to 2021); Head of Mission-Related Investing Research, Cambridge Associates (2018 to 2019)
Number of Portfolios in Fund Complex Overseen by Trustee: 24
Other Director/Trustee Positions Held by Trustee During Past 5 Years: None
Interested Trustees(1)(2)(3)
David Eikenberg (54)(5)
Position, Term of Office and Length of Time Served with the Trust: Trustee since October 2022
Principal Occupation(s) During Past 5 Years: President and Chief Executive Officer, RBC Funds (2022 to present); Head of Intermediary Sales at RBC Global Asset Management (U.S.) Inc. (2018 to present); Vice President, T. Rowe Price (2010 to 2018)
Number of Portfolios in Fund Complex Overseen by Trustee: 24
Other Director/Trustee Positions Held by Trustee During Past 5 Years: None
84
MANAGEMENT (UNAUDITED)
|
Executive Officers(1)(3)(4)
David Eikenberg (54)(5)
Position, Term of Office and Length of Time Served with the Trust: President and Chief Executive Officer since October 2022
Principal Occupation(s) During Past 5 Years: President and Chief Executive Officer, RBC Funds (2022 to present); Head of Intermediary Sales at RBC Global Asset Management (U.S.) Inc. (2018 to present); Vice President, T. Rowe Price (2010 to 2018)
Kathleen A. Hegna (56)
Position, Term of Office and Length of Time Served with the Trust: Chief Financial Officer and Principal Accounting Officer since May 2009 and Treasurer since March 2014
Principal Occupation(s) During Past 5 Years: Head, Fund Operations (US), RBC Global Asset Management (U.S.) Inc. (September 2022 to present); Associate Vice President and Director, Mutual Fund Services, RBC Global Asset Management (U.S.) Inc. (2009 to September 2022)
Christina M. Weber (55)
Position, Term of Office and Length of Time Served with the Trust: Chief Compliance Officer since December 2012 and Secretary since September 2017
Principal Occupation(s) During Past 5 Years: Chief Compliance Officer, RBC Global Asset Management (U.S.) Inc. (June 2018 to present); Chief Compliance Officer, RBC Funds (2012 to present); Assistant Secretary, RBC Funds (2013 to 2017)
Jodi DeFeyter (52)
Position, Term of Office and Length of Time Served with the Trust: Assistant Secretary since October 2022
Principal Occupation(s) During Past 5 Years: Director, Regulatory Administration, RBC Global Asset Management (U.S.) Inc. (2012 to present)
Tara Tilbury (49)
Position, Term of Office and Length of Time Served with the Trust: Assistant Secretary since October 2022
Principal Occupation(s) During Past 5 Years: Managing Counsel, RBC Global Asset Management (U.S.) Inc. (2018 to present); Vice President and Chief Counsel – Asset Management, Ameriprise Financial, Inc. (2105 to 2018)
| (1) | The address of each Trustee/Officer except David Eikenberg is 50 South Sixth Street, Suite 2350,Minneapolis, Minnesota 55402. The address of David Eikenberg is 225 Franklin Street, Boston, Massachusetts 02110. |
| (2) | All Trustees must retire on or before December 31 of the year in which they reach age 75. The Board may temporarily waive this requirement when necessary to avoid depriving the Board of a Trustee with critical skills. |
| (3) | On December 31, 2009, Voyageur Asset Management Inc. changed its name to RBC Global Asset Management (U.S.) Inc. Any references to RBC Global Asset Management (U.S.) Inc. for prior periods are deemed to be references to the prior entity. |
85
MANAGEMENT (UNAUDITED)
|
| (4) | Each officer serves in such capacity for an indefinite period of time until his or her removal, resignation or retirement. |
| (5) | David Eikenberg has been determined to be an interested Trustee by virtue of his position with the Advisor. |
The Fund’s Statement of Additional Information includes information about the Funds’ Trustees. To receive your free copy of the Statement of Additional Information, call toll free: 1-800-422-2766.
86
SHARE CLASS INFORMATION (UNAUDITED)
|
The Funds offer Class A, Class IS, Class I, Class R6 and Class Y shares.
Class A
Class A shares are available for purchase primarily through investment advisors, broker-dealers, banks and other financial services intermediaries. Class A shares are currently subject to a maximum up-front sales charge of 3.75% and a 1.00% CDSC for redemption within 12 months of a $1 million or greater purchase. Class A shares currently include a 0.25% annual 12b-1 service and distribution fee.
Class I
Class I shares are intended for investors meeting certain minimum investment thresholds. This share class does not have an up-front sales charge (load) or a 12b-1 service and distribution fee.
Class IS
Class IS shares are offered in Access Capital Community Investment Fund and are available to investors who meet the $2,500 minimum initial investment requirement. This share class does not have an up-front sales charge (load) or a 12b-1 service and distribution fee.
Class R6
Class R6 shares are available in Impact Bond Fund. This share class is intended for investors meeting certain minimum investment thresholds. This share class does not have an up-front sales charge (load) or a 12b-1 service and distribution fee.
Class Y
Class Y shares are offered in Impact Bond Fund for institutional investors that hold shares through an account held directly with the Fund and meet the $5,000,000 minimum requirement for initial investment. This share class does not have an upfront sales charge (load) or a 12b-1 distribution and servicing fee.
87
SUPPLEMENTAL INFORMATION (UNAUDITED)
|
Shareholder Expense Examples
As a shareholder of the RBC Funds, you incur two types of costs: (1) transaction costs and (2) ongoing costs, including management fees; and other Fund expenses. This example is intended to help you understand your ongoing costs (in dollars) of investing in the RBC Funds and to compare these costs with the ongoing costs of investing in other mutual funds.
The example is based on an investment of $1,000 invested at the beginning of the period and held for the entire period from April 1, 2023 through September 30, 2023.
Actual Expenses
The table below provides information about actual account values and actual expenses. You may use the information below, together with the amount you invested, to estimate the expenses that you paid over the period. Simply divide your account value by $1,000 (for example, an $8,600 account value divided by $1,000 = 8.6), then multiply the result by the number in the table under the heading entitled “Expenses Paid During Period” to estimate the expenses you paid on your account during this period.
| Beginning Account Value 4/1/23 | Ending Account Value 9/30/23 | Expenses Paid During Period* 4/1/23–9/30/23 | Annualized Expense Ratio During Period 4/1/23–9/30/23 | |||||||||||||||
RBC BlueBay Access Capital Community Investment Fund |
| |||||||||||||||||
| Class A | $1,000.00 | $952.10 | $3.87 | 0.79% | ||||||||||||||
| Class I | 1,000.00 | 953.80 | 2.16 | 0.44% | ||||||||||||||
| Class IS | 1,000.00 | 954.00 | 1.91 | 0.39% | ||||||||||||||
RBC BlueBay Impact Bond Fund | ||||||||||||||||||
| Class A | 1,000.00 | 963.40 | 3.35 | 0.68% | ||||||||||||||
| Class I | 1,000.00 | 964.70 | 2.12 | 0.43% | ||||||||||||||
| Class R6 | 1,000.00 | 964.90 | 1.87 | 0.38% | ||||||||||||||
| Class Y | 1,000.00 | 964.90 | 1.87 | 0.38% | ||||||||||||||
*Expenses are equal to the average account value times the Fund’s annualized expense ratio multiplied by 183/365 (to reflect one half year period).
88
SUPPLEMENTAL INFORMATION (UNAUDITED)
|
Hypothetical Example for Comparison Purposes
The table below provides information about hypothetical account values and hypothetical expenses based on each RBC Funds’ actual expense ratio and an assumed rate of return of 5% per year before expenses, which is not the Fund’s actual return. The hypothetical account values and expenses may not be used to estimate the actual ending account balance or expenses you paid for the period. You may use this information to compare this 5% hypothetical example with the 5% hypothetical examples that appear in the shareholder reports of other funds.
Please note that the expenses shown in the table are meant to highlight your ongoing costs only and do not reflect any transactional costs, such as sales charges (loads), redemption fees, or exchange fees. Therefore, the table is useful in comparing ongoing costs only, and will not help you determine the relative total costs of owning different funds. In addition, if these transactional costs were included, your costs would have been higher.
| Beginning Account Value 4/1/23 | Ending Account Value 9/30/23 | Expenses Paid During Period* 4/1/23-9/30/23 | Annualized Expense Ratio During Period 4/1/23-9/30/23 | |||||||||||||||
RBC BlueBay Access Capital Community Investment Fund |
| |||||||||||||||||
| Class A | $1,000.00 | $1,021.11 | $4.00 | 0.79% | ||||||||||||||
| Class I | 1,000.00 | 1,022.86 | 2.23 | 0.44% | ||||||||||||||
| Class IS | 1,000.00 | 1,023.11 | 1.98 | 0.39% | ||||||||||||||
RBC BlueBay Impact Bond Fund | ||||||||||||||||||
| Class A | 1,000.00 | 1,021.66 | 3.45 | 0.68% | ||||||||||||||
| Class I | 1,000.00 | 1,022.91 | 2.18 | 0.43% | ||||||||||||||
| Class R6 | 1,000.00 | 1,023.16 | 1.93 | 0.38% | ||||||||||||||
| Class Y | 1,000.00 | 1,023.16 | 1.93 | 0.38% | ||||||||||||||
*Expenses are equal to the average account value times the Fund’s annualized expense ratio multiplied by 183/365 (to reflect one half year period).
89
APPROVAL OF INVESTMENT ADVISORY AGREEMENT (UNAUDITED)
|
Information Regarding the Approval of Investment Advisory Agreement
In September 2023, after evaluating the services provided by RBC Global Asset Management (U.S.) Inc. (the “Advisor”) and reviewing the performance, fees, and expenses of the Funds, the RBC Funds Board of Trustees determined to approve the continuation of the investment advisory agreement (“Agreement”) with the Advisor for each Fund for an additional year.
As part of their review of the Agreement, the Trustees requested and considered information regarding the advisory services performed by the Advisor; the staffing and qualifications of the personnel responsible for operating and managing the Funds; and the Funds’ performance, fees, and expenses. The Trustees considered information provided at regular quarterly Board and Committee meetings throughout the year; information presented at both a special meeting held to review requested material related to the proposed renewals and a regular meeting at which the proposed renewals were considered, and their experience with the management and portfolio management teams over the years. The information included material provided by the Advisor, as well as reports prepared by Broadridge Financial Solutions, Inc., an independent statistical compilation company, providing comparative fee and expense information and comparative performance information for the Funds vs. funds in the same category and funds in more tailored peer groups. In connection with their deliberations, the independent Trustees were advised by independent legal counsel with regard to the materials and their responsibilities under relevant laws and regulations.
The Trustees met with representatives from the Advisor’s senior management team, as well as the senior investment professionals responsible for managing the Funds, to discuss the information and the Advisor’s ongoing management of the Funds. The Trustees reviewed the nature and quality of the services provided to the Funds by the Advisor, including information as to each Fund’s performance relative to appropriate index benchmarks and their respective Morningstar categories and peer groups as well as information with respect to custom peer groups designed to align more closely with the Funds’ specific investment strategies. With respect to the RBC BlueBay Access Capital Community Investment Fund, the Trustees were informed that the Fund’s category consists of funds that own Treasury bonds in addition to mortgage bonds, while the Fund does not invest in Treasuries, and that only one other fund in its category employs a socially conscious strategy and, accordingly, the available comparative data is not necessarily fully applicable.
In considering the nature and quality of services to be provided by the Advisor, the Trustees were informed with respect to the research, credit, and fundamental analysis capabilities; the specialized expertise in the area of fixed income investments eligible for regulatory credit under the Community Reinvestment Act of 1977 (“CRA”); the Advisor’s significant expertise with regard to evaluating environmental, social and governance (ESG) factors, and the extensive portfolio management experience of the Advisor’s staff as well as its operational and compliance structure and systems and financial strength. The Trustees noted that advisory fees and expense ratios were competitive and, in particular, that neither of the Funds had total net expenses that exceeded the median of its peer group. The Trustees also received reports from the Advisor regarding the performance and fee levels for other advisory client accounts it advises in similar strategies and discussed differences in services provided, noting that the need to: manage liquidity for shareholder redemptions; collateral requirements, and regulatory matters; and evaluating relevant ESG factors and CRA eligibility, all require additional time and attention from the investment team.
The Trustees reviewed advisory fee and expense information for each Fund compared to similarly situated funds, including information regarding other client accounts advised or sub-advised by the Advisor with similar investment strategies and the reasons for any differences in fees. The Trustees considered, and viewed favorably, the arrangements to subsidize Fund expenses at competitive levels through expense limitation agreements. The Trustees reviewed profitability data — including year-over-year variances — for the Advisor and considered information regarding other benefits the Advisor and its affiliates derived from their relationships with the Funds.
Based upon their review, the Trustees determined that the advisory fees payable to the Advisor were fair and reasonable in light of the nature and quality of services provided under all the circumstances
90
APPROVAL OF INVESTMENT ADVISORY AGREEMENT (UNAUDITED)
|
and was within the range of what might have been negotiated at arms’ length. The Trustees concluded that it is in the interests of the Funds and their shareholders for the Trustees to approve the approval of the Agreement, as well as continuation of the expense limitation agreement for the Funds for an additional year. In arriving at their collective decision to approve the Agreement, the Trustees did not assign relative weights to the factors discussed above or deem any one or group of them to be controlling in and of itself.
91
| ||||||
92
|
This Page Intentionally Left Blank
93
|
This Page Intentionally Left Blank
94
|
This Page Intentionally Left Blank
95
|
This Page Intentionally Left Blank
96
This Page Intentionally Left Blank
RBC Funds
P.O. Box 701
Milwaukee, WI 53201-0701
800-422-2766
www.rbcgam.com
Performance data represents past performance and does not guarantee future results. The principal value of an investment and investment return will fluctuate so that an investor’s shares, when redeemed, may be worth more or less than their original cost.
This report and the financial statements contained herein are provided for the information of RBC Funds shareholders. This report is not authorized for distribution to prospective investors unless preceded or accompanied by a current prospectus, which contains information concerning investment objectives, risks, charges and expenses of the funds. Please read the prospectus carefully before investing.
This report and the financial statements contained herein are not intended to be a forecast of future events, a guarantee of future results, or investment advice. There is no assurance that certain securities will remain in or out of each fund’s portfolio. The views expressed in this report reflect those of the portfolio managers through the year ended September 30, 2023.
NOT FDIC INSURED • NO BANK GUARANTEE • MAY LOSE VALUE
RBC Global Asset Management (U.S.) Inc. serves as investment advisor for the RBC Funds. RBC Funds are distributed by Quasar Distributors LLC.

This product is made of material from well-managed FSC®-certified forests,
recycled materials, and other controlled sources.
RBCF-II AR 09-23

RBC Global Asset Management Annual Report For the year ended September 30, 2023 RBC BlueBay Emerging Market Debt Fund RBC BlueBay High Yield Bond Fund RBC BlueBay Core Plus Bond Fund RBC BlueBay Strategic Income Fund
| ||||||||||||
RBC Funds | ||||||||||||
| About your Annual Report |
This annual report includes detailed information about your Fund including financial statements, performance, and a complete list of its holdings.
| |||||||||||
The RBC Funds compare their performance against various indices. Each of these indices is a widely recognized measure of return for the underlying category of securities. However, the indices are unmanaged, do not include fees, and cannot be invested in directly.
| ||||||||||||
We hope the financial information presented will help you evaluate your investment in the RBC Funds. We also encourage you to read your Fund’s prospectus for further detail as to your Fund’s investment policies and risk profile. RBC Funds prospectuses and performance information subsequent to the date of this report are available on our website at www.rbcgam.com.
| ||||||||||||
A description of the policies and procedures that your Fund uses to determine how to vote proxies relating to portfolio securities is available (i) without charge, upon request, by calling 1-800-422-2766; (ii) on the Fund’s website at www.rbcgam.com; and (iii) on the Securities and Exchange Commission’s (the “Commission”) website at http://www.sec.gov.
| ||||||||||||
Each year the Trust files its proxy voting record for the twelve-month period ended June 30 with the SEC on Form N-PX no later than August 31. The records can be obtained on the SEC’s website at www.sec.gov and without charge by calling the Funds at 1-800-422-2766.
| ||||||||||||
| �� | A schedule of each Fund’s portfolio holdings is filed with the Commission for the first and third quarters of each fiscal year on Form N-PORT. This information is available on the Commission’s website at http://www.sec.gov and on the Funds’ website at www.dfinview.com/usrbcgam. Fund holdings and/or sector allocations are subject to change at any time and are not recommendations to buy or sell any security. Current and future holdings are subject to risk.
| |||||||||||
Table of Contents | Letter from the Chief Investment Officer | 1 | ||||||||||
| Portfolio Managers | 4 | |||||||||||
| Performance Summary (Unaudited) | 7 | |||||||||||
| Management Discussion and Analysis (Unaudited) | ||||||||||||
| RBC BlueBay Emerging Market Debt Fund | 10 | |||||||||||
| RBC BlueBay High Yield Bond Fund | 14 | |||||||||||
| RBC BlueBay Core Plus Bond Fund | 16 | |||||||||||
| - RBC BlueBay Strategic Income Fund | 18 | |||||||||||
| Schedules of Portfolio Investments | 21 | |||||||||||
| Financial Statements | ||||||||||||
| - Statements of Assets and Liabilities | 66 | |||||||||||
| - Statements of Operations | 69 | |||||||||||
| - Statements of Changes in Net Assets | 71 | |||||||||||
| Financial Highlights | 75 | |||||||||||
| Notes to Financial Statements | 83 | |||||||||||
| Report of Independent Registered Public Accounting Firm | 109 | |||||||||||
| Other Federal Income Tax Information (Unaudited) | 110 | |||||||||||
| Management (Unaudited) | 111 | |||||||||||
| Share Class Information (Unaudited) | 115 | |||||||||||
| Supplemental Information (Unaudited) | 116 | |||||||||||
| Approval of Investment Advisory Agreements (Unaudited) | 118 | |||||||||||
| �� | ||||||||||||
| LETTER FROM THE PORTFOLIO MANAGERS | ||||||
| The twelve-month period ended September 30, 2023 was characterized by a general decline in market volatility and strong recovery in risk asset prices both in equities and fixed income following the much more tumultuous period for financial markets in the earlier parts of 2022. For context, on the equity side, the S&P 500 Index returned 21.62% over the period. In the fixed income space, U.S. investment grade corporate credit, as measured by the ICE BofA US Corporate Index, returned 3.98%, and U.S. high yield and emerging market debt both returned in excess of 10%, with the ICE BofA US High Yield Index’s and the J.P. Morgan Emerging Market Bond Index (EMBI) Global Diversified’s returning 10.17% and 10.12%, respectively. Credit spreads were generally tighter over the period as risk sentiment improved and investor appetite returned; conversely, core government bond yields remained under some pressure. The 10-year U.S. Treasury yield rose from 3.83% to 4.57% over the period, with moves even more pronounced at the front end of the curve as market participants moved to price in the need for more interest rate hikes than initially anticipated to bring inflation under control. | ||||||
| On the macro side, global Central Banks stayed the course and continued to hike interest rates in an effort to combat inflation. In the U.S. for example, the Federal Reserve (the “Fed”) hiked interest rates at every meeting in the past twelve months except June and September 2023, doing so initially in 75-basis point (“bp”) and 50-bp increments before moderating to 25-bp increments more recently as underlying inflation dynamics improved. Having been stubbornly high and rising in the early parts of 2022, inflation finally began to moderate and come down over the period with U.S. headline Consumer Price Index (“CPI”) reducing from 8.2% to 3.7%, and U.S. core CPI reducing from 6.6% to 4.3% in a similar dynamic. This marks a significant move downward from the multi-decade highs, but still some way above the Fed’s 2% target rate. | ||||||
| The main source of volatility over the period came in the first quarter of 2023, as stresses in the banking sector came to the fore on both sides of the Atlantic, with the forced takeover of Credit Suisse by UBS in Europe coupled with the failure of a number of regional banks in the U.S. leading to heightened fears of a repeat of the 2008 global financial crisis by many market participants. However, these fears were short-lived, and by the summer months, contagion worries had subsided as it became apparent the stresses were more contained in a small number of banks with their own idiosyncratic issues as opposed to system-wide. Thereafter there was some angst among investors relating to the U.S. debt ceiling debacle and the prospect of a self-inflicted U.S. debt default, which was narrowly averted following a last minute deal in early June. Tensions in Washington, D.C. remained elevated with the threat of a government shutdown throughout September, which, too, was narrowly averted at the eleventh hour, but ultimately cost Kevin McCarthy his job as House speaker given rising divisions among the Republican Party. | ||||||
| Outside of the U.S., emerging markets (“EM”) had an eventful twelve months. There were key presidential elections in both Brazil and Turkey, the conflict between Russia and Ukraine entered its second year showing no signs of coming to a near-term resolution, and in China, the growth outlook deteriorated meaningfully over the course of 2023 with optimism about strong growth on the back of the “reopening” trade running out of steam early in the year. There were, however, some positive developments for a number of distressed EM sovereigns and their respective negotiations with the International Monetary Fund (“IMF”). In Argentina, this was in the shape of a | ||||||
1
| LETTER FROM THE PORTFOLIO MANAGERS | ||||||
reworking of the near-term program parameters and bringing forward program financing into 2023. Elsewhere, Zambia reached an agreement on its debt restructuring with creditors, while Pakistan reached an agreement on new short-term financing to get through to early 2024.
Looking ahead, uncertainty over data, and therefore policy, remains high as we enter the final quarter of the year. We would expect to see some incremental evidence of slower economic activity and somewhat higher inflation pressures over the coming weeks and months, particularly in light of the recent rise in oil prices. This does not project a particularly supportive backdrop for financial market assets broadly speaking, and therefore we are happy to remain patient, looking for markets to overshoot in either direction before meaningfully increasing directional risk. We remain modestly constructive on corporate credit, reflecting solid technicals on the back of ongoing demand that comes with the attractive yield levels and moderating supply into year-end. Even looking at fundamentals, balance sheets on average are in good shape, and default and downgrade activity at or below historical levels, even if growth disappoints somewhat from here. Active selection should remain key. We see pockets of value, but also issuers and sectors to avoid. An uncertain growth/inflation/policy backdrop should not only mean volatility that can be tactically traded but should also create bottom-up sector and issuer performance dispersion as analysts try to assess the impact of higher prices, divergent growth paths, and shifts in monetary and fiscal policy on their names. While we remain cautious given the uncertain growth path, we see room for spreads on average to tighten a little further on solid technicals and see bottom-up opportunities from issuer dispersion and from mispricing in certain pockets of the market
Sincerely,
Andrzej Skiba, CFA
Managing Director, Head of U.S. Fixed Income, Senior Portfolio Manager RBC Global Asset Management (U.S.) Inc.
Polina Kurdyavko, CFA
Managing Director, Head of BlueBay Emerging Markets, Senior Portfolio Manager RBC Global Asset Management (UK) Limited
Past performance does not guarantee future results.
Mutual fund investing involves risk. Principal loss is possible.
The S&P 500 is widely regarded as the best single gauge of large-cap U.S. equities. The index includes 500 leading companies and covers approximately 80% of available market capitalization.
The ICE BofA US Corporate Index tracks the performance of U.S. dollar-denominated investment grade corporate debt publicly issued and settled in the U.S. domestic market.
The ICE BofA US High Yield Index tracks the performance of U.S. dollar-denominated below investment grade corporate debt publicly issued in the U.S. domestic market.
The J.P. Morgan Emerging Market Bond Index tracks the performance of U.S. dollar-denominated Brady bonds, Eurobonds, and traded loans issued by sovereign and quasi-sovereign entities in emerging markets. The J.P. Morgan Emerging Market Bond Index Global Diversified limits the weights of countries with larger debt stocks by including only a specified portion of these countries’ eligible current face amounts of debt outstanding. | ||||||
2
3
4
| PORTFOLIO MANAGERS | ||||||
| Management and International Business Economics from the University of Manchester Institute of Science and Technology. He is also a CFA® charterholder. | ||||||
| Tim Leary | ||||||
| Senior Portfolio Manager | ||||||
| Tim is a BlueBay senior portfolio manager on the BlueBay Fixed Income team at RBC Global Asset Management (U.S.) Inc., focused on U.S. fixed income. In this role, he manages several global leveraged finance and environmental, social and governance (“ESG”) strategies. Tim was promoted to his current position in 2021 after working as a portfolio manager for four years and was previously head of Trading, North America, since joining the firm in 2012. Prior to joining the firm, Tim worked with two major investment banks in the high yield and distressed credit trading and leverage loan trading domains. He started his career in the investment industry in 2005. Tim holds a BS in Business Administration with Finance concentration from Fordham University, U.S. | ||||||
| RBC BlueBay Core Plus Bond Fund and RBC BlueBay Strategic Income Fund | ||||||
| Andrzej Skiba, CFA | ||||||
| Managing Director, Head of U.S. Fixed Income, BlueBay Senior Portfolio Manager | ||||||
| Andrzej is head of U.S. Fixed Income on the BlueBay Fixed Income team at RBC Global Asset Management (U.S.) Inc. and is based in the U.S. He assumed this role in 2013 when he moved to the U.S. from London to oversee the buildout of global investment grade capability. This followed a period from 2009, where he was a portfolio manager responsible for corporate investments within BlueBay’s Investment Grade strategies. Prior to joining the organization in 2005 as a credit analyst, Andrzej had worked for an investment bank as a credit analyst covering European investment grade issues in the telecom, media, and utility sectors. He started his career in the investment industry in 2001. Andrzej holds a Bachelor of Science (Honors) in Management and International Business Economics from the University of Manchester Institute of Science and Technology. He is also a CFA® charterholder. | ||||||
| Brian Svendahl, CFA | ||||||
| BlueBay Senior Portfolio Manager | ||||||
| Brian is a BlueBay senior portfolio manager on the BlueBay Fixed Income team at RBC Global Asset Management (U.S.) Inc. He has had a leadership role within the Minneapolis-based fixed income group since 2012 and has been the lead portfolio manager for the firm’s impact investing strategies since 2006. He also managed many government and mortgage strategies. Brian joined the organization in 2005, having held risk management, research, and trading positions with a large American multinational financial services company since 1992. Brian holds an MBA, a BBA in Finance and a Bachelor of Science in Economics from the University of Minnesota. He is also a CFA® charterholder and a Financial Risk Manager (FRM®). | ||||||
5
| PORTFOLIO MANAGERS | ||||||
| Brandon Swensen, CFA | ||||||
| BlueBay Senior Portfolio Manager | ||||||
Brandon is a BlueBay senior portfolio manager on the BlueBay Fixed Income team at RBC Global Asset Management (U.S.) Inc. In addition to co-leading the fixed income group based in Minneapolis, he is a portfolio manager for several cash management and core solutions. Brandon began his career in the investment industry in 1998 and held positions as a research analyst and financial analyst prior to joining the RBC GAM Mortgage and Government team in 2000. Brandon holds an MBA in Finance from the University of St. Thomas and a Bachelor of Science in Finance from St. Cloud State University. He is also a CFA® charterholder. | ||||||
| ||||||
| ||||||
| ||||||
| ||||||
| ||||||
| ||||||
| ||||||
| ||||||
| ||||||
| ||||||
6
| PERFORMANCE SUMMARY (UNAUDITED) | ||
| 1 Year | 5 Year | 10 Year | Since Inception(a) | Net Expense Ratio(b)(c) | Gross Expense Ratio(b)(c) | |||||||||||||||||||
Average Annual Total Returns as of September 30, 2023 (Unaudited) | ||||||||||||||||||||||||
RBC BlueBay Emerging Market Debt Fund | ||||||||||||||||||||||||
Class A | ||||||||||||||||||||||||
- Including Max Sales Charge of 4.25% | 9.31% | (0.26)% | 0.40% | 0.83% | ||||||||||||||||||||
- At Net Asset Value | 14.12% | 0.61% | 0.84% | 1.20% | 1.04% | 17.51% | ||||||||||||||||||
Class I | ||||||||||||||||||||||||
- At Net Asset Value | 14.42% | 0.89% | 1.08% | 1.44% | 0.79% | 1.65% | ||||||||||||||||||
Class R6 | ||||||||||||||||||||||||
- At Net Asset Value | 14.54% | 0.93% | 1.15% | 1.52% | 0.74% | 31.35% | ||||||||||||||||||
JPM EMBI Global Diversified Index(d) | 10.12% | (0.35)% | 2.44% | 2.98% | ||||||||||||||||||||
RBC BlueBay High Yield Bond Fund | ||||||||||||||||||||||||
Class A | ||||||||||||||||||||||||
- Including Max Sales Charge of 4.25% | 5.36% | 2.91% | 3.94% | 4.84% | ||||||||||||||||||||
- At Net Asset Value | 10.06% | 3.81% | 4.39% | 5.22% | 0.82% | 1.16% | ||||||||||||||||||
Class I | ||||||||||||||||||||||||
- At Net Asset Value | 10.34% | 4.06% | 4.67% | 5.50% | 0.57% | 0.82% | ||||||||||||||||||
ICE BofA US High Yield Index(d) | 10.17% | 2.79% | 4.16% | 5.33% | ||||||||||||||||||||
RBC BlueBay Core Plus Bond Fund(e) | ||||||||||||||||||||||||
Class A | ||||||||||||||||||||||||
- Including Max Sales Charge of 3.75% | (0.37)% | N/A | N/A | (9.03)% | ||||||||||||||||||||
- At Net Asset Value | 4.11% | N/A | N/A | (6.96)% | 0.70% | 1.51% | ||||||||||||||||||
Class I | ||||||||||||||||||||||||
- At Net Asset Value | 4.34% | N/A | N/A | (6.70)% | 0.45% | 1.15% | ||||||||||||||||||
Class R6 | ||||||||||||||||||||||||
- At Net Asset Value | 4.39% | N/A | N/A | (6.65)% | 0.40% | 1.19% | ||||||||||||||||||
Bloomberg US Aggregate Bond Index(d) | 0.64% | N/A | N/A | (7.55)% | ||||||||||||||||||||
RBC BlueBay Strategic Income Fund(f) | ||||||||||||||||||||||||
Class A | ||||||||||||||||||||||||
- Including Max Sales Charge of 3.75% | 3.68% | N/A | N/A | 0.50% | ||||||||||||||||||||
- At Net Asset Value | 8.33% | N/A | N/A | 2.79% | 0.89% | 1.63% | ||||||||||||||||||
Class I | ||||||||||||||||||||||||
- At Net Asset Value | 8.48% | N/A | N/A | 3.03% | 0.64% | 1.29% | ||||||||||||||||||
Class R6 | ||||||||||||||||||||||||
- At Net Asset Value | 8.54% | N/A | N/A | 3.08% | 0.59% | 1.33% | ||||||||||||||||||
ICE BofA US Dollar 3-Month Deposit Offered Rate Constant Maturity Index(d) | 4.54% | N/A | N/A | 2.56% | ||||||||||||||||||||
Bloomberg US Aggregate Bond Index (d) | 0.64% | N/A | N/A | (7.56)% | ||||||||||||||||||||
Parentheses indicate negative performance returns.
7
| PERFORMANCE SUMMARY (UNAUDITED) | ||
Performance data quoted represents past performance. Past performance is no guarantee of future results. Investment return and principal value of an investment will fluctuate so that an investor’s shares, when redeemed, may be worth more or less than their original cost. Current performance may be lower or higher than performance quoted. Performance shown reflects contractual fee waivers, without such fee waivers total returns would be reduced. For performance data current to the most recent month-end go to www.rbcgam.com. Please see footnotes below.
| (a) | For BlueBay Emerging Market Debt Fund and BlueBay High Yield Bond Fund, the inception date (commencement of operations) is November 27, 2013 for Class A shares, November 30, 2011 for Class I shares, and December 27, 2016 for Class R6 shares of BlueBay Emerging Market Debt Fund. The performance in the table for the Class A and Class R6 shares prior to the inception of those classes reflects the performance of the Class I shares since the Fund’s inception, adjusted to reflect the fees and expenses of Class A shares and Class R6 shares, respectively. |
| (b) | The Funds’ expenses are from the Funds’ most recent prospectus dated January 27, 2023, and reflect actual expenses for the fiscal year ended September 30, 2022. |
| (c) | The advisor has contractually agreed to waive fees and/or make payments in order to keep total operating expenses to the levels disclosed in the Funds’ prospectus until January 31, 2025. |
| (d) | Each of the comparative indices is a widely recognized market value weighted measure of the return of securities, but does not include sales fees or operating expenses. You cannot invest directly in indices. |
| (e) | The inception date for the RBC BlueBay Core Plus Bond Fund is November 1, 2021. |
| (f) | The inception date for the RBC BlueBay Strategic Income Fund is November 1, 2021. |
JPM EMBI Global Diversified Index is a subset of the JPMorgan EMBI. The JPMorgan EMBI tracks the performance of U.S. dollar-denominated Brady bonds, Eurobonds and traded loans issued by sovereign and quasi-sovereign entities in emerging markets. The JPMorgan EMBI Global Diversified limits the weights of countries with larger debt stocks by including only a specified portion of these countries’ eligible current face amounts of debt outstanding.
The ICE BofA US High Yield Index tracks the performance of U.S. dollar-denominated below investment grade corporate debt publicly issued in the U.S. domestic market.
The Bloomberg US Aggregate Bond Index is a broad-based benchmark that measures the investment grade, U.S. dollar-denominated, fixed-rate taxable bond market. This includes Treasuries, government-related and corporate securities, mortgage-backed securities, asset-backed securities and collateralised mortgage-backed securities.
ICE BofA US Dollar 3-Month Deposit Offered Rate Constant Maturity Index tracks the performance of a synthetic asset paying a deposit offered rate to a stated maturity. The index is based on the assumed purchase at par of a synthetic instrument having exactly its stated maturity and with a coupon equal to that day’s fixing rate. That issue is assumed to be sold the following business day (priced at a yield equal to the current day fixing rate) and rolled into a new instrument.
You cannot invest directly in an index.
Fund holdings and/or sector allocations are subject to change at any time and are not recommendations to buy or sell any security.
Mutual fund investing involves risk. Principal loss is possible.
8
|
This Page Intentionally Left Blank
9
10
| MANAGEMENT DISCUSSION AND ANALYSIS (UNAUDITED) | ||||||
RBC BlueBay Emerging Market Debt Fund | ||||||
| The J.P. Morgan Emerging Market Bond Index tracks the performance of U.S. dollar-denominated Brady bonds, Eurobonds, and traded loans issued by sovereign and quasi-sovereign entities in emerging markets. The J.P. Morgan Emerging Market Bond Index Global Diversified limits the weights of countries with larger debt stocks by including only a specified portion of these countries’ eligible current face amounts of debt outstanding. You cannot invest directly in an index. | ||||||
| Fund holdings and/or sector allocations are subject to change and should not be considered a recommendation to buy or sell any security. Current and future holdings are subject to risk. | ||||||
| Beta is a volatility measurement of a portfolio compared to a benchmark or the overall market and indicates the sensitivity of a portfolio’s returns to benchmark or market movements. | ||||||
| Spread measures the difference between two rates or yields. | ||||||
| Past performance is not a guarantee of future results. | ||||||
| ||||||
11
| MANAGEMENT DISCUSSION AND ANALYSIS (UNAUDITED) |
| |||||||||||||||||||||||
RBC BlueBay Emerging Market Debt Fund
|
| |||||||||||||||||||||||
Investment Objective | The Fund seeks to achieve a high level of total return consisting of income and capital appreciation.
|
| ||||||||||||||||||||||
Benchmark | JPM EMBI Global Diversified Index
|
| ||||||||||||||||||||||
Asset Allocation as of 9/30/23 (% of Fund’s investments) & Top Five GICS sectors (as of 9/30/23) (% of Fund’s net assets) |
|
| ||||||||||||||||||||||
*Includes U.S. dollar denominated cash equivalent investments representing 3.33% of investments.
|
| |||||||||||||||||||||||
Top Ten Holdings (excluding investment companies) (as of 9/30/23) (% of Fund’s net assets) |
U.S. Treasury Notes, 2.75%, 2/15/24 |
|
7.19 |
% |
Turkey Government International Bond, 5.75%, 5/11/47 |
|
1.56 |
% | ||||||||||||||||
Oman Government International Bond, 6.75%, 1/17/48 | 2.40 | % | Mexico Government International Bond, 3.77%, 5/24/61 | 1.51 | % | |||||||||||||||||||
Petroleos Mexicanos, 5.63%, 1/23/46 | 1.99 | % | DP World Salaam, 6.00% | 1.27 | % | |||||||||||||||||||
Turkey Government International Bond, 4.88%, 4/16/43 | 1.80 | % | Uruguay Government International Bond, 4.98%, 4/20/55 | 1.25 | % | |||||||||||||||||||
Corp. Nacional del Cobre de Chile, 5.95%, 1/8/34 | 1.62 | % | Oman Government International Bond, 6.75%, 10/28/27 | 1.22 | % | |||||||||||||||||||
A listing of all portfolio holdings can be found beginning on page 21
| ||||||||||||||||||||||||
Growth of $1,000,000 Initial Investment Over 10 Years |
|
| ||||||||||||||||||||||
| The graph reflects an initial hypothetical investment of $1,000,000 over the 10-year period and is based on Class I shares. The Fund’s total return includes reinvested dividends and capital gains. The Fund’s total return also includes operating expenses that reduce return, while the total return of the index does not. The graph does not reflect the deduction of taxes that a shareholder would pay on fund distributions or redemption of fund shares. Performance of other classes will vary due to differences in fee structures. This chart does not imply any future performance. |
| |||||||||||||||||||||||
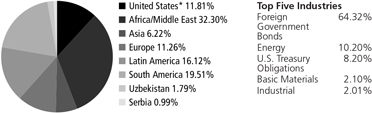
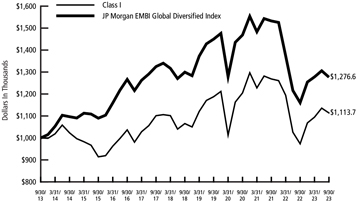
12
|
This Page Intentionally Left Blank
13
14
MANAGEMENT DISCUSSION AND ANALYSIS (UNAUDITED)
|
| |||||||||||||||||||||||||
RBC BlueBay High Yield Bond Fund
|
| |||||||||||||||||||||||||
The Fund seeks to achieve a high level of total return consisting of income and capital appreciation.
|
|
Investment Objective
Benchmark | ||||||||||||||||||||||||
ICE BofA US High Yield Index
|
| |||||||||||||||||||||||||
*Includes U.S. dollar denominated cash equivalent investments representing 3.40% of investments. |
| Asset Allocation as of 9/30/23 (% of Fund’s investments) & Top Five GICS sectors (as of 9/30/23) (% of Fund’s net assets) | ||||||||||||||||||||||||
U.S. Treasury Notes, 5.00%, 8/31/25 |
|
2.43 |
% |
CCO Holdings LLC / CCO Holdings Capital Corp., 7.38%, 3/1/31 |
|
1.04 |
% | Top Ten Holdings (excluding investment companies) (as of 9/30/23) (% of Fund’s net assets) | ||||||||||||||||||
Boxer Parent Co., Inc., 7.13%, 10/2/25 | 1.36 | % | Ferrellgas LP / Ferrellgas Finance Corp., 5.88%, 4/1/29 | 1.02 | % | |||||||||||||||||||||
Intelligent Packaging Ltd. Finco, Inc. / Intelligent Packaging Ltd. Co-Issuer LLC, 6.00%, 9/15/28 | 1.26 | % | Specialty Building Products Holdings LLC / SBP Finance Corp., 6.38%, 9/30/26 | 1.00 | % | |||||||||||||||||||||
Dealer Tire LLC / DT Issuer LLC, 8.00%, 2/1/28 | 1.12 | % | ITT Holdings LLC, 6.50%, 8/1/29 | 0.99 | % | |||||||||||||||||||||
GTCR W-2 Merger Sub LLC, 7.50%, 1/15/31 | 1.04 | % | CQP Holdco LP / BIP-V Chinook Holdco LLC, 5.50%, 6/15/31 | 0.98 | % | |||||||||||||||||||||
A listing of all portfolio holdings can be found beginning on page 34
| ||||||||||||||||||||||||||
|
| Growth of $1,000,000 Initial Investment Over 10 Years | ||||||||||||||||||||||||
| The graph reflects an initial hypothetical investment of $1,000,000 over the 10-year period and is based on Class I shares. The Fund’s total return includes reinvested dividends and capital gains. The Fund’s total return also includes operating expenses that reduce return, while the total return of the index does not. The graph does not reflect the deduction of taxes that a shareholder would pay on fund distributions or redemption of fund shares. Performance of other classes will vary due to differences in fee structures. This chart does not imply any future performance. |
| |||||||||||||||||||||||||
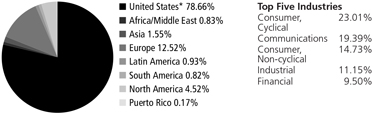
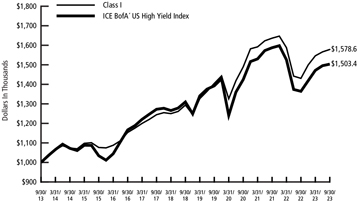
15
16
MANAGEMENT DISCUSSION AND ANALYSIS (UNAUDITED)
|
| |||||||||||||||||||||||||
RBC BlueBay Core Plus Bond Fund
|
| |||||||||||||||||||||||||
The Fund seeks to provide total return.
|
|
Investment Objective
Benchmark | ||||||||||||||||||||||||
Bloomberg US Aggregate Bond Index
|
| |||||||||||||||||||||||||
|
| Asset Allocation as of 9/30/23 (% of Fund’s investments) & Top Five GICS sectors (as of 9/30/23) (% of Fund’s net assets) | ||||||||||||||||||||||||
Fannie Mae, (TBA), 2.00%, 10/15/53 |
|
6.60 |
% |
Fannie Mae, (TBA), 3.00%, 10/1/53 |
|
1.37 |
% | Top Ten Holdings (excluding investment companies) (as of 9/30/23) (% of Fund’s net assets) | ||||||||||||||||||
Fannie Mae, (TBA), 2.50%, 10/1/53 | 5.44 | % | Credit Suisse Mortgage Capital Certificates, Series 2020-SPT1, Certificates, Series 2020-SPT1, Class A2, 2.23%, 4/25/65 | 1.35 | % | |||||||||||||||||||||
Mexican Bonos, Series M, 8.50%, 5/31/29 | 2.54 | % | Freddie Mac Structured Agency Credit Risk Debt Notes, Series 2023-HQA2, Class M1B, (SOFR30A + 3.350%), 8.67%, 6/25/43 | 1.29 | % | |||||||||||||||||||||
Fannie Mae, Pool #BT8271, 4.00%, 7/1/52 | 1.80 | % | Fannie Mae, Pool #CB4768, 5.00%, 9/1/52 | 1.23 | % | |||||||||||||||||||||
Fannie Mae, (TBA), 3.50%, 10/1/53 | 1.72 | % | ||||||||||||||||||||||||
Fannie Mae, Pool #CB7160, 6.50%, 9/1/53 | 1.47 | % | ||||||||||||||||||||||||
A listing of all portfolio holdings can be found beginning on page 43
| ||||||||||||||||||||||||||
|
| Growth of $1,000,000 Initial Investment Since Inception (11/01/21) | ||||||||||||||||||||||||
| The graph reflects an initial hypothetical investment of $1,000,000 over the period from November 1, 2021 (commencement of operations) through September 30, 2023 and is based on Class I shares. The Fund’s total return includes reinvested dividends and capital gains. The Fund’s total return also includes operating expenses that reduce return, while the total return of the index does not. The graph does not reflect the deduction of taxes that a shareholder would pay on fund distributions or redemption of fund shares. Performance of other classes will vary due to differences in fee structures. This chart does not imply any future performance. |
| |||||||||||||||||||||||||
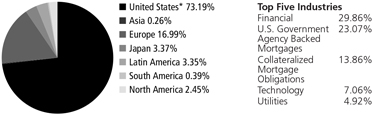
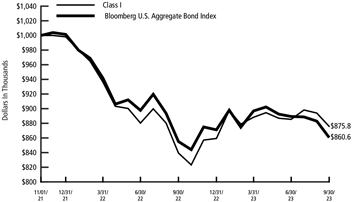
17
18
MANAGEMENT DISCUSSION AND ANALYSIS (UNAUDITED)
| ||||||||||||||||
RBC BlueBay Strategic Income Fund
| ||||||||||||||||
The Fund seeks to provide total return (capital appreciation and income). | Investment | |||||||||||||||
Objective
| ||||||||||||||||
ICE BofA US Dollar 3-Month Deposit Offered Rate Constant Maturity Index Bloomberg US Aggregate Bond Index
|
Benchmark | |||||||||||||||
*Includes U.S. dollar denominated cash equivalents representing 9.0% of investments.
|
| Asset Allocation as of 9/30/23 (% of Fund’s investments) & Top Five GICS sectors (as of 9/30/23) (% of Fund’s net assets)
| ||||||||||||||
U.S. Treasury Notes, 4.13%, 1/31/25 | 4.46% | Credit Suisse Mortgage Capital Certificates, Series 2020-SPT1, Class A2, 2.23%, 4/25/65 | 1.12% | Top Ten Holdings (excluding investment companies) (as of 9/30/23) (% of Fund’s net assets) | ||||||||||||
U.S. Treasury Notes, 5.00%, 8/31/25 | 3.96% | Freddie Mac Structured Agency Credit Risk Debt Notes, Series 2023-HQA2, Class M1B, (SOFR30A + 3.350%), 8.67%, 6/25/43 | 1.11% | |||||||||||||
Mexican Bonos, Series M, 8.50%, 5/31/29 | 2.46% | Avolon US LLC, 1st Lien Term Loan B5, (SOFR 1M + 2.25%), 7.68%, 12/1/27 | 1.11% | |||||||||||||
U.S. Treasury Notes, 4.38%, 10/31/24 | 1.87% | Triton Container International Ltd., 1.15%, 6/7/24 | 0.97% | |||||||||||||
Hilton Worldwide Finance LLC, 1st Lien Term Loan B2, (SOFR 1M + 1.75%), 7.17%, 6/21/26 | 1.13% | |||||||||||||||
NextEra Energy Capital Holdings, Inc., 5.75%, 9/1/25 | 1.13% | |||||||||||||||
A listing of all portfolio holdings can be found beginning on page 55
| ||||||||||||||||
| ||||||||||||||||
| ||||||||||||||||
| ||||||||||||||||
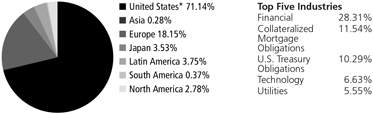
19
MANAGEMENT DISCUSSION AND ANALYSIS (UNAUDITED)
| ||||||||||||||||||||||
RBC BlueBay Strategic Income Fund
| ||||||||||||||||||||||
Growth of $1,000,000 Initial |
The graph reflects an initial hypothetical investment of $1,000,000 over the period from November 1, 2021 (commencement of operations) through September 30, 2023 and is based on Class I shares. The Fund’s total return includes reinvested dividends and capital gains. The Fund’s total return also includes operating expenses that reduce return, while the total return of the index does not. The graph does not reflect the deduction of taxes that a shareholder would pay on fund distributions or redemption of fund shares. Performance of other classes will vary due to differences in fee structures. This chart does not imply any future performance. | |||||||||||||||||||||
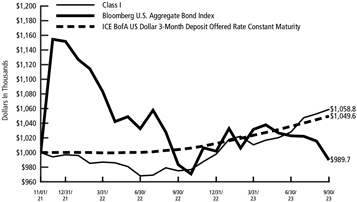
20
SCHEDULE OF PORTFOLIO INVESTMENTS
|
RBC BlueBay Emerging Market Debt Fund
September 30, 2023
Principal Amount | Value | |||||
| ||||||
Foreign Government Bonds — 64.32% | ||||||
Angola — 1.60% | ||||||
$ 460,000 | Angolan Government International Bond, 8.25%, 5/9/28(a) | $ | 399,197 | |||
280,000 | Angolan Government International Bond, 8.75%, 4/14/32(a) | 225,221 | ||||
|
| |||||
| 624,418 | ||||||
|
| |||||
Argentina — 1.79% | ||||||
1,653,816 | Argentine Republic Government International Bond, 3.50%, 7/9/41 | 431,922 | ||||
1,067,095 | Argentine Republic Government International Bond, 3.63%, 7/9/35 | 265,386 | ||||
|
| |||||
| 697,308 | ||||||
|
| |||||
Armenia — 0.52% | ||||||
200,000 | Republic of Armenia International Bond, 7.15%, 3/26/25(a) | 203,200 | ||||
|
| |||||
Bahrain — 0.40% | ||||||
200,000 | Bahrain Government International Bond, 6.00%, 9/19/44(a) | 154,147 | ||||
|
| |||||
Brazil — 0.42% | ||||||
235,000 | Brazilian Government International Bond, 4.75%, 1/14/50 | 163,086 | ||||
|
| |||||
Chile — 2.13% | ||||||
308,000 | Chile Government International Bond, 3.10%, 5/7/41 | 209,846 | ||||
200,000 | Chile Government International Bond, 4.00%, 1/31/52 | 145,895 | ||||
200,000 | Chile Government International Bond, 4.34%, 3/7/42 | 161,925 | ||||
350,000 | Chile Government International Bond, 5.33%, 1/5/54 | 312,599 | ||||
|
| |||||
| 830,265 | ||||||
|
| |||||
Colombia — 4.01% | ||||||
410,000 | Colombia Government International Bond, 3.25%, 4/22/32 | 295,338 | ||||
550,000 | Colombia Government International Bond, 3.88%, 2/15/61 | 286,428 | ||||
255,000 | Colombia Government International Bond, 4.13%, 5/15/51 | 142,622 | ||||
460,000 | Colombia Government International Bond, 5.00%, 6/15/45 | 302,447 | ||||
240,000 | Colombia Government International Bond, 7.50%, 2/2/34 | 227,147 | ||||
310,000 | Colombia Government International Bond, 8.00%, 4/20/33 | 307,059 | ||||
|
| |||||
| 1,561,041 | ||||||
|
| |||||
Costa Rica — 0.50% | ||||||
200,000 | Costa Rica Government International Bond, 6.55%, 4/3/34(b) | 194,517 | ||||
|
| |||||
Dominican Republic — 3.18% | ||||||
456,000 | Dominican Republic International Bond, 5.50%, 1/27/25(a) | 450,424 | ||||
620,000 | Dominican Republic International Bond, 5.88%, 1/30/60(a) | 444,044 | ||||
200,000 | Dominican Republic International Bond, 7.05%, 2/3/31(a) | 193,539 | ||||
8,350,000(c) | Dominican Republic International Bond, 11.25%, 9/15/35(b) | 149,258 | ||||
|
| |||||
| 1,237,265 | ||||||
|
| |||||
21
SCHEDULE OF PORTFOLIO INVESTMENTS
|
RBC BlueBay Emerging Market Debt Fund (cont.)
September 30, 2023
Principal Amount | Value | |||||
| ||||||
Ecuador — 0.66% | ||||||
$ 698,779 | Ecuador Government International Bond, 3.50%, 7/31/35(a) | $ | 257,119 | |||
|
| |||||
Egypt — 1.93% | ||||||
211,000 | Egypt Government International Bond, 6.59%, 2/21/28(a) | 137,241 | ||||
400,000 | Egypt Government International Bond, EMTN, 7.50%, 2/16/61(a) | 202,372 | ||||
800,000 | Egypt Government International Bond, 7.90%, 2/21/48(a) | 410,427 | ||||
|
| |||||
| 750,040 | ||||||
|
| |||||
El Salvador — 0.97% | ||||||
281,000 | El Salvador Government International Bond, 6.38%, 1/18/27(a) | 230,005 | ||||
208,000 | El Salvador Government International Bond, 7.65%, 6/15/35(a) | 147,903 | ||||
|
| |||||
| 377,908 | ||||||
|
| |||||
Ghana — 1.07% | ||||||
297,000 | Ghana Government International Bond, 7.63%, 5/16/29(a) | 131,812 | ||||
235,000 | Ghana Government International Bond, 8.63%, 4/7/34(a) | 104,765 | ||||
205,000 | Ghana Government International Bond, 8.88%, 5/7/42(a) | 87,651 | ||||
215,000 | Ghana Government International Bond, 8.95%, 3/26/51(a) | 92,093 | ||||
|
| |||||
| 416,321 | ||||||
|
| |||||
Guatemala — 1.25% | ||||||
290,000 | Guatemala Government Bond, 3.70%, 10/7/33(a) | 223,198 | ||||
275,000 | Guatemala Government Bond, 6.60%, 6/13/36(a) | 264,661 | ||||
|
| |||||
| 487,859 | ||||||
|
| |||||
Hungary — 0.63% | ||||||
440,000 | Hungary Government International Bond, 3.13%, 9/21/51(a) | 243,861 | ||||
|
| |||||
Indonesia — 1.92% | ||||||
600,000 | Indonesia Government International Bond, 3.35%, 3/12/71 | 359,829 | ||||
3,000,000,000(d) | Indonesia Treasury Bond, Series FR98, 7.13%, 6/15/38 | 196,101 | ||||
270,000 | Perusahaan Penerbit SBSN Indonesia III, 3.80%, 6/23/50(a) | 193,304 | ||||
|
| |||||
| 749,234 | ||||||
|
| |||||
Iraq — 0.67% | ||||||
281,250 | Iraq International Bond, 5.80%, 1/15/28(a) | 260,833 | ||||
|
| |||||
Jordan — 0.92% | ||||||
200,000 | Jordan Government International Bond, 4.95%, 7/7/25(a) | 193,686 | ||||
200,000 | Jordan Government International Bond, 7.38%, 10/10/47(a) | 164,543 | ||||
|
| |||||
| 358,229 | ||||||
|
| |||||
Kenya — 0.48% | ||||||
200,000 | Republic of Kenya Government International Bond, 6.88%, 6/24/24(a) | 185,586 | ||||
|
| |||||
22
SCHEDULE OF PORTFOLIO INVESTMENTS
|
RBC BlueBay Emerging Market Debt Fund (cont.)
September 30, 2023
Principal Amount | Value | |||||
| ||||||
Lebanon — 0.36% | ||||||
$ 36,000 | Lebanon Government International Bond, GMTN, 5.80%, 4/14/20(a),(e) | $ | 2,833 | |||
166,000 | Lebanon Government International Bond, 6.00%, 1/27/23(a),(e) | 13,259 | ||||
85,000 | Lebanon Government International Bond, EMTN, 6.10%, 10/4/22(a),(e) | 6,788 | ||||
261,000 | Lebanon Government International Bond, EMTN, 6.15%, 6/19/20(e) | 20,675 | ||||
930,000 | Lebanon Government International Bond, GMTN, 6.38%, 3/9/20(e) | 66,852 | ||||
366,000 | Lebanon Government International Bond, EMTN, 8.25%, 4/12/21(a),(e) | 29,470 | ||||
5,000 | Lebanon Government International Bond, 8.25%, 5/17/34(e) | 404 | ||||
|
| |||||
| 140,281 | ||||||
|
| |||||
Macedonia — 0.50% | ||||||
180,000(f) | North Macedonia Government International Bond, 6.96%, 3/13/27(a) | 193,715 | ||||
|
| |||||
Mexico — 2.60% | ||||||
1,000,000 | Mexico Government International Bond, 3.77%, 5/24/61 | 587,543 | ||||
200,000 | Mexico Government International Bond, 5.40%, 2/9/28 | 197,051 | ||||
250,000 | Mexico Government International Bond, 6.34%, 5/4/53 | 228,066 | ||||
|
| |||||
| 1,012,660 | ||||||
|
| |||||
Morocco — 0.51% | ||||||
200,000 | Morocco Government International Bond, 5.95%, 3/8/28(a) | 197,185 | ||||
|
| |||||
Nigeria — 2.10% | ||||||
500,000 | Nigeria Government International Bond, EMTN, 6.13%, 9/28/28(a) | 398,703 | ||||
220,000 | Nigeria Government International Bond, EMTN, 7.63%, 11/28/47(a) | 147,125 | ||||
344,000 | Nigeria Government International Bond, 7.88%, 2/16/32(a) | 271,453 | ||||
|
| |||||
| 817,281 | ||||||
|
| |||||
Oman — 6.10% | ||||||
200,000 | Oman Government International Bond, 4.75%, 6/15/26(a) | 194,105 | ||||
404,000 | Oman Government International Bond, EMTN, 4.88%, 2/1/25(a) | 397,293 | ||||
465,000 | Oman Government International Bond, 6.75%, 10/28/27(a) | 473,281 | ||||
1,015,000 | Oman Government International Bond, 6.75%, 1/17/48(a) | 933,342 | ||||
400,000 | Oman Government International Bond, 7.00%, 1/25/51(a) | 377,329 | ||||
|
| |||||
| 2,375,350 | ||||||
|
| |||||
Pakistan — 1.31% | ||||||
200,000 | Pakistan Government International Bond, EMTN, 6.00%, 4/8/26(a) | 104,469 | ||||
23
SCHEDULE OF PORTFOLIO INVESTMENTS
|
RBC BlueBay Emerging Market Debt Fund (cont.)
September 30, 2023
Principal Amount | Value | |||||
| ||||||
$ 600,000 | Pakistan Government International Bond, EMTN, 7.38%, 4/8/31(a) | $ | 281,980 | |||
200,000 | Pakistan Government International Bond, 8.25%, 9/30/25(a) | 124,090 | ||||
|
| |||||
| 510,539 | ||||||
|
| |||||
Panama — 2.02% | ||||||
615,000 | Panama Government International Bond, 3.87%, 7/23/60 | 356,211 | ||||
290,000 | Panama Government International Bond, 4.50%, 4/1/56 | 191,467 | ||||
240,000 | Panama Government International Bond, 6.88%, 1/31/36 | 240,302 | ||||
|
| |||||
| 787,980 | ||||||
|
| |||||
Paraguay — 1.18% | ||||||
305,000 | Paraguay Government International Bond, 5.40%, 3/30/50(a) | 240,021 | ||||
230,000 | Paraguay Government International Bond, 5.85%, 8/21/33(b) | 217,555 | ||||
|
| |||||
| 457,576 | ||||||
|
| |||||
Philippines — 1.72% | ||||||
400,000 | Philippine Government International Bond, 2.95%, 5/5/45 | 256,312 | ||||
200,000 | Philippine Government International Bond, 5.00%, 7/17/33 | 192,815 | ||||
220,000 | Philippine Government International Bond, 5.61%, 4/13/33 | 220,354 | ||||
|
| |||||
| 669,481 | ||||||
|
| |||||
Poland — 1.49% | ||||||
200,000 | Bank Gospodarstwa Krajowego, 5.38%, 5/22/33(b) | 188,666 | ||||
210,000 | Republic of Poland Government International Bond, 5.50%, 4/4/53 | 190,152 | ||||
200,000 | Republic of Poland Government International Bond, 5.75%, 11/16/32 | 200,502 | ||||
|
| |||||
| 579,320 | ||||||
|
| |||||
Qatar — 1.01% | ||||||
484,000 | Qatar Government International Bond, 4.40%, 4/16/50(a) | 394,614 | ||||
|
| |||||
Romania — 2.25% | ||||||
95,000(f) | Romanian Government International Bond, EMTN, 2.00%, 4/14/33(a) | 68,867 | ||||
260,000(f) | Romanian Government International Bond, 2.63%, 12/2/40(a) | 160,931 | ||||
460,000(f) | Romanian Government International Bond, EMTN, 2.75%, 4/14/41(a) | 284,508 | ||||
277,000(f) | Romanian Government International Bond, EMTN, 3.38%, 2/8/38(a) | 205,989 | ||||
247,000(f) | Romanian Government International Bond, EMTN, 3.38%, 1/28/50(a) | 153,822 | ||||
|
| |||||
| 874,117 | ||||||
|
| |||||
Serbia — 0.96% | ||||||
285,000(f) | Serbia International Bond, EMTN, 2.05%, 9/23/36(a) | 177,910 | ||||
200,000 | Serbia International Bond, 6.25%, 5/26/28(b) | 196,173 | ||||
|
| |||||
| 374,083 | ||||||
|
| |||||
24
SCHEDULE OF PORTFOLIO INVESTMENTS
|
RBC BlueBay Emerging Market Debt Fund (cont.)
September 30, 2023
Principal Amount | Value | |||||
| ||||||
South Africa — 1.86% | ||||||
$ 400,000 | Republic of South Africa Government International Bond, 4.85%, 9/30/29 | $ | 343,332 | |||
400,000 | Republic of South Africa Government International Bond, 5.00%, 10/12/46 | 247,918 | ||||
200,000 | Republic of South Africa Government International Bond, 5.38%, 7/24/44 | 134,520 | ||||
|
| |||||
| 725,770 | ||||||
|
| |||||
Sri Lanka — 1.07% | ||||||
280,000 | Sri Lanka Government International Bond, 5.75%, 4/18/24 | 134,008 | ||||
390,000 | Sri Lanka Government International Bond, 6.83%, 7/18/26(a) | 187,898 | ||||
200,000 | Sri Lanka Government International Bond, 7.55%, 3/28/30(a) | 92,919 | ||||
|
| |||||
| 414,825 | ||||||
|
| |||||
Tunisia — 1.08% | ||||||
100,000(f) | Banque Centrale de Tunisie International Bond, 6.75%, 10/31/23(a) | 101,907 | ||||
344,000(f) | Tunisian Republic, 5.63%, 2/17/24(a) | 319,769 | ||||
|
| |||||
| 421,676 | ||||||
|
| |||||
Turkey — 3.37% | ||||||
1,105,000 | Turkey Government International Bond, 4.88%, 4/16/43 | 702,135 | ||||
899,000 | Turkey Government International Bond, 5.75%, 5/11/47 | 609,209 | ||||
|
| |||||
| 1,311,344 | ||||||
|
| |||||
Ukraine — 1.62% | ||||||
1,393,000 | Ukraine Government International Bond, 7.38%, 9/25/34(a) | 369,685 | ||||
230,000 | Ukraine Government International Bond, 7.75%, 9/1/28(a) | 67,000 | ||||
420,000 | Ukraine Government International Bond, 7.75%, 8/1/41(a) | 195,973 | ||||
|
| |||||
| 632,658 | ||||||
|
| |||||
United Arab Emirates — 1.75% | ||||||
277,000 | Abu Dhabi Government International Bond, EMTN, 2.70%, 9/2/70(a) | 147,621 | ||||
360,000 | Abu Dhabi Government International Bond, 3.13%, 9/30/49(a) | 234,243 | ||||
515,000 | Finance Department Government of Sharjah, GMTN, 4.00%, 7/28/50(a) | 300,491 | ||||
|
| |||||
| 682,355 | ||||||
|
| |||||
Uruguay — 1.74% | ||||||
562,599 | Uruguay Government International Bond, 4.98%, 4/20/55 | 488,020 | ||||
7,305,400(g) | Uruguay Government International Bond, 9.75%, 7/20/33 | 190,463 | ||||
|
| |||||
| 678,483 | ||||||
|
| |||||
Uzbekistan — 1.73% | ||||||
200,000 | Republic of Uzbekistan International Bond, 3.90%, 10/19/31(a) | 156,290 | ||||
25
SCHEDULE OF PORTFOLIO INVESTMENTS
|
RBC BlueBay Emerging Market Debt Fund (cont.)
September 30, 2023
Principal Amount | Value | |||||
| ||||||
$ 340,000 | Republic of Uzbekistan International Bond, EMTN, 4.75%, 2/20/24(a) | $ | 335,517 | |||
225,000 | Uzbekneftegaz JSC, 4.75%, 11/16/28(a) | 181,352 | ||||
|
| |||||
| 673,159 | ||||||
|
| |||||
Venezuela — 0.07% | ||||||
85,000 | Venezuela Government International Bond, 7.75%, 10/13/19(a),(e) | 5,950 | ||||
73,800 | Venezuela Government International Bond, 8.25%, 10/13/24(a),(e) | 7,011 | ||||
170,000 | Venezuela Government International Bond, 11.75%, 10/21/26(a),(e) | 16,150 | ||||
|
| |||||
| 29,111 | ||||||
|
| |||||
Zambia — 0.87% | ||||||
460,000 | Zambia Government International Bond, 5.38%, 9/20/24 | 229,384 | ||||
200,000 | Zambia Government International Bond, 8.97%, 7/30/27(a) | 109,125 | ||||
|
| |||||
| 338,509 | ||||||
|
| |||||
Total Foreign Government Bonds | 25,044,309 | |||||
|
| |||||
(Cost $27,646,471) |
| |||||
Corporate Bonds — 20.49% |
| |||||
Brazil — 0.76% |
| |||||
336,236 | MV24 Capital BV, 6.75%, 6/1/34(a) | 296,728 | ||||
|
| |||||
Chile — 2.50% | ||||||
200,000 | Corp. Nacional del Cobre de Chile, 5.13%, 2/2/33(a) | 184,548 | ||||
650,000 | Corp. Nacional del Cobre de Chile, 5.95%, 1/8/34(b) | 630,262 | ||||
250,000 | Empresa de los Ferrocarriles del Estado, 3.83%, 9/14/61(a) | 157,125 | ||||
|
| |||||
| 971,935 | ||||||
|
| |||||
Colombia — 1.63% | ||||||
95,000 | Ecopetrol SA, 5.88%, 5/28/45 | 62,591 | ||||
285,000 | Ecopetrol SA, 5.88%, 11/2/51 | 180,633 | ||||
200,000 | Ecopetrol SA, 8.63%, 1/19/29 | 200,728 | ||||
195,000 | Ecopetrol SA, 8.88%, 1/13/33 | 190,277 | ||||
|
| |||||
| 634,229 | ||||||
|
| |||||
Mexico — 5.07% | ||||||
6,960,000(h) | America Movil SAB de CV, 9.50%, 1/27/31 | 371,467 | ||||
280,000 | Comision Federal de Electricidad, 4.69%, 5/15/29(a) | 252,041 | ||||
290,000 | Mexico City Airport Trust, 5.50%, 7/31/47(a) | 220,586 | ||||
1,407,000 | Petroleos Mexicanos, 5.63%, 1/23/46 | 773,558 | ||||
624,000 | Petroleos Mexicanos, 6.35%, 2/12/48 | 357,389 | ||||
|
| |||||
| 1,975,041 | ||||||
|
| |||||
Oman — 1.80% | ||||||
250,000 | EDO Sukuk Ltd., 5.88%, 9/21/33(b) | 247,100 | ||||
26
SCHEDULE OF PORTFOLIO INVESTMENTS
|
RBC BlueBay Emerging Market Debt Fund (cont.)
September 30, 2023
Principal Amount | Value | |||||
| ||||||
$275,000 | OQ SAOC, GMTN, 5.13%, 5/6/28(a) | $ | 263,022 | |||
200,000 | Oryx Funding Ltd., 5.80%, 2/3/31(a) | 191,022 | ||||
|
| |||||
| 701,144 | ||||||
|
| |||||
Paraguay — 0.75% | ||||||
173,333 | Rutas 2 & 7 Finance Ltd., 0.00%, 9/30/36(a),(i) | 110,916 | ||||
200,000 | Telefonica Celular del Paraguay SA, 5.88%, 4/15/27(a) | 181,000 | ||||
|
| |||||
| 291,916 | ||||||
|
| |||||
Peru — 0.88% | ||||||
400,000 | InRetail Consumer, 3.25%, 3/22/28(a) | 340,960 | ||||
|
| |||||
Qatar — 0.72% | ||||||
200,000 | Qatar Energy, 3.13%, 7/12/41(a) | 137,836 | ||||
220,000 | Qatar Energy, 3.30%, 7/12/51(a) | 142,590 | ||||
|
| |||||
| 280,426 | ||||||
|
| |||||
Saudi Arabia — 1.83% | ||||||
240,000 | Greensaif Pipelines Bidco Sarl, 6.13%, 2/23/38(a) | 234,866 | ||||
200,000 | Greensaif Pipelines Bidco Sarl, 6.51%, 2/23/42(a) | 197,290 | ||||
280,000 | TMS Issuer Sarl, 5.78%, 8/23/32(a) | 280,000 | ||||
|
| |||||
| 712,156 | ||||||
|
| |||||
South Africa — 0.50% | ||||||
200,000 | Eskom Holdings SOC Ltd., 7.13%, 2/11/25(a) | 195,327 | ||||
|
| |||||
United Arab Emirates — 3.69% | ||||||
500,000 | DP World Salaam, 6.00%, (a),(j),(k) | 493,391 | ||||
206,694 | Galaxy Pipeline Assets Bidco Ltd., 2.16%, 3/31/34(a) | 172,448 | ||||
504,370 | Galaxy Pipeline Assets Bidco Ltd., 2.94%, 9/30/40(a) | 388,524 | ||||
200,000 | MDGH GMTN RSC Ltd., 4.38%, 11/22/33(b) | 181,800 | ||||
200,000 | MDGH GMTN RSC Ltd., 5.50%, 4/28/33(a) | 199,341 | ||||
|
| |||||
| 1,435,504 | ||||||
|
| |||||
Venezuela — 0.36% | ||||||
173,584 | Petroleos de Venezuela SA, 6.00%, 11/15/26(a),(e) | 9,113 | ||||
260,000 | Petroleos de Venezuela SA, 8.50%, 10/27/20(a),(e) | 132,513 | ||||
|
| |||||
| 141,626 | ||||||
|
| |||||
Total Corporate Bonds | 7,976,992 | |||||
|
| |||||
(Cost $8,941,157) | ||||||
27
SCHEDULE OF PORTFOLIO INVESTMENTS
|
RBC BlueBay Emerging Market Debt Fund (cont.)
September 30, 2023
Principal Amount | Value | |||||
| ||||||
U.S. Treasury Obligations — 8.20% | ||||||
United States — 8.20% | ||||||
$2,830,000 | U.S. Treasury Notes, 2.75%, 2/15/24 | $ | 2,801,368 | |||
400,000 | U.S. Treasury Notes, 3.00%, 6/30/24 | 392,703 | ||||
|
| |||||
| 3,194,071 | ||||||
|
| |||||
Total U.S. Treasury Obligations | 3,194,071 | |||||
|
| |||||
(Cost $3,195,598) | ||||||
Municipal Bond — 0.52% | ||||||
Turkey — 0.52% | ||||||
200,000 | Istanbul Metropolitan Municipality(a) | 203,174 | ||||
|
| |||||
Total Municipal Bond | 203,174 | |||||
|
| |||||
(Cost $195,350) | ||||||
Shares | ||||||
Investment Company — 3.23% | ||||||
1,255,527 | RBC BlueBay U.S. Goverment Money Market Fund, Institutional Class 1 (l) | 1,255,527 | ||||
|
| |||||
Total Investment Company | 1,255,527 | |||||
|
| |||||
(Cost $1,255,527) | ||||||
Total Investments | $ | 37,674,073 | ||||
(Cost $41,234,103)(m) — 96.76% | ||||||
Other assets in excess of liabilities — 3.24% | 1,263,298 | |||||
|
| |||||
NET ASSETS — 100.00% | $ | 38,937,371 | ||||
|
| |||||
28
SCHEDULE OF PORTFOLIO INVESTMENTS
|
RBC BlueBay Emerging Market Debt Fund (cont.)
September 30, 2023
| (a) | This security may be resold to qualified foreign investors and foreign institutional buyers under Regulation S of the Securities Act of 1933. |
| (b) | Security exempt from registration under Rule 144A or Section 4(2) of the Securities Act of 1933, as amended. These securities may be resold in transactions exempt from registration, normally to qualified institutional buyers. |
| (c) | Principal amount denoted in Dominican peso. |
| (d) | Principal amount denoted in Indonesian rupiah. |
| (e) | Issuer filed for bankruptcy and/or is in default of interest payments. |
| (f) | Principal amount denoted in Euros. |
| (g) | Principal amount denoted in Uruguayan peso. |
| (h) | Principal amount denoted in Mexican peso. |
| (i) | Zero Coupon Bond. The rate represents the yield at time of purchase. |
| (j) | Security is a fix-to-float security, which carries a fixed coupon until a certain date, upon which it switches to a floating rate. Reference rate and spread are provided if the rate is currently floating. |
| (k) | Perpetual security with no stated maturity date. |
| (l) | Affiliated investment. |
| (m) | See Notes to Schedules of Portfolio Investments for the tax cost of securities and the breakdown of unrealized appreciation (depreciation). |
29
SCHEDULE OF PORTFOLIO INVESTMENTS
|
RBC BlueBay Emerging Market Debt Fund (cont.)
September 30, 2023
Foreign currency exchange contracts as of September 30, 2023:
Currency Purchased | Currency Sold | Counterparty | Settlement Date | Value/Unrealized Appreciation (Depreciation) | ||||||||||||||||||||||||
CLP | 189,035,093 | USD | 212,099 | Citibank N.A. | 10/19/23 | $ | 307 | |||||||||||||||||||||
CZK | 5,002,706 | EUR | 203,661 | Citibank N.A. | 10/19/23 | 1,134 | ||||||||||||||||||||||
CZK | 2,364,566 | EUR | 96,339 | Citibank N.A. | 10/19/23 | 455 | ||||||||||||||||||||||
EUR | 297,986 | CZK | 7,170,739 | Citibank N.A. | 10/19/23 | 4,791 | ||||||||||||||||||||||
IDR | 2,828,476,830 | USD | 182,616 | Citibank N.A. | 10/19/23 | 161 | ||||||||||||||||||||||
USD | 396,407 | CLP | 323,404,406 | Citibank N.A. | 10/19/23 | 33,019 | ||||||||||||||||||||||
USD | 360,962 | CLP | 298,238,750 | Citibank N.A. | 10/19/23 | 25,851 | ||||||||||||||||||||||
USD | 110,207 | COP | 439,065,883 | Citibank N.A. | 10/19/23 | 3,258 | ||||||||||||||||||||||
USD | 144,519 | COP | 586,459,279 | Citibank N.A. | 10/19/23 | 1,668 | ||||||||||||||||||||||
USD | 388,831 | COP | 1,571,422,141 | Citibank N.A. | 10/19/23 | 6,060 | ||||||||||||||||||||||
USD | 156,442 | COP | 633,277,742 | Citibank N.A. | 10/19/23 | 2,187 | ||||||||||||||||||||||
USD | 79,515 | EUR | 72,012 | Citibank N.A. | 10/19/23 | 3,315 | ||||||||||||||||||||||
USD | 2,618,302 | EUR | 2,336,220 | Citibank N.A. | 10/19/23 | 146,235 | ||||||||||||||||||||||
USD | 227,168 | IDR | 3,461,176,734 | Citibank N.A. | 10/19/23 | 3,506 | ||||||||||||||||||||||
USD | 182,886 | IDR | 2,741,422,140 | Citibank N.A. | 10/19/23 | 5,735 | ||||||||||||||||||||||
USD | 76,421 | INR | 6,325,330 | Citibank N.A. | 10/19/23 | 381 | ||||||||||||||||||||||
USD | 123,259 | INR | 10,204,117 | Citibank N.A. | 10/19/23 | 591 | ||||||||||||||||||||||
USD | 155,028 | INR | 12,846,255 | Citibank N.A. | 10/19/23 | 598 | ||||||||||||||||||||||
USD | 321 | INR | 26,519 | Citibank N.A. | 10/19/23 | 2 | ||||||||||||||||||||||
USD | 444,972 | INR | 36,867,028 | Citibank N.A. | 10/19/23 | 1,779 | ||||||||||||||||||||||
USD | 497,282 | JPY | 71,580,260 | Citibank N.A. | 10/19/23 | 16,558 | ||||||||||||||||||||||
USD | 397,689 | MXN | 6,922,440 | Citibank N.A. | 10/19/23 | 1,861 | ||||||||||||||||||||||
USD | 195,865 | MXN | 3,409,560 | Citibank N.A. | 10/19/23 | 905 | ||||||||||||||||||||||
USD | 52,383 | THB | 1,797,407 | Citibank N.A. | 10/19/23 | 2,935 | ||||||||||||||||||||||
USD | 400,000 | MYR | 1,808,722 | HSBC Bank Plc | 10/19/23 | 13,665 | ||||||||||||||||||||||
|
| |||||||||||||||||||||||||||
| $ | 276,957 | |||||||||||||||||||||||||||
CLP | 76,133,250 | USD | 91,545 | Citibank N.A. | 10/19/23 | $ | (5,999 | ) | ||||||||||||||||||||
CLP | 281,282,719 | USD | 329,510 | Citibank N.A. | 10/19/23 | (13,451 | ) | |||||||||||||||||||||
CLP | 174,152,919 | USD | 199,447 | Citibank N.A. | 10/19/23 | (3,763 | ) | |||||||||||||||||||||
CLP | 215,589,973 | USD | 242,399 | Citibank N.A. | 10/19/23 | (155 | ) | |||||||||||||||||||||
CLP | 211,043,000 | USD | 245,000 | Citibank N.A. | 10/19/23 | (7,865 | ) | |||||||||||||||||||||
EUR | 517,000 | USD | 571,075 | Citibank N.A. | 10/19/23 | (24,013 | ) | |||||||||||||||||||||
EUR | 90,000 | USD | 96,534 | Citibank N.A. | 10/19/23 | (1,301 | ) | |||||||||||||||||||||
INR | 6,578,848 | USD | 80,000 | Citibank N.A. | 10/19/23 | (913 | ) | |||||||||||||||||||||
INR | 59,446,260 | USD | 718,453 | Citibank N.A. | 10/19/23 | (3,827 | ) | |||||||||||||||||||||
JPY | 71,580,260 | USD | 516,886 | Citibank N.A. | 10/19/23 | (36,161 | ) | |||||||||||||||||||||
30
SCHEDULE OF PORTFOLIO INVESTMENTS
|
RBC BlueBay Emerging Market Debt Fund (cont.)
September 30, 2023
Currency Purchased | Currency Sold | Counterparty | Settlement Date | Value/Unrealized Appreciation (Depreciation) | ||||||||||||||||||||||||
MYR | 1,808,722 | USD | 391,176 | HSBC Bank Plc | 10/19/23 | $ | (4,841 | ) | ||||||||||||||||||||
THB | 6,773,960 | USD | 200,000 | Citibank N.A. | 10/19/23 | (13,642 | ) | |||||||||||||||||||||
|
| |||||||||||||||||||||||||||
| $ | (115,931 | ) | ||||||||||||||||||||||||||
|
| |||||||||||||||||||||||||||
Total | $ | 161,026 | ||||||||||||||||||||||||||
|
| |||||||||||||||||||||||||||
Financial futures contracts as of September 30, 2023:
Long Position | Number of Contracts | Expiration Date | Value/Unrealized Depreciation | Notional Value | Clearinghouse | |||||||||||||||||||||||
2 Year U.S. Treasury Note | 16 | December 2023 | $ | (9,399 | ) | USD | $ | 3,243,375 | Morgan Stanley & Co. LLC | |||||||||||||||||||
|
| |||||||||||||||||||||||||||
Total | $ | (9,399 | ) | |||||||||||||||||||||||||
|
| |||||||||||||||||||||||||||
Short Position | Number of Contracts | Expiration Date | Value/Unrealized Appreciation | Notional Value | Clearinghouse | |||||||||||||||||||||||
10 Year U.S. Ultra Treasury Bond | 4 | December 2023 | $ | 12,292 | USD | $ | 446,250 | Morgan Stanley & Co. LLC | ||||||||||||||||||||
|
| |||||||||||||||||||||||||||
Total | $ | 12,292 | ||||||||||||||||||||||||||
|
| |||||||||||||||||||||||||||
Credit default swaps buy protection as of September 30, 2023:
Fixed | Issuer | Payment Frequency | Counterparty | Expiration Date | Notional Amount (000) | Premium Paid/ (Received) | Unrealized Appreciation (Depreciation) | Value | ||||||||||||||||||||||||||||
| 1.00% | Turkey Government International Bond | Quarterly | Barclays Bank plc | 6/20/24 | USD | 896 | $ | 21,172 | $(21,109) | $ | 63 | |||||||||||||||||||||||||
| 1.00% | ICE - CDX EM S38 DEC-27 | Quarterly | Morgan Stanley & Co. LLC | 12/20/27 | USD | 1,600 | 19,279 | (35,203) | (15,924 | ) | ||||||||||||||||||||||||||
| 1.00% | Colombia Government International Bond | Quarterly | Citigroup Global Markets Limited | 6/20/26 | USD | 330 | 9,068 | (6,748) | 2,320 | |||||||||||||||||||||||||||
31
SCHEDULE OF PORTFOLIO INVESTMENTS
|
RBC BlueBay Emerging Market Debt Fund (cont.)
September 30, 2023
Fixed | Issuer | Payment Frequency | Counterparty | Expiration Date | Notional Amount (000) | Premium Paid/ (Received) | Unrealized Appreciation (Depreciation) | Value | ||||||||||||||||||||||||||||||||
| 1.00% | Republic of South Africa Government International Bond | Quarterly | Citibank N.A. | 6/20/24 | USD | 370 | 1,815 | (2,289) | (474 | ) | ||||||||||||||||||||||||||||||
| 1.00% | Republic of South Africa Government International Bond | Quarterly | Barclays Bank plc | 6/20/24 | USD | 360 | 1,766 | (2,227) | (461 | ) | ||||||||||||||||||||||||||||||
| 1.00% | Turkey Government International Bond | Quarterly | Morgan Stanley & Co. International plc | 6/20/24 | USD | 370 | 7,533 | (7,507) | 26 | |||||||||||||||||||||||||||||||
| 1.00% | ICE - CDX EM S39 JUN-28 | Quarterly | Morgan Stanley & Co. LLC | 6/20/28 | USD | 1,550 | (16,580 | ) | (3,061) | (19,641 | ) | |||||||||||||||||||||||||||||
| 1.00% | ICE - CDX EM S39 JUN-28 | Quarterly | Morgan Stanley & Co. LLC | 6/20/28 | USD | 1,550 | (18,483 | ) | (1,158) | (19,641 | ) | |||||||||||||||||||||||||||||
| 1.00% | Turkey Government International Bond | Quarterly | Barclays Bank plc | 6/20/25 | USD | 800 | 20,290 | (2,558) | 17,733 | |||||||||||||||||||||||||||||||
| 1.00% | Israel Government International Bond | Quarterly | Barclays Bank plc | 12/20/28 | USD | 2,000 | (46,103 | ) | 6,015 | (40,088 | ) | |||||||||||||||||||||||||||||
| 1.00% | Petroleos Mexicanos | Quarterly | Morgan Stanley & Co. International plc | 12/20/26 | USD | 76 | 9,671 | (20) | 9,651 | |||||||||||||||||||||||||||||||
| 1.00% | Petroleos Mexicanos | Quarterly | Barclays Bank plc | 12/20/26 | USD | 124 | 15,720 | 27 | 15,746 | |||||||||||||||||||||||||||||||
|
|
|
|
|
| |||||||||||||||||||||||||||||||||||
| Total | $ | 25,148 | $ | (75,838) | $ | (50,690 | ) | |||||||||||||||||||||||||||||||||
|
|
|
|
|
| |||||||||||||||||||||||||||||||||||
Credit default swaps sell protection as of September 30, 2023:
Fixed | Issuer | Payment Frequency | Counterparty | Expiration Date | ICS | Notional Amount (000) | Premium Paid/ (Received) | Unreal. App. | Value | |||||||||||||||||||||||||||||||||||
| 1.00% | Colombia Government International Bond | Quarterly | Citigroup Global Markets Limited | 6/20/28 | 0.022 | USD | 250 | $ | (20,751 | ) | $9,213 | $ | (11,538 | ) | ||||||||||||||||||||||||||||||
|
|
|
|
|
| |||||||||||||||||||||||||||||||||||||||
| Total | $ | (20,751 | ) | $9,213 | $ | (11,538) | ||||||||||||||||||||||||||||||||||||||
|
|
|
|
|
| |||||||||||||||||||||||||||||||||||||||
32
SCHEDULE OF PORTFOLIO INVESTMENTS
|
RBC BlueBay Emerging Market Debt Fund (cont.)
September 30, 2023
Abbreviations used are defined below:
CLP - Chilean Peso
COP - Colombian Peso
CZK - Czech Koruna
EMTN - Euro Medium Term Note
EUR - Euro
GMTN - Global Medium Term Note
IDR - Indonesian Rupiah
INR - Indian Rupee
JPY - Japanese Yen
MXN - Mexican Peso
MYR - Malaysian Ringgit
THB - Thai Baht
USD - United States Dollar
Portfolio Diversification (Unaudited)
Industries | Percentage of Net Assets | |||
Foreign Government Bonds | 64.32 | % | ||
Energy | 10.20 | % | ||
U.S. Treasury Obligations | 8.20 | % | ||
Basic Materials | 2.10 | % | ||
Industrial | 2.01 | % | ||
Utilities | 1.64 | % | ||
Communications | 1.41 | % | ||
Consumer, Non-cyclical | 1.27 | % | ||
Financial | 0.98 | % | ||
Consumer, Cyclical | 0.88 | % | ||
Municipal Bond | 0.52 | % | ||
Other | 6.47 | % | ||
|
| |||
| 100.00 | % | |||
|
| |||
See Notes to the Financial Statements.
33
SCHEDULE OF PORTFOLIO INVESTMENTS
|
RBC BlueBay High Yield Bond Fund
September 30, 2023
Principal Amount | Value | |||||
| ||||||
Corporate Bonds — 93.48% |
| |||||
Australia — 1.24% | ||||||
$1,505,000 | FMG Resources August 2006 Pty Ltd., 6.13%, 4/15/32(a) | $ | 1,368,549 | |||
1,612,000 | Mineral Resources Ltd., 8.00%, 11/1/27(a) | 1,581,775 | ||||
1,134,000 | Mineral Resources Ltd., 8.50%, 5/1/30(a) | 1,116,820 | ||||
1,523,000 | Mineral Resources Ltd., 9.25%, 10/1/28(a) | 1,536,326 | ||||
143,548 | Quintis Australia Pty Ltd., PIK, 0.00%, 10/1/28(a),(b),(c) | — | ||||
220,972 | Quintis Australia Pty Ltd., PIK, 7.50%, 10/1/26(a),(b),(c) | 76,015 | ||||
|
| |||||
| 5,679,485 | ||||||
|
| |||||
Austria — 0.98% | ||||||
4,443,000 | Benteler International AG, 10.50%, 5/15/28(a) | 4,460,653 | ||||
|
| |||||
Bermuda — 0.63% | ||||||
2,904,964 | Highlands Holdings Bond Issuer Ltd. / Highlands Holdings Bond Co-Issuer, Inc., PIK, 7.63%, 10/15/25(a) | 2,853,626 | ||||
|
| |||||
Canada — 4.49% | ||||||
2,350,000 | 1011778 BC ULC / New Red Finance, Inc., 4.38%, 1/15/28(a) | 2,119,798 | ||||
1,750,000 | Bombardier, Inc., 6.00%, 2/15/28(a) | 1,587,906 | ||||
2,198,000 | Bombardier, Inc., 7.50%, 2/1/29(a) | 2,091,984 | ||||
623,000 | Bombardier, Inc., 7.88%, 4/15/27(a) | 606,733 | ||||
6,543,000 | Intelligent Packaging Ltd. Finco, Inc. / Intelligent Packaging Ltd. Co-Issuer LLC, 6.00%, 9/15/28(a) | 5,734,940 | ||||
2,203,000 | Kronos Acquisition Holdings, Inc. / KIK Custom Products, Inc., 5.00%, 12/31/26(a) | 1,998,717 | ||||
2,991,000 | Kronos Acquisition Holdings, Inc. / KIK Custom Products, Inc., 7.00%, 12/31/27(a) | 2,579,684 | ||||
1,510,000 | Ontario Gaming GTA LP, 8.00%, 8/1/30(a) | 1,507,798 | ||||
2,641,000 | Primo Water Holdings, Inc., 4.38%, 4/30/29(a) | 2,257,431 | ||||
|
| |||||
| 20,484,991 | ||||||
|
| |||||
Cayman Islands — 0.82% | ||||||
3,907,804 | Global Aircraft Leasing Co. Ltd., PIK, 6.50%, 9/15/24(a) | 3,722,183 | ||||
|
| |||||
Czech Republic — 0.55% | ||||||
2,525,000 | Allwyn Entertainment Financing UK Plc, 7.88%, 4/30/29(a) | 2,525,000 | ||||
|
| |||||
France — 2.35% | ||||||
2,000,000 | Altice France SA, 5.13%, 7/15/29(a) | 1,425,000 | ||||
3,465,000 | Altice France SA/France, 8.13%, 2/1/27(a) | 3,060,169 | ||||
1,526,000 | BNP Paribas SA, 7.75%, (a),(d),(e) | 1,452,392 | ||||
2,554,000 | Iliad Holding SASU, 6.50%, 10/15/26(a) | 2,397,510 | ||||
2,631,000 | Iliad Holding SASU, 7.00%, 10/15/28(a) | 2,392,447 | ||||
|
| |||||
| 10,727,518 | ||||||
|
| |||||
34
SCHEDULE OF PORTFOLIO INVESTMENTS
|
RBC BlueBay High Yield Bond Fund (cont.)
September 30, 2023
Principal Amount | Value | |||||
| ||||||
Germany — 2.62% | ||||||
$3,561,000 | Cheplapharm Arzneimittel GmbH, 5.50%, 1/15/28(a) | $ | 3,216,117 | |||
2,400,000 | Commerzbank AG, 7.00%, (d),(e),(f) | 2,163,593 | ||||
2,255,000 | IHO Verwaltungs GmbH, PIK, 4.75%, 9/15/26(a) | 2,073,998 | ||||
2,365,000 | IHO Verwaltungs GmbH, PIK, 6.00%, 5/15/27(a) | 2,217,471 | ||||
2,394,000 | ZF North America Capital, Inc., 4.75%, 4/29/25(a) | 2,303,749 | ||||
|
| |||||
| 11,974,928 | ||||||
|
| |||||
India — 0.29% | ||||||
1,514,000 | CA Magnum Holdings, 5.38%, 10/31/26(a) | 1,342,350 | ||||
|
| |||||
Italy — 1.01% | ||||||
3,056,000 | Telecom Italia Capital SA, 6.38%, 11/15/33 | 2,654,900 | ||||
2,162,000 | UniCredit SpA, 5.86%, 6/19/32(a),(d) | 1,968,968 | ||||
|
| |||||
| 4,623,868 | ||||||
|
| |||||
Luxembourg — 0.85% | ||||||
2,023,000 | Altice Financing SA, 5.00%, 1/15/28(a) | 1,729,665 | ||||
2,603,000 | Altice Financing SA, 5.75%, 8/15/29(a) | 2,131,338 | ||||
|
| |||||
| 3,861,003 | ||||||
|
| |||||
Mexico — 0.30% | ||||||
1,739,000 | Banco Mercantil del Norte SA, 6.63%, (d),(e),(f) | 1,362,941 | ||||
|
| |||||
Netherlands — 1.16% | ||||||
3,078,000 | UPC Holding BV, 5.50%, 1/15/28(a) | 2,740,036 | ||||
1,712,000 | VZ Secured Financing BV, 5.00%, 1/15/32(a) | 1,341,754 | ||||
1,650,000 | Ziggo Bond Co. BV, 5.13%, 2/28/30(a) | 1,231,449 | ||||
|
| |||||
| 5,313,239 | ||||||
|
| |||||
Puerto Rico — 0.17% | ||||||
780,000 | Popular, Inc., 7.25%, 3/13/28 | 778,655 | ||||
|
| |||||
United Arab Emirates — 0.82% | ||||||
3,841,000 | GEMS MENASA Cayman Ltd. / GEMS Education Delaware LLC, 7.13%, 7/31/26(a) | 3,737,770 | ||||
|
| |||||
United Kingdom — 2.91% | ||||||
1,707,000 | Barclays Plc, 8.00%, (d),(e) | 1,535,095 | ||||
1,424,000 | Jaguar Land Rover Automotive Plc, 4.50%, 10/1/27(a) | 1,238,589 | ||||
1,200,000 | Jaguar Land Rover Automotive Plc, 5.50%, 7/15/29(a) | 1,026,560 | ||||
2,088,000 | Jaguar Land Rover Automotive Plc, 5.88%, 1/15/28(a) | 1,881,810 | ||||
2,050,000 | Macquarie Airfinance Holdings Ltd., 8.13%, 3/30/29(a) | 2,052,767 | ||||
4,377,000 | Vmed O2 UK Financing I Plc, 4.75%, 7/15/31(a) | 3,536,879 | ||||
2,594,000 | Vodafone Group Plc, 4.13%, 6/4/81(d) | 1,988,742 | ||||
|
| |||||
| 13,260,442 | ||||||
|
| |||||
35
SCHEDULE OF PORTFOLIO INVESTMENTS
|
RBC BlueBay High Yield Bond Fund (cont.)
September 30, 2023
Principal Amount | Value | |||||
| ||||||
United States — 72.29% | ||||||
$2,450,000 | Adient Global Holdings Ltd., 4.88%, 8/15/26(a) | $ | 2,312,749 | |||
1,534,000 | Adient Global Holdings Ltd., 8.25%, 4/15/31(a) | 1,536,301 | ||||
2,664,000 | ADT Security Corp. (The), 4.13%, 8/1/29(a) | 2,255,989 | ||||
791,000 | ADT Security Corp. (The), 4.88%, 7/15/32(a) | 659,126 | ||||
4,031,000 | Albertsons Cos., Inc. / Safeway, Inc. / New Albertsons LP / Albertsons LLC, 7.50%, 3/15/26(a) | 4,087,313 | ||||
2,736,000 | AmeriTex HoldCo Intermediate LLC, 10.25%, 10/15/28(a) | 2,704,694 | ||||
2,195,000 | Ardagh Packaging Finance Plc / Ardagh Holdings USA, Inc., 5.25%, 4/30/25(a) | 2,140,125 | ||||
1,626,000 | Asbury Automotive Group, Inc., 5.00%, 2/15/32(a) | 1,347,846 | ||||
2,790,000 | ATI, Inc., 7.25%, 8/15/30 | 2,771,720 | ||||
2,236,000 | Ball Corp., 4.88%, 3/15/26 | 2,146,211 | ||||
1,541,333 | BCPE Ulysses Intermediate, Inc., PIK, 7.75%, 4/1/27(a) | 1,350,858 | ||||
6,250,000 | Boxer Parent Co., Inc., 7.13%, 10/2/25(a) | 6,222,596 | ||||
2,449,000 | Bread Financial Holdings, Inc., 7.00%, 1/15/26(a) | 2,305,132 | ||||
4,496,000 | Brundage-Bone Concrete Pumping Holdings, Inc., 6.00%, 2/1/26(a) | 4,287,759 | ||||
2,014,000 | Cablevision Lightpath LLC, 3.88%, 9/15/27(a) | 1,692,655 | ||||
1,376,000 | Cablevision Lightpath LLC, 5.63%, 9/15/28(a) | 1,056,983 | ||||
3,011,000 | Caesars Entertainment, Inc., 6.25%, 7/1/25(a) | 2,972,419 | ||||
1,275,000 | Caesars Entertainment, Inc., 7.00%, 2/15/30(a) | 1,239,977 | ||||
3,348,000 | Camelot Return Merger Sub, Inc., 8.75%, 8/1/28(a) | 3,231,804 | ||||
3,638,000 | Carriage Services, Inc., 4.25%, 5/15/29(a) | 3,119,032 | ||||
1,515,000 | CCO Holdings LLC / CCO Holdings Capital Corp., 4.25%, 1/15/34(a) | 1,117,118 | ||||
2,919,000 | CCO Holdings LLC / CCO Holdings Capital Corp., 4.50%, 6/1/33(a) | 2,233,165 | ||||
2,498,000 | CCO Holdings LLC / CCO Holdings Capital Corp., 4.75%, 3/1/30(a) | 2,100,806 | ||||
1,740,000 | CCO Holdings LLC / CCO Holdings Capital Corp., 5.13%, 5/1/27(a) | 1,620,601 | ||||
4,915,000 | CCO Holdings LLC / CCO Holdings Capital Corp., 7.38%, 3/1/31(a) | 4,749,686 | ||||
1,217,000 | Cedar Fair LP / Canada’s Wonderland Co. / Magnum Management Corp. / Millennium Op, 5.38%, 4/15/27 | 1,140,639 | ||||
963,000 | Cedar Fair LP / Canada’s Wonderland Co. / Magnum Management Corp. / Millennium Op, 5.50%, 5/1/25(a) | 943,612 | ||||
2,991,000 | Central Garden & Pet Co., 4.13%, 4/30/31(a) | 2,452,620 | ||||
2,152,000 | Chart Industries, Inc., 7.50%, 1/1/30(a) | 2,163,042 | ||||
2,430,000 | Chart Industries, Inc., 9.50%, 1/1/31(a) | 2,584,561 | ||||
3,888,000 | Churchill Downs, Inc., 6.75%, 5/1/31(a) | 3,678,700 | ||||
2,063,000 | Civitas Resources, Inc., 8.38%, 7/1/28(a) | 2,098,872 | ||||
2,184,000 | Civitas Resources, Inc., 8.75%, 7/1/31(a) | 2,235,625 | ||||
3,805,000 | Clarios Global LP / Clarios US Finance Co., 6.25%, 5/15/26(a) | 3,714,669 | ||||
2,989,000 | Cloud Software Group, Inc., 6.50%, 3/31/29(a) | 2,627,859 | ||||
1,000,000 | Cloud Software Group, Inc., 9.00%, 9/30/29(a) | 871,470 | ||||
2,089,000 | CMG Media Corp., 8.88%, 12/15/27(a) | 1,635,077 | ||||
2,729,000 | Constellium SE, 3.75%, 4/15/29(a) | 2,284,046 | ||||
36
SCHEDULE OF PORTFOLIO INVESTMENTS
|
RBC BlueBay High Yield Bond Fund (cont.)
September 30, 2023
Principal Amount | Value | |||||
| ||||||
$1,690,000 | Constellium SE, 5.63%, 6/15/28(a) | $ | 1,589,073 | |||
3,167,000 | Coty Inc/HFC Prestige Products, Inc./HFC Prestige International US LLC, 6.63%, 7/15/30(a) | 3,094,026 | ||||
3,724,000 | Coty, Inc., 5.00%, 4/15/26(a) | 3,576,429 | ||||
5,047,000 | CQP Holdco LP / BIP-V Chinook Holdco LLC, 5.50%, 6/15/31(a) | 4,471,972 | ||||
3,118,000 | CSC Holdings LLC, 7.50%, 4/1/28(a) | 2,023,400 | ||||
1,650,000 | CSC Holdings LLC, 11.25%, 5/15/28(a) | 1,643,005 | ||||
1,358,000 | Cushman & Wakefield US Borrower LLC, 8.88%, 9/1/31(a) | 1,309,773 | ||||
5,430,000 | Dealer Tire LLC / DT Issuer LLC, 8.00%, 2/1/28(a) | 5,091,220 | ||||
2,439,000 | DISH DBS Corp., 5.25%, 12/1/26(a) | 2,072,691 | ||||
1,872,000 | DISH DBS Corp., 5.75%, 12/1/28(a) | 1,438,625 | ||||
2,902,000 | DISH Network Corp., 11.75%, 11/15/27(a) | 2,911,988 | ||||
3,540,000 | Domtar Corp., 6.75%, 10/1/28(a) | 2,932,363 | ||||
3,315,000 | Dream Finders Homes, Inc., 8.25%, 8/15/28(a) | 3,336,211 | ||||
2,825,000 | Ferrellgas LP / Ferrellgas Finance Corp., 5.38%, 4/1/26(a) | 2,648,361 | ||||
5,159,000 | Ferrellgas LP / Ferrellgas Finance Corp., 5.88%, 4/1/29(a) | 4,640,724 | ||||
3,566,000 | Ford Motor Co., 6.10%, 8/19/32 | 3,360,416 | ||||
1,766,000 | Ford Motor Credit Co. LLC, 2.70%, 8/10/26 | 1,572,304 | ||||
3,828,000 | Ford Motor Credit Co. LLC, 3.66%, 9/8/24 | 3,703,537 | ||||
1,238,000 | Ford Motor Credit Co. LLC, 6.80%, 5/12/28 | 1,236,222 | ||||
2,900,000 | Ford Motor Credit Co. LLC, 7.20%, 6/10/30 | 2,915,075 | ||||
2,477,000 | Ford Motor Credit Co. LLC, 7.35%, 3/6/30 | 2,507,787 | ||||
2,357,000 | Forestar Group, Inc., 3.85%, 5/15/26(a) | 2,147,750 | ||||
1,629,000 | Freedom Mortgage Corp., 8.13%, 11/15/24(a) | 1,629,642 | ||||
1,043,000 | Freedom Mortgage Corp., 12.00%, 10/1/28(a) | 1,058,654 | ||||
1,455,000 | Gap, Inc. (The), 3.63%, 10/1/29(a) | 1,077,614 | ||||
1,523,000 | Gap, Inc. (The), 3.88%, 10/1/31(a) | 1,069,862 | ||||
1,224,000 | Gen Digital, Inc., 6.75%, 9/30/27(a) | 1,199,240 | ||||
1,284,000 | Gen Digital, Inc., 7.13%, 9/30/30(a) | 1,266,176 | ||||
2,486,000 | Global Partners LP / GLP Finance Corp., 6.88%, 1/15/29 | 2,311,865 | ||||
1,830,000 | Global Partners LP / GLP Finance Corp., 7.00%, 8/1/27 | 1,785,237 | ||||
1,377,000 | GPD Cos., Inc., 10.13%, 4/1/26(a) | 1,270,232 | ||||
3,676,000 | Gray Television, Inc., 7.00%, 5/15/27(a) | 3,153,572 | ||||
2,869,000 | Griffon Corp., 5.75%, 3/1/28 | 2,602,768 | ||||
4,754,000 | GTCR W-2 Merger Sub LLC, 7.50%, 1/15/31(a) | 4,760,014 | ||||
2,347,000 | Hanesbrands, Inc., 9.00%, 2/15/31(a) | 2,232,738 | ||||
2,414,000 | Herc Holdings, Inc., 5.50%, 7/15/27(a) | 2,282,132 | ||||
3,316,000 | International Game Technology Plc, 4.13%, 4/15/26(a) | 3,118,499 | ||||
3,639,000 | IRB Holding Corp., 7.00%, 6/15/25(a) | 3,638,603 | ||||
3,676,000 | Iron Mountain, Inc., REIT, 5.25%, 7/15/30(a) | 3,203,158 | ||||
5,309,000 | ITT Holdings LLC, 6.50%, 8/1/29(a) | 4,539,208 | ||||
1,871,000 | Jefferies Finance LLC / JFIN Co-Issuer Corp., 5.00%, 8/15/28(a) | 1,574,980 | ||||
1,747,000 | Kaiser Aluminum Corp., 4.50%, 6/1/31(a) | 1,376,547 | ||||
2,468,000 | Kaiser Aluminum Corp., 4.63%, 3/1/28(a) | 2,157,480 | ||||
1,750,000 | KeyBank NA, Series BKNt, (SOFR Index + 0.320%), 5.66%, 6/14/24(g) | 1,720,104 | ||||
870,000 | KeyBank NA, 6.95%, 2/1/28 | 842,173 | ||||
620,000 | KeyCorp, MTN, 3.88%, 5/23/25(d) | 594,000 | ||||
37
SCHEDULE OF PORTFOLIO INVESTMENTS
|
RBC BlueBay High Yield Bond Fund (cont.)
September 30, 2023
Principal Amount | Value | |||||
| ||||||
$2,175,000 | KFC Holding Co./Pizza Hut Holdings LLC/Taco Bell of America LLC, 4.75%, 6/1/27(a) | $ | 2,067,574 | |||
2,509,000 | LBM Acquisition LLC, 6.25%, 1/15/29(a) | 2,058,072 | ||||
2,200,000 | LCPR Senior Secured Financing DAC, 5.13%, 7/15/29(a) | 1,777,109 | ||||
2,245,000 | LCPR Senior Secured Financing DAC, 6.75%, 10/15/27(a) | 2,062,032 | ||||
1,085,000 | Level 3 Financing, Inc., 4.63%, 9/15/27(a) | 781,200 | ||||
1,842,000 | Level 3 Financing, Inc., 10.50%, 5/15/30(a) | 1,852,891 | ||||
2,693,000 | LifePoint Health, Inc., 9.88%, 8/15/30(a) | 2,609,383 | ||||
1,540,000 | LifePoint Health, Inc., 11.00%, 10/15/30(a) | 1,540,000 | ||||
1,831,000 | Macy’s Retail Holdings LLC, 5.88%, 3/15/30(a) | 1,551,855 | ||||
2,467,000 | Macy’s Retail Holdings LLC, 6.13%, 3/15/32(a) | 2,036,917 | ||||
2,104,000 | MasTec, Inc., 4.50%, 8/15/28(a) | 1,892,584 | ||||
3,390,000 | Matthews International Corp., 5.25%, 12/1/25(a) | 3,249,491 | ||||
2,475,000 | McAfee Corp., 7.38%, 2/15/30(a) | 2,073,106 | ||||
3,741,000 | Medline Borrower LP, 3.88%, 4/1/29(a) | 3,160,910 | ||||
2,262,000 | MGM Resorts International, 4.75%, 10/15/28 | 1,991,849 | ||||
2,346,000 | Nationstar Mortgage Holdings, Inc., 5.00%, 2/1/26(a) | 2,191,728 | ||||
1,461,000 | Nationstar Mortgage Holdings, Inc., 6.00%, 1/15/27(a) | 1,381,354 | ||||
3,626,000 | Neptune Bidco US, Inc., 9.29%, 4/15/29(a) | 3,286,275 | ||||
4,795,000 | NESCO Holdings II, Inc., 5.50%, 4/15/29(a) | 4,225,129 | ||||
2,040,000 | NGL Energy Operating LLC / NGL Energy Finance Corp., 7.50%, 2/1/26(a) | 2,016,606 | ||||
1,935,000 | NuStar Logistics LP, 5.75%, 10/1/25 | 1,881,565 | ||||
3,519,000 | OneMain Finance Corp., 9.00%, 1/15/29 | 3,505,002 | ||||
2,036,000 | OT Merger Corp., 7.88%, 10/15/29(a) | 1,255,352 | ||||
3,986,000 | Paramount Global, 6.38%, 3/30/62(d) | 3,128,788 | ||||
1,471,000 | Pike Corp., 5.50%, 9/1/28(a) | 1,290,138 | ||||
1,493,000 | Post Holdings, Inc., 5.75%, 3/1/27(a) | 1,433,460 | ||||
867,000 | Prime Security Services Borrower LLC / Prime Finance, Inc., 5.25%, 4/15/24(a) | 862,094 | ||||
2,721,000 | Railworks Holdings LP / Railworks Rally, Inc., 8.25%, 11/15/28(a) | 2,580,336 | ||||
3,798,000 | Rayonier AM Products, Inc., 7.63%, 1/15/26(a) | 3,207,340 | ||||
1,124,000 | RegionalCare Hospital Partners Holdings, Inc. / LifePoint Health, Inc., 9.75%, 12/1/26(a) | 1,090,502 | ||||
2,159,000 | RHP Hotel Properties LP / RHP Finance Corp., REIT, 7.25%, 7/15/28(a) | 2,127,292 | ||||
1,024,000 | Rockies Express Pipeline LLC, 4.80%, 5/15/30(a) | 883,516 | ||||
2,111,000 | Rockies Express Pipeline LLC, 4.95%, 7/15/29(a) | 1,879,091 | ||||
2,097,000 | Scientific Games Holdings LP/Scientific Games US FinCo, Inc., 6.63%, 3/1/30(a) | 1,809,652 | ||||
3,033,000 | Sinclair Television Group, Inc., 4.13%, 12/1/30(a) | 1,867,448 | ||||
1,377,000 | Sirius XM Radio, Inc., 3.13%, 9/1/26(a) | 1,230,135 | ||||
3,672,000 | Sirius XM Radio, Inc., 4.00%, 7/15/28(a) | 3,134,437 | ||||
4,533,000 | Smyrna Ready Mix Concrete LLC, 6.00%, 11/1/28(a) | 4,183,925 | ||||
4,862,000 | Specialty Building Products Holdings LLC / SBP Finance Corp., 6.38%, 9/30/26(a) | 4,559,892 | ||||
4,373,000 | Sprint LLC, 7.13%, 6/15/24 | 4,400,354 | ||||
2,717,000 | Standard Industries, Inc., 5.00%, 2/15/27(a) | 2,523,311 | ||||
1,827,000 | Summer BC Bidco B LLC, 5.50%, 10/31/26(a) | 1,648,857 | ||||
38
SCHEDULE OF PORTFOLIO INVESTMENTS
|
RBC BlueBay High Yield Bond Fund (cont.)
September 30, 2023
Principal Amount | Value | |||||
| ||||||
$1,822,000 | Tallgrass Energy Partners LP / Tallgrass Energy Finance Corp., 6.00%, 3/1/27(a) | $ | 1,717,789 | |||
1,130,000 | Tallgrass Energy Partners LP / Tallgrass Energy Finance Corp., 6.00%, 12/31/30(a) | 997,458 | ||||
1,632,000 | Tallgrass Energy Partners LP / Tallgrass Energy Finance Corp., 7.50%, 10/1/25(a) | 1,628,009 | ||||
4,572,000 | TEGNA, Inc., 5.00%, 9/15/29 | 3,839,300 | ||||
1,785,000 | Tenet Healthcare Corp., 4.88%, 1/1/26 | 1,711,453 | ||||
1,888,000 | Tenet Healthcare Corp., 6.13%, 10/1/28 | 1,771,850 | ||||
1,587,000 | Tenet Healthcare Corp., 6.25%, 2/1/27 | 1,535,038 | ||||
2,040,000 | Tenneco, Inc., 8.00%, 11/17/28(a) | 1,659,077 | ||||
2,005,000 | TransDigm, Inc., 4.63%, 1/15/29 | 1,748,682 | ||||
1,555,000 | TransDigm, Inc., 6.25%, 3/15/26(a) | 1,533,716 | ||||
1,530,000 | U.S. Cellular Corp., 6.70%, 12/15/33 | 1,481,945 | ||||
2,596,000 | U.S. Foods, Inc., 6.88%, 9/15/28(a) | 2,590,643 | ||||
1,389,000 | U.S. Foods, Inc., 7.25%, 1/15/32(a) | 1,387,593 | ||||
1,542,000 | Uniti Group LP / Uniti Group Finance, Inc. / CSL Capital LLC, REIT, 10.50%, 2/15/28(a) | 1,511,281 | ||||
2,930,000 | Univision Communications, Inc., 6.63%, 6/1/27(a) | 2,725,973 | ||||
1,174,000 | Venture Global LNG, Inc., 8.13%, 6/1/28(a) | 1,162,576 | ||||
2,064,000 | Victoria’s Secret & Co., 4.63%, 7/15/29(a) | 1,495,880 | ||||
521,000 | Voyager Aviation Holdings LLC, 8.50%, 5/9/26(a),(h) | 414,835 | ||||
1,336,000 | White Cap Parent LLC, PIK, 8.25%, 3/15/26(a) | 1,290,301 | ||||
3,168,000 | Wynn Resorts Finance LLC / Wynn Resorts Capital Corp., 7.13%, 2/15/31(a) | 3,009,212 | ||||
|
| |||||
| 329,882,070 | ||||||
|
| |||||
Total Corporate Bonds | 426,590,722 | |||||
|
| |||||
(Cost $444,452,522) | ||||||
U.S. Treasury Obligations — 2.43% | ||||||
United States — 2.43% | ||||||
11,111,100 | U.S. Treasury Notes, 5.00%, 8/31/25 | 11,087,663 | ||||
|
| |||||
Total U.S. Treasury Obligations | 11,087,663 | |||||
|
| |||||
(Cost $11,139,439) | ||||||
Shares | ||||||
Common Stocks — 0.00% | ||||||
United Kingdom — 0.00% | ||||||
12,023 | AVTCAP WARR* | 3,074 | ||||
|
| |||||
United States — 0.00% | ||||||
70,137 | Quintis Ltd.*,(b),(c) | 1 | ||||
1,445 | Voyager Aviation Holdings LLC*,(b),(c),(i) | 14 | ||||
39
SCHEDULE OF PORTFOLIO INVESTMENTS
|
RBC BlueBay High Yield Bond Fund (cont.)
September 30, 2023
| Shares | Value | |||||
| ||||||
241 | Voyager Aviation Holdings LLC*,(b),(c),(i) | $ | 0 | |||
12,785 | W R Grace & Co.*,(b),(c),(i) | 0 | ||||
|
| |||||
| 15 | ||||||
|
| |||||
Total Common Stocks | 3,089 | |||||
|
| |||||
(Cost $3) | ||||||
Rights/Warrants — 0.00% | ||||||
Mexico — 0.00% | ||||||
3,026 | Urbi Desarrollos Urbanos SAB de CV Warrants, Expire 12/31/49*,(i) | 0 | ||||
|
| |||||
Total Rights/Warrants | 0 | |||||
|
| |||||
(Cost $0) | ||||||
Investment Company — 3.38% | ||||||
15,420,395 | RBC BlueBay U.S. Goverment Money Market Fund, Institutional Class 1 (j) | 15,420,395 | ||||
|
| |||||
Total Investment Company | 15,420,395 | |||||
|
| |||||
(Cost $15,420,395) | ||||||
Total Investments | $ | 453,101,869 | ||||
(Cost $471,012,359) — 99.29% | ||||||
Other assets in excess of liabilities — 0.71% | 3,253,901 | |||||
|
| |||||
NET ASSETS — 100.00% | $ | 456,355,770 | ||||
|
| |||||
| * | Non-income producing security. |
| (a) | Security exempt from registration under Rule 144A or Section 4(2) of the Securities Act of 1933, as amended. These securities may be resold in transactions exempt from registration, normally to qualified institutional buyers. |
| (b) | The Pricing Committee has fair valued this security under procedures established by the Fund’s Board of Trustees. |
| (c) | Security is valued using significant unobservable inputs and is classified as Level 3 in the fair value hierarchy. |
| (d) | Security is a fix-to-float security, which carries a fixed coupon until a certain date, upon which it switches to a floating rate. Reference rate and spread are provided if the rate is currently floating. |
| (e) | Perpetual security with no stated maturity date. |
| (f) | This security may be resold to qualified foreign investors and foreign institutional buyers under Regulation S of the Securities Act of 1933. |
| (g) | Variable rate security. The rate reflected in the Schedule of Portfolio Investments is the rate in effect on September 30, 2023. |
| (h) | Issuer filed for bankruptcy and/or is in default of interest payments. |
| (i) | Security delisted or issuer in bankruptcy. |
| (j) | Affiliated investment. |
40
SCHEDULE OF PORTFOLIO INVESTMENTS
|
RBC BlueBay High Yield Bond Fund (cont.)
September 30, 2023
Foreign currency exchange contracts as of September 30, 2023:
Currency Purchased | Currency Sold | Counterparty | Settlement | Value/Unrealized Appreciation | ||||||||||||||||||||||||||||
USD | 1,283,149 | EUR | 1,159,000 | Citibank N.A. | 10/19/23 | $ | 56,756 | |||||||||||||||||||||||||
|
| |||||||||||||||||||||||||||||||
Total | $ | 56,756 | ||||||||||||||||||||||||||||||
|
| |||||||||||||||||||||||||||||||
Financial futures contracts as of September 30, 2023:
Long Position | Number of Contracts | Expiration Date | Value/Unrealized Depreciation | Notional Value | Clearinghouse | |||||||||||||||||||||||
2 Year U.S. Treasury Note | 65 | December 2023 | $ | (56,466 | ) | USD | $ | 13,176,211 | Morgan Stanley & Co. LLC | |||||||||||||||||||
Ten Year U.S. Treasury Note | 80 | December 2023 | (116,009 | ) | USD | 8,645,000 | Morgan Stanley & Co. LLC | |||||||||||||||||||||
|
| |||||||||||||||||||||||||||
Total | $ | (172,475) | ||||||||||||||||||||||||||
|
| |||||||||||||||||||||||||||
Credit default swaps sell protection as of September 30, 2023:
| Fixed Rate | Issuer | Payment Frequency | Counterparty | Expiration Date | ICS | Notional Amount (000) | Premium Paid/ (Received) | Unreal. App. | Value | |||||||||||||||||||||||||||||||
| 5.00% | | Markit CDX HY Index Series 40 | | Quarterly | | Morgan Stanley & Co. LLC | | 6/20/28 | 0.046 | USD | 13,750 | $ | 227,986 | $ | 8,537 | $ | 236,522 | |||||||||||||||||||||||
|
|
|
|
|
| |||||||||||||||||||||||||||||||||||
| Total | $ | 227,986 | $ | 8,537 | $ | 236,522 | ||||||||||||||||||||||||||||||||||
|
|
|
|
|
| |||||||||||||||||||||||||||||||||||
Abbreviations used are defined below:
EUR - Euro
MTN - Medium Term Note
REIT - Real Estate Investment Trust
SOFR - Secured Overnight Financing Rate
USD - United States Dollar
41
SCHEDULE OF PORTFOLIO INVESTMENTS
|
RBC BlueBay High Yield Bond Fund (cont.)
September 30, 2023
| Portfolio Diversification (Unaudited) |
| |||
Industries | Percentage of Net Assets | |||
Consumer, Cyclical | 23.01% | |||
Communications | 19.39% | |||
Consumer, Non-cyclical | 14.73% | |||
Industrial | 11.15% | |||
Financial | 9.50% | |||
Energy | 6.48% | |||
Basic Materials | 5.09% | |||
Technology | 2.87% | |||
U.S. Treasury Obligations | 2.43% | |||
Diversified | 0.98% | |||
Utilities | 0.28% | |||
Common Stocks | 0.00% | |||
Other* | 4.09% | |||
|
| |||
| 100.00% | ||||
|
| |||
* Includes cash, Investment Company, interest and dividend receivable, pending trades and Fund share transactions, warrants, credit default swaps, financial futures contracts, foreign currency exchange contracts and accrued expenses payable.
See Notes to the Financial Statements.
42
SCHEDULE OF PORTFOLIO INVESTMENTS
|
RBC BlueBay Core Plus Bond Fund
September 30, 2023
Principal Amount | Value | |||||
| ||||||
Corporate Bonds — 55.99% | ||||||
Australia — 0.29% | ||||||
$ 160,000 | Santos Finance Ltd., 3.65%, 4/29/31(a) | $ | 128,177 | |||
|
| |||||
Belgium — 0.58% | ||||||
260,000 | KBC Group NV, 6.32%, 9/21/34(b),(c) | 252,431 | ||||
|
| |||||
Bermuda — 1.00% | ||||||
458,000 | Triton Container International Ltd., 1.15%, 6/7/24(b) | 439,577 | ||||
|
| |||||
Canada — 2.74% | ||||||
190,000 | Bank of Nova Scotia (The), 4.59%, 5/4/37(c) | 158,413 | ||||
230,000 | Canadian Imperial Bank of Commerce, 6.09%, 10/3/33 | 228,445 | ||||
320,000 | Enbridge, Inc., 5.97%, 3/8/26 | 319,214 | ||||
200,000 | Enbridge, Inc., 8.50%, 1/15/84(c) | 200,200 | ||||
160,000 | Kinross Gold Corp., 6.25%, 7/15/33(b) | 153,760 | ||||
192,000 | Rogers Communications, Inc., 4.55%, 3/15/52 | 139,789 | ||||
|
| |||||
| 1,199,821 | ||||||
|
| |||||
Chile — 0.44% | ||||||
200,000 | Corp. Nacional del Cobre de Chile, 6.30%, 9/8/53(b) | 190,648 | ||||
|
| |||||
Denmark — 0.33% | ||||||
150,000 | AP Moller - Maersk A/S, 5.88%, 9/14/33(b) | 145,209 | ||||
|
| |||||
France — 3.32% | ||||||
300,000(d) | Atos SE, 1.00%, 11/12/29(a) | 182,276 | ||||
200,000(d) | Electricite de France SA, 3.00%, (a),(c),(e) | 178,804 | ||||
200,000(d) | Electricite de France SA, 3.38%, (a),(c),(e) | 162,526 | ||||
100,000(f) | Electricite de France SA, EMTN, 5.88%, (a),(c),(e) | 101,442 | ||||
200,000(f) | Electricite de France SA, EMTN, 6.00%, (a),(c),(e) | 225,029 | ||||
200,000 | Electricite de France SA, 6.90%, 5/23/53(b) | 198,143 | ||||
200,000 | Electricite de France SA, 9.13%, (b),(c),(e) | 207,983 | ||||
200,000 | Societe Generale SA, 9.38%, (b),(c),(e) | 196,642 | ||||
|
| |||||
| 1,452,845 | ||||||
|
| |||||
Germany — 1.60% | ||||||
200,000(d) | Commerzbank AG, 6.13%, (a),(c),(e) | 189,947 | ||||
200,000(d) | Deutsche Bank AG, EMTN, 1.75%, 11/19/30(a),(c) | 167,021 | ||||
200,000 | Deutsche Bank AG, 4.88%, 12/1/32(c) | 170,676 | ||||
200,000(d) | Deutsche Bank AG, 6.75%, (a),(c),(e) | 170,994 | ||||
|
| |||||
| 698,638 | ||||||
|
| |||||
Ireland — 1.25% | ||||||
220,000 | AerCap Ireland Capital DAC / AerCap Global Aviation Trust, 4.63%, 10/15/27 | 206,287 | ||||
43
SCHEDULE OF PORTFOLIO INVESTMENTS
|
RBC BlueBay Core Plus Bond Fund (cont.)
September 30, 2023
Principal Amount | Value | |||||
| ||||||
$ 200,000 | AIB Group Plc, 6.61%, 9/13/29(b),(c) | $ | 199,230 | |||
160,000 | Avolon Holdings Funding Ltd., 3.25%, 2/15/27(b) | 142,527 | ||||
|
| |||||
| 548,044 | ||||||
|
| |||||
Italy — 1.83% | ||||||
250,000(d) | Intesa Sanpaolo SpA, EMTN, 5.50%, (a),(c),(e) | 224,040 | ||||
230,000 | Intesa Sanpaolo SpA, 6.63%, 6/20/33(b) | 216,406 | ||||
204,000 | Intesa Sanpaolo SpA, 8.25%, 11/21/33(b),(c) | 205,628 | ||||
200,000 | UniCredit SpA, 3.13%, 6/3/32(b),(c) | 152,909 | ||||
|
| |||||
| 798,983 | ||||||
|
| |||||
Japan — 3.77% | ||||||
380,000 | Mizuho Financial Group, Inc., 2.65%, 5/22/26(c) | 357,761 | ||||
200,000 | Mizuho Financial Group, Inc., 5.75%, 5/27/34(c) | 192,070 | ||||
220,000 | Mizuho Financial Group, Inc., 5.78%, 7/6/29(c) | 216,926 | ||||
230,000 | Nissan Motor Co. Ltd., 4.35%, 9/17/27(b) | 209,722 | ||||
267,000 | Nomura Holdings, Inc., 2.61%, 7/14/31 | 204,453 | ||||
200,000 | Nomura Holdings, Inc., 5.61%, 7/6/29 | 193,483 | ||||
80,000 | Nomura Holdings, Inc., 6.18%, 1/18/33 | 78,771 | ||||
210,000 | Renesas Electronics Corp., 1.54%, 11/26/24(b) | 198,101 | ||||
|
| |||||
| 1,651,287 | ||||||
|
| |||||
Norway — 0.72% | ||||||
300,000 | Var Energi ASA, 8.00%, 11/15/32(b) | 314,205 | ||||
|
| |||||
Spain — 2.74% | ||||||
300,000(d) | Abertis Infraestructuras Finance BV, 2.63%, (a),(c),(e) | 268,192 | ||||
200,000(d) | Abertis Infraestructuras Finance BV, 3.25%, (a),(c),(e) | 192,952 | ||||
200,000(d) | Banco Bilbao Vizcaya Argentaria SA, 6.00%, (a),(c),(e) | 208,475 | ||||
200,000(d) | CaixaBank SA, (5 Year EUR Swap + 6.498%), 6.75%, (a),(c),(e) | 209,096 | ||||
200,000 | CaixaBank SA, 6.84%, 9/13/34(b),(c) | 195,564 | ||||
160,000 | Telefonica Emisiones SA, 5.21%, 3/8/47 | 127,240 | ||||
|
| |||||
| 1,201,519 | ||||||
|
| |||||
Sweden — 0.99% | ||||||
282,000(d) | Heimstaden Bostad Treasury BV, EMTN, 1.38%, 7/24/28(a) | 217,116 | ||||
223,000 | Swedbank AB, 5.34%, 9/20/27(b) | 216,083 | ||||
|
| |||||
| 433,199 | ||||||
|
| |||||
Switzerland — 2.59% | ||||||
500,000 | UBS Group AG, 6.54%, 8/12/33(b),(c) | 494,916 | ||||
300,000(d) | UBS Group AG, 7.75%, 3/1/29(a),(c) | 349,850 | ||||
250,000 | UBS Group AG, 9.02%, 11/15/33(b),(c) | 288,895 | ||||
|
| |||||
| 1,133,661 | ||||||
|
| |||||
United Kingdom — 1.50% | ||||||
240,000 | Barclays Plc, 6.50%, 9/13/27(c) | 239,405 | ||||
44
SCHEDULE OF PORTFOLIO INVESTMENTS
|
RBC BlueBay Core Plus Bond Fund (cont.)
September 30, 2023
Principal Amount | Value | |||||
| ||||||
200,000(f) | Barclays Plc, 7.13%, (c),(e) | $ | 227,274 | |||
$ 200,000 | HSBC Holdings Plc, 4.76%, 6/9/28(c) | 189,150 | ||||
|
| |||||
| 655,829 | ||||||
|
| |||||
United States — 30.30% | ||||||
153,000 | Aircastle Ltd., 2.85%, 1/26/28(b) | 129,880 | ||||
190,000 | Ally Financial, Inc., 6.99%, 6/13/29(c) | 185,918 | ||||
200,000(d) | American Tower Corp., REIT, 4.63%, 5/16/31 | 207,010 | ||||
180,000 | Amgen, Inc., 5.75%, 3/2/63 | 166,222 | ||||
178,000 | Arrow Electronics, Inc., 6.13%, 3/1/26 | 177,075 | ||||
220,000 | AT&T, Inc., 3.65%, 9/15/59 | 133,701 | ||||
240,000 | AT&T, Inc., 5.40%, 2/15/34 | 224,485 | ||||
260,000 | Bank of America Corp., 2.48%, 9/21/36(c) | 190,045 | ||||
230,000 | Bank of America Corp., 4.57%, 4/27/33(c) | 204,214 | ||||
220,000 | Bank of America Corp., 5.29%, 4/25/34(c) | 204,683 | ||||
210,000 | Bank of America Corp., 5.87%, 9/15/34(c) | 204,172 | ||||
175,000 | Bank of America Corp., Series U, (Term SOFR 3M + 3.397%), 8.81%, (e),(g) | 174,958 | ||||
160,000 | Booz Allen Hamilton, Inc., 5.95%, 8/4/33 | 155,514 | ||||
186,000 | Broadcom, Inc., 2.60%, 2/15/33(b) | 138,709 | ||||
321,000 | Broadcom, Inc., 4.93%, 5/15/37(b) | 276,520 | ||||
86,000 | Charles Schwab Corp. (The), 5.85%, 5/19/34(c) | 81,816 | ||||
223,000 | Charter Communications Operating LLC / Charter Communications Operating Capital, 3.85%, 4/1/61 | 124,152 | ||||
220,000 | Citigroup, Inc., 3.06%, 1/25/33(c) | 173,372 | ||||
250,000 | Citizens Bank NA, 4.58%, 8/9/28(c) | 227,884 | ||||
180,000 | Citizens Financial Group, Inc., 2.50%, 2/6/30 | 139,707 | ||||
160,000 | Columbia Pipelines Holding Co. LLC, 6.04%, 8/15/28(b) | 159,227 | ||||
167,000 | Columbia Pipelines Operating Co. LLC, 6.04%, 11/15/33(b) | 163,150 | ||||
203,000 | Comerica, Inc., 4.00%, 2/1/29 | 169,438 | ||||
240,000 | Constellation Energy Generation LLC, 6.13%, 1/15/34 | 239,917 | ||||
140,000 | Constellation Energy Generation LLC, 6.50%, 10/1/53 | 140,516 | ||||
185,000 | Continental Resources, Inc., 4.90%, 6/1/44 | 135,850 | ||||
140,000 | Energy Transfer LP, 6.25%, 4/15/49 | 128,450 | ||||
150,000 | Essential Utilities, Inc., 5.30%, 5/1/52 | 128,719 | ||||
190,000 | Exelon Corp., 5.60%, 3/15/53 | 172,965 | ||||
180,000 | Fifth Third Bancorp, 6.36%, 10/27/28(c) | 178,449 | ||||
170,000 | Flex Intermediate Holdco LLC, 4.32%, 12/30/39(b) | 115,926 | ||||
200,000 | Foundry JV Holdco LLC, 5.88%, 1/25/34(b) | 191,047 | ||||
133,000 | General Motors Co., 5.40%, 4/1/48 | 104,936 | ||||
110,000 | Global Payments, Inc., 5.30%, 8/15/29 | 104,877 | ||||
236,000 | Global Payments, Inc., 5.95%, 8/15/52 | 210,872 | ||||
276,000 | Goldman Sachs Group, Inc. (The), 2.38%, 7/21/32(c) | 210,104 | ||||
250,000 | Huntington National Bank (The), 5.65%, 1/10/30 | 234,828 | ||||
187,000 | Intel Corp., 5.70%, 2/10/53 | 175,301 | ||||
200,000 | Intel Corp., 5.90%, 2/10/63 | 189,674 | ||||
250,000 | KeyBank NA, 4.39%, 12/14/27 | 223,721 | ||||
250,000 | KeyBank NA, 5.85%, 11/15/27 | 237,526 | ||||
45
SCHEDULE OF PORTFOLIO INVESTMENTS
|
RBC BlueBay Core Plus Bond Fund (cont.)
September 30, 2023
Principal Amount | Value | |||||
| ||||||
$ 259,000 | Kyndryl Holdings, Inc., 3.15%, 10/15/31 | $ | 195,653 | |||
200,000 | Kyndryl Holdings, Inc., 4.10%, 10/15/41 | 130,868 | ||||
140,000 | LKQ Corp., 5.75%, 6/15/28(b) | 136,782 | ||||
110,000 | LKQ Corp., 6.25%, 6/15/33(b) | 106,398 | ||||
164,000 | M&T Bank Corp., 5.05%, 1/27/34(c) | 142,095 | ||||
190,000 | Marvell Technology, Inc., 5.95%, 9/15/33 | 186,510 | ||||
179,000 | Meta Platforms, Inc., 4.45%, 8/15/52 | 141,652 | ||||
210,000 | Micron Technology, Inc., 5.88%, 2/9/33 | 200,689 | ||||
191,000 | Micron Technology, Inc., 5.88%, 9/15/33 | 181,875 | ||||
260,000 | Morgan Stanley, 2.48%, 9/16/36(c) | 189,997 | ||||
280,000 | Morgan Stanley, GMTN, 4.89%, 7/20/33(c) | 254,506 | ||||
210,000 | Morgan Stanley, GMTN, 5.25%, 4/21/34(c) | 195,022 | ||||
136,000 | Morgan Stanley, 5.30%, 4/20/37(c) | 121,461 | ||||
152,000 | MPLX LP, 5.00%, 3/1/33 | 138,422 | ||||
160,000 | Nasdaq, Inc., 5.55%, 2/15/34 | 152,638 | ||||
230,000 | New York State Electric & Gas Corp., 5.85%, 8/15/33(b) | 226,744 | ||||
200,000 | NextEra Energy Capital Holdings, Inc., 5.25%, 2/28/53 | 173,060 | ||||
180,000 | Oracle Corp., 4.10%, 3/25/61 | 119,684 | ||||
160,000 | Oracle Corp., 5.55%, 2/6/53 | 140,232 | ||||
289,000 | Paramount Global, 6.38%, 3/30/62(c) | 226,849 | ||||
170,000 | Pfizer Investment Enterprises Pte Ltd., 5.34%, 5/19/63 | 154,860 | ||||
150,000 | Pilgrim’s Pride Corp., 6.25%, 7/1/33 | 141,131 | ||||
200,000 | Royalty Pharma Plc, 3.55%, 9/2/50 | 122,045 | ||||
200,000(d) | Simon International Finance SCA, REIT, 1.13%, 3/19/33(a) | 149,537 | ||||
260,000 | U.S. Cellular Corp., 6.70%, 12/15/33 | 251,834 | ||||
140,000(d) | Upjohn Finance BV, 1.91%, 6/23/32(a) | 113,602 | ||||
200,000 | Utah Acquisition Sub, Inc., 5.25%, 6/15/46 | 146,870 | ||||
196,000 | Viatris, Inc., 4.00%, 6/22/50 | 118,362 | ||||
170,000 | VICI Properties LP, REIT, 4.95%, 2/15/30 | 155,848 | ||||
145,000 | Warnermedia Holdings, Inc., 4.05%, 3/15/29 | 129,343 | ||||
188,000 | Warnermedia Holdings, Inc., 5.05%, 3/15/42 | 145,425 | ||||
410,000 | Warnermedia Holdings, Inc., 5.14%, 3/15/52 | 304,184 | ||||
200,000 | Warnermedia Holdings, Inc., 6.41%, 3/15/26 | 199,979 | ||||
300,000 | Wells Fargo & Co., 5.39%, 4/24/34(c) | 280,959 | ||||
210,000 | Wells Fargo & Co., GMTN, 5.56%, 7/25/34(c) | 198,998 | ||||
180,000 | Western Midstream Operating LP, 4.05%, 2/1/30 | 156,990 | ||||
|
| |||||
| 13,266,634 | ||||||
|
| |||||
Total Corporate Bonds | 24,510,707 | |||||
|
| |||||
(Cost $26,508,930) | ||||||
U.S. Government Agency Backed Mortgages — 23.07% | ||||||
United States — 23.07% | ||||||
875,000 | Fannie Mae, (TBA), 3.50%, 10/1/53 | 751,972 | ||||
725,000 | Fannie Mae, (TBA), 3.00%, 10/1/53 | 599,497 | ||||
3,000,000 | Fannie Mae, (TBA), 2.50%, 10/1/53 | 2,379,948 | ||||
3,800,000 | Fannie Mae, (TBA), 2.00%, 10/15/53 | 2,887,654 | ||||
882,783 | Fannie Mae, Pool #BT8271, 4.00%, 7/1/52 | 786,990 | ||||
192,206 | Fannie Mae, Pool #CB4766, 5.00%, 9/1/52 | 181,896 | ||||
46
SCHEDULE OF PORTFOLIO INVESTMENTS
|
RBC BlueBay Core Plus Bond Fund (cont.)
September 30, 2023
Principal Amount | Value | |||||
| ||||||
$ 564,444 | Fannie Mae, Pool #CB4768, 5.00%, 9/1/52 | $ | 537,083 | |||
222,543 | Fannie Mae, Pool #BT7932, 5.50%, 10/1/52 | 216,510 | ||||
434,692 | Fannie Mae, Pool #CB5344, 6.50%, 12/1/52 | 440,990 | ||||
98,800 | Fannie Mae, Pool #CB4969, 5.50%, 10/1/52 | 96,111 | ||||
636,957 | Fannie Mae, Pool #CB7160, 6.50%, 9/1/53 | 645,136 | ||||
439,878 | Freddie Mac, Pool #RA7718, 4.50%, 7/1/52 | 403,910 | ||||
173,238 | Freddie Mac, Pool #QF4133, 6.00%, 11/1/52 | 172,464 | ||||
|
| |||||
| 10,100,161 | ||||||
|
| |||||
Total U.S. Government Agency Backed Mortgages | 10,100,161 | |||||
|
| |||||
(Cost $10,565,547) | ||||||
Shares | ||||||
Collateralized Mortgage Obligations — 13.86% | ||||||
United States — 13.86% | ||||||
312,772 | BX Commercial Mortgage Trust, Series 2021-XL2, Class D, (Term SOFR 1M + 1.511%), 6.84%, 10/15/38(b),(h) | 303,650 | ||||
223,503 | BX Commercial Mortgage Trust, Series 2021-21M, Class D, (Term SOFR 1M + 1.540%), 6.87%, 10/15/36(b),(h) | 213,811 | ||||
300,000 | BX Commercial Mortgage Trust, Series 2022-CSMO, Class C, (Term SOFR 1M + 3.889%), 9.22%, 6/15/27(b),(h) | 300,143 | ||||
216,577 | BX Trust, Series 2022-IND, Class D, (Term SOFR 1M + 2.839%), 8.17%, 4/15/37(b),(h) | 209,584 | ||||
207,000 | Connecticut Avenue Securities Trust, Series 2022-R01, Class 1M2, (SOFR30A + 1.900%), 7.22%, 12/25/41(b),(h) | 203,469 | ||||
100,000 | Connecticut Avenue Securities Trust, Series 2023-R06, Class 1M2, (SOFR30A + 2.700%), 8.02%, 7/25/43(b),(h) | 100,453 | ||||
88,000 | Connecticut Avenue Securities Trust, Series 2022-R04, Class 1M2, (SOFR30A + 3.100%), 8.42%, 3/25/42(b),(h) | 89,483 | ||||
277,000 | Connecticut Avenue Securities Trust, Series 2023-R05, Class 1M2, (SOFR30A + 3.100%), 8.42%, 6/25/43(b),(h) | 282,306 | ||||
366,000 | Connecticut Avenue Securities Trust, Series 2023-R04, Class 1M2, (SOFR30A + 3.550%), 8.87%, 5/25/43(b),(h) | 382,799 | ||||
625,000 | Credit Suisse Mortgage Capital Certificates, Series 2020-SPT1, Class A2, 2.23%, 4/25/65(b),(i) | 591,632 | ||||
364,715 | Freddie Mac STACR REMIC Trust, Series 2023-HQA1, Class M1A, (SOFR30A + 2.000%), 7.32%, 5/25/43(b),(h) | 366,940 | ||||
113,639 | Freddie Mac STACR REMIC Trust, (SOFR30A + 2.100%), 7.42%, 3/25/43(b),(h) | 114,550 | ||||
460,000 | Freddie Mac STACR REMIC Trust, Series 2022-DNA2, Class M1B, (SOFR30A + 2.400%), 7.72%, 2/25/42(b),(h) | 462,170 | ||||
550,000 | Freddie Mac Structured Agency Credit Risk Debt Notes, Series 2023-HQA2, Class M1B, (SOFR30A + 3.350%), 8.67%, 6/25/43(b),(h) | 564,019 | ||||
250,000 | HONO Mortgage Trust, Series 2021-LULU, Class A, (Term SOFR 1M + 1.264%), 6.60%, 10/15/36(b),(h) | 240,236 | ||||
268,939 | MFA Trust, Series 2020-NQM3, Class A3, 1.63%, 1/26/65(b),(i) | 237,534 | ||||
400,000 | SMRT, Series 2022-MINI, Class D, (Term SOFR 1M + 1.950%), 7.28%, 1/15/39(b),(h) | 384,088 | ||||
47
SCHEDULE OF PORTFOLIO INVESTMENTS
|
RBC BlueBay Core Plus Bond Fund (cont.)
September 30, 2023
| Shares | Value | |||||
| �� | |||||
$ 400,000 | Verus Securitization Trust, Series 2019-INV3, Class M1, 3.28%, 11/25/59(b),(i) | $ | 350,344 | |||
400,000 | Verus Securitization Trust, Series 2020-4, Class M1, 3.29%, 5/25/65(b),(i) | 335,294 | ||||
400,000 | Vista Point Securitization Trust, Series 2020-2, Class M1, 3.40%, 4/25/65(b),(i) | 337,056 | ||||
|
| |||||
| 6,069,561 | ||||||
|
| |||||
Total Collateralized Mortgage Obligations | 6,069,561 | |||||
|
| |||||
(Cost $6,333,917) | ||||||
Asset Backed Securities — 4.39% | ||||||
United States — 4.39% | ||||||
500,000 | Dell Equipment Finance Trust, Series 2023-2, Class D, 6.74%, 7/23/29(b) | 499,776 | ||||
450,000 | Exeter Automobile Receivables Trust, Series 2021-4A, Class D, 1.96%, 1/17/28 | 416,532 | ||||
450,000 | Exeter Automobile Receivables Trust, Series 2023-2A, Class D, 6.32%, 8/15/29 | 441,281 | ||||
185,000 | Exeter Automobile Receivables Trust, Series 2023-3A, Class D, 6.68%, 4/16/29 | 184,170 | ||||
208,025 | MVW LLC, Series 2021-2A, Class B, 1.83%, 5/20/39(b) | 182,149 | ||||
200,000 | Santander Drive Auto Receivables Trust, Series 2023-3, Class C, 5.77%, 11/15/30 | 196,778 | ||||
|
| |||||
| 1,920,686 | ||||||
|
| |||||
Total Asset Backed Securities | 1,920,686 | |||||
|
| |||||
(Cost $1,992,778) | ||||||
Principal Amount | ||||||
Bank Loans —3.93% | ||||||
Ireland — 1.14% | ||||||
500,000 | Setanta Aircraft Leasing DAC, 1st Lein Term Loan B, 7.54%, 11/5/28(h) | 499,455 | ||||
|
| |||||
United States — 2.79% | ||||||
391,940 | Avolon US LLC, 1st Lien Term Loan B5, (SOFR 1M + 2.25%), 7.68%, 12/1/27(h) | 391,548 | ||||
429,814 | Entegris, Inc., (SOFR 1M + 2.75%), 7.77%, 7/6/29(h) | 428,739 | ||||
400,000 | Hilton Worldwide Finance LLC, 1st Lien Term Loan B2, (SOFR 1M + 1.75%), 7.17%, 6/21/26(h) | 399,588 | ||||
|
| |||||
| 1,219,875 | ||||||
|
| |||||
Total Bank Loans | 1,719,330 | |||||
|
| |||||
(Cost $1,719,148) | ||||||
48
SCHEDULE OF PORTFOLIO INVESTMENTS
|
RBC BlueBay Core Plus Bond Fund (cont.)
September 30, 2023
Principal Amount | Value | |||||
| ||||||
Foreign Government Bonds — 3.19% | ||||||
Mexico — 2.75% | ||||||
20,700,000(j) | Mexican Bonos, Series M, 8.50%, 5/31/29 | $ | 1,110,819 | |||
130,000(d) | Mexico Government International Bond, 4.00%, 3/15/2115 | 92,925 | ||||
|
| |||||
| 1,203,744 | ||||||
|
| |||||
Romania — 0.44% | ||||||
$ 190,000 | Romanian Government International Bond, 7.63%, 1/17/53(b) | 193,814 | ||||
|
| |||||
Total Foreign Government Bonds | 1,397,558 | |||||
|
| |||||
(Cost $1,536,058) | ||||||
Shares | ||||||
Investment Company — 7.56% | ||||||
3,307,444 | RBC BlueBay U.S. Goverment Money Market Fund, Institutional Class 1 (k) | 3,307,444 | ||||
|
| |||||
Total Investment Company | 3,307,444 | |||||
|
| |||||
(Cost $3,307,444) | ||||||
Total Investments | $ | 49,025,447 | ||||
(Cost $51,963,822)(l) — 111.99% | ||||||
Liabilities in excess of other assets — (11.99)% | (5,247,778 | ) | ||||
|
| |||||
NET ASSETS — 100.00% | $ | 43,777,669 | ||||
|
| |||||
49
SCHEDULE OF PORTFOLIO INVESTMENTS
|
RBC BlueBay Core Plus Bond Fund (cont.)
September 30, 2023
| (a) | This security may be resold to qualified foreign investors and foreign institutional buyers under Regulation S of the Securities Act of 1933. |
| (b) | Security exempt from registration under Rule 144A or Section 4(2) of the Securities Act of 1933, as amended. These securities may be resold in transactions exempt from registration, normally to qualified institutional buyers. |
| (c) | Security is a fix-to-float security, which carries a fixed coupon until a certain date, upon which it switches to a floating rate. Reference rate and spread are provided if the rate is currently floating. |
| (d) | Principal amount denoted in Euros. |
| (e) | Perpetual security with no stated maturity date. |
| (f) | Principal amount denoted in British Pounds. |
| (g) | Variable rate security. The rate reflected in the Schedule of Portfolio Investments is the rate in effect on September 30, 2023. |
| (h) | Floating rate note. Rate shown is as of report date. |
| (i) | Variable or floating rate security, which interest rate adjusts periodically based on changes in current interest rates and prepayments on the underlying pool of assets. Rate shown is the rate in effect as of period end. |
| (j) | Principal amount denoted in Mexican peso. |
| (k) | Affiliated investment. |
| (l) | See Notes to Schedules of Portfolio Investments for the tax cost of securities and the breakdown of unrealized appreciation (depreciation). |
50
SCHEDULE OF PORTFOLIO INVESTMENTS
|
RBC BlueBay Core Plus Bond Fund (cont.)
September 30, 2023
Foreign currency exchange contracts as of September 30, 2023:
Currency Purchased | Currency Sold | Counterparty | Settlement Date | Value/Unrealized Appreciation (Depreciation) | ||||||||||||||||||||||||||||||
EUR | 313,942 | CHF | 302,923 | Citibank N.A. | 10/19/23 | $ | 535 | |||||||||||||||||||||||||||
EUR | 508,974 | GBP | 435,917 | Citibank N.A. | 10/19/23 | 6,639 | ||||||||||||||||||||||||||||
EUR | 311,970 | GBP | 269,555 | Citibank N.A. | 10/19/23 | 1,185 | ||||||||||||||||||||||||||||
USD | 431,432 | EUR | 389,725 | Citibank N.A. | 10/19/23 | 19,046 | ||||||||||||||||||||||||||||
USD | 225,493 | EUR | 200,000 | Citibank N.A. | 10/19/23 | 13,864 | ||||||||||||||||||||||||||||
USD | 442,417 | EUR | 400,000 | Citibank N.A. | 10/19/23 | 19,158 | ||||||||||||||||||||||||||||
USD | 2,721,646 | EUR | 2,437,497 | Citibank N.A. | 10/19/23 | 142,412 | ||||||||||||||||||||||||||||
USD | 680,000 | EUR | 614,858 | Citibank N.A. | 10/19/23 | 29,389 | ||||||||||||||||||||||||||||
USD | 220,114 | EUR | 200,000 | Citibank N.A. | 10/19/23 | 8,484 | ||||||||||||||||||||||||||||
USD | 5,636 | EUR | 5,000 | Citibank N.A. | 10/19/23 | 345 | ||||||||||||||||||||||||||||
USD | 1,061,325 | GBP | 818,010 | Citibank N.A. | 10/19/23 | 63,144 | ||||||||||||||||||||||||||||
USD | 293,183 | MXN | 4,965,000 | Citibank N.A. | 10/19/23 | 9,282 | ||||||||||||||||||||||||||||
USD | 589,187 | MXN | 10,214,639 | Citibank N.A. | 10/19/23 | 5,109 | ||||||||||||||||||||||||||||
USD | 309,099 | MXN | 5,215,000 | Citibank N.A. | 10/19/23 | 10,903 | ||||||||||||||||||||||||||||
|
| |||||||||||||||||||||||||||||||||
| $ | 329,495 | |||||||||||||||||||||||||||||||||
CHF | 300,000 | EUR | 315,866 | Citibank N.A. | 10/19/23 | $ | (5,771) | |||||||||||||||||||||||||||
EUR | 389,725 | USD | 430,464 | Citibank N.A. | 10/19/23 | (18,077) | ||||||||||||||||||||||||||||
GBP | 268,344 | USD | 344,063 | Citibank N.A. | 10/19/23 | (16,615) | ||||||||||||||||||||||||||||
JPY | 99,561,470 | USD | 719,103 | Citibank N.A. | 10/19/23 | (50,460) | ||||||||||||||||||||||||||||
USD | 195,021 | GBP | 159,976 | Citibank N.A. | 10/19/23 | (191) | ||||||||||||||||||||||||||||
|
| |||||||||||||||||||||||||||||||||
| $ | (91,114) | |||||||||||||||||||||||||||||||||
|
| |||||||||||||||||||||||||||||||||
Total | $ | 238,381 | ||||||||||||||||||||||||||||||||
|
| |||||||||||||||||||||||||||||||||
51
SCHEDULE OF PORTFOLIO INVESTMENTS
|
RBC BlueBay Core Plus Bond Fund (cont.)
September 30, 2023
Financial futures contracts as of September 30, 2023:
Long Position | Number of Contracts | Expiration Date | Value/Unrealized Appreciation (Depreciation) | Notional Value | Clearinghouse | |||||||||||||||||||||
10 Year U.S. Treasury Note | 88 | December 2023 | $ | (72,748) | USD | $ | 9,509,500 | Morgan Stanley & Co. LLC | ||||||||||||||||||
2 Year U.S. Treasury Note | 56 | December 2023 | (30,713) | USD | 11,351,813 | Morgan Stanley & Co. LLC | ||||||||||||||||||||
30 Year U.S. Ultra Treasury Bond | 17 | December 2023 | (121,527 | ) | USD | 2,017,688 | Morgan Stanley & Co. LLC | |||||||||||||||||||
5 Year U.S. Treasury Note | 21 | December 2023 | 1,231 | USD | 2,212,547 | Morgan Stanley & Co. LLC | ||||||||||||||||||||
|
| |||||||||||||||||||||||||
Total | $(223,757) | |||||||||||||||||||||||||
|
| |||||||||||||||||||||||||
Short Position | Number of Contracts | Expiration Date | Value/Unrealized Appreciation | Notional Value | Clearinghouse | |||||||||||||||||||||
10 Year Euro-Bund | 2 | December 2023 | $ | 6,104 | EUR | $ | 272,009 | Morgan Stanley & Co. LLC | ||||||||||||||||||
10 Year U.S. Ultra Treasury Bond | 61 | December 2023 | 118,420 | USD | 6,805,313 | Morgan Stanley & Co. LLC | ||||||||||||||||||||
30 Year Euro-Buxl | 1 | December 2023 | 9,187 | EUR | 129,365 | Morgan Stanley & Co. LLC | ||||||||||||||||||||
5 Year Euro-Bobl | 12 | December 2023 | 15,212 | EUR | 1,468,520 | Morgan Stanley & Co. LLC | ||||||||||||||||||||
EURO-BTP FUTURE | 1 | December 2023 | 4,767 | EUR | 116,012 | Morgan Stanley & Co. LLC | ||||||||||||||||||||
EURO-SCHATZ FUT | 3 | December 2023 | 1,329 | EUR | 333,002 | Morgan Stanley & Co. LLC | ||||||||||||||||||||
JPN 10Y BOND(OSE) | 2 | December 2023 | 14,232 | JPY | 1,940,043 | Morgan Stanley & Co. LLC | ||||||||||||||||||||
Long Gilt Future | 14 | December 2023 | 19,992 | GBP | 1,608,385 | Morgan Stanley & Co. LLC | ||||||||||||||||||||
|
| |||||||||||||||||||||||||
Total | $ | 189,243 | ||||||||||||||||||||||||
|
| |||||||||||||||||||||||||
52
SCHEDULE OF PORTFOLIO INVESTMENTS
|
RBC BlueBay Core Plus Bond Fund (cont.)
September 30, 2023
Interest rate swaps as of September 30, 2023:
Fixed | Floating Rate | Payment Frequency | Counterparty | Expiration Date | Notional Amount (000) | Value/Unrealized Appreciation (Depreciation) | ||||||||||||||||||||||
| 3.83% | CAD-CBNALDN | Semi-Annually | | Morgan Stanley & Co. LLC | | 10/19/33 | CAD | 700 | $ | 13,182 | ||||||||||||||||||
| 0.76% | JPY-BCAPLDN | Yearly | | Morgan Stanley & Co. LLC | | 10/19/33 | JPY | 160,000 | 23,102 | |||||||||||||||||||
| 0.90% | JPY-BCAPLDN | Daily | | Morgan Stanley & Co. LLC | | 4/19/33 | JPY | 100,000 | 113 | |||||||||||||||||||
|
| |||||||||||||||||||||||||||
| $ | 36,397 | |||||||||||||||||||||||||||
| 4.72% | CAD-CBNALDN | Daily | | Morgan Stanley & Co. LLC | | 10/19/25 | CAD | 3,300 | (11,819 | ) | ||||||||||||||||||
| 2.61% | EUR-CITILDN | Daily | | Morgan Stanley & Co. LLC | | 6/15/43 | EUR | 240 | (1,745 | ) | ||||||||||||||||||
|
| |||||||||||||||||||||||||||
| $ | (13,564 | ) | ||||||||||||||||||||||||||
|
| |||||||||||||||||||||||||||
| Total | $ | 22,833 | ||||||||||||||||||||||||||
|
| |||||||||||||||||||||||||||
Credit default swaps buy protection as of September 30, 2023:
Fixed | Issuer | Payment Frequency | Counterparty | Expiration Date | Notional Amount (000) | Premium Paid/ (Received) | Unrealized Appreciation (Depreciation) | Value | ||||||||||||||||||||||||||||
| 1.00% | | Markit CDX IG Index Series 41 | | Quarterly | | Morgan Stanley & Co. LLC | | 12/20/28 | USD | 2,517 | $ | (35,705 | ) | $ | 4,787 | $ | (30,919 | ) | ||||||||||||||||||
| 1.00% | | Markit CDX IG Index Series 41 | | Quarterly | | Morgan Stanley & Co. LLC | | 12/20/28 | USD | 8,923 | (127,073 | ) | 17,464 | (109,609 | ) | |||||||||||||||||||||
| 1.00% | | Markit CDX IG Index Series 41 | | Quarterly | | Morgan Stanley & Co. LLC | | 12/20/28 | USD | 7,805 | (111,548 | ) | 15,672 | (95,876 | ) | |||||||||||||||||||||
| 1.00% | | Markit CDX IG Index Series 41 | | Quarterly | | Morgan Stanley & Co. LLC | | 12/20/28 | USD | 2,948 | (41,983 | ) | 5,769 | (36,213 | ) | |||||||||||||||||||||
| 1.00% | | Markit CDX IG Index Series 41 | | Quarterly | | Morgan Stanley & Co. LLC | | 12/20/28 | USD | 2,000 | (22,586 | ) | (1,982 | ) | (24,568 | ) | ||||||||||||||||||||
|
|
|
|
|
| |||||||||||||||||||||||||||||||
| Total | $ | (338,895 | ) | $ | 41,710 | $ | (297,185 | ) | ||||||||||||||||||||||||||||
|
|
|
|
|
| |||||||||||||||||||||||||||||||
53
SCHEDULE OF PORTFOLIO INVESTMENTS
|
RBC BlueBay Core Plus Bond Fund (cont.)
September 30, 2023
Abbreviations used are defined below:
Bobl - German Bundesobligationen
BTP - Italian Buoni del Tesoro Poliannuali
CAD - Canadian Dollar
CHF - Swiss Franc
EMTN - Euro Medium Term Note
EUR - Euro
GBP - United Kingdom Pound Sterling
GMTN - Global Medium Term Note
JPY - Japanese Yen
MXN - Mexican Peso
REIT - Real Estate Investment Trust
SOFR - Secured Overnight Financing Rate
SOFR30A - Secured Overnight Financing Rate 30 Day Average
TBA - To-be-announced
USD - United States Dollar
Portfolio Diversification (Unaudited)
Industries | Percentage | |||||||
Financial | 29.86% | |||||||
U.S. Government Agency Backed Mortgages | 23.07% | |||||||
Collateralized Mortgage Obligations | 13.86% | |||||||
Technology | 7.06% | |||||||
Utilities | 4.92% | |||||||
Energy | 4.48% | |||||||
Asset Backed Securities | 4.39% | |||||||
Consumer, Cyclical | 3.96% | |||||||
Consumer, Non-cyclical | 3.93% | |||||||
Foreign Government Bonds | 3.19% | |||||||
Communications | 3.13% | |||||||
Industrial | 1.79% | |||||||
Basic Materials | 0.79% | |||||||
Other* | (4.43)% | |||||||
|
| |||||||
| 100.00% | ||||||||
|
| |||||||
| * Includes cash, Investment Company, interest and dividend receivable, pending trades and Fund share transactions, interest rate swaps, credit default swaps, financial futures contracts, foreign currency exchange contracts and accrued expenses payable. | ||||||||
See Notes to the Financial Statements.
54
SCHEDULE OF PORTFOLIO INVESTMENTS
|
RBC BlueBay Strategic Income Fund
September 30, 2023
Principal Amount | Value | |||||
| ||||||
Corporate Bonds — 53.83% | ||||||
Australia — 0.27% | ||||||
$ 180,000 | Santos Finance Ltd., 3.65%, 4/29/31(a) | $ | 144,200 | |||
|
| |||||
Belgium — 0.57% | ||||||
310,000 | KBC Group NV, 6.32%, 9/21/34(b),(c) | 300,975 | ||||
|
| |||||
Bermuda — 0.97% | ||||||
536,000 | Triton Container International Ltd., 1.15%, 6/7/24(b) | 514,439 | ||||
|
| |||||
Canada — 2.67% | ||||||
215,000 | Bank of Nova Scotia (The), 4.59%, 5/4/37(c) | 179,256 | ||||
300,000 | Canadian Imperial Bank of Commerce, 6.09%, 10/3/33 | 297,972 | ||||
370,000 | Enbridge, Inc., 5.97%, 3/8/26 | 369,092 | ||||
230,000 | Enbridge, Inc., 8.50%, 1/15/84(c) | 230,230 | ||||
180,000 | Kinross Gold Corp., 6.25%, 7/15/33(b) | 172,980 | ||||
225,000 | Rogers Communications, Inc., 4.55%, 3/15/52 | 163,815 | ||||
|
| |||||
| 1,413,345 | ||||||
|
| |||||
Chile — 0.36% | ||||||
200,000 | Corp. Nacional del Cobre de Chile, 6.30%, 9/8/53(b) | 190,648 | ||||
|
| |||||
Denmark — 0.27% | ||||||
150,000 | AP Moller - Maersk A/S, 5.88%, 9/14/33(b) | 145,208 | ||||
|
| |||||
France — 2.86% | ||||||
400,000(d) | Atos SE, 1.00%, 11/12/29(a) | 243,034 | ||||
200,000(d) | Electricite de France SA, 3.00%, (a),(c),(e) | 178,804 | ||||
200,000(d) | Electricite de France SA, 3.38%, (a),(c),(e) | 162,526 | ||||
100,000(f) | Electricite de France SA, EMTN, 5.88%, (a),(c),(e) | 101,442 | ||||
200,000(f) | Electricite de France SA, EMTN, 6.00%, (a),(c),(e) | 225,029 | ||||
200,000 | Electricite de France SA, 6.90%, 5/23/53(b) | 198,143 | ||||
200,000 | Electricite de France SA, 9.13%, (b),(c),(e) | 207,983 | ||||
200,000 | Societe Generale SA, 9.38%, (b),(c),(e) | 196,642 | ||||
|
| |||||
| 1,513,603 | ||||||
|
| |||||
Germany — 1.48% | ||||||
200,000(d) | Commerzbank AG, 6.13%, (a),(c),(e) | 189,947 | ||||
300,000(d) | Deutsche Bank AG, EMTN, 1.75%, 11/19/30(a),(c) | 250,531 | ||||
200,000 | Deutsche Bank AG, 4.88%, 12/1/32(c) | 170,676 | ||||
200,000(d) | Deutsche Bank AG, 6.75%, (a),(c),(e) | 170,994 | ||||
|
| |||||
| 782,148 | ||||||
|
| |||||
Ireland — 1.47% | ||||||
220,000 | AerCap Ireland Capital DAC / AerCap Global Aviation Trust, 4.63%, 10/15/27 | 206,287 | ||||
55
SCHEDULE OF PORTFOLIO INVESTMENTS
|
RBC BlueBay Strategic Income Fund (cont.)
September 30, 2023
Principal Amount | Value | |||||
| ||||||
$ 200,000 | AIB Group Plc, 6.61%, 9/13/29(b),(c) | $ | 199,230 | |||
160,000 | Avolon Holdings Funding Ltd., 3.25%, 2/15/27(b) | 142,527 | ||||
230,000 | Avolon Holdings Funding Ltd., 5.13%, 10/1/23(b) | 230,000 | ||||
|
| |||||
| 778,044 | ||||||
|
| |||||
Italy — 1.62% | ||||||
250,000(d) | Intesa Sanpaolo SpA, EMTN, 5.50%, (a),(c),(e) | 224,040 | ||||
260,000 | Intesa Sanpaolo SpA, 6.63%, 6/20/33(b) | 244,633 | ||||
231,000 | Intesa Sanpaolo SpA, 8.25%, 11/21/33(b),(c) | 232,844 | ||||
200,000 | UniCredit SpA, 3.13%, 6/3/32(b),(c) | 152,909 | ||||
|
| |||||
| 854,426 | ||||||
|
| |||||
Japan — 3.40% | ||||||
380,000 | Mizuho Financial Group, Inc., 2.65%, 5/22/26(c) | 357,761 | ||||
220,000 | Mizuho Financial Group, Inc., 5.75%, 5/27/34(c) | 211,277 | ||||
260,000 | Mizuho Financial Group, Inc., 5.78%, 7/6/29(c) | 256,367 | ||||
230,000 | Nissan Motor Co. Ltd., 4.35%, 9/17/27(b) | 209,722 | ||||
267,000 | Nomura Holdings, Inc., 2.61%, 7/14/31 | 204,453 | ||||
200,000 | Nomura Holdings, Inc., 5.61%, 7/6/29 | 193,483 | ||||
120,000 | Nomura Holdings, Inc., 6.18%, 1/18/33 | 118,156 | ||||
260,000 | Renesas Electronics Corp., 1.54%, 11/26/24(b) | 245,269 | ||||
|
| |||||
| 1,796,488 | ||||||
|
| |||||
Norway — 0.75% | ||||||
380,000 | Var Energi ASA, 8.00%, 11/15/32(b) | 397,993 | ||||
|
| |||||
Spain — 2.33% | ||||||
300,000(d) | Abertis Infraestructuras Finance BV, 2.63%, (a),(c),(e) | 268,192 | ||||
200,000(d) | Abertis Infraestructuras Finance BV, 3.25%, (a),(c),(e) | 192,952 | ||||
200,000(d) | Banco Bilbao Vizcaya Argentaria SA, 6.00%, (a),(c),(e) | 208,475 | ||||
200,000(d) | CaixaBank SA, (5 Year EUR Swap + 6.498%), 6.75%, (a),(c),(e) | 209,096 | ||||
210,000 | CaixaBank SA, 6.84%, 9/13/34(b),(c) | 205,343 | ||||
190,000 | Telefonica Emisiones SA, 5.21%, 3/8/47 | 151,097 | ||||
|
| |||||
| 1,235,155 | ||||||
|
| |||||
Sweden — 0.93% | ||||||
317,000(d) | Heimstaden Bostad Treasury BV, EMTN, 1.38%, 7/24/28(a) | 244,062 | ||||
257,000 | Swedbank AB, 5.34%, 9/20/27(b) | 249,029 | ||||
|
| |||||
| 493,091 | ||||||
|
| |||||
Switzerland — 2.38% | ||||||
510,000 | UBS Group AG, 6.54%, 8/12/33(b),(c) | 504,814 | ||||
398,000(d) | UBS Group AG, 7.75%, 3/1/29(a),(c) | 464,134 | ||||
250,000 | UBS Group AG, 9.02%, 11/15/33(b),(c) | 288,895 | ||||
|
| |||||
| 1,257,843 | ||||||
|
| |||||
United Kingdom — 1.42% | ||||||
290,000 | Barclays Plc, 6.50%, 9/13/27(c) | 289,281 | ||||
56
SCHEDULE OF PORTFOLIO INVESTMENTS
|
RBC BlueBay Strategic Income Fund (cont.)
September 30, 2023
Principal Amount | Value | |||||
| ||||||
200,000(f) | Barclays Plc, 7.13%, (c),(e) | $ | 227,274 | |||
$ 250,000 | HSBC Holdings Plc, 4.76%, 6/9/28(c) | 236,438 | ||||
|
| |||||
| 752,993 | ||||||
|
| |||||
United States — 30.08% | ||||||
184,000 | Aircastle Ltd., 2.85%, 1/26/28(b) | 156,195 | ||||
210,000 | Ally Financial, Inc., 6.99%, 6/13/29(c) | 205,488 | ||||
100,000(d) | American Tower Corp., REIT, 4.63%, 5/16/31 | 103,505 | ||||
210,000 | Amgen, Inc., 5.75%, 3/2/63 | 193,926 | ||||
200,000 | Arrow Electronics, Inc., 6.13%, 3/1/26 | 198,961 | ||||
230,000 | AT&T, Inc., 3.65%, 9/15/59 | 139,778 | ||||
280,000 | AT&T, Inc., 5.40%, 2/15/34 | 261,899 | ||||
385,000 | Athene Global Funding, (SOFR Index + 0.700%), 6.04%, 5/24/24(b),(g) | 382,655 | ||||
260,000 | Bank of America Corp., 2.48%, 9/21/36(c) | 190,045 | ||||
250,000 | Bank of America Corp., 4.57%, 4/27/33(c) | 221,972 | ||||
250,000 | Bank of America Corp., 5.29%, 4/25/34(c) | 232,594 | ||||
250,000 | Bank of America Corp., 5.87%, 9/15/34(c) | 243,062 | ||||
195,000 | Bank of America Corp., Series U, (Term SOFR 3M + 3.397%), 8.81%, (e),(h) | 194,953 | ||||
180,000 | Booz Allen Hamilton, Inc., 5.95%, 8/4/33 | 174,954 | ||||
209,000 | Broadcom, Inc., 2.60%, 2/15/33(b) | 155,862 | ||||
375,000 | Broadcom, Inc., 4.93%, 5/15/37(b) | 323,037 | ||||
95,000 | Charles Schwab Corp. (The), 5.85%, 5/19/34(c) | 90,378 | ||||
250,000 | Charter Communications Operating LLC / Charter Communications Operating Capital, 3.85%, 4/1/61 | 139,184 | ||||
220,000 | Citigroup, Inc., 3.06%, 1/25/33(c) | 173,372 | ||||
250,000 | Citizens Bank NA, 4.58%, 8/9/28(c) | 227,884 | ||||
207,000 | Citizens Financial Group, Inc., 2.50%, 2/6/30 | 160,663 | ||||
187,000 | Columbia Pipelines Holding Co. LLC, 6.04%, 8/15/28(b) | 186,097 | ||||
200,000 | Columbia Pipelines Operating Co. LLC, 6.04%, 11/15/33(b) | 195,389 | ||||
234,000 | Comerica, Inc., 4.00%, 2/1/29 | 195,312 | ||||
280,000 | Constellation Energy Generation LLC, 6.13%, 1/15/34 | 279,904 | ||||
170,000 | Constellation Energy Generation LLC, 6.50%, 10/1/53 | 170,626 | ||||
208,000 | Continental Resources, Inc., 4.90%, 6/1/44 | 152,740 | ||||
170,000 | Energy Transfer LP, 6.25%, 4/15/49 | 155,975 | ||||
160,000 | Essential Utilities, Inc., 5.30%, 5/1/52 | 137,300 | ||||
220,000 | Exelon Corp., 5.60%, 3/15/53 | 200,275 | ||||
210,000 | Fifth Third Bancorp, 6.36%, 10/27/28(c) | 208,190 | ||||
170,000 | Flex Intermediate Holdco LLC, 4.32%, 12/30/39(b) | 115,926 | ||||
200,000 | Foundry JV Holdco LLC, 5.88%, 1/25/34(b) | 191,047 | ||||
155,000 | General Motors Co., 5.40%, 4/1/48 | 122,294 | ||||
110,000 | Global Payments, Inc., 5.30%, 8/15/29 | 104,877 | ||||
276,000 | Global Payments, Inc., 5.95%, 8/15/52 | 246,613 | ||||
324,000 | Goldman Sachs Group, Inc. (The), 2.38%, 7/21/32(c) | 246,644 | ||||
270,000 | Huntington National Bank (The), 5.65%, 1/10/30 | 253,614 | ||||
225,000 | Intel Corp., 5.70%, 2/10/53 | 210,923 | ||||
233,000 | Intel Corp., 5.90%, 2/10/63 | 220,971 | ||||
57
SCHEDULE OF PORTFOLIO INVESTMENTS
|
RBC BlueBay Strategic Income Fund (cont.)
September 30, 2023
Principal Amount | Value | |||||
| ||||||
$ 250,000 | KeyBank NA, 4.39%, 12/14/27 | $ | 223,721 | |||
250,000 | KeyBank NA, 5.85%, 11/15/27 | 237,526 | ||||
261,000 | Kyndryl Holdings, Inc., 3.15%, 10/15/31 | 197,163 | ||||
200,000 | Kyndryl Holdings, Inc., 4.10%, 10/15/41 | 130,868 | ||||
160,000 | LKQ Corp., 5.75%, 6/15/28(b) | 156,323 | ||||
120,000 | LKQ Corp., 6.25%, 6/15/33(b) | 116,070 | ||||
186,000 | M&T Bank Corp., 5.05%, 1/27/34(c) | 161,157 | ||||
230,000 | Marvell Technology, Inc., 5.95%, 9/15/33 | 225,776 | ||||
211,000 | Meta Platforms, Inc., 4.45%, 8/15/52 | 166,975 | ||||
245,000 | Micron Technology, Inc., 5.88%, 2/9/33 | 234,137 | ||||
240,000 | Micron Technology, Inc., 5.88%, 9/15/33 | 228,534 | ||||
260,000 | Morgan Stanley, 2.48%, 9/16/36(c) | 189,997 | ||||
320,000 | Morgan Stanley, GMTN, 4.89%, 7/20/33(c) | 290,864 | ||||
240,000 | Morgan Stanley, GMTN, 5.25%, 4/21/34(c) | 222,883 | ||||
154,000 | Morgan Stanley, 5.30%, 4/20/37(c) | 137,537 | ||||
173,000 | MPLX LP, 5.00%, 3/1/33 | 157,546 | ||||
180,000 | Nasdaq, Inc., 5.55%, 2/15/34 | 171,718 | ||||
270,000 | New York State Electric & Gas Corp., 5.85%, 8/15/33(b) | 266,178 | ||||
240,000 | NextEra Energy Capital Holdings, Inc., 5.25%, 2/28/53 | 207,672 | ||||
600,000 | NextEra Energy Capital Holdings, Inc., 5.75%, 9/1/25 | 598,225 | ||||
215,000 | Oracle Corp., 4.10%, 3/25/61 | 142,956 | ||||
180,000 | Oracle Corp., 5.55%, 2/6/53 | 157,761 | ||||
336,000 | Paramount Global, 6.38%, 3/30/62(c) | 263,741 | ||||
210,000 | Pfizer Investment Enterprises Pte Ltd., 5.34%, 5/19/63 | 191,298 | ||||
190,000 | Pilgrim’s Pride Corp., 6.25%, 7/1/33 | 178,765 | ||||
200,000 | Royalty Pharma Plc, 3.55%, 9/2/50 | 122,045 | ||||
230,000(d) | Simon International Finance SCA, REIT, 1.13%, 3/19/33(a) | 171,968 | ||||
300,000 | U.S. Cellular Corp., 6.70%, 12/15/33 | 290,578 | ||||
240,000(d) | Upjohn Finance BV, 1.91%, 6/23/32(a) | 194,747 | ||||
200,000 | Utah Acquisition Sub, Inc., 5.25%, 6/15/46 | 146,870 | ||||
221,000 | Viatris, Inc., 4.00%, 6/22/50 | 133,460 | ||||
180,000 | VICI Properties LP, REIT, 4.95%, 2/15/30 | 165,016 | ||||
169,000 | Warnermedia Holdings, Inc., 4.05%, 3/15/29 | 150,751 | ||||
212,000 | Warnermedia Holdings, Inc., 5.05%, 3/15/42 | 163,990 | ||||
500,000 | Warnermedia Holdings, Inc., 5.14%, 3/15/52 | 370,956 | ||||
230,000 | Warnermedia Holdings, Inc., 6.41%, 3/15/26 | 229,975 | ||||
340,000 | Wells Fargo & Co., 5.39%, 4/24/34(c) | 318,420 | ||||
270,000 | Wells Fargo & Co., GMTN, 5.56%, 7/25/34(c) | 255,855 | ||||
210,000 | Western Midstream Operating LP, 4.05%, 2/1/30 | 183,154 | ||||
|
| |||||
| 15,918,260 | ||||||
|
| |||||
Total Corporate Bonds | 28,488,859 | |||||
|
| |||||
(Cost $30,679,915) | ||||||
58
SCHEDULE OF PORTFOLIO INVESTMENTS
|
RBC BlueBay Strategic Income Fund (cont.)
September 30, 2023
| Shares | Value | |||||
| ||||||
Collateralized Mortgage Obligations — 11.54% | ||||||
United States — 11.54% | ||||||
$312,772 | BX Commercial Mortgage Trust, Series 2021-XL2, Class D, (Term SOFR 1M + 1.511%), 6.84%, 10/15/38(b),(g) | $ | 303,650 | |||
223,503 | BX Commercial Mortgage Trust, Series 2021-21M, Class D, (Term SOFR 1M + 1.540%), 6.87%, 10/15/36(b),(g) | 213,811 | ||||
300,000 | BX Commercial Mortgage Trust, Series 2022-CSMO, Class C, (Term SOFR 1M + 3.889%), 9.22%, 6/15/27(b),(g) | 300,142 | ||||
216,577 | BX Trust, Series 2022-IND, Class D, (Term SOFR 1M + 2.839%), 8.17%, 4/15/37(b),(g) | 209,584 | ||||
207,000 | Connecticut Avenue Securities Trust, Series 2022-R01, Class 1M2, (SOFR30A + 1.900%), 7.22%, 12/25/41(b),(g) | 203,469 | ||||
110,000 | Connecticut Avenue Securities Trust, Series 2023-R06, Class 1M2, (SOFR30A + 2.700%), 8.02%, 7/25/43(b),(g) | 110,498 | ||||
88,000 | Connecticut Avenue Securities Trust, Series 2022-R04, Class 1M2, (SOFR30A + 3.100%), 8.42%, 3/25/42(b),(g) | 89,483 | ||||
277,000 | Connecticut Avenue Securities Trust, Series 2023-R05, Class 1M2, (SOFR30A + 3.100%), 8.42%, 6/25/43(b),(g) | 282,306 | ||||
366,000 | Connecticut Avenue Securities Trust, Series 2023-R04, Class 1M2, (SOFR30A + 3.550%), 8.87%, 5/25/43(b),(g) | 382,799 | ||||
625,000 | Credit Suisse Mortgage Capital Certificates, Series 2020-SPT1, Class A2, 2.23%, 4/25/65(b) | 591,632 | ||||
364,715 | Freddie Mac STACR REMIC Trust, Series 2023-HQA1, Class M1A, (SOFR30A + 2.000%), 7.32%, 5/25/43(b),(g) | 366,940 | ||||
113,639 | Freddie Mac STACR REMIC Trust, (SOFR30A + 2.100%), 7.42%, 3/25/43(b),(g) | 114,550 | ||||
460,000 | Freddie Mac STACR REMIC Trust, Series 2022-DNA2, Class M1B, (SOFR30A + 2.400%), 7.72%, 2/25/42(b),(g) | 462,170 | ||||
575,000 | Freddie Mac Structured Agency Credit Risk Debt Notes, Series 2023-HQA2, Class M1B, (SOFR30A + 3.350%), 8.67%, 6/25/43(b),(g) | 589,657 | ||||
250,000 | HONO Mortgage Trust, Series 2021-LULU, Class A, (Term SOFR 1M + 1.264%), 6.60%, 10/15/36(b),(g) | 240,236 | ||||
268,939 | MFA Trust, Series 2020-NQM3, Class A3, 1.63%, 1/26/65(b),(i) | 237,534 | ||||
400,000 | SMRT, Series 2022-MINI, Class D, (Term SOFR 1M + 1.950%), 7.28%, 1/15/39(b),(g) | 384,088 | ||||
400,000 | Verus Securitization Trust, Series 2019-INV3, Class M1, 3.28%, 11/25/59(b),(i) | 350,344 | ||||
400,000 | Verus Securitization Trust, Series 2020-4, Class M1, 3.29%, 5/25/65(b),(i) | 335,294 | ||||
400,000 | Vista Point Securitization Trust, Series 2020-2, Class M1, 3.40%, 4/25/65(b),(i) | 337,056 | ||||
|
| |||||
| 6,105,243 | ||||||
|
| |||||
Total Collateralized Mortgage Obligations | 6,105,243 | |||||
|
| |||||
(Cost $6,368,917) | ||||||
59
SCHEDULE OF PORTFOLIO INVESTMENTS
|
RBC BlueBay Strategic Income Fund (cont.)
September 30, 2023
Principal Amount | Value | |||||
| ||||||
U.S. Treasury Obligations — 10.29% | ||||||
United States — 10.29% | ||||||
$2,400,000 | U.S. Treasury Notes, 4.13%, 1/31/25 | $ | 2,362,688 | |||
1,000,000 | U.S. Treasury Notes, 4.38%, 10/31/24 | 988,672 | ||||
2,100,000 | U.S. Treasury Notes, 5.00%, 8/31/25 | 2,095,570 | ||||
|
| |||||
| 5,446,930 | ||||||
|
| |||||
Total U.S. Treasury Obligations | 5,446,930 | |||||
|
| |||||
(Cost $5,467,044) | ||||||
| Shares | ||||||
| ||||||
Asset Backed Securities — 4.84% | ||||||
United States — 4.84% | ||||||
141,710 | ACM Auto Trust, 6.61%, 1/22/30(b) | 141,484 | ||||
415,324 | ACM Auto Trust, Series 2023-2A, Class A, 7.97%, 6/20/30(b) | 415,591 | ||||
500,000 | Dell Equipment Finance Trust, Series 2023-2, Class D, 6.74%, 7/23/29(b) | 499,776 | ||||
450,000 | Exeter Automobile Receivables Trust, Series 2021-4A, Class D, 1.96%, 1/17/28 | 416,533 | ||||
500,000 | Exeter Automobile Receivables Trust, Series 2023-2A, Class D, 6.32%, 8/15/29 | 490,312 | ||||
200,000 | Exeter Automobile Receivables Trust, Series 2023-3A, Class D, 6.68%, 4/16/29 | 199,103 | ||||
208,025 | MVW LLC, Series 2021-2A, Class B, 1.83%, 5/20/39(b) | 182,149 | ||||
220,000 | Santander Drive Auto Receivables Trust, Series 2023-3, Class C, 5.77%, 11/15/30 | 216,455 | ||||
|
| |||||
| 2,561,403 | ||||||
|
| |||||
Total Asset Backed Securities | 2,561,403 | |||||
|
| |||||
(Cost $2,634,784) | ||||||
Principal Amount | ||||||
| ||||||
Bank Loans — 4.00% | ||||||
Ireland — 0.95% | ||||||
500,000 | Setanta Aircraft Leasing DAC, 1st Lein Term Loan B, 7.54%, 11/5/28(g) | 499,455 | ||||
|
| |||||
United States — 3.05% | ||||||
587,909 | Avolon US LLC, 1st Lien Term Loan B5, (SOFR 1M + 2.25%), 7.68%, 12/1/27(g) | 587,321 | ||||
429,814 | Entegris, Inc., (SOFR 1M + 2.75%), 7.77%, 7/6/29(g) | 428,740 | ||||
600,000 | Hilton Worldwide Finance LLC, 1st Lien Term Loan B2, (SOFR 1M + 1.75%), 7.17%, 6/21/26(g) | 599,382 | ||||
|
| |||||
| 1,615,443 | ||||||
|
| |||||
Total Bank Loans | 2,114,898 | |||||
|
| |||||
(Cost $2,114,316) | ||||||
60
SCHEDULE OF PORTFOLIO INVESTMENTS
|
RBC BlueBay Strategic Income Fund (cont.)
September 30, 2023
Principal Amount | Value | |||||
| ||||||
Foreign Government Bonds — 3.08% | ||||||
Mexico — 2.64% | ||||||
24,300,000(j) | Mexican Bonos, Series M, 8.50%, 5/31/29 | $ | 1,304,005 | |||
130,000(d) | Mexico Government International Bond, 4.00%, 3/15/2115 | 92,925 | ||||
|
| |||||
| 1,396,930 | ||||||
|
| |||||
Romania — 0.44% | ||||||
$ 230,000 | Romanian Government International Bond, 7.63%, 1/17/53(b) | 234,617 | ||||
|
| |||||
Total Foreign Government Bonds | 1,631,547 | |||||
|
| |||||
(Cost $1,781,560) | ||||||
| Shares | ||||||
| ||||||
Investment Company — 8.68% | ||||||
4,594,438 | RBC BlueBay U.S. Government Money Market Fund, Institutional Class 1 (k) | 4,594,438 | ||||
|
| |||||
Total Investment Company | 4,594,438 | |||||
|
| |||||
(Cost $4,594,438) | ||||||
Total Investments | $ | 50,943,318 | ||||
(Cost $53,640,974) — 96.26% | ||||||
Other assets in excess of liabilities — 3.74% | 1,979,808 | |||||
|
| |||||
NET ASSETS — 100.00% | $ | 52,923,126 | ||||
|
| |||||
| (a) | This security may be resold to qualified foreign investors and foreign institutional buyers under Regulation S of the Securities Act of 1933. |
| (b) | Security exempt from registration under Rule 144A or Section 4(2) of the Securities Act of 1933, as amended. These securities may be resold in transactions exempt from registration, normally to qualified institutional buyers. |
| (c) | Security is a fix-to-float security, which carries a fixed coupon until a certain date, upon which it switches to a floating rate. Reference rate and spread are provided if the rate is currently floating. |
| (d) | Principal amount denoted in Euros. |
| (e) | Perpetual security with no stated maturity date. |
| (f) | Principal amount denoted in British Pounds. |
| (g) | Floating rate note. Rate shown is as of report date. |
| (h) | Variable rate security. The rate reflected in the Schedule of Portfolio Investments is the rate in effect on September 30, 2023. |
| (i) | Variable or floating rate security, which interest rate adjusts periodically based on changes in current interest rates and prepayments on the underlying pool of assets. Rate shown is the rate in effect as of period end. |
| (j) | Principal amount denoted in Mexican peso. |
| (k) | Affiliated investment. |
61
SCHEDULE OF PORTFOLIO INVESTMENTS
|
RBC BlueBay Strategic Income Fund (cont.)
September 30, 2023
Foreign currency exchange contracts as of September 30, 2023:
Currency Purchased | Currency Sold | Counterparty | Settlement Date | Value/Unrealized | ||||||||||||||||||||||||||||||||
EUR | 354,451 | CHF | 342,009 | Citibank N.A. | 10/19/23 | $ | 604 | |||||||||||||||||||||||||||||
EUR | 563,959 | GBP | 483,010 | Citibank N.A. | 10/19/23 | 7,356 | ||||||||||||||||||||||||||||||
EUR | 376,597 | GBP | 325,395 | Citibank N.A. | 10/19/23 | 1,430 | ||||||||||||||||||||||||||||||
USD | 478,974 | EUR | 432,671 | Citibank N.A. | 10/19/23 | 21,145 | ||||||||||||||||||||||||||||||
USD | 110,775 | EUR | 100,000 | Citibank N.A. | 10/19/23 | 4,960 | ||||||||||||||||||||||||||||||
USD | 112,747 | EUR | 100,000 | Citibank N.A. | 10/19/23 | 6,932 | ||||||||||||||||||||||||||||||
USD | 442,417 | EUR | 400,000 | Citibank N.A. | 10/19/23 | 19,158 | ||||||||||||||||||||||||||||||
USD | 2,887,997 | EUR | 2,586,481 | Citibank N.A. | 10/19/23 | 151,117 | ||||||||||||||||||||||||||||||
USD | 780,000 | EUR | 705,279 | Citibank N.A. | 10/19/23 | 33,711 | ||||||||||||||||||||||||||||||
USD | 275,142 | EUR | 250,000 | Citibank N.A. | 10/19/23 | 10,605 | ||||||||||||||||||||||||||||||
USD | 28,179 | EUR | 25,000 | Citibank N.A. | 10/19/23 | 1,726 | ||||||||||||||||||||||||||||||
USD | 1,334,909 | GBP | 1,028,808 | Citibank N.A. | 10/19/23 | 79,500 | ||||||||||||||||||||||||||||||
USD | 344,261 | MXN | 5,830,000 | Citibank N.A. | 10/19/23 | 10,899 | ||||||||||||||||||||||||||||||
USD | 686,359 | MXN | 11,899,306 | Citibank N.A. | 10/19/23 | 5,952 | ||||||||||||||||||||||||||||||
USD | 362,740 | MXN | 6,120,000 | Citibank N.A. | 10/19/23 | 12,795 | ||||||||||||||||||||||||||||||
|
| |||||||||||||||||||||||||||||||||||
| $ | 367,890 | |||||||||||||||||||||||||||||||||||
CHF | 340,000 | EUR | 357,981 | Citibank N.A. | 10/19/23 | $ | (6,540 | ) | ||||||||||||||||||||||||||||
EUR | 432,671 | USD | 477,899 | Citibank N.A. | 10/19/23 | (20,069 | ) | |||||||||||||||||||||||||||||
GBP | 327,148 | USD | 419,461 | Citibank N.A. | 10/19/23 | (20,256 | ) | |||||||||||||||||||||||||||||
JPY | 113,223,258 | USD | 817,778 | Citibank N.A. | 10/19/23 | (57,385 | ) | |||||||||||||||||||||||||||||
|
| |||||||||||||||||||||||||||||||||||
| $ | (104,250 | ) | ||||||||||||||||||||||||||||||||||
|
| |||||||||||||||||||||||||||||||||||
Total | $ | 263,640 | ||||||||||||||||||||||||||||||||||
|
| |||||||||||||||||||||||||||||||||||
Financial futures contracts as of September 30, 2023:
Long Position | Number of Contracts | Expiration Date | Value/Unrealized Depreciation | Notional Value | Clearinghouse | |||||||||||||||||||||
10 Year U.S. Treasury Note | 126 | December 2023 | $ | (114,921 | ) | USD | $ | 13,615,875 | Morgan Stanley & Co. LLC | |||||||||||||||||
|
| |||||||||||||||||||||||||
Total | $ | (114,921 | ) | |||||||||||||||||||||||
|
| |||||||||||||||||||||||||
62
SCHEDULE OF PORTFOLIO INVESTMENTS
|
RBC BlueBay Strategic Income Fund (cont.)
September 30, 2023
Short Position | Number of Contracts | Expiration Date | Value/ Unrealized Appreciation (Depreciation) | Notional Value | Clearinghouse | |||||||||||||||||||||||
10 Year Euro-Bund | 4 | December 2023 | $ | 12,229 | EUR | $ | 544,019 | Morgan Stanley & Co. LLC | ||||||||||||||||||||
10 Year U.S. Ultra Treasury Bond | 104 | December 2023 | 219,429 | USD | 11,602,500 | Morgan Stanley & Co. LLC | ||||||||||||||||||||||
2 Year U.S. Treasury Note | 22 | December 2023 | 5,085 | USD | 4,459,641 | Morgan Stanley & Co. LLC | ||||||||||||||||||||||
30 Year Euro-Buxl | 1 | December 2023 | 9,187 | EUR | 129,365 | Morgan Stanley & Co. LLC | ||||||||||||||||||||||
30 Year U.S. Treasury Bond | 44 | December 2023 | 288,295 | USD | 5,006,375 | Morgan Stanley & Co. LLC | ||||||||||||||||||||||
30 Year U.S. Ultra Treasury Bond | 6 | December 2023 | 38,615 | USD | 712,125 | Morgan Stanley & Co. LLC | ||||||||||||||||||||||
5 Year Euro-Bobl | 14 | December 2023 | 17,747 | EUR | 1,713,274 | Morgan Stanley & Co. LLC | ||||||||||||||||||||||
EURO-BTP FUTURE | 1 | December 2023 | 4,767 | EUR | 116,012 | Morgan Stanley & Co. LLC | ||||||||||||||||||||||
EURO-SCHATZ FUT | 3 | December 2023 | 1,329 | EUR | 333,002 | Morgan Stanley & Co. LLC | ||||||||||||||||||||||
Five Year U.S. Treasury Note | 15 | December 2023 | (1,543 | ) | USD | 1,580,391 | Morgan Stanley & Co. LLC | |||||||||||||||||||||
JPN 10Y BOND(OSE) | 2 | December 2023 | 14,232 | JPY | 1,940,043 | Morgan Stanley & Co. LLC | ||||||||||||||||||||||
Long Gilt Future | 17 | December 2023 | 24,190 | GBP | 1,953,038 | Morgan Stanley & Co. LLC | ||||||||||||||||||||||
|
| |||||||||||||||||||||||||||
Total | $ | 633,562 | ||||||||||||||||||||||||||
|
| |||||||||||||||||||||||||||
Interest rate swaps as of September 30, 2023:
Fixed Rate | Floating Rate | Payment Frequency | Counterparty | Expiration Date | Notional Amount (000) | Value/Unrealized Appreciation (Depreciation) | ||||||||||||||||||||
| 3.83% | CAD-CBNALDN | Semi-Annual | Morgan Stanley & Co. LLC | 10/19/33 | CAD | 900 | $ 16,949 | |||||||||||||||||||
63
SCHEDULE OF PORTFOLIO INVESTMENTS
|
RBC BlueBay Strategic Income Fund (cont.)
September 30, 2023
Fixed Rate | Floating Rate | Payment Frequency | Counterparty | Expiration Date | Notional Amount (000) | Value/Unrealized Appreciation (Depreciation) | ||||||||||||||||||||||||
| 0.76% | JPY-BCAPLDN | Annual | Morgan Stanley & Co. LLC | 10/19/33 | JPY | 215,000 | $ | 31,043 | ||||||||||||||||||||||
| 0.76% | JPY-CBNALDN | Annual | Morgan Stanley & Co. LLC | 10/19/33 | JPY | 140,000 | 20,214 | |||||||||||||||||||||||
|
| |||||||||||||||||||||||||||||
| $ | 68,206 | |||||||||||||||||||||||||||||
| 4.72% | CAD-CBNALDN | Semi-Annual | Morgan Stanley & Co. LLC | 10/19/25 | CAD | 4,000 | (14,325 | ) | ||||||||||||||||||||||
| 2.61% | EUR-CITILDN | Daily | Morgan Stanley & Co. LLC | 6/15/43 | EUR | 275 | (2,000 | ) | ||||||||||||||||||||||
|
| |||||||||||||||||||||||||||||
| $ | (16,325 | ) | ||||||||||||||||||||||||||||
|
| |||||||||||||||||||||||||||||
| Total | $ | 51,881 | ||||||||||||||||||||||||||||
|
| |||||||||||||||||||||||||||||
Credit default swaps buy protection as of September 30, 2023:
Fixed | Issuer | Payment Frequency | Counterparty | Expiration Date | Notional Amount (000) | Premium Paid/ (Received) | Unrealized Appreciation | Value | ||||||||||||||||||||
| 1.00% | Markit CDX IG Index Series 41 | Quarterly | Morgan Stanley & Co. LLC | 12/20/28 | USD | 4,156 | $ | (58,956 | ) | $ | 7,904 | $ | (51,052 | ) | ||||||||||||||
| 1.00% | Markit CDX IG Index Series 41 | Quarterly | Morgan Stanley & Co. LLC | 12/20/28 | USD | 14,732 | (209,800 | ) | 28,833 | (180,967 | ) | |||||||||||||||||
| 1.00% | Markit CDX IG Index Series 41 | Quarterly | Morgan Stanley & Co. LLC | 12/20/28 | USD | 12,887 | (184,179 | ) | 25,876 | (158,303 | ) | |||||||||||||||||
| 1.00% | Markit CDX IG Index Series 41 | Quarterly | Morgan Stanley & Co. LLC | 12/20/28 | USD | 4,867 | (69,311 | ) | 9,525 | (59,786 | ) | |||||||||||||||||
|
|
|
|
|
| |||||||||||||||||||||||
| Total | $ | (522,246 | ) | $ | 72,138 | $ | (450,108 | ) | ||||||||||||||||||||
|
|
|
|
|
| |||||||||||||||||||||||
64
SCHEDULE OF PORTFOLIO INVESTMENTS
|
RBC BlueBay Strategic Income Fund (cont.)
September 30, 2023
Abbreviations used are defined below:
Bobl - German Bundesobligationen
BTP - Italian Buoni del Tesoro Poliannuali
CAD - Canadian Dollar
CHF - Swiss Franc
EMTN - Euro Medium Term Note
EUR - Euro GBP - United Kingdom Pound Sterling
GMTN - Global Medium Term Note
JPY - Japanese Yen
MXN - Mexican Peso
REIT - Real Estate Investment Trust
SOFR - Secured Overnight Financing Rate
SOFR30A - Secured Overnight Financing Rate 30 Day Average
USD - United States Dollar
Portfolio Diversification (Unaudited)
Industries | Percentage of Net Assets | |||||||
Financial | 28.31 | % | ||||||
Collateralized Mortgage Obligations | 11.54 | % | ||||||
U.S. Treasury Obligations | 10.29 | % | ||||||
Technology | 6.63 | % | ||||||
Utilities | 5.55 | % | ||||||
Asset Backed Securities | 4.84 | % | ||||||
Energy | 4.32 | % | ||||||
Consumer, Cyclical | 4.00 | % | ||||||
Consumer, Non-cyclical | 3.83 | % | ||||||
Foreign Government Bonds | 3.08 | % | ||||||
Communications | 2.98 | % | ||||||
Industrial | 1.52 | % | ||||||
Basic Materials | 0.69 | % | ||||||
Other | 12.42 | % | ||||||
|
| |||||||
| 100.00 | % | |||||||
|
| |||||||
See Notes to the Financial Statements.
65
|
Statements of Assets and Liabilities
September 30, 2023
| RBC BlueBay | RBC BlueBay | RBC BlueBay | RBC BlueBay | |||||||||||||
| Emerging Market | High Yield | Core Plus | Strategic | |||||||||||||
| Debt Fund | Bond Fund | Bond Fund | Income Fund | |||||||||||||
Assets: | ||||||||||||||||
Investments in securities, at value: | ||||||||||||||||
Unaffiliated investments (cost $39,978,576, $455,591,964, $48,656,378 and $49,046,536, respectively) | $ | 36,418,546 | $ | 437,681,474 | $ | 45,718,003 | $ | 46,348,880 | ||||||||
Affiliated investments (cost $1,255,527, $15,420,395, $3,307,444 and $4,594,438, respectively) | 1,255,527 | 15,420,395 | 3,307,444 | 4,594,438 | ||||||||||||
Cash | 50,101 | 1,240,920 | 42,865 | 52,838 | ||||||||||||
Cash at broker for financial futures contracts | 170,860 | 490,058 | 518,872 | 19,701 | ||||||||||||
Segregated cash for swap contracts | 278,576 | 801,112 | 705,387 | 1,087,277 | ||||||||||||
Cash at broker for forward foreign currency exchange contracts | 70,147 | 40,000 | 10,000 | 250,000 | ||||||||||||
Foreign currency, at value (cost $238,393, $1,150,969, $77,207 and $121,820,respectively) | 237,532 | 1,103,318 | 76,396 | 117,989 | ||||||||||||
Interest and dividend receivable | 683,201 | 7,398,930 | 411,342 | 485,252 | ||||||||||||
Receivable from advisor | 4,522 | — | 18,037 | 6,756 | ||||||||||||
Receivable for capital shares issued | — | 3,368,355 | — | — | ||||||||||||
Receivable for investments sold | — | 3,679,238 | 5,445,392 | 3,760,761 | ||||||||||||
Due from broker | — | — | 250,000 | — | ||||||||||||
Credit default swaps at value (premiums paid $106,314, $227,986, $0 and $0,respectively) | 45,539 | 236,522 | — | — | ||||||||||||
Unrealized appreciation on futures contracts | 12,292 | — | 190,474 | 635,105 | ||||||||||||
Unrealized appreciation on interest rate swaps contracts | — | — | 36,397 | 68,206 | ||||||||||||
Unrealized appreciation on forward foreign currency exchange contracts | 276,957 | 56,756 | 329,495 | 367,890 | ||||||||||||
Prepaid expenses and other assets | 2,225 | 10,853 | 27,076 | 27,080 | ||||||||||||
|
|
|
|
|
|
|
| |||||||||
Total Assets | 39,506,025 | 471,527,931 | 57,087,180 | 57,822,173 | ||||||||||||
|
|
|
|
|
|
|
| |||||||||
Liabilities: | ||||||||||||||||
Professional fees payable | 4,929 | 4,929 | 5,254 | 5,273 | ||||||||||||
Payable for capital shares redeemed | — | 158,267 | — | — | ||||||||||||
66
FINANCIAL STATEMENTS
|
Statements of Assets and Liabilities (cont.)
September 30, 2023
| RBC BlueBay | RBC BlueBay | RBC BlueBay | RBC BlueBay | |||||||||||||
| Emerging Market | High Yield | Core Plus | Strategic | |||||||||||||
| Debt Fund | Bond Fund | Bond Fund | Income Fund | |||||||||||||
Payable for investments purchased | $ | 238,049 | $ | 14,564,766 | $ | 12,560,389 | $ | 4,087,635 | ||||||||
Credit default swaps at value (premiums received $101,917, $0, $338,895 and $522,246, respectively) | 107,767 | — | 297,185 | 450,108 | ||||||||||||
Unrealized depreciation on forward foreign currency exchange contracts | 115,931 | — | 91,114 | 104,250 | ||||||||||||
Unrealized depreciation on interest rate swaps contracts | — | — | 13,564 | 16,325 | ||||||||||||
Unrealized depreciation on futures contracts | 9,399 | 172,475 | 224,988 | 116,464 | ||||||||||||
Accrued expenses and other payables: | ||||||||||||||||
Investment advisory fees | — | 103,998 | — | — | ||||||||||||
Accounting fees | 10,858 | 15,690 | 11,785 | 11,883 | ||||||||||||
Audit fees | 45,822 | 46,503 | 45,841 | 45,856 | ||||||||||||
Trustees’ fees | 16 | 111 | 54 | 40 | ||||||||||||
Distribution fees | — | 1,246 | 21,478 | 23,837 | ||||||||||||
Custodian fees | 14,885 | 9,153 | 15,913 | 15,494 | ||||||||||||
Shareholder reports | 7,382 | 25,924 | 6,881 | 7,135 | ||||||||||||
Transfer agent fees | 2,612 | 54,649 | 1,759 | 1,759 | ||||||||||||
Other | 11,004 | 14,450 | 13,306 | 12,988 | ||||||||||||
|
|
|
|
|
|
|
| |||||||||
Total Liabilities | 568,654 | 15,172,161 | 13,309,511 | 4,899,047 | ||||||||||||
|
|
|
|
|
|
|
| |||||||||
Net Assets | $ | 38,937,371 | $ | 456,355,770 | $ | 43,777,669 | $ | 52,923,126 | ||||||||
|
|
|
|
|
|
|
| |||||||||
Net Assets Consists of: | ||||||||||||||||
Capital | $ | 51,928,186 | $ | 494,123,642 | $ | 51,899,071 | $ | 53,006,863 | ||||||||
Accumulated earnings | (12,990,815 | ) | (37,767,872 | ) | (8,121,402 | ) | (83,737 | ) | ||||||||
|
|
|
|
|
|
|
| |||||||||
Net Assets | $ | 38,937,371 | $ | 456,355,770 | $ | 43,777,669 | $ | 52,923,126 | ||||||||
|
|
|
|
|
|
|
| |||||||||
67
FINANCIAL STATEMENTS
|
Statements of Assets and Liabilities (cont.)
September 30, 2023
| RBC BlueBay | RBC BlueBay | RBC BlueBay | RBC BlueBay | |||||||||||||
| Emerging Market | High Yield | Core Plus | Strategic | |||||||||||||
| Debt Fund | Bond Fund | Bond Fund | Income Fund | |||||||||||||
Net Assets | ||||||||||||||||
Class A | $ | 17,110 | $ | 3,580,359 | $ | 4,358,157 | $ | 5,268,617 | ||||||||
Class I | 38,908,829 | 452,775,411 | 30,653,112 | 37,056,753 | ||||||||||||
Class R6 | 11,432 | N/A | 8,766,400 | 10,597,756 | ||||||||||||
|
|
|
|
|
|
|
| |||||||||
Total | $ | 38,937,371 | $ | 456,355,770 | $ | 43,777,669 | $ | 52,923,126 | ||||||||
|
|
|
|
|
|
|
| |||||||||
Shares Outstanding (Unlimited number of shares authorized, no par value): | ||||||||||||||||
Class A | 2,272 | 385,669 | 520,422 | 529,683 | ||||||||||||
Class I | 5,063,413 | 48,260,389 | 3,658,057 | 3,724,425 | ||||||||||||
Class R6 | 1,480 | N/A | 1,046,113 | 1,065,069 | ||||||||||||
|
|
|
|
|
|
|
| |||||||||
Total | 5,067,165 | 48,646,058 | 5,224,592 | 5,319,177 | ||||||||||||
|
|
|
|
|
|
|
| |||||||||
Net Asset Values and Redemption Prices Per Share: | ||||||||||||||||
Class A | $ | 7.53 | $ | 9.28 | $ | 8.37 | $ | 9.95 | ||||||||
|
|
|
|
|
|
|
| |||||||||
Class I | $ | 7.68 | $ | 9.38 | $ | 8.38 | $ | 9.95 | ||||||||
|
|
|
|
|
|
|
| |||||||||
Class R6 | $ | 7.72 | $ | N/A | $ | 8.38 | $ | 9.95 | ||||||||
|
|
|
|
|
|
|
| |||||||||
Maximum Offering Price Per Share: | ||||||||||||||||
Class A | $ | 7.86 | $ | 9.69 | $ | 8.70 | $ | 10.34 | ||||||||
|
|
|
|
|
|
|
| |||||||||
Maximum Sales Charge - Class A | 4.25 | % | 4.25 | % | 3.75 | % | 3.75 | % | ||||||||
|
|
|
|
|
|
|
| |||||||||
See Notes to the Financial Statements.
68
FINANCIAL STATEMENTS
|
For the Year Ended September 30, 2023
| RBC BlueBay | RBC BlueBay | RBC BlueBay | RBC BlueBay | |||||||||||||
| Emerging Market | High Yield | Core Plus | Strategic | |||||||||||||
| Debt Fund | Bond Fund | Bond Fund | Income Fund | |||||||||||||
Investment Income: | ||||||||||||||||
Interest income | $ | 2,930,460 | $ | 24,096,504 | $ | 2,186,548 | $ | 2,465,159 | ||||||||
Dividend income - affiliated | 34,053 | 505,206 | 74,137 | 130,048 | ||||||||||||
Foreign tax withholding | — | — | (785 | ) | (785 | ) | ||||||||||
|
|
|
|
|
|
|
| |||||||||
Total Investment Income | 2,964,513 | 24,601,710 | 2,259,900 | 2,594,422 | ||||||||||||
Expenses: | ||||||||||||||||
Investment advisory fees | 235,841 | 1,926,322 | 153,342 | 268,939 | ||||||||||||
Distribution fees–Class A | 63 | 7,897 | 10,917 | 12,644 | ||||||||||||
Accounting fees | 66,520 | 87,108 | 73,487 | 72,829 | ||||||||||||
Audit fees | 43,992 | 44,754 | 44,848 | 44,878 | ||||||||||||
Custodian fees | 73,449 | 71,670 | 75,548 | 75,506 | ||||||||||||
Insurance fees | 3,509 | 3,509 | 3,509 | 3,509 | ||||||||||||
Legal fees | 4,597 | 22,564 | — | — | ||||||||||||
Registrations and filing fees | 69,346 | 65,792 | 41,143 | 41,088 | ||||||||||||
Shareholder reports | 26,177 | 82,019 | 29,709 | 30,681 | ||||||||||||
Transfer agent fees–Class A | 3,456 | 7,136 | 3,517 | 3,520 | ||||||||||||
Transfer agent fees–Class I | 27,156 | 489,961 | 3,519 | 3,523 | ||||||||||||
Transfer agent fees–Class R6 | 3,516 | — | 3,517 | 3,517 | ||||||||||||
Trustees’ fees and expenses | 2,097 | 19,679 | 2,598 | 2,978 | ||||||||||||
Tax expense | 5,455 | 5,455 | 6,183 | 6,420 | ||||||||||||
Offering fees | — | — | 6,823 | 6,834 | ||||||||||||
Other fees | 5,306 | 8,049 | 4,068 | 4,556 | ||||||||||||
|
|
|
|
|
|
|
| |||||||||
Total expenses before fee waiver/reimbursement | 570,480 | 2,841,915 | 462,728 | 581,422 | ||||||||||||
Expenses waived/reimbursed by: | ||||||||||||||||
Advisor | (285,068 | ) | (855,874 | ) | (261,771 | ) | (259,042 | ) | ||||||||
|
|
|
|
|
|
|
| |||||||||
Net expenses | 285,412 | 1,986,041 | 200,957 | 322,380 | ||||||||||||
|
|
|
|
|
|
|
| |||||||||
Net Investment Income | 2,679,101 | 22,615,669 | 2,058,943 | 2,272,042 | ||||||||||||
|
|
|
|
|
|
|
| |||||||||
Realized/Unrealized Gains/(Losses): | ||||||||||||||||
Net realized gains/(losses) on: | ||||||||||||||||
Investment transactions | (1,795,266 | ) | (13,608,370 | ) | (1,885,997 | ) | (1,169,055 | ) | ||||||||
Foreign currency transactions | 3,152 | 165,565 | 3,154 | 12,612 | ||||||||||||
Foreign currency exchange contracts | (166,428 | ) | (151,133 | ) | (330,018 | ) | (367,052 | ) | ||||||||
Futures contracts | 103,007 | (730,074 | ) | (395,823 | ) | 1,679,815 | ||||||||||
Swap agreements | (130,235 | ) | 1,021,485 | (316,323 | ) | 866,302 | ||||||||||
|
|
|
|
|
|
|
| |||||||||
Net realized gains/(losses) | (1,985,770 | ) | (13,302,527 | ) | (2,925,007 | ) | 1,022,622 | |||||||||
Net change in unrealized appreciation/ (depreciation) on: | ||||||||||||||||
Investments | 3,914,995 | 22,098,142 | 2,359,457 | 2,234,099 | ||||||||||||
69
FINANCIAL STATEMENTS
|
Statements of Operations (cont.)
For the Year Ended September 30, 2023
| RBC BlueBay | RBC BlueBay | RBC BlueBay | RBC BlueBay | |||||||||||||
| Emerging Market | High Yield | Core Plus | Strategic | |||||||||||||
| Debt Fund | Bond Fund | Bond Fund | Income Fund | |||||||||||||
Foreign currency | $ | 8,851 | $ | 3,460 | $ | 22,131 | $ | 47,894 | ||||||||
Foreign currency exchange contracts | 130,779 | (137,478 | ) | 171,399 | 202,395 | |||||||||||
Futures contracts | (61,712 | ) | (172,475 | ) | 169,984 | (26,521 | ) | |||||||||
Swap agreements | (107,544 | ) | 8,537 | (47,018 | ) | (1,602,448 | ) | |||||||||
|
|
|
|
|
|
|
| |||||||||
Net unrealized gains | 3,885,369 | 21,800,186 | 2,675,953 | 855,419 | ||||||||||||
|
|
|
|
|
|
|
| |||||||||
Change in net assets resulting from operations | $ | 4,578,700 | $ | 31,113,328 | $ | 1,809,889 | $ | 4,150,083 | ||||||||
|
|
|
|
|
|
|
| |||||||||
See Notes to the Financial Statements.
70
FINANCIAL STATEMENTS |
Statements of Changes in Net Assets
| RBC BlueBay | ||||||||
| Emerging Market | ||||||||
| Debt Fund | ||||||||
| For the | For the | |||||||
| Year Ended | Year Ended | |||||||
| September 30, 2023 | September 30, 2022 | |||||||
From Investment Activities | ||||||||
Operations: | ||||||||
Net investment income | $ | 2,679,101 | $ | 1,716,262 | ||||
Net realized losses from investments, foreign currency, written options, futures contracts and swap contracts transactions | (1,985,770 | ) | (2,818,617 | ) | ||||
Net change in unrealized appreciation/(depreciation) on investments, foreign currency, futures contracts and swap contracts | 3,885,369 | (6,642,251 | ) | |||||
|
|
|
| |||||
Change in net assets resulting from operations | 4,578,700 | (7,744,606 | ) | |||||
|
|
|
| |||||
Distributions to Shareholders: | ||||||||
Class A | (1,644 | ) | (1,321 | ) | ||||
Class I | (2,351,904 | ) | (1,719,310 | ) | ||||
Class R6 | (730 | ) | (663 | ) | ||||
|
|
|
| |||||
Change in net assets resulting from shareholder distributions | (2,354,278 | ) | (1,721,294 | ) | ||||
|
|
|
| |||||
Capital Transactions: | ||||||||
Proceeds from shares issued | 6,458,822 | 9,281,136 | ||||||
Distributions reinvested | 2,322,313 | 1,719,037 | ||||||
Cost of shares redeemed | (2,269,729 | ) | (22,044 | ) | ||||
|
|
|
| |||||
Change in net assets resulting from capital transactions | 6,511,406 | 10,978,129 | ||||||
|
|
|
| |||||
Net increase in net assets | 8,735,828 | 1,512,229 | ||||||
Net Assets: | ||||||||
Beginning of year | 30,207,466 | 28,695,237 | ||||||
|
|
|
| |||||
End of year | $ | 38,943,294 | $ | 30,207,466 | ||||
|
|
|
| |||||
Share Transactions: | ||||||||
Issued | 863,993 | 1,115,129 | ||||||
Reinvested | 301,880 | 201,298 | ||||||
Redeemed | (313,122 | ) | (2,609 | ) | ||||
|
|
|
| |||||
Change in shares resulting from capital transactions | 852,751 | 1,313,818 | ||||||
|
|
|
| |||||
See Notes to the Financial Statements.
71
FINANCIAL STATEMENTS |
Statements of Changes in Net Assets
| RBC BlueBay High Yield Bond Fund | ||||||||||||||||
| For the Year Ended September 30, 2023 | For the Year Ended September 30, 2022 | |||||||||||||||
From Investment Activities | ||||||||||||||||
Operations: | ||||||||||||||||
Net investment income | $ | 22,615,669 | $ | 13,784,773 | ||||||||||||
Net realized losses from investments, foreign currency, futures contracts and swap contracts transactions | (13,302,527 | ) | (9,066,133 | ) | ||||||||||||
Net change in unrealized appreciation/(depreciation) on investments, foreign currency, futures contracts and swap contracts | 21,800,186 | (44,456,103 | ) | |||||||||||||
|
|
|
| |||||||||||||
Change in net assets resulting from operations | 31,113,328 | (39,737,463 | ) | |||||||||||||
|
|
|
| |||||||||||||
Distributions to Shareholders: | ||||||||||||||||
Class A | (198,284 | ) | (202,455 | ) | ||||||||||||
Class I | (21,675,937 | ) | (16,268,017 | ) | ||||||||||||
|
|
|
| |||||||||||||
Change in net assets resulting from shareholder distributions | (21,874,221 | ) | (16,470,472 | ) | ||||||||||||
|
|
|
| |||||||||||||
Capital Transactions: | ||||||||||||||||
Proceeds from shares issued | 288,660,291 | 259,560,711 | ||||||||||||||
Distributions reinvested | 19,832,281 | 14,827,024 | ||||||||||||||
Cost of shares redeemed | (142,056,239 | ) | (185,870,515 | ) | ||||||||||||
|
|
|
| |||||||||||||
Change in net assets resulting from capital transactions | 166,436,333 | 88,517,220 | ||||||||||||||
|
|
|
| |||||||||||||
Net increase in net assets | 175,675,440 | 32,309,285 | ||||||||||||||
Net Assets: | ||||||||||||||||
Beginning of year | 280,680,330 | 248,371,045 | ||||||||||||||
|
|
|
| |||||||||||||
End of year | $ | 456,355,770 | $ | 280,680,330 | ||||||||||||
|
|
|
| |||||||||||||
Share Transactions: | ||||||||||||||||
Issued | 30,657,082 | 25,540,716 | ||||||||||||||
Reinvested | 2,113,892 | 1,453,365 | ||||||||||||||
Redeemed | (15,090,663 | ) | (18,659,416 | ) | ||||||||||||
|
|
|
| |||||||||||||
Change in shares resulting from capital transactions | 17,680,311 | 8,334,665 | ||||||||||||||
|
|
|
| |||||||||||||
See Notes to the Financial Statements.
72
FINANCIAL STATEMENTS |
Statements of Changes in Net Assets
| RBC BlueBay Core Plus Bond Fund | ||||||||||||||||
| For the Year Ended September 30, 2023 | For the Period Ended September 30, 2022(a) | |||||||||||||||
From Investment Activities | ||||||||||||||||
Operations: | ||||||||||||||||
Net investment income | $ | 2,058,943 | $ | 989,744 | ||||||||||||
Net realized losses from investments, foreign currency, futures contracts and swap contracts transactions | (2,925,007 | ) | (3,695,964 | ) | ||||||||||||
Net change in unrealized appreciation/(depreciation) on investments, foreign currency, futures contracts and swap contracts | 2,675,953 | (5,326,000 | ) | |||||||||||||
|
|
|
| |||||||||||||
Change in net assets resulting from operations | 1,809,889 | (8,032,220 | ) | |||||||||||||
|
|
|
| |||||||||||||
Distributions to Shareholders: | ||||||||||||||||
Class A | (100,947 | ) | (75,065 | ) | ||||||||||||
Class I | (777,143 | ) | (588,490 | ) | ||||||||||||
Class R6 | (226,512 | ) | (171,927 | ) | ||||||||||||
|
|
|
| |||||||||||||
Change in net assets resulting from shareholder distributions | (1,104,602 | ) | (835,482 | ) | ||||||||||||
|
|
|
| |||||||||||||
Capital Transactions: | ||||||||||||||||
Proceeds from shares issued | — | 50,000,000 | ||||||||||||||
Distributions reinvested | 1,104,602 | 835,482 | ||||||||||||||
Cost of shares redeemed | — | — | ||||||||||||||
|
|
|
| |||||||||||||
Change in net assets resulting from capital transactions | 1,104,602 | 50,835,482 | ||||||||||||||
|
|
|
| |||||||||||||
Net increase in net assets | 1,809,889 | 41,967,780 | ||||||||||||||
Net Assets: | ||||||||||||||||
Beginning of year | 41,967,780 | — | ||||||||||||||
|
|
|
| |||||||||||||
End of year | $ | 43,777,669 | $ | 41,967,780 | ||||||||||||
|
|
|
| |||||||||||||
Share Transactions: | ||||||||||||||||
Issued | — | 5,000,000 | ||||||||||||||
Reinvested | 131,680 | 92,912 | ||||||||||||||
Redeemed | — | — | ||||||||||||||
|
|
|
| |||||||||||||
Change in shares resulting from capital transactions | 131,680 | 5,092,912 | ||||||||||||||
|
|
|
| |||||||||||||
(a) For the period from November 1, 2021 (commencement of operations) through September 30, 2022.
See Notes to the Financial Statements.
73
FINANCIAL STATEMENTS |
Statements of Changes in Net Assets
| RBC BlueBay Strategic Income Fund | ||||||||||||||
| For the Year Ended September 30, 2023 | For the Period Ended September 30, 2022(a) | |||||||||||||
From Investment Activities | ||||||||||||||
Operations: | ||||||||||||||
Net investment income | $ | 2,272,042 | $ | 940,642 | ||||||||||
Net realized gains from investments, foreign currency, futures contracts and swap contracts transactions | 1,022,622 | 488,421 | ||||||||||||
Net change in unrealized appreciation/(depreciation) on investments, foreign currency, futures contracts and swap contracts | 855,419 | (2,656,019 | ) | |||||||||||
|
|
|
| |||||||||||
Change in net assets resulting from operations | 4,150,083 | (1,226,956 | ) | |||||||||||
|
|
|
| |||||||||||
Distributions to Shareholders: | ||||||||||||||
Class A | (217,746 | ) | (66,020 | ) | ||||||||||
Class I | (1,616,185 | ) | (531,813 | ) | ||||||||||
Class R6 | (467,016 | ) | (155,930 | ) | ||||||||||
|
|
|
| |||||||||||
Change in net assets resulting from shareholder distributions | (2,300,947 | ) | (753,763 | ) | ||||||||||
|
|
|
| |||||||||||
Capital Transactions: | ||||||||||||||
Proceeds from shares issued | — | 50,000,000 | ||||||||||||
Distributions reinvested | 2,300,946 | 753,763 | ||||||||||||
Cost of shares redeemed | — | — | ||||||||||||
|
|
|
| |||||||||||
Change in net assets resulting from capital transactions | 2,300,946 | 50,753,763 | ||||||||||||
|
|
|
| |||||||||||
Net increase in net assets | 4,150,082 | 48,773,044 | ||||||||||||
Net Assets: | ||||||||||||||
Beginning of year | 48,773,044 | — | ||||||||||||
|
|
|
| |||||||||||
End of year | $ | 52,923,126 | $ | 48,773,044 | ||||||||||
|
|
|
| |||||||||||
Share Transactions: | ||||||||||||||
Issued | — | 5,000,000 | ||||||||||||
Reinvested | 241,708 | 77,470 | ||||||||||||
Redeemed | — | — | ||||||||||||
|
|
|
| |||||||||||
Change in shares resulting from capital transactions | 241,708 | 5,077,470 | ||||||||||||
|
|
|
| |||||||||||
(a) For the period from November 1, 2021 (commencement of operations) through September 30, 2022.
See Notes to the Financial Statements.
74
|
RBC BlueBay Emerging Market Debt Fund
(Selected data for a share outstanding throughout the periods indicated)
| Investment Activities | Distributions | |||||||||||||||||||||||||||||||||||
| Net Asset Value, Beginning of Year | Net Investment Income(a) | Net Realized and Unrealized Gains (Losses) on Investments | Total from Investment Activities | Net Investment Income | Total Distributions | Net Asset Value, End of Year | ||||||||||||||||||||||||||||||
Class A | ||||||||||||||||||||||||||||||||||||
Year Ended 9/30/23 | $ | 7.03 | 0.54 | 0.45 | 0.99 | (0.49 | ) | (0.49 | ) | $ | 7.53 | |||||||||||||||||||||||||
Year Ended 9/30/22 | 9.77 | 0.48 | (2.70 | ) | (2.22 | ) | (0.52 | ) | (0.52 | ) | 7.03 | |||||||||||||||||||||||||
Year Ended 9/30/21 | 9.78 | 0.45 | 0.04 | (b) | 0.49 | (0.50 | ) | (0.50 | ) | 9.77 | ||||||||||||||||||||||||||
Year Ended 9/30/20 | 10.14 | 0.48 | (0.38 | ) | 0.10 | (0.46 | ) | (0.46 | ) | 9.78 | ||||||||||||||||||||||||||
Year Ended 9/30/19 | 9.63 | 0.52 | 0.51 | 1.03 | (0.52 | ) | (0.52 | ) | 10.14 | |||||||||||||||||||||||||||
Class I | ||||||||||||||||||||||||||||||||||||
Year Ended 9/30/23 | $ | 7.17 | 0.57 | 0.45 | 1.02 | (0.51 | ) | (0.51 | ) | $ | 7.68 | |||||||||||||||||||||||||
Year Ended 9/30/22 | 9.89 | 0.50 | (2.73 | ) | (2.23 | ) | (0.49 | ) | (0.49 | ) | 7.17 | |||||||||||||||||||||||||
Year Ended 9/30/21 | 9.90 | 0.48 | 0.03 | (b) | 0.51 | (0.52 | ) | (0.52 | ) | 9.89 | ||||||||||||||||||||||||||
Year Ended 9/30/20 | 10.23 | 0.47 | (0.33 | ) | 0.14 | (0.47 | ) | (0.47 | ) | 9.90 | ||||||||||||||||||||||||||
Year Ended 9/30/19 | 9.71 | 0.55 | 0.52 | 1.07 | (0.55 | ) | (0.55 | ) | 10.23 | |||||||||||||||||||||||||||
Class R6 | ||||||||||||||||||||||||||||||||||||
Year Ended 9/30/23 | $ | 7.20 | 0.58 | 0.45 | 1.03 | (0.51 | ) | (0.51 | ) | $ | 7.72 | |||||||||||||||||||||||||
Year Ended 9/30/22 | 9.94 | 0.51 | (2.76 | ) | (2.25 | ) | (0.49 | ) | (0.49 | ) | 7.20 | |||||||||||||||||||||||||
Year Ended 9/30/21 | 9.94 | 0.49 | 0.04 | (b) | 0.53 | (0.53 | ) | (0.53 | ) | 9.94 | ||||||||||||||||||||||||||
Year Ended 9/30/20 | 10.27 | 0.48 | (0.33 | ) | 0.15 | (0.48 | ) | (0.48 | ) | 9.94 | ||||||||||||||||||||||||||
Year Ended 9/30/19 | 9.74 | 0.56 | 0.52 | 1.08 | (0.55 | ) | (0.55 | ) | 10.27 | |||||||||||||||||||||||||||
| (a) | Per share net investment income (loss) has been calculated using the average daily shares method. |
| (b) | Calculation of the net gain per share (both realized and unrealized) does not correlate to the aggregate realized and unrealized losses presented in the Statement of Operations due to the timing of the sales and repurchases of Fund shares in relation to fluctuating market values of the investments of the Fund. |
75
FINANCIAL HIGHLIGHTS
|
RBC BlueBay Emerging Market Debt Fund
(Selected data for a share outstanding throughout the periods indicated)
| Ratios/Supplemental Data | ||||||||||||||||||||||||||||
| Total Return(a)(b) | Net Assets, End of Year (000’s) | Ratio of Net Expenses to Average Net Assets | Ratio of Net Investment Income (Loss) to Average Net Assets | Ratio of Expenses to Average Net Assets* | Portfolio Turnover Rate** | |||||||||||||||||||||||
Class A | ||||||||||||||||||||||||||||
Year Ended 9/30/23 | 14.12% | $ | 17 | 1.04% | 7.09% | 15.47% | 85% | |||||||||||||||||||||
Year Ended 9/30/22 | (23.47)% | 25 | 1.04% | 5.67% | 17.51% | 98% | ||||||||||||||||||||||
Year Ended 9/30/21 | 5.06% | 15 | 1.04% | 4.52% | 43.25% | 181% | ||||||||||||||||||||||
Year Ended 9/30/20 | 1.06% | 7 | 1.11%(c) | 4.95% | 28.23% | 249% | ||||||||||||||||||||||
Year Ended 9/30/19 | 11.17% | 21 | 1.12% | 5.38% | 20.37% | 236% | ||||||||||||||||||||||
Class I | ||||||||||||||||||||||||||||
Year Ended 9/30/23 | 14.42% | $ | 38,909 | 0.79% | 7.38% | 1.55% | 85% | |||||||||||||||||||||
Year Ended 9/30/22 | (23.27)% | 30,173 | 0.79% | 5.82% | 1.65% | 98% | ||||||||||||||||||||||
Year Ended 9/30/21 | 5.28% | 28,667 | 0.79% | 4.76% | 1.72% | 181% | ||||||||||||||||||||||
Year Ended 9/30/20 | 1.44% | 21,356 | 0.85%(c) | 4.87% | 2.14% | 249% | ||||||||||||||||||||||
Year Ended 9/30/19 | 11.48% | 21,529 | 0.87% | 5.62% | 2.13% | 236% | ||||||||||||||||||||||
Class R6 | ||||||||||||||||||||||||||||
Year Ended 9/30/23 | 14.54% | $ | 11 | 0.74% | 7.43% | 32.92% | 85% | |||||||||||||||||||||
Year Ended 9/30/22 | (23.27)% | 10 | 0.74% | 5.77% | 31.35% | 98% | ||||||||||||||||||||||
Year Ended 9/30/21 | 5.35% | 13 | 0.74% | 4.82% | 28.96% | 181% | ||||||||||||||||||||||
Year Ended 9/30/20 | 1.40% | 12 | 0.79%(c) | 4.91% | 31.83% | 249% | ||||||||||||||||||||||
Year Ended 9/30/19 | 11.57% | 12 | 0.82% | 5.67% | 33.09% | 236% | ||||||||||||||||||||||
| * | During the period, certain fees were contractually or voluntarily reduced and/or reimbursed. If such contractual/voluntary fee reductions and reimbursements had not occurred, the ratio would have been as indicated. |
| ** | Portfolio turnover rate is calculated on the basis of the Fund as a whole without distinguishing between the classes of shares issued. |
| (a) | Excludes sales charge. |
| (b) | Assumes investment at net asset value at the beginning of the period, reinvestment of all dividends and distributions, and a complete redemption of the investment at net asset value at the end of the period. |
| (c) | Beginning June 18, 2020, the net operating expenses were contractually limited to 1.04%, 0.79% and 0.74% of average daily net assets for Class A, Class I and Class R6, respectively. The ratio of net expenses to average net assets represents a blended percentage for the year ended September 30, 2020. |
76
FINANCIAL HIGHLIGHTS |
RBC BlueBay High Yield Bond Fund
(Selected data for a share outstanding throughout the periods indicated)
| Investment Activities | Distributions | |||||||||||||||||||||||||||||||||||
| Net Asset Value, Beginning of Year | Net Investment Income(a) | Net Realized and Unrealized Gains (Losses) on Investments | Redemption Fees | Total from Investment Activities | Net Investment Income | Net Realized Gains | Total Distributions | Net Asset Value, End of Year | ||||||||||||||||||||||||||||
Class A | ||||||||||||||||||||||||||||||||||||
Year Ended 9/30/23 | $ | 8.98 | 0.57 | 0.31 | — | 0.88 | (0.58 | ) | — | (0.58 | ) | $ | 9.28 | |||||||||||||||||||||||
Year Ended 9/30/22 | 10.89 | 0.47 | (1.94 | ) | — | (1.47 | ) | (0.44 | ) | — | (0.44 | ) | 8.98 | |||||||||||||||||||||||
Year Ended 9/30/21 | 10.56 | 0.47 | 0.52 | — | (b) | 0.99 | (0.52 | ) | (0.14 | ) | (0.66 | ) | 10.89 | |||||||||||||||||||||||
Year Ended 9/30/20 | 10.46 | 0.48 | 0.09 | — | 0.57 | (0.47 | ) | — | (0.47 | ) | 10.56 | |||||||||||||||||||||||||
Year Ended 9/30/19 | 10.42 | 0.54 | 0.26 | — | 0.80 | (0.76 | ) | — | (0.76 | ) | 10.46 | |||||||||||||||||||||||||
Class I | ||||||||||||||||||||||||||||||||||||
Year Ended 9/30/23 | $ | 9.07 | 0.61 | 0.30 | — | 0.91 | (0.60 | ) | — | (0.60 | ) | $ | 9.38 | |||||||||||||||||||||||
Year Ended 9/30/22 | 10.98 | 0.48 | (1.95 | ) | — | (1.47 | ) | (0.44 | ) | — | (0.44 | ) | 9.07 | |||||||||||||||||||||||
Year Ended 9/30/21 | 10.64 | 0.50 | 0.53 | — | (b) | 1.03 | (0.55 | ) | (0.14 | ) | (0.69 | ) | 10.98 | |||||||||||||||||||||||
Year Ended 9/30/20 | 10.52 | 0.51 | 0.10 | — | 0.61 | (0.49 | ) | — | (0.49 | ) | 10.64 | |||||||||||||||||||||||||
Year Ended 9/30/19 | 10.47 | 0.58 | 0.25 | — | 0.83 | (0.78 | ) | — | (0.78 | ) | 10.52 | |||||||||||||||||||||||||
| (a) | Per share net investment income (loss) has been calculated using the average daily shares method. |
| (b) | Less than $0.01 or $(0.01) per share. |
77
FINANCIAL HIGHLIGHTS |
RBC BlueBay High Yield Bond Fund
(Selected data for a share outstanding throughout the periods indicated)
| Ratios/Supplemental Data | ||||||||||||||||||||||||
| Total Return(a)(b) | Net Assets, End of Year (000’s) | Ratio of Net Expenses to Average Net Assets | Ratio of Net Investment Income (Loss) to Average Net Assets | Ratio of Expenses to Average Net Assets* | Portfolio Turnover Rate** | |||||||||||||||||||
Class A | ||||||||||||||||||||||||
Year Ended 9/30/23 | 10.06 | % | $ | 3,580 | 0.81 | % | 6.18 | % | 1.14 | % | 72% | |||||||||||||
Year Ended 9/30/22 | (12.74 | )% | 2,983 | 0.82 | % | 4.45 | % | 1.16 | % | 75% | ||||||||||||||
Year Ended 9/30/21 | 9.60 | % | 3,727 | 0.82 | % | 4.32 | % | 1.18 | % | 100% | ||||||||||||||
Year Ended 9/30/20 | 5.64 | % | 1,586 | 0.82 | % | 4.64 | % | 1.92 | % | 187% | ||||||||||||||
Year Ended 9/30/19 | 8.41 | % | 460 | 0.82 | % | 5.35 | % | 2.50 | % | 143% | ||||||||||||||
Class I | ||||||||||||||||||||||||
Year Ended 9/30/23 | 10.34 | % | $ | 452,775 | 0.56 | % | 6.46 | % | 0.81 | % | 72% | |||||||||||||
Year Ended 9/30/22 | (12.57 | )% | 277,697 | 0.57 | % | 4.76 | % | 0.82 | % | 75% | ||||||||||||||
Year Ended 9/30/21 | 9.89 | % | 244,644 | 0.57 | % | 4.57 | % | 0.87 | % | 100% | ||||||||||||||
Year Ended 9/30/20 | 6.03 | % | 128,846 | 0.57 | % | 4.92 | % | 1.10 | % | 187% | ||||||||||||||
Year Ended 9/30/19 | 8.58 | % | 49,397 | 0.57 | % | 5.66 | % | 1.39 | % | 143% | ||||||||||||||
| * | During the period, certain fees were contractually or voluntarily reduced and/or reimbursed. If such contractual/voluntary fee reductions and reimbursements had not occurred, the ratio would have been as indicated. |
| ** | Portfolio turnover rate is calculated on the basis of the Fund as a whole without distinguishing between the classes of shares issued. |
| (a) | Excludes sales charge. |
| (b) | Assumes investment at net asset value at the beginning of the period, reinvestment of all dividends and distributions, and a complete redemption of the investment at net asset value at the end of the period. |
See Notes to the Financial Statements.
78
FINANCIAL HIGHLIGHTS
|
RBC BlueBay Core Plus Bond Fund
(Selected data for a share outstanding throughout the periods indicated)
| Investment Activities | Distributions | |||||||||||||||||||||||||||||||
| Net Asset Value, Beginning of Year | Net Investment Income(a) | Net Realized and Unrealized Gains (Losses) on Investments | Total from Investment Activities | Net Investment Income | Total Distributions | Net Asset Value, End of Year | ||||||||||||||||||||||||||
Class A | ||||||||||||||||||||||||||||||||
Year Ended 9/30/23 | $ | 8.24 | 0.38 | (0.05 | ) | 0.33 | (0.20 | ) | (0.20 | ) | $8.37 | |||||||||||||||||||||
Period Ended 9/30/22(b) | 10.00 | 0.18 | (1.79 | ) | (1.61 | ) | (0.15 | ) | (0.15 | ) | 8.24 | |||||||||||||||||||||
Class I | ||||||||||||||||||||||||||||||||
Year Ended 9/30/23 | $ | 8.24 | 0.40 | (0.04 | ) | 0.36 | (0.22 | ) | (0.22 | ) | $8.38 | |||||||||||||||||||||
Period Ended 9/30/22(b) | 10.00 | 0.20 | (1.79 | ) | (1.59 | ) | (0.17 | ) | (0.17 | ) | 8.24 | |||||||||||||||||||||
Class R6 | ||||||||||||||||||||||||||||||||
Year Ended 9/30/23 | $ | 8.24 | 0.40 | (0.04 | ) | 0.36 | (0.22 | ) | (0.22 | ) | $8.38 | |||||||||||||||||||||
Period Ended 9/30/22(b) | 10.00 | 0.20 | (1.79 | ) | (1.59 | ) | (0.17 | ) | (0.17 | ) | 8.24 | |||||||||||||||||||||
| (a) | Per share net investment income (loss) has been calculated using the average daily shares method. |
| (b) | For the period from November 1, 2021 (commencement of operations) through September 30, 2022. |
79
FINANCIAL HIGHLIGHTS
|
RBC BlueBay Core Plus Bond Fund
(Selected data for a share outstanding throughout the periods indicated)
| Ratios/Supplemental Data | ||||||||||||||||||||||||
| Total Return(a)(b) | Net Assets, End of Year (000’s) | Ratio of Net Expenses to Average Net Assets | Ratio of Net Investment Income (Loss) to Average Net Assets | Ratio of Expenses to Average Net Assets* | Portfolio Turnover Rate** | |||||||||||||||||||
Class A | �� | |||||||||||||||||||||||
Year Ended 9/30/23 | 4.11 | % | $ | 4,358 | 0.70 | % | 4.46 | % | 1.34 | % | 750 | % | ||||||||||||
Period Ended 9/30/22(c) | (16.32 | )%(d) | 4,188 | 0.70 | %(e) | 2.09 | %(e) | 1.51 | %(e) | 254 | % | |||||||||||||
Class I | ||||||||||||||||||||||||
Year Ended 9/30/23 | 4.34 | % | $ | 30,653 | 0.45 | % | 4.71 | % | 1.02 | % | 750 | % | ||||||||||||
Period Ended 9/30/22(c) | (16.06 | )%(d) | 29,381 | 0.45 | %(e) | 2.34 | %(e) | 1.15 | %(e) | 254 | % | |||||||||||||
Class R6 | ||||||||||||||||||||||||
Year Ended 9/30/23 | 4.39 | % | $ | 8,766 | 0.40 | % | 4.76 | % | 1.05 | % | 750 | % | ||||||||||||
Period Ended 9/30/22(c) | (16.03 | )%(d) | 8,399 | 0.40 | %(e) | 2.39 | %(e) | 1.19 | %(e) | 254 | % | |||||||||||||
| * | During the period, certain fees were contractually or voluntarily reduced and/or reimbursed. If such contractual/voluntary fee reductions and reimbursements had not occurred, the ratio would have been as indicated. |
| ** | Portfolio turnover rate is calculated on the basis of the Fund as a whole without distinguishing between the classes of shares issued. |
| (a) | Excludes sales charge. |
| (b) | Assumes investment at net asset value at the beginning of the period, reinvestment of all dividends and distributions, and a complete redemption of the investment at net asset value at the end of the period. |
| (c) | For the period from November 1, 2021 (commencement of operations) through September 30, 2022. |
| (d) | Not annualized. |
| (e) | Annualized. |
See Notes to the Financial Statements.
80
FINANCIAL HIGHLIGHTS
|
RBC BlueBay Strategic Income Fund
(Selected data for a share outstanding throughout the periods indicated)
| Investment Activities | Distributions | |||||||||||||||||||||||||||||||||||||||
| Net Asset Value, Beginning of Year | Net Investment Income(a) | Net Realized and Unrealized Gains (Losses) on Investments | Total from Investment Activities | Net Investment Income | Net Realized Gains | Total Distributions | Net Asset Value, End of Year | |||||||||||||||||||||||||||||||||
Class A | ||||||||||||||||||||||||||||||||||||||||
Year Ended 9/30/23 | $ | 9.60 | 0.41 | 0.36 | 0.77 | (0.23 | ) | (0.19 | ) | (0.42 | ) | $9.95 | ||||||||||||||||||||||||||||
Period Ended 9/30/22(b) | 10.00 | 0.17 | (0.44 | ) | (0.27 | ) | (0.13 | ) | — | (0.13 | ) | 9.60 | ||||||||||||||||||||||||||||
Class I | ||||||||||||||||||||||||||||||||||||||||
Year Ended 9/30/23 | $ | 9.61 | 0.43 | 0.36 | 0.79 | (0.26 | ) | (0.19 | ) | (0.45 | ) | $9.95 | ||||||||||||||||||||||||||||
Period Ended 9/30/22(b) | 10.00 | 0.19 | (0.43 | ) | (0.24 | ) | (0.15 | ) | — | (0.15 | ) | 9.61 | ||||||||||||||||||||||||||||
Class R6 | ||||||||||||||||||||||||||||||||||||||||
Year Ended 9/30/23 | $ | 9.61 | 0.44 | 0.35 | 0.79 | (0.26 | ) | (0.19 | ) | (0.45 | ) | $9.95 | ||||||||||||||||||||||||||||
Period Ended 9/30/22(b) | 10.00 | 0.19 | (0.42 | ) | (0.23 | ) | (0.16 | ) | — | (0.16 | ) | 9.61 | ||||||||||||||||||||||||||||
| (a) | Per share net investment income (loss) has been calculated using the average daily shares method. |
| (b) | For the period from November 1, 2021 (commencement of operations) through September 30, 2022. |
81
FINANCIAL HIGHLIGHTS
|
RBC BlueBay Strategic Income Fund
(Selected data for a share outstanding throughout the periods indicated)
| Ratios/Supplemental Data | ||||||||||||||||||||||||||||
| Total Return(a)(b) | Net Assets, End of Year (000’s) | Ratio of Net Expenses to Average Net Assets | Ratio of Net Investment Income (Loss) to Average Net Assets | Ratio of Expenses to Average Net Assets* | Portfolio Turnover Rate** | |||||||||||||||||||||||
Class A | ||||||||||||||||||||||||||||
Year Ended 9/30/23 | 8.33% | $ | 5,269 | 0.88% | 4.24% | 1.42% | 712% | |||||||||||||||||||||
Period Ended 9/30/22(c) | (2.70)%(d) | 4,867 | 0.88%(e) | 1.85%(e) | 1.62%(e) | 159% | ||||||||||||||||||||||
Class I | ||||||||||||||||||||||||||||
Year Ended 9/30/23 | 8.48% | $ | 37,057 | 0.63% | 4.49% | 1.11% | 712% | |||||||||||||||||||||
Period Ended 9/30/22(c) | (2.50)%(d) | 34,146 | 0.63%(e) | 2.10%(e) | 1.28%(e) | 159% | ||||||||||||||||||||||
Class R6 | ||||||||||||||||||||||||||||
Year Ended 9/30/23 | 8.54% | $ | 10,598 | 0.58% | 4.54% | 1.13% | 712% | |||||||||||||||||||||
Period Ended 9/30/22(c) | (2.46)%(d) | 9,760 | 0.58%(e) | 2.15%(e) | 1.32%(e) | 159% | ||||||||||||||||||||||
| * | During the period, certain fees were contractually or voluntarily reduced and/or reimbursed. If such contractual/voluntary fee reductions and reimbursements had not occurred, the ratio would have been as indicated. |
| ** | Portfolio turnover rate is calculated on the basis of the Fund as a whole without distinguishing between the classes of shares issued. |
| (a) | Excludes sales charge. |
| (b) | Assumes investment at net asset value at the beginning of the period, reinvestment of all dividends and distributions, and a complete redemption of the investment at net asset value at the end of the period. |
| (c) | For the period from November 1, 2021 (commencement of operations) through September 30, 2022. |
| (d) | Not annualized. |
| (e) | Annualized. |
See Notes to the Financial Statements.
82
|
September 30, 2023
1. Organization:
RBC Funds Trust (the “Trust”) is registered under the Investment Company Act of 1940 (as amended) as an open-end management investment company. The Trust was organized as a Delaware statutory trust on December 16, 2003 and currently consists of 24 portfolios. Overall responsibility for the management of the Trust is vested in its Board of Trustees (the “Board”). This report includes the following four investment portfolios (each a “Fund” and collectively, the “Funds”):
- RBC BlueBay Emerging Market Debt Fund (“Emerging Market Debt Fund”)
- RBC BlueBay High Yield Bond Fund (“High Yield Bond Fund”)
- RBC BlueBay Core Plus Bond Fund (“Core Plus Bond Fund”)
- RBC BlueBay Strategic Income Fund (“Strategic Income Fund”)
Class A and Class I shares are offered by each Fund; Class R6 shares are offered by Emerging Market Debt Fund, Core Plus Bond Fund and the Strategic Income Fund. Class A shares are offered with a maximum front-end sales charge of 4.25% for Emerging Market Debt Fund and High Yield Bond Fund and 3.75% for Core Plus Bond Fund and Strategic Income Fund and a 1.00% contingent deferred sales charge (“CDSC”) for redemption within 12 months of a $1 million or greater purchase on which no front-end sales charge was paid. Class I shares and Class R6 shares (intended for investors meeting certain investment minimum thresholds) are not subject to either a front-end sales charge or a CDSC.
RBC Global Asset Management (U.S.) Inc. (“RBC GAM-US)” or “Advisor” or “Co-Administrator”) acts as the investment advisor for the Funds and RBC Global Asset Management (UK) Limited (“RBC GAM-UK” or Sub-Advisor”) acts as a sub-advisor for Emerging Market Debt Fund and High Yield Bond Fund. The officers of the Trust (“Fund Management”) are also employees of RBC GAM-US.
2. Significant Accounting Policies
Each Fund is an investment company that follows accounting and reporting guidance under the Financial Accounting Standards Board. Summarized below are the significant accounting policies of the Funds. These policies conform to accounting principles generally accepted in the United States of America (“U.S. GAAP”). Fund Management follows these policies when preparing financial statements. Fund Management may also be required to make estimates and assumptions that affect the reported amounts of assets and liabilities at the date of the financial statements and the reported amounts of income and expenses for the period. Actual results could differ from those estimates. The financial statements are as of the close of regular trading on the New York Stock Exchange (“NYSE”).
To be announced securities
The Fund may trade securities on a To Be Announced (TBA) basis. As with other delayed-delivery transactions, a seller agrees to issue a TBA security at a future date. However, the seller does not specify the particular securities to be delivered. Instead, the Fund agrees to accept any security that meets specified terms.
In some cases, Master Securities Forward Transaction Agreements (MSFTAs) may be used to govern transactions of certain forward-settling agency mortgage-backed securities, such as delayed-delivery and TBAs, between the Fund and counterparty. The MSFTA maintains provisions for, among other things, initiation and confirmation, payment and transfer, events of default, termination, and maintenance of collateral relating to such transactions.
Security Valuation:
The Board has approved pricing and valuation procedures of the Advisor for determining the fair value of each Fund’s investments. Fair value of a security is considered to be the price that a fund might reasonably expect to receive upon its current sale in an orderly transaction between market participants.
Equity securities are generally valued on the basis of prices furnished by third-party pricing services approved by the Board. Equity securities listed on one or more exchanges shall be valued at the last
83
NOTES TO FINANCIAL STATEMENTS
|
available quoted sale price on the primary trading exchange as of the regularly scheduled closing time of the exchange and are categorized as Level 1 in the fair value hierarchy. (See “Fair Value Measurements” below for additional information). An equity security not listed on an exchange but listed on NASDAQ shall be valued at the NASDAQ official closing price and is also categorized as Level 1. If there was no sale on the primary exchange on the day the net asset value is calculated or a NASDAQ official closing price is not available, the most recent bid quotation generally will be used and such securities will generally be categorized as Level 2. Investments in open-end investment companies (mutual funds) are valued at net asset value and are categorized as Level 1 in the fair value hierarchy.
Fixed income securities, including to-be-announced (“TBA”) commitments and municipal bonds, are generally valued based on evaluated prices received from third-party pricing services or from broker-dealers who make markets in the securities and are generally categorized as Level 2 in the fair value hierarchy (see “Fair Value Measurements” below for additional information). The pricing services utilize both dealer-supplied valuations and electronic data processing techniques that take into account multiple appropriate factors such as institutional-size trading in similar groups of securities, market spreads, interest rates, and fundamental security analytical data including yield, quality, coupon rate, maturity and type of issue.
Bank loans are valued based on evaluated prices received from third-party pricing services or fair valued using recently executed transactions, market price quotations, credit/market events, and cross-asset pricing. Inputs are generally observable market inputs obtained from independent sources. Bank Loans are generally categorized as Level 2 of the fair value hierarchy, unless key inputs are unobservable which would then be as Level 3.
Exchange-traded options, futures and options on futures are valued at the last sale price at the close of the market on the principal exchange on which they are traded. In the absence of any transactions on that day, the closing bid price shall be used for purchased options, futures and options on futures, and the closing ask price shall be used for written options. Such instruments are categorized as Level 1 of the fair value hierarchy. Options contracts traded in the over-the-counter (“OTC”) market shall be valued at the evaluated price provided by an independent pricing service or broker-dealer using a mathematical model which incorporates a number of market data factors, such as trades and prices of the underlying instruments. These contracts are categorized as Level 2 of the fair value hierarchy. Forward foreign currency exchange contracts are marked to market daily based upon foreign currency exchange rates provided by an independent pricing service as of the close of the NYSE, generally 4:00 p.m. EST, and are generally classified as Level 2 within the fair value hierarchy.
Swaps, including credit-default swaps, interest rate swaps and total return swaps, are generally valued by an independent pricing service using a discounted cash flow methodology. This technique is used to value both the fixed and variable components of the swap contracts and takes into account market data and inputs sourced from various institutions and market-makers and includes daily intra-day and closing spreads, credit index quotes, yield curves, and recovery rate assumptions. The Fund’s net benefit or obligation under the derivative contract, as measured by the fair market value of the contract, is included in the Fund’s net assets. These swap contracts are categorized as Level 2 in the fair valuation hierarchy.
Foreign securities valued in non-U.S. dollars are valued in the foreign currency and then converted into the U.S. dollar equivalent using the foreign exchange rate in effect at the close of NYSE on the day the security’s value is determined. The value of securities traded in markets outside the United States may be affected on a day that the NYSE is closed and an investor is not able to purchase, exchange or redeem shares of the Funds.
The Board has designated the Advisor with the responsibility for implementing the pricing and valuation procedures, including responsibility for determining the fair value of the Funds’ securities or other assets and liabilities, and has established a Pricing Committee to assist in carrying out supervisory functions related to such responsibilities. The Pricing Committee includes representatives of the Funds’ Advisor, Co-Administrator and Sub-Advisor, including personnel from accounting and operations, trading, risk management and compliance. The Pricing Committee meets at least quarterly to review and approve Fund valuation matters, including a review of the Funds’ pricing activity and operations,
84
NOTES TO FINANCIAL STATEMENTS
|
fair value measurements, pricing vendors, policies and procedures, and related controls. At least a quorum of the Pricing Committee shall meet more frequently, as needed, to consider and approve time-sensitive fair valuation matters. The Pricing Committee provides periodic reports to the Valuation, Portfolio Management and Performance Committee (“Valuation Committee”) of the Board regarding pricing and valuation matters. Members of the Pricing Committee meet with the Valuation Committee and the Board at each of their regularly scheduled meetings to discuss valuation matters and actions taken during the period.
The Advisor has procedures to determine the fair value of a security when a price is not available from a pricing service or broker- dealer or the Advisor has determined that a price provided by a pricing service or broker-dealer does not approximate fair value. Fair valuation may also be used when a significant valuation event affecting the value of a security or market sector is determined to have occurred between the time when a security’s market closes and the time the Fund’s net asset value is calculated. The fair value of the security will be determined in good faith by the Advisor in accordance with procedures and methodologies approved by the Board. General factors used in determining the fair value of securities include, but are not limited to, fundamental analytical data relating to the security, the issuer and the market, such as duration, prepayment and default rates; general level of interest rates and changes in interest rates; information from broker-dealers; trading in similar securities; any restrictions on disposition of the security; and an evaluation of the forces that influence the market in which the investments are traded. These securities are either categorized as Level 2 or 3 in the fair value hierarchy, depending on the relevant inputs used.
When the Funds utilize fair valuation methods that use significant unobservable inputs to determine a security’s value, such securities will be categorized as Level 3 of the fair value hierarchy. These methods may require subjective determinations about the value of a security. While the Funds’ policy is intended to result in a calculation of a Fund’s net asset value that fairly reflects security values as of the time of pricing, the Funds cannot guarantee that values determined by the Advisor or persons acting at their direction would accurately reflect the price that the Funds could obtain for a security if they were to dispose of it as of the time of pricing (for instance, in a forced or distressed sale). The prices used by the Funds may differ from the value that would be realized if the securities were sold.
The Advisor employs various methods for calibrating the valuation approach related to securities categorized within Level 2 and Level 3 of the fair value hierarchy. These methods may include regular due diligence of the Funds’ pricing vendors, a regular review of key inputs and assumptions, transaction back-testing or disposition analysis to compare unrealized gains and losses to realized gains and losses, reviews of missing and stale prices and large movements in market value, and reviews of any market related activities. Additionally, the pricing of all fair value holdings is subsequently reported to the Valuation Committee and Board.
Foreign Taxes:
The Funds may be subject to foreign taxes on income, gains on investments or currency repatriation, a portion of which may be recoverable. The Funds will accrue such taxes and recoveries, as applicable, based upon its current interpretation of tax rules and regulations that exist in the markets in which it invests.
Realized gains in certain countries may be subject to foreign taxes at the Fund level, based on statutory rates. The Funds accrue for such foreign taxes on realized and unrealized gains at the appropriate rate for each jurisdiction, as applicable. The amount, if any, is disclosed as a liability in the Statement of Assets and Liabilities.
Fair Value Measurements:
The Funds disclose the fair value of their investments in a hierarchy that categorizes investments based on the inputs to valuation techniques used to measure fair value. The three levels of the fair value hierarchy are as follows:
• Level 1 - Inputs that reflect unadjusted quoted prices in active markets for identical assets or liabilities that the Funds have the ability to access at the measurement date.
85
NOTES TO FINANCIAL STATEMENTS
|
• Level 2 - Significant inputs other than quoted prices that are observable for the asset or liability either directly or indirectly, including inputs in markets that are not considered to be active. Observable inputs may include quoted prices for similar securities, interest rates, spreads, prepayment spreads, etc.
• Level 3 - Significant unobservable inputs based on the best information available in the circumstances, to the extent observable inputs are not available (including the Fund’s own assumptions in determining the fair value of investments).
The inputs or methodology used for valuing investments are not necessarily an indication of the risk associated with investing in those securities.
Inputs used in determining fair value of an investment may include, but are not limited to, price information, volatility statistics, credit and market data, and other factors, all of which may be either observable or unobservable. Inputs can vary among investments and will be impacted by the investment type and volume of activity for the particular security or similar securities in the market. Investments in the Level 2 category are generally supported by transactions and quoted prices from dealers participating in the market for those investments. Investments may be included in the Level 3 category due to a lack of market activity or transparency. Internal valuation models may also be used as a pricing source for Level 3 investments. Internal valuation models may rely on one or more unobservable inputs, such as estimated cash flows, financial statement analysis and discount rates.
The summary of inputs used to determine the fair value of the Funds’ investments as of September 30, 2023 is as follows:
| Level 1 Quoted Prices | Level 2 Significant Observable Inputs | Level 3 Significant Unobservable Inputs | Total | |||||||||||||||||
Emerging Market Debt Fund | ||||||||||||||||||||
Assets: | ||||||||||||||||||||
Investments in Securities | ||||||||||||||||||||
Foreign Government Bonds | $ | — | $ | 25,044,309 | $ | — | $ | 25,044,309 | ||||||||||||
Corporate Bonds | — | 7,976,992 | — | 7,976,992 | ||||||||||||||||
U.S. Treasury Obligations | — | 3,194,071 | — | 3,194,071 | ||||||||||||||||
Investment Company | 1,255,527 | — | — | 1,255,527 | ||||||||||||||||
Municipal Bond | — | 203,174 | — | 203,174 | ||||||||||||||||
Other Financial Instruments* | ||||||||||||||||||||
Foreign currency exchange contracts - forward contracts | — | 276,957 | — | 276,957 | ||||||||||||||||
Financial futures contracts | 12,292 | — | — | 12,292 | ||||||||||||||||
Credit default swaps | — | 45,539 | — | 45,539 | ||||||||||||||||
|
|
|
|
|
|
|
| |||||||||||||
Total Assets | $ | 1,267,819 | $ | 36,741,042 | $ | — | $ | 38,008,861 | ||||||||||||
|
|
|
|
|
|
|
| |||||||||||||
|
|
|
|
|
|
|
| |||||||||||||
Liabilities: | ||||||||||||||||||||
Other Financial Instruments* | ||||||||||||||||||||
Financial futures contracts | $ | (9,399 | ) | $ | — | $ | — | $ | (9,399 | ) | ||||||||||
Credit default swaps | — | (107,767 | ) | — | (107,767 | ) | ||||||||||||||
Foreign currency exchange contracts - forward contracts | — | (115,931 | ) | — | (115,931 | ) | ||||||||||||||
|
|
|
|
|
|
|
| |||||||||||||
Total Liabilities | $ | (9,399 | ) | $ | (223,698 | ) | $ | — | $ | (233,097 | ) | |||||||||
|
|
|
|
|
|
|
| |||||||||||||
86
NOTES TO FINANCIAL STATEMENTS
|
| Level 1 Quoted Prices | Level 2 Significant Observable Inputs | Level 3 Significant Unobservable Inputs | Total | |||||||||||||
High Yield Bond Fund | ||||||||||||||||
Assets: | ||||||||||||||||
Investments in Securities | ||||||||||||||||
Corporate Bonds | ||||||||||||||||
Australia | $ | — | $ | 5,603,470 | $ | 76,015 | $ | 5,679,485 | ||||||||
Austria | — | 4,460,653 | — | 4,460,653 | ||||||||||||
Bermuda | — | 2,853,626 | — | 2,853,626 | ||||||||||||
Canada | — | 20,484,991 | — | 20,484,991 | ||||||||||||
Cayman Islands | — | 3,722,183 | — | 3,722,183 | ||||||||||||
Czech Republic | — | 2,525,000 | — | 2,525,000 | ||||||||||||
France | — | 10,727,518 | — | 10,727,518 | ||||||||||||
Germany | — | 11,974,928 | — | 11,974,928 | ||||||||||||
India | — | 1,342,350 | — | 1,342,350 | ||||||||||||
Italy | — | 4,623,868 | — | 4,623,868 | ||||||||||||
Luxembourg | — | 3,861,003 | — | 3,861,003 | ||||||||||||
Mexico | — | 1,362,941 | — | 1,362,941 | ||||||||||||
Netherlands | — | 5,313,239 | — | 5,313,239 | ||||||||||||
Puerto Rico | — | 778,655 | — | 778,655 | ||||||||||||
United Arab Emirates | — | 3,737,770 | — | 3,737,770 | ||||||||||||
United Kingdom | — | 13,260,442 | — | 13,260,442 | ||||||||||||
United States | — | 329,882,070 | — | 329,882,070 | ||||||||||||
Investment Company | 15,420,395 | — | — | 15,420,395 | ||||||||||||
U.S. Treasury Obligations | — | 11,087,663 | — | 11,087,663 | ||||||||||||
Common Stocks | ||||||||||||||||
United Kingdom | — | 3,074 | — | 3,074 | ||||||||||||
United States | — | — | 15 | 15 | ||||||||||||
Rights/Warrants | ||||||||||||||||
Mexico | — | — | — | — | ||||||||||||
Other Financial Instruments* | ||||||||||||||||
Foreign currency exchange contracts - forward contracts | — | 56,756 | — | 56,756 | ||||||||||||
Credit default swaps | — | 236,522 | — | 236,522 | ||||||||||||
|
|
|
|
|
|
|
| |||||||||
Total Assets | $ | 15,420,395 | $ | 437,898,722 | $ | 76,030 | $ | 453,395,147 | ||||||||
|
|
|
|
|
|
|
| |||||||||
Liabilities: | ||||||||||||||||
Other Financial Instruments* | ||||||||||||||||
Financial futures contracts | $ | (172,475 | ) | $ | — | $ | — | $ | (172,475 | ) | ||||||
|
|
|
|
|
|
|
| |||||||||
87
NOTES TO FINANCIAL STATEMENTS
|
| Level 1 Quoted Prices | Level 2 Significant Observable Inputs | Level 3 Significant Unobservable Inputs | Total | |||||||||||||||||
Core Plus Bond Fund | ||||||||||||||||||||
Assets: | ||||||||||||||||||||
Investments in Securities | ||||||||||||||||||||
Corporate Bonds | $ | — | $ | 24,510,707 | $ | — | $ | 24,510,707 | ||||||||||||
U.S. Government Agency Backed Mortgages | — | 10,100,161 | — | 10,100,161 | ||||||||||||||||
Collateralized Mortgage Obligations | — | 6,069,561 | — | 6,069,561 | ||||||||||||||||
Investment Company | 3,307,444 | — | — | 3,307,444 | ||||||||||||||||
Asset Backed Securities | — | 1,920,686 | — | 1,920,686 | ||||||||||||||||
Bank Loans | — | 1,719,330 | — | 1,719,330 | ||||||||||||||||
Foreign Government Bonds | — | 1,397,558 | — | 1,397,558 | ||||||||||||||||
Other Financial Instruments* | ||||||||||||||||||||
Foreign currency exchange contracts - forward contracts | — | 329,495 | — | 329,495 | ||||||||||||||||
Financial futures contracts | 190,474 | — | — | 190,474 | ||||||||||||||||
Interest rate swaps - Appreciation | — | 36,397 | — | 36,397 | ||||||||||||||||
|
|
|
|
|
|
|
| |||||||||||||
Total Assets | $ | 3,497,918 | $ | 46,083,895 | $ | — | $ | 49,581,813 | ||||||||||||
|
|
|
|
|
|
|
| |||||||||||||
|
|
|
|
|
|
|
| |||||||||||||
Liabilities: | ||||||||||||||||||||
Other Financial Instruments* | ||||||||||||||||||||
Interest Rate Swaps | $ | — | $ | (13,564 | ) | $ | — | $ | (13,564 | ) | ||||||||||
Foreign currency exchange contracts - forward contracts | — | (91,114 | ) | — | (91,114 | ) | ||||||||||||||
Financial futures contracts | (224,988 | ) | — | — | (224,988 | ) | ||||||||||||||
Credit default swaps | — | (297,185 | ) | — | (297,185 | ) | ||||||||||||||
|
|
|
|
|
|
|
| |||||||||||||
Total Liabilities | $ | (224,988) | $ | (401,863) | $ | — | $ | (626,851) | ||||||||||||
|
|
|
|
|
|
|
| |||||||||||||
88
NOTES TO FINANCIAL STATEMENTS
|
| Level 1 Quoted Prices | Level 2 Significant Observable Inputs | Level 3 Significant Unobservable Inputs | Total | |||||||||||||||||
Strategic Income Fund | ||||||||||||||||||||
Assets: | ||||||||||||||||||||
Investments in Securities | ||||||||||||||||||||
Corporate Bonds | $ | — | $ | 28,488,859 | $ | — | $ | 28,488,859 | ||||||||||||
Collateralized Mortgage Obligations | — | 6,105,243 | — | 6,105,243 | ||||||||||||||||
U.S. Treasury Obligations | — | 5,446,930 | — | 5,446,930 | ||||||||||||||||
Investment Company | 4,594,438 | — | — | 4,594,438 | ||||||||||||||||
Asset Backed Securities | — | 2,561,403 | — | 2,561,403 | ||||||||||||||||
Bank Loans | — | 2,114,898 | — | 2,114,898 | ||||||||||||||||
Foreign Government Bonds | — | 1,631,547 | — | 1,631,547 | ||||||||||||||||
Other Financial Instruments* | ||||||||||||||||||||
Foreign currency exchange contracts - forward contracts | — | 367,890 | — | 367,890 | ||||||||||||||||
Financial futures contracts | 635,105 | — | — | 635,105 | ||||||||||||||||
Interest rate swaps - Appreciation | — | 68,206 | — | 68,206 | ||||||||||||||||
|
|
|
|
|
|
|
| |||||||||||||
Total Assets | $ | 5,229,543 | $ | 46,784,976 | $ | — | $ | 52,014,519 | ||||||||||||
|
|
|
|
|
|
|
| |||||||||||||
Liabilities: | ||||||||||||||||||||
Other Financial Instruments* | ||||||||||||||||||||
Interest Rate Swaps | $ | — | $ | (16,325) | $ | — | $ | (16,325) | ||||||||||||
Foreign currency exchange contracts - forward contracts | — | (104,250) | — | (104,250) | ||||||||||||||||
Financial futures contracts | (116,464 | ) | — | — | (116,464) | |||||||||||||||
Credit default swaps | — | (450,108) | — | (450,108) | ||||||||||||||||
|
|
|
|
|
|
|
| |||||||||||||
Total Liabilities | $ | (116,464) | $ | (570,683) | $ | — | $ | (687,147) | ||||||||||||
|
|
|
|
|
|
|
| |||||||||||||
*Other financial instruments are instruments shown on the Schedule of Portfolio Investments, such as futures contracts, swaps and foreign currency contracts which are valued at fair value.
| BlueBay High Yield Bond Fund | ||||||||||
| Common Stocks | Corporate Bonds– (Australia) | |||||||||
Balance as of 9/30/22(value) | $ | 2,783 | $ | 231,956 | ||||||
Change in unrealized appreciation (depreciation) | (2,782 | ) | (155,941 | ) | ||||||
|
|
|
| |||||||
Balance as of 9/30/23(value) | $ | 1 | $ | 76,015 | ||||||
|
|
|
| |||||||
The Funds’ assets assigned to the Level 3 category are valued utilizing the valuation technique deemed the most appropriate in the circumstances. The significant unobservable inputs used include assumptions regarding the particular security’s cash flow profile and potential defaults that may not be generally observable for the security. The Common Stock in High Yield Bond Fund were fair valued using a discounted cash flow model based on unobservable inputs that include estimated cash flows, implied credit spread and discount rate (weighted average cost of capital). The Corporate Bonds in High Yield Bond Fund were fair valued using discounted cash flows. Significant changes in any of these assumptions may result in a lower or higher fair value measurement.
89
NOTES TO FINANCIAL STATEMENTS
|
Quantitative Information about Level 3 Fair Value Measurements | ||||||||||||||||||||||||
| Fund | Fair Value at September 30, 2023 | Valuation Technique(s) | Unobservable Input | Range (Weighted Average) | ||||||||||||||||||||
Corporate Bonds (Australia) | High Yield Bond Fund | $76,015 | Discounted Cash Flow | Discount Rate of Cash Flows | 12.1% —22.3% (18.1%) | |||||||||||||||||||
| Liquidity Discount | 5.0% —7.5% (5.3%) | |||||||||||||||||||||||
Common Stocks | High Yield Bond Fund | $ 1 | Discounted Cash Flow | Discount Rate of Cash Flows | 19.4% —30.0% (23.3%) | |||||||||||||||||||
| Liquidity Discount | 10% | |||||||||||||||||||||||
Foreign Currency Transactions:
The values of foreign securities, foreign currencies and other assets and liabilities denominated in foreign currencies are translated into U.S. dollars using current exchange rates each business day. Fluctuations in the value of foreign currency holdings and other assets and liabilities resulting from movements in currency exchange rates are recorded as unrealized foreign currency gains or losses. The effects of changes in foreign currency exchange rates on investments in securities are not segregated from the effects of changes in market prices of those securities on the Statements of Operations. Such fluctuations are included with the net change in unrealized appreciation/depreciation on investment transactions. However, for tax purposes, the effects of fluctuations in foreign currency exchange rates when determining the realized gain or loss upon the sale or maturity of foreign currency denominated debt obligations are segregated pursuant to U.S. Federal income tax regulations; such amounts are categorized as foreign exchange gain or loss for both financial reporting and income tax reporting purposes.
Bank Loans:
A Fund may invest in fixed and floating rate loans from one or more financial institutions (“lender(s)”) to a borrower by way of: (i) assignment/transfer of; or (ii) participation in the whole or part of the loan amount outstanding. In both instances, assignments or participations of such loans must be capable of being freely traded and transferred between investors in the loans. Participations typically will result in a Fund having a contractual relationship only with a lender as grantor of the participation but not with the borrower. A Fund acquires a participation interest only if the lender(s) positioned between the Fund and the borrower is determined by the Sub-Advisor to be creditworthy. When purchasing loan participations, a Fund assumes the economic risk associated with the corporate borrower and the credit risk associated with an interposed bank or other financial intermediary. Loan assignments typically involve a transfer of debt from a lender to a third party. When purchasing loan assignments, a Fund assumes the credit risk associated with the corporate borrower only.
Such loans may be secured or unsecured. Loans that are fully secured offer a Fund more protection than an unsecured loan in the event of non-payment of scheduled interest or principal. However, there is no assurance that the liquidation of collateral from a secured loan would satisfy the corporate borrower’s obligation. In addition, investments in loans through a direct assignment include the risk that if a loan is terminated, a Fund could become part owner of any collateral, and would bear the costs and liabilities associated with owning and disposing of the collateral.
Loan participations typically represent direct participation in a loan to a corporate borrower, and generally are offered by banks or other financial institutions or lending syndicates.
A loan is often administered by an agent bank acting as agent for all holders. Unless, under the terms of the loan or other indebtedness, a Fund has direct recourse against the corporate borrower, the Fund may have to rely on the agent bank or other financial intermediary to apply appropriate credit remedies against a corporate borrower.
90
NOTES TO FINANCIAL STATEMENTS
|
When a Fund purchases a floating rate loan interest, it may receive a facility fee and when it sells a floating rate loan interest, it may pay a facility fee. On an ongoing basis, the Funds may receive a commitment fee based on the undrawn portion of the underlying line of credit amount of a floating rate loan interest. Facility and commitment fees are typically amortized to income over the term of the loan or term of the commitment, respectively. Consent and amendment fees are recorded to income as earned. Prepayment penalty fees, which may be received by the Funds upon the prepayment of a floating rate loan interest by a borrower, are recorded as realized gains. The Funds may invest in multiple series or tranches of a loan. A different series or tranche may have varying terms and carry different associated risks.
In connection with floating rate loan interests, the Funds may also enter into unfunded floating rate loan interests (“commitments”). In connection with these commitments, the Funds earn a commitment fee, typically set as a percentage of the commitment amount. Such fee income, which is included in interest income in the Statement of Operations, is recognized ratably over the commitment period. Unfunded floating rate loan interests are marked-to-market daily, and any unrealized appreciation or depreciation is included in the Statements of Assets and Liabilities and Statements of Operations.
As of September 30, 2023, Core Plus Bond Fund and Strategic Income Fund held bank loans.
Payment-in-Kind Securities:
The Funds may invest in payment-in-kind securities (“PIKs”). PIKs give the issuer the option at each interest payment date of making interest payments in either cash or additional debt securities. Those additional debt securities usually have the same terms, including maturity dates and interest rates, and associated risks as the original bonds. The daily market quotations of the original bonds may include the accrued interest (referred to as a dirty price) and require a pro-rata adjustment from the unrealized appreciation or depreciation on investments to interest receivable on the Statement of Assets and Liabilities.
For the year ended September 30, 2023, the total in-kind payments received by the High Yield Bond Fund with respect to PIKs constituted less than 5% of the Fund’s total income and, therefore, such payments were not disclosed as a separate line item on the Statement of Operations.
Derivatives:
The Funds may use derivative instruments, including futures, forwards, options, indexed securities, swaps and inverse securities as tools in the management of portfolio assets. A Fund may use such derivatives through either the creation of long or short positions to hedge various investments, for investment purposes, for risk management and/or to increase income or gain to the Fund. Derivatives allow a Fund to increase or decrease its risk exposure more quickly and efficiently than other types of instruments. Derivatives may be riskier than other types of investments and could result in losses that significantly exceed a Fund’s original investment. Derivatives are subject to the risk that changes in the value of a derivative may not correlate perfectly with the underlying asset, rate or index. The use of derivatives may not be successful, resulting in losses to a Fund, and the cost of such strategies may reduce the Fund’s returns.
Hedging also involves the risk that changes in the value of the derivative will not match those of the holdings being hedged as expected by the Funds, in which case any losses on the holdings being hedged may not be reduced and may be increased. There can be no assurance that a Fund’s hedging strategy will reduce risk or that hedging transactions will be available or cost effective. The Funds are subject to interest rate risk and foreign currency exchange risk in the normal course of pursuing their investment objectives by investing in various derivative financial instruments, as described below.
In addition to the risks associated with derivatives in general, the Funds will also be subject to risks related to swap agreements. Because swap agreements are not exchange-traded, but are private contracts into which a Fund and a swap counterparty enter as principals, a Fund may experience a loss or delay in recovering assets if the counterparty defaults on its obligations. Each Fund will segregate or earmark liquid assets in an amount sufficient to cover its obligations under swap agreements.
91
NOTES TO FINANCIAL STATEMENTS
|
Financial Futures Contracts:
The Funds may enter into futures contracts in an effort to manage the duration of the portfolio and hedge against certain market risk. A futures contract on a securities index is an agreement obligating one party to pay, and entitling the other party to receive, during the term of the contract, cash payments based on the level of a specified securities index. Futures transactions involve brokerage costs and require a Fund to segregate assets to cover contracts that would require it to purchase securities or currencies. A Fund may lose the expected benefit of futures transactions if interest rates, exchange rates or securities prices change in an unanticipated manner. Such unanticipated changes may also result in lower overall performance than if a Fund had not entered into any futures transactions.
The Funds entered into U.S. Treasury Bond futures, Japanese treasury bond futures, Euro Dollar futures and Euro-Bund futures during the year ended September 30, 2023.
Upon entering into a futures contract, a Fund is required to pledge to the broker an amount of cash, U.S. government securities, or other assets equal to a certain percentage of the contract amount. Subsequent payments are made or received by the Funds each day, depending on the daily fluctuations in the fair value of the underlying instrument. A Fund would record an unrealized gain or loss each day equal to these daily payments.
Open futures contracts are shown on the Schedules of Portfolio Investments. Underlying collateral pledged for open futures contracts is the cash at brokers for financial futures contracts shown on the Statements of Assets and Liabilities at September 30, 2023.
Options:
The Funds may write (or sell) put and call options on the securities that the Funds are authorized to buy or already hold in their portfolio. The Funds may also purchase put and call options.
A call option gives the purchaser of the option the right (but not the obligation) to buy, and obligates the seller to sell (when the option is exercised), the underlying instrument at the exercise price at any time or at a specified time during the option period. A put option gives the holder the right to sell and obligates the writer to buy the underlying instrument at the exercise price at any time or at a specified time during the option period. When a Fund purchases (writes) an option, an amount equal to the premium paid (received) by a Fund is reflected as an asset (liability). The amount of the asset (liability) is subsequently marked-to-market to reflect the current market value of the option purchased (written). When an instrument is purchased or sold through an exercise of an option, the related premium paid (or received) is added to (or deducted from) the basis of the instrument acquired or deducted from (or added to) the proceeds of the instrument sold. When an option expires (or a Fund enters into a closing transaction), a Fund realizes a gain or loss on the option to the extent of the premiums received or paid (or gain or loss to the extent the cost of the closing transaction exceeds the premium received or paid). When a Fund writes a call option, such option is “covered,” meaning that a Fund holds the underlying instrument subject to being called by the option counterparty, or cash in an amount sufficient to cover the obligation. When a Fund writes a put option, such option is covered by cash in an amount sufficient to cover the obligation.
In purchasing and writing options, a Fund bears the market risk of an unfavorable change in the price of the underlying instrument or the risk that a Fund may not be able to enter into a closing transaction due to an illiquid market. Exercise of a written option could result in a Fund purchasing or selling a security at a price different from the current market value.
A Fund may execute transactions in both listed (exchange-traded) and OTC options. Listed options involve minimal counterparty risk since listed options are guaranteed against default by the exchange on which they trade. Transactions in certain OTC options may expose a Fund to the risk of default by the counterparty to the transaction. In the event of default by the counterparty to the OTC option transaction, a Fund’s maximum amount of loss is the premium paid (as purchaser) or the unrealized gain of the contract (as writer).
92
NOTES TO FINANCIAL STATEMENTS
|
Forward Foreign Currency Exchange Contracts:
The Funds enter into forward foreign currency contracts (“Forward”) to hedge their exposure to changes in foreign currency exchange rates on foreign portfolio holdings (foreign currency exchange risk). In addition, certain Funds may use a Forward to provide exposure to the foreign currency market. A Forward is an agreement between two parties to purchase or sell a foreign currency at a future date at a negotiated forward rate. A Forward is marked-to-market daily and the change in market value is recorded by the Funds as unrealized appreciation or depreciation until the contract settlement date.
The market value of the Forward is determined using the forward rate for the remainder of the outstanding period of the contract, through the delivery date. When a Forward is closed or settled, the Funds record a realized gain or loss equal to the fluctuation in rates during the period a Forward was open.
In the event of default by the counterparty to the transaction, the Fund’s maximum amount of loss, as either the buyer or seller, is the unrealized gain of the contract.
Details of Forward contracts at period end are included in the Schedules of Portfolio Investments under the caption “Foreign currency exchange contracts.”
Swap Agreements:
The Funds may enter into swap agreements, which are agreements involving two parties to exchange the return generated by a security, currency, commodity, interest rate, index, or other measures for the return generated by another instrument, for example, the agreement to pay interest in exchange for a market-linked return based on a notional amount. The Funds entered into interest rate, credit default and other swap agreements as of September 30, 2023.
Interest rate swap agreements generally involve the agreement by a Fund to pay a counterparty a fixed or floating rate on a fixed notional amount and to receive a fixed or floating rate on a fixed notional amount, but may also involve the agreement to pay or receive payments derived from changes in interest rates. Periodic payments are generally made during the life of the swap agreement according to the terms and conditions of the agreement and at termination or maturity.
The Funds enter into cross-currency swaps to gain or reduce exposure to foreign currencies or as an economic hedge against either specific transactions or portfolio instruments (foreign currency exchange rate and/or interest rate risk). Cross-currency swaps are interest rate swaps in which one party pays a stream of interest payments, either fixed or floating, in exchange for another party’s stream of interest payments, either fixed or floating, based on the notional amounts of two different currencies. The notional amounts are typically determined based on the spot exchange rates at the inception of the trade. Cross-currency swaps may also involve an exchange of notional amounts at the start, during and/or at expiration of the contract, either at the current spot rate or another specified rate.
The Funds enter into credit default swaps to manage their exposure to the market or certain sectors of the market, to reduce their risk exposure to defaults of corporate and/or sovereign issuers or to create exposure to corporate and/or sovereign issuers to which they are not otherwise exposed (credit risk). The Funds enter into credit default swap agreements to provide a measure of protection against the default of an issuer (as buyer of protection) and/or gain credit exposure to an issuer to which it is not otherwise exposed (as seller of protection). The Funds may either buy or sell (write) credit default swaps on single-name issuers (corporate or sovereign), a combination or basket of single-name issuers or traded indexes. Credit default swaps on single-name issuers are agreements in which the buyer pays fixed periodic payments to the seller in consideration for a guarantee from the seller to make a specific payment should a negative credit event take place with respect to the referenced entity (e.g., bankruptcy, failure to pay, obligation accelerators, repudiation, moratorium or restructuring). Credit default swaps on traded indexes are agreements in which the buyer pays fixed periodic payments to the seller in consideration for a guarantee from the seller to make a specific payment should a writedown, principal or interest shortfall or default of all or individual underlying securities included in the index occurs. As a buyer, if an underlying credit event occurs, the Funds will either receive from the seller an amount equal to the notional amount of the swap and deliver the referenced security or underlying securities comprising the index or receive a net settlement of cash equal to the notional
93
NOTES TO FINANCIAL STATEMENTS
|
amount of the swap less the recovery value of the security or underlying securities comprising the index. As a seller (writer), if an underlying credit event occurs, the Funds will either pay the buyer an amount equal to the notional amount of the swap and take delivery of the referenced security or underlying securities comprising the index or pay a net settlement of cash equal to the notional amount of the swap less the recovery value of the security or underlying securities comprising the index.
Total return swap agreements involve the commitments to pay or receive an amount generally determined by reference to a security, index or other measure in exchange for a specific market linked return, based on notional amounts. To the extent that the total return of the security, index or other measure underlying the transaction exceeds or falls short of the offsetting interest rate-based obligation, the Funds receive or make a payment to the counterparty. Interim payments and payments received or made by a Fund at the expiration or other termination of the swap agreements are recorded in the Statement of Operations as realized gains or losses, respectively. Swap agreements are marked-to-market daily based on dealer-supplied valuations, and changes in value, including the periodic amounts of interest to be paid or received on swaps, are recorded as unrealized appreciation/ (depreciation). Risks may exceed amounts recognized on the Statements of Assets and Liabilities. These risks include changes in the returns of the underlying instruments, failure of the counterparties to perform under the contracts’ terms and the possible lack of liquidity with respect to the swap agreements. Details of swap agreements open at period end are included in the Schedules of Portfolio Investments under the captions “Interest rate swaps” and “Credit default swaps”.
Fair Values of Derivative Financial Instrument as of September 30, 2023(1) | ||||||||||||||||
Statement of Assets and Liabilities Location | ||||||||||||||||
Asset Derivatives | ||||||||||||||||
| BlueBay Emerging Market Debt Fund | BlueBay High Yield Bond Fund | BlueBay Core Plus Bond Fund | BlueBay Strategic Income Fund | |||||||||||||
Credit Risk: | ||||||||||||||||
Credit default swaps, at value | $ | 45,539 | $ | 236,522 | $ | — | $ | — | ||||||||
Interest Rate Risk: | ||||||||||||||||
Unrealized appreciation on interest rate swaps contracts | — | — | 36,397 | 68,206 | ||||||||||||
Unrealized appreciation on futures contracts | 12,292 | — | 190,474 | 635,105 | ||||||||||||
Foreign currency exchange risk: | ||||||||||||||||
Unrealized appreciation on forward foreign currency exchange contracts | 276,957 | 56,756 | 329,495 | 367,890 | ||||||||||||
|
|
|
|
|
|
|
| |||||||||
Total | $ | 334,788 | $ | 293,278 | $ | 556,366 | $ | 1,071,201 | ||||||||
|
|
|
|
|
|
|
| |||||||||
Liability Derivatives | ||||||||||||||||
| BlueBay Emerging Market Debt Fund | BlueBay High Yield Bond Fund | BlueBay Core Plus Bond Fund | BlueBay Strategic Income Fund | |||||||||||||
Credit Risk: | ||||||||||||||||
Credit default swaps, at value | $ | 107,767 | $ | — | $ | 297,185 | $ | 450,108 | ||||||||
Interest Rate Risk: | ||||||||||||||||
Unrealized depreciation on interest rate swaps | — | — | 13,564 | 16,325 | ||||||||||||
94
NOTES TO FINANCIAL STATEMENTS
|
Liability Derivatives | ||||||||||||||||
| BlueBay Emerging Market Debt Fund | BlueBay High Yield Bond Fund | BlueBay Core Plus Bond Fund | BlueBay Strategic Income Fund | |||||||||||||
Unrealized depreciation on futures contracts | $ | 9,399 | $ | 172,475 | $ | 224,988 | $ | 116,464 | ||||||||
Foreign currency exchange risk: | ||||||||||||||||
Unrealized depreciation on forward foreign currency exchange contracts | 115,931 | — | 91,114 | 104,250 | ||||||||||||
|
|
|
|
|
|
|
| |||||||||
Total | $ | 233,097 | $ | 172,475 | $ | 626,851 | $ | 687,147 | ||||||||
|
|
|
|
|
|
|
| |||||||||
The effect of derivative instruments on the Statement of Operations during the year ended September 30, 2023 is as follows:
Derivative Instruments Categorized by Risk Exposure | BlueBay Emerging Market Debt Fund | BlueBay High Yield Bond Fund | BlueBay Core Plus Bond Fund | BlueBay Strategic Income Fund | ||||||||||||
Net realized Gain/(Loss) From: | ||||||||||||||||
Credit Risk: | ||||||||||||||||
Credit default swaps | $ | (130,235 | ) | $ | 1,021,485 | $ | (496,382 | ) | $ | (902,917 | ) | |||||
Interest Rate Risk: | ||||||||||||||||
Interest rate swaps | — | — | 180,059 | 1,769,219 | ||||||||||||
Financial futures contracts | 103,007 | (730,074 | ) | (395,823 | ) | 1,679,815 | ||||||||||
Foreign currency exchange risk: | ||||||||||||||||
Forward foreign currency exchange contracts | (163,276 | ) | 14,431 | (326,864 | ) | (354,440 | ) | |||||||||
|
|
|
|
|
|
|
| |||||||||
Total | $ | (190,504 | ) | $ | 305,842 | $ | (1,039,010 | ) | $ | 2,191,677 | ||||||
|
|
|
|
|
|
|
| |||||||||
Derivative Instruments Categorized by Risk Exposure | BlueBay Emerging Market Debt Fund | BlueBay High Yield Bond Fund | BlueBay Core Plus Bond Fund | BlueBay Strategic Income Fund | ||||||||||||
Net Change in Unrealized Appreciation/(Depreciation) From: | ||||||||||||||||
Credit Risk: | ||||||||||||||||
Credit default swaps | $ | (107,544 | ) | $ | 8,537 | $ | 60,640 | $ | 102,380 | |||||||
Interest Rate Risk: | ||||||||||||||||
Interest rate swaps | — | — | (107,658 | ) | (1,704,828 | ) | ||||||||||
Financial futures contracts | (61,712 | ) | (172,475 | ) | 169,984 | (26,521 | ) | |||||||||
Foreign currency exchange risk: | ||||||||||||||||
Forward foreign currency exchange contracts | 130,779 | (137,478 | ) | 171,399 | 202,395 | |||||||||||
|
|
|
|
|
|
|
| |||||||||
Total | $ | (38,477 | ) | $ | (301,416 | ) | $ | 294,365 | $ | (1,426,574 | ) | |||||
|
|
|
|
|
|
|
| |||||||||
| (1) | Not considered to be hedging instruments for accounting disclosure purposes. |
95
NOTES TO FINANCIAL STATEMENTS
|
For the year ended September 30, 2023, the average volume of derivative activities based on ending quarterly outstanding amounts are as follows:
| BlueBay Emerging Market Debt Fund | BlueBay High Yield Bond Fund | BlueBay Core Plus Bond Fund | BlueBay Strategic Income Fund | |||||||||||||
Futures long position (contracts) | 4 | 119 | 115 | 79 | ||||||||||||
Futures short position (contracts) | 12 | — | 78 | 245 | ||||||||||||
Forward foreign currency exchange contracts purchased (U.S. dollar amounts) | $4,784,218 | $ | 2,800,879 | $ | 4,661,378 | $ | 5,136,274 | |||||||||
Forward foreign currency exchange contracts sold (U.S. dollar amounts) | 2,769,984 | 872,483 | 1,711,076 | 1,771,425 | ||||||||||||
Forward foreign currency exchange contracts Purchased in non-U.S. dollars (U.S. dollar equivalent) | 726,634 | — | 1,966,083 | 2,264,701 | ||||||||||||
Purchased options (Cost $) | 782 | — | — | — | ||||||||||||
Interest rate swaps (Notional Amount in U.S. Dollars) | — | — | 5,234,464 | 11,096,099 | ||||||||||||
Credit default swaps (Notional Amount in U.S. Dollars) | 5,776,049 | 8,662,250 | 18,068,000 | 31,642,000 | ||||||||||||
Counterparty Credit Risk:
Derivatives may also expose a Fund to counterparty risk (the risk that the derivative counterparty will not fulfill its contractual obligations). To the extent amounts due to the Funds from their counterparties are not fully collateralized contractually or otherwise, the Funds bear the risk of loss from counterparty non-performance. A Fund’s maximum risk of loss from counterparty credit risk on over-the-counter (“OTC”) derivatives is generally the aggregate unrealized gain in excess of any collateral pledged by the counterparty to the Funds.
For foreign currency exchange contracts, risks may arise upon entering into these contracts from the potential inability of the counterparties to meet the terms of their contracts, or if the foreign currency rates change unfavorably.
The Funds’ risk of loss from counterparty credit risk on OTC derivatives is generally limited to the aggregate unrealized gain netted against any collateral held by the Funds. For OTC purchased options, the Funds bear the risk of loss in the amount of the premiums paid and change in market value of the options should the counterparty not perform under the contracts. Written options by the Funds do not give rise to counterparty credit risk, as written options obligate the Funds to perform and not the counterparty. Counterparty risk related to exchange-traded financial futures contracts and options is minimal because of the protection against defaults provided by the exchange on which they trade.
With exchange-traded purchased options and futures and centrally cleared swaps, the exchange or clearinghouse, as counterparty to such instruments, guarantees against a possible default. The clearinghouse stands between the buyer and the seller of the contract; therefore, credit risk is limited to failure of the clearinghouse. While offset rights may exist under applicable law, the Fund does not have a contractual right of offset against a clearing broker or clearinghouse in the event of a default (including the bankruptcy or insolvency) of the clearing broker or clearinghouse. Additionally, credit risk exists in exchange-traded futures and centrally cleared swaps with respect to initial and variation margin that is held in a clearing broker’s customer accounts. While clearing brokers are required to segregate customer margin from their own assets, in the event that a clearing broker becomes insolvent or goes into bankruptcy and at that time there is a shortfall in the aggregate amount of margin held by the clearing broker for all its clients, typically the shortfall would be allocated on a pro rata basis across all the clearing broker’s customers, potentially resulting in losses to the Funds.
96
NOTES TO FINANCIAL STATEMENTS
|
In order to better define its contractual rights and to secure rights that will help the Funds mitigate its counterparty risk, the Funds may enter into an International Swaps and Derivatives Association, Inc. Master Agreement (“ISDA Master Agreement”) or similar agreement with its derivative contract counterparties. An ISDA Master Agreement is a bilateral agreement between a Fund and a counterparty that governs certain OTC derivatives and typically contains, among other things, collateral posting terms and netting provisions in the event of a default and/or termination event. Under an ISDA Master Agreement, a Fund may, under certain circumstances, offset with the counterparty certain derivative financial instruments’ payables and/or receivables with collateral held and/or posted and create one single net payment. The provisions of the ISDA Master Agreement typically permit a single net payment in the event of default including the bankruptcy or insolvency of the counterparty. However, bankruptcy or insolvency laws of a particular jurisdiction may impose restrictions on or prohibitions against the right of offset in bankruptcy, insolvency or other events. In addition, certain ISDA Master Agreements allow counterparties to OTC derivatives to terminate derivative contracts prior to maturity in the event a Fund’s net assets decline by a stated percentage or the Fund fails to meet the terms of its ISDA Master Agreements, which would cause the Fund to accelerate payment of any net liability owed to the counterparty.
Collateral Requirements:
For derivatives traded under an ISDA Master Agreement, the collateral requirements are typically calculated by netting the mark-to-market amount for each transaction under such agreement and comparing that amount to the value of any collateral currently pledged by the Fund and the counterparty.
Cash collateral that has been pledged to cover obligations of a Fund and cash collateral received from the counterparty, if any, is reported separately on the Statements of Assets and Liabilities as cash due to broker for options contracts, cash at broker for financial futures contracts and segregated cash and foreign currency for options contracts and swap contracts and cash received as payable to broker, respectively. Non-cash collateral pledged by the Fund, if any, is noted in the Schedule of Portfolio Investments. Generally, the amount of collateral due from or to a party has to exceed a minimum transfer amount threshold (e.g. $500,000) before a transfer is required, which is determined at the close of business of a Fund and any additional required collateral is delivered to/pledged by a Fund on the next business day. Typically, a Fund and its counterparties are not permitted to sell, re-pledge or use the collateral they receive. To the extent amounts due to a Fund from its counterparties are not fully collateralized, contractually or otherwise, a Fund bears the risk of loss from counterparty non-performance. The Funds attempt to mitigate counterparty risk by entering into agreements only with counterparties that it believes have the financial resources to honor their obligations and by monitoring the financial stability of those counterparties.
97
NOTES TO FINANCIAL STATEMENTS
|
Emerging Market Debt Fund
| Citibank N.A. | HSBC Bank Plc | Barclays Bank plc | Morgan Stanley & Co LLC | Total | ||||||||||||||||
Assets: | ||||||||||||||||||||
Forward Currency Exchange Contracts | $ | 263,292 | $ | 13,665 | $ | — | $ | — | $ | 276,957 | ||||||||||
Swaps | 2,320 | — | 33,542 | 9,677 | 45,539 | |||||||||||||||
|
|
|
|
|
|
|
|
|
| |||||||||||
Total Assets | 265,612 | 13,665 | 33,542 | 9,677 | 322,496 | |||||||||||||||
|
|
|
|
|
|
|
|
|
| |||||||||||
Liabilities: | ||||||||||||||||||||
Forward Currency Exchange Contracts | 111,090 | 4,841 | — | — | 115,931 | |||||||||||||||
Swaps | 12,012 | — | 40,549 | 55,206 | 107,767 | |||||||||||||||
|
|
|
|
|
|
|
|
|
| |||||||||||
Total Liabilities | 123,102 | 4,841 | 40,549 | 55,206 | 223,698 | |||||||||||||||
|
|
|
|
|
|
|
|
|
| |||||||||||
Total Financial and Derivative Net Assets1 | 142,510 | 8,824 | (7,007 | ) | (45,529 | ) | 98,798 | |||||||||||||
Total Collateral (Received) Pledged2 | — | — | — | 45,529 | 45,529 | |||||||||||||||
|
|
|
|
|
|
|
|
|
| |||||||||||
Net Amount3 | $ | 142,510 | $ | 8,824 | $ | (7,007 | ) | $ | — | $ | 144,327 | |||||||||
|
|
|
|
|
|
|
|
|
| |||||||||||
High Yield Bond Fund
| Citibank N.A. | Morgan Stanley & Co LLC | Total | ||||||||||||||||||
Assets: | ||||||||||||||||||||
Forward Currency Exchange Contracts | $ | 56,756 | $ | — | $ | 56,756 | ||||||||||||||
Swaps | — | 236,522 | 236,522 | |||||||||||||||||
|
|
|
|
|
| |||||||||||||||
Total Assets | 56,756 | 236,522 | 293,278 | |||||||||||||||||
|
|
|
|
|
| |||||||||||||||
Total Financial and Derivative Net Assets1 | 56,756 | 236,522 | 293,278 | |||||||||||||||||
|
|
|
|
|
| |||||||||||||||
Net Amount3 | $ | 56,756 | $ | 236,522 | $ | 293,278 | ||||||||||||||
|
|
|
|
|
| |||||||||||||||
98
NOTES TO FINANCIAL STATEMENTS
|
Core Plus Bond Fund
| Citibank N.A. | Morgan Stanley & Co LLC | Total | ||||||||||||||||||
Assets: | ||||||||||||||||||||
Forward Currency Exchange Contracts | $ | 329,495 | $ | — | $ | 329,495 | ||||||||||||||
Swaps | — | 36,397 | 36,397 | |||||||||||||||||
|
|
|
|
|
| |||||||||||||||
Total Assets | 329,495 | 36,397 | 365,892 | |||||||||||||||||
|
|
|
|
|
| |||||||||||||||
Liabilities: | ||||||||||||||||||||
Forward Currency Exchange Contracts | 91,114 | — | 91,114 | |||||||||||||||||
Swaps | — | 310,749 | 310,749 | |||||||||||||||||
|
|
|
|
|
| |||||||||||||||
Total Liabilities | 91,114 | 310,749 | 401,863 | |||||||||||||||||
|
|
|
|
|
| |||||||||||||||
Total Financial and Derivative Net Assets1 | 238,381 | (274,352 | ) | (35,971 | ) | |||||||||||||||
Total Collateral (Received) Pledged2 | — | 274,352 | 274,352 | |||||||||||||||||
|
|
|
|
|
| |||||||||||||||
Net Amount3 | $ | 238,381 | $ | — | $ | 238,381 | ||||||||||||||
|
|
|
|
|
| |||||||||||||||
Strategic Income Fund
| ||||||||||||||||||||
| Citibank N.A. | Morgan Stanley & Co LLC | Total | ||||||||||||||||||
Assets: | ||||||||||||||||||||
Forward Currency Exchange Contracts | $ | 367,890 | $ | — | $ | 367,890 | ||||||||||||||
Swaps | — | 68,206 | 68,206 | |||||||||||||||||
|
|
|
|
|
| |||||||||||||||
Total Assets | 367,890 | 68,206 | 436,096 | |||||||||||||||||
|
|
|
|
|
| |||||||||||||||
Liabilities: | ||||||||||||||||||||
Forward Currency Exchange Contracts | 104,250 | — | 104,250 | |||||||||||||||||
Swaps | — | 466,433 | 466,433 | |||||||||||||||||
|
|
|
|
|
| |||||||||||||||
Total Liabilities | 104,250 | 466,433 | 570,683 | |||||||||||||||||
|
|
|
|
|
| |||||||||||||||
Total Financial and Derivative Net Assets1 | 263,640 | (398,227 | ) | (134,587 | ) | |||||||||||||||
Total Collateral (Received) Pledged2 | — | 398,227 | 398,227 | |||||||||||||||||
|
|
|
|
|
| |||||||||||||||
Net Amount3 | $ | 263,640 | $ | — | $ | 263,640 | ||||||||||||||
|
|
|
|
|
| |||||||||||||||
1 The amount of derivatives for offset is limited to the amount of assets and/or liabilities that are subject to a MNA.
2 Excess of collateral (received) pledged from/to the individual counterparty may not be shown for financial reporting purposes.
3 Net amount represents the net amount receivable (payable) from/to the individual counterparty in the event of default.
Affiliated Investments:
The Funds invest in another Fund of the Trust (an “Affiliated Fund”), RBC BlueBay U.S. Government Money Market Fund-RBC Institutional Class 1, as a cash sweep vehicle. The income earned by the Funds from the Affiliated Fund for the period is disclosed in the Statement of Operations. The table below details the transactions of the Funds in the Affiliated Fund.
As the affiliated investment is a money market fund in which shares are issued and redeemed at $1.00 per share, the number of shares purchased and sold equal the dollar amount shown as purchased and sold, and no gain or loss was realized on the sale of shares of the affiliated money market fund.
99
NOTES TO FINANCIAL STATEMENTS
|
| Value September 30, 2022 | Purchases | Sales | Value September 30, 2023 | Dividends | ||||||||||||||||
| Investments in RBC BlueBay U.S. Government Money Market Fund—RBC Institutional Class 1 | ||||||||||||||||||||
Emerging Market Debt Fund | $ | 2,571,521 | $ | 18,982,172 | $ | 20,298,166 | $ | 1,255,527 | $ | 34,053 | ||||||||||
High Yield Bond Fund | 7,884,517 | 294,175,602 | 286,639,724 | 15,420,395 | 505,206 | |||||||||||||||
Core Plus Bond Fund | 3,468,902 | 87,516,119 | 87,677,577 | 3,307,444 | 74,137 | |||||||||||||||
Strategic Income Fund | 8,444,957 | 108,723,946 | 112,574,465 | 4,594,438 | 130,048 | |||||||||||||||
Credit Enhancement:
Certain obligations held by the Funds have credit enhancement or liquidity features that may, under certain circumstances, provide for repayment of principal and interest on the obligation upon demand date, interest rate reset date or final maturity. These enhancements may include: letters of credit; liquidity guarantees; security purchase agreements; tender option purchase agreements and third party insurance.
Investment Transactions and Income:
Investment transactions are recorded on trade date. Dividend income net of non-reclaimable withholding taxes is recorded on the ex-dividend date. Non-cash dividends, if any, are recorded on the ex-dividend date at fair value. Realized gains and losses from investment transactions are calculated based on the cost of the specific security (also known as identified cost basis). Interest income is recognized on the accrual basis and includes, where applicable, the amortization or accretion of premium or discount using the effective yield method.
Expense, Investment Income and Gain/Loss Allocation:
Each Fund pays the expenses that are directly related to its operations, such as custodian fees or advisory fees. Expenses incurred by the Trust, such as trustee or legal fees, are allocated among each of the Funds in the Trust either proportionately based upon each Fund’s relative net assets or using another reasonable basis such as equally across all Funds in the Trust, depending on the nature of the expense. Individual share classes within a Fund are charged expenses specific to that class, such as distribution fees and transfer agent fees. Within a Fund, expenses other than class specific expenses are allocated daily to each class based upon the proportion of relative net assets. Investment income and realized and unrealized gains or losses are allocated to each class of shares based on relative net assets.
Indemnifications:
Under the Trust’s organizational documents, each Trustee, officer, employee or other agent of the Trust is indemnified against certain liabilities that may arise out of their duties to the Funds. Additionally, in the normal course of business, the Funds enter into contracts, including the Funds’ servicing agreements, that contain a variety of indemnification clauses. The Funds’ maximum exposure under these arrangements is unknown as this would involve future claims that may be made against the Funds that have not yet occurred.
Distributions to Shareholders:
Each Fund pays out any income that it receives, less expenses, in the form of dividends and capital gains to its shareholders. Income dividends are declared and paid monthly. Capital gain distributions
100
NOTES TO FINANCIAL STATEMENTS
|
are declared and paid at least annually. Distributions to shareholders are recorded on the ex-dividend date. The amount of dividends and distributions are calculated based on federal income tax regulations, which may differ from US GAAP. These “book/tax” differences may be either temporary or permanent in nature. To the extent these differences are determined, as of the end of the tax year, to be permanent, they are reclassified within a Fund’s capital accounts based on their federal tax basis treatment. Permanent differences include reclassification of foreign currency from capital to ordinary, currency treatment for the accrual of certain foreign denominated swaps and early termination on such swaps, and reclassification of foreign currency options from capital to currency.
3. Agreements and Other Transactions with Affiliates:
The Trust has entered into an investment advisory agreement with RBC GAM-US under which RBC GAM-US manages each Fund’s assets and furnishes related office facilities, equipment, research and personnel. The agreement requires each Fund to pay RBC GAM-US a monthly fee based upon average daily net assets. Under the terms of the agreement, RBC GAM-US is entitled to receive fees based on a percentage of the average daily net assets of each of the Funds as follows:
| Annual Rate | ||||
Emerging Market Debt Fund | 0.65 | % | ||
High Yield Bond Fund | 0.55 | % | ||
Core Plus Bond Fund | 0.35 | % | ||
Strategic Income Fund | 0.53 | % | ||
RBC GAM-US has contractually agreed to waive fees and/or make payments in order to keep total operating expenses (excluding certain fees such as interest, taxes and acquired fund fees and expenses) of the Funds to the following levels pursuant to an expense limitation agreement.
| Class A Annual Rate | Class I Annual Rate | Class R6 Annual Rate | ||||||||||
Emerging Market Debt Fund | 1.04 | % | 0.79 | % | 0.74 | % | ||||||
High Yield Bond Fund | 0.82 | % | 0.57 | % | N/A | |||||||
Core Plus Bond Fund | 0.70 | % | 0.45 | % | 0.40 | % | ||||||
Strategic Income Fund | 0.88 | % | 0.63 | % | 0.58 | % | ||||||
This expense limitation agreement is in place until January 31, 2025 and may not be terminated by RBC GAM-US prior to that date. The agreement shall continue for additional one-year terms unless terminated or revised by the Board at any time or by RBC GAM-US at the expiration of any one-year period. The Advisor is entitled to recoup from the Fund or class the fees and/or operating expenses waived or reimbursed during any of the previous 3 years, provided the Fund is able to do so and remain in compliance with the expense limitation in place at the time the fees were waived or expenses paid.
The amounts subject to possible recoupment under the expense limitation agreement were:
| FYE 9/30/21 | FYE 9/30/22 | FYE 9/30/23 | Total | |||||||||||||
Emerging Market Debt Fund | $ | 262,011 | $ | 233,671 | $ | 283,786 | $ | 779,468 | ||||||||
High Yield Bond Fund | 535,173 | 704,969 | 837,648 | 2,077,790 | ||||||||||||
Core Plus Bond Fund | N/A | 304,698 | 259,043 | 563,741 | ||||||||||||
Strategic Income Fund | N/A | 300,597 | 254,175 | 554,772 | ||||||||||||
There was no recoupment of expense reimbursement/waivers during the year. Amounts from years prior to those shown are no longer subject to recoupment
RBC GAM-US may also voluntarily waive and/or reimburse operating expenses of any Fund from time to time. Any such voluntary program may be changed or eliminated at any time without notice, and expenses waived under such program are not subject to recoupment.
101
NOTES TO FINANCIAL STATEMENTS
|
RBC GAM-US voluntarily agreed to waive its investment advisory fees by the amount of investment advisory fees the Funds pay to RBC GAM-US indirectly through its investment in an affiliated money market fund. For the period ended September 30, 2023, the amount waived was $1,282, $18,226, $2,728 and $4,867 for the Emerging Market Debt Fund, High Yield Bond Fund, Core Plus Bond Fund and Strategic Income Fund respectively, and is included in expenses waived/reimbursed by Advisory in the Statement of Operations.
Emerging Market Debt Fund and High Yield Bond Fund are sub-advised by RBC GAM-UK a wholly-owned subsidiary of Royal Bank of Canada, which is also the parent company of the Advisor. The Sub-Advisor is paid by the Advisor out of the advisory fee paid by the Funds to the Advisor.
RBC GAM-US serves as co-administrator to the Funds. BNY Mellon serves as co-administrator and fund accounting agent. Services provided under the administrative services agreement include providing day-to-day administration of matters related to the Funds, maintenance of their records and the preparation of reports. Under the terms of the administrative services agreement, RBC GAM-US does not receive a fee for its role as co-administrator. BNY Mellon receives a fee for its services payable by the Funds based in part on the Funds’ average net assets. BNY Mellon’s fee is included with “Accounting fees” in the Statements of Operations.
Certain Officers and Trustees of the Trust are affiliated with the Advisor. Such Officers and Trustees receive no compensation from the Funds for serving in their respective roles.
The Trust currently pays each of the independent Trustees (Trustees of the Trust who are not directors, officers or employees of the Advisor, either Co-Administrator or Distributor) an annual retainer of $84,000. The Board Chairperson and Audit Committee Chairperson each receive an additional retainer of $2,500 annually, and all other trustees serving as Chair of a Board committee each receive an additional retainer of $1,000 annually. In addition, Independent Trustees receive a quarterly meeting fee of $6,500 for each in-person Board meeting attended, a meeting fee of $1,500 for each telephonic or Special Board meeting attended, a $1,500 fee for each Board committee meeting attended, and are reimbursed for all out-of-pocket expenses relating to attendance at such meetings. These amounts are included in the Statement of Operations in “Trustees’ fees”.
In conjunction with the launch of each of the Funds or additional share classes, the Advisor invested seed capital to provide each Fund or share class with its initial investment assets. The table below shows, as of September 30, 2023, each Fund’s net assets, the shares (if any) of each Fund held by the Advisor, and the percent of total net assets represented by the Advisor’s investment.
| Net Assets | Shares held by Advisor | % of Fund Net Assets | ||||||||||
Emerging Market Debt Fund | $ | 38,937,371 | 1,480 | 0.0 | % | |||||||
Core Plus Bond Fund | $ | 43,777,669 | 5,224,592 | 100.0 | % | |||||||
Strategic Income Fund | $ | 52,923,126 | 5,319,177 | 100.0 | % | |||||||
4. Fund Distribution:
Each of the Funds that offers Class A shares has adopted a Master Distribution 12b-1 Plan (the “Plan”) in which Quasar Distributors LLC (the “Distributor”) acts as the Funds’ distributor. The Plan permits each Fund to make payments for, or to reimburse the Distributor for, distribution-related costs and expenses of marketing shares of Class A covered under the Plan, and/or for providing shareholder services. The Plan does not apply to Class I and Class R6. The following chart shows the current Plan fee rate for Class A.
| Class A | ||||
12b-1 Plan Fee | 0.25 | %* | ||
* Under the 12b-1 plan, the maximum fee rate for Class A shares is 0.50%. Currently the Board has approved an annual limit of 0.25%.
102
NOTES TO FINANCIAL STATEMENTS
|
Plan fees are based on average daily net assets of Class A. Up to 0.25% of each Plan fee may be designated as a service fee, as defined by the applicable rules of the Financial Industry Regulatory Authority. The Distributor, subject to applicable legal requirements, may waive the Plan fee voluntarily, in whole or in part. For the year ended September 30, 2023, there were no fees waived by the Distributor.
The Distributor did not receive any CDSC fees from Class A shares of the Funds during the year ended September 30, 2023.
For the year ended September 30, 2023, the Distributor received commissions of $3,700 for front-end sales charges of Class A shares of the Funds, of which $3,700 was paid to affiliated broker-dealers.
5. Securities Transactions:
The cost of securities purchased and proceeds from securities sold (excluding securities maturing less than one year from acquisition) for the year ended September 30, 2023 were as follows:
| Purchases (Excl. U.S. Gov’t) | Sales (Excl. U.S. Gov’t) | Purchases of U.S. Gov’t. | Sales of U.S. Gov’t. | |||||||||||||
Emerging Market Debt Fund | $ | 31,359,653 | $ | 25,607,550 | $ | 782,750 | $ | 2,403,538 | ||||||||
High Yield Bond Fund | 377,049,597 | 220,146,185 | 30,317,541 | 19,191,780 | ||||||||||||
Core Plus Bond Fund | 251,717,207 | 252,947,091 | 104,335,569 | 106,578,082 | ||||||||||||
Strategic Income Fund | 291,106,342 | 288,978,946 | 22,995,128 | 19,376,322 | ||||||||||||
6. Capital Share Transactions:
The Trust is authorized to issue an unlimited number of shares of beneficial interest (“shares outstanding”) without par value. Transactions in capital stock of the Funds are summarized on the following pages:
| Emerging Market Debt Fund | High Yield Bond Fund | |||||||||||||||||||||||||||||
| For the Year Ended September 30, 2023 | For the Year Ended September 30, 2022 | For the Year Ended September 30, 2023 | For the Year Ended September 30, 2022 | |||||||||||||||||||||||||||
CAPITAL TRANSACTIONS: | ||||||||||||||||||||||||||||||
Class A | ||||||||||||||||||||||||||||||
Proceeds from shares issued | $ | 12 | $ | 21,622 | $ | 1,415,522 | $ | 1,434,024 | ||||||||||||||||||||||
Distributions reinvested | 1,644 | 1,321 | 197,830 | 198,485 | ||||||||||||||||||||||||||
Cost of shares redeemed | (11,195 | ) | (4,893 | ) | (1,111,918 | ) | (1,720,571 | ) | ||||||||||||||||||||||
|
|
|
|
|
|
|
| |||||||||||||||||||||||
Change in Class A | $ | (9,539 | ) | $ | 18,050 | $ | 501,434 | $ | (88,062 | ) | ||||||||||||||||||||
|
|
|
|
|
|
|
| |||||||||||||||||||||||
Class I | ||||||||||||||||||||||||||||||
Proceeds from shares issued | $ | 6,458,810 | $ | 9,259,514 | $ | 287,244,769 | $ | 258,126,687 | ||||||||||||||||||||||
Distributions reinvested | 2,319,939 | 1,717,053 | 19,634,451 | 14,628,539 | ||||||||||||||||||||||||||
Cost of shares redeemed | (2,258,534 | ) | (17,151 | ) | (140,944,321 | ) | (184,149,944 | ) | ||||||||||||||||||||||
|
|
|
|
|
|
|
| |||||||||||||||||||||||
Change in Class I | $ | 6,520,215 | $ | 10,959,416 | $ | 165,934,899 | $ | 88,605,282 | ||||||||||||||||||||||
|
|
|
|
|
|
|
| |||||||||||||||||||||||
Class R6 | ||||||||||||||||||||||||||||||
Distributions reinvested | $ | 730 | $ | 663 | $ | — | $ | — | ||||||||||||||||||||||
|
|
|
|
|
|
|
| |||||||||||||||||||||||
Change in Class R6 | $ | 730 | $ | 663 | $ | — | $ | — | ||||||||||||||||||||||
|
|
|
|
|
|
|
| |||||||||||||||||||||||
Change in net assets resulting from capital transactions | $ | 6,511,406 | $ | 10,978,129 | $ | 166,436,333 | $ | 88,517,220 | ||||||||||||||||||||||
|
|
|
|
|
|
|
| |||||||||||||||||||||||
103
NOTES TO FINANCIAL STATEMENTS
|
| Emerging Market Debt Fund | High Yield Bond Fund | |||||||||||||||||||||||||||||||
| For the Year Ended September 30, 2023 | For the Year Ended September 30, 2022 | For the Year Ended September 30, 2023 | For the Year Ended September 30, 2022 | |||||||||||||||||||||||||||||
SHARE TRANSACTIONS: | ||||||||||||||||||||||||||||||||
Class A | ||||||||||||||||||||||||||||||||
Issued | 1 | 2,378 | 152,070 | 139,226 | ||||||||||||||||||||||||||||
Reinvested | 219 | 158 | 21,315 | 19,447 | ||||||||||||||||||||||||||||
Redeemed | (1,468 | ) | (548 | ) | (120,061 | ) | (168,456 | ) | ||||||||||||||||||||||||
|
|
|
|
|
|
|
| |||||||||||||||||||||||||
Change in Class A | (1,248 | ) | 1,988 | 53,324 | (9,783 | ) | ||||||||||||||||||||||||||
|
|
|
|
|
|
|
| |||||||||||||||||||||||||
Class I | ||||||||||||||||||||||||||||||||
Issued | 863,992 | 1,112,751 | 30,505,012 | 25,401,490 | ||||||||||||||||||||||||||||
Reinvested | 301,566 | 201,064 | 2,092,577 | 1,433,918 | ||||||||||||||||||||||||||||
Redeemed | (311,654 | ) | (2,061 | ) | (14,970,602 | ) | (18,490,960 | ) | ||||||||||||||||||||||||
|
|
|
|
|
|
|
| |||||||||||||||||||||||||
Change in Class I | 853,904 | 1,311,754 | 17,626,987 | 8,344,448 | ||||||||||||||||||||||||||||
|
|
|
|
|
|
|
| |||||||||||||||||||||||||
Class R6 | ||||||||||||||||||||||||||||||||
Reinvested | 95 | 76 | — | — | ||||||||||||||||||||||||||||
|
|
|
|
|
|
|
| |||||||||||||||||||||||||
Change in Class R6 | 95 | 76 | — | — | ||||||||||||||||||||||||||||
|
|
|
|
|
|
|
| |||||||||||||||||||||||||
Change in shares resulting from capital transactions | 852,751 | 1,313,818 | 17,680,311 | 8,334,665 | ||||||||||||||||||||||||||||
|
|
|
|
|
|
|
| |||||||||||||||||||||||||
| Core Plus Bond Fund | Strategic Income Fund | |||||||||||||||||||||||||||||||
| For the Year Ended September 30, 2023 | For the Period Ended September 30, 2022(a) | For the Year Ended September 30, 2023 | For the Period Ended September 30, 2022(a) | |||||||||||||||||||||||||||||
CAPITAL TRANSACTIONS: | ||||||||||||||||||||||||||||||||
Class A | ||||||||||||||||||||||||||||||||
Proceeds from shares issued | $ | — | $ | 5,000,000 | $ | — | $ | 5,000,000 | ||||||||||||||||||||||||
Distributions reinvested | 100,947 | 75,065 | 217,745 | 66,020 | ||||||||||||||||||||||||||||
|
|
|
|
|
|
|
| |||||||||||||||||||||||||
Change in Class A | $ | 100,947 | $ | 5,075,065 | $ | 217,745 | $ | 5,066,020 | ||||||||||||||||||||||||
|
|
|
|
|
|
|
| |||||||||||||||||||||||||
Class I | ||||||||||||||||||||||||||||||||
Proceeds from shares issued | $ | — | $ | 35,000,000 | $ | — | $ | 35,000,000 | ||||||||||||||||||||||||
Distributions reinvested | 777,143 | 588,490 | 1,616,186 | 531,813 | ||||||||||||||||||||||||||||
|
|
|
|
|
|
|
| |||||||||||||||||||||||||
Change in Class I | $ | 777,143 | $ | 35,588,490 | $ | 1,616,186 | $ | 35,531,813 | ||||||||||||||||||||||||
|
|
|
|
|
|
|
| |||||||||||||||||||||||||
Class R6 | ||||||||||||||||||||||||||||||||
Proceeds from shares issued | $ | — | $ | 10,000,000 | $ | — | $ | 10,000,000 | ||||||||||||||||||||||||
Distributions reinvested | 226,512 | 171,927 | 467,015 | 155,930 | ||||||||||||||||||||||||||||
|
|
|
|
|
|
|
| |||||||||||||||||||||||||
Change in Class R6 | $ | 226,512 | $ | 10,171,927 | $ | 467,015 | $ | 10,155,930 | ||||||||||||||||||||||||
|
|
|
|
|
|
|
| |||||||||||||||||||||||||
Change in net assets resulting from capital transactions | $ | 1,104,602 | $ | 50,835,482 | $ | 2,300,946 | $ | 50,753,763 | ||||||||||||||||||||||||
|
|
|
|
|
|
|
| |||||||||||||||||||||||||
104
NOTES TO FINANCIAL STATEMENTS
|
| Core Plus Bond Fund | Strategic Income Fund | |||||||||||||||||||||||||||||||
| For the Year Ended September 30, 2023 | For the Period Ended September 30, 2022(a) | For the Year Ended September 30, 2023 | For the Period Ended September 30, 2022(a) | |||||||||||||||||||||||||||||
SHARE TRANSACTIONS: | ||||||||||||||||||||||||||||||||
Class A | ||||||||||||||||||||||||||||||||
Issued | — | 500,000 | — | 500,000 | ||||||||||||||||||||||||||||
Reinvested | 12,051 | 8,371 | 22,894 | 6,790 | ||||||||||||||||||||||||||||
|
|
|
|
|
|
|
| |||||||||||||||||||||||||
Change in Class A | 12,051 | 508,371 | 22,894 | 506,790 | ||||||||||||||||||||||||||||
|
|
|
|
|
|
|
| |||||||||||||||||||||||||
Class I | ||||||||||||||||||||||||||||||||
Issued | — | 3,500,000 | — | 3,500,000 | ||||||||||||||||||||||||||||
Reinvested | 92,623 | 65,434 | 169,769 | 54,656 | ||||||||||||||||||||||||||||
|
|
|
|
|
|
|
| |||||||||||||||||||||||||
Change in Class I | 92,623 | 3,565,434 | 169,769 | 3,554,656 | ||||||||||||||||||||||||||||
|
|
|
|
|
|
|
| |||||||||||||||||||||||||
Class R6 | ||||||||||||||||||||||||||||||||
Issued | — | 1,000,000 | — | 1,000,000 | ||||||||||||||||||||||||||||
Reinvested | 27,006 | 19,107 | 49,045 | 16,024 | ||||||||||||||||||||||||||||
|
|
|
|
|
|
|
| |||||||||||||||||||||||||
Change in Class R6 | 27,006 | 1,019,107 | 49,045 | 1,016,024 | ||||||||||||||||||||||||||||
|
|
|
|
|
|
|
| |||||||||||||||||||||||||
Change in shares resulting from capital transactions | 131,680 | 5,092,912 | 241,708 | 5,077,470 | ||||||||||||||||||||||||||||
|
|
|
|
|
|
|
| |||||||||||||||||||||||||
(a) For the period from November 1, 2021 (commencement of operations) through September 30, 2022.
7. Federal Income Taxes:
It is the policy of each Fund to continue to qualify as a regulated investment company by complying with the provisions available to certain investment companies, as defined under Subchapter M of the Internal Revenue Code, and to distribute substantially all of its net investment income and net realized capital gains. Therefore, no federal tax liability is recorded in the financial statements of each Fund.
For all open tax years and all major taxing jurisdictions, management of the Funds has concluded that there are no significant uncertain tax positions that would require recognition in the financial statements. Open tax years are those that are open for examination by taxing authorities (i.e., generally the last three tax year ends and the interim tax period since then). Furthermore, management of the Funds is also not aware of any tax positions for which it is reasonably possible that the total amounts of unrecognized tax benefits will significantly change in the next twelve months.
As of September 30, 2023, the tax cost of investments and the breakdown of unrealized appreciation (depreciation) for each Fund was as follows:
| Tax Cost Of Investments | Unrealized Appreciation | Unrealized Depreciation | Net Unrealized Appreciation/ (Depreciation) | |||||||||||||
Emerging Market Debt Fund | $ | 42,758,231 | $ | 684,163 | $ | (5,686,764 | ) | $ | (5,002,601 | ) | ||||||
High Yield Bond Fund | 472,221,925 | 1,166,160 | (20,465,328 | ) | (19,299,168 | ) | ||||||||||
Core Plus Bond Fund | 52,153,457 | 306,869 | (3,146,551 | ) | (2,839,682 | ) | ||||||||||
Strategic Income Fund | 54,407,726 | 322,351 | (2,889,998 | ) | (2,567,647 | ) | ||||||||||
105
NOTES TO FINANCIAL STATEMENTS
|
The difference between book basis and tax basis unrealized appreciation/depreciation is attributable primarily to the tax deferral of losses on wash sales, currency straddle losses, significant debt modifications and mark to market on derivatives.
The tax character of distributions during the year ended September 30, 2023 were as follows:
| Distributions Paid From | ||||||||||||||||
| Ordinary Income | Net Long Term Capital Gains | Total Taxable Distributions | Total Distributions Paid | |||||||||||||
Emerging Market Debt Fund | $ | 2,354,279 | $ | — | $ | 2,354,279 | $ | 2,354,279 | ||||||||
High Yield Bond Fund | 21,874,221 | — | 21,874,221 | 21,874,221 | ||||||||||||
Core Plus Bond Fund | 1,104,602 | — | 1,104,602 | 1,104,602 | ||||||||||||
Strategic Income Fund | 1,303,132 | 997,815 | 2,300,947 | 2,300,947 | ||||||||||||
The tax character of distributions during the year ended September 30, 2022 were as follows:
| Distributions Paid From | ||||||||||||||||
| Ordinary Income | Net Long Term Capital Gains | Total Taxable Distributions | Total Distributions Paid | |||||||||||||
Emerging Market Debt Fund | $ | 1,721,294 | $ | — | $ | 1,721,294 | $ | 1,721,294 | ||||||||
High Yield Bond Fund | 15,858,016 | 612,456 | 16,470,472 | 16,470,472 | ||||||||||||
Core Plus Bond Fund | 835,482 | — | 835,482 | 835,482 | ||||||||||||
Strategic Income Fund | 753,763 | — | 753,763 | 753,763 | ||||||||||||
As of September 30, 2023, the components of accumulated earnings/(losses) on a tax basis were as follows:
| BlueBay Emerging Market Debt Fund | BlueBay High Yield Bond Fund | BlueBay Core Plus Bond Fund | BlueBay Strategic Income Fund | |||||||||||||
Undistributed ordinary income | $ | 714,428 | $ | 4,009,588 | $ | 942,285 | $ | 1,506,599 | ||||||||
Undistributed long term gain | — | — | — | 977,311 | ||||||||||||
|
|
|
|
|
|
|
| |||||||||
Accumulated earnings | 714,428 | 4,009,588 | 942,285 | 2,483,910 | ||||||||||||
Accumulated capital loss carryforwards | (8,702,642 | ) | (22,478,292 | ) | (6,224,005 | ) | — | |||||||||
Unrealized depreciation | (5,002,601 | ) | (19,299,168 | ) | (2,839,682 | ) | (2,567,647 | ) | ||||||||
|
|
|
|
|
|
|
| |||||||||
Total Accumulated Losses | $ | (12,990,815 | ) | $ | (37,767,872 | ) | $ | (8,121,402 | ) | $ | (83,737 | ) | ||||
|
|
|
|
|
|
|
| |||||||||
As of September 30, 2023, the Emerging Market Debt Fund, the High Yield Bond Fund, and the Core Plus Bond Fund had short-term capital loss carryforwards of $6,292,737, $9,282,856 and $3,711,925 and long-term capital loss carryforwards of $2,409,905, $13,195,436 and $2,512,080 respectively, available to offset future realized capital gains in accordance with the Regulated Investment Company Modernization Act of 2010. These capital loss carryforwards are not subject to expiration and must first be utilized to offset future realized gains of the same character.
Under current tax law, Post-October Capital Losses and Late-Year Ordinary Losses may be deferred and treated as occurring on the first business day of the following fiscal year for tax purposes.
106
NOTES TO FINANCIAL STATEMENTS
|
8. Market Timing:
The Trust strongly discourages attempts at market timing by Fund shareholders. Prior to June 11, 2021, each Fund charged a redemption fee of 2% of the value of the shares redeemed or exchanged within 30 days of purchase. In addition, the Trust may limit the number of exchanges that may be made between Funds to five (5) per calendar year. When assessed, the redemption fee was deducted from the redemption proceeds and retained by the Fund, not by the Advisor. This redemption fee was not charged in cases where, for example, the redemption resulted from an automatic reinvestment or asset re-allocation not specifically directed by the shareholder. The Trust also reserves the right to reject any Fund purchase order made by persons deemed to be market timers. The Funds’ prospectus contains a full description of the Trust’s policies on market timing and/or excessive trading. The redemption fee is recorded as a credit to capital and is included in the capital transactions on the Statements of Changes in Net Assets.
9. Commitments:
High Yield Bond Fund may invest in floating rate loan interests. In connection with these investments, High Yield Bond Fund may also enter into bridge loan commitments (“commitments”). Commitments may obligate the Fund to furnish temporary financing to a borrower until permanent financing can be arranged. As of September 30, 2023, High Yield Bond Fund had no outstanding commitments. In connection with these commitments, High Yield Bond Fund earns a commitment fee, typically set as a percentage of the commitment amount. Such fee income, which is included in interest income in the Statements of Operations, is recognized ratably over the commitment period.
10. Line of Credit
The Funds are participants in a single uncommitted, unsecured $50,000,000 line of credit with The Bank of New York Mellon, the Funds’ custodian, to be used to fund shareholder redemption requests and for other short-term temporary or emergency general business purposes. Interest is charged on borrowings under this line of credit at the Bank’s prime lending rate per annum. Since each Fund participates in the line of credit, there is no assurance that an individual fund will have access to all or any part of the $50,000,000 at any particular time. During the year ended September 30, 2023, none of the Funds borrowed under the line of credit.
11. Significant Risks
Shareholder concentration risk:
As of September 30, 2023, the Funds had broker-dealer omnibus accounts which each owned more than 10% of a Fund’s outstanding shares as shown below:
| # of Omnibus Accounts | % of Fund | |||||||
High Yield Bond Fund | 2 | 45.3% | ||||||
In addition, three unaffiliated shareholders in aggregate owned 92.0% of the Emerging Market Debt Fund as of September 30, 2023. Significant transactions by these shareholders may impact the Funds’ performance.
Market risk:
One or more markets in which a Fund invests may go down in value, sometimes sharply and unpredictably, and the value of a Fund’s portfolio securities may fall or fail to rise. Market risk may affect a single issuer, sector of the economy, industry or the market as a whole. In addition, global economies and financial markets are becoming increasingly interconnected, and political, economic and other conditions and events (including, but not limited to, natural disasters, pandemics, epidemics, and social unrest) in one country, region, or financial market may adversely impact issuers in a different country, region or financial market. Furthermore, the occurrence of, among other events, natural or man-made disasters, severe weather or geological events, fires, floods, earthquakes, outbreaks of disease (such as COVID-19, avian influenza or H1N1/09), epidemics, pandemics, malicious acts, cyber-attacks, terrorist acts or the occurrence of climate change, may also adversely impact the
107
NOTES TO FINANCIAL STATEMENTS
|
performance of a Fund. Such events could adversely impact issuers, markets and economies over the short- and long-term, including in ways that cannot necessarily be foreseen. A Fund could be negatively impacted if the value of a portfolio holding were harmed by such political or economic conditions or events. Moreover, such negative political and economic conditions and events could disrupt the processes necessary for a Fund’s operations.
Interest Rate Risk:
A Fund’s yield and value will fluctuate as the general level of interest rates change. During periods when interest rates are low, a Fund’s yield may also be low. When interest rates increase, securities held by a Fund will generally decline in value. Interest rate changes are influenced by a number of factors including government policy, inflation expectations, and supply and demand. Municipal securities may be issued on a when-issued or delayed delivery basis, where payment and delivery take place at a future date. A Fund assumes the risk that the value of the security at delivery may be more or less than the purchase price.
Credit Spread Risk:
A Fund’s investments may be adversely affected if any of the issuers it is invested in are subject to an actual or perceived (whether by market participants, rating agencies, pricing services or otherwise) deterioration to their credit quality. Any actual or perceived deterioration may lead to an increase in the credit spreads and a decline in price of the issuer’s securities.
Currency Risk:
Changes in foreign currency exchange rates will affect the value of a Fund’s securities and the price of a Fund’s shares. Generally, when the value of the U.S. Dollar rises in value relative to a foreign currency, an investment in that country loses value because that currency is worth fewer U.S. Dollars. Devaluation of a currency by a country’s government or banking authority also may have a significant impact on the value of any investment denominated in that currency. Currency markets generally are not as regulated as securities markets.
12. Subsequent Events:
Fund Management has evaluated the impact of all subsequent events on the Funds and has determined that, other than as noted below, there were no subsequent events requiring recognition or disclosure in the financial statements.
Following the period end, unaffiliated shareholders of the RBC Bluebay Emerging Market Debt Fund purchased $33,461,569 which represented 85.9% of the Fund’s net assets as of September 30, 2023
108
REPORT OF INDEPENDENT REGISTERED PUBLIC ACCOUNTING FIRM
|
To the Board of Trustees of RBC Funds Trust and Shareholders of RBC BlueBay Emerging Market Debt Fund, RBC BlueBay High Yield Bond Fund, RBC BlueBay Core Plus Bond Fund, and RBC BlueBay Strategic Income Fund
Opinions on the Financial Statements
We have audited the accompanying statements of assets and liabilities, including the schedules of portfolio investments, of each of the funds listed in the table below (four of the funds constituting RBC Funds Trust, hereafter collectively referred to as the “Funds”) as of September 30, 2023, the related statements of operations and of changes in net assets for each of the periods indicated in the table below, including the related notes, and the financial highlights for each of the periods indicated therein (collectively referred to as the “financial statements”). In our opinion, the financial statements present fairly, in all material respects, the financial position of each of the Funds as of September 30, 2023, the results of each of their operations and the changes in each of their net assets for the periods indicated in the table below, and each of the financial highlights for each of the periods indicated therein, in conformity with accounting principles generally accepted in the United States of America.
RBC BlueBay Emerging Market Debt Fund (1)
RBC BlueBay High Yield Bond Fund (1)
RBC BlueBay Core Plus Bond Fund (2)
RBC BlueBay Strategic Income Fund (2)
(1) Statement of operations for the year ended September 30, 2023 and the statement of changes in net assets for the years ended September 30, 2023 and 2022
(2) Statement of operations for the year ended September 30, 2023, and the statement of changes in net assets for the year ended September 30, 2023 and period November 1, 2021 (commencement of operations) through September 30, 2022
Basis for Opinions
These financial statements are the responsibility of the Funds’ management. Our responsibility is to express an opinion on the Funds’ financial statements based on our audits. We are a public accounting firm registered with the Public Company Accounting Oversight Board (United States) (PCAOB) and are required to be independent with respect to the Funds in accordance with the U.S. federal securities laws and the applicable rules and regulations of the Securities and Exchange Commission and the PCAOB.
We conducted our audits of these financial statements in accordance with the standards of the PCAOB. Those standards require that we plan and perform the audit to obtain reasonable assurance about whether the financial statements are free of material misstatement, whether due to error or fraud.
Our audits included performing procedures to assess the risks of material misstatement of the financial statements, whether due to error or fraud, and performing procedures that respond to those risks. Such procedures included examining, on a test basis, evidence regarding the amounts and disclosures in the financial statements. Our audits also included evaluating the accounting principles used and significant estimates made by management, as well as evaluating the overall presentation of the financial statements. Our procedures included confirmation of securities owned as of September 30, 2023 by correspondence with the custodian, brokers, and agent banks; when replies were not received from brokers, we performed other auditing procedures. We believe that our audits provide a reasonable basis for our opinions.
/s/PricewaterhouseCoopers LLP
Minneapolis, Minnesota
November 21, 2023
We have served as the auditor of one or more investment companies in the RBC Funds since 2016.
109
OTHER FEDERAL INCOME TAX INFORMATION (UNAUDITED)
|
For the year ended September 30, 2023, the following Funds had a qualified dividend income percentage of:
Qualified | ||||
Emerging Market Debt Fund | 0.41% | |||
High Yield Bond Fund | 0.10% | |||
Core Plus Bond Fund | 1.36% | |||
Strategic Income Fund | 3.44% | |||
For the year ended September 30, 2023, the following Funds had a qualified interest income percentage of:
Qualified | ||||
Emerging Market Debt Fund | 88.04% | |||
High Yield Bond Fund | 99.12% | |||
Core Plus Bond Fund | 83.45% | |||
Strategic Income Fund | 80.98% | |||
For the year ended September 30, 2023, the following Funds had a qualified short term gains percentage of :
Qualified | ||||
Strategic Income Fund | 21.67% | |||
For the year ended September 30, 2023, the following Funds had a qualified foreign source income percentage of:
Pursuant to Internal Revenue Code Section 852(b)(3), the Strategic Income Fund reported $1,076,906, respectively, as long-term capital gain distributions for the year ended September 30, 2023.
All reportings are based on financial information available as of the date of this annual report and, accordingly, are subject to change. For each item above, it is the intention of the Funds to report the maximum amount permitted under the Internal Revenue Code and the regulations thereunder.
110
|
Independent Trustees(1)(2)
Lucy Hancock Bode (72)
Position, Term of Office and Length of Time Served with the Trust: Trustee since January 2004
Principal Occupation(s) During Past 5 Years: Healthcare consultant (self-employed) (1986 to present)
Number of Portfolios in Fund Complex Overseen by Trustee: 24
Other Director/Trustee Positions Held by Trustee During Past 5 Years: Franklin Street Partners (2014 to 2018 and 2019 to present)
Leslie H. Garner Jr. (73)
Position, Term of Office and Length of Time Served with the Trust: Trustee since January 2004
Principal Occupation(s) During Past 5 Years: President and Chief Executive Officer, The Greater Cedar Rapids Community Foundation (2010 to 2023); President, Cornell College (1994 to 2010)
Number of Portfolios in Fund Complex Overseen by Trustee: 24
Other Director/Trustee Positions Held by Trustee During Past 5 Years: None
Phillip G. Goff (59)
Position, Term of Office and Length of Time Served with the Trust: Trustee since January 2020
Principal Occupation(s) During Past 5 Years: Senior Vice President/Corporate Controller and Funds Treasurer, TIAA (2006 - 2017)
Number of Portfolios in Fund Complex Overseen by Trustee: 24
Other Director/Trustee Positions Held by Trustee During Past 5 Years: None
Ronald James (72)
Position, Term of Office and Length of Time Served with the Trust: Trustee since January 2004
Principal Occupation(s) During Past 5 Years: Faculty member (part time), University of St. Thomas (2004 to present), President and Chief Executive Officer, Center for Ethical Business Cultures (2000 to January 2017)
Number of Portfolios in Fund Complex Overseen by Trustee: 24
Other Director/Trustee Positions Held by Trustee During Past 5 Years: Bremer Financial Corporation (2004 to present); Greater Twin Cities United Way (2012 to 2020); Best Buy Co. Inc. (2004 to 2013)
John A. MacDonald (74)
Position, Term of Office and Length of Time Served with the Trust: Trustee since January 2004
Principal Occupation(s) During Past 5 Years: Retired. Independent Consultant (2020 to present); Vice President and Treasurer, Hall Family Foundation (1988 to 2020); Chief Investment Officer, Chinquapin Trust Company (1999 to 2020)
Number of Portfolios in Fund Complex Overseen by Trustee: 24
Other Director/Trustee Positions Held by Trustee During Past 5 Years: None
111
MANAGEMENT (UNAUDITED)
|
Independent Trustees(1)(2)
James R. Seward, CFA (70)
Position, Term of Office and Length of Time Served with the Trust: Chairman of the Board and Trustee since January 2004
Principal Occupation(s) During Past 5 Years: Private investor (2000 to present); CFA (1987 to present)
Number of Portfolios in Fund Complex Overseen by Trustee: 24
Other Director/Trustee Positions Held by Trustee During Past 5 Years: Brookdale Senior Living Inc. (2008 to 2019)
Christie Zarkovich (49)
Position, Term of Office and Length of Time Served with the Trust: Trustee since March 2023
Principal Occupation(s) During Past 5 Years: Chief Administrative, Financial and Investment Officer, Health Forward Foundation (2021 to present); Investment Director, Chinquapin Trust Company (2019 to 2021); Head of Mission-Related Investing Research, Cambridge Associates (2018 to 2019)
Number of Portfolios in Fund Complex Overseen by Trustee: 24
Other Director/Trustee Positions Held by Trustee During Past 5 Years: None
Interested Trustees(1)(2)(3)
David Eikenberg (54)(5)
Position, Term of Office and Length of Time Served with the Trust: Trustee since October 2022
Principal Occupation(s) During Past 5 Years: President and Chief Executive Officer, RBC Funds (2022 to present); Head of Intermediary Sales at RBC Global Asset Management (U.S.) Inc. (2018 to present); Vice President, T. Rowe Price (2010 to 2018)
Number of Portfolios in Fund Complex Overseen by Trustee: 24
Other Director/Trustee Positions Held by Trustee During Past 5 Years: None
112
MANAGEMENT (UNAUDITED)
|
Executive Officers(1)(3)(4)
David Eikenberg (54)(5)
Position, Term of Office and Length of Time Served with the Trust: President and Chief Executive Officer since October 2022
Principal Occupation(s) During Past 5 Years: President and Chief Executive Officer, RBC Funds (2022 to present); Head of Intermediary Sales at RBC Global Asset Management (U.S.) Inc. (2018 to present); Vice President, T. Rowe Price (2010 to 2018)
Kathleen A. Hegna (56)
Position, Term of Office and Length of Time Served with the Trust: Chief Financial Officer and Principal Accounting Officer since May 2009 and Treasurer since March 2014
Principal Occupation(s) During Past 5 Years: Head, Fund Operations (US), RBC Global Asset Management (U.S.) Inc. (September 2022 to present); Associate Vice President and Director, Mutual Fund Services, RBC Global Asset Management (U.S.) Inc. (2009 to September 2022)
Christina M. Weber (55)
Position, Term of Office and Length of Time Served with the Trust: Chief Compliance Officer since December 2012 and Secretary since September 2017
Principal Occupation(s) During Past 5 Years: Chief Compliance Officer, RBC Global Asset Management (U.S.) Inc. (June 2018 to present); Chief Compliance Officer, RBC Funds (2012 to present); Assistant Secretary, RBC Funds (2013 to 2017)
Jodi DeFeyter (52)
Position, Term of Office and Length of Time Served with the Trust: Assistant Secretary since October 2022
Principal Occupation(s) During Past 5 Years: Director, Regulatory Administration, RBC Global Asset Management (U.S.) Inc. (2012 to present)
Tara Tilbury (49)
Position, Term of Office and Length of Time Served with the Trust: Assistant Secretary since October 2022
Principal Occupation(s) During Past 5 Years: Managing Counsel, RBC Global Asset Management (U.S.) Inc. (2018 to present); Vice President and Chief Counsel – Asset Management, Ameriprise Financial, Inc. (2105 to 2018)
| (1) | The address of each Trustee/Officer except David Eikenberg is 50 South Sixth Street, Suite 2350,Minneapolis, Minnesota 55402. The address of David Eikenberg is 225 Franklin Street, Boston, Massachusetts 02110. |
| (2) | All Trustees must retire on or before December 31 of the year in which they reach age 75. The Board may temporarily waive this requirement when necessary to avoid depriving the Board of a Trustee with critical skills. |
| (3) | On December 31, 2009, Voyageur Asset Management Inc. changed its name to RBC Global Asset Management (U.S.) Inc. Any references to RBC Global Asset Management (U.S.) Inc. for prior periods are deemed to be references to the prior entity. |
113
MANAGEMENT (UNAUDITED)
|
| (4) | Each officer serves in such capacity for an indefinite period of time until his or her removal, resignation or retirement. |
| (5) | David Eikenberg has been determined to be an interested Trustee by virtue of his position with the Advisor. |
The Fund’s Statement of Additional Information includes information about the Funds’ Trustees. To receive your free copy of the Statement of Additional Information, call toll free: 1-800-422-2766.
114
SHARE CLASS INFORMATION (UNAUDITED)
|
The Funds offer Class A, Class I and Class R6 shares.
Class A
Class A shares are available in all Funds. This share class is available for purchase primarily through investment advisors, broker-dealers, banks and other financial services intermediaries. Class A shares of the Funds are currently subject to a maximum up-front sales charge of 4.25% (3.75% for the Core Plus Bond Fund and Strategic Income Fund) and a 1.00% CDSC for redemption within 12 months of a $1 million or greater purchase. Class A shares currently include a 0.25% (25 bps) annual 12b-1 service and distribution fee.
Class I
Class I shares are available in all Funds. This share class is intended for investors meeting certain minimum investment thresholds. This share class does not have an up-front sales charge (load) or a 12b-1 service and distribution fee.
Class R6
Class R6 shares are available in Emerging Market Debt Fund, Core Plus Bond Fund and Strategic Income Fund. This share class is intended for investors meeting certain minimum investment thresholds. This share class does not have an up-front sales charge (load) or a 12b-1 service and distribution fee.
115
SUPPLEMENTAL INFORMATION (UNAUDITED)
|
Shareholder Expense Examples
As a shareholder of the RBC Funds, you incur two types of costs: (1) transaction costs and (2) ongoing costs, including management fees; and other Fund expenses. This example is intended to help you understand your ongoing costs (in dollars) of investing in the RBC Funds and to compare these costs with the ongoing costs of investing in other mutual funds.
The example is based on an investment of $1,000 invested at the beginning of the period and held for the entire period from April 1, 2023 through September 30, 2023.
Actual Expenses
The table below provides information about actual account values and actual expenses. You may use the information below, together with the amount you invested, to estimate the expenses that you paid over the period. Simply divide your account value by $1,000 (for example, an $8,600 account value divided by $1,000 = 8.6), then multiply the result by the number in the table under the heading entitled “Expenses Paid During Period” to estimate the expenses you paid on your account during this period.
| Beginning Account Value 4/1/23 | Ending Account Value 9/30/23 | Expenses Paid During Period1 4/1/23–9/30/23 | Annualized Expense Ratio During Period 4/1/23–9/30/23 | |||||||||||||||
Emerging Market Debt Fund | ||||||||||||||||||
| Class A | $1,000.00 | $1,016.50 | $5.21 | 1.03 | % | |||||||||||||
| Class I | 1,000.00 | 1,017.40 | 3.94 | 0.78 | % | |||||||||||||
| Class R6 | 1,000.00 | 1,017.50 | 3.69 | 0.73 | % | |||||||||||||
High Yield Bond Fund | ||||||||||||||||||
| Class A | 1,000.00 | 1,020.00 | 4.05 | 0.80 | % | |||||||||||||
| Class I | 1,000.00 | 1,021.00 | 2.84 | 0.56 | % | |||||||||||||
Core Plus Bond Fund | ||||||||||||||||||
| Class A | 1,000.00 | 984.40 | 3.43 | 0.69 | % | |||||||||||||
| Class I | 1,000.00 | 986.00 | 2.19 | 0.44 | % | |||||||||||||
| Class R6 | 1,000.00 | 986.30 | 1.94 | 0.39 | % | |||||||||||||
Strategic Income Fund | ||||||||||||||||||
| Class A | 1,000.00 | 1,047.20 | 4.41 | 0.86 | % | |||||||||||||
| Class I | 1,000.00 | 1,047.80 | 3.13 | 0.61 | % | |||||||||||||
| Class R6 | 1,000.00 | 1,048.10 | 2.88 | 0.56 | % | |||||||||||||
1Expenses are equal to the average account value times the Fund’s annualized expense ratio multiplied by 183/365 (to reflect one half year period).
116
SUPPLEMENTAL INFORMATION (UNAUDITED)
|
Hypothetical Example for Comparison Purposes
The table below provides information about hypothetical account values and hypothetical expenses based on each RBC Funds’ actual expense ratio and an assumed rate of return of 5% per year before expenses, which is not the Fund’s actual return. The hypothetical account values and expenses may not be used to estimate the actual ending account balance or expenses you paid for the period. You may use this information to compare this 5% hypothetical example with the 5% hypothetical examples that appear in the shareholder reports of other funds.
Please note that the expenses shown in the table are meant to highlight your ongoing costs only and do not reflect any transactional costs, such as sales charges (loads), redemption fees, or exchange fees. Therefore, the table is useful in comparing ongoing costs only, and will not help you determine the relative total costs of owning different funds. In addition, if these transactional costs were included, your costs would have been higher.
| Beginning Account Value 4/1/23 | Ending Account Value 9/30/23 | Expenses Paid During Period1 4/1/23-9/30/23 | Annualized Expense Ratio During Period 4/1/23-9/30/23 | |||||||||||||||
Emerging Market Debt Fund | ||||||||||||||||||
| Class A | $1,000.00 | $1,019.90 | $5.22 | 1.03 | % | |||||||||||||
| Class I | 1,000.00 | 1,021.16 | 3.95 | 0.78 | % | |||||||||||||
| Class R6 | 1,000.00 | 1,021.41 | 3.70 | 0.73 | % | |||||||||||||
High Yield Bond Fund | ||||||||||||||||||
| Class A | 1,000.00 | 1,021.06 | 4.05 | 0.80 | % | |||||||||||||
| Class I | 1,000.00 | 1,022.26 | 2.84 | 0.56 | % | |||||||||||||
Core Plus Bond Fund | ||||||||||||||||||
| Class A | 1,000.00 | 1,021.61 | 3.50 | 0.69 | % | |||||||||||||
| Class I | 1,000.00 | 1,022.86 | 2.23 | 0.44 | % | |||||||||||||
| Class R6 | 1,000.00 | 1,023.11 | 1.98 | 0.39 | % | |||||||||||||
Strategic Income Fund | ||||||||||||||||||
| Class A | 1,000.00 | 1,020.76 | 4.36 | 0.86 | % | |||||||||||||
| Class I | 1,000.00 | 1,022.01 | 3.09 | 0.61 | % | |||||||||||||
| Class R6 | 1,000.00 | 1,022.26 | 2.84 | 0.56 | % | |||||||||||||
1Expenses are equal to the average account value times the Fund’s annualized expense ratio multiplied by 183/365 (to reflect one half year period).
117
APPROVAL OF INVESTMENT ADVISORY AGREEMENT (UNAUDITED)
|
Information Regarding the Approval of Investment Advisory and Sub-Advisory Agreements
In September 2023, after evaluating the services provided by RBC Global Asset Management (U.S.) Inc. (the “Advisor”) and, for the RBC BlueBay Emerging Market Debt Fund and RBC BlueBay High Yield Bond Fund, the services provided by RBC Global Asset Management (UK) Limited (the “Sub-Advisor”), and reviewing the performance, fees, and expenses of the Funds, the RBC Funds Board of Trustees determined to approve the continuation of the investment advisory agreements with the Advisor and sub-advisory agreements with the Sub-Advisor (the investment advisory and sub-advisory agreements, collectively, being the “Agreements”) for each Fund for an additional year.
As part of their review of the Agreements, the Trustees requested and considered information regarding the advisory services performed by the Advisor and Sub-Advisor; the staffing and qualifications of the personnel responsible for operating and managing the Funds; and the Funds’ performance, fees, and expenses. The Trustees considered information provided at regular quarterly Board and Committee meetings throughout the year; information presented at both a special meeting held to review requested material related to the proposed renewals and a regular meeting at which the proposed renewals were considered; and their experience with the portfolio management teams over the years. The information included material provided by the Advisor and Sub-Advisor, as well as reports prepared by Broadridge Financial Solutions, Inc., an independent statistical compilation company, providing comparative fee and expense information and comparative performance information for the Funds vs. funds in the same category and funds in more tailored peer groups. In connection with their deliberations, the independent Trustees were advised by independent legal counsel with regard to the materials and their responsibilities under relevant laws and regulations.
The Trustees met with representatives from the Advisor’s senior management and investment teams, as well as senior investment professionals from the Sub-Advisor, to discuss the information and the ongoing management of the Funds. The Trustees reviewed the nature and quality of the services provided to the Funds by the Advisor and Sub-Advisor, including information as to each Fund’s performance relative to appropriate index benchmarks as well as their respective Morningstar categories and peer groups, including in the case of the RBC BlueBay Strategic Income Fund, a custom peer group more aligned with that fund’s specific investment strategy. The Board noted that each of the RBC BlueBay Core Plus Bond Fund and RBC BlueBay Strategic Income Fund had not yet completed three full years of operations, but for the trailing one year, each had outperformed its benchmark and showed performance in the top quartile of its category and, for the RBC BlueBay Strategic Income Fund, toward the top of its custom peer group. The other two Funds showed performance in the top half of both their category and peer groups for each of the one-, three- and five-year periods.
In considering the nature and quality of services provided to the Funds, the Trustees discussed the Sub-Advisor’s strong research, credit, and fundamental analysis capabilities and specialized expertise in the area of emerging market debt instruments and absolute return strategies. The Trustees also considered the extensive portfolio management experience of the Sub-Advisor’s staff as well as the Advisor’s and Sub-Advisor’s operational and compliance structure and systems, and the Advisor’s expertise in coordinating the investment management and related operations of the Funds. The Trustees continued to have confidence in the Advisor and Sub-Advisor and were satisfied with the nature, extent, and quality of the advisory and other services provided to the Funds.
The Trustees reviewed advisory fee and expense information for each Fund compared to similarly situated funds, including information regarding other client accounts advised or sub-advised by the Advisor with similar investment strategies and the reasons for any differences in fees. The Trustees considered, and viewed favorably, the arrangements to subsidize Fund expenses at competitive levels through expense limitation agreements with the Adviser. The Trustees evaluated profitability data for the Advisor and considered information regarding other benefits the Advisor and its affiliates derived from their relationships with the Funds, including any fall-out benefits. The Trustees noted that the advisory fees and expense ratios appeared to be fair and reasonable in light of the level and quality of the services provided under all the circumstances and were within the range of what might have been negotiated at arms’ length.
118
APPROVAL OF INVESTMENT ADVISORY AGREEMENT (UNAUDITED)
|
Based upon their review, the Trustees concluded that the nature and quality of the services provided by both the Advisor and Sub-Advisor were of a high quality and it is in the interests of the Funds and their shareholders for the Trustees to approve the Agreement and expense limitation arrangement for each Fund for an additional year. In arriving at their collective decision to approve the renewal of the Agreements, the Trustees did not assign relative weights to the factors discussed above or deem any one or group of them to be controlling in and of itself.
119
|
| ||||||
120
RBC Funds
P.O. Box 701
Milwaukee, WI 53201-0701
800-422-2766
www.rbcgam.com
Performance data represents past performance and does not guarantee future results. The principal value of an investment and investment return will fluctuate so that an investor’s shares, when redeemed, may be worth more or less than their original cost.
This report and the financial statements contained herein are provided for the information of RBC Funds shareholders. This report is not authorized for distribution to prospective investors unless preceded or accompanied by a current prospectus, which contains information concerning investment objectives, risks, charges and expenses of the funds. Please read the prospectus carefully before investing.
This report and the financial statements contained herein are not intended to be a forecast of future events, a guarantee of future results, or investment advice. There is no assurance that certain securities will remain in or out of each fund’s portfolio. The views expressed in this report reflect those of the portfolio managers through the year ended September 30, 2023.
NOT FDIC INSURED • NO BANK GUARANTEE • MAY LOSE VALUE
RBC Global Asset Management (U.S.) Inc. serves as investment advisor for the RBC Funds. RBC Funds are distributed by Quasar Distributors LLC.
This product is made of material from well-managed FSC®-certified forests,
recycled materials, and other controlled sources.
RBCF-BB AR 09-23

Annual Report For the year ended September 30, 2023 RBC SMID Cap Growth Fund RBC Enterprise Fund RBC Small Cap Core Fund RBC Microcap Value Fund RBC Small Cap Value Fund
|
| |||||||||
RBC Funds
|
| |||||||||
About your Annual Report | This annual report includes detailed information about your Fund including financial statements, performance, and a complete list of its holdings. | |||||||||
| The RBC Funds compare their performance against various indices. Each of these indices is a widely recognized measure of return for the underlying category of securities. However, the indices are unmanaged, do not include fees, and cannot be invested in directly. |
| |||||||||
| We hope the financial information presented will help you evaluate your investment in the RBC Funds. We also encourage you to read your Fund’s prospectus for further detail as to your Fund’s investment policies and risk profile. RBC Funds prospectuses and performance information subsequent to the date of this report are available on our website at www.rbcgam.com. |
| |||||||||
| A description of the policies and procedures that your Fund uses to determine how to vote proxies relating to portfolio securities is available (i) without charge, upon request, by calling 1-800-422-2766; (ii) on the Fund’s website at www.rbcgam.com; and (iii) on the Securities and Exchange Commission’s (the “Commission”) website at http://www.sec.gov. |
| |||||||||
| Each year the Trust files its proxy voting record for the twelve-month period ended June 30 with the SEC on Form N-PX no later than August 31. The records can be obtained on the SEC’s website at www.sec.gov and without charge by calling the Funds at 1-800-422-2766. |
| |||||||||
A schedule of each Fund’s portfolio holdings is filed with the Commission for the first and third quarters of each fiscal year on Form N-PORT. This information is available on the Commission’s website at http://www.sec.gov and on the Funds’ website at www.dfinview.com/usrbcgam. Fund holdings and/or sector allocations are subject to change at any time and are not recommendations to buy or sell any security. Current and future holdings are subject to risk.
|
| |||||||||
| Table of | 1 | |||||||||
| Contents | 3 | |||||||||
| 5 | ||||||||||
| 8 | ||||||||||
| 10 | ||||||||||
| 12 | ||||||||||
| 14 | ||||||||||
| 16 | ||||||||||
| 18 | ||||||||||
| 42 | ||||||||||
| 46 | ||||||||||
| 48 | ||||||||||
| 53 | ||||||||||
| 64 | ||||||||||
| 78 | ||||||||||
| 79 | ||||||||||
| 81 | ||||||||||
| 85 | ||||||||||
| 86 | ||||||||||
| 88 | ||||||||||
1
LETTER FROM THE PORTFOLIO MANAGERS
| ||||||||||
Past performance is not a guarantee of future results.
Mutual fund investing involves risk. Principal loss is possible.
The S&P 500 Index is widely regarded as the best single gauge of large-cap U.S. equities. The index includes 500 leading companies and covers approximately 80% of available market capitalization.
The Nasdaq 100 Index is a large capitalization growth index comprising 100-plus of the largest domestic and international non-financial companies listed on the Nasdaq Stock Market based on market capitalization.
The Russell 2000 Index measures the performance of the small capitalization segment of the U.S. equity market. It comprises approximately 2,000 small capitalization companies in the Russell 3000 Index.
Indexes are unmanaged and it is not possible to invest directly in an index. | ||||||||||
2


3
PORTFOLIO MANAGERS | ||||||
|
Murphy O’Flaherty, CFA
Portfolio Manager
Murphy O’Flaherty is a portfolio manager for the RBC Enterprise Fund and senior equity analyst providing research for the U.S. Microcap Core, Small Cap Core and Small Cap Value investment strategies. Prior to joining RBC GAM-US in 2015, she was executive director at a large global full-service brokerage and investment bank. In that role, she utilized fundamental equity research to advise and make stock recommendations to asset managers employing all major investment strategies within all market capitalizations. Previously, Murphy served in a similar role as director at a large Canadian financial institution. She also worked in equities and fixed income for two separate global financial services companies. Murphy earned a BA from Yale University and MBA from Duke University and has worked in the investment industry since 1995. | |||||

4
PERFORMANCE SUMMARY (UNAUDITED)
|
| 1 Year | 5 Year | 10 Year | Net Expense Ratio(a)(b) | Gross Expense Ratio(a)(b) | ||||||||||||||||
Average Annual Total Returns as of September 30, 2023 (Unaudited) |
| |||||||||||||||||||
RBC SMID Cap Growth Fund(c) |
| |||||||||||||||||||
Class A | ||||||||||||||||||||
- Including Max Sales Charge of 5.75% | 7.63 | % | 5.64 | % | 8.45 | % | ||||||||||||||
- At Net Asset Value | 14.23 | % | 6.90 | % | 9.09 | % | 1.07 | % | 1.27 | % | ||||||||||
Class I | ||||||||||||||||||||
- At Net Asset Value | 14.45 | % | 7.16 | % | 9.36 | % | 0.82 | % | 1.04 | % | ||||||||||
Class R6 | ||||||||||||||||||||
- At Net Asset Value | 14.54 | % | 7.22 | % | 9.42 | % | 0.77 | % | 18.45 | % | ||||||||||
Russell 2500 Growth Index(e) | 10.61 | % | 4.05 | % | 8.37 | % | ||||||||||||||
RBC Enterprise Fund(d) | ||||||||||||||||||||
Class A | ||||||||||||||||||||
- Including Max Sales Charge of 5.75% | 6.17 | % | 0.83 | % | 3.52 | % | ||||||||||||||
- At Net Asset Value | 12.63 | % | 2.03 | % | 4.14 | % | 1.34 | % | 2.03 | % | ||||||||||
Class I | ||||||||||||||||||||
- At Net Asset Value | 12.93 | % | 2.28 | % | 4.40 | % | 1.09 | % | 1.28 | % | ||||||||||
Russell Microcap Index(e) | (1.35 | )% | 0.23 | % | 5.25 | % | ||||||||||||||
RBC Small Cap Core Fund(f) | ||||||||||||||||||||
Class A | ||||||||||||||||||||
- Including Max Sales Charge of 5.75% | 11.69 | % | 0.72 | % | 4.18 | % | ||||||||||||||
- At Net Asset Value | 18.47 | % | 1.92 | % | 4.80 | % | 1.16 | % | 1.69 | % | ||||||||||
Class I | ||||||||||||||||||||
- At Net Asset Value | 18.75 | % | 2.18 | % | 5.06 | % | 0.91 | % | 1.29 | % | ||||||||||
Class R6 | ||||||||||||||||||||
- At Net Asset Value | 18.74 | % | 2.17 | % | 5.07 | % | 0.88 | % | 1.45 | % | ||||||||||
Russell 2000 Index(e) | 8.93 | % | 2.40 | % | 6.65 | % | ||||||||||||||
RBC Microcap Value Fund | ||||||||||||||||||||
Class A | ||||||||||||||||||||
- Including Max Sales Charge of 5.75% | 5.48 | % | 2.94 | % | 6.04 | % | ||||||||||||||
- At Net Asset Value | 11.89 | % | 4.16 | % | 6.67 | % | 1.35 | % | 1.60 | % | ||||||||||
Class I | ||||||||||||||||||||
- At Net Asset Value | 12.12 | % | 4.42 | % | 6.93 | % | 1.10 | % | 1.21 | % | ||||||||||
Russell Microcap | ||||||||||||||||||||
Value Index(e) | (0.70 | )% | 1.78 | % | 6.39 | % | ||||||||||||||
5
PERFORMANCE SUMMARY (UNAUDITED)
|
| 1 Year | 5 Year | Since Inception | Net Expense Ratio(a)(b) | Gross Expense Ratio(b) | ||||||||||||||||
Average Annual Total Returns as of September 30, 2023 (Unaudited) |
| |||||||||||||||||||
RBC Small Cap Value Fund(g) | ||||||||||||||||||||
Class A | ||||||||||||||||||||
- Including Max Sales Charge of 5.75% | 7.14 | % | 0.56 | % | 4.73 | % | ||||||||||||||
- At Net Asset Value | 13.68 | % | 1.76 | % | 5.44 | % | 1.11 | % | 33.12 | % | ||||||||||
Class I | ||||||||||||||||||||
- At Net Asset Value | 13.37 | % | 1.90 | % | 5.57 | % | 0.86 | % | 1.23 | % | ||||||||||
Class R6 | ||||||||||||||||||||
- At Net Asset Value | 14.04 | % | 2.09 | % | 5.72 | % | 0.81 | % | 1.28 | % | ||||||||||
Russell 2000 | ||||||||||||||||||||
Value Index(e) | 7.84 | % | 2.59 | % | 5.73 | % | ||||||||||||||
Parentheses indicate negative performance returns.
Performance data quoted represents past performance. Past performance is no guarantee of future results. Investment return and principal value of an investment will fluctuate so that an investor’s shares, when redeemed, may be worth more or less than their original cost. Current performance may be lower or higher than performance quoted. Performance shown reflects contractual fee waivers, without such fee waivers total returns would be reduced. For performance data current to the most recent month-end go to www.rbcgam.com. Please see footnotes below.
| (a) | The Funds’ expenses are from the Funds’ most recent prospectus dated January 27, 2023. For current expense ratio information, please see the Financial Highlights starting on page 53. |
| (b) | The advisor has contractually agreed to waive fees and/or make payments in order to keep total operating expenses at the levels shown in the Funds’ prospectus until January 31, 2025. |
| (c) | The since inception date (commencement of operations) of the Fund is December 31, 1990 for Class I and Class A shares and November 21, 2016 for Class R6 shares. The performance in the table for the Class R6 shares prior to November 21, 2016 reflects the performance of the Class I shares since the Fund’s inception and has been adjusted to reflect the fees and expenses of Class R6. |
| (d) | The since inception date (commencement of operations) of the Fund is December 2, 1983. The performance of the index since inception of the Fund is calculated from November 30, 1983. |
| (e) | Each of the comparative indices is a widely recognized market value weighted measure of the return of securities, but does not include sales fees or operating expenses. You cannot invest directly in indices. |
| (f) | The since inception date (commencement of operations) of the Fund is August 5, 1991 for Class I and Class A shares and November 21, 2016 for Class R6 shares. The performance in the table for the Class R6 shares prior to November 21, 2016 reflects the performance of the Class I shares since the Fund’s inception and has been adjusted to reflect the fees and expenses of Class R6. |
| (g) | The since inception date (commencement of operations) of the Fund is December 3, 2014 for Class I shares, November 21, 2016 for Class R6 shares and January 28, 2021 for Class A shares. The performance in the table for the Class R6 shares prior to November 21, 2016 and for Class A shares prior to January 28, 2021 reflects the performance of the Class I shares since the Fund’s inception and has been adjusted to reflect the fees and expenses of Classes R6 and Class A, respectively. The performance of the index since inception of the Fund is calculated from December 3, 2014. |
6
PERFORMANCE SUMMARY (UNAUDITED)
|
The Russell 2500 Growth Index measures the performance of the small and mid capitalization growth segment of the U.S. equity market. It includes those companies with higher price-to-book ratios and higher forecasted growth rates in the Russell 2500™ Index, which comprises the smallest 2,500 companies in the Russell 3000® Index.
The Russell Microcap Index measures the performance of the micro capitalization segment of the U.S. equity market. It comprises the smallest 1,000 companies in the Russell 2000 Index plus 1,000 smaller U.S. equities.
The Russell 2000 Index measures the performance of the small capitalization segment of the U.S. equity market. It comprises approximately 2,000 small capitalization companies in the Russell 3000® Index
The Russell Microcap Value Index measures the performance of the micro capitalization value segment of the U.S. equity market. It includes those companies with lower price-to-book ratios and lower forecasted growth rates in the Russell Microcap® Index.
The Russell 2000 Value Index measures the performance of the small capitalization value segment of the U.S. equity market. It includes those companies with lower price-to-book ratios and lower forecasted growth rates in the Russell 2000® Index.
You cannot invest directly in an index.
Fund holdings and/or sector allocations are subject to change at any time and are not recommendations to buy or sell any security.
Mutual Fund investing involves risk. Principal loss is possible.
7
8
MANAGEMENT DISCUSSION AND ANALYSIS (UNAUDITED)
| ||||||||||||||||
RBC SMID Cap Growth Fund
| ||||||||||||||||
The Fund seeks long-term capital appreciation.
| Investment Objective | |||||||||||||||
Russell 2500 Growth Index
|
|
Benchmark | ||||||||||||||
| Asset Allocation as of 9/30/23 (% of Fund’s investments) & Top Five GICS sectors (as of 9/30/23) (% of Fund’s net assets)
| |||||||||||||||
TechnipFMC Plc Onto Innovation, Inc. Merit Medical Systems, Inc. Kinsale Capital Group, Inc. WEX, Inc. Applied Industrial Technologies, Inc. | | 3.44% 2.10% 2.02% 1.86% 1.85% |
| Tetra Tech, Inc. SPS Commerce, Inc. Woodward, Inc. ePlus, Inc. | | 1.84% 1.81% 1.80% 1.77% |
| Top Ten Holdings (excluding investment companies) (as of 9/30/22) (% of Fund’s net assets) | ||||||||
A listing of all portfolio holdings can be found beginning on page 18
|
| |||||||||||||||
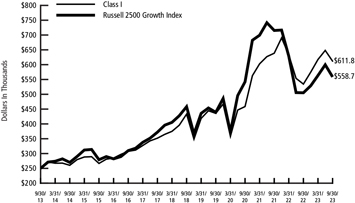 | Growth of $250,000 Initial Investment Over 10 Years | |||||||||||||||
| The graph reflects an initial hypothetical investment of $250,000 over 10 year period and is based on Class I shares. The Fund’s total return includes reinvested dividends and capital gains. The Fund’s total return also includes operating expenses that reduce return, while the total return of the index does not. The graph does not reflect the deduction of taxes that a shareholder would pay on fund distributions or redemption of fund shares. Performance of other classes will vary due to differences in fee structures. This chart does not imply any future performance. | ||||||||||||||||
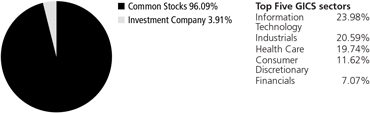
9
| MANAGEMENT DISCUSSION AND ANALYSIS (UNAUDITED) | ||||||
| ||||||
Investment Strategy | The Fund normally invests primarily in common stocks of companies whose market capitalizations at the time of the Fund’s initial purchase are below the dollar-weighted median market capitalization of companies in the Russell 2000® Index, which are often referred to as “micro-cap” companies.
| |||||
| Performance | For the twelve-month period ended September 30, 2023, the Fund had an annualized total return of 12.93% (Class I). That compares to an annualized total return of -1.35% for the Russell Microcap Index, the Fund’s primary benchmark.
| |||||
Factors That Contributed to Relative Returns | • Stock selection in the information technology sector
• Stock selection in the health care sector
• Stock selection in the industrial sector
| |||||
Factors That Detracted From Relative Returns | • Stock selection in the communication services sector
• Stock selection in the financials sector
| |||||
Mutual fund investing involves risk. Principal loss is possible. The Fund invests in small and micro capitalization companies, which involve greater risks such as more volatility and less liquidity than larger companies. These risks are more fully described in the prospectus.
The Russell 2000 Index measures the performance of the small capitalization segment of the U.S. equity market. It comprises approximately 2,000 small capitalization companies in the Russell 3000 Index. The Russell Microcap Index measures the performance of the micro capitalization segment of the U.S. equity market. It comprises the smallest 1,000 companies in the Russell 2000 Index plus 1,000 smaller U.S. equities. You cannot invest directly in an index. Fund holdings and/or sector allocations are subject to change and should not be considered a recommendation to buy or sell any security. Current and future holdings are subject to risk.
Past performance is not a guarantee of future results.
| ||||||
10
MANAGEMENT DISCUSSION AND ANALYSIS (UNAUDITED)
| ||||||||||||||
RBC Enterprise Fund
|
| |||||||||||||
The Fund seeks long-term growth of capital.
|
|
Investment Objective | ||||||||||||
Russell Microcap Index
|
|
Benchmark | ||||||||||||
| Asset Allocation as of 9/30/23 (% of Fund’s investments) & Top Five GICS sectors (as of 9/30/23) (% of Fund’s net assets)
| |||||||||||||
Super Micro Computer, Inc. iShares Russell Microcap Index Fund Lantheus Holdings, Inc. Ducommun, Inc. Magnolia Oil & Gas Corp. | 3.49% 3.41% 3.29% | iShares Biotechnology ETF Par Pacific Holdings, Inc. Insteel Industries, Inc. Onto Innovation, Inc. Barrett Business Services, Inc. | | 2.24% 2.23% 2.09% 2.08% 2.05% |
| Top Ten Holdings (excluding investment companies) (as of 9/30/22) (% of Fund’s net assets) | ||||||||
A listing of all portfolio holdings can be found beginning on page 21
|
| |||||||||||||
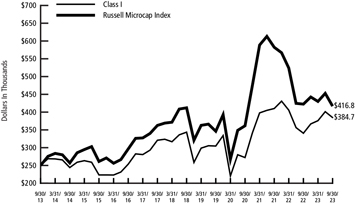 | Growth of $250,000 Initial Investment Over 10 Years | |||||||||||||
| The graph reflects an initial hypothetical investment of $250,000 over 10 year period and is based on Class I shares. The Fund’s total return includes reinvested dividends and capital gains. The Fund’s total return also includes operating expenses that reduce return, while the total return of the index does not. The graph does not reflect the deduction of taxes that a shareholder would pay on fund distributions or redemption of fund shares. Performance of other classes will vary due to differences in fee structures. This chart does not imply any future performance. | ||||||||||||||
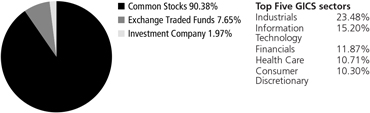
11
| MANAGEMENT DISCUSSION AND ANALYSIS (UNAUDITED) | ||||||
| ||||||
Investment Strategy | The Fund normally invests at least 80% of its assets in common stocks of small companies. The Fund currently considers “small companies” to be those within the market capitalization range of the Russell 2000®Index at the time of initial purchase by the Fund.
| |||||
| Performance | For the twelve-month period ended September 30, 2023, the Fund had an annualized total return of 18.75% (Class I). That compares to an annualized total return of 8.93% for the Russell 2000 Index, the Fund’s primary benchmark.
| |||||
Factors That Contributed to Relative Returns
| • Stock selection in the information technology sector
• Stock selection in the industrials sector
• Stock selection in the consumer discretionary sector
| |||||
Factors That Detracted From Relative Returns | • Stock selection in the financials sector.
• Stock selection in the communication services sector
| |||||
| Mutual fund investing involves risk. Principal loss is possible. The Fund invests in small capitalization companies, which involve greater risks such as more volatility and less liquidity than larger companies. These risks are more fully described in the prospectus. | ||||||
| The Russell 2000 Index measures the performance of the small capitalization segment of the U.S. equity market. It comprises approximately 2,000 small capitalization companies in the Russell 3000 Index. You cannot invest directly in an index. | ||||||
| Fund holdings and/or sector allocations are subject to change and should not be considered a recommendation to buy or sell any security. Current and future holdings are subject to risk. | ||||||
| Past performance is not a guarantee of future results. | ||||||
12
MANAGEMENT DISCUSSION AND ANALYSIS (UNAUDITED)
| ||||||||||||||||
RBC Small Cap Core Fund
| ||||||||||||||||
The Fund seeks long-term growth of capital. | Investment | |||||||||||||||
Objective
| ||||||||||||||||
Russell 2000 Index
|
Benchmark | |||||||||||||||
|
| Asset Allocation as of 9/30/23 (% of Fund’s investments) & Top Five GICS sectors (as of 9/30/23) (% of Fund’s net assets) | ||||||||||||||
Atkore, Inc. Magnolia Oil & Gas Corp. Ducommun, Inc. Compass Diversified Holdings Lantheus Holdings, Inc.
| | 3.75% 3.63% 3.47% 3.27% 3.13% |
| Super Micro Computer, Inc. Matador Resources Co. Group 1 Automotive, Inc. Barrett Business Services, Inc. CBIZ, Inc. | | 3.12% 3.05% 2.83% 2.73% 2.50% |
| Top Ten Holdings (excluding investment companies) (as of 9/30/23) (% of | ||||||||
| A listing of all portfolio holdings can be found beginning on page 24 | Fund’s net assets)
| |||||||||||||||
|
| Growth of $250,000 Initial Investment Over 10 Years | ||||||||||||||
The graph reflects an initial hypothetical investment of $250,000 over 10 year period and is based on Class I shares. The Fund’s total return includes reinvested dividends and capital gains. The Fund’s total return also includes operating expenses that reduce return, while the total return of the index does not. The graph does not reflect the deduction of taxes that a shareholder would pay on fund distributions or redemption of fund shares. Performance of other classes will vary due to differences in fee structures. This chart does not imply any future performance.
|
| |||||||||||||||
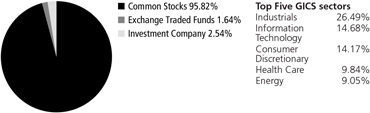
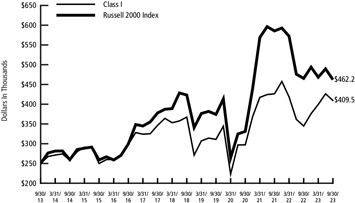
13
MANAGEMENT DISCUSSION AND ANALYSIS (UNAUDITED) | ||||||
| ||||||
Investment Strategy | The Fund invests, under normal circumstances, at least 80% of its assets in microcap value stocks. The Fund buys microcap value stocks using a quantitative model. Microcap value stocks combine the characteristics of “microcap stocks” and “value stocks.” The Fund defines “microcap stocks” as stocks of companies that have market capitalization at the time of the Fund’s initial purchase of between $20 million and the market capitalization that marks the point between the 8th and 9th deciles of New York Stock Exchange listed stocks (“upper limit”). The Fund defines “value stocks” primarily as those with low price-to-book characteristics
| |||||
| Performance | For the twelve-month period ended September 30, 2023, the Fund had an annualized total return of 12.12% (Class I). That compares to an annualized total return of -0.70% for the Russell Microcap Value Index, the Fund’s primary benchmark.
| |||||
Factors That Contributed to Relative Returns
| • Underweight in the health care sector
• Stock selection in the industrials sector
• Stock selection in the financials sector
| |||||
Factors That Detracted From Relative Returns | • Underweight in the energy sector
• Overweight in the consumer staples sector
| |||||
| Mutual fund investing involves risk. Principal loss is possible. The Fund invests in small and micro capitalization companies, which involve greater risks such as more volatility and less liquidity than larger companies. These risks are more fully described in the prospectus. | ||||||
| Price to book is a ratio used to compare the market value of a company’s stock to its book value. | ||||||
| The Russell Microcap Value Index measures the performance of the micro capitalization value segment of the U.S. equity market. It includes those companies with lower price-to-book ratios and lower forecasted growth rates in the Russell Microcap Index, which comprises the smallest 1,000 companies in the Russell 2000 Index plus 1,000 smaller U.S. equities. You cannot invest directly in an index. | ||||||
| Fund holdings and/or sector allocations are subject to change and should not be considered a recommendation to buy or sell any security. Current and future holdings are subject to risk. | ||||||
| Past performance is not a guarantee of future results. | ||||||
14
MANAGEMENT DISCUSSION AND ANALYSIS (UNAUDITED)
| ||||||||||||||||
RBC Microcap Value Fund
| ||||||||||||||||
The Fund seeks long-term growth of capital. | Investment | |||||||||||||||
Objective
| ||||||||||||||||
Russell Microcap Value Index
|
Benchmark | |||||||||||||||
|
| Asset Allocation as of 9/30/23 (% of Fund’s investments) & Top Five GICS sectors (as of 9/30/23) (% of Fund’s net assets) | ||||||||||||||
Federal Agricultural Mortgage Corp. Ducommun, Inc. North American Construction Group Ltd. National Western Life Group, Inc. Enova International, Inc.
| | 1.30% 1.19% 1.15% 1.10% 1.04% |
| Stride, Inc. Miller Industries, Inc. Oil-Dri Corp. of America Ingles Markets, Inc. Beazer Homes USA, Inc. | | 1.04% 0.96% 0.91% 0.87% 0.86% |
| Top Ten Holdings (excluding investment companies) (as of 9/30/23) (% of | ||||||||
| A listing of all portfolio holdings can be found beginning on page 27 | Fund’s net assets)
| |||||||||||||||
|
| Growth of $250,000 Initial Investment Over 10 Years | ||||||||||||||
The graph reflects an initial hypothetical investment of $250,000 over 10 year period and is based on Class I shares. The Fund’s total return includes reinvested dividends and capital gains. The Fund’s total return also includes operating expenses that reduce return, while the total return of the index does not. The graph does not reflect the deduction of taxes that a shareholder would pay on fund distributions or redemption of fund shares. Performance of other classes will vary due to differences in fee structures. This chart does not imply any future performance.
|
| |||||||||||||||
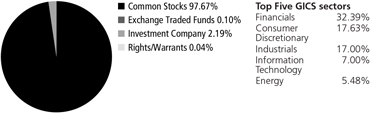
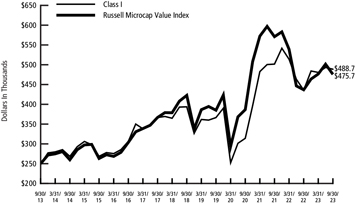
15
MANAGEMENT DISCUSSION AND ANALYSIS (UNAUDITED)
| ||||||
| ||||||
Investment Strategy | The Fund normally invests at least 80% of its assets in common stocks of small companies that are considered to be undervalued in relation to earnings, dividends and/or assets. Small companies are defined by the Fund as companies that fall within the market capitalization range of the Russell 2000® Value Index at the time of purchase.
| |||||
| Performance | For the twelve-month period ended September 30, 2023, the Fund had an annualized total return of 13.37%. That compares to an annualized total return of 7.84% for the Russell 2000 Value Index, the Fund’s primary benchmark.
| |||||
Factors That Contributed to Relative Returns
| • Stock selection in the information technology sector
• Stock selection in the consumer discretionary sector
• Stock selection in the materials sector
| |||||
Factors That Detracted From Relative Returns | • Stock selection in the financials sector
• Stock selection in the health care sector
| |||||
| Mutual fund investing involves risk. Principal loss is possible. The Fund invests in small capitalization companies, which involve greater risks such as more volatility and less liquidity than larger companies. The Fund invests in value stocks, which may not increase in price as anticipated by the Adviser if they fall out of favor with investors or the markets favor faster growing companies. These risks are described more fully in the prospectus. | ||||||
| The Russell 2000 Value Index measures the performance of the small capitalization value segment of the U.S. equity market. It includes those companies with lower price-to-book ratios and lower forecasted growth rates in the Russell 2000 Index, which comprises approximately 2,000 small capitalization companies in the Russell 3000 Index. You cannot invest directly in an index. | ||||||
| Fund holdings and/or sector allocations are subject to change and should not be considered a recommendation to buy or sell any security. Current and future holdings are subject to risk. | ||||||
| Past performance is not a guarantee of future results. | ||||||
16
MANAGEMENT DISCUSSION AND ANALYSIS (UNAUDITED)
| ||||||||||||||||
RBC Small Cap Value Fund
| ||||||||||||||||
The Fund seeks long-term capital appreciation. | Investment | |||||||||||||||
Objective
| ||||||||||||||||
Russell 2000 Value Index
|
Benchmark | |||||||||||||||
|
| Asset Allocation as of 9/30/23 (% of Fund’s investments) & Top Five GICS sectors (as of 9/30/23) (% of Fund’s net assets) | ||||||||||||||
Southwest Gas Holdings, Inc. Delek US Holdings, Inc. Magnolia Oil & Gas Corp. Columbus McKinnon Corp. Group 1 Automotive, Inc. Par Pacific Holdings, Inc. | | 2.94% 2.60% 2.43% 2.36% 2.32% 2.30% |
| Reinsurance Group of America, Inc. Compass Diversified Holdings Matador Resources Co. Koppers Holdings, Inc. | | 2.20% 2.20% 2.19% 2.19% |
| Top Ten Holdings (excluding investment companies) (as of 9/30/23) (% of Fund’s net assets) | ||||||||
A listing of all portfolio holdings can be found beginning on page 39
| ||||||||||||||||
|
| Growth of $100,000 Initial Investment Since Inception (12/3/14) | ||||||||||||||
The graph reflects an initial hypothetical investment of $100,000 over the period from December 3, 2014 (commencement of operations) to September 30, 2023 and is based on Class I shares. The Fund’s total return includes reinvested dividends and capital gains. The Fund’s total return also includes operating expenses that reduce return, while the total return of the index does not. The graph does not reflect the deduction of taxes that a shareholder would pay on fund distributions or redemption of fund shares. Performance of other classes will vary due to differences in fee structures. This chart does not imply any future performance.
|
| |||||||||||||||
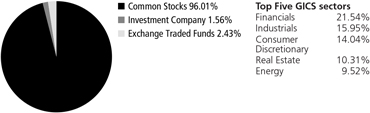
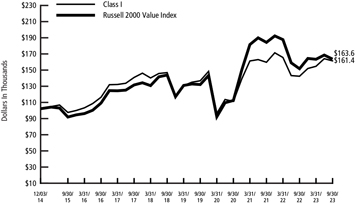
17
SCHEDULE OF PORTFOLIO INVESTMENTS
|
RBC SMID Cap Growth Fund
September 30, 2023
| Shares | Value | |||||
Common Stocks — 98.21% | ||||||
Communication Services — 2.99% | ||||||
| 10,567 | Nexstar Media Group, Inc. | $ | 1,514,991 | |||
| 63,208 | PubMatic, Inc., Class A* | 764,817 | ||||
| 33,020 | TechTarget, Inc.* | 1,002,487 | ||||
|
| |||||
| 3,282,295 | ||||||
|
| |||||
Consumer Discretionary — 11.62% | ||||||
| 7,840 | Burlington Stores, Inc.* | 1,060,752 | ||||
| 15,619 | Columbia Sportswear Co. | 1,157,368 | ||||
| 14,310 | Fox Factory Holding Corp.* | 1,417,835 | ||||
| 19,879 | Gentherm, Inc.* | 1,078,634 | ||||
| 41,610 | G-III Apparel Group Ltd.* | 1,036,921 | ||||
| 11,336 | Installed Building Products, Inc. | 1,415,753 | ||||
| 12,948 | LCI Industries | 1,520,354 | ||||
| 25,170 | Ollie’s Bargain Outlet Holdings, Inc.* | 1,942,621 | ||||
| 17,790 | Planet Fitness, Inc., Class A* | 874,912 | ||||
| 13,190 | Texas Roadhouse, Inc. | 1,267,559 | ||||
|
| |||||
| 12,772,709 | ||||||
|
| |||||
Consumer Staples — 2.99% | ||||||
| 6,205 | Casey’s General Stores, Inc. | 1,684,781 | ||||
| 27,131 | Performance Food Group Co.* | 1,596,931 | ||||
|
| |||||
| 3,281,712 | ||||||
|
| |||||
Energy — 3.44% | ||||||
| 185,830 | TechnipFMC Plc | 3,779,782 | ||||
|
| |||||
Financials — 7.07% | ||||||
| 12,376 | FirstCash Holdings, Inc. | 1,242,303 | ||||
| 6,892 | Jack Henry & Associates, Inc. | 1,041,657 | ||||
| 5,367 | Kinsale Capital Group, Inc. | 2,222,636 | ||||
| 19,830 | Stifel Financial Corp. | 1,218,355 | ||||
| 10,883 | WEX, Inc.* | 2,046,983 | ||||
|
| |||||
| 7,771,934 | ||||||
|
| |||||
Health Care — 19.74% | ||||||
| 74,390 | Avid Bioservices, Inc.* | 702,242 | ||||
| 20,131 | Azenta, Inc.* | 1,010,375 | ||||
| 23,490 | Bio-Techne Corp. | 1,598,964 | ||||
| 43,950 | Certara, Inc.* | 639,033 | ||||
| 7,650 | Charles River Laboratories International, Inc.* | 1,499,247 | ||||
| 10,680 | CONMED Corp. | 1,077,078 | ||||
| 19,997 | Haemonetics Corp.* | 1,791,331 | ||||
| 15,954 | HealthEquity, Inc.* | 1,165,440 | ||||
| 13,100 | Henry Schein, Inc.* | 972,675 | ||||
| 22,470 | Integer Holdings Corp.* | 1,762,322 | ||||
| 23,255 | Integra LifeSciences Holdings Corp.* | 888,108 | ||||
| 6,700 | Medpace Holdings, Inc.* | 1,622,271 | ||||
18
SCHEDULE OF PORTFOLIO INVESTMENTS
|
RBC SMID Cap Growth Fund (cont.)
September 30, 2023
| Shares | Value | |||||
| 32,928 | Merit Medical Systems, Inc.* | $ | 2,272,691 | |||
| 72,770 | Neogen Corp.* | 1,349,156 | ||||
| 24,460 | Omnicell, Inc.* | 1,101,678 | ||||
| 9,260 | Repligen Corp.* | 1,472,433 | ||||
| 19,190 | STAAR Surgical Co.* | 771,054 | ||||
|
| |||||
| 21,696,098 | ||||||
|
| |||||
Industrials — 20.59% | ||||||
| 8,490 | AGCO Corp. | 1,004,197 | ||||
| 29,264 | Ameresco, Inc., Class A* | 1,128,420 | ||||
| 13,153 | Applied Industrial Technologies, Inc. | 2,033,585 | ||||
| 12,780 | ASGN, Inc.* | 1,043,871 | ||||
| 4,030 | CACI International, Inc., Class A* | 1,265,138 | ||||
| 9,770 | EnPro Industries, Inc. | 1,184,026 | ||||
| 49,155 | ExlService Holdings, Inc.* | 1,378,306 | ||||
| 15,762 | ICF International, Inc. | 1,904,207 | ||||
| 11,850 | John Bean Technologies Corp. | 1,245,909 | ||||
| 6,547 | Landstar System, Inc. | 1,158,426 | ||||
| 39,224 | Mercury Systems, Inc.* | 1,454,818 | ||||
| 9,551 | MSC Industrial Direct Co., Inc., Class A | 937,431 | ||||
| 6,730 | Paylocity Holding Corp.* | 1,222,841 | ||||
| 7,090 | RBC Bearings, Inc.* | 1,659,982 | ||||
| 13,330 | Tetra Tech, Inc. | 2,026,560 | ||||
| 15,909 | Woodward, Inc. | 1,976,852 | ||||
|
| |||||
| 22,624,569 | ||||||
|
| |||||
Information Technology — 23.98% | ||||||
| 18,637 | Altair Engineering, Inc., Class A* | 1,165,931 | ||||
| 10,673 | Badger Meter, Inc. | 1,535,524 | ||||
| 10,139 | CyberArk Software Ltd.* | 1,660,464 | ||||
| 23,389 | Diodes, Inc.* | 1,843,989 | ||||
| 30,620 | Dynatrace, Inc.* | 1,430,873 | ||||
| 20,141 | Envestnet, Inc.* | 886,808 | ||||
| 30,678 | ePlus, Inc.* | 1,948,667 | ||||
| 12,290 | Five9, Inc.* | 790,247 | ||||
| 5,216 | Globant SA* | 1,031,986 | ||||
| 4,648 | Littelfuse, Inc. | 1,149,543 | ||||
| 8,603 | Manhattan Associates, Inc.* | 1,700,469 | ||||
| 11,266 | Novanta, Inc.* | 1,615,995 | ||||
| 18,070 | Onto Innovation, Inc.* | 2,304,286 | ||||
| 21,630 | Perficient, Inc.* | 1,251,512 | ||||
| 17,020 | Plexus Corp.* | 1,582,520 | ||||
| 43,180 | Sapiens International Corp. NV | 1,227,607 | ||||
| 10,670 | Silicon Laboratories, Inc.* | 1,236,546 | ||||
| 11,632 | SPS Commerce, Inc.* | 1,984,535 | ||||
|
| |||||
| 26,347,502 | ||||||
|
| |||||
Materials — 4.81% | ||||||
| 10,105 | AptarGroup, Inc. | 1,263,529 | ||||
19
SCHEDULE OF PORTFOLIO INVESTMENTS
|
RBC SMID Cap Growth Fund (cont.)
September 30, 2023
| Shares | Value | |||||
| 9,498 | Balchem Corp. | $ | 1,178,132 | |||
| 20,983 | HB Fuller Co. | 1,439,644 | ||||
| 5,352 | Reliance Steel & Aluminum Co. | 1,403,455 | ||||
|
| |||||
| 5,284,760 | ||||||
|
| |||||
Real Estate — 0.98% | ||||||
| 12,884 | Lamar Advertising Co., REIT, Class A | 1,075,428 | ||||
|
| |||||
Total Common Stocks | 107,916,789 | |||||
|
| |||||
(Cost $93,953,743) | ||||||
Investment Company — 3.99% | ||||||
| 4,385,678 | �� | RBC BlueBay U.S. Goverment Money Market Fund, | ||||
Institutional Class 1(a) | 4,385,678 | |||||
|
| |||||
Total Investment Company | 4,385,678 | |||||
|
| |||||
(Cost $4,385,678) | ||||||
Total Investments | $ | 112,302,467 | ||||
(Cost $98,339,421)(b) — 102.20% | ||||||
Liabilities in excess of other assets — (2.20)% | (2,421,727) | |||||
|
| |||||
NET ASSETS — 100.00% | $ | 109,880,740 | ||||
|
| |||||
| * | Non-income producing security. |
| (a) | Affiliated investment. |
| (b) | See Notes to Schedules of Portfolio Investments for the tax cost of securities and the breakdown of unrealized appreciation (depreciation). |
Abbreviations used are defined below:
REIT - Real Estate Investment Trust
See Notes to the Financial Statements.
20
SCHEDULE OF PORTFOLIO INVESTMENTS
|
RBC Enterprise Fund
September 30, 2023
| Shares | Value | |||||
Common Stocks — 90.49% | ||||||
Consumer Discretionary — 10.30% | ||||||
| 19,667 | Delta Apparel, Inc.* | $ | 130,392 | |||
| 132,810 | Destination XL Group, Inc.* | 594,989 | ||||
| 14,600 | Genesco, Inc.* | 449,972 | ||||
| 43,260 | G-III Apparel Group Ltd.* | 1,078,039 | ||||
| 2,560 | Group 1 Automotive, Inc. | 687,898 | ||||
| 38,980 | Lazydays Holdings, Inc.* | 296,248 | ||||
| 14,164 | Malibu Boats, Inc., Class A* | 694,319 | ||||
| 8,400 | Oxford Industries, Inc. | 807,492 | ||||
| 12,613 | Patrick Industries, Inc. | 946,732 | ||||
| 19,800 | Steven Madden Ltd. | 629,046 | ||||
|
| |||||
| 6,315,127 | ||||||
|
| |||||
Consumer Staples — 2.99% | ||||||
| 8,180 | John B Sanfilippo & Son, Inc. | 808,184 | ||||
| 9,730 | MGP Ingredients, Inc. | 1,026,320 | ||||
|
| |||||
| 1,834,504 | ||||||
|
| |||||
Energy — 7.66% | ||||||
| 28,800 | Delek US Holdings, Inc. | 818,208 | ||||
| 63,710 | Magnolia Oil & Gas Corp., Class A | 1,459,596 | ||||
| 17,680 | Matador Resources Co. | 1,051,607 | ||||
| 38,100 | Par Pacific Holdings, Inc.* | 1,369,314 | ||||
|
| |||||
| 4,698,725 | ||||||
|
| |||||
Financials — 11.87% | ||||||
| 9,100 | AMERISAFE, Inc. | 455,637 | ||||
| 34,300 | Banc of California, Inc. | 424,634 | ||||
| 3,000 | Cambridge Bancorp | 186,870 | ||||
| 66,798 | Compass Diversified Holdings | 1,253,798 | ||||
| 24,370 | First Bancorp/Southern Pines, NC | 685,772 | ||||
| 13,250 | German American Bancorp, Inc. | 358,942 | ||||
| 31,466 | Mercantile Bank Corp. | 972,614 | ||||
| 11,630 | Northrim BanCorp, Inc. | 460,781 | ||||
| 14,080 | Preferred Bank/Los Angeles, CA | 876,480 | ||||
| 26,700 | Silvercrest Asset Management Group, Inc., Class A | 423,729 | ||||
| 10,180 | Southern First Bancshares, Inc.* | 274,249 | ||||
| 21,902 | Stellar Bancorp, Inc. | 466,951 | ||||
| 11,240 | Stock Yards Bancorp, Inc. | 441,620 | ||||
|
| |||||
| 7,282,077 | ||||||
|
| |||||
Health Care — 10.71% | ||||||
| 34,200 | Apollo Medical Holdings, Inc.* | 1,055,070 | ||||
| 29,030 | Lantheus Holdings, Inc.* | 2,017,004 | ||||
| 41,300 | Maravai LifeSciences Holdings, Inc., Class A* | 413,000 | ||||
| 114,770 | MiMedx Group, Inc.* | 836,673 | ||||
21
SCHEDULE OF PORTFOLIO INVESTMENTS
|
RBC Enterprise Fund (cont.)
September 30, 2023
| Shares | Value | |||||
| 34,840 | Surmodics, Inc.* | $ | 1,118,016 | |||
| 6,990 | UFP Technologies, Inc.* | 1,128,536 | ||||
|
| |||||
| 6,568,299 | ||||||
|
| |||||
Industrials — 23.48% | ||||||
| 111,210 | ACCO Brands Corp. | 638,345 | ||||
| 39,255 | Allient Inc. | 1,213,765 | ||||
| 13,930 | Barrett Business Services, Inc. | 1,257,043 | ||||
| 20,930 | Bowman Consulting Group Ltd.* | 586,668 | ||||
| 8,158 | Casella Waste Systems, Inc., Class A* | 622,455 | ||||
| 19,480 | CBIZ, Inc.* | 1,011,012 | ||||
| 34,010 | Columbus McKinnon Corp. | 1,187,289 | ||||
| 21,100 | Douglas Dynamics, Inc. | 636,798 | ||||
| 41,488 | Ducommun, Inc.* | 1,805,143 | ||||
| 24,766 | Greenbrier Cos., Inc. (The) | 990,640 | ||||
| 66,290 | Hudson Technologies, Inc.* | 881,657 | ||||
| 39,543 | Insteel Industries, Inc. | 1,283,566 | ||||
| 21,880 | Northwest Pipe Co.* | 660,120 | ||||
| 5,600 | Standex International Corp. | 815,864 | ||||
| 29,400 | Thermon Group Holdings, Inc.* | 807,618 | ||||
|
| |||||
| 14,397,983 | ||||||
|
| |||||
Information Technology — 15.20% | ||||||
| 29,600 | Cohu, Inc.* | 1,019,424 | ||||
| 41,900 | Model N, Inc.* | 1,022,779 | ||||
| 22,130 | Napco Security Technologies, Inc. | 492,392 | ||||
| 6,053 | Novanta, Inc.* | 868,242 | ||||
| 9,980 | Onto Innovation, Inc.* | 1,272,650 | ||||
| 12,762 | PC Connection, Inc. | 681,236 | ||||
| 35,726 | Sapiens International Corp. NV | 1,015,690 | ||||
| 7,810 | Super Micro Computer, Inc.* | 2,141,658 | ||||
| 24,015 | Vishay Precision Group, Inc.* | 806,424 | ||||
|
| |||||
| 9,320,495 | ||||||
|
| |||||
Materials — 4.94% | ||||||
| 87,679 | FutureFuel Corp. | 628,658 | ||||
| 30,337 | Koppers Holdings, Inc. | 1,199,828 | ||||
| 11,770 | Materion Corp. | 1,199,481 | ||||
|
| |||||
| 3,027,967 | ||||||
|
| |||||
Real Estate — 2.52% | ||||||
| 67,100 | Chatham Lodging Trust, REIT | 642,147 | ||||
| 15,700 | Community Healthcare Trust, Inc., REIT | 466,290 | ||||
| 31,370 | UMH Properties, Inc., REIT | 439,807 | ||||
|
| |||||
| 1,548,244 | ||||||
|
| |||||
22
SCHEDULE OF PORTFOLIO INVESTMENTS
|
RBC Enterprise Fund (cont.)
September 30, 2023
| Shares | Value | |||||
Utilities — 0.82% | ||||||
| 11,710 | Unitil Corp. | $ | 500,134 | |||
|
| |||||
Total Common Stocks | 55,493,555 | |||||
|
| |||||
(Cost $37,041,421) | ||||||
Exchange Traded Funds — 7.66% |
| |||||
| 11,210 | iShares Biotechnology ETF | 1,370,871 | ||||
| 20,920 | iShares Russell Microcap Index Fund | 2,094,092 | ||||
| 16,880 | SPDR S&P Biotech ETF | 1,232,578 | ||||
|
| |||||
Total Exchange Traded Funds | 4,697,541 | |||||
|
| |||||
(Cost $5,193,453) | ||||||
Investment Company — 1.97% | ||||||
| 1,206,823 | RBC BlueBay U.S. Goverment Money Market Fund, | |||||
Institutional Class 1(a) | 1,206,823 | |||||
|
| |||||
Total Investment Company | 1,206,823 | |||||
|
| |||||
(Cost $1,206,823) | ||||||
Total Investments | $ | 61,397,919 | ||||
(Cost $43,441,697)(b) — 100.12% | ||||||
Liabilities in excess of other assets — (0.12)% | (74,392) | |||||
|
| |||||
NET ASSETS — 100.00% | $ | 61,323,527 | ||||
|
| |||||
| ||||||
| * | Non-income producing security. |
| (a) | Affiliated investment. |
| (b) | See Notes to Schedules of Portfolio Investments for the tax cost of securities and the breakdown of unrealized appreciation (depreciation). |
Abbreviations used are defined below:
REIT - Real Estate Investment Trust
See Notes to the Financial Statements.
23
SCHEDULE OF PORTFOLIO INVESTMENTS
|
RBC Small Cap Core Fund
September 30, 2023
| Shares | Value | |||||
Common Stocks — 96.22% |
| |||||
Communication Services — 2.17% |
| |||||
| 6,294 | Nexstar Media Group, Inc. | $ | 902,371 | |||
|
| |||||
Consumer Discretionary — 14.17% | ||||||
| 1,411 | Deckers Outdoor Corp.* | 725,381 | ||||
| 4,680 | Fox Factory Holding Corp.* | 463,694 | ||||
| 18,663 | G-III Apparel Group Ltd.* | 465,082 | ||||
| 4,380 | Group 1 Automotive, Inc. | 1,176,950 | ||||
| 3,232 | LCI Industries | 379,502 | ||||
| 6,312 | Malibu Boats, Inc., Class A* | 309,414 | ||||
| 5,500 | Oxford Industries, Inc. | 528,715 | ||||
| 8,274 | Patrick Industries, Inc. | 621,047 | ||||
| 21,340 | Taylor Morrison Home Corp.* | 909,297 | ||||
| 22,966 | Topgolf Callaway Brands Corp.* | 317,849 | ||||
|
| |||||
| 5,896,931 | ||||||
|
| |||||
Consumer Staples — 2.80% | ||||||
| 5,968 | Hostess Brands, Inc.* | 198,794 | ||||
| 2,090 | John B Sanfilippo & Son, Inc. | 206,492 | ||||
| 7,210 | MGP Ingredients, Inc. | 760,511 | ||||
|
| |||||
| 1,165,797 | ||||||
|
| |||||
Energy — 9.05% | ||||||
| 65,966 | Magnolia Oil & Gas Corp., Class A | 1,511,281 | ||||
| 21,350 | Matador Resources Co. | 1,269,898 | ||||
| 27,389 | Par Pacific Holdings, Inc.* | 984,361 | ||||
|
| |||||
| 3,765,540 | ||||||
|
| |||||
Financials — 7.56% | ||||||
| 72,592 | Compass Diversified Holdings | 1,362,552 | ||||
| 5,270 | Independent Bank Group, Inc. | 208,428 | ||||
| 4,420 | Pinnacle Financial Partners, Inc. | 296,317 | ||||
| 6,314 | Preferred Bank/Los Angeles, CA | 393,046 | ||||
| 9,240 | Stellar Bancorp, Inc. | 196,997 | ||||
| 6,217 | TriCo Bancshares | 199,131 | ||||
| 7,696 | United Community Banks, Inc. | 195,555 | ||||
| 3,910 | Wintrust Financial Corp. | 295,205 | ||||
|
| |||||
| 3,147,231 | ||||||
|
| |||||
Health Care — 9.84% | ||||||
| 19,111 | Apollo Medical Holdings, Inc.* | 589,574 | ||||
| 11,044 | Globus Medical, Inc., Class A* | 548,335 | ||||
| 18,756 | Lantheus Holdings, Inc.* | 1,303,167 | ||||
| 17,870 | Maravai LifeSciences Holdings, Inc., Class A* | 178,700 | ||||
| 1,763 | Masimo Corp.* | 154,580 | ||||
| 72,150 | MiMedx Group, Inc.* | 525,974 | ||||
24
SCHEDULE OF PORTFOLIO INVESTMENTS
|
RBC Small Cap Core Fund (cont.)
September 30, 2023
| Shares | Value | |||||
| 5,111 | Omnicell, Inc.* | $ | 230,199 | |||
| 1,501 | West Pharmaceutical Services, Inc. | 563,190 | ||||
|
| |||||
| 4,093,719 | ||||||
|
| |||||
Industrials — 26.49% | ||||||
| 159,125 | ACCO Brands Corp. | 913,377 | ||||
| 11,530 | Arcosa, Inc. | 829,007 | ||||
| 10,469 | Atkore, Inc.* | 1,561,870 | ||||
| 12,590 | Barrett Business Services, Inc. | 1,136,122 | ||||
| 20,066 | CBIZ, Inc.* | 1,041,425 | ||||
| 26,171 | Columbus McKinnon Corp. | 913,630 | ||||
| 33,211 | Ducommun, Inc.* | 1,445,011 | ||||
| 16,045 | Greenbrier Cos., Inc. (The) | 641,800 | ||||
| 49,650 | Hudson Technologies, Inc.* | 660,345 | ||||
| 31,480 | Insteel Industries, Inc. | 1,021,841 | ||||
| 9,360 | Terex Corp. | 539,323 | ||||
| 11,690 | Thermon Group Holdings, Inc.* | 321,124 | ||||
|
| |||||
| 11,024,875 | ||||||
|
| |||||
Information Technology — 14.68% | ||||||
| 4,123 | Ambarella, Inc.* | 218,643 | ||||
| 18,870 | Cohu, Inc.* | 649,883 | ||||
| 6,344 | MKS Instruments, Inc. | 549,010 | ||||
| 13,779 | Model N, Inc.* | 336,345 | ||||
| 3,396 | Novanta, Inc.* | 487,122 | ||||
| 7,511 | Onto Innovation, Inc.* | 957,803 | ||||
| 20,539 | Sapiens International Corp. NV | 583,924 | ||||
| 4,730 | Super Micro Computer, Inc.* | 1,297,060 | ||||
| 12,070 | Tenable Holdings, Inc.* | 540,736 | ||||
| 14,490 | Vishay Precision Group, Inc.* | 486,574 | ||||
|
| |||||
| 6,107,100 | ||||||
|
| |||||
Materials — 4.66% | ||||||
| 65,476 | FutureFuel Corp. | 469,463 | ||||
| 19,791 | Koppers Holdings, Inc. | 782,734 | ||||
| 6,730 | Materion Corp. | 685,854 | ||||
|
| |||||
| 1,938,051 | ||||||
|
| |||||
Real Estate — 4.17% | ||||||
| 29,250 | DiamondRock Hospitality Co., REIT | 234,878 | ||||
| 4,070 | EastGroup Properties, Inc., REIT | 677,777 | ||||
| 19,748 | STAG Industrial, Inc., REIT | 681,503 | ||||
| 10,199 | UMH Properties, Inc., REIT | 142,990 | ||||
|
| |||||
| 1,737,148 | ||||||
|
| |||||
25
SCHEDULE OF PORTFOLIO INVESTMENTS
|
RBC Small Cap Core Fund (cont.)
September 30, 2023
| Shares | Value | |||||
Utilities — 0.63% | ||||||
| 6,180 | Unitil Corp. | $ | 263,948 | |||
|
| |||||
Total Common Stocks | 40,042,711 | |||||
|
| |||||
(Cost $26,050,849) | ||||||
Exchange Traded Funds — 1.65% | ||||||
| 168 | iShares Russell 2000 Index Fund | 29,692 | ||||
| 8,990 | SPDR S&P Biotech ETF | 656,450 | ||||
|
| |||||
Total Exchange Traded Funds | 686,142 | |||||
|
| |||||
(Cost $1,153,213) | ||||||
Investment Company — 2.55% | ||||||
| 1,059,949 | RBC BlueBay U.S. Goverment Money Market Fund, Institutional Class 1(a) | 1,059,949 | ||||
|
| |||||
Total Investment Company | 1,059,949 | |||||
|
| |||||
(Cost $1,059,949) | ||||||
Total Investments | $ | 41,788,802 | ||||
(Cost $28,264,011)(b) — 100.42% | ||||||
Liabilities in excess of other assets — (0.42)% | (174,948) | |||||
|
| |||||
NET ASSETS — 100.00% | $ | 41,613,854 | ||||
|
| |||||
| * | Non-income producing security. |
| (a) | Affiliated investment. |
| (b) | See Notes to Schedules of Portfolio Investments for the tax cost of securities and the breakdown of unrealized appreciation (depreciation). |
Abbreviations used are defined below:
REIT - Real Estate Investment Trust
See Notes to the Financial Statements.
26
SCHEDULE OF PORTFOLIO INVESTMENTS
|
RBC Microcap Value Fund
September 30, 2023
| Shares | Value | |||||
Common Stocks — 97.76% | ||||||
Communication Services — 1.54% | ||||||
| 10,700 | Cumulus Media, Inc., Class A* | $ | 54,463 | |||
| 54,350 | DHI Group, Inc.* | 166,311 | ||||
| 50,900 | Entravision Communications Corp., Class A | 185,785 | ||||
| 21,143 | EW Scripps Co. (The), Class A* | 115,864 | ||||
| 9,100 | Outbrain, Inc.* | 44,317 | ||||
| 119,400 | Point.360*,(a),(b),(c) | 0 | ||||
| 19,600 | Reservoir Media, Inc.* | 119,560 | ||||
| 18,900 | Saga Communications, Inc., Class A | 405,594 | ||||
| 17,600 | Spok Holdings, Inc. | 251,152 | ||||
| 7,810 | Townsquare Media, Inc., Class A | 68,103 | ||||
| 18,300 | Urban One, Inc.* | 91,866 | ||||
| 28,900 | Zedge, Inc., Class B* | 63,291 | ||||
|
| |||||
| 1,566,306 | ||||||
|
| |||||
Consumer Discretionary — 17.63% | ||||||
| 550 | AMCON Distributing Co. | 113,300 | ||||
| 6,800 | America’s Car-Mart, Inc.* | 618,732 | ||||
| 21,300 | Anemostat Door Products*,(a),(b),(c) | 0 | ||||
| 21,300 | Anemostat, Inc.*,(a),(b),(c) | 0 | ||||
| 16,000 | Bassett Furniture Industries, Inc. | 234,400 | ||||
| 35,300 | Beazer Homes USA, Inc.* | 879,323 | ||||
| 26,400 | Big 5 Sporting Goods Corp. | 185,064 | ||||
| 2,230 | Build-A-Bear Workshop, Inc. | 65,584 | ||||
| 6,300 | Canterbury Park Holding Corp. | 127,449 | ||||
| 1,700 | Carriage Services, Inc. | 48,025 | ||||
| 15,000 | Century Casinos, Inc.* | 76,950 | ||||
| 9,693 | Century Communities, Inc. | 647,299 | ||||
| 1,730 | Chuy’s Holdings, Inc.* | 61,553 | ||||
| 8,500 | Citi Trends, Inc.* | 188,870 | ||||
| 24,730 | Container Store Group, Inc. (The)* | 55,643 | ||||
| 41,500 | Crown Crafts, Inc. | 195,465 | ||||
| 13,500 | Delta Apparel, Inc.* | 89,505 | ||||
| 9,800 | Designer Brands, Inc., Class A | 124,068 | ||||
| 23,700 | Destination XL Group, Inc.* | 106,176 | ||||
| 5,900 | Dream Finders Homes, Inc., Class A* | 131,157 | ||||
| 17,700 | El Pollo Loco Holdings, Inc. | 158,415 | ||||
| 13,300 | Escalade, Inc. | 203,623 | ||||
| 12,400 | Ethan Allen Interiors, Inc. | 370,760 | ||||
| 7,000 | Flanigan’s Enterprises, Inc. | 231,000 | ||||
| 13,400 | Flexsteel Industries, Inc. | 278,184 | ||||
| 1,900 | Genesco, Inc.* | 58,558 | ||||
| 4,500 | Hamilton Beach Brands Holding Co., Class A | 55,845 | ||||
| 20,180 | Haverty Furniture Cos., Inc. | 580,780 | ||||
| 10,400 | hhgregg, Inc.*,(b) | 2 | ||||
| 2,600 | Hibbett, Inc. | 123,526 | ||||
| 49,900 | Holley, Inc.* | 249,001 | ||||
27
SCHEDULE OF PORTFOLIO INVESTMENTS
|
RBC Microcap Value Fund (cont.)
September 30, 2023
| Shares | Value | |||||
| 8,600 | Hooker Furnishings Corp. | $ | 167,270 | |||
| 3,300 | Hovnanian Enterprises, Inc., Class A* | 335,478 | ||||
| 12,300 | Inspired Entertainment, Inc.* | 147,108 | ||||
| 4,300 | J Jill, Inc.* | 127,280 | ||||
| 5,400 | JAKKS Pacific, Inc.* | 100,386 | ||||
| 39,900 | Jerash Holdings US, Inc. | 120,099 | ||||
| 7,340 | Johnson Outdoors, Inc., Class A | 401,425 | ||||
| 23,500 | Kid Brands, Inc.*,(a),(b) | 0 | ||||
| 42,520 | Lakeland Industries, Inc. | 640,776 | ||||
| 13,700 | Landsea Homes Corp.* | 123,163 | ||||
| 95,270 | Lazare Kaplan International, Inc.*,(a),(b),(c) | 0 | ||||
| 8,900 | La-Z-Boy, Inc. | 274,832 | ||||
| 17,100 | Lazydays Holdings, Inc.* | 129,960 | ||||
| 16,100 | Legacy Housing Corp.* | 312,501 | ||||
| 38,800 | Lincoln Educational Services Corp.* | 327,860 | ||||
| 7,700 | Live Ventures, Inc.* | 217,833 | ||||
| 2,700 | Lovesac Co. (The)* | 53,784 | ||||
| 9,580 | M/I Homes, Inc.* | 805,103 | ||||
| 19,980 | MarineMax, Inc.* | 655,744 | ||||
| 9,750 | McRae Industries, Inc., Class A | 414,375 | ||||
| 2,285 | Mecklermedia Corp.*,(a),(b),(c) | 0 | ||||
| 15,700 | Mestek, Inc.* | 329,700 | ||||
| 5,100 | Modine Manufacturing Co.* | 233,325 | ||||
| 16,940 | Movado Group, Inc. | 463,309 | ||||
| 4,600 | Nathan’s Famous, Inc. | 325,036 | ||||
| 13,000 | Nobility Homes, Inc. | 386,750 | ||||
| 4,700 | OneWater Marine, Inc., Class A* | 120,414 | ||||
| 41,000 | Orleans Homebuilders, Inc.*,(a),(b),(c) | 0 | ||||
| 9,025 | Patrick Industries, Inc. | 677,417 | ||||
| 26,600 | Rocky Brands, Inc. | 391,020 | ||||
| 4,100 | Sleep Number Corp.* | 100,819 | ||||
| 11,150 | Solo Brands, Inc., Class A* | 56,865 | ||||
| 3,860 | Sonic Automotive, Inc., Class A | 184,354 | ||||
| 17,000 | Sportsman’s Warehouse Holdings, Inc.* | 76,330 | ||||
| 14,000 | Standard Motor Products, Inc. | 470,680 | ||||
| 4,930 | Strattec Security Corp.* | 113,883 | ||||
| 23,410 | Stride, Inc.* | 1,054,152 | ||||
| 9,089 | Superior Group of Cos., Inc. | 70,712 | ||||
| 1,740 | Taylor Morrison Home Corp.* | 74,141 | ||||
| 21,100 | Tile Shop Holdings, Inc.* | 115,839 | ||||
| 11,900 | Tilly’s, Inc., Class A* | 96,628 | ||||
| 58,800 | Torrid Holdings, Inc.* | 129,948 | ||||
| 23,200 | Tupperware Brands Corp.* | 32,480 | ||||
| 8,800 | Unifi, Inc.* | 62,480 | ||||
| 21,500 | Universal Technical Institute, Inc.* | 180,170 | ||||
| 30,000 | Universal Travel Group*,(a),(b),(c) | 0 | ||||
| 1,397 | Walking Co. Holdings, Inc. (The)*,(a),(b),(c) | 0 | ||||
28
SCHEDULE OF PORTFOLIO INVESTMENTS
|
RBC Microcap Value Fund (cont.)
September 30, 2023
| Shares | Value | |||||
| 16,100 | Weyco Group, Inc. | $ | 408,135 | |||
| 9,200 | Zumiez, Inc.* | 163,760 | ||||
|
| |||||
| 17,931,581 | ||||||
|
| |||||
Consumer Staples — 5.43% | ||||||
| 5,350 | Andersons, Inc. (The) | 275,579 | ||||
| 13,425 | Central Garden & Pet Co.* | 592,579 | ||||
| 36 | Hawaiian Macadamia Nut Orchards L.P.*,(b) | 82,800 | ||||
| 11,760 | Ingles Markets, Inc., Class A | 885,881 | ||||
| 7,900 | Lifevantage Corp. | 50,955 | ||||
| 5,600 | Lifeway Foods, Inc.* | 57,904 | ||||
| 7,600 | Limoneira Co. | 116,432 | ||||
| 20,400 | Natural Alternatives International, Inc.* | 132,396 | ||||
| 47,660 | Natural Grocers by Vitamin Cottage, Inc. | 615,291 | ||||
| 19,500 | Nature’s Sunshine Products, Inc.* | 323,115 | ||||
| 15,030 | Oil-Dri Corp. of America | 928,102 | ||||
| 5,800 | Seneca Foods Corp., Class A* | 312,214 | ||||
| 23,260 | SpartanNash Co. | 511,720 | ||||
| 22,500 | Thorne HealthTech, Inc.* | 229,275 | ||||
| 15,600 | Village Super Market, Inc., Class A | 353,184 | ||||
| 15,400 | Whole Earth Brands, Inc.* | 55,440 | ||||
|
| |||||
| 5,522,867 | ||||||
|
| |||||
Energy — 5.48% | ||||||
| 2,500 | Adams Resources & Energy, Inc. | 84,225 | ||||
| 45,500 | Aegean Marine Petroleum Network, Inc.*,(a),(b),(c) | 0 | ||||
| 21,800 | Amplify Energy Corp.* | 160,230 | ||||
| 33,940 | Baytex Energy Corp. | 149,675 | ||||
| 1 | Bristow Group, Inc.* | 28 | ||||
| 3,000 | CONSOL Energy, Inc. | 314,730 | ||||
| 4,700 | DMC Global, Inc.* | 115,009 | ||||
| 10,400 | Dorian LPG Ltd. | 298,792 | ||||
| 15,200 | Energy Services of America Corp. | 61,484 | ||||
| 22,700 | Epsilon Energy Ltd. | 119,856 | ||||
| 9,000 | Global Partners LP | 317,880 | ||||
| 13,400 | Hallador Energy Co.* | 193,228 | ||||
| 2,950 | Harvest Natural Resources, Inc.*,(a),(b),(c) | 0 | ||||
| 25,900 | Mammoth Energy Services, Inc.* | 120,176 | ||||
| 3,900 | NACCO Industries, Inc., Class A | 136,773 | ||||
| 5,100 | Natural Gas Services Group, Inc.* | 74,256 | ||||
| 29,800 | Nine Energy Service, Inc.* | 122,776 | ||||
| 53,940 | North American Construction Group Ltd. | 1,171,577 | ||||
| 11,700 | Oil States International, Inc.* | 97,929 | ||||
| 25,600 | PermRock Royalty Trust | 169,472 | ||||
| 62,000 | PHX Minerals, Inc. | 225,680 | ||||
| 1,950 | PrimeEnergy Resources Corp.* | 226,180 | ||||
| 18,900 | Profire Energy, Inc.* | 52,542 | ||||
| 15,600 | Ranger Energy Services, Inc. | 221,208 | ||||
| 14,230 | REX American Resources Corp.* | 579,446 | ||||
29
SCHEDULE OF PORTFOLIO INVESTMENTS
|
RBC Microcap Value Fund (cont.)
September 30, 2023
| Shares | Value | |||||
| 87,200 | Ring Energy, Inc.* | $ | 170,040 | |||
| 2,950 | Sitio Royalties Corp., Class A | 71,420 | ||||
| 64,300 | Smart Sand, Inc.* | 149,176 | ||||
| 15,800 | Solaris Oilfield Infrastructure, Inc., Class A | 168,428 | ||||
|
| |||||
| 5,572,216 | ||||||
|
| |||||
Financials — 32.39% | ||||||
| 12,700 | Acacia Research Corp.* | 46,355 | ||||
| 4,700 | ACNB Corp. | 148,567 | ||||
| 8,400 | AFC Gamma, Inc., REIT | 98,616 | ||||
| 39,150 | Affirmative Insurance Holdings, Inc.*,(a),(b),(c) | 0 | ||||
| 8,700 | AG Mortgage Investment Trust, Inc., REIT | 48,285 | ||||
| 9,200 | Amalgamated Financial Corp. | 158,424 | ||||
| 8,900 | Amerant Bancorp, Inc. | 155,216 | ||||
| 3,900 | American Business Bank* | 120,666 | ||||
| 7,300 | American National Bankshares, Inc. | 276,962 | ||||
| 7,600 | Ames National Corp. | 126,084 | ||||
| 9,668 | Apollo Commercial Real Estate Finance, Inc., REIT | 97,937 | ||||
| 5,926 | Arbor Realty Trust, Inc., REIT | 89,957 | ||||
| 33,070 | Ares Commercial Real Estate Corp., REIT | 314,826 | ||||
| 5,300 | Atlanticus Holdings Corp.* | 160,643 | ||||
| 2,700 | Avantax, Inc.* | 69,066 | ||||
| 29,250 | Banc of California, Inc. | 362,115 | ||||
| 13,200 | Banco Latinoamericano de Comercio Exterior SA, Class E | 279,840 | ||||
| 6,900 | Bancorp, Inc. (The)* | 238,050 | ||||
| 2,800 | Bank First Corp. | 216,020 | ||||
| 5,142 | Bank of Marin Bancorp | 93,996 | ||||
| 6,000 | Bank7 Corp. | 135,060 | ||||
| 14,400 | BankFinancial Corp. | 124,128 | ||||
| 7,000 | Bankwell Financial Group, Inc. | 169,890 | ||||
| 2,628 | Banner Corp. | 111,375 | ||||
| 9,200 | Bar Harbor Bankshares | 217,396 | ||||
| 5,300 | BayCom Corp. | 101,813 | ||||
| 10,500 | BCB Bancorp, Inc. | 116,970 | ||||
| 100,000 | Beverly Hills Bancorp, Inc.*,(a),(b),(c) | 0 | ||||
| 31,100 | BlackRock Capital Investment Corp. | 115,381 | ||||
| 16,500 | BM Technologies, Inc.* | 33,000 | ||||
| 3,500 | BNCCORP, Inc.* | 80,465 | ||||
| 19,000 | Bridgewater Bancshares, Inc.* | 180,120 | ||||
| 10,174 | Brookline Bancorp, Inc. | 92,685 | ||||
| 5,500 | Business First Bancshares, Inc. | 103,180 | ||||
| 1,700 | C&F Financial Corp. | 91,120 | ||||
| 12,300 | California First Leasing Corp.* | 204,180 | ||||
| 1,500 | Cambridge Bancorp | 93,435 | ||||
| 6,200 | Capital Bancorp, Inc. | 118,606 | ||||
| 9,400 | Capital City Bank Group, Inc. | 280,402 | ||||
| 38,000 | Capitol Bancorp Ltd.*,(a),(b),(c) | 0 | ||||
| 10,300 | Capstar Financial Holdings, Inc. | 146,157 | ||||
| 5,700 | Central Valley Community Bancorp | 80,427 | ||||
30
SCHEDULE OF PORTFOLIO INVESTMENTS
|
RBC Microcap Value Fund (cont.)
September 30, 2023
| Shares | Value | |||||
| 6,500 | CF Bankshares, Inc. | $ | 109,980 | |||
| 1,900 | Chemung Financial Corp. | 75,259 | ||||
| 10,100 | Chicago Atlantic Real Estate Finance, Inc., REIT | 148,672 | ||||
| 8,200 | Citizens & Northern Corp. | 143,910 | ||||
| 6,300 | Citizens Community Bancorp, Inc. | 60,480 | ||||
| 2,727 | Citizens Financial Services, Inc. | 130,678 | ||||
| 12,200 | Civista Bancshares, Inc. | 189,100 | ||||
| 10,000 | CNB Financial Corp. | 181,100 | ||||
| 3,000 | Coastal Financial Corp.* | 128,730 | ||||
| 3,800 | Codorus Valley Bancorp, Inc. | 70,832 | ||||
| 6,600 | Colony Bankcorp, Inc. | 65,967 | ||||
| 86,543 | Consumer Portfolio Services, Inc.* | 784,945 | ||||
| 10,600 | Crescent Capital BDC, Inc. | 181,260 | ||||
| 1,400 | Croghan Bancshares, Inc. | 64,848 | ||||
| 11,048 | Dime Community Bancshares, Inc. | 220,518 | ||||
| 4,846 | Dynex Capital, Inc., REIT | 57,861 | ||||
| 8,000 | Embassy Bancorp, Inc. | 123,040 | ||||
| 20,740 | Enova International, Inc.* | 1,055,044 | ||||
| 8,300 | Enterprise Bancorp, Inc. | 227,254 | ||||
| 5,878 | Enterprise Financial Services Corp. | 220,425 | ||||
| 4,700 | Equity Bancshares, Inc., Class A | 113,129 | ||||
| 5,300 | Esquire Financial Holdings, Inc. | 242,157 | ||||
| 6,800 | ESSA Bancorp, Inc. | 102,068 | ||||
| 4,400 | Evans Bancorp, Inc. | 117,920 | ||||
| 12,400 | EZCORP, Inc., Class A* | 102,300 | ||||
| 16,500 | Farmers National Banc Corp. | 190,740 | ||||
| 6,987 | FB Financial Corp. | 198,151 | ||||
| 8,590 | Federal Agricultural Mortgage Corp., Class C | 1,325,437 | ||||
| 2,800 | Fidelity D&D Bancorp, Inc. | 127,120 | ||||
| 2,900 | Fidus Investment Corp. | 55,680 | ||||
| 8,000 | Financial Institutions, Inc. | 134,640 | ||||
| 6,700 | First Bancorp, Inc. (The) | 157,450 | ||||
| 10,400 | First Bank | 112,112 | ||||
| 7,700 | First Business Financial Services, Inc. | 231,077 | ||||
| 6,700 | First Community Bankshares, Inc. | 197,315 | ||||
| 9,200 | First Financial Corp. | 311,052 | ||||
| 10,000 | First Financial Northwest, Inc. | 127,200 | ||||
| 9,200 | First Internet Bancorp | 149,132 | ||||
| 3,423 | First Merchants Corp. | 95,228 | ||||
| 9,800 | First of Long Island Corp. (The) | 112,798 | ||||
| 38,000 | First Place Financial Corp.*,(a),(b),(c) | 0 | ||||
| 10,100 | First Reliance Bancshares, Inc.* | 72,721 | ||||
| 5,400 | First Savings Financial Group, Inc. | 80,730 | ||||
| 6,600 | First Western Financial, Inc.* | 119,790 | ||||
| 8,600 | Flushing Financial Corp. | 112,918 | ||||
| 8,400 | FS Bancorp, Inc. | 247,800 | ||||
| 13,250 | FVCBankcorp, Inc.* | 169,733 | ||||
| 12,500 | GCM Grosvenor, Inc., Class A | 97,000 | ||||
31
SCHEDULE OF PORTFOLIO INVESTMENTS
|
RBC Microcap Value Fund (cont.)
September 30, 2023
| Shares | Value | |||||
| 11,000 | Gladstone Capital Corp. | $ | 106,040 | |||
| 10,200 | Gladstone Investment Corp. | 129,948 | ||||
| 12,428 | Great Ajax Corp., REIT | 80,036 | ||||
| 8,550 | Guaranty Bancshares, Inc. | 245,299 | ||||
| 8,700 | Guild Holdings Co., Class A | 95,439 | ||||
| 11,700 | Hanmi Financial Corp. | 189,891 | ||||
| 14,200 | HBT Financial, Inc. | 259,008 | ||||
| 700 | Hingham Institution for Savings (The), FOR | 130,725 | ||||
| 5,000 | Home Bancorp, Inc. | 159,350 | ||||
| 11,340 | HomeTrust Bancshares, Inc. | 245,738 | ||||
| 11,600 | Independent Bank Corp. | 212,744 | ||||
| 8,500 | Investar Holding Corp. | 90,015 | ||||
| 3,904 | Investors Title Co. | 578,143 | ||||
| 7,874 | Lakeland Bancorp, Inc. | 99,370 | ||||
| 6,400 | LCNB Corp. | 91,328 | ||||
| 28,000 | Macatawa Bank Corp. | 250,880 | ||||
| 3,100 | MainStreet Bancshares, Inc. | 63,674 | ||||
| 38,700 | Manhattan Bridge Capital, Inc., REIT | 185,760 | ||||
| 16,700 | Medallion Financial Corp. | 117,234 | ||||
| 5,000 | Mercantile Bank Corp. | 154,550 | ||||
| 10,050 | Merchants Bancorp | 278,586 | ||||
| 13,000 | Meridian Corp. | 127,335 | ||||
| 8,000 | Metrocity Bankshares, Inc. | 157,440 | ||||
| 5,900 | Metropolitan Bank Holding Corp.* | 214,052 | ||||
| 5,500 | Mid Penn Bancorp, Inc. | 110,715 | ||||
| 8,700 | Midland States Bancorp, Inc. | 178,698 | ||||
| 6,700 | MidWestOne Financial Group, Inc. | 136,211 | ||||
| 7,600 | Monroe Capital Corp. | 56,620 | ||||
| 7,200 | MVB Financial Corp. | 162,576 | ||||
| 6,200 | National Bankshares, Inc. | 155,248 | ||||
| 2,560 | National Western Life Group, Inc., Class A | 1,119,974 | ||||
| 2,900 | Nexpoint Real Estate Finance, Inc., REIT | 47,444 | ||||
| 7,100 | Northeast Bank | 313,110 | ||||
| 14,600 | Northeast Community Bancorp, Inc. | 215,496 | ||||
| 5,100 | Northrim BanCorp, Inc. | 202,062 | ||||
| 38,510 | Northwest Bancshares, Inc. | 393,957 | ||||
| 19,100 | OFG Bancorp | 570,326 | ||||
| 20,400 | Old Second Bancorp, Inc. | 277,644 | ||||
| 13,200 | OP Bancorp | 120,780 | ||||
| 12,200 | Oppenheimer Holdings, Inc., Class A | 467,382 | ||||
| 4,000 | Orange County Bancorp, Inc. | 172,680 | ||||
| 10,200 | Orrstown Financial Services, Inc. | 214,302 | ||||
| 8,500 | Pacific Financial Corp. | 84,575 | ||||
| 9,300 | Parke Bancorp, Inc. | 151,497 | ||||
| 16,200 | Partners Bancorp | 125,550 | ||||
| 6,600 | PCB Bancorp | 101,970 | ||||
| 5,500 | Peapack-Gladstone Financial Corp. | 141,075 | ||||
| 700 | PennyMac Financial Services, Inc. | 46,620 | ||||
| 20,048 | Peoples Bancorp, Inc. | 508,818 | ||||
32
SCHEDULE OF PORTFOLIO INVESTMENTS
|
RBC Microcap Value Fund (cont.)
September 30, 2023
| Shares | Value | |||||
| 3,900 | Peoples Financial Services Corp. | $ | 156,390 | |||
| 7,300 | Pinnacle Bank/Gilroy CA* | 99,645 | ||||
| 380 | Piper Sandler Cos. | 55,218 | ||||
| 34,964 | Premier Financial Corp. | 596,486 | ||||
| 18,400 | Primis Financial Corp. | 149,960 | ||||
| 5,500 | Princeton Bancorp, Inc. | 159,445 | ||||
| 17,000 | Priority Technology Holdings, Inc.* | 55,080 | ||||
| 5,900 | Private Bancorp of America, Inc.* | 183,549 | ||||
| 15,500 | Provident Financial Holdings, Inc. | 202,895 | ||||
| 7,220 | Provident Financial Services, Inc. | 110,394 | ||||
| 12,400 | RBB Bancorp | 158,472 | ||||
| 16,781 | Ready Capital Corp., REIT | 169,656 | ||||
| 3,700 | Red River Bancshares, Inc. | 170,052 | ||||
| 16,660 | Regional Management Corp. | 461,149 | ||||
| 19,100 | Riverview Bancorp, Inc. | 106,196 | ||||
| 3,050 | S&T Bancorp, Inc. | 82,594 | ||||
| 44,800 | Sachem Capital Corp., REIT | 158,144 | ||||
| 6,620 | Safety Insurance Group, Inc. | 451,418 | ||||
| 6,800 | Saratoga Investment Corp. | 174,760 | ||||
| 6,300 | SB Financial Group, Inc. | 86,436 | ||||
| 5,716 | Seacoast Banking Corp. of Florida | 125,523 | ||||
| 10,500 | Security National Financial Corp., Class A* | 82,320 | ||||
| 14,100 | Seven Hills Realty Trust, REIT | 153,972 | ||||
| 11,000 | Shore Bancshares, Inc. | 115,720 | ||||
| 10,300 | Sierra Bancorp | 195,288 | ||||
| 3,500 | Silvercrest Asset Management Group, Inc., Class A | 55,545 | ||||
| 5,545 | Simmons First National Corp., Class A | 94,043 | ||||
| 11,500 | SmartFinancial, Inc. | 245,755 | ||||
| 6,300 | South Atlantic Bancshares, Inc. | 64,197 | ||||
| 12,400 | South Plains Financial, Inc. | 327,856 | ||||
| 5,900 | Southern First Bancshares, Inc.* | 158,946 | ||||
| 6,900 | Southern Missouri Bancorp, Inc. | 266,961 | ||||
| 9,300 | Stellus Capital Investment Corp. | 126,480 | ||||
| 9,400 | Stewart Information Services Corp. | 411,720 | ||||
| 6,100 | Summit Financial Group, Inc. | 137,494 | ||||
| 12,200 | SWK Holdings Corp.* | 192,150 | ||||
| 4,700 | Third Coast Bancshares, Inc.* | 80,370 | ||||
| 6,900 | Timberland Bancorp, Inc. | 186,990 | ||||
| 4,400 | Trinity Capital, Inc. | 61,248 | ||||
| 19,000 | United Western Bancorp, Inc.*,(a),(b),(c) | 0 | ||||
| 5,900 | Unity Bancorp, Inc. | 138,237 | ||||
| 4,500 | Universal Insurance Holdings, Inc. | 63,090 | ||||
| 14,800 | Waterstone Financial, Inc. | 162,060 | ||||
| 10,100 | West BanCorp, Inc. | 164,731 | ||||
| 26,300 | Western New England Bancorp, Inc. | 170,687 | ||||
|
| |||||
| 32,947,953 | ||||||
|
| |||||
33
SCHEDULE OF PORTFOLIO INVESTMENTS
|
RBC Microcap Value Fund (cont.)
September 30, 2023
| Shares | Value | |||||
Health Care — 1.67% |
| |||||
| 34,300 | Assertio Holdings, Inc.* | $ | 87,808 | |||
| 18,700 | Biote Corp., Class A* | 95,744 | ||||
| 83,400 | Chimerix, Inc.* | 80,047 | ||||
| 18,700 | Community Health Systems, Inc.* | 54,230 | ||||
| 8,100 | Computer Programs and Systems, Inc.* | 129,114 | ||||
| 4,900 | Cullinan Oncology, Inc.* | 44,345 | ||||
| 14,900 | FONAR Corp.* | 229,460 | ||||
| 10,500 | MacroGenics, Inc.* | 48,930 | ||||
| 15,400 | Ocuphire Pharma, Inc.* | 51,590 | ||||
| 21,100 | OraSure Technologies, Inc.* | 125,123 | ||||
| 70,700 | Organogenesis Holdings, Inc.* | 224,826 | ||||
| 7,200 | Phibro Animal Health Corp., Class A | 91,944 | ||||
| 16,800 | SCYNEXIS, Inc.* | 38,304 | ||||
| 35,700 | Sensus Healthcare, Inc.* | 98,889 | ||||
| 380 | UFP Technologies, Inc.* | 61,351 | ||||
| 30,700 | Vanda Pharmaceuticals, Inc.* | 132,624 | ||||
| 8,260 | Viemed Healthcare, Inc.* | 55,590 | ||||
| 8,200 | Zymeworks, Inc.* | 51,988 | ||||
|
| |||||
| 1,701,907 | ||||||
|
| |||||
Industrials — 17.00% | ||||||
| 9,700 | Acme United Corp. | 289,933 | ||||
| 1,300 | Alamo Group, Inc. | 224,718 | ||||
| 83,100 | ARC Document Solutions, Inc. | 264,258 | ||||
| 21,400 | BGSF, Inc. | 205,654 | ||||
| 5,400 | BlueLinx Holdings, Inc.* | 443,286 | ||||
| 14,774 | CECO Environmental Corp.* | 235,941 | ||||
| 10,678 | Cenveo, Inc.*,(a),(b),(c) | 0 | ||||
| 31,578 | CompX International, Inc. | 587,035 | ||||
| 24,400 | Concrete Pumping Holdings, Inc.* | 209,352 | ||||
| 43,300 | Costamare, Inc. | 416,546 | ||||
| 10,700 | Covenant Logistics Group, Inc. | 469,195 | ||||
| 13,300 | DLH Holdings Corp.* | 155,211 | ||||
| 27,760 | Ducommun, Inc.* | 1,207,838 | ||||
| 1,400 | Eagle Bulk Shipping, Inc. | 58,842 | ||||
| 20,200 | Eastern Co. (The) | 366,630 | ||||
| 700 | Encore Wire Corp. | 127,722 | ||||
| 33,160 | Ennis, Inc. | 703,655 | ||||
| 13,990 | Espey Mfg. & Electronics Corp. | 225,938 | ||||
| 6,700 | EVI Industries, Inc.* | 166,294 | ||||
| 12,500 | Gencor Industries, Inc.* | 176,625 | ||||
| 2,380 | Gibraltar Industries, Inc.* | 160,674 | ||||
| 3,600 | Graham Corp.* | 59,760 | ||||
| 12,810 | Greenbrier Cos., Inc. (The) | 512,400 | ||||
| 7,300 | Hudson Global, Inc.* | 141,474 | ||||
| 6,300 | Hurco Cos., Inc. | 141,309 | ||||
| 9,300 | Insteel Industries, Inc. | 301,878 | ||||
| 10,600 | Interface, Inc. | 103,986 | ||||
34
SCHEDULE OF PORTFOLIO INVESTMENTS
|
RBC Microcap Value Fund (cont.)
September 30, 2023
| Shares | Value | |||||
| 4,750 | Karat Packaging, Inc. | $ | 109,535 | |||
| 3,500 | L B Foster Co., Class A* | 66,185 | ||||
| 17,100 | Limbach Holdings, Inc.* | 542,583 | ||||
| 28,700 | LS Starrett Co. (The), Class A* | 308,525 | ||||
| 22,750 | LSI Industries, Inc. | 361,270 | ||||
| 8,940 | Marten Transport Ltd. | 176,207 | ||||
| 13,100 | Mastech Digital, Inc.* | 117,900 | ||||
| 12,600 | Mayville Engineering Co., Inc.* | 138,222 | ||||
| 24,779 | Miller Industries, Inc. | 971,585 | ||||
| 26,200 | Mistras Group, Inc.* | 142,790 | ||||
| 4,300 | National Presto Industries, Inc. | 311,578 | ||||
| 11,900 | Northwest Pipe Co.* | 359,023 | ||||
| 4,800 | PAM Transportation Services, Inc.* | 103,440 | ||||
| 11,200 | Park Aerospace Corp. | 173,936 | ||||
| 7,300 | Powell Industries, Inc. | 605,170 | ||||
| 3,240 | Preformed Line Products Co. | 526,759 | ||||
| 9,400 | Quad/Graphics, Inc.* | 47,282 | ||||
| 14,500 | Quanex Building Products Corp. | 408,465 | ||||
| 44,100 | Radiant Logistics, Inc.* | 249,165 | ||||
| 13,600 | Resources Connection, Inc. | 202,776 | ||||
| 2,960 | Rush Enterprises, Inc., Class A | 120,857 | ||||
| 44,400 | Safe Bulkers, Inc. | 143,856 | ||||
| 920 | Standex International Corp. | 134,035 | ||||
| 2,950 | Sterling Infrastructure, Inc.* | 216,766 | ||||
| 10,300 | Taylor Devices, Inc.* | 219,390 | ||||
| 21,710 | Textainer Group Holdings Ltd. | 808,697 | ||||
| 12,100 | Titan Machinery, Inc.* | 321,618 | ||||
| 4,100 | TrueBlue, Inc.* | 60,147 | ||||
| 15,500 | Twin Disc, Inc.* | 212,660 | ||||
| 5,600 | Ultralife Corp.* | 54,656 | ||||
| 4,130 | V2X, Inc.* | 213,356 | ||||
| 14,000 | VirTra, Inc.* | 78,120 | ||||
| 4,200 | VSE Corp. | 211,848 | ||||
| 2,700 | Willdan Group, Inc.* | 55,161 | ||||
| 13,338 | Willis Lease Finance Corp.* | 564,197 | ||||
|
| |||||
| 17,293,914 | ||||||
|
| |||||
Information Technology — 7.00% | ||||||
| 16,500 | Amtech Systems, Inc.* | 125,730 | ||||
| 14,400 | AstroNova, Inc.* | 180,000 | ||||
| 8,750 | Aviat Networks, Inc.* | 273,000 | ||||
| 28,100 | AXT, Inc.* | 67,440 | ||||
| 12,800 | Bel Fuse, Inc., Class B | 610,816 | ||||
| 11,800 | Coda Octopus Group, Inc.* | 73,160 | ||||
| 22,700 | CompoSecure, Inc.* | 146,415 | ||||
| 17,900 | Computer Task Group, Inc.* | 184,907 | ||||
| 7,600 | CPI Card Group, Inc.* | 140,752 | ||||
| 3,000 | CSP, Inc. | 52,500 | ||||
35
SCHEDULE OF PORTFOLIO INVESTMENTS
|
RBC Microcap Value Fund (cont.)
September 30, 2023
| Shares | Value | |||||
| 4,050 | CTS Corp. | $ | 169,047 | |||
| 5,900 | Daktronics, Inc.* | 52,628 | ||||
| 5,750 | Digi International, Inc.* | 155,250 | ||||
| 24,300 | Eastman Kodak Co.* | 102,303 | ||||
| 3,700 | Ebix, Inc. | 36,556 | ||||
| 8,280 | ePlus, Inc.* | 525,946 | ||||
| 39,400 | Immersion Corp. | 260,434 | ||||
| 3,600 | inTEST Corp.* | 54,612 | ||||
| 2,800 | Issuer Direct Corp.* | 52,640 | ||||
| 30,800 | Key Tronic Corp.* | 137,676 | ||||
| 22,400 | Kimball Electronics, Inc.* | 613,312 | ||||
| 20,700 | KVH Industries, Inc.* | 105,570 | ||||
| 13,740 | Methode Electronics, Inc. | 313,959 | ||||
| 12,900 | Nortech Systems, Inc.* | 119,970 | ||||
| 10,990 | Park City Group, Inc. | 96,272 | ||||
| 12,920 | PC Connection, Inc. | 689,670 | ||||
| 46,400 | PCTEL, Inc. | 193,024 | ||||
| 32,130 | Photronics, Inc.* | 649,347 | ||||
| 17,500 | Richardson Electronics Ltd. | 191,275 | ||||
| 19,700 | SigmaTron International, Inc.* | 61,661 | ||||
| 8,600 | TransAct Technologies, Inc.* | 55,212 | ||||
| 18,680 | Vishay Precision Group, Inc.* | 627,274 | ||||
|
| |||||
| 7,118,358 | ||||||
|
| |||||
Materials — 4.21% | ||||||
| 13,900 | Alto Ingredients, Inc.* | 61,438 | ||||
| 38,800 | American Vanguard Corp. | 424,084 | ||||
| 37,000 | Blue Earth Refineries, Inc.*,(a),(b),(c) | 0 | ||||
| 9,600 | Clearwater Paper Corp.* | 348,000 | ||||
| 18,800 | Core Molding Technologies, Inc.* | 535,612 | ||||
| 41,200 | Fortitude Gold Corp. | 246,376 | ||||
| 19,000 | Friedman Industries, Inc. | 254,600 | ||||
| 65,990 | FutureFuel Corp. | 473,149 | ||||
| 2,700 | Hawkins, Inc. | 158,895 | ||||
| 4,200 | Haynes International, Inc. | 195,384 | ||||
| 7,100 | Intrepid Potash, Inc.* | 178,636 | ||||
| 1,330 | Materion Corp. | 135,540 | ||||
| 10,400 | Olympic Steel, Inc. | 584,584 | ||||
| 20,300 | Ramaco Resources, Inc., Class A | 223,097 | ||||
| 18,300 | Rayonier Advanced Materials, Inc.* | 64,782 | ||||
| 6,400 | Ryerson Holding Corp. | 186,176 | ||||
| 18,000 | Tredegar Corp. | 97,380 | ||||
| 8,400 | Valhi, Inc. | 111,384 | ||||
|
| |||||
| 4,279,117 | ||||||
|
| |||||
Real Estate — 4.54% | ||||||
| 18,100 | Alpine Income Property Trust, Inc., REIT | 296,116 | ||||
| 8,000 | American Realty Investors, Inc.* | 116,960 | ||||
| 13,000 | AMREP Corp.* | 218,692 | ||||
36
SCHEDULE OF PORTFOLIO INVESTMENTS
|
RBC Microcap Value Fund (cont.)
September 30, 2023
| Shares | Value | |||||
| 9,100 | BRT Apartments Corp., REIT | $ | 157,157 | |||
| 5,800 | Chatham Lodging Trust, REIT | 55,506 | ||||
| 6,000 | Community Healthcare Trust, Inc., REIT | 178,200 | ||||
| 38,400 | Comstock Holding Cos., Inc.* | 180,480 | ||||
| 3,675 | CTO Realty Growth, Inc., REIT | 59,572 | ||||
| 23,300 | Farmland Partners, Inc., REIT | 239,058 | ||||
| 66,500 | Franklin Street Properties Corp., REIT | 123,025 | ||||
| 4,600 | FRP Holdings, Inc.* | 248,262 | ||||
| 11,242 | Getty Realty Corp., REIT | 311,741 | ||||
| 13,800 | Global Medical REIT, Inc., REIT | 123,786 | ||||
| 24,000 | Hersha Hospitality Trust, REIT, Class A | 236,640 | ||||
| 7,500 | Newlake Capital Partners, Inc., REIT | 102,150 | ||||
| 26,432 | One Liberty Properties, Inc., REIT | 498,772 | ||||
| 10,900 | Postal Realty Trust, Inc., REIT, Class A | 147,150 | ||||
| 7,500 | RE/MAX Holdings, Inc., Class A | 97,050 | ||||
| 1,820 | Regency Centers Corp., REIT | 108,181 | ||||
| 3,000 | RMR Group, Inc. (The), Class A | 73,560 | ||||
| 23,400 | RPT Realty, REIT | 247,104 | ||||
| 2,700 | Stratus Properties, Inc.* | 73,980 | ||||
| 6,700 | Tejon Ranch Co.* | 108,674 | ||||
| 63,710 | Whitestone, REIT | 613,527 | ||||
|
| |||||
| 4,615,343 | ||||||
|
| |||||
Utilities — 0.87% | ||||||
| 1,300 | Artesian Resources Corp., Class A | 54,587 | ||||
| 7,800 | Genie Energy Ltd., Class B | 114,894 | ||||
| 14,300 | Pure Cycle Corp.* | 137,280 | ||||
| 1,000 | SJW Group | 60,110 | ||||
| 12,266 | Unitil Corp. | 523,881 | ||||
|
| |||||
| 890,752 | ||||||
|
| |||||
Total Common Stocks | 99,440,314 | |||||
|
| |||||
(Cost $84,129,900) | ||||||
Exchange Traded Funds — 0.10% | ||||||
| 1,000 | iShares Russell Microcap Index Fund | 100,100 | ||||
|
| |||||
Total Exchange Traded Funds | 100,100 | |||||
|
| |||||
(Cost $110,563) | ||||||
Rights/Warrants — 0.04% | ||||||
| 1,136 | Chord Energy Corp, * | 31,172 | ||||
| 568 | Chord Energy Corp, * | 9,360 | ||||
| 8,600 | LGL Group, Inc. (The), Warrants, Expire 11/16/25* | 1,290 | ||||
|
| |||||
Total Rights/Warrants | 41,822 | |||||
|
| |||||
(Cost $95,622) | ||||||
37
SCHEDULE OF PORTFOLIO INVESTMENTS
|
RBC Microcap Value Fund (cont.)
September 30, 2023
Principal Amount | Value | |||||
Corporate Bonds — 0.00% | ||||||
Financial — 0.00% | ||||||
| $1,947 | Trenwick America Corp., 0.00%, *,(a),(b),(c) | $0 | ||||
| 1,098 | Trenwick America Corp., 0.00%, *,(a),(b),(c) | 0 | ||||
| 0 | ||||||
Total Corporate Bonds | 0 | |||||
(Cost $0) | ||||||
Shares | ||||||
Investment Company — 2.20% | ||||||
2,233,645 | RBC BlueBay U.S. Goverment Money Market Fund, Institutional Class 1(d) | 2,233,645 | ||||
|
| |||||
Total Investment Company | 2,233,645 | |||||
|
| |||||
(Cost $2,233,645) | ||||||
Total Investments | $ | 101,815,881 | ||||
(Cost $86,569,730)(e) — 100.10% | ||||||
Liabilities in excess of other assets — (0.10)% | (101,227) | |||||
|
| |||||
NET ASSETS — 100.00% | $ | 101,714,654 | ||||
|
| |||||
| * | Non-income producing security. |
| (a) | Security delisted or issuer in bankruptcy. |
| (b) | The Pricing Committee has fair valued this security under procedures established by the Fund’s Board of Trustees. |
| (c) | Security is valued using significant unobservable inputs and is classified as Level 3 in the fair value hierarchy. |
| (d) | Affiliated investment. |
| (e) | See Notes to Schedules of Portfolio Investments for the tax cost of securities and the breakdown of unrealized appreciation (depreciation). |
Abbreviations used are defined below:
FOR - Foreign Ownership Receipt
REIT - Real Estate Investment Trust
See Notes to the Financial Statements.
38
SCHEDULE OF PORTFOLIO INVESTMENTS
|
RBC Small Cap Value Fund
September 30, 2023
| Shares | Value | |||||
Common Stocks — 96.54% | ||||||
Communication Services — 1.86% | ||||||
| 3,590 | Nexstar Media Group, Inc. | $ | 514,698 | |||
|
| |||||
Consumer Discretionary — 14.04% | ||||||
| 4,560 | Cheesecake Factory, Inc. (The) | 138,168 | ||||
| 24,710 | Dana, Inc. | 362,496 | ||||
| 9,210 | Genesco, Inc.* | 283,852 | ||||
| 21,860 | G-III Apparel Group Ltd.* | 544,751 | ||||
| 2,390 | Group 1 Automotive, Inc. | 642,217 | ||||
| 4,160 | Malibu Boats, Inc., Class A* | 203,923 | ||||
| 3,130 | Oxford Industries, Inc. | 300,887 | ||||
| 6,790 | Patrick Industries, Inc. | 509,657 | ||||
| 12,295 | Steven Madden Ltd. | 390,612 | ||||
| 12,150 | Taylor Morrison Home Corp.* | 517,712 | ||||
|
| |||||
| 3,894,275 | ||||||
|
| |||||
Consumer Staples — 3.43% | ||||||
| 340 | Hostess Brands, Inc.* | 11,325 | ||||
| 5,080 | John B Sanfilippo & Son, Inc. | 501,904 | ||||
| 4,150 | MGP Ingredients, Inc. | 437,742 | ||||
|
| |||||
| 950,971 | ||||||
|
| |||||
Energy — 9.52% | ||||||
| 25,340 | Delek US Holdings, Inc. | 719,909 | ||||
| 29,460 | Magnolia Oil & Gas Corp., Class A | 674,929 | ||||
| 10,210 | Matador Resources Co. | 607,291 | ||||
| 17,710 | Par Pacific Holdings, Inc.* | 636,497 | ||||
|
| |||||
| 2,638,626 | ||||||
|
| |||||
Financials — 21.54% | ||||||
| 4,030 | American Financial Group, Inc. | 450,030 | ||||
| 7,910 | AMERISAFE, Inc. | 396,054 | ||||
| 20,080 | Brookline Bancorp, Inc. | 182,929 | ||||
| 21,550 | Columbia Banking System, Inc. | 437,465 | ||||
| 32,432 | Compass Diversified Holdings | 608,749 | ||||
| 7,950 | Independent Bank Group, Inc. | 314,422 | ||||
| 14,897 | Mercantile Bank Corp. | 460,466 | ||||
| 16,955 | Pacific Premier Bancorp, Inc. | 368,941 | ||||
| 7,520 | Pinnacle Financial Partners, Inc. | 504,141 | ||||
| 4,200 | Reinsurance Group of America, Inc. | 609,798 | ||||
| 15,640 | Seacoast Banking Corp. of Florida | 343,454 | ||||
| 5,170 | Stock Yards Bancorp, Inc. | 203,129 | ||||
| 8,990 | TriCo Bancshares | 287,950 | ||||
| 8,940 | United Community Banks, Inc. | 227,165 | ||||
| 13,420 | Veritex Holdings, Inc. | 240,889 | ||||
| 9,230 | WSFS Financial Corp. | 336,895 | ||||
|
| |||||
| 5,972,477 | ||||||
|
| |||||
39
SCHEDULE OF PORTFOLIO INVESTMENTS
|
RBC Small Cap Value Fund (cont.)
September 30, 2023
| Shares | Value | |||||
Health Care — 5.46% |
| |||||
| 8,440 | Globus Medical, Inc., Class A* | $ | 419,046 | |||
| 5,980 | Lantheus Holdings, Inc.* | 415,491 | ||||
| 23,500 | Maravai LifeSciences Holdings, Inc., Class A* | 235,000 | ||||
| 39,970 | MiMedx Group, Inc.* | 291,381 | ||||
| 3,420 | Omnicell, Inc.* | 154,037 | ||||
|
| |||||
| 1,514,955 | ||||||
|
| |||||
Industrials — 15.95% | ||||||
| 103,458 | ACCO Brands Corp. | 593,849 | ||||
| 7,810 | Arcosa, Inc. | 561,539 | ||||
| 3,405 | Atkore, Inc.* | 507,992 | ||||
| 5,830 | Barrett Business Services, Inc. | 526,099 | ||||
| 18,710 | Columbus McKinnon Corp. | 653,166 | ||||
| 13,096 | Ducommun, Inc.* | 569,807 | ||||
| 12,898 | Greenbrier Cos., Inc. (The) | 515,920 | ||||
| 15,190 | Insteel Industries, Inc. | 493,068 | ||||
|
| |||||
| 4,421,440 | ||||||
|
| |||||
Information Technology — 5.51% | ||||||
| 5,850 | MKS Instruments, Inc. | 506,259 | ||||
| 6,973 | Model N, Inc.* | 170,211 | ||||
| 4,110 | Onto Innovation, Inc.* | 524,107 | ||||
| 1,190 | Super Micro Computer, Inc.* | 326,322 | ||||
|
| |||||
| 1,526,899 | ||||||
|
| |||||
Materials — 5.98% | ||||||
| 2,900 | Kaiser Aluminum Corp. | 218,254 | ||||
| 15,339 | Koppers Holdings, Inc. | 606,658 | ||||
| 3,890 | Materion Corp. | 396,430 | ||||
| 1,670 | Reliance Steel & Aluminum Co. | 437,924 | ||||
|
| |||||
| 1,659,266 | ||||||
|
| |||||
Real Estate — 10.31% | ||||||
| 16,399 | Community Healthcare Trust, Inc., REIT | 487,050 | ||||
| 8,230 | CubeSmart, REIT | 313,810 | ||||
| 34,250 | DiamondRock Hospitality Co., REIT | 275,028 | ||||
| 2,620 | EastGroup Properties, Inc., REIT | 436,309 | ||||
| 8,424 | National Storage Affiliates Trust, REIT | 267,378 | ||||
| 29,660 | RLJ Lodging Trust, REIT | 290,371 | ||||
| 13,140 | STAG Industrial, Inc., REIT | 453,461 | ||||
| 24,011 | UMH Properties, Inc., REIT | 336,634 | ||||
|
| |||||
| 2,860,041 | ||||||
|
| |||||
40
SCHEDULE OF PORTFOLIO INVESTMENTS
|
RBC Small Cap Value Fund (cont.)
September 30, 2023
| Shares | Value | |||||
Utilities — 2.94% |
| |||||
| 13,490 | Southwest Gas Holdings, Inc. | $ | 814,931 | |||
|
| |||||
Total Common Stocks | 26,768,579 | |||||
|
| |||||
(Cost $27,331,629) | ||||||
Exchange Traded Funds — 2.45% |
| |||||
| 1,050 | iShares Russell 2000 Value ETF | 142,327 | ||||
| 7,330 | SPDR S&P Biotech ETF | 535,237 | ||||
|
| |||||
Total Exchange Traded Funds | 677,564 | |||||
|
| |||||
(Cost $791,864) | ||||||
Investment Company — 1.57% |
| |||||
| 436,014 | RBC BlueBay U.S. Goverment Money Market Fund, Institutional Class 1(a) | 436,014 | ||||
|
| |||||
Total Investment Company | 436,014 | |||||
|
| |||||
(Cost $436,014) | ||||||
Total Investments | $ | 27,882,157 | ||||
(Cost $28,559,507)(b) — 100.56% | ||||||
Liabilities in excess of other assets — (0.56)% | (154,397) | |||||
|
| |||||
NET ASSETS — 100.00% | $ | 27,727,760 | ||||
|
| |||||
| * | Non-income producing security. |
| (a) | Affiliated investment. |
| (b) | See Notes to Schedules of Portfolio Investments for the tax cost of securities and the breakdown of unrealized appreciation (depreciation). |
Abbreviations used are defined below:
REIT - Real Estate Investment Trust
See Notes to the Financial Statements.
41
|
Statements of Assets and Liabilities
| September 30, 2023 |
| RBC SMID Cap Growth Fund | RBC Enterprise Fund | RBC Small Cap Core Fund | ||||||||||
Assets: | ||||||||||||
Investments in securities, at value: | ||||||||||||
Unaffiliated investments (cost $93,953,743, $42,234,874 and $27,204,062, respectively) | $ | 107,916,789 | $ | 60,191,096 | $ | 40,728,853 | ||||||
Affiliated investments (cost $4,385,678, $1,206,823 and $1,059,949, respectively) | 4,385,678 | 1,206,823 | 1,059,949 | |||||||||
Cash | 3,658 | — | — | |||||||||
Interest and dividend receivable | 14,957 | 36,372 | 14,303 | |||||||||
Receivable for capital shares issued | 139,383 | — | 28,819 | |||||||||
Receivable for investments sold | — | 7,201 | 87,352 | |||||||||
Prepaid expenses and other assets | 19,250 | 13,447 | 11,690 | |||||||||
|
|
|
|
|
| |||||||
Total Assets | 112,479,715 | 61,454,939 | 41,930,966 | |||||||||
|
|
|
|
|
| |||||||
Liabilities: | ||||||||||||
Professional fees payable | 4,929 | 4,929 | 4,929 | |||||||||
Payable for capital shares redeemed | 111,991 | 12,682 | 1,500 | |||||||||
Payable for investments purchased | 2,306,827 | — | 227,355 | |||||||||
Accrued expenses and other payables: | ||||||||||||
Investment advisory fees | 37,833 | 49,790 | 24,208 | |||||||||
Accounting fees | 7,420 | 6,822 | 6,569 | |||||||||
Audit fees | 36,382 | 36,326 | 36,275 | |||||||||
Trustees’ fees | 51 | 15 | 18 | |||||||||
Distribution fees | 70,975 | 506 | 966 | |||||||||
Custodian fees | 2,012 | 513 | 991 | |||||||||
Shareholder reports | 9,526 | 8,412 | 7,285 | |||||||||
Transfer agent fees | 5,425 | 6,156 | 1,972 | |||||||||
Other | 5,604 | 5,261 | 5,044 | |||||||||
|
|
|
|
|
| |||||||
Total Liabilities | 2,598,975 | 131,412 | 317,112 | |||||||||
|
|
|
|
|
| |||||||
Net Assets | $ | 109,880,740 | $ | 61,323,527 | $ | 41,613,854 | ||||||
|
|
|
|
|
| |||||||
Net Assets Consists of: | ||||||||||||
Capital | $ | 93,693,755 | $ | 42,652,984 | $ | 28,539,077 | ||||||
Accumulated earnings | 16,186,985 | 18,670,543 | 13,074,777 | |||||||||
|
|
|
|
|
| |||||||
Net Assets | $ | 109,880,740 | $ | 61,323,527 | $ | 41,613,854 | ||||||
|
|
|
|
|
| |||||||
42
FINANCIAL STATEMENTS
|
Statements of Assets and Liabilities (cont.)
| September 30, 2023 |
| RBC SMID Cap Growth Fund | RBC Enterprise Fund | RBC Small Cap Core Fund | ||||||||||
Net Assets | ||||||||||||
Class A | $ | 13,320,925 | $ | 664,316 | $ | 7,705,110 | ||||||
Class I | 87,116,322 | 60,659,211 | 33,898,021 | |||||||||
Class R6 | 9,443,493 | N/A | 10,723 | |||||||||
|
|
|
|
|
| |||||||
Total | $ | 109,880,740 | $ | 61,323,527 | $ | 41,613,854 | ||||||
|
|
|
|
|
| |||||||
Shares Outstanding (Unlimited number of shares authorized, no par value): | ||||||||||||
Class A | 1,188,483 | 47,240 | 631,823 | |||||||||
Class I | 6,159,585 | 3,959,895 | 2,369,508 | |||||||||
Class R6 | 663,968 | N/A | 746 | |||||||||
|
|
|
|
|
| |||||||
Total | 8,012,036 | 4,007,135 | 3,002,077 | |||||||||
|
|
|
|
|
| |||||||
Net Asset Values and Redemption Prices Per Share: | ||||||||||||
Class A | $ | 11.21 | $ | 14.06 | $ | 12.20 | ||||||
|
|
|
|
|
| |||||||
Class I | $ | 14.14 | $ | 15.32 | $ | 14.31 | ||||||
|
|
|
|
|
| |||||||
Class R6 | $ | 14.22 | $ | N/A | $ | 14.37 | ||||||
|
|
|
|
|
| |||||||
Maximum Offering Price Per Share: | ||||||||||||
Class A | $ | 11.89 | $ | 14.92 | $ | 12.94 | ||||||
|
|
|
|
|
| |||||||
Maximum Sales Charge - Class A | 5.75 | % | 5.75 | % | 5.75 | % | ||||||
|
|
|
|
|
| |||||||
43
FINANCIAL STATEMENTS
|
Statements of Assets and Liabilities (cont.)
| September 30, 2023 |
| RBC Microcap Value Fund | RBC Small Cap Value Fund | |||||||
Assets: | ||||||||
Investments in securities, at value: | ||||||||
Unaffiliated investments (cost $84,336,085 and $28,123,493, respectively) | $ | 99,582,236 | $ | 27,446,143 | ||||
Affiliated investments (cost $2,233,645 and $436,014, respectively) | 2,233,645 | 436,014 | ||||||
Cash | 756 | — | ||||||
Interest and dividend receivable | 115,966 | 19,059 | ||||||
Receivable for capital shares issued | 4,818 | 165 | ||||||
Receivable for investments sold | — | 149,497 | ||||||
Prepaid expenses and other assets | 10,685 | 67,467 | ||||||
|
|
|
| |||||
Total Assets | 101,948,106 | 28,118,345 | ||||||
|
|
|
| |||||
Liabilities: | ||||||||
Professional fees payable | 4,929 | 4,929 | ||||||
Payable for capital shares redeemed | 56,048 | — | ||||||
Payable for investments purchased | — | 288,211 | ||||||
Accrued expenses and other payables: | ||||||||
Investment advisory fees | 86,815 | 38,818 | ||||||
Accounting fees | 7,350 | 6,391 | ||||||
Audit fees | 36,443 | 36,257 | ||||||
Trustees’ fees | 56 | 49 | ||||||
Distribution fees | 3,663 | 74 | ||||||
Custodian fees | 2,434 | 529 | ||||||
Shareholder reports | 11,888 | 6,341 | ||||||
Transfer agent fees | 11,751 | 3,991 | ||||||
Other | 12,075 | 4,995 | ||||||
|
|
|
| |||||
Total Liabilities | 233,452 | 390,585 | ||||||
|
|
|
| |||||
Net Assets | $ | 101,714,654 | $ | 27,727,760 | ||||
|
|
|
| |||||
Net Assets Consists of: | ||||||||
Capital | $ | 77,436,910 | $ | 31,989,163 | ||||
Accumulated earnings | 24,277,744 | (4,261,403 | ) | |||||
|
|
|
| |||||
Net Assets | $ | 101,714,654 | $ | 27,727,760 | ||||
|
|
|
| |||||
44
FINANCIAL STATEMENTS
|
Statements of Assets and Liabilities (cont.)
| September 30, 2023 |
| RBC Microcap Value Fund | RBC Small Cap Value Fund | |||||||||||
Net Assets | ||||||||||||
Class A | $ | 2,471,398 | $ | 11,155 | ||||||||
Class I | 99,243,256 | 27,705,921 | ||||||||||
Class R6 | N/A | 10,684 | ||||||||||
|
|
|
| |||||||||
Total | $ | 101,714,654 | $ | 27,727,760 | ||||||||
|
|
|
| |||||||||
Shares Outstanding (Unlimited number of shares authorized, no par value): | ||||||||||||
Class A | 98,245 | 839 | ||||||||||
Class I | 3,943,960 | 2,095,507 | ||||||||||
Class R6 | N/A | 799 | ||||||||||
|
|
|
| |||||||||
Total | 4,042,205 | 2,097,145 | ||||||||||
|
|
|
| |||||||||
Net Asset Values and Redemption Prices Per Share: | ||||||||||||
Class A | $ | 25.16 | $ | 13.29 | ||||||||
|
|
|
| |||||||||
Class I | $ | 25.16 | $ | 13.22 | ||||||||
|
|
|
| |||||||||
Class R6 | $ | N/A | $ | 13.38 | ||||||||
|
|
|
| |||||||||
Maximum Offering Price Per Share: | ||||||||||||
Class A | $ | 26.69 | $ | 14.10 | ||||||||
|
|
|
| |||||||||
Maximum Sales Charge - Class A | 5.75 | % | 5.75 | % | ||||||||
|
|
|
| |||||||||
See Notes to the Financial Statements.
45
FINANCIAL STATEMENTS
|
| For the Year Ended September 30, 2023 | ||||||||||||
| RBC SMID Cap Growth Fund | RBC Enterprise Fund | RBC Small Cap Core Fund | ||||||||||
Investment Income: | ||||||||||||
Interest income | $ | 23,665 | $ | — | $ | 61,364 | ||||||
Dividend income - unaffiliated | 535,736 | 833,449 | 532,187 | |||||||||
Dividend income - affiliated | 99,929 | 85,541 | 46,730 | |||||||||
Foreign tax withholding | (4,863 | ) | (3,530 | ) | (2,108 | ) | ||||||
|
|
|
|
|
| |||||||
Total Investment Income | 654,467 | 915,460 | 638,173 | |||||||||
Expenses: | ||||||||||||
Investment advisory fees | 670,484 | 590,803 | 358,628 | |||||||||
Distribution fees–Class A | 31,307 | 1,739 | 18,610 | |||||||||
Accounting fees | 33,783 | 31,577 | 30,151 | |||||||||
Audit fees | 34,672 | 34,559 | 34,457 | |||||||||
Custodian fees | 6,263 | 2,703 | 4,453 | |||||||||
Insurance fees | 3,509 | 3,509 | 3,509 | |||||||||
Legal fees | 5,160 | 3,533 | 2,184 | |||||||||
Registrations and filing fees | 62,957 | 46,313 | 65,228 | |||||||||
Shareholder reports | 24,194 | 19,977 | 15,024 | |||||||||
Transfer agent fees–Class A | 12,091 | 5,130 | 14,427 | |||||||||
Transfer agent fees–Class I | 124,304 | 36,169 | 16,162 | |||||||||
Transfer agent fees–Class R6 | 3,517 | — | 3,531 | |||||||||
Trustees’ fees and expenses | 5,383 | 3,594 | 2,369 | |||||||||
Tax expense | 5,346 | 5,376 | 5,283 | |||||||||
Other fees | 6,334 | 5,292 | 5,780 | |||||||||
|
|
|
|
|
| |||||||
Total expenses before fee waiver/reimbursement | 1,029,304 | 790,274 | 579,796 | |||||||||
Expenses waived/reimbursed by: | ||||||||||||
Advisor | (217,421 | ) | (118,604 | ) | (183,155 | ) | ||||||
|
|
|
|
|
| |||||||
Net expenses | 811,883 | 671,670 | 396,641 | |||||||||
|
|
|
|
|
| |||||||
Net Investment Income (Loss) | (157,416 | ) | 243,790 | 241,532 | ||||||||
|
|
|
|
|
| |||||||
Realized/Unrealized Gains/(Losses): | ||||||||||||
Net realized gains from investment transactions | 2,756,776 | 1,903,799 | 3,132,687 | |||||||||
Net change in unrealized appreciation on investments | 8,348,755 | 5,247,453 | 3,659,166 | |||||||||
|
|
|
|
|
| |||||||
Net realized/unrealized gains | 11,105,531 | 7,151,252 | 6,791,853 | |||||||||
|
|
|
|
|
| |||||||
Change in net assets resulting from operations | $ | 10,948,115 | $ | 7,395,042 | $ | 7,033,385 | ||||||
|
|
|
|
|
| |||||||
46
FINANCIAL STATEMENTS
|
Statements of Operations (cont.)
| For the Year Ended September 30, 2023 | ||||||||
| RBC Microcap Value Fund | RBC Small Cap Value Fund | |||||||
Investment Income: | ||||||||
Interest income | $ | 12,082 | $ | 28,057 | ||||
Dividend income - unaffiliated | 2,521,818 | 649,667 | ||||||
Dividend income - affiliated | 85,026 | 20,790 | ||||||
Foreign tax withholding | (4,508 | ) | — | |||||
|
|
|
| |||||
Total Investment Income | 2,614,418 | 698,514 | ||||||
Expenses: | ||||||||
Investment advisory fees | 958,419 | 219,308 | ||||||
Distribution fees–Class A | 6,718 | 28 | ||||||
Accounting fees | 51,857 | 30,438 | ||||||
Audit fees | 34,793 | 34,421 | ||||||
Custodian fees | 10,089 | 3,392 | ||||||
Insurance fees | 3,509 | 3,509 | ||||||
Legal fees | 8,075 | 1,756 | ||||||
Registrations and filing fees | 50,412 | 65,641 | ||||||
Shareholder reports | 27,277 | 15,540 | ||||||
Transfer agent fees–Class A | 7,461 | 3,910 | ||||||
Transfer agent fees–Class I | 96,279 | 41,006 | ||||||
Transfer agent fees–Class R6 | — | 3,522 | ||||||
Trustees’ fees and expenses | 6,328 | 1,758 | ||||||
Tax expense | 5,323 | 5,368 | ||||||
Other fees | 5,895 | 4,841 | ||||||
|
|
|
| |||||
Total expenses before fee waiver/reimbursement | 1,272,435 | 434,438 | ||||||
Expenses waived/reimbursed by: | ||||||||
Advisor | (129,336 | ) | (168,901 | ) | ||||
|
|
|
| |||||
Net expenses | 1,143,099 | 265,537 | ||||||
|
|
|
| |||||
Net Investment Income | 1,471,319 | 432,977 | ||||||
|
|
|
| |||||
Realized/Unrealized Gains/(Losses): | ||||||||
Net realized gains/(losses) on: | ||||||||
Investment transactions | 8,377,700 | (714,017 | ) | |||||
Foreign currency transactions | (50 | ) | — | |||||
|
|
|
| |||||
Net realized gains/(losses) | 8,377,650 | (714,017 | ) | |||||
Net change in unrealized appreciation on: | ||||||||
Investments | 2,435,600 | 4,487,404 | ||||||
Foreign currency | 174 | — | ||||||
|
|
|
| |||||
Net unrealized gains | 2,435,774 | 4,487,404 | ||||||
|
|
|
| |||||
Net realized/unrealized gains | 10,813,424 | 3,773,387 | ||||||
|
|
|
| |||||
Change in net assets resulting from operations | $ | 12,284,743 | $ | 4,206,364 | ||||
|
|
|
| |||||
See Notes to the Financial Statements.
47
FINANCIAL STATEMENTS
|
Statements of Changes in Net Assets
| RBC SMID Cap Growth Fund | ||||||||||||||
| For the Year Ended September 30, 2023 | For the Year Ended September 30, 2022 | |||||||||||||
From Investment Activities | ||||||||||||||
Operations: | ||||||||||||||
Net investment loss | $ | (157,416 | ) | $ | (282,566 | ) | ||||||||
Net realized gains from investments | 2,756,776 | 5,973,308 | ||||||||||||
Net change in unrealized appreciation/(depreciation) on investments | 8,348,755 | (20,671,816 | ) | |||||||||||
|
|
|
| |||||||||||
Change in net assets resulting from operations | 10,948,115 | (14,981,074 | ) | |||||||||||
|
|
|
| |||||||||||
Distributions to Shareholders: | ||||||||||||||
Class A | (1,069,066 | ) | (3,541,196 | ) | ||||||||||
Class I | (5,152,780 | ) | (16,697,691 | ) | ||||||||||
Class R6 | (1,350 | ) | (4,389 | ) | ||||||||||
|
|
|
| |||||||||||
Change in net assets resulting from shareholder distributions | (6,223,196 | ) | (20,243,276 | ) | ||||||||||
|
|
|
| |||||||||||
Capital Transactions: | ||||||||||||||
Proceeds from shares issued | 41,527,647 | 23,276,342 | ||||||||||||
Distributions reinvested | 6,199,042 | 20,170,357 | ||||||||||||
Cost of shares redeemed | (20,840,943 | ) | (25,529,899 | ) | ||||||||||
|
|
|
| |||||||||||
Change in net assets resulting from capital transactions | 26,885,746 | 17,916,800 | ||||||||||||
|
|
|
| |||||||||||
Net increase/(decrease) in net assets | 31,610,665 | (17,307,550 | ) | |||||||||||
Net Assets: | ||||||||||||||
Beginning of year | 78,270,075 | 95,577,625 | ||||||||||||
|
|
|
| |||||||||||
End of year | $ | 109,880,740 | $ | 78,270,075 | ||||||||||
|
|
|
| |||||||||||
Share Transactions: | ||||||||||||||
Issued | 2,921,773 | 1,449,636 | ||||||||||||
Reinvested | 481,767 | 1,269,460 | ||||||||||||
Redeemed | (1,470,723 | ) | (1,550,770 | ) | ||||||||||
|
|
|
| |||||||||||
Change in shares resulting from capital transactions | 1,932,817 | 1,168,326 | ||||||||||||
|
|
|
| |||||||||||
See Notes to the Financial Statements.
48
FINANCIAL STATEMENTS
|
Statements of Changes in Net Assets
| RBC Enterprise Fund | ||||||||||||||
| For the Year Ended September 30, 2023 | For the Year Ended September 30, 2022 | |||||||||||||
From Investment Activities | ||||||||||||||
Operations: | ||||||||||||||
Net investment income | $ | 243,790 | $ | 51,246 | ||||||||||
Net realized gains from investments | 1,903,799 | 9,022,114 | ||||||||||||
Net change in unrealized appreciation/(depreciation) on investments | 5,247,453 | (20,953,488 | ) | |||||||||||
|
|
|
| |||||||||||
Change in net assets resulting from operations | 7,395,042 | (11,880,128 | ) | |||||||||||
|
|
|
| |||||||||||
Distributions to Shareholders: | ||||||||||||||
Class A | (100,032 | ) | (96,604 | ) | ||||||||||
Class I | (8,190,700 | ) | (8,428,370 | ) | ||||||||||
|
|
|
| |||||||||||
Change in net assets resulting from shareholder distributions | (8,290,732 | ) | (8,524,974 | ) | ||||||||||
|
|
|
| |||||||||||
Capital Transactions: | ||||||||||||||
Proceeds from shares issued | 304,662 | 337,429 | ||||||||||||
Distributions reinvested | 7,908,506 | 8,011,273 | ||||||||||||
Cost of shares redeemed | (3,640,935 | ) | (5,095,608 | ) | ||||||||||
|
|
|
| |||||||||||
Change in net assets resulting from capital transactions | 4,572,233 | 3,253,094 | ||||||||||||
|
|
|
| |||||||||||
Net increase/(decrease) in net assets | 3,676,543 | (17,152,008 | ) | |||||||||||
Net Assets: | ||||||||||||||
Beginning of year | 57,646,984 | 74,798,992 | ||||||||||||
|
|
|
| |||||||||||
End of year | $ | 61,323,527 | $ | 57,646,984 | ||||||||||
|
|
|
| |||||||||||
Share Transactions: | ||||||||||||||
Issued | 19,459 | 17,578 | ||||||||||||
Reinvested | 541,164 | 418,026 | ||||||||||||
Redeemed | (228,567 | ) | (268,045 | ) | ||||||||||
|
|
|
| |||||||||||
Change in shares resulting from capital transactions | 332,056 | 167,559 | ||||||||||||
|
|
|
| |||||||||||
See Notes to the Financial Statements.
49
FINANCIAL STATEMENTS
|
Statements of Changes in Net Assets
| RBC Small Cap Core Fund | ||||||||||||||
| For the Year Ended September 30, 2023 | For the Year Ended September 30, 2022 | |||||||||||||
From Investment Activities | ||||||||||||||
Operations: | ||||||||||||||
Net investment income | $ | 241,532 | $ | 77,837 | ||||||||||
Net realized gains from investments | 3,132,687 | 9,784,564 | ||||||||||||
Net change in unrealized appreciation/(depreciation) on investments | 3,659,166 | (18,177,694 | ) | |||||||||||
|
|
|
| |||||||||||
Change in net assets resulting from operations | 7,033,385 | (8,315,293 | ) | |||||||||||
|
|
|
| |||||||||||
Distributions to Shareholders: | ||||||||||||||
Class A | (1,827,175 | ) | (3,564,899 | ) | ||||||||||
Class I | (7,940,427 | ) | (19,265,009 | ) | ||||||||||
Class R6 | (2,074 | ) | (4,378 | ) | ||||||||||
|
|
|
| |||||||||||
Change in net assets resulting from shareholder distributions | (9,769,676 | ) | (22,834,286 | ) | ||||||||||
|
|
|
| |||||||||||
Capital Transactions: | ||||||||||||||
Proceeds from shares issued | 1,633,077 | 3,311,183 | ||||||||||||
Distributions reinvested | 9,477,777 | 21,704,430 | ||||||||||||
Cost of shares redeemed | (4,708,695 | ) | (21,993,835 | ) | ||||||||||
|
|
|
| |||||||||||
Change in net assets resulting from capital transactions | 6,402,159 | 3,021,778 | ||||||||||||
|
|
|
| |||||||||||
Net increase/(decrease) in net assets | 3,665,868 | (28,127,801 | ) | |||||||||||
Net Assets: | ||||||||||||||
Beginning of year | 37,947,986 | 66,075,787 | ||||||||||||
|
|
|
| |||||||||||
End of year | $ | 41,613,854 | $ | 37,947,986 | ||||||||||
|
|
|
| |||||||||||
Share Transactions: | ||||||||||||||
Issued | 127,925 | 157,928 | ||||||||||||
Reinvested | 742,583 | 1,096,661 | ||||||||||||
Redeemed | (325,240 | ) | (777,116 | ) | ||||||||||
|
|
|
| |||||||||||
Change in shares resulting from capital transactions | 545,268 | 477,473 | ||||||||||||
|
|
|
| |||||||||||
See Notes to the Financial Statements.
50
FINANCIAL STATEMENTS
|
Statements of Changes in Net Assets
| RBC Microcap Value Fund | ||||||||||||||
| For the Year Ended September 30, 2023 | For the Year Ended September 30, 2022 | |||||||||||||
From Investment Activities | ||||||||||||||
Operations: | ||||||||||||||
Net investment income | $ | 1,471,319 | $ | 1,451,244 | ||||||||||
Net realized gains from investments and foreign currency | 8,377,650 | 14,251,978 | ||||||||||||
Net change in unrealized appreciation/(depreciation) on investments and foreign currency | 2,435,774 | (31,543,865 | ) | |||||||||||
|
|
|
| |||||||||||
Change in net assets resulting from operations | 12,284,743 | (15,840,643 | ) | |||||||||||
|
|
|
| |||||||||||
Distributions to Shareholders: | ||||||||||||||
Class A | (386,707 | ) | (210,055 | ) | ||||||||||
Class I | (14,533,878 | ) | (8,194,361 | ) | ||||||||||
|
|
|
| |||||||||||
Change in net assets resulting from shareholder distributions | (14,920,585 | ) | (8,404,416 | ) | ||||||||||
|
|
|
| |||||||||||
Capital Transactions: | ||||||||||||||
Proceeds from shares issued | 3,922,016 | 16,531,713 | ||||||||||||
Distributions reinvested | 13,551,024 | 7,608,831 | ||||||||||||
Cost of shares redeemed | (12,542,941 | ) | (23,286,745 | ) | ||||||||||
|
|
|
| |||||||||||
Change in net assets resulting from capital transactions | 4,930,099 | 853,799 | ||||||||||||
|
|
|
| |||||||||||
Net increase/(decrease) in net assets | 2,294,257 | (23,391,260 | ) | |||||||||||
Net Assets: | ||||||||||||||
Beginning of year | 99,420,397 | 122,811,657 | ||||||||||||
|
|
|
| |||||||||||
End of year | $ | 101,714,654 | $ | 99,420,397 | ||||||||||
|
|
|
| |||||||||||
Share Transactions: | ||||||||||||||
Issued | 153,053 | 546,186 | ||||||||||||
Reinvested | 541,368 | 243,552 | ||||||||||||
Redeemed | (479,213 | ) | (799,352 | ) | ||||||||||
|
|
|
| |||||||||||
Change in shares resulting from capital transactions | 215,208 | (9,614 | ) | |||||||||||
|
|
|
| |||||||||||
See Notes to the Financial Statements.
51
FINANCIAL STATEMENTS
|
Statements of Changes in Net Assets
| RBC Small Cap Value Fund | ||||||||||||||
| For the Year Ended September 30, 2023 | For the Year Ended September 30, 2022 | |||||||||||||
From Investment Activities | ||||||||||||||
Operations: | ||||||||||||||
Net investment income | $ | 432,977 | $ | 353,769 | ||||||||||
Net realized gains/(losses) from investments | (714,017 | ) | 11,629,799 | |||||||||||
Net change in unrealized appreciation/(depreciation) on investments | 4,487,404 | (17,274,873 | ) | |||||||||||
Net increase from payment by affiliate (Note 3) | — | 862,113 | ||||||||||||
|
|
|
| |||||||||||
Change in net assets resulting from operations | 4,206,364 | (4,429,192 | ) | |||||||||||
|
|
|
| |||||||||||
Distributions to Shareholders: | ||||||||||||||
Class A | (498 | ) | (132 | ) | ||||||||||
Class I | (1,724,866 | ) | (822,863 | ) | ||||||||||
Class R6 | (526 | ) | (361 | ) | ||||||||||
|
|
|
| |||||||||||
Change in net assets resulting from shareholder distributions | (1,725,890 | ) | (823,356 | ) | ||||||||||
|
|
|
| |||||||||||
Capital Transactions: | ||||||||||||||
Proceeds from shares issued | 5,370,625 | 33,968,192 | ||||||||||||
Distributions reinvested | 772,713 | 359,470 | ||||||||||||
Cost of shares redeemed | (11,717,378 | ) | (82,213,221 | ) | ||||||||||
|
|
|
| |||||||||||
Change in net assets resulting from capital transactions | (5,574,040 | ) | (47,885,559 | ) | ||||||||||
|
|
|
| |||||||||||
Net decrease in net assets | (3,093,566 | ) | (53,138,107 | ) | ||||||||||
Net Assets: | ||||||||||||||
Beginning of year | 30,821,326 | 83,959,433 | ||||||||||||
|
|
|
| |||||||||||
End of year | $ | 27,727,760 | $ | 30,821,326 | ||||||||||
|
|
|
| |||||||||||
Share Transactions: | ||||||||||||||
Issued | 401,888 | 2,375,706 | ||||||||||||
Reinvested | 61,966 | 25,279 | ||||||||||||
Redeemed | (876,500 | ) | (5,892,447 | ) | ||||||||||
|
|
|
| |||||||||||
Change in shares resulting from capital transactions | (412,646 | ) | (3,491,462 | ) | ||||||||||
|
|
|
| |||||||||||
See Notes to the Financial Statements.
52
|
RBC SMID Cap Growth Fund
(Selected data for a share outstanding throughout the periods indicated)
| Investment Activities | Distributions | |||||||||||||||||||||||||||||||||||
| Net Asset Value, Beginning of Year | Net Investment Loss(a) | Net Realized and Unrealized Gains (Losses) on Investments | Redemption Fees | Total from Investment Activities | Net Investment Income | Net Realized Gains | Total Distributions | Net Asset Value, End of Year | ||||||||||||||||||||||||||||
Class A | ||||||||||||||||||||||||||||||||||||
Year Ended 9/30/23 | $10.77 | (0.04 | ) | 1.52 | — | 1.48 | — | (1.04 | ) | (1.04 | ) | $11.21 | ||||||||||||||||||||||||
Year Ended 9/30/22 | 16.98 | (0.07 | ) | (1.90 | ) | — | (1.97 | ) | — | (4.24 | ) | (4.24 | ) | 10.77 | ||||||||||||||||||||||
Year Ended 9/30/21 | 12.60 | (0.09 | ) | 4.93 | —(b) | 4.84 | — | (0.46 | ) | (0.46 | ) | 16.98 | ||||||||||||||||||||||||
Year Ended 9/30/20 | 13.04 | (0.06 | ) | 0.72 | —(b) | 0.66 | — | (1.10 | ) | (1.10 | ) | 12.60 | ||||||||||||||||||||||||
Year Ended 9/30/19 | 14.39 | (0.06 | ) | (0.18 | ) | —(b) | (0.24 | ) | — | (1.11 | ) | (1.11 | ) | 13.04 | ||||||||||||||||||||||
Class I | ||||||||||||||||||||||||||||||||||||
Year Ended 9/30/23 | $13.31 | (0.02 | ) | 1.89 | — | 1.87 | — | (1.04 | ) | (1.04 | ) | $14.14 | ||||||||||||||||||||||||
Year Ended 9/30/22 | 19.98 | (0.04 | ) | (2.39 | ) | — | (2.43 | ) | — | (4.24 | ) | (4.24 | ) | 13.31 | ||||||||||||||||||||||
Year Ended 9/30/21 | 14.73 | (0.05 | ) | 5.76 | —(b) | 5.71 | — | (0.46 | ) | (0.46 | ) | 19.98 | ||||||||||||||||||||||||
Year Ended 9/30/20 | 15.02 | (0.03 | ) | 0.84 | —(b) | 0.81 | — | (1.10 | ) | (1.10 | ) | 14.73 | ||||||||||||||||||||||||
Year Ended 9/30/19 | 16.33 | (0.04 | ) | (0.16 | ) | — | (0.20 | ) | — | (1.11 | ) | (1.11 | ) | 15.02 | ||||||||||||||||||||||
Class R6 | ||||||||||||||||||||||||||||||||||||
Year Ended 9/30/23 | $13.38 | (0.02 | ) | 1.90 | — | 1.88 | — | (1.04 | ) | (1.04 | ) | $14.22 | ||||||||||||||||||||||||
Year Ended 9/30/22 | 20.04 | (0.04 | ) | (2.38 | ) | — | (2.42 | ) | — | (4.24 | ) | (4.24 | ) | 13.38 | ||||||||||||||||||||||
Year Ended 9/30/21 | 14.76 | (0.05 | ) | 5.79 | — | 5.74 | — | (0.46 | ) | (0.46 | ) | 20.04 | ||||||||||||||||||||||||
Year Ended 9/30/20 | 15.05 | (0.02 | ) | 0.83 | — | 0.81 | — | (1.10 | ) | (1.10 | ) | 14.76 | ||||||||||||||||||||||||
Year Ended 9/30/19 | 16.35 | (0.03 | ) | (0.16 | ) | — | (0.19 | ) | — | (1.11 | ) | (1.11 | ) | 15.05 | ||||||||||||||||||||||
| (a) | Per share net investment income (loss) has been calculated using the average daily shares method. |
| (b) | Less than $0.01 or $(0.01) per share. |
53
FINANCIAL HIGHLIGHTS
|
RBC SMID Cap Growth Fund
(Selected data for a share outstanding throughout the periods indicated)
| Ratios/Supplemental Data | ||||||||||||||||||||||||
| Total Return(a)(b) | Net Assets, End of Year (000’s) | Ratio of Net Expenses to Average Net Assets | Ratio of Net Investment Income (Loss) to Average Net Assets | Ratio of Expenses to Average Net Assets* | Portfolio Turnover Rate** | |||||||||||||||||||
Class A | ||||||||||||||||||||||||
Year Ended 9/30/23 | 14.23 | % | $ | 13,321 | 1.07 | % | (0.38 | )% | 1.25 | % | 19 | % | ||||||||||||
Year Ended 9/30/22 | (16.50 | )% | 11,259 | 1.07 | % | (0.52 | )% | 1.27 | % | 25 | % | |||||||||||||
Year Ended 9/30/21 | 38.95 | % | 14,318 | 1.07 | % | (0.54 | )% | 1.26 | % | 28 | %(c) | |||||||||||||
Year Ended 9/30/20 | 4.90 | % | 11,553 | 1.07 | % | (0.45 | )% | 1.37 | % | 15 | % | |||||||||||||
Year Ended 9/30/19 | 0.41 | % | 12,059 | 1.07 | % | (0.51 | )% | 1.38 | % | 17 | % | |||||||||||||
Class I | ||||||||||||||||||||||||
Year Ended 9/30/23 | 14.45 | % | $ | 87,116 | 0.82 | % | (0.13 | )% | 1.05 | % | 19 | % | ||||||||||||
Year Ended 9/30/22 | (16.30 | )% | 66,994 | 0.82 | % | (0.27 | )% | 1.04 | % | 25 | % | |||||||||||||
Year Ended 9/30/21 | 39.23 | % | 81,239 | 0.82 | % | (0.29 | )% | 0.99 | % | 28 | %(c) | |||||||||||||
Year Ended 9/30/20 | 5.27 | % | 83,211 | 0.82 | % | (0.20 | )% | 1.03 | % | 15 | % | |||||||||||||
Year Ended 9/30/19 | 0.62 | % | 81,193 | 0.82 | % | (0.26 | )% | 0.99 | % | 17 | % | |||||||||||||
Class R6 | ||||||||||||||||||||||||
Year Ended 9/30/23 | 14.54 | % | $ | 9,443 | 0.77 | % | (0.14 | )% | 0.98 | % | 19 | % | ||||||||||||
Year Ended 9/30/22 | (16.24 | )% | 17 | 0.77 | % | (0.23 | )% | 18.45 | % | 25 | % | |||||||||||||
Year Ended 9/30/21 | 39.36 | % | 21 | 0.77 | % | (0.25 | )% | 19.28 | % | 28 | %(c) | |||||||||||||
Year Ended 9/30/20 | 5.26 | % | 15 | 0.77 | % | (0.16 | )% | 25.69 | % | 15 | % | |||||||||||||
Year Ended 9/30/19 | 0.69 | % | 14 | 0.77 | % | (0.21 | )% | 27.43 | % | 17 | % | |||||||||||||
| * | During the period, certain fees were contractually or voluntarily reduced and/or reimbursed. If such contractual/voluntary fee reductions and reimbursements had not occurred, the ratio would have been as indicated. |
| ** | Portfolio turnover rate is calculated on the basis of the Fund as a whole without distinguishing between the classes of shares issued. |
| (a) | Excludes sales charge. |
| (b) | Assumes investment at net asset value at the beginning of the period, reinvestment of all dividends and distributions, and a complete redemption of the investment at net asset value at the end of the period. |
| (c) | Portfolio turnover rate excludes in-kind transactions. |
See Notes to the Financial Statements.
54
FINANCIAL HIGHLIGHTS
|
RBC Enterprise Fund
(Selected data for a share outstanding throughout the periods indicated)
| Investment Activities | Distributions | |||||||||||||||||||||||||||||||||||
| Net Asset Value, Beginning of Year | Net Investment Income/ (Loss)(a) | Net Realized and Unrealized Gains (Losses) on Investments | Redemption Fees | Total from Investment Activities | Net Investment Income | Net Realized Gains | Total Distributions | Net Asset Value, End of Year | ||||||||||||||||||||||||||||
Class A | ||||||||||||||||||||||||||||||||||||
Year Ended 9/30/23 | $14.62 | 0.02 | 1.72 | — | 1.74 | — | (2.30 | ) | (2.30 | ) | $14.06 | |||||||||||||||||||||||||
Year Ended 9/30/22 | 20.04 | (0.03 | ) | (2.97 | ) | — | (3.00 | ) | (0.02) | (2.40 | ) | (2.42 | ) | 14.62 | ||||||||||||||||||||||
Year Ended 9/30/21 | 14.65 | 0.04 | 6.98 | —(b) | 7.02 | —(b) | (1.63 | ) | (1.63 | ) | 20.04 | |||||||||||||||||||||||||
Year Ended 9/30/20 | 17.59 | 0.03 | (1.70 | ) | —(b) | (1.67 | ) | — | (1.27 | ) | (1.27 | ) | 14.65 | |||||||||||||||||||||||
Year Ended 9/30/19 | 23.38 | (0.05 | ) | (3.17 | ) | — | (3.22 | ) | — | (2.57 | ) | (2.57 | ) | 17.59 | ||||||||||||||||||||||
Class I | ||||||||||||||||||||||||||||||||||||
Year Ended 9/30/23 | $15.70 | 0.06 | 1.86 | — | 1.92 | — | (2.30 | ) | (2.30 | ) | $15.32 | |||||||||||||||||||||||||
Year Ended 9/30/22 | 21.34 | 0.01 | (3.18 | ) | — | (3.17 | ) | (0.07) | (2.40 | ) | (2.47 | ) | 15.70 | |||||||||||||||||||||||
Year Ended 9/30/21 | 15.51 | 0.09 | 7.41 | —(b) | 7.50 | (0.04) | (1.63 | ) | (1.67 | ) | 21.34 | |||||||||||||||||||||||||
Year Ended 9/30/20 | 18.52 | 0.07 | (1.79 | ) | —(b) | (1.72 | ) | (0.01) | (1.28 | ) | (1.29 | ) | 15.51 | |||||||||||||||||||||||
Year Ended 9/30/19 | 24.39 | (0.01 | ) | (3.29 | ) | —(b) | (3.30 | ) | — | (2.57 | ) | (2.57 | ) | 18.52 | ||||||||||||||||||||||
| (a) | Per share net investment income (loss) has been calculated using the average daily shares method. |
| (b) | Less than $0.01 or $(0.01) per share. |
55
FINANCIAL HIGHLIGHTS
|
RBC Enterprise Fund
(Selected data for a share outstanding throughout the periods indicated)
| Ratios/Supplemental Data | ||||||||||||||||||||||||
| Total Return(a)(b) | Net Assets, End of Year (000’s) | Ratio of Net Expenses to Average Net Assets | Ratio of Net Investment Income (Loss) to Average Net Assets | Ratio of Expenses to Average Net Assets* | Portfolio Turnover Rate** | |||||||||||||||||||
Class A | ||||||||||||||||||||||||
Year Ended 9/30/23 | 12.63 | % | $ | 664 | 1.33 | % | 0.14 | % | 2.19 | % | 28 | % | ||||||||||||
Year Ended 9/30/22 | (17.18 | )% | 683 | 1.33 | % | (0.19 | )% | 2.02 | % | 43 | % | |||||||||||||
Year Ended 9/30/21 | 50.27 | % | 803 | 1.33 | % | 0.21 | % | 2.15 | % | 19 | % | |||||||||||||
Year Ended 9/30/20 | (10.85 | )% | 553 | 1.33 | % | 0.19 | % | 2.35 | % | 25 | % | |||||||||||||
Year Ended 9/30/19 | (11.52 | )% | 787 | 1.33 | % | (0.28 | )% | 2.13 | % | 20 | % | |||||||||||||
Class I | ||||||||||||||||||||||||
Year Ended 9/30/23 | 12.93 | % | $ | 60,659 | 1.08 | % | 0.39 | % | 1.26 | % | 28 | % | ||||||||||||
Year Ended 9/30/22 | (16.94 | )% | 56,964 | 1.08 | % | 0.08 | % | 1.27 | % | 43 | % | |||||||||||||
Year Ended 9/30/21 | 50.67 | % | 73,996 | 1.08 | % | 0.45 | % | 1.25 | % | 19 | % | |||||||||||||
Year Ended 9/30/20 | (10.64 | )% | 53,380 | 1.08 | % | 0.44 | % | 1.38 | % | 25 | % | |||||||||||||
Year Ended 9/30/19 | (11.35 | )% | 68,122 | 1.08 | % | (0.05 | )% | 1.30 | % | 20 | % | |||||||||||||
| * | During the period, certain fees were contractually or voluntarily reduced and/or reimbursed. If such contractual/voluntary fee reductions and reimbursements had not occurred, the ratio would have been as indicated. |
| ** | Portfolio turnover rate is calculated on the basis of the Fund as a whole without distinguishing between the classes of shares issued. |
| (a) | Excludes sales charge. |
| (b) | Assumes investment at net asset value at the beginning of the period, reinvestment of all dividends and distributions, and a complete redemption of the investment at net asset value at the end of the period. |
See Notes to the Financial Statements.
56
FINANCIAL HIGHLIGHTS
|
RBC Small Cap Core Fund
(Selected data for a share outstanding throughout the periods indicated)
| Investment Activities | Distributions | |||||||||||||||||||||||||||||||||||
| Net Asset Value, Beginning of Year | Net Investment Income/ (Loss)(a) | Net Realized and Unrealized Gains (Losses) on Investments | Redemption Fees | Total from Investment Activities | Net Investment Income | Net Realized Gains | Total Distributions | Net Asset Value, End of Year | ||||||||||||||||||||||||||||
Class A | ||||||||||||||||||||||||||||||||||||
Year Ended 9/30/23 | $14.01 | 0.05 | 2.20 | — | 2.25 | — | (4.06 | ) | (4.06 | ) | $12.20 | |||||||||||||||||||||||||
Year Ended 9/30/22 | 31.43 | (0.02 | ) | (2.85 | ) | — | (2.87 | ) | — | (14.55 | ) | (14.55 | ) | 14.01 | ||||||||||||||||||||||
Year Ended 9/30/21 | 26.44 | 0.07 | 10.46 | 0.01 | 10.54 | (0.01) | (5.54 | ) | (5.55 | ) | 31.43 | |||||||||||||||||||||||||
Year Ended 9/30/20 | 29.14 | 0.11 | (1.27 | ) | — | (1.16 | ) | — | (1.54 | ) | (1.54 | ) | 26.44 | |||||||||||||||||||||||
Year Ended 9/30/19 | 39.96 | (0.05 | ) | (6.83 | ) | —(b) | (6.88 | ) | — | (3.94 | ) | (3.94 | ) | 29.14 | ||||||||||||||||||||||
Class I | ||||||||||||||||||||||||||||||||||||
Year Ended 9/30/23 | $15.78 | 0.09 | 2.52 | — | 2.61 | (0.02) | (4.06 | ) | (4.08 | ) | $14.31 | |||||||||||||||||||||||||
Year Ended 9/30/22 | 33.65 | 0.04 | (3.27 | ) | — | (3.23 | ) | (0.09) | (14.55 | ) | (14.64 | ) | 15.78 | |||||||||||||||||||||||
Year Ended 9/30/21 | 27.97 | 0.12 | 11.16 | 0.01 | 11.29 | (0.07) | (5.54 | ) | (5.61 | ) | 33.65 | |||||||||||||||||||||||||
Year Ended 9/30/20 | 30.70 | 0.17 | (1.34 | ) | —(b) | (1.17 | ) | (0.02) | (1.54 | ) | (1.56 | ) | 27.97 | |||||||||||||||||||||||
Year Ended 9/30/19 | 41.71 | 0.03 | (7.10 | ) | —(b) | (7.07 | ) | — | (3.94 | ) | (3.94 | ) | 30.70 | |||||||||||||||||||||||
Class R6 | ||||||||||||||||||||||||||||||||||||
Year Ended 9/30/23 | $15.82 | 0.09 | 2.54 | — | 2.63 | (0.02) | (4.06 | ) | (4.08 | ) | $14.37 | |||||||||||||||||||||||||
Year Ended 9/30/22 | 33.70 | 0.41 | (3.66 | ) | — | (3.25 | ) | (0.08) | (14.55 | ) | (14.63 | ) | 15.82 | |||||||||||||||||||||||
Year Ended 9/30/21 | 28.01 | 0.21 | 11.11 | — | 11.32 | (0.09) | (5.54 | ) | (5.63 | ) | 33.70 | |||||||||||||||||||||||||
Year Ended 9/30/20 | 30.72 | 0.15 | (1.31 | ) | — | (1.16 | ) | (0.01) | (1.54 | ) | (1.55 | ) | 28.01 | |||||||||||||||||||||||
Year Ended 9/30/19 | 41.78 | 0.08 | (7.20 | ) | — | (7.12 | ) | — | (3.94 | ) | (3.94 | ) | 30.72 | |||||||||||||||||||||||
| (a) | Per share net investment income (loss) has been calculated using the average daily shares method. |
| (b) | Less than $0.01 or $(0.01) per share. |
57
FINANCIAL HIGHLIGHTS
|
RBC Small Cap Core Fund
(Selected data for a share outstanding throughout the periods indicated)
| Ratios/Supplemental Data | ||||||||||||||||||||||||||||
| Total Return(a)(b) | Net Assets, End of Year (000’s) | Ratio of Net Expenses to Average Net Assets | Ratio of Net Investment Income (Loss) to Average Net Assets | Ratio of Expenses to Average Net Assets* | Portfolio Turnover Rate** | |||||||||||||||||||||||
Class A | ||||||||||||||||||||||||||||
Year Ended 9/30/23 | 18.47% | $ | 7,705 | 1.15% | 0.36% | 1.69% | 41% | |||||||||||||||||||||
Year Ended 9/30/22 | (19.32)% | 6,430 | 1.15% | (0.12)% | 1.68% | 29% | ||||||||||||||||||||||
Year Ended 9/30/21 | 43.04% | 7,692 | 1.15% | 0.24% | 1.52% | 81%(c) | ||||||||||||||||||||||
Year Ended 9/30/20 | (4.71)% | 6,200 | 1.15% | 0.40% | 1.55% | 40% | ||||||||||||||||||||||
Year Ended 9/30/19 | (15.57)% | 7,004 | 1.15% | (0.16)% | 1.46% | 28% | ||||||||||||||||||||||
Class I | ||||||||||||||||||||||||||||
Year Ended 9/30/23 | 18.75% | $ | 33,898 | 0.90% | 0.62% | 1.30% | 41% | |||||||||||||||||||||
Year Ended 9/30/22 | (19.12)% | 31,510 | 0.90% | 0.18% | 1.28% | 29% | ||||||||||||||||||||||
Year Ended 9/30/21 | 43.46% | 53,689 | 0.90% | 0.38% | 1.16% | 81%(c) | ||||||||||||||||||||||
Year Ended 9/30/20 | (4.49)% | 68,845 | 0.90% | 0.59% | 1.18% | 40% | ||||||||||||||||||||||
Year Ended 9/30/19 | (15.35)% | 136,072 | 0.90% | 0.10% | 1.11% | 28% | ||||||||||||||||||||||
Class R6 | ||||||||||||||||||||||||||||
Year Ended 9/30/23 | 18.74% | $ | 11 | 0.87% | 0.63% | 38.44% | 41% | |||||||||||||||||||||
Year Ended 9/30/22 | (19.10)% | 8 | 0.83% | 1.12% | 1.44% | 29% | ||||||||||||||||||||||
Year Ended 9/30/21 | 43.52% | 4,695 | 0.87% | 0.61% | 1.25% | 81%(c) | ||||||||||||||||||||||
Year Ended 9/30/20 | (4.46)% | 52 | 0.87% | 0.52% | 10.94% | 40% | ||||||||||||||||||||||
Year Ended 9/30/19 | (15.46)% | 35 | 0.87% | 0.25% | 11.85% | 28% | ||||||||||||||||||||||
| * | During the period, certain fees were contractually or voluntarily reduced and/or reimbursed. If such contractual/voluntary fee reductions and reimbursements had not occurred, the ratio would have been as indicated. |
| ** | Portfolio turnover rate is calculated on the basis of the Fund as a whole without distinguishing between the classes of shares issued. |
| (a) | Excludes sales charge. |
| (b) | Assumes investment at net asset value at the beginning of the period, reinvestment of all dividends and distributions, and a complete redemption of the investment at net asset value at the end of the period. |
| (c) | Portfolio turnover rate excludes in-kind transactions. |
See Notes to the Financial Statements.
58
FINANCIAL HIGHLIGHTS
|
RBC Microcap Value Fund
(Selected data for a share outstanding throughout the periods indicated)
| Investment Activities | Distributions | |||||||||||||||||||||||||||||||||||
| Net Asset Value, Beginning of Year | Net Investment Income(a) | Net Realized and Unrealized Gains (Losses) on Investments | Redemption Fees | Total from Investment Activities | Net Investment Income | Net Realized Gains | Total Distributions | Net Asset Value, End of Year | ||||||||||||||||||||||||||||
Class A | ||||||||||||||||||||||||||||||||||||
Year Ended 9/30/23 | $25.96 | 0.30 | 2.78 | — | 3.08 | (0.31 | ) | (3.57 | ) | (3.88 | ) | $25.16 | ||||||||||||||||||||||||
Year Ended 9/30/22 | 31.99 | 0.29 | (4.20 | ) | — | (3.91 | ) | (0.12 | ) | (2.00 | ) | (2.12 | ) | 25.96 | ||||||||||||||||||||||
Year Ended 9/30/21 | 21.34 | 0.20 | 12.02 | —(b) | 12.22 | (0.20 | ) | (1.37 | ) | (1.57 | ) | 31.99 | ||||||||||||||||||||||||
Year Ended 9/30/20 | 26.52 | 0.14 | (3.65 | ) | —(b) | (3.51 | ) | (0.23 | ) | (1.44 | ) | (1.67 | ) | 21.34 | ||||||||||||||||||||||
Year Ended 9/30/19 | 31.95 | 0.23 | (2.89 | ) | —(b) | (2.66 | ) | (0.21 | ) | (2.56 | ) | (2.77 | ) | 26.52 | ||||||||||||||||||||||
Class I | ||||||||||||||||||||||||||||||||||||
Year Ended 9/30/23 | $25.98 | 0.36 | 2.77 | — | 3.13 | (0.38 | ) | (3.57 | ) | (3.95 | ) | $25.16 | ||||||||||||||||||||||||
Year Ended 9/30/22 | 32.01 | 0.37 | (4.19 | ) | — | (3.82 | ) | (0.21 | ) | (2.00 | ) | (2.21 | ) | 25.98 | ||||||||||||||||||||||
Year Ended 9/30/21 | 21.35 | 0.29 | 12.00 | —(b) | 12.29 | (0.26 | ) | (1.37 | ) | (1.63 | ) | 32.01 | ||||||||||||||||||||||||
Year Ended 9/30/20 | 26.55 | 0.20 | (3.65 | ) | —(b) | (3.45 | ) | (0.31 | ) | (1.44 | ) | (1.75 | ) | 21.35 | ||||||||||||||||||||||
Year Ended 9/30/19 | 32.01 | 0.30 | (2.91 | ) | — | (2.61 | ) | (0.29 | ) | (2.56 | ) | (2.85 | ) | 26.55 | ||||||||||||||||||||||
| (a) | Per share net investment income (loss) has been calculated using the average daily shares method. |
| (b) | Less than $0.01 or $(0.01) per share. |
59
FINANCIAL HIGHLIGHTS
|
RBC Microcap Value Fund
(Selected data for a share outstanding throughout the periods indicated)
| Ratios/Supplemental Data | |||||||||||||||||||||||||
| Total Return(a)(b) | Net Assets, End of Year (000’s) | Ratio of Net Expenses to Average Net Assets | Ratio of Net Investment Income (Loss) to Average Net Assets | Ratio of Expenses to Average Net Assets* | Portfolio Turnover Rate** | |||||||||||||||||||||
Class A | ||||||||||||||||||||||||||
Year Ended 9/30/23 | 11.89% | $ | 2,471 | 1.32 | % | 1.14 | % | 1.62 | % | 30 | % | |||||||||||||||
Year Ended 9/30/22 | (13.35)% | 2,673 | 1.32 | % | 0.93 | % | 1.57 | % | 26 | % | ||||||||||||||||
Year Ended 9/30/21 | 59.29% | 3,420 | 1.32 | % | 0.70 | % | 1.62 | % | 11 | % | ||||||||||||||||
Year Ended 9/30/20 | (14.48)% | 2,293 | 1.32 | % | 0.60 | % | 1.80 | % | 20 | % | ||||||||||||||||
Year Ended 9/30/19 | (7.16)% | 3,597 | 1.32 | % | 0.86 | % | 1.68 | % | 9 | % | ||||||||||||||||
Class I | ||||||||||||||||||||||||||
Year Ended 9/30/23 | 12.12% | $ | 99,243 | 1.07 | % | 1.39 | % | 1.18 | % | 30 | % | |||||||||||||||
Year Ended 9/30/22 | (13.11)% | 96,748 | 1.07 | % | 1.20 | % | 1.18 | % | 26 | % | ||||||||||||||||
Year Ended 9/30/21 | 59.69% | 119,392 | 1.07 | % | 1.00 | % | 1.19 | % | 11 | % | ||||||||||||||||
Year Ended 9/30/20 | (14.29)% | 92,886 | 1.07 | % | 0.87 | % | 1.27 | % | 20 | % | ||||||||||||||||
Year Ended 9/30/19 | (6.92)% | 112,921 | 1.07 | % | 1.12 | % | 1.20 | % | 9 | % | ||||||||||||||||
| * | During the period, certain fees were contractually or voluntarily reduced and/or reimbursed. If such contractual/voluntary fee reductions and reimbursements had not occurred, the ratio would have been as indicated. |
| ** | Portfolio turnover rate is calculated on the basis of the Fund as a whole without distinguishing between the classes of shares issued. |
| (a) | Excludes sales charge. |
| (b) | Assumes investment at net asset value at the beginning of the period, reinvestment of all dividends and distributions, and a complete redemption of the investment at net asset value at the end of the period. |
See Notes to the Financial Statements.
60
FINANCIAL HIGHLIGHTS
|
RBC Small Cap Value Fund
(Selected data for a share outstanding throughout the periods indicated)
| Investment Activities | Distributions | |||||||||||||||||||||||||||||||||||
| Net Asset Value, Beginning of Year | Net Investment Income(a) | Net Realized and Unrealized Gains (Losses) on Investments | Redemption Fees | Total from Investment Activities | Net Investment Income | Net Realized Gains | Total Distributions | Net Asset Value, End of Year | ||||||||||||||||||||||||||||
Class A | ||||||||||||||||||||||||||||||||||||
Year Ended 9/30/23 | $ | 12.27 | 0.15 | 1.49 | — | 1.64 | (0.40 | ) | (0.22 | ) | (0.62 | ) | $ | 13.29 | ||||||||||||||||||||||
Year Ended 9/30/22 | 13.96 | 0.06 | (1.58 | ) | — | (1.52 | ) | (0.17 | ) | — | (0.17 | ) | 12.27 | |||||||||||||||||||||||
Period Ended 9/30/21(b) | 12.61 | 0.09 | 1.26 | — | 1.35 | — | — | — | 13.96 | |||||||||||||||||||||||||||
Class I | ||||||||||||||||||||||||||||||||||||
Year Ended 9/30/23 | $ | 12.28 | 0.18 | 1.42 | — | 1.60 | (0.44 | ) | (0.22 | ) | (0.66 | ) | $ | 13.22 | ||||||||||||||||||||||
Year Ended 9/30/22 | 13.98 | 0.10 | (1.59 | ) | — | (1.49 | ) | (0.21 | ) | — | (0.21 | ) | 12.28 | |||||||||||||||||||||||
Year Ended 9/30/21 | 9.84 | 0.15 | 4.11 | — | 4.26 | (0.12 | ) | — | (0.12 | ) | 13.98 | |||||||||||||||||||||||||
Year Ended 9/30/20 | 12.24 | 0.15 | (2.39 | ) | —(c) | (2.24 | ) | (0.16 | ) | — | (0.16 | ) | 9.84 | |||||||||||||||||||||||
Year Ended 9/30/19 | 13.63 | 0.11 | (1.13 | ) | —(c) | (1.02 | ) | (0.09 | ) | (0.28 | ) | (0.37 | ) | 12.24 | ||||||||||||||||||||||
Class R6 | ||||||||||||||||||||||||||||||||||||
Year Ended 9/30/23 | $ | 12.38 | 0.19 | 1.50 | — | 1.69 | (0.47 | ) | (0.22 | ) | (0.69 | ) | $ | 13.38 | ||||||||||||||||||||||
Year Ended 9/30/22 | 14.07 | 0.22 | (1.70 | ) | — | (1.48 | ) | (0.21 | ) | — | (0.21 | ) | 12.38 | |||||||||||||||||||||||
Year Ended 9/30/21 | 9.90 | 0.16 | 4.14 | — | 4.30 | (0.13 | ) | — | (0.13 | ) | 14.07 | |||||||||||||||||||||||||
Year Ended 9/30/20 | 12.31 | 0.16 | (2.40 | ) | — | (2.24 | ) | (0.17 | ) | — | (0.17 | ) | 9.90 | |||||||||||||||||||||||
Year Ended 9/30/19 | 13.71 | 0.13 | (1.15 | ) | — | (1.02 | ) | (0.10 | ) | (0.28 | ) | (0.38 | ) | 12.31 | ||||||||||||||||||||||
| (a) | Per share net investment income (loss) has been calculated using the average daily shares method. |
| (b) | For the period from January 28, 2021 (commencement of operations) to September 30, 2021. |
| (c) | Less than $0.01 or $(0.01) per share. |
61
FINANCIAL HIGHLIGHTS
|
RBC Small Cap Value Fund
(Selected data for a share outstanding throughout the periods indicated)
| Ratios/Supplemental Data | ||||||||||||||||||||||||
| Total Return(a)(b) | Net Assets, End of Year (000’s) | Ratio of Net Expenses to Average Net Assets | Ratio of Net Investment Income (Loss) to Average Net Assets | Ratio of Expenses to Average Net Assets* | Portfolio Turnover Rate** | |||||||||||||||||||
Class A | ||||||||||||||||||||||||
Year Ended 9/30/23 | 13.68% | $ | 11 | 1.10 | % | 1.12 | % | 37.03 | % | 55 | % | |||||||||||||
Year Ended 9/30/22 | (11.07)%(c) | 10 | 1.10 | % | 0.43 | % | 33.11 | % | 83 | % | ||||||||||||||
Period Ended 9/30/21(d) | 10.71%(e) | 11 | 1.10 | %(f) | 1.01 | %(f) | 37.36 | %(f) | 61 | % | ||||||||||||||
Class I | ||||||||||||||||||||||||
Year Ended 9/30/23 | 13.37% | $ | 27,706 | 0.85 | % | 1.38 | % | 1.36 | % | 55 | % | |||||||||||||
Year Ended 9/30/22 | (10.85)%(c) | 30,802 | 0.85 | % | 0.70 | % | 1.22 | % | 83 | % | ||||||||||||||
Year Ended 9/30/21 | 43.48% | 77,582 | 0.85 | % | 1.17 | % | 1.09 | % | 61 | % | ||||||||||||||
Year Ended 9/30/20 | (18.62)% | 52,496 | 0.85 | % | 1.34 | % | 1.15 | % | 77 | % | ||||||||||||||
Year Ended 9/30/19 | (6.91)% | 55,686 | 0.85 | % | 0.95 | % | 0.98 | % | 52 | % | ||||||||||||||
Class R6 | ||||||||||||||||||||||||
Year Ended 9/30/23 | 14.04% | $ | 11 | 0.80 | % | 1.42 | % | 34.70 | % | 55 | % | |||||||||||||
Year Ended 9/30/22 | (10.72)%(c) | 9 | 0.76 | % | 1.45 | % | 1.27 | % | 83 | % | ||||||||||||||
Year Ended 9/30/21 | 43.64% | 6,366 | 0.80 | % | 1.21 | % | 1.03 | % | 61 | % | ||||||||||||||
Year Ended 9/30/20 | (18.56)% | 4,423 | 0.80 | % | 1.40 | % | 1.07 | % | 77 | % | ||||||||||||||
Year Ended 9/30/19 | (6.89)% | 7,278 | 0.80 | % | 1.07 | % | 0.95 | % | 52 | % | ||||||||||||||
| * | During the period, certain fees were contractually or voluntarily reduced and/or reimbursed. If such contractual/voluntary fee reductions and reimbursements had not occurred, the ratio would have been as indicated. |
| ** | Portfolio turnover rate is calculated on the basis of the Fund as a whole without distinguishing between the classes of shares issued. |
| (a) | Excludes sales charge. |
| (b) | Assumes investment at net asset value at the beginning of the period, reinvestment of all dividends and distributions, and a complete redemption of the investment at net asset value at the end of the period. |
| (c) | The Advisor reimbursed the Fund $862,113 for Losses from a trading policy error. The payment had an impact of 2.4% to the total return of each share class. |
| (d) | For the period from January 28, 2021 (commencement of operations) to September 30, 2021. |
| (e) | Not annualized. |
| (f) | Annualized. |
62
FINANCIAL HIGHLIGHTS
|
RBC Small Cap Value Fund
(Selected data for a share outstanding throughout the periods indicated)
See Notes to the Financial Statements.
63
|
September 30, 2023
1. Organization:
RBC Funds Trust (the “Trust”) is registered under the Investment Company Act of 1940 (as amended) as an open-end management investment company. The Trust was organized as a Delaware statutory trust on December 16, 2003 and currently consists of 24 portfolios. Overall responsibility for the management of the Trust is vested in its Board of Trustees (the “Board”). Predecessor funds to the Trust were reorganized as portfolios of the Trust effective April 16, 2004. This report includes the following five investment portfolios (each a “Fund” and collectively, the “Funds”):
- RBC SMID Cap Growth Fund (“SMID Cap Growth Fund”)
- RBC Enterprise Fund (“Enterprise Fund”)
- RBC Small Cap Core Fund (“Small Cap Core Fund”)
- RBC Microcap Value Fund (“Microcap Value Fund”)
- RBC Small Cap Value Fund (“Small Cap Value Fund”)
The SMID Cap Growth, Small Cap Core and Small Cap Value Funds offer three share classes: Class A, Class R6 and Class I shares. The Enterprise and Microcap Value Funds offer two share classes: Class A and Class I shares. Class A shares are offered with a 5.75% maximum front-end sales charge and a 1.00% contingent deferred sales charge (“CDSC”) for redemption within 12 months of a $1 million or greater purchase on which no front-end sales charge was paid. Class I and Class R6 shares (intended for investors meeting certain investment minimum thresholds) are not subject to either a front-end sales charge or a CDSC.
RBC Global Asset Management (U.S.) Inc. (“RBC GAM-US” or “Advisor” or “Co-Administrator”) acts as the investment advisor for the Funds. The officers of the Trust (“Fund Management”) are also employees of RBC GAM-US.
2. Significant Accounting Policies
Each Fund is an investment company that follows accounting and reporting guidance under the Financial Accounting Standards Board. Summarized below are the significant accounting policies of the Funds. These policies conform to accounting principles generally accepted in the United States of America (“U.S. GAAP”). Fund Management follows these policies when preparing financial statements. Fund Management may also be required to make estimates and assumptions that affect the reported amounts of assets and liabilities at the date of the financial statements and the reported amounts of income and expenses for the period. Actual results could differ from those estimates. The financial statements are as of the close of regular trading on the New York Stock Exchange (“NYSE”).
Security Valuation:
The Board has approved pricing and valuation procedures of the Advisor for determining the fair value of each Fund’s investments. Fair value of a security is considered to be the price that a fund might reasonably expect to receive upon its current sale in an orderly transaction between market participants.
Equity securities are generally valued on the basis of prices furnished by third-party pricing services approved by the Board. Equity securities listed on one or more exchanges shall be valued at the last available quoted sale price on the primary trading exchange as of the regularly scheduled closing time of the exchange and are categorized as Level 1 in the fair value hierarchy. (See “Fair Value Measurements” below for additional information). An equity security not listed on an exchange but listed on NASDAQ shall be valued at the NASDAQ official closing price and is also categorized as Level 1. If there was no sale on the primary exchange on the day the net asset value is calculated or a NASDAQ official closing price is not available, the most recent bid quotation generally will be used and such securities will generally be categorized as Level 2. Investments in open-end investment companies (mutual funds) are valued at net asset value and are categorized as Level 1 in the fair value hierarchy.
Fixed income securities, including to-be-announced (“TBA”) commitments and municipal bonds, are generally valued based on evaluated prices received from third-party pricing services or from
64
NOTES TO FINANCIAL STATEMENTS |
broker-dealers who make markets in the securities and are generally categorized as Level 2 in the fair value hierarchy (see “Fair Value Measurements” below for additional information). The pricing services utilize both dealer-supplied valuations and electronic data processing techniques that take into account multiple appropriate factors such as institutional-size trading in similar groups of securities, market spreads, interest rates, and fundamental security analytical data including yield, quality, coupon rate, maturity and type of issue.
Foreign securities valued in non-U.S. dollars are valued in the foreign currency and then converted into the U.S. dollar equivalent using the foreign exchange rate in effect at the close of NYSE on the day the security’s value is determined. The value of securities traded in markets outside the United States may be affected on a day that the NYSE is closed and an investor is not able to purchase, exchange or redeem shares of the Funds.
The Board has designated the Advisor with the responsibility for implementing the pricing and valuation procedures, including responsibility for determining the fair value of the Funds’ securities or other assets and liabilities, and has established a Pricing Committee to assist in carrying out supervisory functions related to such responsibilities. The Pricing Committee includes representatives of the Funds’ Advisor, and Co-Administrator, including personnel from accounting and operations, trading, risk management and compliance. The Pricing Committee meets at least quarterly to review and approve Fund valuation matters, including a review of the Funds’ pricing activity and operations, fair value measurements, pricing vendors, policies and procedures, and related controls. At least a quorum of the Pricing Committee shall meet more frequently, as needed, to consider and approve time-sensitive fair valuation matters. The Pricing Committee provides periodic reports to the Valuation, Portfolio Management and Performance Committee (“Valuation Committee”) of the Board regarding pricing and valuation matters. Members of the Pricing Committee meet with the Valuation Committee and the Board at each of their regularly scheduled meetings to discuss valuation matters and actions taken during the period.
The Advisor has procedures to determine the fair value of a security when a price is not available from a pricing service or broker- dealer or the Advisor has determined that a price provided by a pricing service or broker-dealer does not approximate fair value. Fair valuation may also be used when a significant valuation event affecting the value of a security or market sector is determined to have occurred between the time when a security’s market closes and the time the Fund’s net asset value is calculated. The fair value of the security will be determined in good faith by the Advisor in accordance with procedures and methodologies approved by the Board. General factors used in determining the fair value of securities include, but are not limited to, fundamental analytical data relating to the security, the issuer and the market, such as duration, prepayment and default rates; general level of interest rates and changes in interest rates; information from broker-dealers; trading in similar securities; any restrictions on disposition of the security; and an evaluation of the forces that influence the market in which the investments are traded. These securities are either categorized as Level 2 or 3 in the fair value hierarchy, depending on the relevant inputs used.
When the Funds utilize fair valuation methods that use significant unobservable inputs to determine a security’s value, such securities will be categorized as Level 3 of the fair value hierarchy. These methods may require subjective determinations about the value of a security. While the Funds’ policy is intended to result in a calculation of a Fund’s net asset value that fairly reflects security values as of the time of pricing, the Funds cannot guarantee that values determined by the Advisor or persons acting at their direction would accurately reflect the price that the Funds could obtain for a security if they were to dispose of it as of the time of pricing (for instance, in a forced or distressed sale). The prices used by the Funds may differ from the value that would be realized if the securities were sold.
The Advisor employs various methods for calibrating the valuation approach related to securities categorized within Level 2 and Level 3 of the fair value hierarchy. These methods may include regular due diligence of the Funds’ pricing vendors, a regular review of key inputs and assumptions, transaction back-testing or disposition analysis to compare unrealized gains and losses to realized gains and losses, reviews of missing and stale prices and large movements in market value, and reviews of
65
NOTES TO FINANCIAL STATEMENTS |
any market related activities. Additionally, the pricing of all fair value holdings is subsequently reported to the Valuation Committee and Board.
Foreign Taxes:
The Funds may be subject to foreign taxes on income, gains on investments or currency repatriation, a portion of which may be recoverable. The Funds will accrue such taxes and recoveries, as applicable, based upon its current interpretation of tax rules and regulations that exist in the markets in which it invests.
Realized gains in certain countries may be subject to foreign taxes at the Fund level, based on statutory rates. The Funds accrue for such foreign taxes on realized and unrealized gains at the appropriate rate for each jurisdiction, as applicable. The amount, if any, is disclosed as a liability in the Statement of Assets and Liabilities.
Fair Value Measurements:
The Funds disclose the fair value of their investments in a hierarchy that categorizes investments based on the inputs to valuation techniques used to measure fair value. The three levels of the fair value hierarchy are as follows:
• Level 1 - Inputs that reflect unadjusted quoted prices in active markets for identical assets or liabilities that the Funds have the ability to access at the measurement date.
• Level 2 - Significant inputs other than quoted prices that are observable for the asset or liability either directly or indirectly, including inputs in markets that are not considered to be active. Observable inputs may include quoted prices for similar securities, interest rates, spreads, prepayment spreads, etc.
• Level 3 - Significant unobservable inputs based on the best information available in the circumstances, to the extent observable inputs are not available (including the Fund’s own assumptions in determining the fair value of investments).
The inputs or methodology used for valuing investments are not necessarily an indication of the risk associated with investing in those securities.
Inputs used in determining fair value of an investment may include, but are not limited to, price information, volatility statistics, credit and market data, and other factors, all of which may be either observable or unobservable. Inputs can vary among investments and will be impacted by the investment type and volume of activity for the particular security or similar securities in the market. Investments in the Level 2 category are generally supported by transactions and quoted prices from dealers participating in the market for those investments. Investments may be included in the Level 3 category due to a lack of market activity or transparency. Internal valuation models may also be used as a pricing source for Level 3 investments. Internal valuation models may rely on one or more unobservable inputs, such as estimated cash flows, financial statement analysis and discount rates.
The summary of inputs used to determine the fair value of the Funds’ investments as of September 30, 2023 is as follows:
| Funds | Level 1 Quoted Prices | Level 2 Significant Observable Inputs | Level 3 Significant Unobservable Inputs | Total | ||||||||||||
Assets: | ||||||||||||||||
Investments in Securities | ||||||||||||||||
SMID Cap Growth Fund | 112,302,467 | (a) | $ | — | $ | — | $ | 112,302,467 | ||||||||
Enterprise Fund | 61,397,919 | (a) | — | — | 61,397,919 | |||||||||||
Small Cap Core Fund | 41,788,802 | (a) | — | — | 41,788,802 | |||||||||||
Microcap Value Fund | 99,942,062 | (a) | 1,873,819 | (b) | — | (c) | 101,815,881 | |||||||||
Small Cap Value Fund | 27,882,157 | (a) | — | — | 27,882,157 | |||||||||||
| (a) | The breakdown of the Fund’s investments into major categories is disclosed in the Schedule of Portfolio Investments. |
66
NOTES TO FINANCIAL STATEMENTS |
| (b) | Represents securities in the Consumer Discretionary ($1,130,827), Financials ($660,192) and Consumer Staples ($82,800) sections of the Schedule of Portfolio Investments. |
| (c) | Includes securities fair valued at zero. |
The Fund’s assets assigned to the Level 3 category were valued using the valuation methodology and technique deemed most appropriate in the circumstances. The significant unobservable inputs used may include assumptions regarding the particular security’s cash flow profile and potential defaults which may not be generally observable for either the security or for assets of a similar type. Significant changes in any of these assumptions may result in a lower or higher fair value.
Repurchase Agreements:
The Funds, except SMID Cap Growth Fund, may enter into repurchase agreements with counterparties whom the Advisor has deemed creditworthy, including primary dealers that report to the Federal Reserve Bank of New York or other large U.S. commercial banks or broker-dealers. These repurchase agreements are subject to the seller’s agreement to repurchase such securities at a mutually agreed upon date and price. The repurchase price generally equals the price paid by the Funds plus interest negotiated on the basis of current short-term rates.
Securities pledged by the dealers as collateral for repurchase agreements are held by a custodian bank until maturity of the repurchase agreement. The Funds have procedures to monitor additional collateral, if needed, to ensure that the daily market value of the collateral remains in excess of the market value of the repurchase agreement in the event of a default.
There were no repurchase agreements held during the year ended September 30, 2023.
Affiliated Investments:
The Funds invest in another Fund of the Trust (an “Affiliated Fund”), RBC BlueBay U.S. Government Money Market Fund-RBC Institutional Class 1, as a cash sweep vehicle. The income earned by the Funds from the Affiliated Fund for the period is disclosed in the Statement of Operations. The table below details the transactions of the Funds in the Affiliated Fund. As the affiliated investment is a money market fund in which shares are issued and redeemed at $1.00 per share, the number of shares purchased and sold equal the dollar amount shown as purchased and sold, and no gain or loss was realized on the sale of shares of the money market fund.
| Value September 30, 2022 | Purchases | Sales | Value September 30, 2023 | Dividends | ||||||||||||||||
Investments in RBC BlueBay U.S. Government Money Market Fund—RBC Institutional Class 1 |
| |||||||||||||||||||
SMID Cap Growth Fund | $1,812,271 | $34,935,893 | $(32,362,486 | ) | $4,385,678 | $99,929 | ||||||||||||||
Enterprise Fund | 870,444 | 10,483,670 | (10,147,291 | ) | 1,206,823 | 85,541 | ||||||||||||||
Small Cap Core Fund | 900,374 | 7,388,982 | (7,229,407 | ) | 1,059,949 | 46,730 | ||||||||||||||
Microcap Value Fund | 1,735,997 | 12,329,575 | (11,831,927 | ) | 2,233,645 | 85,026 | ||||||||||||||
Small Cap Value Fund | 233,786 | 10,608,358 | (10,406,130 | ) | 436,014 | 20,790 | ||||||||||||||
Investment Transactions and Income:
Investment transactions are recorded on trade date. Dividend income is recorded on the ex-dividend date. Non-cash dividends, if any, are recorded on the ex-dividend date at fair value. Realized gains and losses from investment transactions are calculated based on the cost of the specific security (also
67
NOTES TO FINANCIAL STATEMENTS |
known as identified cost basis). Interest income is recognized on the accrual basis and includes, where applicable, the amortization or accretion of premium or discount using the effective yield method.
Expense, Investment Income and Gain/Loss Allocation:
Each Fund pays the expenses that are directly related to its operations, such as custodian fees or advisory fees. Expenses incurred by the Trust, such as trustee or legal fees, are allocated among each of the Funds in the Trust either proportionately based upon each Fund’s relative net assets or using another reasonable basis such as equally across all Funds in the Trust, depending on the nature of the expense. Individual share classes within a Fund are charged expenses specific to that class, such as distribution fees and transfer agent fees. Within a Fund, expenses other than class specific expenses are allocated daily to each class based upon the proportion of relative net assets. Investment income and realized and unrealized gains or losses are allocated to each class of shares based on relative net assets.
Indemnifications:
Under the Trust’s organizational documents, each Trustee, officer, employee or other agent of the Trust is indemnified against certain liabilities that may arise out of their duties to the Funds. Additionally, in the normal course of business, the Funds enter into contracts, including the Funds’ servicing agreements, that contain a variety of indemnification clauses. The Funds’ maximum exposure under these arrangements is unknown as this would involve future claims that may be made against the Funds that have not yet occurred.
Real Estate Investment Trusts:
The Funds may own shares of real estate investment trusts (“REITs”) which report information on the source of their distributions annually. Dividends paid by a REIT, other than capital gain distributions, will be taxable as ordinary income up to the amount of the REIT’s current and accumulated earnings and profits. Capital gain dividends paid by a REIT to a Fund will be treated as long term capital gains by the Fund and, in turn, may be distributed by the Fund to its shareholders as a capital gain distribution. Distributions received from a REIT in excess of its income are recorded as a return of capital and a reduction to the cost basis of the REIT.
Distributions to Shareholders:
Each Fund pays out any income that it receives, less expenses, in the form of dividends and capital gain distributions to its shareholders. Income dividends and capital gain distributions for each Fund are declared and paid at least annually. Distributions to shareholders are recorded on the ex-dividend date. The amount of dividends and distributions are calculated based on federal income tax regulations, which may differ from US GAAP. These “book/tax” differences may be either temporary or permanent in nature. To the extent these differences are determined, as of the end of the tax year, to be permanent (e.g., net operating loss, redesignation of distributions, basis adjustments on investments in passive foreign investment companies (PFICs) and partnerships), they are reclassified within a Fund’s capital accounts based on their federal tax basis treatment.
| Increase/(Decrease) Paid in Capital | Increase/(Decrease) Accumulated Earnings | |||||||
SMID Cap Growth Fund | $(214,616 | ) | $214,616 | |||||
3. Agreements and Other Transactions with Affiliates:
The Trust has entered into an investment advisory agreement with RBC GAM-US under which RBC GAM-US manages each Fund’s assets and furnishes related office facilities, equipment, research and personnel. The agreement requires each Fund to pay RBC GAM-US a monthly fee based upon average
68
NOTES TO FINANCIAL STATEMENTS |
daily net assets. Under the terms of the agreement, RBC GAM-US is entitled to receive fees based on a percentage of the average daily net assets of each of the Funds as follows:
| Average Daily Net Assets of Fund | Annual Rate | |||||
SMID Cap Growth Fund | All Net Assets | 0.70% | ||||
Enterprise Fund | Up to $30 Million | 1.00% | ||||
| Over $30 Million | 0.90% | |||||
Small Cap Core Fund | All Net Assets | 0.85% | ||||
Microcap Value Fund | All Net Assets | 0.90% | ||||
Small Cap Value Fund | All Net Assets | 0.70% | ||||
RBC GAM-US has contractually agreed to waive fees and/or make payments in order to keep total operating expenses (excluding certain fees such as interest, taxes and acquired fund fees and expenses) of the Funds to the following levels pursuant to an expense limitation agreement.
| Class A Annual Rate | Class I Annual Rate | Class R6 Annual Rate | ||||||||||
SMID Cap Growth Fund | 1.07% | 0.82% | 0.77% | |||||||||
Enterprise Fund | 1.33% | 1.08% | N/A | |||||||||
Small Cap Core Fund | 1.15% | 0.90% | 0.87% | |||||||||
Microcap Value Fund | 1.32% | 1.07% | N/A | |||||||||
Small Cap Value Fund | 1.10% | 0.85% | 0.80% | |||||||||
This expense limitation agreement is in place until January 31, 2025, and may not be terminated by RBC GAM-US prior to that date. The agreement shall continue for additional one-year terms unless terminated or revised by the Board at any time or by RBC GAM-US at the expiration of any one-year period. The Advisor is entitled to recoup from the Fund or class the fees and/or operating expenses waived or reimbursed during any of the previous 12 months (3 years for the Small Cap Value Fund), provided the Fund is able to do so and remain in compliance with the expense limitation in place at the time the fees were waived or expenses paid.
At September 30, 2023, the amounts subject to possible recoupment under the expense limitation agreement were:
| FYE 9/30/21 | FYE 9/30/22 | FYE 9/30/23 | Total | |||||||||||||
SMID Cap Growth Fund | $ | N/A | $ | N/A | $ | 213,956 | $ | 213,956 | ||||||||
Enterprise Fund | N/A | N/A | 115,572 | 115,572 | ||||||||||||
Small Cap Core Fund | N/A | N/A | 181,465 | 181,465 | ||||||||||||
Microcap Value Fund | N/A | N/A | 126,263 | 126,263 | ||||||||||||
Small Cap Value Fund | 190,586 | 186,786 | 168,114 | 545,486 | ||||||||||||
There was no recoupment of expense reimbursements/waivers during the year. Amounts from years prior to those shown are no longer subject to recoupment.
RBC GAM-US may also voluntarily waive and/or reimburse operating expenses of any Fund from time to time. Any such voluntary program may be changed or eliminated at any time without notice, and expenses waived under such program are not subject to recoupment.
RBC GAM-US voluntarily agreed to waive its investment advisory fees by the amount of investment advisory fees the Funds pay to RBC GAM-US indirectly through its investment in an affiliated money market fund. For the year ended September 30, 2023, the amount waived was $3,465, $3,032, $1,690, $3,073 and $787 for the SMID Cap Growth Fund, Enterprise Fund, Small Cap Core Fund, Microcap Value Fund and Small Cap Value Fund, respectively, and is included in expenses waived/reimbursed by Advisor in the Statements of Operations.
RBC GAM-US serves as co-administrator to the Funds. BNY Mellon serves as co-administrator and fund accounting agent. Services provided under the administrative services contract include providing
69
NOTES TO FINANCIAL STATEMENTS |
day-to-day administration of matters related to the Funds, maintenance of their records and the preparation of reports. Under the terms of the administrative services agreement, RBC GAM-US does not receive an administrative services fee. BNY Mellon receives a fee for its services payable by each Fund based in part on each Funds’ average net assets. BNY Mellon’s fee is included with “Accounting fees” in the Statements of Operations.
Certain officers and trustees of the Trust are affiliated with the Advisor or the Co-Administrator. Such Officers and Trustees receive no compensation from the Funds for serving in their respective roles.
The Trust currently pays each of the independent trustees (trustees of the Trust who are not directors, officers or employees of the Advisor, either Co-Administrator or Distributor) an annual retainer of $84,000. The Board Chairperson and Audit Committee Chairperson each receive an additional retainer of $2,500 annually, and all other trustees serving as Chair of a Board committee each receive an additional retainer of $1,000 annually. In addition, independent trustees receive a quarterly meeting fee of $6,500 for each in-person Board meeting attended, a meeting fee of $1,500 for each telephonic or special board meeting attended, a $1,500 fee for each Board committee meeting attended, and are reimbursed for all out-of-pocket expenses relating to attendance at such meetings. These amounts are included in the Statement of Operations in “Trustees’ fees”.
In conjunction with the launch of the Class A shares and Class R6 shares of Small Cap Value Fund and Class R6 Shares of SMID Cap Growth Fund, the Advisor invested seed capital to provide each share class its initial investment assets. In addition, the Advisor has purchased Class R6 shares of Small Cap Core Fund. The table below shows, as of September 30, 2023, the Fund’s net assets, the shares of the Fund held by the Advisor, and the percent of total net assets represented by the Advisor’s investment.
| Net Assets | Shares held by Advisor | % of Fund Net Assets | ||||||||||
SMID Cap Growth Fund | $ | 109,880,740 | 1,399 | 0.0% | ||||||||
Small Cap Core Fund | $ | 41,613,854 | 666 | 0.0% | ||||||||
Small Cap Value Fund | $ | 27,727,760 | 1,638 | 0.1% | ||||||||
4. Fund Distribution:
Each of the Funds that offers Class A shares has adopted a Master Distribution 12b-1 Plan (the “Plan”) in which Quasar Distributors LLC (the “Distributor”) acts as the Funds’ distributor. The Plan permits each Fund to make payments for, or to reimburse the Distributor for, distribution-related costs and expenses of marketing shares of Class A covered under the Plan, and/or for providing shareholder services. The Plan does not apply to Class I and Class R6. The following chart shows the current Plan fee rate for Class A.
| Class A | ||||
12b-1 Plan Fee | 0.25%* | |||
* Under the 12b-1 plan, the maximum fee rate for Class A shares is 0.50%. Currently the Board has approved an annual limit of 0.25%.
Plan fees are based on average daily net assets of Class A. Up to 0.25% of each Plan fee may be designated as a service fee, as defined by the applicable rules of the Financial Industry Regulatory Authority. The Distributor, subject to applicable legal requirements, may waive the Plan fee voluntarily, in whole or in part. For the year ended September 30, 2023, there were no fees waived by the Distributor.
The Distributor did not receive any CDSC fees from Class A shares of the Funds during the year ended September 30, 2023.
For the year ended September 30, 2023, the Distributor received commissions of $8,984 front-end sales charges of Class A shares of the Funds, of which $511 was paid to affiliated broker-dealers, and the remainder was either paid to unaffiliated broker-dealers or retained by the Distributor.
70
NOTES TO FINANCIAL STATEMENTS |
5. Securities Transactions:
The cost of securities purchased and proceeds from securities sold (excluding securities maturing less than one year from acquisition) for the year ended September 30, 2023 were as follows:
| Purchases | Sales | |||||||
SMID Cap Growth Fund | $ | 38,294,112 | $ | 18,096,265 | ||||
Enterprise Fund | 17,256,199 | 21,234,719 | ||||||
Small Cap Core Fund | 16,789,271 | 19,904,330 | ||||||
Microcap Value Fund | 31,178,190 | 39,935,924 | ||||||
Small Cap Value Fund | 16,946,994 | 22,740,209 | ||||||
Within the guidelines established by the Funds to always seek best execution when entering into portfolio transactions, the Funds participated in a “commission recapture” program until January 13, 2023, under which brokerage transactions were directed to Cowen and Company, LLC and its correspondent brokers. A portion of the commissions paid under this program were reimbursed to the Funds and recorded as net realized gains from investment transactions in the financial statements.
6. Capital Share Transactions:
The Trust is authorized to issue an unlimited number of shares of beneficial interest (“shares outstanding”) without par value. Transactions in capital stock of the Funds are summarized on the following pages:
| SMID Cap Growth Fund | Enterprise Fund | |||||||||||||||
| For the Year Ended September 30, 2023 | For the Year Ended September 30, 2022 | For the Year Ended September 30, 2023 | For the Year Ended September 30, 2022 | |||||||||||||
CAPITAL TRANSACTIONS: | ||||||||||||||||
Class A | ||||||||||||||||
Proceeds from shares issued | $ | 2,287,796 | $ | 127,690 | $ | 3,024 | $ | 44,790 | ||||||||
Distributions reinvested | 1,062,780 | 3,541,196 | 99,368 | 90,539 | ||||||||||||
Cost of shares redeemed | (1,711,779 | ) | (926,884 | ) | (103,509 | ) | (16,420 | ) | ||||||||
|
|
|
|
|
|
|
| |||||||||
Change in Class A | $ | 1,638,797 | $ | 2,742,002 | $ | (1,117 | ) | $ | 118,909 | |||||||
|
|
|
|
|
|
|
| |||||||||
Class I | ||||||||||||||||
Proceeds from shares issued | $ | 29,415,120 | $ | 23,148,652 | $ | 301,638 | $ | 292,639 | ||||||||
Distributions reinvested | 5,134,912 | 16,624,772 | 7,809,138 | 7,920,734 | ||||||||||||
Cost of shares redeemed | (18,858,220 | ) | (24,603,015 | ) | (3,537,426 | ) | (5,079,188 | ) | ||||||||
|
|
|
|
|
|
|
| |||||||||
Change in Class I | $ | 15,691,812 | $ | 15,170,409 | $ | 4,573,350 | $ | 3,134,185 | ||||||||
|
|
|
|
|
|
|
| |||||||||
Class R6 | ||||||||||||||||
Proceeds from shares issued | $ | 9,824,731 | $ | — | $ | — | $ | — | ||||||||
Distributions reinvested | 1,350 | 4,389 | — | — | ||||||||||||
Cost of shares redeemed | (270,944 | ) | — | — | — | |||||||||||
|
|
|
|
|
|
|
| |||||||||
Change in Class R6 | $ | 9,555,137 | $ | 4,389 | $ | — | $ | — | ||||||||
|
|
|
|
|
|
|
| |||||||||
Change in net assets resulting from capital transactions | $ | 26,885,746 | $ | 17,916,800 | $ | 4,572,233 | $ | 3,253,094 | ||||||||
|
|
|
|
|
|
|
| |||||||||
71
NOTES TO FINANCIAL STATEMENTS |
| SMID Cap Growth Fund | Enterprise Fund | |||||||||||||||
| For the Year Ended September 30, 2023 | For the Year Ended September 30, 2022 | For the Year Ended September 30, 2023 | For the Year Ended September 30, 2022 | |||||||||||||
SHARE TRANSACTIONS: | ||||||||||||||||
Class A | ||||||||||||||||
Issued | 194,672 | 9,981 | 207 | 2,461 | ||||||||||||
Reinvested | 99,605 | 264,071 | 7,388 | 5,058 | ||||||||||||
Redeemed | (150,909 | ) | (72,177 | ) | (7,083 | ) | (865 | ) | ||||||||
|
|
|
|
|
|
|
| |||||||||
Change in Class A | 143,368 | 201,875 | 512 | 6,654 | ||||||||||||
|
|
|
|
|
|
|
| |||||||||
Class I | ||||||||||||||||
Issued | 2,046,358 | 1,439,655 | 19,252 | 15,117 | ||||||||||||
Reinvested | 382,062 | 1,005,125 | 533,776 | 412,968 | ||||||||||||
Redeemed | (1,301,640 | ) | (1,478,593 | ) | (221,484 | ) | (267,180 | ) | ||||||||
|
|
|
|
|
|
|
| |||||||||
Change in Class I | 1,126,780 | 966,187 | 331,544 | 160,905 | ||||||||||||
|
|
|
|
|
|
|
| |||||||||
Class R6 | ||||||||||||||||
Issued | 680,743 | — | — | — | ||||||||||||
Reinvested | 100 | 264 | — | — | ||||||||||||
Redeemed | (18,174 | ) | — | — | — | |||||||||||
|
|
|
|
|
|
|
| |||||||||
Change in Class R6 | 662,669 | 264 | — | — | ||||||||||||
|
|
|
|
|
|
|
| |||||||||
Change in shares resulting from capital transactions | 1,932,817 | 1,168,326 | 332,056 | 167,559 | ||||||||||||
|
|
|
|
|
|
|
| |||||||||
| Small Cap Core Fund | Microcap Value Fund | |||||||||||||||
| For the Year Ended September 30, 2023 | For the Year Ended September 30, 2022 | For the Year Ended September 30, 2023 | For the Year Ended September 30, 2022 | |||||||||||||
CAPITAL TRANSACTIONS: | ||||||||||||||||
Class A | ||||||||||||||||
Proceeds from shares issued | $ | 1,348,122 | $ | 2,554,737 | $ | 94,198 | $ | 164,622 | ||||||||
Distributions reinvested | 1,814,942 | 3,521,048 | 372,237 | 202,078 | ||||||||||||
Cost of shares redeemed | (1,242,176 | ) | (2,207,350 | ) | (598,664 | ) | (515,984 | ) | ||||||||
|
|
|
|
|
|
|
| |||||||||
Change in Class A | $ | 1,920,888 | $ | 3,868,435 | $ | (132,229 | ) | $ | (149,284 | ) | ||||||
|
|
|
|
|
|
|
| |||||||||
Class I | ||||||||||||||||
Proceeds from shares issued | $ | 283,741 | $ | 358,109 | $ | 3,827,818 | $ | 16,367,091 | ||||||||
Distributions reinvested | 7,660,760 | 18,179,003 | 13,178,787 | 7,406,753 | ||||||||||||
Cost of shares redeemed | (3,466,519 | ) | (14,437,123 | ) | (11,944,277 | ) | (22,770,761 | ) | ||||||||
|
|
|
|
|
|
|
| |||||||||
Change in Class I | $ | 4,477,982 | $ | 4,099,989 | $ | 5,062,328 | $ | 1,003,083 | ||||||||
|
|
|
|
|
|
|
| |||||||||
Class R6 | ||||||||||||||||
Proceeds from shares issued | $ | 1,214 | $ | 398,337 | $ | — | $ | — | ||||||||
Distributions reinvested | 2,075 | 4,379 | — | — | ||||||||||||
Cost of shares redeemed | — | (5,349,362 | ) | — | — | |||||||||||
|
|
|
|
|
|
|
| |||||||||
Change in Class R6 | $ | 3,289 | $ | (4,946,646 | ) | $ | — | $ | — | |||||||
|
|
|
|
|
|
|
| |||||||||
Change in net assets resulting from capital transactions | $ | 6,402,159 | $ | 3,021,778 | $ | 4,930,099 | $ | 853,799 | ||||||||
|
|
|
|
|
|
|
| |||||||||
72
NOTES TO FINANCIAL STATEMENTS |
| Small Cap Core Fund | Microcap Value Fund | |||||||||||||||
| For the Year Ended September 30, 2023 | For the Year Ended September 30, 2022 | For the Year Ended September 30, 2023 | For the Year Ended September 30, 2022 | |||||||||||||
SHARE TRANSACTIONS: | ||||||||||||||||
Class A | ||||||||||||||||
Issued | 108,467 | 129,777 | 3,567 | 5,318 | ||||||||||||
Reinvested | 161,185 | 196,049 | 14,848 | 6,460 | ||||||||||||
Redeemed | (96,891 | ) | (111,469 | ) | (23,118 | ) | (15,740 | ) | ||||||||
|
|
|
|
|
|
|
| |||||||||
Change in Class A | 172,761 | 214,357 | (4,703 | ) | (3,962 | ) | ||||||||||
|
|
|
|
|
|
|
| |||||||||
Class I | ||||||||||||||||
Issued | 19,377 | 17,165 | 149,486 | 540,868 | ||||||||||||
Reinvested | 581,241 | 900,396 | 526,520 | 237,092 | ||||||||||||
Redeemed | (228,349 | ) | (515,625 | ) | (456,095 | ) | (783,612 | ) | ||||||||
|
|
|
|
|
|
|
| |||||||||
Change in Class I | 372,269 | 401,936 | 219,911 | (5,652 | ) | |||||||||||
|
|
|
|
|
|
|
| |||||||||
Class R6 | ||||||||||||||||
Issued | 81 | 10,986 | — | — | ||||||||||||
Reinvested | 157 | 216 | — | — | ||||||||||||
Redeemed | — | (150,022 | ) | — | — | |||||||||||
|
|
|
|
|
|
|
| |||||||||
Change in Class R6 | 238 | (138,820 | ) | — | — | |||||||||||
|
|
|
|
|
|
|
| |||||||||
Change in shares resulting from capital transactions | 545,268 | 477,473 | 215,208 | (9,614 | ) | |||||||||||
|
|
|
|
|
|
|
| |||||||||
| Small Cap Value Fund | ||||||||
| For the Year Ended September 30, 2023 | For the Year Ended September 30, 2022 | |||||||
CAPITAL TRANSACTIONS: | ||||||||
Class A | ||||||||
Distributions reinvested | $ | 498 | $ | 132 | ||||
|
|
|
| |||||
Change in Class A | $ | 498 | $ | 132 | ||||
|
|
|
| |||||
Class I | ||||||||
Proceeds from shares issued | $ | 5,370,625 | $ | 33,939,527 | ||||
Distributions reinvested | 771,688 | 358,977 | ||||||
Cost of shares redeemed | (11,717,378 | ) | (75,657,975 | ) | ||||
|
|
|
| |||||
Change in Class I | $ | (5,575,065 | ) | $ | (41,359,471 | ) | ||
|
|
|
| |||||
Class R6 | ||||||||
Proceeds from shares issued | $ | — | $ | 28,665 | ||||
Distributions reinvested | 527 | 361 | ||||||
Cost of shares redeemed | — | (6,555,246 | ) | |||||
|
|
|
| |||||
Change in Class R6 | $ | 527 | $ | (6,526,220 | ) | |||
|
|
|
| |||||
Change in net assets resulting from capital transactions | $ | (5,574,040 | ) | $ | (47,885,559 | ) | ||
|
|
|
| |||||
73
NOTES TO FINANCIAL STATEMENTS |
| Small Cap Value Fund | ||||||||
| For the Year Ended September 30, 2023 | For the Year Ended September 30, 2022 | |||||||
SHARE TRANSACTIONS: | ||||||||
Class A | ||||||||
Reinvested | 40 | 10 | ||||||
|
|
|
| |||||
Change in Class A | 40 | 10 | ||||||
|
|
|
| |||||
Class I | ||||||||
Issued | 401,888 | 2,373,648 | ||||||
Reinvested | 61,884 | 25,244 | ||||||
Redeemed | (876,500 | ) | (5,438,605 | ) | ||||
|
|
|
| |||||
Change in Class I | (412,728 | ) | (3,039,713 | ) | ||||
|
|
|
| |||||
Class R6 | ||||||||
Issued | — | 2,058 | ||||||
Reinvested | 42 | 25 | ||||||
Redeemed | — | (453,842 | ) | |||||
|
|
|
| |||||
Change in Class R6 | 42 | (451,759 | ) | |||||
|
|
|
| |||||
Change in shares resulting from capital transactions | (412,646 | ) | (3,491,462 | ) | ||||
|
|
|
| |||||
7. Federal Income Taxes:
It is the policy of each Fund to continue to qualify as a regulated investment company by complying with the provisions available to certain investment companies, as defined under Subchapter M of the Internal Revenue Code, and to distribute substantially all of its net investment income and net realized capital gains. Therefore, no federal tax liability is recorded in the financial statements of each Fund.
Fund Management has analyzed the Funds’ tax positions taken or expected to be taken on federal income tax returns for all open tax years (current and prior three tax years), and has concluded that no provision for federal income tax is required in the Funds’ financial statements. The Funds’ federal and state income and federal excise tax returns for tax years for which the applicable statutes of limitations have not expired are subject to examination by the Internal Revenue Service and state departments of revenue.
As of September 30, 2023, the tax cost of investments and the breakdown of unrealized appreciation (depreciation) for each Fund was as follows:
| Tax Cost Of Investments | Unrealized Appreciation | Unrealized Depreciation | Net Unrealized Appreciation/ (Depreciation) | |||||||||||||
SMID Cap Growth Fund | $ | 98,797,234 | $ | 22,199,009 | $ | (8,693,776 | ) | $ | 13,505,233 | |||||||
Enterprise Fund | 44,356,183 | 20,198,201 | (3,156,465 | ) | 17,041,736 | |||||||||||
Small Cap Core Fund | 31,530,003 | 15,316,581 | (5,057,782 | ) | 10,258,799 | |||||||||||
Microcap Value Fund | 86,728,481 | 31,735,591 | (16,648,188 | ) | 15,087,403 | |||||||||||
Small Cap Value Fund | 31,414,190 | 2,198,832 | (5,730,865 | ) | (3,532,033 | ) | ||||||||||
74
NOTES TO FINANCIAL STATEMENTS |
The difference between book basis and tax basis unrealized appreciation/depreciation is attributable primarily to the tax deferral of losses on wash sales, Passive Foreign Investment Companies (PFICs) mark to market adjustment, and cumulative partnership basis adjustment.
The tax character of distributions during the year ended September 30, 2023 were as follows:
| Distributions Paid From | ||||||||||||||||
| Ordinary Income | Net Long Term Capital Gains | Total Taxable Distributions | Total Distributions Paid | |||||||||||||
SMID Cap Growth Fund | $ | — | $ | 6,223,196 | $ | 6,223,196 | $ | 6,223,196 | ||||||||
Enterprise Fund | — | 8,290,732 | 8,290,732 | 8,290,732 | ||||||||||||
Small Cap Core Fund | 1,160,788 | 8,608,888 | 9,769,676 | 9,769,676 | ||||||||||||
Microcap Value Fund | 1,464,645 | 13,455,940 | 14,920,585 | 14,920,585 | ||||||||||||
Small Cap Value Fund | 1,142,082 | 583,808 | 1,725,890 | 1,725,890 | ||||||||||||
The tax character of distributions during the year ended September 30, 2022 were as follows:
| Distributions Paid From | ||||||||||||||||
| Ordinary Income | Net Long Term Capital Gains | Total Taxable Distributions | Total Distributions Paid | |||||||||||||
SMID Cap Growth Fund | $ | — | $ | 20,243,276 | $ | 20,243,276 | $ | 20,243,276 | ||||||||
Enterprise Fund | 944,170 | 7,580,804 | 8,524,974 | 8,524,974 | ||||||||||||
Small Cap Core Fund | 5,104,506 | 17,729,780 | 22,834,286 | 22,834,286 | ||||||||||||
Microcap Value Fund | 1,130,992 | 7,273,424 | 8,404,416 | 8,404,416 | ||||||||||||
Small Cap Value Fund | 823,356 | — | 823,356 | 823,356 | ||||||||||||
As of September 30, 2023, the components of accumulated earnings/(losses) on a tax basis were as follows:
| SMID Cap Growth Fund | Enterprise Fund | Small Cap Core Fund | Microcap Value Fund | Small Cap Value Fund | ||||||||||||||||
Undistributed ordinary income | $ | — | $ | 585,215 | $ | 157,645 | $ | 1,090,618 | $ | 242,055 | ||||||||||
Undistributed long term gain | 2,793,451 | 1,043,592 | 2,658,333 | 8,592,822 | — | |||||||||||||||
|
|
|
|
|
|
|
|
|
| |||||||||||
Accumulated earnings | 2,793,451 | 1,628,807 | 2,815,978 | 9,683,440 | 242,055 | |||||||||||||||
Accumulated capital loss carryforwards | — | — | — | — | (971,425 | ) | ||||||||||||||
Unrealized appreciation/depreciation | 13,505,233 | 17,041,736 | 10,258,799 | 15,087,403 | (3,532,033 | ) | ||||||||||||||
|
|
|
|
|
|
|
|
|
| |||||||||||
Total Accumulated Earnings/(Losses) | $ | 16,298,684 | $ | 18,670,543 | $ | 13,074,777 | $ | 24,770,843 | $ | (4,261,403 | ) | |||||||||
|
|
|
|
|
|
|
|
|
| |||||||||||
As of September 30, 2023, the Small Cap Value Fund had long-term capital loss carryforwards of $971,425.
Under current tax law, Post-October Capital Losses and Late-Year Ordinary Losses may be deferred and treated as occurring on the first business day of the following fiscal year for tax purposes. The SMID Cap Growth Fund had deferred qualified late-year ordinary losses of $111,699 and the Microcap Value Fund had deferred post-October capital losses of $493,099 which will be treated as arising on the first business day of the fiscal year ending September 30, 2023.
75
NOTES TO FINANCIAL STATEMENTS |
8. Market Timing:
The Trust strongly discourages attempts at market timing by Fund shareholders. Prior to June 11, 2021, each Fund charged a redemption fee of 2% of the value of the shares redeemed or exchanged within 30 days of purchase. In addition, the Trust may limit the number of exchanges that may be made between Funds to five (5) per calendar year. When assessed, the redemption fee was deducted from the redemption proceeds and retained by the Fund, not by the Advisor. This redemption fee was not charged in cases where, for example, the redemption resulted from an automatic reinvestment or asset re-allocation not specifically directed by the shareholder. The Trust also reserves the right to reject any Fund purchase order made by persons deemed to be market timers. The Funds’ prospectus contains a full description of the Trust’s policies on market timing and/or excessive trading. The redemption fee is recorded as a credit to capital and is included in the capital transactions on the Statements of Changes in Net Assets.
9. Soft Dollars:
Soft dollar arrangements and commission sharing arrangements (CSAs) are arrangements under which RBC GAM-US directs client brokerage transactions to a broker-dealer and obtains other products and services, such as research, in addition to trade execution. Federal securities laws permit a fund advisor to incur commission charges on behalf of a fund that are higher than another broker-dealer would have charged if the advisor believes the charges are reasonable in relation to the brokerage and research services received. RBC GAM-US has a fiduciary duty to the shareholders of the Funds to seek the best execution for all of the Funds’ securities transactions. Fund Management believes that using soft dollars to purchase brokerage and research services may, in certain cases, be in a Fund’s best interest. During the year ended September 30, 2023, the Funds used soft dollar and commission sharing arrangements. Fund Management continues to closely monitor its current use of soft dollars, in addition to regulatory developments in this area for any possible impact on Fund policies.
10. Line of Credit
The Funds are participants in an uncommitted, secured $500,000,000 line of credit with U.S. Bank, N.A. (the “Bank”), the Funds’ custodian, to be used to fund shareholder redemption requests and for other short-term temporary or emergency general business purposes. The line of credit has a scheduled termination date of July 27, 2024. Interest is charged on borrowings under this line of credit at the Bank’s prime lending rate per annum. Since each Fund participates in this line of credit, there is no assurance that an individual fund will have access to all or any part of the $500,000,000 at any particular time. There were no loans outstanding pursuant to this line of credit at September 30, 2023. There were no borrowings made by the Funds under the line of credit during the year ended September 30, 2023.
11. Significant Risks
Shareholder concentration risk:
As of September 30, 2023, the Funds had broker-dealer omnibus accounts which each owned more than 10% of a Fund’s outstanding shares as shown below:
76
NOTES TO FINANCIAL STATEMENTS |
| # of Omnibus Accounts | % of Fund | |||||||
SMID Cap Growth Fund | 1 | 64.9% | ||||||
Enterprise Fund | 1 | 11.1% | ||||||
Small Cap Core Fund | 2 | 24.7% | ||||||
Microcap Value Fund | 1 | 21.9% | ||||||
Small Cap Value Fund | 1 | 20.5% | ||||||
In addition, one unaffiliated shareholder owned 17.6% of Small Cap Core Fund as of September 30, 2023. Significant transactions by these shareholders may impact the Funds’ performance.
Market risk
One or more markets in which a Fund invests may go down in value, sometimes sharply and unpredictably, and the value of a Fund’s portfolio securities may fall or fail to rise. Market risk may affect a single issuer, sector of the economy, industry or the market as a whole. In addition, global economies and financial markets are becoming increasingly interconnected, and political, economic and other conditions and events (including, but not limited to, natural disasters, pandemics, epidemics, and social unrest) in one country, region, or financial market may adversely impact issuers in a different country, region or financial market. Furthermore, the occurrence of, among other events, natural or man-made disasters, severe weather or geological events, fires, floods, earthquakes, outbreaks of disease (such as COVID-19, avian influenza or H1N1/09), epidemics, pandemics, malicious acts, cyber-attacks, terrorist acts or the occurrence of climate change, may also adversely impact the performance of a Fund. Such events could adversely impact issuers, markets and economies over the short- and long-term, including in ways that cannot necessarily be foreseen. A Fund could be negatively impacted if the value of a portfolio holding were harmed by such political or economic conditions or events. Moreover, such negative political and economic conditions and events could disrupt the processes necessary for a Fund’s operations.
In response to political and military actions undertaken by Russia, the U.S., European Union and other jurisdictions have imposed economic sanctions against certain Russian individuals, entities and sectors. These sanctions and the threat of further sanctions may result in the decline of the value and liquidity of Russian securities, a weakening of the ruble or other adverse consequences to the Russian economy. Sanctions could impair a fund’s ability to invest in accordance with its investment program, to determine the overall value of its net assets, and to sell holdings as needed to meet shareholder redemptions. As of September 30, 2023, none of the Funds’ investments were in violation of such sanctions.
Industry and sector focus risk
At times the Funds may increase the relative emphasis of its investments in a particular industry or sector. The prices of securities of issuers in a particular industry or sector may be more susceptible to fluctuations due to changes in economic or business conditions, government regulations, availability of basic resources or supplies, or other events affect that industry or sector more than securities of issuers in other industries and sectors. To the extent that the Fund increases the relative emphasis of its investments in a particular industry or sector, its shares’ values may fluctuate in response to events affecting that industry or sector.
12. Subsequent Events:
Fund Management has evaluated the impact of all subsequent events on the Funds and has determined that there were no subsequent events requiring recognition or disclosure in the financial statements.
77
|
To the Board of Trustees of RBC Funds Trust and Shareholders of RBC SMID Cap Growth Fund, RBC Enterprise Fund, RBC Small Cap Core Fund, RBC Microcap Value Fund, and RBC Small Cap Value Fund
Opinions on the Financial Statements
We have audited the accompanying statements of assets and liabilities, including the schedules of portfolio investments, of RBC SMID Cap Growth Fund, RBC Enterprise Fund, RBC Small Cap Core Fund, RBC Microcap Value Fund, and RBC Small Cap Value Fund (five of the funds constituting RBC Funds Trust, hereafter collectively referred to as the “Funds”) as of September 30, 2023, the related statements of operations for the year ended September 30, 2023, the statements of changes in net assets for each of the two years in the period ended September 30, 2023, including the related notes, and the financial highlights for each of the periods indicated therein (collectively referred to as the “financial statements”). In our opinion, the financial statements present fairly, in all material respects, the financial position of each of the Funds as of September 30, 2023, the results of each of their operations for the year then ended, the changes in each of their net assets for each of the two years in the period ended September 30, 2023 and each of the financial highlights for each of the periods indicated therein in conformity with accounting principles generally accepted in the United States of America.
Basis for Opinions
These financial statements are the responsibility of the Funds’ management. Our responsibility is to express an opinion on the Funds’ financial statements based on our audits. We are a public accounting firm registered with the Public Company Accounting Oversight Board (United States) (PCAOB) and are required to be independent with respect to the Funds in accordance with the U.S. federal securities laws and the applicable rules and regulations of the Securities and Exchange Commission and the PCAOB.
We conducted our audits of these financial statements in accordance with the standards of the PCAOB. Those standards require that we plan and perform the audit to obtain reasonable assurance about whether the financial statements are free of material misstatement, whether due to error or fraud.
Our audits included performing procedures to assess the risks of material misstatement of the financial statements, whether due to error or fraud, and performing procedures that respond to those risks. Such procedures included examining, on a test basis, evidence regarding the amounts and disclosures in the financial statements. Our audits also included evaluating the accounting principles used and significant estimates made by management, as well as evaluating the overall presentation of the financial statements. Our procedures included confirmation of securities owned as of September 30, 2023 by correspondence with the custodian and brokers; when replies were not received from brokers, we performed other auditing procedures. We believe that our audits provide a reasonable basis for our opinions.
/s/PricewaterhouseCoopers LLP
Minneapolis, Minnesota
November 21, 2023
We have served as the auditor of one or more investment companies in the RBC Funds since 2016.
78
|
For the fiscal year ended September 30, 2023, certain dividends paid by the Funds may be subject to a maximum tax rate of 15% as provided for by the Jobs and Growth Tax Reconciliation Act of 2003. The Funds intend to report the maximum amount allowable as taxed at a maximum rate of 15%. Complete information will be reported in conjunction with your 2020 Form 1099-DIV.
All reportings are based on financial information available as of the date of this annual report and, accordingly, are subject to change. For each item above, it is the intention of the Funds to report the maximum amount permitted under the Internal Revenue Code and the regulations thereunder.
For the year ended September 30, 2023, the following Funds had a qualified dividend income percentage of:
| Qualified Dividend Income | ||||
Small Cap Core Fund | 39.27% | |||
Microcap Value Fund | 100.00% | |||
Small Cap Value Fund | 56.16% | |||
For corporate shareholders, the following percentage of the total ordinary income distributions paid during the fiscal year ended September 30, 2023 qualify for the corporate dividends received deduction:
| Dividends Received Deduction | ||||
Small Cap Core Fund | 41.51% | |||
Microcap Value Fund | 100.00% | |||
Small Cap Value Fund | 61.01% | |||
For the year ended September 30, 2023, the following Funds had a qualified interest income percentage of:
| Qualified Interest Income | ||||
Small Cap Core Fund | 0.29% | |||
Microcap Value Fund | 1.39% | |||
Small Cap Value Fund | 0.56% | |||
79
OTHER FEDERAL INCOME TAX INFORMATION (UNAUDITED) |
For the year ended September 30, 2023, the following Funds had a qualified short term gains percentage of :
| Qualified Short-Term Gains | ||||
Small Cap Core Fund | 1.67% | |||
Microcap Value Fund | 2.22% | |||
Pursuant to Internal Revenue Code Section 852(b)(3), SMID Cap Growth Fund, Enterprise Fund, Small Cap Core Fund, Microcap Value Fund and Small Cap Value Fund reported $6,223,196, $8,290,732, $8,608,888, $13,455,940 and 583,808 respectively as long-term capital gain distributions for the year ended September 30, 2023.
All reportings are based on financial information available as of the date of this annual report and, accordingly, are subject to change. For each item above, it is the intention of the Funds to report the maximum amount permitted under the Internal Revenue Code and the regulations thereunder.
80
|
Independent Trustees(1)(2)
Lucy Hancock Bode (72)
Position, Term of Office and Length of Time Served with the Trust: Trustee since January 2004
Principal Occupation(s) During Past 5 Years: Healthcare consultant (self-employed) (1986 to present)
Number of Portfolios in Fund Complex Overseen by Trustee: 24
Other Director/Trustee Positions Held by Trustee During Past 5 Years: Franklin Street Partners (2014 to 2018 and 2019 to present)
Leslie H. Garner Jr. (73)
Position, Term of Office and Length of Time Served with the Trust: Trustee since January 2004
Principal Occupation(s) During Past 5 Years: President and Chief Executive Officer, The Greater Cedar Rapids Community Foundation (2010 to 2023); President, Cornell College (1994 to 2010)
Number of Portfolios in Fund Complex Overseen by Trustee: 24
Other Director/Trustee Positions Held by Trustee During Past 5 Years: None
Phillip G. Goff (59)
Position, Term of Office and Length of Time Served with the Trust: Trustee since January 2020
Principal Occupation(s) During Past 5 Years: Senior Vice President/Corporate Controller and Funds Treasurer, TIAA (2006 - 2017)
Number of Portfolios in Fund Complex Overseen by Trustee: 24
Other Director/Trustee Positions Held by Trustee During Past 5 Years: None
Ronald James (72)
Position, Term of Office and Length of Time Served with the Trust: Trustee since January 2004
Principal Occupation(s) During Past 5 Years: Faculty member (part time), University of St. Thomas (2004 to present), President and Chief Executive Officer, Center for Ethical Business Cultures (2000 to January 2017)
Number of Portfolios in Fund Complex Overseen by Trustee: 24
Other Director/Trustee Positions Held by Trustee During Past 5 Years: Bremer Financial
Corporation (2004 to present); Greater Twin Cities United Way (2012 to 2020); Best Buy Co. Inc. (2004 to 2013)
John A. MacDonald (74)
Position, Term of Office and Length of Time Served with the Trust: Trustee since January 2004
Principal Occupation(s) During Past 5 Years: Retired. Independent Consultant (2020 to present); Vice President and Treasurer, Hall Family Foundation (1988 to 2020); Chief Investment Officer, Chinquapin Trust Company (1999 to 2020)
Number of Portfolios in Fund Complex Overseen by Trustee: 24
Other Director/Trustee Positions Held by Trustee During Past 5 Years: None
81
MANAGEMENT (UNAUDITED) |
Independent Trustees(1)(2)
James R. Seward, CFA (70)
Position, Term of Office and Length of Time Served with the Trust: Chairman of the Board and Trustee since January 2004
Principal Occupation(s) During Past 5 Years: Private investor (2000 to present); CFA (1987 to present)
Number of Portfolios in Fund Complex Overseen by Trustee: 24
Other Director/Trustee Positions Held by Trustee During Past 5 Years: Brookdale Senior Living Inc. (2008 to 2019)
Christie Zarkovich (49)
Position, Term of Office and Length of Time Served with the Trust: Trustee since March 2023
Principal Occupation(s) During Past 5 Years: Chief Administrative, Financial and Investment Officer, Health Forward Foundation (2021 to present); Investment Director, Chinquapin Trust Company (2019 to 2021); Head of Mission-Related Investing Research, Cambridge Associates (2018 to 2019)
Number of Portfolios in Fund Complex Overseen by Trustee: 24
Other Director/Trustee Positions Held by Trustee During Past 5 Years: None
Interested Trustees(1)(2)(3)
David Eikenberg (54)(5)
Position, Term of Office and Length of Time Served with the Trust: Trustee since October 2022
Principal Occupation(s) During Past 5 Years: President and Chief Executive Officer, RBC Funds (2022 to present); Head of Intermediary Sales at RBC Global Asset Management (U.S.) Inc. (2018 to present); Vice President, T. Rowe Price (2010 to 2018)
Number of Portfolios in Fund Complex Overseen by Trustee: 24
Other Director/Trustee Positions Held by Trustee During Past 5 Years: None
82
MANAGEMENT (UNAUDITED) |
Executive Officers(1)(3)(4)
David Eikenberg (54)(5)
Position, Term of Office and Length of Time Served with the Trust: President and Chief Executive Officer since October 2022
Principal Occupation(s) During Past 5 Years: President and Chief Executive Officer, RBC Funds (2022 to present); Head of Intermediary Sales at RBC Global Asset Management (U.S.) Inc. (2018 to present); Vice President, T. Rowe Price (2010 to 2018)
Kathleen A. Hegna (56)
Position, Term of Office and Length of Time Served with the Trust: Chief Financial Officer and Principal Accounting Officer since May 2009 and Treasurer since March 2014
Principal Occupation(s) During Past 5 Years: Head, Fund Operations (US), RBC Global Asset Management (U.S.) Inc. (September 2022 to present); Associate Vice President and Director, Mutual Fund Services, RBC Global Asset Management (U.S.) Inc. (2009 to September 2022)
Christina M. Weber (55)
Position, Term of Office and Length of Time Served with the Trust: Chief Compliance Officer since December 2012 and Secretary since September 2017
Principal Occupation(s) During Past 5 Years: Chief Compliance Officer, RBC Global Asset Management (U.S.) Inc. (June 2018 to present); Chief Compliance Officer, RBC Funds (2012 to present); Assistant Secretary, RBC Funds (2013 to 2017)
Jodi DeFeyter (52)
Position, Term of Office and Length of Time Served with the Trust: Assistant Secretary since October 2022
Principal Occupation(s) During Past 5 Years: Director, Regulatory Administration, RBC Global Asset Management (U.S.) Inc. (2012 to present)
Tara Tilbury (49)
Position, Term of Office and Length of Time Served with the Trust: Assistant Secretary since October 2022
Principal Occupation(s) During Past 5 Years: Managing Counsel, RBC Global Asset Management (U.S.) Inc. (2018 to present); Vice President and Chief Counsel – Asset Management, Ameriprise Financial, Inc. (2105 to 2018)
| (1) | The address of each Trustee/Officer except David Eikenberg is 50 South Sixth Street, Suite 2350, Minneapolis, Minnesota 55402. The address of David Eikenberg is 225 Franklin Street, Boston, Massachusetts 02110. |
| (2) | All Trustees must retire on or before December 31 of the year in which they reach age 75. The Board may temporarily waive this requirement when necessary to avoid depriving the Board of a Trustee with critical skills. |
| (3) | On December 31, 2009, Voyageur Asset Management Inc. changed its name to RBC Global Asset |
83
MANAGEMENT (UNAUDITED) |
| Management (U.S.) Inc. Any references to RBC Global Asset Management (U.S.) Inc. for prior periods are deemed to be references to the prior entity. |
| (4) | Each officer serves in such capacity for an indefinite period of time until his or her removal, resignation or retirement. |
| (5) | David Eikenberg has been determined to be an interested Trustee by virtue of his position with the Advisor. |
The Fund’s Statement of Additional Information includes information about the Funds’ Trustees. To receive your free copy of the Statement of Additional Information, call toll free: 1-800-422-2766.
84
SHARE CLASS INFORMATION (UNAUDITED)
|
The RBC Equity Funds offer three share classes. These three share classes are the A, R6 and I classes.
Class A
Class A shares are offered by all Funds and are available for purchase primarily through investment advisors, broker-dealers, banks and other financial services intermediaries. Class A shares of the Funds are currently subject to a maximum up-front sales charge of 5.75% and a 1.00% CDSC for redemption within 12 months of a $1 million or greater purchase. Class A shares currently include a 0.25% (25 bps) annual 12b-1 service and distribution fee.
Class I
Class I shares are available in all Funds. This share class is intended for investors meeting certain minimum investment thresholds. This share class does not have an up-front sales charge (load) or a 12b-1 service and distribution fee.
Class R6
Class R6 shares are available in SMID Cap Growth Fund, Small Cap Core Fund and Small Cap Value Fund. This share class is intended for investors meeting certain minimum investment thresholds. This share class does not have an up-front sales charge (load) or a 12b-1 service and distribution fee.
85
SUPPLEMENTAL INFORMATION (UNAUDITED)
|
Shareholder Expense Examples
As a shareholder of the RBC Funds, you incur two types of costs: (1) transaction costs and (2) ongoing costs, including management fees; and other Fund expenses. This example is intended to help you understand your ongoing costs (in dollars) of investing in the RBC Funds and to compare these costs with the ongoing costs of investing in other mutual funds.
The example is based on an investment of $1,000 invested at the beginning of the period and held for the entire period from April 1, 2023 through September 30, 2023.
Actual Expenses
The table below provides information about actual account values and actual expenses. You may use the information below, together with the amount you invested, to estimate the expenses that you paid over the period. Simply divide your account value by $1,000 (for example, an $8,600 account value divided by $1,000 = 8.6), then multiply the result by the number in the table under the heading entitled “Expenses Paid During Period” to estimate the expenses you paid on your account during this period.
| Beginning Account Value 4/1/23 | Ending Account Value 9/30/23 | Expenses Paid During Period1 4/1/23–9/30/23 | Annualized Expense Ratio During Period 4/1/23–9/30/23 | |||||||||||||||||
SMID Cap Growth Fund | ||||||||||||||||||||
| Class A | $1,000.00 | $ 990.30 | $5.24 | 1.05% | ||||||||||||||||
| Class I | 1,000.00 | 990.90 | 4.04 | 0.81% | ||||||||||||||||
| Class R6 | 1,000.00 | 991.60 | 3.79 | 0.76% | ||||||||||||||||
Enterprise Fund | ||||||||||||||||||||
| Class A | 1,000.00 | 1,021.80 | 6.64 | 1.31% | ||||||||||||||||
| Class I | 1,000.00 | 1,023.40 | 5.38 | 1.06% | ||||||||||||||||
Small Cap Core Fund | ||||||||||||||||||||
| Class A | 1,000.00 | 1,024.40 | 5.73 | 1.13% | ||||||||||||||||
| Class I | 1,000.00 | 1,025.10 | 4.52 | 0.89% | ||||||||||||||||
| Class R6 | 1,000.00 | 1,025.00 | 4.37 | 0.86% | ||||||||||||||||
Microcap Value Fund | ||||||||||||||||||||
| Class A | 1,000.00 | 1,016.20 | 6.57 | 1.30% | ||||||||||||||||
| Class I | 1,000.00 | 1,017.00 | 5.31 | 1.05% | ||||||||||||||||
Small Cap Value Fund | ||||||||||||||||||||
| Class A | 1,000.00 | 1,042.40 | 5.58 | 1.09% | ||||||||||||||||
| Class I | 1,000.00 | 1,043.40 | 4.30 | 0.84% | ||||||||||||||||
| Class R6 | 1,000.00 | 1,044.50 | 4.05 | 0.79% | ||||||||||||||||
1Expenses are equal to the average account value times the Fund’s annualized expense ratio multiplied by 183/365 (to reflect one half year period).
86
SUPPLEMENTAL INFORMATION (UNAUDITED)
|
Hypothetical Example for Comparison Purposes
The table below provides information about hypothetical account values and hypothetical expenses based on each RBC Funds’ actual expense ratio and an assumed rate of return of 5% per year before expenses, which is not the Fund’s actual return. The hypothetical account values and expenses may not be used to estimate the actual ending account balance or expenses you paid for the period. You may use this information to compare this 5% hypothetical example with the 5% hypothetical examples that appear in the shareholder reports of other funds.
Please note that the expenses shown in the table are meant to highlight your ongoing costs only and do not reflect any transactional costs, such as sales charges (loads), redemption fees, or exchange fees. Therefore, the table is useful in comparing ongoing costs only, and will not help you determine the relative total costs of owning different funds. In addition, if these transactional costs were included, your costs would have been higher.
| Beginning Account Value 4/1/23 | Ending Account Value 9/30/23 | Expenses Paid During Period 4/1/23-9/30/23 | Annualized Expense Ratio During Period 4/1/23-9/30/23 | |||||||||||||||||
SMID Cap Growth Fund | ||||||||||||||||||||
| Class A | $1,000.00 | $1,019.80 | $5.32 | 1.05% | ||||||||||||||||
| Class I | 1,000.00 | 1,021.01 | 4.10 | 0.81% | ||||||||||||||||
| Class R6 | 1,000.00 | 1,021.26 | 3.85 | 0.76% | ||||||||||||||||
Enterprise Fund | ||||||||||||||||||||
| Class A | 1,000.00 | 1,018.50 | 6.63 | 1.31% | ||||||||||||||||
| Class I | 1,000.00 | 1,019.75 | 5.37 | 1.06% | ||||||||||||||||
Small Cap Core Fund | ||||||||||||||||||||
| Class A | 1,000.00 | 1,019.40 | 5.72 | 1.13% | ||||||||||||||||
| Class I | 1,000.00 | 1,020.61 | 4.51 | 0.89% | ||||||||||||||||
| Class R6 | 1,000.00 | 1,020.76 | 4.36 | 0.86% | ||||||||||||||||
Microcap Value Fund | ||||||||||||||||||||
| Class A | 1,000.00 | 1,018.55 | 6.58 | 1.30% | ||||||||||||||||
| Class I | 1,000.00 | 1,019.80 | 5.32 | 1.05% | ||||||||||||||||
Small Cap Value Fund | ||||||||||||||||||||
| Class A | 1,000.00 | 1,019.60 | 5.52 | 1.09% | ||||||||||||||||
| Class I | 1,000.00 | 1,020.86 | 4.26 | 0.84% | ||||||||||||||||
| Class R6 | 1,000.00 | 1,021.11 | 4.00 | 0.79% | ||||||||||||||||
87
APPROVAL OF INVESTMENT ADVISORY AGREEMENT (UNAUDITED)
|
Information Regarding the Approval of Investment Advisory Agreements
In September 2023, after evaluating the services provided by RBC Global Asset Management (U.S.) Inc. (the “Advisor”) and reviewing the performance, fees, and expenses of the Funds, the RBC Funds Board of Trustees determined to approve the continuation of the investment advisory agreement (“Agreement”) with the Advisor for each Fund for an additional year.
As part of their review of the Agreement, the Trustees requested and considered information regarding the advisory services performed by the Advisor; the staffing and qualifications of the personnel responsible for operating and managing the Funds; and the Funds’ performance, fees, and expenses. The Trustees considered information provided at regular quarterly Board and Committee meetings throughout the year, information presented at both a special meeting held to review requested material related to the proposed renewals and a regular meeting at which the proposed renewals were considered, and their experience with the management and portfolio management teams over the years. The information included material provided by the Advisor, as well as reports prepared by Broadridge Financial Solutions, Inc., an independent statistical compilation company, providing comparative fee and expense information and comparative performance information for the Funds vs. funds in the same category and funds in more tailored peer groups. In connection with their deliberations, the independent Trustees were advised by independent legal counsel with regard to the materials and their responsibilities under relevant laws and regulations.
The Trustees met with representatives from the Advisor’s senior management team, as well as senior investment professionals, to discuss the information and the Advisor’s ongoing management of the Funds. The Trustees reviewed the nature and quality of the services provided to the Funds by the Advisor, including information as to each Fund’s performance relative to appropriate index benchmarks as well as their respective Morningstar categories and peer groups. For several of the Funds, the Board also reviewed comparative information with respect to custom peer groups designed to align more closely with the Funds’ specific investment strategies. The Board noted that the Enterprise and Microcap Value Funds had outperformed the microcap benchmark for the year-to-date and trailing 1, 3 and 5 year periods, with mixed results vs. their custom peer group; the absolute performance of the Small Cap Core and Small Cap Value Funds was favorable over all periods with significant outperformance over the benchmarks and peers in the near term; and the absolute performance of the SMID Cap Growth Fund was consistently favorable over the long term with the Fund performing in the top half of its peer groups for the year-to-date and trailing 1, 3 and 5 year periods. The Board was satisfied with the Funds’ performance.
The Trustees recognized the strong research and fundamental analysis capabilities of the Advisor’s investment teams and their extensive portfolio management experience, as well as the Advisor’s effective trading, operational, and compliance structure and systems. The Trustees also noted the Advisor’s application of portfolio engineering approaches to the management of the funds. The Trustees reviewed advisory fee and expense information for each Fund compared to similarly situated funds, including information regarding other client accounts advised or sub-advised by the Advisor with similar investment strategies and the reasons for any differences in fees. The Trustees considered, and viewed favorably, the arrangements to subsidize Fund expenses at competitive levels through expense limitation agreements with the Adviser. The Trustees noted that advisory fees and expense ratios were competitive and, in particular, that none of the Funds had total net expenses that exceeded the median of its peer group.
The Trustees also reviewed reports from the Advisor regarding its management of other investment client accounts with similar strategies, including the advisory fees paid and the reasons for differences in fees, which included liquidity management and matters related to mutual fund operations. The Trustees reviewed profitability data—including year-over-year variances—for the Advisor and considered information regarding other benefits the Advisor and its affiliates derived from their relationships with the Funds, including soft dollar research. The Board also noted that the Advisor does not receive any additional fee for its administrative services to the Funds.
88
APPROVAL OF INVESTMENT ADVISORY AGREEMENT (UNAUDITED)
|
Based upon their review, the Trustees determined that the advisory fees proposed to be payable to the Advisor were fair and reasonable in light of the nature and quality of services provided under all of the circumstances and were within the range of what might have been negotiated at arms’ length. The Trustees concluded that it was in the interests of the Funds and their shareholders for the Trustees to approve the continuation of the Agreement and the expense limitation agreements for the Funds for an additional year. In arriving at their collective decision to approve the renewal of the Agreement, the Trustees did not assign relative weights to the factors discussed above or deem any one or group of them to be controlling in and of itself.
89
| ||||||
90
|
This Page Intentionally Left Blank
91
|
This Page Intentionally Left Blank
92
|
This Page Intentionally Left Blank
93
|
This Page Intentionally Left Blank
94
|
This Page Intentionally Left Blank
95
|
This Page Intentionally Left Blank
96
RBC Funds
P.O. Box 701
Milwaukee, WI 53201-0701
800-422-2766
www.rbcgam.com
Performance data represents past performance and does not guarantee future results. The principal value of an investment and investment return will fluctuate so that an investor’s shares, when redeemed, may be worth more or less than their original cost.
This report and the financial statements contained herein are provided for the information of RBC Funds shareholders. This report is not authorized for distribution to prospective investors unless preceded or accompanied by a current prospectus, which contains information concerning investment objectives, risks, charges and expenses of the funds. Please read the prospectus carefully before investing.
This report and the financial statements contained herein are not intended to be a forecast of future events, a guarantee of future results, or investment advice. There is no assurance that certain securities will remain in or out of each fund’s portfolio. The views expressed in this report reflect those of the portfolio managers through the year ended September 30, 2023.
NOT FDIC INSURED • NO BANK GUARANTEE • MAY LOSE VALUE
RBC Global Asset Management (U.S.) Inc. serves as investment advisor for the RBC Funds.
RBC Funds are distributed by Quasar Distributors LLC.
This product is made of material from well-managed FSC®-certified forests,
recycled materials, and other controlled sources.
RBCF-EQ AR 09-23

Annual Report
For the year ended September 30, 2023
RBC BlueBay U.S. Government Money Market Fund (formerly, U.S. Government Money Market Fund)
| ||||||||||
RBC Funds | ||||||||||
About your Annual Report |
This annual report includes detailed information about your Fund including financial statements, performance, and a complete list of its holdings. | |||||||||
| We hope the financial information presented will help you evaluate your investment in the RBC Funds. We also encourage you to read your Fund’s prospectus for further detail as to your Fund’s investment policies and risk profile. RBC Funds prospectuses and performance information subsequent to the date of this report are available on our website at www.rbcgam.com. | ||||||||||
A description of the policies and procedures that your Fund uses to determine how to vote proxies relating to portfolio securities is available (i) without charge, upon request, by calling 1-800-422-2766; (ii) on the Fund’s website at www.rbcgam.com; and (iii) on the Securities and Exchange Commission’s (the “Commission”) website at http://www.sec.gov. | ||||||||||
Each year the Trust files its proxy voting record for the twelve-month period ended June 30 with the SEC on Form N-PX no later than August 31. The records can be obtained on the SEC’s website at www.sec.gov and without charge by calling the Funds at 1-800-422-2766. | ||||||||||
A schedule of the Fund’s portfolio holdings is filed with the Commission for the first and third quarters of each fiscal year on Form N-PORT. This information is available on the Commission’s website at http://www.sec.gov and on the Funds’ website at www.dfinview.com/usrbcgam. | ||||||||||
| Table of | 1 | |||||||||
| Contents | 3 | |||||||||
| 4 | ||||||||||
| 6 | ||||||||||
| 14 | ||||||||||
| 16 | ||||||||||
| 17 | ||||||||||
| 18 | ||||||||||
| 21 | ||||||||||
| 29 | ||||||||||
| 30 | ||||||||||
| 31 | ||||||||||
| 35 | ||||||||||
| 37 | ||||||||||
| 1 |
LETTER FROM THE PORTFOLIO MANAGERS
|
| |||||||||
Past performance does not guarantee future results.
The name of the fund was changed from U.S. Government Money Market Fund to RBC BlueBay U.S. Government Money Market Fund on July 26, 2023.
Opinions expressed are subject to change, not guaranteed, and not recommendations to buy or sell any security.
The Consumer Price Index (“CPI”) is a measure of the average change over time in the prices paid by urban consumers for a market basket of consumer goods and services. Indexes are available for the U.S. and various geographic areas.
A basis point is a unit of measure equal to one one-hundredth of a percent.
The U.S. Treasury yield curve represents the yield of a U.S. Treasury bond at different maturities. A U.S. Treasury bond is theoretically considered to be free of default risk, and represents the minimum yield investors are prepared to accept for bonds of different maturities.
You could lose money by investing in the Fund. Although the Fund seeks to preserve the value of your investment at $1.00 per share, it cannot guarantee it will do so. An investment in the Fund is not a bank account and is not insured or guaranteed by the Federal Deposit Insurance Corporation or any other government agency. The Fund’s sponsor is not required to reimburse the Fund for losses, and you should not expect that the sponsor will provide financial support to the Fund at any time, including during periods of market stress. |
| |||||||||
|
| |||||||||
|
| |||||||||
|
| |||||||||
2 |
| ||||||
RBC Global Asset Management (U.S.) Inc. (“RBC GAM-US”), serves as the investment advisor to the Fund. RBC GAM-US employs a team approach to the management of the RBC BlueBay U.S. Government Money Market Fund, with no individual team member being solely responsible for the investment decisions. The Fund’s management team has access to RBC GAM-US’s investment research and other money management resources.
| ||||||
Brandon Swensen, CFA BlueBay Senior Portfolio Manager
Brandon is a BlueBay senior portfolio manager on the BlueBay Fixed Income team at RBC Global Asset Management (U.S.) Inc. In addition to co-leading the fixed income group based in Minneapolis, he is a portfolio manager for several cash management and core solutions. Brandon began his career in the investment industry in 1998 and held positions as a research analyst and financial analyst prior to joining the RBC GAM Mortgage and Government team in 2000. Brandon holds an MBA in Finance from the University of St. Thomas and a Bachelor of Science in Finance from St. Cloud State University. He is also a CFA® charterholder.
|
Brandon T. Swensen, CFA | |||||
Brian Svendahl, CFA BlueBay Senior Portfolio Manager
Brian is a BlueBay senior portfolio manager on the BlueBay Fixed Income team at RBC Global Asset Management (U.S.) Inc. He has had a leadership role within the Minneapolis-based fixed income group since 2012 and has been the lead portfolio manager for the firm’s impact investing strategies since 2006. He also managed many government and mortgage strategies. Brian joined the organization in 2005, having held risk management, research, and trading positions with a large American multinational financial services company since 1992. Brian holds an MBA, a BBA in Finance and a Bachelor of Science in Economics from the University of Minnesota. He is also a CFA® charterholder and a Financial Risk Manager (FRM®). |
Brian Svendahl, CFA | |||||


| 3 |
4 |
PERFORMANCE SUMMARY (UNAUDITED)
| ||||||||||||
| Money Market Maturity Schedule | Asset Allocation | |||||||||||
| As a percentage of value of investments based on effective maturity as of September 30, 2023. | ||||||||||||
| RBC BlueBay U.S. Government Money Market Fund | ||||||||||||
Less than 8 days | 74.8% | |||||||||||
8 to 14 days | 0.0% | |||||||||||
15 to 30 days | 18.1% | |||||||||||
31 to 180 days | 5.7% | |||||||||||
Over 180 days | 1.4% | |||||||||||
| 5 |
SCHEDULE OF PORTFOLIO INVESTMENTS
|
RBC BlueBay U.S. Government Money Market Fund
September 30, 2023
| Principal Amount | Value | |||||||||||
U.S. Government Agency Backed Mortgages — 21.07% | ||||||||||||
| Federal Farm Credit — 10.15% | ||||||||||||
| $ | 25,000,000 | 0.00%, 10/16/23(a),(b) | $ | 24,948,438 | ||||||||
| 25,000,000 | (3 mo. U.S. Treasury Money Market Yield - 0.015%), 5.39%, 1/29/24(c) | 25,007,384 | ||||||||||
| 99,000,000 | (SOFR RATE + 0.025%), 5.34%, 10/27/23(c) | 99,000,000 | ||||||||||
| 87,000,000 | (SOFR RATE + 0.045%), 5.36%, 10/16/23(c) | 87,000,000 | ||||||||||
| 64,000,000 | (SOFR RATE + 0.055%), 5.37%, 1/10/24(c) | 64,000,000 | ||||||||||
| 75,000,000 | (SOFR RATE + 0.120%), 5.43%, 5/1/25(c) | 75,000,000 | ||||||||||
| 50,000,000 | (SOFR RATE + 0.130%), 5.44%, 4/10/25(c) | 49,992,483 | ||||||||||
| 58,000,000 | (SOFR RATE + 0.130%), 5.44%, 1/28/25(c) | 58,000,000 | ||||||||||
| 50,000,000 | (SOFR RATE + 0.140%), 5.45%, 4/25/25(c) | 49,969,246 | ||||||||||
| 50,000,000 | (SOFR RATE + 0.140%), 5.45%, 2/26/25(c) | 49,993,188 | ||||||||||
| 35,000,000 | (SOFR RATE + 0.150%), 5.46%, 3/17/25(c) | 34,975,003 | ||||||||||
| 11,000,000 | (SOFR RATE + 0.150%), 5.46%, 1/3/25(c) | 11,000,000 | ||||||||||
| 32,000,000 | (SOFR RATE + 0.150%), 5.46%, 5/27/25(c) | 32,000,000 | ||||||||||
| 100,000,000 | (SOFR RATE + 0.150%), 5.46%, 7/11/25(c) | 100,000,000 | ||||||||||
| 70,000,000 | (SOFR RATE + 0.155%), 5.47%, 5/2/25(c) | 70,000,000 | ||||||||||
| 45,000,000 | (SOFR RATE + 0.155%), 5.47%, 8/28/25(c) | 45,000,000 | ||||||||||
| 100,000,000 | (SOFR RATE + 0.155%), 5.47%, 9/5/25(c) | 100,000,000 | ||||||||||
| 40,000,000 | (SOFR RATE + 0.155%), 5.47%, 9/15/25(c) | 39,996,265 | ||||||||||
| 90,000,000 | (SOFR RATE + 0.155%), 5.47%, 9/25/25(c) | 90,000,000 | ||||||||||
| 75,000,000 | (SOFR RATE + 0.160%), 5.47%, 7/7/25(c) | 75,000,000 | ||||||||||
| 40,000,000 | (SOFR RATE + 0.180%), 5.49%, 4/28/25(c) | 40,023,378 | ||||||||||
| 50,000,000 | (SOFR RATE + 0.180%), 5.49%, 3/7/25(c) | 50,000,000 | ||||||||||
| 53,000,000 | Series 0001, (SOFR RATE + 0.120%), 5.43%, 1/21/25(c) | 53,000,000 | ||||||||||
| 30,000,000 | Series 0001, (SOFR RATE + 0.195%), 5.51%, 6/2/25(c) | 30,000,000 | ||||||||||
|
| |||||||||||
| 1,353,905,385 | ||||||||||||
|
| |||||||||||
Federal Home Loan Banks — 10.92% | ||||||||||||
| 101,270,000 | 0.00%, 11/15/23(a),(b) | 100,627,041 | ||||||||||
| 50,000,000 | 0.00%, 10/4/23(a),(b) | 49,978,500 | ||||||||||
| 25,000,000 | 5.30%, 3/6/24 | 25,000,000 | ||||||||||
| 12,000,000 | 0.00%, 3/1/24(a),(b) | 11,745,400 | ||||||||||
| 194,760,000 | 0.00%, 10/27/23(a),(b) | 194,061,927 | ||||||||||
| 63,475,000 | 0.00%, 10/6/23(a),(b) | 63,428,892 | ||||||||||
| 55,408,000 | 0.00%, 11/24/23(a),(b) | 54,973,912 | ||||||||||
| 100,000,000 | 5.50%, 8/12/24 | 99,984,764 | ||||||||||
| 30,000,000 | 0.00%, 10/17/23(a),(b) | 29,933,333 | ||||||||||
| 50,000,000 | 0.00%, 11/17/23(a),(b) | 49,658,924 | ||||||||||
| 75,000,000 | (SOFR RATE + 0.120%), 5.43%, 5/1/25(c) | 75,000,000 | ||||||||||
| 75,000,000 | (SOFR RATE + 0.120%), 5.43%, 11/25/24(c) | 75,000,000 | ||||||||||
| 50,000,000 | (SOFR RATE + 0.130%), 5.44%, 2/10/25(c) | 50,000,000 | ||||||||||
| 75,000,000 | (SOFR RATE + 0.140%), 5.45%, 4/21/25(c) | 75,000,000 | ||||||||||
| 200,000,000 | (SOFR RATE + 0.155%), 5.47%, 8/22/25(c) | 200,000,000 | ||||||||||
| 100,000,000 | (SOFR RATE + 0.155%), 5.47%, 9/29/25(c) | 100,000,000 | ||||||||||
| 75,000,000 | (SOFR RATE + 0.160%), 5.47%, 7/10/25(c) | 75,000,000 | ||||||||||
6 |
SCHEDULE OF PORTFOLIO INVESTMENTS
|
RBC BlueBay U.S. Government Money Market Fund (cont.)
September 30, 2023
| Principal Amount | Value | |||||||||||
| $ | 55,000,000 | (SOFR RATE + 0.170%), 5.48%, 4/1/25(c) | $ | 55,022,116 | ||||||||
| 75,000,000 | Series 0001, (SOFR RATE + 0.140%), 5.45%, 5/19/25(c) | 75,000,000 | ||||||||||
|
| |||||||||||
| 1,459,414,809 | ||||||||||||
|
| |||||||||||
Total U.S. Government Agency Backed Mortgages | 2,813,320,194 | |||||||||||
|
| |||||||||||
(Cost $2,813,320,194) | ||||||||||||
U.S. Government Agency Obligations — 6.85% | ||||||||||||
U.S. International Development Finance Corp. — 6.85% | ||||||||||||
| 25,435,000 | 0.00%, 12/14/23(b) | 26,464,344 | ||||||||||
| 10,500,000 | 0.00%, 6/21/24(b) | 10,665,337 | ||||||||||
| 10,775,000 | 0.00%, 7/23/24(b) | 10,892,326 | ||||||||||
| 10,755,000 | 0.00%, 7/23/24(b) | 10,872,109 | ||||||||||
| 5,000,000 | 0.00%, 8/11/24(b) | 5,040,967 | ||||||||||
| 15,000,000 | 0.00%, 8/16/24(b) | 15,110,852 | ||||||||||
| 16,700,000 | 0.00%, 9/30/24(b) | 16,700,000 | ||||||||||
| 7,300,000 | 0.00%, 9/30/24(b) | 7,300,000 | ||||||||||
| 5,000,000 | (US Treasury Bill Yield 3-Month + 0.000%), 5.45%, 8/15/29(c) | 5,000,000 | ||||||||||
| 19,259,259 | (US Treasury Bill Yield 3-Month + 0.000%), 5.45%, 3/15/30(c) | 19,259,259 | ||||||||||
| 8,305,840 | (US Treasury Bill Yield 3-Month + 0.000%), 5.45%, 4/20/35(c) | 8,305,840 | ||||||||||
| 750,000 | (US Treasury Bill Yield 3-Month + 0.000%), 5.54%, 5/15/24(c) | 750,000 | ||||||||||
| 692,308 | (US Treasury Bill Yield 3-Month + 0.000%), 5.54%, 5/15/24(c) | 692,308 | ||||||||||
| 681,819 | (US Treasury Bill Yield 3-Month + 0.000%), 5.54%, 5/15/24(c) | 681,819 | ||||||||||
| 625,000 | (US Treasury Bill Yield 3-Month + 0.000%), 5.54%, 5/15/24(c) | 625,000 | ||||||||||
| 4,190,476 | (US Treasury Bill Yield 3-Month + 0.000%), 5.54%, 8/15/25(c) | 4,190,476 | ||||||||||
| 4,000,001 | (US Treasury Bill Yield 3-Month + 0.000%), 5.54%, 8/15/25(c) | 4,000,001 | ||||||||||
| 3,826,087 | (US Treasury Bill Yield 3-Month + 0.000%), 5.54%, 8/15/25(c) | 3,826,087 | ||||||||||
| 3,333,333 | (US Treasury Bill Yield 3-Month + 0.000%), 5.54%, 8/15/25(c) | 3,333,333 | ||||||||||
| 842,105 | (US Treasury Bill Yield 3-Month + 0.000%), 5.54%, 8/15/25(c) | 842,105 | ||||||||||
| 3,184,211 | (US Treasury Bill Yield 3-Month + 0.000%), 5.54%, 5/15/26(c) | 3,184,211 | ||||||||||
| 2,444,445 | (US Treasury Bill Yield 3-Month + 0.000%), 5.54%, 5/15/26(c) | 2,444,445 | ||||||||||
| 1,210,000 | (US Treasury Bill Yield 3-Month + 0.000%), 5.54%, 5/15/26(c) | 1,210,000 | ||||||||||
| 15,256,603 | (US Treasury Bill Yield 3-Month + 0.000%), 5.54%, 1/15/30(c) | 15,256,603 | ||||||||||
| 1,115,789 | (US Treasury Bill Yield 3-Month + 0.000%), 5.55%, 3/15/24(c) | 1,115,789 | ||||||||||
| 10,946,439 | (US Treasury Bill Yield 3-Month + 0.000%), 5.55%, 6/20/27(c) | 10,946,439 | ||||||||||
| 6,500,002 | (US Treasury Bill Yield 3-Month + 0.000%), 5.55%, 6/20/27(c) | 6,500,002 | ||||||||||
| 5,625,001 | (US Treasury Bill Yield 3-Month + 0.000%), 5.55%, 6/20/27(c) | 5,625,001 | ||||||||||
| 4,050,002 | (US Treasury Bill Yield 3-Month + 0.000%), 5.55%, 6/20/27(c) | 4,050,002 | ||||||||||
| 3,475,001 | (US Treasury Bill Yield 3-Month + 0.000%), 5.55%, 6/20/27(c) | 3,475,001 | ||||||||||
| 3,300,001 | (US Treasury Bill Yield 3-Month + 0.000%), 5.55%, 6/20/27(c) | 3,300,001 | ||||||||||
| 2,500,001 | (US Treasury Bill Yield 3-Month + 0.000%), 5.55%, 6/20/27(c) | 2,500,001 | ||||||||||
| 11,285,713 | (US Treasury Bill Yield 3-Month + 0.000%), 5.55%, 9/20/27(c) | 11,285,713 | ||||||||||
| 5,757,576 | (US Treasury Bill Yield 3-Month + 0.000%), 5.55%, 6/15/28(c) | 5,757,576 | ||||||||||
| 3,840,303 | (US Treasury Bill Yield 3-Month + 0.000%), 5.55%, 6/15/28(c) | 3,840,303 | ||||||||||
| 32,500,000 | (US Treasury Bill Yield 3-Month + 0.000%), 5.55%, 3/15/30(c) | 32,500,000 | ||||||||||
| 6,357,000 | (US Treasury Bill Yield 3-Month + 0.000%), 5.55%, 5/15/30(c) | 6,357,000 | ||||||||||
| 31,931,249 | (US Treasury Bill Yield 3-Month + 0.000%), 5.55%, 9/20/32(c) | 31,931,249 | ||||||||||
| 7 |
SCHEDULE OF PORTFOLIO INVESTMENTS
|
RBC BlueBay U.S. Government Money Market Fund (cont.)
September 30, 2023
| Principal Amount | Value | |||||||||||
| $ | 6,987,180 | (US Treasury Bill Yield 3-Month + 0.000%), 5.55%, 10/15/32(c) | $ | 6,987,180 | ||||||||
| 3,910,257 | (US Treasury Bill Yield 3-Month + 0.000%), 5.55%, 11/15/33(c) | 3,910,257 | ||||||||||
| 8,827,920 | (US Treasury Bill Yield 3-Month + 0.000%), 5.55%, 6/15/34(c) | 8,827,920 | ||||||||||
| 8,269,284 | (US Treasury Bill Yield 3-Month + 0.000%), 5.55%, 6/15/34(c) | 8,269,284 | ||||||||||
| 6,076,405 | (US Treasury Bill Yield 3-Month + 0.000%), 5.55%, 6/15/34(c) | 6,076,405 | ||||||||||
| 24,624,236 | (US Treasury Bill Yield 3-Month + 0.000%), 5.55%, 7/7/40(c) | 24,624,236 | ||||||||||
| 23,568,912 | (US Treasury Bill Yield 3-Month + 0.000%), 5.55%, 7/7/40(c) | 23,568,912 | ||||||||||
| 13,191,555 | (US Treasury Bill Yield 3-Month + 0.000%), 5.55%, 7/7/40(c) | 13,191,555 | ||||||||||
| 12,971,696 | (US Treasury Bill Yield 3-Month + 0.000%), 5.55%, 7/7/40(c) | 12,971,696 | ||||||||||
| 9,229,691 | (US Treasury Bill Yield 3-Month + 0.000%), 5.55%, 7/7/40(c) | 9,229,691 | ||||||||||
| 6,001,947 | (US Treasury Bill Yield 3-Month + 0.000%), 5.55%, 7/7/40(c) | 6,001,947 | ||||||||||
| 3,957,467 | (US Treasury Bill Yield 3-Month + 0.000%), 5.55%, 7/7/40(c) | 3,957,466 | ||||||||||
| 3,500,000 | (US Treasury Bill Yield 3-Month + 0.000%), 5.60%, 6/15/25(c) | 3,500,000 | ||||||||||
| 6,012,632 | (US Treasury Bill Yield 3-Month + 0.000%), 5.60%, 9/15/25(c) | 6,012,632 | ||||||||||
| 7,920,000 | (US Treasury Bill Yield 3-Month + 0.000%), 5.60%, 9/15/26(c) | 7,920,000 | ||||||||||
| 5,000,000 | (US Treasury Bill Yield 3-Month + 0.000%), 5.60%, 9/15/26(c) | 5,000,000 | ||||||||||
| 3,950,000 | (US Treasury Bill Yield 3-Month + 0.000%), 5.60%, 12/15/26(c) | 3,950,000 | ||||||||||
| 20,416,665 | (US Treasury Bill Yield 3-Month + 0.000%), 5.60%, 1/20/27(c) | 20,416,665 | ||||||||||
| 6,684,091 | (US Treasury Bill Yield 3-Month + 0.000%), 5.60%, 9/30/27(c) | 6,684,091 | ||||||||||
| 60,151,500 | (US Treasury Bill Yield 3-Month + 0.000%), 5.60%, 2/15/28(c) | 60,151,500 | ||||||||||
| 34,638,461 | (US Treasury Bill Yield 3-Month + 0.000%), 5.60%, 6/20/28(c) | 34,638,461 | ||||||||||
| 7,875,000 | (US Treasury Bill Yield 3-Month + 0.000%), 5.60%, 11/15/28(c) | 7,875,000 | ||||||||||
| 22,333,334 | (US Treasury Bill Yield 3-Month + 0.070%), 5.60%, 8/15/29(c) | 22,333,334 | ||||||||||
| 9,900,000 | (US Treasury Bill Yield 3-Month + 0.000%), 5.60%, 8/15/29(c) | 9,900,000 | ||||||||||
| 40,950,000 | (US Treasury Bill Yield 3-Month + 0.000%), 5.60%, 3/15/30(c) | 40,950,000 | ||||||||||
| 10,472,222 | (US Treasury Bill Yield 3-Month + 0.000%), 5.60%, 10/15/30(c) | 10,472,222 | ||||||||||
| 2,989,359 | (US Treasury Bill Yield 3-Month + 0.000%), 5.60%, 12/15/33(c) | 2,989,359 | ||||||||||
| 20,973,600 | (US Treasury Bill Yield 3-Month + 0.000%), 5.60%, 1/20/35(c) | 20,973,600 | ||||||||||
| 16,691,490 | (US Treasury Bill Yield 3-Month + 0.000%), 5.60%, 1/20/35(c) | 16,691,490 | ||||||||||
| 16,254,540 | (US Treasury Bill Yield 3-Month + 0.000%), 5.60%, 1/20/35(c) | 16,254,540 | ||||||||||
| 15,730,200 | (US Treasury Bill Yield 3-Month + 0.000%), 5.60%, 1/20/35(c) | 15,730,200 | ||||||||||
| 12,234,600 | (US Treasury Bill Yield 3-Month + 0.000%), 5.60%, 1/20/35(c) | 12,234,580 | ||||||||||
| 7,340,760 | (US Treasury Bill Yield 3-Month + 0.000%), 5.60%, 1/20/35(c) | 7,340,760 | ||||||||||
| 6,903,810 | (US Treasury Bill Yield 3-Month + 0.000%), 5.60%, 1/20/35(c) | 6,903,810 | ||||||||||
| 4,369,500 | (US Treasury Bill Yield 3-Month + 0.000%), 5.60%, 1/20/35(c) | 4,369,500 | ||||||||||
| 1,398,240 | (US Treasury Bill Yield 3-Month + 0.000%), 5.60%, 1/20/35(c) | 1,398,240 | ||||||||||
| 22,090,000 | (US Treasury Bill Yield 3-Month + 0.000%), 5.60%, 4/20/35(c) | 22,090,000 | ||||||||||
| 18,378,880 | (US Treasury Bill Yield 3-Month + 0.000%), 5.60%, 4/20/35(c) | 18,378,880 | ||||||||||
| 18,202,160 | (US Treasury Bill Yield 3-Month + 0.000%), 5.60%, 4/20/35(c) | 18,202,160 | ||||||||||
| 13,695,800 | (US Treasury Bill Yield 3-Month + 0.000%), 5.60%, 4/20/35(c) | 13,695,800 | ||||||||||
| 13,430,720 | (US Treasury Bill Yield 3-Month + 0.000%), 5.60%, 4/20/35(c) | 13,430,720 | ||||||||||
| 7,687,320 | (US Treasury Bill Yield 3-Month + 0.000%), 5.60%, 4/20/35(c) | 7,687,320 | ||||||||||
| 7,245,520 | (US Treasury Bill Yield 3-Month + 0.000%), 5.60%, 4/20/35(c) | 7,245,520 | ||||||||||
| 6,450,280 | (US Treasury Bill Yield 3-Month + 0.000%), 5.60%, 4/20/35(c) | 6,450,280 | ||||||||||
| 4,418,000 | (US Treasury Bill Yield 3-Month + 0.000%), 5.60%, 4/20/35(c) | 4,418,000 | ||||||||||
| 5,413,760 | (US Treasury Bill Yield 3-Month + 0.000%), 5.60%, 3/30/37(c) | 5,413,760 | ||||||||||
8 |
SCHEDULE OF PORTFOLIO INVESTMENTS
|
RBC BlueBay U.S. Government Money Market Fund (cont.)
September 30, 2023
| Principal Amount | Value | |||||||||||
| $ 14,606,370 | (US Treasury Bill Yield 3-Month + 0.000%), 5.60%, 11/20/37(c) | $ | 14,606,370 | |||||||||
| 4,200,000 | 5.90%, 9/30/24(b) | 4,200,000 | ||||||||||
|
| |||||||||||
| 913,956,842 | ||||||||||||
|
| |||||||||||
| Total U.S. Government Agency Obligations | 913,956,842 | ||||||||||
|
| |||||||||||
(Cost $913,956,842) | ||||||||||||
U.S. Treasury Obligations — 2.09% | ||||||||||||
U.S. Cash Management Bill — 0.56% | ||||||||||||
| 25,000,000 | 5.18%, 10/19/23(a) | 24,936,641 | ||||||||||
| 25,000,000 | 5.26%, 11/16/23(a) | 24,836,141 | ||||||||||
| 25,000,000 | 5.43%, 11/9/23(a) | 24,856,472 | ||||||||||
|
| |||||||||||
| 74,629,254 | ||||||||||||
|
| |||||||||||
U.S. Treasury Floating Rate Notes — 1.53% | ||||||||||||
| 150,000,000 | (3 mo. U.S. Treasury Money Market Yield - 0.075%), 5.33%, 4/30/24(c) | 149,970,588 | ||||||||||
| 25,000,000 | (3 mo. U.S. Treasury Money Market Yield + 0.037%), 5.44%, 7/31/24(c) | 25,005,630 | ||||||||||
| 30,000,000 | (3 mo. U.S. Treasury Money Market Yield + 0.140%), 5.54%, 10/31/24(c) | 29,970,856 | ||||||||||
|
| |||||||||||
| 204,947,074 | ||||||||||||
|
| |||||||||||
| Total U.S. Treasury Obligations | 279,576,328 | ||||||||||
|
| |||||||||||
(Cost $279,576,328) | ||||||||||||
Variable Rate Demand Note — 0.10% | ||||||||||||
Municipal Bonds — 0.10% | ||||||||||||
New York — 0.10% | ||||||||||||
| 3,900,000 | New York City Housing Development Corp. 90 West Street Revenue, Series B, 5.33%, 3/15/36, (Credit Support: Fannie Mae), Callable 9/29/23 @ 100(d) | 3,900,000 | ||||||||||
| 2,800,000 | New York State Housing Finance Agency Series B, 5.36%, 5/15/33, (Credit Support: Fannie Mae), Callable 9/29/23 @ 100(d) | 2,800,000 | ||||||||||
| 6,100,000 | New York State Housing Finance Agency 316 11th Avenue Housing Revenue, Series B, 5.33%, 5/15/41, (Credit Support: Fannie Mae), Callable 9/29/23 @ 100(d) | 6,100,000 | ||||||||||
|
| |||||||||||
| 12,800,000 | ||||||||||||
|
| |||||||||||
| 12,800,000 | ||||||||||||
|
| |||||||||||
Total Variable Rate Demand Note | 12,800,000 | |||||||||||
|
| |||||||||||
(Cost $12,800,000) | ||||||||||||
| 9 |
SCHEDULE OF PORTFOLIO INVESTMENTS
|
RBC BlueBay U.S. Government Money Market Fund (cont.)
September 30, 2023
Principal Amount | Value | |||||||||||
Repurchase Agreements — 68.15% | ||||||||||||
| $ | 350,000,000 | Citigroup Global Markets, Inc., dated 9/30/23; due 10/2/23 at 5.30% with maturity value of $ 350,154,583 (fully collateralized by Fannie Mae and Ginnie Mae securities with maturity dates ranging from 2/1/53 to 9/1/53 at rates ranging from 4.00% to 7.00%, aggregate original par and fair value of $388,599,123 and $357,000,000, respectively) | $ | 350,000,000 | ||||||||
| 250,000,000 | Citigroup Global Markets, Inc., dated 9/30/23; due 10/2/23 at 5.30% with maturity value of $ 250,110,417 (fully collateralized by Federal Home Loan Bank , Fannie Mae , Freddie Mac , Federal Farm Credit Bank securities and U.S. Treasury securities with maturity dates ranging from 10/12/23 to 8/15/48 at rates ranging from 0.00% to 6.25%, aggregate original par and fair value of $262,392,727 and $255,000,000, respectively) | 250,000,000 | ||||||||||
| 200,000,000 | Citigroup Global Markets, Inc., dated 9/30/23; due 10/03/23 at 5.30% with maturity value of $200,206,111 (fully collateralized by U.S. Treasury securities with maturity dates ranging from 5/15/24 to 5/15/30 at rate of 0.00%, aggregate original par and fair value of $242,104,249 and $204,000,000, respectively) | 200,000,000 | ||||||||||
| ||||||||||||
Total Value of Citigroup Global Markets, Inc., (collateral value of $ 816,000,000) | 800,000,000 | |||||||||||
| ||||||||||||
| 150,000,000 | Credit Agricole Corporate and Investment Bank, dated 9/30/23; due 10/02/23 at 5.24% with maturity value of $150,065,500 (fully collateralized by Fannie Mae and U.S. Treasury securities with maturity dates ranging from 9/30/25 to 8/1/51 at rates ranging from 0.25% to 2.50%, aggregate original par and fair value of $203,713,920 and $153,000,016, respectively) | 150,000,000 | ||||||||||
| 95,000,000 | Credit Agricole Corporate and Investment Bank, dated 9/30/23; due 10/02/23 at 5.30% with maturity value of $95,041,958 (fully collateralized by U.S. Treasury securities with maturity dates ranging from 8/31/25 to 8/15/26 at rates ranging from 4.38% to 5.00%, aggregate original par and fair value of $96,966,100 and $96,900,068, respectively) | 95,000,000 | ||||||||||
| ||||||||||||
Total Value of Credit Agricole Corporate and Investment Bank, (collateral value of $ 249,900,084) | 245,000,000 | |||||||||||
| ||||||||||||
| 250,000,000 | Deutsche Bank Securities, dated 9/30/23; due 10/02/23 at 5.30% with maturity value of $250,110,417 (fully collateralized by U.S. Treasury securities with maturity dates ranging from 8/15/26 to 11/15/42 at rates ranging from 4.00% to 4.38%, aggregate original par and fair value of $258,086,600 and $255,000,045, respectively) | 250,000,000 | ||||||||||
| ||||||||||||
Total Value of Deutsche Bank Securities, (collateral value of $ 255,000,045) | 250,000,000 | |||||||||||
| ||||||||||||
10 |
SCHEDULE OF PORTFOLIO INVESTMENTS
|
RBC BlueBay U.S. Government Money Market Fund (cont.)
September 30, 2023
Principal Amount | Value | |||||||||||
| $ | 5,450,000,000 | Federal Reserve, dated 9/30/23; due 10/02/23 at 5.30% with maturity value of $5,452,407,083 (fully collateralized by U.S. Treasury securities with maturity dates ranging from 5/31/24 to 8/15/43 at rates ranging from 0.63% to 3.63% , aggregate original par and fair value of $6,924,790,400 and $5,452,407,097, respectively) | $5,450,000,000 | |||||||||
| ||||||||||||
Total Value of Federal Reserve, (collateral value of $ 5,452,407,097) | 5,450,000,000 | |||||||||||
| ||||||||||||
| 300,000,000 | Fixed Income Clearing Corporation, dated 9/30/23; due 10/02/23 at 5.30% with maturity value of $300,132,500 (fully collateralized by U.S. Treasury security with maturity date of 11/15/41 at a rate 2.00% , aggregate original par and fair value of $466,435,500 and $306,000,066, respectively) | 300,000,000 | ||||||||||
| ||||||||||||
Total Value of Fixed Income Clearing Corporation, (collateral value of $ 306,000,066) | 300,000,000 | |||||||||||
| ||||||||||||
| 200,000,000 | Goldman Sachs & Co., dated 9/30/23; due 10/03/23 at 5.30% with maturity value of $ 200,206,111.00 (fully collateralized by Freddie Mac , Fannie Mae , Ginnie Mae and U.S. Treasury securities with maturity dates ranging from 12/19/23 to 12/15/61 at rates ranging from 0.00% to 6.50%, aggregate original par and fair value of $360,453,230 and $204,000,001, respectively) | 200,000,000 | ||||||||||
| ||||||||||||
Total Value of Goldman Sachs & Co., (collateral value of $ 204,000,001) | 200,000,000 | |||||||||||
| ||||||||||||
| 100,000,000 | ING Financial Markets LLC, dated 9/30/23; due 10/02/23 at 5.30% with maturity value of $100,044,167 (fully collateralized by U.S. Treasury security with maturity date of 3/15/25 at a rate 1.75% , aggregate original par and fair value of $100,000,000 and $102,143,261, respectively) | 100,000,000 | ||||||||||
| ||||||||||||
Total Value of ING Financial Markets LLC, (collateral value of $ 102,143,261) | 100,000,000 | |||||||||||
| ||||||||||||
| 11 |
SCHEDULE OF PORTFOLIO INVESTMENTS
|
RBC BlueBay U.S. Government Money Market Fund (cont.)
September 30, 2023
Principal Amount | Value | |||||||||||
| $ | 500,000,000 | Merrill Lynch, Pierce, Fenner, Smith, dated 9/30/23; due 10/02/23 at 5.30% with maturity value of $500,220,833 (fully collateralized by Freddie Mac securities with maturity dates ranging from 9/1/35 to 10/1/53 at rates ranging from 1.50% to 6.50%, aggregate original par and fair value of $786,270,332 and $510,000,001, respectively) | $ | 500,000,000 | ||||||||
| 105,000,000 | Merrill Lynch, Pierce, Fenner, Smith, dated 9/30/23; due 10/02/23 at 5.29% with maturity value of $105,046,288 (fully collateralized by U.S. Treasury securities with maturity dates ranging from 4/15/28 to 7/15/28 at rates ranging from 0.75% to 1.25%, aggregate original par and fair value of $103,657,100 and $107,100,109, respectively) | 105,000,000 | ||||||||||
| ||||||||||||
Total Value of Merrill Lynch, Pierce, Fenner, Smith, (collateral value of $ 617,100,110) | 605,000,000 | |||||||||||
| ||||||||||||
| 300,000,000 | National Australia Bank, dated 9/30/23; due 10/02/23 at 5.30% with maturity value of $300,132,500 (fully collateralized by U.S. Treasury security with maturity date of 10/31/27 at a rate 0.50% , aggregate original par and fair value of $300,000,000 and $306,170,787, respectively) | 300,000,000 | ||||||||||
| ||||||||||||
Total Value of National Australia Bank, (collateral value of $ 306,170,787) | 300,000,000 | |||||||||||
| ||||||||||||
| 200,000,000 | TD Securities (USA), dated 9/30/23; due 10/03/2023 at 5.31% with maturity value of $200,206,500 (fully collateralized by Freddie Mac securities with maturity dates ranging from 2/1/52 to 5/1/53 at a rates ranging from 2.50% to 6.00%, aggregate original par and fair value of $244,209,249 and $204,000,000, respectively) | 200,000,000 | ||||||||||
| 200,000,000 | TD Securities (USA), dated 9/30/23; due 10/04/2023 at 5.31% with maturity value of $200,206,500 (fully collateralized by Freddie Mac securities with maturity dates ranging from 1/1/53 to 9/1/53 at rates ranging from 6.00% to 6.50%, aggregate original par and fair value of $208,869,714 and $204,000,000, respectively) | 200,000,000 | ||||||||||
| ||||||||||||
Total Value of TD Securities (USA), (collateral value of $ 408,000,000) | 400,000,000 | |||||||||||
| ||||||||||||
| 450,000,000 | Wells Fargo Securities LLC, dated 9/30/23; due 11/02/2023 at 5.36% with maturity value of $452,814,000 (fully collateralized by Freddie Mac securities with maturity dates ranging from 4/1/24 to 9/1/53 at rates ranging from 1.50% to 6.50%, aggregate original par and fair value of $625,649,252 and $459,000,000, respectively) | 450,000,000 | ||||||||||
| ||||||||||||
Total Value of Wells Fargo Securities LLC, (collateral value of $ 459,000,000) | 450,000,000 | |||||||||||
| ||||||||||||
12 |
SCHEDULE OF PORTFOLIO INVESTMENTS
|
RBC BlueBay U.S. Government Money Market Fund (cont.)
September 30, 2023
| Principal Amount | Value | |||||||
Total Repurchase Agreements | 9,100,000,000 | |||||||
|
| |||||||
(Cost $9,100,000,000) | ||||||||
Total Investments | $ | 13,119,653,364 | ||||||
(Cost $13,119,653,364)(e) — 98.26% | ||||||||
Other assets in excess of liabilities — 1.74% | 232,245,778 | |||||||
|
| |||||||
NET ASSETS — 100.00% | $ | 13,351,899,142 | ||||||
|
| |||||||
| (a) | Represents effective yield to maturity on date of purchase. |
| (b) | Zero Coupon Bond. The rate represents the yield at time of purchase. |
| (c) | Floating rate note. Rate shown is as of report date. |
| (d) | Variable or floating rate security, which interest rate adjusts periodically based on changes in current interest rates and prepayments on the underlying pool of assets. Rate shown is the rate in effect as of period end. |
| (e) | Tax cost of securities is equal to book cost of securities. |
Abbreviations used are defined below:
SOFR - Secured Overnight Financing Rate
See Notes to the Financial Statements.
| 13 |
|
Statement of Assets and Liabilities
| September 30, 2023 | ||||
RBC BlueBay U.S. Government | ||||
Assets: | ||||||
Investments, at value (cost $4,019,653,364) | $ 4,019,653,364 | |||||
Repurchase agreements, at value (cost $9,100,000,000) | 9,100,000,000 | |||||
Cash | 247,830,104 | |||||
Interest and dividend receivable | 27,513,611 | |||||
Receivable from advisor | 1,390,496 | |||||
Receivable for capital shares issued | 2,653,000 | |||||
Prepaid expenses and other assets | 54,257 | |||||
|
| |||||
Total Assets | 13,399,094,832 | |||||
|
| |||||
Liabilities: | ||||||
Professional fees payable | 4,929 | |||||
Distributions payable | 14,781,806 | |||||
Payable for investments purchased | 28,200,000 | |||||
Accrued expenses and other payables: | ||||||
Investment advisory fees | 2,287,608 | |||||
Accounting fees | 170,340 | |||||
Audit fees | 55,495 | |||||
Trustees’ fees | 19,316 | |||||
Distribution fees | 1,382,248 | |||||
Custodian fees | 35,478 | |||||
Shareholder reports | 134,693 | |||||
Transfer agent fees | 2,094 | |||||
Other | 121,683 | |||||
|
| |||||
Total Liabilities | 47,195,690 | |||||
|
| |||||
Net Assets | $13,351,899,142 | |||||
|
| |||||
Net Assets Consists of: | ||||||
Capital | $13,351,477,810 | |||||
Accumulated earnings | 421,332 | |||||
|
| |||||
Net Assets | $13,351,899,142 | |||||
|
|
14 |
FINANCIAL STATEMENTS
|
Statement of Assets and Liabilities (cont.)
| September 30, 2023 | ||||||
RBC BlueBay U.S. Government Money Market Fund | ||||||
Net Assets | ||||||
Class A | $ | 408,069 | ||||
RBC Institutional Class 1 | 8,243,529,427 | |||||
RBC Institutional Class 2 | 3,705,386,657 | |||||
RBC Investor Class | 1,402,574,989 | |||||
|
| |||||
Total | $ | 13,351,899,142 | ||||
|
| |||||
Shares Outstanding (Unlimited number of shares authorized, no par value): | ||||||
Class A | 408,066 | |||||
RBC Institutional Class 1 | 8,243,289,570 | |||||
RBC Institutional Class 2 | 3,705,211,428 | |||||
RBC Investor Class | 1,402,603,664 | |||||
|
| |||||
Total | 13,351,512,728 | |||||
|
| |||||
Net Asset Values and Redemption Prices Per Share: | ||||||
Class A | $ | 1.00 | ||||
|
| |||||
RBC Institutional Class 1 | $ | 1.00 | ||||
|
| |||||
RBC Institutional Class 2 | $ | 1.00 | ||||
|
| |||||
RBC Investor Class | $ | 1.00 | ||||
|
| |||||
See Notes to the Financial Statements.
| 15 |
FINANCIAL STATEMENTS
|
| For the Year Ended September 30, 2023 | ||||
RBC BlueBay U.S. Government | ||||
Investment Income: | ||||
Interest income | $576,019,035 | |||
| ||||
Expenses: | ||||
Investment advisory fees | 12,167,591 | |||
Distribution fees–Class A | 41 | |||
Distribution fees–RBC Institutional Class 2 | 4,916,870 | |||
Distribution fees–RBC Investor Class | 18,958,000 | |||
Accounting fees | 723,731 | |||
Audit fees | 86,804 | |||
Custodian fees | 166,413 | |||
Insurance fees | 44,551 | |||
Legal fees | 805,309 | |||
Registrations and filing fees | 117,356 | |||
Shareholder reports | 931,821 | |||
Transfer agent fees–Class A | 2,148 | |||
Transfer agent fees–RBC Institutional Class 1 | 76,620 | |||
Transfer agent fees–RBC Institutional Class 2 | 10,045 | |||
Transfer agent fees–RBC Investor Class | 5,934 | |||
Trustees’ fees and expenses | 633,292 | |||
Shareholder services administration fees–RBC Institutional Class 1 | 2,269,835 | |||
Tax expense | 5,455 | |||
Other fees | 532,293 | |||
| ||||
Total expenses before fee waiver/reimbursement | 42,454,109 | |||
Expenses waived/reimbursed by: | ||||
Distributor - Class Specific | (2,613,925) | |||
Shareholder Services Administrator - RBC Institutional Class 1 | (2,269,750) | |||
Advisor | (2,111) | |||
| ||||
Net expenses | 37,568,323 | |||
| ||||
Net Investment Income | 538,450,712 | |||
| ||||
Realized/Unrealized Gains/(Losses): | ||||
Net realized gains from investment transactions | 661,146 | |||
| ||||
Change in net assets resulting from operations | $539,111,858 | |||
| ||||
See Notes to the Financial Statements.
16 |
FINANCIAL STATEMENTS
|
Statements of Changes in Net Assets
| RBC BlueBay U.S. Government Money Market Fund | ||||||||
| For the Year Ended September 30, 2023 | For the Year Ended September 30, 2022 | |||||||
From Investment Activities | ||||||||
Operations: | ||||||||
Net investment income | $ | 538,450,712 | $ | 48,994,711 | ||||
Net realized gains from investments | 661,146 | 113,246 | ||||||
|
|
|
| |||||
Change in net assets resulting from operations | 539,111,858 | 49,107,957 | ||||||
|
|
|
| |||||
Distributions to Shareholders: | ||||||||
Class A | (2,008 | ) | — | |||||
RBC Institutional Class 1 | (331,811,480 | ) | (23,625,621 | ) | ||||
RBC Institutional Class 2 | (142,876,259 | ) | (16,098,055 | ) | ||||
RBC Investor Class | (64,150,146 | ) | (9,278,908 | ) | ||||
|
|
|
| |||||
Change in net assets resulting from shareholder distributions | (538,839,893 | ) | (49,002,584 | ) | ||||
|
|
|
| |||||
Capital Transactions: | ||||||||
Proceeds from shares issued | 93,936,872,717 | 60,873,552,818 | ||||||
Distributions reinvested | 378,977,087 | 38,732,508 | ||||||
Cost of shares redeemed | (89,667,340,055 | ) | (72,563,871,364 | ) | ||||
|
|
|
| |||||
Change in net assets resulting from capital transactions | 4,648,509,749 | (11,651,586,038 | ) | |||||
|
|
|
| |||||
Net increase/(decrease) in net assets | 4,648,781,714 | (11,651,480,665 | ) | |||||
Net Assets: | ||||||||
Beginning of year | 8,703,117,428 | 20,354,598,093 | ||||||
|
|
|
| |||||
End of year | $ | 13,351,899,142 | $ | 8,703,117,428 | ||||
|
|
|
| |||||
Share Transactions: | ||||||||
Issued | 93,936,872,717 | 60,873,552,818 | ||||||
Reinvested | 378,977,087 | 38,732,508 | ||||||
Redeemed | (89,667,340,055 | ) | (72,563,871,364 | ) | ||||
|
|
|
| |||||
Change in shares resulting from capital transactions | 4,648,509,749 | (11,651,586,038 | ) | |||||
|
|
|
| |||||
See Notes to the Financial Statements.
| 17 |
|
RBC BlueBay U.S. Government Money Market Fund
(Selected data for a share outstanding throughout the periods indicated)
| Investment Activities | Distributions | |||||||||||||||||||||||||||
| Net Asset Value, Beginning of Year | Net Investment Income(a) | Net Realized and Unrealized Gains (Losses) on Investments | Total from Investment Activities | Net Investment Income | Total Distributions | Net Asset Value, End of Year | ||||||||||||||||||||||
Class A | ||||||||||||||||||||||||||||
Period Ended 9/30/23(b) | $ 1.00 | 0.02 | —(c) | 0.02 | (0.02) | (0.02) | $1.00 | |||||||||||||||||||||
RBC Institutional Class 1 | ||||||||||||||||||||||||||||
Year Ended 9/30/23 | $1.00 | 0.05 | (0.01) | 0.04 | (0.04) | (0.04) | $1.00 | |||||||||||||||||||||
Year Ended 9/30/22 | 1.00 | —(c) | 0.01 | 0.01 | (0.01) | (0.01) | 1.00 | |||||||||||||||||||||
Year Ended 9/30/21 | 1.00 | —(c) | —(c) | —(c) | —(c) | —(c) | 1.00 | |||||||||||||||||||||
Year Ended 9/30/20 | 1.00 | 0.01 | —(c) | 0.01 | (0.01) | (0.01) | 1.00 | |||||||||||||||||||||
Year Ended 9/30/19 | 1.00 | 0.02 | —(c) | 0.02 | (0.02) | (0.02) | 1.00 | |||||||||||||||||||||
RBC Institutional Class 2 | ||||||||||||||||||||||||||||
Year Ended 9/30/23 | $1.00 | 0.04 | —(c) | 0.04 | (0.04) | (0.04) | $1.00 | |||||||||||||||||||||
Year Ended 9/30/22 | 1.00 | —(c) | 0.01 | 0.01 | (0.01) | (0.01) | 1.00 | |||||||||||||||||||||
Year Ended 9/30/21 | 1.00 | —(c) | —(c) | —(c) | —(c) | —(c) | 1.00 | |||||||||||||||||||||
Year Ended 9/30/20 | 1.00 | 0.01 | —(c) | 0.01 | (0.01) | (0.01) | 1.00 | |||||||||||||||||||||
Year Ended 9/30/19 | 1.00 | 0.02 | —(c) | 0.02 | (0.02) | (0.02) | 1.00 | |||||||||||||||||||||
RBC Investor Class | ||||||||||||||||||||||||||||
Year Ended 9/30/23 | $1.00 | 0.03 | 0.01 | 0.04 | (0.04) | (0.04) | $1.00 | |||||||||||||||||||||
Year Ended 9/30/22 | 1.00 | —(c) | — | — | —(c) | —(c) | 1.00 | |||||||||||||||||||||
Year Ended 9/30/21 | 1.00 | —(c) | —(c) | —(c) | —(c) | —(c) | 1.00 | |||||||||||||||||||||
Year Ended 9/30/20 | 1.00 | —(c) | —(c) | —(c) | —(c) | —(c) | 1.00 | |||||||||||||||||||||
Year Ended 9/30/19 | 1.00 | 0.01 | —(c) | 0.01 | (0.01) | (0.01) | 1.00 | |||||||||||||||||||||
| (a) | Per share net investment income (loss) has been calculated using the average daily shares method. |
| (b) | For the period from June 8, 2023, (commencement of operations) to September 30, 2023. |
| (c) | Less than $0.01 or $(0.01) per share. |
18 |
FINANCIAL HIGHLIGHTS
|
RBC BlueBay U.S. Government Money Market Fund
(Selected data for a share outstanding throughout the periods indicated)
| Ratios/Supplemental Data | ||||||||||||||||||||
| Total Return | Net Assets, End of Year (millions) | Ratio of Net Expenses to Average Net Assets | Ratio of Net Investment Income (Loss) to Average Net Assets | Ratio of Expenses to Average Net Assets* | ||||||||||||||||
Class A | ||||||||||||||||||||
Period Ended 9/30/23(a) | 1.58%(b) | $ | — | 0.25%(c)(d) | 4.94%(c) | 5.53%(c) | ||||||||||||||
RBC Institutional Class 1 | ||||||||||||||||||||
Year Ended 9/30/23 | 4.54% | $ | 8,244 | 0.13%(e) | 4.74% | 0.17% | ||||||||||||||
Year Ended 9/30/22 | 0.60% | 2,724 | 0.07%(e) | 0.29% | 0.17% | |||||||||||||||
Year Ended 9/30/21 | 0.02% | 11,201 | 0.09%(e) | 0.02% | 0.17% | |||||||||||||||
Year Ended 9/30/20 | 0.83% | 10,821 | 0.16%(e) | 0.43% | 0.17% | |||||||||||||||
Year Ended 9/30/19 | 2.19% | 1,916 | 0.19% | 2.17% | 0.19% | |||||||||||||||
RBC Institutional Class 2 | ||||||||||||||||||||
Year Ended 9/30/23 | 4.39% | $ | 3,705 | 0.28% | 4.36% | 0.28% | ||||||||||||||
Year Ended 9/30/22 | 0.52% | 2,967 | 0.15%(f) | 0.43% | 0.27% | |||||||||||||||
Year Ended 9/30/21 | 0.02% | 3,935 | 0.09%(f) | 0.02% | 0.27% | |||||||||||||||
Year Ended 9/30/20 | 0.71% | 3,358 | 0.26%(f) | 0.62% | 0.27% | |||||||||||||||
Year Ended 9/30/19 | 2.09% | 2,510 | 0.29% | 2.08% | 0.29% | |||||||||||||||
RBC Investor Class | ||||||||||||||||||||
Year Ended 9/30/23 | 3.64% | $ | 1,403 | 1.00% | 3.38% | 1.13% | ||||||||||||||
Year Ended 9/30/22 | 0.25% | 3,012 | 0.36%(g) | 0.18% | 1.12% | |||||||||||||||
Year Ended 9/30/21 | 0.02% | 5,218 | 0.08%(g) | 0.02% | 1.12% | |||||||||||||||
Year Ended 9/30/20 | 0.34% | 2,394 | 0.54%(g) | 0.25% | 1.12% | |||||||||||||||
Year Ended 9/30/19 | 1.37% | 1,040 | 1.00% | 1.36% | 1.14% | |||||||||||||||
| * | During the period, certain fees were contractually or voluntarily reduced and/or reimbursed. If such contractual/voluntary fee reductions and reimbursements had not occurred, the ratio would have been as indicated. |
| (a) | For the period from June 8, 2023, (commencement of operations) to September 30, 2023. |
| (b) | Not annualized. |
| (c) | Annualized. |
| (d) | During the period ended September 30, 2023, the Advisor and/or Distributor voluntarily waived a portion of its fees. The Fund’s net expense ratio would increase by an amount of 5.19%, if such voluntary waivers were excluded for the period ended September 30, 2023. See Note 3 – Agreements and Other Transactions with Affiliates and Note 4 – Fund Distribution for more information. |
| 19 |
FINANCIAL HIGHLIGHTS
|
RBC BlueBay U.S. Government Money Market Fund
(Selected data for a share outstanding throughout the periods indicated)
| (e) | During the periods ended September 30, 2023, September 30, 2022, September 30, 2021 and September 30, 2020, the Advisor voluntarily waived a portion of its fees. The Fund’s net expense ratio would increase by an amount of 0.03%, 0.09%, 0.08% and 0.01%, respectively, if such voluntary waivers were excluded for the periods ended September 30, 2023, September 30, 2022, September 30, 2021 and September 30, 2020. See Note 3 – Agreements and Other Transactions with Affiliates and Note 4 – Fund Distribution for more information. |
| (f) | During the periods ended September 30, 2022, September 30, 2021 and September 30, 2020, the Advisor and/or Distributor voluntarily waived a portion of its fees. The Fund’s net expense ratio would increase by an amount of 0.11%, 0.18% and 0.01%, respectively, if such voluntary waivers were excluded for the periods ended September 30, 2022, September 30, 2021 and September 30, 2020. See Note 3 –Agreements and Other Transactions with Affiliates and Note 4 – Fund Distribution for more information. |
| (g) | During the periods ended September 30, 2022, September 30, 2021 and September 30, 2020, the Advisor and/or Distributor voluntarily waived a portion of its fees. The Fund’s net expense ratio would increase by an amount of 0.65%, 0.92% and 0.46%, respectively, if such voluntary waivers were excluded for the periods ended September 30, 2022, September 30, 2021 and September 30, 2020. See Note 3 – Agreements and Other Transactions with Affiliates and Note 4 – Fund Distribution for more information. |
See Notes to the Financial Statements.
20 |
|
September 30, 2023
1. Organization:
RBC Funds Trust (the “Trust”) is registered under the Investment Company Act of 1940 (as amended) as an open-end management investment company. The Trust was organized as a Delaware statutory trust on December 16, 2003 and currently consists of 24 portfolios. Overall responsibility for the management of the Trust is vested in its Board of Trustees (the “Board”).Predecessor funds to the Trust were reorganized as portfolios of the Trust effective April 16, 2004. This report includes the RBC BlueBay U.S. Government Money Market Fund (“Fund”).
The Fund offers four share classes: Class A, RBC Institutional Class 1, RBC Institutional Class 2 and RBC Investor Class. Prior to November 9, 2017, the Fund also offered shares in RBC Select Class and RBC Reserve Class.
RBC Global Asset Management (U.S.) Inc. (“RBC GAM-US” or “Advisor” or “Co-Administrator”) acts as the investment advisor for the Fund. The officers of the Trust (“Fund Management”) are also employees of RBC GAM-US.
2. Significant Accounting Policies
The Fund is an investment company that follows accounting and reporting guidance under the Financial Accounting Standards Board. Summarized below are the significant accounting policies of the Funds. These policies conform to accounting principles generally accepted in the United States of America (“U.S. GAAP”). Fund Management follows these policies when preparing financial statements. Fund Management may also be required to make estimates and assumptions that affect the reported amounts of assets and liabilities at the date of the financial statements and the reported amounts of income and expenses for the period. Actual results could differ from those estimates. The financial statements are as of the close of regular trading on the New York Stock Exchange (“NYSE”).
Security Valuation:
The Fund has elected to use the amortized cost method to value its securities (other than other investment companies) pursuant to Rule 2a-7 of the Investment Company Act of 1940, as amended, which the Board believes approximates fair market value. The amortized cost method involves valuing a security initially at its cost, and, thereafter, a constant proportionate accretion of discounts and amortization of premiums are recorded until the maturity of the security. Amortized cost approximates the current fair value of a security, but since the value is not obtained from a quoted price in an active market, securities valued at amortized cost are categorized as Level 2 in the fair value hierarchy (see “Fair Value Measurements” below for additional information). If amortized cost no longer approximates fair value due to credit or other impairments of an issuer, the Fund will determine the fair value of its securities by using pricing and valuation procedures approved by the Board. Investments in open-end investment companies (mutual funds) are valued at net asset value and are categorized as Level 1 in the fair value hierarchy.
The Board has designated the Advisor with the responsibility for implementing the pricing and valuation procedures, including responsibility for determining the fair value of the Fund’s securities or other assets and liabilities, and has established a Pricing Committee to assist in carrying out supervisory functions related to such responsibilities. The Pricing Committee includes representatives of the Fund’s Advisor, and Co-Administrator, including personnel from accounting and operations, trading, risk management and compliance. The Pricing Committee meets at least quarterly to review and approve Fund valuation matters, including a review of the Fund’s pricing activity and operations, fair value measurements, pricing vendors, policies and procedures, and related controls. At least a quorum of the Pricing Committee shall meet more frequently, as needed, to consider and approve time-sensitive fair valuation matters. The Pricing Committee provides periodic reports to the Valuation, Portfolio Management and Performance Committee (“Valuation Committee”) of the Board regarding pricing and valuation matters. Members of the Pricing Committee meet with the Valuation Committee and the Board at each of their regularly scheduled meetings to discuss valuation matters and actions taken during the period.
| 21 |
NOTES TO FINANCIAL STATEMENTS
|
In accordance with Rule 2a-7, the fair values of the securities held in the Fund are determined at least once per week using evaluated prices supplied by third-party pricing vendors approved by the Board. The pricing services utilize both dealer-supplied valuations and electronic data processing techniques that take into account appropriate factors such as institutional-sized trading in similar groups of securities, yield, quality, coupon rate, maturity and type of issue. These security values are then compared to the securities’ amortized cost. If a security price is not available from a pricing service or broker-dealer, or the Advisor determines that a price provided by a pricing service or broker-dealer does not approximate fair value for purposes of this comparison, the security’s fair value will be determined in good faith by the Pricing Committee in accordance with procedures and methodologies approved by the Board. General factors used in determining the fair value of securities include, but are not limited to, fundamental analytical data relating to the security, the issuer and the market, such as duration, prepayment and default rates; general level of interest rates and changes in interest rates; information from broker-dealers; trading in similar securities; any restrictions on disposition of the security; and an evaluation of the forces that influence the market in which the investments are traded.
Fair Value Measurements:
The Funds disclose the fair value of their investments in a hierarchy that categorizes investments based on the inputs to valuation techniques used to measure fair value. The three levels of the fair value hierarchy are as follows:
• Level 1 - Inputs that reflect unadjusted quoted prices in active markets for identical assets or liabilities that the Funds have the ability to access at the measurement date.
• Level 2 - Significant inputs other than quoted prices that are observable for the asset or liability either directly or indirectly, including inputs in markets that are not considered to be active. Observable inputs may include quoted prices for similar securities, interest rates, spreads, prepayment spreads, etc.
• Level 3 - Significant unobservable inputs based on the best information available in the circumstances, to the extent observable inputs are not available (including the Fund’s own assumptions in determining the fair value of investments).
The inputs or methodology used for valuing investments are not necessarily an indication of the risk associated with investing in those securities.
Inputs used in determining fair value of an investment may include, but are not limited to, price information, volatility statistics, credit and market data, and other factors, all of which may be either observable or unobservable. Inputs can vary among investments and will be impacted by the investment type and volume of activity for the particular security or similar securities in the market. Investments in the Level 2 category are generally supported by transactions and quoted prices from dealers participating in the market for those investments. Investments may be included in the Level 3 category due to a lack of market activity or transparency. Internal valuation models may also be used as a pricing source for Level 3 investments. Internal valuation models may rely on one or more unobservable inputs, such as estimated cash flows, financial statement analysis and discount rates.
The summary of inputs used to determine the fair value of the Fund’s investments as of September 30, 2023 is as follows:
| Level 2 | Level 3 | |||||||||||||||
| Significant | Significant | |||||||||||||||
| Level 1 | Observable | Unobservable | ||||||||||||||
| Funds | Quoted Prices | Inputs | Inputs | Total | ||||||||||||
Assets: | ||||||||||||||||
Investments in Securities | ||||||||||||||||
RBC BlueBay | ||||||||||||||||
U.S. Government Money Market Fund | $ | — | 13,119,653,364 | $ | — | 13,119,653,364 | ||||||||||
Repurchase Agreements:
The Fund may enter into repurchase agreements with counterparties whom the Advisor has deemed creditworthy, including primary dealers that report to the Federal Reserve Bank of New York or other large U.S. commercial banks or broker-dealers. These repurchase agreements are subject to the seller’s
22 |
NOTES TO FINANCIAL STATEMENTS
|
agreement to repurchase such securities at a mutually agreed upon date and price. The repurchase price generally equals the price paid by the Fund plus interest negotiated on the basis of current short-term rates.
Securities pledged by the dealers as collateral for repurchase agreements are held by a custodian bank until maturity of the repurchase agreement. The Fund has procedures to monitor additional collateral, if needed, to ensure that the daily market value of the collateral remains in excess of the market value of the repurchase agreement in the event of a default.
Master Repurchase Agreements (“MRA”) permit the Fund, under certain circumstances, including an event of default (such as bankruptcy or insolvency), to offset payables and/or receivables under the MRA with collateral held and/or posted to the counterparty and create one single net payment due to or from the Fund. However, bankruptcy or insolvency laws of a particular jurisdiction may impose restrictions on or prohibitions against such a right of offset in the event of a MRA counterparty’s bankruptcy or insolvency. Pursuant to the terms of the MRA, the Fund receives securities as collateral with a market value in excess of the repurchase price to be received by the Fund upon the maturity of the repurchase transaction. Upon a bankruptcy or insolvency of the MRA counterparty, the Fund recognizes a liability with respect to such excess collateral to reflect the Fund’s obligation under bankruptcy law to return the excess to the counterparty. Details of the counterparties and collateral for repurchase agreements are shown on the Schedule of Portfolio Investments.
Credit Enhancement:
Certain obligations held by the Fund have credit enhancement or liquidity features that may, under certain circumstances, provide for repayment of principal and interest on the obligation upon demand date, interest rate reset date or final maturity. These enhancements may include: letters of credit; liquidity guarantees; security purchase agreements; tender option purchase agreements and third party insurance.
Investment Transactions and Income:
Investment transactions are accounted for on the date the security is bought or sold (“trade date”). Dividend income is recorded on the ex-dividend date. Realized gains and losses from investment transactions are calculated based on the cost of the specific security (also known as identified cost basis). Interest income is recognized on the accrual basis and includes, where applicable, the amortization or accretion of premium or discount.
Expense, Investment Income and Gain/Loss Allocation:
The Fund pays the expenses that are directly related to its operations, such as custodian fees or advisory fees. Expenses incurred by the Trust, such as trustee or legal fees, are allocated among each of the Funds in the Trust either proportionately based upon the Fund’s relative net assets or using another reasonable basis such as equally across all Funds in the Trust, depending on the nature of the expense. Individual share classes within the Fund are charged expenses specific to that class, such as distribution fees and transfer agent fees. Within the Fund, expenses other than class specific expenses are allocated daily to each class based upon the proportion of relative net assets. Investment income and realized and unrealized gains or losses are allocated to each class of shares based on relative net assets.
Distributions to Shareholders:
The Fund pays out any income that it receives, less expenses, in the form of dividends and capital gain distributions to its shareholders. Income dividends are declared daily and paid monthly. Dividends will also be paid at any time during the month upon total redemption of shares in an account. Capital gains, if any, are declared and paid at least annually. Distributions to shareholders are recorded on the ex-dividend date. The amount of dividends and distributions are calculated based on federal income tax regulations, which may differ from US GAAP. These “book/tax” differences may be either temporary or permanent in nature. To the extent these differences are determined, as of the end of the tax year, to be permanent (e.g. paydowns), they are reclassified within the Fund’s capital accounts based on their federal tax basis treatment.
When-Issued Transactions:
The Fund may engage in when-issued transactions. The Fund records when-issued securities on the trade date and maintains sufficient liquidity so that cash will be available to make payment for the
| 23 |
NOTES TO FINANCIAL STATEMENTS
|
securities purchased. Securities purchased on a when-issued basis are valued daily beginning on trade date and begin earning interest on the settlement date. As of September 30, 2023, the Fund held no when-issued securities.
Indemnifications:
Under the Trust’s organizational documents, each Trustee, officer, employee or other agent of the Trust is indemnified against certain liabilities that may arise out of the performance of their duties to the Fund. Additionally in the normal course of business, the Fund enters into contracts, including the Fund’s servicing agreements, that contain a variety of indemnification clauses. The Fund’s maximum exposure under these arrangements is unknown as this would involve future claims that may be made against the Fund that have not yet occurred. The Fund has not had prior claims or losses pursuant to these contracts.
3. Agreements and Other Transactions with Affiliates:
The Trust has entered into an investment advisory agreement with RBC GAM-US under which RBC GAM-US manages the Fund’s assets and furnishes related office facilities, equipment, research and personnel. The agreement requires the Fund to pay RBC GAM-US a monthly fee based upon average daily net assets. Under the terms of the agreement, RBC GAM-US is entitled to receive fees based on a percentage of the average daily net assets of the Fund as follows:
| Annual Rate | ||||
RBC BlueBay U.S. Government Money Market Fund | 0.10% | |||
RBC Institutional Class 1 of the Fund pays an annual shareholder services administration fee of up to 0.05% of the average daily net assets attributable to RBC Institutional Class 1 shares that is used to reimburse or compensate a servicing agent (or pay the Advisor, which the Advisor will use to reimburse or compensate a servicing agent) for its efforts and expenses incurred in connection with servicing shareholder accounts. This shareholder services administration fee is not paid pursuant to Rule 12b-1.
RBC GAM-US has contractually agreed to waive fees and/or reimburse expenses under an expense limitation agreement in order to maintain the net annual Fund operating expenses (excluding certain fees such as interest, taxes and acquired fund fees and expenses) at 0.20% for RBC Institutional Class 1 until January 31, 2025. During the year ended September 30, 2023, there were no fees waived under this agreement.
RBC GAM-US serves as co-administrator to the Fund. BNY Mellon serves as co-administrator and fund accounting agent. Services provided under the administrative services agreement include providing day-to-day administration of matters related to the Fund, maintenance of the records and the preparation of reports. Under the terms of the administrative services agreement, RBC GAM-US does not receive an administration services fee. BNY Mellon receives a fee for its services payable by the Fund based in part on the Fund’s average net assets. BNY Mellon’s fee is included with “Accounting fees” in the Statement of Operations.
Certain Officers and Trustees of the Trust are affiliated with the Advisor. Such Officers and Trustees receive no compensation from the Fund for serving in their respective roles.
The Trust currently pays each of the independent Trustees (Trustees of the Trust who are not directors, officers or employees of the Advisor, either Co-Administrator or Distributor) an annual retainer of $84,000. The Board Chairperson and Audit Committee Chairperson each receive an additional retainer of $2,500 annually, and all other Trustees serving as Chair of a Board committee each receive an additional retainer of $1,000 annually. In addition, independent Trustees receive a quarterly meeting fee of $6,500 for each in-person Board meeting attended, a meeting fee of $1,500 for each telephonic or special board meeting attended, a $1,500 fee for each Board committee meeting attended, and are reimbursed for all out-of-pocket expenses relating to attendance at such meetings. These amounts are included in the Statement of Operations in “Trustees’ fees”.
24 |
NOTES TO FINANCIAL STATEMENTS
|
The Advisor has invested in and, as of September 30, 2023, owns 22,272,607 shares of the Fund, representing 0.2% of total Fund net assets.
4. Fund Distribution:
The Fund has adopted a Shareholder Account and Distribution Services (12b-1) Plan (the “Plan”) with respect to Class A, RBC Institutional Class 2 and RBC Investor Class, in which Quasar Distributors LLC (the “Distributor”) acts as the Fund’s distributor. The Plan permits the Fund to make payments for or to reimburse the Distributor or others, including RBC Capital Markets, LLC, monthly for distribution-related costs and expenses of marketing shares of each share class covered under the Plan, and/or for providing shareholder services. The following chart shows the current Plan fee rate for each class:
| Class A | RBC Institutional Class 2 | RBC Investor Class | ||||||||||
12b-1 Plan Fee | 0.10% | 0.15% | 1.00% | |||||||||
Plan fees are based on average daily net assets of the applicable class. Up to 0.25% of each Plan fee may be designated as a service fee, as defined by the applicable rules of the Financial Industry Regulatory Authority.
Pursuant to a shareholder account and distribution services agreement between the Distributor and RBC Capital Markets, LLC, the Distributor has agreed to compensate RBC Capital Markets, LLC for certain shareholder account servicing support provided to the Fund. RBC Capital Markets, LLC has agreed to waive fees and/or reimburse expenses in order to maintain the net annual Fund operating expenses for each class listed below to the following amounts:
Share Class | Operating Expense Limit | |||
Class A | 0.25% | |||
RBC Institutional Class 2 | 0.30% | |||
RBC Investor Class | 1.00% | |||
This expense limitation agreement is in place until January 31, 2025. The Fund will carry forward, for a period not to exceed 12 months from the date on which a waiver or reimbursement is made by RBC Capital Markets, LLC, any expenses in excess of the expense limitation and repay RBC Capital Markets, LLC such amounts, provided the Fund is able to effect such repayment and remain in compliance with the expense limitation. At September 30, 2023, the amount subject to possible recoupment under the expense limitation agreement is $2,613,925.
RBC Capital Markets, LLC and/or the Advisor may voluntarily waive and/or reimburse additional Fund operating expenses at any time, such as to maintain a minimum yield in the fund. Any such voluntary program may be modified or discontinued at any time without notice.
For the year ended September 30, 2023, the following distribution fees were waived either contractually or voluntarily:
Share Class | Distribution Fees Waived | |||
Class A | $ 36 | |||
RBC Institutional Class 2 | 74,040 | |||
RBC Investor Class | 2,539,849 | |||
During the year ended September 30, 2023, shareholder servicing fees were voluntarily waived for RBC Institutional Class 1 in the amount of $2,269,750. In addition, the Advisor voluntarily waived fees or reimbursed expenses for Class A in the amount of $2,111 during the year.
| 25 |
NOTES TO FINANCIAL STATEMENTS
|
5. Capital Share Transactions
The number of shares sold, reinvested and redeemed correspond to the net proceeds from sale of shares, reinvestments of dividends and cost of shares redeemed, respectively, since shares are issued, reinvested and redeemed at $1.00 per share.
Transactions for the period were as follows:
| RBC BlueBay U.S. Government Money Market Fund | ||||||||
| For the | For the | |||||||
| Year Ended | Year Ended | |||||||
| September 30, 2023 | September 30, 2022 | |||||||
CAPITAL TRANSACTIONS: | ||||||||
Class A | ||||||||
Proceeds from shares issued | $ | 406,000 | $ | — | ||||
Distributions reinvested | 2,067 | — | ||||||
|
|
|
| |||||
Change in Class A | $ | 408,067 | $ | — | ||||
|
|
|
| |||||
RBC Institutional Class 1 | ||||||||
Proceeds from shares issued | $ | 83,136,112,876 | $ | 47,378,176,192 | ||||
Distributions reinvested | 172,202,136 | 12,673,306 | ||||||
Cost of shares redeemed | (77,789,184,784 | ) | (55,867,762,410 | ) | ||||
|
|
|
| |||||
Change in RBC Institutional Class 1 | $ | 5,519,130,228 | $ | (8,476,912,912 | ) | |||
|
|
|
| |||||
RBC Institutional Class 2 | ||||||||
Proceeds from shares issued | $ | 7,486,727,325 | $ | 7,552,972,925 | ||||
Distributions reinvested | 142,748,302 | 16,496,567 | ||||||
Cost of shares redeemed | (6,890,856,888 | ) | (8,538,063,178 | ) | ||||
|
|
|
| |||||
Change in RBC Institutional Class 2 | $ | 738,618,739 | $ | (968,593,686 | ) | |||
|
|
|
| |||||
RBC Investor Class | ||||||||
Proceeds from shares issued | $ | 3,313,626,516 | $ | 5,942,403,701 | ||||
Distributions reinvested | 64,024,582 | 9,562,635 | ||||||
Cost of shares redeemed | (4,987,298,383 | ) | (8,158,045,776 | ) | ||||
|
|
|
| |||||
Change in RBC Investor Class | $ | (1,609,647,285 | ) | $ | (2,206,079,440 | ) | ||
|
|
|
| |||||
Change in net assets resulting from capital transactions | $ | 4,648,509,749 | $ | (11,651,586,038 | ) | |||
|
|
|
| |||||
6. Federal Income Taxes:
It is the policy of the Fund to continue to qualify as a regulated investment company by complying with the provisions available to certain investment companies, as defined under Subchapter M of the Internal Revenue Code, and to distribute substantially all of its net investment income and net realized capital gains. Therefore, no federal tax liability is recorded in the financial statements of the Fund.
For all open tax years and all major taxing jurisdictions, management of the Funds has concluded that there are no significant uncertain tax positions that would require recognition in the financial statements. Open tax years are those that are open for examination by taxing authorities (i.e., generally the last three tax year ends and the interim tax period since then). Furthermore, management of the
26 |
NOTES TO FINANCIAL STATEMENTS
|
Funds is also not aware of any tax positions for which it is reasonably possible that the total amounts of unrecognized tax benefits will significantly change in the next twelve months.
The tax character of distributions during the year ended September 30, 2023 were as follows:
| Distributions Paid From | ||||||||||||||||||
| Total | ||||||||||||||||||
| Ordinary | Net Long Term | Total Taxable | Distributions | |||||||||||||||
| Income | Capital Gains | Distributions | Paid | |||||||||||||||
RBC BlueBay | ||||||||||||||||||
U.S. Government Money Market Fund | $ | 537,614,906 | $ | 90,609 | $ | 537,705,515 | $ | 537,705,515 | ||||||||||
The tax character of distributions during the year ended September 30, 2022 were as follows:
| Distributions Paid From | ||||||||||||
| Ordinary Income | Total Taxable Distributions | Total Distributions Paid | ||||||||||
RBC BlueBay | ||||||||||||
U.S. Government Money Market Fund | $ | 35,754,236 | $ | 35,754,236 | $ | 35,754,236 | ||||||
Total distributions paid may differ from the Statements of Changes in Net Assets because distributions are recognized when actually paid for tax purposes.
As of September 30, 2023, the components of accumulated earnings/(losses) on a tax basis were as follows:
Undistributed | Undistributed Long Term Gain | Distributions Payable | Unrealized Appreciation | Other Temporary Differences | Total Accumulated Earnings | |||||||||||||||
| $14,845,399 | $357,739 | $(14,781,806) | $— | $— | $421,332 | |||||||||||||||
As of September 30, 2023, the Fund does not have any capital loss carryforward.
Under current tax law, Post-October Capital Losses and Late-Year Ordinary Losses may be deferred and treated as occurring on the first business day of the following fiscal year for tax purposes. The Fund did not have any Post-October Capital Losses or Late-Year Ordinary Losses for the year ending September 30, 2023.
7. Line of Credit
The Fund, along with other Funds within the Trust, participates in an uncommitted, secured $500,000,000 line of credit with U.S. Bank, N.A. (the “Bank”), the Funds’ custodian, to be used to fund shareholder redemption requests and for other short-term temporary or emergency general business purposes. The line of credit has a scheduled termination date of July 27, 2024. Interest is charged on borrowings under this line of credit at the Bank’s prime lending rate per annum. Since multiple funds within the Trust participate in this line of credit, there is no assurance that an individual fund will have access to all or any part of the $500,000,000 at any particular time. There were no loans outstanding pursuant to this line of credit at September 30, 2023 and there were no borrowings made by the Fund during the period.
8. Significant Risks
Shareholder concentration risk:
As of September 30, 2023, affiliated broker-dealer omnibus accounts owned 38.6% of the Fund’s outstanding shares. Significant transactions by these shareholders may impact the Fund’s performance.
| 27 |
NOTES TO FINANCIAL STATEMENTS
|
Market risk:
One or more markets in which a Fund invests may go down in value, sometimes sharply and unpredictably, and the value of a Fund’s portfolio securities may fall or fail to rise. Market risk may affect a single issuer, sector of the economy, industry or the market as a whole. In addition, global economies and financial markets are becoming increasingly interconnected, and political, economic and other conditions and events (including, but not limited to, natural disasters, pandemics, epidemics, and social unrest) in one country, region, or financial market may adversely impact issuers in a different country, region or financial market. Furthermore, the occurrence of, among other events, natural or man-made disasters, severe weather or geological events, fires, floods, earthquakes, outbreaks of disease (such as COVID-19, avian influenza or H1N1/09), epidemics, pandemics, malicious acts, cyber-attacks, terrorist acts or the occurrence of climate change, may also adversely impact the performance of a Fund. Such events could adversely impact issuers, markets and economies over the short- and long-term, including in ways that cannot necessarily be foreseen. A Fund could be negatively impacted if the value of a portfolio holding were harmed by such political or economic conditions or events. Moreover, such negative political and economic conditions and events could disrupt the processes necessary for a Fund’s operations.
9. Subsequent Events:
Fund Management has evaluated the impact of all subsequent events on the Fund and has determined that there were no subsequent events requiring recognition or disclosure in the financial statements.
28 |
REPORT OF INDEPENDENT REGISTERED PUBLIC ACCOUNTING FIRM
|
To the Board of Trustees of RBC Funds Trust and Shareholders of RBC BlueBay U.S. Government Money Market Fund
Opinion on the Financial Statements
We have audited the accompanying statement of assets and liabilities, including the schedule of portfolio investments, of RBC BlueBay U.S. Government Money Market Fund (one of the funds constituting RBC Funds Trust, referred to hereafter as the “Fund”) as of September 30, 2023, the related statement of operations for the year ended September 30, 2023, the statements of changes in net assets for each of the two years in the period ended September 30, 2023, including the related notes, and the financial highlights for each of the periods indicated therein (collectively referred to as the “financial statements”). In our opinion, the financial statements present fairly, in all material respects, the financial position of the Fund as of September 30, 2023, the results of its operations for the year then ended, the changes in its net assets for each of the two years in the period ended September 30, 2023 and the financial highlights for each of the periods indicated therein, in conformity with accounting principles generally accepted in the United States of America.
Basis for Opinion
These financial statements are the responsibility of the Fund’s management. Our responsibility is to express an opinion on the Fund’s financial statements based on our audits. We are a public accounting firm registered with the Public Company Accounting Oversight Board (United States) (PCAOB) and are required to be independent with respect to the Fund in accordance with the U.S. federal securities laws and the applicable rules and regulations of the Securities and Exchange Commission and the PCAOB. We conducted our audits of these financial statements in accordance with the standards of the PCAOB. Those standards require that we plan and perform the audit to obtain reasonable assurance about whether the financial statements are free of material misstatement, whether due to error or fraud.
Our audits included performing procedures to assess the risks of material misstatement of the financial statements, whether due to error or fraud, and performing procedures that respond to those risks. Such procedures included examining, on a test basis, evidence regarding the amounts and disclosures in the financial statements. Our audits also included evaluating the accounting principles used and significant estimates made by management, as well as evaluating the overall presentation of the financial statements. Our procedures included confirmation of securities owned as of September 30, 2023 by correspondence with the custodian and brokers. We believe that our audits provide a reasonable basis for our opinions.
/s/PricewaterhouseCoopers LLP
Minneapolis, Minnesota
November 21, 2023
We have served as the auditor of one or more investment companies in the RBC Funds since 2016.
| 29 |
OTHER FEDERAL INCOME TAX INFORMATION (UNAUDITED)
|
The Fund reports a portion of the income dividends distributed during the fiscal year ended September 30, 2023, as U.S. Government Income as 28.86%.
U. S. Government Income represents the amount of interest that was derived from direct U. S. Government obligations. Generally, such interest is exempt from state income tax. For residents of California, New York and Connecticut the statutory threshold requirements were satisfied. Due to the diversity in state and local tax law, it is recommended you consult a tax adviser as to the applicability of the information provided for your specific situation.
The Fund reports a portion of the income dividends distributed during the fiscal year ended September 30, 2023, as Qualified Interest Income as defined in the Internal Revenue Code as 99.94%.
For the year ended September 30, 2023, the Fund has a qualified short term gains percentage of 0.11%.
All reportings are based on financial information available as of the date of this annual report and, accordingly, are subject to change. For each item above, it is the intention of the Fund to report the maximum amount permitted under the Internal Revenue Code and the regulations thereunder.
30 |
|
Independent Trustees(1)(2)
Lucy Hancock Bode (72)
Position, Term of Office and Length of Time Served with the Trust: Trustee since January 2004
Principal Occupation(s) During Past 5 Years: Healthcare consultant (self-employed) (1986 to present)
Number of Portfolios in Fund Complex Overseen by Trustee: 24
Other Director/Trustee Positions Held by Trustee During Past 5 Years: Franklin Street Partners (2014 to 2018 and 2019 to present)
Leslie H. Garner Jr. (73)
Position, Term of Office and Length of Time Served with the Trust: Trustee since January 2004
Principal Occupation(s) During Past 5 Years: President and Chief Executive Officer, The Greater Cedar Rapids Community Foundation (2010 to 2023); President, Cornell College (1994 to 2010)
Number of Portfolios in Fund Complex Overseen by Trustee: 24
Other Director/Trustee Positions Held by Trustee During Past 5 Years: None
Phillip G. Goff (59)
Position, Term of Office and Length of Time Served with the Trust: Trustee since January 2020
Principal Occupation(s) During Past 5 Years: Senior Vice President/Corporate Controller and Funds Treasurer, TIAA (2006 - 2017)
Number of Portfolios in Fund Complex Overseen by Trustee: 24
Other Director/Trustee Positions Held by Trustee During Past 5 Years: None
Ronald James (72)
Position, Term of Office and Length of Time Served with the Trust: Trustee since January 2004
Principal Occupation(s) During Past 5 Years: Faculty member (part time), University of St. Thomas (2004 to present), President and Chief Executive Officer, Center for Ethical Business Cultures (2000 to January 2017)
Number of Portfolios in Fund Complex Overseen by Trustee: 24
Other Director/Trustee Positions Held by Trustee During Past 5 Years: Bremer Financial Corporation (2004 to present); Greater Twin Cities United Way (2012 to 2020); Best Buy Co. Inc. (2004 to 2013)
John A. MacDonald (74)
Position, Term of Office and Length of Time Served with the Trust: Trustee since January 2004
Principal Occupation(s) During Past 5 Years: Retired. Independent Consultant (2020 to present); Vice President and Treasurer, Hall Family Foundation (1988 to 2020); Chief Investment Officer, Chinquapin Trust Company (1999 to 2020)
Number of Portfolios in Fund Complex Overseen by Trustee: 24
Other Director/Trustee Positions Held by Trustee During Past 5 Years: None
| 31 |
MANAGEMENT (UNAUDITED)
|
Independent Trustees(1)(2)
James R. Seward, CFA (70)
Position, Term of Office and Length of Time Served with the Trust: Chairman of the Board and Trustee since January 2004
Principal Occupation(s) During Past 5 Years: Private investor (2000 to present); CFA (1987 to present)
Number of Portfolios in Fund Complex Overseen by Trustee: 24
Other Director/Trustee Positions Held by Trustee During Past 5 Years: Brookdale Senior Living Inc. (2008 to 2019)
Christie Zarkovich (49)
Position, Term of Office and Length of Time Served with the Trust: Trustee since March 2023
Principal Occupation(s) During Past 5 Years: Chief Administrative, Financial and Investment Officer, Health Forward Foundation (2021 to present); Investment Director, Chinquapin Trust Company (2019 to 2021); Head of Mission-Related Investing Research, Cambridge Associates (2018 to 2019)
Number of Portfolios in Fund Complex Overseen by Trustee: 24
Other Director/Trustee Positions Held by Trustee During Past 5 Years: None
Interested Trustees(1)(2)(3)
David Eikenberg (54)(5)
Position, Term of Office and Length of Time Served with the Trust: Trustee since October 2022
Principal Occupation(s) During Past 5 Years: President and Chief Executive Officer, RBC Funds (2022 to present); Head of Intermediary Sales at RBC Global Asset Management (U.S.) Inc. (2018 to present); Vice President, T. Rowe Price (2010 to 2018)
Number of Portfolios in Fund Complex Overseen by Trustee: 24
Other Director/Trustee Positions Held by Trustee During Past 5 Years: None
32 |
MANAGEMENT (UNAUDITED)
|
Executive Officers(1)(3)(4)
David Eikenberg (54)(5)
Position, Term of Office and Length of Time Served with the Trust: President and Chief Executive Officer since October 2022
Principal Occupation(s) During Past 5 Years: President and Chief Executive Officer, RBC Funds (2022 to present); Head of Intermediary Sales at RBC Global Asset Management (U.S.) Inc. (2018 to present); Vice President, T. Rowe Price (2010 to 2018)
Kathleen A. Hegna (56)
Position, Term of Office and Length of Time Served with the Trust: Chief Financial Officer and Principal Accounting Officer since May 2009 and Treasurer since March 2014
Principal Occupation(s) During Past 5 Years: Head, Fund Operations (US), RBC Global Asset Management (U.S.) Inc. (September 2022 to present); Associate Vice President and Director, Mutual Fund Services, RBC Global Asset Management (U.S.) Inc. (2009 to September 2022)
Christina M. Weber (55)
Position, Term of Office and Length of Time Served with the Trust: Chief Compliance Officer since December 2012 and Secretary since September 2017
Principal Occupation(s) During Past 5 Years: Chief Compliance Officer, RBC Global Asset Management (U.S.) Inc. (June 2018 to present); Chief Compliance Officer, RBC Funds (2012 to present); Assistant Secretary, RBC Funds (2013 to 2017)
Jodi DeFeyter (52)
Position, Term of Office and Length of Time Served with the Trust: Assistant Secretary since October 2022
Principal Occupation(s) During Past 5 Years: Director, Regulatory Administration, RBC Global Asset Management (U.S.) Inc. (2012 to present)
Tara Tilbury (49)
Position, Term of Office and Length of Time Served with the Trust: Assistant Secretary since October 2022
Principal Occupation(s) During Past 5 Years: Managing Counsel, RBC Global Asset Management
(U.S.) Inc. (2018 to present); Vice President and Chief Counsel – Asset Management, Ameriprise Financial, Inc. (2105 to 2018)
| (1) | The address of each Trustee/Officer except David Eikenberg is 50 South Sixth Street, Suite 2350, Minneapolis, Minnesota 55402. The address of David Eikenberg is 225 Franklin Street, Boston, Massachusetts 02110. |
| (2) | All Trustees must retire on or before December 31 of the year in which they reach age 75. The Board may temporarily waive this requirement when necessary to avoid depriving the Board of a Trustee with critical skills. |
| (3) | On December 31, 2009, Voyageur Asset Management Inc. changed its name to RBC Global Asset |
| 33 |
MANAGEMENT (UNAUDITED)
|
Management (U.S.) Inc. Any references to RBC Global Asset Management (U.S.) Inc. for prior periods are deemed to be references to the prior entity. |
| (4) | Each officer serves in such capacity for an indefinite period of time until his or her removal, resignation or retirement. |
| (5) | David Eikenberg has been determined to be an interested Trustee by virtue of his position with the Advisor. |
The Fund’s Statement of Additional Information includes information about the Funds’ Trustees. To receive your free copy of the Statement of Additional Information, call toll free: 1-800-422-2766.
34 |
SUPPLEMENTAL INFORMATION (UNAUDITED)
|
Shareholder Expense Examples
As a shareholder of the RBC Funds, you incur two types of costs: (1) transaction costs and (2) ongoing costs, including management fees; and other Fund expenses. This example is intended to help you understand your ongoing costs (in dollars) of investing in the RBC Funds and to compare these costs with the ongoing costs of investing in other mutual funds.
The example is based on an investment of $1,000 invested at the beginning of the period and held for the entire period from April 1, 2023 through September 30, 2023.
Actual Expenses
The table below provides information about actual account values and actual expenses. You may use the information below, together with the amount you invested, to estimate the expenses that you paid over the period. Simply divide your account value by $1,000 (for example, an $8,600 account value divided by $1,000 = 8.6), then multiply the result by the number in the table under the heading entitled “Expenses Paid During Period” to estimate the expenses you paid on your account during this period.
| Beginning Account Value 4/1/23 | Ending Account Value 9/30/23 | Expenses Paid During Period* 4/1/23–9/30/23 | Annualized Expense Ratio During Period 4/1/23–9/30/23 | |||||||||||||
RBC BlueBay U.S. Government Money Market Fund | ||||||||||||||||
Class A | $1,000.00 | $1,015.80 | $0.79 | 0.25% | ||||||||||||
RBC Institutional Class 1 | 1,000.00 | 1,025.60 | 0.66 | 0.13% | ||||||||||||
RBC Institutional Class 2 | 1,000.00 | 1,024.80 | 1.42 | 0.28% | ||||||||||||
RBC Investor Class | 1,000.00 | 1,021.20 | 5.02 | 0.99% | ||||||||||||
*Expenses are equal to the average account value times the Fund’s annualized expense ratio multiplied by 183/365 (to reflect one half year period).
| 35 |
SUPPLEMENTAL INFORMATION (UNAUDITED)
|
Hypothetical Example for Comparison Purposes
The table below provides information about hypothetical account values and hypothetical expenses based on the Fund’s actual expense ratio and an assumed rate of return of 5% per year before expenses, which is not the Fund’s actual return. The hypothetical account values and expenses may not be used to estimate the actual ending account balance or expenses you paid for the period. You may use this information to compare this 5% hypothetical example with the 5% hypothetical examples that appear in the shareholder reports of other funds.
Please note that the expenses shown in the table are meant to highlight your ongoing costs only and do not reflect any transactional costs, such as sales charges (loads), redemption fees, or exchange fees. Therefore, the table is useful in comparing ongoing costs only, and will not help you determine the relative total costs of owning different funds. In addition, if these transactional costs were included, your costs would have been higher.
| Beginning Account Value 4/1/23 | Ending Account Value 9/30/23 | Expenses Paid During Period* 4/1/23-9/30/23 | Annualized Expense Ratio During Period 4/1/23-9/30/23 | |||||||||||||
RBC BlueBay U.S. Government Money Market Fund | ||||||||||||||||
Class A | $1,000.00 | $1,014.84 | $0.79 | 0.25% | ||||||||||||
RBC Institutional Class 1 | 1,000.00 | 1,024.42 | 0.66 | 0.13% | ||||||||||||
RBC Institutional Class 2 | 1,000.00 | 1,023.66 | 1.42 | 0.28% | ||||||||||||
RBC Investor Class | 1,000.00 | 1,020.10 | 5.01 | 0.99% | ||||||||||||
*Expenses are equal to the average account value times the Fund’s annualized expense ratio multiplied by 183/365 (to reflect one half year period).
36 |
APPROVAL OF INVESTMENT ADVISORY AGREEMENTS (UNAUDITED)
|
In September 2023, after evaluating the services provided by RBC Global Asset Management (U.S.) Inc. (the “Advisor”) and reviewing the performance, fees, and expenses of the Fund, the RBC Funds Board of Trustees determined to approve the continuation of the investment advisory agreement (“Agreement”) with the Advisor for the Fund for an additional year.
As part of their review of the Agreement the Trustees requested and considered information regarding the advisory services performed by the Advisor, the staffing and qualifications of the personnel responsible for operating and managing the Fund, and the Fund’s performance and expenses. The Trustees considered information provided at regular quarterly Board and Committee meetings throughout the year as well as information presented at both a special meeting held to review requested material related to the proposed renewals and a regular meeting at which the proposed renewals were considered, and their experience with the portfolio management team with regard to other products over the years. The information included material provided by the Advisor, as well as reports prepared by Broadridge Financial Solutions, Inc., an independent statistical compilation company, providing comparative fee and expense information and comparative performance information for the Fund. In connection with their deliberations, the independent Trustees were advised by independent legal counsel with regard to the materials and their responsibilities under the relevant laws and regulations.
The Trustees met with representatives from the Advisor’s senior management team, as well as senior investment professionals, to discuss the information and the Advisor’s ongoing management of the Fund. The Trustees reviewed the nature and quality of the services provided to the Fund by the Advisor, including information as to the Fund’s performance.
The Trustees were provided with comparative Morningstar data for U.S. government money market funds. The Trustees were informed that the Fund had outperformed the median return of its Morningstar category for recent periods and over the longer term. The Trustees were satisfied with the quality and capabilities of the money market fund portfolio management and analyst team and with the overall investment performance of the Fund.
The Trustees reviewed advisory fee and expense information for the Fund compared to similarly situated funds, including information regarding other client accounts advised or sub-advised by the Advisor with a similar investment strategy and the reasons for any differences in fees. The Trustees were informed that the Fund’s net expense ratio was within the top quartile of both its peer group and its Morningstar category. The Trustees considered, and viewed favorably, arrangements to waive certain fees to achieve competitive expense levels. The Trustees evaluated profitability data for the Advisor and considered information regarding other benefits the Advisor and its affiliates derived from their relationships with the Fund.
Based upon their review, the Trustees determined that the advisory fees proposed to be payable to the Advisor were reasonable and fair in light of the nature and quality of services provided under all the circumstances and were within the range of what might have been negotiated at arms’ length. The Trustees concluded that it is in the interests of the Fund and its shareholders for the Trustees to approve the Agreement as well as the continuation of the expense limitation agreement for the Fund for an additional year. In arriving at their collective decision to approve the Agreement, the Trustees did not assign relative weights to the factors discussed above or deem any one or group of them to be controlling in and of itself.
| 37 |
|
| |||||||||
|
| |||||||||
|
| |||||||||
|
| |||||||||
38 |
|
This Page Intentionally Left Blank
| 39 |
|
This Page Intentionally Left Blank
40 |
RBC Funds
P.O. Box 701
Milwaukee, WI 53201-0701
800-422-2766
www.rbcgam.com
Performance data represents past performance and does not guarantee future results. The principal value of an investment and investment return will fluctuate so that an investor’s shares, when redeemed, may be worth more or less than their original cost.
This report and the financial statements contained herein are provided for the information of RBC Funds shareholders. This report is not authorized for distribution to prospective investors unless preceded or accompanied by a current prospectus, which contains information concerning investment objectives, risks, charges and expenses of the funds. Please read the prospectus carefully before investing.
This report and the financial statements contained herein are not intended to be a forecast of future events, a guarantee of future results, or investment advice. There is no assurance that certain securities will remain in or out of each fund’s portfolio. The views expressed in this report reflect those of the portfolio managers through the year ended September 30, 2023.
NOT FDIC INSURED • NO BANK GUARANTEE • MAY LOSE VALUE
RBC Global Asset Management (U.S.) Inc. serves as investment advisor for the RBC Funds. RBC Funds are distributed by Quasar Distributors LLC.
This product is made of material from well-managed FSC®-certified forests,
recycled materials, and other controlled sources.
RBCF-MM AR 09-23
| (b) | Not applicable. |
Item 2. Code of Ethics.
| (a) | The registrant, as of the end of the period covered by this report, has adopted a code of ethics that applies to the registrant’s principal executive officer, principal financial officer, principal accounting officer or controller, or persons performing similar functions, regardless of whether these individuals are employed by the registrant or a third party. |
| (c) | There have been no amendments, during the period covered by this report, to a provision of the code of ethics that applies to the registrant’s principal executive officer, principal financial officer, principal accounting officer or controller, or persons performing similar functions, regardless of whether these individuals are employed by the registrant or a third party, and that relates to any element of the code of ethics description. |
| (d) | The registrant has not granted any waivers, including an implicit waiver, from a provision of the code of ethics that applies to the registrant’s principal executive officer, principal financial officer, principal accounting officer or controller, or persons performing similar functions, regardless of whether these individuals are employed by the registrant or a third party, that relates to one or more of the items set forth in paragraph (b) of this item’s instructions. |
Item 3. Audit Committee Financial Expert.
As of the end of the period covered by the report, the registrant’s board of directors has determined that Phillip G. Goff and James R. Seward are qualified to serve as an audit committee financial expert serving on its audit committee and that they are “independent,” as defined by Item 3 of Form N-CSR.
Item 4. Principal Accountant Fees and Services.
| ● | Registrant may incorporate the following information by reference, if this information has been disclosed in the registrant’s definitive proxy statement or definitive information statement. The proxy statement or information statement must be filed no later than 120 days after the end of the fiscal year covered by the Annual Report. |
Audit Fees
| (a) | The aggregate fees billed for each of the last two fiscal years for professional services rendered by the principal accountant for the audit of the registrant’s annual financial statements or services that are normally provided by the accountant in connection with statutory and regulatory filings or engagements for those fiscal years are $ _506,650 for 2023 and $__482,500 for 2022. |
Audit-Related Fees
| (b) | The aggregate fees billed in each of the last two fiscal years for assurance and related services by the principal accountant that are reasonably related to the performance of the audit of the registrant’s financial statements and are not reported under paragraph (a) of this Item are $__0 for 2023 and $_0 for 2022. |
Tax Fees
| (c) | The aggregate fees billed in each of the last two fiscal years for professional services rendered by the principal accountant for tax compliance, tax advice, and tax planning are $__60,900 for 2023 and $_58,200 for 2022. |
Tax fees for both years relate to the review of the registrant’s tax returns and review of required shareholder distribution calculations. Amount requiring approval of the registrant’s audit committee is $___0 and $ 0 , respectively.
All Other Fees
| (d) | The aggregate fees billed in each of the last two fiscal years for products and services provided by the principal accountant, other than the services reported in paragraphs (a) through (c) of this Item are $__0 for 2023 and $ 0 for 2022. |
| (e)(1) | Disclose the audit committee’s pre-approval policies and procedures described in paragraph (c)(7) of Rule 2-01 of Regulation S-X. |
The Audit Committee (“Committee”) will review and approve in advance any proposal (except as set forth in (1) through (3) below) that the Trust employ the Funds’ auditor to render “permissible non-audit services” to the Funds. A “permissible non-audit service” is defined as a non-audit service that is not prohibited by Rule 2-01(c)(4) of Regulation S-X or other applicable law or regulation. The Committee will also review and approve in advance any proposal (except as set forth in (1) through (3) below) that the Adviser, and any entity controlling, controlled by, or under common control with the Adviser that provides ongoing services to the Funds (an “Adviser-affiliated service provider”), employ the Funds’ auditor to render non-audit services, if such engagement would relate directly to the operations and financial reporting of the Funds. As a part of its review, the Committee shall consider whether the provision of such services is consistent with the auditor’s independence. (See also “Delegation” below.)
Pre-approval by the Committee of non-audit services is not required so long as:
(1) (A) with respect to the Funds, the aggregate amount of all such permissible non-audit services provided to the Funds constitutes no more than 5% of the total amount of revenues paid to the auditor by the Funds during the fiscal year in which the services are provided; or
(B) with respect to the Adviser and any Adviser-affiliated service provider, the aggregate amount of all such non-audit services provided constitutes no more than 5% of the total amount of revenues (of the type that would have to be pre-approved by the Committee) paid to the auditor by the Funds, the Adviser and any Adviser-affiliated service provider during the fiscal year in which the services are provided;
(2) such services were not recognized by the Funds at the time of the engagement to be non-audit services; and
(3) such services are promptly brought to the attention of the Committee and approved by the Committee or its delegate or delegates, as defined below, prior to the completion of the audit.
Delegation
The Committee may delegate to one or more of its members and/or to officers of the Trust the authority to pre-approve the auditor’s provision of audit services or permissible non-audit services to the Funds in amounts up to and including $50,000. Any pre-approval determination made by a delegate will be presented to the full Committee at its next meeting. The Committee will communicate any pre-approval made by a delegate to the Trust’s fund accounting agent, which will ensure that the appropriate disclosure is made in the Funds’ periodic reports and other documents as required under the Federal securities laws.
| (e)(2) | The percentage of services described in each of paragraphs (b) through (d) of this Item that were approved by the audit committee pursuant to paragraph (c)(7)(i)(C) of Rule 2-01 of Regulation S-X are as follows: |
(b) 0
(c) 100
(d) 0
| (f) | The percentage of hours expended on the principal accountant’s engagement to audit the registrant’s financial statements for the most recent fiscal year that were attributed to work performed by persons other than the principal accountant’s full-time, permanent employees was less than fifty percent. |
| (g) | The aggregate non-audit fees billed by the registrant’s accountant for services rendered to the registrant, and rendered to the registrant’s investment adviser (not including any sub-adviser whose role is primarily portfolio management and is subcontracted with or overseen by another investment adviser), and any entity controlling, controlled by, or under common control with the adviser that provides ongoing services to the registrant for each of the last two fiscal years of the registrant was $_482,213 for 2023 and $ 326,828 for 2022. |
| (h) | The registrant’s audit committee of the board of directors has considered whether the provision of non-audit services that were rendered to the registrant’s investment adviser (not including any sub-adviser whose role is primarily portfolio management and is subcontracted with or overseen by another investment adviser), and any entity controlling, controlled by, or under common control with the investment adviser that provides ongoing services to the registrant that were not pre-approved pursuant to paragraph (c)(7)(ii) of Rule 2-01 of Regulation S-X is compatible with maintaining the principal accountant’s independence. |
| (i) | Not applicable. |
| (j) | Not applicable. |
Item 5. Audit Committee of Listed Registrants.
Not applicable.
Item 6. Investments.
| (a) | Schedule of Investments in securities of unaffiliated issuers as of the close of the reporting period is included as part of the report to shareholders filed under Item 1 of this form. |
| (b) | Not applicable. |
| Item 7. | Disclosure of Proxy Voting Policies and Procedures for Closed-End Management Investment Companies. |
Not applicable.
| Item 8. | Portfolio Managers of Closed-End Management Investment Companies. |
Not applicable.
| Item 9. | Purchases of Equity Securities by Closed-End Management Investment Company and Affiliated Purchasers. |
Not applicable.
| Item 10. | Submission of Matters to a Vote of Security Holders. |
There have been no material changes to the procedures by which the shareholders may recommend nominees to the registrant’s board of directors, where those changes were implemented after the registrant last provided disclosure in response to the requirements of Item 407(c)(2)(iv) of Regulation S-K (17 CFR 229.407) (as required by Item 22(b)(15) of Schedule 14A (17 CFR 240.14a-101)), or this Item.
| Item 11. | Controls and Procedures. |
| (a) | The registrant’s principal executive and principal financial officers, or persons performing similar functions, have concluded that the registrant’s disclosure controls and procedures (as defined in Rule 30a-3(c) under the Investment Company Act of 1940, as amended (the “1940 Act”) (17 CFR 270.30a-3(c))) are effective, as of a date within 90 days of the filing date of the report that includes the disclosure required by this paragraph, based on their evaluation of these controls and procedures required by Rule 30a-3(b) under the 1940 Act (17 CFR 270.30a-3(b)) and Rules 13a-15(b) or 15d-15(b) under the Securities Exchange Act of 1934, as amended (17 CFR 240.13a-15(b) or 240.15d-15(b)). |
| (b) | There were no changes in the registrant’s internal control over financial reporting (as defined in Rule 30a-3(d) under the 1940 Act (17 CFR 270.30a-3(d))) that occurred during the period covered by this report that has materially affected, or is reasonably likely to materially affect, the registrant’s internal control over financial reporting. |
| Item 12. | Disclosure of Securities Lending Activities for Closed-End Management Investment Companies. |
Not applicable.
Item 13. Exhibits.
| (a)(1) | ||
| (a)(2) | ||
| (a)(3) | Not applicable. | |
| (a)(4) | Not applicable. | |
| (b) | ||
SIGNATURES
Pursuant to the requirements of the Securities Exchange Act of 1934 and the Investment Company Act of 1940, the registrant has duly caused this report to be signed on its behalf by the undersigned, thereunto duly authorized.
| (Registrant) RBC Funds Trust |
| By (Signature and Title)* /s/ David Eikenberg |
David Eikenberg, President and Chief Executive Officer (principal executive officer) |
| Date November 29, 2023 |
Pursuant to the requirements of the Securities Exchange Act of 1934 and the Investment Company Act of 1940, this report has been signed below by the following persons on behalf of the registrant and in the capacities and on the dates indicated.
| By (Signature and Title)* /s/ David Eikenberg |
David Eikenberg, President and Chief Executive Officer |
(principal executive officer) |
| Date November 29, 2023 |
| By (Signature and Title)* /s/ Kathleen A. Hegna |
Kathleen A. Hegna, Treasurer and Chief Financial Officer |
(principal financial officer) |
| Date November 29, 2023 |
* Print the name and title of each signing officer under his or her signature.