UNITED STATES
SECURITIES AND EXCHANGE COMMISSION
Washington, D.C. 20549
FORM NCSR/A
CERTIFIED SHAREHOLDER REPORT OF REGISTERED MANAGEMENT
INVESTMENT COMPANIES
Investment Company Act file number 811-21475
RBC Funds Trust
(Exact name of registrant as specified in charter)
50 South Sixth Street, Suite 2350
Minneapolis, MN 55402
(Address of principal executive offices) (Zip code)
Tara Tilbury
50 South Sixth Street, Suite 2350
Minneapolis, MN 55402
(Name and address of agent for service)
Registrant’s telephone number, including area code: (612) 376-7132
Date of fiscal year end: March 31
Date of reporting period: March 31, 2023
Explanatory Note
The Registrant is filing this amendment to its Form N-CSR for the period ended March 31, 2023, originally filed with the Securities and Exchange Commission on May 31, 2023 (Accession Number 0001193125-23-157767), to amend Item 1, “Reports to Stockholders.” The purpose of the amendment to Item 1 is to supplement the Annual Reports to include material inadvertently omitted.
Item 1. Reports to Stockholders.
(a) The Report to Shareholders is attached herewith.
RBC FUNDS TRUST
(the “Trust”)
RBC Emerging Markets Equity Fund
RBC Emerging Markets ex-China Equity Fund
RBC Emerging Markets Value Equity Fund
RBC Global Opportunities Fund
RBC Global Equity Leaders Fund
RBC International Opportunities Fund
RBC International Equity Fund
RBC International Small Cap Equity Fund
RBC China Equity Fund
RBC BlueBay Short Duration Fixed Income Fund (formerly, RBC Short Duration Fixed Income Fund)
RBC BlueBay Ultra-Short Fixed Income Fund (formerly, RBC Ultra-Short Fixed Income Fund)
(each, a “Fund” and collectively, the “Funds”)
Supplement dated March 15, 2024 to the Funds’ Annual Reports for the period ended March 31, 2023
(the “Annual Reports”)
This Supplement updates certain information contained in the Funds’ Annual Reports. A copy of each Annual Report is available (i) without charge, upon request, by calling 1-800-422-2766; (ii) on the Fund’s website at www.rbcgam.com; and (iii) on the Securities and Exchange Commission’s (the “Commission”) website at http://www.sec.gov.
Effective immediately, the following section is hereby inserted after the “Supplemental Information” section of each Annual Report:
Voting Results of Special Meeting of Shareholders (Unaudited)
A Special Meeting of Shareholders (the “Meeting”) of RBC Funds Trust (the “Trust”) was held on March 15, 2023 to consider and elect trustees to serve on the Board of Trustees of the Trust. At the Meeting, Ms. Lucy Hancock Bode, Mr. David Eikenberg, Mr. Leslie H. Garner Jr., Mr. Phillip G. Goff, Mr. Ronald James, Mr. James Seward and Ms. Christie Zarkovich were elected to the Trust’s Board of Trustees. In electing the nominees, the Trust’s shareholders voted as follows:
| | | | |
Proposal Election of Trustees | | For | | Withheld |
Ms. Lucy Hancock Bode | | 3,715,603,957 | | 27,077,182 |
Mr. David Eikenberg | | 3,737,584,400 | | 5,113,746 |
Mr. Leslie H. Garner Jr. | | 3,719,510,847 | | 23,187,296 |
Mr. Phillip G. Goff | | 3,721,800,083 | | 20,898,062 |
Mr. Ronald James | | 3,716,118,779 | | 26,579,363 |
Mr. James Seward | | 3,721,239,523 | | 21,458,624 |
Ms. Christie Zarkovich | | 3,736,221,805 | | 6,476,342 |
INVESTORS SHOULD RETAIN THIS SUPPLEMENT FOR FUTURE REFERENCE
RBC Global Asset Management Annual Report For the year ended March 31, 2023 RBC Emerging Markets Equity Fund RBC Emerging Markets ex-China Equity Fund RBC Emerging Markets Value Equity Fund RBC Global Opportunities Fund RBC Global Equity Leaders Fund RBC International Opportunities Fund RBC International Equity Fund RBC International Small Cap Equity Fund RBC China Equity Fund
|
LETTER FROM THE PORTFOLIO MANAGERS |
Dear Shareholder:
Market Review
2022 was a challenging year for global equity markets as central bankers tightened monetary policy in an attempt to combat persistent and elevated inflation. Entering the year, many investors and central bankers believed inflation would be transitory and gradually drift lower as major economies surfaced from COVID-19-related lockdowns and subsequent supply chain challenges eased. However, as it became increasingly apparent that inflation was more prevalent and stubborn, interest rate expectations needed to be ratcheted higher significantly, putting pressure on long duration growth stocks that are more sensitive to changes in the discount rate’s being applied to future cash flows. Instead, investors gravitated towards ‘old economy’ sectors such as energy, materials and traditional banks that were seen as beneficiaries of the high inflation/interest rate backdrop. Russia’s invasion of Ukraine introduced more geo-political uncertainty, creating fears around the significantly diminished flow of natural gas to European energy markets.
Following a late summer swoon, equity markets rallied into the year end on hopes that central banks were approaching the latter stages of their tightening cycles. In addition, China unexpectedly announced a loosening of their zero-COVID-19 policies, allowing the economy to re-open and return to some degree of normalcy.
Portfolio Review – RBC Global Opportunities Fund
For the 12-month period ended March 31, 2023, the Fund had an annualized total return of -11.44% (Class I shares). That compares to an annualized total return of -7.44% for the MSCI ACWI Net Total Return USD Index, the Fund’s primary benchmark.
Stock selection was responsible for the majority of negative excess returns. Underperformance in Financials, Health Care and Energy holdings offset positive alpha derived from positions in Consumer Staples, Consumer Discretionary and Information Technology. At the stock level, relative returns were aided by Anheuser-Busch InBev, as the Belgium-based brewer delivered robust revenue growth aided by strong pricing power. Other positive contributors included AutoZone, T-Mobile and Fortive. Stocks that detracted from returns were First Republic Bank, SVB Financial and Alphabet.
Portfolio Review – RBC Global Equity Leaders Fund
For the 12-month period ended March 31, 2023, the Fund had an annualized total return of -9.48% (Class I shares). That compares to an annualized total return of -7.44% for the MSCI ACWI Net Total Return USD Index, the Fund’s primary benchmark.
Stock selection was responsible for the majority of negative excess returns. Underperformance in Financials, Energy and Health Care holdings offset positive alpha derived from positions in Consumer Staples, Consumer Discretionary and Communication Services. At the stock level, relative returns were aided by the discount retailer TJX’s delivering robust sales growth. Other positive contributors included T-Mobile, Anheuser-Busch InBev and PepsiCo. Stocks that detracted from returns were Charles Schwab, Blackstone and Alphabet.
Portfolio Review – RBC International Opportunities Fund
For the 12-month period ended March 31, 2023, the Fund had an annualized total return of -8.33% (Class I shares). That compares to an annualized total return of -5.07% for the MSCI ACWI ex USA Net Total Return USD Index, the Fund’s primary benchmark.
Stock selection was responsible for the majority of negative excess returns. Underperformance in Health Care, Industrials and Utilities holdings offset positive alpha derived from positions in Consumer Staples, Consumer Discretionary and Information Technology. At the stock level, relative returns were aided by technology investor Naspers, as management engaged in various shareholder value-enhancing actions. Other positive contributors included HDFC Bank, Essity and Anheuser-Busch InBev. Stocks that detracted from returns were Nidec, Roche and E.Sun Financial.
2
|
LETTER FROM THE PORTFOLIO MANAGERS |
Portfolio Review – RBC International Equity Fund
For the period from December 14, 2022 (commencement of operations) through March 31, 2023, the Fund had a total return of 4.50% (Class I shares). That compares to a total return of 7.54% for the MSCI EAFE Total Return Net Index, the Fund’s primary benchmark, for the same period.
Stock selection was responsible for the majority of negative excess returns. Underperformance in Financials, Industrials and Energy holdings offset positive alpha derived from positions in Communications Services, Real Estate and Information Technology. At the stock level, relative returns were aided by LVMH Moet Hennessy Louis Vuitton, Mitsubishi UFJ Financial and Novo Nordisk. Stocks that detracted from returns were Aker BP, Roche and Sampo.
Portfolio Review – RBC International Small Cap Equity Fund
For the period from December 14, 2022 (commencement of operations) through March 31, 2023, the Fund had a total return of 2.60% (Class I shares). That compares to a total return of 4.37% for the MSCI ACWI ex USA Small Cap Total Return Net Index, the Fund’s primary benchmark, for the same period.
Stock selection was responsible for the majority of negative excess returns. Underperformance in Information Technology, Materials and Energy holdings offset positive alpha derived from positions in Real Estate, Financials and Consumer Discretionary. At the stock level, relative returns were aided by Howden Joinery, MIPS and BayCurrent Consulting. Stocks that detracted from returns were Mineral Resources, Aker BP and Abcam.
Portfolio Review – RBC Emerging Markets Equity Fund
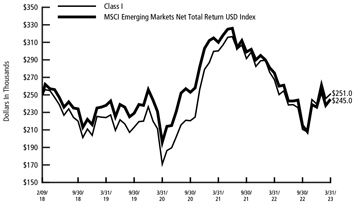
For the 12-month period ended March 31, 2023, the Fund had an annualized total return of -4.38% (Class I shares). That compares to an annualized total return of -10.70% for the MSCI Emerging Markets Net Total Return USD Index, the Fund’s primary benchmark.
Stock selection, particularly in the Consumer Discretionary and Health Care sectors, was the primary driver of outperformance for the period. Stock selection in India and China also benefited relative returns along with the Fund’s overweight exposure to Turkey. However, stock selection in South Korea partially offset those gains.
Portfolio Review – RBC Emerging Markets ex-China Equity Fund
For the period from December 15, 2022 (commencement of operations) through March 31, 2023, the Fund had a total return of 4.10% (Class I shares). That compares to a total return of 3.51% for the MSCI Emerging Markets ex-China Total Return Net Index, the Fund’s primary benchmark, for the same period.
Stock selection and asset weighting contributed positively at the sector level for the period. Weaker stock selection in Information Technology was offset by strong stock selection in Health Care and Industrials sectors. Overweight exposure to Taiwan and Mexico benefited relative returns along with strong stock selection in India.
Portfolio Review – RBC Emerging Markets Value Equity Fund
For the 12-month period ended March 31, 2023, the Fund had an annualized total return of -6.10% (Class I shares). That compares to an annualized total return of -10.70% for the MSCI Emerging Markets Net Total Return USD Index, the Fund’s primary benchmark.
Stock selection was the primary driver of outperformance for the period. Stock selection was particularly strong in Financials and Information Technology sectors, while underweight exposure and stock selection within Communication Services detracted. Stock selection in India and Taiwan also benefited relative returns, though partially offset by selection in Vietnam.
Portfolio Review – RBC China Equity Fund
For the period from April 11, 2022 (commencement of operations) through March 31, 2023, the Fund had a total return of -5.44% (Class I shares). That compares to a total return of -0.44% for the MSCI China Net Total Return USD Index, the Fund’s primary benchmark, for the same period.
3
|
LETTER FROM THE PORTFOLIO MANAGERS |
Stock selection was the primary driver of underperformance. Strong stock selection in the Real Estate and Information Technology sectors was offset by weaker stock selection in Consumer Discretionary and Financials.
Outlook
Despite markets’ starting 2023 in a more buoyant mood, significant uncertainties remain. The outlook for corporate profitability appears uncertain. The full impact of previous rate increases likely has yet to be fully realized and companies may have to deal with the prospect of slowing demand in coming quarters as tighter monetary policy weighs on economic activity. On the other hand, if interest rates are close to peaking and may in fact revert lower at some point, such a development might be supportive for equity valuations. Against such a backdrop, stock prices may remain volatile, which we believe will place extra emphasis on effective portfolio construction and disciplined risk management.
Our long-held belief in owning great businesses at attractive valuations remains unwavering. Whilst the near-term outlook is uncertain, over the long run, share prices have historically followed company fundamentals. By investing in leading companies that enjoy strong competitive advantages, we remain optimistic that we can deliver attractive risk-adjusted returns for our investors.
Phil Langham
Senior Portfolio Manager and Head, Emerging Market Equities
RBC Global Asset Management (UK) Limited
Habib Subjally
Senior Portfolio Manager and Head, Global Equities
RBC Global Asset Management (UK) Limited
David Lambert
Senior Portfolio Manager and Head, European Equities
RBC Global Asset Management (UK) Limited
The information provided herein represents the opinions of the Funds’ Portfolio Managers and is not intended to be a forecast of future events, a guarantee of future results or investment advice.
Mutual fund investing involves risk. Principal loss is possible. The Funds invest in foreign securities, which involve greater volatility and political, economic, and currency risks, and differences in accounting methods. These risks may be greater in emerging markets. The RBC Global Equity Leaders Fund and the RBC China Equity Fund are non-diversified, which means they may concentrate their assets in fewer individual holdings than a diversified fund. Therefore, the Funds are more exposed to individual security volatility than a diversified fund. The RBC International Equity Fund, the RBC International Small Cap Equity Fund, the RBC Emerging Markets ex-China Equity Fund and the RBC China Equity Fund are new with no operating history or track record on which to base investment decisions. The RBC Emerging Markets Value Equity Fund invests in value stocks, which may not increase in price as anticipated by the Adviser if they fall out of favor with investors or the markets favor faster growing companies. Investing in securities economically tied to China may subject the RBC China Equity Fund to a higher degree of risk of loss than investing in other countries or groups of countries because of the risks associated with, among other things, adverse securities markets, negative foreign currency rate fluctuations and social, political, regulatory, economic or environmental instabilities and natural disasters. The Funds may be subject to the risk that a particular investment may be difficult to purchase or sell and that the Fund may be unable to sell illiquid securities at an advantageous time or price. A Fund’s consideration of ESG factors could cause it to perform differently compared to funds that do not take ESG factors into account. These risks are described more fully in the prospectuses.
The MSCI ACWI Index is a free floatadjusted market capitalization weighted index that is designed to measure the equity market performance of developed and emerging markets. It captures large- and mid-capitalization representation across developed markets and emerging markets countries and covers approximately 85% of the global investable equity opportunity set. The Net Index is net of any foreign withholding tax.
4
|
LETTER FROM THE PORTFOLIO MANAGERS |
The MSCI ACWI ex USA Index is a free floatadjusted market capitalization weighted index that is designed to measure the equity market performance of developed and emerging markets excluding the U.S. It captures large- and mid-capitalization representation across developed markets and emerging markets countries excluding the U.S. and covers approximately 85% of the global investable equity opportunity set outside the U.S. The Net Index is net of any foreign withholding tax.
The MSCI EAFE Index is an equity index which captures large- and mid-capitalization representation across 21 Developed Markets countries around the world, excluding the U.S. and Canada. With 796 constituents, the index covers approximately 85% of the free float-adjusted market capitalization in each country.
The MSCI ACWI ex USA Small Cap Index captures small capitalization representation across 22 of 23 Developed Markets (DM) countries (excluding the U.S.) and 23 Emerging Markets (EM) countries. With 4,330 constituents, the index covers approximately 14% of the global equity opportunity set outside the U.S. The Net Index is net of any foreign withholding tax.
The MSCI Emerging Markets Index is a free floatadjusted market capitalization index that is designed to measure equity market performance of emerging markets. It captures large- and mid-capitalization representation across emerging markets countries and covers approximately 85% of the free float-adjusted market capitalization in each country. The Net Index is net of any foreign withholding tax. The MSCI Emerging Markets ex-China Index captures large- and mid-capitalization representation across 23 of the 24 Emerging Markets (EM) countries excluding China. With 663 constituents, the index covers approximately 85% of the free float-adjusted market capitalization in each country. The Net Index is net of any foreign withholding tax. The MSCI China and MSCI China All Shares Indices capture large- and mid-capitalization representation across China A shares, H shares, B shares, Red chips, P chips, and foreign listings (e.g., ADRs). The MSCI China Index covers about 85% of this China equity universe, and currently includes large- and mid-capitalization A shares represented at 20% of their free float-adjusted market capitalization. The MSCI China All Shares Index aims to reflect the opportunity set of China share classes listed in Hong Kong, Shanghai, Shenzhen, and outside of China, and is based on the concept of the integrated MSCI China equity universe with China A shares included. The Net Indices are net of any foreign withholding tax.
You cannot invest directly in an index.
Excess return is the difference between the benchmark return and the portfolio return, which may be either positive or negative.
Alpha is a risk-adjusted performance measurement of a portfolio’s excess return relative to its benchmark after considering its risk relative to the benchmark.
Fund holdings and/or sector allocations are subject to change at any time and are not recommendations to buy or sell any security. Current and future holdings are subject to risk. Please refer to the Schedule of Investments in this report for complete lists of Fund holdings.
Fund performance attribution data excludes Fund holdings that are fair-valued.
Past performance does not guarantee future results.
5
| | | | | | |
| | | | | | PORTFOLIO MANAGERS |
| | | | | | |
| | | | | | RBC Global Asset Management (U.S.) Inc. (“RBC GAM-US”) serves as the investment advisor and RBC Global Asset Management (UK) Limited (“RBC GAM-UK”) serves as the investment sub-advisor to the Funds and is responsible for the overall management of the Funds’ portfolios. The individual primarily responsible for the day-to-day management of each Fund’s portfolio is set forth below. |
| | | | | | Philippe Langham Senior Portfolio Manager and Head of Emerging Market Equities Philippe Langham is Head of Emerging Market Equities at RBC GAM-UK and is responsible for portfolio management of RBC Emerging Markets Equity Fund and RBC Emerging Markets ex-China Equity Fund. Philippe joined RBC GAM-UK in November 2009 from Societe Generale Asset Management, where he was Head of Global Emerging Markets. He was previously Director and Head of Emerging Markets and Asia at Credit Suisse in Zurich. Prior to that, he managed Global Emerging Markets, Asian, Latin American and U.S. portfolios for nine years at the Kuwait Investment Office. Philippe holds a BSc in economics from the University of Manchester in England and is a Chartered Accountant. |
| | | | | | Laurence Bensafi Senior Portfolio Manager and Deputy Head of Emerging Markets Equity Laurence Bensafi is Deputy Head of Emerging Markets Equity at RBC GAM-UK and is responsible for portfolio management of RBC Emerging Markets Value Equity Fund. Prior to joining RBC GAM-UK in 2013, Laurence was the Head of Aviva Investors’ Emerging Markets team, where she was responsible for managing Global Emerging Markets income funds and for developing quantitative stock selection and analysis models. Laurence began her investment career as a Quantitative Analyst at Societe Generale Asset Management, supporting European and Global Equity portfolio management by developing quantitative models to assist in the portfolio construction and security selection process. In 1997, Laurence obtained a Magistere d’Economiste Statisticien & D.E.S.S. Statistique et Econometrie from Toulouse University in France. Laurence is a CFA charterholder. |
| | | | | | Habib Subjally Senior Portfolio Manager and Head of Global Equities Habib Subjally is Head of Global Equities at RBC GAM-UK and is responsible for portfolio management of RBC Global Opportunities Fund, RBC International Opportunities Fund and RBC Global Equity Leaders Fund. Prior to joining RBC GAM-UK in 2014 Habib and his team spent eight years together at First State managing global equities. Previously he was Head of Small & Mid Cap Research at Credit Suisse and Head of the Global equities team at Invesco. Habib began his fund management career at Merrill Lynch Investment Managers, where he was Head of North American and Global equities research. He holds a BSc (Hons) from the London School of Economics and holds Chartered Accountant and ASIP designations. |
| | | | | | Siguo Chen Portfolio Manager Siguo Chen is a portfolio manager on the RBC Asian Equity team at RBC Global Asset Management and for RBC China Equity Fund. She is the lead |
| | | | | | |
| | | | | | |
| | | | | | |
6
| | | | | | |
PORTFOLIO MANAGERS | | | | | | |
manager for the team’s China strategy and is also the team’s healthcare specialist. Prior to joining RBC in 2017, Siguo was a sell-side equity analyst with a multinational investment bank where she specialized in China and Hong Kong consumer sectors and Hong Kong Equity strategy. | | | | | | |
Mayur Nallamala Head of Asian Equity, Senior Portfolio Manager Mayur Nallamala is a senior portfolio manager on the RBC Asian Equity team at RBC Global Asset Management and for RBC China Equity Fund. Prior to joining the firm in 2013, he was a portfolio manager at a global asset management firm, responsible for Asia Pacific ex-Japan mandates, managing assets on behalf of sovereign wealth, institutional and retail clients around the world. Mayur had earlier worked at major brokerage firms in London and Hong Kong, working in derivatives and equity research. He began his career in the investment industry in 1998. | | | | | | |
David Lambert Senior Portfolio Manager and Head of European Equities David Lambert is Senior Portfolio Manager and Head of the European Equity Team at RBC GAM-UK and is responsible for portfolio management of RBC International Equity Fund and RBC International Small Cap Equity Fund. He joined the organization directly from university in 1999, originally as a quantitative analyst. During his time at RBC GAM-UK, David has completed the UK Institute of Investment Management and Research (now UKSIP) examinations. He has managed a number of UK and European portfolios for the firm over the years. | | | | | | |
7
|
PERFORMANCE SUMMARY (UNAUDITED) |
Average Annual Total Returns as of March 31, 2023 (Unaudited)
| | | | | | | | | | | | | | | | | | | | |
| | | 1
Year | | | 5
Year | | | Since
Inception(a) | | | Net
Expense
Ratio(b)(c) | | | Gross
Expense
Ratio(b)(c) | |
RBC Emerging Markets Equity Fund | | | | | | | | | | | | | | | | | | | | |
Class A | | | | | | | | | | | | | | | | | | | | |
- Including Max Sales Charge of 5.75% | | | (10.03 | )%(e) | | | (0.08)% | (e) | | | 3.58% | | | | | | | | | |
-At Net Asset Value | | | (4.57 | )%(e) | | | 1.12% | | | | 4.25% | | | | 1.13% | | | | 1.68% | |
Class I | | | | | | | | | | | | | | | | | | | | |
-At Net Asset Value | | | (4.38 | )%(e) | | | 1.36% | | | | 4.49% | | | | 0.88% | | | | 0.99% | |
Class R6 | | | | | | | | | | | | | | | | | | | | |
-At Net Asset Value | | | (4.36 | )%(e) | | | 1.38% | | | | 4.57% | | | | 0.88% | | | | 0.88% | |
MSCI Emerging Markets
Net Total Return
USD Index(f) | | | (10.70 | )%(e) | | | (0.91 | )%(e) | | | 2.43% | | | | | | | | | |
RBC Emerging Markets ex-China Equity Fund(d) | | | | | | | | | | | | | | | | | | | | |
Class A | | | | | | | | | | | | | | | | | | | | |
- Including Max Sales Charge of 5.75% | | | N/A | | | | N/A | | | | (1.98)% | (e) | | | | | | | | |
- At Net Asset Value | | | N/A | | | | N/A | | | | 4.00% | | | | 1.13% | | | | 2.03% | |
Class I | | | | | | | | | | | | | | | | | | | | |
- At Net Asset Value | | | N/A | | | | N/A | | | | 4.10% | | | | 0.88% | | | | 1.66% | |
Class R6 | | | | | | | | | | | | | | | | | | | | |
- At Net Asset Value | | | N/A | | | | N/A | | | | 4.10% | | | | 0.88% | | | | 1.83% | |
MSCI Emerging Markets ex-China | | | | | | | | | | | | | | | | | | | | |
Total Return Net Index(f) | | | N/A | | | | N/A | | | | 3.51% | | | | | | | | | |
RBC Emerging Markets Value Equity Fund | | | | | | | | | | | | | | | | | | | | |
Class A | | | | | | | | | | | | | | | | | | | | |
- Including Max Sales Charge of 5.75% | | | (11.65 | )%(e) | | | (1.69)% | (e) | | | (1.28)% | (e) | | | | | | | | |
-At Net Asset Value | | | (6.24 | )%(e) | | | (0.52)% | (e) | | | (0.14)% | (e) | | | 1.20% | | | | 36.74% | |
Class I | | | | | | | | | | | | | | | | | | | | |
-At Net Asset Value | | | (6.10 | )%(e) | | | (0.30)% | (e) | | | 0.08% | | | | 0.95% | | | | 1.41% | |
Class R6 | | | | | | | | | | | | | | | | | | | | |
-At Net Asset Value | | | (6.01 | )%(e) | | | (0.22)% | (e) | | | 0.15% | | | | 0.88% | | | | 1.33% | |
MSCI Emerging Markets
Net Total Return
USD Index(f) | | | (10.70 | )%(e) | | | (0.91 | )%(e) | | | (0.36 | )%(e) | | | | | | | | |
RBC Global Opportunities Fund | | | | | | | | | | | | | | | | | | | | |
Class A | | | | | | | | | | | | | | | | | | | | |
- Including Max Sales Charge of 5.75% | | | (16.72 | )%(e) | | | 5.63% | | | | 8.04% | | | | | | | | | |
- At Net Asset Value | | | (11.66 | )%(e) | | | 6.90% | | | | 8.81% | | | | 1.00% | | | | 24.16% | |
Class I | | | | | | | | | | | | | | | | | | | | |
- At Net Asset Value | | | (11.44 | )%(e) | | | 7.17% | | | | 9.01% | | | | 0.75% | | | | 0.81% | |
Class R6 | | | | | | | | | | | | | | | | | | | | |
- At Net Asset Value | | | (11.35 | )%(e) | | | 7.23% | | | | 9.06% | | | | 0.70% | | | | 0.72% | |
MSCI ACWI Net
Total Return USD Index(f) | | | (7.44 | )%(e) | | | 6.94% | | | | 7.14% | | | | | | | | | |
8
|
PERFORMANCE SUMMARY (UNAUDITED) |
Average Annual Total Returns as of March 31, 2023 (Unaudited)
| | | | | | | | | | | | | | | | | | | | |
| | | 1
Year | | | 5
Year | | | Since
Inception(a) | | | Net
Expense
Ratio(b)(c) | | | Gross
Expense
Ratio(b)(c) | |
RBC Global Equity Leaders Fund | | | | | | | | | | | | | | | | | | | | |
Class A | | | | | | | | | | | | | | | | | | | | |
- Including Max Sales Charge of 5.75% | | | (14.91)% | (e) | | | N/A | | | | (18.48)% | (e) | | | | | | | | |
-At Net Asset Value | | | (9.73)% | (e) | | | N/A | | | | (14.65)% | (e) | | | 1.00% | | | | 2.26% | |
Class I | | | | | | | | | | | | | | | | | | | | |
-At Net Asset Value | | | (9.48)% | (e) | | | N/A | | | | (14.39)% | (e) | | | 0.75% | | | | 1.60% | |
Class R6 | | | | | | | | | | | | | | | | | | | | |
-At Net Asset Value | | | (9.43)% | (e) | | | N/A | | | | (14.35)% | (e) | | | 0.70% | | | | 1.58% | |
MSCI ACWI Net Total Return USD Index(f) | | | (7.44)% | (e) | | | N/A | | | | (8.48)% | (e) | | | | | | | | |
RBC International Opportunities Fund | | | | | | | | | | | | | | | | | | | | |
Class A | | | | | | | | | | | | | | | | | | | | |
- Including Max Sales Charge of 5.75% | | | (13.84)% | (e) | | | 1.73% | | | | 3.20% | | | | | | | | | |
-At Net Asset Value | | | (8.55)% | (e) | | | 2.95% | | | | 3.94% | | | | 1.05% | | | | 6.35% | |
Class I | | | | | | | | | | | | | | | | | | | | |
-At Net Asset Value | | | (8.33)% | (e) | | | 3.41% | | | | 4.28% | | | | 0.80% | | | | 0.98% | |
Class R6 | | | | | | | | | | | | | | | | | | | | |
-At Net Asset Value | | | (8.19)% | (e) | | | 3.49% | | | | 4.34% | | | | 0.75% | | | | 1.03% | |
MSCI ACWI ex US Index(f) | | | (5.07)% | (e) | | | 2.47% | | | | 3.75% | | | | | | | | | |
RBC International Equity Fund(d) | | | | | | | | | | | | | | | | | | | | |
Class A | | | | | | | | | | | | | | | | | | | | |
- Including Max Sales Charge of 5.75% | | | N/A | | | | N/A | | | | (1.60)% | (e) | | | | | | | | |
- At Net Asset Value | | | N/A | | | | N/A | | | | 4.40% | | | | 1.04% | | | | 2.24% | |
Class I | | | | | | | | | | | | | | | | | | | | |
- At Net Asset Value | | | N/A | | | | N/A | | | | 4.50% | | | | 0.79% | | | | 1.71% | |
Class R6 | | | | | | | | | | | | | | | | | | | | |
- At Net Asset Value | | | N/A | | | | N/A | | | | 4.50% | | | | 0.74% | | | | 1.68% | |
MSCI EAFE Total Return Net Index(f) | | | N/A | | | | N/A | | | | 7.54% | | | | | | | | | |
RBC International Small Cap Equity Fund(d) | | | | | | | | | | | | | | | | | | | | |
Class A | | | | | | | | | | | | | | | | | | | | |
- Including Max Sales Charge of 5.75% | | | N/A | | | | N/A | | | | (3.39)% | (e) | | | | | | | | |
- At Net Asset Value | | | N/A | | | | N/A | | | | 2.50% | | | | 1.24% | | | | 2.47% | |
Class I | | | | | | | | | | | | | | | | | | | | |
- At Net Asset Value | | | N/A | | | | N/A | | | | 2.60% | | | | 0.99% | | | | 1.94% | |
Class R6 | | | | | | | | | | | | | | | | | | | | |
- At Net Asset Value | | | N/A | | | | N/A | | | | 2.60% | | | | 0.94% | | | | 1.91% | |
MSCI ACWI ex USA Small Cap Index(f) | | | N/A | | | | N/A | | | | 4.37% | | | | | | | | | |
9
|
PERFORMANCE SUMMARY (UNAUDITED) |
Average Annual Total Returns as of March 31, 2023 (Unaudited)
| | | | | | | | | | | | | | | | | | | | |
| | | 1
Year | | | 5
Year | | | Since
Inception(a) | | | Net
Expense
Ratio(b)(c) | | | Gross
Expense
Ratio(b)(c) | |
RBC China Equity Fund(g) | | | | | | | | | | | | | | | | | | | | |
Class A | | | | | | | | | | | | | | | | | | | | |
- Including Max Sales Charge of 5.75% | | | N/A | | | | N/A | | | | (11.14 | )%(e) | | | | | | | | |
- At Net Asset Value | | | N/A | | | | N/A | | | | (5.72 | )%(e) | | | 1.30% | | | | 3.47% | |
Class I | | | | | | | | | | | | | | | | | | | | |
- At Net Asset Value | | | N/A | | | | N/A | | | | (5.44 | )%(e) | | | 1.05% | | | | 3.04% | |
Class R6 | | | | | | | | | | | | | | | | | | | | |
- At Net Asset Value | | | N/A | | | | N/A | | | | (5.40 | )%(e) | | | 1.00% | | | | 3.06% | |
MSCI China Index(f) | | | N/A | | | | N/A | | | | (0.44 | )%(e) | | | | | | | | |
MSCI China All Shares Index(f) | | | N/A | | | | N/A | | | | (2.47 | )%(e) | | | | | | | | |
Parentheses indicate negative performance returns.
Performance data quoted represents past performance. Past performance is no guarantee of future results. Investment return and principal value of an investment will fluctuate so that an investor’s shares, when redeemed, may be worth more or less than their original cost. Current performance may be lower or higher than performance quoted. Performance shown reflects contractual fee waivers, without such fee waivers total returns would be reduced. For performance data current to the most recent month-end go to www.rbcgam.com. Please see footnotes below.
| (a) | The since inception date (commencement of operations) is December 20, 2013 for RBC Emerging Markets Equity Fund for Class A and Class I shares and November 22, 2016 for Class R6 shares and February 9, 2018 for RBC Emerging Markets Value Equity Fund for Class I and Class R6 shares and April 19, 2022 for Class A shares and December 3, 2014 for RBC Global Opportunities Fund and RBC International Opportunities Fund for Class I shares, November 22, 2016 for Class R6 shares and January 28, 2020 for Class A Shares. The performance in the table for Class R6 shares prior to November 22, 2016 reflects the performance of the Class I shares since the Fund’s inception, adjusted to reflect the fees and expenses of Class R6 shares. The performance in the table for Class A shares of Global Opportunities Fund and International Opportunities Fund prior to January 28, 2020, reflects the performance of Class I shares since the Fund’s inception, adjusted to reflect the fees and expenses of Class A shares. |
| (b) | The Funds’ expenses are from the Funds’ most recent prospectus dated July 28, 2022, and reflect the fiscal year ended March 31, 2022. For Global Equity Leaders Fund, the expenses reflect the period from December 15, 2021 (commencement of operations) to March 31, 2022. For China Equity Fund, Emerging Markets ex-China Equity Fund, International Equity Fund and International Small Cap Equity Fund expenses are based on estimates for each Fund’s first fiscal year. |
| (c) | The Advisor has contractually agreed to waive fees and/or make payments in order to keep total operating expenses of the Fund to the levels disclosed in the Funds’ prospectuses until July 31, 2024 (September 30, 2024 for RBC Emerging Markets Equity Fund). |
| (d) | The inception date for the RBC Emerging Markets ex-China Equity Fund is December 15, 2022. The inception date for the RBC International Equity Fund and RBC International Small Cap Equity Fund is December 14, 2022. Short-term performance, in particular, is not a good indication of the fund’s future performance, and an investment should not be made based solely on returns. |
| (e) | Parentheses indicate negative performance returns. |
10
|
PERFORMANCE SUMMARY (UNAUDITED) |
| (f) | Each of the comparative indices is a widely recognized market value weighted measure of the return of securities, but does not include sales fees or operating expenses. You cannot invest directly in indices. |
| (g) | The inception date for the RBC China Equity Fund is April 11, 2022. Short term performance, in particular, is not a good indication of the fund’s future performance, and an investment should not be made based solely on returns. |
The MSCI ACWI Index is a free float-adjusted market capitalization weighted index that is designed to measure the equity market performance of developed and emerging markets. It captures large- and mid-capitalization representation across developed markets and emerging markets countries and covers approximately 85% of the global investable equity opportunity set. The Net Index is net of any foreign withholding tax.
The MSCI ACWI ex USA Index is a free float-adjusted market capitalization weighted index that is designed to measure the equity market performance of developed and emerging markets excluding the U.S. It captures large- and mid-capitalization representation across developed markets and emerging markets countries excluding the U.S. and covers approximately 85% of the global investable equity opportunity set outside the U.S. The Net Index is net of any foreign withholding tax.
The MSCI EAFE Index is an equity index which captures large- and mid-capitalization representation across 21 Developed Markets countries around the world, excluding the U.S. and Canada. With 796 constituents, the index covers approximately 85% of the free float-adjusted market capitalization in each country.
The MSCI ACWI ex USA Small Cap Index captures small capitalization representation across 22 of 23 Developed Markets (DM) countries (excluding the U.S.) and 23 Emerging Markets (EM) countries. With 4,330 constituents, the index covers approximately 14% of the global equity opportunity set outside the U.S. The Net Index is net of any foreign withholding tax.
The MSCI Emerging Markets Index is a free float-adjusted market capitalization index that is designed to measure equity market performance of emerging markets. It captures large- and mid-capitalization representation across emerging markets countries and covers approximately 85% of the free float-adjusted market capitalization in each country. The Net Index is net of any foreign withholding tax. The MSCI Emerging Markets ex-China Index captures large- and mid-capitalization representation across 23 of the 24 Emerging Markets (EM) countries excluding China. With 663 constituents, the index covers approximately 85% of the free float-adjusted market capitalization in each country. The Net Index is net of any foreign withholding tax. The MSCI China and MSCI China All Shares Indices capture large- and mid-capitalization representation across China A shares, H shares, B shares, Red chips, P chips, and foreign listings (e.g., ADRs). The MSCI China Index covers about 85% of this China equity universe, and currently includes large- and mid-capitalization A shares represented at 20% of their free float-adjusted market capitalization. The MSCI China All Shares Index aims to reflect the opportunity set of China share classes listed in Hong Kong, Shanghai, Shenzhen, and outside of China, and is based on the concept of the integrated MSCI China equity universe with China A shares included. The Net Indices are net of any foreign withholding tax.
You cannot invest directly in an index.
Mutual fund investing involves risk. Principal loss is possible.
11
| | | | | | | | |
| | | | | | | | MANAGEMENT DISCUSSION AND ANALYSIS (UNAUDITED) |
| | | | | | | | RBC Emerging Markets Equity Fund |
| | | | | | | | |
| | | | |
Investment
Strategy | | | | | | | | The Fund seeks to achieve its investment objective by investing, under normal circumstances, at least 80% of its assets in equity securities tied to emerging market countries that are considered by the Fund to have the potential to provide long-term capital growth. For purposes of this policy, the term “assets” means net assets plus the amount of borrowings for investment purposes. |
| | | | |
| Performance | | | | | | | | For the 12-month period ended March 31, 2023, the Fund had an annualized total return of -4.38% (Class I). That compares to an annualized total return of -10.70% for the MSCI Emerging Markets Net Total Return USD Index, the Fund’s primary benchmark. |
| | | | |
Factors That
Contributed to
Relative Returns | | | | | | | | • Performance of stocks within the Consumer Discretionary and Health Care sectors • Stock selection in India and China, as well as the Fund’s overweight exposure to Turkey |
| | | | |
Factors That
Detracted From
Relative Returns | | | | | | | | • Stock selection in South Korea |
| | | | | | | | Mutual fund investing involves risk. Principal loss is possible. The Fund invests in foreign securities, which involve greater volatility and political, economic, and currency risks, and differences in accounting methods. These risks may be greater in emerging markets. The Fund may be subject to the risk that a particular investment may be difficult to purchase or sell and that the Fund may be unable to sell illiquid securities at an advantageous time or price. These risks are described more fully in the prospectus. |
| | | | |
| | | | | | | | The MSCI Emerging Markets Index is a free float-adjusted market capitalization index that is designed to measure equity market performance of emerging markets. It captures large- and mid-capitalization representation across emerging markets countries and covers approximately 85% of the free float-adjusted market capitalization in each country. The Net Index is net of any foreign withholding tax. The Net Index are net of any foreign withholding tax. |
| | | | | | | | Fund holdings and/or sector allocations are subject to change at any time and are not recommendations to buy or sell any security. Current and future holdings are subject to risk. Please refer to the Schedule of Investments in this report for a complete list of Fund holdings. |
| | | | | | | | Fund performance attribution data excludes Fund holdings that are fair-valued. |
| | | | | | | | Past performance is not a guarantee of future results. |
12
| | | | | | | | | | | | | | | | |
| | | |
MANAGEMENT DISCUSSION AND ANALYSIS (UNAUDITED) | | | | | | |
RBC Emerging Markets Equity Fund | | | | | | |
| | | | | | | |
| | | | |
| The Fund seeks to provide long-term capital growth. | | | | | | | | Investment Objective |
| | | | | | | | | | | | | | | |
| MSCI Emerging Markets Net Total Return USD Index | | | | | | Benchmark |
| | | | | | | | | | | | | | | | | |
| | | | | | | | | | | | | | | | | |
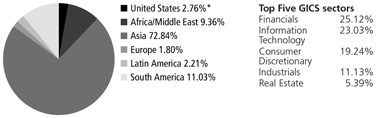
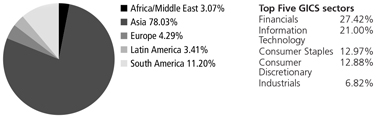 | | | | | | Asset Allocation as of 3/31/23 (% of Fund’s investments) & Top Five GICS sectors (as of 3/31/23) (% of Fund’s net assets) |
| | | | | | | |
| | | | | | |
Taiwan Semiconductor Manufacturing Co. Ltd. | | 6.84% | | Tata Consultancy Services Ltd. | | 3.72% | | | | | | Top Ten Holdings (excluding investment companies) (as of 3/31/23) (% of Fund’s net assets) |
Tencent Holdings Ltd. | | | | 4.99% | | Fomento Economico Mexicano SAB de CV | | 3.40% | | | | |
SK Hynix, Inc. | | | | 4.48% | | Ping An Insurance Group Co. of China Ltd. | | 3.35% | | | | |
Antofagasta Plc | | | | 3.99% | | Unilever Plc | | 3.12% | | | | |
Housing Development Finance Corp. Ltd. Plc | | | | 3.90% | | Alibaba Group Holding Ltd. | | | | 2.97% | | | | |
*A listing of all portfolio holdings can be found beginning on page 33 | | | | | | |
| | | | | | | | | | | | | | | | | |
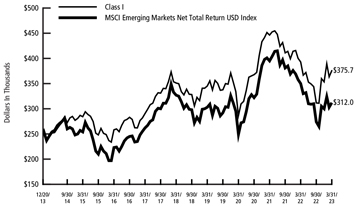
| | | | | | Growth of $250,000 Initial Investment Since Inception (12/20/13) |
| | | | | | |
| The graph reflects an initial hypothetical investment of $250,000 over the period from December 20, 2013 (commencement of operations) to March 31, 2023 and is based on Class I shares. The Fund’s total return includes reinvested dividends and capital gains. The Fund’s total return also includes operating expenses that reduce return while the total return of the index does not. The graph does not reflect the deduction of taxes that a shareholder would pay on fund distributions or redemption of fund shares. Performance of other classes will vary due to differences in fee structures. This chart does not imply any future performance. | | | | | | |
| | | | | | | |
13
| | | | | | |
| | | | | | MANAGEMENT DISCUSSION AND ANALYSIS (UNAUDITED) |
| | | | | | RBC Emerging Markets ex-China Equity Fund |
| | | | | | |
| | | |
Investment Strategy | | | | | | The Fund seeks to achieve its investment objective by investing, under normal circumstances, at least 80% of its assets in equity securities economically tied to emerging market countries (excluding China). For purposes of this policy, the term “assets” means net assets plus the amount of borrowings for investment purposes. |
| | | |
| Performance | | | | | | For the period from December 15, 2022 (commencement of operations) through March 31, 2023, the Fund had a total return of 4.10% (Class I). That compares to a total return of 3.51% for the MSCI Emerging Markets ex-China Total Return Net Index, the Fund’s primary benchmark, for the same period. |
| | | |
Factors That
Contributed to
Relative Returns | | | | | | • Performance of stocks within the Health Care and Industrials sectors. • Overweight exposure to Taiwan and Mexico, as well as strong stock selection in India. |
| | | |
Factors That
Detracted From
Relative Returns | | | | | | Performance of stocks within the Information Technology sector negatively impacted the Fund’s performance. |
| | | | | | Mutual fund investing involves risk. Principal loss is possible. The Fund is new with no operating history or track record on which to base investment decisions. The Fund invests in foreign securities, which involve greater volatility and political, economic, and currency risks, and differences in accounting methods. These risks may be greater in emerging markets. The Fund’s consideration of ESG factors could cause it to perform differently compared to funds that do not take ESG factors into account. These risks are described more fully in the prospectus. |
| | | | | | The MSCI Emerging Markets ex-China Total Return Net Index captures large and mid cap representation across 23 of the 24 Emerging Markets (EM) countries excluding China. With 663 constituents, the index covers approximately 85% of the free float-adjusted market capitalization in each country. The Net Index is net of any foreign withholding tax. You cannot invest directly in an index. |
| | | | | | Fund holdings and/or sector allocations are subject to change at any time and are not recommendations to buy or sell any security. Current and future holdings are subject to risks. |
| | | | | | Fund performance attribution data excludes Fund holdings that are fair-valued. |
| | | | | | Past performance is not a guarantee of future results. |
14
| | | | | | | | | | | | | | | | | | |
| | | |
MANAGEMENT DISCUSSION AND ANALYSIS (UNAUDITED) | | | | | | |
RBC Emerging Markets ex-China Equity Fund | | | | | | |
| | | | | | | |
| | | | |
| The Fund seeks to provide long-term capital growth. | | | | | | | | Investment Objective |
| | | | | | | | | | | | | | | | | |
| MSCI Emerging Markets ex-China Net Total Return Index | | | | | | Benchmark |
| | | | | | | | | | | | | | | | | | |
| | | | | | | | | | | | | | | | | | |
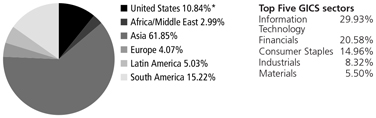 | | | | | | Asset Allocation as of 3/31/23 (% of Fund’s investments) & Top Five GICS sectors (as of 3/31/23) (% of Fund’s net assets) |
| *Includes U.S. dollar denominated cash equivalent investments and exchange-traded funds representing 2.81% and 8.03% of investments, respectively. | | | | | | |
| | | | | | | |
| | | | | | |
Taiwan Semiconductor Manufacturing Co. Ltd. | | | 9.62% | | | Antofagasta Plc | | 3.92% | | | | | | Top Ten Holdings (excluding investment companies) (as of 3/31/23) (% of Fund’s net assets) |
Samsung Electronics Co. Ltd. | | | 5.28% | | | Fomento Economico Mexicano
SAB de CV | | 3.77% | | | | |
HDFC Bank Ltd. | | | 4.53% | | | iShares India 50 ETF | | 3.68% | | | | |
Infosys Ltd. | | | 4.36% | | | Voltronic Power Technology Corp. | | 3.19% | | | | |
iShares MSCI India | | | 4.33% | | | Unilever Plc | | | | 3.10% | | | | |
*A listing of all portfolio holdings can be found beginning on page 36 | | | | | | |
| | | | | | | | | | | | | | | | | | |
| | | | | | |
| | | | | | |
| | | | | | |
| | | | | | |
| | | | | | |
| | | | | | |
| | | | | | |
| | | | | | |
| | | | | | |
| | | | | | |
| | | | | | |
| | | | | | |
| | | | | | |
| | | | | | |
| | | | | | |
| | | | | | |
| | | | | | |
| | | | | | |
| | | | | | |
| | | | | | |
| | | | | | |
| | | | | | |
| | | | | | |
| | | | | | |
15
| | | | | | | | |
| | | | | | | | MANAGEMENT DISCUSSION AND ANALYSIS (UNAUDITED) |
| | | | | | | | RBC Emerging Markets Value Equity Fund |
| | | | | | | | |
| | | | |
Investment Strategy | | | | | | | | The Fund seeks to achieve its investment objective by investing, under normal circumstances, at least 80% of its assets in equity securities tied economically to emerging market countries that are considered to be undervalued in relation to earnings, dividends and/or assets. For purposes of this policy, the term “assets” means net assets plus the amount of borrowings for investment purposes. |
| | | | | | | | |
| | | | |
| Performance | | | | | | | | For the 12-month period ended March 31, 2023, the Fund had an annualized total return of -6.10% (Class I). That compares to an annualized total return of -10.70% for the MSCI Emerging Markets Net Total Return USD Index, the Fund’s primary benchmark. |
| | | | | | | | |
| | | | |
| Factors That Contributed to Relative Returns | | | | | | | | • Performance of stocks within the Financials and Information Technology sectors. • Stock selection in India and Taiwan |
| | | | | | | | |
| | | | |
Factors That Detracted From Relative Returns | | | | | | | | • An underweight exposure and stock selection within the Communication Services sector. • Stock selection in Vietnam. |
| | | | | | | | |
| | | | |
| | | | | | | | Mutual fund investing involves risk. Principal loss is possible. The Fund invests in foreign securities, which involve greater volatility and political, economic, and currency risks, and differences in accounting methods. These risks may be greater in emerging markets. The Fund invests in value stocks, which may not increase in price as anticipated by the Adviser if they fall out of favor with investors or the markets favor faster growing companies. The Fund may be subject to the risk that a particular investment may be difficult to purchase or sell and that the Fund may be unable to sell illiquid securities at an advantageous time or price. These risks are described more fully in the prospectus. |
| | | | | | | | The MSCI Emerging Markets Index is a free float-adjusted market capitalization index that is designed to measure equity market performance of emerging markets. It captures large- and mid-capitalization representation across emerging markets countries and covers approximately 85% of the free float-adjusted market capitalization in each country. The Net Index is net of any foreign withholding tax. You cannot invest directly in an index. |
| | | | | | | | Fund holdings and/or sector allocations are subject to change at any time and are not recommendations to buy or sell any security. Current and future holdings are subject to risk. Please refer to the Schedule of Investments in this report for a complete list of Fund holdings. |
| | | | | | | | Fund performance attribution data excludes Fund holdings that are fair-valued. |
| | | | | | | | Past performance is not a guarantee of future results. |
16
| | | | | | | | | | | | | | | | |
| | | |
MANAGEMENT DISCUSSION AND ANALYSIS (UNAUDITED) | | | | | | |
RBC Emerging Markets Value Equity Fund | | | | | | |
| | | | | | | |
| | | | |
| The Fund seeks to provide long-term capital growth. | | | | | | | | Investment Objective |
| | | | | | | | | | | | | | | |
| MSCI Emerging Markets Net Total Return USD Index | | | | | | Benchmark |
| | | | | | | | | | | | | | | | | |
| | | | | | | | | | | | | | | | | |
 | | | | | | Asset Allocation as of 3/31/23 (% of Fund’s investments) & Top Five GICS sectors (as of 3/31/23) (% of Fund’s net assets) |
| *Includes U.S. dollar denominated cash equivalent investments representing 1.36% of investments. | | | | | | |
| | | | | | | |
| | | | | | |
Taiwan Semiconductor Manufacturing Co. Ltd. | | 6.78% | | Antofagasta Plc | | 2.20% | | | | | | Top Ten Holdings (excluding investment companies) (as of 3/31/23) (% of Fund’s net assets) |
Alibaba Group Holding Ltd. | | 5.03% | | Ping An Bank Co. Ltd. | | 2.10% | | | | |
Samsung Electronics Co. Ltd. | | 4.68% | | Innodisk Corp. | | 1.86% | | | | |
Naspers Ltd. | | 2.96% | | Axis Bank Ltd. | | | | 1.84% | | | | |
Ping An Insurance Group Co. of China Ltd. | | 2.74% | | LG Corp. | | | | 1.83% | | | | |
*A listing of all portfolio holdings can be found beginning on page 39 | | | | | | |
| | | | | | | | | | | | | | | | | |
| | | | | | Growth of $250,000 Initial Investment Since Inception (2/9/18) |
| | | | | | |
| The graph reflects an initial hypothetical investment of $250,000 over the period from February 9, 2018 (commencement of operations) to March 31, 2023 and is based on Class I shares. The Fund’s total return includes reinvested dividends and capital gains. The Fund’s total return also includes operating expenses that reduce return while the total return of the index does not. The graph does not reflect the deduction of taxes that a shareholder would pay on fund distributions or redemption of fund shares. Performance of other classes will vary due to differences in fee structures. This chart does not imply any future performance. | | | | | | |
| | | | | | | |
| | | | | | | |
17
| | | | | | | | |
| | | | | | | | MANAGEMENT DISCUSSION AND ANALYSIS (UNAUDITED) |
| | | | | | | | RBC Global Opportunities Fund |
| | | | | | | | |
| | | | |
Investment Strategy | | | | | | | | The Fund seeks to achieve its investment objective by primarily investing in equity securities of issuers located throughout the world, including both developed and emerging markets. Under normal circumstances, the Fund will typically invest at least the lesser of (i) 40% of its total assets in the securities of issuers located in countries other than the United States or (ii) an amount of its total assets equal to the approximate percentage of issuers located in countries other than the United States included in the MSCI ACWI Net Total Return USD Index, unless the Sub-Advisor determines, in its sole discretion, that conditions are not favorable. If the Sub-Advisor determines that conditions are not favorable, the Fund may invest under 40% of its total assets in the securities of issuers located outside of the United States, provided that the Fund will not invest less than 30% of its total assets in such securities except for temporary defensive purposes. The Fund will normally invest in equity securities of companies domiciled in at least three countries (one of which may be the United States). The Fund will invest in securities across all market capitalizations, although the Fund may invest a significant portion of its assets in companies of one particular market capitalization category. |
| | | | | | | | |
| | | | |
| Performance | | | | | | | | For the 12-month period ended March 31, 2023, the Fund had an annualized total return of -11.44% (Class I). That compares to an annualized total return of -7.44% for the MSCI ACWI Net Total Return USD Index, the Fund’s primary benchmark. |
| | | | | | | | |
| | | | |
| Factors That Contributed to Relative Returns | | | | | | | | • Performance of stocks within the Consumer Staples, Consumer Discretionary and Information Technology sectors • At the stock level, Anheuser-Busch InBev, as the Belgium-based brewer delivered robust revenue growth aided by strong pricing power • Other individual stocks that made positive contributions to the Fund’s performance included AutoZone, T-Mobile and Fortive. |
| | | | | | | | |
| | | | |
Factors That Detracted From Relative Returns | | | | | | | | • Underperformance in the Financials, Health Care, and Energy sectors • Individual stocks that detracted from the Fund’s performance included First Republic Bank, SVB Financial and Alphabet. |
| | | | | | | | |
| | | | |
| | | | | | | | Mutual fund investing involves risk. Principal loss is possible. The Fund invests in foreign securities, which involve greater volatility and political, economic, and currency risks, and differences in accounting methods. These risks may be greater in emerging markets. The Fund may focus its investments in a region or small group of countries. As a result, the Fund’s performance may be subject to greater volatility than a more geographically diversified fund.The Fund’s investments in smaller companies subject it to greater levels of credit, market and issuer risk. The Fund may be subject to the risk that a particular investment may be difficult to purchase or sell and that the Fund may be unable to sell illiquid securities at an advantageous time or price. These risks are described more fully in the prospectus. |
| | | | | | | | The MSCI ACWI Index is a free float-adjusted market capitalization weighted index that is designed to measure the equity market performance of developed and emerging markets. It captures large- and mid-capitalization representation across developed markets and emerging markets countries and covers approximately 85% of the global investable equity opportunity set. The Net Index is net of any foreign withholding tax. You cannot invest directly in an index. |
18
| | | | |
MANAGEMENT DISCUSSION AND ANALYSIS (UNAUDITED) | | | | |
| | |
| RBC Global Opportunities Fund | | | | |
| | |
| Fund holdings and/or sector allocations are subject to change at any time and are not recommendations to buy or sell any security. Current and future holdings are subject to risk. Please refer to the Schedule of Investments in this report for a complete list of Fund holdings. | | | | |
| | |
| Fund performance attribution data excludes Fund holdings that are fair-valued. | | | | |
| | |
| Past performance is not a guarantee of future results. | | | | |
19
| | | | | | | | | | | | | | | | | | | | |
| | | | | | | | | | MANAGEMENT DISCUSSION AND ANALYSIS (UNAUDITED) | |
| | | | | | | | | | RBC Global Opportunities Fund | |
Investment Objective | | | | | | | | | | The Fund seeks to provide long-term capital growth. | |
Benchmark | | | | | | | | | | MSCI ACWI Net Total Return USD Index | |
Asset Allocation as of 3/31/23 (% of Fund’s investments) & Top Five GICS
sectors (as of 3/31/23) (% of
Fund’s net assets) | | | | | | | | 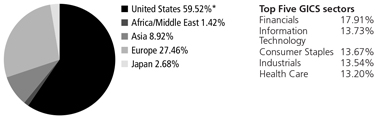
| |
| | | |
| | | | | | | | | | * Includes U.S. dollar denominated cash equivalent investments representing 3.89% of investments. | |
| | | | | | |
Top Ten Holdings (excluding investment companies) (as of 3/31/23) (% of Fund’s net assets) | | | | | | | | | | Microsoft Corp. | | | 6.15 | % | | Fortive Corp. | | | 3.69 | % |
| | Anheuser-Busch InBev NV | | | 5.66 | % | | Incyte Corp. | | | 3.48 | % |
| | UnitedHealth Group, Inc. | | | 4.68 | % | | EOG Resources, Inc. | | | 3.36 | % |
| | AIA Group Ltd. | | | 4.66 | % | | PepsiCo, Inc. | | | 3.34 | % |
| | T-Mobile US, Inc. | | | 4.60 | % | | | | | | |
| | | | | | | | | | Taiwan Semiconductor | | | 4.54 | % | | | | | | |
| | | | | | | | | | Manufacturing Co. Ltd. | | | | | | | | | | |
| | | | | | | | | | *A listing of all portfolio holdings can be found beginning on page 44 | |
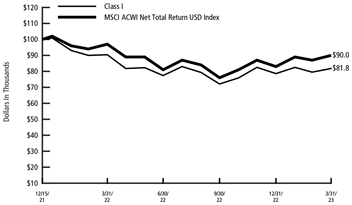
Growth of $100,000 Initial Investment Since Inception (12/3/14) | | | | | | | | | | 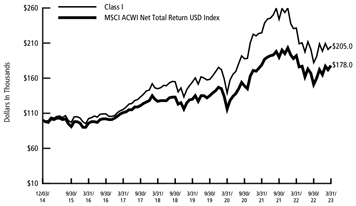
The graph reflects an initial hypothetical investment of $100,000 over the period from December 3, 2014 (commencement of operations) to March 31, 2023 and is based on Class I shares. The Fund’s total return includes reinvested dividends and capital gains. The Fund’s total return also includes operating expenses that reduce return while the total return of the index does not. The graph does not reflect the deduction of taxes that a shareholder would pay on fund distributions or redemption of fund shares. Performance of other classes will vary due to differences in fee structures. This chart does not imply any future performance. | |
| | | | | | | | | | | | | | | | | | | | |
20
This Page Intentionally Left Blank
21
| | | | | | | | |
| | | | | | | | MANAGEMENT DISCUSSION AND ANALYSIS (UNAUDITED) |
| | | | | | | | RBC Global Equity Leaders Fund |
| | | | | | | | |
| | | | |
Investment Strategy | | | | | | | | The Fund seeks to achieve its investment objective by primarily investing in equity securities of issuers located throughout the world, including both developed and emerging markets. Under normal circumstances, the Fund aims to achieve its investment objective by investing at least 80% of the value of its net assets (plus any borrowings for investment purposes) in equity securities. The Fund also will, under normal market conditions: (1) invest at least 40% of its assets outside the United States, or if market conditions are not favorable, at least 30% of its assets outside the United States, and (2) hold securities of issuers located in at least three countries. |
| | | | |
| Performance | | | | | | | | For the 12-month period ended March 31, 2023, the Fund had an annualized total return of -9.48% (Class I). That compares to an annualized total return of -7.44% for the MSCI ACWI Net Total Return USD Index, the Fund’s primary benchmark. |
| | | | |
Factors That Contributed to Relative Returns | | | | | | | | • Performance of stocks within the Consumer Staples, Consumer Discretionary and Communication Services sectors • At the stock level, discount retailer TJX’s delivering robust sales growth • Other individual stocks that contributed to the Fund’s performance included T-Mobile, Anheuser-Busch InBev and PepsiCo. |
| | | | |
Factors That Detracted From Relative Returns | | | | | | | | • Underperformance in the Financials, Energy and Health Care sectors • Individual stocks that detracted from the Fund’s performance included Charles Schwab, Blackstone and Alphabet. |
| | | | | | | | Mutual fund investing involves risk. Principal loss is possible. The Fund invests in foreign securities, which involve greater volatility and political, economic, and currency risks, and differences in accounting methods. These risks may be greater in emerging markets. The Fund is non-diversified, which means it may concentrate its assets in fewer individual holdings than a diversified fund. Therefore, the Fund is more exposed to individual security volatility than a diversified fund. The Fund’s consideration of ESG factors could cause it to perform differently compared to funds that do not take ESG factors into account. These risks are described more fully in the prospectus. |
| | | | | | | | The MSCI ACWI Index is a free float-adjusted market capitalization weighted index that is designed to measure the equity market performance of developed and emerging markets. It captures large- and mid-capitalization representation across developed markets and emerging markets countries and covers approximately 85% of the global investable equity opportunity set. The Net Index is net of any foreign withholding tax. You cannot invest directly in an index. Fund holdings and/or sector allocations are subject to change at any time and are not recommendations to buy or sell any security. Current and future holdings are subject to risk. Please refer to the Schedule of Investments in this report for complete lists of Fund holdings. Fund performance attribution data excludes Fund holdings that are fair-valued. |
| | | | | | | | Past performance is not a guarantee of future results. |
22
| | | | | | | | | | | | | | | | | | |
MANAGEMENT DISCUSSION AND ANALYSIS (UNAUDITED) | | | | | | | | | | | |
RBC Global Equity Leaders Fund | | | | | | | | | | | |
The Fund seeks to provide long-term capital growth. | | | | | | | | | | | Investment Objective |
MSCI ACWI Net Total Return USD Index | | | | | | | | | | | Benchmark |

| | | | | | | | | Asset Allocation as of 3/31/23 (% of Fund’s investments) & Top Five GICS sectors (as of 3/31/23) (% of Fund’s net assets) |
| | | |
*Includes U.S. dollar denominated cash equivalent investments representing 0.97% of investments. | | | | | | | | | | | |
| | | | | | | |
Microsoft Corp. | | 6.92% | | NVIDIA Corp. | | | 4.64 | % | | | | | | | | | | Top Ten Holdings (excluding investment companies) (as of 3/31/23) (% of Fund’s net assets) |
UnitedHealth Group, Inc. | | 5.75% | | Anheuser-Busch InBev NV | | | 4.59 | % | | | | | | | | |
T-Mobile US, Inc. | | 5.73% | | Estee Lauder Cos, Inc. (The) | | | 4.33 | % | | | | | | | | |
Alphabet, Inc. | | 4.90% | | Roche Holding AG | | | 3.95 | % | | | | | | | | |
PepsiCo, Inc. | | 4.84% | | Deutsche Post AG | | | 3.94 | % | | | | | | | | |
* A listing of all portfolio holdings can be found beginning on page 47 | | | | | | | | | | | | |
The graph reflects an initial hypothetical investment of $100,000 over the period from December 15, 2021 (commencement of operations) to March 31, 2023 and is based on Class I shares. The Fund’s total return includes reinvested dividends and capital gains. The Fund’s total return also includes operating expenses that reduce return while the total return of the index does not. The graph does not reflect the deduction of taxes that a shareholder would pay on fund distributions or redemption of fund shares. Performance of other classes will vary due to differences in fee structures. This chart does not imply any future performance. | | | | | | | | | | | | | | Growth of $100,000 Initial Investment Since Inception (12/15/2021) |
23
| | | | | | | | |
| | | | | | | | MANAGEMENT DISCUSSION AND ANALYSIS (UNAUDITED) |
| | | | | | | | RBC International Opportunities Fund |
| | | | | | | | |
| | | | |
Investment
Strategy | | | | | | | | The Fund seeks to achieve its investment objective by primarily investing in equity securities of issuers located throughout the world, including both developed and emerging markets, excluding the U.S. The Fund will invest in securities across all market capitalizations, although the Fund may invest a significant portion of its assets in companies of one particular market capitalization category. |
| | | | |
| Performance | | | | | | | | For the 12-month period ended March 31, 2023, the Fund had an annualized total return of -8.33% (Class I). That compares to an annualized total return of -5.07% for the MSCI ACWI ex USA Net Total Return USD Index, the Fund’s primary benchmark. |
| | | | |
Factors That
Contributed to
Relative Returns
Factors That
Detracted From
Relative Returns | | | | | | | | • Performance of stocks within the Real Estate and Information Technology sectors |
| | | | | | | | • Underperformance in the Health Care, Industrials and Utilities • Individual stocks that detracted from the Fund’s performance included Nidec, Roche and E.Sun Financial. |
| | | | | | | | Mutual fund investing involves risk. Principal loss is possible. The Fund invests in foreign securities, which involve greater volatility and political, economic, and currency risks, and differences in accounting methods. These risks may be greater in emerging markets. The Fund may focus its investments in a region or small group of countries. As a result, the Fund’s performance may be subject to greater volatility than a more geographically diversified fund. The Fund’s investments in smaller companies subject it to greater levels of credit, market and issuer risk. The Fund may be subject to the risk that a particular investment may be difficult to purchase or sell and that the Fund may be unable to sell illiquid securities at an advantageous time or price. These risks are described more fully in the prospectus. |
| | | | | | | | The MSCI ACWI ex USA Index is a free float-adjusted market capitalization weighted index that is designed to measure the equity market performance of developed and emerging markets excluding the U.S. It captures large- and mid-capitalization representation across developed markets and emerging markets countries excluding the U.S. and covers approximately 85% of the global investable equity opportunity set outside the U.S. The Net Index is net of any foreign withholding tax. You cannot invest directly in an index. |
| | | | | | | | Fund holdings and/or sector allocations are subject to change at any time and are not recommendations to buy or sell any security. Current and future holdings are subject to risk. Please refer to the Schedule of Investments in this report for a complete list of Fund holdings. |
| | | | |
| | | | | | | | Fund performance attribution data excludes Fund holdings that are fair-valued. |
| | | | |
| | | | | | | | Past performance is not a guarantee of future results. |
24
| | | | | | | | | | | | | | | | | | |
| | | |
MANAGEMENT DISCUSSION AND ANALYSIS (UNAUDITED) | | | | | | |
RBC International Opportunities Fund | | | | | | |
| | | | | | | |
| | | | |
| The Fund seeks to provide long-term capital growth. | | | | | | | | Investment Objective |
| | | | | | | | | | | | | | | | | |
| | | |
| MSCI ACWI ex USA Net Total Return USD Index | | | | | | Benchmark |
| | | | | | | | | | | | | | | | | | |
| | | | | | | | | | | | | | | | | | |
 | | | | | | Asset Allocation as of 3/31/23 (% of Fund’s investments) & Top Five GICS sectors (as of 3/31/23) (% of Fund’s net assets) |
| * Includes U.S. dollar denominated cash equivalent investments representing 0.06% of investments. | | | | | | |
| | | | | | | |
| | | | | | |
Taiwan Semiconductor
Manufacturing Co. Ltd. | | | 5.77% | | | DBS Group Holdings Ltd. | | 4.33% | | | | | | Top Ten Holdings (excluding investment companies) (as of 3/31/23) (% of Fund’s net assets) |
AIA Group Ltd. | | | 5.55% | | | Roche Holding AG | | 4.26% | | | | |
HDFC Bank Ltd. | | | 4.46% | | | E.Sun Financial Holding Co. Ltd. | | 3.93% | | | | |
Anheuser-Busch InBev NV | | | 4.44% | | | Oriental Land Co. Ltd | | 3.67% | | | | |
Essity AB | | | 4.36% | | | Kerry Group Plc | | | | 3.55% | | | | |
*A listing of all portfolio holdings can be found beginning on page 50 | | | | | | |
| | | | | | | | | | | | | | | | | | |
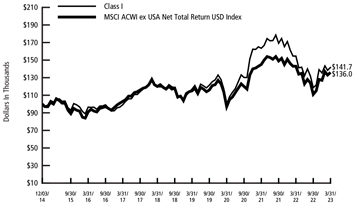
| | | | | | Growth of $100,000 Initial Investment Since Inception (12/3/14) |
| | | | | | |
The graph reflects an initial hypothetical investment of $100,000 over the period from December 3, 2014 (commencement of operations) to March 31, 2023 and is based on Class I shares. The Fund’s total return includes reinvested dividends and capital gains. The Fund’s total return also includes operating expenses that reduce return while the total return of the index does not. The graph does not reflect the deduction of taxes that a shareholder would pay on fund distributions or redemption of fund shares. Performance of other classes will vary due to differences in fee structures. This chart does not imply any future performance. | | | | | | |
| | | | | | | |
25
| | | | | | | | |
| | | | | | | | MANAGEMENT DISCUSSION AND ANALYSIS (UNAUDITED) |
| | | | | | | | RBC International Equity Fund |
| | | | | | | | |
| | | | |
Investment Strategy | | | | | | | | The Fund seeks to achieve its investment objective by investing, under normal circumstances, at least 80% of its assets in equity securities of companies located throughout the world, excluding the United States. |
| | | | | | | | |
| | | | |
| Performance | | | | | | | | For the period from December 14, 2022 (commencement of operations) through March 31, 2023, the Fund had a total return of 4.50% (Class I). That compares to a total return of 7.54% for the MSCI EAFE Total Return Net Index, the Fund’s primary benchmark, for the same period. |
| | | | | | | | |
| | | | |
Factors That Contributed to Relative Returns | | | | | | | | • Performance of stocks within the Communications Services, Real Estate and Information Technology sectors • At the stock level, LVMH Moet Hennessy Luis Vuitton, Mitsubishi UFJ Financial and Novo Nordisk |
| | | | | | | | |
| | | | |
Factors That Detracted From Relative Returns | | | | | | | | • Underperformance in the Financials, Industrials and Energy sectors • Individual stocks that detracted from the Fund’s performance included Aker BP, Roche and Sampo. |
| | | | | | | | |
| | | | |
| | | | | | | | Mutual fund investing involves risk. Principal loss is possible. The Fund is new with no operating history or track record on which to base investment decisions. The Fund invests in foreign securities, which involve greater volatility and political, economic, and currency risks, and differences in accounting methods. These risks may be greater in emerging markets. The Fund’s consideration of ESG factors could cause it to perform differently compared to funds that do not take ESG factors into account. These risks are described more fully in the prospectus. |
| | | | | | | | The MSCI EAFE Index is an equity index which captures large- and mid-capitalization representation across 21 Developed Markets countries around the world, excluding the U.S. and Canada. With 796 constituents, the index covers approximately 85% of the free float-adjusted market capitalization in each country. You cannot invest directly in an index. |
| | | | | | | | Fund holdings and/or sector allocations are subject to change at any time and are not recommendations to buy or sell any security. Current and future holdings are subject to risk. Please refer to the Schedule of Investments in this report for a complete list of Fund holdings. |
| | | | | | | | Fund performance attribution data excludes Fund holdings that are fair-valued. |
| | | | | | | | Past performance is not a guarantee of future results. |
26
| | | | | | | | | | | | | | |
| | | |
MANAGEMENT DISCUSSION AND ANALYSIS (UNAUDITED) | | | | | | |
| | | |
RBC International Equity Fund | | | | | | |
| | | | | | | | | | | | | | | |
| | | |
| The Fund seeks to provide long-term capital growth. | | | | | | Investment
Objective |
| | | | | | | | | | | | | |
| | | |
| MSCI EAFE Total Return Net Index | | | | | | Benchmark |
| | | | | | | | | | | | | | | |
| | | | | | | | | | | | | | | |
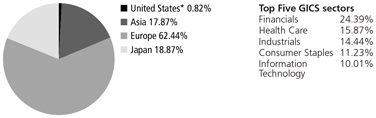 | | | | | | Asset Allocation as of 3/31/23 (% of Fund’s investments) & Top Five GICS sectors (as of 3/31/23) (% of Fund’s net assets) |
| *Includes U.S. dollar denominated cash equivalent investments representing 0.82% of investments. | | | | | | |
| | | | | | | |
| | | | | | | |
Novo Nordisk A/S | | 3.87% | | | | ASML Holding NV | | 2.90% | | | | | | Top Ten Holdings (excluding investment companies) (as of 3/31/23) (% of Fund’s net assets) |
Mitsubishi UFJ Financial Group, Inc. | | 3.80% | | | | London Stock Exchange Group Plc | | 2.89% | | | | |
LVMH Moet Hennessy Louis Vuitton SE | | 3.79% | | | | CSL Ltd. | | 2.73% | | | | |
Tokio Marine Holdings, Inc. | | 3.43% | | | | Diageo Plc | | 2.55% | | | | |
Taiwan Semiconductor Manufacturing Co. Ltd. | | 3.19% | | | | EssilorLuxottica SA | | 2.41% | | | | |
*A listing of all portfolio holdings can be found beginning on page 54 | | | | |
| | | | | | | | | | | | | |
| | | | | | | | | | | | | | | |
27
| | | | | | |
| | | | | | MANAGEMENT DISCUSSION AND ANALYSIS (UNAUDITED) |
| | | | | | RBC International Small Cap Equity Fund |
| | | | | | |
| | | |
Investment Strategy | | | | | | The Fund seeks to achieve its investment objective by investing, under normal circumstances, at least 80% of its assets in equity securities of small companies located throughout the world, excluding the United States. The Fund currently considers “small companies” to be those within the market capitalization range of the MSCI ACWI ex USA Small Cap Index at the time of inital purchase by the Fund. |
| | | |
| Performance | | | | | | For the period from December 14, 2022 (commencement of operations) through March 31, 2023, the Fund had a total return of 2.60% (Class I). That compares to a total return of 4.37% for the MSCI ACWI ex US Small Cap Total Return Net Index, the Fund’s primary benchmark. |
| | | |
Factors That Contributed to Relative Returns | | | | | | • Performance of stocks within the Real Estate, Financials and Consumer Discretionary sectors • At the stock level, Howden Joinery, MIPS and BayCurrent Consulting |
| | | |
Factors That Detracted From Relative Returns | | | | | | • Underperformance in the Information Technology, Materials and Energy sectors • Individual stocks that detracted from the Fund’s performance included Mineral Resources, Aker BP and Abcam. |
| | | |
| | | | | | Mutual fund investing involves risk. Principal loss is possible. The Fund is new with no operating history or track record on which to base investment decisions. The Fund invests in foreign securities, which involve greater volatility and political, economic, and currency risks, and differences in accounting methods. These risks may be greater in emerging markets. The Fund’s investments in smaller companies subject it to greater levels of credit, market and issuer risk. The Fund’s consideration of ESG factors could cause it to perform differently compared to funds that do not take ESG factors into account. These risks are described more fully in the prospectus. |
| | | |
| | | | | | The MSCI ACWI ex USA Small Cap Index captures small capitalization representation across 22 of 23 Developed Markets (DM) countries (excluding the U.S.) and 23 Emerging Markets (EM) countries. With 4,330 constituents, the index covers approximately 14% of the global equity opportunity set outside the U.S. The Net Index is net of any foreign withholding tax. You cannot invest directly in an index. |
| | | |
| | | | | | Fund holdings and/or sector allocations are subject to change at any time and are not recommendations to buy or sell any security. Current and future holdings are subject to risk. Please refer to the Schedule of Investments in this report for a complete list of Fund holdings. |
| | | | | | Fund performance attribution data excludes Fund holdings that are fair-valued. |
| | | | | | Past performance is not a guarantee of future results. |
28
| | | | | | | | | | | | | | |
| | | |
MANAGEMENT DISCUSSION AND ANALYSIS (UNAUDITED) | | | | | | |
| | | |
RBC International Small Cap Equity Fund | | | | | | |
| | | | | | | | | | | | | | | |
| | | |
| The Fund seeks to provide long-term capital growth. | | | | | | Investment
Objective |
| | | | | | | | | | | | | |
| | | |
| MSCI ACWI ex USA Small Cap Total Return Net Index | | | | | | Benchmark |
| | | | | | | | | | | | | | | |
| | | | | | | | | | | | | | | |
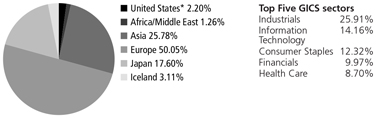 | | | | | | Asset Allocation as of 3/31/23 (% of Fund’s investments) & Top Five GICS sectors (as of 3/31/23) (% of Fund’s net assets) |
| *Includes U.S. dollar denominated cash equivalent investments representing 2.20% of investments. | | | | | | |
| | | | | | | |
| | | | | | | |
Fabrinet | | 3.94% | | | | Chailease Holding Co. Ltd. | | 3.01% | | | | | | Top Ten Holdings (excluding investment companies) (as of 3/31/23) (% of Fund’s net assets) |
BayCurrent Consulting, Inc. | | 3.48% | | | | Howden Joinery Group Plc | | 2.97% | | | | |
Topdanmark AS | | 3.46% | | | | Laboratorios Farmaceuticos Rovi | | 2.72% | | | | |
Voltronic Power Technology Corp. | | 3.33% | | | | SA | | | | | | |
Milbon Co. Ltd. | | 3.30% | | | | Altium Ltd. | | 2.68% | | | | |
Lotus Bakeries NV | | 3.14% | | | | | | | | | | |
*A listing of all portfolio holdings can be found beginning on page 58 | | | | |
| | | | | | | | | | | | | | | |
| | | | | | | | | | | | | | | |
29
| | | | | | | | |
| | | | | | | | MANAGEMENT DISCUSSION AND ANALYSIS (UNAUDITED) |
| | | | | | | | RBC China Equity Fund |
Investment Strategy | | | | | | | | The Fund seeks to achieve its investment objective by investing, under normal circumstances, at least 80% of its assets in equity investments in issuers economically tied to China. For purposes of this policy, the term “assets” means net assets plus the amount of borrowings for investment purposes. For purposes of the 80% investment policy, China includes Mainland China, Hong Kong, and Macau. |
Performance | | | | | | | | For the period from April 11, 2022 (commencement of operations) through March 31, 2023, the Fund had a total return of -5.44% (Class I). That compares to a total return of -0.44% for the MSCI China Net Total Return USD Index, the Fund’s primary benchmark, and - 2.47% for the MSCI China All Shares Net Total Return USD Index, the Fund’s secondary benchmark, for the same period. |
Factors That
Contributed to
Relative Returns
Factors That
Detracted From
Relative Returns | | | | | | | | • Performance of stocks within the Real Estate and Information Technology sectors |
| | | | | | | | • Underperformance in the Consumer Discretionary and Financials sectors detracted from Fund’s relative returns. |
| | | | | | | | Mutual fund investing involves risk. Principal loss is possible. The Fund is new with no operating history or track record on which to base investment decisions. Investing in securities economically tied to China may subject the Fund to a higher degree of risk of loss than investing in other countries or groups of countries because of the risks associated with, among other things, adverse securities markets, negative foreign currency rate fluctuations and social, political, regulatory, economic or environmental instabilities and natural disasters. Investing in China A Shares through the Shanghai-Hong Kong and Shenzhen-Hong Kong Stock Connect (“Stock Connect”) program is subject to trading, clearance, settlement, and other procedures, which could pose risks to the Fund. The Fund invests in foreign securities, which involve greater volatility and political, economic, and currency risks, and differences in accounting methods. These risks may be greater in emerging markets. The Fund is non-diversified, which means it may concentrate its assets in fewer individual holdings than a diversified fund. Therefore, the Fund is more exposed to individual security volatility than a diversified fund. The Fund’s consideration of ESG factors could cause it to perform differently compared to funds that do not take ESG factors into account. These risks are described more fully in the prospectus. |
| | | | | | | | The MSCI China and MSCI China All Shares Indices capture large- and mid-capitalization representation across China A shares, H shares, B shares, Red chips, P chips, and foreign listings (e.g., ADRs). The MSCI China Index covers about 85% of this China equity universe, and currently includes large- and mid-capitalization A shares represented at 20% of their free float-adjusted market capitalization. The MSCI China All Shares Index aims to reflect the opportunity set of China share classes listed in Hong Kong, Shanghai, Shenzhen, and outside of China, and is based on the concept of the integrated MSCI China equity universe with China A shares included. The Net Indices are net of any foreign withholding tax. You cannot invest directly in an index. |
| | | | | | | | |
30
| | | | |
MANAGEMENT DISCUSSION AND ANALYSIS (UNAUDITED) | | | | |
| | |
RBC China Equity Fund Fund holdings and/or sector allocations are subject to change at any time and are not recommendations to buy or sell any security. Current and future holdings are subject to risk. Please refer to the Schedule of Investments in this report for a complete list of Fund holdings. | | | | |
| | | | |
Fund performance attribution data excludes Fund holdings that are fair-valued. | | | | |
| | | | |
| Past performance is not a guarantee of future results. | | | | |
| | | | |
31
| | | | | | | | | | | | | | | | | | | | |
| | | | | | | | | | MANAGEMENT DISCUSSION AND ANALYSIS (UNAUDITED) | |
| | | | | | | | | | RBC China Equity Fund | |
Investment Objective | | | | | | | | | | The Fund seeks to provide long-term capital growth. | |
Benchmark | | | | | | | | | | MSCI China Net Total Return USD Index (primary) MSCI China All Shares Net Total Return USD Index (secondary) | |
Asset Allocation as of 3/31/23 (% of Fund’s investments) & Top Five GICS
sectors (as of 3/31/23) (% of
Fund’s net assets) | | | | | | | | 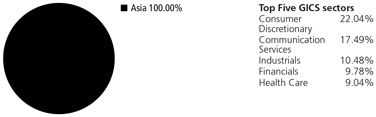
| |
| | | |
| | | | | | | | | | | |
Top Ten Holdings
(excluding
investment
companies) (as
of 3/31/23) (%
of Fund’s net
assets)
| | | | | | | | | | Tencent Holdings Ltd. | | | 9.56 | % | | Meituan | | | 2.88 | % |
| | Alibaba Group Holding Ltd. | | | 8.59 | % | | China Resources Land Ltd. | | | 2.81 | % |
| | Baidu, Inc. | | | 4.15 | % | | 360 DigiTech, Inc. | | | 2.46 | % |
| | China Merchants Bank Co. Ltd. | | | 3.39 | % | | Ping An Insurance Group Co. of | | | 2.29 | % |
| | Sunresin New Materials Co. Ltd. | | | 3.10 | % | | China Ltd. | | | | |
| | | | | | | | | | PDD Holdings, Inc. | | | 2.90 | % | | | | | | |
| | | |
| | | | | | | | | | *A listing of all portfolio holdings can be found beginning on page 62 | |
| | | | | | | | | | | | | | | | | | | | |
32
|
SCHEDULE OF PORTFOLIO INVESTMENTS |
RBC Emerging Markets Equity Fund |
|
| March 31, 2023 |
| | | | | | |
| Shares | | | | Value | |
Common Stocks — 99.91% | | | | |
Austria — 1.17% | | | | | | |
1,565,093 | | Mondi Plc | | $ | 24,819,642 | |
| | | | | | |
| | |
Brazil — 5.46% | | | | | | |
17,955,483 | | B3 SA - Brasil Bolsa Balcao | | | 36,595,042 | |
6,900,906 | | Banco Bradesco SA | | | 16,147,884 | |
16,849 | | MercadoLibre, Inc.* | | | 22,207,993 | |
8,474,930 | | Raia Drogasil SA | | | 40,782,398 | |
| | | | | | |
| | | | | 115,733,317 | |
| | | | | | |
Chile — 4.71% | | | | | | |
4,323,069 | | Antofagasta Plc | | | 84,678,036 | |
6,635,116 | | Falabella SA | | | 15,258,705 | |
| | | | | | |
| | | | | 99,936,741 | |
| | | | | | |
China — 25.48% | | | | | | |
213,700 | | Alibaba Group Holding Ltd., ADR* | | | 21,835,866 | |
4,974,158 | | Alibaba Group Holding Ltd.* | | | 63,000,178 | |
13,095,906 | | China Resources Land Ltd. | | | 59,636,588 | |
3,094,852 | | LONGi Green Energy Technology Co. Ltd., Class A | | | 18,211,022 | |
3,350,164 | | Midea Group Co. Ltd., Class A | | | 26,214,227 | |
7,317,790 | | NARI Technology Co. Ltd., Class A | | | 28,852,135 | |
10,966,334 | | Ping An Insurance Group Co. of China Ltd., Series H | | | 70,943,556 | |
2,676,712 | | Shenzhen Inovance Technology Co. Ltd., Class A | | | 27,421,896 | |
517,328 | | Shenzhen Mindray Bio-Medical Electronics Co. Ltd., Class A | | | 23,472,284 | |
1,945,775 | | Sunny Optical Technology Group Co. Ltd. | | | 23,478,951 | |
2,163,368 | | Tencent Holdings Ltd. | | | 105,722,331 | |
478,062 | | Yum China Holdings, Inc. | | | 30,304,350 | |
657,350 | | Yum China Holdings, Inc. | | | 41,168,064 | |
| | | | | | |
| | | | | 540,261,448 | |
| | | | | | |
Hong Kong — 5.70% | | | | |
5,915,590 | | AIA Group Ltd. | | | 62,038,912 | |
1,325,140 | | Hong Kong Exchanges & Clearing Ltd. | | | 58,736,473 | |
| | | | | | |
| | | | | 120,775,385 | |
| | | | | | |
India — 15.39% | | | | | | |
1,040,129 | | Dr Reddy’s Laboratories Ltd. | | | 58,651,407 | |
2,692,704 | | HDFC Bank Ltd. | | | 52,962,372 | |
2,579,613 | | Housing Development Finance Corp. Ltd. | | | 82,723,208 | |
3,750,242 | | Mahindra & Mahindra Ltd. | | | 52,996,296 | |
2,012,803 | | Tata Consultancy Services Ltd. | | | 78,897,546 | |
| | | | | | |
| | | | | 326,230,829 | |
| | | | | | |
Indonesia — 3.62% | | | | |
59,295,024 | | Bank Central Asia Tbk PT | | | 34,690,204 | |
299,571,617 | | Kalbe Farma Tbk PT | | | 41,985,244 | |
| | | | | | |
| | | | | 76,675,448 | |
| | | | | | |
33
|
SCHEDULE OF PORTFOLIO INVESTMENTS |
RBC Emerging Markets Equity Fund (cont.) |
|
| March 31, 2023 |
| | | | | | |
| Shares | | | | Value | |
Korea — 9.30% | | | | | | |
462,948 | | LG Corp. | | $ | 29,478,792 | |
243,114 | | Samsung Fire & Marine Insurance Co. Ltd. | | | 38,429,581 | |
1,268,743 | | Shinhan Financial Group Co. Ltd. | | | 34,465,810 | |
1,386,744 | | SK Hynix, Inc. | | | 94,901,766 | |
| | | | | | |
| | | | | 197,275,949 | |
| | | | | | |
| | |
Mexico — 3.40% | | | | | | |
758,300 | | Fomento Economico Mexicano SAB de CV, ADR | | | 72,182,577 | |
| | | | | | |
| |
Peru — 1.02% | | | | |
163,460 | | Credicorp Ltd. | | | 21,640,469 | |
| | | | | | |
| |
Philippines — 1.98% | | | | |
2,561,500 | | SM Investments Corp. | | | 42,045,210 | |
| | | | | | |
| |
South Africa —3.07% | | | | |
2,392,345 | | Clicks Group Ltd. | | | 34,414,436 | |
3,901,472 | | Discovery Ltd.* | | | 30,607,453 | |
| | | | | | |
| | | | | 65,021,889 | |
| | | | | | |
| |
Taiwan — 15.57% | | | | |
2,067,752 | | Advantech Co. Ltd. | | | 25,296,516 | |
3,196,769 | | Delta Electronics, Inc. | | | 31,717,188 | |
26,317,255 | | E.Sun Financial Holding Co. Ltd. | | | 21,916,259 | |
1,070,897 | | MediaTek, Inc. | | | 27,764,210 | |
2,083,721 | | President Chain Store Corp. | | | 18,467,009 | |
1,558,000 | | Taiwan Semiconductor Manufacturing Co. Ltd., ADR | | | 144,925,160 | |
18,266,186 | | Uni-President Enterprises Corp. | | | 43,181,052 | |
296,981 | | Voltronic Power Technology Corp. | | | 16,911,193 | |
| | | | | | |
| | | | | 330,178,587 | |
| | | | | | |
| |
Thailand — 0.92% | | | | |
5,007,298 | | Kasikornbank Public Co. Ltd., NVDR | | | 19,424,090 | |
| | | | | | |
| |
Turkey — 0.00% | | | | |
1 | | Enka Insaat ve Sanayi AS | | | 1 | |
| | | | | | |
United Kingdom — 3.12% | | | | |
1,276,262 | | Unilever Plc | | | 66,134,665 | |
| | | | | | |
| |
Total Common Stocks | | | 2,118,336,247 | |
| | | | | | |
(Cost $2,212,765,915) | | | | |
34
|
SCHEDULE OF PORTFOLIO INVESTMENTS |
RBC Emerging Markets Equity Fund (cont.) |
|
| March 31, 2023 |
| | | | | | |
Total Investments | | | $2,118,336,247 | |
(Cost $2,212,765,915)(a) — 99.91% | | | | |
| |
Other assets in excess of liabilities — 0.09% | | | 1,898,917 | |
| | | | | | |
| |
NET ASSETS — 100.00% | | | $2,120,235,164 | |
| | | | | | |
| * | Non-income producing security. |
| (a) | See Notes to Schedules of Portfolio Investments for the tax cost of securities and the breakdown of unrealized appreciation (depreciation). |
Abbreviations used are defined below:
ADR - American Depositary Receipt
NVDR - Non-Voting Depository Receipt
| | | | |
| Portfolio Diversification (Unaudited) | | | |
Industries | | Percentage
of Net Assets | |
Financials | | | 27.42% | |
Information Technology | | | 21.00% | |
Consumer Staples | | | 12.97% | |
Consumer Discretionary | | | 12.88% | |
Industrials | | | 6.82% | |
Health Care | | | 5.86% | |
Materials | | | 5.16% | |
Communication Services | | | 4.99% | |
Real Estate | | | 2.81% | |
Other* | | | 0.09% | |
| | | | |
| | | 100.00% | |
| | | | |
| * | Includes cash, interest and dividend receivable, pending trades and Fund share transactions, and accrued expenses payable. |
See Notes to the Financial Statements.
35
|
SCHEDULE OF PORTFOLIO INVESTMENTS |
RBC Emerging Markets ex-China Equity Fund |
|
| March 31, 2023 |
| | | | | | |
| Shares | | | | Value | |
Common Stocks — 88.97% | | | | |
Austria — 0.96% | | | | | | |
20,508 | | Mondi Plc | | $ | 325,221 | |
| | | | | | |
| | |
Brazil — 9.05% | | | | | | |
297,500 | | B3 SA - Brasil Bolsa Balcao | | | 606,334 | |
131,800 | | Banco Bradesco SA | | | 308,408 | |
500 | | MercadoLibre, Inc.* | | | 659,030 | |
184,400 | | Raia Drogasil SA | | | 887,355 | |
75,800 | | WEG SA | | | 605,688 | |
| | | | | | |
| | | | | 3,066,815 | |
| | | | | | |
Chile — 5.24% | | | | | | |
67,827 | | Antofagasta Plc | | | 1,328,560 | |
193,577 | | Falabella SA | | | 445,167 | |
| | | | | | |
| | | | | 1,773,727 | |
| | | | | | |
India — 11.49% | | | | | | |
15,500 | | Dr. Reddy’s Laboratories Ltd., ADR | | | 882,415 | |
23,000 | | HDFC Bank Ltd., ADR | | | 1,533,410 | |
84,700 | | Infosys Ltd., ADR | | | 1,477,168 | |
| | | | | | |
| | | | | 3,892,993 | |
| | | | | | |
Indonesia — 5.34% | | | | | | |
5,274,100 | | Avia Avian Tbk PT | | | 209,390 | |
1,445,200 | | Bank Central Asia Tbk PT | | | 845,506 | |
5,389,300 | | Kalbe Farma Tbk PT | | | 755,316 | |
| | | | | | |
| | | | | 1,810,212 | |
| | | | | | |
Korea — 15.67% | | | | | | |
3,299 | | LEENO Industrial, Inc. | | | 365,860 | |
6,329 | | LG Corp. | | | 403,007 | |
2,062 | | NAVER Corp. | | | 323,097 | |
36,177 | | Samsung Electronics Co. Ltd. | | | 1,788,987 | |
4,596 | | Samsung Fire & Marine Insurance Co. Ltd. | | | 726,500 | |
28,935 | | Shinhan Financial Group Co. Ltd. | | | 786,029 | |
13,393 | | SK Hynix, Inc. | | | 916,549 | |
| | | | | | |
| | | | | 5,310,029 | |
| | | | | | |
Mexico — 5.02% | | | | | | |
198,700 | | Bolsa Mexicana de Valores SAB de CV | | | 424,856 | |
134,100 | | Fomento Economico Mexicano SAB de CV | | | 1,276,629 | |
| | | | | | |
| | | | | 1,701,485 | |
| | | | | | |
Peru — 0.90% | | | | | | |
2,300 | | Credicorp Ltd. | | | 304,497 | |
| | | | | | |
36
|
SCHEDULE OF PORTFOLIO INVESTMENTS |
RBC Emerging Markets ex-China Equity Fund (cont.) |
|
| March 31, 2023 |
| | | | | | |
| Shares | | | | Value | |
Philippines — 3.30% | | | | |
818,200 | | Century Pacific Food, Inc. | | $ | 389,577 | |
44,420 | | SM Investments Corp. | | | 729,123 | |
| | | | | | |
| | | | | 1,118,700 | |
| | | | | | |
| |
South Africa — 2.98% | | | | |
67,361 | | AVI Ltd. | | | 266,811 | |
31,811 | | Clicks Group Ltd. | | | 457,608 | |
36,289 | | Discovery Ltd.* | | | 284,691 | |
| | | | | | |
| | | | | 1,009,110 | |
| | | | | | |
Taiwan — 24.71% | | | | | | |
31,000 | | Advantech Co. Ltd. | | | 379,249 | |
133,000 | | Chroma ATE, Inc. | | | 777,650 | |
82,000 | | Delta Electronics, Inc. | | | 813,574 | |
895,000 | | E.Sun Financial Holding Co. Ltd. | | | 745,331 | |
37,000 | | Giant Manufacturing Co. Ltd. | | | 215,111 | |
14,000 | | MediaTek, Inc. | | | 362,966 | |
186,000 | | Taiwan Semiconductor Manufacturing Co. Ltd. | | | 3,259,580 | |
312,000 | | Uni-President Enterprises Corp. | | | 737,564 | |
19,000 | | Voltronic Power Technology Corp. | | | 1,081,930 | |
| | | | | | |
| | | | | 8,372,955 | |
| | | | | | |
Thailand — 1.20% | | | | | | |
104,600 | | Kasikornbank Public Co. Ltd., NVDR | | | 405,760 | |
| | | | | | |
| |
United Kingdom — 3.11% | | | | |
20,291 | | Unilever Plc | | | 1,051,460 | |
| | | | | | |
| |
Total Common Stocks | | | 30,142,964 | |
| | | | | | |
(Cost $28,589,832) | | | | |
| |
Exchange Traded Funds — 8.01% | | | | |
United States — 8.01% | | | | |
30,338 | | iShares India 50 ETF | | | 1,247,195 | |
37,300 | | iShares MSCI India* | | | 1,468,128 | |
| | | | | | |
| | | | | 2,715,323 | |
| | | | | | |
Total Exchange Traded Funds | | | 2,715,323 | |
| | | | | | |
(Cost $2,857,596) | | | | |
37
|
SCHEDULE OF PORTFOLIO INVESTMENTS |
RBC Emerging Markets ex-China Equity Fund (cont.) |
|
| March 31, 2023 |
| | | | | | |
| Shares | | | | Value | |
| Investment Company — 2.80% | | | | |
950,554 | | U.S. Government Money Market Fund,
RBC Institutional Class 1 (a) | | $ | 950,554 | |
| | | | | | |
Total Investment Company | | | 950,554 | |
| | | | | | |
(Cost $950,554) | | | | |
| |
Total Investments | | $ | 33,808,841 | |
(Cost $32,397,982) — 99.78% | | | | |
| |
Other assets in excess of liabilities — 0.22% | | | 73,053 | |
| | | | | | |
| |
NET ASSETS — 100.00% | | $ | 33,881,894 | |
| | | | | | |
| * | Non-income producing security. |
| (a) | Affiliated investment. |
Abbreviations used are defined below:
ADR – American Depositary Receipt
NVDR – Non-Voting Depository Receipt
| | | | |
| Portfolio Diversification (Unaudited) | | | |
Industries | | Percentage
of Net Assets | |
Information Technology | | | 29.93% | |
Financials | | | 20.58% | |
Consumer Staples | | | 14.96% | |
Industrials | | | 8.32% | |
Materials | | | 5.50% | |
Health Care | | | 4.83% | |
Consumer Discretionary | | | 3.90% | |
Communication Services | | | 0.95% | |
Other* | | | 11.03% | |
| | | | |
| | | 100.00% | |
| | | | |
| * | Includes cash, Investment Company, interest and dividend receivable, pending trades and Fund share transactions, and accrued expenses payable. |
See Notes to the Financial Statements.
38
|
SCHEDULE OF PORTFOLIO INVESTMENTS |
RBC Emerging Markets Value Equity Fund |
|
| March 31, 2023 |
| | | | | | |
| Shares | | | | Value | |
Common Stocks — 97.23% | | | | |
Brazil — 5.73% | | | | | | |
107,800 | | Banco do Brasil SA | | $ | 832,462 | |
263,400 | | Cia Brasileira de Aluminio | | | 394,961 | |
79,900 | | Hypera SA | | | 597,463 | |
106,500 | | Intelbras SA Industria de Telecomunicacao Eletronica Brasileira | | | 482,443 | |
145,100 | | Sao Martinho SA | | | 776,680 | |
81,400 | | SLC Agricola SA | | | 732,181 | |
| | | | | | |
| | | | | 3,816,190 | |
| | | | | | |
| | |
Chile — 2.20% | | | | | | |
74,777 | | Antofagasta Plc | | | 1,464,693 | |
| | | | | | |
| | |
China — 28.44% | | | | | | |
264,800 | �� | Alibaba Group Holding Ltd.* | | | 3,353,823 | |
60,500 | | Baidu, Inc., Class A* | | | 1,139,897 | |
157,698 | | Beijing New Building Materials Plc, Class A | | | 615,216 | |
402,000 | | China Overseas Land & Investment Ltd. | | | 969,816 | |
616,000 | | Chinasoft International Ltd. | | | 390,248 | |
908,000 | | CIMC Enric Holdings Ltd. | | | 878,683 | |
928,000 | | CSPC Pharmaceutical Group Ltd. | | | 909,735 | |
4,500 | | Daqo New Energy Corp., ADR* | | | 210,780 | |
241,000 | | Flat Glass Group Co. Ltd., Class H | | | 689,301 | |
140,100 | | Midea Group Co. Ltd., Class A | | | 1,096,249 | |
1,110,000 | | Nexteer Automotive Group Ltd. | | | 701,054 | |
769,410 | | Ping An Bank Co. Ltd., Class A | | | 1,402,056 | |
281,999 | | Ping An Insurance Group Co. of China Ltd., Series H | | | 1,824,312 | |
102,492 | | Sieyuan Electric Co. Ltd., Class A | | | 682,135 | |
226,000 | | SITC International Holdings Co. Ltd. | | | 485,710 | |
1,143,000 | | Topsports International Holdings Ltd.(a) | | | 1,041,903 | |
17,200 | | Trip.com Group Ltd.* | | | 647,983 | |
80,898 | | Wuxi Lead Intelligent Equipment Co. Ltd., Class A | | | 477,062 | |
309,868 | | Xinyi Glass Holdings Ltd. | | | 554,322 | |
1,665,600 | | Zoomlion Heavy Industry Science and Technology Co. Ltd., Class H | | | 880,903 | |
| | | | | | |
| | | | | 18,951,188 | |
| | | | | | |
| | |
Egypt — 0.74% | | | | | | |
381,559 | | Commercial International Bank Egypt SAE, GDR | | | 493,348 | |
| | | | | | |
| |
Hong Kong — 0.69% | | | | |
1,186,000 | | Pacific Basin Shipping Ltd. | | | 458,977 | |
| | | | | | |
| | |
Hungary — 1.05% | | | | | | |
24,628 | | OTP Bank Nyrt | | | 703,117 | |
| | | | | | |
39
|
SCHEDULE OF PORTFOLIO INVESTMENTS |
RBC Emerging Markets Value Equity Fund (cont.) |
|
| March 31, 2023 |
| | | | | | |
| Shares | | | | Value | |
India — 9.50% | | | | |
207,010 | | Apollo Tyres Ltd. | | $ | 807,829 | |
116,824 | | Axis Bank Ltd. | | | 1,223,938 | |
205,217 | | Hindalco Industries Ltd. | | | 1,017,492 | |
174,115 | | KEC International Ltd. | | | 968,294 | |
477,942 | | Redington Ltd. | | | 972,811 | |
68,005 | | Shriram Finance Ltd. | | | 1,045,452 | |
33,496 | | UPL Ltd. | | | 293,058 | |
| | | | | | |
| | | | | 6,328,874 | |
| | | | | | |
| | |
Indonesia — 1.26% | | | | | | |
1,345,200 | | Bank Negara Indonesia Persero Tbk PT | | | 841,746 | |
| | | | | | |
| | |
Korea — 13.36% | | | | | | |
12,581 | | DB Insurance Co. Ltd. | | | 723,815 | |
12,019 | | E-MART, Inc. | | | 977,495 | |
26,549 | | Hana Financial Group, Inc. | | | 831,487 | |
16,703 | | HL Mando Co. Ltd. | | | 591,553 | |
4,553 | | Hyundai Motor Co. | | | 647,767 | |
19,121 | | LG Corp. | | | 1,217,554 | |
63,050 | | Samsung Electronics Co. Ltd. | | | 3,117,883 | |
11,670 | | SK Hynix, Inc. | | | 798,636 | |
| | | | | | |
| | | | | 8,906,190 | |
| | | | | | |
| | |
Mexico — 2.22% | | | | | | |
503,214 | | Gentera SAB de CV | | | 550,408 | |
121,300 | | Regional SAB de CV | | | 926,578 | |
| | | | | | |
| | | | | 1,476,986 | |
| | | | | | |
| | |
Pakistan — 0.33% | | | | | | |
851,530 | | Habib Bank Ltd. | | | 219,842 | |
| | | | | | |
| | |
Peru — 1.53% | | | | | | |
7,700 | | Credicorp Ltd. | | | 1,019,403 | |
| | | | | | |
| |
Philippines — 1.61% | | | | |
453,540 | | BDO Unibank, Inc. | | | 1,075,651 | |
| | | | | | |
| | |
Russia — 0.00% | | | | | | |
2,322,600 | | Sistema PJSFC*,(b),(c) | | | 0 | |
893,930 | | United Co. RUSAL International PJSC(b),(c) | | | 0 | |
30,666 | | X5 Retail Group NV, GDR*,(b),(c) | | | 0 | |
| | | | | | |
| | | | | 0 | |
| | | | | | |
| |
South Africa —7.30% | | | | |
1,246,620 | | Growthpoint Properties Ltd., REIT | | | 915,682 | |
65,995 | | Mr Price Group Ltd. | | | 534,869 | |
99,900 | | MTN Group Ltd. | | | 715,729 | |
40
|
SCHEDULE OF PORTFOLIO INVESTMENTS |
RBC Emerging Markets Value Equity Fund (cont.) |
|
| March 31, 2023 |
| | | | | | |
| Shares | | | | Value | |
10,642 | | Naspers Ltd., N Shares | | $ | 1,971,903 | |
1,095,370 | | Old Mutual Ltd. | | | 726,106 | |
| | | | | | |
| | | | | 4,864,289 | |
| | | | | | |
| |
Taiwan — 15.34% | | | | |
141,143 | | Chailease Holding Co. Ltd. | | | 1,038,017 | |
148,000 | | Elite Material Co. Ltd. | | | 889,866 | |
119,583 | | Innodisk Corp. | | | 1,236,210 | |
29,703 | | Lotes Co. Ltd. | | | 897,757 | |
44,000 | | MediaTek, Inc. | | | 1,140,750 | |
90,000 | | Merida Industry Co. Ltd. | | | 500,706 | |
258,000 | | Taiwan Semiconductor Manufacturing Co. Ltd. | | | 4,521,352 | |
| | | | | | |
| | | | | 10,224,658 | |
| | | | | | |
| |
Thailand — 1.24% | | | | |
212,500 | | Kasikornbank Public Co. Ltd. | | | 824,321 | |
| | | | | | |
| |
Turkey — 0.74% | | | | |
37,638 | | BIM Birlesik Magazalar AS | | | 292,327 | |
50,641 | | KOC Holding AS | | | 202,282 | |
| | | | | | |
| | | | | 494,609 | |
| | | | | | |
| |
United Arab Emirates — 1.34% | | | | |
704,235 | | Aldar Properties PJSC | | | 893,086 | |
| | | | | | |
| |
United States — 1.40% | | | | |
300,300 | | Samsonite International SA*,(a) | | | 931,156 | |
| | | | | | |
| |
Vietnam — 1.21% | | | | |
365,950 | | Vinhomes JSC(a) | | | 804,127 | |
| | | | | | |
| |
Total Common Stocks | | | 64,792,451 | |
| | | | | | |
(Cost $72,526,675) | | | | |
| |
Preferred Stocks — 1.60% | | | | |
Brazil — 0.94% | | | | | | |
87,600 | | Centrais Eletricas Brasileiras SA, Class B | | | 626,350 | |
| | | | | | |
| |
Colombia — 0.66% | | | | |
85,082 | | Banco Davivienda SA | | | 440,300 | |
| | | | | | |
| |
Total Preferred Stocks | | | 1,066,650 | |
| | | | | | |
(Cost $1,334,901) | | | | |
41
|
SCHEDULE OF PORTFOLIO INVESTMENTS |
RBC Emerging Markets Value Equity Fund (cont.) |
|
| March 31, 2023 |
| | | | | | |
| Shares | | | | Value | |
Investment Company — 1.36% | | | | |
909,723 | | U.S. Government Money Market Fund, RBC Institutional Class 1 (d) | | $ | 909,723 | |
| | | | | | |
Total Investment Company | | | 909,723 | |
| | | | | | |
(Cost $909,723) | | | | |
| |
Total Investments | | $ | 66,768,824 | |
(Cost $74,771,299)(e) — 100.19% | | | | |
| |
Liabilities in excess of other assets — (0.19)% | | | (128,023) | |
| | | | | | |
| |
NET ASSETS — 100.00% | | $ | 66,640,801 | |
| | | | | | |
| * | Non-income producing security. |
| (a) | Security exempt from registration under Rule 144A or Section 4(2) of the Securities Act of 1933, as amended. These securities may be resold in transactions exempt from registration, normally to qualified institutional buyers. |
| (b) | The Pricing Committee has fair valued this security under procedures established by the Fund’s Board of Trustees. |
| (c) | Security is valued using significant unobservable inputs and is classified as Level 3 in the fair value hierarchy. |
| (d) | Affiliated investment. |
| (e) | See Notes to Schedules of Portfolio Investments for the tax cost of securities and the breakdown of unrealized appreciation (depreciation). |
Abbreviations used are defined below:
ADR - American Depositary Receipt
GDR - Global Depositary Receipt
REIT - Real Estate Investment Trust
42
|
SCHEDULE OF PORTFOLIO INVESTMENTS |
RBC Emerging Markets Value Equity Fund (cont.) |
|
| March 31, 2023 |
| | | | |
| Portfolio Diversification (Unaudited) | | | |
Industries | | Percentage
of Net Assets | |
Financials | | | 25.12 | % |
Information Technology | | | 23.03 | % |
Consumer Discretionary | | | 19.24 | % |
Industrials | | | 11.13 | % |
Real Estate | | | 5.39 | % |
Materials | | | 4.76 | % |
Consumer Staples | | | 4.17 | % |
Communication Services | | | 2.78 | % |
Health Care | | | 2.27 | % |
Utilities | | | 0.94 | % |
Other* | | | 1.17 | % |
| | | | |
| | | 100.00 | % |
| | | | |
| * | Includes cash, Investment Company, interest and dividend receivable, pending trades and Fund share transactions, and accrued expenses payable. |
See Notes to the Financial Statements.
43
|
SCHEDULE OF PORTFOLIO INVESTMENTS |
RBC Global Opportunities Fund |
|
| March 31,2023 |
| | | | | | | |
| Shares | | | | Value |
| |
Common Stocks — 99.06% | | | | | |
Belgium — 5.66% | | | | | |
| 396,677 | | Anheuser-Busch InBev NV | | | $ | 26,442,448 | |
| | | | | | | |
France — 4.88% | | | | | |
| 11,021 | | LVMH Moet Hennessy Louis Vuitton SE | | | | 10,116,270 | |
| 85,756 | | Safran SA | | | | 12,695,033 | |
| | | | | | | |
| | | | | | 22,811,303 | |
| | | | | | | |
Germany — 3.06% | | | | | |
| 305,332 | | Deutsche Post AG | | | | 14,300,422 | |
| | | | | | | |
Hong Kong — 4.66% | | | | | |
| 2,074,224 | | AIA Group Ltd. | | | | 21,753,130 | |
| | | | | | | |
Ireland — 2.27% | | | | | |
| 106,336 | | Kerry Group Plc, Class A | | | | 10,604,388 | |
| | | | | | | |
Japan — 2.76% | | | | | |
| 137,298 | | MISUMI Group, Inc. | | | | 3,450,067 | |
| 181,895 | | Nidec Corp. | | | | 9,466,000 | |
| | | | | | | |
| | | | | | 12,916,067 | |
| | | | | | | |
Luxembourg — 0.98% | | | | | |
| 68,653 | | Eurofins Scientific SE | | | | 4,596,985 | |
| | | | | | | |
Netherlands — 1.41% | | | | | |
| 4,134 | | Adyen NV*,(a) | | | | 6,587,235 | |
| | | | | | | |
Norway — 1.99% | | | | | |
| 327,043 | | Equinor ASA | | | | 9,297,316 | |
| | | | | | | |
Switzerland — 3.01% | | | | | |
| 49,173 | | Roche Holding AG | | | | 14,050,821 | |
| | | | | | | |
Taiwan — 4.54% | | | | | |
| 227,800 | | Taiwan Semiconductor Manufacturing Co. Ltd., ADR | | | | 21,189,956 | |
| | | | | | | |
United Kingdom — 5.04% | | | | | |
| 63,025 | | Croda International Plc | | | | 5,065,541 | |
| 169,192 | | InterContinental Hotels Group Plc | | | | 11,076,272 | |
| 2,502,380 | | Legal & General Group Plc | | | | 7,401,062 | |
| | | | | | | |
| | | | | | 23,542,875 | |
| | | | | | | |
United States — 57.34% | | | | | |
| 146,260 | | Alphabet, Inc., Class A* | | | | 15,171,550 | |
44
|
SCHEDULE OF PORTFOLIO INVESTMENTS |
RBC Global Opportunities Fund (cont.) |
|
| March 31, 2023 |
| | | | | | |
| Shares | | | | Value | |
| 107,500 | | Amazon.com, Inc.* | | $ | 11,103,675 | |
| 38,100 | | American Water Works Co., Inc. | | | 5,581,269 | |
| 6,000 | | AutoZone, Inc.* | | | 14,748,900 | |
| 62,300 | | Blackstone, Inc. | | | 5,472,432 | |
| 120,800 | | Charles Schwab Corp. (The) | | | 6,327,504 | |
| 204,500 | | CSX Corp. | | | 6,122,730 | |
| 11,600 | | Danaher Corp. | | | 2,923,664 | |
| 137,100 | | EOG Resources, Inc. | | | 15,715,773 | |
| 45,512 | | Estee Lauder Cos, Inc. (The), Class A | | | 11,216,888 | |
| 252,750 | | Fortive Corp. | | | 17,229,967 | |
| 225,000 | | Incyte Corp.* | | | 16,260,750 | |
| 29,000 | | MarketAxess Holdings, Inc. | | | 11,347,410 | |
| 99,600 | | Microsoft Corp. | | | 28,714,680 | |
| 141,200 | | Morgan Stanley | | | 12,397,360 | |
| 51,200 | | NVIDIA Corp. | | | 14,221,824 | |
| 85,700 | | PepsiCo, Inc. | | | 15,623,110 | |
| 3,400 | | Thermo Fisher Scientific, Inc. | | | 1,959,658 | |
| 148,300 | | T-Mobile US, Inc.* | | | 21,479,772 | |
| 46,300 | | UnitedHealth Group, Inc. | | | 21,880,917 | |
| 55,100 | | Visa, Inc., Class A | | | 12,422,846 | |
| | | | | | |
| | | | | 267,922,679 | |
| | | | | | |
Zambia — 1.46% | | | | |
| 296,809 | | First Quantum Minerals Ltd. | | | 6,823,423 | |
| | | | | | |
| |
Total Common Stocks | | | 462,839,048 | |
| | | | | | |
(Cost $502,655,670) | | | | | | |
| |
Investment Company — 4.01% | | | | |
| 18,735,873 | | U.S. Government Money Market Fund,
RBC Institutional Class 1 (b) | | | 18,735,873 | |
| | | | | | |
| |
Total Investment Company | | | 18,735,873 | |
| | | | | | |
(Cost $18,735,873) | | | | | | |
| |
Total Investments | | $ | 481,574,921 | |
(Cost $521,391,543)(c) — 103.07% | | | | |
| |
Liabilities in excess of other assets — (3.07)% | | | (14,326,313 | ) |
| | | | | | |
| |
NET ASSETS — 100.00% | | $ | 467,248,608 | |
| | | | | | |
| * | Non-income producing security. |
| (a) | Security exempt from registration under Rule 144A or Section 4(2) of the Securities Act of 1933, as amended. These securities may be resold in transactions exempt from registration, normally to qualified institutional buyers. |
| (b) | Affiliated investment. |
| (c) | See Notes to Schedules of Portfolio Investments for the tax cost of securities and the breakdown of unrealized appreciation (depreciation). |
45
|
SCHEDULE OF PORTFOLIO INVESTMENTS |
RBC Global Opportunities Fund (cont.) |
|
| March 31, 2023 |
Abbreviations used are defined below:
ADR - American Depositary Receipt
Portfolio Diversification (Unaudited)
| | | | | |
Industries | | Percentage
of Net Assets |
Financials | | | | 17.91 | % |
Information Technology | | | | 13.73 | % |
Consumer Staples | | | | 13.67 | % |
Industrials | | | | 13.54 | % |
Health Care | | | | 13.20 | % |
Consumer Discretionary | | | | 10.07 | % |
Communication Services | | | | 7.85 | % |
Energy | | | | 5.35 | % |
Materials | | | | 2.55 | % |
Utilities | | | | 1.19 | % |
Other* | | | | 0.94 | % |
| | | | | |
| | | | 100.00 | % |
| | | | | |
| * | Includes cash, Investment Company, interest and dividend receivable, pending trades and Fund share transactions, and accrued expenses payable. |
See Notes to the Financial Statements.
46
|
SCHEDULE OF PORTFOLIO INVESTMENTS |
RBC Global Equity Leaders Fund |
|
| March 31, 2023 |
| | | | | | | |
| Shares | | | | Value |
| |
Common Stocks — 101.74% | | | | | |
| |
Belgium — 4.59% | | | | | |
| 2,812 | | Anheuser-Busch InBev NV | | | $ | 187,448 | |
| | | | | | | |
| |
France — 6.15% | | | | | |
| 129 | | LVMH Moet Hennessy Louis Vuitton SE | | | | 118,410 | |
| 897 | | Safran SA | | | | 132,789 | |
| | | | | | | |
| | | | | | 251,199 | |
| | | | | | | |
| |
Germany — 3.94% | | | | | |
| 3,434 | | Deutsche Post AG | | | | 160,834 | |
| | | | | | | |
| |
Hong Kong — 2.89% | | | | | |
| 11,264 | | AIA Group Ltd. | | | | 118,130 | |
| | | | | | | |
| |
Japan — 2.77% | | | | | |
| 2,179 | | Nidec Corp. | | | | 113,397 | |
| | | | | | | |
| |
Netherlands — 1.56% | | | | | |
| 40 | | Adyen NV*,(a) | | | | 63,737 | |
| | | | | | | |
| |
Norway — 2.04% | | | | | |
| 2,936 | | Equinor ASA | | | | 83,466 | |
| | | | | | | |
| |
Singapore — 2.27% | | | | | |
| 3,736 | | DBS Group Holdings Ltd. | | | | 92,883 | |
| | | | | | | |
| |
Switzerland — 3.95% | | | | | |
| 565 | | Roche Holding AG | | | | 161,444 | |
| | | | | | | |
| |
Taiwan — 3.72% | | | | | |
| 1,635 | | Taiwan Semiconductor Manufacturing Co. Ltd., ADR | | | | 152,088 | |
| | | | | | | |
| |
United States — 67.86% | | | | | |
| 1,932 | | Alphabet, Inc., Class A* | | | | 200,406 | |
| 1,330 | | Amazon.com, Inc.* | | | | 137,376 | |
| 1,019 | | Blackstone, Inc. | | | | 89,509 | |
| 2,237 | | Charles Schwab Corp. (The) | | | | 117,174 | |
| 5,192 | | CSX Corp. | | | | 155,449 | |
| 270 | | Danaher Corp. | | | | 68,051 | |
| 353 | | Deere & Co. | | | | 145,747 | |
| 1,196 | | EOG Resources, Inc. | | | | 137,097 | |
| 718 | | Estee Lauder Cos, Inc. (The), Class A | | | | 176,958 | |
| 981 | | Microsoft Corp. | | | | 282,822 | |
| 1,717 | | Morgan Stanley | | | | 150,753 | |
47
|
SCHEDULE OF PORTFOLIO INVESTMENTS |
RBC Global Equity Leaders Fund (cont.) |
|
| March 31, 2023 |
| | | | | | |
| Shares | | | | Value | |
| | |
| 682 | | NVIDIA Corp. | | $ | 189,439 | |
| 1,086 | | PepsiCo, Inc. | | | 197,978 | |
| 808 | | Prologis, Inc., REIT | | | 100,814 | |
| 89 | | Thermo Fisher Scientific, Inc. | | | 51,297 | |
| 1,618 | | T-Mobile US, Inc.* | | | 234,351 | |
| 497 | | UnitedHealth Group, Inc. | | | 234,877 | |
| 458 | | Visa, Inc., Class A | | | 103,261 | |
| | | | | | |
| | | | | 2,773,359 | |
| | | | | | |
| |
Total Common Stocks | | | 4,157,985 | |
| | | | | | |
(Cost $4,670,215) | | | | |
| |
Investment Company — 1.00% | | | | |
| 40,927 | | U.S. Government Money Market Fund, RBC Institutional Class 1 (b) | | | 40,927 | |
| | | | | | |
| |
Total Investment Company | | | 40,927 | |
| | | | | | |
(Cost $40,927) | | | | | | |
| |
Total Investments | | $ | 4,198,912 | |
(Cost $4,711,142)(c) — 102.74% | | | | |
| |
Liabilities in excess of other assets — (2.74)% | | | (111,805) | |
| | | | | | |
| |
NET ASSETS — 100.00% | | $ | 4,087,107 | |
| | | | | | |
| * | Non-income producing security. |
| (a) | Security exempt from registration under Rule 144A or Section 4(2) of the Securities Act of 1933, as amended. These securities may be resold in transactions exempt from registration, normally to qualified institutional buyers. |
| (b) | Affiliated investment. |
| (c) | See Notes to Schedules of Portfolio Investments for the tax cost of securities and the breakdown of unrealized appreciation (depreciation). |
Abbreviations used are defined below:
ADR - American Depositary Receipt
REIT - Real Estate Investment Trust
48
|
SCHEDULE OF PORTFOLIO INVESTMENTS |
RBC Global Equity Leaders Fund (cont.) |
|
| March 31, 2023 |
Portfolio Diversification (Unaudited)
| | | | | |
Industries | | Percentage
of Net Assets |
Financials | | | | 17.99 | % |
Industrials | | | | 17.33 | % |
Information Technology | | | | 15.27 | % |
Consumer Staples | | | | 13.76 | % |
Health Care | | | | 12.62 | % |
Communication Services | | | | 10.64 | % |
Consumer Discretionary | | | | 6.26 | % |
Energy | | | | 5.40 | % |
Real Estate | | | | 2.47 | % |
Other* | | | | (1.74 | )% |
| | | | | |
| | | | 100.00 | % |
| | | | | |
| * | Includes cash, Investment Company, interest and dividend receivable, pending trades and Fund share transactions, and accrued expenses payable. |
See Notes to the Financial Statements.
49
|
SCHEDULE OF PORTFOLIO INVESTMENTS |
RBC International Opportunities Fund |
|
| March 31, 2023 |
| | | | | | |
| Shares | | | | Value | |
| |
Common Stocks — 99.00% | | | | |
Australia — 5.39% | | | | |
49,255 | | Rio Tinto Plc | | $ | 3,343,330 | |
177,226 | | Woodside Energy Group Ltd. | | | 3,959,257 | |
| | | | | | |
| | | 7,302,587 | |
| | | | | | |
| |
Austria — 1.67% | | | | |
68,112 | | Erste Group Bank AG | | | 2,256,508 | |
| | | | | | |
| |
Belgium — 4.44% | | | | |
90,179 | | Anheuser-Busch InBev NV | | | 6,011,323 | |
| | | | | | |
| |
China — 1.12% | | | | |
108,646 | | Wanhua Chemical Group Co. Ltd., Class A | | | 1,514,275 | |
| | | | | | |
| |
Denmark — 1.17% | | | | |
18,533 | | Orsted A/S(a) | | | 1,580,272 | |
| | | | | | |
| |
Finland — 1.33% | | | | |
36,416 | | Neste Oyj | | | 1,799,093 | |
| | | | | | |
| |
France — 5.62% | | | | |
4,380 | | LVMH Moet Hennessy Louis Vuitton SE | | | 4,020,439 | |
24,213 | | Safran SA | | | 3,584,412 | |
| | | | | | |
| | | 7,604,851 | |
| | | | | | |
| |
Germany — 2.62% | | | | |
75,688 | | Deutsche Post AG | | | 3,544,896 | |
| | | | | | |
| |
Hong Kong — 5.55% | | | | |
716,400 | | AIA Group Ltd. | | | 7,513,143 | |
| | | | | | |
| |
India — 4.46% | | | | |
90,666 | | HDFC Bank Ltd., ADR | | | 6,044,702 | |
| | | | | | |
| |
Indonesia — 1.74% | | | | |
7,453,200 | | Bank Rakyat Indonesia Persero Tbk PT | | | 2,361,567 | |
| | | | | | |
| |
Ireland — 3.55% | | | | |
48,238 | | Kerry Group Plc, Class A | | | 4,810,548 | |
20 | | Kerry Group Plc, Class A | | | 1,997 | |
| | | | | | |
| | | 4,812,545 | |
| | | | | | |
| |
Japan — 11.41% | | | | |
315,500 | | Astellas Pharma, Inc. | | | 4,482,409 | |
89,300 | | MISUMI Group, Inc. | | | 2,243,958 | |
50
|
SCHEDULE OF PORTFOLIO INVESTMENTS |
RBC International Opportunities Fund (cont.) |
|
| March 31, 2023 |
| | | | | | |
| Shares | | | | Value | |
| |
72,302 | | Nidec Corp. | | $ | 3,762,670 | |
145,000 | | Oriental Land Co. Ltd | | | 4,964,690 | |
| | | | | | |
| | | 15,453,727 | |
| | | | | | |
| |
Luxembourg — 1.15% | | | | |
23,223 | | Eurofins Scientific SE | | | 1,555,005 | |
| | | | | | |
| |
Netherlands — 4.07% | | | | |
1,758 | | Adyen NV*,(a) | | | 2,801,248 | |
21,443 | | Wolters Kluwer NV | | | 2,706,891 | |
| | | | | | |
| | | 5,508,139 | |
| | | | | | |
| |
Norway — 3.48% | | | | |
165,728 | | Equinor ASA | | | 4,711,385 | |
| | | | | | |
| |
Singapore — 4.33% | | | | |
235,890 | | DBS Group Holdings Ltd. | | | 5,864,636 | |
| | | | | | |
| |
South Africa — 3.35% | | | | |
24,485 | | Naspers Ltd., N Shares | | | 4,536,933 | |
| | | | | | |
| |
Sweden — 4.36% | | | | |
206,530 | | Essity AB, Class B | | | 5,899,303 | |
| | | | | | |
| |
Switzerland — 5.65% | | | | |
1,998 | | Partners Group Holding AG | | | 1,881,562 | |
20,176 | | Roche Holding AG | | | 5,765,143 | |
| | | | | | |
| | | 7,646,705 | |
| | | | | | |
| |
Taiwan — 9.70% | | | | |
6,397,555 | | E.Sun Financial Holding Co. Ltd. | | | 5,327,701 | |
84,018 | | Taiwan Semiconductor Manufacturing Co. Ltd., ADR | | | 7,815,355 | |
| | | | | | |
| | | 13,143,056 | |
| | | | | | |
| |
Thailand — 2.50% | | | | |
3,586,100 | | Minor International Public Co. Ltd.* | | | 3,390,241 | |
| | | | | | |
| |
United Kingdom — 8.22% | | | | |
52,733 | | Croda International Plc | | | 4,238,337 | |
71,310 | | InterContinental Hotels Group Plc | | | 4,668,359 | |
751,827 | | Legal & General Group Plc | | | 2,223,610 | |
| | | | | | |
| | | 11,130,306 | |
| | | | | | |
51
|
SCHEDULE OF PORTFOLIO INVESTMENTS |
RBC International Opportunities Fund (cont.) |
|
| March 31, 2023 |
| | | | | | |
| Shares | | | | Value | |
| |
Zambia — 2.12% | | | | |
124,762 | | First Quantum Minerals Ltd. | | $ | 2,868,187 | |
| | | | | | |
| |
Total Common Stocks | | | 134,053,385 | |
| | | | | | |
(Cost $137,184,467) | | | | |
| |
Rights/Warrants — 0.00% | | | | |
Thailand — 0.00% | | | | |
87,828 | | Minor International Public Co. Ltd., Warrants , Expire 12/31/24 | | | 9,247 | |
| | | | | | |
| |
Total Rights/Warrants | | | 9,247 | |
| | | | | | |
(Cost $0) | | | | | | |
| |
Investment Company — 0.06% | | | | |
79,760 | | U.S. Government Money Market Fund, RBC Institutional Class 1 (b) | | | 79,760 | |
| | | | | | |
| |
Total Investment Company | | | 79,760 | |
| | | | | | |
(Cost $79,760) | | | | |
| |
Total Investments | | $ | 134,142,392 | |
(Cost $137,264,227)(c) — 99.06% | | | | |
| |
Other assets in excess of liabilities — 0.94% | | | 1,268,224 | |
| | | | | | |
| |
NET ASSETS — 100.00% | | $ | 135,410,616 | |
| | | | | | |
| * | Non-income producing security. |
| (a) | Security exempt from registration under Rule 144A or Section 4(2) of the Securities Act of 1933, as amended. These securities may be resold in transactions exempt from registration, normally to qualified institutional buyers. |
| (b) | Affiliated investment. |
| (c) | See Notes to Schedules of Portfolio Investments for the tax cost of securities and the breakdown of unrealized appreciation (depreciation). |
Abbreviations used are defined below:
ADR - American Depositary Receipt
52
|
SCHEDULE OF PORTFOLIO INVESTMENTS |
RBC International Opportunities Fund (cont.) |
|
| March 31, 2023 |
Portfolio Diversification (Unaudited)
| | | | | |
Industries | | Percentage
of Net Assets |
Financials | | | | 26.78 | % |
Consumer Discretionary | | | | 15.93 | % |
Consumer Staples | | | | 12.35 | % |
Industrials | | | | 11.71 | % |
Materials | | | | 8.84 | % |
Health Care | | | | 8.72 | % |
Energy | | | | 7.73 | % |
Information Technology | | | | 5.77 | % |
Utilities | | | | 1.17 | % |
Other* | | | | 1.00 | % |
| | | | | |
| | | | 100.00 | % |
| | | | | |
| * | Includes cash, Investment Company, interest and dividend receivable, pending trades and Fund share transactions, warrants, and accrued expenses payable. |
See Notes to the Financial Statements.
53
|
SCHEDULE OF PORTFOLIO INVESTMENTS |
RBC International Equity Fund |
|
| March 31, 2023 |
| | | | | | |
| Shares | | | | Value | |
Common Stocks — 98.88% | | | | |
Australia — 9.11% | | | | | | |
12,500 | | BHP Group Ltd. | | $ | 395,174 | |
2,950 | | CSL Ltd. | | | 571,328 | |
2,722 | | Macquarie Group Ltd. | | | 322,284 | |
4,016 | | Mineral Resources Ltd. | | | 217,093 | |
3,959 | | Rio Tinto Plc | | | 268,730 | |
27,977 | | Santos Ltd. | | | 128,761 | |
| | | | | | |
| | | | | 1,903,370 | |
| | | | | | |
China — 3.97% | | | | | | |
79,800 | | Budweiser Brewing Co. APAC Ltd.(a) | | | 242,858 | |
134,000 | | CSPC Pharmaceutical Group Ltd. | | | 131,362 | |
9,300 | | Tencent Holdings Ltd. | | | 454,485 | |
| | | | | | |
| | | | | 828,705 | |
| | | | | | |
Denmark — 4.83% | | | | | | |
457 | | Chr Hansen Holding A/S | | | 34,764 | |
5,097 | | Novo Nordisk A/S, Class B | | | 809,513 | |
3,243 | | Novozymes A/S, Class B | | | 166,052 | |
| | | | | | |
| | | | | 1,010,329 | |
| | | | | | |
Finland — 2.26% | | | | | | |
10,010 | | Sampo Oyj, Class A | | | 472,323 | |
| | | | | | |
| | |
France — 9.51% | | | | | | |
2,794 | | EssilorLuxottica SA | | | 503,822 | |
863 | | LVMH Moet Hennessy Louis Vuitton SE | | | 792,155 | |
2,279 | | Schneider Electric SE | | | 380,875 | |
5,246 | | TotalEnergies SE | | | 309,324 | |
| | | | | | |
| | | | | 1,986,176 | |
| | | | | | |
Hong Kong — 1.56% | | | | |
31,000 | | AIA Group Ltd. | | | 325,108 | |
| | | | | | |
| | |
Ireland — 3.56% | | | | | | |
14,211 | | Bank of Ireland Group Plc | | | 143,791 | |
2,866 | | CRH Plc | | | 144,774 | |
578 | | Flutter Entertainment Plc* | | | 104,296 | |
3,725 | | Ryanair Holdings Plc, ADR* | | | 351,230 | |
| | | | | | |
| | | | | 744,091 | |
| | | | | | |
Japan — 18.81% | | | | | | |
8,200 | | Ajinomoto Co., Inc. | | | 285,261 | |
11,000 | | Daiichi Sankyo Co. Ltd. | | | 401,254 | |
7,700 | | Hitachi Ltd. | | | 423,197 | |
1,700 | | Hoya Corp. | | | 187,871 | |
23,000 | | Inpex Corp. | | | 243,398 | |
900 | | Keyence Corp. | | | 441,098 | |
54
|
SCHEDULE OF PORTFOLIO INVESTMENTS |
RBC International Equity Fund (cont.) |
|
| March 31, 2023 |
| | | | | | |
| Shares | | | | Value | |
124,000 | | Mitsubishi UFJ Financial Group, Inc. | | $ | 794,675 | |
7,000 | | Recruit Holdings Co. Ltd. | | | 192,563 | |
2,700 | | Sony Group Corp. | | | 245,925 | |
37,200 | | Tokio Marine Holdings, Inc. | | | 715,913 | |
| | | | | | |
| | | | | 3,931,155 | |
| | | | | | |
Netherlands — 9.39% | | | | |
121 | | Adyen NV*,(a) | | | 192,805 | |
888 | | ASML Holding NV | | | 605,126 | |
4,663 | | Heineken NV | | | 501,043 | |
41,800 | | ING Groep NV | | | 496,390 | |
4,618 | | NN Group NV | | | 167,679 | |
| | | | | | |
| | | | | 1,963,043 | |
| | | | | | |
Norway — 2.86% | | | | |
9,521 | | Aker BP ASA | | | 233,503 | |
13,193 | | DNB Bank ASA | | | 236,099 | |
8,244 | | Nordic Semiconductor ASA* | | | 127,094 | |
| | | | | | |
| | | | | 596,696 | |
| | | | | | |
Spain — 0.95% | | | | |
2,965 | | Amadeus IT Group SA* | | | 198,903 | |
| | | | | | |
| | |
Sweden — 3.53% | | | | | | |
12,370 | | Assa Abloy AB, Class B | | | 296,292 | |
15,032 | | Atlas Copco AB, Class A | | | 190,431 | |
21,885 | | Hexagon AB, Class B | | | 251,883 | |
| | | | | | |
| | | | | 738,606 | |
| | | | | | |
Switzerland — 6.27% | | | | |
2,219 | | Nestle SA | | | 270,564 | |
1,581 | | Roche Holding AG | | | 451,759 | |
602 | | Sika AG | | | 168,858 | |
19,808 | | UBS Group AG | | | 419,153 | |
| | | | | | |
| | | | | 1,310,334 | |
| | | | | | |
Taiwan — 3.19% | | | | |
38,000 | | Taiwan Semiconductor Manufacturing Co. Ltd. | | | 665,936 | |
| | | | | | |
| |
United Kingdom — 19.08% | | | | |
6,914 | | Ashtead Group Plc | | | 424,554 | |
1,869 | | AstraZeneca Plc | | | 258,958 | |
57,543 | | Barratt Developments Plc | | | 331,148 | |
3,823 | | DCC Plc | | | 222,848 | |
11,940 | | Diageo Plc | | | 532,878 | |
5,718 | | Experian Plc | | | 188,281 | |
7,020 | | Fevertree Drinks Plc | | | 111,004 | |
1,014 | | Linde Plc | | | 356,407 | |
6,213 | | London Stock Exchange Group Plc | | | 603,467 | |
55
|
SCHEDULE OF PORTFOLIO INVESTMENTS |
RBC International Equity Fund (cont.) |
|
| March 31, 2023 |
| | | | | | |
| Shares | | | | Value | |
10,682 | | RELX Plc | | $ | 345,970 | |
36,271 | | Schroders Plc | | | 206,834 | |
7,786 | | Unilever Plc | | | 403,463 | |
| | | | | | |
| | | | | 3,985,812 | |
| | | | | | |
Total Common Stocks | | | 20,660,587 | |
| | | | | | |
(Cost $19,764,804) | | | | |
| |
Investment Company — 0.82% | | | | |
171,228 | | U.S. Government Money Market Fund, RBC Institutional Class 1 (b) | | | 171,228 | |
| | | | | | |
Total Investment Company | | | 171,228 | |
| | | | | | |
(Cost $171,228) | | | | |
| |
Total Investments | | $ | 20,831,815 | |
(Cost $19,936,032)(c) — 99.70% | | | | |
| |
Other assets in excess of liabilities — 0.30% | | | 62,196 | |
| | | | | | |
| |
NET ASSETS — 100.00% | | $ | 20,894,011 | |
| | | | | | |
| * | Non-income producing security. |
| (a) | Security exempt from registration under Rule 144A or Section 4(2) of the Securities Act of 1933, as amended. These securities may be resold in transactions exempt from registration, normally to qualified institutional buyers. |
| (b) | Affiliated investment. |
| (c) | See Notes to Schedules of Portfolio Investments for the tax cost of securities and the breakdown of unrealized appreciation (depreciation). |
Abbreviations used are defined below:
ADR - American Depositary Receipt
56
|
SCHEDULE OF PORTFOLIO INVESTMENTS |
RBC International Equity Fund (cont.) |
|
| March 31, 2023 |
| | | | | |
| Portfolio Diversification (Unaudited) | | |
Industries | | Percentage
of Net Assets |
Financials | | | | 24.39 | % |
Health Care | | | | 15.87 | % |
Industrials | | | | 14.44 | % |
Consumer Staples | | | | 11.23 | % |
Information Technology | | | | 10.01 | % |
Materials | | | | 8.38 | % |
Consumer Discretionary | | | | 8.00 | % |
Energy | | | | 4.38 | % |
Communication Services | | | | 2.18 | % |
Other* | | | | 1.12 | % |
| | | | | |
| | | | 100.00 | % |
| | | | | |
| * | Includes cash, Investment Company, interest and dividend receivable, pending trades and Fund share transactions, and accrued expenses payable. |
See Notes to the Financial Statements.
57
|
SCHEDULE OF PORTFOLIO INVESTMENTS |
RBC International Small Cap Equity Fund |
|
| March 31, 2023 |
| | | | | | |
| Shares | | | | Value | |
Common Stocks — 98.24% | | | | |
Australia — 5.28% | | | | |
5,346 | | Altium Ltd. | | $ | 137,348 | |
2,469 | | Mineral Resources Ltd. | | | 133,467 | |
| | | | | | |
| | | | | 270,815 | |
| | | | | | |
Belgium — 3.14% | | | | |
23 | | Lotus Bakeries NV | | | 160,971 | |
| | | | | | |
| |
China — 2.50% | | | | |
105,000 | | China Overseas Property Holdings Ltd. | | | 128,101 | |
| | | | | | |
| |
Denmark — 4.92% | | | | |
985 | | Chr Hansen Holding A/S | | | 74,930 | |
3,321 | | Topdanmark AS | | | 177,538 | |
| | | | | | |
| | | | | 252,468 | |
| | | | | | |
Egypt — 1.26% | | | | |
4,029 | | Energean Plc | | | 64,682 | |
| | | | | | |
| |
France — 3.52% | | | | |
644 | | Gaztransport Et Technigaz SA | | | 65,899 | |
629 | | Remy Cointreau SA | | | 114,530 | |
| | | | | | |
| | | | | 180,429 | |
| | | | | | |
Iceland — 3.13% | | | | |
19,996 | | Marel HF(a) | | | 81,764 | |
17,315 | | Ossur HF* | | | 78,604 | |
| | | | | | |
| | | | | 160,368 | |
| | | | | | |
Indonesia — 1.84% | | | | |
1,527,500 | | Sarana Menara Nusantara Tbk PT | | | 94,490 | |
| | | | | | |
| |
Ireland — 1.98% | | | | |
2,974 | | Keywords Studios Plc | | | 101,406 | |
| | | | | | |
| |
Japan — 17.67% | | | | |
1,500 | | As One Corp. | | | 63,842 | |
4,300 | | BayCurrent Consulting, Inc. | | | 178,528 | |
4,100 | | Milbon Co. Ltd. | | | 169,089 | |
4,500 | | Miura Co. Ltd. | | | 115,412 | |
7,800 | | Nihon M&A Center Holdings, Inc. | | | 58,464 | |
2,500 | | Organo Corp. | | | 68,342 | |
4,600 | | Rakus Co. Ltd. | | | 66,808 | |
29,800 | | SBI Global Asset Management Co., Ltd. | | | 108,364 | |
3,200 | | SMS Co. Ltd. | | | 77,825 | |
| | | | | | |
| | | | | 906,674 | |
| | | | | | |
58
|
SCHEDULE OF PORTFOLIO INVESTMENTS |
RBC International Small Cap Equity Fund (cont.) |
|
| March 31, 2023 |
| | | | | | |
| Shares | | | | Value | |
Korea — 1.96% | | | | | | |
1,528 | | AfreecaTV Co. Ltd. | | $ | 100,427 | |
| | | | | | |
Norway — 4.68% | | | | | | |
2,787 | | Aker BP ASA | | | 68,351 | |
5,073 | | Nordic Semiconductor ASA* | | | 78,208 | |
8,790 | | Veidekke ASA | | | 93,295 | |
| | | | | | |
| | | | | 239,854 | |
| | | | | | |
| |
Philippines — 3.67% | | | | |
675,400 | | D&L Industries, Inc. | | | 102,042 | |
22,020 | | International Container Terminal Services, Inc. | | | 86,459 | |
| | | | | | |
| | | | | 188,501 | |
| | | | | | |
| | |
Spain — 2.72% | | | | | | |
3,342 | | Laboratorios Farmaceuticos Rovi SA | | | 139,537 | |
| | | | | | |
| | |
Sweden — 8.27% | | | | | | |
1,727 | | MIPS AB | | | 87,573 | |
4,919 | | Sdiptech AB, Class B* | | | 114,301 | |
10,356 | | Sweco AB, Class B | | | 131,528 | |
3,677 | | Thule Group AB(a) | | | 90,697 | |
| | | | | | |
| | | | | 424,099 | |
| | | | | | |
| | |
Taiwan — 6.34% | | | | | | |
21,000 | | Chailease Holding Co. Ltd. | | | 154,442 | |
3,000 | | Voltronic Power Technology Corp. | | | 170,831 | |
| | | | | | |
| | | | | 325,273 | |
| | | | | | |
| | |
Thailand — 4.30% | | | | | | |
1,700 | | Fabrinet* | | | 201,892 | |
12,300 | | Moshi Moshi Retail Corp. Plc* | | | 18,975 | |
| | | | | | |
| | | | | 220,867 | |
| | | | | | |
| |
United Kingdom — 21.06% | | | | |
5,300 | | Abcam Plc, ADR* | | | 71,338 | |
13,043 | | Auto Trader Group Plc | | | 99,488 | |
17,960 | | Barratt Developments Plc | | | 103,356 | |
3,022 | | Cranswick Plc | | | 112,488 | |
2,843 | | Dechra Pharmaceuticals Plc | | | 93,078 | |
4,727 | | Fevertree Drinks Plc | | | 74,746 | |
12,016 | | GB Group Plc | | | 44,427 | |
17,622 | | Howden Joinery Group Plc | | | 152,157 | |
41,696 | | Ibstock Plc(a) | | | 89,040 | |
5,638 | | Liontrust Asset Management Plc | | | 71,313 | |
59
|
SCHEDULE OF PORTFOLIO INVESTMENTS |
RBC International Small Cap Equity Fund (cont.) |
|
| March 31, 2023 |
| | | | | | |
| Shares | | | | Value | |
| |
10,439 | | Rightmove Plc | | $ | 72,662 | |
5,990 | | Softcat Plc | | | 96,222 | |
| | | | | | |
| | | | | 1,080,315 | |
| | | | | | |
Total Common Stocks | | | 5,039,277 | |
| | | | | | |
(Cost $4,908,273) | | | | |
| |
Investment Company — 2.21% | | | | |
113,376 | | U.S. Government Money Market Fund, RBC Institutional Class 1 (b) | | | 113,376 | |
| | | | | | |
Total Investment Company | | | 113,376 | |
| | | | | | |
(Cost $113,376) | | | | |
| |
Total Investments | | $ | 5,152,653 | |
(Cost $5,021,649)(c) — 100.45% | | | | |
| |
Liabilities in excess of other assets — (0.45)% | | | (23,265) | |
| | | | | | |
| |
NET ASSETS — 100.00% | | $ | 5,129,388 | |
| | | | | | |
| * | Non-income producing security. |
| (a) | Security exempt from registration under Rule 144A or Section 4(2) of the Securities Act of 1933, as amended. These securities may be resold in transactions exempt from registration, normally to qualified institutional buyers. |
| (b) | Affiliated investment. |
| (c) | See Notes to Schedules of Portfolio Investments for the tax cost of securities and the breakdown of unrealized appreciation (depreciation). |
Abbreviations used are defined below:
ADR – American Depositary Receipt
60
|
SCHEDULE OF PORTFOLIO INVESTMENTS |
RBC International Small Cap Equity Fund (cont.) |
|
| March 31, 2023 |
| | | | | |
| Portfolio Diversification (Unaudited) | | |
Industries | | Percentage
of Net Assets |
Industrials | | | | 25.91 | % |
Information Technology | | | | 14.16 | % |
Consumer Staples | | | | 12.32 | % |
Financials | | | | 9.97 | % |
Health Care | | | | 8.70 | % |
Materials | | | | 7.79 | % |
Communication Services | | | | 7.15 | % |
Consumer Discretionary | | | | 5.86 | % |
Energy | | | | 3.88 | % |
Real Estate | | | | 2.50 | % |
Other* | | | | 1.76 | % |
| | | | | |
| | | | 100.00 | % |
| | | | | |
| * | Includes cash, Investment Company, interest and dividend receivable, pending trades and Fund share transactions, and accrued expenses payable. |
See Notes to the Financial Statements.
61
|
SCHEDULE OF PORTFOLIO INVESTMENTS |
RBC China Equity Fund |
|
| March 31, 2023 |
| | | | | | |
| Shares | | | | Value | |
| |
Common Stocks — 96.27% | | | | |
China — 94.31% | | | | |
6,000 | | 360 DigiTech, Inc., ADR | | $ | 116,400 | |
32,058 | | Alibaba Group Holding Ltd.* | | | 406,030 | |
10,100 | | Anhui Guangxin Agrochemical Co. Ltd., Class A | | | 48,531 | |
3,400 | | Anjoy Foods Group Co. Ltd., Class A | | | 81,084 | |
10,408 | | Baidu, Inc., Class A* | | | 196,100 | |
56,000 | | Beijing Dabeinong Technology Group Co. Ltd., Class A* | | | 63,666 | |
3,500 | | BYD Co. Ltd., Class H | | | 102,957 | |
31,500 | | China Merchants Bank Co. Ltd., Class H | | | 159,958 | |
10,500 | | China Resources Beer Holdings Co. Ltd. | | | 84,351 | |
29,197 | | China Resources Land Ltd. | | | 132,958 | |
18,200 | | CITIC Securities Co. Ltd., Class A | | | 54,318 | |
31,900 | | CSPC Innovation Pharmaceutical Co. Ltd., Class A | | | 94,949 | |
48,000 | | Guangdong Investment Ltd. | | | 49,103 | |
31,900 | | Guanghui Energy Co. Ltd., Class A | | | 42,948 | |
2,295 | | Hangzhou Honghua Digital Technology Stock Co. Ltd., Class A | | | 56,476 | |
12,400 | | Hundsun Technologies, Inc., Class A | | | 96,093 | |
12,660 | | Hygeia Healthcare Holdings Co. Ltd.*,(a) | | | 90,272 | |
3,726 | | InnoCare Pharma Ltd.*,(a) | | | 3,973 | |
2,500 | | JD.com, Inc., Class A | | | 54,590 | |
23,400 | | Jiangsu Eastern Shenghong Co. Ltd., Class A | | | 46,324 | |
3,495 | | Kanzhun Ltd., ADR* | | | 66,510 | |
5,000 | | KE Holdings, Inc., ADR* | | | 94,200 | |
10,600 | | Kingsoft Corp. Ltd. | | | 52,109 | |
4,500 | | Li Ning Co. Ltd. | | | 35,388 | |
15,600 | | Longshine Technology Group Co. Ltd., Class A | | | 60,812 | |
17,800 | | Luxshare Precision Industry Co. Ltd., Class A | | | 78,630 | |
7,491 | | Meituan, Class B*,(a) | | | 135,903 | |
12,500 | | NARI Technology Co. Ltd., Class A | | | 49,284 | |
3,400 | | NetEase, Inc. | | | 60,020 | |
17,524 | | New Horizon Health Ltd.*,(a) | | | 60,728 | |
1,807 | | PDD Holdings, Inc. , ADR* | | | 137,151 | |
16,747 | | Ping An Insurance Group Co. of China Ltd., Series H | | | 108,340 | |
9,300 | | Shandong Hualu Hengsheng Chemical Co. Ltd., Class A | | | 47,715 | |
6,800 | | Shanghai International Airport Co. Ltd., Class A* | | | 55,170 | |
33,899 | | Shanghai Liangxin Electrical Co. Ltd., Class A | | | 62,955 | |
4,800 | | Shenyang Xingqi Pharmaceutical Co. Ltd., Class A | | | 91,915 | |
4,100 | | Shenzhen Inovance Technology Co. Ltd., Class A | | | 42,003 | |
1,000 | | Shenzhen Mindray Bio-Medical Electronics Co. Ltd., Class A | | | 45,372 | |
6,533 | | Shenzhou International Group Holdings Ltd. | | | 68,532 | |
15,200 | | Sinoseal Holding Co. Ltd., Class A | | | 95,791 | |
10,600 | | Sunresin New Materials Co. Ltd., Class A | | | 146,709 | |
9,246 | | Tencent Holdings Ltd. | | | 451,846 | |
2,672 | | Trip.com Group Ltd.* | | | 100,663 | |
3,600 | | Wuliangye Yibin Co. Ltd., Class A | | | 102,853 | |
6,500 | | Wuxi Biologics Cayman, Inc.*,(a) | | | 40,053 | |
23,500 | | Zhuzhou Kibing Group Co. Ltd., Class A | | | 35,726 | |
62
|
SCHEDULE OF PORTFOLIO INVESTMENTS |
RBC China Equity Fund (cont.) |
|
| March 31, 2023 |
| | | | | | |
| Shares | | | | Value | |
| |
30,777 | | Zijin Mining Group Co. Ltd., Class H | | $ | 51,347 | |
3,400 | | ZTO Express Cayman, Inc., ADR | | | 97,444 | |
| | | | | | |
| | | | | 4,456,250 | |
| | | | | | |
| |
Hong Kong — 0.49% | | | | |
2,200 | | AIA Group Ltd. | | | 23,072 | |
| | | | | | |
| |
Korea — 1.47% | | | | |
1,018 | | SK Hynix, Inc. | | | 69,667 | |
| | | | | | |
| |
Total Common Stocks | | | 4,548,989 | |
| | | | | | |
(Cost $4,421,692) | | | | |
Total Investments | | $ | 4,548,989 | |
(Cost $4,421,692)(b) — 96.27% | | | | |
Other assets in excess of liabilities — 3.73% | | | 176,140 | |
| | | | | | |
NET ASSETS — 100.00% | | $ | 4,725,129 | |
| | | | | | |
| * | Non-income producing security. |
| (a) | Security exempt from registration under Rule 144A or Section 4(2) of the Securities Act of 1933, as amended. These securities may be resold in transactions exempt from registration, normally to qualified institutional buyers. |
| (b) | See Notes to Schedules of Portfolio Investments for the tax cost of securities and the breakdown of unrealized appreciation (depreciation). |
Abbreviations used are defined below:
ADR – American Depositary Receipt
63
|
SCHEDULE OF PORTFOLIO INVESTMENTS |
RBC China Equity Fund (cont.) |
|
| March 31, 2023 |
Portfolio Diversification (Unaudited)
| | | | | |
Industries | | Percentage
of Net Assets |
Consumer Discretionary | | | | 22.04 | % |
Communication Services | | | | 17.49 | % |
Industrials | | | | 10.48 | % |
Financials | | | | 9.78 | % |
Health Care | | | | 9.04 | % |
Materials | | | | 7.21 | % |
Consumer Staples | | | | 7.03 | % |
Information Technology | | | | 6.45 | % |
Real Estate | | | | 4.80 | % |
Utilities | | | | 1.04 | % |
Energy | | | | 0.91 | % |
Other* | | | | 3.73 | % |
| | | | | |
| | | | 100.00 | % |
| | | | | |
| * | Includes cash, interest and dividend receivable, pending trades and Fund share transactions, and accrued expenses payable. |
See Notes to the Financial Statements.
64
|
FINANCIAL STATEMENTS |
Statements of Assets and Liabilities |
March 31, 2023 |
| | | | | | | | | | | | | | | | | | | | |
| | | | | RBC Emerging Markets
Equity Fund | | | | RBC Emerging Markets
Ex-China Equity Fund |
Assets: | | | | | | | | | | | | | | | | | | | | |
Investments in securities, at value: | | | | | | | | | | | | | | | | | | | | |
Unaffiliated investments (cost $2,212,765,915 and $31,447,428, respectively) | | | | | | | | $ | 2,118,336,247 | | | | | | | | | $ | 32,858,287 | |
Affiliated investments (cost $0 and $950,554, respectively) | | | | | | | | | — | | | | | | | | | | 950,554 | |
Cash | | | | | | | | | — | | | | | | | | | | 1 | |
Foreign currency, at value (cost $17 and $0, respectively) | | | | | | | | | 17 | | | | | | | | | | — | |
Interest and dividend receivable | | | | | | | | | 7,372,851 | | | | | | | | | | 109,888 | |
Receivable from advisor | | | | | | | | | — | | | | | | | | | | 24,733 | |
Receivable for capital shares issued | | | | | | | | | 5,725,516 | | | | | | | | | | — | |
Prepaid expenses and other assets | | | | | | | | | 53,401 | | | | | | | | | | 4,767 | |
| | | | | | | | | | | | | | | | | | | | |
Total Assets | | | | | | | | | 2,131,488,032 | | | | | | | | | | 33,948,230 | |
| | | | | | | | | | | | | | | | | | | | |
Liabilities: | | | | | | | | | | | | | | | | | | | | |
Cash overdraft | | | | | | | | | 170,185 | | | | | | | | | | — | |
Current tax payable | | | | | | | | | 8,192,460 | | | | | | | | | | — | |
Professional fees payable | | | | | | | | | 74,301 | | | | | | | | | | 3,126 | |
Distributions payable | | | | | | | | | 2 | | | | | | | | | | — | |
Payable for capital shares redeemed | | | | | | | | | 536,981 | | | | | | | | | | — | |
Payable for investments purchased | | | | | | | | | 42,497 | | | | | | | | | | — | |
Accrued expenses and other payables: | | | | | | | | | | | | | | | | | | | | |
Investment advisory fees | | | | | | | | | 1,075,271 | | | | | | | | | | — | |
Accounting fees | | | | | | | | | 36,558 | | | | | | | | | | 10,765 | |
Audit fees | | | | | | | | | 32,766 | | | | | | | | | | 27,871 | |
Trustees’ fees | | | | | | | | | 55,405 | | | | | | | | | | 366 | |
Distribution fees | | | | | | | | | 69,883 | | | | | | | | | | 363 | |
Custodian fees | | | | | | | | | 206,806 | | | | | | | | | | 10,692 | |
Transfer agent fees | | | | | | | | | 701,902 | | | | | | | | | | 3,762 | |
Other | | | | | | | | | 57,851 | | | | | | | | | | 9,391 | |
| | | | | | | | | | | | | | | | | | | | |
Total Liabilities | | | | | | | | | 11,252,868 | | | | | | | | | | 66,336 | |
| | | | | | | | | | | | | | | | | | | | |
Net Assets | | | | | | | | $ | 2,120,235,164 | | | | | | | | | $ | 33,881,894 | |
| | | | | | | | | | | | | | | | | | | | |
Net Assets Consists of: | | | | | | | | | | | | | | | | | | | | |
Capital | | | | | | | | $ | 2,299,357,355 | | | | | | | | | $ | 32,406,934 | |
Accumulated earnings | | | | | | | | | (179,122,191 | ) | | | | | | | | | 1,474,960 | |
| | | | | | | | | | | | | | | | | | | | |
Net Assets | | | | | | | | $ | 2,120,235,164 | | | | | | | | | $ | 33,881,894 | |
| | | | | | | | | | | | | | | | | | | | |
65
|
FINANCIAL STATEMENTS |
Statements of Assets and Liabilities (cont.) |
|
March 31, 2023 |
| | | | | | | | | | | | | | | | | | | | |
| | | | | RBC Emerging Markets
Equity Fund | | | | RBC Emerging Markets
Ex-China Equity Fund |
Net Assets | | | | | | | | | | | | | | | | | | | | |
Class A | | | | | | | | $ | 124,373,242 | | | | | | | | | $ | 520,106 | |
Class I | | | | | | | | | 1,751,023,066 | | | | | | | | | | 32,320,840 | |
Class R6 | | | | | | | | | 244,838,856 | | | | | | | | | | 1,040,948 | |
| | | | | | | | | | | | | | | | | | | | |
Total | | | | | | | | $ | 2,120,235,164 | | | | | | | | | $ | 33,881,894 | |
| | | | | | | | | | | | | | | | | | | | |
Shares Outstanding (Unlimited number of shares authorized, no par value): | | | | | | | | | | | | | | | | | | | | |
Class A | | | | | | | | | 10,492,218 | | | | | | | | | | 50,000 | |
Class I | | | | | | | | | 145,374,841 | | | | | | | | | | 3,104,547 | |
Class R6 | | | | | | | | | 20,226,509 | | | | | | | | | | 100,000 | |
| | | | | | | | | | | | | | | | | | | | |
Total | | | | | | | | | 176,093,568 | | | | | | | | | | 3,254,547 | |
| | | | | | | | | | | | | | | | | | | | |
Net Asset Values and Redemption Prices Per Share: | | | | | | | | | | | | | | | | | | | | |
Class A | | | | | | | | $ | 11.85 | | | | | | | | | $ | 10.40 | |
| | | | | | | | | | | | | | | | | | | | |
Class I | | | | | | | | $ | 12.04 | | | | | | | | | $ | 10.41 | |
| | | | | | | | | | | | | | | | | | | | |
Class R6 | | | | | | | | $ | 12.10 | | | | | | | | | $ | 10.41 | |
| | | | | | | | | | | | | | | | | | | | |
Maximum Offering Price Per Share: | | | | | | | | | | | | | | | | | | | | |
Class A | | | | | | | | $ | 12.57 | | | | | | | | | $ | 11.03 | |
| | | | | | | | | | | | | | | | | | | | |
Maximum Sales Charge - Class A | | | | | | | | | 5.75 | % | | | | | | | | | 5.75 | % |
| | | | | | | | | | | | | | | | | | | | |
66
|
FINANCIAL STATEMENTS |
Statements of Assets and Liabilities (cont.) |
March 31, 2023 |
| | | | | | | | | | | | | | | | | | | | |
| | | RBC Emerging
Markets Value
Equity Fund | | | | RBC Global
Opportunities Fund |
Assets: | | | | | | | | | | | | | | | | | | | | |
Investments in securities, at value: | | | | | | | | | | | | | | | | | | | | |
Unaffiliated investments (cost $73,861,576 and $502,655,670, respectively) | | | | | | | | $ | 65,859,101 | | | | | | | | | $ | 462,839,048 | |
Affiliated investments (cost $909,723 and $18,735,873, respectively) | | | | | | | | | 909,723 | | | | | | | | | | 18,735,873 | |
Cash | | | | | | | | | 4 | | | | | | | | | | 95,680 | |
Foreign currency, at value (cost $209,204 and $35, respectively) | | | | | | | | | 208,987 | | | | | | | | | | 39 | |
Interest and dividend receivable | | | | | | | | | 332,845 | | | | | | | | | | 966,749 | |
Receivable from advisor | | | | | | | | | 5,103 | | | | | | | | | | — | |
Receivable for capital shares issued | | | | | | | | | 8,568 | | | | | | | | | | 604,467 | |
Receivable for investments sold | | | | | | | | | 496,023 | | | | | | | | | | 4,263,599 | |
Prepaid expenses and other assets | | | | | | | | | 29,649 | | | | | | | | | | 26,254 | |
| | | | | | | | | | | | | | | | | | | | |
Total Assets | | | | | | | | | 67,850,003 | | | | | | | | | | 487,531,709 | |
| | | | | | | | | | | | | | | | | | | | |
Liabilities: | | | | | | | | | | | | | | | | | | | | |
Current tax payable | | | | | | | | | 113,295 | | | | | | | | | | — | |
Professional fees payable | | | | | | | | | 39,802 | | | | | | | | | | 4,568 | |
Payable for capital shares redeemed | | | | | | | | | 47,727 | | | | | | | | | | 95,616 | |
Payable for investments purchased | | | | | | | | | 907,563 | | | | | | | | | | 19,837,070 | |
Accrued expenses and other payables: | | | | | | | | | | | | | | | | | | | | |
Investment advisory fees | | | | | | | | | — | | | | | | | | | | 187,691 | |
Accounting fees | | | | | | | | | 11,177 | | | | | | | | | | 15,833 | |
Audit fees | | | | | | | | | 24,766 | | | | | | | | | | 40,766 | |
Trustees’ fees | | | | | | | | | 1,696 | | | | | | | | | | 12,037 | |
Distribution fees | | | | | | | | | 20 | | | | | | | | | | 98 | |
Custodian fees | | | | | | | | | 41,393 | | | | | | | | | | 4,952 | |
Shareholder reports | | | | | | | | | 4,289 | | | | | | | | | | 4,107 | |
Transfer agent fees | | | | | | | | | 1,221 | | | | | | | | | | 64,003 | |
Other | | | | | | | | | 16,253 | | | | | | | | | | 16,360 | |
| | | | | | | | | | | | | | | | | | | | |
Total Liabilities | | | | | | | | | 1,209,202 | | | | | | | | | | 20,283,101 | |
| | | | | | | | | | | | | | | | | | | | |
Net Assets | | | | | | | | $ | 66,640,801 | | | | | | | | | $ | 467,248,608 | |
| | | | | | | | | | | | | | | | | | | | |
Net Assets Consists of: | | | | | | | | | | | | | | | | | | | | |
Capital | | | | | | | | $ | 79,593,092 | | | | | | | | | $ | 545,736,720 | |
Accumulated earnings | | | | | | | | | (12,952,291 | ) | | | | | | | | | (78,488,112 | ) |
| | | | | | | | | | | | | | | | | | | | |
Net Assets | | | | | | | | $ | 66,640,801 | | | | | | | | | $ | 467,248,608 | |
| | | | | | | | | | | | | | | | | | | | |
67
|
FINANCIAL STATEMENTS |
Statements of Assets and Liabilities (cont.) |
March 31, 2023 |
| | | | | | | | | | | | | | | | | | | | | | | | | |
| | | RBC Emerging
Markets Value
Equity Fund | | RBC Global
Opportunities Fund |
Net Assets | | | | | | | | | | | | | | | | | | | | | | | | | |
Class A | | | | | | | | $ | 14,155 | | | | | | | | | | | | | | $ | 20,114 | |
Class I | | | | | | | | | 64,106,247 | | | | | | | | | | | | | | | 313,879,169 | |
Class R6 | | | | | | | | | 2,520,399 | | | | | | | | | | | | | | | 153,349,325 | |
| | | | | | | | | | | | | | | | | | | | | | | | | |
Total | | | | | | | | $ | 66,640,801 | | | | | | | | | | | | | | $ | 467,248,608 | |
| | | | | | | | | | | | | | | | | | | | | | | | | |
Shares Outstanding (Unlimited number of shares authorized, no par value): | | | | | | | | | | | | | | | | | | | | | | | | | |
Class A | | | | | | | | | 1,834 | | | | | | | | | | | | | | | 1,193 | |
Class I | | | | | | | | | 8,291,742 | | | | | | | | | | | | | | | 18,592,553 | |
Class R6 | | | | | | | | | 339,998 | | | | | | | | | | | | | | | 9,052,821 | |
| | | | | | | | | | | | | | | | | | | | | | | | | |
Total | | | | | | | | | 8,633,574 | | | | | | | | | | | | | | | 27,646,567 | |
| | | | | | | | | | | | | | | | | | | | | | | | | |
Net Asset Values and Redemption Prices Per Share: | | | | | | | | | | | | | | | | | | | | | | | | | |
Class A | | | | | | | | $ | 7.72 | | | | | | | | | | | | | | $ | 16.86 | |
| | | | | | | | | | | | | | | | | | | | | | | | | |
Class I | | | | | | | | $ | 7.73 | | | | | | | | | | | | | | $ | 16.88 | |
| | | | | | | | | | | | | | | | | | | | | | | | | |
Class R6 | | | | | | | | $ | 7.41 | | | | | | | | | | | | | | $ | 16.94 | |
| | | | | | | | | | | | | | | | | | | | | | | | | |
Maximum Offering Price Per Share: | | | | | | | | | | | | | | | | | | | | | | | | | |
Class A | | | | | | | | $ | 8.19 | | | | | | | | | | | | | | $ | 17.89 | |
| | | | | | | | | | | | | | | | | | | | | | | | | |
Maximum Sales Charge - Class A | | | | | | | | | 5.75 | % | | | | | | | | | | | | | | 5.75 | % |
| | | | | | | | | | | | | | | | | | | | | | | | | |
68
|
FINANCIAL STATEMENTS |
Statements of Assets and Liabilities (cont.) |
|
| March 31, 2023 |
| | | | | | | | | | | | | | | | | | | | |
| | | | | RBC Global Equity
Leaders Fund | | | | RBC International
Opportunities Fund |
Assets: | | | | | | | | | | | | | | | | | |
Investments in securities, at value: | | | | | | | | | | | | | | | | | |
Unaffiliated investments (cost $4,670,215 and $137,184,467, respectively) | | | | | $ | 4,157,985 | | | | | | | | | $ | 134,062,632 | |
Affiliated investments (cost $40,927 and $79,760, respectively) | | | | | | 40,927 | | | | | | | | | | 79,760 | |
Cash | | | | | | 1,249 | | | | | | | | | | — | |
Foreign currency, at value (cost $0 and $48, respectively) | | | | | | — | | | | | | | | | | 53 | |
Interest and dividend receivable | | | | | | 5,187 | | | | | | | | | | 1,263,244 | |
Receivable for capital shares issued | | | | | | — | | | | | | | | | | 22,000 | |
Receivable for investments sold | | | | | | 8,805 | | | | | | | | | | 592,451 | |
Prepaid expenses and other assets | | | | | | 24,540 | | | | | | | | | | 24,221 | |
| | | | | | | | | | | | | | | | | |
Total Assets | | | | | | 4,238,693 | | | | | | | | | | 136,044,361 | |
| | | | | | | | | | | | | | | | | |
Liabilities: | | | | | | | | | | | | | | | | | |
Foreign currency overdraft, at value (cost $5 and $0, respectively) | | | | | | 5 | | | | | | | | | | — | |
Professional fees payable | | | | | | 2,130 | | | | | | | | | | 15,013 | |
Payable for capital shares redeemed | | | | | | — | | | | | | | | | | 24,236 | |
Payable for investments purchased | | | | | | 77,291 | | | | | | | | | | 403,218 | |
Accrued expenses and other payables: | | | | | | | | | | | | | | | | | |
Investment advisory fees | | | | | | 14,390 | | | | | | | | | | 43,710 | |
Accounting fees | | | | | | 10,417 | | | | | | | | | | 11,963 | |
Audit fees | | | | | | 32,165 | | | | | | | | | | 40,766 | |
Trustees’ fees | | | | | | 101 | | | | | | | | | | 3,376 | |
Distribution fees | | | | | | 2,666 | | | | | | | | | | 111 | |
Custodian fees | | | | | | 1,176 | | | | | | | | | | 10,745 | |
Shareholder reports | | | | | | 4,521 | | | | | | | | | | 4,307 | |
Transfer agent fees | | | | | | 1,757 | | | | | | | | | | 61,155 | |
Other | | | | | | 4,967 | | | | | | | | | | 15,145 | |
| | | | | | | | | | | | | | | | | |
Total Liabilities | | | | | | 151,586 | | | | | | | | | | 633,745 | |
| | | | | | | | | | | | | | | | | |
Net Assets | | | | | $ | 4,087,107 | | | | | | | | | $ | 135,410,616 | |
| | | | | | | | | | | | | | | | | |
Net Assets Consists of: | | | | | | | | | | | | | | | | | |
Capital | | | | | $ | 5,025,175 | | | | | | | | | $ | 140,974,655 | |
Accumulated earnings | | | | | | (938,068 | ) | | | | | | | | | (5,564,039 | ) |
| | | | | | | | | | | | | | | | | |
Net Assets | | | | | $ | 4,087,107 | | | | | | | | | $ | 135,410,616 | |
| | | | | | | | | | | | | | | | | |
69
|
FINANCIAL STATEMENTS |
Statements of Assets and Liabilities (cont.) |
|
| March 31, 2023 |
| | | | | | | | | | | | | | | | |
| | | | | | RBC Global Equity
Leaders Fund | | | | | | RBC International
Opportunities Fund | |
Net Assets | | | | | | | | | | | | | | | | |
Class A | | | | | | $ | 815,206 | | | | | | | $ | 140,007 | |
Class I | | | | | | | 2,453,530 | | | | | | | | 129,859,327 | |
Class R6 | | | | | | | 818,371 | | | | | | | | 5,411,282 | |
| | | | | | | | | | | | | | | | |
Total | | | | | | $ | 4,087,107 | | | | | | | $ | 135,410,616 | |
| | | | | | | | | | | | | | | | |
Shares Outstanding (Unlimited number of shares authorized, no par value): | | | | | | | | | | | | | | | | |
Class A | | | | | | | 100,633 | | | | | | | | 13,944 | |
Class I | | | | | | | 302,718 | | | | | | | | 12,829,782 | |
Class R6 | | | | | | | 100,960 | | | | | | | | 530,040 | |
| | | | | | | | | | | | | | | | |
Total | | | | | | | 504,311 | | | | | | | | 13,373,766 | |
| | | | | | | | | | | | | | | | |
Net Asset Values and Redemption Prices Per Share: | | | | | | | | | | | | | | | | |
Class A | | | | | | $ | 8.10 | | | | | | | $ | 10.04 | |
| | | | | | | | | | | | | | | | |
Class I | | | | | | $ | 8.11 | | | | | | | $ | 10.12 | |
| | | | | | | | | | | | | | | | |
Class R6 | | | | | | $ | 8.11 | | | | | | | $ | 10.21 | |
| | | | | | | | | | | | | | | | |
Maximum Offering Price Per Share: | | | | | | | | | | | | | | | | |
Class A | | | | | | $ | 8.59 | | | | | | | $ | 10.65 | |
| | | | | | | | | | | | | | | | |
Maximum Sales Charge - Class A | | | | | | | 5.75 | % | | | | | | | 5.75 | % |
| | | | | | | | | | | | | | | | |
70
|
FINANCIAL STATEMENTS |
Statements of Assets and Liabilities (cont.) |
|
| March 31, 2023 |
| | | | | | | | | | | | | | | | | | | | |
| | | | | RBC International
Equity Fund | | | | RBC International
Small Cap Equity Fund |
Assets: | | | | | | | | | | | | | | | | | | | | |
Investments in securities, at value: | | | | | | | | | | | | | | | | | | | | |
Unaffiliated investments (cost $19,764,804 and $4,908,273, respectively) | | | | | | | | $ | 20,660,587 | | | | | | | | | $ | 5,039,277 | |
Affiliated investments (cost $171,228 and $113,376, respectively) | | | | | | | | | 171,228 | | | | | | | | | | 113,376 | |
Cash | | | | | | | | | 4 | | | | | | | | | | 5 | |
Foreign currency, at value (cost $14,696 and $1,919, respectively) | | | | | | | | | 14,663 | | | | | | | | | | 1,913 | |
Interest and dividend receivable | | | | | | | | | 70,990 | | | | | | | | | | 7,711 | |
Receivable from advisor | | | | | | | | | 28,389 | | | | | | | | | | 37,921 | |
Receivable for investments sold | | | | | | | | | 7,706 | | | | | | | | | | — | |
Prepaid expenses and other assets | | | | | | | | | 23,252 | | | | | | | | | | 11,433 | |
| | | | | | | | | | | | | | | | | | | | |
Total Assets | | | | | | | | | 20,976,819 | | | | | | | | | | 5,211,636 | |
| | | | | | | | | | | | | | | | | | | | |
Liabilities: | | | | | | | | | | | | | | | | | | | | |
Professional fees payable | | | | | | | | | 4,461 | | | | | | | | | | 4,543 | |
Accrued expenses and other payables: | | | | | | | | | | | | | | | | | | | | |
Accounting fees | | | | | | | | | 10,616 | | | | | | | | | | 10,429 | |
Audit fees | | | | | | | | | 27,863 | | | | | | | | | | 27,863 | |
Trustees’ fees | | | | | | | | | 248 | | | | | | | | | | 124 | |
Distribution fees | | | | | | | | | 743 | | | | | | | | | | 367 | |
Custodian fees | | | | | | | | | 12,381 | | | | | | | | | | 16,258 | |
Transfer agent fees | | | | | | | | | 1,776 | | | | | | | | | | 1,775 | |
Other | | | | | | | | | 24,720 | | | | | | | | | | 20,889 | |
| | | | | | | | | | | | | | | | | | | | |
Total Liabilities | | | | | | | | | 82,808 | | | | | | | | | | 82,248 | |
| | | | | | | | | | | | | | | | | | | | |
Net Assets | | | | | | | | $ | 20,894,011 | | | | | | | | | $ | 5,129,388 | |
| | | | | | | | | | | | | | | | | | | | |
Net Assets Consists of: | | | | | | | | | | | | | | | | | | | | |
Capital | | | | | | | | $ | 19,993,568 | | | | | | | | | $ | 4,997,653 | |
Accumulated earnings | | | | | | | | | 900,443 | | | | | | | | | | 131,735 | |
| | | | | | | | | | | | | | | | | | | | |
Net Assets | | | | | | | | $ | 20,894,011 | | | | | | | | | $ | 5,129,388 | |
| | | | | | | | | | | | | | | | | | | | |
71
|
FINANCIAL STATEMENTS |
Statements of Assets and Liabilities (cont.) |
|
| March 31, 2023 |
| | | | | | | | | | | | | | | | | | | | |
| | | RBC International
Equity Fund | | | | RBC International
Small Cap Equity Fund |
Net Assets | | | | | | | | | | | | | | | | | | | | |
Class A | | | | | | | | $ | 1,043,969 | | | | | | | | | $ | 512,589 | |
Class I | | | | | | | | | 18,282,724 | | | | | | | | | | 3,590,728 | |
Class R6 | | | | | | | | | 1,567,318 | | | | | | | | | | 1,026,071 | |
| | | | | | | | | | | | | | | | | | | | |
Total | | | | | | | | $ | 20,894,011 | | | | | | | | | $ | 5,129,388 | |
| | | | | | | | | | | | | | | | | | | | |
Shares Outstanding (Unlimited number of shares authorized, no par value): | | | | | | | | | | | | | | | | | | | | |
Class A | | | | | | | | | 100,000 | | | | | | | | | | 50,000 | |
Class I | | | | | | | | | 1,750,000 | | | | | | | | | | 350,000 | |
Class R6 | | | | | | | | | 150,000 | | | | | | | | | | 100,000 | |
| | | | | | | | | | | | | | | | | | | | |
Total | | | | | | | | | 2,000,000 | | | | | | | | | | 500,000 | |
| | | | | | | | | | | | | | | | | | | | |
Net Asset Values and Redemption Prices Per Share: | | | | | | | | | | | | | | | | | | | | |
Class A | | | | | | | | $ | 10.44 | | | | | | | | | $ | 10.25 | |
| | | | | | | | | | | | | | | | | | | | |
Class I | | | | | | | | $ | 10.45 | | | | | | | | | $ | 10.26 | |
| | | | | | | | | | | | | | | | | | | | |
Class R6 | | | | | | | | $ | 10.45 | | | | | | | | | $ | 10.26 | |
| | | | | | | | | | | | | | | | | | | | |
Maximum Offering Price Per Share: | | | | | | | | | | | | | | | | | | | | |
Class A | | | | | | | | $ | 11.08 | | | | | | | | | $ | 10.88 | |
| | | | | | | | | | | | | | | | | | | | |
Maximum Sales Charge - Class A | | | | | | | | | 5.75 | % | | | | | | | | | 5.75 | % |
| | | | | | | | | | | | | | | | | | | | |
72
|
FINANCIAL STATEMENTS |
Statements of Assets and Liabilities (cont.) |
|
| March 31, 2023 |
| | | | | | | | |
| | | | | | RBC China
Equity Fund | |
Assets: | | | | | | | | |
Investments in securities, at value: | | | | | | | | |
Unaffiliated investments (cost $4,421,692) | | | | | | $ | 4,548,989 | |
Cash | | | | | | | 138,072 | |
Foreign currency, at value (cost $10) | | | | | | | 10 | |
Interest and dividend receivable | | | | | | | 196 | |
Receivable from advisor | | | | | | | 31,676 | |
Receivable for investments sold | | | | | | | 28,018 | |
Prepaid expenses and other assets | | | | | | | 40,502 | |
| | | | | | | | |
Total Assets | | | | | | | 4,787,463 | |
| | | | | | | | |
Liabilities: | | | | | | | | |
Professional fees payable | | | | | | | 3,075 | |
Payable for investments purchased | | | | | | | 6,931 | |
Accrued expenses and other payables: | | | | | | | | |
Accounting fees | | | | | | | 9,006 | |
Audit fees | | | | | | | 36,800 | |
Trustees’ fees | | | | | | | 119 | |
Distribution fees | | | | | | | 1,135 | |
Shareholder reports | | | | | | | 3,381 | |
Transfer agent fees | | | | | | | 1,747 | |
Other | | | | | | | 140 | |
| | | | | | | | |
Total Liabilities | | | | | | | 62,334 | |
| | | | | | | | |
Net Assets | | | | | | $ | 4,725,129 | |
| | | | | | | | |
Net Assets Consists of: | | | | | | | | |
Capital | | | | | | $ | 5,032,931 | |
Accumulated earnings | | | | | | | (307,802 | ) |
| | | | | | | | |
Net Assets | | | | | | $ | 4,725,129 | |
| | | | | | | | |
73
|
FINANCIAL STATEMENTS |
Statements of Assets and Liabilities (cont.) |
|
| March 31, 2023 |
| | | | |
| | | RBC China
Equity Fund | |
Net Assets | | | | |
Class A | | $ | 471,439 | |
Class I | | | 3,308,070 | |
Class R6 | | | 945,620 | |
| | | | |
Total | | $ | 4,725,129 | |
| | | | |
Shares Outstanding (Unlimited number of shares authorized, no par value): | | | | |
Class A | | | 50,419 | |
Class I | | | 353,593 | |
Class R6 | | | 101,064 | |
| | | | |
Total | | | 505,076 | |
| | | | |
Net Asset Values and Redemption Prices Per Share: | | | | |
Class A | | $ | 9.35 | |
| | | | |
Class I | | $ | 9.36 | |
| | | | |
Class R6 | | $ | 9.36 | |
| | | | |
Maximum Offering Price Per Share: | | | | |
Class A | | $ | 9.92 | |
| | | | |
Maximum Sales Charge - Class A | | | 5.75 | % |
| | | | |
See Notes to the Financial Statements.
74
|
FINANCIAL STATEMENTS |
Statements of Operations |
|
| For the Year Ended March 31, 2023 |
| | | | | | | | | | | | | | | | |
| | | RBC Emerging Markets
Equity Fund | | | RBC Emerging Markets
Ex-China Equity Fund(a) | |
Investment Income: | | | | | | | | | | | | | | | | |
Interest income | | | | | | $ | 215,553 | | | | | | | $ | 17,153 | |
Dividend income - unaffiliated | | | | | | | 65,067,803 | | | | | | | | 151,922 | |
Dividend income - affiliated | | | | | | | 331,332 | | | | | | | | 12,022 | |
Foreign tax withholding | | | | | | | (7,800,307 | ) | | | | | | | (23,835 | ) |
| | | | | | | | | | | | | | | | |
Total Investment Income | | | | | | | 57,814,381 | | | | | | | | 157,262 | |
Expenses: | | | | | | | | | | | | | | | | |
Investment advisory fees | | | | | | | 17,686,840 | | | | | | | | 68,465 | |
Distribution fees–Class A | | | | | | | 545,241 | | | | | | | | 363 | |
Accounting fees | | | | | | | 185,371 | | | | | | | | 15,386 | |
Audit fees | | | | | | | 36,800 | | | | | | | | 27,871 | |
Custodian fees | | | | | | | 1,014,543 | | | | | | | | 15,802 | |
Insurance fees | | | | | | | 9,795 | | | | | | | | — | |
Legal fees | | | | | | | 199,360 | | | | | | | | 13,457 | |
Registrations and filing fees | | | | | | | 100,458 | | | | | | | | 1,552 | |
Shareholder reports | | | | | | | 279,641 | | | | | | | | 9,570 | |
Transfer agent fees–Class A | | | | | | | 1,483,109 | | | | | | | | 2,680 | |
Transfer agent fees–Class I | | | | | | | 2,238,550 | | | | | | | | 8,837 | |
Transfer agent fees–Class R6 | | | | | | | 4,053 | | | | | | | | 2,676 | |
Trustees’ fees and expenses | | | | | | | 163,311 | | | | | | | | 749 | |
Tax expense | | | | | | | 58,014 | | | | | | | | 4,544 | |
Offering fees | | | | | | | — | | | | | | | | 20,911 | |
Other fees | | | | | | | 140,336 | | | | | | | | 2,611 | |
| | | | | | | | | | | | | | | | |
Total expenses before fee waiver/reimbursement | | | | | | | 24,145,422 | | | | | | | | 195,474 | |
Expenses waived/reimbursed by: | | | | | | | | | | | | | | | | |
Advisor | | | | | | | (4,079,779 | ) | | | | | | | (120,324 | ) |
| | | | | | | | | | | | | | | | |
Net expenses | | | | | | | 20,065,643 | | | | | | | | 75,150 | |
| | | | | | | | | | | | | | | | |
Net Investment Income | | | | | | | 37,748,738 | | | | | | | | 82,112 | |
| | | | | | | | | | | | | | | | |
Realized/Unrealized Gains/(Losses): | | | | | | | | | | | | | | | | |
Net realized gains/(losses) on: | | | | | | | | | | | | | | | | |
Investment transactions | | | | | | | (41,977,730 | ) | | | | | | | 66,872 | |
Foreign currency transactions | | | | | | | (1,908,170 | ) | | | | | | | (92,574 | ) |
Foreign tax | | | | | | | (5,383,853 | ) | | | | | | | — | |
| | | | | | | | | | | | | | | | |
Net realized losses | | | | | | | (49,269,753 | ) | | | | | | | (25,702 | ) |
Net change in unrealized appreciation/ (depreciation) on: | | | | | | | | | | | | | | | | |
Investments | | | | | | | (147,232,034 | ) | | | | | | | 1,410,859 | |
Foreign currency | | | | | | | 67,758 | | | | | | | | (490 | ) |
Foreign tax | | | | | | | 1,796,819 | | | | | | | | — | |
| | | | | | | | | | | | | | | | |
Net unrealized gains/(losses) | | | | | | | (145,367,457 | ) | | | | | | | 1,410,369 | |
| | | | | | | | | | | | | | | | |
Change in net assets resulting from operations | | | | | | $ | (156,888,472 | ) | | | | | | $ | 1,466,779 | |
| | | | | | | | | | | | | | | | |
| (a) | For the period from December 15, 2022 (commencement of operations) to March 31, 2023. |
75
|
FINANCIAL STATEMENTS |
Statements of Operations (cont.) |
|
| For the Year Ended March 31, 2023 |
| | | | | | | | |
| | | RBC Emerging
Markets Value
Equity Fund | | | RBC Global
Opportunities Fund | |
Investment Income: | | | | | | | | |
Interest income | | $ | 12,206 | | | $ | 85,895 | |
Dividend income - unaffiliated | | | 2,727,339 | | | | 7,364,950 | |
Dividend income - affiliated | | | 814 | | | | 94,077 | |
Foreign tax withholding | | | (251,698 | ) | | | (650,385 | ) |
| | | | | | | | |
Total Investment Income | | | 2,488,661 | | | | 6,894,537 | |
Expenses: | | | | | | | | |
Investment advisory fees | | | 522,536 | | | | 3,161,219 | |
Distribution fees–Class A | | | 21 | | | | 50 | |
Accounting fees | | | 74,118 | | | | 77,970 | |
Audit fees | | | 36,800 | | | | 36,800 | |
Custodian fees | | | 113,343 | | | | 56,399 | |
Insurance fees | | | 3,466 | | | | 3,472 | |
Legal fees | | | 64,294 | | | | 44,112 | |
Registrations and filing fees | | | 55,331 | | | | 53,840 | |
Shareholder reports | | | 50,426 | | | | 38,293 | |
Transfer agent fees–Class A | | | 1,500 | | | | 3,894 | |
Transfer agent fees–Class I | | | 66,903 | | | | 337,344 | |
Transfer agent fees–Class R6 | | | 3,519 | | | | 4,793 | |
Trustees’ fees and expenses | | | 4,912 | | | | 36,712 | |
Tax expense | | | 25,150 | | | | 5,508 | |
Other fees | | | 8,582 | | | | 26,126 | |
| | | | | | | | |
Total expenses before fee waiver/reimbursement | | | 1,030,901 | | | | 3,886,532 | |
Expenses waived/reimbursed by: | | | | | | | | |
Advisor | | | (413,059 | ) | | | (332,560 | ) |
| | | | | | | | |
Net expenses | | | 617,842 | | | | 3,553,972 | |
| | | | | | | | |
Net Investment Income | | | 1,870,819 | | | | 3,340,565 | |
| | | | | | | | |
Realized/Unrealized Gains/(Losses): | | | | | | | | |
Net realized gains/(losses) on: | | | | | | | | |
Investment transactions | | | (4,758,525 | ) | | | (33,323,368 | ) |
Foreign currency transactions | | | (150,232 | ) | | | (531,774 | ) |
Foreign tax | | | (60,493 | ) | | | — | |
| | | | | | | | |
Net realized losses | | | (4,969,250 | ) | | | (33,855,142 | ) |
Net change in unrealized appreciation/ (depreciation) on: | | | | | | | | |
Investments | | | (937,452 | ) | | | (38,616,256 | ) |
Foreign currency | | | (2,473 | ) | | | 21,906 | |
Foreign tax | | | (9,318 | ) | | | — | |
| | | | | | | | |
Net unrealized losses | | | (949,243 | ) | | | (38,594,350 | ) |
| | | | | | | | |
Change in net assets resulting from operations | | $ | (4,047,674 | ) | | $ | (69,108,927 | ) |
| | | | | | | | |
76
|
FINANCIAL STATEMENTS |
Statements of Operations (cont.) |
|
| For the Year Ended March 31, 2023 |
| | | | | | | | | | | | | | | | |
| | | RBC Global Equity
Leaders Fund | | | RBC International
Opportunities Fund | |
Investment Income: | | | | | | | | | | | | | | | | |
Interest income | | | | | | $ | — | | | | | | | $ | 20,784 | |
Dividend income - unaffiliated | | | | | | | 69,801 | | | | | | | | 3,834,893 | |
Dividend income - affiliated | | | | | | | 1,278 | | | | | | | | 35,910 | |
Foreign tax withholding | | | | | | | (5,629 | ) | | | | | | | (407,740 | ) |
| | | | | | | | | | | | | | | | |
Total Investment Income | | | | | | | 65,450 | | | | | | | | 3,483,847 | |
Expenses: | | | | | | | | | | | | | | | | |
Investment advisory fees | | | | | | | 25,978 | | | | | | | | 969,996 | |
Distribution fees–Class A | | | | | | | 1,995 | | | | | | | | 271 | |
Accounting fees | | | | | | | 45,809 | | | | | | | | 63,981 | |
Audit fees | | | | | | | 37,000 | | | | | | | | 36,800 | |
Custodian fees | | | | | | | — | | | | | | | | 73,481 | |
Insurance fees | | | | | | | 2,662 | | | | | | | | 3,469 | |
Legal fees | | | | | | | 13,970 | | | | | | | | 12,463 | |
Registrations and filing fees | | | | | | | 31,734 | | | | | | | | 54,535 | |
Shareholder reports | | | | | | | 47,750 | | | | | | | | 33,846 | |
Transfer agent fees–Class A | | | | | | | 2,152 | | | | | | | | 4,105 | |
Transfer agent fees–Class I | | | | | | | — | | | | | | | | 192,609 | |
Transfer agent fees–Class R6 | | | | | | | 2,151 | | | | | | | | 3,562 | |
Trustees’ fees and expenses | | | | | | | — | | | | | | | | 10,019 | |
Tax expense | | | | | | | 744 | | | | | | | | 12,756 | |
Offering fees | | | | | | | 77,013 | | | | | | | | — | |
Other fees | | | | | | | 6,621 | | | | | | | | 10,881 | |
| | | | | | | | | | | | | | | | |
Total expenses before fee waiver/reimbursement | | | | | | | 295,579 | | | | | | | | 1,482,774 | |
Expenses waived/reimbursed by: | | | | | | | | | | | | | | | | |
Advisor | | | | | | | (264,021 | ) | | | | | | | (378,285 | ) |
| | | | | | | | | | | | | | | | |
Net expenses | | | | | | | 31,558 | | | | | | | | 1,104,489 | |
| | | | | | | | | | | | | | | | |
Net Investment Income | | | | | | | 33,892 | | | | | | | | 2,379,358 | |
| | | | | | | | | | | | | | | | |
Realized/Unrealized Gains/(Losses): | | | | | | | | | | | | | | | | |
Net realized gains/(losses) on: | | | | | | | | | | | | | | | | |
Investment transactions | | | | | | | (238,340 | ) | | | | | | | 6,003,206 | |
Foreign currency transactions | | | | | | | (2,771 | ) | | | | | | | (480,152 | ) |
| | | | | | | | | | | | | | | | |
Net realized gains/(losses) | | | | | | | (241,111 | ) | | | | | | | 5,523,054 | |
Net change in unrealized appreciation/ (depreciation) on: | | | | | | | | | | | | | | | | |
Investments | | | | | | | (224,506 | ) | | | | | | | (24,126,803 | ) |
Foreign currency | | | | | | | 56 | | | | | | | | 4,693 | |
| | | | | | | | | | | | | | | | |
Net unrealized losses | | | | | | | (224,450 | ) | | | | | | | (24,122,110 | ) |
| | | | | | | | | | | | | | | | |
Change in net assets resulting from operations | | | | | | $ | (431,669 | ) | | | | | | $ | (16,219,698 | ) |
| | | | | | | | | | | | | | | | |
77
|
FINANCIAL STATEMENTS |
Statements of Operations (cont.) |
|
| For the Year Ended March 31, 2023 |
| | | | | | | | | | | | | | | | |
| | | RBC International
Equity Fund(a) | | | RBC International
Small Cap Equity Fund(a) | |
Investment Income: | | | | | | | | | | | | | | | | |
Interest income | | | | | | $ | 44 | | | | | | | $ | — | |
Dividend income - unaffiliated | | | | | | | 170,895 | | | | | | | | 19,427 | |
Dividend income - affiliated | | | | | | | 10,079 | | | | | | | | 3,041 | |
Foreign tax withholding | | | | | | | (12,390 | ) | | | | | | | (2,442 | ) |
| | | | | | | | | | | | | | | | |
Total Investment Income | | | | | | | 168,628 | | | | | | | | 20,026 | |
Expenses: | | | | | | | | | | | | | | | | |
Investment advisory fees | | | | | | | 41,054 | | | | | | | | 13,073 | |
Distribution fees–Class A | | | | | | | 744 | | | | | | | | 367 | |
Accounting fees | | | | | | | 15,690 | | | | | | | | 15,466 | |
Audit fees | | | | | | | 27,863 | | | | | | | | 27,863 | |
Custodian fees | | | | | | | 15,972 | | | | | | | | 18,877 | |
Legal fees | | | | | | | 13,282 | | | | | | | | 12,983 | |
Registrations and filing fees | | | | | | | 1,597 | | | | | | | | 1,598 | |
Shareholder reports | | | | | | | 9,704 | | | | | | | | 9,683 | |
Transfer agent fees–Class A | | | | | | | 2,680 | | | | | | | | 2,680 | |
Transfer agent fees–Class I | | | | | | | 2,680 | | | | | | | | 2,680 | |
Transfer agent fees–Class R6 | | | | | | | 2,680 | | | | | | | | 2,680 | |
Trustees’ fees and expenses | | | | | | | 506 | | | | | | | | 188 | |
Tax expense | | | | | | | 4,543 | | | | | | | | 4,543 | |
Offering fees | | | | | | | 21,471 | | | | | | | | 21,471 | |
Other fees | | | | | | | 2,613 | | | | | | | | 2,603 | |
| | | | | | | | | | | | | | | | |
Total expenses before fee waiver/reimbursement | | | | | | | 163,079 | | | | | | | | 136,755 | |
Expenses waived/reimbursed by: | | | | | | | | | | | | | | | | |
Advisor | | | | | | | (115,648 | ) | | | | | | | (122,030 | ) |
| | | | | | | | | | | | | | | | |
Net expenses | | | | | | | 47,431 | | | | | | | | 14,725 | |
| | | | | | | | | | | | | | | | |
Net Investment Income | | | | | | | 121,197 | | | | | | | | 5,301 | |
| | | | | | | | | | | | | | | | |
Realized/Unrealized Gains/(Losses): | | | | | | | | | | | | | | | | |
Net realized gains/(losses) on: | | | | | | | | | | | | | | | | |
Investment transactions | | | | | | | (23,470 | ) | | | | | | | 13,404 | |
Foreign currency transactions | | | | | | | (100,033 | ) | | | | | | | (20,317 | ) |
| | | | | | | | | | | | | | | | |
Net realized losses | | | | | | | (123,503 | ) | | | | | | | (6,913 | ) |
Net change in unrealized appreciation/ (depreciation) on: | | | | | | | | | | | | | | | | |
Investments | | | | | | | 895,783 | | | | | | | | 131,004 | |
Foreign currency | | | | | | | 534 | | | | | | | | (4 | ) |
| | | | | | | | | | | | | | | | |
Net unrealized gains | | | | | | | 896,317 | | | | | | | | 131,000 | |
| | | | | | | | | | | | | | | | |
Change in net assets resulting from operations | | | | | | $ | 894,011 | | | | | | | $ | 129,388 | |
| | | | | | | | | | | | | | | | |
| (a) | For the period from December 14, 2022 (commencement of operations) to March 31, 2023. |
78
|
FINANCIAL STATEMENTS |
Statements of Operations (cont.) |
|
|
For the Year Ended March 31, 2023
| | | | | | | | |
| | | RBC China
Equity Fund(a) | |
Investment Income: | | | | | | | | |
Interest income | | | | | | $ | 1,297 | |
Dividend income | | | | | | | 102,383 | |
Foreign tax withholding | | | | | | | (3,230 | ) |
| �� | | | | | | | |
Total Investment Income | | | | | | | 100,450 | |
Expenses: | | | | | | | | |
Investment advisory fees | | | | | | | 36,363 | |
Distribution fees–Class A | | | | | | | 1,135 | |
Accounting fees | | | | | | | 50,823 | |
Audit fees | | | | | | | 36,800 | |
Custodian fees | | | | | | | 8,682 | |
Insurance fees | | | | | | | 2,662 | |
Legal fees | | | | | | | 30,183 | |
Registrations and filing fees | | | | | | | 8,580 | |
Shareholder reports | | | | | | | 52,995 | |
Transfer agent fees–Class A | | | | | | | 4,943 | |
Transfer agent fees–Class I | | | | | | | 4,942 | |
Transfer agent fees–Class R6 | | | | | | | 4,942 | |
Trustees’ fees and expenses | | | | | | | 350 | |
Tax expense | | | | | | | 4,500 | |
Offering fees | | | | | | | 92,955 | |
Other fees | | | | | | | 8,006 | |
| | | | | | | | |
Total expenses before fee waiver/reimbursement | | | | | | | 348,861 | |
Expenses waived/reimbursed by: | | | | | | | | |
Advisor | | | | | | | (300,454 | ) |
| | | | | | | | |
Net expenses | | | | | | | 48,407 | |
| | | | | | | | |
Net Investment Income | | | | | | | 52,043 | |
| | | | | | | | |
Realized/Unrealized Gains/(Losses): | | | | | | | | |
Net realized gains/(losses) on: | | | | | | | | |
Investment transactions | | | | | | | (448,361 | ) |
Foreign currency transactions | | | | | | | (5,850 | ) |
| | | | | | | | |
Net realized losses | | | | | | | (454,211 | ) |
Net change in unrealized appreciation on investments | | | | | | | 127,297 | |
| | | | | | | | |
Net realized/unrealized losses | | | | | | | (326,914 | ) |
| | | | | | | | |
Change in net assets resulting from operations | | | | | | $ | (274,871 | ) |
| | | | | | | | |
(a) For the period from April 11, 2022 (commencement of operations) to March 31, 2023.
See Notes to the Financial Statements.
79
|
FINANCIAL STATEMENTS |
Statements of Changes in Net Assets |
|
|
| | | | | | | | | | | | |
| | | | | | RBC Emerging Markets
Equity Fund | |
| | | |
| | | | | | For the
Year Ended
March 31, 2023 | | | For the
Year Ended
March 31, 2022 | |
From Investment Activities | | | | | | | | | | | | |
Operations: | | | | | | | | | | | | |
Net investment income | | | | | | $ | 37,748,738 | | | $ | 27,165,966 | |
Net realized losses from investments and foreign currency | | | | | | | (49,269,753 | ) | | | (18,649,943 | ) |
Net change in unrealized depreciation on investments and foreign currency | | | | | | | (145,367,457 | ) | | | (363,376,096 | ) |
| | | | | | | | | | | | |
Change in net assets resulting from operations | | | | | | | (156,888,472 | ) | | | (354,860,073 | ) |
| | | | | | | | | | | | |
Distributions to Shareholders: | | | | | | | | | | | | |
Class A | | | | | | | (977,762 | ) | | | (7,375,551 | ) |
Class I | | | | | | | (22,625,012 | ) | | | (59,331,717 | ) |
Class R6 | | | | | | | (2,923,824 | ) | | | (7,112,253 | ) |
| | | | | | | | | | | | |
Change in net assets resulting from shareholder distributions | | | | | | | (26,526,598 | ) | | | (73,819,521 | ) |
| | | | | | | | | | | | |
Capital Transactions: | | | | | | | | | | | | |
Proceeds from shares issued | | | | | | | 659,865,763 | | | | 973,876,127 | |
Distributions reinvested | | | | | | | 23,706,699 | | | | 68,477,810 | |
Cost of shares redeemed | | | | | | | (1,036,626,850 | ) | | | (620,079,112 | ) |
| | | | | | | | | | | | |
Change in net assets resulting from capital transactions | | | | | | | (353,054,388 | ) | | | 422,274,825 | |
| | | | | | | | | | | | |
Net decrease in net assets | | | | | | | (536,469,458 | ) | | | (6,404,769 | ) |
Net Assets: | | | | | | | | | | | | |
Beginning of year | | | | | | | 2,656,704,622 | | | | 2,663,109,391 | |
| | | | | | | | | | | | |
End of year | | | | | | $ | 2,120,235,164 | | | $ | 2,656,704,622 | |
| | | | | | | | | | | | |
Share Transactions: | | | | | | | | | | | | |
Issued | | | | | | | 57,942,703 | | | | 68,999,419 | |
Reinvested | | | | | | | 2,081,272 | | | | 5,190,955 | |
Redeemed | | | | | | | (92,509,478 | ) | | | (44,518,567 | ) |
| | | | | | | | | | | | |
Change in shares resulting from capital transactions | | | | | | | (32,485,503 | ) | | | 29,671,807 | |
| | | | | | | | | | | | |
See Notes to the Financial Statements.
80
|
FINANCIAL STATEMENTS |
Statements of Changes in Net Assets |
|
|
| | | | | | | | |
| | | RBC Emerging Markets
Ex-China Equity Fund | |
| | | For the Period Ended
March 31, 2023(a) | |
From Investment Activities | | | | | | | | |
Operations: | | | | | | | | |
Net investment income | | | | | | $ | 82,112 | |
Net realized losses from investments and foreign currency | | | | | | | (25,702 | ) |
Net change in unrealized appreciation on investments and foreign currency | | | | | | | 1,410,369 | |
| | | | | | | | |
Change in net assets resulting from operations | | | | | | | 1,466,779 | |
| | | | | | | | |
Capital Transactions: | | | | | | | | |
Proceeds from shares issued | | | | | | | 32,415,115 | |
Distributions reinvested | | | | | | | — | |
Cost of shares redeemed | | | | | | | — | |
| | | | | | | | |
Change in net assets resulting from capital transactions | | | | | | | 32,415,115 | |
| | | | | | | | |
Net increase in net assets | | | | | | | 33,881,894 | |
Net Assets: | | | | | | | | |
Beginning of period | | | | | | | — | |
| | | | | | | | |
End of period | | | | | | $ | 33,881,894 | |
| | | | | | | | |
Share Transactions: | | | | | | | | |
Issued | | | | | | | 3,254,547 | |
Reinvested | | | | | | | — | |
Redeemed | | | | | | | — | |
| | | | | | | | |
Change in shares resulting from capital transactions | | | | | | | 3,254,547 | |
| | | | | | | | |
(a) For the period from December 15, 2022 (commencement of operations) to March 31, 2023.
See Notes to the Financial Statements.
81
|
FINANCIAL STATEMENTS |
Statements of Changes in Net Assets |
|
|
| | | | | | | | | | | | |
| | | RBC Emerging
Markets Value
Equity Fund | |
| | |
| | | For the
Year Ended
March 31, 2023 | | | For the
Year Ended
March 31, 2022 | |
From Investment Activities | | | | | | | | | | | | |
Operations: | | | | | | | | | | | | |
Net investment income | | | | | | $ | 1,870,819 | | | $ | 975,691 | |
Net realized gains/(losses) from investments and foreign currency | | | | | | | (4,969,250 | ) | | | 6,203,699 | |
Net change in unrealized depreciation on investments and foreign currency | | | | | | | (949,243 | ) | | | (15,719,504 | ) |
| | | | | | | | | | | | |
Change in net assets resulting from operations | | | | | | | (4,047,674 | ) | | | (8,540,114 | ) |
| | | | | | | | | | | | |
Distributions to Shareholders: | | | | | | | | | | | | |
Class A | | | | | | | (614 | ) | | | — | |
Class I | | | | | | | (4,205,317 | ) | | | (6,390,198 | ) |
Class R6 | | | | | | | (164,015 | ) | | | (369,306 | ) |
| | | | | | | | | | | | |
Change in net assets resulting from shareholder distributions | | | | | | | (4,369,946 | ) | | | (6,759,504 | ) |
| | | | | | | | | | | | |
Capital Transactions: | | | | | | | | | | | | |
Proceeds from shares issued | | | | | | | 18,578,022 | | | | 63,889,887 | |
Distributions reinvested | | | | | | | 4,168,652 | | | | 6,757,845 | |
Cost of shares redeemed | | | | | | | (23,236,066 | ) | | | (23,762,488 | ) |
| | | | | | | | | | | | |
Change in net assets resulting from capital transactions | | | | | | | (489,392 | ) | | | 46,885,244 | |
| | | | | | | | | | | | |
Net increase/(decrease) in net assets | | | | | | | (8,907,012 | ) | | | 31,585,626 | |
Net Assets: | | | | | | | | | | | | |
Beginning of year | | | | | | | 75,547,813 | | | | 43,962,187 | |
| | | | | | | | | | | | |
End of year | | | | | | $ | 66,640,801 | | | $ | 75,547,813 | |
| | | | | | | | | | | | |
Share Transactions: | | | | | | | | | | | | |
Issued | | | | | | | 2,464,598 | | | | 6,115,971 | |
Reinvested | | | | | | | 565,799 | | | | 722,842 | |
Redeemed | | | | | | | (2,987,061 | ) | | | (2,173,190 | ) |
| | | | | | | | | | | | |
Change in shares resulting from capital transactions | | | | | | | 43,336 | | | | 4,665,623 | |
| | | | | | | | | | | | |
See Notes to the Financial Statements.
82
|
FINANCIAL STATEMENTS |
Statements of Changes in Net Assets |
|
|
| | | | | | | | | | | | |
| | | RBC Global
Opportunities Fund | |
| | |
| | | For the
Year Ended
March 31, 2023 | | | For the
Year Ended
March 31, 2022 | |
From Investment Activities | | | | | | | | | | | | |
Operations: | | | | | | | | | | | | |
Net investment income | | | | | | $ | 3,340,565 | | | $ | 1,289,508 | |
Net realized gains/(losses) from investments and foreign currency | | | | | | | (33,855,142 | ) | | | 9,767,561 | |
Net change in unrealized depreciation on investments and foreign currency | | | | | | | (38,594,350 | ) | | | (28,995,967 | ) |
| | | | | | | | | | | | |
Change in net assets resulting from operations | | | | | | | (69,108,927 | ) | | | (17,938,898 | ) |
| | | | | | | | | | | | |
Distributions to Shareholders: | | | | | | | | | | | | |
Class A | | | | | | | (5 | ) | | | (723 | ) |
Class I | | | | | | | (759,651 | ) | | | (17,271,661 | ) |
Class R6 | | | | | | | (546,878 | ) | | | (11,981,425 | ) |
| | | | | | | | | | | | |
Change in net assets resulting from shareholder distributions | | | | | | | (1,306,534 | ) | | | (29,253,809 | ) |
| | | | | | | | | | | | |
Capital Transactions: | | | | | | | | | | | | |
Proceeds from shares issued | | | | | | | 109,866,252 | | | | 453,003,623 | |
Distributions reinvested | | | | | | | 1,017,623 | | | | 25,973,331 | |
Cost of shares redeemed | | | | | | | (150,203,075 | ) | | | (119,372,553 | ) |
| | | | | | | | | | | | |
Change in net assets resulting from capital transactions | | | | | | | (39,319,200 | ) | | | 359,604,401 | |
| | | | | | | | | | | | |
Net increase/(decrease) in net assets | | | | | | | (109,734,661 | ) | | | 312,411,694 | |
Net Assets: | | | | | | | | | | | | |
Beginning of year | | | | | | | 576,983,269 | | | | 264,571,575 | |
| | | | | | | | | | | | |
End of year | | | | | | $ | 467,248,608 | | | $ | 576,983,269 | |
| | | | | | | | | | | | |
Share Transactions: | | | | | | | | | | | | |
Issued | | | | | | | 6,544,970 | | | | 21,011,273 | |
Reinvested | | | | | | | 61,557 | | | | 1,234,223 | |
Redeemed | | | | | | | (9,111,454 | ) | | | (5,708,564 | ) |
| | | | | | | | | | | | |
Change in shares resulting from capital transactions | | | | | | | (2,504,927 | ) | | | 16,536,932 | |
| | | | | | | | | | | | |
See Notes to the Financial Statements.
83
|
FINANCIAL STATEMENTS |
Statements of Changes in Net Assets |
|
| |
| | | | | | | | | | | | | | | | | | | | |
| | | RBC Global Equity
Leaders Fund |
| | |
| | | For the
Year Ended
March 31, 2023 | | For the
Period Ended
March 31, 2022(a) |
From Investment Activities | | | | | | | | | | | | | | | | | | | | |
Operations: | | | | | | | | | | | | | | | | | | | | |
Net investment income | | | | | | | | $ | 33,892 | | | | | | | | | $ | 4,232 | |
Net realized losses from investments and foreign currency | | | | | | | | | (241,111 | ) | | | | | | | | | (197,739 | ) |
Net change in unrealized depreciation on investments and foreign currency | | | | | | | | | (224,450 | ) | | | | | | | | | (287,717 | ) |
| | | | | | | | | | | | | | | | | | | | |
Change in net assets resulting from operations | | | | | | | | | (431,669 | ) | | | | | | | | | (481,224 | ) |
| | | | | | | | | | | | | | | | | | | | |
Distributions to Shareholders: | | | | | | | | | | | | | | | | | | | | |
Class A | | | | | | | | | (4,991 | ) | | | | | | | | | — | |
Class I | | | | | | | | | (21,414 | ) | | | | | | | | | — | |
Class R6 | | | | | | | | | (7,568 | ) | | | | | | | | | — | |
| | | | | | | | | | | | | | | | | | | | |
Change in net assets resulting from shareholder distributions | | | | | | | | | (33,973 | ) | | | | | | | | | — | |
| | | | | | | | | | | | | | | | | | | | |
Capital Transactions: | | | | | | | | | | | | | | | | | | | | |
Proceeds from shares issued | | | | | | | | | — | | | | | | | | | | 5,000,000 | |
Distributions reinvested | | | | | | | | | 33,973 | | | | | | | | | | — | |
Cost of shares redeemed | | | | | | | | | — | | | | | | | | | | — | |
| | | | | | | | | | | | | | | | | | | | |
Change in net assets resulting from capital transactions | | | | | | | | | 33,973 | | | | | | | | | | 5,000,000 | |
| | | | | | | | | | | | | | | | | | | | |
Net increase/(decrease) in net assets | | | | | | | | | (431,669 | ) | | | | | | | | | 4,518,776 | |
Net Assets: | | | | | | | | | | | | | | | | | | | | |
Beginning of year | | | | | | | | | 4,518,776 | | | | | | | | | | — | |
| | | | | | | | | | | | | | | | | | | | |
End of year | | | | | | | | $ | 4,087,107 | | | | | | | | | $ | 4,518,776 | |
| | | | | | | | | | | | | | | | | | | | |
Share Transactions: | | | | | | | | | | | | | | | | | | | | |
Issued | | | | | | | | | — | | | | | | | | | | 500,000 | |
Reinvested | | | | | | | | | 4,311 | | | | | | | | | | — | |
Redeemed | | | | | | | | | — | | | | | | | | | | — | |
| | | | | | | | | | | | | | | | | | | | |
Change in shares resulting from capital transactions | | | | | | | | | 4,311 | | | | | | | | | | 500,000 | |
| | | | | | | | | | | | | | | | | | | | |
(a) For the period from December 15, 2021 (commencement of operations) to March 31, 2022.
See Notes to the Financial Statements.
84
|
FINANCIAL STATEMENTS |
Statements of Changes in Net Assets |
|
| |
| | | | | | | | | | | | |
| | | RBC International Opportunities Fund | |
| | |
| | | For the
Year Ended
March 31, 2023 | | | For the
Year Ended
March 31, 2022 | |
From Investment Activities | | | | | | | | | | | | |
Operations: | | | | | | | | | | | | |
Net investment income | | | | | | $ | 2,379,358 | | | $ | 1,319,684 | |
Net realized gains from investments and foreign currency | | | | | | | 5,523,054 | | | | 7,169,074 | |
Net change in unrealized depreciation on investments and foreign currency | | | | | | | (24,122,110 | ) | | | (21,409,396 | ) |
| | | | | | | | | | | | |
Change in net assets resulting from operations | | | | | | | (16,219,698 | ) | | | (12,920,638 | ) |
| | | | | | | | | | | | |
Distributions to Shareholders: | | | | | | | | | | | | |
Class A | | | | | | | (6,886 | ) | | | (6,022 | ) |
Class I | | | | | | | (6,433,994 | ) | | | (10,507,947 | ) |
Class R6 | | | | | | | (240,898 | ) | | | (282,283 | ) |
| | | | | | | | | | | | |
Change in net assets resulting from shareholder distributions | | | | | | | (6,681,778 | ) | | | (10,796,252 | ) |
| | | | | | | | | | | | |
Capital Transactions: | | | | | | | | | | | | |
Proceeds from shares issued | | | | | | | 68,352,360 | | | | 67,005,546 | |
Distributions reinvested | | | | | | | 4,853,068 | | | | 7,906,846 | |
Cost of shares redeemed | | | | | | | (93,146,243 | ) | | | (43,771,004 | ) |
| | | | | | | | | | | | |
Change in net assets resulting from capital transactions | | | | | | | (19,940,815 | ) | | | 31,141,388 | |
| | | | | | | | | | | | |
Net increase/(decrease) in net assets | | | | | | | (42,842,291 | ) | | | 7,424,498 | |
Net Assets: | | | | | | | | | | | | |
Beginning of year | | | | | | | 178,252,907 | | | | 170,828,409 | |
| | | | | | | | | | | | |
End of year | | | | | | $ | 135,410,616 | | | $ | 178,252,907 | |
| | | | | | | | | | | | |
Share Transactions: | | | | | | | | | | | | |
Issued | | | | | | | 6,838,330 | | | | 4,994,318 | |
Reinvested | | | | | | | 497,530 | | | | 628,367 | |
Redeemed | | | | | | | (9,304,282 | ) | | | (3,450,230 | ) |
| | | | | | | | | | | | |
Change in shares resulting from capital transactions | | | | | | | (1,968,422 | ) | | | 2,172,455 | |
| | | | | | | | | | | | |
See Notes to the Financial Statements.
85
|
FINANCIAL STATEMENTS |
Statements of Changes in Net Assets |
|
| |
| | | | | | | | |
| | | RBC International
Equity Fund | |
| | | For the
Period Ended
March 31, 2023(a) | |
From Investment Activities | | | | | | | | |
Operations: | | | | | | | | |
Net investment income | | | | | | $ | 121,197 | |
Net realized losses from investments and foreign currency | | | | | | | (123,503 | ) |
Net change in unrealized appreciation on investments and foreign currency | | | | | | | 896,317 | |
| | | | | | | | |
Change in net assets resulting from operations | | | | | | | 894,011 | |
| | | | | | | | |
Capital Transactions: | | | | | | | | |
Proceeds from shares issued | | | | | | | 20,000,000 | |
Distributions reinvested | | | | | | | — | |
Cost of shares redeemed | | | | | | | — | |
| | | | | | | | |
Change in net assets resulting from capital transactions | | | | | | | 20,000,000 | |
| | | | | | | | |
Net increase in net assets | | | | | | | 20,894,011 | |
Net Assets: | | | | | | | | |
Beginning of period | | | | | | | — | |
| | | | | | | | |
End of period | | | | | | $ | 20,894,011 | |
| | | | | | | | |
Share Transactions: | | | | | | | | |
Issued | | | | | | | 2,000,000 | |
Reinvested | | | | | | | — | |
Redeemed | | | | | | | — | |
| | | | | | | | |
Change in shares resulting from capital transactions | | | | | | | 2,000,000 | |
| | | | | | | | |
(a) For the period from December 14, 2022 (commencement of operations) to March 31, 2023.
See Notes to the Financial Statements.
86
|
FINANCIAL STATEMENTS |
Statements of Changes in Net Assets |
|
| |
| | | | | | | | |
| | | RBC International
Small Cap Equity Fund | |
| | | For the
Period Ended
March 31, 2023(a) | |
From Investment Activities | | | | | | | | |
Operations: | | | | | | | | |
Net investment income | | | | | | $ | 5,301 | |
Net realized losses from investments and foreign currency | | | | | | | (6,913 | ) |
Net change in unrealized appreciation on investments and foreign currency | | | | | | | 131,000 | |
| | | | | | | | |
Change in net assets resulting from operations | | | | | | | 129,388 | |
| | | | | | | | |
Capital Transactions: | | | | | | | | |
Proceeds from shares issued | | | | | | | 5,000,000 | |
Distributions reinvested | | | | | | | — | |
Cost of shares redeemed | | | | | | | — | |
| | | | | | �� | | |
Change in net assets resulting from capital transactions | | | | | | | 5,000,000 | |
| | | | | | | | |
Net increase in net assets | | | | | | | 5,129,388 | |
Net Assets: | | | | | | | | |
Beginning of period | | | | | | | — | |
| | | | | | | | |
End of period | | | | | | $ | 5,129,388 | |
| | | | | | | | |
Share Transactions: | | | | | | | | |
Issued | | | | | | | 500,000 | |
Reinvested | | | | | | | — | |
Redeemed | | | | | | | — | |
| | | | | | | | |
Change in shares resulting from capital transactions | | | | | | | 500,000 | |
| | | | | | | | |
(a) For the period from December 14, 2022 (commencement of operations) to March 31, 2023.
See Notes to the Financial Statements.
87
|
FINANCIAL STATEMENTS |
Statements of Changes in Net Assets |
|
| |
| | | | | | | | |
| | | RBC China
Equity Fund | |
| | | For the
Period Ended
March 31, 2023(a) | |
From Investment Activities | | | | | | | | |
Operations: | | | | | | | | |
Net investment income | | | | | | $ | 52,043 | |
Net realized losses from investments and foreign currency | | | | | | | (454,211 | ) |
Net change in unrealized appreciation on investments | | | | | | | 127,297 | |
| | | | | | | | |
Change in net assets resulting from operations | | | | | | | (274,871 | ) |
| | | | | | | | |
Distributions to Shareholders: | | | | | | | | |
Class A | | | | | | | (3,788 | ) |
Class I | | | | | | | (32,480 | ) |
Class R6 | | | | | | | (9,618 | ) |
| | | | | | | | |
Change in net assets resulting from shareholder distributions | | | | | | | (45,886 | ) |
| | | | | | | | |
Capital Transactions: | | | | | | | | |
Proceeds from shares issued | | | | | | | 5,000,000 | |
Distributions reinvested | | | | | | | 45,886 | |
Cost of shares redeemed | | | | | | | — | |
| | | | | | | | |
Change in net assets resulting from capital transactions | | | | | | | 5,045,886 | |
| | | | | | | | |
Net increase in net assets | | | | | | | 4,725,129 | |
Net Assets: | | | | | | | | |
Beginning of period | | | | | | | — | |
| | | | | | | | |
End of period | | | | | | $ | 4,725,129 | |
| | | | | | | | |
Share Transactions: | | | | | | | | |
Issued | | | | | | | 500,000 | |
Reinvested | | | | | | | 5,076 | |
Redeemed | | | | | | | — | |
| | | | | | | | |
Change in shares resulting from capital transactions | | | | | | | 505,076 | |
| | | | | | | | |
(a) For the period from April 11, 2022 (commencement of operations) to March 31, 2023.
See Notes to the Financial Statements.
88
|
FINANCIAL HIGHLIGHTS |
RBC Emerging Markets Equity Fund |
(Selected data for a share outstanding throughout the periods indicated)
| | | | | | | | | | | | | | | | | | | | | | | | | | | | | | | | | | | | |
| | | | | | Investment Activities | | | Distributions | | | | |
| | | Net Asset
Value, Beginning
of Year | | | Net
Investment
Income(a) | | | Net Realized and Unrealized
Gains (Losses)
on Investments | | | Redemption
Fees | | | Total from
Investment
Activities | | | Net
Investment
Income | | | Net
Realized
Gains | | | Total
Distributions | | | Net Asset
Value, End
of Year | |
Class A | | | | | | | | | | | | | | | | | | | | | | | | | | | | | | | | | | | | |
Year Ended 3/31/23 | | | $12.52 | | | | 0.18 | | | | (0.76) | | | | — | | | | (0.58) | | | | (0.09) | | | | — | | | | (0.09) | | | | $11.85 | |
Year Ended 3/31/22 | | | 14.64 | | | | 0.11 | | | | (1.88) | | | | —(b) | | | | (1.77) | | | | (0.15) | | | | (0.20) | | | | (0.35) | | | | 12.52 | |
Year Ended 3/31/21 | | | 9.50 | | | | —(b) | | | | 5.25 | | | | —(b) | | | | 5.25 | | | | (0.11) | | | | — | | | | (0.11) | | | | 14.64 | |
Year Ended 3/31/20 | | | 11.82 | | | | 0.38(c) | | | | (2.33) | | | | — | | | | (1.95) | | | | (0.36) | | | | (0.01) | | | | (0.37) | | | | 9.50 | |
Year Ended 3/31/19 | | | 13.05 | | | | 0.21 | | | | (0.56) | | | | — | | | | (0.35) | | | | (0.10) | | | | (0.78) | | | | (0.88) | | | | 11.82 | |
Class I | | | | | | | | | | | | | | | | | | | | | | | | | | | | | | | | | | | | |
Year Ended 3/31/23 | | | $12.76 | | | | 0.20 | | | | (0.77) | | | | — | | | | (0.57) | | | | (0.15) | | | | — | | | | (0.15) | | | | $12.04 | |
Year Ended 3/31/22 | | | 14.91 | | | | 0.14 | | | | (1.91) | | | | —(b) | | | | (1.77) | | | | (0.18) | | | | (0.20) | | | | (0.38) | | | | 12.76 | |
Year Ended 3/31/21 | | | 9.67 | | | | 0.07 | | | | 5.32 | | | | —(b) | | | | 5.39 | | | | (0.15) | | | | — | | | | (0.15) | | | | 14.91 | |
Year Ended 3/31/20 | | | 12.01 | | | | 0.44(c) | | | | (2.39) | | | | — | | | | (1.95) | | | | (0.38) | | | | (0.01) | | | | (0.39) | | | | 9.67 | |
Year Ended 3/31/19 | | | 13.26 | | | | 0.18 | | | | (0.51) | | | | — | | | | (0.33) | | | | (0.14) | | | | (0.78) | | | | (0.92) | | | | 12.01 | |
Class R6 | | | | | | | | | | | | | | | | | | | | | | | | | | | | | | | | | | | | |
Year Ended 3/31/23 | | | $12.82 | | | | 0.20 | | | | (0.77) | | | | — | | | | (0.57) | | | | (0.15) | | | | — | | | | (0.15) | | | | $12.10 | |
Year Ended 3/31/22 | | | 14.98 | | | | 0.15 | | | | (1.93) | | | | — | | | | (1.78) | | | | (0.18) | | | | (0.20) | | | | (0.38) | | | | 12.82 | |
Year Ended 3/31/21 | | | 9.72 | | | | 0.07 | | | | 5.34 | | | | — | | | | 5.41 | | | | (0.15) | | | | — | | | | (0.15) | | | | 14.98 | |
Year Ended 3/31/20 | | | 12.07 | | | | 0.38(c) | | | | (2.34) | | | | — | | | | (1.96) | | | | (0.38) | | | | (0.01) | | | | (0.39) | | | | 9.72 | |
Year Ended 3/31/19 | | | 13.31 | | | | 0.18 | | | | (0.50) | | | | — | | | | (0.32) | | | | (0.14) | | | | (0.78) | | | | (0.92) | | | | 12.07 | |
| (a) | Per share net investment income (loss) has been calculated using the average daily shares method. |
| (b) | Less than $0.01 or $(0.01) per share. |
| (c) | Net investment income per share and the ratio of net investment income to average net assets include $0.27 and 2.30%, for Class A and $0.27 and 2.30% for Class I and $0.28 and 2.30% for the Class R6, respectively, resulting from the special dividend from Naspers LTD/Prosus in September 2019. |
89
|
FINANCIAL HIGHLIGHTS |
RBC Emerging Markets Equity Fund |
(Selected data for a share outstanding throughout the periods indicated)
| | | | | | | | | | | | | | | | | | | | | | | | |
| | | | | | Ratios/Supplemental Data | |
| | | Total
Return(a)(b) | | | Net Assets,
End of
Year (000’s) | | | Ratio of
Net Expenses
to Average
Net Assets | | | Ratio of
Net Investment Income (Loss)
to Average
Net Assets | | | Ratio of
Expenses to
Average Net
Assets* | | | Portfolio
Turnover
Rate** | |
Class A | | | | | | | | | | | | | | | | | | | | | | | | |
Year Ended 3/31/23 | | | (4.57)% | | | | $ 124,373 | | | | 1.13% | | | | 1.56% | | | | 1.82% | | | | 19% | |
Year Ended 3/31/22 | | | (12.17)% | | | | 297,037 | | | | 1.13% | | | | 0.77% | | | | 1.68% | | | | 14% | |
Year Ended 3/31/21 | | | 55.33% | | | | 287,862 | | | | 1.13% | | | | 0.00% | | | | 1.45% | | | | 15% | |
Year Ended 3/31/20 | | | (17.22)% | | | | 19,435 | | | | 1.13% | | | | 3.19%(c) | | | | 1.36% | | | | 20% | |
Year Ended 3/31/19 | | | (1.90)% | | | | 14,815 | | | | 1.13% | | | | 1.74% | | | | 1.47% | | | | 19% | |
Class I | | | | | | | | | | | | | | | | | | | | | | | | |
Year Ended 3/31/23 | | | (4.38)% | | | | $1,751,023 | | | | 0.88% | | | | 1.73% | | | | 1.03% | | | | 19% | |
Year Ended 3/31/22 | | | (11.97)% | | | | 2,111,110 | | | | 0.88% | | | | 1.01% | | | | 0.99% | | | | 14% | |
Year Ended 3/31/21 | | | 55.77% | | | | 2,069,695 | | | | 0.88% | | | | 0.57% | | | | 0.99% | | | | 15% | |
Year Ended 3/31/20 | | | (16.97)% | | | | 1,047,077 | | | | 0.88% | | | | 3.65%(c) | | | | 1.02% | | | | 20% | |
Year Ended 3/31/19 | | | (1.71)% | | | | 766,141 | | | | 0.88% | | | | 1.46% | | | | 1.08% | | | | 19% | |
Class R6 | | | | | | | | | | | | | | | | | | | | | | | | |
Year Ended 3/31/23 | | | (4.36)% | | | | $244,839 | | | | 0.88% | | | | 1.70% | | | | 0.90% | | | | 19% | |
Year Ended 3/31/22 | | | (11.99)% | | | | 248,557 | | | | 0.88% | | | | 1.05% | | | | 0.88% | | | | 14% | |
Year Ended 3/31/21 | | | 55.70% | | | | 305,553 | | | | 0.88% | | | | 0.58% | | | | 0.88% | | | | 15% | |
Year Ended 3/31/20 | | | (16.97)% | | | | 146,156 | | | | 0.88% | | | | 3.20%(c) | | | | 0.91% | | | | 20% | |
Year Ended 3/31/19 | | | (1.62)% | | | | 99,198 | | | | 0.88% | | | | 1.47% | | | | 0.98% | | | | 19% | |
| * | During the period, certain fees were contractually or voluntarily reduced and/or reimbursed. If such contractual/voluntary fee reductions and reimbursements had not occurred, the ratio would have been as indicated. |
| ** | Portfolio turnover rate is calculated on the basis of the Fund as a whole without distinguishing between the classes of shares issued. |
| (a) | Excludes sales charge. |
| (b) | Assumes investment at net asset value at the beginning of the period, reinvestment of all dividends and distributions, and a complete redemption of the investment at net asset value at the end of the period. |
| (c) | Net investment income per share and the ratio of net investment income to average net assets include $0.27 and 2.30%, for Class A and $0.27 and 2.30% for Class I and $0.28 and 2.30% for the Class R6, respectively, resulting from the special dividend from Naspers LTD/Prosus in September 2019. |
90
|
FINANCIAL HIGHLIGHTS |
RBC Emerging Markets Equity Fund |
|
| (Selected data for a share outstanding throughout the periods indicated) |
See Notes to the Financial Statements. |
91
|
FINANCIAL HIGHLIGHTS |
RBC Emerging Markets ex-China Equity Fund |
|
|
(Selected data for a share outstanding throughout the periods indicated)
| | | | | | | | | | | | | | | | | | | | | | | | |
| | | | | | Investment Activities | | | Distributions | | | | |
| | | Net Asset
Value,
Beginning
of Year | | | Net
Investment
Income(a) | | | Net Realized
and Unrealized
Gains (Losses)
on Investments | | | Total from
Investment
Activities | | | Net
Investment
Income | | | Net Asset
Value, End
of Year | |
Class A | | | | | | | | | | | | | | | | | | | | | | | | |
Period Ended 3/31/23(b) | | | $10.00 | | | | 0.03 | | | | 0.37 | | | | 0.40 | | | | — | | | | $10.40 | |
Class I | | | | | | | | | | | | | | | | | | | | | | | | |
Period Ended 3/31/23(b) | | | $10.00 | | | | 0.03 | | | | 0.38 | | | | 0.41 | | | | — | | | | $10.41 | |
Class R6 | | | | | | | | | | | | | | | | | | | | | | | | |
Period Ended 3/31/23(b) | | | $10.00 | | | | 0.04 | | | | 0.37 | | | | 0.41 | | | | — | | | | $10.41 | |
| (a) | Per share net investment income (loss) has been calculated using the average daily shares method. |
| (b) | For the period from December 15, 2022 (commencement of operations) to March 31, 2023. |
92
|
FINANCIAL HIGHLIGHTS |
RBC Emerging Markets ex-China Equity Fund |
(Selected data for a share outstanding throughout the periods indicated)
| | | | | | | | | | | | | | | | | | | | | | | | |
| | | | | | Ratios/Supplemental Data | |
| | | Total
Return(a) | | | Net Assets,
End of
Year (000’s) | | | Ratio of
Net Expenses
to Average
Net Assets | | | Ratio of
Net Investment
Income (Loss)
to Average
Net Assets | | | Ratio of
Expenses to
Average Net
Assets* | | | Portfolio
Turnover
Rate | |
Class A | | | | | | | | | | | | | | | | | | | | | | | | |
Period Ended 3/31/23(b) | | | 4.00%(c) | | | | $ 520 | | | | 1.13%(d) | | | | 1.06%(d) | | | | 4.27%(d) | | | | 2% | |
Class I | | | | | | | | | | | | | | | | | | | | | | | | |
Period Ended 3/31/23(b) | | | 4.10%(c) | | | | $32,321 | | | | 0.88%(d) | | | | 0.94%(d) | | | | 2.22%(d) | | | | 2% | |
Class R6 | | | | | | | | | | | | | | | | | | | | | | | | |
Period Ended 3/31/23(b) | | | 4.10%(c) | | | | $ 1,041 | | | | 0.88%(d) | | | | 1.31%(d) | | | | 3.10%(d) | | | | 2% | |
| * | During the period, certain fees were contractually or voluntarily reduced and/or reimbursed. If such contractual/voluntary fee reductions and reimbursements had not occurred, the ratio would have been as indicated. |
| (a) | Assumes investment at net asset value at the beginning of the period, reinvestment of all dividends and distributions, and a complete redemption of the investment at net asset value at the end of the period. |
| (b) | For the period from December 15, 2022 (commencement of operations) to March 31, 2023. (c) Not annualized. |
See Notes to the Financial Statements.
93
|
FINANCIAL HIGHLIGHTS |
RBC Emerging Markets Value Equity Fund |
| | | | | | | | | | | | | | | | | | | | | | | | | | | | | | | | |
| | | (Selected data for a share outstanding throughout the periods indicated) | |
| | | | | | Investment Activities | | | Distributions | | | | |
| | | Net Asset
Value,
Beginning
of Year | | | Net
Investment
Income(a) | | | Net Realized
and Unrealized
Gains (Losses)
on Investments | | | Total from
Investment
Activities | | | Net
Investment
Income | | | Net
Realized
Gains | | | Total
Distributions | | | Net Asset
Value, End
of Year | |
Class A | | | | | | | | | | | | | | | | | | | | | | | | | | | | | | | | |
Period Ended 3/31/23(b) | | | $8.62 | | | | 0.12 | | | | (0.50 | ) | | | (0.38 | ) | | | — | | | | (0.52 | ) | | | (0.52 | ) | | | $ 7.72 | |
Class I | | | | | | | | | | | | | | | | | | | | | | | | | | | | | | | | |
Year Ended 3/31/23 | | | $8.81 | | | | 0.22 | | | | (0.78 | ) | | | (0.56 | ) | | | — | | | | (0.52 | ) | | | (0.52 | ) | | | $ 7.73 | |
Year Ended 3/31/22 | | | 11.22 | | | | 0.15 | | | | (1.30 | ) | | | (1.15 | ) | | | (0.18 | ) | | | (1.08 | ) | | | (1.26 | ) | | | 8.81 | |
Year Ended 3/31/21 | | | 6.42 | | | | 0.08 | | | | 4.76 | | | | 4.84 | | | | (0.03 | ) | | | (0.01 | ) | | | (0.04 | ) | | | 11.22 | |
Year Ended 3/31/20 | | | 8.74 | | | | 0.33(c | ) | | | (2.31 | ) | | | (1.98 | ) | | | (0.34 | ) | | | — | | | | (0.34 | ) | | | 6.42 | |
Year Ended 3/31/19 | | | 10.17 | | | | 0.21 | | | | (1.44 | ) | | | (1.23 | ) | | | (0.18 | ) | | | (0.02 | ) | | | (0.20 | ) | | | 8.74 | |
Class R6 | | | | | | | | | | | | | | | | | | | | | | | | | | | | | | | | |
Year Ended 3/31/23 | | | $8.46 | | | | 0.22 | | | | (0.75 | ) | | | (0.53 | ) | | | — | | | | (0.52 | ) | | | (0.52 | ) | | | $ 7.41 | |
Year Ended 3/31/22 | | | 10.90 | | | | 0.19 | | | | (1.29 | ) | | | (1.10 | ) | | | (0.26 | ) | | | (1.08 | ) | | | (1.34 | ) | | | 8.46 | |
Year Ended 3/31/21 | | | 6.42 | | | | 0.12 | | | | 4.68 | | | | 4.80 | | | | (0.31 | ) | | | (0.01 | ) | | | (0.32 | ) | | | 10.90 | |
Year Ended 3/31/20 | | | 8.74 | | | | 0.34(c | ) | | | (2.31 | ) | | | (1.97 | ) | | | (0.35 | ) | | | — | | | | (0.35 | ) | | | 6.42 | |
Year Ended 3/31/19 | | | 10.17 | | | | 0.21 | | | | (1.43 | ) | | | (1.22 | ) | | | (0.19 | ) | | | (0.02 | ) | | | (0.21 | ) | | | 8.74 | |
| (a) | Per share net investment income (loss) has been calculated using the average daily shares method. |
| (b) | For the period from April 19, 2022 (commencement of operations) to March 31, 2023. |
| (c) | Net investment income per share and the ratio of net investment income to average net assets include $0.14 and 1.63% for Class I and $0.14 and 1.63% for Class R6, respectively, resulting from the special dividend from Naspers LTD/Prosus in September 2019. |
94
|
FINANCIAL HIGHLIGHTS |
RBC Emerging Markets Value Equity Fund |
| | | | | | | | | | | | | | | | | | | | | | | | | | |
| | | (Selected data for a share outstanding throughout the periods indicated) | |
| | | | | | | Ratios/Supplemental Data | |
| | | | | Total
Return(a) | | Net Assets,
End of
Year (000’s) | | | Ratio of
Net Expenses
to Average
Net Assets | | Ratio of
Net Investment
Income (Loss)
to Average
Net Assets | | Ratio of
Expenses to
Average Net
Assets* | | Portfolio
Turnover
Rate** | |
Class A | | | | | | | | | | | | | | | | | | | | | | | | | | |
Period Ended 3/31/23(b) | | | | | (4.16 | )%(c) | | | $14 | | | | 1.20 | %(d) | | | 1.67 | %(d) | | | 19.67 | %(d) | | | 44 | % |
Class I | | | | | | | | | | | | | | | | | | | | | | | | | | |
Year Ended 3/31/23 | | | | | (6.10 | )% | | | $64,106 | | | | 0.95 | % | | | 2.86 | % | | | 1.57 | % | | | 44 | % |
Year Ended 3/31/22 | | | | | (10.95 | )% | | | 72,867 | | | | 0.95 | % | | | 1.43 | % | | | 1.41 | % | | | 67 | % |
Year Ended 3/31/21 | | | | | 75.61 | % | | | 40,956 | | | | 0.95 | % | | | 0.79 | % | | | 1.97 | % | | | 68 | % |
Year Ended 3/31/20 | | | | | (23.71 | )% | | | 1,762 | | | | 0.95 | % | | | 3.91 | %(e) | | | 6.68 | % | | | 71 | % |
Year Ended 3/31/19 | | | | | (12.04 | )% | | | 2,245 | | | | 0.99 | %(f) | | | 2.35 | % | | | 7.02 | % | | | 75 | % |
Class R6 | | | | | | | | | | | | | | | | | | | | | | | | | | |
Year Ended 3/31/23 | | | | | (6.01 | )% | | | $2,520 | | | | 0.88 | % | | | 2.93 | % | | | 1.62 | % | | | 44 | % |
Year Ended 3/31/22 | | | | | (10.84 | )% | | | 2,681 | | | | 0.88 | % | | | 1.74 | % | | | 1.33 | % | | | 67 | % |
Year Ended 3/31/21 | | | | | 75.44 | % | | | 3,006 | | | | 0.88 | % | | | 1.36 | % | | | 3.37 | % | | | 68 | % |
Year Ended 3/31/20 | | | | | (23.58 | )% | | | 1,712 | | | | 0.88 | % | | | 3.99 | %(e) | | | 6.67 | % | | | 71 | % |
Year Ended 3/31/19 | | | | | (11.98 | )% | | | 2,242 | | | | 0.93 | %(f) | | | 2.41 | % | | | 6.96 | % | | | 75 | % |
| * | During the period, certain fees were contractually or voluntarily reduced and/or reimbursed. If such contractual/voluntary fee reductions and reimbursements had not occurred, the ratio would have been as indicated. |
| ** | Portfolio turnover rate is calculated on the basis of the Fund as a whole without distinguishing between the classes of shares issued. |
| (a) | Assumes investment at net asset value at the beginning of the period, reinvestment of all dividends and distributions, and a complete redemption of the investment at net asset value at the end of the period. |
| (b) | For period from April 19, 2022 (commencement of operations) to March 31, 2023. |
| (e) | Net investment income per share and the ratio of net investment income to average net assets include $0.14 and 1.63% for Class I and $0.14 and 1.63% for Class R6, respectively, resulting from the special dividend from Naspers LTD/Prosus in September 2019. |
| (f) | Beginning July 2, 2018, the net operating expenses were contractually limited to 0.95% and 0.88% of average daily net assets for Class I and Class R6, respectively. The ratio of net expenses to average net assets represents a blended percentage for the year ended March 31, 2019. |
95
|
FINANCIAL HIGHLIGHTS |
RBC Emerging Markets Value Equity Fund |
|
| (Selected data for a share outstanding throughout the periods indicated) |
See Notes to the Financial Statements. |
96
|
FINANCIAL HIGHLIGHTS |
RBC Global Opportunities Fund |
| | | | | | | | | | | | | | | | | | | | | | | | | | | | | | | | | | | | |
| | | (Selected data for a share outstanding throughout the periods indicated) | |
| | | | | | Investment Activities | | | Distributions | | | | |
| | | Net Asset
Value,
Beginning
of Year | | | Net
Investment
Income/
(Loss)(a) | | | Net Realized
and Unrealized
Gains (Losses)
on Investments | | | Redemption
Fees | | | Total from
Investment
Activities | | | Net
Investment
Income | | | Net
Realized
Gains | | | Total
Distributions | | | Net Asset
Value, End
of Year | |
Class A | | | | | | | | | | | | | | | | | | | | | | | | | | | | | | | | | | | | |
Year Ended 3/31/23 | | | $19.09 | | | | 0.07 | | | | (2.30 | ) | | | — | | | | (2.23 | ) | | | —(b | ) | | | — | | | | — | | | | $ 16.86 | |
Year Ended 3/31/22 | | | 19.39 | | | | —(b | ) | | | 0.64 | | | | — | | | | 0.64 | | | | (0.03 | ) | | | (0.91 | ) | | | (0.94 | ) | | | 19.09 | |
Year Ended 3/31/21 | | | 12.28 | | | | (0.01 | ) | | | 7.51 | | | | —(b | ) | | | 7.50 | | | | — | | | | (0.39 | ) | | | (0.39 | ) | | | 19.39 | |
Period Ended 3/31/20(c) | | | 15.50 | | | | 0.02 | | | | (3.24 | ) | | | — | | | | (3.22 | ) | | | — | | | | — | | | | — | | | | 12.28 | |
Class I | | | | | | | | | | | | | | | | | | | | | | | | | | | | | | | | | | | | |
Year Ended 3/31/23 | | | $19.11 | | | | 0.11 | | | | (2.30 | ) | | | — | | | | (2.19 | ) | | | (0.04 | ) | | | — | | | | (0.04 | ) | | | $ 16.88 | |
Year Ended 3/31/22 | | | 19.41 | | | | 0.05 | | | | 0.64 | | | | — | | | | 0.69 | | | | (0.08 | ) | | | (0.91 | ) | | | (0.99 | ) | | | 19.11 | |
Year Ended 3/31/21 | | | 12.28 | | | | 0.04 | | | | 7.53 | | | | — | | | | 7.57 | | | | (0.05 | ) | | | (0.39 | ) | | | (0.44 | ) | | | 19.41 | |
Year Ended 3/31/20 | | | 14.04 | | | | 0.20(d | ) | | | (1.53 | ) | | | — | | | | (1.33 | ) | | | (0.16 | ) | | | (0.27 | ) | | | (0.43 | ) | | | 12.28 | |
Year Ended 3/31/19 | | | 13.69 | | | | 0.09 | | | | 0.72 | | | | — | | | | 0.81 | | | | (0.02 | ) | | | (0.44 | ) | | | (0.46 | ) | | | 14.04 | |
Class R6 | | | | | | | | | | | | | | | | | | | | | | | | | | | | | | | | | | | | |
Year Ended 3/31/23 | | | $19.17 | | | | 0.12 | | | | (2.30 | ) | | | — | | | | (2.18 | ) | | | (0.05 | ) | | | — | | | | (0.05 | ) | | | $ 16.94 | |
Year Ended 3/31/22 | | | 19.47 | | | | 0.06 | | | | 0.63 | | | | — | | | | 0.69 | | | | (0.08 | ) | | | (0.91 | ) | | | (0.99 | ) | | | 19.17 | |
Year Ended 3/31/21 | | | 12.30 | | | | 0.06 | | | | 7.52 | | | | — | | | | 7.58 | | | | (0.02 | ) | | | (0.39 | ) | | | (0.41 | ) | | | 19.47 | |
Year Ended 3/31/20 | | | 14.08 | | | | 0.16(d | ) | | | (1.48 | ) | | | — | | | | (1.32 | ) | | | (0.19 | ) | | | (0.27 | ) | | | (0.46 | ) | | | 12.30 | |
Year Ended 3/31/19 | | | 13.77 | | | | 0.13 | | | | 0.68 | | | | — | | | | 0.81 | | | | (0.06 | ) | | | (0.44 | ) | | | (0.50 | ) | | | 14.08 | |
| (a) | Per share net investment income (loss) has been calculated using the average daily shares method. |
| (b) | Less than $0.01 or $(0.01) per share. |
| (c) | For the period from January 28, 2020 (commencement of operations) to March 31, 2020. |
| (d) | Net investment income per share and the ratio of net investment income to average net assets include $0.13 and 0.87% for Class I and $0.12 and 0.87% for Class R6, respectively, resulting from the special dividend from Naspers LTD/Prosus in September 2019. |
97
|
FINANCIAL HIGHLIGHTS |
RBC Global Opportunities Fund |
| | | | | | | | | | | | | | | | | | | | | | | | | | |
| | | (Selected data for a share outstanding throughout the periods indicated) | |
| | | | | | | Ratios/Supplemental Data | |
| | | | | Total
Return(a)(b) | | Net Assets,
End of
Year (000’s) | | | Ratio of
Net Expenses
to Average
Net Assets | | Ratio of
Net Investment
Income (Loss)
to Average
Net Assets | | Ratio of
Expenses to
Average Net
Assets* | | Portfolio
Turnover
Rate** | |
Class A | | | | | | | | | | | | | | | | | | | | | | | | | | |
Year Ended 3/31/23 | | | | | (11.66 | )% | | | $20 | | | | 1.00 | % | | | 0.41 | % | | | 20.49 | % | | | 38 | % |
Year Ended 3/31/22 | | | | | 2.86 | % | | | 25 | | | | 1.00 | % | | | (0.01 | )% | | | 24.16 | % | | | 44 | % |
Year Ended 3/31/21 | | | | | 61.21 | % | | | 13 | | | | 1.02 | %(c) | | | (0.07 | )% | | | 33.96 | % | | | 62 | % |
Period Ended 3/31/20(d) | | | | | (20.77 | )%(e) | | | 8 | | | | 1.11 | %(f) | | | 0.82 | %(f) | | | 1.64 | %(f) | | | 23 | % |
Class I | | | | | | | | | | | | | | | | | | | | | | | | | | |
Year Ended 3/31/23 | | | | | (11.44 | )% | | | $313,879 | | | | 0.75 | % | | | 0.66 | % | | | 0.84 | % | | | 38 | % |
Year Ended 3/31/22 | | | | | 3.09 | % | | | 330,052 | | | | 0.75 | % | | | 0.23 | % | | | 0.81 | % | | | 44 | % |
Year Ended 3/31/21 | | | | | 61.74 | % | | | 144,339 | | | | 0.77 | %(c) | | | 0.25 | % | | | 0.99 | % | | | 62 | % |
Year Ended 3/31/20 | | | | | (10.10 | )% | | | 58,090 | | | | 0.86 | % | | | 1.35 | %(g) | | | 1.25 | % | | | 23 | % |
Year Ended 3/31/19 | | | | | 6.49 | % | | | 18,873 | | | | 0.86 | % | | | 0.64 | % | | | 1.94 | % | | | 28 | % |
Class R6 | | | | | | | | | | | | | | | | | | | | | | | | | | |
Year Ended 3/31/23 | | | | | (11.35 | )% | | | $153,349 | | | | 0.70 | % | | | 0.73 | % | | | 0.73 | % | | | 38 | % |
Year Ended 3/31/22 | | | | | 3.11 | % | | | 246,907 | | | | 0.70 | % | | | 0.30 | % | | | 0.72 | % | | | 44 | % |
Year Ended 3/31/21 | | | | | 61.76 | % | | | 120,220 | | | | 0.71 | %(c) | | | 0.31 | % | | | 0.90 | % | | | 62 | % |
Year Ended 3/31/20 | | | | | (10.01 | )% | | | 788 | | | | 0.81 | % | | | 1.19 | %(g) | | | 5.44 | % | | | 23 | % |
Year Ended 3/31/19 | | | | | 6.54 | % | | | 55 | | | | 0.81 | % | | | 0.95 | % | | | 18.77 | % | | | 28 | % |
| * | During the period, certain fees were contractually or voluntarily reduced and/or reimbursed. If such contractual/voluntary fee reductions and reimbursements had not occurred, the ratio would have been as indicated. |
| ** | Portfolio turnover rate is calculated on the basis of the Fund as a whole without distinguishing between the classes of shares issued. |
| (a) | Excludes sales charge. |
| (b) | Assumes investment at net asset value at the beginning of the period, reinvestment of all dividends and distributions, and a complete redemption of the investment at net asset value at the end of the period. |
| (c) | Beginning June 18, 2020, the net operating expenses were contractually limited to 1.00%, 0.75% and 0.70% of average daily net assets for Class A and Class I and Class R6, respectively. The ratio of net expenses to average net assets represents a blended percentage for the period ended March 31, 2021. |
| (d) | For the period from January 28, 2020 (commencement of operations) to March 31, 2020. |
98
|
FINANCIAL HIGHLIGHTS |
RBC Global Opportunities Fund |
(Selected data for a share outstanding throughout the periods indicated)
|
(e) Not annualized. (f) Annualized. (g) Net investment income per share and the ratio of net investment income to average net assets include $0.13 and 0.87% for Class I and $0.12 and 0.87% for Class R6, respectively, resulting from the special dividend from Naspers LTD/Prosus in September 2019. See Notes to the Financial Statements. |
99
|
FINANCIAL HIGHLIGHTS |
RBC Global Equity Leaders Fund |
| | | | | | | | | | | | | | | | | | | | | | | | | | | | |
| | | (Selected data for a share outstanding throughout the periods indicated) | |
| | | | | | Investment Activities | | | Distributions | | | | |
| | | Net Asset
Value,
Beginning
of Year | | | Net
Investment
Income(a) | | | Net Realized
and Unrealized
Gains (Losses)
on Investments | | | Total from
Investment
Activities | | | Net
Investment
Income | | | Total
Distributions | | | Net Asset
Value, End
of Year | |
Class A | | | | | | | | | | | | | | | | | | | | | | | | | | | | |
Year Ended 3/31/23 | | | $ 9.03 | | | | 0.05 | | | | (0.93 | ) | | | (0.88 | ) | | | (0.05 | ) | | | (0.05 | ) | | | $ 8.10 | |
Period Ended 3/31/22(b) | | | 10.00 | | | | —(c | ) | | | (0.97 | ) | | | (0.97 | ) | | | — | | | | — | | | | 9.03 | |
Class I | | | | | | | | | | | | | | | | | | | | | | | | | | | | |
Year Ended 3/31/23 | | | $ 9.04 | | | | 0.07 | | | | (0.93 | ) | | | (0.86 | ) | | | (0.07 | ) | | | (0.07 | ) | | | $ 8.11 | |
Period Ended 3/31/22(b) | | | 10.00 | | | | 0.01 | | | | (0.97 | ) | | | (0.96 | ) | | | — | | | | — | | | | 9.04 | |
Class R6 | | | | | | | | | | | | | | | | | | | | | | | | | | | | |
Year Ended 3/31/23 | | | $ 9.04 | | | | 0.08 | | | | (0.93 | ) | | | (0.85 | ) | | | (0.08 | ) | | | (0.08 | ) | | | $ 8.11 | |
Period Ended 3/31/22(b) | | | 10.00 | | | | 0.01 | | | | (0.97 | ) | | | (0.96 | ) | | | — | | | | — | | | | 9.04 | |
| (a) | Per share net investment income (loss) has been calculated using the average daily shares method. |
| (b) | For the period from December 15, 2021 (commencement of operations) to March 31, 2022. |
| (c) | Less than $0.01 or $(0.01) per share. |
100
|
FINANCIAL HIGHLIGHTS |
RBC Global Equity Leaders Fund |
| | | | | | | | | | | | | | | | | | | | | | | | |
| | | (Selected data for a share outstanding throughout the periods indicated) |
| | | | | Ratios/Supplemental Data | |
| | | Total
Return(a)(b) | | Net Assets,
End of
Year (000’s) | | | Ratio of
Net Expenses
to Average
Net Assets | | Ratio of
Net Investment
Income (Loss)
to Average
Net Assets | | Ratio of
Expenses to
Average Net
Assets* | | Portfolio
Turnover
Rate | |
Class A | | | | | | | | | | | | | | | | | | | | | | | | |
Year Ended 3/31/23 | | | (9.73) | % | | | $ 815 | | | | 1.00 | % | | | 0.64 | % | | | 7.76 | % | | | 37% | |
Period Ended 3/31/22(c) | | | (9.70) | %(d) | | | 903 | | | | 1.00 | %(e) | | | 0.10 | %(e) | | | 10.29 | %(e) | | | 28% | |
Class I | | | | | | | | | | | | | | | | | | | | | | | | |
Year Ended 3/31/23 | | | (9.48) | % | | | $ 2,454 | | | | 0.75 | % | | | 0.89 | % | | | 7.24 | % | | | 37% | |
Period Ended 3/31/22(c) | | | (9.60) | %(d) | | | 2,712 | | | | 0.75 | %(e) | | | 0.36 | %(e) | | | 9.32 | %(e) | | | 28% | |
Class R6 | | | | | | | | | | | | | | | | | | | | | | | | |
Year Ended 3/31/23 | | | (9.43) | % | | | $ 818 | | | | 0.70 | % | | | 0.94 | % | | | 7.51 | % | | | 37% | |
Period Ended 3/31/22(c) | | | (9.60) | %(d) | | | 904 | | | | 0.70 | %(e) | | | 0.41 | %(e) | | | 10.04 | %(e) | | | 28% | |
| * | During the period, certain fees were contractually or voluntarily reduced and/or reimbursed. If such contractual/voluntary fee reductions and reimbursements had not occurred, the ratio would have been as indicated. |
| (a) | Excludes sales charge. |
| (b) | Assumes investment at net asset value at the beginning of the period, reinvestment of all dividends and distributions, and a complete redemption of the investment at net asset value at the end of the period. |
| (c) | For the period from December 15, 2021 (commencement of operations) to March 31, 2022. (d) Not annualized. |
See Notes to the Financial Statements.
101
|
FINANCIAL HIGHLIGHTS |
RBC International Opportunities Fund |
| | | | | | | | | | | | | | | | | | | | | | | | | | | | | | | | | | | | |
| | | (Selected data for a share outstanding throughout the periods indicated) | |
| | | | | | Investment Activities | | | Distributions | | | | |
| | | Net Asset
Value,
Beginning
of Year | | | Net
Investment
Income(a) | | | Net Realized
and Unrealized
Gains (Losses)
on Investments | | | Redemption
Fees | | | Total from
Investment
Activities | | | Net
Investment
Income | | | Net
Realized
Gains | | | Total
Distributions | | | Net Asset
Value, End
of Year | |
Class A | | | | | | | | | | | | | | | | | | | | | | | | | | | | | | | | | | | | |
Year Ended 3/31/23 | | | $11.56 | | | | 0.14 | | | | (1.15) | | | | — | | | | (1.01) | | | | — | | | | (0.51) | | | | (0.51) | | | | $10.04 | |
Year Ended 3/31/22 | | | 12.92 | | | | 0.04 | | | | (0.73) | | | | —(b) | | | | (0.69) | | | | (0.31) | | | | (0.36) | | | | (0.67) | | | | 11.56 | |
Year Ended 3/31/21 | | | 8.41 | | | | 0.02 | | | | 5.17 | | | | — | | | | 5.19 | | | | — | | | | (0.68) | | | | (0.68) | | | | 12.92 | |
Period Ended 3/31/20(c) | | | 11.03 | | | | 0.02 | | | | (2.64) | | | | — | | | | (2.62) | | | | — | | | | — | | | | — | | | | 8.41 | |
Class I | | | | | | | | | | | | | | | | | | | | | | | | | | | | | | | | | | | | |
Year Ended 3/31/23 | | | $11.62 | | | | 0.17 | | | | (1.16) | | | | — | | | | (0.99) | | | | — | | | | (0.51) | | | | (0.51) | | | | $10.12 | |
Year Ended 3/31/22 | | | 12.97 | | | | 0.09 | | | | (0.75) | | | | — | | | | (0.66) | | | | (0.33) | | | | (0.36) | | | | (0.69) | | | | 11.62 | |
Year Ended 3/31/21 | | | 8.41 | | | | 0.07 | | | | 5.29 | | | | — | | | | 5.36 | | | | (0.12) | | | | (0.68) | | | | (0.80) | | | | 12.97 | |
Year Ended 3/31/20 | | | 10.27 | | | | 0.29(d) | | | | (1.70) | | | | — | | | | (1.41) | | | | (0.31) | | | | (0.14) | | | | (0.45) | | | | 8.41 | |
Year Ended 3/31/19 | | | 11.39 | | | | 0.18 | | | | (0.56) | | | | — | | | | (0.38) | | | | (0.10) | | | | (0.64) | | | | (0.74) | | | | 10.27 | |
Class R6 | | | | | | | | | | | | | | | | | | | | | | | | | | | | | | | | | | | | |
Year Ended 3/31/23 | | | $11.70 | | | | 0.18 | | | | (1.16) | | | | — | | | | (0.98) | | | | — | | | | (0.51) | | | | (0.51) | | | | $10.21 | |
Year Ended 3/31/22 | | | 13.05 | | | | 0.08 | | | | (0.74) | | | | — | | | | (0.66) | | | | (0.33) | | | | (0.36) | | | | (0.69) | | | | 11.70 | |
Year Ended 3/31/21 | | | 8.46 | | | | 0.08 | | | | 5.32 | | | | — | | | | 5.40 | | | | (0.13) | | | | (0.68) | | | | (0.81) | | | | 13.05 | |
Year Ended 3/31/20 | | | 10.33 | | | | 0.29(d) | | | | (1.70) | | | | — | | | | (1.41) | | | | (0.32) | | | | (0.14) | | | | (0.46) | | | | 8.46 | |
Year Ended 3/31/19 | | | 11.44 | | | | 0.18 | | | | (0.55) | | | | — | | | | (0.37) | | | | (0.10) | | | | (0.64) | | | | (0.74) | | | | 10.33 | |
| (a) | Per share net investment income (loss) has been calculated using the average daily shares method. |
| (b) | Less than $0.01 or $(0.01) per share. |
| (c) | For the period from January 28, 2020 (commencement of operations) to March 31, 2020. |
| (d) | Net investment income per share and the ratio of net investment income to average net assets include $0.17 and 1.58% for Class I and $0.17 and 1.58% for Class R6, respectively, resulting from the special dividend from Naspers LTD/Prosus in September 2019. |
102
|
FINANCIAL HIGHLIGHTS |
RBC International Opportunities Fund |
| | | | | | | | | | | | | | | | | | | | | | | | |
| | | (Selected data for a share outstanding throughout the periods indicated) |
| | | | | Ratios/Supplemental Data | |
| | | Total
Return(a)(b) | | Net Assets,
End of
Year (000’s) | | | Ratio of
Net Expenses
to Average
Net Assets | | Ratio of
Net Investment
Income (Loss)
to Average
Net Assets | | Ratio of
Expenses to
Average Net
Assets* | | Portfolio
Turnover
Rate** | |
Class A | | | | | | | | | | | | | | | | | | | | | | | | |
Year Ended 3/31/23 | | | (8.55) | % | | | $ 140 | | | | 1.05 | % | | | 1.45 | % | | | 4.98 | % | | | 52% | |
Year Ended 3/31/22 | | | (5.68) | % | | | 108 | | | | 1.05 | % | | | 0.29 | % | | | 6.35 | % | | | 37% | |
Year Ended 3/31/21 | | | 62.00 | % | | | 22 | | | | 1.10 | %(c) | | | 0.15 | % | | | 3.67 | % | | | 37% | |
Period Ended 3/31/20(d) | | | (23.75) | %(e) | | | 8 | | | | 1.14 | %(f) | | | 1.42 | %(f) | | | 1.38 | %(f) | | | 45% | |
Class I | | | | | | | | | | | | | | | | | | | | | | | | |
Year Ended 3/31/23 | | | (8.33) | % | | | $ 129,859 | | | | 0.80 | % | | | 1.71 | % | | | 1.07 | % | | | 52% | |
Year Ended 3/31/22 | | | (5.45) | % | | | 172,283 | | | | 0.80 | % | | | 0.71 | % | | | 0.98 | % | | | 37% | |
Year Ended 3/31/21 | | | 63.90 | % | | | 170,788 | | | | 0.81 | %(c) | | | 0.59 | % | | | 1.11 | % | | | 37% | |
Year Ended 3/31/20 | | | (14.68) | % | | | 73,562 | | | | 0.89 | % | | | 2.76 | %(g) | | | 1.21 | % | | | 45% | |
Year Ended 3/31/19 | | | (2.46) | % | | | 66,202 | | | | 0.89 | %(h) | | | 1.71 | % | | | 1.26 | %(h) | | | 49% | |
Class R6 | | | | | | | | | | | | | | | | | | | | | | | | |
Year Ended 3/31/23 | | | (8.19) | % | | | $ 5,411 | | | | 0.75 | % | | | 1.79 | % | | | 1.00 | % | | | 52% | |
Year Ended 3/31/22 | | | (5.47) | % | | | 5,862 | | | | 0.75 | % | | | 0.68 | % | | | 1.03 | % | | | 37% | |
Year Ended 3/31/21 | | | 64.15 | % | | | 18 | | | | 0.76 | %(c) | | | 0.67 | % | | | 24.83 | % | | | 37% | |
Year Ended 3/31/20 | | | (14.74) | % | | | 11 | | | | 0.84 | % | | | 2.74 | %(g) | | | 28.05 | % | | | 45% | |
Year Ended 3/31/19 | | | (2.27) | % | | | 13 | | | | 0.84 | %(h) | | | 1.69 | % | | | 29.90 | %(h) | | | 49% | |
| * | During the period, certain fees were contractually or voluntarily reduced and/or reimbursed. If such contractual/voluntary fee reductions and reimbursements had not occurred, the ratio would have been as indicated. |
| ** | Portfolio turnover rate is calculated on the basis of the Fund as a whole without distinguishing between the classes of shares issued. |
| (a) | Excludes sales charge. |
| (b) | Assumes investment at net asset value at the beginning of the period, reinvestment of all dividends and distributions, and a complete redemption of the investment at net asset value at the end of the period. |
| (c) | Beginning June 18, 2020, the net operating expenses were contractually limited to 1.05%, 0.80% and 0.75% of average daily net assets for Class A and Class I and Class R6, respectively. The ratio of net expenses to average net assets represents a blended percentage for the period ended March 31, 2021. |
| (d) | For the period from January 28, 2020 (commencement of operations) to March 31, 2020. |
103
|
FINANCIAL HIGHLIGHTS |
RBC International Opportunities Fund |
(Selected data for a share outstanding throughout the periods indicated)
|
(e) Not annualized. (f) Annualized. (g) Net investment income per share and the ratio of net investment income to average net assets include $0.17 and 1.58% for Class I and $0.17 and 1.58% for Class R6, respectively, resulting from the special dividend from Naspers LTD/Prosus in September 2019. (h) Ratios include line of credit interest expense which is less than 0.01%. See Notes to the Financial Statements. |
104
|
FINANCIAL HIGHLIGHTS |
RBC International Equity Fund |
| | | | | | | | | | | | | | | | | | | | | | | | |
| | | (Selected data for a share outstanding throughout the periods indicated) | |
| | | | | | Investment Activities | | | Distributions | | | | |
| | | Net Asset
Value,
Beginning
of Year | | | Net
Investment
Income(a) | | | Net Realized
and Unrealized
Gains (Losses)
on
Investments | | | Total from
Investment
Activities | | | Net
Investment
Income | | | Net Asset
Value, End
of Year | |
Class A | | | | | | | | | | | | | | | | | | | | | | | | |
Period Ended 3/31/23(b) | | | $ 10.00 | | | | 0.05 | | | | 0.39 | | | | 0.44 | | | | — | | | | $10.44 | |
Class I | | | | | | | | | | | | | | | | | | | | | | | | |
Period Ended 3/31/23(b) | | | $ 10.00 | | | | 0.06 | | | | 0.39 | | | | 0.45 | | | | — | | | | $10.45 | |
Class R6 | | | | | | | | | | | | | | | | | | | | | | | | |
Period Ended 3/31/23(b) | | | $ 10.00 | | | | 0.06 | | | | 0.39 | | | | 0.45 | | | | — | | | | $10.45 | |
| (a) | Per share net investment income (loss) has been calculated using the average daily shares method. |
| (b) | For the period from December 14, 2022 (commencement of operations) to March 31, 2023. |
105
RBC International Equity Fund
(Selected data for a share outstanding throughout the periods indicated)
| | | | | | | | | | | | | | | | | | | | | | | | |
| | | | | | Ratios/Supplemental Data | |
| | | Total
Return(a) | | | Net Assets,
End of
Year (000’s) | | | Ratio of
Net Expenses
to Average
Net Assets | | | Ratio of
Net Investment
Income (Loss)
to Average
Net Assets | | | Ratio of
Expenses to
Average Net
Assets* | | | Portfolio
Turnover
Rate | |
Class A | | | | | | | | | | | | | | | | | | | | | | | | |
Period Ended 3/31/23(b) | | | 4.40%(c) | | | $ | 1,044 | | | | 1.04%(d) | | | | 1.80%(d) | | | | 3.74%(d) | | | | 10% | |
Class I | | | | | | | | | | | | | | | | | | | | | | | | |
Period Ended 3/31/23(b) | | | 4.50%(c) | | | $ | 18,283 | | | | 0.79%(d) | | | | 2.05%(d) | | | | 2.64%(d) | | | | 10% | |
Class R6 | | | | | | | | | | | | | | | | | | | | | | | | |
Period Ended 3/31/23(b) | | | 4.50%(c) | | | $ | 1,567 | | | | 0.74%(d) | | | | 2.10%(d) | | | | 3.19%(d) | | | | 10% | |
| * | During the period, certain fees were contractually or voluntarily reduced and/or reimbursed. If such contractual/voluntary fee reductions and reimbursements had not occurred, the ratio would have been as indicated. |
| (a) | Assumes investment at net asset value at the beginning of the period, reinvestment of all dividends and distributions, and a complete redemption of the investment at net asset value at the end of the period. |
| (b) | For the period from December 14, 2022 (commencement of operations) to March 31, 2023. |
See Notes to the Financial Statements.
106
RBC International Small Cap Equity Fund
(Selected data for a share outstanding throughout the periods indicated)
| | | | | | | | | | | | | | | | | | | | | | | | |
| | | | | | Investment Activities | | | Distributions | | | | |
| | | Net Asset
Value,
Beginning
of Year | | | Net
Investment
Income(a) | | | Net Realized
and Unrealized
Gains (Losses)
on
Investments | | | Total from
Investment
Activities | | | Net
Investment
Income | | | Net Asset
Value, End
of Year | |
Class A | | | | | | | | | | | | | | | | | | | | | | | | |
Period Ended 3/31/23(b) | | | $ 10.00 | | | | — | | | | 0.25 | | | | 0.25 | | | | — | | | | $10.25 | |
Class I | | | | | | | | | | | | | | | | | | | | | | | | |
Period Ended 3/31/23(b) | | | $ 10.00 | | | | 0.01 | | | | 0.25 | | | | 0.26 | | | | — | | | | $10.26 | |
Class R6 | | | | | | | | | | | | | | | | | | | | | | | | |
Period Ended 3/31/23(b) | | | $ 10.00 | | | | 0.01 | | | | 0.25 | | | | 0.26 | | | | — | | | | $10.26 | |
| (a) | Per share net investment income (loss) has been calculated using the average daily shares method. |
| (b) | For the period from December 14, 2022 (commencement of operations) to March 31, 2023. |
107
RBC International Small Cap Equity Fund
(Selected data for a share outstanding throughout the periods indicated)
| | | | | | | | | | | | | | | | | | | | | | | | |
| | | | | | Ratios/Supplemental Data | |
| | | Total
Return(a) | | | Net Assets,
End of
Year (000’s) | | | Ratio of
Net Expenses
to Average
Net Assets | | | Ratio of
Net Investment
Income (Loss)
to Average
Net Assets | | | Ratio of
Expenses to
Average Net
Assets* | | | Portfolio
Turnover
Rate | |
Class A | | | | | | | | | | | | | | | | | | | | | | | | |
Period Ended 3/31/23(b) | | | 2.50%(c) | | | | $ 513 | | | | 1.24%(d) | | | | 0.13%(d) | | | | 10.81%(d) | | | | 5% | |
Class I | | | | | | | | | | | | | | | | | | | | | | | | |
Period Ended 3/31/23(b) | | | 2.60%(c) | | | | $ 3,591 | | | | 0.99%(d) | | | | 0.38%(d) | | | | 9.00%(d) | | | | 5% | |
Class R6 | | | | | | | | | | | | | | | | | | | | | | | | |
Period Ended 3/31/23(b) | | | 2.60%(c) | | | | $ 1,026 | | | | 0.94%(d) | | | | 0.43%(d) | | | | 9.65%(d) | | | | 5% | |
| * | During the period, certain fees were contractually or voluntarily reduced and/or reimbursed. If such contractual/voluntary fee reductions and reimbursements had not occurred, the ratio would have been as indicated. |
| (a) | Assumes investment at net asset value at the beginning of the period, reinvestment of all dividends and distributions, and a complete redemption of the investment at net asset value at the end of the period. |
| (b) | For the period from December 14, 2022 (commencement of operations) to March 31, 2023. |
See Notes to the Financial Statements.
108
|
FINANCIAL HIGHLIGHTS |
RBC China Equity Fund |
(Selected data for a share outstanding throughout the periods indicated)
| | | | | | | | | | | | | | | | | | | | | | | | | | | | |
| | | | | | Investment Activities | | | Distributions | |
| | | Net Asset
Value,
Beginning
of Year | | | Net
Investment
Income(a) | | | Net Realized
and Unrealized
Gains (Losses)
on Investments | | | Total from
Investment
Activities | | | Net
Investment
Income | | | Total
Distributions | | | Net Asset
Value, End
of Year | |
Class A | | | | | | | | | | | | | | | | | | | | | | | | | | | | |
Period Ended 3/31/23(b) | | | $10.00 | | | | 0.08 | | | | (0.65) | | | | (0.57) | | | | (0.08) | | | | (0.08) | | | | $9.35 | |
Class I | | | | | | | | | | | | | | | | | | | | | | | | | | | | |
Period Ended 3/31/23(b) | | | $10.00 | | | | 0.11 | | | | (0.66) | | | | (0.55) | | | | (0.09) | | | | (0.09) | | | | $9.36 | |
Class R6 | | | | | | | | | | | | | | | | | | | | | | | | | | | | |
Period Ended 3/31/23(b) | | | $10.00 | | | | 0.11 | | | | (0.65) | | | | (0.54) | | | | (0.10) | | | | (0.10) | | | | $9.36 | |
| (a) | Per share net investment income (loss) has been calculated using the average daily shares method. |
| (b) | For the period from April 11, 2022 (commencement of operations) to March 31, 2023. |
109
|
FINANCIAL HIGHLIGHTS |
RBC China Equity Fund |
|
|
(Selected data for a share outstanding throughout the periods indicated)
| | | | | | | | | | | | | | | | | | | | | | | | |
| | | | | | Ratios/Supplemental Data | |
| | | Total
Return(a) | | | Net Assets,
End of
Year (000’s) | | | Ratio of
Net Expenses
to Average
Net Assets | | | Ratio of
Net Investment
Income (Loss)
to Average
Net Assets | | | Ratio of
Expenses to
Average Net
Assets* | | | Portfolio
Turnover
Rate | |
Class A | | | | | | | | | | | | | | | | | | | | | | | | |
Period Ended 3/31/23(b) | | | (5.72)%(c) | | | | $ 471 | | | | 1.30%(d) | | | | 0.91%(d) | | | | 8.66% | | | | 130% | |
Class I | | | | | | | | | | | | | | | | | | | | | | | | |
Period Ended 3/31/23(b) | | | (5.44)%(c) | | | | $3,308 | | | | 1.05%(d) | | | | 1.16%(d) | | | | 7.48% | | | | 130% | |
Class R6 | | | | | | | | | | | | | | | | | | | | | | | | |
Period Ended 3/31/23(b) | | | (5.40)%(c) | | | | $ 946 | | | | 1.00%(d) | | | | 1.21%(d) | | | | 7.87% | | | | 130% | |
| * | During the period, certain fees were contractually or voluntarily reduced and/or reimbursed. If such contractual/voluntary fee reductions and reimbursements had not occurred, the ratio would have been as indicated. |
| (a) | Assumes investment at net asset value at the beginning of the period, reinvestment of all dividends and distributions, and a complete redemption of the investment at net asset value at the end of the period. |
| (b) | For the period from April 11, 2022 (commencement of operations) to March 31, 2023. |
See Notes to the Financial Statements.
110
|
NOTES TO FINANCIAL STATEMENTS |
March 31, 2023 |
1. Organization:
RBC Funds Trust (the “Trust”) is registered under the Investment Company Act of 1940 (as amended) as an open-end management investment company. The Trust was organized as a Delaware statutory trust on December 16, 2003 and currently consists of 24 portfolios. Overall responsibility for the management of the Trust is vested in its Board of Trustees (the “Board”). This report includes the following nine investment portfolios (each a “Fund” and collectively, the “Funds”):
- RBC Emerging Markets Equity Fund (“Emerging Markets Equity Fund”)
- RBC Emerging Markets ex-China Equity Fund (“Emerging Markets ex-China Equity Fund”)
- RBC Emerging Markets Value Equity Fund (“Emerging Markets Value Equity Fund”)
- RBC Global Equity Leaders Fund (“Global Equity Leaders Fund”)
- RBC Global Opportunities Fund (“Global Opportunities Fund”)
- RBC International Opportunities Fund (“International Opportunities Fund”)
- RBC International Equity Fund (“International Equity Fund”)
- RBC International Small Cap Equity Fund ( “International Small Cap Equity Fund”)
- RBC China Equity Fund (“China Equity Fund”)
Each Fund offers three share classes: Class A, Class R6 and Class I shares. Class A shares are offered with a 5.75% maximum front-end sales charge and a 1.00% contingent deferred sales charge (“CDSC”) for redemption within 12 months of a $1 million or greater purchase on which no front-end sales charge was paid. Class I and Class R6 shares (intended for investors meeting certain investment minimum thresholds) are not subject to either a front-end sales charge or a CDSC.
RBC Global Asset Management (U.S.) Inc. (“RBC GAM-US” or “Advisor” or “Co-Administrator”) acts as the investment advisor for the Funds and RBC Global Asset Management (UK) Limited (“RBC GAM-UK” or “Sub-Advisor”) serves as the investment sub-advisor. The officers of the Trust (“Fund Management”) are also employees of RBC GAM-US.
2. Significant Accounting Policies
Each Fund is an investment company that follows accounting and reporting guidance under the Financial Accounting Standards Board. Summarized below are the significant accounting policies of the Funds. These policies conform to accounting principles generally accepted in the United States of America (“U.S. GAAP”). Fund Management follows these policies when preparing financial statements. Fund Management may also be required to make estimates and assumptions that affect the reported amounts of assets and liabilities at the date of the financial statements and the reported amounts of income and expenses for the period. Actual results could differ from those estimates. The financial statements are as of the close of regular trading on the New York Stock Exchange (“NYSE”).
Security Valuation:
The Board has approved pricing and valuation procedures of the Advisor for determining the fair value of each Fund’s investments. Fair value of a security is considered to be the price that a fund might reasonably expect to receive upon its current sale in an orderly transaction between market participants.
Equity securities are generally valued on the basis of prices furnished by third-party pricing services approved by the Board. Equity securities listed on one or more exchanges shall be valued at the last available quoted sale price on the primary trading exchange as of the regularly scheduled closing time of the exchange and are categorized as Level 1 in the fair value hierarchy. (See “Fair Value Measurements” below for additional information). An equity security not listed on an exchange but listed on NASDAQ shall be valued at the NASDAQ official closing price and is also categorized as Level 1. If there was no sale on the primary exchange on the day the net asset value is calculated or a NASDAQ official closing price is not available, the most recent bid quotation generally will be used and such securities will generally be categorized as Level 2. Investments in open-end investment companies (mutual funds) are valued at net asset value and are categorized as Level 1 in the fair value hierarchy.
111
|
NOTES TO FINANCIAL STATEMENTS |
Fixed income securities, including to-be-announced (“TBA”) commitments and municipal bonds, are generally valued based on evaluated prices received from third-party pricing services or from broker-dealers who make markets in the securities and are generally categorized as Level 2 in the fair value hierarchy (see “Fair Value Measurements” below for additional information). The pricing services utilize both dealer-supplied valuations and electronic data processing techniques that take into account multiple appropriate factors such as institutional-size trading in similar groups of securities, market spreads, interest rates, and fundamental security analytical data including yield, quality, coupon rate, maturity and type of issue.
Foreign securities valued in non-U.S. dollars are valued in the foreign currency and then converted into the U.S. dollar equivalent using the foreign exchange rate in effect at the close of NYSE on the day the security’s value is determined. The value of securities traded in markets outside the United States may be affected on a day that the NYSE is closed and an investor is not able to purchase, exchange or redeem shares of the Funds.
Many securities markets and exchanges outside of North American and South American time zones close prior to the close of the NYSE; therefore, the closing prices for equity securities in such markets or on such exchanges may not fully reflect events that occur after such close but before the close of the NYSE. The Funds have procedures in place to fair value foreign equity securities traded in countries outside North American and South American time zones daily in order to take into account, among other things, any significant events occurring after the close of trading in a foreign market. The Funds receive adjusted fair value prices from a designated independent pricing vendor. In general, the vendor utilizes a multi-factor model to consider such information as the issue’s closing price, relevant general and sector indices and currency fluctuations to generate an evaluated adjustment factor for each security and provide an evaluated fair value price. The Funds generally categorize such evaluated fair value prices as Level 2 in the fair value hierarchy.
The Board has designated the Advisor with the responsibility for implementing the pricing and valuation procedures, including responsibility for determining the fair value of the Funds’ securities or other assets and liabilities, and has established a Pricing Committee to assist in carrying out supervisory functions related to such responsibilities. The Pricing Committee includes representatives of the Funds’ Advisor, and Co-Administrator, including personnel from accounting and operations, trading, risk management and compliance. The Pricing Committee meets at least quarterly to review and approve Fund valuation matters, including a review of the Funds’ pricing activity and operations, fair value measurements, pricing vendors, policies and procedures, and related controls. At least a quorum of the Pricing Committee shall meet more frequently, as needed, to consider and approve time-sensitive fair valuation matters. The Pricing Committee provides periodic reports to the Valuation, Portfolio Management and Performance Committee (“Valuation Committee”) of the Board regarding pricing and valuation matters. Members of the Pricing Committee meet with the Valuation Committee and the Board at each of their regularly scheduled meetings to discuss valuation matters and actions taken during the period.
The Advisor has procedures to determine the fair value of a security when a price is not available from a pricing service or broker- dealer or the Advisor has determined that a price provided by a pricing service or broker-dealer does not approximate fair value. Fair valuation may also be used when a significant valuation event affecting the value of a security or market sector is determined to have occurred between the time when a security’s market closes and the time the Fund’s net asset value is calculated. The fair value of the security will be determined in good faith by the Advisor in accordance with procedures and methodologies approved by the Board. General factors used in determining the fair value of securities include, but are not limited to, fundamental analytical data relating to the security, the issuer and the market, such as duration, prepayment and default rates; general level of interest rates and changes in interest rates; information from broker-dealers; trading in similar securities; any restrictions on disposition of the security; and an evaluation of the forces that influence the market in which the investments are traded. These securities are either categorized as Level 2 or 3 in the fair value hierarchy, depending on the relevant inputs used.
112
|
NOTES TO FINANCIAL STATEMENTS |
When the Funds utilize fair valuation methods that use significant unobservable inputs to determine a security’s value, such securities will be categorized as Level 3 of the fair value hierarchy. These methods may require subjective determinations about the value of a security. While the Funds’ policy is intended to result in a calculation of a Fund’s net asset value that fairly reflects security values as of the time of pricing, the Funds cannot guarantee that values determined by the Advisor or persons acting at their direction would accurately reflect the price that the Funds could obtain for a security if they were to dispose of it as of the time of pricing (for instance, in a forced or distressed sale). The prices used by the Funds may differ from the value that would be realized if the securities were sold.
The Advisor employs various methods for calibrating the valuation approach related to securities categorized within Level 2 and Level 3 of the fair value hierarchy. These methods may include regular due diligence of the Funds’ pricing vendors, a regular review of key inputs and assumptions, transaction back-testing or disposition analysis to compare unrealized gains and losses to realized gains and losses, reviews of missing and stale prices and large movements in market value, and reviews of any market related activities. Additionally, the pricing of all fair value holdings is subsequently reported to the Valuation Committee and Board.
Foreign Taxes:
The Funds may be subject to foreign taxes on income, gains on investments or currency repatriation, a portion of which may be recoverable. The Funds will accrue such taxes and recoveries, as applicable, based upon its current interpretation of tax rules and regulations that exist in the markets in which it invests.
Realized gains in certain countries may be subject to foreign taxes at the Fund level, based on statutory rates. The Funds accrue for such foreign taxes on realized and unrealized gains at the appropriate rate for each jurisdiction, as applicable. The amount, if any, is disclosed as a liability in the Statement of Assets and Liabilities.
Fair Value Measurements:
The Funds disclose the fair value of their investments in a hierarchy that categorizes investments based on the inputs to valuation techniques used to measure fair value. The three levels of the fair value hierarchy are as follows:
• Level 1 - Inputs that reflect unadjusted quoted prices in active markets for identical assets or liabilities that the Funds have the ability to access at the measurement date.
• Level 2 - Significant inputs other than quoted prices that are observable for the asset or liability either directly or indirectly, including inputs in markets that are not considered to be active. Observable inputs may include quoted prices for similar securities, interest rates, spreads, prepayment spreads, etc.
• Level 3 - Significant unobservable inputs based on the best information available in the circumstances, to the extent observable inputs are not available (including the Fund’s own assumptions in determining the fair value of investments).
The inputs or methodology used for valuing investments are not necessarily an indication of the risk associated with investing in those securities.
Inputs used in determining fair value of an investment may include, but are not limited to, price information, volatility statistics, credit and market data, and other factors, all of which may be either observable or unobservable. Inputs can vary among investments and will be impacted by the investment type and volume of activity for the particular security or similar securities in the market. Investments in the Level 2 category are generally supported by transactions and quoted prices from dealers participating in the market for those investments. Investments may be included in the Level 3 category due to a lack of market activity or transparency. Internal valuation models may also be used as a pricing source for Level 3 investments. Internal valuation models may rely on one or more unobservable inputs, such as estimated cash flows, financial statement analysis and discount rates.
113
NOTES TO FINANCIAL STATEMENTS
The summary of inputs used to determine the fair value of the Funds’ investments as of March 31, 2023 is as follows:
| | | | | | | | | | | | | | | | | | | | | | | | | | | | | | | | | | | | | |
| | | Level 1
Quoted Prices | | Level 2
Significant
Observable
Inputs | | Level 3
Significant
Unobservable
Inputs | | Total |
Emerging Markets Equity Fund Assets: | | | | | | | | | | | | | | | | |
Investments in Securities | | | | | | | | | | | | | | | | | | | | | | | | | | | | | | | | | | | | | |
Common Stocks | | | | | | | | | | | | | | | | | | | | | | | | | | | | | | | | | | | | | |
Austria | | | | | | | | $ | — | | | | | | | | | $ | 24,819,642 | | | | | | | | | $ | — | | | | | | $ | 24,819,642 | |
Brazil | | | | | | | | | 115,733,317 | | | | | | | | | | — | | | | | | | | | | — | | | | | | | 115,733,317 | |
Chile | | | | | | | | | 15,258,705 | | | | | | | | | | 84,678,036 | | | | | | | | | | — | | | | | | | 99,936,741 | |
China | | | | | | | | | 52,140,216 | | | | | | | | | | 488,121,232 | | | | | | | | | | — | | | | | | | 540,261,448 | |
Hong Kong | | | | | | | | | — | | | | | | | | | | 120,775,385 | | | | | | | | | | — | | | | | | | 120,775,385 | |
India | | | | | | | | | — | | | | | | | | | | 326,230,829 | | | | | | | | | | — | | | | | | | 326,230,829 | |
Indonesia | | | | | | | | | — | | | | | | | | | | 76,675,448 | | | | | | | | | | — | | | | | | | 76,675,448 | |
Korea | | | | | | | | | — | | | | | | | | | | 197,275,949 | | | | | | | | | | — | | | | | | | 197,275,949 | |
Mexico | | | | | | | | | 72,182,577 | | | | | | | | | | — | | | | | | | | | | — | | | | | | | 72,182,577 | |
Peru | | | | | | | | | 21,640,469 | | | | | | | | | | — | | | | | | | | | | — | | | | | | | 21,640,469 | |
Philippines | | | | | | | | | — | | | | | | | | | | 42,045,210 | | | | | | | | | | — | | | | | | | 42,045,210 | |
South Africa | | | | | | | | | — | | | | | | | | | | 65,021,889 | | | | | | | | | | — | | | | | | | 65,021,889 | |
Taiwan | | | | | | | | | 144,925,160 | | | | | | | | | | 185,253,427 | | | | | | | | | | — | | | | | | | 330,178,587 | |
Thailand | | | | | | | | | — | | | | | | | | | | 19,424,090 | | | | | | | | | | — | | | | | | | 19,424,090 | |
Turkey | | | | | | | | | — | | | | | | | | | | 1 | | | | | | | | | | — | | | | | | | 1 | |
United Kingdom | | | | | | | | | — | | | | | | | | | | 66,134,665 | | | | | | | | | | — | | | | | | | 66,134,665 | |
| | | | | | | | | | | | | | | | | | | | | | | | | | | | | | | | | | | | | |
Total Assets | | | | | | | | $ | 421,880,444 | | | | | | | | | $ | 1,696,455,803 | | | | | | | | | $ | — | | | | | | $ | 2,118,336,247 | |
| | | | | | | | | | | | | | | | | | | | | | | | | | | | | | | | | | | | | |
114
NOTES TO FINANCIAL STATEMENTS
| | | | | | | | | | | | | | | | | | | | | | | | | | | | | | | | | | | | | | | | |
| | | Level 1
Quoted Prices | | Level 2 Significant
Observable
Inputs | | Level 3
Significant
Unobservable
Inputs | | Total |
Emerging Markets Ex-China Equity Fund Assets: | | | | | | | | | | | | | | | | |
Investments in Securities | | | | | | | | | | | | | | | | | | | | | | | | | | | | | | | | | | | | | | | | |
Common Stocks | | | | | | | | | | | | | | | | | | | | | | | | | | | | | | | | | | | | | | | | |
Austria | | | | | | | | $ | — | | | | | | | | | $ | 325,221 | | | | | | | | | | $— | | | | | | | | | $ | 325,221 | |
Brazil | | | | | | | | | 3,066,815 | | | | | | | | | | — | | | | | | | | | | — | | | | | | | | | | 3,066,815 | |
Chile | | | | | | | | | 445,167 | | | | | | | | | | 1,328,560 | | | | | | | | | | — | | | | | | | | | | 1,773,727 | |
India | | | | | | | | | 3,892,993 | | | | | | | | | | — | | | | | | | | | | — | | | | | | | | | | 3,892,993 | |
Indonesia | | | | | | | | | — | | | | | | | | | | 1,810,212 | | | | | | | | | | — | | | | | | | | | | 1,810,212 | |
Korea | | | | | | | | | — | | | | | | | | | | 5,310,029 | | | | | | | | | | — | | | | | | | | | | 5,310,029 | |
Mexico | | | | | | | | | 1,701,485 | | | | | | | | | | — | | | | | | | | | | — | | | | | | | | | | 1,701,485 | |
Peru | | | | | | | | | 304,497 | | | | | | | | | | — | | | | | | | | | | — | | | | | | | | | | 304,497 | |
Philippines | | | | | | | | | — | | | | | | | | | | 1,118,700 | | | | | | | | | | — | | | | | | | | | | 1,118,700 | |
South Africa | | | | | | | | | — | | | | | | | | | | 1,009,110 | | | | | | | | | | — | | | | | | | | | | 1,009,110 | |
Taiwan | | | | | | | | | — | | | | | | | | | | 8,372,955 | | | | | | | | | | — | | | | | | | | | | 8,372,955 | |
Thailand | | | | | | | | | — | | | | | | | | | | 405,760 | | | | | | | | | | — | | | | | | | | | | 405,760 | |
United Kingdom | | | | | | | | | — | | | | | | | | | | 1,051,460 | | | | | | | | | | — | | | | | | | | | | 1,051,460 | |
Exchange Traded Funds | | | | | | | | | 2,715,323 | | | | | | | | | | — | | | | | | | | | | — | | | | | | | | | | 2,715,323 | |
Investment Company | | | | | | | | | 950,554 | | | | | | | | | | — | | | | | | | | | | — | | | | | | | | | | 950,554 | |
| | | | | | | | | | | | | | | | | | | | | | | | | | | | | | | | | | | | | | | | |
Total Assets | | | | | | | | $ | 13,076,834 | | | | | | | | | $ | 20,732,007 | | | | | | | | | | $— | | | | | | | | | $ | 33,808,841 | |
| | | | | | | | | | | | | | | | | | | | | | | | | | | | | | | | | | | | | | | | |
115
NOTES TO FINANCIAL STATEMENTS
| | | | | | | | | | | | | | | | | | | | | | | | | | | | | | | | | | | | | | | | |
| | | Level 1
Quoted Prices | | Level 2
Significant
Observable
Inputs | | Level 3
Significant
Unobservable
Inputs | | Total |
Emerging Markets Value Equity Fund Assets: | | | | | | | | | | | | | | | | |
Investments in Securities | | | | | | | | | | | | | | | | | | | | | | | | | | | | | | | | | | | | | | | | |
Common Stocks | | | | | | | | | | | | | | | | | | | | | | | | | | | | | | | | | | | | | | | | |
Brazil | | | | | | | | | $3,816,190 | | | | | | | | | | $ — | | | | | | | | | | $— | | | | | | | | | $ | 3,816,190 | |
Chile | | | | | | | | | — | | | | | | | | | | 1,464,693 | | | | | | | | | | — | | | | | | | | | | 1,464,693 | |
China | | | | | | | | | 210,780 | | | | | | | | | | 18,740,408 | | | | | | | | | | — | | | | | | | | | | 18,951,188 | |
Egypt | | | | | | | | | — | | | | | | | | | | 493,348 | | | | | | | | | | — | | | | | | | | | | 493,348 | |
Hong Kong | | | | | | | | | — | | | | | | | | | | 458,977 | | | | | | | | | | — | | | | | | | | | | 458,977 | |
Hungary | | | | | | | | | — | | | | | | | | | | 703,117 | | | | | | | | | | — | | | | | | | | | | 703,117 | |
India | | | | | | | | | — | | | | | | | | | | 6,328,874 | | | | | | | | | | — | | | | | | | | | | 6,328,874 | |
Indonesia | | | | | | | | | — | | | | | | | | | | 841,746 | | | | | | | | | | — | | | | | | | | | | 841,746 | |
Korea | | | | | | | | | — | | | | | | | | | | 8,906,190 | | | | | | | | | | — | | | | | | | | | | 8,906,190 | |
Mexico | | | | | | | | | 1,476,986 | | | | | | | | | | — | | | | | | | | | | — | | | | | | | | | | 1,476,986 | |
Pakistan | | | | | | | | | — | | | | | | | | | | 219,842 | | | | | | | | | | — | | | | | | | | | | 219,842 | |
Peru | | | | | | | | | 1,019,403 | | | | | | | | | | — | | | | | | | | | | — | | | | | | | | | | 1,019,403 | |
Philippines | | | | | | | | | — | | | | | | | | | | 1,075,651 | | | | | | | | | | — | | | | | | | | | | 1,075,651 | |
Russia | | | | | | | | | — | | | | | | | | | | — | | | | | | | | | | — | | | | | | | | | | — | |
South Africa | | | | | | | | | — | | | | | | | | | | 4,864,289 | | | | | | | | | | — | | | | | | | | | | 4,864,289 | |
Taiwan | | | | | | | | | — | | | | | | | | | | 10,224,658 | | | | | | | | | | — | | | | | | | | | | 10,224,658 | |
Thailand | | | | | | | | | — | | | | | | | | | | 824,321 | | | | | | | | | | — | | | | | | | | | | 824,321 | |
Turkey | | | | | | | | | — | | | | | | | | | | 494,609 | | | | | | | | | | — | | | | | | | | | | 494,609 | |
United Arab Emirates | | | | | | | | | — | | | | | | | | | | 893,086 | | | | | | | | | | — | | | | | | | | | | 893,086 | |
United States | | | | | | | | | — | | | | | | | | | | 931,156 | | | | | | | | | | — | | | | | | | | | | 931,156 | |
Vietnam | | | | | | | | | — | | | | | | | | | | 804,127 | | | | | | | | | | — | | | | | | | | | | 804,127 | |
Preferred Stocks | | | | | | | | | 1,066,650 | | | | | | | | | | — | | | | | | | | | | — | | | | | | | | | | 1,066,650 | |
Investment Company | | | | | | | | | 909,723 | | | | | | | | | | — | | | | | | | | | | — | | | | | | | | | | 909,723 | |
| | | | | | | | | | | | | | | | | | | | | | | | | | | | | | | | | | | | | | | | |
Total Assets | | | | | | | | | $8,499,732 | | | | | | | | | | $58,269,092 | | | | | | | | | | $— | | | | | | | | | $ | 66,768,824 | |
| | | | | | | | | | | | | | | | | | | | | | | | | | | | | | | | | | | | | | | | |
| | | | |
| | | Level 1
Quoted Prices | | Level 2
Significant
Observable
Inputs | | Level 3
Significant
Unobservable
Inputs | | Total |
Global Opportunities Fund Assets: | | | | | | | | | | | | | | | | |
Investments in Securities | | | | | | | | | | | | | | | | | | | | | | | | | | | | | | | | | | | | | | | | |
Common Stocks | | | | | | | | | | | | | | | | | | | | | | | | | | | | | | | | | | | | | | | | |
Belgium | | | | | | | | $ | — | | | | | | | | | $ | 26,442,448 | | | | | | | | | | $— | | | | | | | | | $ | 26,442,448 | |
France | | | | | | | | | — | | | | | | | | | | 22,811,303 | | | | | | | | | | — | | | | | | | | | | 22,811,303 | |
Germany | | | | | | | | | — | | | | | | | | | | 14,300,422 | | | | | | | | | | — | | | | | | | | | | 14,300,422 | |
Hong Kong | | | | | | | | | — | | | | | | | | | | 21,753,130 | | | | | | | | | | — | | | | | | | | | | 21,753,130 | |
Ireland | | | | | | | | | — | | | | | | | | | | 10,604,388 | | | | | | | | | | — | | | | | | | | | | 10,604,388 | |
Japan | | | | | | | | | — | | | | | | | | | | 12,916,067 | | | | | | | | | | — | | | | | | | | | | 12,916,067 | |
Luxembourg | | | | | | | | | — | | | | | | | | | | 4,596,985 | | | | | | | | | | — | | | | | | | | | | 4,596,985 | |
Netherlands | | | | | | | | | — | | | | | | | | | | 6,587,235 | | | | | | | | | | — | | | | | | | | | | 6,587,235 | |
Norway | | | | | | | | | — | | | | | | | | | | 9,297,316 | | | | | | | | | | — | | | | | | | | | | 9,297,316 | |
Switzerland | | | | | | | | | — | | | | | | | | | | 14,050,821 | | | | | | | | | | — | | | | | | | | | | 14,050,821 | |
Taiwan | | | | | | | | | 21,189,956 | | | | | | | | | | — | | | | | | | | | | — | | | | | | | | | | 21,189,956 | |
United Kingdom | | | | | | | | | — | | | | | | | | | | 23,542,875 | | | | | | | | | | — | | | | | | | | | | 23,542,875 | |
United States | | | | | | | | | 267,922,679 | | | | | | | | | | — | | | | | | | | | | — | | | | | | | | | | 267,922,679 | |
Zambia | | | | | | | | | 6,823,423 | | | | | | | | | | — | | | | | | | | | | — | | | | | | | | | | 6,823,423 | |
Investment Company | | | | | | | | | 18,735,873 | | | | | | | | | | — | | | | | | | | | | — | | | | | | | | | | 18,735,873 | |
| | | | | | | | | | | | | | | | | | | | | | | | | | | | | | | | | | | | | | | | |
Total Assets | | | | | | | | $ | 314,671,931 | | | | | | | | | $ | 166,902,990 | | | | | | | | | | $— | | | | | | | | | $ | 481,574,921 | |
| | | | | | | | | | | | | | | | | | | | | | | | | | | | | | | | | | | | | | | | |
116
NOTES TO FINANCIAL STATEMENTS
| | | | | | | | | | | | | | | | | | | | | | | | | | | | | | | | | | | | | | | | |
| | | Level 1
Quoted Prices | | Level 2 Significant
Observable
Inputs | | Level 3
Significant
Unobservable
Inputs | | Total |
Global Equity Leaders Fund Assets: | | | | | | | | | | | | | | | | |
Investments in Securities | | | | | | | | | | | | | | | | | | | | | | | | | | | | | | | | | | | | | | | | |
Common Stocks | | | | | | | | | | | | | | | | | | | | | | | | | | | | | | | | | | | | | | | | |
Belgium | | | | | | | | $ | — | | | | | | | | | $ | 187,448 | | | | | | | | | | $— | | | | | | | | | $ | 187,448 | |
France | | | | | | | | | — | | | | | | | | | | 251,199 | | | | | | | | | | — | | | | | | | | | | 251,199 | |
Germany | | | | | | | | | — | | | | | | | | | | 160,834 | | | | | | | | | | — | | | | | | | | | | 160,834 | |
Hong Kong | | | | | | | | | — | | | | | | | | | | 118,130 | | | | | | | | | | — | | | | | | | | | | 118,130 | |
Japan | | | | | | | | | — | | | | | | | | | | 113,397 | | | | | | | | | | — | | | | | | | | | | 113,397 | |
Netherlands | | | | | | | | | — | | | | | | | | | | 63,737 | | | | | | | | | | — | | | | | | | | | | 63,737 | |
Norway | | | | | | | | | — | | | | | | | | | | 83,466 | | | | | | | | | | — | | | | | | | | | | 83,466 | |
Singapore | | | | | | | | | — | | | | | | | | | | 92,883 | | | | | | | | | | — | | | | | | | | | | 92,883 | |
Switzerland | | | | | | | | | — | | | | | | | | | | 161,444 | | | | | | | | | | — | | | | | | | | | | 161,444 | |
Taiwan | | | | | | | | | 152,088 | | | | | | | | | | — | | | | | | | | | | — | | | | | | | | | | 152,088 | |
United States | | | | | | | | | 2,773,359 | | | | | | | | | | — | | | | | | | | | | — | | | | | | | | | | 2,773,359 | |
Investment Company | | | | | | | | | 40,927 | | | | | | | | | | — | | | | | | | | | | — | | | | | | | | | | 40,927 | |
Total Assets | | | | | | | | | $2,966,373 | | | | | | | | | | $1,232,539 | | | | | | | | | | $— | | | | | | | | | | $4,198,912 | |
| | | | | | | | | | | | | | | | | | | | | | | | | | | | | | | | | | | | | | | | |
| | | | |
| | | Level 1
Quoted Prices | | Level 2
Significant
Observable
Inputs | | Level 3
Significant
Unobservable
Inputs | | Total |
International Opportunities Fund Assets: | | | | | | | | | | | | | | | | |
Investments in Securities | | | | | | | | | | | | | | | | | | | | | | | | | | | | | | | | | | | | | | | | |
Common Stocks | | | | | | | | | | | | | | | | | | | | | | | | | | | | | | | | | | | | | | | | |
Australia | | | | | | | | $ | — | | | | | | | | | $ | 7,302,587 | | | | | | | | | | $— | | | | | | | | | $ | 7,302,587 | |
Austria | | | | | | | | | — | | | | | | | | | | 2,256,508 | | | | | | | | | | — | | | | | | | | | | 2,256,508 | |
Belgium | | | | | | | | | — | | | | | | | | | | 6,011,323 | | | | | | | | | | — | | | | | | | | | | 6,011,323 | |
China | | | | | | | | | — | | | | | | | | | | 1,514,275 | | | | | | | | | | — | | | | | | | | | | 1,514,275 | |
Denmark | | | | | | | | | — | | | | | | | | | | 1,580,272 | | | | | | | | | | — | | | | | | | | | | 1,580,272 | |
Finland | | | | | | | | | — | | | | | | | | | | 1,799,093 | | | | | | | | | | — | | | | | | | | | | 1,799,093 | |
France | | | | | | | | | — | | | | | | | | | | 7,604,851 | | | | | | | | | | — | | | | | | | | | | 7,604,851 | |
Germany | | | | | | | | | — | | | | | | | | | | 3,544,896 | | | | | | | | | | — | | | | | | | | | | 3,544,896 | |
Hong Kong | | | | | | | | | — | | | | | | | | | | 7,513,143 | | | | | | | | | | — | | | | | | | | | | 7,513,143 | |
India | | | | | | | | | 6,044,702 | | | | | | | | | | — | | | | | | | | | | — | | | | | | | | | | 6,044,702 | |
Indonesia | | | | | | | | | — | | | | | | | | | | 2,361,567 | | | | | | | | | | — | | | | | | | | | | 2,361,567 | |
Ireland | | | | | | | | | — | | | | | | | | | | 4,812,545 | | | | | | | | | | — | | | | | | | | | | 4,812,545 | |
Japan | | | | | | | | | — | | | | | | | | | | 15,453,727 | | | | | | | | | | — | | | | | | | | | | 15,453,727 | |
Luxembourg | | | | | | | | | — | | | | | | | | | | 1,555,005 | | | | | | | | | | — | | | | | | | | | | 1,555,005 | |
Netherlands | | | | | | | | | — | | | | | | | | | | 5,508,139 | | | | | | | | | | — | | | | | | | | | | 5,508,139 | |
Norway | | | | | | | | | — | | | | | | | | | | 4,711,385 | | | | | | | | | | — | | | | | | | | | | 4,711,385 | |
Singapore | | | | | | | | | — | | | | | | | | | | 5,864,636 | | | | | | | | | | — | | | | | | | | | | 5,864,636 | |
South Africa | | | | | | | | | — | | | | | | | | | | 4,536,933 | | | | | | | | | | — | | | | | | | | | | 4,536,933 | |
Sweden | | | | | | | | | — | | | | | | | | | | 5,899,303 | | | | | | | | | | — | | | | | | | | | | 5,899,303 | |
Switzerland | | | | | | | | | — | | | | | | | | | | 7,646,705 | | | | | | | | | | — | | | | | | | | | | 7,646,705 | |
Taiwan | | | | | | | | | 7,815,355 | | | | | | | | | | 5,327,701 | | | | | | | | | | — | | | | | | | | | | 13,143,056 | |
Thailand | | | | | | | | | — | | | | | | | | | | 3,390,241 | | | | | | | | | | — | | | | | | | | | | 3,390,241 | |
United Kingdom | | | | | | | | | — | | | | | | | | | | 11,130,306 | | | | | | | | | | — | | | | | | | | | | 11,130,306 | |
Zambia | | | | | | | | | 2,868,187 | | | | | | | | | | — | | | | | | | | | | — | | | | | | | | | | 2,868,187 | |
Investment Company | | | | | | | | | 79,760 | | | | | | | | | | — | | | | | | | | | | — | | | | | | | | | | 79,760 | |
Rights/Warrants | | | | | | | | | 9,247 | | | | | | | | | | — | | | | | | | | | | — | | | | | | | | | | 9,247 | |
| | | | | | | | | | | | | | | | | | | | | | | | | | | | | | | | | | | | | | | | |
Total Assets | | | | | | | | $ | 16,817,251 | | | | | | | | | $ | 117,325,141 | | | | | | | | | | $— | | | | | | | | | $ | 134,142,392 | |
| | | | | | | | | | | | | | | | | | | | | | | | | | | | | | | | | | | | | | | | |
117
NOTES TO FINANCIAL STATEMENTS
| | | | | | | | | | | | | | | | | | | | | | | | | | | | | | | | | | | | | |
| | | Level 1
Quoted Prices | | Level 2 Significant
Observable
Inputs | | Level 3
Significant
Unobservable
Inputs | | Total |
International Equity Fund Assets: | | | | | | | | | | | | | | | | |
Investments in Securities | | | | | | | | | | | | | | | | | | | | | | | | | | | | | | | | | | | | | |
Common Stocks | | | | | | | | | | | | | | | | | | | | | | | | | | | | | | | | | | | | | |
Australia | | | | | | | | $ | — | | | | | | | | | $ | 1,903,370 | | | | | | | | | $ | — | | | | | | $ | 1,903,370 | |
China | | | | | | | | | — | | | | | | | | | | 828,705 | | | | | | | | | | — | | | | | | | 828,705 | |
Denmark | | | | | | | | | — | | | | | | | | | | 1,010,329 | | | | | | | | | | — | | | | | | | 1,010,329 | |
Finland | | | | | | | | | — | | | | | | | | | | 472,323 | | | | | | | | | | — | | | | | | | 472,323 | |
France | | | | | | | | | — | | | | | | | | | | 1,986,176 | | | | | | | | | | — | | | | | | | 1,986,176 | |
Hong Kong | | | | | | | | | — | | | | | | | | | | 325,108 | | | | | | | | | | — | | | | | | | 325,108 | |
Ireland | | | | | | | | | 351,230 | | | | | | | | | | 392,861 | | | | | | | | | | — | | | | | | | 744,091 | |
Japan | | | | | | | | | — | | | | | | | | | | 3,931,155 | | | | | | | | | | — | | | | | | | 3,931,155 | |
Netherlands | | | | | | | | | — | | | | | | | | | | 1,963,043 | | | | | | | | | | — | | | | | | | 1,963,043 | |
Norway | | | | | | | | | — | | | | | | | | | | 596,696 | | | | | | | | | | — | | | | | | | 596,696 | |
Spain | | | | | | | | | — | | | | | | | | | | 198,903 | | | | | | | | | | — | | | | | | | 198,903 | |
Sweden | | | | | | | | | — | | | | | | | | | | 738,606 | | | | | | | | | | — | | | | | | | 738,606 | |
Switzerland | | | | | | | | | — | | | | | | | | | | 1,310,334 | | | | | | | | | | — | | | | | | | 1,310,334 | |
Taiwan | | | | | | | | | — | | | | | | | | | | 665,936 | | | | | | | | | | — | | | | | | | 665,936 | |
United Kingdom | | | | | | | | | 356,407 | | | | | | | | | | 3,629,405 | | | | | | | | | | — | | | | | | | 3,985,812 | |
Investment Company | | | | | | | | | 171,228 | | | | | | | | | | — | | | | | | | | | | — | | | | | | | 171,228 | |
| | | | | | | | | | | | | | | | | | | | | | | | | | | | | | | | | | | | | |
Total Assets | | | | | | | | $ | 878,865 | | | | | | | | | $ | 19,952,950 | | | | | | | | | $ | — | | | | | | $ | 20,831,815 | |
| | | | | | | | | | | | | | | | | | | | | | | | | | | | | | | | | | | | | |
118
|
NOTES TO FINANCIAL STATEMENTS |
| | | | | | | | | | | | | | | | | | | | | | | | | | | | | | | | | | | |
| | | Level 1
Quoted Prices | | Level 2
Significant
Observable
Inputs | | Level 3
Significant
Unobservable
Inputs | | Total |
International Small Cap Equity Fund
Assets: | | | | | | | | | | | | | | |
Investments in Securities | | | | | | | | | | | | | | | | | | | | | | | | | | | | | | | | | | | |
Common Stocks | | | | | | | | | | | | | | | | | | | | | | | | | | | | | | | | | | | |
Australia | | | | | | | | $ | — | | | | | | | | | $ | 270,815 | | | | | | | | | $ | — | | | | $ | 270,815 | |
Belgium | | | | | | | | | — | | | | | | | | | | 160,971 | | | | | | | | | | — | | | | | 160,971 | |
China | | | | | | | | | — | | | | | | | | | | 128,101 | | | | | | | | | | — | | | | | 128,101 | |
Denmark | | | | | | | | | — | | | | | | | | | | 252,468 | | | | | | | | | | — | | | | | 252,468 | |
Egypt | | | | | | | | | — | | | | | | | | | | 64,682 | | | | | | | | | | — | | | | | 64,682 | |
France | | | | | | | | | — | | | | | | | | | | 180,429 | | | | | | | | | | — | | | | | 180,429 | |
Iceland | | | | | | | | | — | | | | | | | | | | 160,368 | | | | | | | | | | — | | | | | 160,368 | |
Indonesia | | | | | | | | | — | | | | | | | | | | 94,490 | | | | | | | | | | — | | | | | 94,490 | |
Ireland | | | | | | | | | — | | | | | | | | | | 101,406 | | | | | | | | | | — | | | | | 101,406 | |
Japan | | | | | | | | | — | | | | | | | | | | 906,674 | | | | | | | | | | — | | | | | 906,674 | |
Korea | | | | | | | | | — | | | | | | | | | | 100,427 | | | | | | | | | | — | | | | | 100,427 | |
Norway | | | | | | | | | — | | | | | | | | | | 239,854 | | | | | | | | | | — | | | | | 239,854 | |
Philippines | | | | | | | | | — | | | | | | | | | | 188,501 | | | | | | | | | | — | | | | | 188,501 | |
Spain | | | | | | | | | — | | | | | | | | | | 139,537 | | | | | | | | | | — | | | | | 139,537 | |
Sweden | | | | | | | | | — | | | | | | | | | | 424,099 | | | | | | | | | | — | | | | | 424,099 | |
Taiwan | | | | | | | | | — | | | | | | | | | | 325,273 | | | | | | | | | | — | | | | | 325,273 | |
Thailand | | | | | | | | | 201,892 | | | | | | | | | | 18,975 | | | | | | | | | | — | | | | | 220,867 | |
United Kingdom | | | | | | | | | 71,338 | | | | | | | | | | 1,008,977 | | | | | | | | | | — | | | | | 1,080,315 | |
Investment Company | | | | | | | | | 113,376 | | | | | | | | | | — | | | | | | | | | | — | | | | | 113,376 | |
| | | | | | | | | | | | | | | | | | | | | | | | | | | | | | | | | | | |
Total Assets | | | | | | | | $ | 386,606 | | | | | | | | | $ | 4,766,047 | | | | | | | | | $ | — | | | | $ | 5,152,653 | |
| | | | | | | | | | | | | | | | | | | | | | | | | | | | | | | | | | | |
119
|
NOTES TO FINANCIAL STATEMENTS |
| | | | | | | | | | | | | | | | | | | | | | | | | | | | | | | | | | | |
| | | Level 1
Quoted Prices | | Level 2
Significant
Observable
Inputs | | Level 3
Significant
Unobservable
Inputs | | Total |
China Equity Fund
Assets: | | | | | | | | | | | | | | |
Investments in Securities | | | | | | | | | | | | | | | | | | | | | | | | | | | | | | | | | | | |
Common Stocks | | | | | | | | | | | | | | | | | | | | | | | | | | | | | | | | | | | |
China | | | | | | | | $ | 511,705 | | | | | | | | | $ | 3,944,545 | | | | | | | | | $ | — | | | | $ | 4,456,250 | |
Hong Kong | | | | | | | | | — | | | | | | | | | | 23,072 | | | | | | | | | | — | | | | | 23,072 | |
Korea | | | | | | | | | — | | | | | | | | | | 69,667 | | | | | | | | | | — | | | | | 69,667 | |
| | | | | | | | | | | | | | | | | | | | | | | | | | | | | | | | | | | |
Total Assets | | | | | | | | $ | 511,705 | | | | | | | | | $ | 4,037,284 | | | | | | | | | $ | — | | | | $ | 4,548,989 | |
| | | | | | | | | | | | | | | | | | | | | | | | | | | | | | | | | | | |
Repurchase Agreements:
The Funds, may enter into repurchase agreements with counterparties whom the Advisor has deemed creditworthy, including primary dealers that report to the Federal Reserve Bank of New York or other large U.S. commercial banks or broker-dealers. These repurchase agreements are subject to the seller’s agreement to repurchase such securities at a mutually agreed upon date and price. The repurchase price generally equals the price paid by the Funds plus interest negotiated on the basis of current short-term rates.
Securities pledged by the dealers as collateral for repurchase agreements are held by a custodian bank until maturity of the repurchase agreement. The Funds have procedures to monitor additional collateral, if needed, to ensure that the daily market value of the collateral remains in excess of the market value of the repurchase agreement in the event of a default.
There were no repurchase agreements held during the year ended March 31, 2023.
Affiliated Investments:
The Funds invest in another Fund of the Trust (an “Affiliated Fund”), U.S. Government Money Market Fund-RBC Institutional Class 1, as a cash sweep vehicle. The income earned by the Funds from the Affiliated Fund for the period is disclosed in the Statement of Operations. The table below details the transactions of the Funds in the Affiliated Fund. As the affiliated investment is a money market fund in which shares are issued and redeemed at $1.00 per share, the number of shares purchased and sold equal the dollar amount shown as purchased and sold, and no gain or loss was realized on the sale of shares of the money market fund.
120
|
NOTES TO FINANCIAL STATEMENTS |
| | | | | | | | | | | | | | | | | | | | |
| | | Value
March 31, 2022 | | | Purchases | | | Sales | | | Value
March 31, 2023 | | | Dividends | |
Investments in U.S. Government Money Market Fund —RBC Institutional Class 1 | | | | | | | | | | | | | | | | | | | | |
Emerging Markets Equity Fund | | | $28,297,986 | | | $ | 443,223,703 | | | $ | 471,521,689 | | | | $ — | | | | $331,332 | |
Emerging Markets Ex-China Equity Fund | | | — | | | | 13,657,283 | | | | (12,706,729 | ) | | | 950,554 | | | | 12,022 | |
Emerging Markets Value Equity Fund | | | 2,600,911 | | | | 17,661,877 | | | | 19,353,065 | | | | 909,723 | | | | 814 | |
Global Opportunities Fund | | | 8,686,928 | | | | 149,975,880 | | | | 139,926,935 | | | | 18,735,873 | | | | 94,077 | |
Global Equity Leaders Fund | | | 23,598 | | | | 929,562 | | | | 912,233 | | | | 40,927 | | | | 1,278 | |
International Opportunities Fund | | | 3,832,453 | | | | 72,207,070 | | | | 75,959,763 | | | | 79,760 | | | | 35,910 | |
International Equity Fund | | | — | | | | 593,457 | | | | 422,229 | | | | 171,228 | | | | 10,079 | |
International Small Cap Equity Fund | | | — | | | | 182,581 | | | | 69,205 | | | | 113,376 | | | | 3,041 | |
Investment Transactions and Income:
Investment transactions are recorded on trade date. Dividend income is recorded on the ex- dividend date. In certain foreign markets where declaration of a dividend follows the ex-dividend date, the dividend will be recorded when the Fund is notified of the declaration date. Non-cash dividends, if any, are recorded on the ex-dividend date at fair value. Realized gains and losses from investment transactions are calculated based on the cost of the specific security (also known as identified cost basis). Realized gains and losses from investment transactions and the net change in unrealized appreciation/(depreciation) relating to movements in foreign currency exchange rates are reported as realized gains and losses on foreign currency transactions and net change in unrealized appreciation/(depreciation) on foreign currency, respectively, in the statements of operations. Interest income is recognized on the accrual basis and includes, where applicable, the amortization or accretion of premium or discount using the effective yield method.
Expense, Investment Income and Gain/Loss Allocation:
Each Fund pays the expenses that are directly related to its operations, such as custodian fees or advisory fees. Expenses incurred by the Trust, such as trustee or legal fees, are allocated among each of the Funds in the Trust either proportionately based upon each Fund’s relative net assets or using another reasonable basis such as equally across all Funds in the Trust, depending on the nature of the expense. Individual share classes within a Fund are charged expenses specific to that class, such as distribution fees and transfer agent fees. Within a Fund, expenses other than class specific expenses are allocated daily to each class based upon the proportion of relative net assets. Investment income and realized and unrealized gains or losses are allocated to each class of shares based on relative net assets.
Indemnifications:
Under the Trust’s organizational documents, each Trustee, officer, employee or other agent of the Trust is indemnified against certain liabilities that may arise out of their duties to the Funds. Additionally, in the normal course of business, the Funds enter into contracts, including the Funds’ servicing agreements, that contain a variety of indemnification clauses. The Funds’ maximum exposure under these arrangements is unknown as this would involve future claims that may be made against the Funds that have not yet occurred.
121
|
NOTES TO FINANCIAL STATEMENTS |
Real Estate Investment Trusts:
The Funds may own shares of real estate investment trusts (“REITs”) which report information on the source of their distributions annually. Dividends paid by a REIT, other than capital gain distributions, will be taxable as ordinary income up to the amount of the REIT’s current and accumulated earnings and profits. Capital gain dividends paid by a REIT to a Fund will be treated as long term capital gains by the Fund and, in turn, may be distributed by the Fund to its shareholders as a capital gain distribution. Distributions received from a REIT in excess of its income are recorded as a return of capital and a reduction to the cost basis of the REIT.
Distributions to Shareholders:
Each Fund pays out any income that it receives, less expenses, in the form of dividends and capital gain distributions to its shareholders. Income dividends and capital gain distributions for each Fund are declared and paid at least annually. Distributions to shareholders are recorded on the ex-dividend date. The amount of dividends and distributions are calculated based on federal income tax regulations, which may differ from US GAAP. These “book/tax” differences may be either temporary or permanent in nature. To the extent these differences are determined, as of the end of the tax year, to be permanent, they are reclassified within a Fund’s capital accounts based on their federal tax basis treatment. These differences are primarily due to differing book and tax treatments in the timing and/or treatment of the recognition of net investment income or gain and losses, including foreign currency gains and losses, foreign taxes and passive foreign investment companies (PFICs).
| | | | | | | | | | |
| | | Increase/(Decrease)
Paid in Capital | | Increase/(Decrease)
Accumulated
Earnings |
Emerging Markets Ex-China Equity Fund | | | | $ (8,181) | | | | | $ 8,181 | |
Global Equity Leaders Fund | | | | (8,225) | | | | | 8,225 | |
International Opportunities Fund | | | | (81,070) | | | | | 81,070 | |
International Equity Fund | | | | (6,432) | | | | | 6,432 | |
International Small Cap Equity Fund | | | | (2,347) | | | | | 2,347 | |
China Equity Fund | | | | (12,955) | | | | | 12,955 | |
3. Agreements and Other Transactions with Affiliates:
The Trust has entered into investment advisory agreements with RBC GAM-US under which RBC GAM-US manages each Fund’s assets and furnishes related office facilities, equipment, research and personnel. The agreements require each Fund to pay RBC GAM-US a monthly fee based upon average daily net assets. Under the terms of the agreement, RBC GAM-US is entitled to receive fees based on a percentage of the average daily net assets of each of the Funds as follows:
| | | | |
Emerging Market Equity Fund | | | 0.80 | % |
Emerging Markets Value Equity Fund | | | 0.80 | % |
Global Equity Leaders Fund | | | 0.65 | % |
Global Opportunities Fund | | | 0.65 | % |
International Opportunities Fund | | | 0.70 | % |
China Equity Fund | | | 0.80 | % |
Emerging Markets ex-China Equity Fund | | | 0.80 | % |
International Equity Fund | | | 0.69 | % |
International Small Cap Equity Fund | | | 0.89 | % |
122
|
NOTES TO FINANCIAL STATEMENTS |
RBC GAM-US has contractually agreed to waive fees and/or make payments in order to keep total operating expenses (excluding certain fees such as interest, taxes and acquired fund fees and expenses) of Class A, Class I and Class R6 shares of each Fund to the following levels:
| | | | | | | | | | | | |
| | | Class A
Annual Rate | | | Class I
Annual Rate | | | Class R6
Annual Rate | |
Emerging Markets Equity Fund | | | 1.13% | | | | 0.88% | | | | 0.88% | |
Emerging Markets ex-China Equity Fund | | | 1.13% | | | | 0.88% | | | | 0.88% | |
Emerging Markets Value Equity Fund | | | 1.20% | | | | 0.95% | | | | 0.88% | |
Global Opportunities Fund | | | 1.00% | | | | 0.75% | | | | 0.70% | |
Global Equity Leaders Fund | | | 1.00% | | | | 0.75% | | | | 0.70% | |
International Opportunities Fund | | | 1.05% | | | | 0.80% | | | | 0.75% | |
International Equity Fund | | | 1.04% | | | | 0.79% | | | | 0.74% | |
International Small Cap Equity Fund | | | 1.24% | | | | 0.99% | | | | 0.94% | |
China Equity Fund | | | 1.30% | | | | 1.05% | | | | 1.00% | |
This expense limitation agreement is in place until July 31, 2024 (September 30, 2024 for Emerging Markets Equity Fund) and may not be terminated by RBC GAM-US prior to that date. The agreement shall continue for additional one-year terms unless terminated or revised by the Board at any time or by RBC GAM-US at the expiration of any one-year period. The Advisor is entitled to recoup from the Fund or class the fees and/or operating expenses waived or reimbursed during any of the previous 3 years, provided the Fund is able to do so and remain in compliance with the expense limitation in place at the time the fees were waived or expenses paid.
At March 31, 2023, the amounts subject to possible recoupment under the expense limitation agreement were:
| | | | | | | | | | | | | | | | |
| | | FYE 3/31/21 | | | FYE 3/31/22 | | | FYE 3/31/23 | | | Total | |
| | | | |
Emerging Markets Equity Fund | | $ | 1,751,584 | | | $ | 3,922,710 | | | $ | 4,061,290 | | | $ | 9,735,584 | |
Emerging Markets Ex-China Equity Fund | | | N/A | | | | N/A | | | | 119,799 | | | | 119,799 | |
Emerging Markets Value Equity Fund | | | 284,653 | | | | 307,554 | | | | 412,064 | | | | 1,004,271 | |
Global Opportunities Fund | | | 271,393 | | | | 195,659 | | | | 326,481 | | | | 793,533 | |
Global Equity Leaders Fund | | | N/A | | | | 119,121 | | | | 263,924 | | | | 383,045 | |
International Opportunities Fund | | | 410,189 | | | | 338,560 | | | | 376,370 | | | | 1,125,119 | |
International Equity Fund | | | N/A | | | | N/A | | | | 115,555 | | | | 115,555 | |
International Small Cap Equity Fund | | | N/A | | | | N/A | | | | 121,993 | | | | 121,993 | |
China Equity Fund | | | N/A | | | | N/A | | | | 300,454 | | | | 300,454 | |
RBC GAM-US may also voluntarily waive and/or reimburse operating expenses of any Fund from time to time. Any such voluntary program may be changed or eliminated at any time without notice, and expenses waived under such program are not subject to recoupment.
RBC GAM-US voluntarily agreed to waive its investment advisory fees by the amount of investment advisory fees the Funds pay to RBC GAM-US indirectly through its investment in an affiliated money market fund. For the year ended March 31, 2023, the amount waived was $18,489, $525, $995, $6,079, $97, $1,915 $ ,$93, $37 and $0 for the Emerging Markets Equity Fund,Emerging Markets ex-China Equity Fund, Emerging Markets Value Equity Fund, Global Opportunities Fund, Global Equity Leaders Fund, International Opportunities Fund, International Equity Fund, International Small Cap Equity Fund and China Equity Fund respectively, and is included in expenses waived/reimbursed by Advisor in the Statements of Operations.
The Funds are sub-advised by RBC GAM-UK, which is a wholly-owned subsidiary of Royal Bank of Canada, which is the parent company of the Advisor. The Sub-Advisor is paid by the Advisor out of the advisory fee paid by the Funds to the Advisor.
RBC GAM-US serves as co-administrator to the Funds. The Bank of New York Mellon Investment Servicing (US) Inc. (“BNY Mellon”) serves as co-administrator and fund accounting agent. Services
123
NOTES TO FINANCIAL STATEMENTS
provided under the administrative services contract include providing day-to-day administration of matters related to the Funds, maintenance of their records and the preparation of reports. Under the terms of the administrative services contract, RBC GAM-US does not receive a fee for its role as co-administrator. BNY Mellon receives a fee for its services payable by each Fund based in part on each Fund’s average net assets. BNY Mellon’s fee is included with “Accounting fees” in the Statements of Operations.
Certain Officers and Trustees of the Trust are affiliated with the Advisor. Such Officers and Trustees receive no compensation from the Funds for serving in their respective roles.
The Trust currently pays each of the independent Trustees (Trustees of the Trust who are not directors, officers or employees of the Advisor, either Co-Administrator or Distributor) an annual retainer of $84,000. The Board Chairperson and Audit Committee Chairperson each receive an additional retainer of $2,500 annually, and all other trustees serving as Chair of a Board committee each receive an additional retainer of $1,000 annually. In addition, Independent Trustees receive a quarterly meeting fee of $6,500 for each in-person Board meeting attended, a meeting fee of $1,500 for each telephonic or Special Board meeting attended, a $1,500 fee for each Board committee meeting attended, and are reimbursed for all out-of-pocket expenses relating to attendance at such meetings. These amounts are included in the Statement of Operations in “Trustees’ fees”.
In conjunction with the launch of each of the Funds or additional share classes, the Advisor invested seed capital to provide each Fund or share class with its initial investment assets. The table below shows, as of March 31, 2023, each Fund’s net assets, the shares of each Fund held by the Advisor, and the percent of total net assets represented by the Advisor’s investment.
| | | | | | | | | | | | |
| | | Net Assets | | | Shares held
by Advisor | | | % of Fund
Net Assets | |
Emerging Markets Ex-China Equity Fund | | $ | 33,881,894 | | | | 1,500,000 | | | | 46.1 | % |
Emerging Markets Value Equity Fund | | $ | 66,640,801 | | | | 664,700 | | | | 7.5 | % |
Global Opportunities Fund | | $ | 467,248,608 | | | | 688 | | | | 0.0 | % |
Global Equity Leaders Fund | | $ | 4,087,107 | | | | 504,311 | | | | 100.0 | % |
International Opportunities Fund | | $ | 135,410,616 | | | | 2,563 | | | | 0.0 | % |
International Equity Fund | | $ | 20,894,011 | | | | 2,000,000 | | | | 100.0 | % |
International Small Cap Equity Fund | | $ | 5,129,388 | | | | 500,000 | | | | 100.0 | % |
China Equity Fund | | $ | 4,725,129 | | | | 505,076 | | | | 100.0 | % |
4. Fund Distribution:
Each of the Funds that offers Class A shares has adopted a Master Distribution 12b-1 Plan (the “Plan”) in which Quasar Distributors LLC (the “Distributor”) acts as the Funds’ distributor. The Plan permits each Fund to make payments for, or to reimburse the Distributor for, distribution-related costs and expenses of marketing shares of Class A covered under the Plan, and/or for providing shareholder services. The Plan does not apply to Class I and Class R6. The following chart shows the current Plan fee rate for Class A.
| | | | | |
| | | Class A |
| 12b-1 Plan Fee | | 0.25%* |
* Under the 12b-1 plan, the maximum fee rate for Class A shares is 0.50%. Currently the Board has approved an annual limit of 0.25%.
Plan fees are based on average daily net assets of Class A. Up to 0.25% of each Plan fee may be designated as a service fee, as defined by the applicable rules of the Financial Industry Regulatory Authority. The Distributor, subject to applicable legal requirements, may waive the Plan fee voluntarily, in whole or in part. For the year ended March 31, 2023, there were no fees waived by the Distributor.
124
NOTES TO FINANCIAL STATEMENTS
The Distributor did not receive any CDSC fees from Class A shares of the Funds during the year ended March 31, 2023.
For the year ended March 31, 2023, the Distributor received commissions of $1,737 front-end sales charges of Class A shares, of the Funds, of which $1,737 was paid to affiliated broker-dealers.
5. Securities Transactions:
The cost of securities purchased and proceeds from securities sold (excluding securities maturing less than one year from acquisition) for the year ended March 31, 2023 were as follows:
| | | | | | | | | | | | |
| | | Purchases | | | | | | Sales | |
Emerging Markets Equity Fund | | $ | 425,464,307 | | | | | | | $ | 750,497,587 | |
Emerging Markets Ex-China Equity Fund | | | 31,845,088 | | | | | | | | 464,532 | |
Emerging Markets Value Equity Fund | | | 28,640,945 | | | | | | | | 32,003,084 | |
Global Opportunities Fund | | | 185,006,235 | | | | | | | | 220,566,236 | |
Global Equity Leaders Fund | | | 1,684,165 | | | | | | | | 1,501,938 | |
International Opportunities Fund | | | 72,521,247 | | | | | | | | 95,142,535 | |
International Equity Fund | | | 21,470,526 | | | | | | | | 1,682,252 | |
International Small Cap Equity Fund | | | 5,076,222 | | | | | | | | 181,354 | |
China Equity Fund | | | 10,781,046 | | | | | | | | 5,910,993 | |
125
NOTES TO FINANCIAL STATEMENTS
6. Capital Share Transactions:
The Trust is authorized to issue an unlimited number of shares of beneficial interest (“shares outstanding”) without par value. Transactions in capital stock of the Funds are summarized on the following pages:
| | | | | | | | | | | | | | | | | | | | |
| | | Emerging Markets Equity Fund | | Emerging Markets Ex-China Equity Fund |
| | | For the
Year Ended
March 31,
2023 | | For the
Year Ended
March 31,
2022 | | For the
Period Ended
March 31,
2023(a) |
CAPITAL | | | | | | | | | | | | | | | | | | | | |
TRANSACTIONS: | | | | | | | | | | | | | | | | | | | | |
Class A | | | | | | | | | | | | | | | | | | | | |
Proceeds from shares issued | | | $ | 134,841,914 | | | | $ | 140,921,129 | | | | | | | | | $ | 500,000 | |
Distributions reinvested | | | | 823,864 | | | | | 7,256,298 | | | | | | | | | | — | |
Cost of shares redeemed | | | | (272,846,896 | ) | | | | (94,971,848 | ) | | | | | | | | | — | |
| | | | | | | | | | | | | | | | | | | | |
Change in Class A | | | $ | (137,181,118 | ) | | | $ | 53,205,579 | | | | | | | | | $ | 500,000 | |
| | | | | | | | | | | | | | | | | | | | |
Class I | | | | | | | | | | | | | | | | | | | | |
Proceeds from shares issued | | | $ | 493,696,381 | | | | $ | 772,795,344 | | | | | | | | | $ | 30,915,115 | |
Distributions reinvested | | | | 20,307,410 | | | | | 54,796,328 | | | | | | | | | | — | |
Cost of shares redeemed | | | | (740,191,833 | ) | | | | (443,767,824 | ) | | | | | | | | | — | |
| | | | | | | | | | | | | | | | | | | | |
Change in Class I | | | $ | (226,188,042 | ) | | | $ | 383,823,848 | | | | | | | | | $ | 30,915,115 | |
| | | | | | | | | | | | | | | | | | | | |
Class R6 | | | | | | | | | | | | | | | | | | | | |
Proceeds from shares issued | | | $ | 31,327,468 | | | | $ | 60,159,654 | | | | | | | | | $ | 1,000,000 | |
Distributions reinvested | | | | 2,575,425 | | | | | 6,425,184 | | | | | | | | | | — | |
Cost of shares redeemed | | | | (23,588,121 | ) | | | | (81,339,440 | ) | | | | | | | | | — | |
| | | | | | | | | | | | | | | | | | | | |
Change in Class R6 | | | $ | 10,314,772 | | | | $ | (14,754,602 | ) | | | | | | | | $ | 1,000,000 | |
| | | | | | | | | | | | | | | | | | | | |
Change in net assets resulting from capital transactions | | | $ | (353,054,388 | ) | | | $ | 422,274,825 | | | | | | | | | $ | 32,415,115 | |
| | | | | | | | | | | | | | | | | | | | |
126
NOTES TO FINANCIAL STATEMENTS
| | | | | | | | | | | | | | | | | | | | |
| | | Emerging Markets Equity Fund | | Emerging Markets Ex-China Equity Fund |
| | | For the
Year Ended
March 31,
2023 | | For the
Year Ended
March 31,
2022 | | For the
Period Ended
March 31,
2023(a) |
SHARE TRANSACTIONS: | | | | | | | | | | | | | | | | | | | | |
Class A | | | | | | | | | | | | | | | | | | | | |
Issued | | | | 12,221,113 | | | | | 10,440,868 | | | | | | | | | | 50,000 | |
Reinvested | | | | 73,428 | | | | | 559,037 | | | | | | | | | | — | |
Redeemed | | | | (25,523,476 | ) | | | | (6,936,302 | ) | | | | | | | | | — | |
| | | | | | | | | | | | | | | | | | | | |
Change in Class A | | | | (13,228,935 | ) | | | | 4,063,603 | | | | | | | | | | 50,000 | |
| | | | | | | | | | | | | | | | | | | | |
Class I | | | | | | | | | | | | | | | | | | | | |
Issued | | | | 43,045,595 | | | | | 54,372,157 | | | | | | | | | | 3,104,547 | |
Reinvested | | | | 1,782,916 | | | | | 4,148,094 | | | | | | | | | | — | |
Redeemed | | | | (64,924,227 | ) | | | | (31,898,225 | ) | | | | | | | | | — | |
| | | | | | | | | | | | | | | | | | | | |
Change in Class I | | | | (20,095,716 | ) | | | | 26,622,026 | | | | | | | | | | 3,104,547 | |
| | | | | | | | | | | | | | | | | | | | |
Class R6 | | | | | | | | | | | | | | | | | | | | |
Issued | | | | 2,675,995 | | | | | 4,186,394 | | | | | | | | | | 100,000 | |
Reinvested | | | | 224,928 | | | | | 483,824 | | | | | | | | | | — | |
Redeemed | | | | (2,061,775 | ) | | | | (5,684,040 | ) | | | | | | | | | — | |
| | | | | | | | | | | | | | | | | | | | |
Change in Class R6 | | | | 839,148 | | | | | (1,013,822 | ) | | | | | | | | | 100,000 | |
| | | | | | | | | | | | | | | | | | | | |
Change in shares resulting from capital transactions | | | | (32,485,503 | ) | | | | 29,671,807 | | | | | | | | | | 3,254,547 | |
| | | | | | | | | | | | | | | | | | | | |
(a) For the period from December 15, 2022 (commencement of operations) to March 31, 2023.
127
NOTES TO FINANCIAL STATEMENTS
| | | | | | | | | | | | | | | | |
| | | Emerging Markets Value Equity Fund | | | Global Opportunities Fund | |
| | | For the
Year Ended
March 31,
2023 | | | For the
Year Ended
March 31,
2022 | | | For the
Year Ended
March 31,
2023 | | | For the
Year Ended
March 31,
2022 | |
CAPITAL TRANSACTIONS: | | | | | | | | | | | | | | | | |
Class A | | | | | | | | | | | | | | | | |
Proceeds from shares issued | | $ | 14,712 | | | $ | — | | | $ | — | | | $ | 11,551 | |
Distributions reinvested | | | 614 | | | | — | | | | 5 | | | | 724 | |
Cost of shares redeemed | | | — | | | | — | | | | (1,938 | ) | | | — | |
| | | | | | | | | | | | | | | | |
Change in Class A | | $ | 15,326 | | | $ | — | | | $ | (1,933 | ) | | $ | 12,275 | |
| | | | | | | | | | | | | | | | |
Class I | | | | | | | | | | | | | | | | |
Proceeds from shares issued | | $ | 18,563,310 | | | $ | 56,989,887 | | | $ | 64,616,537 | | | $ | 289,474,048 | |
Distributions reinvested | | | 4,004,023 | | | | 6,388,540 | | | | 655,226 | | | | 16,945,013 | |
Cost of shares redeemed | | | (23,236,066 | ) | | | (17,332,499 | ) | | | (42,470,619 | ) | | | (87,829,552 | ) |
| | | | | | | | | | | | | | | | |
Change in Class I | | $ | (668,733 | ) | | $ | 46,045,928 | | | $ | 22,801,144 | | | $ | 218,589,509 | |
| | | | | | | | | | | | | | | | |
Class R6 | | | | | | | | | | | | | | | | |
Proceeds from shares issued | | $ | — | | | $ | 6,900,000 | | | $ | 45,249,715 | | | $ | 163,518,024 | |
Distributions reinvested | | | 164,015 | | | | 369,305 | | | | 362,392 | | | | 9,027,594 | |
Cost of shares redeemed | | | — | | | | (6,429,989 | ) | | | (107,730,518 | ) | | | (31,543,001 | ) |
| | | | | | | | | | | | | | | | |
Change in Class R6 | | $ | 164,015 | | | $ | 839,316 | | | $ | (62,118,411 | ) | | $ | 141,002,617 | |
| | | | | | | | | | | | | | | | |
Change in net assets resulting from capital transactions | | $ | (489,392 | ) | | $ | 46,885,244 | | | $ | (39,319,200 | ) | | $ | 359,604,401 | |
| | | | | | | | | | | | | | | | |
SHARE TRANSACTIONS: | | | | | | | | | | | | | | | | |
Class A | | | | | | | | | | | | | | | | |
Issued | | | 1,751 | | | | — | | | | — | | | | 595 | |
Reinvested | | | 83 | | | | — | | | | — | | | | 34 | |
Redeemed | | | — | | | | — | | | | (105 | ) | | | — | |
| | | | | | | | | | | | | | | | |
Change in Class A | | | 1,834 | | | | — | | | | (105 | ) | | | 629 | |
| | | | | | | | | | | | | | | | |
Class I | | | | | | | | | | | | | | | | |
Issued | | | 2,462,847 | | | | 5,492,911 | | | | 3,833,771 | | | | 13,247,308 | |
Reinvested | | | 542,550 | | | | 681,808 | | | | 39,687 | | | | 806,138 | |
Redeemed | | | (2,987,061 | ) | | | (1,550,129 | ) | | | (2,553,969 | ) | | | (4,218,486 | ) |
| | | | | | | | | | | | | | | | |
Change in Class I | | | 18,336 | | | | 4,624,590 | | | | 1,319,489 | | | | 9,834,960 | |
| | | | | | | | | | | | | | | | |
Class R6 | | | | | | | | | | | | | | | | |
Issued | | | — | | | | 623,060 | | | | 2,711,199 | | | | 7,763,370 | |
Reinvested | | | 23,166 | | | | 41,034 | | | | 21,870 | | | | 428,051 | |
Redeemed | | | — | | | | (623,061 | ) | | | (6,557,380 | ) | | | (1,490,078 | ) |
| | | | | | | | | | | | | | | | |
Change in Class R6 | | | 23,166 | | | | 41,033 | | | | (3,824,311 | ) | | | 6,701,343 | |
| | | | | | | | | | | | | | | | |
Change in shares resulting from capital transactions | | | 43,336 | | | | 4,665,623 | | | | (2,504,927 | ) | | | 16,536,932 | |
| | | | | | | | | | | | | | | | |
128
NOTES TO FINANCIAL STATEMENTS
| | | | | | | | | | | | | | | | |
| | | Global Equity Leaders Fund | | | International Opportunities Fund | |
| | | For the
Year Ended
March 31,
2023 | | | For the
Period Ended
March 31,
2022(a) | | | For the
Year Ended
March 31,
2023 | | | For the
Year Ended
March 31,
2022 | |
CAPITAL TRANSACTIONS: | | | | | | | | | | | | | | | | |
Class A | | | | | | | | | | | | | | | | |
Proceeds from shares issued | | $ | — | | | $ | 1,000,000 | | | $ | 43,985 | | | $ | 98,570 | |
Distributions reinvested | | | 21,414 | | | | — | | | | 6,886 | | | | 6,022 | |
Cost of shares redeemed | | | — | | | | — | | | | (6,549 | ) | | | (670 | ) |
| | | | | | | | | | | | | | | | |
Change in Class A | | $ | 21,414 | | | $ | 1,000,000 | | | $ | 44,322 | | | $ | 103,922 | |
| | | | | | | | | | | | | | | | |
Class I | | | | | | | | | | | | | | | | |
Proceeds from shares issued | | $ | — | | | $ | 3,000,000 | | | $ | 67,220,711 | | | $ | 60,295,546 | |
Distributions reinvested | | | 7,568 | | | | — | | | | 4,605,284 | | | | 7,618,541 | |
Cost of shares redeemed | | | — | | | | — | | | | (92,067,865 | ) | | | (43,667,026 | ) |
| | | | | | | | | | | | | | | | |
Change in Class I | | $ | 7,568 | | | $ | 3,000,000 | | | $ | (20,241,870 | ) | | $ | 24,247,061 | |
| | | | | | | | | | | | | | | | |
Class R6 | | | | | | | | | | | | | | | | |
Proceeds from shares issued | | $ | — | | | $ | 1,000,000 | | | $ | 1,087,664 | | | $ | 6,611,430 | |
Distributions reinvested | | | 4,991 | | | | — | | | | 240,898 | | | | 282,283 | |
Cost of shares redeemed | | | — | | | | — | | | | (1,071,829 | ) | | | (103,308 | ) |
| | | | | | | | | | | | | | | | |
Change in Class R6 | | $ | 4,991 | | | $ | 1,000,000 | | | $ | 256,733 | | | $ | 6,790,405 | |
| | | | | | | | | | | | | | | | |
Change in net assets resulting from capital transactions | | $ | 33,973 | | | $ | 5,000,000 | | | $ | (19,940,815 | ) | | $ | 31,141,388 | |
| | | | | | | | | | | | | | | | |
SHARE TRANSACTIONS: | | | | | | | | | | | | | | | | |
Class A | | | | | | | | | | | | | | | | |
Issued | | | — | | | | 100,000 | | | | 4,599 | | | | 7,145 | |
Reinvested | | | 633 | | | | — | | | | 711 | | | | 481 | |
Redeemed | | | — | | | | — | | | | (676 | ) | | | (53 | ) |
| | | | | | | | | | | | | | | | |
Change in Class A | | | 633 | | | | 100,000 | | | | 4,634 | | | �� | 7,573 | |
| | | | | | | | | | | | | | | | |
Class I | | | | | | | | | | | | | | | | |
Issued | | | — | | | | 300,000 | | | | 6,725,505 | | | | 4,501,962 | |
Reinvested | | | 2,718 | | | | — | | | | 472,337 | | | | 605,607 | |
Redeemed | | | — | | | | — | | | | (9,200,028 | ) | | | (3,442,244 | ) |
| | | | | | | | | | | | | | | | |
Change in Class I | | | 2,718 | | | | 300,000 | | | | (2,002,186 | ) | | | 1,665,325 | |
| | | | | | | | | | | | | | | | |
Class R6 | | | | | | | | | | | | | | | | |
Issued | | | — | | | | 100,000 | | | | 108,226 | | | | 485,211 | |
Reinvested | | | 960 | | | | — | | | | 24,482 | | | | 22,279 | |
Redeemed | | | — | | | | — | | | | (103,578 | ) | | | (7,933 | ) |
| | | | | | | | | | | | | | | | |
Change in Class R6 | | | 960 | | | | 100,000 | | | | 29,130 | | | | 499,557 | |
| | | | | | | | | | | | | | | | |
Change in shares resulting from capital transactions | | | 4,311 | | | | 500,000 | | | | (1,968,422 | ) | | | 2,172,455 | |
| | | | | | | | | | | | | | | | |
(a) For the period from December 15, 2021 (commencement of operations) to March 31, 2022.
129
NOTES TO FINANCIAL STATEMENTS
| | | | | | | | | | | | | | | | | | | | |
| | | International Equity Fund | | International Small Cap Equity Fund |
| | | For the
Period Ended
March 31,
2023(a) | | For the
Period Ended
March 31,
2023(a) |
CAPITAL TRANSACTIONS: | | | | | | | | | | | | | | | | | | | | |
Class A | | | | | | | | | | | | | | | | | | | | |
Proceeds from shares issued | | | | | | | | $ | 1,000,000 | | | | | | | | | $ | 500,000 | |
| | | | | | | | | | | | | | | | | | | | |
Change in Class A | | | | | | | | $ | 1,000,000 | | | | | | | | | $ | 500,000 | |
| | | | | | | | | | | | | | | | | | | | |
Class I | | | | | | | | | | | | | | | | | | | | |
Proceeds from shares issued | | | | | | | | $ | 17,500,000 | | | | | | | | | $ | 3,500,000 | |
| | | | | | | | | | | | | | | | | | | | |
Change in Class I | | | | | | | | $ | 17,500,000 | | | | | | | | | $ | 3,500,000 | |
| | | | | | | | | | | | | | | | | | | | |
Class R6 | | | | | | | | | | | | | | | | | | | | |
Proceeds from shares issued | | | | | | | | $ | 1,500,000 | | | | | | | | | $ | 1,000,000 | |
| | | | | | | | | | | | | | | | | | | | |
Change in Class R6 | | | | | | | | $ | 1,500,000 | | | | | | | | | $ | 1,000,000 | |
| | | | | | | | | | | | | | | | | | | | |
Change in net assets resulting from capital transactions | | | | | | | | $ | 20,000,000 | | | | | | | | | $ | 5,000,000 | |
| | | | | | | | | | | | | | | | | | | | |
SHARE TRANSACTIONS: | | | | | | | | | | | | | | | | | | | | |
Class A | | | | | | | | | | | | | | | | | | | | |
Issued | | | | | | | | | 100,000 | | | | | | | | | | 50,000 | |
| | | | | | | | | | | | | | | | | | | | |
Change in Class A | | | | | | | | | 100,000 | | | | | | | | | | 50,000 | |
| | | | | | | | | | | | | | | | | | | | |
Class I | | | | | | | | | | | | | | | | | | | | |
Issued | | | | | | | | | 1,750,000 | | | | | | | | | | 350,000 | |
| | | | | | | | | | | | | | | | | | | | |
Change in Class I | | | | | | | | | 1,750,000 | | | | | | | | | | 350,000 | |
| | | | | | | | | | | | | | | | | | | | |
Class R6 | | | | | | | | | | | | | | | | | | | | |
Issued | | | | | | | | | 150,000 | | | | | | | | | | 100,000 | |
| | | | | | | | | | | | | | | | | | | | |
Change in Class R6 | | | | | | | | | 150,000 | | | | | | | | | | 100,000 | |
| | | | | | | | | | | | | | | | | | | | |
Change in shares resulting from capital transactions | | | | | | | | | 2,000,000 | | | | | | | | | | 500,000 | |
| | | | | | | | | | | | | | | | | | | | |
(a) For the period from December 14, 2022 (commencement of operations) to March 31, 2023.
130
NOTES TO FINANCIAL STATEMENTS
| | | | | | | | | | | | | | | | | | | | | | | | | |
| | | | | | | | | China Equity Fund |
| | | | | | | | | For the
Period Ended
March 31,
2023(a) |
CAPITAL TRANSACTIONS: | | | | | | | | | | | | | | | | | | | | | | | | | |
Class A | | | | | | | | | | | | | | | | | | | | | | | | | |
Proceeds from shares issued | | | | | | | | | | | | | | | | | | | | | | | $ | 500,000 | |
Distributions reinvested | | | | | | | | | | | | | | | | | | | | | | | | 3,788 | |
| | | | | | | | | | | | | | | | | | | | | | | | | |
Change in Class A | | | | | | | | | | | | | | | | | | | | | | | $ | 503,788 | |
| | | | | | | | | | | | | | | | | | | | | | | | | |
Class I | | | | | | | | | | | | | | | | | | | | | | | | | |
Proceeds from shares issued | | | | | | | | | | | | | | | | | | | | | | | $ | 3,500,000 | |
Distributions reinvested | | | | | | | | | | | | | | | | | | | | | | | | 32,480 | |
| | | | | | | | | | | | | | | | | | | | | | | | | |
Change in Class I | | | | | | | | | | | | | | | | | | | | | | | $ | 3,532,480 | |
| | | | | | | | | | | | | | | | | | | | | | | | | |
Class R6 | | | | | | | | | | | | | | | | | | | | | | | | | |
Proceeds from shares issued | | | | | | | | | | | | | | | | | | | | | | | $ | 1,000,000 | |
Distributions reinvested | | | | | | | | | | | | | | | | | | | | | | | | 9,618 | |
| | | | | | | | | | | | | | | | | | | | | | | | | |
Change in Class R6 | | | | | | | | | | | | | | | | | | | | | | | $ | 1,009,618 | |
| | | | | | | | | | | | | | | | | | | | | | | | | |
Change in net assets resulting from capital transactions | | | | | | | | | | | | | | | | | | | | | | | $ | 5,045,886 | |
| | | | | | | | | | | | | | | | | | | | | | | | | |
SHARE TRANSACTIONS: | | | | | | | | | | | | | | | | | | | | | | | | | |
Class A | | | | | | | | | | | | | | | | | | | | | | | | | |
Issued | | | | | | | | | | | | | | | | | | | | | | | | 50,000 | |
Reinvested | | | | | | | | | | | | | | | | | | | | | | | | 419 | |
| | | | | | | | | | | | | | | | | | | | | | | | | |
Change in Class A | | | | | | | | | | | | | | | | | | | | | | | | 50,419 | |
| | | | | | | | | | | | | | | | | | | | | | | | | |
Class I | | | | | | | | | | | | | | | | | | | | | | | | | |
Issued | | | | | | | | | | | | | | | | | | | | | | | | 350,000 | |
Reinvested | | | | | | | | | | | | | | | | | | | | | | | | 3,593 | |
| | | | | | | | | | | | | | | | | | | | | | | | | |
Change in Class I | | | | | | | | | | | | | | | | | | | | | | | | 353,593 | |
| | | | | | | | | | | | | | | | | | | | | | | | | |
Class R6 | | | | | | | | | | | | | | | | | | | | | | | | | |
Issued | | | | | | | | | | | | | | | | | | | | | | | | 100,000 | |
Reinvested | | | | | | | | | | | | | | | | | | | | | | | | 1,064 | |
| | | | | | | | | | | | | | | | | | | | | | | | | |
Change in Class R6 | | | | | | | | | | | | | | | | | | | | | | | | 101,064 | |
| | | | | | | | | | | | | | | | | | | | | | | | | |
Change in shares resulting from capital transactions | | | | | | | | | | | | | | | | | | | | | | | | 505,076 | |
| | | | | | | | | | | | | | | | | | | | | | | | | |
(a) For the period from April 11, 2022 (commencement of operations) to March 31, 2023.
7. Federal Income Taxes:
It is the policy of each Fund to continue to qualify as a regulated investment company by complying with the provisions available to certain investment companies, as defined under Subchapter M of the Internal Revenue Code, and to distribute substantially all of its net investment income and net realized capital gains. Therefore, no federal tax liability is recorded in the financial statements of each Fund.
For all open tax years and all major taxing jurisdictions, management of the Funds has concluded that there are no significant uncertain tax positions that would require recognition in the financial statements. Open tax years are those that are open for examination by taxing authorities (i.e., generally
131
NOTES TO FINANCIAL STATEMENTS
the last four tax year ends and the interim tax period since then). Furthermore, management of the Funds is also not aware of any tax positions for which it is reasonably possible that the total amounts of unrecognized tax benefits will significantly change in the next twelve months.
As of March 31, 2023, the tax cost of investments and the breakdown of unrealized appreciation (depreciation) for each Fund was as follows:
| | | | | | | | | | | | | | | | |
| | | Tax Cost Of
Investments | | | Unrealized
Appreciation | | | Unrealized
Depreciation | | | Net Unrealized
Appreciation/
(Depreciation) | |
| | | | |
Emerging Markets Equity Fund | | | $2,237,411,205 | | | | $200,954,465 | | | | $(328,305,579) | | | | $(127,351,114) | |
Emerging Markets Ex-China Equity Fund | | | 32,397,982 | | | | 2,209,529 | | | | (799,160 | ) | | | 1,410,369 | |
Emerging Markets Value Equity Fund | | | 76,712,562 | | | | 4,693,406 | | | | (14,757,603 | ) | | | (10,064,197 | ) |
Global Opportunities Fund | | | 527,402,703 | | | | 19,069,712 | | | | (64,897,325 | ) | | | (45,827,613 | ) |
Global Equity Leaders Fund | | | 4,746,317 | | | | 150,797 | | | | (698,139 | ) | | | (547,342 | ) |
International Opportunities Fund | | | 140,892,059 | | | | 8,146,538 | | | | (14,889,701 | ) | | | (6,743,163 | ) |
International Equity Fund | | | 19,942,627 | | | | 1,486,491 | | | | (596,769 | ) | | | 889,722 | |
International Small Cap Equity Fund | | | 5,027,832 | | | | 327,078 | | | | (202,261 | ) | | | 124,817 | |
China Equity Fund | | | 4,528,530 | | | | 310,378 | | | | (289,919 | ) | | | 20,459 | |
132
NOTES TO FINANCIAL STATEMENTS
The difference between book basis and tax basis unrealized appreciation/depreciation is attributable to the tax deferral of losses on wash sales and passive foreign investment company mark-to-market adjustment.
The tax character of distributions during the year ended March 31, 2023 were as follows:
| | | | | | | | | | | | | | | | | | | | |
| | | Distributions Paid From |
| | | Ordinary
Income | | Net Long Term
Capital Gains | | Total Taxable
Distributions | | Total
Distributions
Paid |
Emerging Markets Equity Fund | | | $ | 26,526,596 | | | | $ | — | | | | $ | 26,526,596 | | | | $ | 26,526,596 | |
Emerging Markets Ex-China Equity Fund | | | | — | | | | | — | | | | | — | | | | | — | |
Emerging Markets Value Equity Fund | | | | 798,119 | | | | | 3,571,827 | | | | | 4,369,946 | | | | | 4,369,946 | |
Global Opportunities Fund | | | | 1,306,534 | | | | | — | | | | | 1,306,534 | | | | | 1,306,534 | |
Global Equity Leaders Fund | | | | 33,973 | | | | | — | | | | | 33,973 | | | | | 33,973 | |
International Opportunities Fund | | | | — | | | | | 6,681,778 | | | | | 6,681,778 | | | | | 6,681,778 | |
International Equity Fund | | | | — | | | | | — | | | | | — | | | | | — | |
International Small Cap Equity Fund | | | | — | | | | | — | | | | | — | | | | | — | |
China Equity Fund | | | | 45,886 | | | | | — | | | | | 45,886 | | | | | 45,886 | |
| |
| The tax character of distributions during the year ended March 31, 2022 were as follows: | | | | | | |
| |
| | | Distributions Paid From |
| | | Ordinary
Income | | Net Long Term
Capital Gains | | Total Taxable
Distributions | | Total
Distributions
Paid |
Emerging Markets Equity Fund | | | $ | 34,602,313 | | | | $ | 39,217,208 | | | | $ | 73,819,521 | | | | $ | 73,819,521 | |
Emerging Markets Value Equity Fund | | | | 5,438,637 | | | | | 1,320,867 | | | | | 6,759,504 | | | | | 6,759,504 | |
Global Opportunities Fund | | | | 5,569,383 | | | | | 23,684,426 | | | | | 29,253,809 | | | | | 29,253,809 | |
Global Equity Leaders Fund | | | | — | | | | | — | | | | | — | | | | | — | |
International Opportunities Fund | | | | 5,110,059 | | | | | 5,686,193 | | | | | 10,796,252 | | | | | 10,796,252 | |
Total distributions paid may differ from the Statements of Changes in Net Assets because distributions are recognized when actually paid for tax purposes.
133
NOTES TO FINANCIAL STATEMENTS
As of March 31, 2023, the components of accumulated earnings/(losses) on a tax basis were as follows:
| | | | | | | | | | | | | | | | | | | | | | | | | | | | | | | | |
| | | Emerging
Markets
Equity
Fund | | | Emerging Markets ex-China Equity Fund | | Emerging Markets Value Equity Fund | | Global Opportunities Fund | | Global Equity
Leaders Fund | |
Undistributed
ordinary income | | $ | 17,129,741 | | | | | $ | 66,872 | | | | | | | $ | 2,563,128 | | | | | | | $ | 473,934 | | | | | $ | 5,648 | |
Undistributed long
term gain | | | — | | | | | | — | | | | | | | | — | | | | | | | | — | | | | | | — | |
| | | | | | | | | | | | | | | | | | | | | | | | | | | | | | | | |
Accumulated
earnings | | | 17,129,741 | | | | | | 66,872 | | | | | | | | 2,563,128 | | | | | | | | 473,934 | | | | | | 5,648 | |
Accumulated capital
loss carryforwards | | | (68,900,816) | | | | | | — | | | | | | | | (5,451,223) | | | | | | | | (33,134,433) | | | | | | (396,374) | |
Deferred qualified
late-year losses | | | — | | | | | | (2,281) | | | | | | | | — | | | | | | | | — | | | | | | — | |
Unrealized
appreciation/
depreciation | | | (127,351,114) | | | | | | 1,410,369 | | | | | | | | (10,064,196) | | | | | | | | (45,827,613) | | | | | | (547,342) | |
Other temporary
differences | | | (2) | | | | | | — | | | | | | | | — | | | | | | | | — | | | | | | — | |
| | | | | | | | | | | | | | | | | | | | | | | | | | | | | | | | |
Total Accumulated
Earnings/(Losses) | | $ | (179,122,191) | | | | | $ | 1,474,960 | | | | | | | $ | (12,952,291) | | | | | | | $ | (78,488,112) | | | | | $ | (938,068) | |
| | | | | | | | | | | | | | | | | | | | | | | | | | | | | | | | |
| | | | | |
| | | International
Opportunities
Fund | | | International Equity Fund | | International Small Cap Equity Fund | | China Equity Fund | | | |
Undistributed
ordinary income | | $ | — | | | | | $ | 27,596 | | | | | | | $ | 13,404 | | | | | | | $ | 13,262 | | | | | | | |
Undistributed long
term gain | | | 1,179,124 | | | | | | — | | | | | | | | — | | | | | | | | — | | | | | | | |
| | | | | | | | | | | | | | | | | | | | | | | | | | | | | | | | |
Accumulated
earnings | | | 1,179,124 | | | | | | 27,596 | | | | | | | | 13,404 | | | | | | | | 13,262 | | | | | | | |
Accumulated capital
loss carryforwards | | | — | | | | | | (16,875) | | | | | | | | — | | | | | | | | (341,523) | | | | | | | |
Deferred qualified
late-year losses | | | — | | | | | | — | | | | | | | | (6,486) | | | | | | | | — | | | | | | | |
Unrealized
appreciation/
depreciation | | | (6,743,163) | | | | | | 889,722 | | | | | | | | 124,817 | | | | | | | | 20,459 | | | | | | | |
Other temporary
differences | | | — | | | | | | — | | | | | | | | — | | | | | | | | — | | | | | | | |
| | | | | | | | | | | | | | | | | | | | | | | | | | | | | | | | |
Total Accumulated
Earnings/(Losses) | | $ | (5,564,039) | | | | | $ | 900,443 | | | | | | | $ | 131,735 | | | | | | | $ | (307,802) | | | | | | | |
| | | | | | | | | | | | | | | | | | | | | | | | | | | | | | | | |
As of March 31, 2023 , the Emerging Markets Equity Fund, Emerging Markets Value Equity Fund, Global Opportunities Fund, and Global Equity Leaders Fund had a short-term capital loss carryforward of $18,387,900, $2,269,374, $18,143,537, $352,512 and a long-term capital loss carryforward of $50,512,916, $3,181,849, $14,990,896, $43,862 respectively and International Equity Fund and China Equity Fund had a short-term capital loss carryforward of $16,875 and $341,523 respectively available to offset future realized capital gains in accordance with the Regulated Investment Company Modernization Act of 2010. Emerging Markets Value Equity Fund’s amount includes losses
134
NOTES TO FINANCIAL STATEMENTS
in connection with an ownership change, therefore utilization of capital loss carryover is subject to annual limitations. These capital loss carryforwards are not subject to expiration.
Under current tax law, capital losses realized after October 31 and ordinary losses after December 31 of a Fund’s fiscal year may be deferred and treated as occurring on the first business day of the following fiscal year for tax purposes. The Emerging Markets ex-China Equity Fund and the International Small Cap Equity Fund had deferred qualified late-year ordinary losses of $2,281 and $6,486 respectively which will be treated as arising on the first business day of the fiscal year ending March 31, 2023.
8. Market Timing:
The Trust strongly discourages attempts at market timing by Fund shareholders. Prior to June 11, 2021, each Fund charged a redemption fee of 2% of the value of the shares redeemed or exchanged within 30 days of purchase. In addition, the Trust may limit the number of exchanges that may be made between Funds to five (5) per calendar year. When assessed, the redemption fee was deducted from the redemption proceeds and retained by the Fund, not by the Advisor. This redemption fee was not charged in cases where, for example, the redemption resulted from an automatic reinvestment or asset re-allocation not specifically directed by the shareholder. The Trust also reserves the right to reject any Fund purchase order made by persons deemed to be market timers. The Funds’ prospectus contains a full description of the Trust’s policies on market timing and/or excessive trading. The redemption fee is recorded as a credit to capital and is included in the capital transactions on the Statements of Changes in Net Assets.
9. Line of Credit
Emerging Markets Equity Fund, International Opportunities Fund and Global Opportunities Fund (“Participating Funds”) are participants in a single uncommitted, unsecured $30,000,000 line of credit with The Bank of New York Mellon, the Funds’ custodian, to be used to fund shareholder redemptions requests and for other short-term temporary or emergency general business purposes. Interest is charged on borrowings under this line of credit at the Bank’s prime lending rate per annum. Since each Participating Fund participates in the line of credit, there is no assurance that an individual fund will have access to all or any part of the $30,000,000 at any particular time. During the year ended March 31, 2023, Emerging Markets Equity Fund borrowed a total of $62,400,000 and incurred interest expense of $83,375, and Global Opportunities Fund borrowed $20,000,000 and incurred interest expense of $6,556.
10. Significant Risks
Shareholder concentration risk:
As of March 31, 2023, the Funds had broker-dealer omnibus accounts which each owned more than 10% of a Fund’s outstanding shares as shown below:
| | | | | | | | |
| | | # of Omnibus Accounts | | | % of Fund | |
Emerging Markets Equity Fund | | | 2 | | | | 23.1% | |
Emerging Markets Ex-China Equity Fund | | | 1 | | | | 53.9% | |
Emerging Markets Value Equity Fund | | | 1 | | | | 24.6% | |
Global Opportunities Fund | | | 1 | | | | 11.5% | |
International Opportunities Fund | | | 3 | | | | 73.6% | |
In addition, one unaffiliated shareholder owned 22.5% of Global Opportunities Fund and two unaffiliated shareholders owned in aggregate 44.8% of Emerging Markets Value Equity Fund as of March 31, 2023. Significant transactions by these shareholders may impact the Funds’ performance.
Market risk
One or more markets in which a Fund invests may go down in value, sometimes sharply and unpredictably, and the value of a Fund’s portfolio securities may fall or fail to rise. Market risk may affect a single issuer, sector of the economy, industry or the market as a whole. In addition, global economies and financial markets are becoming increasingly interconnected, and political, economic
135
NOTES TO FINANCIAL STATEMENTS
and other conditions and events (including, but not limited to, natural disasters, pandemics, epidemics, and social unrest) in one country, region, or financial market may adversely impact issuers in a different country, region or financial market. Furthermore, the occurrence of, among other events, natural or man-made disasters, severe weather or geological events, fires, floods, earthquakes, outbreaks of disease (such as COVID-19, avian influenza or H1N1/09), epidemics, pandemics, malicious acts, cyber-attacks, terrorist acts or the occurrence of climate change, may also adversely impact the performance of a Fund. Such events could adversely impact issuers, markets and economies over the short- and long-term, including in ways that cannot necessarily be foreseen. A Fund could be negatively impacted if the value of a portfolio holding were harmed by such political or economic conditions or events. Moreover, such negative political and economic conditions and events could disrupt the processes necessary for a Fund’s operations.
In response to political and military actions undertaken by Russia, the U.S., European Union and other jurisdictions have imposed economic sanctions against certain Russian individuals, entities and sectors. These sanctions and the threat of further sanctions may result in the decline of the value and liquidity of Russian securities, a weakening of the ruble or other adverse consequences to the Russian economy. Sanctions could impair a fund’s ability to invest in accordance with its investment program, to determine the overall value of its net assets, and to sell holdings as needed to meet shareholder redemptions. As of March 31, 2023, none of the Funds’ investments were in violation of such sanctions.
Industry and sector focus risk
At times the Funds may increase the relative emphasis of its investments in a particular industry or sector. The prices of securities of issuers in a particular industry or sector may be more susceptible to fluctuations due to changes in economic or business conditions, government regulations, availability of basic resources or supplies, or other events affect that industry or sector more than securities of issuers in other industries and sectors. To the extent that the Fund increases the relative emphasis of its investments in a particular industry or sector, its shares’ values may fluctuate in response to events affecting that industry or sector.
Emerging Markets Risk
The securities markets of most emerging market countries are less liquid, are especially subject to greater price volatility, have smaller market capitalizations, have less government regulation and are not subject to as extensive and frequent accounting, auditing, financial and other reporting requirements as the securities markets of more developed countries. In addition, a Fund is limited in its ability to exercise its legal rights or enforce a counterparty’s legal obligations in emerging market countries. These risks are not normally associated with investments in more developed countries.
Foreign Risk
Foreign securities may be subject to risk of loss because of less foreign government regulation, less public information and less economic, political, environmental and social stability in these countries. Loss may also result from the imposition of exchange controls, confiscation of assets and property and other government restrictions, or from problems in registration, settlement or custody. Foreign risk also involves the risk of negative foreign currency rate fluctuations, which may cause the value of securities denominated in such foreign currency (or other instruments through which a Fund has exposure to foreign currencies) to decline in value. Currency exchange rates may fluctuate significantly over short periods of time. Additionally, foreign securities and dividends and interest payable on those securities may be subject to foreign taxes, including taxes withheld from payments on those securities.
Currency Risk
Changes in foreign currency exchange rates will affect the value of a Fund’s securities and the price of a Fund’s shares. Generally, when the value of the U.S. Dollar rises in value relative to a foreign currency, an investment in that country loses value because that currency is worth fewer U.S. Dollars. Devaluation of a currency by a country’s government or banking authority also may have a significant impact on the value of any investments denominated in that currency. Currency markets generally are not as regulated as securities markets.
136
NOTES TO FINANCIAL STATEMENTS
China Risk
Investing in securities economically tied to China may subject a Fund to a higher degree of risk of loss than investing in other countries or groups of countries because of the risks associated with, among other things, adverse securities markets, negative foreign currency rate fluctuations and social, political, regulatory, economic or environmental instabilities and natural disasters. The economy, industries, and securities and currency markets of China are particularly vulnerable to the region’s dependence on exports and international trade and increasing competition from Asia’s other low cost emerging economies. Political, diplomatic, or regional conflicts, including the imposition of tariffs or other trade barriers by the U.S. or foreign governments on exports from China, may also have an adverse impact on Chinese issuers. In addition, currency fluctuations, currency convertibility, interest rate fluctuations and higher rates of inflation as a result of internal social unrest or conflicts with other countries have had, and may continue to have, negative effects on the economies and securities markets of Greater China. The government of the People’s Republic of China (“PRC”) exercises significant regulatory control over the economy in Mainland China, and may at any time alter or discontinue economic reforms. Taiwan and Hong Kong do not exercise the same level of control over their economies as does the PRC with respect to Mainland China, but changes to their political and economic relationships with the PRC could adversely impact a Fund’s investments in Taiwan and Hong Kong.
11. Subsequent Events:
Fund Management has evaluated the impact of all subsequent events on the Funds and has determined that there were no subsequent events requiring recognition or disclosure in the financial statements.
137
REPORT OF INDEPENDENT REGISTERED PUBLIC ACCOUNTING FIRM
To the Board of Trustees of RBC Funds Trust and Shareholders of RBC Emerging Markets Equity Fund, RBC Emerging Market ex-China Equity Fund, RBC Emerging Markets Value Equity Fund, RBC Global Opportunities Fund, RBC Global Equity Leaders Fund, RBC International Opportunities Fund, RBC International Equity Fund, RBC International Small Cap Equity Fund, and RBC China Equity Fund
Opinions on the Financial Statements
We have audited the accompanying statements of assets and liabilities, including the schedules of portfolio investments, of each of the funds listed in the table below (nine of the funds constituting RBC Funds Trust, hereafter collectively referred to as the “Funds”) as of March 31, 2023, the related statements of operations and of changes in net assets for each of the periods indicated in the table below, including the related notes, and the financial highlights for each of the periods indicated therein (collectively referred to as the “financial statements”). In our opinion, the financial statements present fairly, in all material respects, the financial position of each of the Funds as of March 31, 2023, the results of each of their operations for each of the periods indicated in the table below, the changes in each of their net assets for each of the periods indicated in the table below and each of the financial highlights for each of the periods indicated therein, in conformity with accounting principles generally accepted in the United States of America.
RBC Emerging Markets Equity Fund (1)
RBC Emerging Markets ex-China Equity Fund (2)
RBC Emerging Markets Value Equity Fund (1)
RBC Global Opportunities Fund (1)
RBC Global Equity Leaders Fund (3)
RBC International Opportunities Fund (1)
RBC International Equity Fund (4)
RBC International Small Cap Equity Fund (4)
RBC China Equity Fund (5)
(1) Statement of operations for the year ended March 31, 2023 and statement of changes in net assets for the years ended March 31, 2023 and 2022
(2) Statement of operations and statement of changes in net assets for the period December 15, 2022 (commencement of operations) through March 31, 2023
(3) Statement of operations for the year ended March 31, 2023, and statement of changes in net assets for the year ended March 31, 2023 and for the period December 15, 2021 (commencement of operations) through March 31, 2022
(4) Statement of operations and statement of changes in net assets for the period December 14, 2022 (commencement of operations) through March 31, 2023
(5) Statements of operations and statement of changes in net assets for the period April 11, 2022 (commencement of operations) through March 31, 2023
Basis for Opinions
These financial statements are the responsibility of the Funds’ management. Our responsibility is to express an opinion on the Funds’ financial statements based on our audits. We are a public accounting firm registered with the Public Company Accounting Oversight Board (United States) (PCAOB) and are required to be independent with respect to the Funds in accordance with the U.S. federal securities laws and the applicable rules and regulations of the Securities and Exchange Commission and the PCAOB.
138
REPORT OF INDEPENDENT REGISTERED PUBLIC ACCOUNTING FIRM
We conducted our audits of these financial statements in accordance with the standards of the PCAOB. Those standards require that we plan and perform the audit to obtain reasonable assurance about whether the financial statements are free of material misstatement, whether due to error or fraud.
Our audits included performing procedures to assess the risks of material misstatement of the financial statements, whether due to error or fraud, and performing procedures that respond to those risks. Such procedures included examining, on a test basis, evidence regarding the amounts and disclosures in the financial statements. Our audits also included evaluating the accounting principles used and significant estimates made by management, as well as evaluating the overall presentation of the financial statements. Our procedures included confirmation of securities owned as of March 31, 2023 by correspondence with the custodian, and brokers; when replies were not received from brokers, we performed other auditing procedures. We believe that our audits provide a reasonable basis for our opinions.
/s/PricewaterhouseCoopers LLP
Minneapolis, Minnesota
May 24, 2023
We have served as the auditor of one or more investment companies in the RBC Funds since 2016.
139
OTHER FEDERAL INCOME TAX INFORMATION (UNAUDITED)
For the year ended March 31, 2023, certain dividends paid by the Funds may be subject to a maximum tax rate of 20% as provided for by the Jobs and Growth Tax Reconciliation Act of 2003. The Funds intend to report the maximum amount allowable as taxed at a maximum rate of 20%. Complete information will be reported in conjunction with your 2020 Form 1099-DIV.
For the year ended March 31, 2023, the following Funds had a qualified dividend income percentage of:
| | | | |
| | | Qualified
Dividend
Income | |
Emerging Markets Equity Fund | | | 75.47% | |
Emerging Markets Ex-China Equity Fund | | | 100.00% | |
Emerging Markets Value Equity Fund | | | 33.54% | |
Global Opportunities Fund | | | 100.00% | |
Global Equity Leaders Fund | | | 100.00% | |
International Opportunities Fund | | | 100.00% | |
International Equity Fund | | | 100.00% | |
International Small Cap Equity Fund | | | 100.00% | |
China Equity Fund | | | 48.92% | |
For corporate shareholders, the following percentage of the total ordinary income distributions paid during the fiscal year ended March 31, 2023 qualify for the corporate dividends received deduction:
| | | | |
| | | Dividends
Received
Deduction | |
Emerging Markets Equity Fund | | | 1.41% | |
Global Opportunities Fund | | | 100.00% | |
Global Equity Leaders Fund | | | 82.33% | |
For the year ended March 31, 2023, the following Funds had a qualified interest income percentage of:
| | | | |
| | | Qualified
Interest
Income | |
Emerging Markets Equity Fund | | | 0.26% | |
Global Opportunities Fund | | | 1.61% | |
Global Equity Leaders Fund | | | 1.57% | |
China Equity Fund | | | 1.02% | |
For the year ended March 31, 2023, the following Funds had a qualified foreign source income percentage of:
| | | | |
| | | Qualified Foreign Source Income % | |
Emerging Markets Equity Fund | | | 85.13% | |
Emerging Markets Ex-China Equity Fund | | | 63.44% | |
Emerging Markets Value Equity Fund | | | 74.09% | |
140
OTHER FEDERAL INCOME TAX INFORMATION (UNAUDITED)
| | | | |
| | | Qualified Foreign Source Income % | |
Global Opportunities Fund | | | 0.00% | |
Global Equity Leaders Fund | | | 0.00% | |
International Opportunities Fund | | | 99.66% | |
International Equity Fund | | | 91.17% | |
International Small Cap Equity Fund | | | 43.75% | |
China Equity Fund | | | 87.78% | |
The Funds have elected to pass through to their shareholders the foreign taxes paid for the year ended March 31, 2023 as follows:
| | | | | | | | |
| | | Foreign Taxes Paid | | | Foreign Source Income | |
Emerging Markets Equity Fund | | $ | 12,372,867 | | | $ | 64,796,869 | |
Emerging Markets Ex-China Equity Fund | | | 17,084 | | | | 163,944 | |
Emerging Markets Value Equity Fund | | | 228,940 | | | | 2,730,896 | |
Global Opportunities Fund | | | 0 | | | | 0 | |
Global Equity Leaders Fund | | | 0 | | | | 0 | |
International Opportunities Fund | | | 319,520 | | | | 3,880,621 | |
International Equity Fund | | | 10,131 | | | | 170,896 | |
International Small Cap Equity Fund | | | 2,360 | | | | 19,427 | |
China Equity Fund | | | 3,230 | | | | 102,383 | |
Pursuant to Internal Revenue Code Section 852(b)(3), Emerging Markets Value Equity Fund, and International Opportunities Fund reported $3,571,827 and $6,681,778 respectively as long-term capital gain distributions for the year ended March 31, 2023.
All reportings are based on financial information available as of the date of this annual report and, accordingly, are subject to change. For each item above, it is the intention of the Funds to report the maximum amount permitted under the Internal Revenue Code and the regulations thereunder.
141
Independent Trustees(1)(2)
Lucy Hancock Bode (71)
Position, Term of Office and Length of Time Served with the Trust: Trustee since January 2004
Principal Occupation(s) During Past 5 Years: Healthcare consultant (self-employed) (1986 to present)
Number of Portfolios in Fund Complex Overseen by Trustee: 24
Other Director/Trustee Positions Held by Trustee During Past 5 Years: Franklin Street Partners (2014 to present); BioSignia (2006 to 2010).
Leslie H. Garner Jr. (72)
Position, Term of Office and Length of Time Served with the Trust: Trustee since January 2004
Principal Occupation(s) During Past 5 Years: President and Chief Executive Officer, The Greater Cedar Rapids Community Foundation (2010 to present); President, Cornell College (1994 to 2010)
Number of Portfolios in Fund Complex Overseen by Trustee: 24
Other Director/Trustee Positions Held by Trustee During Past 5 Years: None
Phillip G. Goff. (59)
Position, Term of Office and Length of Time Served with the Trust: Trustee since January 2020
Principal Occupation(s) During Past 5 Years: Senior Vice President/Corporate Controller and Funds Treasurer, TIAA (2006 - 2017)
Number of Portfolios in Fund Complex Overseen by Trustee: 24
Other Director/Trustee Positions Held by Trustee During Past 5 Years: None
Ronald James (72)
Position, Term of Office and Length of Time Served with the Trust: Trustee since January 2004
Principal Occupation(s) During Past 5 Years: Faculty member (part time), University of St. Thomas (2004 to present), President and Chief Executive Officer, Center for Ethical Business Cultures (2000 to January 2017)
Number of Portfolios in Fund Complex Overseen by Trustee: 24
Other Director/Trustee Positions Held by Trustee During Past 5 Years: Bremer Financial Corporation (2004 to present); Greater Twin Cities United Way (2012 to 2020); Best Buy Co. Inc. (2004 to 2013)
John A. MacDonald (74)
Position, Term of Office and Length of Time Served with the Trust: Trustee since January 2004
Principal Occupation(s) During Past 5 Years: Retired. Independent Consultant (2020 to present); Vice President and Treasurer, Hall Family Foundation (1988 to 2020); Chief Investment Officer, Chinquapin Trust Company (1999 to 2020)
Number of Portfolios in Fund Complex Overseen by Trustee: 24
Other Director/Trustee Positions Held by Trustee During Past 5 Years: None
142
Independent Trustees(1)(2)
James R. Seward, CFA (70)
Position, Term of Office and Length of Time Served with the Trust: Chairman of the Board and Trustee since January 2004
Principal Occupation(s) During Past 5 Years: Private investor (2000 to present); CFA (1987 to present)
Number of Portfolios in Fund Complex Overseen by Trustee: 24
Other Director/Trustee Positions Held by Trustee During Past 5 Years: Sooner Holdings (formerly Syntroleum Corporation) (1988 to 2015); Brookdale Senior Living Inc. (2008 to 2019)
Christie Zarkovich (48)
Position, Term of Office and Length of Time Served with the Trust: Trustee since March 2023
Principal Occupation(s) During Past 5 Years: Chief Administrative, Financial and Investment Officer, Health Forward Foundation (2021 to present); Investment Director, Chinquapin Trust Company (2019 to 2021); Head of Mission-Related Investing Research, Cambridge Associates (2018 to 2019)
Number of Portfolios in Fund Complex Overseen by Trustee: 24
Other Director/Trustee Positions Held by Trustee During Past 5 Years: None
Interested Trustees(1)(2)(3)
David Eikenberg (54)(5)
Position, Term of Office and Length of Time Served with the Trust: Trustee since October 2022
Principal Occupation(s) During Past 5 Years: President and Chief Executive Officer, RBC Funds (2022 to present); Head of Intermediary Sales at RBC Global Asset Management (U.S.) Inc. (2018 to present); Vice President, T. Rowe Price (2010 to 2018)
Number of Portfolios in Fund Complex Overseen by Trustee: 24
Other Director/Trustee Positions Held by Trustee During Past 5 Years: None
143
Executive Officers(1)(3)(4)
David Eikenberg (54)(5)
Position, Term of Office and Length of Time Served with the Trust: President and Chief Executive Officer since October 2022
Principal Occupation(s) During Past 5 Years: President and Chief Executive Officer, RBC Funds (2022 to present); Head of Intermediary Sales at RBC Global Asset Management (U.S.) Inc. (2018 to present); Vice President, T. Rowe Price (2010 to 2018)
Kathleen A. Hegna (56)
Position, Term of Office and Length of Time Served with the Trust: Chief Financial Officer and Principal Accounting Officer since May 2009 and Treasurer since March 2014
Principal Occupation(s) During Past 5 Years: Head, Fund Operations (US), RBC Global Asset Management (U.S.) Inc. (September 2022 to present); Associate Vice President and Director, Mutual Fund Services, RBC Global Asset Management (U.S.) Inc. (2009 to September 2022)
Christina M. Weber (54)
Position, Term of Office and Length of Time Served with the Trust: Chief Compliance Officer since December 2012 and Secretary since September 2017
Principal Occupation(s) During Past 5 Years: Chief Compliance Officer, RBC Global Asset Management (U.S.) Inc. (June 2018 to present); Chief Compliance Officer, RBC Funds (2012 to present); Assistant Secretary, RBC Funds (2013 to 2017)
Jodi DeFeyter (51)
Position, Term of Office and Length of Time Served with the Trust: Assistant Secretary since October 2022
Principal Occupation(s) During Past 5 Years: Director, Regulatory Administration, RBC Global Asset Management (U.S.) Inc. (2012 to present)
Tara Tilbury (49)
Position, Term of Office and Length of Time Served with the Trust: Assistant Secretary since October 2022
Principal Occupation(s) During Past 5 Years: Managing Counsel, RBC Global Asset Management (U.S.) Inc. (2018 to present); Vice President and Chief Counsel – Asset Management, Ameriprise Financial, Inc. (2105 to 2018)
| (1) | The address of each Trustee/Officer except David Eikenberg is 50 South Sixth Street, Suite 2350,Minneapolis, Minnesota 55402. The address of David Eikenberg is 225 Franklin Street, Boston, Massachusetts 02110. |
| (2) | All Trustees must retire on or before December 31 of the year in which they reach age 75. The Board may temporarily waive this requirement when necessary to avoid depriving the Board of a Trustee with critical skills. |
| (3) | On December 31, 2009, Voyageur Asset Management Inc. changed its name to RBC Global Asset Management (U.S.) Inc. Any references to RBC Global Asset Management (U.S.) Inc. for prior periods are deemed to be references to the prior entity. |
144
| (4) | Each officer serves in such capacity for an indefinite period of time until his or her removal, resignation or retirement. |
| (5) | David Eikenberg has been determined to be an interested Trustee by virtue of his position with the Advisor. |
The Fund’s Statement of Additional Information includes information about the Funds’ Trustees. To receive your free copy of the Statement of Additional Information, call toll free: 1-800-422-2766.
145
|
SHARE CLASS INFORMATION (UNAUDITED) |
The Funds offer three share classes: Class A, Class I and Class R6.
Class A
Class A shares, are available in all Funds and are available for purchase primarily through investment advisors, broker-dealers, banks and other financial services intermediaries. Class A shares of the Funds are currently subject to a maximum upfront sales charge of 5.75% and a 1.00% CDSC for redemption within 12 months of a $1 million or greater purchase. Class A shares currently include a 0.25% (25 bps) annual 12b-1 service and distribution fee.
Class I
Class I shares are available in all Funds and are intended for investors meeting certain minimum investment thresholds. This share class does not have an up-front sales charge (load) or a 12b-1 service and distribution fee.
Class R6
Class R6 shares are available in all Funds and are intended for investors meeting certain minimum investment thresholds. This share class does not have an up-front sales charge (load) or a 12b-1 service and distribution fee.
146
|
SUPPLEMENTAL INFORMATION (UNAUDITED) |
Shareholder Expense Examples
As a shareholder of the RBC Funds, you incur two types of costs: (1) transaction costs and (2) ongoing costs, including management fees; and other Fund expenses. This example is intended to help you understand your ongoing costs (in dollars) of investing in the RBC Funds and to compare these costs with the ongoing costs of investing in other mutual funds.
The example is based on an investment of $1,000 invested at the beginning of the period and held for the entire period from October 1, 2022 through March 31, 2023.
Actual Expenses
The table below provides information about actual account values and actual expenses. You may use the information below, together with the amount you invested, to estimate the expenses that you paid over the period. Simply divide your account value by $1,000 (for example, an $8,600 account value divided by $1,000 = 8.6), then multiply the result by the number in the table under the heading entitled “Expenses Paid During Period” to estimate the expenses you paid on your account during this period.
| | | | | | | | | | | | | | | | | | |
| | | Beginning
Account Value
10/1/22 | | | Ending
Account Value
3/31/23 | | | Expenses Paid
During Period*
10/1/22–3/31/23 | | | Annualized
Expense Ratio
During Period
10/1/22–3/31/23 | |
Emerging Markets Equity Fund | | | | | | | | | | | | | | | | |
| | Class A | | | $1,000.00 | | | | $1,204.50 | | | | $6.23 | | | | 1.12% | |
| | Class I | | | 1,000.00 | | | | 1,205.70 | | | | 4.87 | | | | 0.88% | |
| | Class R6 | | | 1,000.00 | | | | 1,206.80 | | | | 4.87 | | | | 0.88% | |
Emerging Markets ex-China Equity Fund** | | | | | | | | | | | | | | | | |
| | Class A | | | 1,000.00 | | | | 1,040.00 | | | | 3.25 | | | | 1.13% | |
| | Class I | | | 1,000.00 | | | | 1,041.00 | | | | 2.51 | | | | 0.87% | |
| | Class R6 | | | 1,000.00 | | | | 1,041.00 | | | | 2.51 | | | | 0.87% | |
Emerging Markets Value Equity Fund | | | | | | | | | | | | | | | | |
| | Class A | | | 1,000.00 | | | | 1,190.40 | | | | 6.49 | | | | 1.13% | |
| | Class I | | | 1,000.00 | | | | 1,192.00 | | | | 5.14 | | | | 0.94% | |
| | Class R6 | | | 1,000.00 | | | | 1,192.20 | | | | 4.75 | | | | 0.87% | |
Global Opportunities Fund | | | | | | | | | | | | | | | | |
| | Class A | | | 1,000.00 | | | | 1,125.00 | | | | 5.24 | | | | 1.00% | |
| | Class I | | | 1,000.00 | | | | 1,126.10 | | | | 3.93 | | | | 0.75% | |
| | Class R6 | | | 1,000.00 | | | | 1,126.90 | | | | 3.67 | | | | 0.70% | |
Global Equity Leaders Fund | | | | | | | | | | | | | | | | |
| | Class A | | | 1,000.00 | | | | 1,132.10 | | | | 5.21 | | | | 0.98% | |
| | Class I | | | 1,000.00 | | | | 1,135.00 | | | | 3.99 | | | | 0.75% | |
| | Class R6 | | | 1,000.00 | | | | 1,135.60 | | | | 3.67 | | | | 0.69% | |
International Opportunities Fund | | | | | | | | | | | | | | | | |
| | Class A | | | 1,000.00 | | | | 1,193.10 | | | | 5.68 | | | | 1.05% | |
| | Class I | | | 1,000.00 | | | | 1,194.10 | | | | 4.33 | | | | 0.80% | |
| | Class R6 | | | 1,000.00 | | | | 1,194.80 | | | | 4.06 | | | | 0.75% | |
International Equity Fund*** | | | | | | | | | | | | | | | | |
| | Class A | | | 1,000.00 | | | | 1,044.00 | | | | 3.09 | | | | 1.04% | |
| | Class I | | | 1,000.00 | | | | 1,045.00 | | | | 2.35 | | | | 0.79% | |
| | Class R6 | | | 1,000.00 | | | | 1,045.00 | | | | 2.20 | | | | 0.74% | |
International Small Cap Equity Fund*** | | | | | | | | | | | | | | | | |
| | Class A | | | 1,000.00 | | | | 1,025.00 | | | | 3.65 | | | | 1.24% | |
| | Class I | | | 1,000.00 | | | | 1,026.00 | | | | 2.91 | | | | 0.99% | |
| | Class R6 | | | $1,000.00 | | | | $1,026.00 | | | | $2.77 | | | | 0.94% | |
147
|
SUPPLEMENTAL INFORMATION (UNAUDITED) |
| | | | | | | | | | | | | | | | | | |
| | | Beginning
Account Value
10/1/22 | | | Ending
Account Value
3/31/23 | | | Expenses Paid
During Period*
10/1/22–3/31/23 | | | Annualized
Expense Ratio
During Period
10/1/22–3/31/23 | |
China Equity Fund | | | | | | | | | | | | | | | | |
| | Class A | | | 1,000.00 | | | | 1,123.80 | | | | 6.83 | | | | 1.29% | |
| | Class I | | | 1,000.00 | | | | 1,125.70 | | | | 5.51 | | | | 1.04% | |
| | Class R6 | | | 1,000.00 | | | | 1,126.20 | | | | 5.25 | | | | 0.99% | |
**Expenses are equal to the average account value times the Fund’s annualized expense ratio multiplied by 107/365 (to reflect December 15, 2022 (commencement of operations) through March 31, 2023).
***Expenses are equal to the average account value times the Fund’s annualized expense ratio multiplied by 108/365 (to reflect December 14, 2022 (commencement of operations) through March 31, 2023).
*Expenses are equal to the average account value times the Fund’s annualized expense ratio multiplied by 182/365 (to reflect one half year period).
148
SUPPLEMENTAL INFORMATION (UNAUDITED)
Hypothetical Example for Comparison Purposes
The table below provides information about hypothetical account values and hypothetical expenses based on each RBC Funds’ actual expense ratio and an assumed rate of return of 5% per year before expenses, which is not the Fund’s actual return. The hypothetical account values and expenses may not be used to estimate the actual ending account balance or expenses you paid for the period. You may use this information to compare this 5% hypothetical example with the 5% hypothetical examples that appear in the shareholder reports of other funds.
Please note that the expenses shown in the table are meant to highlight your ongoing costs only and do not reflect any transactional costs, such as sales charges (loads), redemption fees, or exchange fees. Therefore, the table is useful in comparing ongoing costs only, and will not help you determine the relative total costs of owning different funds. In addition, if these transactional costs were included, your costs would have been higher.
| | | | | | | | | | | | | | | | |
| | | Beginning
Account Value
10/1/22 | | | Ending
Account Value
3/31/23 | | | Expenses Paid
During Period*
10/1/22-3/31/23 | | | Annualized
Expense Ratio
During Period
10/1/22-3/31/23 | |
Emerging Markets Equity Fund | | | | | | | | | | | | | | | | |
Class A | | | $1,000.00 | | | | $1,019.35 | | | | $5.64 | | | | 1.12% | |
Class I | | | 1,000.00 | | | | 1,020.54 | | | | 4.43 | | | | 0.88% | |
Class R6 | | | 1,000.00 | | | | 1,020.54 | | | | 4.43 | | | | 0.88% | |
Emerging Markets ex-China Equity Fund** | | | | | | | | | | | | | | | | |
Class A | | | 1,000.00 | | | | 1,010.92 | | | | 3.21 | | | | 1.13% | |
Class I | | | 1,000.00 | | | | 1,011.65 | | | | 2.47 | | | | 0.87% | |
Class R6 | | | 1,000.00 | | | | 1,011.65 | | | | 2.47 | | | | 0.87% | |
Emerging Markets Value Equity Fund | | | | | | | | | | | | | | | | |
Class A | | | 1,000.00 | | | | 1,020.30 | | | | 5.99 | | | | 1.13% | |
Class I | | | 1,000.00 | | | | 1,020.24 | | | | 4.73 | | | | 0.94% | |
Class R6 | | | 1,000.00 | | | | 1,020.59 | | | | 4.38 | | | | 0.87% | |
Global Opportunities Fund | | | | | | | | | | | | | | | | |
Class A | | | 1,000.00 | | | | 1,019.73 | | | | 4.98 | | | | 1.00% | |
Class I | | | 1,000.00 | | | | 1,020.96 | | | | 3.74 | | | | 0.75% | |
Class R6 | | | 1,000.00 | | | | 1,021.21 | | | | 3.49 | | | | 0.70% | |
Global Equity Leaders Fund | | | | | | | | | | | | | | | | |
Class A | | | 1,000.00 | | | | 1,020.04 | | | | 4.94 | | | | 0.98% | |
Class I | | | 1,000.00 | | | | 1,021.19 | | | | 3.78 | | | | 0.75% | |
Class R6 | | | 1,000.00 | | | | 1,021.49 | | | | 3.48 | | | | 0.69% | |
International Opportunities Fund | | | | | | | | | | | | | | | | |
Class A | | | 1,000.00 | | | | 1,019.48 | | | | 5.23 | | | | 1.05% | |
Class I | | | 1,000.00 | | | | 1,020.71 | | | | 3.99 | | | | 0.80% | |
Class R6 | | | 1,000.00 | | | | 1,020.96 | | | | 3.74 | | | | 0.75% | |
International Equity Fund*** | | | | | | | | | | | | | | | | |
Class A | | | 1,000.00 | | | | 1,011.50 | | | | 3.04 | | | | 1.04% | |
Class I | | | 1,000.00 | | | | 1,012.23 | | | | 2.31 | | | | 0.79% | |
Class R6 | | | 1,000.00 | | | | 1,012.37 | | | | 2.16 | | | | 0.74% | |
International Small Cap Equity Fund*** | | | | | | | | | | | | | | | | |
Class A | | | 1,000.00 | | | | 1,010.92 | | | | 3.62 | | | | 1.24% | |
Class I | | | 1,000.00 | | | | 1,011.65 | | | | 2.89 | | | | 0.99% | |
Class R6 | | | 1,000.00 | | | | 1,011.79 | | | | 2.75 | | | | 0.94% | |
China Equity Fund | | | | | | | | | | | | | | | | |
Class A | | | 1,000.00 | | | | 1,018.50 | | | | 6.49 | | | | 1.29% | |
Class I | | | 1,000.00 | | | | 1,019.75 | | | | 5.24 | | | | 1.04% | |
Class R6 | | | 1,000.00 | | | | 1,020.00 | | | | 4.99 | | | | 0.99% | |
149
SUPPLEMENTAL INFORMATION (UNAUDITED)
| | | | | | | | |
| | | Beginning
Account Value
10/1/22 | | Ending
Account Value
3/31/23 | | Expenses Paid
During Period*
10/1/22-3/31/23 | | Annualized
Expense Ratio
During Period
10/1/22-3/31/23 |
**Expenses are equal to the average account value times the Fund’s annualized expense ratio multiplied by 107/365 (to reflect December 15, 2022 (commencement of operations) through March 31, 2023).
***Expenses are equal to the average account value times the Fund’s annualized expense ratio multiplied by 108/365 (to reflect December 14, 2022 (commencement of operations) through March 31, 2023).
*Expenses are equal to the average account value times the Fund’s annualized expense ratio multiplied by 182/365 (to reflect one half year period).
150
Information Regarding the Approval of Investment Advisory and Sub-Advisory Agreements
In October 2022, the RBC Funds Board of Trustees determined to approve an investment advisory agreement with the Advisor and a sub-advisory agreement (together with the investment advisory agreement, the “Agreements”) with RBC Global Asset Management UK (the “Sub-Advisor”) for the RBC Emerging Markets ex-China Equity Fund, RBC International Equity Fund and RBC International Small Cap Equity Fund (the “Funds”).
As part of their review of the Agreements, the Trustees requested and considered information regarding the advisory services expected to be performed by the Advisor and the Sub-Advisor; the staffing and qualifications of the personnel expected to be responsible for operating and managing the Funds; the proposed fees and anticipated expenses expected to be incurred by each of the Funds; and the Sub-Advisor’s performance track records for existing accounts that employ strategies similar to those to be used by the Funds. In connection with their deliberations, the independent Trustees were advised by independent legal counsel with regard to the materials and their responsibilities under relevant laws and regulations.
The Trustees met with representatives from the Advisor’s senior management team, as well as the senior investment professionals expected to be responsible for managing the Funds, to discuss the information as well as the Advisor’s ongoing management of the Trust and how that would extend to the Funds. The Trustees reviewed the nature, quality, and extent of the services expected to be provided to the Funds by the Advisor and the Sub-Advisor, including information with respect to the Sub-Advisor’s performance track records for existing accounts that employed strategies similar to those to be used by the Funds relative to appropriate index benchmarks as well as information with respect to the performance of appropriate peer groups of funds.
In considering the nature and quality of services expected to be to be provided by the Advisor and the Sub-Advisor, the Trustees were informed with respect to the Sub-Advisor’s research and analysis capabilities and the portfolio management experience of the Sub-Advisor’s staff as well as the Advisor’s and Sub-Advisor’s operational and compliance structure and systems and financial strength. The Trustees reviewed the Funds’ proposed investment advisory fees and reviewed comparative fee and expense information for similarly situated funds. The Trustees also received reports from the Advisor and the Sub-Advisor regarding the performance and fee levels for other advisory client accounts they advise in similar strategies and discussed differences in services provided, noting that the need to: manage liquidity for shareholder redemptions, collateral requirements, and regulatory matters all require additional time and attention from the investment team.
The Trustees reviewed projected profitability data for the Advisor’s management of the Funds and considered information regarding other benefits the Advisor, the Sub-Advisor and their affiliates expected to derive from their relationships with the Funds.
Based upon their review, the Trustees determined that the proposed advisory fees to be payable to the Advisor and the Sub-Advisor were fair and reasonable in light of the nature and quality of services expected to be provided under all the circumstances and were within the range of what might have been negotiated at arms’ length. The Trustees concluded that it was in the interests of the Funds and their future shareholders for the Trustees to approve the Agreements. In arriving at their collective decision to approve the Agreements, the Trustees did not assign relative weights to the factors discussed above or deem any one or group of them to be controlling in and of itself.
151
STATEMENT REGARDING LIQUIDITY RISK MANAGEMENT PROGRAM (UNAUDITED)
Statement Regarding Liquidity Risk Management Program
This section discusses the operation and effectiveness of the Liquidity Risk Management Program for the RBC Funds established in accordance with Rule 22e-4 under the Investment Company Act of 1940 (the “Liquidity Rule”). RBC Global Asset Management (U.S.) Inc. (“RBC GAM”), the investment adviser to each Fund, serves as the Program Administrator and administers day-to-day implementation of the Program through a working group known as the Liquidity Risk Committee.
RBC GAM, as Program Administrator, provided the Board with a report addressing the operation of the Program during the year ending December 31, 2022 and assessing its adequacy and effectiveness of implementation, including, if applicable, the operation of any Fund’s highly liquid investments minimum and any material changes to the Program.
I. Key Conclusions of the Report
During the review period, the Program was implemented and operated effectively to achieve the goal of assessing and managing each Fund’s liquidity risk. Each Fund was able to meet requests for redemption without significant dilution of remaining investors’ interests in the Fund, and no Fund was required to set a highly liquid investments minimum. There were no material changes to the Program implemented during the review period.
II. Summary of the Review
A. Liquidity Risk Assessment and Review
Throughout the review period, the Program Administrator, in consultation with investment personnel, monitored the Funds’ portfolio liquidity and liquidity risk on an ongoing basis, as described in the Program, monthly in connection with recording the liquidity classification for each portfolio investment for reporting on Form N-PORT, and provided quarterly reports to the Board throughout the review period.
The Program Administrator also conducted an annual review assessing each Fund’s liquidity risk, in accordance with the requirements of the Program and the Liquidity Rule, taking into account the following factors, as applicable:
a. Each Fund’s investment strategy and liquidity of portfolio investments during both normal and reasonably foreseeable stressed conditions, including: (i) whether the Fund’s investment strategy is appropriate for an open-end fund; (ii) the extent to which the Fund’s strategy involves a relatively concentrated portfolio or large positions in particular issuers; (iii) the Fund’s use of borrowings for investment purposes; and (iv) the Fund’s use of derivatives (including for hedging purposes);
b. Short-term and long-term cash flow projections during both normal and reasonably foreseeable stressed conditions; and
c. Holdings of cash and cash equivalents, as well as borrowing arrangements and other funding sources.
Investment Strategy and Portfolio Liquidity. The Program Administrator considered the factors identified above, among others, during both normal and reasonably foreseeable stressed conditions as provided in the Program. Pursuant to the review, the Program Administrator determined that each Fund’s investment strategy and use of derivatives are appropriate for an open-end fund.
Cash Flow. The Funds’ cash flows did not have a material effect on the ability to meet redemptions during the review period.
Holdings of Cash and Borrowing Arrangements. As described in the Report, the Program Administrator determined that the Funds’ holdings of cash and borrowing arrangements were adequate for meeting the Funds’ expected cash flow needs to meet redemptions during the review period.
Cash Flow. The Funds’ cash flows did not have a material effect on the ability to meet redemptions during the Review Period.
152
STATEMENT REGARDING LIQUIDITY RISK MANAGEMENT PROGRAM (UNAUDITED)
Holdings of Cash and Borrowing Arrangements. As described in the Report, the Program Administrator determined that the Funds’ holdings of cash and borrowing arrangements were adequate for meeting the Funds’ expected cash flow needs to meet redemptions during the Review Period.
In light of the assessment and review as discussed above, the Program Administrator did not recommend any material changes in the management of the Funds’ liquidity risks, including with respect to any of the above factors.
B. Review of Initial Liquidity Risk
During the review period, four new RBC Funds were launched. The Program Administrator conducted initial liquidity risk reviews for each of these Funds and concluded that there were no significant liquidity risk concerns.
C. Portfolio Holdings Classifications
During the review period, each Fund’s portfolio holdings (including derivative investments) were classified monthly as Highly Liquid Investments, Moderately Liquid Investments, Less Liquid Investments and Illiquid Investments pursuant to the Program, as required by the Liquidity Rule.
During the review period, the Funds also classified portfolio investments (including, as applicable, derivatives transactions) according to asset class when appropriate, as described in the Program. In addition, pursuant to the Program, each Fund must separately classify and review any investment within an asset class if any market, trading, or investment-specific considerations are reasonably expected to significantly affect the liquidity of the investment as compared the Fund’s other portfolio holdings within that asset class. During the review period, there were no circumstances in which a Fund was required to separately classify any investment within an asset class.
Market Depth—Reasonably Anticipated Trading Size (“RATS”). In classifying and reviewing its portfolio investments or asset classes (as applicable), each Fund must determine whether trading varying portions of a position in a particular portfolio investment or asset class, in sizes that the Fund would reasonably anticipate trading, is reasonably expected to significantly affect its liquidity. Each Fund must take this determination into account when classifying the liquidity of that investment or asset class. There were no material changes to the RATS assumptions for the Funds during the review period.
Classification Review. As required by the Liquidity Rule, the Program Administrator reviewed the Funds’ liquidity classifications on a monthly basis as described in the Program. The Committee met monthly to review its portfolio investments’ classifications in connection with recording the liquidity classification for each portfolio investment for reporting on Form N-PORT. The Program Administrator oversaw the Funds’ process for classifying portfolio holdings under the Liquidity Rule and reviewed the classifications, as described in the Program. This review included a review of the methodology and data inputs used. Due to the Russian-Ukrainian conflict, there were widespread sanctions against Russian-affiliated assets resulting in affected Russian holdings being classified as illiquid. During the review period, the Program Administrator determined that there were no material operational issues with the process for classifying portfolio holdings.
D. Highly Liquid Investments Minimum
The Program Administrator reviewed the process and standards for determining that each Fund primarily holds investments that are highly liquid. There were no changes recommended in the Report with respect to the status of any Fund as a Primarily Highly Liquid Fund (“PHLF”) and, with one exception, each Fund qualified as a PHLF on an ongoing basis during the review period as described in the Report. The newly launched RBC International Small Cap Equity Fund did not initially qualify as a PHLF, however, it was expected to meet the relevant threshold as soon as its access to all the relevant trading markets had been completed. Accordingly, a highly liquid investments minimum was not required for any Fund during the review period pursuant to the relevant provisions of the Program.
E. Compliance with the 15% Limitation on Illiquid Investments
Pursuant to the Liquidity Rule, no Fund may acquire any illiquid investment if, after the acquisition, the Fund would have invested more than 15% of its assets in illiquid investments that are assets (the
153
STATEMENT REGARDING LIQUIDITY RISK MANAGEMENT PROGRAM (UNAUDITED)
“15% Limit”). The Program Administrator monitored compliance with the 15% Limit as described in the Program. At no time during the review period did any Fund breach the 15% limit.
F. Redemptions in Kind
There were no planned redemptions in-kind effected during the review period.
G. SEC Reporting
The Funds met their monthly Form N-PORT filing requirements during the period. No reports on Form N-LIQUID were required to be filed during the period and none were filed.
154
This Page Intentionally Left Blank
155
This Page Intentionally Left Blank
156
This Page Intentionally Left Blank
157
This Page Intentionally Left Blank
158
This Page Intentionally Left Blank
159
This Page Intentionally Left Blank
160
RBC Funds
P.O. Box 701
Milwaukee, WI 53201-0701
800-422-2766
www.rbcgam.com
Performance data represents past performance and does not guarantee future results. The principal value of an investment and investment return will fluctuate so that an investor’s shares, when redeemed, may be worth more or less than their original cost.
This report and the financial statements contained herein are provided for the information of RBC Funds shareholders. This report is not authorized for distribution to prospective investors unless preceded or accompanied by a current prospectus, which contains information concerning investment objectives, risks, charges and expenses of the funds. Please read the prospectus carefully before investing.
This report and the financial statements contained herein are not intended to be a forecast of future events, a guarantee of future results, or investment advice. There is no assurance that certain securities will remain in or out of each fund’s portfolio. The views expressed in this report reflect those of the portfolio managers through the year ended March 31, 2023.
NOT FDIC INSURED • NO BANK GUARANTEE • MAY LOSE VALUE
RBC Global Asset Management (U.S.) Inc. serves as investment advisor for the RBC Funds. RBC Funds are distributed by Quasar Distributors LLC.

The RBC Funds are pleased to offer shareholder reports printed entirely on Forest Stewardship Council® certified paper. FSC® certification ensures that the paper used in this report contains fiber from well-managed and responsibly harvested forests that meet strict environmental and socioeconomic standards.
RBCF-EM AR 03-23
Annual Report For the year ended March 31, 2023 RBC Short Duration Fixed Income Fund RBC Ultra-Short Fixed Income Fund About your Annual Report
| | |
LETTER FROM THE PORTFOLIO MANAGERS | | |
Dear Shareholder: | | |
RBC Global Asset Management (U.S.) Inc. (“RBC GAM-US)”) launched the RBC Short Duration Fixed Income Fund and RBC Ultra-Short Fixed Income Fund (the “Funds”) on December 30, 2013. We are pleased that the Funds have a long track record of delivering what we believe are high quality, diversified fixed income vehicles to clients seeking shorter-duration investment solutions. | | |
For the 12-month period ended March 31, 2023, the RBC Short Duration Fixed Income Fund had an annualized total return of 0.59% (Class I shares) compared to a return of 0.23% for the ICE BofA 1-3 Year US Corporate & Government Index, the Fund’s primary benchmark. The RBC Ultra-Short Fixed Income Fund had an annualized total return of 1.71% (Class I shares) compared to a return of 1.74% for the ICE BofA US 1-Year Treasury Bill Index, the Fund’s primary benchmark. The Funds’ performance during this period was dominated by the rapid rise in interest rates, especially on the front end of the yield curve. Persistently higher inflation drove the Federal Reserve (the “Fed”) to its most aggressive hiking cycle in years. This directly affected short-term fixed income markets and our Funds, as the magnitude and speed of the moves higher repriced bonds across the board. While performance was influenced by a massive movement in interest rates, the Funds’ focus on generating income through exposure to spread sectors allowed the funds to take advantage of the higher reset in yields. | | |
It was an extraordinary period defined by stubbornly high inflation and the Fed’s aggressive response to tighten monetary policy, sending interest rates soaring. Fighting inflation was the key focus for the Fed as U.S. Consumer Price Index (“CPI”) readings were at multi-decade highs, even peaking as high as 9.1% in June 2022. In response, the Fed delivered several policy rate hikes throughout the year, bringing the Fed Funds rate to a range of 4.75%-5.00% by the end of March 2023. For perspective, recall that at the beginning of March 2022, the policy rate was still in the range of 0.00%-0.25%. Worse than expected CPI inflation prints continued to drive the outsized hikes and intensify the Fed’s hawkish sentiment throughout most of 2022. Nevertheless, there was a substantial amount of optimism going into 2023. The upbeat market tone was driven by ascending inflation and positive economic data showing the U.S. economy still had good momentum, despite the Fed’s massive tightening cycle over the last year. The most obvious sign of this continued strength was in the labor market, with the monster January job number pushing the unemployment rate to a five-decade low of 3.4%. Even with a highly anticipated recession looming, the U.S. economy continues to demonstrate resiliency. By the end of the first quarter 2023, volatility returned due to the sudden collapse of Silicon Valley Bank and a general lack of confidence in the banking system that caused an extreme flight to quality. This stress was a clear sign that the historic pace of rate increases in 2022 are beginning to have broader economic consequences. The Fed is in an even more difficult position of continuing to push hard on inflation while trying to prevent other parts of the economy from breaking. Even so, the Fed has remained unwavering in their commitment to controlling inflation, even as economic cracks begin to show. The pace of hikes may have slowed, but their job is not yet done. | | |
U.S. Treasury yields have risen at an incredibly rapid pace during the period, especially on the very front end of the yield curve. The yield curve has been fully inverted since mid-2022, and by February 2023, the curve was severely inverted with the spread between 10- year Treasury and 2-year Treasury falling | | |
| | |
| | |
| | |
| | |
| | |
| | |
| | |
| | |
| | |
| | |
| | |
| | |
1
| | |
| | | LETTER FROM THE PORTFOLIO MANAGERS |
| | | to a 40-year low of -89 basis points (“bps”). The 2-year Treasury increased a total of 369 bps during 2022, while the 10-year Treasury increased 236 bps over the year. U.S. Treasury yields were particularly volatile in March 2023 on the heels of the banking stress and elevated risk aversion. The yield on the 2-year Treasury climbed to as high as 5.07% at the beginning of March and fell as a low as 3.77%, with plenty of wild intra-day swings around the height of the banking collapses before ending the quarter at 4.03%. The 10-year Treasury fell to 3.37% from a high of 4.05% in March, ending the period at 3.47%. Given the rapid rate movement upward, fixed income total return performance for most of 2022 was therefore extremely battered as a result of the rate volatility, but recovered a bit by the first quarter in 2023 given the drastic fall in yields. |
| | | Fixed income spreads widened for all major sectors in 2022, including investment grade credit spreads, which continued to widen in 2023 on the volatility induced by the banking sector. Over the period, investment grade (“IG”) corporate spreads widened to 138 bps by the end of March 2023, from a starting point of 116 bps at the end of March 2022. In 2022, IG corporates, as measured by the Bloomberg US Corporate Bond Index, returned -15.76%, one of the worst performing years in decades, however yields on IG corporates continued to improve higher. Even amid the volatility and uncertain path ahead, credit spreads remain well supported by solid fundamentals and continued demand from investors seeking attractive yields. In this environment, we remain cautious and continue to look for opportunities in investment grade credit and to take advantage of attractive higher yields to generate income. |
| | | Looking forward, we will continue to seek opportunities to positively impact performance by focusing on well researched security selection opportunities and maintaining a diversified portfolio of higher quality bonds. Thank you for your confidence and trust in the RBC Funds. |
| | | Brandon Swensen, CFA Senior Portfolio Manager RBC Global Asset Management (U.S.) Inc. |
| | |
| | | Brian Svendahl, CFA Senior Portfolio Manager RBC Global Asset Management (U.S.) Inc. |
| | | Past performance does not guarantee future results. |
| | | Opinions expressed are subject to change, are not guaranteed, and should not be considered a recommendation to buy or sell any security. Diversification does not assure a profit or protect against loss in a declining market. |
| | | Mutual fund investing involves risk. Principal loss is possible. Investments in debt securities typically decrease in value when interest rates rise. This risk is usually greater for longer-term debt securities. The Funds invest in mortgage-related securities including pass-throughs and collateralized mortgage obligations, which include additional risks that an investor should be aware of such as credit risk, prepayment risk, possible illiquidity and default, and increased susceptibility to adverse economic developments. Investments in lower- and non-rated securities present a greater risk of loss to principal and interest than higher-rated securities. The Funds may invest in derivatives, including futures contracts, which involve risks |
| | | |
| | | |
| | | |
| | | |
| | | |
| | | |
| | | |
| | | |
| | | |
| | | |
2
| | |
LETTER FROM THE PORTFOLIO MANAGERS | | |
different from and, in certain cases, greater than risks presented by more traditional investments. These risks are described more fully in the prospectus. | | |
The ICE BofA 1-3 Year US Corporate & Government Index tracks the performance of U.S. dollar-denominated, investment grade debt publicly issued in the U.S. domestic market, including U.S. Treasury, U.S. agency, foreign government, supranational, and corporate securities with a remaining term to final maturity less than three years. | | |
The ICE BofA US 1-Year Treasury Bill Index comprises a single issue purchased at the beginning of the month and held for a full month. At the end of the month that issue is sold and rolled into a newly selected issue. The issue selected at each month-end rebalancing is the outstanding Treasury Bill that matures closest to, but not beyond, one year from the rebalancing date. | | |
The Consumer Price Index is a measure of the average change over time in the prices paid by urban consumers for a market basket of consumer goods and services. | | |
The Bloomberg US Corporate Bond Index measures the investment grade, fixed-rate, taxable corporate bond market. It includes U.S. dollar-denominated securities publicly issued by U.S. and non-U.S. industrial, utility and financial issuers. | | |
You cannot invest directly in an index. | | |
The U.S. Treasury yield curve represents the yield of a U.S. Treasury bond at different maturities. A U.S. Treasury bond is theoretically considered to be free of default risk, and represents the minimum yield investors are prepared to accept for bonds of different maturities. | | |
Duration is a measure of price sensitivity of a debt security or a portfolio of debt securities relative to changes in interest rates. The longer a security’s duration, the more sensitive it will be to changes in interest rates. | | |
A basis point is a unit of measure equal to one one-hundredth of a percent. | | |
The federal funds rate is the interest rate banks charge one another for loans made overnight to maintain their reserve requirements. The Federal Open Market Committee, within the Federal Reserve, sets these rates. | | |
Spreads refer to the difference in yield between two similar securities. | | |
Fund holdings and/or sector allocations are subject to change at any time and are not recommendations to buy or sell any security. Current and future holdings are subject to risk. Please refer to the Schedule of Investments in this report for complete lists of Fund holdings. | | |
| | |
| | |
| | |
| | |
| | |
| | |
| | |
| | |
| | |
| | |
| | |
| | |
| | |
| | |
| | |
| | |
| | |
| | |
| | |
| | |
3
| | | | | | |
| | | | | | PORTFOLIO MANAGERS |
| | | | | | |
| | | |
| | | | | | RBC Global Asset Management (U.S.) Inc.(“RBC GAM-US”) serves as the investment advisor to the RBC Funds. RBC GAM-US employs a team approach to the management of the Funds, with no individual team member being solely responsible for the investment decisions. Each Fund’s management team has access to RBC GAM-US’s investment research and other money management resources. |

Brian Svendahl,CFA | | | | | | Brian Svendahl, CFA Senior Portfolio Manager Brian is a senior portfolio manager within the RBC GAM-US fixed income team. He has been the lead portfolio manager for RBC GAM-US’s impact investing strategies since 2006 along with many government and mortgage strategies. Brian joined RBC GAM-US in 2005 and has co-led the Minneapolis-based fixed income group since 2012. He had previously held several risk management, research, and trading positions with a large American multinational financial services company and first started in the investment industry in 1992. Brian earned a BS in economics from the University of Minnesota and a BBA in finance and MBA from the University of Minnesota Carlson School of Management. Brian is a CFA charterholder. |

Brandon T. Swensen, CFA | | | | | | Brandon T. Swensen, CFA Senior Portfolio Manager Brandon is a senior portfolio manager within the RBC GAM-US fixed income team. In addition to co-leading the fixed income group based in Minneapolis, he is a portfolio manager for several cash management and core solutions. Brandon joined the RBC GAM-US Mortgage and Government team in 2000, having earlier held positions as a research analyst covering asset-backed securities and credit, and as a financial analyst. Brandon began his career in the investment industry in 1998. He earned a BS in finance from St. Cloud State University and an MBA in finance from the University of St. Thomas. He is a CFA charterholder and member of the CFA Society of Minnesota. |
| | | | | | | |
| | | | | | |
| | | | | | |
| | | | | | |
| | | | | | |
| | | | | | |
| | | | | | |
| | | | | | |
| | | | | | |
| | | | | | |
| | | | | | |
| | | | | | |
| | | | | | |
| | | | | | |
| | | | | | |
| | | | | | |
| | | | | | |
| | | | | | |
| | | | | | |
4
|
|
PERFORMANCE SUMMARY (UNAUDITED) |
Average Annual Total Returns as of March 31, 2023 (Unaudited)
| | | | | | | | | | | | | | | | | | |
| | | 1
Year | | 5
Year | | | Since
Inception(a) | | | Net
Expense
Ratio(b)(c) | | | Gross
Expense
Ratio(b)(c) | |
RBC Short Duration Fixed Income Fund | | | | | | | | | | | | | | | | |
Class A | | | | | | | | | | | | | | | | | | |
- Including Max Sales Charge of 1.50% | | (1.04)% | | | 1.22% | | | | 1.33% | | | | | | | | | |
- At Net Asset Value | | 0.49% | | | 1.53% | | | | 1.49% | | | | 0.45% | | | | 1.22% | |
Class I | | | | | | | | | | | | | | | | | | |
- At Net Asset Value | | 0.59% | | | 1.63% | | | | 1.58% | | | | 0.35% | | | | 0.78% | |
| | | | | |
ICE BofA 1-3 | | | | | | | | | | | | | | | | | | |
Year US Corporate | | | | | | | | | | | | | | | | | | |
& Government Index(d) | | 0.23% | | | 1.27% | | | | 1.05% | | | | | | | | | |
RBC Ultra-Short Fixed Income Fund | | | | | | | | | | | | | | | | |
Class A | | | | | | | | | | | | | | | | | | |
- At Net Asset Value | | 1.61% | | | 1.55% | | | | 1.38% | | | | 0.38% | | | | 0.55% | |
Class I | | | | | | | | | | | | | | | | | | |
- At Net Asset Value | | 1.71% | | | 1.66% | | | | 1.47% | | | | 0.28% | | | | 0.48% | |
| | | | | |
ICE BofA US
1-Year Treasury Bill Index(d) | | 1.74% | | | 1.49% | | | | 1.04% | | | | | | | | | |
Parentheses indicate negative performance returns.
Performance data quoted represents past performance. Past performance is no guarantee of future results. Investment return and principal value of an investment will fluctuate so that an investor’s shares, when redeemed, may be worth more or less than their original cost. Current performance may be lower or higher than performance quoted. Performance shown reflects contractual fee waivers, without such fee waivers total returns would be reduced. For performance data current to the most recent month-end go to www.rbcgam.com. Please see footnotes below.
| (a) | The inception date (commencement date) is March 3, 2014 for Class A shares and December 30, 2013 for Class I shares. The performance in the table for the Class A shares prior to March 3, 2014 reflects the performance of the Class I shares since the Fund’s inception and has been adjusted to reflect fees and expenses of Class A. |
| (b) | The Funds’ expenses reflect expense ratios shown in the prospectus dated July 28, 2022, as supplemented September 9, 2022. For current expense ratio information, please see the Financial Highlights starting on page 32. |
| (c) | The advisor has contractually agreed to waive certain fees and/or pay certain operating expenses until at least July 31, 2024. |
| (d) | Each of the comparative indices is a widely recognized market value weighted measure of the return of securities, but do not include sales fees or operating expenses. You cannot invest directly in indices. |
The ICE BofA 1-3 Year US Corporate & Government Index tracks the performance of U.S. dollar-denominated, investment grade debt publicly issued in the U.S. domestic market, including U.S. Treasury, U.S. agency, foreign government, supranational, and corporate securities with a remaining term to final maturity less than three years. You cannot invest directly in an index.
The ICE BofA US 1-Year Treasury Bill Index comprises a single issue purchased at the beginning of the month and held for a full month. At the end of the month that issue is sold and rolled into a newly
5
PERFORMANCE SUMMARY (UNAUDITED)
selected issue. The issue selected at each month-end rebalancing is the outstanding Treasury Bill that matures closest to, but not beyond, one year from the rebalancing date. You cannot invest directly in an index.
6
| | | | | | | | | | | | |
| | | | | | | | |
This Page Intentionally Left Blank | | | | | | | | |
7
| | | | | | | | | | |
| | | | | | | | MANAGEMENT DISCUSSION AND ANALYSIS (UNAUDITED) |
| | | | |
| | | | | | | | RBC Short Duration Fixed Income Fund |
Investment Strategy | | | | | | | | The Fund seeks to achieve its investment objective by investing, under normal circumstances, at least 80% of its assets in fixed income securities. The fixed income securities in which the Fund may invest include, but are not limited to, bonds, municipal securities, mortgage-related and asset-backed securities, and obligations of U.S. and foreign governments and their agencies. The Fund may invest in securities with fixed, floating or variable rates of interest. The Fund may invest up to 25% of its net assets in securities that are non-investment grade (high yield/junk bond). The Fund typically seeks to maintain a duration of three years or less. |
Performance | | | | | | | | For the 12-month period ended March 31, 2023, the Fund had an annualized total return of 0.59% (Class I). That compares to an annualized total return of 0.23% for the ICE BofA 1-3 Year US Corporate & Government Index, the Fund’s primary benchmark. |
Factors That Contributed to Relative Returns | | | | | | | | • Income from the Fund’s overweight in investment grade corporate bonds and securitized bonds • An overweight to Industrials was a large contributor, and positive security selection in Consumer Non-Cyclicals and Basic Industry credits • Exposure to Asset-Backed Securities (ABS) • The Fund’s curve positioning |
Factors That Detracted From Relative Returns | | | | | | | | • An allocation to non-agency commercial mortgage-backed securities (“CMBS”) • A headwind to performance in 2022 was the rapid increase in interest rates. |
| | | | | | | | Mutual fund investing involves risk. Principal loss is possible. Investments in debt securities typically decrease in value when interest rates rise. This risk is usually greater for longer-term debt securities. The Fund invests in mortgage-related securities including pass-throughs and collateralized mortgage obligations, which include additional risks that an investor should be aware of such as credit risk, prepayment risk, possible illiquidity and default, and increased susceptibility to adverse economic developments. Investments in lower- and non-rated securities present a greater risk of loss to principal and interest than higher-rated securities. The Fund may invest in derivatives, including futures contracts, which involve risks different from and, in certain cases, greater than risks presented by more traditional investments. These risks are described more fully in the prospectus. The ICE BofA 1-3 Year US Corporate & Government Index tracks the performance of U.S. dollar-denominated, investment grade debt publicly issued in the U.S. domestic market, including U.S. Treasury, U.S. agency, foreign government, supranational, and corporate securities with a remaining term to final maturity less than three years. You cannot invest directly in an index. Fund holdings and/or sector allocations are subject to change at any time and are not recommendations to buy or sell any security. Current and future holdings are subject to risk. Past performance is not a guarantee of future results. |
8
| | | | | | | | | | | | | | | | |
MANAGEMENT DISCUSSION AND ANALYSIS (UNAUDITED) | | | | | | | |
RBC Short Duration Fixed Income Fund | | | | | | | | | | |
The Fund seeks to achieve a high level of current income consistent with preservation of capital. | | | | | | | Investment Objective |
ICE BofA 1-3 Year US Corporate & Government Index | | | | | | | Benchmark |
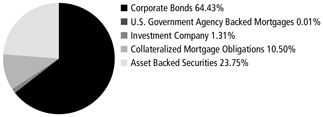
| | | | | | | Asset Allocation as of 3/31/23 (% of Fund’s investments) |
| | | | | | |
Hewlett Packard Enterprise Co.,
6.10%, 4/1/26 | | | 1.70% | | | Exeter Automobile Receivables
Trust, 6.69%, 6/15/29 | | | 1.28% | | | | | | | Top Ten Holdings (excluding investment companies) (as of 3/31/23) (% of Fund’s net assets) |
GM Financial Consumer
Automobile Receivables Trust,
Series 2023-1, Class B, 5.03%,
9/18/28 | | | 1.68% | | | Mitsubishi UFJ Financial Group,
Inc., 5.06%, 9/12/25 | | | 1.13% | | | | | |
AmeriCredit Automobile
Receivables Trust, Series
2019-3, Class D, 2.58%,
9/18/25 | | | | | | Mitsubishi UFJ Financial Group,
Inc., 5.72%, 2/20/26 | | | 1.10% | | | | | |
Exeter Automobile Receivables
Trust, Series 2019-3A, Class E,
4.00%, 8/17/26 | | | 1.56% | | | TransCanada PipeLines Ltd.,
6.20%, 3/9/26 | | | 1.02% | | | | | |
| | | | | | UBS Group AG, 4.49%, 5/12/26 | | | 0.97% | | | | | |
| | | 1.33% | | | Take-Two Interactive Software,
Inc., 3.30%, 3/28/24 | | | 0.95% | | | | | |
*A listing of all portfolio holdings can be found beginning on page 13 | | | | | | | | | | | |
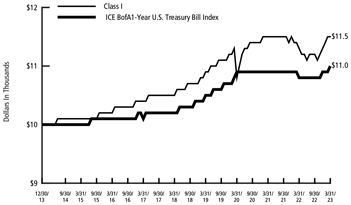 | | | | | | | | | | Growth of $10,000 Initial Investment Since Inception (12/30/13) |
| The graph reflects an initial hypothetical investment of $10,000 over the period from December 30, 2013 (commencement of operations) to March 31, 2023 and is based on Class I shares. The Fund’s total return includes reinvested dividends and capital gains. The Fund’s total return also includes operating expenses that reduce return while the total return of the index does not. The graph does not reflect the deduction of taxes that a shareholder would pay on fund distributions or redemption of fund shares. Performance of other share classes will vary due to differences in fee structures. This chart does not imply any future performance. | | | | | | | |
| | | | | | | | | | | | | | | | |
9
| | | | | | | | | | |
| | | | | | | | MANAGEMENT DISCUSSION AND ANALYSIS (UNAUDITED) |
| | | | |
| | | | | | | | RBC Ultra-Short Fixed Income Fund |
Investment Strategy | | | | | | | | The Fund seeks to achieve its investment objective by investing, under normal circumstances, at least 80% of its assets in fixed income securities. The fixed income securities in which the Fund may invest include, but are not limited to, bonds, municipal securities, mortgage-related and asset-backed securities, and obligations of U.S. and foreign governments and their agencies. The Fund may invest in securities with fixed, floating or variable rates of interest. The Fund may invest up to 25% of its net assets in securities that are non-investment grade (high yield/junk bond). The Fund typically seeks to maintain a duration of 6 to 18 months. |
Performance | | | | | | | | For the 12-month period ended March 31, 2023, the Fund had an annualized total return of 1.71% (Class I). That compares to an annualized total return of 1.74% for the ICE BofA US 1-Year Treasury Bill Index, the Fund’s primary benchmark. |
Factors That Contributed to Relative Returns | | | | | | | | • Income from the Fund’s overweight in investment grade corporate bonds and securitized bonds • Allocations to Industrials and Utilities • Yield curve positioning with a bias away from the very front-end rates, relative to the index |
Factors That Detracted From Relative Returns | | | | | | | | • A bias away from Treasuries in favor of spread sectors during a period when spreads generally widened • Allocations to Financials and asset-backed securities (ABS) • Exposure to Non-Agency Commercial Mortgage-Backed Securities (“CMBS”) |
| | | | | | | | Mutual fund investing involves risk. Principal loss is possible. Investments in debt securities typically decrease in value when interest rates rise. This risk is usually greater for longer-term debt securities. The Fund invests in mortgage-related securities including pass-throughs and collateralized mortgage obligations, which include additional risks that an investor should be aware of such as credit risk, prepayment risk, possible illiquidity and default, and increased susceptibility to adverse economic developments. Investments in lower- and non-rated securities present a greater risk of loss to principal and interest than higher-rated securities. The Fund may invest in derivatives, including futures contracts, which involve risks different from and, in certain cases, greater than risks presented by more traditional investments. These risks are described more fully in the prospectus. The ICE BofA US 1-Year Treasury Bill Index comprises a single issue purchased at the beginning of the month and held for a full month. At the end of the month that issue is sold and rolled into a newly selected issue. The issue selected at each month-end rebalancing is the outstanding Treasury Bill that matures closest to, but not beyond, one year from the rebalancing date. You cannot invest directly in an index. Fund holdings and/or sector allocations are subject to change at any time and are not recommendations to buy or sell any security. Current and future holdings are subject to risk. Past performance is not a guarantee of future results. |
| | | | | | | | |
| | | | | | | | |
| | | | | | | | |
| | | | | | | | |
10
| | | | | | | | | | | | | | | | |
MANAGEMENT DISCUSSION AND ANALYSIS (UNAUDITED) | | | | | | | |
RBC Ultra-Short Fixed Income Fund | | | | | | | | | | |
The Fund seeks to achieve a high level of current income consistent with preservation of capital. | | | | | | | Investment Objective |
ICE BofA US 1-Year Treasury Bill Index | | | | | | | Benchmark |
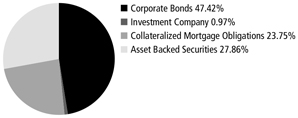
| | | | | | | Asset Allocation as of 3/31/23 (% of Fund’s investments) |
| | | | | | |
Exeter Automobile Receivables
Trust, Series 2019-3A, Class E,
4.00%, 8/17/26 | | | 2.86% | | | SMRT, Series 2022-MINI, Class D,
(Term SOFR 1M + 1.950%),
6.78%, 1/15/39 | | | 1.72% | | | | | | | Top Ten Holdings (excluding investment companies) (as of 3/31/23) (% of Fund’s net assets) |
Carvana Auto Receivables Trust,
Series 2021-N3, Class D,
1.58%, 6/12/28 | | | 2.05% | | | Dell Equipment Finance Trust,
Series 2021-2, Class D,
1.21%, 6/22/27 | | | 1.70% | | | | | |
Eagle RE Ltd., Series 2019-1,
Class M1B, (LIBOR USD
1-Month + 1.800%), 6.65%, 4/25/29 | | | 1.89% | | | UBS Group AG,
4.49%, 5/12/26 | | | 1.70% | | | | | |
Exeter Automobile Receivables
Trust, Series 2019-1A,
Class E, 5.20%, 1/15/26 | | | 1.87% | | | Freddie Mac STACR REMIC Trust,
Series 2022-DNA2, Class M1B,
(Secured Overnight Financing Rate 30 Day Average + 2.400%), 6.96%, 2/25/42 | | | 1.67% | | | | | |
Vista Point Securitization Trust,
Series 2020-1, Class M1,
4.15%, 3/25/65 | | | 1.75% | | | Ellington Financial Mortgage Trust,
Series 2019-2, Class M1,
3.47%, 11/25/59 | | | 1.66% | | | | | |
*A listing of all portfolio holdings can be found beginning on page 21 | | | | | | | | |
| | | | | | | | |
| | | | | |
| | | | | | | | | | | | | | |
| | | | | | | | | | | | | | | | |
| | | | | | | | | | | | | | | | |
| | | | | | | | | | | | | | | | |
| | | | | | | | | | | | | | | | |
| | | | | | | | | | | | | | | | |
| | | | | | | | | | | | | | | | |
| | | | | | | | | | | | | | | | |
| | | | | | | | | | | | | | | | |
| | | | | | | | | | | | | | | | |
| | | | | | | | | | | | | | | | |
| | | | | | | | | | | | | | | | |
| | | | | | | | | | | | | | | | |
| | | | | | | | | | | | | | | | |
11
| | | | | | | | |
| | | | | | | | MANAGEMENT DISCUSSION AND ANALYSIS (UNAUDITED) |
| | | | |
| | | | | | | | RBC Ultra-Short Fixed Income Fund |
Growth of
$10,000 Initial Investment Since Inception (12/30/13) | | | | | | | |
|
| | | | | | | | The graph reflects an initial hypothetical investment of $10,000 over the period from December 30, 2013 (commencement of operations) to March 31, 2023 and is based on Class I shares. The Fund’s total return includes reinvested dividends and capital gains. The Fund’s total return also includes operating expenses that reduce return while the total return of the index does not. The graph does not reflect the deduction of taxes that a shareholder would pay on fund distributions or redemption of fund shares. Performance of other share classes will vary due to differences in fee structures. This chart does not imply any future performance. |
| | | | | | | | |
| | | | | | | | |
| | | | | | | | |
| | | | | | | | |
| | | | | | | | |
| | | | | | | | |
| | | | | | | | |
| | | | | | | | |
| | | | | | | | |
| | | | | | | | |
| | | | | | | | |
| | | | | | | | |
| | | | | | | | |
| | | | | | | | |
| | | | | | | | |
| | | | | | | | |
| | | | | | | | |
| | | | | | | | |
| | | | | | | | |
| | | | | | | | |
12
|
SCHEDULE OF PORTFOLIO INVESTMENTS |
RBC Short Duration Fixed Income Fund |
|
| March 31, 2023 |
| | | | | | |
Principal
Amount | | | | Value | |
| |
Corporate Bonds — 63.74% | | | | |
Basic Materials — 0.83% | | | | |
| $200,000 | | Celanese US Holdings LLC, 5.90%, 7/5/24 | | $ | 200,094 | |
| 100,000 | | International Flavors & Fragrances, Inc., 1.23%, 10/1/25(a) | | | 89,538 | |
| 100,000 | | Nutrien Ltd., 5.90%, 11/7/24 | | | 101,436 | |
| 100,000 | | Nutrien Ltd., 5.95%, 11/7/25 | | | 102,877 | |
| | | | | | |
| | | | | 493,945 | |
| | | | | | |
Communications — 1.24% | | | | |
| 300,000 | | Charter Communications Operating LLC / Charter Communications Operating Capital, 4.50%, 2/1/24 | | | 296,872 | |
| 250,000 | | Rogers Communications, Inc., 2.95%, 3/15/25(a) | | | 240,603 | |
| 196,000 | | Walt Disney Co. (The), 7.75%, 1/20/24 | | | 199,805 | |
| | | | | | |
| | | | | 737,280 | |
| | | | | | |
Consumer, Cyclical — 6.73% | | | | |
| 200,000 | | 7-Eleven, Inc., 0.80%, 2/10/24(a) | | | 191,643 | |
| 365,000 | | Aptiv Plc / Aptiv Corp., 2.40%, 2/18/25 | | | 347,498 | |
| 175,000 | | Brunswick Corp., 0.85%, 8/18/24 | | | 163,714 | |
| 500,000 | | Daimler Truck Finance North America LLC, 5.15%, 1/16/26(a) | | | 502,071 | |
| 300,000 | | Daimler Truck Finance North America LLC, 5.20%, 1/17/25(a) | | | 300,567 | |
| 275,000 | | Daimler Truck Finance North America LLC, (SOFR RATE + 1.000%), 5.53%, 4/5/24(a),(b) | | | 273,886 | |
| 500,000 | | Ford Motor Credit Co. LLC, 3.66%, 9/8/24 | | | 481,413 | |
| 165,000 | | General Motors Financial Co., Inc., 4.00%, 1/15/25 | | | 160,872 | |
| 150,000 | | General Motors Financial Co., Inc., 4.15%, 6/19/23 | | | 149,461 | |
| 265,000 | | General Motors Financial Co., Inc., (SOFR RATE + 1.040%), 5.80%, 2/26/27(b) | | | 258,404 | |
| 260,000 | | Volkswagen Group of America Finance LLC, 0.88%, 11/22/23(a) | | | 252,329 | |
| 250,000 | | Volkswagen Group of America Finance LLC, 3.95%, 6/6/25(a) | | | 245,197 | |
| 250,000 | | Volkswagen Group of America Finance LLC, 4.25%, 11/13/23(a) | | | 248,022 | |
| 180,000 | | Warnermedia Holdings, Inc., 3.43%, 3/15/24(a) | | | 175,946 | |
| 250,000 | | Warnermedia Holdings, Inc., 6.41%, 3/15/26 | | | 251,212 | |
| | | | | | |
| | | | | 4,002,235 | |
| | | | | | |
Consumer, Non-cyclical — 8.90% | | | | |
| 375,000 | | Amgen, Inc., 5.15%, 3/2/28 | | | 382,958 | |
| 182,000 | | Becton Dickinson & Co., 3.36%, 6/6/24 | | | 178,653 | |
| 275,000 | | Conagra Brands, Inc., 0.50%, 8/11/23 | | | 270,084 | |
| 475,000 | | CVS Health Corp., 5.00%, 2/20/26 | | | 480,486 | |
| 200,000 | | Elevance Health, Inc., 4.90%, 2/8/26 | | | 199,430 | |
| 250,000 | | EMD Finance LLC, 3.25%, 3/19/25(a) | | | 242,250 | |
| 475,000 | | GE HealthCare Technologies, Inc., 5.55%, 11/15/24(a) | | | 477,871 | |
| 550,000 | | GE HealthCare Technologies, Inc., 5.60%, 11/15/25(a) | | | 556,824 | |
| 225,000 | | Global Payments, Inc., 1.50%, 11/15/24 | | | 211,911 | |
| 525,000 | | Haleon UK Capital Plc, 3.13%, 3/24/25 | | | 507,310 | |
| 350,000 | | HCA, Inc., 5.38%, 2/1/25 | | | 350,115 | |
| 250,000 | | Health Care Service Corp. A Mutual Legal Reserve Co., 1.50%, 6/1/25(a) | | | 231,014 | |
13
|
SCHEDULE OF PORTFOLIO INVESTMENTS |
RBC Short Duration Fixed Income Fund (cont.) |
|
| March 31, 2023 |
| | | | | | |
Principal
Amount | | | | Value | |
| |
| $175,000 | | Humana, Inc., 0.65%, 8/3/23 | | $ | 172,533 | |
| 200,000 | | JBS USA LUX SA / JBS USA Food Co. / JBS USA Finance, Inc., 2.50%, 1/15/27(a) | | | 176,225 | |
| 400,000 | | JDE Peet’s NV, 0.80%, 9/24/24(a) | | | 372,552 | |
| 275,000 | | PerkinElmer, Inc., 0.85%, 9/15/24 | | | 257,767 | |
| 240,000 | | Zimmer Biomet Holdings, Inc., 1.45%, 11/22/24 | | | 226,887 | |
| | | | | | |
| | | 5,294,870 | |
| | | | | | |
Energy — 5.26% | | | | |
| 100,000 | | Baker Hughes Holdings LLC / Baker Hughes Co.-Obligor, Inc., 2.06%, 12/15/26 | | | 90,670 | |
| 400,000 | | Continental Resources, Inc., 2.27%, 11/15/26(a) | | | 354,586 | |
| 225,000 | | Enbridge, Inc., 0.55%, 10/4/23 | | | 219,106 | |
| 500,000 | | Enbridge, Inc., 2.50%, 1/15/25 | | | 479,798 | |
| 250,000 | | Energy Transfer LP, 4.50%, 4/15/24 | | | 247,103 | |
| 500,000 | | Enterprise Products Operating LLC, 5.05%, 1/10/26 | | | 507,108 | |
| 70,000 | | EQT Corp., 5.68%, 10/1/25 | | | 69,860 | |
| 200,000 | | Kinder Morgan Energy Partners LP, 4.25%, 9/1/24 | | | 197,732 | |
| 125,000 | | Kinder Morgan, Inc., 1.75%, 11/15/26 | | | 112,622 | |
| 250,000 | | Kinder Morgan, Inc., 4.30%, 6/1/25 | | | 246,286 | |
| 600,000 | | TransCanada PipeLines Ltd., 6.20%, 3/9/26 | | | 604,162 | |
| | | | | | |
| | | 3,129,033 | |
| | | | | | |
Financial — 24.64% | | | | |
| 300,000 | | AerCap Ireland Capital DAC / AerCap Global Aviation Trust, 4.88%, 1/16/24 | | | 296,486 | |
| 500,000 | | American Tower Corp., REIT, 5.00%, 2/15/24 | | | 498,239 | |
| 250,000 | | Athene Global Funding, 1.61%, 6/29/26(a) | | | 216,463 | |
| 125,000 | | Athene Global Funding, 1.73%, 10/2/26(a) | | | 108,462 | |
| 250,000 | | Bank of America Corp., 5.08%, 1/20/27(c) | | | 249,457 | |
| 510,000 | | Barclays Plc, 5.30%, 8/9/26(c) | | | 499,948 | |
| 149,000 | | Camden Property Trust, REIT, 4.88%, 6/15/23 | | | 148,796 | |
| 235,000 | | Capital One Financial Corp., 2.64%, 3/3/26(c) | | | 217,788 | |
| 390,000 | | Charles Schwab Corp. (The), (Secured Overnight Financing Average Index + 1.050%), 5.83%, 3/3/27(b) | | | 372,236 | |
| 170,000 | | Citigroup, Inc., 1.28%, 11/3/25(c) | | | 158,768 | |
| 350,000 | | Citigroup, Inc., 4.04%, 6/1/24(c) | | | 348,955 | |
| 115,000 | | Citigroup, Inc., 4.14%, 5/24/25(c) | | | 113,067 | |
| 350,000 | | Citigroup, Inc., (SOFR RATE + 0.770%), 5.58%, 6/9/27(b) | | | 342,656 | |
| 480,000 | | Comerica Bank, 2.50%, 7/23/24 | | | 440,800 | |
| 275,000 | | Corebridge Financial, Inc., 3.50%, 4/4/25(a) | | | 264,495 | |
| 300,000 | | Credit Agricole SA, 3.75%, 4/24/23(a) | | | 299,770 | |
| 275,000 | | Crown Castle, Inc., REIT, 1.35%, 7/15/25 | | | 253,562 | |
| 325,000 | | Deutsche Bank AG, Series E, 0.96%, 11/8/23 | | | 311,713 | |
| 475,000 | | Deutsche Bank AG, 4.16%, 5/13/25 | | | 454,192 | |
| 200,000 | | DNB Bank ASA, 1.54%, 5/25/27(a),(c) | | | 177,611 | |
| 425,000 | | Fifth Third Bank NA, 5.85%, 10/27/25(c) | | | 419,886 | |
| 300,000 | | GA Global Funding Trust, 2.25%, 1/6/27(a) | | | 268,207 | |
| 150,000 | | Goldman Sachs Group, Inc. (The), 0.93%, 10/21/24(c) | | | 146,053 | |
14
|
SCHEDULE OF PORTFOLIO INVESTMENTS |
RBC Short Duration Fixed Income Fund (cont.) |
|
| March 31, 2023 |
| | | | | | |
Principal
Amount | | | | Value | |
| |
| $ 220,000 | | Goldman Sachs Group, Inc. (The), 1.76%, 1/24/25(c) | | $ | 213,265 | |
| 200,000 | | HSBC Holdings Plc, 0.98%, 5/24/25(c) | | | 188,301 | |
| 382,000 | | Huntington Bancshares, Inc., 2.63%, 8/6/24 | | | 357,454 | |
| 455,000 | | Huntington National Bank (The), 5.70%, 11/18/25(c) | | | 440,339 | |
| 100,000 | | Jackson Financial, Inc., 1.13%, 11/22/23 | | | 96,984 | |
| 430,000 | | JPMorgan Chase & Co., 3.85%, 6/14/25(c) | | | 422,540 | |
| 200,000 | | JPMorgan Chase & Co., (LIBOR USD 3-Month + 0.890%), 5.71%, 7/23/24(b) | | | 199,957 | |
| 425,000 | | KeyBank NA, 4.15%, 8/8/25 | | | 402,691 | |
| 510,000 | | Lloyds Banking Group Plc, 4.72%, 8/11/26(c) | | | 496,213 | |
| 425,000 | | Manufacturers & Traders Trust Co., 4.65%, 1/27/26 | | | 400,197 | |
| 675,000 | | Mitsubishi UFJ Financial Group, Inc., 5.06%, 9/12/25(c) | | | 670,073 | |
| 650,000 | | Mitsubishi UFJ Financial Group, Inc., 5.72%, 2/20/26(c) | | | 651,632 | |
| 150,000 | | Morgan Stanley, MTN, 1.16%, 10/21/25(c) | | | 140,104 | |
| 355,000 | | Morgan Stanley, 3.62%, 4/17/25(c) | | | 348,439 | |
| 465,000 | | Morgan Stanley, 5.05%, 1/28/27(c) | | | 464,128 | |
| 350,000 | | Nomura Holdings, Inc., 5.10%, 7/3/25 | | | 344,161 | |
| 250,000 | | Realty Income Corp., REIT, 4.60%, 2/6/24 | | | 247,990 | |
| 300,000 | | Santander Holdings USA, Inc., 4.26%, 6/9/25(c) | | | 289,517 | |
| 250,000 | | Societe Generale SA, (SOFR RATE + 1.050%), 5.67%, 1/21/26(a),(b) | | | 243,928 | |
| 600,000 | | UBS Group AG, 4.49%, 5/12/26(a),(c) | | | 578,823 | |
| 110,000 | | VICI Properties LP, REIT, 4.38%, 5/15/25 | | | 106,770 | |
| 420,000 | | Wells Fargo & Co., GMTN, 3.53%, 3/24/28(c) | | | 396,250 | |
| 360,000 | | Wells Fargo & Co., GMTN, 3.91%, 4/25/26(c) | | | 349,061 | |
| | | | | | |
| | | | | 14,656,427 | |
| | | | | | |
Industrial — 2.60% | | | | |
| 200,000 | | Boeing Co. (The), 1.43%, 2/4/24 | | | 193,304 | |
| 150,000 | | Boeing Co. (The), 2.20%, 2/4/26 | | | 139,142 | |
| 300,000 | | CNH Industrial Capital LLC, 1.45%, 7/15/26 | | | 268,853 | |
| 300,000 | | Huntington Ingalls Industries, Inc., 0.67%, 8/16/23 | | | 294,076 | |
| 425,000 | | Teledyne Technologies, Inc., 0.95%, 4/1/24 | | | 407,415 | |
| 250,000 | | Trane Technologies Luxembourg Finance SA, 3.55%, 11/1/24 | | | 244,373 | |
| | | | | | |
| | | | | 1,547,163 | |
| | | | | | |
Technology — 6.70% | | | | |
| 80,000 | | Dell International LLC / EMC Corp., 5.45%, 6/15/23 | | | 79,975 | |
| 1,000,000 | | Hewlett Packard Enterprise Co., 6.10%, 4/1/26 | | | 1,008,366 | |
| 260,000 | | Kyndryl Holdings, Inc., 2.05%, 10/15/26 | | | 227,249 | |
| 375,000 | | Microchip Technology, Inc., 0.97%, 2/15/24 | | | 359,995 | |
| 100,000 | | Microchip Technology, Inc., 0.98%, 9/1/24 | | | 94,236 | |
| 100,000 | | NXP BV / NXP Funding LLC / NXP USA, Inc., 2.70%, 5/1/25 | | | 94,843 | |
| 295,000 | | Oracle Corp., 5.80%, 11/10/25 | | | 302,366 | |
| 300,000 | | Qorvo, Inc., 1.75%, 12/15/24(a) | | | 279,773 | |
| 225,000 | | Roper Technologies, Inc., 2.35%, 9/15/24 | | | 216,542 | |
| 125,000 | | Skyworks Solutions, Inc., 0.90%, 6/1/23 | | | 124,082 | |
| 575,000 | | Take-Two Interactive Software, Inc., 3.30%, 3/28/24 | | | 562,789 | |
15
|
SCHEDULE OF PORTFOLIO INVESTMENTS |
RBC Short Duration Fixed Income Fund (cont.) |
|
| March 31, 2023 |
| | | | | | |
Principal
Amount | | | | Value | |
| |
| $200,000 | | TSMC Arizona Corp., 1.75%, 10/25/26 | | $ | 181,580 | |
| 250,000 | | VMware, Inc., 1.00%, 8/15/24 | | | 235,677 | |
| 225,000 | | Western Digital Corp., 4.75%, 2/15/26 | | | 216,719 | |
| | | | | | |
| | | 3,984,192 | |
| | | | | | |
Utilities — 6.84% | | | | |
| 275,000 | | Ameren Corp., 1.95%, 3/15/27 | | | 246,651 | |
| 400,000 | | American Electric Power Co., Inc., Series M, 0.75%, 11/1/23 | | | 390,584 | |
| 100,000 | | American Electric Power Co., Inc., 2.03%, 3/15/24 | | | 96,976 | |
| 250,000 | | CenterPoint Energy, Inc., (TBA), 1.45%, 6/1/26 | | | 226,357 | |
| 370,000 | | Consolidated Edison, Inc., Series A, 0.65%, 12/1/23 | | | 359,072 | |
| 280,000 | | Emera US Finance LP, 0.83%, 6/15/24 | | | 264,402 | |
| 500,000 | | Evergy, Inc., 2.45%, 9/15/24 | | | 479,909 | |
| 335,000 | | Eversource Energy, 4.20%, 6/27/24 | | | 331,400 | |
| 250,000 | | Fells Point Funding Trust, 3.05%, 1/31/27(a) | | | 232,080 | |
| 325,000 | | OGE Energy Corp., 0.70%, 5/26/23 | | | 322,688 | |
| 325,000 | | Pacific Gas and Electric Co., 1.70%, 11/15/23 | | | 316,729 | |
| 190,000 | | Southern Co. (The), 4.48%, 8/1/24 | | | 187,482 | |
| 300,000 | | System Energy Resources, Inc., 6.00%, 4/15/28 | | | 307,527 | |
| 310,000 | | Vistra Operations Co. LLC, 5.13%, 5/13/25(a) | | | 302,535 | |
| | | | | | |
| | | 4,064,392 | |
| | | | | | |
| |
Total Corporate Bonds | | | 37,909,537 | |
| | | | | | |
(Cost $39,102,100) | | | | |
| |
Asset Backed Securities — 23.49% | | | | |
| 240,000 | | AmeriCredit Automobile Receivables Trust, Series 2019-1, Class D, 3.62%, 3/18/25 | | | 237,503 | |
| 74,062 | | AmeriCredit Automobile Receivables Trust, Series 2019-2, Class C, 2.74%, 4/18/25 | | | 73,448 | |
| 955,000 | | AmeriCredit Automobile Receivables Trust, Series 2019-3, Class D, 2.58%, 9/18/25 | | | 926,683 | |
| 315,000 | | AmeriCredit Automobile Receivables Trust, Series 2021-1, Class D, 1.21%, 12/18/26 | | | 284,804 | |
| 250,000 | | CarMax Auto Owner Trust, Series 2019-3, Class C, 2.60%, 6/16/25 | | | 246,243 | |
| 310,000 | | CarMax Auto Owner Trust, Series 2019-4, Class C, 2.60%, 9/15/25 | | | 303,037 | |
| 175,000 | | CarMax Auto Owner Trust, Series 2020-1, Class C, 2.34%, 11/17/25 | | | 169,896 | |
| 506,000 | | CarMax Auto Owner Trust, Series 2020-2, Class D, 5.75%, 5/17/27 | | | 504,400 | |
| 256,127 | | Carvana Auto Receivables Trust, Series 2021-N1, Class D, 1.50%, 1/10/28 | | | 245,034 | |
| 500,000 | | Carvana Auto Receivables Trust, Series 2021-N3, Class D, 1.58%, 6/12/28 | | | 466,137 | |
| 430,000 | | Carvana Auto Receivables Trust, Series 2021-N4, Class D, 2.30%, 9/11/28 | | | 377,232 | |
16
|
SCHEDULE OF PORTFOLIO INVESTMENTS |
RBC Short Duration Fixed Income Fund (cont.) |
|
| March 31, 2023 |
| | | | | | |
Principal
Amount | | | | Value | |
| |
| $ 470,000 | | Dell Equipment Finance Trust, Series 2021-2, Class D, 1.21%, 6/22/27(a) | | | $ 445,576 | |
| 35,307 | | Drive Auto Receivables Trust, Series 2019-4, Class D, 2.70%, 2/16/27 | | | 34,737 | |
| 400,000 | | Drive Auto Receivables Trust, Series 2021-1, Class D, 1.45%, 1/16/29 | | | 378,011 | |
| 566,000 | | Drive Auto Receivables Trust, Series 2021-2, Class D, 1.39%, 3/15/29 | | | 527,069 | |
| 750,000 | | Exeter Automobile Receivables Trust, 6.69%, 6/15/29 | | | 762,002 | |
| 810,000 | | Exeter Automobile Receivables Trust, Series 2019-3A, Class E, 4.00%, 8/17/26(a) | | | 789,068 | |
| 282,609 | | Exeter Automobile Receivables Trust, Series 2019-4A, Class D, 2.58%, 9/15/25(a) | | | 277,240 | |
| 330,000 | | Exeter Automobile Receivables Trust, Series 2022-1A, Class D, 3.02%, 6/15/28 | | | 305,608 | |
| 300,000 | | Exeter Automobile Receivables Trust, Series 2022-5A, Class B, 5.97%, 3/15/27 | | | 301,583 | |
| 300,000 | | Ford Credit Auto Lease Trust, Series 2021-A, Class C, 0.78%, 9/15/25 | | | 296,717 | |
| 325,000 | | GM Financial Automobile Leasing Trust, Series 2021-1, Class D, 1.01%, 7/21/25 | | | 320,116 | |
| 410,000 | | GM Financial Consumer Automobile Receivables Trust, Series 2019-3, Class B, 2.32%, 12/16/24 | | | 409,549 | |
| 120,000 | | GM Financial Consumer Automobile Receivables Trust, Series 2019-3, Class C, 2.62%, 1/16/25 | | | 119,880 | |
| 80,000 | | GM Financial Consumer Automobile Receivables Trust, Series 2020-1, Class B, 2.03%, 4/16/25 | | | 78,575 | |
| 60,000 | | GM Financial Consumer Automobile Receivables Trust, Series 2020-1, Class C, 2.18%, 5/16/25 | | | 58,972 | |
| 1,000,000 | | GM Financial Consumer Automobile Receivables Trust, Series 2023-1, Class B, 5.03%, 9/18/28 | | | 1,001,781 | |
| 218,151 | | MVW LLC, Series 2021-2A, Class B, 1.83%, 5/20/39(a) | | | 197,020 | |
| 250,000 | | OZLM VIII Ltd., Series 2014-8A, Class A2R3, (LIBOR USD 3-Month + 1.650%), 6.44%, 10/17/29(a),(b) | | | 243,775 | |
| 22,173 | | Santander Drive Auto Receivables Trust, Series 2019-3, Class D, 2.68%, 10/15/25 | | | 22,067 | |
| 400,000 | | Santander Drive Auto Receivables Trust, Series 2021-1, Class D, 1.13%, 11/16/26 | | | 380,216 | |
| 400,000 | | Santander Drive Auto Receivables Trust, Series 2021-2, Class D, 1.35%, 7/15/27 | | | 377,346 | |
| 500,000 | | Santander Drive Auto Receivables Trust, Series 2021-3, Class D, 1.33%, 9/15/27 | | | 471,797 | |
| 200,000 | | Santander Drive Auto Receivables Trust, Series 2021-4, Class D, 1.67%, 10/15/27 | | | 186,539 | |
| 562,000 | | Santander Revolving Auto Loan Trust, Series 2019-A, Class D, 3.45%, 1/26/32(a) | | | 523,343 | |
| 438,209 | | Sunnova Helios II Issuer LLC, Series 2019-AA, Class A, 3.75%, 6/20/46(a) | | | 390,497 | |
| 500,000 | | Tesla Auto Lease Trust, Series 2021-A, Class D, 1.34%, 3/20/25(a) | | | 481,419 | |
17
|
SCHEDULE OF PORTFOLIO INVESTMENTS |
RBC Short Duration Fixed Income Fund (cont.) |
|
| March 31, 2023 |
| | | | |
Principal Amount | | | | Value |
| | |
| $425,000 | | Tesla Auto Lease Trust, Series 2021-B, Class D, 1.32%, 9/22/25(a) | | $ 399,517 |
| | |
| 77,293 | | Verizon Owner Trust, Series 2019-C, Class B, 2.06%, 4/22/24 | | 77,180 |
| | |
| 291,811 | | VSE VOI Mortgage LLC, Series 2018-A, Class C, 4.02%, 2/20/36(a) | | 283,088 |
| | | | | |
| | | | |
Total Asset Backed Securities | | 13,974,705 |
| | | | |
| (Cost $14,529,127) | | |
| |
Collateralized Mortgage Obligations — 10.39% | | |
| 330,000 | | AREIT Trust, Series 2022-CRE6, Class B, (Secured Overnight Financing Rate 30 Day Average + 1.850%), 6.41%, 1/16/37(a),(b) | | 313,198 |
| 380,097 | | Bellemeade Re Ltd., Series 2019-2A, Class M1C, (LIBOR USD 1-Month + 2.000%), 6.85%, 4/25/29(a),(b) | | 379,490 |
| 223,503 | | BX Commercial Mortgage Trust, Series 2021-21M, Class D, (LIBOR USD 1-Month + 1.426%), 6.11%, 10/15/36(a),(b) | | 204,268 |
| 254,847 | | BX Commercial Mortgage Trust, Series 2021-XL2, Class D, (LIBOR USD 1-Month + 1.397%), 6.08%, 10/15/38(a),(b) | | 238,320 |
| 500,000 | | BX Commercial Mortgage Trust, Series 2022-CSMO, Class C, (Term SOFR 1M + 3.889%), 8.72%, 6/15/27(a),(b) | | 485,027 |
| 400,000 | | BX Mortgage Trust, Series 2022-MVRK, Class D, (Term SOFR 1M + 2.864%), 7.52%, 3/15/39(a),(b) | | 377,290 |
| 289,412 | | BX Trust, Series 2022-IND, Class D, (Term SOFR 1M + 2.839%), 7.67%, 4/15/37(a),(b) | | 270,863 |
| 500,000 | | COMM Mortgage Trust, Series 2014-CR15, Class D, 4.67%, 2/10/47(a),(d) | | 430,642 |
| 191,408 | | Connecticut Avenue Securities Trust, (Secured Overnight Financing Rate 30 Day Average + 2.000%), 6.56%, 3/25/42(a),(b) | | 190,932 |
| 207,000 | | Connecticut Avenue Securities Trust, Series 2022-R01, Class 1M2, (Secured Overnight Financing Rate 30 Day Average + 1.900%), 6.46%, 12/25/41(a),(b) | | 196,504 |
| 250,000 | | Connecticut Avenue Securities Trust, Series 2022-R03, Class 1M2, (Secured Overnight Financing Rate 30 Day Average + 3.500%), 8.06%, 3/25/42(a),(b) | | 248,796 |
| 110,000 | | Connecticut Avenue Securities Trust, Series 2022-R04, Class 1M2, (Secured Overnight Financing Rate 30 Day Average + 3.100%), 7.66%, 3/25/42(a),(b) | | 108,980 |
| 499,299 | | Eagle RE Ltd., Series 2019-1, Class M1B, (LIBOR USD 1-Month + 1.800%), 6.65%, 4/25/29(a),(b) | | 498,492 |
| 500,000 | | Ellington Financial Mortgage Trust, Series 2019-2, Class M1, 3.47%, 11/25/59(a),(d) | | 439,997 |
| 200,589 | | Fannie Mae Connecticut Avenue Securities, Series 2021-R02, Class 2M1, (Secured Overnight Financing Rate 30 Day Average + 0.900%), 5.46%, 11/25/41(a),(b) | | 198,093 |
| 125,000 | | Freddie Mac STACR REMIC Trust, (Secured Overnight Financing Rate 30 Day Average + 2.100%), 6.66%, 3/25/43(a),(b) | | 125,116 |
| 460,000 | | Freddie Mac STACR REMIC Trust, Series 2022-DNA2, Class M1B, (Secured Overnight Financing Rate 30 Day Average + 2.400%), 6.96%, 2/25/42(a),(b) | | 444,120 |
18
|
SCHEDULE OF PORTFOLIO INVESTMENTS |
RBC Short Duration Fixed Income Fund (cont.) |
|
| March 31, 2023 |
| | | | |
Principal Amount | | | | Value |
| $199,271 | | Freddie Mac STACR REMIC Trust, Series 2022-DNA3, Class M1A, (Secured Overnight Financing Rate 30 Day Average + 2.000%), 6.56%, 4/25/42(a),(b) | | $ 199,229 |
| 400,000 | | SMRT, Series 2022-MINI, Class D, (Term SOFR 1M + 1.950%), 6.78%, 1/15/39(a),(b) | | 364,578 |
| 500,000 | | Vista Point Securitization Trust, Series 2020-1, Class M1, 4.15%, 3/25/65(a),(d) | | 464,892 |
| | | | |
Total Collateralized Mortgage Obligations | | 6,178,827 |
| | | | |
| (Cost $6,521,162) | | |
| |
U.S. Government Agency Backed Mortgages — 0.01% | | |
Fannie Mae — 0.01% | | |
| 1,722 | | Series 2001-70, Class OF, (LIBOR USD 1-Month + 0.950%), 5.80%, 10/25/31(b) | | 1,742 |
| 1,331 | | Series 2009-87, Class FX, (LIBOR USD 1-Month + 0.750%), 5.60%, 11/25/39(b) | | 1,337 |
| | | | |
| | | | 3,079 |
| | | | |
Freddie Mac — 0.00% | | |
| 1,346 | | Series 2448, Class FT, (LIBOR USD 1-Month + 1.000%), 5.68%, 3/15/32(b) | | 1,364 |
| 1,475 | | Series 2488, Class FQ, (LIBOR USD 1-Month + 1.000%), 5.68%, 3/15/32(b) | | 1,497 |
| 152 | | Series 2627, Class MW, 5.00%, 6/15/23 | | 152 |
| 341 | | Series 3770, Class FP, (LIBOR USD 1-Month + 0.500%), 5.18%, 11/15/40(b) | | 342 |
| | | | |
| | | | 3,355 |
| | | | |
| |
Total U.S. Government Agency Backed Mortgages | | 6,434 |
| | | | |
| (Cost $6,359) | | |
| | |
| Shares | | | | |
Investment Company — 1.30% | | |
| 771,303 | | U.S. Government Money Market Fund, RBC Institutional Class 1(e) | | 771,303 |
| | | | |
| | |
| |
Total Investment Company | | 771,303 |
| | |
| (Cost $771,303) | | |
| |
Total Investments | | $58,840,806 |
| (Cost $60,930,051)(f) — 98.93% | | |
| |
Other assets in excess of liabilities — 1.07% | | 634,471 |
| | |
| |
NET ASSETS — 100.00% | | $59,475,277 |
| | |
|
|
19
|
SCHEDULE OF PORTFOLIO INVESTMENTS |
RBC Short Duration Fixed Income Fund (cont.) |
|
| March 31, 2023 |
| (a) | Security exempt from registration under Rule 144A or Section 4(2) of the Securities Act of 1933, as amended. These securities may be resold in transactions exempt from registration, normally to qualified institutional buyers. |
| (b) | Floating rate note. Rate shown is as of report date. |
| (c) | Security is a fix-to-float security, which carries a fixed coupon until a certain date, upon which it switches to a floating rate. Reference rate and spread are provided if the rate is currently floating. |
| (d) | Variable or floating rate security, which interest rate adjusts periodically based on changes in current interest rates and prepayments on the underlying pool of assets. Rate shown is the rate in effect as of period end. |
| (e) | Affiliated investment. |
| (f) | See Notes to Schedules of Portfolio Investments for the tax cost of securities and the breakdown of unrealized appreciation (depreciation). |
Financial futures contracts as of March 31, 2023:
| | | | | | | | | | | | | | | | | | | | | | | | |
Short Position | | Number of
Contracts | | | Expiration
Date | | | Value/Unrealized
Appreciation | | | Notional
Value | | | Clearinghouse | |
Two Year U.S. Treasury Note | | | 44 | | | | June 2023 | | | | | | | $ | 99,688 | | | | USD $9,083,938 | | |
| Barclays
Capital Group |
|
| | | | | | | | | | | | | | | | | | | | | | | | |
Total | | | | | | | | | | | | | | $ | 99,688 | | | | | | | | | |
| | | | | | | | | | | | | | | | | | | | | | | | |
Abbreviations used are defined below:
GMTN - Global Medium Term Note
LIBOR - London Interbank Offered Rate
MTN - Medium Term Note
REIT - Real Estate Investment Trust
SOFR - Secured Overnight Financing Rate
TBA - To-be-announced
USD - United States Dollar
See Notes to the Financial Statements.
20
|
SCHEDULE OF PORTFOLIO INVESTMENTS |
RBC Ultra-Short Fixed Income Fund |
|
| March 31, 2023 |
| | | | |
Principal Amount | | | | Value |
| |
Corporate Bonds — 47.05% | | |
Basic Materials — 0.50% | | |
| $ 400,000 | | Celanese US Holdings LLC, 5.90%, 7/5/24 | | $ 400,188 |
| | | | |
| |
Consumer, Cyclical — 4.37% | | |
| 525,000 | | Brunswick Corp., 0.85%, 8/18/24 | | 491,141 |
| 725,000 | | Daimler Truck Finance North America LLC, (SOFR RATE + 1.000%), 5.53%, 4/5/24(a),(b) | | 722,063 |
| 500,000 | | Ford Motor Credit Co. LLC, 3.66%, 9/8/24 | | 481,413 |
| 865,000 | | General Motors Financial Co., Inc., (SOFR RATE + 1.040%), 5.80%, 2/26/27(b) | | 843,470 |
| 575,000 | | Warnermedia Holdings, Inc., 3.43%, 3/15/24(a) | | 562,051 |
| 375,000 | | Warnermedia Holdings, Inc., 6.41%, 3/15/26 | | 376,818 |
| | | | |
| | | | 3,476,956 |
| | | | |
| |
Consumer, Non-cyclical — 3.20% | | |
| 600,000 | | CVS Health Corp., 5.00%, 2/20/26 | | 606,929 |
| 1,150,000 | | HCA, Inc., 5.38%, 2/1/25 | | 1,150,379 |
| 850,000 | | JDE Peet’s NV, 0.80%, 9/24/24(a) | | 791,673 |
| | | | |
| | | | 2,548,981 |
| | | | |
| |
Energy — 0.92% | | |
| 825,000 | | Continental Resources, Inc., 2.27%, 11/15/26(a) | | 731,335 |
| | | | |
| |
Financial — 30.45% | | |
| 500,000 | | AerCap Ireland Capital DAC / AerCap Global Aviation Trust, 4.88%, 1/16/24 | | 494,143 |
| 1,000,000 | | Athene Global Funding, (Secured Overnight Financing Average Index + 0.715%), 5.25%, 1/7/25(a),(b) | | 971,766 |
| 650,000 | | Bank of America Corp., GMTN, 0.52%, 6/14/24(c) | | 642,932 |
| 1,250,000 | | Bank of America Corp., (LIBOR USD 3-Month + 0.960%), GMTN, 5.78%, 7/23/24(b) | | 1,251,180 |
| 250,000 | | Barclays Plc, 1.01%, 12/10/24(c) | | 241,122 |
| 600,000 | | Barclays Plc, 3.65%, 3/16/25 | | 572,475 |
| 1,000,000 | | Barclays Plc, 5.30%, 8/9/26(c) | | 980,289 |
| 300,000 | | Canadian Imperial Bank of Commerce, (LIBOR USD 3-Month + 0.660%), 5.81%, 9/13/23(b) | | 299,899 |
| 1,305,000 | | Charles Schwab Corp. (The), (Secured Overnight Financing Average Index + 1.050%), 5.83%, 3/3/27(b) | | 1,245,558 |
| 1,000,000 | | Citigroup, Inc., (SOFR RATE + 0.770%), 5.58%, 6/9/27(b) | | 979,016 |
| 645,000 | | Comerica Bank, 2.50%, 7/23/24 | | 592,325 |
| 575,000 | | Fifth Third Bank NA, 5.85%, 10/27/25(c) | | 568,081 |
| 750,000 | | Goldman Sachs Group, Inc. (The), (SOFR RATE + 0.700%), 5.32%, 1/24/25(b) | | 740,738 |
| 250,000 | | HSBC Holdings Plc, 0.73%, 8/17/24(c) | | 244,749 |
| 550,000 | | HSBC Holdings Plc, 0.98%, 5/24/25(c) | | 517,828 |
| 350,000 | | HSBC Holdings Plc, 3.95%, 5/18/24(c) | | 348,724 |
| 1,000,000 | | HSBC Holdings Plc, (SOFR RATE + 1.430%), 6.22%, 3/10/26(b) | | 991,618 |
21
|
SCHEDULE OF PORTFOLIO INVESTMENTS |
RBC Ultra-Short Fixed Income Fund (cont.) |
|
| March 31, 2023 |
| | | | |
Principal Amount | | | | Value |
| $ 530,000 | | Huntington Bancshares, Inc., 2.63%, 8/6/24 | | $ 495,944 |
| 500,000 | | Huntington National Bank (The), 5.70%, 11/18/25(c) | | 483,889 |
| 500,000 | | JPMorgan Chase & Co., (SOFR RATE + 0.580%), 5.42%, 6/23/25(b) | | 493,227 |
| 1,000,000 | | JPMorgan Chase & Co., (LIBOR USD 3-Month + 0.850%), GMTN, 5.66%, 1/10/25(b) | | 999,692 |
| 575,000 | | KeyBank NA, 4.15%, 8/8/25 | | 544,818 |
| 400,000 | | Lloyds Banking Group Plc, 0.70%, 5/11/24(c) | | 397,503 |
| 1,000,000 | | Lloyds Banking Group Plc, 4.72%, 8/11/26(c) | | 972,967 |
| 575,000 | | Manufacturers & Traders Trust Co., 4.65%, 1/27/26 | | 541,443 |
| 535,000 | | Mitsubishi UFJ Financial Group, Inc., 5.06%, 9/12/25(c) | | 531,095 |
| 875,000 | | Mitsubishi UFJ Financial Group, Inc., 5.72%, 2/20/26(c) | | 877,197 |
| 475,000 | | Morgan Stanley, MTN, 1.16%, 10/21/25(c) | | 443,663 |
| 905,000 | | Morgan Stanley, 3.62%, 4/17/25(c) | | 888,273 |
| 775,000 | | Nomura Holdings, Inc., 5.10%, 7/3/25 | | 762,070 |
| 680,000 | | Santander Holdings USA, Inc., 4.26%, 6/9/25(c) | | 656,238 |
| 750,000 | | Societe Generale SA, (SOFR RATE + 1.050%), 5.67%, 1/21/26(a),(b) | | 731,784 |
| 1,400,000 | | UBS Group AG, 4.49%, 5/12/26(a),(c) | | 1,350,587 |
| 285,000 | | VICI Properties LP, REIT, 4.38%, 5/15/25 | | 276,631 |
| 1,170,000 | | Wells Fargo & Co., GMTN, 3.53%, 3/24/28(c) | | 1,103,839 |
| | | | |
| | | | 24,233,303 |
| | | | |
Technology — 4.20% | | |
| 375,000 | | Kyndryl Holdings, Inc., 2.05%, 10/15/26 | | 327,762 |
| 525,000 | | Microchip Technology, Inc., 0.97%, 2/15/24 | | 503,993 |
| 500,000 | | NXP BV / NXP Funding LLC / NXP USA, Inc., 2.70%, 5/1/25 | | 474,214 |
| 500,000 | | Qorvo, Inc., 1.75%, 12/15/24(a) | | 466,288 |
| 875,000 | | Skyworks Solutions, Inc., 0.90%, 6/1/23 | | 868,574 |
| 725,000 | | Western Digital Corp., 4.75%, 2/15/26 | | 698,318 |
| | | | |
| | | | 3,339,149 |
| | | | |
Utilities — 3.41% | | |
| 1,000,000 | | CenterPoint Energy, Inc., (Secured Overnight Financing Average Index + 0.650%), 5.37%, 5/13/24(b) | | 990,467 |
| 1,115,000 | | Emera US Finance LP, 0.83%, 6/15/24 | | 1,052,884 |
| 690,000 | | Vistra Operations Co. LLC, 5.13%, 5/13/25(a) | | 673,384 |
| | | | |
| | | | 2,716,735 |
| | | | |
| |
Total Corporate Bonds | | 37,446,647 |
| | | | |
(Cost $38,578,495) | | |
Asset Backed Securities — 27.64% | | |
| 234,000 | | AmeriCredit Automobile Receivables Trust, Series 2020-3, Class D, 1.49%, 9/18/26 | | 215,834 |
| 160,000 | | AmeriCredit Automobile Receivables Trust, Series 2019-1, Class D, 3.62%, 3/18/25 | | 158,335 |
| 100,000 | | AmeriCredit Automobile Receivables Trust, Series 2020-1, Class D, 1.80%, 12/18/25 | | 95,485 |
22
|
SCHEDULE OF PORTFOLIO INVESTMENTS |
RBC Ultra-Short Fixed Income Fund (cont.) |
|
| March 31, 2023 |
| | | | | | | |
Principal
Amount | | | | Value |
| $ 390,000 | | AmeriCredit Automobile Receivables Trust, Series 2021-1, Class D, 1.21%, 12/18/26 | | | $ | 352,614 | |
| 100,000 | | CarMax Auto Owner Trust, Series 2019-4, Class C, 2.60%, 9/15/25 | | | | 97,754 | |
| 125,000 | | CarMax Auto Owner Trust, Series 2020-1, Class C, 2.34%, 11/17/25 | | | | 121,355 | |
| 572,000 | | CarMax Auto Owner Trust, Series 2020-2, Class D, 5.75%, 5/17/27 | | | | 570,191 | |
| 900,000 | | CarMax Auto Owner Trust, Series 2021-1, Class D, 1.28%, 7/15/27 | | | | 771,757 | |
| 844,675 | | Carvana Auto Receivables Trust, Series 2021-N1, Class D, 1.50%, 1/10/28 | | | | 808,091 | |
| 1,750,000 | | Carvana Auto Receivables Trust, Series 2021-N3, Class D, 1.58%, 6/12/28 | | | | 1,631,478 | |
| 1,399,000 | | Carvana Auto Receivables Trust, Series 2021-N4, Class D, 2.30%, 9/11/28 | | | | 1,227,318 | |
| 1,430,000 | | Dell Equipment Finance Trust, Series 2021-2, Class D, 1.21%, 6/22/27(a) | | | | 1,355,689 | |
| 80,336 | | Drive Auto Receivables Trust, Series 2019-2, Class D, 3.69%, 8/17/26 | | | | 79,461 | |
| 52,290 | | Drive Auto Receivables Trust, Series 2020-2, Class C, 2.28%, 8/17/26 | | | | 51,980 | |
| 1,100,000 | | Drive Auto Receivables Trust, Series 2021-1, Class D, 1.45%, 1/16/29 | | | | 1,039,530 | |
| 775,000 | | Drive Auto Receivables Trust, Series 2021-2, Class D, 1.39%, 3/15/29 | | | | 721,694 | |
| 1,500,000 | | Exeter Automobile Receivables Trust, Series 2019-1A, Class E, 5.20%, 1/15/26(a) | | | | 1,490,248 | |
| 2,340,000 | | Exeter Automobile Receivables Trust, Series 2019-3A, Class E, 4.00%, 8/17/26(a) | | | | 2,279,530 | |
| 1,100,000 | | Exeter Automobile Receivables Trust, Series 2021-4A, Class D, 1.96%, 1/17/28 | | | | 1,004,663 | |
| 1,000,000 | | Exeter Automobile Receivables Trust, Series 2022-1A, Class D, 3.02%, 6/15/28 | | | | 926,085 | |
| 700,000 | | Exeter Automobile Receivables Trust, Series 2022-5A, Class B, 5.97%, 3/15/27 | | | | 703,693 | |
| 60,000 | | GM Financial Consumer Automobile Receivables Trust, Series 2020-1, Class B, 2.03%, 4/16/25 | | | | 58,931 | |
| 50,000 | | GM Financial Consumer Automobile Receivables Trust, Series 2020-1, Class C, 2.18%, 5/16/25 | | | | 49,143 | |
| 1,040,000 | | GreatAmerica Leasing Receivables Funding LLC, Series 2021-1, Class C, 0.92%, 12/15/27(a) | | | | 925,628 | |
| 743,075 | | MVW LLC, Series 2021-2A, Class B, 1.83%, 5/20/39(a) | | | | 671,098 | |
| 460,081 | | MVW Owner Trust, Series 2018-1A, Class B, 3.60%, 1/21/36(a) | | | | 448,356 | |
| 900,000 | | OZLM VIII Ltd., Series 2014-8A, Class A2R3, (LIBOR USD 3-Month + 1.650%), 6.44%, 10/17/29(a),(b) | | | | 877,590 | |
| 173 | | Santander Drive Auto Receivables Trust, Series 2019-1, Class D, 3.65%, 4/15/25 | | | | 173 | |
| 44,345 | | Santander Drive Auto Receivables Trust, Series 2019-3, Class D, 2.68%, 10/15/25 | | | | 44,134 | |
23
|
SCHEDULE OF PORTFOLIO INVESTMENTS |
RBC Ultra-Short Fixed Income Fund (cont.) |
|
| March 31, 2023 |
| | | | | | | |
Principal
Amount | | | | Value |
| $ 625,000 | | Santander Drive Auto Receivables Trust, Series 2021-3, Class D, 1.33%, 9/15/27 | | | $ | 589,747 | |
| 879,481 | | Sunnova Helios II Issuer LLC, Series 2019-AA, Class A, 3.75%, 6/20/46(a) | | | | 783,726 | |
| 600,000 | | Tesla Auto Lease Trust, Series 2021-A, Class D, 1.34%, 3/20/25(a) | | | | 577,703 | |
| 1,300,000 | | Tesla Auto Lease Trust, Series 2021-B, Class D, 1.32%, 9/22/25(a) | | | | 1,222,052 | |
| 47,781 | | Verizon Owner Trust, Series 2019-C, Class B, 2.06%, 4/22/24 | | | | 47,711 | |
| | | | | | | |
| | | | | | | |
Total Asset Backed Securities | | | | 21,998,777 | |
| | | | | | | |
(Cost $23,518,911) | | | | | |
| |
Collateralized Mortgage Obligations — 23.56% | | | | | |
| 1,010,000 | | AREIT Trust, Series 2022-CRE6, Class B, (Secured Overnight Financing Rate 30 Day Average + 1.850%), 6.41%, 1/16/37(a),(b) | | | | 958,576 | |
| 1,260,106 | | Bellemeade Re Ltd., Series 2019-2A, Class M1C, (LIBOR USD 1-Month + 2.000%), 6.85%, 4/25/29(a),(b) | | | | 1,258,095 | |
| 633,260 | | BX Commercial Mortgage Trust, Series 2021-21M, Class D, (LIBOR USD 1-Month + 1.426%), 6.11%, 10/15/36(a),(b) | | | | 578,760 | |
| 857,211 | | BX Commercial Mortgage Trust, Series 2021-XL2, Class D, (LIBOR USD 1-Month + 1.397%), 6.08%, 10/15/38(a),(b) | | | | 801,620 | |
| 1,250,000 | | BX Commercial Mortgage Trust, Series 2022-CSMO, Class C, (Term SOFR 1M + 3.889%), 8.72%, 6/15/27(a),(b) | | | | 1,212,567 | |
| 1,200,000 | | BX Mortgage Trust, Series 2022-MVRK, Class D, (Term SOFR 1M + 2.864%), 7.52%, 3/15/39(a),(b) | | | | 1,131,871 | |
| 886,907 | | BX Trust, Series 2022-IND, Class D, (Term SOFR 1M + 2.839%), 7.67%, 4/15/37(a),(b) | | | | 830,065 | |
| 1,500,000 | | COMM Mortgage Trust, Series 2014-CR15, Class D, 4.67%, 2/10/47(a),(d) | | | | 1,291,927 | |
| 535,355 | | Connecticut Avenue Securities Trust, Series 2021-R01, Class 1M2, (Secured Overnight Financing Rate 30 Day Average + 1.550%), 6.11%, 10/25/41(a),(b) | | | | 519,792 | |
| 670,000 | | Connecticut Avenue Securities Trust, Series 2022-R01, Class 1M2, (Secured Overnight Financing Rate 30 Day Average + 1.900%), 6.46%, 12/25/41(a),(b) | | | | 636,028 | |
| 750,000 | | Connecticut Avenue Securities Trust, Series 2022-R03, Class 1M2, (Secured Overnight Financing Rate 30 Day Average + 3.500%), 8.06%, 3/25/42(a),(b) | | | | 746,389 | |
| 329,000 | | Connecticut Avenue Securities Trust, Series 2022-R04, Class 1M2, (Secured Overnight Financing Rate 30 Day Average + 3.100%), 7.66%, 3/25/42(a),(b) | | | | 325,950 | |
| 1,503,912 | | Eagle RE Ltd., Series 2019-1, Class M1B, (LIBOR USD 1-Month + 1.800%), 6.65%, 4/25/29(a),(b) | | | | 1,501,482 | |
| 1,500,000 | | Ellington Financial Mortgage Trust, Series 2019-2, Class M1, 3.47%, 11/25/59(a),(d) | | | | 1,319,991 | |
| 625,367 | | Fannie Mae Connecticut Avenue Securities, Series 2021-R02, Class 2M1, (Secured Overnight Financing Rate 30 Day Average + 0.900%), 5.46%, 11/25/41(a),(b) | | | | 617,584 | |
24
|
SCHEDULE OF PORTFOLIO INVESTMENTS |
RBC Ultra-Short Fixed Income Fund (cont.) |
|
| March 31, 2023 |
| | | | | | |
Principal
Amount | | | | Value | |
| $1,380,000 | | Freddie Mac STACR REMIC Trust, Series 2022-DNA2, Class M1B, (Secured Overnight Financing Rate 30 Day Average + 2.400%), 6.96%, 2/25/42(a),(b) | | $ | 1,332,359 | |
| 490,870 | | MFA Trust, Series 2020-NQM3, Class A3, 1.63%, 1/26/65(a),(d) | | | 434,568 | |
| 1,500,000 | | SMRT, Series 2022-MINI, Class D, (Term SOFR 1M + 1.950%), 6.78%, 1/15/39(a),(b) | | | 1,367,166 | |
| 300,000 | | Verus Securitization Trust, Series 2020-4, Class M1, 3.29%, 5/25/65(a),(d) | | | 251,190 | |
| 1,500,000 | | Vista Point Securitization Trust, Series 2020-1, Class M1, 4.15%, 3/25/65(a),(d) | | | 1,394,674 | |
| 286,000 | | Vista Point Securitization Trust, Series 2020-2, Class M1, 3.40%, 4/25/65(a),(d) | | | 243,474 | |
| | | | | | |
| | | | | | |
Total Collateralized Mortgage Obligations | | | 18,754,128 | |
| | | | | | |
(Cost $19,969,268) | | | | |
| |
U.S. Government Agency Backed Mortgages — 0.00% | | | | |
Fannie Mae — 0.00% | | | | |
| 98 | | Series 2003-55, Class CD, 5.00%, 6/25/23 | | | 98 | |
| | | | | | |
| |
Total U.S. Government Agency Backed Mortgages (Cost $98) | | | 98 | |
| | | | | | |
| | |
| Shares | | | | | |
Investment Company — 0.96% | | | | |
| 762,424 | | U.S. Government Money Market Fund, RBC Institutional Class 1(e) | | | 762,424 | |
| | | | | | |
| |
Total Investment Company (Cost $762,424) | | | 762,424 | |
| | | | | | |
| |
Total Investments (Cost $82,829,196)(f) — 99.21% | | $ | 78,962,074 | |
| |
Other assets in excess of liabilities — 0.79% | | | 631,410 | |
| | | | | | |
| |
NET ASSETS — 100.00% | | $ | 79,593,484 | |
| | | | | | |
25
|
SCHEDULE OF PORTFOLIO INVESTMENTS |
RBC Ultra-Short Fixed Income Fund (cont.) |
|
| March 31, 2023 |
| (a) | Security exempt from registration under Rule 144A or Section 4(2) of the Securities Act of 1933, as amended. These securities may be resold in transactions exempt from registration, normally to qualified institutional buyers. |
| (b) | Floating rate note. Rate shown is as of report date. |
| (c) | Security is a fix-to-float security, which carries a fixed coupon until a certain date, upon which it switches to a floating rate. Reference rate and spread are provided if the rate is currently floating. |
| (d) | Variable or floating rate security, which interest rate adjusts periodically based on changes in current interest rates and prepayments on the underlying pool of assets. Rate shown is the rate in effect as of period end. |
| (e) | Affiliated investment. |
| (f) | See Notes to Schedules of Portfolio Investments for the tax cost of securities and the breakdown of unrealized appreciation (depreciation). |
Financial futures contracts as of March 31, 2023:
| | | | | | | | | | | | | | | | | | | | | | | | |
Short Position | | Number of
Contracts | | | Expiration
Date | | | Value/Unrealized
Depreciation | | | Notional Value | | | Clearinghouse | |
Two Year U.S. Treasury Note | | | 75 | | | | June 2023 | | | | | | | $ | (170,508 | ) | | | USD $15,483,984 | | | | Barclays Capital Group | |
| | | | | | | | | | | | | | | | | | | | | | | | |
Total | | | | | | | | | | | | | | $ | (170,508 | ) | | | | | | | | |
| | | | | | | | | | | | | | | | | | | | | | | | |
Abbreviations used are defined below:
GMTN - Global Medium Term Note
LIBOR - London Interbank Offered Rate
MTN - Medium Term Note
REIT - Real Estate Investment Trust
SOFR - Secured Overnight Financing Rate
USD - United States Dollar
See Notes to the Financial Statements.
26
|
FINANCIAL STATEMENTS |
Statements of Assets and Liabilities |
|
March 31, 2023 |
| | | | | | | | | | | | | | | | |
| | | RBC Short Duration
Fixed Income
Fund | | | RBC Ultra-Short
Fixed Income
Fund | |
Assets: | | | | | | | | | | | | | | | | |
Investments in securities, at value: | | | | | | | | | | | | | | | | |
Unaffiliated investments (cost $60,158,748 and $82,066,772, respectively) | | | | | | $ | 58,069,503 | | | | | | | $ | 78,199,650 | |
Affiliated investments (cost $771,303 and $762,424, respectively) | | | | | | | 771,303 | | | | | | | | 762,424 | |
Cash at broker for financial futures contracts | | | | | | | 234,976 | | | | | | | | 585,129 | |
Interest and dividend receivable | | | | | | | 334,675 | | | | | | | | 390,156 | |
Receivable from advisor | | | | | | | 13,238 | | | | | | | | 6,286 | |
Receivable for capital shares issued | | | | | | | — | | | | | | | | 996 | |
Unrealized appreciation on futures contracts | | | | | | | 99,688 | | | | | | | | — | |
Prepaid expenses and other assets | | | | | | | 23,284 | | | | | | | | 25,416 | |
| | | | | | | | | | | | | | | | |
Total Assets | | | | | | | 59,546,667 | | | | | | | | 79,970,057 | |
| | | | | | | | | | | | | | | | |
Liabilities: | | | | | | | | | | | | | | | | |
Professional fees payable | | | | | | | 1,972 | | | | | | | | 1,972 | |
Distributions payable | | | | | | | — | | | | | | | | 2,174 | |
Payable for capital shares redeemed | | | | | | | 6,201 | | | | | | | | 107,384 | |
Unrealized depreciation on futures contracts | | | | | | | — | | | | | | | | 170,508 | |
Accrued expenses and other payables: | | | | | | | | | | | | | | | | |
Accounting fees | | | | | | | 6,733 | | | | | | | | 7,006 | |
Audit fees | | | | | | | 34,966 | | | | | | | | 34,966 | |
Trustees’ fees | | | | | | | 1,480 | | | | | | | | 2,649 | |
Distribution fees | | | | | | | — | | | | | | | | 806 | |
Custodian fees | | | | | | | 420 | | | | | | | | 585 | |
Shareholder reports | | | | | | | 4,950 | | | | | | | | 6,781 | |
Transfer agent fees | | | | | | | 8,311 | | | | | | | | 20,025 | |
Other | | | | | | | 6,357 | | | | | | | | 21,717 | |
| | | | | | | | | | | | | | | | |
Total Liabilities | | | | | | | 71,390 | | | | | | | | 376,573 | |
| | | | | | | | | | | | | | | | |
Net Assets | | | | | | $ | 59,475,277 | | | | | | | $ | 79,593,484 | |
| | | | | | | | | | | | | | | | |
Net Assets Consists of: | | | | | | | | | | | | | | | | |
Capital | | | | | | $ | 62,060,766 | | | | | | | $ | 85,703,940 | |
Accumulated earnings | | | | | | | (2,585,489 | ) | | | | | | | (6,110,456 | ) |
| | | | | | | | | | | | | | | | |
Net Assets | | | | | | $ | 59,475,277 | | | | | | | $ | 79,593,484 | |
| | | | | | | | | | | | | | | | |
27
|
FINANCIAL STATEMENTS |
Statements of Assets and Liabilities (cont.) |
|
| March 31, 2023 |
| | | | | | | | | | | | | | | | |
| | | RBC Short Duration
Fixed Income
Fund | | | RBC Ultra-Short
Fixed Income
Fund | |
Net Assets | | | | | | | | | | | | | | | | |
Class A | | | | | | $ | 501,936 | | | | | | | $ | 16,565,426 | |
Class I | | | | | | | 58,973,341 | | | | | | | | 63,028,058 | |
| | | | | | | | | | | | | | | | |
Total | | | | | | $ | 59,475,277 | | | | | | | $ | 79,593,484 | |
| | | | | | | | | | | | | | | | |
Shares Outstanding (Unlimited number of shares authorized, no par value): | | | | | | | | | | | | | | | | |
Class A | | | | | | | 52,767 | | | | | | | | 1,727,047 | |
Class I | | | | | | | 6,207,310 | | | | | | | | 6,580,013 | |
| | | | | | | | | | | | | | | | |
Total | | | | | | | 6,260,077 | | | | | | | | 8,307,060 | |
| | | | | | | | | | | | | | | | |
Net Asset Values and Redemption Prices Per Share: | | | | | | | | | | | | | | | | |
Class A | | | | | | $ | 9.51 | | | | | | | $ | 9.59 | |
| | | | | | | | | | | | | | | | |
Class I | | | | | | $ | 9.50 | | | | | | | $ | 9.58 | |
| | | | | | | | | | | | | | | | |
Maximum Offering Price Per Share: | | | | | | | | | | | | | | | | |
Class A | | | | | | $ | 9.65 | | | | | | | $ | N/A | |
| | | | | | | | | | | | | | | | |
Maximum Sales Charge - Class A | | | | | | | 1.50 | % | | | | | | | N/A | |
| | | | | | | | | | | | | | | | |
| | | | |
See Notes to the Financial Statements. | | | | | | | | | | | | | | | | |
28
|
FINANCIAL STATEMENTS |
Statements of Operations |
|
For the Year Ended March 31, 2023 |
| | | | | | | | | | | | | | | | |
| | | RBC Short Duration
Fixed Income
Fund | | | RBC Ultra-Short
Fixed Income
Fund | |
Investment Income: | | | | | | | | | | | | | | | | |
Interest income | | | | | | $ | 1,575,024 | | | | | | | $ | 2,954,504 | |
Dividend income - affiliated | | | | | | | 24,260 | | | | | | | | 47,102 | |
| | | | | | | | | | | | | | | | |
Total Investment Income | | | | | | | 1,599,284 | | | | | | | | 3,001,606 | |
Expenses: | | | | | | | | | | | | | | | | |
Investment advisory fees | | | | | | | 169,539 | | | | | | | | 246,058 | |
Distribution fees–Class A | | | | | | | 673 | | | | | | | | 32,809 | |
Accounting fees | | | | | | | 61,763 | | | | | | | | 67,246 | |
Audit fees | | | | | | | 39,000 | | | | | | | | 39,000 | |
Custodian fees | | | | | | | 2,544 | | | | | | | | 3,718 | |
Insurance fees | | | | | | | 3,467 | | | | | | | | 3,469 | |
Legal fees | | | | | | | 8,637 | | | | | | | | 9,279 | |
Registrations and filing fees | | | | | | | 39,492 | | | | | | | | 62,215 | |
Shareholder reports | | | | | | | 42,293 | | | | | | | | 50,626 | |
Transfer agent fees–Class A | | | | | | | 3,821 | | | | | | | | 9,832 | |
Transfer agent fees–Class I | | | | | | | 62,556 | | | | | | | | 61,722 | |
Trustees’ fees and expenses | | | | | | | 4,180 | | | | | | | | 8,089 | |
Tax expense | | | | | | | 4,209 | | | | | | | | 4,210 | |
Other fees | | | | | | | 5,250 | | | | | | | | 6,354 | |
| | | | | | | | | | | | | | | | |
Total expenses before fee waiver/reimbursement | | | | | | | 447,424 | | | | | | | | 604,627 | |
Advisor | | | | | | | (250,504 | ) | | | | | | | (275,666 | ) |
| | | | | | | | | | | | | | | | |
Net expenses | | | | | | | 196,920 | | | | | | | | 328,961 | |
| | | | | | | | | | | | | | | | |
Net Investment Income | | | | | | | 1,402,364 | | | | | | | | 2,672,645 | |
| | | | | | | | | | | | | | | | |
Realized/Unrealized Gains/(Losses): | | | | | | | | | | | | | | | | |
Net realized gains/(losses) on: | | | | | | | | | | | | | | | | |
Investment transactions | | | | | | | (270,121 | ) | | | | | | | (3,043,438 | ) |
Futures contracts | | | | | | | (238,977 | ) | | | | | | | 1,501,545 | |
| | | | | | | | | | | | | | | | |
Net realized losses | | | | | | | (509,098 | ) | | | | | | | (1,541,893 | ) |
Net change in unrealized appreciation/ | | | | | | | | | | | | | | | | |
(depreciation) on: | | | | | | | | | | | | | | | | |
Investments | | | | | | | (676,010 | ) | | | | | | | 498,521 | |
Futures contracts | | | | | | | 167,546 | | | | | | | | (630,008 | ) |
| | | | | | | | | | | | | | | | |
Net unrealized losses | | | | | | | (508,464 | ) | | | | | | | (131,487 | ) |
| | | | | | | | | | | | | | | | |
Change in net assets resulting from operations | | | | | | $ | 384,802 | | | | | | | $ | 999,265 | |
| | | | | | | | | | | | | | | | |
| | | | |
See Notes to the Financial Statements. | | | | | | | | | | | | | | | | |
29
|
FINANCIAL STATEMENTS |
Statements of Changes in Net Assets |
|
|
| | | | | | | | |
| | | RBC Short Duration
Fixed Income
Fund | |
| | | For the
Year Ended
March 31, 2023 | | | For the
Year Ended
March 31, 2022 | |
From Investment Activities | | | | | | | | |
Operations: | | | | | | | | |
Net investment income | | $ | 1,402,364 | | | $ | 596,863 | |
Net realized gains/(losses) from investments and futures contracts | | | (509,098 | ) | | | 259,277 | |
Net change in unrealized depreciation on investments and futures contracts | | | (508,464 | ) | | | (2,250,016 | ) |
| | | | | | | | |
Change in net assets resulting from operations | | | 384,802 | | | | (1,393,876 | ) |
| | | | | | | | |
Distributions to Shareholders: | | | | | | | | |
Class A | | | (15,140 | ) | | | (17,852 | ) |
Class I | | | (1,382,383 | ) | | | (972,679 | ) |
| | | | | | | | |
Change in net assets resulting from shareholder distributions | | | (1,397,523 | ) | | | (990,531 | ) |
| | | | | | | | |
Capital Transactions: | | | | | | | | |
Proceeds from shares issued | | | 7,762,045 | | | | 25,315,849 | |
Distributions reinvested | | | 1,387,284 | | | | 961,974 | |
Cost of shares redeemed | | | (4,017,143 | ) | | | (33,136,367 | ) |
| | | | | | | | |
Change in net assets resulting from capital transactions | | | 5,132,186 | | | | (6,858,544 | ) |
| | | | | | | | |
Net increase/(decrease) in net assets | | | 4,119,465 | | | | (9,242,951 | ) |
Net Assets: | | | | | | | | |
Beginning of year | | | 55,355,812 | | | | 64,598,763 | |
| | | | | | | | |
End of year | | $ | 59,475,277 | | | $ | 55,355,812 | |
| | | | | | | | |
Share Transactions: | | | | | | | | |
Issued | | | 816,371 | | | | 2,533,250 | |
Reinvested | | | 146,637 | | | | 96,024 | |
Redeemed | | | (423,226 | ) | | | (3,264,783 | ) |
| | | | | | | | |
Change in shares resulting from capital transactions | | | 539,782 | | | | (635,509 | ) |
| | | | | | | | |
| | |
See Notes to the Financial Statements. | | | | | | | | |
30
|
FINANCIAL STATEMENTS |
Statements of Changes in Net Assets |
|
|
| | | | | | | | |
| | | RBC Ultra-Short
Fixed Income
Fund | |
| | | Fund For
the Year Ended
March 31, 2023 | | | For the
Year Ended
March 31, 2022 | |
From Investment Activities | | | | | | | | |
Operations: | | | | | | | | |
Net investment income | | $ | 2,672,645 | | | $ | 1,136,544 | |
Net realized gains/(losses) from investments and futures contracts | | | (1,541,893 | ) | | | 195,573 | |
Net change in unrealized depreciation on investments and futures contracts | | | (131,487 | ) | | | (4,300,233 | ) |
| | | | | | | | |
Change in net assets resulting from operations | | | 999,265 | | | | (2,968,116 | ) |
| | | | | | | | |
Distributions to Shareholders: | | | | | | | | |
Class A | | | (868,824 | ) | | | (278,925 | ) |
Class I | | | (2,228,135 | ) | | | (915,830 | ) |
| | | | | | | | |
Change in net assets resulting from shareholder distributions | | | (3,096,959 | ) | | | (1,194,755 | ) |
| | | | | | | | |
Capital Transactions: | | | | | | | | |
Proceeds from shares issued | | | 73,981,334 | | | | 188,429,977 | |
Distributions reinvested | | | 3,027,793 | | | | 1,127,394 | |
Cost of shares redeemed | | | (145,266,311 | ) | | | (131,366,375 | ) |
| | | | | | | | |
Change in net assets resulting from capital transactions | | | (68,257,184 | ) | | | 58,190,996 | |
| | | | | | | | |
Net increase/(decrease) in net assets | | | (70,354,878 | ) | | | 54,028,125 | |
Net Assets: | | | | | | | | |
Beginning of year | | | 149,948,362 | | | | 95,920,237 | |
| | | | | | | | |
End of year | | $ | 79,593,484 | | | $ | 149,948,362 | |
| | | | | | | | |
Share Transactions: | | | | | | | | |
Issued | | | 7,706,978 | | | | 18,954,315 | |
Reinvested | | | 316,238 | | | | 113,813 | |
Redeemed | | | (15,137,723 | ) | | | (13,253,764 | ) |
| | | | | | | | |
Change in shares resulting from capital transactions | | | (7,114,507 | ) | | | 5,814,364 | |
| | | | | | | | |
| | |
See Notes to the Financial Statements. | | | | | | | | |
31
RBC Short Duration Fixed Income Fund
(Selected data for a share outstanding throughout the periods indicated)
| | | | | | | | | | | | | | | | | | | | | | | | | | | | | | | | |
| | | | | | Investment Activities | | | Distributions | | | | |
| | | Net Asset
Value,
Beginning
of Year | | | Net
Investment
Income(a) | | | Net Realized
and Unrealized
Gains (Losses)
on Investments | | | Total from
Investment
Activities | | | Net
Investment
Income | | | Net
Realized
Gains | | | Total
Distributions | | | Net Asset
Value, End
of Year | |
Class A | | | | | | | | | | | | | | | | | | | | | | | | | | | | | | | | |
Year Ended 3/31/23 | | | $ 9.69 | | | | 0.22 | | | | (0.18 | ) | | | 0.04 | | | | (0.22 | ) | | | — | | | | (0.22 | ) | | | $ 9.51 | |
Year Ended 3/31/22 | | | 10.18 | | | | 0.12 | | | | (0.41 | ) | | | (0.29 | ) | | | (0.13 | ) | | | (0.07 | ) | | | (0.20 | ) | | | 9.69 | |
Year Ended 3/31/21 | | | 9.98 | | | | 0.17 | | | | 0.21 | | | | 0.38 | | | | (0.18 | ) | | | — | | | | (0.18 | ) | | | 10.18 | |
Year Ended 3/31/20 | | | 9.94 | | | | 0.25 | | | | 0.04 | | | | 0.29 | | | | (0.25 | ) | | | — | | | | (0.25 | ) | | | 9.98 | |
Year Ended 3/31/19 | | | 9.85 | | | | 0.24 | | | | 0.09 | | | | 0.33 | | | | (0.24 | ) | | | — | | | | (0.24 | ) | | | 9.94 | |
Class I | | | | | | | | | | | | | | | | | | | | | | | | | | | | | | | | |
Year Ended 3/31/23 | | | $ 9.68 | | | | 0.24 | | | | (0.19 | ) | | | 0.05 | | | | (0.23 | ) | | | — | | | | (0.23 | ) | | | $ 9.50 | |
Year Ended 3/31/22 | | | 10.16 | | | | 0.13 | | | | (0.40 | ) | | | (0.27 | ) | | | (0.14 | ) | | | (0.07 | ) | | | (0.21 | ) | | | 9.68 | |
Year Ended 3/31/21 | | | 9.98 | | | | 0.18 | | | | 0.19 | | | | 0.37 | | | | (0.19 | ) | | | — | | | | (0.19 | ) | | | 10.16 | |
Year Ended 3/31/20 | | | 9.94 | | | | 0.25 | | | | 0.05 | | | | 0.30 | | | | (0.26 | ) | | | — | | | | (0.26 | ) | | | 9.98 | |
Year Ended 3/31/19 | | | 9.84 | | | | 0.25 | | | | 0.10 | | | | 0.35 | | | | (0.25 | ) | | | — | | | | (0.25 | ) | | | 9.94 | |
| (a) | Per share net investment income (loss) has been calculated using the average daily shares method. |
32
RBC Short Duration Fixed Income Fund
(Selected data for a share outstanding throughout the periods indicated)
| | | | | | | | | | | | | | | | | | | | | | | | |
| | | | | | Ratios/Supplemental Data | |
| | | Total
Return(a)(b) | | | Net Assets,
End of
Year (000’s) | | | Ratio of
Net Expenses
to Average
Net Assets | | Ratio of
Net Investment
Income (Loss)
to Average
Net Assets | | Ratio of
Expenses to
Average Net
Assets* | | Portfolio
Turnover
Rate** | |
Class A | | | | | | | | | | | | | | | | | | | | | | | | |
Year Ended 3/31/23 | | | 0.49% | | | | $ 502 | | | | 0.45% | | | | 2.26% | | | | 1.32% | | | | 35% | |
Year Ended 3/31/22 | | | (2.84)% | | | | 887 | | | | 0.45% | | | | 1.18% | | | | 1.22% | | | | 76% | |
Year Ended 3/31/21 | | | 6.45% | | | | 419 | | | | 0.45% | | | | 1.70% | | | | 1.58% | | | | 54% | |
Year Ended 3/31/20 | | | 0.34% | | | | 294 | | | | 0.45% | | | | 2.48% | | | | 2.07% | | | | 33% | |
Year Ended 3/31/19 | | | 3.44% | | | | 310 | | | | 0.45% | | | | 2.41% | | | | 1.99% | | | | 48% | |
Class I | | | | | | | | | | | | | | | | | | | | | | | | |
Year Ended 3/31/23 | | | 0.59% | | | | $58,973 | | | | 0.35% | | | | 2.48% | | | | 0.79% | | | | 35% | |
Year Ended 3/31/22 | | | (2.66)% | | | | 54,469 | | | | 0.35% | | | | 1.30% | | | | 0.78% | | | | 76% | |
Year Ended 3/31/21 | | | 6.35% | | | | 64,179 | | | | 0.35% | | | | 1.79% | | | | 0.68% | | | | 54% | |
Year Ended 3/31/20 | | | 0.45% | | | | 56,016 | | | | 0.35% | | | | 2.53% | | | | 0.79% | | | | 33% | |
Year Ended 3/31/19 | | | 3.65% | | | | 27,563 | | | | 0.35% | | | | 2.55% | | | | 1.04% | | | | 48% | |
| * | During the period, certain fees were contractually or voluntarily reduced and/or reimbursed. If such contractual/voluntary fee reductions and reimbursements had not occurred, the ratio would have been as indicated. |
| ** | Portfolio turnover rate is calculated on the basis of the Fund as a whole without distinguishing between the classes of shares issued. |
| (a) | Excludes sales charge. |
| (b) | Assumes investment at net asset value at the beginning of the period, reinvestment of all dividends and distributions, and a complete redemption of the investment at net asset value at the end of the period. |
See Notes to the Financial Statements.
33
RBC Ultra-Short Fixed Income Fund
(Selected data for a share outstanding throughout the periods indicated)
| | | | | | | | | | | | | | | | | | | | | | | | | | | | | | | | |
| | | | | | Investment Activities | | | Distributions | | | | |
| | | Net Asset
Value,
Beginning
of Year | | | Net
Investment
Income(a) | | | Net Realized
and Unrealized
Gains (Losses)
on Investments | | | Total from
Investment
Activities | | | Net
Investment
Income | | | Net
Realized
Gains | | | Total
Distributions | | | Net Asset
Value, End
of Year | |
Class A | | | | | | | | | | | | | | | | | | | | | | | | | | | | | | | | |
Year Ended 3/31/23 | | $ | 9.73 | | | | 0.23 | | | | (0.08 | ) | | | 0.15 | | | | (0.25 | ) | | | (0.04 | ) | | | (0.29 | ) | | | $ 9.59 | |
Year Ended 3/31/22 | | | 9.99 | | | | 0.08 | | | | (0.26 | ) | | | (0.18 | ) | | | (0.08 | ) | | | — | | | | (0.08 | ) | | | 9.73 | |
Year Ended 3/31/21 | | | 9.58 | | | | 0.13 | | | | 0.42 | | | | 0.55 | | | | (0.14 | ) | | | — | | | | (0.14 | ) | | | 9.99 | |
Year Ended 3/31/20 | | | 9.89 | | | | 0.23 | | | | (0.29 | ) | | | (0.06 | ) | | | (0.25 | ) | | | — | | | | (0.25 | ) | | | 9.58 | |
Year Ended 3/31/19 | | | 9.84 | | | | 0.24 | | | | 0.06 | | | | 0.30 | | | | (0.25 | ) | | | — | | | | (0.25 | ) | | | 9.89 | |
Class I | | | | | | | | | | | | | | | | | | | | | | | | | | | | | | | | |
Year Ended 3/31/23 | | $ | 9.72 | | | | 0.25 | | | | (0.09 | ) | | | 0.16 | | | | (0.26 | ) | | | (0.04 | ) | | | (0.30 | ) | | | $ 9.58 | |
Year Ended 3/31/22 | | | 9.98 | | | | 0.09 | | | | (0.26 | ) | | | (0.17 | ) | | | (0.09 | ) | | | — | | | | (0.09 | ) | | | 9.72 | |
Year Ended 3/31/21 | | | 9.57 | | | | 0.14 | | | | 0.42 | | | | 0.56 | | | | (0.15 | ) | | | — | | | | (0.15 | ) | | | 9.98 | |
Year Ended 3/31/20 | | | 9.87 | | | | 0.25 | | | | (0.29 | ) | | | (0.04 | ) | | | (0.26 | ) | | | — | | | | (0.26 | ) | | | 9.57 | |
Year Ended 3/31/19 | | | 9.83 | | | | 0.25 | | | | 0.04 | | | | 0.29 | | | | (0.25 | ) | | | — | | | | (0.25 | ) | | | 9.87 | |
| (a) | Per share net investment income (loss) has been calculated using the average daily shares method. |
34
RBC Ultra-Short Fixed Income Fund
(Selected data for a share outstanding throughout the periods indicated)
| | | | | | | | | | | | | | | | | | | | | | | | |
| | | | | | Ratios/Supplemental Data | |
| | | Total
Return(a) | | | Net Assets,
End of
Year (000’s) | | | Ratio of
Net Expenses
to Average
Net Assets | | Ratio of
Net Investment
Income (Loss)
to Average Net
Assets | | Ratio of
Expenses to
Average Net
Assets* | | Portfolio
Turnover
Rate** | |
Class A | | | | | | | | | | | | | | | | | | | | | | | | |
Year Ended 3/31/23 | | | 1.61% | | | | $ 16,565 | | | | 0.38% | | | | 2.34% | | | | 0.59% | | | | 32% | |
Year Ended 3/31/22 | | | (1.81)% | | | | 46,963 | | | | 0.38% | | | | 0.78% | | | | 0.55% | | | | 62% | |
Year Ended 3/31/21 | | | 5.78% | | | | 16,173 | | | | 0.38% | | | | 1.30% | | | | 0.81% | | | | 56% | |
Year Ended 3/31/20 | | | (0.67)% | | | | 5,745 | | | | 0.38% | | | | 2.34% | | | | 1.07% | | | | 93% | |
Year Ended 3/31/19 | | | 3.04% | | | | 1,728 | | | | 0.38% | | | | 2.41% | | | | 1.30% | | | | 57% | |
Class I | | | | | | | | | | | | | | | | | | | | | | | | |
Year Ended 3/31/23 | | | 1.71% | | | | $ 63,028 | | | | 0.28% | | | | 2.57% | | | | 0.55% | | | | 32% | |
Year Ended 3/31/22 | | | (1.72)% | | | | 102,986 | | | | 0.28% | | | | 0.87% | | | | 0.48% | | | | 62% | |
Year Ended 3/31/21 | | | 5.89% | | | | 79,747 | | | | 0.28% | | | | 1.42% | | | | 0.77% | | | | 56% | |
Year Ended 3/31/20 | | | (0.47)% | | | | 34,948 | | | | 0.28% | | | | 2.56% | | | | 0.99% | | | | 93% | |
Year Ended 3/31/19 | | | 3.04% | | | | 30,249 | | | | 0.28% | | | | 2.57% | | | | 1.07% | | | | 57% | |
| * | During the period, certain fees were contractually or voluntarily reduced and/or reimbursed. If such contractual/voluntary fee reductions and reimbursements had not occurred, the ratio would have been as indicated. |
| ** | Portfolio turnover rate is calculated on the basis of the Fund as a whole without distinguishing between the classes of shares issued. |
| (a) | Assumes investment at net asset value at the beginning of the period, reinvestment of all dividends and distributions, and a complete redemption of the investment at net asset value at the end of the period. |
See Notes to the Financial Statements.
35
NOTES TO FINANCIAL STATEMENTS
March 31, 2023
1. Organization:
RBC Funds Trust (the “Trust”) is registered under the Investment Company Act of 1940 (as amended) as an open-end management investment company. The Trust was organized as a Delaware statutory trust on December 16, 2003 and currently consists of 24 portfolios. Overall responsibility for the management of the Trust is vested in its Board of Trustees (the “Board”). This report includes the following two investment portfolios (each a “Fund” and collectively, the “Funds”):
- RBC Short Duration Fixed Income Fund (“Short Duration Fixed Income Fund”)
- RBC Ultra-Short Fixed Income Fund (“Ultra-Short Fixed Income Fund”)
The Funds offer Class A (formerly Class F) and Class I shares. Class A shares of Short Duration Fixed Income Fund are offered with a 1.50% maximum front-end sales charge and a 1.00% contingent deferred sales charge (“CDSC”) for redemptions within 12 months of a $500,000 or greater purchase on which no front-end sales charge was paid. Class A shares of Ultra-Short Fixed Income Fund and Class I shares are not subject to either a front-end sales charge or a CDSC.
RBC Global Asset Management (U.S.) Inc. (“RBC GAM-US” or “Advisor” or “Co-Administrator”) acts as the investment advisor for the Funds. The officers of the Trust (“Fund Management”) are also employees of RBC GAM-US.
2. Significant Accounting Policies
Each Fund is an investment company that follows accounting and reporting guidance under the Financial Accounting Standards Board. Summarized below are the significant accounting policies of the Funds. These policies conform to accounting principles generally accepted in the United States of America (“U.S. GAAP”). Fund Management follows these policies when preparing financial statements. Fund Management may also be required to make estimates and assumptions that affect the reported amounts of assets and liabilities at the date of the financial statements and the reported amounts of income and expenses for the period. Actual results could differ from those estimates. The financial statements are as of the close of regular trading on the New York Stock Exchange (“NYSE”).
Security Valuation:
The Trust’s Board of Trustees (the ”Board“) has approved pricing and valuation procedures of the Advisor for determining the fair value of each Fund’s investments. Fair value of a security is considered to be the price that a fund might reasonably expect to receive upon its current sale in an orderly transaction between market participants.
Fixed income securities, including to-be-announced (“TBA”) commitments and municipal bonds, are generally valued based on evaluated prices received from third-party pricing services or from broker-dealers who make markets in the securities and are generally categorized as Level 2 in the fair value hierarchy (see “Fair Value Measurements” below for additional information). The pricing services utilize both dealer-supplied valuations and electronic data processing techniques that take into account multiple appropriate factors such as institutional-size trading in similar groups of securities, market spreads, interest rates, and fundamental security analytical data including yield, quality, coupon rate, maturity and type of issue.
Mortgage-related securities represent direct or indirect participation in, or are secured by and payable from, mortgage loans secured by real property and include pass-through securities and collateralized mortgage obligations. These securities may be issued or guaranteed by U.S. Government agencies or instrumentalities, or private issuers, including commercial banks, savings and loan institutions, private mortgage insurance bankers and other secondary market issuers. These mortgage-related securities are generally valued by pricing services that use broker-dealer quotations or valuation estimates from their internal pricing models. These pricing models generally consider such factors as current market data, estimated cash flows, market-based yield spreads, and estimated prepayment rates. Securities valued using such techniques and inputs are generally categorized as Level 2 in the fair value hierarchy. To the extent significant inputs are unobservable, the securities will be categorized as Level 3.
36
NOTES TO FINANCIAL STATEMENTS
Exchange-traded futures are valued at the last sale price at the close of the market on the principal exchange on which they are traded and are categorized as Level 1 in the fair value hierarchy. Investments in open-end investment companies (mutual funds) are valued at net asset value and are categorized as Level 1 in the fair value hierarchy.
The Board has designated the Advisor with the responsibility for implementing the pricing and valuation procedures, including responsibility for determining the fair value of the Funds’ securities or other assets and liabilities, and has established a Pricing Committee to assist in carrying out supervisory functions related to such responsibilities. The Pricing Committee includes representatives of the Funds’ Advisor, and Co-Administrator, including personnel from accounting and operations, trading, risk management and compliance. The Pricing Committee meets at least quarterly to review and approve Fund valuation matters, including a review of the Funds’ pricing activity and operations, fair value measurements, pricing vendors, policies and procedures, and related controls. At least a quorum of the Pricing Committee shall meet more frequently, as needed, to consider and approve time-sensitive fair valuation matters. The Pricing Committee provides periodic reports to the Valuation, Portfolio Management and Performance Committee (“Valuation Committee”) of the Board regarding pricing and valuation matters. Members of the Pricing Committee meet with the Valuation Committee and the Board at each of their regularly scheduled meetings to discuss valuation matters and actions taken during the period.
The Advisor has procedures to determine the fair value of a security when a price is not available from a pricing service or broker- dealer or the Advisor has determined that a price provided by a pricing service or broker-dealer does not approximate fair value. Fair valuation may also be used when a significant valuation event affecting the value of a security or market sector is determined to have occurred between the time when a security’s market closes and the time the Fund’s net asset value is calculated. The fair value of the security will be determined in good faith by the Advisor in accordance with procedures and methodologies approved by the Board. General factors used in determining the fair value of securities include, but are not limited to, fundamental analytical data relating to the security, the issuer and the market, such as duration, prepayment and default rates; general level of interest rates and changes in interest rates; information from broker-dealers; trading in similar securities; any restrictions on disposition of the security; and an evaluation of the forces that influence the market in which the investments are traded. These securities are either categorized as Level 2 or 3 in the fair value hierarchy, depending on the relevant inputs used.
When the Funds utilize fair valuation methods that use significant unobservable inputs to determine a security’s value, such securities will be categorized as Level 3 of the fair value hierarchy. These methods may require subjective determinations about the value of a security. While the Funds’ policy is intended to result in a calculation of a Fund’s net asset value that fairly reflects security values as of the time of pricing, the Funds cannot guarantee that values determined by the Advisor or persons acting at their direction would accurately reflect the price that the Funds could obtain for a security if they were to dispose of it as of the time of pricing (for instance, in a forced or distressed sale). The prices used by the Funds may differ from the value that would be realized if the securities were sold.
The Advisor employs various methods for calibrating the valuation approach related to securities categorized within Level 2 and Level 3 of the fair value hierarchy. These methods may include regular due diligence of the Funds’ pricing vendors, a regular review of key inputs and assumptions, transaction back-testing or disposition analysis to compare unrealized gains and losses to realized gains and losses, reviews of missing and stale prices and large movements in market value, and reviews of any market related activities. Additionally, the pricing of all fair value holdings is subsequently reported to the Valuation Committee and Board.
Foreign Taxes:
The Funds may be subject to foreign taxes on income, gains on investments or currency repatriation, a portion of which may be recoverable. The Funds will accrue such taxes and recoveries, as applicable, based upon its current interpretation of tax rules and regulations that exist in the markets in which it invests.
37
NOTES TO FINANCIAL STATEMENTS
Realized gains in certain countries may be subject to foreign taxes at the Fund level, based on statutory rates. The Funds accrue for such foreign taxes on realized and unrealized gains at the appropriate rate for each jurisdiction, as applicable. The amount, if any, is disclosed as a liability in the Statement of Assets and Liabilities.
Fair Value Measurements:
The Funds disclose the fair value of their investments in a hierarchy that categorizes investments based on the inputs to valuation techniques used to measure fair value. The three levels of the fair value hierarchy are as follows:
• Level 1 - Inputs that reflect unadjusted quoted prices in active markets for identical assets or liabilities that the Funds have the ability to access at the measurement date.
• Level 2 - Significant inputs other than quoted prices that are observable for the asset or liability either directly or indirectly, including inputs in markets that are not considered to be active. Observable inputs may include quoted prices for similar securities, interest rates, spreads, prepayment spreads, etc.
• Level 3 - Significant unobservable inputs based on the best information available in the circumstances, to the extent observable inputs are not available (including the Fund’s own assumptions in determining the fair value of investments).
The inputs or methodology used for valuing investments are not necessarily an indication of the risk associated with investing in those securities.
Inputs used in determining fair value of an investment may include, but are not limited to, price information, volatility statistics, credit and market data, and other factors, all of which may be either observable or unobservable. Inputs can vary among investments and will be impacted by the investment type and volume of activity for the particular security or similar securities in the market. Investments in the Level 2 category are generally supported by transactions and quoted prices from dealers participating in the market for those investments. Investments may be included in the Level 3 category due to a lack of market activity or transparency. Internal valuation models may also be used as a pricing source for Level 3 investments. Internal valuation models may rely on one or more unobservable inputs, such as estimated cash flows, financial statement analysis and discount rates.
The summary of inputs used to determine the fair value of the Funds’ investments as of March 31, 2023 is as follows:
| | | | | | | | | | | | | | | | | | | | | | | | | | | | | | | | |
| | | Level 1
Quoted Prices | | | Level 2
Significant
Observable
Inputs | | | Level 3
Significant
Unobservable
Inputs | | | Total | |
Short Duration Fixed Income Fund | | | | | | | | | | | | | | | | | | | | | | | | | | | | | | | | |
Assets: | | | | | | | | | | | | | | | | | | | | | | | | | | | | | | | | |
Investments in Securities | | | | | | | | | | | | | | | | | | | | | | | | | | | | | | | | |
Corporate Bonds | | | | | | $ | — | | | | | | | $ | 37,909,537 | | | | | | | $ | — | | | | | | | $ | 37,909,537 | |
Asset Backed Securities | | | | | | | — | | | | | | | | 13,974,705 | | | | | | | | — | | | | | | | | 13,974,705 | |
Collateralized Mortgage Obligations | | | | | | | — | | | | | | | | 6,178,827 | | | | | | | | — | | | | | | | | 6,178,827 | |
Investment Company | | | | | | | 771,303 | | | | | | | | — | | | | | | | | — | | | | | | | | 771,303 | |
U.S. Government Agency Backed Mortgages | | | | | | | — | | | | | | | | 6,434 | | | | | | | | — | | | | | | | | 6,434 | |
Other Financial Instruments* | | | | | | | | | | | | | | | | | | | | | | | | | | | | | | | | |
Financial futures contracts | | | | | | | 99,688 | | | | | | | | — | | | | | | | | — | | | | | | | | 99,688 | |
| | | | | | | | | | | | | | | | | | | | | | | | | | | | | | | | |
Total Assets | | | | | | $ | 870,991 | | | | | | | $ | 58,069,503 | | | | | | | $ | — | | | | | | | $ | 58,940,494 | |
| | | | | | | | | | | | | | | | | | | | | | | | | | | | | | | | |
38
NOTES TO FINANCIAL STATEMENTS
| | | | | | | | | | | | | | | | | | | | | | | | | | | | | | | | |
| | | Level 1
Quoted Prices | | | Level 2 Significant
Observable
Inputs | | | Level 3
Significant
Unobservable
Inputs | | | Total | |
Ultra-Short Fixed Income Fund | | | | | | | | | | | | | | | | | | | | | | | | | | | | | | | | |
Assets: | | | | | | | | | | | | | | | | | | | | | | | | | | | | | | | | |
Investments in Securities | | | | | | | | | | | | | | | | | | | | | | | | | | | | | | | | |
Corporate Bonds | | | | | | $ | — | | | | | | | $ | 37,446,647 | | | | | | | $ | — | | | | | | | $ | 37,446,647 | |
Asset Backed Securities | | | | | | | — | | | | | | | | 21,998,777 | | | | | | | | — | | | | | | | | 21,998,777 | |
Collateralized Mortgage Obligations | | | | | | | — | | | | | | | | 18,754,128 | | | | | | | | — | | | | | | | | 18,754,128 | |
Investment Company | | | | | | | 762,424 | | | | | | | | — | | | | | | | | — | | | | | | | | 762,424 | |
U.S. Government Agency Backed Mortgages | | | | | | | — | | | | | | | | 98 | | | | | | | | — | | | | | | | | 98 | |
| | | | | | | | | | | | | | | | | | | | | | | | | | | | | | | | |
Total Assets | | | | | | $ | 762,424 | | | | | | | $ | 78,199,650 | | | | | | | $ | — | | | | | | | $ | 78,962,074 | |
| | | | | | | | | | | | | | | | | | | | | | | | | | | | | | | | |
Liabilities: | | | | | | | | | | | | | | | | | | | | | | | | | | | | | | | | |
Other Financial Instruments* | | | | | | | | | | | | | | | | | | | | | | | | | | | | | | | | |
Financial futures contracts | | | | | | $ | (170,508 | ) | | | | | | | $— | | | | | | | $ | — | | | | | | | | $(170,508 | ) |
| | | | | | | | | | | | | | | | | | | | | | | | | | | | | | | | |
*Other financial instruments are instruments shown on the Schedule of Portfolio Investments, such as futures contracts which are valued at fair value.
TBA Commitments:
The Funds may enter into TBA commitments to purchase or sell securities for a fixed price at a future date. TBA commitments are considered securities in themselves, and involve a risk of loss if the value of the security to be purchased/sold declines/increases prior to settlement date, which is in addition to the risk of decline in the value of a Fund’s other assets. Unsettled TBA commitments are valued at the current value of the underlying securities, according to the procedures described under “Security Valuation”.
Derivatives:
The Funds may use derivative instruments, including futures, forwards, options, indexed securities, swaps and inverse securities for hedging purposes only. Derivatives allow the Funds to manage their risk exposure more quickly and efficiently than other types of instruments. Derivatives may be riskier than other types of investments and could result in losses that significantly exceed a Fund’s original investment. Derivatives are subject to the risk that changes in the value of a derivative may not correlate perfectly with the underlying asset, rate or index. The use of derivatives may not be successful, resulting in losses to a Fund, and the cost of such strategies may reduce the Fund’s returns.
Hedging also involves the risk that changes in the value of the derivative will not match those of the holdings being hedged as expected by the Funds, in which case any losses on the holdings being hedged may not be reduced and may be increased. There can be no assurance that a Fund’s hedging strategy will reduce risk or that hedging transactions will be available or cost effective. The Funds are subject to interest rate risk in the normal course of pursuing their investment objectives by investing in various derivative financial instruments, as described below.
Financial Futures Contracts:
The Funds entered into futures contracts in an effort to manage the duration of the portfolio and hedge against certain market risk. A futures contract on a securities index is an agreement obligating one party to pay, and entitling the other party to receive, during the term of the contract, cash payments based on the level of a specified securities index. Futures transactions involve brokerage costs and require a Fund to segregate assets to cover contracts that would require it to purchase securities or currencies. A Fund may lose the expected benefit of futures transactions if interest rates, exchange rates or securities prices change in an unanticipated manner. Such unanticipated changes may also result in lower overall performance than if a Fund had not entered into any futures transactions.
The Funds entered into U.S. Treasury Notes futures during the year ended March 31, 2023.
39
NOTES TO FINANCIAL STATEMENTS
Upon entering into a futures contract, a Fund is required to pledge to the broker an amount of cash, U.S. government securities, or other assets equal to a certain percentage of the contract amount. Subsequent payments are made or received by the Funds each day, depending on the daily fluctuations in the fair value of the underlying instrument. A Fund would record an unrealized gain or loss each day equal to these daily payments.
Open futures contracts are shown on the Schedules of Portfolio Investments. Underlying collateral pledged for open futures contracts is the cash at brokers for financial futures contracts shown on the Statements of Assets and Liabilities at March 31, 2023.
| | | | | | | | | | | | | | | | |
Fair Values of Derivative Financial Instrument as of March 31, 2023(1) | |
Statement of Assets and Liabilities Location | |
Asset Derivatives | |
| | | Short Duration
Fixed Income
Fund | | | Ultra-Short
Fixed Income
Fund | |
Interest Rate Risk: | | | | | | | | | | | | | | | | |
Unrealized appreciation on futures contracts | | | | | | $ | 99,688 | | | | | | | | $— | |
| | | | | | | | | | | | | | | | |
Total | | | | | | $ | 99,688 | | | | | | | | $— | |
| | | | | | | | | | | | | | | | |
| |
Liability Derivatives | |
| | | Short Duration
Fixed Income
Fund | | | Ultra-Short
Fixed Income
Fund | |
Interest Rate Risk: | | | | | | | | | | | | | | | | |
Unrealized depreciation on futures contracts | | | | | | | $— | | | | | | | $ | 170,508 | |
| | | | | | | | | | | | | | | | |
Total | | | | | | | $— | | | | | | | $ | 170,508 | |
| | | | | | | | | | | | | | | | |
The effect of derivative instruments on the Statement of Operations during the year ended March 31, 2023 is as follows:
| | | | | | | | | | | | | | | | | | | | |
Derivative Instruments Categorized by Risk Exposure | | Short Duration
Fixed Income
Fund | | Ultra-Short
Fixed Income
Fund |
Net realized Gain/(Loss) From: | | | | | | | | | | | | | | | | | | | | |
Interest Rate Risk: | | | | | | | | | | | | | | | | | | | | |
Financial futures contracts | | | | | | | | $ | (238,977 | ) | | | | | | | | $ | 1,501,545 | |
| | | | | | | | | | | | | | | | | | | | |
Total | | | | | | | | $ | (238,977 | ) | | | | | | | | $ | 1,501,545 | |
| | | | | | | | | | | | | | | | | | | | |
| | |
Derivative Instruments Categorized by Risk Exposure | | Short Duration
Fixed Income
Fund | | Ultra-Short
Fixed Income
Fund |
Net Change in Unrealized Appreciation/(Depreciation) From: | | | | | | | | | | | | | | | | | | | | |
Interest Rate Risk: | | | | | | | | | | | | | | | | | | | | |
Financial futures contracts | | | | | | | | $ | 167,546 | | | | | | | | | $ | (630,008 | ) |
| | | | | | | | | | | | | | | | | | | | |
Total | | | | | | | | $ | 167,546 | | | | | | | | | $ | (630,008 | ) |
| | | | | | | | | | | | | | | | | | | | |
(1) Not considered to be hedging instruments for accounting disclosure purposes.
40
NOTES TO FINANCIAL STATEMENTS
For the year ended March 31, 2023, the average volume of derivative activities based on ending quarterly outstanding amounts are as follows:
| | | | | | | | | | | | | | | | |
| | | Short Duration
Fixed Income
Fund | | | Ultra-Short
Fixed Income
Fund | |
Futures long position (contracts) | | | | | | | 28 | | | | | | | | — | |
Futures short position (contracts) | | | | | | | — | | | | | | | | 135 | |
Counterparty Credit Risk:
Derivatives may also expose a Fund to counterparty risk (the risk that the derivative counterparty will not fulfill its contractual obligations). To the extent amounts due to the Funds from their counterparties are not fully collateralized contractually or otherwise, the Funds bear the risk of loss from counterparty non-performance. A Fund’s maximum risk of loss from counterparty credit risk on over-the-counter (“OTC”) derivatives is generally the aggregate unrealized gain in excess of any collateral pledged by the counterparty to the Funds.
With exchange-traded futures, the exchange or clearinghouse, as counterparty to such instruments, guarantees against a possible default. The clearinghouse stands between the buyer and the seller of the contract; therefore, credit risk is limited to failure of the clearinghouse. While offset rights may exist under applicable law, the Funds do not have a contractual right of offset against a clearing broker or clearinghouse in the event of a default (including the bankruptcy or insolvency) of the clearing broker or clearinghouse. Additionally, credit risk exists in exchange-traded futures with respect to initial and variation margin that is held in a clearing broker’s customer accounts. While clearing brokers are required to segregate customer margin from their own assets, in the event that a clearing broker becomes insolvent or goes into bankruptcy and at that time there is a shortfall in the aggregate amount of margin held by the clearing broker for all its clients, typically the shortfall would be allocated on a pro rata basis across all the clearing broker’s customers, potentially resulting in losses to the Funds.
Affiliated Investments:
The Funds invest in another Fund of the Trust (an “Affiliated Fund”), U.S. Government Money Market Fund-RBC Institutional Class 1, as a cash sweep vehicle. The income earned by the Funds from the Affiliated Fund for the period is disclosed in the Statement of Operations. The table below details the transactions of the Funds in the Affiliated Fund. As the affiliated investment is a money market fund in which shares are issued and redeemed at $1.00 per share, the number of shares purchased and sold equal the dollar amount shown as purchased and sold, and no gain or loss was realized on the sale of shares of the money market fund.
| | | | | | | | | | | | | | | | | | | | |
| | | Value
March 31, 2022 | | | Purchases | | | Sales | | | Value
March 31, 2023 | | | Dividends | |
Investments in U.S. Government Money Market Fund —RBC Institutional Class 1 | | | | | | | | | | | | | | | | | |
Short Duration Fixed Income Fund | | | $1,318,402 | | | $ | 23,624,243 | | | $ | 24,171,342 | | | | $771,303 | | | | $ 24,260 | |
Ultra-Short Fixed Income Fund | | | 524,983 | | | | 76,794,316 | | | | 76,556,875 | | | | 762,424 | | | | 47,102 | |
Credit Enhancement:
Certain obligations held by the Funds have credit enhancement or liquidity features that may, under certain circumstances, provide for repayment of principal and interest on the obligation upon demand date, interest rate reset date or final maturity. These enhancements may include: letters of credit; liquidity guarantees; security purchase agreements; tender option purchase agreements and third party insurance.
41
NOTES TO FINANCIAL STATEMENTS
Investment Transactions and Income:
Investment transactions are recorded on trade date. Dividend income is recorded on the ex-dividend date. Non-cash dividends, if any, are recorded on the ex-dividend date at fair value. Realized gains and losses from investment transactions are calculated based on the cost of the specific security (also known as identified cost basis). Realized gains and losses from investment transactions and the net change in unrealized appreciation/(depreciation) relating to movements in foreign currency exchange rates are reported as realized gains and losses on foreign currency transactions and net change in unrealized appreciation/(depreciation) on foreign currency, respectively, in the statements of operations. Interest income is recognized on the accrual basis and includes, where applicable, the amortization or accretion of premium or discount using the effective yield method. Paydown gains and losses on mortgage- and asset-backed securities are included in the financial statements as interest income.
Expense, Investment Income and Gain/Loss Allocation:
Each Fund pays the expenses that are directly related to its operations, such as custodian fees or advisory fees. Expenses incurred by the Trust, such as trustee or legal fees, are allocated among each of the Funds in the Trust either proportionately based upon each Fund’s relative net assets or using another reasonable basis such as equally across all Funds in the Trust, depending on the nature of the expense. Individual share classes within a Fund are charged expenses specific to that class, such as distribution fees and transfer agent fees. Within a Fund, expenses other than class specific expenses are allocated daily to each class based upon the proportion of relative net assets. Investment income and realized and unrealized gains or losses are allocated to each class of shares based on relative net assets.
Indemnifications:
Under the Trust’s organizational documents, each Trustee, officer, employee or other agent of the Trust is indemnified against certain liabilities that may arise out of their duties to the Funds. Additionally, in the normal course of business, the Funds enter into contracts, including the Funds’ servicing agreements, that contain a variety of indemnification clauses. The Funds’ maximum exposure under these arrangements is unknown as this would involve future claims that may be made against the Funds that have not yet occurred.
Distributions to Shareholders:
The Funds pay out any income that it receives, less expenses, in the form of dividends and capital gains to its shareholders. Income dividends are declared daily and paid monthly. Capital gain distributions are declared and paid at least annually. Distributions to shareholders are recorded on the ex-dividend date. The amount of dividends and distributions are calculated based on federal income tax regulations, which may differ from US GAAP. These ”book/tax“ differences may be either temporary or permanent in nature. To the extent these differences are determined, as of the end of the tax year, to be permanent (e.g., reclassification of paydown gains and losses), they are reclassified within a Fund’s capital account based on their federal tax basis treatment.
3. Agreements and Other Transactions with Affiliates:
The Trust has entered into an investment advisory agreement with RBC GAM-US under which RBC GAM-US manages each Fund’s assets and furnishes related office facilities, equipment, research and personnel. The agreement requires each Fund to pay RBC GAM-US a monthly fee based upon average daily net assets. Under the terms of the agreement, RBC GAM-US is entitled to receive fees based on a percentage of the average daily net assets of each of the Funds as follows:
| | | | |
| | | Annual Rate | |
Short Duration Fixed Income Fund | | | 0.30% | |
Ultra-Short Fixed Income Fund | | | 0.23% | |
RBC GAM-US has contractually agreed to waive fees and/or make payments in order to keep total operating expenses (excluding certain fees such as interest, taxes and acquired fund fees and expenses) of Class A and Class I shares of each Fund to the following levels. This expense limitation agreement is in place until July 31, 2024.
42
NOTES TO FINANCIAL STATEMENTS
| | | | | | | | |
| | | Class A
Annual Rate | | | Class I
Annual Rate | |
Short Duration Fixed Income Fund | | | 0.45 | % | | | 0.35 | % |
Ultra-Short Fixed Income Fund | | | 0.38 | % | | | 0.28 | % |
The Advisor is entitled to recoup from the Fund or class the fees and/or operating expenses waived or reimbursed during any of the previous 3 years, provided the Fund is able to do so and remain in compliance with the expense limitation in place at the time the fees were waived or expenses paid.
The amounts subject to possible recoupment under the expense limitation agreement as of March 31, 2023 were:
| | | | | | | | | | | | | | | | | | | | |
| | | FYE 3/31/21 | | FYE 3/31/22 | | FYE 3/31/23 | | Total |
Short Duration Fixed Income Fund | | | | $217,611 | | | | | $200,733 | | | | | $248,956 | | | | | $667,300 | |
Ultra-Short Fixed Income Fund | | | | 260,145 | | | | | 249,432 | | | | | 272,270 | | | | | 781,847 | |
RBC GAM-US voluntarily agreed to waive its investment advisory fees by the amount of investment advisory fees each Fund pays to RBC GAM-US indirectly through its investment in an affiliated money market fund. These waivers are voluntary and not subject to recoupment. These amounts are included in expenses waived/reimbursed by Advisor in the Statements of Operations. For the year ended March 31, 2023, the amounts waived were as follows:
| | | | | |
| | | Fees Waived |
Short Duration Fixed Income Fund | | | | $1,548 | |
Ultra-Short Fixed Income Fund | | | | 3,397 | |
RBC GAM-US serves as co-administrator to the Funds. The Bank of New York Mellon. (”BNY Mellon“) serves as co-administrator and fund accounting agent. Services provided under the administrative services contract include providing day-to-day administration of matters related to the Funds, maintenance of their records and the preparation of reports. Under the terms of the administrative services contract, RBC GAM-US does not receive a fee for its role as co-administrator. BNY Mellon receives a fee for its services payable by the Funds based in part on the Funds’ average net assets. BNY Mellon’s fee is included with “Accounting fees” in the Statements of Operations.
Certain Officers and Trustees of the Trust are affiliated with the Advisor. Such Officers and Trustees receive no compensation from the Funds for serving in their respective roles.
The Trust currently pays each of the independent trustees (trustees of the Trust who are not directors, officers or employees of the Advisor, either Co-Administrator or Distributor) an annual retainer of $84,000. The Board Chairperson and Audit Committee Chairperson each receive an additional retainer of $2,500 annually, and all other trustees serving as Chair of a Board committee each receive an additional retainer of $1,000 annually. In addition, independent trustees receive a quarterly meeting fee of $6,500, for each in-person Board meeting attended, a meeting fee of $1,500 for each telephonic or special board meeting attended, a $1,500 fee for each Board committee meeting attended, and are reimbursed for all out-of-pocket expenses relating to attendance at such meetings. These amounts are included in the Statement of Operations in “Trustees’ fees”.
4. Fund Distribution:
Each of the Funds has adopted a Master Distribution 12b-1 Plan (the “Plan”) in which Quasar Distributors LLC (the “Distributor”) acts as the Funds’ distributor. The Plan permits each Fund to make payments for or to reimburse the Distributor for distribution-related costs and expenses of marketing shares of Class A covered under the Plan, and/or for providing shareholder services. The Plan does not apply to Class I. The current Plan fee rate for Class A is 0.10%.
43
NOTES TO FINANCIAL STATEMENTS
Plan fees are based on average daily net assets of Class A. The Distributor, subject to applicable legal requirements, may waive a Plan fee voluntarily, in whole or in part. For the year ended March 31, 2023, there were no fees waived by the Distributor.
The Distributor did not receive any CDSC fees from Class A shares of the Funds during the year ended March 31, 2023.
For the year ended March 31, 2023, the Distributor received no commissions from front-end sales charges of Class A shares.
5. Securities Transactions:
The cost of securities purchased and proceeds from securities sold (excluding securities maturing less than one year from acquisition) for the year ended March 31, 2023 were as follows:
| | | | | | | | | | | | | | | | |
| | | Purchases
(Excl. U.S. Gov’t) | | | Sales
(Excl. U.S. Gov’t) | | | Purchases
of U.S. Gov’t. | | | Sales
of U.S. Gov’t. | |
| | | | |
Short Duration Fixed Income Fund | | | $21,648,026 | | | | $16,086,505 | | | | $2,954,595 | | | | $2,800,788 | |
Ultra-Short Fixed Income Fund | | | 28,608,950 | | | | 96,506,995 | | | | 4,806,267 | | | | 5,231,873 | |
6. Capital Share Transactions:
The Trust is authorized to issue an unlimited number of shares of beneficial interest (“shares outstanding”) without par value. Transactions in capital stock of the Funds are summarized on the following pages:
| | | | | | | | | | | | | | | | |
| | | Short Duration Fixed Income Fund | | | Ultra-Short Fixed Income Fund | |
| | | For the
Year Ended
March 31,
2023 | | | For the
Year Ended
March 31,
2022 | | | For the
Year Ended
March 31,
2023 | | | For the
Year Ended
March 31,
2022 | |
CAPITAL TRANSACTIONS: | | | | | | | | | | | | | | | | |
Class A | | | | | | | | | | | | | | | | |
Proceeds from shares issued | | | $ 297,500 | | | | $ 932,000 | | | | $ 3,611,529 | | | | $ 51,479,702 | |
Distributions reinvested | | | 15,232 | | | | 17,852 | | | | 871,243 | | | | 278,124 | |
Cost of shares redeemed | | | (680,092 | ) | | | (434,544 | ) | | | (34,169,108 | ) | | | (19,746,525 | ) |
| | | | | | | | | | | | | | | | |
Change in Class A | | | $ (367,360) | | | | $515,308 | | | | $ (29,686,336) | | | | $ 32,011,301 | |
| | | | | | | | | | | | | | | | |
Class I | | | | | | | | | | | | | | | | |
Proceeds from shares issued | | | $ 7,464,545 | | | | $ 24,383,849 | | | | $ 70,369,805 | | | | $ 136,950,275 | |
Distributions reinvested | | | 1,372,052 | | | | 944,122 | | | | 2,156,550 | | | | 849,270 | |
Cost of shares redeemed | | | (3,337,051 | ) | | | (32,701,823 | ) | | | (111,097,203 | ) | | | (111,619,850 | ) |
| | | | | | | | | | | | | | | | |
Change in Class I | | | $ 5,499,546 | | | | $ (7,373,852) | | | | $ (38,570,848) | | | | $ 26,179,695 | |
| | | | | | | | | | | | | | | | |
Change in net assets resulting from capital transactions | | | $ 5,132,186 | | | | $ (6,858,544) | | | | $ (68,257,184) | | | | $ 58,190,996 | |
| | | | | | | | | | | | | | | | |
44
NOTES TO FINANCIAL STATEMENTS
| | | | | | | | | | | | | | | | |
| | | Short Duration Fixed Income Fund | | | Ultra-Short Fixed Income Fund | |
| | | For the
Year Ended
March 31,
2023 | | | For the
Year Ended
March 31,
2022 | | | For the
Year Ended
March 31,
2023 | | | For the
Year Ended
March 31,
2022 | |
SHARE TRANSACTIONS: | | | | | | | | | | | | | | | | |
Class A | | | | | | | | | | | | | | | | |
Issued | | | 31,218 | | | | 91,553 | | | | 376,294 | | | | 5,167,589 | |
Reinvested | | | 1,607 | | | | 1,781 | | | | 90,933 | | | | 28,087 | |
Redeemed | | | (71,605 | ) | | | (42,984 | ) | | | (3,565,750 | ) | | | (1,988,266 | ) |
| | | | | | | | | | | | | | | | |
Change in Class A | | | (38,780 | ) | | | 50,350 | | | | (3,098,523 | ) | | | 3,207,410 | |
| | | | | | | | | | | | | | | | |
Class I | | | | | | | | | | | | | | | | |
Issued | | | 785,153 | | | | 2,441,697 | | | | 7,330,684 | | | | 13,786,726 | |
Reinvested | | | 145,030 | | | | 94,243 | | | | 225,305 | | | | 85,726 | |
Redeemed | | | (351,621 | ) | | | (3,221,799 | ) | | | (11,571,973 | ) | | | (11,265,498 | ) |
| | | | | | | | | | | | | | | | |
Change in Class I | | | 578,562 | | | | (685,859 | ) | | | (4,015,984 | ) | | | 2,606,954 | |
| | | | | | | | | | | | | | | | |
Change in shares resulting from capital transactions | | | 539,782 | | | | (635,509 | ) | | | (7,114,507 | ) | | | 5,814,364 | |
| | | | | | | | | | | | | | | | |
7. Federal Income Taxes:
It is the policy of each Fund to continue to qualify as a regulated investment company by complying with the provisions available to certain investment companies, as defined under Subchapter M of the Internal Revenue Code, and to distribute substantially all of its net investment income and net realized capital gains. Therefore, no federal tax liability is recorded in the financial statements of each Fund.
Fund Management has analyzed the Fund’s tax positions taken or expected to be taken on federal income tax returns for all open tax years (current and prior three tax years) and has concluded that no provision for federal income tax is required in the Funds’ financial statements. The Funds’ federal and state income and federal excise tax returns for tax years for which the applicable statutes of limitations have not expired are subject to examination by the Internal Revenue Service and state departments of revenue.
As of and during the year ended March 31, 2023, the Funds did not have a liability for any unrecognized tax benefits. The Funds recognize interest and penalties, if any, related to unrecognized tax benefits as income tax expense in the Statement of Operations. During the year ended March 31, 2023, the Funds did not incur any interest or penalties.
As of March 31, 2023, the tax cost of investments and the breakdown of unrealized appreciation (depreciation) for each Fund was as follows:
| | | | | | | | | | | | | | | | |
| | | Tax Cost Of
Investments | | | Unrealized
Appreciation | | | Unrealized
Depreciation | | | Net Unrealized
Appreciation/
(Depreciation) | |
Short Duration Fixed Income Fund | | $ | 60,930,051 | | | | $109,225 | | | $ | (2,198,470 | ) | | $ | (2,089,245 | ) |
Ultra-Short Fixed Income Fund | | | 82,829,196 | | | | 30,294 | | | | (3,897,416 | ) | | | (3,867,122 | ) |
45
NOTES TO FINANCIAL STATEMENTS
The difference between book basis and tax basis unrealized appreciation/depreciation is attributable to the mark to market on derivatives.
The tax character of distributions during the year ended March 31, 2023 were as follows:
| | | | | | | | | | | | | | | | |
| | | Distributions Paid From | |
| | | Ordinary
Income | | | Net Long Term
Capital Gains | | | Total Taxable
Distributions | | | Total
Distributions
Paid | |
Short Duration Fixed Income Fund | | $ | 1,390,160 | | | | $ — | | | | $1,390,160 | | | | $1,390,160 | |
Ultra-Short Fixed Income Fund | | | 2,741,904 | | | | 356,227 | | | | 3,098,131 | | | | 3,098,131 | |
The tax character of distributions during the year ended March 31, 2022 were as follows:
| | | | | | | | | | | | | | | | |
| | | Distributions Paid From | |
| | | Ordinary
Income | | | Net Long Term
Capital Gains | | | Total Taxable
Distributions | | | Total
Distributions
Paid | |
Short Duration Fixed Income Fund | | $ | 660,793 | | | | $329,272 | | | | $ 990,065 | | | | $ 990,065 | |
Ultra-Short Fixed Income Fund | | | 1,194,953 | | | | 2,113 | | | | 1,197,066 | | | | 1,197,066 | |
Total distributions paid may differ from the Statements of Changes in Net Assets because distributions are recognized when actually paid for tax purposes.
As of March 31, 2023, the components of accumulated earnings/(losses) on a tax basis were as follows:
| | | | | | | | | | | | |
| | | | | | Short
Duration
Fixed Income
Fund | | | Ultra-Short
Fixed Income
Fund | |
Undistributed ordinary income | | | | | | $ | 16,494 | | | $ | 660 | |
Undistributed long term gain | | | | | | | — | | | | — | |
| | | | | | | | | | | | |
Accumulated earnings | | | | | | | 16,494 | | | | 660 | |
Accumulated capital loss carryforwards | | | | | | | (503,999 | ) | | | (2,241,820 | ) |
Unrealized depreciation | | | | | | | (2,089,245 | ) | | | (3,867,122 | ) |
Other temporary differences | | | | | | | (8,739 | ) | | | (2,174 | ) |
| | | | | | | | | | | | |
Total Accumulated Losses | | | | | | $ | (2,585,489 | ) | | $ | (6,110,456 | ) |
| | | | | | | | | | | | |
As of March 31, 2023, the Short Duration Fixed Income Fund and the Ultra-Short Fixed Income Fund had a short-term capital loss carryforward of $152,049 and $667,337 and a long-term capital loss carryforward of $351,950 and $1,574,483 respectively, available to offset future realized capital gains in accordance with the Regulated Investment Company Modernization Act of 2010. This capital loss carryforward is not subject to expiration.
46
NOTES TO FINANCIAL STATEMENTS
Under current tax law, Post-October Capital Losses and Late-Year Ordinary Losses may be deferred and treated as occurring on the first business day of the following fiscal year for tax purposes. Short Duration Fixed Income Fund and Ultra Short Fixed Income Fund didn’t have any qualified late-year losses this year.
8. Line of Credit
The Funds, along with other Funds within the Trust, participate in an uncommitted, secured $500,000,000 line of credit with U.S. Bank, N.A. (the “Bank”), the Funds’ custodian, to be used to fund shareholder redemption requests and for other short-term temporary or emergency general business purposes. The line of credit has a scheduled termination date of July 29, 2023. Interest is charged on borrowings under this line of credit at the Bank’s prime lending rate per annum. Since multiple funds within the Trust participate in this line of credit, there is no assurance that an individual fund will have access to all or any part of the $500,000,000 at any particular time. There were no loans outstanding pursuant to this line of credit at March 31, 2023 and there were no borrowings made by the Funds during the period.
9. Significant Risks
Shareholder concentration risk:
As of March 31, 2023, the Funds had broker-dealer omnibus accounts which each owned more than 10% of a Fund’s outstanding shares as shown below:
| | | | | | |
| | | # of Omnibus Accounts | | % of Fund | |
Short Duration Fixed Income Fund | | 2 | | | 90.9 | % |
Ultra-Short Fixed Income Fund | | 1 | | | 62.8 | % |
In addition, an unaffiliated shareholder owned 26.7% of the Ultra-Short Fixed Income Fund as of March 31, 2023. Significant transactions by these shareholders may impact the Funds’ performance.
Market risk:
One or more markets in which a Fund invests may go down in value, sometimes sharply and unpredictably, and the value of a Fund’s portfolio securities may fall or fail to rise. Market risk may affect a single issuer, sector of the economy, industry or the market as a whole. In addition, global economies and financial markets are becoming increasingly interconnected, and political, economic and other conditions and events (including, but not limited to, natural disasters, pandemics, epidemics, and social unrest) in one country, region, or financial market may adversely impact issuers in a different country, region or financial market. Furthermore, the occurrence of, among other events, natural or man-made disasters, severe weather or geological events, fires, floods, earthquakes, outbreaks of disease (such as COVID-19, avian influenza or H1N1/09), epidemics, pandemics, malicious acts, cyber-attacks, terrorist acts or the occurrence of climate change, may also adversely impact the performance of a Fund. Such events could adversely impact issuers, markets and economies over the short- and long-term, including in ways that cannot necessarily be foreseen. A Fund could be negatively impacted if the value of a portfolio holding were harmed by such political or economic conditions or events. Moreover, such negative political and economic conditions and events could disrupt the processes necessary for a Fund’s operations.
Interest Rate Risk:
A Fund’s yield and value will fluctuate as the general level of interest rates change. During periods when interest rates are low, a Fund’s yield may also be low. When interest rates increase, securities held by a Fund will generally decline in value. Interest rate changes are influenced by a number of factors including government policy, inflation expectations, and supply and demand. Municipal securities may be issued on a when-issued or delayed delivery basis, where payment and delivery take place at a future date. A Fund assumes the risk that the value of the security at delivery may be more or less than the purchase price.
47
NOTES TO FINANCIAL STATEMENTS
Credit Spread Risk:
A Fund’s investments may be adversely affected if any of the issuers it is invested in are subject to an actual or perceived (whether by market participants, rating agencies, pricing services or otherwise) deterioration to their credit quality. Any actual or perceived deterioration may lead to an increase in the credit spreads and a decline in price of the issuer’s securities.
10. Subsequent Events:
Fund Management has evaluated the impact of all subsequent events on the Funds and has determined that there were no subsequent events requiring recognition or disclosure in the financial statements.
48
REPORT OF INDEPENDENT REGISTERED PUBLIC ACCOUNTING FIRM
To the Board of Trustees of RBC Funds Trust and Shareholders of RBC Short Duration Fixed Income Fund and RBC Ultra-Short Fixed Income Fund
Opinions on the Financial Statements
We have audited the accompanying statements of assets and liabilities, including the schedules of portfolio investments, of RBC Short Duration Fixed Income Fund and RBC Ultra-Short Fixed Income Fund (two of the funds constituting RBC Funds Trust, hereafter collectively referred to as the “Funds”) as of March 31, 2023, the related statements of operations for the year ended March 31, 2023, the statements of changes in net assets for each of the two years in the period ended March 31, 2023, including the related notes, and the financial highlights for each of the five years in the period ended March 31, 2023 (collectively referred to as the “financial statements”). In our opinion, the financial statements present fairly, in all material respects, the financial position of each of the Funds as of March 31, 2023, the results of each of their operations for the year then ended, the changes in each of their net assets for each of the two years in the period ended March 31, 2023 and each of the financial highlights for each of the five years in the period ended March 31, 2023 in conformity with accounting principles generally accepted in the United States of America.
Basis for Opinions
These financial statements are the responsibility of the Funds’ management. Our responsibility is to express an opinion on the Funds’ financial statements based on our audits. We are a public accounting firm registered with the Public Company Accounting Oversight Board (United States) (PCAOB) and are required to be independent with respect to the Funds in accordance with the U.S. federal securities laws and the applicable rules and regulations of the Securities and Exchange Commission and the PCAOB.
We conducted our audits of these financial statements in accordance with the standards of the PCAOB. Those standards require that we plan and perform the audit to obtain reasonable assurance about whether the financial statements are free of material misstatement, whether due to error or fraud.
Our audits included performing procedures to assess the risks of material misstatement of the financial statements, whether due to error or fraud, and performing procedures that respond to those risks. Such procedures included examining, on a test basis, evidence regarding the amounts and disclosures in the financial statements. Our audits also included evaluating the accounting principles used and significant estimates made by management, as well as evaluating the overall presentation of the financial statements. Our procedures included confirmation of securities owned as of March 31, 2023 by correspondence with the custodian and brokers. We believe that our audits provide a reasonable basis for our opinions.
/s/PricewaterhouseCoopers LLP
Minneapolis, Minnesota
May 24, 2023
We have served as the auditor of one or more investment companies in the RBC Funds since 2016.
49
OTHER FEDERAL INCOME TAX INFORMATION (UNAUDITED)
For the year ended March 31, 2023, the following Funds had a qualified interest income percentage of:
| | | | |
| | | Qualified
Interest
Income | |
Short Duration Fixed Income Fund | | | 81.28% | |
Ultra-Short Fixed Income Fund | | | 82.80% | |
Pursuant to Internal Revenue Code Section 852(b)(3), the Ultra-Short Fixed Income Fund reported $356,227 as long-term capital gain distributions for the year ended March 31, 2023.
All reportings are based on financial information available as of the date of this annual report and, accordingly, are subject to change. For each item above, it is the intention of the Funds to report the maximum amount permitted under the Internal Revenue Code and the regulations thereunder.
50
Independent Trustees(1)(2)
Lucy Hancock Bode (71)
Position, Term of Office and Length of Time Served with the Trust: Trustee since January 2004
Principal Occupation(s) During Past 5 Years: Healthcare consultant (self-employed) (1986 to present)
Number of Portfolios in Fund Complex Overseen by Trustee: 24
Other Director/Trustee Positions Held by Trustee During Past 5 Years: Franklin Street Partners (2014 to present); BioSignia (2006 to 2010).
Leslie H. Garner Jr. (72)
Position, Term of Office and Length of Time Served with the Trust: Trustee since January 2004
Principal Occupation(s) During Past 5 Years: President and Chief Executive Officer, The Greater Cedar Rapids Community Foundation (2010 to present); President, Cornell College (1994 to 2010)
Number of Portfolios in Fund Complex Overseen by Trustee: 24
Other Director/Trustee Positions Held by Trustee During Past 5 Years: None
Phillip G. Goff. (59)
Position, Term of Office and Length of Time Served with the Trust: Trustee since January 2020
Principal Occupation(s) During Past 5 Years: Senior Vice President/Corporate Controller and Funds Treasurer, TIAA (2006 - 2017)
Number of Portfolios in Fund Complex Overseen by Trustee: 24
Other Director/Trustee Positions Held by Trustee During Past 5 Years: None
Ronald James (72)
Position, Term of Office and Length of Time Served with the Trust: Trustee since January 2004
Principal Occupation(s) During Past 5 Years: Faculty member (part time), University of St. Thomas (2004 to present), President and Chief Executive Officer, Center for Ethical Business Cultures (2000 to January 2017)
Number of Portfolios in Fund Complex Overseen by Trustee: 24
Other Director/Trustee Positions Held by Trustee During Past 5 Years: Bremer Financial Corporation (2004 to present); Greater Twin Cities United Way (2012 to 2020); Best Buy Co. Inc. (2004 to 2013)
John A. MacDonald (74)
Position, Term of Office and Length of Time Served with the Trust: Trustee since January 2004
Principal Occupation(s) During Past 5 Years: Retired. Independent Consultant (2020 to present); Vice President and Treasurer, Hall Family Foundation (1988 to 2020); Chief Investment Officer, Chinquapin Trust Company (1999 to 2020)
Number of Portfolios in Fund Complex Overseen by Trustee: 24
Other Director/Trustee Positions Held by Trustee During Past 5 Years: None
51
Independent Trustees(1)(2)
James R. Seward, CFA (70)
Position, Term of Office and Length of Time Served with the Trust: Chairman of the Board and Trustee since January 2004
Principal Occupation(s) During Past 5 Years: Private investor (2000 to present); CFA (1987 to present)
Number of Portfolios in Fund Complex Overseen by Trustee: 24
Other Director/Trustee Positions Held by Trustee During Past 5 Years: Sooner Holdings (formerly Syntroleum Corporation) (1988 to 2015); Brookdale Senior Living Inc. (2008 to 2019)
Christie Zarkovich (48)
Position, Term of Office and Length of Time Served with the Trust: Trustee since March 2023
Principal Occupation(s) During Past 5 Years: Chief Administrative, Financial and Investment Officer, Health Forward Foundation (2021 to present); Investment Director, Chinquapin Trust Company (2019 to 2021); Head of Mission-Related Investing Research, Cambridge Associates (2018 to 2019)
Number of Portfolios in Fund Complex Overseen by Trustee: 24
Other Director/Trustee Positions Held by Trustee During Past 5 Years: None
Interested Trustees(1)(2)(3)
David Eikenberg (54)(5)
Position, Term of Office and Length of Time Served with the Trust: Trustee since October 2022
Principal Occupation(s) During Past 5 Years: President and Chief Executive Officer, RBC Funds (2022 to present); Head of Intermediary Sales at RBC Global Asset Management (U.S.) Inc. (2018 to present); Vice President, T. Rowe Price (2010 to 2018)
Number of Portfolios in Fund Complex Overseen by Trustee: 24
Other Director/Trustee Positions Held by Trustee During Past 5 Years: None
52
Executive Officers(1)(3)(4)
David Eikenberg (54)(5)
Position, Term of Office and Length of Time Served with the Trust: President and Chief Executive Officer since October 2022
Principal Occupation(s) During Past 5 Years: President and Chief Executive Officer, RBC Funds (2022 to present); Head of Intermediary Sales at RBC Global Asset Management (U.S.) Inc. (2018 to present); Vice President, T. Rowe Price (2010 to 2018)
Kathleen A. Hegna (56)
Position, Term of Office and Length of Time Served with the Trust: Chief Financial Officer and Principal Accounting Officer since May 2009 and Treasurer since March 2014
Principal Occupation(s) During Past 5 Years: Head, Fund Operations (US), RBC Global Asset Management (U.S.) Inc. (September 2022 to present); Associate Vice President and Director, Mutual Fund Services, RBC Global Asset Management (U.S.) Inc. (2009 to September 2022)
Christina M. Weber (54)
Position, Term of Office and Length of Time Served with the Trust: Chief Compliance Officer since December 2012 and Secretary since September 2017
Principal Occupation(s) During Past 5 Years: Chief Compliance Officer, RBC Global Asset Management (U.S.) Inc. (June 2018 to present); Chief Compliance Officer, RBC Funds (2012 to present); Assistant Secretary, RBC Funds (2013 to 2017)
Jodi DeFeyter (51)
Position, Term of Office and Length of Time Served with the Trust: Assistant Secretary since October 2022
Principal Occupation(s) During Past 5 Years: Director, Regulatory Administration, RBC Global Asset Management (U.S.) Inc. (2012 to present)
Tara Tilbury (49)
Position, Term of Office and Length of Time Served with the Trust: Assistant Secretary since October 2022
Principal Occupation(s) During Past 5 Years: Managing Counsel, RBC Global Asset Management (U.S.) Inc. (2018 to present); Vice President and Chief Counsel – Asset Management, Ameriprise Financial, Inc. (2105 to 2018)
| (1) | The address of each Trustee/Officer except David Eikenberg is 50 South Sixth Street, Suite 2350,Minneapolis, Minnesota 55402. The address of David Eikenberg is 225 Franklin Street, Boston, Massachusetts 02110. |
| (2) | All Trustees must retire on or before December 31 of the year in which they reach age 75. The Board may temporarily waive this requirement when necessary to avoid depriving the Board of a Trustee with critical skills. |
| (3) | On December 31, 2009, Voyageur Asset Management Inc. changed its name to RBC Global Asset |
53
| | Management (U.S.) Inc. Any references to RBC Global Asset Management (U.S.) Inc. for prior periods are deemed to be references to the prior entity. |
| (4) | Each officer serves in such capacity for an indefinite period of time until his or her removal, resignation or retirement. |
| (5) | David Eikenberg has been determined to be an interested Trustee by virtue of his position with the Advisor. |
The Fund’s Statement of Additional Information includes information about the Funds’ Trustees. To receive your free copy of the Statement of Additional Information, call toll free: 1-800-422-2766.
54
SHARE CLASS INFORMATION (UNAUDITED)
The Funds offer Class A and Class I shares.
Class A
Class A shares are intended for investors meeting certain minimum investment thresholds. Class A shares of Short Duration Fixed Income Fund are subject to a maximum up-front sales charge of 1.50% and a 1.00% CDSC for redemption within 12 months of a $500,000 or greater purchase. Class A shares of Ultra-Short Fixed Income Fund are not subject to an up-front sales charge or CDSC. Class A shares currently include a 0.10% (10 bps) annual 12b-1 service and distribution fee.
Class I
Class I shares are intended for investors meeting certain minimum investment thresholds. This share class does not have an up-front sales charge (load) or a 12b-1 service and distribution fee.
55
SUPPLEMENTAL INFORMATION (UNAUDITED)
Shareholder Expense Examples
As a shareholder of the RBC Funds, you incur two types of costs: (1) transaction costs and (2) ongoing costs, including management fees; and other Fund expenses. This example is intended to help you understand your ongoing costs (in dollars) of investing in the RBC Funds and to compare these costs with the ongoing costs of investing in other mutual funds.
The example is based on an investment of $1,000 invested at the beginning of the period and held for the entire period from October 1, 2022 through March 31, 2023.
Actual Expenses
The table below provides information about actual account values and actual expenses. You may use the information below, together with the amount you invested, to estimate the expenses that you paid over the period. Simply divide your account value by $1,000 (for example, an $8,600 account value divided by $1,000 = 8.6), then multiply the result by the number in the table under the heading entitled “Expenses Paid During Period” to estimate the expenses you paid on your account during this period.
| | | | | | | | |
| | | Beginning
Account Value
10/1/22 | | Ending
Account Value
3/31/23 | | Expenses Paid
During Period*
10/1/22–3/31/23 | | Annualized
Expense Ratio
During Period
10/1/22–3/31/23 |
Short Duration Fixed Income Fund | | | | | | | | |
Class A | | $1,000.00 | | $1,028.10 | | $2.22 | | 0.44% |
Class I | | 1,000.00 | | 1,028.60 | | 1.72 | | 0.34% |
Ultra-Short Fixed Income Fund | | | | | | | | |
Class A | | 1,000.00 | | 1,026.40 | | 1.87 | | 0.37% |
Class I | | 1,000.00 | | 1,026.90 | | 1.36 | | 0.27% |
*Expenses are equal to the average account value times the Fund’s annualized expense ratio multiplied by 182/365 (to reflect one half year period).
56
SUPPLEMENTAL INFORMATION (UNAUDITED)
Hypothetical Example for Comparison Purposes
The table below provides information about hypothetical account values and hypothetical expenses based on each RBC Funds’ actual expense ratio and an assumed rate of return of 5% per year before expenses, which is not the Fund’s actual return. The hypothetical account values and expenses may not be used to estimate the actual ending account balance or expenses you paid for the period. You may use this information to compare this 5% hypothetical example with the 5% hypothetical examples that appear in the shareholder reports of other funds.
Please note that the expenses shown in the table are meant to highlight your ongoing costs only and do not reflect any transactional costs, such as sales charges (loads), redemption fees, or exchange fees. Therefore, the table is useful in comparing ongoing costs only, and will not help you determine the relative total costs of owning different funds. In addition, if these transactional costs were included, your costs would have been higher.
| | | | | | | | |
| | | Beginning
Account Value
10/1/22 | | Ending
Account Value
3/31/23 | | Expenses Paid
During Period
10/1/22-3/31/23 | | Annualized
Expense Ratio
During Period
10/1/22-3/31/23 |
Short Duration Fixed Income Fund | | | | | | | | |
Class A | | $1,000.00 | | $1,022.74 | | $2.22 | | 0.44% |
Class I | | 1,000.00 | | 1,023.24 | | 1.72 | | 0.34% |
Ultra-Short Fixed Income Fund | | | | | | | | |
Class A | | 1,000.00 | | 1,023.09 | | 1.87 | | 0.37% |
Class I | | 1,000.00 | | 1,023.59 | | 1.36 | | 0.27% |
57
STATEMENT REGARDING LIQUIDITY RISK MANAGEMENT PROGRAM (UNAUDITED)
Statement Regarding Liquidity Risk Management Program
This section discusses the operation and effectiveness of the Liquidity Risk Management Program for the RBC Funds established in accordance with Rule 22e-4 under the Investment Company Act of 1940 (the “Liquidity Rule”). RBC Global Asset Management (U.S.) Inc. (“RBC GAM”), the investment adviser to each Fund, serves as the Program Administrator and administers day-to-day implementation of the Program through a working group known as the Liquidity Risk Committee.
RBC GAM, as Program Administrator, provided the Board with a report addressing the operation of the Program during the year ending December 31, 2022 and assessing its adequacy and effectiveness of implementation, including, if applicable, the operation of any Fund’s highly liquid investments minimum and any material changes to the Program.
I. Key Conclusions of the Report
During the review period, the Program was implemented and operated effectively to achieve the goal of assessing and managing each Fund’s liquidity risk. Each Fund was able to meet requests for redemption without significant dilution of remaining investors’ interests in the Fund, and no Fund was required to set a highly liquid investments minimum. There were no material changes to the Program implemented during the review period.
II. Summary of the Review
A. Liquidity Risk Assessment and Review
Throughout the review period, the Program Administrator, in consultation with investment personnel, monitored the Funds’ portfolio liquidity and liquidity risk on an ongoing basis, as described in the Program, monthly in connection with recording the liquidity classification for each portfolio investment for reporting on Form N-PORT, and provided quarterly reports to the Board throughout the review period.
The Program Administrator also conducted an annual review assessing each Fund’s liquidity risk, in accordance with the requirements of the Program and the Liquidity Rule, taking into account the following factors, as applicable:
a. Each Fund’s investment strategy and liquidity of portfolio investments during both normal and reasonably foreseeable stressed conditions, including: (i) whether the Fund’s investment strategy is appropriate for an open-end fund; (ii) the extent to which the Fund’s strategy involves a relatively concentrated portfolio or large positions in particular issuers; (iii) the Fund’s use of borrowings for investment purposes; and (iv) the Fund’s use of derivatives (including for hedging purposes);
b. Short-term and long-term cash flow projections during both normal and reasonably foreseeable stressed conditions; and
c. Holdings of cash and cash equivalents, as well as borrowing arrangements and other funding sources.
Investment Strategy and Portfolio Liquidity. The Program Administrator considered the factors identified above, among others, during both normal and reasonably foreseeable stressed conditions as provided in the Program. Pursuant to the review, the Program Administrator determined that each Fund’s investment strategy and use of derivatives are appropriate for an open-end fund.
Cash Flow. The Funds’ cash flows did not have a material effect on the ability to meet redemptions during the review period.
Holdings of Cash and Borrowing Arrangements. As described in the Report, the Program Administrator determined that the Funds’ holdings of cash and borrowing arrangements were adequate for meeting the Funds’ expected cash flow needs to meet redemptions during the review period.
Cash Flow. The Funds’ cash flows did not have a material effect on the ability to meet redemptions during the Review Period.
58
STATEMENT REGARDING LIQUIDITY RISK MANAGEMENT PROGRAM (UNAUDITED)
Holdings of Cash and Borrowing Arrangements. As described in the Report, the Program Administrator determined that the Funds’ holdings of cash and borrowing arrangements were adequate for meeting the Funds’ expected cash flow needs to meet redemptions during the Review Period.
In light of the assessment and review as discussed above, the Program Administrator did not recommend any material changes in the management of the Funds’ liquidity risks, including with respect to any of the above factors.
B. Review of Initial Liquidity Risk
During the review period, four new RBC Funds were launched. The Program Administrator conducted initial liquidity risk reviews for each of these Funds and concluded that there were no significant liquidity risk concerns.
C. Portfolio Holdings Classifications
During the review period, each Fund’s portfolio holdings (including derivative investments) were classified monthly as Highly Liquid Investments, Moderately Liquid Investments, Less Liquid Investments and Illiquid Investments pursuant to the Program, as required by the Liquidity Rule.
During the review period, the Funds also classified portfolio investments (including, as applicable, derivatives transactions) according to asset class when appropriate, as described in the Program. In addition, pursuant to the Program, each Fund must separately classify and review any investment within an asset class if any market, trading, or investment-specific considerations are reasonably expected to significantly affect the liquidity of the investment as compared the Fund’s other portfolio holdings within that asset class. During the review period, there were no circumstances in which a Fund was required to separately classify any investment within an asset class.
Market Depth—Reasonably Anticipated Trading Size (“RATS”). In classifying and reviewing its portfolio investments or asset classes (as applicable), each Fund must determine whether trading varying portions of a position in a particular portfolio investment or asset class, in sizes that the Fund would reasonably anticipate trading, is reasonably expected to significantly affect its liquidity. Each Fund must take this determination into account when classifying the liquidity of that investment or asset class. There were no material changes to the RATS assumptions for the Funds during the review period.
Classification Review. As required by the Liquidity Rule, the Program Administrator reviewed the Funds’ liquidity classifications on a monthly basis as described in the Program. The Committee met monthly to review its portfolio investments’ classifications in connection with recording the liquidity classification for each portfolio investment for reporting on Form N-PORT. The Program Administrator oversaw the Funds’ process for classifying portfolio holdings under the Liquidity Rule and reviewed the classifications, as described in the Program. This review included a review of the methodology and data inputs used. Due to the Russian-Ukrainian conflict, there were widespread sanctions against Russian-affiliated assets resulting in affected Russian holdings being classified as illiquid. During the review period, the Program Administrator determined that there were no material operational issues with the process for classifying portfolio holdings.
D. Highly Liquid Investments Minimum
The Program Administrator reviewed the process and standards for determining that each Fund primarily holds investments that are highly liquid. There were no changes recommended in the Report with respect to the status of any Fund as a Primarily Highly Liquid Fund (“PHLF”) and, with one exception, each Fund qualified as a PHLF on an ongoing basis during the review period as described in the Report. The newly launched RBC International Small Cap Equity Fund did not initially qualify as a PHLF, however, it was expected to meet the relevant threshold as soon as its access to all the relevant trading markets had been completed. Accordingly, a highly liquid investments minimum was not required for any Fund during the review period pursuant to the relevant provisions of the Program.
E. Compliance with the 15% Limitation on Illiquid Investments
Pursuant to the Liquidity Rule, no Fund may acquire any illiquid investment if, after the acquisition, the Fund would have invested more than 15% of its assets in illiquid investments that are assets (the
59
STATEMENT REGARDING LIQUIDITY RISK MANAGEMENT PROGRAM (UNAUDITED)
“15% Limit”). The Program Administrator monitored compliance with the 15% Limit as described in the Program. At no time during the review period did any Fund breach the 15% limit.
F. Redemptions in Kind
There were no planned redemptions in-kind effected during the review period.
G. SEC Reporting
The Funds met their monthly Form N-PORT filing requirements during the period. No reports on Form N-LIQUID were required to be filed during the period and none were filed.
60
|
|
| |
This Page Intentionally Left Blank |
61
|
|
| |
|
This Page Intentionally Left Blank |
62
|
|
| |
|
This Page Intentionally Left Blank |
63
|
|
| |
|
This Page Intentionally Left Blank |
64
RBC Funds
P.O. Box 701
Milwaukee, WI 53201-0701
800-422-2766
www.rbcgam.com
Performance data represents past performance and does not guarantee future results. The principal value of an investment and investment return will fluctuate so that an investor’s shares, when redeemed, may be worth more or less than their original cost.
This report and the financial statements contained herein are provided for the information of RBC Funds shareholders. This report is not authorized for distribution to prospective investors unless preceded or accompanied by a current prospectus, which contains information concerning investment objectives, risks, charges and expenses of the funds. Please read the prospectus carefully before investing.
This report and the financial statements contained herein are not intended to be a forecast of future events, a guarantee of future results, or investment advice. There is no assurance that certain securities will remain in or out of each fund’s portfolio. The views expressed in this report reflect those of the portfolio managers through the year ended March 31, 2023.
NOT FDIC INSURED • NO BANK GUARANTEE • MAY LOSE VALUE
RBC Global Asset Management (U.S.) Inc. serves as investment advisor for the RBC Funds. RBC Funds are distributed by Quasar Distributors LLC.
The RBC Funds are pleased to offer shareholder reports printed entirely on Forest Stewardship Council® certified paper. FSC® certification ensures that the paper used in this report contains fiber from well-managed and responsibly harvested forests that meet strict environmental and socioeconomic standards.
RBCF-FI AR 03-23
| | (a) | The registrant, as of the end of the period covered by this report, has adopted a code of ethics that applies to the registrant’s principal executive officer, principal financial officer, principal accounting officer or controller, or persons performing similar functions, regardless of whether these individuals are employed by the registrant or a third party. |
| | (c) | There have been no amendments, during the period covered by this report, to a provision of the code of ethics that applies to the registrant’s principal executive officer, principal financial officer, principal accounting officer or controller, or persons performing similar functions, regardless of whether these individuals are employed by the registrant or a third party, and that relates to any element of the code of ethics description. |
| | (d) | The registrant has not granted any waivers, including an implicit waiver, from a provision of the code of ethics that applies to the registrant’s principal executive officer, principal financial officer, principal accounting officer or controller, or persons performing similar functions, regardless of whether these individuals are employed by the registrant or a third party, that relates to one or more of the items set forth in paragraph (b) of this item’s instructions. |
| Item 3. | Audit Committee Financial Expert. |
As of the end of the period covered by the report, the registrant’s board of directors has determined that Phillip G. Goff and James R. Seward are qualified to serve as an audit committee financial expert serving on its audit committee and that they are “independent,” as defined by Item 3 of Form N-CSR.
| Item 4. | Principal Accountant Fees and Services. |
Audit Fees
| | (a) | The aggregate fees billed for each of the last two fiscal years for professional services rendered by the principal accountant for the audit of the registrant’s annual financial statements or services that are normally provided by the accountant in connection with statutory and regulatory filings or engagements for those fiscal years are $381,600 for 2023 and $252,800 for 2022. |
Audit-Related Fees
| | (b) | The aggregate fees billed in each of the last two fiscal years for assurance and related services by the principal accountant that are reasonably related to the performance of the audit of the registrant’s financial statements and are not reported under paragraph (a) of this Item are $0 for 2023 and $0 for 2022. |
Tax Fees
| | (c) | The aggregate fees billed in each of the last two fiscal years for professional services rendered by the principal accountant for tax compliance, tax advice, and tax planning are $46,975 for 2023 and $28,755 for 2022. |
Tax fees for both years relate to the review of the registrant’s tax returns and review of required shareholder distribution calculations. Amount requiring approval of the registrant’s audit committee is $0 and $0, respectively.
All Other Fees
| | (d) | The aggregate fees billed in each of the last two fiscal years for products and services provided by the principal accountant, other than the services reported in paragraphs (a) through (c) of this Item are $0 for 2023 and $0 for 2022. |
| | (e)(1) | Disclose the audit committee’s pre-approval policies and procedures described in paragraph (c)(7) of Rule 2-01 of Regulation S-X. |
The Audit Committee (“Committee”) will review and approve in advance any proposal (except as set forth in (1) through (3) below) that the Trust employ the Funds’ auditor to render “permissible non-audit services” to the Funds. A “permissible non-audit service” is defined as a non-audit service that is not prohibited by Rule 2-01(c)(4) of Regulation S-X or other applicable law or regulation. The Committee will also review and approve in advance any proposal (except as set forth in (1) through (3) below) that the Adviser, and any entity controlling, controlled by, or under common control with the Adviser that provides ongoing services to the Funds (an “Adviser-affiliated service provider”), employ the Funds’ auditor to render non-audit services, if such engagement would relate directly to the operations and financial reporting of the Funds. As a part of its review, the Committee shall consider whether the provision of such services is consistent with the auditor’s independence. (See also “Delegation” below.)
Pre-approval by the Committee of non-audit services is not required so long as:
(1) (A) with respect to the Funds, the aggregate amount of all such permissible non-audit services provided to the Funds constitutes no more than 5% of the total amount of revenues paid to the auditor by the Funds during the fiscal year in which the services are provided; or
(B) with respect to the Adviser and any Adviser-affiliated service provider, the aggregate amount of all such non-audit services provided constitutes no more than 5% of the total amount of revenues (of the type that would have to be pre-approved by the Committee) paid to the auditor by the Funds, the Adviser and any Adviser-affiliated service provider during the fiscal year in which the services are provided;
(2) such services were not recognized by the Funds at the time of the engagement to be non-audit services; and
(3) such services are promptly brought to the attention of the Committee and approved by the Committee or its delegate or delegates, as defined below, prior to the completion of the audit.
(c) Delegation
The Committee may delegate to one or more of its members the authority to pre-approve the auditor’s provision of audit services or permissible non-audit services to the Funds up to a predetermined amount. Any pre-approval determination made by a delegate will be presented to the full Committee at its next meeting. The Committee will communicate any pre-approval made by a delegate to the Trust’s fund accounting agent, which will ensure that the appropriate disclosure is made in the Funds’ periodic reports and other documents as required under the Federal securities laws.
| (e)(2) | The percentage of services described in each of paragraphs (b) through (d) of this Item that were approved by the audit committee pursuant to paragraph (c)(7)(i)(C) of Rule 2-01 of Regulation S-X are as follows: |
(b) 0 %
(c) 100 %
(d) 0 %
| | (f) | The percentage of hours expended on the principal accountant’s engagement to audit the registrant’s financial statements for the most recent fiscal year that were attributed to work performed by persons other than the principal accountant’s full-time, permanent employees was less than fifty percent. |
| | (g) | The aggregate non-audit fees billed by the registrant’s accountant for services rendered to the registrant, and rendered to the registrant’s investment adviser (not including any sub-adviser whose role is primarily portfolio management and is subcontracted with or overseen by another investment adviser), and any entity controlling, controlled by, or under common control with the adviser that provides ongoing services to the registrant for each of the last two fiscal years of the registrant was $398,491 for 2023 and $326,828 for 2022. |
| | (h) | The registrant’s audit committee of the board of directors has considered whether the provision of non-audit services that were rendered to the registrant’s investment adviser (not including any sub-adviser whose role is primarily portfolio management and is subcontracted with or overseen by another investment adviser), and any entity controlling, controlled by, or under common control with the investment adviser that provides ongoing services to the registrant that were not pre-approved pursuant to paragraph (c)(7)(ii) of Rule 2-01 of Regulation S-X is compatible with maintaining the principal accountant’s independence. |
| Item 5. | Audit Committee of Listed Registrants. |
Not applicable.
| (a) | Schedule of Investments in securities of unaffiliated issuers as of the close of the reporting period is included as part of the report to shareholders filed under Item 1 of this form. |
| Item 7. | Disclosure of Proxy Voting Policies and Procedures for Closed-End Management Investment Companies. |
Not applicable.
| Item 8. | Portfolio Managers of Closed-End Management Investment Companies. |
Not applicable.
| Item 9. | Purchases of Equity Securities by Closed-End Management Investment Company and Affiliated Purchasers. |
Not applicable.
| Item 10. | Submission of Matters to a Vote of Security Holders. |
There have been no material changes to the procedures by which the shareholders may recommend nominees to the registrant’s board of directors, where those changes were implemented after the registrant last provided disclosure in response to the requirements of Item 407(c)(2)(iv) of Regulation S-K (17 CFR 229.407) (as required by Item 22(b)(15) of Schedule 14A (17 CFR 240.14a-101)), or this Item.
| Item 11. | Controls and Procedures. |
| | (a) | The registrant’s principal executive and principal financial officers, or persons performing similar functions, have concluded that the registrant’s disclosure controls and procedures (as defined in Rule 30a-3(c) under the Investment Company Act of 1940, as amended (the “1940 Act”) (17 CFR 270.30a-3(c))) are effective, as of a date within 90 days of the filing date of the report that includes the disclosure required by this paragraph, based on their evaluation of these controls and procedures required by Rule 30a-3(b) under the 1940 Act (17 CFR 270.30a-3(b)) and Rules 13a-15(b) or 15d-15(b) under the Securities Exchange Act of 1934, as amended (17 CFR 240.13a-15(b) or 240.15d-15(b)). |
| | (b) | There were no changes in the registrant’s internal control over financial reporting (as defined in Rule 30a-3(d) under the 1940 Act (17 CFR 270.30a-3(d))) that occurred during the period covered by this report that has materially affected, or is reasonably likely to materially affect, the registrant’s internal control over financial reporting. |
| Item 12. | Disclosure of Securities Lending Activities for Closed-End Management Investment Companies. |
SIGNATURES
Pursuant to the requirements of the Securities Exchange Act of 1934 and the Investment Company Act of 1940, the registrant has duly caused this report to be signed on its behalf by the undersigned, thereunto duly authorized.
|
(Registrant) RBC Funds Trust |
|
By (Signature and Title)* /s/ David Eikenberg |
David Eikenberg, President and Chief Executive Officer |
(principal executive officer) |
|
Date March 12, 2024 |
Pursuant to the requirements of the Securities Exchange Act of 1934 and the Investment Company Act of 1940, this report has been signed below by the following persons on behalf of the registrant and in the capacities and on the dates indicated.
|
|
By (Signature and Title)* /s/ David Eikenberg |
David Eikenberg, President and Chief Executive Officer |
(principal executive officer) |
|
Date March 12, 2024 |
|
By (Signature and Title)* /s/ Kathleen A. Hegna |
Kathleen A. Hegna, Treasurer and Chief Financial Officer (principal financial officer) |
|
Date March 12, 2024 |
* Print the name and title of each signing officer under his or her signature.