0001272950 rft1:C000074294Member rft1:FannieMaeTBA45010154Member 2024-09-30
UNITED STATES
SECURITIES AND EXCHANGE COMMISSION
Washington, D.C. 20549
FORM N-CSR
CERTIFIED SHAREHOLDER REPORT OF REGISTERED MANAGEMENT INVESTMENT COMPANIES
Investment Company Act file number
(Exact name of registrant as specified in charter)
50 South Sixth Street, Suite 2350
Minneapolis, MN 55402
(Address of principal executive offices) (Zip code)
Tara Tilbury
50 South Sixth Street, Suite 2350
Minneapolis, MN 55402(Name and address of agent for service)
Registrant's telephone number, including area code:
Date of reporting period:
Item 1. Report to Stockholders
(a) The registrant’s annual report transmitted to shareholders pursuant to Rule 30e-1 under the Investment Company Act of 1940 is as follows:
RBC SMID Cap Growth Fund
Class A / TMCAX
Annual SHAREHOLDER REPORT | September 30, 2024
This annual shareholder report contains important information about the RBC SMID Cap Growth Fund (“Fund”) for the period of October 1, 2023, to September 30, 2024. You can find additional information about the Fund at https://www.dfinview.com/usrbcgam. You can also request this information by contacting us at 1-800-422-2766.
Fund Expenses
(Based on a hypothetical $10,000 investment)
| Fund (Class) | Costs of a $10,000 investment | Costs paid as a percentage
of a $10,000 investment |
RBC SMID Cap Growth Fund
(Class A/TMCAX) | $118 | 1.07% |
Management’s Discussion of Fund Performance
SUMMARY OF RESULTS
The Fund seeks long-term capital appreciation by normally investing at least 80% of its assets in common stocks of small- and mid-capitalization growth companies that fall within the market capitalization range of the Russell 2500™ Growth Index at the time of investment.
The following table outlines key factors that materially affected the Fund’s performance compared to its benchmark during the reporting period October 1, 2023 to September 30, 2024.
TOP PERFORMANCE CONTRIBUTORS
| FACTOR | IMPACT | SUMMARY |
| Stock Selection | Positive | The Fund’s positions in Installed Building Projects Inc., Onto Innovation Inc. and CyberArk Software Ltd. all contributed positively to performance. |
| Stock Selection | Negative | The Fund’s positions in Fox Factory Holding Corp., Alphatec Holdings Inc., and Omnicell Inc. were negative contributors to relative performance. |
Fund Performance
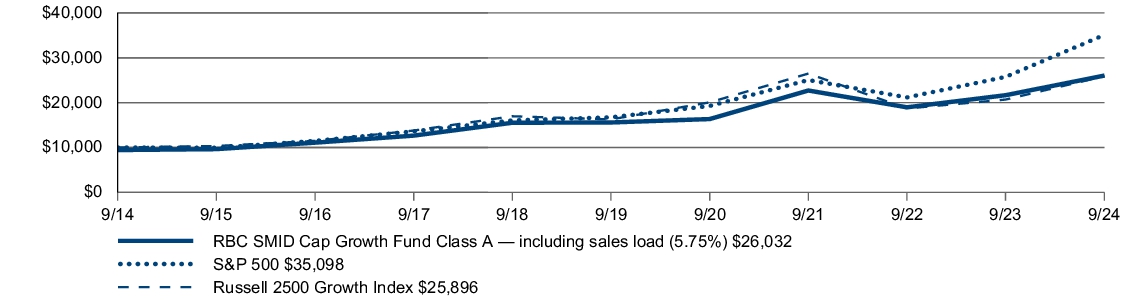
Growth of $10,000 Initial Investment Over 10 Years
| AVERAGE ANNUAL TOTAL RETURN | 1 Year | 5 Years | 10 Years |
| RBC SMID Cap Growth Fund (Class A/TMCAX)— including sales load (5.75%) | 13.33% | 9.50% | 10.04% |
| RBC SMID Cap Growth Fund (Class A/TMCAX) — excluding sales load | 20.21% | 10.82% | 10.69% |
| S&P 500 | 36.35% | 15.98% | 13.38% |
| Russell 2500 Growth Index | 25.20% | 9.75% | 9.98% |
The Fund’s past performance is not a good predictor of how the Fund will perform in the future. For performance data current to the most recent month-end, visit https://usmutualfunds.rbcgam.com/fund-list/ after the seventh business day after month-end, or call 1-800-973-0073.
The graph and table do not reflect the deduction of taxes that a shareholder would pay on Fund distributions or redemption of Fund shares. Performance shown may reflect contractual fee waivers. Without such waivers, total returns would be reduced.
Key Fund Statistics
The following table outlines key fund statistics that you should pay attention to.
| Fund net assets | $170,381,039 |
| Total number of portfolio holdings | 78 |
| Portfolio turnover rate as of the end of the reporting period | 16% |
| Total advisory fee paid (net of fee waivers/reimbursements) | $711,485 |
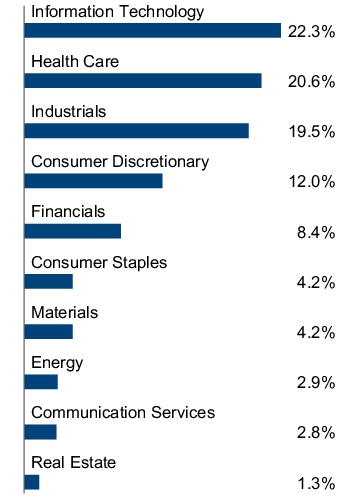
Graphical Representation of Holdings
The tables below show the investment makeup of the Fund, representing percentage of the total net assets of the Fund.
| TechnipFMC Plc | 2.9% |
| Merit Medical Systems, Inc. | 2.4% |
| Integer Holdings Corp. | 2.4% |
| Tetra Tech, Inc. | 2.3% |
| Onto Innovation, Inc. | 2.1% |
| Burlington Stores, Inc. | 2.0% |
| Ollie's Bargain Outlet Holdings, Inc. | 1.9% |
| Woodward, Inc. | 1.9% |
| CyberArk Software Ltd. | 1.8% |
| Stifel Financial Corp. | 1.8% |
Availability of Additional Information
You can find additional information about the Fund, such as the prospectus, financial information, fund holdings and proxy voting information, at www.dfinview.com/usrbcgam, by scanning the QR code or by contacting us at 1-800-422-2766.
Householding
To help lower operating costs, the RBC Funds attempt to eliminate mailing duplicate documents to the same address. When two or more RBC Fund shareholders have the same last name and address, the Funds may send only one prospectus, proxy, financial report or other communications to that address rather than mailing separate documents to each shareholders. This practice is known as "householding". Shareholders may opt out of this single mailing at any time by calling us at 1-800-422-2766.
Not FDIC Insured. No Bank Guarantee. May Lose Value.
RBC Global Asset Management (U.S.) Inc. is the Adviser for the RBC Funds Trust. Securities are offered through RBC Wealth Management, a division of RBC Capital Markets, LLC, member NYSE/FINRA/SIPC.
RBC Global Asset Management (RBC GAM) is the asset management division of Royal Bank of Canada (RBC) which includes RBC Global Asset Management Inc., RBC Global Asset Management (U.S.) Inc., RBC Global Asset Management (UK) Limited, RBC Global Asset Management (Asia) Limited and RBC Indigo Asset Management Inc. which are separate, but affiliated subsidiaries of RBC. ® / ™ Trademark(s) of Royal Bank of Canada. Used under license. ©2024 RBC Global Asset Management (U.S.) Inc.
RBCF- AR 09-24
RBC SMID Cap Growth Fund
Class I / TMCIX
Annual SHAREHOLDER REPORT | September 30, 2024
This annual shareholder report contains important information about the RBC SMID Cap Growth Fund (“Fund”) for the period of October 1, 2023, to September 30, 2024. You can find additional information about the Fund at https://www.dfinview.com/usrbcgam. You can also request this information by contacting us at 1-800-422-2766.
Fund Expenses
(Based on a hypothetical $10,000 investment)
| Fund (Class) | Costs of a $10,000 investment | Costs paid as a percentage
of a $10,000 investment |
RBC SMID Cap Growth Fund
(Class I/TMCIX) | $90 | 0.82% |
Management’s Discussion of Fund Performance
SUMMARY OF RESULTS
The Fund seeks long-term capital appreciation by normally investing at least 80% of its assets in common stocks of small- and mid-capitalization growth companies that fall within the market capitalization range of the Russell 2500™ Growth Index at the time of investment.
The following table outlines key factors that materially affected the Fund’s performance compared to its benchmark during the reporting period October 1, 2023 to September 30, 2024.
TOP PERFORMANCE CONTRIBUTORS
| FACTOR | IMPACT | SUMMARY |
| Stock Selection | Positive | The Fund’s positions in Installed Building Projects Inc., Onto Innovation Inc. and CyberArk Software Ltd. all contributed positively to performance. |
| Stock Selection | Negative | The Fund’s positions in Fox Factory Holding Corp., Alphatec Holdings Inc., and Omnicell Inc. were negative contributors to relative performance. |
Fund Performance
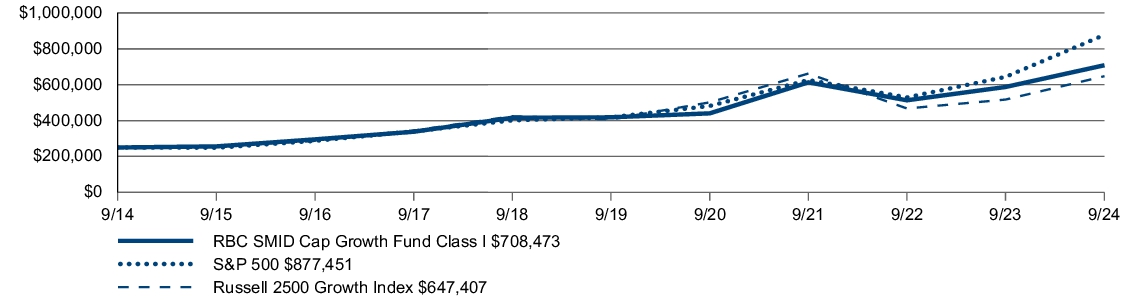
Growth of $250,000 Initial Investment Over 10 Years
| AVERAGE ANNUAL TOTAL RETURN | 1 Year | 5 Years | 10 Years |
| RBC SMID Cap Growth Fund (Class I/TMCIX) | 20.62% | 11.12% | 10.98% |
| S&P 500 | 36.35% | 15.98% | 13.38% |
| Russell 2500 Growth Index | 25.20% | 9.75% | 9.98% |
The Fund’s past performance is not a good predictor of how the Fund will perform in the future. For performance data current to the most recent month-end, visit https://usmutualfunds.rbcgam.com/fund-list/ after the seventh business day after month-end, or call 1-800-973-0073.
The graph and table do not reflect the deduction of taxes that a shareholder would pay on Fund distributions or redemption of Fund shares. Performance shown may reflect contractual fee waivers. Without such waivers, total returns would be reduced.
Key Fund Statistics
The following table outlines key fund statistics that you should pay attention to.
| Fund net assets | $170,381,039 |
| Total number of portfolio holdings | 78 |
| Portfolio turnover rate as of the end of the reporting period | 16% |
| Total advisory fee paid (net of fee waivers/reimbursements) | $711,485 |
Graphical Representation of Holdings
The tables below show the investment makeup of the Fund, representing percentage of the total net assets of the Fund.
| TechnipFMC Plc | 2.9% |
| Merit Medical Systems, Inc. | 2.4% |
| Integer Holdings Corp. | 2.4% |
| Tetra Tech, Inc. | 2.3% |
| Onto Innovation, Inc. | 2.1% |
| Burlington Stores, Inc. | 2.0% |
| Ollie's Bargain Outlet Holdings, Inc. | 1.9% |
| Woodward, Inc. | 1.9% |
| CyberArk Software Ltd. | 1.8% |
| Stifel Financial Corp. | 1.8% |
Availability of Additional Information
You can find additional information about the Fund, such as the prospectus, financial information, fund holdings and proxy voting information, at www.dfinview.com/usrbcgam, by scanning the QR code or by contacting us at 1-800-422-2766.
Householding
To help lower operating costs, the RBC Funds attempt to eliminate mailing duplicate documents to the same address. When two or more RBC Fund shareholders have the same last name and address, the Funds may send only one prospectus, proxy, financial report or other communications to that address rather than mailing separate documents to each shareholders. This practice is known as "householding". Shareholders may opt out of this single mailing at any time by calling us at 1-800-422-2766.
Not FDIC Insured. No Bank Guarantee. May Lose Value.
RBC Global Asset Management (U.S.) Inc. is the Adviser for the RBC Funds Trust. Securities are offered through RBC Wealth Management, a division of RBC Capital Markets, LLC, member NYSE/FINRA/SIPC.
RBC Global Asset Management (RBC GAM) is the asset management division of Royal Bank of Canada (RBC) which includes RBC Global Asset Management Inc., RBC Global Asset Management (U.S.) Inc., RBC Global Asset Management (UK) Limited, RBC Global Asset Management (Asia) Limited and RBC Indigo Asset Management Inc. which are separate, but affiliated subsidiaries of RBC. ® / ™ Trademark(s) of Royal Bank of Canada. Used under license. ©2024 RBC Global Asset Management (U.S.) Inc.
RBCF- AR 09-24
RBC SMID Cap Growth Fund
Class R6 / RSMRX
Annual SHAREHOLDER REPORT | September 30, 2024
This annual shareholder report contains important information about the RBC SMID Cap Growth Fund (“Fund”) for the period of October 1, 2023, to September 30, 2024. You can find additional information about the Fund at https://www.dfinview.com/usrbcgam. You can also request this information by contacting us at 1-800-422-2766.
Fund Expenses
(Based on a hypothetical $10,000 investment)
| Fund (Class) | Costs of a $10,000 investment | Costs paid as a percentage
of a $10,000 investment |
RBC SMID Cap Growth Fund
(Class R6/RSMRX) | $85 | 0.77% |
Management’s Discussion of Fund Performance
SUMMARY OF RESULTS
The Fund seeks long-term capital appreciation by normally investing at least 80% of its assets in common stocks of small- and mid-capitalization growth companies that fall within the market capitalization range of the Russell 2500™ Growth Index at the time of investment.
The following table outlines key factors that materially affected the Fund’s performance compared to its benchmark during the reporting period October 1, 2023 to September 30, 2024.
TOP PERFORMANCE CONTRIBUTORS
| FACTOR | IMPACT | SUMMARY |
| Stock Selection | Positive | The Fund’s positions in Installed Building Projects Inc., Onto Innovation Inc. and CyberArk Software Ltd. all contributed positively to performance. |
| Stock Selection | Negative | The Fund’s positions in Fox Factory Holding Corp., Alphatec Holdings Inc., and Omnicell Inc. were negative contributors to relative performance. |
Fund Performance
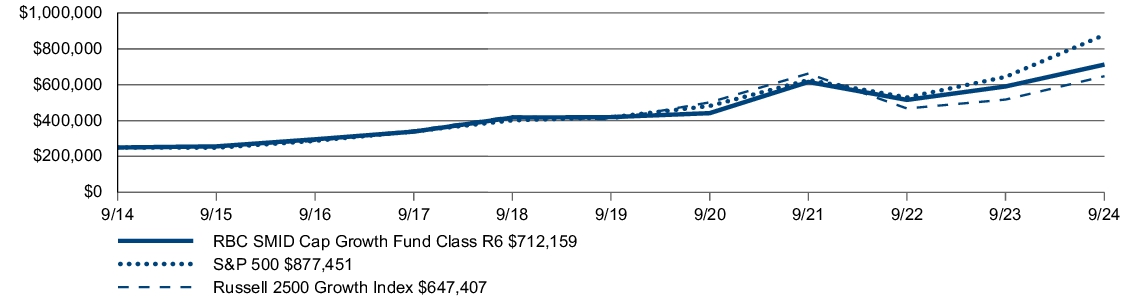
Growth of $250,000 Initial Investment Over 10 Years
| AVERAGE ANNUAL TOTAL RETURN | 1 Year | 5 Years | 10 Years |
| RBC SMID Cap Growth Fund (Class R6/RSMRX) | 20.65% | 11.17% | 11.04% |
| S&P 500 | 36.35% | 15.98% | 13.38% |
| Russell 2500 Growth Index | 25.20% | 9.75% | 9.98% |
The Fund’s past performance is not a good predictor of how the Fund will perform in the future. For performance data current to the most recent month-end, visit https://usmutualfunds.rbcgam.com/fund-list/ after the seventh business day after month-end, or call 1-800-973-0073.
The graph and table do not reflect the deduction of taxes that a shareholder would pay on Fund distributions or redemption of Fund shares. Performance shown may reflect contractual fee waivers. Without such waivers, total returns would be reduced.
Key Fund Statistics
The following table outlines key fund statistics that you should pay attention to.
| Fund net assets | $170,381,039 |
| Total number of portfolio holdings | 78 |
| Portfolio turnover rate as of the end of the reporting period | 16% |
| Total advisory fee paid (net of fee waivers/reimbursements) | $711,485 |
Graphical Representation of Holdings
The tables below show the investment makeup of the Fund, representing percentage of the total net assets of the Fund.
| TechnipFMC Plc | 2.9% |
| Merit Medical Systems, Inc. | 2.4% |
| Integer Holdings Corp. | 2.4% |
| Tetra Tech, Inc. | 2.3% |
| Onto Innovation, Inc. | 2.1% |
| Burlington Stores, Inc. | 2.0% |
| Ollie's Bargain Outlet Holdings, Inc. | 1.9% |
| Woodward, Inc. | 1.9% |
| CyberArk Software Ltd. | 1.8% |
| Stifel Financial Corp. | 1.8% |
Availability of Additional Information
You can find additional information about the Fund, such as the prospectus, financial information, fund holdings and proxy voting information, at www.dfinview.com/usrbcgam, by scanning the QR code or by contacting us at 1-800-422-2766.
Householding
To help lower operating costs, the RBC Funds attempt to eliminate mailing duplicate documents to the same address. When two or more RBC Fund shareholders have the same last name and address, the Funds may send only one prospectus, proxy, financial report or other communications to that address rather than mailing separate documents to each shareholders. This practice is known as "householding". Shareholders may opt out of this single mailing at any time by calling us at 1-800-422-2766.
Not FDIC Insured. No Bank Guarantee. May Lose Value.
RBC Global Asset Management (U.S.) Inc. is the Adviser for the RBC Funds Trust. Securities are offered through RBC Wealth Management, a division of RBC Capital Markets, LLC, member NYSE/FINRA/SIPC.
RBC Global Asset Management (RBC GAM) is the asset management division of Royal Bank of Canada (RBC) which includes RBC Global Asset Management Inc., RBC Global Asset Management (U.S.) Inc., RBC Global Asset Management (UK) Limited, RBC Global Asset Management (Asia) Limited and RBC Indigo Asset Management Inc. which are separate, but affiliated subsidiaries of RBC. ® / ™ Trademark(s) of Royal Bank of Canada. Used under license. ©2024 RBC Global Asset Management (U.S.) Inc.
RBCF- AR 09-24
RBC Small Cap Value Fund
Class A / RBVAX
Annual SHAREHOLDER REPORT | September 30, 2024
This annual shareholder report contains important information about the RBC Small Cap Value Fund (“Fund”) for the period of October 1, 2023, to September 30, 2024. You can find additional information about the Fund at https://www.dfinview.com/usrbcgam. You can also request this information by contacting us at 1-800-422-2766.
Fund Expenses
(Based on a hypothetical $10,000 investment)
| Fund (Class) | Costs of a $10,000 investment | Costs paid as a percentage
of a $10,000 investment |
RBC Small Cap Value Fund
(Class A/RBVAX) | $121 | 1.10% |
Management’s Discussion of Fund Performance
SUMMARY OF RESULTS
The Fund normally invests at least 80% of its assets in common stocks of small companies that are considered to be undervalued in relation to earnings, dividends and/or assets. For purposes of this policy, the term “assets” means net assets plus the amount of borrowings for investment purposes. Small companies are defined by the Fund as companies that fall within the market capitalization range of the Russell 2000® Value Index at the time of purchase.
The following table outlines key factors that materially affected the Fund’s performance compared to its benchmark during the reporting period October 1, 2023 to September 30, 2024.
TOP PERFORMANCE CONTRIBUTORS
| FACTOR | IMPACT | SUMMARY |
| Stock Selection | Positive | The Fund’s positions in Super Micro Computer Inc., Barrett Business Services Inc., and Taylor Morrison Home Corp. contributed positively to performance. |
| Stock Selection | Negative | The Fund’s positions in Par Pacific Holdings Inc., Atkore Inc., and Delek US Holdings Inc. were negative contributors to relative performance. |
Fund Performance
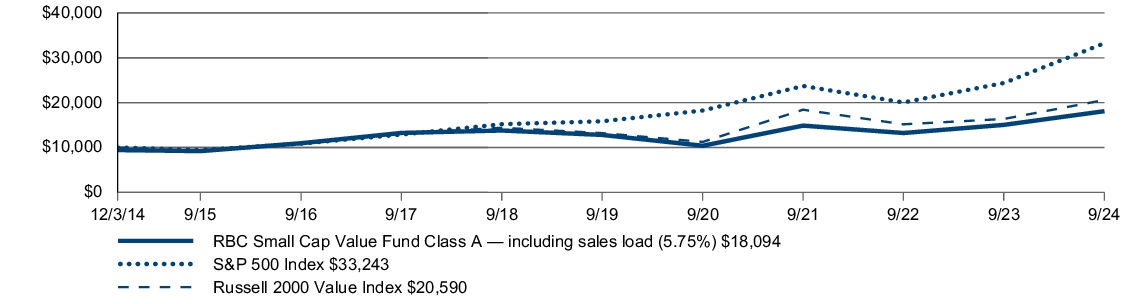
Growth of $10,000 Initial Investment Since Inception
| AVERAGE ANNUAL TOTAL RETURN | 1 Year | 5 Years | Since
Inception |
| RBC Small Cap Value Fund (Class A/RBVAX)— including sales load (5.75%) | 13.42% | 5.90% | 6.22%(a) |
| RBC Small Cap Value Fund (Class A/RBVAX) — excluding sales load | 20.33% | 7.17% | 6.86%(a) |
| S&P 500 | 36.35% | 15.98% | 13.00% |
| Russell 2000 Value Index | 25.88% | 9.29% | 7.63% |
(a) | The Fund’s Class A shares commenced operations on January 28, 2021. Performance shown for this share class prior to commencement of operations reflects the performance of Class I shares and has been adjusted to reflect the fees and expenses of Class A. |
The Fund’s past performance is not a good predictor of how the Fund will perform in the future. For performance data current to the most recent month-end, visit https://usmutualfunds.rbcgam.com/fund-list/ after the seventh business day after month-end, or call 1-800-973-0073.
The graph and table do not reflect the deduction of taxes that a shareholder would pay on Fund distributions or redemption of Fund shares. Performance shown may reflect contractual fee waivers. Without such waivers, total returns would be reduced.
Key Fund Statistics
The following table outlines key fund statistics that you should pay attention to.
| Fund net assets | $31,557,350 |
| Total number of portfolio holdings | 69 |
| Portfolio turnover rate as of the end of the reporting period | 56% |
| Total advisory fee paid (net of fee waivers/reimbursements) | $(40,614) |
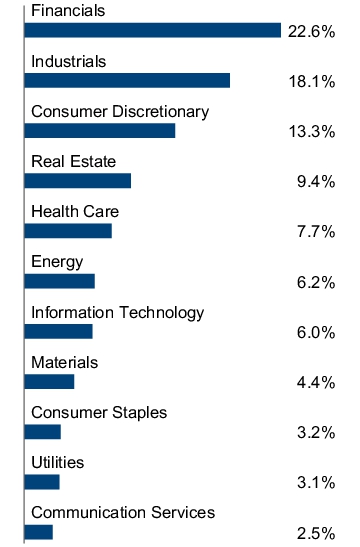
Graphical Representation of Holdings
The tables below show the investment makeup of the Fund, representing percentage of the total net assets of the Fund.
| Magnolia Oil & Gas Corp. | 3.0% |
| Barrett Business Services, Inc. | 2.9% |
| Taylor Morrison Home Corp. | 2.8% |
| Group 1 Automotive, Inc. | 2.8% |
| Matador Resources Co. | 2.7% |
| Nexstar Media Group, Inc. | 2.5% |
| Cheesecake Factory, Inc. (The) | 2.4% |
| Reinsurance Group of America, Inc. | 2.4% |
| Lantheus Holdings, Inc. | 2.4% |
| Pinnacle Financial Partners, Inc. | 2.4% |
Availability of Additional Information
You can find additional information about the Fund, such as the prospectus, financial information, fund holdings and proxy voting information, at www.dfinview.com/usrbcgam, by scanning the QR code or by contacting us at 1-800-422-2766.
Householding
To help lower operating costs, the RBC Funds attempt to eliminate mailing duplicate documents to the same address. When two or more RBC Fund shareholders have the same last name and address, the Funds may send only one prospectus, proxy, financial report or other communications to that address rather than mailing separate documents to each shareholders. This practice is known as "householding". Shareholders may opt out of this single mailing at any time by calling us at 1-800-422-2766.
Not FDIC Insured. No Bank Guarantee. May Lose Value.
RBC Global Asset Management (U.S.) Inc. is the Adviser for the RBC Funds Trust. Securities are offered through RBC Wealth Management, a division of RBC Capital Markets, LLC, member NYSE/FINRA/SIPC.
RBC Global Asset Management (RBC GAM) is the asset management division of Royal Bank of Canada (RBC) which includes RBC Global Asset Management Inc., RBC Global Asset Management (U.S.) Inc., RBC Global Asset Management (UK) Limited, RBC Global Asset Management (Asia) Limited and RBC Indigo Asset Management Inc. which are separate, but affiliated subsidiaries of RBC. ® / ™ Trademark(s) of Royal Bank of Canada. Used under license. ©2024 RBC Global Asset Management (U.S.) Inc.
RBCF- AR 09-24
RBC Small Cap Value Fund
Class I / RSVIX
Annual SHAREHOLDER REPORT | September 30, 2024
This annual shareholder report contains important information about the RBC Small Cap Value Fund (“Fund”) for the period of October 1, 2023, to September 30, 2024. You can find additional information about the Fund at https://www.dfinview.com/usrbcgam. You can also request this information by contacting us at 1-800-422-2766.
Fund Expenses
(Based on a hypothetical $10,000 investment)
| Fund (Class) | Costs of a $10,000 investment | Costs paid as a percentage
of a $10,000 investment |
RBC Small Cap Value Fund
(Class I/RSVIX) | $94 | 0.85% |
Management’s Discussion of Fund Performance
SUMMARY OF RESULTS
The Fund normally invests at least 80% of its assets in common stocks of small companies that are considered to be undervalued in relation to earnings, dividends and/or assets. For purposes of this policy, the term “assets” means net assets plus the amount of borrowings for investment purposes. Small companies are defined by the Fund as companies that fall within the market capitalization range of the Russell 2000® Value Index at the time of purchase.
The following table outlines key factors that materially affected the Fund’s performance compared to its benchmark during the reporting period October 1, 2023 to September 30, 2024.
TOP PERFORMANCE CONTRIBUTORS
| FACTOR | IMPACT | SUMMARY |
| Stock Selection | Positive | The Fund’s positions in Super Micro Computer Inc., Barrett Business Services Inc., and Taylor Morrison Home Corp. contributed positively to performance. |
| Stock Selection | Negative | The Fund’s positions in Par Pacific Holdings Inc., Atkore Inc., and Delek US Holdings Inc. were negative contributors to relative performance. |
Fund Performance
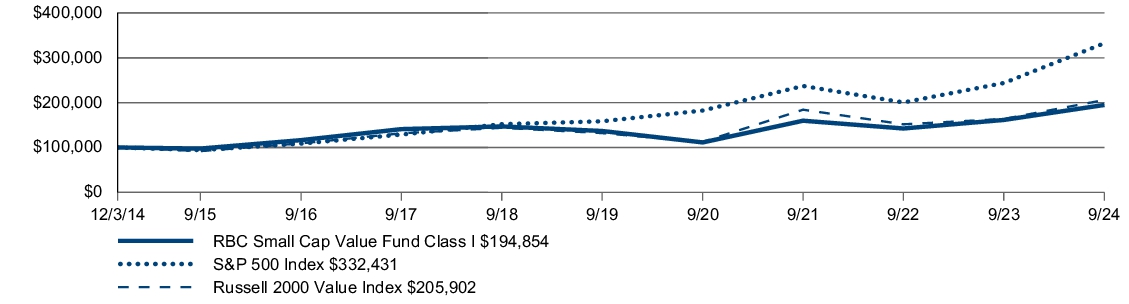
Growth of $100,000 Initial Investment Since Inception
| AVERAGE ANNUAL TOTAL RETURN | 1 Year | 5 Years | Since
Inception |
| RBC Small Cap Value Fund (Class I/RSVIX) | 20.73% | 7.34% | 7.03%(a) |
| S&P 500 | 36.35% | 15.98% | 13.00% |
| Russell 2000 Value Index | 25.88% | 9.29% | 7.63% |
(a) | Commenced operations on December 3, 2014. |
The Fund’s past performance is not a good predictor of how the Fund will perform in the future. For performance data current to the most recent month-end, visit https://usmutualfunds.rbcgam.com/fund-list/ after the seventh business day after month-end, or call 1-800-973-0073.
The graph and table do not reflect the deduction of taxes that a shareholder would pay on Fund distributions or redemption of Fund shares. Performance shown may reflect contractual fee waivers. Without such waivers, total returns would be reduced.
Key Fund Statistics
The following table outlines key fund statistics that you should pay attention to.
| Fund net assets | $31,557,350 |
| Total number of portfolio holdings | 69 |
| Portfolio turnover rate as of the end of the reporting period | 56% |
| Total advisory fee paid (net of fee waivers/reimbursements) | $(40,614) |
Graphical Representation of Holdings
The tables below show the investment makeup of the Fund, representing percentage of the total net assets of the Fund.
| Magnolia Oil & Gas Corp. | 3.0% |
| Barrett Business Services, Inc. | 2.9% |
| Taylor Morrison Home Corp. | 2.8% |
| Group 1 Automotive, Inc. | 2.8% |
| Matador Resources Co. | 2.7% |
| Nexstar Media Group, Inc. | 2.5% |
| Cheesecake Factory, Inc. (The) | 2.4% |
| Reinsurance Group of America, Inc. | 2.4% |
| Lantheus Holdings, Inc. | 2.4% |
| Pinnacle Financial Partners, Inc. | 2.4% |
Availability of Additional Information
You can find additional information about the Fund, such as the prospectus, financial information, fund holdings and proxy voting information, at www.dfinview.com/usrbcgam, by scanning the QR code or by contacting us at 1-800-422-2766.
Householding
To help lower operating costs, the RBC Funds attempt to eliminate mailing duplicate documents to the same address. When two or more RBC Fund shareholders have the same last name and address, the Funds may send only one prospectus, proxy, financial report or other communications to that address rather than mailing separate documents to each shareholders. This practice is known as "householding". Shareholders may opt out of this single mailing at any time by calling us at 1-800-422-2766.
Not FDIC Insured. No Bank Guarantee. May Lose Value.
RBC Global Asset Management (U.S.) Inc. is the Adviser for the RBC Funds Trust. Securities are offered through RBC Wealth Management, a division of RBC Capital Markets, LLC, member NYSE/FINRA/SIPC.
RBC Global Asset Management (RBC GAM) is the asset management division of Royal Bank of Canada (RBC) which includes RBC Global Asset Management Inc., RBC Global Asset Management (U.S.) Inc., RBC Global Asset Management (UK) Limited, RBC Global Asset Management (Asia) Limited and RBC Indigo Asset Management Inc. which are separate, but affiliated subsidiaries of RBC. ® / ™ Trademark(s) of Royal Bank of Canada. Used under license. ©2024 RBC Global Asset Management (U.S.) Inc.
RBCF- AR 09-24
RBC Small Cap Value Fund
Class R6 / RRSVX
Annual SHAREHOLDER REPORT | September 30, 2024
This annual shareholder report contains important information about the RBC Small Cap Value Fund (“Fund”) for the period of October 1, 2023, to September 30, 2024. You can find additional information about the Fund at https://www.dfinview.com/usrbcgam. You can also request this information by contacting us at 1-800-422-2766.
Fund Expenses
(Based on a hypothetical $10,000 investment)
| Fund (Class) | Costs of a $10,000 investment | Costs paid as a percentage
of a $10,000 investment |
RBC Small Cap Value Fund
(Class R6/RRSVX) | $88 | 0.80% |
Management’s Discussion of Fund Performance
SUMMARY OF RESULTS
The Fund normally invests at least 80% of its assets in common stocks of small companies that are considered to be undervalued in relation to earnings, dividends and/or assets. For purposes of this policy, the term “assets” means net assets plus the amount of borrowings for investment purposes. Small companies are defined by the Fund as companies that fall within the market capitalization range of the Russell 2000® Value Index at the time of purchase.
The following table outlines key factors that materially affected the Fund’s performance compared to its benchmark during the reporting period October 1, 2023 to September 30, 2024.
TOP PERFORMANCE CONTRIBUTORS
| FACTOR | IMPACT | SUMMARY |
| Stock Selection | Positive | The Fund’s positions in Super Micro Computer Inc., Barrett Business Services Inc., and Taylor Morrison Home Corp. contributed positively to performance. |
| Stock Selection | Negative | The Fund’s positions in Par Pacific Holdings Inc., Atkore Inc., and Delek US Holdings Inc. were negative contributors to relative performance. |
Fund Performance
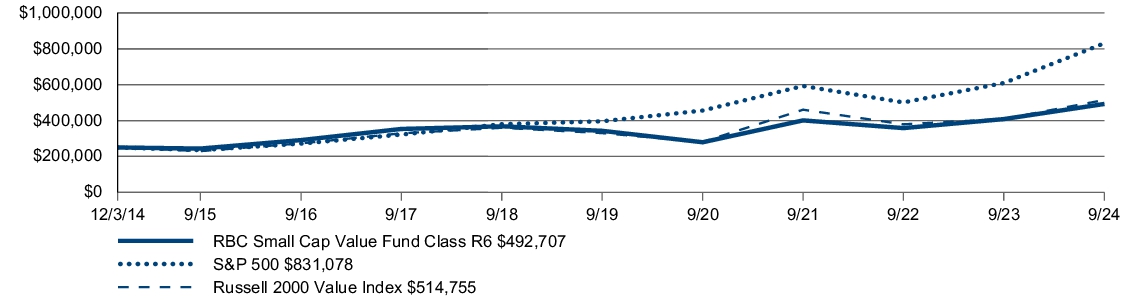
Growth of $250,000 Initial Investment Since Inception
| AVERAGE ANNUAL TOTAL RETURN | 1 Year | 5 Years | Since
Inception |
| RBC Small Cap Value Fund (Class R6/RRSVX) | 20.67% | 7.52% | 7.15%(a) |
| S&P 500 | 36.35% | 15.98% | 13.00% |
| Russell 2000 Value Index | 25.88% | 9.29% | 7.63% |
(a) | The Fund’s Class R6 shares commenced operations on November 21, 2016. Performance shown for this share class prior to commencement of operations reflects the performance of Class I shares and has been adjusted to reflect the fees and expenses of Class R6. |
The Fund’s past performance is not a good predictor of how the Fund will perform in the future. For performance data current to the most recent month-end, visit https://usmutualfunds.rbcgam.com/fund-list/ after the seventh business day after month-end, or call 1-800-973-0073.
The graph and table do not reflect the deduction of taxes that a shareholder would pay on Fund distributions or redemption of Fund shares. Performance shown may reflect contractual fee waivers. Without such waivers, total returns would be reduced.
Key Fund Statistics
The following table outlines key fund statistics that you should pay attention to.
| Fund net assets | $31,557,350 |
| Total number of portfolio holdings | 69 |
| Portfolio turnover rate as of the end of the reporting period | 56% |
| Total advisory fee paid (net of fee waivers/reimbursements) | $(40,614) |
Graphical Representation of Holdings
The tables below show the investment makeup of the Fund, representing percentage of the total net assets of the Fund.
| Magnolia Oil & Gas Corp. | 3.0% |
| Barrett Business Services, Inc. | 2.9% |
| Taylor Morrison Home Corp. | 2.8% |
| Group 1 Automotive, Inc. | 2.8% |
| Matador Resources Co. | 2.7% |
| Nexstar Media Group, Inc. | 2.5% |
| Cheesecake Factory, Inc. (The) | 2.4% |
| Reinsurance Group of America, Inc. | 2.4% |
| Lantheus Holdings, Inc. | 2.4% |
| Pinnacle Financial Partners, Inc. | 2.4% |
Availability of Additional Information
You can find additional information about the Fund, such as the prospectus, financial information, fund holdings and proxy voting information, at www.dfinview.com/usrbcgam, by scanning the QR code or by contacting us at 1-800-422-2766.
Householding
To help lower operating costs, the RBC Funds attempt to eliminate mailing duplicate documents to the same address. When two or more RBC Fund shareholders have the same last name and address, the Funds may send only one prospectus, proxy, financial report or other communications to that address rather than mailing separate documents to each shareholders. This practice is known as "householding". Shareholders may opt out of this single mailing at any time by calling us at 1-800-422-2766.
Not FDIC Insured. No Bank Guarantee. May Lose Value.
RBC Global Asset Management (U.S.) Inc. is the Adviser for the RBC Funds Trust. Securities are offered through RBC Wealth Management, a division of RBC Capital Markets, LLC, member NYSE/FINRA/SIPC.
RBC Global Asset Management (RBC GAM) is the asset management division of Royal Bank of Canada (RBC) which includes RBC Global Asset Management Inc., RBC Global Asset Management (U.S.) Inc., RBC Global Asset Management (UK) Limited, RBC Global Asset Management (Asia) Limited and RBC Indigo Asset Management Inc. which are separate, but affiliated subsidiaries of RBC. ® / ™ Trademark(s) of Royal Bank of Canada. Used under license. ©2024 RBC Global Asset Management (U.S.) Inc.
RBCF- AR 09-24
RBC Small Cap Core Fund
Class A / TEEAX
Annual SHAREHOLDER REPORT | September 30, 2024
This annual shareholder report contains important information about the RBC Small Cap Core Fund (“Fund”) for the period of October 1, 2023, to September 30, 2024. You can find additional information about the Fund at https://www.dfinview.com/usrbcgam. You can also request this information by contacting us at 1-800-422-2766.
This report describes changes to the Fund that occurred during the reporting period.
Fund Expenses
(Based on a hypothetical $10,000 investment)
| Fund (Class) | Costs of a $10,000 investment | Costs paid as a percentage
of a $10,000 investment |
RBC Small Cap Core Fund
(Class A/TEEAX) | $125 | 1.13% |
Management’s Discussion of Fund Performance
SUMMARY OF RESULTS
The Fund normally invests at least 80% of its assets in common stocks of small companies. For purposes of this policy, the term “assets” means net assets plus the amount of borrowings for investment purposes. The Fund currently considers “small companies” to be those within the market capitalization range of the Russell 2000® Index at the time of initial purchase by the Fund.
The following table outlines key factors that materially affected the Fund’s performance compared to its benchmark during the reporting period October 1, 2023 to September 30, 2024.
TOP PERFORMANCE CONTRIBUTORS
| FACTOR | IMPACT | SUMMARY |
| Stock Selection | Positive | The Fund’s positions in Super Micro Computer Inc., Barrett Business Services Inc., and Taylor Morrison Home Corp. contributed positively to performance. |
| Stock Selection | Negative | The Fund’s positions in Par Pacific Holdings Inc., Atkore Inc., and Hudson Technologies Inc. were negative contributors to relative performance. |
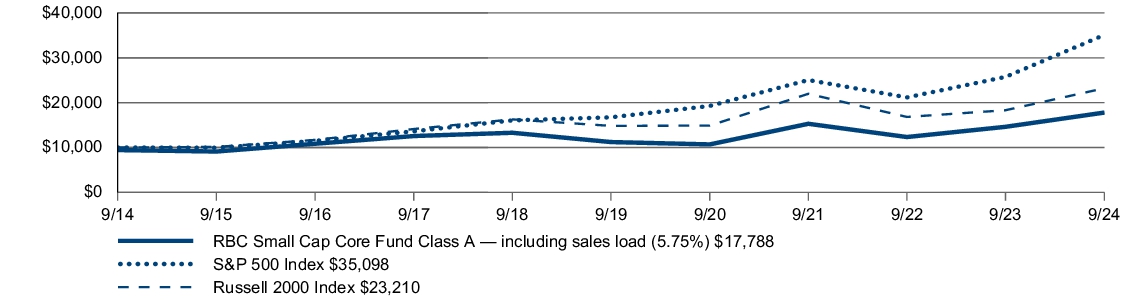
Fund Performance
Growth of $10,000 Initial Investment Over 10 Years
| AVERAGE ANNUAL TOTAL RETURN | 1 Year | 5 Years | 10 Years |
| RBC Small Cap Core Fund (Class A/TEEAX)— including sales load (5.75%) | 14.79% | 8.38% | 5.93% |
| RBC Small Cap Core Fund (Class A/TEEAX) — excluding sales load | 21.75% | 9.67% | 6.56% |
| S&P 500 | 36.35% | 15.98% | 13.38% |
| Russell 2000 Index | 26.76% | 9.39% | 8.78% |
The Fund’s past performance is not a good predictor of how the Fund will perform in the future. For performance data current to the most recent month-end, visit https://usmutualfunds.rbcgam.com/fund-list/ after the seventh business day after month-end, or call 1-800-973-0073.
The graph and table do not reflect the deduction of taxes that a shareholder would pay on Fund distributions or redemption of Fund shares. Performance shown may reflect contractual fee waivers. Without such waivers, total returns would be reduced.
Key Fund Statistics
The following table outlines key fund statistics that you should pay attention to.
| Fund net assets | $41,574,062 |
| Total number of portfolio holdings | 63 |
| Portfolio turnover rate as of the end of the reporting period | 37% |
| Total advisory fee paid (net of fee waivers/reimbursements) | $142,752 |
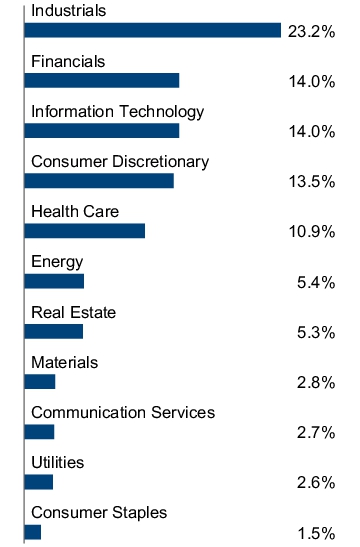
Graphical Representation of Holdings
The tables below show the investment makeup of the Fund, representing percentage of the total net assets of the Fund.
| Barrett Business Services, Inc. | 3.8% |
| Lantheus Holdings, Inc. | 3.8% |
| Ducommun, Inc. | 3.6% |
| Taylor Morrison Home Corp. | 3.5% |
| Compass Diversified Holdings | 3.3% |
| Patrick Industries, Inc. | 3.1% |
| Group 1 Automotive, Inc. | 3.0% |
| Magnolia Oil & Gas Corp. | 2.8% |
| SPDR S&P Biotech ETF | 2.7% |
| Nexstar Media Group, Inc. | 2.7% |
Material Fund Changes
Effective July 1, 2024, the Fund’s management fee rate was reduced from 0.85% to 0.70%, and the expense limitation agreement was amended such that total expenses for Class A are now limited to 1.10% (was previously 1.15%).
Availability of Additional Information
You can find additional information about the Fund, such as the prospectus, financial information, fund holdings and proxy voting information, at www.dfinview.com/usrbcgam, by scanning the QR code or by contacting us at 1-800-422-2766.
Householding
To help lower operating costs, the RBC Funds attempt to eliminate mailing duplicate documents to the same address. When two or more RBC Fund shareholders have the same last name and address, the Funds may send only one prospectus, proxy, financial report or other communications to that address rather than mailing separate documents to each shareholders. This practice is known as "householding". Shareholders may opt out of this single mailing at any time by calling us at 1-800-422-2766.
Not FDIC Insured. No Bank Guarantee. May Lose Value.
RBC Global Asset Management (U.S.) Inc. is the Adviser for the RBC Funds Trust. Securities are offered through RBC Wealth Management, a division of RBC Capital Markets, LLC, member NYSE/FINRA/SIPC.
RBC Global Asset Management (RBC GAM) is the asset management division of Royal Bank of Canada (RBC) which includes RBC Global Asset Management Inc., RBC Global Asset Management (U.S.) Inc., RBC Global Asset Management (UK) Limited, RBC Global Asset Management (Asia) Limited and RBC Indigo Asset Management Inc. which are separate, but affiliated subsidiaries of RBC. ® / ™ Trademark(s) of Royal Bank of Canada. Used under license. ©2024 RBC Global Asset Management (U.S.) Inc.
RBCF- AR 09-24
RBC Small Cap Core Fund
Class I / RCSIX
Annual SHAREHOLDER REPORT | September 30, 2024
This annual shareholder report contains important information about the RBC Small Cap Core Fund (“Fund”) for the period of October 1, 2023, to September 30, 2024. You can find additional information about the Fund at https://www.dfinview.com/usrbcgam. You can also request this information by contacting us at 1-800-422-2766.
This report describes changes to the Fund that occurred during the reporting period.
Fund Expenses
(Based on a hypothetical $10,000 investment)
| Fund (Class) | Costs of a $10,000 investment | Costs paid as a percentage
of a $10,000 investment |
RBC Small Cap Core Fund
(Class I/RCSIX) | $99 | 0.89% |
Management’s Discussion of Fund Performance
SUMMARY OF RESULTS
The Fund normally invests at least 80% of its assets in common stocks of small companies. For purposes of this policy, the term “assets” means net assets plus the amount of borrowings for investment purposes. The Fund currently considers “small companies” to be those within the market capitalization range of the Russell 2000® Index at the time of initial purchase by the Fund.
The following table outlines key factors that materially affected the Fund’s performance compared to its benchmark during the reporting period October 1, 2023 to September 30, 2024.
TOP PERFORMANCE CONTRIBUTORS
| FACTOR | IMPACT | SUMMARY |
| Stock Selection | Positive | The Fund’s positions in Super Micro Computer Inc., Barrett Business Services Inc., and Taylor Morrison Home Corp. contributed positively to performance. |
| Stock Selection | Negative | The Fund’s positions in Par Pacific Holdings Inc., Atkore Inc., and Hudson Technologies Inc. were negative contributors to relative performance. |
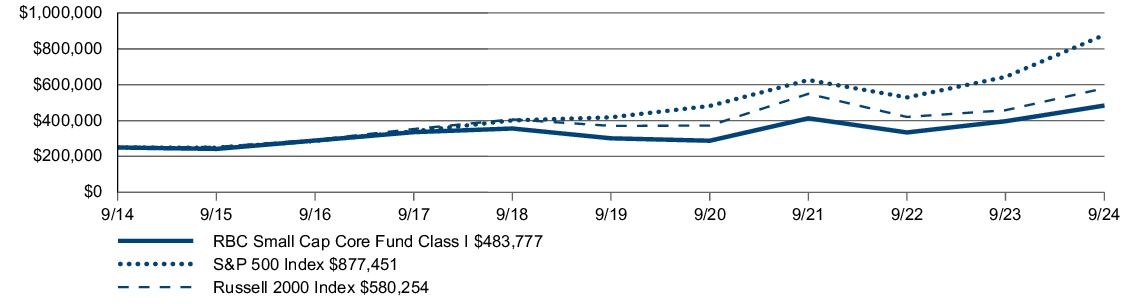
Fund Performance
Growth of $250,000 Initial Investment Over 10 Years
| AVERAGE ANNUAL TOTAL RETURN | 1 Year | 5 Years | 10 Years |
| RBC Small Cap Core Fund (Class I/RCSIX) | 22.11% | 9.94% | 6.82% |
| S&P 500 | 36.35% | 15.98% | 13.38% |
| Russell 2000 Index | 26.76% | 9.39% | 8.78% |
The Fund’s past performance is not a good predictor of how the Fund will perform in the future. For performance data current to the most recent month-end, visit https://usmutualfunds.rbcgam.com/fund-list/ after the seventh business day after month-end, or call 1-800-973-0073.
The graph and table do not reflect the deduction of taxes that a shareholder would pay on Fund distributions or redemption of Fund shares. Performance shown may reflect contractual fee waivers. Without such waivers, total returns would be reduced.
Key Fund Statistics
The following table outlines key fund statistics that you should pay attention to.
| Fund net assets | $41,574,062 |
| Total number of portfolio holdings | 63 |
| Portfolio turnover rate as of the end of the reporting period | 37% |
| Total advisory fee paid (net of fee waivers/reimbursements) | $142,752 |
Graphical Representation of Holdings
The tables below show the investment makeup of the Fund, representing percentage of the total net assets of the Fund.
| Barrett Business Services, Inc. | 3.8% |
| Lantheus Holdings, Inc. | 3.8% |
| Ducommun, Inc. | 3.6% |
| Taylor Morrison Home Corp. | 3.5% |
| Compass Diversified Holdings | 3.3% |
| Patrick Industries, Inc. | 3.1% |
| Group 1 Automotive, Inc. | 3.0% |
| Magnolia Oil & Gas Corp. | 2.8% |
| SPDR S&P Biotech ETF | 2.7% |
| Nexstar Media Group, Inc. | 2.7% |
Material Fund Changes
Effective July 1, 2024, the Fund’s management fee rate was reduced from 0.85% to 0.70%, and the expense limitation agreement was amended such that total expenses for Class I are now limited to 0.85% of average net assets (was previously 0.90%).
Availability of Additional Information
You can find additional information about the Fund, such as the prospectus, financial information, fund holdings and proxy voting information, at www.dfinview.com/usrbcgam, by scanning the QR code or by contacting us at 1-800-422-2766.
Householding
To help lower operating costs, the RBC Funds attempt to eliminate mailing duplicate documents to the same address. When two or more RBC Fund shareholders have the same last name and address, the Funds may send only one prospectus, proxy, financial report or other communications to that address rather than mailing separate documents to each shareholders. This practice is known as "householding". Shareholders may opt out of this single mailing at any time by calling us at 1-800-422-2766.
Not FDIC Insured. No Bank Guarantee. May Lose Value.
RBC Global Asset Management (U.S.) Inc. is the Adviser for the RBC Funds Trust. Securities are offered through RBC Wealth Management, a division of RBC Capital Markets, LLC, member NYSE/FINRA/SIPC.
RBC Global Asset Management (RBC GAM) is the asset management division of Royal Bank of Canada (RBC) which includes RBC Global Asset Management Inc., RBC Global Asset Management (U.S.) Inc., RBC Global Asset Management (UK) Limited, RBC Global Asset Management (Asia) Limited and RBC Indigo Asset Management Inc. which are separate, but affiliated subsidiaries of RBC. ® / ™ Trademark(s) of Royal Bank of Canada. Used under license. ©2024 RBC Global Asset Management (U.S.) Inc.
RBCF- AR 09-24
RBC Small Cap Core Fund
Class R6 / RBRCX
Annual SHAREHOLDER REPORT | September 30, 2024
This annual shareholder report contains important information about the RBC Small Cap Core Fund (“Fund”) for the period of October 1, 2023, to September 30, 2024. You can find additional information about the Fund at https://www.dfinview.com/usrbcgam. You can also request this information by contacting us at 1-800-422-2766.
This report describes changes to the Fund that occurred during the reporting period.
Fund Expenses
(Based on a hypothetical $10,000 investment)
| Fund (Class) | Costs of a $10,000 investment | Costs paid as a percentage
of a $10,000 investment |
RBC Small Cap Core Fund
(Class R6/RBRCX) | $94 | 0.85% |
Management’s Discussion of Fund Performance
SUMMARY OF RESULTS
The Fund normally invests at least 80% of its assets in common stocks of small companies. For purposes of this policy, the term “assets” means net assets plus the amount of borrowings for investment purposes. The Fund currently considers “small companies” to be those within the market capitalization range of the Russell 2000® Index at the time of initial purchase by the Fund.
The following table outlines key factors that materially affected the Fund’s performance compared to its benchmark during the reporting period October 1, 2023 to September 30, 2024.
TOP PERFORMANCE CONTRIBUTORS
| FACTOR | IMPACT | SUMMARY |
| Stock Selection | Positive | The Fund’s positions in Super Micro Computer Inc., Barrett Business Services Inc., and Taylor Morrison Home Corp. contributed positively to performance. |
| Stock Selection | Negative | The Fund’s positions in Par Pacific Holdings Inc., Atkore Inc., and Hudson Technologies Inc. were negative contributors to relative performance. |
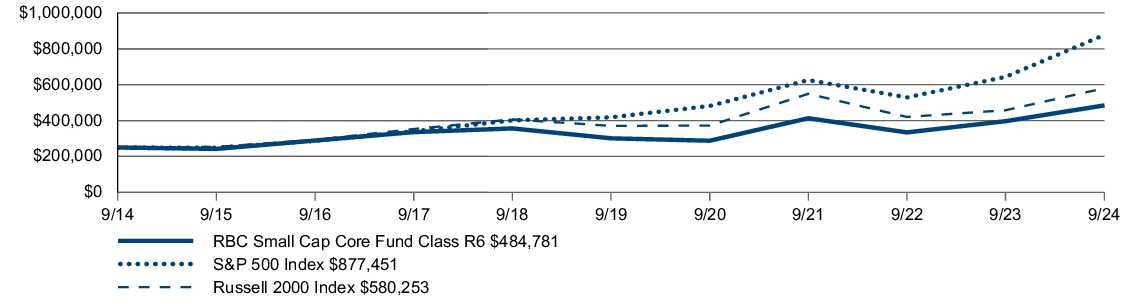
Fund Performance
Growth of $250,000 Initial Investment Over 10 Years
| AVERAGE ANNUAL TOTAL RETURN | 1 Year | 5 Years | 10 Years |
| RBC Small Cap Core Fund (Class R6/RBRCX) | 22.21% | 9.99% | 6.85% |
| S&P 500 | 36.35% | 15.98% | 13.38% |
| Russell 2000 Index | 26.76% | 9.39% | 8.78% |
The Fund’s past performance is not a good predictor of how the Fund will perform in the future. For performance data current to the most recent month-end, visit https://usmutualfunds.rbcgam.com/fund-list/ after the seventh business day after month-end, or call 1-800-973-0073.
The graph and table do not reflect the deduction of taxes that a shareholder would pay on Fund distributions or redemption of Fund shares. Performance shown may reflect contractual fee waivers. Without such waivers, total returns would be reduced.
Key Fund Statistics
The following table outlines key fund statistics that you should pay attention to.
| Fund net assets | $41,574,062 |
| Total number of portfolio holdings | 63 |
| Portfolio turnover rate as of the end of the reporting period | 37% |
| Total advisory fee paid (net of fee waivers/reimbursements) | $142,752 |
Graphical Representation of Holdings
The tables below show the investment makeup of the Fund, representing percentage of the total net assets of the Fund.
| Barrett Business Services, Inc. | 3.8% |
| Lantheus Holdings, Inc. | 3.8% |
| Ducommun, Inc. | 3.6% |
| Taylor Morrison Home Corp. | 3.5% |
| Compass Diversified Holdings | 3.3% |
| Patrick Industries, Inc. | 3.1% |
| Group 1 Automotive, Inc. | 3.0% |
| Magnolia Oil & Gas Corp. | 2.8% |
| SPDR S&P Biotech ETF | 2.7% |
| Nexstar Media Group, Inc. | 2.7% |
Material Fund Changes
Effective July 1, 2024, the Fund’s management fee rate was reduced from 0.85% to 0.70%, and the expense limitation agreement was amended such that total expenses for Class R6 are now limited to 0.82% of average net assets (was previously 0.87%).
Availability of Additional Information
You can find additional information about the Fund, such as the prospectus, financial information, fund holdings and proxy voting information, at www.dfinview.com/usrbcgam, by scanning the QR code or by contacting us at 1-800-422-2766.
Householding
To help lower operating costs, the RBC Funds attempt to eliminate mailing duplicate documents to the same address. When two or more RBC Fund shareholders have the same last name and address, the Funds may send only one prospectus, proxy, financial report or other communications to that address rather than mailing separate documents to each shareholders. This practice is known as "householding". Shareholders may opt out of this single mailing at any time by calling us at 1-800-422-2766.
Not FDIC Insured. No Bank Guarantee. May Lose Value.
RBC Global Asset Management (U.S.) Inc. is the Adviser for the RBC Funds Trust. Securities are offered through RBC Wealth Management, a division of RBC Capital Markets, LLC, member NYSE/FINRA/SIPC.
RBC Global Asset Management (RBC GAM) is the asset management division of Royal Bank of Canada (RBC) which includes RBC Global Asset Management Inc., RBC Global Asset Management (U.S.) Inc., RBC Global Asset Management (UK) Limited, RBC Global Asset Management (Asia) Limited and RBC Indigo Asset Management Inc. which are separate, but affiliated subsidiaries of RBC. ® / ™ Trademark(s) of Royal Bank of Canada. Used under license. ©2024 RBC Global Asset Management (U.S.) Inc.
RBCF- AR 09-24
RBC Microcap Value Fund
Class A / TMVAX
Annual SHAREHOLDER REPORT | September 30, 2024
This annual shareholder report contains important information about the RBC Microcap Value Fund (“Fund”) for the period of October 1, 2023, to September 30, 2024. You can find additional information about the Fund at https://www.dfinview.com/usrbcgam. You can also request this information by contacting us at 1-800-422-2766.
Fund Expenses
(Based on a hypothetical $10,000 investment)
| Fund (Class) | Costs of a $10,000 investment | Costs paid as a percentage
of a $10,000 investment |
RBC Microcap Value Fund
(Class A/TMVAX) | $149 | 1.32% |
Management’s Discussion of Fund Performance
SUMMARY OF RESULTS
The Fund invests, under normal circumstances, at least 80% of its assets in microcap value stocks. For purposes of this policy, the term “assets” means net assets plus the amount of borrowings for investment purposes. The Fund buys microcap value stocks using a quantitative model. Microcap value stocks combine the characteristics of “microcap stocks” and “value stocks.” The Fund defines “microcap stocks” as stocks of companies that have market capitalization at the time of the Fund’s initial purchase of between $20 million and the market capitalization that marks the point between the 8th and 9th deciles of New York Stock Exchange listed stocks (“upper limit”). The Fund defines “value stocks” primarily as those with low price-to-book characteristics.
The following table outlines key factors that materially affected the Fund’s performance compared to its benchmark during the reporting period October 1, 2023 to September 30, 2024.
TOP PERFORMANCE CONTRIBUTORS
| FACTOR | IMPACT | SUMMARY |
| Stock Selection | Positive | The Fund’s positions in Willis Lease Finance Corp., Natural Grocers by Vitamin Cottage Inc., and Ducommun Inc. contributed positively to performance. |
| Stock Selection | Negative | The Fund’s positions in America’s Car-Mart Inc/TX, American Vanguard Corp., and Core Molding Technologies were negative contributors to relative performance. |
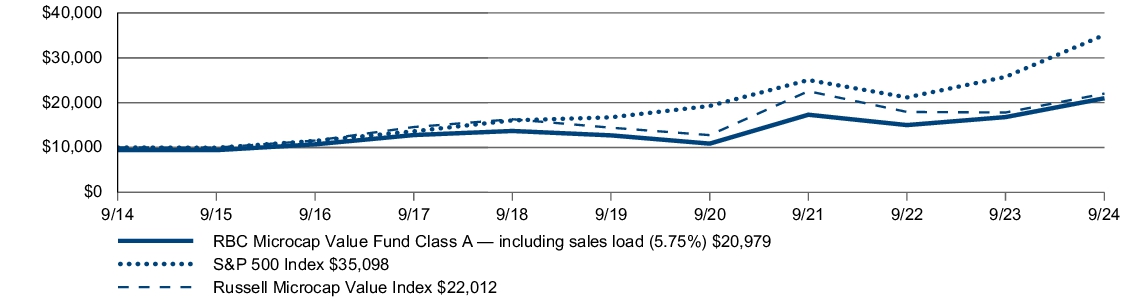
Fund Performance
Growth of $10,000 Initial Investment Over 10 Years
| AVERAGE ANNUAL TOTAL RETURN | 1 Year | 5 Years | 10 Years |
| RBC Microcap Value Fund (Class A/TMVAX)— including sales load (5.75%) | 17.87% | 9.25% | 7.69% |
| RBC Microcap Value Fund (Class A/TMVAX) — excluding sales load | 25.04% | 10.56% | 8.33% |
| S&P 500 | 36.35% | 15.98% | 13.38% |
| Russell Microcap Value Index | 23.65% | 8.84% | 8.21% |
The Fund’s past performance is not a good predictor of how the Fund will perform in the future. For performance data current to the most recent month-end, visit https://usmutualfunds.rbcgam.com/fund-list/ after the seventh business day after month-end, or call 1-800-973-0073.
The graph and table do not reflect the deduction of taxes that a shareholder would pay on Fund distributions or redemption of Fund shares. Performance shown may reflect contractual fee waivers. Without such waivers, total returns would be reduced.
Key Fund Statistics
The following table outlines key fund statistics that you should pay attention to.
| Fund net assets | $115,909,019 |
| Total number of portfolio holdings | 480 |
| Portfolio turnover rate as of the end of the reporting period | 22% |
| Total advisory fee paid (net of fee waivers/reimbursements) | $829,194 |
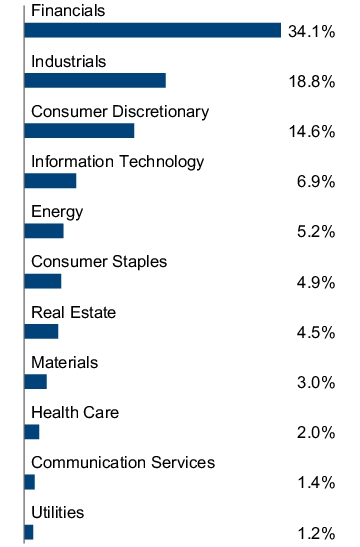
Graphical Representation of Holdings
The tables below show the investment makeup of the Fund, representing percentage of the total net assets of the Fund.
| Willis Lease Finance Corp. | 1.6% |
| Ducommun, Inc. | 1.6% |
| Miller Industries, Inc. | 1.2% |
| iShares Russell Microcap Index Fund | 1.2% |
| Beazer Homes USA, Inc. | 1.0% |
| Natural Grocers by Vitamin Cottage, Inc. | 1.0% |
| North American Construction Group Ltd. | 0.9% |
| Enova International, Inc. | 0.9% |
| Oil-Dri Corp. of America | 0.9% |
| Bel Fuse, Inc. | 0.9% |
Availability of Additional Information
You can find additional information about the Fund, such as the prospectus, financial information, fund holdings and proxy voting information, at www.dfinview.com/usrbcgam, by scanning the QR code or by contacting us at 1-800-422-2766.
Householding
To help lower operating costs, the RBC Funds attempt to eliminate mailing duplicate documents to the same address. When two or more RBC Fund shareholders have the same last name and address, the Funds may send only one prospectus, proxy, financial report or other communications to that address rather than mailing separate documents to each shareholders. This practice is known as "householding". Shareholders may opt out of this single mailing at any time by calling us at 1-800-422-2766.
Not FDIC Insured. No Bank Guarantee. May Lose Value.
RBC Global Asset Management (U.S.) Inc. is the Adviser for the RBC Funds Trust. Securities are offered through RBC Wealth Management, a division of RBC Capital Markets, LLC, member NYSE/FINRA/SIPC.
RBC Global Asset Management (RBC GAM) is the asset management division of Royal Bank of Canada (RBC) which includes RBC Global Asset Management Inc., RBC Global Asset Management (U.S.) Inc., RBC Global Asset Management (UK) Limited, RBC Global Asset Management (Asia) Limited and RBC Indigo Asset Management Inc. which are separate, but affiliated subsidiaries of RBC. ® / ™ Trademark(s) of Royal Bank of Canada. Used under license. ©2024 RBC Global Asset Management (U.S.) Inc.
RBCF- AR 09-24
RBC Microcap Value Fund
Class I / RMVIX
Annual SHAREHOLDER REPORT | September 30, 2024
This annual shareholder report contains important information about the RBC Microcap Value Fund (“Fund”) for the period of October 1, 2023, to September 30, 2024. You can find additional information about the Fund at https://www.dfinview.com/usrbcgam. You can also request this information by contacting us at 1-800-422-2766.
Fund Expenses
(Based on a hypothetical $10,000 investment)
| Fund (Class) | Costs of a $10,000 investment | Costs paid as a percentage
of a $10,000 investment |
RBC Microcap Value Fund
(Class I/RMVIX) | $121 | 1.07% |
Management’s Discussion of Fund Performance
SUMMARY OF RESULTS
The Fund invests, under normal circumstances, at least 80% of its assets in microcap value stocks. For purposes of this policy, the term “assets” means net assets plus the amount of borrowings for investment purposes. The Fund buys microcap value stocks using a quantitative model. Microcap value stocks combine the characteristics of “microcap stocks” and “value stocks.” The Fund defines “microcap stocks” as stocks of companies that have market capitalization at the time of the Fund’s initial purchase of between $20 million and the market capitalization that marks the point between the 8th and 9th deciles of New York Stock Exchange listed stocks (“upper limit”). The Fund defines “value stocks” primarily as those with low price-to-book characteristics.
The following table outlines key factors that materially affected the Fund’s performance compared to its benchmark during the reporting period October 1, 2023 to September 30, 2024.
TOP PERFORMANCE CONTRIBUTORS
| FACTOR | IMPACT | SUMMARY |
| Stock Selection | Positive | The Fund’s positions in Willis Lease Finance Corp., Natural Grocers by Vitamin Cottage Inc., and Ducommun Inc. contributed positively to performance. |
| Stock Selection | Negative | The Fund’s positions in America’s Car-Mart Inc/TX, American Vanguard Corp., and Core Molding Technologies were negative contributors to relative performance. |
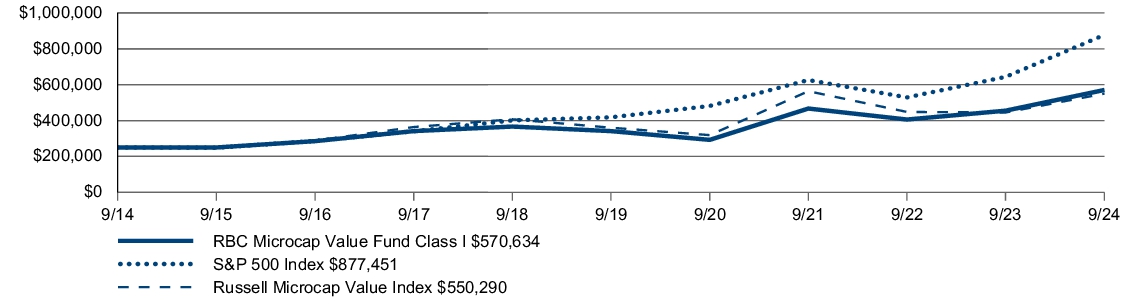
Fund Performance
Growth of $250,000 Initial Investment Over 10 Years
| AVERAGE ANNUAL TOTAL RETURN | 1 Year | 5 Years | 10 Years |
| RBC Microcap Value Fund (Class I/RMVIX) | 25.39% | 10.83% | 8.60% |
| S&P 500 | 36.35% | 15.98% | 13.38% |
| Russell Microcap Value Index | 23.65% | 8.84% | 8.21% |
The Fund’s past performance is not a good predictor of how the Fund will perform in the future. For performance data current to the most recent month-end, visit https://usmutualfunds.rbcgam.com/fund-list/ after the seventh business day after month-end, or call 1-800-973-0073.
The graph and table do not reflect the deduction of taxes that a shareholder would pay on Fund distributions or redemption of Fund shares. Performance shown may reflect contractual fee waivers. Without such waivers, total returns would be reduced.
Key Fund Statistics
The following table outlines key fund statistics that you should pay attention to.
| Fund net assets | $115,909,019 |
| Total number of portfolio holdings | 480 |
| Portfolio turnover rate as of the end of the reporting period | 22% |
| Total advisory fee paid (net of fee waivers/reimbursements) | $829,194 |
Graphical Representation of Holdings
The tables below show the investment makeup of the Fund, representing percentage of the total net assets of the Fund.
| Willis Lease Finance Corp. | 1.6% |
| Ducommun, Inc. | 1.6% |
| Miller Industries, Inc. | 1.2% |
| iShares Russell Microcap Index Fund | 1.2% |
| Beazer Homes USA, Inc. | 1.0% |
| Natural Grocers by Vitamin Cottage, Inc. | 1.0% |
| North American Construction Group Ltd. | 0.9% |
| Enova International, Inc. | 0.9% |
| Oil-Dri Corp. of America | 0.9% |
| Bel Fuse, Inc. | 0.9% |
Availability of Additional Information
You can find additional information about the Fund, such as the prospectus, financial information, fund holdings and proxy voting information, at www.dfinview.com/usrbcgam, by scanning the QR code or by contacting us at 1-800-422-2766.
Householding
To help lower operating costs, the RBC Funds attempt to eliminate mailing duplicate documents to the same address. When two or more RBC Fund shareholders have the same last name and address, the Funds may send only one prospectus, proxy, financial report or other communications to that address rather than mailing separate documents to each shareholders. This practice is known as "householding". Shareholders may opt out of this single mailing at any time by calling us at 1-800-422-2766.
Not FDIC Insured. No Bank Guarantee. May Lose Value.
RBC Global Asset Management (U.S.) Inc. is the Adviser for the RBC Funds Trust. Securities are offered through RBC Wealth Management, a division of RBC Capital Markets, LLC, member NYSE/FINRA/SIPC.
RBC Global Asset Management (RBC GAM) is the asset management division of Royal Bank of Canada (RBC) which includes RBC Global Asset Management Inc., RBC Global Asset Management (U.S.) Inc., RBC Global Asset Management (UK) Limited, RBC Global Asset Management (Asia) Limited and RBC Indigo Asset Management Inc. which are separate, but affiliated subsidiaries of RBC. ® / ™ Trademark(s) of Royal Bank of Canada. Used under license. ©2024 RBC Global Asset Management (U.S.) Inc.
RBCF- AR 09-24
RBC Enterprise Fund
Class A / TETAX
Annual SHAREHOLDER REPORT | September 30, 2024
This annual shareholder report contains important information about the RBC Enterprise Fund (“Fund”) for the period of October 1, 2023, to September 30, 2024. You can find additional information about the Fund at https://www.dfinview.com/usrbcgam. You can also request this information by contacting us at 1-800-422-2766.
Fund Expenses
(Based on a hypothetical $10,000 investment)
| Fund (Class) | Costs of a $10,000 investment | Costs paid as a percentage
of a $10,000 investment |
RBC Enterprise Fund
(Class A/TETAX) | $148 | 1.33% |
Management’s Discussion of Fund Performance
SUMMARY OF RESULTS
The Fund normally invests primarily in common stocks of companies whose market capitalizations at the time of the Fund’s initial purchase are below the dollar-weighted median market capitalization of companies in the Russell 2000® Index, which are often referred to as “micro-cap” companies.
The following table outlines key factors that materially affected the Fund’s performance compared to its benchmark during the reporting period October 1, 2023 to September 30, 2024.
TOP PERFORMANCE CONTRIBUTORS
| FACTOR | IMPACT | SUMMARY |
| Stock Selection | Positive | The Fund’s positions in Super Micro Computer Inc., UFP Technologies, and Astrana Health contributed positively to performance. |
| Stock Selection | Negative | The Fund’s positions in Par Pacific Holdings Inc., Alphatec Holdings inc., and Allient Inc. were negative contributors to relative performance. |
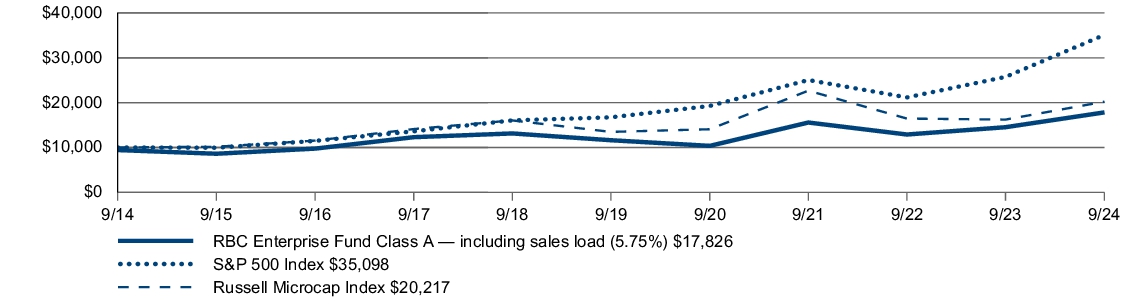
Fund Performance
Growth of $10,000 Initial Investment Over 10 Years
| AVERAGE ANNUAL TOTAL RETURN | 1 Year | 5 Years | 10 Years |
| RBC Enterprise Fund (Class A/TETAX)— including sales load (5.75%) | 15.68% | 7.66% | 5.95% |
| RBC Enterprise Fund (Class A/TETAX) — excluding sales load | 22.75% | 8.93% | 6.58% |
| S&P 500 | 36.35% | 15.98% | 13.38% |
| Russell Microcap Index | 24.63% | 8.45% | 7.29% |
The Fund’s past performance is not a good predictor of how the Fund will perform in the future. For performance data current to the most recent month-end, visit https://usmutualfunds.rbcgam.com/fund-list/ after the seventh business day after month-end, or call 1-800-973-0073.
The graph and table do not reflect the deduction of taxes that a shareholder would pay on Fund distributions or redemption of Fund shares. Performance shown may reflect contractual fee waivers. Without such waivers, total returns would be reduced.
Key Fund Statistics
The following table outlines key fund statistics that you should pay attention to.
| Fund net assets | $69,861,274 |
| Total number of portfolio holdings | 72 |
| Portfolio turnover rate as of the end of the reporting period | 41% |
| Total advisory fee paid (net of fee waivers/reimbursements) | $493,398 |
Graphical Representation of Holdings
The tables below show the investment makeup of the Fund, representing percentage of the total net assets of the Fund.
| Lantheus Holdings, Inc. | 3.6% |
| Astrana Health, Inc. | 3.5% |
| SPDR S&P Biotech ETF | 3.3% |
| UFP Technologies, Inc. | 3.0% |
| Ducommun, Inc. | 2.9% |
| iShares Russell Microcap Index Fund | 2.6% |
| Novanta, Inc. | 2.4% |
| Onto Innovation, Inc. | 2.3% |
| Barrett Business Services, Inc. | 2.2% |
| Napco Security Technologies, Inc. | 2.1% |
Availability of Additional Information
You can find additional information about the Fund, such as the prospectus, financial information, fund holdings and proxy voting information, at www.dfinview.com/usrbcgam, by scanning the QR code or by contacting us at 1-800-422-2766.
Householding
To help lower operating costs, the RBC Funds attempt to eliminate mailing duplicate documents to the same address. When two or more RBC Fund shareholders have the same last name and address, the Funds may send only one prospectus, proxy, financial report or other communications to that address rather than mailing separate documents to each shareholders. This practice is known as "householding". Shareholders may opt out of this single mailing at any time by calling us at 1-800-422-2766.
Not FDIC Insured. No Bank Guarantee. May Lose Value.
RBC Global Asset Management (U.S.) Inc. is the Adviser for the RBC Funds Trust. Securities are offered through RBC Wealth Management, a division of RBC Capital Markets, LLC, member NYSE/FINRA/SIPC.
RBC Global Asset Management (RBC GAM) is the asset management division of Royal Bank of Canada (RBC) which includes RBC Global Asset Management Inc., RBC Global Asset Management (U.S.) Inc., RBC Global Asset Management (UK) Limited, RBC Global Asset Management (Asia) Limited and RBC Indigo Asset Management Inc. which are separate, but affiliated subsidiaries of RBC. ® / ™ Trademark(s) of Royal Bank of Canada. Used under license. ©2024 RBC Global Asset Management (U.S.) Inc.
RBCF- AR 09-24
RBC Enterprise Fund
Class I / TETIX
Annual SHAREHOLDER REPORT | September 30, 2024
This annual shareholder report contains important information about the RBC Enterprise Fund (“Fund”) for the period of October 1, 2023, to September 30, 2024. You can find additional information about the Fund at https://www.dfinview.com/usrbcgam. You can also request this information by contacting us at 1-800-422-2766.
Fund Expenses
(Based on a hypothetical $10,000 investment)
| Fund (Class) | Costs of a $10,000 investment | Costs paid as a percentage
of a $10,000 investment |
RBC Enterprise Fund
(Class I/TETIX) | $120 | 1.08% |
Management’s Discussion of Fund Performance
SUMMARY OF RESULTS
The Fund normally invests primarily in common stocks of companies whose market capitalizations at the time of the Fund’s initial purchase are below the dollar-weighted median market capitalization of companies in the Russell 2000® Index, which are often referred to as “micro-cap” companies.
The following table outlines key factors that materially affected the Fund’s performance compared to its benchmark during the reporting period October 1, 2023 to September 30, 2024.
TOP PERFORMANCE CONTRIBUTORS
| FACTOR | IMPACT | SUMMARY |
| Stock Selection | Positive | The Fund’s positions in Super Micro Computer Inc., UFP Technologies, and Astrana Health contributed positively to performance. |
| Stock Selection | Negative | The Fund’s positions in Par Pacific Holdings Inc., Alphatec Holdings inc., and Allient Inc. were negative contributors to relative performance. |
Fund Performance
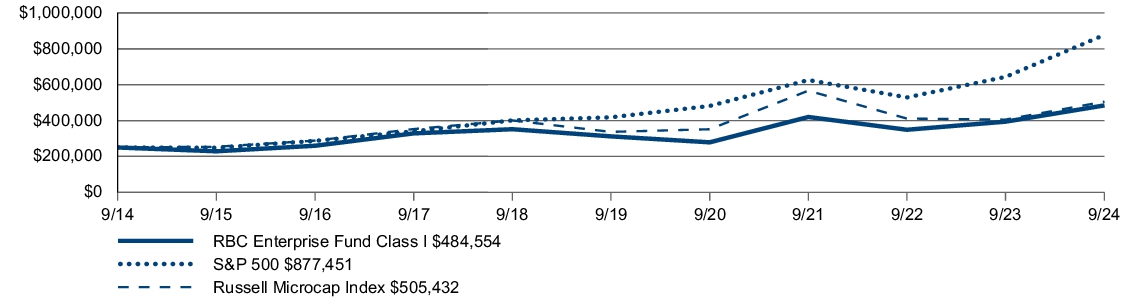
Growth of $250,000 Initial Investment Over 10 Years
| AVERAGE ANNUAL TOTAL RETURN | 1 Year | 5 Years | 10 Years |
| RBC Enterprise Fund (Class I/TETIX) | 22.99% | 9.21% | 6.84% |
| S&P 500 | 36.35% | 15.98% | 13.38% |
| Russell Microcap Index | 24.63% | 8.45% | 7.29% |
The Fund’s past performance is not a good predictor of how the Fund will perform in the future. For performance data current to the most recent month-end, visit https://usmutualfunds.rbcgam.com/fund-list/ after the seventh business day after month-end, or call 1-800-973-0073.
The graph and table do not reflect the deduction of taxes that a shareholder would pay on Fund distributions or redemption of Fund shares. Performance shown may reflect contractual fee waivers. Without such waivers, total returns would be reduced.
Key Fund Statistics
The following table outlines key fund statistics that you should pay attention to.
| Fund net assets | $69,861,274 |
| Total number of portfolio holdings | 72 |
| Portfolio turnover rate as of the end of the reporting period | 41% |
| Total advisory fee paid (net of fee waivers/reimbursements) | $493,398 |
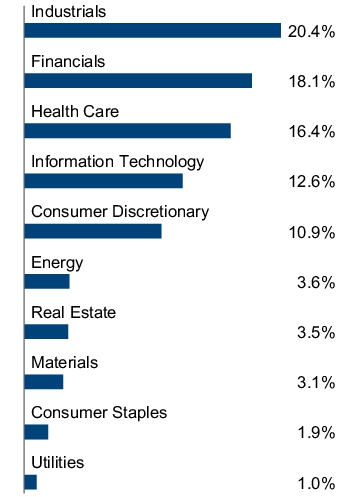
Graphical Representation of Holdings
The tables below show the investment makeup of the Fund, representing percentage of the total net assets of the Fund.
| Lantheus Holdings, Inc. | 3.6% |
| Astrana Health, Inc. | 3.5% |
| SPDR S&P Biotech ETF | 3.3% |
| UFP Technologies, Inc. | 3.0% |
| Ducommun, Inc. | 2.9% |
| iShares Russell Microcap Index Fund | 2.6% |
| Novanta, Inc. | 2.4% |
| Onto Innovation, Inc. | 2.3% |
| Barrett Business Services, Inc. | 2.2% |
| Napco Security Technologies, Inc. | 2.1% |
Availability of Additional Information
You can find additional information about the Fund, such as the prospectus, financial information, fund holdings and proxy voting information, at www.dfinview.com/usrbcgam, by scanning the QR code or by contacting us at 1-800-422-2766.
Householding
To help lower operating costs, the RBC Funds attempt to eliminate mailing duplicate documents to the same address. When two or more RBC Fund shareholders have the same last name and address, the Funds may send only one prospectus, proxy, financial report or other communications to that address rather than mailing separate documents to each shareholders. This practice is known as "householding". Shareholders may opt out of this single mailing at any time by calling us at 1-800-422-2766.
Not FDIC Insured. No Bank Guarantee. May Lose Value.
RBC Global Asset Management (U.S.) Inc. is the Adviser for the RBC Funds Trust. Securities are offered through RBC Wealth Management, a division of RBC Capital Markets, LLC, member NYSE/FINRA/SIPC.
RBC Global Asset Management (RBC GAM) is the asset management division of Royal Bank of Canada (RBC) which includes RBC Global Asset Management Inc., RBC Global Asset Management (U.S.) Inc., RBC Global Asset Management (UK) Limited, RBC Global Asset Management (Asia) Limited and RBC Indigo Asset Management Inc. which are separate, but affiliated subsidiaries of RBC. ® / ™ Trademark(s) of Royal Bank of Canada. Used under license. ©2024 RBC Global Asset Management (U.S.) Inc.
RBCF- AR 09-24
RBC BlueBay Strategic Income Fund
Class A / RBIAX
Annual SHAREHOLDER REPORT | September 30, 2024
This annual shareholder report contains important information about the RBC BlueBay Strategic Income Fund (“Fund”) for the period of October 1, 2023, to September 30, 2024. You can find additional information about the Fund at https://www.dfinview.com/usrbcgam. You can also request this information by contacting us at 1-800-422-2766.
Fund Expenses
(Based on a hypothetical $10,000 investment)
| Fund (Class) | Costs of a $10,000 investment | Costs paid as a percentage
of a $10,000 investment |
RBC BlueBay Strategic Income Fund
(Class A/RBIAX) | $92 | 0.87% |
Management’s Discussion of Fund Performance
SUMMARY OF RESULTS
The Fund seeks to provide total return (capital appreciation and income) by investing in fixed income securities. The fixed income securities in which the Fund may invest include, but are not limited to, bonds, municipal securities, mortgage-related and asset-backed securities (including Collateralized Mortgage Obligations (“CMOs”)), and obligations of U.S. and foreign governments and their agencies.
The following table outlines key factors that materially affected the Fund’s performance compared to its benchmark during the reporting period October 1, 2023 to September 30, 2024.
TOP PERFORMANCE CONTRIBUTORS
| FACTOR | IMPACT | SUMMARY |
| Interest Rates | Positive | The Fund’s benchmark duration positioning was longer than the benchmark, which was beneficial to Fund performance as rates fell over the past 12-months. |
| Credit Alpha | Positive | The Fund’s overweight allocations to spread sectors like corporate bonds was one of the significant drivers of positive relative performance. |
| Credit Allocation | Positive | The Fund’s larger allocations to sectors such as Banking and Financial Services helped drive positive relative fund performance over the period as well. |
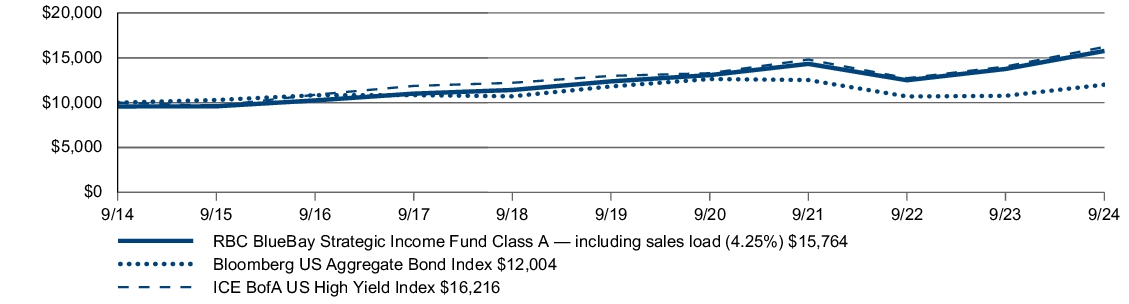
Fund Performance
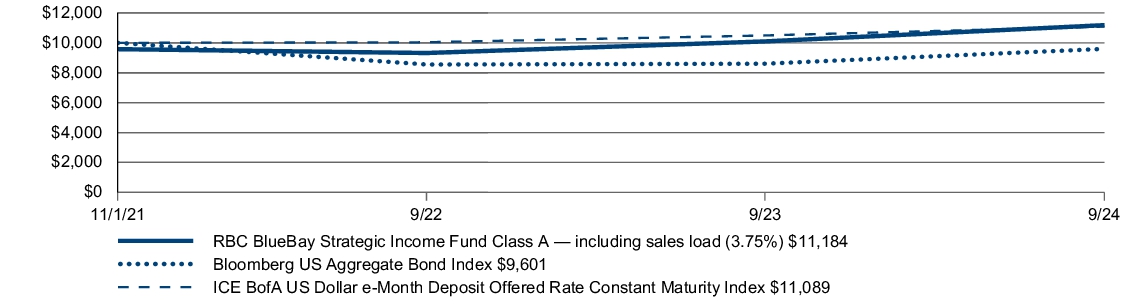
Growth of $10,000 Initial Investment Since Inception
| AVERAGE ANNUAL TOTAL RETURN | 1 Year | Since
Inception |
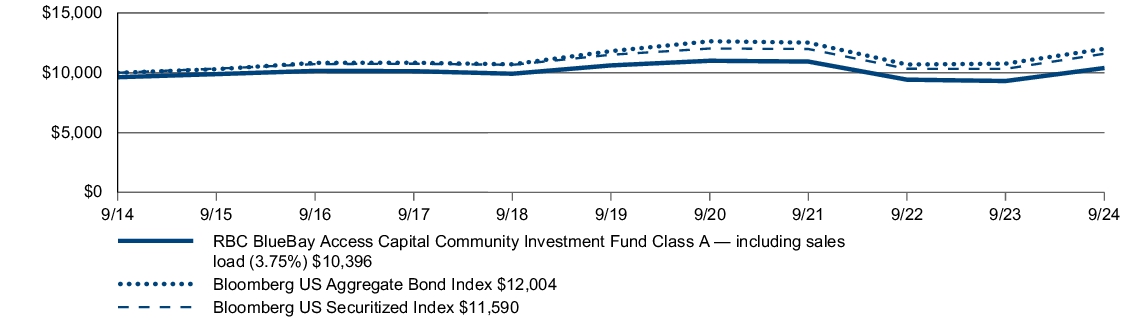
| RBC BlueBay Strategic Income Fund (Class A/RBIAX)— including sales load (3.75%) | 6.08% | 3.92%(a) |
| RBC BlueBay Strategic Income Fund (Class A/RBIAX) — excluding sales load | 10.77% | 5.46%(a) |
| Bloomberg US Aggregate Bond Index | 11.57% | (1.39)% |
| ICE BofA US Dollar 3-Month Deposit Offered Rate Constant Maturity Index | 5.64% | 3.61% |
(a) | Commenced operations November 1, 2021. |
The Fund’s past performance is not a good predictor of how the Fund will perform in the future. For performance data current to the most recent month-end, visit https://usmutualfunds.rbcgam.com/fund-list/ after the seventh business day after month-end, or call 1-800-973-0073.
The graph and table do not reflect the deduction of taxes that a shareholder would pay on Fund distributions or redemption of Fund shares. Performance shown may reflect contractual fee waivers. Without such waivers, total returns would be reduced.
Key Fund Statistics
The following table outlines key fund statistics that you should pay attention to.
| Fund net assets | $60,612,818 |
| Total number of portfolio holdings | 230 |
| Portfolio turnover rate as of the end of the reporting period | 890% |
| Total advisory fee paid (net of fee waivers/reimbursements) | $(13,547) |
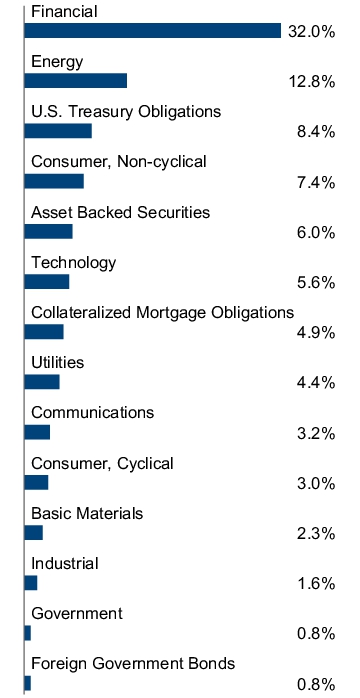
Graphical Representation of Holdings
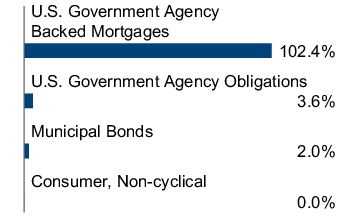
The tables below show the investment makeup of the Fund, representing percentage of the total net assets of the Fund.
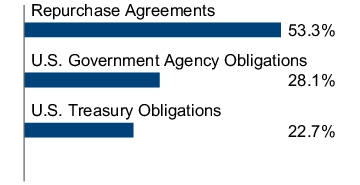
| U.S. Treasury Notes, 4.25%, 3/15/27 | 8.4% |
| Retained Vantage Data Centers Issuer LLC, Series 2024-1A, Class B, 5.78%, 9/15/49 | 1.2% |
| Plains All American Pipeline LP, Series B, (Term SOFR 3M + 4.372%), 9.49% | 1.2% |
| EQM Midstream Partners LP, 4.75%, 1/15/31 | 1.0% |
| Hilton Domestic Operating Co, Inc., (Term SOFR 1M + 1.75%), 7.03%, 11/8/30 | 1.0% |
| Intel Corp., 4.88%, 2/10/26 | 1.0% |
| Avolon TLB Borrower 1 US LLC, (Term SOFR 1M + 2.00%), 6.96%, 6/22/28 | 1.0% |
| EnLink Midstream Partners LP, Series C, (Term SOFR 3M + 4.372%), 9.31% | 0.9% |
| Banco de Credito e Inversiones SA, 7.50% | 0.9% |
| Citadel Securities LP, (Term SOFR 1M + 2.36%), 7.50%, 7/29/30 | 0.9% |
| United States | 69.6% |
| Europe | 11.7% |
| North America | 5.5% |
| South America | 4.9% |
| Latin America | 2.0% |
| Asia | 1.0% |
| Africa/Middle East | 0.8% |
Availability of Additional Information
You can find additional information about the Fund, such as the prospectus, financial information, fund holdings and proxy voting information, at www.dfinview.com/usrbcgam, by scanning the QR code or by contacting us at 1-800-422-2766.
Householding
To help lower operating costs, the RBC Funds attempt to eliminate mailing duplicate documents to the same address. When two or more RBC Fund shareholders have the same last name and address, the Funds may send only one prospectus, proxy, financial report or other communications to that address rather than mailing separate documents to each shareholders. This practice is known as "householding". Shareholders may opt out of this single mailing at any time by calling us at 1-800-422-2766.
Not FDIC Insured. No Bank Guarantee. May Lose Value.
RBC Global Asset Management (U.S.) Inc. is the Adviser for the RBC Funds Trust. Securities are offered through RBC Wealth Management, a division of RBC Capital Markets, LLC, member NYSE/FINRA/SIPC.
RBC Global Asset Management (RBC GAM) is the asset management division of Royal Bank of Canada (RBC) which includes RBC Global Asset Management Inc., RBC Global Asset Management (U.S.) Inc., RBC Global Asset Management (UK) Limited, RBC Global Asset Management (Asia) Limited and RBC Indigo Asset Management Inc. which are separate, but affiliated subsidiaries of RBC. ® / ™ Trademark(s) of Royal Bank of Canada. Used under license. ©2024 RBC Global Asset Management (U.S.) Inc.
RBCF- AR 09-24
RBC BlueBay Strategic Income Fund
Class I / RBSIX
Annual SHAREHOLDER REPORT | September 30, 2024
This annual shareholder report contains important information about the RBC BlueBay Strategic Income Fund (“Fund”) for the period of October 1, 2023, to September 30, 2024. You can find additional information about the Fund at https://www.dfinview.com/usrbcgam. You can also request this information by contacting us at 1-800-422-2766.
Fund Expenses
(Based on a hypothetical $10,000 investment)
| Fund (Class) | Costs of a $10,000 investment | Costs paid as a percentage
of a $10,000 investment |
RBC BlueBay Strategic Income Fund
(Class I/RBSIX) | $65 | 0.62% |
Management’s Discussion of Fund Performance
SUMMARY OF RESULTS
The Fund seeks to provide total return (capital appreciation and income) by investing in fixed income securities. The fixed income securities in which the Fund may invest include, but are not limited to, bonds, municipal securities, mortgage-related and asset-backed securities (including Collateralized Mortgage Obligations (“CMOs”)), and obligations of U.S. and foreign governments and their agencies.
The following table outlines key factors that materially affected the Fund’s performance compared to its benchmark during the reporting period October 1, 2023 to September 30, 2024.
TOP PERFORMANCE CONTRIBUTORS
| FACTOR | IMPACT | SUMMARY |
| Interest Rates | Positive | The Fund’s benchmark duration positioning was longer than the benchmark, which was beneficial to Fund performance as rates fell over the past 12-months. |
| Credit Alpha | Positive | The Fund’s overweight allocations to spread sectors like corporate bonds was one of the significant drivers of positive relative performance. |
| Credit Allocation | Positive | The Fund’s larger allocations to sectors such as Banking and Financial Services helped drive positive relative fund performance over the period as well. |
Fund Performance
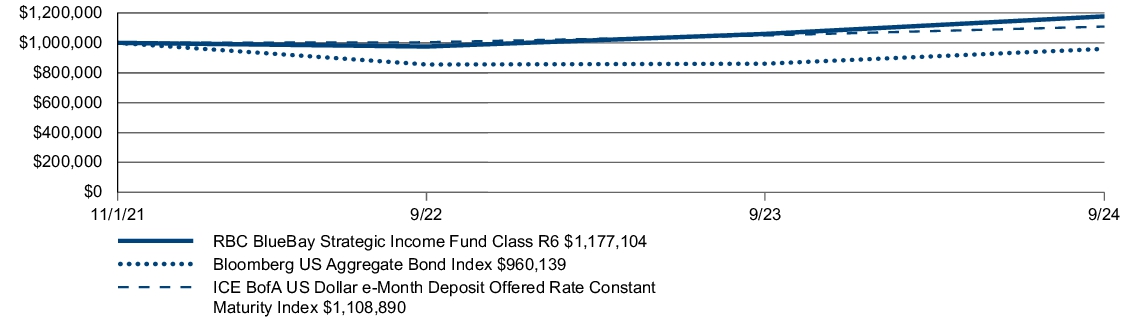
Growth of $1,000,000 Initial Investment Since Inception
| AVERAGE ANNUAL TOTAL RETURN | 1 Year | Since
Inception |
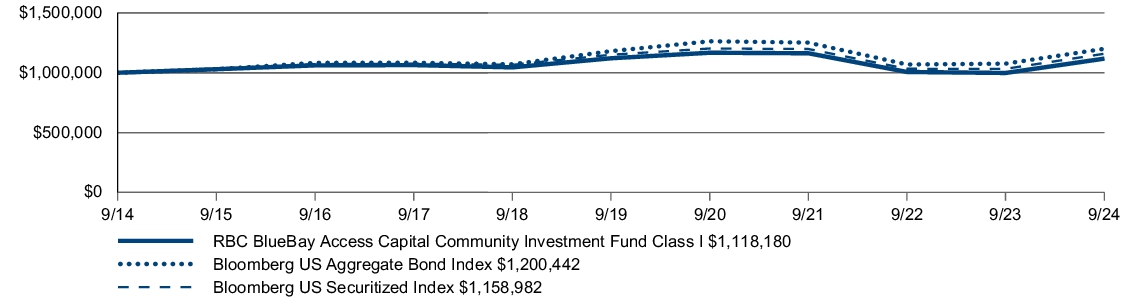
| RBC BlueBay Strategic Income Fund (Class I/RBSIX) | 11.02% | 5.71%(a) |
| Bloomberg US Aggregate Bond Index | 11.57% | (1.39)% |
| ICE BofA US Dollar 3-Month Deposit Offered Rate Constant Maturity Index | 5.64% | 3.61% |
(a) | Commenced operations November 1, 2021. |
The Fund’s past performance is not a good predictor of how the Fund will perform in the future. For performance data current to the most recent month-end, visit https://usmutualfunds.rbcgam.com/fund-list/ after the seventh business day after month-end, or call 1-800-973-0073.
The graph and table do not reflect the deduction of taxes that a shareholder would pay on Fund distributions or redemption of Fund shares. Performance shown may reflect contractual fee waivers. Without such waivers, total returns would be reduced.
Key Fund Statistics
The following table outlines key fund statistics that you should pay attention to.
| Fund net assets | $60,612,818 |
| Total number of portfolio holdings | 230 |
| Portfolio turnover rate as of the end of the reporting period | 890% |
| Total advisory fee paid (net of fee waivers/reimbursements) | $(13,547) |
Graphical Representation of Holdings
The tables below show the investment makeup of the Fund, representing percentage of the total net assets of the Fund.
| U.S. Treasury Notes, 4.25%, 3/15/27 | 8.4% |
| Retained Vantage Data Centers Issuer LLC, Series 2024-1A, Class B, 5.78%, 9/15/49 | 1.2% |
| Plains All American Pipeline LP, Series B, (Term SOFR 3M + 4.372%), 9.49% | 1.2% |
| EQM Midstream Partners LP, 4.75%, 1/15/31 | 1.0% |
| Hilton Domestic Operating Co, Inc., (Term SOFR 1M + 1.75%), 7.03%, 11/8/30 | 1.0% |
| Intel Corp., 4.88%, 2/10/26 | 1.0% |
| Avolon TLB Borrower 1 US LLC, (Term SOFR 1M + 2.00%), 6.96%, 6/22/28 | 1.0% |
| EnLink Midstream Partners LP, Series C, (Term SOFR 3M + 4.372%), 9.31% | 0.9% |
| Banco de Credito e Inversiones SA, 7.50% | 0.9% |
| Citadel Securities LP, (Term SOFR 1M + 2.36%), 7.50%, 7/29/30 | 0.9% |
| United States | 69.6% |
| Europe | 11.7% |
| North America | 5.5% |
| South America | 4.9% |
| Latin America | 2.0% |
| Asia | 1.0% |
| Africa/Middle East | 0.8% |
Availability of Additional Information
You can find additional information about the Fund, such as the prospectus, financial information, fund holdings and proxy voting information, at www.dfinview.com/usrbcgam, by scanning the QR code or by contacting us at 1-800-422-2766.
Householding
To help lower operating costs, the RBC Funds attempt to eliminate mailing duplicate documents to the same address. When two or more RBC Fund shareholders have the same last name and address, the Funds may send only one prospectus, proxy, financial report or other communications to that address rather than mailing separate documents to each shareholders. This practice is known as "householding". Shareholders may opt out of this single mailing at any time by calling us at 1-800-422-2766.
Not FDIC Insured. No Bank Guarantee. May Lose Value.
RBC Global Asset Management (U.S.) Inc. is the Adviser for the RBC Funds Trust. Securities are offered through RBC Wealth Management, a division of RBC Capital Markets, LLC, member NYSE/FINRA/SIPC.
RBC Global Asset Management (RBC GAM) is the asset management division of Royal Bank of Canada (RBC) which includes RBC Global Asset Management Inc., RBC Global Asset Management (U.S.) Inc., RBC Global Asset Management (UK) Limited, RBC Global Asset Management (Asia) Limited and RBC Indigo Asset Management Inc. which are separate, but affiliated subsidiaries of RBC. ® / ™ Trademark(s) of Royal Bank of Canada. Used under license. ©2024 RBC Global Asset Management (U.S.) Inc.
RBCF- AR 09-24
RBC BlueBay Strategic Income Fund
Class R6 / RBSRX
Annual SHAREHOLDER REPORT | September 30, 2024
This annual shareholder report contains important information about the RBC BlueBay Strategic Income Fund (“Fund”) for the period of October 1, 2023, to September 30, 2024. You can find additional information about the Fund at https://www.dfinview.com/usrbcgam. You can also request this information by contacting us at 1-800-422-2766.
Fund Expenses
(Based on a hypothetical $10,000 investment)
| Fund (Class) | Costs of a $10,000 investment | Costs paid as a percentage
of a $10,000 investment |
RBC BlueBay Strategic Income Fund
(Class R6/RBSRX) | $60 | 0.57% |
Management’s Discussion of Fund Performance
SUMMARY OF RESULTS
The Fund seeks to provide total return (capital appreciation and income) by investing in fixed income securities. The fixed income securities in which the Fund may invest include, but are not limited to, bonds, municipal securities, mortgage-related and asset-backed securities (including Collateralized Mortgage Obligations (“CMOs”)), and obligations of U.S. and foreign governments and their agencies.
The following table outlines key factors that materially affected the Fund’s performance compared to its benchmark during the reporting period October 1, 2023 to September 30, 2024.
TOP PERFORMANCE CONTRIBUTORS
| FACTOR | IMPACT | SUMMARY |
| Interest Rates | Positive | The Fund’s benchmark duration positioning was longer than the benchmark, which was beneficial to Fund performance as rates fell over the past 12-months. |
| Credit Alpha | Positive | The Fund’s overweight allocations to spread sectors like corporate bonds was one of the significant drivers of positive relative performance. |
| Credit Allocation | Positive | The Fund’s larger allocations to sectors such as Banking and Financial Services helped drive positive relative fund performance over the period as well. |
Fund Performance
Growth of $1,000,000 Initial Investment Since Inception
| AVERAGE ANNUAL TOTAL RETURN | 1 Year | Since
Inception |
| RBC BlueBay Strategic Income Fund (Class R6/RBSRX) | 11.08% | 5.76%(a) |
| Bloomberg US Aggregate Bond Index | 11.57% | (1.39)% |
| ICE BofA US Dollar 3-Month Deposit Offered Rate Constant Maturity Index | 5.64% | 3.61% |
(a) | Commenced operations November 1, 2021. |
The Fund’s past performance is not a good predictor of how the Fund will perform in the future. For performance data current to the most recent month-end, visit https://usmutualfunds.rbcgam.com/fund-list/ after the seventh business day after month-end, or call 1-800-973-0073.
The graph and table do not reflect the deduction of taxes that a shareholder would pay on Fund distributions or redemption of Fund shares. Performance shown may reflect contractual fee waivers. Without such waivers, total returns would be reduced.
Key Fund Statistics
The following table outlines key fund statistics that you should pay attention to.
| Fund net assets | $60,612,818 |
| Total number of portfolio holdings | 230 |
| Portfolio turnover rate as of the end of the reporting period | 890% |
| Total advisory fee paid (net of fee waivers/reimbursements) | $(13,547) |
Graphical Representation of Holdings
The tables below show the investment makeup of the Fund, representing percentage of the total net assets of the Fund.
| U.S. Treasury Notes, 4.25%, 3/15/27 | 8.4% |
| Retained Vantage Data Centers Issuer LLC, Series 2024-1A, Class B, 5.78%, 9/15/49 | 1.2% |
| Plains All American Pipeline LP, Series B, (Term SOFR 3M + 4.372%), 9.49% | 1.2% |
| EQM Midstream Partners LP, 4.75%, 1/15/31 | 1.0% |
| Hilton Domestic Operating Co, Inc., (Term SOFR 1M + 1.75%), 7.03%, 11/8/30 | 1.0% |
| Intel Corp., 4.88%, 2/10/26 | 1.0% |
| Avolon TLB Borrower 1 US LLC, (Term SOFR 1M + 2.00%), 6.96%, 6/22/28 | 1.0% |
| EnLink Midstream Partners LP, Series C, (Term SOFR 3M + 4.372%), 9.31% | 0.9% |
| Banco de Credito e Inversiones SA, 7.50% | 0.9% |
| Citadel Securities LP, (Term SOFR 1M + 2.36%), 7.50%, 7/29/30 | 0.9% |
| United States | 69.6% |
| Europe | 11.7% |
| North America | 5.5% |
| South America | 4.9% |
| Latin America | 2.0% |
| Asia | 1.0% |
| Africa/Middle East | 0.8% |
Availability of Additional Information
You can find additional information about the Fund, such as the prospectus, financial information, fund holdings and proxy voting information, at www.dfinview.com/usrbcgam, by scanning the QR code or by contacting us at 1-800-422-2766.
Householding
To help lower operating costs, the RBC Funds attempt to eliminate mailing duplicate documents to the same address. When two or more RBC Fund shareholders have the same last name and address, the Funds may send only one prospectus, proxy, financial report or other communications to that address rather than mailing separate documents to each shareholders. This practice is known as "householding". Shareholders may opt out of this single mailing at any time by calling us at 1-800-422-2766.
Not FDIC Insured. No Bank Guarantee. May Lose Value.
RBC Global Asset Management (U.S.) Inc. is the Adviser for the RBC Funds Trust. Securities are offered through RBC Wealth Management, a division of RBC Capital Markets, LLC, member NYSE/FINRA/SIPC.
RBC Global Asset Management (RBC GAM) is the asset management division of Royal Bank of Canada (RBC) which includes RBC Global Asset Management Inc., RBC Global Asset Management (U.S.) Inc., RBC Global Asset Management (UK) Limited, RBC Global Asset Management (Asia) Limited and RBC Indigo Asset Management Inc. which are separate, but affiliated subsidiaries of RBC. ® / ™ Trademark(s) of Royal Bank of Canada. Used under license. ©2024 RBC Global Asset Management (U.S.) Inc.
RBCF- AR 09-24
RBC BlueBay Impact Bond Fund
Class A / RIBAX
Annual SHAREHOLDER REPORT | September 30, 2024
This annual shareholder report contains important information about the RBC BlueBay Impact Bond Fund (“Fund”) for the period of October 1, 2023, to September 30, 2024. You can find additional information about the Fund at https://www.dfinview.com/usrbcgam. You can also request this information by contacting us at 1-800-422-2766.
Fund Expenses
(Based on a hypothetical $10,000 investment)
| Fund (Class) | Costs of a $10,000 investment | Costs paid as a percentage
of a $10,000 investment |
RBC BlueBay Impact Bond Fund
(Class A/RIBAX) | $73 | 0.69% |
Management’s Discussion of Fund Performance
SUMMARY OF RESULTS
Under normal circumstances, the Fund will invest at least 80% of its assets in fixed income securities meeting the Fund’s impact criteria, as determined by the Advisor’s impact methodology. For purposes of this policy, the term “assets” means net assets plus the amount of borrowings for investment purposes. The fixed income securities in which the Fund may invest include, but are not limited to, bonds, municipal securities, mortgage-related, mortgage-backed and asset-backed securities, and obligations of U.S. governments and their agencies. The Fund may invest in securities with fixed, floating or variable rates of interest.
The following table outlines key factors that materially affected the Fund’s performance compared to its benchmark during the reporting period October 1, 2023 to September 30, 2024.
TOP PERFORMANCE CONTRIBUTORS
| FACTOR | IMPACT | SUMMARY |
| Income/Carry | Positive | The Fund maintains a yield advantage relative to the benchmark, and this was the primary contributor to Fund outperformance over the past trailing 12-months. This yield advantage is driven by overweights to spread sectors. |
| Interest Rates | Positive | Falling interest rates resulted in positive absolute performance. However, as the fund was duration neutral throughout the period, it had minimal impact on benchmark relative performance. |
| Sector Allocation | Positive | The Fund’s allocations to both taxable municipals and mortgage-backed securities outperformed over the period as spreads tightened. |
| Sector Allocation | Positive | The performance of corporate bond holdings generally kept pace with the benchmark, having little impact on benchmark relative performance. |
| Sector Allocation | Negative | The Fund had an overweight position in asset-backed securities, which underperformed during the year. |
Fund Performance
Growth of $10,000 Initial Investment Since Inception
| AVERAGE ANNUAL TOTAL RETURN | 1 Year | 5 Years | Since
Inception |
| RBC BlueBay Impact Bond Fund (Class A/RIBAX)— including sales load (3.75%) | 7.32% | (0.85)% | 0.30%(a) |
| RBC BlueBay Impact Bond Fund (Class A/RIBAX) — excluding sales load | 11.51% | (0.08)% | 0.87%(a) |
| Bloomberg US Aggregate Bond Index | 11.57% | 0.33% | 1.47% |
(a) | The Fund’s Class A shares commenced operations on January 28, 2020. Performance shown for this share class prior to commencement of operations reflects the performance of Class I shares and has been adjusted to reflect the fees and expenses of Class A. |
The Fund’s past performance is not a good predictor of how the Fund will perform in the future. For performance data current to the most recent month-end, visit https://usmutualfunds.rbcgam.com/fund-list/ after the seventh business day after month-end, or call 1-800-973-0073.
The graph and table do not reflect the deduction of taxes that a shareholder would pay on Fund distributions or redemption of Fund shares. Performance shown may reflect contractual fee waivers. Without such waivers, total returns would be reduced.
Key Fund Statistics
The following table outlines key fund statistics that you should pay attention to.
| Fund net assets | $293,911,496 |
| Total number of portfolio holdings | 362 |
| Portfolio turnover rate as of the end of the reporting period | 79% |
| Total advisory fee paid (net of fee waivers/reimbursements) | $531,900 |
Graphical Representation of Holdings
The tables below show the investment makeup of the Fund, representing percentage of the total net assets of the Fund.
| Fannie Mae, (TBA), 4.50%, 10/1/54 | 5.0% |
| Fannie Mae, Pool #BT1616, 2.00%, 4/1/51 | 2.3% |
| City of Hope, 5.48%, 10/16/24 | 1.7% |
| Baptist Healthcare System Obligated Group, 4.97%, 10/24/24 | 1.7% |
| Trinity Health Corp., 5.32%, 10/28/24 | 1.7% |
| Amgen, Inc., 5.25%, 3/2/33 | 1.2% |
| Fannie Mae, Pool #BZ0523, 4.50%, 2/1/29 | 1.2% |
| Fannie Mae, Pool #BS1730, 1.53%, 4/1/28 | 1.1% |
| Elevance Health, Inc., 5.15%, 6/15/29 | 1.1% |
| American Water Capital Corp., 4.45%, 6/1/32 | 1.1% |
Availability of Additional Information
You can find additional information about the Fund, such as the prospectus, financial information, fund holdings and proxy voting information, at www.dfinview.com/usrbcgam, by scanning the QR code or by contacting us at 1-800-422-2766.
Householding
To help lower operating costs, the RBC Funds attempt to eliminate mailing duplicate documents to the same address. When two or more RBC Fund shareholders have the same last name and address, the Funds may send only one prospectus, proxy, financial report or other communications to that address rather than mailing separate documents to each shareholders. This practice is known as "householding". Shareholders may opt out of this single mailing at any time by calling us at 1-800-422-2766.
Not FDIC Insured. No Bank Guarantee. May Lose Value.
RBC Global Asset Management (U.S.) Inc. is the Adviser for the RBC Funds Trust. Securities are offered through RBC Wealth Management, a division of RBC Capital Markets, LLC, member NYSE/FINRA/SIPC.
RBC Global Asset Management (RBC GAM) is the asset management division of Royal Bank of Canada (RBC) which includes RBC Global Asset Management Inc., RBC Global Asset Management (U.S.) Inc., RBC Global Asset Management (UK) Limited, RBC Global Asset Management (Asia) Limited and RBC Indigo Asset Management Inc. which are separate, but affiliated subsidiaries of RBC. ® / ™ Trademark(s) of Royal Bank of Canada. Used under license. ©2024 RBC Global Asset Management (U.S.) Inc.
RBCF- AR 09-24
RBC BlueBay Impact Bond Fund
Class I / RIBIX
Annual SHAREHOLDER REPORT | September 30, 2024
This annual shareholder report contains important information about the RBC BlueBay Impact Bond Fund (“Fund”) for the period of October 1, 2023, to September 30, 2024. You can find additional information about the Fund at https://www.dfinview.com/usrbcgam. You can also request this information by contacting us at 1-800-422-2766.
Fund Expenses
(Based on a hypothetical $10,000 investment)
| Fund (Class) | Costs of a $10,000 investment | Costs paid as a percentage
of a $10,000 investment |
RBC BlueBay Impact Bond Fund
(Class I/RIBIX) | $47 | 0.44% |
Management’s Discussion of Fund Performance
SUMMARY OF RESULTS
Under normal circumstances, the Fund will invest at least 80% of its assets in fixed income securities meeting the Fund’s impact criteria, as determined by the Advisor’s impact methodology. For purposes of this policy, the term “assets” means net assets plus the amount of borrowings for investment purposes. The fixed income securities in which the Fund may invest include, but are not limited to, bonds, municipal securities, mortgage-related, mortgage-backed and asset-backed securities, and obligations of U.S. governments and their agencies. The Fund may invest in securities with fixed, floating or variable rates of interest.
The following table outlines key factors that materially affected the Fund’s performance compared to its benchmark during the reporting period October 1, 2023 to September 30, 2024.
TOP PERFORMANCE CONTRIBUTORS
| FACTOR | IMPACT | SUMMARY |
| Income/Carry | Positive | The Fund maintains a yield advantage relative to the benchmark, and this was the primary contributor to Fund outperformance over the past trailing 12-months. This yield advantage is driven by overweights to spread sectors. |
| Interest Rates | Positive | Falling interest rates resulted in positive absolute performance. However, as the fund was duration neutral throughout the period, it had minimal impact on benchmark relative performance. |
| Sector Allocation | Positive | The Fund’s allocations to both taxable municipals and mortgage-backed securities outperformed over the period as spreads tightened. |
| Sector Allocation | Positive | The performance of corporate bond holdings generally kept pace with the benchmark, having little impact on benchmark relative performance. |
| Sector Allocation | Negative | The Fund had an overweight position in asset-backed securities, which underperformed during the year. |
Fund Performance
Growth of $1,000,000 Initial Investment Since Inception
| AVERAGE ANNUAL TOTAL RETURN | 1 Year | 5 Years | Since
Inception |
| RBC BlueBay Impact Bond Fund (Class I/RIBIX) | 11.89% | 0.23% | 1.17%(a) |
| Bloomberg US Aggregate Bond Index | 11.57% | 0.33% | 1.47% |
(a) | Commenced operations on December 18, 2017. |
The Fund’s past performance is not a good predictor of how the Fund will perform in the future. For performance data current to the most recent month-end, visit https://usmutualfunds.rbcgam.com/fund-list/ after the seventh business day after month-end, or call 1-800-973-0073.
The graph and table do not reflect the deduction of taxes that a shareholder would pay on Fund distributions or redemption of Fund shares. Performance shown may reflect contractual fee waivers. Without such waivers, total returns would be reduced.
Key Fund Statistics
The following table outlines key fund statistics that you should pay attention to.
| Fund net assets | $293,911,496 |
| Total number of portfolio holdings | 362 |
| Portfolio turnover rate as of the end of the reporting period | 79% |
| Total advisory fee paid (net of fee waivers/reimbursements) | $531,900 |
Graphical Representation of Holdings
The tables below show the investment makeup of the Fund, representing percentage of the total net assets of the Fund.
| Fannie Mae, (TBA), 4.50%, 10/1/54 | 5.0% |
| Fannie Mae, Pool #BT1616, 2.00%, 4/1/51 | 2.3% |
| City of Hope, 5.48%, 10/16/24 | 1.7% |
| Baptist Healthcare System Obligated Group, 4.97%, 10/24/24 | 1.7% |
| Trinity Health Corp., 5.32%, 10/28/24 | 1.7% |
| Amgen, Inc., 5.25%, 3/2/33 | 1.2% |
| Fannie Mae, Pool #BZ0523, 4.50%, 2/1/29 | 1.2% |
| Fannie Mae, Pool #BS1730, 1.53%, 4/1/28 | 1.1% |
| Elevance Health, Inc., 5.15%, 6/15/29 | 1.1% |
| American Water Capital Corp., 4.45%, 6/1/32 | 1.1% |
Availability of Additional Information
You can find additional information about the Fund, such as the prospectus, financial information, fund holdings and proxy voting information, at www.dfinview.com/usrbcgam, by scanning the QR code or by contacting us at 1-800-422-2766.
Householding
To help lower operating costs, the RBC Funds attempt to eliminate mailing duplicate documents to the same address. When two or more RBC Fund shareholders have the same last name and address, the Funds may send only one prospectus, proxy, financial report or other communications to that address rather than mailing separate documents to each shareholders. This practice is known as "householding". Shareholders may opt out of this single mailing at any time by calling us at 1-800-422-2766.
Not FDIC Insured. No Bank Guarantee. May Lose Value.
RBC Global Asset Management (U.S.) Inc. is the Adviser for the RBC Funds Trust. Securities are offered through RBC Wealth Management, a division of RBC Capital Markets, LLC, member NYSE/FINRA/SIPC.
RBC Global Asset Management (RBC GAM) is the asset management division of Royal Bank of Canada (RBC) which includes RBC Global Asset Management Inc., RBC Global Asset Management (U.S.) Inc., RBC Global Asset Management (UK) Limited, RBC Global Asset Management (Asia) Limited and RBC Indigo Asset Management Inc. which are separate, but affiliated subsidiaries of RBC. ® / ™ Trademark(s) of Royal Bank of Canada. Used under license. ©2024 RBC Global Asset Management (U.S.) Inc.
RBCF- AR 09-24
RBC BlueBay Impact Bond Fund
Class R6 / RIBRX
Annual SHAREHOLDER REPORT | September 30, 2024
This annual shareholder report contains important information about the RBC BlueBay Impact Bond Fund (“Fund”) for the period of October 1, 2023, to September 30, 2024. You can find additional information about the Fund at https://www.dfinview.com/usrbcgam. You can also request this information by contacting us at 1-800-422-2766.
Fund Expenses
(Based on a hypothetical $10,000 investment)
| Fund (Class) | Costs of a $10,000 investment | Costs paid as a percentage
of a $10,000 investment |
RBC BlueBay Impact Bond Fund
(Class R6/RIBRX) | $41 | 0.39% |
Management’s Discussion of Fund Performance
SUMMARY OF RESULTS
Under normal circumstances, the Fund will invest at least 80% of its assets in fixed income securities meeting the Fund’s impact criteria, as determined by the Advisor’s impact methodology. For purposes of this policy, the term “assets” means net assets plus the amount of borrowings for investment purposes. The fixed income securities in which the Fund may invest include, but are not limited to, bonds, municipal securities, mortgage-related, mortgage-backed and asset-backed securities, and obligations of U.S. governments and their agencies. The Fund may invest in securities with fixed, floating or variable rates of interest.
The following table outlines key factors that materially affected the Fund’s performance compared to its benchmark during the reporting period October 1, 2023 to September 30, 2024.
TOP PERFORMANCE CONTRIBUTORS
| FACTOR | IMPACT | SUMMARY |
| Income/Carry | Positive | The Fund maintains a yield advantage relative to the benchmark, and this was the primary contributor to Fund outperformance over the past trailing 12-months. This yield advantage is driven by overweights to spread sectors. |
| Interest Rates | Positive | Falling interest rates resulted in positive absolute performance. However, as the fund was duration neutral throughout the period, it had minimal impact on benchmark relative performance. |
| Sector Allocation | Positive | The Fund’s allocations to both taxable municipals and mortgage-backed securities outperformed over the period as spreads tightened. |
| Sector Allocation | Positive | The performance of corporate bond holdings generally kept pace with the benchmark, having little impact on benchmark relative performance. |
| Sector Allocation | Negative | The Fund had an overweight position in asset-backed securities, which underperformed during the year. |
Fund Performance
Growth of $10,000,000 Initial Investment Since Inception
| AVERAGE ANNUAL TOTAL RETURN | 1 Year | 5 Years | Since
Inception |
| RBC BlueBay Impact Bond Fund (Class R6/RIBRX) | 11.82% | 0.26% | 1.20%(a) |
| Bloomberg US Aggregate Bond Index | 11.57% | 0.33% | 1.47% |
(a) | Commenced operations on December 18, 2017. |
The Fund’s past performance is not a good predictor of how the Fund will perform in the future. For performance data current to the most recent month-end, visit https://usmutualfunds.rbcgam.com/fund-list/ after the seventh business day after month-end, or call 1-800-973-0073.
The graph and table do not reflect the deduction of taxes that a shareholder would pay on Fund distributions or redemption of Fund shares. Performance shown may reflect contractual fee waivers. Without such waivers, total returns would be reduced.
Key Fund Statistics
The following table outlines key fund statistics that you should pay attention to.
| Fund net assets | $293,911,496 |
| Total number of portfolio holdings | 362 |
| Portfolio turnover rate as of the end of the reporting period | 79% |
| Total advisory fee paid (net of fee waivers/reimbursements) | $531,900 |
Graphical Representation of Holdings
The tables below show the investment makeup of the Fund, representing percentage of the total net assets of the Fund.
| Fannie Mae, (TBA), 4.50%, 10/1/54 | 5.0% |
| Fannie Mae, Pool #BT1616, 2.00%, 4/1/51 | 2.3% |
| City of Hope, 5.48%, 10/16/24 | 1.7% |
| Baptist Healthcare System Obligated Group, 4.97%, 10/24/24 | 1.7% |
| Trinity Health Corp., 5.32%, 10/28/24 | 1.7% |
| Amgen, Inc., 5.25%, 3/2/33 | 1.2% |
| Fannie Mae, Pool #BZ0523, 4.50%, 2/1/29 | 1.2% |
| Fannie Mae, Pool #BS1730, 1.53%, 4/1/28 | 1.1% |
| Elevance Health, Inc., 5.15%, 6/15/29 | 1.1% |
| American Water Capital Corp., 4.45%, 6/1/32 | 1.1% |
Availability of Additional Information
You can find additional information about the Fund, such as the prospectus, financial information, fund holdings and proxy voting information, at www.dfinview.com/usrbcgam, by scanning the QR code or by contacting us at 1-800-422-2766.
Householding
To help lower operating costs, the RBC Funds attempt to eliminate mailing duplicate documents to the same address. When two or more RBC Fund shareholders have the same last name and address, the Funds may send only one prospectus, proxy, financial report or other communications to that address rather than mailing separate documents to each shareholders. This practice is known as "householding". Shareholders may opt out of this single mailing at any time by calling us at 1-800-422-2766.
Not FDIC Insured. No Bank Guarantee. May Lose Value.
RBC Global Asset Management (U.S.) Inc. is the Adviser for the RBC Funds Trust. Securities are offered through RBC Wealth Management, a division of RBC Capital Markets, LLC, member NYSE/FINRA/SIPC.
RBC Global Asset Management (RBC GAM) is the asset management division of Royal Bank of Canada (RBC) which includes RBC Global Asset Management Inc., RBC Global Asset Management (U.S.) Inc., RBC Global Asset Management (UK) Limited, RBC Global Asset Management (Asia) Limited and RBC Indigo Asset Management Inc. which are separate, but affiliated subsidiaries of RBC. ® / ™ Trademark(s) of Royal Bank of Canada. Used under license. ©2024 RBC Global Asset Management (U.S.) Inc.
RBCF- AR 09-24
RBC BlueBay Impact Bond Fund
Class Y / RIBYX
Annual SHAREHOLDER REPORT | September 30, 2024
This annual shareholder report contains important information about the RBC BlueBay Impact Bond Fund (“Fund”) for the period of October 1, 2023, to September 30, 2024. You can find additional information about the Fund at https://www.dfinview.com/usrbcgam. You can also request this information by contacting us at 1-800-422-2766.
Fund Expenses
(Based on a hypothetical $10,000 investment)
| Fund (Class) | Costs of a $10,000 investment | Costs paid as a percentage
of a $10,000 investment |
RBC BlueBay Impact Bond Fund
(Class Y/RIBYX) | $41 | 0.39% |
Management’s Discussion of Fund Performance
SUMMARY OF RESULTS
Under normal circumstances, the Fund will invest at least 80% of its assets in fixed income securities meeting the Fund’s impact criteria, as determined by the Advisor’s impact methodology. For purposes of this policy, the term “assets” means net assets plus the amount of borrowings for investment purposes. The fixed income securities in which the Fund may invest include, but are not limited to, bonds, municipal securities, mortgage-related, mortgage-backed and asset-backed securities, and obligations of U.S. governments and their agencies. The Fund may invest in securities with fixed, floating or variable rates of interest.
The following table outlines key factors that materially affected the Fund’s performance compared to its benchmark during the reporting period October 1, 2023 to September 30, 2024.
TOP PERFORMANCE CONTRIBUTORS
| FACTOR | IMPACT | SUMMARY |
| Income/Carry | Positive | The Fund maintains a yield advantage relative to the benchmark, and this was the primary contributor to Fund outperformance over the past trailing 12-months. This yield advantage is driven by overweights to spread sectors. |
| Interest Rates | Positive | Falling interest rates resulted in positive absolute performance. However, as the fund was duration neutral throughout the period, it had minimal impact on benchmark relative performance. |
| Sector Allocation | Positive | The Fund’s allocations to both taxable municipals and mortgage-backed securities outperformed over the period as spreads tightened. |
| Sector Allocation | Positive | The performance of corporate bond holdings generally kept pace with the benchmark, having little impact on benchmark relative performance. |
| Sector Allocation | Negative | The Fund had an overweight position in asset-backed securities, which underperformed during the year. |
Fund Performance
Growth of $5,000,000 Initial Investment Since Inception
| AVERAGE ANNUAL TOTAL RETURN | 1 Year | Since
Inception |
| RBC BlueBay Impact Bond Fund (Class Y/RIBYX) | 11.96% | (1.06)%(a) |
| Bloomberg US Aggregate Bond Index | 11.57% | (0.80)% |
(a) | The Fund’s Class Y shares commenced operations on April 12, 2021. |
The Fund’s past performance is not a good predictor of how the Fund will perform in the future. For performance data current to the most recent month-end, visit https://usmutualfunds.rbcgam.com/fund-list/ after the seventh business day after month-end, or call 1-800-973-0073.
The graph and table do not reflect the deduction of taxes that a shareholder would pay on Fund distributions or redemption of Fund shares. Performance shown may reflect contractual fee waivers. Without such waivers, total returns would be reduced.
Key Fund Statistics
The following table outlines key fund statistics that you should pay attention to.
| Fund net assets | $293,911,496 |
| Total number of portfolio holdings | 362 |
| Portfolio turnover rate as of the end of the reporting period | 79% |
| Total advisory fee paid (net of fee waivers/reimbursements) | $531,900 |
Graphical Representation of Holdings
The tables below show the investment makeup of the Fund, representing percentage of the total net assets of the Fund.
| Fannie Mae, (TBA), 4.50%, 10/1/54 | 5.0% |
| Fannie Mae, Pool #BT1616, 2.00%, 4/1/51 | 2.3% |
| City of Hope, 5.48%, 10/16/24 | 1.7% |
| Baptist Healthcare System Obligated Group, 4.97%, 10/24/24 | 1.7% |
| Trinity Health Corp., 5.32%, 10/28/24 | 1.7% |
| Amgen, Inc., 5.25%, 3/2/33 | 1.2% |
| Fannie Mae, Pool #BZ0523, 4.50%, 2/1/29 | 1.2% |
| Fannie Mae, Pool #BS1730, 1.53%, 4/1/28 | 1.1% |
| Elevance Health, Inc., 5.15%, 6/15/29 | 1.1% |
| American Water Capital Corp., 4.45%, 6/1/32 | 1.1% |
Availability of Additional Information
You can find additional information about the Fund, such as the prospectus, financial information, fund holdings and proxy voting information, at www.dfinview.com/usrbcgam, by scanning the QR code or by contacting us at 1-800-422-2766.
Householding
To help lower operating costs, the RBC Funds attempt to eliminate mailing duplicate documents to the same address. When two or more RBC Fund shareholders have the same last name and address, the Funds may send only one prospectus, proxy, financial report or other communications to that address rather than mailing separate documents to each shareholders. This practice is known as "householding". Shareholders may opt out of this single mailing at any time by calling us at 1-800-422-2766.
Not FDIC Insured. No Bank Guarantee. May Lose Value.
RBC Global Asset Management (U.S.) Inc. is the Adviser for the RBC Funds Trust. Securities are offered through RBC Wealth Management, a division of RBC Capital Markets, LLC, member NYSE/FINRA/SIPC.
RBC Global Asset Management (RBC GAM) is the asset management division of Royal Bank of Canada (RBC) which includes RBC Global Asset Management Inc., RBC Global Asset Management (U.S.) Inc., RBC Global Asset Management (UK) Limited, RBC Global Asset Management (Asia) Limited and RBC Indigo Asset Management Inc. which are separate, but affiliated subsidiaries of RBC. ® / ™ Trademark(s) of Royal Bank of Canada. Used under license. ©2024 RBC Global Asset Management (U.S.) Inc.
RBCF- AR 09-24
RBC BlueBay High Yield Bond Fund
Class A / RHYAX
Annual SHAREHOLDER REPORT | September 30, 2024
This annual shareholder report contains important information about the RBC BlueBay High Yield Bond Fund (“Fund”) for the period of October 1, 2023, to September 30, 2024. You can find additional information about the Fund at https://www.dfinview.com/usrbcgam. You can also request this information by contacting us at 1-800-422-2766.
Fund Expenses
(Based on a hypothetical $10,000 investment)
| Fund (Class) | Costs of a $10,000 investment | Costs paid as a percentage
of a $10,000 investment |
RBC BlueBay High Yield Bond Fund
(Class A/RHYAX) | $88 | 0.82% |
Management’s Discussion of Fund Performance
SUMMARY OF RESULTS
The Fund seeks to achieve a high level of total return consisting of income and capital appreciation by investing, under normal circumstances, at least 80% of its assets in fixed income securities and/or investments that, at the time of purchase, have similar economic characteristics as fixed income securities that are non-investment grade (high yield /junk bond), and are considered by the Fund to have the potential to provide a high level of total return. For purposes of this policy, the term “assets” means net assets plus the amount of borrowings for investment purposes. Up to 20% of the Fund’s total assets may be invested in other securities, including investment grade securities. The Fund may also invest in loans.
The following table outlines key factors that materially affected the Fund’s performance compared to its benchmark during the reporting period October 1, 2023 to September 30, 2024.
TOP PERFORMANCE CONTRIBUTORS
| FACTOR | IMPACT | SUMMARY |
| Credit Selection | Positive | Credit selection overall was a positive contributor to relative performance and selection generated positive relative returns in the majority of sectors within the benchmark over the past twelve months. |
| Sector Allocation | Positive | Security selection was particularly additive to performance within the Automotive, Banking, and Energy sectors. A modest overweight to Automotives compared to the benchmark was beneficial as well. |
| Sector Allocation | Negative | The Fund’s underweight position in the Healthcare sector detracted from relative performance for the period. |
| Credit Beta | Negative | The Fund’s underweight spread duration relative to the benchmark was a detractor to relative performance as spreads tightened. |
Fund Performance
Growth of $10,000 Initial Investment Over 10 Years
| AVERAGE ANNUAL TOTAL RETURN | 1 Year | 5 Years | 10 Years |
| RBC BlueBay High Yield Bond Fund (Class A/RHYAX)— including sales load (4.25%) | 9.75% | 4.07% | 4.66% |
| RBC BlueBay High Yield Bond Fund (Class A/RHYAX) — excluding sales load | 14.60% | 4.96% | 5.11% |
| Bloomberg US Aggregate Bond Index | 11.57% | 0.33% | 1.84% |
| ICE BofA US High Yield Index | 15.66% | 4.55% | 4.95% |
The Fund’s past performance is not a good predictor of how the Fund will perform in the future. For performance data current to the most recent month-end, visit https://usmutualfunds.rbcgam.com/fund-list/ after the seventh business day after month-end, or call 1-800-973-0073.
The graph and table do not reflect the deduction of taxes that a shareholder would pay on Fund distributions or redemption of Fund shares. Performance shown may reflect contractual fee waivers. Without such waivers, total returns would be reduced.
Key Fund Statistics
The following table outlines key fund statistics that you should pay attention to.
| Fund net assets | $729,218,077 |
| Total number of portfolio holdings | 224 |
| Portfolio turnover rate as of the end of the reporting period | 111% |
| Total advisory fee paid (net of fee waivers/reimbursements) | $2,093,628 |
Graphical Representation of Holdings
The tables below show the investment makeup of the Fund, representing percentage of the total net assets of the Fund.
| Credit Agricole SA, 6.70% | 1.3% |
| Dealer Tire LLC / DT Issuer LLC, 8.00%, 2/1/28 | 1.2% |
| Venture Global LNG, Inc., 7.00%, 1/15/30 | 1.0% |
| Rocket Software, Inc., 9.00%, 11/28/28 | 1.0% |
| Calpine Corp., 5.25%, 6/1/26 | 1.0% |
| Prairie Acquiror LP, 9.00%, 8/1/29 | 1.0% |
| NESCO Holdings II, Inc., 5.50%, 4/15/29 | 0.9% |
| Specialty Building Products Holdings LLC / SBP Finance Corp., 6.38%, 9/30/26 | 0.9% |
| Allied Universal Holdco LLC, 7.88%, 2/15/31 | 0.8% |
| Clarios Global LP / Clarios US Finance Co., 6.25%, 5/15/26 | 0.8% |
Availability of Additional Information
You can find additional information about the Fund, such as the prospectus, financial information, fund holdings and proxy voting information, at www.dfinview.com/usrbcgam, by scanning the QR code or by contacting us at 1-800-422-2766.
Householding
To help lower operating costs, the RBC Funds attempt to eliminate mailing duplicate documents to the same address. When two or more RBC Fund shareholders have the same last name and address, the Funds may send only one prospectus, proxy, financial report or other communications to that address rather than mailing separate documents to each shareholders. This practice is known as "householding". Shareholders may opt out of this single mailing at any time by calling us at 1-800-422-2766.
Not FDIC Insured. No Bank Guarantee. May Lose Value.
RBC Global Asset Management (U.S.) Inc. is the Adviser for the RBC Funds Trust. Securities are offered through RBC Wealth Management, a division of RBC Capital Markets, LLC, member NYSE/FINRA/SIPC.
RBC Global Asset Management (RBC GAM) is the asset management division of Royal Bank of Canada (RBC) which includes RBC Global Asset Management Inc., RBC Global Asset Management (U.S.) Inc., RBC Global Asset Management (UK) Limited, RBC Global Asset Management (Asia) Limited and RBC Indigo Asset Management Inc. which are separate, but affiliated subsidiaries of RBC. ® / ™ Trademark(s) of Royal Bank of Canada. Used under license. ©2024 RBC Global Asset Management (U.S.) Inc.
RBCF- AR 09-24
RBC BlueBay High Yield Bond Fund
Class I / RGHYX
Annual SHAREHOLDER REPORT | September 30, 2024
This annual shareholder report contains important information about the RBC BlueBay High Yield Bond Fund (“Fund”) for the period of October 1, 2023, to September 30, 2024. You can find additional information about the Fund at https://www.dfinview.com/usrbcgam. You can also request this information by contacting us at 1-800-422-2766.
Fund Expenses
(Based on a hypothetical $10,000 investment)
| Fund (Class) | Costs of a $10,000 investment | Costs paid as a percentage
of a $10,000 investment |
RBC BlueBay High Yield Bond Fund
(Class I/RGHYX) | $61 | 0.57% |
Management’s Discussion of Fund Performance
SUMMARY OF RESULTS
The Fund seeks to achieve a high level of total return consisting of income and capital appreciation by investing, under normal circumstances, at least 80% of its assets in fixed income securities and/or investments that, at the time of purchase, have similar economic characteristics as fixed income securities that are non-investment grade (high yield /junk bond), and are considered by the Fund to have the potential to provide a high level of total return. For purposes of this policy, the term “assets” means net assets plus the amount of borrowings for investment purposes. Up to 20% of the Fund’s total assets may be invested in other securities, including investment grade securities. The Fund may also invest in loans.
The following table outlines key factors that materially affected the Fund’s performance compared to its benchmark during the reporting period October 1, 2023 to September 30, 2024.
TOP PERFORMANCE CONTRIBUTORS
| FACTOR | IMPACT | SUMMARY |
| Credit Selection | Positive | Credit selection overall was a positive contributor to relative performance and selection generated positive relative returns in the majority of sectors within the benchmark over the past twelve months. |
| Sector Allocation | Positive | Security selection was particularly additive to performance within the Automotive, Banking, and Energy sectors. A modest overweight to Automotives compared to the benchmark was beneficial as well. |
| Sector Allocation | Negative | The Fund’s underweight position in the Healthcare sector detracted from relative performance for the period. |
| Credit Beta | Negative | The Fund’s underweight spread duration relative to the benchmark was a detractor to relative performance as spreads tightened. |
Fund Performance
Growth of $1,000,000 Initial Investment Over 10 Years
| AVERAGE ANNUAL TOTAL RETURN | 1 Year | 5 Years | 10 Years |
| RBC BlueBay High Yield Bond Fund (Class I/RGHYX) | 14.82% | 5.23% | 5.38% |
| Bloomberg US Aggregate Bond Index | 11.57% | 0.33% | 1.84% |
| ICE BofA US High Yield Index | 15.66% | 4.55% | 4.95% |
The Fund’s past performance is not a good predictor of how the Fund will perform in the future. For performance data current to the most recent month-end, visit https://usmutualfunds.rbcgam.com/fund-list/ after the seventh business day after month-end, or call 1-800-973-0073.
The graph and table do not reflect the deduction of taxes that a shareholder would pay on Fund distributions or redemption of Fund shares. Performance shown may reflect contractual fee waivers. Without such waivers, total returns would be reduced.
Key Fund Statistics
The following table outlines key fund statistics that you should pay attention to.
| Fund net assets | $729,218,077 |
| Total number of portfolio holdings | 224 |
| Portfolio turnover rate as of the end of the reporting period | 111% |
| Total advisory fee paid (net of fee waivers/reimbursements) | $2,093,628 |
Graphical Representation of Holdings
The tables below show the investment makeup of the Fund, representing percentage of the total net assets of the Fund.
| Credit Agricole SA, 6.70% | 1.3% |
| Dealer Tire LLC / DT Issuer LLC, 8.00%, 2/1/28 | 1.2% |
| Venture Global LNG, Inc., 7.00%, 1/15/30 | 1.0% |
| Rocket Software, Inc., 9.00%, 11/28/28 | 1.0% |
| Calpine Corp., 5.25%, 6/1/26 | 1.0% |
| Prairie Acquiror LP, 9.00%, 8/1/29 | 1.0% |
| NESCO Holdings II, Inc., 5.50%, 4/15/29 | 0.9% |
| Specialty Building Products Holdings LLC / SBP Finance Corp., 6.38%, 9/30/26 | 0.9% |
| Allied Universal Holdco LLC, 7.88%, 2/15/31 | 0.8% |
| Clarios Global LP / Clarios US Finance Co., 6.25%, 5/15/26 | 0.8% |
Availability of Additional Information
You can find additional information about the Fund, such as the prospectus, financial information, fund holdings and proxy voting information, at www.dfinview.com/usrbcgam, by scanning the QR code or by contacting us at 1-800-422-2766.
Householding
To help lower operating costs, the RBC Funds attempt to eliminate mailing duplicate documents to the same address. When two or more RBC Fund shareholders have the same last name and address, the Funds may send only one prospectus, proxy, financial report or other communications to that address rather than mailing separate documents to each shareholders. This practice is known as "householding". Shareholders may opt out of this single mailing at any time by calling us at 1-800-422-2766.
Not FDIC Insured. No Bank Guarantee. May Lose Value.
RBC Global Asset Management (U.S.) Inc. is the Adviser for the RBC Funds Trust. Securities are offered through RBC Wealth Management, a division of RBC Capital Markets, LLC, member NYSE/FINRA/SIPC.
RBC Global Asset Management (RBC GAM) is the asset management division of Royal Bank of Canada (RBC) which includes RBC Global Asset Management Inc., RBC Global Asset Management (U.S.) Inc., RBC Global Asset Management (UK) Limited, RBC Global Asset Management (Asia) Limited and RBC Indigo Asset Management Inc. which are separate, but affiliated subsidiaries of RBC. ® / ™ Trademark(s) of Royal Bank of Canada. Used under license. ©2024 RBC Global Asset Management (U.S.) Inc.
RBCF- AR 09-24
RBC BlueBay Emerging Market Debt Fund
Class A / RESAX
Annual SHAREHOLDER REPORT | September 30, 2024
This annual shareholder report contains important information about the RBC BlueBay Emerging Market Debt Fund (“Fund”) for the period of October 1, 2023, to September 30, 2024. You can find additional information about the Fund at https://www.dfinview.com/usrbcgam. You can also request this information by contacting us at 1-800-422-2766.
Fund Expenses
(Based on a hypothetical $10,000 investment)
| Fund (Class) | Costs of a $10,000 investment | Costs paid as a percentage
of a $10,000 investment |
RBC BlueBay Emerging Market Debt Fund
(Class A/RESAX) | $114 | 1.04% |
Management’s Discussion of Fund Performance
SUMMARY OF RESULTS
The Fund seeks to achieve a high level of total return consisting of income and capital appreciation by investing, under normal circumstances, at least 80% of its assets in fixed income securities and/or investments that have similar economic characteristics as fixed income securities of issuers economically tied to emerging market countries that are considered by the Fund to have the potential to provide a high level of total return. For purposes of this policy, the term “assets” means net assets plus the amount of borrowings for investment purposes.
The following table outlines key factors that materially affected the Fund’s performance compared to its benchmark during the reporting period October 1, 2023 to September 30, 2024.
TOP PERFORMANCE CONTRIBUTORS
| FACTOR | IMPACT | SUMMARY |
| Credit Beta | Positive | The fund maintained an overweight risk stance in hard currency credit over the period, and given the spread tightening environment that played out, the fund’s “long risk” posture was a contributor to relative performance. |
| Credit Alpha | Positive | Key country overweights in select high yielding, lowly-rated countries such as Pakistan, Ukraine, Venezuela, Tunisia and Egypt were all positive contributors to performance over the period given the strong performance from the stressed and distressed sub-segment of the EM sovereign market. |
| Interest Rate Duration | Positive | The fund held some off-benchmark exposure in i) EM local markets and ii) Euro-denominated sovereign bonds, both of which combined to generate strong performance from non-USD duration. This was partially offset by the fund’s underweight position in USD duration which was a modest drag on performance given the move lower in US Treasury yields. |
| Currencies | Negative | The fund had some tactical off-benchmark positioning in EM local currencies, for example the Malaysian Ringgit, the Nigerian Naira and the Dominican Republic Peso – which cumulatively led to some underperformance at the fund level. |
Fund Performance
Growth of $10,000 Initial Investment Over 10 Years
| AVERAGE ANNUAL TOTAL RETURN | 1 Year | 5 Years | 10 Years |
| RBC BlueBay Emerging Market Debt Fund (Class A/RESAX)— including sales load (4.25%) | 14.46% | 1.19% | 2.17% |
| RBC BlueBay Emerging Market Debt Fund (Class A/RESAX) — excluding sales load | 19.47% | 2.07% | 2.44% |
| Bloomberg Global Aggregate Bond Index | 11.99% | (0.83)% | 0.57% |
| JPMorgan EMBI Global Diversified Index | 18.60% | 0.87% | 3.28% |
The Fund’s past performance is not a good predictor of how the Fund will perform in the future. For performance data current to the most recent month-end, visit https://usmutualfunds.rbcgam.com/fund-list/ after the seventh business day after month-end, or call 1-800-973-0073.
The graph and table do not reflect the deduction of taxes that a shareholder would pay on Fund distributions or redemption of Fund shares. Performance shown may reflect contractual fee waivers. Without such waivers, total returns would be reduced.
Key Fund Statistics
The following table outlines key fund statistics that you should pay attention to.
| Fund net assets | $115,761,460 |
| Total number of portfolio holdings | 266 |
| Portfolio turnover rate as of the end of the reporting period | 70% |
| Total advisory fee paid (net of fee waivers/reimbursements) | $201,256 |
Graphical Representation of Holdings
The tables below show the investment makeup of the Fund, representing percentage of the total net assets of the Fund.
| Oman Government International Bond, 6.75%, 1/17/48 | 2.4% |
| Petroleos Mexicanos, 5.63%, 1/23/46 | 2.0% |
| Petroleos Mexicanos, 6.35%, 2/12/48 | 1.8% |
| Turkey Government International Bond, 4.88%, 4/16/43 | 1.7% |
| Turkey Government International Bond, 5.75%, 5/11/47 | 1.4% |
| Argentine Republic Government International Bond, 4.13%, 7/9/35 | 1.2% |
| Argentine Republic Government International Bond, 3.50%, 7/9/41 | 1.2% |
| Colombia Government International Bond, 8.00%, 11/14/35 | 1.2% |
| Panama Government International Bond, 4.50%, 4/1/56 | 1.2% |
| Angolan Government International Bond, 8.25%, 5/9/28 | 1.0% |
| United States | 28.9% |
| Africa/Middle East | 27.1% |
| South America | 20.7% |
| Latin America | 17.4% |
| Europe | 13.2% |
| Asia | 7.1% |
| Serbia | 2.4% |
| Uzbekistan | 1.9% |
| Senegal | 0.4% |
| Montenegro | 0.3% |
Availability of Additional Information
You can find additional information about the Fund, such as the prospectus, financial information, fund holdings and proxy voting information, at www.dfinview.com/usrbcgam, by scanning the QR code or by contacting us at 1-800-422-2766.
Householding
To help lower operating costs, the RBC Funds attempt to eliminate mailing duplicate documents to the same address. When two or more RBC Fund shareholders have the same last name and address, the Funds may send only one prospectus, proxy, financial report or other communications to that address rather than mailing separate documents to each shareholders. This practice is known as "householding". Shareholders may opt out of this single mailing at any time by calling us at 1-800-422-2766.
Not FDIC Insured. No Bank Guarantee. May Lose Value.
RBC Global Asset Management (U.S.) Inc. is the Adviser for the RBC Funds Trust. Securities are offered through RBC Wealth Management, a division of RBC Capital Markets, LLC, member NYSE/FINRA/SIPC.
RBC Global Asset Management (RBC GAM) is the asset management division of Royal Bank of Canada (RBC) which includes RBC Global Asset Management Inc., RBC Global Asset Management (U.S.) Inc., RBC Global Asset Management (UK) Limited, RBC Global Asset Management (Asia) Limited and RBC Indigo Asset Management Inc. which are separate, but affiliated subsidiaries of RBC. ® / ™ Trademark(s) of Royal Bank of Canada. Used under license. ©2024 RBC Global Asset Management (U.S.) Inc.
RBCF- AR 09-24
RBC BlueBay Emerging Market Debt Fund
Class I / RBESX
Annual SHAREHOLDER REPORT | September 30, 2024
This annual shareholder report contains important information about the RBC BlueBay Emerging Market Debt Fund (“Fund”) for the period of October 1, 2023, to September 30, 2024. You can find additional information about the Fund at https://www.dfinview.com/usrbcgam. You can also request this information by contacting us at 1-800-422-2766.
Fund Expenses
(Based on a hypothetical $10,000 investment)
| Fund (Class) | Costs of a $10,000 investment | Costs paid as a percentage
of a $10,000 investment |
RBC BlueBay Emerging Market Debt Fund
(Class I/RBESX) | $87 | 0.79% |
Management’s Discussion of Fund Performance
SUMMARY OF RESULTS
The Fund seeks to achieve a high level of total return consisting of income and capital appreciation by investing, under normal circumstances, at least 80% of its assets in fixed income securities and/or investments that have similar economic characteristics as fixed income securities of issuers economically tied to emerging market countries that are considered by the Fund to have the potential to provide a high level of total return. For purposes of this policy, the term “assets” means net assets plus the amount of borrowings for investment purposes.
The following table outlines key factors that materially affected the Fund’s performance compared to its benchmark during the reporting period October 1, 2023 to September 30, 2024.
TOP PERFORMANCE CONTRIBUTORS
| FACTOR | IMPACT | SUMMARY |
| Credit Beta | Positive | The fund maintained an overweight risk stance in hard currency credit over the period, and given the spread tightening environment that played out, the fund’s “long risk” posture was a contributor to relative performance. |
| Credit Alpha | Positive | Key country overweights in select high yielding, lowly-rated countries such as Pakistan, Ukraine, Venezuela, Tunisia and Egypt were all positive contributors to performance over the period given the strong performance from the stressed and distressed sub-segment of the EM sovereign market. |
| Interest Rate Duration | Positive | The fund held some off-benchmark exposure in i) EM local markets and ii) Euro-denominated sovereign bonds, both of which combined to generate strong performance from non-USD duration. This was partially offset by the fund’s underweight position in USD duration which was a modest drag on performance given the move lower in US Treasury yields. |
| Currencies | Negative | The fund had some tactical off-benchmark positioning in EM local currencies, for example the Malaysian Ringgit, the Nigerian Naira and the Dominican Republic Peso – which cumulatively led to some underperformance at the fund level. |
Fund Performance
Growth of $1,000,000 Initial Investment Over 10 Years
| AVERAGE ANNUAL TOTAL RETURN | 1 Year | 5 Years | 10 Years |
| RBC BlueBay Emerging Market Debt Fund (Class I/RBESX) | 19.92% | 2.37% | 2.70% |
| Bloomberg Global Aggregate Bond Index | 11.99% | (0.83)% | 0.57% |
| JPMorgan EMBI Global Diversified Index | 18.60% | 0.87% | 3.28% |
The Fund’s past performance is not a good predictor of how the Fund will perform in the future. For performance data current to the most recent month-end, visit https://usmutualfunds.rbcgam.com/fund-list/ after the seventh business day after month-end, or call 1-800-973-0073.
The graph and table do not reflect the deduction of taxes that a shareholder would pay on Fund distributions or redemption of Fund shares. Performance shown may reflect contractual fee waivers. Without such waivers, total returns would be reduced.
Key Fund Statistics
The following table outlines key fund statistics that you should pay attention to.
| Fund net assets | $115,761,460 |
| Total number of portfolio holdings | 266 |
| Portfolio turnover rate as of the end of the reporting period | 70% |
| Total advisory fee paid (net of fee waivers/reimbursements) | $201,256 |
Graphical Representation of Holdings
The tables below show the investment makeup of the Fund, representing percentage of the total net assets of the Fund.
| Oman Government International Bond, 6.75%, 1/17/48 | 2.4% |
| Petroleos Mexicanos, 5.63%, 1/23/46 | 2.0% |
| Petroleos Mexicanos, 6.35%, 2/12/48 | 1.8% |
| Turkey Government International Bond, 4.88%, 4/16/43 | 1.7% |
| Turkey Government International Bond, 5.75%, 5/11/47 | 1.4% |
| Argentine Republic Government International Bond, 4.13%, 7/9/35 | 1.2% |
| Argentine Republic Government International Bond, 3.50%, 7/9/41 | 1.2% |
| Colombia Government International Bond, 8.00%, 11/14/35 | 1.2% |
| Panama Government International Bond, 4.50%, 4/1/56 | 1.2% |
| Angolan Government International Bond, 8.25%, 5/9/28 | 1.0% |
| United States | 28.9% |
| Africa/Middle East | 27.1% |
| South America | 20.7% |
| Latin America | 17.4% |
| Europe | 13.2% |
| Asia | 7.1% |
| Serbia | 2.4% |
| Uzbekistan | 1.9% |
| Senegal | 0.4% |
| Montenegro | 0.3% |
Availability of Additional Information
You can find additional information about the Fund, such as the prospectus, financial information, fund holdings and proxy voting information, at www.dfinview.com/usrbcgam, by scanning the QR code or by contacting us at 1-800-422-2766.
Householding
To help lower operating costs, the RBC Funds attempt to eliminate mailing duplicate documents to the same address. When two or more RBC Fund shareholders have the same last name and address, the Funds may send only one prospectus, proxy, financial report or other communications to that address rather than mailing separate documents to each shareholders. This practice is known as "householding". Shareholders may opt out of this single mailing at any time by calling us at 1-800-422-2766.
Not FDIC Insured. No Bank Guarantee. May Lose Value.
RBC Global Asset Management (U.S.) Inc. is the Adviser for the RBC Funds Trust. Securities are offered through RBC Wealth Management, a division of RBC Capital Markets, LLC, member NYSE/FINRA/SIPC.
RBC Global Asset Management (RBC GAM) is the asset management division of Royal Bank of Canada (RBC) which includes RBC Global Asset Management Inc., RBC Global Asset Management (U.S.) Inc., RBC Global Asset Management (UK) Limited, RBC Global Asset Management (Asia) Limited and RBC Indigo Asset Management Inc. which are separate, but affiliated subsidiaries of RBC. ® / ™ Trademark(s) of Royal Bank of Canada. Used under license. ©2024 RBC Global Asset Management (U.S.) Inc.
RBCF- AR 09-24
RBC BlueBay Emerging Market Debt Fund
Class R6 / RBERX
Annual SHAREHOLDER REPORT | September 30, 2024
This annual shareholder report contains important information about the RBC BlueBay Emerging Market Debt Fund (“Fund”) for the period of October 1, 2023, to September 30, 2024. You can find additional information about the Fund at https://www.dfinview.com/usrbcgam. You can also request this information by contacting us at 1-800-422-2766.
Fund Expenses
(Based on a hypothetical $10,000 investment)
| Fund (Class) | Costs of a $10,000 investment | Costs paid as a percentage
of a $10,000 investment |
RBC BlueBay Emerging Market Debt Fund
(Class R6/RBERX) | $81 | 0.74% |
Management’s Discussion of Fund Performance
SUMMARY OF RESULTS
The Fund seeks to achieve a high level of total return consisting of income and capital appreciation by investing, under normal circumstances, at least 80% of its assets in fixed income securities and/or investments that have similar economic characteristics as fixed income securities of issuers economically tied to emerging market countries that are considered by the Fund to have the potential to provide a high level of total return. For purposes of this policy, the term “assets” means net assets plus the amount of borrowings for investment purposes.
The following table outlines key factors that materially affected the Fund’s performance compared to its benchmark during the reporting period October 1, 2023 to September 30, 2024.
TOP PERFORMANCE CONTRIBUTORS
| FACTOR | IMPACT | SUMMARY |
| Credit Beta | Positive | The fund maintained an overweight risk stance in hard currency credit over the period, and given the spread tightening environment that played out, the fund’s “long risk” posture was a contributor to relative performance. |
| Credit Alpha | Positive | Key country overweights in select high yielding, lowly-rated countries such as Pakistan, Ukraine, Venezuela, Tunisia and Egypt were all positive contributors to performance over the period given the strong performance from the stressed and distressed sub-segment of the EM sovereign market. |
| Interest Rate Duration | Positive | The fund held some off-benchmark exposure in i) EM local markets and ii) Euro-denominated sovereign bonds, both of which combined to generate strong performance from non-USD duration. This was partially offset by the fund’s underweight position in USD duration which was a modest drag on performance given the move lower in US Treasury yields. |
| Currencies | Negative | The fund had some tactical off-benchmark positioning in EM local currencies, for example the Malaysian Ringgit, the Nigerian Naira and the Dominican Republic Peso – which cumulatively led to some underperformance at the fund level. |
Fund Performance
Growth of $1,000,000 Initial Investment Over 10 Years
| AVERAGE ANNUAL TOTAL RETURN | 1 Year | 5 Years | 10 Years |
| RBC BlueBay Emerging Market Debt Fund (Class R6/RBERX) | 20.10% | 2.43% | 2.77% |
| Bloomberg Global Aggregate Bond Index | 11.99% | (0.83)% | 0.57% |
| JPMorgan EMBI Global Diversified Index | 18.60% | 0.87% | 3.28% |
The Fund’s past performance is not a good predictor of how the Fund will perform in the future. For performance data current to the most recent month-end, visit https://usmutualfunds.rbcgam.com/fund-list/ after the seventh business day after month-end, or call 1-800-973-0073.
The graph and table do not reflect the deduction of taxes that a shareholder would pay on Fund distributions or redemption of Fund shares. Performance shown may reflect contractual fee waivers. Without such waivers, total returns would be reduced.
Key Fund Statistics
The following table outlines key fund statistics that you should pay attention to.
| Fund net assets | $115,761,460 |
| Total number of portfolio holdings | 266 |
| Portfolio turnover rate as of the end of the reporting period | 70% |
| Total advisory fee paid (net of fee waivers/reimbursements) | $201,256 |
Graphical Representation of Holdings
The tables below show the investment makeup of the Fund, representing percentage of the total net assets of the Fund.
| Oman Government International Bond, 6.75%, 1/17/48 | 2.4% |
| Petroleos Mexicanos, 5.63%, 1/23/46 | 2.0% |
| Petroleos Mexicanos, 6.35%, 2/12/48 | 1.8% |
| Turkey Government International Bond, 4.88%, 4/16/43 | 1.7% |
| Turkey Government International Bond, 5.75%, 5/11/47 | 1.4% |
| Argentine Republic Government International Bond, 4.13%, 7/9/35 | 1.2% |
| Argentine Republic Government International Bond, 3.50%, 7/9/41 | 1.2% |
| Colombia Government International Bond, 8.00%, 11/14/35 | 1.2% |
| Panama Government International Bond, 4.50%, 4/1/56 | 1.2% |
| Angolan Government International Bond, 8.25%, 5/9/28 | 1.0% |
| United States | 28.9% |
| Africa/Middle East | 27.1% |
| South America | 20.7% |
| Latin America | 17.4% |
| Europe | 13.2% |
| Asia | 7.1% |
| Serbia | 2.4% |
| Uzbekistan | 1.9% |
| Senegal | 0.4% |
| Montenegro | 0.3% |
Availability of Additional Information
You can find additional information about the Fund, such as the prospectus, financial information, fund holdings and proxy voting information, at www.dfinview.com/usrbcgam, by scanning the QR code or by contacting us at 1-800-422-2766.
Householding
To help lower operating costs, the RBC Funds attempt to eliminate mailing duplicate documents to the same address. When two or more RBC Fund shareholders have the same last name and address, the Funds may send only one prospectus, proxy, financial report or other communications to that address rather than mailing separate documents to each shareholders. This practice is known as "householding". Shareholders may opt out of this single mailing at any time by calling us at 1-800-422-2766.
Not FDIC Insured. No Bank Guarantee. May Lose Value.
RBC Global Asset Management (U.S.) Inc. is the Adviser for the RBC Funds Trust. Securities are offered through RBC Wealth Management, a division of RBC Capital Markets, LLC, member NYSE/FINRA/SIPC.
RBC Global Asset Management (RBC GAM) is the asset management division of Royal Bank of Canada (RBC) which includes RBC Global Asset Management Inc., RBC Global Asset Management (U.S.) Inc., RBC Global Asset Management (UK) Limited, RBC Global Asset Management (Asia) Limited and RBC Indigo Asset Management Inc. which are separate, but affiliated subsidiaries of RBC. ® / ™ Trademark(s) of Royal Bank of Canada. Used under license. ©2024 RBC Global Asset Management (U.S.) Inc.
RBCF- AR 09-24
RBC BlueBay Core Plus Bond Fund
Class A / RCPAX
Annual SHAREHOLDER REPORT | September 30, 2024
This annual shareholder report contains important information about the RBC BlueBay Core Plus Bond Fund (“Fund”) for the period of October 1, 2023, to September 30, 2024. You can find additional information about the Fund at https://www.dfinview.com/usrbcgam. You can also request this information by contacting us at 1-800-422-2766.
Fund Expenses
(Based on a hypothetical $10,000 investment)
| Fund (Class) | Costs of a $10,000 investment | Costs paid as a percentage
of a $10,000 investment |
RBC BlueBay Core Plus Bond Fund
(Class A/RCPAX) | $75 | 0.69% |
Management’s Discussion of Fund Performance
SUMMARY OF RESULTS
The Fund seeks to provide total return by investing, under normal circumstances, at least 80% of its assets in fixed income securities. For purposes of this policy, the term “assets” means net assets plus the amount of borrowings for investment purposes. The fixed income securities in which the Fund may invest include, but are not limited to, bonds, municipal securities, mortgage-related and asset-backed securities (including Collateralized Mortgage Obligations (“CMOs”)), and obligations of U.S. and foreign governments (and supranational organizations) and their agencies. The Fund may invest in securities with fixed, floating or variable rates of interest. The Fund may invest up to 20% of its net assets in securities that are non-investment grade (high yield/junk bond).
The following table outlines key factors that materially affected the Fund’s performance compared to its benchmark during the reporting period October 1, 2023 to September 30, 2024.
TOP PERFORMANCE CONTRIBUTORS
| FACTOR | IMPACT | SUMMARY |
| Credit Alpha | Positive | Strong credit selection in the majority of underlying sectors was a significant source of Fund outperformance for the period. Credit allocation was also an overall positive contributor. |
| Sector Allocation | Positive | Strong security selection within the Banking and Financial Services sectors was particularly additive to relative Fund performance. Overweight allocations to both sectors were beneficial as well. |
| Credit Beta | Positive | The Fund was overweight spread duration relative to the benchmark over the period as spreads tightened, which was beneficial to relative fund performance. |
Fund Performance
Growth of $10,000 Initial Investment Since Inception
| AVERAGE ANNUAL TOTAL RETURN | 1 Year | Since
Inception |
| RBC BlueBay Core Plus Bond Fund (Class A/RCPAX)— including sales load (3.75%) | 11.12% | (1.10)%(a) |
| RBC BlueBay Core Plus Bond Fund (Class A/RCPAX) — excluding sales load | 16.03% | 0.37%(a) |
| Bloomberg US Aggregate Bond Index | 11.57% | (1.39)% |
(a) | Commenced operations November 1, 2021. |
The Fund’s past performance is not a good predictor of how the Fund will perform in the future. For performance data current to the most recent month-end, visit https://usmutualfunds.rbcgam.com/fund-list/ after the seventh business day after month-end, or call 1-800-973-0073.
The graph and table do not reflect the deduction of taxes that a shareholder would pay on Fund distributions or redemption of Fund shares. Performance shown may reflect contractual fee waivers. Without such waivers, total returns would be reduced.
Key Fund Statistics
The following table outlines key fund statistics that you should pay attention to.
| Fund net assets | $60,624,182 |
| Total number of portfolio holdings | 245 |
| Portfolio turnover rate as of the end of the reporting period | 910% |
| Total advisory fee paid (net of fee waivers/reimbursements) | $(147,559) |
Graphical Representation of Holdings
The tables below show the investment makeup of the Fund, representing percentage of the total net assets of the Fund.
| Fannie Mae, (TBA), 4.50%, 10/1/54 | 9.7% |
| U.S. Treasury Bill- When Issued, 0.00%, 12/3/24 | 5.1% |
| Fannie Mae, (TBA), 2.00%, 10/15/54 | 4.7% |
| U.S. Treasury Bill- When Issued, 5.31%, 10/15/24 | 4.5% |
| Fannie Mae, (TBA), 2.50%, 10/1/54 | 3.8% |
| Fannie Mae, (TBA), 3.00%, 10/1/54 | 2.4% |
| U.S. Treasury Notes, 5.00%, 8/31/25 | 1.8% |
| Fannie Mae, (TBA), 3.50%, 10/1/54 | 1.8% |
| Fannie Mae, Pool #BT8271, 4.00%, 7/1/52 | 1.4% |
| Retained Vantage Data Centers Issuer LLC, Series 2024-1A, Class B, 5.78%, 9/15/49 | 1.2% |
Availability of Additional Information
You can find additional information about the Fund, such as the prospectus, financial information, fund holdings and proxy voting information, at www.dfinview.com/usrbcgam, by scanning the QR code or by contacting us at 1-800-422-2766.
Householding
To help lower operating costs, the RBC Funds attempt to eliminate mailing duplicate documents to the same address. When two or more RBC Fund shareholders have the same last name and address, the Funds may send only one prospectus, proxy, financial report or other communications to that address rather than mailing separate documents to each shareholders. This practice is known as "householding". Shareholders may opt out of this single mailing at any time by calling us at 1-800-422-2766.
Not FDIC Insured. No Bank Guarantee. May Lose Value.
RBC Global Asset Management (U.S.) Inc. is the Adviser for the RBC Funds Trust. Securities are offered through RBC Wealth Management, a division of RBC Capital Markets, LLC, member NYSE/FINRA/SIPC.
RBC Global Asset Management (RBC GAM) is the asset management division of Royal Bank of Canada (RBC) which includes RBC Global Asset Management Inc., RBC Global Asset Management (U.S.) Inc., RBC Global Asset Management (UK) Limited, RBC Global Asset Management (Asia) Limited and RBC Indigo Asset Management Inc. which are separate, but affiliated subsidiaries of RBC. ® / ™ Trademark(s) of Royal Bank of Canada. Used under license. ©2024 RBC Global Asset Management (U.S.) Inc.
RBCF- AR 09-24
RBC BlueBay Core Plus Bond Fund
Class I / RCPIX
Annual SHAREHOLDER REPORT | September 30, 2024
This annual shareholder report contains important information about the RBC BlueBay Core Plus Bond Fund (“Fund”) for the period of October 1, 2023, to September 30, 2024. You can find additional information about the Fund at https://www.dfinview.com/usrbcgam. You can also request this information by contacting us at 1-800-422-2766.
Fund Expenses
(Based on a hypothetical $10,000 investment)
| Fund (Class) | Costs of a $10,000 investment | Costs paid as a percentage
of a $10,000 investment |
RBC BlueBay Core Plus Bond Fund
(Class I/RCPIX) | $48 | 0.44% |
Management’s Discussion of Fund Performance
SUMMARY OF RESULTS
The Fund seeks to provide total return by investing, under normal circumstances, at least 80% of its assets in fixed income securities. For purposes of this policy, the term “assets” means net assets plus the amount of borrowings for investment purposes. The fixed income securities in which the Fund may invest include, but are not limited to, bonds, municipal securities, mortgage-related and asset-backed securities (including Collateralized Mortgage Obligations (“CMOs”)), and obligations of U.S. and foreign governments (and supranational organizations) and their agencies. The Fund may invest in securities with fixed, floating or variable rates of interest. The Fund may invest up to 20% of its net assets in securities that are non-investment grade (high yield/junk bond).
The following table outlines key factors that materially affected the Fund’s performance compared to its benchmark during the reporting period October 1, 2023 to September 30, 2024.
TOP PERFORMANCE CONTRIBUTORS
| FACTOR | IMPACT | SUMMARY |
| Credit Alpha | Positive | Strong credit selection in the majority of underlying sectors was a significant source of Fund outperformance for the period. Credit allocation was also an overall positive contributor. |
| Sector Allocation | Positive | Strong security selection within the Banking and Financial Services sectors was particularly additive to relative Fund performance. Overweight allocations to both sectors were beneficial as well. |
| Credit Beta | Positive | The Fund was overweight spread duration relative to the benchmark over the period as spreads tightened, which was beneficial to relative fund performance. |
Fund Performance
Growth of $1,000,000 Initial Investment Since Inception
| AVERAGE ANNUAL TOTAL RETURN | 1 Year | Since
Inception |
| RBC BlueBay Core Plus Bond Fund (Class I/RCPIX) | 16.31% | 0.64%(a) |
| Bloomberg US Aggregate Bond Index | 11.57% | (1.39)% |
(a) | Commenced operations November 1, 2021. |
The Fund’s past performance is not a good predictor of how the Fund will perform in the future. For performance data current to the most recent month-end, visit https://usmutualfunds.rbcgam.com/fund-list/ after the seventh business day after month-end, or call 1-800-973-0073.
The graph and table do not reflect the deduction of taxes that a shareholder would pay on Fund distributions or redemption of Fund shares. Performance shown may reflect contractual fee waivers. Without such waivers, total returns would be reduced.
Key Fund Statistics
The following table outlines key fund statistics that you should pay attention to.
| Fund net assets | $60,624,182 |
| Total number of portfolio holdings | 245 |
| Portfolio turnover rate as of the end of the reporting period | 910% |
| Total advisory fee paid (net of fee waivers/reimbursements) | $(147,559) |
Graphical Representation of Holdings
The tables below show the investment makeup of the Fund, representing percentage of the total net assets of the Fund.
| Fannie Mae, (TBA), 4.50%, 10/1/54 | 9.7% |
| U.S. Treasury Bill- When Issued, 0.00%, 12/3/24 | 5.1% |
| Fannie Mae, (TBA), 2.00%, 10/15/54 | 4.7% |
| U.S. Treasury Bill- When Issued, 5.31%, 10/15/24 | 4.5% |
| Fannie Mae, (TBA), 2.50%, 10/1/54 | 3.8% |
| Fannie Mae, (TBA), 3.00%, 10/1/54 | 2.4% |
| U.S. Treasury Notes, 5.00%, 8/31/25 | 1.8% |
| Fannie Mae, (TBA), 3.50%, 10/1/54 | 1.8% |
| Fannie Mae, Pool #BT8271, 4.00%, 7/1/52 | 1.4% |
| Retained Vantage Data Centers Issuer LLC, Series 2024-1A, Class B, 5.78%, 9/15/49 | 1.2% |
Availability of Additional Information
You can find additional information about the Fund, such as the prospectus, financial information, fund holdings and proxy voting information, at www.dfinview.com/usrbcgam, by scanning the QR code or by contacting us at 1-800-422-2766.
Householding
To help lower operating costs, the RBC Funds attempt to eliminate mailing duplicate documents to the same address. When two or more RBC Fund shareholders have the same last name and address, the Funds may send only one prospectus, proxy, financial report or other communications to that address rather than mailing separate documents to each shareholders. This practice is known as "householding". Shareholders may opt out of this single mailing at any time by calling us at 1-800-422-2766.
Not FDIC Insured. No Bank Guarantee. May Lose Value.
RBC Global Asset Management (U.S.) Inc. is the Adviser for the RBC Funds Trust. Securities are offered through RBC Wealth Management, a division of RBC Capital Markets, LLC, member NYSE/FINRA/SIPC.
RBC Global Asset Management (RBC GAM) is the asset management division of Royal Bank of Canada (RBC) which includes RBC Global Asset Management Inc., RBC Global Asset Management (U.S.) Inc., RBC Global Asset Management (UK) Limited, RBC Global Asset Management (Asia) Limited and RBC Indigo Asset Management Inc. which are separate, but affiliated subsidiaries of RBC. ® / ™ Trademark(s) of Royal Bank of Canada. Used under license. ©2024 RBC Global Asset Management (U.S.) Inc.
RBCF- AR 09-24
RBC BlueBay Core Plus Bond Fund
Class R6 / RCPRX
Annual SHAREHOLDER REPORT | September 30, 2024
This annual shareholder report contains important information about the RBC BlueBay Core Plus Bond Fund (“Fund”) for the period of October 1, 2023, to September 30, 2024. You can find additional information about the Fund at https://www.dfinview.com/usrbcgam. You can also request this information by contacting us at 1-800-422-2766.
Fund Expenses
(Based on a hypothetical $10,000 investment)
| Fund (Class) | Costs of a $10,000 investment | Costs paid as a percentage
of a $10,000 investment |
RBC BlueBay Core Plus Bond Fund
(Class R6/RCPRX) | $42 | 0.39% |
Management’s Discussion of Fund Performance
SUMMARY OF RESULTS
The Fund seeks to provide total return by investing, under normal circumstances, at least 80% of its assets in fixed income securities. For purposes of this policy, the term “assets” means net assets plus the amount of borrowings for investment purposes. The fixed income securities in which the Fund may invest include, but are not limited to, bonds, municipal securities, mortgage-related and asset-backed securities (including Collateralized Mortgage Obligations (“CMOs”)), and obligations of U.S. and foreign governments (and supranational organizations) and their agencies. The Fund may invest in securities with fixed, floating or variable rates of interest. The Fund may invest up to 20% of its net assets in securities that are non-investment grade (high yield/junk bond).
The following table outlines key factors that materially affected the Fund’s performance compared to its benchmark during the reporting period October 1, 2023 to September 30, 2024.
TOP PERFORMANCE CONTRIBUTORS
| FACTOR | IMPACT | SUMMARY |
| Credit Alpha | Positive | Strong credit selection in the majority of underlying sectors was a significant source of Fund outperformance for the period. Credit allocation was also an overall positive contributor. |
| Sector Allocation | Positive | Strong security selection within the Banking and Financial Services sectors was particularly additive to relative Fund performance. Overweight allocations to both sectors were beneficial as well. |
| Credit Beta | Positive | The Fund was overweight spread duration relative to the benchmark over the period as spreads tightened, which was beneficial to relative fund performance. |
Fund Performance
Growth of $1,000,000 Initial Investment Since Inception
| AVERAGE ANNUAL TOTAL RETURN | 1 Year | Since
Inception |
| RBC BlueBay Core Plus Bond Fund (Class R6/RCPRX) | 16.37% | 0.69%(a) |
| Bloomberg US Aggregate Bond Index | 11.57% | (1.39)% |
(a) | Commenced operations November 1, 2021. |
The Fund’s past performance is not a good predictor of how the Fund will perform in the future. For performance data current to the most recent month-end, visit https://usmutualfunds.rbcgam.com/fund-list/ after the seventh business day after month-end, or call 1-800-973-0073.
The graph and table do not reflect the deduction of taxes that a shareholder would pay on Fund distributions or redemption of Fund shares. Performance shown may reflect contractual fee waivers. Without such waivers, total returns would be reduced.
Key Fund Statistics
The following table outlines key fund statistics that you should pay attention to.
| Fund net assets | $60,624,182 |
| Total number of portfolio holdings | 245 |
| Portfolio turnover rate as of the end of the reporting period | 910% |
| Total advisory fee paid (net of fee waivers/reimbursements) | $(147,559) |
Graphical Representation of Holdings
The tables below show the investment makeup of the Fund, representing percentage of the total net assets of the Fund.
| Fannie Mae, (TBA), 4.50%, 10/1/54 | 9.7% |
| U.S. Treasury Bill- When Issued, 0.00%, 12/3/24 | 5.1% |
| Fannie Mae, (TBA), 2.00%, 10/15/54 | 4.7% |
| U.S. Treasury Bill- When Issued, 5.31%, 10/15/24 | 4.5% |
| Fannie Mae, (TBA), 2.50%, 10/1/54 | 3.8% |
| Fannie Mae, (TBA), 3.00%, 10/1/54 | 2.4% |
| U.S. Treasury Notes, 5.00%, 8/31/25 | 1.8% |
| Fannie Mae, (TBA), 3.50%, 10/1/54 | 1.8% |
| Fannie Mae, Pool #BT8271, 4.00%, 7/1/52 | 1.4% |
| Retained Vantage Data Centers Issuer LLC, Series 2024-1A, Class B, 5.78%, 9/15/49 | 1.2% |
Availability of Additional Information
You can find additional information about the Fund, such as the prospectus, financial information, fund holdings and proxy voting information, at www.dfinview.com/usrbcgam, by scanning the QR code or by contacting us at 1-800-422-2766.
Householding
To help lower operating costs, the RBC Funds attempt to eliminate mailing duplicate documents to the same address. When two or more RBC Fund shareholders have the same last name and address, the Funds may send only one prospectus, proxy, financial report or other communications to that address rather than mailing separate documents to each shareholders. This practice is known as "householding". Shareholders may opt out of this single mailing at any time by calling us at 1-800-422-2766.
Not FDIC Insured. No Bank Guarantee. May Lose Value.
RBC Global Asset Management (U.S.) Inc. is the Adviser for the RBC Funds Trust. Securities are offered through RBC Wealth Management, a division of RBC Capital Markets, LLC, member NYSE/FINRA/SIPC.
RBC Global Asset Management (RBC GAM) is the asset management division of Royal Bank of Canada (RBC) which includes RBC Global Asset Management Inc., RBC Global Asset Management (U.S.) Inc., RBC Global Asset Management (UK) Limited, RBC Global Asset Management (Asia) Limited and RBC Indigo Asset Management Inc. which are separate, but affiliated subsidiaries of RBC. ® / ™ Trademark(s) of Royal Bank of Canada. Used under license. ©2024 RBC Global Asset Management (U.S.) Inc.
RBCF- AR 09-24
RBC BlueBay Access Capital Community Investment Fund
Class A / ACASX
Annual SHAREHOLDER REPORT | September 30, 2024
This annual shareholder report contains important information about the RBC BlueBay Access Capital Community Investment Fund (“Fund”) for the period of October 1, 2023, to September 30, 2024. You can find additional information about the Fund at https://www.dfinview.com/usrbcgam. You can also request this information by contacting us at 1-800-422-2766.
Fund Expenses
(Based on a hypothetical $10,000 investment)
| Fund (Class) | Costs of a $10,000 investment | Costs paid as a percentage
of a $10,000 investment |
RBC BlueBay Access Capital Community Investment Fund
(Class A/ACASX) | $85 | 0.80% |
Management’s Discussion of Fund Performance
SUMMARY OF RESULTS
The Fund’s investment objective is to provide current income consistent with the preservation of capital. The Fund seeks to achieve its investment objective by investing primarily in high quality debt securities and other debt instruments supporting low-and moderate-income (“LMI”) individuals and communities and underserved areas of the United States. The Fund seeks to invest in affordable homeownership, affordable rental housing, small businesses and other community development activities with an aim to improve livability in LMI communities and underserved areas.
The following table outlines key factors that materially affected the Fund’s performance compared to its benchmark during the reporting period October 1, 2023 to September 30, 2024.
TOP PERFORMANCE CONTRIBUTORS
| FACTOR | IMPACT | SUMMARY |
| Sector Allocation | Positive | As spreads tightened throughout the period, the Fund’s holdings in agency mortgage-backed securities, all specified pools, outperformed generic mortgage-backed securities held in the benchmark. |
| Income/Carry | Positive | The Fund’s yield advantage maintained over the benchmark was a positive contributor to relative outperformance over the period. |
| Sector Allocation | Negative | The Fund’s holdings in agency collateralized mortgage-backed securities underperformed the benchmark and modestly detracted from strategy relative performance. |
Fund Performance
Growth of $10,000 Initial Investment Over 10 Years
| AVERAGE ANNUAL TOTAL RETURN | 1 Year | 5 Years | 10 Years |
| RBC BlueBay Access Capital Community Investment Fund (Class A/ACASX)— including sales load (3.75%) | 7.54% | (1.17)% | 0.39% |
| RBC BlueBay Access Capital Community Investment Fund (Class A/ACASX) — excluding sales load | 11.68% | (0.41)% | 0.77% |
| Bloomberg US Aggregate Bond Index | 11.57% | 0.33% | 1.84% |
| Bloomberg US Securitized Index | 12.22% | 0.15% | 1.49% |
The Fund’s past performance is not a good predictor of how the Fund will perform in the future. For performance data current to the most recent month-end, visit https://usmutualfunds.rbcgam.com/fund-list/ after the seventh business day after month-end, or call 1-800-973-0073.
The graph and table do not reflect the deduction of taxes that a shareholder would pay on Fund distributions or redemption of Fund shares. Performance shown may reflect contractual fee waivers. Without such waivers, total returns would be reduced.
Key Fund Statistics
The following table outlines key fund statistics that you should pay attention to.
| Fund net assets | $669,389,532 |
| Total number of portfolio holdings | 944 |
| Portfolio turnover rate as of the end of the reporting period | 127% |
| Total advisory fee paid (net of fee waivers/reimbursements) | $1,648,736 |
Graphical Representation of Holdings
The tables below show the investment makeup of the Fund, representing percentage of the total net assets of the Fund.
| Fannie Mae, (TBA), 2.00%, 10/15/54 | 5.6% |
| Fannie Mae, (TBA), 2.50%, 10/1/54 | 2.7% |
| Fannie Mae, Pool #CB4463, 4.50%, 8/1/52 | 1.8% |
| Fannie Mae, Pool #CB5037, 5.50%, 11/1/52 | 1.5% |
| Fannie Mae, Pool #CB4314, 4.50%, 8/1/52 | 1.4% |
| Freddie Mac, Pool #RA7503, 4.50%, 7/1/52 | 1.2% |
| Fannie Mae, Pool #BL4650, 2.30%, 10/1/31 | 1.2% |
| Fannie Mae, (TBA), 4.50%, 10/1/54 | 1.1% |
| Fannie Mae, Pool #CB3797, 4.00%, 6/1/52 | 1.1% |
| Freddie Mac, Pool #RA5427, 2.50%, 6/1/51 | 0.9% |
Availability of Additional Information
You can find additional information about the Fund, such as the prospectus, financial information, fund holdings and proxy voting information, at www.dfinview.com/usrbcgam, by scanning the QR code or by contacting us at 1-800-422-2766.
Householding
To help lower operating costs, the RBC Funds attempt to eliminate mailing duplicate documents to the same address. When two or more RBC Fund shareholders have the same last name and address, the Funds may send only one prospectus, proxy, financial report or other communications to that address rather than mailing separate documents to each shareholders. This practice is known as "householding". Shareholders may opt out of this single mailing at any time by calling us at 1-800-422-2766.
Not FDIC Insured. No Bank Guarantee. May Lose Value.
RBC Global Asset Management (U.S.) Inc. is the Adviser for the RBC Funds Trust. Securities are offered through RBC Wealth Management, a division of RBC Capital Markets, LLC, member NYSE/FINRA/SIPC.
RBC Global Asset Management (RBC GAM) is the asset management division of Royal Bank of Canada (RBC) which includes RBC Global Asset Management Inc., RBC Global Asset Management (U.S.) Inc., RBC Global Asset Management (UK) Limited, RBC Global Asset Management (Asia) Limited and RBC Indigo Asset Management Inc. which are separate, but affiliated subsidiaries of RBC. ® / ™ Trademark(s) of Royal Bank of Canada. Used under license. ©2024 RBC Global Asset Management (U.S.) Inc.
RBCF- AR 09-24
RBC BlueBay Access Capital Community Investment Fund
Class I / ACCSX
Annual SHAREHOLDER REPORT | September 30, 2024
This annual shareholder report contains important information about the RBC BlueBay Access Capital Community Investment Fund (“Fund”) for the period of October 1, 2023, to September 30, 2024. You can find additional information about the Fund at https://www.dfinview.com/usrbcgam. You can also request this information by contacting us at 1-800-422-2766.
Fund Expenses
(Based on a hypothetical $10,000 investment)
| Fund (Class) | Costs of a $10,000 investment | Costs paid as a percentage
of a $10,000 investment |
RBC BlueBay Access Capital Community Investment Fund
(Class I/ACCSX) | $48 | 0.45% |
Management’s Discussion of Fund Performance
SUMMARY OF RESULTS
The Fund’s investment objective is to provide current income consistent with the preservation of capital. The Fund seeks to achieve its investment objective by investing primarily in high quality debt securities and other debt instruments supporting low-and moderate-income (“LMI”) individuals and communities and underserved areas of the United States. The Fund seeks to invest in affordable homeownership, affordable rental housing, small businesses and other community development activities with an aim to improve livability in LMI communities and underserved areas.
The following table outlines key factors that materially affected the Fund’s performance compared to its benchmark during the reporting period October 1, 2023 to September 30, 2024.
TOP PERFORMANCE CONTRIBUTORS
| FACTOR | IMPACT | SUMMARY |
| Sector Allocation | Positive | As spreads tightened throughout the period, the Fund’s holdings in agency mortgage-backed securities, all specified pools, outperformed generic mortgage-backed securities held in the benchmark. |
| Income/Carry | Positive | The Fund’s yield advantage maintained over the benchmark was a positive contributor to relative outperformance over the period. |
| Sector Allocation | Negative | The Fund’s holdings in agency collateralized mortgage-backed securities underperformed the benchmark and modestly detracted from strategy relative performance. |
Fund Performance
Growth of $1,000,000 Initial Investment Over 10 Years
| AVERAGE ANNUAL TOTAL RETURN | 1 Year | 5 Years | 10 Years |
| RBC BlueBay Access Capital Community Investment Fund (Class I/ACCSX) | 12.03% | (0.05)% | 1.12% |
| Bloomberg US Aggregate Bond Index | 11.57% | 0.33% | 1.84% |
| Bloomberg US Securitized Index | 12.22% | 0.15% | 1.49% |
The Fund’s past performance is not a good predictor of how the Fund will perform in the future. For performance data current to the most recent month-end, visit https://usmutualfunds.rbcgam.com/fund-list/ after the seventh business day after month-end, or call 1-800-973-0073.
The graph and table do not reflect the deduction of taxes that a shareholder would pay on Fund distributions or redemption of Fund shares. Performance shown may reflect contractual fee waivers. Without such waivers, total returns would be reduced.
Key Fund Statistics
The following table outlines key fund statistics that you should pay attention to.
| Fund net assets | $669,389,532 |
| Total number of portfolio holdings | 944 |
| Portfolio turnover rate as of the end of the reporting period | 127% |
| Total advisory fee paid (net of fee waivers/reimbursements) | $1,648,736 |
Graphical Representation of Holdings
The tables below show the investment makeup of the Fund, representing percentage of the total net assets of the Fund.
| Fannie Mae, (TBA), 2.00%, 10/15/54 | 5.6% |
| Fannie Mae, (TBA), 2.50%, 10/1/54 | 2.7% |
| Fannie Mae, Pool #CB4463, 4.50%, 8/1/52 | 1.8% |
| Fannie Mae, Pool #CB5037, 5.50%, 11/1/52 | 1.5% |
| Fannie Mae, Pool #CB4314, 4.50%, 8/1/52 | 1.4% |
| Freddie Mac, Pool #RA7503, 4.50%, 7/1/52 | 1.2% |
| Fannie Mae, Pool #BL4650, 2.30%, 10/1/31 | 1.2% |
| Fannie Mae, (TBA), 4.50%, 10/1/54 | 1.1% |
| Fannie Mae, Pool #CB3797, 4.00%, 6/1/52 | 1.1% |
| Freddie Mac, Pool #RA5427, 2.50%, 6/1/51 | 0.9% |
Availability of Additional Information
You can find additional information about the Fund, such as the prospectus, financial information, fund holdings and proxy voting information, at www.dfinview.com/usrbcgam, by scanning the QR code or by contacting us at 1-800-422-2766.
Householding
To help lower operating costs, the RBC Funds attempt to eliminate mailing duplicate documents to the same address. When two or more RBC Fund shareholders have the same last name and address, the Funds may send only one prospectus, proxy, financial report or other communications to that address rather than mailing separate documents to each shareholders. This practice is known as "householding". Shareholders may opt out of this single mailing at any time by calling us at 1-800-422-2766.
Not FDIC Insured. No Bank Guarantee. May Lose Value.
RBC Global Asset Management (U.S.) Inc. is the Adviser for the RBC Funds Trust. Securities are offered through RBC Wealth Management, a division of RBC Capital Markets, LLC, member NYSE/FINRA/SIPC.
RBC Global Asset Management (RBC GAM) is the asset management division of Royal Bank of Canada (RBC) which includes RBC Global Asset Management Inc., RBC Global Asset Management (U.S.) Inc., RBC Global Asset Management (UK) Limited, RBC Global Asset Management (Asia) Limited and RBC Indigo Asset Management Inc. which are separate, but affiliated subsidiaries of RBC. ® / ™ Trademark(s) of Royal Bank of Canada. Used under license. ©2024 RBC Global Asset Management (U.S.) Inc.
RBCF- AR 09-24
RBC BlueBay Access Capital Community Investment Fund
Class IS / ACATX
Annual SHAREHOLDER REPORT | September 30, 2024
This annual shareholder report contains important information about the RBC BlueBay Access Capital Community Investment Fund (“Fund”) for the period of October 1, 2023, to September 30, 2024. You can find additional information about the Fund at https://www.dfinview.com/usrbcgam. You can also request this information by contacting us at 1-800-422-2766.
Fund Expenses
(Based on a hypothetical $10,000 investment)
| Fund (Class) | Costs of a $10,000 investment | Costs paid as a percentage
of a $10,000 investment |
RBC BlueBay Access Capital Community Investment Fund
(Class IS/ACATX) | $42 | 0.40% |
Management’s Discussion of Fund Performance
SUMMARY OF RESULTS
The Fund’s investment objective is to provide current income consistent with the preservation of capital. The Fund seeks to achieve its investment objective by investing primarily in high quality debt securities and other debt instruments supporting low-and moderate-income (“LMI”) individuals and communities and underserved areas of the United States. The Fund seeks to invest in affordable homeownership, affordable rental housing, small businesses and other community development activities with an aim to improve livability in LMI communities and underserved areas.
The following table outlines key factors that materially affected the Fund’s performance compared to its benchmark during the reporting period October 1, 2023 to September 30, 2024.
TOP PERFORMANCE CONTRIBUTORS
| FACTOR | IMPACT | SUMMARY |
| Sector Allocation | Positive | As spreads tightened throughout the period, the Fund’s holdings in agency mortgage-backed securities, all specified pools, outperformed generic mortgage-backed securities held in the benchmark. |
| Income/Carry | Positive | The Fund’s yield advantage maintained over the benchmark was a positive contributor to relative outperformance over the period. |
| Sector Allocation | Negative | The Fund’s holdings in agency collateralized mortgage-backed securities underperformed the benchmark and modestly detracted from strategy relative performance. |
Fund Performance
Growth of $2,500 Initial Investment Over 10 Years
| AVERAGE ANNUAL TOTAL RETURN | 1 Year | 5 Years | 10 Years |
| RBC BlueBay Access Capital Community Investment Fund (Class IS/ACATX) | 11.95% | 0.00% | 1.23% |
| Bloomberg US Aggregate Bond Index | 11.57% | 0.33% | 1.84% |
| Bloomberg US Securitized Index | 12.22% | 0.15% | 1.49% |
The Fund’s past performance is not a good predictor of how the Fund will perform in the future. For performance data current to the most recent month-end, visit https://usmutualfunds.rbcgam.com/fund-list/ after the seventh business day after month-end, or call 1-800-973-0073.
The graph and table do not reflect the deduction of taxes that a shareholder would pay on Fund distributions or redemption of Fund shares. Performance shown may reflect contractual fee waivers. Without such waivers, total returns would be reduced.
Key Fund Statistics
The following table outlines key fund statistics that you should pay attention to.
| Fund net assets | $669,389,532 |
| Total number of portfolio holdings | 944 |
| Portfolio turnover rate as of the end of the reporting period | 127% |
| Total advisory fee paid (net of fee waivers/reimbursements) | $1,648,736 |
Graphical Representation of Holdings
The tables below show the investment makeup of the Fund, representing percentage of the total net assets of the Fund.
| Fannie Mae, (TBA), 2.00%, 10/15/54 | 5.6% |
| Fannie Mae, (TBA), 2.50%, 10/1/54 | 2.7% |
| Fannie Mae, Pool #CB4463, 4.50%, 8/1/52 | 1.8% |
| Fannie Mae, Pool #CB5037, 5.50%, 11/1/52 | 1.5% |
| Fannie Mae, Pool #CB4314, 4.50%, 8/1/52 | 1.4% |
| Freddie Mac, Pool #RA7503, 4.50%, 7/1/52 | 1.2% |
| Fannie Mae, Pool #BL4650, 2.30%, 10/1/31 | 1.2% |
| Fannie Mae, (TBA), 4.50%, 10/1/54 | 1.1% |
| Fannie Mae, Pool #CB3797, 4.00%, 6/1/52 | 1.1% |
| Freddie Mac, Pool #RA5427, 2.50%, 6/1/51 | 0.9% |
Availability of Additional Information
You can find additional information about the Fund, such as the prospectus, financial information, fund holdings and proxy voting information, at www.dfinview.com/usrbcgam, by scanning the QR code or by contacting us at 1-800-422-2766.
Householding
To help lower operating costs, the RBC Funds attempt to eliminate mailing duplicate documents to the same address. When two or more RBC Fund shareholders have the same last name and address, the Funds may send only one prospectus, proxy, financial report or other communications to that address rather than mailing separate documents to each shareholders. This practice is known as "householding". Shareholders may opt out of this single mailing at any time by calling us at 1-800-422-2766.
Not FDIC Insured. No Bank Guarantee. May Lose Value.
RBC Global Asset Management (U.S.) Inc. is the Adviser for the RBC Funds Trust. Securities are offered through RBC Wealth Management, a division of RBC Capital Markets, LLC, member NYSE/FINRA/SIPC.
RBC Global Asset Management (RBC GAM) is the asset management division of Royal Bank of Canada (RBC) which includes RBC Global Asset Management Inc., RBC Global Asset Management (U.S.) Inc., RBC Global Asset Management (UK) Limited, RBC Global Asset Management (Asia) Limited and RBC Indigo Asset Management Inc. which are separate, but affiliated subsidiaries of RBC. ® / ™ Trademark(s) of Royal Bank of Canada. Used under license. ©2024 RBC Global Asset Management (U.S.) Inc.
RBCF- AR 09-24
RBC BlueBay U.S. Government Money Market Fund
Class A / RGMXX
Annual SHAREHOLDER REPORT | September 30, 2024
This annual shareholder report contains important information about the RBC BlueBay U.S. Government Money Market Fund (“Fund”) for the period of October 1, 2023, to September 30, 2024. You can find additional information about the Fund at https://www.dfinview.com/usrbcgam. You can also request this information by contacting us at 1-800-422-2766.
Fund Expenses
(Based on a hypothetical $10,000 investment)
| Fund (Class) | Costs of a $10,000 investment | Costs paid as a percentage
of a $10,000 investment |
RBC BlueBay U.S. Government Money Market Fund
(Class A/RGMXX) | $26 | 0.25% |
Key Fund Statistics
The following table outlines key fund statistics that you should pay attention to.
| Fund net assets | $15,480,310,153 |
| Total number of portfolio holdings | 166 |
| Total advisory fee paid | $15,050,421 |
Graphical Representation of Holdings
The tables below show the investment makeup of the Fund, representing percentage of the total net assets of the Fund.
| Federal Reserve, 4.80%, 10/1/24 | 21.3% |
| Bank of Montreal, 4.84%, 10/1/24 | 3.2% |
| Citigroup Global Markets, Inc., 4.88%, 10/1/24 | 2.6% |
| U.S. Treasury Bills, U.S. Treasury Bill- When Issued, 4.43%, 3/20/25 | 2.5% |
| U.S. Treasury Bills, U.S. Treasury Bill- When Issued, 4.55%, 1/21/25 | 2.5% |
| Citigroup Global Markets, Inc., 4.85%, 10/1/24 | 2.3% |
| Citigroup Global Markets, Inc., 4.86%, 10/1/24 | 2.3% |
| ING Financial Markets LLC, 4.87%, 10/1/24 | 2.3% |
| U.S. Treasury Bills, U.S. Treasury Bill- When Issued, 0.00%, 1/28/25 | 2.2% |
| National Australia Bank, 4.85%, 10/1/24 | 1.9% |
| Less than 8 days | 55.5% |
| 8 to 14 days | 1.7% |
| 15 to 30 days | 22.3% |
| 31 to 180 days | 20.4% |
| Over 180 days | 0.1% |
Availability of Additional Information
You can find additional information about the Fund, such as the prospectus, financial information, fund holdings and proxy voting information, at www.dfinview.com/usrbcgam, by scanning the QR code or by contacting us at 1-800-422-2766.
Householding
To help lower operating costs, the RBC Funds attempt to eliminate mailing duplicate documents to the same address. When two or more RBC Fund shareholders have the same last name and address, the Funds may send only one prospectus, proxy, financial report or other communications to that address rather than mailing separate documents to each shareholders. This practice is known as "householding". Shareholders may opt out of this single mailing at any time by calling us at 1-800-422-2766.
Not FDIC Insured. No Bank Guarantee. May Lose Value.
RBC Global Asset Management (U.S.) Inc. is the Adviser for the RBC Funds Trust. Securities are offered through RBC Wealth Management, a division of RBC Capital Markets, LLC, member NYSE/FINRA/SIPC.
RBC Global Asset Management (RBC GAM) is the asset management division of Royal Bank of Canada (RBC) which includes RBC Global Asset Management Inc., RBC Global Asset Management (U.S.) Inc., RBC Global Asset Management (UK) Limited, RBC Global Asset Management (Asia) Limited and RBC Indigo Asset Management Inc. which are separate, but affiliated subsidiaries of RBC. ® / ™ Trademark(s) of Royal Bank of Canada. Used under license. ©2024 RBC Global Asset Management (U.S.) Inc.
RBCF- AR 09-24
RBC BlueBay U.S. Government Money Market Fund
Institutional Class 1 / TUGXX
Annual SHAREHOLDER REPORT | September 30, 2024
This annual shareholder report contains important information about the RBC BlueBay U.S. Government Money Market Fund (“Fund”) for the period of October 1, 2023, to September 30, 2024. You can find additional information about the Fund at https://www.dfinview.com/usrbcgam. You can also request this information by contacting us at 1-800-422-2766.
Fund Expenses
(Based on a hypothetical $10,000 investment)
| Fund (Class) | Costs of a $10,000 investment | Costs paid as a percentage
of a $10,000 investment |
RBC BlueBay U.S. Government Money Market Fund
(Institutional Class 1/TUGXX) | $14 | 0.14% |
Key Fund Statistics
The following table outlines key fund statistics that you should pay attention to.
| Fund net assets | $15,480,310,153 |
| Total number of portfolio holdings | 166 |
| Total advisory fee paid | $15,050,421 |
Graphical Representation of Holdings
The tables below show the investment makeup of the Fund, representing percentage of the total net assets of the Fund.
| Federal Reserve, 4.80%, 10/1/24 | 21.3% |
| Bank of Montreal, 4.84%, 10/1/24 | 3.2% |
| Citigroup Global Markets, Inc., 4.88%, 10/1/24 | 2.6% |
| U.S. Treasury Bills, U.S. Treasury Bill- When Issued, 4.43%, 3/20/25 | 2.5% |
| U.S. Treasury Bills, U.S. Treasury Bill- When Issued, 4.55%, 1/21/25 | 2.5% |
| Citigroup Global Markets, Inc., 4.85%, 10/1/24 | 2.3% |
| Citigroup Global Markets, Inc., 4.86%, 10/1/24 | 2.3% |
| ING Financial Markets LLC, 4.87%, 10/1/24 | 2.3% |
| U.S. Treasury Bills, U.S. Treasury Bill- When Issued, 0.00%, 1/28/25 | 2.2% |
| National Australia Bank, 4.85%, 10/1/24 | 1.9% |
| Less than 8 days | 55.5% |
| 8 to 14 days | 1.7% |
| 15 to 30 days | 22.3% |
| 31 to 180 days | 20.4% |
| Over 180 days | 0.1% |
Availability of Additional Information
You can find additional information about the Fund, such as the prospectus, financial information, fund holdings and proxy voting information, at www.dfinview.com/usrbcgam, by scanning the QR code or by contacting us at 1-800-422-2766.
Householding
To help lower operating costs, the RBC Funds attempt to eliminate mailing duplicate documents to the same address. When two or more RBC Fund shareholders have the same last name and address, the Funds may send only one prospectus, proxy, financial report or other communications to that address rather than mailing separate documents to each shareholders. This practice is known as "householding". Shareholders may opt out of this single mailing at any time by calling us at 1-800-422-2766.
Not FDIC Insured. No Bank Guarantee. May Lose Value.
RBC Global Asset Management (U.S.) Inc. is the Adviser for the RBC Funds Trust. Securities are offered through RBC Wealth Management, a division of RBC Capital Markets, LLC, member NYSE/FINRA/SIPC.
RBC Global Asset Management (RBC GAM) is the asset management division of Royal Bank of Canada (RBC) which includes RBC Global Asset Management Inc., RBC Global Asset Management (U.S.) Inc., RBC Global Asset Management (UK) Limited, RBC Global Asset Management (Asia) Limited and RBC Indigo Asset Management Inc. which are separate, but affiliated subsidiaries of RBC. ® / ™ Trademark(s) of Royal Bank of Canada. Used under license. ©2024 RBC Global Asset Management (U.S.) Inc.
RBCF- AR 09-24
RBC BlueBay U.S. Government Money Market Fund
Institutional Class 2 / TIMXX
Annual SHAREHOLDER REPORT | September 30, 2024
This annual shareholder report contains important information about the RBC BlueBay U.S. Government Money Market Fund (“Fund”) for the period of October 1, 2023, to September 30, 2024. You can find additional information about the Fund at https://www.dfinview.com/usrbcgam. You can also request this information by contacting us at 1-800-422-2766.
Fund Expenses
(Based on a hypothetical $10,000 investment)
| Fund (Class) | Costs of a $10,000 investment | Costs paid as a percentage
of a $10,000 investment |
RBC BlueBay U.S. Government Money Market Fund
(Institutional Class 2/TIMXX) | $28 | 0.27% |
Key Fund Statistics
The following table outlines key fund statistics that you should pay attention to.
| Fund net assets | $15,480,310,153 |
| Total number of portfolio holdings | 166 |
| Total advisory fee paid | $15,050,421 |
Graphical Representation of Holdings
The tables below show the investment makeup of the Fund, representing percentage of the total net assets of the Fund.
| Federal Reserve, 4.80%, 10/1/24 | 21.3% |
| Bank of Montreal, 4.84%, 10/1/24 | 3.2% |
| Citigroup Global Markets, Inc., 4.88%, 10/1/24 | 2.6% |
| U.S. Treasury Bills, U.S. Treasury Bill- When Issued, 4.43%, 3/20/25 | 2.5% |
| U.S. Treasury Bills, U.S. Treasury Bill- When Issued, 4.55%, 1/21/25 | 2.5% |
| Citigroup Global Markets, Inc., 4.85%, 10/1/24 | 2.3% |
| Citigroup Global Markets, Inc., 4.86%, 10/1/24 | 2.3% |
| ING Financial Markets LLC, 4.87%, 10/1/24 | 2.3% |
| U.S. Treasury Bills, U.S. Treasury Bill- When Issued, 0.00%, 1/28/25 | 2.2% |
| National Australia Bank, 4.85%, 10/1/24 | 1.9% |
| Less than 8 days | 55.5% |
| 8 to 14 days | 1.7% |
| 15 to 30 days | 22.3% |
| 31 to 180 days | 20.4% |
| Over 180 days | 0.1% |
Availability of Additional Information
You can find additional information about the Fund, such as the prospectus, financial information, fund holdings and proxy voting information, at www.dfinview.com/usrbcgam, by scanning the QR code or by contacting us at 1-800-422-2766.
Householding
To help lower operating costs, the RBC Funds attempt to eliminate mailing duplicate documents to the same address. When two or more RBC Fund shareholders have the same last name and address, the Funds may send only one prospectus, proxy, financial report or other communications to that address rather than mailing separate documents to each shareholders. This practice is known as "householding". Shareholders may opt out of this single mailing at any time by calling us at 1-800-422-2766.
Not FDIC Insured. No Bank Guarantee. May Lose Value.
RBC Global Asset Management (U.S.) Inc. is the Adviser for the RBC Funds Trust. Securities are offered through RBC Wealth Management, a division of RBC Capital Markets, LLC, member NYSE/FINRA/SIPC.
RBC Global Asset Management (RBC GAM) is the asset management division of Royal Bank of Canada (RBC) which includes RBC Global Asset Management Inc., RBC Global Asset Management (U.S.) Inc., RBC Global Asset Management (UK) Limited, RBC Global Asset Management (Asia) Limited and RBC Indigo Asset Management Inc. which are separate, but affiliated subsidiaries of RBC. ® / ™ Trademark(s) of Royal Bank of Canada. Used under license. ©2024 RBC Global Asset Management (U.S.) Inc.
RBCF- AR 09-24
RBC BlueBay U.S. Government Money Market Fund
Investor Class / TUIXX
Annual SHAREHOLDER REPORT | September 30, 2024
This annual shareholder report contains important information about the RBC BlueBay U.S. Government Money Market Fund (“Fund”) for the period of October 1, 2023, to September 30, 2024. You can find additional information about the Fund at https://www.dfinview.com/usrbcgam. You can also request this information by contacting us at 1-800-422-2766.
Fund Expenses
(Based on a hypothetical $10,000 investment)
| Fund (Class) | Costs of a $10,000 investment | Costs paid as a percentage
of a $10,000 investment |
RBC BlueBay U.S. Government Money Market Fund
(Investor Class/TUIXX) | $102 | 1.00% |
Key Fund Statistics
The following table outlines key fund statistics that you should pay attention to.
| Fund net assets | $15,480,310,153 |
| Total number of portfolio holdings | 166 |
| Total advisory fee paid | $15,050,421 |
Graphical Representation of Holdings
The tables below show the investment makeup of the Fund, representing percentage of the total net assets of the Fund.
| Federal Reserve, 4.80%, 10/1/24 | 21.3% |
| Bank of Montreal, 4.84%, 10/1/24 | 3.2% |
| Citigroup Global Markets, Inc., 4.88%, 10/1/24 | 2.6% |
| U.S. Treasury Bills, U.S. Treasury Bill- When Issued, 4.43%, 3/20/25 | 2.5% |
| U.S. Treasury Bills, U.S. Treasury Bill- When Issued, 4.55%, 1/21/25 | 2.5% |
| Citigroup Global Markets, Inc., 4.85%, 10/1/24 | 2.3% |
| Citigroup Global Markets, Inc., 4.86%, 10/1/24 | 2.3% |
| ING Financial Markets LLC, 4.87%, 10/1/24 | 2.3% |
| U.S. Treasury Bills, U.S. Treasury Bill- When Issued, 0.00%, 1/28/25 | 2.2% |
| National Australia Bank, 4.85%, 10/1/24 | 1.9% |
| Less than 8 days | 55.5% |
| 8 to 14 days | 1.7% |
| 15 to 30 days | 22.3% |
| 31 to 180 days | 20.4% |
| Over 180 days | 0.1% |
Availability of Additional Information
You can find additional information about the Fund, such as the prospectus, financial information, fund holdings and proxy voting information, at www.dfinview.com/usrbcgam, by scanning the QR code or by contacting us at 1-800-422-2766.
Householding
To help lower operating costs, the RBC Funds attempt to eliminate mailing duplicate documents to the same address. When two or more RBC Fund shareholders have the same last name and address, the Funds may send only one prospectus, proxy, financial report or other communications to that address rather than mailing separate documents to each shareholders. This practice is known as "householding". Shareholders may opt out of this single mailing at any time by calling us at 1-800-422-2766.
Not FDIC Insured. No Bank Guarantee. May Lose Value.
RBC Global Asset Management (U.S.) Inc. is the Adviser for the RBC Funds Trust. Securities are offered through RBC Wealth Management, a division of RBC Capital Markets, LLC, member NYSE/FINRA/SIPC.
RBC Global Asset Management (RBC GAM) is the asset management division of Royal Bank of Canada (RBC) which includes RBC Global Asset Management Inc., RBC Global Asset Management (U.S.) Inc., RBC Global Asset Management (UK) Limited, RBC Global Asset Management (Asia) Limited and RBC Indigo Asset Management Inc. which are separate, but affiliated subsidiaries of RBC. ® / ™ Trademark(s) of Royal Bank of Canada. Used under license. ©2024 RBC Global Asset Management (U.S.) Inc.
RBCF- AR 09-24
Item 2. Code of Ethics.
| | (a) | The registrant, as of the end of the period covered by this report, has adopted a code of ethics that applies to the registrant’s principal executive officer, principal financial officer, principal accounting officer or controller, or persons performing similar functions, regardless of whether these individuals are employed by the registrant or a third party. |
| | (c) | There have been no amendments, during the period covered by this report, to a provision of the code of ethics that applies to the registrant’s principal executive officer, principal financial officer, principal accounting officer or controller, or persons performing similar functions, regardless of whether these individuals are employed by the registrant or a third party, and that relates to any element of the code of ethics definition enumerated in paragraph (b) of this item’s instructions. |
| | (d) | The registrant has not granted any waivers, including an implicit waiver, from a provision of the code of ethics that applies to the registrant’s principal executive officer, principal financial officer, principal accounting officer or controller, or persons performing similar functions, regardless of whether these individuals are employed by the registrant or a third party, that relates to one or more of the items set forth in paragraph (b) of this item’s instructions. |
| | (f) | A copy of the Code of Ethics is filed as an Exhibit. |
Item 3. Audit Committee Financial Expert.
As of the end of the period covered by the report, the registrant’s board of directors has determined that William B. Taylor and James R. Seward are qualified to serve as an audit committee financial expert serving on its audit committee and that they are “independent,” as defined by Item 3 of Form N-CSR.
Item 4. Principal Accountant Fees and Services.
Audit Fees
| | (a) | The aggregate fees billed for each of the last two fiscal years for professional services rendered by the principal accountant for the audit of the registrant’s annual financial statements or services that are normally provided by the accountant in connection with statutory and regulatory filings or engagements for those fiscal years are $512,650 for 2024 and $506,650 for 2023. |
Audit-Related Fees
| | (b) | The aggregate fees billed in each of the last two fiscal years for assurance and related services by the principal accountant that are reasonably related to the performance of the audit of the registrant’s financial statements and are not reported under paragraph (a) of this Item are $0 for 2024 and $0 for 2023. |
Tax Fees
| | (c) | The aggregate fees billed in each of the last two fiscal years for professional services rendered by the principal accountant for tax compliance, tax advice, and tax planning are $60,900 for 2024 and $60,900 for 2023. |
Tax fees for both years relate to the review of the registrant’s tax returns and review of required shareholder distribution calculations. Amount requiring approval of the registrant’s audit committee is $0 and $0, respectively.
All Other Fees
| | (d) | The aggregate fees billed in each of the last two fiscal years for products and services provided by the principal accountant, other than the services reported in paragraphs (a) through (c) of this Item are $0 for 2024 and $0 for 2023. |
| | (e)(1) | Disclose the audit committee’s pre-approval policies and procedures described in paragraph (c)(7) of Rule 2-01 of Regulation S-X. |
The Audit Committee (“Committee”) will review and approve in advance any proposal (except as set forth in (1) through (3) below) that the Trust employ the Funds’ auditor to render “permissible non-audit services” to the Funds. A “permissible non-audit service” is defined as a non-audit service that is not prohibited by Rule 2-01(c)(4) of Regulation S-X or other applicable law or regulation. The Committee will also review and approve in advance any proposal (except as set forth in (1) through (3) below) that the Adviser, and any entity controlling, controlled by, or under common control with the Adviser that provides ongoing services to the Funds (an “Adviser-affiliated service provider”), employ the Funds’ auditor to render non-audit services, if such engagement would relate directly to the operations and financial reporting of the Funds. As a part of its review, the Committee shall consider whether the provision of such services is consistent with the auditor’s independence. (See also “Delegation” below.)
Pre-approval by the Committee of non-audit services is not required so long as:
(1) (A) with respect to the Funds, the aggregate amount of all such permissible non-audit services provided to the Funds constitutes no more than 5% of the total amount of revenues paid to the auditor by the Funds during the fiscal year in which the services are provided; or
(B) with respect to the Adviser and any Adviser-affiliated service provider, the aggregate amount of all such non-audit services provided constitutes no more than 5% of the total amount of revenues (of the type that would have to be pre-approved by the Committee) paid to the auditor by the Funds, the Adviser and any Adviser-affiliated service provider during the fiscal year in which the services are provided;
(2) such services were not recognized by the Funds at the time of the engagement to be non-audit services; and
(3) such services are promptly brought to the attention of the Committee and approved by the Committee or its delegate or delegates, as defined below, prior to the completion of the audit.
Delegation
The Committee may delegate to one or more of its members and/or to officers of the Trust the authority to pre-approve the auditor’s provision of audit services or permissible non-audit services to the Funds up to a predetermined amount. Any pre-approval determination made by a delegate will be presented to the full Committee at its next meeting. The Committee will communicate any pre-approval made by a delegate to the Trust’s fund accounting agent, which will ensure that the appropriate disclosure is made in the Funds’ periodic reports and other documents as required under the Federal securities laws.
(e)(2) The percentage of services described in each of paragraphs (b) through (d) of this Item that were approved by the audit committee pursuant to paragraph (c)(7)(i)(C) of Rule 2-01 of Regulation S-X are as follows:
| | (f) | The percentage of hours expended on the principal accountant’s engagement to audit the registrant’s financial statements for the most recent fiscal year that were attributed to work performed by persons other than the principal accountant’s full-time, permanent employees was less than fifty percent. |
| | (g) | The aggregate non-audit fees billed by the registrant’s accountant for services rendered to the registrant, and rendered to the registrant’s investment adviser (not including any sub-adviser whose role is primarily portfolio management and is subcontracted with or overseen by another investment adviser), and any entity controlling, controlled by, or under common control with the adviser that provides ongoing services to the registrant for each of the last two fiscal years of the registrant was $626,010 for 2024 and $482,213 for 2023. |
| | (h) | The registrant’s audit committee of the board of directors has considered whether the provision of non-audit services that were rendered to the registrant’s investment adviser (not including any sub-adviser whose role is primarily portfolio management and is subcontracted with or overseen by another investment adviser), and any entity controlling, controlled by, or under common control with the investment adviser that provides ongoing services to the registrant that were not pre-approved pursuant to paragraph (c)(7)(ii) of Rule 2-01 of Regulation S-X is compatible with maintaining the principal accountant’s independence. |
Item 5. Audit Committee of Listed Registrants.
Item 6. Investments.
| (a) | The Registrant’s “Schedule I – Investments in securities of unaffiliated issuers” as of the close of the reporting period is included as part of the Report to Shareholders filed under Item 7 of this form. |
Item 7. Financial Statements and Financial Highlights for Open-End Management Investment Companies.

Financial Statements and Other Important Information For the year ended September 30, 2024 RBC BlueBay Access Capital Community Investment Fund RBC BlueBay Impact Bond Fund
|
|
| SCHEDULE OF PORTFOLIO INVESTMENTS |
|
| RBC BlueBay Access Capital Community Investment Fund |
|
| September 30, 2024 |
| | | | | | | | |
Principal
Amount | | | | | Value |
U.S. Government Agency Backed Mortgages — 102.4% | | |
Fannie Mae — 65.6% | | |
| | | $ 7,500,000 | | | (TBA), 4.50%, 10/1/54 | | $ 7,374,382 |
| | | 20,900,000 | | | (TBA), 2.50%, 10/1/54 | | 18,030,764 |
| | | 45,500,000 | | | (TBA), 2.00%, 10/15/54 | | 37,583,000 |
| | | 42,261 | | | Pool #258022, 5.50%, 5/1/34 | | 43,958 |
| | | 38,282 | | | Pool #258070, 5.00%, 6/1/34 | | 39,166 |
| | | 43,310 | | | Pool #258157, 5.00%, 8/1/34 | | 44,312 |
| | | 44,652 | | | Pool #258163, 5.50%, 8/1/34 | | 46,446 |
| | | 65,745 | | | Pool #258251, 5.50%, 1/1/35 | | 68,398 |
| | | 77,782 | | | Pool #258305, 5.00%, 3/1/35 | | 79,663 |
| | | 46,629 | | | Pool #258394, 5.00%, 5/1/35 | | 47,750 |
| | | 34,746 | | | Pool #258410, 5.00%, 4/1/35 | | 35,581 |
| | | 45,006 | | | Pool #258448, 5.00%, 8/1/35 | | 46,099 |
| | | 73,742 | | | Pool #258450, 5.50%, 8/1/35 | | 76,816 |
| | | 130,031 | | | Pool #258627, 5.50%, 2/1/36 | | 135,449 |
| | | 18,787 | | | Pool #258737, 5.50%, 12/1/35 | | 19,665 |
| | | 17,830 | | | Pool #259378, 6.00%, 12/1/31 | | 18,575 |
| | | 13,215 | | | Pool #259393, 6.00%, 1/1/32 | | 13,767 |
| | | 28,241 | | | Pool #259590, 5.50%, 11/1/32 | | 29,312 |
| | | 65,686 | | | Pool #259611, 5.50%, 11/1/32 | | 68,175 |
| | | 22,040 | | | Pool #259671, 5.50%, 2/1/33 | | 22,875 |
| | | 53,122 | | | Pool #259686, 5.50%, 3/1/33 | | 55,177 |
| | | 44,425 | | | Pool #259725, 5.00%, 5/1/33 | | 45,431 |
| | | 41,095 | | | Pool #259761, 5.00%, 6/1/33 | | 42,026 |
| | | 60,560 | | | Pool #259777, 5.00%, 7/1/33 | | 61,931 |
| | | 33,830 | | | Pool #259789, 5.00%, 7/1/33 | | 34,593 |
| | | 34,648 | | | Pool #259830, 5.00%, 8/1/33 | | 35,432 |
| | | 22,708 | | | Pool #259848, 5.00%, 9/1/33 | | 23,221 |
| | | 49,530 | | | Pool #259867, 5.50%, 10/1/33 | | 51,448 |
| | | 29,326 | | | Pool #259869, 5.50%, 10/1/33 | | 30,461 |
| | | 24,805 | | | Pool #259998, 5.00%, 3/1/34 | | 25,377 |
| | | 245,853 | | | Pool #470828, 3.53%, 3/1/32 | | 237,795 |
| | | 1,464 | | | Pool #576445, 6.00%, 1/1/31 | | 1,508 |
| | | 20,618 | | | Pool #579402, 6.50%, 4/1/31 | | 21,605 |
| | | 19,463 | | | Pool #583728, 6.50%, 6/1/31 | | 20,395 |
| | | 7,913 | | | Pool #590931, 6.50%, 7/1/31 | | 8,295 |
| | | 28,451 | | | Pool #607611, 6.50%, 11/1/31 | | 29,814 |
| | | 25,951 | | | Pool #644437, 6.50%, 6/1/32 | | 27,387 |
| | | 556,865 | | | Pool #663159, 5.00%, 7/1/32 | | 569,433 |
| | | 24,654 | | | Pool #670278, 5.50%, 11/1/32 | | 25,589 |
| | | 6,536 | | | Pool #676702, 5.50%, 11/1/32 | | 6,784 |
| | | 34,560 | | | Pool #677591, 5.50%, 12/1/32 | | 35,869 |
| | | 9,431 | | | Pool #681883, 6.00%, 3/1/33 | | 9,948 |
| | | 142,515 | | | Pool #695961, 5.50%, 1/1/33 | | 147,953 |
| | | 88,835 | | | Pool #696407, 5.50%, 4/1/33 | | 92,274 |
| | | 238,805 | | | Pool #702478, 5.50%, 6/1/33 | | 248,074 |
1
|
|
| SCHEDULE OF PORTFOLIO INVESTMENTS |
|
| RBC BlueBay Access Capital Community Investment Fund (cont.) |
|
| September 30, 2024 |
| | | | | | | | |
Principal
Amount | | | | | Value |
| | | $ 76,867 | | | Pool #702479, 5.00%, 6/1/33 | | $ 78,608 |
| | | 27,895 | | | Pool #723066, 5.00%, 4/1/33 | | 28,526 |
| | | 116,527 | | | Pool #723067, 5.50%, 5/1/33 | | 121,051 |
| | | 102,801 | | | Pool #723070, 4.50%, 5/1/33 | | 104,682 |
| | | 165,798 | | | Pool #727311, 4.50%, 9/1/33 | | 168,125 |
| | | 90,918 | | | Pool #727312, 5.00%, 9/1/33 | | 92,973 |
| | | 45,794 | | | Pool #727315, 6.00%, 10/1/33 | | 48,312 |
| | | 26,721 | | | Pool #738589, 5.00%, 9/1/33 | | 27,325 |
| | | 33,185 | | | Pool #739269, 5.00%, 9/1/33 | | 33,934 |
| | | 60,052 | | | Pool #748041, 4.50%, 10/1/33 | | 60,833 |
| | | 61,237 | | | Pool #749891, 5.00%, 9/1/33 | | 62,622 |
| | | 71,649 | | | Pool #753533, 5.00%, 11/1/33 | | 73,269 |
| | | 29,244 | | | Pool #755679, 6.00%, 1/1/34 | | 30,848 |
| | | 268,956 | | | Pool #777621, 5.00%, 2/1/34 | | 275,042 |
| | | 59,203 | | | Pool #781741, 6.00%, 9/1/34 | | 62,469 |
| | | 31,011 | | | Pool #781959, 5.50%, 6/1/34 | | 32,256 |
| | | 20,163 | | | Pool #783893, 5.50%, 12/1/34 | | 20,973 |
| | | 53,091 | | | Pool #783929, 5.50%, 10/1/34 | | 55,224 |
| | | 44,557 | | | Pool #799548, 6.00%, 9/1/34 | | 47,014 |
| | | 496,686 | | | Pool #806754, 4.50%, 9/1/34 | | 500,160 |
| | | 210,972 | | | Pool #806757, 6.00%, 9/1/34 | | 222,629 |
| | | 247,292 | | | Pool #806761, 5.50%, 9/1/34 | | 257,250 |
| | | 83,105 | | | Pool #808205, 5.00%, 1/1/35 | | 85,038 |
| | | 142,835 | | | Pool #815009, 5.00%, 4/1/35 | | 146,303 |
| | | 37,612 | | | Pool #820336, 5.00%, 9/1/35 | | 38,516 |
| | | 75,955 | | | Pool #822008, 5.00%, 5/1/35 | | 77,792 |
| | | 114,921 | | | Pool #829276, 5.00%, 8/1/35 | | 117,712 |
| | | 82,523 | | | Pool #829649, 5.50%, 3/1/35 | | 85,839 |
| | | 11,701 | | | Pool #844361, 5.50%, 11/1/35 | | 12,189 |
| | | 22,110 | | | Pool #845245, 5.50%, 11/1/35 | | 23,028 |
| | | 17,041 | | | Pool #866969, 6.00%, 2/1/36 | | 18,082 |
| | | 61,904 | | | Pool #884693, 5.50%, 4/1/36 | | 64,788 |
| | | 169,985 | | | Pool #885724, 5.50%, 6/1/36 | | 177,941 |
| | | 56,168 | | | Pool #919368, 5.50%, 4/1/37 | | 58,814 |
| | | 222,605 | | | Pool #922582, 6.00%, 12/1/36 | | 237,531 |
| | | 80,760 | | | Pool #934941, 5.00%, 8/1/39 | | 83,099 |
| | | 244,455 | | | Pool #934942, 5.00%, 9/1/39 | | 251,563 |
| | | 163,067 | | | Pool #948600, 6.00%, 8/1/37 | | 174,149 |
| | | 59,031 | | | Pool #952678, 6.50%, 8/1/37 | | 63,885 |
| | | 80,765 | | | Pool #986239, 6.00%, 7/1/38 | | 86,218 |
| | | 101,612 | | | Pool #986957, 5.50%, 7/1/38 | | 106,494 |
| | | 135,484 | | | Pool #990617, 5.50%, 9/1/38 | | 141,954 |
| | | 130,284 | | | Pool #AA0645, 4.50%, 3/1/39 | | 131,537 |
| | | 116,400 | | | Pool #AA3207, 4.50%, 3/1/39 | | 117,739 |
| | | 87,914 | | | Pool #AA7042, 4.50%, 6/1/39 | | 88,760 |
| | | 217,837 | | | Pool #AA7658, 4.00%, 6/1/39 | | 215,121 |
| | | 577,860 | | | Pool #AB7798, 3.00%, 1/1/43 | | 533,427 |
| | | 779,038 | | | Pool #AB9204, 3.00%, 4/1/43 | | 719,487 |
2
|
|
| SCHEDULE OF PORTFOLIO INVESTMENTS |
|
| RBC BlueBay Access Capital Community Investment Fund (cont.) |
|
| September 30, 2024 |
| | | | | | | | |
Principal
Amount | | | | | Value |
| | | $ 62,224 | | | Pool #AC1463, 5.00%, 8/1/39 | | $ 64,026 |
| | | 220,942 | | | Pool #AC2109, 4.50%, 7/1/39 | | 223,067 |
| | | 220,288 | | | Pool #AC4395, 5.00%, 9/1/39 | | 226,669 |
| | | 82,567 | | | Pool #AC5329, 5.00%, 10/1/39 | | 84,958 |
| | | 169,046 | | | Pool #AC6305, 5.00%, 11/1/39 | | 173,961 |
| | | 118,518 | | | Pool #AC6307, 5.00%, 12/1/39 | | 121,972 |
| | | 249,606 | | | Pool #AC6790, 5.00%, 12/1/39 | | 256,863 |
| | | 263,395 | | | Pool #AC7199, 5.00%, 12/1/39 | | 271,048 |
| | | 247,675 | | | Pool #AD1470, 5.00%, 2/1/40 | | 254,579 |
| | | 502,879 | | | Pool #AD1471, 4.50%, 2/1/40 | | 506,636 |
| | | 360,601 | | | Pool #AD1585, 4.50%, 2/1/40 | | 363,296 |
| | | 294,820 | | | Pool #AD1586, 5.00%, 1/1/40 | | 303,421 |
| | | 189,607 | | | Pool #AD1638, 4.50%, 2/1/40 | | 190,982 |
| | | 120,701 | | | Pool #AD1640, 4.50%, 3/1/40 | | 121,577 |
| | | 483,901 | | | Pool #AD1942, 4.50%, 1/1/40 | | 487,517 |
| | | 138,493 | | | Pool #AD1988, 4.50%, 2/1/40 | | 139,565 |
| | | 154,788 | | | Pool #AD2896, 5.00%, 3/1/40 | | 159,124 |
| | | 10,685 | | | Pool #AD4456, 4.50%, 4/1/40 | | 10,799 |
| | | 366,559 | | | Pool #AD4458, 4.50%, 4/1/40 | | 370,129 |
| | | 161,955 | | | Pool #AD4940, 4.50%, 6/1/40 | | 163,388 |
| | | 60,704 | | | Pool #AD4946, 4.50%, 6/1/40 | | 61,241 |
| | | 101,963 | | | Pool #AD5728, 5.00%, 4/1/40 | | 104,819 |
| | | 45,270 | | | Pool #AD7242, 4.50%, 7/1/40 | | 45,755 |
| | | 77,896 | | | Pool #AD7256, 4.50%, 7/1/40 | | 78,655 |
| | | 207,565 | | | Pool #AD7271, 4.50%, 7/1/40 | | 209,197 |
| | | 225,509 | | | Pool #AD7272, 4.50%, 7/1/40 | | 227,705 |
| | | 75,593 | | | Pool #AD8960, 5.00%, 6/1/40 | | 77,707 |
| | | 283,421 | | | Pool #AD9614, 4.50%, 8/1/40 | | 285,476 |
| | | 1,190 | | | Pool #AE2011, 4.00%, 9/1/40 | | 1,171 |
| | | 616,673 | | | Pool #AE2012, 4.00%, 9/1/40 | | 607,046 |
| | | 100,654 | | | Pool #AE2023, 4.00%, 9/1/40 | | 99,353 |
| | | 201,137 | | | Pool #AE5432, 4.00%, 10/1/40 | | 198,539 |
| | | 283,516 | | | Pool #AE5435, 4.50%, 9/1/40 | | 285,560 |
| | | 108,280 | | | Pool #AE5806, 4.50%, 9/1/40 | | 109,439 |
| | | 251,660 | | | Pool #AE5861, 4.00%, 10/1/40 | | 247,731 |
| | | 111,872 | | | Pool #AE5862, 4.00%, 10/1/40 | | 110,328 |
| | | 234,691 | | | Pool #AE6850, 4.00%, 10/1/40 | | 231,028 |
| | | 131,844 | | | Pool #AE7699, 4.00%, 11/1/40 | | 129,794 |
| | | 354,146 | | | Pool #AE7703, 4.00%, 10/1/40 | | 348,640 |
| | | 108,240 | | | Pool #AH0300, 4.00%, 11/1/40 | | 106,746 |
| | | 136,048 | | | Pool #AH0301, 3.50%, 11/1/40 | | 129,742 |
| | | 1,391 | | | Pool #AH0302, 4.00%, 11/1/40 | | 1,371 |
| | | 203,769 | | | Pool #AH0306, 4.00%, 12/1/40 | | 201,137 |
| | | 315,645 | | | Pool #AH0508, 4.00%, 11/1/40 | | 310,717 |
| | | 493,401 | | | Pool #AH0537, 4.00%, 12/1/40 | | 486,591 |
| | | 472,431 | | | Pool #AH0914, 4.50%, 11/1/40 | | 475,857 |
| | | 230,154 | | | Pool #AH0917, 4.00%, 12/1/40 | | 226,561 |
3
|
|
| SCHEDULE OF PORTFOLIO INVESTMENTS |
|
| RBC BlueBay Access Capital Community Investment Fund (cont.) |
|
| September 30, 2024 |
| | | | | | | | |
Principal
Amount | | | | | Value |
| | | $ 188,530 | | | Pool #AH1077, 4.00%, 1/1/41 | | $ 186,839 |
| | | 168,655 | | | Pool #AH2973, 4.00%, 12/1/40 | | 166,476 |
| | | 198,622 | | | Pool #AH2980, 4.00%, 1/1/41 | | 195,880 |
| | | 507,997 | | | Pool #AH5656, 4.00%, 1/1/41 | | 500,986 |
| | | 293,244 | | | Pool #AH5658, 4.00%, 2/1/41 | | 288,666 |
| | | 189,527 | | | Pool #AH5662, 4.00%, 2/1/41 | | 187,079 |
| | | 48,096 | | | Pool #AH5882, 4.00%, 2/1/26 | | 47,785 |
| | | 139,492 | | | Pool #AH6764, 4.00%, 3/1/41 | | 137,314 |
| | | 472,011 | | | Pool #AH6768, 4.00%, 3/1/41 | | 464,917 |
| | | 272,919 | | | Pool #AH7281, 4.00%, 3/1/41 | | 268,818 |
| | | 97,766 | | | Pool #AH7526, 4.50%, 3/1/41 | | 98,569 |
| | | 365,479 | | | Pool #AH7537, 4.00%, 3/1/41 | | 359,986 |
| | | 125,137 | | | Pool #AH8878, 4.50%, 4/1/41 | | 126,046 |
| | | 62,370 | | | Pool #AH8885, 4.50%, 4/1/41 | | 62,998 |
| | | 26,926 | | | Pool #AH9050, 3.50%, 2/1/26 | | 26,674 |
| | | 314,348 | | | Pool #AI0114, 4.00%, 3/1/41 | | 309,624 |
| | | 220,190 | | | Pool #AI1846, 4.50%, 5/1/41 | | 221,583 |
| | | 248,939 | | | Pool #AI1847, 4.50%, 5/1/41 | | 250,982 |
| | | 456,993 | | | Pool #AI1848, 4.50%, 5/1/41 | | 459,874 |
| | | 283,364 | | | Pool #AI1849, 4.50%, 5/1/41 | | 285,964 |
| | | 154,722 | | | Pool #AJ0651, 4.00%, 8/1/41 | | 152,398 |
| | | 511,632 | | | Pool #AJ9133, 4.00%, 1/1/42 | | 503,942 |
| | | 188,647 | | | Pool #AK6715, 3.50%, 3/1/42 | | 179,842 |
| | | 310,722 | | | Pool #AK6716, 3.50%, 3/1/42 | | 296,219 |
| | | 150,735 | | | Pool #AK6718, 3.50%, 2/1/42 | | 143,686 |
| | | 207,498 | | | Pool #AM6907, 3.68%, 10/1/32 | | 199,070 |
| | | 350,000 | | | Pool #AN0360, 3.95%, 12/1/45 | | 306,118 |
| | | 842,058 | | | Pool #AN2066, 2.75%, 7/1/26 | | 821,675 |
| | | 857,283 | | | Pool #AN2746, 2.30%, 9/1/26 | | 830,512 |
| | | 774,216 | | | Pool #AN5053, 3.34%, 4/1/27 | | 762,285 |
| | | 190,603 | | | Pool #AN6580, 3.36%, 9/1/29 | | 185,081 |
| | | 871,985 | | | Pool #AN7154, 3.21%, 10/1/32 | | 821,907 |
| | | 1,977,307 | | | Pool #AN8055, 3.05%, 1/1/30 | | 1,891,264 |
| | | 1,487,559 | | | Pool #AN8121, 3.16%, 1/1/35 | | 1,343,653 |
| | | 485,787 | | | Pool #AN8915, 3.48%, 4/1/30 | | 471,930 |
| | | 172,272 | | | Pool #AO2923, 3.50%, 5/1/42 | | 165,030 |
| | | 524,496 | | | Pool #AO8029, 3.50%, 7/1/42 | | 500,014 |
| | | 119,532 | | | Pool #AP7483, 3.50%, 9/1/42 | | 114,343 |
| | | 91,921 | | | Pool #AQ6710, 2.50%, 10/1/27 | | 89,984 |
| | | 549,039 | | | Pool #AQ7193, 3.50%, 7/1/43 | | 523,152 |
| | | 122,948 | | | Pool #AR6928, 3.00%, 3/1/43 | | 113,949 |
| | | 729,014 | | | Pool #AS3494, 4.00%, 10/1/44 | | 713,828 |
| | | 174,671 | | | Pool #AS3929, 4.00%, 12/1/44 | | 171,082 |
| | | 210,756 | | | Pool #AS4070, 4.00%, 12/1/44 | | 205,653 |
| | | 138,000 | | | Pool #AS4390, 3.50%, 2/1/45 | | 131,463 |
| | | 159,166 | | | Pool #AS4732, 3.50%, 4/1/45 | | 151,188 |
| | | 459,446 | | | Pool #AS4905, 3.50%, 4/1/45 | | 436,072 |
| | | 876,291 | | | Pool #AS5341, 3.50%, 7/1/45 | | 831,772 |
4
|
|
| SCHEDULE OF PORTFOLIO INVESTMENTS |
|
| RBC BlueBay Access Capital Community Investment Fund (cont.) |
|
|
| September 30, 2024 |
| | | | | | | | |
Principal Amount | | | | | Value |
| | | $ 235,165 | | | Pool #AS5576, 4.00%, 8/1/45 | | $ 230,127 |
| | | 386,696 | | | Pool #AS5919, 3.50%, 9/1/45 | | 368,370 |
| | | 202,576 | | | Pool #AS6303, 4.00%, 11/1/45 | | 198,235 |
| | | 557,835 | | | Pool #AS6778, 3.50%, 3/1/46 | | 529,141 |
| | | 250,431 | | | Pool #AS6958, 3.50%, 4/1/46 | | 237,896 |
| | | 694,360 | | | Pool #AS7138, 3.50%, 5/1/46 | | 657,192 |
| | | 360,493 | | | Pool #AS7139, 3.50%, 5/1/46 | | 341,196 |
| | | 655,514 | | | Pool #AS7334, 3.00%, 6/1/46 | | 600,606 |
| | | 700,083 | | | Pool #AS7335, 3.00%, 5/1/46 | | 640,812 |
| | | 310,581 | | | Pool #AS7336, 3.00%, 6/1/46 | | 280,750 |
| | | 1,171,074 | | | Pool #AS7504, 3.00%, 7/1/46 | | 1,071,928 |
| | | 424,689 | | | Pool #AS7516, 3.00%, 7/1/46 | | 388,734 |
| | | 278,957 | | | Pool #AS7517, 3.00%, 6/1/46 | | 256,254 |
| | | 114,828 | | | Pool #AS7518, 3.00%, 7/1/46 | | 105,617 |
| | | 142,861 | | | Pool #AS7674, 3.00%, 8/1/46 | | 130,766 |
| | | 939,595 | | | Pool #AS7676, 3.00%, 8/1/46 | | 860,047 |
| | | 223,196 | | | Pool #AS8289, 3.00%, 10/1/46 | | 204,300 |
| | | 708,761 | | | Pool #AS8633, 3.50%, 1/1/47 | | 670,823 |
| | | 289,811 | | | Pool #AS8776, 3.50%, 2/1/47 | | 274,298 |
| | | 321,763 | | | Pool #AS9381, 4.00%, 4/1/47 | | 313,950 |
| | | 152,366 | | | Pool #AS9549, 4.00%, 5/1/47 | | 148,770 |
| | | 563,918 | | | Pool #AS9550, 4.00%, 5/1/47 | | 549,015 |
| | | 181,377 | | | Pool #AS9825, 4.00%, 6/1/47 | | 176,973 |
| | | 401,391 | | | Pool #AT2688, 3.00%, 5/1/43 | | 371,606 |
| | | 166,435 | | | Pool #AT3963, 2.50%, 3/1/28 | | 162,400 |
| | | 61,618 | | | Pool #AT7873, 2.50%, 6/1/28 | | 60,179 |
| | | 36,883 | | | Pool #AU0971, 3.50%, 8/1/43 | | 35,144 |
| | | 340,890 | | | Pool #AU2165, 3.50%, 7/1/43 | | 324,817 |
| | | 308,774 | | | Pool #AU2188, 3.50%, 8/1/43 | | 294,215 |
| | | 243,386 | | | Pool #AU7003, 4.00%, 11/1/43 | | 240,201 |
| | | 165,603 | | | Pool #AU7005, 4.00%, 11/1/43 | | 163,074 |
| | | 112,213 | | | Pool #AV0679, 4.00%, 12/1/43 | | 110,795 |
| | | 244,011 | | | Pool #AV9282, 4.00%, 2/1/44 | | 239,593 |
| | | 123,950 | | | Pool #AW1565, 4.00%, 4/1/44 | | 121,803 |
| | | 520,155 | | | Pool #AW5046, 4.00%, 7/1/44 | | 510,737 |
| | | 75,292 | | | Pool #AW5047, 4.00%, 7/1/44 | | 74,264 |
| | | 98,390 | | | Pool #AW7040, 4.00%, 6/1/44 | | 96,830 |
| | | 627,349 | | | Pool #AX2884, 3.50%, 11/1/44 | | 592,412 |
| | | 431,990 | | | Pool #AX4860, 3.50%, 12/1/44 | | 410,985 |
| | | 526,267 | | | Pool #AY1389, 3.50%, 4/1/45 | | 499,530 |
| | | 159,855 | | | Pool #AY3435, 3.50%, 5/1/45 | | 152,279 |
| | | 329,526 | | | Pool #AY5571, 3.50%, 6/1/45 | | 312,785 |
| | | 252,071 | | | Pool #BC0802, 3.50%, 4/1/46 | | 239,105 |
| | | 212,138 | | | Pool #BC0804, 3.50%, 4/1/46 | | 200,783 |
| | | 342,437 | | | Pool #BC1135, 3.00%, 6/1/46 | | 314,147 |
| | | 658,871 | | | Pool #BD5021, 3.50%, 2/1/47 | | 623,655 |
| | | 883,487 | | | Pool #BD7140, 4.00%, 4/1/47 | | 860,138 |
5
|
|
| SCHEDULE OF PORTFOLIO INVESTMENTS |
|
| RBC BlueBay Access Capital Community Investment Fund (cont.) |
|
|
| September 30, 2024 |
| | | | | | | | |
Principal
Amount | | | | | Value |
| | | |
| | | $ 820,034 | | | Pool #BE4232, 3.00%, 12/1/46 | | $ 750,608 |
| | | 168,305 | | | Pool #BE9743, 3.50%, 4/1/47 | | 159,202 |
| | | 458,663 | | | Pool #BH2665, 3.50%, 9/1/47 | | 433,109 |
| | | 100,255 | | | Pool #BH4659, 4.00%, 6/1/47 | | 98,108 |
| | | 250,026 | | | Pool #BJ0657, 4.00%, 2/1/48 | | 243,091 |
| | | 274,022 | | | Pool #BJ2670, 4.00%, 4/1/48 | | 266,439 |
| | | 716,247 | | | Pool #BJ5158, 4.00%, 4/1/48 | | 696,424 |
| | | 287,960 | | | Pool #BK7685, 4.00%, 10/1/48 | | 279,991 |
| | | 407,877 | | | Pool #BK7924, 4.00%, 11/1/48 | | 397,544 |
| | | 8,920,000 | | | Pool #BL4650, 2.30%, 10/1/31 | | 7,981,039 |
| | | 443,255 | | | Pool #BL5454, 2.77%, 1/1/35 | | 394,725 |
| | | 97,714 | | | Pool #BO1263, 3.50%, 6/1/49 | | 92,516 |
| | | 423,024 | | | Pool #BO3599, 3.00%, 9/1/49 | | 384,293 |
| | | 545,644 | | | Pool #BO5263, 3.00%, 9/1/49 | | 495,686 |
| | | 2,155,959 | | | Pool #BO6771, 2.50%, 5/1/51 | | 1,871,138 |
| | | 486,533 | | | Pool #BP3417, 2.50%, 5/1/51 | | 422,107 |
| | | 537,062 | | | Pool #BP8731, 2.50%, 6/1/50 | | 470,630 |
| | | 854,756 | | | Pool #BP8741, 2.50%, 6/1/50 | | 744,342 |
| | | 1,491,773 | | | Pool #BQ4469, 2.00%, 2/1/51 | | 1,240,168 |
| | | 468,221 | | | Pool #BQ4493, 1.50%, 2/1/51 | | 370,017 |
| | | 932,429 | | | Pool #BQ7523, 2.00%, 11/1/50 | | 775,923 |
| | | 675,035 | | | Pool #BQ7524, 2.50%, 10/1/50 | | 590,700 |
| | | 4,059,222 | | | Pool #BR0940, 2.00%, 4/1/51 | | 3,369,768 |
| | | 788,582 | | | Pool #BR1037, 2.50%, 5/1/51 | | 684,404 |
| | | 1,878,831 | | | Pool #BR1113, 2.00%, 11/1/50 | | 1,563,071 |
| | | 787,953 | | | Pool #BR1114, 1.50%, 11/1/50 | | 622,810 |
| | | 269,757 | | | Pool #BR1115, 2.50%, 12/1/50 | | 235,008 |
| | | 1,114,488 | | | Pool #BR2051, 2.50%, 6/1/51 | | 966,909 |
| | | 2,469,177 | | | Pool #BR2234, 2.50%, 8/1/51 | | 2,140,683 |
| | | 880,952 | | | Pool #BR3565, 2.00%, 1/1/51 | | 732,658 |
| | | 753,167 | | | Pool #BR3566, 2.50%, 12/1/50 | | 658,604 |
| | | 211,971 | | | Pool #BR7088, 2.00%, 3/1/51 | | 176,033 |
| | | 3,000,000 | | | Pool #BS0046, 1.23%, 12/1/27 | | 2,745,484 |
| | | 1,011,090 | | | Pool #BS0345, 1.61%, 1/1/36 | | 804,707 |
| | | 2,545,000 | | | Pool #BS0391, 1.63%, 1/1/33 | | 2,130,866 |
| | | 500,000 | | | Pool #BS0915, 1.62%, 3/1/31 | | 420,277 |
| | | 1,000,000 | | | Pool #BS1281, 1.59%, 3/1/31 | | 857,993 |
| | | 184,649 | | | Pool #BS1326, 1.19%, 3/1/26 | | 176,976 |
| | | 1,851,351 | | | Pool #BS1482, 1.61%, 3/1/31 | | 1,613,346 |
| | | 700,000 | | | Pool #BS1524, 2.01%, 3/1/33 | | 598,969 |
| | | 1,500,000 | | | Pool #BS1560, 2.03%, 4/1/31 | | 1,314,477 |
| | | 956,253 | | | Pool #BS4422, 2.59%, 3/1/32 | | 869,287 |
| | | 1,000,000 | | | Pool #BS5203, 2.41%, 4/1/32 | | 895,576 |
| | | 238,236 | | | Pool #BS5840, 3.78%, 7/1/32 | | 226,845 |
| | | 669,000 | | | Pool #BS6083, 4.38%, 7/1/32 | | 665,567 |
| | | 400,000 | | | Pool #BS6178, 3.41%, 7/1/29 | | 386,276 |
| | | 884,000 | | | Pool #BS8032, 5.00%, 3/1/28 | | 902,802 |
| | | 1,000,000 | | | Pool #BS8302, 4.61%, 4/1/28 | | 1,017,010 |
6
|
|
| SCHEDULE OF PORTFOLIO INVESTMENTS |
|
| RBC BlueBay Access Capital Community Investment Fund (cont.) |
|
|
| September 30, 2024 |
| | | | | | | | |
Principal
Amount | | | | | Value |
| | | |
| | | $1,000,000 | | | Pool #BS8303, 4.61%, 4/1/28 | | $1,018,821 |
| | | 2,735,000 | | | Pool #BS8483, 4.81%, 5/1/28 | | 2,773,930 |
| | | 531,127 | | | Pool #BS8518, 4.30%, 5/1/28 | | 535,129 |
| | | 2,800,000 | | | Pool #BS8572, 4.23%, 5/1/28 | | 2,820,967 |
| | | 3,400,000 | | | Pool #BS9849, 4.97%, 11/1/28 | | 3,503,879 |
| | | 600,000 | | | Pool #BS9972, 5.76%, 11/1/28 | | 636,127 |
| | | 1,732,271 | | | Pool #BT6821, 2.50%, 10/1/51 | | 1,500,741 |
| | | 1,204,905 | | | Pool #BT8237, 4.00%, 6/1/52 | | 1,158,176 |
| | | 236,706 | | | Pool #BT8243, 4.00%, 6/1/52 | | 227,489 |
| | | 1,659,377 | | | Pool #BT9419, 2.50%, 11/1/51 | | 1,437,075 |
| | | 1,068,356 | | | Pool #BU1334, 2.50%, 2/1/52 | | 924,238 |
| | | 1,757,841 | | | Pool #BU1337, 3.00%, 2/1/52 | | 1,585,195 |
| | | 211,242 | | | Pool #BV4205, 3.00%, 2/1/52 | | 190,896 |
| | | 2,456,850 | | | Pool #BV8876, 3.50%, 4/1/52 | | 2,289,506 |
| | | 1,400,000 | | | Pool #BZ0540, 5.04%, 2/1/34 | | 1,474,893 |
| | | 546,232 | | | Pool #CA0114, 3.50%, 8/1/47 | | 515,800 |
| | | 547,219 | | | Pool #CA0334, 3.50%, 9/1/47 | | 516,877 |
| | | 157,410 | | | Pool #CA0536, 3.50%, 10/1/47 | | 148,682 |
| | | 573,226 | | | Pool #CA0551, 4.00%, 10/1/47 | | 558,076 |
| | | 457,003 | | | Pool #CA0565, 3.50%, 10/1/47 | | 432,018 |
| | | 233,543 | | | Pool #CA0743, 3.50%, 11/1/47 | | 220,912 |
| | | 626,520 | | | Pool #CA0825, 3.50%, 12/1/47 | | 591,614 |
| | | 618,223 | | | Pool #CA0981, 3.50%, 12/1/47 | | 583,779 |
| | | 180,852 | | | Pool #CA1070, 3.50%, 1/1/48 | | 170,824 |
| | | 461,610 | | | Pool #CA1115, 3.50%, 1/1/48 | | 435,892 |
| | | 901,783 | | | Pool #CA1130, 3.50%, 1/1/48 | | 851,541 |
| | | 177,850 | | | Pool #CA1131, 3.50%, 2/1/48 | | 167,988 |
| | | 278,722 | | | Pool #CA1132, 3.50%, 1/1/48 | | 263,193 |
| | | 202,831 | | | Pool #CA1144, 3.50%, 2/1/48 | | 191,531 |
| | | 102,124 | | | Pool #CA1152, 3.50%, 2/1/48 | | 96,435 |
| | | 382,455 | | | Pool #CA1160, 3.50%, 2/1/48 | | 361,770 |
| | | 452,241 | | | Pool #CA1161, 3.50%, 2/1/48 | | 426,713 |
| | | 266,127 | | | Pool #CA1338, 4.00%, 3/1/48 | | 258,745 |
| | | 533,606 | | | Pool #CA1339, 3.50%, 3/1/48 | | 503,486 |
| | | 173,500 | | | Pool #CA1418, 4.00%, 3/1/48 | | 168,688 |
| | | 179,364 | | | Pool #CA1468, 4.00%, 3/1/48 | | 174,684 |
| | | 457,760 | | | Pool #CA1469, 4.00%, 3/1/48 | | 445,063 |
| | | 168,042 | | | Pool #CA1471, 4.00%, 3/1/48 | | 163,785 |
| | | 1,041,058 | | | Pool #CA1507, 4.00%, 4/1/48 | | 1,012,246 |
| | | 386,329 | | | Pool #CA1610, 3.50%, 3/1/48 | | 364,522 |
| | | 395,420 | | | Pool #CA1611, 4.00%, 4/1/48 | | 384,476 |
| | | 395,551 | | | Pool #CA1612, 3.50%, 4/1/48 | | 373,516 |
| | | 480,013 | | | Pool #CA1613, 4.00%, 4/1/48 | | 466,729 |
| | | 185,848 | | | Pool #CA2381, 4.00%, 9/1/48 | | 180,999 |
| | | 206,024 | | | Pool #CA2440, 4.00%, 9/1/48 | | 200,309 |
| | | 164,673 | | | Pool #CA2441, 4.00%, 10/1/48 | | 160,501 |
| | | 158,387 | | | Pool #CA2442, 4.00%, 10/1/48 | | 154,375 |
7
|
|
| SCHEDULE OF PORTFOLIO INVESTMENTS |
|
| RBC BlueBay Access Capital Community Investment Fund (cont.) |
|
|
| September 30, 2024 |
| | | | | | | | |
Principal
Amount | | | | | Value |
| | | |
| | | $ 196,482 | | | Pool #CA2443, 4.00%, 10/1/48 | | $ 191,355 |
| | | 186,300 | | | Pool #CA2468, 4.00%, 10/1/48 | | 181,438 |
| | | 446,335 | | | Pool #CA2594, 4.00%, 11/1/48 | | 435,358 |
| | | 238,344 | | | Pool #CA2913, 4.00%, 1/1/49 | | 231,747 |
| | | 299,309 | | | Pool #CA3042, 4.00%, 1/1/49 | | 291,028 |
| | | 341,120 | | | Pool #CA3043, 4.00%, 2/1/49 | | 332,219 |
| | | 165,586 | | | Pool #CA3045, 4.50%, 1/1/49 | | 165,588 |
| | | 26,769 | | | Pool #CA3132, 4.00%, 2/1/49 | | 26,058 |
| | | 153,443 | | | Pool #CA3557, 3.50%, 5/1/49 | | 144,952 |
| | | 345,128 | | | Pool #CA3628, 3.50%, 6/1/49 | | 324,688 |
| | | 189,648 | | | Pool #CA3793, 3.50%, 6/1/49 | | 178,893 |
| | | 131,777 | | | Pool #CA3936, 3.50%, 7/1/49 | | 124,304 |
| | | 405,294 | | | Pool #CA4043, 3.00%, 8/1/49 | | 368,185 |
| | | 475,590 | | | Pool #CA4320, 3.00%, 9/1/49 | | 432,046 |
| | | 310,163 | | | Pool #CA5106, 3.00%, 1/1/50 | | 281,765 |
| | | 408,373 | | | Pool #CA5132, 3.00%, 2/1/50 | | 370,983 |
| | | 661,783 | | | Pool #CA5309, 3.00%, 3/1/50 | | 600,729 |
| | | 521,871 | | | Pool #CA5312, 3.00%, 3/1/50 | | 473,725 |
| | | 1,110,585 | | | Pool #CA6151, 2.50%, 6/1/50 | | 969,165 |
| | | 276,404 | | | Pool #CA6251, 3.00%, 6/1/50 | | 251,010 |
| | | 1,237,678 | | | Pool #CA6263, 2.50%, 7/1/50 | | 1,077,801 |
| | | 1,230,070 | | | Pool #CA6966, 2.00%, 9/1/50 | | 1,024,061 |
| | | 2,204,240 | | | Pool #CA6967, 2.00%, 9/1/50 | | 1,835,458 |
| | | 1,324,356 | | | Pool #CA6968, 2.00%, 9/1/50 | | 1,102,556 |
| | | 1,032,531 | | | Pool #CA6969, 2.00%, 9/1/50 | | 859,783 |
| | | 1,242,659 | | | Pool #CA6971, 2.50%, 9/1/50 | | 1,083,352 |
| | | 1,348,016 | | | Pool #CA6972, 2.50%, 8/1/50 | | 1,173,050 |
| | | 964,863 | | | Pool #CA6973, 2.50%, 9/1/50 | | 839,628 |
| | | 885,517 | | | Pool #CA7258, 2.50%, 9/1/50 | | 771,995 |
| | | 1,136,587 | | | Pool #CA7259, 2.50%, 9/1/50 | | 990,878 |
| | | 1,387,637 | | | Pool #CA7317, 2.00%, 10/1/50 | | 1,154,862 |
| | | 1,739,300 | | | Pool #CA7549, 2.00%, 10/1/50 | | 1,447,534 |
| | | 1,485,877 | | | Pool #CA7917, 2.00%, 11/1/50 | | 1,245,968 |
| | | 852,671 | | | Pool #CA8069, 1.50%, 12/1/50 | | 673,898 |
| | | 1,033,934 | | | Pool #CA8070, 2.00%, 12/1/50 | | 860,110 |
| | | 3,585,358 | | | Pool #CA8077, 2.00%, 12/1/50 | | 2,982,590 |
| | | 619,702 | | | Pool #CA8425, 1.50%, 12/1/50 | | 493,822 |
| | | 1,008,439 | | | Pool #CA8432, 2.00%, 12/1/50 | | 838,685 |
| | | 1,309,330 | | | Pool #CA8685, 1.50%, 1/1/51 | | 1,034,813 |
| | | 3,810,832 | | | Pool #CA8811, 2.00%, 1/1/51 | | 3,168,090 |
| | | 4,024,850 | | | Pool #CA9048, 2.00%, 2/1/51 | | 3,346,011 |
| | | 275,877 | | | Pool #CB0245, 2.50%, 4/1/51 | | 239,432 |
| | | 732,321 | | | Pool #CB0437, 2.50%, 5/1/51 | | 636,575 |
| | | 605,427 | | | Pool #CB0480, 2.50%, 5/1/51 | | 526,084 |
| | | 140,319 | | | Pool #CB0576, 2.50%, 5/1/51 | | 122,262 |
| | | 256,434 | | | Pool #CB0582, 2.50%, 5/1/51 | | 222,828 |
| | | 1,889,642 | | | Pool #CB0688, 2.50%, 6/1/51 | | 1,642,714 |
| | | 416,053 | | | Pool #CB0689, 2.50%, 6/1/51 | | 361,528 |
8
|
|
| SCHEDULE OF PORTFOLIO INVESTMENTS |
|
| RBC BlueBay Access Capital Community Investment Fund (cont.) |
|
|
| September 30, 2024 |
| | | | | | | | |
Principal
Amount | | | | | Value |
| | | |
| | | $ 933,116 | | | Pool #CB0972, 2.50%, 6/1/51 | | $ 810,539 |
| | | 467,306 | | | Pool #CB1003, 2.50%, 7/1/51 | | 405,282 |
| | | 296,810 | | | Pool #CB1010, 2.50%, 7/1/51 | | 257,415 |
| | | 1,164,783 | | | Pool #CB1060, 2.00%, 7/1/51 | | 965,501 |
| | | 1,871,024 | | | Pool #CB1311, 2.50%, 8/1/51 | | 1,624,661 |
| | | 1,676,898 | | | Pool #CB1444, 2.50%, 8/1/51 | | 1,453,287 |
| | | 958,511 | | | Pool #CB1515, 2.50%, 8/1/51 | | 830,696 |
| | | 1,495,059 | | | Pool #CB1532, 2.50%, 9/1/51 | | 1,297,738 |
| | | 1,427,582 | | | Pool #CB1809, 2.50%, 10/1/51 | | 1,236,775 |
| | | 769,473 | | | Pool #CB1956, 2.50%, 10/1/51 | | 670,517 |
| | | 780,727 | | | Pool #CB2029, 2.50%, 11/1/51 | | 677,201 |
| | | 1,712,467 | | | Pool #CB2205, 2.50%, 11/1/51 | | 1,482,523 |
| | | 695,349 | | | Pool #CB2268, 2.50%, 12/1/51 | | 601,980 |
| | | 485,585 | | | Pool #CB2467, 2.50%, 12/1/51 | | 420,232 |
| | | 1,752,600 | | | Pool #CB2515, 2.50%, 12/1/51 | | 1,516,723 |
| | | 2,609,324 | | | Pool #CB2761, 3.00%, 2/1/52 | | 2,353,050 |
| | | 5,616,347 | | | Pool #CB2797, 3.00%, 2/1/52 | | 5,064,740 |
| | | 5,499,194 | | | Pool #CB2938, 3.00%, 2/1/52 | | 4,949,109 |
| | | 1,147,044 | | | Pool #CB3052, 3.00%, 2/1/52 | | 1,032,305 |
| | | 877,735 | | | Pool #CB3249, 3.00%, 4/1/52 | | 793,744 |
| | | 1,932,695 | | | Pool #CB3281, 3.50%, 4/1/52 | | 1,801,053 |
| | | 419,509 | | | Pool #CB3413, 3.50%, 4/1/52 | | 392,896 |
| | | 791,213 | | | Pool #CB3489, 2.50%, 4/1/52 | | 683,075 |
| | | 633,473 | | | Pool #CB3490, 3.00%, 4/1/52 | | 569,615 |
| | | 7,342,671 | | | Pool #CB3797, 4.00%, 6/1/52 | | 7,057,904 |
| | | 5,384,639 | | | Pool #CB4056, 4.50%, 7/1/52 | | 5,302,801 |
| | | 2,870,742 | | | Pool #CB4208, 4.50%, 7/1/52 | | 2,827,111 |
| | | 2,342,008 | | | Pool #CB4272, 4.50%, 7/1/52 | | 2,306,051 |
| | | 9,287,815 | | | Pool #CB4314, 4.50%, 8/1/52 | | 9,145,217 |
| | | 11,982,217 | | | Pool #CB4463, 4.50%, 8/1/52 | | 11,796,396 |
| | | 336,045 | | | Pool #CB4473, 4.50%, 8/1/52 | | 333,092 |
| | | 4,731,115 | | | Pool #CB4539, 4.50%, 9/1/52 | | 4,657,744 |
| | | 4,288,827 | | | Pool #CB4595, 4.00%, 9/1/52 | | 4,120,503 |
| | | 5,787,193 | | | Pool #CB4767, 5.00%, 9/1/52 | | 5,793,014 |
| | | 2,638,259 | | | Pool #CB4966, 5.50%, 10/1/52 | | 2,675,527 |
| | | 1,601,221 | | | Pool #CB4967, 5.50%, 10/1/52 | | 1,625,680 |
| | | 9,683,954 | | | Pool #CB5037, 5.50%, 11/1/52 | | 9,818,597 |
| | | 3,995,434 | | | Pool #CB5048, 6.00%, 11/1/52 | | 4,083,949 |
| | | 5,564,752 | | | Pool #CB5166, 6.00%, 11/1/52 | | 5,688,035 |
| | | 2,761,807 | | | Pool #CB5199, 6.00%, 11/1/52 | | 2,822,992 |
| | | 2,537,122 | | | Pool #CB5202, 6.50%, 11/1/52 | | 2,615,740 |
| | | 389,012 | | | Pool #CB5220, 6.50%, 12/1/52 | | 401,124 |
| | | 3,151,131 | | | Pool #CB5343, 6.00%, 12/1/52 | | 3,220,942 |
| | | 304,016 | | | Pool #CB5344, 6.50%, 12/1/52 | | 317,474 |
| | | 1,695,395 | | | Pool #CB5385, 6.00%, 12/1/52 | | 1,732,991 |
| | | 2,580,364 | | | Pool #CB5549, 6.00%, 1/1/53 | | 2,637,314 |
| | | 892,658 | | | Pool #CB5586, 6.00%, 1/1/53 | | 912,360 |
9
|
|
| SCHEDULE OF PORTFOLIO INVESTMENTS |
|
| RBC BlueBay Access Capital Community Investment Fund (cont.) |
|
|
| September 30, 2024 |
| | | | | | | | |
Principal
Amount | | | | | Value |
| | | |
| | | $4,469,692 | | | Pool #CB5728, 5.50%, 2/1/53 | | $4,535,820 |
| | | 1,419,770 | | | Pool #CB5732, 5.50%, 2/1/53 | | 1,438,674 |
| | | 4,513,479 | | | Pool #CB5797, 5.50%, 3/1/53 | | 4,570,448 |
| | | 1,892,563 | | | Pool #CB5804, 6.00%, 2/1/53 | | 1,934,495 |
| | | 2,817,324 | | | Pool #CB5946, 5.50%, 3/1/53 | | 2,852,885 |
| | | 2,140,502 | | | Pool #CB5980, 5.50%, 3/1/53 | | 2,167,885 |
| | | 180,718 | | | Pool #CB6005, 5.50%, 4/1/53 | | 183,030 |
| | | 1,882,283 | | | Pool #CB6126, 5.00%, 4/1/53 | | 1,881,033 |
| | | 502,769 | | | Pool #CB6138, 5.00%, 4/1/53 | | 502,435 |
| | | 610,147 | | | Pool #CB6208, 5.50%, 5/1/53 | | 617,914 |
| | | 395,524 | | | Pool #CB6368, 5.00%, 5/1/53 | | 395,261 |
| | | 1,222,822 | | | Pool #CB6400, 5.00%, 5/1/53 | | 1,222,010 |
| | | 1,395,286 | | | Pool #CB6564, 5.50%, 6/1/53 | | 1,412,876 |
| | | 331,723 | | | Pool #CB6607, 5.50%, 7/1/53 | | 336,397 |
| | | 334,652 | | | Pool #CB6783, 5.00%, 7/1/53 | | 335,223 |
| | | 234,276 | | | Pool #CB6826, 5.50%, 7/1/53 | | 238,033 |
| | | 1,822,473 | | | Pool #CB6953, 5.50%, 8/1/53 | | 1,844,799 |
| | | 2,362,456 | | | Pool #CB6955, 6.00%, 8/1/53 | | 2,414,799 |
| | | 2,606,465 | | | Pool #CB7160, 6.50%, 9/1/53 | | 2,686,735 |
| | | 330,784 | | | Pool #CB7202, 6.50%, 10/1/53 | | 340,971 |
| | | 3,338,482 | | | Pool #CB7222, 5.50%, 10/1/53 | | 3,379,173 |
| | | 1,228,633 | | | Pool #CB7223, 6.00%, 10/1/53 | | 1,256,076 |
| | | 635,188 | | | Pool #CB7362, 6.00%, 10/1/53 | | 652,887 |
| | | 2,769,333 | | | Pool #CB7376, 6.00%, 10/1/53 | | 2,830,350 |
| | | 2,180,651 | | | Pool #CB7454, 6.00%, 11/1/53 | | 2,228,697 |
| | | 604,964 | | | Pool #CB7455, 6.50%, 11/1/53 | | 629,156 |
| | | 213,720 | | | Pool #CB7467, 6.50%, 11/1/53 | | 222,267 |
| | | 531,499 | | | Pool #CB7548, 6.50%, 11/1/53 | | 547,868 |
| | | 2,144,359 | | | Pool #CB7585, 6.50%, 11/1/53 | | 2,210,398 |
| | | 1,154,745 | | | Pool #CB7586, 7.00%, 12/1/53 | | 1,198,778 |
| | | 1,104,619 | | | Pool #CB7625, 6.50%, 12/1/53 | | 1,148,793 |
| | | 1,840,952 | | | Pool #CB7683, 6.00%, 12/1/53 | | 1,881,514 |
| | | 2,074,873 | | | Pool #CB7704, 6.50%, 12/1/53 | | 2,138,772 |
| | | 1,554,927 | | | Pool #CB7728, 7.00%, 12/1/53 | | 1,614,193 |
| | | 349,935 | | | Pool #CB7733, 6.50%, 12/1/53 | | 360,763 |
| | | 1,303,147 | | | Pool #CB7918, 6.00%, 1/1/54 | | 1,337,413 |
| | | 908,971 | | | Pool #CB7919, 6.50%, 1/1/54 | | 943,160 |
| | | 1,915,540 | | | Pool #CB8093, 5.50%, 3/1/54 | | 1,938,079 |
| | | 1,931,092 | | | Pool #CB8094, 6.00%, 2/1/54 | | 1,985,160 |
| | | 1,980,756 | | | Pool #CB8108, 5.50%, 3/1/54 | | 2,007,442 |
| | | 2,151,661 | | | Pool #CB8261, 5.50%, 3/1/54 | | 2,177,459 |
| | | 1,066,577 | | | Pool #CB8284, 5.50%, 4/1/54 | | 1,079,365 |
| | | 1,252,460 | | | Pool #CB8285, 6.00%, 4/1/54 | | 1,295,809 |
| | | 839,440 | | | Pool #CB8445, 6.50%, 5/1/54 | | 871,331 |
| | | 1,069,050 | | | Pool #CB8463, 6.00%, 5/1/54 | | 1,100,875 |
| | | 756,379 | | | Pool #CB8585, 5.00%, 5/1/54 | | 755,843 |
| | | 1,235,469 | | | Pool #CB8587, 6.00%, 5/1/54 | | 1,272,248 |
| | | 1,312,250 | | | Pool #CB8618, 6.00%, 5/1/54 | | 1,351,315 |
10
|
|
| SCHEDULE OF PORTFOLIO INVESTMENTS |
|
| RBC BlueBay Access Capital Community Investment Fund (cont.) |
|
|
| September 30, 2024 |
| | | | | | | | |
Principal
Amount | | | | | Value |
|
| | | |
| | | $ 784,060 | | | Pool #CB8795, 6.00%, 6/1/54 | | $ 806,727 |
| | | 2,672,128 | | | Pool #CB8936, 5.50%, 7/1/54 | | 2,704,166 |
| | | 4,250,094 | | | Pool #CB9076, 5.50%, 8/1/54 | | 4,340,373 |
| | | 576,900 | | | Pool #CB9265, 5.00%, 9/1/54 | | 582,722 |
| | | 2,517,225 | | | Pool #CB9267, 5.50%, 9/1/54 | | 2,577,212 |
| | | 43,656 | | | Pool #MC0013, 5.50%, 12/1/38 | | 45,749 |
| | | 71,151 | | | Pool #MC0014, 5.50%, 12/1/38 | | 74,569 |
| | | 59,253 | | | Pool #MC0016, 5.50%, 11/1/38 | | 62,100 |
| | | 74,101 | | | Pool #MC0127, 4.50%, 7/1/39 | | 74,953 |
| | | 226,918 | | | Pool #MC0154, 4.50%, 8/1/39 | | 228,672 |
| | | 74,597 | | | Pool #MC0160, 4.50%, 8/1/39 | | 75,455 |
| | | 148,134 | | | Pool #MC0177, 4.50%, 9/1/39 | | 149,559 |
| | | 102,541 | | | Pool #MC0270, 4.50%, 3/1/40 | | 103,448 |
| | | 130,049 | | | Pool #MC0584, 4.00%, 1/1/42 | | 128,095 |
| | | | | | | | |
| | | |
| | | | | | | | 441,568,599 |
| | | | | | | | |
|
| Freddie Mac — 32.0% |
| | | 406,902 | | | Pool #Q63813, 3.50%, 4/1/49 | | 383,527 |
| | | 1,172,045 | | | Pool #QB5731, 2.00%, 11/1/50 | | 975,319 |
| | | 1,799,375 | | | Pool #QB5732, 2.50%, 11/1/50 | | 1,564,710 |
| | | 1,489,061 | | | Pool #QB6982, 2.00%, 11/1/50 | | 1,238,721 |
| | | 358,843 | | | Pool #QB6992, 1.50%, 12/1/50 | | 283,635 |
| | | 1,049,949 | | | Pool #QC4676, 2.50%, 7/1/51 | | 911,031 |
| | | 751,791 | | | Pool #QC6090, 2.50%, 8/1/51 | | 654,583 |
| | | 1,456,761 | | | Pool #QC6108, 2.50%, 8/1/51 | | 1,264,494 |
| | | 999,171 | | | Pool #QC6643, 2.50%, 8/1/51 | | 867,298 |
| | | 1,049,722 | | | Pool #QC9175, 2.50%, 10/1/51 | | 913,340 |
| | | 1,606,149 | | | Pool #QD0152, 2.50%, 10/1/51 | | 1,390,978 |
| | | 259,941 | | | Pool #QD1762, 2.00%, 11/1/51 | | 215,226 |
| | | 2,341,568 | | | Pool #QD4183, 2.50%, 12/1/51 | | 2,027,150 |
| | | 809,065 | | | Pool #QD7419, 3.00%, 2/1/52 | | 731,140 |
| | | 376,625 | | | Pool #QE0994, 3.50%, 4/1/52 | | 351,001 |
| | | 3,145,509 | | | Pool #QE2342, 4.00%, 5/1/52 | | 3,024,006 |
| | | 4,727,358 | | | Pool #QE7866, 4.00%, 8/1/52 | | 4,542,555 |
| | | 1,155,073 | | | Pool #QE9025, 4.00%, 8/1/52 | | 1,109,919 |
| | | 583,943 | | | Pool #QE9026, 5.00%, 8/1/52 | | 584,892 |
| | | 1,028,667 | | | Pool #QE9027, 4.50%, 8/1/52 | | 1,012,874 |
| | | 1,378,720 | | | Pool #QF0539, 4.00%, 9/1/52 | | 1,324,609 |
| | | 241,645 | | | Pool #QG5944, 5.00%, 6/1/53 | | 241,978 |
| | | 236,493 | | | Pool #RA1234, 3.50%, 8/1/49 | | 222,482 |
| | | 247,207 | | | Pool #RA1382, 3.00%, 9/1/49 | | 224,573 |
| | | 1,301,087 | | | Pool #RA1383, 3.00%, 9/1/49 | | 1,181,961 |
| | | 246,810 | | | Pool #RA1470, 3.00%, 10/1/49 | | 224,213 |
| | | 263,149 | | | Pool #RA1713, 3.00%, 11/1/49 | | 239,055 |
| | | 457,791 | | | Pool #RA1714, 3.00%, 11/1/49 | | 415,876 |
| | | 610,599 | | | Pool #RA1716, 3.00%, 11/1/49 | | 554,693 |
| | | 455,090 | | | Pool #RA1724, 2.50%, 10/1/49 | | 397,092 |
| | | 364,057 | | | Pool #RA1979, 3.00%, 12/1/49 | | 330,720 |
11
|
|
| SCHEDULE OF PORTFOLIO INVESTMENTS |
|
| RBC BlueBay Access Capital Community Investment Fund (cont.) |
|
|
| September 30, 2024 |
| | | | | | | | |
Principal Amount | | | | | Value |
| | | |
| | | $ 642,895 | | | Pool #RA1987, 3.00%, 12/1/49 | | $ 584,033 |
| | | 1,312,927 | | | Pool #RA1988, 3.00%, 1/1/50 | | 1,192,717 |
| | | 721,287 | | | Pool #RA2158, 3.00%, 2/1/50 | | 654,967 |
| | | 716,332 | | | Pool #RA2162, 3.00%, 2/1/50 | | 650,467 |
| | | 704,869 | | | Pool #RA2255, 3.00%, 3/1/50 | | 640,059 |
| | | 1,031,989 | | | Pool #RA2256, 3.00%, 3/1/50 | | 937,101 |
| | | 704,322 | | | Pool #RA2340, 3.00%, 3/1/50 | | 639,344 |
| | | 282,546 | | | Pool #RA2395, 2.50%, 4/1/50 | | 246,743 |
| | | 1,327,197 | | | Pool #RA3207, 2.50%, 7/1/50 | | 1,157,875 |
| | | 2,737,609 | | | Pool #RA3208, 2.50%, 7/1/50 | | 2,383,129 |
| | | 796,652 | | | Pool #RA3339, 2.00%, 8/1/50 | | 663,367 |
| | | 1,205,294 | | | Pool #RA3552, 2.00%, 9/1/50 | | 1,003,641 |
| | | 1,113,402 | | | Pool #RA3553, 2.50%, 8/1/50 | | 971,011 |
| | | 2,677,075 | | | Pool #RA3679, 2.00%, 9/1/50 | | 2,228,459 |
| | | 1,602,725 | | | Pool #RA3680, 2.50%, 9/1/50 | | 1,394,699 |
| | | 470,842 | | | Pool #RA3733, 2.00%, 10/1/50 | | 391,967 |
| | | 518,037 | | | Pool #RA3734, 2.50%, 10/1/50 | | 451,625 |
| | | 777,773 | | | Pool #RA3747, 2.00%, 9/1/50 | | 647,647 |
| | | 1,536,819 | | | Pool #RA3751, 2.00%, 10/1/50 | | 1,286,253 |
| | | 2,425,665 | | | Pool #RA3803, 1.50%, 12/1/50 | | 1,917,096 |
| | | 378,975 | | | Pool #RA3861, 1.50%, 10/1/50 | | 299,577 |
| | | 1,451,334 | | | Pool #RA3862, 2.00%, 10/1/50 | | 1,208,124 |
| | | 1,365,778 | | | Pool #RA3917, 1.50%, 10/1/50 | | 1,079,638 |
| | | 2,930,670 | | | Pool #RA3918, 2.00%, 10/1/50 | | 2,438,763 |
| | | 583,961 | | | Pool #RA3928, 1.50%, 11/1/50 | | 461,572 |
| | | 192,206 | | | Pool #RA3929, 2.00%, 10/1/50 | | 160,999 |
| | | 521,648 | | | Pool #RA4018, 2.00%, 1/1/51 | | 433,696 |
| | | 678,299 | | | Pool #RA4056, 1.50%, 11/1/50 | | 536,138 |
| | | 6,737,012 | | | Pool #RA4195, 2.00%, 12/1/50 | | 5,604,390 |
| | | 4,500,216 | | | Pool #RA4254, 2.00%, 12/1/50 | | 3,742,680 |
| | | 759,648 | | | Pool #RA4274, 1.50%, 12/1/50 | | 600,437 |
| | | 830,087 | | | Pool #RA4357, 2.00%, 1/1/51 | | 690,308 |
| | | 1,227,457 | | | Pool #RA4377, 2.00%, 2/1/51 | | 1,026,000 |
| | | 2,021,540 | | | Pool #RA4420, 2.00%, 1/1/51 | | 1,680,583 |
| | | 2,942,196 | | | Pool #RA4503, 2.00%, 2/1/51 | | 2,445,960 |
| | | 745,138 | | | Pool #RA4548, 2.00%, 2/1/51 | | 619,462 |
| | | 1,804,685 | | | Pool #RA4578, 2.00%, 2/1/51 | | 1,498,721 |
| | | 288,454 | | | Pool #RA4590, 2.00%, 2/1/51 | | 239,550 |
| | | 252,801 | | | Pool #RA4597, 2.00%, 2/1/51 | | 210,163 |
| | | 236,697 | | | Pool #RA4618, 2.00%, 2/1/51 | | 196,789 |
| | | 782,879 | | | Pool #RA4621, 2.00%, 2/1/51 | | 650,151 |
| | | 1,317,808 | | | Pool #RA4738, 2.00%, 3/1/51 | | 1,094,389 |
| | | 3,443,407 | | | Pool #RA4745, 2.00%, 3/1/51 | | 2,859,617 |
| | | 1,349,653 | | | Pool #RA4775, 2.00%, 3/1/51 | | 1,120,835 |
| | | 1,079,200 | | | Pool #RA4835, 2.50%, 3/1/51 | | 936,962 |
| | | 1,938,429 | | | Pool #RA4872, 2.50%, 4/1/51 | | 1,682,946 |
| | | 7,332,382 | | | Pool #RA5020, 2.00%, 4/1/51 | | 6,086,986 |
| | | 2,834,162 | | | Pool #RA5021, 1.50%, 4/1/51 | | 2,237,572 |
12
|
|
| SCHEDULE OF PORTFOLIO INVESTMENTS |
|
| RBC BlueBay Access Capital Community Investment Fund (cont.) |
|
|
| September 30, 2024 |
| | | | | | | | |
Principal Amount | | | | | Value |
| | | |
| | | $ 350,155 | | | Pool #RA5043, 2.50%, 4/1/51 | | $ 303,897 |
| | | 625,570 | | | Pool #RA5045, 2.50%, 5/1/51 | | 545,263 |
| | | 2,869,639 | | | Pool #RA5068, 2.00%, 4/1/51 | | 2,381,345 |
| | | 1,423,064 | | | Pool #RA5173, 2.50%, 4/1/51 | | 1,235,065 |
| | | 908,212 | | | Pool #RA5195, 2.50%, 5/1/51 | | 783,465 |
| | | 708,610 | | | Pool #RA5197, 2.50%, 5/1/51 | | 614,996 |
| | | 1,212,221 | | | Pool #RA5217, 2.50%, 5/1/51 | | 1,062,070 |
| | | 1,077,076 | | | Pool #RA5237, 2.50%, 5/1/51 | | 936,255 |
| | | 1,840,360 | | | Pool #RA5350, 2.50%, 6/1/51 | | 1,596,662 |
| | | 1,426,694 | | | Pool #RA5387, 2.50%, 6/1/51 | | 1,246,060 |
| | | 220,229 | | | Pool #RA5404, 2.50%, 6/1/51 | | 191,299 |
| | | 7,268,235 | | | Pool #RA5427, 2.50%, 6/1/51 | | 6,303,536 |
| | | 1,087,620 | | | Pool #RA5509, 2.50%, 7/1/51 | | 947,325 |
| | | 455,125 | | | Pool #RA5525, 2.50%, 7/1/51 | | 394,717 |
| | | 690,393 | | | Pool #RA5541, 2.50%, 7/1/51 | | 598,759 |
| | | 1,889,119 | | | Pool #RA5621, 2.50%, 8/1/51 | | 1,637,795 |
| | | 232,605 | | | Pool #RA5686, 2.50%, 7/1/51 | | 202,065 |
| | | 1,649,763 | | | Pool #RA5701, 2.00%, 8/1/51 | | 1,366,995 |
| | | 1,335,816 | | | Pool #RA5719, 2.50%, 10/1/51 | | 1,158,684 |
| | | 3,111,739 | | | Pool #RA5726, 2.50%, 8/1/51 | | 2,701,044 |
| | | 1,716,184 | | | Pool #RA5796, 2.50%, 8/1/51 | | 1,487,335 |
| | | 1,616,222 | | | Pool #RA5873, 2.50%, 9/1/51 | | 1,400,703 |
| | | 686,768 | | | Pool #RA5874, 2.50%, 9/1/51 | | 594,977 |
| | | 2,529,676 | | | Pool #RA5948, 2.50%, 12/1/51 | | 2,193,627 |
| | | 138,762 | | | Pool #RA5951, 2.50%, 9/1/51 | | 120,734 |
| | | 3,266,261 | | | Pool #RA6030, 2.50%, 10/1/51 | | 2,829,701 |
| | | 63,817 | | | Pool #RA6108, 3.50%, 3/1/52 | | 59,481 |
| | | 1,253,044 | | | Pool #RA6117, 2.50%, 10/1/51 | | 1,085,177 |
| | | 1,134,403 | | | Pool #RA6276, 2.50%, 11/1/51 | | 986,667 |
| | | 376,174 | | | Pool #RA6305, 2.50%, 11/1/51 | | 327,185 |
| | | 1,209,340 | | | Pool #RA6317, 2.50%, 11/1/51 | | 1,047,328 |
| | | 81,600 | | | Pool #RA6389, 2.50%, 11/1/51 | | 71,181 |
| | | 1,708,387 | | | Pool #RA6516, 2.50%, 12/1/51 | | 1,478,461 |
| | | 1,303,003 | | | Pool #RA6687, 3.00%, 1/1/52 | | 1,175,029 |
| | | 2,820,609 | | | Pool #RA6743, 2.50%, 1/1/52 | | 2,440,993 |
| | | 1,899,486 | | | Pool #RA6760, 3.00%, 2/1/52 | | 1,712,928 |
| | | 768,375 | | | Pool #RA6782, 3.00%, 2/1/52 | | 696,196 |
| | | 2,225,563 | | | Pool #RA6801, 3.00%, 2/1/52 | | 2,015,737 |
| | | 3,725,956 | | | Pool #RA6858, 3.00%, 3/1/52 | | 3,353,248 |
| | | 1,273,022 | | | Pool #RA6930, 3.50%, 3/1/52 | | 1,186,510 |
| | | 921,644 | | | Pool #RA6978, 3.50%, 3/1/52 | | 866,255 |
| | | 1,414,510 | | | Pool #RA6983, 2.50%, 3/1/52 | | 1,224,345 |
| | | 468,481 | | | Pool #RA7098, 3.50%, 3/1/52 | | 436,607 |
| | | 167,191 | | | Pool #RA7146, 3.50%, 4/1/52 | | 155,803 |
| | | 2,037,954 | | | Pool #RA7162, 3.50%, 4/1/52 | | 1,899,142 |
| | | 160,645 | | | Pool #RA7284, 3.50%, 4/1/52 | | 150,454 |
| | | 107,905 | | | Pool #RA7344, 4.00%, 4/1/52 | | 104,359 |
13
|
|
| SCHEDULE OF PORTFOLIO INVESTMENTS |
|
| RBC BlueBay Access Capital Community Investment Fund (cont.) |
|
|
| September 30, 2024 |
| | | | | | | | |
Principal Amount | | | | | Value |
| | | |
| | | $5,647,714 | | | Pool #RA7454, 4.00%, 6/1/52 | | $5,427,807 |
| | | 4,160,196 | | | Pool #RA7469, 4.00%, 5/1/52 | | 3,998,853 |
| | | 8,466,383 | | | Pool #RA7503, 4.50%, 7/1/52 | | 8,337,707 |
| | | 2,537,296 | | | Pool #RA7714, 4.50%, 7/1/52 | | 2,498,733 |
| | | 2,333,546 | | | Pool #RA7872, 4.50%, 9/1/52 | | 2,297,357 |
| | | 4,808,583 | | | Pool #RA7897, 4.50%, 9/1/52 | | 4,734,011 |
| | | 3,054,681 | | | Pool #RA8627, 5.50%, 3/1/53 | | 3,103,942 |
| | | 1,648,545 | | | Pool #RA8684, 5.00%, 3/1/53 | | 1,651,357 |
| | | 297,286 | | | Pool #RA9790, 6.00%, 9/1/53 | | 305,103 |
| | | 929,797 | | | Pool #RA9975, 6.00%, 10/1/53 | | 950,398 |
| | | 960,032 | | | Pool #WA3211, 1.91%, 9/1/35 | | 770,674 |
| | | 1,051,982 | | | Pool #WA3305, 1.75%, 6/1/37 | | 803,549 |
| | | 910,754 | | | Pool #WA5002, 2.62%, 11/1/31 | | 832,766 |
| | | 250,000 | | | Pool #WN2304, 4.45%, 12/1/32 | | 250,023 |
| | | 1,000,000 | | | Pool #WN3049, 2.39%, 9/1/31 | | 897,314 |
| | | 46,881 | | | Pool #ZA4891, 3.50%, 3/1/47 | | 44,659 |
| | | 417,271 | | | Pool #ZA4892, 4.00%, 5/1/47 | | 406,248 |
| | | 599,783 | | | Pool #ZA4912, 3.50%, 5/1/47 | | 566,366 |
| | | 595,024 | | | Pool #ZA4913, 4.00%, 5/1/47 | | 579,298 |
| | | 883,882 | | | Pool #ZA5070, 3.50%, 11/1/47 | | 834,872 |
| | | 371,264 | | | Pool #ZA5174, 3.50%, 12/1/47 | | 351,184 |
| | | 1,227,127 | | | Pool #ZA5238, 3.50%, 2/1/48 | | 1,158,759 |
| | | 398,640 | | | Pool #ZA5245, 3.50%, 1/1/48 | | 376,430 |
| | | 764,164 | | | Pool #ZA5253, 3.50%, 1/1/48 | | 721,793 |
| | | 352,930 | | | Pool #ZA5254, 4.00%, 1/1/48 | | 344,599 |
| | | 568,380 | | | Pool #ZA5308, 4.00%, 1/1/48 | | 553,358 |
| | | 626,188 | | | Pool #ZA5575, 4.00%, 7/1/48 | | 608,857 |
| | | 603,345 | | | Pool #ZA5637, 4.50%, 8/1/48 | | 601,555 |
| | | 503,864 | | | Pool #ZA5645, 4.00%, 8/1/48 | | 490,716 |
| | | 57,272 | | | Pool #ZA6576, 3.50%, 4/1/49 | | 54,254 |
| | | 68,666 | | | Pool #ZI0238, 5.00%, 6/1/33 | | 70,218 |
| | | 127,373 | | | Pool #ZI0412, 5.00%, 8/1/33 | | 130,256 |
| | | 55,588 | | | Pool #ZI0543, 4.50%, 8/1/33 | | 56,420 |
| | | 53,114 | | | Pool #ZI1023, 5.50%, 11/1/33 | | 55,171 |
| | | 74,689 | | | Pool #ZI1353, 5.50%, 1/1/34 | | 77,579 |
| | | 112,978 | | | Pool #ZI1493, 5.50%, 1/1/34 | | 117,354 |
| | | 90,123 | | | Pool #ZI1524, 5.50%, 2/1/34 | | 93,612 |
| | | 57,064 | | | Pool #ZI1689, 5.50%, 4/1/34 | | 59,357 |
| | | 45,385 | | | Pool #ZI1802, 5.50%, 4/1/34 | | 47,213 |
| | | 115,484 | | | Pool #ZI1991, 5.00%, 5/1/34 | | 118,161 |
| | | 65,121 | | | Pool #ZI2332, 5.00%, 6/1/34 | | 66,623 |
| | | 123,859 | | | Pool #ZI2939, 5.50%, 12/1/34 | | 128,862 |
| | | 69,415 | | | Pool #ZI3102, 5.00%, 1/1/35 | | 71,013 |
| | | 71,466 | | | Pool #ZI3254, 5.50%, 4/1/35 | | 74,431 |
| | | 152,026 | | | Pool #ZI3507, 5.00%, 9/1/35 | | 155,718 |
| | | 78,374 | | | Pool #ZI3713, 5.00%, 5/1/35 | | 80,278 |
| | | 69,966 | | | Pool #ZI4118, 5.50%, 1/1/36 | | 72,873 |
| | | 125,343 | | | Pool #ZI4120, 5.50%, 1/1/36 | | 130,538 |
14
|
|
| SCHEDULE OF PORTFOLIO INVESTMENTS |
|
| RBC BlueBay Access Capital Community Investment Fund (cont.) |
|
|
| September 30, 2024 |
| | | | | | | | |
Principal Amount | | | | | Value |
| | | |
| | | $169,215 | | | Pool #ZI4200, 5.50%, 2/1/36 | | $176,269 |
| | | 72,083 | | | Pool #ZI4201, 6.00%, 2/1/36 | | 76,515 |
| | | 56,319 | | | Pool #ZI4429, 5.00%, 6/1/35 | | 57,681 |
| | | 50,550 | | | Pool #ZI4521, 5.50%, 7/1/35 | | 52,650 |
| | | 138,360 | | | Pool #ZI4572, 5.50%, 8/1/35 | | 144,127 |
| | | 53,182 | | | Pool #ZI4605, 5.50%, 9/1/35 | | 55,392 |
| | | 2,513 | | | Pool #ZI4606, 5.50%, 9/1/35 | | 2,618 |
| | | 35,439 | | | Pool #ZI4704, 5.00%, 11/1/35 | | 36,291 |
| | | 104,320 | | | Pool #ZI4705, 5.00%, 11/1/35 | | 106,854 |
| | | 44,149 | | | Pool #ZI4706, 5.50%, 11/1/35 | | 45,981 |
| | | 176,572 | | | Pool #ZI4979, 6.00%, 6/1/36 | | 188,439 |
| | | 19,657 | | | Pool #ZI5006, 6.00%, 6/1/36 | | 20,981 |
| | | 154,491 | | | Pool #ZI5912, 5.50%, 4/1/37 | | 161,657 |
| | | 79,944 | | | Pool #ZI6311, 5.50%, 6/1/37 | | 83,652 |
| | | 54,054 | | | Pool #ZI6814, 6.00%, 10/1/37 | | 57,691 |
| | | 48,233 | | | Pool #ZI6976, 5.50%, 7/1/37 | | 50,511 |
| | | 189,747 | | | Pool #ZI9925, 5.00%, 4/1/40 | | 195,036 |
| | | 63,246 | | | Pool #ZJ0038, 4.50%, 5/1/40 | | 63,924 |
| | | 191,112 | | | Pool #ZJ0482, 4.50%, 9/1/40 | | 193,159 |
| | | 202,835 | | | Pool #ZJ0844, 4.00%, 12/1/40 | | 200,035 |
| | | 83,161 | | | Pool #ZJ1264, 4.00%, 1/1/41 | | 82,157 |
| | | 217,286 | | | Pool #ZJ1444, 4.00%, 3/1/41 | | 214,508 |
| | | 92,574 | | | Pool #ZJ1445, 4.50%, 3/1/41 | | 93,334 |
| | | 40,762 | | | Pool #ZJ5032, 6.50%, 5/1/31 | | 42,728 |
| | | 24,561 | | | Pool #ZJ5458, 6.50%, 11/1/31 | | 25,737 |
| | | 18,113 | | | Pool #ZJ5928, 6.50%, 3/1/32 | | 19,115 |
| | | 64,585 | | | Pool #ZJ6638, 6.00%, 11/1/32 | | 68,102 |
| | | 53,324 | | | Pool #ZJ6955, 5.50%, 3/1/33 | | 55,384 |
| | | 38,556 | | | Pool #ZJ6956, 5.50%, 3/1/33 | | 40,046 |
| | | 27,264 | | | Pool #ZK4661, 2.50%, 11/1/27 | | 26,644 |
| | | 265,904 | | | Pool #ZL2630, 3.50%, 12/1/41 | | 253,517 |
| | | 305,475 | | | Pool #ZL2708, 3.50%, 1/1/42 | | 291,246 |
| | | 808,184 | | | Pool #ZL5676, 3.00%, 4/1/43 | | 746,405 |
| | | 369,043 | | | Pool #ZL6090, 3.00%, 6/1/43 | | 341,680 |
| | | 175,219 | | | Pool #ZL6097, 3.00%, 6/1/43 | | 161,801 |
| | | 486,801 | | | Pool #ZL9372, 3.00%, 4/1/45 | | 448,623 |
| | | 329,997 | | | Pool #ZL9669, 3.50%, 6/1/45 | | 313,232 |
| | | 188,628 | | | Pool #ZM1422, 3.50%, 7/1/46 | | 178,531 |
| | | 208,185 | | | Pool #ZM1423, 3.50%, 7/1/46 | | 197,041 |
| | | 151,590 | | | Pool #ZM1736, 3.00%, 9/1/46 | | 139,066 |
| | | 645,425 | | | Pool #ZM1738, 3.00%, 9/1/46 | | 591,363 |
| | | 510,533 | | | Pool #ZM8750, 4.00%, 9/1/48 | | 496,404 |
| | | 276,957 | | | Pool #ZN1022, 4.00%, 11/1/48 | | 269,292 |
| | | 5,108 | | | Pool #ZN5269, 6.50%, 10/1/31 | | 5,353 |
| | | 57,868 | | | Pool #ZN5321, 5.50%, 5/1/34 | | 60,203 |
| | | 35,453 | | | Pool #ZN5322, 5.50%, 5/1/34 | | 36,878 |
| | | 42,149 | | | Pool #ZN5332, 5.00%, 11/1/34 | | 43,122 |
15
|
|
| SCHEDULE OF PORTFOLIO INVESTMENTS |
|
| RBC BlueBay Access Capital Community Investment Fund (cont.) |
|
|
| September 30, 2024 |
| | | | | | | | |
Principal Amount | | | | | Value |
|
| | | |
| | | $ 558,728 | | | Series 2017-SB42, Class A10F, 2.96%, 10/25/27(a) | | $ 535,287 |
| | | 299,113 | | | Series 2018-SB52, Class A10F, 3.48%, 6/25/28(a) | | 290,127 |
| | | 681,112 | | | Series 2018-SB53, Class A10F, 3.66%, 6/25/28(a) | | 659,792 |
| | | 248,132 | | | Series 2018-SB56, Class A10F, 3.70%, 10/25/28(a) | | 241,298 |
| | | 429,388 | | | Series 2019-SB64, Class A10F, 2.71%, 5/25/29(a) | | 403,486 |
| | | 574,184 | | | Series 2019-SB66, Class A5H, (SOFR30A + 0.814%), 4.50%, 6/25/39(b) | | 569,911 |
| | | 1,329,670 | | | Series 2020-SB81, Class A10H, 1.26%, 10/25/40(a) | | 1,125,144 |
| | | 973,202 | | | Series 2022-SB100, Class A10F, 2.01%, 5/25/32(a) | | 845,768 |
| | | 726,565 | | | Series 2022-SB96, Class A7F, 1.88%, 1/25/29(a) | | 662,863 |
| | | 2,769,159 | | | Series Q014, Class A1, 1.56%, 1/25/36 | | 2,323,363 |
| | | | | | | | |
| | | |
| | | | | | | | 209,622,552 |
| | | | | | | | |
| Ginnie Mae — 3.5% | | |
| | | 176,985 | | | Pool #442423, 4.00%, 9/20/41 | | 175,910 |
| | | 77,214 | | | Pool #616936, 5.50%, 1/15/36 | | 80,863 |
| | | 662,490 | | | Pool #618363, 4.00%, 9/20/41 | | 658,442 |
| | | 329,609 | | | Pool #664269, 5.85%, 6/15/38 | | 329,609 |
| | | 130,328 | | | Pool #697672, 5.50%, 12/15/38 | | 136,579 |
| | | 57,599 | | | Pool #697814, 5.00%, 2/15/39 | | 58,954 |
| | | 289,209 | | | Pool #697885, 4.50%, 3/15/39 | | 293,310 |
| | | 89,051 | | | Pool #698112, 4.50%, 5/15/39 | | 90,313 |
| | | 413,866 | | | Pool #698113, 4.50%, 5/15/39 | | 419,734 |
| | | 591,146 | | | Pool #713519, 6.00%, 7/15/39 | | 632,308 |
| | | 151,916 | | | Pool #716822, 4.50%, 4/15/39 | | 154,069 |
| | | 54,430 | | | Pool #716823, 4.50%, 4/15/39 | | 55,201 |
| | | 202,140 | | | Pool #720080, 4.50%, 6/15/39 | | 205,005 |
| | | 230,389 | | | Pool #724629, 5.00%, 7/20/40 | | 237,223 |
| | | 290,512 | | | Pool #726550, 5.00%, 9/15/39 | | 299,113 |
| | | 136,937 | | | Pool #729346, 4.50%, 7/15/41 | | 138,952 |
| | | 202,115 | | | Pool #738844, 3.50%, 10/15/41 | | 193,659 |
| | | 134,604 | | | Pool #738845, 3.50%, 10/15/41 | | 128,973 |
| | | 191,383 | | | Pool #738862, 4.00%, 10/15/41 | | 190,098 |
| | | 164,108 | | | Pool #747241, 5.00%, 9/20/40 | | 168,976 |
| | | 504,922 | | | Pool #748654, 3.50%, 9/15/40 | | 484,134 |
| | | 78,236 | | | Pool #748846, 4.50%, 9/20/40 | | 79,325 |
| | | 241,148 | | | Pool #757016, 3.50%, 11/15/40 | | 231,231 |
| | | 148,831 | | | Pool #757017, 4.00%, 12/15/40 | | 147,847 |
| | | 187,516 | | | Pool #759297, 4.00%, 1/20/41 | | 186,564 |
| | | 133,326 | | | Pool #759298, 4.00%, 2/20/41 | | 132,644 |
| | | 134,612 | | | Pool #762877, 4.00%, 4/15/41 | | 133,702 |
| | | 75,469 | | | Pool #763564, 4.50%, 5/15/41 | | 76,580 |
| | | 164,094 | | | Pool #770481, 4.00%, 8/15/41 | | 162,991 |
| | | 37,747 | | | Pool #770482, 4.50%, 8/15/41 | | 38,303 |
| | | 116,095 | | | Pool #770517, 4.00%, 8/15/41 | | 115,315 |
| | | 109,160 | | | Pool #770529, 4.00%, 8/15/41 | | 108,421 |
| | | 41,625 | | | Pool #770537, 4.00%, 8/15/41 | | 41,345 |
| | | 126,062 | | | Pool #770738, 4.50%, 6/20/41 | | 127,980 |
16
|
|
| SCHEDULE OF PORTFOLIO INVESTMENTS |
|
| RBC BlueBay Access Capital Community Investment Fund (cont.) |
|
|
| September 30, 2024 |
| | | | | | | | |
Principal Amount | | | | | Value |
|
| | | |
| | | $ 146,858 | | | Pool #779592, 4.00%, 11/20/41 | | $ 145,966 |
| | | 95,189 | | | Pool #779593, 4.00%, 11/20/41 | | 94,606 |
| | | 227,090 | | | Pool #AA6312, 3.00%, 4/15/43 | | 209,039 |
| | | 308,919 | | | Pool #AA6424, 3.00%, 5/15/43 | | 285,720 |
| | | 370,554 | | | Pool #AB2733, 3.50%, 8/15/42 | | 354,616 |
| | | 275,722 | | | Pool #AB2745, 3.00%, 8/15/42 | | 255,045 |
| | | 614,379 | | | Pool #AB2841, 3.00%, 9/15/42 | | 568,304 |
| | | 41,180 | | | Pool #AB2843, 3.00%, 9/15/42 | | 38,093 |
| | | 368,296 | | | Pool #AE6946, 3.00%, 6/15/43 | | 340,639 |
| | | 66,229 | | | Pool #AG8915, 4.00%, 2/20/44 | | 65,318 |
| | | 296,180 | | | Pool #AK6446, 3.00%, 1/15/45 | | 272,568 |
| | | 368,983 | | | Pool #AK7036, 3.00%, 4/15/45 | | 339,605 |
| | | 276,423 | | | Pool #AO3594, 3.50%, 8/20/45 | | 263,064 |
| | | 143,127 | | | Pool #AP3887, 3.50%, 9/20/45 | | 136,203 |
| | | 307,827 | | | Pool #AR4919, 3.50%, 3/20/46 | | 292,210 |
| | | 451,059 | | | Pool #AR4970, 3.50%, 4/20/46 | | 428,154 |
| | | 406,864 | | | Pool #AS2921, 3.50%, 4/20/46 | | 386,203 |
| | | 340,197 | | | Pool #AS4332, 3.00%, 6/20/46 | | 312,804 |
| | | 394,212 | | | Pool #AS5511, 3.50%, 3/20/46 | | 374,194 |
| | | 675,485 | | | Pool #AX7237, 3.50%, 11/20/46 | | 641,172 |
| | | 537,537 | | | Pool #BO2104, 3.00%, 8/20/49 | | 485,534 |
| | | 1,436,242 | | | Pool #BR3787, 3.00%, 12/20/49 | | 1,308,847 |
| | | 640,683 | | | Series 2012-100, Class B, 2.31%, 11/16/51(a) | | 580,685 |
| | | 248,318 | | | Series 2012-107, Class A, 1.15%, 1/16/45 | | 230,351 |
| | | 833,794 | | | Series 2012-115, Class A, 2.13%, 4/16/45 | | 732,019 |
| | | 805,025 | | | Series 2012-120, Class A, 1.90%, 2/16/53 | | 700,379 |
| | | 361,678 | | | Series 2012-131, Class A, 1.90%, 2/16/53 | | 314,889 |
| | | 130,268 | | | Series 2012-144, Class AD, 1.77%, 1/16/53 | | 115,090 |
| | | 56,236 | | | Series 2013-105, Class A, 1.71%, 2/16/37 | | 55,549 |
| | | 79,038 | | | Series 2013-126, Class BK, 2.45%, 10/16/47(a) | | 69,899 |
| | | 164,145 | | | Series 2013-29, Class AB, 1.77%, 10/16/45 | | 152,557 |
| | | 79,235 | | | Series 2013-63, Class AB, 1.38%, 3/16/45 | | 77,609 |
| | | 261,134 | | | Series 2013-97, Class AC, 2.00%, 6/16/45 | | 237,421 |
| | | 31,722 | | | Series 2015-107, Class AB, 2.50%, 11/16/49 | | 28,528 |
| | | 247,355 | | | Series 2015-114, Class AD, 2.50%, 11/15/51 | | 237,488 |
| | | 160,993 | | | Series 2015-128, Class AD, 2.50%, 12/16/50 | | 151,532 |
| | | 131,923 | | | Series 2015-130, Class AH, 2.90%, 8/16/47(a) | | 127,413 |
| | | 844,283 | | | Series 2015-135, Class AC, 2.35%, 4/16/49 | | 745,262 |
| | | 303,221 | | | Series 2015-136, Class AC, 2.50%, 3/16/47 | | 279,944 |
| | | 118,614 | | | Series 2015-15, Class A, 2.00%, 11/16/48 | | 107,059 |
| | | 360,879 | | | Series 2015-154, Class AD, 2.50%, 5/16/54 | | 315,746 |
| | | 300,791 | | | Series 2015-171, Class DA, 2.37%, 3/16/46 | | 268,527 |
| | | 271,207 | | | Series 2015-22, Class A, 2.40%, 8/16/47 | | 254,857 |
| | | 404,123 | | | Series 2015-70, Class AB, 2.30%, 11/16/48 | | 362,079 |
| | | 56,729 | | | Series 2016-11, Class AD, 2.25%, 11/16/43 | | 55,290 |
| | | 109,396 | | | Series 2016-14, Class AB, 2.15%, 8/16/42 | | 105,236 |
| | | 758,197 | | | Series 2016-152, Class EA, 2.20%, 8/15/58 | | 617,865 |
17
|
|
| SCHEDULE OF PORTFOLIO INVESTMENTS |
|
| RBC BlueBay Access Capital Community Investment Fund (cont.) |
|
|
| September 30, 2024 |
| | | | | | | | |
Principal Amount | | | | | Value |
|
| | | |
| | | $ 776,852 | | | Series 2016-157, Class AC, 2.00%, 11/16/50 | | $ 672,490 |
| | | 254,202 | | | Series 2016-39, Class AH, 2.50%, 9/16/44 | | 238,508 |
| | | 77,646 | | | Series 2016-50, Class A, 2.30%, 7/16/52 | | 74,980 |
| | | 355,764 | | | Series 2016-64, Class CA, 2.30%, 3/16/45 | | 337,037 |
| | | 162,696 | | | Series 2016-94, Class AC, 2.20%, 8/16/57 | | 136,615 |
| | | 103,815 | | | Series 2016-96, Class BA, 1.95%, 3/16/43 | | 99,697 |
| | | 486,825 | | | Series 2017-127, Class AB, 2.50%, 2/16/59 | | 409,905 |
| | | 799,220 | | | Series 2017-135, Class AE, 2.60%, 10/16/58 | | 679,503 |
| | | 289,833 | | | Series 2017-140, Class A, 2.50%, 2/16/59 | | 243,449 |
| | | 61,909 | | | Series 2017-157, Class AH, 2.55%, 2/16/53 | | 57,308 |
| | | 125,710 | | | Series 2017-41, Class AC, 2.25%, 3/16/57 | | 121,135 |
| | | 360,673 | | | Series 2017-46, Class A, 2.50%, 11/16/57 | | 302,744 |
| | | 251,423 | | | Series 2017-71, Class AS, 2.70%, 4/16/57 | | 230,425 |
| | | 156,397 | | | Series 2017-9, Class AE, 2.40%, 9/16/50 | | 142,142 |
| | | 401,524 | | | Series 2018-2, Class AD, 2.40%, 3/16/59 | | 356,078 |
| | | 205,170 | | | Series 2018-26, Class AD, 2.50%, 3/16/52 | | 192,309 |
| | | | | | | | |
| | | |
| | | | | | | | 25,529,176 |
| | | | | | | | |
| Small Business Administration — 1.3% | | |
| | | 588,390 | | | Pool #130612, 10.63%, 5/25/34 | | 661,066 |
| | | 42,266 | | | Pool #510751, (Prime Index + 0.325%), 8.83%, 6/25/30(b) | | 44,001 |
| | | 240,070 | | | Pool #530089, (Prime Index - 0.125%), 8.38%, 1/25/47(b) | | 257,683 |
| | | 49,659 | | | Pool #530222, (Prime Index + 0.635%), 9.14%, 7/25/32(b) | | 51,065 |
| | | 65,834 | | | Pool #530390, (Prime Index - 1.000%), 7.50%, 11/25/33(b) | | 68,386 |
| | | 218,695 | | | Pool #530413, (Prime Index + 0.825%), 9.33%, 1/25/34(b) | | 238,754 |
| | | 356,187 | | | Pool #530536, (Prime Index - 2.600%), 5.90%, 3/25/34(b) | | 357,015 |
| | | 490,052 | | | Pool #530566, (Prime Index + 1.625%), 10.13%, 5/25/34(b) | | 550,132 |
| | | 95,918 | | | Pool #530594, (Prime Index + 3.625%), 12.13%, 2/25/34(b) | | 113,068 |
| | | 198,189 | | | Pool #530597, (Prime Index + 3.375%), 11.88%, 6/25/34(b) | | 232,695 |
| | | 891,785 | | | Pool #530624, (Prime Index + 3.375%), 11.88%, 5/25/34(b) | | 1,046,047 |
| | | 1,692,831 | | | Pool #530625, (Prime Index + 3.625%), 12.13%, 8/25/34(b) | | 2,007,630 |
| | | 1,059,387 | | | Pool #530626, (Prime Index + 1.625%), 10.13%, 8/25/34(b) | | 1,191,837 |
| | | 863,654 | | | Pool #530627, (Prime Index + 2.125%), 10.63%, 8/25/34(b) | | 975,028 |
| | | 104,200 | | | Pool #540104, (Prime Index + 2.600%), 11.10%, 3/25/33(b) | | 116,986 |
| | | 525,508 | | | Pool #540109, (Prime Index + 1.183%), 9.68%, 5/25/33(b) | | 575,615 |
| | | 98,628 | | | Pool #540110, (Prime Index + 2.499%), 11.00%, 7/25/33(b) | | 111,277 |
| | | | | | | | |
| | | |
| | | | | | | | 8,598,285 |
| | | | | | | | |
| |
Total U.S. Government Agency Backed Mortgages | | 685,318,612 |
| | | | | | | | |
(Cost $742,574,181) | | |
| |
U.S. Government Agency Obligations — 3.6% | | |
Small Business Administration — 3.6% | | |
| | | 135,965 | | | Certificate of Originator’s Fee, 0.23%, 4/15/31(b),(c) | | 548 |
| | | 200,734 | | | Certificate of Originator’s Fee, 0.70%, 4/23/32(b),(c) | | 2,234 |
| | | 560,469 | | | Certificate of Originator’s Fee, 0.98%, 4/15/31(b),(c) | | 9,620 |
| | | 304,864 | | | Certificate of Originator’s Fee, 1.23%, 3/15/31(b),(c) | | 6,568 |
| | | 749,754 | | | Certificate of Originator’s Fee, 1.23%, 4/15/31(b),(c) | | 16,152 |
18
|
|
| SCHEDULE OF PORTFOLIO INVESTMENTS |
|
| RBC BlueBay Access Capital Community Investment Fund (cont.) |
|
|
| September 30, 2024 |
| | | | | | | | |
Principal Amount | | | | | Value |
|
| | | |
| | | $ 404,145 | | | Certificate of Originator’s Fee, 1.23%, 5/15/31(b),(c) | | $ 8,707 |
| | | 243,399 | | | Certificate of Originator’s Fee, 1.23%, 5/15/31(b),(c) | | 5,244 |
| | | 373,275 | | | Certificate of Originator’s Fee, 1.68%, 9/11/32(b),(c) | | 9,926 |
| | | 531,055 | | | Certificate of Originator’s Fee, 1.93%, 5/4/32(b),(c) | | 16,223 |
| | | 339,564 | | | Certificate of Originator’s Fee, 2.22%, 2/20/29(b),(c) | | 11,905 |
| | | 52,015 | | | 4.33%, 12/15/30(b),(c) | | 52,306 |
| | | 239,119 | | | (Prime Index - 2.600%), 5.90%, 9/25/41(b) | | 238,894 |
| | | 131,971 | | | (Prime Index - 2.600%), 5.90%, 9/25/41(b) | | 131,830 |
| | | 190,729 | | | (Prime Index - 2.600%), 5.90%, 7/25/42(b) | | 190,535 |
| | | 396,829 | | | (Prime Index - 2.550%), 5.95%, 7/25/42(b) | | 396,892 |
| | | 139,717 | | | (Prime Index - 2.525%), 5.98%, 11/25/41(b) | | 139,730 |
| | | 145,036 | | | (Prime Index - 2.500%), 6.00%, 2/25/28(b) | | 145,172 |
| | | 90,388 | | | 6.08%, 12/19/29(a),(c) | | 91,270 |
| | | 111,368 | | | 6.58%, 4/8/29(b),(c) | | 112,396 |
| | | 175,675 | | | 7.08%, 7/25/30 | | 176,593 |
| | | 340,349 | | | (Prime Index - 1.400%), 7.10%, 7/25/41(b) | | 348,705 |
| | | 777,329 | | | (Prime Index - 0.675%), 7.83%, 9/25/43(b) | | 809,791 |
| | | 3,188,470 | | | (Prime Index - 0.675%), 7.83%, 11/25/45(b) | | 3,334,431 |
| | | 748,590 | | | (Prime Index - 0.675%), 7.83%, 1/25/46(b) | | 777,125 |
| | | 60,190 | | | (Prime Index - 0.453%), 8.05%, 11/25/27(b) | | 60,659 |
| | | 769,658 | | | (Prime Index - 0.344%), 8.16%, 12/25/45(b) | | 812,267 |
| | | 118,692 | | | (Prime Index - 0.210%), 8.29%, 2/25/40(b) | | 122,847 |
| | | 141,869 | | | (Prime Index - 0.095%), 8.41%, 7/25/29(b) | | 145,379 |
| | | 52,236 | | | (Prime Index + 0.073%), 8.57%, 12/25/40(b) | | 54,657 |
| | | 159,865 | | | (Prime Index + 0.093%), 8.59%, 6/25/29(b) | | 164,612 |
| | | 185,125 | | | (Prime Index + 0.116%), 8.62%, 8/25/29(b) | | 190,936 |
| | | 383,162 | | | (Prime Index + 0.118%), 8.62%, 1/25/46(b) | | 410,975 |
| | | 190,919 | | | (Prime Index + 0.203%), 8.70%, 11/25/28(b) | | 195,646 |
| | | 68,411 | | | (Prime Index + 0.325%), 8.83%, 10/25/30(b) | | 71,399 |
| | | 1,572,587 | | | (Prime Index + 0.325%), 8.83%, 11/25/30(b) | | 1,636,361 |
| | | 612,131 | | | (Prime Index + 0.325%), 8.83%, 6/25/31(b) | | 636,494 |
| | | 1,132,744 | | | (Prime Index + 0.325%), 8.83%, 7/25/31(b) | | 1,186,885 |
| | | 377,104 | | | (Prime Index + 0.325%), 8.83%, 2/25/45(b) | | 404,219 |
| | | 915,712 | | | (Prime Index + 0.325%), 8.83%, 8/25/46(b) | | 983,706 |
| | | 6,660 | | | (Prime Index + 0.355%), 8.86%, 2/25/26(b) | | 6,690 |
| | | 1,233,965 | | | (Prime Index + 0.375%), 8.88%, 5/25/31(b) | | 1,287,894 |
| | | 195,609 | | | (Prime Index + 0.375%), 8.88%, 10/25/31(b) | | 204,258 |
| | | 815,534 | | | (Prime Index + 0.375%), 8.88%, 8/25/46(b) | | 866,756 |
| | | 1,257,653 | | | (Prime Index + 0.517%), 9.02%, 12/25/45(b) | | 1,363,660 |
| | | 29,624 | | | 9.08%, 9/25/29 | | 30,470 |
| | | 637,288 | | | (Prime Index + 0.575%), 9.08%, 4/25/31(b) | | 664,419 |
| | | 16,020 | | | (Prime Index + 0.634%), 9.13%, 8/25/27(b) | | 16,277 |
| | | 392,852 | | | (Prime Index + 0.664%), 9.16%, 11/25/30(b) | | 413,640 |
| | | 23,772 | | | (Prime Index + 0.700%), 9.20%, 2/25/28(b) | | 24,393 |
| | | 239,566 | | | (Prime Index + 0.701%), 9.20%, 5/25/29(b) | | 246,614 |
| | | 146,863 | | | (Prime Index + 0.715%), 9.22%, 3/25/30(b) | | 153,009 |
| | | 106,666 | | | (Prime Index + 0.791%), 9.29%, 2/25/28(b) | | 109,429 |
19
|
|
| SCHEDULE OF PORTFOLIO INVESTMENTS |
|
| RBC BlueBay Access Capital Community Investment Fund (cont.) |
|
|
| September 30, 2024 |
| | | | | | | | |
Principal Amount | | | | | Value |
|
| | | |
| | | $ 66,190 | | | (Prime Index + 0.792%), 9.29%, 9/25/28(b) | | $ 68,173 |
| | | 196,105 | | | (Prime Index + 0.824%), 9.32%, 2/25/29(b) | | 202,350 |
| | | 59,319 | | | (Prime Index + 0.828%), 9.33%, 3/25/29(b) | | 61,054 |
| | | 689,079 | | | (Prime Index + 0.825%), 9.33%, 9/25/31(b) | | 727,168 |
| | | 63,699 | | | (Prime Index + 0.844%), 9.34%, 3/25/31(b) | | 67,155 |
| | | 202,563 | | | (Prime Index + 0.849%), 9.35%, 6/25/29(b) | | 210,559 |
| | | 62,617 | | | (Prime Index + 0.872%), 9.37%, 2/25/30(b) | | 65,440 |
| | | 128,351 | | | (Prime Index + 0.890%), 9.39%, 8/25/30(b) | | 134,758 |
| | | 28,370 | | | (Prime Index + 0.924%), 9.42%, 6/25/28(b) | | 29,079 |
| | | 514,023 | | | (Prime Index + 0.920%), 9.42%, 12/25/30(b) | | 540,073 |
| | | 35,967 | | | (Prime Index + 0.930%), 9.43%, 1/25/29(b) | | 37,109 |
| | | 86,480 | | | (Prime Index + 0.930%), 9.43%, 5/25/29(b) | | 90,126 |
| | | 31,690 | | | (Prime Index + 0.951%), 9.45%, 7/25/29(b) | | 33,059 |
| | | 106,184 | | | (Prime Index + 0.979%), 9.48%, 7/25/29(b) | | 110,400 |
| | | 148,585 | | | (Prime Index + 0.982%), 9.48%, 7/25/30(b) | | 156,255 |
| | | 108,259 | | | (Prime Index + 0.997%), 9.50%, 1/25/31(b) | | 113,693 |
| | | 25,298 | | | (Prime Index + 1.006%), 9.51%, 11/25/28(b) | | 26,241 |
| | | 146,341 | | | (Prime Index + 1.025%), 9.53%, 2/25/31(b) | | 154,023 |
| | | 79,267 | | | (Prime Index + 1.048%), 9.55%, 9/25/29(b) | | 82,814 |
| | | 145,796 | | | (Prime Index + 1.062%), 9.56%, 12/25/29(b) | | 152,527 |
| | | 78,457 | | | (Prime Index + 1.071%), 9.57%, 6/25/30(b) | | 82,272 |
| | | 153,194 | | | (Prime Index + 1.155%), 9.66%, 9/25/28(b) | | 157,322 |
| | | 12,093 | | | (Prime Index + 1.185%), 9.69%, 11/25/26(b) | | 12,331 |
| | | 102,356 | | | (Prime Index + 1.234%), 9.73%, 5/25/29(b) | | 105,367 |
| | | 61,212 | | | (Prime Index + 1.232%), 9.73%, 6/25/29(b) | | 64,127 |
| | | 43,720 | | | (Prime Index + 1.276%), 9.78%, 10/25/31(b) | | 46,592 |
| | | 247,865 | | | (Prime Index + 1.307%), 9.81%, 6/25/31(b) | | 263,093 |
| | | 66,570 | | | 9.88%, 6/7/29(c) | | 68,682 |
| | | 136,872 | | | (Prime Index + 1.575%), 10.08%, 7/25/30(b) | | 144,038 |
| | | 14,214 | | | (Prime Index + 1.602%), 10.10%, 7/25/28(b) | | 14,519 |
| | | 37,188 | | | (Prime Index + 2.325%), 10.83%, 10/25/30(b) | | 39,617 |
| | | 145,824 | | | (Prime Index + 2.325%), 10.83%, 1/25/31(b) | | 158,127 |
| | | | | | | | |
| | | |
| | | | | | | | 23,715,491 |
| | | | | | | | |
| |
Total U.S. Government Agency Obligations | | 23,715,491 |
| | | | | | | | |
(Cost $24,521,657) | | |
| |
Municipal Bonds — 2.0% | | |
California — 0.9% | | |
| | | 2,000,000 | | | California Health Facilities Financing Authority Revenue, 2.93%, 6/1/32, Callable 6/1/29 @ 100 | | 1,820,696 |
| | | 800,000 | | | California Statewide Communities Development Authority Revenue, Series B, 5.25%, 10/20/42, (Credit Support: Ginnie Mae), Callable 10/31/24 @ 100 | | 800,550 |
| | | 200,000 | | | City & County of San Francisco GO, 1.95%, 6/15/27 | | 189,821 |
20
|
|
| SCHEDULE OF PORTFOLIO INVESTMENTS |
|
| RBC BlueBay Access Capital Community Investment Fund (cont.) |
|
|
| September 30, 2024 |
| | | | | | | | |
Principal Amount | | | | | Value |
| | | $1,790,000 | | | City & County of San Francisco GO, Series A, 1.78%, 6/15/29 | | $1,619,901 |
| | | 1,675,000 | | | City of Los Angeles Housing GO, Series A, 2.95%, 9/1/28, Callable 9/1/27 @ 100 | | 1,623,092 |
| | | | | | | | |
| | | | | | | | 6,054,060 |
| | | | | | | | |
| |
| Colorado — 0.00% | | |
| | | 120,655 | | | Colorado Housing & Finance Authority Revenue, Series V, 3.40%, 11/1/45, (Credit Support: FHA) | | 107,214 |
| | | | | | | | |
| |
District of Columbia — 0.1% | | |
| | | 529,948 | | | District of Columbia Housing Finance Agency Revenue, Series A, 3.24%, 3/1/49, (Credit Support: FHA),
Callable 1/1/70 @ 100 | | 502,156 |
| | | | | | | | |
| |
Illinois — 0.00% | | |
| | | 140,000 | | | City of Chicago Multi Family Revenue, Mercy Preservation Project, 4.55%, 8/1/26, (Credit Support: Freddie Mac),
Callable 10/31/24 @ 100 | | 140,141 |
| | | | | | | | |
| |
Minnesota — 0.1% | | |
| | | 453,246 | | | City of Minnetonka Housing Revenue, Series A, 3.00%, 11/1/34, (Credit Support: Fannie Mae) | | 421,464 |
| | | | | | | | |
| |
Missouri — 0.1% | | |
| | | 745,329 | | | Missouri Housing Development Commission Revenue, Series 1, 3.75%, 3/1/42, (Credit Support: FHA),
Callable 3/1/25 @ 100 | | 617,124 |
| | | | | | | | |
| |
New York — 0.7% | | |
| | | 40,000 | | | New York City Housing Development Corp. Revenue, Series G, 2.47%, 11/1/24 | | 39,912 |
| | | 300,000 | | | New York City Housing Development Corp. Revenue, Series B, 1.02%, 5/1/26 | | 284,867 |
| | | 300,000 | | | New York City Housing Development Corp. Revenue, Series G, 2.62%, 5/1/26, Callable 11/1/25 @ 100 | | 292,085 |
| | | 200,000 | | | New York City Housing Development Corp. Revenue, Series B, 1.12%, 11/1/26 | | 187,694 |
| | | 500,000 | | | New York City Housing Development Corp. Revenue, Series B, 3.56%, 11/1/26, Callable 2/1/26 @ 100 | | 493,275 |
| | | 160,000 | | | New York City Housing Development Corp. Revenue, Series B, 1.38%, 5/1/27 | | 148,903 |
| | | 250,000 | | | New York City Housing Development Corp. Revenue, Series B, 1.48%, 11/1/27 | | 230,207 |
| | | 1,000,000 | | | New York City Housing Development Corp. Revenue, Series B, 3.61%, 11/1/27, Callable 2/1/26 @ 100 | | 981,794 |
| | | 500,000 | | | New York City Housing Development Corp. Revenue, State of New York Mortgage Agency, 3.33%, 2/1/28, (Credit Support: SONYMA), Callable 10/4/24 @ 100 | | 499,932 |
| | | 500,000 | | | New York City Housing Development Corp. Revenue, Series B, 3.81%, 11/1/29, Callable 2/1/26 @ 100 | | 487,630 |
21
|
|
| SCHEDULE OF PORTFOLIO INVESTMENTS |
|
| RBC BlueBay Access Capital Community Investment Fund (cont.) |
|
|
| September 30, 2024 |
| | | | | | | | |
Principal Amount | | | | | Value |
| | | $ 265,000 | | | New York State Housing Finance Agency Revenue, Series A, 4.50%, 11/15/27, Callable 10/31/24 @ 100 | | $ 265,161 |
| | | 1,000,000 | | | New York State Housing Finance Agency Revenue, Series A, 4.65%, 11/15/38, Callable 10/31/24 @ 100 | | 1,000,556 |
| | | | | | | | |
| | | | | | | | 4,912,016 |
| | | | | | | | |
| |
| Vermont — 0.00% | | |
| | | 100,000 | | | Vermont Housing Finance Agency Property Transfer Tax Revenue Revenue, 3.45%, 11/1/29 | | 95,981 |
| | | | | | | | |
| |
Washington — 0.1% | | |
| | | 800,000 | | | City of Seattle WA GO, Series B, 3.38%, 12/1/28, Callable 12/1/27 @ 100 | | 785,270 |
| | | | | | | | |
| |
Total Municipal Bonds | | 13,635,426 |
| | | | | | | | |
(Cost $14,260,972) | | |
| |
Corporate Bond — 0.00% | | |
| Consumer, Non-cyclical — 0.00% | | |
| | | 135,000 | | | Montefiore Medical Center, 2.15%, 10/20/26 | | 130,003 |
| | | | | | | | |
| |
Total Corporate Bond | | 130,003 |
| | | | | | | | |
(Cost $135,000) | | |
| | |
| Shares | | | | | |
Investment Company — 1.1% | | |
| | | 7,567,885 | | | RBC BlueBay U.S. Government Money Market Fund, Institutional Class 1(d) | | 7,567,885 |
| | | | | | | | |
| |
Total Investment Company | | 7,567,885 |
| | | | | | | | |
(Cost $7,567,885) | | |
| |
Total Investments | | $730,367,417 |
(Cost $789,059,695)(e) — 109.1% | | |
| |
Liabilities in excess of other assets — (9.1)% | | (60,977,885) |
| | | | | | | | |
| |
| NET ASSETS — 100.0% | | $669,389,532 |
| | | | | | | | |
22
|
|
| SCHEDULE OF PORTFOLIO INVESTMENTS |
|
| RBC BlueBay Access Capital Community Investment Fund (cont.) |
|
|
| September 30, 2024 |
| (a) | Variable or floating rate security, which interest rate adjusts periodically based on changes in current interest rates and prepayments on the underlying pool of assets. Rate shown is the rate in effect as of period end. |
| (b) | Floating rate note. Rate shown is as of report date. |
| (c) | The Pricing Committee has fair valued this security under procedures established by the Fund’s Board of Trustees. |
| (d) | Affiliated investment. |
| (e) | See Notes to Schedules of Portfolio Investments for the tax cost of securities and the breakdown of unrealized appreciation (depreciation). |
Financial futures contracts as of September 30, 2024:
| | | | | | | | | | | | | | | | | | |
Long Position | | Number of Contracts | | Expiration Date | | Value/Unrealized
Depreciation | | | Notional Value | | Clearinghouse |
| 10 Year U.S. Ultra Treasury Bond | | 7 | | December 2024 | | | | | | $ | (897) | | | USD | | $828,078 | | Barclays Capital Group |
| | | | | | | | | | | | | | | | | | |
Total | | | | | | | | | | $ | (897) | | | | | | | |
| | | | | | | | | | | | | | | | | | |
| | | | | | | | | | | | | | | | | | |
Short Position | | Number of Contracts | | Expiration Date | | Value/Unrealized
Appreciation | | | Notional Value | | Clearinghouse |
| 5 Year U.S. Treasury Note | | 302 | | December 2024 | | | | | | $ | 42,275 | | | USD | | $33,184,609 | | Barclays Capital Group |
| | | | | | | | | | | | | | | | | | |
Total | | | | | | | | | | $ | 42,275 | | | | | | | |
| | | | | | | | | | | | | | | | | | |
Abbreviations used are defined below:
FHA - Insured by Federal Housing Administration
GO - General Obligations
SOFR30A - Secured Overnight Financing Rate 30 Day Average
SONYMA - State of New York Mortgage Agency
TBA - To-be-announced
USD - United States Dollar
See Notes to the Financial Statements.
23
|
|
| SCHEDULE OF PORTFOLIO INVESTMENTS |
|
| RBC BlueBay Impact Bond Fund |
|
|
| September 30, 2024 |
| | | | | | | | |
| | | Principal Amount | | | | | Value |
|
U.S. Government Agency Backed Mortgages — 36.6% |
Fannie Mae — 27.6% |
| | | $ 14,900,000 | | | (TBA), 4.50%, 10/1/54 | | $ 14,650,440 |
| | | 3,000,000 | | | (TBA), 2.00%, 10/15/54 | | 2,478,000 |
| | | 50,000 | | | Pool #AN0360, 3.95%, 12/1/45 | | 43,731 |
| | | 2,190,560 | | | Pool #AN0509, 2.72%, 3/1/26 | | 2,145,225 |
| | | 88,037 | | | Pool #AN7868, 3.06%, 12/1/27 | | 85,852 |
| | | 9,304 | | | Pool #BJ0657, 4.00%, 2/1/48 | | 9,046 |
| | | 25,094 | | | Pool #BJ2670, 4.00%, 4/1/48 | | 24,400 |
| | | 51,919 | | | Pool #BJ3178, 4.00%, 11/1/47 | | 50,770 |
| | | 35,919 | | | Pool #BJ5158, 4.00%, 4/1/48 | | 34,925 |
| | | 41,186 | | | Pool #BJ9439, 4.00%, 2/1/48 | | 40,143 |
| | | 47,586 | | | Pool #BJ9477, 4.00%, 4/1/48 | | 46,381 |
| | | 46,156 | | | Pool #BK7924, 4.00%, 11/1/48 | | 44,986 |
| | | 20,954 | | | Pool #BO1263, 3.50%, 6/1/49 | | 19,839 |
| | | 518,655 | | | Pool #BP3417, 2.50%, 5/1/51 | | 449,976 |
| | | 146,310 | | | Pool #BP8741, 2.50%, 6/1/50 | | 127,410 |
| | | 196,057 | | | Pool #BQ7523, 2.00%, 11/1/50 | | 163,149 |
| | | 286,950 | | | Pool #BQ7524, 2.50%, 10/1/50 | | 251,100 |
| | | 1,403,049 | | | Pool #BR2051, 2.50%, 6/1/51 | | 1,217,260 |
| | | 300,000 | | | Pool #BS0915, 1.62%, 3/1/31 | | 252,166 |
| | | 3,500,000 | | | Pool #BS1730, 1.53%, 4/1/28 | | 3,223,282 |
| | | 1,575,000 | | | Pool #BS9741, 5.16%, 10/1/28 | | 1,633,536 |
| | | 2,500,000 | | | Pool #BS9849, 4.97%, 11/1/28 | | 2,458,789 |
| | | 7,950,561 | | | Pool #BT1616, 2.00%, 4/1/51 | | 6,631,344 |
| | | 1,446,931 | | | Pool #BT8237, 4.00%, 6/1/52 | | 1,390,815 |
| | | 3,500,000 | | | Pool #BZ0523, 4.50%, 2/1/29 | | 3,563,586 |
| | | 2,542,706 | | | Pool #BZ0624, 4.87%, 3/1/29 | | 2,621,667 |
| | | 2,225,000 | | | Pool #BZ1147, 4.78%, 6/1/29 | | 2,291,520 |
| | | 42,584 | | | Pool #CA1066, 4.00%, 1/1/48 | | 41,458 |
| | | 21,185 | | | Pool #CA1068, 3.50%, 1/1/48 | | 20,005 |
| | | 34,520 | | | Pool #CA2595, 4.50%, 11/1/48 | | 34,417 |
| | | 63,018 | | | Pool #CA2912, 4.00%, 12/1/48 | | 61,468 |
| | | 43,562 | | | Pool #CA3132, 4.00%, 2/1/49 | | 42,405 |
| | | 43,252 | | | Pool #CA3174, 4.00%, 2/1/49 | | 42,156 |
| | | 258,122 | | | Pool #CA3451, 3.50%, 5/1/49 | | 242,835 |
| | | 186,599 | | | Pool #CA3456, 3.50%, 5/1/49 | | 176,017 |
| | | 312,738 | | | Pool #CA9048, 2.00%, 2/1/51 | | 259,991 |
| | | 976,240 | | | Pool #CB0480, 2.50%, 5/1/51 | | 848,300 |
| | | 560,598 | | | Pool #CB0576, 2.50%, 5/1/51 | | 488,459 |
| | | 1,381,817 | | | Pool #CB2761, 3.00%, 2/1/52 | | 1,246,102 |
| | | 2,131,563 | | | Pool #CB3227, 3.50%, 3/1/52 | | 1,986,584 |
| | | 2,678,123 | | | Pool #CB3764, 4.00%, 6/1/52 | | 2,574,259 |
| | | 1,935,379 | | | Pool #CB3797, 4.00%, 6/1/52 | | 1,860,320 |
| | | 2,095,099 | | | Pool #CB4272, 4.50%, 7/1/52 | | 2,062,932 |
| | | 1,955,009 | | | Pool #CB4314, 4.50%, 8/1/52 | | 1,924,993 |
| | | 1,914,902 | | | Pool #CB4463, 4.50%, 8/1/52 | | 1,885,205 |
| | | 1,968,126 | | | Pool #CB4767, 5.00%, 9/1/52 | | 1,970,106 |
24
|
|
| SCHEDULE OF PORTFOLIO INVESTMENTS |
|
| RBC BlueBay Impact Bond Fund (cont.) |
|
|
| September 30, 2024 |
| | | | | | | | |
| | | Principal Amount | | | | | Value |
|
| | | $2,168,405 | | | Pool #CB4967, 5.50%, 10/1/52 | | $ 2,201,528 |
| | | 1,473,840 | | | Pool #CB5166, 6.00%, 11/1/52 | | 1,506,491 |
| | | 531,325 | | | Pool #CB5202, 6.50%, 11/1/52 | | 547,789 |
| | | 1,071,236 | | | Pool #CB5220, 6.50%, 12/1/52 | | 1,104,587 |
| | | 1,353,832 | | | Pool #CB6607, 5.50%, 7/1/53 | | 1,372,907 |
| | | 1,887,321 | | | Pool #CB6783, 5.00%, 7/1/53 | | 1,890,540 |
| | | 2,013,831 | | | Pool #CB6784, 5.50%, 7/1/53 | | 2,046,254 |
| | | 2,092,429 | | | Pool #CB6826, 5.50%, 7/1/53 | | 2,125,988 |
| | | 2,199,048 | | | Pool #CB7160, 6.50%, 9/1/53 | | 2,266,770 |
| | | 2,081,446 | | | Pool #CB9076, 5.50%, 8/1/54 | | 2,125,660 |
| | | | | | | | |
| | | |
| | | | | | | | 80,905,864 |
| | | | | | | | |
| FNMA, TBA — 0.9% | | |
| | | |
| | | 2,470,000 | | | 4.36%, 10/1/29(a) | | 2,511,970 |
| | | | | | | | |
| |
| Freddie Mac — 7.7% | | |
| | | 37,872 | | | Pool #Q59453, 4.00%, 11/1/48 | | 36,864 |
| | | 191,966 | | | Pool #QB5731, 2.00%, 11/1/50 | | 159,745 |
| | | 190,648 | | | Pool #QB5732, 2.50%, 11/1/50 | | 165,785 |
| | | 861,019 | | | Pool #QC3844, 2.00%, 6/1/51 | | 714,042 |
| | | 247,106 | | | Pool #QC3845, 2.50%, 6/1/51 | | 214,308 |
| | | 950,002 | | | Pool #QC7895, 2.00%, 9/1/51 | | 787,172 |
| | | 767,351 | | | Pool #QE4428, 4.00%, 6/1/52 | | 737,592 |
| | | 1,928,497 | | | Pool #QE6510, 4.50%, 7/1/52 | | 1,902,670 |
| | | 2,073,702 | | | Pool #QG5944, 5.00%, 6/1/53 | | 2,076,559 |
| | | 50,024 | | | Pool #RA1713, 3.00%, 11/1/49 | | 45,444 |
| | | 78,080 | | | Pool #RA1714, 3.00%, 11/1/49 | | 70,931 |
| | | 130,901 | | | Pool #RA2256, 3.00%, 3/1/50 | | 118,865 |
| | | 173,117 | | | Pool #RA2340, 3.00%, 3/1/50 | | 157,146 |
| | | 162,492 | | | Pool #RA2395, 2.50%, 4/1/50 | | 141,901 |
| | | 386,486 | | | Pool #RA2575, 2.50%, 5/1/50 | | 336,801 |
| | | 135,424 | | | Pool #RA2727, 2.00%, 5/1/50 | | 112,885 |
| | | 134,249 | | | Pool #RA2728, 2.50%, 5/1/50 | | 116,949 |
| | | 341,747 | | | Pool #RA2740, 2.50%, 6/1/50 | | 299,581 |
| | | 288,084 | | | Pool #RA3680, 2.50%, 9/1/50 | | 250,692 |
| | | 190,276 | | | Pool #RA3751, 2.00%, 10/1/50 | | 159,253 |
| | | 320,202 | | | Pool #RA4503, 2.00%, 2/1/51 | | 266,196 |
| | | 304,180 | | | Pool #RA4927, 2.00%, 3/1/51 | | 252,610 |
| | | 441,131 | | | Pool #RA5020, 2.00%, 4/1/51 | | 366,205 |
| | | 1,185,929 | | | Pool #RA5195, 2.50%, 5/1/51 | | 1,023,037 |
| | | 822,925 | | | Pool #RA5197, 2.50%, 5/1/51 | | 714,210 |
| | | 451,329 | | | Pool #RA5237, 2.50%, 5/1/51 | | 392,321 |
| | | 1,360,841 | | | Pool #RA5571, 2.50%, 7/1/51 | | 1,179,798 |
| | | 208,165 | | | Pool #RA5621, 2.50%, 8/1/51 | | 180,471 |
| | | 688,778 | | | Pool #RA5701, 2.00%, 8/1/51 | | 570,722 |
| | | 185,656 | | | Pool #RA5874, 2.50%, 9/1/51 | | 160,842 |
| | | 2,264,310 | | | Pool #RA6108, 3.50%, 3/1/52 | | 2,110,478 |
| | | 1,846,698 | | | Pool #RA6760, 3.00%, 2/1/52 | | 1,665,325 |
25
|
|
| SCHEDULE OF PORTFOLIO INVESTMENTS |
|
| RBC BlueBay Impact Bond Fund (cont.) |
|
|
| September 30, 2024 |
| | | | | | | | |
| | | Principal Amount | | | | | Value |
|
| | | $2,014,693 | | | Pool #RA7454, 4.00%, 6/1/52 | | $ 1,936,246 |
| | | 1,645,338 | | | Pool #RA7714, 4.50%, 7/1/52 | | 1,620,331 |
| | | 44,286 | | | Pool #V84506, 4.00%, 7/1/48 | | 43,108 |
| | | 40,846 | | | Pool #V84836, 4.00%, 11/1/48 | | 39,826 |
| | | 59,813 | | | Pool #V85365, 3.50%, 4/1/49 | | 56,744 |
| | | 173,806 | | | Pool #V85381, 3.50%, 4/1/49 | | 164,181 |
| | | 35,953 | | | Series 2018-SB45, Class A10F, 3.16%, 11/25/27(b) | | 35,055 |
| | | 45,083 | | | Series 2018-SB48, Class A10F, 3.37%, 2/25/28(b) | | 43,661 |
| | | 129,646 | | | Series 2019-SB59, Class A10F, 3.47%, 1/25/29(b) | | 126,191 |
| | | 1,070,941 | | | Series 2021-SB87, Class A5H, 0.78%, 4/25/41(b) | | 1,016,948 |
| | | 51,324 | | | Series KF57, Class A, (SOFR30A + 0.654%), 6.00%, 12/25/28(c) | | 51,479 |
| | | 304,686 | | | Series Q014, Class A1, 1.56%, 1/25/36 | | 255,636 |
| | | | | | | | |
| | | |
| | | | | | | | 22,876,806 |
| | | | | | | | |
| Ginnie Mae — 0.0% | | |
| | | 85,407 | | | Pool #AC3667, 1.66%, 8/15/26 | | 81,831 |
| | | 21,075 | | | Pool #BB3740, 4.00%, 11/15/47 | | 20,582 |
| | | 55,425 | | | Pool #BE3008, 4.00%, 4/20/48 | | 54,061 |
| | | 28,680 | | | Series 2018-2, Class AD, 2.40%, 3/16/59 | | 25,434 |
| | | 20,517 | | | Series 2018-26, Class AD, 2.50%, 3/16/52 | | 19,231 |
| | | | | | | | |
| | | |
| | | | | | | | 201,139 |
| | | | | | | | |
| Small Business Administration — 0.2% | | |
| | | 277,230 | | | Pool #130612, 10.63%, 5/25/34 | | 311,472 |
| | | 147,016 | | | Pool #530566, (Prime Index + 1.625%), 10.13%, 5/25/34(c) | | 165,040 |
| | | | | | | | |
| | | |
| | | | | | | | 476,512 |
| | | | | | | | |
| U.S. International Development Finance Corp. — 0.2% | | |
| | | 500,000 | | | Series AA-1, 0.00%, 1/17/26(d) | | 546,824 |
| | | | | | | | |
| |
Total U.S. Government Agency Backed Mortgages | | 107,519,115 |
| | | | | | | | |
(Cost $111,119,414) | | |
| |
Corporate Bonds — 29.8% | | |
Consumer, Non-cyclical — 21.6% | | |
| | | 545,000 | | | AbbVie, Inc., 3.60%, 5/14/25 | | 541,236 |
| | | 2,030,000 | | | AbbVie, Inc., 3.80%, 3/15/25 | | 2,022,264 |
| | | 1,525,000 | | | Amgen, Inc., 4.20%, 2/22/52 | | 1,296,468 |
| | | 3,500,000 | | | Amgen, Inc., 5.25%, 3/2/33 | | 3,643,082 |
| | | 2,892,000 | | | Astrazeneca Finance LLC, 1.75%, 5/28/28 | | 2,670,291 |
| | | 490,000 | | | Astrazeneca Finance LLC, 2.25%, 5/28/31 | | 434,301 |
| | | 2,650,000 | | | Astrazeneca Finance LLC, 5.00%, 2/26/34 | | 2,766,017 |
| | | 2,500,000 | | | Baxalta, Inc., 4.00%, 6/23/25 | | 2,487,517 |
| | | 2,780,000 | | | Becton Dickinson & Co., 5.08%, 6/7/29 | | 2,871,529 |
| | | 2,500,000 | | | Bristol-Myers Squibb Co., 4.90%, 2/22/29 | | 2,583,972 |
| | | 995,000 | | | DH Europe Finance II Sarl, 2.60%, 11/15/29 | | 926,711 |
| | | 100,000 | | | Doris Duke Charitable Foundation (The), Series 2020, 2.35%, 7/1/50 | | 65,099 |
| | | 3,100,000 | | | Elevance Health, Inc., 5.15%, 6/15/29 | | 3,215,262 |
26
|
|
| SCHEDULE OF PORTFOLIO INVESTMENTS |
|
| RBC BlueBay Impact Bond Fund (cont.) |
|
|
| September 30, 2024 |
| | | | | | | | |
| | | Principal Amount | | | | | Value |
|
| | | $1,850,000 | | | EMD Finance LLC, 3.25%, 3/19/25(e) | | $ 1,832,650 |
| | | 1,500,000 | | | Gilead Sciences, Inc., 3.65%, 3/1/26 | | 1,488,044 |
| | | 2,500,000 | | | GlaxoSmithKline Capital, Inc., 3.88%, 5/15/28 | | 2,488,067 |
| | | 2,114,000 | | | Haleon US Capital LLC, 3.63%, 3/24/32 | | 1,986,570 |
| | | 1,861,000 | | | HCA, Inc., 5.45%, 9/15/34 | | 1,915,163 |
| | | 2,250,000 | | | IQVIA, Inc., 6.25%, 2/1/29 | | 2,392,175 |
| | | 400,000 | | | John D and Catherine T MacArthur Foundation, 1.30%, 12/1/30 | | 329,100 |
| | | 2,625,000 | | | Johnson & Johnson, 4.80%, 6/1/29 | | 2,732,382 |
| | | 2,500,000 | | | Kenvue, Inc., 5.00%, 3/22/30 | | 2,610,059 |
| | | 1,200,000 | | | Mary Free Bed Rehabilitation Hospital, Series 2021, 3.79%, 4/1/51 | | 942,593 |
| | | 150,000 | | | Mass General Brigham, Inc., Series 2020, 3.19%, 7/1/49 | | 112,990 |
| | | 250,000 | | | Medtronic, Inc., 4.38%, 3/15/35 | | 248,443 |
| | | 2,600,000 | | | Pfizer Investment Enterprises Pte Ltd., 5.11%, 5/19/43 | | 2,643,209 |
| | | 2,500,000 | | | Reckitt Benckiser Treasury Services Plc, 3.00%, 6/26/27(e) | | 2,425,498 |
| | | 2,000,000 | | | Revvity, Inc., 3.63%, 3/15/51 | | 1,495,619 |
| | | 2,140,000 | | | Roche Holdings, Inc., 5.22%, 3/8/54(e) | | 2,248,471 |
| | | 1,940,000 | | | Royalty Pharma Plc, 5.15%, 9/2/29 | | 1,989,390 |
| | | 1,665,000 | | | Solventum Corp., 5.45%, 2/25/27(e) | | 1,699,509 |
| | | 2,000,000 | | | Southeast Alaska Regional Health Consortium, 2.26%, 7/1/31 | | 1,706,025 |
| | | 2,250,000 | | | Thermo Fisher Scientific, Inc., 2.00%, 10/15/31 | | 1,948,176 |
| | | 100,000 | | | Trinity Health Corp., 4.13%, 12/1/45 | | 89,133 |
| | | 2,500,000 | | | UnitedHealth Group, Inc., 4.90%, 4/15/31 | | 2,585,758 |
| | | | | | | | |
| | | |
| | | | | | | | 63,432,773 |
| | | | | | | | |
| Financial — 4.3% | | |
| | | 350,000 | | | Andrew W Mellon Foundation (The), Series 2020, 0.95%, 8/1/27 | | 323,548 |
| | | 250,000 | | | BlueHub Loan Fund, Inc., Series 2020, 2.89%, 1/1/27 | | 243,490 |
| | | 2,375,000 | | | BlueHub Loan Fund, Inc., Series 2020, 3.10%, 1/1/30 | | 2,217,603 |
| | | 1,600,000 | | | Bridge Housing Corp., 3.25%, 7/15/30 | | 1,420,869 |
| | | 250,000 | | | Community Preservation Corp. (The), Series 2020, 2.87%, 2/1/30 | | 225,610 |
| | | 2,100,000 | | | Healthcare Realty Holdings LP, REIT, 2.40%, 3/15/30 | | 1,832,060 |
| | | 590,000 | | | Low Income Investment Fund, Series 2019, 3.39%, 7/1/26 | | 577,621 |
| | | 1,300,000 | | | Low Income Investment Fund, Series 2019, 3.71%, 7/1/29 | | 1,206,796 |
| | | 2,160,000 | | | Preservation of Affordable Housing, Inc., 4.48%, 12/1/32 | | 2,134,944 |
| | | 2,500,000 | | | Reinvestment Fund, Inc. (The), 3.93%, 2/15/28 | | 2,471,617 |
| | | | | | | | |
| | | |
| | | | | | | | 12,654,158 |
| | | | | | | | |
| Government — 0.4% | | |
| | | 1,200,000 | | | African Development Bank, 5.75%, (f),(g) | | 1,192,500 |
| | | | | | | | |
| |
| Industrial — 1.5% | | |
| | | 2,600,000 | | | Agilent Technologies, Inc., 2.75%, 9/15/29 | | 2,417,210 |
| | | 1,000,000 | | | Nature Conservancy (The), Series A, 0.94%, 7/1/26 | | 941,971 |
| | | 1,000,000 | | | Nature Conservancy (The), Series A, 1.15%, 7/1/27 | | 924,426 |
27
|
|
| SCHEDULE OF PORTFOLIO INVESTMENTS |
|
| RBC BlueBay Impact Bond Fund (cont.) |
|
|
| September 30, 2024 |
| | | | | | | | |
| | | Principal Amount | | | | | Value |
|
| | | $ 70,000 | | | Nature Conservancy (The), Series A, 1.51%, 7/1/29 | | $ 61,885 |
| | | 53,000 | | | Nature Conservancy (The), Series A, 1.86%, 7/1/33 | | 42,381 |
| | | | | | | | |
| | | |
| | | | | | | | 4,387,873 |
| | | | | | | | |
| Utilities — 2.0% | | |
| | | 3,150,000 | | | American Water Capital Corp., 4.45%, 6/1/32 | | 3,162,669 |
| | | 1,534,000 | | | Avangrid, Inc., 3.15%, 12/1/24 | | 1,527,403 |
| | | 1,350,000 | | | Avangrid, Inc., 3.80%, 6/1/29 | | 1,312,821 |
| | | | | | | | |
| | | |
| | | | | | | | 6,002,893 |
| | | | | | | | |
| |
Total Corporate Bonds | | 87,670,197 |
| | | | | | | | |
(Cost $89,552,961) | | |
| |
Municipal Bonds — 14.4% | | |
Alabama — 0.2% | | |
| | | 730,000 | | | Water Works Board of the City of Birmingham Revenue, 2.39%, 1/1/35, Callable 7/1/31 @ 100 | | 611,564 |
| | | | | | | | |
| |
Arizona — 0.3% | | |
| | | 750,000 | | | City of Phoenix Civic Improvement Corp. Revenue, Series C, 1.38%, 7/1/27 | | 703,082 |
| | | 250,000 | | | City of Tucson Water System Revenue, 1.88%, 7/1/30 | | 221,626 |
| | | | | | | | |
| | | |
| | | | | | | | 924,708 |
| | | | | | | | |
Arkansas — 0.00% | | |
| | | 100,000 | | | City of Russellville Water & Sewer Revenue, Series B, 1.23%, 7/1/26, (Credit Support: BAM) | | 95,240 |
| | | | | | | | |
| |
California — 4.5% | | |
| | | 250,000 | | | California Health Facilities. Financing Authority Revenue, 1.68%, 6/1/28 | | 230,312 |
| | | 815,000 | | | California Health Facilities. Financing Authority Revenue, 1.98%, 6/1/30 | | 725,912 |
| | | 990,000 | | | California Health Facilities. Financing Authority Revenue, 2.53%, 6/1/35 | | 831,082 |
| | | 460,000 | | | Calleguas Municipal Water District Revenue, Series A, 2.52%, 7/1/36 | | 371,801 |
| | | 100,000 | | | City & County of San Francisco GO, 1.95%, 6/15/27 | | 94,910 |
| | | 100,000 | | | City of Los Angeles Housing GO, Series A, 2.95%, 9/1/28, Callable 9/1/27 @ 100 | | 96,901 |
| | | 350,000 | | | City of San Buenaventura Revenue, 1.17%, 1/1/26 | | 337,419 |
| | | 750,000 | | | City of Santa Rosa Wastewater Revenue, Series B, 2.12%, 9/1/31 | | 658,931 |
| | | 300,000 | | | City of Santa Rosa Wastewater Revenue, Series B, 2.32%, 9/1/33 | | 255,334 |
| | | 100,000 | | | City of Sunnyvale Wastewater Revenue, Series A, 3.20%, 4/1/26 | | 98,871 |
| | | 210,000 | | | Cucamonga Valley Water District Financing Authority Revenue, Series A, 1.54%, 9/1/27 | | 196,739 |
28
|
|
| SCHEDULE OF PORTFOLIO INVESTMENTS |
|
| RBC BlueBay Impact Bond Fund (cont.) |
|
|
| September 30, 2024 |
| | | | | | | | |
| | | Principal Amount | | | | | Value |
|
| | | $1,500,000 | | | Cucamonga Valley Water District Financing Authority Revenue, Series B, 3.60%, 9/1/27 | | $ 1,489,740 |
| | | 150,000 | | | Escondido Joint Powers Financing Authority Revenue, Series B, 2.44%, 9/1/25 | | 147,497 |
| | | 150,000 | | | Kern Community College District GO, 2.54%, 11/1/26 | | 145,791 |
| | | 240,000 | | | Lancaster Power Authority Revenue, 1.67%, 11/1/27, (Credit Support: AGM) | | 220,994 |
| | | 285,000 | | | Lancaster Power Authority Revenue, 1.92%, 11/1/28, (Credit Support: AGM) | | 257,665 |
| | | 525,000 | | | Lancaster Power Authority Revenue, 2.56%, 11/1/33, (Credit Support: AGM), Callable 11/1/31 @ 100 | | 440,312 |
| | | 525,000 | | | Lancaster Power Authority Revenue, 2.68%, 11/1/34, (Credit Support: AGM), Callable 11/1/31 @ 100 | | 435,490 |
| | | 755,000 | | | Lancaster Power Authority Revenue, 2.79%, 11/1/35, (Credit Support: AGM), Callable 11/1/31 @ 100 | | 620,040 |
| | | 200,000 | | | Rosemead School District GO, Series A, 2.17%, 8/1/25 | | 196,476 |
| | | 250,000 | | | Rowland Water District Revenue, Series A, 1.61%, 12/1/29 | | 222,295 |
| | | 1,000,000 | | | Rowland Water District Revenue, Series A, 1.91%, 12/1/31 | | 861,010 |
| | | 800,000 | | | Rowland Water District Revenue, Series A, 2.56%, 12/1/36, Callable 12/1/31 @ 100 | | 646,318 |
| | | 125,000 | | | San Diego County Water Authority Revenue, Series A, 1.17%, 5/1/27 | | 116,726 |
| | | 100,000 | | | San Francisco City & County Public Utilities Commission Wastewater Revenue, 5.40%, 10/1/28 | | 105,285 |
| | | 400,000 | | | Santa Clara Valley Water District Certificate Participation, Series D, 1.78%, 6/1/31, Callable 6/1/30 @ 100 | | 343,637 |
| | | 1,060,000 | | | Santa Clara Valley Water District Certificate Participation, Series D, 1.88%, 6/1/32, Callable 6/1/30 @ 100 | | 892,883 |
| | | 950,000 | | | Santa Clara Valley Water District Certificate Participation, Series D, 2.08%, 6/1/34, Callable 6/1/30 @ 100 | | 772,978 |
| | | 600,000 | | | Sonoma-Marin Area Rail Transit District Revenue, Series A, 2.02%, 3/1/28 | | 561,680 |
| | | 100,000 | | | State of California Department of Water Resources Revenue, 0.92%, 12/1/26 | | 94,233 |
| | | 315,000 | | | Walnut Valley Water District Revenue, Series A, 0.96%, 6/1/26 | | 300,032 |
| | | 320,000 | | | Walnut Valley Water District Revenue, Series A, 1.17%, 6/1/27 | | 298,499 |
| | | 325,000 | | | Walnut Valley Water District Revenue, Series A, 1.37%, 6/1/28 | | 297,195 |
| | | | | | | | |
| | | |
| | | | | | | | 13,364,988 |
| | | | | | | | |
| Colorado — 0.1% | | |
| | | 50,000 | | | Denver City & County School District No 1 GO, Series B, 2.99%, 12/1/24, (Credit Support: State Aid Withholding) | | 49,854 |
| | | 275,000 | | | Parker Water & Sanitation District GO, 2.10%, 8/1/29 | | 253,901 |
| | | | | | | | |
| | | |
| | | | | | | | 303,755 |
| | | | | | | | |
29
|
|
| SCHEDULE OF PORTFOLIO INVESTMENTS |
|
| RBC BlueBay Impact Bond Fund (cont.) |
|
|
| September 30, 2024 |
| | | | | | | | |
| | | Principal Amount | | | | | Value |
|
Connecticut — 0.1% | | |
| | | $ 325,000 | | | Connecticut Green Bank Revenue, 1.95%, 11/15/28 | | $ 298,711 |
| | | 150,000 | | | South Central Connecticut Regional Water Authority Revenue, Series B, 2.86%, 8/1/30, Callable 8/1/29 @ 100 | | 139,935 |
| | | | | | | | |
| | | |
| | | | | | | | 438,646 |
| | | | | | | | |
| District of Columbia — 0.7% | | |
| | | 340,000 | | | District of Columbia Housing Finance Agency Revenue, Series A, 1.05%, 3/1/25, (Credit Support: FHA) | | 334,675 |
| | | 155,000 | | | District of Columbia Housing Finance Agency Revenue, Series A, 1.15%, 9/1/25, (Credit Support: FHA) | | 150,324 |
| | | 350,000 | | | District of Columbia Housing Finance Agency Revenue, Series A, 1.20%, 3/1/26, (Credit Support: FHA) | | 334,848 |
| | | 195,000 | | | District of Columbia Housing Finance Agency Revenue, Series A, 1.50%, 3/1/27, (Credit Support: FHA) | | 182,910 |
| | | 195,000 | | | District of Columbia Housing Finance Agency Revenue, Series A, 1.60%, 9/1/27, (Credit Support: FHA) | | 181,085 |
| | | 200,000 | | | District of Columbia Housing Finance Agency Revenue, Series A, 1.70%, 3/1/28, (Credit Support: FHA) | | 183,963 |
| | | 135,000 | | | District of Columbia Housing Finance Agency Revenue, Series A, 1.75%, 9/1/28, (Credit Support: FHA) | | 122,849 |
| | | 140,000 | | | District of Columbia Housing Finance Agency Revenue, Series A, 1.95%, 9/1/29, (Credit Support: FHA) | | 125,390 |
| | | 590,000 | | | District of Columbia Housing Finance Agency Revenue, Series A, 2.15%, 3/1/31, (Credit Support: FHA), Callable 3/1/30 @ 100 | | 515,874 |
| | | | | | | | |
| | | |
| | | | | | | | 2,131,918 |
| | | | | | | | |
| |
| Florida — 0.6% | | |
| | | 2,000,000 | | | City of Palm Coast Utility Revenue, 1.44%, 10/1/28 | | 1,820,779 |
| | | | | | | | |
| |
| Georgia — 0.3% | | |
| | | 285,000 | | | Carroll County Water Authority Revenue, Series B, 1.51%, 7/1/27 | | 267,845 |
| | | 75,000 | | | Macon-Bibb County Urban Development Authority Revenue, Series A, 3.00%, 12/1/24, (Credit Support: County Guaranteed) | | 74,766 |
| | | 425,000 | | | Tift County Hospital Authority Revenue, 1.05%, 12/1/25, (Credit Support: County Guaranteed) | | 408,323 |
| | | | | | | | |
| | | |
| | | | | | | | 750,934 |
| | | | | | | | |
| Hawaii — 0.3% | | |
| | | 695,000 | | | City & County of Honolulu GO, Series C, 1.47%, 7/1/28 | | 637,481 |
| | | 250,000 | | | Honolulu City & County Board of Water Supply Revenue, Series B, 1.98%, 7/1/27 | | 237,901 |
| | | | | | | | |
| | | |
| | | | | | | | 875,382 |
| | | | | | | | |
| Idaho — 0.1% | | |
| | | 500,000 | | | Idaho Energy Resources Authority Revenue, 2.86%, 9/1/46 | | 378,674 |
| | | | | | | | |
30
|
|
| SCHEDULE OF PORTFOLIO INVESTMENTS |
|
| RBC BlueBay Impact Bond Fund (cont.) |
|
|
| September 30, 2024 |
| | | | | | | | |
| | | Principal Amount | | | | | Value |
|
Iowa — 0.00% | | |
| | | $ 100,000 | | | Northeast Iowa Community College GO, Series 1, 3.45%, 6/1/26, Callable 10/31/24 @ 100 | | $ 99,193 |
| | | | | | | | |
| |
| Maryland — 0.1% | | |
| | | 225,000 | | | City of Baltimore Revenue, Series B, 1.58%, 7/1/28 | | 206,940 |
| | | | | | | | |
| |
| Massachusetts — 0.5% | | |
| | | 600,000 | | | Boston Water & Sewer Commission Revenue, 1.37%, 11/1/27 | | 558,407 |
| | | 1,040,000 | | | Massachusetts Bay Transportation Authority Sales Tax Revenue, Series B, 2.49%, 7/1/33, Callable 7/1/31 @ 100 | | 901,486 |
| | | | | | | | |
| | | |
| | | | | | | | 1,459,893 |
| | | | | | | | |
| Michigan — 0.7% | | |
| | | 750,000 | | | City of Grand Rapids Sanitary Sewer System Revenue, 1.86%, 1/1/31 | | 658,863 |
| | | 1,330,000 | | | City of Grand Rapids Sanitary Sewer System Revenue, 2.01%, 1/1/32, Callable 1/1/31 @ 100 | | 1,152,020 |
| | | 95,000 | | | Marquette Brownfield Redevelopment Authority Revenue, 3.05%, 5/1/27, (Credit Support: Municipal Government Guaranteed), Callable 5/1/26 @ 100 | | 92,018 |
| | | 225,000 | | | State of Michigan GO, Series B, 1.54%, 5/15/30 | | 196,054 |
| | | | | | | | |
| | | |
| | | | | | | | 2,098,955 |
| | | | | | | | |
| Nebraska — 0.1% | | |
| | | 100,000 | | | City of Omaha Sewer Revenue, Series B, 1.04%, 4/1/26 | | 95,679 |
| | | 250,000 | | | Papio-Missouri River Natural Resource District Special Tax, 2.20%, 12/15/25, Callable 10/31/24 @ 100 | | 243,886 |
| | | | | | | | |
| | | | | | | | 339,565 |
| | | | | | | | |
| Nevada — 0.1% | | |
| | | 250,000 | | | City of Henderson GO, Series A, 2.23%, 6/1/28 | | 235,400 |
| | | | | | | | |
| |
| New York — 0.3% | | |
| | | 600,000 | | | Western Nassau County Water Authority Revenue, Series B, 2.50%, 4/1/34 | | 510,327 |
| | | 500,000 | | | Western Nassau County Water Authority Revenue, Series B, 2.58%, 4/1/35 | | 419,328 |
| | | | | | | | |
| | | |
| | | | | | | | 929,655 |
| | | | | | | | |
| Ohio — 0.1% | | |
| | | 130,000 | | | City of Cincinnati Revenue, Series C, 3.95%, 11/1/28 | | 129,670 |
| | | 100,000 | | | County of Franklin Revenue, 2.88%, 11/1/50, Callable 5/1/50 @ 100 | | 69,708 |
| | | | | | | | |
| | | |
| | | | | | | | 199,378 |
| | | | | | | | |
31
|
|
| SCHEDULE OF PORTFOLIO INVESTMENTS |
|
| RBC BlueBay Impact Bond Fund (cont.) |
|
|
| September 30, 2024 |
| | | | | | | | |
| | | Principal Amount | | | | | Value |
|
Oklahoma — 0.5% | | |
| | | $ 715,000 | | | Oklahoma Capitol Improvement Authority Revenue, Series A, 2.58%, 7/1/28 | | $ 679,964 |
| | | 745,000 | | | Oklahoma Capitol Improvement Authority Revenue, Series A, 2.63%, 7/1/29 | | 698,107 |
| | | | | | | | |
| | | |
| | | | | | | | 1,378,071 |
| | | | | | | | |
| Oregon — 0.6% | | |
| | | 350,000 | | | City of Portland GO, Series B, 1.51%, 6/15/28 | | 321,918 |
| | | 300,000 | | | City of Tigard Water Revenue, 2.00%, 8/1/28, (Credit Support: BAM) | | 278,019 |
| | | 345,000 | | | State of Oregon GO, Series F, 1.32%, 6/1/27 | | 323,264 |
| | | 700,000 | | | State of Oregon GO, Series B, 3.89%, 5/1/30 | | 698,963 |
| | | | | | | | |
| | | |
| | | | | | | | 1,622,164 |
| | | | | | | | |
| Pennsylvania — 1.1% | | |
| | | 1,750,000 | | | City of Philadelphia Water & Wastewater Revenue, Series B, 1.49%, 7/1/27 | | 1,642,755 |
| | | 185,000 | | | City of Philadelphia Water & Wastewater Revenue, Series A, 3.55%, 10/1/28 | | 182,540 |
| | | 825,000 | | | Economy Borough Municipal Authority Revenue, Series A, 1.65%, 12/15/28, (Credit Support: BAM) | | 747,838 |
| | | 500,000 | | | Redevelopment Authority of the City of Philadelphia Revenue, Series A, 1.38%, 9/1/25 | | 484,592 |
| | | 100,000 | | | Redevelopment Authority of the City of Philadelphia Revenue, 4.50%, 11/1/31, Callable 11/1/28 @ 100 | | 99,093 |
| | | | | | | | |
| | | |
| | | | | | | | 3,156,818 |
| | | | | | | | |
| Rhode Island — 0.9% | | |
| | | 1,295,000 | | | Narragansett Bay Commission Revenue, 2.09%, 9/1/30 | | 1,159,939 |
| | | 400,000 | | | Narragansett Bay Commission Revenue, 2.26%, 9/1/32, Callable 9/1/30 @ 100 | | 346,448 |
| | | 150,000 | | | Rhode Island Infrastructure Bank Revenue, 2.70%, 10/1/28 | | 142,730 |
| | | 1,000,000 | | | Rhode Island Infrastructure Bank State Revolving Fund Revenue, Series A, 1.40%, 10/1/28 | | 908,932 |
| | | | | | | | |
| | | |
| | | | | | | | 2,558,049 |
| | | | | | | | |
| Tennessee — 0.1% | | |
| | | 160,000 | | | Metropolitan Government of Nashville & Davidson County Water & Sewer Revenue, Series B, 1.47%, 7/1/27 | | 150,158 |
| | | | | | | | |
| |
| Texas — 1.1% | | |
| | | 250,000 | | | City of Houston Combined Utility System Revenue, Series C, 2.05%, 11/15/26 | | 240,717 |
| | | 170,000 | | | City of Temple Utility System Revenue, 1.11%, 8/1/25 | | 165,571 |
| | | 300,000 | | | City of Temple Utility System Revenue, 1.53%, 8/1/27 | | 281,335 |
| | | 690,000 | | | City of Temple Utility System Revenue, 1.80%, 8/1/29 | | 624,957 |
| | | 800,000 | | | Dallas Area Rapid Transit Revenue, 2.18%, 12/1/32 | | 691,890 |
| | | 335,000 | | | Hidalgo County Drain District No 1 GO, Series A, 0.96%, 9/1/25 | | 325,375 |
| | | 275,000 | | | Hidalgo County Drain District No 1 GO, Series A, 1.11%, 9/1/26 | | 261,416 |
32
|
|
| SCHEDULE OF PORTFOLIO INVESTMENTS |
|
| RBC BlueBay Impact Bond Fund (cont.) |
|
|
| September 30, 2024 |
| | | | | | | | |
| | | Principal Amount | | | | | Value |
|
| | | $ 225,000 | | | Hidalgo County Drain District No 1 GO, Series A, 1.35%, 9/1/27 | | $ 210,438 |
| | | 130,000 | | | Hidalgo County Drain District No 1 GO, Series A, 1.50%, 9/1/28 | | 119,578 |
| | | 300,000 | | | Hidalgo County Drain District No 1 GO, Series A, 1.67%, 9/1/29 | | 271,744 |
| | | | | | | | |
| | | |
| | | | | | | | 3,193,021 |
| | | | | | | | |
| Utah — 0.2% | | |
| | | 520,000 | | | Metropolitan Water District of Salt Lake & Sandy Revenue, Series B, 1.52%, 7/1/28 | | 478,046 |
| | | | | | | | |
| |
| Vermont — 0.00% | | |
| | | 100,000 | | | Vermont Housing Finance Agency Property Transfer Tax Revenue Revenue, 3.45%, 11/1/29 | | 95,981 |
| | | | | | | | |
| |
| Washington — 0.8% | | |
| | | 2,400,000 | | | City of Tacoma Electric System Revenue, Series C, 5.64%, 1/1/27 | | 2,469,995 |
| | | | | | | | |
| |
Total Municipal Bonds | | 42,367,870 |
| | | | | | | | |
(Cost $47,060,824) | | |
| |
Asset Backed Securities — 10.8% | | |
| | | 2,065,000 | | | DEXT ABS 2023-1 LLC, 7.13%, 9/15/32(e) | | 2,159,272 |
| | | 1,550,000 | | | Dext ABS LLC, Series 2021-1, Class D, 2.81%, 3/15/29(e) | | 1,501,038 |
| | | 1,430,000 | | | Dext ABS LLC, Series 2023-1, Class D, 8.82%, 3/15/33(e) | | 1,522,871 |
| | | 1,758,000 | | | Dext ABS LLC, Series 2023-2, Class D, 8.30%, 5/15/34(e) | | 1,812,862 |
| | | 1,559,412 | | | Lendbuzz Securitization Trust, Series 2022-1A, Class A, 4.22%, 5/17/27(e) | | 1,546,634 |
| | | 3,087,578 | | | Lendbuzz Securitization Trust, Series 2023-3A, Class A2, 7.50%, 12/15/28(e) | | 3,154,058 |
| | | 1,000,000 | | | Lendbuzz Securitization Trust, Series 2024-1A, Class B, 6.58%, 9/15/29(e) | | 1,027,915 |
| | | 1,200,000 | | | Lendbuzz Securitization Trust, Series 2024-2A, Class A2, 5.99%, 5/15/29(e) | | 1,211,331 |
| | | 750,000 | | | Lendbuzz Securitization Trust, Series 2024-2A, Class B, 6.52%, 7/16/29(e) | | 774,490 |
| | | 1,085,000 | | | Lendbuzz Securitization Trust, Series 2024-3A, Class C, 5.90%, 11/15/31(e) | | 1,082,187 |
| | | 3,192,948 | | | Luminace Issuer LLC, Series 2022-1, Class B, 5.91%, 7/31/62(e) | | 3,043,637 |
| | | 901,015 | | | Sunnova Helios II Issuer LLC, Series 2021-B, Class A, 1.62%, 7/20/48(e) | | 787,100 |
| | | 1,344,194 | | | Sunnova Helios V Issuer LLC, Series 2021-A, Class A, 1.80%, 2/20/48(e) | | 1,063,026 |
| | | 825,373 | | | Sunnova Helios VII Issuer LLC, Series 2021-C, Class A, 2.03%, 10/20/48(e) | | 701,016 |
| | | 206,343 | | | Sunnova Helios VII Issuer LLC, Series 2021-C, Class C, 2.63%, 10/20/48(e) | | 128,872 |
| | | 1,904,271 | | | Sunnova Helios XI Issuer LLC, Series 2023-A, Class B, 5.60%, 5/20/50(e) | | 1,832,449 |
33
|
|
| SCHEDULE OF PORTFOLIO INVESTMENTS |
|
| RBC BlueBay Impact Bond Fund (cont.) |
|
|
| September 30, 2024 |
| | | | | | | | |
| | | Principal Amount | | | | | Value |
|
| | | $2,390,158 | | | Sunnova Helios XIII Issuer LLC, Series 2024-A, Class C, 7.00%, 2/20/51(e) | | $ 2,262,248 |
| | | 3,764,423 | | | Sunnova Sol IV Issuer LLC, Series 2022-A, Class C, 3.53%, 2/22/49(e) | | 2,469,917 |
| | | 320,000 | | | Switch ABS Issuer LLC, Series 2024-1A, Class A2, 6.28%, 3/25/54(e) | | 329,729 |
| | | 825,000 | | | Switch ABS Issuer LLC, Series 2024-2A, Class A2, 5.44%, 6/25/54(e) | | 833,588 |
| | | 2,400,000 | | | Tesla Auto Lease Trust, Series 2023-A, Class B, 6.41%, 7/20/27(e) | | 2,437,006 |
| | | |
| | | | | | | | |
| |
Total Asset Backed Securities | | 31,681,246 |
| | | | | | | | |
(Cost $32,508,130) | | |
| |
U.S. Government Agency Obligations — 2.8% | | |
Small Business Administration — 1.6% | | |
| | | 244,717 | | | Certificate of Originator’s Fee, 0.03%, 4/15/31(a),(c) | | 114 |
| | | 447,502 | | | Certificate of Originator’s Fee, 0.23%, 3/15/31(a),(c) | | 1,592 |
| | | 344,250 | | | Certificate of Originator’s Fee, 0.23%, 5/15/31(a),(c) | | 1,225 |
| | | 108,364 | | | Certificate of Originator’s Fee, 0.23%, 1/1/34(a) | | 610 |
| | | 179,309 | | | Certificate of Originator’s Fee, 0.23%, 3/1/34(a) | | 1,009 |
| | | 164,250 | | | Certificate of Originator’s Fee, 0.23%, 3/1/34(a) | | 925 |
| | | 187,500 | | | Certificate of Originator’s Fee, 0.23%, 4/1/34(a) | | 1,055 |
| | | 187,500 | | | Certificate of Originator’s Fee, 0.23%, 4/1/34(a) | | 1,055 |
| | | 135,000 | | | Certificate of Originator’s Fee, 0.23%, 4/1/34(a) | | 760 |
| | | 389,700 | | | Certificate of Originator’s Fee, 0.28%, 5/17/46(a),(c) | | 2,966 |
| | | 450,000 | | | Certificate of Originator’s Fee, 0.48%, 9/1/31(a) | | 4,168 |
| | | 85,000 | | | Certificate of Originator’s Fee, 0.48%, 4/1/34(a) | | 999 |
| | | 48,450 | | | Certificate of Originator’s Fee, 0.48%, 4/1/34(a) | | 569 |
| | | 443,934 | | | Certificate of Originator’s Fee, 0.53%, 6/15/31(a),(c) | | 3,640 |
| | | 132,635 | | | Certificate of Originator’s Fee, 0.73%, 2/28/34(a) | | 2,416 |
| | | 262,500 | | | Certificate of Originator’s Fee, 0.73%, 3/26/34(a) | | 4,781 |
| | | 262,500 | | | Certificate of Originator’s Fee, 0.73%, 3/28/34(a) | | 4,781 |
| | | 187,500 | | | Certificate of Originator’s Fee, 0.73%, 3/28/34(a) | | 3,415 |
| | | 222,833 | | | Certificate of Originator’s Fee, 0.78%, 4/15/31(a),(c) | | 2,689 |
| | | 1,350,000 | | | Certificate of Originator’s Fee, 0.78%, 7/15/31(a),(c) | | 16,290 |
| | | 495,000 | | | Certificate of Originator’s Fee, 0.78%, 8/15/31(a),(c) | | 5,973 |
| | | 103,500 | | | Certificate of Originator’s Fee, 0.78%, 8/15/31(a),(c) | | 1,249 |
| | | 404,563 | | | Certificate of Originator’s Fee, 1.03%, 4/15/46(a),(c) | | 11,328 |
| | | 346,986 | | | Certificate of Originator’s Fee, 1.23%, 5/10/31(a) | | 8,236 |
| | | 270,000 | | | Certificate of Originator’s Fee, 1.23%, 8/2/31(a) | | 6,408 |
| | | 139,500 | | | Certificate of Originator’s Fee, 1.23%, 9/16/31(a) | | 3,311 |
| | | 940,950 | | | Certificate of Originator’s Fee, 1.28%, 4/7/46(a),(c) | | 32,743 |
| | | 437,400 | | | Certificate of Originator’s Fee, 1.28%, 6/23/46(a),(c) | | 15,220 |
| | | 1,226,700 | | | Certificate of Originator’s Fee, 1.28%, 6/30/46(a),(c) | | 42,686 |
| | | 212,509 | | | Certificate of Originator’s Fee, 1.73%, 9/8/33(a) | | 9,172 |
| | | 197,638 | | | Certificate of Originator’s Fee, 1.73%, 10/27/33(a) | | 8,530 |
| | | 149,272 | | | Certificate of Originator’s Fee, 1.98%, 8/10/33(a) | | 7,374 |
| | | 127,500 | | | Certificate of Originator’s Fee, 1.98%, 11/16/33(a) | | 6,298 |
34
|
|
| SCHEDULE OF PORTFOLIO INVESTMENTS |
|
| RBC BlueBay Impact Bond Fund (cont.) |
|
|
| September 30, 2024 |
| | | | | | | | |
| | | Principal Amount | | | | | Value |
|
| | | $ 129,939 | | | Certificate of Originator’s Fee, 1.98%, 12/12/33(a) | | $ 6,419 |
| | | 186,547 | | | Certificate of Originator’s Fee, 1.98%, 12/18/33(a) | | 9,215 |
| | | 26,839 | | | (TBA), 5.27%, 3/30/28(a),(c) | | 27,097 |
| | | 11,727 | | | (TBA), 5.58%, 9/23/25(a),(c) | | 11,703 |
| | | 14,504 | | | (Prime Index - 2.500%), 6.00%, 2/25/28(c) | | 14,517 |
| | | 67,614 | | | (Prime Index - 2.500%), 6.00%, 4/25/44(c) | | 67,750 |
| | | 64,461 | | | 7.08%, 7/25/30 | | 64,798 |
| | | 32,389 | | | (Prime Index - 0.675%), 7.83%, 9/25/43(c) | | 33,741 |
| | | 143,490 | | | (Prime Index - 0.675%), 7.83%, 11/25/45(c) | | 150,059 |
| | | 143,686 | | | (Prime Index + 0.118%), 8.62%, 1/25/46(c) | | 154,116 |
| | | 181,955 | | | (Prime Index + 0.325%), 8.83%, 6/25/31(c) | | 189,196 |
| | | 269,060 | | | (Prime Index + 0.325%), 8.83%, 7/25/31(c) | | 281,920 |
| | | 264,372 | | | (Prime Index + 0.325%), 8.83%, 2/25/32(c) | | 277,749 |
| | | 59,075 | | | (Prime Index + 0.325%), 8.83%, 9/25/44(c) | | 63,244 |
| | | 788,866 | | | (Prime Index + 0.325%), 8.83%, 8/25/46(c) | | 847,441 |
| | | 452,533 | | | (Prime Index + 0.375%), 8.88%, 10/25/31(c) | | 472,543 |
| | | 533,323 | | | (Prime Index + 0.375%), 8.88%, 8/25/46(c) | | 566,820 |
| | | 29,624 | | | 9.08%, 9/25/29 | | 30,470 |
| | | 133,864 | | | (Prime Index + 0.575%), 9.08%, 4/25/31(c) | | 139,563 |
| | | 23,685 | | | (Prime Index + 0.592%), 9.09%, 3/25/43(c) | | 25,164 |
| | | 13,777 | | | (Prime Index + 0.700%), 9.20%, 2/25/28(c) | | 14,136 |
| | | 345,116 | | | (Prime Index + 0.825%), 9.33%, 9/25/31(c) | | 364,193 |
| | | 270,158 | | | (Prime Index + 0.875%), 9.38%, 1/25/32(c) | | 286,567 |
| | | 16,866 | | | (Prime Index + 1.006%), 9.51%, 11/25/28(c) | | 17,494 |
| | | 35,020 | | | (Prime Index + 1.232%), 9.73%, 6/25/29(c) | | 36,688 |
| | | 46,063 | | | (Prime Index + 1.575%), 10.08%, 7/25/30(c) | | 48,474 |
| | | 43,138 | | | (Prime Index + 2.325%), 10.83%, 10/25/30(c) | | 45,956 |
| | | 65,376 | | | (Prime Index + 2.325%), 10.83%, 1/25/31(c) | | 70,891 |
| | | | | | | | |
| | | |
| | | | | | | | 4,531,511 |
| | | | | | | | |
| |
| U.S. International Development Finance Corp. — 1.2% | | |
| | | 1,000,000 | | | 1.44%, 4/15/28 | | 936,524 |
| | | 500,000 | | | 1.65%, 4/15/28 | | 471,216 |
| | | 2,108,180 | | | (US Treasury Bill Yield 3-Month + 0.000%), 5.45%, 7/7/40(c) | | 2,108,180 |
| | | | | | | | |
| | | |
| | | | | | | | 3,515,920 |
| | | | | | | | |
| |
Total U.S. Government Agency Obligations | | 8,047,431 |
| | | | | | | | |
(Cost $8,473,115) | | |
| |
Collateralized Mortgage Obligation — 0.9% | | |
| | | 2,800,000 | | | BX Commercial Mortgage Trust, Series 2022-AHP, Class C, (Term SOFR 1M + 2.090%), 7.19%, 1/17/39(c),(e) | | 2,735,639 |
| | | |
| | | | | | | | |
| |
Total Collateralized Mortgage Obligation | | 2,735,639 |
| | | | | | | | |
(Cost $2,787,865) | | |
35
|
|
| SCHEDULE OF PORTFOLIO INVESTMENTS |
|
| RBC BlueBay Impact Bond Fund (cont.) |
|
|
| September 30, 2024 |
| | | | | | | | |
|
Commercial Paper — 8.0% | | |
| | | $5,000,000 | | | Baptist Healthcare System Obligated Group, 4.97%, 10/24/24(h) | | $ 4,983,627 |
| | | 1,000,000 | | | Baptist Healthcare System Obligated Group, 5.27%, 10/3/24(h) | | 999,592 |
| | | 2,250,000 | | | Charlotte-Mecklenburg Hospital Authority, 5.22%, 10/8/24(h) | | 2,247,390 |
| | | 5,000,000 | | | City of Hope, 5.48%, 10/16/24(h) | | 4,988,349 |
| | | 3,000,000 | | | Duke University Health System Inc., 5.35%, 10/16/24(h) | | 2,993,509 |
| | | 2,250,000 | | | Sentara Health, 5.38%, 10/1/24(a),(h) | | 2,250,002 |
| | | 5,000,000 | | | Trinity Health Corp., 5.32%, 10/28/24(h) | | 4,981,298 |
| | | |
| | | | | | | | |
| |
Total Commercial Paper | | 23,443,767 |
| | | | | | | | |
(Cost $23,443,986) | | |
| | |
| Shares | | | | | Value |
Investment Company — 2.5% | | |
| | | 7,460,944 | | | RBC BlueBay U.S. Government Money Market Fund, Institutional Class 1(i) | | 7,460,944 |
| | | | | | | | |
| |
Total Investment Company | | 7,460,944 |
| | | | | | | | |
(Cost $7,460,944) | | |
| |
Total Investments | | $310,926,209 |
(Cost $322,407,239)(j) — 105.8% | | |
| |
Liabilities in excess of other assets — (5.8)% | | (17,014,713) |
| | | | | | | | |
| |
| NET ASSETS — 100.0% | | $293,911,496 |
| | | | | | | | |
| (a) | The Pricing Committee has fair valued this security under procedures established by the Fund’s Board of Trustees. |
| (b) | Variable or floating rate security, which interest rate adjusts periodically based on changes in current interest rates and prepayments on the underlying pool of assets. Rate shown is the rate in effect as of period end. |
| (c) | Floating rate note. Rate shown is as of report date. |
| (d) | Zero Coupon Bond. The rate represents the yield at time of purchase. |
| (e) | Security exempt from registration under Rule 144A or Section 4(2) of the Securities Act of 1933, as amended. These securities may be resold in transactions exempt from registration, normally to qualified institutional buyers. |
| (f) | Security is a fix-to-float security, which carries a fixed coupon until a certain date, upon which it switches to a floating rate. Reference rate and spread are provided if the rate is currently floating. |
| (g) | Perpetual security with no stated maturity date. |
| (h) | The rate represents effective yield at the time of purchase. |
| (i) | Affiliated investment. |
| (j) | See Notes to Schedules of Portfolio Investments for the tax cost of securities and the breakdown of unrealized appreciation (depreciation). |
36
|
|
| SCHEDULE OF PORTFOLIO INVESTMENTS |
|
| RBC BlueBay Impact Bond Fund (cont.) |
|
|
| September 30, 2024 |
Financial futures contracts as of September 30, 2024:
| | | | | | | | | | | | | | | | | | |
Long Position | | Number of Contracts | | Expiration Date | | Value/Unrealized
Appreciation
(Depreciation) | | | Notional Value | | Clearinghouse |
| 2 Year U.S. Treasury Note | | 77 | | December 2024 | | | | | | $ | 36,470 | | | USD | | $16,034,648 | | Barclays Capital Group |
| 30 Year U.S. Treasury Bond | | 172 | | December 2024 | | | | | | | (45,915) | | | USD | | 21,360,250 | | Barclays Capital Group |
| 30 Year U.S. Ultra Treasury Bond | | 136 | | December 2024 | | | | | | | (134,821) | | | USD | | 18,100,750 | | Barclays Capital Group |
| | | | | | | | | | | | | | | | | | |
Total | | | | | | | | | | $ | (144,266) | | | | | | | |
| | | | | | | | | | | | | | | | | | |
| | | | | | | | | | | | | | | | | | |
Short Position | | Number of Contracts | | Expiration Date | | Value/Unrealized
Appreciation | | | Notional Value | | Clearinghouse |
| 5 Year U.S. Treasury Note | | 99 | | December 2024 | | | | | | $ | 7,446 | | | USD | | $10,878,398 | | Barclays Capital Group |
| | | | | | | | | | | | | | | | | | |
Total | | | | | | | | | | $ | 7,446 | | | | | | | |
| | | | | | | | | | | | | | | | | | |
Abbreviations used are defined below:
AGM - Assured Guaranty Municipal Corp.
BAM - Bank of America
FHA - Insured by Federal Housing Administration
GO - General Obligations
REIT - Real Estate Investment Trust
SOFR - Secured Overnight Financing Rate
SOFR30A - Secured Overnight Financing Rate 30 Day Average
TBA - To-be-announced
USD - United States Dollar
See Notes to the Financial Statements.
37
|
|
| FINANCIAL STATEMENTS |
|
| Statements of Assets and Liabilities |
|
|
| September 30, 2024 |
| | | | | | | | | | | | | | |
| | | RBC BlueBay Access Capital | | | | |
| | | Community | | | RBC BlueBay Impact | |
| | | Investment Fund | | | Bond Fund | |
Assets: | | | | | | | | | | | | | | |
Investments in securities, at value: | | | | | | | | | | | | | | |
Unaffiliated investments (cost $781,491,810 and $314,946,295, respectively) | | | | $ | 722,799,532 | | | | | | | $ | 303,465,265 | |
Affiliated investments (cost $7,567,885 and $7,460,944, respectively) | | | | | 7,567,885 | | | | | | | | 7,460,944 | |
Cash at broker for financial futures contracts | | | | | 513,865 | | | | | | | | 1,484,501 | |
Interest and dividend receivable | | | | | 2,577,639 | | | | | | | | 1,621,440 | |
Receivable for capital shares issued | | | | | 403,133 | | | | | | | | 125,655 | |
Receivable for investments sold | | | | | 344,512 | | | | | | | | 37,994 | |
Unrealized appreciation on futures contracts | | | | | 42,275 | | | | | | | | 43,916 | |
Prepaid expenses and other assets | | | | | 14,069 | | | | | | | | 22,690 | |
| | | | | | | | | | | | | | |
| | | | |
Total Assets | | | | | 734,262,910 | | | | | | | | 314,262,405 | |
| | | | | | | | | | | | | | |
Liabilities: | | | | | | | | | | | | | | |
Professional fees payable | | | | | 4,674 | | | | | | | | 4,674 | |
Distributions payable | | | | | 564,049 | | | | | | | | 153,212 | |
Payable for capital shares redeemed | | | | | 503,763 | | | | | | | | 155,562 | |
Payable for investments purchased | | | | | 63,426,336 | | | | | | | | 19,694,740 | |
Unrealized depreciation on futures contracts | | | | | 897 | | | | | | | | 180,736 | |
Accrued expenses and other payables: | | | | | | | | | | | | | | |
Investment advisory fees | | | | | 134,590 | | | | | | | | 55,963 | |
Accounting fees | | | | | 9,651 | | | | | | | | 6,432 | |
Audit fees | | | | | 43,008 | | | | | | | | 43,008 | |
Distribution fees | | | | | 3,301 | | | | | | | | 396 | |
Custodian fees | | | | | 7,189 | | | | | | | | 1,190 | |
Shareholder reports | | | | | 24,921 | | | | | | | | 9,146 | |
Shareholder servicing fees | | | | | 23,851 | | | | | | | | — | |
Transfer agent fees | | | | | 72,531 | | | | | | | | 25,011 | |
Other | | | | | 54,617 | | | | | | | | 20,839 | |
| | | | | | | | | | | | | | |
| | | | |
Total Liabilities | | | | | 64,873,378 | | | | | | | | 20,350,909 | |
| | | | | | | | | | | | | | |
| | | | |
Net Assets | | | | $ | 669,389,532 | | | | | | | $ | 293,911,496 | |
| | | | | | | | | | | | | | |
Net Assets Consists of: | | | | | | | | | | | | | | |
Capital | | | | $ | 792,215,470 | | | | | | | $ | 323,667,531 | |
Accumulated earnings | | | | | (122,825,938 | ) | | | | | | | (29,756,035 | ) |
| | | | | | | | | | | | | | |
| | | | |
Net Assets | | | | $ | 669,389,532 | | | | | | | $ | 293,911,496 | |
| | | | | | | | | | | | | | |
38
|
|
| FINANCIAL STATEMENTS |
|
| Statements of Assets and Liabilities (cont.) |
|
|
| September 30, 2024 |
| | | | | | | | | | | | | | |
| | | RBC BlueBay Access Capital | | | | |
| | | Community | | | RBC BlueBay Impact | |
| | | Investment Fund | | | Bond Fund | |
| | | | |
| Net Assets | | | | | | | | | | | |
Class A | | | | $ | 6,045,460 | | | | | | | $ | 1,551,673 | |
Class I | | | | | 615,905,914 | | | | | | | | 119,229,739 | |
Class IS | | | | | 47,438,158 | | | | | | | | N/A | |
Class R6 | | | | | N/A | | | | | | | | 125,646,380 | |
Class Y | | | | | N/A | | | | | | | | 47,483,704 | |
| | | | | | | | | | | | | | |
| | | | |
Total | | | | $ | 669,389,532 | | | | | | | $ | 293,911,496 | |
| | | | | | | | | | | | | | |
Shares Outstanding (Unlimited number of shares authorized, no par value): | | | | | | | | | | | | | | |
Class A | | | | | 770,584 | | | | | | | | 176,131 | |
Class I | | | | | 78,497,549 | | | | | | | | 13,494,199 | |
Class IS | | | | | 6,048,460 | | | | | | | | N/A | |
Class R6 | | | | | N/A | | | | | | | | 14,224,712 | |
Class Y | | | | | N/A | | | | | | | | 5,380,426 | |
| | | | | | | | | | | | | | |
| | | | |
Total | | | | | 85,316,593 | | | | | | | | 33,275,468 | |
| | | | | | | | | | | | | | |
Net Asset Values and Redemption Prices Per Share: | | | | | | | | | | | | | | |
Class A | | | | $ | 7.85 | | | | | | | $ | 8.81 | |
| | | | | | | | | | | | | | |
Class I | | | | $ | 7.85 | | | | | | | $ | 8.84 | |
| | | | | | | | | | | | | | |
Class IS | | | | $ | 7.84 | | | | | | | $ | N/A | |
| | | | | | | | | | | | | | |
Class R6 | | | | $ | N/A | | | | | | | $ | 8.83 | |
| | | | | | | | | | | | | | |
Class Y | | | | $ | N/A | | | | | | | $ | 8.83 | |
| | | | | | | | | | | | | | |
Maximum Offering Price Per Share: | | | | | | | | | | | | | | |
Class A | | | | $ | 8.16 | | | | | | | $ | 9.15 | |
| | | | | | | | | | | | | | |
Maximum Sales Charge - Class A | | | | | 3.75 | % | | | | | | | 3.75 | % |
| | | | | | | | | | | | | | |
See Notes to the Financial Statements.
39
|
|
| FINANCIAL STATEMENTS |
|
| Statements of Operations |
|
|
| |
For the Year Ended September 30, 2024
| | | | | | | | | | | | | | |
| | | RBC BlueBay Access Capital | | | | |
| | | Community | | | RBC BlueBay Impact | |
| | | Investment Fund | | | Bond Fund | |
Investment Income: | | | | | | | | | | | | | | |
Interest income | | | | $ | 24,036,454 | | | | | | | $ | 10,471,529 | |
Dividend income - affiliated | | | | | 782,054 | | | | | | | | 871,198 | |
| | | | | | | | | | | | | | |
Total Investment Income | | | | | 24,818,508 | | | | | | | | 11,342,727 | |
Expenses: | | | | | | | | | | | | | | |
Investment advisory fees | | | | | 2,315,955 | | | | | | | | 918,223 | |
Distribution fees–Class A | | | | | 16,150 | | | | | | | | 3,024 | |
Accounting fees | | | | | 191,619 | | | | | | | | 89,464 | |
Audit fees | | | | | 47,755 | | | | | | | | 48,926 | |
Custodian fees | | | | | 41,608 | | | | | | | | 8,674 | |
Insurance fees | | | | | 3,683 | | | | | | | | 3,393 | |
Legal fees | | | | | 25,348 | | | | | | | | 66,268 | |
Registrations and filing fees | | | | | 72,819 | | | | | | | | 64,690 | |
Shareholder reports | | | | | 101,598 | | | | | | | | 47,689 | |
Transfer agent fees–Class A | | | | | 391 | | | | | | | | 3,583 | |
Transfer agent fees–Class I | | | | | 398,020 | | | | | | | | 166,933 | |
Transfer agent fees–Class IS | | | | | 46,504 | | | | | | | | — | |
Transfer agent fees–Class R6 | | | | | — | | | | | | | | 19,561 | |
Transfer agent fees–Class Y | | | | | — | | | | | | | | 3,517 | |
Trustees’ fees and expenses | | | | | 24,740 | | | | | | | | 10,158 | |
Shareholder services administration fees–Class I | | | | | 302,800 | | | | | | | | — | |
Tax expense | | | | | 4,420 | | | | | | | | 4,420 | |
Other fees | | | | | 15,544 | | | | | | | | 9,533 | |
| | | | | | | | | | | | | | |
Total expenses before fee waiver/reimbursement | | | | | 3,608,954 | | | | | | | | 1,468,056 | |
Expenses waived/reimbursed by: | | | | | | | | | | | | | | |
Advisor | | | | | (667,219 | ) | | | | | | | (386,323 | ) |
| | | | | | | | | | | | | | |
Net expenses | | | | | 2,941,735 | | | | | | | | 1,081,733 | |
| | | | | | | | | | | | | | |
Net Investment Income | | | | | 21,876,773 | | | | | | | | 10,260,994 | |
| | | | | | | | | | | | | | |
Realized/Unrealized Gains/(Losses): | | | | | | | | | | | | | | |
Net realized gains/(losses) on: | | | | | | | | | | | | | | |
Investment transactions | | | | | 7,582,613 | | | | | | | | (605,761 | ) |
Futures contracts | | | | | (4,382,151 | ) | | | | | | | (618,707 | ) |
| | | | | | | | | | | | | | |
Net realized gains/(losses) | | | | | 3,200,462 | | | | | | | | (1,224,468 | ) |
Net change in unrealized appreciation on: | | | | | | | | | | | | | | |
Investments | | | | | 49,410,925 | | | | | | | | 18,501,967 | |
Futures contracts | | | | | 1,079,817 | | | | | | | | 1,337,969 | |
| | | | | | | | | | | | | | |
Net unrealized gains | | | | | 50,490,742 | | | | | | | | 19,839,936 | |
| | | | | | | | | | | | | | |
Change in net assets resulting from operations | | | | $ | 75,567,977 | | | | | | | $ | 28,876,462 | |
| | | | | | | | | | | | | | |
See Notes to the Financial Statements.
40
|
|
| FINANCIAL STATEMENTS |
|
| Statements of Changes in Net Assets |
|
| | | | | | | | | | | | | | | | |
| | | RBC BlueBay Access Capital | |
| | | Community | |
| | | Investment Fund | |
| | | For the | | | For the | |
| | | Year Ended | | | Year Ended | |
| | | September 30, 2024 | | | September 30, 2023 | |
From Investment Activities | | | | | | | | | | | | | | | | |
Operations: | | | | | | | | | | | | | | | | |
Net investment income | | | | | | $ | 21,876,773 | | | | | | | $ | 20,758,918 | |
Net realized gains/(losses) from investments and futures contracts | | | | | | | 3,200,462 | | | | | | | | (24,502,692 | ) |
Net change in unrealized appreciation/(depreciation) on investments and futures contracts | | | | | | | 50,490,742 | | | | | | | | (1,507,577 | ) |
| | | | | | | | | | | | | | | | |
Change in net assets resulting from operations | | | | | | | 75,567,977 | | | | | | | | (5,251,351 | ) |
| | | | | | | | | | | | | | | | |
Distributions to Shareholders: | | | | | | | | | | | | | | | | |
Class A | | | | | | | (209,509 | ) | | | | | | | (226,861 | ) |
Class I | | | | | | | (21,527,633 | ) | | | | | | | (20,261,352 | ) |
Class IS | | | | | | | (1,712,275 | ) | | | | | | | (1,742,538 | ) |
| | | | | | | | | | | | | | | | |
Change in net assets resulting from shareholder distributions | | | | | | | (23,449,417 | ) | | | | | | | (22,230,751 | ) |
| | | | | | | | | | | | | | | | |
Capital Transactions: (Note 6) | | | | | | | | | | | | | | | | |
Proceeds from shares issued | | | | | | | 90,056,666 | | | | | | | | 121,474,790 | |
Distributions reinvested | | | | | | | 16,034,292 | | | | | | | | 14,581,994 | |
Cost of shares redeemed | | | | | | | (148,286,842 | ) | | | | | | | (153,251,128 | ) |
| | | | | | | | | | | | | | | | |
Change in net assets resulting from capital transactions | | | | | | | (42,195,884 | ) | | | | | | | (17,194,344 | ) |
| | | | | | | | | | | | | | | | |
Net increase/(decrease) in net assets | | | | | | | 9,922,676 | | | | | | | | (44,676,446 | ) |
Net Assets: | | | | | | | | | | | | | | | | |
Beginning of year | | | | | | | 659,466,856 | | | | | | | | 704,143,302 | |
| | | | | | | | | | | | | | | | |
End of year | | | | | | $ | 669,389,532 | | | | | | | $ | 659,466,856 | |
| | | | | | | | | | | | | | | | |
Share Transactions: | | | | | | | | | | | | | | | | |
Issued | | | | | | | 11,981,562 | | | | | | | | 16,040,760 | |
Reinvested | | | | | | | 2,126,253 | | | | | | | | 1,918,222 | |
Redeemed | | | | | | | (19,640,630 | ) | | | | | | | (20,260,166 | ) |
| | | | | | | | | | | | | | | | |
Change in shares resulting from capital transactions | | | | | | | (5,532,815 | ) | | | | | | | (2,301,184 | ) |
| | | | | | | | | | | | | | | | |
See Notes to the Financial Statements.
41
|
|
| FINANCIAL STATEMENTS |
|
| Statements of Changes in Net Assets |
|
| | | | | | | | | | | | | | | | |
| | | RBC BlueBay Impact
Bond Fund | |
| | | For the
Year Ended
September 30, 2024 | | | For the
Year Ended
September 30, 2023 | |
From Investment Activities | | | | | | | | | | | | | | | | |
Operations: | | | | | | | | | | | | | | | | |
Net investment income | | | | | | $ | 10,260,994 | | | | | | | $ | 7,327,167 | |
Net realized losses from investments and futures contracts | | | | | | | (1,224,468 | ) | | | | | | | (10,113,113 | ) |
Net change in unrealized appreciation on investments and futures contracts | | | | | | | 19,839,936 | | | | | | | | 3,098,325 | |
| | | | | | | | | | | | | | | | |
Change in net assets resulting from operations | | | | | | | 28,876,462 | | | | | | | | 312,379 | |
| | | | | | | | | | | | | | | | |
Distributions to Shareholders: | | | | | | | | | | | | | | | | |
Class A | | | | | | | (43,807 | ) | | | | | | | (29,225 | ) |
Class I | | | | | | | (4,395,789 | ) | | | | | | | (3,371,710 | ) |
Class R6 | | | | | | | (3,676,830 | ) | | | | | | | (2,376,728 | ) |
Class Y | | | | | | | (2,076,581 | ) | | | | | | | (1,708,221 | ) |
| | | | | | | | | | | | | | | | |
Change in net assets resulting from shareholder distributions | | | | | | | (10,193,007 | ) | | | | | | | (7,485,884 | ) |
| | | | | | | | | | | | | | | | |
Capital Transactions: (Note 6) | | | | | | | | | | | | | | | | |
Proceeds from shares issued | | | | | | | 71,764,723 | | | | | | | | 46,839,383 | |
Distributions reinvested | | | | | | | 9,039,430 | | | | | | | | 7,260,946 | |
Cost of shares redeemed | | | | | | | (46,746,385 | ) | | | | | | | (19,401,797 | ) |
| | | | | | | | | | | | | | | | |
Change in net assets resulting from capital transactions | | | | | | | 34,057,768 | | | | | | | | 34,698,532 | |
| | | | | | | | | | | | | | | | |
Net increase in net assets | | | | | | | 52,741,223 | | | | | | | | 27,525,027 | |
Net Assets: | | | | | | | | | | | | | | | | |
Beginning of year | | | | | | | 241,170,273 | | | | | | | | 213,645,246 | |
| | | | | | | | | | | | | | | | |
End of year | | | | | | $ | 293,911,496 | | | | | | | $ | 241,170,273 | |
| | | | | | | | | | | | | | | | |
Share Transactions: | | | | | | | | | | | | | | | | |
Issued | | | | | | | 8,359,273 | | | | | | | | 5,487,959 | |
Reinvested | | | | | | | 1,058,893 | | | | | | | | 854,695 | |
Redeemed | | | | | | | (5,517,191 | ) | | | | | | | (2,280,281 | ) |
| | | | | | | | | | | | | | | | |
Change in shares resulting from capital transactions | | | | | | | 3,900,975 | | | | | | | | 4,062,373 | |
| | | | | | | | | | | | | | | | |
See Notes to the Financial Statements.
42
RBC BlueBay Access Capital Community Investment Fund
(Selected data for a share outstanding throughout the periods indicated)
| | | | | | | | | | | | | | | | | | | | | | | | | | | | | | | | | | | | |
| | | | | | | | | Investment Activities | | | Distributions | | | | | | | |
| | | Net Asset
Value,
Beginning
of Year | | | Net
Investment
Income(a) | | | Net Realized
and Unrealized
Gains (Losses)
on Investments | | | Total from
Investment
Activities | | | Net
Investment
Income | | | Total
Distributions | | | Net Asset
Value, End
of Year | |
Class A | | | | | | | | | | | | | | | | | | | | | | | | | | | | | | | | | | | | |
Year Ended 9/30/24 | | | | | | | $7.26 | | | | 0.22 | | | | 0.61 | | | | 0.83 | | | | (0.24 | ) | | | (0.24 | ) | | | | | | | $7.85 | |
Year Ended 9/30/23 | | | | | | | 7.56 | | | | 0.20 | | | | (0.28 | ) | | | (0.08 | ) | | | (0.22 | ) | | | (0.22 | ) | | | | | | | 7.26 | |
Year Ended 9/30/22 | | | | | | | 8.93 | | | | 0.11 | | | | (1.33 | ) | | | (1.22 | ) | | | (0.15 | ) | | | (0.15 | ) | | | | | | | 7.56 | |
Year Ended 9/30/21 | | | | | | | 9.13 | | | | 0.10 | | | | (0.15 | ) | | | (0.05 | ) | | | (0.15 | ) | | | (0.15 | ) | | | | | | | 8.93 | |
Year Ended 9/30/20 | | | | | | | 9.00 | | | | 0.16 | | | | 0.17 | | | | 0.33 | | | | (0.20 | ) | | | (0.20 | ) | | | | | | | 9.13 | |
Class I | | | | | | | | | | | | | | | | | | | | | | | | | | | | | | | | | | | | |
Year Ended 9/30/24 | | | | | | | $7.26 | | | | 0.25 | | | | 0.61 | | | | 0.86 | | | | (0.27 | ) | | | (0.27 | ) | | | | | | | $7.85 | |
Year Ended 9/30/23 | | | | | | | 7.56 | | | | 0.23 | | | | (0.29 | ) | | | (0.06 | ) | | | (0.24 | ) | | | (0.24 | ) | | | | | | | 7.26 | |
Year Ended 9/30/22 | | | | | | | 8.92 | | | | 0.15 | | | | (1.33 | ) | | | (1.18 | ) | | | (0.18 | ) | | | (0.18 | ) | | | | | | | 7.56 | |
Year Ended 9/30/21 | | | | | | | 9.13 | | | | 0.13 | | | | (0.16 | ) | | | (0.03 | ) | | | (0.18 | ) | | | (0.18 | ) | | | | | | | 8.92 | |
Year Ended 9/30/20 | | | | | | | 8.99 | | | | 0.19 | | | | 0.18 | | | | 0.37 | | | | (0.23 | ) | | | (0.23 | ) | | | | | | | 9.13 | |
Class IS | | | | | | | | | | | | | | | | | | | | | | | | | | | | | | | | | | | | |
Year Ended 9/30/24 | | | | | | | $7.26 | | | | 0.25 | | | | 0.60 | | | | 0.85 | | | | (0.27 | ) | | | (0.27 | ) | | | | | | | $7.84 | |
Year Ended 9/30/23 | | | | | | | 7.56 | | | | 0.23 | | | | (0.28 | ) | | | (0.05 | ) | | | (0.25 | ) | | | (0.25 | ) | | | | | | | 7.26 | |
Year Ended 9/30/22 | | | | | | | 8.92 | | | | 0.15 | | | | (1.33 | ) | | | (1.18 | ) | | | (0.18 | ) | | | (0.18 | ) | | | | | | | 7.56 | |
Year Ended 9/30/21 | | | | | | | 9.12 | | | | 0.13 | | | | (0.15 | ) | | | (0.02 | ) | | | (0.18 | ) | | | (0.18 | ) | | | | | | | 8.92 | |
Year Ended 9/30/20 | | | | | | | 8.98 | | | | 0.19 | | | | 0.18 | | | | 0.37 | | | | (0.23 | ) | | | (0.23 | ) | | | | | | | 9.12 | |
| (a) | Per share net investment income (loss) has been calculated using the average daily shares method. |
43
RBC BlueBay Access Capital Community Investment Fund
(Selected data for a share outstanding throughout the periods indicated)
| | | | | | | | | | | | | | | | | | | | | | | | | | | | | | | | |
| | | | | | Ratios/Supplemental Data | |
| | | Total
Return(a)(b) | | | Net Assets,
End of
Year (000’s) | | | Ratio of
Net Expenses
to Average
Net Assets | | | Ratio of
Expenses to
Average Net
Assets After
Fees Waived/
Reimbursed and
Excluding
Interest Expense | | | Ratio of
Net Investment
Income (Loss)
to Average
Net Assets | | | Ratio of
Expenses to
Average Net
Assets* | | | Portfolio
Turnover
Rate** | |
Class A | | | | | | | | | | | | | | | | | | | | | | | | | | | | | | | | |
Year Ended 9/30/24 | | | 11.68% | | | | | | | $ | 6,045 | | | | 0.80% | | | | 0.80% | | | | 2.97% | | | | 0.80% | | | | 127% | |
Year Ended 9/30/23 | | | (1.20)% | | | | | | | | 6,963 | | | | 0.80% | | | | 0.80% | | | | 2.61% | | | | 1.05% | | | | 74% | |
Year Ended 9/30/22 | | | (13.84)% | | | | | | | | 9,515 | | | | 0.80% | | | | 0.80% | | | | 1.36% | | | | 0.84% | | | | 21% | |
Year Ended 9/30/21 | | | (0.61)% | | | | | | | | 14,233 | | | | 0.80% | | | | 0.80% | | | | 1.07% | | | | 0.86% | | | | 25% | |
Year Ended 9/30/20 | | | 3.65% | | | | | | | | 16,662 | | | | 0.80% | | | | 0.80% | | | | 1.71% | | | | 0.90% | | | | 23% | |
Class I | | | | | | | | | | | | | | | | | | | | | | | | | | | | | | | | |
Year Ended 9/30/24 | | | 12.03% | | | | | | | $ | 615,906 | | | | 0.45% | | | | 0.45% | | | | 3.32% | | | | 0.55% | | | | 127% | |
Year Ended 9/30/23 | | | (0.85)% | | | | | | | | 600,100 | | | | 0.45% | | | | 0.45% | | | | 2.98% | | | | 0.53% | | | | 74% | |
Year Ended 9/30/22 | | | (13.44)% | | | | | | | | 643,252 | | | | 0.45% | | | | 0.45% | | | | 1.74% | | | | 0.51% | | | | 21% | |
Year Ended 9/30/21 | | | (0.37)% | | | | | | | | 701,768 | | | | 0.45% | | | | 0.45% | | | | 1.42% | | | | 0.52% | | | | 25% | |
Year Ended 9/30/20 | | | 4.13% | | | | | | | | 562,573 | | | | 0.45% | | | | 0.45% | | | | 2.06% | | | | 0.51% | | | | 23% | |
Class IS | | | | | | | | | | | | | | | | | | | | | | | | | | | | | | | | |
Year Ended 9/30/24 | | | 11.95% | | | | | | | $ | 47,438 | | | | 0.40% | | | | 0.40% | | | | 3.36% | | | | 0.53% | | | | 127% | |
Year Ended 9/30/23 | | | (0.80)% | | | | | | | | 52,403 | | | | 0.40% | | | | 0.40% | | | | 3.03% | | | | 0.53% | | | | 74% | |
Year Ended 9/30/22 | | | (13.40)% | | | | | | | | 51,376 | | | | 0.40% | | | | 0.40% | | | | 1.87% | | | | 0.50% | | | | 21% | |
Year Ended 9/30/21 | | | (0.21)% | | | | | | | | 31,237 | | | | 0.40% | | | | 0.40% | | | | 1.47% | | | | 0.55% | | | | 25% | |
Year Ended 9/30/20 | | | 4.19% | | | | | | | | 15,566 | | | | 0.40% | | | | 0.40% | | | | 2.06% | | | | 0.59% | | | | 23% | |
| * | During the period, certain fees were contractually or voluntarily reduced and/or reimbursed. If such contractual/voluntary fee reductions and reimbursements had not occurred, the ratio would have been as indicated. |
| ** | Portfolio turnover rate is calculated on the basis of the Fund as a whole without distinguishing between the classes of shares issued. |
| (a) | Excludes sales charge. |
| (b) | Assumes investment at net asset value at the beginning of the period, reinvestment of all dividends and distributions, and a complete redemption of the investment at net asset value at the end of the period. |
See Notes to the Financial Statements.
44
RBC BlueBay Impact Bond Fund
(Selected data for a share outstanding throughout the periods indicated)
| | | | | | | | | | | | | | | | | | | | | | | | | | | | | | | | |
| | | | | | Investment Activities | | | Distributions | | | | |
| | | Net Asset
Value,
Beginning
of Period | | | Net
Investment
Income(a) | | | Net Realized
and Unrealized
Gains (Losses)
on Investments | | | Total from
Investment
Activities | | | Net
Investment
Income | | | Net
Realized
Gains | | | Total
Distributions | | | Net Asset
Value, End
of Year | |
Class A | | | | | | | | | | | | | | | | | | | | | | | | | | | | | | | | |
Year Ended 9/30/24 | | | $ 8.19 | | | | 0.31 | | | | 0.62 | | | | 0.93 | | | | (0.31 | ) | | | — | | | | (0.31 | ) | | | $8.81 | |
Year Ended 9/30/23 | | | 8.42 | | | | 0.25 | | | | (0.23 | ) | | | 0.02 | | | | (0.25 | ) | | | — | | | | (0.25 | ) | | | 8.19 | |
Year Ended 9/30/22 | | | 10.17 | | | | 0.17 | | | | (1.71 | ) | | | (1.54 | ) | | | (0.14 | ) | | | (0.07 | ) | | | (0.21 | ) | | | 8.42 | |
Year Ended 9/30/21 | | | 10.58 | | | | 0.09 | | | | (0.24 | ) | | | (0.15 | ) | | | (0.12 | ) | | | (0.14 | ) | | | (0.26 | ) | | | 10.17 | |
Period Ended 9/30/20(b) | | | 10.15 | | | | 0.11 | | | | 0.44 | | | | 0.55 | | | | (0.12 | ) | | | — | | | | (0.12 | ) | | | 10.58 | |
Class I | | | | | | | | | | | | | | | | | | | | | | | | | | | | | | | | |
Year Ended 9/30/24 | | | $ 8.21 | | | | 0.33 | | | | 0.63 | | | | 0.96 | | | | (0.33 | ) | | | — | | | | (0.33 | ) | | | $8.84 | |
Year Ended 9/30/23 | | | 8.44 | | | | 0.27 | | | | (0.23 | ) | | | 0.04 | | | | (0.27 | ) | | | — | | | | (0.27 | ) | | | 8.21 | |
Year Ended 9/30/22 | | | 10.19 | | | | 0.16 | | | | (1.67 | ) | | | (1.51 | ) | | | (0.17 | ) | | | (0.07 | ) | | | (0.24 | ) | | | 8.44 | |
Year Ended 9/30/21 | | | 10.59 | | | | 0.12 | | | | (0.23 | ) | | | (0.11 | ) | | | (0.15 | ) | | | (0.14 | ) | | | (0.29 | ) | | | 10.19 | |
Year Ended 9/30/20 | | | 10.22 | | | | 0.20 | | | | 0.52 | | | | 0.72 | | | | (0.23 | ) | | | (0.12 | ) | | | (0.35 | ) | | | 10.59 | |
Class R6 | | | | | | | | | | | | | | | | | | | | | | | | | | | | | | | | |
Year Ended 9/30/24 | | | $ 8.21 | | | | 0.34 | | | | 0.61 | | | | 0.95 | | | | (0.33 | ) | | | — | | | | (0.33 | ) | | | $8.83 | |
Year Ended 9/30/23 | | | 8.44 | | | | 0.27 | | | | (0.22 | ) | | | 0.05 | | | | (0.28 | ) | | | — | | | | (0.28 | ) | | | 8.21 | |
Year Ended 9/30/22 | | | 10.19 | | | | 0.16 | | | | (1.67 | ) | | | (1.51 | ) | | | (0.17 | ) | | | (0.07 | ) | | | (0.24 | ) | | | 8.44 | |
Year Ended 9/30/21 | | | 10.60 | | | | 0.12 | | | | (0.24 | ) | | | (0.12 | ) | | | (0.15 | ) | | | (0.14 | ) | | | (0.29 | ) | | | 10.19 | |
Year Ended 9/30/20 | | | 10.22 | | | | 0.21 | | | | 0.52 | | | | 0.73 | | | | (0.23 | ) | | | (0.12 | ) | | | (0.35 | ) | | | 10.60 | |
Class Y | | | | | | | | | | | | | | | | | | | | | | | | | | | | | | | | |
Year Ended 9/30/24 | | | $ 8.20 | | | | 0.33 | | | | 0.63 | | | | 0.96 | | | | (0.33 | ) | | | — | | | | (0.33 | ) | | | $8.83 | |
Year Ended 9/30/23 | | | 8.43 | | | | 0.27 | | | | (0.22 | ) | | | 0.05 | | | | (0.28 | ) | | | — | | | | (0.28 | ) | | | 8.20 | |
Year Ended 9/30/22 | | | 10.19 | | | | 0.16 | | | | (1.68 | ) | | | (1.52 | ) | | | (0.17 | ) | | | (0.07 | ) | | | (0.24 | ) | | | 8.43 | |
Period Ended 9/30/21(c) | | | 10.15 | | | | 0.05 | | | | 0.04 | | | | 0.09 | | | | (0.05 | ) | | | — | | | | (0.05 | ) | | | 10.19 | |
| (a) | Per share net investment income (loss) has been calculated using the average daily shares method. |
| (b) | For the period from January 28, 2020 (commencement of operations) through September 30, 2020. |
| (c) | For the period from April 12, 2021 (commencement of operations) through September 30, 2021. |
45
RBC BlueBay Impact Bond Fund
(Selected data for a share outstanding throughout the periods indicated)
| | | | | | | | | | | | | | | | | | | | | | | | | | | | |
| | | | | | Ratios/Supplemental Data | |
| | | Total
Return(a) | | | Net Assets,
End of
Year (000’s) | | | Ratio of
Net Expenses
to Average
Net Assets | | | Ratio of
Net Investment
Income (Loss)
to Average
Net Assets | | | Ratio of
Expenses to
Average Net
Assets* | | | Portfolio
Turnover
Rate** | |
Class A | | | | | | | | | | | | | | | | | | | | | | | | | | | | |
Year Ended 9/30/24 | | | 11.51% | | | | | | | $ | 1,552 | | | | 0.69% | | | | 3.66% | | | | 1.03% | | | | 79% | |
Year Ended 9/30/23 | | | 0.18% | | | | | | | | 974 | | | | 0.70% | | | | 2.89% | | | | 1.09% | | | | 79% | |
Year Ended 9/30/22 | | | (15.30)% | | | | | | | | 941 | | | | 0.70% | | | | 1.91% | | | | 0.70% | | | | 33% | |
Year Ended 9/30/21 | | | (1.47)% | | | | | | | | 21 | | | | 0.70% | | | | 0.91% | | | | 54.43% | | | | 36% | |
Period Ended 9/30/20(b) | | | 5.48%(c) | | | | | | | | 11 | | | | 0.70%(d) | | | | 1.56%(d) | | | | 85.65%(d) | | | | 31% | |
Class I | | | | | | | | | | | | | | | | | | | | | | | | | | | | |
Year Ended 9/30/24 | | | 11.89% | | | | | | | $ | 119,230 | | | | 0.44% | | | | 3.88% | | | | 0.63% | | | | 79% | |
Year Ended 9/30/23 | | | 0.44% | | | | | | | | 108,268 | | | | 0.45% | | | | 3.15% | | | | 0.62% | | | | 79% | |
Year Ended 9/30/22 | | | (15.05)% | | | | | | | | 95,006 | | | | 0.45% | | | | 1.70% | | | | 0.65% | | | | 33% | |
Year Ended 9/30/21 | | | (1.13)% | | | | | | | | 77,793 | | | | 0.45% | | | | 1.14% | | | | 0.73% | | | | 36% | |
Year Ended 9/30/20 | | | 7.18% | | | | | | | | 21,661 | | | | 0.45% | | | | 1.94% | | | | 1.08% | | | | 31% | |
Class R6 | | | | | | | | | | | | | | | | | | | | | | | | | | | | |
Year Ended 9/30/24 | | | 11.82% | | | | | | | $ | 125,646 | | | | 0.39% | | | | 3.95% | | | | 0.50% | | | | 79% | |
Year Ended 9/30/23 | | | 0.49% | | | | | | | | 80,372 | | | | 0.40% | | | | 3.21% | | | | 0.48% | | | | 79% | |
Year Ended 9/30/22 | | | (15.01)% | | | | | | | | 66,391 | | | | 0.40% | | | | 1.69% | | | | 0.52% | | | | 33% | |
Year Ended 9/30/21 | | | (1.17)% | | | | | | | | 81,762 | | | | 0.40% | | | | 1.14% | | | | 0.62% | | | | 36% | |
Year Ended 9/30/20 | | | 7.33% | | | | | | | | 16,113 | | | | 0.40% | | | | 2.06% | | | | 0.97% | | | | 31% | |
Class Y | | | | | | | | | | | | | | | | | | | | | | | | | | | | |
Year Ended 9/30/24 | | | 11.96% | | | | | | | $ | 47,484 | | | | 0.39% | | | | 3.92% | | | | 0.49% | | | | 79% | |
Year Ended 9/30/23 | | | 0.49% | | | | | | | | 51,555 | | | | 0.40% | | | | 3.19% | | | | 0.49% | | | | 79% | |
Year Ended 9/30/22 | | | (15.11)% | | | | | | | | 51,307 | | | | 0.40% | | | | 1.70% | | | | 0.50% | | | | 33% | |
Period Ended 9/30/21(e) | | | 0.90%(c) | | | | | | | | 60,373 | | | | 0.40%(d) | | | | 0.99%(d) | | | | 0.59%(d) | | | | 36% | |
| * | During the period, certain fees were contractually or voluntarily reduced and/or reimbursed. If such contractual/voluntary fee reductions and reimbursements had not occurred, the ratio would have been as indicated. |
| ** | Portfolio turnover rate is calculated on the basis of the Fund as a whole without distinguishing between the classes of shares issued. |
| (a) | Assumes investment at net asset value at the beginning of the period, reinvestment of all dividends and distributions, and a complete redemption of the investment at net asset value at the end of the period. |
46
RBC BlueBay Impact Bond Fund
(Selected data for a share outstanding throughout the periods indicated)
| (b) | For the period from January 28, 2020 (commencement of operations) through September 30, 2020. |
| (e) | For the period from April 12, 2021 (commencement of operations) through September 30, 2021. |
See Notes to the Financial Statements.
47
|
|
| NOTES TO FINANCIAL STATEMENTS |
September 30, 2024
1. Organization:
RBC Funds Trust (the “Trust”) is registered under the Investment Company Act of 1940 (as amended) as an open-end management investment company. The Trust was organized as a Delaware statutory trust on December 16, 2003 and currently consists of 23 portfolios. Overall responsibility for the management of the Trust is vested in its Board of Trustees (the “Board”). The predecessor fund for the RBC BlueBay Access Capital Fund (formerly, Access Capital Community Investment Fund) was reorganized into a series of the Trust, effective July 28, 2008. This report includes the following two investment portfolios (each a “Fund” and collectively, the “Funds”):
-RBC BlueBay Access Capital Community Investment Fund (“Access Capital Community Investment Fund”)
-RBC BlueBay Impact Bond Fund (“Impact Bond Fund”)
The Access Capital Community Investment Fund offers three share classes: Class A, Class I and Class IS shares. The Impact Bond Fund offers four share classes: Class A, Class I, Class R6, and Class Y shares. Class A shares are offered with a 3.75% maximum front-end sales charge and a 1.00% contingent deferred sales charge (“CDSC”) for redemption within 12 months of a $1 million or greater purchase on which no front-end sales charge was paid. Class I, Class IS, Class R6 and Class Y shares (intended for investors meeting certain investment minimum thresholds) are not subject to either a front-end sales charge or a CDSC.
RBC Global Asset Management (U.S.) Inc. (“RBC GAM-US” or “Advisor” or “Co-Administrator”) acts as the investment advisor for the Funds. The officers of the Trust (“Fund Management”) are also employees of RBC GAM-US or its affiliates.
2. Significant Accounting Policies
Each Fund is an investment company that follows accounting and reporting guidance under the Financial Accounting Standards Board (“FASB”) Accounting Standards Codification Topic 946, Financial Services - Investment Companies (ASC 946). The financial statements are prepared in accordance with U.S. generally accepted accounting principles (“U.S. GAAP”). Fund Management may also be required to make estimates and assumptions that affect the reported amounts of assets and liabilities at the date of the financial statements and the reported amounts of income and expenses for the period. Actual results could differ from those estimates. The financial statements are as of the close of regular trading on the New York Stock Exchange (“NYSE”).
Security Valuation:
The Board has approved pricing and valuation procedures of the Advisor for determining the fair value of each Fund’s investments. Fair value of a security is considered to be the price that a fund might reasonably expect to receive upon its current sale in an orderly transaction between market participants.
Fixed income securities, including to-be-announced (“TBA”) commitments and municipal bonds, are generally valued based on evaluated prices received from third-party pricing services or from broker-dealers who make markets in the securities and are generally categorized as Level 2 in the fair value hierarchy (see “Fair Value Measurements” below for additional information). The pricing services utilize both dealer-supplied valuations and electronic data processing techniques that take into account multiple appropriate factors such as institutional-size trading in similar groups of securities, market spreads, interest rates, and fundamental security analytical data including yield, quality, coupon rate, maturity and type of issue.
Mortgage-related securities represent direct or indirect participation in, or are secured by and payable from, mortgage loans secured by real property and include pass-through securities and collateralized mortgage obligations. These securities may be issued or guaranteed by U.S. Government agencies or instrumentalities, or private issuers, including commercial banks, savings and loan institutions, private mortgage insurance bankers and other secondary market issuers. These mortgage-related securities are
48
|
|
| NOTES TO FINANCIAL STATEMENTS |
generally valued by pricing services that use broker-dealer quotations or valuation estimates from their internal pricing models. These pricing models generally consider such factors as current market data, estimated cash flows, market-based yield spreads, and estimated prepayment rates. Securities valued using such techniques and inputs are generally categorized as Level 2 in the fair value hierarchy. To the extent significant inputs are unobservable, the securities will be categorized as Level 3.
Exchange-traded futures are valued at the last sale price at the close of the market on the principal exchange on which they are traded and are categorized as Level 1 in the fair value hierarchy. Investments in open-end investment companies (mutual funds) are valued at net asset value and are categorized as Level 1 in the fair value hierarchy.
The Board has designated the Advisor with the responsibility for implementing the pricing and valuation procedures, including responsibility for determining the fair value of the Funds’ securities or other assets and liabilities, and has established a Pricing Committee to assist in carrying out supervisory functions related to such responsibilities. The Pricing Committee includes representatives of the Funds’ Advisor, and Co-Administrator, including personnel from accounting and operations, trading, risk management and compliance. The Pricing Committee meets at least quarterly to review and approve Fund valuation matters, including a review of the Funds’ pricing activity and operations, fair value measurements, pricing vendors, policies and procedures, and related controls. At least a quorum of the Pricing Committee shall meet more frequently, as needed, to consider and approve time-sensitive fair valuation matters. The Pricing Committee provides periodic reports to the Valuation, Portfolio Management and Performance Committee (“Valuation Committee”) of the Board regarding pricing and valuation matters. Members of the Pricing Committee meet with the Valuation Committee and the Board at each of their regularly scheduled meetings to discuss valuation matters and actions taken during the period.
The Advisor has procedures to determine the fair value of a security when a price is not available from a pricing service or broker- dealer or the Advisor has determined that a price provided by a pricing service or broker-dealer does not approximate fair value. Fair valuation may also be used when a significant valuation event affecting the value of a security or market sector is determined to have occurred between the time when a security’s market closes and the time the Fund’s net asset value is calculated. The fair value of the security will be determined in good faith by the Advisor in accordance with procedures and methodologies approved by the Board. General factors used in determining the fair value of securities include, but are not limited to, fundamental analytical data relating to the security, the issuer and the market, such as duration, prepayment and default rates; general level of interest rates and changes in interest rates; information from broker-dealers; trading in similar securities; any restrictions on disposition of the security; and an evaluation of the forces that influence the market in which the investments are traded. These securities are either categorized as Level 2 or 3 in the fair value hierarchy, depending on the relevant inputs used.
When the Funds utilize fair valuation methods that use significant unobservable inputs to determine a security’s value, such securities will be categorized as Level 3 of the fair value hierarchy. These methods may require subjective determinations about the value of a security. While the Funds’ policy is intended to result in a calculation of a Fund’s net asset value that fairly reflects security values as of the time of pricing, the Funds cannot guarantee that values determined by the Advisor or persons acting at their direction would accurately reflect the price that the Funds could obtain for a security if they were to dispose of it as of the time of pricing (for instance, in a forced or distressed sale). The prices used by the Funds may differ from the value that would be realized if the securities were sold.
The Advisor employs various methods for calibrating the valuation approach related to securities categorized within Level 2 and Level 3 of the fair value hierarchy. These methods may include regular due diligence of the Funds’ pricing vendors, a regular review of key inputs and assumptions, transaction back-testing or disposition analysis to compare unrealized gains and losses to realized gains and losses, reviews of missing and stale prices and large movements in market value, and reviews of any market related activities. Additionally, the pricing of all fair value holdings is subsequently reported to the Valuation Committee and Board.
49
|
|
| NOTES TO FINANCIAL STATEMENTS |
Foreign Taxes:
The Funds may be subject to foreign taxes on income, gains on investments or currency repatriation, a portion of which may be recoverable. The Funds will accrue such taxes and recoveries, as applicable, based upon its current interpretation of tax rules and regulations that exist in the markets in which it invests.
Realized gains in certain countries may be subject to foreign taxes at the Fund level, based on statutory rates. The Funds accrue for such foreign taxes on realized and unrealized gains at the appropriate rate for each jurisdiction, as applicable. The amount, if any, is disclosed as a liability in the Statement of Assets and Liabilities.
Fair Value Measurements:
The Funds disclose the fair value of their investments in a hierarchy that categorizes investments based on the inputs to valuation techniques used to measure fair value. The three levels of the fair value hierarchy are as follows:
• Level 1 - Inputs that reflect unadjusted quoted prices in active markets for identical assets or liabilities that the Funds have the ability to access at the measurement date.
• Level 2 - Significant inputs other than quoted prices that are observable for the asset or liability either directly or indirectly, including inputs in markets that are not considered to be active. Observable inputs may include quoted prices for similar securities, interest rates, spreads, prepayment spreads, etc.
• Level 3 - Significant unobservable inputs based on the best information available in the circumstances, to the extent observable inputs are not available (including the Fund’s own assumptions in determining the fair value of investments).
The inputs or methodology used for valuing investments are not necessarily an indication of the risk associated with investing in those securities.
Inputs used in determining fair value of an investment may include, but are not limited to, price information, volatility statistics, credit and market data, and other factors, all of which may be either observable or unobservable. Inputs can vary among investments and will be impacted by the investment type and volume of activity for the particular security or similar securities in the market. Investments in the Level 2 category are generally supported by transactions and quoted prices from dealers participating in the market for those investments. Investments may be included in the Level 3 category due to a lack of market activity or transparency. Internal valuation models may also be used as a pricing source for Level 3 investments. Internal valuation models may rely on one or more unobservable inputs, such as estimated cash flows, financial statement analysis and discount rates.
50
|
|
| NOTES TO FINANCIAL STATEMENTS |
The summary of inputs used to determine the fair value of the Funds’ investments as of September 30, 2024 is as follows:
| | | | | | | | | | | | | | | | | | | | | | | | | |
| | | Level 1
Quoted Prices | | Level 2
Significant
Observable
Inputs | | Level 3
Significant
Unobservable
Inputs | | Total |
RBC BlueBay Access Capital Community Investment Fund | | | | | | | | | | | | | | | | | | | | | | | | | |
Assets: | | | | | | | | | | |
Investments in Securities | | | | | | | | | | | | | | | | | | | | | | | | | |
Municipal Bonds | | | $ | — | | | | $ | 13,635,426 | | | | | | | | | $ | — | | | | $ | 13,635,426 | |
U.S. Government Agency Backed Mortgages | | | | — | | | | | 685,318,612 | | | | | | | | | | — | | | | | 685,318,612 | |
U.S. Government Agency Obligations | | | | — | | | | | 23,715,491 | | | | | | | | | | — | | | | | 23,715,491 | |
Investment Company | | | | 7,567,885 | | | | | — | | | | | | | | | | — | | | | | 7,567,885 | |
Corporate Bond | | | | — | | | | | 130,003 | | | | | | | | | | — | | | | | 130,003 | |
Other Financial Instruments* | | | | | | | | | | | | | | | | | | | | | | | | | |
Financial futures contracts | | | | 42,275 | | | | | — | | | | | | | | | | — | | | | | 42,275 | |
| | | | | | | | | | | | | | | | | | | | | | | | | |
Total Assets | | | $ | 7,610,160 | | | | $ | 722,799,532 | | | | | | | | | $ | — | | | | $ | 730,409,692 | |
| | | | | | | | | | | | | | | | | | | | | | | | | |
Liabilities: | | | | | | | | | | |
Other Financial Instruments: | | | | | | | | | | | | | | | | | | | | | | | | | |
Financial futures contracts | | | $ | (897 | ) | | | $ | — | | | | | | | | | $ | — | | | | $ | (897 | ) |
| | | | | | | | | | | | | | | | | | | | | | | | | |
RBC BlueBay Impact Bond Fund | | | | | | | | | | | | | | | | | | | | | | | | | |
Assets: | | | | | | | | | | |
Investments in Securities | | | | | | | | | | | | | | | | | | | | | | | | | |
Municipal Bonds | | | | — | | | | | 42,367,870 | | | | | | | | | | — | | | | | 42,367,870 | |
U.S. Government Agency Backed Mortgages | | | | — | | | | | 107,519,115 | | | | | | | | | | — | | | | | 107,519,115 | |
U.S. Government Agency Obligations | | | | — | | | | | 8,047,431 | | | | | | | | | | — | | | | | 8,047,431 | |
Asset Backed Securities | | | | — | | | | | 31,681,246 | | | | | | | | | | — | | | | | 31,681,246 | |
Collateralized Mortgage Obligation | | | | — | | | | | 2,735,639 | | | | | | | | | | — | | | | | 2,735,639 | |
Commercial Paper | | | | — | | | | | 23,443,767 | | | | | | | | | | — | | | | | 23,443,767 | |
Investment Company | | | | 7,460,944 | | | | | — | | | | | | | | | | — | | | | | 7,460,944 | |
Corporate Bonds | | | | — | | | | | 87,670,197 | | | | | | | | | | — | | | | | 87,670,197 | |
Other Financial Instruments* | | | | | | | | | | | | | | | | | | | | | | | | | |
Financial futures contracts | | | | 43,916 | | | | | — | | | | | | | | | | — | | | | | 43,916 | |
| | | | | | | | | | | | | | | | | | | | | | | | | |
Total Assets | | | $ | 7,504,860 | | | | $ | 303,465,265 | | | | | | | | | $ | — | | | | $ | 310,970,125 | |
| | | | | | | | | | | | | | | | | | | | | | | | | |
Liabilities: | | | | | | | | | | |
Other Financial Instruments: | | | | | | | | | | | | | | | | | | | | | | | | | |
Financial futures contracts | | | $ | (180,736 | ) | | | $ | — | | | | | | | | | $ | — | | | | $ | (180,736 | ) |
| | | | | | | | | | | | | | | | | | | | | | | | | |
* Other financial instruments are instruments shown on the Schedule of Portfolio Investments, such as futures contracts which are valued at fair value.
Reverse Repurchase Agreements:
To obtain short-term financing, the Access Capital Community Investment Fund may enter into reverse repurchase agreements with primary dealers that report to the Federal Reserve Bank of New York or the 100 largest U.S. commercial banks, who are deemed creditworthy under guidelines approved by the Board. Interest on the value of the reverse repurchase agreements is based upon competitive market rates at the time of issuance. Based on requirements with certain exchanges and third party broker-dealers, the Fund may also be required to deliver or deposit securities or cash as collateral.
51
|
|
| NOTES TO FINANCIAL STATEMENTS |
As of September 30, 2024 there were no open reverse Repurchase Agreements.
Reverse repurchase transactions are entered into by the Fund under Master Repurchase Agreements (“MRA”), which permit the Fund, under certain circumstances, including an event of default (such as bankruptcy or insolvency), to offset payables and/or receivables under the MRA with collateral held and/or posted to the counterparty and create one single net payment due to or from the Fund. With reverse repurchase transactions, typically the Fund and the counterparties are permitted to sell, repledge, or use the collateral associated with the transaction. However, bankruptcy or insolvency laws of a particular jurisdiction may impose restrictions on or prohibitions against such a right of offset in the event of the MRA counterparty’s bankruptcy or insolvency. Pursuant to the terms of the MRA, the Fund receives or posts securities as collateral with a market value in excess of the repurchase price to be received or paid by the Fund upon the maturity of the transaction. Upon a bankruptcy or insolvency of the MRA counterparty, the Fund is considered an unsecured creditor with respect to excess collateral and, as such, the return of excess collateral may be delayed.
In the event the buyer of securities under a MRA files for bankruptcy or becomes insolvent, the Fund’s use of the proceeds of the agreement may be restricted while the other party, or its trustee or receiver, determines whether or not to enforce the Fund’s obligation to repurchase the securities.
TBA Commitments:
The Funds may enter into TBA commitments to purchase or sell securities for a fixed price at a future date. TBA commitments are considered securities in themselves, and involve a risk of loss if the value of the security to be purchased/sold declines/increases prior to settlement date, which is in addition to the risk of decline in the value of a Fund’s other assets. Unsettled TBA commitments are valued at the current value of the underlying securities, according to the procedures described under “Security Valuation”.
Mortgage Backed Securities:
Because the Funds will focus on community development investments, such as securities backed by commercial and/or residential mortgage loans, it will be affected by risks not typically associated with funds that do not specialize in community development investments. These risks include credit and prepayment risk and risk due to default on underlying loans within a security. Changes in economic conditions, including delinquencies and/or defaults or assets underlying these securities, can affect the value, income and/or liquidity of such positions.
In addition, the RBC BlueBay Access Capital Fund invests in certain mortgage backed securities that qualify under the Community Reinvestment Act of 1977 (“CRA”) in which the Fund may pay a premium for the geographically or other targeted nature of the securities. There can be no guarantee, however, that a similar premium will be received if the security is sold by the Fund.
Derivatives:
The Funds may use derivative instruments, including futures, forwards, options, indexed securities, swaps and inverse securities as tools in the management of portfolio assets. The Funds may use such derivatives through either the creation of long or short positions to hedge various investments, for investment purposes, for risk management and/or to increase income or gain to the Funds. Derivatives allow the Funds to manage their risk exposure more quickly and efficiently than other types of instruments. Derivatives may be riskier than other types of investments and could result in losses that significantly exceed a Fund’s original investment. Derivatives are subject to the risk that changes in the value of a derivative may not correlate perfectly with the underlying asset, rate or index. The use of derivatives may not be successful, resulting in losses to a Fund, and the cost of such strategies may reduce the Fund’s returns.
Hedging also involves the risk that changes in the value of the derivative will not match those of the holdings being hedged as expected by the Funds, in which case any losses on the holdings being hedged may not be reduced and may be increased. There can be no assurance that a Fund’s hedging strategy will reduce risk or that hedging transactions will be available or cost effective. The Funds are subject to interest rate risk in the normal course of pursuing their investment objectives by investing in various derivative financial instruments, as described below.
52
|
|
| NOTES TO FINANCIAL STATEMENTS |
Financial Futures Contracts:
The Funds may enter into futures contracts in an effort to manage the duration of the portfolio and hedge against certain market risk. A futures contract on a securities index is an agreement obligating one party to pay, and entitling the other party to receive, during the term of the contract, cash payments based on the level of a specified securities index. Futures transactions involve brokerage costs. A Fund may lose the expected benefit of futures transactions if interest rates, exchange rates or securities prices change in an unanticipated manner. Such unanticipated changes may also result in lower overall performance than if a Fund had not entered into any futures transactions.
The Funds entered into U.S. Treasury Bond futures and U.S. Treasury Notes futures during the year ended September 30, 2024.
Upon entering into a futures contract, a Fund is required to pledge to the broker an amount of cash, U.S. government securities, or other assets equal to a certain percentage of the contract amount. Subsequent payments are made or received by the Funds each day, depending on the daily fluctuations in the fair value of the underlying instrument. A Fund would record an unrealized gain or loss each day equal to these daily payments.
Open futures contracts are shown on the Schedules of Portfolio Investments. Underlying collateral pledged for open futures contracts is the cash at brokers for financial futures contracts shown on the Statements of Assets and Liabilities at September 30, 2024.
| | | | | | | | | | | | | | | | |
Fair Values of Derivative Financial Instrument as of September 30, 2024(1) | |
Statement of Assets and Liabilities Location | |
Asset Derivatives | |
| | | RBC BlueBay Access Capital
Community
Investment Fund | | | RBC BlueBay Impact
Bond Fund | |
Interest Rate Risk: | | | | | | | | | | | | | | | | |
Unrealized appreciation on futures contracts | | | | | | $ | 42,275 | | | | | | | $ | 43,916 | |
| | | | | | | | | | | | | | | | |
Total | | | | | | $ | 42,275 | | | | | | | $ | 43,916 | |
| | | | | | | | | | | | | | | | |
| | | | | | | | | | | | | | | | |
Liability Derivatives | |
| | | RBC BlueBay Access Capital
Community
Investment Fund | | | RBC BlueBay Impact
Bond Fund | |
Interest Rate Risk: | | | | | | | | | | | | | | | | |
Unrealized depreciation on futures contracts | | | | | | $ | 897 | | | | | | | $ | 180,736 | |
| | | | | | | | | | | | | | | | |
Total | | | | | | $ | 897 | | | | | | | $ | 180,736 | |
| | | | | | | | | | | | | | | | |
53
|
|
| NOTES TO FINANCIAL STATEMENTS |
The effect of derivative instruments on the Statement of Operations during the year ended September 30, 2024 is as follows:
| | | | | | | | | | | | | | | | |
Derivative Instruments Categorized by Risk Exposure | | RBC BlueBay Access Capital
Community
Investment Fund | | | RBC BlueBay Impact
Bond Fund | |
Net realized Gain/(Loss) From: | | | | | | | | | | | | | | | | |
Interest Rate Risk: | | | | | | | | | | | | | | | | |
Financial futures contracts | | | | | | $ | (4,382,151 | ) | | | | | | $ | (618,707 | ) |
| | | | | | | | | | | | | | | | |
Total | | | | | | $ | (4,382,151 | ) | | | | | | $ | (618,707 | ) |
| | | | | | | | | | | | | | | | |
| | | | | | | | | | | | | | | | |
Derivative Instruments Categorized by Risk Exposure | | RBC BlueBay Access Capital
Community
Investment Fund | | | RBC BlueBay Impact
Bond Fund | |
Net Change in Unrealized Appreciation/(Depreciation) From: | | | | | | | | | | | | | | | | |
Interest Rate Risk: | | | | | | | | | | | | | | | | |
Financial futures contracts | | | | | | $ | 1,079,817 | | | | | | | $ | 1,337,969 | |
| | | | | | | | | | | | | | | | |
Total | | | | | | $ | 1,079,817 | | | | | | | $ | 1,337,969 | |
| | | | | | | | | | | | | | | | |
| (1) | Not considered to be hedging instruments for accounting disclosure purposes. |
For the year ended September 30, 2024, the average volume of derivative activities based on ending quarterly outstanding amounts are as follows:
| | | | | | | | | | |
| | | | | RBC BlueBay Access Capital
Community
Investment Fund | | | RBC BlueBay Impact
Bond Fund | |
Futures long position (contracts) | | | | | 102 | | | | 360 | |
Futures short position (contracts) | | | | | 151 | | | | 116 | |
Counterparty Credit Risk:
Derivatives may also expose a Fund to counterparty risk (the risk that the derivative counterparty will not fulfill its contractual obligations). To the extent amounts due to the Funds from their counterparties are not fully collateralized contractually or otherwise, the Funds bear the risk of loss from counterparty non-performance. A Fund’s maximum risk of loss from counterparty credit risk on over-the-counter (“OTC”) derivatives is generally the aggregate unrealized gain in excess of any collateral pledged by the counterparty to the Funds.
With exchange-traded futures, the exchange or clearinghouse, as counterparty to such instruments, guarantees against a possible default. The clearinghouse stands between the buyer and the seller of the contract; therefore, credit risk is limited to failure of the clearinghouse. While offset rights may exist under applicable law, the Fund does not have a contractual right of offset against a clearing broker or clearinghouse in the event of a default (including the bankruptcy or insolvency) of the clearing broker or clearinghouse. Additionally, credit risk exists in exchange-traded futures with respect to initial and variation margin that is held in a clearing broker’s customer accounts. While clearing brokers are required to segregate customer margin from their own assets, in the event that a clearing broker becomes insolvent or goes into bankruptcy and at that time there is a shortfall in the aggregate amount of margin held by the clearing broker for all its clients, typically the shortfall would be allocated on a pro rata basis across all the clearing broker’s customers, potentially resulting in losses to the Funds.
54
|
|
| NOTES TO FINANCIAL STATEMENTS |
Affiliated Investments:
The Funds invest in another Fund of the Trust (an “Affiliated Fund”), RBC BlueBay U.S. Government Money Market Fund- Institutional Class 1, as a cash sweep vehicle. The income earned by the Funds from the Affiliated Fund for the period is disclosed in the Statement of Operations. The table below details the transactions of the Funds in the Affiliated Fund. As the affiliated investment is a money market fund in which shares are issued and redeemed at $1.00 per share, the number of shares purchased and sold equal the dollar amount shown as purchased and sold, and no gain or loss was realized on the sale of shares of the money market fund.
| | | | | | | | | | | | | | | | | | | | |
| | | Value
September 30, 2023 | | | Purchases | | | Sales | | | Value
September 30, 2024 | | | Dividends | |
| Investments in RBC BlueBay U.S. Government Money Market Fund—Institutional Class 1 | | | | | | | | | | | | | | | | | | | | |
RBC BlueBay Access Capital Community Investment Fund | | | $37,795,609 | | | | $125,571,840 | | | | $(155,799,564 | ) | | | $7,567,885 | | | | $782,054 | |
RBC BlueBay Impact Bond Fund | | | 22,167,440 | | | | 123,743,230 | | | | (138,449,726 | ) | | | 7,460,944 | | | | 871,198 | |
Credit Enhancement:
Certain obligations held by the Funds have credit enhancement or liquidity features that may, under certain circumstances, provide for repayment of principal and interest on the obligation upon demand date, interest rate reset date or final maturity. These enhancements may include: letters of credit; liquidity guarantees; security purchase agreements; tender option purchase agreements and third party insurance.
Investment Transactions and Income:
Investment transactions are recorded on trade date. Dividend income is recorded on the ex-dividend date. Non-cash dividends, if any, are recorded on the ex-dividend date at fair value. Realized gains and losses from investment transactions are calculated based on the cost of the specific security (also known as identified cost basis). Interest income is recognized on the accrual basis and includes, where applicable, the amortization or accretion of premium or discount using the effective yield method. Paydown gains and losses on mortgage- and asset-backed securities are included in the financial statements as interest income.
Expense, Investment Income and Gain/Loss Allocation:
Each Fund pays the expenses that are directly related to its operations, such as custodian fees or advisory fees. Expenses incurred by the Trust, such as trustee or legal fees, are allocated among each of the Funds in the Trust either proportionately based upon each Fund’s relative net assets or using another reasonable basis such as equally across all Funds in the Trust, depending on the nature of the expense. Individual share classes within a Fund are charged expenses specific to that class, such as distribution fees and transfer agent fees. Within a Fund, expenses other than class specific expenses are allocated daily to each class based upon the proportion of relative net assets. Investment income and realized and unrealized gains or losses are allocated to each class of shares based on relative net assets.
55
|
|
| NOTES TO FINANCIAL STATEMENTS |
Distributions to Shareholders:
Each Fund pays out any income that it receives, less expenses, in the form of dividends and capital gains to its shareholders. Income dividends are declared daily and paid monthly. Capital gain distributions are declared and paid at least annually. Distributions to shareholders are recorded on the ex-dividend date. The amount of dividends and distributions are calculated based on federal income tax regulations, which may differ from US GAAP. These “book/tax” differences may be either temporary or permanent in nature. To the extent these differences are determined, as of the end of the tax year, to be permanent (e.g., reclassification of paydown gains and losses), they are reclassified within a Fund’s capital account based on their federal tax basis treatment.
Indemnifications:
Under the Trust’s organizational documents, each Trustee, officer, employee or other agent of the Trust is indemnified against certain liabilities that may arise out of their duties to the Funds. Additionally, in the normal course of business, the Funds enter into contracts, including the Funds’ servicing agreements, that contain a variety of indemnification clauses. The Funds’ maximum exposure under these arrangements is unknown as this would involve future claims that may be made against the Funds that have not yet occurred.
3. Agreements and Other Transactions with Affiliates:
The Trust has entered into an investment advisory agreement with RBC GAM-US under which RBC GAM-US manages each Fund’s assets and furnishes related office facilities, equipment, research and personnel. The agreement requires each Fund to pay RBC GAM-US a monthly fee based upon average daily net assets. Under the terms of the agreement, RBC GAM-US is entitled to receive fees based on a percentage of the average daily net assets of each of the Funds as follows:
| | | | |
| | | Annual Rate | |
RBC BlueBay Access Capital Community Investment Fund | | | 0.35% | |
RBC BlueBay Impact Bond Fund | | | 0.35% | |
RBC GAM-US has contractually agreed to waive fees and/or make payments in order to keep total operating expenses (excluding certain fees such as interest, taxes and acquired fund fees and expenses) of the Funds to the following levels pursuant to an expense limitation agreement.
| | | | | | | | | | | | | | | | | | | | |
| | | Class A
Annual Rate | | | Class I
Annual Rate | | | Class IS
Annual Rate | | | Class R6
Annual Rate | | | Class Y
Annual Rate | |
RBC BlueBay Access Capital Community Investment Fund | | | 0.80% | | | | 0.45% | | | | 0.40% | | | | N/A | | | | N/A | |
RBC BlueBay Impact Bond Fund | | | 0.70% | | | | 0.45% | | | | N/A | | | | 0.40% | | | | 0.40% | |
This expense limitation agreement is in place until January 31, 2025, and shall continue for additional one-year terms unless terminated by either party at any time. The Advisor is entitled to recoup from the Fund or class the fees and/or operating expenses waived or reimbursed during any of the previous 12 months (3 years for the Impact Bond Fund), provided the Fund is able to do so and remain in compliance with the expense limitation in place at the time the fees were waived or expenses paid.
As of September 30, 2024, the amounts subject to possible recoupment under the expense limitation agreement were:
| | | | | | | | | | | | | | | | | | | | |
| | | FYE 9/30/22 | | | FYE 9/30/23 | | | FYE 9/30/24 | | | Total | |
RBC BlueBay Access Capital Community Investment Fund | | $ | N/A | | | $ | N/A | | | | | | | $ | 634,555 | | | $ | 634,555 | |
RBC BlueBay Impact Bond Fund | | | 308,395 | | | | 291,003 | | | | | | | | 357,998 | | | | 957,396 | |
There was no recoupment of expense reimbursements/waivers during the year. Amounts from years prior to those shown are no longer subject to recoupment.
RBC GAM-US may also voluntarily waive and/or reimburse operating expenses of any Fund from time to time. Any such voluntary program may be changed or eliminated at any time without notice, and expenses waived under such programs are not subject to recoupment.
56
|
|
| NOTES TO FINANCIAL STATEMENTS |
RBC GAM-US voluntarily agreed to waive its investment advisory fees by the amount of investment advisory fees the Funds pay to RBC GAM-US indirectly through its investment in an affiliated money market fund. For the year ended September 30, 2024, the amount waived was $25,331 and $28,325 for RBC BlueBay Access Capital Community Investment Fund and RBC BlueBay Impact Bond Fund, respectively, and is included in expenses waived/reimbursed by Advisor in the Statement of Operations.
RBC GAM-US serves as co-administrator to the Funds. Bank of New York Mellon (“BNY Mellon”) serves as co-administrator and fund accounting agent. Services provided under the administrative services contract include providing day-to-day administration of matters related to the Funds, maintenance of their records and the preparation of reports. Under the terms of the administrative services contract, RBC GAM-US does not receive a fee for its role as co-administrator. BNY Mellon receives a fee for its services payable by each Fund based in part on each Fund’s average net assets. BNY Mellon’s fee is included with “Accounting fees” in the Statement of Operation.
RBC GAM-US also provides certain CRA-related administrative services to Class I shareholders of Access Capital Community Investment Fund pursuant to a Special Administrative Services Agreement with the Trust. In consideration for such services and the assumption of related expenses, RBC GAM-US receives a fee of 0.05% of the average daily net assets of Class I shares of the Fund.
Certain Officers and Trustees of the Trust are affiliated with the Advisor. Such Officers and Trustees receive no compensation from the Funds for serving their respective roles.
The Trust currently pays each of the independent Trustees (Trustees of the Trust who are not directors, officers or employees of the Advisor, either Co-Administrator or Distributor) an annual retainer of $92,000. The Board Chairperson and Audit Committee Chairperson each receive an additional retainer of $2,500 annually, and all other trustees serving as Chair of a Board committee each receive an additional retainer of $1,000 annually. In addition, Independent Trustees receive a quarterly meeting fee of $6,500 for each in-person Board meeting attended, a meeting fee of $1,500 for each telephonic or Special Board meeting attended, a $1,500 fee for each Board committee meeting attended, and are reimbursed for all out-of-pocket expenses relating to attendance at such meetings. These amounts are included in the Statements of Operations in “Trustee’ fees”.
The table below shows, as of September 30, 2024, the Fund’s net assets, the shares held by the Advisor, and the percent of total net assets represented by the Advisor’s investment in the Funds.
| | | | | | | | | | | | | | | | | | | | |
| | | Net Assets | | | | | | Shares held
by Advisor | | | | | | % of Fund
Net Assets | |
RBC BlueBay Impact Bond Fund | | $ | 293,911,496 | | | | | | | | 5,687,440 | | | | | | | | 17.1% | |
4. Fund Distribution:
Each of the Funds that offers Class A shares has adopted a Master Distribution 12b-1 Plan (the “Plan”) in which Quasar Distributors LLC (the “Distributor”) acts as the Funds’ distributor. The Plan permits each Fund to make payments for, or to reimburse the Distributor for, distribution-related costs and expenses of marketing shares of Class A covered under the Plan, and/or for providing shareholder services. The Plan does not apply to Class I and Class R6. The following chart shows the current Plan fee rate for Class A.
| | | | |
| | | Class A | |
12b-1 Plan Fee | | | 0.25%* | |
* Under the 12b-1 plan, the maximum fee rate for Class A shares is 0.50%. Currently the Board has approved an annual limit of 0.25%.
Plan fees are based on average daily net assets of Class A. Up to 0.25% of each Plan fee may be designated as a service fee, as defined by the applicable rules of the Financial Industry Regulatory Authority. The Distributor, subject to applicable legal requirements, may waive the Plan fee voluntarily, in whole or in part. For the year ended September 30, 2024, there were no fees waived by the Distributor.
57
|
|
| NOTES TO FINANCIAL STATEMENTS |
For the year ended September 30, 2024, the Distributor received commissions of $5,004 in front-end sales charges of Class A shares of the Funds, of which $5,000 was paid to affiliated broker-dealers, and the remainder was either paid to unaffiliated broker-dealers or retained by the Distributor.
The Distributor did not receive any CDSC fees from Class A shares of the Funds during the year ended September 30, 2024.
5. Securities Transactions:
The cost of securities purchased and proceeds from securities sold (excluding securities maturing less than one year from acquisition) for the year ended September 30, 2024 were as follows:
| | | | | | | | | | | | | | | | |
| | | Purchases
(Excl. U.S. Gov’t) | | | Sales
(Excl. U.S. Gov’t) | | | Purchases
of U.S. Gov’t. | | | Sales
of U.S. Gov’t. | |
RBC BlueBay Access Capital Community Investment Fund | | $ | — | | | $ | 940,041 | | | $ | 928,750,653 | | | $ | 889,529,038 | |
RBC BlueBay Impact Bond Fund | | | 61,060,724 | | | | 54,377,418 | | | | 176,352,341 | | | | 138,994,695 | |
6. Capital Share Transactions:
The Trust is authorized to issue an unlimited number of shares of beneficial interest (“Shares Outstanding”) without par value. Transactions in capital stock of the Funds are summarized on the following pages:
| | | | | | | | | | | | | | | | | | | | | | | | | | | | | | |
| | | | | RBC BlueBay Access Capital
Community Investment Fund | | | | | | RBC BlueBay Impact Bond Fund | |
| | | | | For the
Year Ended
September 30,
2024 | | | | | | For the
Year Ended
September 30,
2023 | | | | | | For the
Year Ended
September 30,
2024 | | | | | | For the
Year Ended
September 30,
2023 | |
CAPITAL TRANSACTIONS: | | | | | | | | | | | | | | | | | | | | | | | | | | | | | | |
Class A | | | | | | | | | | | | | | | | | | | | | | | | | | | | | | |
Proceeds from shares issued | | | | $ | 141,191 | | | | | | | $ | 408,295 | | | | | | | $ | 500,000 | | | | | | | $ | 60,793 | |
Distributions reinvested | | | | | 206,765 | | | | | | | | 223,108 | | | | | | | | 43,697 | | | | | | | | 29,194 | |
Cost of shares redeemed | | | | | (1,760,200 | ) | | | | | | | (2,904,215 | ) | | | | | | | (64,438 | ) | | | | | | | (28,543 | ) |
| | | | | | | | | | | | | | | | | | | | | | | | | | | | | | |
Change in Class A | | | | $ | (1,412,244 | ) | | | | | | $ | (2,272,812 | ) | | | | | | $ | 479,259 | | | | | | | $ | 61,444 | |
| | | | | | | | | | | | | | | | | | | | | | | | | | | | | | |
Class I | | | | | | | | | | | | | | | | | | | | | | | | | | | | | | |
Proceeds from shares issued | | | | $ | 77,994,836 | | | | | | | $ | 103,160,902 | | | | | | | $ | 21,536,884 | | | | | | | $ | 31,047,111 | |
Distributions reinvested | | | | | 14,144,109 | | | | | | | | 12,620,383 | | | | | | | | 4,305,097 | | | | | | | | 3,313,753 | |
Cost of shares redeemed | | | | | (123,806,572 | ) | | | | | | | (134,043,813 | ) | | | | | | | (23,110,439 | ) | | | | | | | (17,880,242 | ) |
| | | | | | | | | | | | | | | | | | | | | | | | | | | | | | |
Change in Class I | | | | $ | (31,667,627 | ) | | | | | | $ | (18,262,528 | ) | | | | | | $ | 2,731,542 | | | | | | | $ | 16,480,622 | |
| | | | | | | | | | | | | | | | | | | | | | | | | | | | | | |
Class IS | | | | | | | | | | | | | | | | | | | | | | | | | | | | | | |
Proceeds from shares issued | | | | $ | 11,920,639 | | | | | | | $ | 17,905,593 | | | | | | | $ | — | | | | | | | $ | — | |
Distributions reinvested | | | | | 1,683,418 | | | | | | | | 1,738,503 | | | | | | | | — | | | | | | | | — | |
Cost of shares redeemed | | | | | (22,720,070 | ) | | | | | | | (16,303,100 | ) | | | | | | | — | | | | | | | | — | |
| | | | | | | | | | | | | | | | | | | | | | | | | | | | | | |
Change in Class IS | | | | $ | (9,116,013 | ) | | | | | | $ | 3,340,996 | | | | | | | $ | — | | | | | | | $ | — | |
| | | | | | | | | | | | | | | | | | | | | | | | | | | | | | |
Class R6 | | | | | | | | | | | | | | | | | | | | | | | | | | | | | | |
Proceeds from shares issued | | | | $ | — | | | | | | | $ | — | | | | | | | $ | 49,727,839 | | | | | | | $ | 15,731,479 | |
Distributions reinvested | | | | | — | | | | | | | | — | | | | | | | | 2,619,363 | | | | | | | | 2,212,031 | |
Cost of shares redeemed | | | | | — | | | | | | | | — | | | | | | | | (13,571,508 | ) | | | | | | | (1,493,012 | ) |
| | | | | | | | | | | | | | | | | | | | | | | | | | | | | | |
Change in Class R6 | | | | $ | — | | | | | | | $ | — | | | | | | | $ | 38,775,694 | | | | | | | $ | 16,450,498 | |
| | | | | | | | | | | | | | | | | | | | | | | | | | | | | | |
58
|
|
| NOTES TO FINANCIAL STATEMENTS |
| | | | | | | | | | | | | | | | | | | | | | | | | | | | | | | | |
| | | | | | RBC BlueBay Access Capital
Community Investment Fund | | | | | | RBC BlueBay Impact Bond Fund | |
| | | | | | For the
Year Ended
September 30,
2024 | | | | | | For the
Year Ended
September 30,
2023 | | | | | | For the
Year Ended
September 30,
2024 | | | | | | For the
Year Ended
September 30,
2023 | |
Class Y | | | | | | | | | | | | | | | | | | | | | | | | | | | | | | | | |
Distributions reinvested | | | | | | $ | — | | | | | | | $ | — | | | | | | | $ | 2,071,273 | | | | | | | $ | 1,705,968 | |
Cost of shares redeemed | | | | | | | — | | | | | | | | — | | | | | | | | (10,000,000 | ) | | | | | | | — | |
| | | | | | | | | | | | | | | | | | | | | | | | | | | | | | | | |
Change in Class Y | | | | | | $ | — | | | | | | | $ | — | | | | | | | $ | (7,928,727 | ) | | | | | | $ | 1,705,968 | |
| | | | | | | | | | | | | | | | | | | | | | | | | | | | | | | | |
Change in net assets resulting from capital transactions | | | | | | $ | (42,195,884 | ) | | | | | | $ | (17,194,344 | ) | | | | | | $ | 34,057,768 | | | | | | | $ | 34,698,532 | |
| | | | | | | | | | | | | | | | | | | | | | | | | | | | | | | | |
SHARE TRANSACTIONS: | | | | | | | | | | | | | | | | | | | | | | | | | | | | | | | | |
Class A | | | | | | | | | | | | | | | | | | | | | | | | | | | | | | | | |
Issued | | | | | | | 18,684 | | | | | | | | 53,280 | | | | | | | | 59,595 | | | | | | | | 7,118 | |
Reinvested | | | | | | | 27,435 | | | | | | | | 29,342 | | | | | | | | 5,122 | | | | | | | | 3,444 | |
Redeemed | | | | | | | (234,479 | ) | | | | | | | (381,958 | ) | | | | | | | (7,548 | ) | | | | | | | (3,367 | ) |
| | | | | | | | | | | | | | | | | | | | | | | | | | | | | | | | |
Change in Class A | | | | | | | (188,360 | ) | | | | | | | (299,336 | ) | | | | | | | 57,169 | | | | | | | | 7,195 | |
| | | | | | | | | | | | | | | | | | | | | | | | | | | | | | | | |
Class I | | | | | | | | | | | | | | | | | | | | | | | | | | | | | | | | |
Issued | | | | | | | 10,386,548 | | | | | | | | 13,648,609 | | | | | | | | 2,514,330 | | | | | | | | 3,638,268 | |
Reinvested | | | | | | | 1,875,271 | | | | | | | | 1,660,052 | | | | | | | | 504,099 | | | | | | | | 389,941 | |
Redeemed | | | | | | | (16,432,616 | ) | | | | | | | (17,732,669 | ) | | | | | | | (2,706,684 | ) | | | | | | | (2,097,983 | ) |
| | | | | | | | | | | | | | | | | | | | | | | | | | | | | | | | |
Change in Class I | | | | | | | (4,170,797 | ) | | | | | | | (2,424,008 | ) | | | | | | | 311,745 | | | | | | | | 1,930,226 | |
| | | | | | | | | | | | | | | | | | | | | | | | | | | | | | | | |
Class IS | | | | | | | | | | | | | | | | | | | | | | | | | | | | | | | | |
Issued | | | | | | | 1,576,330 | | | | | | | | 2,338,871 | | | | | | | | — | | | | | | | | — | |
Reinvested | | | | | | | 223,547 | | | | | | | | 228,828 | | | | | | | | — | | | | | | | | — | |
Redeemed | | | | | | | (2,973,535 | ) | | | | | | | (2,145,539 | ) | | | | | | | — | | | | | | | | — | |
| | | | | | | | | | | | | | | | | | | | | | | | | | | | | | | | |
Change in Class IS | | | | | | | (1,173,658 | ) | | | | | | | 422,160 | | | | | | | | — | | | | | | | | — | |
| | | | | | | | | | | | | | | | | | | | | | | | | | | | | | | | |
Class R6 | | | | | | | | | | | | | | | | | | | | | | | | | | | | | | | | |
Issued | | | | | | | — | | | | | | | | — | | | | | | | | 5,785,348 | | | | | | | | 1,842,573 | |
Reinvested | | | | | | | — | | | | | | | | — | | | | | | | | 306,699 | | | | | | | | 260,326 | |
Redeemed | | | | | | | — | | | | | | | | — | | | | | | | | (1,656,146 | ) | | | | | | | (178,931 | ) |
| | | | | | | | | | | | | | | | | | | | | | | | | | | | | | | | |
Change in Class R6 | | | | | | | — | | | | | | | | — | | | | | | | | 4,435,901 | | | | | | | | 1,923,968 | |
| | | | | | | | | | | | | | | | | | | | | | | | | | | | | | | | |
Class Y | | | | | | | | | | | | | | | | | | | | | | | | | | | | | | | | |
Reinvested | | | | | | | — | | | | | | | | — | | | | | | | | 242,973 | | | | | | | | 200,984 | |
Redeemed | | | | | | | — | | | | | | | | — | | | | | | | | (1,146,813 | ) | | | | | | | — | |
| | | | | | | | | | | | | | | | | | | | | | | | | | | | | | | | |
Change in Class Y | | | | | | | — | | | | | | | | — | | | | | | | | (903,840 | ) | | | | | | | 200,984 | |
| | | | | | | | | | | | | | | | | | | | | | | | | | | | | | | | |
Change in shares resulting from capital transactions | | | | | | | (5,532,815 | ) | | | | | | | (2,301,184 | ) | | | | | | | 3,900,975 | | | | | | | | 4,062,373 | |
| | | | | | | | | | | | | | | | | | | | | | | | | | | | | | | | |
7. Federal Income Taxes:
It is the policy of each Fund to continue to qualify as a regulated investment company by complying with the provisions available to certain investment companies, as defined under Subchapter M of the Internal Revenue Code, and to distribute substantially all of its net investment income and net realized capital gains. Therefore, no federal tax liability is recorded in the financial statements of each Fund.
59
|
|
| NOTES TO FINANCIAL STATEMENTS |
For all open tax years and all major taxing jurisdictions, management of the Funds has concluded that there are no significant uncertain tax positions that would require recognition in the financial statements. Open tax years are those that are open for examination by taxing authorities (i.e., generally the last three tax year ends and the interim tax period since then). Furthermore, management of the Funds is also not aware of any tax positions for which it is reasonably possible that the total amounts of unrecognized tax benefits will significantly change in the next twelve months.
As of September 30, 2024, the tax cost of investments and the breakdown of unrealized appreciation (depreciation) for each Fund was as follows:
| | | | | | | | | | | | | | | | |
| | | Tax Cost Of
Investments | | | Unrealized
Appreciation | | | Unrealized
Depreciation | | | Net Unrealized
Appreciation/
(Depreciation) | |
RBC BlueBay Access Capital Community Investment Fund | | $ | 789,059,695 | | | $ | 2,191,662 | | | $ | (60,883,940 | ) | | $ | (58,692,278 | ) |
RBC BlueBay Impact Bond Fund | | | 322,407,239 | | | | 3,013,098 | | | | (14,494,128 | ) | | | (11,481,030 | ) |
The difference between book basis and tax basis unrealized appreciation/depreciation is attributable primarily to the tax mark-to-market of derivatives.
The tax character of distributions during the year ended September 30, 2024 were as follows:
| | | | | | | | | | | | |
| | | Distributions Paid From | |
| | | Ordinary
Income | | | Total Taxable
Distributions | | | Total
Distributions
Paid | |
RBC BlueBay Access Capital Community Investment Fund | | $ | 23,438,888 | | | $ | 23,438,888 | | | $ | 23,438,888 | |
RBC BlueBay Impact Bond Fund | | | 10,063,324 | | | | 10,063,324 | | | | 10,063,324 | |
The tax character of distributions during the year ended September 30, 2023 were as follows:
| | | | | | | | | | | | |
| | | Distributions Paid From | |
| | | Ordinary
Income | | | Total Taxable
Distributions | | | Total
Distributions
Paid | |
RBC BlueBay Access Capital Community Investment Fund | | $ | 23,287,093 | | | $ | 23,287,093 | | | $ | 23,287,093 | |
RBC BlueBay Impact Bond Fund | | | 7,490,077 | | | | 7,490,077 | | | | 7,490,077 | |
Total distributions paid may differ from the Statements of Changes in Net Assets because distributions are recognized when actually paid for tax purposes.
60
|
|
| NOTES TO FINANCIAL STATEMENTS |
As of September 30, 2024, the components of accumulated earnings/(losses) on a tax basis were as follows:
| | | | | | | | |
| | | RBC BlueBay
Access Capital
Community
Investment
Fund | | | RBC BlueBay
Impact
Bond Fund | |
Undistributed ordinary income | | $ | 8,859 | | | $ | 158,415 | |
Undistributed long term gain | | | — | | | | — | |
| | | | | | | | |
Accumulated earnings | | | 8,859 | | | | 158,415 | |
Accumulated capital loss carryforwards | | | (63,578,470 | ) | | | (18,280,208 | ) |
Unrealized depreciation | | | (58,692,278 | ) | | | (11,481,030 | ) |
Other temporary differences | | | (564,049 | ) | | | (153,212 | ) |
| | | | | | | | |
Total Accumulated Losses | | $ | (122,825,938 | ) | | $ | (29,756,035 | ) |
| | | | | | | | |
As of September 30, 2024, the Access Capital Community Investment Fund and the Impact Bond Fund had a short-term capital loss carryforward of $11,811,252 and $3,894,129 and a long-term capital loss carryforward of $51,767,218 and $14,386,079 respectively, available to offset future realized capital gains in accordance with the Regulated Investment Company Modernization Act of 2010. These capital loss carryforwards are not subject to expiration and must first be utilized to offset future realized gains of the same character.
As of September 30, 2024, the Access Capital Community Investment Fund and the Impact Bond Fund had utilized capital loss carryforward of $6,994,555 and $2,018,127 respectively.
Under current tax law, Post-October Capital Losses and Late-Year Ordinary Losses may be deferred and treated as occurring on the first business day of the following fiscal year for tax purposes.
8. Line of Credit
The Funds are participants in an uncommitted, secured $500,000,000 line of credit with U.S. Bank, N.A. (the “Bank”), the Funds’ custodian, to be used to fund shareholder redemption requests and for other short-term temporary or emergency general business purposes. The line of credit has a scheduled termination date of July 26, 2025. Interest is charged on borrowings under this line of credit at the Bank’s prime lending rate per annum. Since each Fund participates in this line of credit, there is no assurance that an individual fund will have access to all or any part of the $500,000,000 at any particular time. There were no loans outstanding pursuant to this line of credit at September 30, 2024. There were no borrowings made by the Funds under the line of credit during the year ended September 30, 2024.
61
|
|
| NOTES TO FINANCIAL STATEMENTS |
9. Significant Risks
Shareholder concentration risk:
As of September 30, 2024, the following Funds had broker-dealer omnibus accounts which each owned more than 10% of a Fund’s outstanding shares as shown below:
| | | | | | | | |
| | | # of Omnibus Accounts | | | % of Fund | |
RBC BlueBay Access Capital Community Investment Fund | | | 1 | | | | 20.1% | |
RBC BlueBay Impact Bond Fund | | | 1 | | | | 15.8% | |
In addition, an unaffiliated shareholder owned 15.7% of the Impact Bond Fund as of September 30, 2024. Significant transactions by these shareholders may impact the Funds’ performance.
10. Subsequent Events:
Fund Management has evaluated the impact of all subsequent events on the Funds and has determined that there were no subsequent events requiring recognition or disclosure in the financial statements.
62
|
|
| REPORT OF INDEPENDENT REGISTERED PUBLIC ACCOUNTING FIRM |
To the Board of Trustees of RBC Funds Trust and Shareholders of RBC BlueBay Access Capital Community Investment Fund and RBC BlueBay Impact Bond Fund.
Opinions on the Financial Statements
We have audited the accompanying statements of assets and liabilities, including the schedules of portfolio investments, of RBC BlueBay Access Capital Community Investment Fund and RBC BlueBay Impact Bond Fund (two of the funds constituting RBC Funds Trust, hereafter collectively referred to as the “Funds”) as of September 30, 2024, the related statements of operations for the year ended September 30, 2024, the statements of changes in net assets for each of the two years in the period ended September 30, 2024, including the related notes, and the financial highlights for each of the periods indicated therein (collectively referred to as the “financial statements”). In our opinion, the financial statements present fairly, in all material respects, the financial position of each of the Funds as of September 30, 2024, the results of each of their operations for the year then ended, the changes in each of their net assets for each of the two years in the period ended September 30, 2024 and each of the financial highlights for each of the periods indicated therein in conformity with accounting principles generally accepted in the United States of America.
Basis for Opinions
These financial statements are the responsibility of the Funds’ management. Our responsibility is to express an opinion on the Funds’ financial statements based on our audits. We are a public accounting firm registered with the Public Company Accounting Oversight Board (United States) (PCAOB) and are required to be independent with respect to the Funds in accordance with the U.S. federal securities laws and the applicable rules and regulations of the Securities and Exchange Commission and the PCAOB.
We conducted our audits of these financial statements in accordance with the standards of the PCAOB. Those standards require that we plan and perform the audit to obtain reasonable assurance about whether the financial statements are free of material misstatement, whether due to error or fraud.
Our audits included performing procedures to assess the risks of material misstatement of the financial statements, whether due to error or fraud, and performing procedures that respond to those risks. Such procedures included examining, on a test basis, evidence regarding the amounts and disclosures in the financial statements. Our audits also included evaluating the accounting principles used and significant estimates made by management, as well as evaluating the overall presentation of the financial statements. Our procedures included confirmation of securities owned as of September 30, 2024 by correspondence with the custodian and brokers; when replies were not received from brokers, we performed other auditing procedures. We believe that our audits provide a reasonable basis for our opinions.
/s/PricewaterhouseCoopers LLP
Minneapolis, Minnesota
November 22, 2024
We have served as the auditor of one or more investment companies in the RBC Funds since 2016.
63
|
|
| OTHER FEDERAL INCOME TAX INFORMATION (UNAUDITED) |
For the year ended September 30, 2024, the following Funds had a qualified interest income percentage of:
| | | | |
| | | Qualified
Interest
Income | |
RBC BlueBay Access Capital Community Investment Fund | | | 99.91% | |
RBC BlueBay Impact Bond Fund | | | 99.22% | |
All reportings are based on financial information available as of the date of this annual report and, accordingly, are subject to change. For each item above, it is the intention of the Funds to report the maximum amount permitted under the Internal Revenue Code and the regulations thereunder.
64
|
|
| APPROVAL OF INVESTMENT ADVISORY AGREEMENT (UNAUDITED) |
Information Regarding the Approval of Investment Advisory Agreement
In September 2024, after evaluating the services provided by RBC Global Asset Management (U.S.) Inc. (the “Advisor”) and reviewing the performance, fees, and expenses of the Funds, the RBC Funds Board of Trustees determined to approve the continuation of the investment advisory agreement (“Agreement”) with the Advisor for each Fund for an additional year.
As part of their review of the Agreement, the Trustees requested and considered information regarding the advisory services performed by the Advisor; the staffing and qualifications of the personnel responsible for operating and managing the Funds; and the Funds’ performance, fees, and expenses. The Trustees considered information provided at regular quarterly Board and Committee meetings throughout the year; information presented at both a special meeting held to review requested material related to the proposed renewals and a regular meeting at which the proposed renewals were considered, and their experience with the management and portfolio management teams over the years. The information included material provided by the Advisor, as well as reports prepared by Broadridge Financial Solutions, Inc., an independent statistical compilation company, providing comparative fee and expense information and comparative performance information for the Funds vs. funds in the same category and funds in more tailored peer groups. In connection with their deliberations, the independent Trustees were advised by independent legal counsel with regard to the materials and their responsibilities under relevant laws and regulations.
The Trustees met with representatives from the Advisor’s senior management team, as well as the senior investment professionals responsible for managing the Funds, to discuss the information and the Advisor’s ongoing management of the Funds. The Trustees reviewed the nature and quality of the services provided to the Funds by the Advisor, including information as to each Fund’s performance relative to appropriate index benchmarks and their respective Morningstar categories and peer groups as well as information with respect to custom peer groups designed to align more closely with the Funds’ specific investment strategies. With respect to the RBC BlueBay Access Capital Community Investment Fund, the Trustees were informed that the Fund’s category consists of funds that own Treasury bonds in addition to mortgage bonds, while the Fund does not invest in Treasuries, and that only one other fund in its category employs a socially conscious strategy and, accordingly, the available comparative data is not necessarily fully applicable. For the RBC BlueBay Impact Bond Fund, the Board noted that while the Fund had underperformed the median performance of its custom peer group for the 1, 3 and 5 year periods, it has shown recent improvement by outperforming the median performance of its Morningstar category and its benchmark index for the 1 year period.
In considering the nature and quality of services to be provided by the Advisor, the Trustees were informed with respect to the research, credit, and fundamental analysis capabilities; the specialized expertise in the area of fixed income investments eligible for regulatory credit under the Community Reinvestment Act of 1977 (“CRA”); the Advisor’s significant expertise with regard to evaluating environmental, social and governance (ESG) factors, and the extensive portfolio management experience of the Advisor’s staff as well as its operational and compliance structure and systems and financial strength. The Trustees noted that advisory fees and expense ratios were competitive and, in particular, that neither of the Funds had total net expenses that exceeded the median of its peer group. The Trustees also received reports from the Advisor regarding the performance and fee levels for other advisory client accounts it advises in similar strategies and discussed differences in services provided, noting that the need to: manage liquidity for shareholder redemptions; collateral requirements, and regulatory matters; and evaluating relevant ESG factors and CRA eligibility, all require additional time and attention from the investment team.
The Trustees reviewed advisory fee and expense information for each Fund compared to similarly situated funds, including information regarding other client accounts advised or sub-advised by the Advisor with similar investment strategies and the reasons for any differences in fees. The Trustees considered, and viewed favorably, the arrangements to subsidize Fund expenses at competitive levels through expense limitation agreements. The Trustees reviewed profitability data — including year-over-year variances — for the Advisor and considered information regarding other benefits the Advisor and its affiliates derived from their relationships with the Funds.
65
|
|
| APPROVAL OF INVESTMENT ADVISORY AGREEMENT (UNAUDITED) |
Based upon their review, the Trustees determined that the advisory fees payable to the Advisor were fair and reasonable in light of the nature and quality of services provided under all the circumstances and was within the range of what might have been negotiated at arms’ length. The Trustees concluded that it is in the interests of the Funds and their shareholders for the Trustees to approve the approval of the Agreement, as well as continuation of the expense limitation agreement for the Funds for an additional year. In arriving at their collective decision to approve the Agreement, the Trustees did not assign relative weights to the factors discussed above or deem any one or group of them to be controlling in and of itself.
66
RBC Funds
P.O. Box 701
Milwaukee, WI 53201-0701
800-422-2766
www.rbcgam.com
Performance data represents past performance and does not guarantee future results. The principal value of an investment and investment return will fluctuate so that an investor’s shares, when redeemed, may be worth more or less than their original cost.
This report and the financial statements contained herein are provided for the information of RBC Funds shareholders. This report is not authorized for distribution to prospective investors unless preceded or accompanied by a current prospectus, which contains information concerning investment objectives, risks, charges and expenses of the funds. Please read the prospectus carefully before investing.
This report and the financial statements contained herein are not intended to be a forecast of future events, a guarantee of future results, or investment advice. There is no assurance that certain securities will remain in or out of each fund’s portfolio. The views expressed in this report reflect those of the portfolio managers through the year ended September 30, 2024.
NOT FDIC INSURED • NO BANK GUARANTEE • MAY LOSE VALUE
RBC Global Asset Management (U.S.) Inc. serves as investment advisor for the RBC Funds. RBC Funds are distributed by Quasar Distributors LLC.
The RBC Funds are pleased to offer shareholder reports printed entirely on Forest Stewardship Council® certified paper. This product is made of material from well-managed FSC®-certified forests, recycled materials, and other controlled sources. The Forest Stewardship Council® promotes environmentally appropriate, socially beneficial, and economically viable management of the world’s forests.
RBCF-II AR 09-24
RBC Global Asset Management Financial Statements and Other Important Information For the year ended September 30, 2024 RBC BlueBay Emerging Market Debt Fund RBC BlueBay High Yield Bond Fund RBC BlueBay Core Plus Bond Fund RBC BlueBay Strategic Income Fund
|
SCHEDULE OF PORTFOLIO INVESTMENTS |
RBC BlueBay Emerging Market Debt Fund
September 30, 2024
| | | | | | |
Principal Amount | | | | Value | |
| |
Foreign Government Bonds — 66.9% | | | | |
Angola — 1.6% | | | | |
$ 465,000 | | Angolan Government International Bond, EMTN, 8.00%, 11/26/29(a) | | $ | 422,581 | |
1,240,000 | | Angolan Government International Bond, 8.25%, 5/9/28(a) | | | 1,175,433 | |
296,000 | | Angolan Government International Bond, 8.75%, 4/14/32(a) | | | 265,544 | |
| | | | | | |
| | | | | 1,863,558 | |
| | | | | | |
| |
Argentina — 2.5% | | | | |
3,108,816 | | Argentine Republic Government International Bond, 3.50%, 7/9/41 | | | 1,416,863 | |
3,007,095 | | Argentine Republic Government International Bond, 4.13%, 7/9/35 | | | 1,443,818 | |
| | | | | | |
| | | | | 2,860,681 | |
| | | | | | |
| |
Bahrain — 0.3% | | | | |
400,000 | | Bahrain Government International Bond, 6.00%, 9/19/44(a) | | | 353,169 | |
| | | | | | |
| |
Brazil — 1.7% | | | | |
1,000,000 | | Brazilian Government International Bond, 6.13%, 3/15/34 | | | 1,020,810 | |
890,000 | | Brazilian Government International Bond, 7.13%, 5/13/54 | | | 923,518 | |
| | | | | | |
| | | | | 1,944,328 | |
| | | | | | |
| |
Bulgaria — 0.4% | | | | |
530,000 | | Bulgaria Government International Bond, 5.00%, 3/5/37(a) | | | 530,289 | |
| | | | | | |
| |
Chile — 1.5% | | | | |
490,000 | | Chile Government International Bond, 4.00%, 1/31/52 | | | 405,788 | |
425,000 | | Chile Government International Bond, 4.85%, 1/22/29 | | | 434,281 | |
925,000 | | Chile Government International Bond, 5.33%, 1/5/54 | | | 937,511 | |
| | | | | | |
| | | | | 1,777,580 | |
| | | | | | |
| |
Colombia — 3.1% | | | | |
735,000 | | Colombia Government International Bond, 3.25%, 4/22/32 | | | 593,221 | |
1,320,000 | | Colombia Government International Bond, 3.88%, 2/15/61 | | | 769,704 | |
210,000 | | Colombia Government International Bond, 4.13%, 5/15/51 | | | 132,652 | |
1,310,000 | | Colombia Government International Bond, 8.00%, 11/14/35 | | | 1,397,428 | |
635,000 | | Colombia Government International Bond, 8.75%, 11/14/53 | | | 697,412 | |
| | | | | | |
| | | | | 3,590,417 | |
| | | | | | |
| |
Costa Rica — 1.0% | | | | |
200,000 | | Costa Rica Government International Bond, 6.55%, 4/3/34(b) | | | 213,300 | |
200,000 | | Costa Rica Government International Bond, 6.55%, 4/3/34(a) | | | 213,300 | |
650,000 | | Costa Rica Government International Bond, 7.30%, 11/13/54(a) | | | 719,111 | |
| | | | | | |
| | | | | 1,145,711 | |
| | | | | | |
| |
Dominican Republic — 3.6% | | | | |
967,000 | | Dominican Republic International Bond, 5.95%, 1/25/27(a) | | | 979,408 | |
1
|
SCHEDULE OF PORTFOLIO INVESTMENTS |
RBC BlueBay Emerging Market Debt Fund (cont.)
September 30, 2024
| | | | | | |
Principal Amount | | | | Value | |
| |
$ 350,000 | | Dominican Republic International Bond, 6.00%, 7/19/28(a) | | $ | 358,907 | |
480,000 | | Dominican Republic International Bond, Series REGs, 6.60%, 6/1/36(a) | | | 509,991 | |
500,000 | | Dominican Republic International Bond, 6.88%, 1/29/26(a) | | | 508,815 | |
585,000 | | Dominican Republic International Bond, 7.05%, 2/3/31(a) | | | 630,967 | |
8,350,000(c) | | Dominican Republic International Bond, 11.25%, 9/15/35(b) | | | 152,278 | |
55,000,000(c) | | Dominican Republic International Bond, 11.25%, 9/15/35(a) | | | 1,003,026 | |
| | | | | | |
| | | | | 4,143,392 | |
| | | | | | |
|
Ecuador — 1.1% | |
505,000 | | Ecuador Government International Bond, 5.00%, 7/31/40(a) | | | 261,226 | |
1,848,779 | | Ecuador Government International Bond, 5.50%, 7/31/35(a) | | | 1,049,807 | |
| | | | | | |
| | | | | 1,311,033 | |
| | | | | | |
|
Egypt — 2.2% | |
880,000 | | Egypt Government International Bond, 6.59%, 2/21/28(a) | | | 839,073 | |
200,000 | | Egypt Government International Bond, EMTN, 7.30%, 9/30/33(a) | | | 169,780 | |
1,014,000 | | Egypt Government International Bond, EMTN, 7.50%, 2/16/61(a) | | | 732,255 | |
1,010,000 | | Egypt Government International Bond, 7.90%, 2/21/48(a) | | | 776,977 | |
| | | | | | |
| | | | | 2,518,085 | |
| | | | | | |
| |
El Salvador — 1.6% | | | | |
406,000 | | El Salvador Government International Bond, 6.38%, 1/18/27(a) | | | 389,874 | |
390,000 | | El Salvador Government International Bond, 7.63%, 2/1/41(a) | | | 318,430 | |
783,000 | | El Salvador Government International Bond, 7.65%, 6/15/35(a) | | | 675,858 | |
510,000 | | El Salvador Government International Bond, 9.25%, 4/17/30(a) | | | 507,747 | |
| | | | | | |
| | | | | 1,891,909 | |
| | | | | | |
|
Ghana — 1.0% | |
1,129,000 | | Ghana Government International Bond, 7.75%, 4/7/29(a) | | | 592,534 | |
730,000 | | Ghana Government International Bond, 8.95%, 3/26/51(a) | | | 387,158 | |
295,000 | | Ghana Government International Bond, 10.75%, 10/14/30(b) | | | 201,918 | |
| | | | | | |
| | | | | 1,181,610 | |
| | | | | | |
| |
Guatemala — 1.9% | | | | |
390,000 | | Guatemala Government Bond, 3.70%, 10/7/33(a) | | | 333,892 | |
665,000 | | Guatemala Government Bond, 6.05%, 8/6/31(a) | | | 682,634 | |
680,000 | | Guatemala Government Bond, 6.55%, 2/6/37(a) | | | 707,247 | |
475,000 | | Guatemala Government Bond, 6.60%, 6/13/36(a) | | | 498,679 | |
| | | | | | |
| | | | | 2,222,452 | |
| | | | | | |
|
Hungary — 0.6% | |
1,100,000 | | Hungary Government International Bond, 3.13%, 9/21/51(a) | | | 733,860 | |
| | | | | | |
2
|
SCHEDULE OF PORTFOLIO INVESTMENTS |
RBC BlueBay Emerging Market Debt Fund (cont.)
September 30, 2024
| | | | | | |
Principal Amount | | | | Value | |
| |
Indonesia — 1.1% | | | | |
$ 1,235,000 | | Indonesia Government International Bond, 3.35%, 3/12/71 | | $ | 867,911 | |
6,000,000,000(d) | | Indonesia Treasury Bond, Series FR98, 7.13%, 6/15/38 | | | 412,664 | |
| | | | | | |
| | | | | 1,280,575 | |
| | | | | | |
|
Iraq — 0.3% | |
367,500 | | Iraq International Bond, 5.80%, 1/15/28(a) | | | 356,703 | |
| | | | | | |
|
Ivory Coast — 0.6% | |
200,000 | | Ivory Coast Government International Bond, 7.63%, 1/30/33(a) | | | 205,310 | |
220,000 | | Ivory Coast Government International Bond, 7.63%, 1/30/33(b) | | | 225,840 | |
210,000 | | Ivory Coast Government International Bond, 8.25%, 1/30/37(b) | | | 215,873 | |
| | | | | | |
| | | | | 647,023 | |
| | | | | | |
|
Jordan — 0.5% | |
640,000 | | Jordan Government International Bond, 7.38%, 10/10/47(a) | | | 589,724 | |
| | | | | | |
|
Kenya — 0.4% | |
520,000 | | Republic of Kenya Government International Bond, 9.75%, 2/16/31(a) | | | 525,562 | |
| | | | | | |
|
Lebanon — 0.3% | |
36,000 | | Lebanon Government International Bond, GMTN, 5.80%, 4/14/20(a),(e) | | | 2,827 | |
166,000 | | Lebanon Government International Bond, 6.00%, 1/27/23(a),(e) | | | 12,878 | |
85,000 | | Lebanon Government International Bond, EMTN, 6.10%, 10/4/22(a),(e) | | | 6,613 | |
261,000 | | Lebanon Government International Bond, EMTN, 6.15%, 6/19/20(e) | | | 20,286 | |
1,680,000 | | Lebanon Government International Bond, GMTN, 6.38%, 3/9/20(e) | | | 130,911 | |
1,951,000 | | Lebanon Government International Bond, EMTN, 8.25%, 4/12/21(a),(e) | | | 151,459 | |
5,000 | | Lebanon Government International Bond, 8.25%, 5/17/34(e) | | | 390 | |
| | | | | | |
| | | | | 325,364 | |
| | | | | | |
| |
Macedonia — 0.5% | | | | |
480,000(f) | | North Macedonia Government International Bond, 6.96%, 3/13/27(a) | | | 557,513 | |
| | | | | | |
| |
Montenegro — 0.3% | | | | |
370,000 | | Montenegro Government International Bond, 7.25%, 3/12/31(a) | | | 387,197 | |
| | | | | | |
|
Morocco — 0.3% | |
340,000 | | Morocco Government International Bond, 5.95%, 3/8/28(a) | | | 351,186 | |
| | | | | | |
3
|
SCHEDULE OF PORTFOLIO INVESTMENTS |
RBC BlueBay Emerging Market Debt Fund (cont.)
September 30, 2024
| | | | | | |
Principal Amount | | | | Value | |
| |
|
Nigeria — 1.3% | |
$ 850,000 | | Nigeria Government International Bond, EMTN, 6.13%, 9/28/28(a) | | $ | 770,208 | |
200,000 | | Nigeria Government International Bond, EMTN, 7.38%, 9/28/33(a) | | | 170,027 | |
644,000 | | Nigeria Government International Bond, 7.88%, 2/16/32(a) | | | 579,332 | |
| | | | | | |
| | | | | 1,519,567 | |
| | | | | | |
|
Oman — 2.4% | |
2,560,000 | | Oman Government International Bond, 6.75%, 1/17/48(a) | | | 2,769,960 | |
| | | | | | |
|
Pakistan — 2.1% | |
830,000 | | Pakistan Government International Bond, EMTN, 6.00%, 4/8/26(a) | | | 777,496 | |
610,000 | | Pakistan Government International Bond, EMTN, 7.38%, 4/8/31(a) | | | 517,257 | |
145,000 | | Pakistan Government International Bond, 7.88%, 3/31/36(a) | | | 116,643 | |
1,035,000 | | Pakistan Government International Bond, 8.25%, 9/30/25(a) | | | 1,015,120 | |
| | | | | | |
| | | | | 2,426,516 | |
| | | | | | |
|
Panama — 3.1% | |
1,535,000 | | Panama Government International Bond, 3.87%, 7/23/60 | | | 965,973 | |
1,920,000 | | Panama Government International Bond, 4.50%, 4/1/56 | | | 1,382,314 | |
250,000 | | Panama Government International Bond, 6.85%, 3/28/54 | | | 253,532 | |
885,000 | | Panama Government International Bond, 8.00%, 3/1/38 | | | 999,295 | |
| | | | | | |
| | | | | 3,601,114 | |
| | | | | | |
|
Paraguay — 2.0% | |
860,000 | | Paraguay Government International Bond, 5.40%, 3/30/50(a) | | | 801,835 | |
230,000 | | Paraguay Government International Bond, 5.85%, 8/21/33(b) | | | 239,599 | |
425,000 | | Paraguay Government International Bond, 5.85%, 8/21/33(a) | | | 442,736 | |
230,000 | | Paraguay Government International Bond, 6.00%, 2/9/36(a) | | | 242,556 | |
4,379,000,000(g) | | Paraguay Government International Bond, 7.90%, 2/9/31(b) | | | 573,621 | |
| | | | | | |
| | | | | 2,300,347 | |
| | | | | | |
|
Peru — 0.5% | |
585,000 | | Peruvian Government International Bond, 5.88%, 8/8/54 | | | 614,921 | |
| | | | | | |
|
Philippines — 2.2% | |
835,000 | | Philippine Government International Bond, 2.95%, 5/5/45 | | | 617,125 | |
710,000 | | Philippine Government International Bond, 5.60%, 5/14/49 | | | 765,881 | |
520,000 | | Philippine Government International Bond, 5.61%, 4/13/33 | | | 556,467 | |
550,000 | | ROP Sukuk Trust, 5.05%, 6/6/29(a) | | | 567,566 | |
| | | | | | |
| | | | | 2,507,039 | |
| | | | | | |
|
Poland — 2.3% | |
600,000 | | Bank Gospodarstwa Krajowego, EMTN, 5.38%, 5/22/33(a) | | | 615,229 | |
455,000 | | Republic of Poland Government International Bond, 5.50%, 4/4/53 | | | 466,002 | |
4
|
SCHEDULE OF PORTFOLIO INVESTMENTS |
RBC BlueBay Emerging Market Debt Fund (cont.)
September 30, 2024
| | | | | | |
Principal Amount | | | | Value | |
| |
$ 1,045,000 | | Republic of Poland Government International Bond, 5.50%, 3/18/54 | | $ | 1,067,867 | |
450,000 | | Republic of Poland Government International Bond, 5.75%, 11/16/32 | | | 483,065 | |
| | | | | | |
| | | | | 2,632,163 | |
| | | | | | |
|
Qatar — 0.6% | |
540,000 | | Qatar Government International Bond, 4.82%, 3/14/49(a) | | | 533,057 | |
200,000 | | Qatar Government International Bond, 5.10%, 4/23/48(a) | | | 205,682 | |
| | | | | | |
| | | | | 738,739 | |
| | | | | | |
|
Romania — 3.0% | |
190,000(f) | | Romanian Government International Bond, EMTN, 2.00%, 4/14/33(a) | | | 163,960 | |
807,000(f) | | Romanian Government International Bond, EMTN, 2.75%, 4/14/41(a) | | | 605,521 | |
497,000(f) | | Romanian Government International Bond, EMTN, 3.38%, 1/28/50(a) | | | 376,514 | |
437,000(f) | | Romanian Government International Bond, 5.13%, 9/24/31(b) | | | 488,711 | |
452,000 | | Romanian Government International Bond, 5.75%, 3/24/35(b) | | | 450,045 | |
130,000 | | Romanian Government International Bond, 5.88%, 1/30/29(a) | | | 133,151 | |
350,000 | | Romanian Government International Bond, 5.88%, 1/30/29(b) | | | 358,484 | |
366,000(f) | | Romanian Government International Bond, 6.00%, 9/24/44(b) | | | 404,492 | |
130,000 | | Romanian Government International Bond, 6.38%, 1/30/34(a) | | | 135,057 | |
340,000 | | Romanian Government International Bond, 6.38%, 1/30/34(b) | | | 353,225 | |
| | | | | | |
| | | | | 3,469,160 | |
| | | | | | |
|
Senegal — 0.4% | |
450,000 | | Senegal Government International Bond, Series 7Y, 7.75%, 6/10/31(a) | | | 429,937 | |
| | | | | | |
|
Serbia — 2.4% | |
690,000(f) | | Serbia International Bond, EMTN, 2.05%, 9/23/36(a) | | | 572,666 | |
1,080,000 | | Serbia International Bond, 6.00%, 6/12/34(a) | | | 1,112,836 | |
400,000 | | Serbia International Bond, 6.25%, 5/26/28(a) | | | 415,750 | |
600,000 | | Serbia International Bond, 6.50%, 9/26/33(a) | | | 641,127 | |
| | | | | | |
| | | | | 2,742,379 | |
| | | | | | |
|
South Africa — 2.4% | |
275,000 | | Republic of South Africa Government International Bond, 4.85%, 9/30/29 | | | 267,061 | |
915,000 | | Republic of South Africa Government International Bond, 5.00%, 10/12/46 | | | 707,399 | |
1,200,000 | | Republic of South Africa Government International Bond, 5.38%, 7/24/44 | | | 999,463 | |
5
|
SCHEDULE OF PORTFOLIO INVESTMENTS |
RBC BlueBay Emerging Market Debt Fund (cont.)
September 30, 2024
| | | | | | |
Principal Amount | | | | Value | |
| |
$ 620,000 | | Republic of South Africa Government International Bond, 5.88%, 6/22/30 | | $ | 625,635 | |
200,000 | | Republic of South Africa Government International Bond, 7.30%, 4/20/52 | | | 198,882 | |
| | | | | | |
| | | | | 2,798,440 | |
| | | | | | |
|
Sri Lanka — 1.6% | |
280,000 | | Sri Lanka Government International Bond, 5.75%, 4/18/25 | | | 153,667 | |
250,000 | | Sri Lanka Government International Bond, 6.20%, 5/11/27(a) | | | 139,462 | |
275,000 | | Sri Lanka Government International Bond, 6.35%, 6/28/25(a) | | | 151,352 | |
390,000 | | Sri Lanka Government International Bond, 6.83%, 7/18/26(a) | | | 218,541 | |
911,000 | | Sri Lanka Government International Bond, 6.85%, 3/14/99(a) | | | 501,136 | |
730,000 | | Sri Lanka Government International Bond, 7.55%, 3/28/30(a) | | | 408,685 | |
424,000 | | Sri Lanka Government International Bond, 7.85%, 3/14/29(a) | | | 238,395 | |
| | | | | | |
| | | | | 1,811,238 | |
| | | | | | |
|
Tunisia — 0.5% | |
600,000 | | Tunisian Republic, 5.75%, 1/30/25(a) | | | 579,686 | |
| | | | | | |
|
Turkey — 4.2% | |
650,000 | | Hazine Mustesarligi Varlik Kiralama AS, 8.51%, 1/14/29(a) | | | 711,272 | |
280,000 | | Istanbul Metropolitan Municipality, 10.50%, 12/6/28(b) | | | 307,449 | |
2,660,000 | | Turkey Government International Bond, 4.88%, 4/16/43 | | | 2,004,265 | |
1,954,000 | | Turkey Government International Bond, 5.75%, 5/11/47 | | | 1,584,152 | |
200,000 | | Turkiye Ihracat Kredi Bankasi AS, EMTN, 9.00%, 1/28/27(a) | | | 213,409 | |
| | | | | | |
| | | | | 4,820,547 | |
| | | | | | |
|
Ukraine — 1.5% | |
66,457 | | Ukraine Government International Bond, 0.00%, 2/1/30(b) | | | 29,150 | |
248,341 | | Ukraine Government International Bond, 0.00%, 2/1/34(b) | | | 83,399 | |
209,866 | | Ukraine Government International Bond, 0.00%, 2/1/35(b) | | | 91,092 | |
174,888 | | Ukraine Government International Bond, 0.00%, 2/1/36(b) | | | 75,559 | |
119,702 | | Ukraine Government International Bond, 1.75%, 2/1/29(b) | | | 70,526 | |
298,787 | | Ukraine Government International Bond, 1.75%, 2/1/34(b) | | | 133,168 | |
378,583 | | Ukraine Government International Bond, 1.75%, 2/1/35(b) | | | 164,717 | |
419,542 | | Ukraine Government International Bond, 1.75%, 2/1/36(b) | | | 180,516 | |
1,267,000 | | Ukraine Government International Bond, 7.75%, 8/1/41(a),(h) | | | 892,233 | |
| | | | | | |
| | | | | 1,720,360 | |
| | | | | | |
|
United Arab Emirates — 1.5% | |
1,000,000 | | Abu Dhabi Government International Bond, 3.13%, 9/30/49(a) | | | 733,897 | |
799,000 | | Finance Department Government of Sharjah, GMTN, 4.00%, 7/28/50(a) | | | 557,360 | |
415,000(f) | | Finance Department Government of Sharjah, Series REgs, 4.63%, 1/17/31(a) | | | 462,607 | |
| | | | | | |
| | | | | 1,753,864 | |
| | | | | | |
6
|
SCHEDULE OF PORTFOLIO INVESTMENTS |
RBC BlueBay Emerging Market Debt Fund (cont.)
September 30, 2024
| | | | | | |
Principal Amount | | | | Value | |
| |
Uruguay — 1.5% | |
$ 1,147,599 | | Uruguay Government International Bond, 4.98%, 4/20/55 | | $ | 1,114,342 | |
24,005,400(i) | | Uruguay Government International Bond, 9.75%, 7/20/33 | | | 574,963 | |
| | | | | | |
| | | 1,689,305 | |
| | | | | | |
|
Uzbekistan — 1.9% | |
430,000 | | Republic of Uzbekistan International Bond, 3.90%, 10/19/31(a) | | | 367,663 | |
675,000 | | Republic of Uzbekistan International Bond, 6.90%, 2/28/32(a) | | | 679,440 | |
560,000 | | Republic of Uzbekistan International Bond, 7.85%, 10/12/28(b) | | | 591,238 | |
650,000 | | Uzbekneftegaz JSC, 4.75%, 11/16/28(a) | | | 573,939 | |
| | | | | | |
| | | | | 2,212,280 | |
| | | | | | |
|
Venezuela — 0.6% | |
2,675,000 | | Venezuela Government International Bond, 7.75%, 10/13/19(a),(e) | | | 336,003 | |
73,800 | | Venezuela Government International Bond, 8.25%, 10/13/24(a),(e) | | | 10,138 | |
1,720,000 | | Venezuela Government International Bond, 11.75%, 10/21/26(a),(e) | | | 275,575 | |
125,000 | | Venezuela Government International Bond, 11.95%, 8/5/31(a),(e) | | | 19,847 | |
375,000 | | Venezuela Government International Bond, 12.75%, 8/23/22(a),(e) | | | 59,968 | |
| | | | | | |
| | | | | 701,531 | |
| | | | | | |
|
Zambia — 0.5% | |
470,000 | | Zambia Government International Bond, 0.50%, 12/31/53(a) | | | 230,875 | |
406,022 | | Zambia Government International Bond, 5.75%, 6/30/33(a) | | | 358,047 | |
| | | | | | |
| | | | | 588,922 | |
| | | | | | |
Total Foreign Government Bonds | | | 77,516,936 | |
| | | | | | |
(Cost $73,414,960) | | | | |
|
Corporate Bonds — 23.4% | |
Brazil — 0.4% | |
520,278 | | MV24 Capital BV, 6.75%, 6/1/34(a) | | | 507,749 | |
| | | | | | |
|
Cayman Islands — 0.5% | |
515,000 | | EDO Sukuk Ltd., 5.66%, 7/3/31(a) | | | 530,197 | |
| | | | | | |
|
Chile — 1.4% | |
200,000 | | Corp. Nacional del Cobre de Chile, 5.13%, 2/2/33(a) | | | 199,007 | |
200,000 | | Corp. Nacional del Cobre de Chile, 5.95%, 1/8/34(a) | | | 209,916 | |
600,000 | | Corp. Nacional del Cobre de Chile, 5.95%, 1/8/34(b) | | | 629,746 | |
400,000 | | Corp. Nacional del Cobre de Chile, 6.30%, 9/8/53(a) | | | 423,302 | |
200,000 | | Empresa Nacional del Petroleo, 5.95%, 7/30/34(b) | | | 209,912 | |
| | | | | | |
| | | | | 1,671,883 | |
| | | | | | |
7
|
SCHEDULE OF PORTFOLIO INVESTMENTS |
RBC BlueBay Emerging Market Debt Fund (cont.)
September 30, 2024
| | | | | | |
Principal Amount | | | | Value | |
| |
Colombia — 1.6% | | | | |
$ 225,000 | | Ecopetrol SA, 5.88%, 5/28/45 | | $ | 169,228 | |
695,000 | | Ecopetrol SA, 5.88%, 11/2/51 | | | 505,792 | |
530,000 | | Ecopetrol SA, 8.63%, 1/19/29 | | | 570,950 | |
530,000 | | Ecopetrol SA, 8.88%, 1/13/33 | | | 568,004 | |
| | | | | | |
| | | | | 1,813,974 | |
| | | | | | |
|
Jamaica — 0.2% | |
200,000 | | Kingston Airport Revenue Finance Ltd., 6.75%, 12/15/36(b) | | | 207,387 | |
| | | | | | |
|
Kazakhstan — 0.2% | |
102,500,000(j) | | Development Bank of Kazakhstan JSC, 13.00%, 4/15/27(b) | | | 210,784 | |
| | | | | | |
|
Mexico — 6.0% | |
12,580,000(k) | | America Movil SAB de CV, 9.50%, 1/27/31 | | | 623,914 | |
530,000 | | Comision Federal de Electricidad, 4.69%, 5/15/29(a) | | | 514,272 | |
235,000 | | Comision Federal de Electricidad, 6.45%, 1/24/35(b) | | | 233,854 | |
370,000 | | FIEMEX Energia - Banco Actinver SA Institucion de Banca Multiple, 7.25%, 1/31/41(b) | | | 385,677 | |
790,000 | | Mexico City Airport Trust, 5.50%, 7/31/47(a) | | | 678,697 | |
3,612,000 | | Petroleos Mexicanos, 5.63%, 1/23/46 | | | 2,355,183 | |
3,059,000 | | Petroleos Mexicanos, 6.35%, 2/12/48 | | | 2,111,702 | |
| | | | | | |
| | | | | 6,903,299 | |
| | | | | | |
|
Oman — 1.6% | |
500,000 | | EDO Sukuk Ltd., 5.88%, 9/21/33(a) | | | 526,473 | |
440,000 | | Lamar Funding Ltd., 3.96%, 5/7/25(a) | | | 435,707 | |
890,000 | | OQ SAOC, GMTN, 5.13%, 5/6/28(a) | | | 893,941 | |
| | | | | | |
| | | | | 1,856,121 | |
| | | | | | |
|
Paraguay — 0.5% | |
416,018 | | Rutas 2 & 7 Finance Ltd., 0.00%, 9/30/36(a),(l) | | | 298,656 | |
262,000 | | Telefonica Celular del Paraguay SA, 5.88%, 4/15/27(a) | | | 260,397 | |
| | | | | | |
| | | | | 559,053 | |
| | | | | | |
|
Peru — 1.6% | |
1,190,000(m) | | Credicorp Capital Sociedad Titulizadora SA, 10.10%, 12/15/43(a),(b) | | | 335,376 | |
815,000 | | InRetail Consumer, 3.25%, 3/22/28(a) | | | 763,262 | |
713,000 | | Niagara Energy SAC, 5.75%, 10/3/34(b) | | | 716,499 | |
| | | | | | |
| | | | | 1,815,137 | |
| | | | | | |
|
Qatar — 0.7% | |
400,000 | | Qatar Energy, 3.13%, 7/12/41(a) | | | 317,590 | |
620,000 | | QatarEnergy, 3.30%, 7/12/51(a) | | | 463,177 | |
| | | | | | |
| | | | | 780,767 | |
| | | | | | |
|
Saudi Arabia — 2.5% | |
875,000 | | Greensaif Pipelines Bidco Sarl, EMTN, 5.85%, 2/23/36(a) | | | 905,818 | |
8
|
SCHEDULE OF PORTFOLIO INVESTMENTS |
RBC BlueBay Emerging Market Debt Fund (cont.)
September 30, 2024
| | | | | | |
Principal Amount | | | | Value | |
| |
$ 1,105,000 | | Greensaif Pipelines Bidco Sarl, 6.10%, 8/23/42(a) | | $ | 1,145,362 | |
440,000 | | Greensaif Pipelines Bidco Sarl, 6.13%, 2/23/38(a) | | | 466,067 | |
400,000 | | Greensaif Pipelines Bidco Sarl, 6.51%, 2/23/42(a) | | | 431,528 | |
| | | | | | |
| | | | | 2,948,775 | |
| | | | | | |
|
South Africa — 0.2% | |
200,000 | | Eskom Holdings SOC Ltd., 7.13%, 2/11/25(a) | | | 199,993 | |
| | | | | | |
|
Turkey — 0.5% | |
410,000 | | TC Ziraat Bankasi AS, EMTN, 8.00%, 1/16/29(a) | | | 429,985 | |
200,000 | | Ziraat Katilim Varlik Kiralama AS, 9.38%, 11/12/26(a) | | | 214,822 | |
| | | | | | |
| | | | | 644,807 | |
| | | | | | |
|
United Arab Emirates — 5.3% | |
927,000 | | Abu Dhabi Developmental Holding Co. PJSC, 5.25%, 10/2/54(b) | | | 914,563 | |
917,000 | | Adnoc Murban Rsc Ltd., 5.13%, 9/11/54(b) | | | 902,334 | |
400,000 | | DP World Crescent Ltd., 5.50%, 9/13/33(a) | | | 417,590 | |
1,030,000 | | DP World Salaam, 6.00%, (a),(n),(o) | | | 1,028,589 | |
393,339 | | Galaxy Pipeline Assets Bidco Ltd., 2.16%, 3/31/34(a) | | | 349,085 | |
909,637 | | Galaxy Pipeline Assets Bidco Ltd., 2.94%, 9/30/40(a) | | | 766,868 | |
710,000 | | Masdar Abu Dhabi Future Energy Co., EMTN, 4.88%, 7/25/29(a) | | | 722,296 | |
610,000 | | Masdar Abu Dhabi Future Energy Co., EMTN, 5.25%, 7/25/34(a) | | | 632,129 | |
200,000 | | MDGH GMTN RSC Ltd., EMTN, 4.38%, 11/22/33(a) | | | 196,974 | |
200,000 | | MDGH GMTN RSC Ltd., 5.50%, 4/28/33(a) | | | 213,179 | |
| | | | | | |
| | | | | 6,143,607 | |
| | | | | | |
|
Venezuela — 0.2% | |
173,584 | | Petroleos de Venezuela SA, 6.00%, 11/15/26(a),(e) | | | 16,388 | |
260,000 | | Petroleos de Venezuela SA, 8.50%, 10/27/20(a),(e) | | | 239,347 | |
| | | | | | |
| | | | | 255,735 | |
| | | | | | |
Total Corporate Bonds | | | 27,049,268 | |
| | | | | | |
(Cost $26,533,570) | | | | |
| | | | | | |
Contracts Put Option Purchased — 0.00% | |
110,000 | | CAD CALL VERSUS EUR PUT, Strike Price USD 1.4320, Expires 10/31/24, Notional Amount EUR 157,520 | | | 1,467 | |
890,000 | | USD CALL VERSUS GBP PUT, Strike Price USD 1.215, Expires 10/03/24, Notional Amount GBP 1,081,350 | | | — | |
| | | | | | |
| |
Total Put Option Purchased | | | 1,467 | |
| | | | | | |
(Cost $20,126) | | | | | | |
9
|
SCHEDULE OF PORTFOLIO INVESTMENTS |
RBC BlueBay Emerging Market Debt Fund (cont.)
September 30, 2024
| | | | | | |
Principal Amount | | | | Value | |
| |
Municipal Bond — 0.2% | | | | |
Turkey — 0.2% | | | | |
200,000 | | Istanbul Metropolitan Municipality, 10.75%, 4/12/27(a) | | $ | 217,235 | |
| | | | | | |
| |
Total Municipal Bond | | | 217,235 | |
| | | | | | |
(Cost $196,486) | | | | |
| | | | | | |
| | |
Shares | | | | | | |
Investment Company — 28.9% | | | | |
33,397,607 | | RBC BlueBay U.S. Government Money Market Fund, Institutional Class 1 (p) | | | 33,397,607 | |
| | | | | | |
| |
Total Investment Company | | | 33,397,607 | |
| | | | | | |
(Cost $33,397,607) | | | | |
| |
Total Investments | | $ | 138,182,513 | |
(Cost $133,562,749)(q) — 119.4% | | | | |
| |
Liabilities in excess of other assets — (19.4)% | | | (22,421,053) | |
| | | | | | |
| |
NET ASSETS — 100.0% | | $ | 115,761,460 | |
| | | | | | |
10
|
SCHEDULE OF PORTFOLIO INVESTMENTS |
RBC BlueBay Emerging Market Debt Fund (cont.)
September 30, 2024
| (a) | This security may be resold to qualified foreign investors and foreign institutional buyers under Regulation S of the Securities Act of 1933. |
| (b) | Security exempt from registration under Rule 144A or Section 4(2) of the Securities Act of 1933, as amended. These securities may be resold in transactions exempt from registration, normally to qualified institutional buyers. |
| (c) | Principal amount denoted in Dominican peso. |
| (d) | Principal amount denoted in Indonesian Rupiah. |
| (e) | Issuer filed for bankruptcy and/or is in default of interest payments. |
| (f) | Principal amount denoted in Euros. |
| (g) | Principal amount denoted in Paraguayan Guarani. |
| (h) | Variable or floating rate security, which interest rate adjusts periodically based on changes in current interest rates and prepayments on the underlying pool of assets. Rate shown is the rate in effect as of period end. |
| (i) | Principal amount denoted in Uruguayan peso. |
| (j) | Principal amount denoted in Kazakhstani tenge. |
| (k) | Principal amount denoted in Mexican peso. |
| (l) | Zero Coupon Bond. The rate represents the yield at time of purchase. |
| (m) | Principal amount denoted in Peruvian sol. |
| (n) | Security is a fix-to-float security, which carries a fixed coupon until a certain date, upon which it switches to a floating rate. Reference rate and spread are provided if the rate is currently floating. |
| (o) | Perpetual security with no stated maturity date. |
| (p) | Affiliated investment. |
| (q) | See Notes to Schedules of Portfolio Investments for the tax cost of securities and the breakdown of unrealized appreciation (depreciation). |
11
|
SCHEDULE OF PORTFOLIO INVESTMENTS |
RBC BlueBay Emerging Market Debt Fund (cont.)
September 30, 2024
Foreign currency exchange contracts as of September 30, 2024:
| | | | | | | | | | | | | | | | | | | | | | | | | | | | | | | | | | | | | | | | | | | | | | |
Currency Purchased | | | Currency Sold | | | Counterparty | | | | | | Settlement Date | | Value/Unrealized
Appreciation
(Depreciation) | |
BRL | | | 486,773 | | | | | | | | USD | | | | 88,927 | | | | | | | | Citibank N.A. | | | | | | | 11/4/24 | | | | | | | | | | | $ 59 | | | | | |
BRL | | | 5,085,484 | | | | | | | | USD | | | | 920,000 | | | | | | | | Citibank N.A. | | | | | | | 11/4/24 | | | | | | | | | | | 9,666 | | | | | |
BRL | | | 339,420 | | | | | | | | USD | | | | 62,013 | | | | | | | | Citibank N.A. | | | | | | | 11/4/24 | | | | | | | | | | | 35 | | | | | |
CLP | | | 246,295,971 | | | | | | | | USD | | | | 262,249 | | | | | | | | Citibank N.A. | | | | | | | 10/17/24 | | | | | | | | | | | 11,589 | | | | | |
CLP | | | 117,524,492 | | | | | | | | USD | | | | 125,876 | | | | | | | | Citibank N.A. | | | | | | | 10/17/24 | | | | | | | | | | | 4,790 | | | | | |
CLP | | | 93,688,546 | | | | | | | | USD | | | | 100,701 | | | | | | | | Citibank N.A. | | | | | | | 10/17/24 | | | | | | | | | | | 3,464 | | | | | |
CLP | | | 494,780,422 | | | | | | | | USD | | | | 538,151 | | | | | | | | Citibank N.A. | | | | | | | 10/17/24 | | | | | | | | | | | 11,958 | | | | | |
CLP | | | 37,554,242 | | | | | | | | USD | | | | 41,748 | | | | | | | | Citibank N.A. | | | | | | | 10/17/24 | | | | | | | | | | | 6 | | | | | |
CLP | | | 23,210,053 | | | | | | | | USD | | | | 25,175 | | | | | | | | Citibank N.A. | | | | | | | 10/17/24 | | | | | | | | | | | 630 | | | | | |
CLP | | | 49,561,802 | | | | | | | | USD | | | | 54,931 | | | | | | | | Citibank N.A. | | | | | | | 10/17/24 | | | | | | | | | | | 173 | | | | | |
EUR | | | 925,000 | | | | | | | | USD | | | | 1,004,578 | | | | | | | | Citibank N.A. | | | | | | | 10/17/24 | | | | | | | | | | | 25,862 | | | | | |
EUR | | | 180,000 | | | | | | | | USD | | | | 197,362 | | | | | | | | Citibank N.A. | | | | | | | 10/17/24 | | | | | | | | | | | 3,156 | | | | | |
KRW | | | 1,142,400,000 | | | | | | | | USD | | | | 840,000 | | | | | | | | Citibank N.A. | | | | | | | 10/17/24 | | | | | | | | | | | 30,146 | | | | | |
KRW | | | 196,993,500 | | | | | | | | USD | | | | 150,000 | | | | | | | | Citibank N.A. | | | | | | | 10/17/24 | | | | | | | | | | | 47 | | | | | |
MYR | | | 3,858,216 | | | | | | | | USD | | | | 910,000 | | | | | | | | Barclays Bank Plc | | | | | | | 10/17/24 | | | | | | | | | | | 25,230 | | | | | |
TRY | | | 8,713,491 | | | | | | | | USD | | | | 240,161 | | | | | | | | Citibank N.A. | | | | | | | 10/17/24 | | | | | | | | | | | 9,960 | | | | | |
TRY | | | 20,943,426 | | | | | | | | USD | | | | 542,211 | | | | | | | | Citibank N.A. | | | | | | | 11/12/24 | | | | | | | | | | | 42,177 | | | | | |
USD | | | 17,757 | | | | | | | | COP | | | | 73,459,139 | | | | | | | | Citibank N.A. | | | | | | | 10/17/24 | | | | | | | | | | | 333 | | | | | |
USD | | | 203,165 | | | | | | | | MXN | | | | 3,824,367 | | | | | | | | Citibank N.A. | | | | | | | 10/17/24 | | | | | | | | | | | 9,461 | | | | | |
USD | | | 946,973 | | | | | | | | MXN | | | | 17,448,111 | | | | | | | | Citibank N.A. | | | | | | | 10/17/24 | | | | | | | | | | | 63,229 | | | | | |
USD | | | 203,164 | | | | | | | | MXN | | | | 3,822,234 | | | | | | | | Citibank N.A. | | | | | | | 10/17/24 | | | | | | | | | | | 9,569 | | | | | |
ZAR | | | 1,150,000 | | | | | | | | USD | | | | 62,848 | | | | | | | | Citibank N.A. | | | | | | | 10/17/24 | | | | | | | | | | | 3,613 | | | | | |
ZAR | | | 23,043,563 | | | | | | | | USD | | | | 1,286,986 | | | | | | | | Citibank N.A. | | | | | | | 10/17/24 | | | | | | | | | | | 44,757 | | | | | |
| | | | | | | | | | | | | | | | | | | | | | | | | | | | | | | | | | | | | | | | | | | | | | |
| | | | | | | | | | | | | | | | | | | | | | | | | | | | | | | | | | | | | | | | | $ 309,910 | | | | | |
| | | | | | | | | | | | | | | | | | | | | | | | | | | | | | | | | | | | | | | | | | | | | | |
BRL | | | 2,049,000 | | | | | | | | USD | | | | 375,000 | | | | | | | | Citibank N.A. | | | | | | | 11/4/24 | | | | | | | | | | | $ (427) | | | | | |
BRL | | | 1,522,633 | | | | | | | | USD | | | | 279,060 | | | | | | | | Citibank N.A. | | | | | | | 11/4/24 | | | | | | | | | | | (711) | | | | | |
CLP | | | 184,457,399 | | | | | | | | USD | | | | 205,164 | | | | | | | | Citibank N.A. | | | | | | | 10/17/24 | | | | | | | | | | | (80) | | | | | |
COP | | | 36,729,569 | | | | | | | | USD | | | | 9,009 | | | | | | | | Citibank N.A. | | | | | | | 10/17/24 | | | | | | | | | | | (296) | | | | | |
MXN | | | 5,630,131 | | | | | | | | USD | | | | 287,864 | | | | | | | | Citibank N.A. | | | | | | | 10/17/24 | | | | | | | | | | | (2,699) | | | | | |
MXN | | | 6,675,059 | | | | | | | | USD | | | | 342,136 | | | | | | | | Citibank N.A. | | | | | | | 10/17/24 | | | | | | | | | | | (4,045) | | | | | |
MXN | | | 597,844 | | | | | | | | USD | | | | 30,912 | | | | | | | | Citibank N.A. | | | | | | | 10/17/24 | | | | | | | | | | | (631) | | | | | |
PHP | | | 19,717,088 | | | | | | | | USD | | | | 353,163 | | | | | | | | Citibank N.A. | | | | | | | 10/17/24 | | | | | | | | | | | (1,708) | | | | | |
PHP | | | 27,733,444 | | | | | | | | USD | | | | 496,837 | | | | | | | | Citibank N.A. | | | | | | | 10/17/24 | | | | | | | | | | | (2,492) | | | | | |
PHP | | | 23,809,100 | | | | | | | | USD | | | | 430,000 | | | | | | | | Citibank N.A. | | | | | | | 10/17/24 | | | | | | | | | | | (5,606) | | | | | |
USD | | | 835,658 | | | | | | | | MYR | | | | 3,922,580 | | | | | | | | Barclays Bank Plc | | | | | | | 10/17/24 | | | | | | | | | | | (115,174) | | | | | |
USD | | | 258,477 | | | | | | | | CLP | | | | 238,294,858 | | | | | | | | Citibank N.A. | | | | | | | 10/17/24 | | | | | | | | | | | (6,465) | | | | | |
USD | | | 264,161 | | | | | | | | CLP | | | | 242,993,816 | | | | | | | | Citibank N.A. | | | | | | | 10/17/24 | | | | | | | | | | | (6,005) | | | | | |
USD | | | 145,879 | | | | | | | | CLP | | | | 134,595,222 | | | | | | | | Citibank N.A. | | | | | | | 10/17/24 | | | | | | | | | | | (3,767) | | | | | |
USD | | | 121,483 | | | | | | | | CLP | | | | 112,080,474 | | | | | | | | Citibank N.A. | | | | | | | 10/17/24 | | | | | | | | | | | (3,130) | | | | | |
USD | | | 3,548,939 | | | | | | | | EUR | | | | 3,258,783 | | | | | | | | Citibank N.A. | | | | | | | 10/17/24 | | | | | | | | | | | (81,310) | | | | | |
USD | | | 470,863 | | | | | | | | EUR | | | | 430,000 | | | | | | | | Citibank N.A. | | | | | | | 10/17/24 | | | | | | | | | | | (8,152) | | | | | |
USD | | | 393,106 | | | | | | | | IDR | | | | 6,431,981,044 | | | | | | | | Citibank N.A. | | | | | | | 10/17/24 | | | | | | | | | | | (30,654) | | | | | |
USD | | | 430,000 | | | | | | | | KRW | | | | 574,423,240 | | | | | | | | Citibank N.A. | | | | | | | 10/17/24 | | | | | | | | | | | (7,527) | | | | | |
12
|
SCHEDULE OF PORTFOLIO INVESTMENTS |
RBC BlueBay Emerging Market Debt Fund (cont.)
September 30, 2024
| | | | | | | | | | | | | | | | | | | | | | | | | | | | | | | | | | | | | | | | | | | | | | | | |
Currency Purchased | | | Currency Sold | | | Counterparty | | | | | | Settlement
Date | | | Value/Unrealized
Appreciation
(Depreciation) | |
USD | | | 243,218 | | | | | | | | TRY | | | | 8,713,490 | | | | | | | | Citibank N.A. | | | | | | | | 10/17/24 | | | | | | | | | | | $ | (6,903) | | | | | |
USD | | | 673,007 | | | | | | | | ZAR | | | | 12,302,523 | | | | | | | | Citibank N.A. | | | | | | | | 10/17/24 | | | | | | | | | | | | (37,986) | | | | | |
USD | | | 517,254 | | | | | | | | ZAR | | | | 9,370,000 | | | | | | | | Citibank N.A. | | | | | | | | 10/17/24 | | | | | | | | | | | | (24,261) | | | | | |
USD | | | 568,451 | | | | | | | | TRY | | | | 20,943,426 | | | | | | | | Citibank N.A. | | | | | | | | 11/12/24 | | | | | | | | | | | | (15,937) | | | | | |
| | | | | | | | | | | | | | | | | | | | | | | | | | | | | | | | | | | | | | | | | | | | | | | | |
| | | | | | | | | | | | | | | | | | | | | | | | | | | | | | | | | | | | | | | | | | $ | (365,966) | | | | | |
| | | | | | | | | | | | |
| | | | | | | | | | | | | | | | | | | | | | | | | | | | | | | | | | | | | | | | | | | | | | | | |
Total | | | | | | | | | | | | | | | | | | | | | | | | | | | | | | | | | | | | | | | | | | $ | (56,056) | | | | | |
| | | | | | | | | | | | | | | | | | | | | | | | | | | | | | | | | | | | | | | | | | | | | | | | |
Financial futures contracts as of September 30, 2024:
| | | | | | | | | | | | | | | | | | | | | | | | | | | | |
Short Position | | Number of
Contracts | | | Expiration
Date | | | Value/Unrealized
Appreciation
(Depreciation) | | | Notional
Value | | | Clearinghouse | |
10 Year Euro-Bund | | | 12 | | | | December 2024 | | | | | | | $ | (28,282) | | | | EUR | | | $ | 1,802,234 | | | | Morgan Stanley & Co. LLC | |
10 Year U.S. Ultra Treasury Bond | | | 10 | | | | December 2024 | | | | | | | | 4,513 | | | | USD | | | | 1,182,969 | | | | Morgan Stanley & Co. LLC | |
30 Year U.S. Ultra Treasury Bond | | | 9 | | | | December 2024 | | | | | | | | 12,967 | | | | USD | | | | 1,197,844 | | | | Morgan Stanley & Co. LLC | |
| | | | | | | | | | | | | | | | | | | | | | | | | | | | |
Total | | | | | | | | | | | | | | $ | (10,802) | | | | | | | | | | | | | |
| | | | | | | | | | | | | | | | | | | | | | | | | | | | |
Total return swaps as of September 30, 2024:
| | | | | | | | | | | | | | | | | | | | | | | | | | | | | | | | | | | | | | | | | | | | |
Fixed Rate | | Pay/ Receive | | Reference
Entity | | | Payment Freq | | Counterparty | | | Exp
Date | | | Notional
Amount
(000) | | | Upfront
Premiums
Paid
(Received) | | | Value | | | Unreal
App
(Dep) | |
| 1.00% | | Receive | |
| Nigeria
Government Bond |
| | Y | | | Citibank N.A. | | | | 2/21/34 | | | | NGN503,657 | | | | | | | | 0 | | | | | | | $ | (15,534) | | | | | | | | (15,534 | ) |
| | | | | | | | | | | | | | | | | | | | | | | | | | | | | | | | | | | | | | | | | | | | |
Total | | | | | | | | | | | | | | | | | | | | | | | | | | | | | | | | $ | (15,534) | | | | | | | | | |
| | | | | | | | | | | | | | | | | | | | | | | | | | | | | | | | | | | | | | | | | | | | |
13
|
SCHEDULE OF PORTFOLIO INVESTMENTS |
RBC BlueBay Emerging Market Debt Fund (cont.)
September 30, 2024
Interest rate swaps as of September 30, 2024:
| | | | | | | | | | | | | | | | | | | | | | | | | | | | | | | | | | |
Fixed
Rate | | Float Rate | | Pay
Receive | | | Pay Freq | | Counterparty | | | Exp.
Date | | | Notional
Amount
(000) | | | Premium Paid/ (Received) | | Unreal
Dep | | | Value | |
| 10.73% | | BRL-HSBCLDN | | | Receive | | | Yearly | |
| Morgan
Stanley
& Co.
LLC |
| | | 1/4/27 | | | | BRL15,996 | | | | | $0 | | | | $ | (95,954) | | | $ | (95,954) | |
| | | | | | | | | | | | | | | | | | | | | | | | | | | | | | | | | | |
| Total | | | | | | | | | | | | | | | | | | | | | | | | $0 | | | | $ | (95,954) | | | $ | (95,954) | |
| | | | | | | | | | | | | | | | | | | | | | | | | | | | | | | | | | |
Credit default swaps buy protection as of September 30, 2024:
| | | | | | | | | | | | | | | | | | | | | | | | | | | | | | | | | | | | | | |
Fixed
Rate | | | Issuer | | Payment
Frequency | | Counterparty | | Expiration
Date | | Notional
Amount
(000) | | | Premium
Paid/
(Received) | | | Unrealized
Depreciation | | | Value | |
| | 1.00% | | | Egypt Government International Bond | | Quarterly | | Citigroup Global Markets Limited | | 12/20/25 | | | USD | | | | 200 | | | | | | | $ | 30,791 | | | | | | | | $(24,426) | | | $ | 6,365 | |
| | 1.00% | | | Markit CDX EM Index Series 42 | | Quarterly | | Morgan Stanley & Co. LLC | | 12/20/29 | | | EUR | | | | 4,053 | | | | | | | | (89,414 | ) | | | | | | | (2,513) | | | | (91,927 | ) |
| | 1.00% | | | Markit CDX EM Index Series 42 | | Quarterly | | Morgan Stanley & Co. LLC | | 12/20/29 | | | EUR | | | | 1,400 | | | | | | | | (31,425 | ) | | | | | | | (329) | | | | (31,754 | ) |
| | 1.00% | | | Mexico Government International Bond | | Quarterly | | Barclays Bank plc | | 6/20/29 | | | USD | | | | 3,980 | | | | | | | | 34,231 | | | | | | | | (18,638) | | | | 15,593 | |
| | 1.00% | | | Petroleos Mexicanos | | Quarterly | | Morgan Stanley & Co. International plc | | 12/20/26 | | | USD | | | | 76 | | | | | | | | 6,661 | | | | | | | | (3,690) | | | | 2,971 | |
| | 1.00% | | | Petroleos Mexicanos | | Quarterly | | Barclays Bank plc | | 12/20/26 | | | USD | | | | 124 | | | | | | | | 10,827 | | | | | | | | (5,979) | | | | 4,848 | |
| | 1.00% | | | Petroleos Mexicanos | | Quarterly | | Morgan Stanley & Co. International plc | | 12/20/26 | | | USD | | | | 170 | | | | | | | | 13,769 | | | | | | | | (7,123) | | | | 6,646 | |
| | 1.00% | | | Saudi Government International Bond | | Quarterly | | Barclays Bank plc | | 12/20/29 | | | USD | | | | 1,730 | | | | | | | | (30,365 | ) | | | | | | | (1,205) | | | | (31,571 | ) |
| | 1.00% | | | Saudi Government International Bond | | Quarterly | | Barclays Bank plc | | 12/20/29 | | | USD | | | | 580 | | | | | | | | (10,187 | ) | | | | | | | (398) | | | | (10,584 | ) |
14
|
SCHEDULE OF PORTFOLIO INVESTMENTS |
RBC BlueBay Emerging Market Debt Fund (cont.)
September 30, 2024
| | | | | | | | | | | | | | | | | | | | | | | | | | | | | | | | | | | | | | | | |
Fixed
Rate | | Issuer | | Payment
Frequency | | | Counterparty | | Expiration
Date | | | Notional
Amount
(000) | | | Premium
Paid/
(Received) | | | Unrealized
Depreciation | | | Value | |
| 1.00% | | Turkey Government International Bond | | | Quarterly | | | Morgan Stanley & Co. International plc | | | 6/20/25 | | | | USD | | | | 1,110 | | | | | | | $ | 5,314 | | | | | | | $ | (8,651) | | | $ | (3,337) | |
| 1.00% | | Turkey Government International Bond | | | Quarterly | | | Citigroup Global Markets Limited | | | 12/20/29 | | | | USD | | | | 1,800 | | | | | | | | 141,017 | | | | | | | | (7,544) | | | | 133,473 | |
| 1.00% | | Turkey Government International Bond | | | Quarterly | | | Barclays Bank plc | | | 12/20/29 | | | | USD | | | | 580 | | | | | | | | 43,423 | | | | | | | | (415) | | | | 43,008 | |
| | | | | | | | | | | | | | | | | | | | | | | | | | | | | | | | | | | | | | | | |
| Total | | | | | | | | | | | | | | | | | | | | | | | | | | $ | 124,642 | | | | | | | $ | (80,911) | | | $ | 43,731 | |
| | | | | | | | | | | | | | | | | | | | | | | | | | | | | | | | | | | | | | | | |
Credit default swaps sell protection as of September 30, 2024:
| | | | | | | | | | | | | | | | | | | | | | | | | | | | | | | | | | | | |
Fixed
Rate | | Issuer | | Payment
Frequency | | | Counterparty | | Expiration
Date | | | ICS% | | | Notional
Amount
(000) | | | Premium Paid/
(Received) | | Unreal.
App. | | Value |
| 1.00% | | Egypt Government International Bond* | | | Quarterly | | | Morgan Stanley & Co. International plc | | | 6/20/29 | | | | 2.644 | | | | USD | | | | 820 | | | | | | | $(159,141) | | | | $9,672 | | $(149,469) |
| | | | | | | | | | | | | | | | | | | | | | | | | | | | | | | | | | | | |
| Total | | | | | | | | | | | | | | | | | | | | | | | | | | | | | | $(159,141) | | | | $9,672 | | $(149,469) |
| | | | | | | | | | | | | | | | | | | | | | | | | | | | | | | | | | | | |
| * | Credit Rating of the issuer or the underlying security is B, provided by Fitch Ratings. |
15
|
SCHEDULE OF PORTFOLIO INVESTMENTS |
RBC BlueBay Emerging Market Debt Fund (cont.)
September 30, 2024
Abbreviations used are defined below:
BRL - Brazilian Real
CLP - Chilean Peso
COP - Colombian Peso
EMTN - Euro Medium Term Note
EUR - Euro
GMTN - Global Medium Term Note
ICS - Implied Credit Spread
IDR - Indonesian Rupiah
KRW - South Korean Won
MXN - Mexican Peso
MYR - Malaysian Ringgit
NGN - Nigerian Naira
PHP - Philippine Peso
TRY - Turkish Lira
USD - United States Dollar
ZAR - South African Rand
See Notes to the Financial Statements.
16
|
SCHEDULE OF PORTFOLIO INVESTMENTS |
RBC BlueBay High Yield Bond Fund
September 30, 2024
| | | | | | |
Principal Amount | | | | Value | |
| |
Corporate Bonds — 95.0% | | | | |
Australia — 0.8% | | | | | | |
$ 1,644,000 | | Mineral Resources Ltd., 8.00%, 11/1/27(a) | | $ | 1,686,756 | |
1,542,000 | | Mineral Resources Ltd., 8.50%, 5/1/30(a) | | | 1,607,066 | |
2,127,000 | | Mineral Resources Ltd., 9.25%, 10/1/28(a) | | | 2,258,995 | |
143,548 | | Quintis Australia Pty Ltd., PIK, 0.00%, 10/1/28(a),(b),(c) | | | — | |
220,972 | | Quintis Australia Pty Ltd., PIK, 7.50%, 10/1/26(a),(b),(c) | | | 17,236 | |
| | | | | | |
| | | | | 5,570,053 | |
| | | | | | |
| |
Bermuda — 0.5% | | | | |
3,587,964 | | Highlands Holdings Bond Issuer Ltd. / Highlands Holdings Bond Co-Issuer, Inc., PIK, 7.63%, 10/15/25(a) | | | 3,580,713 | |
| | | | | | |
| |
Canada — 3.2% | | | | |
4,125,000 | | AltaGas Ltd., 7.20%, 10/15/54(a),(d) | | | 4,210,154 | |
2,200,000 | | Bank of Nova Scotia (The), 8.00%, 1/27/84(d) | | | 2,360,297 | |
2,139,000 | | Bombardier, Inc., 6.00%, 2/15/28(a) | | | 2,152,213 | |
2,521,000 | | Bombardier, Inc., 7.00%, 6/1/32(a) | | | 2,636,550 | |
308,000 | | Bombardier, Inc., 7.88%, 4/15/27(a) | | | 308,849 | |
5,089,000 | | Intelligent Packaging Ltd. Finco, Inc. / Intelligent Packaging Ltd. Co-Issuer LLC, 6.00%, 9/15/28(a) | | | 5,057,922 | |
2,875,000 | | NOVA Chemicals Corp., 4.25%, 5/15/29(a) | | | 2,673,150 | |
1,125,000 | | NOVA Chemicals Corp., 9.00%, 2/15/30(a) | | | 1,218,542 | |
2,795,000 | | Primo Water Holdings, Inc., 4.38%, 4/30/29(a) | | | 2,679,103 | |
| | | | | | |
| | | | | 23,296,780 | |
| | | | | | |
| |
Czech Republic — 0.3% | | | | |
1,984,000 | | Allwyn Entertainment Financing UK Plc, 7.88%, 4/30/29(a) | | | 2,092,436 | |
| | | | | | |
| | |
Finland — 0.6% | | | | | | |
4,397,000 | | Nordea Bank Abp, 6.30%, (a),(d),(e) | | | 4,364,022 | |
| | | | | | |
| |
France — 3.7% | | | | |
3,665,000 | | Altice France SA, 8.13%, 2/1/27(a) | | | 2,975,418 | |
1,526,000 | | BNP Paribas SA, 7.75%, (a),(d),(e) | | | 1,604,459 | |
9,431,000 | | Credit Agricole SA, 6.70%, (a),(d),(e) | | | 9,408,247 | |
1,353,000 | | Iliad Holding SASU, 6.50%, 10/15/26(a) | | | 1,367,014 | |
2,881,000 | | Iliad Holding SASU, 7.00%, 10/15/28(a) | | | 2,932,444 | |
3,415,000 | | Iliad Holding SASU, 8.50%, 4/15/31(a) | | | 3,674,912 | |
5,310,000 | | Societe Generale SA, 8.50%, (a),(d),(e) | | | 5,405,866 | |
| | | | | | |
| | | | | 27,368,360 | |
| | | | | | |
| |
Germany — 2.6% | | | | |
4,325,000 | | Cerdia Finanz GmbH, 9.38%, 10/3/31(a) | | | 4,411,934 | |
3,044,000 | | Cheplapharm Arzneimittel GmbH, 5.50%, 1/15/28(a) | | | 2,952,524 | |
4,400,000 | | Commerzbank AG, 7.00%, (d),(e),(f) | | | 4,399,678 | |
17
|
SCHEDULE OF PORTFOLIO INVESTMENTS |
RBC BlueBay High Yield Bond Fund (cont.)
September 30, 2024
| | | | | | |
Principal Amount | | | | Value | |
| |
$2,505,000 | | IHO Verwaltungs GmbH, PIK, 4.75%, 9/15/26(a) | | $ | 2,465,557 | |
4,682,000 | | ZF North America Capital, Inc., 4.75%, 4/29/25(a) | | | 4,643,441 | |
| | | | | | |
| | | | | 18,873,134 | |
| | | | | | |
| | |
Hong Kong — 0.6% | | | | | | |
4,133,000 | | Melco Resorts Finance Ltd., 7.63%, 4/17/32(a) | | | 4,260,537 | |
| | | | | | |
| | |
Israel — 0.3% | | | | | | |
2,500,000 | | Teva Pharmaceutical Finance Netherlands III BV, 3.15%, 10/1/26 | | | 2,403,549 | |
| | | | | | |
| | |
Italy — 0.7% | | | | | | |
2,802,000 | | Optics Bidco SpA, Series 2033, 6.38%, 11/15/33(a) | | | 2,923,425 | |
2,362,000 | | UniCredit SpA, 5.86%, 6/19/32(a),(d) | | | 2,376,861 | |
| | | | | | |
| | | | | 5,300,286 | |
| | | | | | |
| |
Luxembourg — 1.9% | | | | |
3,596,000 | | Altice Financing SA, 5.00%, 1/15/28(a) | | | 3,040,970 | |
1,475,000 | | Altice Financing SA, 5.75%, 8/15/29(a) | | | 1,188,786 | |
2,204,000 | | Altice Financing SA, 9.63%, 7/15/27(a) | | | 2,156,059 | |
1,374,000 | | Altice France Holding SA, 10.50%, 5/15/27(a) | | | 480,022 | |
3,078,000 | | INEOS Finance Plc, 7.50%, 4/15/29(a) | | | 3,217,399 | |
3,678,000 | | Intelsat Jackson Holdings SA, 6.50%, 3/15/30(a) | | | 3,534,159 | |
| | | | | | |
| | | | | 13,617,395 | |
| | | | | | |
| |
Netherlands — 1.1% | | | | |
4,256,000 | | Sunrise HoldCo IV BV, 5.50%, 1/15/28(a) | | | 4,237,243 | |
1,946,000 | | VZ Secured Financing BV, 5.00%, 1/15/32(a) | | | 1,789,909 | |
1,883,000 | | Ziggo Bond Co. BV, 5.13%, 2/28/30(a) | | | 1,736,530 | |
| | | | | | |
| | | | | 7,763,682 | |
| | | | | | |
| |
United Kingdom — 4.8% | | | | |
3,282,000 | | Ardonagh Finco Ltd., 7.75%, 2/15/31(a) | | | 3,394,767 | |
3,317,000 | | Barclays Plc, 8.00%, (d),(e) | | | 3,493,370 | |
3,240,000 | | Barclays Plc, 9.63%, (d),(e) | | | 3,636,873 | |
1,815,000 | | Connect Finco Sarl / Connect US Finco LLC, 9.00%, 9/15/29(a) | | | 1,754,573 | |
3,196,000 | | Global Auto Holdings Ltd/AAG FH UK Ltd., 8.38%, 1/15/29(a) | | | 3,091,915 | |
3,162,000 | | Global Auto Holdings Ltd/AAG FH UK Ltd., 8.75%, 1/15/32(a) | | | 2,961,633 | |
2,088,000 | | Howden UK Refinance PLC / Howden UK Refinance 2 Plc / Howden US Refinance LLC, 7.25%, 2/15/31(a) | | | 2,166,459 | |
1,642,000 | | Howden UK Refinance PLC / Howden UK Refinance 2 Plc / Howden US Refinance LLC, 8.13%, 2/15/32(a) | | | 1,686,006 | |
1,652,000 | | Jaguar Land Rover Automotive Plc, 4.50%, 10/1/27(a) | | | 1,616,404 | |
6,141,000 | | Vmed O2 UK Financing I Plc, 4.75%, 7/15/31(a) | | | 5,467,079 | |
3,683,000 | | Vmed O2 UK Financing I Plc, 7.75%, 4/15/32(a) | | | 3,779,387 | |
2,563,000 | | Vodafone Group Plc, 4.13%, 6/4/81(d) | | | 2,322,309 | |
| | | | | | |
| | | | | 35,370,775 | |
| | | | | | |
18
|
SCHEDULE OF PORTFOLIO INVESTMENTS |
RBC BlueBay High Yield Bond Fund (cont.)
September 30, 2024
| | | | | | |
Principal Amount | | | | Value | |
| |
United States — 73.9% | | | | | | |
$2,298,000 | | Acrisure LLC / Acrisure Finance, Inc., 7.50%, 11/6/30(a) | | $ | 2,366,675 | |
3,945,000 | | Acrisure LLC / Acrisure Finance, Inc., 8.25%, 2/1/29(a) | | | 4,071,648 | |
5,941,000 | | Adient Global Holdings Ltd., 4.88%, 8/15/26(a) | | | 5,882,718 | |
1,643,000 | | Adient Global Holdings Ltd., 8.25%, 4/15/31(a) | | | 1,744,184 | |
2,703,000 | | ADT Security Corp. (The), 4.13%, 8/1/29(a) | | | 2,581,521 | |
3,117,000 | | Aethon United BR LP / Aethon United Finance Corp., 7.50%, 10/1/29(a) | | | 3,159,665 | |
5,542,000 | | Albertsons Cos., Inc. / Safeway, Inc. / New Albertsons LP / Albertsons LLC, 7.50%, 3/15/26(a) | | | 5,599,051 | |
6,022,000 | | Allied Universal Holdco LLC, 7.88%, 2/15/31(a) | | | 6,155,489 | |
4,596,000 | | Ally Financial, Inc., Series B, 4.70%, (d),(e) | | | 3,998,780 | |
2,032,000 | | Alpha Generation LLC, 6.75%, 10/15/32(a) | | | 2,062,378 | |
2,543,000 | | AMC Networks, Inc., 10.25%, 1/15/29(a) | | | 2,618,647 | |
3,725,000 | | AmeriTex HoldCo Intermediate LLC, 10.25%, 10/15/28(a) | | | 3,894,899 | |
4,988,000 | | Anywhere Real Estate Group LLC / Anywhere Co.-Issuer Corp., 7.00%, 4/15/30(a) | | | 4,632,086 | |
3,550,000 | | APX Group, Inc., 5.75%, 7/15/29(a) | | | 3,514,279 | |
1,785,000 | | Avient Corp., 6.25%, 11/1/31(a) | | | 1,830,197 | |
1,750,000 | | Avient Corp., 7.13%, 8/1/30(a) | | | 1,825,548 | |
2,104,000 | | Avis Budget Car Rental LLC / Avis Budget Finance, Inc., 5.75%, 7/15/27(a) | | | 2,093,838 | |
3,075,000 | | Avis Budget Car Rental LLC / Avis Budget Finance, Inc., 8.00%, 2/15/31(a) | | | 3,145,412 | |
2,246,000 | | Ball Corp., 6.88%, 3/15/28 | | | 2,322,612 | |
3,098,333 | | BCPE Ulysses Intermediate, Inc., PIK, 7.75%, 4/1/27(a) | | | 3,065,448 | |
2,000,000 | | Boost Newco Borrower LLC, 7.50%, 1/15/31(a) | | | 2,145,430 | |
3,116,000 | | Brandywine Operating Partnership LP, REIT, 8.88%, 4/12/29 | | | 3,444,450 | |
3,463,000 | | Bread Financial Holdings, Inc., 9.75%, 3/15/29(a) | | | 3,661,637 | |
1,690,000 | | Brink’s Co. (The), 6.50%, 6/15/29(a) | | | 1,750,689 | |
5,236,000 | | Brundage-Bone Concrete Pumping Holdings, Inc., 6.00%, 2/1/26(a) | | | 5,215,751 | |
2,014,000 | | Cablevision Lightpath LLC, 3.88%, 9/15/27(a) | | | 1,915,067 | |
3,651,000 | | Cablevision Lightpath LLC, 5.63%, 9/15/28(a) | | | 3,426,751 | |
2,059,000 | | Caesars Entertainment, Inc., 6.50%, 2/15/32(a) | | | 2,129,655 | |
1,301,000 | | Caesars Entertainment, Inc., 7.00%, 2/15/30(a) | | | 1,359,386 | |
7,037,000 | | Calpine Corp., 5.25%, 6/1/26(a) | | | 7,016,284 | |
4,147,000 | | Camelot Return Merger Sub, Inc., 8.75%, 8/1/28(a) | | | 4,199,465 | |
5,221,000 | | Carriage Services, Inc., 4.25%, 5/15/29(a) | | | 4,843,880 | |
3,825,565 | | Carvana Co., PIK, 12.00%, 12/1/28(a) | | | 4,011,916 | |
958,500 | | Carvana Co., PIK, 13.00%, 6/1/30(a) | | | 1,042,403 | |
4,675,000 | | CCO Holdings LLC / CCO Holdings Capital Corp., 4.75%, 3/1/30(a) | | | 4,295,113 | |
2,944,000 | | CCO Holdings LLC / CCO Holdings Capital Corp., 5.00%, 2/1/28(a) | | | 2,864,623 | |
3,484,000 | | CCO Holdings LLC / CCO Holdings Capital Corp., 5.13%, 5/1/27(a) | | | 3,426,827 | |
5,264,000 | | CCO Holdings LLC / CCO Holdings Capital Corp., 7.38%, 3/1/31(a) | | | 5,382,329 | |
19
|
SCHEDULE OF PORTFOLIO INVESTMENTS |
RBC BlueBay High Yield Bond Fund (cont.)
September 30, 2024
| | | | | | |
Principal Amount | | | | Value | |
| |
$1,966,000 | | Cedar Fair LP / Canada’s Wonderland Co. / Magnum Management Corp. / Millennium Op, 5.38%, 4/15/27 | | $ | 1,958,812 | |
2,384,000 | | Champions Financing, Inc., 8.75%, 2/15/29(a) | | | 2,429,394 | |
3,710,000 | | Chart Industries, Inc., 9.50%, 1/1/31(a) | | | 4,046,152 | |
1,735,000 | | CHS/Community Health Systems, Inc., 8.00%, 12/15/27(a) | | | 1,739,804 | |
3,589,000 | | CHS/Community Health Systems, Inc., 10.88%, 1/15/32(a) | | | 3,955,823 | |
3,254,000 | | Churchill Downs, Inc., 6.75%, 5/1/31(a) | | | 3,364,757 | |
4,239,000 | | Cinemark USA, Inc., 7.00%, 8/1/32(a) | | | 4,428,891 | |
4,590,000 | | Citizens Financial Group, Inc., Series B, (Term SOFR 3M + 3.265%), 8.58%, (e),(g) | | | 4,564,747 | |
1,436,000 | | Civitas Resources, Inc., 8.75%, 7/1/31(a) | | | 1,522,160 | |
6,136,000 | | Clarios Global LP / Clarios US Finance Co., 6.25%, 5/15/26(a) | | | 6,136,739 | |
2,368,000 | | Clear Channel Outdoor Holdings, Inc., 7.88%, 4/1/30(a) | | | 2,478,254 | |
2,989,000 | | Cloud Software Group, Inc., 6.50%, 3/31/29(a) | | | 2,974,832 | |
2,655,000 | | Cloud Software Group, Inc., 8.25%, 6/30/32(a) | | | 2,775,287 | |
4,902,000 | | Cloud Software Group, Inc., 9.00%, 9/30/29(a) | | | 4,989,084 | |
3,636,000 | | Constellium SE, 5.63%, 6/15/28(a) | | | 3,632,264 | |
2,569,000 | | Coty Inc/HFC Prestige Products, Inc./HFC Prestige International US LLC, 6.63%, 7/15/30(a) | | | 2,669,098 | |
2,139,000 | | Coty, Inc., 5.00%, 4/15/26(a) | | | 2,129,945 | |
1,656,000 | | CQP Holdco LP / BIP-V Chinook Holdco LLC, 5.50%, 6/15/31(a) | | | 1,623,282 | |
3,218,000 | | CQP Holdco LP / BIP-V Chinook Holdco LLC, 7.50%, 12/15/33(a) | | | 3,491,477 | |
1,660,000 | | CSC Holdings LLC, 7.50%, 4/1/28(a) | | | 1,106,939 | |
4,182,000 | | CSC Holdings LLC, 11.25%, 5/15/28(a) | | | 4,038,250 | |
9,021,000 | | Dealer Tire LLC / DT Issuer LLC, 8.00%, 2/1/28(a) | | | 9,015,309 | |
1,535,000 | | Directv Financing LLC, 8.88%, 2/1/30(a) | | | 1,546,414 | |
2,488,000 | | DISH DBS Corp., 5.25%, 12/1/26(a) | | | 2,307,292 | |
3,334,000 | | DISH DBS Corp., 5.75%, 12/1/28(a) | | | 2,927,439 | |
2,960,000 | | DISH Network Corp., 11.75%, 11/15/27(a) | | | 3,104,366 | |
4,745,000 | | Domtar Corp., 6.75%, 10/1/28(a) | | | 4,348,805 | |
3,438,000 | | EMRLD Borrower LP / Emerald Co.-Issuer, Inc., 6.63%, 12/15/30(a) | | | 3,544,642 | |
3,485,000 | | EQM Midstream Partners LP, 4.75%, 1/15/31(a) | | | 3,375,380 | |
3,743,000 | | EQM Midstream Partners LP, 6.38%, 4/1/29(a) | | | 3,867,276 | |
698,000 | | EQM Midstream Partners LP, 6.50%, 7/15/48 | | | 722,335 | |
2,228,000 | | Esab Corp., 6.25%, 4/15/29(a) | | | 2,291,159 | |
4,375,000 | | Ferrellgas LP / Ferrellgas Finance Corp., 5.38%, 4/1/26(a) | | | 4,364,537 | |
3,447,000 | | Ferrellgas LP / Ferrellgas Finance Corp., 5.88%, 4/1/29(a) | | | 3,225,296 | |
2,300,000 | | Fiesta Purchaser, Inc., 9.63%, 9/15/32(a) | | | 2,379,784 | |
3,065,000 | | Focus Financial Partners LLC, 6.75%, 9/15/31(a) | | | 3,088,576 | |
5,301,000 | | Ford Motor Credit Co. LLC, 2.70%, 8/10/26 | | | 5,094,781 | |
2,404,000 | | Forestar Group, Inc., 3.85%, 5/15/26(a) | | | 2,352,100 | |
1,754,000 | | Forestar Group, Inc., 5.00%, 3/1/28(a) | | | 1,711,755 | |
4,080,000 | | Freedom Mortgage Corp., 12.00%, 10/1/28(a) | | | 4,459,877 | |
3,187,000 | | Freedom Mortgage Holdings LLC, 9.25%, 2/1/29(a) | | | 3,315,372 | |
2,243,000 | | Gap, Inc. (The), 3.63%, 10/1/29(a) | | | 2,028,281 | |
2,262,000 | | Gen Digital, Inc., 6.75%, 9/30/27(a) | | | 2,325,118 | |
1,983,000 | | GFL Environmental, Inc., 6.75%, 1/15/31(a) | | | 2,080,759 | |
20
|
SCHEDULE OF PORTFOLIO INVESTMENTS |
RBC BlueBay High Yield Bond Fund (cont.)
September 30, 2024
| | | | | | |
Principal Amount | | | | Value | |
| |
$ 2,133,000 | | Global Partners LP / GLP Finance Corp., 7.00%, 8/1/27 | | $ | 2,147,027 | |
4,418,000 | | Graphic Packaging International LLC, 6.38%, 7/15/32(a) | | | 4,564,067 | |
3,916,000 | | Gray Television, Inc., 10.50%, 7/15/29(a) | | | 4,094,519 | |
3,616,000 | | Griffon Corp., 5.75%, 3/1/28 | | | 3,566,373 | |
3,172,000 | | Herc Holdings, Inc., 5.50%, 7/15/27(a) | | | 3,168,677 | |
3,435,000 | | Hilton Domestic Operating Co., Inc., 5.88%, 4/1/29(a) | | | 3,523,542 | |
2,287,000 | | International Game Technology Plc, 4.13%, 4/15/26(a) | | | 2,258,478 | |
2,829,000 | | ITT Holdings LLC, 6.50%, 8/1/29(a) | | | 2,683,663 | |
2,108,000 | | Jefferies Finance LLC / JFIN Co-Issuer Corp., 5.00%, 8/15/28(a) | | | 2,006,036 | |
4,654,000 | | Kaiser Aluminum Corp., 4.63%, 3/1/28(a) | | | 4,505,552 | |
3,561,000 | | Kraken Oil & Gas Partners LLC, 7.63%, 8/15/29(a) | | | 3,556,753 | |
4,252,000 | | LBM Acquisition LLC, 6.25%, 1/15/29(a) | | | 4,023,206 | |
3,782,000 | | Leeward Renewable Energy Operations LLC, 4.25%, 7/1/29(a) | | | 3,565,202 | |
3,422,000 | | Level 3 Financing, Inc., 10.50%, 5/15/30(a) | | | 3,708,637 | |
3,060,405 | | Level 3 Financing, Inc., 11.00%, 11/15/29(a) | | | 3,392,638 | |
2,828,000 | | LifePoint Health, Inc., 9.88%, 8/15/30(a) | | | 3,115,261 | |
4,772,000 | | LifePoint Health, Inc., 11.00%, 10/15/30(a) | | | 5,395,814 | |
5,184,000 | | Lightning Power LLC, 7.25%, 8/15/32(a) | | | 5,443,160 | |
2,556,000 | | Macy’s Retail Holdings LLC, 5.88%, 3/15/30(a) | | | 2,504,879 | |
2,164,000 | | Macy’s Retail Holdings LLC, 6.13%, 3/15/32(a) | | | 2,098,385 | |
3,994,000 | | McAfee Corp., 7.38%, 2/15/30(a) | | | 3,896,970 | |
1,850,000 | | McGraw-Hill Education, Inc., 7.38%, 9/1/31(a) | | | 1,919,283 | |
4,424,000 | | Medline Borrower LP, 3.88%, 4/1/29(a) | | | 4,188,255 | |
1,368,000 | | Medline Borrower LP/Medline Co.-Issuer, Inc., 6.25%, 4/1/29(a) | | | 1,410,698 | |
2,513,000 | | Nationstar Mortgage Holdings, Inc., 5.00%, 2/1/26(a) | | | 2,500,982 | |
1,564,000 | | Nationstar Mortgage Holdings, Inc., 6.00%, 1/15/27(a) | | | 1,563,804 | |
831,000 | | Nationstar Mortgage Holdings, Inc., 6.50%, 8/1/29(a) | | | 845,461 | |
2,064,000 | | Nationstar Mortgage Holdings, Inc., 7.13%, 2/1/32(a) | | | 2,158,812 | |
2,286,000 | | Neptune Bidco US, Inc., 9.29%, 4/15/29(a) | | | 2,237,936 | |
7,149,000 | | NESCO Holdings II, Inc., 5.50%, 4/15/29(a) | | | 6,587,655 | |
815,000 | | NGL Energy Operating LLC / NGL Energy Finance Corp., 8.13%, 2/15/29(a) | | | 835,676 | |
3,366,000 | | NGL Energy Operating LLC / NGL Energy Finance Corp., 8.38%, 2/15/32(a) | | | 3,469,056 | |
2,000,000 | | Novelis Corp., 3.25%, 11/15/26(a) | | | 1,932,887 | |
3,456,000 | | NuStar Logistics LP, 5.75%, 10/1/25 | | | 3,458,233 | |
3,348,000 | | NuStar Logistics LP, 6.38%, 10/1/30 | | | 3,474,613 | |
2,924,000 | | OneMain Finance Corp., 9.00%, 1/15/29 | | | 3,097,895 | |
2,700,000 | | Organon & Co. / Organon Foreign Debt Co-Issuer BV, 5.13%, 4/30/31(a) | | | 2,540,891 | |
2,718,000 | | Piedmont Operating Partnership LP, REIT, 6.88%, 7/15/29 | | | 2,858,173 | |
5,162,000 | | Pike Corp., 5.50%, 9/1/28(a) | | | 5,053,200 | |
803,000 | | Post Holdings, Inc., 5.63%, 1/15/28(a) | | | 809,927 | |
1,875,000 | | Post Holdings, Inc., 6.25%, 10/15/34(a) | | | 1,889,793 | |
4,133,000 | | PRA Group, Inc., 8.88%, 1/31/30(a) | | | 4,301,635 | |
6,718,000 | | Prairie Acquiror LP, 9.00%, 8/1/29(a) | | | 6,941,603 | |
3,520,000 | | Rand Parent LLC, 8.50%, 2/15/30(a) | | | 3,585,920 | |
6,976,000 | | Rocket Software, Inc., 9.00%, 11/28/28(a) | | | 7,278,972 | |
21
|
SCHEDULE OF PORTFOLIO INVESTMENTS |
RBC BlueBay High Yield Bond Fund (cont.)
September 30, 2024
| | | | | | |
Principal Amount | | | | Value | |
| |
$3,916,000 | | Royal Caribbean Cruises Ltd., 5.63%, 9/30/31(a) | | $ | 3,966,588 | |
3,479,000 | | Royal Caribbean Cruises Ltd., 6.25%, 3/15/32(a) | | | 3,609,223 | |
4,304,000 | | Scientific Games Holdings LP/Scientific Games US FinCo, Inc., 6.63%, 3/1/30(a) | | | 4,273,485 | |
2,401,000 | | Service Corp. International, 5.75%, 10/15/32 | | | 2,416,522 | |
3,586,000 | | Shift4 Payments LLC / Shift4 Payments Finance Sub, Inc., 6.75%, 8/15/32(a) | | | 3,747,025 | |
2,878,000 | | Sinclair Television Group, Inc., 4.13%, 12/1/30(a) | | | 2,256,517 | |
1,762,000 | | Sirius XM Radio, Inc., 3.13%, 9/1/26(a) | | | 1,703,228 | |
5,652,000 | | Sirius XM Radio, Inc., 4.00%, 7/15/28(a) | | | 5,332,018 | |
3,353,000 | | Six Flags Entertainment Corp., 7.25%, 5/15/31(a) | | | 3,470,118 | |
3,398,000 | | Smyrna Ready Mix Concrete LLC, 6.00%, 11/1/28(a) | | | 3,416,325 | |
3,123,000 | | Smyrna Ready Mix Concrete LLC, 8.88%, 11/15/31(a) | | | 3,369,477 | |
6,365,000 | | Specialty Building Products Holdings LLC / SBP Finance Corp., 6.38%, 9/30/26(a) | | | 6,342,219 | |
4,342,000 | | Standard Industries, Inc., 5.00%, 2/15/27(a) | | | 4,309,988 | |
2,031,000 | | Staples, Inc., 10.75%, 9/1/29(a) | | | 1,971,436 | |
2,070,000 | | Summer BC Bidco B LLC, 5.50%, 10/31/26(a) | | | 2,045,057 | |
1,830,000 | | Tallgrass Energy Partners LP / Tallgrass Energy Finance Corp., 6.00%, 12/31/30(a) | | | 1,739,596 | |
3,056,000 | | Tallgrass Energy Partners LP / Tallgrass Energy Finance Corp., 7.38%, 2/15/29(a) | | | 3,089,753 | |
4,574,000 | | Tapestry, Inc., 7.05%, 11/27/25 | | | 4,667,410 | |
2,022,000 | | Tenet Healthcare Corp., 6.13%, 10/1/28 | | | 2,038,754 | |
3,455,000 | | Terex Corp., 6.25%, 10/15/32(a) | | | 3,455,000 | |
1,369,000 | | TransDigm, Inc., 5.50%, 11/15/27 | | | 1,364,404 | |
4,606,000 | | TransDigm, Inc., 6.75%, 8/15/28(a) | | | 4,745,109 | |
3,157,000 | | U.S. Cellular Corp., 6.70%, 12/15/33 | | | 3,514,261 | |
2,113,000 | | U.S. Foods, Inc., 6.88%, 9/15/28(a) | | | 2,202,809 | |
2,013,000 | | UKG, Inc., 6.88%, 2/1/31(a) | | | 2,080,848 | |
2,930,000 | | Univision Communications, Inc., 6.63%, 6/1/27(a) | | | 2,938,913 | |
1,740,000 | | Univision Communications, Inc., 8.50%, 7/31/31(a) | | | 1,743,578 | |
5,200,000 | | Venture Global Calcasieu Pass LLC, 3.88%, 8/15/29(a) | | | 4,914,148 | |
7,119,000 | | Venture Global LNG, Inc., 7.00%, 1/15/30(a) | | | 7,306,041 | |
3,304,000 | | Venture Global LNG, Inc., 9.00%, (a),(d),(e) | | | 3,349,080 | |
5,246,000 | | Viasat, Inc., 7.50%, 5/30/31(a) | | | 3,611,772 | |
6,300,000 | | Vital Energy, Inc., 7.88%, 4/15/32(a) | | | 6,102,838 | |
372,649 | | Voyager Aviation Holdings LLC, 8.50%, 5/9/26(a),(b),(c),(h) | | | 126,701 | |
5,893,000 | | Walgreens Boots Alliance, Inc., 8.13%, 8/15/29 | | | 5,882,663 | |
3,132,000 | | White Cap Parent LLC, PIK, 8.25%, 3/15/26(a) | | | 3,134,795 | |
2,420,000 | | Yum! Brands, Inc., 4.63%, 1/31/32 | | | 2,318,374 | |
| | | | | | |
| | | | | 538,945,647 | |
| | | | | | |
Total Corporate Bonds | | | 692,807,369 | |
| | | | | | |
(Cost $674,047,494) | | | | |
22
|
SCHEDULE OF PORTFOLIO INVESTMENTS |
RBC BlueBay High Yield Bond Fund (cont.)
September 30, 2024
| | | | | | |
| Shares | | | | Value | |
| |
Common Stocks — 0.00% | | | | |
United Kingdom — 0.00% | |
12,023 | | AVTCAP WARR*,(i) | | $ | 6,197 | |
| | | | | | |
| |
United States — 0.00% | | | | |
70,137 | | Quintis Ltd.*,(b),(c) | | | 0 | |
1,445 | | Voyager Aviation Holdings LLC*,(b),(c),(i) | | | 14 | |
241 | | Voyager Aviation Holdings LLC*,(b),(c),(i) | | | 0 | |
12,785 | | W R Grace & Co.*,(b),(c),(i) | | | 0 | |
| | | | | | |
| | | | | 14 | |
| | | | | | |
Total Common Stocks | | | 6,211 | |
| | | | | | |
(Cost $2) | | | | |
| |
Rights/Warrants — 0.00% | | | | |
Mexico — 0.00% | |
3,026 | | Urbi Desarrollos Urbanos SAB de CV Warrants, Expire 12/31/49*,(b),(c),(i) | | | 0 | |
| | | | | | |
| |
Total Rights/Warrants | | | 0 | |
| | | | | | |
(Cost $0) | | | | |
| |
Investment Company — 5.7% | | | | |
41,624,511 | | RBC BlueBay U.S. Government Money Market Fund, Institutional Class 1 (j) | | | 41,624,511 | |
| | | | | | |
Total Investment Company | | | 41,624,511 | |
| | | | | | |
(Cost $41,624,511) | | | | |
| |
Total Investments | | $ | 734,438,091 | |
(Cost $715,672,007)(k) — 100.7% | | | | |
| |
Liabilities in excess of other assets — (0.7)% | | | (5,220,014 | ) |
| | | | | | |
| |
NET ASSETS — 100.0% | | $ | 729,218,077 | |
| | | | | | |
23
|
SCHEDULE OF PORTFOLIO INVESTMENTS |
RBC BlueBay High Yield Bond Fund (cont.)
September 30, 2024
| * | Non-income producing security. |
| (a) | Security exempt from registration under Rule 144A or Section 4(2) of the Securities Act of 1933, as amended. These securities may be resold in transactions exempt from registration, normally to qualified institutional buyers. |
| (b) | The Pricing Committee has fair valued this security under procedures established by the Fund’s Board of Trustees. |
| (c) | Security is valued using significant unobservable inputs and is classified as Level 3 in the fair value hierarchy. |
| (d) | Security is a fix-to-float security, which carries a fixed coupon until a certain date, upon which it switches to a floating rate. Reference rate and spread are provided if the rate is currently floating. |
| (e) | Perpetual security with no stated maturity date. |
| (f) | This security may be resold to qualified foreign investors and foreign institutional buyers under Regulation S of the Securities Act of 1933. |
| (g) | Variable rate security. The rate reflected in the Schedule of Portfolio Investments is the rate in effect on September 30, 2024. |
| (h) | Issuer filed for bankruptcy and/or is in default of interest payments. |
| (i) | Security delisted or issuer in bankruptcy. |
| (j) | Affiliated investment. |
| (k) | See Notes to Schedules of Portfolio Investments for the tax cost of securities and the breakdown of unrealized appreciation (depreciation). |
Abbreviations used are defined below:
REIT - Real Estate Investment Trust
SOFR - Secured Overnight Financing Rate
See Notes to the Financial Statements.
24
|
SCHEDULE OF PORTFOLIO INVESTMENTS |
RBC BlueBay Core Plus Bond Fund
September 30, 2024
| | | | | | |
Principal Amount | | | | Value | |
| |
Corporate Bonds — 60.3% | | | | |
Australia — 0.9% | | | | |
$ 179,000 | | CIMIC Finance USA Pty Ltd., 7.00%, 3/25/34(a) | | $ | 192,183 | |
160,000 | | Santos Finance Ltd., 3.65%, 4/29/31(b) | | | 145,475 | |
220,000 | | Woodside Finance Ltd., 5.70%, 9/12/54 | | | 218,756 | |
| | | | | | |
| | | | | 556,414 | |
| | | | | | |
| |
Brazil — 2.0% | | | | |
165,630 | | Guara Norte Sarl, 5.20%, 6/15/34(b) | | | 157,612 | |
200,000 | | Nexa Resources SA, 6.75%, 4/9/34(a) | | | 211,786 | |
366,000 | | Raizen Fuels Finance SA, 5.70%, 1/17/35(a) | | | 362,729 | |
200,000 | | Raizen Fuels Finance SA, 6.45%, 3/5/34(a) | | | 211,740 | |
280,000 | | Yinson Boronia Production BV, 8.95%, 7/31/42(a) | | | 299,304 | |
| | | | | | |
| | | | | 1,243,171 | |
| | | | | | |
| |
Canada — 5.0% | | | | |
349,000 | | AltaGas Ltd., 7.20%, 10/15/54(a),(c) | | | 356,204 | |
190,000 | | Bank of Nova Scotia (The), 4.59%, 5/4/37(c) | | | 181,150 | |
430,000 | | CI Financial Corp., 7.50%, 5/30/29(a) | | | 448,593 | |
244,000 | | Enbridge, Inc., 7.20%, 6/27/54(c) | | | 256,946 | |
200,000 | | Enbridge, Inc., 8.50%, 1/15/84(c) | | | 224,271 | |
233,000 | | Fairfax Financial Holdings Ltd., 6.10%, 3/15/55(a) | | | 242,716 | |
190,000 | | South Bow Canadian Infrastructure Holdings Ltd., 7.50%, 3/1/55(a),(c) | | | 199,755 | |
250,000 | | South Bow USA Infrastructure Holdings LLC, 4.91%, 9/1/27(a) | | | 251,914 | |
210,000 | | South Bow USA Infrastructure Holdings LLC, 5.58%, 10/1/34(a) | | | 212,162 | |
295,000 | | South Bow USA Infrastructure Holdings LLC, 6.18%, 10/1/54(a) | | | 298,337 | |
349,000 | | Toronto-Dominion Bank (The), 7.25%, 7/31/84(c) | | | 364,534 | |
| | | | | | |
| | | | | 3,036,582 | |
| | | | | | |
| |
Chile — 2.7% | | | | |
200,000 | | Antofagasta Plc, 6.25%, 5/2/34(a) | | | 213,056 | |
547,000 | | Banco de Credito e Inversiones SA, 7.50%, (a),(c),(d) | | | 555,869 | |
200,000 | | Corp. Nacional del Cobre de Chile, 6.30%, 9/8/53(a) | | | 211,651 | |
410,000 | | Corp. Nacional del Cobre de Chile, 6.44%, 1/26/36(a) | | | 445,198 | |
200,000 | | Inversiones CMPC SA, 6.13%, 2/26/34(a) | | | 211,759 | |
| | | | | | |
| | | | | 1,637,533 | |
| | | | | | |
| |
France — 2.4% | | | | |
200,000(e) | | Electricite de France SA, 3.00%, (b),(c),(d) | | | 212,368 | |
200,000(e) | | Electricite de France SA, 3.38%, (b),(c),(d) | | | 202,593 | |
100,000(f) | | Electricite de France SA, EMTN, 5.88%, (b),(c),(d) | | | 130,189 | |
319,000 | | Societe Generale SA, 1.49%, 12/14/26(a),(c) | | | 305,636 | |
380,000 | | Societe Generale SA, 8.50%, (a),(c),(d) | | | 386,861 | |
200,000 | | Societe Generale SA, 9.38%, (a),(c),(d) | | | 209,796 | |
| | | | | | |
| | | | | 1,447,443 | |
| | | | | | |
| |
Germany — 2.1% | | | | |
210,000 | | Bayer US Finance LLC, 6.38%, 11/21/30(a) | | | 224,831 | |
25
|
SCHEDULE OF PORTFOLIO INVESTMENTS |
RBC BlueBay Core Plus Bond Fund (cont.)
September 30, 2024
| | | | | | |
Principal Amount | | | | Value | |
| |
200,000(e) | | Commerzbank AG, EMTN, 7.88%, (b),(c),(d) | | $ | 237,685 | |
100,000(e) | | Deutsche Bank AG, EMTN, 1.75%, 11/19/30(b),(c) | | | 101,721 | |
$ 200,000 | | Deutsche Bank AG, 4.88%, 12/1/32(c) | | | 197,327 | |
270,000 | | Deutsche Bank AG, 5.40%, 9/11/35(c) | | | 271,924 | |
200,000(e) | | Deutsche Bank AG, 6.75%, (b),(c),(d) | | | 220,125 | |
| | | | | | |
| | | | | 1,253,613 | |
| | | | | | |
| |
Ireland — 1.3% | | | | |
200,000 | | AIB Group Plc, 6.61%, 9/13/29(a),(c) | | | 214,166 | |
160,000 | | Avolon Holdings Funding Ltd., 3.25%, 2/15/27(a) | | | 154,333 | |
380,000 | | Avolon Holdings Funding Ltd., 5.75%, 3/1/29(a) | | | 391,154 | |
| | | | | | |
| | | | | 759,653 | |
| | | | | | |
| |
Italy — 1.2% | | | | |
250,000(e) | | Intesa Sanpaolo SpA, EMTN, 5.50%, (b),(c),(d) | | | 276,891 | |
204,000 | | Intesa Sanpaolo SpA, 8.25%, 11/21/33(a),(c) | | | 236,928 | |
200,000(e) | | UniCredit SpA, EMTN, 4.45%, (b),(c),(d) | | | 212,333 | |
| | | | | | |
| | | | | 726,152 | |
| | | | | | |
| |
Mexico — 1.6% | | | | |
360,000 | | BBVA Bancomer SA, 5.25%, 9/10/29(a) | | | 365,189 | |
200,000 | | Buffalo Energy Mexico Holdings / Buffalo Energy Infrastructure / Buffalo Energy, 7.88%, 2/15/39(a) | | | 212,995 | |
200,000 | | Comision Federal de Electricidad, 6.45%, 1/24/35(a) | | | 199,025 | |
200,000 | | FIEMEX Energia - Banco Actinver SA Institucion de Banca Multiple, 7.25%, 1/31/41(a) | | | 208,474 | |
| | | | | | |
| | | | | 985,683 | |
| | | | | | |
| |
Nigeria — 0.7% | | | | |
440,000 | | African Development Bank, 5.75%, (c),(d) | | | 437,250 | |
| | | | | | |
| |
Norway — 0.8% | | | | |
157,000 | | Aker BP ASA, 5.80%, 10/1/54(a) | | | 154,364 | |
300,000 | | Var Energi ASA, 8.00%, 11/15/32(a) | | | 347,362 | |
| | | | | | |
| | | | | 501,726 | |
| | | | | | |
| |
Spain — 1.8% | | | | |
200,000 | | Banco Bilbao Vizcaya Argentaria SA, 6.03%, 3/13/35(c) | | | 212,254 | |
200,000(e) | | Banco de Sabadell SA, 5.75%, (b),(c),(d) | | | 221,244 | |
200,000 | | Banco Santander SA, (SOFR RATE + 1.380%), 6.29%, 3/14/28(g) | | | 201,253 | |
200,000 | | Banco Santander SA, 8.00%, (c),(d) | | | 213,278 | |
200,000 | | CaixaBank SA, 6.84%, 9/13/34(a),(c) | | | 223,055 | |
| | | | | | |
| | | | | 1,071,084 | |
| | | | | | |
| |
United Kingdom — 0.8% | | | | |
217,000(f) | | Barclays Plc, 8.50%, (c),(d) | | | 300,664 | |
155,000 | | Macquarie Airfinance Holdings Ltd., 5.15%, 3/17/30(a) | | | 155,237 | |
| | | | | | |
| | | | | 455,901 | |
| | | | | | |
26
|
SCHEDULE OF PORTFOLIO INVESTMENTS |
RBC BlueBay Core Plus Bond Fund (cont.)
September 30, 2024
| | | | | | |
Principal Amount | | | | Value | |
| |
United States — 37.0% | | | | |
$ 213,000 | | Aircastle Ltd., 2.85%, 1/26/28(a) | | $ | 199,151 | |
270,000 | | Ally Financial, Inc., Series B, 4.70%, (c),(d) | | | 234,915 | |
94,000 | | Ally Financial, Inc., 6.99%, 6/13/29(c) | | | 99,369 | |
179,000 | | American National Group, Inc., 5.75%, 10/1/29 | | | 179,949 | |
242,000(e) | | Aptiv Plc / Aptiv Global Financing Ltd., 4.25%, 6/11/36 | | | 272,186 | |
260,000 | | Bank of America Corp., 2.48%, 9/21/36(c) | | | 219,434 | |
340,000 | | BGC Group, Inc., 6.60%, 6/10/29(a) | | | 351,675 | |
239,000 | | Boardwalk Pipelines LP, 5.63%, 8/1/34 | | | 246,551 | |
321,000 | | Broadcom, Inc., 4.93%, 5/15/37(a) | | | 320,434 | |
223,000 | | Charter Communications Operating LLC / Charter Communications Operating Capital, 3.85%, 4/1/61 | | | 136,643 | |
180,000 | | Charter Communications Operating LLC / Charter Communications Operating Capital, 6.55%, 6/1/34 | | | 186,982 | |
290,000 | | Citizens Financial Group, Inc., 5.72%, 7/23/32(c) | | | 301,214 | |
209,000 | | Citizens Financial Group, Inc., 6.65%, 4/25/35(c) | | | 229,288 | |
480,000 | | Citizens Financial Group, Inc., Series B, (Term SOFR 3M + 3.265%), 8.58%, (d),(h) | | | 477,359 | |
160,000 | | CNO Financial Group, Inc., 6.45%, 6/15/34 | | | 168,965 | |
150,000 | | Comerica, Inc., 5.98%, 1/30/30(c) | | | 154,599 | |
140,000 | | Constellation Energy Generation LLC, 6.50%, 10/1/53 | | | 161,959 | |
185,000 | | Continental Resources, Inc., 4.90%, 6/1/44 | | | 157,947 | |
430,000 | | Discover Financial Services, Series C, 5.50%, (c),(d) | | | 412,027 | |
142,000 | | Discover Financial Services, 7.96%, 11/2/34(c) | | | 166,756 | |
188,000 | | Energy Transfer LP, 8.00%, 5/15/54(c) | | | 202,352 | |
302,000 | | Energy Transfer LP, (Term SOFR 3M + 3.279%), 8.53%, 11/1/66(g) | | | 287,149 | |
547,000 | | EnLink Midstream Partners LP, Series C, (Term SOFR 3M + 4.372%), 9.31%, (d),(h) | | | 547,759 | |
200,000 | | Entergy Corp., 7.13%, 12/1/54(c) | | | 207,828 | |
228,000 | | Enterprise Products Operating LLC, Series D, (Term SOFR 3M + 3.248%), 8.34%, 8/16/77(h) | | | 227,424 | |
520,000 | | EQM Midstream Partners LP, 4.75%, 1/15/31(a) | | | 503,643 | |
215,000 | | Essent Group Ltd., 6.25%, 7/1/29 | | | 224,248 | |
207,000 | | F&G Global Funding, 5.88%, 6/10/27(a) | | | 212,082 | |
223,000 | | Fifth Third Bancorp, Series H, (Term SOFR 3M + 3.295%), 7.90%, (d),(h) | | | 222,299 | |
324,000 | | Fifth Third Bancorp, Series J, (Term SOFR 3M + 3.391%), 7.99%, (d),(h) | | | 323,048 | |
410,000 | | First American Financial Corp., 5.45%, 9/30/34 | | | 408,094 | |
170,000 | | Flex Intermediate Holdco LLC, 4.32%, 12/30/39(a) | | | 136,390 | |
200,000 | | Ford Motor Credit Co. LLC, 7.12%, 11/7/33 | | | 215,935 | |
400,000 | | Foundry JV Holdco LLC, 5.88%, 1/25/34(a) | | | 407,470 | |
200,000 | | Foundry JV Holdco LLC, 6.15%, 1/25/32(a) | | | 208,136 | |
200,000 | | Foundry JV Holdco LLC, 6.40%, 1/25/38(a) | | | 210,537 | |
133,000 | | General Motors Co., 5.40%, 4/1/48 | | | 122,650 | |
169,000 | | Global Atlantic Fin Co., 6.75%, 3/15/54(a) | | | 179,604 | |
378,000 | | Global Atlantic Fin Co., 7.95%, 10/15/54(a),(c) | | | 393,723 | |
27
|
SCHEDULE OF PORTFOLIO INVESTMENTS |
RBC BlueBay Core Plus Bond Fund (cont.)
September 30, 2024
| | | | | | |
Principal Amount | | | | Value | |
| |
$ 140,000 | | Global Payments, Inc., 5.95%, 8/15/52 | | $ | 144,207 | |
292,000 | | GLP Capital LP / GLP Financing II, Inc., REIT, 5.63%, 9/15/34 | | | 298,467 | |
250,000 | | GLP Capital LP / GLP Financing II, Inc., REIT, 6.25%, 9/15/54 | | | 263,633 | |
167,000 | | GXO Logistics, Inc., 6.25%, 5/6/29 | | | 175,724 | |
167,000 | | GXO Logistics, Inc., 6.50%, 5/6/34 | | | 177,718 | |
200,000 | | Health Care Service Corp. A Mutual Legal Reserve Co., 5.88%, 6/15/54(a) | | | 211,328 | |
159,000 | | Helmerich & Payne, Inc., 4.65%, 12/1/27(a) | | | 159,311 | |
248,000 | | Helmerich & Payne, Inc., 5.50%, 12/1/34(a) | | | 241,584 | |
176,000 | | Hewlett Packard Enterprise Co., 4.85%, 10/15/31 | | | 175,525 | |
215,000 | | Hewlett Packard Enterprise Co., 5.60%, 10/15/54 | | | 211,028 | |
230,000 | | Host Hotels & Resorts LP, REIT, 5.50%, 4/15/35 | | | 232,979 | |
140,000 | | Humana, Inc., 5.75%, 4/15/54 | | | 143,194 | |
200,000 | | Icon Investments Six DAC, 6.00%, 5/8/34 | | | 212,659 | |
283,000 | | Intel Corp., 3.20%, 8/12/61 | | | 173,498 | |
530,000 | | Intel Corp., 4.88%, 2/10/26 | | | 532,599 | |
210,000 | | Intel Corp., 5.60%, 2/21/54 | | | 204,550 | |
199,000 | | Intel Corp., 5.70%, 2/10/53 | | | 195,468 | |
150,000 | | Jefferies Financial Group, Inc., 6.20%, 4/14/34 | | | 160,598 | |
250,000 | | KeyBank NA, 4.39%, 12/14/27 | | | 248,110 | |
310,000 | | KeyBank NA, GMTN, 5.00%, 1/26/33 | | | 307,169 | |
250,000 | | KeyBank NA, 5.85%, 11/15/27 | | | 259,115 | |
200,000 | | Kroger Co. (The), 5.50%, 9/15/54 | | | 201,208 | |
223,000 | | Kroger Co. (The), 5.65%, 9/15/64 | | | 224,229 | |
200,000 | | Kyndryl Holdings, Inc., 4.10%, 10/15/41 | | | 161,283 | |
410,000 | | Liberty Utilities Co., 5.87%, 1/31/34(a) | | | 429,723 | |
164,000 | | M&T Bank Corp., 5.05%, 1/27/34(c) | | | 162,569 | |
160,000 | | M&T Bank Corp., 6.08%, 3/13/32(c) | | | 169,206 | |
290,000 | | Meta Platforms, Inc., 5.55%, 8/15/64 | | | 307,437 | |
266,000 | | Morgan Stanley, 2.48%, 9/16/36(c) | | | 222,624 | |
200,000 | | Newmark Group, Inc., 7.50%, 1/12/29 | | | 216,074 | |
180,000 | | Oracle Corp., 4.10%, 3/25/61 | | | 141,464 | |
289,000 | | Paramount Global, 6.38%, 3/30/62(c) | | | 265,838 | |
186,000 | | PG&E Corp., 7.38%, 3/15/55(c) | | | 195,337 | |
300,000 | | Piedmont Operating Partnership LP, REIT, 6.88%, 7/15/29 | | | 315,472 | |
189,000 | | Pilgrim’s Pride Corp., 6.25%, 7/1/33 | | | 200,533 | |
610,000 | | Plains All American Pipeline LP, Series B, (Term SOFR 3M + 4.372%), 9.49%, (d),(h) | | | 609,543 | |
360,000 | | Regions Financial Corp., 5.50%, 9/6/35(c) | | | 366,333 | |
180,000 | | Royalty Pharma Plc, 5.90%, 9/2/54 | | | 186,186 | |
164,000 | | Solventum Corp., 5.45%, 2/25/27(a) | | | 167,399 | |
313,000 | | Solventum Corp., 5.60%, 3/23/34(a) | | | 324,219 | |
173,000 | | Solventum Corp., 5.90%, 4/30/54(a) | | | 179,526 | |
226,000 | | Synchrony Financial, 5.94%, 8/2/30(c) | | | 232,318 | |
147,000 | | Tapestry, Inc., 7.70%, 11/27/30 | | | 158,331 | |
174,000(e) | | Timken Co. (The), 4.13%, 5/23/34 | | | 192,242 | |
260,000 | | U.S. Cellular Corp., 6.70%, 12/15/33 | | | 289,423 | |
140,000(e) | | Upjohn Finance BV, 1.91%, 6/23/32(b) | | | 136,131 | |
28
|
SCHEDULE OF PORTFOLIO INVESTMENTS |
RBC BlueBay Core Plus Bond Fund (cont.)
September 30, 2024
| | | | | | |
Principal Amount | | | | Value | |
| |
$ 200,000 | | Utah Acquisition Sub, Inc., 5.25%, 6/15/46 | | $ | 175,198 | |
170,000 | | VICI Properties LP, REIT, 4.95%, 2/15/30 | | | 171,030 | |
150,000 | | VICI Properties LP, REIT, 5.75%, 4/1/34 | | | 157,232 | |
100,000 | | VICI Properties LP, REIT, 6.13%, 4/1/54 | | | 104,832 | |
166,000 | | VICI Properties LP / VICI Note Co., Inc., REIT, 3.88%, 2/15/29(a) | | | 158,910 | |
410,000 | | Warnermedia Holdings, Inc., 5.14%, 3/15/52 | | | 316,088 | |
300,000 | | Wells Fargo & Co., 5.39%, 4/24/34(c) | | | 311,205 | |
110,000 | | Whistler Pipeline LLC, 5.70%, 9/30/31(a) | | | 113,856 | |
197,000 | | Whistler Pipeline LLC, 5.95%, 9/30/34(a) | | | 204,055 | |
| | | | | | |
| | | | | 22,413,292 | |
| | | | | | |
Total Corporate Bonds | | | 36,525,497 | |
| | | | | | |
(Cost $35,506,796) | |
|
U.S. Government Agency Backed Mortgages — 29.1% | |
United States — 29.1% | |
1,175,000 | | Fannie Mae, (TBA), 3.50%, 10/1/54 | | | 1,094,240 | |
675,000 | | Fannie Mae, (TBA), 4.00%, 10/1/54 | | | 648,268 | |
6,000,000 | | Fannie Mae, (TBA), 4.50%, 10/1/54 | | | 5,899,506 | |
1,625,000 | | Fannie Mae, (TBA), 3.00%, 10/1/54 | | | 1,458,052 | |
2,650,000 | | Fannie Mae, (TBA), 2.50%, 10/1/54 | | | 2,286,198 | |
3,425,000 | | Fannie Mae, (TBA), 2.00%, 10/15/54 | | | 2,829,050 | |
862,579 | | Fannie Mae, Pool #BT8271, 4.00%, 7/1/52 | | | 830,124 | |
189,159 | | Fannie Mae, Pool #CB4766, 5.00%, 9/1/52 | | | 191,192 | |
526,563 | | Fannie Mae, Pool #CB4768, 5.00%, 9/1/52 | | | 533,254 | |
219,739 | | Fannie Mae, Pool #BT7932, 5.50%, 10/1/52 | | | 226,520 | |
397,927 | | Fannie Mae, Pool #CB5344, 6.50%, 12/1/52 | | | 415,542 | |
97,395 | | Fannie Mae, Pool #CB4969, 5.50%, 10/1/52 | | | 100,328 | |
557,688 | | Fannie Mae, Pool #CB7160, 6.50%, 9/1/53 | | | 574,863 | |
406,992 | | Freddie Mac, Pool #RA7718, 4.50%, 7/1/52 | | | 401,647 | |
170,905 | | Freddie Mac, Pool #QF4133, 6.00%, 11/1/52 | | | 178,918 | |
| | | | | | |
| | | | | 17,667,702 | |
| | | | | | |
Total U.S. Government Agency Backed Mortgages | | | 17,667,702 | |
| | | | | | |
(Cost $17,761,643) | |
|
U.S. Treasury Obligations — 11.4% | |
United States — 11.4% | |
3,090,000 | | U.S. Treasury Bill- When Issued, 0.00%, 12/3/24(i) | | | 3,065,532 | |
2,730,000 | | U.S. Treasury Bill- When Issued, 5.31%, 10/15/24(i) | | | 2,725,035 | |
1,100,000 | | U.S. Treasury Notes, 5.00%, 8/31/25 | | | 1,109,110 | |
| | | | | | |
| | | | | 6,899,677 | |
| | | | | | |
Total U.S. Treasury Obligations | | | 6,899,677 | |
| | | | | | |
(Cost $6,893,701) | | | | |
| |
Bank Loans — 5.8% | | | | |
Ireland — 0.4% | | | | |
250,000 | | Setanta Aircraft Leasing DAC, (Term SOFR 1M + 1.75%), 7.35%, 11/6/28(g) | | | 251,115 | |
| | | | | | |
29
|
SCHEDULE OF PORTFOLIO INVESTMENTS |
RBC BlueBay Core Plus Bond Fund (cont.)
September 30, 2024
| | | | | | |
Principal Amount | | | | Value | |
| |
United States — 5.4% | | | | |
$389,000 | | Avolon TLB Borrower 1 US LLC, (Term SOFR 1M + 2.00%), 6.96%, 6/22/28(g) | | $ | 389,619 | |
436,607 | | Belron Finance US LLC, (Term SOFR 1M + 2.11%), 7.32%, 4/28/28(g) | | | 436,244 | |
436,700 | | Charter Communications Operating LLC, (Term SOFR 1M + 2.00%), 7.33%, 12/9/30(g) | | | 432,757 | |
437,092 | | Citadel Securities LP, (Term SOFR 1M + 2.36%), 7.50%, 7/29/30(g) | | | 436,694 | |
259,330 | | ENTEGRIS, Inc., 7.09%, 7/6/29(g) | | | 259,753 | |
400,000 | | Hilton Domestic Operating Co, Inc., (Term SOFR 1M + 1.75%), 7.03%, 11/8/30(g) | | | 399,772 | |
437,341 | | SUMMIT MATERIALS LLC, 7.05%, 1/12/29(g) | | | 438,797 | |
457,700 | | United Rentals North America, Inc., (Term SOFR 1M + 1.75%), 7.00%, 2/14/31(g) | | | 460,446 | |
| | | | | | |
| | | | | 3,254,082 | |
| | | | | | |
Total Bank Loans | | | 3,505,197 | |
| | | | | | |
(Cost $3,500,079) | | | | |
| |
Collateralized Mortgage Obligations — 4.6% | | | | |
United States — 4.6% | | | | |
258,000 | | Connecticut Avenue Securities Trust, Series 2024-R05, Class 2M2, (SOFR30A + 1.700%), 6.98%, 7/25/44(a),(g) | | | 257,902 | |
100,000 | | Connecticut Avenue Securities Trust, Series 2024-R01, Class 1M2, (SOFR30A + 1.800%), 7.08%, 1/25/44(a),(g) | | | 100,651 | |
225,000 | | Connecticut Avenue Securities Trust, Series 2024-R02, Class 1M2, (SOFR30A + 1.800%), 7.08%, 2/25/44(a),(g) | | | 226,806 | |
165,000 | | Connecticut Avenue Securities Trust, Series 2023-R08, Class 1M2, (SOFR30A + 2.500%), 7.78%, 10/25/43(a),(g) | | | 168,015 | |
88,000 | | Connecticut Avenue Securities Trust, Series 2022-R04, Class 1M2, (SOFR30A + 3.100%), 8.38%, 3/25/42(a),(g) | | | 91,502 | |
313,360 | | CSMC Trust, Series 2020-SPT1, Class A2, 3.23%, 4/25/65(a) | | | 309,218 | |
80,000 | | Freddie Mac STACR REMIC Trust, Series 2024-DNA2, Class M2, (SOFR30A + 1.700%), 6.98%, 5/25/44(a),(g) | | | 80,131 | |
279,785 | | Freddie Mac STACR REMIC Trust, Series 2023-HQA1, Class M1A, (SOFR30A + 2.000%), 7.28%, 5/25/43(a),(g) | | | 282,352 | |
92,352 | | Freddie Mac STACR REMIC Trust, Series 2023-DNA1, Class M1A, (SOFR30A + 2.100%), 7.36%, 3/25/43(a),(g) | | | 93,449 | |
250,000 | | HONO Mortgage Trust, Series 2021-LULU, Class A, (Term SOFR 1M + 1.264%), 6.36%, 10/15/36(a),(g) | | | 245,251 | |
214,616 | | MFA Trust, Series 2020-NQM3, Class A3, 1.63%, 1/26/65(a),(j) | | | 200,549 | |
30
|
SCHEDULE OF PORTFOLIO INVESTMENTS |
RBC BlueBay Core Plus Bond Fund (cont.)
September 30, 2024
| | | | | | |
Principal Amount | | | | Value | |
| |
$ 400,000 | | Verus Securitization Trust, Series 2019-INV3, Class M1, 3.28%, 11/25/59(a),(j) | | $ | 378,129 | |
400,000 | | Verus Securitization Trust, Series 2020-4, Class M1, 3.29%, 5/25/65(a),(j) | | | 375,738 | |
| | | | | | |
| | | | | 2,809,693 | |
| | | | | | |
Total Collateralized Mortgage Obligations | | | 2,809,693 | |
| | | | | | |
(Cost $2,872,645) | | | | |
| |
Asset Backed Securities — 3.1% | | | | |
United States — 3.1% | | | | |
175,000 | | Dell Equipment Finance Trust, Series 2024-1, Class D, 6.12%, 9/23/30(a) | | | 177,890 | |
180,000 | | Exeter Automobile Receivables Trust, Series 2024-5A, Class D, 5.06%, 2/18/31 | | | 179,486 | |
215,000 | | Exeter Automobile Receivables Trust, Series 2024-3A, Class D, 5.98%, 9/16/30 | | | 220,227 | |
300,000 | | HPEFS Equipment Trust, Series 2024-1A, Class D, 5.82%, 11/20/31(a) | | | 307,210 | |
140,392 | | MVW LLC, Series 2021-2A, Class B, 1.83%, 5/20/39(a) | | | 132,768 | |
715,000 | | Retained Vantage Data Centers Issuer LLC, Series 2024-1A, Class B, 5.78%, 9/15/49(a),(k) | | | 715,000 | |
161,418 | | Tricolor Auto Securitization Trust, Series 2024-2A, Class A, 6.36%, 12/15/27(a) | | | 162,665 | |
| | | | | | |
| | | | | 1,895,246 | |
| | | | | | |
Total Asset Backed Securities | | | 1,895,246 | |
| | | | | | |
(Cost $1,886,655) | | | | |
| |
Foreign Government Bonds — 0.6% | | | | |
Mexico — 0.2% | | | | |
2,670,000(l) | | Mexican Bonos, Series M, 8.50%, 3/1/29 | | | 132,231 | |
| | | | | | |
| |
Romania — 0.4% | | | | |
190,000 | | Romanian Government International Bond, 7.63%, 1/17/53(a) | | | 218,224 | |
| | | | | | |
| |
Total Foreign Government Bonds | | | 350,455 | |
| | | | | | |
(Cost $329,221) | | | | |
31
|
SCHEDULE OF PORTFOLIO INVESTMENTS |
RBC BlueBay Core Plus Bond Fund (cont.)
September 30, 2024
| | | | | | |
| Shares | | | | Value | |
| |
Investment Company — 4.7% | | | | |
2,878,559 | | RBC BlueBay U.S. Government Money Market Fund, Institutional Class 1 (m) | | $ | 2,878,559 | |
| | | | | | |
Total Investment Company | | | 2,878,559 | |
| | | | | | |
(Cost $2,878,559) | | | | |
| |
Total Investments | | $ | 72,532,026 | |
(Cost $71,629,299)(n) — 119.6% | | | | |
| |
Liabilities in excess of other assets — (19.6)% | | | (11,907,844 | ) |
| | | | | | |
| |
NET ASSETS — 100.0% | | $ | 60,624,182 | |
| | | | | | |
| (a) | Security exempt from registration under Rule 144A or Section 4(2) of the Securities Act of 1933, as amended. These securities may be resold in transactions exempt from registration, normally to qualified institutional buyers. |
| (b) | This security may be resold to qualified foreign investors and foreign institutional buyers under Regulation S of the Securities Act of 1933. |
| (c) | Security is a fix-to-float security, which carries a fixed coupon until a certain date, upon which it switches to a floating rate. Reference rate and spread are provided if the rate is currently floating. |
| (d) | Perpetual security with no stated maturity date. |
| (e) | Principal amount denoted in Euros. |
| (f) | Principal amount denoted in British Pounds. |
| (g) | Floating rate note. Rate shown is as of report date. |
| (h) | Variable rate security. The rate reflected in the Schedule of Portfolio Investments is the rate in effect on September 30, 2024. |
| (i) | Zero Coupon Bond. The rate represents the yield at time of purchase. |
| (j) | Variable or floating rate security, which interest rate adjusts periodically based on changes in current interest rates and prepayments on the underlying pool of assets. Rate shown is the rate in effect as of period end. |
| (k) | The Pricing Committee has fair valued this security under procedures established by the Fund’s Board of Trustees. |
| (l) | Principal amount denoted in Mexican peso. |
| (m) | Affiliated investment. |
| (n) | See Notes to Schedules of Portfolio Investments for the tax cost of securities and the breakdown of unrealized appreciation (depreciation). |
32
|
SCHEDULE OF PORTFOLIO INVESTMENTS |
RBC BlueBay Core Plus Bond Fund (cont.)
September 30, 2024
Foreign currency exchange contracts as of September 30, 2024:
| | | | | | | | | | | | | | | | | | | | | | | | | | | | |
Currency Purchased | | | Currency Sold | | | Counterparty | | Settlement
Date | | Value/Unrealized
Appreciation
(Depreciation) | |
AUD | | | 410,726 | | | | USD | | | | 270,000 | | | Citibank N.A. | | 10/17/24 | | | | | | $ | 14,036 | | | | | |
EUR | | | 270,145 | | | | USD | | | | 300,000 | | | Citibank N.A. | | 10/17/24 | | | | | | | 938 | | | | | |
JPY | | | 82,794,920 | | | | USD | | | | 520,000 | | | Citibank N.A. | | 10/17/24 | | | | | | | 57,526 | | | | | |
NOK | | | 260,623 | | | | EUR | | | | 21,813 | | | Citibank N.A. | | 10/17/24 | | | | | | | 402 | | | | | |
NOK | | | 2,985,797 | | | | EUR | | | | 250,000 | | | Citibank N.A. | | 10/17/24 | | | | | | | 4,492 | | | | | |
USD | | | 290,000 | | | | EUR | | | | 260,161 | | | Citibank N.A. | | 10/17/24 | | | | | | | 184 | | | | | |
USD | | | 533,139 | | | | MXN | | | | 9,710,435 | | | Citibank N.A. | | 10/17/24 | | | | | | | 41,307 | | | | | |
| | | | | | | | | | | | | | | | | | | | | | | | | | | | |
| | | | | | | | | | | | | | | | | | | | | | $ | 118,885 | | | | | |
| | | | | | | | |
JPY | | | 1,349,894 | | | | USD | | | | 9,441 | | | Citibank N.A. | | 10/17/24 | | | | | | $ | (25 | ) | | | | |
MXN | | | 7,162,000 | | | | USD | | | | 376,536 | | | Citibank N.A. | | 10/17/24 | | | | | | | (13,782 | ) | | | | |
USD | | | 267,684 | | | | AUD | | | | 410,726 | | | Citibank N.A. | | 10/17/24 | | | | | | | (16,352 | ) | | | | |
USD | | | 1,321,661 | | | | EUR | | | | 1,215,968 | | | Citibank N.A. | | 10/17/24 | | | | | | | (32,914 | ) | | | | |
USD | | | 1,385,100 | | | | EUR | | | | 1,275,215 | | | Citibank N.A. | | 10/17/24 | | | | | | | (35,475 | ) | | | | |
USD | | | 241,245 | | | | EUR | | | | 220,000 | | | Citibank N.A. | | 10/17/24 | | | | | | | (3,832 | ) | | | | |
USD | | | 909,269 | | | | GBP | | | | 709,642 | | | Citibank N.A. | | 10/17/24 | | | | | | | (39,480 | ) | | | | |
USD | | | 530,000 | | | | JPY | | | | 84,144,814 | | | Citibank N.A. | | 10/17/24 | | | | | | | (56,942 | ) | | | | |
| | | | | | | | | | | | | | | | | | | | | | | | | | | | |
| | | | | | | | | | | | | | | | | | | | | | $ | (198,802 | ) | | | | |
| | | | | | | | | | | | | | | | | | | | | | | | | | | | |
Total | | | | | | | | | | | | | | | | | | | | | | $ | (79,917 | ) | | | | |
| | | | | | | | | | | | | | | | | | | | | | | | | | | | |
Financial futures contracts as of September 30, 2024:
| | | | | | | | | | | | | | | | | | | | | | | | | | | | |
Long Position | | Number of
Contracts | | | Expiration
Date | | | Value/Unrealized
Appreciation
(Depreciation) | | | Notional
Value | | | Clearinghouse | |
10 Year U.S. Treasury Note | | | 37 | | | | December 2024 | | | | | | | $ | (19,303) | | | | USD | | | $ | 4,228,406 | | | | Morgan Stanley & Co. LLC | |
2 Year U.S. Treasury Note | | | 59 | | | | December 2024 | | | | | | | | 6,658 | | | | USD | | | | 12,286,289 | | | | Morgan Stanley & Co. LLC | |
30 Year U.S. Treasury Bond | | | 12 | | | | December 2024 | | | | | | | | (13,842) | | | | USD | | | | 1,490,250 | | | | Morgan Stanley & Co. LLC | |
30 Year U.S. Ultra Treasury Bond | | | 8 | | | | December 2024 | | | | | | | | (10,200) | | | | USD | | | | 1,064,750 | | | | Morgan Stanley & Co. LLC | |
| | | | | | | | | | | | | | | | | | | | | | | | | | | | |
Total | | | | | | | | | | | | | | $ | (36,687) | | | | | | | | | | | | | |
| | | | | | | | | | | | | | | | | | | | | | | | | | | | |
33
|
SCHEDULE OF PORTFOLIO INVESTMENTS |
RBC BlueBay Core Plus Bond Fund (cont.)
September 30, 2024
| | | | | | | | | | | | | | | | | | | | | | | | | | | | | | | | | | | |
Short Position | | Number of
Contracts | | Expiration
Date | | Value/Unrealized
Appreciation
(Depreciation) | | Notional
Value | | Clearinghouse |
10 Year Euro-Bund | | | | 5 | | | | | December 2024 | | | | | | | | | $ | (10,747) | | | | | EUR | | | | $ | 750,931 | | | | | Morgan Stanley & Co. LLC | |
10 Year U.S. Ultra Treasury Bond | | | | 14 | | | | | December 2024 | | | | | | | | | | 10,480 | | | | | USD | | | | | 1,656,156 | | | | | Morgan Stanley & Co. LLC | |
3 Month Secured Overnight Financing Rate | | | | 57 | | | | | March 2025 | | | | | | | | | | (79,153) | | | | | USD | | | | | 13,674,300 | | | | | Morgan Stanley & Co. LLC | |
5 Year Euro-Bobl | | | | 5 | | | | | December 2024 | | | | | | | | | | (7,491) | | | | | EUR | | | | | 668,168 | | | | | Morgan Stanley & Co. LLC | |
5 Year U.S. Treasury Note | | | | 25 | | | | | December 2024 | | | | | | | | | | 13,250 | | | | | USD | | | | | 2,747,070 | | | | | Morgan Stanley & Co. LLC | |
EURO-BTP FUTURE | | | | 1 | | | | | December 2024 | | | | | | | | | | (3,406) | | | | | EUR | | | | | 135,214 | | | | | Morgan Stanley & Co. LLC | |
EURO-SCHATZ FUT | | | | 3 | | | | | December 2024 | | | | | | | | | | (1,973) | | | | | EUR | | | | | 357,906 | | | | | Morgan Stanley & Co. LLC | |
JPN 10Y BOND(OSE) | | | | 3 | | | | | December 2024 | | | | | | | | | | (11,184) | | | | | JPY | | | | | 3,019,308 | | | | | Morgan Stanley & Co. LLC | |
Long Gilt Future | | | | 1 | | | | | December 2024 | | | | | | | | | | 752 | | | | | GBP | | | | | 131,596 | | | | | Morgan Stanley & Co. LLC | |
| | | | | | | | | | | | | | | | | | | | | | | | | | | | | | | | | | | |
Total | | | | | | | | | | | | | | | | | | $ | (89,472) | | | | | | | | | | | | | | | | |
| | | | | | | | | | | | | | | | | | | | | | | | | | | | | | | | | | | |
Inflation swaps as of September 30, 2024:
| | | | | | | | | | | | | | | | | | | | | | | | | | | | |
Notional Amount (000) | | Termination Date | | Payment
Frequency | | Counterparty | | Fixed
Rate | | Floating Rate | | Value at Trade Date | | Value at
September 30,
2024 | | | Unreal.
App. (Dep.) | |
EUR 700 | | 09/15/34 | | Quarterly | | Morgan Stanley & Co. LLC | | 1.93 | | EUR-BNALDN | | | | | | $0.00 | | | | | | | $ 458 | | | $ | 458 | |
USD 3,300 | | 09/23/29 | | Yearly | | Morgan Stanley & Co. LLC | | 2.33 | | USD-CITILDN | | | | | | $0.00 | | | | | | | $ 894 | | | $ | 894 | |
USD 1,297 | | 09/19/29 | | Yearly | | Morgan Stanley & Co. LLC | | 2.25 | | USD-CITILDN | | | | | | $0.00 | | | | | | | $ 5,003 | | | $ | 5,003 | |
USD 918 | | 09/23/29 | | Yearly | | Morgan Stanley & Co. LLC | | 2.29 | | USD-CAPLDN | | | | | | $0.00 | | | | | | | $ 1,756 | | | $ | 1,756 | |
34
|
SCHEDULE OF PORTFOLIO INVESTMENTS |
RBC BlueBay Core Plus Bond Fund (cont.)
September 30, 2024
| | | | | | | | | | | | | | | | | | | | | | | | | | | | |
Notional
Amount (000) | | Termination Date | | Payment Frequency | | Counterparty | | Fixed
Rate | | Floating Rate | | Value at
Trade Date | | Value at
September 30,
2024 | | Unreal.
App.
(Dep.) |
USD 782 | | 09/20/29 | | Yearly | | Morgan Stanley & Co. LLC | | | | 2.28 | | | USD-CITILDN | | | $ | 0.00 | | | | $ | 2,166 | | | | $ | 2,166 | |
USD 303 | | 09/19/29 | | Yearly | | Morgan Stanley & Co. LLC | | | | 2.26 | | | USD-CITILDN | | | $ | 0.00 | | | | $ | 1,081 | | | | $ | 1,081 | |
| | | | | | | | | | | | | | | | | | | | | | | | | | | | |
| | | | | | | | | | | | | | | | $ | 0.00 | | | | $ | 11,358 | | | | $ | 11,358 | |
EUR 700 | | 09/15/34 | | Quarterly | | Morgan Stanley & Co. LLC | | | | 1.97 | | | EUR-CITILDN | | | $ | 0.00 | | | | $ | (2,622) | | | | $ | (2,622) | |
| | | | | | | | | | | | | | | | | | | | | | | | | | | | |
| | | | | | | | | | | | | | | | $ | 0.00 | | | | $ | (2,622) | | | | $ | (2,622) | |
| | | | | | | | | | | | | | | | | | | | | | | | | | | | |
Total | | | | | | | | | | | | | | | | $ | 0.00 | | | | $ | 8,736 | | | | $ | 8,736 | |
| | | | | | | | | | | | | | | | | | | | | | | | | | | | |
Interest rate swaps as of September 30, 2024:
| | | | | | | | | | | | | | | | | | | | | | | | | | | | | | | | | | | | | | | | | | | | |
Fixed
Rate | | Float Rate | | Pay
Receive | | | Pay Freq | | Counterparty | | | Exp.
Date | | | Notional
Amount
(000) | | | Premium
Paid/
(Received) | | | Unreal
App (Dep) | | | Value | |
| 2.42% | | EUR-BNALDN | | | Receive | | | Y | | | Morgan Stanley & Co. LLC | | | | 9/27/34 | | | | EUR | | | | 800 | | | | | | | $ | 0 | | | | | | | $ | 5,563 | | | $ | 5,563 | |
| 2.36% | | EUR-BNALDN | | | Receive | | | Y | | | Morgan Stanley & Co. LLC | | | | 10/1/34 | | | | EUR | | | | 800 | | | | | | | $ | 0 | | | | | | | $ | 1,095 | | | $ | 1,095 | |
| | | | | | | | | | | | | | | | | | | | | | | | | | | | | | | | | | | | | | | | | | | | |
| | | | | | | | | | | | | | | | | | | | | | | | | | | | | | $ | 0 | | | | | | | $ | 6,658 | | | $ | 6,658 | |
| 1.12% | | JPY-BNPLDN | | | Pay | | | Y | | | Morgan Stanley & Co. LLC | | | | 10/30/33 | | | | JPY | | | | 260,000 | | | | | | | $ | (58) | | | | | | | $ | (63,578) | | | $ | (63,636) | |
35
|
SCHEDULE OF PORTFOLIO INVESTMENTS |
RBC BlueBay Core Plus Bond Fund (cont.)
September 30, 2024
| | | | | | | | | | | | | | | | | | | | | | | | | | | | | | | | | | | | | | | | | | | | |
Fixed
Rate | | Float Rate | | Pay
Receive | | | Pay Freq | | Counterparty | | | Exp.
Date | | | Notional
Amount
(000) | | | Premium
Paid/
(Received) | | | Unreal
App (Dep) | | | Value | |
| 1.01% | | JPY-BNALDN | | | Pay | | | Y | | | Morgan Stanley & Co. LLC | | | | 5/1/34 | | | | JPY | | | | 79,800 | | | | | | | $ | 0 | | | | | | | | $ (9,668) | | | $ | (9,668) | |
| 3.35% | | USD-GSLDN | | | Pay | | | Y | | | Morgan Stanley & Co. LLC | | | | 8/20/54 | | | | USD | | | | 800 | | | | | | | $ | 0 | | | | | | | | $ (2,754) | | | $ | (2,754) | |
| | | | | | | | | | | | | | | | | | | | | | | | | | | | | | | | | | | | | | | | | | | | |
| | | | | | | | | | | | | | | | | | | | | | | | | | | | | | $ | (58) | | | | | | | | $(76,000) | | | $ | (76,058) | |
| | | | | | | | | | | | | | | | | | | | | | | | | | | | | | | | | | | | | | | | | | | | |
| Total | | | | | | | | | | | | | | | | | | | | | | | | | | | | | | $ | (58) | | | | | | | | $(69,342) | | | $ | (69,400) | |
| | | | | | | | | | | | | | | | | | | | | | | | | | | | | | | | | | | | | | | | | | | | |
Credit default swaps buy protection as of September 30, 2024:
| | | | | | | | | | | | | | | | | | | | | | | | | | | | | | | | | | | | | | | | |
Fixed
Rate | | Issuer | | Payment
Frequency | | | Counterparty | | Expiration
Date | | | Notional
Amount
(000) | | | Premium Paid/
(Received) | | | Unrealized
Depreciation | | | Value | |
| 1.00% | | Markit CDX IG Index Series 43 | | | Quarterly | | | Morgan Stanley & Co. LLC | | | 12/20/29 | | | | USD | | | | 12,057 | | | | | | | $ | (271,502) | | | | | | | | $(1,744) | | | $ | (273,246) | |
| 1.00% | | Markit CDX IG Index Series 43 | | | Quarterly | | | Morgan Stanley & Co. LLC | | | 12/20/29 | | | | USD | | | | 6,028 | | | | | | | | (136,177) | | | | | | | | (435) | | | | (136,612) | |
| 1.00% | | Markit CDX IG Index Series 43 | | | Quarterly | | | Morgan Stanley & Co. LLC | | | 12/20/29 | | | | USD | | | | 6,028 | | | | | | | | (135,740) | | | | | | | | (872) | | | | (136,612) | |
| 1.00% | | Markit CDX IG Index Series 43 | | | Quarterly | | | Morgan Stanley & Co. LLC | | | 12/20/29 | | | | USD | | | | 6,029 | | | | | | | | (135,135) | | | | | | | | (1,499) | | | | (136,634) | |
| 1.00% | | Markit CDX IG Index Series 43 | | | Quarterly | | | Morgan Stanley & Co. LLC | | | 12/20/29 | | | | USD | | | | 1,851 | | | | | | | | (41,860) | | | | | | | | (89) | | | | (41,949) | |
| | | | | | | | | | | | | | | | | | | | | | | | | | | | | | | | | | | | | | | | |
| Total | | | | | | | | | | | | | | | | | | | | | | | | | | $ | (720,414) | | | | | | | | $(4,639) | | | $ | (725,053) | |
| | | | | | | | | | | | | | | | | | | | | | | | | | | | | | | | | | | | | | | | |
36
|
SCHEDULE OF PORTFOLIO INVESTMENTS |
RBC BlueBay Core Plus Bond Fund (cont.)
September 30, 2024
Abbreviations used are defined below:
AUD - Australian Dollar
Bobl - German Bundesobligationen
BTP - Italian Buoni del Tesoro Poliannuali
EMTN - Euro Medium Term Note
EUR - Euro
GBP - United Kingdom Pound Sterling
GMTN - Global Medium Term Note
JPY - Japanese Yen
MXN - Mexican Peso
NOK - Norwegian Krone
REIT - Real Estate Investment Trust
SOFR - Secured Overnight Financing Rate
SOFR30A - Secured Overnight Financing Rate 30 Day Average
TBA - To-be-announced
USD - United States Dollar
See Notes to the Financial Statements.
37
|
SCHEDULE OF PORTFOLIO INVESTMENTS |
RBC BlueBay Strategic Income Fund
September 30, 2024
| | | | | | |
Principal Amount | | | | Value | |
| |
|
Corporate Bonds — 65.7% | |
Australia — 1.0% | | | | |
$ 174,000 | | CIMIC Finance USA Pty Ltd., 7.00%, 3/25/34(a) | | $ | 186,815 | |
180,000 | | Santos Finance Ltd., 3.65%, 4/29/31(b) | | | 163,659 | |
230,000 | | Woodside Finance Ltd., 5.70%, 9/12/54 | | | 228,700 | |
| | | | | | |
| | | | | 579,174 | |
| | | | | | |
Brazil — 2.1% | | | | |
181,365 | | Guara Norte Sarl, 5.20%, 6/15/34(b) | | | 172,585 | |
200,000 | | Nexa Resources SA, 6.75%, 4/9/34(a) | | | 211,786 | |
363,000 | | Raizen Fuels Finance SA, 5.70%, 1/17/35(a) | | | 359,756 | |
200,000 | | Raizen Fuels Finance SA, 6.45%, 3/5/34(a) | | | 211,741 | |
290,000 | | Yinson Boronia Production BV, 8.95%, 7/31/42(a) | | | 309,993 | |
| | | | | | |
| | | | | 1,265,861 | |
| | | | | | |
Canada — 5.5% | | | | |
347,000 | | AltaGas Ltd., 7.20%, 10/15/54(a),(c) | | | 354,163 | |
215,000 | | Bank of Nova Scotia (The), 4.59%, 5/4/37(c) | | | 204,985 | |
510,000 | | CI Financial Corp., 7.50%, 5/30/29(a) | | | 532,053 | |
274,000 | | Enbridge, Inc., 7.20%, 6/27/54(c) | | | 288,537 | |
230,000 | | Enbridge, Inc., 8.50%, 1/15/84(c) | | | 257,912 | |
263,000 | | Fairfax Financial Holdings Ltd., 6.10%, 3/15/55(a) | | | 273,967 | |
200,000 | | South Bow Canadian Infrastructure Holdings Ltd., 7.50%, 3/1/55(a),(c) | | | 210,268 | |
260,000 | | South Bow USA Infrastructure Holdings LLC, 4.91%, 9/1/27(a) | | | 261,990 | |
215,000 | | South Bow USA Infrastructure Holdings LLC, 5.58%, 10/1/34(a) | | | 217,214 | |
290,000 | | South Bow USA Infrastructure Holdings LLC, 6.18%, 10/1/54(a) | | | 293,280 | |
406,000 | | Toronto-Dominion Bank (The), 7.25%, 7/31/84(c) | | | 424,071 | |
| | | | | | |
| | | | | 3,318,440 | |
| | | | | | |
Chile — 2.8% | | | | |
200,000 | | Antofagasta Plc, 6.25%, 5/2/34(a) | | | 213,055 | |
557,000 | | Banco de Credito e Inversiones SA, 7.50%, (a),(c),(d) | | | 566,031 | |
200,000 | | Corp. Nacional del Cobre de Chile, 6.30%, 9/8/53(a) | | | 211,651 | |
480,000 | | Corp. Nacional del Cobre de Chile, 6.44%, 1/26/36(a) | | | 521,208 | |
200,000 | | Inversiones CMPC SA, 6.13%, 2/26/34(a) | | | 211,759 | |
| | | | | | |
| | | | | 1,723,704 | |
| | | | | | |
France — 2.5% | | | | | | |
200,000(e) | | Electricite de France SA, 3.00%, (b),(c),(d) | | | 212,368 | |
200,000(e) | | Electricite de France SA, 3.38%, (b),(c),(d) | | | 202,593 | |
100,000(f) | | Electricite de France SA, EMTN, 5.88%, (b),(c),(d) | | | 130,189 | |
386,000 | | Societe Generale SA, 1.49%, 12/14/26(a),(c) | | | 369,829 | |
380,000 | | Societe Generale SA, 8.50%, (a),(c),(d) | | | 386,861 | |
200,000 | | Societe Generale SA, 9.38%, (a),(c),(d) | | | 209,796 | |
| | | | | | |
| | | | | 1,511,636 | |
| | | | | | |
38
|
SCHEDULE OF PORTFOLIO INVESTMENTS |
RBC BlueBay Strategic Income Fund (cont.)
September 30, 2024
| | | | | | |
Principal Amount | | | | Value | |
| |
| |
Germany — 2.2% | | | | |
270,000 | | Bayer US Finance LLC, 6.38%, 11/21/30(a) | | $ | 289,068 | |
200,000(e) | | Commerzbank AG, EMTN, 7.88%, (b),(c),(d) | | | 237,685 | |
100,000(e) | | Deutsche Bank AG, EMTN, 1.75%, 11/19/30(b),(c) | | | 101,721 | |
$ 200,000 | | Deutsche Bank AG, 4.88%, 12/1/32(c) | | | 197,327 | |
280,000 | | Deutsche Bank AG, 5.40%, 9/11/35(c) | | | 281,995 | |
200,000(e) | | Deutsche Bank AG, 6.75%, (b),(c),(d) | | | 220,126 | |
| | | | | | |
| | | | | 1,327,922 | |
| | | | | | |
Ireland — 1.4% | | | | |
200,000 | | AIB Group Plc, 6.61%, 9/13/29(a),(c) | | | 214,165 | |
160,000 | | Avolon Holdings Funding Ltd., 3.25%, 2/15/27(a) | | | 154,333 | |
450,000 | | Avolon Holdings Funding Ltd., 5.75%, 3/1/29(a) | | | 463,209 | |
| | | | | | |
| | | | | 831,707 | |
| | | | | | |
Italy — 1.2% | | | | |
250,000(e) | | Intesa Sanpaolo SpA, EMTN, 5.50%, (b),(c),(d) | | | 276,891 | |
231,000 | | Intesa Sanpaolo SpA, 8.25%, 11/21/33(a),(c) | | | 268,286 | |
200,000(e) | | UniCredit SpA, EMTN, 4.45%, (b),(c),(d) | | | 212,333 | |
| | | | | | |
| | | | | 757,510 | |
| | | | | | |
Mexico — 1.6% | | | | |
360,000 | | BBVA Bancomer SA, 5.25%, 9/10/29(a) | | | 365,189 | |
200,000 | | Buffalo Energy Mexico Holdings / Buffalo Energy Infrastructure / Buffalo Energy, 7.88%, 2/15/39(a) | | | 212,995 | |
200,000 | | Comision Federal de Electricidad, 6.45%, 1/24/35(a) | | | 199,025 | |
200,000 | | FIEMEX Energia - Banco Actinver SA Institucion de Banca Multiple, 7.25%, 1/31/41(a) | | | 208,474 | |
| | | | | | |
| | | | | 985,683 | |
| | | | | | |
Nigeria — 0.8% | | | | |
520,000 | | African Development Bank, 5.75%, (c),(d) | | | 516,750 | |
| | | | | | |
Norway — 1.0% | | | | |
157,000 | | Aker BP ASA, 5.80%, 10/1/54(a) | | | 154,364 | |
380,000 | | Var Energi ASA, 8.00%, 11/15/32(a) | | | 439,992 | |
| | | | | | |
| | | | | 594,356 | |
| | | | | | |
Spain — 1.8% | | | | |
200,000 | | Banco Bilbao Vizcaya Argentaria SA, 6.03%, 3/13/35(c) | | | 212,254 | |
200,000(e) | | Banco de Sabadell SA, 5.75%, (b),(c),(d) | | | 221,244 | |
200,000 | | Banco Santander SA, (SOFR RATE + 1.380%), 6.29%, 3/14/28(g) | | | 201,253 | |
200,000 | | Banco Santander SA, 8.00%, (c),(d) | | | 213,278 | |
210,000 | | CaixaBank SA, 6.84%, 9/13/34(a),(c) | | | 234,208 | |
| | | | | | |
| | | | | 1,082,237 | |
| | | | | | |
39
|
SCHEDULE OF PORTFOLIO INVESTMENTS |
RBC BlueBay Strategic Income Fund (cont.)
September 30, 2024
| | | | | | |
Principal Amount | | | | Value | |
| |
United Kingdom — 0.8% | | | | |
221,000(f) | | Barclays Plc, 8.50%, (c),(d) | | $ | 306,206 | |
$ 154,000 | | Macquarie Airfinance Holdings Ltd., 5.15%, 3/17/30(a) | | | 154,236 | |
| | | | | | |
| | | | | 460,442 | |
| | | | | | |
United States — 41.0% | | | | |
224,000 | | Aircastle Ltd., 2.85%, 1/26/28(a) | | | 209,435 | |
306,000 | | Ally Financial, Inc., Series B, 4.70%, (c),(d) | | | 266,237 | |
104,000 | | Ally Financial, Inc., 6.99%, 6/13/29(c) | | | 109,940 | |
185,000 | | American National Group, Inc., 5.75%, 10/1/29 | | | 185,982 | |
290,000(e) | | Aptiv Plc / Aptiv Global Financing Ltd., 4.25%, 6/11/36 | | | 326,173 | |
260,000 | | Bank of America Corp., 2.48%, 9/21/36(c) | | | 219,434 | |
410,000 | | BGC Group, Inc., 6.60%, 6/10/29(a) | | | 424,079 | |
294,000 | | Boardwalk Pipelines LP, 5.63%, 8/1/34 | | | 303,288 | |
375,000 | | Broadcom, Inc., 4.93%, 5/15/37(a) | | | 374,339 | |
250,000 | | Charter Communications Operating LLC / Charter Communications Operating Capital, 3.85%, 4/1/61 | | | 153,187 | |
210,000 | | Charter Communications Operating LLC / Charter Communications Operating Capital, 6.55%, 6/1/34 | | | 218,146 | |
320,000 | | Citizens Financial Group, Inc., 5.72%, 7/23/32(c) | | | 332,374 | |
256,000 | | Citizens Financial Group, Inc., 6.65%, 4/25/35(c) | | | 280,850 | |
520,000 | | Citizens Financial Group, Inc., Series B, (Term SOFR 3M + 3.265%), 8.58%, (d),(h) | | | 517,139 | |
190,000 | | CNO Financial Group, Inc., 6.45%, 6/15/34 | | | 200,646 | |
190,000 | | Comerica, Inc., 5.98%, 1/30/30(c) | | | 195,826 | |
170,000 | | Constellation Energy Generation LLC, 6.50%, 10/1/53 | | | 196,664 | |
208,000 | | Continental Resources, Inc., 4.90%, 6/1/44 | | | 177,584 | |
510,000 | | Discover Financial Services, Series C, 5.50%, (c),(d) | | | 488,683 | |
168,000 | | Discover Financial Services, 7.96%, 11/2/34(c) | | | 197,289 | |
226,000 | | Energy Transfer LP, 8.00%, 5/15/54(c) | | | 243,252 | |
372,000 | | Energy Transfer LP, (Term SOFR 3M + 3.279%), 8.53%, 11/1/66(g) | | | 353,706 | |
568,000 | | EnLink Midstream Partners LP, Series C, (Term SOFR 3M + 4.372%), 9.31%, (d),(h) | | | 568,788 | |
300,000 | | Entergy Corp., 7.13%, 12/1/54(c) | | | 311,742 | |
280,000 | | Enterprise Products Operating LLC, Series D, (Term SOFR 3M + 3.248%), 8.34%, 8/16/77(h) | | | 279,292 | |
620,000 | | EQM Midstream Partners LP, 4.75%, 1/15/31(a) | | | 600,498 | |
242,000 | | Essent Group Ltd., 6.25%, 7/1/29 | | | 252,409 | |
247,000 | | F&G Global Funding, 5.88%, 6/10/27(a) | | | 253,064 | |
227,000 | | Fifth Third Bancorp, Series H, (Term SOFR 3M + 3.295%), 7.90%, (d),(h) | | | 226,287 | |
330,000 | | Fifth Third Bancorp, Series J, (Term SOFR 3M + 3.391%), 7.99%, (d),(h) | | | 329,031 | |
410,000 | | First American Financial Corp., 5.45%, 9/30/34 | | | 408,094 | |
170,000 | | Flex Intermediate Holdco LLC, 4.32%, 12/30/39(a) | | | 136,390 | |
200,000 | | Ford Motor Credit Co. LLC, 7.12%, 11/7/33 | | | 215,935 | |
400,000 | | Foundry JV Holdco LLC, 5.88%, 1/25/34(a) | | | 407,470 | |
200,000 | | Foundry JV Holdco LLC, 6.15%, 1/25/32(a) | | | 208,136 | |
40
|
SCHEDULE OF PORTFOLIO INVESTMENTS |
RBC BlueBay Strategic Income Fund (cont.)
September 30, 2024
| | | | | | |
Principal Amount | | | | Value | |
| |
$200,000 | | Foundry JV Holdco LLC, 6.40%, 1/25/38(a) | | $ | 210,537 | |
155,000 | | General Motors Co., 5.40%, 4/1/48 | | | 142,938 | |
160,000 | | Global Atlantic Fin Co., 6.75%, 3/15/54(a) | | | 170,039 | |
382,000 | | Global Atlantic Fin Co., 7.95%, 10/15/54(a),(c) | | | 397,889 | |
175,000 | | Global Payments, Inc., 5.95%, 8/15/52 | | | 180,259 | |
290,000 | | GLP Capital LP / GLP Financing II, Inc., REIT, 5.63%, 9/15/34 | | | 296,423 | |
278,000 | | GLP Capital LP / GLP Financing II, Inc., REIT, 6.25%, 9/15/54 | | | 293,160 | |
233,000 | | GXO Logistics, Inc., 6.25%, 5/6/29 | | | 245,172 | |
200,000 | | GXO Logistics, Inc., 6.50%, 5/6/34 | | | 212,836 | |
230,000 | | Health Care Service Corp. A Mutual Legal Reserve Co., 5.88%, 6/15/54(a) | | | 243,028 | |
159,000 | | Helmerich & Payne, Inc., 4.65%, 12/1/27(a) | | | 159,311 | |
248,000 | | Helmerich & Payne, Inc., 5.50%, 12/1/34(a) | | | 241,584 | |
175,000 | | Hewlett Packard Enterprise Co., 4.85%, 10/15/31 | | | 174,527 | |
213,000 | | Hewlett Packard Enterprise Co., 5.60%, 10/15/54 | | | 209,065 | |
230,000 | | Host Hotels & Resorts LP, REIT, 5.50%, 4/15/35 | | | 232,979 | |
170,000 | | Humana, Inc., 5.75%, 4/15/54 | | | 173,878 | |
200,000 | | Icon Investments Six DAC, 6.00%, 5/8/34 | | | 212,659 | |
283,000 | | Intel Corp., 3.20%, 8/12/61 | | | 173,498 | |
590,000 | | Intel Corp., 4.88%, 2/10/26 | | | 592,894 | |
227,000 | | Intel Corp., 5.60%, 2/21/54 | | | 221,109 | |
210,000 | | Intel Corp., 5.70%, 2/10/53 | | | 206,272 | |
190,000 | | Jefferies Financial Group, Inc., 6.20%, 4/14/34 | | | 203,424 | |
250,000 | | KeyBank NA, 4.39%, 12/14/27 | | | 248,110 | |
320,000 | | KeyBank NA, GMTN, 5.00%, 1/26/33 | | | 317,078 | |
250,000 | | KeyBank NA, 5.85%, 11/15/27 | | | 259,115 | |
200,000 | | Kroger Co. (The), 5.50%, 9/15/54 | | | 201,208 | |
222,000 | | Kroger Co. (The), 5.65%, 9/15/64 | | | 223,224 | |
300,000 | | Kyndryl Holdings, Inc., 4.10%, 10/15/41 | | | 241,924 | |
488,000 | | Liberty Utilities Co., 5.87%, 1/31/34(a) | | | 511,475 | |
186,000 | | M&T Bank Corp., 5.05%, 1/27/34(c) | | | 184,377 | |
200,000 | | M&T Bank Corp., 6.08%, 3/13/32(c) | | | 211,507 | |
300,000 | | Meta Platforms, Inc., 5.55%, 8/15/64 | | | 318,039 | |
264,000 | | Morgan Stanley, 2.48%, 9/16/36(c) | | | 220,950 | |
240,000 | | Newmark Group, Inc., 7.50%, 1/12/29 | | | 259,289 | |
215,000 | | Oracle Corp., 4.10%, 3/25/61 | | | 168,971 | |
336,000 | | Paramount Global, 6.38%, 3/30/62(c) | | | 309,071 | |
185,000 | | PG&E Corp., 7.38%, 3/15/55(c) | | | 194,287 | |
360,000 | | Piedmont Operating Partnership LP, REIT, 6.88%, 7/15/29 | | | 378,566 | |
190,000 | | Pilgrim’s Pride Corp., 6.25%, 7/1/33 | | | 201,594 | |
714,000 | | Plains All American Pipeline LP, Series B, (Term SOFR 3M + 4.372%), 9.49%, (d),(h) | | | 713,465 | |
370,000 | | Regions Financial Corp., 5.50%, 9/6/35(c) | | | 376,509 | |
190,000 | | Royalty Pharma Plc, 5.90%, 9/2/54 | | | 196,530 | |
378,000 | | Solventum Corp., 5.60%, 3/23/34(a) | | | 391,549 | |
167,000 | | Solventum Corp., 5.90%, 4/30/54(a) | | | 173,300 | |
253,000 | | Synchrony Financial, 5.94%, 8/2/30(c) | | | 260,073 | |
186,000 | | Tapestry, Inc., 7.70%, 11/27/30 | | | 200,337 | |
41
|
SCHEDULE OF PORTFOLIO INVESTMENTS |
RBC BlueBay Strategic Income Fund (cont.)
September 30, 2024
| | | | | | |
Principal Amount | | | | Value | |
| |
208,000(e) | | Timken Co. (The), 4.13%, 5/23/34 | | $ | 229,807 | |
$ 300,000 | | U.S. Cellular Corp., 6.70%, 12/15/33 | | | 333,949 | |
240,000(e) | | Upjohn Finance BV, 1.91%, 6/23/32(b) | | | 233,367 | |
200,000 | | Utah Acquisition Sub, Inc., 5.25%, 6/15/46 | | | 175,198 | |
180,000 | | VICI Properties LP, REIT, 4.95%, 2/15/30 | | | 181,091 | |
180,000 | | VICI Properties LP, REIT, 5.75%, 4/1/34 | | | 188,678 | |
120,000 | | VICI Properties LP, REIT, 6.13%, 4/1/54 | | | 125,799 | |
198,000 | | VICI Properties LP / VICI Note Co., Inc., REIT, 3.88%, 2/15/29(a) | | | 189,543 | |
500,000 | | Warnermedia Holdings, Inc., 5.14%, 3/15/52 | | | 385,473 | |
340,000 | | Wells Fargo & Co., 5.39%, 4/24/34(c) | | | 352,699 | |
120,000 | | Whistler Pipeline LLC, 5.70%, 9/30/31(a) | | | 124,207 | |
220,000 | | Whistler Pipeline LLC, 5.95%, 9/30/34(a) | | | 227,879 | |
| | | | | | |
| | | | | 24,873,108 | |
| | | | | | |
Total Corporate Bonds | | | 39,828,530 | |
| | | | | | |
(Cost $38,678,331) | | | | |
| |
U.S. Treasury Obligations — 8.4% | | | | |
United States — 8.4% | | | | |
5,018,000 | | U.S. Treasury Notes, 4.25%, 3/15/27 | | | 5,096,014 | |
| | | | | | |
| |
Total U.S. Treasury Obligations | | | 5,096,014 | |
| | | | | | |
(Cost $5,073,677) | | | | |
| |
Bank Loans — 7.4% | | | | |
Ireland — 0.4% | | | | |
250,000 | | Setanta Aircraft Leasing DAC, (Term SOFR 1M + 1.75%), 7.35%, 11/6/28(g) | | | 251,115 | |
| | | | | | |
| |
United States — 7.0% | | | | |
583,500 | | Avolon TLB Borrower 1 US LLC, (Term SOFR 1M + 2.00%), 6.96%, 6/22/28(g) | | | 584,428 | |
555,681 | | Belron Finance US LLC, (Term SOFR 1M + 2.11%), 7.32%, 4/28/28(g) | | | 555,220 | |
555,800 | | Charter Communications Operating LLC, (Term SOFR 1M + 2.00%), 7.33%, 12/9/30(g) | | | 550,781 | |
566,288 | | Citadel Securities LP, (Term SOFR 1M + 2.36%), 7.50%, 7/29/30(g) | | | 565,772 | |
259,330 | | ENTEGRIS, Inc., 7.09%, 7/6/29(g) | | | 259,753 | |
600,000 | | Hilton Domestic Operating Co, Inc., (Term SOFR 1M + 1.75%), 7.03%, 11/8/30(g) | | | 599,658 | |
556,615 | | SUMMIT MATERIALS LLC, 7.05%, 1/12/29(g) | | | 558,469 | |
537,300 | | United Rentals North America, Inc., (Term SOFR 1M + 1.75%), 7.00%, 2/14/31(g) | | | 540,524 | |
| | | | | | |
| | | | | 4,214,605 | |
| | | | | | |
Total Bank Loans | | | 4,465,720 | |
| | | | | | |
(Cost $4,460,022) | | | | |
42
|
SCHEDULE OF PORTFOLIO INVESTMENTS |
RBC BlueBay Strategic Income Fund (cont.)
September 30, 2024
| | | | | | |
Principal Amount | | | | Value | |
| |
Asset Backed Securities — 6.0% | | | | |
United States — 6.0% | | | | |
$112,551 | | ACM Auto Trust, Series 2023-2A, Class A, 7.97%, 6/20/30(a) | | $ | 113,286 | |
225,000 | | Dell Equipment Finance Trust, Series 2024-1, Class D, 6.12%, 9/23/30(a) | | | 228,716 | |
500,000 | | Dell Equipment Finance Trust, Series 2023-2, Class D, 6.74%, 7/23/29(a) | | | 508,808 | |
150,000 | | Exeter Automobile Receivables Trust, Series 2024-5A, Class D, 5.06%, 2/18/31 | | | 149,572 | |
265,000 | | Exeter Automobile Receivables Trust, Series 2024-3A, Class D, 5.98%, 9/16/30 | | | 271,443 | |
500,000 | | Exeter Automobile Receivables Trust, Series 2023-2A, Class D, 6.32%, 8/15/29 | | | 511,946 | |
300,000 | | HPEFS Equipment Trust, Series 2024-1A, Class D, 5.82%, 11/20/31(a) | | | 307,210 | |
140,392 | | MVW LLC, Series 2021-2A, Class B, 1.83%, 5/20/39(a) | | | 132,768 | |
715,000 | | Retained Vantage Data Centers Issuer LLC, Series 2024-1A, Class B, 5.78%, 9/15/49(a),(i) | | | 715,000 | |
460,000 | | Santander Drive Auto Receivables Trust, Series 2024-1, Class C, 5.45%, 3/15/30 | | | 467,337 | |
201,772 | | Tricolor Auto Securitization Trust, Series 2024-2A, Class A, 6.36%, 12/15/27(a) | | | 203,331 | |
| | | | | | |
| | | | | 3,609,417 | |
| | | | | | |
Total Asset Backed Securities | | | 3,609,417 | |
| | | | | | |
(Cost $3,569,385) | | | | |
| |
Collateralized Mortgage Obligations — 4.9% | | | | |
United States — 4.9% | | | | |
287,000 | | Connecticut Avenue Securities Trust, Series 2024-R05, Class 2M2, (SOFR30A + 1.700%), 6.98%, 7/25/44(a),(g) | | | 286,891 | |
125,000 | | Connecticut Avenue Securities Trust, Series 2024-R01, Class 1M2, (SOFR30A + 1.800%), 7.08%, 1/25/44(a),(g) | | | 125,814 | |
275,000 | | Connecticut Avenue Securities Trust, Series 2024-R02, Class 1M2, (SOFR30A + 1.800%), 7.08%, 2/25/44(a),(g) | | | 277,208 | |
210,000 | | Connecticut Avenue Securities Trust, Series 2023-R08, Class 1M2, (SOFR30A + 2.500%), 7.78%, 10/25/43(a),(g) | | | 213,838 | |
88,000 | | Connecticut Avenue Securities Trust, Series 2022-R04, Class 1M2, (SOFR30A + 3.100%), 8.38%, 3/25/42(a),(g) | | | 91,502 | |
313,360 | | CSMC Trust, Series 2020-SPT1, Class A2, 3.23%, 4/25/65(a) | | | 309,218 | |
100,000 | | Freddie Mac STACR REMIC Trust, Series 2024-DNA2, Class M2, (SOFR30A + 1.700%), 6.98%, 5/25/44(a),(g) | | | 100,163 | |
279,785 | | Freddie Mac STACR REMIC Trust, Series 2023-HQA1, Class M1A, (SOFR30A + 2.000%), 7.28%, 5/25/43(a),(g) | | | 282,352 | |
92,352 | | Freddie Mac STACR REMIC Trust, Series 2023-DNA1, Class M1A, (SOFR30A + 2.100%), 7.36%, 3/25/43(a),(g) | | | 93,449 | |
250,000 | | HONO Mortgage Trust, Series 2021-LULU, Class A, (Term SOFR 1M + 1.264%), 6.36%, 10/15/36(a),(g) | | | 245,251 | |
214,616 | | MFA Trust, Series 2020-NQM3, Class A3, 1.63%, 1/26/65(a),(j) | | | 200,549 | |
43
|
SCHEDULE OF PORTFOLIO INVESTMENTS |
RBC BlueBay Strategic Income Fund (cont.)
September 30, 2024
| | | | | | |
Principal Amount | | | | Value | |
| |
$ 400,000 | | Verus Securitization Trust, Series 2019-INV3, Class M1, 3.28%, 11/25/59(a),(j) | | $ | 378,128 | |
400,000 | | Verus Securitization Trust, Series 2020-4, Class M1, 3.29%, 5/25/65(a),(j) | | | 375,738 | |
| | | | | | |
| | | | | 2,980,101 | |
| | | | | | |
Total Collateralized Mortgage Obligations | | | 2,980,101 | |
| | | | | | |
(Cost $3,041,645) | | | | |
| |
Foreign Government Bonds — 0.8% | | | | |
Mexico — 0.4% | | | | |
4,490,000(k) | | Mexican Bonos, Series M, 8.50%, 3/1/29 | | | 222,366 | |
| | | | | | |
| |
Romania — 0.4% | | | | |
230,000 | | Romanian Government International Bond, 7.63%, 1/17/53(a) | | | 264,166 | |
| | | | | | |
| |
Total Foreign Government Bonds | | | 486,532 | |
| | | | | | |
(Cost $464,760) | | | | |
| | |
Shares | | | | | |
Investment Company — 2.3% | | | | |
1,422,553 | | RBC BlueBay U.S. Government Money Market Fund, Institutional Class 1 (l) | | | 1,422,553 | |
| | | | | | |
Total Investment Company | | | 1,422,553 | |
| | | | | | |
(Cost $1,422,553) | | | | |
| |
Total Investments | | $ | 57,888,867 | |
(Cost $56,710,373)(m) — 95.5% | | | | |
| |
Other assets in excess of liabilities — 4.5% | | | 2,723,951 | |
| | | | | | |
| |
NET ASSETS — 100.0% | | $ | 60,612,818 | |
| | | | | | |
44
|
SCHEDULE OF PORTFOLIO INVESTMENTS |
RBC BlueBay Strategic Income Fund (cont.)
September 30, 2024
| (a) | Security exempt from registration under Rule 144A or Section 4(2) of the Securities Act of 1933, as amended. These securities may be resold in transactions exempt from registration, normally to qualified institutional buyers. |
| (b) | This security may be resold to qualified foreign investors and foreign institutional buyers under Regulation S of the Securities Act of 1933. |
| (c) | Security is a fix-to-float security, which carries a fixed coupon until a certain date, upon which it switches to a floating rate. Reference rate and spread are provided if the rate is currently floating. |
| (d) | Perpetual security with no stated maturity date. |
| (e) | Principal amount denoted in Euros. |
| (f) | Principal amount denoted in British Pounds. |
| (g) | Floating rate note. Rate shown is as of report date. |
| (h) | Variable rate security. The rate reflected in the Schedule of Portfolio Investments is the rate in effect on September 30, 2024. |
| (i) | The Pricing Committee has fair valued this security under procedures established by the Fund’s Board of Trustees. |
| (j) | Variable or floating rate security, which interest rate adjusts periodically based on changes in current interest rates and prepayments on the underlying pool of assets. Rate shown is the rate in effect as of period end. |
| (k) | Principal amount denoted in Mexican peso. |
| (l) | Affiliated investment. |
| (m) | See Notes to Schedules of Portfolio Investments for the tax cost of securities and the breakdown of unrealized appreciation (depreciation). |
45
|
SCHEDULE OF PORTFOLIO INVESTMENTS |
RBC BlueBay Strategic Income Fund (cont.)
September 30, 2024
Foreign currency exchange contracts as of September 30, 2024:
| | | | | | | | | | | | | | | | | | | | | | | | | | | | | | | | | | | | |
Currency Purchased | | | | | Currency Sold | | | | | Counterparty | | | | Settlement
Date | | | | | Value/Unrealized
Appreciation
(Depreciation) | |
AUD | | | 456,363 | | | | | USD | | | 300,000 | | | | | Citibank N.A. | | | | | 10/17/24 | | | | | | | | | $ | 15,596 | | | | | |
EUR | | | 1,080,145 | | | | | USD | | | 1,200,839 | | | | | Citibank N.A. | | | | | 10/17/24 | | | | | | | | | | 2,430 | | | | | |
JPY | | | 93,940,390 | | | | | USD | | | 590,000 | | | | | Citibank N.A. | | | | | 10/17/24 | | | | | | | | | | 65,270 | | | | | |
MXN | | | 6,888,000 | | | | | USD | | | 345,128 | | | | | Citibank N.A. | | | | | 10/17/24 | | | | | | | | | | 3,748 | | | | | |
NOK | | | 3,344,093 | | | | | EUR | | | 280,000 | | | | | Citibank N.A. | | | | | 10/17/24 | | | | | | | | | | 5,031 | | | | | |
USD | | | 300,000 | | | | | EUR | | | 269,132 | | | | | Citibank N.A. | | | | | 10/17/24 | | | | | | | | | | 190 | | | | | |
USD | | | 1,886 | | | | | JPY | | | 269,748 | | | | | Citibank N.A. | | | | | 10/17/24 | | | | | | | | | | 5 | | | | | |
USD | | | 855,604 | | | | | MXN | | | 15,583,722 | | | | | Citibank N.A. | | | | | 10/17/24 | | | | | | | | | | 66,291 | | | | | |
| | | | | | | | | | | | | | | | | | | | | | | | | | | | | | | | | | | | |
| | | | | | | | | | | | | | | | | | | | | | | | | | | | | | $ | 158,561 | | | | | |
| | | | | | | | | | | | |
MXN | | | 4,437,000 | | | | | USD | | | 229,386 | | | | | Citibank N.A. | | | | | 10/17/24 | | | | | | | | | $ | (4,652) | | | | | |
USD | | | 297,427 | | | | | AUD | | | 456,363 | | | | | Citibank N.A. | | | | | 10/17/24 | | | | | | | | | | (18,169) | | | | | |
USD | | | 1,663,045 | | | | | EUR | | | 1,530,051 | | | | | Citibank N.A. | | | | | 10/17/24 | | | | | | | | | | (41,415) | | | | | |
USD | | | 1,742,870 | | | | | EUR | | | 1,604,601 | | | | | Citibank N.A. | | | | | 10/17/24 | | | | | | | | | | (44,639) | | | | | |
USD | | | 899,040 | | | | | GBP | | | 701,659 | | | | | Citibank N.A. | | | | | 10/17/24 | | | | | | | | | | (39,035) | | | | | |
USD | | | 590,000 | | | | | JPY | | | 93,670,642 | | | | | Citibank N.A. | | | | | 10/17/24 | | | | | | | | | | (63,389) | | | | | |
| | | | | | | | | | | | | | | | | | | | | | | | | | | | | | | | | | | | |
| | | | | | | | | | | | | | | | | | | | | | | | | | | | | | $ | (211,299) | | | | | |
| | | | | | | | | | | | | | | | | | | | | | | | | | | | | | | | | | | | |
| | | | | | | | | | | | | | | | | | | | | | | | | | | | | | | | | | | | |
Total | | | | | | | | | | | | | | | | | | | | | | | | | | | | | | $ | (52,738) | | | | | |
| | | | | | | | | | | | | | | | | | | | | | | | | | | | | | | | | | | | |
Financial futures contracts as of September 30, 2024:
| | | | | | | | | | | | | | | | | | | | | | | | | | | | |
Long Position | | Number of
Contracts | | | Expiration
Date | | | Value/Unrealized
Appreciation
(Depreciation) | | | Notional
Value | | | Clearinghouse | |
10 Year U.S. Treasury Note | | | 49 | | | | December 2024 | | | | | | | $ | (25,242 | ) | | | USD | | | $ | 5,599,781 | | | | Morgan Stanley & Co. LLC | |
2 Year U.S. Treasury Note | | | 148 | | | | December 2024 | | | | | | | | 52,834 | | | | USD | | | | 30,819,844 | | | | Morgan Stanley & Co. LLC | |
EURO-SCHATZ FUT | | | 3 | | | | December 2024 | | | | | | | | 1,837 | | | | EUR | | | | 357,906 | | | | Morgan Stanley & Co. LLC | |
| | | | | | | | | | | | | | | | | | | | | | | | | | | | |
Total | | | | | | | | | | | | | | $ | 29,429 | | | | | | | | | | | | | |
| | | | | | | | | | | | | | | | | | | | | | | | | | | | |
46
|
SCHEDULE OF PORTFOLIO INVESTMENTS |
RBC BlueBay Strategic Income Fund (cont.)
September 30, 2024
| | | | | | | | | | | | | | | | | | | | | | |
Short Position | | Number of
Contracts | | | Expiration Date | | Value/Unrealized
Appreciation
(Depreciation) | | | Notional Value | | | Clearinghouse |
10 Year Euro-Bund | | | 9 | | | December 2024 | | | | | | $ | (20,141) | | | EUR | | $ | 1,351,676 | | | Morgan Stanley & Co. LLC |
10 Year U.S. Ultra Treasury Bond | | | 123 | | | December 2024 | | | | | | | 56,822 | | | USD | | | 14,550,516 | | | Morgan Stanley & Co. LLC |
3 Month Secured Overnight Financing Rate | | | 61 | | | March 2025 | | | | | | | (87,004) | | | USD | | | 14,633,900 | | | Morgan Stanley & Co. LLC |
30 Year U.S. Treasury Bond | | | 49 | | | December 2024 | | | | | | | 68,118 | | | USD | | | 6,085,188 | | | Morgan Stanley & Co. LLC |
30 Year U.S. Ultra Treasury Bond | | | 23 | | | December 2024 | | | | | | | 66,088 | | | USD | | | 3,061,156 | | | Morgan Stanley & Co. LLC |
5 Year Euro-Bobl | | | 2 | | | December 2024 | | | | | | | (2,996) | | | EUR | | | 267,267 | | | Morgan Stanley & Co. LLC |
5 Year U.S. Treasury Note | | | 24 | | | December 2024 | | | | | | | 11,190 | | | USD | | | 2,637,187 | | | Morgan Stanley & Co. LLC |
EURO-BTP FUTURE | | | 1 | | | December 2024 | | | | | | | (3,406) | | | EUR | | | 135,214 | | | Morgan Stanley & Co. LLC |
JPN 10Y BOND(OSE) | | | 3 | | | December 2024 | | | | | | | (11,184) | | | JPY | | | 3,019,308 | | | Morgan Stanley & Co. LLC |
Long Gilt Future | | | 2 | | | December 2024 | | | | | | | 2,007 | | | GBP | | | 263,192 | | | Morgan Stanley & Co. LLC |
| | | | | | | | | | | | | | | | | | | | | | |
Total | | | | | | | | | | | | $ | 79,494 | | | | | | | | | |
| | | | | | | | | | | | | | | | | | | | | | |
Inflation swaps as of September 30, 2024:
| | | | | | | | | | | | | | | | | | | | | | | | | | | | | | |
Notional
Amount
(000) | | Termination
Date | | | Payment
Frequency | | | Counterparty | | Fixed
Rate | | | Floating
Rate | | | Value at
Trade Date | | | Value at
September 30,
2024 | | | Unreal.
App.
(Dep.) | |
| EUR 700 | | | 09/15/34 | | | | Yearly | | | Morgan Stanley & Co. LLC | | | 1.93 | | | | EUR-BNALDN | | | $ | 0.00 | | | $ | 458 | | | $ | 458 | |
| USD 3,300 | | | 09/23/29 | | | | Yearly | | | Morgan Stanley & Co. LLC | | | 2.33 | | | | USD-CITILDN | | | $ | 0.00 | | | $ | 894 | | | $ | 894 | |
| USD 1,297 | | | 09/19/29 | | | | Yearly | | | Morgan Stanley & Co. LLC | | | 2.25 | | | | USD-CITILDN | | | $ | 0.00 | | | $ | 5,003 | | | $ | 5,003 | |
47
|
SCHEDULE OF PORTFOLIO INVESTMENTS |
RBC BlueBay Strategic Income Fund (cont.)
September 30, 2024
| | | | | | | | | | | | | | | | | | | | | | | | | | | | | | | | |
Notional
Amount
(000) | | Termination
Date | | | Payment
Frequency | | | Counterparty | | | Fixed
Rate | | | Floating
Rate | | | Value at
Trade Date | | | Value at
September 30,
2024 | | | Unreal.
App.
(Dep.) | |
| USD 918 | | | 09/23/29 | | | | Yearly | | | | Morgan Stanley & Co. LLC | | | | 2.29 | | | | USD-CAPLDN | | | $ | 0.00 | | | $ | 1,756 | | | $ | 1,756 | |
| USD 782 | | | 09/20/29 | | | | Yearly | | | | Morgan Stanley & Co. LLC | | | | 2.28 | | | | USD-CITILDN | | | $ | 0.00 | | | $ | 2,166 | | | $ | 2,166 | |
| USD 303 | | | 09/19/29 | | | | Yearly | | | | Morgan Stanley & Co. LLC | | | | 2.26 | | | | USD-CITILDN | | | $ | 0.00 | | | $ | 1,081 | | | $ | 1,081 | |
| | | | | | | | | | | | | | | | | | | | | | | | | | | | | | | | |
| | | | | | | | | | | | | | | | | | | | | | $ | 0.00 | | | $ | 11,358 | | | $ | 11,358 | |
| EUR 700 | | | 09/15/34 | | | | Yearly | | | | Morgan Stanley & Co. LLC | | | | 1.97 | | | | EUR-CITILDN | | | $ | 0.00 | | | $ | (2,622 | ) | | $ | (2,622 | ) |
| | | | | | | | | | | | | | | | | | | | | | | | | | | | | | | | |
| | | | | | | | | | | | | | | | | | | | | | $ | 0.00 | | | $ | (2,622 | ) | | $ | (2,622 | ) |
| | | | | | | | |
| | | | | | | | | | | | | | | | | | | | | | | | | | | | | | | | |
| Total | | | | | | | | | | | | | | | | | | | | | | $ | 0.00 | | | $ | 8,736 | | | $ | 8,736 | |
| | | | | | | | | | | | | | | | | | | | | | | | | | | | | | | | |
Interest rate swaps as of September 30, 2024:
| | | | | | | | | | | | | | | | | | | | | | | | | | | | | | | | |
Fixed Rate | | Float Rate | | Pay
Receive | | Pay
Freq | | Counterparty | | Exp.
Date | | | Notional
Amount
(000) | | | Premium
Paid/
(Received) | | | Unreal
App
(Dep) | | | Value | |
2.42% | | EUR-BNALDN | | Receive | | Yearly | | Morgan Stanley & Co. LLC | | | 9/27/34 | | | | EUR | | | | 800 | | | $ | 0 | | | $ | 5,563 | | | $ | 5,563 | |
2.36% | | EUR-BNALDN | | Receive | | Yearly | | Morgan Stanley & Co. LLC | | | 10/1/34 | | | | EUR | | | | 800 | | | $ | 0 | | | $ | 1,095 | | | $ | 1,095 | |
| | | | | | | | | | | | | | | | | | | | | | | | | | | | | | | | |
| | | | | | | | | | | | | | | | | | | | | | $ | 0 | | | $ | 6,658 | | | $ | 6,658 | |
1.12% | | JPY-BNPLDN | | Pay | | Yearly | | Morgan Stanley & Co. LLC | | | 10/30/33 | | | | JPY | | | | 355,000 | | | $ | (79 | ) | | $ | (86,808 | ) | | $ | (86,887 | ) |
48
|
SCHEDULE OF PORTFOLIO INVESTMENTS |
RBC BlueBay Strategic Income Fund (cont.)
September 30, 2024
| | | | | | | | | | | | | | | | | | | | | | | | | | | | | | | | | | | | | | |
Fixed Rate | | Float Rate | | Pay
Receive | | | Pay
Freq | | | Counterparty | | | Exp.
Date | | | Notional
Amount
(000) | | | Premium
Paid/
(Received) | | | Unreal
App
(Dep) | | | Value | |
1.01% | | JPY-BNALDN | | | Pay | | | | Yearly | | | | Morgan Stanley & Co. LLC | | | | 5/1/34 | | | | JPY | | | | 98,070 | | | $ | 0 | | | $ | (11,882) | | | $ | (11,882) | |
3.35% | | USD-GSLDN | | | Pay | | | | Yearly | | | | Morgan Stanley & Co. LLC | | | | 8/20/54 | | | | USD | | | | 800 | | | $ | 0 | | | $ | (2,754) | | | $ | (2,754) | |
| | | | | | | | | | | | | | | | | | | | | | | | | | | | | | | | | | | | | | |
| | | | | | | | | | | | | | | | | | | | | | | | | | | | $ | (79) | | | $ | (101,444) | | | $ | (101,523) | |
| | | | | | | | | | |
| | | | | | | | | | | | | | | | | | | | | | | | | | | | | | | | | | | | | | |
Total | | | | | | | | | | | | | | | | | | | | | | | | | | | | $ | (79) | | | $ | (94,786) | | | $ | (94,865) | |
| | | | | | | | | | | | | | | | | | | | | | | | | | | | | | | | | | | | | | |
Credit default swaps buy protection as of September 30, 2024:
| | | | | | | | | | | | | | | | | | | | | | | | | | | | | | | | | | |
Fixed Rate | | Issuer | | Payment
Frequency | | | Counterparty | | | Expiration
Date | | | Notional
Amount
(000) | | | Premium
Paid/
(Received) | | | Unrealized
Depreciation | | | Value | |
1.00% | | Markit CDX IG Index Series 43 | | | Quarterly | | | | Morgan Stanley & Co. LLC | | | | 12/20/29 | | | | USD | | | | 18,708 | | | $ | (421,270) | | | $ | (2,707) | | | $ | (423,977) | |
1.00% | | Markit CDX IG Index Series 43 | | | Quarterly | | | | Morgan Stanley & Co. LLC | | | | 12/20/29 | | | | USD | | | | 9,354 | | | | (211,314) | | | | (675) | | | | (211,989) | |
1.00% | | Markit CDX IG Index Series 43 | | | Quarterly | | | | Morgan Stanley & Co. LLC | | | | 12/20/29 | | | | USD | | | | 9,354 | | | | (210,635) | | | | (1,353) | | | | (211,988) | |
1.00% | | Markit CDX IG Index Series 43 | | | Quarterly | | | | Morgan Stanley & Co. LLC | | | | 12/20/29 | | | | USD | | | | 9,354 | | | | (209,662) | | | | (2,326) | | | | (211,988) | |
1.00% | | Markit CDX IG Index Series 43 | | | Quarterly | | | | Morgan Stanley & Co. LLC | | | | 12/20/29 | | | | USD | | | | 2,872 | | | | (64,950) | | | | (138) | | | | (65,088) | |
| | | | | | | | | | | | | | | | | | | | | | | | | | | | | | | | | | |
Total | | | | | | | | | | | | | | | | | | | | | | | | $ | (1,117,831) | | | $ | (7,199) | | | $ | (1,125,030) | |
| | | | | | | | | | | | | | | | | | | | | | | | | | | | | | | | | | |
49
|
SCHEDULE OF PORTFOLIO INVESTMENTS |
RBC BlueBay Strategic Income Fund (cont.)
September 30, 2024
Abbreviations used are defined below:
AUD - Australian Dollar
Bobl - German Bundesobligationen
BTP - Italian Buoni del Tesoro Poliannuali
EMTN - Euro Medium Term Note
EUR - Euro
GBP - United Kingdom Pound Sterling
GMTN - Global Medium Term Note
JPY - Japanese Yen
MXN - Mexican Peso
NOK - Norwegian Krone
REIT - Real Estate Investment Trust
SOFR - Secured Overnight Financing Rate
SOFR30A - Secured Overnight Financing Rate 30 Day Average
USD - United States Dollar
See Notes to the Financial Statements.
50
Statements of Assets and Liabilities
September 30, 2024
| | | | | | | | | | | | | | | | | | | | |
| | | RBC BlueBay | | | RBC BlueBay | | | RBC BlueBay | | | RBC BlueBay | |
| | | Emerging Market | | | High Yield | | | Core Plus | | | Strategic | |
| | | Debt Fund | | | Bond Fund | | | Bond Fund | | | Income Fund | |
Assets: | | | | | | | | | | | | | | | | | | | | |
Investments in securities, at value: | | | | | | | | | | | | | | | | | | | | |
Unaffiliated investments (cost $100,165,142, $674,047,496, $68,750,740 and $55,287,820, respectively) | | | | | | $ | 104,784,906 | | | $ | 692,813,580 | | | $ | 69,653,467 | | | $ | 56,466,314 | |
Affiliated investments (cost $33,397,607, $41,624,511, $2,878,559 and $1,422,553, respectively) | | | | | | | 33,397,607 | | | | 41,624,511 | | | | 2,878,559 | | | | 1,422,553 | |
Cash | | | | | | | 50,546 | | | | 50,998 | | | | 209,206 | | | | 177,016 | |
Cash at broker for financial futures contracts | | | | | | | 164,153 | | | | — | | | | 436,463 | | | | 730,490 | |
Segregated cash for swap contracts | | | | | | | 324,342 | | | | — | | | | 1,582,753 | | | | 2,254,528 | |
Cash at broker for forward foreign currency exchange contracts | | | | | | | 620,018 | | | | — | | | | 50,000 | | | | 230,000 | |
Foreign currency, at value (cost $137,072, $54,842, $1,131,835 and $475,338, respectively) | | | | | | | 137,439 | | | | 55,408 | | | | 1,138,074 | | | | 479,330 | |
Interest and dividend receivable | | | | | | | 1,539,145 | | | | 11,800,498 | | | | 511,173 | | | | 561,069 | |
Receivable from advisor | | | | | | | — | | | | — | | | | 12,392 | | | | 3,326 | |
Receivable for capital shares issued | | | | | | | — | | | | 2,175,562 | | | | — | | | | 8,380 | |
Receivable for investments sold | | | | | | | 180,184 | | | | 4,090,182 | | | | 3,797,839 | | | | 3,777,851 | |
Inflation swaps at value | | | | | | | — | | | | — | | | | 11,358 | | | | 11,358 | |
Credit default swaps at value (premiums paid $280,719, $0, $0 and $0, respectively) | | | | | | | 212,904 | | | | — | | | | — | | | | — | |
Unrealized appreciation on futures contracts | | | | | | | 17,480 | | | | — | | | | 31,140 | | | | 258,896 | |
Unrealized appreciation on interest rate swaps contracts | | | | | | | — | | | | — | | | | 6,658 | | | | 6,658 | |
Unrealized appreciation on forward foreign currency exchange contracts | | | | | | | 309,910 | | | | — | | | | 118,885 | | | | 158,561 | |
Prepaid expenses and other assets | | | | | | | 36,205 | | | | 38,039 | | | | 38,661 | | | | 38,634 | |
| | | | | | | | | | | | | | | | | | | | |
Total Assets | | | | | | | 141,774,839 | | | | 752,648,778 | | | | 80,476,628 | | | | 66,584,964 | |
| | | | | | | | | | | | | | | | | | | | |
Liabilities: | | | | | | | | | | | | | | | | | | | | |
Professional fees payable | | | | | | | 5,874 | | | | 5,874 | | | | 5,874 | | | | 5,874 | |
Payable for capital shares redeemed | | | | | | | 82,964 | | | | 134,493 | | | | — | | | | — | |
51
Statements of Assets and Liabilities (cont.)
September 30, 2024
| | | | | | | | | | | | | | | | | | | | |
| | | RBC BlueBay | | | RBC BlueBay | | | RBC BlueBay | | | RBC BlueBay | |
| | | Emerging Market | | | High Yield | | | Core Plus | | | Strategic | |
| | | Debt Fund | | | Bond Fund | | | Bond Fund | | | Income Fund | |
Payable for investments purchased | | | | | | $ | 24,991,397 | | | $ | 22,879,000 | | | $ | 18,566,295 | | | $ | 4,250,212 | |
Inflation swaps at value | | | | | | | — | | | | — | | | | 2,622 | | | | 2,622 | |
Credit default swaps at value (premiums received $315,218, $0, $720,414 and $1,117,831, respectively) | | | | | | | 318,642 | | | | — | | | | 725,053 | | | | 1,125,030 | |
Interest rate swaps at value (premiums received $0, $0, $58 and $79, respectively) | | | | | | | 95,954 | | | | — | | | | 76,058 | | | | 101,523 | |
Unrealized depreciation on forward foreign currency exchange contracts | | | | | | | 365,966 | | | | — | | | | 198,802 | | | | 211,299 | |
Unrealized depreciation on futures contracts | | | | | | | 28,282 | | | | — | | | | 157,299 | | | | 149,973 | |
Unrealized depreciation on total return swaps | | | | | | | 15,534 | | | | — | | | | — | | | | — | |
Accrued expenses and other payables: | | | | | | | | | | | | | | | | | | | | |
Investment advisory fees | | | | | | | 18,241 | | | | 189,004 | | | | — | | | | — | |
Accounting fees | | | | | | | 7,641 | | | | 12,842 | | | | 8,743 | | | | 8,753 | |
Audit fees | | | | | | | 50,258 | | | | 50,258 | | | | 50,258 | | | | 50,258 | |
Distribution fees | | | | | | | — | | | | 1,620 | | | | 33,334 | | | | 37,718 | |
Custodian fees | | | | | | | 5,989 | | | | 7,280 | | | | 7,416 | | | | 7,678 | |
Shareholder reports | | | | | | | 6,073 | | | | 26,443 | | | | 4,294 | | | | 4,537 | |
Transfer agent fees | | | | | | | 8,551 | | | | 105,432 | | | | 2,252 | | | | 2,308 | |
Other | | | | | | | 12,013 | | | | 18,455 | | | | 14,146 | | | | 14,361 | |
| | | | | | | | | | | | | | | | | | | | |
Total Liabilities | | | | | | | 26,013,379 | | | | 23,430,701 | | | | 19,852,446 | | | | 5,972,146 | |
| | | | | | | | | | | | | | | | | | | | |
Net Assets | | | | | | $ | 115,761,460 | | | $ | 729,218,077 | | | $ | 60,624,182 | | | $ | 60,612,818 | |
| | | | | | | | | | | | | | | | | | | | |
| | | | | |
Net Assets Consists of: | | | | | | | | | | | | | | | | | | | | |
Capital | | | | | | $ | 119,971,058 | | | $ | 727,134,748 | | | $ | 63,689,242 | | | $ | 58,997,718 | |
Accumulated earnings | | | | | | | (4,209,598 | ) | | | 2,083,329 | | | | (3,065,060 | ) | | | 1,615,100 | |
| | | | | | | | | | | | | | | | | | | | |
Net Assets | | | | | | $ | 115,761,460 | | | $ | 729,218,077 | | | $ | 60,624,182 | | | $ | 60,612,818 | |
| | | | | | | | | | | | | | | | | | | | |
52
Statements of Assets and Liabilities (cont.)
September 30, 2024
| | | | | | | | | | | | | | | | | | | | |
| | | RBC BlueBay | | | RBC BlueBay | | | RBC BlueBay | | | RBC BlueBay | |
| | | Emerging Market | | | High Yield | | | Core Plus | | | Strategic | |
| | | Debt Fund | | | Bond Fund | | | Bond Fund | | | Income Fund | |
Net Assets | | | | | | | | | | | | | | | | | | | | |
Class A | | | | | | $ | 7,613 | | | $ | 7,180,892 | | | $ | 5,637,072 | | | $ | 5,924,428 | |
Class I | | | | | | | 49,258,502 | | | | 722,037,185 | | | | 44,728,059 | | | | 42,856,878 | |
Class R6 | | | | | | | 66,495,345 | | | | N/A | | | | 10,259,051 | | | | 11,831,512 | |
| | | | | | | | | | | | | | | | | | | | |
Total | | | | | | $ | 115,761,460 | | | $ | 729,218,077 | | | $ | 60,624,182 | | | $ | 60,612,818 | |
| | | | | | | | | | | | | | | | | | | | |
Shares Outstanding (Unlimited number of shares authorized, no par value): | | | | | | | | | | | | | | | | | | | | |
Class A | | | | | | | 907 | | | | 724,153 | | | | 609,799 | | | | 580,321 | |
Class I | | | | | | | 5,741,089 | | | | 71,997,026 | | | | 4,835,253 | | | | 4,195,596 | |
Class R6 | | | | | | | 7,697,833 | | | | N/A | | | | 1,109,032 | | | | 1,158,260 | |
| | | | | | | | | | | | | | | | | | | | |
Total | | | | | | | 13,439,829 | | | | 72,721,179 | | | | 6,554,084 | | | | 5,934,177 | |
| | | | | | | | | | | | | | | | | | | | |
Net Asset Values and Redemption Prices Per Share: | | | | | | | | | | | | | | | | | | | | |
Class A | | | | | | $ | 8.39 | | | $ | 9.92 | | | $ | 9.24 | | | $ | 10.21 | |
| | | | | | | | | | | | | | | | | | | | |
Class I | | | | | | $ | 8.58 | | | $ | 10.03 | | | $ | 9.25 | | | $ | 10.21 | |
| | | | | | | | | | | | | | | | | | | | |
Class R6 | | | | | | $ | 8.64 | | | $ | N/A | | | $ | 9.25 | | | $ | 10.21 | |
| | | | | | | | | | | | | | | | | | | | |
Maximum Offering Price Per Share: | | | | | | | | | | | | | | | | | | | | |
Class A | | | | | | $ | 8.76 | | | $ | 10.36 | | | $ | 9.60 | | | $ | 10.61 | |
| | | | | | | | | | | | | | | | | | | | |
Maximum Sales Charge - Class A | | | | | | | 4.25 | % | | | 4.25 | % | | | 3.75 | % | | | 3.75 | % |
| | | | | | | | | | | | | | | | | | | | |
| | | |
See Notes to the Financial Statements. | | | | | | | | | | | | | |
53
Statements of Operations
For the Year Ended September 30, 2024
| | | | | | | | | | | | | | | | | | | | |
| | | RBC BlueBay | | | RBC BlueBay | | | RBC BlueBay | | | RBC BlueBay | |
| | | Emerging Market | | | High Yield | | | Core Plus | | | Strategic | |
| | | Debt Fund | | | Bond Fund | | | Bond Fund | | | Income Fund | |
Investment Income: | | | | | | | | | | | | | | | | | | | | |
Interest income | | | | | | $ | 5,736,761 | | | $ | 45,180,369 | | | $ | 2,740,554 | | | $ | 3,191,907 | |
Dividend income - affiliated | | | | | | | 103,912 | | | | 902,121 | | | | 122,040 | | | | 164,174 | |
Foreign tax withholding | | | | | | | (1,869 | ) | | | — | | | | (3,092 | ) | | | (3,414 | ) |
| | | | | | | | | | | | | | | | | | | | |
Total Investment Income | | | | | | | 5,838,804 | | | | 46,082,490 | | | | 2,859,502 | | | | 3,352,667 | |
Expenses: | | | | | | | | | | | | | | | | | | | | |
Investment advisory fees | | | | | | | 484,545 | | | | 3,330,358 | | | | 172,446 | | | | 304,828 | |
Distribution fees–Class A | | | | | | | 39 | | | | 13,499 | | | | 12,087 | | | | 14,022 | |
Accounting fees | | | | | | | 73,812 | | | | 105,298 | | | | 79,732 | | | | 79,843 | |
Audit fees | | | | | | | 56,622 | | | | 55,941 | | | | 56,603 | | | | 56,588 | |
Custodian fees | | | | | | | 74,297 | | | | 91,703 | | | | 81,136 | | | | 83,064 | |
Insurance fees | | | | | | | 3,393 | | | | 3,683 | | | | 3,393 | | | | 3,393 | |
Legal fees | | | | | | | 11,088 | | | | 23,421 | | | | 1,868 | | | | 2,280 | |
Registrations and filing fees | | | | | | | 60,724 | | | | 95,519 | | | | 83,416 | | | | 83,490 | |
Shareholder reports | | | | | | | 38,200 | | | | 106,246 | | | | 28,271 | | | | 29,359 | |
Transfer agent fees–Class A | | | | | | | 3,575 | | | | 4,552 | | | | 3,525 | | | | 3,587 | |
Transfer agent fees–Class I | | | | | | | 28,530 | | | | 796,320 | | | | 4,436 | | | | 4,404 | |
Transfer agent fees–Class R6 | | | | | | | 3,533 | | | | — | | | | 3,530 | | | | 3,530 | |
Trustees’ fees and expenses | | | | | | | 2,676 | | | | 22,796 | | | | 1,810 | | | | 2,237 | |
Tax expense | | | | | | | 6,820 | | | | 6,820 | | | | 6,495 | | | | 6,476 | |
Other fees | | | | | | | 6,214 | | | | 16,434 | | | | 6,289 | | | | 6,553 | |
| | | | | | | | | | | | | | | | | | | | |
Total expenses before fee waiver/reimbursement | | | | | | | 854,068 | | | | 4,672,590 | | | | 545,037 | | | | 683,654 | |
Expenses waived/reimbursed by: | | | | | | | | | | | | | | | | | | | | |
Advisor | | | | | | | (283,289 | ) | | | (1,236,730 | ) | | | (320,005 | ) | | | (318,375 | ) |
| | | | | | | | | | | | | | | | | | | | |
Net expenses | | | | | | | 570,779 | | | | 3,435,860 | | | | 225,032 | | | | 365,279 | |
| | | | | | | | | | | | | | | | | | | | |
Net Investment Income | | | | | | | 5,268,025 | | | | 42,646,630 | | | | 2,634,470 | | | | 2,987,388 | |
| | | | | | | | | | | | | | | | | | | | |
Realized/Unrealized Gains/(Losses): | | | | | | | | | | | | | | | | | | | | |
Net realized gains/(losses) on: | | | | | | | | | | | | | | | | | | | | |
Investment transactions | | | | | | | 769,616 | | | | 529,904 | | | | 1,707,127 | | | | 1,548,445 | |
Foreign currency transactions | | | | | | | 8,260 | | | | (12,548 | ) | | | (13,404 | ) | | | (34,472 | ) |
Foreign currency exchange contracts | | | | | | | 53,515 | | | | 20,436 | | | | 92,497 | | | | 108,389 | |
Written options | | | | | | | 65,006 | | | | — | | | | — | | | | — | |
Futures contracts | | | | | | | (135,285 | ) | | | 148,088 | | | | 165,745 | | | | (890,803 | ) |
Swap agreements | | | | | | | (341,170 | ) | | | 1,672,102 | | | | (392,202 | ) | | | (614,690 | ) |
| | | | | | | | | | | | | | | | | | | | |
Net realized gains | | | | | | | 419,942 | | | | 2,357,982 | | | | 1,559,763 | | | | 116,869 | |
Net change in unrealized appreciation/ (depreciation) on: | | | | | | | | | | | | | | | | | | | | |
Investments | | | | | | | 8,179,794 | | | | 36,676,574 | | | | 3,841,102 | | | | 3,876,150 | |
Foreign currency | | | | | | | 16,657 | | | | 72,156 | | | | (6,484 | ) | | | 32,241 | |
54
Statements of Operations (cont.)
For the Year Ended September 30, 2024
| | | | | | | | | | | | | | | | | | | | |
| | | RBC BlueBay | | | RBC BlueBay | | | RBC BlueBay | | | RBC BlueBay | |
| | | Emerging Market | | | High Yield | | | Core Plus | | | Strategic | |
| | | Debt Fund | | | Bond Fund | | | Bond Fund | | | Income Fund | |
Foreign currency exchange contracts | | | | | | $ | (217,082 | ) | | $ | (56,756 | ) | | $ | (318,298 | ) | | $ | (316,378 | ) |
Futures contracts | | | | | | | (13,695 | ) | | | 172,475 | | | | (91,645 | ) | | | (409,718 | ) |
Swap agreements | | | | | | | (116,102 | ) | | | (8,536 | ) | | | (129,788 | ) | | | (217,268 | ) |
| | | | | | | | | | | | | | | | | | | | |
Net unrealized gains | | | | | | | 7,849,572 | | | | 36,855,913 | | | | 3,294,887 | | | | 2,965,027 | |
| | | | | | | | | | | | | | | | | | | | |
Change in net assets resulting from operations | | | | | | $ | 13,537,539 | | | $ | 81,860,525 | | | $ | 7,489,120 | | | $ | 6,069,284 | |
| | | | | | | | | | | | | | | | | | | | |
See Notes to the Financial Statements.
55
Statements of Changes in Net Assets
| | | | | | | | | | | | | | | | |
| | | RBC BlueBay
Emerging Market
Debt Fund | |
| | | For the
Year Ended
September 30, 2024 | | | For the
Year Ended
September 30, 2023 | |
From Investment Activities | | | | | | | | | | | | | | | | |
Operations: | | | | | | | | | | | | | | | | |
Net investment income | | | | | | $ | 5,268,025 | | | | | | | $ | 2,679,101 | |
Net realized gains/(losses) from investments, foreign currency, written options, futures contracts and swap contracts transactions | | | | | | | 419,942 | | | | | | | | (1,985,770 | ) |
Net change in unrealized appreciation on investments, foreign currency, futures contracts and swap contracts | | | | | | | 7,849,572 | | | | | | | | 3,885,369 | |
| | | | | | | | | | | | | | | | |
Change in net assets resulting from operations | | | | | | | 13,537,539 | | | | | | | | 4,578,700 | |
| | | | | | | | | | | | | | | | |
Distributions to Shareholders: | | | | | | | | | | | | | | | | |
Class A | | | | | | | (1,040 | ) | | | | | | | (1,644 | ) |
Class I | | | | | | | (3,026,804 | ) | | | | | | | (2,351,904 | ) |
Class R6 | | | | | | | (1,728,478 | ) | | | | | | | (730 | ) |
| | | | | | | | | | | | | | | | |
Change in net assets resulting from shareholder distributions | | | | | | | (4,756,322 | ) | | | | | | | (2,354,278 | ) |
| | | | | | | | | | | | | | | | |
Capital Transactions: (Note 6) | | | | | | | | | | | | | | | | |
Proceeds from shares issued | | | | | | | 82,014,060 | | | | | | | | 6,452,899 | |
Distributions reinvested | | | | | | | 4,622,595 | | | | | | | | 2,322,313 | |
Cost of shares redeemed | | | | | | | (18,593,783 | ) | | | | | | | (2,269,729 | ) |
| | | | | | | | | | | | | | | | |
Change in net assets resulting from capital transactions | | | | | | | 68,042,872 | | | | | | | | 6,505,483 | |
| | | | | | | | | | | | | | | | |
Net increase in net assets | | | | | | | 76,824,089 | | | | | | | | 8,729,905 | |
Net Assets: | | | | | | | | | | | | | | | | |
Beginning of year | | | | | | | 38,937,371 | | | | | | | | 30,207,466 | |
| | | | | | | | | | | | | | | | |
End of year | | | | | | $ | 115,761,460 | | | | | | | $ | 38,937,371 | |
| | | | | | | | | | | | | | | | |
Share Transactions: | | | | | | | | | | | | | | | | |
Issued | | | | | | | 10,109,196 | | | | | | | | 863,993 | |
Reinvested | | | | | | | 570,858 | | | | | | | | 301,880 | |
Redeemed | | | | | | | (2,307,390 | ) | | | | | | | (313,122 | ) |
| | | | | | | | | | | | | | | | |
Change in shares resulting from capital transactions | | | | | | | 8,372,664 | | | | | | | | 852,751 | |
| | | | | | | | | | | | | | | | |
See Notes to the Financial Statements.
56
Statements of Changes in Net Assets
| | | | | | | | | | | | | | | | |
| | | RBC BlueBay
High Yield
Bond Fund | |
| | | For the
Year Ended
September 30, 2024 | | | For the
Year Ended
September 30, 2023 | |
From Investment Activities | | | | | | | | | | | | | | | | |
Operations: | | | | | | | | | | | | | | | | |
Net investment income | | | | | | $ | 42,646,630 | | | | | | | $ | 22,615,669 | |
Net realized gains/(losses) from investments, foreign currency, futures contracts and swap contracts transactions | | | | | | | 2,357,982 | | | | | | | | (13,302,527 | ) |
Net change in unrealized appreciation on investments, foreign currency, futures contracts and swap contracts | | | | | | | 36,855,913 | | | | | | | | 21,800,186 | |
| | | | | | | | | | | | | | | | |
Change in net assets resulting from operations | | | | | | | 81,860,525 | | | | | | | | 31,113,328 | |
| | | | | | | | | | | | | | | | |
Distributions to Shareholders: | | | | | | | | | | | | | | | | |
Class A | | | | | | | (362,095 | ) | | | | | | | (198,284 | ) |
Class I | | | | | | | (41,647,229 | ) | | | | | | | (21,675,937 | ) |
| | | | | | | | | | | | | | | | |
Change in net assets resulting from shareholder distributions | | | | | | | (42,009,324 | ) | | | | | | | (21,874,221 | ) |
| | | | | | | | | | | | | | | | |
Capital Transactions: (Note 6) | | | | | | | | | | | | | | | | |
Proceeds from shares issued | | | | | | | 361,077,219 | | | | | | | | 288,660,291 | |
Distributions reinvested | | | | | | | 35,960,020 | | | | | | | | 19,832,281 | |
Cost of shares redeemed | | | | | | | (164,026,133 | ) | | | | | | | (142,056,239 | ) |
| | | | | | | | | | | | | | | | |
Change in net assets resulting from capital transactions | | | | | | | 233,011,106 | | | | | | | | 166,436,333 | |
| | | | | | | | | | | | | | | | |
Net increase in net assets | | | | | | | 272,862,307 | | | | | | | | 175,675,440 | |
Net Assets: | | | | | | | | | | | | | | | | |
Beginning of year | | | | | | | 456,355,770 | | | | | | | | 280,680,330 | |
| | | | | | | | | | | | | | | | |
End of year | | | | | | $ | 729,218,077 | | | | | | | $ | 456,355,770 | |
| | | | | | | | | | | | | | | | |
Share Transactions: | | | | | | | | | | | | | | | | |
Issued | | | | | | | 37,308,354 | | | | | | | | 30,657,082 | |
Reinvested | | | | | | | 3,725,690 | | | | | | | | 2,113,892 | |
Redeemed | | | | | | | (16,958,923 | ) | | | | | | | (15,090,663 | ) |
| | | | | | | | | | | | | | | | |
Change in shares resulting from capital transactions | | | | | | | 24,075,121 | | | | | | | | 17,680,311 | |
| | | | | | | | | | | | | | | | |
See Notes to the Financial Statements.
57
Statements of Changes in Net Assets
| | | | | | | | | | | | | | | | |
| | | RBC BlueBay
Core Plus
Bond Fund | |
| | | For the
Year Ended
September 30, 2024 | | | For the
Year Ended
September 30, 2023 | |
From Investment Activities | | | | | | | | | | | | | | | | |
Operations: | | | | | | | | | | | | | | | | |
Net investment income | | | | | | $ | 2,634,470 | | | | | | | $ | 2,058,943 | |
Net realized gains/(losses) from investments, foreign currency, futures contracts and swap contracts transactions | | | | | | | 1,559,763 | | | | | | | | (2,925,007 | ) |
Net change in unrealized appreciation on investments, foreign currency, futures contracts and swap contracts | | | | | | | 3,294,887 | | | | | | | | 2,675,953 | |
| | | | | | | | | | | | | | | | |
Change in net assets resulting from operations | | | | | | | 7,489,120 | | | | | | | | 1,809,889 | |
| | | | | | | | | | | | | | | | |
Distributions to Shareholders: | | | | | | | | | | | | | | | | |
Class A | | | | | | | (229,699 | ) | | | | | | | (100,947 | ) |
Class I | | | | | | | (1,719,221 | ) | | | | | | | (777,143 | ) |
Class R6 | | | | | | | (483,858 | ) | | | | | | | (226,512 | ) |
| | | | | | | | | | | | | | | | |
Change in net assets resulting from shareholder distributions | | | | | | | (2,432,778 | ) | | | | | | | (1,104,602 | ) |
| | | | | | | | | | | | | | | | |
Capital Transactions: (Note 6) | | | | | | | | | | | | | | | | |
Proceeds from shares issued | | | | | | | 9,380,775 | | | | | | | | — | |
Distributions reinvested | | | | | | | 2,432,778 | | | | | | | | 1,104,602 | |
Cost of shares redeemed | | | | | | | (23,382 | ) | | | | | | | — | |
| | | | | | | | | | | | | | | | |
Change in net assets resulting from capital transactions | | | | | | | 11,790,171 | | | | | | | | 1,104,602 | |
| | | | | | | | | | | | | | | | |
Net increase in net assets | | | | | | | 16,846,513 | | | | | | | | 1,809,889 | |
Net Assets: | | | | | | | | | | | | | | | | |
Beginning of year | | | | | | | 43,777,669 | | | | | | | | 41,967,780 | |
| | | | | | | | | | | | | | | | |
End of year | | | | | | $ | 60,624,182 | | | | | | | $ | 43,777,669 | |
| | | | | | | | | | | | | | | | |
Share Transactions: | | | | | | | | | | | | | | | | |
Issued | | | | | | | 1,046,496 | | | | | | | | — | |
Reinvested | | | | | | | 285,595 | | | | | | | | 131,680 | |
Redeemed | | | | | | | (2,599 | ) | | | | | | | — | |
| | | | | | | | | | | | | | | | |
Change in shares resulting from capital transactions | | | | | | | 1,329,492 | | | | | | | | 131,680 | |
| | | | | | | | | | | | | | | | |
See Notes to the Financial Statements.
58
Statements of Changes in Net Assets
| | | | | | | | | | | | | | |
| | | RBC BlueBay
Strategic
Income Fund | |
| | | For the
Year Ended
September 30, 2024 | | | For the Year Ended
September 30, 2023 | |
From Investment Activities | | | | | | | | | | | | | | |
Operations: | | | | | | | | | | | | | | |
Net investment income | | | | | | $ | 2,987,388 | | | | | $ | 2,272,042 | |
Net realized gains from investments, foreign currency, futures contracts and swap contracts transactions | | | | | | | 116,869 | | | | | | 1,022,622 | |
Net change in unrealized appreciation on investments, foreign currency, futures contracts and swap contracts | | | | | | | 2,965,027 | | | | | | 855,419 | |
| | | | | | | | | | | | | | |
Change in net assets resulting from operations | | | | | | | 6,069,284 | | | | | | 4,150,083 | |
| | | | | | | | | | | | | | |
Distributions to Shareholders: | | | | | | | | | | | | | | |
Class A | | | | | | | (413,586 | ) | | | | | (217,746 | ) |
Class I | | | | | | | (3,101,514 | ) | | | | | (1,616,185 | ) |
Class R6 | | | | | | | (855,347 | ) | | | | | (467,016 | ) |
| | | | | | | | | | | | | | |
Change in net assets resulting from shareholder distributions | | | | | | | (4,370,447 | ) | | | | | (2,300,947 | ) |
| | | | | | | | | | | | | | |
Capital Transactions: (Note 6) | | | | | | | | | | | | | | |
Proceeds from shares issued | | | | | | | 4,298,609 | | | | | | — | |
Distributions reinvested | | | | | | | 4,370,447 | | | | | | 2,300,946 | |
Cost of shares redeemed | | | | | | | (2,678,201 | ) | | | | | — | |
| | | | | | | | | | | | | | |
Change in net assets resulting from capital transactions | | | | | | | 5,990,855 | | | | | | 2,300,946 | |
| | | | | | | | | | | | | | |
Net increase in net assets | | | | | | | 7,689,692 | | | | | | 4,150,082 | |
Net Assets: | | | | | | | | | | | | | | |
Beginning of year | | | | | | | 52,923,126 | | | | | | 48,773,044 | |
| | | | | | | | | | | | | | |
End of year | | | | | | $ | 60,612,818 | | | | | $ | 52,923,126 | |
| | | | | | | | | | | | | | |
Share Transactions: | | | | | | | | | | | | | | |
Issued | | | | | | | 435,561 | | | | | | — | |
Reinvested | | | | | | | 449,167 | | | | | | 241,708 | |
Redeemed | | | | | | | (269,728 | ) | | | | | — | |
| | | | | | | | | | | | | | |
Change in shares resulting from capital transactions | | | | | | | 615,000 | | | | | | 241,708 | |
| | | | | | | | | | | | | | |
See Notes to the Financial Statements.
59
RBC BlueBay Emerging Market Debt Fund
(Selected data for a share outstanding throughout the periods indicated)
| | | | | | | | | | | | | | | | | | | | | | | | | | | | | | | | |
| | | | | | | | | Investment Activities | | | Distributions | | | | |
| | | Net Asset
Value,
Beginning
of Year | | | Net
Investment
Income(a) | | | Net Realized
and Unrealized
Gains (Losses)
on Investments | | | Total from
Investment
Activities | | | Net
Investment
Income | | | Total
Distributions | | | Net Asset
Value, End
of Year | |
Class A | | | | | | | | | | | | | | | | | | | | | | | | | | | | | | | | |
Year Ended 9/30/24 | | | | | | $ | 7.53 | | | | 0.54 | | | | 0.87 | | | | 1.41 | | | | (0.55) | | | | (0.55) | | | | $8.39 | |
Year Ended 9/30/23 | | | | | | | 7.03 | | | | 0.54 | | | | 0.45 | | | | 0.99 | | | | (0.49) | | | | (0.49) | | | | 7.53 | |
Year Ended 9/30/22 | | | | | | | 9.77 | | | | 0.48 | | | | (2.70) | | | | (2.22) | | | | (0.52) | | | | (0.52) | | | | 7.03 | |
Year Ended 9/30/21 | | | | | | | 9.78 | | | | 0.45 | | | | 0.04(b) | | | | 0.49 | | | | (0.50) | | | | (0.50) | | | | 9.77 | |
Year Ended 9/30/20 | | | | | | | 10.14 | | | | 0.48 | | | | (0.38) | | | | 0.10 | | | | (0.46) | | | | (0.46) | | | | 9.78 | |
Class I | | | | | | | | | | | | | | | | | | | | | | | | | | | | | | | | |
Year Ended 9/30/24 | | | | | | $ | 7.68 | | | | 0.58 | | | | 0.89 | | | | 1.47 | | | | (0.57) | | | | (0.57) | | | | $8.58 | |
Year Ended 9/30/23 | | | | | | | 7.17 | | | | 0.57 | | | | 0.45 | | | | 1.02 | | | | (0.51) | | | | (0.51) | | | | 7.68 | |
Year Ended 9/30/22 | | | | | | | 9.89 | | | | 0.50 | | | | (2.73) | | | | (2.23) | | | | (0.49) | | | | (0.49) | | | | 7.17 | |
Year Ended 9/30/21 | | | | | | | 9.90 | | | | 0.48 | | | | 0.03(b) | | | | 0.51 | | | | (0.52) | | | | (0.52) | | | | 9.89 | |
Year Ended 9/30/20 | | | | | | | 10.23 | | | | 0.47 | | | | (0.33) | | | | 0.14 | | | | (0.47) | | | | (0.47) | | | | 9.90 | |
Class R6 | | | | | | | | | | | | | | | | | | | | | | | | | | | | | | | | |
Year Ended 9/30/24 | | | | | | $ | 7.72 | | | | 0.58 | | | | 0.91 | | | | 1.49 | | | | (0.57) | | | | (0.57) | | | | $8.64 | |
Year Ended 9/30/23 | | | | | | | 7.20 | | | | 0.58 | | | | 0.45 | | | | 1.03 | | | | (0.51) | | | | (0.51) | | | | 7.72 | |
Year Ended 9/30/22 | | | | | | | 9.94 | | | | 0.51 | | | | (2.76) | | | | (2.25) | | | | (0.49) | | | | (0.49) | | | | 7.20 | |
Year Ended 9/30/21 | | | | | | | 9.94 | | | | 0.49 | | | | 0.04(b) | | | | 0.53 | | | | (0.53) | | | | (0.53) | | | | 9.94 | |
Year Ended 9/30/20 | | | | | | | 10.27 | | | | 0.48 | | | | (0.33) | | | | 0.15 | | | | (0.48) | | | | (0.48) | | | | 9.94 | |
| (a) | Per share net investment income (loss) has been calculated using the average daily shares method. |
| (b) | Calculation of the net gain per share (both realized and unrealized) does not correlate to the aggregate realized and unrealized losses presented in the Statement of Operations due to the timing of the sales and repurchases of Fund shares in relation to fluctuating market values of the investments of the Fund. |
60
RBC BlueBay Emerging Market Debt Fund
(Selected data for a share outstanding throughout the periods indicated)
| | | | | | | | | | | | | | | | | | | | | | | | | | | | |
| | | | | | Ratios/Supplemental Data | |
| | | Total
Return(a)(b) | | | Net
Assets,
End of
Year (000’s) | | | Ratio of
Net Expenses
to Average
Net Assets | | | Ratio of
Net Investment
Income (Loss)
to Average
Net Assets | | | Ratio of
Expenses to
Average Net
Assets* | | | Portfolio
Turnover
Rate** | |
Class A | | | | | | | | | | | | | | | | | | | | | | | | | | | | |
Year Ended 9/30/24 | | | 19.47% | | | | | | | $ | 8 | | | | 1.04% | | | | 6.83% | | | | 24.70% | | | | 70% | |
Year Ended 9/30/23 | | | 14.12% | | | | | | | | 17 | | | | 1.04% | | | | 7.09% | | | | 15.47% | | | | 85% | |
Year Ended 9/30/22 | | | (23.47)% | | | | | | | | 25 | | | | 1.04% | | | | 5.67% | | | | 17.51% | | | | 98% | |
Year Ended 9/30/21 | | | 5.06% | | | | | | | | 15 | | | | 1.04% | | | | 4.52% | | | | 43.25% | | | | 181% | |
Year Ended 9/30/20 | | | 1.06% | | | | | | | | 7 | | | | 1.11%(c) | | | | 4.95% | | | | 28.23% | | | | 249% | |
Class I | | | | | | | | | | | | | | | | | | | | | | | | | | | | |
Year Ended 9/30/24 | | | 19.92% | | | | | | | $ | 49,259 | | | | 0.79% | | | | 7.09% | | | | 1.18% | | | | 70% | |
Year Ended 9/30/23 | | | 14.42% | | | | | | | | 38,909 | | | | 0.79% | | | | 7.38% | | | | 1.55% | | | | 85% | |
Year Ended 9/30/22 | | | (23.27)% | | | | | | | | 30,173 | | | | 0.79% | | | | 5.82% | | | | 1.65% | | | | 98% | |
Year Ended 9/30/21 | | | 5.28% | | | | | | | | 28,667 | | | | 0.79% | | | | 4.76% | | | | 1.72% | | | | 181% | |
Year Ended 9/30/20 | | | 1.44% | | | | | | | | 21,356 | | | | 0.85%(c) | | | | 4.87% | | | | 2.14% | | | | 249% | |
Class R6 | | | | | | | | | | | | | | | | | | | | | | | | | | | | |
Year Ended 9/30/24 | | | 20.10% | | | | | | | $ | 66,495 | | | | 0.74% | | | | 7.04% | | | | 1.09% | | | | 70% | |
Year Ended 9/30/23 | | | 14.54% | | | | | | | | 11 | | | | 0.74% | | | | 7.43% | | | | 32.92% | | | | 85% | |
Year Ended 9/30/22 | | | (23.27)% | | | | | | | | 10 | | | | 0.74% | | | | 5.77% | | | | 31.35% | | | | 98% | |
Year Ended 9/30/21 | | | 5.35% | | | | | | | | 13 | | | | 0.74% | | | | 4.82% | | | | 28.96% | | | | 181% | |
Year Ended 9/30/20 | | | 1.40% | | | | | | | | 12 | | | | 0.79%(c) | | | | 4.91% | | | | 31.83% | | | | 249% | |
| * | During the period, certain fees were contractually or voluntarily reduced and/or reimbursed. If such contractual/voluntary fee reductions and reimbursements had not occurred, the ratio would have been as indicated. |
| ** | Portfolio turnover rate is calculated on the basis of the Fund as a whole without distinguishing between the classes of shares issued. |
| (a) | Excludes sales charge. |
| (b) | Assumes investment at net asset value at the beginning of the period, reinvestment of all dividends and distributions, and a complete redemption of the investment at net asset value at the end of the period. |
| (c) | Beginning June 18, 2020, the net operating expenses were contractually limited to 1.04%, 0.79% and 0.74% of average daily net assets for Class A, Class I and Class R6, respectively. The ratio of net expenses to average net assets represents a blended percentage for the year ended September 30, 2020. |
See Notes to the Financial Statements.
61
RBC BlueBay High Yield Bond Fund
(Selected data for a share outstanding throughout the periods indicated)
| | | | | | | | | | | | | | | | | | | | | | | | | | | | | | | | | | | | | | | | |
| | | | | | | | | Investment Activities | | | Distributions | | | | |
| | | Net Asset
Value,
Beginning
of Year | | | Net
Investment
Income(a) | | | Net Realized
and Unrealized
Gains (Losses)
on Investments | | | Redemption
Fees | | | Total from
Investment
Activities | | | Net
Investment
Income | | | Net
Realized
Gains | | | Total
Distributions | | | Net Asset
Value, End
of Year | |
Class A | | | | | | | | | | | | | | | | | | | | | | | | | | | | | | | | | | | | | | | | |
Year Ended 9/30/24 | | | | | | $ | 9.28 | | | | 0.65 | | | | 0.66 | | | | — | | | | 1.31 | | | | (0.67) | | | | — | | | | (0.67) | | | | $ 9.92 | |
Year Ended 9/30/23 | | | | | | | 8.98 | | | | 0.57 | | | | 0.31 | | | | — | | | | 0.88 | | | | (0.58) | | | | — | | | | (0.58) | | | | 9.28 | |
Year Ended 9/30/22 | | | | | | | 10.89 | | | | 0.47 | | | | (1.94) | | | | — | | | | (1.47) | | | | (0.44) | | | | — | | | | (0.44) | | | | 8.98 | |
Year Ended 9/30/21 | | | | | | | 10.56 | | | | 0.47 | | | | 0.52 | | | | —(b) | | | | 0.99 | | | | (0.52) | | | | (0.14) | | | | (0.66) | | | | 10.89 | |
Year Ended 9/30/20 | | | | | | | 10.46 | | | | 0.48 | | | | 0.09 | | | | — | | | | 0.57 | | | | (0.47) | | | | — | | | | (0.47) | | | | 10.56 | |
Class I | | | | | | | | | | | | | | | | | | | | | | | | | | | | | | | | | | | | | | | | |
Year Ended 9/30/24 | | | | | | $ | 9.38 | | | | 0.68 | | | | 0.66 | | | | — | | | | 1.34 | | | | (0.69) | | | | — | | | | (0.69) | | | | $ 10.03 | |
Year Ended 9/30/23 | | | | | | | 9.07 | | | | 0.61 | | | | 0.30 | | | | — | | | | 0.91 | | | | (0.60) | | | | — | | | | (0.60) | | | | 9.38 | |
Year Ended 9/30/22 | | | | | | | 10.98 | | | | 0.48 | | | | (1.95) | | | | — | | | | (1.47) | | | | (0.44) | | | | — | | | | (0.44) | | | | 9.07 | |
Year Ended 9/30/21 | | | | | | | 10.64 | | | | 0.50 | | | | 0.53 | | | | —(b) | | | | 1.03 | | | | (0.55) | | | | (0.14) | | | | (0.69) | | | | 10.98 | |
Year Ended 9/30/20 | | | | | | | 10.52 | | | | 0.51 | | | | 0.10 | | | | — | | | | 0.61 | | | | (0.49) | | | | — | | | | (0.49) | | | | 10.64 | |
| (a) | Per share net investment income (loss) has been calculated using the average daily shares method. |
| (b) | Less than $0.01 or $(0.01) per share. |
62
RBC BlueBay High Yield Bond Fund
(Selected data for a share outstanding throughout the periods indicated)
| | | | | | | | | | | | | | | | | | | | | | | | | | | | |
| | | | | | Ratios/Supplemental Data | |
| | | Total
Return(a)(b) | | | Net Assets,
End of
Year (000’s) | | | Ratio of
Net Expenses
to Average
Net Assets | | | Ratio of
Net Investment
Income (Loss)
to Average
Net Assets | | | Ratio of
Expenses to
Average Net
Assets* | | | Portfolio
Turnover
Rate** | |
Class A | | | | | | | | | | | | | | | | | | | | | | | | | | | | |
Year Ended 9/30/24 | | | 14.60% | | | | | | | $ | 7,181 | | | | 0.82% | | | | 6.79% | | | | 0.97% | | | | 111% | |
Year Ended 9/30/23 | | | 10.06% | | | | | | | | 3,580 | | | | 0.81% | | | | 6.18% | | | | 1.14% | | | | 72% | |
Year Ended 9/30/22 | | | (12.74)% | | | | | | | | 2,983 | | | | 0.82% | | | | 4.45% | | | | 1.16% | | | | 75% | |
Year Ended 9/30/21 | | | 9.60% | | | | | | | | 3,727 | | | | 0.82% | | | | 4.32% | | | | 1.18% | | | | 100% | |
Year Ended 9/30/20 | | | 5.64% | | | | | | | | 1,586 | | | | 0.82% | | | | 4.64% | | | | 1.92% | | | | 187% | |
Class I | | | | | | | | | | | | | | | | | | | | | | | | | | | | |
Year Ended 9/30/24 | | | 14.82% | | | | | | | $ | 722,037 | | | | 0.57% | | | | 7.05% | | | | 0.77% | | | | 111% | |
Year Ended 9/30/23 | | | 10.34% | | | | | | | | 452,775 | | | | 0.56% | | | | 6.46% | | | | 0.81% | | | | 72% | |
Year Ended 9/30/22 | | | (12.57)% | | | | | | | | 277,697 | | | | 0.57% | | | | 4.76% | | | | 0.82% | | | | 75% | |
Year Ended 9/30/21 | | | 9.89% | | | | | | | | 244,644 | | | | 0.57% | | | | 4.57% | | | | 0.87% | | | | 100% | |
Year Ended 9/30/20 | | | 6.03% | | | | | | | | 128,846 | | | | 0.57% | | | | 4.92% | | | | 1.10% | | | | 187% | |
| * | During the period, certain fees were contractually or voluntarily reduced and/or reimbursed. If such contractual/voluntary fee reductions and reimbursements had not occurred, the ratio would have been as indicated. |
| ** | Portfolio turnover rate is calculated on the basis of the Fund as a whole without distinguishing between the classes of shares issued. |
| (a) | Excludes sales charge. |
| (b) | Assumes investment at net asset value at the beginning of the period, reinvestment of all dividends and distributions, and a complete redemption of the investment at net asset value at the end of the period. |
See Notes to the Financial Statements.
63
RBC BlueBay Core Plus Bond Fund
(Selected data for a share outstanding throughout the periods indicated)
| | | | | | | | | | | | | | | | | | | | | | | | | | | | | | | | |
| | | | | | | | | Investment Activities | | | Distributions | | | | |
| | | | | | Net Asset
Value,
Beginning
of Year | | | Net
Investment
Income(a) | | | Net Realized
and Unrealized
Gains (Losses)
on Investments | | | Total from
Investment
Activities | | | Net
Investment
Income | | | Total
Distributions | | | Net Asset
Value, End
of Year | |
Class A | | | | | | | | | | | | | | | | | | | | | | | | | | | | | | | | |
Year Ended 9/30/24 | | | | | | | $ 8.37 | | | | 0.45 | | | | 0.85 | | | | 1.30 | | | | (0.43) | | | | (0.43) | | | | $9.24 | |
Year Ended 9/30/23 | | | | | | | 8.24 | | | | 0.38 | | | | (0.05) | | | | 0.33 | | | | (0.20) | | | | (0.20) | | | | 8.37 | |
Period Ended 9/30/22(b) | | | | | | | 10.00 | | | | 0.18 | | | | (1.79) | | | | (1.61) | | | | (0.15) | | | | (0.15) | | | | 8.24 | |
Class I | | | | | | | | | | | | | | | | | | | | | | | | | | | | | | | | |
Year Ended 9/30/24 | | | | | | | $ 8.38 | | | | 0.47 | | | | 0.85 | | | | 1.32 | | | | (0.45) | | | | (0.45) | | | | $9.25 | |
Year Ended 9/30/23 | | | | | | | 8.24 | | | | 0.40 | | | | (0.04) | | | | 0.36 | | | | (0.22) | | | | (0.22) | | | | 8.38 | |
Period Ended 9/30/22(b) | | | | | | | 10.00 | | | | 0.20 | | | | (1.79) | | | | (1.59) | | | | (0.17) | | | | (0.17) | | | | 8.24 | |
Class R6 | | | | | | | | | | | | | | | | | | | | | | | | | | | | | | | | |
Year Ended 9/30/24 | | | | | | | $ 8.38 | | | | 0.47 | | | | 0.85 | | | | 1.32 | | | | (0.45) | | | | (0.45) | | | | $9.25 | |
Year Ended 9/30/23 | | | | | | | 8.24 | | | | 0.40 | | | | (0.04) | | | | 0.36 | | | | (0.22) | | | | (0.22) | | | | 8.38 | |
Period Ended 9/30/22(b) | | | | | | | 10.00 | | | | 0.20 | | | | (1.79) | | | | (1.59) | | | | (0.17) | | | | (0.17) | | | | 8.24 | |
| (a) | Per share net investment income (loss) has been calculated using the average daily shares method. |
| (b) | For the period from November 1, 2021 (commencement of operations) through September 30, 2022. |
64
RBC BlueBay Core Plus Bond Fund
(Selected data for a share outstanding throughout the periods indicated)
| | | | | | | | | | | | | | | | | | | | | | | | |
| | | | | | Ratios/Supplemental Data | |
| | | Total
Return(a)(b) | | | Net Assets,
End of
Year (000’s) | | | Ratio of
Net Expenses
to Average
Net Assets | | | Ratio of
Net Investment
Income (Loss)
to Average
Net Assets | | | Ratio of
Expenses to
Average Net
Assets* | | | Portfolio
Turnover
Rate** | |
Class A | | | | | | | | | | | | | | | | | | | | | | | | |
Year Ended 9/30/24 | | | 16.03% | | | $ | 5,637 | | | | 0.69% | | | | 5.11% | | | | 1.38% | | | | 910% | |
Year Ended 9/30/23 | | | 4.11% | | | | 4,358 | | | | 0.70% | | | | 4.46% | | | | 1.34% | | | | 750% | |
Period Ended 9/30/22(c) | | | (16.32)%(d) | | | | 4,188 | | | | 0.70%(e) | | | | 2.09%(e) | | | | 1.51%(e) | | | | 254% | |
Class I | | | | | | | | | | | | | | | | | | | | | | | | |
Year Ended 9/30/24 | | | 16.31% | | | $ | 44,728 | | | | 0.44% | | | | 5.36% | | | | 1.07% | | | | 910% | |
Year Ended 9/30/23 | | | 4.34% | | | | 30,653 | | | | 0.45% | | | | 4.71% | | | | 1.02% | | | | 750% | |
Period Ended 9/30/22(c) | | | (16.06)%(d) | | | | 29,381 | | | | 0.45%(e) | | | | 2.34%(e) | | | | 1.15%(e) | | | | 254% | |
Class R6 | | | | | | | | | | | | | | | | | | | | | | | | |
Year Ended 9/30/24 | | | 16.37% | | | $ | 10,259 | | | | 0.39% | | | | 5.41% | | | | 1.09% | | | | 910% | |
Year Ended 9/30/23 | | | 4.39% | | | | 8,766 | | | | 0.40% | | | | 4.76% | | | | 1.05% | | | | 750% | |
Period Ended 9/30/22(c) | | | (16.03)%(d) | | | | 8,399 | | | | 0.40%(e) | | | | 2.39%(e) | | | | 1.19%(e) | | | | 254% | |
| * | During the period, certain fees were contractually or voluntarily reduced and/or reimbursed. If such contractual/voluntary fee reductions and reimbursements had not occurred, the ratio would have been as indicated. |
| ** | Portfolio turnover rate is calculated on the basis of the Fund as a whole without distinguishing between the classes of shares issued. |
| (a) | Excludes sales charge. |
| (b) | Assumes investment at net asset value at the beginning of the period, reinvestment of all dividends and distributions, and a complete redemption of the investment at net asset value at the end of the period. |
| (c) | For the period from November 1, 2021 (commencement of operations) through September 30, 2022. |
See Notes to the Financial Statements.
65
RBC BlueBay Strategic Income Fund
(Selected data for a share outstanding throughout the periods indicated)
| | | | | | | | | | | | | | | | | | | | | | | | | | | | | | | | | | | | | | | | |
| | | | | | | | | Investment Activities | | | Distributions | | | | | | | |
| | | | | | Net Asset
Value,
Beginning
of Year | | | Net
Investment
Income(a) | | | Net Realized
and Unrealized
Gains (Losses)
on Investments | | | Total from
Investment
Activities | | | Net
Investment
Income | | | Net
Realized
Gains | | | Total
Distributions | | | | | | Net Asset
Value, End
of Year | |
Class A | | | | | | | | | | | | | | | | | | | | | | | | | | | | | | | | | | | | | | | | |
Year Ended 9/30/24 | | | | | | $ | 9.95 | | | | 0.49 | | | | 0.52 | | | | 1.01 | | | | (0.47) | | | | (0.28) | | | | (0.75) | | | | | | | | $10.21 | |
Year Ended 9/30/23 | | | | | | | 9.60 | | | | 0.41 | | | | 0.36 | | | | 0.77 | | | | (0.23) | | | | (0.19) | | | | (0.42) | | | | | | | | 9.95 | |
Period Ended 9/30/22(b) | | | | | | | 10.00 | | | | 0.17 | | | | (0.44) | | | | (0.27) | | | | (0.13) | | | | — | | | | (0.13) | | | | | | | | 9.60 | |
Class I | | | | | | | | | | | | | | | | | | | | | | | | | | | | | | | | | | | | | | | | |
Year Ended 9/30/24 | | | | | | $ | 9.95 | | | | 0.52 | | | | 0.51 | | | | 1.03 | | | | (0.49) | | | | (0.28) | | | | (0.77) | | | | | | | | $10.21 | |
Year Ended 9/30/23 | | | | | | | 9.61 | | | | 0.43 | | | | 0.36 | | | | 0.79 | | | | (0.26) | | | | (0.19) | | | | (0.45) | | | | | | | | 9.95 | |
Period Ended 9/30/22(b) | | | | | | | 10.00 | | | | 0.19 | | | | (0.43) | | | | (0.24) | | | | (0.15) | | | | — | | | | (0.15) | | | | | | | | 9.61 | |
Class R6 | | | | | | | | | | | | | | | | | | | | | | | | | | | | | | | | | | | | | | | | |
Year Ended 9/30/24 | | | | | | $ | 9.95 | | | | 0.52 | | | | 0.52 | | | | 1.04 | | | | (0.50) | | | | (0.28) | | | | (0.78) | | | | | | | | $10.21 | |
Year Ended 9/30/23 | | | | | | | 9.61 | | | | 0.44 | | | | 0.35 | | | | 0.79 | | | | (0.26) | | | | (0.19) | | | | (0.45) | | | | | | | | 9.95 | |
Period Ended 9/30/22(b) | | | | | | | 10.00 | | | | 0.19 | | | | (0.42) | | | | (0.23) | | | | (0.16) | | | | — | | | | (0.16) | | | | | | | | 9.61 | |
| (a) | Per share net investment income (loss) has been calculated using the average daily shares method. |
| (b) | For the period from November 1, 2021 (commencement of operations) through September 30, 2022. |
66
RBC BlueBay Strategic Income Fund
(Selected data for a share outstanding throughout the periods indicated)
| | | | | | | | | | | | | | | | | | | | | | | | | | | | |
| | | | | | Ratios/Supplemental Data | |
| | | Total
Return(a)(b) | | | | | | Net Assets,
End of
Year (000’s) | | | Ratio of
Net Expenses
to Average
Net Assets | | | Ratio of
Net Investment
Income (Loss)
to Average
Net Assets | | | Ratio of
Expenses to
Average Net
Assets* | | | Portfolio
Turnover
Rate** | |
Class A | | | | | | | | | | | | | | | | | | | | | | | | | | | | |
Year Ended 9/30/24 | | | 10.77% | | | | | | | $ | 5,924 | | | | 0.87% | | | | 4.96% | | | | 1.46% | | | | 890% | |
Year Ended 9/30/23 | | | 8.33% | | | | | | | | 5,269 | | | | 0.88% | | | | 4.24% | | | | 1.42% | | | | 712% | |
Period Ended 9/30/22(c) | | | (2.70)%(d) | | | | | | | | 4,867 | | | | 0.88%(e) | | | | 1.85%(e) | | | | 1.62%(e) | | | | 159% | |
Class I | | | | | | | | | | | | | | | | | | | | | | | | | | | | |
Year Ended 9/30/24 | | | 11.02% | | | | | | | $ | 42,857 | | | | 0.62% | | | | 5.21% | | | | 1.16% | | | | 890% | |
Year Ended 9/30/23 | | | 8.48% | | | | | | | | 37,057 | | | | 0.63% | | | | 4.49% | | | | 1.11% | | | | 712% | |
Period Ended 9/30/22(c) | | | (2.50)%(d) | | | | | | | | 34,146 | | | | 0.63%(e) | | | | 2.10%(e) | | | | 1.28%(e) | | | | 159% | |
Class R6 | | | | | | | | | | | | | | | | | | | | | | | | | | | | |
Year Ended 9/30/24 | | | 11.08% | | | | | | | $ | 11,832 | | | | 0.57% | | | | 5.26% | | | | 1.18% | | | | 890% | |
Year Ended 9/30/23 | | | 8.54% | | | | | | | | 10,598 | | | | 0.58% | | | | 4.54% | | | | 1.13% | | | | 712% | |
Period Ended 9/30/22(c) | | | (2.46)%(d) | | | | | | | | 9,760 | | | | 0.58%(e) | | | | 2.15%(e) | | | | 1.32%(e) | | | | 159% | |
| * | During the period, certain fees were contractually or voluntarily reduced and/or reimbursed. If such contractual/voluntary fee reductions and reimbursements had not occurred, the ratio would have been as indicated. |
| ** | Portfolio turnover rate is calculated on the basis of the Fund as a whole without distinguishing between the classes of shares issued. |
| (a) | Excludes sales charge. |
| (b) | Assumes investment at net asset value at the beginning of the period, reinvestment of all dividends and distributions, and a complete redemption of the investment at net asset value at the end of the period. |
| (c) | For the period from November 1, 2021 (commencement of operations) through September 30, 2022. |
See Notes to the Financial Statements.
67
|
NOTES TO FINANCIAL STATEMENTS |
September 30, 2024
1. Organization:
RBC Funds Trust (the “Trust”) is registered under the Investment Company Act of 1940 (as amended) as an open-end management investment company. The Trust was organized as a Delaware statutory trust on December 16, 2003 and currently consists of 23 portfolios. Overall responsibility for the management of the Trust is vested in its Board of Trustees (the “Board”).This report includes the following four investment portfolios (each a “Fund” and collectively, the “Funds”):
- RBC BlueBay Emerging Market Debt Fund (“Emerging Market Debt Fund”)
- RBC BlueBay High Yield Bond Fund (“High Yield Bond Fund”)
- RBC BlueBay Core Plus Bond Fund (“Core Plus Bond Fund”)
- RBC BlueBay Strategic Income Fund (“Strategic Income Fund”)
Class A and Class I shares are offered by each Fund; Class R6 shares are offered by Emerging Market Debt Fund, Core Plus Bond Fund and the Strategic Income Fund. Class A shares are offered with a maximum front-end sales charge of 4.25% for Emerging Market Debt Fund and High Yield Bond Fund and 3.75% for Core Plus Bond Fund and Strategic Income Fund and a 1.00% contingent deferred sales charge (“CDSC”) for redemption within 12 months of a $1 million or greater purchase on which no front-end sales charge was paid. Class I shares and Class R6 shares (intended for investors meeting certain investment minimum thresholds) are not subject to either a front-end sales charge or a CDSC.
RBC Global Asset Management (U.S.) Inc. (“RBC GAM-US)” or “Advisor” or “Co-Administrator”) acts as the investment advisor for the Funds and RBC Global Asset Management (UK) Limited (“RBC GAM-UK” or Sub-Advisor“) acts as a sub-advisor for Emerging Market Debt Fund and High Yield Bond Fund. The officers of the Trust (“Fund Management”) are also employees of RBC GAM-US.
2. Significant Accounting Policies
Each Fund is an investment company that follows accounting and reporting guidance under the Financial Accounting Standards Board (“FASB”) Accounting Standards Codification Topic 946, Financial Services — Investment Companies (ASC 946). The financial statements are prepared in accordance with U.S. generally accepted accounting principles (“U.S. GAAP”). Fund Management may also be required to make estimates and assumptions that affect the reported amounts of assets and liabilities at the date of the financial statements and the reported amounts of income and expenses for the period. Actual results could differ from those estimates. The financial statements are as of the close of regular trading on the New York Stock Exchange (“NYSE”).
To be announced securities
The Fund may trade securities on a To Be Announced (TBA) basis. As with other delayed-delivery transactions, a seller agrees to issue a TBA security at a future date. However, the seller does not specify the particular securities to be delivered. Instead, the Fund agrees to accept any security that meets specified terms.
In some cases, Master Securities Forward Transaction Agreements (MSFTAs) may be used to govern transactions of certain forward-settling agency mortgage-backed securities, such as delayed-delivery and TBAs, between the Fund and counterparty. The MSFTA maintains provisions for, among other things, initiation and confirmation, payment and transfer, events of default, termination, and maintenance of collateral relating to such transactions.
Security Valuation:
The Board has approved pricing and valuation procedures of the Advisor for determining the fair value of each Fund’s investments. Fair value of a security is considered to be the price that a fund might reasonably expect to receive upon its current sale in an orderly transaction between market participants.
68
|
NOTES TO FINANCIAL STATEMENTS |
Equity securities are generally valued on the basis of prices furnished by third-party pricing services approved by the Board. Equity securities listed on one or more exchanges shall be valued at the last available quoted sale price on the primary trading exchange as of the regularly scheduled closing time of the exchange and are categorized as Level 1 in the fair value hierarchy. (See “Fair Value Measurements” below for additional information). An equity security not listed on an exchange but listed on NASDAQ shall be valued at the NASDAQ official closing price and is also categorized as Level 1. If there was no sale on the primary exchange on the day the net asset value is calculated or a NASDAQ official closing price is not available, the most recent bid quotation generally will be used and such securities will generally be categorized as Level 2. Investments in open-end investment companies (mutual funds) are valued at net asset value and are categorized as Level 1 in the fair value hierarchy.
Fixed income securities, including to-be-announced (“TBA”) commitments and municipal bonds, are generally valued based on evaluated prices received from third-party pricing services or from broker-dealers who make markets in the securities and are generally categorized as Level 2 in the fair value hierarchy (see “Fair Value Measurements” below for additional information). The pricing services utilize both dealer-supplied valuations and electronic data processing techniques that take into account multiple appropriate factors such as institutional-size trading in similar groups of securities, market spreads, interest rates, and fundamental security analytical data including yield, quality, coupon rate, maturity and type of issue.
Bank loans are valued based on evaluated prices received from third-party pricing services or fair valued using recently executed transactions, market price quotations, credit/market events, and cross-asset pricing. Inputs are generally observable market inputs obtained from independent sources. Bank Loans are generally categorized as Level 2 of the fair value hierarchy, unless key inputs are unobservable which would then be as Level 3.
Exchange-traded options, futures and options on futures are valued at the last sale price at the close of the market on the principal exchange on which they are traded. In the absence of any transactions on that day, the closing bid price shall be used for purchased options, futures and options on futures, and the closing ask price shall be used for written options. Such instruments are categorized as Level 1 of the fair value hierarchy. Options contracts traded in the over-the-counter (“OTC”) market shall be valued at the evaluated price provided by an independent pricing service or broker-dealer using a mathematical model which incorporates a number of market data factors, such as trades and prices of the underlying instruments. These contracts are categorized as Level 2 of the fair value hierarchy. Forward foreign currency exchange contracts are marked to market daily based upon foreign currency exchange rates provided by an independent pricing service as of the close of the NYSE, generally 4:00 p.m. EST, and are generally classified as Level 2 within the fair value hierarchy.
Swaps, including credit-default swaps, interest rate swaps and total return swaps, are generally valued by an independent pricing service using a discounted cash flow methodology. This technique is used to value both the fixed and variable components of the swap contracts and takes into account market data and inputs sourced from various institutions and market-makers and includes daily intra-day and closing spreads, credit index quotes, yield curves, and recovery rate assumptions. The Fund’s net benefit or obligation under the derivative contract, as measured by the fair market value of the contract, is included in the Fund’s net assets. These swap contracts are categorized as Level 2 in the fair valuation hierarchy.
Foreign securities valued in non-U.S. dollars are valued in the foreign currency and then converted into the U.S. dollar equivalent using the foreign exchange rate in effect at the close of NYSE on the day the security’s value is determined. The value of securities traded in markets outside the United States may be affected on a day that the NYSE is closed and an investor is not able to purchase, exchange or redeem shares of the Funds.
The Board has designated the Advisor with the responsibility for implementing the pricing and valuation procedures, including responsibility for determining the fair value of the Funds’ securities or other assets and liabilities, and has established a Pricing Committee to assist in carrying out supervisory functions related to such responsibilities. The Pricing Committee includes representatives of the Funds’ Advisor, Co-Administrator and Sub-Advisor, including personnel from accounting and operations, trading, risk management and compliance. The Pricing Committee meets at least quarterly to review and approve Fund valuation matters, including a review of the Funds’ pricing activity and operations,
69
|
NOTES TO FINANCIAL STATEMENTS |
fair value measurements, pricing vendors, policies and procedures, and related controls. At least a quorum of the Pricing Committee shall meet more frequently, as needed, to consider and approve time-sensitive fair valuation matters. The Pricing Committee provides periodic reports to the Valuation, Portfolio Management and Performance Committee (“Valuation Committee”) of the Board regarding pricing and valuation matters. Members of the Pricing Committee meet with the Valuation Committee and the Board at each of their regularly scheduled meetings to discuss valuation matters and actions taken during the period.
The Advisor has procedures to determine the fair value of a security when a price is not available from a pricing service or broker- dealer or the Advisor has determined that a price provided by a pricing service or broker-dealer does not approximate fair value. Fair valuation may also be used when a significant valuation event affecting the value of a security or market sector is determined to have occurred between the time when a security’s market closes and the time the Fund’s net asset value is calculated. The fair value of the security will be determined in good faith by the Advisor in accordance with procedures and methodologies approved by the Board. General factors used in determining the fair value of securities include, but are not limited to, fundamental analytical data relating to the security, the issuer and the market, such as duration, prepayment and default rates; general level of interest rates and changes in interest rates; information from broker-dealers; trading in similar securities; any restrictions on disposition of the security; and an evaluation of the forces that influence the market in which the investments are traded. These securities are either categorized as Level 2 or 3 in the fair value hierarchy, depending on the relevant inputs used.
When the Funds utilize fair valuation methods that use significant unobservable inputs to determine a security’s value, such securities will be categorized as Level 3 of the fair value hierarchy. These methods may require subjective determinations about the value of a security. While the Funds’ policy is intended to result in a calculation of a Fund’s net asset value that fairly reflects security values as of the time of pricing, the Funds cannot guarantee that values determined by the Advisor or persons acting at their direction would accurately reflect the price that the Funds could obtain for a security if they were to dispose of it as of the time of pricing (for instance, in a forced or distressed sale). The prices used by the Funds may differ from the value that would be realized if the securities were sold.
The Advisor employs various methods for calibrating the valuation approach related to securities categorized within Level 2 and Level 3 of the fair value hierarchy. These methods may include regular due diligence of the Funds’ pricing vendors, a regular review of key inputs and assumptions, transaction back-testing or disposition analysis to compare unrealized gains and losses to realized gains and losses, reviews of missing and stale prices and large movements in market value, and reviews of any market related activities. Additionally, the pricing of all fair value holdings is subsequently reported to the Valuation Committee and Board.
Foreign Taxes:
The Funds may be subject to foreign taxes on income, gains on investments or currency repatriation, a portion of which may be recoverable. The Funds will accrue such taxes and recoveries, as applicable, based upon its current interpretation of tax rules and regulations that exist in the markets in which it invests.
Realized gains in certain countries may be subject to foreign taxes at the Fund level, based on statutory rates. The Funds accrue for such foreign taxes on realized and unrealized gains at the appropriate rate for each jurisdiction, as applicable. The amount, if any, is disclosed as a liability in the Statement of Assets and Liabilities.
Fair Value Measurements:
The Funds disclose the fair value of their investments in a hierarchy that categorizes investments based on the inputs to valuation techniques used to measure fair value.There were no material level 3 transfers as these funds hold level 3 securities. The three levels of the fair value hierarchy are as follows:
• Level 1 - Inputs that reflect unadjusted quoted prices in active markets for identical assets or liabilities that the Funds have the ability to access at the measurement date.
70
|
NOTES TO FINANCIAL STATEMENTS |
• Level 2 - Significant inputs other than quoted prices that are observable for the asset or liability either directly or indirectly, including inputs in markets that are not considered to be active. Observable inputs may include quoted prices for similar securities, interest rates, spreads, prepayment spreads, etc.
• Level 3 - Significant unobservable inputs based on the best information available in the circumstances, to the extent observable inputs are not available (including the Fund’s own assumptions in determining the fair value of investments).
The inputs or methodology used for valuing investments are not necessarily an indication of the risk associated with investing in those securities.
Inputs used in determining fair value of an investment may include, but are not limited to, price information, volatility statistics, credit and market data, and other factors, all of which may be either observable or unobservable. Inputs can vary among investments and will be impacted by the investment type and volume of activity for the particular security or similar securities in the market. Investments in the Level 2 category are generally supported by transactions and quoted prices from dealers participating in the market for those investments. Investments may be included in the Level 3 category due to a lack of market activity or transparency. Internal valuation models may also be used as a pricing source for Level 3 investments. Internal valuation models may rely on one or more unobservable inputs, such as estimated cash flows, financial statement analysis and discount rates. The summary of inputs used to determine the fair value of the Funds’ investments as of September 30, 2024 is as follows:
| | | | | | | | | | | | | | | | | | | | | | | | | | |
| | | | | | Level 1
Quoted Prices | | | Level 2
Significant
Observable
Inputs | | | Level 3
Significant
Unobservable
Inputs | | Total | |
Emerging Market Debt Fund | | | | | | | | | | | | | | | | | | | | | | | | | | |
Assets: | | | | | | | | | | | | | | | | | | | | |
Investments in Securities | | | | | | | | | | | | | | | | | | | | | | | | | | |
Foreign Government Bonds | | | | | | | | | | $ | — | | | $ | 77,516,936 | | | | | | | $— | | $ | 77,516,936 | |
Investment Company | | | | | | | | | | | 33,397,607 | | | | — | | | | | | | — | | | 33,397,607 | |
Corporate Bonds | | | | | | | | | | | — | | | | 27,049,268 | | | | | | | — | | | 27,049,268 | |
Municipal Bond | | | | | | | | | | | — | | | | 217,235 | | | | | | | — | | | 217,235 | |
Put Option Purchased | | | | | | | | | | | — | | | | 1,467 | | | | | | | — | | | 1,467 | |
Other Financial Instruments* | | | | | | | | | | | | | | | | | | | | | | | | | | |
Foreign currency exchange contracts - forward contracts | | | | | | | | | | | — | | | | 309,910 | | | | | | | — | | | 309,910 | |
Financial futures contracts | | | | | | | | | | | 17,480 | | | | — | | | | | | | — | | | 17,480 | |
Credit default swaps | | | | | | | | | | | — | | | | 212,904 | | | | | | | — | | | 212,904 | |
| | | | | | | | | | | | | | | | | | | | | | | | | | |
Total Assets | | | | | | | | | | $ | 33,415,087 | | | $ | 105,307,720 | | | | | | | $— | | $ | 138,722,807 | |
| | | | | | | | | | | | | | | | | | | | | | | | | | |
Liabilities: | | | | | | | | | | | | | | | | | | | | |
Other Financial Instruments* | | | | | | | | | | | | | | | | | | | | | | | | | | |
Total Return Swaps | | | | | | | | | | $ | — | | | $ | (15,534 | ) | | | | | | $— | | $ | (15,534 | ) |
Financial futures contracts | | | | | | | | | | | (28,282 | ) | | | — | | | | | | | — | | | (28,282 | ) |
Interest rate swaps | | | | | | | | | | | — | | | | (95,954 | ) | | | | | | — | | | (95,954 | ) |
Credit default swaps | | | | | | | | | | | — | | | | (318,642 | ) | | | | | | — | | | (318,642 | ) |
Foreign currency exchange contracts - forward contracts | | | | | | | | | | | — | | | | (365,966 | ) | | | | | | — | | | (365,966 | ) |
| | | | | | | | | | | | | | | | | | | | | | | | | | |
Total Liabilities | | | | | | | | | | $ | (28,282 | ) | | $ | (796,096 | ) | | | | | | $— | | $ | (824,378 | ) |
| | | | | | | | | | | | | | | | | | | | | | | | | | |
71
|
NOTES TO FINANCIAL STATEMENTS |
| | | | | | | | | | | | | | | | | | | | | | | | | | | | |
| | | | | | Level 1
Quoted Prices | | | Level 2
Significant
Observable
Inputs | | | Level 3
Significant
Unobservable
Inputs | | | Total | |
High Yield Bond Fund | | | | | | | | | | | | | | | | | | | | | | | | | | | | |
Assets: | | | | | | | | | | | | | | | | | | | | | | | | | | | | |
Investments in Securities | | | | | | | | | | | | | | | | | | | | | | | | | | | | |
Corporate Bonds | | | | | | | | | | | | | | | | | | | | | | | | | | | | |
Australia | | | | | | | | | | $ | — | | | $ | 5,552,817 | | | | | | | $ | 17,236 | | | $ | 5,570,053 | |
Bermuda | | | | | | | | | | | — | | | | 3,580,713 | | | | | | | | — | | | | 3,580,713 | |
Canada | | | | | | | | | | | — | | | | 23,296,780 | | | | | | | | — | | | | 23,296,780 | |
Czech Republic | | | | | | | | | | | — | | | | 2,092,436 | | | | | | | | — | | | | 2,092,436 | |
Finland | | | | | | | | | | | — | | | | 4,364,022 | | | | | | | | — | | | | 4,364,022 | |
France | | | | | | | | | | | — | | | | 27,368,360 | | | | | | | | — | | | | 27,368,360 | |
Germany | | | | | | | | | | | — | | | | 18,873,134 | | | | | | | | — | | | | 18,873,134 | |
Hong Kong | | | | | | | | | | | — | | | | 4,260,537 | | | | | | | | — | | | | 4,260,537 | |
Israel | | | | | | | | | | | — | | | | 2,403,549 | | | | | | | | — | | | | 2,403,549 | |
Italy | | | | | | | | | | | — | | | | 5,300,286 | | | | | | | | — | | | | 5,300,286 | |
Luxembourg | | | | | | | | | | | — | | | | 13,617,395 | | | | | | | | — | | | | 13,617,395 | |
Netherlands | | | | | | | | | | | — | | | | 7,763,682 | | | | | | | | — | | | | 7,763,682 | |
United Kingdom | | | | | | | | | | | — | | | | 35,370,775 | | | | | | | | — | | | | 35,370,775 | |
United States | | | | | | | | | | | — | | | | 538,818,946 | | | | | | | | 126,701 | | | | 538,945,647 | |
Investment Company | | | | | | | | | | | 41,624,511 | | | | — | | | | | | | | — | | | | 41,624,511 | |
Common Stocks | | | | | | | | | | | | | | | | | | | | | | | | | | | | |
United Kingdom | | | | | | | | | | | — | | | | 6,197 | | | | | | | | — | | | | 6,197 | |
United States | | | | | | | | | | | — | | | | — | | | | | | | | 14 | | | | 14 | |
Rights/Warrants | | | | | | | | | | | | | | | | | | | | | | | | | | | | |
Mexico | | | | | | | | | | | — | | | | — | | | | | | | | — | | | | — | |
| | | | | | | | | | | | | | | | | | | | | | | | | | | | |
Total Assets | | | | | | | | | | $ | 41,624,511 | | | $ | 692,669,629 | | | | | | | $ | 143,951 | | | $ | 734,438,091 | |
| | | | | | | | | | | | | | | | | | | | | | | | | | | | |
72
|
NOTES TO FINANCIAL STATEMENTS |
| | | | | | | | | | | | | | | | | | | | | | | | | | |
| | | | | | Level 1
Quoted Prices | | | Level 2
Significant
Observable
Inputs | | | Level 3
Significant
Unobservable
Inputs | | Total | |
Core Plus Bond Fund | | | | | | | | | | | | | | | | | | | | | | | | | | |
Assets: | | | | | | | | | | | | | | | | | | | | |
Investments in Securities | | | | | | | | | | | | | | | | | | | | | | | | | | |
Corporate Bonds | | | | | | | | | | $ | — | | | $ | 36,525,497 | | | | | | | $— | | $ | 36,525,497 | |
U.S. Government Agency Backed Mortgages | | | | | | | | | | | — | | | | 17,667,702 | | | | | | | — | | | 17,667,702 | |
U.S. Treasury Obligations | | | | | | | | | | | — | | | | 6,899,677 | | | | | | | — | | | 6,899,677 | |
Bank Loans | | | | | | | | | | | — | | | | 3,505,197 | | | | | | | — | | | 3,505,197 | |
Investment Company | | | | | | | | | | | 2,878,559 | | | | — | | | | | | | — | | | 2,878,559 | |
Collateralized Mortgage Obligations | | | | | | | | | | | — | | | | 2,809,693 | | | | | | | — | | | 2,809,693 | |
Asset Backed Securities | | | | | | | | | | | — | | | | 1,895,246 | | | | | | | — | | | 1,895,246 | |
Foreign Government Bonds | | | | | | | | | | | — | | | | 350,455 | | | | | | | — | | | 350,455 | |
Other Financial Instruments* | | | | | | | | | | | | | | | | | | | | | | | | | | |
Foreign currency exchange contracts - forward contracts | | | | | | | | | | | — | | | | 118,885 | | | | | | | — | | | 118,885 | |
Financial futures contracts | | | | | | | | | | | 31,140 | | | | — | | | | | | | — | | | 31,140 | |
Inflation swaps | | | | | | | | | | | — | | | | 11,358 | | | | | | | — | | | 11,358 | |
Interest rate swaps - | | | | | | | | | | | | | | | | | | | | | | | | | | |
Appreciation | | | | | | | | | | | — | | | | 6,658 | | | | | | | — | | | 6,658 | |
| | | | | | | | | | | | | | | | | | | | | | | | | | |
Total Assets | | | | | | | | | | $ | 2,909,699 | | | $ | 69,790,368 | | | | | | | $— | | $ | 72,700,067 | |
| | | | | | | | | | | | | | | | | | | | | | | | | | |
| Liabilities: | | | | | | | | | | | | | | | | | | | | | | | | | | |
Other Financial Instruments* | | | | | | | | | | | | | | | | | | | | | | | | | | |
Inflation swaps | | | | | | | | | | $ | — | | | $ | (2,622 | ) | | | | | | $— | | $ | (2,622 | ) |
Interest rate swaps | | | | | | | | | | | — | | | | (76,058 | ) | | | | | | — | | | (76,058 | ) |
Financial futures contracts | | | | | | | | | | | (157,299 | ) | | | — | | | | | | | — | | | (157,299 | ) |
Foreign currency exchange contracts - forward contracts | | | | | | | | | | | — | | | | (198,802 | ) | | | | | | — | | | (198,802 | ) |
Credit default swaps | | | | | | | | | | | — | | | | (725,053 | ) | | | | | | — | | | (725,053 | ) |
| | | | | | | | | | | | | | | | | | | | | | | | | | |
Total Liabilities | | | | | | | | | | $ | (157,299 | ) | | $ | (1,002,535 | ) | | | | | | $— | | $ | (1,159,834 | ) |
| | | | | | | | | | | | | | | | | | | | | | | | | | |
73
|
NOTES TO FINANCIAL STATEMENTS |
| | | | | | | | | | | | | | | | | | | | | | | | | | |
| | | | | | Level 1
Quoted Prices | | | Level 2
Significant
Observable
Inputs | | | Level 3
Significant
Unobservable
Inputs | | Total | |
Strategic Income Fund | | | | | | | | | | | | | | | | | | | | | | | | | | |
| Assets: | | | | | | | | | | | | | | | | | | | | | | | | | | |
Investments in Securities | | | | | | | | | | | | | | | | | | | | | | | | | | |
Corporate Bonds | | | | | | | | | | $ | — | | | $ | 39,828,530 | | | | | | | $— | | $ | 39,828,530 | |
U.S. Treasury Obligations | | | | | | | | | | | — | | | | 5,096,014 | | | | | | | — | | | 5,096,014 | |
Bank Loans | | | | | | | | | | | — | | | | 4,465,720 | | | | | | | — | | | 4,465,720 | |
Asset Backed Securities | | | | | | | | | | | — | | | | 3,609,417 | | | | | | | — | | | 3,609,417 | |
Collateralized Mortgage Obligations | | | | | | | | | | | — | | | | 2,980,101 | | | | | | | — | | | 2,980,101 | |
Investment Company | | | | | | | | | | | 1,422,553 | | | | — | | | | | | | — | | | 1,422,553 | |
Foreign Government Bonds | | | | | | | | | | | — | | | | 486,532 | | | | | | | — | | | 486,532 | |
Other Financial Instruments* | | | | | | | | | | | | | | | | | | | | | | | | | | |
Foreign currency exchange contracts - forward contracts | | | | | | | | | | | — | | | | 158,561 | | | | | | | — | | | 158,561 | |
Financial futures contracts | | | | | | | | | | | 258,896 | | | | — | | | | | | | — | | | 258,896 | |
Inflation swaps | | | | | | | | | | | — | | | | 11,358 | | | | | | | — | | | 11,358 | |
Interest rate swaps - Appreciation | | | | | | | | | | | — | | | | 6,658 | | | | | | | — | | | 6,658 | |
| | | | | | | | | | | | | | | | | | | | | | | | | | |
Total Assets | | | | | | | | | | $ | 1,681,449 | | | $ | 56,642,891 | | | | | | | $— | | $ | 58,324,340 | |
| | | | | | | | | | | | | | | | | | | | | | | | | | |
| Liabilities: | | | | | | | | | | | | | | | | | | | | | | | | | | |
Other Financial Instruments* | | | | | | | | | | | | | | | | | | | | | | | | | | |
Inflation swaps | | | | | | | | | | $ | — | | | $ | (2,622) | | | | | | | $— | | $ | (2,622) | |
Interest rate swaps | | | | | | | | | | | — | | | | (101,523) | | | | | | | — | | | (101,523) | |
Financial futures contracts | | | | | | | | | | | (149,973 | ) | | | — | | | | | | | — | | | (149,973) | |
Foreign currency exchange contracts - forward contracts | | | | | | | | | | | — | | | | (211,299) | | | | | | | — | | | (211,299) | |
Credit default swaps | | | | | | | | | | | — | | | | (1,125,030) | | | | | | | — | | | (1,125,030) | |
| | | | | | | | | | | | | | | | | | | | | | | | | | |
Total Liabilities | | | | | | | | | | $ | (149,973 | ) | | $ | (1,440,474 | ) | | | | | | $— | | $ | (1,590,447 | ) |
| | | | | | | | | | | | | | | | | | | | | | | | | | |
*Other financial instruments are instruments shown on the Schedule of Portfolio Investments, such as futures contracts, swaps and foreign currency contracts which are valued at fair value.
| | | | | | | | | | | | | | | | | | | | |
| | | BlueBay
High Yield
Bond Fund |
| | | Common Stocks | | Corporate Bonds |
Balance as of 9/30/23(value) | | | | | | | | $ | 1 | | | | | | | | | $ | 76,015 | |
Sales (Paydowns) | | | | | | | | | — | | | | | | | | | | (148,351 | ) |
Amortization | | | | | | | | | — | | | | | | | | | | (4,532 | ) |
Realized gain (loss) | | | | | | | | | — | | | | | | | | | | 34,562 | |
Transfer into Level 3 | | | | | | | | | 14 | | | | | | | | | | 414,835 | |
Change in unrealized appreciation (depreciation) | | | | | | | | | (1 | ) | | | | | | | | | (228,592 | ) |
| | | | | | | | | | | | | | | | | | | | |
Balance as of 9/30/24(value) | | | | | | | | $ | 14 | | | | | | | | | $ | 143,937 | |
| | | | | | | | | | | | | | | | | | | | |
The Funds’ assets assigned to the Level 3 category are valued utilizing the valuation technique deemed the most appropriate in the circumstances. The significant unobservable inputs used include assumptions regarding the particular security’s cash flow profile and potential defaults that may not be generally observable for the security. The Common Stock in High Yield Bond Fund were fair valued using a discounted cash flow model based on unobservable inputs that include estimated cash flows,
74
|
NOTES TO FINANCIAL STATEMENTS |
implied credit spread and discount rate (weighted average cost of capital). The Corporate Bonds in High Yield Bond Fund were fair valued using discounted cash flows. Significant changes in any of these assumptions may result in a lower or higher fair value measurement.
| | | | | | | | | | | | | | | | | | | | | | | | |
Quantitative Information about Level 3 Fair Value Measurements |
| | | Fund | | | | | Fair Value
at
September 30,
2024 | | | | | | Valuation
Technique(s) | | | | Unobservable
Input | | | | Range (Weighted
Average) |
Corporate Bonds | | High Yield
BondFund | | | | | | | $143,937 | | | | | | | Discounted
Cash Flow | | | | Discount Rate of
Cash Flows | | | | 22.3% —30.0%
(26.7%) |
| | | | | | | | | | | | | | | | | | | | Liquidity
Discount | | | | 5.0% —7.5%
(5.0%) |
Common Stocks | | High Yield
BondFund | | | | | | | $ 14 | | | | | | | Discounted
Cash Flow | | | | Discount Rate of
Cash Flows | | | | 30% |
| | | | | | | | | | | | | | | | | | | | Liquidity
Discount | | | | 10% |
Foreign Currency Transactions:
The values of foreign securities, foreign currencies and other assets and liabilities denominated in foreign currencies are translated into U.S. dollars using current exchange rates each business day. Fluctuations in the value of foreign currency holdings and other assets and liabilities resulting from movements in currency exchange rates are recorded as unrealized foreign currency gains or losses. The effects of changes in foreign currency exchange rates on investments in securities are not segregated from the effects of changes in market prices of those securities on the Statements of Operations. Such fluctuations are included with the net change in unrealized appreciation/depreciation on investment transactions. However, for tax purposes, the effects of fluctuations in foreign currency exchange rates when determining the realized gain or loss upon the sale or maturity of foreign currency denominated debt obligations are segregated pursuant to U.S. Federal income tax regulations; such amounts are categorized as foreign exchange gain or loss for both financial reporting and income tax reporting purposes.
Bank Loans:
A Fund may invest in fixed and floating rate loans from one or more financial institutions (“lender(s)”) to a borrower by way of: (i) assignment/transfer of; or (ii) participation in the whole or part of the loan amount outstanding. In both instances, assignments or participations of such loans must be capable of being freely traded and transferred between investors in the loans. Participations typically will result in a Fund having a contractual relationship only with a lender as grantor of the participation but not with the borrower. A Fund acquires a participation interest only if the lender(s) positioned between the Fund and the borrower is determined by the Sub-Advisor to be creditworthy. When purchasing loan participations, a Fund assumes the economic risk associated with the corporate borrower and the credit risk associated with an interposed bank or other financial intermediary. Loan assignments typically involve a transfer of debt from a lender to a third party. When purchasing loan assignments, a Fund assumes the credit risk associated with the corporate borrower only.
Such loans may be secured or unsecured. Loans that are fully secured offer a Fund more protection than an unsecured loan in the event of non-payment of scheduled interest or principal. However, there is no assurance that the liquidation of collateral from a secured loan would satisfy the corporate borrower’s obligation. In addition, investments in loans through a direct assignment include the risk that if a loan is terminated, a Fund could become part owner of any collateral, and would bear the costs and liabilities associated with owning and disposing of the collateral.
Loan participations typically represent direct participation in a loan to a corporate borrower, and generally are offered by banks or other financial institutions or lending syndicates.
75
|
NOTES TO FINANCIAL STATEMENTS |
A loan is often administered by an agent bank acting as agent for all holders. Unless, under the terms of the loan or other indebtedness, a Fund has direct recourse against the corporate borrower, the Fund may have to rely on the agent bank or other financial intermediary to apply appropriate credit remedies against a corporate borrower.
When a Fund purchases a floating rate loan interest, it may receive a facility fee and when it sells a floating rate loan interest, it may pay a facility fee. On an ongoing basis, the Funds may receive a commitment fee based on the undrawn portion of the underlying line of credit amount of a floating rate loan interest. Facility and commitment fees are typically amortized to income over the term of the loan or term of the commitment, respectively. Consent and amendment fees are recorded to income as earned. Prepayment penalty fees, which may be received by the Funds upon the prepayment of a floating rate loan interest by a borrower, are recorded as realized gains. The Funds may invest in multiple series or tranches of a loan. A different series or tranche may have varying terms and carry different associated risks.
In connection with floating rate loan interests, the Funds may also enter into unfunded floating rate loan interests (“commitments”). In connection with these commitments, the Funds earn a commitment fee, typically set as a percentage of the commitment amount. Such fee income, which is included in interest income in the Statement of Operations, is recognized ratably over the commitment period. Unfunded floating rate loan interests are marked-to-market daily, and any unrealized appreciation or depreciation is included in the Statements of Assets and Liabilities and Statements of Operations.
As of September 30, 2024, Core Plus Bond Fund and Strategic Income Fund held bank loans.
Payment-in-Kind Securities:
The Funds may invest in payment-in-kind securities (“PIKs”). PIKs give the issuer the option at each interest payment date of making interest payments in either cash or additional debt securities. Those additional debt securities usually have the same terms, including maturity dates and interest rates, and associated risks as the original bonds. The daily market quotations of the original bonds may include the accrued interest (referred to as a dirty price) and require a pro-rata adjustment from the unrealized appreciation or depreciation on investments to interest receivable on the Statement of Assets and Liabilities.
For the year ended September 30, 2024, the total in-kind payments received by the High Yield Bond Fund with respect to PIKs constituted less than 5% of the Fund’s total income and, therefore, such payments were not disclosed as a separate line item on the Statement of Operations.
Derivatives:
The Funds may use derivative instruments, including futures, forwards, options, indexed securities, swaps and inverse securities as tools in the management of portfolio assets. A Fund may use such derivatives through either the creation of long or short positions to hedge various investments, for investment purposes, for risk management and/or to increase income or gain to the Fund. Derivatives allow a Fund to increase or decrease its risk exposure more quickly and efficiently than other types of instruments. Derivatives may be riskier than other types of investments and could result in losses that significantly exceed a Fund’s original investment. Derivatives are subject to the risk that changes in the value of a derivative may not correlate perfectly with the underlying asset, rate or index. The use of derivatives may not be successful, resulting in losses to a Fund, and the cost of such strategies may reduce the Fund’s returns.
Hedging also involves the risk that changes in the value of the derivative will not match those of the holdings being hedged as expected by the Funds, in which case any losses on the holdings being hedged may not be reduced and may be increased. There can be no assurance that a Fund’s hedging strategy will reduce risk or that hedging transactions will be available or cost effective. The Funds are subject to interest rate risk and foreign currency exchange risk in the normal course of pursuing their investment objectives by investing in various derivative financial instruments, as described below.
In addition to the risks associated with derivatives in general, the Funds will also be subject to risks related to swap agreements. Because swap agreements are not exchange-traded, but are private contracts into which a Fund and a swap counterparty enter as principals, a Fund may experience a loss or delay in recovering assets if the counterparty defaults on its obligations.
76
|
NOTES TO FINANCIAL STATEMENTS |
Financial Futures Contracts:
The Funds may enter into futures contracts in an effort to manage the duration of the portfolio and hedge against certain market risk. A futures contract on a securities index is an agreement obligating one party to pay, and entitling the other party to receive, during the term of the contract, cash payments based on the level of a specified securities index. Futures transactions involve brokerage costs. A Fund may lose the expected benefit of futures transactions if interest rates, exchange rates or securities prices change in an unanticipated manner. Such unanticipated changes may also result in lower overall performance than if a Fund had not entered into any futures transactions.
The Funds entered into U.S. Treasury Bond futures, Japanese treasury bond futures, Euro Dollar futures and Euro-Bund futures during the year ended September 30, 2024.
Upon entering into a futures contract, a Fund is required to pledge to the broker an amount of cash, U.S. government securities, or other assets equal to a certain percentage of the contract amount. Subsequent payments are made or received by the Funds each day, depending on the daily fluctuations in the fair value of the underlying instrument. A Fund would record an unrealized gain or loss each day equal to these daily payments.
Open futures contracts are shown on the Schedules of Portfolio Investments. Underlying collateral pledged for open futures contracts is the cash at brokers for financial futures contracts shown on the Statements of Assets and Liabilities at September 30, 2024.
Options:
The Funds may write (or sell) put and call options on the securities that the Funds are authorized to buy or already hold in their portfolio. The Funds may also purchase put and call options.
A call option gives the purchaser of the option the right (but not the obligation) to buy, and obligates the seller to sell (when the option is exercised), the underlying instrument at the exercise price at any time or at a specified time during the option period. A put option gives the holder the right to sell and obligates the writer to buy the underlying instrument at the exercise price at any time or at a specified time during the option period. When a Fund purchases (writes) an option, an amount equal to the premium paid (received) by a Fund is reflected as an asset (liability). The amount of the asset (liability) is subsequently marked-to-market to reflect the current market value of the option purchased (written). When an instrument is purchased or sold through an exercise of an option, the related premium paid (or received) is added to (or deducted from) the basis of the instrument acquired or deducted from (or added to) the proceeds of the instrument sold. When an option expires (or a Fund enters into a closing transaction), a Fund realizes a gain or loss on the option to the extent of the premiums received or paid (or gain or loss to the extent the cost of the closing transaction exceeds the premium received or paid). When a Fund writes a call option, such option is “covered,” meaning that a Fund holds the underlying instrument subject to being called by the option counterparty, or cash in an amount sufficient to cover the obligation. When a Fund writes a put option, such option is covered by cash in an amount sufficient to cover the obligation.
In purchasing and writing options, a Fund bears the market risk of an unfavorable change in the price of the underlying instrument or the risk that a Fund may not be able to enter into a closing transaction due to an illiquid market. Exercise of a written option could result in a Fund purchasing or selling a security at a price different from the current market value.
A Fund may execute transactions in both listed (exchange-traded) and OTC options. Listed options involve minimal counterparty risk since listed options are guaranteed against default by the exchange on which they trade. Transactions in certain OTC options may expose a Fund to the risk of default by the counterparty to the transaction. In the event of default by the counterparty to the OTC option transaction, a Fund’s maximum amount of loss is the premium paid (as purchaser) or the unrealized gain of the contract (as writer).
77
|
NOTES TO FINANCIAL STATEMENTS |
Forward Foreign Currency Exchange Contracts:
The Funds enter into forward foreign currency contracts (“Forward”) to hedge their exposure to changes in foreign currency exchange rates on foreign portfolio holdings (foreign currency exchange risk). In addition, certain Funds may use a Forward to provide exposure to the foreign currency market. A Forward is an agreement between two parties to purchase or sell a foreign currency at a future date at a negotiated forward rate. A Forward is marked-to-market daily and the change in market value is recorded by the Funds as unrealized appreciation or depreciation until the contract settlement date.
The market value of the Forward is determined using the forward rate for the remainder of the outstanding period of the contract, through the delivery date. When a Forward is closed or settled, the Funds record a realized gain or loss equal to the fluctuation in rates during the period a Forward was open.
In the event of default by the counterparty to the transaction, the Fund’s maximum amount of loss, as either the buyer or seller, is the unrealized gain of the contract.
Details of Forward contracts at period end are included in the Schedules of Portfolio Investments under the caption “Foreign currency exchange contracts.”
Swap Agreements:
The Funds may enter into swap agreements, which are agreements involving two parties to exchange the return generated by a security, currency, commodity, interest rate, index, or other measures for the return generated by another instrument, for example, the agreement to pay interest in exchange for a market-linked return based on a notional amount. The Funds entered into interest rate, credit default and other swap agreements as of September 30, 2024.
Interest rate swap agreements generally involve the agreement by a Fund to pay a counterparty a fixed or floating rate on a fixed notional amount and to receive a fixed or floating rate on a fixed notional amount, but may also involve the agreement to pay or receive payments derived from changes in interest rates. Periodic payments are generally made during the life of the swap agreement according to the terms and conditions of the agreement and at termination or maturity.
The Funds enter into cross-currency swaps to gain or reduce exposure to foreign currencies or as an economic hedge against either specific transactions or portfolio instruments (foreign currency exchange rate and/or interest rate risk). Cross-currency swaps are interest rate swaps in which one party pays a stream of interest payments, either fixed or floating, in exchange for another party’s stream of interest payments, either fixed or floating, based on the notional amounts of two different currencies. The notional amounts are typically determined based on the spot exchange rates at the inception of the trade. Cross-currency swaps may also involve an exchange of notional amounts at the start, during and/or at expiration of the contract, either at the current spot rate or another specified rate.
The Funds enter into credit default swaps to manage their exposure to the market or certain sectors of the market, to reduce their risk exposure to defaults of corporate and/or sovereign issuers or to create exposure to corporate and/or sovereign issuers to which they are not otherwise exposed (credit risk). The Funds enter into credit default swap agreements to provide a measure of protection against the default of an issuer (as buyer of protection) and/or gain credit exposure to an issuer to which it is not otherwise exposed (as seller of protection). The Funds may either buy or sell (write) credit default swaps on single-name issuers (corporate or sovereign), a combination or basket of single-name issuers or traded indexes. Credit default swaps on single-name issuers are agreements in which the buyer pays fixed periodic payments to the seller in consideration for a guarantee from the seller to make a specific payment should a negative credit event take place with respect to the referenced entity (e.g., bankruptcy, failure to pay, obligation accelerators, repudiation, moratorium or restructuring). Credit default swaps on traded indexes are agreements in which the buyer pays fixed periodic payments to the seller in consideration for a guarantee from the seller to make a specific payment should a writedown, principal or interest shortfall or default of all or individual underlying securities included in the index occurs. As a buyer, if an underlying credit event occurs, the Funds will either receive from the seller an amount equal to the notional amount of the swap and deliver the referenced security or underlying securities comprising the index or receive a net settlement of cash equal to the notional
78
|
NOTES TO FINANCIAL STATEMENTS |
amount of the swap less the recovery value of the security or underlying securities comprising the index. As a seller (writer), if an underlying credit event occurs, the Funds will either pay the buyer an amount equal to the notional amount of the swap and take delivery of the referenced security or underlying securities comprising the index or pay a net settlement of cash equal to the notional amount of the swap less the recovery value of the security or underlying securities comprising the index.
The Funds entered into inflation swap agreements to protect against fluctuations in inflation rates. Inflation swaps are characterized by one party paying a fixed rate in exchange for floating rate that is derived from an inflation index, such as the Consumer price Index or UK Retail Price Index, Inflation swaps subject the Fund to interest rate risk.
Total return swap agreements involve the commitments to pay or receive an amount generally determined by reference to a security, index or other measure in exchange for a specific market linked return, based on notional amounts. To the extent that the total return of the security, index or other measure underlying the transaction exceeds or falls short of the offsetting interest rate-based obligation, the Funds receive or make a payment to the counterparty. Interim payments and payments received or made by a Fund at the expiration or other termination of the swap agreements are recorded in the Statement of Operations as realized gains or losses, respectively. Swap agreements are marked-to-market daily based on dealer-supplied valuations, and changes in value, including the periodic amounts of interest to be paid or received on swaps, are recorded as unrealized appreciation/ (depreciation). Risks may exceed amounts recognized on the Statements of Assets and Liabilities. These risks include changes in the returns of the underlying instruments, failure of the counterparties to perform under the contracts’ terms and the possible lack of liquidity with respect to the swap agreements. Details of swap agreements open at period end are included in the Schedules of Portfolio Investments under the captions “Interest rate swaps”, “Total return swaps”, “Inflation swaps” and “Credit default swaps”.
| | | | | | | | | | | | | | | | | | | | | | | | | | | | | | | | |
Fair Values of Derivative Financial Instrument as of September 30, 2024(1) | |
Statement of Assets and Liabilities Location | |
Asset Derivatives | |
| | | BlueBay
Emerging Market
Debt Fund | | | BlueBay
High Yield
Bond Fund | | | BlueBay
Core Plus
Bond Fund | | | BlueBay
Strategic
Income Fund | |
Credit Risk: | | | | | | | | | | | | | | | | | | | | | | | | | | | | | | | | |
Credit default swaps, at value | | | | | | $ | 212,904 | | | | | | | $ | — | | | | | | | $ | — | | | | | | | $ | — | |
Interest Rate Risk: | | | | | | | | | | | | | | | | | | | | | | | | | | | | | | | | |
Unrealized appreciation on interest rate swaps contracts | | | | | | | — | | | | | | | | — | | | | | | | | 6,658 | | | | | | | | 6,658 | |
Unrealized appreciation on inflation swaps | | | | | | | — | | | | | | | | — | | | | | | | | 11,358 | | | | | | | | 11,358 | |
Unrealized appreciation on futures contracts | | | | | | | 17,480 | | | | | | | | — | | | | | | | | 31,140 | | | | | | | | 258,896 | |
Foreign currency exchange risk: | | | | | | | | | | | | | | | | | | | | | | | | | | | | | | | | |
Investments, at value (purchased options) | | | | | | | 1,467 | | | | | | | | — | | | | | | | | — | | | | | | | | — | |
Unrealized appreciation on forward foreign currency exchange contracts | | | | | | | 309,910 | | | | | | | | — | | | | | | | | 118,885 | | | | | | | | 158,561 | |
| | | | | | | | | | | | | | | | | | | | | | | | | | | | | | | | |
Total | | | | | | $ | 541,761 | | | | | | | $ | — | | | | | | | $ | 168,041 | | | | | | | $ | 435,473 | |
| | | | | | | | | | | | | | | | | | | | | | | | | | | | | | | | |
79
|
NOTES TO FINANCIAL STATEMENTS |
| | | | | | | | | | | | | | | | | | | | | | | | | | | | | | | | |
Liability Derivatives | |
| | | BlueBay
Emerging Market
Debt Fund | | | BlueBay
High Yield
Bond Fund | | | BlueBay
Core Plus
Bond Fund | | | BlueBay
Strategic
Income Fund | |
Credit Risk: | | | | | | | | | | | | | | | | | | | | | | | | | | | | | | | | |
Credit default swaps, at value | | | | | | $ | 318,642 | | | | | | | $ | — | | | | | | | $ | 725,053 | | | | | | | $ | 1,125,030 | |
Interest Rate Risk: | | | | | | | | | | | | | | | | | | | | | | | | | | | | | | | | |
Unrealized depreciation on interest rate swaps contracts | | | | | | | 95,954 | | | | | | | | — | | | | | | | | 76,058 | | | | | | | | 101,523 | |
Unrealized depreciation on inflation swaps | | | | | | | — | | | | | | | | — | | | | | | | | 2,622 | | | | | | | | 2,622 | |
Unrealized depreciation on total return swaps | | | | | | | 15,534 | | | | | | | | — | | | | | | | | — | | | | | | | | — | |
Unrealized depreciation on futures contracts | | | | | | | 28,282 | | | | | | | | — | | | | | | | | 157,299 | | | | | | | | 149,973 | |
Foreign currency exchange risk: | | | | | | | | | | | | | | | | | | | | | | | | | | | | | | | | |
Unrealized depreciation on forward foreign currency exchange contracts | | | | | | | 365,966 | | | | | | | | — | | | | | | | | 198,802 | | | | | | | | 211,299 | |
| | | | | | | | | | | | | | | | | | | | | | | | | | | | | | | | |
Total | | | | | | $ | 824,378 | | | | | | | $ | — | | | | | | | $ | 1,159,834 | | | | | | | $ | 1,590,447 | |
| | | | | | | | | | | | | | | | | | | | | | | | | | | | | | | | |
The effect of derivative instruments on the Statement of Operations during the year ended September 30, 2024 is as follows:
| | | | | | | | | | | | | | | | | | | | | | | | | | | | | | | | |
Derivative Instruments Categorized by Risk Exposure | | BlueBay
Emerging Market
Debt Fund | | | BlueBay
High Yield Bond
Fund | | | BlueBay Core
Plus Bond Fund | | | BlueBay Strategic
Income Fund | |
Net realized Gain/(Loss) From: | | | | | | | | | | | | | | | | | | | | | | | | | | | | | | | | |
Credit Risk: | | | | | | | | | | | | | | | | | | | | | | | | | | | | | | | | |
Credit default swaps | | | | | | $ | (341,170 | ) | | | | | | $ | 1,672,102 | | | | | | | $ | (495,985 | ) | | | | | | $ | (777,714 | ) |
Interest Rate Risk: | | | | | | | | | | | | | | | | | | | | | | | | | | | | | | | | |
Interest rate swaps | | | | | | | — | | | | | | | | — | | | | | | | | 103,783 | | | | | | | | 163,024 | |
Financial futures contracts | | | | | | | (135,285 | ) | | | | | | | 148,088 | | | | | | | | 165,745 | | | | | | | | (890,803 | ) |
Foreign currency exchange risk: | | | | | | | | | | | | | | | | | | | | | | | | | | | | | | | | |
Forward foreign currency exchange contracts | | | | | | | 53,515 | | | | | | | | 20,436 | | | | | | | | 92,497 | | | | | | | | 108,389 | |
Written Options | | | | | | | 65,006 | | | | | | | | — | | | | | | | | — | | | | | | | | — | |
| | | | | | | | | | | | | | | | | | | | | | | | | | | | | | | | |
Total | | | | | | $ | (357,934 | ) | | | | | | $ | 1,840,626 | | | | | | | $ | (133,960 | ) | | | | | | $ | (1,397,104 | ) |
| | | | | | | | | | | | | | | | | | | | | | | | | | | | | | | | |
| | | | | | | | | | | | | | | | | | | | | | | | | | | | | | | | |
Derivative Instruments Categorized by Risk Exposure | | BlueBay
Emerging Market
Debt Fund | | | BlueBay High
Yield Bond Fund | | | BlueBay Core
Plus Bond Fund | | | BlueBay Strategic
Income Fund | |
Net Change in Unrealized | | | | | | | | | | | | | | | | | | | | | | | | | | | | | | | | |
Appreciation/(Depreciation) From: | | | | | | | | | | | | | | | | | | | | | | | | | | | | | | | | |
Credit Risk: | | | | | | | | | | | | | | | | | | | | | | | | | | | | | | | | |
Credit default swaps | | | | | | $ | (4,614 | ) | | | | | | $ | (8,536) | | | | | | | $ | (46,349) | | | | | | | $ | (79,337 | ) |
Interest Rate Risk: | | | | | | | | | | | | | | | | | | | | | | | | | | | | | | | | |
Interest rate swaps | | | | | | | (95,954 | ) | | | | | | | — | | | | | | | | (92,175 | ) | | | | | | | (146,667 | ) |
Inflation swaps | | | | | | | — | | | | | | | | — | | | | | | | | 8,736 | | | | | | | | 8,736 | |
80
|
NOTES TO FINANCIAL STATEMENTS |
| | | | | | | | | | | | | | | | | | | | | | | | |
| | | | |
Derivative Instruments Categorized by Risk Exposure | | BlueBay
Emerging Market
Debt Fund | | | BlueBay
High Yield
Bond Fund | | | BlueBay
Core Plus
Bond Fund | | | BlueBay
Strategic
Income Fund | |
Total return swaps | | | | | | $ | (15,534 | ) | | $ | — | | | $ | — | | | | | | | $ | — | |
Financial futures contracts | | | | | | | (13,695 | ) | | | 172,475 | | | | (91,645 | ) | | | | | | | (409,718 | ) |
Foreign currency exchange risk: | | | | | | | | | | | | | | | | | | | | | | | | |
Forward foreign currency exchange contracts | | | | | | | (217,082 | ) | | | (56,756 | ) | | | (318,298 | ) | | | | | | | (316,378 | ) |
| | | | | | | | | | | | | | | | | | | | | | | | |
Total | | | | | | $ | (346,879 | ) | | $ | 107,183 | | | $ | (539,731 | ) | | | | | | $ | (943,364 | ) |
| | | | | | | | | | | | | | | | | | | | | | | | |
| (1) | Not considered to be hedging instruments for accounting disclosure purposes. |
For the year ended September 30, 2024, the average volume of derivative activities based on ending quarterly outstanding amounts are as follows:
| | | | | | | | | | | | | | | | |
| | | BlueBay
Emerging Market
Debt Fund | | | BlueBay
High Yield
Bond Fund | | | BlueBay
Core Plus
Bond Fund | | | BlueBay
Strategic
Income
Fund | |
Futures long position (contracts) | | | 16 | | | | 84 | | | | 127 | | | | 199 | |
Futures short position (contracts) | | | 25 | | | | — | | | | 101 | | | | 255 | |
Forward foreign currency exchange contracts purchased (U.S. dollar amounts) | | | $ 9,794,371 | | | | $ 307,112 | | | | $ 6,198,426 | | | | $ 7,000,269 | |
Forward foreign currency exchange contracts sold (U.S. dollar amounts) | | | 5,811,152 | | | | 273,410 | | | | 1,737,747 | | | | 2,171,178 | |
Forward foreign currency exchange contracts | | | | | | | | | | | | | | | | |
Purchased in non-U.S. dollars | | | | | | | | | | | | | | | | |
(U.S. dollar equivalent) | | | 988,513 | | | | — | | | | 1,952,339 | | | | 2,330,365 | |
Purchased options (Cost $) | | | 17,283 | | | | — | | | | — | | | | — | |
Written Options (Premium received $) | | | 12,281 | | | | — | | | | — | | | | — | |
Inflation swaps (Notional | | | | | | | | | | | | | | | | |
Amount in U.S. Dollar) | | | — | | | | — | | | | 2,039,602 | | | | 2,039,602 | |
Interest rate swaps (Notional | | | | | | | | | | | | | | | | |
Amount in U.S. Dollars) | | | 1,449,415 | | | | — | | | | 4,458,137 | | | | 5,574,691 | |
Credit default swaps (Notional | | | | | | | | | | | | | | | | |
Amount in U.S. Dollars) | | | 15,722,045 | | | | 8,083,598 | | | | 25,793,000 | | | | 43,042,000 | |
Total return swaps (Notional | | | | | | | | | | | | | | | | |
Amount in U.S. Dollars) | | | 158,510 | | | | — | | | | — | | | | — | |
Counterparty Credit Risk:
Derivatives may also expose a Fund to counterparty risk (the risk that the derivative counterparty will not fulfill its contractual obligations). To the extent amounts due to the Funds from their counterparties are not fully collateralized contractually or otherwise, the Funds bear the risk of loss from counterparty non-performance. A Fund’s maximum risk of loss from counterparty credit risk on over-the-counter (“OTC”) derivatives is generally the aggregate unrealized gain in excess of any collateral pledged by the counterparty to the Funds.
For foreign currency exchange contracts, risks may arise upon entering into these contracts from the potential inability of the counterparties to meet the terms of their contracts, or if the foreign currency rates change unfavorably.
81
|
NOTES TO FINANCIAL STATEMENTS |
The Funds’ risk of loss from counterparty credit risk on OTC derivatives is generally limited to the aggregate unrealized gain netted against any collateral held by the Funds. For OTC purchased options, the Funds bear the risk of loss in the amount of the premiums paid and change in market value of the options should the counterparty not perform under the contracts. Written options by the Funds do not give rise to counterparty credit risk, as written options obligate the Funds to perform and not the counterparty. Counterparty risk related to exchange-traded financial futures contracts and options is minimal because of the protection against defaults provided by the exchange on which they trade.
With exchange-traded purchased options and futures and centrally cleared swaps, the exchange or clearinghouse, as counterparty to such instruments, guarantees against a possible default. The clearinghouse stands between the buyer and the seller of the contract; therefore, credit risk is limited to failure of the clearinghouse. While offset rights may exist under applicable law, the Fund does not have a contractual right of offset against a clearing broker or clearinghouse in the event of a default (including the bankruptcy or insolvency) of the clearing broker or clearinghouse. Additionally, credit risk exists in exchange-traded futures and centrally cleared swaps with respect to initial and variation margin that is held in a clearing broker’s customer accounts. While clearing brokers are required to segregate customer margin from their own assets, in the event that a clearing broker becomes insolvent or goes into bankruptcy and at that time there is a shortfall in the aggregate amount of margin held by the clearing broker for all its clients, typically the shortfall would be allocated on a pro rata basis across all the clearing broker’s customers, potentially resulting in losses to the Funds.
In order to better define its contractual rights and to secure rights that will help the Funds mitigate its counterparty risk, the Funds may enter into an International Swaps and Derivatives Association, Inc. Master Agreement (“ISDA Master Agreement”) or similar agreement with its derivative contract counterparties. An ISDA Master Agreement is a bilateral agreement between a Fund and a counterparty that governs certain OTC derivatives and typically contains, among other things, collateral posting terms and netting provisions in the event of a default and/or termination event. Under an ISDA Master Agreement, a Fund may, under certain circumstances, offset with the counterparty certain derivative financial instruments’ payables and/or receivables with collateral held and/or posted and create one single net payment. The provisions of the ISDA Master Agreement typically permit a single net payment in the event of default including the bankruptcy or insolvency of the counterparty. However, bankruptcy or insolvency laws of a particular jurisdiction may impose restrictions on or prohibitions against the right of offset in bankruptcy, insolvency or other events. In addition, certain ISDA Master Agreements allow counterparties to OTC derivatives to terminate derivative contracts prior to maturity in the event a Fund’s net assets decline by a stated percentage or the Fund fails to meet the terms of its ISDA Master Agreements, which would cause the Fund to accelerate payment of any net liability owed to the counterparty.
Collateral Requirements:
For derivatives traded under an ISDA Master Agreement, the collateral requirements are typically calculated by netting the mark-to-market amount for each transaction under such agreement and comparing that amount to the value of any collateral currently pledged by the Fund and the counterparty.
Cash collateral that has been pledged to cover obligations of a Fund and cash collateral received from the counterparty, if any, is reported separately on the Statements of Assets and Liabilities as cash due to broker for options contracts, cash at broker for financial futures contracts and segregated cash and foreign currency for options contracts and swap contracts and cash received as payable to broker, respectively. Non-cash collateral pledged by the Fund, if any, is noted in the Schedule of Portfolio Investments. Generally, the amount of collateral due from or to a party has to exceed a minimum transfer amount threshold (e.g. $500,000) before a transfer is required, which is determined at the close of business of a Fund and any additional required collateral is delivered to/pledged by a Fund on the next business day. Typically, a Fund and its counterparties are not permitted to sell, re-pledge or use the collateral they receive. To the extent amounts due to a Fund from its counterparties are not fully collateralized, contractually or otherwise, a Fund bears the risk of loss from counterparty non-performance. The Funds attempt to mitigate counterparty risk by entering into agreements only with counterparties that it believes have the financial resources to honor their obligations and by monitoring the financial stability of those counterparties.
82
|
NOTES TO FINANCIAL STATEMENTS |
Emerging Market Debt Fund
| | | | | | | | | | | | | | | | | | | | | | | | |
| | | Barclays
Bank Plc | | | Citibank
N.A. | | | Citigroup
Global
Markets
Limited | | | Morgan
Stanley Co.
International
plc | | | Morgan
Stanley Co.
LLC | | | Total | |
Assets: | | | | | | | | | | | | | | | | | | | | | | | | |
Forward Currency Exchange Contracts | | $ | 25,230 | | | $ | 284,680 | | | $ | — | | | $ | — | | | $ | — | | | $ | 309,910 | |
Swaps | | | 63,449 | | | | — | | | | 139,838 | | | | 9,617 | | | | — | | | | 212,904 | |
| | | | | | | | | | | | | | | | | | | | | | | | |
Total Assets | | | 88,679 | | | | 284,680 | | | | 139,838 | | | | 9,617 | | | | — | | | | 522,814 | |
| | | | | | | | | | | | | | | | | | | | | | | | |
Liabilities: | | | | | | | | | | | | | | | | | | | | | | | | |
Forward Currency Exchange Contracts | | | 115,174 | | | | 250,792 | | | | — | | | | — | | | | — | | | | 365,966 | |
Swaps | | | 42,155 | | | | 15,534 | | | | — | | | | 152,806 | | | | 219,635 | | | | 430,130 | |
| | | | | | | | | | | | | | | | | | | | | | | | |
Total Liabilities | | | 157,329 | | | | 266,326 | | | | — | | | | 152,806 | | | | 219,635 | | | | 796,096 | |
| | | | | | | | | | | | | | | | | | | | | | | | |
Total Financial and Derivative Net Assets1 | | | (68,650 | ) | | | 18,354 | | | | 139,838 | | | | (143,189 | ) | | | (219,635 | ) | | | (273,282 | ) |
Total Collateral (Received) Pledged2 | | | — | | | | — | | | | — | | | | — | | | | 219,635 | | | | 219,635 | |
| | | | | | | | | | | | | | | | | | | | | | | | |
Net Amount3 | | $ | (68,650 | ) | | $ | 18,354 | | | $ | 139,838 | | | $ | (143,189 | ) | | $ | — | | | $ | (53,647 | ) |
| | | | | | | | | | | | | | | | | | | | | | | | |
Core Plus Bond Fund
| | | | | | | | | | | | | | | | | | | | | | | | |
| Assets: | | Citibank N.A. | | | Morgan Stanley
Co. LLC | | | Total | |
Forward Currency Exchange Contracts | | | | | | $ | 118,885 | | | | | | | $ | — | | | | | | | $ | 118,885 | |
Swaps | | | | | | | — | | | | | | | | 18,016 | | | | | | | | 18,016 | |
| | | | | | | | | | | | | | | | | | | | | | | | |
Total Assets | | | | | | | 118,885 | | | | | | | | 18,016 | | | | | | | | 136,901 | |
| | | | | | | | | | | | | | | | | | | | | | | | |
Liabilities: | | | | | | | | | | | | | | | | | | | | | | | | |
Forward Currency Exchange Contracts | | | | | | | 198,802 | | | | | | | | — | | | | | | | | 198,802 | |
Swaps | | | | | | | — | | | | | | | | 803,733 | | | | | | | | 803,733 | |
| | | | | | | | | | | | | | | | | | | | | | | | |
Total Liabilities | | | | | | | 198,802 | | | | | | | | 803,733 | | | | | | | | 1,002,535 | |
| | | | | | | | | | | | | | | | | | | | | | | | |
Total Financial and Derivative Net Assets1 | | | | | | | (79,917 | ) | | | | | | | (785,717 | ) | | | | | | | (865,634 | ) |
Total Collateral (Received) Pledged2 | | | | | | | — | | | | | | | | 785,717 | | | | | | | | 785,717 | |
| | | | | | | | | | | | | | | | | | | | | | | | |
Net Amount3 | | | | | | $ | (79,917 | ) | | | | | | $ | — | | | | | | | $ | (79,917 | ) |
| | | | | | | | | | | | | | | | | | | | | | | | |
83
|
NOTES TO FINANCIAL STATEMENTS |
Strategic Income Fund
| | | | | | | | | | | | |
| | | Citibank
N.A | | | Morgan
Stanley &
Co. LLC | | | Total | |
Assets: | | | | | | | | | | | | |
Forward Currency Exchange Contracts | | $ | 158,561 | | | $ | — | | | $ | 158,561 | |
Swaps | | | — | | | | 18,016 | | | | 18,016 | |
| | | | | | | | | | | | |
Total Assets | | | 158,561 | | | | 18,016 | | | | 176,577 | |
| | | | | | | | | | | | |
Liabilities: | | | | | | | | | | | | |
Forward Currency Exchange Contracts | | | 211,299 | | | | — | | | | 211,299 | |
Swaps | | | — | | | | 1,229,175 | | | | 1,229,175 | |
| | | | | | | | | | | | |
Total Liabilities | | | 211,299 | | | | 1,229,175 | | | | 1,440,474 | |
| | | | | | | | | | | | |
Total Financial and Derivative Net Assets1 | | | (52,738 | ) | | | (1,211,159 | ) | | | (1,263,897 | ) |
Total Collateral (Received) Pledged2 | | | — | | | | 1,211,159 | | | | 1,211,159 | |
| | | | | | | | | | | | |
Net Amount3 | | $ | (52,738 | ) | | $ | — | | | $ | (52,738 | ) |
| | | | | | | | | | | | |
1 The amount of derivatives for offset is limited to the amount of assets and/or liabilities that are subject to a MNA.
2 Excess of collateral (received) pledged from/to the individual counterparty may not be shown for financial reporting purposes.
3 Net amount represents the net amount receivable (payable) from/to the individual counterparty in the event of default.
Affiliated Investments:
The Funds invest in another Fund of the Trust (an “Affiliated Fund”), U.S. Government Money Market Fund- Institutional Class 1, as a cash sweep vehicle. The income earned by the Funds from the Affiliated Fund for the period is disclosed in the Statement of Operations. The table below details the transactions of the Funds in the Affiliated Fund.
As the affiliated investment is a money market fund in which shares are issued and redeemed at $1.00 per share, the number of shares purchased and sold equal the dollar amount shown as purchased and sold, and no gain or loss was realized on the sale of shares of the affiliated money market fund.
| | | | | | | | | | | | | | | | | | | | |
| | | Value
September 30, 2023 | | | Purchases | | | Sales | | | Value
September 30, 2024 | | | Dividends | |
| Investments in RBC BlueBay U.S. Government Money Market Fund — Institutional Class 1 | | | | | | | | | | | | | | | | | | | | |
Emerging Market Debt Fund | | | $ 1,255,527 | | | $ | 101,790,429 | | | $ | (69,648,349 | ) | | | $33,397,607 | | | $ | 103,912 | |
High Yield Bond Fund | | | 15,420,395 | | | | 473,951,697 | | | | (447,747,581 | ) | | | 41,624,511 | | | | 902,121 | |
Core Plus Bond Fund | | | 3,307,444 | | | | 108,154,748 | | | | (108,583,633 | ) | | | 2,878,559 | | | | 122,040 | |
Strategic Income Fund | | | 4,594,438 | | | | 134,279,596 | | | | (137,451,481 | ) | | | 1,422,553 | | | | 164,174 | |
84
|
NOTES TO FINANCIAL STATEMENTS |
Credit Enhancement:
Certain obligations held by the Funds have credit enhancement or liquidity features that may, under certain circumstances, provide for repayment of principal and interest on the obligation upon demand date, interest rate reset date or final maturity. These enhancements may include: letters of credit; liquidity guarantees; security purchase agreements; tender option purchase agreements and third party insurance.
Investment Transactions and Income:
Investment transactions are recorded on trade date. Dividend income net of non-reclaimable withholding taxes is recorded on the ex-dividend date. Non-cash dividends, if any, are recorded on the ex-dividend date at fair value. Realized gains and losses from investment transactions are calculated based on the cost of the specific security (also known as identified cost basis). Interest income is recognized on the accrual basis and includes, where applicable, the amortization or accretion of premium or discount using the effective yield method.
Expense, Investment Income and Gain/Loss Allocation:
Each Fund pays the expenses that are directly related to its operations, such as custodian fees or advisory fees. Expenses incurred by the Trust, such as trustee or legal fees, are allocated among each of the Funds in the Trust either proportionately based upon each Fund’s relative net assets or using another reasonable basis such as equally across all Funds in the Trust, depending on the nature of the expense. Individual share classes within a Fund are charged expenses specific to that class, such as distribution fees and transfer agent fees. Within a Fund, expenses other than class specific expenses are allocated daily to each class based upon the proportion of relative net assets. Investment income and realized and unrealized gains or losses are allocated to each class of shares based on relative net assets.
Indemnifications:
Under the Trust’s organizational documents, each Trustee, officer, employee or other agent of the Trust is indemnified against certain liabilities that may arise out of their duties to the Funds. Additionally, in the normal course of business, the Funds enter into contracts, including the Funds’ servicing agreements, that contain a variety of indemnification clauses. The Funds’ maximum exposure under these arrangements is unknown as this would involve future claims that may be made against the Funds that have not yet occurred.
Distributions to Shareholders:
Each Fund pays out any income that it receives, less expenses, in the form of dividends and capital gains to its shareholders. Income dividends are declared and paid monthly. Capital gain distributions are declared and paid at least annually. Distributions to shareholders are recorded on the ex-dividend date. The amount of dividends and distributions are calculated based on federal income tax regulations, which may differ from US GAAP. These “book/tax” differences may be either temporary or permanent in nature. To the extent these differences are determined, as of the end of the tax year, to be permanent, they are reclassified within a Fund’s capital accounts based on their federal tax basis treatment. Permanent differences include reclassification of foreign currency from capital to ordinary, currency treatment for the accrual of certain foreign denominated swaps and early termination on such swaps, and reclassification of foreign currency options from capital to currency. Permanent differences include reclassification of foreign currency from capital to ordinary, currency treatment for the accrual of certain foreign denominated swaps and early termination on such swaps, and reclassification of foreign currency options from capital to currency.
85
|
NOTES TO FINANCIAL STATEMENTS |
3. Agreements and Other Transactions with Affiliates:
The Trust has entered into an investment advisory agreement with RBC GAM-US under which RBC GAM-US manages each Fund’s assets and furnishes related office facilities, equipment, research and personnel. The agreement requires each Fund to pay RBC GAM-US a monthly fee based upon average daily net assets. Under the terms of the agreement, RBC GAM-US is entitled to receive fees based on a percentage of the average daily net assets of each of the Funds as follows:
| | | | |
| | | Annual Rate | |
Emerging Market Debt Fund | | | 0.65% | |
High Yield Bond Fund | | | 0.55% | |
Core Plus Bond Fund | | | 0.35% | |
Strategic Income Fund | | | 0.53% | |
RBC GAM-US has contractually agreed to waive fees and/or make payments in order to keep total operating expenses (excluding certain fees such as interest, taxes and acquired fund fees and expenses) of the Funds to the following levels pursuant to an expense limitation agreement.
| | | | | | | | | | | | |
| | | Class A
Annual Rate | | | Class I
Annual Rate | | | Class R6
Annual Rate | |
Emerging Market Debt Fund | | | 1.04% | | | | 0.79% | | | | 0.74% | |
High Yield Bond Fund | | | 0.82% | | | | 0.57% | | | | N/A | |
Core Plus Bond Fund | | | 0.70% | | | | 0.45% | | | | 0.40% | |
Strategic Income Fund | | | 0.88% | | | | 0.63% | | | | 0.58% | |
This expense limitation agreement is in place until January 31, 2026 and may not be terminated by RBC GAM-US prior to that date. The agreement shall continue for additional one-year terms unless terminated or revised by the Board at any time or by RBC GAM-US at the expiration of any one-year period. The Advisor is entitled to recoup from the Fund or class the fees and/or operating expenses waived or reimbursed during any of the previous 3 years, provided the Fund is able to do so and remain in compliance with the expense limitation in place at the time the fees were waived or expenses paid.
The amounts subject to possible recoupment under the expense limitation agreement were:
| | | | | | | | | | | | | | | | | | | | | | | | | | | | | | | | |
| | | FYE 9/30/22 | | | FYE 9/30/23 | | | FYE 9/30/24 | | | Total | |
Emerging Market Debt Fund | | | | | | $ | 233,671 | | | | | | | $ | 283,786 | | | | | | | $ | 280,376 | | | | | | | $ | 797,833 | |
High Yield Bond Fund | | | | | | | 704,969 | | | | | | | | 837,648 | | | | | | | | 1,207,628 | | | | | | | | 2,750,245 | |
Core Plus Bond Fund | | | | | | | 304,698 | | | | | | | | 259,043 | | | | | | | | 315,983 | | | | | | | | 879,724 | |
Strategic Income Fund | | | | | | | 300,597 | | | | | | | | 254,175 | | | | | | | | 312,892 | | | | | | | | 867,664 | |
There was no recoupment of expense reimbursement/waivers during the year. Amounts from years prior to those shown are no longer subject to recoupment
RBC GAM-US may also voluntarily waive and/or reimburse operating expenses of any Fund from time to time. Any such voluntary program may be changed or eliminated at any time without notice, and expenses waived under such program are not subject to recoupment.
RBC GAM-US voluntarily agreed to waive its investment advisory fees by the amount of investment advisory fees the Funds pay to RBC GAM-US indirectly through its investment in an affiliated money market fund. For the period ended September 30, 2024, the amount waived was $2,913, $29,102, $4,022 and $5,483 for the Emerging Market Debt Fund, High Yield Bond Fund, Core Plus Bond Fund and Strategic Income Fund respectively, and is included in expenses waived/reimbursed by Advisory in the Statement of Operations.
Emerging Market Debt Fund and High Yield Bond Fund are sub-advised by RBC GAM-UK, a wholly-owned subsidiary of Royal Bank of Canada, which is also the parent company of the Advisor. The Sub-Advisor is paid by the Advisor out of the advisory fee paid by the Funds to the Advisor.
RBC GAM-US serves as co-administrator to the Funds. BNY Mellon serves as co-administrator and fund accounting agent. Services provided under the administrative services agreement include providing day-to-day administration of matters related to the Funds, maintenance of their records and the preparation of reports. Under the terms of the administrative services agreement, RBC GAM-US does not receive a fee for its role as co-administrator. BNY Mellon receives a fee for its services payable by the Funds based in part on the Funds’ average net assets. BNY Mellon’s fee is included with “Accounting fees” in the Statements of Operations.
86
|
NOTES TO FINANCIAL STATEMENTS |
Certain Officers and Trustees of the Trust are affiliated with the Advisor. Such Officers and Trustees receive no compensation from the Funds for serving in their respective roles.
The Trust currently pays each of the independent Trustees (Trustees of the Trust who are not directors, officers or employees of the Advisor, either Co-Administrator or Distributor) an annual retainer of $92,000. The Board Chairperson and Audit Committee Chairperson each receive an additional retainer of $2,500 annually, and all other trustees serving as Chair of a Board committee each receive an additional retainer of $1,000 annually. In addition, Independent Trustees receive a quarterly meeting fee of $6,500 for each in-person Board meeting attended, a meeting fee of $1,500 for each telephonic or Special Board meeting attended, a $1,500 fee for each Board committee meeting attended, and are reimbursed for all out-of-pocket expenses relating to attendance at such meetings. These amounts are included in the Statement of Operations in “Trustees’ fees”.
The table below shows, as of September 30, 2024, each Fund’s net assets, the shares (if any) of each Fund held by the Advisor, and the percent of total net assets represented by the Advisor’s investment.
| | | | | | | | | | | | | | |
| | | Net Assets | | | Shares held
by Advisor | | | % of Fund
Net Assets | | | |
Emerging Market Debt Fund | | $ | 115,761,460 | | | | 1,558 | | | | 0.0% | |
High Yield Bond Fund | | $ | 729,218,077 | | | | 15,613 | | | | 0.0% | |
Core Plus Bond Fund | | $ | 60,624,182 | | | | 5,510,430 | | | | 84.1% | |
Strategic Income Fund | | $ | 60,612,818 | | | | 5,759,463 | | | | 97.0% | |
4. Fund Distribution:
Each of the Funds that offers Class A shares has adopted a Master Distribution 12b-1 Plan (the “Plan”) in which Quasar Distributors LLC (the “Distributor”) acts as the Funds’ distributor. The Plan permits each Fund to make payments for, or to reimburse the Distributor for, distribution-related costs and expenses of marketing shares of Class A covered under the Plan, and/or for providing shareholder services. The Plan does not apply to Class I and Class R6. The following chart shows the current Plan fee rate for Class A.
| | | | |
| | | Class A | |
12b-1 Plan Fee | | | 0.25%* | |
* Under the 12b-1 plan, the maximum fee rate for Class A shares is 0.50%. Currently the Board has approved an annual limit of 0.25%.
Plan fees are based on average daily net assets of Class A. Up to 0.25% of each Plan fee may be designated as a service fee, as defined by the applicable rules of the Financial Industry Regulatory Authority. The Distributor, subject to applicable legal requirements, may waive the Plan fee voluntarily, in whole or in part. For the year ended September 30, 2024, there were no fees waived by the Distributor.
The Distributor did not receive any CDSC fees from Class A shares of the Funds during the year ended September 30, 2024.
For the year ended September 30, 2024, the Distributor received commissions of $84,888 for front-end sales charges of Class A shares of the Funds, of which $81,688 was paid to affiliated broker-dealers.
87
|
NOTES TO FINANCIAL STATEMENTS |
5. Securities Transactions:
The cost of securities purchased and proceeds from securities sold (excluding securities maturing less than one year from acquisition) for the year ended September 30, 2024 were as follows:
| | | | | | | | | | | | | | | | | | | | | | | | | | | | | | | | |
| | | Purchases
(Excl. U.S. Gov’t) | | | Sales
(Excl. U.S. Gov’t) | | | Purchases
of U.S. Gov’t. | | | Sales
of U.S. Gov’t. | |
Emerging Market Debt Fund | | | | | | $ | 110,468,613 | | | | | | | $ | 49,428,162 | | | | | | | $ | — | | | | | | | $ | — | |
High Yield Bond Fund | | | | | | | 770,409,609 | | | | | | | | 547,322,154 | | | | | | | | 85,836,185 | | | | | | | | 96,424,876 | |
Core Plus Bond Fund | | | | | | | 370,220,666 | | | | | | | | 364,465,800 | | | | | | | | 118,175,611 | | | | | | | | 111,397,373 | |
Strategic Income Fund | | | | | | | 435,325,930 | | | | | | | | 429,216,594 | | | | | | | | 23,737,881 | | | | | | | | 25,253,098 | |
88
|
NOTES TO FINANCIAL STATEMENTS |
6. Capital Share Transactions:
The Trust is authorized to issue an unlimited number of shares of beneficial interest (“shares outstanding”) without par value. Transactions in capital stock of the Funds are summarized below:
| | | | | | | | | | | | | | | | | | | | | | | | | | | | | | | | |
| | | | | | Emerging Market Debt Fund | | | | | | High Yield Bond Fund | |
| | | | | | For the
Year Ended
September 30,
2024 | | | | | | For the
Year Ended
September 30,
2023 | | | | | | For the
Year Ended
September 30,
2024 | | | | | | For the
Year Ended
September 30,
2023 | |
CAPITAL TRANSACTIONS: | | | | | | | | | | | | | | | | | | | | | | | | | | | | | | | | |
Class A | | | | | | | | | | | | | | | | | | | | | | | | | | | | | | | | |
Proceeds from shares issued | | | | | | $ | — | | | | | | | $ | 12 | | | | | | | $ | 3,934,884 | | | | | | | $ | 1,415,522 | |
Distributions reinvested | | | | | | | 1,040 | | | | | | | | 1,644 | | | | | | | | 362,095 | | | | | | | | 197,830 | |
Cost of shares redeemed | | | | | | | (12,046 | ) | | | | | | | (11,195 | ) | | | | | | | (1,071,663 | ) | | | | | | | (1,111,918 | ) |
| | | | | | | | | | | | | | | | | | | | | | | | | | | | | | | | |
Change in Class A | | | | | | $ | (11,006 | ) | | | | | | $ | (9,539 | ) | | | | | | $ | 3,225,316 | | | | | | | $ | 501,434 | |
| | | | | | | | | | | | | | | | | | | | | | | | | | | | | | | | |
Class I | | | | | | | | | | | | | | | | | | | | | | | | | | | | | | | | |
Proceeds from shares issued | | | | | | $ | 17,976,081 | | | | | | | $ | 6,452,887 | | | | | | | $ | 357,142,335 | | | | | | | $ | 287,244,769 | |
Distributions reinvested | | | | | | | 2,893,077 | | | | | | | | 2,319,939 | | | | | | | | 35,597,925 | | | | | | | | 19,634,451 | |
Cost of shares redeemed | | | | | | | (15,361,904 | ) | | | | | | | (2,258,534 | ) | | | | | | | (162,954,470 | ) | | | | | | | (140,944,321 | ) |
| | | | | | | | | | | | | | | | | | | | | | | | | | | | | | | | |
Change in Class I | | | | | | $ | 5,507,254 | | | | | | | $ | 6,514,292 | | | | | | | $ | 229,785,790 | | | | | | | $ | 165,934,899 | |
| | | | | | | | | | | | | | | | | | | | | | | | | | | | | | | | |
Class R6 | | | | | | | | | | | | | | | | | | | | | | | | | | | | | | | | |
Proceeds from shares issued | | | | | | $ | 64,037,979 | | | | | | | $ | — | | | | | | | $ | — | | | | | | | $ | — | |
Distributions reinvested | | | | | | | 1,728,478 | | | | | | | | 730 | | | | | | | | — | | | | | | | | — | |
Cost of shares redeemed | | | | | | | (3,219,833 | ) | | | | | | | — | | | | | | | | — | | | | | | | | — | |
| | | | | | | | | | | | | | | | | | | | | | | | | | | | | | | | |
Change in Class R6 | | | | | | $ | 62,546,624 | | | | | | | $ | 730 | | | | | | | $ | — | | | | | | | $ | — | |
| | | | | | | | | | | | | | | | | | | | | | | | | | | | | | | | |
Change in net assets resulting from capital transactions | | | | | | $ | 68,042,872 | | | | | | | $ | 6,505,483 | | | | | | | $ | 233,011,106 | | | | | | | $ | 166,436,333 | |
| | | | | | | | | | | | | | | | | | | | | | | | | | | | | | | | |
| | | | | | | | |
SHARE TRANSACTIONS: | | | | | | | | | | | | | | | | | | | | | | | | | | | | | | | | |
Class A | | | | | | | | | | | | | | | | | | | | | | | | | | | | | | | | |
Issued | | | | | | | — | | | | | | | | 1 | | | | | | | | 412,462 | | | | | | | | 152,070 | |
Reinvested | | | | | | | 133 | | | | | | | | 219 | | | | | | | | 37,896 | | | | | | | | 21,315 | |
Redeemed | | | | | | | (1,498 | ) | | | | | | | (1,468 | ) | | | | | | | (111,874 | ) | | | | | | | (120,061 | ) |
| | | | | | | | | | | | | | | | | | | | | | | | | | | | | | | | |
Change in Class A | | | | | | | (1,365 | ) | | | | | | | (1,248 | ) | | | | | | | 338,484 | | | | | | | | 53,324 | |
| | | | | | | | | | | | | | | | | | | | | | | | | | | | | | | | |
Class I | | | | | | | | | | | | | | | | | | | | | | | | | | | | | | | | |
Issued | | | | | | | 2,233,216 | | | | | | | | 863,992 | | | | | | | | 36,895,892 | | | | | | | | 30,505,012 | |
Reinvested | | | | | | | 361,404 | | | | | | | | 301,566 | | | | | | | | 3,687,794 | | | | | | | | 2,092,577 | |
Redeemed | | | | | | | (1,916,944 | ) | | | | | | | (311,654 | ) | | | | | | | (16,847,049 | ) | | | | | | | (14,970,602 | ) |
| | | | | | | | | | | | | | | | | | | | | | | | | | | | | | | | |
Change in Class I | | | | | | | 677,676 | | | | | | | | 853,904 | | | | | | | | 23,736,637 | | | | | | | | 17,626,987 | |
| | | | | | | | | | | | | | | | | | | | | | | | | | | | | | | | |
Class R6 | | | | | | | | | | | | | | | | | | | | | | | | | | | | | | | | |
Issued | | | | | | | 7,875,980 | | | | | | | | — | | | | | | | | — | | | | | | | | — | |
Reinvested | | | | | | | 209,321 | | | | | | | | 95 | | | | | | | | — | | | | | | | | — | |
Redeemed | | | | | | | (388,948 | ) | | | | | | | — | | | | | | | | — | | | | | | | | — | |
| | | | | | | | | | | | | | | | | | | | | | | | | | | | | | | | |
Change in Class R6 | | | | | | | 7,696,353 | | | | | | | | 95 | | | | | | | | — | | | | | | | | — | |
| | | | | | | | | | | | | | | | | | | | | | | | | | | | | | | | |
Change in shares resulting from capital transactions | | | | | | | 8,372,664 | | | | | | | | 852,751 | | | | | | | | 24,075,121 | | | | | | | | 17,680,311 | |
| | | | | | | | | | | | | | | | | | | | | | | | | | | | | | | | |
89
|
NOTES TO FINANCIAL STATEMENTS |
| | | | | | | | | | | | | | | | | | | | | | | | | | | | | | | | |
| | | | | | Core Plus Bond Fund | | | | | | Strategic Income Fund | |
| | | | | | For the
Year Ended
September 30,
2024 | | | | | | For the
Year Ended
September 30,
2023 | | | | | | For the
Year Ended
September 30,
2024 | | | | | | For the
Year Ended
September 30,
2023 | |
CAPITAL TRANSACTIONS: | | | | | | | | | | | | | | | | | | | | | | | | | | | | | | | | |
Class A | | | | | | | | | | | | | | | | | | | | | | | | | | | | | | | | |
Proceeds from shares issued | | | | | | $ | 556,756 | | | | | | | $ | — | | | | | | | $ | 113,277 | | | | | | | $ | — | |
Distributions reinvested | | | | | | | 229,699 | | | | | | | | 100,947 | | | | | | | | 413,586 | | | | | | | | 217,745 | |
Cost of shares redeemed | | | | | | | (1,077 | ) | | | | | | | — | | | | | | | | (32,921 | ) | | | | | | | — | |
| | | | | | | | | | | | | | | | | | | | | | | | | | | | | | | | |
Change in Class A | | | | | | $ | 785,378 | | | | | | | $ | 100,947 | | | | | | | $ | 493,942 | | | | | | | $ | 217,745 | |
| | | | | | | | | | | | | | | | | | | | | | | | | | | | | | | | |
Class I | | | | | | | | | | | | | | | | | | | | | | | | | | | | | | | | |
Proceeds from shares issued | | | | | | $ | 8,770,539 | | | | | | | $ | — | | | | | | | $ | 4,133,563 | | | | | | | $ | — | |
Distributions reinvested | | | | | | | 1,719,221 | | | | | | | | 777,143 | | | | | | | | 3,101,514 | | | | | | | | 1,616,186 | |
Cost of shares redeemed | | | | | | | (22,305 | ) | | | | | | | — | | | | | | | | (2,645,280 | ) | | | | | | | — | |
| | | | | | | | | | | | | | | | | | | | | | | | | | | | | | | | |
Change in Class I | | | | | | $ | 10,467,455 | | | | | | | $ | 777,143 | | | | | | | $ | 4,589,797 | | | | | | | $ | 1,616,186 | |
| | | | | | | | | | | | | | | | | | | | | | | | | | | | | | | | |
Class R6 | | | | | | | | | | | | | | | | | | | | | | | | | | | | | | | | |
Proceeds from shares issued | | | | | | $ | 53,480 | | | | | | | $ | — | | | | | | | $ | 51,769 | | | | | | | $ | — | |
Distributions reinvested | | | | | | | 483,858 | | | | | | | | 226,512 | | | | | | | | 855,347 | | | | | | | | 467,015 | |
| | | | | | | | | | | | | | | | | | | | | | | | | | | | | | | | |
Change in Class R6 | | | | | | $ | 537,338 | | | | | | | $ | 226,512 | | | | | | | $ | 907,116 | | | | | | | $ | 467,015 | |
| | | | | | | | | | | | | | | | | | | | | | | | | | | | | | | | |
Change in net assets resulting from capital transactions | | | | | | $ | 11,790,171 | | | | | | | $ | 1,104,602 | | | | | | | $ | 5,990,855 | | | | | | | $ | 2,300,946 | |
| | | | | | | | | | | | | | | | | | | | | | | | | | | | | | | | |
| | | | | | | | |
SHARE TRANSACTIONS: | | | | | | | | | | | | | | | | | | | | | | | | | | | | | | | | |
Class A | | | | | | | | | | | | | | | | | | | | | | | | | | | | | | | | |
Issued | | | | | | | 62,496 | | | | | | | | — | | | | | | | | 11,434 | | | | | | | | — | |
Reinvested | | | | | | | 27,000 | | | | | | | | 12,051 | | | | | | | | 42,529 | | | | | | | | 22,894 | |
Redeemed | | | | | | | (119 | ) | | | | | | | — | | | | | | | | (3,325 | ) | | | | | | | — | |
| | | | | | | | | | | | | | | | | | | | | | | | | | | | | | | | |
Change in Class A | | | | | | | 89,377 | | | | | | | | 12,051 | | | | | | | | 50,638 | | | | | | | | 22,894 | |
| | | | | | | | | | | | | | | | | | | | | | | | | | | | | | | | |
Class I | | | | | | | | | | | | | | | | | | | | | | | | | | | | | | | | |
Issued | | | | | | | 977,930 | | | | | | | | — | | | | | | | | 418,834 | | | | | | | | — | |
Reinvested | | | | | | | 201,746 | | | | | | | | 92,623 | | | | | | | | 318,740 | | | | | | | | 169,769 | |
Redeemed | | | | | | | (2,480 | ) | | | | | | | — | | | | | | | | (266,403 | ) | | | | | | | — | |
| | | | | | | | | | | | | | | | | | | | | | | | | | | | | | | | |
Change in Class I | | | | | | | 1,177,196 | | | | | | | | 92,623 | | | | | | | | 471,171 | | | | | | | | 169,769 | |
| | | | | | | | | | | | | | | | | | | | | | | | | | | | | | | | |
Class R6 | | | | | | | | | | | | | | | | | | | | | | | | | | | | | | | | |
Issued | | | | | | | 6,070 | | | | | | | | — | | | | | | | | 5,293 | | | | | | | | — | |
Reinvested | | | | | | | 56,849 | | | | | | | | 27,006 | | | | | | | | 87,898 | | | | | | | | 49,045 | |
| | | | | | | | | | | | | | | | | | | | | | | | | | | | | | | | |
Change in Class R6 | | | | | | | 62,919 | | | | | | | | 27,006 | | | | | | | | 93,191 | | | | | | | | 49,045 | |
| | | | | | | | | | | | | | | | | | | | | | | | | | | | | | | | |
Change in shares resulting from capital transactions | | | | | | | 1,329,492 | | | | | | | | 131,680 | | | | | | | | 615,000 | | | | | | | | 241,708 | |
| | | | | | | | | | | | | | | | | | | | | | | | | | | | | | | | |
7. Federal Income Taxes:
It is the policy of each Fund to continue to qualify as a regulated investment company by complying with the provisions available to certain investment companies, as defined under Subchapter M of the Internal Revenue Code, and to distribute substantially all of its net investment income and net realized capital gains. Therefore, no federal tax liability is recorded in the financial statements of each Fund.
90
|
NOTES TO FINANCIAL STATEMENTS |
For all open tax years and all major taxing jurisdictions, management of the Funds has concluded that there are no significant uncertain tax positions that would require recognition in the financial statements. Open tax years are those that are open for examination by taxing authorities (i.e., generally the last three tax year ends and the interim tax period since then). Furthermore, management of the Funds is also not aware of any tax positions for which it is reasonably possible that the total amounts of unrecognized tax benefits will significantly change in the next twelve months.
As of September 30, 2024, the tax cost of investments and the breakdown of unrealized appreciation (depreciation) for each Fund was as follows:
| | | | | | | | | | | | | | | | |
| | | Tax Cost Of
Investments | | | Unrealized
Appreciation | | | Unrealized
Depreciation | | | Net Unrealized
Appreciation/
(Depreciation) | |
Emerging Market Debt Fund | | $ | 134,644,503 | | | $ | 5,711,997 | | | $ | (2,411,850 | ) | | $ | 3,300,147 | |
High Yield Bond Fund | | | 716,729,277 | | | | 22,180,812 | | | | (4,471,771 | ) | | | 17,709,041 | |
Core Plus Bond Fund | | | 71,437,449 | | | | 1,505,166 | | | | (668,476 | ) | | | 836,690 | |
Strategic Income Fund | | | 56,679,972 | | | | 1,810,298 | | | | (735,577 | ) | | | 1,074,721 | |
The difference between book basis and tax basis unrealized appreciation/depreciation is attributable primarily to the tax deferral of losses on wash sales, currency straddle losses, significant debt modifications and mark to market on derivatives.
The tax character of distributions during the year ended September 30, 2024 were as follows:
| | | | | | | | | | | | | | | | |
| | | Distributions Paid From | |
| | | Ordinary
Income | | | Net Long Term
Capital Gains | | | Total Taxable
Distributions | | | Total
Distributions
Paid | |
Emerging Market Debt Fund | | $ | 4,756,322 | | | $ | — | | | $ | 4,756,322 | | | $ | 4,756,322 | |
High Yield Bond Fund | | | 42,009,324 | | | | — | | | | 42,009,324 | | | | 42,009,324 | |
Core Plus Bond Fund | | | 2,432,778 | | | | — | | | | 2,432,778 | | | | 2,432,778 | |
Strategic Income Fund | | | 3,216,783 | | | | 1,153,664 | | | | 4,370,447 | | | | 4,370,447 | |
The tax character of distributions during the year ended September 30, 2023 were as follows:
| | | | | | | | | | | | | | | | |
| | | Distributions Paid From | |
| | | Ordinary
Income | | | Net Long Term
Capital Gains | | | Total Taxable
Distributions | | | Total
Distributions
Paid | |
Emerging Market Debt Fund | | $ | 2,354,279 | | | $ | — | | | $ | 2,354,279 | | | $ | 2,354,279 | |
High Yield Bond Fund | | | 21,874,221 | | | | — | | | | 21,874,221 | | | | 21,874,221 | |
Core Plus Bond Fund | | | 1,104,602 | | | | — | | | | 1,104,602 | | | | 1,104,602 | |
Strategic Income Fund | | | 1,303,132 | | | | 997,815 | | | | 2,300,947 | | | | 2,300,947 | |
91
|
NOTES TO FINANCIAL STATEMENTS |
As of September 30, 2024, the components of accumulated earnings/(losses) on a tax basis were as follows:
| | | | | | | | | | | | | | | | |
| | | BlueBay
Emerging
Market
Debt Fund | | | BlueBay High
Yield
Bond Fund | | | BlueBay Core
Plus
Bond Fund | | | BlueBay
Strategic
Income Fund | |
Undistributed ordinary income | | $ | 1,159,691 | | | $ | 5,011,918 | | | $ | 770,821 | | | $ | 967,575 | |
Undistributed long term gain | | | — | | | | — | | | | — | | | | — | |
| | | | | | | | | | | | | | | | |
Accumulated earnings | | | 1,159,691 | | | | 5,011,918 | | | | 770,821 | | | | 967,575 | |
Accumulated capital loss carryforwards | | | (8,669,436 | ) | | | (20,637,630 | ) | | | (4,672,571 | ) | | | — | |
Unrealized appreciation | | | 3,300,147 | | | | 17,709,041 | | | | 836,690 | | | | 1,074,721 | |
| | | | | | | | | | | | | | | | |
Total Accumulated Earnings/(Losses) | | $ | (4,209,598 | ) | | $ | 2,083,329 | | | $ | (3,065,060 | ) | | $ | 2,042,296 | |
| | | | | | | | | | | | | | | | |
As of September 30, 2024, the Emerging Market Debt Fund, the High Yield Bond Fund, and the Core Plus Bond Fund had short-term capital loss carryforwards of $6,268,727, $3,098,572 and $1,977,597 and long-term capital loss carryforwards of $2,400,709, $17,539,058 and $2,694,974 respectively, available to offset future realized capital gains in accordance with the Regulated Investment Company Modernization Act of 2010. These capital loss carryforwards are not subject to expiration and must first be utilized to offset future realized gains of the same character.
As of September 30, 2024, the Emerging Market Debt Fund, the High Yield Bond Fund, and the Core Plus Bond Fund had utilized capital loss carryforwards of $33,206, $6,184,284 and $1,734,328 respectively.
Under current tax law, Post-October Capital Losses and Late-Year Ordinary Losses may be deferred and treated as occurring on the first business day of the following fiscal year for tax purposes. The Strategic Income Fund had deferred qualified late-year capital losses of $427,196 which will be treated as arising on the first business day of the fiscal year ending September 30, 2024.
8. Market Timing:
The Trust strongly discourages attempts at market timing by Fund shareholders. Prior to June 11, 2021, each Fund charged a redemption fee of 2% of the value of the shares redeemed or exchanged within 30 days of purchase. In addition, the Trust may limit the number of exchanges that may be made between Funds to five (5) per calendar year. When assessed, the redemption fee was deducted from the redemption proceeds and retained by the Fund, not by the Advisor. This redemption fee was not charged in cases where, for example, the redemption resulted from an automatic reinvestment or asset re-allocation not specifically directed by the shareholder. The Trust also reserves the right to reject any Fund purchase order made by persons deemed to be market timers. The Funds’ prospectus contains a full description of the Trust’s policies on market timing and/or excessive trading. The redemption fee is recorded as a credit to capital and is included in the capital transactions on the Statements of Changes in Net Assets.
9. Commitments:
High Yield Bond Fund may invest in floating rate loan interests. In connection with these investments, High Yield Bond Fund may also enter into bridge loan commitments (“commitments”). Commitments may obligate the Fund to furnish temporary financing to a borrower until permanent financing can be arranged. As of September 30, 2024, High Yield Bond Fund had no outstanding commitments. In connection with these commitments, High Yield Bond Fund earns a commitment fee, typically set as a
92
|
NOTES TO FINANCIAL STATEMENTS |
percentage of the commitment amount. Such fee income, which is included in interest income in the Statements of Operations, is recognized ratably over the commitment period.
10. Line of Credit
The Funds are participants in a single uncommitted, unsecured $60,000,000 line of credit with The Bank of New York Mellon, the Funds’ custodian, to be used to fund shareholder redemption requests and for other short-term temporary or emergency general business purposes. The line of credit has a scheduled termination date of June 13, 2025. Interest is charged on borrowings under this line of credit at the Bank’s prime lending rate per annum. Since each Fund participates in the line of credit, there is no assurance that an individual fund will have access to all or any part of the $60,000,000 at any particular time. During the year ended September 30, 2024, none of the Funds borrowed under the line of credit.
11. Significant Risks
Shareholder concentration risk:
As of September 30, 2024, the following Funds had broker-dealer omnibus accounts which each owned more than 10% of a Fund’s outstanding shares as shown below:
| | | | | | | | |
| | | # of Omnibus Accounts | | | % of Fund | |
Emerging Market Debt Fund | | | 1 | | | | 19.4% | |
High Yield Bond Fund | | | 2 | | | | 46.5% | |
Core Plus Bond Fund | | | 1 | | | | 15.9% | |
In addition, one unaffiliated shareholder owned 57.5% of the Emerging Market Debt Fund as of September 30, 2024. Significant transactions by these shareholders may impact the Funds’ performance.
Market risk:
One or more markets in which a Fund invests may go down in value, sometimes sharply and unpredictably, and the value of a Fund’s portfolio securities may fall or fail to rise. Market risk may affect a single issuer, sector of the economy, industry or the market as a whole. In addition, global economies and financial markets are becoming increasingly interconnected, and political, economic and other conditions and events (including, but not limited to, natural disasters, pandemics, epidemics, and social unrest) in one country, region, or financial market may adversely impact issuers in a different country, region or financial market. Furthermore, the occurrence of, among other events, natural or man-made disasters, severe weather or geological events, fires, floods, earthquakes, outbreaks of disease (such as COVID-19, avian influenza or H1N1/09), epidemics, pandemics, malicious acts, cyber-attacks, terrorist acts or the occurrence of climate change, may also adversely impact the performance of a Fund. Such events could adversely impact issuers, markets and economies over the short- and long-term, including in ways that cannot necessarily be foreseen. A Fund could be negatively impacted if the value of a portfolio holding were harmed by such political or economic conditions or events. Moreover, such negative political and economic conditions and events could disrupt the processes necessary for a Fund’s operations.
Interest Rate Risk:
A Fund’s yield and value will fluctuate as the general level of interest rates change. During periods when interest rates are low, a Fund’s yield may also be low. When interest rates increase, securities held by a Fund will generally decline in value. Interest rate changes are influenced by a number of factors including government policy, inflation expectations, and supply and demand. Municipal securities may be issued on a when-issued or delayed delivery basis, where payment and delivery take place at a future date. A Fund assumes the risk that the value of the security at delivery may be more or less than the purchase price.
Credit Spread Risk:
A Fund’s investments may be adversely affected if any of the issuers it is invested in are subject to an actual or perceived (whether by market participants, rating agencies, pricing services or otherwise)
93
|
NOTES TO FINANCIAL STATEMENTS |
deterioration to their credit quality. Any actual or perceived deterioration may lead to an increase in the credit spreads and a decline in price of the issuer’s securities.
Currency Risk:
Changes in foreign currency exchange rates will affect the value of a Fund’s securities and the price of a Fund’s shares. Generally, when the value of the U.S. Dollar rises in value relative to a foreign currency, an investment in that country loses value because that currency is worth fewer U.S. Dollars. Devaluation of a currency by a country’s government or banking authority also may have a significant impact on the value of any investment denominated in that currency. Currency markets generally are not as regulated as securities markets.
The Funds may be exposed to currency exchange risk where the assets and income are denominated in foreign currencies. Currency exchange rates may fluctuate significantly over short periods of time. They generally are determined by supply and demand in the currency exchange markets and relative merits of investment in different countries, actual or perceived changes in interest rates and other complex factors. Currency exchange rates can also be affected unpredictably by intervention (or failure to intervene) by governments or central banks, or by currency controls or political developments. Such events may prevent or restrict a Fund’s ability to enter into foreign currency transactions, force a Fund to exit a foreign currency transaction at a disadvantageous time or price, or result in penalties for the Fund, any of which may result in a loss to the Fund.
12. Subsequent Events:
Fund Management has evaluated the impact of all subsequent events on the Funds and has determined that there were no subsequent events requiring recognition or disclosure in the financial statements.
94
|
REPORT OF INDEPENDENT REGISTERED PUBLIC ACCOUNTING FIRM |
To the Board of Trustees of RBC Funds Trust and Shareholders of RBC BlueBay Emerging Market Debt Fund, RBC BlueBay High Yield Bond Fund, RBC BlueBay Core Plus Bond Fund, and RBC BlueBay Strategic Income Fund
Opinions on the Financial Statements
We have audited the accompanying statements of assets and liabilities, including the schedules of portfolio investments, of RBC BlueBay Emerging Market Debt Fund, RBC BlueBay High Yield Bond Fund, RBC BlueBay Core Plus Bond Fund, and RBC BlueBay Strategic Income Fund (four of the funds constituting RBC Funds Trust, hereafter collectively referred to as the “Funds”) as of September 30, 2024, the related statements of operations for the year ended September 30, 2024, the statements of changes in net assets for each of the two years in the period ended September 30, 2024, including the related notes, and the financial highlights for each of the periods indicated therein (collectively referred to as the “financial statements”). In our opinion, the financial statements present fairly, in all material respects, the financial position of each of the Funds as of September 30, 2024, the results of each of their operations for the year then ended, the changes in each of their net assets for each of the two years in the period ended September 30, 2024 and each of the financial highlights for each of the periods indicated therein in conformity with accounting principles generally accepted in the United States of America.
Basis for Opinions
These financial statements are the responsibility of the Funds’ management. Our responsibility is to express an opinion on the Funds’ financial statements based on our audits. We are a public accounting firm registered with the Public Company Accounting Oversight Board (United States) (PCAOB) and are required to be independent with respect to the Funds in accordance with the U.S. federal securities laws and the applicable rules and regulations of the Securities and Exchange Commission and the PCAOB.
We conducted our audits of these financial statements in accordance with the standards of the PCAOB. Those standards require that we plan and perform the audit to obtain reasonable assurance about whether the financial statements are free of material misstatement, whether due to error or fraud.
Our audits included performing procedures to assess the risks of material misstatement of the financial statements, whether due to error or fraud, and performing procedures that respond to those risks. Such procedures included examining, on a test basis, evidence regarding the amounts and disclosures in the financial statements. Our audits also included evaluating the accounting principles used and significant estimates made by management, as well as evaluating the overall presentation of the financial statements. Our procedures included confirmation of securities owned as of September 30, 2024 by correspondence with the custodian, brokers, and agent banks; when replies were not received from brokers, we performed other auditing procedures. We believe that our audits provide a reasonable basis for our opinions.
/s/PricewaterhouseCoopers LLP
Minneapolis, Minnesota
November 22, 2024
We have served as the auditor of one or more investment companies in the RBC Funds since 2016.
95
|
OTHER FEDERAL INCOME TAX INFORMATION (UNAUDITED) |
For the year ended September 30, 2024, the following Funds had a qualified interest income percentage of:
| | | | |
| | | Qualified
Interest
Income | |
Emerging Market Debt Fund | | | 90.25% | |
High Yield Bond Fund | | | 98.94% | |
Core Plus Bond Fund | | | 88.58% | |
Strategic Income Fund | | | 69.23% | |
For the year ended September 30, 2024, the following Funds had a qualified short term gains percentage of :
| | | | |
| | | Qualified
Short-Term
Gains | |
Strategic Income Fund | | | 4.56% | |
For the year ended September 30, 2024, the following Funds had a qualified foreign source income percentage of:
Pursuant to Internal Revenue Code Section 852(b)(3), the Strategic Income Fund reported $1,153,664, respectively, as long-term capital gain distributions for the year ended September 30, 2024.
All reportings are based on financial information available as of the date of this annual report and, accordingly, are subject to change. For each item above, it is the intention of the Funds to report the maximum amount permitted under the Internal Revenue Code and the regulations thereunder.
96
|
APPROVAL OF INVESTMENT ADVISORY AGREEMENT (UNAUDITED) |
Information Regarding the Approval of Investment Advisory and Sub-Advisory Agreements
In September 2024, after evaluating the services provided by RBC Global Asset Management (U.S.) Inc. (the “Advisor”) and, for the RBC BlueBay Emerging Market Debt Fund, RBC BlueBay High Yield Bond Fund, the services provided by RBC Global Asset Management (UK) Limited (the “Sub-Advisor”), and reviewing the performance, fees, and expenses of the Funds, the RBC Funds Board of Trustees determined to approve the continuation of the investment advisory agreements with the Advisor and sub-advisory agreements with the Sub-Advisor (the investment advisory and sub-advisory agreements, collectively, being the “Agreements”) for each Fund for an additional year.
As part of their review of the Agreements, the Trustees requested and considered information regarding the advisory services performed by the Advisor and Sub-Advisor; the staffing and qualifications of the personnel responsible for operating and managing the Funds; and the Funds’ performance, fees, and expenses. The Trustees considered information provided at regular quarterly Board and Committee meetings throughout the year; information presented at both a special meeting held to review requested material related to the proposed renewals and a regular meeting at which the proposed renewals were considered; and their experience with the portfolio management teams over the years. The information included material provided by the Advisor and Sub-Advisor, as well as reports prepared by Broadridge Financial Solutions, Inc., an independent statistical compilation company, providing comparative fee and expense information and comparative performance information for the Funds vs. funds in the same category and funds in more tailored peer groups. In connection with their deliberations, the independent Trustees were advised by independent legal counsel with regard to the materials and their responsibilities under relevant laws and regulations.
The Trustees met with representatives from the Advisor’s senior management and investment teams, as well as senior investment professionals from the Sub-Advisor, to discuss the information and the ongoing management of the Funds. The Trustees reviewed the nature and quality of the services provided to the Funds by the Advisor and Sub-Advisor, including information as to each Fund’s performance relative to appropriate index benchmarks as well as their respective Morningstar categories and peer groups, including in the case of the RBC BlueBay Strategic Income Fund, a custom peer group more aligned with that fund’s specific investment strategy. The Board noted that each of the RBC BlueBay Core Plus Bond Fund and RBC BlueBay Strategic Income Fund had not yet completed three full years of operations, but for the trailing one year, each had outperformed its benchmark as well as the median performance of its respective peer group. The other two Funds showed performance in the top half of each of their category and peer groups for each of the one-, three- and five-year periods as well as outperforming their benchmark indices for the same periods.
In considering the nature and quality of services provided to the Funds, the Trustees discussed the Sub-Advisor’s strong research, credit, and fundamental analysis capabilities and specialized expertise in the area of emerging market debt instruments and absolute return strategies. The Trustees also considered the extensive portfolio management experience of the Sub-Advisor’s staff as well as the Advisor’s and Sub-Advisor’s operational and compliance structure and systems, and the Advisor’s expertise in coordinating the investment management and related operations of the Funds. The Trustees continued to have confidence in the Advisor and Sub-Advisor and were satisfied with the nature, extent, and quality of the advisory and other services provided to the Funds.
The Trustees reviewed advisory fee and expense information for each Fund compared to similarly situated funds, including information regarding other client accounts advised or sub-advised by the Advisor with similar investment strategies and the reasons for any differences in fees. The Trustees considered, and viewed favorably, the arrangements to subsidize Fund expenses at competitive levels through expense limitation agreements with the Adviser. The Trustees evaluated profitability data for the Advisor and considered information regarding other benefits the Advisor and its affiliates derived from their relationships with the Funds, including any fall-out benefits. The Trustees noted that the advisory fees and expense ratios for all four Funds were below the median expense ratios for their respective peer groups and appeared to be fair and reasonable in light of the level and quality of the services provided under all the circumstances and were within the range of what might have been negotiated at arms’ length.
97
|
APPROVAL OF INVESTMENT ADVISORY AGREEMENT (UNAUDITED) |
Based upon their review, the Trustees concluded that the nature and quality of the services provided by both the Advisor and Sub-Advisor were of a high quality and it is in the interests of the Funds and their shareholders for the Trustees to approve the Agreement and expense limitation arrangement for each Fund for an additional year. In arriving at their collective decision to approve the renewal of the Agreements, the Trustees did not assign relative weights to the factors discussed above or deem any one or group of them to be controlling in and of itself.
98
RBC Funds
P.O. Box 701
Milwaukee, WI 53201-0701
800-422-2766
www.rbcgam.com
Performance data represents past performance and does not guarantee future results. The principal value of an investment and investment return will fluctuate so that an investor’s shares, when redeemed, may be worth more or less than their original cost.
This report and the financial statements contained herein are provided for the information of RBC Funds shareholders. This report is not authorized for distribution to prospective investors unless preceded or accompanied by a current prospectus, which contains information concerning investment objectives, risks, charges and expenses of the funds. Please read the prospectus carefully before investing.
This report and the financial statements contained herein are not intended to be a forecast of future events, a guarantee of future results, or investment advice. There is no assurance that certain securities will remain in or out of each fund’s portfolio. The views expressed in this report reflect those of the portfolio managers through the year ended September 30, 2024.
NOT FDIC INSURED • NO BANK GUARANTEE • MAY LOSE VALUE
RBC Global Asset Management (U.S.) Inc. serves as investment advisor for the RBC Funds. RBC Funds are distributed by Quasar Distributors LLC.
The RBC Funds are pleased to offer shareholder reports printed entirely on Forest Stewardship Council® certified paper. This product is made of material from well-managed FSC®-certified forests, recycled materials, and other controlled sources. The Forest Stewardship Council® promotes environmentally appropriate, socially beneficial, and economically viable management of the world’s forests.
100
Financial Statements and Other Important Information For the year ended September 30, 2024 RBC SMID Cap Growth Fund RBC Enterprise Fund RBC Small Cap Core Fund RBC Microcap Value Fund RBC Small Cap Value Fund
|
SCHEDULE OF PORTFOLIO INVESTMENTS |
RBC SMID Cap Growth Fund
September 30, 2024
| | | | | | |
| Shares | | | | Value | |
Common Stocks — 98.2% | | | | |
Communication Services — 2.8% | | | | |
| 14,437 | | Nexstar Media Group, Inc. | | $ | 2,387,158 | |
| 87,768 | | PubMatic, Inc., Class A* | | | 1,305,110 | |
| 47,610 | | TechTarget, Inc.* | | | 1,164,065 | |
| | | | | | |
| | | | | 4,856,333 | |
| | | | | | |
Consumer Discretionary — 12.0% | | | | |
| 12,760 | | Burlington Stores, Inc.* | | | 3,362,005 | |
| 37,720 | | Fox Factory Holding Corp.* | | | 1,565,380 | |
| 36,379 | | Gentherm, Inc.* | | | 1,693,443 | |
| 52,420 | | G-III Apparel Group Ltd.* | | | 1,599,858 | |
| 12,086 | | Installed Building Products, Inc. | | | 2,976,419 | |
| 16,348 | | LCI Industries | | | 1,970,588 | |
| 33,790 | | Ollie’s Bargain Outlet Holdings, Inc.* | | | 3,284,388 | |
| 22,440 | | Planet Fitness, Inc., Class A* | | | 1,822,577 | |
| 12,320 | | Texas Roadhouse, Inc. | | | 2,175,712 | |
| | | | | | |
| | | | | 20,450,370 | |
| | | | | | |
Consumer Staples — 4.2% | | | | |
| 6,855 | | Casey’s General Stores, Inc. | | | 2,575,492 | |
| 16,390 | | Freshpet, Inc.* | | | 2,241,660 | |
| 30,661 | | Performance Food Group Co.* | | | 2,402,903 | |
| | | | | | |
| | | | | 7,220,055 | |
| | | | | | |
Energy — 2.9% | | | | |
| 185,900 | | TechnipFMC Plc | | | 4,876,157 | |
| | | | | | |
| |
Financials — 8.4% | | | | |
| 49,230 | | Baldwin Insurance Group, Inc. (The)* | | | 2,451,654 | |
| 14,316 | | FirstCash Holdings, Inc. | | | 1,643,477 | |
| 8,692 | | Jack Henry & Associates, Inc. | | | 1,534,486 | |
| 5,337 | | Kinsale Capital Group, Inc. | | | 2,484,747 | |
| 32,970 | | Stifel Financial Corp. | | | 3,095,883 | |
| 14,663 | | WEX, Inc.* | | | 3,075,271 | |
| | | | | | |
| | | | | 14,285,518 | |
| | | | | | |
Health Care — 20.6% | | | | |
| 14,600 | | Acadia Healthcare Co., Inc.* | | | 925,786 | |
| 216,670 | | Alphatec Holdings, Inc.* | | | 1,204,685 | |
| 156,260 | | Avid Bioservices, Inc.* | | | 1,778,239 | |
| 28,871 | | Azenta, Inc.* | | | 1,398,511 | |
| 31,800 | | Bio-Techne Corp. | | | 2,541,774 | |
| 84,570 | | Certara, Inc.* | | | 990,315 | |
| 8,770 | | Charles River Laboratories International, Inc.* | | | 1,727,427 | |
| 16,220 | | CONMED Corp. | | | 1,166,542 | |
| 33,697 | | Haemonetics Corp.* | | | 2,708,565 | |
| 22,294 | | HealthEquity, Inc.* | | | 1,824,764 | |
| 31,420 | | Integer Holdings Corp.* | | | 4,084,600 | |
1
|
SCHEDULE OF PORTFOLIO INVESTMENTS |
RBC SMID Cap Growth Fund (cont.)
September 30, 2024
| | | | | | |
| Shares | | | | Value | |
| 8,250 | | Medpace Holdings, Inc.* | | $ | 2,753,850 | |
| 41,488 | | Merit Medical Systems, Inc.* | | | 4,100,259 | |
| 122,530 | | Neogen Corp.* | | | 2,059,729 | |
| 11,630 | | Repligen Corp.* | | | 1,730,777 | |
| 59,370 | | Stevanato Group SpA | | | 1,187,400 | |
| 3,660 | | UFP Technologies, Inc.* | | | 1,159,122 | |
| 39,870 | | Vericel Corp.* | | | 1,684,507 | |
| | | | | | |
| | | | | 35,026,852 | |
| | | | | | |
Industrials — 19.5% | | | | |
| 12,950 | | AGCO Corp. | | | 1,267,287 | |
| 62,544 | | Ameresco, Inc., Class A* | | | 2,372,919 | |
| 11,983 | | Applied Industrial Technologies, Inc. | | | 2,673,767 | |
| 5,020 | | CACI International, Inc., Class A* | | | 2,532,891 | |
| 13,630 | | EnPro Industries, Inc. | | | 2,210,514 | |
| 66,995 | | ExlService Holdings, Inc.* | | | 2,555,859 | |
| 16,842 | | ICF International, Inc. | | | 2,809,077 | |
| 18,240 | | John Bean Technologies Corp. | | | 1,796,823 | |
| 8,197 | | Landstar System, Inc. | | | 1,548,167 | |
| 49,414 | | Mercury Systems, Inc.* | | | 1,828,318 | |
| 10,940 | | Paylocity Holding Corp.* | | | 1,804,772 | |
| 8,870 | | RBC Bearings, Inc.* | | | 2,655,501 | |
| 83,850 | | Tetra Tech, Inc. | | | 3,954,366 | |
| 18,989 | | Woodward, Inc. | | | 3,256,803 | |
| | | | | | |
| | | | | 33,267,064 | |
| | | | | | |
Information Technology — 22.3% | | | | |
| 29,977 | | Alkami Technology, Inc.* | | | 945,475 | |
| 23,497 | | Altair Engineering, Inc., Class A* | | | 2,244,198 | |
| 16,150 | | ASGN, Inc.* | | | 1,505,664 | |
| 8,733 | | Badger Meter, Inc. | | | 1,907,375 | |
| 10,749 | | CyberArk Software Ltd.* | | | 3,134,516 | |
| 34,599 | | Diodes, Inc.* | | | 2,217,450 | |
| 35,070 | | Dynatrace, Inc.* | | | 1,875,193 | |
| 25,628 | | ePlus, Inc.* | | | 2,520,258 | |
| 7,636 | | Globant SA* | | | 1,512,997 | |
| 87,270 | | Informatica, Inc., Class A* | | | 2,206,186 | |
| 5,798 | | Littelfuse, Inc. | | | 1,537,919 | |
| 8,793 | | Manhattan Associates, Inc.* | | | 2,474,174 | |
| 12,076 | | Novanta, Inc.* | | | 2,160,638 | |
| 17,070 | | Onto Innovation, Inc.* | | | 3,543,049 | |
| 15,420 | | Perficient, Inc.* | | | 1,163,902 | |
| 65,900 | | Sapiens International Corp. NV | | | 2,456,093 | |
| 14,600 | | Silicon Laboratories, Inc.* | | | 1,687,322 | |
| 14,602 | | SPS Commerce, Inc.* | | | 2,835,270 | |
| | | | | | |
| | | | | 37,927,679 | |
| | | | | | |
2
|
SCHEDULE OF PORTFOLIO INVESTMENTS |
RBC SMID Cap Growth Fund (cont.)
September 30, 2024
| | | | | | |
| Shares | | | | Value | |
Materials — 4.2% | | | | |
| 15,245 | | AptarGroup, Inc. | | $ | 2,442,096 | |
| 10,998 | | Balchem Corp. | | | 1,935,648 | |
| 16,873 | | HB Fuller Co. | | | 1,339,379 | |
| 5,082 | | Reliance, Inc. | | | 1,469,765 | |
| | | | | | |
| | | | | 7,186,888 | |
| | | | | | |
Real Estate — 1.3% | | | | |
| 16,274 | | Lamar Advertising Co., REIT, Class A | | | 2,174,206 | |
| | | | | | |
| |
Total Common Stocks | | | 167,271,122 | |
| | | | | | |
(Cost $128,471,963) | | | | |
| |
Investment Company — 2.2% | | | | |
| 3,868,926 | | RBC BlueBay U.S. Government Money Market Fund, Institutional Class 1(a) | | | 3,868,926 | |
| | | | | | |
| |
Total Investment Company | | | 3,868,926 | |
| | | | | | |
(Cost $3,868,926) | | | | |
| |
Total Investments | | $ | 171,140,048 | |
(Cost $132,340,889)(b) — 100.4% | | | | |
| |
Liabilities in excess of other assets — (0.4)% | | | (759,009) | |
| | | | | | |
| |
NET ASSETS — 100.0% | | $ | 170,381,039 | |
| | | | | | |
| * | Non-income producing security. |
| (a) | Affiliated investment. |
| (b) | See Notes to Schedules of Portfolio Investments for the tax cost of securities and the breakdown of unrealized appreciation (depreciation). |
Abbreviations used are defined below:
REIT - Real Estate Investment Trust
See Notes to the Financial Statements.
3
|
SCHEDULE OF PORTFOLIO INVESTMENTS |
RBC Enterprise Fund
September 30, 2024
| | | | | | |
| Shares | | | | Value | |
Common Stocks — 91.5% | | | | |
Consumer Discretionary — 10.9% | | | | |
| 38,580 | | Beazer Homes USA, Inc.* | | $ | 1,318,279 | |
| 25,610 | | Genesco, Inc.* | | | 695,824 | |
| 43,480 | | G-III Apparel Group Ltd.* | | | 1,327,009 | |
| 3,280 | | Group 1 Automotive, Inc. | | | 1,256,371 | |
| 24,700 | | Legacy Housing Corp.* | | | 675,545 | |
| 5,860 | | Oxford Industries, Inc. | | | 508,414 | |
| 7,433 | | Patrick Industries, Inc. | | | 1,058,236 | |
| 15,290 | | Steven Madden Ltd. | | | 749,057 | |
| | | | | | |
| | | | | 7,588,735 | |
| | | | | | |
Consumer Staples — 1.9% | | | | |
| 5,810 | | John B Sanfilippo & Son, Inc. | | | 547,941 | |
| 9,100 | | MGP Ingredients, Inc. | | | 757,575 | |
| | | | | | |
| | | | | 1,305,516 | |
| | | | | | |
Energy — 3.6% | | | | |
| 50,350 | | Magnolia Oil & Gas Corp., Class A | | | 1,229,547 | |
| 18,820 | | Matador Resources Co. | | | 930,084 | |
| 19,120 | | Par Pacific Holdings, Inc.* | | | 336,512 | |
| | | | | | |
| | | | | 2,496,143 | |
| | | | | | |
Financials — 18.1% | | | | |
| 7,100 | | AMERISAFE, Inc. | | | 343,143 | |
| 44,050 | | Banc of California, Inc. | | | 648,857 | |
| 40,908 | | Compass Diversified Holdings | | | 905,294 | |
| 42,042 | | Eastern Bankshares, Inc. | | | 689,068 | |
| 19,430 | | Esquire Financial Holdings, Inc. | | | 1,267,030 | |
| 14,750 | | First Bancorp/Southern Pines, NC | | | 613,453 | |
| 17,440 | | German American Bancorp, Inc. | | | 675,800 | |
| 24,006 | | Mercantile Bank Corp. | | | 1,049,542 | |
| 13,890 | | Northrim BanCorp, Inc. | | | 989,246 | |
| 13,210 | | Preferred Bank/Los Angeles, CA | | | 1,060,102 | |
| 15,410 | | QCR Holdings, Inc. | | | 1,140,802 | |
| 20,850 | | Silvercrest Asset Management Group, Inc., Class A | | | 359,454 | |
| 19,820 | | Southern First Bancshares, Inc.* | | | 675,466 | |
| 11,280 | | Stewart Information Services Corp. | | | 843,067 | |
| 23,020 | | Stock Yards Bancorp, Inc. | | | 1,427,010 | |
| | | | | | |
| | | | | 12,687,334 | |
| | | | | | |
Health Care — 16.4% | | | | |
| 86,440 | | Alphatec Holdings, Inc.* | | | 480,606 | |
| 12,220 | | Amphastar Pharmaceuticals, Inc.* | | | 593,037 | |
| 42,090 | | Astrana Health, Inc.* | | | 2,438,695 | |
| 23,130 | | Lantheus Holdings, Inc.* | | | 2,538,517 | |
| 151,060 | | Maravai LifeSciences Holdings, Inc., Class A* | | | 1,255,309 | |
| 172,400 | | MiMedx Group, Inc.* | | | 1,018,884 | |
4
|
SCHEDULE OF PORTFOLIO INVESTMENTS |
RBC Enterprise Fund (cont.)
September 30, 2024
| | | | | | |
| Shares | | | | Value | |
| 25,440 | | Surmodics, Inc.* | | $ | 986,563 | |
| 6,720 | | UFP Technologies, Inc.* | | | 2,128,224 | |
| | | | | | |
| | | | | 11,439,835 | |
| | | | | | |
Industrials — 20.4% | | | | |
| 64,480 | | ACCO Brands Corp. | | | 352,705 | |
| 17,715 | | Allient Inc. | | | 336,408 | |
| 40,970 | | Barrett Business Services, Inc. | | | 1,536,785 | |
| 29,660 | | Bowman Consulting Group Ltd.* | | | 714,213 | |
| 67,920 | | BrightView Holdings, Inc.* | | | 1,069,061 | |
| 10,778 | | Casella Waste Systems, Inc., Class A* | | | 1,072,303 | |
| 17,310 | | CBIZ, Inc.* | | | 1,164,790 | |
| 15,540 | | Columbus McKinnon Corp. | | | 559,440 | |
| 17,280 | | Douglas Dynamics, Inc. | | | 476,582 | |
| 31,036 | | Ducommun, Inc.* | | | 2,043,100 | |
| 21,210 | | Enerpac Tool Group Corp. | | | 888,487 | |
| 17,606 | | Greenbrier Cos., Inc. (The) | | | 895,969 | |
| 62,550 | | Hudson Technologies, Inc.* | | | 521,667 | |
| 14,753 | | Insteel Industries, Inc. | | | 458,671 | |
| 3,910 | | Standex International Corp. | | | 714,670 | |
| 47,860 | | Thermon Group Holdings, Inc.* | | | 1,428,143 | |
| | | | | | |
| | | | | 14,232,994 | |
| | | | | | |
Information Technology — 12.6% | | | | |
| 34,030 | | Cohu, Inc.* | | | 874,571 | |
| 11,900 | | Crane NXT Co. | | | 667,590 | |
| 36,390 | | Napco Security Technologies, Inc. | | | 1,472,340 | |
| 9,183 | | Novanta, Inc.* | | | 1,643,022 | |
| 7,780 | | Onto Innovation, Inc.* | | | 1,614,817 | |
| 15,242 | | PC Connection, Inc. | | | 1,149,704 | |
| 32,796 | | Sapiens International Corp. NV | | | 1,222,307 | |
| 390 | | Super Micro Computer, Inc.* | | | 162,396 | |
| | | | | | |
| | | | | 8,806,747 | |
| | | | | | |
Materials — 3.1% | | | | |
| 18,577 | | Koppers Holdings, Inc. | | | 678,618 | |
| 9,190 | | Materion Corp. | | | 1,027,993 | |
| 32,030 | | Metallus, Inc.* | | | 475,005 | |
| | | | | | |
| | | | | 2,181,616 | |
| | | | | | |
Real Estate — 3.5% | | | | |
| 82,570 | | Chatham Lodging Trust, REIT | | | 703,496 | |
| 20,700 | | Community Healthcare Trust, Inc., REIT | | | 375,705 | |
| 125,370 | | Summit Hotel Properties, Inc., REIT | | | 860,038 | |
| 27,150 | | UMH Properties, Inc., REIT | | | 534,041 | |
| | | | | | |
| | | | | 2,473,280 | |
| | | | | | |
5
|
SCHEDULE OF PORTFOLIO INVESTMENTS |
RBC Enterprise Fund (cont.)
September 30, 2024
| | | | | | |
| Shares | | | | Value | |
Utilities — 1.0% | | | | | | |
| 11,510 | | Unitil Corp. | | $ | 697,276 | |
| | | | | | |
| |
Total Common Stocks | | | 63,909,476 | |
| | | | | | |
(Cost $41,520,801) | | | | |
|
Exchange Traded Funds — 6.9% | |
| 4,790 | | iShares Biotechnology ETF | | | 697,424 | |
| 14,880 | | iShares Russell Microcap Index Fund | | | 1,835,002 | |
| 23,540 | | SPDR S&P Biotech ETF | | | 2,325,752 | |
| | |
| | | | | | |
Total Exchange Traded Funds | | | 4,858,178 | |
| | | | | | |
(Cost $4,219,222) | | | | |
| |
Investment Company — 1.7% | | | | |
| 1,148,146 | | RBC BlueBay U.S. Government Money Market Fund, Institutional Class 1(a) | | | 1,148,146 | |
| | | | | | |
| |
Total Investment Company | | | 1,148,146 | |
| | | | | | |
(Cost $1,148,146) | | | | |
| |
Total Investments | | $ | 69,915,800 | |
(Cost $46,888,169)(b) — 100.1% | | | | |
| |
Liabilities in excess of other assets — (0.1)% | | | (54,526) | |
| | | | | | |
| |
NET ASSETS — 100.0% | | $ | 69,861,274 | |
| | | | | | |
| | | | | | |
| * | Non-income producing security. |
| (a) | Affiliated investment. |
| (b) | See Notes to Schedules of Portfolio Investments for the tax cost of securities and the breakdown of unrealized appreciation (depreciation). |
Abbreviations used are defined below:
REIT - Real Estate Investment Trust
See Notes to the Financial Statements.
6
|
SCHEDULE OF PORTFOLIO INVESTMENTS |
RBC Small Cap Core Fund
September 30, 2024
| | | | | | |
| Shares | | | | Value | |
Common Stocks — 95.9% | |
Communication Services — 2.7% | |
| 6,754 | | Nexstar Media Group, Inc. | | $ | 1,116,774 | |
| | | | | | |
| |
Consumer Discretionary — 13.5% | | | | |
| 730 | | Cavco Industries, Inc.* | | | 312,615 | |
| 3,066 | | Deckers Outdoor Corp.* | | | 488,874 | |
| 15,523 | | G-III Apparel Group Ltd.* | | | 473,762 | |
| 3,260 | | Group 1 Automotive, Inc. | | | 1,248,710 | |
| 3,500 | | Oxford Industries, Inc. | | | 303,660 | |
| 9,154 | | Patrick Industries, Inc. | | | 1,303,255 | |
| 20,820 | | Taylor Morrison Home Corp.* | | | 1,462,813 | |
| | | | | | |
| | | | | 5,593,689 | |
| | | | | | |
Consumer Staples — 1.5% | | | | |
| 3,320 | | John B Sanfilippo & Son, Inc. | | | 313,109 | |
| 3,720 | | MGP Ingredients, Inc. | | | 309,690 | |
| | | | | | |
| | | | | 622,799 | |
| | | | | | |
Energy — 5.4% | | | | |
| 47,196 | | Magnolia Oil & Gas Corp., Class A | | | 1,152,526 | |
| 17,920 | | Matador Resources Co. | | | 885,607 | |
| 11,789 | | Par Pacific Holdings, Inc.* | | | 207,486 | |
| | | | | | |
| | | | | 2,245,619 | |
| | | | | | |
Financials — 14.0% | | | | |
| 62,462 | | Compass Diversified Holdings | | | 1,382,284 | |
| 7,820 | | Independent Bank Group, Inc. | | | 450,901 | |
| 8,260 | | Pinnacle Financial Partners, Inc. | | | 809,233 | |
| 7,284 | | Preferred Bank/Los Angeles, CA | | | 584,541 | |
| 6,470 | | QCR Holdings, Inc. | | | 478,974 | |
| 9,280 | | Stewart Information Services Corp. | | | 693,587 | |
| 7,770 | | Wintrust Financial Corp. | | | 843,278 | |
| 11,730 | | WSFS Financial Corp. | | | 598,113 | |
| | | | | | |
| | | | | 5,840,911 | |
| | | | | | |
Health Care — 10.9% | | | | |
| 19,131 | | Astrana Health, Inc.* | | | 1,108,450 | |
| 12,054 | | Globus Medical, Inc., Class A* | | | 862,343 | |
| 14,556 | | Lantheus Holdings, Inc.* | | | 1,597,521 | |
| 1,053 | | Masimo Corp.* | | | 140,397 | |
| 85,690 | | MiMedx Group, Inc.* | | | 506,428 | |
| 1,101 | | West Pharmaceutical Services, Inc. | | | 330,476 | |
| | | | | | |
| | | | | 4,545,615 | |
| | | | | | |
Industrials — 23.2% | | | | |
| 102,375 | | ACCO Brands Corp. | | | 559,991 | |
| 6,840 | | Arcosa, Inc. | | | 648,158 | |
| 4,249 | | Atkore, Inc. | | | 360,060 | |
7
|
SCHEDULE OF PORTFOLIO INVESTMENTS |
RBC Small Cap Core Fund (cont.)
September 30, 2024
| | | | | | |
| Shares | | | | Value | |
| 42,630 | | Barrett Business Services, Inc. | | $ | 1,599,051 | |
| 41,870 | | BrightView Holdings, Inc.* | | | 659,034 | |
| 13,366 | | CBIZ, Inc.* | | | 899,398 | |
| 15,001 | | Columbus McKinnon Corp. | | | 540,036 | |
| 22,423 | | Ducommun, Inc.* | | | 1,476,106 | |
| 15,850 | | Enerpac Tool Group Corp. | | | 663,957 | |
| 12,865 | | Greenbrier Cos., Inc. (The) | | | 654,700 | |
| 43,850 | | Hudson Technologies, Inc.* | | | 365,709 | |
| 12,100 | | Insteel Industries, Inc. | | | 376,189 | |
| 5,950 | | Terex Corp. | | | 314,815 | |
| 17,390 | | Thermon Group Holdings, Inc.* | | | 518,918 | |
| | | | | | |
| | | | | 9,636,122 | |
| | | | | | |
Information Technology — 14.0% | | | | |
| 4,523 | | Ambarella, Inc.* | | | 255,120 | |
| 12,980 | | Cohu, Inc.* | | | 333,586 | |
| 7,050 | | InterDigital, Inc. | | | 998,491 | |
| 8,674 | | MKS Instruments, Inc. | | | 942,951 | |
| 3,676 | | Novanta, Inc.* | | | 657,710 | |
| 4,121 | | Onto Innovation, Inc.* | | | 855,355 | |
| 7,240 | | PC Connection, Inc. | | | 546,113 | |
| 15,889 | | Sapiens International Corp. NV | | | 592,183 | |
| 300 | | Super Micro Computer, Inc.* | | | 124,920 | |
| 12,240 | | Tenable Holdings, Inc.* | | | 495,965 | |
| | | | | | |
| | | | | 5,802,394 | |
| | | | | | |
Materials — 2.8% | | | | |
| 13,111 | | Koppers Holdings, Inc. | | | 478,945 | |
| 3,770 | | Materion Corp. | | | 421,712 | |
| 18,840 | | Metallus, Inc.* | | | 279,397 | |
| | | | | | |
| | | | | 1,180,054 | |
| | | | | | |
Real Estate — 5.3% | | | | |
| 11,270 | | Agree Realty Corp., REIT | | | 848,969 | |
| 25,290 | | DiamondRock Hospitality Co., REIT | | | 220,781 | |
| 2,990 | | EastGroup Properties, Inc., REIT | | | 558,592 | |
| 15,188 | | STAG Industrial, Inc., REIT | | | 593,699 | |
| | | | | | |
| | | | | 2,222,041 | |
| | | | | | |
Utilities — 2.6% | | | | |
| 7,310 | | Southwest Gas Holdings, Inc. | | | 539,186 | |
| 8,920 | | Unitil Corp. | | | 540,373 | |
| | | | | | |
| | | | | 1,079,559 | |
| | | | | | |
| |
Total Common Stocks | | | 39,885,577 | |
| | | | | | |
(Cost $24,359,748) | | | | |
| |
Exchange Traded Funds — 2.8% | | | | |
| 168 | | iShares Russell 2000 Index Fund | | | 37,110 | |
8
|
SCHEDULE OF PORTFOLIO INVESTMENTS |
RBC Small Cap Core Fund (cont.)
September 30, 2024
| | | | | | |
| Shares | | | | Value | |
| 11,390 | | SPDR S&P Biotech ETF | | $ | 1,125,332 | |
| | | | | | |
Total Exchange Traded Funds | | | 1,162,442 | |
| | | | | | |
(Cost $1,385,614) | | | | | | |
| |
Investment Company — 1.3% | | | | |
| 538,429 | | RBC BlueBay U.S. Government Money Market Fund, Institutional Class 1(a) | | | 538,429 | |
| | | | | | |
| |
Total Investment Company | | | 538,429 | |
| | | | | | |
(Cost $538,429) | | | | |
| |
Total Investments | | $ | 41,586,448 | |
(Cost $26,283,791)(b) — 100.0% | | | | |
| |
Liabilities in excess of other assets — (0.0)% | | | (12,386) | |
| | | | | | |
| |
NET ASSETS — 100.0% | | $ | 41,574,062 | |
| | | | | | |
| * | Non-income producing security. |
| (a) | Affiliated investment. |
| (b) | See Notes to Schedules of Portfolio Investments for the tax cost of securities and the breakdown of unrealized appreciation (depreciation). |
Abbreviations used are defined below:
REIT - Real Estate Investment Trust
See Notes to the Financial Statements.
9
|
SCHEDULE OF PORTFOLIO INVESTMENTS |
RBC Microcap Value Fund
September 30, 2024
| | | | | | |
| Shares | | | | Value | |
Common Stocks — 96.6% | | | | |
Communication Services — 1.4% | | | | |
| 13,700 | | AMC Networks, Inc., Class A* | | $ | 119,053 | |
| 72,450 | | DHI Group, Inc.* | | | 133,308 | |
| 26,600 | | Gray Television, Inc. | | | 142,576 | |
| 51,000 | | National CineMedia, Inc.* | | | 359,550 | |
| 16,200 | | Reservoir Media, Inc.* | | | 131,382 | |
| 21,400 | | Saga Communications, Inc., Class A | | | 307,304 | |
| 38,900 | | SPAR Group, Inc.* | | | 95,305 | |
| 20,800 | | Spok Holdings, Inc. | | | 313,248 | |
| | | | | | |
| | | | | 1,601,726 | |
| | | | | | |
Consumer Discretionary — 14.6% | | | | |
| 550 | | AMCON Distributing Co. | | | 79,722 | |
| 9,000 | | American Public Education, Inc.* | | | 132,750 | |
| 1,900 | | America’s Car-Mart, Inc.* | | | 79,648 | |
| 21,300 | | Anemostat Door Products*,(a),(b),(c) | | | 0 | |
| 21,300 | | Anemostat, Inc.*,(a),(b),(c) | | | 0 | |
| 33,200 | | Beazer Homes USA, Inc.* | | | 1,134,444 | |
| 870 | | Biglari Holdings, Inc., Class B* | | | 149,649 | |
| 6,300 | | Canterbury Park Holding Corp. | | | 121,590 | |
| 2,043 | | Century Communities, Inc. | | | 210,388 | |
| 3,700 | | Chuy’s Holdings, Inc.* | | | 138,380 | |
| 41,500 | | Crown Crafts, Inc. | | | 199,200 | |
| 20,700 | | Denny’s Corp.* | | | 133,515 | |
| 34,900 | | Destination XL Group, Inc.* | | | 102,606 | |
| 2,300 | | Dine Brands Global, Inc. | | | 71,829 | |
| 21,300 | | El Pollo Loco Holdings, Inc.* | | | 291,810 | |
| 13,300 | | Escalade, Inc. | | | 187,131 | |
| 12,400 | | Ethan Allen Interiors, Inc. | | | 395,436 | |
| 7,000 | | Flanigan’s Enterprises, Inc. | | | 184,800 | |
| 14,800 | | Flexsteel Industries, Inc. | | | 655,492 | |
| 7,300 | | Hamilton Beach Brands Holding Co., Class A | | | 222,139 | |
| 20,180 | | Haverty Furniture Cos., Inc. | | | 554,345 | |
| 10,400 | | hhgregg, Inc.* | | | 2 | |
| 62,400 | | Holley, Inc.* | | | 184,080 | |
| 8,300 | | Hooker Furnishings Corp. | | | 150,064 | |
| 3,300 | | Hovnanian Enterprises, Inc., Class A* | | | 674,421 | |
| 13,000 | | Inspired Entertainment, Inc.* | | | 120,510 | |
| 7,400 | | JAKKS Pacific, Inc.* | | | 188,848 | |
| 6,440 | | Johnson Outdoors, Inc., Class A | | | 233,128 | |
| 23,500 | | Kid Brands, Inc.*,(a),(b) | | | 0 | |
| 36,120 | | Lakeland Industries, Inc. | | | 726,012 | |
| 18,100 | | Landsea Homes Corp.* | | | 223,535 | |
| 24,400 | | Latham Group, Inc.* | | | 165,920 | |
| 95,270 | | Lazare Kaplan International, Inc.*,(a),(b),(c) | | | 0 | |
| 8,900 | | La-Z-Boy, Inc. | | | 382,077 | |
| 17,600 | | Legacy Housing Corp.* | | | 481,360 | |
| 48,000 | | Leslie’s, Inc.* | | | 151,680 | |
10
|
SCHEDULE OF PORTFOLIO INVESTMENTS |
RBC Microcap Value Fund (cont.)
September 30, 2024
| | | | | | |
| Shares | | | | Value | |
| 42,300 | | Lincoln Educational Services Corp.* | | $ | 505,062 | |
| 3,900 | | Lovesac Co. (The)* | | | 111,735 | |
| 2,080 | | M/I Homes, Inc.* | | | 356,429 | |
| 18,480 | | MarineMax, Inc.* | | | 651,790 | |
| 9,800 | | MasterCraft Boat Holdings, Inc.* | | | 178,458 | |
| 9,750 | | McRae Industries, Inc., Class A | | | 476,287 | |
| 2,285 | | Mecklermedia Corp.*,(a),(b),(c) | | | 0 | |
| 15,700 | | Mestek, Inc.* | | | 467,075 | |
| 18,340 | | Movado Group, Inc. | | | 341,124 | |
| 4,600 | | Nathan’s Famous, Inc. | | | 372,140 | |
| 13,000 | | Nobility Homes, Inc. | | | 455,000 | |
| 41,000 | | Orleans Homebuilders, Inc.*,(a),(b),(c) | | | 0 | |
| 2,025 | | Patrick Industries, Inc. | | | 288,299 | |
| 119,400 | | Point.360*,(a),(b),(c) | | | 0 | |
| 2,000 | | RCI Hospitality Holdings, Inc. | | | 89,100 | |
| 5,900 | | Regis Corp.* | | | 162,309 | |
| 26,900 | | Rocky Brands, Inc. | | | 857,034 | |
| 10,300 | | Smith & Wesson Brands, Inc. | | | 133,694 | |
| 1,960 | | Sonic Automotive, Inc., Class A | | | 114,621 | |
| 15,400 | | Standard Motor Products, Inc. | | | 511,280 | |
| 11,100 | | Stoneridge, Inc.* | | | 124,209 | |
| 5,330 | | Strattec Security Corp.* | | | 227,378 | |
| 4,310 | | Stride, Inc.* | | | 367,686 | |
| 11,389 | | Superior Group of Cos., Inc. | | | 176,416 | |
| 26,600 | | Tile Shop Holdings, Inc.* | | | 175,294 | |
| 58,800 | | Torrid Holdings, Inc.* | | | 231,084 | |
| 6,200 | | Universal Technical Institute, Inc.* | | | 100,812 | |
| 30,000 | | Universal Travel Group*,(a),(b),(c) | | | 0 | |
| 14,600 | | Vera Bradley, Inc.* | | | 79,716 | |
| 1,397 | | Walking Co. Holdings, Inc. (The)*,(a),(b),(c) | | | 0 | |
| 17,600 | | Weyco Group, Inc. | | | 599,104 | |
| 3,700 | | Zumiez, Inc.* | | | 78,810 | |
| | | | | | |
| | | | | 16,958,457 | |
| | | | | | |
Consumer Staples — 4.9% | | | | |
| 7,900 | | Alico, Inc. | | | 220,963 | |
| 5,350 | | Andersons, Inc. (The) | | | 268,249 | |
| 3,225 | | Central Garden & Pet Co.* | | | 117,616 | |
| 36 | | Hawaiian Macadamia Nut Orchards L.P.*,(b) | | | 82,800 | |
| 11,760 | | Ingles Markets, Inc., Class A | | | 877,296 | |
| 3,900 | | Limoneira Co. | | | 103,350 | |
| 4,400 | | Medifast, Inc. | | | 84,216 | |
| 37,560 | | Natural Grocers by Vitamin Cottage, Inc. | | | 1,115,156 | |
| 22,300 | | Nature’s Sunshine Products, Inc.* | | | 303,726 | |
| 15,130 | | Oil-Dri Corp. of America | | | 1,043,819 | |
| 6,500 | | Seneca Foods Corp., Class A* | | | 405,145 | |
11
|
SCHEDULE OF PORTFOLIO INVESTMENTS |
RBC Microcap Value Fund (cont.)
September 30, 2024
| | | | | | |
| Shares | | | | Value | |
| 23,260 | | SpartanNash Co. | | $ | 521,256 | |
| 17,300 | | Village Super Market, Inc., Class A | | | 549,967 | |
| | | | | | |
| | | | | 5,693,559 | |
| | | | | | |
Energy — 5.2% | | | | |
| 45,500 | | Aegean Marine Petroleum Network, Inc.*,(a),(b),(c) | | | 0 | |
| 28,800 | | Amplify Energy Corp.* | | | 188,064 | |
| 21,700 | | Berry Corp. | | | 111,538 | |
| 10,700 | | DMC Global, Inc.* | | | 138,886 | |
| 10,400 | | Dorian LPG Ltd. | | | 357,968 | |
| 22,700 | | Epsilon Energy Ltd. | | | 133,022 | |
| 74,490 | | FutureFuel Corp. | | | 428,317 | |
| 10,800 | | Geospace Technologies Corp.* | | | 111,672 | |
| 9,000 | | Global Partners LP | | | 419,040 | |
| 13,400 | | Hallador Energy Co.* | | | 126,362 | |
| 2,950 | | Harvest Natural Resources, Inc.*,(a),(b),(c) | | | 0 | |
| 11,700 | | Mexco Energy Corp. | | | 142,038 | |
| 7,200 | | Natural Gas Services Group, Inc.* | | | 137,592 | |
| 24,100 | | Newpark Resources, Inc.* | | | 167,013 | |
| 56,140 | | North American Construction Group Ltd. | | | 1,049,818 | |
| 36,700 | | OPAL Fuels, Inc., Class A* | | | 133,955 | |
| 25,600 | | PermRock Royalty Trust | | | 101,120 | |
| 62,000 | | PHX Minerals, Inc. | | | 209,560 | |
| 1,950 | | PrimeEnergy Resources Corp.* | | | 268,710 | |
| 19,800 | | Ranger Energy Services, Inc. | | | 235,818 | |
| 14,230 | | REX American Resources Corp.* | | | 658,707 | |
| 4,500 | | Riley Exploration Permian, Inc. | | | 119,205 | |
| 87,200 | | Ring Energy, Inc.* | | | 139,520 | |
| 8,700 | | SandRidge Energy, Inc. | | | 106,401 | |
| 64,300 | | Smart Sand, Inc.* | | | 126,671 | |
| 20,900 | | Solaris Energy Infrastructure, Inc., Class A | | | 266,684 | |
| 16,500 | | VAALCO Energy, Inc. | | | 94,710 | |
| | | | | | |
| | | | | 5,972,391 | |
| | | | | | |
Financials — 34.1% | | | | |
| 17,400 | | Acacia Research Corp.* | | | 81,084 | |
| 4,700 | | ACNB Corp. | | | 205,249 | |
| 8,400 | | AFC Gamma, Inc., REIT | | | 85,764 | |
| 39,150 | | Affirmative Insurance Holdings, Inc.*,(a),(b),(c) | | | 0 | |
| 12,700 | | AG Mortgage Investment Trust, Inc., REIT | | | 95,377 | |
| 4,000 | | Alerus Financial Corp. | | | 91,520 | |
| 8,030 | | Amalgamated Financial Corp. | | | 251,901 | |
| 6,700 | | Ambac Financial Group, Inc.* | | | 75,107 | |
| 8,900 | | Amerant Bancorp, Inc. | | | 190,193 | |
| 3,900 | | American Business Bank* | | | 147,966 | |
| 7,600 | | Ames National Corp. | | | 138,548 | |
| 7,100 | | Angel Oak Mortgage REIT, Inc., REIT | | | 74,053 | |
| 9,070 | | Ares Commercial Real Estate Corp., REIT | | | 63,490 | |
| 2,800 | | Arrow Financial Corp. | | | 80,248 | |
12
|
SCHEDULE OF PORTFOLIO INVESTMENTS |
RBC Microcap Value Fund (cont.)
September 30, 2024
| | | | | | |
| Shares | | | | Value | |
| 3,272 | | Atlantic Union Bankshares Corp. | | $ | 123,256 | |
| 5,300 | | Atlanticus Holdings Corp.* | | | 185,924 | |
| 11,600 | | Banco Latinoamericano de Comercio Exterior SA, Class E | | | 376,884 | |
| 2,800 | | Bancorp, Inc. (The)* | | | 149,800 | |
| 2,800 | | Bank First Corp. | | | 253,960 | |
| 5,142 | | Bank of Marin Bancorp | | | 103,303 | |
| 6,000 | | Bank7 Corp. | | | 224,820 | |
| 14,400 | | BankFinancial Corp. | | | 175,392 | |
| 7,000 | | Bankwell Financial Group, Inc. | | | 209,650 | |
| 2,628 | | Banner Corp. | | | 156,524 | |
| 8,500 | | Bar Harbor Bankshares | | | 262,140 | |
| 5,300 | | BayCom Corp. | | | 125,716 | |
| 10,500 | | BCB Bancorp, Inc. | | | 129,570 | |
| 100,000 | | Beverly Hills Bancorp, Inc.*,(a),(b),(c) | | | 0 | |
| 9,423 | | BlackRock TCP Capital Corp. | | | 78,117 | |
| 3,500 | | BNCCORP, Inc. | | | 92,750 | |
| 17,700 | | Bridgewater Bancshares, Inc.* | | | 250,809 | |
| 10,174 | | Brookline Bancorp, Inc. | | | 102,656 | |
| 3,076 | | Burke & Herbert Financial Services Corp. | | | 187,605 | |
| 5,500 | | Business First Bancshares, Inc. | | | 141,185 | |
| 1,700 | | C&F Financial Corp. | | | 99,195 | |
| 4,929 | | California BanCorp* | | | 72,900 | |
| 3,887 | | California First Leasing Corp. | | | 82,599 | |
| 2,100 | | Camden National Corp. | | | 86,772 | |
| 6,200 | | Capital Bancorp, Inc. | | | 159,402 | |
| 7,890 | | Capital City Bank Group, Inc. | | | 278,438 | |
| 38,000 | | Capitol Bancorp Ltd.*,(a),(b),(c) | | | 0 | |
| 5,700 | | Carter Bankshares, Inc.* | | | 99,123 | |
| 4,100 | | Central Pacific Financial Corp. | | | 120,991 | |
| 6,500 | | CF Bankshares, Inc. | | | 140,725 | |
| 1,900 | | Chemung Financial Corp. | | | 91,238 | |
| 12,500 | | Chicago Atlantic Real Estate Finance, Inc., REIT | | | 193,875 | |
| 2,800 | | ChoiceOne Financial Services, Inc. | | | 86,548 | |
| 8,200 | | Citizens & Northern Corp. | | | 161,458 | |
| 6,300 | | Citizens Community Bancorp, Inc. | | | 89,271 | |
| 2,754 | | Citizens Financial Services, Inc. | | | 161,798 | |
| 12,200 | | Civista Bancshares, Inc. | | | 217,404 | |
| 10,000 | | CNB Financial Corp. | | | 240,600 | |
| 3,000 | | Coastal Financial Corp.* | | | 161,970 | |
| 6,600 | | Colony Bankcorp, Inc. | | | 102,432 | |
| 9,808 | | Community West Bancshares | | | 188,902 | |
| 72,603 | | Consumer Portfolio Services, Inc.* | | | 681,016 | |
| 10,600 | | Crescent Capital BDC, Inc. | | | 196,100 | |
| 1,400 | | Croghan Bancshares, Inc. | | | 64,596 | |
| 10,088 | | Dime Community Bancshares, Inc. | | | 290,534 | |
| 5,200 | | Donegal Group, Inc., Class A | | | 76,648 | |
| 5,734 | | Eastern Bankshares, Inc. | | | 93,980 | |
| 18,900 | | Ellington Credit Co., REIT | | | 131,922 | |
13
|
SCHEDULE OF PORTFOLIO INVESTMENTS |
RBC Microcap Value Fund (cont.)
September 30, 2024
| | | | | | |
| Shares | | | | Value | |
| 8,000 | | Embassy Bancorp, Inc. | | $ | 125,920 | |
| 12,480 | | Enova International, Inc.* | | | 1,045,699 | |
| 8,300 | | Enterprise Bancorp, Inc. | | | 265,268 | |
| 5,878 | | Enterprise Financial Services Corp. | | | 301,306 | |
| 4,700 | | Equity Bancshares, Inc., Class A | | | 192,136 | |
| 5,300 | | Esquire Financial Holdings, Inc. | | | 345,613 | |
| 6,800 | | ESSA Bancorp, Inc. | | | 130,696 | |
| 4,400 | | Evans Bancorp, Inc. | | | 171,468 | |
| 12,400 | | EZCORP, Inc., Class A* | | | 139,004 | |
| 3,600 | | Farmers & Merchants Bancorp, Inc. | | | 99,540 | |
| 14,900 | | Farmers National Banc Corp. | | | 225,288 | |
| 4,787 | | FB Financial Corp. | | | 224,654 | |
| 5,230 | | Federal Agricultural Mortgage Corp., Class C | | | 980,154 | |
| 2,800 | | Fidelity D&D Bancorp, Inc. | | | 138,152 | |
| 4,400 | | Fidus Investment Corp. | | | 86,240 | |
| 8,000 | | Financial Institutions, Inc. | | | 203,760 | |
| 6,700 | | First Bancorp, Inc. (The) | | | 176,344 | |
| 10,400 | | First Bank | | | 158,080 | |
| 7,700 | | First Business Financial Services, Inc. | | | 351,043 | |
| 6,700 | | First Community Bankshares, Inc. | | | 289,105 | |
| 6,400 | | First Community Corp. | | | 137,216 | |
| 7,060 | | First Financial Corp. | | | 309,581 | |
| 10,000 | | First Financial Northwest, Inc. | | | 225,200 | |
| 17,000 | | First Foundation, Inc. | | | 106,080 | |
| 7,760 | | First Internet Bancorp | | | 265,858 | |
| 9,800 | | First of Long Island Corp. (The) | | | 126,126 | |
| 38,000 | | First Place Financial Corp.*,(a),(b),(c) | | | 0 | |
| 10,100 | | First Reliance Bancshares, Inc.* | | | 102,414 | |
| 5,400 | | First Savings Financial Group, Inc. | | | 128,574 | |
| 3,800 | | First United Corp. | | | 113,392 | |
| 6,600 | | First Western Financial, Inc.* | | | 132,000 | |
| 3,200 | | Five Star Bancorp | | | 95,136 | |
| 8,600 | | Flushing Financial Corp. | | | 125,388 | |
| 7,400 | | FS Bancorp, Inc. | | | 329,226 | |
| 13,250 | | FVCBankcorp, Inc.* | | | 172,912 | |
| 5,500 | | Gladstone Capital Corp. | | | 132,275 | |
| 10,200 | | Gladstone Investment Corp. | | | 147,390 | |
| 8,050 | | Guaranty Bancshares, Inc. | | | 276,759 | |
| 8,700 | | Guild Holdings Co., Class A | | | 144,681 | |
| 11,700 | | Hanmi Financial Corp. | | | 217,620 | |
| 8,800 | | HarborOne Bancorp, Inc. | | | 114,224 | |
| 3,500 | | Hawthorn Bancshares, Inc. | | | 87,605 | |
| 13,000 | | HBT Financial, Inc. | | | 284,440 | |
| 13,600 | | Heritage Commerce Corp. | | | 134,368 | |
| 12,200 | | Heritage Insurance Holdings, Inc.* | | | 149,328 | |
| 700 | | Hingham Institution for Savings (The), FOR | | | 170,317 | |
| 5,000 | | Home Bancorp, Inc. | | | 222,900 | |
| 9,940 | | HomeTrust Bancshares, Inc. | | | 338,755 | |
| 10,000 | | Independent Bank Corp. | | | 333,500 | |
14
|
SCHEDULE OF PORTFOLIO INVESTMENTS |
RBC Microcap Value Fund (cont.)
September 30, 2024
| | | | | | |
| Shares | | | | Value | |
| 8,500 | | Investar Holding Corp. | | $ | 164,900 | |
| 3,693 | | Investors Title Co. | | | 848,651 | |
| 6,400 | | LCNB Corp. | | | 96,448 | |
| 8,000 | | MainStreet Bancshares, Inc. | | | 147,600 | |
| 38,700 | | Manhattan Bridge Capital, Inc., REIT | | | 215,559 | |
| 16,700 | | Medallion Financial Corp. | | | 135,938 | |
| 5,000 | | Mercantile Bank Corp. | | | 218,600 | |
| 6,580 | | Merchants Bancorp | | | 295,837 | |
| 13,000 | | Meridian Corp. | | | 164,320 | |
| 8,000 | | Metrocity Bankshares, Inc. | | | 244,960 | |
| 5,900 | | Metropolitan Bank Holding Corp.* | | | 310,222 | |
| 5,500 | | Mid Penn Bancorp, Inc. | | | 164,065 | |
| 4,100 | | Middlefield Banc Corp. | | | 118,080 | |
| 8,700 | | Midland States Bancorp, Inc. | | | 194,706 | |
| 6,700 | | MidWestOne Financial Group, Inc. | | | 191,151 | |
| 7,200 | | MVB Financial Corp. | | | 139,392 | |
| 6,200 | | National Bankshares, Inc. | | | 185,380 | |
| 14,000 | | NewtekOne, Inc. | | | 174,440 | |
| 5,960 | | Northeast Bank | | | 459,695 | |
| 14,600 | | Northeast Community Bancorp, Inc. | | | 386,170 | |
| 9,700 | | Northfield Bancorp, Inc. | | | 112,520 | |
| 5,100 | | Northrim BanCorp, Inc. | | | 363,222 | |
| 31,470 | | Northwest Bancshares, Inc. | | | 421,069 | |
| 2,600 | | Norwood Financial Corp. | | | 71,708 | |
| 2,900 | | Oak Valley Bancorp | | | 77,053 | |
| 11,640 | | OFG Bancorp | | | 522,869 | |
| 4,496 | | Old National Bancorp | | | 83,895 | |
| 20,400 | | Old Second Bancorp, Inc. | | | 318,036 | |
| 2,600 | | Onity Group, Inc.* | | | 83,044 | |
| 13,200 | | OP Bancorp | | | 164,736 | |
| 10,770 | | Oppenheimer Holdings, Inc., Class A | | | 550,993 | |
| 4,000 | | Orange County Bancorp, Inc. | | | 241,280 | |
| 13,525 | | Orrstown Financial Services, Inc. | | | 486,359 | |
| 25,800 | | Oxford Square Capital Corp. | | | 73,014 | |
| 8,500 | | Pacific Financial Corp. | | | 99,025 | |
| 9,900 | | Palmer Square Capital BDC, Inc. | | | 161,370 | |
| 9,300 | | Parke Bancorp, Inc. | | | 194,370 | |
| 6,600 | | PCB Bancorp | | | 124,014 | |
| 5,500 | | Peapack-Gladstone Financial Corp. | | | 150,755 | |
| 24,100 | | PennantPark Investment Corp. | | | 168,459 | |
| 3,700 | | Penns Woods Bancorp, Inc. | | | 88,005 | |
| 4,100 | | Peoples Bancorp of North Carolina, Inc. | | | 104,099 | |
| 15,458 | | Peoples Bancorp, Inc. | | | 465,131 | |
| 3,900 | | Peoples Financial Services Corp. | | | 182,832 | |
| 7,300 | | Pinnacle Bank/Gilroy CA* | | | 140,525 | |
| 2,000 | | Plumas Bancorp | | | 81,560 | |
| 9,900 | | Ponce Financial Group, Inc.* | | | 115,731 | |
| 25,564 | | Premier Financial Corp. | | | 600,243 | |
15
|
SCHEDULE OF PORTFOLIO INVESTMENTS |
RBC Microcap Value Fund (cont.)
September 30, 2024
| | | | | | |
| Shares | | | | Value | |
| 18,400 | | Primis Financial Corp. | | $ | 224,112 | |
| 5,500 | | Princeton Bancorp, Inc. | | | 203,390 | |
| 5,900 | | Private Bancorp of America, Inc.* | | | 265,500 | |
| 7,600 | | Provident Bancorp, Inc.* | | | 82,004 | |
| 11,700 | | Provident Financial Holdings, Inc. | | | 167,895 | |
| 13,770 | | Provident Financial Services, Inc. | | | 255,571 | |
| 11,200 | | RBB Bancorp | | | 257,824 | |
| 9,681 | | Ready Capital Corp., REIT | | | 73,866 | |
| 3,700 | | Red River Bancshares, Inc. | | | 192,400 | |
| 14,660 | | Regional Management Corp. | | | 479,529 | |
| 19,100 | | Riverview Bancorp, Inc. | | | 89,961 | |
| 3,050 | | S&T Bancorp, Inc. | | | 128,009 | |
| 61,700 | | Sachem Capital Corp., REIT | | | 155,484 | |
| 6,020 | | Safety Insurance Group, Inc. | | | 492,316 | |
| 3,400 | | Saratoga Investment Corp. | | | 78,846 | |
| 6,300 | | SB Financial Group, Inc. | | | 129,528 | |
| 11,025 | | Security National Financial Corp., Class A* | | | 101,430 | |
| 17,700 | | Seven Hills Realty Trust, REIT | | | 243,729 | |
| 11,000 | | Shore Bancshares, Inc. | | | 153,890 | |
| 10,300 | | Sierra Bancorp | | | 297,464 | |
| 11,500 | | SmartFinancial, Inc. | | | 335,110 | |
| 6,300 | | South Atlantic Bancshares, Inc. | | | 88,452 | |
| 10,310 | | South Plains Financial, Inc. | | | 349,715 | |
| 5,900 | | Southern First Bancshares, Inc.* | | | 201,072 | |
| 5,900 | | Southern Missouri Bancorp, Inc. | | | 333,291 | |
| 3,000 | | Southern States Bancshares, Inc. | | | 92,190 | |
| 9,300 | | Stellus Capital Investment Corp. | | | 127,317 | |
| 6,680 | | Stewart Information Services Corp. | | | 499,263 | |
| 1 | | Sunrise Realty Trust, Inc., REIT | | | 14 | |
| 12,200 | | SWK Holdings Corp.* | | | 210,938 | |
| 4,700 | | Third Coast Bancshares, Inc.* | | | 125,819 | |
| 6,900 | | Timberland Bancorp, Inc. | | | 208,794 | |
| 5,400 | | Tiptree, Inc. | | | 105,678 | |
| 9,300 | | United Security Bancshares | | | 81,003 | |
| 19,000 | | United Western Bancorp, Inc.*,(a),(b),(c) | | | 0 | |
| 5,900 | | Unity Bancorp, Inc. | | | 200,954 | |
| 4,500 | | Universal Insurance Holdings, Inc. | | | 99,720 | |
| 5,400 | | Velocity Financial, Inc.* | | | 105,894 | |
| 2,600 | | Washington Trust Bancorp, Inc. | | | 83,746 | |
| 14,800 | | Waterstone Financial, Inc. | | | 217,560 | |
| 10,100 | | West BanCorp, Inc. | | | 192,001 | |
| 26,300 | | Western New England Bancorp, Inc. | | | 223,550 | |
| 6,880 | | Westwood Holdings Group, Inc. | | | 97,696 | |
| 6,100 | | William Penn Bancorp | | | 74,725 | |
| 2,516 | | Wintrust Financial Corp. | | | 273,061 | |
| | | | | | |
| | | | | 39,556,075 | |
| | | | | | |
Health Care — 2.0% | | | | |
| 6,200 | | Cross Country Healthcare, Inc.* | | | 83,328 | |
16
|
SCHEDULE OF PORTFOLIO INVESTMENTS |
RBC Microcap Value Fund (cont.)
September 30, 2024
| | | | | | |
| Shares | | | | Value | |
| 57,600 | | DocGo, Inc.* | | $ | 191,232 | |
| 36,900 | | Eagle Pharmaceuticals, Inc.* | | | 137,637 | |
| 6,100 | | Entrada Therapeutics, Inc.* | | | 97,478 | |
| 17,700 | | FONAR Corp.* | | | 286,563 | |
| 2,500 | | Kewaunee Scientific Corp.* | | | 83,225 | |
| 31,400 | | OraSure Technologies, Inc.* | | | 134,078 | |
| 65,000 | | Organogenesis Holdings, Inc.* | | | 185,900 | |
| 9,500 | | Pacira BioSciences, Inc.* | | | 142,975 | |
| 7,200 | | Phibro Animal Health Corp., Class A | | | 162,144 | |
| 29,100 | | Sensus Healthcare, Inc.* | | | 168,780 | |
| 9,100 | | Tactile Systems Technology, Inc.* | | | 132,951 | |
| 1,300 | | Utah Medical Products, Inc. | | | 86,983 | |
| 22,700 | | Vanda Pharmaceuticals, Inc.* | | | 106,463 | |
| 6,000 | | Varex Imaging Corp.* | | | 71,520 | |
| 17,900 | | Voyager Therapeutics, Inc.* | | | 104,715 | |
| 6,600 | | Zymeworks, Inc.* | | | 82,830 | |
| | | | | | |
| | | | | 2,258,802 | |
| | | | | | |
Industrials — 18.8% | | | | |
| 11,000 | | Acme United Corp. | | | 458,040 | |
| 6,500 | | Allient Inc. | | | 123,435 | |
| 83,100 | | ARC Document Solutions, Inc. | | | 280,878 | |
| 9,500 | | Aris Water Solutions, Inc., Class A | | | 160,265 | |
| 26,100 | | BGSF, Inc. | | | 219,762 | |
| 5,250 | | BlueLinx Holdings, Inc.* | | | 553,455 | |
| 45,400 | | Broadwind Energy, Inc.* | | | 103,058 | |
| 4,274 | | CECO Environmental Corp.* | | | 120,527 | |
| 10,678 | | Cenveo, Inc.*,(a),(b),(c) | | | 0 | |
| 8,600 | | Civeo Corp. | | | 235,640 | |
| 33,178 | | CompX International, Inc. | | | 969,129 | |
| 31,200 | | Concrete Pumping Holdings, Inc.* | | | 180,648 | |
| 36,000 | | Conduent, Inc.* | | | 145,080 | |
| 43,300 | | Costamare, Inc. | | | 680,676 | |
| 11,600 | | Covenant Logistics Group, Inc. | | | 612,944 | |
| 16,800 | | DLH Holdings Corp.* | | | 157,248 | |
| 27,760 | | Ducommun, Inc.* | | | 1,827,441 | |
| 2,400 | | DXP Enterprises, Inc.* | | | 128,064 | |
| 21,700 | | Eastern Co. (The) | | | 704,165 | |
| 33,660 | | Ennis, Inc. | | | 818,611 | |
| 15,590 | | Espey Mfg. & Electronics Corp. | | | 469,103 | |
| 8,700 | | EVI Industries, Inc. | | | 168,171 | |
| 4,900 | | Forrester Research, Inc.* | | | 88,249 | |
| 14,500 | | Gencor Industries, Inc.* | | | 302,470 | |
| 2,700 | | Graham Corp.* | | | 79,893 | |
| 18,900 | | Great Lakes Dredge & Dock Corp.* | | | 199,017 | |
| 12,810 | | Greenbrier Cos., Inc. (The) | | | 651,901 | |
| 9,700 | | Hudson Technologies, Inc.* | | | 80,898 | |
| 10,700 | | Insteel Industries, Inc. | | | 332,663 | |
17
|
SCHEDULE OF PORTFOLIO INVESTMENTS |
RBC Microcap Value Fund (cont.)
September 30, 2024
| | | | | | |
| Shares | | | | Value | |
| 10,600 | | Interface, Inc. | | $ | 201,082 | |
| 3,900 | | L B Foster Co., Class A* | | | 79,677 | |
| 7,300 | | Limbach Holdings, Inc.* | | | 553,048 | |
| 25,350 | | LSI Industries, Inc. | | | 409,403 | |
| 24,500 | | Manitex International, Inc.* | | | 137,935 | |
| 15,500 | | Manitowoc Co., Inc. (The)* | | | 149,110 | |
| 8,940 | | Marten Transport Ltd. | | | 158,238 | |
| 15,300 | | Mayville Engineering Co., Inc.* | | | 322,524 | |
| 22,579 | | Miller Industries, Inc. | | | 1,377,319 | |
| 11,400 | | Mistras Group, Inc.* | | | 129,618 | |
| 4,900 | | National Presto Industries, Inc. | | | 368,186 | |
| 20,000 | | NL Industries, Inc. | | | 148,600 | |
| 13,000 | | Northwest Pipe Co.* | | | 586,690 | |
| 7,600 | | PAM Transportation Services, Inc.* | | | 140,600 | |
| 11,600 | | Park Aerospace Corp. | | | 151,148 | |
| 3,400 | | Park-Ohio Holdings Corp. | | | 104,380 | |
| 10,900 | | Perma-Pipe International Holdings, Inc.* | | | 141,482 | |
| 1,000 | | Powell Industries, Inc. | | | 221,990 | |
| 3,540 | | Preformed Line Products Co. | | | 453,403 | |
| 14,500 | | Quanex Building Products Corp. | | | 402,375 | |
| 52,800 | | Radiant Logistics, Inc.* | | | 339,504 | |
| 17,200 | | Resources Connection, Inc. | | | 166,840 | |
| 44,400 | | Safe Bulkers, Inc. | | | 229,992 | |
| 11,400 | | Shyft Group, Inc. (The) | | | 143,070 | |
| 7,200 | | Sun Country Airlines Holdings, Inc.* | | | 80,712 | |
| 8,500 | | Taylor Devices, Inc.* | | | 424,320 | |
| 12,100 | | Titan International, Inc.* | | | 98,373 | |
| 14,800 | | Titan Machinery, Inc.* | | | 206,164 | |
| 18,500 | | Twin Disc, Inc. | | | 231,065 | |
| 8,800 | | Ultralife Corp.* | | | 79,552 | |
| 13,700 | | Virco Mfg. Corp. | | | 189,197 | |
| 19,000 | | VirTra, Inc.* | | | 118,180 | |
| 4,200 | | VSE Corp. | | | 347,466 | |
| 3,000 | | Willdan Group, Inc.* | | | 122,850 | |
| 12,638 | | Willis Lease Finance Corp. | | | 1,880,661 | |
| | | | | | |
| | | | | 21,746,185 | |
| | | | | | |
Information Technology — 6.9% | | | | |
| 17,700 | | AstroNova, Inc.* | | | 238,242 | |
| 10,050 | | Aviat Networks, Inc.* | | | 217,381 | |
| 12,800 | | Bel Fuse, Inc., Class B | | | 1,004,928 | |
| 6,600 | | BK Technologies Corp.* | | | 143,682 | |
| 11,800 | | Coda Octopus Group, Inc.* | | | 85,550 | |
| 29,200 | | CompoSecure, Inc., Class A | | | 409,384 | |
| 5,300 | | Consensus Cloud Solutions, Inc.* | | | 124,815 | |
| 16,800 | | CoreCard Corp.* | | | 243,936 | |
| 7,600 | | CPI Card Group, Inc.* | | | 211,508 | |
| 29,800 | | Crexendo, Inc.* | | | 138,272 | |
| 4,050 | | CTS Corp. | | | 195,939 | |
18
|
SCHEDULE OF PORTFOLIO INVESTMENTS |
RBC Microcap Value Fund (cont.)
September 30, 2024
| | | | | | |
| Shares | | | | Value | |
| 6,900 | | Daktronics, Inc.* | | $ | 89,079 | |
| 5,750 | | Digi International, Inc.* | | | 158,298 | |
| 32,600 | | Eastman Kodak Co.* | | | 153,872 | |
| 4,680 | | ePlus, Inc.* | | | 460,231 | |
| 11,200 | | Frequency Electronics, Inc. | | | 135,296 | |
| 44,000 | | Immersion Corp. | | | 392,480 | |
| 29,800 | | Information Services Group, Inc. | | | 98,340 | |
| 9,900 | | Intellinetics, Inc.* | | | 110,781 | |
| 20,500 | | inTEST Corp.* | | | 149,650 | |
| 23,400 | | Key Tronic Corp.* | | | 133,848 | |
| 24,100 | | Kimball Electronics, Inc.* | | | 446,091 | |
| 12,900 | | Nortech Systems, Inc.* | | | 151,059 | |
| 12,920 | | PC Connection, Inc. | | | 974,556 | |
| 32,130 | | Photronics, Inc.* | | | 795,539 | |
| 3,590 | | ReposiTrak, Inc. | | | 66,307 | |
| 9,000 | | Richardson Electronics Ltd. | | | 111,060 | |
| 38,900 | | Rimini Street, Inc.* | | | 71,965 | |
| 20,180 | | Vishay Precision Group, Inc.* | | | 522,662 | |
| | | | | | |
| | | | | 8,034,751 | |
| | | | | | |
Materials — 3.0% | | | | |
| 3,700 | | AdvanSix, Inc. | | | 112,406 | |
| 34,400 | | American Vanguard Corp. | | | 182,320 | |
| 37,000 | | Blue Earth Refineries, Inc.*,(a),(b),(c) | | | 0 | |
| 9,600 | | Clearwater Paper Corp.* | | | 273,984 | |
| 21,300 | | Core Molding Technologies, Inc.* | | | 366,573 | |
| 19,000 | | Flotek Industries, Inc.* | | | 94,620 | |
| 41,200 | | Fortitude Gold Corp. | | | 210,532 | |
| 22,000 | | Friedman Industries, Inc. | | | 352,440 | |
| 4,200 | | Haynes International, Inc. | | | 250,068 | |
| 27,100 | | LSB Industries, Inc.* | | | 217,884 | |
| 8,900 | | Metallus, Inc.* | | | 131,987 | |
| 9,800 | | Myers Industries, Inc. | | | 135,436 | |
| 11,400 | | Olympic Steel, Inc. | | | 444,600 | |
| 15,800 | | Ramaco Resources, Inc., Class A | | | 184,860 | |
| 6,400 | | Ryerson Holding Corp. | | | 127,424 | |
| 17,000 | | SunCoke Energy, Inc. | | | 147,560 | |
| 3,000 | | Universal Stainless & Alloy Products, Inc.* | | | 115,890 | |
| 4,500 | | Valhi, Inc. | | | 150,165 | |
| | | | | | |
| | | | | 3,498,749 | |
| | | | | | |
Real Estate — 4.5% | | | | |
| 6,820 | | Alpine Income Property Trust, Inc., REIT | | | 124,124 | |
| 8,000 | | American Realty Investors, Inc.* | | | 140,320 | |
| 13,000 | | AMREP Corp.* | | | 385,970 | |
| 9,300 | | BRT Apartments Corp., REIT | | | 163,494 | |
| 5,900 | | Community Healthcare Trust, Inc., REIT | | | 107,085 | |
| 38,400 | | Comstock Holding Cos., Inc.* | | | 383,616 | |
| 11,800 | | CTO Realty Growth, Inc., REIT | | | 224,436 | |
19
|
SCHEDULE OF PORTFOLIO INVESTMENTS |
RBC Microcap Value Fund (cont.)
September 30, 2024
| | | | | | |
| Shares | | | | Value | |
| 26,500 | | Farmland Partners, Inc., REIT | | $ | 276,925 | |
| 53,000 | | Five Point Holdings LLC, Class A* | | | 219,950 | |
| 10,700 | | FRP Holdings, Inc.* | | | 319,502 | |
| 11,242 | | Getty Realty Corp., REIT | | | 357,608 | |
| 4,800 | | Gladstone Land Corp., REIT | | | 66,720 | |
| 13,600 | | Global Medical REIT, Inc., REIT | | | 134,776 | |
| 4,054 | | Kimco Realty Corp., REIT | | | 94,134 | |
| 9,700 | | Newlake Capital Partners, Inc., REIT | | | 196,134 | |
| 27,432 | | One Liberty Properties, Inc., REIT | | | 755,477 | |
| 14,200 | | Postal Realty Trust, Inc., REIT, Class A | | | 207,888 | |
| 3,000 | | RMR Group, Inc. (The), Class A | | | 76,140 | |
| 9,300 | | Tejon Ranch Co.* | | | 163,215 | |
| 61,710 | | Whitestone, REIT | | | 834,937 | |
| | | | | | |
| | | | | 5,232,451 | |
| | | | | | |
Utilities — 1.2% | | | | |
| 40,300 | | Altus Power, Inc.* | | | 128,154 | |
| 2,400 | | Artesian Resources Corp., Class A | | | 89,232 | |
| 10,900 | | Genie Energy Ltd., Class B | | | 177,125 | |
| 19,300 | | Pure Cycle Corp.* | | | 207,861 | |
| 3,900 | | RGC Resources, Inc. | | | 88,023 | |
| 12,266 | | Unitil Corp. | | | 743,074 | |
| | | | | | |
| | | | | 1,433,469 | |
| | | | | | |
| |
Total Common Stocks | | | 111,986,615 | |
| | | | | | |
(Cost $82,885,374) | | | | |
| |
Exchange Traded Funds — 1.2% | | | | |
| 10,890 | | iShares Russell Microcap Index Fund | | | 1,342,955 | |
| | | | | | |
Total Exchange Traded Funds | | | 1,342,955 | |
| | | | | | |
(Cost $1,327,123) | | | | |
| |
Rights/Warrants — 0.00% | | | | |
| 568 | | Chord Energy Corp, * | | | 7,321 | |
| 8,600 | | LGL Group, Inc. (The), Warrants, Expire 11/16/25* | | | 1,634 | |
| | | | | | |
| |
Total Rights/Warrants | | | 8,955 | |
| | | | | | |
(Cost $25,047) | | | | | | |
20
|
SCHEDULE OF PORTFOLIO INVESTMENTS |
RBC Microcap Value Fund (cont.)
September 30, 2024
| | | | | | |
Principal Amount | | | | Value | |
Corporate Bonds — 0.00% | | | | |
Financial — 0.00% | | | | |
| $1,947 | | Trenwick America Corp., 0.00%, *,(a),(b),(c) | | | $0 | |
| 1,098 | | Trenwick America Corp., 0.00%, *,(a),(b),(c) | | | 0 | |
| | | | | | |
| | | | | 0 | |
| | | | | | |
| |
Total Corporate Bonds | | | 0 | |
| | | | | | |
(Cost $0) | | | | | | |
| | | | | | |
| | |
Shares | | | | | |
Investment Company — 2.2% | | | | |
2,572,022 | | RBC BlueBay U.S. Government Money Market Fund, Institutional Class 1(d) | | | 2,572,022 | |
| | | | | | |
| |
Total Investment Company | | | 2,572,022 | |
| | | | | | |
(Cost $2,572,022) | | | | |
| |
Total Investments | | $ | 115,910,547 | |
(Cost $86,809,566)(e) — 100.0% | | | | |
| |
Liabilities in excess of other assets — (0.0)% | | | (1,528) | |
| | | | |
| |
NET ASSETS — 100.0% | | $ | 115,909,019 | |
| | | | | | |
| | | | | | | |
| * | Non-income producing security. |
| (a) | Security delisted or issuer in bankruptcy. |
| (b) | The Pricing Committee has fair valued this security under procedures established by the Fund’s Board of Trustees. |
| (c) | Security is valued using significant unobservable inputs and is classified as Level 3 in the fair value hierarchy. |
| (d) | Affiliated investment. |
| (e) | See Notes to Schedules of Portfolio Investments for the tax cost of securities and the breakdown of unrealized appreciation (depreciation). |
Abbreviations used are defined below:
FOR - Foreign Ownership Receipt
REIT - Real Estate Investment Trust
See Notes to the Financial Statements.
21
|
SCHEDULE OF PORTFOLIO INVESTMENTS |
RBC Small Cap Value Fund
September 30, 2024
| | | | | | |
| Shares | | | | Value | |
Common Stocks — 96.5% | | | | |
Communication Services — 2.5% | | | | |
| 4,720 | | Nexstar Media Group, Inc. | | $ | 780,452 | |
| | | | | | |
| |
Consumer Discretionary — 13.3% | | | | |
| 19,020 | | Cheesecake Factory, Inc. (The) | | | 771,261 | |
| 13,770 | | Genesco, Inc.* | | | 374,131 | |
| 5,040 | | G-III Apparel Group Ltd.* | | | 153,821 | |
| 2,280 | | Group 1 Automotive, Inc. | | | 873,331 | |
| 3,600 | | Oxford Industries, Inc. | | | 312,336 | |
| 3,230 | | Patrick Industries, Inc. | | | 459,855 | |
| 7,215 | | Steven Madden Ltd. | | | 353,463 | |
| 12,590 | | Taylor Morrison Home Corp.* | | | 884,573 | |
| | | | | | |
| | | | | 4,182,771 | |
| | | | | | |
Consumer Staples — 3.2% | | | | |
| 2,640 | | John B Sanfilippo & Son, Inc. | | | 248,978 | |
| 5,450 | | MGP Ingredients, Inc. | | | 453,713 | |
| 7,180 | | TreeHouse Foods, Inc.* | | | 301,416 | |
| | | | | | |
| | | | | 1,004,107 | |
| | | | | | |
Energy — 6.2% | | | | |
| 38,660 | | Magnolia Oil & Gas Corp., Class A | | | 944,078 | |
| 17,410 | | Matador Resources Co. | | | 860,402 | |
| 9,520 | | Par Pacific Holdings, Inc.* | | | 167,552 | |
| | | | | | |
| | | | | 1,972,032 | |
| | | | | | |
Financials — 22.6% | | | | |
| 2,270 | | American Financial Group, Inc. | | | 305,542 | |
| 2,760 | | AMERISAFE, Inc. | | | 133,391 | |
| 23,612 | | Compass Diversified Holdings | | | 522,533 | |
| 8,000 | | Independent Bank Group, Inc. | | | 461,280 | |
| 12,497 | | Mercantile Bank Corp. | | | 546,369 | |
| 7,570 | | Pinnacle Financial Partners, Inc. | | | 741,633 | |
| 6,620 | | Preferred Bank/Los Angeles, CA | | | 531,255 | |
| 5,770 | | QCR Holdings, Inc. | | | 427,153 | |
| 3,510 | | Reinsurance Group of America, Inc. | | | 764,724 | |
| 12,640 | | Seacoast Banking Corp. of Florida | | | 336,856 | |
| 4,490 | | Stewart Information Services Corp. | | | 335,583 | |
| 10,390 | | Stock Yards Bancorp, Inc. | | | 644,076 | |
| 6,150 | | Veritex Holdings, Inc. | | | 161,868 | |
| 6,500 | | Wintrust Financial Corp. | | | 705,445 | |
| 9,860 | | WSFS Financial Corp. | | | 502,761 | |
| | | | | | |
| | | | | 7,120,469 | |
| | | | | | |
Health Care — 7.7% | | | | |
| 3,590 | | Amphastar Pharmaceuticals, Inc.* | | | 174,223 | |
| 4,190 | | Astrana Health, Inc.* | | | 242,769 | |
| 8,230 | | Globus Medical, Inc., Class A* | | | 588,774 | |
22
|
SCHEDULE OF PORTFOLIO INVESTMENTS |
RBC Small Cap Value Fund (cont.)
September 30, 2024
| | | | | | |
| Shares | | | | Value | |
| 6,760 | | Lantheus Holdings, Inc.* | | $ | 741,910 | |
| 4,420 | | Merit Medical Systems, Inc.* | | | 436,828 | |
| 5,660 | | Omnicell, Inc.* | | | 246,776 | |
| | | | | | |
| | | | | 2,431,280 | |
| | | | | | |
Industrials — 18.1% | | | | |
| 58,138 | | ACCO Brands Corp. | | | 318,015 | |
| 6,220 | | Arcosa, Inc. | | | 589,407 | |
| 3,065 | | Atkore, Inc. | | | 259,728 | |
| 24,780 | | Barrett Business Services, Inc. | | | 929,498 | |
| 29,270 | | BrightView Holdings, Inc.* | | | 460,710 | |
| 6,350 | | CBIZ, Inc.* | | | 427,291 | |
| 10,070 | | Columbus McKinnon Corp. | | | 362,520 | |
| 12,030 | | Douglas Dynamics, Inc. | | | 331,787 | |
| 10,626 | | Ducommun, Inc.* | | | 699,510 | |
| 19,460 | | Gates Industrial Corp. Plc* | | | 341,523 | |
| 9,138 | | Greenbrier Cos., Inc. (The) | | | 465,033 | |
| 7,440 | | Insteel Industries, Inc. | | | 231,310 | |
| 5,800 | | Terex Corp. | | | 306,878 | |
| | | | | | |
| | | | | 5,723,210 | |
| | | | | | |
Information Technology — 6.0% | | | | |
| 3,820 | | Crane NXT Co. | | | 214,302 | |
| 6,580 | | MKS Instruments, Inc. | | | 715,312 | |
| 2,710 | | Onto Innovation, Inc.* | | | 562,487 | |
| 5,130 | | PC Connection, Inc. | | | 386,956 | |
| | | | | | |
| | | | | 1,879,057 | |
| | | | | | |
Materials — 4.4% | | | | |
| 8,099 | | Koppers Holdings, Inc. | | | 295,856 | |
| 3,830 | | Materion Corp. | | | 428,424 | |
| 24,030 | | Metallus, Inc.* | | | 356,365 | |
| 1,100 | | Reliance, Inc. | | | 318,131 | |
| | | | | | |
| | | | | 1,398,776 | |
| | | | | | |
Real Estate — 9.4% | | | | |
| 6,790 | | Agree Realty Corp., REIT | | | 511,491 | |
| 37,050 | | Chatham Lodging Trust, REIT | | | 315,666 | |
| 7,880 | | CubeSmart, REIT | | | 424,180 | |
| 36,050 | | DiamondRock Hospitality Co., REIT | | | 314,717 | |
| 2,570 | | EastGroup Properties, Inc., REIT | | | 480,127 | |
| 10,810 | | STAG Industrial, Inc., REIT | | | 422,563 | |
| 73,050 | | Summit Hotel Properties, Inc., REIT | | | 501,123 | |
| | | | | | |
| | | | | 2,969,867 | |
| | | | | | |
23
|
SCHEDULE OF PORTFOLIO INVESTMENTS |
RBC Small Cap Value Fund (cont.)
September 30, 2024
| | | | | | |
| Shares | | | | Value | |
Utilities — 3.1% | |
| 7,810 | | Southwest Gas Holdings, Inc. | | $ | 576,065 | |
| 6,670 | | Unitil Corp. | | | 404,069 | |
| | | | | | |
| | | | | 980,134 | |
| | | | | | |
| |
Total Common Stocks | | �� | 30,442,155 | |
| | | | | | |
(Cost $26,368,151) | | | | | | |
|
Exchange Traded Funds — 2.2% | |
| 370 | | iShares Russell 2000 Value ETF | | | 61,724 | |
| 6,550 | | SPDR S&P Biotech ETF | | | 647,140 | |
| | | | | | |
Total Exchange Traded Funds | | | 708,864 | |
| | | | | | |
(Cost $624,316) | | | | | | |
|
Investment Company — 1.4% | |
| 423,074 | | RBC BlueBay U.S. Government Money Market Fund, Institutional Class 1(a) | | | 423,074 | |
| | | | | | |
| |
Total Investment Company | | | 423,074 | |
| | | | | | |
(Cost $423,074) | | | | | | |
| |
Total Investments | | $ | 31,574,093 | |
(Cost $27,415,541)(b) — 100.1% | | | | |
| |
Liabilities in excess of other assets — (0.1)% | | | (16,743) | |
| | | | | | |
| |
NET ASSETS — 100.0% | | $ | 31,557,350 | |
| | | | | | |
| * | Non-income producing security. |
| (a) | Affiliated investment. |
| (b) | See Notes to Schedules of Portfolio Investments for the tax cost of securities and the breakdown of unrealized appreciation (depreciation). |
Abbreviations used are defined below:
REIT - Real Estate Investment Trust
See Notes to the Financial Statements.
24
Statements of Assets and Liabilities
| | | | | | | | | | | | |
| | | RBC SMID Cap
Growth Fund | | | RBC Enterprise
Fund | | | RBC Small Cap
Core Fund | |
Assets: | | | | | | | | | | | | |
Investments in securities, at value: | | | | | | | | | | | | |
Unaffiliated investments (cost $128,471,963, $45,740,023 and $25,745,362, respectively) | | $ | 167,271,122 | | | $ | 68,767,654 | | | $ | 41,048,019 | |
Affiliated investments (cost $3,868,926, $1,148,146 and $538,429, respectively) | | | 3,868,926 | | | | 1,148,146 | | | | 538,429 | |
Cash | | | 15,450 | | | | — | | | | 16,845 | |
Interest and dividend receivable | | | 20,411 | | | | 30,143 | | | | 12,538 | |
Receivable for capital shares issued | | | 165,551 | | | | 100 | | | | 3,991 | |
Receivable for investments sold | | | 54,262 | | | | — | | | | — | |
Prepaid expenses and other assets | | | 17,286 | | | | 21,885 | | | | 24,656 | |
| | | | | | | | | | | | |
Total Assets | | | 171,413,008 | | | | 69,967,928 | | | | 41,644,478 | |
| | | | | | | | | | | | |
Liabilities: | | | | | | | | | | | | |
Professional fees payable | | | 4,674 | | | | 4,674 | | | | 4,674 | |
Distributions payable | | | 2,505 | | | | — | | | | — | |
Payable for capital shares redeemed | | | 191,556 | | | | — | | | | — | |
Payable for investments purchased | | | 601,693 | | | | — | | | | — | |
Accrued expenses and other payables: | | | | | | | | | | | | |
Investment advisory fees | | | 53,386 | | | | 34,402 | | | | 7,100 | |
Accounting fees | | | 5,413 | | | | 4,608 | | | | 4,373 | |
Audit fees | | | 40,698 | | | | 40,698 | | | | 40,698 | |
Distribution fees | | | 92,107 | | | | 765 | | | | 2,114 | |
Custodian fees | | | 268 | | | | 324 | | | | 579 | |
Shareholder reports | | | 9,650 | | | | 5,945 | | | | 2,856 | |
Transfer agent fees | | | 23,341 | | | | 9,219 | | | | 2,870 | |
Other | | | 6,678 | | | | 6,019 | | | | 5,152 | |
| | | | | | | | | | | | |
Total Liabilities | | | 1,031,969 | | | | 106,654 | | | | 70,416 | |
| | | | | | | | | | | | |
Net Assets | | $ | 170,381,039 | | | $ | 69,861,274 | | | $ | 41,574,062 | |
| | | | | | | | | | | | |
Net Assets Consists of: | | | | | | | | | | | | |
Capital | | $ | 130,250,842 | | | $ | 39,340,852 | | | $ | 23,286,112 | |
Accumulated earnings | | | 40,130,197 | | | | 30,520,422 | | | | 18,287,950 | |
| | | | | | | | | | | | |
Net Assets | | $ | 170,381,039 | | | $ | 69,861,274 | | | $ | 41,574,062 | |
| | | | | | | | | | | | |
25
Statements of Assets and Liabilities (cont.)
| | | | | | | | | | | | |
| | | RBC SMID Cap
Growth Fund | | | RBC Enterprise
Fund | | | RBC Small Cap
Core Fund | |
Net Assets | | | | | | | | | | | | |
Class A | | $ | 24,705,559 | | | $ | 754,036 | | | $ | 8,525,454 | |
Class I | | | 128,958,024 | | | | 69,107,238 | | | | 32,759,174 | |
Class R6 | | | 16,717,456 | | | | N/A | | | | 289,434 | |
| | | | | | | | | | | | |
Total | | $ | 170,381,039 | | | $ | 69,861,274 | | | $ | 41,574,062 | |
| | | | | | | | | | | | |
Shares Outstanding (Unlimited number of shares authorized, no par value): | | | | | | | | | | | | |
Class A | | | 1,881,083 | | | | 44,919 | | | | 623,585 | |
Class I | | | 7,719,070 | | | | 3,769,899 | | | | 2,017,580 | |
Class R6 | | | 994,497 | | | | N/A | | | | 17,714 | |
| | | | | | | | | | | | |
Total | | | 10,594,650 | | | | 3,814,818 | | | | 2,658,879 | |
| | | | | | | | | | | | |
Net Asset Values and Redemption Prices Per Share: | | | | | | | | | | | | |
Class A | | $ | 13.13 | | | $ | 16.79 | | | $ | 13.67 | |
| | | | | | | | | | | | |
Class I | | $ | 16.71 | | | $ | 18.33 | | | $ | 16.24 | |
| | | | | | | | | | | | |
Class R6 | | $ | 16.81 | | | $ | N/A | | | $ | 16.34 | |
| | | | | | | | | | | | |
Maximum Offering Price Per Share: | | | | | | | | | | | | |
Class A | | $ | 13.93 | | | $ | 17.81 | | | $ | 14.50 | |
| | | | | | | | | | | | |
Maximum Sales Charge - Class A | | | 5.75 | % | | | 5.75 | % | | | 5.75 | % |
| | | | | | | | | | | | |
26
Statements of Assets and Liabilities (cont.)
| | | | | | | | |
| | | RBC Microcap
Value Fund | | | RBC Small Cap
Value Fund | |
Assets: | | | | | | | | |
Investments in securities, at value: | | | | | | | | |
Unaffiliated investments (cost $84,237,544 and $26,992,467, respectively) | | $ | 113,338,525 | | | $ | 31,151,019 | |
Affiliated investments (cost $2,572,022 and $423,074, respectively) | | | 2,572,022 | | | | 423,074 | |
Cash | | | 5,242 | | | | — | |
Interest and dividend receivable | | | 116,888 | | | | 16,720 | |
Receivable from advisor | | | — | | | | 8,563 | |
Receivable for capital shares issued | | | 25,640 | | | | 2,052 | |
Receivable for investments sold | | | 14,826 | | | | — | |
Prepaid expenses and other assets | | | 13,884 | | | | 23,587 | |
| | | | | | | | |
Total Assets | | | 116,087,027 | | | | 31,625,015 | |
| | | | | | | | |
| | |
Liabilities: | | | | | | | | |
Professional fees payable | | | 4,674 | | | | 4,674 | |
Payable for capital shares redeemed | | | 11,727 | | | | — | |
Accrued expenses and other payables: | | | | | | | | |
Investment advisory fees | | | 74,878 | | | | — | |
Accounting fees | | | 4,969 | | | | 4,290 | |
Audit fees | | | 40,698 | | | | 40,698 | |
Distribution fees | | | 3,919 | | | | 105 | |
Custodian fees | | | — | | | | 511 | |
Shareholder reports | | | 8,580 | | | | 4,388 | |
Transfer agent fees | | | 16,588 | | | | 7,547 | |
Other | | | 11,975 | | | | 5,452 | |
| | | | | | | | |
Total Liabilities | | | 178,008 | | | | 67,665 | |
| | | | | | | | |
Net Assets | | $ | 115,909,019 | | | $ | 31,557,350 | |
| | | | | | | | |
Net Assets Consists of: | | | | | | | | |
Capital | | $ | 76,904,130 | | | $ | 30,825,651 | |
Accumulated earnings | | | 39,004,889 | | | | 731,699 | |
| | | | | | | | |
Net Assets | | $ | 115,909,019 | | | $ | 31,557,350 | |
| | | | | | | | |
27
Statements of Assets and Liabilities (cont.)
| | | | | | | | |
| | | RBC Microcap
Value Fund | | | RBC Small Cap
Value Fund | |
Net Assets | | | | | | | | |
Class A | | $ | 2,513,629 | | | $ | 13,427 | |
Class I | | | 113,395,390 | | | | 31,531,024 | |
Class R6 | | | N/A | | | | 12,899 | |
| | | | | | | | |
Total | | $ | 115,909,019 | | | $ | 31,557,350 | |
| | | | | | | | |
Shares Outstanding (Unlimited number of shares authorized, no par value): | | | | | | | | |
Class A | | | 87,206 | | | | 848 | |
Class I | | | 3,933,079 | | | | 2,002,567 | |
Class R6 | | | N/A | | | | 809 | |
| | | | | | | | |
Total | | | 4,020,285 | | | | 2,004,224 | |
| | | | | | | | |
Net Asset Values and Redemption Prices Per Share: | | | | | | | | |
Class A | | $ | 28.82 | | | $ | 15.83 | |
| | | | | | | | |
Class I | | $ | 28.83 | | | $ | 15.75 | |
| | | | | | | | |
Class R6 | | $ | N/A | | | $ | 15.94 | |
| | | | | | | | |
Maximum Offering Price Per Share: | | | | | | | | |
Class A | | $ | 30.58 | | | $ | 16.80 | |
| | | | | | | | |
Maximum Sales Charge - Class A | | | 5.75 | % | | | 5.75 | % |
| | | | | | | | |
See Notes to the Financial Statements.
28
Statements of Operations
| | | | | | | | | | | | |
| For the Year Ended September 30, 2024 | | | | | | | | | | | | |
| | | RBC SMID Cap
Growth Fund | | | RBC Enterprise
Fund | | | RBC Small Cap
Core Fund | |
Investment Income: | | | | | | | | | | | | |
Interest income | | $ | 2,299 | | | $ | 40,999 | | | $ | 77,512 | |
Dividend income - unaffiliated | | | 791,404 | | | | 1,016,755 | | | | 658,343 | |
Dividend income - affiliated | | | 172,992 | | | | 80,761 | | | | 31,713 | |
Foreign tax withholding | | | (9,208 | ) | | | (3,999 | ) | | | (2,320 | ) |
| | | | | | | | | | | | |
Total Investment Income | | | 957,487 | | | | 1,134,516 | | | | 765,248 | |
Expenses: | | | | | | | | | | | | |
Investment advisory fees | | | 1,027,413 | | | | 630,823 | | | | 343,195 | |
Distribution fees–Class A | | | 52,175 | | | | 1,773 | | | | 21,146 | |
Accounting fees | | | 38,581 | | | | 33,679 | | | | 32,024 | |
Audit fees | | | 46,942 | | | | 46,999 | | | | 47,050 | |
Custodian fees | | | 2,879 | | | | 2,649 | | | | 3,981 | |
Insurance fees | | | 3,393 | | | | 3,393 | | | | 3,393 | |
Legal fees | | | 50,939 | | | | 2,616 | | | | 1,649 | |
Registrations and filing fees | | | 71,985 | | | | 44,565 | | | | 60,581 | |
Shareholder reports | | | 62,864 | | | | 35,391 | | | | 32,005 | |
Transfer agent fees–Class A | | | 26,851 | | | | 4,709 | | | | 16,818 | |
Transfer agent fees–Class I | | | 155,100 | | | | 38,599 | | | | 17,809 | |
Transfer agent fees–Class R6 | | | 3,609 | | | | — | | | | 3,565 | |
Trustees’ fees and expenses | | | 5,624 | | | | 2,630 | | | | 1,701 | |
Tax expense | | | 4,420 | | | | 4,420 | | | | 4,420 | |
Other fees | | | 6,671 | | | | 5,338 | | | | 5,822 | |
| | | | | | | | | | | | |
Total expenses before fee waiver/reimbursement | | | 1,559,446 | | | | 857,584 | | | | 595,159 | |
Expenses waived/reimbursed by: | | | | | | | | | | | | |
Advisor | | | (315,928 | ) | | | (137,425 | ) | | | (200,443 | ) |
| | | | | | | | | | | | |
Net expenses | | | 1,243,518 | | | | 720,159 | | | | 394,716 | |
| | | | | | | | | | | | |
Net Investment Income (Loss) | | | (286,031 | ) | | | 414,357 | | | | 370,532 | |
| | | | | | | | | | | | |
Realized/Unrealized Gains/(Losses): | | | | | | | | | | | | |
Net realized gains from investment transactions | | | 2,017,216 | | | | 8,164,468 | | | | 6,171,567 | |
Net change in unrealized appreciation on investments | | | 24,836,113 | | | | 5,071,409 | | | | 1,777,866 | |
| | | | | | | | | | | | |
Net realized/unrealized gains | | | 26,853,329 | | | | 13,235,877 | | | | 7,949,433 | |
| | | | | | | | | | | | |
Change in net assets resulting from operations | | $ | 26,567,298 | | | $ | 13,650,234 | | | $ | 8,319,965 | |
| | | | | | | | | | | | |
29
Statements of Operations (cont.)
| | | | | | | | |
| For the Year Ended September 30, 2024 | | | | | | | | |
| | | RBC Microcap
Value Fund | | | RBC Small Cap
Value Fund | |
Investment Income: | | | | | | | | |
Interest income | | $ | 26,604 | | | $ | 10,777 | |
Dividend income - unaffiliated | | | 2,770,294 | | | | 573,297 | |
Dividend income - affiliated | | | 90,651 | | | | 32,867 | |
Foreign tax withholding | | | (6,165 | ) | | | — | |
| | | | | | | | |
Total Investment Income | | | 2,881,384 | | | | 616,941 | |
Expenses: | | | | | | | | |
Investment advisory fees | | | 969,362 | | | | 204,625 | |
Distribution fees–Class A | | | 6,070 | | | | 31 | |
Accounting fees | | | 55,375 | | | | 31,372 | |
Audit fees | | | 46,882 | | | | 47,068 | |
Custodian fees | | | 2,354 | | | | 2,916 | |
Insurance fees | | | 3,393 | | | | 3,393 | |
Legal fees | | | 4,203 | | | | 7,807 | |
Registrations and filing fees | | | 42,914 | | | | 120,057 | |
Shareholder reports | | | 44,377 | | | | 30,121 | |
Transfer agent fees–Class A | | | 6,874 | | | | 3,915 | |
Transfer agent fees–Class I | | | 99,449 | | | | 26,707 | |
Transfer agent fees–Class R6 | | | — | | | | 3,515 | |
Trustees’ fees and expenses | | | 4,175 | | | | 1,100 | |
Tax expense | | | 4,420 | | | | 4,420 | |
Other fees | | | 5,987 | | | | 5,638 | |
| | | | | | | | |
Total expenses before fee waiver/reimbursement | | | 1,295,835 | | | | 492,685 | |
Expenses waived/reimbursed by: | | | | | | | | |
Advisor | | | (140,168 | ) | | | (245,239 | ) |
| | | | | | | | |
Net expenses | | | 1,155,667 | | | | 247,446 | |
| | | | | | | | |
Net Investment Income | | | 1,725,717 | | | | 369,495 | |
| | | | | | | | |
Realized/Unrealized Gains/(Losses): | | | | | | | | |
Net realized gains/(losses) on: | | | | | | | | |
Investment transactions | | | 8,969,897 | | | | 171,447 | |
Foreign currency transactions | | | 29 | | | | — | |
| | | | | | | | |
Net realized gains | | | 8,969,926 | | | | 171,447 | |
Net change in unrealized appreciation/(depreciation) on: | | | | | | | | |
Investments | | | 13,854,830 | | | | 4,835,902 | |
Foreign currency | | | (16 | ) | | | — | |
| | | | | | | | |
Net unrealized gains | | | 13,854,814 | | | | 4,835,902 | |
| | | | | | | | |
Net realized/unrealized gains | | | 22,824,740 | | | | 5,007,349 | |
| | | | | | | | |
Change in net assets resulting from operations | | $ | 24,550,457 | | | $ | 5,376,844 | |
| | | | | | | | |
See Notes to the Financial Statements.
30
Statements of Changes in Net Assets
| | | | | | | | | | | | | | |
| | | RBC SMID Cap
Growth Fund | |
| | | For the
Year Ended
September 30, 2024 | | | For the
Year Ended
September 30, 2023 | |
From Investment Activities | | | | | | | | | | | | | | |
Operations: | | | | | | | | | | | | | | |
Net investment loss | | | | $ | (286,031 | ) | | | | | | $ | (157,416 | ) |
Net realized gains from investments | | | | | 2,017,216 | | | | | | | | 2,756,776 | |
Net change in unrealized appreciation on investments | | | | | 24,836,113 | | | | | | | | 8,348,755 | |
| | | | | | | | | | | | | | |
Change in net assets resulting from operations | | | | | 26,567,298 | | | | | | | | 10,948,115 | |
| | | | | | | | | | | | | | |
Distributions to Shareholders: | | | | | | | | | | | | | | |
Class A | | | | | (447,576 | ) | | | | | | | (1,069,066 | ) |
Class I | | | | | (2,119,764 | ) | | | | | | | (5,152,780 | ) |
Class R6 | | | | | (226,162 | ) | | | | | | | (1,350 | ) |
| | | | | | | | | | | | | | |
Change in net assets resulting from shareholder distributions | | | | | (2,793,502 | ) | | | | | | | (6,223,196 | ) |
| | | | | | | | | | | | | | |
Capital Transactions: (Note 6) | | | | | | | | | | | | | | |
Proceeds from shares issued | | | | | 75,236,314 | | | | | | | | 41,527,647 | |
Distributions reinvested | | | | | 2,541,901 | | | | | | | | 6,199,042 | |
Cost of shares redeemed | | | | | (41,051,712 | ) | | | | | | | (20,840,943 | ) |
| | | | | | | | | | | | | | |
Change in net assets resulting from capital transactions | | | | | 36,726,503 | | | | | | | | 26,885,746 | |
| | | | | | | | | | | | | | |
Net increase in net assets | | | | | 60,500,299 | | | | | | | | 31,610,665 | |
Net Assets: | | | | | | | | | | | | | | |
Beginning of year | | | | | 109,880,740 | | | | | | | | 78,270,075 | |
| | | | | | | | | | | | | | |
End of year | | | | $ | 170,381,039 | | | | | | | $ | 109,880,740 | |
| | | | | | | | | | | | | | |
Share Transactions: | | | | | | | | | | | | | | |
Issued | | | | | 5,100,798 | | | | | | | | 2,921,773 | |
Reinvested | | | | | 176,804 | | | | | | | | 481,767 | |
Redeemed | | | | | (2,694,988 | ) | | | | | | | (1,470,723 | ) |
| | | | | | | | | | | | | | |
Change in shares resulting from capital transactions | | | | | 2,582,614 | | | | | | | | 1,932,817 | |
| | | | | | | | | | | | | | |
See Notes to the Financial Statements.
31
Statements of Changes in Net Assets
| | | | | | | | | | | | | | | | |
| | | RBC Enterprise
Fund | |
| | | For the
Year Ended
September 30, 2024 | | | For the
Year Ended
September 30, 2023 | |
From Investment Activities | | | | | | | | | | | | | | | | |
Operations: | | | | | | | | | | | | | | | | |
Net investment income | | | | | | $ | 414,357 | | | | | | | $ | 243,790 | |
Net realized gains from investments | | | | | | | 8,164,468 | | | | | | | | 1,903,799 | |
Net change in unrealized appreciation on investments | | | | | | | 5,071,409 | | | | | | | | 5,247,453 | |
| | | | | | | | | | | | | | | | |
Change in net assets resulting from operations | | | | | | | 13,650,234 | | | | | | | | 7,395,042 | |
| | | | | | | | | | | | | | | | |
Distributions to Shareholders: | | | | | | | | | | | | | | | | |
Class A | | | | | | | (18,713 | ) | | | | | | | (100,032 | ) |
Class I | | | | | | | (1,781,642 | ) | | | | | | | (8,190,700 | ) |
| | | | | | | | | | | | | | | | |
Change in net assets resulting from shareholder distributions | | | | | | | (1,800,355 | ) | | | | | | | (8,290,732 | ) |
| | | | | | | | | | | | | | | | |
Capital Transactions: (Note 6) | | | | | | | | | | | | | | | | |
Proceeds from shares issued | | | | | | | 405,236 | | | | | | | | 304,662 | |
Distributions reinvested | | | | | | | 1,694,543 | | | | | | | | 7,908,506 | |
Cost of shares redeemed | | | | | | | (5,411,911 | ) | | | | | | | (3,640,935 | ) |
| | | | | | | | | | | | | | | | |
Change in net assets resulting from capital transactions | | | | | | | (3,312,132 | ) | | | | | | | 4,572,233 | |
| | | | | | | | | | | | | | | | |
Net increase in net assets | | | | | | | 8,537,747 | | | | | | | | 3,676,543 | |
Net Assets: | | | | | | | | | | | | | | | | |
Beginning of year | | | | | | | 61,323,527 | | | | | | | | 57,646,984 | |
| | | | | | | | | | | | | | | | |
End of year | | | | | | $ | 69,861,274 | | | | | | | $ | 61,323,527 | |
| | | | | | | | | | | | | | | | |
Share Transactions: | | | | | | | | | | | | | | | | |
Issued | | | | | | | 22,988 | | | | | | | | 19,459 | |
Reinvested | | | | | | | 103,302 | | | | | | | | 541,164 | |
Redeemed | | | | | | | (318,607 | ) | | | | | | | (228,567 | ) |
| | | | | | | | | | | | | | | | |
Change in shares resulting from capital transactions | | | | | | | (192,317 | ) | | | | | | | 332,056 | |
| | | | | | | | | | | | | | | | |
See Notes to the Financial Statements.
32
Statements of Changes in Net Assets
| | | | | | | | | | | | | | |
| | | RBC Small Cap
Core Fund | |
| | | For the
Year Ended
September 30, 2024 | | | For the
Year Ended
September 30, 2023 | |
From Investment Activities | | | | | | | | | | | | | | |
Operations: | | | | | | | | | | | | | | |
Net investment income | | | | $ | 370,532 | | | | | | | $ | 241,532 | |
Net realized gains from investments | | | | | 6,171,567 | | | | | | | | 3,132,687 | |
Net change in unrealized appreciation on investments | | | | | 1,777,866 | | | | | | | | 3,659,166 | |
| | | | | | | | | | | | | | |
Change in net assets resulting from operations | | | | | 8,319,965 | | | | | | | | 7,033,385 | |
| | | | | | | | | | | | | | |
Distributions to Shareholders: | | | | | | | | | | | | | | |
Class A | | | | | (681,312 | ) | | | | | | | (1,827,175 | ) |
Class I | | | | | (2,424,572 | ) | | | | | | | (7,940,427 | ) |
Class R6 | | | | | (908 | ) | | | | | | | (2,074 | ) |
| | | | | | | | | | | | | | |
Change in net assets resulting from shareholder distributions | | | | | (3,106,792 | ) | | | | | | | (9,769,676 | ) |
| | | | | | | | | | | | | | |
Capital Transactions: (Note 6) | | | | | | | | | | | | | | |
Proceeds from shares issued | | | | | 4,292,144 | | | | | | | | 1,633,077 | |
Distributions reinvested | | | | | 3,032,603 | | | | | | | | 9,477,777 | |
Cost of shares redeemed | | | | | (12,577,712 | ) | | | | | | | (4,708,695 | ) |
| | | | | | | | | | | | | | |
Change in net assets resulting from capital transactions | | | | | (5,252,965 | ) | | | | | | | 6,402,159 | |
| | | | | | | | | | | | | | |
Net increase/(decrease) in net assets | | | | | (39,792 | ) | | | | | | | 3,665,868 | |
Net Assets: | | | | | | | | | | | | | | |
Beginning of year | | | | | 41,613,854 | | | | | | | | 37,947,986 | |
| | | | | | | | | | | | | | |
End of year | | | | $ | 41,574,062 | | | | | | | $ | 41,613,854 | |
| | | | | | | | | | | | | | |
Share Transactions: | | | | | | | | | | | | | | |
Issued | | | | | 312,881 | | | | | | | | 127,925 | |
Reinvested | | | | | 217,201 | | | | | | | | 742,583 | |
Redeemed | | | | | (873,280 | ) | | | | | | | (325,240 | ) |
| | | | | | | | | | | | | | |
Change in shares resulting from capital transactions | | | | | (343,198 | ) | | | | | | | 545,268 | |
| | | | | | | | | | | | | | |
See Notes to the Financial Statements.
33
Statements of Changes in Net Assets
| | | | | | | | | | | | | | |
| | | RBC Microcap
Value Fund | |
| | | For the
Year Ended
September 30, 2024 | | | For the
Year Ended
September 30, 2023 | |
From Investment Activities | | | | | | | | | | | | | | |
Operations: | | | | | | | | | | | | | | |
Net investment income | | | | $ | 1,725,717 | | | | | | | $ | 1,471,319 | |
Net realized gains from investments and foreign currency | | | | | 8,969,926 | | | | | | | | 8,377,650 | |
Net change in unrealized appreciation on investments and foreign currency | | | | | 13,854,814 | | | | | | | | 2,435,774 | |
| | | | | | | | | | | | | | |
Change in net assets resulting from operations | | | | | 24,550,457 | | | | | | | | 12,284,743 | |
| | | | | | | | | | | | | | |
Distributions to Shareholders: | | | | | | | | | | | | | | |
Class A | | | | | (236,278 | ) | | | | | | | (386,707 | ) |
Class I | | | | | (9,587,034 | ) | | | | | | | (14,533,878 | ) |
| | | | | | | | | | | | | | |
Change in net assets resulting from shareholder distributions | | | | | (9,823,312 | ) | | | | | | | (14,920,585 | ) |
| | | | | | | | | | | | | | |
Capital Transactions: (Note 6) | | | | | | | | | | | | | | |
Proceeds from shares issued | | | | | 4,134,011 | | | | | | | | 3,922,016 | |
Distributions reinvested | | | | | 8,941,659 | | | | | | | | 13,551,024 | |
Cost of shares redeemed | | | | | (13,608,450 | ) | | | | | | | (12,542,941 | ) |
| | | | | | | | | | | | | | |
Change in net assets resulting from capital transactions | | | | | (532,780 | ) | | | | | | | 4,930,099 | |
| | | | | | | | | | | | | | |
Net increase in net assets | | | | | 14,194,365 | | | | | | | | 2,294,257 | |
Net Assets: | | | | | | | | | | | | | | |
Beginning of year | | | | | 101,714,654 | | | | | | | | 99,420,397 | |
| | | | | | | | | | | | | | |
End of year | | | | $ | 115,909,019 | | | | | | | $ | 101,714,654 | |
| | | | | | | | | | | | | | |
Share Transactions: | | | | | | | | | | | | | | |
Issued | | | | | 155,036 | | | | | | | | 153,053 | |
Reinvested | | | | | 339,716 | | | | | | | | 541,368 | |
Redeemed | | | | | (516,672 | ) | | | | | | | (479,213 | ) |
| | | | | | | | | | | | | | |
Change in shares resulting from capital transactions | | | | | (21,920 | ) | | | | | | | 215,208 | |
| | | | | | | | | | | | | | |
See Notes to the Financial Statements.
34
Statements of Changes in Net Assets
| | | | | | | | | | | | | | | | |
| | | RBC Small Cap
Value Fund | |
| | | For the
Year Ended
September 30, 2024 | | | For the
Year Ended
September 30, 2023 | |
From Investment Activities | | | | | | | | | | | | | | | | |
Operations: | | | | | | | | | | | | | | | | |
Net investment income | | | | | | $ | 369,495 | | | | | | | $ | 432,977 | |
Net realized gains/(losses) from investments | | | | | | | 171,447 | | | | | | | | (714,017 | ) |
Net change in unrealized appreciation on investments | | | | | | | 4,835,902 | | | | | | | | 4,487,404 | |
| | | | | | | | | | | | | | | | |
Change in net assets resulting from operations | | | | | | | 5,376,844 | | | | | | | | 4,206,364 | |
| | | | | | | | | | | | | | | | |
Distributions to Shareholders: | | | | | | | | | | | | | | | | |
Class A | | | | | | | (125 | ) | | | | | | | (498 | ) |
Class I | | | | | | | (383,466 | ) | | | | | | | (1,724,866 | ) |
Class R6 | | | | | | | (151 | ) | | | | | | | (526 | ) |
| | | | | | | | | | | | | | | | |
Change in net assets resulting from shareholder distributions | | | | | | | (383,742 | ) | | | | | | | (1,725,890 | ) |
| | | | | | | | | | | | | | | | |
Capital Transactions: (Note 6) | | | | | | | | | | | | | | | | |
Proceeds from shares issued | | | | | | | 2,399,213 | | | | | | | | 5,370,625 | |
Distributions reinvested | | | | | | | 130,252 | | | | | | | | 772,713 | |
Cost of shares redeemed | | | | | | | (3,692,977 | ) | | | | | | | (11,717,378 | ) |
| | | | | | | | | | | | | | | | |
Change in net assets resulting from capital transactions | | | | | | | (1,163,512 | ) | | | | | | | (5,574,040 | ) |
| | | | | | | | | | | | | | | | |
Net increase/(decrease) in net assets | | | | | | | 3,829,590 | | | | | | | | (3,093,566 | ) |
Net Assets: | | | | | | | | | | | | | | | | |
Beginning of year | | | | | | | 27,727,760 | | | | | | | | 30,821,326 | |
| | | | | | | | | | | | | | | | |
End of year | | | | | | $ | 31,557,350 | | | | | | | $ | 27,727,760 | |
| | | | | | | | | | | | | | | | |
Share Transactions: | | | | | | | | | | | | | | | | |
Issued | | | | | | | 159,418 | | | | | | | | 401,888 | |
Reinvested | | | | | | | 8,995 | | | | | | | | 61,966 | |
Redeemed | | | | | | | (261,334 | ) | | | | | | | (876,500 | ) |
| | | | | | | | | | | | | | | | |
Change in shares resulting from capital transactions | | | | | | | (92,921 | ) | | | | | | | (412,646 | ) |
| | | | | | | | | | | | | | | | |
See Notes to the Financial Statements.
35
RBC SMID Cap Growth Fund
(Selected data for a share outstanding throughout the periods indicated)
| | | | | | | | | | | | | | | | | | | | | | | | | | | | | | | | | | | | |
| | | | | | Investment Activities | | | Distributions | | | | |
| | | Net Asset
Value,
Beginning
of Year | | | Net
Investment
Loss(a) | | | Net Realized
and Unrealized
Gains (Losses)
on Investments | | | Redemption
Fees | | | Total from
Investment
Activities | | | Net
Investment
Income | | | Net
Realized
Gains | | | Total
Distributions | | | Net Asset
Value, End
of Year | |
Class A | | | | | | | | | | | | | | | | | | | | | | | | | | | | | | | | | | | | |
Year Ended 9/30/24 | | | $11.21 | | | | (0.05) | | | | 2.28 | | | | — | | | | 2.23 | | | | — | | | | (0.31) | | | | (0.31) | | | | $13.13 | |
Year Ended 9/30/23 | | | 10.77 | | | | (0.04) | | | | 1.52 | | | | — | | | | 1.48 | | | | — | | | | (1.04) | | | | (1.04) | | | | 11.21 | |
Year Ended 9/30/22 | | | 16.98 | | | | (0.07) | | | | (1.90) | | | | — | | | | (1.97) | | | | — | | | | (4.24) | | | | (4.24) | | | | 10.77 | |
Year Ended 9/30/21 | | | 12.60 | | | | (0.09) | | | | 4.93 | | | | —(b) | | | | 4.84 | | | | — | | | | (0.46) | | | | (0.46) | | | | 16.98 | |
Year Ended 9/30/20 | | | 13.04 | | | | (0.06) | | | | 0.72 | | | | —(b) | | | | 0.66 | | | | — | | | | (1.10) | | | | (1.10) | | | | 12.60 | |
Class I | | | | | | | | | | | | | | | | | | | | | | | | | | | | | | | | | | | | |
Year Ended 9/30/24 | | | $14.14 | | | | (0.03) | | | | 2.91 | | | | — | | | | 2.88 | | | | — | | | | (0.31) | | | | (0.31) | | | | $16.71 | |
Year Ended 9/30/23 | | | 13.31 | | | | (0.02) | | | | 1.89 | | | | — | | | | 1.87 | | | | — | | | | (1.04) | | | | (1.04) | | | | 14.14 | |
Year Ended 9/30/22 | | | 19.98 | | | | (0.04) | | | | (2.39) | | | | — | | | | (2.43) | | | | — | | | | (4.24) | | | | (4.24) | | | | 13.31 | |
Year Ended 9/30/21 | | | 14.73 | | | | (0.05) | | | | 5.76 | | | | —(b) | | | | 5.71 | | | | — | | | | (0.46) | | | | (0.46) | | | | 19.98 | |
Year Ended 9/30/20 | | | 15.02 | | | | (0.03) | | | | 0.84 | | | | —(b) | | | | 0.81 | | | | — | | | | (1.10) | | | | (1.10) | | | | 14.73 | |
Class R6 | | | | | | | | | | | | | | | | | | | | | | | | | | | | | | | | | | | | |
Year Ended 9/30/24 | | | $14.22 | | | | (0.02) | | | | 2.92 | | | | — | | | | 2.90 | | | | — | | | | (0.31) | | | | (0.31) | | | | $16.81 | |
Year Ended 9/30/23 | | | 13.38 | | | | (0.02) | | | | 1.90 | | | | — | | | | 1.88 | | | | — | | | | (1.04) | | | | (1.04) | | | | 14.22 | |
Year Ended 9/30/22 | | | 20.04 | | | | (0.04) | | | | (2.38) | | | | — | | | | (2.42) | | | | — | | | | (4.24) | | | | (4.24) | | | | 13.38 | |
Year Ended 9/30/21 | | | 14.76 | | | | (0.05) | | | | 5.79 | | | | — | | | | 5.74 | | | | — | | | | (0.46) | | | | (0.46) | | | | 20.04 | |
Year Ended 9/30/20 | | | 15.05 | | | | (0.02) | | | | 0.83 | | | | — | | | | 0.81 | | | | — | | | | (1.10) | | | | (1.10) | | | | 14.76 | |
| (a) | Per share net investment income (loss) has been calculated using the average daily shares method. |
| (b) | Less than $0.01 or $(0.01) per share. |
36
RBC SMID Cap Growth Fund
(Selected data for a share outstanding throughout the periods indicated)
| | | | | | | | | | | | | | | | | | | | | | | | |
| | | | | | Ratios/Supplemental Data | |
| | | Total
Return(a)(b) | | | Net Assets,
End of
Year (000’s) | | | Ratio of
Net Expenses
to Average
Net Assets | | | Ratio of
Net Investment
Income (Loss)
to Average
Net Assets | | | Ratio of
Expenses to
Average Net
Assets* | | | Portfolio
Turnover
Rate** | |
Class A | | | | | | | | | | | | | | | | | | | | | | | | |
Year Ended 9/30/24 | | | 20.21% | | | | $ 24,706 | | | | 1.07% | | | | (0.41)% | | | | 1.28% | | | | 16% | |
Year Ended 9/30/23 | | | 14.23% | | | | 13,321 | | | | 1.07% | | | | (0.38)% | | | | 1.25% | | | | 19% | |
Year Ended 9/30/22 | | | (16.50)% | | | | 11,259 | | | | 1.07% | | | | (0.52)% | | | | 1.27% | | | | 25% | |
Year Ended 9/30/21 | | | 38.95% | | | | 14,318 | | | | 1.07% | | | | (0.54)% | | | | 1.26% | | | | 28% | (c) |
Year Ended 9/30/20 | | | 4.90% | | | | 11,553 | | | | 1.07% | | | | (0.45)% | | | | 1.37% | | | | 15% | |
Class I | | | | | | | | | | | | | | | | | | | | | | | | |
Year Ended 9/30/24 | | | 20.62% | | | | $128,958 | | | | 0.82% | | | | (0.16)% | | | | 1.04% | | | | 16% | |
Year Ended 9/30/23 | | | 14.45% | | | | 87,116 | | | | 0.82% | | | | (0.13)% | | | | 1.05% | | | | 19% | |
Year Ended 9/30/22 | | | (16.30)% | | | | 66,994 | | | | 0.82% | | | | (0.27)% | | | | 1.04% | | | | 25% | |
Year Ended 9/30/21 | | | 39.23% | | | | 81,239 | | | | 0.82% | | | | (0.29)% | | | | 0.99% | | | | 28% | (c) |
Year Ended 9/30/20 | | | 5.27% | | | | 83,211 | | | | 0.82% | | | | (0.20)% | | | | 1.03% | | | | 15% | |
Class R6 | | | | | | | | | | | | | | | | | | | | | | | | |
Year Ended 9/30/24 | | | 20.65% | | | | $ 16,717 | | | | 0.77% | | | | (0.11)% | | | | 0.93% | | | | 16% | |
Year Ended 9/30/23 | | | 14.54% | | | | 9,443 | | | | 0.77% | | | | (0.14)% | | | | 0.98% | | | | 19% | |
Year Ended 9/30/22 | | | (16.24)% | | | | 17 | | | | 0.77% | | | | (0.23)% | | | | 18.45% | | | | 25% | |
Year Ended 9/30/21 | | | 39.36% | | | | 21 | | | | 0.77% | | | | (0.25)% | | | | 19.28% | | | | 28% | (c) |
Year Ended 9/30/20 | | | 5.26% | | | | 15 | | | | 0.77% | | | | (0.16)% | | | | 25.69% | | | | 15% | |
| * | During the period, certain fees were contractually or voluntarily reduced and/or reimbursed. If such contractual/voluntary fee reductions and reimbursements had not occurred, the ratio would have been as indicated. |
| ** | Portfolio turnover rate is calculated on the basis of the Fund as a whole without distinguishing between the classes of shares issued. |
| (a) | Excludes sales charge. |
| (b) | Assumes investment at net asset value at the beginning of the period, reinvestment of all dividends and distributions, and a complete redemption of the investment at net asset value at the end of the period. |
| (c) | Portfolio turnover rate excludes in-kind transactions. |
See Notes to the Financial Statements.
37
RBC Enterprise Fund
(Selected data for a share outstanding throughout the periods indicated)
| | | | | | | | | | | | | | | | | | | | | | | | | | | | | | | | | | | | |
| | | | | | Investment Activities | | | Distributions | | | | |
| | | Net Asset
Value,
Beginning
of Year | | | Net
Investment
Income/
(Loss)(a) | | | Net Realized
and Unrealized
Gains (Losses)
on Investments | | | Redemption
Fees | | | Total from
Investment
Activities | | | Net
Investment
Income | | | Net
Realized
Gains | | | Total
Distributions | | | Net Asset
Value, End
of Year | |
Class A | | | | | | | | | | | | | | | | | | | | | | | | | | | | | | | | | | | | |
Year Ended 9/30/24 | | | $14.06 | | | | 0.06 | | | | 3.09 | | | | — | | | | 3.15 | | | | (0.03) | | | | (0.39) | | | | (0.42) | | | | $16.79 | |
Year Ended 9/30/23 | | | 14.62 | | | | 0.02 | | | | 1.72 | | | | — | | | | 1.74 | | | | — | | | | (2.30) | | | | (2.30) | | | | 14.06 | |
Year Ended 9/30/22 | | | 20.04 | | | | (0.03) | | | | (2.97) | | | | — | | | | (3.00) | | | | (0.02) | | | | (2.40) | | | | (2.42) | | | | 14.62 | |
Year Ended 9/30/21 | | | 14.65 | | | | 0.04 | | | | 6.98 | | | | —(b) | | | | 7.02 | | | | —(b) | | | | (1.63) | | | | (1.63) | | | | 20.04 | |
Year Ended 9/30/20 | | | 17.59 | | | | 0.03 | | | | (1.70) | | | | —(b) | | | | (1.67) | | | | — | | | | (1.27) | | | | (1.27) | | | | 14.65 | |
Class I | | | | | | | | | | | | | | | | | | | | | | | | | | | | | | | | | | | | |
Year Ended 9/30/24 | | | $15.32 | | | | 0.11 | | | | 3.36 | | | | — | | | | 3.47 | | | | (0.07) | | | | (0.39) | | | | (0.46) | | | | $18.33 | |
Year Ended 9/30/23 | | | 15.70 | | | | 0.06 | | | | 1.86 | | | | — | | | | 1.92 | | | | — | | | | (2.30) | | | | (2.30) | | | | 15.32 | |
Year Ended 9/30/22 | | | 21.34 | | | | 0.01 | | | | (3.18) | | | | — | | | | (3.17) | | | | (0.07) | | | | (2.40) | | | | (2.47) | | | | 15.70 | |
Year Ended 9/30/21 | | | 15.51 | | | | 0.09 | | | | 7.41 | | | | —(b) | | | | 7.50 | | | | (0.04) | | | | (1.63) | | | | (1.67) | | | | 21.34 | |
Year Ended 9/30/20 | | | 18.52 | | | | 0.07 | | | | (1.79) | | | | —(b) | | | | (1.72) | | | | (0.01) | | | | (1.28) | | | | (1.29) | | | | 15.51 | |
| (a) | Per share net investment income (loss) has been calculated using the average daily shares method. |
| (b) | Less than $0.01 or $(0.01) per share. |
38
RBC Enterprise Fund
(Selected data for a share outstanding throughout the periods indicated)
| | | | | | | | | | | | | | | | | | | | | | | | |
| | | | | | Ratios/Supplemental Data | |
| | | Total
Return(a)(b) | | | Net Assets,
End of
Year (000’s) | | | Ratio of
Net Expenses
to Average
Net Assets | | | Ratio of
Net Investment
Income (Loss)
to Average
Net Assets | | | Ratio of
Expenses to
Average Net
Assets* | | | Portfolio
Turnover
Rate** | |
Class A | | | | | | | | | | | | | | | | | | | | | | | | |
Year Ended 9/30/24 | | | 22.75% | | | | $ 754 | | | | 1.33% | | | | 0.37%(c) | | | | 2.13% | | | | 41% | |
Year Ended 9/30/23 | | | 12.63% | | | | 664 | | | | 1.33% | | | | 0.14% | | | | 2.19% | | | | 28% | |
Year Ended 9/30/22 | | | (17.18)% | | | | 683 | | | | 1.33% | | | | (0.19)% | | | | 2.02% | | | | 43% | |
Year Ended 9/30/21 | | | 50.27% | | | | 803 | | | | 1.33% | | | | 0.21% | | | | 2.15% | | | | 19% | |
Year Ended 9/30/20 | | | (10.85)% | | | | 553 | | | | 1.33% | | | | 0.19% | | | | 2.35% | | | | 25% | |
Class I | | | | | | | | | | | | | | | | | | | | | | | | |
Year Ended 9/30/24 | | | 22.99% | | | | $69,107 | | | | 1.08% | | | | 0.62% | | | | 1.28% | | | | 41% | |
Year Ended 9/30/23 | | | 12.93% | | | | 60,659 | | | | 1.08% | | | | 0.39% | | | | 1.26% | | | | 28% | |
Year Ended 9/30/22 | | | (16.94)% | | | | 56,964 | | | | 1.08% | | | | 0.08% | | | | 1.27% | | | | 43% | |
Year Ended 9/30/21 | | | 50.67% | | | | 73,996 | | | | 1.08% | | | | 0.45% | | | | 1.25% | | | | 19% | |
Year Ended 9/30/20 | | | (10.64)% | | | | 53,380 | | | | 1.08% | | | | 0.44% | | | | 1.38% | | | | 25% | |
| * | During the period, certain fees were contractually or voluntarily reduced and/or reimbursed. If such contractual/voluntary fee reductions and reimbursements had not occurred, the ratio would have been as indicated. |
| ** | Portfolio turnover rate is calculated on the basis of the Fund as a whole without distinguishing between the classes of shares issued. |
| (a) | Excludes sales charge. |
| (b) | Assumes investment at net asset value at the beginning of the period, reinvestment of all dividends and distributions, and a complete redemption of the investment at net asset value at the end of the period. |
| (c) | Reflects special dividend which amounted to $2.98 per share and 19.05% of average net assets. |
See Notes to the Financial Statements.
39
RBC Small Cap Core Fund
(Selected data for a share outstanding throughout the periods indicated)
| | | | | | | | | | | | | | | | | | | | | | | | | | | | | | | | | | | | |
| | | | | | Investment Activities | | | Distributions | | | | |
| | | Net Asset
Value,
Beginning
of Year | | | Net
Investment
Income/
(Loss)(a) | | | Net Realized
and Unrealized
Gains (Losses)
on Investments | | | Redemption
Fees | | | Total from
Investment
Activities | | | Net
Investment
Income | | | Net
Realized
Gains | | | Total
Distributions | | | Net Asset
Value, End
of Year | |
Class A | | | | | | | | | | | | | | | | | | | | | | | | | | | | | | | | | | | | |
Year Ended 9/30/24 | | | $12.20 | | | | 0.09 | | | | 2.44 | | | | — | | | | 2.53 | | | | (0.03) | | | | (1.03) | | | | (1.06) | | | | $13.67 | |
Year Ended 9/30/23 | | | 14.01 | | | | 0.05 | | | | 2.20 | | | | — | | | | 2.25 | | | | — | | | | (4.06) | | | | (4.06) | | | | 12.20 | |
Year Ended 9/30/22 | | | 31.43 | | | | (0.02) | | | | (2.85) | | | | — | | | | (2.87) | | | | — | | | | (14.55) | | | | (14.55) | | | | 14.01 | |
Year Ended 9/30/21 | | | 26.44 | | | | 0.07 | | | | 10.46 | | | | 0.01 | | | | 10.54 | | | | (0.01) | | | | (5.54) | | | | (5.55) | | | | 31.43 | |
Year Ended 9/30/20 | | | 29.14 | | | | 0.11 | | | | (1.27) | | | | — | | | | (1.16) | | | | — | | | | (1.54) | | | | (1.54) | | | | 26.44 | |
Class I | | | | | | | | | | | | | | | | | | | | | | | | | | | | | | | | | | | | |
Year Ended 9/30/24 | | | $14.31 | | | | 0.14 | | | | 2.89 | | | | — | | | | 3.03 | | | | (0.07) | | | | (1.03) | | | | (1.10) | | | | $16.24 | |
Year Ended 9/30/23 | | | 15.78 | | | | 0.09 | | | | 2.52 | | | | — | | | | 2.61 | | | | (0.02) | | | | (4.06) | | | | (4.08) | | | | 14.31 | |
Year Ended 9/30/22 | | | 33.65 | | | | 0.04 | | | | (3.27) | | | | — | | | | (3.23) | | | | (0.09) | | | | (14.55) | | | | (14.64) | | | | 15.78 | |
Year Ended 9/30/21 | | | 27.97 | | | | 0.12 | | | | 11.16 | | | | 0.01 | | | | 11.29 | | | | (0.07) | | | | (5.54) | | | | (5.61) | | | | 33.65 | |
Year Ended 9/30/20 | | | 30.70 | | | | 0.17 | | | | (1.34) | | | | —(b) | | | | (1.17) | | | | (0.02) | | | | (1.54) | | | | (1.56) | | | | 27.97 | |
Class R6 | | | | | | | | | | | | | | | | | | | | | | | | | | | | | | | | | | | | |
Year Ended 9/30/24 | | | $14.37 | | | | 0.13 | | | | 2.93 | | | | — | | | | 3.06 | | | | (0.06) | | | | (1.03) | | | | (1.09) | | | | $16.34 | |
Year Ended 9/30/23 | | | 15.82 | | | | 0.09 | | | | 2.54 | | | | — | | | | 2.63 | | | | (0.02) | | | | (4.06) | | | | (4.08) | | | | 14.37 | |
Year Ended 9/30/22 | | | 33.70 | | | | 0.41 | | | | (3.66) | | | | — | | | | (3.25) | | | | (0.08) | | | | (14.55) | | | | (14.63) | | | | 15.82 | |
Year Ended 9/30/21 | | | 28.01 | | | | 0.21 | | | | 11.11 | | | | — | | | | 11.32 | | | | (0.09) | | | | (5.54) | | | | (5.63) | | | | 33.70 | |
Year Ended 9/30/20 | | | 30.72 | | | | 0.15 | | | | (1.31) | | | | — | | | | (1.16) | | | | (0.01) | | | | (1.54) | | | | (1.55) | | | | 28.01 | |
| (a) | Per share net investment income (loss) has been calculated using the average daily shares method. |
| (b) | Less than $0.01 or $(0.01) per share. |
40
RBC Small Cap Core Fund
(Selected data for a share outstanding throughout the periods indicated)
| | | | | | | | | | | | | | | | | | | | | | | | | | | | |
| | | | | | Ratios/Supplemental Data | |
| | | Total
Return(a)(b) | | | Net Assets,
End of
Year (000’s) | | | Ratio of
Net Expenses
to Average
Net Assets | | | Ratio of
Net Investment
Income (Loss)
to Average
Net Assets | | | Ratio of
Expenses to
Average Net
Assets* | | | Portfolio
Turnover
Rate** | |
Class A | | | | | | | | | | | | | | | | | | | | | | | | | | | | |
Year Ended 9/30/24 | | | 21.75% | | | | | | | | $ 8,525 | | | | 1.13%(c) | | | | 0.68% | | | | 1.72% | | | | 37% | |
Year Ended 9/30/23 | | | 18.47% | | | | | | | | 7,705 | | | | 1.15% | | | | 0.36% | | | | 1.69% | | | | 41% | |
Year Ended 9/30/22 | | | (19.32)% | | | | | | | | 6,430 | | | | 1.15% | | | | (0.12)% | | | | 1.68% | | | | 29% | |
Year Ended 9/30/21 | | | 43.04% | | | | | | | | 7,692 | | | | 1.15% | | | | 0.24% | | | | 1.52% | | | | 81%(d) | |
Year Ended 9/30/20 | | | (4.71)% | | | | | | | | 6,200 | | | | 1.15% | | | | 0.40% | | | | 1.55% | | | | 40% | |
Class I | | | | | | | | | | | | | | | | | | | | | | | | | | | | |
Year Ended 9/30/24 | | | 22.11% | | | | | | | | $32,759 | | | | 0.89%(c) | | | | 0.93% | | | | 1.32% | | | | 37% | |
Year Ended 9/30/23 | | | 18.75% | | | | | | | | 33,898 | | | | 0.90% | | | | 0.62% | | | | 1.30% | | | | 41% | |
Year Ended 9/30/22 | | | (19.12)% | | | | | | | | 31,510 | | | | 0.90% | | | | 0.18% | | | | 1.28% | | | | 29% | |
Year Ended 9/30/21 | | | 43.46% | | | | | | | | 53,689 | | | | 0.90% | | | | 0.38% | | | | 1.16% | | | | 81%(d) | |
Year Ended 9/30/20 | | | (4.49)% | | | | | | | | 68,845 | | | | 0.90% | | | | 0.59% | | | | 1.18% | | | | 40% | |
Class R6 | | | | | | | | | | | | | | | | | | | | | | | | | | | | |
Year Ended 9/30/24 | | | 22.21% | | | | | | | | $ 289 | | | | 0.85%(c) | | | | 0.84% | | | | 3.16% | | | | 37% | |
Year Ended 9/30/23 | | | 18.74% | | | | | | | | 11 | | | | 0.87% | | | | 0.63% | | | | 38.44% | | | | 41% | |
Year Ended 9/30/22 | | | (19.10)% | | | | | | | | 8 | | | | 0.83% | | | | 1.12% | | | | 1.44% | | | | 29% | |
Year Ended 9/30/21 | | | 43.52% | | | | | | | | 4,695 | | | | 0.87% | | | | 0.61% | | | | 1.25% | | | | 81%(d) | |
Year Ended 9/30/20 | | | (4.46)% | | | | | | | | 52 | | | | 0.87% | | | | 0.52% | | | | 10.94% | | | | 40% | |
| * | During the period, certain fees were contractually or voluntarily reduced and/or reimbursed. If such contractual/voluntary fee reductions and reimbursements had not occurred, the ratio would have been as indicated. |
| ** | Portfolio turnover rate is calculated on the basis of the Fund as a whole without distinguishing between the classes of shares issued. |
| (a) | Excludes sales charge. |
| (b) | Assumes investment at net asset value at the beginning of the period, reinvestment of all dividends and distributions, and a complete redemption of the investment at net asset value at the end of the period. |
| (c) | Beginning July 1, 2024, the net operating expenses were contractually limited to 1.10%, 0.85% and 0.82% of average daily net assets for Class A, Class I and Class R6, respectively. The ratio of net expenses to average net assets represents a blended percentage for the year ended September 30, 2024. |
41
RBC Small Cap Core Fund
(Selected data for a share outstanding throughout the periods indicated)
| (d) | Portfolio turnover rate excludes in-kind transactions. |
|
| See Notes to the Financial Statements. |
42
RBC Microcap Value Fund
(Selected data for a share outstanding throughout the periods indicated)
| | | | | | | | | | | | | | | | | | | | | | | | | | | | | | | | | | | | |
| | | | | | Investment Activities | | | Distributions | | | | |
| | | Net Asset
Value,
Beginning
of Year | | | Net
Investment
Income(a) | | | Net Realized
and Unrealized
Gains (Losses)
on Investments | | | Redemption
Fees | | | Total from
Investment
Activities | | | Net
Investment
Income | | | Net
Realized
Gains | | | Total
Distributions | | | Net Asset
Value, End
of Year | |
Class A | | | | | | | | | | | | | | | | | | | | | | | | | | | | | | | | | | | | |
Year Ended 9/30/24 | | | $25.16 | | | | 0.36 | | | | 5.72 | | | | — | | | | 6.08 | | | | (0.25) | | | | (2.17) | | | | (2.42) | | | | $28.82 | |
Year Ended 9/30/23 | | | 25.96 | | | | 0.30 | | | | 2.78 | | | | — | | | | 3.08 | | | | (0.31) | | | | (3.57) | | | | (3.88) | | | | 25.16 | |
Year Ended 9/30/22 | | | 31.99 | | | | 0.29 | | | | (4.20) | | | | — | | | | (3.91) | | | | (0.12) | | | | (2.00) | | | | (2.12) | | | | 25.96 | |
Year Ended 9/30/21 | | | 21.34 | | | | 0.20 | | | | 12.02 | | | | —(b) | | | | 12.22 | | | | (0.20) | | | | (1.37) | | | | (1.57) | | | | 31.99 | |
Year Ended 9/30/20 | | | 26.52 | | | | 0.14 | | | | (3.65) | | | | —(b) | | | | (3.51) | | | | (0.23) | | | | (1.44) | | | | (1.67) | | | | 21.34 | |
Class I | | | | | | | | | | | | | | | | | | | | | | | | | | | | | | | | | | | | |
Year Ended 9/30/24 | | | $25.16 | | | | 0.42 | | | | 5.73 | | | | — | | | | 6.15 | | | | (0.31) | | | | (2.17) | | | | (2.48) | | | | $28.83 | |
Year Ended 9/30/23 | | | 25.98 | | | | 0.36 | | | | 2.77 | | | | — | | | | 3.13 | | | | (0.38) | | | | (3.57) | | | | (3.95) | | | | 25.16 | |
Year Ended 9/30/22 | | | 32.01 | | | | 0.37 | | | | (4.19) | | | | — | | | | (3.82) | | | | (0.21) | | | | (2.00) | | | | (2.21) | | | | 25.98 | |
Year Ended 9/30/21 | | | 21.35 | | | | 0.29 | | | | 12.00 | | | | —(b) | | | | 12.29 | | | | (0.26) | | | | (1.37) | | | | (1.63) | | | | 32.01 | |
Year Ended 9/30/20 | | | 26.55 | | | | 0.20 | | | | (3.65) | | | | —(b) | | | | (3.45) | | | | (0.31) | | | | (1.44) | | | | (1.75) | | | | 21.35 | |
| (a) | Per share net investment income (loss) has been calculated using the average daily shares method. |
| (b) | Less than $0.01 or $(0.01) per share. |
43
RBC Microcap Value Fund
(Selected data for a share outstanding throughout the periods indicated)
| | | | | | | | | | | | | | | | | | | | | | | | |
| | | | | | Ratios/Supplemental Data | |
| | | Total
Return(a)(b) | | | Net Assets,
End of
Year (000’s) | | | Ratio of
Net Expenses
to Average
Net Assets | | | Ratio of
Net Investment
Income (Loss)
to Average
Net Assets | | | Ratio of
Expenses to
Average Net
Assets* | | | Portfolio
Turnover
Rate** | |
Class A | | | | | | | | | | | | | | | | | | | | | | | | |
Year Ended 9/30/24 | | | 25.04% | | | | $ 2,514 | | | | 1.32% | | | | 1.36% | | | | 1.63% | | | | 22% | |
Year Ended 9/30/23 | | | 11.89% | | | | 2,471 | | | | 1.32% | | | | 1.14% | | | | 1.62% | | | | 30% | |
Year Ended 9/30/22 | | | (13.35)% | | | | 2,673 | | | | 1.32% | | | | 0.93% | | | | 1.57% | | | | 26% | |
Year Ended 9/30/21 | | | 59.29% | | | | 3,420 | | | | 1.32% | | | | 0.70% | | | | 1.62% | | | | 11% | |
Year Ended 9/30/20 | | | (14.48)% | | | | 2,293 | | | | 1.32% | | | | 0.60% | | | | 1.80% | | | | 20% | |
Class I | | | | | | | | | | | | | | | | | | | | | | | | |
Year Ended 9/30/24 | | | 25.39% | | | | $113,395 | | | | 1.07% | | | | 1.61% | | | | 1.19% | | | | 22% | |
Year Ended 9/30/23 | | | 12.12% | | | | 99,243 | | | | 1.07% | | | | 1.39% | | | | 1.18% | | | | 30% | |
Year Ended 9/30/22 | | | (13.11)% | | | | 96,748 | | | | 1.07% | | | | 1.20% | | | | 1.18% | | | | 26% | |
Year Ended 9/30/21 | | | 59.69% | | | | 119,392 | | | | 1.07% | | | | 1.00% | | | | 1.19% | | | | 11% | |
Year Ended 9/30/20 | | | (14.29)% | | | | 92,886 | | | | 1.07% | | | | 0.87% | | | | 1.27% | | | | 20% | |
| * | During the period, certain fees were contractually or voluntarily reduced and/or reimbursed. If such contractual/voluntary fee reductions and reimbursements had not occurred, the ratio would have been as indicated. |
| ** | Portfolio turnover rate is calculated on the basis of the Fund as a whole without distinguishing between the classes of shares issued. |
| (a) | Excludes sales charge. |
| (b) | Assumes investment at net asset value at the beginning of the period, reinvestment of all dividends and distributions, and a complete redemption of the investment at net asset value at the end of the period. |
See Notes to the Financial Statements.
44
RBC Small Cap Value Fund
(Selected data for a share outstanding throughout the periods indicated)
| | | | | | | | | | | | | | | | | | | | | | | | | | | | | | | | | | | | |
| | | | | | Investment Activities | | | Distributions | | | | |
| | | Net Asset
Value,
Beginning
of Year | | | Net
Investment
Income(a) | | | Net Realized
and Unrealized
Gains (Losses)
on Investments | | | Redemption
Fees | | | Total from
Investment
Activities | | | Net
Investment
Income | | | Net
Realized
Gains | | | Total
Distributions | | | Net Asset
Value, End
of Year | |
Class A | | | | | | | | | | | | | | | | | | | | | | | | | | | | | | | | | | | | |
Year Ended 9/30/24 | | | $13.29 | | | | 0.15 | | | | 2.54 | | | | — | | | | 2.69 | | | | (0.15) | | | | — | | | | (0.15) | | | | $15.83 | |
Year Ended 9/30/23 | | | 12.27 | | | | 0.15 | | | | 1.49 | | | | — | | | | 1.64 | | | | (0.40) | | | | (0.22) | | | | (0.62) | | | | 13.29 | |
Year Ended 9/30/22 | | | 13.96 | | | | 0.06 | | | | (1.58) | | | | — | | | | (1.52) | | | | (0.17) | | | | — | | | | (0.17) | | | | 12.27 | |
Period Ended 9/30/21(b) | | | 12.61 | | | | 0.09 | | | | 1.26 | | | | — | | | | 1.35 | | | | — | | | | — | | | | — | | | | 13.96 | |
Class I | | | | | | | | | | | | | | | | | | | | | | | | | | | | | | | | | | | | |
Year Ended 9/30/24 | | | $13.22 | | | | 0.19 | | | | 2.53 | | | | — | | | | 2.72 | | | | (0.19) | | | | — | | | | (0.19) | | | | $15.75 | |
Year Ended 9/30/23 | | | 12.28 | | | | 0.18 | | | | 1.42 | | | | — | | | | 1.60 | | | | (0.44) | | | | (0.22) | | | | (0.66) | | | | 13.22 | |
Year Ended 9/30/22 | | | 13.98 | | | | 0.10 | | | | (1.59) | | | | — | | | | (1.49) | | | | (0.21) | | | | — | | | | (0.21) | | | | 12.28 | |
Year Ended 9/30/21 | | | 9.84 | | | | 0.15 | | | | 4.11 | | | | — | | | | 4.26 | | | | (0.12) | | | | — | | | | (0.12) | | | | 13.98 | |
Year Ended 9/30/20 | | | 12.24 | | | | 0.15 | | | | (2.39) | | | | —(c) | | | | (2.24) | | | | (0.16) | | | | — | | | | (0.16) | | | | 9.84 | |
Class R6 | | | | | | | | | | | | | | | | | | | | | | | | | | | | | | | | | | | | |
Year Ended 9/30/24 | | | $13.38 | | | | 0.19 | | | | 2.56 | | | | — | | | | 2.75 | | | | (0.19) | | | | — | | | | (0.19) | | | | $15.94 | |
Year Ended 9/30/23 | | | 12.38 | | | | 0.19 | | | | 1.50 | | | | — | | | | 1.69 | | | | (0.47) | | | | (0.22) | | | | (0.69) | | | | 13.38 | |
Year Ended 9/30/22 | | | 14.07 | | | | 0.22 | | | | (1.70) | | | | — | | | | (1.48) | | | | (0.21) | | | | — | | | | (0.21) | | | | 12.38 | |
Year Ended 9/30/21 | | | 9.90 | | | | 0.16 | | | | 4.14 | | | | — | | | | 4.30 | | | | (0.13) | | | | — | | | | (0.13) | | | | 14.07 | |
Year Ended 9/30/20 | | | 12.31 | | | | 0.16 | | | | (2.40) | | | | — | | | | (2.24) | | | | (0.17) | | | | — | | | | (0.17) | | | | 9.90 | |
| (a) | Per share net investment income (loss) has been calculated using the average daily shares method. |
| (b) | For the period from January 28, 2021 (commencement of operations) through September 30, 2021. |
| (c) | Less than $0.01 or $(0.01) per share. |
45
RBC Small Cap Value Fund
(Selected data for a share outstanding throughout the periods indicated)
| | | | | | | | | | | | | | | | | | | | | | | | |
| | | | | | Ratios/Supplemental Data | |
| | | Total
Return(a)(b) | | | Net Assets,
End of
Year (000’s) | | | Ratio of
Net Expenses
to Average
Net Assets | | | Ratio of
Net Investment
Income (Loss)
to Average
Net Assets | | | Ratio of
Expenses to
Average Net
Assets* | | | Portfolio
Turnover
Rate** | |
Class A | | | | | | | | | | | | | | | | | | | | | | | | |
Year Ended 9/30/24 | | | 20.33% | | | | $ 13 | | | | 1.10% | | | | 1.02% | | | | 33.10% | | | | 56% | |
Year Ended 9/30/23 | | | 13.68% | | | | 11 | | | | 1.10% | | | | 1.12% | | | | 37.03% | | | | 55% | |
Year Ended 9/30/22 | | | (11.07)%(c) | | | | 10 | | | | 1.10% | | | | 0.43% | | | | 33.11% | | | | 83% | |
Period Ended 9/30/21(d) | | | 10.71%(e) | | | | 11 | | | | 1.10%(f) | | | | 1.01%(f) | | | | 37.36%(f) | | | | 61% | |
Class I | | | | | | | | | | | | | | | | | | | | | | | | |
Year Ended 9/30/24 | | | 20.73% | | | | $31,531 | | | | 0.85% | | | | 1.26% | | | | 1.66% | | | | 56% | |
Year Ended 9/30/23 | | | 13.37% | | | | 27,706 | | | | 0.85% | | | | 1.38% | | | | 1.36% | | | | 55% | |
Year Ended 9/30/22 | | | (10.85)%(c) | | | | 30,802 | | | | 0.85% | | | | 0.70% | | | | 1.22% | | | | 83% | |
Year Ended 9/30/21 | | | 43.48% | | | | 77,582 | | | | 0.85% | | | | 1.17% | | | | 1.09% | | | | 61% | |
Year Ended 9/30/20 | | | (18.62)% | | | | 52,496 | | | | 0.85% | | | | 1.34% | | | | 1.15% | | | | 77% | |
Class R6 | | | | | | | | | | | | | | | | | | | | | | | | |
Year Ended 9/30/24 | | | 20.67% | | | | $ 13 | | | | 0.80% | | | | 1.31% | | | | 30.86% | | | | 56% | |
Year Ended 9/30/23 | | | 14.04% | | | | 11 | | | | 0.80% | | | | 1.42% | | | | 34.70% | | | | 55% | |
Year Ended 9/30/22 | | | (10.72)%(c) | | | | 9 | | | | 0.76% | | | | 1.45% | | | | 1.27% | | | | 83% | |
Year Ended 9/30/21 | | | 43.64% | | | | 6,366 | | | | 0.80% | | | | 1.21% | | | | 1.03% | | | | 61% | |
Year Ended 9/30/20 | | | (18.56)% | | | | 4,423 | | | | 0.80% | | | | 1.40% | | | | 1.07% | | | | 77% | |
| * | During the period, certain fees were contractually or voluntarily reduced and/or reimbursed. If such contractual/voluntary fee reductions and reimbursements had not occurred, the ratio would have been as indicated. |
| ** | Portfolio turnover rate is calculated on the basis of the Fund as a whole without distinguishing between the classes of shares issued. |
| (a) | Excludes sales charge. |
| (b) | Assumes investment at net asset value at the beginning of the period, reinvestment of all dividends and distributions, and a complete redemption of the investment at net asset value at the end of the period. |
| (c) | The Advisor reimbursed the Fund $862,113 for Losses from a trading policy error. The payment had an impact of 2.4% to the total return of each share class. |
| (d) | For the period from January 28, 2021 (commencement of operations) through September 30, 2021. |
46
RBC Small Cap Value Fund
(Selected data for a share outstanding throughout the periods indicated)
|
| See Notes to the Financial Statements. |
47
|
NOTES TO FINANCIAL STATEMENTS |
September 30, 2024
1. Organization:
RBC Funds Trust (the “Trust”) is registered under the Investment Company Act of 1940 (as amended) as an open-end management investment company. The Trust was organized as a Delaware statutory trust on December 16, 2003 and currently consists of 23 portfolios. Overall responsibility for the management of the Trust is vested in its Board of Trustees (the “Board”). Predecessor funds to the Trust were reorganized as portfolios of the Trust effective April 16, 2004. This report includes the following five investment portfolios (each a “Fund” and collectively, the “Funds”):
- RBC SMID Cap Growth Fund (“SMID Cap Growth Fund”)
- RBC Enterprise Fund (“Enterprise Fund”)
- RBC Small Cap Core Fund (“Small Cap Core Fund”)
- RBC Microcap Value Fund (“Microcap Value Fund”)
- RBC Small Cap Value Fund (“Small Cap Value Fund”)
The SMID Cap Growth, Small Cap Core and Small Cap Value Funds offer three share classes: Class A, Class R6 and Class I shares. The Enterprise and Microcap Value Funds offer two share classes: Class A and Class I shares. Class A shares are offered with a 5.75% maximum front-end sales charge and a 1.00% contingent deferred sales charge (“CDSC”) for redemption within 12 months of a $1 million or greater purchase on which no front-end sales charge was paid. Class I and Class R6 shares (intended for investors meeting certain investment minimum thresholds) are not subject to either a front-end sales charge or a CDSC.
RBC Global Asset Management (U.S.) Inc. (”RBC GAM-US“ or ”Advisor“ or ”Co-Administrator“) acts as the investment advisor for the Funds. The officers of the Trust (“Fund Management”) are also employees of RBC GAM-US.
2. Significant Accounting Policies
Each Fund is an investment company that follows accounting and reporting guidance under the Financial Accounting Standards Board (“FASB”) Accounting Standards Codification Topic 946, Financial Services - Investment Companies (ASC 946). The financial statements are prepared in accordance with U.S. generally accepted accounting principles (“U.S. GAAP”). Fund Management may also be required to make estimates and assumptions that affect the reported amounts of assets and liabilities at the date of the financial statements and the reported amounts of income and expenses for the period. Actual results could differ from those estimates. The financial statements are as of the close of regular trading on the New York Stock Exchange (“NYSE”).
Security Valuation:
The Board has approved pricing and valuation procedures of the Advisor for determining the fair value of each Fund’s investments. Fair value of a security is considered to be the price that a fund might reasonably expect to receive upon its current sale in an orderly transaction between market participants.
Equity securities are generally valued on the basis of prices furnished by third-party pricing services approved by the Board. Equity securities listed on one or more exchanges shall be valued at the last available quoted sale price on the primary trading exchange as of the regularly scheduled closing time of the exchange and are categorized as Level 1 in the fair value hierarchy. (See “Fair Value Measurements” below for additional information). An equity security not listed on an exchange but listed on NASDAQ shall be valued at the NASDAQ official closing price and is also categorized as Level 1. If there was no sale on the primary exchange on the day the net asset value is calculated or a NASDAQ official closing price is not available, the most recent bid quotation generally will be used and such securities will generally be categorized as Level 2. Investments in open-end investment companies (mutual funds) are valued at net asset value and are categorized as Level 1 in the fair value hierarchy.
48
|
NOTES TO FINANCIAL STATEMENTS |
Fixed income securities, including to-be-announced (“TBA”) commitments and municipal bonds, are generally valued based on evaluated prices received from third-party pricing services or from broker-dealers who make markets in the securities and are generally categorized as Level 2 in the fair value hierarchy (see “Fair Value Measurements” below for additional information). The pricing services utilize both dealer-supplied valuations and electronic data processing techniques that take into account multiple appropriate factors such as institutional-size trading in similar groups of securities, market spreads, interest rates, and fundamental security analytical data including yield, quality, coupon rate, maturity and type of issue.
Foreign securities valued in non-U.S. dollars are valued in the foreign currency and then converted into the U.S. dollar equivalent using the foreign exchange rate in effect at the close of NYSE on the day the security’s value is determined. The value of securities traded in markets outside the United States may be affected on a day that the NYSE is closed and an investor is not able to purchase, exchange or redeem shares of the Funds.
The Board has designated the Advisor with the responsibility for implementing the pricing and valuation procedures, including responsibility for determining the fair value of the Funds’ securities or other assets and liabilities, and has established a Pricing Committee to assist in carrying out supervisory functions related to such responsibilities. The Pricing Committee includes representatives of the Funds’ Advisor, and Co-Administrator, including personnel from accounting and operations, trading, risk management and compliance. The Pricing Committee meets at least quarterly to review and approve Fund valuation matters, including a review of the Funds’ pricing activity and operations, fair value measurements, pricing vendors, policies and procedures, and related controls. At least a quorum of the Pricing Committee shall meet more frequently, as needed, to consider and approve time-sensitive fair valuation matters. The Pricing Committee provides periodic reports to the Valuation, Portfolio Management and Performance Committee (“Valuation Committee”) of the Board regarding pricing and valuation matters. Members of the Pricing Committee meet with the Valuation Committee and the Board at each of their regularly scheduled meetings to discuss valuation matters and actions taken during the period.
The Advisor has procedures to determine the fair value of a security when a price is not available from a pricing service or broker- dealer or the Advisor has determined that a price provided by a pricing service or broker-dealer does not approximate fair value. Fair valuation may also be used when a significant valuation event affecting the value of a security or market sector is determined to have occurred between the time when a security’s market closes and the time the Fund’s net asset value is calculated. The fair value of the security will be determined in good faith by the Advisor in accordance with procedures and methodologies approved by the Board. General factors used in determining the fair value of securities include, but are not limited to, fundamental analytical data relating to the security, the issuer and the market, such as duration, prepayment and default rates; general level of interest rates and changes in interest rates; information from broker-dealers; trading in similar securities; any restrictions on disposition of the security; and an evaluation of the forces that influence the market in which the investments are traded. These securities are either categorized as Level 2 or 3 in the fair value hierarchy, depending on the relevant inputs used.
When the Funds utilize fair valuation methods that use significant unobservable inputs to determine a security’s value, such securities will be categorized as Level 3 of the fair value hierarchy. These methods may require subjective determinations about the value of a security. While the Funds’ policy is intended to result in a calculation of a Fund’s net asset value that fairly reflects security values as of the time of pricing, the Funds cannot guarantee that values determined by the Advisor or persons acting at their direction would accurately reflect the price that the Funds could obtain for a security if they were to dispose of it as of the time of pricing (for instance, in a forced or distressed sale). The prices used by the Funds may differ from the value that would be realized if the securities were sold.
The Advisor employs various methods for calibrating the valuation approach related to securities categorized within Level 2 and Level 3 of the fair value hierarchy. These methods may include regular due diligence of the Funds’ pricing vendors, a regular review of key inputs and assumptions, transaction back-testing or disposition analysis to compare unrealized gains and losses to realized gains and losses, reviews of missing and stale prices and large movements in market value, and reviews of any market related activities. Additionally, the pricing of all fair value holdings is subsequently reported to the Valuation Committee and Board.
49
|
NOTES TO FINANCIAL STATEMENTS |
Foreign Taxes:
The Funds may be subject to foreign taxes on income, gains on investments or currency repatriation, a portion of which may be recoverable. The Funds will accrue such taxes and recoveries, as applicable, based upon its current interpretation of tax rules and regulations that exist in the markets in which it invests.
Realized gains in certain countries may be subject to foreign taxes at the Fund level, based on statutory rates. The Funds accrue for such foreign taxes on realized and unrealized gains at the appropriate rate for each jurisdiction, as applicable. The amount, if any, is disclosed as a liability in the Statement of Assets and Liabilities.
Fair Value Measurements:
The Funds disclose the fair value of their investments in a hierarchy that categorizes investments based on the inputs to valuation techniques used to measure fair value. There were no material level 3 transfers as these funds hold level 3 securities. The three levels of the fair value hierarchy are as follows:
• Level 1 - Inputs that reflect unadjusted quoted prices in active markets for identical assets or liabilities that the Funds have the ability to access at the measurement date.
• Level 2 - Significant inputs other than quoted prices that are observable for the asset or liability either directly or indirectly, including inputs in markets that are not considered to be active. Observable inputs may include quoted prices for similar securities, interest rates, spreads, prepayment spreads, etc.
• Level 3 - Significant unobservable inputs based on the best information available in the circumstances, to the extent observable inputs are not available (including the Fund’s own assumptions in determining the fair value of investments).
The inputs or methodology used for valuing investments are not necessarily an indication of the risk associated with investing in those securities.
Inputs used in determining fair value of an investment may include, but are not limited to, price information, volatility statistics, credit and market data, and other factors, all of which may be either observable or unobservable. Inputs can vary among investments and will be impacted by the investment type and volume of activity for the particular security or similar securities in the market. Investments in the Level 2 category are generally supported by transactions and quoted prices from dealers participating in the market for those investments. Investments may be included in the Level 3 category due to a lack of market activity or transparency. Internal valuation models may also be used as a pricing source for Level 3 investments. Internal valuation models may rely on one or more unobservable inputs, such as estimated cash flows, financial statement analysis and discount rates. The summary of inputs used to determine the fair value of the Funds’ investments as of September 30, 2024 is as follows:
| | | | | | | | | | | | | | | | |
| Funds | | Level 1
Quoted Prices | | | Level 2
Significant
Observable
Inputs | | | Level 3
Significant
Unobservable
Inputs | | | Total | |
| | | | |
Assets: | | | | | | | | | | | | | | | | |
Investments in Securities | | | | | | | | | | | | | | | | |
SMID Cap Growth Fund | | | $171,140,048 | (a) | | | $ — | | | | $— | | | $ | 171,140,048 | |
Enterprise Fund | | | 69,915,800 | (a) | | | — | | | | — | | | | 69,915,800 | |
Small Cap Core Fund | | | 41,586,448 | (a) | | | — | | | | — | | | | 41,586,448 | |
Microcap Value Fund | | | 114,813,861 | (a) | | | 1,096,686 | (b) | | | — | (c) | | | 115,910,547 | |
Small Cap Value Fund | | | 31,574,093 | (a) | | | — | | | | — | | | | 31,574,093 | |
| (a) | The breakdown of the Fund’s investments into major categories is disclosed in the Schedule of Portfolio Investments. |
50
|
NOTES TO FINANCIAL STATEMENTS |
| (b) | Represents securities in the Consumer Discretionary ($931,287), Financials ($82,599) and Consumer Staples ($82,800) sections of the Schedule of Portfolio Investments. |
| (c) | Includes securities fair valued at zero. |
The Fund’s assets assigned to the Level 3 category were valued using the valuation methodology and technique deemed most appropriate in the circumstances. The significant unobservable inputs used may include assumptions regarding the particular security’s cash flow profile and potential defaults which may not be generally observable for either the security or for assets of a similar type. Significant changes in any of these assumptions may result in a lower or higher fair value.
Repurchase Agreements:
The Funds, except SMID Cap Growth Fund, may enter into repurchase agreements with counterparties whom the Advisor has deemed creditworthy, including primary dealers that report to the Federal Reserve Bank of New York or other large U.S. commercial banks or broker-dealers. These repurchase agreements are subject to the seller’s agreement to repurchase such securities at a mutually agreed upon date and price. The repurchase price generally equals the price paid by the Funds plus interest negotiated on the basis of current short-term rates.
Securities pledged by the dealers as collateral for repurchase agreements are held by a custodian bank until maturity of the repurchase agreement. The Funds have procedures to monitor additional collateral, if needed, to ensure that the daily market value of the collateral remains in excess of the market value of the repurchase agreement in the event of a default.
There were no repurchase agreements held during the year ended September 30, 2024.
Affiliated Investments:
The Funds invest in another Fund of the Trust (an “Affiliated Fund”), RBC BlueBay U.S. Government Money Market Fund- Institutional Class 1, as a cash sweep vehicle. The income earned by the Funds from the Affiliated Fund for the period is disclosed in the Statement of Operations. The table below details the transactions of the Funds in the Affiliated Fund. As the affiliated investment is a money market fund in which shares are issued and redeemed at $1.00 per share, the number of shares purchased and sold equal the dollar amount shown as purchased and sold, and no gain or loss was realized on the sale of shares of the money market fund.
| | | | | | | | | | | | | | | | | | | | |
| | | Value
September 30, 2023 | | | Purchases | | | Sales | | | Value
September 30, 2024 | | | Dividends | |
Investments in RBC BlueBay U.S. Government Money Market Fund—Institutional Class 1 | | | | | | | | | | | | | | | | | |
SMID Cap Growth Fund | | | $4,385,678 | | | | $53,595,354 | | | | $(54,112,106 | ) | | | $3,868,926 | | | | $172,992 | |
Enterprise Fund | | | 1,206,823 | | | | 12,379,277 | | | | (12,437,954 | ) | | | 1,148,146 | | | | 80,761 | |
Small Cap Core Fund | | | 1,059,949 | | | | 9,838,798 | | | | (10,360,318 | ) | | | 538,429 | | | | 31,713 | |
Microcap Value Fund | | | 2,233,645 | | | | 12,233,256 | | | | (11,894,879 | ) | | | 2,572,022 | | | | 90,651 | |
Small Cap Value Fund | | | 436,014 | | | | 6,824,455 | | | | (6,837,395 | ) | | | 423,074 | | | | 32,867 | |
51
|
NOTES TO FINANCIAL STATEMENTS |
Investment Transactions and Income:
Investment transactions are recorded on trade date. Dividend income is recorded on the ex-dividend date. Non-cash dividends, if any, are recorded on the ex-dividend date at fair value. Realized gains and losses from investment transactions are calculated based on the cost of the specific security (also known as identified cost basis). Interest income is recognized on the accrual basis and includes, where applicable, the amortization or accretion of premium or discount using the effective yield method. Realized gains and losses from investment transactions and the net change in unrealized appreciation/(depreciation) relating to movements in foreign currency exchange rates are reported as realized gains and losses on foreign currency transactions and net change in unrealized appreciation/(depreciation) on foreign currency, respectively, in the statements of operations.
Expense, Investment Income and Gain/Loss Allocation:
Each Fund pays the expenses that are directly related to its operations, such as custodian fees or advisory fees. Expenses incurred by the Trust, such as trustee or legal fees, are allocated among each of the Funds in the Trust either proportionately based upon each Fund’s relative net assets or using another reasonable basis such as equally across all Funds in the Trust, depending on the nature of the expense. Individual share classes within a Fund are charged expenses specific to that class, such as distribution fees and transfer agent fees. Within a Fund, expenses other than class specific expenses are allocated daily to each class based upon the proportion of relative net assets. Investment income and realized and unrealized gains or losses are allocated to each class of shares based on relative net assets.
Indemnifications:
Under the Trust’s organizational documents, each Trustee, officer, employee or other agent of the Trust is indemnified against certain liabilities that may arise out of their duties to the Funds. Additionally, in the normal course of business, the Funds enter into contracts, including the Funds’ servicing agreements, that contain a variety of indemnification clauses. The Funds’ maximum exposure under these arrangements is unknown as this would involve future claims that may be made against the Funds that have not yet occurred.
Real Estate Investment Trusts:
The Funds may own shares of real estate investment trusts (”REITs“) which report information on the source of their distributions annually. Dividends paid by a REIT, other than capital gain distributions, will be taxable as ordinary income up to the amount of the REIT’s current and accumulated earnings and profits. Capital gain dividends paid by a REIT to a Fund will be treated as long term capital gains by the Fund and, in turn, may be distributed by the Fund to its shareholders as a capital gain distribution. Distributions received from a REIT in excess of its income are recorded as a return of capital and a reduction to the cost basis of the REIT.
Distributions to Shareholders:
Each Fund pays out any income that it receives, less expenses, in the form of dividends and capital gain distributions to its shareholders. Income dividends and capital gain distributions for each Fund are declared and paid at least annually. Distributions to shareholders are recorded on the ex-dividend date. The amount of dividends and distributions are calculated based on federal income tax regulations, which may differ from US GAAP. These “book/tax” differences may be either temporary or permanent in nature. To the extent these differences are determined, as of the end of the tax year, to be permanent (e.g., net operating loss, redesignation of distributions, basis adjustments on investments in passive foreign investment companies (PFICs) and partnerships), they are reclassified within a Fund’s capital accounts based on their federal tax basis treatment.
| | | | | | | | |
| | | Increase/(Decrease)
Paid in Capital | | | Increase/(Decrease)
Accumulated
Earnings | |
SMID Cap Growth Fund | | | $(169,416 | ) | | | $169,416 | |
3. Agreements and Other Transactions with Affiliates:
The Trust has entered into an investment advisory agreement with RBC GAM-US under which RBC GAM-US manages each Fund’s assets and furnishes related office facilities, equipment, research and personnel. The agreement requires each Fund to pay RBC GAM-US a monthly fee based upon average
52
|
NOTES TO FINANCIAL STATEMENTS |
daily net assets. Under the terms of the agreement, RBC GAM-US is entitled to receive fees based on a percentage of the average daily net assets of each of the Funds as follows:
| | | | | | |
| | | Average Daily Net Assets of Fund | | Annual Rate | |
SMID Cap Growth Fund | | All Net Assets | | | 0.70% | |
Enterprise Fund | | Up to $30 Million | | | 1.00% | |
| | Over $30 Million | | | 0.90% | |
Small Cap Core Fund | | All Net Assets | | | 0.70%* | |
Microcap Value Fund | | All Net Assets | | | 0.90% | |
Small Cap Value Fund | | All Net Assets | | | 0.70% | |
* Prior to July 1, 2024, the annual rate for Small Cap Core Fund was 0.85%
RBC GAM-US has contractually agreed to waive fees and/or make payments in order to keep total operating expenses (excluding certain fees such as interest, taxes and acquired fund fees and expenses) of the Funds to the following levels pursuant to an expense limitation agreement.
| | | | | | | | | | | | |
| | | Class A
Annual Rate | | | Class I
Annual Rate | | | Class R6
Annual Rate | |
SMID Cap Growth Fund | | | 1.07% | | | | 0.82% | | | | 0.77% | |
Enterprise Fund | | | 1.33% | | | | 1.08% | | | | N/A | |
Small Cap Core Fund* | | | 1.10% | | | | 0.85% | | | | 0.82% | |
Microcap Value Fund | | | 1.32% | | | | 1.07% | | | | N/A | |
Small Cap Value Fund | | | 1.10% | | | | 0.85% | | | | 0.80% | |
* Prior to July 1, 2024, the annual rates under the expense limitation agreement were 1.15%, 0.90% and 0.87% for Class A, Class I and Class R6, respectively, for Small Cap Core Fund.
This expense limitation agreement is in place until January 31, 2026, and may not be terminated by RBC GAM-US prior to that date. The agreement shall continue for additional one-year terms unless terminated or revised by the Board at any time or by RBC GAM-US at the expiration of any one-year period. The Advisor is entitled to recoup from the Fund or class the fees and/or operating expenses waived or reimbursed during any of the previous 12 months (3 years for the Small Cap Value Fund), provided the Fund is able to do so and remain in compliance with the expense limitation in place at the time the fees were waived or expenses paid.
At September 30, 2024, the amounts subject to possible recoupment under the expense limitation agreement were:
| | | | | | | | | | | | | | | | |
| | | FYE 9/30/22 | | | FYE 9/30/23 | | | FYE 9/30/24 | | | Total | |
SMID Cap Growth Fund | | $ | N/A | | | $ | N/A | | | | $310,255 | | | $ | 310,255 | |
Enterprise Fund | | | N/A | | | | N/A | | | | 134,824 | | | | 134,824 | |
Small Cap Core Fund | | | N/A | | | | N/A | | | | 199,413 | | | | 199,413 | |
Microcap Value Fund | | | N/A | | | | N/A | | | | 137,302 | | | | 137,302 | |
Small Cap Value Fund | | | 186,786 | | | | 168,114 | | | | 244,188 | | | | 599,088 | |
There was no recoupment of expense reimbursements/waivers during the year. Amounts from years prior to those shown are no longer subject to recoupment.
RBC GAM-US may also voluntarily waive and/or reimburse operating expenses of any Fund from time to time. Any such voluntary program may be changed or eliminated at any time without notice, and expenses waived under such program are not subject to recoupment.
RBC GAM-US voluntarily agreed to waive its investment advisory fees by the amount of investment advisory fees the Funds pay to RBC GAM-US indirectly through its investment in an affiliated money market fund. For the year ended September 30, 2024, the amount waived was $5,673, $2,601, $1,030, $2,866 and $1,051 for the SMID Cap Growth Fund, Enterprise Fund, Small Cap Core Fund, Microcap Value Fund and Small Cap Value Fund, respectively, and is included in expenses waived/reimbursed by Advisor in the Statements of Operations.
53
|
NOTES TO FINANCIAL STATEMENTS |
RBC GAM-US serves as co-administrator to the Funds. BNY Mellon serves as co-administrator and fund accounting agent. Services provided under the administrative services contract include providing day-to-day administration of matters related to the Funds, maintenance of their records and the preparation of reports. Under the terms of the administrative services agreement, RBC GAM-US does not receive an administrative services fee. BNY Mellon receives a fee for its services payable by each Fund based in part on each Funds’ average net assets. BNY Mellon’s fee is included with ”Accounting fees“ in the Statements of Operations.
Certain officers and trustees of the Trust are affiliated with the Advisor or the Co-Administrator. Such Officers and Trustees receive no compensation from the Funds for serving in their respective roles.
The Trust currently pays each of the independent trustees (trustees of the Trust who are not directors, officers or employees of the Advisor, either Co-Administrator or Distributor) an annual retainer of $92,000. The Board Chairperson and Audit Committee Chairperson each receive an additional retainer of $2,500 annually, and all other trustees serving as Chair of a Board committee each receive an additional retainer of $1,000 annually. In addition, independent trustees receive a quarterly meeting fee of $6,500 for each in-person Board meeting attended, a meeting fee of $1,500 for each telephonic or special board meeting attended, a $1,500 fee for each Board committee meeting attended, and are reimbursed for all out-of-pocket expenses relating to attendance at such meetings. These amounts are included in the Statement of Operations in “Trustees’ fees”.
The table below shows, as of September 30, 2024, the Fund’s net assets, the shares of the Fund held by the Advisor, and the percent of total net assets represented by the Advisor’s investments in the Funds.
| | | | | | | | | | | | |
| | | Net Assets | | | Shares held
by Advisor | | | % of Fund
Net Assets | |
SMID Cap Growth Fund | | $ | 170,381,039 | | | | 17,462 | | | | 0.2% | |
Small Cap Core Fund | | $ | 41,574,062 | | | | 17,325 | | | | 0.7% | |
Small Cap Value Fund | | $ | 31,557,350 | | | | 1,657 | | | | 0.1% | |
4. Fund Distribution:
Each of the Funds that offers Class A shares has adopted a Master Distribution 12b-1 Plan (the “Plan”) in which Quasar Distributors LLC (the “Distributor”) acts as the Funds’ distributor. The Plan permits each Fund to make payments for, or to reimburse the Distributor for, distribution-related costs and expenses of marketing shares of Class A covered under the Plan, and/or for providing shareholder services. The Plan does not apply to Class I and Class R6. The following chart shows the current Plan fee rate for Class A.
| | | | |
| | | Class A | |
12b-1 Plan Fee | | | 0.25%* | |
* Under the 12b-1 plan, the maximum fee rate for Class A shares is 0.50%. Currently the Board has approved an annual limit of 0.25%.
Plan fees are based on average daily net assets of Class A. Up to 0.25% of each Plan fee may be designated as a service fee, as defined by the applicable rules of the Financial Industry Regulatory Authority. The Distributor, subject to applicable legal requirements, may waive the Plan fee voluntarily, in whole or in part. For the year ended September 30, 2024, there were no fees waived by the Distributor.
The Distributor did not receive any CDSC fees from Class A shares of the Funds during the year ended September 30, 2024.
54
|
NOTES TO FINANCIAL STATEMENTS |
For the year ended September 30, 2024, the Distributor received commissions of $50,797 front-end sales charges of Class A shares of the Funds, of which $45,175 was paid to affiliated broker-dealers, and the remainder was either paid to unaffiliated broker-dealers or retained by the Distributor.
5. Securities Transactions:
The cost of securities purchased and proceeds from securities sold (excluding securities maturing less than one year from acquisition) for the year ended September 30, 2024 were as follows:
| | | | | | | | |
| | | Purchases | | | Sales | |
SMID Cap Growth Fund | | $ | 56,040,825 | | | $ | 23,539,827 | |
Enterprise Fund | | | 26,761,475 | | | | 31,384,700 | |
Small Cap Core Fund | | | 15,365,757 | | | | 22,984,737 | |
Microcap Value Fund | | | 23,347,106 | | | | 32,225,976 | |
Small Cap Value Fund | | | 16,097,611 | | | | 17,371,818 | |
Within the guidelines established by the Funds to always seek best execution when entering into portfolio transactions, the Funds participated in a “commission recapture” program until January 13, 2023, under which brokerage transactions were directed to Cowen and Company, LLC and its correspondent brokers. A portion of the commissions paid under this program were reimbursed to the Funds and recorded as net realized gains from investment transactions in the financial statements.
55
|
NOTES TO FINANCIAL STATEMENTS |
6. Capital Share Transactions:
The Trust is authorized to issue an unlimited number of shares of beneficial interest (“shares outstanding”) without par value. Transactions in capital stock of the Funds are summarized below:
| | | | | | | | | | | | | | | | |
| | | SMID Cap Growth Fund | | | Enterprise Fund | |
| | | For the
Year Ended
September 30,
2024 | | | For the
Year Ended
September 30,
2023 | | | For the
Year Ended
September 30,
2024 | | | For the
Year Ended
September 30,
2023 | |
CAPITAL TRANSACTIONS: | | | | | | | | | | | | | | | | |
Class A | | | | | | | | | | | | | | | | |
Proceeds from shares issued | | $ | 11,369,599 | | | $ | 2,287,796 | | | $ | 2,874 | | | $ | 3,024 | |
Distributions reinvested | | | 428,649 | | | | 1,062,780 | | | | 18,645 | | | | 99,368 | |
Cost of shares redeemed | | | (3,673,101 | ) | | | (1,711,779 | ) | | | (52,097 | ) | | | (103,509 | ) |
| | | | | | | | | | | | | | | | |
Change in Class A | | $ | 8,125,147 | | | $ | 1,638,797 | | | $ | (30,578 | ) | | $ | (1,117 | ) |
| | | | | | | | | | | | | | | | |
Class I | | | | | | | | | | | | | | | | |
Proceeds from shares issued | | $ | 57,763,050 | | | $ | 29,415,120 | | | $ | 402,362 | | | $ | 301,638 | |
Distributions reinvested | | | 2,108,984 | | | | 5,134,912 | | | | 1,675,898 | | | | 7,809,138 | |
Cost of shares redeemed | | | (36,418,956 | ) | | | (18,858,220 | ) | | | (5,359,814 | ) | | | (3,537,426 | ) |
| | | | | | | | | | | | | | | | |
Change in Class I | | $ | 23,453,078 | | | $ | 15,691,812 | | | $ | (3,281,554 | ) | | $ | 4,573,350 | |
| | | | | | | | | | | | | | | | |
Class R6 | | | | | | | | | | | | | | | | |
Proceeds from shares issued | | $ | 6,103,665 | | | $ | 9,824,731 | | | $ | — | | | $ | — | |
Distributions reinvested | | | 4,268 | | | | 1,350 | | | | — | | | | — | |
Cost of shares redeemed | | | (959,655 | ) | | | (270,944 | ) | | | — | | | | — | |
| | | | | | | | | | | | | | | | |
Change in Class R6 | | $ | 5,148,278 | | | $ | 9,555,137 | | | $ | — | | | $ | — | |
| | | | | | | | | | | | | | | | |
Change in net assets resulting from capital transactions | | $ | 36,726,503 | | | $ | 26,885,746 | | | $ | (3,312,132 | ) | | $ | 4,572,233 | |
| | | | | | | | | | | | | | | | |
SHARE TRANSACTIONS: | | | | | | | | | | | | | | | | |
Class A | | | | | | | | | | | | | | | | |
Issued | | | 955,741 | | | | 194,672 | | | | 183 | | | | 207 | |
Reinvested | | | 36,203 | | | | 99,605 | | | | 1,238 | | | | 7,388 | |
Redeemed | | | (299,344 | ) | | | (150,909 | ) | | | (3,742 | ) | | | (7,083 | ) |
| | | | | | | | | | | | | | | | |
Change in Class A | | | 692,600 | | | | 143,368 | | | | (2,321 | ) | | | 512 | |
| | | | | | | | | | | | | | | | |
| | | | |
Class I | | | | | | | | | | | | | | | | |
Issued | | | 3,753,804 | | | | 2,046,358 | | | | 22,805 | | | | 19,252 | |
Reinvested | | | 140,318 | | | | 382,062 | | | | 102,064 | | | | 533,776 | |
Redeemed | | | (2,334,637 | ) | | | (1,301,640 | ) | | | (314,865 | ) | | | (221,484 | ) |
| | | | | | | | | | | | | | | | |
Change in Class I | | | 1,559,485 | | | | 1,126,780 | | | | (189,996 | ) | | | 331,544 | |
| | | | | | | | | | | | | | | | |
| | | | |
Class R6 | | | | | | | | | | | | | | | | |
Issued | | | 391,253 | | | | 680,743 | | | | — | | | | — | |
Reinvested | | | 283 | | | | 100 | | | | — | | | | — | |
Redeemed | | | (61,007 | ) | | | (18,174 | ) | | | — | | | | — | |
| | | | | | | | | | | | | | | | |
Change in Class R6 | | | 330,529 | | | | 662,669 | | | | — | | | | — | |
| | | | | | | | | | | | | | | | |
Change in shares resulting from capital transactions | | | 2,582,614 | | | | 1,932,817 | | | | (192,317 | ) | | | 332,056 | |
| | | | | | | | | | | | | | | | |
56
|
NOTES TO FINANCIAL STATEMENTS |
| | | | | | | | | | | | | | | | |
| | | Small Cap Core Fund | | | Microcap Value Fund | |
| | | For the
Year Ended
September 30,
2024 | | | For the
Year Ended
September 30,
2023 | | | For the
Year Ended
September 30,
2024 | | | For the
Year Ended
September 30,
2023 | |
CAPITAL TRANSACTIONS: | | | | | | | | | | | | | | | | |
Class A | | | | | | | | | | | | | | | | |
Proceeds from shares issued | | $ | 3,185,447 | | | $ | 1,348,122 | | | $ | 123,535 | | | $ | 94,198 | |
Distributions reinvested | | | 678,359 | | | | 1,814,942 | | | | 225,849 | | | | 372,237 | |
Cost of shares redeemed | | | (4,021,064 | ) | | | (1,242,176 | ) | | | (638,325 | ) | | | (598,664 | ) |
| | | | | | | | | | | | | | | | |
Change in Class A | | $ | (157,258 | ) | | $ | 1,920,888 | | | $ | (288,941 | ) | | $ | (132,229 | ) |
| | | | | | | | | | | | | | | | |
Class I | | | | | | | | | | | | | | | | |
Proceeds from shares issued | | $ | 854,362 | | | $ | 283,741 | | | $ | 4,010,476 | | | $ | 3,827,818 | |
Distributions reinvested | | | 2,353,335 | | | | 7,660,760 | | | | 8,715,810 | | | | 13,178,787 | |
Cost of shares redeemed | | | (8,556,636 | ) | | | (3,466,519 | ) | | | (12,970,125 | ) | | | (11,944,277 | ) |
| | | | | | | | | | | | | | | | |
Change in Class I | | $ | (5,348,939 | ) | | $ | 4,477,982 | | | $ | (243,839 | ) | | $ | 5,062,328 | |
| | | | | | | | | | | | | | | | |
Class R6 | | | | | | | | | | | | | | | | |
Proceeds from shares issued | | $ | 252,335 | | | $ | 1,214 | | | $ | — | | | $ | — | |
Distributions reinvested | | | 909 | | | | 2,075 | | | | — | | | | — | |
Cost of shares redeemed | | | (12 | ) | | | — | | | | — | | | | — | |
| | | | | | | | | | | | | | | | |
Change in Class R6 | | $ | 253,232 | | | $ | 3,289 | | | $ | — | | | $ | — | |
| | | | | | | | | | | | | | | | |
Change in net assets resulting from capital transactions | | $ | (5,252,965 | ) | | $ | 6,402,159 | | | $ | (532,780 | ) | | $ | 4,930,099 | |
| | | | | | | | | | | | | | | | |
SHARE TRANSACTIONS: | | | | | | | | | | | | | | | | |
Class A | | | | | | | | | | | | | | | | |
Issued | | | 240,959 | | | | 108,467 | | | | 4,559 | | | | 3,567 | |
Reinvested | | | 55,286 | | | | 161,185 | | | | 8,568 | | | | 14,848 | |
Redeemed | | | (304,483 | ) | | | (96,891 | ) | | | (24,166 | ) | | | (23,118 | ) |
| | | | | | | | | | | | | | | | |
Change in Class A | | | (8,238 | ) | | | 172,761 | | | | (11,039 | ) | | | (4,703 | ) |
| | | | | | | | | | | | | | | | |
Class I | | | | | | | | | | | | | | | | |
Issued | | | 55,015 | | | | 19,377 | | | | 150,477 | | | | 149,486 | |
Reinvested | | | 161,853 | | | | 581,241 | | | | 331,148 | | | | 526,520 | |
Redeemed | | | (568,796 | ) | | | (228,349 | ) | | | (492,506 | ) | | | (456,095 | ) |
| | | | | | | | | | | | | | | | |
Change in Class I | | | (351,928 | ) | | | 372,269 | | | | (10,881 | ) | | | 219,911 | |
| | | | | | | | | | | | | | | | |
Class R6 | | | | | | | | | | | | | | | | |
Issued | | | 16,907 | | | | 81 | | | | — | | | | — | |
Reinvested | | | 62 | | | | 157 | | | | — | | | | — | |
Redeemed | | | (1 | ) | | | — | | | | — | | | | — | |
| | | | | | | | | | | | | | | | |
Change in Class R6 | | | 16,968 | | | | 238 | | | | — | | | | — | |
| | | | | | | | | | | | | | | | |
Change in shares resulting from capital transactions | | | (343,198 | ) | | | 545,268 | | | | (21,920 | ) | | | 215,208 | |
| | | | | | | | | | | | | | | | |
57
|
NOTES TO FINANCIAL STATEMENTS |
| | | | | | | | |
| | | Small Cap Value Fund | |
| | | For the
Year Ended
September 30,
2024 | | | For the
Year Ended
September 30,
2023 | |
CAPITAL TRANSACTIONS: | | | | | | | | |
Class A | | | | | | | | |
Distributions reinvested | | $ | 125 | | | $ | 498 | |
| | | | | | | | |
Change in Class A | | $ | 125 | | | $ | 498 | |
| | | | | | | | |
Class I | | | | | | | | |
Proceeds from shares issued | | $ | 2,399,213 | | | $ | 5,370,625 | |
Distributions reinvested | | | 129,976 | | | | 771,688 | |
Cost of shares redeemed | | | (3,692,977 | ) | | | (11,717,378 | ) |
| | | | | | | | |
Change in Class I | | $ | (1,163,788 | ) | | $ | (5,575,065 | ) |
| | | | | | | | |
Class R6 | | | | | | | | |
Distributions reinvested | | $ | 151 | | | $ | 527 | |
| | | | | | | | |
Change in Class R6 | | $ | 151 | | | $ | 527 | |
| | | | | | | | |
Change in net assets resulting from capital transactions | | $ | (1,163,512 | ) | | $ | (5,574,040 | ) |
| | | | | | | | |
SHARE TRANSACTIONS: | | | | | | | | |
Class A | | | | | | | | |
Reinvested | | | 9 | | | | 40 | |
| | | | | | | | |
Change in Class A | | | 9 | | | | 40 | |
| | | | | | | | |
Class I | | | | | | | | |
Issued | | | 159,418 | | | | 401,888 | |
Reinvested | | | 8,976 | | | | 61,884 | |
Redeemed | | | (261,334 | ) | | | (876,500 | ) |
| | | | | | | | |
Change in Class I | | | (92,940 | ) | | | (412,728 | ) |
| | | | | | | | |
Class R6 | | | | | | | | |
Reinvested | | | 10 | | | | 42 | |
| | | | | | | | |
Change in Class R6 | | | 10 | | | | 42 | |
| | | | | | | | |
Change in shares resulting from capital transactions | | | (92,921 | ) | | | (412,646 | ) |
| | | | | | | | |
7. Federal Income Taxes:
It is the policy of each Fund to continue to qualify as a regulated investment company by complying with the provisions available to certain investment companies, as defined under Subchapter M of the Internal Revenue Code, and to distribute substantially all of its net investment income and net realized capital gains. Therefore, no federal tax liability is recorded in the financial statements of each Fund.
Fund Management has analyzed the Funds’ tax positions taken or expected to be taken on federal income tax returns for all open tax years (current and prior three tax years), and has concluded that no provision for federal income tax is required in the Funds’ financial statements. The Funds’ federal and state income and federal excise tax returns for tax years for which the applicable statutes of limitations have not expired are subject to examination by the Internal Revenue Service and state departments of revenue.
58
|
NOTES TO FINANCIAL STATEMENTS |
As of September 30, 2024, the tax cost of investments and the breakdown of unrealized appreciation (depreciation) for each Fund was as follows:
| | | | | | | | | | | | | | | | |
| | | Tax Cost Of
Investments | | | Unrealized
Appreciation | | | Unrealized
Depreciation | | | Net Unrealized
Appreciation/
(Depreciation) | |
SMID Cap Growth Fund | | $ | 132,775,431 | | | $ | 46,536,527 | | | $ | (8,171,910 | ) | | $ | 38,364,617 | |
Enterprise Fund | | | 47,393,189 | | | | 25,268,353 | | | | (2,745,742 | ) | | | 22,522,611 | |
Small Cap Core Fund | | | 29,077,544 | | | | 16,301,846 | | | | (3,792,942 | ) | | | 12,508,904 | |
Microcap Value Fund | | | 86,942,156 | | | | 40,945,107 | | | | (11,976,729 | ) | | | 28,968,378 | |
Small Cap Value Fund | | | 28,405,124 | | | | 5,053,242 | | | | (1,884,273 | ) | | | 3,168,969 | |
The difference between book basis and tax basis unrealized appreciation/depreciation is attributable primarily to the tax deferral of losses on wash sales, Passive Foreign Investment Companies (PFICs) mark to market adjustment, and cumulative partnership basis adjustment.
The tax character of distributions during the year ended September 30, 2024 were as follows:
| | | | | | | | | | | | | | | | |
| | | Distributions Paid From | |
| | | Ordinary
Income | | | Net Long Term
Capital Gains | | | Total Taxable
Distributions | | | Total
Distributions
Paid | |
SMID Cap Growth Fund | | $ | — | | | | $2,793,502 | | | | $2,793,502 | | | | $2,793,502 | |
Enterprise Fund | | | 756,755 | | | | 1,043,600 | | | | 1,800,355 | | | | 1,800,355 | |
Small Cap Core Fund | | | 193,644 | | | | 2,913,148 | | | | 3,106,792 | | | | 3,106,792 | |
Microcap Value Fund | | | 1,230,454 | | | | 8,592,858 | | | | 9,823,312 | | | | 9,823,312 | |
Small Cap Value Fund | | | 383,742 | | | | — | | | | 383,742 | | | | 383,742 | |
The tax character of distributions during the year ended September 30, 2023 were as follows:
| | | | | | | | | | | | | | | | |
| | | Distributions Paid From | |
| | | Ordinary
Income | | | Net Long Term
Capital Gains | | | Total Taxable
Distributions | | | Total
Distributions
Paid | |
SMID Cap Growth Fund | | $ | — | | | $ | 6,223,196 | | | $ | 6,223,196 | | | $ | 6,223,196 | |
Enterprise Fund | | | — | | | | 8,290,732 | | | | 8,290,732 | | | | 8,290,732 | |
Small Cap Core Fund | | | 1,160,788 | | | | 8,608,888 | | | | 9,769,676 | | | | 9,769,676 | |
Microcap Value Fund | | | 1,464,645 | | | | 13,455,940 | | | | 14,920,585 | | | | 14,920,585 | |
Small Cap Value Fund | | | 1,142,082 | | | | 583,808 | | | | 1,725,890 | | | | 1,725,890 | |
59
|
NOTES TO FINANCIAL STATEMENTS |
As of September 30, 2024, the components of accumulated earnings/(losses) on a tax basis were as follows:
| | | | | | | | | | | | | | | | | | | | |
| | | SMID Cap
Growth Fund | | | Enterprise
Fund | | | Small Cap
Core Fund | | | Microcap
Value Fund | | | Small Cap
Value Fund | |
Undistributed ordinary income | | $ | — | | | $ | 201,818 | | | $ | 257,021 | | | $ | 1,559,740 | | | $ | 217,031 | |
Undistributed long term gain | | | 1,996,194 | | | | 7,795,993 | | | | 5,522,025 | | | | 8,476,771 | | | | — | |
| | | | | | | | | | | | | | | | | | | | |
Accumulated earnings | | | 1,996,194 | | | | 7,997,811 | | | | 5,779,046 | | | | 10,036,511 | | | | 217,031 | |
Accumulated capital loss carryforwards | | | — | | | | — | | | | — | | | | — | | | | (2,654,301 | ) |
Unrealized appreciation | | | 38,364,617 | | | | 22,522,611 | | | | 12,508,904 | | | | 28,968,378 | | | | 3,168,969 | |
| | | | | | | | | | | | | | | | | | | | |
Total Accumulated Earnings | | $ | 40,360,811 | | | $ | 30,520,422 | | | $ | 18,287,950 | | | $ | 39,004,889 | | | $ | 731,699 | |
| | | | | | | | | | | | | | | | | | | | |
As of September 30, 2024, the Small Cap Value Fund had long-term capital loss carryforwards of $2,654,301.
Under current tax law, Post-October Capital Losses and Late-Year Ordinary Losses may be deferred and treated as occurring on the first business day of the following fiscal year for tax purposes. The SMID Cap Growth Fund had deferred qualified late-year ordinary losses of $230,614 which will be treated as arising on the first business day of the fiscal year ending September 30, 2024.
8. Market Timing:
The Trust strongly discourages attempts at market timing by Fund shareholders. Prior to June 11, 2021, each Fund charged a redemption fee of 2% of the value of the shares redeemed or exchanged within 30 days of purchase. In addition, the Trust may limit the number of exchanges that may be made between Funds to five (5) per calendar year. When assessed, the redemption fee was deducted from the redemption proceeds and retained by the Fund, not by the Advisor. This redemption fee was not charged in cases where, for example, the redemption resulted from an automatic reinvestment or asset re-allocation not specifically directed by the shareholder. The Trust also reserves the right to reject any Fund purchase order made by persons deemed to be market timers. The Funds’ prospectus contains a full description of the Trust’s policies on market timing and/or excessive trading. The redemption fee is recorded as a credit to capital and is included in the capital transactions on the Statements of Changes in Net Assets.
9. Soft Dollars:
Soft dollar arrangements and commission sharing arrangements (CSAs) are arrangements under which RBC GAM-US directs client brokerage transactions to a broker-dealer and obtains other products and services, such as research, in addition to trade execution. Federal securities laws permit a fund advisor to incur commission charges on behalf of a fund that are higher than another broker-dealer would have charged if the advisor believes the charges are reasonable in relation to the brokerage and research services received. RBC GAM-US has a fiduciary duty to the shareholders of the Funds to seek the best execution for all of the Funds’ securities transactions. Fund Management believes that using soft dollars to purchase brokerage and research services may, in certain cases, be in a Fund’s best interest. During the year ended September 30, 2024, the Funds used soft dollar and commission sharing arrangements. Fund Management continues to closely monitor its current use of soft dollars, in addition to regulatory developments in this area for any possible impact on Fund policies.
60
|
NOTES TO FINANCIAL STATEMENTS |
10. Line of Credit
The Funds are participants in an uncommitted, secured $500,000,000 line of credit with U.S. Bank, N.A. (the “Bank”), the Funds’ custodian, to be used to fund shareholder redemption requests and for other short-term temporary or emergency general business purposes. The line of credit has a scheduled termination date of July 26, 2025. Interest is charged on borrowings under this line of credit at the Bank’s prime lending rate per annum. Since each Fund participates in this line of credit, there is no assurance that an individual fund will have access to all or any part of the $500,000,000 at any particular time. There were no loans outstanding pursuant to this line of credit at September 30, 2024. There were no borrowings made by the Funds under the line of credit during the year ended September 30, 2024.
11. Significant Risks
Shareholder concentration risk:
As of September 30, 2024, the following Funds had broker-dealer omnibus accounts which each owned more than 10% of a Fund’s outstanding shares as shown below:
| | | | | | | | |
| | | # of Omnibus Accounts | | | % of Fund | |
SMID Cap Growth Fund | | | 2 | | | | 69.1% | |
Enterprise Fund | | | 1 | | | | 12.1% | |
Small Cap Core Fund | | | 2 | | | | 27.7% | |
Microcap Value Fund | | | 1 | | | | 22.3% | |
Small Cap Value Fund | | | 2 | | | | 31.3% | |
Significant transactions by these shareholders may impact the Funds’ performance.
Market risk
One or more markets in which a Fund invests may go down in value, sometimes sharply and unpredictably, and the value of a Fund’s portfolio securities may fall or fail to rise. Market risk may affect a single issuer, sector of the economy, industry or the market as a whole. In addition, global economies and financial markets are becoming increasingly interconnected, and political, economic and other conditions and events (including, but not limited to, natural disasters, pandemics, epidemics, and social unrest) in one country, region, or financial market may adversely impact issuers in a different country, region or financial market. Furthermore, the occurrence of, among other events, natural or man-made disasters, severe weather or geological events, fires, floods, earthquakes, outbreaks of disease (such as COVID-19, avian influenza or H1N1/09), epidemics, pandemics, malicious acts, cyber-attacks, terrorist acts or the occurrence of climate change, may also adversely impact the performance of a Fund. Such events could adversely impact issuers, markets and economies over the short- and long-term, including in ways that cannot necessarily be foreseen. A Fund could be negatively impacted if the value of a portfolio holding were harmed by such political or economic conditions or events. Moreover, such negative political and economic conditions and events could disrupt the processes necessary for a Fund’s operations.
In response to political and military actions undertaken by Russia, the U.S., European Union and other jurisdictions have imposed economic sanctions against certain Russian individuals, entities and sectors. These sanctions and the threat of further sanctions may result in the decline of the value and liquidity of Russian securities, a weakening of the ruble or other adverse consequences to the Russian economy. Sanctions could impair a fund’s ability to invest in accordance with its investment program, to determine the overall value of its net assets, and to sell holdings as needed to meet shareholder redemptions. As of September 30, 2024, none of the Funds’ investments were in violation of such sanctions.
61
|
NOTES TO FINANCIAL STATEMENTS |
Industry and sector focus risk
At times the Funds may increase the relative emphasis of its investments in a particular industry or sector. The prices of securities of issuers in a particular industry or sector may be more susceptible to fluctuations due to changes in economic or business conditions, government regulations, availability of basic resources or supplies, or other events affect that industry or sector more than securities of issuers in other industries and sectors. To the extent that the Fund increases the relative emphasis of its investments in a particular industry or sector, its shares’ values may fluctuate in response to events affecting that industry or sector.
12. Subsequent Events:
Fund Management has evaluated the impact of all subsequent events on the Fund and has determined that there were no subsequent events requiring recognition or disclosure in the financial statements.
62
|
REPORT OF INDEPENDENT REGISTERED PUBLIC ACCOUNTING FIRM |
To the Board of Trustees of RBC Funds Trust and Shareholders of RBC SMID Cap Growth Fund, RBC Enterprise Fund, RBC Small Cap Core Fund, RBC Microcap Value Fund, and RBC Small Cap Value Fund
Opinions on the Financial Statements
We have audited the accompanying statements of assets and liabilities, including the schedules of portfolio investments, of RBC SMID Cap Growth Fund, RBC Enterprise Fund, RBC Small Cap Core Fund, RBC Microcap Value Fund, and RBC Small Cap Value Fund ( five of the funds constituting RBC Funds Trust, hereafter collectively referred to as the “Funds”) as of September 30, 2024, the related statements of operations for the year ended September 30, 2024, the statements of changes in net assets for each of the two years in the period ended September 30, 2024, including the related notes, and the financial highlights for each of the periods indicated therein (collectively referred to as the “financial statements”). In our opinion, the financial statements present fairly, in all material respects, the financial position of each of the Funds as of September 30, 2024, the results of each of their operations for the year then ended, the changes in each of their net assets for each of the two years in the period ended September 30, 2024 and each of the financial highlights for each of the periods indicated therein in conformity with accounting principles generally accepted in the United States of America.
Basis for Opinions
These financial statements are the responsibility of the Funds’ management. Our responsibility is to express an opinion on the Funds’ financial statements based on our audits. We are a public accounting firm registered with the Public Company Accounting Oversight Board (United States) (PCAOB) and are required to be independent with respect to the Funds in accordance with the U.S. federal securities laws and the applicable rules and regulations of the Securities and Exchange Commission and the PCAOB.
We conducted our audits of these financial statements in accordance with the standards of the PCAOB. Those standards require that we plan and perform the audit to obtain reasonable assurance about whether the financial statements are free of material misstatement, whether due to error or fraud.
Our audits included performing procedures to assess the risks of material misstatement of the financial statements, whether due to error or fraud, and performing procedures that respond to those risks. Such procedures included examining, on a test basis, evidence regarding the amounts and disclosures in the financial statements. Our audits also included evaluating the accounting principles used and significant estimates made by management, as well as evaluating the overall presentation of the financial statements. Our procedures included confirmation of securities owned as of September 30, 2024 by correspondence with the custodian, and brokers; when replies were not received from brokers we performed other auditing procedures. We believe that our audits provide a reasonable basis for our opinions.
/s/PricewaterhouseCoopers LLP
Minneapolis, Minnesota
November 22, 2024
We have served as the auditor of one or more investment companies in the RBC Funds since 2016.
63
|
OTHER FEDERAL INCOME TAX INFORMATION (UNAUDITED) |
For the fiscal year ended September 30, 2024, certain dividends paid by the Funds may be subject to a maximum tax rate of 15% as provided for by the Jobs and Growth Tax Reconciliation Act of 2003. The Funds intend to report the maximum amount allowable as taxed at a maximum rate of 15%.
Complete information will be reported in conjunction with your 2020 Form 1099-DIV.
All reportings are based on financial information available as of the date of this annual report and, accordingly, are subject to change. For each item above, it is the intention of the Funds to report the maximum amount permitted under the Internal Revenue Code and the regulations thereunder.
For the year ended September 30, 2024, the following Funds had a qualified dividend income percentage of:
| | | | |
| | | Qualified
Dividend
Income | |
Enterprise Fund | | | 100.00% | |
Small Cap Core Fund | | | 100.00% | |
Microcap Value Fund | | | 100.00% | |
Small Cap Value Fund | | | 100.00% | |
For corporate shareholders, the following percentage of the total ordinary income distributions paid during the fiscal year ended September 30, 2024 qualify for the corporate dividends received deduction:
| | | | |
| | | Dividends
Received
Deduction | |
Enterprise Fund | | | 100.00% | |
Small Cap Core Fund | | | 100.00% | |
Microcap Value Fund | | | 100.00% | |
Small Cap Value Fund | | | 100.00% | |
For the year ended September 30, 2024, the following Funds had a qualified interest income percentage of:
| | | | |
| | | Qualified
Interest
Income | |
Enterprise Fund | | | 1.67% | |
Small Cap Core Fund | | | 6.67% | |
Microcap Value Fund | | | 3.14% | |
Small Cap Value Fund | | | 3.94% | |
64
|
OTHER FEDERAL INCOME TAX INFORMATION (UNAUDITED) |
There were no qualified short term gains held during the year ended September 30, 2024.
Pursuant to Internal Revenue Code Section 852(b)(3), SMID Cap Growth Fund, Enterprise Fund, Small Cap Core Fund, Microcap Value Fund and Small Cap Value Fund reported $2,793,502, $7,796,001, $5,776,840, $8,592,858 and $0 respectively as long-term capital gain distributions for the year ended September 30, 2024.
All reportings are based on financial information available as of the date of this annual report and, accordingly, are subject to change. For each item above, it is the intention of the Funds to report the maximum amount permitted under the Internal Revenue Code and the regulations thereunder.
65
|
APPROVAL OF INVESTMENT ADVISORY AGREEMENT (UNAUDITED) |
Information Regarding the Approval of Investment Advisory Agreement
In September 2024, after evaluating the services provided by RBC Global Asset Management (U.S.) Inc. (the “Advisor”) and reviewing the performance, fees, and expenses of the Funds, the RBC Funds Board of Trustees determined to approve the continuation of the investment advisory agreement (“Agreement”) with the Advisor for each Fund for an additional year.
As part of their review of the Agreement, the Trustees requested and considered information regarding the advisory services performed by the Advisor; the staffing and qualifications of the personnel responsible for operating and managing the Funds; and the Funds’ performance, fees, and expenses. The Trustees considered information provided at regular quarterly Board and Committee meetings throughout the year, information presented at both a special meeting held to review requested material related to the proposed renewals and a regular meeting at which the proposed renewals were considered, and their experience with the management and portfolio management teams over the years. The information included material provided by the Advisor, as well as reports prepared by Broadridge Financial Solutions, Inc., an independent statistical compilation company, providing comparative fee and expense information and comparative performance information for the Funds vs. funds in the same category and funds in more tailored peer groups. In connection with their deliberations, the independent Trustees were advised by independent legal counsel with regard to the materials and their responsibilities under relevant laws and regulations.
The Trustees met with representatives from the Advisor’s senior management team, as well as senior investment professionals, to discuss the information and the Advisor’s ongoing management of the Funds. The Trustees reviewed the nature and quality of the services provided to the Funds by the Advisor, including information as to each Fund’s performance relative to appropriate index benchmarks as well as their respective Morningstar categories and peer groups. For several of the Funds, the Board also reviewed comparative information with respect to custom peer groups designed to align more closely with the Funds’ specific investment strategies. The Board noted that the Small Cap Core and Microcap Value Funds had outperformed the median performance of their respective Morningstar categories for the trailing 1, 3 and 5 year periods, with Small Cap Core also outperforming its custom peer group and its benchmark index for those periods, while the Microcap Value Fund showed mixed results when compared to its custom peer group and benchmark index. The Board also noted that the performance of the Enterprise and Small Cap Value Funds was favorable over the 1, and 3 year periods when compared to both their respective Morningstar categories and peer groups as well as their benchmarks, with both underperforming these measures for the 5 year period. Conversely, the performance of the SMID Cap Growth Fund was more favorable over the long term with the Fund outperforming the median performance of its Morningstar category and benchmark index and performing in the top half of its peer group for the 3 and 5 year periods, while trailing those measures for the 1 year period. Overall, the Board was satisfied with the Funds’ performance.
The Trustees recognized the strong research and fundamental analysis capabilities of the Advisor’s investment teams and their extensive portfolio management experience, as well as the Advisor’s effective trading, operational, and compliance structure and systems, including a discussion of certain changes in the investment teams for some Funds. The Trustees also noted the Advisor’s application of portfolio engineering approaches to the management of the Funds.
The Trustees reviewed advisory fee and expense information for each Fund compared to similarly situated funds, including information regarding other client accounts advised or sub-advised by the Advisor with similar investment strategies and the reasons for any differences in fees. The Trustees considered, and viewed favorably, the arrangements to subsidize Fund expenses at competitive levels through expense limitation agreements with the Adviser. The Trustees noted that advisory fees and expense ratios were competitive and, in particular, that none of the Funds had total net expenses that exceeded the median of its peer group.
66
|
APPROVAL OF INVESTMENT ADVISORY AGREEMENT (UNAUDITED) |
The Trustees also reviewed reports from the Advisor regarding its management of other investment client accounts with similar strategies, including the advisory fees paid and the reasons for differences in fees, which included liquidity management and matters related to mutual fund operations. The Trustees reviewed profitability data—including year-over-year variances—for the Advisor and considered information regarding other benefits the Advisor and its affiliates derived from their relationships with the Funds, including soft dollar research. The Board also noted that the Advisor does not receive any additional fee for its administrative services to the Funds.
Based upon their review, the Trustees determined that the advisory fees proposed to be payable to the Advisor were fair and reasonable in light of the nature and quality of services provided under all of the circumstances and were within the range of what might have been negotiated at arms’ length. The Trustees concluded that it was in the interests of the Funds and their shareholders for the Trustees to approve the continuation of the Agreement and the expense limitation agreements for the Funds for an additional year. In arriving at their collective decision to approve the renewal of the Agreement, the Trustees did not assign relative weights to the factors discussed above or deem any one or group of them to be controlling in and of itself.
67
RBC Funds
P.O. Box 701
Milwaukee, WI 53201-0701
800-422-2766
www.rbcgam.com
Performance data represents past performance and does not guarantee future results. The principal value of an investment and investment return will fluctuate so that an investor’s shares, when redeemed, may be worth more or less than their original cost.
This report and the financial statements contained herein are provided for the information of RBC Funds shareholders. This report is not authorized for distribution to prospective investors unless preceded or accompanied by a current prospectus, which contains information concerning investment objectives, risks, charges and expenses of the funds. Please read the prospectus carefully before investing.
This report and the financial statements contained herein are not intended to be a forecast of future events, a guarantee of future results, or investment advice. There is no assurance that certain securities will remain in or out of each fund’s portfolio. The views expressed in this report reflect those of the portfolio managers through the year ended September 30, 2024.
NOT FDIC INSURED • NO BANK GUARANTEE • MAY LOSE VALUE
RBC Global Asset Management (U.S.) Inc. serves as investment advisor for the RBC Funds.
RBC Funds are distributed by Quasar Distributors LLC.
The RBC Funds are pleased to offer shareholder reports printed entirely on Forest Stewardship Council® certified paper. This product is made of material from well-managed FSC®-certified forests, recycled materials, and other controlled sources. The Forest Stewardship Council® promotes environmentally appropriate, socially beneficial, and economically viable management of the world’s forests.
RBCF-EQ AR 09-24

RBC Global Asset Management Financial Statements and Other Important Information For the year ended September 30, 2024 RBC BlueBay U.S. Government Money Market Fund
|
SCHEDULE OF PORTFOLIO INVESTMENTS |
RBC BlueBay U.S. Government Money Market Fund
September 30, 2024
| | | | | | | | | | | | |
| | | | Principal
Amount | | | | | Value | |
| | U.S. Government Agency Obligations — 28.1% | | | | |
| | Fannie Mae — 1.5% | | | | |
| | | | | $ 68,000,000 | | | (SOFR RATE + 0.140%), 5.18%, 9/11/26(a) | | | $ 68,000,000 | |
| | | | | 124,000,000 | | | (SOFR RATE + 0.135%), 5.34%, 8/21/26(a) | | | 124,000,000 | |
| | | | | 48,000,000 | | | (SOFR RATE + 0.120%), 5.38%, 7/29/26(a) | | | 48,000,000 | |
| | | | | | | | | | | | |
| | | | | | | | | | | 240,000,000 | |
| | | | | | | | | | | | |
| | Federal Farm Credit — 9.7% | |
| | | | | 40,000,000 | | | (SOFR RATE + 0.140%), 4.97%, 9/25/26(a) | | | 40,000,000 | |
| | | | | 90,000,000 | | | (SOFR RATE + 0.155%), 4.99%, 9/25/25(a) | | | 90,000,000 | |
| | | | | 129,000,000 | | | (SOFR RATE + 0.105%), 5.02%, 3/18/26(a) | | | 128,989,618 | |
| | | | | 35,000,000 | | | (SOFR RATE + 0.150%), 5.10%, 3/17/25(a) | | | 34,991,948 | |
| | | | | | 40,000,000 | | | (SOFR RATE + 0.155%), 5.16%, 9/15/25(a) | | | 39,998,133 | |
| | | | | 10,000,000 | | | (SOFR RATE + 0.140%), 5.24%, 9/9/26(a) | | | 10,000,000 | |
| | | | | 30,000,000 | | | (SOFR RATE + 0.140%), 5.27%, 9/4/26(a) | | | 30,000,000 | |
| | | | | 100,000,000 | | | (SOFR RATE + 0.155%), 5.29%, 9/5/25(a) | | | 100,000,000 | |
| | | | | 37,000,000 | | | (SOFR RATE + 0.140%), 5.29%, 9/3/26(a) | | | 37,000,000 | |
| | | | | 50,000,000 | | | (SOFR RATE + 0.180%), 5.30%, 3/7/25(a) | | | 50,000,000 | |
| | | | | 50,000,000 | | | (SOFR RATE + 0.140%), 5.33%, 2/26/25(a) | | | 49,998,008 | |
| | | | | 32,000,000 | | | (SOFR RATE + 0.150%), 5.34%, 5/27/25(a) | | | 32,000,000 | |
| | | | | 45,000,000 | | | (SOFR RATE + 0.155%), 5.34%, 8/28/25(a) | | | 45,000,000 | |
| | | | | 30,000,000 | | | (SOFR RATE + 0.195%), 5.35%, 6/2/25(a) | | | 30,000,000 | |
| | | | | 100,000,000 | | | (SOFR RATE + 0.135%), 5.35%, 8/19/26(a) | | | 100,000,000 | |
| | | | | 75,000,000 | | | (SOFR RATE + 0.120%), 5.37%, 5/1/25(a) | | | 75,000,000 | |
| | | | | 53,000,000 | | | (SOFR RATE + 0.120%), 5.39%, 1/21/25(a) | | | 53,000,000 | |
| | | | | 58,000,000 | | | (SOFR RATE + 0.130%), 5.39%, 1/28/25(a) | | | 58,000,000 | |
| | | | | 50,000,000 | | | (SOFR RATE + 0.140%), 5.40%, 4/25/25(a) | | | 49,988,663 | |
| | | | | 70,000,000 | | | (SOFR RATE + 0.155%), 5.40%, 5/2/25(a) | | | 70,000,000 | |
| | | | | 50,000,000 | | | (SOFR RATE + 0.130%), 5.41%, 4/10/25(a) | | | 49,997,361 | |
| | | | | 25,000,000 | | | (SOFR RATE + 0.160%), 5.41%, 11/3/25(a) | | | 25,000,000 | |
| | | | | 15,000,000 | | | (SOFR RATE + 0.160%), 5.42%, 10/27/25(a) | | | 15,000,000 | |
| | | | | 11,000,000 | | | (SOFR RATE + 0.150%), 5.43%, 1/3/25(a) | | | 11,000,000 | |
| | | | | 100,000,000 | | | (SOFR RATE + 0.150%), 5.43%, 7/11/25(a) | | | 100,000,000 | |
| | | | | 25,000,000 | | | (SOFR RATE + 0.160%), 5.43%, 10/17/25(a) | | | 25,000,000 | |
| | | | | 40,000,000 | | | (SOFR RATE + 0.180%), 5.44%, 4/28/25(a) | | | 40,008,696 | |
| | | | | 75,000,000 | | | (SOFR RATE + 0.160%), 5.44%, 7/7/25(a) | | | 75,000,000 | |
| | | | | 30,000,000 | | | (SOFR RATE + 0.160%), 5.44%, 10/6/25(a) | | | 30,000,000 | |
| | | | | | | | | | | | |
| | | | | | | | | | | 1,494,972,427 | |
| | | | | | | | | | | | |
| | Federal Home Loan Banks — 12.1% | | | | |
| | | | | 85,000,000 | | | (SOFR RATE + 0.030%), 4.86%, 3/24/25(a) | | | 85,000,000 | |
| | | | | 43,000,000 | | | 4.94%, 1/6/25 | | | 42,997,655 | |
| | | | | 85,000,000 | | | (SOFR RATE + 0.020%), 4.97%, 3/17/25(a) | | | 85,000,000 | |
| | | | | 200,000,000 | | | (SOFR RATE + 0.145%), 4.98%, 9/25/26(a) | | | 200,000,000 | |
| | | | | 100,000,000 | | | (SOFR RATE + 0.155%), 4.99%, 9/29/25(a) | | | 100,000,000 | |
| | | | | 86,000,000 | | | 5.04%, 2/10/25(b),(c) | | | 84,492,707 | |
| | | | | 170,000,000 | | | (SOFR RATE + 0.025%), 5.07%, 3/25/25(a) | | | 170,000,000 | |
| | | | | 100,000,000 | | | (SOFR RATE + 0.020%), 5.10%, 3/10/25(a) | | | 100,000,000 | |
|
SCHEDULE OF PORTFOLIO INVESTMENTS |
RBC BlueBay U.S. Government Money Market Fund (cont.)
September 30, 2024
| | | | | | | | | | | | |
| | | | Principal
Amount | | | | | Value | |
| | | | | $ 42,125,000 | | | (SOFR RATE + 0.030%), 5.11%, 4/10/25(a) | | | $ 42,125,000 | |
| | | | | 85,000,000 | | | (SOFR RATE + 0.020%), 5.21%, 1/27/25(a) | | | 85,000,000 | |
| | | | | 75,000,000 | | | (SOFR RATE + 0.120%), 5.32%, 11/25/24(a) | | | 75,000,000 | |
| | | | | 75,000,000 | | | (SOFR RATE + 0.140%), 5.35%, 5/19/25(a) | | | 75,000,000 | |
| | | | | 100,000,000 | | | (SOFR RATE + 0.155%), 5.36%, 8/22/25(a) | | | 100,000,000 | |
| | | | | 100,000,000 | | | (SOFR RATE + 0.155%), 5.36%, 8/22/25(a) | | | 100,000,000 | |
| | | | | 50,000,000 | | | (SOFR RATE + 0.130%), 5.36%, 2/13/26(a) | | | 50,000,000 | |
| | | | | 50,000,000 | | | (SOFR RATE + 0.130%), 5.37%, 2/10/25(a) | | | 50,000,000 | |
| | | | | 75,000,000 | | | (SOFR RATE + 0.120%), 5.37%, 5/1/25(a) | | | 75,000,000 | |
| | | | | 75,000,000 | | | (SOFR RATE + 0.140%), 5.41%, 4/21/25(a) | | | 75,000,000 | |
| | | | | 50,000,000 | | | (SOFR RATE + 0.160%), 5.43%, 10/20/25(a) | | | 50,000,000 | |
| | | | | 50,000,000 | | | (SOFR RATE + 0.160%), 5.43%, 10/20/25(a) | | | 50,000,000 | |
| | | | | 75,000,000 | | | (SOFR RATE + 0.160%), 5.44%, 7/10/25(a) | | | 75,000,000 | |
| | | | | | 55,000,000 | | | (SOFR RATE + 0.170%), 5.45%, 4/1/25(a) | | | 55,007,521 | |
| | | | | | | | | | | | |
| | | | | | | | | | | 1,824,622,883 | |
| | | | | | | | | | | | |
| | Freddie Mac — 0.4% | | | | |
| | | | | 63,000,000 | | | (SOFR RATE + 0.140%), 5.28%, 9/4/26(a) | | | 63,000,000 | |
| | | | | | | | | | | | |
| | U.S. International Development Finance Corp. — 4.4% | | | | |
| | | | | 4,718,182 | | | (US Treasury Bill Yield 3-Month + 0.000%), 5.00%, 9/30/27(a) | | | 4,718,182 | |
| | | | | 27,346,154 | | | (US Treasury Bill Yield 3-Month + 0.000%), 5.00%, 6/20/28(a) | | | 27,346,154 | |
| | | | | 4,853,760 | | | (US Treasury Bill Yield 3-Month + 0.000%), 5.00%, 3/30/37(a) | | | 4,853,760 | |
| | | | | 1,500,000 | | | (US Treasury Bill Yield 3-Month + 0.000%), 5.08%, 6/15/25(a) | | | 1,500,000 | |
| | | | | 3,006,316 | | | (US Treasury Bill Yield 3-Month + 0.000%), 5.08%, 9/15/25(a) | | | 3,006,316 | |
| | | | | 5,280,000 | | | (US Treasury Bill Yield 3-Month + 0.000%), 5.08%, 9/15/26(a) | | | 5,280,000 | |
| | | | | 3,333,333 | | | (US Treasury Bill Yield 3-Month + 0.000%), 5.08%, 9/15/26(a) | | | 3,333,333 | |
| | | | | 2,734,616 | | | (US Treasury Bill Yield 3-Month + 0.000%), 5.08%, 12/15/26(a) | | | 2,734,616 | |
| | | | | 34,650,000 | | | (US Treasury Bill Yield 3-Month + 0.000%), 5.08%, 3/15/30(a) | | | 34,650,000 | |
| | | | | 2,728,514 | | | (US Treasury Bill Yield 3-Month + 0.000%), 5.08%, 12/15/33(a) | | | 2,728,514 | |
| | | | | 6,217,949 | | | (US Treasury Bill Yield 3-Month + 0.000%), 5.19%, 10/15/32(a) | | | 6,217,949 | |
| | | | | 3,525,641 | | | (US Treasury Bill Yield 3-Month + 0.000%), 5.19%, 11/15/33(a) | | | 3,525,641 | |
| | | | | 7,500,053 | | | (US Treasury Bill Yield 3-Month + 0.000%), 5.19%, 6/15/34(a) | | | 7,500,053 | |
| | | | | 8,026,439 | | | (US Treasury Bill Yield 3-Month + 0.000%), 5.21%, 6/20/27(a) | | | 8,026,439 | |
| | | | | 4,766,668 | | | (US Treasury Bill Yield 3-Month + 0.000%), 5.21%, 6/20/27(a) | | | 4,766,668 | |
| | | | | 4,125,001 | | | (US Treasury Bill Yield 3-Month + 0.000%), 5.21%, 6/20/27(a) | | | 4,125,001 | |
| | | | | 2,970,002 | | | (US Treasury Bill Yield 3-Month + 0.000%), 5.21%, 6/20/27(a) | | | 2,970,002 | |
| | | | | 2,548,335 | | | (US Treasury Bill Yield 3-Month + 0.000%), 5.21%, 6/20/27(a) | | | 2,548,335 | |
| | | | | 2,420,001 | | | (US Treasury Bill Yield 3-Month + 0.000%), 5.21%, 6/20/27(a) | | | 2,420,001 | |
| | | | | 1,833,334 | | | (US Treasury Bill Yield 3-Month + 0.000%), 5.21%, 6/20/27(a) | | | 1,833,334 | |
| | | | | 8,464,284 | | | (US Treasury Bill Yield 3-Month + 0.000%), 5.21%, 9/20/27(a) | | | 8,464,284 | |
| | | | | 43,766,666 | | | (US Treasury Bill Yield 3-Month + 0.000%), 5.21%, 9/20/32(a) | | | 43,766,666 | |
| | | | | 16,296,296 | | | (US Treasury Bill Yield 3-Month + 0.000%), 5.26%, 3/15/30(a) | | | 16,296,296 | |
| | | | | 4,545,455 | | | (US Treasury Bill Yield 3-Month + 0.000%), 5.27%, 6/15/28(a) | | | 4,545,455 | |
| | | | | 3,031,818 | | | (US Treasury Bill Yield 3-Month + 0.000%), 5.27%, 6/15/28(a) | | | 3,031,818 | |
| | | | | 43,214,285 | | | (US Treasury Bill Yield 3-Month + 0.000%), 5.27%, 3/15/30(a) | | | 43,214,285 | |
| | | | | 8,184,234 | | | (US Treasury Bill Yield 3-Month + 0.000%), 5.27%, 6/15/34(a) | | | 8,184,234 | |
| | | | | 5,559,930 | | | (US Treasury Bill Yield 3-Month + 0.000%), 5.27%, 6/15/34(a) | | | 5,559,929 | |
|
SCHEDULE OF PORTFOLIO INVESTMENTS |
RBC BlueBay U.S. Government Money Market Fund (cont.)
September 30, 2024
| | | | | | | | | | | | |
| | | | Principal
Amount | | | | | Value | |
| | | | | $ 46,784,500 | | | (US Treasury Bill Yield 3-Month + 0.000%), 5.29%, 2/15/28(a) | | | $ 46,784,500 | |
| | | | | 6,375,000 | | | (US Treasury Bill Yield 3-Month + 0.000%), 5.29%, 11/15/28(a) | | | 6,375,000 | |
| | | | | 18,611,112 | | | (US Treasury Bill Yield 3-Month + 0.070%), 5.29%, 8/15/29(a) | | | 18,611,112 | |
| | | | | 9,900,000 | | | (US Treasury Bill Yield 3-Month + 0.000%), 5.29%, 8/15/29(a) | | | 9,900,000 | |
| | | | | 5,000,000 | | | (US Treasury Bill Yield 3-Month + 0.000%), 5.29%, 8/15/29(a) | | | 5,000,000 | |
| | | | | 13,849,425 | | | (US Treasury Bill Yield 3-Month + 0.000%), 5.29%, 11/20/37(a) | | | 13,849,425 | |
| | | | | 9,027,778 | | | (US Treasury Bill Yield 3-Month + 0.000%), 5.37%, 10/15/30(a) | | | 9,027,778 | |
| | | | | 14,583,332 | | | (US Treasury Bill Yield 3-Month + 0.000%), 5.40%, 1/20/27(a) | | | 14,583,332 | |
| | | | | 19,759,200 | | | (US Treasury Bill Yield 3-Month + 0.000%), 5.40%, 1/20/35(a) | | | 19,759,200 | |
| | | | | 15,725,030 | | | (US Treasury Bill Yield 3-Month + 0.000%), 5.40%, 1/20/35(a) | | | 15,725,030 | |
| | | | | 15,313,380 | | | (US Treasury Bill Yield 3-Month + 0.000%), 5.40%, 1/20/35(a) | | | 15,313,380 | |
| | | | | 14,819,400 | | | (US Treasury Bill Yield 3-Month + 0.000%), 5.40%, 1/20/35(a) | | | 14,819,400 | |
| | | | | 11,526,200 | | | (US Treasury Bill Yield 3-Month + 0.000%), 5.40%, 1/20/35(a) | | | 11,526,181 | |
| | | | | 6,915,720 | | | (US Treasury Bill Yield 3-Month + 0.000%), 5.40%, 1/20/35(a) | | | 6,915,720 | |
| | | | | | 6,504,070 | | | (US Treasury Bill Yield 3-Month + 0.000%), 5.40%, 1/20/35(a) | | | 6,504,070 | |
| | | | | 4,116,500 | | | (US Treasury Bill Yield 3-Month + 0.000%), 5.40%, 1/20/35(a) | | | 4,116,500 | |
| | | | | 1,317,280 | | | (US Treasury Bill Yield 3-Month + 0.000%), 5.40%, 1/20/35(a) | | | 1,317,280 | |
| | | | | 20,847,500 | | | (US Treasury Bill Yield 3-Month + 0.000%), 5.40%, 4/20/35(a) | | | 20,847,500 | |
| | | | | 17,345,120 | | | (US Treasury Bill Yield 3-Month + 0.000%), 5.40%, 4/20/35(a) | | | 17,345,120 | |
| | | | | 17,178,340 | | | (US Treasury Bill Yield 3-Month + 0.000%), 5.40%, 4/20/35(a) | | | 17,178,340 | |
| | | | | 12,925,450 | | | (US Treasury Bill Yield 3-Month + 0.000%), 5.40%, 4/20/35(a) | | | 12,925,450 | |
| | | | | 12,675,280 | | | (US Treasury Bill Yield 3-Month + 0.000%), 5.40%, 4/20/35(a) | | | 12,675,280 | |
| | | | | 7,838,660 | | | (US Treasury Bill Yield 3-Month + 0.000%), 5.40%, 4/20/35(a) | | | 7,838,660 | |
| | | | | 7,254,930 | | | (US Treasury Bill Yield 3-Month + 0.000%), 5.40%, 4/20/35(a) | | | 7,254,930 | |
| | | | | 6,837,980 | | | (US Treasury Bill Yield 3-Month + 0.000%), 5.40%, 4/20/35(a) | | | 6,837,980 | |
| | | | | 6,087,470 | | | (US Treasury Bill Yield 3-Month + 0.000%), 5.40%, 4/20/35(a) | | | 6,087,470 | |
| | | | | 4,169,500 | | | (US Treasury Bill Yield 3-Month + 0.000%), 5.40%, 4/20/35(a) | | | 4,169,500 | |
| | | | | 13,600,000 | | | (US Treasury Bill Yield 3-Month + 0.000%), 5.42%, 7/17/25(a) | | | 13,753,482 | |
| | | | | 12,909,434 | | | (US Treasury Bill Yield 3-Month + 0.000%), 5.44%, 1/15/30(a) | | | 12,909,434 | |
| | | | | 5,616,000 | | | (US Treasury Bill Yield 3-Month + 0.000%), 5.45%, 5/15/30(a) | | | 5,616,000 | |
| | | | | 23,611,616 | | | (US Treasury Bill Yield 3-Month + 0.000%), 5.45%, 7/7/40(a) | | | 23,611,616 | |
| | | | | 22,599,690 | | | (US Treasury Bill Yield 3-Month + 0.000%), 5.45%, 7/7/40(a) | | | 22,599,690 | |
| | | | | 12,649,080 | | | (US Treasury Bill Yield 3-Month + 0.000%), 5.45%, 7/7/40(a) | | | 12,649,080 | |
| | | | | 12,438,262 | | | (US Treasury Bill Yield 3-Month + 0.000%), 5.45%, 7/7/40(a) | | | 12,438,262 | |
| | | | | 8,850,140 | | | (US Treasury Bill Yield 3-Month + 0.000%), 5.45%, 7/7/40(a) | | | 8,850,140 | |
| | | | | 5,755,129 | | | (US Treasury Bill Yield 3-Month + 0.000%), 5.45%, 7/7/40(a) | | | 5,755,129 | |
| | | | | 3,794,724 | | | (US Treasury Bill Yield 3-Month + 0.000%), 5.45%, 7/7/40(a) | | | 3,794,724 | |
| | | | | | | | | | | | |
| | | | | | | | | | | 722,412,960 | |
| | | | | | | | | | | | |
| |
| | Total U.S. Government Agency Obligations | | | 4,345,008,270 | |
| | | | | | | | | | | | |
| | (Cost $4,345,008,270) | | | | |
| |
| | U.S. Treasury Obligations — 22.7% | | | | |
| | U.S. Treasury Bills — 21.0% | | | | |
| | | | | 175,000,000 | | | U.S. Treasury Bill- When Issued, 0.00%, 2/13/25(c) | | | 172,144,656 | |
| | | | | 175,000,000 | | | U.S. Treasury Bill- When Issued, 0.00%, 3/27/25(c) | | | 171,328,172 | |
| | | | | 341,000,000 | | | U.S. Treasury Bill- When Issued, 0.00%, 1/28/25(c) | | | 336,002,020 | |
|
SCHEDULE OF PORTFOLIO INVESTMENTS |
RBC BlueBay U.S. Government Money Market Fund (cont.)
September 30, 2024
| | | | | | | | | | | | |
| | | | Principal
Amount | | | | | Value | |
| | | | | $400,000,000 | | | U.S. Treasury Bill- When Issued, 4.43%, 3/20/25(c) | | | $ 391,810,250 | |
| | | | | 390,000,000 | | | U.S. Treasury Bill- When Issued, 4.55%, 1/21/25(c) | | | 384,556,987 | |
| | | | | 17,150,000 | | | U.S. Treasury Bill- When Issued, 4.92%, 11/29/24(c) | | | 17,017,911 | |
| | | | | 50,000,000 | | | U.S. Treasury Bill- When Issued, 5.04%, 1/30/25(c) | | | 49,173,839 | |
| | | | | 200,000,000 | | | U.S. Treasury Bill- When Issued, 5.07%, 1/23/25(c) | | | 196,867,217 | |
| | | | | 200,000,000 | | | U.S. Treasury Bill- When Issued, 5.08%, 1/16/25(c) | | | 197,054,528 | |
| | | | | 200,000,000 | | | U.S. Treasury Bill- When Issued, 5.12%, 1/2/25(c) | | | 197,416,150 | |
| | | | | 200,000,000 | | | U.S. Treasury Bill- When Issued, 5.12%, 1/9/25(c) | | | 197,226,944 | |
| | | | | 100,000,000 | | | U.S. Treasury Bill- When Issued, 5.29%, 10/10/24(c) | | | 99,871,187 | |
| | | | | 100,000,000 | | | U.S. Treasury Bill- When Issued, 5.30%, 10/3/24(c) | | | 99,971,490 | |
| | | | | 100,000,000 | | | U.S. Treasury Bill- When Issued, 5.30%, 11/14/24(c) | | | 99,368,661 | |
| | | | | 100,000,000 | | | U.S. Treasury Bill- When Issued, 5.30%, 11/7/24(c) | | | 99,469,101 | |
| | | | | 175,000,000 | | | U.S. Treasury Bill- When Issued, 5.30%, 10/8/24(c) | | | 174,822,630 | |
| | | | | 200,000,000 | | | U.S. Treasury Bill- When Issued, 5.30%, 11/21/24(c) | | | 198,537,433 | |
| | | | | | 175,000,000 | | | U.S. Treasury Bill- When Issued, 5.31%, 10/15/24(c) | | | 174,644,580 | |
| | | | | | | | | | | | |
| | | | | | | | | | | 3,257,283,756 | |
| | | | | | | | | | | | |
| | U.S. Treasury Floating Rate Notes — 0.7% | | | | |
| | | | | 75,000,000 | | | (3 mo. U.S. Treasury Money Market Yield + 0.125%), 4.72%, 7/31/25(a) | | | 74,977,799 | |
| | | | | 30,000,000 | | | (3 mo. U.S. Treasury Money Market Yield + 0.140%), 4.73%, 10/31/24(a) | | | 29,997,773 | |
| | | | | | | | | | | | |
| | | | | | | | | | | 104,975,572 | |
| | | | | | | | | | | | |
| |
| | U.S. Treasury Notes — 1.0% | | | | |
| | | | | 17,100,000 | | | 1.00%, 12/15/24 | | | 16,968,189 | |
| | | | | 17,325,000 | | | 2.13%, 11/30/24 | | | 17,245,359 | |
| | | | | 127,125,000 | | | 2.75%, 2/28/25 | | | 125,951,477 | |
| | | | | | | | | | | | |
| | | | | | | | | | | 160,165,025 | |
| | | | | | | | | | | | |
| |
| | Total U.S. Treasury Obligations | | | 3,522,424,353 | |
| | | | | | | | | | | | |
| | (Cost $3,522,424,353) | | | | |
| |
| | Repurchase Agreements — 53.3% | | | | |
| | | | | 255,000,000 | | | Bank of America, National Association, dated 9/30/24; due 10/1/24 at 4.82% with maturity value of $255,034,142 (fully collateralized by U.S. Treasury securities with maturity dates ranging from 5/15/25 to 2/15/54 at rates ranging from 0.00% to 4.25%, aggregate original par and fair value of $358,106,720 and $260,100,000, respectively) | | | 255,000,000 | |
| | | | | 200,000,000 | | | Bank of America, National Association, dated 9/30/24; due 10/1/24 at 4.83% with maturity value of $200,026,833 (fully collateralized by Fannie Mae and Freddie Mac securities with maturity dates ranging from 4/1/27 to 9/1/54 at rates ranging from 1.50% to 7.50%, aggregate original par and fair value of $311,485,185 and $204,000,000, respectively) | | | 200,000,000 | |
|
SCHEDULE OF PORTFOLIO INVESTMENTS |
RBC BlueBay U.S. Government Money Market Fund (cont.)
September 30, 2024
| | | | | | | | | | | | |
| | | | Principal
Amount | | | | | Value | |
| | | | | $125,000,000 | | | Bank of America, National Association, dated 9/30/24; due 10/1/24 at 4.90% with maturity value of $125,017,014 (fully collateralized by U.S. Treasury securities with maturity dates ranging from 9/30/26 to 5/15/54 at rates ranging from 0.00% to 6.63%, aggregate original par and fair value of $149,264,999 and $127,500,000, respectively) | | | $125,000,000 | |
| | | | | 75,000,000 | | | Bank of America, National Association, dated 9/30/24; due 10/1/24 at 4.77% with maturity value of $75,009,937 (fully collateralized by U.S. Treasury security with maturity date of 2/15/32 at a rate 0.00%, aggregate original par and fair value of $101,069,220 and $76,500,000, respectively) | | | 75,000,000 | |
| | | | | | | | | |
| | | | | | | | Total Value of Bank of America, National Association, (collateral value of $ 668,100,000) | | | 655,000,000 | |
| | | | | | | | | |
| | | |
| | | | | 500,000,000 | | | Bank of Montreal, dated 9/30/24; due 10/1/24 at 4.84% with maturity value of $500,067,222 (fully collateralized by Fannie Mae and Freddie Mac securities with maturity dates ranging from 1/1/32 to 9/1/54 at rates ranging from 2.00% to 7.00%, aggregate original par and fair value of $939,545,297 and $510,000,000, respectively) | | | 500,000,000 | |
| | | | | | | | | |
| | | | | | | | Total Value of Bank of Montreal, (collateral value of $ 510,000,000) | | | 500,000,000 | |
| | | | | | | | | |
| | | |
| | | | | 100,000,000 | | | BNP Paribas Securities Corp., dated 9/30/24; due 10/1/24 at 4.85% with maturity value of $100,013,472 (fully collateralized by U.S. Treasury securities with maturity dates ranging from 3/27/25 to 2/15/47 at rates ranging from 0.00% to 4.76%, aggregate original par and fair value of $112,798,749 and $102,000,057, respectively) | | | 100,000,000 | |
| | | | | | | | | |
| | | | | | | | Total Value of BNP Paribas Securities Corp., (collateral value of $ 102,000,057) | | | 100,000,000 | |
| | | | | | | | | |
| | | |
| | | | | 400,000,000 | | | Citigroup Global Markets, Inc., dated 9/30/24; due 10/1/24 at 4.88% with maturity value of $400,054,222 (fully collateralized by U.S. Treasury securities with maturity dates ranging from 8/15/41 to 5/15/42 at rates ranging from 0.75% to 3.75%, aggregate original par and fair value of $490,037,300 and $408,000,072, respectively) | | | 400,000,000 | |
| | | | | 350,000,000 | | | Citigroup Global Markets, Inc., dated 9/30/24; due 10/1/24 at 4.85% with maturity value of $350,047,153 (fully collateralized by Fannie Mae, Federal Farm Credit Bank, Federal Home Loan Bank and Freddie Mac securities with maturity dates ranging from 3/12/26 to 3/10/34 at rates ranging from 0.00% to 7.25%, aggregate original par and fair value of $357,319,000 and $357,004,637, respectively) | | | 350,000,000 | |
|
SCHEDULE OF PORTFOLIO INVESTMENTS |
RBC BlueBay U.S. Government Money Market Fund (cont.)
September 30, 2024
| | | | | | | | | | |
| | | Principal Amount | | | | | Value | |
| | | $350,000,000 | | | Citigroup Global Markets, Inc., dated 9/30/24; due 10/1/24 at 4.86% with maturity value of $350,047,250 (fully collateralized by U.S. Treasury securities with maturity dates ranging from 3/31/26 to 4/30/26 at rates ranging from 0.13% to 4.88%, aggregate original par and fair value of $344,234,100 and $357,000,070, respectively) | | | $ 350,000,000 | |
| | | 200,000,000 | | | Citigroup Global Markets, Inc., dated 9/30/24; due 10/1/24 at 4.85% with maturity value of $200,188,611 (fully collateralized by U.S. Treasury securities with maturity dates ranging from 4/15/27 to 7/15/27 at rates ranging from 0.13% to 4.50%, aggregate original par and fair value of $197,819,500 and $204,000,075, respectively) | | | 200,000,000 | |
| | | | | | | |
| | | | | | Total Value of Citigroup Global Markets, Inc., (collateral value of $ 1,326,004,854) | | | 1,300,000,000 | |
| | | | | | | |
| | | |
| | | 200,000,000 | | | Credit Agricole Corporate and Investment Bank, dated 9/30/24; due 10/1/24 at 4.80% with maturity value of $200,026,667 (fully collateralized by Fannie Mae and Freddie Mac securities with maturity dates ranging from 8/1/53 to 8/1/54 at rates ranging from 5.00% to 6.50%, aggregate original par and fair value of $205,403,058 and $204,000,000, respectively) | | | 200,000,000 | |
| | | 150,000,000 | | | Credit Agricole Corporate and Investment Bank, dated 9/30/24; due 10/1/24 at 4.84% with maturity value of $150,020,167 (fully collateralized by Fannie Mae securities with maturity dates ranging from 1/1/53 to 8/1/54 at rates ranging from 4.50% to 7.00%, aggregate original par and fair value of $156,265,342 and $153,000,001, respectively) | | | 150,000,000 | |
| | | 125,000,000 | | | Credit Agricole Corporate and Investment Bank, dated 9/30/24; due 10/1/24 at 4.83% with maturity value of $125,016,771 (fully collateralized by Fannie Mae and Freddie Mac securities with maturity dates ranging from 6/1/46 to 8/1/54 at rates ranging from 4.00% to 5.50%, aggregate original par and fair value of $137,083,677 and $127,500,001, respectively) | | | 125,000,000 | |
| | | 70,000,000 | | | Credit Agricole Corporate and Investment Bank, dated 9/30/24; due 10/1/24 at 4.84% with maturity value of $70,009,411 (fully collateralized by Fannie Mae security with maturity date of 1/1/54 at a rate 7.00%, original par and fair value of $84,486,030 and $71,400,000, respectively) | | | 70,000,000 | |
| | | | | | | |
| | | | | | Total Value of Credit Agricole Corporate and Investment Bank, (collateral value of $ 555,900,002) | | | 545,000,000 | |
| | | | | | | |
| | | |
| | | 250,000,000 | | | Deutsche Bank Securities, dated 9/30/24; due 10/1/24 at 4.85% with maturity value of $250,033,681 (fully collateralized by Freddie Mac securities with maturity dates ranging from 8/1/52 to 9/1/53 at rates ranging from 4.50% to 5.50%, aggregate original par and fair value of $278,139,602 and $255,000,000, respectively) | | | 250,000,000 | |
| | | | | | | |
| | | | | | Total Value of Deutsche Bank Securities, (collateral value of $ 255,000,000) | | | 250,000,000 | |
| | | | | | | |
|
SCHEDULE OF PORTFOLIO INVESTMENTS |
RBC BlueBay U.S. Government Money Market Fund (cont.)
September 30, 2024
| | | | | | | | | | | | |
| | | | Principal Amount | | | | | Value | |
| | | |
| | | | | $3,300,000,000 | | | Federal Reserve, dated 9/30/24; due 10/1/24 at 4.80% with maturity value of $3,300,440,000 (fully collateralized by U.S. Treasury securities with maturity dates ranging from 5/15/40 to 11/15/46 at rates ranging from 2.88% to 4.38%, aggregate original par and fair value of $3,983,775,700 and $3,300,440,051, respectively) | | | $3,300,000,000 | |
| | | | | | | | | |
| | | | | | | | Total Value of Federal Reserve, (collateral value of $ 3,300,440,051) | | | 3,300,000,000 | |
| | | | | | | | | |
| | | |
| | | | | 250,000,000 | | | Fixed Income Clearing Corporation, dated 9/30/24; due 10/1/24 at 4.88% with maturity value of $250,033,889 (fully collateralized by U.S. Treasury security with maturity date of 11/15/52 at a rate 4.00%, original par and fair value of $256,997,800 and 255,000,087, respectively) | | | 250,000,000 | |
| | | | | | | | | |
| | | | | | | | Total Value of Fixed Income Clearing Corporation, (collateral value of $ 255,000,087) | | | 250,000,000 | |
| | | | | | | | | |
| | | |
| | | | | 200,000,000 | | | Goldman Sachs & Co., dated 9/30/24; due 10/1/24 at 4.84% with maturity value of $200,188,222 (fully collateralized by Fannie Mae, Freddie Mac, Ginnie Mae and U.S. Treasury securities with maturity dates ranging from 2/28/29 to 9/20/54 at rates ranging from 1.50% to 7.00%, aggregate original par and fair value of $400,110,830 and $204,000,001, respectively) | | | 200,000,000 | |
| | | | | | | | | |
| | | | | | | | Total Value of Goldman Sachs & Co., (collateral value of $ 204,000,001) | | | 200,000,000 | |
| | | | | | | | | |
| | | |
| | | | | 350,000,000 | | | ING Financial Markets LLC, dated 9/30/24; due 10/1/24 at 4.87% with maturity value of $350,047,347 (fully collateralized by U.S. Treasury security with maturity date of 8/31/26 at a rate 3.75%, original par and fair value of $355,367,000 and $357,250,445, respectively) | | | 350,000,000 | |
| | | | | | | | | |
| | | | | | | | Total Value of ING Financial Markets LLC, (collateral value of $ 357,250,445) | | | 350,000,000 | |
| | | | | | | | | |
| | | |
| | | | | 300,000,000 | | | National Australia Bank, dated 9/30/24; due 10/1/24 at 4.85% with maturity value of $300,000,000 (fully collateralized by U.S. Treasury security with maturity date of 11/15/29 at a rate 1.75%, original par and fair value of $331,570,000 and 306,106,460, respectively) | | | 300,000,000 | |
| | | | | | | | | |
| | | | | | | | Total Value of National Australia Bank, (collateral value of $ 306,106,460) | | | 300,000,000 | |
| | | | | | | | | |
|
SCHEDULE OF PORTFOLIO INVESTMENTS |
RBC BlueBay U.S. Government Money Market Fund (cont.)
September 30, 2024
| | | | | | | | | | | | |
| | | | Principal Amount | | | | | Value | |
| | | |
| | | | | $200,000,000 | | | TD Securities (USA), dated 9/30/24; due 10/1/24 at 4.84% with maturity value of $200,188,222 (fully collateralized by Freddie Mac securities with maturity dates ranging from 12/1/51 to 9/1/53 at rates ranging from 2.00% to 6.00%, aggregate original par and fair value of $245,007,230 and $204,000,001, respectively) | | $ | 200,000,000 | |
| | | | | | | | | |
| | | | | | | | Total Value of TD Securities (USA), (collateral value of $ 204,000,001) | | | 200,000,000 | |
| | | | | | | | | |
| | | |
| | | | | 200,000,000 | | | Wells Fargo Securities LLC, dated 9/30/24; due 11/1/24 at 5.30% with maturity value of $202,708,889 (fully collateralized by Fannie Mae securities with maturity dates ranging from 9/1/26 to 1/1/59 at rates ranging from 3.00% to 7.00%, aggregate original par and fair value of $255,025,364 and $204,000,000, respectively) | | | 200,000,000 | |
| | | | | 100,000,000 | | | Wells Fargo Securities LLC, dated 9/30/24; due 11/4/24 at 5.17% with maturity value of $100,890,389 (fully collateralized by Fannie Mae securities with maturity dates ranging from 12/1/35 to 9/1/54 at rates ranging from 2.00% to 6.00%, aggregate original par and fair value of $126,801,377 and $102,000,000, respectively) | | | 100,000,000 | |
| | | | | | | | | |
| | | | | | | | | Total Value of Wells Fargo Securities LLC, (collateral value of $ 306,000,000) | | | 300,000,000 | |
| | | | | | | | | |
| |
| | Total Repurchase Agreements | | | 8,250,000,000 | |
| | | | | | | | | | | | |
| | (Cost $8,250,000,000) | | | | |
| |
| | Total Investments | | $ | 16,117,432,623 | |
| | (Cost $16,117,432,623)(d) — 104.1% | | | | |
| |
| | Liabilities in excess of other assets — (4.1)% | | | (637,122,470) | |
| | | | | | | | | | | | |
| |
| | NET ASSETS — 100.0% | | $ | 15,480,310,153 | |
| | | | | | | | | | | | |
(a) Floating rate note. Rate shown is as of report date.
(b) The rate represents effective yield at the time of purchase.
(c) Zero Coupon Bond. The rate represents the yield at time of purchase.
(d) Tax cost of securities is equal to book cost of securities.
Abbreviations used are defined below:
SOFR - Secured Overnight Financing Rate
See Notes to the Financial Statements.
Statement of Assets and Liabilities
September 30, 2024
| | | | |
| | | RBC BlueBay U.S. Government
Money Market Fund |
| | | | | | |
Assets: | | | | | | |
Investments, at value (cost $7,867,432,623) | | | | $ | 7,867,432,623 | |
Repurchase agreements, at value (cost $8,250,000,000) | | | | | 8,250,000,000 | |
Cash | | | | | 30,090,751 | |
Interest and dividend receivable | | | | | 31,863,228 | |
Receivable for capital shares issued | | | | | 1,375,000 | |
Receivable for investments sold | | | | | 494,857 | |
Prepaid expenses and other assets | | | | | 80,033 | |
| | | | | | |
Total Assets | | | | | 16,181,336,492 | |
| | | | | | |
Liabilities: | | | | | | |
Professional fees payable | | | | | 4,674 | |
Distributions payable | | | | | 18,744,595 | |
Payable for investments purchased | | | | | 679,474,848 | |
Accrued expenses and other payables: | | | | | | |
Investment advisory fees | | | | | 1,277,240 | |
Accounting fees | | | | | 122,260 | |
Audit fees | | | | | 56,483 | |
Trustees’ fees | | | | | 5,682 | |
Distribution fees | | | | | 667,028 | |
Custodian fees | | | | | 35,306 | |
Shareholder reports | | | | | 179,641 | |
Transfer agent fees | | | | | 26,803 | |
Other | | | | | 431,779 | |
| | | | | | |
Total Liabilities | | | | | 701,026,339 | |
| | | | | | |
Net Assets | | | | $ | 15,480,310,153 | |
| | | | | | |
Net Assets Consists of: | | | | | | |
Capital | | | | $ | 15,480,642,947 | |
Accumulated earnings | | | | | (332,794 | ) |
| | | | | | |
Net Assets | | | | $ | 15,480,310,153 | |
| | | | | | |
9
Statement of Assets and Liabilities (cont.)
September 30, 2024
| | | | |
| | | RBC BlueBay U.S. Government Money Market Fund |
| | | | | | |
Net Assets | | | | | | |
Class A | | | | $ | 7,584,739 | |
Institutional Class 1 | | | | | 11,700,759,787 | |
Institutional Class 2 | | | | | 3,383,465,572 | |
Investor Class | | | | | 388,500,055 | |
| | | | | | |
Total | | | | $ | 15,480,310,153 | |
| | | | | | |
Shares Outstanding (Unlimited number of shares authorized, no par value): | | | | | | |
Class A | | | | | 7,584,886 | |
Institutional Class 1 | | | | | 11,701,064,827 | |
Institutional Class 2 | | | | | 3,383,477,799 | |
Investor Class | | | | | 388,550,353 | |
| | | | | | |
Total | | | | | 15,480,677,865 | |
| | | | | | |
Net Asset Values and Redemption Prices Per Share: | | | | | | |
Class A | | | | $ | 1.00 | |
| | | | | | |
Institutional Class 1 | | | | $ | 1.00 | |
| | | | | | |
Institutional Class 2 | | | | $ | 1.00 | |
| | | | | | |
Investor Class | | | | $ | 1.00 | |
| | | | | | |
See Notes to the Financial Statements.
10
Statement of Operations
| | | | |
| For the Year Ended September 30, 2024 | | | | |
| | RBC BlueBay U.S. Government Money Market Fund |
| | | | | | |
Investment Income: | | | | | | |
Interest income | | | | $ | 810,981,717 | |
| | | | | | |
Expenses: | | | | | | |
Investment advisory fees | | | | | 15,050,902 | |
Distribution fees–Class A | | | | | 4,062 | |
Distribution fees–Institutional Class 2 | | | | | 5,139,649 | |
Distribution fees–Investor Class | | | | | 5,041,153 | |
Accounting fees | | | | | 888,394 | |
Audit fees | | | | | 43,723 | |
Custodian fees | | | | | 174,194 | |
Insurance fees | | | | | 35,035 | |
Legal fees | | | | | 625,348 | |
Registrations and filing fees | | | | | 136,962 | |
Shareholder reports | | | | | 597,239 | |
Transfer agent fees–Class A | | | | | 4,981 | |
Transfer agent fees–Institutional Class 1 | | | | | 1,789,254 | |
Transfer agent fees–Institutional Class 2 | | | | | 44,071 | |
Transfer agent fees–Investor Class | | | | | 6,215 | |
Trustees’ fees and expenses | | | | | 617,885 | |
Tax expense | | | | | 4,420 | |
Other fees | | | | | 323,872 | |
| | | | | | |
Total expenses before fee waiver/reimbursement | | | | | 30,527,359 | |
Expenses waived/reimbursed by: | | | | | | |
Distributor - Class Specific | | | | | (632,606 | ) |
Advisor | | | | | (481 | ) |
| | | | | | |
Net expenses | | | | | 29,894,272 | |
| | | | | | |
Net Investment Income | | | | | 781,087,445 | |
| | | | | | |
Realized/Unrealized Gains/(Losses): | | | | | | |
Net realized losses from investment transactions | | | | | (2 | ) |
| | | | | | |
Change in net assets resulting from operations | | | | $ | 781,087,443 | |
| | | | | | |
See Notes to the Financial Statements.
11
Statements of Changes in Net Assets
| | | | | | | | |
| | | RBC BlueBay U.S. Government
Money Market Fund | |
| | | For the
Year Ended
September 30, 2024 | | | For the
Year Ended
September 30, 2023 | |
From Investment Activities | | | | | | | | |
Operations: | | | | | | | | |
Net investment income | | $ | 781,087,445 | | | $ | 538,450,712 | |
Net realized gains/(losses) from investments | | | (2 | ) | | | 661,146 | |
| | | | | | | | |
Change in net assets resulting from operations | | | 781,087,443 | | | | 539,111,858 | |
| | | | | | | | |
Distributions to Shareholders: | | | | | | | | |
Class A | | | (205,672 | ) | | | (2,008 | ) |
Institutional Class 1 | | | (583,896,522 | ) | | | (331,811,480 | ) |
Institutional Class 2 | | | (175,537,030 | ) | | | (142,876,259 | ) |
Investor Class | | | (22,202,345 | ) | | | (64,150,146 | ) |
| | | | | | | | |
Change in net assets resulting from shareholder distributions | | | (781,841,569 | ) | | | (538,839,893 | ) |
| | | | | | | | |
Capital Transactions: (Note 5) | | | | | | | | |
Proceeds from shares issued | | | 144,323,802,984 | | | | 93,936,872,717 | |
Distributions reinvested | | | 513,793,819 | | | | 378,977,087 | |
Cost of shares redeemed | | | (142,708,431,666 | ) | | | (89,667,340,055 | ) |
| | | | | | | | |
Change in net assets resulting from capital transactions | | | 2,129,165,137 | | | | 4,648,509,749 | |
| | | | | | | | |
Net increase in net assets | | | 2,128,411,011 | | | | 4,648,781,714 | |
Net Assets: | | | | | | | | |
Beginning of year | | | 13,351,899,142 | | | | 8,703,117,428 | |
| | | | | | | | |
End of year | | $ | 15,480,310,153 | | | $ | 13,351,899,142 | |
| | | | | | | | |
Share Transactions: | | | | | | | | |
Issued | | | 144,323,802,984 | | | | 93,936,872,717 | |
Reinvested | | | 513,793,819 | | | | 378,977,087 | |
Redeemed | | | (142,708,431,666 | ) | | | (89,667,340,055 | ) |
| | | | | | | | |
Change in shares resulting from capital transactions | | | 2,129,165,137 | | | | 4,648,509,749 | |
| | | | | | | | |
See Notes to the Financial Statements.
12
RBC BlueBay U.S. Government Money Market Fund
(Selected data for a share outstanding throughout the periods indicated)
| | | | | | | | | | | | | | | | | | | | | | | | | | | | |
| | | | | | Investment Activities | | | Distributions | | | | |
| | | Net Asset
Value,
Beginning
of Year | | | Net
Investment
Income(a) | | | Net Realized
and Unrealized
Gains (Losses)
on Investments | | | Total from
Investment
Activities | | | Net
Investment
Income | | | Total
Distributions | | | Net Asset
Value, End
of Year | |
Class A | | | | | | | | | | | | | | | | | | | | | | | | | | | | |
Year Ended 9/30/24 | | | $1.00 | | | | 0.05 | | | | —(b) | | | | 0.05 | | | | (0.05) | | | | (0.05) | | | | $1.00 | |
Period Ended 9/30/23(c) | | | 1.00 | | | | 0.02 | | | | —(b) | | | | 0.02 | | | | (0.02) | | | | (0.02) | | | | 1.00 | |
Institutional Class 1 | | | | | | | | | | | | | | | | | | | | | | | | | | | | |
Year Ended 9/30/24 | | | $1.00 | | | | 0.05 | | | | —(b) | | | | 0.05 | | | | (0.05) | | | | (0.05) | | | | $1.00 | |
Year Ended 9/30/23 | | | 1.00 | | | | 0.05 | | | | (0.01)(b) | | | | 0.04 | | | | (0.04) | | | | (0.04) | | | | 1.00 | |
Year Ended 9/30/22 | | | 1.00 | | | | —(b) | | | | 0.01 | | | | 0.01 | | | | (0.01) | | | | (0.01) | | | | 1.00 | |
Year Ended 9/30/21 | | | 1.00 | | | | —(b) | | | | —(b) | | | | —(b) | | | | —(b) | | | | —(b) | | | | 1.00 | |
Year Ended 9/30/20 | | | 1.00 | | | | 0.01 | | | | —(b) | | | | 0.01 | | | | (0.01) | | | | (0.01) | | | | 1.00 | |
Institutional Class 2 | | | | | | | | | | | | | | | | | | | | | | | | | | | | |
Year Ended 9/30/24 | | | $1.00 | | | | 0.05 | | | | —(b) | | | | 0.05 | | | | (0.05) | | | | (0.05) | | | | $1.00 | |
Year Ended 9/30/23 | | | 1.00 | | | | 0.04 | | | | —(b) | | | | 0.04 | | | | (0.04) | | | | (0.04) | | | | 1.00 | |
Year Ended 9/30/22 | | | 1.00 | | | | —(b) | | | | 0.01 | | | | 0.01 | | | | (0.01) | | | | (0.01) | | | | 1.00 | |
Year Ended 9/30/21 | | | 1.00 | | | | —(b) | | | | —(b) | | | | —(b) | | | | —(b) | | | | —(b) | | | | 1.00 | |
Year Ended 9/30/20 | | | 1.00 | | | | 0.01 | | | | —(b) | | | | 0.01 | | | | (0.01) | | | | (0.01) | | | | 1.00 | |
Investor Class | | | | | | | | | | | | | | | | | | | | | | | | | | | | |
Year Ended 9/30/24 | | | $1.00 | | | | 0.04 | | | | —(b) | | | | 0.04 | | | | (0.04) | | | | (0.04) | | | | $1.00 | |
Year Ended 9/30/23 | | | 1.00 | | | | 0.03 | | | | 0.01(b) | | | | 0.04 | | | | (0.04) | | | | (0.04) | | | | 1.00 | |
Year Ended 9/30/22 | | | 1.00 | | | | —(b) | | | | — | | | | — | | | | —(b) | | | | —(b) | | | | 1.00 | |
Year Ended 9/30/21 | | | 1.00 | | | | —(b) | | | | —(b) | | | | —(b) | | | | —(b) | | | | —(b) | | | | 1.00 | |
Year Ended 9/30/20 | | | 1.00 | | | | —(b) | | | | —(b) | | | | —(b) | | | | —(b) | | | | —(b) | | | | 1.00 | |
| (a) | Per share net investment income (loss) has been calculated using the average daily shares method. |
| (b) | Less than $0.01 or $(0.01) per share. |
| (c) | For the period from June 8, 2023, (commencement of operations) through September 30, 2023. |
RBC BlueBay U.S. Government Money Market Fund
(Selected data for a share outstanding throughout the periods indicated)
| | | | | | | | | | | | | | | | | | | | | | |
| | | | | | Ratios/Supplemental Data | |
| | | Total
Return | | | Net Assets,
End of Year
(millions) | | | Ratio of Net Expenses to Average Net Assets | | | Ratio of
Net Investment
Income (Loss)
to Average
Net Assets | | | Ratio of
Expenses to
Average Net
Assets* | |
Class A | | | | | | | | | | | | | | | | | | | | | | |
Year Ended 9/30/24 | | | 5.26% | | | | $ 8 | | | | | | 0.25%(a) | | | | 5.06% | | | | 0.34% | |
Period Ended 9/30/23(b) | | | 1.58%(c) | | | | — | | | | | | 0.25%(a)(d) | | | | 4.94% | | | | 5.53% | |
Institutional Class 1 | | | | | | | | | | | | | | | | | | | | | | |
Year Ended 9/30/24 | | | 5.39% | | | | $11,701 | | | | | | 0.14% | | | | 5.25% | | | | 0.14% | |
Year Ended 9/30/23 | | | 4.54% | | | | 8,244 | | | | | | 0.13%(e) | | | | 4.74% | | | | 0.17% | |
Year Ended 9/30/22 | | | 0.60% | | | | 2,724 | | | | | | 0.07%(e) | | | | 0.29% | | | | 0.17% | |
Year Ended 9/30/21 | | | 0.02% | | | | 11,201 | | | | | | 0.09%(e) | | | | 0.02% | | | | 0.17% | |
Year Ended 9/30/20 | | | 0.83% | | | | 10,821 | | | | | | 0.16%(e) | | | | 0.43% | | | | 0.17% | |
Institutional Class 2 | | | | | | | | | | | | | | | | | | | | | | |
Year Ended 9/30/24 | | | 5.24% | | | | $ 3,383 | | | | | | 0.27% | | | | 5.12% | | | | 0.27% | |
Year Ended 9/30/23 | | | 4.39% | | | | 3,705 | | | | | | 0.28% | | | | 4.36% | | | | 0.28% | |
Year Ended 9/30/22 | | | 0.52% | | | | 2,967 | | | | | | 0.15%(f) | | | | 0.43% | | | | 0.27% | |
Year Ended 9/30/21 | | | 0.02% | | | | 3,935 | | | | | | 0.09%(f) | | | | 0.02% | | | | 0.27% | |
Year Ended 9/30/20 | | | 0.71% | | | | 3,358 | | | | | | 0.26%(f) | | | | 0.62% | | | | 0.27% | |
Investor Class | | | | | | | | | | | | | | | | | | | | | | |
Year Ended 9/30/24 | | | 4.49% | | | | $ 389 | | | | | | 1.00% | | | | 4.40% | | | | 1.12% | |
Year Ended 9/30/23 | | | 3.64% | | | | 1,403 | | | | | | 1.00% | | | | 3.38% | | | | 1.13% | |
Year Ended 9/30/22 | | | 0.25% | | | | 3,012 | | | | | | 0.36%(g) | | | | 0.18% | | | | 1.12% | |
Year Ended 9/30/21 | | | 0.02% | | | | 5,218 | | | | | | 0.08%(g) | | | | 0.02% | | | | 1.12% | |
Year Ended 9/30/20 | | | 0.34% | | | | 2,394 | | | | | | 0.54%(g) | | | | 0.25% | | | | 1.12% | |
| * | During the period, certain fees were contractually or voluntarily reduced and/or reimbursed. If such contractual/voluntary fee reductions and reimbursements had not occurred, the ratio would have been as indicated. |
| (a) | During the periods ended September 30, 2024 and September 30, 2023, the Advisor and/or Distributor voluntarily waived a portion of its fees. The Fund’s net expense ratio would increase by an amount of 0.01% and 5.19%, if such voluntary waivers were excluded for the period ended September 30, 2024 and for the period ended September 30, 2023. See Note 3 – Agreements and Other Transactions with Affiliates and Note 4 – Fund Distribution for more information. |
| (b) | For the period from June 8, 2023, (commencement of operations) through September 30, 2023. |
RBC BlueBay U.S. Government Money Market Fund
(Selected data for a share outstanding throughout the periods indicated)
| (e) | During the periods ended September 30, 2023, September 30, 2022, September 30, 2021 and September 30, 2020, the Advisor voluntarily waived a portion of its fees. The Fund’s net expense ratio would increase by an amount of 0.03%, 0.09%, 0.08% and 0.01%, respectively, if such voluntary waivers were excluded for the periods ended September 30, 2023, September 30, 2022, September 30, 2021 and September 30, 2020. See Note 3 – Agreements and Other Transactions with Affiliates and Note 4 – Fund Distribution for more information. |
| (f) | During the periods ended September 30, 2022, September 30, 2021 and September 30, 2020, the Advisor and/or Distributor voluntarily waived a portion of its fees. The Fund’s net expense ratio would increase by an amount of 0.11%, 0.18% and 0.01%, respectively, if such voluntary waivers were excluded for the periods ended September 30, 2022, September 30, 2021 and September 30, 2020. See Note 3 – Agreements and Other Transactions with Affiliates and Note 4 – Fund Distribution for more information. |
| (g) | During the periods ended September 30, 2022, September 30, 2021 and September 30, 2020, the Advisor and/or Distributor voluntarily waived a portion of its fees. The Fund’s net expense ratio would increase by an amount of 0.65%, 0.92% and 0.46%, respectively, if such voluntary waivers were excluded for the periods ended September 30, 2022, September 30, 2021 and September 30, 2020. See Note 3 – Agreements and Other Transactions with Affiliates and Note 4 – Fund Distribution for more information. |
See Notes to the Financial Statements.
|
NOTES TO FINANCIAL STATEMENTS |
September 30, 2024
1. Organization:
RBC Funds Trust (the “Trust”) is registered under the Investment Company Act of 1940 (as amended) as an open-end management investment company. The Trust was organized as a Delaware statutory trust on December 16, 2003 and currently consists of 23 portfolios. Overall responsibility for the management of the Trust is vested in its Board of Trustees (the “Board”). Predecessor funds to the Trust were reorganized as portfolios of the Trust effective April 16, 2004. This report includes the RBC BlueBay U.S. Government Money Market Fund (“Fund”).
The Fund offers four share classes: Class A, Institutional Class 1, Institutional Class 2 and Investor Class.
RBC Global Asset Management (U.S.) Inc. (“RBC GAM-US” or “Advisor” or “Co-Administrator”) acts as the investment advisor for the Fund. The officers of the Trust (“Fund Management”) are also employees of RBC GAM-US.
2. Significant Accounting Policies
The Fund is an investment company that follows accounting and reporting guidance under the Financial Accounting Standards Board (“FASB”) Accounting Standards Codification Topic 946, Financial Services - Investment Companies (ASC 946). The financial statements are prepared in accordance with U.S. generally accepted accounting principles (“U.S. GAAP”). Fund Management may also be required to make estimates and assumptions that affect the reported amounts of assets and liabilities at the date of the financial statements and the reported amounts of income and expenses for the period. Actual results could differ from those estimates. The financial statements are as of the close of regular trading on the New York Stock Exchange (“NYSE”).
Security Valuation:
The Fund has elected to use the amortized cost method to value its securities (other than other investment companies) pursuant to Rule 2a-7 of the Investment Company Act of 1940, as amended, which the Board believes approximates fair market value. The amortized cost method involves valuing a security initially at its cost, and, thereafter, a constant proportionate accretion of discounts and amortization of premiums are recorded until the maturity of the security. Amortized cost approximates the current fair value of a security, but since the value is not obtained from a quoted price in an active market, securities valued at amortized cost are categorized as Level 2 in the fair value hierarchy (see “Fair Value Measurements” below for additional information). If amortized cost no longer approximates fair value due to credit or other impairments of an issuer, the Fund will determine the fair value of its securities by using pricing and valuation procedures approved by the Board. Investments in open-end investment companies (mutual funds) are valued at net asset value and are categorized as Level 1 in the fair value hierarchy.
The Board has designated the Advisor with the responsibility for implementing the pricing and valuation procedures, including responsibility for determining the fair value of the Fund’s securities or other assets and liabilities, and has established a Pricing Committee to assist in carrying out supervisory functions related to such responsibilities. The Pricing Committee includes representatives of the Fund’s Advisor, and Co-Administrator, including personnel from accounting and operations, trading, risk management and compliance. The Pricing Committee meets at least quarterly to review and approve Fund valuation matters, including a review of the Fund’s pricing activity and operations, fair value measurements, pricing vendors, policies and procedures, and related controls. At least a quorum of the Pricing Committee shall meet more frequently, as needed, to consider and approve time-sensitive fair valuation matters. The Pricing Committee provides periodic reports to the Valuation, Portfolio Management and Performance Committee (“Valuation Committee”) of the Board regarding pricing and valuation matters. Members of the Pricing Committee meet with the Valuation Committee and the Board at each of their regularly scheduled meetings to discuss valuation matters and actions taken during the period.
16
|
NOTES TO FINANCIAL STATEMENTS |
In accordance with Rule 2a-7, the fair values of the securities held in the Fund are determined at least once per week using evaluated prices supplied by third-party pricing vendors approved by the Board. The pricing services utilize both dealer-supplied valuations and electronic data processing techniques that take into account appropriate factors such as institutional-sized trading in similar groups of securities, yield, quality, coupon rate, maturity and type of issue. These security values are then compared to the securities’ amortized cost. If a security price is not available from a pricing service or broker-dealer, or the Advisor determines that a price provided by a pricing service or broker-dealer does not approximate fair value for purposes of this comparison, the security’s fair value will be determined in good faith by the Pricing Committee in accordance with procedures and methodologies approved by the Board. General factors used in determining the fair value of securities include, but are not limited to, fundamental analytical data relating to the security, the issuer and the market, such as duration, prepayment and default rates; general level of interest rates and changes in interest rates; information from broker-dealers; trading in similar securities; any restrictions on disposition of the security; and an evaluation of the forces that influence the market in which the investments are traded.
Fair Value Measurements:
The Funds disclose the fair value of their investments in a hierarchy that categorizes investments based on the inputs to valuation techniques used to measure fair value. The three levels of the fair value hierarchy are as follows:
• Level 1 - Inputs that reflect unadjusted quoted prices in active markets for identical assets or liabilities that the Funds have the ability to access at the measurement date.
• Level 2 - Significant inputs other than quoted prices that are observable for the asset or liability either directly or indirectly, including inputs in markets that are not considered to be active. Observable inputs may include quoted prices for similar securities, interest rates, spreads, prepayment spreads, etc.
• Level 3 - Significant unobservable inputs based on the best information available in the circumstances, to the extent observable inputs are not available (including the Fund’s own assumptions in determining the fair value of investments).
The inputs or methodology used for valuing investments are not necessarily an indication of the risk associated with investing in those securities.
Inputs used in determining fair value of an investment may include, but are not limited to, price information, volatility statistics, credit and market data, and other factors, all of which may be either observable or unobservable. Inputs can vary among investments and will be impacted by the investment type and volume of activity for the particular security or similar securities in the market. Investments in the Level 2 category are generally supported by transactions and quoted prices from dealers participating in the market for those investments. Investments may be included in the Level 3 category due to a lack of market activity or transparency. Internal valuation models may also be used as a pricing source for Level 3 investments. Internal valuation models may rely on one or more unobservable inputs, such as estimated cash flows, financial statement analysis and discount rates.
The summary of inputs used to determine the fair value of the Fund’s investments as of September 30, 2024 is as follows:
| | | | | | | | | | | | | | | | | | | | | | | | | | | | |
| Funds | | | | | Level 1
Quoted Prices | | | Level 2
Significant
Observable
Inputs | | | Level 3
Significant
Unobservable
Inputs | | | Total | |
Assets: | | | | | | | | | | | | | | | | | | | | | | | | | | | | |
Investments in Securities | | | | | | | | | | | | | | | | | | | | | | | | | | | | |
RBC BlueBay U.S. Government Money Market Fund | | | | | | | | | | | $— | | | | $16,117,432,623 | | | | | | | | $— | | | | $16,117,432,623 | |
Repurchase Agreements:
The Fund may enter into repurchase agreements with counterparties whom the Advisor has deemed creditworthy, including primary dealers that report to the Federal Reserve Bank of New York or other large U.S. commercial banks or broker-dealers. These repurchase agreements are subject to the seller’s agreement to repurchase such securities at a mutually agreed upon date and price. The repurchase price generally equals the price paid by the Fund plus interest negotiated on the basis of current short-term rates.
17
|
NOTES TO FINANCIAL STATEMENTS |
Securities pledged by the dealers as collateral for repurchase agreements are held by a custodian bank until maturity of the repurchase agreement. The Fund has procedures to monitor additional collateral, if needed, to ensure that the daily market value of the collateral remains in excess of the market value of the repurchase agreement in the event of a default.
Master Repurchase Agreements (“MRA”) permit the Fund, under certain circumstances, including an event of default (such as bankruptcy or insolvency), to offset payables and/or receivables under the MRA with collateral held and/or posted to the counterparty and create one single net payment due to or from the Fund. However, bankruptcy or insolvency laws of a particular jurisdiction may impose restrictions on or prohibitions against such a right of offset in the event of a MRA counterparty’s bankruptcy or insolvency. Pursuant to the terms of the MRA, the Fund receives securities as collateral with a market value in excess of the repurchase price to be received by the Fund upon the maturity of the repurchase transaction. Upon a bankruptcy or insolvency of the MRA counterparty, the Fund recognizes a liability with respect to such excess collateral to reflect the Fund’s obligation under bankruptcy law to return the excess to the counterparty. Details of the counterparties and collateral for repurchase agreements are shown on the Schedule of Portfolio Investments.
Credit Enhancement:
Certain obligations held by the Fund have credit enhancement or liquidity features that may, under certain circumstances, provide for repayment of principal and interest on the obligation upon demand date, interest rate reset date or final maturity. These enhancements may include: letters of credit; liquidity guarantees; security purchase agreements; tender option purchase agreements and third party insurance.
Investment Transactions and Income:
Investment transactions are accounted for on the date the security is bought or sold (“trade date”). Dividend income is recorded on the ex-dividend date. Realized gains and losses from investment transactions are calculated based on the cost of the specific security (also known as identified cost basis). Interest income is recognized on the accrual basis and includes, where applicable, the amortization or accretion of premium or discount.
Expense, Investment Income and Gain/Loss Allocation:
The Fund pays the expenses that are directly related to its operations, such as custodian fees or advisory fees. Expenses incurred by the Trust, such as trustee or legal fees, are allocated among each of the Funds in the Trust either proportionately based upon the Fund’s relative net assets or using another reasonable basis such as equally across all Funds in the Trust, depending on the nature of the expense. Individual share classes within the Fund are charged expenses specific to that class, such as distribution fees and transfer agent fees. Within the Fund, expenses other than class specific expenses are allocated daily to each class based upon the proportion of relative net assets. Investment income and realized and unrealized gains or losses are allocated to each class of shares based on relative net assets.
Distributions to Shareholders:
The Fund pays out any income that it receives, less expenses, in the form of dividends and capital gain distributions to its shareholders. Income dividends are declared daily and paid monthly. Dividends will also be paid at any time during the month upon total redemption of shares in an account. Capital gains, if any, are declared and paid at least annually. Distributions to shareholders are recorded on the ex-dividend date. The amount of dividends and distributions are calculated based on federal income tax regulations, which may differ from US GAAP. These “book/tax” differences may be either temporary or permanent in nature. To the extent these differences are determined, as of the end of the tax year, to be permanent (e.g. paydowns), they are reclassified within the Fund’s capital accounts based on their federal tax basis treatment.
When-Issued Transactions:
The Fund may engage in when-issued transactions. The Fund records when-issued securities on the trade date and maintains sufficient liquidity so that cash will be available to make payment for the securities purchased. Securities purchased on a when-issued basis are valued daily beginning on trade date and begin earning interest on the settlement date. As of September 30, 2024, the Fund held when-issued securities and details are included in the Schedules of Portfolio Investments.
18
|
NOTES TO FINANCIAL STATEMENTS |
Indemnifications:
Under the Trust’s organizational documents, each Trustee, officer, employee or other agent of the Trust is indemnified against certain liabilities that may arise out of the performance of their duties to the Fund. Additionally in the normal course of business, the Fund enters into contracts, including the Fund’s servicing agreements, that contain a variety of indemnification clauses. The Fund’s maximum exposure under these arrangements is unknown as this would involve future claims that may be made against the Fund that have not yet occurred. The Fund has not had prior claims or losses pursuant to these contracts.
3. Agreements and Other Transactions with Affiliates:
The Trust has entered into an investment advisory agreement with RBC GAM-US under which RBC GAM-US manages the Fund’s assets and furnishes related office facilities, equipment, research and personnel. The agreement requires the Fund to pay RBC GAM-US a monthly fee based upon average daily net assets. Under the terms of the agreement, RBC GAM-US is entitled to receive fees based on a percentage of the average daily net assets of the Fund as follows:
| | | | |
| | | Annual Rate | |
RBC BlueBay U.S. Government Money Market Fund | | | 0.10% | |
Institutional Class 1 of the Fund may pay an annual shareholder services administration fee of up to 0.05% of the average daily net assets attributable to Institutional Class 1 shares that is used to reimburse or compensate a servicing agent (or pay the Advisor, which the Advisor will use to reimburse or compensate a servicing agent) for its efforts and expenses incurred in connection with servicing shareholder accounts. This shareholder services administration fee is not paid pursuant to Rule 12b-1.
RBC GAM-US has contractually agreed to waive fees and/or reimburse expenses under an expense limitation agreement in order to maintain the net annual Fund operating expenses (excluding certain fees such as interest, taxes and acquired fund fees and expenses) at 0.20% for Institutional Class 1 until January 31, 2026. During the year ended September 30, 2024, there were no fees waived under this agreement.
RBC GAM-US serves as co-administrator to the Fund. BNY Mellon serves as co-administrator and fund accounting agent. Services provided under the administrative services agreement include providing day-to-day administration of matters related to the Fund, maintenance of the records and the preparation of reports. Under the terms of the administrative services agreement, RBC GAM-US does not receive an administration services fee. BNY Mellon receives a fee for its services payable by the Fund based in part on the Fund’s average net assets. BNY Mellon’s fee is included with “Accounting fees” in the Statement of Operations.
Certain Officers and Trustees of the Trust are affiliated with the Advisor. Such Officers and Trustees receive no compensation from the Fund for serving in their respective roles.
The Trust currently pays each of the independent Trustees (Trustees of the Trust who are not directors, officers or employees of the Advisor, either Co-Administrator or Distributor) an annual retainer of $92,000. The Board Chairperson and Audit Committee Chairperson each receive an additional retainer of $2,500 annually, and all other Trustees serving as Chair of a Board committee each receive an additional retainer of $1,000 annually. In addition, independent Trustees receive a quarterly meeting fee of $6,500 for each in-person Board meeting attended, a meeting fee of $1,500 for each telephonic or special board meeting attended, a $1,500 fee for each Board committee meeting attended, and are reimbursed for all out-of-pocket expenses relating to attendance at such meetings. These amounts are included in the Statement of Operations in “Trustees’ fees”.
The Advisor has invested in and, as of September 30, 2024, owns 62,234,148 shares of the Fund, representing 0.4% of total Fund net assets.
19
|
NOTES TO FINANCIAL STATEMENTS |
4. Fund Distribution:
The Fund has adopted a Shareholder Account and Distribution Services (12b-1) Plan (the “Plan”) with respect to Class A, Institutional Class 2 and Investor Class, in which Quasar Distributors LLC (the “Distributor”) acts as the Fund’s distributor. The Plan permits the Fund to make payments for or to reimburse the Distributor or others, including RBC Capital Markets, LLC, monthly for distribution-related costs and expenses of marketing shares of each share class covered under the Plan, and/or for providing shareholder services. The following chart shows the current Plan fee rate for each class:
| | | | | | | | | | | | |
| | | Class A | | | Institutional Class 2 | | | Investor Class | |
12b-1 Plan Fee | | | 0.10% | | | | 0.15% | | | | 1.00% | |
Plan fees are based on average daily net assets of the applicable class. Up to 0.25% of each Plan fee may be designated as a service fee, as defined by the applicable rules of the Financial Industry Regulatory Authority.
Pursuant to a shareholder account and distribution services agreement between the Distributor and RBC Capital Markets, LLC, the Distributor has agreed to compensate RBC Capital Markets, LLC for certain shareholder account servicing support provided to the Fund. RBC Capital Markets, LLC has agreed to waive fees and/or reimburse expenses in order to maintain the net annual Fund operating expenses for each class listed below to the following amounts:
| | | | |
Share Class | | Operating Expense Limit | |
Class A | | | 0.25% | |
Institutional Class 2 | | | 0.30% | |
Investor Class | | | 1.00% | |
This expense limitation agreement is in place until January 31, 2026. The Fund will carry forward, for a period not to exceed 12 months from the date on which a waiver or reimbursement is made by RBC Capital Markets, LLC, any expenses in excess of the expense limitation and repay RBC Capital Markets, LLC such amounts, provided the Fund is able to effect such repayment and remain in compliance with the expense limitation. At September 30, 2024, the amount subject to possible recoupment under the expense limitation agreement is $632,606.
RBC Capital Markets, LLC and/or the Advisor may voluntarily waive and/or reimburse additional Fund operating expenses at any time, such as to maintain a minimum yield in the fund. Any such voluntary program may be modified or discontinued at any time without notice.
For the year ended September 30, 2024, the following distribution fees were waived either contractually or voluntarily:
| | | | |
Share Class | | Distribution Fees Waived | |
Class A | | | $ 3,336 | |
Investor Class | | | 629,270 | |
During the year ended September 30, 2024, the Advisor voluntarily waived fees or reimbursed expenses for Class A in the amount of $481.
5. Capital Share Transactions
The number of shares sold, reinvested and redeemed correspond to the net proceeds from sale of shares, reinvestments of dividends and cost of shares redeemed, respectively, since shares are issued, reinvested and redeemed at $1.00 per share.
Transactions for the period were as follows:
20
|
NOTES TO FINANCIAL STATEMENTS |
| | | | | | | | |
| | | RBC BlueBay U.S. Government Money Market Fund | |
| | | For the | | | For the | |
| | | Year Ended | | | Year Ended | |
| | | September 30, 2024 | | | September 30, 2023 | |
CAPITAL TRANSACTIONS: | | | | | | | | |
Class A | | | | | | | | |
Proceeds from shares issued | | $ | 12,533,021 | | | $ | 406,000 | |
Distributions reinvested | | | 205,620 | | | | 2,067 | |
Cost of shares redeemed | | | (5,561,821 | ) | | | — | |
| | | | | | | | |
Change in Class A | | $ | 7,176,820 | | | $ | 408,067 | |
| | | | | | | | |
Institutional Class 1 | | | | | | | | |
Proceeds from shares issued | | $ | 136,638,198,300 | | | $ | 83,136,112,876 | |
Distributions reinvested | | | 317,329,653 | | | | 172,202,136 | |
Cost of shares redeemed | | | (133,497,752,696 | ) | | | (77,789,184,784 | ) |
| | | | | | | | |
Change in Institutional Class 1 | | $ | 3,457,775,257 | | | $ | 5,519,130,228 | |
| | | | | | | | |
Institutional Class 2 | | | | | | | | |
Proceeds from shares issued | | $ | 6,884,015,012 | | | $ | 7,486,727,325 | |
Distributions reinvested | | | 174,218,234 | | | | 142,748,302 | |
Cost of shares redeemed | | | (7,379,966,875 | ) | | | (6,890,856,888 | ) |
| | | | | | | | |
Change in Institutional Class 2 | | $ | (321,733,629 | ) | | $ | 738,618,739 | |
| | | | | | | | |
Investor Class | | | | | | | | |
Proceeds from shares issued | | $ | 789,056,651 | | | $ | 3,313,626,516 | |
Distributions reinvested | | | 22,040,312 | | | | 64,024,582 | |
Cost of shares redeemed | | | (1,825,150,274 | ) | | | (4,987,298,383 | ) |
| | | | | | | | |
Change in Investor Class | | $ | (1,014,053,311 | ) | | $ | (1,609,647,285 | ) |
| | | | | | | | |
Change in net assets resulting from capital transactions | | $ | 2,129,165,137 | | | $ | 4,648,509,749 | |
| | | | | | | | |
6. Federal Income Taxes:
It is the policy of the Fund to continue to qualify as a regulated investment company by complying with the provisions available to certain investment companies, as defined under Subchapter M of the Internal Revenue Code, and to distribute substantially all of its net investment income and net realized capital gains. Therefore, no federal tax liability is recorded in the financial statements of the Fund.
For all open tax years and all major taxing jurisdictions, management of the Funds has concluded that there are no significant uncertain tax positions that would require recognition in the financial statements. Open tax years are those that are open for examination by taxing authorities (i.e., generally the last three tax year ends and the interim tax period since then). Furthermore, management of the Funds is also not aware of any tax positions for which it is reasonably possible that the total amounts of unrecognized tax benefits will significantly change in the next twelve months.
21
|
NOTES TO FINANCIAL STATEMENTS |
The tax character of distributions during the year ended September 30, 2024 were as follows:
| | | | | | | | | | | | | | | | | | |
| | | Distributions Paid From | | | |
| | | | | | | | | | | | Total | |
| | | Ordinary | | | Net Long Term | | | Total Taxable | | | Distributions | |
| | | Income | | | Capital Gains | | | Distributions | | | Paid | |
RBC BlueBay U.S. Government Money Market Fund | | $ | 777,521,041 | | | | $357,739 | | | $ | 777,878,780 | | | $ | 777,878,780 | |
The tax character of distributions during the year ended September 30, 2023 were as follows:
| | | | | | | | | | | | | | | | | | |
| | | Distributions Paid From | | | |
| | | Ordinary
Income | | | Net Long Term
Capital Gains | | | Total Taxable
Distributions | | | Total
Distributions
Paid | |
RBC BlueBay U.S. Government Money Market Fund | | | $537,614,906 | | | | $90,609 | | | | $537,705,515 | | | | $537,705,515 | |
Total distributions paid may differ from the Statements of Changes in Net Assets because distributions are recognized when actually paid for tax purposes.
As of September 30, 2024, the components of accumulated earnings/(losses) on a tax basis were as follows:
| | | | | | | | | | | | | | | | | | | | |
Undistributed
Ordinary
Income | | Distributions
Payable | | | Accumulated
Capital
Loss
Carryforwards | | | Unrealized
Appreciation | | | Other
Temporary
Differences | | | Total
Accumulated
(Losses) | |
| $18,411,803 | | | $(18,744,595) | | | | $(2) | | | | $— | | | | $— | | | | $(332,794) | |
As of September 30, 2024, the Fund had a short-term capital loss carryforward of $2, available to offset future realized capital gains in accordance with the Regulated Investment Company Modernization Act of 2010. These capital loss carryforwards are not subject to expiration and must first be utilized to offset future realized gains of the same character.
Under current tax law, Post-October Capital Losses and Late-Year Ordinary Losses may be deferred and treated as occurring on the first business day of the following fiscal year for tax purposes. The Fund did not have any Post-October Capital Losses or Late-Year Ordinary Losses for the year ending September 30, 2024.
7. Line of Credit
The Fund, along with other Funds within the Trust, participates in an uncommitted, secured $50,000,000 line of credit with U.S. Bank, N.A. (the “Bank”), the Funds’ custodian, to be used to fund shareholder redemption requests and for other short-term temporary or emergency general business purposes. The line of credit has a scheduled termination date of July 26, 2025. Interest is charged on borrowings under this line of credit at the Bank’s prime lending rate per annum. Since multiple funds within the Trust participate in this line of credit, there is no assurance that an individual fund will have access to all or any part of the $50,000,000 at any particular time. There were no loans outstanding pursuant to this line of credit at September 30, 2024 and there were no borrowings made by the Fund during the period.
22
|
NOTES TO FINANCIAL STATEMENTS |
8. Significant Risks
Shareholder concentration risk:
As of September 30, 2024, affiliated broker-dealer omnibus accounts owned 25.0% of the Fund’s outstanding shares. Significant transactions by these shareholders may impact the Fund’s performance.
Market risk:
One or more markets in which a Fund invests may go down in value, sometimes sharply and unpredictably, and the value of a Fund’s portfolio securities may fall or fail to rise. Market risk may affect a single issuer, sector of the economy, industry or the market as a whole. In addition, global economies and financial markets are becoming increasingly interconnected, and political, economic and other conditions and events (including, but not limited to, natural disasters, pandemics, epidemics, and social unrest) in one country, region, or financial market may adversely impact issuers in a different country, region or financial market. Furthermore, the occurrence of, among other events, natural or man-made disasters, severe weather or geological events, fires, floods, earthquakes, outbreaks of disease (such as COVID-19, avian influenza or H1N1/09), epidemics, pandemics, malicious acts, cyber-attacks, terrorist acts or the occurrence of climate change, may also adversely impact the performance of a Fund. Such events could adversely impact issuers, markets and economies over the short- and long-term, including in ways that cannot necessarily be foreseen. A Fund could be negatively impacted if the value of a portfolio holding were harmed by such political or economic conditions or events. Moreover, such negative political and economic conditions and events could disrupt the processes necessary for a Fund’s operations.
9. Subsequent Events:
Fund Management has evaluated the impact of all subsequent events on the Fund and has determined that there were no subsequent events requiring recognition or disclosure in the financial statements.
23
|
REPORT OF INDEPENDENT REGISTERED PUBLIC ACCOUNTING FIRM |
To the Board of Trustees of RBC Funds Trust and Shareholders of RBC BlueBay U.S. Government Money Market Fund
Opinion on the Financial Statements
We have audited the accompanying statement of assets and liabilities, including the schedule of portfolio investments, of RBC BlueBay U.S. Government Money Market Fund (one of the funds constituting RBC Funds Trust, referred to hereafter as the “Fund”) as of September 30, 2024, the related statement of operations for the year ended September 30, 2024, the statements of changes in net assets for each of the two years in the period ended September 30, 2024, including the related notes, and the financial highlights for each of the periods indicated therein (collectively referred to as the “financial statements”). In our opinion, the financial statements present fairly, in all material respects, the financial position of the Fund as of September 30, 2024, the results of its operations for the year then ended, the changes in its net assets for each of the two years in the period ended September 30, 2024 and the financial highlights for each of the periods indicated therein in conformity with accounting principles generally accepted in the United States of America.
Basis for Opinion
These financial statements are the responsibility of the Fund’s management. Our responsibility is to express an opinion on the Fund’s financial statements based on our audits. We are a public accounting firm registered with the Public Company Accounting Oversight Board (United States) (PCAOB) and are required to be independent with respect to the Fund in accordance with the U.S. federal securities laws and the applicable rules and regulations of the Securities and Exchange Commission and the PCAOB.
We conducted our audits of these financial statements in accordance with the standards of the PCAOB. Those standards require that we plan and perform the audit to obtain reasonable assurance about whether the financial statements are free of material misstatement, whether due to error or fraud.
Our audits included performing procedures to assess the risks of material misstatement of the financial statements, whether due to error or fraud, and performing procedures that respond to those risks. Such procedures included examining, on a test basis, evidence regarding the amounts and disclosures in the financial statements. Our audits also included evaluating the accounting principles used and significant estimates made by management, as well as evaluating the overall presentation of the financial statements. Our procedures included confirmation of securities owned as of September 30, 2024 by correspondence with the custodian and brokers; when replies were not received from brokers, we performed other auditing procedures. We believe that our audits provide a reasonable basis for our opinions.
/s/PricewaterhouseCoopers LLP
Minneapolis, Minnesota
November 22, 2024
We have served as the auditor of one or more investment companies in the RBC Funds since 2016.
24
|
OTHER FEDERAL INCOME TAX INFORMATION (UNAUDITED) |
The Fund reports a portion of the income dividends distributed during the fiscal year ended September 30, 2024, as U.S. Government Income as 38.38%.
U.S. Government Income represents the amount of interest that was derived from direct U.S. Government obligations. Generally, such interest is exempt from state income tax. For residents of California, New York and Connecticut the statutory threshold requirements were satisfied. Due to the diversity in state and local tax law, it is recommended you consult a tax adviser as to the applicability of the information provided for your specific situation.
The Fund reports a portion of the income dividends distributed during the fiscal year ended September 30, 2024, as Qualified Interest Income as defined in the Internal Revenue Code as 99.96%.
All reportings are based on financial information available as of the date of this annual report and, accordingly, are subject to change. For each item above, it is the intention of the Fund to report the maximum amount permitted under the Internal Revenue Code and the regulations thereunder.
25
|
APPROVAL OF INVESTMENT ADVISORY AGREEMENT (UNAUDITED) |
In September 2024, after evaluating the services provided by RBC Global Asset Management (U.S.) Inc. (the “Advisor”) and reviewing the performance, fees, and expenses of the Fund, the RBC Funds Board of Trustees determined to approve the continuation of the investment advisory agreement (“Agreement”) with the Advisor for the Fund for an additional year.
As part of their review of the Agreement the Trustees requested and considered information regarding the advisory services performed by the Advisor, the staffing and qualifications of the personnel responsible for operating and managing the Fund, and the Fund’s performance and expenses. The Trustees considered information provided at regular quarterly Board and Committee meetings throughout the year as well as information presented at both a special meeting held to review requested material related to the proposed renewals and a regular meeting at which the proposed renewals were considered, and their experience with the portfolio management team with regard to other products over the years. The information included material provided by the Advisor, as well as reports prepared by Broadridge Financial Solutions, Inc., an independent statistical compilation company, providing comparative fee and expense information and comparative performance information for the Fund. In connection with their deliberations, the independent Trustees were advised by independent legal counsel with regard to the materials and their responsibilities under the relevant laws and regulations.
The Trustees met with representatives from the Advisor’s senior management team, as well as senior investment professionals, to discuss the information and the Advisor’s ongoing management of the Fund. The Trustees reviewed the nature and quality of the services provided to the Fund by the Advisor, including information as to the Fund’s performance.
The Trustees were provided with comparative Morningstar data for U.S. government money market funds. The Trustees were informed that the Fund had outperformed the median return of its Morningstar category for recent periods and over the longer term. The Trustees were satisfied with the quality and capabilities of the money market fund portfolio management and analyst team and with the overall investment performance of the Fund.
The Trustees reviewed advisory fee and expense information for the Fund compared to similarly situated funds, including information regarding other client accounts advised or sub-advised by the Advisor with a similar investment strategy and the reasons for any differences in fees. The Trustees were informed that the Fund’s net expense ratio was within the top quartile of both its peer group and its Morningstar category. The Trustees considered, and viewed favorably, arrangements to waive certain fees to achieve competitive expense levels. The Trustees evaluated profitability data for the Advisor and considered information regarding other benefits the Advisor and its affiliates derived from their relationships with the Fund.
Based upon their review, the Trustees determined that the advisory fees proposed to be payable to the Advisor were reasonable and fair in light of the nature and quality of services provided under all the circumstances and were within the range of what might have been negotiated at arms’ length. The Trustees concluded that it is in the interests of the Fund and its shareholders for the Trustees to approve the Agreement as well as the continuation of the expense limitation agreement for the Fund for an additional year. In arriving at their collective decision to approve the Agreement, the Trustees did not assign relative weights to the factors discussed above or deem any one or group of them to be controlling in and of itself.
26
RBC Funds
P.O. Box 701
Milwaukee, WI 53201-0701
800-422-2766
www.rbcgam.com
Performance data represents past performance and does not guarantee future results. The principal value of an investment and investment return will fluctuate so that an investor’s shares, when redeemed, may be worth more or less than their original cost.
This report and the financial statements contained herein are provided for the information of RBC Funds shareholders. This report is not authorized for distribution to prospective investors unless preceded or accompanied by a current prospectus, which contains information concerning investment objectives, risks, charges and expenses of the funds. Please read the prospectus carefully before investing.
This report and the financial statements contained herein are not intended to be a forecast of future events, a guarantee of future results, or investment advice. There is no assurance that certain securities will remain in or out of each fund’s portfolio. The views expressed in this report reflect those of the portfolio managers through the year ended September 30, 2024.
NOT FDIC INSURED • NO BANK GUARANTEE • MAY LOSE VALUE
RBC Global Asset Management (U.S.) Inc. serves as investment advisor for the RBC Funds. RBC Funds are distributed by Quasar Distributors LLC.
The RBC Funds are pleased to offer shareholder reports printed entirely on Forest Stewardship Council® certified paper. This product is made of material from well-managed FSC®-certified forests, recycled materials, and other controlled sources. The Forest Stewardship Council® promotes environmentally appropriate, socially beneficial, and economically viable management of the world’s forests.
RBCF-MM AR 09-24
Item 8. Changes in and Disagreements with Accountants for Open-End Management Investment Companies.
Not applicable.
Item 9. Proxy Disclosures for Open-End Management Investment Companies.
Not applicable.
Item 10. Remuneration Paid to Directors, Officers, and Others of Open-End Management Investment Companies.
The Fund’s disclosure of remuneration items is included as part of the Financial Statements and Other Important Information filed under Item 7 of this form.
Item 11. Statement Regarding Basis for Approval of Investment Advisory Contract.
Included as part of the Financial Statements and Other Important Information filed under Item 7 of this form.
| | |
Item | | 12. Disclosure of Proxy Voting Policies and Procedures for Closed-End Management Investment Companies. |
Not applicable.
Item 13. Portfolio Managers of Closed-End Management Investment Companies.
Not applicable.
| | |
Item | | 14. Purchases of Equity Securities by Closed-End Management Investment Company and Affiliated Purchasers. |
Not applicable.
Item 15. Submission of Matters to a Vote of Security Holders.
There have been no material changes to the procedures by which the shareholders may recommend nominees to the registrant’s board of directors, where those changes were implemented after the registrant last provided disclosure in response to the requirements of Item 407(c)(2)(iv) of Regulation S-K (17 CFR 229.407) (as required by Item 22(b)(15) of Schedule 14A (17 CFR 240.14a-101)), or this Item.
Item 16. Controls and Procedures.
| | (a) | The registrant’s principal executive and principal financial officers, or persons performing similar functions, have concluded that the registrant’s disclosure controls and procedures (as defined in Rule 30a-3(c) under the Investment Company Act of 1940, as amended (the “1940 Act”) (17 CFR 270.30a-3(c))) are effective, as of a date within 90 days of the filing date of the report that includes the disclosure required by this paragraph, based on their evaluation of these controls and procedures required by Rule 30a-3(b) under the 1940 Act (17 CFR 270.30a-3(b)) and Rules 13a-15(b) or 15d-15(b) under the Securities Exchange Act of 1934, as amended (17 CFR 240.13a-15(b) or 240.15d-15(b)). |
| | (b) | There were no changes in the registrant’s internal control over financial reporting (as defined in Rule 30a-3(d) under the 1940 Act (17 CFR 270.30a-3(d))) that occurred during the period covered by this report that has materially affected, or is reasonably likely to materially affect, the registrant’s internal control over financial reporting. |
Item 17. Disclosure of Securities Lending Activities for Closed-End Management Investment Companies.
Not applicable.
Item 18. Recovery of Erroneously Awarded Compensation.
Not Applicable.
Item 19. Exhibits.
| | (a)(3)(1) | Not applicable. |
| | (a)(3)(2) | Not applicable. |
SIGNATURES
Pursuant to the requirements of the Securities Exchange Act of 1934 and the Investment Company Act of 1940, the registrant has duly caused this report to be signed on its behalf by the undersigned, thereunto duly authorized.
| | |
| (Registrant) RBC Funds Trust |
|
| By (Signature and Title)* /s/ David Eikenberg |
| | David Eikenberg, President and Chief Executive Officer |
| | (principal executive officer) |
|
| Date December 3, 2024 |
Pursuant to the requirements of the Securities Exchange Act of 1934 and the Investment Company Act of 1940, this report has been signed below by the following persons on behalf of the registrant and in the capacities and on the dates indicated.
| | |
| By (Signature and Title)* /s/ David Eikenberg |
| | David Eikenberg, President and Chief Executive Officer |
| | (principal executive officer) |
|
| Date December 3, 2024 |
|
| By (Signature and Title)* /s/ Kathleen A. Hegna |
| | Kathleen A. Hegna, Treasurer and Chief Financial Officer |
| | (principal financial officer) |
|
| Date December 3, 2024 |
* Print the name and title of each signing officer under his or her signature.