UNITED STATES
SECURITIES AND EXCHANGE COMMISSION
WASHINGTON, D.C. 20549
FORM N-CSR
CERTIFIED SHAREHOLDER REPORT OF REGISTERED
MANAGEMENT INVESTMENT COMPANIES
Investment Company Act file number: 811-21497
AB CORPORATE SHARES
(Exact name of registrant as specified in charter)
1345 Avenue of the Americas, New York, New York 10105
(Address of principal executive offices) (Zip code)
Joseph J. Mantineo
AllianceBernstein L.P.
1345 Avenue of the Americas
New York, New York 10105
(Name and address of agent for service)
Registrant’s telephone number, including area code: (800) 221-5672
Date of fiscal year end: April 30, 2018
Date of reporting period: October 31, 2017
| ITEM 1. | REPORTS TO STOCKHOLDERS. |
OCT 10.31.17
SEMI-ANNUAL REPORT
AB CORPORATE INCOME SHARES


| | |
| |
| Investment Products Offered | | • Are Not FDIC Insured • May Lose Value • Are Not Bank Guaranteed |
Investors should consider the investment objectives, risks, charges and expenses of the Fund carefully before investing. For copies of our prospectus or summary prospectus, which contain this and other information, visit us online at www.abfunds.com or contact your AB representative. Please read the prospectus and/or summary prospectus carefully before investing.
This shareholder report must be preceded or accompanied by the Fund’s prospectus for individuals who are not current shareholders of the Fund.
You may obtain a description of the Fund’s proxy voting policies and procedures, and information regarding how the Fund voted proxies relating to portfolio securities during the most recent 12-month period ended June 30, without charge. Simply visit AB’s website at www.abfunds.com, or go to the Securities and Exchange Commission’s (the “Commission”) website at www.sec.gov, or call AB at (800) 227 4618.
The Fund files its complete schedule of portfolio holdings with the Commission for the first and third quarters of each fiscal year on Form N-Q. The Fund’s Forms N-Q are available on the Commission’s website at www.sec.gov. The Fund’s Forms N-Q may also be reviewed and copied at the Commission’s Public Reference Room in Washington, DC; information on the operation of the Public Reference Room may be obtained by calling (800) SEC 0330. AB publishes full portfolio holdings for the Fund monthly at www.abfunds.com.
AllianceBernstein Investments, Inc. (ABI) is the distributor of the AB family of mutual funds. ABI is a member of FINRA and is an affiliate of AllianceBernstein L.P., the Adviser of the funds.
The [A/B] logo is a registered service mark of AllianceBernstein and AllianceBernstein® is a registered service mark used by permission of the owner, AllianceBernstein L.P.
| | |
| FROM THE PRESIDENT | |  |
Dear Shareholder,
We are pleased to provide this report for AB Corporate Income Shares (the “Fund”). Please review the discussion of Fund performance, the market conditions during the reporting period and the Fund’s investment strategy.
As always, AB strives to keep clients ahead of what’s next by:
| + | | Transforming uncommon insights into uncommon knowledge with a global research scope |
| + | | Navigating markets with seasoned investment experience and sophisticated solutions |
| + | | Providing thoughtful investment insights and actionable ideas |
Whether you’re an individual investor or a multi-billion-dollar institution, we put knowledge and experience to work for you.
AB’s global research organization connects and collaborates across platforms and teams to deliver impactful insights and innovative products. Better insights lead to better opportunities—anywhere in the world.
For additional information about AB’s range of products and shareholder resources, please log on to www.abfunds.com.
Thank you for your investment in the AB Mutual Funds.
Sincerely,

Robert M. Keith
President and Chief Executive Officer, AB Mutual Funds
| | |
| abfunds.com | | AB CORPORATE INCOME SHARES | 1 |
SEMI-ANNUAL REPORT
December 18, 2017
This report provides management’s discussion of fund performance for AB Corporate Income Shares for the semi-annual reporting period ended October 31, 2017. Please note, shares of this Fund are available only to separately managed accounts or participants in “wrap fee” programs or other investment programs approved by the Adviser.
The Fund’s investment objective is to earn high current income.
NAV RETURNS AS OF OCTOBER 31, 2017 (unaudited)
| | | | | | | | |
| | | 6 Months | | | 12 Months | |
| AB CORPORATE INCOME SHARES1 | | | 3.10% | | | | 3.26% | |
| Bloomberg Barclays US Credit Bond Index | | | 3.05% | | | | 3.18% | |
| 1 | Includes the impact of proceeds received and credited to the Fund resulting from class-action settlements, which enhanced the performance of the Fund for the six- and 12-month periods ended October 31, 2017, by 0.00% and 0.01%, respectively. |
INVESTMENT RESULTS
The table above shows the Fund’s performance compared to its benchmark, the Bloomberg Barclays US Credit Bond Index, for the six- and 12-month periods ended October 31, 2017.
During the six-month period, the Fund outperformed the benchmark. Security selection drove the outperformance relative to the benchmark, as gains from selections within the banking sector more than offset negative returns from selections in media. Yield-curve positioning was also positive, helped most by overweights in the shorter-than-one-year and six- to seven-year parts of the curve, while an underweight in longer maturities detracted. Industry allocation had an immaterial impact on performance. Positive returns from a lack of exposure to supranationals and sovereign government guaranteed agencies were mostly counterbalanced by losses from the Fund’s allocation to Treasuries and having no exposure to US municipal local government bonds.
During the 12-month period, the Fund outperformed the benchmark. Yield-curve positioning drove the outperformance relative to the benchmark. Overweights in six- to seven-year maturities and along the long end of the curve contributed, more than offsetting losses from an overweight in seven- to 10-year maturities. Security and industry selection did not significantly affect overall performance. Within security decisions, gains from selections within banking and technology contributed, while basic industries and media selections were negative. In the Fund’s industry positioning, a lack of exposure to supranationals was positive, while an exposure to Treasuries detracted.
| | |
| 2 | AB CORPORATE INCOME SHARES | | abfunds.com |
The Fund utilized derivatives in the form of futures and interest rate swaps for hedging purposes and credit default swaps for investment purposes during both periods, which had an immaterial impact on performance, in absolute terms.
MARKET REVIEW AND INVESTMENT STRATEGY
Political events and central bank action had a significant impact on bond markets in the six- and 12-month periods ended October 31, 2017. Donald Trump’s US election victory and the promise of fiscal stimulus, a retreat from globalization and relaxed regulation were treated as positive developments by financial markets. However, uncertainty regarding the Trump administration’s ability to implement meaningful change increased through the 12-month period. UK prime minister Theresa May surprised investors when she called for a snap parliamentary election in an effort to firm up the UK’s mandate going into Brexit negotiations. However, the results of the vote increased political uncertainty when May’s Conservative Party failed to secure a majority position. Investors were relieved when centrist, pro-EU candidate Emmanuel Macron was elected president of France, as his reformist agenda was seen as more business friendly than the protectionist policies espoused by his opponent. In June, the US Federal Reserve (the “Fed”) raised interest rates for the third consecutive quarter, hikes that were well-telegraphed and universally anticipated by markets. Late in the period, the Fed formally confirmed that its balance sheet reduction program would start in October, while the European Central Bank announced that it would start to taper the pace of its monthly asset purchases in January 2018.
Emerging-market debt rallied over both periods, helped by a positive global growth story and increasing oil prices. Outside of Europe, developed-market treasury yields generally rose; in the eurozone and UK, yields moved in different directions. Emerging-market local-currency government bonds, developed-market treasuries and investment-grade credit securities all rose in both periods, yet trailed the rally in global high yield. Within high yield, performance was almost uniformly positive, led by the transportation and basic industries sectors, while consumer sectors tended to lag the rising market.
INVESTMENT POLICIES
The Fund invests, under normal circumstances, at least 80% of its net assets in US corporate bonds. The Fund may also invest in US government securities (other than US government securities that are mortgage-backed or asset-backed securities), repurchase agreements and forward contracts relating to US government securities. The Fund normally invests all of its assets in securities that are rated, at the time of purchase, at least BBB- or the equivalent. The Fund will
(continued on next page)
| | |
| abfunds.com | | AB CORPORATE INCOME SHARES | 3 |
not invest in unrated corporate debt securities. The Fund has the flexibility to invest in long- and short-term fixed-income securities. In making decisions about whether to buy or sell securities, the Adviser will consider, among other things, the strength of certain sectors of the fixed-income market relative to others, interest rates and other general market conditions and the credit quality of individual issuers.
The Fund also may: invest in convertible debt securities; invest up to 10% of its assets in inflation-indexed securities; invest up to 5% of its net assets in preferred stock; purchase and sell interest rate futures contracts and options; enter into swap transactions; invest in zero-coupon securities and “payment-in-kind” debentures; make secured loans of portfolio securities; and invest in US dollar-denominated fixed-income securities issued by non-US companies.
| | |
| 4 | AB CORPORATE INCOME SHARES | | abfunds.com |
DISCLOSURES AND RISKS
Benchmark Disclosure
The Bloomberg Barclays US Credit Bond Index is unmanaged and does not reflect fees and expenses associated with the active management of a fund. The Bloomberg Barclays US Credit Bond Index represents the performance of the US credit securities within the US fixed-income market. An investor cannot invest directly in an index, and its results are not indicative of the performance for any specific investment, including the Fund.
A Word About Risk
Market Risk: The value of the Fund’s assets will fluctuate as the stock or bond market fluctuates. The value of the Fund’s investments may decline, sometimes rapidly and unpredictably, simply because of economic changes or other events that affect large portions of the market.
Credit Risk: An issuer or guarantor of a fixed-income security, or the counterparty to a derivatives or other contract, may be unable or unwilling to make timely payments of interest or principal, or to otherwise honor its obligations. The issuer or guarantor may default, causing a loss of the full principal amount of a security. The degree of risk for a particular security may be reflected in its credit rating. There is the possibility that the credit rating of a fixed-income security may be downgraded after purchase, which may adversely affect the value of the security. Investments in fixed-income securities with lower ratings tend to have a higher probability that an issuer will default or fail to meet its payment obligations.
Interest Rate Risk: Changes in interest rates will affect the value of investments in fixed-income securities. When interest rates rise, the value of existing investments in fixed-income securities tends to fall and this decrease in value may not be offset by higher income from new investments. The Fund may be subject to heightened interest rate risk due to rising rates as the current period of historically low interest rates may be ending. Interest rate risk is generally greater for fixed-income securities with longer maturities or durations.
Inflation Risk: This is the risk that the value of assets or income from investments will be less in the future as inflation decreases the value of money. As inflation increases, the value of the Fund’s assets can decline as can the value of the Fund’s distributions. This risk is significantly greater for fixed-income securities with longer maturities.
Foreign (Non-US) Risk: Investments in securities of non-US issuers may involve more risk than those of US issuers. These securities may fluctuate more widely in price and may be less liquid due to adverse market, economic, political, regulatory or other factors.
| | |
| abfunds.com | | AB CORPORATE INCOME SHARES | 5 |
DISCLOSURES AND RISKS (continued)
Derivatives Risk: Derivatives may be illiquid, difficult to price, and leveraged so that small changes may produce disproportionate losses for the Fund, and may be subject to counterparty risk to a greater degree than more traditional investments.
Management Risk: The Fund is subject to management risk because it is an actively managed investment fund. The Adviser will apply its investment techniques and risk analyses in making investment decisions, but there is no guarantee that its techniques will produce the intended results.
These risks are fully discussed in the Fund’s prospectus. As with all investments, you may lose money by investing in the Fund.
An Important Note About Historical Performance
The performance shown in this report represents past performance and does not guarantee future results. Current performance may be lower or higher than the performance information shown. You may obtain performance information current to the most recent month-end by calling (800) 227 4618. The investment return and principal value of an investment in the Fund will fluctuate, so that your shares, when redeemed, may be worth more or less than their original cost. Performance assumes reinvestment of distributions and does not account for taxes.
Investors should consider the investment objectives, risks, charges and expenses of the Fund carefully before investing. For copies of our prospectus and/or summary prospectus, which contain this and other information, visit us online at www.abfunds.com or contact your AllianceBernstein Investments representative. Please read the prospectus and/or summary prospectus carefully before investing.
| | |
| 6 | AB CORPORATE INCOME SHARES | | abfunds.com |
HISTORICAL PERFORMANCE
AVERAGE ANNUAL RETURNS AS OF OCTOBER 31, 2017 (unaudited)
| | | | |
| | | NAV Returns | |
| 1 Year | | | 3.26% | |
| 5 Years | | | 3.55% | |
| 10 Years | | | 6.22% | |
AVERAGE ANNUAL RETURNS
AS OF THE MOST RECENT CALENDAR QUARTER-END
SEPTEMBER 30, 2017 (unaudited)
| | | | |
| | | NAV Returns | |
| 1 Year | | | 2.00% | |
| 5 Years | | | 3.74% | |
| 10 Years | | | 6.26% | |
The prospectus fee table shows the fees and the total operating expenses of the Fund as 0.00% because the Adviser does not charge any fees or expenses and reimburses Fund operating expenses, except certain extraordinary expenses, taxes, brokerage costs and the interest on borrowings or certain leveraged transactions. Participants in a wrap fee program or other investment program eligible to invest in the Fund pay fees to the program sponsor and should review the program brochure or other literature provided by the sponsor for a discussion of fees and expenses charged.
| | |
| abfunds.com | | AB CORPORATE INCOME SHARES | 7 |
EXPENSE EXAMPLE
(unaudited)
As a shareholder of the Fund, you may incur various ongoing non-operating and extraordinary costs. This example is intended to help you understand your ongoing costs (in dollars) of investing in the Fund and to compare these costs with the ongoing costs of investing in other mutual funds.
The Example is based on an investment of $1,000 invested at the beginning of the period and held for the entire period as indicated below.
Actual Expenses
The table below provides information about actual account values and actual expenses. You may use the information in this line, together with the amount you invested, to estimate the expenses that you paid over the period. Simply divide your account value by $1,000 (for example, an $8,600 account value divided by $1,000 = 8.6), then multiply the result by the number in the first line under the heading entitled “Expenses Paid During Period” to estimate the expenses you paid on your account during this period.
Hypothetical Example for Comparison Purposes
The table below provides information about hypothetical account values and hypothetical expenses based on the Fund’s actual expense ratio and an assumed annual rate of return of 5% before expenses, which is not the Fund’s actual return. The hypothetical account values and expenses may not be used to estimate the actual ending account balance or expenses you paid for the period. You may use this information to compare the ongoing costs of investing in the Fund and other funds by comparing this 5% hypothetical example with the 5% hypothetical examples that appear in the shareholder reports of other funds.
Please note that the expenses shown in the table are meant to highlight your ongoing costs only and do not reflect any transactional costs, such as sales charges (loads), or contingent deferred sales charges on redemptions. Therefore, the hypothetical example is useful in comparing ongoing costs only, and will not help you determine the relative total costs of owning different funds. In addition, if these transactional costs were included, your costs would have been higher.
| | | | | | | | | | | | | | | | |
| | | Beginning
Account Value
May 1, 2017 | | | Ending
Account Value
October 31, 2017 | | | Expenses Paid
During Period* | | | Annualized
Expense Ratio* | |
Actual | | $ | 1,000 | | | $ | 1,031.00 | | | $ | 0 | | | | 0.00 | % |
Hypothetical** | | $ | 1,000 | | | $ | 1,025.21 | | | $ | 0 | | | | 0.00 | % |
| * | Expenses are equal to the Fund’s annualized expense ratio, multiplied by the average account value over the period, multiplied by 184/365 (to reflect the one-half year period). The Fund’s operating expenses are borne by the Adviser or its affiliates. |
| ** | Assumes 5% annual return before expenses. |
| | |
| 8 | AB CORPORATE INCOME SHARES | | abfunds.com |
PORTFOLIO SUMMARY
October 31, 2017 (unaudited)
PORTFOLIO STATISTICS
Net Assets ($mil): $86.0
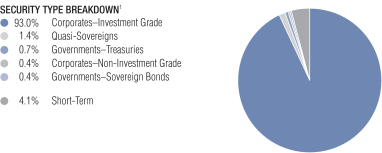
| 1 | All data are as of October 31, 2017. The Fund’s security type breakdown is expressed as a percentage of total investments and may vary over time. The Fund also enters into derivative transactions, which may be used for hedging or investment purposes (see “Portfolio of Investments” section of the report for additional details). |
| | |
| abfunds.com | | AB CORPORATE INCOME SHARES | 9 |
PORTFOLIO OF INVESTMENTS
October 31, 2017 (unaudited)
| | | | | | | | |
| | | Principal
Amount
(000) | | | U.S. $ Value | |
| |
CORPORATES – INVESTMENT GRADE – 93.6% | | | | | |
Industrial – 55.3% | | | | | | | | |
Basic – 3.0% | | | | | | | | |
Alpek SAB de CV
4.50%, 11/20/22(a) | | $ | 200 | | | $ | 203,490 | |
BHP Billiton Finance USA Ltd.
6.42%, 3/01/26 | | | 67 | | | | 82,153 | |
Celulosa Arauco y Constitucion SA
4.50%, 8/01/24 | | | 200 | | | | 209,996 | |
Dow Chemical Co. (The)
4.25%, 11/15/20 | | | 186 | | | | 195,990 | |
EI du Pont de Nemours & Co. | | | | | | | | |
2.20%, 5/01/20 | | | 91 | | | | 91,356 | |
6.00%, 7/15/18 | | | 150 | | | | 154,456 | |
Georgia-Pacific LLC
5.40%, 11/01/20(a) | | | 110 | | | | 120,065 | |
Glencore Funding LLC | | | | | | | | |
4.125%, 5/30/23(a) | | | 125 | | | | 130,900 | |
4.625%, 4/29/24(a) | | | 175 | | | | 186,807 | |
International Paper Co.
3.00%, 2/15/27 | | | 125 | | | | 121,466 | |
Mexichem SAB de CV
4.00%, 10/04/27(a) | | | 200 | | | | 199,740 | |
Monsanto Co.
2.85%, 4/15/25 | | | 155 | | | | 152,300 | |
Mosaic Co. (The) | | | | | | | | |
4.25%, 11/15/23 | | | 155 | | | | 161,915 | |
5.625%, 11/15/43 | | | 65 | | | | 68,028 | |
Praxair, Inc.
3.55%, 11/07/42 | | | 80 | | | | 78,538 | |
Southern Copper Corp.
3.875%, 4/23/25 | | | 180 | | | | 187,200 | |
Vale Overseas Ltd. | | | | | | | | |
6.25%, 8/10/26 | | | 10 | | | | 11,522 | |
6.875%, 11/21/36 | | | 90 | | | | 107,199 | |
Yamana Gold, Inc.
4.95%, 7/15/24 | | | 91 | | | | 93,823 | |
| | | | | | | | |
| | | | | | | 2,556,944 | |
| | | | | | | | |
Capital Goods – 1.8% | |
Boeing Co. (The)
6.125%, 2/15/33 | | | 55 | | | | 72,285 | |
Caterpillar, Inc. | | | | | | | | |
3.40%, 5/15/24 | | | 310 | | | | 324,449 | |
4.30%, 5/15/44 | | | 110 | | | | 122,307 | |
| | |
| 10 | AB CORPORATE INCOME SHARES | | abfunds.com |
PORTFOLIO OF INVESTMENTS (continued)
| | | | | | | | |
| | | Principal
Amount
(000) | | | U.S. $ Value | |
| |
General Electric Co. | | | | | | | | |
3.375%, 3/11/24 | | $ | 150 | | | $ | 156,240 | |
4.50%, 3/11/44 | | | 185 | | | | 203,013 | |
Series D
5.00%, 1/21/21(b) | | | 104 | | | | 108,436 | |
John Deere Capital Corp. | | | | | | | | |
2.65%, 6/10/26 | | | 125 | | | | 121,941 | |
2.80%, 3/06/23 | | | 155 | | | | 157,618 | |
Molex Electronic Technologies LLC
2.878%, 4/15/20(a) | | | 130 | | | | 130,796 | |
Rockwell Collins, Inc.
1.95%, 7/15/19 | | | 120 | | | | 120,031 | |
| | | | | | | | |
| | | | | | | 1,517,116 | |
| | | | | | | | |
Communications – Media – 6.3% | |
21st Century Fox America, Inc. | | | | | | | | |
3.00%, 9/15/22 | | | 405 | | | | 412,327 | |
4.00%, 10/01/23 | | | 40 | | | | 42,323 | |
8.875%, 4/26/23 | | | 125 | | | | 159,458 | |
CBS Corp. | | | | | | | | |
3.375%, 2/15/28 | | | 80 | | | | 77,737 | |
3.50%, 1/15/25 | | | 110 | | | | 111,642 | |
4.00%, 1/15/26 | | | 80 | | | | 82,718 | |
4.90%, 8/15/44 | | | 20 | | | | 20,936 | |
5.75%, 4/15/20 | | | 125 | | | | 135,558 | |
Charter Communications Operating LLC/Charter Communications Operating Capital
4.908%, 7/23/25 | | | 480 | | | | 510,451 | |
Comcast Corp. | | | | | | | | |
2.85%, 1/15/23 | | | 470 | | | | 477,967 | |
4.75%, 3/01/44 | | | 140 | | | | 156,549 | |
Cox Communications, Inc. | | | | | | | | |
2.95%, 6/30/23(a) | | | 28 | | | | 27,674 | |
3.35%, 9/15/26(a) | | | 298 | | | | 292,323 | |
Discovery Communications LLC
3.95%, 3/20/28 | | | 195 | | | | 193,397 | |
Grupo Televisa SAB
6.625%, 3/18/25 | | | 100 | | | | 117,985 | |
NBCUniversal Enterprise, Inc.
1.974%, 4/15/19(a) | | | 390 | | | | 390,827 | |
Omnicom Group, Inc.
3.60%, 4/15/26 | | | 262 | | | | 265,752 | |
4.45%, 8/15/20 | | | 100 | | | | 105,919 | |
Scripps Networks Interactive, Inc.
2.75%, 11/15/19 | | | 68 | | | | 68,635 | |
Thomson Reuters Corp.
4.30%, 11/23/23 | | | 281 | | | | 299,886 | |
| | |
| abfunds.com | | AB CORPORATE INCOME SHARES | 11 |
PORTFOLIO OF INVESTMENTS (continued)
| | | | | | | | |
| | | Principal
Amount
(000) | | | U.S. $ Value | |
| |
Time Warner Cable LLC | | | | | | | | |
4.50%, 9/15/42 | | $ | 65 | | | $ | 60,329 | |
5.875%, 11/15/40 | | | 30 | | | | 32,665 | |
6.55%, 5/01/37 | | | 24 | | | | 28,358 | |
Time Warner, Inc.
3.55%, 6/01/24 | | | 68 | | | | 69,151 | |
3.60%, 7/15/25 | | | 440 | | | | 441,153 | |
4.00%, 1/15/22 | | | 140 | | | | 147,200 | |
4.70%, 1/15/21 | | | 60 | | | | 64,015 | |
6.25%, 3/29/41 | | | 35 | | | | 41,870 | |
Viacom, Inc.
3.875%, 12/15/21 | | | 247 | | | | 253,360 | |
5.85%, 9/01/43 | | | 75 | | | | 76,325 | |
Walt Disney Co. (The)
0.875%, 7/12/19 | | | 165 | | | | 162,612 | |
Series G
4.125%, 6/01/44 | | | 70 | | | | 74,671 | |
| | | | | | | | |
| | | | | | | 5,401,773 | |
| | | | | | | | |
Communications - Telecommunications – 4.6% | |
Ameritech Capital Funding Corp.
6.55%, 1/15/28 | | | 130 | | | | 152,673 | |
AT&T, Inc.
3.40%, 5/15/25 | | | 310 | | | | 306,323 | |
3.90%, 8/14/27 | | | 165 | | | | 164,300 | |
4.125%, 2/17/26 | | | 372 | | | | 381,516 | |
4.45%, 4/01/24 | | | 106 | | | | 112,425 | |
4.50%, 3/09/48 | | | 90 | | | | 81,926 | |
4.75%, 5/15/46 | | | 189 | | | | 177,998 | |
4.90%, 8/14/37 | | | 150 | | | | 149,763 | |
5.15%, 2/14/50 | | | 75 | | | | 73,888 | |
5.45%, 3/01/47 | | | 95 | | | | 99,108 | |
Crown Castle International Corp.
3.70%, 6/15/26 | | | 190 | | | | 191,068 | |
Sprint Spectrum Co. LLC/Sprint Spectrum Co. II LLC/Sprint Spectrum Co. III LLC
3.36%, 9/20/21(a) | | | 200 | | | �� | 202,660 | |
Telefonica Emisiones SAU
4.103%, 3/08/27 | | | 180 | | | | 185,521 | |
Verizon Communications, Inc.
2.625%, 8/15/26 | | | 499 | | | | 470,837 | |
3.50%, 11/01/24 | | | 629 | | | | 643,750 | |
3.85%, 11/01/42 | | | 245 | | | | 215,622 | |
4.125%, 3/16/27 | | | 80 | | | | 83,362 | |
4.862%, 8/21/46 | | | 130 | | | | 131,508 | |
5.15%, 9/15/23 | | | 25 | | | | 28,018 | |
5.50%, 3/16/47 | | | 65 | | | | 71,744 | |
| | | | | | | | |
| | | | | | | 3,924,010 | |
| | | | | | | | |
| | |
| 12 | AB CORPORATE INCOME SHARES | | abfunds.com |
PORTFOLIO OF INVESTMENTS (continued)
| | | | | | | | |
| | | Principal
Amount
(000) | | | U.S. $ Value | |
| |
Consumer Cyclical - Automotive – 2.7% | |
American Honda Finance Corp.
1.20%, 7/12/19 | | $ | 265 | | | $ | 262,114 | |
Ford Motor Credit Co. LLC
3.336%, 3/18/21 | | | 210 | | | | 215,332 | |
3.81%, 1/09/24 | | | 400 | | | | 410,368 | |
5.875%, 8/02/21 | | | 375 | | | | 417,952 | |
General Motors Co.
4.875%, 10/02/23 | | | 50 | | | | 54,509 | |
5.40%, 4/01/48 | | | 195 | | | | 205,955 | |
General Motors Financial Co., Inc.
3.70%, 5/09/23 | | | 255 | | | | 261,497 | |
4.00%, 1/15/25 | | | 59 | | | | 60,433 | |
4.30%, 7/13/25 | | | 70 | | | | 72,563 | |
5.25%, 3/01/26 | | | 75 | | | | 82,075 | |
Hyundai Capital America
2.55%, 4/03/20(a) | | | 102 | | | | 101,638 | |
Nissan Motor Acceptance Corp.
2.25%, 1/13/20(a) | | | 150 | | | | 150,323 | |
| | | | | | | | |
| | | | | | | 2,294,759 | |
| | | | | | | | |
Consumer Cyclical - Entertainment – 0.1% | |
Hasbro, Inc.
5.10%, 5/15/44 | | | 70 | | | | 75,188 | |
| | | | | | | | |
Consumer Cyclical - Other – 0.3% | |
Marriott International, Inc./MD
3.00%, 3/01/19 | | | 151 | | | | 152,646 | |
Owens Corning
7.00%, 12/01/36 | | | 35 | | | | 45,656 | |
Wyndham Worldwide Corp.
2.50%, 3/01/18 | | | 115 | | | | 115,112 | |
| | | | | | | | |
| | | | | | | 313,414 | |
| | | | | | | | |
Consumer Cyclical - Restaurants – 0.3% | |
McDonald’s Corp.
4.60%, 5/26/45 | | | 70 | | | | 76,581 | |
4.875%, 12/09/45 | | | 80 | | | | 91,027 | |
6.30%, 10/15/37 | | | 100 | | | | 131,543 | |
| | | | | | | | |
| | | | | | | 299,151 | |
| | | | | | | | |
Consumer Cyclical - Retailers – 1.6% | |
Advance Auto Parts, Inc.
4.50%, 12/01/23 | | | 115 | | | | 120,681 | |
CVS Health Corp.
2.125%, 6/01/21 | | | 160 | | | | 157,691 | |
3.375%, 8/12/24 | | | 250 | | | | 252,205 | |
Dollar General Corp.
3.25%, 4/15/23 | | | 120 | | | | 122,848 | |
| | |
| abfunds.com | | AB CORPORATE INCOME SHARES | 13 |
PORTFOLIO OF INVESTMENTS (continued)
| | | | | | | | |
| | | Principal
Amount
(000) | | | U.S. $ Value | |
| |
Home Depot, Inc. (The)
4.40%, 3/15/45 | | $ | 105 | | | $ | 115,587 | |
5.40%, 9/15/40 | | | 130 | | | | 161,325 | |
5.875%, 12/16/36 | | | 30 | | | | 39,587 | |
Lowe’s Cos., Inc.
3.70%, 4/15/46 | | | 160 | | | | 155,829 | |
Walgreens Boots Alliance, Inc.
3.80%, 11/18/24 | | | 250 | | | | 256,285 | |
| | | | | | | | |
| | | | | | | 1,382,038 | |
| | | | | | | | |
Consumer Non-Cyclical – 14.7% | |
Abbott Laboratories
3.25%, 4/15/23 | | | 400 | | | | 408,856 | |
4.90%, 11/30/46 | | | 135 | | | | 151,874 | |
AbbVie, Inc.
2.90%, 11/06/22 | | | 280 | | | | 283,100 | |
3.20%, 5/14/26 | | | 199 | | | | 197,679 | |
4.70%, 5/14/45 | | | 60 | | | | 65,114 | |
Allergan Funding SCS
3.00%, 3/12/20 | | | 90 | | | | 91,409 | |
4.75%, 3/15/45 | | | 120 | | | | 126,899 | |
Altria Group, Inc.
3.875%, 9/16/46 | | | 80 | | | | 78,250 | |
4.75%, 5/05/21 | | | 440 | | | | 477,620 | |
Amgen, Inc.
2.70%, 5/01/22 | | | 120 | | | | 120,623 | |
3.125%, 5/01/25 | | | 230 | | | | 231,306 | |
3.45%, 10/01/20 | | | 175 | | | | 181,193 | |
4.40%, 5/01/45 | | | 120 | | | | 126,419 | |
4.663%, 6/15/51 | | | 105 | | | | 113,588 | |
Anheuser-Busch InBev Finance, Inc.
3.65%, 2/01/26 | | | 681 | | | | 702,288 | |
4.90%, 2/01/46 | | | 250 | | | | 280,055 | |
BAT Capital Corp.
3.222%, 8/15/24(a) | | | 300 | | | | 301,224 | |
4.54%, 8/15/47(a) | | | 110 | | | | 113,219 | |
BAT International Finance PLC
2.75%, 6/15/20(a) | | | 70 | | | | 70,825 | |
Baxalta, Inc.
3.60%, 6/23/22 | | | 131 | | | | 135,648 | |
Becton Dickinson and Co.
2.675%, 12/15/19 | | | 37 | | | | 37,380 | |
3.25%, 11/12/20 | | | 79 | | | | 80,885 | |
3.734%, 12/15/24 | | | 17 | | | | 17,455 | |
Biogen, Inc.
3.625%, 9/15/22 | | | 92 | | | | 96,313 | |
4.05%, 9/15/25 | | | 90 | | | | 95,600 | |
5.20%, 9/15/45 | | | 100 | | | | 114,688 | |
| | |
| 14 | AB CORPORATE INCOME SHARES | | abfunds.com |
PORTFOLIO OF INVESTMENTS (continued)
| | | | | | | | |
| | | Principal
Amount
(000) | | | U.S. $ Value | |
| |
BRF SA
4.75%, 5/22/24(a) | | $ | 200 | | | $ | 205,310 | |
Bunge Ltd. Finance Corp.
3.50%, 11/24/20 | | | 174 | | | | 178,409 | |
Cardinal Health, Inc.
3.079%, 6/15/24 | | | 190 | | | | 188,805 | |
Celgene Corp.
3.625%, 5/15/24 | | | 110 | | | | 113,472 | |
5.00%, 8/15/45 | | | 230 | | | | 253,370 | |
Conagra Brands, Inc.
3.20%, 1/25/23 | | | 32 | | | | 32,571 | |
Fresenius Medical Care US Finance, Inc.
5.75%, 2/15/21(a) | | | 70 | | | | 76,673 | |
Gilead Sciences, Inc.
1.85%, 9/04/18 | | | 120 | | | | 120,162 | |
3.50%, 2/01/25 | | | 40 | | | | 41,598 | |
3.65%, 3/01/26 | | | 371 | | | | 386,230 | |
4.15%, 3/01/47 | | | 75 | | | | 77,153 | |
4.60%, 9/01/35 | | | 140 | | | | 155,715 | |
JM Smucker Co. (The)
2.50%, 3/15/20 | | | 42 | | | | 42,346 | |
3.00%, 3/15/22 | | | 65 | | | | 66,025 | |
Johnson & Johnson
4.50%, 9/01/40 | | | 65 | | | | 74,319 | |
Kraft Heinz Foods Co.
3.00%, 6/01/26 | | | 150 | | | | 144,990 | |
3.50%, 6/06/22 | | | 215 | | | | 222,183 | |
4.375%, 6/01/46 | | | 155 | | | | 151,486 | |
Laboratory Corp. of America Holdings
3.20%, 2/01/22 | | | 42 | | | | 42,975 | |
3.60%, 2/01/25 | | | 76 | | | | 77,731 | |
McKesson Corp.
4.75%, 3/01/21 | | | 140 | | | | 149,675 | |
7.50%, 2/15/19 | | | 105 | | | | 112,076 | |
Medtronic Global Holdings SCA
1.70%, 3/28/19 | | | 90 | | | | 89,909 | |
Medtronic, Inc.
2.50%, 3/15/20 | | | 150 | | | | 152,025 | |
3.15%, 3/15/22 | | | 380 | | | | 391,727 | |
4.625%, 3/15/45 | | | 70 | | | | 79,486 | |
Merck & Co., Inc.
2.75%, 2/10/25 | | | 465 | | | | 465,395 | |
3.70%, 2/10/45 | | | 115 | | | | 116,607 | |
Mondelez International Holdings Netherlands BV
1.625%, 10/28/19(a) | | | 200 | | | | 198,028 | |
Mylan NV
3.95%, 6/15/26 | | | 44 | | | | 43,964 | |
| | |
| abfunds.com | | AB CORPORATE INCOME SHARES | 15 |
PORTFOLIO OF INVESTMENTS (continued)
| | | | | | | | |
| | | Principal
Amount
(000) | | | U.S. $ Value | |
| |
Mylan, Inc.
4.20%, 11/29/23 | | $ | 95 | | | $ | 99,731 | |
PepsiCo, Inc.
4.00%, 5/02/47 | | | 110 | | | | 114,839 | |
4.875%, 11/01/40 | | | 170 | | | | 197,492 | |
Philip Morris International, Inc.
2.00%, 2/21/20 | | | 400 | | | | 400,316 | |
4.25%, 11/10/44 | | | 75 | | | | 78,522 | |
Reynolds American, Inc.
4.85%, 9/15/23 | | | 40 | | | | 43,964 | |
Shire Acquisitions Investments Ireland DAC
2.875%, 9/23/23 | | | 115 | | | | 113,843 | |
Sigma Alimentos SA de CV
4.125%, 5/02/26(a) | | | 200 | | | | 199,875 | |
Smithfield Foods, Inc.
3.35%, 2/01/22(a) | | | 65 | | | | 65,759 | |
Stryker Corp.
2.625%, 3/15/21 | | | 193 | | | | 194,969 | |
4.10%, 4/01/43 | | | 75 | | | | 75,554 | |
Teva Pharmaceutical Finance Netherlands III BV 2.80%, 7/21/23 | | | 90 | | | | 82,801 | |
3.15%, 10/01/26 | | | 620 | | | | 548,657 | |
Thermo Fisher Scientific, Inc.
2.15%, 12/14/18 | | | 150 | | | | 150,376 | |
3.60%, 8/15/21 | | | 120 | | | | 124,650 | |
Tyson Foods, Inc.
2.25%, 8/23/21 | | | 75 | | | | 74,480 | |
3.95%, 8/15/24 | | | 145 | | | | 153,119 | |
4.50%, 6/15/22 | | | 110 | | | | 118,996 | |
4.55%, 6/02/47 | | | 75 | | | | 79,964 | |
Whirlpool Corp.
3.70%, 3/01/23 | | | 120 | | | | 124,451 | |
Wyeth LLC
6.00%, 2/15/36 | | | 180 | | | | 236,131 | |
Zimmer Biomet Holdings, Inc.
2.70%, 4/01/20 | | | 190 | | | | 191,613 | |
| | | | | | | | |
| | | | | | | 12,620,027 | |
| | | | | | | | |
Energy – 8.7% | |
Abu Dhabi Crude Oil Pipeline LLC
4.60%, 11/02/47(a) | | | 200 | | | | 204,534 | |
Anadarko Finance Co.
Series B
7.50%, 5/01/31 | | | 45 | | | | 57,158 | |
Anadarko Petroleum Corp.
3.45%, 7/15/24 | | | 35 | | | | 34,908 | |
6.20%, 3/15/40 | | | 35 | | | | 41,640 | |
| | |
| 16 | AB CORPORATE INCOME SHARES | | abfunds.com |
PORTFOLIO OF INVESTMENTS (continued)
| | | | | | | | |
| | | Principal
Amount
(000) | | | U.S. $ Value | |
| |
Andeavor
5.125%, 12/15/26(a) | | $ | 140 | | | $ | 155,141 | |
Apache Finance Canada Corp.
7.75%, 12/15/29 | | | 35 | | | | 45,568 | |
Boardwalk Pipelines LP
4.95%, 12/15/24 | | | 65 | | | | 69,381 | |
BP Capital Markets PLC
2.75%, 5/10/23 | | | 185 | | | | 186,284 | |
3.279%, 9/19/27 | | | 200 | | | | 201,254 | |
Canadian Natural Resources Ltd.
3.85%, 6/01/27 | | | 75 | | | | 76,646 | |
6.50%, 2/15/37 | | | 20 | | | | 24,551 | |
Cenovus Energy, Inc.
4.25%, 4/15/27(a) | | | 150 | | | | 150,189 | |
Chevron Corp.
2.954%, 5/16/26 | | | 90 | | | | 90,171 | |
ConocoPhillips Co.
3.35%, 5/15/25 | | | 60 | | | | 61,720 | |
4.95%, 3/15/26 | | | 135 | | | | 153,414 | |
ConocoPhillips Holding Co.
6.95%, 4/15/29 | | | 101 | | | | 132,232 | |
Devon Energy Corp.
3.25%, 5/15/22 | | | 195 | | | | 197,882 | |
Ecopetrol SA
5.875%, 9/18/23-5/28/45 | | | 102 | | | | 111,631 | |
Enbridge Energy Partners LP
4.20%, 9/15/21 | | | 100 | | | | 105,015 | |
5.875%, 10/15/25 | | | 60 | | | | 68,761 | |
7.375%, 10/15/45 | | | 65 | | | | 86,231 | |
Encana Corp.
3.90%, 11/15/21 | | | 70 | | | | 72,454 | |
Energy Transfer LP
3.60%, 2/01/23 | | | 125 | | | | 127,209 | |
6.05%, 6/01/41 | | | 35 | | | | 38,056 | |
Energy Transfer LP/Regency Energy Finance Corp.
4.50%, 11/01/23 | | | 215 | | | | 225,870 | |
5.00%, 10/01/22 | | | 55 | | | | 59,343 | |
Enterprise Products Operating LLC
3.35%, 3/15/23 | | | 105 | | | | 108,049 | |
3.70%, 2/15/26 | | | 259 | | | | 267,412 | |
3.75%, 2/15/25 | | | 140 | | | | 145,758 | |
4.90%, 5/15/46 | | | 45 | | | | 49,557 | |
Halliburton Co.
3.80%, 11/15/25 | | | 250 | | | | 259,325 | |
Hess Corp.
4.30%, 4/01/27 | | | 307 | | | | 308,992 | |
7.875%, 10/01/29 | | | 23 | | | | 28,565 | |
| | |
| abfunds.com | | AB CORPORATE INCOME SHARES | 17 |
PORTFOLIO OF INVESTMENTS (continued)
| | | | | | | | |
| | | Principal
Amount
(000) | | | U.S. $ Value | |
| |
Husky Energy, Inc.
4.00%, 4/15/24 | | $ | 65 | | | $ | 67,382 | |
Kerr-McGee Corp.
6.95%, 7/01/24 | | | 50 | | | | 59,426 | |
Kinder Morgan Energy Partners LP
4.25%, 9/01/24 | | | 200 | | | | 209,430 | |
5.30%, 9/15/20 | | | 55 | | | | 59,289 | |
6.375%, 3/01/41 | | | 40 | | | | 46,183 | |
Kinder Morgan, Inc./DE
5.05%, 2/15/46 | | | 175 | | | | 181,034 | |
Marathon Oil Corp.
6.80%, 3/15/32 | | | 61 | | | | 72,129 | |
Marathon Petroleum Corp.
5.85%, 12/15/45 | | | 41 | | | | 46,460 | |
MPLX LP
4.875%, 12/01/24 | | | 60 | | | | 65,326 | |
Noble Energy, Inc.
3.85%, 1/15/28 | | | 115 | | | | 115,532 | |
3.90%, 11/15/24 | | | 172 | | | | 177,086 | |
4.15%, 12/15/21 | | | 65 | | | | 68,513 | |
Occidental Petroleum Corp.
3.40%, 4/15/26 | | | 125 | | | | 128,376 | |
4.40%, 4/15/46 | | | 80 | | | | 86,560 | |
ONEOK Partners LP
3.375%, 10/01/22 | | | 55 | | | | 55,918 | |
4.90%, 3/15/25 | | | 30 | | | | 32,482 | |
Phillips 66
4.875%, 11/15/44 | | | 72 | | | | 80,136 | |
Plains All American Pipeline LP/PAA Finance Corp. 3.60%, 11/01/24 | | | 90 | | | | 88,309 | |
3.85%, 10/15/23 | | | 170 | | | | 170,569 | |
4.65%, 10/15/25 | | | 90 | | | | 93,266 | |
Sabine Pass Liquefaction LLC
4.20%, 3/15/28 | | | 90 | | | | 91,704 | |
5.00%, 3/15/27 | | | 135 | | | | 145,102 | |
Shell International Finance BV
4.00%, 5/10/46 | | | 85 | | | | 86,934 | |
4.375%, 5/11/45 | | | 80 | | | | 86,791 | |
Spectra Energy Partners LP
2.95%, 9/25/18 | | | 77 | | | | 77,655 | |
3.50%, 3/15/25 | | | 110 | | | | 111,727 | |
4.50%, 3/15/45 | | | 50 | | | | 51,493 | |
4.60%, 6/15/21 | | | 75 | | | | 79,745 | |
Suncor Energy, Inc.
6.50%, 6/15/38 | | | 92 | | | | 122,550 | |
| | |
| 18 | AB CORPORATE INCOME SHARES | | abfunds.com |
PORTFOLIO OF INVESTMENTS (continued)
| | | | | | | | |
| | | Principal
Amount
(000) | | | U.S. $ Value | |
| |
Sunoco Logistics Partners Operations LP
3.90%, 7/15/26 | | $ | 100 | | | $ | 99,452 | |
5.40%, 10/01/47 | | | 80 | | | | 81,106 | |
Valero Energy Corp.
3.40%, 9/15/26 | | | 110 | | | | 109,657 | |
6.625%, 6/15/37 | | | 46 | | | | 59,139 | |
Williams Partners LP
3.60%, 3/15/22 | | | 200 | | | | 206,436 | |
3.90%, 1/15/25 | | | 109 | | | | 111,968 | |
5.80%, 11/15/43 | | | 75 | | | | 87,131 | |
| | | | | | | | |
| | | | | | | 7,456,897 | |
| | | | | | | | |
Services – 2.8% | |
Amazon.com, Inc.
2.50%, 11/29/22 | | | 150 | | | | 150,868 | |
3.875%, 8/22/37(a) | | | 85 | | | | 88,342 | |
4.80%, 12/05/34 | | | 135 | | | | 155,519 | |
eBay, Inc.
3.60%, 6/05/27 | | | 310 | | | | 310,012 | |
Expedia, Inc.
3.80%, 2/15/28(a) | | | 140 | | | | 136,237 | |
Moody’s Corp.
2.75%, 7/15/19 | | | 229 | | | | 231,512 | |
4.875%, 2/15/24 | | | 100 | | | | 110,334 | |
Priceline Group, Inc. (The)
3.60%, 6/01/26 | | | 190 | | | | 193,790 | |
S&P Global, Inc.
4.00%, 6/15/25 | | | 140 | | | | 147,892 | |
4.40%, 2/15/26 | | | 244 | | | | 263,513 | |
Total System Services, Inc.
2.375%, 6/01/18 | | | 105 | | | | 105,266 | |
3.80%, 4/01/21 | | | 66 | | | | 68,338 | |
Verisk Analytics, Inc.
5.50%, 6/15/45 | | | 60 | | | | 68,332 | |
Visa, Inc.
2.80%, 12/14/22 | | | 300 | | | | 305,754 | |
4.15%, 12/14/35 | | | 70 | | | | 76,403 | |
| | | | | | | | |
| | | | | | | 2,412,112 | |
| | | | | | | | |
Technology – 7.6% | |
Activision Blizzard, Inc.
2.60%, 6/15/22 | | | 139 | | | | 138,709 | |
Agilent Technologies, Inc.
3.875%, 7/15/23 | | | 180 | | | | 187,510 | |
Alphabet, Inc.
1.998%, 8/15/26 | | | 200 | | | | 187,970 | |
Analog Devices, Inc.
3.50%, 12/05/26 | | | 125 | | | | 126,753 | |
| | |
| abfunds.com | | AB CORPORATE INCOME SHARES | 19 |
PORTFOLIO OF INVESTMENTS (continued)
| | | | | | | | |
| | | Principal
Amount
(000) | | | U.S. $ Value | |
| |
Apple, Inc.
2.45%, 8/04/26 | | $ | 155 | | | $ | 149,649 | |
2.85%, 5/06/21 | | | 185 | | | | 189,592 | |
3.45%, 2/09/45 | | | 360 | | | | 341,431 | |
3.85%, 8/04/46 | | | 75 | | | | 75,861 | |
Applied Materials, Inc.
4.35%, 4/01/47 | | | 70 | | | | 76,632 | |
Baidu, Inc.
2.875%, 7/06/22 | | | 200 | | | | 200,610 | |
Broadcom Corp./Broadcom Cayman Finance Ltd. 3.625%, 1/15/24(a) | | | 284 | | | | 293,241 | |
3.875%, 1/15/27(a) | | | 201 | | | | 206,817 | |
Cisco Systems, Inc.
5.50%, 1/15/40 | | | 60 | | | | 76,936 | |
5.90%, 2/15/39 | | | 45 | | | | 59,835 | |
Dell International LLC/EMC Corp.
5.45%, 6/15/23(a) | | | 120 | | | | 131,736 | |
6.02%, 6/15/26(a) | | | 160 | | | | 178,621 | |
DXC Technology Co.
2.875%, 3/27/20 | | | 104 | | | | 105,160 | |
Fidelity National Information Services, Inc.
3.875%, 6/05/24 | | | 19 | | | | 19,845 | |
5.00%, 10/15/25 | | | 2 | | | | 2,222 | |
Hewlett Packard Enterprise Co.
2.10%, 10/04/19(a) | | | 138 | | | | 137,859 | |
6.35%, 10/15/45 | | | 50 | | | | 53,251 | |
HP, Inc.
3.75%, 12/01/20 | | | 14 | | | | 14,574 | |
4.30%, 6/01/21 | | | 80 | | | | 84,708 | |
4.375%, 9/15/21 | | | 25 | | | | 26,594 | |
4.65%, 12/09/21 | | | 89 | | | | 96,004 | |
Intel Corp.
4.90%, 7/29/45 | | | 180 | | | | 214,196 | |
International Business Machines Corp.
2.25%, 2/19/21 | | | 150 | | | | 150,745 | |
3.45%, 2/19/26 | | | 150 | | | | 154,987 | |
4.00%, 6/20/42 | | | 80 | | | | 82,125 | |
Juniper Networks, Inc.
4.35%, 6/15/25 | | | 50 | | | | 52,285 | |
4.50%, 3/15/24 | | | 120 | | | | 127,174 | |
KLA-Tencor Corp.
4.65%, 11/01/24 | | | 215 | | | | 234,283 | |
Lam Research Corp.
2.75%, 3/15/20 | | | 115 | | | | 116,576 | |
Microsoft Corp.
3.45%, 8/08/36 | | | 420 | | | | 426,472 | |
3.70%, 8/08/46 | | | 270 | | | | 271,466 | |
| | |
| 20 | AB CORPORATE INCOME SHARES | | abfunds.com |
PORTFOLIO OF INVESTMENTS (continued)
| | | | | | | | |
| | | Principal
Amount
(000) | | | U.S. $ Value | |
| |
NVIDIA Corp.
2.20%, 9/16/21 | | $ | 150 | | | $ | 149,435 | |
Oracle Corp.
3.875%, 7/15/20 | | | 250 | | | | 263,075 | |
3.90%, 5/15/35 | | | 255 | | | | 268,008 | |
4.50%, 7/08/44 | | | 140 | | | | 156,129 | |
QUALCOMM, Inc.
2.25%, 5/20/20 | | | 150 | | | | 150,892 | |
2.60%, 1/30/23 | | | 190 | | | | 189,447 | |
4.30%, 5/20/47 | | | 61 | | | | 61,634 | |
Seagate HDD Cayman
4.75%, 1/01/25 | | | 38 | | | | 37,708 | |
4.875%, 3/01/24(a) | | | 25 | | | | 25,275 | |
Texas Instruments, Inc.
1.75%, 5/01/20 | | | 115 | | | | 114,442 | |
VMware, Inc.
2.95%, 8/21/22 | | | 60 | | | | 60,194 | |
Xerox Corp.
2.80%, 5/15/20 | | | 95 | | | | 95,662 | |
| | | | | | | | |
| | | | | | | 6,564,330 | |
| | | | | | | | |
Transportation - Railroads – 0.2% | |
Burlington Northern Santa Fe LLC
4.55%, 9/01/44 | | | 85 | | | | 95,591 | |
Union Pacific Corp.
4.00%, 4/15/47 | | | 110 | | | | 115,408 | |
| | | | | | | | |
| | | | | | | 210,999 | |
| | | | | | | | |
Transportation - Services – 0.6% | |
Aviation Capital Group LLC
3.50%, 11/01/27(a) | | | 205 | | | | 202,395 | |
ERAC USA Finance LLC
3.85%, 11/15/24(a) | | | 145 | | | | 150,517 | |
Ryder System, Inc.
2.50%, 9/01/22 | | | 150 | | | | 148,650 | |
| | | | | | | | |
| | | | | | | 501,562 | |
| | | | | | | | |
| | | | | | | 47,530,320 | |
| | | | | | | | |
Financial Institutions – 31.6% | |
Banking – 23.4% | |
American Express Credit Corp.
2.70%, 3/03/22 | | | 270 | | | | 272,722 | |
Series G 2.25%, 8/15/19 | | | 180 | | | | 181,030 | |
Banco Santander SA
3.50%, 4/11/22 | | | 200 | | | | 204,678 | |
4.25%, 4/11/27 | | | 200 | | | | 207,288 | |
| | |
| abfunds.com | | AB CORPORATE INCOME SHARES | 21 |
PORTFOLIO OF INVESTMENTS (continued)
| | | | | | | | |
| | | Principal
Amount
(000) | | | U.S. $ Value | |
| |
Bank of America Corp.
2.881%, 4/24/23 | | $ | 110 | | | $ | 110,375 | |
3.824%, 1/20/28 | | | 255 | | | | 262,714 | |
3.875%, 8/01/25 | | | 125 | | | | 131,186 | |
4.00%, 1/22/25 | | | 615 | | | | 636,857 | |
4.10%, 7/24/23 | | | 400 | | | | 424,972 | |
4.20%, 8/26/24 | | | 125 | | | | 131,909 | |
Series G 3.593%, 7/21/28 | | | 200 | | | | 202,212 | |
Bank One Michigan
8.25%, 11/01/24 | | | 160 | | | | 206,064 | |
Barclays PLC
3.65%, 3/16/25 | | | 400 | | | | 402,140 | |
BB&T Corp.
5.25%, 11/01/19 | | | 275 | | | | 291,805 | |
Capital One Bank USA, NA
3.375%, 2/15/23 | | | 275 | | | | 279,694 | |
Capital One Financial Corp.
3.30%, 10/30/24 | | | 130 | | | | 130,194 | |
3.75%, 3/09/27 | | | 200 | | | | 202,354 | |
Citigroup, Inc.
2.65%, 10/26/20 | | | 115 | | | | 115,981 | |
3.668%, 7/24/28 | | | 190 | | | | 192,231 | |
3.70%, 1/12/26 | | | 285 | | | | 293,769 | |
3.875%, 3/26/25 | | | 190 | | | | 194,748 | |
3.887%, 1/10/28 | | | 435 | | | | 448,411 | |
4.40%, 6/10/25 | | | 280 | | | | 295,982 | |
Citizens Bank NA/Providence RI
2.25%, 3/02/20 | | | 250 | | | | 250,300 | |
Compass Bank
5.50%, 4/01/20 | | | 110 | | | | 116,606 | |
Cooperatieve Rabobank UA
4.375%, 8/04/25 | | | 500 | | | | 529,410 | |
11.00%, 6/30/19(a)(b) | | | 130 | | | | 147,594 | |
Credit Suisse Group AG
4.282%, 1/09/28(a) | | | 250 | | | | 260,700 | |
Deutsche Bank AG
Series G
3.375%, 5/12/21 | | | 61 | | | | 62,030 | |
Discover Bank
3.10%, 6/04/20 | | | 250 | | | | 254,995 | |
Discover Financial Services
4.10%, 2/09/27 | | | 115 | | | | 117,859 | |
Fifth Third Bancorp
3.50%, 3/15/22 | | | 31 | | | | 32,084 | |
| | |
| 22 | AB CORPORATE INCOME SHARES | | abfunds.com |
PORTFOLIO OF INVESTMENTS (continued)
| | | | | | | | |
| | | Principal
Amount
(000) | | | U.S. $ Value | |
| |
Goldman Sachs Group, Inc. (The)
2.905%, 7/24/23 | | $ | 165 | | | $ | 164,513 | |
3.75%, 5/22/25-2/25/26 | | | 490 | | | | 503,114 | |
3.85%, 7/08/24-1/26/27 | | | 465 | | | | 482,492 | |
4.25%, 10/21/25 | | | 325 | | | | 339,310 | |
5.95%, 1/15/27 | | | 40 | | | | 46,857 | |
HSBC Holdings PLC
3.90%, 5/25/26 | | | 400 | | | | 418,208 | |
4.041%, 3/13/28 | | | 200 | | | | 209,506 | |
4.375%, 11/23/26 | | | 200 | | | | 209,654 | |
4.875%, 1/14/22 | | | 105 | | | | 114,420 | |
HSBC USA, Inc.
2.75%, 8/07/20 | | | 100 | | | | 101,592 | |
Huntington National Bank (The)
2.00%, 6/30/18 | | | 300 | | | | 300,477 | |
ING Groep NV
3.15%, 3/29/22 | | | 200 | | | | 204,010 | |
3.95%, 3/29/27 | | | 200 | | | | 209,690 | |
Intesa Sanpaolo SpA
3.125%, 7/14/22(a) | | | 250 | | | | 250,743 | |
JPMorgan Chase & Co.
3.125%, 1/23/25 | | | 640 | | | | 643,661 | |
3.22%, 3/01/25 | | | 300 | | | | 303,138 | |
3.54%, 5/01/28 | | | 225 | | | | 227,536 | |
3.782%, 2/01/28 | | | 346 | | | | 356,280 | |
3.875%, 9/10/24 | | | 160 | | | | 166,814 | |
KeyBank NA/Cleveland OH
3.40%, 5/20/26 | | | 250 | | | | 249,475 | |
Lloyds Banking Group PLC
4.582%, 12/10/25 | | | 200 | | | | 210,972 | |
Manufacturers & Traders Trust Co.
3.40%, 8/17/27 | | | 250 | | | | 251,647 | |
Mitsubishi UFJ Financial Group, Inc.
3.85%, 3/01/26 | | | 200 | | | | 208,190 | |
Morgan Stanley
3.625%, 1/20/27 | | | 415 | | | | 422,549 | |
Series F 3.875%, 4/29/24 | | | 55 | | | | 57,679 | |
Series G 3.75%, 2/25/23 | | | 144 | | | | 150,584 | |
4.00%, 7/23/25 | | | 103 | | | | 108,466 | |
4.35%, 9/08/26 | | | 280 | | | | 293,678 | |
5.50%, 7/24/20 | | | 395 | | | | 428,271 | |
Nationwide Building Society
4.125%, 10/18/32(a) | | | 250 | | | | 250,015 | |
People’s United Financial, Inc.
3.65%, 12/06/22 | | | 83 | | | | 85,411 | |
| | |
| abfunds.com | | AB CORPORATE INCOME SHARES | 23 |
PORTFOLIO OF INVESTMENTS (continued)
| | | | | | | | |
| | | Principal
Amount
(000) | | | U.S. $ Value | |
| |
PNC Bank NA
2.95%, 1/30/23 | | $ | 250 | | | $ | 253,372 | |
Royal Bank of Scotland Group PLC
3.498%, 5/15/23 | | | 200 | | | | 201,684 | |
Santander Holdings USA, Inc.
2.65%, 4/17/20 | | | 200 | | | | 201,206 | |
4.40%, 7/13/27(a) | | | 280 | | | | 288,425 | |
Standard Chartered PLC
5.70%, 1/25/22(a) | | | 200 | | | | 217,886 | |
State Street Corp.
4.956%, 3/15/18 | | | 240 | | | | 242,678 | |
Sumitomo Mitsui Financial Group, Inc.
3.352%, 10/18/27 | | | 410 | | | | 411,086 | |
Sumitomo Mitsui Trust Bank Ltd.
2.05%, 3/06/19(a) | | | 200 | | | | 200,042 | |
SunTrust Bank/Atlanta GA
3.30%, 5/15/26 | | | 200 | | | | 198,178 | |
7.25%, 3/15/18 | | | 145 | | | | 147,894 | |
UBS Group Funding Switzerland AG
4.125%, 9/24/25(a) | | | 405 | | | | 426,996 | |
UniCredit SpA
4.625%, 4/12/27(a) | | | 200 | | | | 212,334 | |
US Bancorp
Series J
5.30%, 4/15/27(b) | | | 27 | | | | 29,622 | |
Wells Fargo & Co.
3.00%, 10/23/26 | | | 1,100 | | | | 1,076,317 | |
3.069%, 1/24/23 | | | 199 | | | | 201,597 | |
3.30%, 9/09/24 | | | 200 | | | | 203,342 | |
Zions Bancorporation
4.50%, 6/13/23 | | | 13 | | | | 13,688 | |
| | | | | | | | |
| | | | | | | 20,086,193 | |
| | | | | | | | |
Finance – 0.6% | |
GE Capital International Funding Co. Unlimited Co.
4.418%, 11/15/35 | | | 200 | | | | 214,258 | |
International Lease Finance Corp.
6.25%, 5/15/19 | | | 90 | | | | 95,447 | |
Peachtree Corners Funding Trust
3.976%, 2/15/25(a) | | | 110 | | | | 112,534 | |
Synchrony Financial
2.70%, 2/03/20 | | | 110 | | | | 110,936 | |
| | | | | | | | |
| | | | | | | 533,175 | |
| | | | | | | | |
Insurance – 4.3% | |
ACE Capital Trust II
9.70%, 4/01/30 | | | 100 | | | | 150,960 | |
| | |
| 24 | AB CORPORATE INCOME SHARES | | abfunds.com |
PORTFOLIO OF INVESTMENTS (continued)
| | | | | | | | |
| | | Principal
Amount
(000) | | | U.S. $ Value | |
| |
Allstate Corp. (The)
6.50%, 5/15/57 | | $ | 84 | | | $ | 101,008 | |
American International Group, Inc.
8.175%, 5/15/58 | | | 65 | | | | 88,596 | |
Anthem, Inc.
3.125%, 5/15/22 | | | 110 | | | | 112,170 | |
7.00%, 2/15/19 | | | 255 | | | | 270,866 | |
Aon Corp.
8.205%, 1/01/27 | | | 100 | | | | 131,263 | |
Aon PLC
4.60%, 6/14/44 | | | 70 | | | | 76,053 | |
Cigna Corp.
4.00%, 2/15/22 | | | 175 | | | | 184,510 | |
7.875%, 5/15/27 | | | 53 | | | | 72,033 | |
Cloverie PLC for Swiss Re Corporate Solutions Ltd.
4.50%, 9/11/44(a) | | | 200 | | | | 206,424 | |
Guardian Life Insurance Co. of America (The)
7.375%, 9/30/39(a) | | | 63 | | | | 90,238 | |
Hartford Financial Services Group, Inc. (The)
5.50%, 3/30/20 | | | 100 | | | | 107,624 | |
6.10%, 10/01/41 | | | 45 | | | | 58,684 | |
Jackson National Life Global Funding
2.50%, 6/27/22(a) | | | 190 | | | | 189,521 | |
Lincoln National Corp. | | | | | | | | |
4.85%, 6/24/21 | | | 200 | | | | 215,434 | |
8.75%, 7/01/19 | | | 26 | | | | 28,757 | |
MetLife Capital Trust IV
7.875%, 12/15/37(a) | | | 150 | | | | 201,764 | |
Nationwide Mutual Insurance Co.
9.375%, 8/15/39(a) | | | 55 | | | | 91,920 | |
Progressive Corp. (The)
4.125%, 4/15/47 | | | 150 | | | | 158,307 | |
Prudential Financial, Inc.
4.50%, 11/15/20 | | | 169 | | | | 180,183 | |
5.375%, 5/15/45 | | | 140 | | | | 150,833 | |
Series B 5.75%, 7/15/33 | | | 135 | | | | 164,321 | |
Reliance Standard Life Global Funding II
2.50%, 4/24/19(a) | | | 140 | | | | 141,160 | |
Swiss Re America Holding Corp.
7.00%, 2/15/26 | | | 90 | | | | 110,245 | |
UnitedHealth Group, Inc.
3.75%, 7/15/25 | | | 180 | | | | 190,571 | |
3.875%, 10/15/20 | | | 170 | | | | 178,231 | |
| | | | | | | | |
| | | | | | | 3,651,676 | |
| | | | | | | | |
| | |
| abfunds.com | | AB CORPORATE INCOME SHARES | 25 |
PORTFOLIO OF INVESTMENTS (continued)
| | | | | | | | |
| | | Principal
Amount
(000) | | | U.S. $ Value | |
| |
REITS – 3.3% | |
Alexandria Real Estate Equities, Inc.
3.90%, 6/15/23 | | $ | 100 | | | $ | 103,737 | |
Brixmor Operating Partnership LP
3.65%, 6/15/24 | | | 150 | | | | 149,250 | |
DDR Corp.
3.90%, 8/15/24 | | | 150 | | | | 151,040 | |
EPR Properties
4.50%, 4/01/25 | | | 20 | | | | 20,588 | |
5.25%, 7/15/23 | | | 175 | | | | 187,406 | |
Essex Portfolio LP
3.25%, 5/01/23 | | | 56 | | | | 56,856 | |
3.375%, 1/15/23 | | | 125 | | | | 127,521 | |
HCP, Inc.
3.875%, 8/15/24 | | | 150 | | | | 154,143 | |
Healthcare Trust of America Holdings LP
2.95%, 7/01/22 | | | 190 | | | | 191,161 | |
Hospitality Properties Trust
3.95%, 1/15/28 | | | 114 | | | | 111,866 | |
4.65%, 3/15/24 | | | 124 | | | | 130,728 | |
Mid-America Apartments LP
3.75%, 6/15/24 | | | 115 | | | | 118,249 | |
Omega Healthcare Investors, Inc.
4.50%, 1/15/25 | | | 108 | | | | 110,017 | |
Realty Income Corp.
3.00%, 1/15/27 | | | 50 | | | | 47,812 | |
5.75%, 1/15/21 | | | 210 | | | | 229,125 | |
Spirit Realty LP
4.45%, 9/15/26 | | | 65 | | | | 64,607 | |
VEREIT Operating Partnership LP
3.00%, 2/06/19 | | | 60 | | | | 60,503 | |
Vornado Realty LP
5.00%, 1/15/22 | | | 215 | | | | 232,196 | |
Washington Real Estate Investment Trust
4.95%, 10/01/20 | | | 140 | | | | 147,592 | |
Welltower, Inc.
4.00%, 6/01/25 | | | 225 | | | | 233,856 | |
4.25%, 4/01/26 | | | 95 | | | | 100,083 | |
Weyerhaeuser Co.
4.625%, 9/15/23 | | | 120 | | | | 130,843 | |
| | | | | | | | |
| | | | | | | 2,859,179 | |
| | | | | | | | |
| | | | | | | 27,130,223 | |
| | | | | | | | |
Utility – 6.7% | |
Electric – 6.1% | |
AEP Transmission Co. LLC
3.75%, 12/01/47(a) | | | 80 | | | | 80,873 | |
| | |
| 26 | AB CORPORATE INCOME SHARES | | abfunds.com |
PORTFOLIO OF INVESTMENTS (continued)
| | | | | | | | |
| | | Principal
Amount
(000) | | | U.S. $ Value | |
| |
Berkshire Hathaway Energy Co.
4.50%, 2/01/45 | | $ | 70 | | | $ | 76,974 | |
6.125%, 4/01/36 | | | 150 | | | | 196,171 | |
Cerro del Aguila SA
4.125%, 8/16/27(a) | | | 200 | | | | 199,616 | |
CMS Energy Corp.
6.25%, 2/01/20 | | | 165 | | | | 178,824 | |
Consolidated Edison Co. of New York, Inc.
4.45%, 6/15/20 | | | 100 | | | | 106,194 | |
Series 12-A 4.20%, 3/15/42 | | | 70 | | | | 75,201 | |
Consolidated Edison, Inc.
2.00%, 5/15/21 | | | 103 | | | | 101,907 | |
Dominion Energy, Inc.
2.579%, 7/01/20 | | | 185 | | | | 186,136 | |
3.90%, 10/01/25 | | | 110 | | | | 115,238 | |
4.70%, 12/01/44 | | | 135 | | | | 149,348 | |
Series A 1.875%, 1/15/19 | | | 150 | | | | 149,610 | |
DTE Electric Co.
3.70%, 3/15/45 | | | 75 | | | | 75,510 | |
Duke Energy Corp.
3.75%, 9/01/46 | | | 120 | | | | 117,044 | |
3.95%, 8/15/47 | | | 80 | | | | 80,430 | |
Duke Energy Progress LLC
3.00%, 9/15/21 | | | 300 | | | | 308,208 | |
Enel Americas SA
4.00%, 10/25/26 | | | 53 | | | | 53,928 | |
Enel Finance International NV
2.875%, 5/25/22(a) | | | 200 | | | | 201,022 | |
Enel Generacion Chile SA
4.25%, 4/15/24 | | | 33 | | | | 34,527 | |
Entergy Corp.
4.00%, 7/15/22 | | | 153 | | | | 161,883 | |
Exelon Corp.
5.10%, 6/15/45 | | | 250 | | | | 289,140 | |
FirstEnergy Corp.
Series B
3.90%, 7/15/27 | | | 190 | | | | 193,973 | |
Florida Power & Light Co.
4.05%, 6/01/42 | | | 70 | | | | 75,179 | |
Georgia Power Co.
2.00%, 3/30/20 | | | 150 | | | | 150,081 | |
ITC Holdings Corp.
3.25%, 6/30/26 | | | 195 | | | | 194,277 | |
| | |
| abfunds.com | | AB CORPORATE INCOME SHARES | 27 |
PORTFOLIO OF INVESTMENTS (continued)
| | | | | | | | |
| | | Principal
Amount
(000) | | | U.S. $ Value | |
| |
NTPC Ltd.
Series E
4.75%, 10/03/22(a) | | $ | 200 | | | $ | 215,790 | |
Oklahoma Gas & Electric Co.
3.85%, 8/15/47 | | | 63 | | | | 64,101 | |
Oncor Electric Delivery Co. LLC
3.80%, 9/30/47(a) | | | 80 | | | | 81,836 | |
Pacific Gas & Electric Co.
3.25%, 9/15/21 | | | 217 | | | | 222,434 | |
PacifiCorp
6.00%, 1/15/39 | | | 70 | | | | 93,397 | |
PECO Energy Co.
3.70%, 9/15/47 | | | 80 | | | | 80,839 | |
PPL Capital Funding, Inc.
4.00%, 9/15/47 | | | 80 | | | | 80,966 | |
PSEG Power LLC
3.00%, 6/15/21 | | | 160 | | | | 162,410 | |
Public Service Enterprise Group, Inc.
1.60%, 11/15/19 | | | 150 | | | | 148,402 | |
Southern Co. (The)
1.85%, 7/01/19 | | | 185 | | | | 184,715 | |
Southern Power Co.
4.15%, 12/01/25 | | | 167 | | | | 176,344 | |
Southwestern Public Service Co.
3.70%, 8/15/47 | | | 75 | | | | 75,074 | |
Virginia Electric & Power Co.
Series B
3.80%, 9/15/47 | | | 80 | | | | 81,191 | |
| | | | | | | | |
| | | | | | | 5,218,793 | |
| | | | | | | | |
Natural Gas – 0.5% | | | | | | | | |
CenterPoint Energy Resources Corp.
4.10%, 9/01/47 | | | 75 | | | | 77,006 | |
GNL Quintero SA
4.634%, 7/31/29(a) | | | 200 | | | | 208,256 | |
NiSource Finance Corp.
5.65%, 2/01/45 | | | 60 | | | | 74,431 | |
6.80%, 1/15/19 | | | 16 | | | | 16,842 | |
Southern Co. Gas Capital Corp.
5.25%, 8/15/19 | | | 105 | | | | 110,394 | |
| | | | | | | | |
| | | | | | | 486,929 | |
| | | | | | | | |
Other Utility – 0.1% | | | | | | | | |
American Water Capital Corp.
3.75%, 9/01/47 | | | 80 | | | | 80,390 | |
| | | | | | | | |
| | | | | | | 5,786,112 | |
| | | | | | | | |
Total Corporates – Investment Grade
(cost $78,923,622) | | | | | | | 80,446,655 | |
| | | | | | | | |
| | |
| 28 | AB CORPORATE INCOME SHARES | | abfunds.com |
PORTFOLIO OF INVESTMENTS (continued)
| | | | | | | | |
| | | Principal
Amount
(000) | | | U.S. $ Value | |
| | | | | | | | |
QUASI-SOVEREIGNS – 1.4% | | | | | | | | |
Quasi-Sovereign Bonds – 1.4% | | | | | | | | |
Chile – 0.2% | | | | | | | | |
Corp. Nacional del Cobre de Chile
3.625%, 8/01/27(a) | | $ | 200 | | | $ | 201,252 | |
| | | | | | | | |
China – 0.2% | |
Sinopec Group Overseas Development 2017 Ltd.
2.50%, 9/13/22(a) | | | 200 | | | | 197,278 | |
| | | | | | | | |
Mexico – 0.7% | | | | | | | | |
Petroleos Mexicanos
3.50%, 1/30/23 | | | 295 | | | | 288,009 | |
4.875%, 1/24/22 | | | 95 | | | | 98,800 | |
5.375%, 3/13/22(a) | | | 49 | | | | 51,984 | |
5.625%, 1/23/46 | | | 125 | | | | 113,331 | |
6.75%, 9/21/47 | | | 14 | | | | 14,430 | |
| | | | | | | | |
| | | | | | | 566,554 | |
| | | | | | | | |
Panama – 0.3% | | | | | | | | |
Aeropuerto Internacional de Tocumen SA
5.625%, 5/18/36(a) | | | 200 | | | | 215,250 | |
| | | | | | | | |
| | |
Total Quasi-Sovereigns
(cost $1,144,317) | | | | | | | 1,180,334 | |
| | | | | | | | |
| | | | | | | | |
GOVERNMENTS – TREASURIES – 0.7% | | | | | | | | |
United States – 0.7% | | | | | | | | |
U.S. Treasury Bonds
2.50%, 5/15/46 | | | 70 | | | | 64,859 | |
U.S. Treasury Notes
1.375%, 2/29/20 | | | 555 | | | | 551,358 | |
| | | | | | | | |
| | |
Total Governments – Treasuries
(cost $619,072) | | | | | | | 616,217 | |
| | | | | | | | |
| | | | | | | | |
CORPORATES – NON-INVESTMENT GRADE – 0.4% | | | | | | | | |
Industrial – 0.2% | | | | | | | | |
Energy – 0.2% | | | | | | | | |
Diamond Offshore Drilling, Inc.
4.875%, 11/01/43 | | | 90 | | | | 67,725 | |
Nabors Industries, Inc.
5.50%, 1/15/23 | | | 153 | | | | 146,962 | |
| | | | | | | | |
| | | | | | | 214,687 | |
| | | | | | | | |
Financial Institutions – 0.2% | | | | | | | | |
Banking – 0.1% | | | | | | | | |
Standard Chartered PLC
2.888% (LIBOR 3 Month + 1.51%), 1/30/27(a)(b)(c) | | | 100 | | | | 86,807 | |
| | | | | | | | |
| | |
| abfunds.com | | AB CORPORATE INCOME SHARES | 29 |
PORTFOLIO OF INVESTMENTS (continued)
| | | | | | | | |
| | | Principal
Amount
(000) | | | U.S. $ Value | |
| |
Finance – 0.1% | | | | | | | | |
Navient Corp.
4.875%, 6/17/19 | | $ | 46 | | | $ | 47,290 | |
| | | | | | | | |
| | | | | | | 134,097 | |
| | | | | | | | |
Total Corporates – Non-Investment Grade
(cost $380,837) | | | | | | | 348,784 | |
| | | | | | | | |
| | | | | | | | |
GOVERNMENTS – SOVEREIGN BONDS – 0.4% | | | | | | | | |
Mexico – 0.4% | | | | | | | | |
Mexico Government International Bond | | | | | | | | |
4.60%, 1/23/46 | | | 200 | | | | 195,000 | |
4.75%, 3/08/44 | | | 150 | | | | 149,550 | |
| | | | | | | | |
| | |
Total Governments – Sovereign Bonds
(cost $321,885) | | | | | | | 344,550 | |
| | | | | | | | |
| | | | | | | | |
SHORT-TERM INVESTMENTS – 4.1% | | | | | | | | |
Time Deposit – 4.1% | | | | | | | | |
State Street Bank & Trust Co.
0.12%, 11/01/17
(cost $3,575,772) | | | 3,576 | | | | 3,575,772 | |
| | | | | | | | |
| | |
Total Investments – 100.6%
(cost $84,965,505) | | | | | | | 86,512,312 | |
Other assets less liabilities – (0.6)% | | | | | | | (555,377 | ) |
| | | | | | | | |
Net Assets – 100.0% | | | | | | $ | 85,956,935 | |
| | | | | | | | |
FUTURES (see Note C)
| | | | | | | | | | | | | | | | | | | | | | | | |
| Description | | Number of
Contracts | | | Expiration
Month | | | Notional
(000) | | | Original
Value | | | Value at
October 31,
2017 | | | Unrealized
Appreciation/
(Depreciation) | |
Purchased Contracts | |
U.S. Long Bond (CBT) Futures | | | 10 | | | | December 2017 | | | USD | 1,000 | | | $ | 1,543,609 | | | $ | 1,524,688 | | | $ | (18,921 | ) |
U.S. Ultra Bond (CBT) Futures | | | 1 | | | | December 2017 | | | USD | 100 | | | | 165,002 | | | | 164,782 | | | | (220 | ) |
| | | | | |
Sold Contracts | | | | | | | | | | | | | | | | | | | | | |
U.S. T-Note 5 Yr (CBT) Futures | | | 15 | | | | December 2017 | | | USD | 1,500 | | | | 1,772,817 | | | | 1,757,813 | | | | 15,004 | |
U.S. T-Note 10 Yr (CBT) Futures | | | 11 | | | | December 2017 | | | USD | 1,100 | | | | 1,390,923 | | | | 1,374,313 | | | | 16,610 | |
| | | | | | | | | | | | | | | | | | | | | | | | |
| | | | | | | | | | | | | | | | | | | | | | $ | 12,473 | |
| | | | | | | | | | | | | | | | | | | | | | | | |
| | |
| 30 | AB CORPORATE INCOME SHARES | | abfunds.com |
PORTFOLIO OF INVESTMENTS (continued)
CENTRALLY CLEARED CREDIT DEFAULT SWAPS (see Note C)
| | | | | | | | | | | | | | | | | | | | | | | | | | | | |
| Description | | Fixed
Rate
(Pay)
Receive | | | Payment
Frequency | | | Implied
Credit
Spread at
October 31,
2017 | | | Notional
Amount
(000) | | | Market
Value | | | Upfront
Premiums
Paid
(Received) | | | Unrealized
Appreciation/
(Depreciation) |
Sale Contracts |
CDX-NAIG Series 28, 5 Year Index, 6/20/22* | | | 1.00 | % | | | Quarterly | | | | 0.51 | % | | | USD 4,200 | | | | $ 96,350 | | | | $ 66,068 | | | $ 30,282 |
CENTRALLY CLEARED INTEREST RATE SWAPS (see Note C)
| | | | | | | | | | | | | | |
| | | | | | Rate Type | | | | | |
Notional
Amount (000) | | Termination
Date | | | Payments
made
by the
Fund | | Payments
received
by the
Fund | | Payment
Frequency
Paid/Received | | Unrealized
Appreciation/
(Depreciation) | |
USD 1,710 | | | 11/16/18 | | | 3 Month LIBOR | | 1.235% | | Quarterly/ Semi-Annual | | $ | (2,582) | |
USD 1,170 | | | 9/09/21 | | | 1.132% | | 3 Month LIBOR | | Semi-Annual/ Quarterly | | | 38,707 | |
USD 1,070 | | | 3/27/22 | | | 2.058% | | 3 Month LIBOR | | Semi-Annual/ Quarterly | | | (937) | |
USD 60 | | | 11/04/44 | | | 3 Month LIBOR | | 3.049% | | Quarterly/ Semi-Annual | | | 5,909 | |
USD 60 | | | 5/05/45 | | | 3 Month LIBOR | | 2.562% | | Quarterly/ Semi-Annual | | | (189) | |
USD 60 | | | 6/02/46 | | | 3 Month LIBOR | | 2.186% | | Quarterly/ Semi-Annual | | | (5,159) | |
USD 690 | | | 7/15/46 | | | 3 Month LIBOR | | 1.783% | | Quarterly/ Semi-Annual | | | (120,072) | |
USD 270 | | | 9/02/46 | | | 3 Month LIBOR | | 1.736% | | Quarterly/ Semi-Annual | | | (50,958) | |
USD 50 | | | 11/02/46 | | | 3 Month LIBOR | | 2.086% | | Quarterly/ Semi-Annual | | | (5,409) | |
| | | | | | | | | | | | | | |
| | | | | | | | | | | | | $ (140,690) | |
| | | | | | | | | | | | | | |
| | |
| abfunds.com | | AB CORPORATE INCOME SHARES | 31 |
PORTFOLIO OF INVESTMENTS (continued)
CREDIT DEFAULT SWAPS (see Note C)
| | | | | | | | | | | | | | | | | | | | | | | | |
Swap
Counterparty
& Referenced
Obligation | | Fixed
Rate
(Pay)
Receive | | | Payment
Frequency | | Implied
Credit
Spread at
October 31,
2017 | | | Notional
Amount
(000) | | | Market
Value | | Upfront
Premiums
Paid
(Received) | | | Unrealized
Appreciation/
(Depreciation) | |
Sale Contracts | | | | | | | | | | | | | | | | | | |
Credit Suisse International | | | | | | | | |
Kohl’s Corp., 6.250%, 12/15/17, 6/20/19* | | | 1.00 | % | | Quarterly | | | 0.29 | % | | | USD 34 | | | $ 413 | | $ | | (150) | | $ | 563 | |
INTEREST RATE SWAPS (see Note C)
| | | | | | | | | | | | |
| | | | | Rate Type | | | | | |
Notional
Amount (000) | | Termination
Date | | Payments
made
by the
Fund | | Payments
received
by the
Fund | | Payment
Frequency
Paid/Received | | Unrealized
Appreciation/
(Depreciation) | |
USD 600 | | 6/10/43 | | 3 Month LIBOR | | 3.191% | | Quarterly/ Semi-Annual | | $ | 77,868 | |
| (a) | Security is exempt from registration under Rule 144A of the Securities Act of 1933. These securities are considered restricted, but liquid and may be resold in transactions exempt from registration, normally to qualified institutional buyers. At October 31, 2017, the aggregate market value of these securities amounted to $10,457,320 or 12.2% of net assets. |
| (b) | Securities are perpetual and, thus, do not have a predetermined maturity date. The date shown, if applicable, reflects the next call date. |
| (c) | Floating Rate Security. Stated interest/floor rate was in effect at October 31, 2017. |
Glossary:
CBT – Chicago Board of Trade
CDX-NAIG – North American Investment Grade Credit Default Swap Index
LIBOR – London Interbank Offered Rates
REIT – Real Estate Investment Trust
See notes to financial statements.
| | |
| 32 | AB CORPORATE INCOME SHARES | | abfunds.com |
STATEMENT OF ASSETS & LIABILITIES
October 31, 2017 (unaudited)
| | | | |
| Assets | | | | |
Investments in securities, at value (cost $84,965,505) | | $ | 86,512,312 | |
Cash collateral due from broker | | | 130,868 | |
Interest receivable | | | 809,852 | |
Receivable for investment securities sold | | | 251,482 | |
Unrealized appreciation on interest rate swaps | | | 77,868 | |
Receivable for variation margin on futures | | | 15,887 | |
Receivable for shares of beneficial interest sold | | | 10,306 | |
Receivable for variation margin on exchange traded swaps | | | 2,197 | |
Receivable due from Adviser | | | 792 | |
Unrealized appreciation on credit default swaps | | | 563 | |
| | | | |
Total assets | | | 87,812,127 | |
| | | | |
| Liabilities | |
Payable for investment securities purchased | | | 1,555,403 | |
Dividends payable | | | 235,435 | |
Payable for shares of beneficial interest redeemed | | | 64,204 | |
Upfront premiums received on credit default swaps | | | 150 | |
| | | | |
Total liabilities | | | 1,855,192 | |
| | | | |
Net Assets | | $ | 85,956,935 | |
| | | | |
| Composition of Net Assets | |
Shares of beneficial interest, at par | | $ | 76 | |
Additional paid-in capital | | | 84,472,932 | |
Undistributed net investment income | | | 21,295 | |
Accumulated net realized loss on investment transactions | | | (64,671 | ) |
Net unrealized appreciation on investments | | | 1,527,303 | |
| | | | |
| | $ | 85,956,935 | |
| | | | |
Net Asset Value Per Share—unlimited shares of beneficial interest authorized, $.00001 par value (based on 7,612,748 common shares outstanding) | | $ | 11.29 | |
| | | | |
See notes to financial statements.
| | |
| abfunds.com | | AB CORPORATE INCOME SHARES | 33 |
STATEMENT OF OPERATIONS
Six Months Ended October 31, 2017 (unaudited)
| | | | | | | | |
| Investment Income | | | | | | | | |
Interest | | $ | 1,306,138 | | | | | |
Other income | | | 1,500 | | | | | |
| | | | | | | | |
Total investment income | | | | | | $ | 1,307,638 | |
| | | | | | | | |
| Realized and Unrealized Gain (Loss) on Investment Transactions | | | | | | | | |
Net realized gain on: | | | | | | | | |
Investment transactions | | | | | | | 377,561 | |
Futures | | | | | | | 13,697 | |
Swaps | | | | | | | 95,366 | |
Net change in unrealized appreciation/depreciation of: | | | | | | | | |
Investments | | | | | | | 588,111 | |
Futures | | | | | | | 12,473 | |
Swaps | | | | | | | (54,144 | ) |
| | | | | | | | |
Net gain on investment transactions | | | | | | | 1,033,064 | |
| | | | | | | | |
Net Increase in Net Assets from Operations | | | | | | $ | 2,340,702 | |
| | | | | | | | |
See notes to financial statements.
| | |
| 34 | AB CORPORATE INCOME SHARES | | abfunds.com |
STATEMENT OF CHANGES IN NET ASSETS
| | | | | | | | |
| | | Six Months
Ended
October 31,
2017
(unaudited) | | | Year Ended
April 30,
2017 | |
| Increase (Decrease) in Net Assets from Operations | | | | | | | | |
Net investment income | | $ | 1,307,638 | | | $ | 2,124,138 | |
Net realized gain on investment transactions | | | 486,624 | | | | 762,648 | |
Net change in unrealized appreciation/depreciation of investments | | | 546,440 | | | | (879,041 | ) |
| | | | | | | | |
Net increase in net assets from operations | | | 2,340,702 | | | | 2,007,745 | |
| Dividends to Shareholders from | | | | | | | | |
Net investment income | | | (1,331,437 | ) | | | (2,162,623 | ) |
| Transactions in Shares of Beneficial Interest | | | | | | | | |
Net increase | | | 10,756,952 | | | | 11,003,203 | |
| | | | | | | | |
Total increase | | | 11,766,217 | | | | 10,848,325 | |
| Net Assets | | | | | | | | |
Beginning of period | | | 74,190,718 | | | | 63,342,393 | |
| | | | | | | | |
End of period (including undistributed net investment income of $21,295 and $45,094, respectively) | | $ | 85,956,935 | | | $ | 74,190,718 | |
| | | | | | | | |
See notes to financial statements.
| | |
| abfunds.com | | AB CORPORATE INCOME SHARES | 35 |
NOTES TO FINANCIAL STATEMENTS
October 31, 2017 (unaudited)
NOTE A
Significant Accounting Policies
AB Corporate Shares (the “Trust”) was organized as a Massachusetts business trust under the laws of The Commonwealth of Massachusetts by an Agreement and Declaration of Trust dated January 26, 2004. The Trust is registered under the Investment Company Act of 1940, as an open-end, diversified management investment company. The Trust operates as a “series” company currently offering four separate portfolios: AB Corporate Income Shares, AB Municipal Income Shares, AB Taxable Multi-Sector Income Shares and AB Impact Municipal Income Shares. Each portfolio is considered to be a separate entity for financial reporting and tax purposes. This report relates only to AB Corporate Income Shares (the “Fund”).
Shares of the Fund are offered exclusively to holders of accounts established under wrap-fee programs sponsored and maintained by certain registered investment advisers approved by AllianceBernstein L.P. (the “Adviser”). The Fund’s shares may be purchased at the relevant net asset value without a sales charge or other fee. The financial statements have been prepared in conformity with U.S. generally accepted accounting principles (“U.S. GAAP”) which require management to make certain estimates and assumptions that affect the reported amounts of assets and liabilities in the financial statements and amounts of income and expenses during the reporting period. Actual results could differ from those estimates. The Fund is an investment company under U.S. GAAP and follows the accounting and reporting guidance applicable to investment companies. The following is a summary of significant accounting policies followed by the Fund.
1. Security Valuation
Portfolio securities are valued at their current market value determined on the basis of market quotations or, if market quotations are not readily available or are deemed unreliable, at “fair value” as determined in accordance with procedures established by and under the general supervision of the Trust’s Board of Trustees (the “Board”).
In general, the market values of securities which are readily available and deemed reliable are determined as follows: securities listed on a national securities exchange (other than securities listed on the NASDAQ Stock Market, Inc. (“NASDAQ”)) or on a foreign securities exchange are valued at the last sale price at the close of the exchange or foreign securities exchange. If there has been no sale on such day, the securities are valued at the last traded price from the previous day. Securities listed on more than one exchange are valued by reference to the principal exchange on which the securities are traded; securities listed only on NASDAQ are valued in accordance with the NASDAQ Official Closing Price; listed or over
| | |
| abfunds.com | | AB CORPORATE INCOME SHARES | 36 |
NOTES TO FINANCIAL STATEMENTS (continued)
the counter (“OTC”) market put or call options are valued at the mid level between the current bid and ask prices. If either a current bid or current ask price is unavailable, the Adviser will have discretion to determine the best valuation (e.g., last trade price in the case of listed options); open futures are valued using the closing settlement price or, in the absence of such a price, the most recent quoted bid price. If there are no quotations available for the day of valuation, the last available closing settlement price is used; U.S. Government securities and any other debt instruments having 60 days or less remaining until maturity are generally valued at market by an independent pricing vendor, if a market price is available. If a market price is not available, the securities are valued at amortized cost. This methodology is commonly used for short term securities that have an original maturity of 60 days or less, as well as short term securities that had an original term to maturity that exceeded 60 days. In instances when amortized cost is utilized, the Valuation Committee (the “Committee”) must reasonably conclude that the utilization of amortized cost is approximately the same as the fair value of the security. Such factors the Committee will consider include, but are not limited to, an impairment of the creditworthiness of the issuer or material changes in interest rates. Fixed-income securities, including mortgage-backed and asset-backed securities, may be valued on the basis of prices provided by a pricing service or at a price obtained from one or more of the major broker-dealers. In cases where broker-dealer quotes are obtained, the Adviser may establish procedures whereby changes in market yields or spreads are used to adjust, on a daily basis, a recently obtained quoted price on a security. Swaps and other derivatives are valued daily, primarily using independent pricing services, independent pricing models using market inputs, as well as third party broker-dealers or counterparties. Open end mutual funds are valued at the closing net asset value per share, while exchange traded funds are valued at the closing market price per share.
Securities for which market quotations are not readily available (including restricted securities) or are deemed unreliable are valued at fair value as deemed appropriate by the Adviser. Factors considered in making this determination may include, but are not limited to, information obtained by contacting the issuer, analysts, analysis of the issuer’s financial statements or other available documents. In addition, the Fund may use fair value pricing for securities primarily traded in non-U.S. markets because most foreign markets close well before the Fund values its securities at 4:00 p.m., Eastern Time. The earlier close of these foreign markets gives rise to the possibility that significant events, including broad market moves, may have occurred in the interim and may materially affect the value of those securities. To account for this, the Fund generally values many of its foreign equity securities using fair value prices based on third party vendor modeling tools to the extent available.
| | |
| 37 | AB CORPORATE INCOME SHARES | | abfunds.com |
NOTES TO FINANCIAL STATEMENTS (continued)
2. Fair Value Measurements
In accordance with U.S. GAAP regarding fair value measurements, fair value is defined as the price that the Fund would receive to sell an asset or pay to transfer a liability in an orderly transaction between market participants at the measurement date. U.S. GAAP establishes a framework for measuring fair value, and a three-level hierarchy for fair value measurements based upon the transparency of inputs to the valuation of an asset or liability (including those valued based on their market values as described in Note A.1 above). Inputs may be observable or unobservable and refer broadly to the assumptions that market participants would use in pricing the asset or liability. Observable inputs reflect the assumptions market participants would use in pricing the asset or liability based on market data obtained from sources independent of the Fund. Unobservable inputs reflect the Fund’s own assumptions about the assumptions that market participants would use in pricing the asset or liability based on the best information available in the circumstances. Each investment is assigned a level based upon the observability of the inputs which are significant to the overall valuation. The three-tier hierarchy of inputs is summarized below.
| | • | | Level 1—quoted prices in active markets for identical investments |
| | • | | Level 2—other significant observable inputs (including quoted prices for similar investments, interest rates, prepayment speeds, credit risk, etc.) |
| | • | | Level 3—significant unobservable inputs (including the Fund’s own assumptions in determining the fair value of investments) |
The fair value of debt instruments, such as bonds, and over-the-counter derivatives is generally based on market price quotations, recently executed market transactions (where observable) or industry recognized modeling techniques and are generally classified as Level 2. Pricing vendor inputs to Level 2 valuations may include quoted prices for similar investments in active markets, interest rate curves, coupon rates, currency rates, yield curves, option adjusted spreads, default rates, credit spreads and other unique security features in order to estimate the relevant cash flows which are then discounted to calculate fair values. If these inputs are unobservable and significant to the fair value, these investments will be classified as Level 3. In addition, non-agency rated investments are classified as Level 3.
Other fixed income investments, including non-U.S. government and corporate debt, are generally valued using quoted market prices, if available, which are typically impacted by current interest rates, maturity dates and any perceived credit risk of the issuer. Additionally, in the absence of quoted market prices, these inputs are used by pricing vendors to derive a valuation based upon industry or proprietary models which incorporate
| | |
| abfunds.com | | AB CORPORATE INCOME SHARES | 38 |
issuer specific data with relevant yield/spread comparisons with more widely quoted bonds with similar key characteristics. Those investments for which there are observable inputs are classified as Level 2. Where the inputs are not observable, the investments are classified as Level 3.
The following table summarizes the valuation of the Fund’s investments by the above fair value hierarchy levels as of October 31, 2017:
| | | | | | | | | | | | | | | | |
Investments in Securities: | | Level 1 | | | Level 2 | | | Level 3 | | | Total | |
Assets: | | | | | | | | | | | | | | | | |
Corporates—Investment Grade | | $ | – 0 | – | | $ | 80,446,655 | | | $ | – 0 | – | | $ | 80,446,655 | |
Quasi-Sovereigns | | | – 0 | – | | | 1,180,334 | | | | – 0 | – | | | 1,180,334 | |
Governments—Treasuries | | | – 0 | – | | | 616,217 | | | | – 0 | – | | | 616,217 | |
Corporates—Non-Investment Grade | | | – 0 | – | | | 348,784 | | | | – 0 | – | | | 348,784 | |
Governments—Sovereign Bonds | | | – 0 | – | | | 344,550 | | | | – 0 | – | | | 344,550 | |
Short-Term Investments | | | – 0 | – | | | 3,575,772 | | | | – 0 | – | | | 3,575,772 | |
| | | | | | | | | | | | | | | | |
Total Investments in Securities | | | – 0 | – | | | 86,512,312 | | | | – 0 | – | | | 86,512,312 | |
Other Financial Instruments(a): | | | | | | | | | | | | | | | | |
Assets: | |
Futures | | | 31,614 | | | | – 0 | – | | | – 0 | – | | | 31,614 | (b) |
Centrally Cleared Credit Default Swaps | | | – 0 | – | | | 96,350 | | | | – 0 | – | | | 96,350 | (b) |
Centrally Cleared Interest Rate Swaps | | | – 0 | – | | | 44,616 | | | | – 0 | – | | | 44,616 | (b) |
Credit Default Swaps | | | – 0 | – | | | 413 | | | | – 0 | – | | | 413 | |
Interest Rate Swaps | | | – 0 | – | | | 77,868 | | | | – 0 | – | | | 77,868 | |
Liabilities: | |
Futures | | | (19,141 | ) | | | – 0 | – | | | – 0 | – | | | (19,141 | )(b) |
Centrally Cleared Interest Rate Swaps | | | – 0 | – | | | (185,306 | ) | | | – 0 | – | | | (185,306 | )(b) |
| | | | | | | | | | | | | | | | |
Total(c) | | $ | 12,473 | | | $ | 86,546,253 | | | $ | – 0 | – | | $ | 86,558,726 | |
| | | | | | | | | | | | | | | | |
| (a) | Other financial instruments are derivative instruments, such as futures, forwards and swaps, which are valued at the unrealized appreciation/depreciation on the instrument. Other financial instruments may also include swaps with upfront premiums which are valued at market value. |
| (b) | Only variation margin receivable/(payable) at period end is reported within the statement of assets and liabilities. This amount reflects cumulative unrealized appreciation/(depreciation) of exchange-traded derivatives as reported in the portfolio of investments. Exchange-traded swaps with upfront premiums are presented here as market value. |
| (c) | There were no transfers between any levels during the reporting period. |
The Fund recognizes all transfers between levels of the fair value hierarchy assuming the financial instruments were transferred at the beginning of the reporting period.
The Adviser established the Committee to oversee the pricing and valuation of all securities held in the Fund. The Committee operates under pricing and valuation policies and procedures established by the Adviser and approved by the Board, including pricing policies which set forth the mechanisms and processes to be employed on a daily basis to implement these policies and procedures. In particular, the pricing policies describe how to determine market quotations for securities and other instruments. The Committee’s responsibilities include: 1) fair value and liquidity determinations (and oversight of any third parties to whom any responsibility for
| | |
| abfunds.com | | AB CORPORATE INCOME SHARES | 39 |
NOTES TO FINANCIAL STATEMENTS (continued)
fair value and liquidity determinations is delegated), and 2) regular monitoring of the Adviser’s pricing and valuation policies and procedures and modification or enhancement of these policies and procedures (or recommendation of the modification of these policies and procedures) as the Committee believes appropriate.
The Committee is also responsible for monitoring the implementation of the pricing policies by the Adviser’s Pricing Group (the “Pricing Group”) and any third party which performs certain pricing functions in accordance with the pricing policies. The Pricing Group is responsible for the oversight of the third party on a day-to-day basis. The Committee and the Pricing Group perform a series of activities to provide reasonable assurance of the accuracy of prices including: 1) periodic vendor due diligence meetings, review of methodologies, new developments and processes at vendors, 2) daily comparison of security valuation versus prior day for all securities that exceeded established thresholds, and 3) daily review of unpriced, stale, and variance reports with exceptions reviewed by senior management and the Committee.
In addition, several processes outside of the pricing process are used to monitor valuation issues including: 1) performance and performance attribution reports are monitored for anomalous impacts based upon benchmark performance, and 2) portfolio managers review all portfolios for performance and analytics (which are generated using the Adviser’s prices).
3. Taxes
It is the Fund’s policy to meet the requirements of the Internal Revenue Code applicable to regulated investment companies and to distribute all of its investment company taxable income and net realized gains, if any, to shareholders. Therefore, no provisions for federal income or excise taxes are required.
In accordance with U.S. GAAP requirements regarding accounting for uncertainties in income taxes, management has analyzed the Fund’s tax positions taken or expected to be taken on federal and state income tax returns for all open tax years (the current and the prior three tax years) and has concluded that no provision for income tax is required in the Fund’s financial statements.
4. Investment Income and Investment Transactions
Dividend income is recorded on the ex-dividend date or as soon as the Fund is informed of the dividend. Interest income is accrued daily. Investment transactions are accounted for on the date the securities are purchased or sold. Investment gains or losses are determined on the identified cost basis. The Fund amortizes premiums and accrete discounts as adjustments to interest income.
| | |
| 40 | AB CORPORATE INCOME SHARES | | abfunds.com |
NOTES TO FINANCIAL STATEMENTS (continued)
5. Dividends and Distributions
Dividends and distributions to shareholders, if any, are recorded on the ex-dividend date. Income dividends and capital gains distributions are determined in accordance with federal tax regulations and may differ from those determined in accordance with U.S. GAAP. To the extent these differences are permanent, such amounts are reclassified within the capital accounts based on their federal tax basis treatment; temporary differences do not require such reclassification.
NOTE B
Advisory Fee and Other Transactions with Affiliates
Under the terms of the advisory agreement, the Fund pays no advisory fee to the Adviser and the Adviser reimburses or pays for the Fund’s operating expenses. The Fund is an integral part of separately managed accounts in wrap-fee programs and other investment programs. Typically, participants in these programs pay a fee to their investment adviser for all costs and expenses of the separately managed account, including costs and expenses associated with the Fund, and a fee is paid by their investment adviser to the Adviser. The Adviser serves as investment manager and adviser of the Fund and continuously furnishes an investment program for the Fund and manages, supervises and conducts the affairs of the Fund, subject to the supervisions of the Fund’s Board. The advisory agreement provides that the Adviser or an affiliate will furnish, or pay the expenses of the Fund for, office space, facilities and equipment, services of executive and other personnel of the Fund and certain administrative services.
The Fund has entered into a distribution agreement with AllianceBernstein Investments, Inc., the Fund’s principal underwriter (the “Underwriter”), to permit the Underwriter to distribute the Fund’s shares, which are sold at their net asset value without any sales charge. The Fund does not pay a fee for this service. The Underwriter is a wholly owned subsidiary of the Adviser.
AllianceBernstein Investor Services, Inc. (“ABIS”), a wholly-owned subsidiary of the Adviser, acts as the Fund’s registrar, transfer agent and dividend-disbursing agent. ABIS registers the transfer, issuance and redemption of Fund shares and disburses dividends and other distributions to Fund shareholders. The Fund does not pay a fee for this service.
NOTE C
Investment Transactions
Purchases and sales of investment securities (excluding short-term investments) for the six months ended October 31, 2017 were as follows:
| | | | | | | | |
| | | Purchases | | | Sales | |
Investment securities (excluding U.S. government securities) | | $ | 32,431,491 | | | $ | 15,697,866 | |
U.S. government securities | | | 732,445 | | | | 6,531,436 | |
| | |
| abfunds.com | | AB CORPORATE INCOME SHARES | 41 |
NOTES TO FINANCIAL STATEMENTS (continued)
The cost of investments for federal income tax purposes was substantially the same as the cost for financial reporting purposes. Accordingly, gross unrealized appreciation and unrealized depreciation are as follows:
| | | | |
Gross unrealized appreciation | | $ | 1,940,861 | |
Gross unrealized depreciation | | | (413,558 | ) |
| | | | |
Net unrealized appreciation | | $ | 1,527,303 | |
| | | | |
1. Derivative Financial Instruments
The Fund may use derivatives in an effort to earn income and enhance returns, to replace more traditional direct investments, to obtain exposure to otherwise inaccessible markets (collectively, “investment purposes”), or to hedge or adjust the risk profile of its portfolio.
The principal types of derivatives utilized by the Fund, as well as the methods in which they may be used are:
The Fund may buy or sell futures for investment purposes or for the purpose of hedging its portfolio against adverse effects of potential movements in the market. The Fund bear the market risk that arises from changes in the value of these instruments and the imperfect correlation between movements in the price of the futures and movements in the price of the assets, reference rates or indices which they are designed to track. Among other things, the Fund may purchase or sell futures for foreign currencies or options thereon for non-hedging purposes as a means of making direct investment in foreign currencies, as described below under “Currency Transactions”.
At the time the Fund enters into futures, the Fund deposits and maintains as collateral an initial margin with the broker, as required by the exchange on which the transaction is effected. Such amount is shown as cash collateral due from broker on the statement of assets and liabilities. Pursuant to the contract, the Fund agrees to receive from or pay to the broker an amount of cash equal to the daily fluctuation in the value of the contract. Such receipts or payments are known as variation margin and are recorded by the Fund as unrealized gains or losses. Risks may arise from the potential inability of a counterparty to meet the terms of the contract. The credit/counterparty risk for exchange-traded futures is generally less than privately negotiated futures, since the clearinghouse, which is the issuer or counterparty to each exchange-traded future, has robust risk mitigation standards, including the requirement to provide initial and variation margin. When the contract is closed, the Fund records a realized gain or loss equal to the difference between the value of the contract at the time it was opened and the time it was closed.
| | |
| 42 | AB CORPORATE INCOME SHARES | | abfunds.com |
NOTES TO FINANCIAL STATEMENTS (continued)
Use of long futures subjects the Fund to risk of loss in excess of the amounts shown on the statement of assets and liabilities, up to the notional value of the futures. Use of short futures subjects the Fund to unlimited risk of loss. Under some circumstances, futures exchanges may establish daily limits on the amount that the price of futures can vary from the previous day’s settlement price, which could effectively prevent liquidation of unfavorable positions.
During the six months ended October 31, 2017, the Fund held futures for hedging purposes.
The Fund may enter into swaps to hedge its exposure to interest rates or credit risk. A swap is an agreement that obligates two parties to exchange a series of cash flows at specified intervals based upon or calculated by reference to changes in specified prices or rates for a specified amount of an underlying asset. The payment flows are usually netted against each other, with the difference being paid by one party to the other. In addition, collateral may be pledged or received by the Fund in accordance with the terms of the respective swaps to provide value and recourse to the Fund or its counterparties in the event of default, bankruptcy or insolvency by one of the parties to the swap.
Risks may arise as a result of the failure of the counterparty to the swap to comply with the terms of the swap. The loss incurred by the failure of a counterparty is generally limited to the net interim payment to be received by the Fund, and/or the termination value at the end of the contract. Therefore, the Fund considers the creditworthiness of each counterparty to a swap in evaluating potential counterparty risk. This risk is mitigated by having a netting arrangement between the Fund and the counterparty and by the posting of collateral by the counterparty to the Fund to cover the Fund’s exposure to the counterparty. Additionally, risks may arise from unanticipated movements in interest rates or in the value of the underlying securities. The Fund accrues for the interim payments on swaps on a daily basis, with the net amount recorded within unrealized appreciation/depreciation of swaps on the statement of assets and liabilities, where applicable. Once the interim payments are settled in cash, the net amount is recorded as realized gain/(loss) on swaps on the statement of operations, in addition to any realized gain/(loss) recorded upon the termination of swaps. Upfront premiums paid or received are recognized as cost or proceeds on the statement of assets and liabilities and are amortized on a straight line basis over the life of the contract. Amortized upfront premiums are included in net realized gain/(loss) from swaps on the statement of operations. Fluctuations in
| | |
| abfunds.com | | AB CORPORATE INCOME SHARES | 43 |
NOTES TO FINANCIAL STATEMENTS (continued)
the value of swaps are recorded as a component of net change in unrealized appreciation/depreciation of swaps on the statement of operations.
Certain standardized swaps, including certain interest rate swaps and credit default swaps, are (or soon will be) subject to mandatory central clearing. Cleared swaps are transacted through futures commission merchants (“FCMs”) that are members of central clearinghouses, with the clearinghouse serving as central counterparty, similar to transactions in futures contracts. Centralized clearing will be required for additional categories of swaps on a phased-in basis based on requirements published by the Securities and Exchange Commission and Commodity Futures Trading Commission.
At the time the Fund enters into a centrally cleared swap, the Fund deposits and maintains as collateral an initial margin with the broker, as required by the clearinghouse on which the transaction is effected. Such amount is shown as cash collateral due from broker on the statement of assets and liabilities. Pursuant to the contract, the Fund agrees to receive from or pay to the broker an amount of cash equal to the daily fluctuation in the value of the contract. Such receipts or payments are known as variation margin and are recorded by the Fund as unrealized gains or losses. Risks may arise from the potential inability of a counterparty to meet the terms of the contract. The credit/counterparty risk for centrally cleared swaps is generally less than non-centrally cleared swaps, since the clearinghouse, which is the issuer or counterparty to each centrally cleared swap, has robust risk mitigation standards, including the requirement to provide initial and variation margin. When the contract is closed, the Fund records a realized gain or loss equal to the difference between the value of the contract at the time it was opened and the time it was closed.
Interest Rate Swaps:
The Fund is subject to interest rate risk exposure in the normal course of pursuing its investment objectives. Because the Fund hold fixed rate bonds, the value of these bonds may decrease if interest rates rise. To help hedge against this risk and to maintain its ability to generate income at prevailing market rates, the Fund may enter into interest rate swaps. Interest rate swaps are agreements between two parties to exchange cash flows based on a notional amount. The Fund may elect to pay a fixed rate and receive a floating rate, or, receive a fixed rate and pay a floating rate on a notional amount.
In addition, the Fund may also enter into interest rate swap transactions to preserve a return or spread on a particular investment or portion of its portfolio, or protecting against an increase in the price of securities the Fund anticipates purchasing at a later date. Interest
| | |
| 44 | AB CORPORATE INCOME SHARES | | abfunds.com |
NOTES TO FINANCIAL STATEMENTS (continued)
rate swaps involve the exchange by a Fund with another party of their respective commitments to pay or receive interest (e.g., an exchange of floating rate payments for fixed rate payments) computed based on a contractually-based principal (or “notional”) amount. Interest rate swaps are entered into on a net basis (i.e., the two payment streams are netted out, with the Fund receiving or paying, as the case may be, only the net amount of the two payments).
During the six months ended October 31, 2017, the Fund held interest rate swaps for hedging purposes.
Credit Default Swaps:
The Fund may enter into credit default swaps, including to manage its exposure to the market or certain sectors of the market, to reduce its risk exposure to defaults by corporate and sovereign issuers held by the Fund, or to create exposure to corporate or sovereign issuers to which it is not otherwise exposed. The Fund may purchase credit protection (“Buy Contract”) or provide credit protection (“Sale Contract”) on the referenced obligation of the credit default swap. During the term of the swap, the Fund receives/(pays) fixed payments from/(to) the respective counterparty, calculated at the agreed upon rate applied to the notional amount. If the Fund is a buyer/(seller) of protection and a credit event occurs, as defined under the terms of the swap, the Fund will either (i) receive from the seller/(pay to the buyer) of protection an amount equal to the notional amount of the swap (the “Maximum Payout Amount”) and deliver/(take delivery of) the referenced obligation or (ii) receive/(pay) a net settlement amount in the form of cash or securities equal to the notional amount of the swap less the recovery value of the referenced obligation.
In certain circumstances Maximum Payout Amounts may be partially offset by recovery values of the respective referenced obligations, upfront premium received upon entering into the agreement, or net amounts received from settlement of buy protection credit default swaps entered into by the Fund for the same referenced obligations with the same counterparty. As of October 31, 2017, the Fund did not have Buy Contracts outstanding with respect to the same referenced obligations and same counterparty for its Sale Contracts outstanding.
Credit default swaps may involve greater risks than if a Fund had invested in the referenced obligation directly. Credit default swaps are subject to general market risk, liquidity risk, counterparty risk and credit risk. If the Fund is a buyer of protection and no credit event occurs, it will lose the payments it made to its counterparty. If the Fund is a seller of protection and a credit event occurs, the value of the referenced obligation received by the Fund coupled with the
| | |
| abfunds.com | | AB CORPORATE INCOME SHARES | 45 |
NOTES TO FINANCIAL STATEMENTS (continued)
periodic payments previously received, may be less than the Maximum Payout Amount it pays to the buyer, resulting in a net loss to the Fund.
Implied credit spreads over U.S. Treasuries of comparable maturity utilized in determining the market value of credit default swaps on issuers as of period end are disclosed in the portfolio of investments. The implied spreads serve as an indicator of the current status of the payment/performance risk and typically reflect the likelihood of default by the issuer of the referenced obligation. The implied credit spread of a particular reference obligation also reflects the cost of buying/selling protection and may reflect upfront payments required to be made to enter into the agreement. Widening credit spreads typically represent a deterioration of the referenced obligation’s credit soundness and greater likelihood of default or other credit event occurring as defined under the terms of the agreement. A credit spread identified as “Defaulted” indicates a credit event has occurred for the referenced obligation.
During the six months ended October 31, 2017, the Fund held credit default swaps for non-hedging purposes.
The Fund typically enter into International Swaps and Derivatives Association, Inc. Master Agreements (“ISDA Master Agreement”) with its OTC derivative contract counterparties in order to, among other things, reduce its credit risk to OTC counterparties. ISDA Master Agreements include provisions for general obligations, representations, collateral and events of default or termination. Under an ISDA Master Agreement, the Fund typically may offset with the OTC counterparty certain derivative financial instruments’ payables and/or receivables with collateral held and/or posted and create one single net payment (close-out netting) in the event of default or termination. In the event of a default by an OTC counterparty, the return of collateral with market value in excess of the Fund’s net liability, held by the defaulting party, may be delayed or denied.
The Fund’s ISDA Master Agreements may contain provisions for early termination of OTC derivative transactions in the event the net assets of the Fund decline below specific levels (“net asset contingent features”). If these levels are triggered, the Fund’s OTC counterparty has the right to terminate such transaction and require the Fund to pay or receive a settlement amount in connection with the terminated transaction. For additional details, please refer to netting arrangements by the OTC counterparty table below.
| | |
| 46 | AB CORPORATE INCOME SHARES | | abfunds.com |
NOTES TO FINANCIAL STATEMENTS (continued)
During the six months ended October 31, 2017, the Fund had entered into the following derivatives:
| | | | | | | | | | | | |
| | | Asset Derivatives | | | Liability Derivatives | |
Derivative Type | | Statement of
Assets and
Liabilities
Location | | Fair Value | | | Statement of
Assets and
Liabilities
Location | | Fair Value | |
Interest rate contracts | | Receivable/Payable for variation margin on futures | | $ | 31,614 | * | | Receivable/Payable for variation margin on futures | | $ | 19,141 | * |
| | | | |
Credit contracts | | Receivable/Payable for variation margin on exchange traded swaps | | | 30,282 | * | | | | | | |
| | | | |
Interest rate contracts | | Receivable/Payable for variation margin on exchange traded swaps | | | 44,616 | * | | Receivable/Payable for variation margin on exchange traded swaps | | | 185,306 | * |
| | | | |
Interest rate contracts | | Unrealized appreciation on interest rate swaps | | | 77,868 | | | | | | | |
| | | | |
Credit contracts | | Unrealized appreciation on credit default swaps | | | 563 | | | | | | | |
| | | | | | | | | | | | |
Total | | | | $ | 184,943 | | | | | $ | 204,447 | |
| | | | | | | | | | | | |
| * | Only variation margin receivable/payable at period end is reported within the statement of assets and liabilities. This amount reflects cumulative appreciation/(depreciation) of exchange-traded derivatives as reported in the portfolio of investments. |
| | | | | | | | | | |
Derivative Type | | Location of Gain
or (Loss) on
Derivatives Within
Statement of
Operations | | Realized Gain
or (Loss) on
Derivatives | | | Change in
Unrealized
Appreciation or
(Depreciation) | |
Interest rate contracts | | Net realized gain (loss) on futures; Net change in unrealized appreciation/depreciation of futures | | $ | 13,697 | | | $ | 12,473 | |
Interest rate contracts | | Net realized gain (loss) on swaps; Net change in unrealized appreciation/depreciation of swaps | | | 80,825 | | | | (80,033 | ) |
Credit contracts | | Net realized gain (loss) on swaps; Net change in unrealized appreciation/depreciation of swaps | | | 14,541 | | | | 25,889 | |
| | | | | | | | | | |
Total | | | | $ | 109,063 | | | $ | (41,671 | ) |
| | | | | | | | | | |
| | |
| abfunds.com | | AB CORPORATE INCOME SHARES | 47 |
NOTES TO FINANCIAL STATEMENTS (continued)
The following table represent the average monthly volume of the Fund’s derivative transactions during the six months ended October 31, 2017:
| | | | |
Futures: | | | | |
Average original value of buy contracts | | $ | 1,649,984 | (a) |
Average original value of sale contracts | | $ | 3,413,075 | (a) |
Interest Rate Swaps: | | | | |
Average notional amount | | $ | 850,000 | |
Centrally Cleared Interest Rate Swaps: | | | | |
Average notional amount | | $ | 5,658,571 | |
Credit Default Swaps: | | | | |
Average notional amount of sale contracts | | $ | 33,934 | |
Centrally Cleared Credit Default Swaps: | | | | |
Average notional amount of sale contracts | | $ | 4,200,000 | |
| (a) | Positions were open for three months during the period. |
For financial reporting purposes, the Fund does not offset derivative assets and derivative liabilities that are subject to netting arrangements in the statement of assets and liabilities. Exchange-traded derivatives are not subject to netting arrangements and as such are excluded from the table.
All OTC derivatives held at period end were subject to netting arrangements. The following table present the Fund’s derivative assets and liabilities by OTC counterparty net of amounts available for offset under ISDA Master Agreements and net of the related collateral received/pledged by the Fund as of October 31, 2017.
| | | | | | | | | | | | | | | | | | | | |
Counterparty | | Derivative
Assets
Subject to a MA | | | Derivative
Available
for Offset | | | Cash
Collateral
Received* | | | Security
Collateral
Received* | | | Net
Amount of
Derivatives
Assets | |
OTC Derivatives: | | | | | | | | | |
Credit Suisse International | | $ | 413 | | | $ | – 0 | – | | $ | – 0 | – | | $ | – 0 | – | | $ | 413 | |
Deutsche Bank AG | | | 77,868 | | | | – 0 | – | | | – 0 | – | | | – 0 | – | | | 77,868 | |
| | | | | | | | | | | | | | | | | | | | |
Total | | $ | 78,281 | | | $ | – 0 | – | | $ | – 0 | – | | $ | – 0 | – | | $ | 78,281^ | |
| | | | | | | | | | | | | | | | | | | | |
| * | The actual collateral received/pledged may be more than the amount reported due to over-collateralization. |
| ^ | Net amount represents the net receivable/payable that would be due from/to the counterparty in the event of default or termination. The net amount from OTC financial derivative instruments can only be netted across transactions governed under the same master agreement with the same counterparty. |
| | |
| 48 | AB CORPORATE INCOME SHARES | | abfunds.com |
NOTES TO FINANCIAL STATEMENTS (continued)
NOTE D
Shares of Beneficial Interest
Transactions in shares of beneficial interest were as follows:
| | | | | | | | | | | | | | | | | | | | | | | | |
| | | | | | | | | | | | | | | | | | | | | | | | |
| | | Shares | | | | | | Amount | | | | |
| | | Six Months Ended
October 31, 2017
(unaudited) | | | Year Ended
April 30, 2017 | | | | | | Six Months Ended
October 31, 2017
(unaudited) | | | Year Ended
April 30, 2017 | | | | |
| | | | | | | | |
Shares sold | | | 1,394,766 | | | | 2,401,487 | | | | | | | $ | 15,717,473 | | | $ | 26,727,267 | | | | | |
| | | | | | | | | | | | | | | | | | | | | | | | |
Shares redeemed | | | (440,828 | ) | | | (1,404,154 | ) | | | | | | | (4,960,521 | ) | | | (15,724,064 | ) | | | | |
| | | | | | | | | | | | | | | | | | | | | | | | |
Net increase | | | 953,938 | | | | 997,333 | | | | | | | $ | 10,756,952 | | | $ | 11,003,203 | | | | | |
| | | | | | | | | | | | | | | | | | | | | | | | |
NOTE E
Risks Involved in Investing in the Fund
Interest Rate Risk and Credit Risk—Interest rate risk is the risk that changes in interest rates will affect the value of the Fund’s investments in fixed-income debt securities such as bonds or notes. Increases in interest rates may cause the value of the Fund’s investments to decline. Credit risk is the risk that the issuer or guarantor of a debt security, or the counterparty to a derivative contract, will be unable or unwilling to make timely principal and/or interest payments, or to otherwise honor its obligations. The degree of risk for a particular security may be reflected in its credit rating. Credit risk is greater for medium quality and lower-rated securities. Lower-rated debt securities and similar unrated securities (commonly known as “junk bonds”) have speculative elements or are predominantly speculative risks.
Inflation Risk—This is the risk that the value of assets or income from investments will be less in the future as inflation decreases the value of money. As inflation increases, the value of the Fund’s assets can decline as can the value of the Fund’s distributions. This risk is significantly greater for fixed-income securities with longer maturities.
Foreign (Non-U.S.) Risk—Investments in securities of non-U.S. issuers may involve more risk than those of U.S. issuers. These securities may fluctuate more widely in price and may be less liquid due to adverse market, economic, political, regulatory or other factors.
Derivatives Risk—The Fund may enter into derivative transactions such as forwards, options, futures and swaps. Derivatives may be illiquid, difficult to price, and leveraged so that small changes may produce disproportionate losses for the Fund, and subject to counterparty risk to a greater degree than more traditional investments. Derivatives may result in significant losses, including losses that are far greater than the value of the derivatives reflected on the statement of assets and liabilities.
| | |
| abfunds.com | | AB CORPORATE INCOME SHARES | 49 |
NOTES TO FINANCIAL STATEMENTS (continued)
Indemnification Risk—In the ordinary course of business, the Fund enter into contracts that contain a variety of indemnifications. The Fund’s maximum exposure under these arrangements is unknown. However, the Fund has not had prior claims or losses pursuant to these indemnification provisions and expects the risk of loss thereunder to be remote. Therefore, the Fund has not accrued any liability in connection with these indemnification provisions.
NOTE F
Joint Credit Facility
A number of open-end mutual funds managed by the Adviser, including the Fund, participate in a $280 million revolving credit facility (the “Facility”) intended to provide short-term financing, if necessary, subject to certain restrictions in connection with abnormal redemption activity. Commitment fees related to the Facility are paid by the participating funds and are included in miscellaneous expenses in the statement of operations. The Fund did not utilize the Facility during the six months ended October 31, 2017.
NOTE G
Distributions to Shareholders
The tax character of distributions to be paid for the year ending April 30, 2018 will be determined at the end of the current fiscal year. The tax character of distributions paid during the fiscal years ended April 30, 2017 and April 30, 2016 were as follows:
| | | | | | | | |
| | | 2017 | | | 2016 | |
Distributions paid from: | | | | | | | | |
Ordinary income | | $ | 2,162,623 | | | $ | 2,163,375 | |
| | | | | | | | |
Total distributions paid | | $ | 2,162,623 | | | $ | 2,163,375 | |
| | | | | | | | |
As of April 30, 2017, the components of accumulated earnings/(deficit) on a tax basis were as follows:
| | | | |
Undistributed ordinary income | | $ | 235,078 | |
Accumulated capital and other losses | | | (494,821 | )(a) |
Unrealized appreciation/(depreciation) | | | 897,874 | (b) |
| | | | |
Total accumulated earnings/(deficit) | | $ | 638,131 | (c) |
| | | | |
| (a) | On April 30, 2017, the Fund had a capital loss carryforward of $243,618. During the fiscal year, the Fund utilized $461,134 of capital loss carryforwards to offset current year net realized gains. On April 30, 2017, the Fund had a post-October short-term capital loss deferral of $251,203. These losses are deemed to arise on May 1, 2017. |
| (b) | The differences between book-basis and tax-basis unrealized appreciation/(depreciation) are attributable primarily to the tax deferral of losses on wash sales and the tax treatment of swaps. |
| (c) | The difference between book-basis and tax-basis components of accumulated earnings/(deficit) is attributable primarily to dividends payable. |
For tax purposes, net capital losses may be carried over to offset future capital gains, if any. Funds are permitted to carry forward capital losses
| | |
| 50 | AB CORPORATE INCOME SHARES | | abfunds.com |
NOTES TO FINANCIAL STATEMENTS (continued)
incurred in taxable years beginning after December 22, 2010 for an indefinite period. These post-December 22, 2010 capital losses must be utilized prior to the earlier capital losses, which are subject to expiration. Post-December 22, 2010 capital loss carryforwards will retain their character as either short-term or long-term capital losses rather than being considered short-term as under previous regulation. As of April 30, 2017, the Fund had a net short-term capital loss carryforward of $243,618 which will expire in 2018.
NOTE H
Recent Accounting Pronouncements
In March 2017, the Financial Accounting Standards Board issued an Accounting Standards Update, ASU 2017-08, Receivables—Nonrefundable Fees and Other Costs (Subtopic 310-20), Premium Amortization on Purchased Callable Debt Securities (the “ASU”) which amends the amortization period for certain purchased callable debt securities held at a premium, shortening such period to the earliest call date. The ASU does not require any accounting change for debt securities held at a discount; the discount continues to be amortized to maturity. The ASU is effective for fiscal years, and interim periods within those fiscal years, beginning after December 15, 2018. At this time, management is evaluating the implications of these changes on the financial statements.
NOTE I
Subsequent Events
Management has evaluated subsequent events for possible recognition or disclosure in the financial statements through the date the financial statements are issued. Management has determined that there are no material events that would require disclosure in the Fund’s financial statements through this date.
| | |
| abfunds.com | | AB CORPORATE INCOME SHARES | 51 |
FINANCIAL HIGHLIGHTS
Selected Data For A Share Of Beneficial Interest Outstanding Throughout Each Period
| | | | | | | | | | | | | | | | | | | | | | | | |
| | | Six Months Ended October 31, 2017
(unaudited) | | | Year Ended April 30, | |
| | | | 2017 | | | 2016 | | | 2015 | | | 2014 | | | 2013 | |
| | | | | | | | | | | | | | | | | | | | | | | | |
Net asset value, beginning of period | | | $11.14 | | | | $11.19 | | | | $11.36 | | | | $11.13 | | | | $11.42 | | | | $10.83 | |
| | | | | | | | | | | | | | | | | | | | | | | | |
Income From Investment Operations | | | | | | | | | | | | | | | | | | | | | | | | |
Net investment income(a) | | | .19 | | | | .38 | | | | .39 | | | | .43 | | | | .42 | | | | .43 | |
Net realized and unrealized gain (loss) on investment transactions | | | .15 | | | | (.04 | ) | | | (.16 | ) | | | .22 | �� | | | (.29 | ) | | | .59 | |
| | | | | | | | | | | | | | | | | | | | | | | | |
Net increase in net asset value from operations | | | .34 | | | | .34 | | | | .23 | | | | .65 | | | | .13 | | | | 1.02 | |
| | | | | | | | | | | | | | | | | | | | | | | | |
Less: Dividends | | | | | | | | | | | | | | | | | | | | | | | | |
Dividends from net investment income | | | (.19 | ) | | | (.39 | ) | | | (.40 | ) | | | (.42 | ) | | | (.42 | ) | | | (.43 | ) |
| | | | | | | | | | | | | | | | | | | | | | | | |
Net asset value, end of period | | | $11.29 | | | | $11.14 | | | | $11.19 | | | | $11.36 | | | | $11.13 | | | | $11.42 | |
| | | | | | | | | | | | | | | | | | | | | | | | |
Total Return | | | | | | | | | | | | | | | | | | | | | | | | |
Total investment return based on net asset value(b) | | | 3.10 | % | | | 3.08 | %* | | | 2.12 | % | | | 5.94 | %* | | | 1.31 | %* | | | 9.53 | %* |
Ratios/Supplemental Data | | | | | | | | | | | | | | | | | | | | | | | | |
Net assets, end of period (000’s omitted) | | | $85,957 | | | | $74,191 | | | | $63,342 | | | | $44,939 | | | | $45,989 | | | | $42,799 | |
Ratio to average net assets of: | | | | | | | | | | | | | | | | | | | | | | | | |
Net investment income | | | 3.35 | %^ | | | 3.43 | % | | | 3.60 | % | | | 3.76 | % | | | 3.89 | % | | | 3.79 | % |
Portfolio turnover rate | | | 29 | % | | | 79 | % | | | 59 | % | | | 42 | % | | | 61 | % | | | 89 | % |
| (a) | Based on average shares outstanding. |
| (b) | Total investment return is calculated assuming an initial investment made at the net asset value at the beginning of the period, reinvestment of all dividends and distributions at net asset value during the period, and redemption on the last day of the period. Total return does not reflect the deduction of taxes that a shareholder would pay on fund distributions or the redemption of fund shares. Total investment return calculated for a period of less than one year is not annualized. |
| * | Includes the impact of proceeds received and credited to the Fund resulting from class action settlements, which enhanced the Fund’s performance for the years ended April 30, 2017, April 30, 2015, April 30, 2014 and April 30, 2013 by 0.01%, 0.01%, 0.05% and 0.03%, respectively. |
See notes to financial statements.
| | |
| 52 | AB CORPORATE INCOME SHARES | | abfunds.com |
BOARD OF TRUSTEES
| | |
Marshall C. Turner, Jr.(1) , Chairman John H. Dobkin(1)(2) Michael J. Downey(1) William H. Foulk, Jr.(1) D. James Guzy(1)(2) Nancy P. Jacklin(1) | | Robert M. Keith, President and Chief Executive Officer Carol C. McMullen(1) Garry L. Moody(1) Earl D. Weiner(1) |
OFFICERS
| | |
Philip L. Kirstein(3), Senior Vice President and Independent Compliance Officer Douglas J. Peebles, Senior Vice President Shawn E. Keegan(4) , Vice President Ashish C. Shah(4) , Vice President | | Emilie D. Wrapp, Secretary Joseph J. Mantineo, Treasurer and Chief Financial Officer Phyllis J. Clarke, Controller Vincent S. Noto, Chief Compliance Officer |
| | |
Custodian and Accounting Agent State Street Bank and Trust Company
State Street Corporation CCB/5
1 Iron Street
Boston, MA 02210 Principal Underwriter AllianceBernstein Investments, Inc.
1345 Avenue of the Americas
New York, NY 10105 | | Legal Counsel Seward & Kissel LLP
One Battery Park Plaza
New York, NY 10004 Independent Registered Public Accounting Firm Ernst & Young LLP 5 Times Square New York, NY 10036 |
Transfer Agent AllianceBernstein Investor Services, Inc.
P.O. Box 786003
San Antonio, TX 78278-6003
Toll-Free (800) 221-5672 |
| 1 | Member of the Audit Committee, the Governance and Nominating Committee and the Independent Directors Committee. |
| 2 | Messrs. Dobkin and Guzy are expected to retire on or about December 31, 2017. |
| 3 | Mr. Kirstein is expected to retire on or about December 31, 2017. |
| 4 | The day-to-day management of, and investment decisions for, the Trust’s Portfolio are made by the Corporate Income Shares Investment Team. Messrs. Shawn E. Keegan and Ashish C. Shah are the investment professionals primarily responsible for the day-to-day management of the Trust’s Portfolio. |
| | |
| abfunds.com | | AB CORPORATE INCOME SHARES | 53 |
Information Regarding the Review and Approval of the Fund’s Advisory Agreement
The disinterested trustees (the “directors”) of AB Corporate Shares (the “Company”) unanimously approved the continuance of the Company’s Advisory Agreement with the Adviser in respect of AB Corporate Income Shares (the “Fund”) at a meeting held on November 1-3, 2016 (the “Meeting”).
Prior to approval of the continuance of the Advisory Agreement, the directors had requested from the Adviser, and received and evaluated, extensive materials. They reviewed the proposed continuance of the Advisory Agreement with the Adviser and with experienced counsel who are independent of the Adviser, who advised on the relevant legal standards. The directors also reviewed an independent evaluation prepared by the Company’s Senior Officer (who is also the Company’s Independent Compliance Officer) of the reasonableness of the advisory fee, in which the Senior Officer concluded that the contractual fee (zero) for the Fund was reasonable. The directors also discussed the proposed continuance in private sessions with counsel and the Company’s Senior Officer.
The directors noted that the Fund is designed as a vehicle for the wrap fee account market (where investors pay fees to a wrap fee sponsor which pays investment fees and expenses from such fee). The directors also noted that no advisory fee is payable by the Fund, that the Advisory Agreement does not include the reimbursement provision for certain administrative expenses included in the advisory agreements of most of the open-end AB Funds, and that the Adviser is responsible for payment of the Fund’s ordinary expenses. The directors noted that the Company acknowledges in the Advisory Agreement that the Adviser and its affiliates expect to receive compensation from third parties in connection with services provided under the Advisory Agreement. The directors further noted that the Adviser receives payments from the wrap fee program sponsors (the “Sponsors”) that use the Fund as an investment vehicle for their clients.
The directors considered their knowledge of the nature and quality of the services provided by the Adviser to the Fund gained from their experience as directors or trustees of most of the registered investment companies advised by the Adviser, their overall confidence in the Adviser’s integrity and competence they have gained from that experience, the Adviser’s initiative in identifying and raising potential issues with the directors and its responsiveness, frankness and attention to concerns raised by the directors in the past, including the Adviser’s willingness to consider and implement organizational and operational changes designed to improve investment results and the services provided to the AB Funds. The directors noted that they have four regular meetings each year, at each of which they receive presentations from the Adviser on the investment results of the Fund and review extensive materials and information presented by the Adviser.
| | |
| 54 | AB CORPORATE INCOME SHARES | | abfunds.com |
The directors also considered all other factors they believed relevant, including the specific matters discussed below. In their deliberations, the directors did not identify any particular information that was all-important or controlling, and different directors may have attributed different weights to the various factors. The directors determined that the selection of the Adviser to manage the Fund and the overall arrangements between the Fund and the Adviser, as provided in the Advisory Agreement, including the advisory fee, were fair and reasonable in light of the services performed, expenses incurred and such other matters as the directors considered relevant in the exercise of their business judgment. The material factors and conclusions that formed the basis for the directors’ determinations included the following:
Nature, Extent and Quality of Services Provided
The directors considered the scope and quality of services provided by the Adviser under the Advisory Agreement, including the quality of the investment research capabilities of the Adviser and the other resources it has dedicated to performing services for the Fund. They also noted the professional experience and qualifications of the Fund’s portfolio management team and other senior personnel of the Adviser. The quality of administrative and other services, including the Adviser’s role in coordinating the activities of the Fund’s other service providers, also was considered. The directors concluded that, overall, they were satisfied with the nature, extent and quality of services provided to the Fund under the Advisory Agreement.
Costs of Services Provided and Profitability
The directors reviewed a schedule of the revenues and expenses and related notes indicating the profitability of the Fund to the Adviser for calendar years 2014 and 2015 that had been prepared with an expense allocation methodology arrived at in consultation with an independent consultant retained by the Company’s Senior Officer. The directors noted the assumptions and methods of allocation used by the Adviser in preparing fund-specific profitability data and understood that there are a number of potentially acceptable allocation methodologies for information of this type. The directors noted that the profitability information reflected all revenues and expenses of the Adviser’s relationship with the Fund. The directors recognized that it is difficult to make comparisons of the profitability of the Advisory Agreement with the profitability of fund advisory contracts for unaffiliated funds because comparative information is not generally publicly available and is affected by numerous factors. The directors focused on the profitability of the Adviser’s relationship with the Fund before taxes. The directors noted that the Fund was not profitable to the Adviser in 2014. The directors concluded that the Adviser’s level of profitability from its relationship with the Fund in 2015 was not unreasonable.
| | |
| abfunds.com | | AB CORPORATE INCOME SHARES | 55 |
Fall-Out Benefits
The directors considered the other benefits to the Adviser and its affiliates from their relationships with the Fund. The directors noted that the Adviser is compensated by the Sponsors. The directors understood that the Adviser also might derive reputational and other benefits from its association with the Fund.
Investment Results
In addition to the information reviewed by the directors in connection with the Meeting, the directors receive detailed performance information for the Fund at each regular Board meeting during the year.
At the Meeting, the directors reviewed information prepared by Broadridge Financial Solutions, Inc. (“Broadridge”), an analytical service that is not affiliated with the Adviser, showing the performance of the Fund against a peer universe selected by Broadridge, and information prepared by the Adviser showing the Fund’s performance against a broad-based securities market index, in each case for the 1-, 3- and 5-year periods ended July 31, 2016 and (in the case of comparisons with the broad-based securities market index) for the period from inception. The directors were cognizant that the Fund was neither designed nor offered as a standalone investment and was intended to serve solely as a component of certain separately managed accounts (“SMAs”). The Adviser had explained that this attribute made it difficult to select an appropriate benchmark for the Fund. At the directors’ request, the Adviser provided information showing the weighting of the Fund in a current SMA and the overall performance of the SMA versus its stated benchmark. Based on their review, the directors concluded that the Fund’s investment performance was acceptable.
Advisory Fees
The directors considered the advisory fee rate paid by the Fund to the Adviser (zero) and information provided by Broadridge showing the fees paid by other fund families used in wrap fee programs similar to that of the Fund. The directors recognized that it is difficult to make comparisons of advisory fees because there are variations in the services that are included in the fees paid by other funds.
The directors noted the unusual arrangements in the Advisory Agreement providing for no advisory fee but were cognizant that the Adviser is indirectly compensated by the Sponsors for its services to the Fund. The directors reviewed the fee arrangements between the Adviser and each of the current Sponsors and noted that such fees were negotiated on an arm’s length basis and were within the range of fees paid by wrap fee sponsors to other advisers of similar funds. While the Adviser’s fee arrangements with the Sponsors vary, the directors acknowledged the Adviser’s view that a portion of such fees (less the expenses of the Fund
| | |
| 56 | AB CORPORATE INCOME SHARES | | abfunds.com |
paid by the Adviser) may reasonably be viewed as compensating the Adviser for advisory services it provides to the Fund (the “implied fee”) and that the Adviser believes that while the Sponsors pay the Adviser different fee rates, the rate of fee attributable to Fund management at the Fund level is the same for all Sponsors. The directors also considered the fee rate schedules used by other registered investment companies that invest in fixed income securities that are advised by the Adviser.
The Adviser informed the directors that there were no institutional products managed by it that have a substantially similar investment style.
Since the Fund does not bear ordinary expenses, the directors did not consider comparative expense information.
Economies of Scale
Since the Advisory Agreement does not provide for any compensation to be paid to the Adviser by the Fund and the Fund’s expense ratio is zero, the directors did not consider the extent to which fee levels in the Advisory Agreement reflect economies of scale. They did note, however, that the fee payable to the Adviser by the current Sponsors declines at a breakpoint based on either individual account sizes or on total assets managed by the Adviser for the Sponsor.
| | |
| abfunds.com | | AB CORPORATE INCOME SHARES | 57 |
This page is not part of the Shareholder Report or the Financial Statements.
AB FAMILY OF FUNDS
US EQUITY
US CORE
Core Opportunities Fund
FlexFee™ US Thematic Portfolio
Select US Equity Portfolio
US GROWTH
Concentrated Growth Fund
Discovery Growth Fund
FlexFee™ Large Cap Growth Portfolio
Growth Fund
Large Cap Growth Fund
Small Cap Growth Portfolio
US VALUE
Discovery Value Fund
Equity Income Fund
Relative Value Fund1
Small Cap Value Portfolio
Value Fund
INTERNATIONAL/ GLOBAL EQUITY
INTERNATIONAL/ GLOBAL CORE
Global Core Equity Portfolio
International Portfolio
International Strategic Core Portfolio
Sustainable Global Thematic Fund1
Tax-Managed International Portfolio
Tax-Managed Wealth Appreciation Strategy
Wealth Appreciation Strategy
INTERNATIONAL/ GLOBAL GROWTH
Concentrated International Growth Portfolio
International Growth Fund
INTERNATIONAL/ GLOBAL EQUITY (continued)
INTERNATIONAL/ GLOBAL VALUE
Asia ex-Japan Equity Portfolio
International Value Fund
FIXED INCOME
MUNICIPAL
High Income Municipal Portfolio
Intermediate California Municipal Portfolio
Intermediate Diversified Municipal Portfolio
Intermediate New York Municipal Portfolio
Municipal Bond Inflation Strategy
Tax-Aware Fixed Income Portfolio
National Portfolio
Arizona Portfolio
California Portfolio
Massachusetts Portfolio
Minnesota Portfolio
New Jersey Portfolio
New York Portfolio
Ohio Portfolio
Pennsylvania Portfolio
Virginia Portfolio
TAXABLE
Bond Inflation Strategy
FlexFee™ International Bond Portfolio
Global Bond Fund
High Income Fund
High Yield Portfolio
Income Fund
Intermediate Bond Portfolio
Limited Duration High Income Portfolio
Short Duration Portfolio
ALTERNATIVES
All Market Real Return Portfolio
Credit Long/Short Portfolio
Global Real Estate Investment Fund
Select US Long/Short Portfolio
Unconstrained Bond Fund
MULTI-ASSET
All Market Income Portfolio
All Market Total Return Portfolio1
Conservative Wealth Strategy
Emerging Markets Multi-Asset Portfolio
Global Risk Allocation Fund
Tax-Managed All Market Income Portfolio1
TARGET-DATE
Multi-Manager Select Retirement Allocation Fund
Multi-Manager Select 2010 Fund
Multi-Manager Select 2015 Fund
Multi-Manager Select 2020 Fund
Multi-Manager Select 2025 Fund
Multi-Manager Select 2030 Fund
Multi-Manager Select 2035 Fund
Multi-Manager Select 2040 Fund
Multi-Manager Select 2045 Fund
Multi-Manager Select 2050 Fund
Multi-Manager Select 2055 Fund
CLOSED-END FUNDS
Alliance California Municipal Income Fund
AllianceBernstein Global High Income Fund
AllianceBernstein National Municipal Income Fund
We also offer Government Money Market Portfolio1, which serves as the money market fund exchange vehicle for the AB mutual funds. An investment in Government Money Market Portfolio is not a deposit in a bank and is not insured or guaranteed by the Federal Deposit Insurance Corporation or any other government agency. Although the Fund seeks to preserve the value of your investment at $1.00 per share, it is possible to lose money by investing in the Fund.
Investors should consider the investment objectives, risks, charges and expenses of the Fund carefully before investing. For copies of our prospectus or summary prospectus, which contain this and other information, visit us online at www.abfunds.com or contact your AB representative. Please read the prospectus and/or summary prospectus carefully before investing.
| 1 | Prior to January 9, 2017, Relative Value Fund was named Growth & Income Fund; prior to April 17, 2017, Tax-Managed All Market Income Portfolio was named Tax-Managed Balanced Wealth Strategy; prior to April 24, 2017, All Market Total Return Portfolio was named Balanced Wealth Strategy; prior to November 10, 2017, Government Money Market Portfolio was named Government Exchange Reserves. |
| | |
| 58 | AB CORPORATE INCOME SHARES | | abfunds.com |
NOTES
| | |
| abfunds.com | | AB CORPORATE INCOME SHARES | 59 |
NOTES
| | |
| 60 | AB CORPORATE INCOME SHARES | | abfunds.com |

AB CORPORATE INCOME SHARES
1345 Avenue of the Americas
New York, NY 10105
800 221 5672
CIS-0152-1017 
OCT 10.31.17
SEMI-ANNUAL REPORT
AB MUNICIPAL INCOME SHARES


| | |
| |
| Investment Products Offered | | • Are Not FDIC Insured • May Lose Value • Are Not Bank Guaranteed |
Investors should consider the investment objectives, risks, charges and expenses of the Fund carefully before investing. For copies of our prospectus or summary prospectus, which contain this and other information, visit us online at www.abfunds.com or contact your AB representative. Please read the prospectus and/or summary prospectus carefully before investing.
This shareholder report must be preceded or accompanied by the Fund’s prospectus for individuals who are not current shareholders of the Fund.
You may obtain a description of the Fund’s proxy voting policies and procedures, and information regarding how the Fund voted proxies relating to portfolio securities during the most recent 12-month period ended June 30, without charge. Simply visit AB’s website at www.abfunds.com, or go to the Securities and Exchange Commission’s (the “Commission”) website at www.sec.gov, or call AB at (800) 227 4618.
The Fund files its complete schedule of portfolio holdings with the Commission for the first and third quarters of each fiscal year on Form N-Q. The Fund’s Forms N-Q are available on the Commission’s website at www.sec.gov. The Fund’s Forms N-Q may also be reviewed and copied at the Commission’s Public Reference Room in Washington, DC; information on the operation of the Public Reference Room may be obtained by calling (800) SEC 0330. AB publishes full portfolio holdings for the Fund monthly at www.abfunds.com.
AllianceBernstein Investments, Inc. (ABI) is the distributor of the AB family of mutual funds. ABI is a member of FINRA and is an affiliate of AllianceBernstein L.P., the Adviser of the funds.
The [A/B] logo is a registered service mark of AllianceBernstein and AllianceBernstein® is a registered service mark used by permission of the owner, AllianceBernstein L.P.
| | |
| FROM THE PRESIDENT | |  |
Dear Shareholder,
We are pleased to provide this report for AB Municipal Income Shares (the “Fund”). Please review the discussion of Fund performance, the market conditions during the reporting period and the Fund’s investment strategy.
As always, AB strives to keep clients ahead of what’s next by:
| + | | Transforming uncommon insights into uncommon knowledge with a global research scope |
| + | | Navigating markets with seasoned investment experience and sophisticated solutions |
| + | | Providing thoughtful investment insights and actionable ideas |
Whether you’re an individual investor or a multi-billion-dollar institution, we put knowledge and experience to work for you.
AB’s global research organization connects and collaborates across platforms and teams to deliver impactful insights and innovative products. Better insights lead to better opportunities—anywhere in the world.
For additional information about AB’s range of products and shareholder resources, please log on to www.abfunds.com.
Thank you for your investment in the AB Mutual Funds.
Sincerely,

Robert M. Keith
President and Chief Executive Officer, AB Mutual Funds
| | |
| abfunds.com | | AB MUNICIPAL INCOME SHARES | 1 |
SEMI-ANNUAL REPORT
December 27, 2017
This report provides management’s discussion of fund performance for AB Municipal Income Shares for the semi-annual reporting period ended October 31, 2017. Please note, shares of this Fund are available only to separately managed accounts or participants in “wrap fee” programs or other investment programs approved by the Adviser.
The investment objective of the Fund is to earn the highest level of current income, exempt from federal taxation, that is available consistent with what the Adviser considers to be an appropriate level of risk.
NAV RETURNS AS OF OCTOBER 31, 2017 (unaudited)
| | | | | | | | |
| | | 6 Months | | | 12 Months | |
| AB MUNICIPAL INCOME SHARES | | | 4.57% | | | | 3.32% | |
| Bloomberg Barclays Municipal Bond Index | | | 2.55% | | | | 2.19% | |
INVESTMENT RESULTS
The table above shows the Fund’s performance compared to its benchmark, the Bloomberg Barclays Municipal Bond Index, for the six- and 12-month periods ended October 31, 2017.
The Fund outperformed the benchmark for both periods. The Fund is generally used to provide exposure to lower-related municipal bonds within separately managed account strategies. As such, the Fund is overweight lower-rated (non-investment grade) bonds relative to the benchmark, which is composed of 100% investment-grade bonds. This overweight was beneficial over both periods.
For the six-month period, yield-curve positioning, specifically an overweight to seven-to-10-year and over 10-year duration municipals contributed, relative to the benchmark. Security selection within the local general obligation (“GO”) and state GO sectors contributed, while selections within the industrial development sector detracted.
For the 12-month period, security selection within the local GO sector contributed, while selections within the industrial development and senior living sectors detracted. Yield-curve positioning also detracted from performance.
The Fund utilized derivatives during both periods, for hedging purposes. Interest rate swaps had no material impact on absolute performance for the six-month period, and added for the 12-month period; Inflation swaps were not used for the six-month period, and had no material impact on the 12-month period.
| | |
| 2 | AB MUNICIPAL INCOME SHARES | | abfunds.com |
MARKET REVIEW AND INVESTMENT STRATEGY
The relatively strong returns in both equities and corporate bonds over both periods were consistent with a positive economic backdrop; major developed and emerging markets—including China—grew at a decent clip while inflation remained moderate. Municipal bond prices were supported by strong technicals, as supply remained low and an historic number of bonds matured or were called by issuers. Municipals delivered positive absolute returns over both periods. Demand for income, along with limited supply, helped mid-grade and high-yield municipals rally strongly.
The US Federal Reserve (the “Fed”) raised its target for the Federal Funds rate by 75 basis points over the past 12 months. On the horizon, major central banks across the globe are likely to normalize monetary policy, which suggests higher interest rates and the eventual end of nearly a decade of quantitative easing. And, in September, the Fed confirmed it would begin the multiyear process of reducing its $4.2 trillion portfolio of Treasury and mortgage-backed bonds.
At the end of the reporting period, municipal investors were focused on the specter of tax reform and how it could potentially impact the after-tax relative attractiveness of municipal bonds. Ultimately, the final legislation included tax reductions for individuals, but the largest reductions in tax rates were those applicable to corporations. The relatively slight lowering of individual tax rates is not expected to significantly reduce the demand from individual investors for municipal bonds. Whether corporations, primarily insurance companies and banks, will reduce their demand for municipal bonds will be a function of the after-tax yield and the potential tax consequences of selling municipal bonds they currently hold, in order to purchase other bonds that offer more attractive after-tax yields. With the after-tax yield advantage for municipal bonds already low by historical standards, the Fund’s Senior Investment Management Team continues to position the Fund with an underweight to the longest maturity bonds; this potentially reduces the Fund’s exposure to a rise in yields, which could result from reduced investor demand for certain municipal bonds.
The Fund may purchase municipal securities that are insured under policies issued by certain insurance companies. Historically, insured municipal securities typically received a higher credit rating, which meant that the issuer of the securities paid a lower interest rate. As a result of declines in the credit quality and associated downgrades of most fund insurers, insurance has less value than it did in the past. The market now values insured municipal securities primarily based on the credit quality of the issuer of the security with little value given to the insurance feature. In purchasing such insured securities, the Adviser evaluates the risk and return of municipal securities through its own research. If an insurance company’s rating is downgraded or the company becomes insolvent, the prices of municipal securities insured by the insurance company may
| | |
| abfunds.com | | AB MUNICIPAL INCOME SHARES | 3 |
decline. As of October 31, 2017, the Fund’s percentages of investments in municipal bonds that are insured and in insured municipal bonds that have been pre-refunded or escrowed to maturity were 3.09% and 0.00%, respectively.
INVESTMENT POLICIES
The Fund pursues its objective by investing principally in high-yielding municipal securities that may be non-investment grade or investment-grade. As a matter of fundamental policy, the Fund invests, under normal circumstances, at least 80% of its net assets in municipal securities that pay interest that is exempt from federal income tax. These securities may pay interest that is subject to the federal alternative minimum tax for certain taxpayers.
The Adviser selects securities for purchase or sale based on its assessment of the securities’ risk and return characteristics as well as the securities’ impact on the overall risk and return characteristics of the Fund. In making this assessment, the Adviser takes into account various factors, including the credit quality and sensitivity to interest rates of the securities under consideration and of the Fund’s other holdings.
The Fund may invest without limit in lower-rated securities (“junk bonds”), which may include securities having the lowest rating, and in unrated securities that, in the Adviser’s judgment, would be lower-rated securities if rated. The Fund may invest in fixed-income securities with any maturity or duration. The Fund will seek to increase income for shareholders by investing in longer maturity bonds. Consistent with its objective of seeking a higher level of income, the Fund may experience greater volatility and a higher risk of loss of principal than other municipal funds.
The Fund may also invest in tender option bond transactions (“TOBs”); forward commitments; zero-coupon municipal securities and variable, floating and inverse floating-rate municipal securities; certain types of mortgage-related securities; and derivatives, such as options, futures contracts, forwards and swaps.
The Fund may make short sales of securities or maintain a short position, and may use other investment techniques. The Fund may use leverage for investment purposes to increase income through the use of TOBs and derivative instruments, such as interest rate swaps.
| | |
| 4 | AB MUNICIPAL INCOME SHARES | | abfunds.com |
DISCLOSURES AND RISKS
Benchmark Disclosure
The Bloomberg Barclays Municipal Bond Index is unmanaged and does not reflect fees and expenses associated with the active management of a fund. The Bloomberg Barclays Municipal Bond Index represents the performance of the long-term tax-exempt bond market consisting of investment-grade bonds. An investor cannot invest directly in an index, and its results are not indicative of the performance for any specific investment, including the Fund.
A Word About Risk
Market Risk: The value of the Fund’s assets will fluctuate as the stock or bond market fluctuates. The value of the Fund’s investments may decline, sometimes rapidly and unpredictably, simply because of economic changes or other events that affect large portions of the market.
Credit Risk: An issuer or guarantor of a fixed-income security, or the counterparty to a derivatives or other contract, may be unable or unwilling to make timely payments of interest or principal, or to otherwise honor its obligations. The issuer or guarantor may default, causing a loss of the full principal amount of a security. The degree of risk for a particular security may be reflected in its credit rating. There is the possibility that the credit rating of a fixed-income security may be downgraded after purchase, which may adversely affect the value of the security. Investments in fixed-income securities with lower ratings tend to have a higher probability that an issuer will default or fail to meet its payment obligations.
Municipal Market Risk: This is the risk that special factors may adversely affect the value of municipal securities and have a significant effect on the yield or value of the Fund’s investments in municipal securities. These factors include economic conditions, political or legislative changes, uncertainties related to the tax status of municipal securities, or the rights of investors in these securities. To the extent that the Fund invests more of its assets in a particular state’s municipal securities, the Fund may be vulnerable to events adversely affecting that state, including economic, political and regulatory occurrences, court decisions, terrorism and catastrophic natural disasters, such as hurricanes or earthquakes. The Fund’s investments in certain municipal securities with principal and interest payments that are made from the revenues of a specific project or facility, and not general tax revenues, may have increased risks. Factors affecting the project or facility, such as local business or economic conditions, could have a significant effect on the project’s ability to make payments of principal and interest on these securities.
The Fund may invest in the municipal securities of Puerto Rico or other US territories and their governmental agencies and municipalities, which are exempt from federal, state, and, where applicable, local income taxes. These
| | |
| abfunds.com | | AB MUNICIPAL INCOME SHARES | 5 |
DISCLOSURES AND RISKS (continued)
municipal securities may have more risks than those of other US issuers of municipal securities. Puerto Rico experienced a significant downturn during the recession. Puerto Rico’s downturn was particularly severe, and Puerto Rico continues to face a very challenging economic and fiscal environment. Municipal securities issued by Puerto Rico issuers have extremely low ratings by the credit rating organizations. More recently Puerto Rico has defaulted on its debt payments, and if the general economic situation in Puerto Rico persists, the volatility and credit quality of Puerto Rican municipal securities will continue to be adversely affected, and the market for such securities may experience continued volatility. In addition, Puerto Rico’s difficulties have resulted in increased volatility in portions of the broader municipal securities market from time to time, and this may recur in the future.
Tax Risk: There is no guarantee that the income on the Fund’s municipal securities will be exempt from regular federal income and state income taxes. Unfavorable legislation, adverse interpretations by federal or state authorities, litigation or noncompliant conduct by the issuer of a municipal security could affect the tax-exempt status of municipal securities. If the Internal Revenue Service or a state authority determines that an issuer of a municipal security has not complied with applicable requirements, interest from the security could become subject to regular federal income tax and/or state personal income tax, possibly retroactively to the date the security was issued, the value of the security could decline significantly, and a portion of the distributions to Fund shareholders could be recharacterized as taxable. Recent federal legislation included reductions in tax rates for individuals, with relatively larger reductions in tax rates for corporations. These tax rate reductions may reduce the demand for municipal bonds which could reduce the value of municipal bonds held by the Fund.
Below Investment Grade Securities Risk: Investments in fixed-income securities with lower ratings (commonly known as “junk bonds”) tend to have a higher probability that an issuer will default or fail to meet its payment obligations. These securities may be subject to greater price volatility due to such factors as specific corporate developments, interest rate sensitivity, negative perceptions of the junk bond market generally and less secondary market liquidity.
Interest Rate Risk: Changes in interest rates will affect the value of investments in fixed-income securities. When interest rates rise, the value of existing investments in fixed-income securities tends to fall and this decrease in value may not be offset by higher income from new investments. The Fund may be subject to heightened interest rate risk due to rising interest rates as the current period of historically low interest rates may be ending. Interest rate risk is generally greater for fixed-income securities with longer maturities or durations.
| | |
| 6 | AB MUNICIPAL INCOME SHARES | | abfunds.com |
DISCLOSURES AND RISKS (continued)
Inflation Risk: This is the risk that the value of assets or income from investments will be less in the future as inflation decreases the value of money. As inflation increases, the value of the Fund’s assets can decline as can the value of the Fund’s distributions. This risk is significantly greater for fixed-income securities with longer maturities.
Leverage Risk: To the extent the Fund uses leveraging techniques, its NAV may be more volatile because leverage tends to exaggerate the effect of changes in interest rates and any increase or decrease in the value of the Fund’s investments.
Liquidity Risk: Liquidity risk exists when particular investments, such as lower-rated securities, are difficult to purchase or sell, possibly preventing the Fund from selling out of these illiquid securities at an advantageous price. The Fund is subject to liquidity risk because the market for municipal securities is generally smaller than many other markets. Derivatives and securities involving substantial market and credit risk tend to involve greater liquidity risk.
Derivatives Risk: Derivatives may be illiquid, difficult to price, and leveraged so that small changes may produce disproportionate losses for the Fund, and may be subject to counterparty risk to a greater degree than more traditional investments.
Management Risk: The Fund is subject to management risk because it is an actively managed investment fund. The Adviser will apply its investment techniques and risk analyses in making investment decisions, but there is no guarantee that its techniques will produce the intended results.
These risks are fully discussed in the Fund’s prospectus. As with all investments, you may lose money by investing in the Fund.
An Important Note About Historical Performance
The performance shown in this report represents past performance and does not guarantee future results. Current performance may be lower or higher than the performance information shown. You may obtain performance information current to the most recent month-end by calling (800) 227 4618. The investment return and principal value of an investment in the Fund will fluctuate, so that your shares, when redeemed, may be worth more or less than their original cost. Performance assumes reinvestment of distributions and does not account for taxes.
Investors should consider the investment objectives, risks, charges and expenses of the Fund carefully before investing. For copies of our prospectus and/or summary prospectus, which contain this and other information, visit us online at www.abfunds.com or contact your AllianceBernstein Investments representative. Please read the prospectus and/or summary prospectus carefully before investing.
| | |
| abfunds.com | | AB MUNICIPAL INCOME SHARES | 7 |
HISTORICAL PERFORMANCE
AVERAGE ANNUAL RETURNS AS OF OCTOBER 31, 2017 (unaudited)
| | | | |
| | | NAV Returns | |
| 1 Year | | | 3.32% | |
| 5 Years | | | 5.36% | |
| Since Inception1 | | | 6.98% | |
AVERAGE ANNUAL RETURNS
AS OF THE MOST RECENT CALENDAR QUARTER-END
SEPTEMBER 30, 2017 (unaudited)
| | | | |
| | | NAV Returns | |
| 1 Year | | | 1.39% | |
| 5 Years | | | 5.60% | |
| Since Inception1 | | | 7.00% | |
The prospectus fee table shows the fees and the total operating expenses of the Fund as 0.00% because the Adviser does not charge any fees or expenses and reimburses Fund operating expenses except certain extraordinary expenses, taxes, brokerage costs and the interest on borrowings or certain leveraged transactions. Participants in a wrap fee program or other investment program eligible to invest in the Fund pay fees to the program sponsor and should review the program brochure or other literature provided by the sponsor for a discussion of fees and expenses charged.
| 1 | Inception date: 9/1/2010. |
| | |
| 8 | AB MUNICIPAL INCOME SHARES | | abfunds.com |
EXPENSE EXAMPLE
(unaudited)
As a shareholder of the Fund, you may incur various ongoing non-operating and extraordinary costs. This example is intended to help you understand your ongoing costs (in dollars) of investing in the Fund and to compare these costs with the ongoing costs of investing in other mutual funds.
The Example is based on an investment of $1,000 invested at the beginning of the period and held for the entire period as indicated below.
Actual Expenses
The table below provides information about actual account values and actual expenses. You may use the information in this line, together with the amount you invested, to estimate the expenses that you paid over the period. Simply divide your account value by $1,000 (for example, an $8,600 account value divided by $1,000 = 8.6), then multiply the result by the number in the first line under the heading entitled “Expenses Paid During Period” to estimate the expenses you paid on your account during this period.
Hypothetical Example for Comparison Purposes
The table below provides information about hypothetical account values and hypothetical expenses based on the Fund’s actual expense ratio and an assumed annual rate of return of 5% before expenses, which is not the Fund’s actual return. The hypothetical account values and expenses may not be used to estimate the actual ending account balance or expenses you paid for the period. You may use this information to compare the ongoing costs of investing in the Fund and other funds by comparing this 5% hypothetical example with the 5% hypothetical examples that appear in the shareholder reports of other funds.
Please note that the expenses shown in the table are meant to highlight your ongoing costs only and do not reflect any transactional costs, such as sales charges (loads), or contingent deferred sales charges on redemptions. Therefore, the hypothetical example is useful in comparing ongoing costs only, and will not help you determine the relative total costs of owning different funds. In addition, if these transactional costs were included, your costs would have been higher.
| | | | | | | | | | | | | | | | |
| | | Beginning
Account Value
May 1, 2017 | | | Ending
Account Value
October 31, 2017 | | | Expenses Paid
During Period* | | | Annualized
Expense Ratio* | |
Actual | | $ | 1,000 | | | $ | 1,045.70 | | | $ | 0.02 | | | | 0.003 | % |
Hypothetical** | | $ | 1,000 | | | $ | 1,025.19 | | | $ | 0.02 | | | | 0.003 | % |
| * | Expenses equal to the Fund’s annualized expense ratio (interest expense incurred) multiplied by the average account value over the period, multiplied by 184/365 (to reflect the one-half year period). The Fund’s operating expenses are borne by the Adviser or its affiliates. |
| ** | Assumes 5% annual return before expenses. |
| | |
| abfunds.com | | AB MUNICIPAL INCOME SHARES | 9 |
PORTFOLIO SUMMARY
October 31, 2017 (unaudited)
PORTFOLIO STATISTICS
Net Assets ($mil): $2,103.6
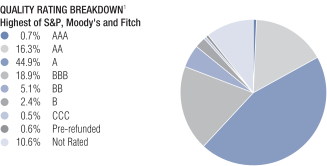
| 1 | All data are as of October 31, 2017. The Fund’s quality rating breakdown is expressed as a percentage of the Fund’s total investments in municipal securities and may vary over time. The Fund also enters into derivative transactions, which may be used for hedging or investment purposes (see “Portfolio of Investments” section of the report for additional details). The quality ratings are determined by using the Standard & Poor’s Global Ratings (“S&P”), Moody’s Investors Services, Inc. (“Moody’s”) and Fitch Ratings, Ltd. (“Fitch”). The Fund considers the credit ratings issued by S&P, Moody’s and Fitch and uses the highest rating issued by the agencies. These ratings are a measure of the quality and safety of a bond or portfolio, based on the issuer’s financial condition. AAA is the highest (best) and D is the lowest (worst). If applicable, the Pre-refunded category includes bonds which are secured by U.S. Government securities and therefore are deemed high-quality investment-grade by the Adviser. If applicable, Not Applicable (N/A) includes non-creditworthy investments, such as equities, currency contracts, futures and options. If applicable, the Not Rated category includes bonds that are not rated by a nationally recognized statistical rating organization. The Adviser evaluates the creditworthiness of non-rated securities based on a number of factors including, but not limited to, cash flows, enterprise value and economic environment. |
| | |
| 10 | AB MUNICIPAL INCOME SHARES | | abfunds.com |
PORTFOLIO OF INVESTMENTS
October 31, 2017 (unaudited)
| | | | | | | | |
| | | Principal Amount (000) | | | U.S. $ Value | |
| |
| | | | | | | | |
MUNICIPAL OBLIGATIONS – 99.9% | |
Long-Term Municipal Bonds – 99.9% | |
Alabama – 2.7% | |
County of Jefferson AL Sewer Revenue
Series 2013D
6.00%, 10/01/42 | | $ | 11,645 | | | $ | 13,585,989 | |
Cullman County Health Care Authority
(Cullman Regional Medical Center, Inc.)
Series 2009A
7.00%, 2/01/36 | | | 400 | | | | 415,764 | |
Infirmary Health System Special Care Facilities Financing Authority of Mobile
Series 2016A
5.00%, 2/01/36-2/01/41 | | | 10,000 | | | | 11,067,750 | |
Lower Alabama Gas District (The)
(Goldman Sachs Group, Inc. (The))
Series 2016A
5.00%, 9/01/46 | | | 10,945 | | | | 13,702,155 | |
Special Care Facilities Financing Authority of the City of Pell City Alabama
(Noland Health Services, Inc.)
Series 2012
5.00%, 12/01/31 | | | 3,000 | | | | 3,296,250 | |
Series 2016A
5.00%, 12/01/31 | | | 10,000 | | | | 10,987,500 | |
Water Works Board of the City of Birmingham (The)
Series 2016B
5.00%, 1/01/33 | | | 3,500 | | | | 4,112,255 | |
| | | | | | | | |
| | | | | | | 57,167,663 | |
| | | | | | | | |
Alaska – 0.5% | |
City of Koyukuk AK
Series 2011
7.75%, 10/01/41 (Pre-refunded/ETM)(a) | | | 100 | | | | 112,131 | |
State of Alaska International Airports System
Series 2016B
5.00%, 10/01/33-10/01/34 | | | 9,000 | | | | 10,468,270 | |
| | | | | | | | |
| | | | | | | 10,580,401 | |
| | | | | | | | |
Arizona – 1.8% | |
Arizona Health Facilities Authority
(Beatitudes Campus (The))
Series 2007
5.10%, 10/01/22(a) | | | 135 | | | | 135,161 | |
5.20%, 10/01/37(a) | | | 5,070 | | | | 5,069,746 | |
| | |
| abfunds.com | | AB MUNICIPAL INCOME SHARES | 11 |
PORTFOLIO OF INVESTMENTS (continued)
| | | | | | | | |
| | | Principal Amount (000) | | | U.S. $ Value | |
| |
| | | | | | | | |
Arizona Sports & Tourism Authority
Series 2012A
5.00%, 7/01/29 | | $ | 3,670 | | | $ | 4,002,135 | |
Glendale Industrial Development Authority
(Royal Oaks Life Care Community)
Series 2016
5.00%, 5/15/39 | | | 2,700 | | | | 2,996,244 | |
Industrial Development Authority of the City of Phoenix (The)
(GreatHearts Arizona)
Series 2014
5.00%, 7/01/44 | | | 3,875 | | | | 4,104,167 | |
Maricopa County Industrial Development Authority
(Banner Health Obligated Group)
Series 2016A
5.00%, 1/01/33-1/01/35 | | | 16,100 | | | | 18,880,637 | |
Series 2017A
5.00%, 1/01/41 | | | 1,800 | | | | 2,085,930 | |
Quechan Indian Tribe of Fort Yuma
Series 2012A
9.75%, 5/01/25 | | | 90 | | | | 102,828 | |
Salt Verde Financial Corp.
(Citigroup, Inc.)
Series 2007
5.00%, 12/01/37 | | | 150 | | | | 182,742 | |
University of Arizona
Series 2014
5.00%, 8/01/33 | | | 1,000 | | | | 1,166,460 | |
| | | | | | | | |
| | | | | | | 38,726,050 | |
| | | | | | | | |
California – 5.6% | |
Abag Finance Authority for Nonprofit Corps.
(Episcopal Senior Communities)
Series 2011
6.125%, 7/01/41 | | | 100 | | | | 111,571 | |
Alameda Corridor Transportation Authority
Series 2016B
5.00%, 10/01/34-10/01/37 | | | 26,130 | | | | 29,807,780 | |
Anaheim Public Financing Authority
(City of Anaheim CA Lease)
Series 2014A
5.00%, 5/01/31 | | | 1,460 | | | | 1,719,778 | |
Bay Area Toll Authority
Series 2013S
5.00%, 4/01/27 (Pre-refunded/ETM) | | | 1,000 | | | | 1,184,760 | |
| | |
| 12 | AB MUNICIPAL INCOME SHARES | | abfunds.com |
PORTFOLIO OF INVESTMENTS (continued)
| | | | | | | | |
| | | Principal Amount (000) | | | U.S. $ Value | |
| |
| | | | | | | | |
California Educational Facilities Authority
(Chapman University)
Series 2015
5.00%, 4/01/31-4/01/34 | | $ | 11,845 | | | $ | 13,543,095 | |
California Educational Facilities Authority
(University of the Pacific)
Series 2012A
5.00%, 11/01/42 | | | 100 | | | | 111,756 | |
California Health Facilities Financing Authority
(Children’s Hospital Los Angeles)
Series 2017A
5.00%, 8/15/37 | | | 1,700 | | | | 1,941,468 | |
California Municipal Finance Authority
Series 2011B
7.75%, 4/01/31 (Pre-refunded/ETM)(a) | | | 85 | | | | 99,935 | |
California Municipal Finance Authority
(Goodwill Industries of Sacramento Valley & Northern Nevada, Inc.)
Series 2012A
6.625%, 1/01/32(a)(b) | | | 1,000 | | | | 1,083,740 | |
Series 2014
5.00%, 1/01/35(a) | | | 1,335 | | | | 1,303,347 | |
California Municipal Finance Authority
(Partnerships to Uplift Communities Lakeview Terrace and Los Angeles Project)
Series 2012A
5.30%, 8/01/47 | | | 1,025 | | | | 1,056,088 | |
California Municipal Finance Authority
(Rocketship Education)
Series 2014A
7.00%, 6/01/34(a) | | | 1,200 | | | | 1,389,576 | |
7.25%, 6/01/43(a) | | | 2,075 | | | | 2,362,035 | |
California Municipal Finance Authority
(Rocketship Seven-Alma Academy)
Series 2012A
6.25%, 6/01/43(a) | | | 750 | | | | 804,390 | |
California Pollution Control Financing Authority
(Poseidon Resources Channelside LP)
Series 2012
5.00%, 11/21/45(b) | | | 6,405 | | | | 6,900,491 | |
California School Finance Authority
(Partnerships to Uplift Communities Valley Project)
Series 2014A
6.40%, 8/01/34 | | | 3,000 | | | | 3,256,170 | |
| | |
| abfunds.com | | AB MUNICIPAL INCOME SHARES | 13 |
PORTFOLIO OF INVESTMENTS (continued)
| | | | | | | | |
| | | Principal Amount (000) | | | U.S. $ Value | |
| |
| | | | | | | | |
California School Finance Authority
(Tri-Valley Learning Corp.)
Series 2012A
7.00%, 6/01/47(a)(c)(d) | | $ | 730 | | | $ | 547,500 | |
California Statewide Communities Development Authority
(Eskaton Properties, Inc. Obligated Group)
Series 2012
5.25%, 11/15/34 | | | 530 | | | | 578,612 | |
California Statewide Communities Development Authority
(Moldaw Residences)
Series 2014A
5.25%, 11/01/44(a)(b) | | | 1,200 | | | | 1,277,208 | |
California Statewide Communities Development Authority
(Rocketship Four-Mosaic Elementary)
Series 2011A
8.50%, 12/01/41(a) | | | 100 | | | | 119,148 | |
California Statewide Communities Development Authority
(Rocklin Academy)
Series 2011A
8.25%, 6/01/41 | | | 140 | | | | 160,161 | |
California Statewide Communities Development Authority
(Terraces at San Joaquin Gardens (The))
Series 2012A
6.00%, 10/01/47(a) | | | 250 | | | | 272,795 | |
City of Roseville CA
(HP Campus Oaks Community Facilities District No 1)
Series 2016
5.50%, 9/01/46(a) | | | 1,000 | | | | 1,082,750 | |
City of San Buenaventura CA
(Community Memorial Health System)
Series 2011
7.50%, 12/01/41 | | | 100 | | | | 116,240 | |
Municipal Improvement Corp. of Los Angeles
(Municipal Improvement Corp. of Los Angeles Lease)
Series 2016B
4.00%, 11/01/36 | | | 2,705 | | | | 2,866,488 | |
| | |
| 14 | AB MUNICIPAL INCOME SHARES | | abfunds.com |
PORTFOLIO OF INVESTMENTS (continued)
| | | | | | | | |
| | | Principal Amount (000) | | | U.S. $ Value | |
| |
| | | | | | | | |
Oakland Unified School District/Alameda County
Series 2015A
5.00%, 8/01/30-8/01/40 | | $ | 6,215 | | | $ | 7,257,006 | |
San Francisco City & County Redevelopment Agency
(Mission Bay South Public Imp)
Series 2013A
5.00%, 8/01/31(a) | | | 1,000 | | | | 1,104,610 | |
San Francisco City & County Redevelopment Agency
(Successor Agency to the Redev of San Francisco – Mission Bay South)
NATL Series 2016C
5.00%, 8/01/41 | | | 1,250 | | | | 1,424,525 | |
San Joaquin County Transportation Authority
(San Joaquin County Transportation Authority Sales Tax)
Series 2017
5.00%, 3/01/36-3/01/37 | | | 5,500 | | | | 6,522,065 | |
San Joaquin Hills Transportation Corridor Agency
Series 2014A
5.00%, 1/15/44 | | | 1,450 | | | | 1,598,987 | |
Series 2014B
5.25%, 1/15/44 | | | 1,000 | | | | 1,095,180 | |
Southern California Logistics Airport Authority
XLCA Series 2006
5.00%, 12/01/36-12/01/43(a) | | | 1,685 | | | | 1,684,994 | |
State of California
Series 2016
4.00%, 9/01/33-9/01/35 | | | 18,000 | | | | 19,524,270 | |
University of California CA Revenues
5.00%, 5/15/33(e) | | | 1,000 | | | | 1,162,740 | |
West Contra Costa Healthcare District
Series 2011
6.25%, 7/01/42(a) | | | 3,375 | | | | 3,678,075 | |
| | | | | | | | |
| | | | | | | 118,749,334 | |
| | | | | | | | |
Colorado – 1.1% | |
Centerra Metropolitan District No 1
Series 2017
5.00%, 12/01/37(a) | | | 5,000 | | | | 5,181,300 | |
Colorado Health Facilities Authority
(Catholic Health Initiatives)
Series 2013
5.25%, 1/01/40 | | | 5,910 | | | | 6,371,275 | |
| | |
| abfunds.com | | AB MUNICIPAL INCOME SHARES | 15 |
PORTFOLIO OF INVESTMENTS (continued)
| | | | | | | | |
| | | Principal Amount (000) | | | U.S. $ Value | |
| |
| | | | | | | | |
Colorado Health Facilities Authority
(Evangelical Lutheran Good Samaritan Obligated Group)
Series 2012
5.00%, 12/01/42 | | $ | 2,910 | | | $ | 3,117,367 | |
Colorado Health Facilities Authority
(Parkview Medical Center, Inc. Obligated Group)
Series 2015B
5.00%, 9/01/30 | | | 1,150 | | | | 1,324,973 | |
Colorado Health Facilities Authority
(Sunny Vista Living Center)
Series 2015A
6.25%, 12/01/50(a)(b) | | | 1,000 | | | | 1,053,680 | |
Copperleaf Metropolitan District No 2
Series 2015
5.75%, 12/01/45(a) | | | 1,000 | | | | 1,054,390 | |
E-470 Public Highway Authority
Series 2010C
5.375%, 9/01/26 | | | 1,000 | | | | 1,101,700 | |
Plaza Metropolitan District No 1
Series 2013
5.00%, 12/01/40(a)(b) | | | 1,500 | | | | 1,555,035 | |
Prairie Center Metropolitan District No 3
Series 2017A
5.00%, 12/15/41(a)(b) | | | 1,350 | | | | 1,360,732 | |
Regional Transportation District
(Denver Transit Partners LLC)
Series 2010
6.00%, 1/15/41 | | | 200 | | | | 219,166 | |
Sterling Ranch Community Authority Board
Series 2015A
5.75%, 12/01/45(a) | | | 1,000 | | | | 997,180 | |
| | | | | | | | |
| | | | | | | 23,336,798 | |
| | | | | | | | |
Connecticut – 4.4% | |
Connecticut State Health & Educational Facility Authority
(Quinnipiac University)
Series 2015L
5.00%, 7/01/45 | | | 5,750 | | | | 6,439,943 | |
Connecticut State Health & Educational Facility Authority
(Seabury Retirement Community)
Series 2016A
5.00%, 9/01/46-9/01/53(b) | | | 2,475 | | | | 2,531,298 | |
| | |
| 16 | AB MUNICIPAL INCOME SHARES | | abfunds.com |
PORTFOLIO OF INVESTMENTS (continued)
| | | | | | | | |
| | | Principal Amount (000) | | | U.S. $ Value | |
| |
| | | | | | | | |
State of Connecticut
Series 2013A
5.00%, 10/15/24 | | $ | 5,000 | | | $ | 5,723,050 | |
Series 2013E
5.00%, 8/15/31(e) | | | 1,000 | | | | 1,113,330 | |
Series 2015F
5.00%, 11/15/25-11/15/32 | | | 7,070 | | | | 8,208,410 | |
Series 2016B
5.00%, 5/15/22 | | | 3,875 | | | | 4,385,686 | |
Series 2016E
5.00%, 10/15/28-10/15/34 | | | 12,845 | | | | 14,835,138 | |
Series 2016F
5.00%, 10/15/31 | | | 10,205 | | | | 11,727,790 | |
Series 2017A
5.00%, 4/15/29-4/15/34 | | | 27,300 | | | | 31,393,800 | |
State of Connecticut Special Tax Revenue
Series 2012
5.00%, 1/01/31 | | | 5,000 | | | | 5,540,500 | |
| | | | | | | | |
| | | | | | | 91,898,945 | |
| | | | | | | | |
Delaware – 0.2% | |
Delaware State Economic Development Authority
(Delaware Military Academy, Inc.)
Series 2014
5.00%, 9/01/44-9/01/49 | | | 2,440 | | | | 2,597,888 | |
Delaware State Economic Development Authority
(Newark Charter School, Inc.)
Series 2012
5.00%, 9/01/42 | | | 1,310 | | | | 1,399,840 | |
| | | | | | | | |
| | | | | | | 3,997,728 | |
| | | | | | | | |
District of Columbia – 0.2% | |
District of Columbia
(Center for Strategic International Studies, Inc.)
Series 2011
6.625%, 3/01/41 | | | 100 | | | | 108,395 | |
District of Columbia
(Friendship Public Charter School, Inc.)
Series 2012
5.00%, 6/01/42 | | | 1,420 | | | | 1,531,115 | |
Series 2016A
5.00%, 6/01/41-6/01/46 | | | 1,400 | | | | 1,510,670 | |
Metropolitan Washington Airports Authority
Series 2016A
5.00%, 10/01/35 | | | 500 | | | | 579,390 | |
| | | | | | | | |
| | | | | | | 3,729,570 | |
| | | | | | | | |
| | |
| abfunds.com | | AB MUNICIPAL INCOME SHARES | 17 |
PORTFOLIO OF INVESTMENTS (continued)
| | | | | | | | |
| | | Principal Amount (000) | | | U.S. $ Value | |
| |
| | | | | | | | |
Florida – 5.0% | |
Alachua County Health Facilities Authority
(Bonita Springs Retirement Village, Inc.)
Series 2011A
8.125%, 11/15/46(a) | | $ | 100 | | | $ | 113,359 | |
Alachua County Health Facilities Authority
(East Ridge Retirement Village, Inc.)
Series 2014
6.25%, 11/15/44 | | | 1,100 | | | | 1,217,073 | |
Alachua County Health Facilities Authority
(Oak Hammock at the University of Florida, Inc.)
Series 2012A
8.00%, 10/01/46(a) | | | 435 | | | | 507,367 | |
Alachua County Health Facilities Authority
(Shands Teaching Hospital and Clinics Obligated Group)
Series 2014A
5.00%, 12/01/44 | | | 1,000 | | | | 1,098,750 | |
Bexley Community Development District
Series 2016
4.875%, 5/01/47(a) | | | 1,000 | | | | 993,030 | |
Cape Coral Health Facilities Authority
(Gulf Care, Inc. Obligated Group)
Series 2015
5.875%, 7/01/40(a)(b) | | | 1,400 | | | | 1,501,010 | |
6.00%, 7/01/45-7/01/50(a)(b) | | | 4,015 | | | | 4,319,316 | |
Central Florida Expressway Authority
Series 2016B
5.00%, 7/01/34 | | | 5,500 | | | | 6,351,730 | |
City of Lakeland FL
(Florida Southern College)
Series 2012A
5.00%, 9/01/37-9/01/42 | | | 2,350 | | | | 2,507,723 | |
City of Lakeland FL
(Lakeland Regional Medical Center Obligated Group)
Series 2015
5.00%, 11/15/40 | | | 5,610 | | | | 6,246,454 | |
City of Tampa FL Solid Waste System Revenue
Series 2013
5.00%, 10/01/21 | | | 3,000 | | | | 3,359,970 | |
County of Miami-Dade FL Aviation Revenue
Series 2014A
5.00%, 10/01/33 | | | 10,000 | | | | 11,367,200 | |
| | |
| 18 | AB MUNICIPAL INCOME SHARES | | abfunds.com |
PORTFOLIO OF INVESTMENTS (continued)
| | | | | | | | |
| | | Principal Amount (000) | | | U.S. $ Value | |
| |
| | | | | | | | |
Series 2015A
5.00%, 10/01/31 | | $ | 1,100 | | | $ | 1,269,840 | |
Florida Development Finance Corp.
(Tuscan Isle ChampionsGate Obligated Group)
Series 2016A
6.375%, 6/01/46(a)(b) | | | 1,400 | | | | 1,352,666 | |
Florida Development Finance Corp.
(Tuscan Isle Obligated Group)
Series 2015A
7.00%, 6/01/35-6/01/45(a)(b) | | | 4,900 | | | | 3,968,348 | |
Greater Orlando Aviation Authority
Series 2017A
5.00%, 10/01/34-10/01/36 | | | 9,650 | | | | 11,233,403 | |
Manatee County School District
(Manatee County School District Sales Tax)
AGM Series 2017
5.00%, 10/01/28-10/01/30 | | | 5,450 | | | | 6,544,091 | |
Marshall Creek Community Development District
(Marshall Creek Community Development District 2015A)
Series 2015A
5.00%, 5/01/32(a) | | | 1,670 | | | | 1,663,955 | |
Martin County Health Facilities Authority
(Martin Memorial Medical Center, Inc.)
Series 2012
5.50%, 11/15/32-11/15/42 | | | 1,950 | | | | 2,149,199 | |
Martin County Industrial Development Authority
(Indiantown Cogeneration LP)
Series 2013
4.20%, 12/15/25(b) | | | 1,150 | | | | 1,178,348 | |
Miami Beach Health Facilities Authority
(Mount Sinai Medical Center of Florida, Inc.)
Series 2012
5.00%, 11/15/29 | | | 2,885 | | | | 3,144,361 | |
Series 2014
5.00%, 11/15/39 | | | 2,000 | | | | 2,162,320
| |
Miami-Dade County Expressway Authority
Series 2014A
5.00%, 7/01/34 | | | 4,000 | | | | 4,554,880 | |
Series 2016A
5.00%, 7/01/32-7/01/33 | | | 8,150 | | | | 9,460,916 | |
| | |
| abfunds.com | | AB MUNICIPAL INCOME SHARES | 19 |
PORTFOLIO OF INVESTMENTS (continued)
| | | | | | | | |
| | | Principal Amount (000) | | | U.S. $ Value | |
| |
| | | | | | | | |
Mid-Bay Bridge Authority
Series 2011A
7.25%, 10/01/40 (Pre-refunded/ETM) | | $ | 80 | | | $ | 97,386 | |
Series 2015A
5.00%, 10/01/28-10/01/40 | | | 3,600 | | | | 4,075,776 | |
Series 2015C
5.00%, 10/01/35-10/01/40 | | | 2,750 | | | | 3,031,492 | |
Reedy Creek Improvement District
Series 2013A
5.00%, 6/01/24 | | | 3,000 | | | | 3,535,410 | |
Town of Davie FL
(Nova Southeastern University, Inc.)
Series 2013A
5.625%, 4/01/43 | | | 3,765 | | | | 4,235,361 | |
Volusia County School Board COP
Series 2014B
5.00%, 8/01/31 | | | 1,625 | | | | 1,877,915 | |
| | | | | | | | |
| | | | | | | 105,118,649 | |
| | | | | | | | |
Georgia – 1.8% | |
Cedartown Polk County Hospital Authority
Series 2016
5.00%, 7/01/39 | | | 4,000 | | | | 4,391,600 | |
City of Atlanta Department of Aviation
(Hartsfield Jackson Atlanta Intl Airport)
Series 2012A
5.00%, 1/01/31 | | | 1,390 | | | | 1,561,095 | |
Series 2014A
5.00%, 1/01/33 | | | 1,820 | | | | 2,120,173 | |
Clarke County Hospital Authority
(Piedmont Healthcare, Inc. Obligated Group)
Series 2016
5.00%, 7/01/31 | | | 2,500 | | | | 2,931,575 | |
Fayette County Hospital Authority/GA
(Piedmont Healthcare, Inc. Obligated Group)
Series 2016
5.00%, 7/01/34-7/01/36 | | | 10,710 | | | | 12,235,206 | |
Fulton County Development Authority
(Piedmont Healthcare, Inc. Obligated Group)
Series 2016A
5.00%, 7/01/32 | | | 2,000 | | | | 2,311,840 | |
Gwinnett County Development Authority
(Board of Regents of the University System of Georgia Lease)
Series 2017A
5.00%, 7/01/32-7/01/37 | | | 10,855 | | | | 12,622,621 | |
| | | | | | | | |
| | | | | | | 38,174,110 | |
| | | | | | | | |
| | |
| 20 | AB MUNICIPAL INCOME SHARES | | abfunds.com |
PORTFOLIO OF INVESTMENTS (continued)
| | | | | | | | |
| | | Principal Amount (000) | | | U.S. $ Value | |
| |
| | | | | | | | |
Idaho – 0.0% | |
Idaho Housing & Finance Association
(Battelle Energy Alliance LLC)
Series 2010A
7.00%, 2/01/36 | | $ | 200 | | | $ | 225,092 | |
| | | | | | | | |
|
Illinois – 12.9% | |
Chicago Board of Education
Series 2011A
5.00%, 12/01/41 | | | 1,170 | | | | 1,155,434 | |
Series 2012A
5.00%, 12/01/42 | | | 5,630 | | | | 5,558,443 | |
Series 2015C
5.25%, 12/01/35-12/01/39 | | | 10,315 | | | | 10,169,661 | |
Series 2015E
5.125%, 12/01/32 | | | 1,000 | | | | 993,210 | |
Series 2016B
6.50%, 12/01/46 | | | 1,900 | | | | 2,156,348 | |
Chicago O’Hare International Airport
Series 2015C
5.00%, 1/01/34 | | | 1,665 | | | | 1,866,765 | |
Series 2016B
5.00%, 1/01/34 | | | 5,000 | | | | 5,762,150 | |
Series 2016C
5.00%, 1/01/35-1/01/38 | | | 9,250 | | | | 10,577,405 | |
Series 2017B
5.00%, 1/01/35-1/01/37 | | | 33,445 | | | | 38,752,937 | |
Chicago Transit Authority
(Chicago Transit Authority Sales Tax)
Series 2011
5.25%, 12/01/23 | | | 4,285 | | | | 4,810,127 | |
Chicago Transit Authority
(City of Chicago IL Fed Hwy Grant)
AGC Series 2008
5.00%, 6/01/18 | | | 1,170 | | | | 1,194,114 | |
City of Chicago IL
Series 2008A
5.00%, 1/01/19 | | | 525 | | | | 526,733 | |
Series 2015A
5.00%, 1/01/19 | | | 300 | | | | 308,472 | |
City of Chicago IL
(Goldblatts Supportive Living Project)
Series 2013
6.375%, 12/01/52(a)(f) | | | 1,050 | | | | 916,682 | |
Illinois Finance Authority
(Ascension Health Credit Group)
Series 2012A
5.00%, 11/15/42 | | | 3,600 | | | | 3,944,592 | |
| | |
| abfunds.com | | AB MUNICIPAL INCOME SHARES | 21 |
PORTFOLIO OF INVESTMENTS (continued)
| | | | | | | | |
| | | Principal Amount (000) | | | U.S. $ Value | |
| |
| | | | | | | | |
Illinois Finance Authority
(Greenfields of Geneva)
Series 2010A
8.125%, 2/15/40(a)(c)(d)(g) | | $ | 3,000 | | | $ | 1,680,000 | |
Illinois Finance Authority
(Illinois Institute of Technology)
Series 2006A
5.00%, 4/01/19-4/01/36 | | | 465 | | | | 459,660 | |
Illinois Finance Authority
(Lake Forest College)
Series 2012A
6.00%, 10/01/48 | | | 400 | | | | 419,344 | |
Illinois Finance Authority
(Lutheran Home & Services Obligated Group)
Series 2012
5.75%, 5/15/46(a) | | | 2,495 | | | | 2,637,340 | |
Illinois Finance Authority
(Mercy Health System Obligated Group)
Series 2016
5.00%, 12/01/40-12/01/46 | | | 3,900 | | | | 4,282,310 | |
Illinois Finance Authority
(Park Place of Elmhurst)
Series 2016A
6.20%, 5/15/30(a) | | | 1,079 | | | | 1,073,345 | |
6.33%, 5/15/48(a) | | | 829 | | | | 819,882 | |
6.44%, 5/15/55(a) | | | 1,998 | | | | 1,981,300 | |
Series 2016C
2.00%, 5/15/55(a)(c)(d)(f) | | | 609 | | | | 33,440 | |
Illinois Finance Authority
(Plymouth Place, Inc.)
Series 2013
6.00%, 5/15/43 | | | 3,500 | | | | 3,853,080 | |
Series 2015
5.25%, 5/15/50 | | | 2,000 | | | | 2,071,660 | |
Illinois Finance Authority
(Presence Health Network Obligated Group)
Series 2016C
5.00%, 2/15/31-2/15/41 | | | 14,335 | | | | 16,122,576 | |
Illinois Finance Authority
(Rosalind Franklin University of Medicine & Science)
Series 2017A
5.00%, 8/01/42-8/01/47 | | | 3,000 | | | | 3,286,030 | |
Series 2017C
5.00%, 8/01/46 | | | 1,000 | | | | 1,092,890 | |
| | |
| 22 | AB MUNICIPAL INCOME SHARES | | abfunds.com |
PORTFOLIO OF INVESTMENTS (continued)
| | | | | | | | |
| | | Principal Amount (000) | | | U.S. $ Value | |
| |
| | | | | | | | |
Illinois Finance Authority
(Silver Cross Hospital Obligated Group)
Series 2015C
5.00%, 8/15/35 | | $ | 4,750 | | | $ | 5,167,525 | |
Illinois Municipal Electric Agency
Series 2015A
5.00%, 2/01/22 | | | 6,700 | | | | 7,587,348 | |
Illinois State Toll Highway Authority
Series 2015A
5.00%, 1/01/31-1/01/32 | | | 3,125 | | | | 3,630,843 | |
Series 2015B
5.00%, 1/01/36-1/01/40 | | | 5,250 | | | | 5,980,940 | |
Series 2016A
5.00%, 12/01/32 | | | 7,000 | | | | 8,122,240 | |
Series 2016B
5.00%, 1/01/41 | | | 3,450 | | | | 3,930,516 | |
Metropolitan Pier & Exposition Authority
Series 2015B
5.00%, 12/15/45 | | | 13,300 | | | | 13,530,090 | |
State of Illinois
Series 2012
5.00%, 8/01/21-3/01/31 | | | 7,445 | | | | 7,901,916 | |
Series 2014
5.00%, 5/01/23-5/01/35 | | | 16,170 | | | | 17,332,849 | |
Series 2016
5.00%, 1/01/22-11/01/35 | | | 43,960 | | | | 47,521,473 | |
Series 2017D
5.00%, 11/01/28(h) | | | 10,000 | | | | 10,919,400 | |
Village of Antioch IL
(Village of Antioch IL Spl Tax)
Series 2016A
4.50%, 3/01/33(a) | | | 4,264 | | | | 4,094,719 | |
Series 2016B
7.00%, 3/01/33(a) | | | 1,869 | | | | 1,805,846 | |
Village of Pingree Grove IL Special Service Area No 7
Series 2015A
4.50%, 3/01/25(a) | | | 1,074 | | | | 1,109,055 | |
5.00%, 3/01/36(a) | | | 2,963 | | | | 3,063,801 | |
Series 2015B
6.00%, 3/01/36(a) | | | 986 | | | | 1,048,927 | |
| | | | | | | | |
| | | | | | | 271,253,418 | |
| | | | | | | | |
Indiana – 0.6% | |
Indiana Finance Authority
(Bethany Circle of King’s Daughters’ of Madison Indiana, Inc. (The))
Series 2010
5.125%, 8/15/27 | | | 1,000 | | | | 1,061,030 | |
| | |
| abfunds.com | | AB MUNICIPAL INCOME SHARES | 23 |
PORTFOLIO OF INVESTMENTS (continued)
| | | | | | | | |
| | | Principal Amount (000) | | | U.S. $ Value | |
| |
| | | | | | | | |
5.50%, 8/15/40-8/15/45 | | $ | 3,020 | | | $ | 3,182,816 | |
Indiana Finance Authority
(Marquette Manor)
Series 2015A
5.00%, 3/01/30 | | | 1,000 | | | | 1,079,420 | |
Indiana Finance Authority
(WVB East End Partners LLC)
Series 2013A
5.00%, 7/01/40-7/01/48 | | | 6,980 | | | | 7,514,389 | |
| | | | | | | | |
| | | | | | | 12,837,655 | |
| | | | | | | | |
Kentucky – 3.0% | |
Kentucky Economic Development Finance Authority
Series 2010A
6.00%, 6/01/30 (Pre-refunded/ETM) | | | 200 | | | | 223,940 | |
6.375%, 6/01/40 (Pre-refunded/ETM) | | | 1,525 | | | | 1,722,015 | |
6.50%, 3/01/45 (Pre-refunded/ETM) | | | 1,000 | | | | 1,132,350 | |
Kentucky Economic Development Finance Authority
(Baptist Healthcare System Obligated Group)
Series 2017B
5.00%, 8/15/34-8/15/46 | | | 15,780 | | | | 17,310,069 | |
Kentucky Economic Development Finance Authority
(Masonic Homes of Kentucky, Inc. Obligated Group)
Series 2012
5.375%, 11/15/42(a) | | | 1,685 | | | | 1,768,542 | |
5.50%, 11/15/45(a) | | | 1,000 | | | | 1,053,340 | |
Kentucky Economic Development Finance Authority
(Next Generation Kentucky Information Highway)
Series 2015A
5.00%, 7/01/40-1/01/45 | | | 10,335 | | | | 11,180,653 | |
Kentucky Economic Development Finance Authority
(Owensboro Health, Inc. Obligated Group)
Series 2017A
5.00%, 6/01/37 | | | 4,325 | | | | 4,716,629 | |
5.25%, 6/01/41 | | | 1,250 | | | | 1,389,063 | |
Kentucky Economic Development Finance Authority
(Rosedale Green)
Series 2015
5.50%, 11/15/35(a) | | | 1,750 | | | | 1,757,857 | |
| | |
| 24 | AB MUNICIPAL INCOME SHARES | | abfunds.com |
PORTFOLIO OF INVESTMENTS (continued)
| | | | | | | | |
| | | Principal Amount (000) | | | U.S. $ Value | |
| |
| | | | | | | | |
5.75%, 11/15/45(a) | | $ | 3,350 | | | $ | 3,397,201 | |
Louisville/Jefferson County Metropolitan Government
(Norton Healthcare Obligated Group)
Series 2016
5.00%, 10/01/30-10/01/33 | | | 15,350 | | | | 17,784,727 | |
| | | | | | | | |
| | | | | | | 63,436,386 | |
| | | | | | | | |
Louisiana – 2.8% | |
Jefferson Parish Hospital Service District No 2
Series 2011
6.375%, 7/01/41 | | | 2,130 | | | | 2,192,303 | |
Jefferson Sales Tax District
AGM Series 2017B
5.00%, 12/01/34-12/01/36 | | | 3,400 | | | | 3,969,498 | |
Louisiana Local Government Environmental Facilities & Community Development Auth
Series 2010A
6.00%, 10/01/44 (Pre-refunded/ETM) | | | 400 | | | | 453,580 | |
Louisiana Local Government Environmental Facilities & Community Development Auth
(St James Place of Baton Rouge)
Series 2015A
6.00%, 11/15/35(a) | | | 2,100 | | | | 2,323,839 | |
Louisiana Local Government Environmental Facilities & Community Development Auth
(Woman’s Hospital Foundation)
Series 2017
5.00%, 10/01/34-10/01/44 | | | 27,600 | | | | 31,387,424 | |
Louisiana Public Facilities Authority
Series 2016
5.00%, 5/15/47 (Pre-refunded/ETM)(a) | | | 10 | | | | 12,379 | |
Louisiana Public Facilities Authority
(Louisiana Pellets, Inc.)
Series 2013B
10.50%, 7/01/39(a)(d)(g) | | | 2,750 | | | | 27,500 | |
Series 2014A
7.50%, 7/01/23(a)(d)(g) | | | 1,250 | | | | 12,500 | |
Louisiana Public Facilities Authority
(Louisiana State University & Agricultural & Mechanical College Lease)
5.00%, 7/01/47 | | | 5,000 | | | | 5,592,800 | |
Series 2017
5.00%, 7/01/42-7/01/57 | | | 7,350 | | | | 8,149,855 | |
Louisiana Public Facilities Authority
(Ochsner Clinic Foundation)
Series 2016
5.00%, 5/15/47 | | | 1,110 | | | | 1,222,465 | |
| | |
| abfunds.com | | AB MUNICIPAL INCOME SHARES | 25 |
PORTFOLIO OF INVESTMENTS (continued)
| | | | | | | | |
| | | Principal Amount (000) | | | U.S. $ Value | |
| |
| | | | | | | | |
New Orleans Aviation Board
Series 2017B
5.00%, 1/01/43 | | $ | 1,000 | | | $ | 1,135,990 | |
Port New Orleans Board of Commissioners
Series 2013B
5.00%, 4/01/29-4/01/31 | | | 1,540 | | | | 1,670,125 | |
| | | | | | | | |
| | | | | | | 58,150,258 | |
| | | | | | | | |
Maine – 0.3% | |
Finance Authority of Maine
(Casella Waste Systems, Inc.)
Series 2017
5.25%, 1/01/25(b) | | | 4,630 | | | | 4,981,186 | |
Maine Health & Higher Educational Facilities Authority
(MaineGeneral Health Obligated Group)
Series 2011
7.50%, 7/01/32 | | | 1,000 | | | | 1,137,470 | |
| | | | | | | | |
| | | | | | | 6,118,656 | |
| | | | | | | | |
Maryland – 0.7% | |
City of Baltimore MD
(Baltimore Hotel Corp.)
Series 2017
5.00%, 9/01/33-9/01/36 | | | 3,250 | | | | 3,735,238 | |
City of Baltimore MD
(East Baltimore Research Park Project)
Series 2017A
5.00%, 9/01/38(a) | | | 1,000 | | | | 1,073,840 | |
City of Rockville MD
(King Farm Presbyterian Retirement Community, Inc.)
Series 2017B
5.00%, 11/01/42-11/01/47(h) | | | 4,750 | | | | 5,156,827 | |
County of Howard MD
(Downtown Columbia Project)
Series 2017A
4.375%, 2/15/39(a)(b) | | | 1,000 | | | | 1,011,390 | |
4.50%, 2/15/47(a)(b) | | | 1,200 | | | | 1,216,512 | |
Maryland Health & Higher Educational Facilities Authority
(Meritus Medical Center Obligated Group)
Series 2015
5.00%, 7/01/31 | | | 3,245 | | | | 3,632,031 | |
| | | | | | | | |
| | | | | | | 15,825,838 | |
| | | | | | | | |
Massachusetts – 1.2% | |
Commonwealth of Massachusetts
Series 2016A
5.00%, 3/01/46 | | | 2,000 | | | | 2,289,740 | |
| | |
| 26 | AB MUNICIPAL INCOME SHARES | | abfunds.com |
PORTFOLIO OF INVESTMENTS (continued)
| | | | | | | | |
| | | Principal Amount (000) | | | U.S. $ Value | |
| |
| | | | | | | | |
NATL Series 2000D
1.665%, 12/01/30(i) | | $ | 2,525 | | | $ | 2,329,413 | |
NATL Series 2000G
1.635%, 12/01/30(i) | | | 5,000 | | | | 4,611,450 | |
Massachusetts Development Finance Agency
(Lowell General Hospital)
Series 2013G
5.00%, 7/01/37 | | | 2,550 | | | | 2,746,222 | |
Massachusetts Development Finance Agency
(Merrimack College)
Series 2012A
5.25%, 7/01/42 | | | 5,000 | | | | 5,400,100 | |
Massachusetts Development Finance Agency
(South Shore Hospital, Inc.)
Series 2016I
5.00%, 7/01/31-7/01/41 | | | 3,850 | | | | 4,323,661 | |
Massachusetts Development Finance Agency
(UMass Memorial Health Care Obligated Group)
Series 2016
5.00%, 7/01/41-7/01/46 | | | 3,980 | | | | 4,377,698 | |
| | | | | | | | |
| | | | | | | 26,078,284 | |
| | | | | | | | |
Michigan – 5.3% | |
City of Detroit MI Sewage Disposal System Revenue
(Great Lakes Water Authority Sewage Disposal System)
Series 2012A
5.00%, 7/01/32 | | | 4,400 | | | | 4,864,904
| |
5.25%, 7/01/39 | | | 4,825 | | | | 5,349,429 | |
City of Detroit MI Water Supply System Revenue
(Great Lakes Water Authority Water Supply System)
Series 2011C
5.00%, 7/01/41 | | | 1,060 | | | | 1,125,052 | |
Detroit City School District
Series 2012A
5.00%, 5/01/31 | | | 120 | | | | 132,793 | |
Great Lakes Water Authority
(Great Lakes Water Authority Water Supply System)
Series 2016D
5.00%, 7/01/36 | | | 25,210 | | | | 28,113,688 | |
| | |
| abfunds.com | | AB MUNICIPAL INCOME SHARES | 27 |
PORTFOLIO OF INVESTMENTS (continued)
| | | | | | | | |
| | | Principal Amount (000) | | | U.S. $ Value | |
| |
| | | | | | | | |
Kalamazoo Hospital Finance Authority
(Bronson Healthcare Group Obligated Group)
Series 2016
4.00%, 5/15/31-5/15/36 | | $ | 20,100 | | | $ | 20,919,101 | |
Michigan Finance Authority
(Great Lakes Water Authority Sewage Disposal System)
Series 2014C
5.00%, 7/01/18 | | | 1,000 | | | | 1,022,810 | |
Series 2014C-1
5.00%, 7/01/44 | | | 1,750 | | | | 1,903,598 | |
Michigan Finance Authority
(Great Lakes Water Authority Water Supply System)
Series 2014D4
5.00%, 7/01/29-7/01/34 | | | 2,100 | | | | 2,355,011 | |
Series 2015D-1
5.00%, 7/01/34 | | | 2,000 | | | | 2,251,560 | |
Series 2015D-2
5.00%, 7/01/34 | | | 3,400 | | | | 3,786,002 | |
Michigan Finance Authority
(Henry Ford Health System Obligated Group)
Series 2016
4.00%, 11/15/35-11/15/36 | | | 5,000 | | | | 5,177,460 | |
5.00%, 11/15/32 | | | 3,850 | | | | 4,407,018 | |
Michigan Finance Authority
(MidMichigan Obligated Group)
Series 2014
5.00%, 6/01/34 | | | 2,000 | | | | 2,267,080 | |
Michigan Finance Authority
(Public Lighting Authority)
Series 2014B
5.00%, 7/01/31-7/01/33 | | | 7,950 | | | | 8,762,918 | |
Michigan Strategic Fund
(Detroit Renewable Energy Obligated Group)
Series 2013
8.50%, 12/01/30(a)(b) | | | 2,240 | | | | 2,484,384 | |
Series 2016
9.00%, 12/01/25(a)(b)(h)(j) | | | 8,970 | | | | 8,608,240 | |
Michigan Strategic Fund
(Evangelical Homes of Michigan Obligated Group)
Series 2013
5.50%, 6/01/47 | | | 2,000 | | | | 2,085,240 | |
| | |
| 28 | AB MUNICIPAL INCOME SHARES | | abfunds.com |
PORTFOLIO OF INVESTMENTS (continued)
| | | | | | | | |
| | | Principal Amount (000) | | | U.S. $ Value | |
| |
| | | | | | | | |
Michigan Tobacco Settlement Finance Authority
Series 2007A
6.00%, 6/01/48 | | $ | 5,775 | | | $ | 5,726,663 | |
| | | | | | | | |
| | | | | | | 111,342,951 | |
| | | | | | | | |
Minnesota – 0.2% | |
City of Minneapolis MN
(Fairview Health Services Obligated Group)
Series 2015A
5.00%, 11/15/33 | | | 1,000 | | | | 1,154,440 | |
Southern Minnesota Municipal Power Agency
Series 2017A
5.00%, 1/01/47 | | | 1,780 | | | | 2,066,117 | |
Western Minnesota Municipal Power Agency
Series 2015A
5.00%, 1/01/34 | | | 1,030 | | | | 1,192,689 | |
| | | | | | | | |
| | | | | | | 4,413,246 | |
| | | | | | | | |
Mississippi – 0.5% | |
Mississippi Development Bank
(Mississippi Development Bank State Lease)
Series 2016C
5.00%, 8/01/27 | | | 7,830 | | | | 9,544,065 | |
| | | | | | | | |
|
Missouri – 1.4% | |
Cape Girardeau County Industrial Development Authority
(SoutheastHEALTH Obligated Group)
Series 2017A
5.00%, 3/01/36 | | | 2,925 | | | | 3,208,052 | |
Health & Educational Facilities Authority of the State of Missouri
(Lutheran Senior Services Obligated Group)
Series 2010
5.50%, 2/01/42 | | | 100 | | | | 105,099 | |
Kansas City Industrial Development Authority
(Kingswood Senior Living Community)
Series 2016
5.75%, 11/15/36(a)(b) | | | 1,780 | | | | 1,743,688 | |
6.00%, 11/15/46(a)(b) | | | 4,400 | | | | 4,322,736 | |
Lees Summit Industrial Development Authority
(John Knox Village Obligated Group)
5.25%, 8/15/39 | | | 620 | | | | 658,428 | |
| | |
| abfunds.com | | AB MUNICIPAL INCOME SHARES | 29 |
PORTFOLIO OF INVESTMENTS (continued)
| | | | | | | | |
| | | Principal Amount (000) | | | U.S. $ Value | |
| |
| | | | | | | | |
Series 2016A
5.00%, 8/15/36-8/15/46 | | $ | 4,060 | | | $ | 4,254,123 | |
Missouri Joint Municipal Electric Utility Commission
Series 2014
5.00%, 1/01/31 | | | 3,240 | | | | 3,686,148 | |
Missouri State Environmental Improvement & Energy Resources Authority
(Union Electric Co.)
NATL
1.92%, 9/01/33(i) | | | 1,025 | | | | 919,835 | |
NATL Series 1992
1.645%, 12/01/22(i) | | | 550 | | | | 525,377 | |
NATL Series 1998A
1.90%, 9/01/33(i) | | | 3,000 | | | | 2,692,170 | |
NATL Series 1998B
1.86%, 9/01/33(i) | | | 1,150 | | | | 1,031,849 | |
St Louis County Industrial Development Authority
(St Andrews Resources for Seniors)
Series 2015A
5.00%, 12/01/35(a) | | | 2,000 | | | | 2,108,600 | |
5.125%, 12/01/45(a) | | | 4,500 | | | | 4,735,305 | |
| | | | | | | | |
| | | | | | | 29,991,410 | |
| | | | | | | | |
Montana – 0.1% | |
Montana Facility Finance Authority
(Benefis Health System Obligated Group)
Series 2016
5.00%, 2/15/34 | | | 1,085 | | | | 1,241,924 | |
| | | | | | | | |
|
Nebraska – 0.2% | |
Central Plains Energy Project
(Goldman Sachs Group, Inc. (The))
Series 2012
5.00%, 9/01/32-9/01/42 | | | 2,975 | | | | 3,267,911 | |
| | | | | | | | |
|
Nevada – 0.9% | |
Las Vegas Redevelopment Agency
Series 2016
5.00%, 6/15/40 | | | 1,800 | | | | 2,002,176 | |
Las Vegas Valley Water District
Series 2016A
5.00%, 6/01/46 | | | 14,000 | | | | 16,230,340 | |
| | | | | | | | |
| | | | | | | 18,232,516 | |
| | | | | | | | |
| | |
| 30 | AB MUNICIPAL INCOME SHARES | | abfunds.com |
PORTFOLIO OF INVESTMENTS (continued)
| | | | | | | | |
| | | Principal Amount (000) | | | U.S. $ Value | |
| |
| | | | | | | | |
New Hampshire – 0.2% | |
New Hampshire Health and Education Facilities Authority Act
(Southern New Hampshire University)
Series 2012
5.00%, 1/01/42 | | $ | 2,940 | | | $ | 3,164,851 | |
Series 2016
5.00%, 1/01/41 | | | 1,435 | | | | 1,641,396 | |
| | | | | | | | |
| | | | | | | 4,806,247 | |
| | | | | | | | |
New Jersey – 9.3% | |
City of Bayonne NJ
BAM Series 2016
5.00%, 7/01/39 | | | 1,075 | | | | 1,208,246 | |
Hudson County Improvement Authority
(County of Hudson NJ)
Series 2016
5.00%, 5/01/32 | | | 3,645 | | | | 4,271,721 | |
New Jersey Economic Development Authority
(New Jersey Economic Development Authority State Lease)
Series 2013
5.00%, 3/01/30 | | | 3,455 | | | | 3,718,789 | |
Series 2014P
5.00%, 6/15/29 | | | 5,000 | | | | 5,439,550 | |
Series 2014U
5.00%, 6/15/21 | | | 3,500 | | | | 3,826,305 | |
Series 2015X
5.00%, 6/15/21 | | | 15,920 | | | | 17,404,222 | |
Series 2017A
5.00%, 7/01/33 | | | 1,640 | | | | 1,796,456 | |
Series 2017B
5.00%, 11/01/20 | | | 7,505 | | | | 8,120,410 | |
Series 2017D
5.00%, 6/15/33-6/15/42 | | | 5,370 | | | | 5,829,380 | |
New Jersey Economic Development Authority
(UMM Energy Partners LLC)
Series 2012A
5.125%, 6/15/43 | | | 735 | | | | 766,061 | |
New Jersey Economic Development Authority
(United Airlines, Inc.)
Series 1999
5.25%, 9/15/29 | | | 2,850 | | | | 3,120,380 | |
Series 2000B
5.625%, 11/15/30 | | | 1,475 | | | | 1,676,264 | |
| | |
| abfunds.com | | AB MUNICIPAL INCOME SHARES | 31 |
PORTFOLIO OF INVESTMENTS (continued)
| | | | | | | | |
| | | Principal Amount (000) | | | U.S. $ Value | |
| |
| | | | | | | | |
New Jersey Health Care Facilities Financing Authority
(Hackensack Meridian Health Obligated Group)
Series 2017A
5.00%, 7/01/35-7/01/37 | | $ | 4,300 | | | $ | 5,013,219 | |
New Jersey Health Care Facilities Financing Authority
(Holy Name Medical Center, Inc.)
Series 2010
5.00%, 7/01/25 | | | 100 | | | | 107,176 | |
New Jersey Health Care Facilities Financing Authority
(Inspira Health Obligated Group)
Series 2017A
5.00%, 7/01/36-7/01/42 | | | 8,645 | | | | 9,789,956 | |
New Jersey Transportation Trust Fund Authority
(New Jersey Transportation Fed Hwy Grant)
Series 2016
5.00%, 6/15/27-6/15/30 | | | 33,625 | | | | 37,826,785 | |
New Jersey Transportation Trust Fund Authority
(New Jersey Transportation Trust Fund Authority State Lease)
Series 2014A
5.00%, 6/15/38 | | | 1,000 | | | | 1,070,210 | |
Series 2015A
5.00%, 6/15/45 | | | 8,450 | | | | 9,011,333 | |
New Jersey Turnpike Authority
Series 2013A
5.00%, 1/01/27 (Pre-refunded/ETM)(a) | | | 170 | | | | 197,035 | |
5.00%, 1/01/27-1/01/32 | | | 3,330 | | | | 3,795,328 | |
Series 2015E
5.00%, 1/01/33-1/01/45 | | | 15,400 | | | | 17,603,362 | |
Series 2016A
5.00%, 1/01/33 | | | 6,500 | | | | 7,521,540 | |
Series 2017A
5.00%, 1/01/33-1/01/34 | | | 15,000 | | | | 17,557,950 | |
Series 2017B
5.00%, 1/01/32-1/01/33 | | | 13,540 | | | | 16,235,340 | |
Tobacco Settlement Financing Corp./NJ
Series 20071A
5.00%, 6/01/41 | | | 13,470 | | | | 12,912,342 | |
| | | | | | | | |
| | | | | | | 195,819,360 | |
| | | | | | | | |
| | |
| 32 | AB MUNICIPAL INCOME SHARES | | abfunds.com |
PORTFOLIO OF INVESTMENTS (continued)
| | | | | | | | |
| | | Principal Amount (000) | | | U.S. $ Value | |
| |
| | | | | | | | |
New Mexico – 0.1% | |
New Mexico Hospital Equipment Loan Council
(Gerald Champion Regional Medical Center)
Series 2012
5.50%, 7/01/42 | | $ | 1,060 | | | $ | 1,146,125 | |
| | | | | | | | |
|
New York – 6.4% | |
Build NYC Resource Corp.
(Metropolitan College of New York)
Series 2014
5.25%, 11/01/34 | | | 2,000 | | | | 2,105,080 | |
City of Newburgh NY
Series 2012A
5.625%, 6/15/34 | | | 245 | | | | 270,206 | |
Dutchess County Local Development Corp.
(Health QuestSystems Obligated Group)
Series 2016B
5.00%, 7/01/46 | | | 9,020 | | | | 10,174,199 | |
Hudson Yards Infrastructure Corp.
Series 2017A
5.00%, 2/15/34-2/15/36 | | | 28,140 | | | | 33,232,081 | |
Metropolitan Transportation Authority
Series 2013E
5.00%, 11/15/32 | | | 4,425 | | | | 5,151,629 | |
Series 2016A
5.00%, 11/15/32 | | | 3,440 | | | | 4,036,702 | |
Nassau County Industrial Development Agency
(Amsterdam House Continuing Care Retirement Community, Inc.)
Series 2014A
6.50%, 1/01/32(a) | | | 75 | | | | 76,416 | |
6.70%, 1/01/49(a) | | | 454 | | | | 459,880 | |
Series 2014B
5.50%, 7/01/20(a) | | | 287 | | | | 291,835 | |
Series 2014C
2.00%, 1/01/49(a)(c)(d)(f) | | | 514 | | | | 87,341 | |
New York City Municipal Water Finance Authority
Series 2017E
5.00%, 6/15/36 | | | 7,305 | | | | 8,706,172 | |
New York Liberty Development Corp.
(7 World Trade Center II LLC)
Series 2012
5.00%, 3/15/44 | | | 100 | | | | 108,130 | |
| | |
| abfunds.com | | AB MUNICIPAL INCOME SHARES | 33 |
PORTFOLIO OF INVESTMENTS (continued)
| | | | | | | | |
| | | Principal Amount (000) | | | U.S. $ Value | |
| |
| | | | | | | | |
New York Liberty Development Corp.
(Goldman Sachs Headquarters LLC)
Series 2005
5.25%, 10/01/35 | | $ | 1,325 | | | $ | 1,693,138 | |
New York NY GO
Series 2013A-1
5.00%, 10/01/28(e) | | | 500 | | | | 575,935 | |
New York State Dormitory Authority
(Orange Regional Medical Center Obligated Group)
Series 2017
5.00%, 12/01/30-12/01/34(b) | | | 4,200 | | | | 4,638,402 | |
New York State Dormitory Authority
(State of New York Pers Income Tax)
Series 2015A
5.00%, 3/15/35 | | | 2,250 | | | | 2,642,918 | |
New York State Energy Research & Development Authority
(Consolidated Edison Co. of New York, Inc.)
AMBAC Series 2001B
1.645%, 10/01/36(i) | | | 3,200 | | | | 2,999,840 | |
XLCA Series 2004A
1.61%, 1/01/39(i) | | | 4,100 | | | | 3,837,764 | |
New York State Thruway Authority
(New York State Thruway Authority Gen Toll Road)
Series 2012I
5.00%, 1/01/37 | | | 2,000 | | | | 2,254,740 | |
Series 2016A
5.00%, 1/01/41 | | | 3,800 | | | | 4,328,846 | |
New York Transportation Development Corp.
(Laguardia Gateway Partners LLC)
Series 2016A
5.00%, 7/01/41-7/01/46 | | | 13,185 | | | | 14,437,995 | |
Orange County Funding Corp.
(The Hamlet at Wallkill)
Series 2013
6.50%, 1/01/46(a) | | | 1,125 | | | | 1,146,555 | |
Port Authority of New York & New Jersey
Series 2012
5.00%, 10/01/34 | | | 3,900 | | | | 4,344,678 | |
Series 2013178
5.00%, 12/01/33 | | | 5,000 | | | | 5,688,850 | |
Triborough Bridge & Tunnel Authority
Series 2012B
5.00%, 11/15/28-11/15/29(e) | | | 1,950 | | | | 2,271,487 | |
| | |
| 34 | AB MUNICIPAL INCOME SHARES | | abfunds.com |
PORTFOLIO OF INVESTMENTS (continued)
| | | | | | | | |
| | | Principal Amount (000) | | | U.S. $ Value | |
| |
| | | | | | | | |
Series 2017B
5.00%, 11/15/35 | | $ | 6,170 | | | $ | 7,419,240 | |
Ulster County Capital Resource Corp.
(Kingston Regional Senior Living Corp.)
Series 2014A
7.50%, 9/15/44(a)(b)(j) | | | 360 | | | | 328,939 | |
Series 2014B
7.00%, 9/15/44(a)(b) | | | 410 | | | | 426,921 | |
Ulster County Industrial Development Agency
(Kingston Regional Senior Living Corp.)
Series 2007A
6.00%, 9/15/27-9/15/37(a) | | | 2,160 | | | | 2,160,666 | |
Westchester County Local Development Corp.
(Kendal on Hudson)
Series 2013
5.00%, 1/01/34 | | | 3,840 | | | | 4,145,549 | |
Westchester County Local Development Corp.
(Westchester County Healthcare Corp./NY)
Series 2016
5.00%, 11/01/46 | | | 4,230 | | | | 4,582,401 | |
| | | | | | | | |
| | | | | | | 134,624,535 | |
| | | | | | | | |
North Carolina – 1.3% | |
County of New Hanover NC
(New Hanover Regional Medical Center)
Series 2017
5.00%, 10/01/42 | | | 4,750 | | | | 5,410,677 | |
North Carolina Medical Care Commission
(Aldersgate United Methodist Retirement Community, Inc.)
Series 2015
4.875%, 7/01/40(a) | | | 5,000 | | | | 5,255,750 | |
5.00%, 7/01/45(a) | | | 1,000 | | | | 1,059,300 | |
North Carolina Medical Care Commission
(Mission Health System, Inc./NC)
Series 2017
5.00%, 10/01/30-10/01/36 | | | 10,025 | | | | 11,922,632 | |
North Carolina Medical Care Commission
(Pennybyrn at Maryfield)
Series 2015
5.00%, 10/01/30(a) | | | 2,250 | | | | 2,404,283 | |
North Carolina Medical Care Commission
(United Church Homes & Services Obligated Group)
Series 2015A
5.00%, 9/01/37(a) | | | 1,735 | | | | 1,796,766 | |
| | | | | | | | |
| | | | | | | 27,849,408 | |
| | | | | | | | |
| | |
| abfunds.com | | AB MUNICIPAL INCOME SHARES | 35 |
PORTFOLIO OF INVESTMENTS (continued)
| | | | | | | | |
| | | Principal Amount (000) | | | U.S. $ Value | |
| |
| | | | | | | | |
Ohio – 3.4% | |
American Municipal Power, Inc.
Series 2016A
5.00%, 2/15/37-2/15/41 | | $ | 10,200 | | | $ | 11,550,072 | |
Buckeye Tobacco Settlement Financing Authority
Series 2007A-2
5.875%, 6/01/47 | | | 15,375 | | | | 14,394,229 | |
Butler County Port Authority
(StoryPoint Obligated Group)
Series 2017A-1
6.375%, 1/15/43(a)(b) | | | 675 | | | | 696,479 | |
City of Chillicothe OH
(Adena Health System Obligated Group)
Series 2017
5.00%, 12/01/37 | | | 7,500 | | | | 8,531,700 | |
County of Cuyahoga OH
(MetroHealth System (The))
Series 2017
5.00%, 2/15/42 | | | 6,490 | | | | 6,936,966 | |
5.25%, 2/15/47 | | | 12,860 | | | | 13,929,823 | |
County of Franklin OH
(First Community Village Obligated Group)
Series 2013
5.625%, 7/01/47(a) | | | 2,300 | | | | 2,318,078 | |
County of Hamilton OH
(Life Enriching Communities Obligated Group)
Series 2012
5.00%, 1/01/42 | | | 1,030 | | | | 1,091,872 | |
Dayton-Montgomery County Port Authority
(StoryPoint Troy Project)
Series 20151
7.00%, 1/15/40(a) | | | 2,500 | | | | 2,546,225 | |
Ohio Air Quality Development Authority
(FirstEnergy Generation LLC)
Series 2009D
4.25%, 8/01/29 | | | 4,840 | | | | 4,784,921 | |
Ohio Air Quality Development Authority
(FirstEnergy Nuclear Generation LLC)
Series 2009A
4.375%, 6/01/33 | | | 3,820 | | | | 3,775,688 | |
Toledo-Lucas County Port Authority
(StoryPoint Obligated Group)
Series 2016
6.375%, 1/15/51(a)(b) | | | 1,000 | | | | 1,040,450 | |
| | | | | | | | |
| | | | | | | 71,596,503 | |
| | | | | | | | |
| | |
| 36 | AB MUNICIPAL INCOME SHARES | | abfunds.com |
PORTFOLIO OF INVESTMENTS (continued)
| | | | | | | | |
| | | Principal Amount (000) | | | U.S. $ Value | |
| |
| | | | | | | | |
Oklahoma – 0.1% | |
Tulsa Airports Improvement Trust
(American Airlines, Inc.)
Series 2013A
5.50%, 6/01/35(a) | | $ | 1,125 | | | $ | 1,219,736 | |
| | | | | | | | |
|
Oregon – 0.3% | |
Hospital Facilities Authority of Multnomah County Oregon
(Mirabella at South Waterfront)
Series 2014A
5.00%, 10/01/19(a) | | | 280 | | | | 290,996 | |
State of Oregon
Series 2017L
5.00%, 8/01/34 | | | 4,170 | | | | 5,042,614 | |
| | | | | | | | |
| | | | | | | 5,333,610 | |
| | | | | | | | |
Pennsylvania – 8.5% | |
Allentown Neighborhood Improvement Zone Development Authority
Series 2017
5.00%, 5/01/42(b) | | | 2,270 | | | | 2,433,077 | |
Bensalem Township School District
Series 2013
5.00%, 6/01/29 | | | 8,570 | | | | 10,094,089 | |
Cheltenham Township School District
Series 2016B
5.00%, 2/15/39 | | | 1,780 | | | | 2,045,327 | |
City of Philadelphia PA
Series 2013A
5.00%, 7/15/21 | | | 1,200 | | | | 1,343,796 | |
Series 2017
5.00%, 8/01/29-8/01/31 | | | 12,110 | | | | 14,390,661 | |
AGM Series 2017A
5.00%, 8/01/33-8/01/34 | | | 13,000 | | | | 15,163,410 | |
City of Philadelphia PA Water & Wastewater Revenue
Series 2017A
5.00%, 10/01/35-10/01/36 | | | 5,105 | | | | 5,973,518 | |
County of Lehigh PA
(Lehigh Valley Health Network Obligated Group)
Series 2016A
4.00%, 7/01/35 | | | 18,200 | | | | 18,875,220 | |
Crawford County Hospital Authority
(Meadville Medical Center Obligated Group)
Series 2016A
6.00%, 6/01/51(a) | | | 2,200 | | | | 2,280,410 | |
| | |
| abfunds.com | | AB MUNICIPAL INCOME SHARES | 37 |
PORTFOLIO OF INVESTMENTS (continued)
| | | | | | | | |
| | | Principal Amount (000) | | | U.S. $ Value | |
| |
| | | | | | | | |
Cumberland County Municipal Authority
(Asbury Pennsylvania Obligated Group)
Series 2010
6.125%, 1/01/45(a) | | $ | 180 | | | $ | 188,642 | |
Series 2012
5.25%, 1/01/41(a) | | | 1,000 | | | | 1,032,730 | |
Delaware River Joint Toll Bridge Commission
Series 2017
5.00%, 7/01/34-7/01/37 | | | 14,500 | | | | 16,967,560 | |
Montgomery County Higher Education & Health Authority
(Philadelphia Presbyterian Homes Obligated Group)
Series 2017
4.00%, 12/01/48 | | | 1,225 | | | | 1,193,040 | |
5.00%, 12/01/47 | | | 1,500 | | | | 1,646,235 | |
Montgomery County Industrial Development Authority/PA
Series 2010
6.50%, 12/01/25 (Pre-refunded/ETM) | | | 200 | | | | 239,962 | |
Montgomery County Industrial Development Authority/PA
(Whitemarsh Continuing Care Retirement Community)
Series 2015
5.00%, 1/01/30(a) | | | 1,040 | | | | 1,053,042 | |
5.25%, 1/01/40(a) | | | 4,740 | | | | 4,762,136 | |
Moon Industrial Development Authority
(Baptist Home Society Obligated Group)
Series 2015
5.75%, 7/01/35(a) | | | 5,135 | | | | 5,543,386 | |
Northeastern Pennsylvania Hospital & Education Authority
(Wilkes University)
Series 2012A
5.25%, 3/01/42 | | | 265 | | | | 284,684 | |
Series 2016A
5.00%, 3/01/37 | | | 1,400 | | | | 1,558,032 | |
Pennsylvania Economic Development Financing Authority
(National Railroad Passenger Corp. (The))
Series 2012A
5.00%, 11/01/41 | | | 1,620 | | | | 1,745,923 | |
Pennsylvania Economic Development Financing Authority
(PA Bridges Finco LP)
Series 2015
5.00%, 12/31/34 | | | 2,830 | | | | 3,203,418 | |
| | |
| 38 | AB MUNICIPAL INCOME SHARES | | abfunds.com |
PORTFOLIO OF INVESTMENTS (continued)
| | | | | | | | |
| | | Principal Amount (000) | | | U.S. $ Value | |
| |
| | | | | | | | |
Pennsylvania Higher Educational Facilities Authority
(Drexel University)
Series 2016
5.00%, 5/01/32 | | $ | 1,000 | | | $ | 1,156,340 | |
Pennsylvania Turnpike Commission
Series 2016
5.00%, 6/01/37 | | | 4,000 | | | | 4,472,760 | |
Series 2017B
5.00%, 6/01/35-6/01/36 | | | 12,850 | | | | 14,704,673 | |
Philadelphia Authority for Industrial Development
(Evangelical Services for the Aging Obligated Group)
Series 2017A
5.00%, 7/01/42 | | | 2,000 | | | | 2,109,640 | |
Philadelphia Gas Works Co.
Series 2016
5.00%, 10/01/31-10/01/34 | | | 5,300 | | | | 6,168,824 | |
School District of Philadelphia (The)
Series 2015A
5.00%, 9/01/34-9/01/35 | | | 2,615 | | | | 2,872,282 | |
Series 2016F
5.00%, 9/01/33-9/01/36 | | | 4,000 | | | | 4,427,460 | |
Scranton-Lackawanna Health & Welfare Authority
(Scranton Parking System Concession Project)
Series 2016A
5.00%, 1/01/51-1/01/57(b) | | | 12,110 | | | | 12,238,694 | |
Series 2016B
6.08%, 1/01/26(b) | | | 1,070 | | | | 1,043,721 | |
Series 2016C
Zero Coupon, 1/01/36(b) | | | 2,945 | | | | 1,053,574 | |
Series 2016D
Zero Coupon, 1/01/57(b) | | | 61,525 | | | | 4,157,244 | |
State Public School Building Authority
(Harrisburg School District)
AGM Series 2016A
5.00%, 12/01/29-12/01/30 | | | 9,880 | | | | 11,613,017 | |
| | | | | | | | |
| | | | | | | 178,036,527 | |
| | | | | | | | |
Puerto Rico – 0.3% | |
Puerto Rico Industrial Tourist Educational Medical & Envirml Ctl Facs Fing Auth
(AES Puerto Rico LP)
Series 2000
6.625%, 6/01/26(g) | | | 7,195 | | | | 5,791,975 | |
| | |
| abfunds.com | | AB MUNICIPAL INCOME SHARES | 39 |
PORTFOLIO OF INVESTMENTS (continued)
| | | | | | | | |
| | | Principal Amount (000) | | | U.S. $ Value | |
| |
| | | | | | | | |
Puerto Rico Industrial Tourist Educational Medical & Envirml Ctl Facs Fing Auth
(Sistema Universitario Ana G Mendez Incorporado)
Series 2012
5.375%, 4/01/42 | | $ | 335 | | | $ | 304,672 | |
| | | | | | | | |
| | | | | | | 6,096,647 | |
| | | | | | | | |
Rhode Island – 0.3% | |
Rhode Island Health & Educational Building Corp.
Series 2011
8.375%, 1/01/46 (Pre-refunded/ETM) | | | 3,150 | | | | 3,841,835 | |
Rhode Island Health & Educational Building Corp.
(City of Woonsocket RI)
AGM Series 2017A
5.00%, 5/15/28-5/15/29 | | | 2,000 | | | | 2,352,270 | |
| | | | | | | | |
| | | | | | | 6,194,105 | |
| | | | | | | | |
South Carolina – 0.5% | |
South Carolina Jobs-Economic Development Authority
(Lutheran Homes of South Carolina Obligated Group)
Series 2013
5.00%, 5/01/43(a) | | | 1,000 | | | | 1,022,640 | |
5.125%, 5/01/48(a) | | | 1,000 | | | | 1,026,220 | |
South Carolina Public Service Authority
Series 2013A
5.00%, 12/01/38 | | | 575 | | | | 633,765 | |
Series 2013B
5.00%, 12/01/38 | | | 810 | | | | 892,782 | |
Series 2014B
5.00%, 12/01/38 | | | 1,160 | | | | 1,282,264 | |
Series 2014C
5.00%, 12/01/36 | | | 495 | | | | 552,702 | |
Series 2016A
5.00%, 12/01/34-12/01/36 | | | 4,565 | | | | 5,197,761 | |
| | | | | | | | |
| | | | | | | 10,608,134 | |
| | | | | | | | |
South Dakota – 1.8% | |
South Dakota Health & Educational Facilities Authority
(Avera Health Obligated Group)
Series 2017
5.00%, 7/01/46 | | | 15,000 | | | | 17,017,500 | |
| | |
| 40 | AB MUNICIPAL INCOME SHARES | | abfunds.com |
PORTFOLIO OF INVESTMENTS (continued)
| | | | | | | | |
| | | Principal Amount (000) | | | U.S. $ Value | |
| |
| | | | | | | | |
South Dakota Health & Educational Facilities Authority
(Regional Health System Obligated Group)
Series 2017
5.00%, 9/01/33-9/01/40 | | $ | 18,295 | | | $ | 20,910,726 | |
| | | | | | | | |
| | | | | | | 37,928,226 | |
| | | | | | | | |
Tennessee – 1.0% | |
Bristol Industrial Development Board
(Bristol Industrial Development Board Sales Tax)
Series 2016A
5.00%, 12/01/35(a)(b) | | | 8,135 | | | | 7,982,794 | |
Johnson City Health & Educational Facilities Board
(Mountain States Health Alliance Obligated Group)
Series 2012
5.00%, 8/15/42 | | | 4,890 | | | | 5,199,341 | |
Metropolitan Government Nashville & Davidson County Health & Educational Facs Bd
(Vanderbilt University Medical Center)
Series 2016
5.00%, 7/01/40 | | | 2,435 | | | | 2,736,818 | |
Series 2017A
5.00%, 7/01/48 | | | 2,335 | | | | 2,612,772 | |
Shelby County Health Educational & Housing Facilities Board
(Village at Germantown, Inc.)
Series 2012
5.25%, 12/01/42(a) | | | 1,000 | | | | 1,036,440 | |
5.375%, 12/01/47(a) | | | 800 | | | | 831,816 | |
| | | | | | | | |
| | | | | | | 20,399,981 | |
| | | | | | | | |
Texas – 7.3% | |
Arlington Higher Education Finance Corp.
(Harmony Public Schools)
Series 2016A
5.00%, 2/15/41-2/15/46 | | | 6,060 | | | | 6,898,114 | |
Arlington Higher Education Finance Corp.
(Wayside Schools)
Series 2016A
4.625%, 8/15/46 | | | 2,450 | | | | 2,465,068 | |
Central Texas Regional Mobility Authority
Series 2011
6.00%, 1/01/41 (Pre-refunded/ETM) | | | 120 | | | | 137,545 | |
| | |
| abfunds.com | | AB MUNICIPAL INCOME SHARES | 41 |
PORTFOLIO OF INVESTMENTS (continued)
| | | | | | | | |
| | | Principal Amount (000) | | | U.S. $ Value | |
| |
| | | | | | | | |
Series 2013
5.00%, 1/01/42 | | $ | 3,500 | | | $ | 3,813,180 | |
Series 2016
5.00%, 1/01/33-1/01/40 | | | 6,855 | | | | 7,757,026 | |
Central Texas Turnpike System
Series 2015C
5.00%, 8/15/37 | | | 6,800 | | | | 7,598,116 | |
City of Houston TX
(City of Houston TX Hotel Occupancy Tax)
Series 2015
5.00%, 9/01/30 | | | 1,965 | | | | 2,247,764 | |
City of Houston TX Airport System Revenue
(United Airlines, Inc.)
Series 2014
5.00%, 7/01/29 | | | 3,155 | | | | 3,457,533 | |
Series 2015B
5.00%, 7/15/30-7/15/35 | | | 2,960 | | | | 3,234,953 | |
City of San Antonio TX Electric & Gas Systems Revenue
Series 2017
5.00%, 2/01/33-2/01/35 | | | 9,295 | | | | 11,047,872 | |
Clifton Higher Education Finance Corp.
(IDEA Public Schools)
Series 2012
5.00%, 8/15/42 | | | 530 | | | | 558,747 | |
Series 2013
6.00%, 8/15/43 | | | 1,000 | | | | 1,159,650 | |
Series 2016A
5.00%, 8/15/34-8/15/36 | | | 4,180 | | | | 4,894,019 | |
Dallas County Flood Control District No 1
Series 2015
5.00%, 4/01/28(a)(b) | | | 1,150 | | | | 1,209,444 | |
Dallas/Fort Worth International Airport
Series 2012E
5.00%, 11/01/35 | | | 1,500 | | | | 1,631,655 | |
Decatur Hospital Authority
(Wise Regional Health System)
Series 2014A
5.25%, 9/01/44 | | | 3,150 | | | | 3,348,292 | |
Mission Economic Development Corp.
(Natgasoline LLC)
Series 2016B
5.75%, 10/01/31(b) | | | 5,225 | | | | 5,488,810 | |
New Hope Cultural Education Facilities Finance Corp.
(Wesleyan Homes, Inc.)
Series 2014
5.50%, 1/01/49(a) | | | 1,700 | | | | 1,768,170 | |
| | |
| 42 | AB MUNICIPAL INCOME SHARES | | abfunds.com |
PORTFOLIO OF INVESTMENTS (continued)
| | | | | | | | |
| | | Principal Amount (000) | | | U.S. $ Value | |
| |
| | | | | | | | |
New Hope Cultural Education Facilities Finance Corp.
(Westminster Manor)
Series 2016
4.00%, 11/01/36 | | $ | 1,475 | | | $ | 1,484,986 | |
North East Texas Regional Mobility Authority
Series 2016
5.00%, 1/01/46 | | | 4,940 | | | | 5,465,715 | |
North Texas Education Finance Corp.
(Uplift Education)
Series 2012A
5.125%, 12/01/42 | | | 280 | | | | 297,755 | |
North Texas Tollway Authority
Series 2014B
5.00%, 1/01/31 | | | 8,975 | | | | 10,287,683 | |
Series 2015A
5.00%, 1/01/35 | | | 7,000 | | | | 7,983,360 | |
Series 2015B
5.00%, 1/01/34 | | | 3,500 | | | | 4,006,310 | |
Series 2016A
5.00%, 1/01/39 | | | 4,000 | | | | 4,572,200 | |
Series 2017B
5.00%, 1/01/33-1/01/43(h) | | | 7,400 | | | | 8,464,882 | |
Red River Health Facilities Development Corp.
Series 2011A
8.00%, 11/15/46 (Pre-refunded/ETM)(a) | | | 1,790 | | | | 2,245,609 | |
Red River Health Facilities Development Corp.
(MRC Crossings Proj)
Series 2014A
7.75%, 11/15/44(a) | | | 1,315 | | | | 1,524,716 | |
Red River Health Facilities Development Corp.
(Wichita Falls Retirement Foundation)
Series 2012
5.50%, 1/01/32 | | | 1,740 | | | | 1,838,414 | |
Sanger Industrial Development Corp.
(Texas Pellets, Inc.)
Series 2012B
8.00%, 7/01/38(a)(c)(d)(g) | | | 2,180 | | | | 501,400 | |
Tarrant County Cultural Education Facilities Finance Corp.
(Buckingham Senior Living Community, Inc.)
Series 2007
5.50%, 11/15/22 | | | 200 | | | | 200,158 | |
| | |
| abfunds.com | | AB MUNICIPAL INCOME SHARES | 43 |
PORTFOLIO OF INVESTMENTS (continued)
| | | | | | | | |
| | | Principal Amount (000) | | | U.S. $ Value | |
| |
| | | | | | | | |
Tarrant County Cultural Education Facilities Finance Corp.
(Buckner Senior Living, Inc.)
Series 2017A
6.625%, 11/15/37(a) | | $ | 2,500 | | | $ | 2,720,025 | |
Series 2017B-3
3.875%, 11/15/22(a) | | | 1,200 | | | | 1,201,140 | |
Tarrant County Cultural Education Facilities Finance Corp.
(CC Young Memorial Home Obligated Group)
Series 2017A
6.375%, 2/15/41-2/15/48(a) | | | 6,875 | | | | 7,347,251 | |
Tarrant County Cultural Education Facilities Finance Corp.
(Edgemere Retirement Senior Quality Lifestyles Corp.)
Series 2015B
5.00%, 11/15/30 | | | 4,000 | | | | 4,272,520 | |
Tarrant County Cultural Education Facilities Finance Corp.
(Stayton at Museum Way)
Series 2009A
8.25%, 11/15/39-11/15/44(a) | | | 5,025 | | | | 5,345,606 | |
Series 2009B
5.25%, 11/15/45(a)(k) | | | 1,075 | | | | 1,075,118 | |
Tarrant County Cultural Education Facilities Finance Corp.
(Trinity Terrace Project)
Series 2014A-1
5.00%, 10/01/44-10/01/49 | | | 2,065 | | | | 2,209,931 | |
Texas Municipal Gas Acquisition & Supply Corp. I
(Bank of America Corp.)
Series 2008D
6.25%, 12/15/26 | | | 1,000 | | | | 1,223,580 | |
Texas Private Activity Bond Surface Transportation Corp.
(Blueridge Transportation Group LLC)
Series 2016
5.00%, 12/31/40 | | | 1,255 | | | | 1,384,805 | |
Texas Private Activity Bond Surface Transportation Corp.
(LBJ Infrastructure Group LLC)
Series 2010
7.00%, 6/30/40 | | | 660 | | | | 744,896 | |
| | |
| 44 | AB MUNICIPAL INCOME SHARES | | abfunds.com |
PORTFOLIO OF INVESTMENTS (continued)
| | | | | | | | |
| | | Principal Amount (000) | | | U.S. $ Value | |
| |
| | | | | | | | |
Texas Private Activity Bond Surface Transportation Corp.
(NTE Mobility Partners LLC)
Series 2009
6.875%, 12/31/39 | | $ | 200 | | | $ | 221,800 | |
Texas Private Activity Bond Surface Transportation Corp.
(NTE Mobility Partners Segments 3 LLC)
Series 2013
6.75%, 6/30/43 | | | 3,600 | | | | 4,168,836 | |
Travis County Health Facilities Development Corp.
(Longhorn Village)
Series 2012A
7.00%, 1/01/32(a) | | | 1,200 | | | | 1,306,644 | |
7.125%, 1/01/46(a) | | | 2,430 | | | | 2,635,335 | |
Uptown Development Authority
Series 2017A
5.00%, 9/01/35 | | | 1,015 | | | | 1,145,377 | |
Viridian Municipal Management District
Series 2011
9.00%, 12/01/37 (Pre-refunded/ETM)(a) | | | 75 | | | | 96,528 | |
| | | | | | | | |
| | | | | | | 154,688,538 | |
| | | | | | | | |
Utah – 0.0% | |
Timber Lakes Water Special Service District
Series 2011
8.125%, 6/15/31(a) | | | 85 | | | | 93,334 | |
Utah Charter School Finance Authority
Series 2010
8.25%, 7/15/46 (Pre-refunded/ETM)(a) | | | 100 | | | | 106,929 | |
Utah Charter School Finance Authority
(North Star Academy)
Series 2010A
7.00%, 7/15/45 | | | 100 | | | | 107,791 | |
| | | | | | | | |
| | | | | | | 308,054 | |
| | | | | | | | |
Vermont – 0.2% | |
Vermont Economic Development Authority
(Wake Robin Corp.)
Series 2012
5.40%, 5/01/33(a) | | | 200 | | | | 212,012 | |
Vermont Educational & Health Buildings Financing Agency
(University of Vermont Health Network Obligated Group)
Series 2016A
5.00%, 12/01/34 | | | 1,500 | | | | 1,708,395 | |
| | |
| abfunds.com | | AB MUNICIPAL INCOME SHARES | 45 |
PORTFOLIO OF INVESTMENTS (continued)
| | | | | | | | |
| | | Principal Amount (000) | | | U.S. $ Value | |
| |
| | | | | | | | |
Series 2016B
5.00%, 12/01/37 | | $ | 1,270 | | | $ | 1,433,195 | |
| | | | | | | | |
| | | | | | | 3,353,602 | |
| | | | | | | | |
Virginia – 0.8% | |
Cherry Hill Community Development Authority
(Potomac Shores Project)
Series 2015
5.15%, 3/01/35(a)(b) | | | 1,000 | | | | 1,028,820 | |
Chesapeake Bay Bridge & Tunnel District
Series 2016
5.00%, 7/01/46 | | | 1,000 | | | | 1,120,750 | |
Chesterfield County Economic Development Authority
(Brandermill Woods)
Series 2012
5.125%, 1/01/43(a) | | | 1,030 | | | | 1,066,390 | |
City of Chesapeake VA Chesapeake Expressway Toll Road Revenue
Series 2012A
5.00%, 7/15/47 | | | 300 | | | | 325,437 | |
Fairfax County Economic Development Authority
(Vinson Hall LLC)
Series 2013A
5.00%, 12/01/47(a) | | | 1,955 | | | | 2,042,369 | |
Tobacco Settlement Financing Corp./VA
Series 2007B-1
5.00%, 6/01/47 | | | 6,790 | | | | 6,526,344 | |
Virginia College Bldg Auth
(Virginia Lease 21st Century College Prog)
Series 2013A
5.00%, 2/01/28(e) | | | 550 | | | | 637,433 | |
Virginia College Building Authority
(Marymount University)
Series 2015B
5.25%, 7/01/35(b) | | | 1,000 | | | | 1,093,440 | |
Virginia Small Business Financing Authority
(Elizabeth River Crossings OpCo LLC)
Series 2012
5.50%, 1/01/42 | | | 3,580 | | | | 3,960,089 | |
| | | | | | | | |
| | | | | | | 17,801,072 | |
| | | | | | | | |
Washington – 1.6% | |
King County Public Hospital District No 4
Series 2015A
5.00%, 12/01/30(a) | | | 2,235 | | | | 2,269,039 | |
| | |
| 46 | AB MUNICIPAL INCOME SHARES | | abfunds.com |
PORTFOLIO OF INVESTMENTS (continued)
| | | | | | | | |
| | | Principal Amount (000) | | | U.S. $ Value | |
| |
| | | | | | | | |
Port of Seattle WA
Series 2015C
5.00%, 4/01/33 | | $ | 5,035 | | | $ | 5,689,600 | |
Washington Health Care Facilities Authority
(Virginia Mason Medical Center Obligated Group)
Series 2017
5.00%, 8/15/33-8/15/37 | | | 12,990 | | | | 14,652,422 | |
Washington State Housing Finance Commission
(Mirabella)
Series 2012A
6.75%, 10/01/47(a)(b) | | | 3,550 | | | | 3,896,800 | |
Washington State Housing Finance Commission
(Presbyterian Retirement Communities Northwest Obligated Group)
Series 2016A
5.00%, 1/01/31-1/01/46(b) | | | 2,790 | | | | 2,985,917 | |
Washington State Housing Finance Commission
(Rockwood Retirement Communities)
Series 2014A
7.375%, 1/01/44(a)(b) | | | 3,215 | | | | 3,752,645 | |
| | | | | | | | |
| | | | | | | 33,246,423 | |
| | | | | | | | |
West Virginia – 0.1% | |
West Virginia Hospital Finance Authority
(West Virginia University Health System Obligated Group)
AGM Series 2004B
1.663%, 2/15/34(i) | | | 850 | | | | 779,612 | |
West Virginia Hospital Finance Authority
(West Virginia University Health System, Inc.)
Series 2013A
5.50%, 6/01/44 | | | 2,100 | | | | 2,354,688 | |
| | | | | | | | |
| | | | | | | 3,134,300 | |
| | | | | | | | |
Wisconsin – 3.0% | |
University of Wisconsin Hospitals & Clinics
Series 2013A
5.00%, 4/01/38 | | | 4,155 | | | | 4,590,236 | |
Wisconsin Health & Educational Facilities Authority
(Aspirus, Inc. Obligated Group)
5.00%, 8/15/52(h) | | | 20,345 | | | | 22,764,834 | |
| | |
| abfunds.com | | AB MUNICIPAL INCOME SHARES | 47 |
PORTFOLIO OF INVESTMENTS (continued)
| | | | | | | | |
| | | Principal Amount (000) | | | U.S. $ Value | |
| |
| | | | | | | | |
Wisconsin Public Finance Authority
(American Dream at Meadowlands Project)
Series 2017
7.00%, 12/01/50(a)(b) | | $ | 4,985 | | | $ | 5,749,549 | |
Wisconsin Public Finance Authority
(Bancroft Neurohealth/Bancroft Rehabilitation Services Obligated Group)
Series 2016
5.125%, 6/01/48(a)(b) | | | 3,335 | | | | 3,356,711 | |
Wisconsin Public Finance Authority
(Celanese US Holdings LLC)
Series 2016C
4.30%, 11/01/30 | | | 2,060 | | | | 2,111,624 | |
Series 2016D
4.05%, 11/01/30 | | | 720 | | | | 738,230 | |
Wisconsin Public Finance Authority
(Gannon University)
Series 2017
5.00%, 5/01/42 | | | 1,000 | | | | 1,084,130 | |
Wisconsin Public Finance Authority
(Mary’s Woods at Marylhurst, Inc.)
Series 2017A
5.25%, 5/15/37-5/15/47(b) | | | 3,225 | | | | 3,466,545 | |
Wisconsin Public Finance Authority
(Million Air Two LLC Obligated Group)
Series 2017B
7.125%, 6/01/41(a)(b) | | | 7,885 | | | | 7,780,051 | |
Wisconsin Public Finance Authority
(Natgasoline LLC)
Series 2016
10.00%, 6/30/21(a)(b) | | | 7,718 | | | | 7,726,761 | |
Wisconsin Public Finance Authority
(Pine Lake Preparatory, Inc.)
Series 2015
5.25%, 3/01/35(b) | | | 1,550 | | | | 1,611,008 | |
Wisconsin Public Finance Authority
(Rose Villa)
Series 2014A
5.75%, 11/15/44(a) | | | 1,000 | | | | 1,079,030 | |
Wisconsin Public Finance Authority
(Seabury Retirement Community)
Series 2015A
5.00%, 9/01/30(b) | | | 545 | | | | 572,611 | |
| | | | | | | | |
| | | | | | | 62,631,320 | |
| | | | | | | | |
Total Municipal Obligations
(cost $2,048,410,595) | | | | | | | 2,100,261,311 | |
| | | | | | | | |
| | |
| 48 | AB MUNICIPAL INCOME SHARES | | abfunds.com |
PORTFOLIO OF INVESTMENTS (continued)
| | | | | | | | |
| Company | | Shares | | | U.S. $ Value | |
| |
| | | | | | | | |
SHORT-TERM INVESTMENTS – 0.6% | | | | | | | | |
Investment Companies – 0.5% | | | | | | | | |
AB Fixed Income Shares, Inc. –
Government Money Market Portfolio – Class AB, 0.85%(l)(m)(n)
(cost $11,257,852) | | | 11,257,852 | | | $ | 11,257,852 | |
| | | | | | | | |
| | |
Corporates - Investment Grade – 0.1% | | | | | | | | |
Texas Pellets, Inc./German Pellets Texas LLC
8.00%, 11/15/17(a)(o)(p)
(cost $2,210,000) | | | 2,210 | | | | 2,210,000 | |
| | | | | | | | |
| | |
Total Short-Term Investments
(cost $13,467,852) | | | | | | | 13,467,852 | |
| | | | | | | | |
| | |
Total Investments – 100.5%
(cost $2,061,878,447) | | | | | | | 2,113,729,163 | |
Other assets less liabilities – (0.5)% | | | | | | | (10,156,701 | ) |
| | | | | | | | |
| | |
Net Assets – 100.0% | | | | | | $ | 2,103,572,462 | |
| | | | | | | | |
CENTRALLY CLEARED INTEREST RATE SWAPS (see Note C)
| | | | | | | | | | | | | | | | | | | | |
| | | | | | | Rate Type | | | | | | |
Notional
Amount
(000) | | | Termination
Date | | | Payments
made by the
Fund | | | Payments
received
by the
Fund | | | Payment
Frequency
Paid/
Received | | Unrealized
Appreciation/
(Depreciation) | |
| USD | 13,500 | | | | 8/25/37 | | | | 3 Month LIBOR | | | | 2.564 | % | | Quarterly/ Semi-Annual | | $ | (163,542 | ) |
| USD | 15,500 | | | | 11/05/37 | | | | 3 Month LIBOR | | | | 2.626 | % | | Quarterly/ Semi-Annual | | | (66,378 | ) |
| | | | | | | | | | | | | | | | | | | | |
| | | | | | | | | | | | | | | | | | $ | (229,920 | ) |
| | | | | | | | | | | | | | | | | | | | |
| (a) | Security in which significant unobservable inputs (Level 3) were used in determining fair value. |
| (b) | Security is exempt from registration under Rule 144A of the Securities Act of 1933. These securities are considered restricted, but liquid and may be resold in transactions exempt from registration, normally to qualified institutional buyers. At October 31, 2017, the aggregate market value of these securities amounted to $138,209,415 or 6.6% of net assets. |
| (c) | Non-income producing security. |
| (e) | Security represents the underlying municipal obligation of an inverse floating rate obligation held by the Fund (see Note H). |
| (g) | Restricted and illiquid security. |
| | |
| abfunds.com | | AB MUNICIPAL INCOME SHARES | 49 |
PORTFOLIO OF INVESTMENTS (continued)
| | | | | | | | | | | | | | | | |
Restricted & Illiquid
Securities | | Acquisition
Date | | | Cost | | | Market
Value | | | Percentage of
Net Assets | |
Illinois Finance Authority
(Greenfields of Geneva)
Series 2010A
8.125%, 02/15/40 | | | 12/18/13 | | | $ | 2,886,677 | | | $ | 1,680,000 | | | | 0.08 | % |
Louisiana Public Facilities Authority
(Louisiana Pellets, Inc.)
Series 2013B
10.50%, 07/01/39 | | | 12/09/13 | | | | 1,973,785 | | | | 27,500 | | | | 0.00 | % |
Louisiana Public Facilities Authority
(Louisiana Pellets, Inc.)
Series 2014A
7.50%, 07/01/23 | | | 7/31/14 | | | | 868,862 | | | | 12,500 | | | | 0.00 | % |
Puerto Rico Industrial Tourist Educational Medical & Envirml Ctl Facs Fing Auth
(AES Puerto Rico LP)
Series 2000
6.625%, 06/01/26 | | | 6/26/14 | | | | 6,847,637 | | | | 5,791,975 | | | | 0.28 | % |
Sanger Industrial Development Corp.
(Texas Pellets, Inc.)
Series 2012B
8.00%, 07/01/38 | | | 5/01/13 | | | | 2,245,809 | | | | 501,400 | | | | 0.02 | % |
| (h) | When-Issued or delayed delivery security. |
| (i) | An auction rate security whose interest rate resets at each auction date. Auctions are typically held every week or month. The rate shown is as of October 31, 2017 and the aggregate market value of these securities amounted to $19,727,310 or 0.94% of net assets. |
| (j) | Indicates a security that has a zero coupon that remains in effect until a predetermined date at which time the stated coupon rate becomes effective until final maturity. |
| (k) | Variable rate coupon, rate shown as of October 31, 2017. |
| (l) | Affiliated investments. |
| (m) | The rate shown represents the 7-day yield as of period end. |
| (n) | To obtain a copy of the fund’s shareholder report, please go to the Securities and Exchange Commission’s website at www.sec.gov, or call AB at (800) 227-4618. |
| (o) | Fair valued by the Adviser. |
| (p) | Security is exempt from registration under Rule 144A of the Securities Act of 1933. These securities, which represent 0.10% of net assets as of October 31, 2017, are considered illiquid and restricted. Additional information regarding such securities follows: |
| | | | | | | | | | | | | | | | |
144A/Restricted & Illiquid
Securities | | Acquisition
Date | | | Cost | | | Market
Value | | | Percentage of
Net Assets | |
Texas Pellets, Inc./German
Pellets Texas LLC
8.00%, 11/15/17 | | | 4/27/17 | | | $ | 900,000 | | | $ | 900,000 | | | | 0.04 | % |
Texas Pellets, Inc./German
Pellets Texas LLC
8.00%, 11/15/17 | | | 6/15/16 | | | | 865,000 | | | | 865,000 | | | | 0.04 | % |
Texas Pellets, Inc./German
Pellets Texas LLC
8.00%, 11/15/17 | | | 9/10/17 | | | | 445,000 | | | | 445,000 | | | | 0.02 | % |
As of October 31, 2017, the Fund’s percentages of investments in municipal bonds that are insured and in insured municipal bonds that have been pre-refunded or escrowed to maturity are 3.1% and 0.0%, respectively.
| | |
| 50 | AB MUNICIPAL INCOME SHARES | | abfunds.com |
PORTFOLIO OF INVESTMENTS (continued)
Glossary:
AGC – Assured Guaranty Corporation
AGM – Assured Guaranty Municipal
AMBAC – Ambac Assurance Corporation
BAM – Build American Mutual
COP – Certificate of Participation
ETM – Escrowed to Maturity
GO – General Obligation
LIBOR – London Interbank Offered Rates
NATL – National Interstate Corporation
XLCA – XL Capital Assurance Inc.
See notes to financial statements.
| | |
| abfunds.com | | AB MUNICIPAL INCOME SHARES | 51 |
STATEMENT OF ASSETS & LIABILITIES
October 31, 2017 (unaudited)
| | | | |
| Assets | | | | |
Investments in securities, at value | | | | |
Unaffiliated issuers (cost $2,050,620,595) | | $ | 2,102,471,311 | |
Affiliated issuers (cost $11,257,852) | | | 11,257,852 | |
Cash | | | 262,796 | |
Cash collateral due from broker | | | 1,825,345 | |
Interest receivable | | | 27,472,895 | |
Receivable for investment securities sold | | | 12,671,096 | |
Receivable for shares of beneficial interest sold | | | 6,157,004 | |
Receivable due from Adviser | | | 62,230 | |
Receivable for variation margin on exchange traded swaps | | | 27,619 | |
Affiliated dividends receivable | | | 3,336 | |
| | | | |
Total assets | | | 2,162,211,484 | |
| | | | |
| Liabilities | | | | |
Payable for investment securities purchased | | | 47,430,722 | |
Dividends payable | | | 6,512,166 | |
Payable for floating rate notes issued* | | | 3,510,000 | |
Payable for shares of beneficial interest redeemed | | | 1,173,306 | |
Other liabilities | | | 12,828 | |
| | | | |
Total liabilities | | | 58,639,022 | |
| | | | |
Net Assets | | $ | 2,103,572,462 | |
| | | | |
| Composition of Net Assets | | | | |
Shares of beneficial interest, at par | | $ | 1,824 | |
Additional paid-in capital | | | 2,051,452,954 | |
Undistributed net investment income | | | 1,069,495 | |
Accumulated net realized loss on investment transactions | | | (572,607 | ) |
Net unrealized appreciation on investments | | | 51,620,796 | |
| | | | |
| | $ | 2,103,572,462 | |
| | | | |
Net Asset Value Per Share—unlimited shares of beneficial interest authorized, $.00001 par value (based on 182,361,039 common shares outstanding) | | $ | 11.54 | |
| | | | |
| * | Represents short-term floating rate certificates issued by tender option bond trusts (see Note H). |
See notes to financial statements.
| | |
| 52 | AB MUNICIPAL INCOME SHARES | | abfunds.com |
STATEMENT OF OPERATIONS
Six Months Ended October 31, 2017 (unaudited)
| | | | | | | | |
| Investment Income | | | | | | | | |
Interest | | $ | 36,809,948 | | | | | |
Dividends—Affiliated issuers | | | 57,473 | | | | | |
Other income(a) | | | 15,514 | | | $ | 36,882,935 | |
| | | | | | | | |
| Expenses | | | | | | | | |
Interest expense | | | 33,464 | | | | | |
| | | | | | | | |
Total expenses | | | | | | | 33,464 | |
| | | | | | | | |
Net investment income | | | | | | | 36,849,471 | |
| | | | | | | | |
| Realized and Unrealized Gain (Loss) on Investment Transactions | | | | | | | | |
Net realized gain on: | | | | | | | | |
Investment transactions | | | | | | | 1,086,097 | |
Swaps | | | | | | | 256,924 | |
Net change in unrealized appreciation/depreciation of: | | | | | | | | |
Investments | | | | | | | 43,965,457 | |
Swaps | | | | | | | (229,920 | ) |
| | | | | | | | |
Net gain on investment transactions | | | | | | | 45,078,558 | |
| | | | | | | | |
Net Increase in Net Assets from Operations | | | | | | $ | 81,928,029 | |
| | | | | | | | |
| (a) | Other income includes a reimbursement for investment in affiliated issuer (see Note B). |
See notes to financial statements.
| | |
| abfunds.com | | AB MUNICIPAL INCOME SHARES | 53 |
STATEMENT OF CHANGES IN NET ASSETS
| | | | | | | | |
| | | Six Months Ended
October 31, 2017
(unaudited) | | | Year Ended
April 30,
2017 | |
| Increase (Decrease) in Net Assets from Operations | | | | | | | | |
Net investment income | | $ | 36,849,471 | | | $ | 54,201,791 | |
Net realized gain on investment transactions | | | 1,343,021 | | | | 5,613,449 | |
Net change in unrealized appreciation/depreciation of investments | | | 43,735,537 | | | | (53,008,165 | ) |
| | | | | | | | |
Net increase in net assets from operations | | | 81,928,029 | | | | 6,807,075 | |
| Dividends to Shareholders from | | | | | | | | |
Net investment income | | | (36,853,251 | ) | | | (54,115,439 | ) |
| Transactions in Shares of Beneficial Interest | | | | | | | | |
Net increase | | | 391,372,152 | | | | 601,893,684 | |
| | | | | | | | |
Total increase | | | 436,446,930 | | | | 554,585,320 | |
| Net Assets | | | | | | | | |
Beginning of period | | | 1,667,125,532 | | | | 1,112,540,212 | |
| | | | | | | | |
End of period (including undistributed net investment income of $1,069,495 and $1,073,275, respectively) | | $ | 2,103,572,462 | | | $ | 1,667,125,532 | |
| | | | | | | | |
See notes to financial statements.
| | |
| 54 | AB MUNICIPAL INCOME SHARES | | abfunds.com |
STATEMENT OF CASH FLOWS
For the Six Months Ended October 31, 2017 (unaudited)
| | | | | | | | |
Net increase in net assets from operations | | | | | | $ | 81,928,029 | |
| Reconciliation of net increase in net assets from operations to net decrease in cash from operating activities: | | | | | | | | |
Purchases of long-term investments | | $ | (681,804,893 | ) | | | | |
Purchases of short-term investments | | | (323,892,962 | ) | | | | |
Proceeds from disposition of long-term investments | | | 189,606,968 | | | | | |
Proceeds from disposition of short-term investments | | | 362,311,292 | | | | | |
Net realized gain on investment transactions | | | (1,343,021 | ) | | | | |
Net change in unrealized appreciation/depreciation on investment transactions | | | (43,735,537 | ) | | | | |
Net accretion of bond discount and amortization of bond premium | | | 6,463,343 | | | | | |
Decrease in receivable for investments sold | | | 42,933,343 | | | | | |
Increase in interest receivable | | | (5,528,210 | ) | | | | |
Decrease in affiliated dividends receivable | | | 16,546 | | | | | |
Increase in receivable due from Adviser | | | (55,318 | ) | | | | |
Increase in cash collateral due from broker | | | (1,825,345 | ) | | | | |
Increase in payable for investments purchased | | | 14,169,666 | | | | | |
Decrease in other liabilities | | | (1,584 | ) | | | | |
Payments for exchange-traded derivatives settlements | | | (615 | ) | | | | |
| | | | | | | | |
Total adjustments | | | | | | | (442,686,327 | ) |
| | | | | | | | |
Net decrease in cash from operating activities | | | | | | $ | (360,758,298 | ) |
| | | | | | | | |
| Cash flows from financing activities | | | | | | | | |
Redemptions in shares of beneficial interest, net | | | 396,709,746 | | | | | |
Cash dividends paid | | | (35,249,033 | ) | | | | |
Repayment of floating rate notes issued | | | (440,000 | ) | | | | |
| | | | | | | | |
Net increase in cash from financing activities | | | | | | | 361,020,713 | |
| | | | | | | | |
Net increase in cash | | | | | | | 262,415 | |
Net change in cash | | | | | | | | |
Cash at beginning of period | | | | | | | 381 | |
| | | | | | | | |
Cash at end of period | | | | | | $ | 262,796 | |
| | | | | | | | |
Supplemental disclosure of cash flow information: | | | | | | | | |
Interest expense paid during the period | | $ | 33,464 | | | | | |
In accordance with U.S. GAAP, the Fund has included a Statement of Cash Flows as a result of its significant investments in Level 3 securities throughout the period.
See notes to financial statements.
| | |
| abfunds.com | | AB MUNICIPAL INCOME SHARES | 55 |
NOTES TO FINANCIAL STATEMENTS
October 31, 2017 (unaudited)
NOTE A
Significant Accounting Policies
AB Corporate Shares (the “Trust”) was organized as a Massachusetts business trust under the laws of The Commonwealth of Massachusetts by an Agreement and Declaration of Trust dated January 26, 2004. The Trust is registered under the Investment Company Act of 1940, as an open-end, diversified management investment company. The Trust operates as a “series” company currently offering four separate portfolios: AB Corporate Income Shares, AB Municipal Income Shares, AB Taxable Multi-Sector Income Shares and AB Impact Municipal Income. Each Fund is considered to be a separate entity for financial reporting and tax purposes. This report relates only to AB Municipal Income Shares (the “Fund”).
Shares of the Fund are offered exclusively to holders of accounts established under wrap-fee programs sponsored and maintained by certain registered investment advisers approved by AllianceBernstein L.P. (the “Adviser”). The Fund’s shares may be purchased at the relevant net asset value without a sales charge or other fee. The financial statements have been prepared in conformity with U.S. generally accepted accounting principles (“U.S. GAAP”) which require management to make certain estimates and assumptions that affect the reported amounts of assets and liabilities in the financial statements and amounts of income and expenses during the reporting period. Actual results could differ from those estimates. The Fund is an investment company under U.S. GAAP and follows the accounting and reporting guidance applicable to investment companies. The following is a summary of significant accounting policies followed by the Fund.
1. Security Valuation
Portfolio securities are valued at their current market value determined on the basis of market quotations or, if market quotations are not readily available or are deemed unreliable, at “fair value” as determined in accordance with procedures established by and under the general supervision of the Trust’s Board of Trustees (the “Board”).
In general, the market values of securities which are readily available and deemed reliable are determined as follows: securities listed on a national securities exchange (other than securities listed on the NASDAQ Stock Market, Inc. (“NASDAQ”)) or on a foreign securities exchange are valued at the last sale price at the close of the exchange or foreign securities exchange. If there has been no sale on such day, the securities are valued at the last traded price from the previous day. Securities listed on more than one exchange are valued by reference to the principal exchange on which the securities are traded; securities listed only on NASDAQ are valued in accordance with the NASDAQ Official Closing Price; listed or over the counter (“OTC”) market put or call options are valued at the mid level between the current bid and ask prices. If either a current bid or current ask
| | |
| 56 | AB MUNICIPAL INCOME SHARES | | abfunds.com |
NOTES TO FINANCIAL STATEMENTS (continued)
price is unavailable, the Adviser will have discretion to determine the best valuation (e.g., last trade price in the case of listed options); open futures are valued using the closing settlement price or, in the absence of such a price, the most recent quoted bid price. If there are no quotations available for the day of valuation, the last available closing settlement price is used; U.S. Government securities and any other debt instruments having 60 days or less remaining until maturity are generally valued at market by an independent pricing vendor, if a market price is available. If a market price is not available, the securities are valued at amortized cost. This methodology is commonly used for short term securities that have an original maturity of 60 days or less, as well as short term securities that had an original term to maturity that exceeded 60 days. In instances when amortized cost is utilized, the Valuation Committee (the “Committee”) must reasonably conclude that the utilization of amortized cost is approximately the same as the fair value of the security. Such factors the Committee will consider include, but are not limited to, an impairment of the creditworthiness of the issuer or material changes in interest rates. Fixed-income securities, including mortgage-backed and asset-backed securities, may be valued on the basis of prices provided by a pricing service or at a price obtained from one or more of the major broker-dealers. In cases where broker-dealer quotes are obtained, the Adviser may establish procedures whereby changes in market yields or spreads are used to adjust, on a daily basis, a recently obtained quoted price on a security. Swaps and other derivatives are valued daily, primarily using independent pricing services, independent pricing models using market inputs, as well as third party broker-dealers or counterparties. Open end mutual funds are valued at the closing net asset value per share, while exchange traded funds are valued at the closing market price per share.
Securities for which market quotations are not readily available (including restricted securities) or are deemed unreliable are valued at fair value as deemed appropriate by the Adviser. Factors considered in making this determination may include, but are not limited to, information obtained by contacting the issuer, analysts, analysis of the issuer’s financial statements or other available documents. In addition, the Fund may use fair value pricing for securities primarily traded in non-U.S. markets because most foreign markets close well before the Fund values its securities at 4:00 p.m., Eastern Time. The earlier close of these foreign markets gives rise to the possibility that significant events, including broad market moves, may have occurred in the interim and may materially affect the value of those securities. To account for this, the Fund generally values many of its foreign equity securities using fair value prices based on third party vendor modeling tools to the extent available.
2. Fair Value Measurements
In accordance with U.S. GAAP regarding fair value measurements, fair value is defined as the price that the Fund would receive to sell an asset or
| | |
| abfunds.com | | AB MUNICIPAL INCOME SHARES | 57 |
NOTES TO FINANCIAL STATEMENTS (continued)
pay to transfer a liability in an orderly transaction between market participants at the measurement date. U.S. GAAP establishes a framework for measuring fair value, and a three-level hierarchy for fair value measurements based upon the transparency of inputs to the valuation of an asset or liability (including those valued based on their market values as described in Note A.1 above). Inputs may be observable or unobservable and refer broadly to the assumptions that market participants would use in pricing the asset or liability. Observable inputs reflect the assumptions market participants would use in pricing the asset or liability based on market data obtained from sources independent of the Fund. Unobservable inputs reflect the Fund’s own assumptions about the assumptions that market participants would use in pricing the asset or liability based on the best information available in the circumstances. Each investment is assigned a level based upon the observability of the inputs which are significant to the overall valuation. The three-tier hierarchy of inputs is summarized below.
| | • | | Level 1—quoted prices in active markets for identical investments |
| | • | | Level 2—other significant observable inputs (including quoted prices for similar investments, interest rates, prepayment speeds, credit risk, etc.) |
| | • | | Level 3—significant unobservable inputs (including the Fund’s own assumptions in determining the fair value of investments) |
The fair value of debt instruments, such as bonds, and over-the-counter derivatives is generally based on market price quotations, recently executed market transactions (where observable) or industry recognized modeling techniques and are generally classified as Level 2. Pricing vendor inputs to Level 2 valuations may include quoted prices for similar investments in active markets, interest rate curves, coupon rates, currency rates, yield curves, option adjusted spreads, default rates, credit spreads and other unique security features in order to estimate the relevant cash flows which are then discounted to calculate fair values. If these inputs are unobservable and significant to the fair value, these investments will be classified as Level 3. In addition, non-agency rated investments are classified as Level 3.
Other fixed income investments, including non-U.S. government and corporate debt, are generally valued using quoted market prices, if available, which are typically impacted by current interest rates, maturity dates and any perceived credit risk of the issuer. Additionally, in the absence of quoted market prices, these inputs are used by pricing vendors to derive a valuation based upon industry or proprietary models which incorporate issuer specific data with relevant yield/spread comparisons with more widely quoted bonds with similar key characteristics. Those investments for which there are observable inputs are classified as Level 2. Where the inputs are not observable, the investments are classified as Level 3.
| | |
| 58 | AB MUNICIPAL INCOME SHARES | | abfunds.com |
NOTES TO FINANCIAL STATEMENTS (continued)
The following table summarizes the valuation of the Fund’s investments by the above fair value hierarchy levels as of October 31, 2017:
| | | | | | | | | | | | | | | | |
Investments in
Securities: | | Level 1 | | | Level 2 | | | Level 3 | | | Total | |
Assets: | | | | | | | | | | | | | | | | |
Long-Term Municipal Bonds: | | | | | | | | | | | | | | | | |
Alaska | | $ | – 0 | – | | $ | 10,468,270 | | | $ | 112,131 | | | $ | 10,580,401 | |
Arizona | | | – 0 | – | | | 33,521,143 | | | | 5,204,907 | | | | 38,726,050 | |
California | | | – 0 | – | | | 101,939,231 | | | | 16,810,103 | | | | 118,749,334 | |
Colorado | | | – 0 | – | | | 12,134,481 | | | | 11,202,317 | | | | 23,336,798 | |
Florida | | | – 0 | – | | | 90,699,598 | | | | 14,419,051 | | | | 105,118,649 | |
Illinois | | | – 0 | – | | | 250,989,081 | | | | 20,264,337 | | | | 271,253,418 | |
Kentucky | | | – 0 | – | | | 55,459,446 | | | | 7,976,940 | | | | 63,436,386 | |
Louisiana | | | – 0 | – | | | 55,774,040 | | | | 2,376,218 | | | | 58,150,258 | |
Maryland | | | – 0 | – | | | 12,524,096 | | | | 3,301,742 | | | | 15,825,838 | |
Michigan | | | – 0 | – | | | 100,250,327 | | | | 11,092,624 | | | | 111,342,951 | |
Missouri | | | – 0 | – | | | 17,081,081 | | | | 12,910,329 | | | | 29,991,410 | |
New Jersey | | | – 0 | – | | | 195,622,325 | | | | 197,035 | | | | 195,819,360 | |
New York | | | – 0 | – | | | 129,645,982 | | | | 4,978,553 | | | | 134,624,535 | |
North Carolina | | | – 0 | – | | | 17,333,309 | | | | 10,516,099 | | | | 27,849,408 | |
Ohio | | | – 0 | – | | | 64,995,271 | | | | 6,601,232 | | | | 71,596,503 | |
Oklahoma | | | – 0 | – | | | – 0 | – | | | 1,219,736 | | | | 1,219,736 | |
Oregon | | | – 0 | – | | | 5,042,614 | | | | 290,996 | | | | 5,333,610 | |
Pennsylvania | | | – 0 | – | | | 163,176,181 | | | | 14,860,346 | | | | 178,036,527 | |
South Carolina | | | – 0 | – | | | 8,559,274 | | | | 2,048,860 | | | | 10,608,134 | |
Tennessee | | | – 0 | – | | | 10,548,931 | | | | 9,851,050 | | | | 20,399,981 | |
Texas | | | – 0 | – | | | 125,711,552 | | | | 28,976,986 | | | | 154,688,538 | |
Utah | | | – 0 | – | | | 107,791 | | | | 200,263 | | | | 308,054 | |
Vermont | | | – 0 | – | | | 3,141,590 | | | | 212,012 | | | | 3,353,602 | |
Virginia | | | – 0 | – | | | 13,663,493 | | | | 4,137,579 | | | | 17,801,072 | |
Washington | | | – 0 | – | | | 23,327,939 | | | | 9,918,484 | | | | 33,246,423 | |
Wisconsin | | | – 0 | – | | | 36,939,218 | | | | 25,692,102 | | | | 62,631,320 | |
Other | | | – 0 | – | | | 336,233,015 | | | | – 0 | – | | | 336,233,015 | |
Short-Term Investments: | | | | | | | | | | | | | | | | |
Investment Companies | | | 11,257,852 | | | | – 0 | – | | | – 0 | – | | | 11,257,852 | |
Corporates—Investment Grade | | | – 0 | – | | | – 0 | – | | | 2,210,000 | | | | 2,210,000 | |
| | | | | | | | | | | | | | | | |
Total Investments in Securities | | | 11,257,852 | | | | 1,874,889,279 | | | | 227,582,032 | | | | 2,113,729,163 | |
Other Financial Instruments(a): | | | | | | | | | | | | | | | | |
Assets | | | | | | | | | | | | | | | | |
Liabilities: | | | | | | | | | | | | | | | | |
Centrally Cleared Interest Rate Swaps | | | – 0 | – | | | (229,920 | ) | | | – 0 | – | | | (229,920 | )(b) |
| | | | | | | | | | | | | | | | |
Total(b) | | $ | 11,257,852 | | | $ | 1,874,659,359 | | | $ | 227,582,032 | | | $ | 2,113,499,243 | |
| | | | | | | | | | | | | | | | |
| (a) | Other financial instruments are derivative instruments, such as futures, forwards and swaps, which are valued at the unrealized appreciation/(depreciation) on the instrument. Other financial instruments may also include swaps with upfront premiums, options written and swaptions which are valued at market value. |
| (b) | There were no transfers between any levels during the reporting period. |
| | |
| abfunds.com | | AB MUNICIPAL INCOME SHARES | 59 |
NOTES TO FINANCIAL STATEMENTS (continued)
The Portfolio recognizes all transfers between levels of the fair value hierarchy assuming the financial instruments were transferred at the beginning of the reporting period.
The following is a reconciliation of investments in which significant unobservable inputs (Level 3) were used in determining fair value.
| | | | | | | | | | | | |
| | | Long-Term
Municipal
Bonds | | | Corporates -
Investment
Grade | | | Total | |
Balance as of 4/30/17 | | $ | 200,397,233 | | | $ | 1,765,000 | | | $ | 202,162,233 | |
Accrued discounts/(premiums) | | | 225,915 | | | | – 0 | – | | | 225,915 | |
Realized gain (loss) | | | 432,278 | | | | – 0 | – | | | 432,278 | |
Change in unrealized appreciation/depreciation | | | 4,525,288 | | | | – 0 | – | | | 4,525,288 | |
Purchases | | | 31,968,527 | | | | 445,000 | | | | 32,413,527 | |
Sales | | | (12,177,209 | ) | | | – 0 | – | | | (12,177,209 | ) |
Transfers in to Level 3 | | | – 0 | – | | | – 0 | – | | | – 0 | – |
Transfers out of Level 3 | | | – 0 | – | | | – 0 | – | | | – 0 | – |
| | | | | | | | | | | | |
Balance as of 10/30/17 | | $ | 225,372,032 | | | $ | 2,210,000 | | | $ | 227,582,032 | |
| | | | | | | | | | | | |
Net change in unrealized appreciation/depreciation from investments held as of 10/30/17(b) | | $ | 4,811,515 | | | $ | – 0 | – | | $ | 4,811,515 | |
| | | | | | | | | | | | |
As of October 31, 2017, all Level 3 securities were priced by third party vendors.
The Adviser established the Committee to oversee the pricing and valuation of all securities held in the Fund. The Committee operates under pricing and valuation policies and procedures established by the Adviser and approved by the Board, including pricing policies which set forth the mechanisms and processes to be employed on a daily basis to implement these policies and procedures. In particular, the pricing policies describe how to determine market quotations for securities and other instruments. The Committee’s responsibilities include: 1) fair value and liquidity determinations (and oversight of any third parties to whom any responsibility for fair value and liquidity determinations is delegated), and 2) regular monitoring of the Adviser’s pricing and valuation policies and procedures and modification or enhancement of these policies and procedures (or recommendation of the modification of these policies and procedures) as the Committee believes appropriate.
The Committee is also responsible for monitoring the implementation of the pricing policies by the Adviser’s Pricing Group (the “Pricing Group”) and any third party which performs certain pricing functions in accordance with the pricing policies. The Pricing Group is responsible for the oversight
| | |
| 60 | AB MUNICIPAL INCOME SHARES | | abfunds.com |
NOTES TO FINANCIAL STATEMENTS (continued)
of the third party on a day-to-day basis. The Committee and the Pricing Group perform a series of activities to provide reasonable assurance of the accuracy of prices including: 1) periodic vendor due diligence meetings, review of methodologies, new developments and processes at vendors, 2) daily comparison of security valuation versus prior day for all securities that exceeded established thresholds, and 3) daily review of unpriced, stale, and variance reports with exceptions reviewed by senior management and the Committee.
In addition, several processes outside of the pricing process are used to monitor valuation issues including: 1) performance and performance attribution reports are monitored for anomalous impacts based upon benchmark performance, and 2) portfolio managers review all portfolios for performance and analytics (which are generated using the Adviser’s prices).
3. Taxes
It is the Fund’s policy to meet the requirements of the Internal Revenue Code applicable to regulated investment companies and to distribute all of its investment company taxable income and net realized gains, if any, to shareholders. Therefore, no provisions for federal income or excise taxes are required.
In accordance with U.S. GAAP requirements regarding accounting for uncertainties in income taxes, management has analyzed the Fund’s tax positions taken or expected to be taken on federal and state income tax returns for all open tax years (the current and the prior three tax years) and has concluded that no provision for income tax is required in the Fund’s financial statements.
4. Investment Income and Investment Transactions
Dividend income is recorded on the ex-dividend date or as soon as the Fund is informed of the dividend. Interest income is accrued daily. Investment transactions are accounted for on the date the securities are purchased or sold. Investment gains or losses are determined on the identified cost basis. The Fund amortizes premiums and accretes discounts as adjustments to interest income.
5. Dividends and Distributions
Dividends and distributions to shareholders, if any, are recorded on the ex-dividend date. Income dividends and capital gains distributions are determined in accordance with federal tax regulations and may differ from those determined in accordance with U.S. GAAP. To the extent these differences are permanent, such amounts are reclassified within the capital accounts based on their federal tax basis treatment; temporary differences do not require such reclassification.
| | |
| abfunds.com | | AB MUNICIPAL INCOME SHARES | 61 |
NOTES TO FINANCIAL STATEMENTS (continued)
NOTE B
Advisory Fee and Other Transactions with Affiliates
Under the terms of the advisory agreement, the Fund pays no advisory fee to the Adviser and the Adviser reimburses or pays for the Fund’s operating expenses. The Fund is an integral part of separately managed accounts in wrap-fee programs and other investment programs. Typically, participants in these programs pay a fee to their investment adviser for all costs and expenses of the separately managed account, including costs and expenses associated with the Fund, and a fee is paid by their investment adviser to the Adviser. The Adviser serves as investment manager and adviser of the Fund and continuously furnishes an investment program for the Fund and manages, supervises and conducts the affairs of the Fund, subject to the supervisions of the Fund’s Board. The advisory agreement provides that the Adviser or an affiliate will furnish, or pay the expenses of the Fund for, office space, facilities and equipment, services of executive and other personnel of the Fund and certain administrative services.
The Fund has entered into a distribution agreement with AllianceBernstein Investments, Inc., the Fund’s principal underwriter (the “Underwriter”), to permit the Underwriter to distribute the Fund’s shares, which are sold at their net asset value without any sales charge. The Fund does not pay a fee for this service. The Underwriter is a wholly owned subsidiary of the Adviser.
AllianceBernstein Investor Services, Inc. (“ABIS”), a wholly-owned subsidiary of the Adviser, acts as the Fund’s registrar, transfer agent and dividend-disbursing agent. ABIS registers the transfer, issuance and redemption of Fund shares and disburses dividends and other distributions to Fund shareholders. The Fund does not pay a fee for this service.
The Fund may invest in AB Government Money Market Portfolio (the “Government Money Market Portfolio”) which has a contractual annual advisory fee rate of ..20% of the portfolio’s average daily net assets and bears its own expenses. In connection with the investment by the Fund in the Government Money Market Portfolio, the Adviser has contractually agreed to reimburse its advisory fee from the Fund in an amount equal to the Fund’s pro rata share of the effective advisory fees of Government Money Market Portfolio, as borne indirectly by the Fund as an acquired fund fee and expense. For the six months ended October 31, 2017, such reimbursement amounted to $15,514.
| | |
| 62 | AB MUNICIPAL INCOME SHARES | | abfunds.com |
NOTES TO FINANCIAL STATEMENTS (continued)
A summary of the Fund’s transactions in AB mutual funds for the six months ended October 31, 2017 is as follows:
| | | | | | | | | | | | | | | | | | | | |
| Fund | | Market Value 4/30/17 (000) | | | Purchases at Cost (000) | | | Sales Proceeds (000) | | | Market Value 10/31/17 (000) | | | Dividend Income (000) | |
Government Money Market Portfolio | | $ | 14,753 | | | $ | 308,448 | | | $ | 311,943 | | | $ | 11,258 | | | $ | 57 | |
NOTE C
Investment Transactions
Purchases and sales of investment securities (excluding short-term investments) for the six months ended October 31, 2017 were as follows:
| | | | | | | | |
| | | Purchases | | | Sales | |
Investment securities (excluding U.S. government securities)................... | | $ | 614,855,620 | | | $ | 122,207,207 | |
U.S. government securities...................... | | | 66,949,273 | | | | 66,610,042 | |
The cost of investments for federal income tax purposes was substantially the same as the cost for financial reporting purposes. Accordingly, gross unrealized appreciation and unrealized depreciation are as follows:
| | | | |
Gross unrealized appreciation | | $ | 68,032,417 | |
Gross unrealized depreciation | | | (16,411,621 | ) |
| | | | |
Net unrealized appreciation | | $ | 51,620,796 | |
| | | | |
1. Derivative Financial Instruments
The Fund may use derivatives in an effort to earn income and enhance returns, to replace more traditional direct investments, to obtain exposure to otherwise inaccessible markets (collectively, “investment purposes”), or to hedge or adjust the risk profile of its portfolio.
The principal types of derivatives utilized by the Fund, as well as the methods in which they may be used are:
The Fund may enter into swaps to hedge its exposure to interest rates or credit risk. A swap is an agreement that obligates two parties to exchange a series of cash flows at specified intervals based upon or calculated by reference to changes in specified prices or rates for a specified amount of an underlying asset. The payment flows are usually netted against each other, with the difference being paid by one party to the other. In addition, collateral may be pledged or received by the Fund in accordance with the terms of the respective
| | |
| abfunds.com | | AB MUNICIPAL INCOME SHARES | 63 |
NOTES TO FINANCIAL STATEMENTS (continued)
swaps to provide value and recourse to the Fund or its counterparties in the event of default, bankruptcy or insolvency by one of the parties to the swap.
Risks may arise as a result of the failure of the counterparty to the swap to comply with the terms of the swap. The loss incurred by the failure of a counterparty is generally limited to the net interim payment to be received by the Fund, and/or the termination value at the end of the contract. Therefore, the Fund considers the creditworthiness of each counterparty to a swap in evaluating potential counterparty risk. This risk is mitigated by having a netting arrangement between the Fund and the counterparty and by the posting of collateral by the counterparty to the Fund to cover the Fund’s exposure to the counterparty. Additionally, risks may arise from unanticipated movements in interest rates or in the value of the underlying securities. The Fund accrues for the interim payments on swaps on a daily basis, with the net amount recorded within unrealized appreciation/depreciation of swaps on the statement of assets and liabilities, where applicable. Once the interim payments are settled in cash, the net amount is recorded as realized gain/(loss) on swaps on the statement of operations, in addition to any realized gain/(loss) recorded upon the termination of swaps. Upfront premiums paid or received are recognized as cost or proceeds on the statement of assets and liabilities and are amortized on a straight line basis over the life of the contract. Amortized upfront premiums are included in net realized gain/(loss) from swaps on the statement of operations. Fluctuations in the value of swaps are recorded as a component of net change in unrealized appreciation/depreciation of swaps on the statement of operations.
Certain standardized swaps, including certain interest rate swaps and credit default swaps, are (or soon will be) subject to mandatory central clearing. Cleared swaps are transacted through futures commission merchants (“FCMs”) that are members of central clearinghouses, with the clearinghouse serving as central counterparty, similar to transactions in futures contracts. Centralized clearing will be required for additional categories of swaps on a phased-in basis based on requirements published by the Securities and Exchange Commission and Commodity Futures Trading Commission.
At the time the Fund enters into a centrally cleared swap, the Fund deposits and maintains as collateral an initial margin with the broker, as required by the clearinghouse on which the transaction is effected. Such amount is shown as cash collateral due from broker on the statement of assets and liabilities. Pursuant to the contract, the Fund agrees to receive from or pay to the broker an amount of cash equal
| | |
| 64 | AB MUNICIPAL INCOME SHARES | | abfunds.com |
NOTES TO FINANCIAL STATEMENTS (continued)
to the daily fluctuation in the value of the contract. Such receipts or payments are known as variation margin and are recorded by the Fund as unrealized gains or losses. Risks may arise from the potential inability of a counterparty to meet the terms of the contract. The credit/counterparty risk for centrally cleared swaps is generally less than non-centrally cleared swaps, since the clearinghouse, which is the issuer or counterparty to each centrally cleared swap, has robust risk mitigation standards, including the requirement to provide initial and variation margin. When the contract is closed, the Fund records a realized gain or loss equal to the difference between the value of the contract at the time it was opened and the time it was closed.
Interest Rate Swaps:
The Fund is subject to interest rate risk exposure in the normal course of pursuing its investment objectives. Because the Fund holds fixed rate bonds, the value of these bonds may decrease if interest rates rise. To help hedge against this risk and to maintain its ability to generate income at prevailing market rates, the Fund may enter into interest rate swaps. Interest rate swaps are agreements between two parties to exchange cash flows based on a notional amount. The Fund may elect to pay a fixed rate and receive a floating rate, or, receive a fixed rate and pay a floating rate on a notional amount.
In addition, the Fund may also enter into interest rate swap transactions to preserve a return or spread on a particular investment or portion of its portfolio, or protecting against an increase in the price of securities the Fund anticipates purchasing at a later date. Interest rate swaps involve the exchange by a Fund with another party of their respective commitments to pay or receive interest (e.g., an exchange of floating rate payments for fixed rate payments) computed based on a contractually-based principal (or “notional”) amount. Interest rate swaps are entered into on a net basis (i.e., the two payment streams are netted out, with the Fund receiving or paying, as the case may be, only the net amount of the two payments).
During the six months ended October 31, 2017, the Fund held interest rate swaps for hedging purposes.
The Fund typically enters into International Swaps and Derivatives Association, Inc. Master Agreements (“ISDA Master Agreement”) with its OTC derivative contract counterparties in order to, among other things, reduce its credit risk to OTC counterparties. ISDA Master Agreements include provisions for general obligations, representations, collateral and events of default or termination. Under an ISDA Master Agreement, the Fund typically may offset with the OTC counterparty certain derivative financial
| | |
| abfunds.com | | AB MUNICIPAL INCOME SHARES | 65 |
NOTES TO FINANCIAL STATEMENTS (continued)
instruments’ payables and/or receivables with collateral held and/or posted and create one single net payment (close-out netting) in the event of default or termination. In the event of a default by an OTC counterparty, the return of collateral with market value in excess of the Fund’s net liability, held by the defaulting party, may be delayed or denied.
The Fund’s ISDA Master Agreements may contain provisions for early termination of OTC derivative transactions in the event the net assets of the Fund decline below specific levels (“net asset contingent features”). If these levels are triggered, the Fund’s OTC counterparty has the right to terminate such transaction and require the Fund to pay or receive a settlement amount in connection with the terminated transaction. For additional details, please refer to netting arrangements by the OTC counterparty tables below.
During the six months ended October 31, 2017, the Fund had entered into the following derivatives:
| | | | | | | | | | | | |
| | | Asset Derivatives | | | Liability Derivatives | |
Derivative Type | | Statement of
Assets and
Liabilities
Location | | Fair Value | | | Statement of
Assets and
Liabilities
Location | | Fair Value | |
Interest rate contracts | | | | | | | | Receivable/Payable for variation margin on exchange traded swaps | | $ | 229,920 | * |
| | | | | | | | | | | | |
Total | | | | | | | | | | $ | 229,920 | |
| | | | | | | | | | | | |
| * | Only variation margin receivable/payable at period end is reported within the statement of assets and liabilities. This amount reflects cumulative appreciation/(depreciation) of exchange-traded derivatives as reported in the portfolio of investments. |
| | | | | | | | | | |
Derivative Type | | Location of Gain or (Loss) on
Derivatives Within Statement of Operations | | Realized Gain
or (Loss) on
Derivatives | | | Change in
Unrealized
Appreciation or
(Depreciation) | |
Interest rate contracts | | Net realized gain (loss) on swaps; Net change in unrealized appreciation/depreciation of swaps | | $ | 256,924 | | | $ | (229,920 | ) |
| | | | | | | | | | |
Total | | | | $ | 256,924 | | | $ | (229,920 | ) |
| | | | | | | | | | |
| | |
| 66 | AB MUNICIPAL INCOME SHARES | | abfunds.com |
NOTES TO FINANCIAL STATEMENTS (continued)
The following table represents the average monthly volume of the Fund’s derivative transactions during the six months ended October 31, 2017:
| | | | |
Centrally Cleared Interest Rate Swaps: | | | | |
Average notional amount | | $ | 79,125,000 | (a) |
| (a) | Positions were open for four months during the period. |
For financial reporting purposes, the Fund does not offset derivative assets and derivative liabilities that are subject to netting arrangements in the statement of assets and liabilities.
Exchange-traded derivatives are not subject to netting arrangements. The Fund did not engage in OTC derivatives transactions for the six months ended October 31, 2017.
NOTE D
Shares of Beneficial Interest
Transactions in shares of beneficial interest were as follows:
| | | | | | | | | | | | | | | | | | | | | | | | |
| | | | | | | | | | | | | | | | | | | | | | | | |
| | | Shares | | | | | | Amount | | | | |
| | | Six Months Ended
October 31, 2017
(unaudited) | | | Year Ended
April 30, 2017 | | | | | | Six Months Ended
October 31, 2017
(unaudited) | | | Year Ended
April 30, 2017 | | | | |
| | | | | | | | |
Shares sold | | | 44,226,320 | | | | 78,438,285 | | | | | | | $ | 506,841,760 | | | $ | 897,745,615 | | | | | |
| | | | | |
Shares redeemed | | | (10,079,937 | ) | | | (26,222,837 | ) | | | | | | | (115,469,608 | ) | | | (295,851,931 | ) | | | | |
| | | | | |
Net increase | | | 34,146,383 | | | | 52,215,448 | | | | | | | $ | 391,372,152 | | | $ | 601,893,684 | | | | | |
| | | | | |
NOTE E
Risks Involved in Investing in the Fund
Interest Rate Risk and Credit Risk—Interest rate risk is the risk that changes in interest rates will affect the6 value of the Fund’s investments in fixed-income debt securities such as bonds or notes. Increases in interest rates may cause the value of the Fund’s investments to decline. Credit risk is the risk that the issuer or guarantor of a debt security, or the counterparty to a derivative contract, will be unable or unwilling to make timely principal and/or interest payments, or to otherwise honor its obligations. The degree of risk for a particular security may be reflected in its credit rating. Credit risk is greater for medium quality and lower-rated securities. Lower-rated debt securities and similar unrated securities (commonly known as “junk bonds”) have speculative elements or are predominantly speculative risks.
Municipal Market Risk—This is the risk that special factors may adversely affect the value of municipal securities and have a significant effect on the yield or value of the Fund’s investments in municipal
| | |
| abfunds.com | | AB MUNICIPAL INCOME SHARES | 67 |
NOTES TO FINANCIAL STATEMENTS (continued)
securities. These factors include economic conditions, political or legislative changes, uncertainties related to the tax status of municipal securities, or the rights of investors in these securities. To the extent that the Fund invests more of its assets in a particular state’s municipal securities, the Fund may be vulnerable to events adversely affecting that state, including economic, political and regulatory occurrences, court decisions, terrorism and catastrophic natural disasters, such as hurricanes or earthquakes. The Fund’s investments in certain municipal securities with principal and interest payments that are made from the revenues of a specific project or facility, and not general tax revenues, may have increased risks. Factors affecting the project or facility, such as local business or economic conditions, could have a significant effect on the project’s ability to make payments of principal and interest on these securities.
The Portfolio may invest in the municipal securities of Puerto Rico and other U.S. territories and their governmental agencies and municipalities, which are exempt from federal, state, and, where applicable, local income taxes. These municipal securities may have more risks than those of other U.S. issuers of municipal securities. Puerto Rico experienced a significant downturn during the recession. Puerto Rico’s downturn was particularly severe, and Puerto Rico continues to face a very challenging economic and fiscal environment. Municipal securities issued by Puerto Rico issuers have extremely low ratings by the credit rating organizations. More recently Puerto Rico has defaulted on its debt payments, and if the general economic situation in Puerto Rico persists, the volatility and credit quality of Puerto Rican municipal securities will continue to be adversely affected, and the market for such securities may experience continued volatility. In addition, Puerto Rico’s difficulties have resulted in increased volatility in portions of the broader municipal securities market from time to time, and this may recur in the future.
Tax Risk—There is no guarantee that the income on the Fund’s municipal securities will be exempt from regular federal income and state income taxes. Unfavorable legislation, adverse interpretations by federal or state authorities, litigation or noncompliant conduct by the issuer of a municipal security could affect the tax-exempt status of municipal securities. If the Internal Revenue Service or a state authority determines that an issuer of a municipal security has not complied with applicable requirements, interest from the security could become subject to regular federal income tax and/or state personal income tax, possibly retroactively to the date the security was issued, the value of the security could decline significantly, and a portion of the distributions to Fund shareholders could be recharacterized as taxable. Recent federal legislation included reductions in tax rates for individuals, with relatively larger reductions in tax rates for corporations. These tax rate reductions may reduce
| | |
| 68 | AB MUNICIPAL INCOME SHARES | | abfunds.com |
NOTES TO FINANCIAL STATEMENTS (continued)
the demand for municipal bonds which could reduce the value of municipal bonds held by the Fund.
Below Investment Grade Securities Risk—Investments in fixed-income securities with lower ratings (commonly known as “junk bonds”) tend to have a higher probability that an issuer will default or fail to meet its payment obligations. These securities may be subject to greater price volatility due to such factors as specific corporate developments, interest rate sensitivity, negative perceptions of the junk bond market generally and less secondary market liquidity.
Inflation Risk—This is the risk that the value of assets or income from investments will be less in the future as inflation decreases the value of money. As inflation increases, the value of the Fund’s assets can decline as can the value of the Fund’s distributions. This risk is significantly greater for fixed-income securities with longer maturities.
Derivatives Risk—The Fund may enter into derivative transactions such as forwards, options, futures and swaps. Derivatives may be illiquid, difficult to price, and leveraged so that small changes may produce disproportionate losses for the Fund, and subject to counterparty risk to a greater degree than more traditional investments. Derivatives may result in significant losses, including losses that are far greater than the value of the derivatives reflected on the statement of assets and liabilities.
Financing and Related Transactions; Leverage and Other Risks—The Fund may utilize financial leverage, including tender option bond transactions, to seek to enhance the yield and net asset value. These objectives may not be achieved in all interest rate environments. Leverage creates certain risks for shareholders, including the likelihood of greater volatility of the net asset value. If income from the securities purchased from the funds made available by leverage is not sufficient to cover the cost of leverage, the Fund’s return will be less than if leverage had not been used. As a result, the amounts available for distribution as dividends and other distributions will be reduced. During periods of rising short-term interest rates, the interest paid on the floaters in tender option bond transactions would increase, which may adversely affect the Fund’s income and distribution to shareholders. A decline in distributions would adversely affect the Fund’s yield. If rising short-term rates coincide with a period of rising long-term rates, the value of the long-term municipal bonds purchased with the proceeds of leverage would decline, adversely affecting the net asset value.
In a tender option bond transaction, the Fund may transfer a highly rated fixed-rate municipal security to a broker, which, in turn, deposits the bond into a special purpose vehicle (typically, a trust) usually sponsored by the
| | |
| abfunds.com | | AB MUNICIPAL INCOME SHARES | 69 |
NOTES TO FINANCIAL STATEMENTS (continued)
broker. The Fund receives cash and a residual interest security (sometimes referred to as an “inverse floater”) issued by the trust in return. The trust simultaneously issues securities, which pay an interest rate that is reset each week based on an index of high-grade short-term seven-day demand notes. These securities, sometimes referred to as “floaters”, are bought by third parties, including tax-exempt money market funds, and can be tendered by these holders to a liquidity provider at par, unless certain events occur. The Fund continues to earn all the interest from the transferred bond less the amount of interest paid on the floaters and the expenses of the trust, which include payments to the trustee and the liquidity provider and organizational costs. The Fund also uses the cash received from the transaction for investment purposes or to retire other forms of leverage. Under certain circumstances, the trust may be terminated and collapsed, either by the Fund or upon the occurrence of certain events, such as a downgrade in the credit quality of the underlying bond, or in the event holders of the floaters tender their securities to the liquidity provider. See Note I to the Financial Statements “Floating Rate Notes in Connection with Securities Held” for more information about tender option bond transactions.
The Fund may also purchase inverse floaters from a tender option bond trust in a secondary market transaction without first owning the underlying bond. The income received from an inverse floater varies inversely with the short-term interest rate paid on the floaters issued by the trust. The prices of inverse floaters are subject to greater volatility than the prices of fixed-income securities that are not inverse floaters. Investments in inverse floaters may amplify the risks of leverage. If short-term interest rates rise, the interest payable on the floaters would increase and income from the inverse floaters decrease.
Liquidity Risk—Liquidity risk exists when particular investments, such as lower-rated securities, are difficult to purchase or sell, possibly preventing the Fund from selling out of these illiquid securities at an advantageous price. The Fund is subject to liquidity risk because the market for municipal securities is generally smaller than many other markets. Derivatives and securities involving substantial market and credit risk tend to involve greater liquidity risk.
Indemnification Risk—In the ordinary course of business, the Fund enters into contracts that contain a variety of indemnifications. The Fund’s maximum exposure under these arrangements is unknown. However, the Fund has not had prior claims or losses pursuant to these indemnification provisions and expects the risk of loss thereunder to be remote. Therefore, the Fund has not accrued any liability in connection with these indemnification provisions.
| | |
| 70 | AB MUNICIPAL INCOME SHARES | | abfunds.com |
NOTES TO FINANCIAL STATEMENTS (continued)
NOTE F
Joint Credit Facility
A number of open-end mutual funds managed by the Adviser, including the Fund, participate in a $280 million revolving credit facility (the “Facility”) intended to provide short-term financing, if necessary, subject to certain restrictions in connection with abnormal redemption activity. Commitment fees related to the Facility are paid by the Adviser on behalf of the Fund. The Fund did not utilize the Facility during the six months ended October 31, 2017.
NOTE G
Distributions to Shareholders
The tax character of distributions to be paid for the year ending April 30, 2018 will be determined at the end of the current fiscal year. The tax character of distributions paid during the fiscal years ended April 30, 2017 and April 30, 2016 were as follows:
| | | | | | | | |
| | | 2017 | | | 2016 | |
Distributions paid from: | | | | | | | | |
Ordinary income | | $ | 640,741 | | | $ | 2,224,599 | |
| | | | | | | | |
Total taxable distributions | | $ | 640,741 | | | $ | 2,224,599 | |
| | | | | | | | |
Tax-exempt distributions | | | 53,474,698 | | | | 32,851,908 | |
| | | | | | | | |
Total distributions paid | | $ | 54,115,439 | | | $ | 35,076,507 | |
| | | | | | | | |
As of April 30, 2017, the components of accumulated earnings/(deficit) on a tax basis were as follows:
| | | | |
Undistributed tax-exempt income | | $ | 6,664,973 | |
Accumulated capital and other losses | | | (1,898,466 | )(a) |
Unrealized appreciation/(depreciation) | | | 7,868,097 | (b) |
| | | | |
Total accumulated earnings/(deficit) | | $ | 12,634,604 | (c) |
| | | | |
| (a) | As of April 30, 2017, the Fund had a net capital loss carryforward of $1,898,466. During the fiscal year, the Fund utilized $4,694,188 of capital loss carryforwards to offset current year net realized gains. |
| (b) | The differences between book-basis and tax-basis unrealized appreciation/(depreciation) are attributable primarily to the tax treatment of tender option bonds. |
| (c) | The difference between book-basis and tax-basis components of accumulated earnings/(deficit) is attributable primarily to dividends payable and the tax treatment of defaulted securities. |
For tax purposes, net realized capital losses may be carried over to offset future capital gains, if any. Funds are permitted to carry forward capital losses for an indefinite period, and such losses will retain their character as either short-term or long-term capital losses. As of April 30, 2017, the Fund had a net short-term capital loss carryforward of $1,898,466 which may be carried forward for an indefinite period.
| | |
| abfunds.com | | AB MUNICIPAL INCOME SHARES | 71 |
NOTES TO FINANCIAL STATEMENTS (continued)
NOTE H
Floating Rate Notes Issued in Connection with Securities Held
The Fund may engage in tender option bond (“TOB”) transactions in which the Fund transfers a fixed rate bond (“Fixed Rate Bond”) into a Special Purpose Vehicle (the “SPV”, which is generally organized as a trust). The Fund buys a residual interest in the assets and cash flows of the SPV, often referred to as an inverse floating rate obligation (“Inverse Floater”). The SPV also issues floating rate notes (“Floating Rate Notes”) which are sold to third parties. The Floating Rate Notes pay interest at rates that generally reset weekly and their holders have the option to tender their notes to a liquidity provider for redemption at par. The Inverse Floater held by the Fund gives the Fund the right (1) to cause the holders of the Floating Rate Notes to tender their notes at par, and (2) to have the trustee transfer the Fixed Rate Bond held by the SPV to the Fund, thereby collapsing the SPV. The SPV may also be collapsed in certain other circumstances. In accordance with U.S. GAAP requirements regarding accounting for transfers and servicing of financial assets and extinguishments of liabilities, the Fund accounts for the transaction described above as a secured borrowing by including the Fixed Rate Bond in its portfolio of investments and the Floating Rate Notes as a liability under the caption “Payable for floating rate notes issued” in its statement of assets and liabilities. Interest expense related to the Fund’s liability with respect to Floating Rate Notes is recorded as incurred. The interest expense is also included in the Fund’s expense ratio. At October 31, 2017, the amount of the Fund’s Floating Rate Notes outstanding was $3,510,000 and the related interest rate was 0.93% to 0.98%. For the six months ended October 31, 2017, the average amount of Floating Rate Notes outstanding and the daily weighted average interest rate were $3,921,304 and 1.63%, respectively.
The Fund may also purchase Inverse Floaters in the secondary market without first owning the underlying bond. Such an Inverse Floater is included in the Fund’s portfolio of investments but is not required to be treated as a secured borrowing and reflected in the Fund’s financial statements as a secured borrowing.
The final rules implementing section 619 of the Dodd-Frank Wall Street Reform and Consumer Protection Act (the “Volcker Rule”) were issued on December 10, 2013. The Volcker Rule precludes banking entities and their affiliates from (i) sponsoring residual interest bond programs, such as the Fund’s TOB transactions (as such programs were then previously or are presently structured), and (ii) continuing certain relationships with or certain services for residual interest bond programs. As a result, such residual interest bond trusts need to be restructured or unwound. The effects of the Volcker Rule may make it more difficult for the Fund to maintain current
| | |
| 72 | AB MUNICIPAL INCOME SHARES | | abfunds.com |
NOTES TO FINANCIAL STATEMENTS (continued)
or desired levels of leverage and may cause the Fund to incur additional expenses to maintain its leverage. Banking entities subject to the Volcker Rule were required to comply by July 21, 2015 for TOBs established after December 31, 2013, and by July 21, 2017 for TOBs established prior to December 31, 2013.
As of May 31, 2017, the Fund’s investments in residual interest bonds that were required to be compliant with the Volcker Rule by July 21, 2017 were restructured by the required compliance date. These restructurings did not have a material impact on the Fund’s financial position or results of operations.
NOTE I
Recent Accounting Pronouncements
In March 2017, the Financial Accounting Standards Board issued an Accounting Standards Update, ASU 2017-08, Receivables—Nonrefundable Fees and Other Costs (Subtopic 310-20), Premium Amortization on Purchased Callable Debt Securities (the “ASU”) which amends the amortization period for certain purchased callable debt securities held at a premium, shortening such period to the earliest call date. The ASU does not require any accounting change for debt securities held at a discount; the discount continues to be amortized to maturity. The ASU is effective for fiscal years, and interim periods within those fiscal years, beginning after December 15, 2018. At this time, management is evaluating the implications of these changes on the financial statements.
NOTE J
Subsequent Events
Management has evaluated subsequent events for possible recognition or disclosure in the financial statements through the date the financial statements are issued. Management has determined that there are no material events that would require disclosure in the Fund’s financial statements through this date.
| | |
| abfunds.com | | AB MUNICIPAL INCOME SHARES | 73 |
FINANCIAL HIGHLIGHTS
Selected Data For A Share Of Beneficial Interest Outstanding Throughout Each Period
| | | | | | | | | | | | | | | | | | | | | | | | |
| | | Six Months
Ended
October 31, 2017 (unaudited) | | | Year Ended April 30, | |
| | | | 2017 | | | 2016 | | | 2015 | | | 2014 | | | 2013 | |
| | | | |
| | | | | | | | | | | | | | | | | | | | | | | | |
Net asset value, beginning of period | | | $ 11.25 | | | | $ 11.59 | | | | $ 11.14 | | | | $ 10.64 | | | | $ 11.22 | | | | $ 10.50 | |
| | | | |
Income From Investment Operations | | | | | | | | | | | | | | | | | | | | | | | | |
Net investment income(a) | | | .22 | | | | .44 | | | | .48 | | | | .51 | | | | .52 | | | | .47 | |
Net realized and unrealized gain (loss) on investment transactions | | | .29 | | | | (.34 | ) | | | .46 | | | | .51 | | | | (.59 | ) | | | .77 | † |
| | | | |
Net increase (decrease) in net asset value from operations | | | .51 | | | | .10 | | | | .94 | | | | 1.02 | | | | (.07 | ) | | | 1.24 | |
| | | | |
Less: Dividends and Distributions | | | | | | | | | | | | | | | | | | | | | | | | |
Dividends from net investment income | | | (.22 | ) | | | (.44 | ) | | | (.49 | ) | | | (.52 | ) | | | (.51 | ) | | | (.52 | ) |
Distributions from net realized gain on investment transactions | | | – 0 | – | | | – 0 | – | | | – 0 | – | | | – 0 | – | | | (.00 | )(b) | | | – 0 | – |
| | | | |
Total dividends and distributions | | | (.22 | ) | | | (.44 | ) | | | (.49 | ) | | | (.52 | ) | | | (.51 | ) | | | (.52 | ) |
| | | | |
Net asset value, end of period | | | $ 11.54 | | | | $ 11.25 | | | | $ 11.59 | | | | $ 11.14 | | | | $ 10.64 | | | | $ 11.22 | |
| | | | |
Total Return | | | | | | | | | | | | | | | | | | | | | | | | |
Total investment return based on net asset value(c) | | | 4.57 | % | | | .87 | % | | | 8.69 | % | | | 9.73 | % | | | (.28 | )% | | | 11.98 | % |
Ratios/Supplemental Data | | | | | | | | | | | | | | | | | | | | | | | | |
Net assets, end of period (000’s omitted) | | | $2,103,572 | | | | $1,667,126 | | | | $1,112,540 | | | | $634,667 | | | | $381,668 | | | | $205,258 | |
Ratio to average net assets of: | | | | | | | | | | | | | | | | | | | | | | | | |
Expenses(d) | | | .00 | %(e)^ | | | .00 | %(e) | | | .01 | % | | | .01 | % | | | .01 | % | | | .03 | % |
Net investment income | | | 3.82 | %^ | | | 3.85 | % | | | 4.25 | % | | | 4.62 | % | | | 5.03 | % | | | 4.41 | % |
Portfolio turnover rate | | | 10 | % | | | 23 | % | | | 8 | % | | | 10 | % | | | 29 | % | | | 7 | % |
See footnote summary on page 75.
| | |
| 74 | AB MUNICIPAL INCOME SHARES | | abfunds.com |
FINANCIAL HIGHLIGHTS (continued)
Selected Data For A Share Of Beneficial Interest Outstanding Throughout Each Period
| (a) | Based on average shares outstanding. |
| (b) | Amount is less than $.005. |
| (c) | Total investment return is calculated assuming an initial investment made at the net asset value at the beginning of the period, reinvestment of all dividends and distributions at net asset value during the period, and redemption on the last day of the period. Total return does not reflect the deduction of taxes that a shareholder would pay on fund distributions or the redemption of fund shares. Total investment return calculated for a period of less than one year is not annualized. |
| (d) | The expense ratios, excluding interest expense are .00%, .00%, .00%, .00%, .00% and .00%, respectively. |
| (e) | Amount is less than .005%. |
| † | Due to timing of sales and repurchase of capital shares, the net realized and unrealized gain (loss) per share is not in accord with the Fund’s change in net realized and unrealized gain (loss) on investment transactions for the period. |
See notes to financial statements.
| | |
| abfunds.com | | AB MUNICIPAL INCOME SHARES | 75 |
BOARD OF TRUSTEES
| | |
Marshall C. Turner, Jr.(1), Chairman John H. Dobkin(1)(2) Michael J. Downey(1) William H. Foulk, Jr.(1) D. James Guzy(1)(2) | | Nancy P. Jacklin(1) Robert M. Keith, President and Chief Executive Officer Carol C. McMullen(1) Garry L. Moody(1) Earl D. Weiner(1) |
| |
| |
| |
| |
OFFICERS
| | |
Philip L. Kirstein(3), Senior Vice President and Independent Compliance Officer Robert “Guy” B. Davidson III(4), Vice President Terrance T. Hults(4), Vice President Matthew J. Norton(4), Vice President | | Emilie D. Wrapp, Secretary Joseph J. Mantineo, Treasurer and Chief Financial Officer Phyllis J. Clarke, Controller Vincent S. Noto, Chief Compliance Officer |
| | |
Custodian and Accounting Agent State Street Bank and Trust Company
State Street Corporation CCB/5
1 Iron Street
Boston, MA 02210 Principal Underwriter AllianceBernstein Investments, Inc.
1345 Avenue of the Americas
New York, NY 10105 Transfer Agent AllianceBernstein Investor Services, Inc.
P.O. Box 786003
San Antonio, TX 78278-6003
Toll-Free (800) 221-5672 | | Legal Counsel Seward & Kissel LLP
One Battery Park Plaza
New York, NY 10004 Independent Registered Public Accounting Firm Ernst & Young LLP
5 Times Square
New York, NY 10036 |
| 1 | Member of the Audit Committee, the Governance and Nominating Committee and the Independent Directors Committee. |
| 2 | Messrs. Dobkin and Guzy are expected to retire on or about December 31, 2017. |
| 3 | Mr. Kirstein is expected to retire on or about December 31, 2017. |
| 4 | The day-to-day management of, and investment decisions for, the Trust’s Portfolio are made by the Municipal Bond Investment Team. Messrs. Robert “Guy” B. Davidson III, Terrance T. Hults and Matthew J. Norton are the investment professionals primarily responsible for the day-to-day management of the Trust’s Portfolio. |
| | |
| 76 | AB MUNICIPAL INCOME SHARES | | abfunds.com |
Information Regarding the Review and Approval of the Fund’s Advisory Agreement
The disinterested trustees (the “directors”) of AB Corporate Shares (the “Company”) unanimously approved the continuance of the Company’s Advisory Agreement with the Adviser in respect of AB Municipal Income Shares (the “Fund”) at a meeting held on November 1-3, 2016 (the “Meeting”).
Prior to approval of the continuance of the Advisory Agreement, the directors had requested from the Adviser, and received and evaluated, extensive materials. They reviewed the proposed continuance of the Advisory Agreement with the Adviser and with experienced counsel who are independent of the Adviser, who advised on the relevant legal standards. The directors also reviewed an independent evaluation prepared by the Company’s Senior Officer (who is also the Company’s Independent Compliance Officer) of the reasonableness of the advisory fee, in which the Senior Officer concluded that the contractual fee (zero) for the Fund was reasonable. The directors also discussed the proposed continuance in private sessions with counsel and the Company’s Senior Officer.
The directors noted that the Fund is designed as a vehicle for the wrap fee account market (where investors pay fees to a wrap fee sponsor which pays investment fees and expenses from such fee). The directors also noted that no advisory fee is payable by the Fund, that the Advisory Agreement does not include the reimbursement provision for certain administrative expenses included in the advisory agreements of most of the open-end AB Funds, and that the Adviser is responsible for payment of the Fund’s ordinary expenses. The directors noted that the Company acknowledges in the Advisory Agreement that the Adviser and its affiliates expect to receive compensation from third parties in connection with services provided under the Advisory Agreement. The directors further noted that the Adviser receives payments from the wrap fee program sponsors (the “Sponsors”) that use the Fund as an investment vehicle for their clients.
The directors considered their knowledge of the nature and quality of the services provided by the Adviser to the Fund gained from their experience as directors or trustees of most of the registered investment companies advised by the Adviser, their overall confidence in the Adviser’s integrity and competence they have gained from that experience, the Adviser’s initiative in identifying and raising potential issues with the directors and its responsiveness, frankness and attention to concerns raised by the directors in the past, including the Adviser’s willingness to consider and implement organizational and operational changes designed to improve investment results and the services provided to the AB Funds. The directors noted that they have four regular meetings each year, at each of which they receive presentations from the Adviser on the investment results of the Fund and review extensive materials and information presented by the Adviser.
| | |
| abfunds.com | | AB MUNICIPAL INCOME SHARES | 77 |
The directors also considered all other factors they believed relevant, including the specific matters discussed below. In their deliberations, the directors did not identify any particular information that was all-important or controlling, and different directors may have attributed different weights to the various factors. The directors determined that the selection of the Adviser to manage the Fund and the overall arrangements between the Fund and the Adviser, as provided in the Advisory Agreement, including the advisory fee, were fair and reasonable in light of the services performed, expenses incurred and such other matters as the directors considered relevant in the exercise of their business judgment. The material factors and conclusions that formed the basis for the directors’ determinations included the following:
Nature, Extent and Quality of Services Provided
The directors considered the scope and quality of services provided by the Adviser under the Advisory Agreement, including the quality of the investment research capabilities of the Adviser and the other resources it has dedicated to performing services for the Fund. They also noted the professional experience and qualifications of the Fund’s portfolio management team and other senior personnel of the Adviser. The quality of administrative and other services, including the Adviser’s role in coordinating the activities of the Fund’s other service providers, also was considered. The directors concluded that, overall, they were satisfied with the nature, extent and quality of services provided to the Fund under the Advisory Agreement.
Costs of Services Provided and Profitability
The directors reviewed a schedule of the revenues and expenses and related notes indicating the profitability of the Fund to the Adviser for calendar years 2014 and 2015 that had been prepared with an expense allocation methodology arrived at in consultation with an independent consultant retained by the Company’s Senior Officer. The directors noted the assumptions and methods of allocation used by the Adviser in preparing fund-specific profitability data and understood that there are a number of potentially acceptable allocation methodologies for information of this type. The directors noted that the profitability information reflected all revenues and expenses of the Adviser’s relationship with the Fund. The directors recognized that it is difficult to make comparisons of the profitability of the Advisory Agreement with the profitability of fund advisory contracts for unaffiliated funds because comparative information is not generally publicly available and is affected by numerous factors. The directors focused on the profitability of the Adviser’s relationship with the Fund before taxes. The directors noted that the Fund was not profitable to the Adviser in the periods reviewed.
Fall-Out Benefits
The directors considered the other benefits to the Adviser and its affiliates from their relationships with the Fund. The directors noted that the Adviser
| | |
| 78 | AB MUNICIPAL INCOME SHARES | | abfunds.com |
is compensated by the Sponsors. The directors understood that the Adviser also might derive reputational and other benefits from its association with the Fund.
Investment Results
In addition to the information reviewed by the directors in connection with the Meeting, the directors receive detailed performance information for the Fund at each regular Board meeting during the year.
At the Meeting, the directors reviewed information prepared by Broadridge Financial Solutions, Inc. (“Broadridge”), an analytical service that is not affiliated with the Adviser, showing the performance of the Fund against a peer universe selected by Broadridge, and information prepared by the Adviser showing the Fund’s performance against a broad-based securities market index, in each case for the 1-, 3- and 5-year periods ended July 31, 2016 and (in the case of comparisons with the broad-based securities market index) for the period from inception. The directors were cognizant that the Fund was neither designed nor offered as a standalone investment and was intended to serve solely as a component of certain separately managed accounts (“SMAs”). The Adviser had explained that this attribute made it difficult to select an appropriate benchmark for the Fund. At the directors’ request, the Adviser provided information showing the weighting of the Fund in a current SMA and the overall performance of the SMA versus its stated benchmark. Based on their review, the directors concluded that the Fund’s investment performance was acceptable.
Advisory Fees
The directors considered the advisory fee rate paid by the Fund to the Adviser (zero) and information provided by Broadridge showing the fees paid by other fund families used in wrap fee programs similar to that of the Fund. The directors recognized that it is difficult to make comparisons of advisory fees because there are variations in the services that are included in the fees paid by other funds.
The directors noted the unusual arrangements in the Advisory Agreement providing for no advisory fee but were cognizant that the Adviser is indirectly compensated by the Sponsors for its services to the Fund. The directors reviewed the fee arrangements between the Adviser and each of the current Sponsors and noted that such fees were negotiated on an arm’s length basis and were within the range of fees paid by wrap fee sponsors to other advisers of similar funds. While the Adviser’s fee arrangements with the Sponsors vary, the directors acknowledged the Adviser’s view that a portion of such fees (less the expenses of the Fund paid by the Adviser) may reasonably be viewed as compensating the Adviser for advisory services it provides to the Fund (the “implied fee”) and that the Adviser believes that while the Sponsors pay the Adviser different fee rates, the rate of fee attributable to Fund management at the Fund level
| | |
| abfunds.com | | AB MUNICIPAL INCOME SHARES | 79 |
is the same for all Sponsors. The directors also considered the fee rate schedules used by other registered investment companies that invest in fixed income securities that are advised by the Adviser.
The Adviser informed the directors that there were no institutional products managed by it that have a substantially similar investment style.
Since the Fund does not bear ordinary expenses, the directors did not consider comparative expense information.
Economies of Scale
Since the Advisory Agreement does not provide for any compensation to be paid to the Adviser by the Fund and the Fund’s expense ratio is zero, the directors did not consider the extent to which fee levels in the Advisory Agreement reflect economies of scale. They did note, however, that the fee payable to the Adviser by the current Sponsors declines at a breakpoint based on either individual account sizes or on total assets managed by the Adviser for the Sponsor.
| | |
| 80 | AB MUNICIPAL INCOME SHARES | | abfunds.com |
This page is not part of the Shareholder Report or the Financial Statements.
AB FAMILY OF FUNDS
US EQUITY
US CORE
Core Opportunities Fund
FlexFee™ US Thematic Portfolio
Select US Equity Portfolio
US GROWTH
Concentrated Growth Fund
Discovery Growth Fund
FlexFee™ Large Cap Growth Portfolio
Growth Fund
Large Cap Growth Fund
Small Cap Growth Portfolio
US VALUE
Discovery Value Fund
Equity Income Fund
Relative Value Fund1
Small Cap Value Portfolio
Value Fund
INTERNATIONAL/ GLOBAL EQUITY
INTERNATIONAL/ GLOBAL CORE
Global Core Equity Portfolio
International Portfolio
International Strategic Core Portfolio
Sustainable Global Thematic Fund1
Tax-Managed International Portfolio
Tax-Managed Wealth Appreciation Strategy
Wealth Appreciation Strategy
INTERNATIONAL/ GLOBAL GROWTH
Concentrated International Growth Portfolio
International Growth Fund
INTERNATIONAL/ GLOBAL EQUITY (continued)
INTERNATIONAL/ GLOBAL VALUE
Asia ex-Japan Equity Portfolio
International Value Fund
FIXED INCOME
MUNICIPAL
High Income Municipal Portfolio
Intermediate California Municipal Portfolio
Intermediate Diversified Municipal Portfolio
Intermediate New York Municipal Portfolio
Municipal Bond Inflation Strategy
Tax-Aware Fixed Income Portfolio
National Portfolio
Arizona Portfolio
California Portfolio
Massachusetts Portfolio
Minnesota Portfolio
New Jersey Portfolio
New York Portfolio
Ohio Portfolio
Pennsylvania Portfolio
Virginia Portfolio
TAXABLE
Bond Inflation Strategy
FlexFee™ International Bond Portfolio
Global Bond Fund
High Income Fund
High Yield Portfolio
Income Fund
Intermediate Bond Portfolio
Limited Duration High Income Portfolio
Short Duration Portfolio
ALTERNATIVES
All Market Real Return Portfolio
Credit Long/Short Portfolio
Global Real Estate Investment Fund
Select US Long/Short Portfolio
Unconstrained Bond Fund
MULTI-ASSET
All Market Income Portfolio
All Market Total Return Portfolio1
Conservative Wealth Strategy
Emerging Markets Multi-Asset Portfolio
Global Risk Allocation Fund
Tax-Managed All Market Income Portfolio1
TARGET-DATE
Multi-Manager Select Retirement Allocation Fund
Multi-Manager Select 2010 Fund
Multi-Manager Select 2015 Fund
Multi-Manager Select 2020 Fund
Multi-Manager Select 2025 Fund
Multi-Manager Select 2030 Fund
Multi-Manager Select 2035 Fund
Multi-Manager Select 2040 Fund
Multi-Manager Select 2045 Fund
Multi-Manager Select 2050 Fund
Multi-Manager Select 2055 Fund
CLOSED-END FUNDS
Alliance California Municipal Income Fund
AllianceBernstein Global High Income Fund
AllianceBernstein National Municipal Income Fund
We also offer Government Money Market Portfolio1, which serves as the money market fund exchange vehicle for the AB mutual funds. An investment in Government Money Market Portfolio is not a deposit in a bank and is not insured or guaranteed by the Federal Deposit Insurance Corporation or any other government agency. Although the Fund seeks to preserve the value of your investment at $1.00 per share, it is possible to lose money by investing in the Fund.
Investors should consider the investment objectives, risks, charges and expenses of the Fund carefully before investing. For copies of our prospectus or summary prospectus, which contain this and other information, visit us online at www.abfunds.com or contact your AB representative. Please read the prospectus and/or summary prospectus carefully before investing.
| 1 | Prior to January 9, 2017, Relative Value Fund was named Growth & Income Fund; prior to April 17, 2017, Tax-Managed All Market Income Portfolio was named Tax-Managed Balanced Wealth Strategy; prior to April 24, 2017, All Market Total Return Portfolio was named Balanced Wealth Strategy; prior to November 10, 2017, Government Money Market Portfolio was named Government Exchange Reserves. |
| | |
| abfunds.com | | AB MUNICIPAL INCOME SHARES | 81 |
NOTES
| | |
| 82 | AB MUNICIPAL INCOME SHARES | | abfunds.com |
NOTES
| | |
| abfunds.com | | AB MUNICIPAL INCOME SHARES | 83 |
NOTES
| | |
| 84 | AB MUNICIPAL INCOME SHARES | | abfunds.com |

AB MUNICIPAL INCOME SHARES
1345 Avenue of the Americas
New York, NY 10105
800 221 5672
MIS-0152-1017 
OCT 10.31.17
SEMI-ANNUAL REPORT
AB TAXABLE MULTI-SECTOR INCOME SHARES


| | |
| |
| Investment Products Offered | | • Are Not FDIC Insured • May Lose Value • Are Not Bank Guaranteed |
Investors should consider the investment objectives, risks, charges and expenses of the Fund carefully before investing. For copies of our prospectus or summary prospectus, which contain this and other information, visit us online at www.abfunds.com or contact your AB representative. Please read the prospectus and/or summary prospectus carefully before investing.
This shareholder report must be preceded or accompanied by the Fund’s prospectus for individuals who are not current shareholders of the Fund.
You may obtain a description of the Fund’s proxy voting policies and procedures, and information regarding how the Fund voted proxies relating to portfolio securities during the most recent 12-month period ended June 30, without charge. Simply visit AB’s website at www.abfunds.com, or go to the Securities and Exchange Commission’s (the “Commission”) website at www.sec.gov, or call AB at (800) 227 4618.
The Fund files its complete schedule of portfolio holdings with the Commission for the first and third quarters of each fiscal year on Form N-Q. The Fund’s Forms N-Q are available on the Commission’s website at www.sec.gov. The Fund’s Forms N-Q may also be reviewed and copied at the Commission’s Public Reference Room in Washington, DC; information on the operation of the Public Reference Room may be obtained by calling (800) SEC 0330. AB publishes full portfolio holdings for the Fund monthly at www.abfunds.com.
AllianceBernstein Investments, Inc. (ABI) is the distributor of the AB family of mutual funds. ABI is a member of FINRA and is an affiliate of AllianceBernstein L.P., the Adviser of the funds.
The [A/B] logo is a registered service mark of AllianceBernstein and AllianceBernstein® is a registered service mark used by permission of the owner, AllianceBernstein L.P.
| | |
| FROM THE PRESIDENT | |  |
Dear Shareholder,
We are pleased to provide this report for AB Taxable Multi-Sector Income Shares (the “Fund”). Please review the discussion of Fund performance, the market conditions during the reporting period and the Fund’s investment strategy.
As always, AB strives to keep clients ahead of what’s next by:
| + | | Transforming uncommon insights into uncommon knowledge with a global research scope |
| + | | Navigating markets with seasoned investment experience and sophisticated solutions |
| + | | Providing thoughtful investment insights and actionable ideas |
Whether you’re an individual investor or a multi-billion-dollar institution, we put knowledge and experience to work for you.
AB’s global research organization connects and collaborates across platforms and teams to deliver impactful insights and innovative products. Better insights lead to better opportunities—anywhere in the world.
For additional information about AB’s range of products and shareholder resources, please log on to www.abfunds.com.
Thank you for your investment in the AB Mutual Funds.
Sincerely,

Robert M. Keith
President and Chief Executive Officer, AB Mutual Funds
| | |
| abfunds.com | | AB TAXABLE MULTI-SECTOR INCOME SHARES | 1 |
SEMI-ANNUAL REPORT
December 18, 2017
This report provides management’s discussion of fund performance for AB Taxable Multi-Sector Income Shares for the semi-annual reporting period ended October 31, 2017. Please note, shares of this Fund are available only to separately managed accounts or participants in “wrap fee” programs or other investment programs approved by the Adviser.
The Fund’s investment objective is to generate income and price appreciation.
NAV RETURNS AS OF OCTOBER 31, 2017 (unaudited)
| | | | | | | | |
| | | 6 Months | | | 12 Months | |
| AB TAXABLE MULTI-SECTOR INCOME SHARES | | | 0.88% | | | | 1.54% | |
| Bloomberg Barclays US Aggregate ex-Government Bond Index | | | 2.11% | | | | 1.87% | |
INVESTMENT RESULTS
The table above shows the Fund’s performance compared to its benchmark, the Bloomberg Barclays US Aggregate ex-Government Bond Index, for the six- and 12-month periods ended October 31, 2017.
During the six-month period, the Fund underperformed the benchmark. Security selection detracted from relative performance, primarily because of selections within the banking, consumer non-cyclicals and financials sectors. Yield-curve positioning was also negative, though the Fund’s shorter-than-benchmark duration offset most of those losses, as shorter and intermediate rates rose in the period. Industry allocation did not have a material impact on performance, as gains from the Fund’s lack of exposure to agency mortgage-backed securities (“MBS”) offset negative returns from an exposure to US Treasuries and an overweight in non-agency mortgages.
For the 12-month period, the Fund underperformed the benchmark. Security decisions detracted relative to the benchmark, specifically within the banking, energy and consumer non-cyclicals sectors. Yield-curve positioning contributed to performance, helped by the Fund’s shorter-than-benchmark duration, as rates rose. Industry allocation was also positive, as gains from the Fund’s lack of exposure to agency MBS more than offset losses from an overweight position in non-agency mortgages.
The Fund utilized derivatives in the form of interest rate swaps for hedging purposes and credit default swaps for investment purposes, which had an immaterial impact on absolute returns during both periods.
| | |
| 2 | AB TAXABLE MULTI-SECTOR INCOME SHARES | | abfunds.com |
MARKET REVIEW AND INVESTMENT STRATEGY
Political events and central bank action had a significant impact on bond markets in the six- and 12-month periods ended October 31, 2017. Donald Trump’s US election victory and the promise of fiscal stimulus, a retreat from globalization and relaxed regulation were treated as positive developments by financial markets. However, uncertainty regarding the Trump administration’s ability to implement meaningful change increased through the 12-month period. UK prime minister Theresa May surprised investors when she called for a snap parliamentary election in an effort to firm up the UK’s mandate going into Brexit negotiations. However, the results of the vote increased political uncertainty when May’s Conservative Party failed to secure a majority position. Investors were relieved when centrist, pro-EU candidate Emmanuel Macron was elected president of France, as his reformist agenda was seen as more business friendly than the protectionist policies espoused by his opponent. In June, the US Federal Reserve (the “Fed”) raised interest rates for the third consecutive quarter, hikes that were well-telegraphed and universally anticipated by markets. Late in the period, the Fed formally confirmed that its balance sheet reduction program would start in October, while the European Central Bank announced that it would start to taper the pace of its monthly asset purchases in January 2018.
Emerging-market debt rallied over both periods, helped by a positive global growth story and increasing oil prices. Outside of Europe, developed-market treasury yields generally rose; in the eurozone and UK, yields moved in different directions. Emerging-market local-currency government bonds, developed-market treasuries and investment-grade credit securities all rose in both periods, yet trailed the rally in global high yield. Within high yield, performance was almost uniformly positive, led by the transportation and basic industries sectors, while consumer sectors tended to lag the rising market.
INVESTMENT POLICIES
The Fund invests, under normal circumstances, at least 80% of its net assets in fixed-income securities. The Fund may invest in a broad range of securities in both developed and emerging markets. The Fund may invest across all fixed-income sectors, including corporate and US and non-US government securities. The Fund may invest up to 50% of its assets in below investment-grade bonds (“junk bonds”). The Fund expects to invest in readily marketable fixed-income securities with a range of maturities from short- to long-term.
The Fund may invest without limit in US dollar-denominated foreign fixed-income securities and may invest up to 50% of its assets in non-US dollar-denominated foreign fixed-income securities. These investments may include, in each case, developed- and emerging-market debt securities.
(continued on next page)
| | |
| abfunds.com | | AB TAXABLE MULTI-SECTOR INCOME SHARES | 3 |
The Adviser selects securities for purchase or sale based on its assessment of the securities’ risk and return characteristics as well as the securities’ impact on the overall risk and return characteristics of the Fund. In making this assessment, the Adviser takes into account various factors, including the credit quality and sensitivity to interest rates of the securities under consideration and of the Fund’s other holdings.
The Fund may also invest in mortgage-related and other asset-backed securities, loan participations, inflation-indexed securities, structured securities, variable, floating, and inverse floating-rate instruments and preferred stock, and may use other investment techniques. The Fund may use leverage for investment purposes. The Fund intends, among other things, to enter into transactions such as reverse repurchase agreements, forward contracts and dollar rolls. The Fund may invest, without limit, in derivatives, such as options, futures contracts, forwards or swap agreements.
Currencies can have a dramatic effect on returns of non-US dollar-denominated fixed-income securities, significantly adding to returns in some years and greatly diminishing them in others. The Adviser evaluates currency and fixed-income positions separately and may seek to hedge the currency exposure resulting from the Fund’s fixed-income securities positions when it finds the currency exposure unattractive. To hedge a portion of its currency risk, the Fund may from time to time invest in currency-related derivatives, including forward currency exchange contracts, futures contracts, options on futures contracts, swaps and options. The Adviser may also seek investment opportunities by taking long or short positions in currencies through the use of currency-related derivatives.
| | |
| 4 | AB TAXABLE MULTI-SECTOR INCOME SHARES | | abfunds.com |
DISCLOSURES AND RISKS
Benchmark Disclosure
The Bloomberg Barclays US Aggregate ex-Government Bond Index is unmanaged and does not reflect fees and expenses associated with the active management of a fund. The Bloomberg Barclays US Aggregate ex-Government Bond Index represents the performance of securities within the US investment-grade fixed-rate bond market, with index components for corporate securities, mortgage pass-through securities, asset-backed securities and commercial mortgage-backed securities. An investor cannot invest directly in an index, and its results are not indicative of the performance for any specific investment, including the Fund.
A Word About Risk
Market Risk: The value of the Fund’s assets will fluctuate as the stock or bond market fluctuates. The value of the Fund’s investments may decline, sometimes rapidly and unpredictably, simply because of economic changes or other events that affect large portions of the market.
Credit Risk: An issuer or guarantor of a fixed-income security, or the counterparty to a derivatives or other contract, may be unable or unwilling to make timely payments of interest or principal, or to otherwise honor its obligations. The issuer or guarantor may default, causing a loss of the full principal amount of a security. The degree of risk for a particular security may be reflected in its credit rating. There is the possibility that the credit rating of a fixed-income security may be downgraded after purchase, which may adversely affect the value of the security.
Interest Rate Risk: Changes in interest rates will affect the value of investments in fixed-income securities. When interest rates rise, the value of existing investments in fixed-income securities tends to fall and this decrease in value may not be offset by higher income from new investments. The Fund may be subject to heightened interest rate risk due to rising interest rates as the current period of historically low interest rates may be ending. Interest rate risk is generally greater for fixed-income securities with longer maturities or durations.
Below Investment Grade Securities Risk: Investments in fixed-income securities with lower ratings (commonly known as “junk bonds”) tend to have a higher probability that an issuer will default or fail to meet its payment obligations. These securities may be subject to greater price volatility due to such factors as specific corporate developments, interest rate sensitivity, negative perceptions of the junk bond market generally and less secondary market liquidity.
Inflation Risk: This is the risk that the value of assets or income from investments will be less in the future as inflation decreases the value of
| | |
| abfunds.com | | AB TAXABLE MULTI-SECTOR INCOME SHARES | 5 |
DISCLOSURES AND RISKS (continued)
money. As inflation increases, the value of the Fund’s assets can decline as can the value of the Fund’s distributions. This risk is significantly greater for fixed-income securities with longer maturities.
Foreign (Non-US) Risk: Investments in securities of non-US issuers may involve more risk than those of US issuers. These securities may fluctuate more widely in price and may be less liquid due to adverse market, economic, political, regulatory or other factors.
Emerging Market Risk: Investments in emerging-market countries may have more risk because the markets are less developed and less liquid as well as being subject to increased economic, political, regulatory or other uncertainties.
Currency Risk: Fluctuations in currency exchange risk may negatively affect the value of the Fund’s investments or reduce its returns.
Prepayment Risk: The value of mortgage-related or asset-backed securities may be particularly sensitive to changes in prevailing interest rates. Early payments of principal on some mortgage-related securities may occur during periods of falling mortgage interest rates and expose the Fund to a lower rate of return upon reinvestment of principal. Early payments associated with mortgage-related securities cause these securities to experience significantly greater price and yield volatility than is experienced by traditional fixed-income securities. During periods of rising interest rates, a reduction in prepayments may increase the effective life of mortgage-related securities, subjecting them to greater risk of decline in market value in response to rising interest rates. If the life of a mortgage-related security is inaccurately predicted, the Fund may not be able to realize the rate of return it expected.
Derivatives Risk: Derivatives may be illiquid, difficult to price, and leveraged so that small changes may produce disproportionate losses for the Fund, and may be subject to counterparty risk to a greater degree than more traditional investments.
Leverage Risk: To the extent the Fund uses leveraging techniques, its net asset value (“NAV”) may be more volatile because leverage tends to exaggerate the effect of changes in interest rates and any increase or decrease in the value of the Fund’s investments.
Management Risk: The Fund is subject to management risk because it is an actively managed investment fund. The Adviser will apply its investment techniques and risk analyses in making investment decisions, but there is no guarantee that its techniques will produce the intended results.
| | |
| 6 | AB TAXABLE MULTI-SECTOR INCOME SHARES | | abfunds.com |
DISCLOSURES AND RISKS (continued)
These risks are fully discussed in the Fund’s prospectus. As with all investments, you may lose money by investing in the Fund.
An Important Note About Historical Performance
The performance shown in this report represents past performance and does not guarantee future results. Current performance may be lower or higher than the performance information shown. You may obtain performance information current to the most recent month-end by calling (800) 227 4618. The investment return and principal value of an investment in the Fund will fluctuate, so that your shares, when redeemed, may be worth more or less than their original cost. Performance assumes reinvestment of distributions and does not account for taxes.
Investors should consider the investment objectives, risks, charges and expenses of the Fund carefully before investing. For copies of our prospectus and/or summary prospectus, which contain this and other information, visit us online at www.abfunds.com or contact your AllianceBernstein Investments representative. Please read the prospectus and/or summary prospectus carefully before investing.
| | |
| abfunds.com | | AB TAXABLE MULTI-SECTOR INCOME SHARES | 7 |
HISTORICAL PERFORMANCE
AVERAGE ANNUAL RETURNS AS OF OCTOBER 31, 2017 (unaudited)
| | | | |
| | | NAV Returns | |
| 1 Year | | | 1.54% | |
| 5 Years | | | 1.27% | |
| Since Inception1 | | | 2.22% | |
AVERAGE ANNUAL RETURNS
AS OF THE MOST RECENT CALENDAR QUARTER-END
SEPTEMBER 30, 2017 (unaudited)
| | | | |
| | | NAV Returns | |
| 1 Year | | | 1.54% | |
| 5 Years | | | 1.29% | |
| Since Inception1 | | | 2.25% | |
The prospectus fee table shows the fees and the total operating expenses of the Fund as 0.00% because the Adviser does not charge any fees or expenses and reimburses Fund operating expenses, except certain extraordinary expenses, taxes, brokerage costs and the interest on borrowings or certain leveraged transactions. Participants in a wrap fee program or other investment program eligible to invest in the Fund pay fees to the program sponsor and should review the program brochure or other literature provided by the sponsor for a discussion of fees and expenses charged.
| 1 | Inception date: 9/15/2010. |
| | |
| 8 | AB TAXABLE MULTI-SECTOR INCOME SHARES | | abfunds.com |
EXPENSE EXAMPLE
(unaudited)
As a shareholder of the Fund, you may incur various ongoing non-operating and extraordinary costs. This example is intended to help you understand your ongoing costs (in dollars) of investing in the Fund and to compare these costs with the ongoing costs of investing in other mutual funds.
The Example is based on an investment of $1,000 invested at the beginning of the period and held for the entire period as indicated below.
Actual Expenses
The table below provides information about actual account values and actual expenses. You may use the information in this line, together with the amount you invested, to estimate the expenses that you paid over the period. Simply divide your account value by $1,000 (for example, an $8,600 account value divided by $1,000 = 8.6), then multiply the result by the number in the first line under the heading entitled “Expenses Paid During Period” to estimate the expenses you paid on your account during this period.
Hypothetical Example for Comparison Purposes
The table below provides information about hypothetical account values and hypothetical expenses based on the Fund’s actual expense ratio and an assumed annual rate of return of 5% before expenses, which is not the Fund’s actual return. The hypothetical account values and expenses may not be used to estimate the actual ending account balance or expenses you paid for the period. You may use this information to compare the ongoing costs of investing in the Fund and other funds by comparing this 5% hypothetical example with the 5% hypothetical examples that appear in the shareholder reports of other funds.
Please note that the expenses shown in the table are meant to highlight your ongoing costs only and do not reflect any transactional costs, such as sales charges (loads), or contingent deferred sales charges on redemptions. Therefore, the hypothetical example is useful in comparing ongoing costs only, and will not help you determine the relative total costs of owning different funds. In addition, if these transactional costs were included, your costs would have been higher.
| | | | | | | | | | | | | | | | |
| | | Beginning
Account Value
May 1, 2017 | | | Ending
Account Value
October 31, 2017 | | | Expenses Paid
During Period* | | | Annualized
Expense Ratio* | |
Actual | | $ | 1,000 | | | $ | 1,008.80 | | | $ | – 0 | – | | | 0.00 | % |
Hypothetical** | | $ | 1,000 | | | $ | 1,025.21 | | | $ | – 0 | – | | | 0.00 | % |
| * | Expenses equal to the Fund’s annualized expense ratio multiplied by the average account value over the period, multiplied by 184/365 (to reflect the one-half year period). The Fund’s operating expenses are borne by the Adviser or its affiliates. |
| ** | Assumes 5% annual return before expenses. |
| | |
| abfunds.com | | AB TAXABLE MULTI-SECTOR INCOME SHARES | 9 |
PORTFOLIO SUMMARY
October 31, 2017 (unaudited)
PORTFOLIO STATISTICS
Net Assets ($mil): $140.2
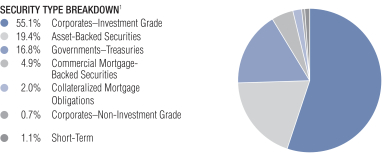
| 1 | All data are as of October 31, 2017. The Fund’s security type breakdown is expressed as a percentage of total investments and may vary over time. The Fund also enters into derivative transactions, which may be used for hedging or investment purposes (see “Portfolio of Investments” section of the report for additional details). |
| | |
| 10 | AB TAXABLE MULTI-SECTOR INCOME SHARES | | abfunds.com |
PORTFOLIO OF INVESTMENTS
October 31, 2017 (unaudited)
| | | | | | | | |
| | | Principal
Amount
(000) | | | U.S. $ Value | |
| | | | | | | | |
| |
CORPORATES – INVESTMENT GRADE – 55.0% | | | | | | | | |
Industrial – 32.7% | | | | | | | | |
Basic – 0.9% | | | | | | | | |
Barrick North America Finance LLC
4.40%, 5/30/21 | | $ | 2 | | | $ | 2,141 | |
Dow Chemical Co. (The)
4.25%, 11/15/20 | | | 7 | | | | 7,376 | |
8.55%, 5/15/19 | | | 475 | | | | 521,080 | |
Glencore Finance Canada Ltd.
4.95%, 11/15/21(a) | | | 505 | | | | 545,329 | |
Glencore Funding LLC
3.00%, 10/27/22(a) | | | 225 | | | | 225,097 | |
| | | | | | | | |
| | | | | | | 1,301,023 | |
| | | | | | | | |
Capital Goods – 4.3% | | | | | | | | |
Boeing Co. (The)
1.65%, 10/30/20 | | | 500 | | | | 496,105 | |
Caterpillar Financial Services Corp.
1.90%, 3/22/19 | | | 115 | | | | 115,186 | |
2.10%, 1/10/20 | | | 435 | | | | 436,462 | |
Series G
1.85%, 9/04/20 | | | 315 | | | | 313,164 | |
Emerson Electric Co.
5.00%, 4/15/19 | | | 504 | | | | 525,359 | |
General Electric Co. Series G
6.00%, 8/07/19 | | | 470 | | | | 503,868 | |
John Deere Capital Corp.
1.25%, 10/09/19 | | | 435 | | | | 429,741 | |
1.463% (LIBOR 3 Month + 0.12%), 7/05/19(b) | | | 465 | | | | 464,991 | |
1.95%, 6/22/20 | | | 100 | | | | 99,905 | |
Northrop Grumman Corp.
2.08%, 10/15/20 | | | 1,000 | | | | 1,000,080 | |
Rockwell Collins, Inc.
1.95%, 7/15/19 | | | 830 | | | | 830,216 | |
United Technologies Corp.
1.50%, 11/01/19 | | | 525 | | | | 521,062 | |
4.50%, 4/15/20 | | | 300 | | | | 317,634 | |
| | | | | | | | |
| | | | | | | 6,053,773 | |
| | | | | | | | |
Communications - Media – 0.6% | | | | | | | | |
21st Century Fox America, Inc.
4.50%, 2/15/21 | | | 105 | | | | 112,006 | |
Comcast Corp.
5.15%, 3/01/20 | | | 78 | | | | 83,716 | |
5.70%, 7/01/19 | | | 502 | | | | 533,646 | |
RELX Capital, Inc.
8.625%, 1/15/19 | | | 25 | | | | 26,848 | |
| | |
| abfunds.com | | AB TAXABLE MULTI-SECTOR INCOME SHARES | 11 |
PORTFOLIO OF INVESTMENTS (continued)
| | | | | | | | |
| | | Principal
Amount
(000) | | | U.S. $ Value | |
| | | | | | | | |
| |
Time Warner Cable LLC
4.00%, 9/01/21 | | $ | 5 | | | $ | 5,186 | |
8.75%, 2/14/19 | | | 40 | | | | 43,265 | |
| | | | | | | | |
| | | | | | | 804,667 | |
| | | | | | | | |
Communications - Telecommunications – 1.1% | | | | | | | | |
AT&T, Inc. | | | | | | | | |
2.45%, 6/30/20 | | | 290 | | | | 292,935 | |
5.80%, 2/15/19 | | | 515 | | | | 539,782 | |
Deutsche Telekom International Finance BV
1.50%, 9/19/19(a) | | | 560 | | | | 553,627 | |
Telefonica Emisiones SAU
5.462%, 2/16/21 | | | 45 | | | | 49,159 | |
Verizon Communications, Inc.
3.50%, 11/01/21 | | | 95 | | | | 98,733 | |
| | | | | | | | |
| | | | | | | 1,534,236 | |
| | | | | | | | |
Consumer Cyclical - Automotive – 3.6% | | | | | | | | |
American Honda Finance Corp.
1.20%, 7/12/19 | | | 410 | | | | 405,535 | |
7.625%, 10/01/18(a) | | | 150 | | | | 158,097 | |
BMW US Capital LLC
1.45%, 9/13/19(a) | | | 190 | | | | 188,594 | |
1.50%, 4/11/19(a) | | | 375 | | | | 373,432 | |
Ford Motor Credit Co. LLC
2.425%, 6/12/20 | | | 400 | | | | 401,236 | |
3.336%, 3/18/21 | | | 325 | | | | 333,252 | |
5.875%, 8/02/21 | | | 210 | | | | 234,053 | |
General Motors Co.
2.112% (LIBOR 3 Month + 0.80%),
8/07/20(b) | | | 125 | | | | 125,474 | |
General Motors Financial Co., Inc.
2.40%, 5/09/19 | | | 315 | | | | 316,332 | |
3.10%, 1/15/19 | | | 270 | | | | 273,356 | |
3.15%, 1/15/20 | | | 100 | | | | 101,849 | |
3.25%, 5/15/18 | | | 8 | | | | 8,063 | |
Harley-Davidson Financial Services, Inc.
2.15%, 2/26/20(a) | | | 435 | | | | 432,312 | |
2.25%, 1/15/19(a) | | | 155 | | | | 155,223 | |
Nissan Motor Acceptance Corp.
1.55%, 9/13/19(a) | | | 560 | | | | 554,736 | |
2.15%, 9/28/20(a) | | | 455 | | | | 453,831 | |
Toyota Motor Credit Corp.
1.70%, 1/09/19 | | | 550 | | | | 549,725 | |
| | | | | | | | |
| | | | | | | 5,065,100 | |
| | | | | | | | |
Consumer Cyclical - Entertainment – 0.6% | | | | | | | | |
Mattel, Inc.
2.35%, 5/06/19 | | | 795 | | | | 781,533 | |
| | | | | | | | |
| | |
| 12 | AB TAXABLE MULTI-SECTOR INCOME SHARES | | abfunds.com |
PORTFOLIO OF INVESTMENTS (continued)
| | | | | | | | |
| | | Principal
Amount
(000) | | | U.S. $ Value | |
| | | | | | | | |
| |
Consumer Cyclical - Other – 0.4% | | | | | | | | |
Marriott International, Inc./MD
6.75%, 5/15/18 | | $ | 515 | | | $ | 528,570 | |
| | | | | | | | |
| | |
Consumer Cyclical - Restaurants – 0.2% | | | | | | | | |
McDonald’s Corp.
2.10%, 12/07/18 | | | 285 | | | | 286,094 | |
| | | | | | | | |
| | |
Consumer Cyclical - Retailers – 1.3% | | | | | | | | |
CVS Health Corp.
2.25%, 12/05/18 | | | 825 | | | | 827,747 | |
Wal-Mart Stores, Inc.
1.75%, 10/09/19 | | | 1,000 | | | | 999,780 | |
| | | | | | | | |
| | | | | | | 1,827,527 | |
| | | | | | | | |
Consumer Non-Cyclical – 9.7% | | | | | | | | |
AbbVie, Inc.
2.00%, 11/06/18 | | | 830 | | | | 831,801 | |
2.50%, 5/14/20 | | | 17 | | | | 17,139 | |
Allergan Funding SCS
2.45%, 6/15/19 | | | 210 | | | | 211,376 | |
3.00%, 3/12/20 | | | 610 | | | | 619,553 | |
Altria Group, Inc.
2.625%, 1/14/20 | | | 120 | | | | 121,517 | |
Amgen, Inc.
5.70%, 2/01/19 | | | 790 | | | | 826,482 | |
Anheuser-Busch InBev Finance, Inc.
2.65%, 2/01/21 | | | 579 | | | | 586,376 | |
Baxalta, Inc.
3.60%, 6/23/22 | | | 75 | | | | 77,661 | |
Becton Dickinson and Co.
2.133%, 6/06/19 | | | 100 | | | | 99,980 | |
2.675%, 12/15/19 | | | 783 | | | | 791,034 | |
Biogen, Inc.
3.625%, 9/15/22 | | | 54 | | | | 56,532 | |
Bunge Ltd. Finance Corp.
8.50%, 6/15/19 | | | 1 | | | | 1,098 | |
Coca-Cola Co. (The)
1.375%, 5/30/19 | | | 565 | | | | 562,531 | |
Conagra Brands, Inc.
1.857% (LIBOR 3 Month + 0.50%), 10/09/20(b) | | | 1,000 | | | | 1,001,850 | |
Gilead Sciences, Inc.
1.85%, 9/20/19 | | | 1,000 | | | | 999,140 | |
Kraft Heinz Foods Co.
2.80%, 7/02/20 | | | 95 | | | | 96,207 | |
Kroger Co. (The)
2.00%, 1/15/19 | | | 385 | | | | 385,146 | |
| | |
| abfunds.com | | AB TAXABLE MULTI-SECTOR INCOME SHARES | 13 |
PORTFOLIO OF INVESTMENTS (continued)
| | | | | | | | |
| | | Principal
Amount
(000) | | | U.S. $ Value | |
| |
| | | | | | | | |
6.15%, 1/15/20 | | $ | 150 | | | $ | 162,366 | |
Laboratory Corp. of America Holdings
2.625%, 2/01/20 | | | 430 | | | | 434,072 | |
Medtronic, Inc.
3.15%, 3/15/22 | | | 100 | | | | 103,086 | |
Molson Coors Brewing Co.
1.45%, 7/15/19 | | | 456 | | | | 451,176 | |
2.25%, 3/15/20(a) | | | 375 | | | | 375,169 | |
Mylan NV
2.50%, 6/07/19 | | | 665 | | | | 667,607 | |
Mylan, Inc.
2.60%, 6/24/18 | | | 26 | | | | 26,103 | |
PepsiCo, Inc.
2.00%, 4/15/21 | | | 1,000 | | | | 997,500 | |
Procter & Gamble Co. (The)
1.90%, 10/23/20 | | | 1,035 | | | | 1,034,224 | |
Reynolds American, Inc.
4.00%, 6/12/22 | | | 100 | | | | 105,352 | |
Stryker Corp.
2.00%, 3/08/19 | | | 560 | | | | 561,198 | |
Thermo Fisher Scientific, Inc.
2.15%, 12/14/18 | | | 575 | | | | 576,443 | |
Tyson Foods, Inc.
1.868% (LIBOR 3 Month + 0.55%), 6/02/20(b) | | | 475 | | | | 477,408 | |
2.25%, 8/23/21 | | | 210 | | | | 208,543 | |
2.65%, 8/15/19 | | | 158 | | | | 159,632 | |
4.50%, 6/15/22 | | | 30 | | | | 32,453 | |
| | | | | | | | |
| | | | | | | 13,657,755 | |
| | | | | | | | |
Energy – 4.2% | | | | | | | | |
BP Capital Markets PLC
1.676%, 5/03/19 | | | 565 | | | | 563,892 | |
1.768%, 9/19/19 | | | 350 | | | | 349,464 | |
Canadian Natural Resources Ltd.
5.90%, 2/01/18 | | | 3 | | | | 3,031 | |
Chevron Corp.
1.561%, 5/16/19 | | | 565 | | | | 563,452 | |
Energy Transfer LP
4.65%, 6/01/21 | | | 10 | | | | 10,617 | |
6.70%, 7/01/18 | | | 65 | | | | 66,977 | |
Enterprise Products Operating LLC
2.85%, 4/15/21 | | | 410 | | | | 417,031 | |
5.20%, 9/01/20 | | | 55 | | | | 59,479 | |
Exxon Mobil Corp.
1.708%, 3/01/19 | | | 560 | | | | 560,409 | |
Kinder Morgan Energy Partners LP
2.65%, 2/01/19 | | | 385 | | | | 387,807 | |
| | |
| 14 | AB TAXABLE MULTI-SECTOR INCOME SHARES | | abfunds.com |
PORTFOLIO OF INVESTMENTS (continued)
| | | | | | | | |
| | | Principal
Amount
(000) | | | U.S. $ Value | |
| |
| | | | | | | | |
3.95%, 9/01/22 | | $ | 99 | | | $ | 103,438 | |
4.15%, 3/01/22 | | | 37 | | | | 38,913 | |
5.30%, 9/15/20 | | | 5 | | | | 5,390 | |
Kinder Morgan, Inc./DE
3.05%, 12/01/19 | | | 435 | | | | 442,591 | |
Marathon Petroleum Corp.
5.125%, 3/01/21 | | | 48 | | | | 51,998 | |
ONEOK, Inc.
4.25%, 2/01/22 | | | 92 | | | | 95,987 | |
Phillips 66
4.30%, 4/01/22 | | | 90 | | | | 96,448 | |
Schlumberger Holdings Corp.
2.35%, 12/21/18(a) | | | 830 | | | | 833,826 | |
3.00%, 12/21/20(a) | | | 85 | | | | 86,796 | |
Shell International Finance BV
1.375%, 9/12/19 | | | 560 | | | | 555,750 | |
Williams Partners LP
4.125%, 11/15/20 | | | 574 | | | | 600,140 | |
| | | | | | | | |
| | | | | | | 5,893,436 | |
| | | | | | | | |
Services – 0.6% | | | | | | | | |
eBay, Inc.
2.15%, 6/05/20 | | | 830 | | | | 830,623 | |
| | | | | | | | |
| | |
Technology – 4.8% | | | | | | | | |
Apple, Inc.
1.70%, 2/22/19 | | | 515 | | | | 515,263 | |
Baidu, Inc.
2.875%, 7/06/22 | | | 375 | | | | 376,144 | |
Broadcom Corp. / Broadcom Cayman
Finance Ltd.
2.20%, 1/15/21(a) | | | 200 | | | | 199,076 | |
Broadcom Corp./Broadcom Cayman
Finance Ltd.
2.375%, 1/15/20(a) | | | 795 | | | | 799,683 | |
Cisco Systems, Inc.
1.60%, 2/28/19 | | | 450 | | | | 449,446 | |
Hewlett Packard Enterprise Co.
2.10%, 10/04/19(a) | | | 605 | | | | 604,383 | |
3.60%, 10/15/20(c) | | | 75 | | | | 77,501 | |
Honeywell International, Inc.
1.418% (LIBOR 3 Month + 0.04%), 10/30/19(b) | | | 1,035 | | | | 1,034,752 | |
HP, Inc.
3.75%, 12/01/20 | | | 8 | | | | 8,328 | |
4.65%, 12/09/21 | | | 23 | | | | 24,810 | |
IBM Credit LLC
1.625%, 9/06/19 | | | 350 | | | | 348,869 | |
| | |
| abfunds.com | | AB TAXABLE MULTI-SECTOR INCOME SHARES | 15 |
PORTFOLIO OF INVESTMENTS (continued)
| | | | | | | | |
| | | Principal
Amount
(000) | | | U.S. $ Value | |
| |
| | | | | | | | |
International Business Machines Corp.
1.80%, 5/17/19 | | $ | 100 | | | $ | 100,100 | |
1.95%, 2/12/19 | | | 420 | | | | 421,327 | |
Lam Research Corp.
2.80%, 6/15/21 | | | 483 | | | | 489,487 | |
Oracle Corp.
2.25%, 10/08/19 | | | 545 | | | | 550,346 | |
VMware, Inc.
2.30%, 8/21/20 | | | 800 | | | | 798,160 | |
| | | | | | | | |
| | | | | | | 6,797,675 | |
| | | | | | | | |
Transportation - Services – 0.4% | | | | | | | | |
Ryder System, Inc.
3.45%, 11/15/21 | | | 500 | | | | 516,760 | |
| | | | | | | | |
| | | | | | | 45,878,772 | |
| | | | | | | | |
Financial Institutions – 20.1% | | | | | | | | |
Banking – 15.4% | | | | | | | | |
ABN AMRO Bank NV
1.80%, 9/20/19(a) | | | 495 | | | | 492,867 | |
American Express Co.
2.20%, 10/30/20 | | | 200 | | | | 199,722 | |
American Express Credit Corp.
Series G
2.25%, 8/15/19 | | | 830 | | | | 834,748 | |
Bank of America Corp.
5.00%, 5/13/21 | | | 30 | | | | 32,566 | |
5.625%, 7/01/20 | | | 100 | | | | 108,571 | |
5.875%, 1/05/21 | | | 40 | | | | 44,198 | |
7.625%, 6/01/19 | | | 190 | | | | 206,118 | |
Series G
2.369%, 7/21/21 | | | 500 | | | | 499,495 | |
Bank of America NA
2.05%, 12/07/18 | | | 250 | | | | 250,603 | |
BB&T Corp.
2.15%, 2/01/21 | | | 200 | | | | 199,684 | |
5.25%, 11/01/19 | | | 770 | | | | 817,055 | |
Canadian Imperial Bank of Commerce
2.10%, 10/05/20 | | | 1,000 | | | | 997,140 | |
Capital One Financial Corp.
2.40%, 10/30/20 | | | 220 | | | | 220,158 | |
2.45%, 4/24/19 | | | 140 | | | | 140,872 | |
2.50%, 5/12/20 | | | 230 | | | | 230,948 | |
4.75%, 7/15/21 | | | 20 | | | | 21,545 | |
Capital One NA/Mclean VA
1.85%, 9/13/19 | | | 425 | | | | 422,378 | |
Citibank NA
2.10%, 6/12/20 | | | 665 | | | | 664,175 | |
2.125%, 10/20/20 | | | 300 | | | | 298,980 | |
| | |
| 16 | AB TAXABLE MULTI-SECTOR INCOME SHARES | | abfunds.com |
PORTFOLIO OF INVESTMENTS (continued)
| | | | | | | | |
| | | Principal
Amount
(000) | | | U.S. $ Value | |
| | | | | | | | |
| |
Citigroup, Inc.
2.50%, 7/29/19 | | $ | 390 | | | $ | 392,652 | |
Discover Bank
2.00%, 2/21/18 | | | 370 | | | | 370,326 | |
3.10%, 6/04/20 | | | 255 | | | | 260,095 | |
Fifth Third Bancorp
3.50%, 3/15/22 | | | 53 | | | | 54,853 | |
Fifth Third Bank/Cincinnati OH
2.20%, 10/30/20 | | | 550 | | | | 550,137 | |
2.30%, 3/15/19 | | | 425 | | | | 427,329 | |
Goldman Sachs Group, Inc. (The)
2.35%, 11/15/21 | | | 48 | | | | 47,481 | |
2.60%, 4/23/20 | | | 200 | | | | 201,452 | |
2.625%, 1/31/19 | | | 465 | | | | 468,567 | |
5.75%, 1/24/22 | | | 195 | | | | 218,267 | |
Series D
6.00%, 6/15/20 | | | 40 | | | | 43,690 | |
Series G
7.50%, 2/15/19 | | | 350 | | | | 373,999 | |
HSBC Holdings PLC
4.00%, 3/30/22 | | | 150 | | | | 158,465 | |
5.10%, 4/05/21 | | | 65 | | | | 70,646 | |
JPMorgan Chase & Co.
2.20%, 10/22/19 | | | 250 | | | | 251,147 | |
4.40%, 7/22/20 | | | 365 | | | | 386,418 | |
4.50%, 1/24/22 | | | 95 | | | | 102,509 | |
6.30%, 4/23/19 | | | 535 | | | | 568,341 | |
KeyBank NA/Cleveland OH
1.60%, 8/22/19 | | | 370 | | | | 367,584 | |
2.35%, 3/08/19 | | | 500 | | | | 503,195 | |
Lloyds Banking Group PLC
3.10%, 7/06/21 | | | 585 | | | | 595,799 | |
Manufacturers & Traders Trust Co.
2.05%, 8/17/20 | | | 355 | | | | 354,290 | |
2.30%, 1/30/19 | | | 475 | | | | 476,971 | |
Mitsubishi UFJ Financial Group, Inc.
2.95%, 3/01/21 | | | 215 | | | | 218,421 | |
Mizuho Financial Group, Inc.
2.632%, 4/12/21(a) | | | 220 | | | | 219,941 | |
Morgan Stanley
5.625%, 9/23/19 | | | 350 | | | | 372,214 | |
Series G
2.45%, 2/01/19 | | | 900 | | | | 904,959 | |
5.50%, 7/28/21 | | | 102 | | | | 112,663 | |
PNC Bank NA
1.95%, 3/04/19 | | | 580 | | | | 580,586 | |
2.30%, 6/01/20 | | | 250 | | | | 251,370 | |
2.45%, 11/05/20 | | | 250 | | | | 252,012 | |
| | |
| abfunds.com | | AB TAXABLE MULTI-SECTOR INCOME SHARES | 17 |
PORTFOLIO OF INVESTMENTS (continued)
| | | | | | | | |
| | | Principal
Amount
(000) | | | U.S. $ Value | |
| |
| | | | | | | | |
PNC Financial Services Group, Inc. (The)
5.125%, 2/08/20 | | $ | 30 | | | $ | 32,025 | |
Royal Bank of Canada
2.15%, 10/26/20 | | | 1,025 | | | | 1,024,785 | |
Santander Holdings USA, Inc.
2.70%, 5/24/19 | | | 560 | | | | 563,651 | |
Toronto-Dominion Bank (The)
1.90%, 10/24/19 | | | 1,030 | | | | 1,029,227 | |
US Bank NA/Cincinnati OH
1.40%, 4/26/19 | | | 585 | | | | 581,630 | |
2.05%, 10/23/20 | | | 440 | | | | 439,833 | |
Wells Fargo & Co.
2.125%, 4/22/19 | | | 355 | | | | 356,299 | |
2.15%, 1/15/19 | | | 110 | | | | 110,360 | |
Wells Fargo Bank NA
1.75%, 5/24/19 | | | 600 | | | | 598,680 | |
| | | | | | | | |
| | | | | | | 21,574,692 | |
| | | | | | | | |
Finance – 1.0% | | | | | | | | |
AIG Global Funding
2.15%, 7/02/20(a) | | | 560 | | | | 559,530 | |
Synchrony Financial
2.60%, 1/15/19 | | | 795 | | | | 799,579 | |
| | | | | | | | |
| | | | | | | 1,359,109 | |
| | | | | | | | |
Insurance – 2.9% | | | | | | | | |
Berkshire Hathaway Finance Corp.
1.70%, 3/15/19 | | | 360 | | | | 360,058 | |
Hartford Financial Services Group, Inc. (The)
5.50%, 3/30/20 | | | 3 | | | | 3,229 | |
Humana, Inc.
7.20%, 6/15/18 | | | 65 | | | | 67,112 | |
Metropolitan Life Global Funding I
1.75%, 9/19/19(a) | | | 365 | | | | 363,485 | |
2.05%, 6/12/20(a) | | | 520 | | | | 519,002 | |
New York Life Global Funding
1.95%, 9/28/20(a) | | | 1,000 | | | | 996,640 | |
Pricoa Global Funding I
1.45%, 9/13/19(a) | | | 560 | | | | 553,941 | |
Prudential Financial, Inc.
4.50%, 11/15/20 | | | 85 | | | | 90,624 | |
Reliance Standard Life Global Funding II
2.50%, 4/24/19(a) | | | 105 | | | | 105,870 | |
UnitedHealth Group, Inc.
1.70%, 2/15/19 | | | 560 | | | | 559,468 | |
1.95%, 10/15/20 | | | 465 | | | | 464,037 | |
XLIT Ltd.
5.75%, 10/01/21 | | | 20 | | | | 22,241 | |
| | | | | | | | |
| | | | | | | 4,105,707 | |
| | | | | | | | |
| | |
| 18 | AB TAXABLE MULTI-SECTOR INCOME SHARES | | abfunds.com |
PORTFOLIO OF INVESTMENTS (continued)
| | | | | | | | |
| | | Principal
Amount
(000) | | | U.S. $ Value | |
| |
| | | | | | | | |
REITS – 0.8% | | | | | | | | |
American Tower Corp.
2.80%, 6/01/20 | | $ | 440 | | | $ | 446,129 | |
Healthcare Trust of America Holdings LP
2.95%, 7/01/22 | | | 110 | | | | 110,672 | |
Simon Property Group LP
2.50%, 9/01/20 | | | 560 | | | | 565,371 | |
| | | | | | | | |
| | | | | | | 1,122,172 | |
| | | | | | | | |
| | | | | | | 28,161,680 | |
| | | | | | | | |
Utility – 2.2% | | | | | | | | |
Electric – 2.2% | | | | | | | | |
Dominion Energy, Inc.
Series A
1.875%, 1/15/19 | | | 105 | | | | 104,727 | |
Series B
1.60%, 8/15/19 | | | 565 | | | | 561,553 | |
Edison International
2.125%, 4/15/20 | | | 555 | | | | 554,733 | |
Entergy Corp.
4.00%, 7/15/22 | | | 78 | | | | 82,529 | |
Exelon Corp.
2.45%, 4/15/21 | | | 548 | | | | 548,088 | |
2.85%, 6/15/20 | | | 145 | | | | 147,565 | |
National Rural Utilities Cooperative Finance Corp.
1.65%, 2/08/19 | | | 560 | | | | 558,432 | |
Southern Co. (The)
1.85%, 7/01/19 | | | 520 | | | | 519,199 | |
TECO Finance, Inc.
5.15%, 3/15/20 | | | 10 | | | | 10,615 | |
| | | | | | | | |
| | | | | | | 3,087,441 | |
| | | | | | | | |
Total Corporates – Investment Grade
(cost $77,114,250) | | | | | | | 77,127,893 | |
| | | | | | | | |
| | | | | | | | |
| | |
ASSET-BACKED SECURITIES – 19.4% | | | | | | | | |
Autos - Fixed Rate – 12.1% | | | | | | | | |
Ally Auto Receivables Trust
Series 2015-2, Class A3
1.49%, 11/15/19 | | | 91 | | | | 90,659 | |
Series 2016-2, Class A4
1.60%, 1/15/21 | | | 1,000 | | | | 997,035 | |
Ally Master Owner Trust
Series 2015-3, Class A
1.63%, 5/15/20 | | | 297 | | | | 296,929 | |
AmeriCredit Automobile Receivables Trust
Series 2016-4, Class A2A
1.34%, 4/08/20 | | | 78 | | | | 77,706 | |
| | |
| abfunds.com | | AB TAXABLE MULTI-SECTOR INCOME SHARES | 19 |
PORTFOLIO OF INVESTMENTS (continued)
| | | | | | | | |
| | | Principal
Amount
(000) | | | U.S. $ Value | |
| |
| | | | | | | | |
Series 2017-3, Class A2A
1.69%, 12/18/20 | | $ | 1,045 | | | $ | 1,043,542 | |
Avis Budget Rental Car Funding AESOP LLC
Series 2013-2A, Class A
2.97%, 2/20/20(a) | | | 185 | | | | 186,205 | |
Bank of The West Auto Trust
Series 2015-1, Class A3
1.31%, 10/15/19(a) | | | 44 | | | | 44,305 | |
California Republic Auto Receivables Trust
Series 2015-2, Class A3
1.31%, 8/15/19 | | | 13 | | | | 12,970 | |
CarMax Auto Owner Trust 2017-4
Series 2017-4, Class A3
2.11%, 10/17/22 | | | 1,350 | | | | 1,349,504 | |
Chrysler Capital Auto Receivables Trust
Series 2015-BA, Class A3
1.91%, 3/16/20(a) | | | 106 | | | | 105,654 | |
CPS Auto Receivables Trust
Series 2013-B, Class A
1.82%, 9/15/20(a) | | | 10 | | | | 10,378 | |
Drive Auto Receivables Trust
Series 2016-CA, Class A3
1.67%, 11/15/19(a) | | | 754 | | | | 754,478 | |
Series 2017-3, Class A3
1.85%, 4/15/20 | | | 1,250 | | | | 1,249,912 | |
DT Auto Owner Trust
Series 2017-3A, Class A
1.73%, 8/17/20(a) | | | 39 | | | | 39,005 | |
Enterprise Fleet Financing LLC
Series 2015-1, Class A2
1.30%, 9/20/20(a) | | | 21 | | | | 21,155 | |
Exeter Automobile Receivables Trust
Series 2016-3A, Class A
1.84%, 11/16/20(a) | | | 12 | | | | 12,429 | |
Series 2017-2A, Class A
2.11%, 6/15/21(a) | | | 40 | | | | 39,719 | |
Fifth Third Auto Trust
Series 2014-3, Class A4
1.47%, 5/17/21 | | | 1,064 | | | | 1,063,526 | |
Fifth Third Auto Trust 2017-1
Series 2017-1, Class A2A
1.59%, 4/15/20 | | | 400 | | | | 399,548 | |
Flagship Credit Auto Trust
Series 2016-3, Class A1
1.61%, 12/15/19(a) | | | 29 | | | | 29,071 | |
Series 2016-4, Class A2
1.96%, 2/16/21(a) | | | 105 | | | | 104,618 | |
| | |
| 20 | AB TAXABLE MULTI-SECTOR INCOME SHARES | | abfunds.com |
PORTFOLIO OF INVESTMENTS (continued)
| | | | | | | | |
| | | Principal
Amount
(000) | | | U.S. $ Value | |
| |
| | | | | | | | |
Ford Credit Auto Owner Trust
Series 2014-2, Class A
2.31%, 4/15/26(a) | | $ | 268 | | | $ | 269,911 | |
Ford Credit Floorplan Master Owner Trust
Series 2015-2, Class A1
1.98%, 1/15/22 | | | 94 | | | | 93,803 | |
Series 2017-1, Class A1
2.07%, 5/15/22 | | | 175 | | | | 174,980 | |
Ford Credit Floorplan Master Owner Trust A
Series 2017-2, Class A1
2.16%, 9/15/22 | | | 1,000 | | | | 1,001,626 | |
GM Financial Automobile Leasing Trust
Series 2015-2, Class A3
1.68%, 12/20/18 | | | 141 | | | | 141,526 | |
GM Financial Automobile Leasing Trust 2017-3
Series 2017-3, Class A3
2.01%, 11/20/20 | | | 1,000 | | | | 995,846 | |
GM Financial Consumer Automobile Receivables Trust 2017-3
Series 2017-3A, Class A3
1.97%, 5/16/22(a) | | | 1,350 | | | | 1,347,577 | |
GMF Floorplan Owner Revolving Trust
Series 2015-1, Class A1
1.65%, 5/15/20(a) | | | 759 | | | | 758,945 | |
Series 2016-1, Class A1
1.96%, 5/17/21(a) | | | 100 | | | | 100,065 | |
Harley-Davidson Motorcycle Trust
Series 2015-1, Class A3
1.41%, 6/15/20 | | | 54 | | | | 54,189 | |
Hertz Vehicle Financing II LP
Series 2016-1A, Class A
2.32%, 3/25/20(a) | | | 1,100 | | | | 1,098,751 | |
Hertz Vehicle Financing LLC
Series 2013-1A, Class A2
1.83%, 8/25/19(a) | | | 160 | | | | 159,881 | |
Honda Auto Receivables 2017-3 Owner Trust
Series 2017-3, Class A4
1.98%, 11/20/23 | | | 400 | | | | 399,907 | |
Hyundai Auto Lease Securitization Trust
Series 2015-B, Class A3
1.40%, 11/15/18(a) | | | 30 | | | | 29,658 | |
Mercedes Benz Auto Lease Trust
Series 2015-B, Class A3
1.34%, 7/16/18 | | | 32 | | | | 32,471 | |
Nissan Auto Lease Trust 2017-B
Series 2017-B, Class A2A
1.83%, 12/16/19 | | | 1,350 | | | | 1,349,767 | |
Santander Drive Auto Receivables Trust
Series 2016-3, Class A2
1.34%, 11/15/19 | | | 22 | | | | 22,109 | |
| | |
| abfunds.com | | AB TAXABLE MULTI-SECTOR INCOME SHARES | 21 |
PORTFOLIO OF INVESTMENTS (continued)
| | | | | | | | |
| | | Principal
Amount
(000) | | | U.S. $ Value | |
| |
| | | | | | | | |
USAA Auto Owner Trust 2017-1
Series 2017-1, Class A4
1.88%, 9/15/22 | | $ | 1,000 | | | $ | 996,602 | |
Westlake Automobile Receivables Trust
Series 2016-2A, Class A2
1.57%, 6/17/19(a) | | | 15 | | | | 15,171 | |
| | | | | | | | |
| | | | | | | 16,971,133 | |
| | | | | | | | |
Other ABS - Fixed Rate – 2.8% | | | | | | | | |
Ascentium Equipment Receivables Trust
Series 2016-1A, Class A2
1.75%, 11/13/18(a) | | | 6 | | | | 5,668 | |
CNH Equipment Trust
Series 2014-B, Class A4
1.61%, 5/17/21 | | | 37 | | | | 37,181 | |
Series 2015-A, Class A4
1.85%, 4/15/21 | | | 619 | | | | 618,881 | |
SBA Tower Trust
3.156%, 10/08/20(a)(d) | | | 67 | | | | 67,838 | |
SoFi Consumer Loan Program LLC
Series 2016-3, Class A
3.05%, 12/26/25(a)(d) | | | 153 | | | | 153,856 | |
Series 2017-2, Class A
3.28%, 2/25/26(a)(d) | | | 732 | | | | 741,099 | |
Series 2017-5, Class A2
2.78%, 9/25/26(a)(d) | | | 1,000 | | | | 994,373 | |
Verizon Owner Trust 2017-3
Series 2017-3A, Class A1A
2.06%, 4/20/22(a)(d) | | | 1,260 | | | | 1,260,208 | |
| | | | | | | | |
| | | | | | | 3,879,104 | |
| | | | | | | | |
Credit Cards - Fixed Rate – 2.6% | | | | | | | | |
Barclays Dryrock Issuance Trust
Series 2015-2, Class A
1.56%, 3/15/21 | | | 100 | | | | 100,001 | |
Cabela’s Credit Card Master Note Trust
Series 2013-1A, Class A
2.71%, 2/17/26(a) | | | 120 | | | | 121,204 | |
Chase Issuance Trust
Series 2014-A2, Class A2
2.77%, 3/15/23 | | | 105 | | | | 107,180 | |
Synchrony Credit Card Master Note Trust
Series 2012-2, Class A
2.22%, 1/15/22 | | | 120 | | | | 120,569 | |
Series 2016-1, Class A
2.04%, 3/15/22 | | | 2,084 | | | | 2,089,695 | |
World Financial Network Credit Card Master Trust
Series 2013-A, Class A
1.61%, 12/15/21 | | | 185 | | | | 185,031 | |
| | |
| 22 | AB TAXABLE MULTI-SECTOR INCOME SHARES | | abfunds.com |
PORTFOLIO OF INVESTMENTS (continued)
| | | | | | | | |
| | | Principal
Amount
(000) | | | U.S. $ Value | |
| |
| | | | | | | | |
Series 2017-B, Class A
1.98%, 6/15/23 | | $ | 1,000 | | | $ | 999,331 | |
| | | | | | | | |
| | | | | | | 3,723,011 | |
| | | | | | | | |
Credit Cards - Floating Rate – 1.0% | | | | | | | | |
American Express Issuance Trust II
Series 2013-1, Class A
1.519% (LIBOR 1 Month + 0.28%), 2/15/19(b) | | | 1,200 | | | | 1,201,151 | |
World Financial Network Credit Card Master Trust
Series 2015-A, Class A
1.719% (LIBOR 1 Month + 0.48%), 2/15/22(b) | | | 167 | | | | 167,282 | |
| | | | | | | | |
| | | | | | | 1,368,433 | |
| | | | | | | | |
Autos - Floating Rate – 0.9% | | | | | | | | |
BMW Floorplan Master Owner Trust
Series 2015-1A, Class A
1.739% (LIBOR 1 Month + 0.50%), 7/15/20(a)(b) | | | 142 | | | | 142,364 | |
Wells Fargo Dealer Floorplan Master Note Trust
Series 2015-1, Class A
1.739% (LIBOR 1 Month + 0.50%), 1/20/20(b) | | | 1,151 | | | | 1,151,206 | |
| | | | | | | | |
| | | | | | | 1,293,570 | |
| | | | | | | | |
Total Asset-Backed Securities
(cost $27,236,291) | | | | | | | 27,235,251 | |
| | | | | | | | |
| | | | | | | | |
GOVERNMENTS – TREASURIES – 16.8% | | | | | | | | |
United States – 16.8% | | | | | | | | |
U.S. Treasury Notes
1.50%, 5/15/20-7/15/20
(cost $23,686,131) | | | 23,680 | | | | 23,562,445 | |
| | | | | | | | |
| | | | | | | | |
COMMERCIAL MORTGAGE-BACKED SECURITIES – 4.8% | | | | | | | | |
Non-Agency Fixed Rate CMBS – 2.8% | | | | | | | | |
Citigroup Commercial Mortgage Trust
Series 2013-GC17, Class A2
2.962%, 11/10/46 | | | 435 | | | | 438,865 | |
Series 2015-GC29, Class A2
2.674%, 4/10/48 | | | 1,000 | | | | 1,009,612 | |
Commercial Mortgage Trust
Series 2013-CR6, Class A2
2.122%, 3/10/46 | | | 104 | | | | 103,989 | |
Series 2014-LC15, Class A2
2.84%, 4/10/47 | | | 440 | | | | 444,595 | |
GS Mortgage Securities Trust
Series 2013-G1, Class A1
2.059%, 4/10/31(a) | | | 639 | | | | 621,496 | |
| | |
| abfunds.com | | AB TAXABLE MULTI-SECTOR INCOME SHARES | 23 |
PORTFOLIO OF INVESTMENTS (continued)
| | | | | | | | |
| | | Principal
Amount
(000) | | | U.S. $ Value | |
| |
| | | | | | | | |
JP Morgan Chase Commercial
Mortgage Securities Trust
Series 2013-C13, Class A2
2.665%, 1/15/46 | | $ | 425 | | | $ | 427,803 | |
Series 2013-C16, Class A2
3.07%, 12/15/46 | | | 289 | | | | 291,155 | |
LSTAR Commercial Mortgage Trust
Series 2016-4, Class A2
2.579%, 3/10/49(a) | | | 100 | | | | 98,734 | |
WF-RBS Commercial Mortgage Trust
Series 2013-C16, Class A2
3.223%, 9/15/46 | | | 430 | | | | 434,028 | |
| | | | | | | | |
| | | | | | | 3,870,277 | |
| | | | | | | | |
Non-Agency Floating Rate CMBS – 1.8% | | | | | | | | |
BX Trust SLCT
Series 2017-IMC, Class A
2.30% (LIBOR 1 Month + 1.05%), 10/15/32(a)(b) | | | 1,000 | | | | 1,002,208 | |
JP Morgan Chase Commercial
Mortgage Securities Trust
Series 2015-SGP, Class A
2.939% (LIBOR 1 Month + 1.70%), 7/15/36(a)(b) | | | 353 | | | | 354,527 | |
Starwood Retail Property Trust
Series 2014-STAR, Class A
2.459% (LIBOR 1 Month + 1.22%), 11/15/27(a)(b) | | | 1,100 | | | | 1,100,075 | |
Waldorf Astoria Boca Raton Trust
Series 2016-BOCA, Class A
2.589% (LIBOR 1 Month + 1.35%), 6/15/29(a)(b) | | | 128 | | | | 128,203 | |
| | | | | | | | |
| | | | | | | 2,585,013 | |
| | | | | | | | |
Agency CMBS – 0.2% | | | | | | | | |
Federal Home Loan Mortgage Corp. Multifamily Structured Pass Through Certificates
Series K011, Class A1
2.917%, 8/25/20 | | | 45 | | | | 45,148 | |
Series K021, Class A1
1.603%, 1/25/22 | | | 120 | | | | 118,432 | |
Series K025, Class A1
1.875%, 4/25/22 | | | 180 | | | | 179,219 | |
| | | | | | | | |
| | | | | | | 342,799 | |
| | | | | | | | |
| | |
Total Commercial Mortgage-Backed Securities
(cost $6,861,897) | | | | | | | 6,798,089 | |
| | | | | | | | |
| | |
| 24 | AB TAXABLE MULTI-SECTOR INCOME SHARES | | abfunds.com |
PORTFOLIO OF INVESTMENTS (continued)
| | | | | | | | |
| | | Principal
Amount
(000) | | | U.S. $ Value | |
| |
| | | | | | | | |
COLLATERALIZED MORTGAGE OBLIGATIONS – 2.0% | | | | | | | | |
Risk Share Floating Rate – 1.5% | | | | | | | | |
Federal Home Loan Mortgage Corp. Structured Agency Credit Risk Debt Notes
Series 2016-DNA2, Class M1
2.488% (LIBOR 1 Month + 1.25%), 10/25/28(b) | | $ | 28 | | | $ | 27,865 | |
Series 2016-HQA1, Class M1
2.988% (LIBOR 1 Month + 1.75%), 9/25/28(b) | | | 333 | | | | 334,127 | |
Series 2016-HQA2, Class M1
2.438% (LIBOR 1 Month + 1.20%), 11/25/28(b) | | | 251 | | | | 251,054 | |
Federal National Mortgage Association
Series 2014-C02, Class 2M1
2.188% (LIBOR 1 Month + 0.95%), 5/25/24(b) | | | 115 | | | | 115,100 | |
Federal National Mortgage Association Connecticut Avenue Securities
Series 2016-C02, Class 1M1
3.388% (LIBOR 1 Month + 2.15%), 9/25/28(b) | | | 901 | | | | 911,270 | |
Series 2016-C03, Class 1M1 | | | | | | | | |
3.238% (LIBOR 1 Month + 2.00%), 10/25/28(b) | | | 492 | | | | 500,187 | |
| | | | | | | | |
| | | | | | | 2,139,603 | |
| | | | | | | | |
Agency Fixed Rate – 0.5% | | | | | | | | |
Federal Home Loan Mortgage Corp. REMICs | | | | | | | | |
Series 4029, Class LD
1.75%, 1/15/27 | | | 442 | | | | 434,848 | |
Series 4459, Class CA
5.00%, 12/15/34 | | | 169 | | | | 178,744 | |
| | | | | | | | |
| | | | | | | 613,592 | |
| | | | | | | | |
| | |
Total Collateralized Mortgage Obligations
(cost $2,741,408) | | | | | | | 2,753,195 | |
| | | | | | | | |
| | | | | | | | |
CORPORATES –
NON-INVESTMENT GRADE – 0.8% | | | | | | | | |
Industrial – 0.8% | | | | | | | | |
Consumer Non-Cyclical – 0.8% | | | | | | | | |
Constellation Brands, Inc.
2.00%, 11/07/19
(cost $1,053,523) | | | 1,055 | | | | 1,053,523 | |
| | | | | | | | |
| | |
| abfunds.com | | AB TAXABLE MULTI-SECTOR INCOME SHARES | 25 |
PORTFOLIO OF INVESTMENTS (continued)
| | | | | | | | |
| | |
Shares | | | U.S. $ Value | |
| |
| | | | | | | | |
SHORT-TERM INVESTMENTS – 1.1% | | | | | | | | |
Investment Companies – 1.1% | | | | | | | | |
AB Fixed Income Shares, Inc. – Government
Money Market Portfolio – Class AB,
0.85%(e)(f)(g) (cost $1,525,234) | | | 1,525,234 | | | $ | 1,525,234 | |
| | | | | | | | |
| | |
Total Investments – 99.9%
(cost $140,218,734) | | | | | | | 140,055,630 | |
Other assets less liabilities – 0.1% | | | | | | | 117,975 | |
| | | | | | | | |
| | |
Net Assets – 100.0% | | | | | | $ | 140,173,605 | |
| | | | | | | | |
CREDIT DEFAULT SWAPS (see Note C)
| | | | | | | | | | | | | | | | | | | | | | | | | | | | |
Swap
Counterparty &
Referenced
Obligation | | Fixed
Rate
(Pay)
Receive | | | Payment
Frequency | | | Implied
Credit
Spread at
October 31,
2017 | | | Notional
Amount
(000) | | | Market
Value | | | Upfront
Premiums
Paid
(Received) | | | Unrealized
Appreciation/
(Depreciation) | |
Sale Contracts | | | | | | | | | | | | | | | | | | | | | | | | | | | | |
Deutsche Bank AG CDX-CMBX.NA.A Series 6, 5/11/63* | | | 2.00 | % | | | Monthly | | | | 3.31 | % | | | USD 1,500 | | | $ | (88,967 | ) | | $ | (84,514 | ) | | $ | (4,453 | ) |
| (a) | Security is exempt from registration under Rule 144A of the Securities Act of 1933. These securities are considered restricted, but liquid and may be resold in transactions exempt from registration, normally to qualified institutional buyers. At October 31, 2017, the aggregate market value of these securities amounted to $22,269,316 or 15.9% of net assets. |
| (b) | Floating Rate Security. Stated interest/floor rate was in effect at October 31, 2017. |
| (c) | Variable rate coupon, rate shown as of October 31, 2017. |
| (d) | Security in which significant unobservable inputs (Level 3) were used in determining fair value. |
| (e) | Affiliated investments. |
| (f) | To obtain a copy of the fund’s shareholder report, please go to the Securities and Exchange Commission’s website at www.sec.gov, or call AB at (800) 227-4618. |
| (g) | The rate shown represents the 7-day yield as of period end. |
Currency Abbreviations:
USD – United States Dollar
Glossary:
ABS – Asset-Backed Securities
CDX-CMBX.NA – North American Commercial Mortgage-Backed Index
CMBS – Commercial Mortgage-Backed Securities
REIT – Real Estate Investment Trust
REMICs – Real Estate Mortgage Investment Conduits
See notes to financial statements.
| | |
| 26 | AB TAXABLE MULTI-SECTOR INCOME SHARES | | abfunds.com |
STATEMENT OF ASSETS & LIABILITIES
October 31, 2017 (unaudited)
| | | | |
| Assets | | | | |
Investments in securities, at value | | | | |
Unaffiliated issuers (cost $138,693,500) | | $ | 138,530,396 | |
Affiliated issuers (cost $1,525,234) | | | 1,525,234 | |
Receivable for shares of beneficial interest sold | | | 1,408,736 | |
Unaffiliated interest and dividends receivable | | | 644,790 | |
Receivable due from Adviser | | | 2,641 | |
Affiliated dividends receivable | | | 2,341 | |
| | | | |
Total assets | | | 142,114,138 | |
| | | | |
| Liabilities | | | | |
Payable for investment securities purchased | | | 1,053,484 | |
Payable for shares of beneficial interest redeemed | | | 581,135 | |
Dividends payable | | | 216,756 | |
Upfront premiums received on credit default swaps | | | 84,514 | |
Unrealized depreciation on credit default swaps | | | 4,453 | |
Payable for terminated interest rate swaps | | | 191 | |
| | | | |
Total liabilities | | | 1,940,533 | |
| | | | |
Net Assets | | $ | 140,173,605 | |
| | | | |
| Composition of Net Assets | | | | |
Shares of beneficial interest, at par | | $ | 143 | |
Additional paid-in capital | | | 140,969,686 | |
Distributions in excess of net investment income | | | (138,499 | ) |
Accumulated net realized loss on investment transactions | | | (490,168 | ) |
Net unrealized depreciation on investments | | | (167,557 | ) |
| | | | |
| | $ | 140,173,605 | |
| | | | |
Net Asset Value Per Share—unlimited shares of beneficial interest authorized, $.00001 par value (based on 14,253,281 common shares outstanding) | | $ | 9.83 | |
| | | | |
See notes to financial statements.
| | |
| abfunds.com | | AB TAXABLE MULTI-SECTOR INCOME SHARES | 27 |
STATEMENT OF OPERATIONS
Six Months Ended October 31, 2017 (unaudited)
| | | | | | | | |
| Investment Income | | | | | | | | |
Interest | | $ | 943,030 | | | | | |
Dividends—Affiliated issuers | | | 12,726 | | | | | |
Other income(a) | | | 3,244 | | | | | |
| | | | | | | | |
Total investment income | | | | | | $ | 959,000 | |
| | | | | | | | |
| Realized and Unrealized Gain (Loss) on Investment Transactions | | | | | | | | |
Net realized gain (loss) on: | | | | | | | | |
Investment transactions | | | | | | | (3,430 | ) |
Swaps | | | | | | | 22,913 | |
Net change in unrealized appreciation/depreciation of: | | | | | | | | |
Investments | | | | | | | (221,930 | ) |
Swaps | | | | | | | (32,777 | ) |
| | | | | | | | |
Net loss on investment transactions | | | | | | | (235,224 | ) |
| | | | | | | | |
Net Increase in Net Assets from Operations | | | | | | $ | 723,776 | |
| | | | | | | | |
| (a) | Other income includes a reimbursement for investment in affiliated issuer (see Note B). |
See notes to financial statements.
| | |
| 28 | AB TAXABLE MULTI-SECTOR INCOME SHARES | | abfunds.com |
STATEMENT OF CHANGES IN NET ASSETS
| | | | | | | | |
| | | Six Months Ended
October 31, 2017
(unaudited) | | | Year Ended
April 30,
2017 | |
| Increase (Decrease) in Net Assets from Operations | | | | | | | | |
Net investment income | | $ | 959,000 | | | $ | 2,930,964 | |
Net realized gain on investment transactions | | | 19,483 | | | | 1,139,697 | |
Net change in unrealized appreciation/depreciation of investments | | | (254,707 | ) | | | (1,233,583 | ) |
| | | | | | | | |
Net increase in net assets from operations | | | 723,776 | | | | 2,837,078 | |
| Dividends to Shareholders from | | | | | | | | |
Net investment income | | | (946,661 | ) | | | (3,408,557 | ) |
| Transactions in Shares of Beneficial Interest | | | | | | | | |
Net increase (decrease) | | | 66,069,083 | | | | (232,334,424 | ) |
| | | | | | | | |
Total increase (decrease) | | | 65,846,198 | | | | (232,905,903 | ) |
| Net Assets | | | | | | | | |
Beginning of period | | | 74,327,407 | | | | 307,233,310 | |
| | | | | | | | |
End of period (including distributions in excess of net investment income of ($138,499) and ($150,838), respectively) | | $ | 140,173,605 | | | $ | 74,327,407 | |
| | | | | | | | |
See notes to financial statements.
| | |
| abfunds.com | | AB TAXABLE MULTI-SECTOR INCOME SHARES | 29 |
NOTES TO FINANCIAL STATEMENTS
October 31, 2017 (unaudited)
NOTE A
Significant Accounting Policies
AB Corporate Shares (the “Trust”) was organized as a Massachusetts business trust under the laws of The Commonwealth of Massachusetts by an Agreement and Declaration of Trust dated January 26, 2004. The Trust is registered under the Investment Company Act of 1940, as an open-end, diversified management investment company. The Trust operates as a “series” company currently offering four separate portfolios: AB Corporate Income Shares, AB Municipal Income Shares, AB Taxable Multi-Sector Income Shares and AB Impact Municipal Income Shares. Each Fund is considered to be a separate entity for financial reporting and tax purposes. This report relates only to AB Taxable Multi-Sector Income Shares (the “Fund”).
Shares of the Fund are offered exclusively to holders of accounts established under wrap-fee programs sponsored and maintained by certain registered investment advisers approved by AllianceBernstein L.P. (the “Adviser”). The Fund’s shares may be purchased at the relevant net asset value without a sales charge or other fee. The financial statements have been prepared in conformity with U.S. generally accepted accounting principles (“U.S. GAAP”) which require management to make certain estimates and assumptions that affect the reported amounts of assets and liabilities in the financial statements and amounts of income and expenses during the reporting period. Actual results could differ from those estimates. The Fund is an investment company under U.S. GAAP and follows the accounting and reporting guidance applicable to investment companies. The following is a summary of significant accounting policies followed by the Fund.
1. Security Valuation
Portfolio securities are valued at their current market value determined on the basis of market quotations or, if market quotations are not readily available or are deemed unreliable, at “fair value” as determined in accordance with procedures established by and under the general supervision of the Trust’s Board of Trustees (the “Board”).
In general, the market values of securities which are readily available and deemed reliable are determined as follows: securities listed on a national securities exchange (other than securities listed on the NASDAQ Stock Market, Inc. (“NASDAQ”)) or on a foreign securities exchange are valued at the last sale price at the close of the exchange or foreign securities exchange. If there has been no sale on such day, the securities are valued at the last traded price from the previous day. Securities listed on more than one exchange are valued by reference to the principal exchange on which the securities are traded; securities listed only on NASDAQ are
| | |
| 30 | AB TAXABLE MULTI-SECTOR INCOME SHARES | | abfunds.com |
NOTES TO FINANCIAL STATEMENTS (continued)
valued in accordance with the NASDAQ Official Closing Price; listed or over the counter (“OTC”) market put or call options are valued at the mid level between the current bid and ask prices. If either a current bid or current ask price is unavailable, the Adviser will have discretion to determine the best valuation (e.g., last trade price in the case of listed options); open futures are valued using the closing settlement price or, in the absence of such a price, the most recent quoted bid price. If there are no quotations available for the day of valuation, the last available closing settlement price is used; U.S. Government securities and any other debt instruments having 60 days or less remaining until maturity are generally valued at market by an independent pricing vendor, if a market price is available. If a market price is not available, the securities are valued at amortized cost. This methodology is commonly used for short term securities that have an original maturity of 60 days or less, as well as short term securities that had an original term to maturity that exceeded 60 days. In instances when amortized cost is utilized, the Valuation Committee (the “Committee”) must reasonably conclude that the utilization of amortized cost is approximately the same as the fair value of the security. Such factors the Committee will consider include, but are not limited to, an impairment of the creditworthiness of the issuer or material changes in interest rates. Fixed-income securities, including mortgage-backed and asset-backed securities, may be valued on the basis of prices provided by a pricing service or at a price obtained from one or more of the major broker-dealers. In cases where broker-dealer quotes are obtained, the Adviser may establish procedures whereby changes in market yields or spreads are used to adjust, on a daily basis, a recently obtained quoted price on a security. Swaps and other derivatives are valued daily, primarily using independent pricing services, independent pricing models using market inputs, as well as third party broker-dealers or counterparties. Open end mutual funds are valued at the closing net asset value per share, while exchange traded funds are valued at the closing market price per share.
Securities for which market quotations are not readily available (including restricted securities) or are deemed unreliable are valued at fair value as deemed appropriate by the Adviser. Factors considered in making this determination may include, but are not limited to, information obtained by contacting the issuer, analysts, analysis of the issuer’s financial statements or other available documents. In addition, the Fund may use fair value pricing for securities primarily traded in non-U.S. markets because most foreign markets close well before the Fund values its securities at 4:00 p.m., Eastern Time. The earlier close of these foreign markets gives rise to the possibility that significant events, including broad market moves, may have occurred in the interim and may materially affect the value of those securities. To account for this, the Fund generally values many of its
| | |
| abfunds.com | | AB TAXABLE MULTI-SECTOR INCOME SHARES | 31 |
NOTES TO FINANCIAL STATEMENTS (continued)
foreign equity securities using fair value prices based on third party vendor modeling tools to the extent available.
2. Fair Value Measurements
In accordance with U.S. GAAP regarding fair value measurements, fair value is defined as the price that the Fund would receive to sell an asset or pay to transfer a liability in an orderly transaction between market participants at the measurement date. U.S. GAAP establishes a framework for measuring fair value, and a three-level hierarchy for fair value measurements based upon the transparency of inputs to the valuation of an asset or liability (including those valued based on their market values as described in Note A.1 above). Inputs may be observable or unobservable and refer broadly to the assumptions that market participants would use in pricing the asset or liability. Observable inputs reflect the assumptions market participants would use in pricing the asset or liability based on market data obtained from sources independent of the Fund. Unobservable inputs reflect the Fund’s own assumptions about the assumptions that market participants would use in pricing the asset or liability based on the best information available in the circumstances. Each investment is assigned a level based upon the observability of the inputs which are significant to the overall valuation. The three-tier hierarchy of inputs is summarized below.
| | • | | Level 1—quoted prices in active markets for identical investments |
| | • | | Level 2—other significant observable inputs (including quoted prices for similar investments, interest rates, prepayment speeds, credit risk, etc.) |
| | • | | Level 3—significant unobservable inputs (including the Fund’s own assumptions in determining the fair value of investments) |
The fair value of debt instruments, such as bonds, and over-the-counter derivatives is generally based on market price quotations, recently executed market transactions (where observable) or industry recognized modeling techniques and are generally classified as Level 2. Pricing vendor inputs to Level 2 valuations may include quoted prices for similar investments in active markets, interest rate curves, coupon rates, currency rates, yield curves, option adjusted spreads, default rates, credit spreads and other unique security features in order to estimate the relevant cash flows which are then discounted to calculate fair values. If these inputs are unobservable and significant to the fair value, these investments will be classified as Level 3. In addition, non-agency rated investments are classified as Level 3.
Valuations of mortgage-backed or other asset-backed securities, by pricing vendors, are based on both proprietary and industry recognized models and discounted cash flow techniques. Significant inputs to the valuation
| | |
| 32 | AB TAXABLE MULTI-SECTOR INCOME SHARES | | abfunds.com |
NOTES TO FINANCIAL STATEMENTS (continued)
of these instruments are value of the collateral, the rates and timing of delinquencies, the rates and timing of prepayments, and default and loss expectations, which are driven in part by housing prices for residential mortgages. Significant inputs are determined based on relative value analyses, which incorporate comparisons to instruments with similar collateral and risk profiles, including relevant indices. Mortgage and asset-backed securities for which management has collected current observable data through pricing services are generally categorized within Level 2. Those investments for which current observable data has not been provided are classified as Level 3.
Other fixed income investments, including non-U.S. government and corporate debt, are generally valued using quoted market prices, if available, which are typically impacted by current interest rates, maturity dates and any perceived credit risk of the issuer. Additionally, in the absence of quoted market prices, these inputs are used by pricing vendors to derive a valuation based upon industry or proprietary models which incorporate issuer specific data with relevant yield/spread comparisons with more widely quoted bonds with similar key characteristics. Those investments for which there are observable inputs are classified as Level 2. Where the inputs are not observable, the investments are classified as Level 3.
The following table summarizes the valuation of the Fund’s investments by the above fair value hierarchy levels as of October 31, 2017:
| | | | | | | | | | | | | | | | |
Investments in
Securities: | | Level 1 | | | Level 2 | | | Level 3 | | | Total | |
Assets: | | | | | | | | | | | | | | | | |
Corporates – Investment Grade | | $ | – 0 | – | | $ | 77,127,893 | | | | – 0 | – | | $ | 77,127,893 | |
Asset-Backed Securities | | | – 0 | – | | | 24,017,877 | | | | 3,217,374 | | | | 27,235,251 | |
Governments – Treasuries | | | – 0 | – | | | 23,562,445 | | | | – 0 | – | | | 23,562,445 | |
Commercial Mortgage-Backed Securities | | | – 0 | – | | | 6,798,089 | | | | – 0 | – | | | 6,798,089 | |
Collateralized Mortgage Obligations | | | – 0 | – | | | 2,753,195 | | | | – 0 | – | | | 2,753,195 | |
Corporates – Non-Investment Grade | | | – 0 | – | | | 1,053,523 | | | | – 0 | – | | | 1,053,523 | |
Short-Term Investments | | | 1,525,234 | | | | – 0 | – | | | – 0 | – | | | 1,525,234 | |
| | | | | | | | | | | | | | | | |
Total Investments in Securities | | | 1,525,234 | | | | 135,313,022 | | | | 3,217,374 | | | | 140,055,630 | |
Other Financial Instruments(a): | | | | | | | | | | | | | | | | |
Assets | | | – 0 | – | | | – 0 | – | | | – 0 | – | | | – 0 | – |
Liabilities: | | | | | | | | | | | | | | | | |
Credit Default Swaps | | | – 0 | – | | | (88,967 | ) | | | – 0 | – | | | (88,967 | ) |
| | | | | | | | | | | | | | | | |
Total(b) | | $ | 1,525,234 | | | $ | 135,224,055 | | | $ | 3,217,374 | | | $ | 139,966,663 | |
| | | | | | | | | | | | | | | | |
| (a) | Other financial instruments are derivative instruments, such as futures, forwards and swaps, which are valued at the unrealized appreciation/(depreciation) on the instrument. Other financial instruments may also include swaps with upfront premiums, options written and swaptions which are valued at market value. |
| (b) | There were no transfers between any levels during the reporting period. |
| | |
| abfunds.com | | AB TAXABLE MULTI-SECTOR INCOME SHARES | 33 |
NOTES TO FINANCIAL STATEMENTS (continued)
The Fund recognizes all transfers between levels of the fair value hierarchy assuming the financial instruments were transferred at the beginning of the reporting period.
The following is a reconciliation of investments in which significant unobservable inputs (Level 3) were used in determining fair value.
| | | | | | | | | | | | |
| | | Asset-
Backed
Securities | | | Commercial
Mortgage-
Backed
Securities | | | Total | |
Balance as of 4/30/17 | | $ | 1,143,675 | | | $ | 5,289 | | | $ | 1,148,964 | |
Accrued discounts/(premiums) | | | 71 | | | | – 0 | – | | | 71 | |
Realized gain (loss) | | | 331 | | | | (137 | ) | | | 194 | |
Change in unrealized appreciation/depreciation | | | (396 | ) | | | 142 | | | | (254 | ) |
Purchases | | | 2,327,128 | | | | – 0 | – | | | 2,327,128 | |
Sales | | | (253,435 | ) | | | (5,294 | ) | | | (258,729 | ) |
Transfers in to Level 3 | | | – 0 | – | | | – 0 | – | | | – 0 | – |
Transfers out of Level 3 | | | – 0 | – | | | – 0 | – | | | – 0 | – |
| | | | | | | | | | | | |
Balance as of 10/31/17 | | $ | 3,217,374 | | | $ | – 0 | – | | $ | 3,217,374 | |
| | | | | | | | | | | | |
Net change in unrealized appreciation/depreciation from investments held as of 10/31/17(a) | | $ | (396 | ) | | $ | – 0 | – | | $ | (396 | ) |
| | | | | | | | | | | | |
| (a) | The unrealized appreciation/(depreciation) is included in net change in unrealized appreciation/(depreciation) on investments and other financial instruments in the accompanying statement of operations. |
As of October 31, 2017, all Level 3 securities were priced by third party vendors.
The Adviser established the Committee to oversee the pricing and valuation of all securities held in the Fund. The Committee operates under pricing and valuation policies and procedures established by the Adviser and approved by the Board, including pricing policies which set forth the mechanisms and processes to be employed on a daily basis to implement these policies and procedures. In particular, the pricing policies describe how to determine market quotations for securities and other instruments. The Committee’s responsibilities include: 1) fair value and liquidity determinations (and oversight of any third parties to whom any responsibility for fair value and liquidity determinations is delegated), and 2) regular monitoring of the Adviser’s pricing and valuation policies and procedures and modification or enhancement of these policies and procedures (or recommendation of the modification of these policies and procedures) as the Committee believes appropriate.
The Committee is also responsible for monitoring the implementation of the pricing policies by the Adviser’s Pricing Group (the “Pricing Group”)
| | |
| 34 | AB TAXABLE MULTI-SECTOR INCOME SHARES | | abfunds.com |
NOTES TO FINANCIAL STATEMENTS (continued)
and any third party which performs certain pricing functions in accordance with the pricing policies. The Pricing Group is responsible for the oversight of the third party on a day-to-day basis. The Committee and the Pricing Group perform a series of activities to provide reasonable assurance of the accuracy of prices including: 1) periodic vendor due diligence meetings, review of methodologies, new developments and processes at vendors, 2) daily comparison of security valuation versus prior day for all securities that exceeded established thresholds, and 3) daily review of unpriced, stale, and variance reports with exceptions reviewed by senior management and the Committee.
In addition, several processes outside of the pricing process are used to monitor valuation issues including: 1) performance and performance attribution reports are monitored for anomalous impacts based upon benchmark performance, and 2) portfolio managers review all portfolios for performance and analytics (which are generated using the Adviser’s prices).
3. Taxes
It is the Fund’s policy to meet the requirements of the Internal Revenue Code applicable to regulated investment companies and to distribute all of its investment company taxable income and net realized gains, if any, to shareholders. Therefore, no provisions for federal income or excise taxes are required.
In accordance with U.S. GAAP requirements regarding accounting for uncertainties in income taxes, management has analyzed the Fund’s tax positions taken or expected to be taken on federal and state income tax returns for all open tax years (the current and the prior three tax years) and has concluded that no provision for income tax is required in the Fund’s financial statements.
4. Investment Income and Investment Transactions
Dividend income is recorded on the ex-dividend date or as soon as the Fund is informed of the dividend. Interest income is accrued daily. Investment transactions are accounted for on the date the securities are purchased or sold. Investment gains or losses are determined on the identified cost basis. The Fund amortizes premiums and accretes discounts as adjustments to interest income.
5. Dividends and Distributions
Dividends and distributions to shareholders, if any, are recorded on the ex-dividend date. Income dividends and capital gains distributions are determined in accordance with federal tax regulations and may differ from those determined in accordance with U.S. GAAP. To the extent these differences are permanent, such amounts are reclassified within the capital
| | |
| abfunds.com | | AB TAXABLE MULTI-SECTOR INCOME SHARES | 35 |
NOTES TO FINANCIAL STATEMENTS (continued)
accounts based on their federal tax basis treatment; temporary differences do not require such reclassification.
NOTE B
Advisory Fee and Other Transactions with Affiliates
Under the terms of the Advisory Agreement, the Fund pays no advisory fee to the Adviser and the Adviser reimburses or pays for the Fund’s operating expenses. The Fund is an integral part of separately managed accounts in wrap-fee programs and other investment programs. Typically, participants in these programs pay a fee to their investment adviser for all costs and expenses of the separately managed account, including costs and expenses associated with the Fund, and a fee is paid by their investment adviser to the Adviser. The Adviser serves as investment manager and adviser of the Fund and continuously furnishes an investment program for the Fund and manages, supervises and conducts the affairs of the Fund, subject to the supervisions of the Fund’s Board. The Advisory Agreement provides that the Adviser or an affiliate will furnish, or pay the expenses of the Fund for, office space, facilities and equipment, services of executive and other personnel of the Fund and certain administrative services.
The Fund has entered into a distribution agreement with AllianceBernstein Investments, Inc., the Fund’s principal underwriter (the “Underwriter”), to permit the Underwriter to distribute the Fund’s shares, which are sold at their net asset value without any sales charge. The Fund does not pay a fee for this service. The Underwriter is a wholly owned subsidiary of the Adviser.
AllianceBernstein Investor Services, Inc. (“ABIS”), a wholly-owned subsidiary of the Adviser, acts as the Fund’s registrar, transfer agent and dividend-disbursing agent. ABIS registers the transfer, issuance and redemption of Fund shares and disburses dividends and other distributions to Fund shareholders. The Fund does not pay a fee for this service.
The Fund may invest in AB Government Money Market Portfolio (the “Government Money Market Portfolio”) which has a contractual annual advisory fee rate of ..20% of the portfolio’s average daily net assets and bears its own expenses. In connection with the investment by the Fund in the Government Money Market Portfolio, the Adviser has contractually agreed to reimburse its advisory fee from the Fund in an amount equal to the Fund’s pro rata share of the effective advisory fees of Government Money Market Portfolio, as borne indirectly by the Fund as an acquired fund fee and expense. For the six months ended October 31, 2017, such reimbursement amounted to $3,244.
| | |
| 36 | AB TAXABLE MULTI-SECTOR INCOME SHARES | | abfunds.com |
NOTES TO FINANCIAL STATEMENTS (continued)
A summary of the Fund’s transactions in AB mutual funds for the six months ended October 31, 2017 is as follows:
| | | | | | | | | | | | | | | | | | | | |
| Fund | | Market
Value
4/30/17
(000) | | | Purchases
at Cost
(000) | | | Sales
Proceeds
(000) | | | Market
Value
10/31/17
(000) | | | Dividend
Income
(000) | |
Government Money Market Portfolio | | $ | 2,612 | | | $ | 75,102 | | | $ | 76,189 | | | $ | 1,525 | | | $ | 13 | |
NOTE C
Investment Transactions
Purchases and sales of investment securities (excluding short-term investments) for the six months ended October 31, 2017 were as follows:
| | | | | | | | |
| | | Purchases | | | Sales | |
Investment securities (excluding
U.S. government securities) | | $ | 49,586,118 | | | $ | 11,416,347 | |
U.S. government securities | | | 38,404,574 | | | | 14,667,543 | |
The cost of investments for federal income tax purposes was substantially the same as the cost for financial reporting purposes. Accordingly, gross unrealized appreciation and unrealized depreciation are as follows:
| | | | |
Gross unrealized appreciation | | $ | 217,821 | |
Gross unrealized depreciation | | | (385,378 | ) |
| | | | |
Net unrealized depreciation | | $ | (167,557 | ) |
| | | | |
1. Derivative Financial Instruments
The Fund may use derivatives in an effort to earn income and enhance returns, to replace more traditional direct investments, to obtain exposure to otherwise inaccessible markets (collectively, “investment purposes”), or to hedge or adjust the risk profile of its portfolio.
The principal types of derivatives utilized by the Fund, as well as the methods in which they may be used are:
The Fund may enter into swaps to hedge its exposure to interest rates, credit risk or currencies. The Fund may also enter into swaps for non-hedging purposes as a means of gaining market exposures, making direct investments in foreign currencies, as described below under “Currency Transactions.” A swap is an agreement that obligates two parties to exchange a series of cash flows at specified intervals based upon or calculated by reference to changes in specified prices or rates for a specified amount of an underlying asset. The payment flows are usually netted against each other, with the difference being paid by one party to the other. In addition, collateral
| | |
| abfunds.com | | AB TAXABLE MULTI-SECTOR INCOME SHARES | 37 |
NOTES TO FINANCIAL STATEMENTS (continued)
may be pledged or received by the Fund in accordance with the terms of the respective swaps to provide value and recourse to the Fund or its counterparties in the event of default, bankruptcy or insolvency by one of the parties to the swap.
Risks may arise as a result of the failure of the counterparty to the swap to comply with the terms of the swap. The loss incurred by the failure of a counterparty is generally limited to the net interim payment to be received by the Fund, and/or the termination value at the end of the contract. Therefore, the Fund considers the creditworthiness of each counterparty to a swap in evaluating potential counterparty risk. This risk is mitigated by having a netting arrangement between the Fund and the counterparty and by the posting of collateral by the counterparty to the Fund to cover the Fund’s exposure to the counterparty. Additionally, risks may arise from unanticipated movements in interest rates or in the value of the underlying securities. The Fund accrues for the interim payments on swaps on a daily basis, with the net amount recorded within unrealized appreciation/depreciation of swaps on the statement of assets and liabilities, where applicable. Once the interim payments are settled in cash, the net amount is recorded as realized gain/(loss) on swaps on the statement of operations, in addition to any realized gain/(loss) recorded upon the termination of swaps. Upfront premiums paid or received are recognized as cost or proceeds on the statement of assets and liabilities and are amortized on a straight line basis over the life of the contract. Amortized upfront premiums are included in net realized gain/(loss) from swaps on the statement of operations. Fluctuations in the value of swaps are recorded as a component of net change in unrealized appreciation/depreciation of swaps on the statement of operations.
Certain standardized swaps, including certain interest rate swaps and credit default swaps, are (or soon will be) subject to mandatory central clearing. Cleared swaps are transacted through futures commission merchants (“FCMs”) that are members of central clearinghouses, with the clearinghouse serving as central counterparty, similar to transactions in futures contracts. Centralized clearing will be required for additional categories of swaps on a phased-in basis based on requirements published by the Securities and Exchange Commission and Commodity Futures Trading Commission.
At the time the Fund enters into a centrally cleared swap, the Fund deposits and maintains as collateral an initial margin with the broker, as required by the clearinghouse on which the transaction is effected. Such amount is shown as cash collateral due from broker on the statement of assets and liabilities. Pursuant to the contract, the Fund
| | |
| 38 | AB TAXABLE MULTI-SECTOR INCOME SHARES | | abfunds.com |
NOTES TO FINANCIAL STATEMENTS (continued)
agrees to receive from or pay to the broker an amount of cash equal to the daily fluctuation in the value of the contract. Such receipts or payments are known as variation margin and are recorded by the Fund as unrealized gains or losses. Risks may arise from the potential inability of a counterparty to meet the terms of the contract. The credit/counterparty risk for centrally cleared swaps is generally less than non-centrally cleared swaps, since the clearinghouse, which is the issuer or counterparty to each centrally cleared swap, has robust risk mitigation standards, including the requirement to provide initial and variation margin. When the contract is closed, the Fund records a realized gain or loss equal to the difference between the value of the contract at the time it was opened and the time it was closed.
Interest Rate Swaps:
The Fund is subject to interest rate risk exposure in the normal course of pursuing its investment objectives. Because the Fund holds fixed rate bonds, the value of these bonds may decrease if interest rates rise. To help hedge against this risk and to maintain its ability to generate income at prevailing market rates, the Fund may enter into interest rate swaps. Interest rate swaps are agreements between two parties to exchange cash flows based on a notional amount. The Fund may elect to pay a fixed rate and receive a floating rate, or, receive a fixed rate and pay a floating rate on a notional amount.
In addition, the Fund may also enter into interest rate swap transactions to preserve a return or spread on a particular investment or portion of its portfolio, or protecting against an increase in the price of securities the Fund anticipates purchasing at a later date. Interest rate swaps involve the exchange by a Fund with another party of their respective commitments to pay or receive interest (e.g., an exchange of floating rate payments for fixed rate payments) computed based on a contractually-based principal (or “notional”) amount. Interest rate swaps are entered into on a net basis (i.e., the two payment streams are netted out, with the Fund receiving or paying, as the case may be, only the net amount of the two payments).
During the six months ended October 31, 2017, the Fund held interest rate swaps for hedging purposes.
Credit Default Swaps:
The Fund may enter into credit default swaps, including to manage its exposure to the market or certain sectors of the market, to reduce its risk exposure to defaults by corporate and sovereign issuers held by the Fund, or to create exposure to corporate or sovereign issuers to which it is not otherwise exposed. The Fund may purchase credit protection (“Buy Contract”) or provide credit protection (“Sale Contract”) on the referenced obligation of the credit default swap.
| | |
| abfunds.com | | AB TAXABLE MULTI-SECTOR INCOME SHARES | 39 |
NOTES TO FINANCIAL STATEMENTS (continued)
During the term of the swap, the Fund receives/(pays) fixed payments from/(to) the respective counterparty, calculated at the agreed upon rate applied to the notional amount. If the Fund is a buyer/(seller) of protection and a credit event occurs, as defined under the terms of the swap, the Fund will either (i) receive from the seller/(pay to the buyer) of protection an amount equal to the notional amount of the swap (the “Maximum Payout Amount”) and deliver/(take delivery of) the referenced obligation or (ii) receive/(pay) a net settlement amount in the form of cash or securities equal to the notional amount of the swap less the recovery value of the referenced obligation.
In certain circumstances Maximum Payout Amounts may be partially offset by recovery values of the respective referenced obligations, upfront premium received upon entering into the agreement, or net amounts received from settlement of buy protection credit default swaps entered into by the Fund for the same referenced obligations with the same counterparty. As of October 31, 2017, the Fund did not have Buy Contracts outstanding with respect to the same referenced obligations and same counterparty for its Sale Contracts outstanding.
Credit default swaps may involve greater risks than if a Fund had invested in the referenced obligation directly. Credit default swaps are subject to general market risk, liquidity risk, counterparty risk and credit risk. If the Fund is a buyer of protection and no credit event occurs, it will lose the payments it made to its counterparty. If the Fund is a seller of protection and a credit event occurs, the value of the referenced obligation received by the Fund coupled with the periodic payments previously received, may be less than the Maximum Payout Amount it pays to the buyer, resulting in a net loss to the Fund.
Implied credit spreads over U.S. Treasuries of comparable maturity utilized in determining the market value of credit default swaps on issuers as of period end are disclosed in the portfolio of investments. The implied spreads serve as an indicator of the current status of the payment/performance risk and typically reflect the likelihood of default by the issuer of the referenced obligation. The implied credit spread of a particular reference obligation also reflects the cost of buying/selling protection and may reflect upfront payments required to be made to enter into the agreement. Widening credit spreads typically represent a deterioration of the referenced obligation’s credit soundness and greater likelihood of default or other credit event occurring as defined under the terms of the agreement. A credit spread identified as “Defaulted” indicates a credit event has occurred for the referenced obligation.
During the six months ended October 31, 2017, the Fund held credit default swaps for non-hedging purposes.
| | |
| 40 | AB TAXABLE MULTI-SECTOR INCOME SHARES | | abfunds.com |
NOTES TO FINANCIAL STATEMENTS (continued)
The Fund typically enters into International Swaps and Derivatives Association, Inc. Master Agreements (“ISDA Master Agreement”) with its OTC derivative contract counterparties in order to, among other things, reduce its credit risk to OTC counterparties. ISDA Master Agreements include provisions for general obligations, representations, collateral and events of default or termination. Under an ISDA Master Agreement, the Fund typically may offset with the OTC counterparty certain derivative financial instruments’ payables and/or receivables with collateral held and/or posted and create one single net payment (close-out netting) in the event of default or termination. In the event of a default by an OTC counterparty, the return of collateral with market value in excess of the Fund’s net liability, held by the defaulting party, may be delayed or denied.
The Fund’s ISDA Master Agreements may contain provisions for early termination of OTC derivative transactions in the event the net assets of the Fund decline below specific levels (“net asset contingent features”). If these levels are triggered, the Fund’s OTC counterparty has the right to terminate such transaction and require the Fund to pay or receive a settlement amount in connection with the terminated transaction. For additional details, please refer to netting arrangements by the OTC counterparty tables below.
During the six months ended October 31, 2017, the Fund had entered into the following derivatives:
| | | | | | | | | | | | |
| | | Asset Derivatives | | | Liability Derivatives | |
Derivative Type | | Statement of
Assets and
Liabilities
Location | | Fair Value | | | Statement of
Assets and
Liabilities
Location | | Fair Value | |
Credit contracts | | | | | | | | Unrealized depreciation on credit default swaps | | $ | 4,453 | |
| | | | | | | | | | | | |
Total | | | | | | | | | | $ | 4,453 | |
| | | | | | | | | | | | |
| | | | | | | | | | |
Derivative Type | | Location of Gain
or (Loss) on
Derivatives Within
Statement of
Operations | | Realized Gain
or (Loss) on
Derivatives | | | Change in
Unrealized
Appreciation or
(Depreciation) | |
Interest rate contracts | | Net realized gain (loss) on swaps; Net change in unrealized appreciation/depreciation of swaps | | $ | 22,986 | | | $ | (28,324 | ) |
Credit contracts | | Net realized gain (loss) on swaps; Net change in unrealized appreciation/depreciation of swaps | | | (73 | ) | | | (4,453 | ) |
| | | | | | | | | | |
Total | | | | $ | 22,913 | | | $ | (32,777 | ) |
| | | | | | | | | | |
| | |
| abfunds.com | | AB TAXABLE MULTI-SECTOR INCOME SHARES | 41 |
NOTES TO FINANCIAL STATEMENTS (continued)
The following table represents the average monthly volume of the Fund’s derivative transactions during the six months ended October 31, 2017:
| | | | |
Centrally Cleared Interest Rate Swaps: | | | | |
Average notional amount | | $ | 13,162,500 | (a) |
Credit Default Swaps: | | | | |
Average notional amount of sale contracts | | $ | 1,500,000 | (b) |
| (a) | Positions were open for three months during the period. |
| (b) | Positions were open for one month during the period. |
For financial reporting purposes, the Fund does not offset derivative assets and derivative liabilities that are subject to netting arrangements in the statement of assets and liabilities.
All OTC derivatives held at period end were subject to netting arrangements. The following table presents the Fund’s derivative assets and liabilities by OTC counterparty net of amounts available for offset under ISDA Master Agreements and net of the related collateral received/pledged by the Fund as of October 31, 2017. Exchange-traded derivatives are not subject to netting arrangements and as such are excluded from the table. At October 31, 2017, all derivatives were subjected to netting arrangements.
| | | | | | | | | | | | | | | | | | | | |
Counterparty | | Derivative
Liabilities
Subject to a
MA | | | Derivative
Available for
Offset | | | Cash
Collateral
Pledged* | | | Security
Collateral
Pledged* | | | Net Amount
of Derivatives
Liabilities | |
OTC Derivatives: | | | | | | | | | | | | | | | | | | | | |
Deutsche Bank AG | | $ | 88,967 | | | $ | – 0 | – | | $ | – 0 | – | | $ | – 0 | – | | $ | 88,967 | |
| | | | | | | | | | | | | | | | | | | | |
Total | | $ | 88,967 | | | $ | – 0 | – | | $ | – 0 | – | | $ | – 0 | – | | $ | 88,967 | ^ |
| | | | | | | | | | | | | | | | | | | | |
| * | The actual collateral received/pledged may be more than the amount reported due to over-collateralization. |
| ^ | Net amount represents the net receivable/payable that would be due from/to the counterparty in the event of default or termination. The net amount from OTC financial derivative instruments can only be netted across transactions governed under the same master agreement with the same counterparty. |
2. Currency Transactions
The Fund may invest in non-U.S. Dollar-denominated securities on a currency hedged or unhedged basis. The Fund may seek investment opportunities by taking long or short positions in currencies through the use of currency-related derivatives, including forward currency exchange contracts, futures and options on futures, swaps, and other options. The Fund may enter into transactions for investment opportunities when it anticipates that a foreign currency will appreciate or depreciate in value but securities denominated in that currency are not held by the Fund and do not present attractive investment opportunities. Such transactions may also be used when the Adviser believes that it may be more efficient than a direct investment in a foreign currency-denominated security. The Fund may also
| | |
| 42 | AB TAXABLE MULTI-SECTOR INCOME SHARES | | abfunds.com |
NOTES TO FINANCIAL STATEMENTS (continued)
conduct currency exchange contracts on a spot basis (i.e., for cash at the spot rate prevailing in the currency exchange market for buying or selling currencies).
NOTE D
Shares of Beneficial Interest
Transactions in shares of beneficial interest were as follows:
| | | | | | | | | | | | | | | | | | | | | | | | |
| | | Shares | | | | | | Amount | | | | |
| | | Six Months Ended
October 31, 2017
(unaudited) | | | Year Ended
April 30,
2017 | | | | | | Six Months Ended
October 31, 2017
(unaudited) | | | Year Ended
April 30,
2017 | | | | |
| | | | | | | | |
Shares sold | | | 9,073,735 | | | | 18,115,283 | | | | | | | $ | 89,432,269 | | | $ | 179,252,094 | | | | | |
| | | | | |
Shares redeemed | | | (2,371,702 | ) | | | (41,561,169 | ) | | | | | | | (23,363,186 | ) | | | (411,586,518 | ) | | | | |
| | | | | |
Net increase (decrease) | | | 6,702,033 | | | | (23,445,886 | ) | | | | | | $ | 66,069,083 | | | $ | (232,334,424 | ) | | | | |
| | | | | |
NOTE E
Risks Involved in Investing in the Fund
Interest Rate Risk and Credit Risk—Interest rate risk is the risk that changes in interest rates will affect the value of the Fund’s investments in fixed-income debt securities such as bonds or notes. Increases in interest rates may cause the value of the Fund’s investments to decline. Credit risk is the risk that the issuer or guarantor of a debt security, or the counterparty to a derivative contract, will be unable or unwilling to make timely principal and/or interest payments, or to otherwise honor its obligations. The degree of risk for a particular security may be reflected in its credit rating. Credit risk is greater for medium quality and lower-rated securities. Lower-rated debt securities and similar unrated securities (commonly known as “junk bonds”) have speculative elements or are predominantly speculative risks.
Below Investment Grade Securities Risk—Investments in fixed-income securities with lower ratings (commonly known as “junk bonds”) tend to have a higher probability that an issuer will default or fail to meet its payment obligations. These securities may be subject to greater price volatility due to such factors as specific corporate developments, interest rate sensitivity, negative perceptions of the junk bond market generally and less secondary market liquidity.
Inflation Risk—This is the risk that the value of assets or income from investments will be less in the future as inflation decreases the value of money. As inflation increases, the value of the Fund’s assets can decline as can the value of the Fund’s distributions. This risk is significantly greater for fixed-income securities with longer maturities.
| | |
| abfunds.com | | AB TAXABLE MULTI-SECTOR INCOME SHARES | 43 |
NOTES TO FINANCIAL STATEMENTS (continued)
Foreign (Non-U.S.) Risk—Investments in securities of non-U.S. issuers may involve more risk than those of U.S. issuers. These securities may fluctuate more widely in price and may be less liquid due to adverse market, economic, political, regulatory or other factors.
Emerging Market Risk—Investments in emerging market countries may have more risk because the markets are less developed and less liquid as well as being subject to increased economic, political, regulatory or other uncertainties.
Currency Risk—Fluctuations in currency exchange rates may negatively affect the value of the Fund’s investments or reduce its returns.
Prepayment Risk—The value of mortgage-related or asset-backed securities may be particularly sensitive to changes in prevailing interest rates. Early payments of principal on some mortgage-related securities may occur during periods of falling mortgage interest rates and expose the Fund to a lower rate of return upon reinvestment of principal. Early payments associated with mortgage-related securities cause these securities to experience significantly greater price and yield volatility than is experienced by traditional fixed-income securities. During periods of rising interest rates, a reduction in prepayments may increase the effective life of mortgage-related securities, subjecting them to greater risk of decline in market value in response to rising interest rates. If the life of a mortgage-related security is inaccurately predicted, the Fund may not be able to realize the rate of return it expected.
Derivatives Risk—The Fund may enter into derivative transactions such as forwards, options, futures and swaps. Derivatives may be illiquid, difficult to price, and leveraged so that small changes may produce disproportionate losses for the Fund, and subject to counterparty risk to a greater degree than more traditional investments. Derivatives may result in significant losses, including losses that are far greater than the value of the derivatives reflected on the statement of assets and liabilities.
Leverage Risk—When the Fund borrows money or otherwise leverages its investments, its performance may be volatile because leverage tends to exaggerate the effect of any increase or decrease in the value of the Fund’s investments. The Fund may create leverage through the use of reverse repurchase arrangements, forward currency exchange contracts, forward commitments, dollar rolls or futures or by borrowing money. The use of other types of derivative instruments by the Fund, such as options and swaps, may also result in a form of leverage. Leverage may result in higher returns to the Fund than if the Fund were not leveraged, but may also adversely affect returns, particularly if the market is declining.
| | |
| 44 | AB TAXABLE MULTI-SECTOR INCOME SHARES | | abfunds.com |
NOTES TO FINANCIAL STATEMENTS (continued)
Indemnification Risk—In the ordinary course of business, the Fund enters into contracts that contain a variety of indemnifications. The Fund’s maximum exposure under these arrangements is unknown. However, the Fund has not had prior claims or losses pursuant to these indemnification provisions and expects the risk of loss thereunder to be remote. Therefore, the Fund has not accrued any liability in connection with these indemnification provisions.
NOTE F
Joint Credit Facility
A number of open-end mutual funds managed by the Adviser, including the Fund, participate in a $280 million revolving credit facility (the “Facility”) intended to provide short-term financing, if necessary, subject to certain restrictions in connection with abnormal redemption activity. Commitment fees related to the Facility are paid by the participating funds and are included in miscellaneous expenses in the statement of operations. The Fund did not utilize the Facility during the six months ended October 31, 2017.
NOTE G
Distributions to Shareholders
The tax character of distributions to be paid for the year ending April 30, 2018 will be determined at the end of the current fiscal year. The tax character of distributions paid during the fiscal years ended April 30, 2017 and April 30, 2016 were as follows:
| | | | | | | | |
| | | 2017 | | | 2016 | |
Distributions paid from: | | | | | | | | |
Ordinary income | | $ | 3,408,557 | | | $ | 1,951,877 | |
| | | | | | | | |
Total distributions paid | | $ | 3,408,557 | | | $ | 1,951,877 | |
| | | | | | | | |
As of April 30, 2017, the components of accumulated earnings/(deficit) on a tax basis were as follows:
| | | | |
Accumulated capital and other losses | | $ | (509,651 | )(a) |
Unrealized appreciation/(depreciation) | | | 73,034 | (b) |
| | | | |
Total accumulated earnings/(deficit) | | $ | (436,617 | )(c) |
| | | | |
| (a) | As of April 30, 2017, the Fund had a net capital loss carryforward of $509,651. During the fiscal year, the Fund utilized $611,596 of capital loss carryforwards to offset current year net realized gains. |
| (b) | The differences between book-basis and tax-basis unrealized appreciation/(depreciation) are attributable primarily to the tax treatment of swaps. |
| (c) | The difference between book-basis and tax-basis components of accumulated earnings/(deficit) is attributable primarily to dividends payable. |
For tax purposes, net realized capital losses may be carried over to offset future capital gains, if any. Funds are permitted to carry forward capital losses for an indefinite period, and such losses will retain their character as either short-term or long-term capital losses. As of April 30, 2017, the
| | |
| abfunds.com | | AB TAXABLE MULTI-SECTOR INCOME SHARES | 45 |
NOTES TO FINANCIAL STATEMENTS (continued)
Fund had a net short-term capital loss carryforward of $509,651 which may be carried forward for an indefinite period.
NOTE H
Recent Accounting Pronouncements
In March 2017, the Financial Accounting Standards Board issued an Accounting Standards Update, ASU 2017-08, Receivables—Nonrefundable Fees and Other Costs (Subtopic 310-20), Premium Amortization on Purchased Callable Debt Securities (the “ASU”) which amends the amortization period for certain purchased callable debt securities held at a premium, shortening such period to the earliest call date. The ASU does not require any accounting change for debt securities held at a discount; the discount continues to be amortized to maturity. The ASU is effective for fiscal years, and interim periods within those fiscal years, beginning after December 15, 2018. At this time, management is evaluating the implications of these changes on the financial statements.
NOTE I
Subsequent Events
Management has evaluated subsequent events for possible recognition or disclosure in the financial statements through the date the financial statements are issued. Management has determined that there are no material events that would require disclosure in the Fund’s financial statements through this date.
| | |
| 46 | AB TAXABLE MULTI-SECTOR INCOME SHARES | | abfunds.com |
FINANCIAL HIGHLIGHTS
Selected Data For A Share Of Beneficial Interest Outstanding Throughout Each Period
| | | | | | | | | | | | | | | | | | | | | | | | |
| | | Six Months
Ended
October 31,
2017
(unaudited) | | | Year Ended April 30, | |
| | | | 2017 | | | 2016 | | | 2015 | | | 2014 | | | 2013 | |
| | | | | | | | | | | | | | | | | | | | | | | | |
| | | | | | | | | | | | | | | | | | | | | | | | |
Net asset value, beginning of period | | | $ 9.84 | | | | $ 9.91 | | | | $ 9.97 | | | | $ 9.97 | | | | $ 9.97 | | | | $ 10.17 | |
| | | | |
Income From Investment Operations | | | | | | | | | | | | | | | | | | | | | | | | |
Net investment income(a) | | | .10 | | | | .17 | | | | .14 | | | | .09 | | | | .10 | | | | .10 | |
Net realized and unrealized gain (loss) on investment transactions | | | (.01 | ) | | | (.01 | ) | | | (.02 | )† | | | .03 | | | | .02† | | | | .15† | |
| | | | |
Net increase in net asset value from operations | | | .09 | | | | .16 | | | | .12 | | | | .12 | | | | .12 | | | | .25 | |
| | | | |
Less: Dividends and Distributions | | | | | | | | | | | | | | | | | | | | | | | | |
Dividends from net investment income | | | (.10 | ) | | | (.23 | ) | | | (.18 | ) | | | (.12 | ) | | | (.12 | ) | | | (.14 | ) |
Distributions from net realized gain on investment transactions | | | – 0 | – | | | – 0 | – | | | – 0 | – | | | – 0 | – | | | – 0 | – | | | (.31 | ) |
| | | | |
Total dividends and distributions | | | (.10 | ) | | | (.23 | ) | | | (.18 | ) | | | (.12 | ) | | | (.12 | ) | | | (.45 | ) |
| | | | |
Net asset value, end of period | | | $ 9.83 | | | | $ 9.84 | | | | $ 9.91 | | | | $ 9.97 | | | | $ 9.97 | | | | $ 9.97 | |
| | | | |
Total Return | | | | | | | | | | | | | | | | | | | | | | | | |
Total investment return based on net asset value(b) | | | .88 | % | | | 1.48 | % | | | 1.26 | % | | | 1.16 | % | | | 1.22 | % | | | 2.47 | % |
Ratios/Supplemental Data | | | | | | | | | | | | | | | | | | | | | | | | |
Net assets, end of period (000’s omitted) | | | $140,174 | | | | $74,327 | | | | $307,233 | | | | $117,588 | | | | $105,158 | | | | $67,791 | |
Ratio to average net assets of: | | | | | | | | | | | | | | | | | | | | | | | | |
Net investment income | | | 1.95 | %^ | | | 1.67 | % | | | 1.44 | % | | | .89 | % | | | 1.04 | % | | | 1.05 | % |
Portfolio turnover rate | | | 27 | % | | | 85 | % | | | 109 | % | | | 109 | % | | | 150 | % | | | 66 | % |
| (a) | Based on average shares outstanding. |
| (b) | Total investment return is calculated assuming an initial investment made at the net asset value at the beginning of the period, reinvestment of all dividends and distributions at net asset value during the period, and redemption on the last day of the period. Total return does not reflect the deduction of taxes that a shareholder would pay on fund distributions or the redemption of fund shares. Total investment return calculated for a period of less than one year is not annualized. |
| † | Due to timing of sales and repurchase of capital shares, the net realized and unrealized gain (loss) per share is not in accord with the Fund’s change in net realized and unrealized gain (loss) on investment transactions for the period. |
See notes to financial statements.
| | |
| abfunds.com | | AB TAXABLE MULTI-SECTOR INCOME SHARES | 47 |
BOARD OF TRUSTEES
| | |
Marshall C. Turner, Jr.(1) , Chairman John H. Dobkin(1)(2) Michael J. Downey(1) William H. Foulk, Jr.(1) D. James Guzy(1)(2) Nancy P. Jacklin(1) | | Robert M. Keith, President and Chief Executive Officer Carol C. McMullen(1) Garry L. Moody(1) Earl D. Weiner(1) |
OFFICERS
| | |
Philip L. Kirstein(3),
Senior Vice President and Independent Compliance Officer Douglas J. Peebles(4) ,
Senior Vice President Paul J. DeNoon(4), Vice President Scott A. DiMaggio(4), Vice President Shawn E. Keegan(4), Vice President | | Greg J. Wilensky(4), Vice President Emilie D. Wrapp, Secretary Joseph J. Mantineo, Treasurer and Chief Financial Officer Phyllis J. Clarke, Controller Vincent S. Noto, Chief Compliance Officer |
| | |
Custodian and Accounting Agent State Street Bank and Trust Company
State Street Corporation CCB/5
1 Iron Street
Boston, MA 02210 Principal Underwriter AllianceBernstein Investments, Inc.
1345 Avenue of the Americas
New York, NY 10105 Transfer Agent AllianceBernstein Investor Services, Inc.
P.O. Box 786003
San Antonio, TX 78278-6003
Toll-Free (800) 221-5672 | | Legal Counsel Seward & Kissel LLP
One Battery Park Plaza
New York, NY 10004 Independent Registered Public Accounting Firm Ernst & Young LLP 5 Times Square New York, NY 10036 |
| 1 | Member of the Audit Committee, the Governance and Nominating Committee and the Independent Directors Committee. |
| 2 | Messrs. Dobkin and Guzy are expected to retire on or about December 31, 2017. |
| 3 | Mr. Kirtstein is expected to retire on or about December 31, 2017. |
| 4 | The day-to-day management of, and investment decisions for, the Trust’s portfolio are made by the Adviser’s Core Fixed-Income Team. Messrs. Paul J. DeNoon, Scott A. DiMaggio, Shawn E. Keegan, Douglas J. Peebles and Greg J. Wilensky are the investment professionals primarily responsible for the day-to-day management of the Trust’s portfolio. |
| | |
| 48 | AB TAXABLE MULTI-SECTOR INCOME SHARES | | abfunds.com |
Information Regarding the Review and Approval of the Fund’s Advisory Agreement
The disinterested trustees (the “directors”) of AB Corporate Shares (the “Company”) unanimously approved the continuance of the Company’s Advisory Agreement with the Adviser in respect of AB Taxable Multi-Sector Income Shares (the “Fund”) at a meeting held on November 1-3, 2016 (the “Meeting”).
Prior to approval of the continuance of the Advisory Agreement, the directors had requested from the Adviser, and received and evaluated, extensive materials. They reviewed the proposed continuance of the Advisory Agreement with the Adviser and with experienced counsel who are independent of the Adviser, who advised on the relevant legal standards. The directors also reviewed an independent evaluation prepared by the Company’s Senior Officer (who is also the Company’s Independent Compliance Officer) of the reasonableness of the advisory fee, in which the Senior Officer concluded that the contractual fee (zero) for the Fund was reasonable. The directors also discussed the proposed continuance in private sessions with counsel and the Company’s Senior Officer.
The directors noted that the Fund is designed as a vehicle for the wrap fee account market (where investors pay fees to a wrap fee sponsor which pays investment fees and expenses from such fee). The directors also noted that no advisory fee is payable by the Fund, that the Advisory Agreement does not include the reimbursement provision for certain administrative expenses included in the advisory agreements of most of the open-end AB Funds, and that the Adviser is responsible for payment of the Fund’s ordinary expenses. The directors noted that the Company acknowledges in the Advisory Agreement that the Adviser and its affiliates expect to receive compensation from third parties in connection with services provided under the Advisory Agreement. The directors further noted that the Adviser receives payments from the wrap fee program sponsors (the “Sponsors”) that use the Fund as an investment vehicle for their clients.
The directors considered their knowledge of the nature and quality of the services provided by the Adviser to the Fund gained from their experience as directors or trustees of most of the registered investment companies advised by the Adviser, their overall confidence in the Adviser’s integrity and competence they have gained from that experience, the Adviser’s initiative in identifying and raising potential issues with the directors and its responsiveness, frankness and attention to concerns raised by the directors in the past, including the Adviser’s willingness to consider and implement organizational and operational changes designed to improve investment results and the services provided to the AB Funds. The directors noted that they have four regular meetings each year, at each of which they receive presentations from the Adviser on the investment results of the Fund and review extensive materials and information presented by the Adviser.
| | |
| abfunds.com | | AB TAXABLE MULTI-SECTOR INCOME SHARES | 49 |
The directors also considered all other factors they believed relevant, including the specific matters discussed below. In their deliberations, the directors did not identify any particular information that was all-important or controlling, and different directors may have attributed different weights to the various factors. The directors determined that the selection of the Adviser to manage the Fund and the overall arrangements between the Fund and the Adviser, as provided in the Advisory Agreement, including the advisory fee, were fair and reasonable in light of the services performed, expenses incurred and such other matters as the directors considered relevant in the exercise of their business judgment. The material factors and conclusions that formed the basis for the directors’ determinations included the following:
Nature, Extent and Quality of Services Provided
The directors considered the scope and quality of services provided by the Adviser under the Advisory Agreement, including the quality of the investment research capabilities of the Adviser and the other resources it has dedicated to performing services for the Fund. They also noted the professional experience and qualifications of the Fund’s portfolio management team and other senior personnel of the Adviser. The quality of administrative and other services, including the Adviser’s role in coordinating the activities of the Fund’s other service providers, also was considered. The directors concluded that, overall, they were satisfied with the nature, extent and quality of services provided to the Fund under the Advisory Agreement.
Costs of Services Provided and Profitability
The directors reviewed a schedule of the revenues and expenses and related notes indicating the profitability of the Fund to the Adviser for calendar years 2014 and 2015 that had been prepared with an expense allocation methodology arrived at in consultation with an independent consultant retained by the Company’s Senior Officer. The directors noted the assumptions and methods of allocation used by the Adviser in preparing fund-specific profitability data and understood that there are a number of potentially acceptable allocation methodologies for information of this type. The directors noted that the profitability information reflected all revenues and expenses of the Adviser’s relationship with the Fund. The directors recognized that it is difficult to make comparisons of the profitability of the Advisory Agreement with the profitability of fund advisory contracts for unaffiliated funds because comparative information is not generally publicly available and is affected by numerous factors. The directors focused on the profitability of the Adviser’s relationship with the Fund before taxes. The directors noted that the Fund was not profitable to the Adviser in the periods reviewed.
Fall-Out Benefits
The directors considered the other benefits to the Adviser and its affiliates from their relationships with the Fund. The directors noted that the Adviser
| | |
| 50 | AB TAXABLE MULTI-SECTOR INCOME SHARES | | abfunds.com |
is compensated by the Sponsors. The directors understood that the Adviser also might derive reputational and other benefits from its association with the Fund.
Investment Results
In addition to the information reviewed by the directors in connection with the Meeting, the directors receive detailed performance information for the Fund at each regular Board meeting during the year.
At the Meeting, the directors reviewed information prepared by Broadridge Financial Solutions, Inc. (“Broadridge”), an analytical service that is not affiliated with the Adviser, showing the performance of the Fund against a peer universe selected by Broadridge, and information prepared by the Adviser showing the Fund’s performance against a broad-based securities market index, in each case for the 1-, 3- and 5-year periods ended July 31, 2016 and (in the case of comparisons with the broad-based securities market index) for the period from inception. The directors were cognizant that the Fund was neither designed nor offered as a standalone investment and was intended to serve solely as a component of certain separately managed accounts (“SMAs”). The Adviser had explained that this attribute made it difficult to select an appropriate benchmark for the Fund. At the directors’ request, the Adviser provided information showing the weighting of the Fund in a current SMA and the overall performance of the SMA versus its stated benchmark. Based on their review, the directors concluded that the Fund’s investment performance was acceptable.
Advisory Fees
The directors considered the advisory fee rate paid by the Fund to the Adviser (zero) and information provided by Broadridge showing the fees paid by other fund families used in wrap fee programs similar to that of the Fund. The directors recognized that it is difficult to make comparisons of advisory fees because there are variations in the services that are included in the fees paid by other funds.
The directors noted the unusual arrangements in the Advisory Agreement providing for no advisory fee but were cognizant that the Adviser is indirectly compensated by the Sponsors for its services to the Fund. The directors reviewed the fee arrangements between the Adviser and each of the current Sponsors and noted that such fees were negotiated on an arm’s length basis and were within the range of fees paid by wrap fee sponsors to other advisers of similar funds. While the Adviser’s fee arrangements with the Sponsors vary, the directors acknowledged the Adviser’s view that a portion of such fees (less the expenses of the Fund paid by the Adviser) may reasonably be viewed as compensating the Adviser for advisory services it provides to the Fund (the “implied fee”) and that the Adviser believes that while the Sponsors pay the Adviser different fee rates, the rate of fee attributable to Fund management at the Fund level
| | |
| abfunds.com | | AB TAXABLE MULTI-SECTOR INCOME SHARES | 51 |
is the same for all Sponsors. The directors also considered the fee rate schedules used by other registered investment companies that invest in fixed income securities that are advised by the Adviser.
The directors also considered the Adviser’s fee schedule for institutional clients pursuing a similar investment style. For this purpose, the directors reviewed the relevant advisory fee information from the Adviser’s Form ADV and the evaluation from the Fund’s Senior Officer and noted the differences between the Fund’s fee schedule, on the one hand, and the institutional fee schedule and the schedule of fees charged to any offshore funds and any sub-advised funds, on the other. The directors recognized that this information was of limited utility in light of the Fund’s unusual fee arrangement.
Since the Fund does not bear ordinary expenses, the directors did not consider comparative expense information.
Economies of Scale
Since the Advisory Agreement does not provide for any compensation to be paid to the Adviser by the Fund and the Fund’s expense ratio is zero, the directors did not consider the extent to which fee levels in the Advisory Agreement reflect economies of scale. They did note, however, that the fee payable to the Adviser by the current Sponsors declines at a breakpoint based on either individual account sizes or on total assets managed by the Adviser for the Sponsor.
| | |
| 52 | AB TAXABLE MULTI-SECTOR INCOME SHARES | | abfunds.com |
This page is not part of the Shareholder Report or the Financial Statements.
AB FAMILY OF FUNDS
US EQUITY
US CORE
Core Opportunities Fund
FlexFee™ US Thematic Portfolio
Select US Equity Portfolio
US GROWTH
Concentrated Growth Fund
Discovery Growth Fund
FlexFee™ Large Cap Growth Portfolio
Growth Fund
Large Cap Growth Fund
Small Cap Growth Portfolio
US VALUE
Discovery Value Fund
Equity Income Fund
Relative Value Fund1
Small Cap Value Portfolio
Value Fund
INTERNATIONAL/ GLOBAL EQUITY
INTERNATIONAL/ GLOBAL CORE
Global Core Equity Portfolio
International Portfolio
International Strategic Core Portfolio
Sustainable Global Thematic Fund1
Tax-Managed International Portfolio
Tax-Managed Wealth Appreciation Strategy
Wealth Appreciation Strategy
INTERNATIONAL/ GLOBAL GROWTH
Concentrated International Growth Portfolio
International Growth Fund
INTERNATIONAL/ GLOBAL EQUITY (continued)
INTERNATIONAL/ GLOBAL VALUE
Asia ex-Japan Equity Portfolio
International Value Fund
FIXED INCOME
MUNICIPAL
High Income Municipal Portfolio
Intermediate California Municipal Portfolio
Intermediate Diversified Municipal Portfolio
Intermediate New York Municipal Portfolio
Municipal Bond Inflation Strategy
Tax-Aware Fixed Income Portfolio
National Portfolio
Arizona Portfolio
California Portfolio
Massachusetts Portfolio
Minnesota Portfolio
New Jersey Portfolio
New York Portfolio
Ohio Portfolio
Pennsylvania Portfolio
Virginia Portfolio
TAXABLE
Bond Inflation Strategy
FlexFee™ International Bond Portfolio
Global Bond Fund
High Income Fund
High Yield Portfolio
Income Fund
Intermediate Bond Portfolio
Limited Duration High Income Portfolio
Short Duration Portfolio
ALTERNATIVES
All Market Real Return Portfolio
Credit Long/Short Portfolio
Global Real Estate Investment Fund
Select US Long/Short Portfolio
Unconstrained Bond Fund
MULTI-ASSET
All Market Income Portfolio
All Market Total Return Portfolio1
Conservative Wealth Strategy
Emerging Markets Multi-Asset Portfolio
Global Risk Allocation Fund
Tax-Managed All Market Income Portfolio1
TARGET-DATE
Multi-Manager Select Retirement Allocation Fund
Multi-Manager Select 2010 Fund
Multi-Manager Select 2015 Fund
Multi-Manager Select 2020 Fund
Multi-Manager Select 2025 Fund
Multi-Manager Select 2030 Fund
Multi-Manager Select 2035 Fund
Multi-Manager Select 2040 Fund
Multi-Manager Select 2045 Fund
Multi-Manager Select 2050 Fund
Multi-Manager Select 2055 Fund
CLOSED-END FUNDS
Alliance California Municipal Income Fund
AllianceBernstein Global High Income Fund
AllianceBernstein National Municipal Income Fund
We also offer Government Money Market Portfolio1, which serves as the money market fund exchange vehicle for the AB mutual funds. An investment in Government Money Market Portfolio is not a deposit in a bank and is not insured or guaranteed by the Federal Deposit Insurance Corporation or any other government agency. Although the Fund seeks to preserve the value of your investment at $1.00 per share, it is possible to lose money by investing in the Fund.
Investors should consider the investment objectives, risks, charges and expenses of the Fund carefully before investing. For copies of our prospectus or summary prospectus, which contain this and other information, visit us online at www.abfunds.com or contact your AB representative. Please read the prospectus and/or summary prospectus carefully before investing.
| 1 | Prior to January 9, 2017, Relative Value Fund was named Growth & Income Fund; prior to April 17, 2017, Tax-Managed All Market Income Portfolio was named Tax-Managed Balanced Wealth Strategy; prior to April 24, 2017, All Market Total Return Portfolio was named Balanced Wealth Strategy; prior to November 10, 2017, Government Money Market Portfolio was named Government Exchange Reserves. |
| | |
| abfunds.com | | AB TAXABLE MULTI-SECTOR INCOME SHARES | 53 |
NOTES
| | |
| 54 | AB TAXABLE MULTI-SECTOR INCOME SHARES | | abfunds.com |
NOTES
| | |
| abfunds.com | | AB TAXABLE MULTI-SECTOR INCOME SHARES | 55 |
NOTES
| | |
| 56 | AB TAXABLE MULTI-SECTOR INCOME SHARES | | abfunds.com |
NOTES
| | |
| abfunds.com | | AB TAXABLE MULTI-SECTOR INCOME SHARES | 57 |
NOTES
| | |
| 58 | AB TAXABLE MULTI-SECTOR INCOME SHARES | | abfunds.com |
NOTES
| | |
| abfunds.com | | AB TAXABLE MULTI-SECTOR INCOME SHARES | 59 |
NOTES
| | |
| 60 | AB TAXABLE MULTI-SECTOR INCOME SHARES | | abfunds.com |

AB TAXABLE MULTI-SECTOR INCOME SHARES
1345 Avenue of the Americas
New York, NY 10105
800 221 5672
TMSIS-0152-1017 
OCT 10.31.17
SEMI-ANNUAL REPORT
AB IMPACT MUNICIPAL INCOME SHARES


A discussion of the Fund’s investment performance is not included in this report. AllianceBernstein L.P. would like to thank you for your interest in the Fund.
| | |
| |
| Investment Products Offered | | • Are Not FDIC Insured • May Lose Value • Are Not Bank Guaranteed |
Investors should consider the investment objectives, risks, charges and expenses of the Fund carefully before investing. For copies of our prospectus or summary prospectus, which contain this and other information, visit us online at www.abfunds.com or contact your AB representative. Please read the prospectus and/or summary prospectus carefully before investing.
This shareholder report must be preceded or accompanied by the Fund’s prospectus for individuals who are not current shareholders of the Fund.
You may obtain a description of the Fund’s proxy voting policies and procedures, and information regarding how the Fund voted proxies relating to portfolio securities during the most recent 12-month period ended June 30, without charge. Simply visit AB’s website at www.abfunds.com, or go to the Securities and Exchange Commission’s (the “Commission”) website at www.sec.gov, or call AB at (800) 227 4618.
The Fund files its complete schedule of portfolio holdings with the Commission for the first and third quarters of each fiscal year on Form N-Q. The Fund’s Forms N-Q are available on the Commission’s website at www.sec.gov. The Fund’s Forms N-Q may also be reviewed and copied at the Commission’s Public Reference Room in Washington, DC; information on the operation of the Public Reference Room may be obtained by calling (800) SEC 0330. AB publishes full portfolio holdings for the Fund monthly at www.abfunds.com.
AllianceBernstein Investments, Inc. (ABI) is the distributor of the AB family of mutual funds. ABI is a member of FINRA and is an affiliate of AllianceBernstein L.P., the Adviser of the funds.
The [A/B] logo is a registered service mark of AllianceBernstein and AllianceBernstein® is a registered service mark used by permission of the owner, AllianceBernstein L.P.
EXPENSE EXAMPLE
(unaudited)
As a shareholder of the Fund, you may incur various ongoing non-operating and extraordinary costs. This example is intended to help you understand your ongoing costs (in dollars) of investing in the Fund and to compare these costs with the ongoing costs of investing in other mutual funds.
The Example is based on an investment of $1,000 invested at the beginning of the period and held for the entire period as indicated below.
Actual Expenses
The table below provides information about actual account values and actual expenses. You may use the information, together with the amount you invested, to estimate the expenses that you paid over the period. Simply divide your account value by $1,000 (for example, an $8,600 account value divided by $1,000 = 8.6), then multiply the result by the number under the heading entitled “Expenses Paid During Period” to estimate the expenses you paid on your account during this period.
Hypothetical Example for Comparison Purposes
The table below also provides information about hypothetical account values and hypothetical expenses based on the Fund’s actual expense ratio and an assumed annual rate of return of 5% before expenses, which is not the Fund’s actual return. The hypothetical account values and expenses may not be used to estimate the actual ending account balance or expenses you paid for the period. You may use this information to compare the ongoing costs of investing in the Fund and other funds by comparing this 5% hypothetical example with the 5% hypothetical examples that appear in the shareholder reports of other funds.
Please note that the expenses shown in the table are meant to highlight your ongoing costs only and do not reflect any transactional costs, such as sales charges (loads), or contingent deferred sales charges on redemptions. Therefore, the hypothetical example is useful in comparing ongoing costs only, and will not help you determine the relative total costs of owning different funds. In addition, if these transactional costs were included, your costs would have been higher.
| | | | | | | | | | | | | | | | |
| | | Beginning
Account Value
September 12, 2017 | | | Ending
Account Value
October 31, 2017 | | | Expenses Paid
During Period* | | | Annualized
Expense Ratio* | |
Actual | | $ | 1,000 | | | $ | 1,003.00 | | | $ | 0 | | | | 0.00 | % |
Hypothetical** | | $ | 1,000 | | | $ | 1,006.85 | | | $ | 0 | | | | 0.00 | % |
| * | Expenses are equal to the Fund’s annualized expense ratio, multiplied by the average account value over the period, multiplied by 50/365 (to reflect the since inception period). The Fund’s operating expenses are borne by the Adviser or its affiliates. |
| ** | Assumes 5% annual return before expenses. |
| | |
| abfunds.com | | AB IMPACT MUNICIPAL INCOME SHARES | 1 |
PORTFOLIO SUMMARY
October 31, 2017 (unaudited)
PORTFOLIO STATISTICS
Net Assets ($mil): $8.5
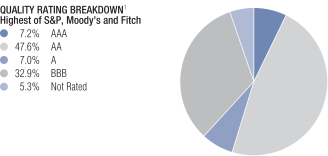
| 1 | All data are as of October 31, 2017. The Fund’s quality rating breakdown is expressed as a percentage of the Fund’s total investments in municipal securities and may vary over time. The Fund also enters into derivative transactions, which may be used for hedging or investment purposes (see “Portfolio of Investments” section of the report for additional details). The quality ratings are determined by using the Standard & Poor’s Global Ratings Services (“S&P”), Moody’s Investors Services, Inc. (“Moody’s”) and Fitch Ratings, Ltd. (“Fitch”). The Fund considers the credit ratings issued by S&P, Moody’s and Fitch and uses the highest rating issued by the agencies. These ratings are a measure of the quality and safety of a bond or portfolio, based on the issuer’s financial condition. AAA is the highest (best) and D is the lowest (worst). If applicable, the Pre-refunded category includes bonds which are secured by U.S. Government securities and therefore are deemed high-quality investment grade by the Adviser. If applicable, Not Applicable (N/A) includes non-creditworthy investments, such as, equities, currency contracts, futures and options. If applicable, the Not Rated category includes bonds that are not rated by a nationally recognized statistical rating organization. The Adviser evaluates the creditworthiness of non-rated securities based on a number of factors including, but not limited to, cash flows, enterprise value and economic environment. |
| | |
| 2 | AB IMPACT MUNICIPAL INCOME SHARES | | abfunds.com |
PORTFOLIO OF INVESTMENTS
October 31, 2017 (unaudited)
| | | | | | | | |
| | | Principal
Amount
(000) | | | U.S. $ Value | |
| | | | | | | | |
| |
MUNICIPAL OBLIGATIONS – 77.9% | | | | | | | | |
Long-Term Municipal Bonds – 77.9% | | | | | | | | |
California – 16.7% | | | | | | | | |
Alameda Corridor Transportation Authority | | | | | | | | |
Series 2016B
5.00%, 10/01/35-10/01/36 | | $ | 380 | | | $ | 432,441 | |
California Health Facilities Financing Authority (Children’s Hospital Los Angeles) | | | | | | | | |
Series 2017A
5.00%, 8/15/42 | | | 235 | | | | 264,608 | |
California School Finance Authority (Downtown College Prep Obligated Group) | | | | | | | | |
Series 2016
5.00%, 6/01/51(a) | | | 250 | | | | 254,882 | |
Los Angeles Department of Water & Power WTR | | | | | | | | |
Series 2016A
5.00%, 7/01/41 | | | 200 | | | | 232,540 | |
Oakland Unified School District/Alameda County | | | | | | | | |
Series 2017C
5.00%, 8/01/33 | | | 200 | | | | 240,324 | |
| | | | | | | | |
| | | | | | | 1,424,795 | |
| | | | | | | | |
Georgia – 2.7% | | | | | | | | |
Atlanta Development Authority | | | | | | | | |
Series 2017
2.061%, 12/01/21 | | | 230 | | | | 228,953 | |
| | | | | | | | |
Massachusetts – 9.5% | | | | | | | | |
Massachusetts Bay Transportation Authority (Massachusetts Bay Transportation Authority Sales Tax) | | | | | | | | |
Series 2017A
5.00%, 7/01/31 | | | 205 | | | | 249,536 | |
Massachusetts Development Finance Agency (Boston Medical Center Corp.) | | | | | | | | |
Series 2015D
5.00%, 7/01/44 | | | 135 | | | | 148,122 | |
Series 2016E
5.00%, 7/01/37 | | | 365 | | | | 408,202 | |
| | | | | | | | |
| | | | | | | 805,860 | |
| | | | | | | | |
Michigan – 2.9% | | | | | | | | |
Grand Rapids Public Schools | | | | | | | | |
AGM Series 2017
5.00%, 5/01/27 | | | 200 | | | | 244,308 | |
| | | | | | | | |
Missouri – 2.5% | | | | | | | | |
St. Louis Community College District | | | | | | | | |
Series 2017
4.00%, 4/01/35 | | | 200 | | | | 212,744 | |
| | | | | | | | |
| | |
| abfunds.com | | AB IMPACT MUNICIPAL INCOME SHARES | 3 |
PORTFOLIO OF INVESTMENTS (continued)
| | | | | | | | |
| | | Principal
Amount
(000) | | | U.S. $ Value | |
| | | | | | | | |
| |
New Jersey – 4.4% | | | | | | | | |
New Jersey Economic Development Authority (North Star Academy Charter School of Newark, Inc.)
5.00%, 7/15/47 | | $ | 250 | | | $ | 268,470 | |
New Jersey Health Care Facilities Financing Authority (St. Joseph’s Healthcare System Obligated Group) | | | | | | | | |
Series 2016
5.00%, 7/01/41 | | | 100 | | | | 109,324 | |
| | | | | | | | |
| | | | | | | 377,794 | |
| | | | | | | | |
New York – 6.9% | | | | | | | | |
Housing Development Corp./NY | | | | | | | | |
Series 2017E
1.50%, 5/01/22 | | | 230 | | | | 229,326 | |
Metropolitan Transportation Authority | | | | | | | | |
Series 2016B
5.00%, 11/15/37 | | | 205 | | | | 238,120 | |
New York City Municipal Water Finance Authority | | | | | | | | |
Series 2017B
5.00%, 6/15/31 | | | 100 | | | | 121,542 | |
| | | | | | | | |
| | | | | | | 588,988 | |
| | | | | | | | |
Ohio – 9.0% | | | | | | | | |
Cleveland Department of Public Utilities Division of Water | | | | | | | | |
Series 2017B
5.00%, 1/01/26 | | | 200 | | | | 244,476 | |
County of Cuyahoga/OH (MetroHealth System (The)) | | | | | | | | |
Series 2017
5.00%, 2/15/42 | | | 280 | | | | 299,284 | |
Northeast Ohio Regional Sewer District | | | | | | | | |
Series 2017
5.00%, 11/15/27 | | | 175 | | | | 219,985 | |
| | | | | | | | |
| | | | | | | 763,745 | |
| | | | | | | | |
Oregon – 2.6% | | | | | | | | |
Tri-County Metropolitan Transportation District of Oregon | | | | | | | | |
Series 2017
5.00%, 10/01/27 | | | 180 | | | | 221,605 | |
| | | | | | | | |
Pennsylvania – 8.5% | | | | | | | | |
Hospitals & Higher Education Facilities Authority of Philadelphia (The) (Temple University Health System Obligated Group)
5.00%, 7/01/34(b) | | | 230 | | | | 255,081 | |
Philadelphia Authority for Industrial Development | | | | | | | | |
AGM Series 2017
5.00%, 12/01/35 | | | 200 | | | | 229,320 | |
| | |
| 4 | AB IMPACT MUNICIPAL INCOME SHARES | | abfunds.com |
PORTFOLIO OF INVESTMENTS (continued)
| | | | | | | | |
| | | Principal
Amount
(000) | | | U.S. $ Value | |
| | | | | | | | |
| |
Southeastern Pennsylvania Transportation Authority | | | | | | | | |
Series 2017
5.00%, 3/01/27 | | $ | 195 | | | $ | 240,638 | |
| | | | | | | | |
| | | | | | | 725,039 | |
| | | | | | | | |
Tennessee – 2.6% | | | | | | | | |
City of Memphis TN Electric System Revenue | | | | | | | | |
Series 2017
5.00%, 12/01/30 | | | 180 | | | | 220,955 | |
| | | | | | | | |
Texas – 5.6% | | | | | | | | |
Alamo Community College District | | | | | | | | |
Series 2017
5.00%, 8/15/27 | | | 190 | | | | 236,793 | |
El Paso County Hospital District | | | | | | | | |
Series 2013
5.00%, 8/15/21 | | | 220 | | | | 244,711 | |
| | | | | | | | |
| | | | | | | 481,504 | |
| | | | | | | | |
Wisconsin – 4.0% | | | | | | | | |
Milwaukee Redevelopment Authority | | | | | | | | |
Series 2017
5.00%, 11/15/25 | | | 200 | | | | 240,388 | |
Wisconsin Public Finance Authority (Bancroft Neurohealth/Bancroft Rehabilitation Services Obligated Group) | | | | | | | | |
Series 2016
5.125%, 6/01/48(a)(c) | | | 100 | | | | 100,651 | |
| | | | | | | | |
| | | | | | | 341,039 | |
| | | | | | | | |
Total Long-Term Municipal Bonds
(cost $6,663,560) | | | | | | | 6,637,329 | |
| | | | | | | | |
Total Municipal Obligations (cost $6,663,560) | | | | | | | 6,637,329 | |
| | | | | | | | |
| | |
| | | Shares | | | | |
SHORT-TERM INVESTMENTS – 24.6% | | | | | | | | |
Investment Companies – 24.6% | | | | | | | | |
AB Fixed Income Shares, Inc. – Government Money Market Portfolio – Class AB, 0.85%(d)(e)(f)
(cost $2,099,271) | | | 2,099,271 | | | | 2,099,271 | |
| | | | | | | | |
| | |
Total Investments – 102.5%
(cost $8,762,831) | | | | | | | 8,736,600 | |
Other assets less liabilities – (2.5)% | | | | | | | (209,385 | ) |
| | | | | | | | |
| | |
Net Assets – 100.0% | | | | | | $ | 8,527,215 | |
| | | | | | | | |
| (a) | Security is exempt from registration under Rule 144A of the Securities Act of 1933. These securities are considered restricted, but liquid and may be resold in transactions exempt from registration, normally to qualified institutional buyers. At October 31, 2017, the aggregate market value of these securities amounted to $355,533 or 4.2% of net assets. |
| | |
| abfunds.com | | AB IMPACT MUNICIPAL INCOME SHARES | 5 |
PORTFOLIO OF INVESTMENTS (continued)
| (b) | When-Issued or delayed delivery security. |
| (c) | Security in which significant unobservable inputs (Level 3) were used in determining fair value. |
| (d) | Affiliated investments. |
| (e) | The rate shown represents the 7-day yield as of period end. |
| (f) | To obtain a copy of the fund’s shareholder report, please go to the Securities and Exchange Commission’s website at www.sec.gov, or call AB at (800) 227-4618. |
As of October 31, 2017, the Fund’s percentages of investments in municipal bonds that are insured and in insured municipal bonds that have been pre-refunded or escrowed to maturity are 7.1% and 0.0%, respectively.
Glossary:
AGM – Assured Guaranty Municipal
See notes to financial statements.
| | |
| 6 | AB IMPACT MUNICIPAL INCOME SHARES | | abfunds.com |
STATEMENT OF ASSETS & LIABILITIES
October 31, 2017 (unaudited)
| | | | |
| Assets | | | | |
Investments in securities, at value | | | | |
Unaffiliated issuers (cost $6,663,560) | | $ | 6,637,329 | |
Affiliated issuers (cost $2,099,271) | | | 2,099,271 | |
Interest receivable | | | 56,085 | |
Affiliated dividends receivable | | | 1,073 | |
Receivable due from Adviser | | | 269 | |
| | | | |
Total assets | | | 8,794,027 | |
| | | | |
| Liabilities | | | | |
Payable for investment securities purchased | | | 253,899 | |
Dividends payable | | | 12,913 | |
| | | | |
Total liabilities | | | 266,812 | |
| | | | |
Net Assets | | $ | 8,527,215 | |
| | | | |
| Composition of Net Assets | | | | |
Shares of beneficial interest, at par | | $ | 9 | |
Additional paid-in capital | | | 8,553,437 | |
Net unrealized depreciation on investments | | | (26,231 | ) |
| | | | |
| | $ | 8,527,215 | |
| | | | |
Net Asset Value Per Share—unlimited shares of beneficial interest authorized, $.00001 par value (based on 856,425 common shares outstanding) | | $ | 9.96 | |
| | | | |
See notes to financial statements.
| | |
| abfunds.com | | AB IMPACT MUNICIPAL INCOME SHARES | 7 |
STATEMENT OF OPERATIONS
For the period of September 12, 2017(a) to October 31, 2017 (unaudited)
| | | | | | | | |
| Investment Income | | | | | | | | |
Interest | | $ | 14,482 | | | | | |
Dividends—Affiliated issuers | | | 1,274 | | | | | |
Other income(b) | | | 269 | | | | | |
| | | | | | | | |
Total investment income | | | | | | $ | 16,025 | |
| | | | | | | | |
| Unrealized Loss on Investment Transactions | | | | | | | | |
Net change in unrealized appreciation/depreciation of investments | | | | | | | (26,231 | ) |
| | | | | | | | |
Net Decrease in Net Assets from Operations | | | | | | $ | (10,206 | ) |
| | | | | | | | |
| (a) | Commencement of operations. |
| (b) | Other income includes a reimbursement for investments in affiliated issuer (see Note B). |
See notes to financial statements.
| | |
| 8 | AB IMPACT MUNICIPAL INCOME SHARES | | abfunds.com |
STATEMENT OF CHANGES IN NET ASSETS
| | | | |
| | | September 12,
2017(a) to
October 31, 2017
(unaudited) | |
| Increase (Decrease) in Net Assets from Operations | | | | |
Net investment income | | $ | 16,025 | |
Net change in unrealized appreciation/depreciation of investments | | | (26,231 | ) |
| | | | |
Net decrease in net assets from operations | | | (10,206 | ) |
| Dividends to Shareholders from | | | | |
Net investment income | | | (16,025 | ) |
| Transactions in Shares of Beneficial Interest | | | | |
Net increase | | | 8,553,446 | |
| | | | |
Total increase | | | 8,527,215 | |
| | | | |
| Net Assets | | | | |
Beginning of period | | | – 0 | – |
| | | | |
End of period (including undistributed net investment income
of $0) | | $ | 8,527,215 | |
| | | | |
| (a) | Commencement of operations. |
See notes to financial statements.
| | |
| abfunds.com | | AB IMPACT MUNICIPAL INCOME SHARES | 9 |
NOTES TO FINANCIAL STATEMENTS
October 31, 2017 (unaudited)
NOTE A
Significant Accounting Policies
AB Corporate Shares (the “Trust”) was organized as a Massachusetts business trust under the laws of The Commonwealth of Massachusetts by an Agreement and Declaration of Trust dated January 26, 2004. The Trust is registered under the Investment Company Act of 1940, as an open-end, diversified management investment company. The Trust operates as a “series” company currently offering four separate portfolios: AB Corporate Income Shares, AB Municipal Income Shares, AB Taxable Multi-Sector Income Shares and AB Impact Municipal Income Shares. Each Fund is considered to be a separate entity for financial reporting and tax purposes. This report relates only to AB Impact Municipal Income Shares (the “Fund”). The Fund commenced operations on September 12, 2017.
Shares of the Fund are offered exclusively to holders of accounts established under wrap-fee programs sponsored and maintained by certain registered investment advisers approved by AllianceBernstein L.P. (the “Adviser”). The Fund’s shares may be purchased at the relevant net asset value without a sales charge or other fee. The financial statements have been prepared in conformity with U.S. generally accepted accounting principles (“U.S. GAAP”) which require management to make certain estimates and assumptions that affect the reported amounts of assets and liabilities in the financial statements and amounts of income and expenses during the reporting period. Actual results could differ from those estimates. Fund is an investment company under U.S. GAAP and follows the accounting and reporting guidance applicable to investment companies. The following is a summary of significant accounting policies followed by the Fund.
1. Security Valuation
Portfolio securities are valued at their current market value determined on the basis of market quotations or, if market quotations are not readily available or are deemed unreliable, at “fair value” as determined in accordance with procedures established by and under the general supervision of the Trust’s Board of Trustees (the “Board”).
In general, the market values of securities which are readily available and deemed reliable are determined as follows: securities listed on a national securities exchange (other than securities listed on the NASDAQ Stock Market, Inc. (“NASDAQ”)) or on a foreign securities exchange are valued at the last sale price at the close of the exchange or foreign securities exchange. If there has been no sale on such day, the securities are valued at the last traded price from the previous day. Securities listed on more than one exchange are valued by reference to the principal exchange on which the securities are traded; securities listed only on NASDAQ are valued in
| | |
| 10 | AB IMPACT MUNICIPAL INCOME SHARES | | abfunds.com |
NOTES TO FINANCIAL STATEMENTS (continued)
accordance with the NASDAQ Official Closing Price; listed or over the counter (“OTC”) market put or call options are valued at the mid level between the current bid and ask prices. If either a current bid or current ask price is unavailable, the Adviser will have discretion to determine the best valuation (e.g., last trade price in the case of listed options); open futures are valued using the closing settlement price or, in the absence of such a price, the most recent quoted bid price. If there are no quotations available for the day of valuation, the last available closing settlement price is used; U.S. Government securities and any other debt instruments having 60 days or less remaining until maturity are generally valued at market by an independent pricing vendor, if a market price is available. If a market price is not available, the securities are valued at amortized cost. This methodology is commonly used for short term securities that have an original maturity of 60 days or less, as well as short term securities that had an original term to maturity that exceeded 60 days. In instances when amortized cost is utilized, the Valuation Committee (the “Committee”) must reasonably conclude that the utilization of amortized cost is approximately the same as the fair value of the security. Such factors the Committee will consider include, but are not limited to, an impairment of the creditworthiness of the issuer or material changes in interest rates. Fixed-income securities, including mortgage-backed and asset-backed securities, may be valued on the basis of prices provided by a pricing service or at a price obtained from one or more of the major broker-dealers. In cases where broker-dealer quotes are obtained, the Adviser may establish procedures whereby changes in market yields or spreads are used to adjust, on a daily basis, a recently obtained quoted price on a security. Swaps and other derivatives are valued daily, primarily using independent pricing services, independent pricing models using market inputs, as well as third party broker-dealers or counterparties. Open end mutual funds are valued at the closing net asset value per share, while exchange traded funds are valued at the closing market price per share.
Securities for which market quotations are not readily available (including restricted securities) or are deemed unreliable are valued at fair value as deemed appropriate by the Adviser. Factors considered in making this determination may include, but are not limited to, information obtained by contacting the issuer, analysts, analysis of the issuer’s financial statements or other available documents. In addition, the Fund may use fair value pricing for securities primarily traded in non-U.S. markets because most foreign markets close well before the Fund values its securities at 4:00 p.m., Eastern Time. The earlier close of these foreign markets gives rise to the possibility that significant events, including broad market moves, may have occurred in the interim and may materially affect the value of those securities. To account for this, the Fund generally values many of its foreign equity securities using fair value prices based on third party vendor modeling tools to the extent available.
| | |
| abfunds.com | | AB IMPACT MUNICIPAL INCOME SHARES | 11 |
NOTES TO FINANCIAL STATEMENTS (continued)
2. Fair Value Measurements
In accordance with U.S. GAAP regarding fair value measurements, fair value is defined as the price that the Fund would receive to sell an asset or pay to transfer a liability in an orderly transaction between market participants at the measurement date. U.S. GAAP establishes a framework for measuring fair value, and a three-level hierarchy for fair value measurements based upon the transparency of inputs to the valuation of an asset or liability (including those valued based on their market values as described in Note A.1 above). Inputs may be observable or unobservable and refer broadly to the assumptions that market participants would use in pricing the asset or liability. Observable inputs reflect the assumptions market participants would use in pricing the asset or liability based on market data obtained from sources independent of the Fund. Unobservable inputs reflect the Fund’s own assumptions about the assumptions that market participants would use in pricing the asset or liability based on the best information available in the circumstances. Each investment is assigned a level based upon the observability of the inputs which are significant to the overall valuation. The three-tier hierarchy of inputs is summarized below.
| | • | | Level 1—quoted prices in active markets for identical investments |
| | • | | Level 2—other significant observable inputs (including quoted prices for similar investments, interest rates, prepayment speeds, credit risk, etc.) |
| | • | | Level 3—significant unobservable inputs (including the Fund’s own assumptions in determining the fair value of investments) |
The fair value of debt instruments, such as bonds, and over-the-counter derivatives is generally based on market price quotations, recently executed market transactions (where observable) or industry recognized modeling techniques and are generally classified as Level 2. Pricing vendor inputs to Level 2 valuations may include quoted prices for similar investments in active markets, interest rate curves, coupon rates, currency rates, yield curves, option adjusted spreads, default rates, credit spreads and other unique security features in order to estimate the relevant cash flows which are then discounted to calculate fair values. If these inputs are unobservable and significant to the fair value, these investments will be classified as Level 3. In addition, non-agency rated investments are classified as Level 3.
Other fixed income investments, including non-U.S. government and corporate debt, are generally valued using quoted market prices, if available, which are typically impacted by current interest rates, maturity dates and any perceived credit risk of the issuer. Additionally, in the absence of quoted market prices, these inputs are used by pricing vendors to derive a valuation based upon industry or proprietary models which incorporate
| | |
| 12 | AB IMPACT MUNICIPAL INCOME SHARES | | abfunds.com |
NOTES TO FINANCIAL STATEMENTS (continued)
issuer specific data with relevant yield/spread comparisons with more widely quoted bonds with similar key characteristics. Those investments for which there are observable inputs are classified as Level 2. Where the inputs are not observable, the investments are classified as Level 3.
The following table summarizes the valuation of the Fund’s investments by the above fair value hierarchy levels as of October 31, 2017:
| | | | | | | | | | | | | | | | |
Investments in Securities: | | Level 1 | | | Level 2 | | | Level 3 | | | Total | |
Assets: | | | | | | | | | | | | | | | | |
Long-Term Municipal Bonds | | $ | – 0 | – | | $ | 6,281,796 | | | $ | 355,533 | | | $ | 6,637,329 | |
Short-Term Investments | | | 2,099,271 | | | | – 0 | – | | | – 0 | – | | | 2,099,271 | |
| | | | | | | | | | | | | | | | |
Total Investments in Securities | | | 2,099,271 | | | | 6,281,796 | | | | 355,533 | | | | 8,736,600 | |
| | | | | | | | | | | | | | | | |
Other Financial Instruments(a) | | | – 0 | – | | | – 0 | – | | | – 0 | – | | | – 0 | – |
| | | | | | | | | | | | | | | | |
Total(b) | | $ | 2,099,271 | | | $ | 6,281,796 | | | $ | 355,533 | | | $ | 8,736,600 | |
| | | | | | | | | | | | | | | | |
| (a) | Other financial instruments are derivative instruments, such as futures, forwards and swaps, which are valued at the unrealized appreciation/(depreciation) on the instrument. Other financial instruments may also include swaps with upfront premiums, options written and swaptions which are valued at market value. |
| (b) | There were no transfers between any levels during the reporting period. |
The Fund recognizes all transfers between levels of the fair value hierarchy assuming the financial instruments were transferred at the beginning of the reporting period.
The following is a reconciliation of investments in which significant unobservable inputs (Level 3) were used in determining fair value.
| | | | | | | | |
| | | Long-Term Municipal
Bonds | | | Total | |
Balance as of 9/12/17^ | | $ | – 0 | – | | $ | – 0 | – |
Accrued discounts/(premiums) | | | (26 | ) | | | (26 | ) |
Realized gain (loss) | | | – 0 | – | | | – 0 | – |
Change in unrealized appreciation/depreciation | | | (1,608 | ) | | | (1,608 | ) |
Purchases | | | 357,167 | | | | 357,167 | |
Sales | | | – 0 | – | | | – 0 | – |
Transfers in to Level 3 | | | – 0 | – | | | – 0 | – |
Transfers out of Level 3 | | | – 0 | – | | | – 0 | – |
| | | | | | | | |
Balance as of 10/31/17 | | $ | 355,533 | | | $ | 355,533 | |
| | | | | | | | |
Net change in unrealized appreciation/depreciation from investments held as of 10/31/17(a) | | $ | (1,608 | ) | | $ | (1,608 | ) |
| | | | | | | | |
| ^ | Commencement of operations. |
| (a) | The unrealized appreciation/(depreciation) is included in net change in unrealized appreciation/(depreciation) on investments and other financial instruments in the accompanying statement of operations. |
| | |
| abfunds.com | | AB IMPACT MUNICIPAL INCOME SHARES | 13 |
NOTES TO FINANCIAL STATEMENTS (continued)
As of October 31, 2017, all Level 3 securities were priced by third party vendors.
The Adviser established the Committee to oversee the pricing and valuation of all securities held in the Fund. The Committee operates under pricing and valuation policies and procedures established by the Adviser and approved by the Board, including pricing policies which set forth the mechanisms and processes to be employed on a daily basis to implement these policies and procedures. In particular, the pricing policies describe how to determine market quotations for securities and other instruments. The Committee’s responsibilities include: 1) fair value and liquidity determinations (and oversight of any third parties to whom any responsibility for fair value and liquidity determinations is delegated), and 2) regular monitoring of the Adviser’s pricing and valuation policies and procedures and modification or enhancement of these policies and procedures (or recommendation of the modification of these policies and procedures) as the Committee believes appropriate.
The Committee is also responsible for monitoring the implementation of the pricing policies by the Adviser’s Pricing Group (the “Pricing Group”) and any third party which performs certain pricing functions in accordance with the pricing policies. The Pricing Group is responsible for the oversight of the third party on a day-to-day basis. The Committee and the Pricing Group perform a series of activities to provide reasonable assurance of the accuracy of prices including: 1) periodic vendor due diligence meetings, review of methodologies, new developments and processes at vendors, 2) daily comparison of security valuation versus prior day for all securities that exceeded established thresholds, and 3) daily review of unpriced, stale, and variance reports with exceptions reviewed by senior management and the Committee.
In addition, several processes outside of the pricing process are used to monitor valuation issues including: 1) performance and performance attribution reports are monitored for anomalous impacts based upon benchmark performance, and 2) portfolio managers review all portfolios for performance and analytics (which are generated using the Adviser’s prices).
3. Taxes
It is the Fund’s policy to meet the requirements of the Internal Revenue Code applicable to regulated investment companies and to distribute all of its investment company taxable income and net realized gains, if any, to shareholders. Therefore, no provisions for federal income or excise taxes are required.
In accordance with U.S. GAAP requirements regarding accounting for uncertainties in income taxes, management has analyzed the Fund’s tax
| | |
| 14 | AB IMPACT MUNICIPAL INCOME SHARES | | abfunds.com |
NOTES TO FINANCIAL STATEMENTS (continued)
positions taken or expected to be taken on federal and state income tax returns for the current tax year and has concluded that no provision for income tax is required in the Fund’s financial statements.
4. Investment Income and Investment Transactions
Dividend income is recorded on the ex-dividend date or as soon as the Fund is informed of the dividend. Interest income is accrued daily. Investment transactions are accounted for on the date the securities are purchased or sold. Investment gains or losses are determined on the identified cost basis. The Fund amortizes premiums and accretes discounts as adjustments to interest income.
5. Dividends and Distributions
Dividends and distributions to shareholders, if any, are recorded on the ex-dividend date. Income dividends and capital gains distributions are determined in accordance with federal tax regulations and may differ from those determined in accordance with U.S. GAAP. To the extent these differences are permanent, such amounts are reclassified within the capital accounts based on their federal tax basis treatment; temporary differences do not require such reclassification.
NOTE B
Advisory Fee and Other Transactions with Affiliates
Under the terms of the advisory agreement, the Fund pays no advisory fee to the Adviser and the Adviser reimburses or pays for the Fund’s operating expenses. The Fund is an integral part of separately managed accounts in wrap-fee programs and other investment programs. Typically, participants in these programs pay a fee to their investment adviser for all costs and expenses of the separately managed account, including costs and expenses associated with the Fund, and a fee is paid by their investment adviser to the Adviser. The Adviser serves as investment manager and adviser of the Fund and continuously furnishes an investment program for the Fund and manages, supervises and conducts the affairs of the Fund, subject to the supervisions of the Fund’s Board. The advisory agreement provides that the Adviser or an affiliate will furnish, or pay the expenses of the Fund for, office space, facilities and equipment, services of executive and other personnel of the Fund and certain administrative services.
The Fund has entered into a distribution agreement with AllianceBernstein Investments, Inc., the Fund’s principal underwriter (the “Underwriter”), to permit the Underwriter to distribute the Fund’s shares, which are sold at their net asset value without any sales charge. The Fund does not pay a fee for this service. The Underwriter is a wholly owned subsidiary of the Adviser.
AllianceBernstein Investor Services, Inc. (“ABIS”), a wholly-owned subsidiary of the Adviser, acts as the Fund’s registrar, transfer agent and
| | |
| abfunds.com | | AB IMPACT MUNICIPAL INCOME SHARES | 15 |
NOTES TO FINANCIAL STATEMENTS (continued)
dividend-disbursing agent. ABIS registers the transfer, issuance and redemption of Fund shares and disburses dividends and other distributions to Fund shareholders. The Fund does not pay a fee for this service.
The Fund may invest in AB Government Money Market Portfolio (the “Government Money Market Portfolio”) which has a contractual annual advisory fee rate of .20% of the portfolio’s average daily net assets and bears its own expenses. In connection with the investment by the Fund in the Government Money Market Portfolio, the Adviser has contractually agreed to reimburse its advisory fee from the Fund in an amount equal to the Fund’s pro rata share of the effective advisory fees of Government Money Market Portfolio, as borne indirectly by the Fund as an acquired fund fee and expense. For the period ended October 31, 2017, such reimbursement amounted to $269.
A summary of the Fund’s transactions in AB mutual funds for the period ended October 31, 2017 is as follows:
| | | | | | | | | | | | | | | | | | | | |
| Fund | | Market Value 9/12/17(a) (000) | | | Purchases at Cost (000) | | | Sales Proceeds (000) | | | Market Value 10/31/17 (000) | | | Dividend Income (000) | |
Government Money Market Portfolio | | $ | – 0 | – | | $ | 5,535 | | | $ | 3,436 | | | $ | 2,099 | | | $ | 1 | |
| (a) | Commencement of operations. |
NOTE C
Investment Transactions
Purchases and sales of investment securities (excluding short-term investments) for the period ended October 31, 2017 were as follows:
| | | | | | | | |
| | | Purchases | | | Sales | |
Investment securities (excluding
U.S. government securities) | | $ | 6,670,015 | | | $ | – 0 | – |
U.S. government securities | | | – 0 | – | | | – 0 | – |
The cost of investments for federal income tax purposes was substantially the same as the cost for financial reporting purposes. Accordingly, gross unrealized appreciation and unrealized depreciation are as follows:
| | | | |
Gross unrealized appreciation | | $ | 29,634 | |
Gross unrealized depreciation | | | (3,403 | ) |
| | | | |
Net unrealized appreciation | | $ | 26,231 | |
| | | | |
1. Derivative Financial Instruments
The Fund may use derivatives in an effort to earn income and enhance returns, to replace more traditional direct investments, to obtain exposure to otherwise inaccessible markets (collectively, “investment purposes”), or to hedge or adjust the risk profile of its portfolio.
| | |
| 16 | AB IMPACT MUNICIPAL INCOME SHARES | | abfunds.com |
NOTES TO FINANCIAL STATEMENTS (continued)
The Fund did not engage in derivatives transactions for the period ended October 31, 2017.
NOTE D
Shares of Beneficial Interest
Transactions in shares of beneficial interest were as follows:
| | | | | | | | | | | | | | | | |
| | | | | | | | | | | | | | | | |
| | | Shares | | | | | | Amount | | | | |
| | | September 12,
2017(a) to
October 31, 2017
(unaudited) | | | | | | September 12,
2017(a) to
October 31, 2017
(unaudited) | | | | |
| | | | | | | | | | | | | | | | |
Shares sold | | | 856,425 | | | | | | | $ | 8,553,446 | | | | | |
| | | | | | | | | | | | | | | | |
Net increase | | | 856,425 | | | | | | | $ | 8,553,446 | | | | | |
| | | | | | | | | | | | | | | | |
| (a) | Commencement of operations. |
NOTE E
Risks Involved in Investing in the Fund
ESG Risk—Applying environmental, social and corporate governance (“ESG”) and sustainability criteria to the investment process may exclude securities of certain issuers for non-investment reasons and therefore the Fund may forgo some market opportunities available to funds that do not use ESG or sustainability criteria. Securities of companies with ESG practices may shift into and out of favor depending on market and economic conditions, and the Fund’s performance may at times be better or worse than the performance of funds that do not use ESG or sustainability criteria.
Interest Rate Risk and Credit Risk—Interest rate risk is the risk that changes in interest rates will affect the value of the Fund’s investments in fixed-income debt securities such as bonds or notes. Increases in interest rates may cause the value of the Fund’s investments to decline. Credit risk is the risk that the issuer or guarantor of a debt security, or the counterparty to a derivative contract, will be unable or unwilling to make timely principal and/or interest payments, or to otherwise honor its obligations. The degree of risk for a particular security may be reflected in its credit rating. Credit risk is greater for medium quality and lower-rated securities. Lower-rated debt securities and similar unrated securities (commonly known as “junk bonds”) have speculative elements or are predominantly speculative risks.
Municipal Market Risk—This is the risk that special factors may adversely affect the value of municipal securities and have a significant effect on the yield or value of the Fund’s investments in municipal securities. These factors include economic conditions, political or legislative
| | |
| abfunds.com | | AB IMPACT MUNICIPAL INCOME SHARES | 17 |
NOTES TO FINANCIAL STATEMENTS (continued)
changes, uncertainties related to the tax status of municipal securities, or the rights of investors in these securities. To the extent that the Fund invests more of its assets in a particular state’s municipal securities, the Fund may be vulnerable to events adversely affecting that state, including economic, political and regulatory occurrences, court decisions, terrorism and catastrophic natural disasters, such as hurricanes or earthquakes. The Fund’s investments in certain municipal securities with principal and interest payments that are made from the revenues of a specific project or facility, and not general tax revenues, may have increased risks. Factors affecting the project or facility, such as local business or economic conditions, could have a significant effect on the project’s ability to make payments of principal and interest on these securities.
Tax Risk—There is no guarantee that the income on the Fund’s municipal securities will be exempt from regular federal income and state income taxes. Unfavorable legislation, adverse interpretations by federal or state authorities, litigation or noncompliant conduct by the issuer of a municipal security could affect the tax-exempt status of municipal securities. If the Internal Revenue Service or a state authority determines that an issuer of a municipal security has not complied with applicable requirements, interest from the security could become subject to regular federal income tax and/or state personal income tax, possibly retroactively to the date the security was issued, the value of the security could decline significantly, and a portion of the distributions to Fund shareholders could be recharacterized as taxable. Recent federal legislation included reductions in tax rates for individuals, with relatively larger reductions in tax rates for corporations. These tax rate reductions may reduce the demand for municipal bonds which could reduce the value of municipal bonds held by the Fund.
Below Investment Grade Securities Risk—Investments in fixed-income securities with lower ratings (commonly known as “junk bonds”) tend to have a higher probability that an issuer will default or fail to meet its payment obligations. These securities may be subject to greater price volatility due to such factors as specific corporate developments, interest rate sensitivity, negative perceptions of the junk bond market generally and less secondary market liquidity.
Inflation Risk—This is the risk that the value of assets or income from investments will be less in the future as inflation decreases the value of money. As inflation increases, the value of the Fund’s assets can decline as can the value of the Fund’s distributions. This risk is significantly greater if the Fund invests a significant portion of its assets in fixed-income securities with longer maturities.
| | |
| 18 | AB IMPACT MUNICIPAL INCOME SHARES | | abfunds.com |
NOTES TO FINANCIAL STATEMENTS (continued)
Leverage Risk—To the extent the Fund uses leveraging techniques, its NAV may be more volatile because leverage tends to exaggerate the effect of changes in interest rates and any increase or decrease in the value of the Fund’s investments.
Liquidity Risk—Liquidity risk exists when particular investments, such as lower-rated securities, are difficult to purchase or sell, possibly preventing the Fund from selling out of these illiquid securities at an advantageous price. The Fund is subject to liquidity risk because the market for municipal securities is generally smaller than many other markets. Derivatives and securities involving substantial market and credit risk tend to involve greater liquidity risk.
Derivatives Risk—The Fund may enter into derivative transactions such as forwards, options, futures and swaps. Derivatives may be illiquid, difficult to price, and leveraged so that small changes may produce disproportionate losses for the Fund, and subject to counterparty risk to a greater degree than more traditional investments. Derivatives may result in significant losses, including losses that are far greater than the value of the derivatives reflected on the statement of assets and liabilities.
Indemnification Risk—In the ordinary course of business, the Fund enters into contracts that contain a variety of indemnifications. The Fund’s maximum exposure under these arrangements is unknown. However, the Fund has not had prior claims or losses pursuant to these indemnification provisions and expects the risk of loss thereunder to be remote. Therefore, the Fund has not accrued any liability in connection with these indemnification provisions.
NOTE F
Distributions to Shareholders
The tax character of distributions to be paid for the year ending April 30, 2018 will be determined at the end of the current fiscal year.
For tax purposes, net capital losses may be carried over to offset future capital gains, if any. Under the Regulated Investment Company Modernization Act of 2010, funds are permitted to carry forward capital losses incurred in taxable years beginning after December 22, 2010 for an indefinite period. These capital loss carryforwards will retain their character as either short-term or long-term capital losses.
| | |
| abfunds.com | | AB IMPACT MUNICIPAL INCOME SHARES | 19 |
NOTES TO FINANCIAL STATEMENTS (continued)
NOTE G
Recent Accounting Pronouncements
In March 2017, the Financial Accounting Standards Board issued an Accounting Standards Update, ASU 2017-08, Receivables —Nonrefundable Fees and Other Costs (Subtopic 310-20), Premium Amortization on Purchased Callable Debt Securities (the “ASU”) which amends the amortization period for certain purchased callable debt securities held at a premium, shortening such period to the earliest call date. The ASU does not require any accounting change for debt securities held at a discount; the discount continues to be amortized to maturity. The ASU is effective for fiscal years, and interim periods within those fiscal years, beginning after December 15, 2018. At this time, management is evaluating the implications of these changes on the financial statements.
NOTE H
Subsequent Events
Management has evaluated subsequent events for possible recognition or disclosure in the financial statements through the date the financial statements are issued. Management has determined that there are no material events that would require disclosure in the Fund’s financial statements through this date.
| | |
| 20 | AB IMPACT MUNICIPAL INCOME SHARES | | abfunds.com |
FINANCIAL HIGHLIGHTS
Selected Data For A Share Of Beneficial Interest Outstanding Throughout Each Period
| | | | |
| | | September 12,
2017(a) to
October 31, 2017
(unaudited) | |
| | | | |
Net asset value, beginning of period | | | $ 10.00 | |
| | | | |
Income From Investment Operations | | | | |
Net investment income(b) | | | .03 | |
Net realized and unrealized loss on investment transactions | | | (.04 | ) |
| | | | |
Net decrease in net asset value from operations | | | (.01 | ) |
Less: Dividends | | | | |
Dividends from net investment income | | | (.03 | ) |
| | | | |
Net asset value, end of period | | | $ 9.96 | |
| | | | |
Total Return | | | | |
Total investment return based on net asset value(c) | | | .30 | % |
Ratios/Supplemental Data | | | | |
Net assets, end of period (000’s omitted) | | | $ 8,527 | |
Ratio to average net assets of: | | | | |
Net investment income^ | | | 1.95 | % |
Portfolio turnover rate | | | 0 | % |
| (a) | Commencement of operations. |
| (b) | Based on average shares outstanding. |
| (c) | Total investment return is calculated assuming an initial investment made at the net asset value at the beginning of the period, reinvestment of all dividends and distributions at net asset value during the period, and redemption on the last day of the period. Total return does not reflect the deduction of taxes that a shareholder would pay on fund distributions or the redemption of fund shares. Total investment return calculated for a period of less than one year is not annualized. |
| | |
| abfunds.com | | AB IMPACT MUNICIPAL INCOME SHARES | 21 |
BOARD OF TRUSTEES
| | |
Marshall C. Turner, Jr.(1) , Chairman John H. Dobkin(1)(2) Michael J. Downey(1) William H. Foulk, Jr.(1) D. James Guzy(1)(2) Nancy P. Jacklin(1) | | Robert M. Keith, President and Chief Executive Officer Carol C. McMullen(1) Garry L. Moody(1) Earl D. Weiner(1) |
OFFICERS
| | |
Philip L. Kirstein(3) , Senior Vice President and Independent Compliance Officer Robert “Guy” B. Davidson III(4), Senior Vice President Eric A. Glass(4), Vice President Matthew J. Norton(4), Vice President | | Emilie D. Wrapp, Secretary Joseph J. Mantineo, Treasurer and Chief Financial Officer Phyllis J. Clarke, Controller Vincent S. Noto, Chief Compliance Officer |
| | |
Custodian and Accounting Agent State Street Bank and Trust Company
State Street Corporation CCB/5
1 Iron Street
Boston, MA 02210 Principal Underwriter AllianceBernstein Investments, Inc.
1345 Avenue of the Americas
New York, NY 10105 | | Legal Counsel Seward & Kissel LLP
One Battery Park Plaza
New York, NY 10004 Independent Registered Public Accounting Firm Ernst & Young LLP 5 Times Square New York, NY 10036 |
Transfer Agent AllianceBernstein Investor Services, Inc.
P.O. Box 786003
San Antonio, TX 78278-6003
Toll-Free (800) 221-5672 |
| 1 | Member of the Audit Committee, the Governance and Nominating Committee and the Independent Directors Committee. |
| 2 | Messrs. Dobkin and Guzy are expected to retire on or about December 31, 2017. |
| 3 | Mr. Kirstein is expected to retire on or about December 31, 2017. |
| 4 | The day-to-day management of, and investment decisions for, the Trust’s Portfolio are made by the Corporate Income Shares Investment Team. Messrs. Robert “Guy” B. Davidson III, Eric A. Glass and Matthew J. Norton are the investment professionals primarily responsible for the day-to-day management of the Trust’s Portfolio. |
| | |
| 22 | AB IMPACT MUNICIPAL INCOME SHARES | | abfunds.com |
Information Regarding the Review and Approval of the Fund’s Advisory Agreement
The disinterested trustees (the “directors”) of AB Corporate Shares (the “Company”) unanimously approved the Company’s Advisory Agreement with the Adviser in respect of AB Impact Municipal Income Shares (the “Fund”) for an initial two-year period at a meeting held on August 1-2, 2017 (the “Meeting”).
Prior to approval of the Advisory Agreement, the directors had requested from the Adviser, and received and evaluated, extensive materials. They reviewed the proposed Advisory Agreement with the Adviser and with experienced counsel who are independent of the Adviser, who advised on the relevant legal standards. The directors also reviewed an independent evaluation prepared by the Company’s Senior Officer (who is also the Company’s Independent Compliance Officer), who acted as their independent fee consultant, of the reasonableness of the proposed advisory fee, in which the Senior Officer concluded that the proposed contractual fee (zero) for the Fund was reasonable. The directors also discussed the proposed approval in private sessions with counsel and the Company’s Senior Officer.
The directors noted that the Fund is designed as a vehicle for the wrap fee account market (where investors pay fees to a wrap fee sponsor which pays investment fees and expenses from such fee). The directors also noted that no advisory fee is payable by the Fund, that the Advisory Agreement does not include the reimbursement provision for certain administrative expenses included in the advisory agreements of most of the open-end AB Funds, and that the Adviser is responsible for payment of the Fund’s ordinary expenses. The directors noted that the Company acknowledges in the Advisory Agreement that the Adviser and its affiliates expect to receive compensation from third parties in connection with services provided under the Advisory Agreement. The directors further noted that the Adviser would receive payments from the wrap fee program sponsors (the “Sponsors”) that use the Fund as an investment vehicle for their clients.
The directors considered their knowledge of the nature and quality of the services to be provided by the Adviser to the Fund gained from their experience as directors or trustees of most of the registered investment companies advised by the Adviser, their overall confidence in the Adviser’s integrity and competence they have gained from that experience, the Adviser’s initiative in identifying and raising potential issues with the directors and its responsiveness, frankness and attention to concerns raised by the directors in the past, including the Adviser’s willingness to consider and implement organizational and operational changes designed to improve investment results and the services provided to the AB Funds. The directors noted that they have four regular meetings each year, at
| | |
| abfunds.com | | AB IMPACT MUNICIPAL INCOME SHARES | 23 |
each of which they review extensive materials and information from the Adviser, including information on the investment performance of the AB Funds.
The directors also considered all factors they believed relevant, including the specific matters discussed below. During the course of their deliberations, the directors evaluated, among other things, the reasonableness of the proposed advisory fee. The directors did not identify any particular information that was all-important or controlling, and different directors may have attributed different weights to the various factors. The directors determined that the selection of the Adviser to manage the Fund and the overall arrangements between the Fund and the Adviser, as provided in the Advisory Agreement, including the advisory fee, were fair and reasonable in light of the services to be performed, expenses to be incurred and such other matters as the directors considered relevant in the exercise of their business judgment. The material factors and conclusions that formed the basis for the directors’ determinations included the following:
Nature, Extent and Quality of Services To Be Provided
The directors considered the scope and quality of services to be provided by the Adviser under the Advisory Agreement, including the quality of the investment research capabilities of the Adviser and the other resources it has dedicated to performing services for the AB Funds. They also noted the professional experience and qualifications of the Fund’s portfolio management team and other senior personnel of the Adviser. The quality of administrative and other services, including the Adviser’s role in coordinating the activities of the Fund’s other service providers, also was considered. The directors concluded that, overall, they were satisfied with the nature, extent and quality of services to be provided to the Fund under the Advisory Agreement.
Costs of Services To Be Provided and Profitability
Because the Fund had not yet commenced operations, the directors were unable to consider historical information about the profitability of the Fund. However, the Adviser agreed to provide the directors with profitability information in connection with future proposed continuances of the Advisory Agreement. They also considered the costs to be borne by the Adviser in providing services to the Fund and that the Fund was unlikely to be profitable to the Adviser unless it achieves a material level of net assets.
Fall-Out Benefits
The directors considered the other benefits to the Adviser and its affiliates from their relationships with the Fund. The directors noted that the Adviser would be compensated by the Sponsors. The directors understood that the Adviser also might derive reputational and other benefits from its association with the Fund.
| | |
| 24 | AB IMPACT MUNICIPAL INCOME SHARES | | abfunds.com |
Investment Results
Since the Fund had not yet commenced operations, no performance or other historical information for the Fund was available. Based on the Adviser’s written and oral presentations regarding the proposed management of the Fund and their general knowledge and confidence in the Adviser’s expertise in managing mutual funds, the directors concluded that they were satisfied that the Adviser was capable of providing high quality Fund management services to the Fund.
Advisory Fees
The directors considered the proposed advisory fee rate payable by the Fund to the Adviser (zero) and reviewed information prepared by an analytical service that is not affiliated with the Adviser showing the fees paid by other fund families used in wrap fee programs similar to that of the Fund. The directors recognized that it is difficult to make comparisons of advisory fees because there are variations in the services that are included in the fees paid by other funds.
The directors noted the unusual arrangements in the Advisory Agreement providing for no advisory fee but were cognizant that the Adviser would be indirectly compensated by the Sponsors for its services to the Fund. While the Adviser’s fee arrangements with the Sponsors would vary, the directors acknowledged the Adviser’s view that a portion of such fees (less the expenses of the Fund to be paid by the Adviser) may reasonably be viewed as compensating the Adviser for advisory services it would provide to the Fund (the “implied fee”) and that the Adviser believes that while the Sponsors would pay the Adviser different fee rates, the rate of fee attributable to Fund management at the Fund level would be the same for all Sponsors. The directors also considered the fee rate schedules used by other registered investment companies that invest in fixed income securities that are advised by the Adviser.
The Adviser informed the directors that there were no institutional products managed by it that have a substantially similar investment style.
Since the Fund would not bear ordinary expenses, the directors did not consider comparative expense information.
Economies of Scale
Since the Advisory Agreement does not provide for any compensation to be paid to the Adviser by the Fund and the Fund’s expense ratio would be zero, the directors did not consider the extent to which fee levels in the Advisory Agreement reflect economies of scale.
| | |
| abfunds.com | | AB IMPACT MUNICIPAL INCOME SHARES | 25 |
This page is not part of the Shareholder Report or the Financial Statements.
AB FAMILY OF FUNDS
US EQUITY
US CORE
Core Opportunities Fund
FlexFee™ US Thematic Portfolio
Select US Equity Portfolio
US GROWTH
Concentrated Growth Fund
Discovery Growth Fund
FlexFee™ Large Cap Growth Portfolio
Growth Fund
Large Cap Growth Fund
Small Cap Growth Portfolio
US VALUE
Discovery Value Fund
Equity Income Fund
Relative Value Fund1
Small Cap Value Portfolio
Value Fund
INTERNATIONAL/ GLOBAL EQUITY
INTERNATIONAL/ GLOBAL CORE
Global Core Equity Portfolio
International Portfolio
International Strategic Core Portfolio
Sustainable Global Thematic Fund1
Tax-Managed International Portfolio
Tax-Managed Wealth Appreciation Strategy
Wealth Appreciation Strategy
INTERNATIONAL/ GLOBAL GROWTH
Concentrated International Growth Portfolio
International Growth Fund
INTERNATIONAL/ GLOBAL EQUITY (continued)
INTERNATIONAL/ GLOBAL VALUE
Asia ex-Japan Equity Portfolio
International Value Fund
FIXED INCOME
MUNICIPAL
High Income Municipal Portfolio
Intermediate California Municipal Portfolio
Intermediate Diversified Municipal Portfolio
Intermediate New York Municipal Portfolio
Municipal Bond Inflation Strategy
Tax-Aware Fixed Income Portfolio
National Portfolio
Arizona Portfolio
California Portfolio
Massachusetts Portfolio
Minnesota Portfolio
New Jersey Portfolio
New York Portfolio
Ohio Portfolio
Pennsylvania Portfolio
Virginia Portfolio
TAXABLE
Bond Inflation Strategy
FlexFee™ International Bond Portfolio
Global Bond Fund
High Income Fund
High Yield Portfolio
Income Fund
Intermediate Bond Portfolio
Limited Duration High Income Portfolio
Short Duration Portfolio
ALTERNATIVES
All Market Real Return Portfolio
Credit Long/Short Portfolio
Global Real Estate Investment Fund
Select US Long/Short Portfolio
Unconstrained Bond Fund
MULTI-ASSET
All Market Income Portfolio
All Market Total Return Portfolio1
Conservative Wealth Strategy
Emerging Markets Multi-Asset Portfolio
Global Risk Allocation Fund
Tax-Managed All Market Income Portfolio1
TARGET-DATE
Multi-Manager Select Retirement Allocation Fund
Multi-Manager Select 2010 Fund
Multi-Manager Select 2015 Fund
Multi-Manager Select 2020 Fund
Multi-Manager Select 2025 Fund
Multi-Manager Select 2030 Fund
Multi-Manager Select 2035 Fund
Multi-Manager Select 2040 Fund
Multi-Manager Select 2045 Fund
Multi-Manager Select 2050 Fund
Multi-Manager Select 2055 Fund
CLOSED-END FUNDS
Alliance California Municipal Income Fund
AllianceBernstein Global High Income Fund
AllianceBernstein National Municipal Income Fund
We also offer Government Money Market Portfolio1, which serves as the money market fund exchange vehicle for the AB mutual funds. An investment in Government Money Market Portfolio is not a deposit in a bank and is not insured or guaranteed by the Federal Deposit Insurance Corporation or any other government agency. Although the Fund seeks to preserve the value of your investment at $1.00 per share, it is possible to lose money by investing in the Fund.
Investors should consider the investment objectives, risks, charges and expenses of the Fund carefully before investing. For copies of our prospectus or summary prospectus, which contain this and other information, visit us online at www.abfunds.com or contact your AB representative. Please read the prospectus and/or summary prospectus carefully before investing.
| 1 | Prior to January 9, 2017, Relative Value Fund was named Growth & Income Fund; prior to April 17, 2017, Tax-Managed All Market Income Portfolio was named Tax-Managed Balanced Wealth Strategy; prior to April 24, 2017, All Market Total Return Portfolio was named Balanced Wealth Strategy; prior to November 10, 2017, Government Money Market Portfolio was named Government Exchange Reserves. |
| | |
| 26 | AB IMPACT MUNICIPAL INCOME SHARES | | abfunds.com |
NOTES
| | |
| abfunds.com | | AB IMPACT MUNICIPAL INCOME SHARES | 27 |
NOTES
| | |
| 28 | AB IMPACT MUNICIPAL INCOME SHARES | | abfunds.com |

AB IMPACT MUNICIPAL INCOME SHARES
1345 Avenue of the Americas
New York, NY 10105
800 221 5672
IMISH-0152-1017 
Not applicable when filing a semi-annual report to shareholders.
| ITEM 3. | AUDIT COMMITTEE FINANCIAL EXPERT. |
Not applicable when filing a semi-annual report to shareholders.
| ITEM 4. | PRINCIPAL ACCOUNTANT FEES AND SERVICES. |
Not applicable when filing a semi-annual report to shareholders.
| ITEM 5. | AUDIT COMMITTEE OF LISTED REGISTRANTS. |
Not applicable to the registrant.
| ITEM 6. | SCHEDULE OF INVESTMENTS. |
Please see Schedule of Investments contained in the Report to Shareholders included under Item 1 of this Form N-CSR.
ITEM 7. DISCLOSURE OF PROXY VOTING POLICIES AND PROCEDURES FOR CLOSED-END MANAGEMENT INVESTMENT COMPANIES.
Not applicable to the registrant.
ITEM 8. PORTFOLIO MANAGERS OF CLOSED-END MANAGEMENT INVESTMENT COMPANIES.
Not applicable to the registrant.
ITEM 9. PURCHASES OF EQUITY SECURITIES BY CLOSED-END MANAGEMENT INVESTMENT COMPANY AND AFFILIATED PURCHASERS.
Not applicable to the registrant.
| ITEM 10. | SUBMISSION OF MATTERS TO A VOTE OF SECURITY HOLDERS. |
There have been no material changes to the procedures by which shareholders may recommend nominees to the Fund’s Board of Directors since the Fund last provided disclosure in response to this item.
| ITEM 11. | CONTROLS AND PROCEDURES. |
(a) The registrant’s principal executive officer and principal financial officer have concluded that the registrant’s disclosure controls and procedures (as defined in Rule 30a-2(c) under the Investment Company Act of 1940, as amended) are effective at the reasonable assurance level based on their evaluation of these controls and procedures as of a date within 90 days of the filing date of this document.
(b) There were no changes in the registrant’s internal controls over financial reporting that occurred during the second fiscal quarter of the period that has materially affected, or is reasonably likely to materially affect, the registrant’s internal control over financial reporting.
The following exhibits are attached to this Form N-CSR:
| | |
EXHIBIT NO. | | DESCRIPTION OF EXHIBIT |
| |
| 12 (b) (1) | | Certification of Principal Executive Officer Pursuant to Section 302 of the Sarbanes-Oxley Act of 2002 |
| |
| 12 (b) (2) | | Certification of Principal Financial Officer Pursuant to Section 302 of the Sarbanes-Oxley Act of 2002 |
| |
| 12 (c) | | Certification of Principal Executive Officer and Principal Financial Officer Pursuant to Section 906 of the Sarbanes-Oxley Act of 2002 |
SIGNATURES
Pursuant to the requirements of the Securities Exchange Act of 1934 and the Investment Company Act of 1940, the registrant has duly caused this report to be signed on its behalf by the undersigned, thereunto duly authorized.
(Registrant): AB Corporate Shares
| | |
| By: | | /s/ Robert M. Keith |
| | Robert M. Keith |
| | President |
| |
| Date: | | December 27, 2017 |
Pursuant to the requirements of the Securities Exchange Act of 1934 and the Investment Company Act of 1940, this report has been signed below by the following persons on behalf of the registrant and in the capacities and on the dates indicated.
| | |
| By: | | /s/ Robert M. Keith |
| | Robert M. Keith |
| | President |
| |
| Date: | | December 27, 2017 |
| |
| By: | | /s/ Joseph J. Mantineo |
| | Joseph J. Mantineo |
| | Treasurer and Chief Financial Officer |
| |
| Date: | | December 27, 2017 |