UNITED STATES
SECURITIES AND EXCHANGE COMMISSION
Washington, D.C. 20549
FORM N-CSR
CERTIFIED SHAREHOLDER REPORT OF REGISTERED
MANAGEMENT INVESTMENT COMPANIES
Investment Company Act file number | 811-21488 |
|
Cohen & Steers Global Infrastructure Fund, Inc. |
(Exact name of registrant as specified in charter) |
|
280 Park Avenue, New York, NY | | 10017 |
(Address of principal executive offices) | | (Zip code) |
|
Tina M. Payne Cohen & Steers Capital Management, Inc. 280 Park Avenue New York, New York 10017 |
(Name and address of agent for service) |
|
Registrant’s telephone number, including area code: | (212) 832-3232 | |
|
Date of fiscal year end: | December 31 | |
|
Date of reporting period: | December 31, 2014 | |
| | | | | | | | |
Item 1. Reports to Stockholders.
COHEN & STEERS GLOBAL INFRASTRUCTURE FUND, INC.
To Our Shareholders:
We would like to share with you our report for the year ended December 31, 2014. The net asset values (NAV) per share at that date were $18.59, $18.77, $18.54, $18.64 and $18.64 and $18.64 for Class A, Class B, Class C, Class I, Class R and Class Z shares, respectively.
The total returns, including income and change in NAV, for the Fund and its comparative benchmarks were:
| | Six Months Ended
December 31, 2014 | | Year Ended
December 31, 2014 | |
Cohen & Steers Global Infrastructure
Fund—Class A | | | –3.01 | % | | | 11.57 | % | |
Cohen & Steers Global Infrastructure
Fund—Class B | | | –3.37 | % | | | 10.80 | % | |
Cohen & Steers Global Infrastructure
Fund—Class C | | | –3.32 | % | | | 10.88 | % | |
Cohen & Steers Global Infrastructure
Fund—Class I | | | –2.94 | % | | | 11.82 | % | |
Cohen & Steers Global Infrastructure
Fund—Class R | | | — | a | | | — | a | |
Cohen & Steers Global Infrastructure
Fund—Class Z | | | — | a | | | — | a | |
UBS Global 50/50 Infrastructure & Utilities
Index—netb | | | –1.42 | % | | | 12.76 | % | |
| S&P 500 Indexb | | | 6.12 | % | | | 13.69 | % | |
The performance data quoted represent past performance. Past performance is no guarantee of future results. The investment return and the principal value of an investment will fluctuate and shares, if redeemed, may be worth more or less than their original cost. Current performance may be lower or higher than the performance data quoted. Current total returns of the Fund can be obtained by visiting our website at cohenandsteers.com. All share class returns assume the reinvestment of all dividends and distributions at NAV. Performance quoted does not reflect the deduction of the maximum 4.50% initial sales charge on Class A shares or the 5.00% and 1.00% maximum contingent deferred sales charge on Class B and Class C shares, respectively. The 1.00% maximum contingent deferred sales charge on Class C shares applies if redemption occurs less than one year from purchase. If such charges were included, returns would have been lower. Index performance does not reflect the
a Inception date of Class R and Class Z shares was October 1, 2014. Total return for Class R and Z shares was 1.61% and 1.74%, respectively, for the period October 1, 2014 through December 31, 2014.
b The UBS Global 50/50 Infrastructure & Utilities Index-net tracks a 50% exposure to global developed market utilities sector and a 50% exposure to global developed market infrastructure sector. The utilities sector excludes the sub-sector generation utilities. The index is free-float market capitalization weighted and is reconstituted annually with quarterly rebalances and is net of dividend withholding taxes. The S&P 500 Index is an unmanaged index of 500 large-cap stocks that is frequently used as a general measure of stock market performance.
1
COHEN & STEERS GLOBAL INFRASTRUCTURE FUND, INC.
deduction of any fees, taxes or expenses. An investor cannot invest directly in an index. Performance figures for periods shorter than one year are not annualized.
The Fund implements fair value pricing when the daily change in a specific U.S. market index exceeds a predetermined percentage. Fair value pricing adjusts the valuation of certain non-U.S. equity holdings to account for such index change following the close of foreign markets. This standard practice has been adopted by a majority of the fund industry. In the event fair value pricing is implemented on the first and/or last day of a performance measurement period, the Fund's return may diverge from the relative performance of its benchmark, which does not use fair value pricing.
Please note that distributions paid by the Fund to shareholders are subject to recharacterization for tax purposes and are taxable up to the amount of the Fund's investment company taxable income and net realized gains. Distributions in excess of the Fund's investment company taxable income and net realized gains are a return of capital distributed from the Fund's assets.
Investment Review
In December 2013, when the Federal Reserve announced it would begin unwinding its bond-buying program in January 2014, investors and analysts were wary about a resulting increase in interest rates and the impact it would have on markets. As it turned out, their concerns were unwarranted; by the end of the year, the yield on 10-year U.S. Treasury bonds had declined from 3.0% to 2.2%.
Markets were volatile over the period, but interest rates were not the driver. The uneven global economic recovery, concerns about Russia's incursions into Crimea and Ukraine and a rapid drop in commodity prices, particularly oil, were far more unsettling. Against this shifting backdrop, global infrastructure securities outperformed the broader markets—the strategy's unique combination of defensive and economically sensitive subsectors provided a broad scope of attractive investment opportunities.
The sustained period of low interest rates in the United States and Europe made utilities particularly attractive to yield-focused investors. Electric utilities (22.3% total returnc,d) received an additional lift from emerging tailwinds. U.S. integrated utilities saw improved capacity pricing as older coal-fired power plants are retired, while European utilities benefited from lower regulatory and political risk and the apparent end to a several-year fundamentals-driven decline in earnings. Water utilities (29.1%) advanced on improved economic data in Europe and lower interest rates in the United States, and led the UBS 50/50 Infrastructure & Utilities Index.
Pipelines (22.0%) were among the index's top performers in the first three quarters on solid fundamentals and an enhanced growth outlook. But by the fourth quarter, the sharp drop in oil and natural gas liquid (NGL) prices turned investors away, even though most assets held by midstream energy companies have long-term contracts that minimize their direct exposure to fluctuations in energy prices. Investor sentiment also turned against gas distribution (21.9%), as several of its components
c Sector returns are in local currencies.
d Sector classifications of securities in the index determined by investment advisor.
2
COHEN & STEERS GLOBAL INFRASTRUCTURE FUND, INC.
have midstream energy businesses. For most of the year, they were valued for their strong cash-flow-growth outlook in the low-interest-rate environment.
Low interest rates helped the highly leveraged communications subsector (20.8%). Tower companies rose as wireless carriers upgraded their networks to meet what analysts expect to be an extended period of fast-growing wireless data demand. By year end, the Federal Communications Commission's broadband spectrum auction had garnered in excess of $40 billion—more than expected, and far more than the $18.9 billion in bids for the last big U.S. spectrum auction, conducted in 2008.
Most of the companies in the index's railways subsector (27.5%) are domiciled in Japan, and rebounded amid a growth in passenger volume and news that the transport ministry had approved Central Japan Railways' plans to build the world's fastest train, using magnetic levitation technology. But it was the only transportation subsector to outperform; the Eurozone's erratic economic progress weighed on airports (20.6%), toll roads (17.1%) and marine ports (3.7%)—although they still managed to outpace the broader markets.
Fund Performance
The Fund advanced in 2014 but underperformed its benchmark. Positive contributors to relative return included stock selection in the pipelines and toll roads subsectors. In pipelines, our out-of-index investments in midstream companies structured as master limited partnerships rose sharply, and were the biggest contributors to performance.
Our underweight in electric utilities was unfavorable in a period when investors valued their defensive nature and comparatively high dividend yields. While our out-of-index investments in North American freight railways were beneficial, our underweights in Japanese rail companies offset that benefit. Stock selection in communications, airports and water utilities was unfavorable as well.
Impact of Foreign Currency on Fund Performance
The currency impact of the Fund's investments in foreign securities detracted from absolute performance during the 12-month period ended December 31, 2014. Although the Fund reports its NAV and pays dividends in U.S. dollars, the Fund's investments denominated in foreign currencies are subject to foreign currency risk. The U.S. dollar rose to a nine-year high during the period, and, consequently, this was a headwind for absolute returns as a result of the changes in the exchange rates between foreign currencies and the U.S. dollar.
Investment Outlook
We remain positive in our outlook for global infrastructure securities and are particularly optimistic about companies domiciled in North America. Developments in Europe, Japan and China require monitoring—their economic recoveries have been uneven, but lower oil prices and central banks' quantitative easing programs may help them achieve sustainable growth.
The sectors that are closely tied to the recovering economy, such as transportation, hold the most interest for us. North American freight railways, whose traffic and revenues are tracking the resurgence
3
COHEN & STEERS GLOBAL INFRASTRUCTURE FUND, INC.
of the continent's economy, are a prime example. We look for toll roads, airports and marine ports to benefit from lower fuel costs. Toll roads, many of which are domiciled in Europe, are also likely to advance if the Eurozone's economic recovery takes hold.
The drop in crude oil and natural gas prices has raised questions about the outlook for the pipelines subsector in 2015. We believe a reduction in crude oil and NGL production growth triggered by lower prices will have a direct impact on the medium-term investment opportunities and growth profile of the midstream energy sector—but we also believe current valuations are beginning to reflect this. As this plays out, we look for a volatile "sorting-out" period as midstream energy companies adjust to an extended period of lower energy commodity prices.
If markets remain unsettled, we expect utilities to do well among risk-averse investors. European utilities have become more attractive to us; they have been executing on a multi-year fundamental restructuring plan, selling non-core assets and using the proceeds to pay down debt. Within the communications subsector, we believe strong wireless data demand and continued low interest rates will support tower performance. However, there are several near-term headwinds, including their rich valuations, increased leverage due to acquisitions and the possibility that high spectrum costs could put pressure on wireless carriers' free cash flows, forcing them to slow network spending.
There are opportunities among infrastructure companies in select emerging markets, in our view, although we have reduced our allocations in countries with weakening regulatory and economic environments. We are also wary of countries that are large commodity exporters, such as Brazil.
Sincerely,

ROBERT H. STEERS
Chairman
| | | | | 
| | 
| |
| | | ROBERT S. BECKER | | BEN MORTON | |
| | | Portfolio Manager | | Portfolio Manager | |
4
COHEN & STEERS GLOBAL INFRASTRUCTURE FUND, INC.
The views and opinions in the preceding commentary are subject to change without notice and are as of the date of publication. There is no guarantee that any market forecast set forth in the commentary will be realized. This material represents an assessment of the market environment at a specific point in time, should not be relied upon as investment advice and is not intended to predict or depict performance of any investment.
Visit Cohen & Steers online at cohenandsteers.com
For more information about the Cohen & Steers family of mutual funds, visit cohenandsteers.com. Here you will find fund net asset values, fund fact sheets and portfolio highlights, as well as educational resources and timely market updates.
Our website also provides comprehensive information about Cohen & Steers, including our most recent press releases, profiles of our senior investment professionals and their investment approach to each asset class. The Cohen & Steers family of mutual funds invests in major real asset categories including real estate, infrastructure and commodities, along with preferred securities and other income solutions.
5
COHEN & STEERS GLOBAL INFRASTRUCTURE FUND, INC.
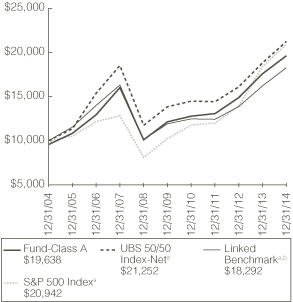
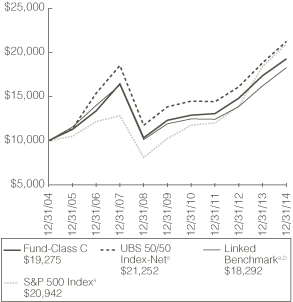
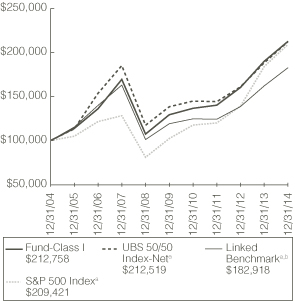
Performance Review (Unaudited)
Class A—Growth of a $10,000 Investment
Class B—Growth of a $10,000 Investment

Class C—Growth of a $10,000 Investment
Class I—Growth of a $100,000 Investment
6
COHEN & STEERS GLOBAL INFRASTRUCTURE FUND, INC.
Performance Review (Unaudited)—(Continued)
Average Annual Total Returns—For Periods Ended December 31, 2014
| | Class A
Shares | | Class B
Shares | | Class C
Shares | | Class I
Shares | | Class R
Shares | | Class Z
Shares | |
1 Year (with sales charge) | | | 6.55 | %c | | | 5.80 | %d | | | 9.88 | %f | | | — | | | | — | | | | — | | |
1 Year (without sales charge) | | | 11.57 | % | | | 10.80 | % | | | 10.88 | % | | | 11.82 | % | | | — | | | | — | | |
5 Years (with sales charge) | | | 9.09 | %c | | | 9.09 | %e | | | 9.40 | % | | | — | | | | — | | | | — | | |
5 Years (without sales charge) | | | 10.10 | % | | | 9.37 | % | | | 9.40 | % | | | 10.47 | % | | | — | | | | — | | |
10 Years (with sales charge) | | | 6.98 | %c | | | 6.78 | % | | | 6.78 | % | | | — | | | | — | | | | — | | |
10 Years (without sales charge) | | | 7.48 | % | | | 6.78 | % | | | 6.78 | % | | | 7.84 | % | | | — | | | | — | | |
Since Inceptiong (with sales charge) | | | 8.51 | %c | | | 8.25 | % | | | 8.34 | % | | | — | | | | — | | | | — | | |
Since Inceptiong (without sales charge) | | | 8.97 | % | | | 8.25 | % | | | 8.34 | % | | | 9.34 | % | | | 1.61 | % | | | 1.74 | % | |
The performance data quoted represent past performance. Past performance is no guarantee of future results. The investment return and principal value of an investment will fluctuate and shares, if redeemed, may be worth more or less than their original cost. Current performance may be lower or higher than the performance data quoted. Performance information current to the most recent month end can be obtained by visiting our website at cohenandsteers.com. All share class returns assume the reinvestment of all dividends and distributions at NAV. The performance table and graphs do not reflect the deduction of taxes that a shareholder would pay on Fund distributions or the redemption of Fund shares. During certain periods presented above, the investment advisor waived fees and/or reimbursed expenses. Without this arrangement, performance would have been lower.
The annualized gross and net expense ratios, respectively, for each class of shares as disclosed in the May 1, 2014 prospectuses for Class A, Class B, Class C and Class I; and in the September 30, 2014 prospectus for Class R and Class Z were as follows: Class A—1.50% and 1.50%; Class B—2.15% and 2.15%; Class C—2.15% and 2.15%; Class I—1.21% and 1.15%; Class R—1.65% and 1.65% and Class Z—1.15% and 1.15%. Through June 30, 2016, the investment advisor has contractually agreed to waive its fee and/or reimburse expenses so that the Fund's total annual operating expenses (excluding acquired fund fees and expenses and extraordinary expenses) do not exceed 1.50% for Class A shares, 2.15% for Class B shares and Class C shares, 1.15% for Class I shares, 1.65% for Class R shares and 1.15% for Class Z shares. This contractual agreement can be amended at any time by agreement of the Fund and the investment advisor and will terminate automatically in the event of termination of the investment advisory agreement between the investment advisor and the Fund.
a The comparative indices are not adjusted to reflect expenses or other fees that the SEC requires to be reflected in the Fund's performance. Index performance does not reflect the deduction of any fees, taxes or expenses. An investor cannot invest directly in an index. The Fund's performance assumes the reinvestment of all dividends and distributions at NAV. For more information, including charges and expenses, please read the prospectus carefully before you invest.
b The linked benchmark is represented by the performance of the S&P 1500 Utilities Index from April 30, 2004 through March 31, 2008, the Macquarie Global Infrastructure Index from April 1, 2008 through May 31, 2008 and the UBS Global 50/50 Infrastructure & Utilities Index from June 1, 2008 through December 31, 2014. The S&P 1500 Utilities Index is an unmanaged market-capitalization-weighted index of 64 companies whose primary business involves the generation, transmission and/or distribution of electricity and/or natural gas. The Macquarie Global Infrastructure Index is a capitalization-weighted, global infrastructure index containing all publicly quoted infrastructure related stocks that are members of the FTSE Global Equity Index Series with market capitalization exceeding $250 million and is net of dividend withholding taxes.
c Reflects a 4.50% front-end sales charge.
d Reflects a contingent deferred sales charge of 5.00%.
e Reflects a contingent deferred sales charge of 2.00%.
f Reflects a contingent deferred sales charge of 1.00%.
g Inception date of May 3, 2004 for Class A, B, C and I, and October 1, 2014 for Class R and Z.
7
COHEN & STEERS GLOBAL INFRASTRUCTURE FUND, INC.
Expense Example (Unaudited)
As a shareholder of the Fund, you incur two types of costs: (1) transaction costs, including sales charges (loads) on purchase payments; and (2) ongoing costs including investment advisory fees; distribution and/or service (12b-1) fees; and other Fund expenses. This example is intended to help you understand your ongoing costs (in dollars) of investing in the Fund and to compare these costs with the ongoing costs of investing in other mutual funds.
The example is based on an investment of $1,000 invested at the beginning of the period and held for the entire period July 1, 2014—December 31, 2014.
Actual Expenses
The first line of the following table provides information about actual account values and expenses. You may use the information in this line, together with the amount you invested, to estimate the expenses that you paid over the period. Simply divide your account value by $1,000 (for example, an $8,600 account value divided by $1,000 = 8.6), then multiply the result by the number in the first line under the heading entitled "Expenses Paid During Period" to estimate the expenses you paid on your account during this period.
Hypothetical Example for Comparison Purposes
The second line of the following table provides information about hypothetical account values and hypothetical expenses based on the Fund's actual expense ratio and an assumed rate of return of 5% per year before expenses, which is not the Fund's actual return. The hypothetical account values and expenses may not be used to estimate the actual ending account balance or expenses you paid for the period. You may use this information to compare the ongoing cost of investing in the Fund and other funds. To do so, compare this 5% hypothetical example with the 5% hypothetical examples that appear in the shareholder reports of other funds.
Please note that the expenses shown in the table are meant to highlight your ongoing costs only and do not reflect any transaction costs, such as sales charges (loads). Therefore, the second line of the table is useful in comparing ongoing costs only, and will not help you determine the relative total costs of owning different funds. In addition, if these transactional costs were included, your costs would have been higher.
8
COHEN & STEERS GLOBAL INFRASTRUCTURE FUND, INC.
Expense Example (Unaudited)—(Continued)
| | | Beginning
Account Value
July 1, 2014 | | Ending
Account Value
December 31, 2014 | | Expenses Paid
During Perioda
July 1, 2014–
December 31, 2014 | |
Class A | |
Actual (–3.01% return) | | $ | 1,000.00 | | | $ | 969.90 | | | $ | 6.75 | | |
Hypothetical (5% annual return before
expenses) | | $ | 1,000.00 | | | $ | 1,018.35 | | | $ | 6.92 | | |
Class B | |
Actual (–3.37% return) | | $ | 1,000.00 | | | $ | 966.30 | | | $ | 9.96 | | |
Hypothetical (5% annual return before
expenses) | | $ | 1,000.00 | | | $ | 1,015.07 | | | $ | 10.21 | | |
Class C | |
Actual (–3.32% return) | | $ | 1,000.00 | | | $ | 966.80 | | | $ | 9.96 | | |
Hypothetical (5% annual return before
expenses) | | $ | 1,000.00 | | | $ | 1,015.07 | | | $ | 10.21 | | |
Class I | |
Actual (–2.94% return) | | $ | 1,000.00 | | | $ | 970.60 | | | $ | 5.46 | | |
Hypothetical (5% annual return before
expenses) | | $ | 1,000.00 | | | $ | 1,019.66 | | | $ | 5.60 | | |
Class R | |
Actual (1.61% return)b | | $ | 1,000.00 | | | $ | 1,016.10 | | | $ | 3.82 | | |
Hypothetical (5% annual return before
expenses)c | | $ | 1,000.00 | | | $ | 1,017.54 | | | $ | 7.73 | | |
Class Z | |
Actual (1.74% return)b | | $ | 1,000.00 | | | $ | 1,017.40 | | | $ | 2.57 | | |
Hypothetical (5% annual return before
expenses)c | | $ | 1,000.00 | | | $ | 1,020.06 | | | $ | 5.19 | | |
a Expenses are equal to the Fund's Class A, Class B, Class C, Class I, Class R and Class Z annualized expense ratios of 1.36%, 2.01%, 2.01%, 1.10%, 1.52% and 1.02%, respectively, multiplied by the average account value over the period, multiplied by 184/365 (to reflect the one-half year period).
b Actual expenses for the period October 1, 2014 (inception date) to December 31, 2014.
c Hypothetical expenses if this class had been in existence from July 1, 2014 through December 31, 2014.
9
COHEN & STEERS GLOBAL INFRASTRUCTURE FUND, INC.
December 31, 2014
Top Ten Holdings
(Unaudited)
Security | | Value | | % of
Net
Assets | |
American Tower Corp. | | $ | 14,315,556 | | | | 5.7 | | |
Crown Castle International Corp. | | | 12,996,439 | | | | 5.2 | | |
Central Japan Railway Co. | | | 10,896,004 | | | | 4.3 | | |
East Japan Railway Co. | | | 8,170,200 | | | | 3.3 | | |
NextEra Energy | | | 8,087,925 | | | | 3.2 | | |
Groupe Eurotunnel SA | | | 7,501,790 | | | | 3.0 | | |
Dominion Resources VA | | | 7,389,936 | | | | 2.9 | | |
Transurban Group | | | 7,261,490 | | | | 2.9 | | |
Vinci SA | | | 7,136,766 | | | | 2.8 | | |
SBA Communications Corp., Class A | | | 6,449,998 | | | | 2.6 | | |
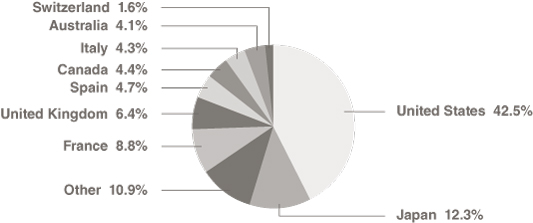
Country Breakdown
(Based on Net Assets)
(Unaudited)
10
COHEN & STEERS GLOBAL INFRASTRUCTURE FUND, INC.
SCHEDULE OF INVESTMENTS
December 31, 2014
| | | | | Number
of Shares | | Value | |
COMMON STOCK | | 96.2% | | | | | | | | | |
AUSTRALIA | | 4.1% | | | | | | | | | |
ELECTRIC—INTEGRATED ELECTRIC | | 0.5% | | | | | | | | | |
AGL Energy Ltd | | | | | 115,392 | | | $ | 1,258,592 | | |
PIPELINES—C-CORP | | 0.5% | | | | | | | | | |
APA Groupa | | | | | 191,231 | | | | 1,156,047 | | |
RAILWAYS | | 0.2% | | | | | | | | | |
Aurizon Holdings Ltd.a | | | | | 163,896 | | | | 613,343 | | |
TOLL ROADS | | 2.9% | | | | | | | | | |
Transurban Groupa | | | | | 1,042,012 | | | | 7,261,490 | | |
TOTAL AUSTRALIA | | | | | | | | | 10,289,472 | | |
AUSTRIA | | 0.1% | | | | | | | | | |
AIRPORTS | |
Flughafen Wien AG | | | | | 2,453 | | | | 228,021 | | |
BRAZIL | | 0.2% | | | | | | | | | |
ELECTRIC—INTEGRATED ELECTRIC | |
Light SA | | | | | 61,256 | | | | 392,212 | | |
CANADA | | 4.4% | | | | | | | | | |
MARINE PORTS | | 0.5% | | | | | | | | | |
Westshore Terminals Investment Corp. | | | | | 39,602 | | | | 1,078,164 | | |
PIPELINES—C-CORP | | 3.5% | | | | | | | | | |
AltaGas Ltd. | | | | | 34,967 | | | | 1,304,415 | | |
Enbridge | | | | | 84,742 | | | | 4,357,451 | | |
TransCanada Corp. | | | | | 64,788 | | | | 3,184,193 | | |
| | | | | | | | 8,846,059 | | |
RAILWAYS | | 0.4% | | | | | | | | | |
Canadian Pacific Railway Ltd | | | | | 5,567 | | | | 1,072,144 | | |
TOTAL CANADA | | | | | | | 10,996,367 | | |
CHILE | | 0.3% | | | | | | | | | |
WATER | |
Aguas Andinas SA, Class Aa | | | | | 1,407,678 | | | | 813,661 | | |
CHINA | | 0.5% | | | | | | | | | |
GAS DISTRIBUTION | |
Towngas China Co., Ltd. (Cayman Islands) (HKD)a | | | | | 1,192,000 | | | | 1,207,952 | | |
See accompanying notes to financial statements.
11
COHEN & STEERS GLOBAL INFRASTRUCTURE FUND, INC.
SCHEDULE OF INVESTMENTS—(Continued)
December 31, 2014
| | | | | Number
of Shares | | Value | |
FRANCE | | 8.8% | | | | | | | | | |
COMMUNICATIONS—SATELLITES | | 0.8% | | | | | | | | | |
Eutelsat Communicationsa | | | | | 59,869 | | | $ | 1,936,142 | | |
ELECTRIC—INTEGRATED ELECTRIC | | 1.8% | | | | | | | | | |
GDF Sueza | | | | | 196,364 | | | | 4,579,016 | | |
TOLL ROADS | | 5.8% | | | | | | | | | |
Groupe Eurotunnel SAa | | | | | 581,076 | | | | 7,501,790 | | |
Vinci SAa | | | | | 130,704 | | | | 7,136,766 | | |
| | | | | | | | 14,638,556 | | |
WATER | | 0.4% | | | | | | | | | |
Suez Environnement Co.a | | | | | 59,565 | | | | 1,037,814 | | |
TOTAL FRANCE | | | | | | | 22,191,528 | | |
GERMANY | | 1.1% | | | | | | | | | |
ELECTRIC—INTEGRATED ELECTRIC | |
E.ON AGa | | | | | 161,372 | | | | 2,758,120 | | |
HONG KONG | | 1.2% | | | | | | | | | |
ELECTRIC—REGULATED ELECTRIC | | 0.9% | | | | | | | | | |
Power Assets Holdings Ltd.a | | | | | 230,500 | | | | 2,226,996 | | |
MARINE PORTS | | 0.3% | | | | | | | | | |
Cosco Pacific Ltd. (Bermuda)a | | | | | 586,000 | | | | 831,440 | | |
TOTAL HONG KONG | | | | | | | 3,058,436 | | |
ITALY | | 4.3% | | | | | | | | | |
COMMUNICATIONS | | 0.8% | | | | | | | | | |
TELECOMMUNICATIONS | | 0.5% | | | | | | | | | |
RAI Way S.p.Ab | | | | | 325,562 | | | | 1,256,689 | | |
TOWERS | | 0.3% | | | | | | | | | |
Ei Towers S.p.A.b | | | | | 12,892 | | | | 645,371 | | |
TOTAL COMMUNICATIONS | | | | | | | 1,902,060 | | |
ELECTRIC—INTEGRATED ELECTRIC | | 1.8% | | | | | | | | | |
Enel S.p.A.a | | | | | 1,020,016 | | | | 4,546,737 | | |
GAS DISTRIBUTION | | 0.4% | | | | | | | | | |
Snam S.p.A.a | | | | | 179,752 | | | | 889,632 | | |
TOLL ROADS | | 1.3% | | | | | | | | | |
Atlantia S.p.A.a | | | | | 145,935 | | | | 3,391,814 | | |
TOTAL ITALY | | | | | | | 10,730,243 | | |
See accompanying notes to financial statements.
12
COHEN & STEERS GLOBAL INFRASTRUCTURE FUND, INC.
SCHEDULE OF INVESTMENTS—(Continued)
December 31, 2014
| | | | | Number
of Shares | | Value | |
JAPAN | | 12.3% | | | | | | | | | |
ELECTRIC—INTEGRATED ELECTRIC | | 1.6% | | | | | | | | | |
Chubu Electric Power Co.a,b | | | | | 212,500 | | | $ | 2,497,093 | | |
Kansai Electric Power Co.a,b | | | | | 149,700 | | | | 1,424,110 | | |
| | | | | | | | 3,921,203 | | |
GAS DISTRIBUTION | | 0.8% | | | | | | | | | |
Tokyo Gas Co., Ltd.a | | | | | 387,000 | | | | 2,088,121 | | |
RAILWAYS | | 9.9% | | | | | | | | | |
Central Japan Railway Co.a | | | | | 72,700 | | | | 10,896,004 | | |
East Japan Railway Co.a | | | | | 108,400 | | | | 8,170,200 | | |
West Japan Railway Co.a | | | | | 119,800 | | | | 5,663,931 | | |
| | | | | | | | 24,730,135 | | |
TOTAL JAPAN | | | | | | | 30,739,459 | | |
LUXEMBOURG | | 1.4% | |
COMMUNICATIONS—SATELLITES | |
SES SAa | | | | | 101,608 | | | | 3,645,693 | | |
MEXICO | | 0.8% | | | | | | | | | |
AIRPORTS | | 0.5% | | | | | | | | | |
Grupo Aeroportuario del Pacifico SAB de CV, ADR | | | | | 19,307 | | | | 1,220,202 | | |
TOLL ROADS | | 0.3% | | | | | | | | | |
OHL Mexico SAB de CVb | | | | | 469,672 | | | | 875,437 | | |
TOTAL MEXICO | | | | | | | 2,095,639 | | |
PORTUGAL | | 0.9% | | | | | | | | | |
ELECTRIC—INTEGRATED ELECTRIC | |
Energias de Portugal SAa | | | | | 583,261 | | | | 2,261,677 | | |
SOUTH KOREA | | 0.6% | | | | | | | | | |
ELECTRIC—REGULATED ELECTRIC | |
Korea Electric Power Corp.a | | | | | 40,827 | | | | 1,573,186 | | |
SPAIN | | 4.7% | | | | | | | | | |
GAS DISTRIBUTION | | 1.2% | | | | | | | | | |
Enagas SAa | | | | | 93,107 | | | | 2,936,691 | | |
TOLL ROADS | | 3.5% | | | | | | | | | |
Abertis Infraestructuras SAa | | | | | 177,047 | | | | 3,510,805 | | |
Ferrovial SAa | | | | | 266,628 | | | | 5,270,746 | | |
| | | | | | | | 8,781,551 | | |
TOTAL SPAIN | | | | | | | 11,718,242 | | |
See accompanying notes to financial statements.
13
COHEN & STEERS GLOBAL INFRASTRUCTURE FUND, INC.
SCHEDULE OF INVESTMENTS—(Continued)
December 31, 2014
| | | | | Number
of Shares | | Value | |
SWITZERLAND | | 1.6% | | | | | | | | | |
AIRPORTS | |
Flughafen Zuerich AGa | | | | | 5,933 | | | $ | 3,967,760 | | |
UNITED KINGDOM | | 6.4% | | | | | | | | | |
COMMUNICATIONS—SATELLITES | | 1.4% | | | | | | | | | |
Inmarsat PLCa | | | | | 279,330 | | | | 3,463,544 | | |
ELECTRIC | | 3.7% | | | | | | | | | |
INTEGRATED ELECTRIC | | 1.5% | | | | | | | | | |
SSE PLCa | | | | | 144,678 | | | | 3,655,591 | | |
REGULATED ELECTRIC | | 2.2% | | | | | | | | | |
National Grid PLCa | | | | | 396,654 | | | | 5,628,238 | | |
TOTAL ELECTRIC | | | | | | | 9,283,829 | | |
WATER | | 1.3% | |
Pennon Group PLCa | | | | | 126,731 | | | | 1,810,565 | | |
United Utilities Group PLCa | | | | | 103,157 | | | | 1,465,233 | | |
| | | | | | | | 3,275,798 | | |
TOTAL UNITED KINGDOM | | | | | | | 16,023,171 | | |
UNITED STATES | | 42.5% | | | | | | | | | |
COMMUNICATIONS—TOWERS | | 13.5% | | | | | | | | | |
American Tower Corp. | | | | | 144,821 | | | | 14,315,556 | | |
Crown Castle International Corp. | | | | | 165,139 | | | | 12,996,439 | | |
SBA Communications Corp., Class Ab | | | | | 58,234 | | | | 6,449,998 | | |
| | | | | | | | 33,761,993 | | |
DIVERSIFIED | | 0.8% | | | | | | | | | |
Macquarie Infrastructure Co LLC | | | | | 27,704 | | | | 1,969,477 | | |
ELECTRIC | | 17.3% | | | | | | | | | |
INTEGRATED ELECTRIC | | 9.0% | | | | | | | | | |
Dominion Resources VA | | | | | 96,098 | | | | 7,389,936 | | |
Exelon Corp. | | | | | 161,953 | | | | 6,005,217 | | |
NextEra Energy | | | | | 76,093 | | | | 8,087,925 | | |
NextEra Energy Partners LP | | | | | 12,994 | | | | 438,548 | | |
PPL Corp. | | | | | 16,976 | | | | 616,738 | | |
| | | | | | | | 22,538,364 | | |
See accompanying notes to financial statements.
14
COHEN & STEERS GLOBAL INFRASTRUCTURE FUND, INC.
SCHEDULE OF INVESTMENTS—(Continued)
December 31, 2014
| | | | | Number
of Shares | | Value | |
REGULATED ELECTRIC | | 8.3% | | | | | | | | | |
Alliant Energy Corp. | | | | | 51,007 | | | $ | 3,387,885 | | |
CenterPoint Energy | | | | | 89,706 | | | | 2,101,811 | | |
CMS Energy Corp. | | | | | 123,776 | | | | 4,301,216 | | |
DTE Energy Co. | | | | | 48,891 | | | | 4,222,716 | | |
Duke Energy Corp. | | | | | 59,672 | | | | 4,984,999 | | |
PG&E Corp. | | | | | 33,428 | | | | 1,779,707 | | |
| | | | | | | | 20,778,334 | | |
TOTAL ELECTRIC | | | | | | | 43,316,698 | | |
GAS DISTRIBUTION | | 3.4% | | | | | | | | | |
Atmos Energy Corp. | | | | | 25,026 | | | | 1,394,949 | | |
NiSource | | | | | 31,725 | | | | 1,345,775 | | |
Sempra Energy | | | | | 51,873 | | | | 5,776,577 | | |
| | | | | | | | 8,517,301 | | |
PIPELINES | | 5.7% | | | | | | | | | |
PIPELINES—C-CORP | | 3.3% | | | | | | | | | |
Kinder Morgan, Inc. | | | | | 14,253 | | | | 603,044 | | |
Plains GP Holdings LP, Class A | | | | | 63,324 | | | | 1,626,160 | | |
SemGroup Corp., Class A | | | | | 23,643 | | | | 1,616,945 | | |
Williams Cos. (The) | | | | | 100,288 | | | | 4,506,943 | | |
| | | | | | | | 8,353,092 | | |
PIPELINES—MLP | | 2.4% | | | | | | | | | |
Antero Midstream Partners LPb | | | | | 52,410 | | | | 1,441,275 | | |
Dominion Midstream Partners LPb | | | | | 35,212 | | | | 1,380,311 | | |
Energy Transfer Equity LP | | | | | 22,108 | | | | 1,268,557 | | |
EQT Midstream Partners LP | | | | | 14,605 | | | | 1,285,240 | | |
Summit Midstream Partners LP | | | | | 15,325 | | | | 582,350 | | |
| | | | | | | | 5,957,733 | | |
TOTAL PIPELINES | | | | | | | 14,310,825 | | |
RAILWAYS | | 1.0% | |
Union Pacific Corp. | | | | | 20,741 | | | | 2,470,875 | | |
SHIPPING | | 0.8% | |
Teekay Corp. (Marshall Islands) | | | | | 41,730 | | | | 2,123,640 | | |
TOTAL UNITED STATES | | | | | | | 106,470,809 | | |
TOTAL COMMON STOCK
(Identified cost—$200,707,385) | | | | | | | 241,161,648 | | |
See accompanying notes to financial statements.
15
COHEN & STEERS GLOBAL INFRASTRUCTURE FUND, INC.
SCHEDULE OF INVESTMENTS—(Continued)
December 31, 2014
| | | | | Number
of Shares | | Value | |
SHORT-TERM INVESTMENTS | | | 1.7% | | | | | | | | | | |
MONEY MARKET FUNDS | |
State Street Institutional Treasury Money
Market Fund, 0.00%c | | | | | 4,300,000 | | | $ | 4,300,000 | | |
TOTAL SHORT-TERM INVESTMENTS
(Identified cost—$4,300,000) | | | | | | | 4,300,000 | | |
TOTAL INVESTMENTS (Identified cost—$205,007,385) | | | 97.9 | % | | | | | | | 245,461,648 | | |
OTHER ASSETS IN EXCESS OF LIABILITIES | | | 2.1 | | | | | | | | 5,286,762 | | |
NET ASSETS | | | 100.0 | % | | | | | | $ | 250,748,410 | | |
Glossary of Portfolio Abbreviations
ADR American Depositary Receipt
HKD Hong Kong Dollar
MLP Master Limited Partnership
Note: Percentages indicated are based on the net assets of the Fund.
a Fair valued security. This security has been valued at its fair value as determined in good faith under procedures established by and under the general supervision of the Fund's Board of Directors. Aggregate fair valued securities represent 47.0% of the net assets of the Fund, all of which have been fair valued pursuant to foreign equity fair value pricing procedures approved by the Board of Directors.
b Non-income producing security.
c Rate quoted represents the annualized seven-day yield of the Fund.
See accompanying notes to financial statements.
16
COHEN & STEERS GLOBAL INFRASTRUCTURE FUND, INC.
SCHEDULE OF INVESTMENTS—(Continued)
December 31, 2014
Sector Summary | | % of
Net Assets | |
Electric | | | 30.4 | | |
Communications | | | 17.9 | | |
Toll Roads | | | 13.8 | | |
Railways | | | 11.5 | | |
Pipelines | | | 9.7 | | |
Gas Distribution | | | 6.3 | | |
Other | | | 3.8 | | |
Airports | | | 2.2 | | |
Water | | | 2.0 | | |
Shipping | | | 0.8 | | |
Diversified | | | 0.8 | | |
Marine Ports | | | 0.8 | | |
| | | | 100.0 | | |
See accompanying notes to financial statements.
17
COHEN & STEERS GLOBAL INFRASTRUCTURE FUND, INC.
STATEMENT OF ASSETS AND LIABILITIES
December 31, 2014
ASSETS: | |
Investments in securities, at value (Identified cost—$205,007,385) | | $ | 245,461,648 | | |
Cash | | | 4,407,344 | | |
Receivable for: | |
Fund shares sold | | | 1,707,301 | | |
Dividends | | | 438,746 | | |
Investment securities sold | | | 162,677 | | |
Other assets | | | 1,795 | | |
Total Assets | | | 252,179,511 | | |
LIABILITIES: | |
Payable for: | |
Investment securities purchased | | | 1,022,340 | | |
Investment advisory fees | | | 157,839 | | |
Shareholder servicing fees | | | 49,789 | | |
Fund shares redeemed | | | 40,786 | | |
Administration fees | | | 4,209 | | |
Distribution fees | | | 1,748 | | |
Directors' fees | | | 13 | | |
Other liabilities | | | 154,377 | | |
Total Liabilities | | | 1,431,101 | | |
NET ASSETS | | $ | 250,748,410 | | |
NET ASSETS consist of: | |
Paid-in capital | | $ | 212,834,226 | | |
| Accumulated undistributed net investment income | | | 264,261 | | |
Accumulated net realized loss | | | (2,797,835 | ) | |
| Net unrealized appreciation | | | 40,447,758 | | |
| | | $ | 250,748,410 | | |
See accompanying notes to financial statements.
18
COHEN & STEERS GLOBAL INFRASTRUCTURE FUND, INC.
STATEMENT OF ASSETS AND LIABILITIES—(Continued)
December 31, 2014
CLASS A SHARES: | |
NET ASSETS | | $ | 48,640,298 | | |
Shares issued and outstanding ($0.001 par value common stock outstanding) | | | 2,616,607 | | |
Net asset value and redemption price per share | | $ | 18.59 | | |
Maximum offering price per share ($18.59 ÷ 0.955)a | | $ | 19.47 | | |
CLASS B SHARES: | |
NET ASSETS | | $ | 57,739 | | |
Shares issued and outstanding ($0.001 par value common stock outstanding) | | | 3,076 | | |
Net asset value and offering price per shareb | | $ | 18.77 | | |
CLASS C SHARES: | |
NET ASSETS | | $ | 26,104,201 | | |
Shares issued and outstanding ($0.001 par value common stock outstanding) | | | 1,408,080 | | |
Net asset value and offering price per shareb | | $ | 18.54 | | |
CLASS I SHARES: | |
NET ASSETS | | $ | 175,925,962 | | |
Shares issued and outstanding ($0.001 par value common stock outstanding) | | | 9,437,234 | | |
Net asset value, offering and redemption price per share | | $ | 18.64 | | |
CLASS R SHARES: | |
NET ASSETS | | $ | 10,105 | | |
Shares issued and outstanding ($0.001 par value common stock outstanding) | | | 542 | | |
Net asset value, offering and redemption price per share | | $ | 18.64 | | |
CLASS Z SHARES: | |
NET ASSETS | | $ | 10,105 | | |
Shares issued and outstanding ($0.001 par value common stock outstanding) | | | 542 | | |
Net asset value, offering and redemption price per share | | $ | 18.64 | | |
a On investments of $100,000 or more, the offering price is reduced.
b Redemption price per share is equal to the net asset value per share less any applicable contingent deferred sales charge which varies with the length of time shares are held.
See accompanying notes to financial statements.
19
COHEN & STEERS GLOBAL INFRASTRUCTURE FUND, INC.
STATEMENT OF OPERATIONS
For the Year Ended December 31, 2014
Investment Income: | |
Dividend income (net of $429,600 of foreign withholding tax) | | $ | 5,380,038 | | |
Expenses: | |
Investment advisory fees | | | 1,479,963 | | |
Distribution fees—Class A | | | 99,617 | | |
Distribution fees—Class B | | | 724 | | |
Distribution fees—Class C | | | 162,828 | | |
Distribution fees—Class R | | | 13 | | |
Shareholder servicing fees—Class A | | | 39,847 | | |
Shareholder servicing fees—Class B | | | 242 | | |
Shareholder servicing fees—Class C | | | 54,276 | | |
Shareholder servicing fees—Class I | | | 125,768 | | |
Registration and filing fees | | | 129,281 | | |
Professional fees | | | 96,807 | | |
Administration fees | | | 76,906 | | |
Transfer agent fees and expenses | | | 58,037 | | |
Shareholder reporting expenses | | | 55,848 | | |
Custodian fees and expenses | | | 52,916 | | |
Directors' fees and expenses | | | 10,887 | | |
Line of credit fees | | | 2,410 | | |
Miscellaneous | | | 24,832 | | |
Total Expenses | | | 2,471,202 | | |
| Net Investment Income | | | 2,908,836 | | |
Net Realized and Unrealized Gain (Loss): | |
Net realized gain (loss) on: | |
| Investments | | | 3,914,586 | | |
Foreign currency transactions | | | (48,114 | ) | |
| Net realized gain | | | 3,866,472 | | |
Net change in unrealized appreciation (depreciation) on: | |
| Investments | | | 10,766,985 | | |
Foreign currency translations | | | (9,498 | ) | |
| Net change in unrealized appreciation (depreciation) | | | 10,757,487 | | |
| Net realized and unrealized gain | | | 14,623,959 | | |
Net Increase in Net Assets Resulting from Operations | | $ | 17,532,795 | | |
See accompanying notes to financial statements.
20
COHEN & STEERS GLOBAL INFRASTRUCTURE FUND, INC.
STATEMENT OF CHANGES IN NET ASSETS
| | | For the
Year Ended
December 31, 2014 | | For the
Year Ended
December 31, 2013 | |
Change in Net Assets: | |
From Operations: | |
Net investment income | | $ | 2,908,836 | | | $ | 1,639,931 | | |
| Net realized gain | | | 3,866,472 | | | | 7,819,468 | | |
Net change in unrealized appreciation
(depreciation) | | | 10,757,487 | | | | 10,266,895 | | |
Net increase in net assets resulting
from operations | | | 17,532,795 | | | | 19,726,294 | | |
Dividends and distributions to Shareholders from: | | | | | | | | | |
Net Investment Income: | |
Class A | | | (486,378 | ) | | | (463,428 | ) | |
Class B | | | (206 | ) | | | (463 | ) | |
Class C | | | (121,856 | ) | | | (134,075 | ) | |
Class I | | | (2,120,079 | ) | | | (1,330,308 | ) | |
Class R | | | (51 | ) | | | — | | |
Class Z | | | (64 | ) | | | — | | |
Net realized gain: | |
Class A | | | (74,522 | ) | | | — | | |
Class B | | | (173 | ) | | | — | | |
Class C | | | (40,380 | ) | | | — | | |
Class I | | | (258,191 | ) | | | — | | |
Class R | | | — | | | | — | | |
Class Z | | | — | | | | |
Total dividends and distributions to
shareholders | | | (3,101,900 | ) | | | (1,928,274 | ) | |
Capital Stock Transactions: | |
Increase in net assets from Fund share
transactions | | | 91,509,661 | | | | 18,793,632 | | |
Total increase in net assets | | | 105,940,556 | | | | 36,591,652 | | |
Net Assets: | |
Beginning of year | | | 144,807,854 | | | | 108,216,202 | | |
End of yeara | | $ | 250,748,410 | | | $ | 144,807,854 | | |
a Includes accumulated undistributed net investment income and dividends in excess of net investment income of $264,261 and $31,486, respectively.
See accompanying notes to financial statements.
21
COHEN & STEERS GLOBAL INFRASTRUCTURE FUND, INC.
FINANCIAL HIGHLIGHTS
The following tables include selected data for a share outstanding throughout each year and other performance information derived from the financial statements. It should be read in conjunction with the financial statements and notes thereto.
| | | Class A | |
| | | For the Year Ended December 31, | |
Per Share Operating Performance: | | 2014 | | 2013 | | 2012 | | 2011 | | 2010 | |
| Net asset value, beginning of year | | $ | 16.88 | | | $ | 14.49 | | | $ | 12.95 | | | $ | 12.93 | | | $ | 12.59 | | |
Income (loss) from investment operations: | |
| Net investment incomea | | | 0.25 | | | | 0.20 | | | | 0.25 | | | | 0.26 | | | | 0.22 | | |
| Net realized and unrealized gain | | | 1.71 | | | | 2.42 | | | | 1.55 | | | | 0.03 | | | | 0.42 | | |
| Total from investment operations | | | 1.96 | | | | 2.62 | �� | | | 1.80 | | | | 0.29 | | | | 0.64 | | |
Less dividends and distributions to shareholders
from: | |
| Net investment income | | | (0.21 | ) | | | (0.23 | ) | | | (0.26 | ) | | | (0.27 | ) | | | (0.29 | ) | |
Net realized gain | | | (0.04 | ) | | | — | | | | — | | | | — | | | | — | | |
| Return of capital | | | — | | | | — | | | | — | | | | (0.00 | )b | | | (0.01 | ) | |
Total dividends and distributions to
shareholders | | | (0.25 | ) | | | (0.23 | ) | | | (0.26 | ) | | | (0.27 | ) | | | (0.30 | ) | |
| Redemption fees retained by the Fund | | | — | | | | — | | | | — | | | | 0.00 | b | | | 0.00 | b | |
| Net increase in net asset value | | | 1.71 | | | | 2.39 | | | | 1.54 | | | | 0.02 | | | | 0.34 | | |
| Net asset value, end of year | | $ | 18.59 | | | $ | 16.88 | | | $ | 14.49 | | | $ | 12.95 | | | $ | 12.93 | | |
| Total investment returnc,d | | | 11.57 | % | | | 18.20 | % | | | 14.04 | % | | | 2.22 | % | | | 5.25 | % | |
Ratios/Supplemental Data: | |
| Net assets, end of year (in millions) | | $ | 48.6 | | | $ | 33.3 | | | $ | 38.3 | | | $ | 35.2 | | | $ | 41.7 | | |
Ratio of expenses to average daily net assets
(before expense reduction) | | | 1.36 | % | | | 1.50 | % | | | 1.66 | %e | | | 1.61 | %e | | | 1.74 | %e | |
Ratio of expenses to average daily net assets
(net of expense reduction) | | | 1.36 | % | | | 1.50 | % | | | 1.50 | %e | | | 1.50 | %e | | | 1.50 | %e | |
Ratio of net investment income to average daily
net assets (before expense reduction) | | | 1.36 | % | | | 1.24 | % | | | 1.66 | %e | | | 1.86 | %e | | | 1.58 | %e | |
Ratio of net investment income to average daily
net assets (net of expense reduction) | | | 1.36 | % | | | 1.24 | % | | | 1.82 | %e | | | 1.97 | %e | | | 1.82 | %e | |
| Portfolio turnover rate | | | 36 | % | | | 68 | % | | | 69 | % | | | 73 | % | | | 79 | % | |
a Calculation based on average shares outstanding.
b Amount is less than $0.005.
c Return assumes the reinvestment of all dividends and distributions at NAV.
d Does not reflect sales charges, which would reduce return.
e Non-class specific expenses are calculated at the Fund level and class specific expenses are calculated at the class level.
See accompanying notes to financial statements.
22
COHEN & STEERS GLOBAL INFRASTRUCTURE FUND, INC.
FINANCIAL HIGHLIGHTS—(Continued)
| | | Class B | |
| | | For the Year Ended December 31, | |
Per Share Operating Performance: | | 2014 | | 2013 | | 2012 | | 2011 | | 2010 | |
| Net asset value, beginning of year | | $ | 17.01 | | | $ | 14.53 | | | $ | 12.94 | | | $ | 12.90 | | | $ | 12.55 | | |
Income (loss) from investment operations: | |
| Net investment incomea | | | 0.14 | | | | 0.08 | | | | 0.14 | | | | 0.16 | | | | 0.14 | | |
| Net realized and unrealized gain | | | 1.70 | | | | 2.45 | | | | 1.57 | | | | 0.04 | | | | 0.42 | | |
| Total from investment operations | | | 1.84 | | | | 2.53 | | | | 1.71 | | | | 0.20 | | | | 0.56 | | |
Less dividends and distributions to shareholders
from: | |
| Net investment income | | | (0.04 | ) | | | (0.05 | ) | | | (0.12 | ) | | | (0.16 | ) | | | (0.20 | ) | |
Net realized gain | | | (0.04 | ) | | | — | | | | — | | | | — | | | | — | | |
| Return of capital | | | — | | | | — | | | | — | | | | (0.00 | )b | | | (0.01 | ) | |
Total dividends and distributions to
shareholders | | | (0.08 | ) | | | (0.05 | ) | | | (0.12 | ) | | | (0.16 | ) | | | (0.21 | ) | |
| Redemption fees retained by the Fund | | | — | | | | — | | | | — | | | | 0.00 | b | | | 0.00 | b | |
| Net increase in net asset value | | | 1.76 | | | | 2.48 | | | | 1.59 | | | | 0.04 | | | | 0.35 | | |
| Net asset value, end of year | | $ | 18.77 | | | $ | 17.01 | | | $ | 14.53 | | | $ | 12.94 | | | $ | 12.90 | | |
| Total investment returnc,d | | | 10.80 | % | | | 17.47 | % | | | 13.28 | % | | | 1.51 | % | | | 4.57 | % | |
Ratios/Supplemental Data: | |
| Net assets, end of year (in millions) | | $ | 0.1 | | | $ | 0.1 | | | $ | 0.4 | | | $ | 1.4 | | | $ | 3.1 | | |
Ratio of expenses to average daily net assets
(before expense reduction) | | | 2.01 | % | | | 2.17 | % | | | 2.31 | %e | | | 2.26 | %e | | | 2.39 | %e | |
Ratio of expenses to average daily net assets
(net of expense reduction) | | | 2.01 | % | | | 2.15 | % | | | 2.15 | %e | | | 2.15 | %e | | | 2.15 | %e | |
Ratio of net investment income to average daily
net assets (before expense reduction) | | | 0.78 | % | | | 0.48 | % | | | 0.88 | %e | | | 1.08 | %e | | | 0.89 | %e | |
Ratio of net investment income to average daily
net assets (net of expense reduction) | | | 0.78 | % | | | 0.50 | % | | | 1.04 | %e | | | 1.19 | %e | | | 1.13 | %e | |
| Portfolio turnover rate | | | 36 | % | | | 68 | % | | | 69 | % | | | 73 | % | | | 79 | % | |
a Calculation based on average shares outstanding.
b Amount is less than $0.005.
c Does not reflect sales charges, which would reduce return.
d Return assumes the reinvestment of all dividends and distributions at NAV.
e Non-class specific expenses are calculated at the Fund level and class specific expenses are calculated at the class level.
See accompanying notes to financial statements.
23
COHEN & STEERS GLOBAL INFRASTRUCTURE FUND, INC.
FINANCIAL HIGHLIGHTS—(Continued)
| | | Class C | |
| | | For the Year Ended December 31, | |
Per Share Operating Performance: | | 2014 | | 2013 | | 2012 | | 2011 | | 2010 | |
| Net asset value, beginning of year | | $ | 16.84 | | | $ | 14.46 | | | $ | 12.92 | | | $ | 12.90 | | | $ | 12.55 | | |
Income (loss) from investment operations: | |
| Net investment incomea | | | 0.13 | | | | 0.10 | | | | 0.16 | | | | 0.17 | | | | 0.14 | | |
| Net realized and unrealized gain | | | 1.71 | | | | 2.41 | | | | 1.55 | | | | 0.03 | | | | 0.43 | | |
| Total from investment operations | | | 1.84 | | | | 2.51 | | | | 1.71 | | | | 0.20 | | | | 0.57 | | |
Less dividends and distributions to shareholders
from: | |
| Net investment income | | | (0.10 | ) | | | (0.13 | ) | | | (0.17 | ) | | | (0.18 | ) | | | (0.21 | ) | |
Net realized gain | | | (0.04 | ) | | | — | | | | — | | | | — | | | | — | | |
| Return of capital | | | — | | | | — | | | | — | | | | (0.00 | )b | | | (0.01 | ) | |
Total dividends and distributions to
shareholders | | | (0.14 | ) | | | (0.13 | ) | | | (0.17 | ) | | | (0.18 | ) | | | (0.22 | ) | |
| Redemption fees retained by the Fund | | | — | | | | — | | | | — | | | | 0.00 | b | | | 0.00 | b | |
| Net increase in net asset value | | | 1.70 | | | | 2.38 | | | | 1.54 | | | | 0.02 | | | | 0.35 | | |
| Net asset value, end of year | | $ | 18.54 | | | $ | 16.84 | | | $ | 14.46 | | | $ | 12.92 | | | $ | 12.90 | | |
| Total investment returnc,d | | | 10.88 | % | | | 17.41 | % | | | 13.30 | % | | | 1.52 | % | | | 4.63 | % | |
Ratios/Supplemental Data: | |
| Net assets, end of year (in millions) | | $ | 26.1 | | | $ | 18.4 | | | $ | 16.0 | | | $ | 17.2 | | | $ | 21.6 | | |
Ratio of expenses to average daily net assets
(before expense reduction) | | | 2.01 | % | | | 2.15 | % | | | 2.31 | %e | | | 2.26 | %e | | | 2.39 | %e | |
Ratio of expenses to average daily net assets
(net of expense reduction) | | | 2.01 | % | | | 2.15 | % | | | 2.15 | %e | | | 2.15 | %e | | | 2.15 | %e | |
Ratio of net investment income to average daily
net assets (before expense reduction) | | | 0.72 | % | | | 0.61 | % | | | 0.99 | %e | | | 1.20 | %e | | | 0.93 | %e | |
Ratio of net investment income to average daily
net assets (net of expense reduction) | | | 0.72 | % | | | 0.61 | % | | | 1.15 | %e | | | 1.31 | %e | | | 1.17 | %e | |
| Portfolio turnover rate | | | 36 | % | | | 68 | % | | | 69 | % | | | 73 | % | | | 79 | % | |
a Calculation based on average shares outstanding.
b Amount is less than $0.005.
c Does not reflect sales charges, which would reduce return.
d Return assumes the reinvestment of all dividends and distributions at NAV.
e Non-class specific expenses are calculated at the Fund level and class specific expenses are calculated at the class level.
See accompanying notes to financial statements.
24
COHEN & STEERS GLOBAL INFRASTRUCTURE FUND, INC.
FINANCIAL HIGHLIGHTS—(Continued)
| | | Class I | |
| | | For the Year Ended December 31, | |
Per Share Operating Performance: | | 2014 | | 2013 | | 2012 | | 2011 | | 2010 | |
| Net asset value, beginning of year | | $ | 16.93 | | | $ | 14.52 | | | $ | 12.97 | | | $ | 12.96 | | | $ | 12.62 | | |
Income (loss) from investment operations: | |
| Net investment incomea | | | 0.30 | | | | 0.26 | | | | 0.30 | | | | 0.32 | | | | 0.30 | | |
| Net realized and unrealized gain | | | 1.71 | | | | 2.43 | | | | 1.56 | | | | 0.01 | | | | 0.38 | | |
| Total from investment operations | | | 2.01 | | | | 2.69 | | | | 1.86 | | | | 0.33 | | | | 0.68 | | |
Less dividends and distributions to shareholders
from: | |
| Net investment income | | | (0.26 | ) | | | (0.28 | ) | | | (0.31 | ) | | | (0.32 | ) | | | (0.33 | ) | |
Net realized gain | | | (0.04 | ) | | | — | | | | — | | | | — | | | | — | | |
| Return of capital | | | — | | | | — | | | | — | | | | (0.00 | )b | | | (0.01 | ) | |
Total dividends and distributions to
shareholders | | | (0.30 | ) | | | (0.28 | ) | | | (0.31 | ) | | | (0.32 | ) | | | (0.34 | ) | |
| Redemption fees retained by the Fund | | | — | | | | — | | | | — | | | | 0.00 | b | | | 0.00 | b | |
| Net increase in net asset value | | | 1.71 | | | | 2.41 | | | | 1.55 | | | | 0.01 | | | | 0.34 | | |
| Net asset value, end of year | | $ | 18.64 | | | $ | 16.93 | | | $ | 14.52 | | | $ | 12.97 | | | $ | 12.96 | | |
| Total investment returnc | | | 11.82 | % | | | 18.69 | % | | | 14.44 | % | | | 2.51 | % | | | 5.65 | % | |
Ratios/Supplemental Data: | |
| Net assets, end of year (in millions) | | $ | 175.9 | | | $ | 93.0 | | | $ | 53.5 | | | $ | 36.9 | | | $ | 28.7 | | |
Ratio of expenses to average daily net assets
(before expense reduction) | | | 1.10 | % | | | 1.16 | % | | | 1.31 | %d | | | 1.26 | %d | | | 1.39 | %d | |
Ratio of expenses to average daily net assets
(net of expense reduction) | | | 1.10 | % | | | 1.15 | % | | | 1.15 | %d | | | 1.15 | %d | | | 1.15 | %d | |
Ratio of net investment income to average daily
net assets (before expense reduction) | | | 1.63 | % | | | 1.62 | % | | | 2.04 | %d | | | 2.33 | %d | | | 2.16 | %d | |
Ratio of net investment income to average daily
net assets (net of expense reduction) | | | 1.63 | % | | | 1.63 | % | | | 2.20 | %d | | | 2.44 | %d | | | 2.40 | %d | |
| Portfolio turnover rate | | | 36 | % | | | 68 | % | | | 69 | % | | | 73 | % | | | 79 | % | |
a Calculation based on average shares outstanding.
b Amount is less than $0.005.
c Return assumes the reinvestment of all dividends and distributions at NAV.
d Non-class specific expenses are calculated at the Fund level and class specific expenses are calculated at the class level.
See accompanying notes to financial statements.
25
COHEN & STEERS GLOBAL INFRASTRUCTURE FUND, INC.
FINANCIAL HIGHLIGHTS—(Continued)
| | | Class R | |
| Per Share Operating Performance: | | For the Period
October 1, 2014a
through
December 31, 2014 | |
Net asset value, beginning of period | | $ | 18.44 | | |
Income (loss) from investment operations: | |
Net investment incomeb | | | 0.04 | | |
Net realized and unrealized gain | | | 0.26 | | |
Total from investment operations | | | 0.30 | | |
Less dividends to shareholders from: | |
Net investment income | | | (0.10 | ) | |
Total dividends to shareholders | | | (0.10 | ) | |
Net increase in net asset value | | | 0.20 | | |
Net asset value, end of period | | $ | 18.64 | | |
Total investment returnc | | | 1.61 | %d | |
Ratios/Supplemental Data: | |
Net assets, end of period (in 000s) | | $ | 10.1 | | |
| Ratio of expenses to average daily net assets (before expense reduction) | | | 1.52 | %e | |
| Ratio of expenses to average daily net assets (net of expense reduction) | | | 1.52 | %e | |
| Ratio of net investment income to average daily net assets (before expense reduction) | | | 0.98 | %e | |
| Ratio of net investment income to average daily net assets (net of expense reduction) | | | 0.98 | %e | |
Portfolio turnover rate | | | 36 | %d | |
a Inception date.
b Calculation based on average shares outstanding.
c Return assumes the reinvestment of all dividends and distributions at NAV.
d Not annualized.
e Annualized.
See accompanying notes to financial statements.
26
COHEN & STEERS GLOBAL INFRASTRUCTURE FUND, INC.
FINANCIAL HIGHLIGHTS—(Continued)
| | | Class Z | |
| Per Share Operating Performance: | | For the Period
October 1, 2014a
through
December 31, 2014 | |
Net asset value, beginning of period | | $ | 18.44 | | |
Income (loss) from investment operations: | |
Net investment incomeb | | | 0.07 | | |
Net realized and unrealized gain | | | 0.25 | | |
Total from investment operations | | | 0.32 | | |
Less dividends to shareholders from: | |
Net investment income | | | (0.12 | ) | |
Total dividends to shareholders | | | (0.12 | ) | |
Net increase in net asset value | | | 0.20 | | |
Net asset value, end of period | | $ | 18.64 | | |
Total investment returnc | | | 1.74 | %d | |
Ratios/Supplemental Data: | |
Net assets, end of period (in 000s) | | $ | 10.1 | | |
| Ratio of expenses to average daily net assets (before expense reduction) | | | 1.02 | %e | |
| Ratio of expenses to average daily net assets (net of expense reduction) | | | 1.02 | %e | |
| Ratio of net investment income to average daily net assets (before expense reduction) | | | 1.49 | %e | |
| Ratio of net investment income to average daily net assets (net of expense reduction) | | | 1.49 | %e | |
Portfolio turnover rate | | | 36 | %d | |
a Inception date.
b Calculation based on average shares outstanding.
c Return assumes the reinvestment of all dividends and distributions at NAV.
d Not annualized.
e Annualized.
See accompanying notes to financial statements.
27
COHEN & STEERS GLOBAL INFRASTRUCTURE FUND, INC.
NOTES TO FINANCIAL STATEMENTS
Note 1. Organization and Significant Accounting Policies
Cohen & Steers Global Infrastructure Fund, Inc. (the Fund), was incorporated under the laws of the State of Maryland on January 13, 2004 and is registered under the Investment Company Act of 1940, as amended (the 1940 Act), as a diversified, open-end management investment company. The Fund's investment objective is total return. On July 22, 2014, the Board of Directors of the Fund approved the Fund's offering of Class R and Class Z shares. Class R and Class Z shares became available for investment on October 1, 2014, on which date the Fund sold 542 shares each of Class R and Class Z for $20,000 to Cohen & Steers Capital Management, Inc. (the investment advisor). The authorized shares of the Fund are divided into six classes designated Class A, B, C, I, R and Z shares. Class B shares are no longer offered except through dividend reinvestment and permitted exchanges by existing Class B shareholders. Each of the Fund's shares has equal dividend, liquidation and voting rights (except for matters relating to distribution and shareholder servicing of such shares). Class B shares automatically convert to Class A shares at the end of the month which precedes the eighth anniversary of the purchase date.
The following is a summary of significant accounting policies consistently followed by the Fund in the preparation of its financial statements. The Fund is an investment company and, accordingly, follows the investment company accounting and reporting guidance of the Financial Accounting Standards Board Accounting Standards Codification Topic 946—Investment Companies. The accounting policies of the Fund are in conformity with accounting principles generally accepted in the United States of America (GAAP). The preparation of the financial statements in accordance with GAAP requires management to make estimates and assumptions that affect the reported amounts of assets and liabilities at the date of the financial statements and the reported amounts of income and expenses during the reporting period. Actual results could differ from those estimates.
Portfolio Valuation: Investments in securities that are listed on the New York Stock Exchange (NYSE) are valued, except as indicated below, at the last sale price reflected at the close of the NYSE on the business day as of which such value is being determined. If there has been no sale on such day, the securities are valued at the mean of the closing bid and ask prices on such day or, if no ask price is available, at the bid price.
Securities not listed on the NYSE but listed on other domestic or foreign securities exchanges are valued in a similar manner. Securities traded on more than one securities exchange are valued at the last sale price reflected at the close of the exchange representing the principal market for such securities on the business day as of which such value is being determined. If after the close of a foreign market, but prior to the close of business on the day the securities are being valued, market conditions change significantly, certain non-U.S. equity holdings may be fair valued pursuant to procedures established by the Board of Directors.
Readily marketable securities traded in the over-the-counter market, including listed securities whose primary market is believed by the investment advisor to be over-the-counter, are valued at the last sale price on the valuation date as reported by sources deemed appropriate by the Board of Directors to reflect their fair market value. If there has been no sale on such day, the securities are
28
COHEN & STEERS GLOBAL INFRASTRUCTURE FUND, INC.
NOTES TO FINANCIAL STATEMENTS—(Continued)
valued at the mean of the closing bid and ask prices on such day or, if no ask price is available, at the bid price.
Short-term debt securities with a maturity date of 60 days or less are valued at amortized cost, which approximates fair value. Investments in open-end mutual funds are valued at their closing net asset value.
The policies and procedures approved by the Fund's Board of Directors delegate authority to make fair value determinations to the investment advisor, subject to the oversight of the Board of Directors. The investment advisor has established a valuation committee (Valuation Committee) to administer, implement and oversee the fair valuation process according to the policies and procedures approved annually by the Board of Directors. Among other things, these procedures allow the Fund to utilize independent pricing services, quotations from securities and financial instrument dealers and other market sources to determine fair value.
Securities for which market prices are unavailable, or securities for which the investment advisor determines that the bid and/or ask price or a counterparty valuation does not reflect market value, will be valued at fair value, as determined in good faith by the Valuation Committee, pursuant to procedures approved by the Fund's Board of Directors. Circumstances in which market prices may be unavailable include, but are not limited to, when trading in a security is suspended, the exchange on which the security is traded is subject to an unscheduled close or disruption or material events occur after the close of the exchange on which the security is principally traded. In these circumstances, the Fund determines fair value in a manner that fairly reflects the market value of the security on the valuation date based on consideration of any information or factors it deems appropriate. These may include, but are not limited to, recent transactions in comparable securities, information relating to the specific security and developments in the markets.
Foreign equity fair value pricing procedures utilized by the Fund may cause certain non-U.S. equity holdings to be fair valued on the basis of fair value factors provided by a pricing service to reflect any significant market movements between the time the Fund values such securities and the earlier closing of foreign markets.
The Fund's use of fair value pricing may cause the net asset value of Fund shares to differ from the net asset value that would be calculated using market quotations. Fair value pricing involves subjective judgments and it is possible that the fair value determined for a security may be materially different than the value that could be realized upon the sale of that security.
Fair value is defined as the price that the Fund would expect to receive upon the sale of an investment or expect to pay to transfer a liability in an orderly transaction with an independent buyer in the principal market or, in the absence of a principal market, the most advantageous market for the investment or liability. The hierarchy of inputs that are used in determining the fair value of the Fund's investments is summarized below.
• Level 1—quoted prices in active markets for identical investments
• Level 2—other significant observable inputs (including quoted prices for similar investments, interest rates, credit risk, etc.)
29
COHEN & STEERS GLOBAL INFRASTRUCTURE FUND, INC.
NOTES TO FINANCIAL STATEMENTS—(Continued)
• Level 3—significant unobservable inputs (including the Fund's own assumptions in determining the fair value of investments)
The inputs or methodology used for valuing securities are not necessarily an indication of the risk associated with investing in those securities.
For movements between the levels within the fair value hierarchy, the Fund has adopted a policy of recognizing the transfer at the end of the period in which the underlying event causing the movement occurred. Changes in valuation techniques may result in transfers into or out of an assigned level within the disclosure hierarchy. As of December, 31, 2014, there were $102,681,079 of securities transferred between Level 1 and Level 2, which resulted from the Fund utilizing foreign equity fair value pricing procedures as of December 31, 2014.
The following is a summary of the inputs used as of December 31, 2014 in valuing the Fund's investments carried at value:
| | Total | | Quoted Prices
In Active
Markets for
Identical
Investments
(Level 1) | | Other
Significant
Observable
Inputs
(Level 2) | | Significant
Unobservable
Inputs
(Level 3) | |
Common Stock—Australia | | $ | 10,289,472 | | | $ | 1,258,592 | | | $ | 9,030,880 | | | $ | — | | |
Common Stock—Austria | | | 228,021 | | | | 228,021 | | | | — | | | | — | | |
Common Stock—Brazil | | | 392,212 | | | | 392,212 | | | | — | | | | — | | |
Common Stock—Canada | | | 10,996,367 | | | | 10,996,367 | | | | — | | | | — | | |
Common Stock—Italy | | | 10,730,243 | | | | 1,902,060 | | | | 8,828,183 | | | | — | | |
Common Stock—Mexico | | | 2,095,639 | | | | 2,095,639 | | | | — | | | | — | | |
Common Stock—United States | | | 106,470,809 | | | | 106,470,809 | | | | — | | | | — | | |
Common Stock—Other
Countries | | | 99,958,885 | | | | — | | | | 99,958,885 | | | | — | | |
Short-Term Investments | | | 4,300,000 | | | | — | | | | 4,300,000 | | | | — | | |
Total Investmentsa | | $ | 245,461,648 | | | $ | 123,343,700 | | | $ | 122,117,948 | | | $ | — | | |
a Portfolio holdings are disclosed individually on the Schedule of Investments.
Security Transactions, Investment Income and Expense Allocations: Security transactions are recorded on trade date. Realized gains and losses on investments sold are recorded on the basis of identified cost. Interest income is recorded on the accrual basis. Discounts are accreted and premiums are amortized over the life of the respective securities. Dividend income is recorded on the ex-dividend date, except for certain dividends on foreign securities, which are recorded as soon as the Fund is informed after the ex-dividend date. Distributions from Master Limited Partnerships (MLPs) are recorded as income and return of capital based on information reported by the MLPs and management's estimates
30
COHEN & STEERS GLOBAL INFRASTRUCTURE FUND, INC.
NOTES TO FINANCIAL STATEMENTS—(Continued)
of such amounts based on historical information. These estimates are adjusted when the actual source of distributions is disclosed by the MLPs and actual amounts may differ from the estimated amounts. Income, expenses (other than expenses attributable to a specific class) and realized and unrealized gains or losses on investments are allocated to each class of shares based on its relative net assets.
Foreign Currency Translation: The books and records of the Fund are maintained in U.S. dollars. Investment securities and other assets and liabilities denominated in foreign currencies are translated into U.S. dollars based upon prevailing exchange rates on the date of valuation. Purchases and sales of investment securities and income and expense items denominated in foreign currencies are translated into U.S. dollars based upon prevailing exchange rates on the respective dates of such transactions. The Fund does not isolate that portion of the results of operations resulting from fluctuations in foreign exchange rates on investments from the fluctuations arising from changes in market prices of securities held. Such fluctuations are included with the net realized and unrealized gain or loss on investments.
Net realized foreign exchange gains or losses arise from sales of foreign currencies, including gains and losses on forward foreign currency exchange contracts, currency gains or losses realized between the trade and settlement dates on securities transactions, and the difference between the amounts of dividends, interest, and foreign withholding taxes recorded on the Fund's books and the U.S. dollar equivalent of the amounts actually received or paid. Net unrealized foreign exchange gains and losses arise from changes in the values of assets and liabilities, other than investments in securities, on the date of valuation, resulting from changes in exchange rates. Pursuant to U.S. federal income tax regulations, certain foreign currency gains/losses included in realized and unrealized gains/losses are included in or are a reduction of ordinary income for federal income tax purposes.
Foreign Securities: The Fund directly purchases securities of foreign issuers. Investing in securities of foreign issuers involves special risks not typically associated with investing in securities of U.S. issuers. The risks include possible revaluation of currencies, the ability to repatriate funds, less complete financial information about companies and possible future adverse political and economic developments. Moreover, securities of many foreign issuers and their markets may be less liquid and their prices more volatile than securities of comparable U.S. issuers.
Dividends and Distributions to Shareholders: Dividends from net investment income and capital gain distributions are determined in accordance with U.S. federal income tax regulations, which may differ from GAAP. Dividends from net investment income, if any, are declared and paid semi-annually. Net realized capital gains, unless offset by any available capital loss carryforward, are typically distributed to shareholders at least annually. Dividends and distributions to shareholders are recorded on the ex-dividend date and are automatically reinvested in full and fractional shares of the Fund based on the net asset value per share at the close of business on the payable date, unless the shareholder has elected to have them paid in cash.
Distributions paid by the Fund are subject to recharacterization for tax purposes. Based upon the results of operations for the year ended December 31, 2014, a portion of the dividends have been reclassified to distributions from net realized capital gains.
31
COHEN & STEERS GLOBAL INFRASTRUCTURE FUND, INC.
NOTES TO FINANCIAL STATEMENTS—(Continued)
Income Taxes: It is the policy of the Fund to continue to qualify as a regulated investment company, if such qualification is in the best interest of the shareholders, by complying with the requirements of Subchapter M of the Internal Revenue Code applicable to regulated investment companies, and by distributing substantially all of its taxable earnings to its shareholders. Accordingly, no provision for federal income or excise tax is necessary. Dividend and interest income from holdings in non-U.S. securities is recorded net of non-U.S. taxes paid. Security and foreign currency transactions and any gains realized by the Fund on the sale of securities in certain non-U.S. markets are subject to non-U.S. taxes. The Fund records a liability based on any unrealized gains on securities held in these markets in order to estimate the potential non-U.S. taxes due upon the sale of these securities. Management has analyzed the Fund's tax positions taken on federal and applicable state income tax returns as well as its tax positions in non-U.S. jurisdictions in which it trades for all open tax years and has concluded that as of December 31, 2014, no additional provisions for income tax are required in the Fund's financial statements. The Fund's tax positions for the tax years for which the applicable statutes of limitations have not expired are subject to examination by the Internal Revenue Service, state departments of revenue and by foreign tax authorities.
Note 2. Investment Advisory, Administration Fees and Other Transactions with Affiliates
Investment Advisory Fees: The investment advisor serves as the Fund's investment advisor pursuant to an investment advisory agreement (the investment advisory agreement). Under the terms of the investment advisory agreement, the investment advisor provides the Fund with day-to-day investment decisions and generally manages the Fund's investments in accordance with the stated policies of the Fund, subject to the supervision of the Board of Directors.
For the services provided to the Fund, the investment advisor receives a fee, accrued daily and paid monthly, at the annual rate of 0.75% of the average daily net assets of the Fund up to and including $1.5 billion and 0.65% of the average daily net assets above $1.5 billion.
For the year ended December 31, 2014, and through June 30, 2016, the investment advisor has contractually agreed to waive its fee and/or reimburse expenses so that the Fund's total annual operating expenses (excluding acquired fund fees and expenses, and extraordinary expenses) do not exceed 1.50% for Class A shares, 2.15% for Class B shares and Class C shares and 1.15% for Class I shares. For the period from October 1, 2014 through June 30, 2016, the investment advisor has contractually agreed to waive its fee and/or reimburse expenses so that the Fund's total annual operating expenses (excluding acquired fund fees and expenses and extraordinary expenses) do not exceed 1.65% for Class R shares and 1.15% for Class Z shares. This contractual agreement can be amended at any time by agreement of the Fund and the investment advisor and will terminate automatically in the event of termination of the investment advisory agreement between the investment advisor and the Fund. For the year ended December 31, 2014, there were no fees waived and/or expenses reimbursed to the Fund.
Under subadvisory agreements between the investment advisor and each of Cohen & Steers Asia Limited and Cohen & Steers UK Limited (collectively, the subadvisors), affiliates of the investment
32
COHEN & STEERS GLOBAL INFRASTRUCTURE FUND, INC.
NOTES TO FINANCIAL STATEMENTS—(Continued)
advisor, the subadvisors are responsible for managing the Fund's investments in certain non-U.S. securities. For their services provided under the subadvisory agreements, the investment advisor (not the Fund) pays the subadvisors. The investment advisor allocates 50% of the investment advisory fee received from the Fund among itself and each subadvisor based on the portion of the Fund's average daily net assets managed by the investment advisor and each subadvisor.
Administration Fees: The Fund has entered into an administration agreement with the investment advisor under which the investment advisor performs certain administrative functions for the Fund and receives a fee, accrued daily and paid monthly, at the annual rate of 0.02% of the average daily net assets of the Fund. For the year ended December 31, 2014, the Fund incurred $39,466 in fees under this administration agreement. Additionally, the Fund pays State Street Bank and Trust Company as co-administrator under a fund accounting and administration agreement.
Distribution Fees: Shares of the Fund are distributed by Cohen & Steers Securities, LLC (the distributor), an affiliated entity of the investment advisor. The Fund has adopted an amended distribution and service plan (the plan) pursuant to Rule 12b-1 under the 1940 Act. The plan provides that the Fund will pay the distributor a fee, accrued daily and paid monthly, at an annual rate of up to 0.25% of the average daily net assets attributable to Class A shares, up to 0.75% of the average daily net assets attributable to Class B and Class C shares, and up to 0.50% of the average daily net assets attributable to Class R shares. In addition, with respect to Class R shares, such amounts may also be used to pay for services to fund shareholders or services related to the maintenance of shareholder accounts.
There is a maximum initial sales charge of 4.50% for Class A shares. There is a contingent deferred sales charge (CDSC) of 1.00% on purchases of $1 million or more of Class A shares, which applies if redemption occurs within one year from purchase. There is a CDSC on Class B shares. There is a CDSC of 1.00% on Class C shares, which applies if redemption occurs within one year from purchase. For the year ended December 31, 2014, the Fund has been advised that the distributor or its affiliates received $18,999 in sales commissions from the sale of Class A shares and $4,342 of CDSC relating to redemptions of Class C shares. The distributor has advised the Fund that proceeds from the CDSC on these classes are used by the distributor to defray its expenses related to providing distribution-related services to the Fund in connection with the sale of these classes.
Shareholder Servicing Fees: For shareholder services, the Fund pays the distributor or its affiliates a fee, accrued daily and paid monthly, at an annual rate of up to 0.10% of the average daily net assets of the Fund's Class A and Class I shares and up to 0.25% of the average daily net assets of the Fund's Class B and Class C shares. The distributor is responsible for paying qualified financial institutions for shareholder services.
Directors' and Officers' Fees: Certain directors and officers of the Fund are also directors, officers and/or employees of the investment advisor. The Fund does not pay compensation to directors and officers affiliated with the investment advisor except for the Chief Compliance Officer, who received compensation from the investment advisor, which was reimbursed by the Fund, in the amount of $2,314 for the year ended December 31, 2014.
33
COHEN & STEERS GLOBAL INFRASTRUCTURE FUND, INC.
NOTES TO FINANCIAL STATEMENTS—(Continued)
Note 3. Purchases and Sales of Securities
Purchases and sales of securities, excluding short-term investments, for the year ended December 31, 2014, totaled $156,977,075 and $69,540,808, respectively.
Note 4. Income Tax Information
The tax character of dividends and distributions paid was as follows:
| | For the Year Ended
December 31, | |
| | 2014 | | 2013 | |
Ordinary income | | $ | 2,728,634 | | | $ | 1,928,274 | | |
| Long-term capital gain | | | 373,266 | | | | — | | |
Total dividends and distributions | | $ | 3,101,900 | | | $ | 1,928,274 | | |
As of December 31, 2014, the tax-basis components of accumulated earnings and the federal tax cost were as follows:
Cost for federal income tax purposes | | $ | 207,585,850 | | |
Gross unrealized appreciation | | $ | 40,016,430 | | |
| Gross unrealized depreciation | | | (2,140,632 | ) | |
Net unrealized appreciation | | $ | 37,875,798 | | |
Undistributed ordinary income | | $ | 46,368 | | |
During the year ended December 31, 2014, the Fund utilized net capital loss carryforwards of $3,694,294.
As of December 31, 2014, the Fund had temporary book/tax differences primarily attributable to wash sales on portfolio securities and partnership investments and permanent book/tax differences primarily attributable to foreign currency transactions, prior year income redesignations and partnership investments. To reflect reclassifications arising from the permanent differences, paid-in capital was charged $67,133, accumulated net realized loss was charged $48,412 and accumulated undistributed net investment income was credited $115,545. Net assets were not affected by this reclassification.
34
COHEN & STEERS GLOBAL INFRASTRUCTURE FUND, INC.
NOTES TO FINANCIAL STATEMENTS—(Continued)
Note 5. Capital Stock
The Fund is authorized to issue 300 million shares of capital stock, at a par value of $0.001 per share. The Board of Directors of the Fund may increase or decrease the aggregate number of shares of common stock that the Fund has authority to issue. Transactions in Fund shares were as follows:
| | For the
Year Ended
December 31, 2014 | | For the
Year Ended
December 31, 2013 | |
| | Shares | | Amount | | Shares | | Amount | |
Class A: | |
Sold | | | 1,118,828 | | | $ | 20,950,654 | | | | 460,618 | | | $ | 7,317,227 | | |
Issued as reinvestment of
dividends | | | 20,424 | | | | 384,895 | | | | 20,015 | | | | 313,118 | | |
Redeemed | | | (493,838 | ) | | | (9,043,739 | ) | | | (1,154,510 | ) | | | (17,699,081 | ) | |
Net increase (decrease) | | | 645,414 | | | $ | 12,291,810 | | | | (673,877 | ) | | $ | (10,068,736 | ) | |
Class B: | |
Sold | | | — | | | $ | — | | | | 7 | | | $ | 101 | | |
Issued as reinvestment of
dividends | | | 19 | | | | 361 | | | | 21 | | | | 334 | | |
Redeemed | | | (3,691 | ) | | | (69,261 | ) | | | (17,549 | ) | | | (274,907 | ) | |
Net decrease | | | (3,672 | ) | | $ | (68,900 | ) | | | (17,521 | ) | | $ | (274,472 | ) | |
Class C: | |
Sold | | | 526,421 | | | $ | 9,743,083 | | | | 153,978 | | | $ | 2,472,171 | | |
Issued as reinvestment of
dividends | | | 5,385 | | | | 101,952 | | | | 5,484 | | | | 85,132 | | |
Redeemed | | | (214,711 | ) | | | (3,921,625 | ) | | | (176,316 | ) | | | (2,768,474 | ) | |
Net increase (decrease) | | | 317,095 | | | $ | 5,923,410 | | | | (16,854 | ) | | $ | (211,171 | ) | |
Class I: | |
Sold | | | 5,018,279 | | | $ | 93,212,874 | | | | 2,828,217 | | | $ | 45,056,776 | | |
Issued as reinvestment of
dividends | | | 91,575 | | | | 1,727,977 | | | | 52,577 | | | | 830,238 | | |
Redeemed | | | (1,169,760 | ) | | | (21,597,510 | ) | | | (1,068,411 | ) | | | (16,539,003 | ) | |
Net increase | | | 3,940,094 | | | $ | 73,343,341 | | | | 1,812,383 | | | $ | 29,348,011 | | |
35
COHEN & STEERS GLOBAL INFRASTRUCTURE FUND, INC.
NOTES TO FINANCIAL STATEMENTS—(Continued)
| | For the
Year Ended
December 31, 2014 | | For the
Year Ended
December 31, 2013 | |
| | Shares | | Amount | | Shares | | Amount | |
Class Ra: | |
Sold | | | 542 | | | $ | 10,000 | | | | — | | | $ | — | | |
Net increase | | | 542 | | | $ | 10,000 | | | | — | | | $ | — | | |
Class Za: | |
Sold | | | 542 | | | $ | 10,000 | | | | — | | | $ | — | | |
Net increase | | | 542 | | | $ | 10,000 | | | | — | | | $ | — | | |
a Inception date of October 1, 2014.
Note 6. Borrowings
As of December 31, 2014, the Fund, in conjunction with other Cohen & Steers open-end funds, was a party to a $200,000,000 syndicated credit agreement (the credit agreement) with State Street Bank and Trust Company, as administrative agent and operations agent, and the lenders identified in the credit agreement (as applicable), which expired January 23, 2015. The Fund paid a commitment fee of 0.10% per annum on its proportionate share of the unused portion of the credit agreement. Effective January 23, 2015, the credit agreement was renewed and expires January 22, 2016. Under the renewed credit agreement, the total commitment amount has been reduced to $50,000,000 and the Fund pays a commitment fee of 0.15% per annum on its proportionate share of the unused portion of the credit agreement.
During the year ended December 31, 2014, the Fund did not borrow under the credit agreement.
Note 7. Other
In the normal course of business, the Fund enters into contracts that provide general indemnifications. The Fund's maximum exposure under these arrangements is dependent on claims that may be made against the Fund in the future and, therefore, cannot be estimated; however, based on experience, the risk of material loss from such claims is considered remote.
Note 8. Subsequent Events
Management has evaluated events and transactions occurring after December 31, 2014 through the date that the financial statements were issued, and has determined that no additional disclosure in the financial statements is required.
36
COHEN & STEERS GLOBAL INFRASTRUCTURE FUND, INC.
REPORT OF INDEPENDENT REGISTERED PUBLIC ACCOUNTING FIRM
To the Board of Directors and Shareholders of
Cohen & Steers Global Infrastructure Fund, Inc.
In our opinion, the accompanying statement of assets and liabilities, including the schedule of investments, and the related statements of operations and of changes in net assets and the financial highlights present fairly, in all material respects, the financial position of Cohen & Steers Global Infrastructure Fund, Inc. (the "Fund") at December 31, 2014, the results of its operations for the year then ended, the changes in its net assets for each of the two years in the period then ended and the financial highlights for each of the periods presented, in conformity with accounting principles generally accepted in the United States of America. These financial statements and financial highlights (hereafter referred to as "financial statements") are the responsibility of the Fund's management. Our responsibility is to express an opinion on these financial statements based on our audits. We conducted our audits of these financial statements in accordance with the standards of the Public Company Accounting Oversight Board (United States). Those standards require that we plan and perform the audit to obtain reasonable assurance about whether the financial statements are free of material misstatement. An audit includes examining, on a test basis, evidence supporting the amounts and disclosures in the financial statements, assessing the accounting principles used and significant estimates made by management, and evaluating the overall financial statement presentation. We believe that our audits, which included confirmation of securities at December 31, 2014 by correspondence with the custodian and brokers, provide a reasonable basis for our opinion.
PricewaterhouseCoopers LLP
New York, New York
February 19, 2015
37
COHEN & STEERS GLOBAL INFRASTRUCTURE FUND, INC.
TAX INFORMATION—2014 (Unaudited)
Pursuant to the Jobs and Growth Relief Reconciliation Act of 2003, the Fund designates qualified dividend income of $3,191,184. Additionally, 43.33% of the ordinary dividends qualified for the dividends received deduction available to corporations. Also, the Fund designates a long-term capital gain distribution of $373,266 at the 20% maximum rate.
The Fund has elected, pursuant to section 853 of the Internal Revenue Code, to pass through foreign taxes of $429,357. The Fund generated net foreign source income of $3,935,043 with respect to this election.
OTHER INFORMATION
A description of the policies and procedures that the Fund uses to determine how to vote proxies relating to portfolio securities is available (i) without charge, upon request, by calling 800-330-7348, (ii) on our website at cohenandsteers.com or (iii) on the Securities and Exchange Commission's (the SEC) website at http://www.sec.gov. In addition, the Fund's proxy voting record for the most recent 12-month period ended June 30 is available by August 31 of each year (i) without charge, upon request, by calling 800-330-7348 or (ii) on the SEC's website at http://www.sec.gov.
The Fund files its complete schedule of portfolio holdings with the SEC for the first and third quarters of each fiscal year on Form N-Q. The Fund's Forms N-Q are available (i) without charge, upon request, by calling 800-330-7348 or (ii) on the SEC's website at http://www.sec.gov. In addition, the Forms N-Q may be reviewed and copied at the SEC's Public Reference Room in Washington, DC. Information on the operation of the Public Reference Room may be obtained by calling 800-SEC-0330.
Please note that distributions paid by the Fund to shareholders are subject to recharacterization for tax purposes. The Fund may also pay distributions in excess of the Fund's net investment company taxable income and this excess could be a tax free return of capital distributed from the Fund's assets. The final tax treatment of all distributions is reported to shareholders on their 1099-DIV forms, which are mailed after the close of each calendar year.
Foreign Investor Policy Change
Effective February 1, 2015, the Fund will no longer accept investments from investors with non-U.S. addresses as well as dealer controlled accounts designated as foreign accounts (Restricted Accounts), consistent with the industry standard. Existing Restricted Accounts can remain in the Fund, but will be prohibited from making further investments into their accounts. U.S. Armed Forces and Diplomatic post office addresses abroad will be treated as U.S. addresses and will continue to be able to invest in the Fund. For more information, please call (800) 437-9912.
38
COHEN & STEERS GLOBAL INFRASTRUCTURE FUND, INC.
MANAGEMENT OF THE FUND
The business and affairs of the Fund are managed under the direction of the Board of Directors. The Board of Directors approves all significant agreements between the Fund and persons or companies furnishing services to it, including the Fund's agreements with its investment advisor, administrator, co-administrator, custodian and transfer agent. The management of the Fund's day-to-day operations is delegated to its officers, the investment advisor, administrator and co-administrator, subject always to the investment objective and policies of the Fund and to the general supervision of the Board of Directors.
The Board of Directors and officers of the Fund and their principal occupations during at least the past five years are set forth below. The statement of additional information (SAI) includes additional information about fund directors and is available, without charge, upon request by calling 800-330-7348.
Name, Address1 and Age | | Position(s) Held
With Fund | | Term of
Office2 | | Principal Occupation
During At Least
The Past 5 Years
(Including Other
Directorships Held) | | Number of
Funds Within
Fund
Complex
Overseen by
Director
(Including
the Fund) | | Length
of Time
Served3 | |
Interested Director4 | |
Robert H. Steers
Age: 61 | | Director and Chairman | | Until next election of directors | | Chief Executive Officer of Cohen & Steers Capital Management, Inc. (CSCM or the Advisor) and its parent, Cohen & Steers, Inc. (CNS) since 2014. Prior to that, Co-Chairman and Co-Chief Executive Officer of the Advisor since 2003 and CNS since 2004. | | | 21 | | | Since 1991 | |
Disinterested Directors | |
Michael G. Clark
Age: 49 | | Director | | Until next election of directors | | From May 2006 to June 2011, President and Chief Executive Officer of DWS Funds and Managing Director of Deutsche Asset Management. | | | 21 | | | Since June 2011 | |
(table continued on next page)
39
COHEN & STEERS GLOBAL INFRASTRUCTURE FUND, INC.
(table continued from previous page)
Name, Address1 and Age | | Position(s) Held
With Fund | | Term of
Office2 | | Principal Occupation
During At Least
The Past 5 Years
(Including Other
Directorships Held) | | Number of
Funds Within
Fund
Complex
Overseen by
Director
(Including
the Fund) | | Length
of Time
Served3 | |
Bonnie Cohen
Age: 72 | | Director | | Until next election of directors | | Consultant. Board Member DC Public Library Foundation since 2012, President since 2014; Board Member, Telluride Mountain Film Festival since 2010; Trustee, H. Rubenstein Foundation since 1996; Trustee, District of Columbia Public Libraries since 2004. | | | 21 | | | Since 2001 | |
George Grossman
Age: 61 | | Director | | Until next election of directors | | Attorney-at-law | | | 21 | | | Since 1993 | |
Richard E. Kroon
Age: 72 | | Director | | Until next election of directors | | Member of Investment Committee, Monmouth University since 2004; Former Director, Retired Chairman and Managing Partner of Sprout Group venture capital funds, then an affiliate of Donaldson, Lufkin and Jenrette Securities Corporation from 1981 to 2001. Former chairman of the National Venture Capital Association for the year 2000. | | | 21 | | | Since 2004 | |
(table continued on next page)
40
COHEN & STEERS GLOBAL INFRASTRUCTURE FUND, INC.
(table continued from previous page)
Name, Address1 and Age | | Position(s) Held
With Fund | | Term of
Office2 | | Principal Occupation
During At Least
The Past 5 Years
(Including Other
Directorships Held) | | Number of
Funds Within
Fund
Complex
Overseen by
Director
(Including
the Fund) | | Length
of Time
Served3 | |
Richard J. Norman
Age: 71 | | Director | | Until next election of directors | | Private Investor. Member, Montgomery County, Maryland Department of Corrections Volunteer Corps since February 2010; Liason for Business Leadership, Salvation Army World Service Organization (SAWSO) since 2010; Advisory Board Member, The Salvation Army since 1985; Prior thereto, Investment Representative of Morgan Stanley Dean Witter from 1966 to 2000. | | | 21 | | | Since 2001 | |
Frank K. Ross
Age: 71 | | Director | | Until next election of directors | | Visiting Professor of Accounting and Director of the Center for Accounting Education at Howard University School of Business since 2004; Board member and member of Audit Committee (Chairman from 2007 to 2012) and Human Resources and Compensation Committee, Pepco Holdings, Inc. (electric utility) from 2004 to 2014; Formerly, Mid-Atlantic Area Managing Partner for Assurance Services at KPMG LLP and Managing Partner of its Washington, DC offices from 1977 to 2003. | | | 21 | | | Since 2004 | |
(table continued on next page)
41
COHEN & STEERS GLOBAL INFRASTRUCTURE FUND, INC.
(table continued from previous page)
Name, Address1 and Age | | Position(s) Held
With Fund | | Term of
Office2 | | Principal Occupation
During At Least
The Past 5 Years
(Including Other
Directorships Held) | | Number of
Funds Within
Fund
Complex
Overseen by
Director
(Including
the Fund) | | Length
of Time
Served3 | |
C. Edward Ward Jr.
Age: 68 | | Director | | Until next election of directors | | Member of The Board of Trustees of Manhattan College, Riverdale, New York from 2004 to 2014. Formerly Director of closed-end fund management for the New York Stock Exchange (the NYSE), where he worked from 1979 to 2004. | | | 21 | | | Since 2004 | |
1 The address for each director is 280 Park Avenue, New York, NY 10017.
2 On March 12, 2008, the Board of Directors adopted a mandatory retirement policy stating a Director must retire from the Board on December 31st of the year in which he or she turns 75 years of age.
3 The length of time served represents the year in which the director was first elected or appointed to any fund in the Cohen & Steers fund complex.
4 "Interested person", as defined in the 1940 Act, of the Fund because of affiliation with CSCM (Interested Directors).
42
COHEN & STEERS GLOBAL INFRASTRUCTURE FUND, INC.
The officers of the Fund (other than Mr. Steers, whose biography is provided above), their address, their ages and their principal occupations for at least the past five years are set forth below.
Name, Address and Age1 | | Position(s) Held
With Fund | | Principal Occupation During At Least the Past 5 Years | | Length
of Time
Served2 | |
Adam M. Derechin
Age: 50 | | President and Chief Executive Officer | | Chief Operating Officer of CSCM since 2003 and CNS since 2004. | | Since 2005 | |
Joseph M. Harvey
Age: 51 | | Vice President | | President and Chief Investment Officer of CSCM since 2003 and President of CNS since 2004. | | Since 2004 | |
Robert S. Becker
Age: 45 | | Vice President | | Senior Vice President of CSCM since 2003. | | Since 2003 | |
Francis C. Poli
Age: 52 | | Secretary | | Executive Vice President, Secretary and General Counsel of CSCM and CNS since March 2007. | | Since 2007 | |
James Giallanza
Age: 48 | | Treasurer and Chief Financial Officer | | Executive Vice President of CSCM since January 2014. Prior to that, Senior Vice President of CSCM since 2006. | | Since 2006 | |
Lisa D. Phelan
Age: 46 | | Chief Compliance Officer | | Senior Vice President of CSCM since 2008. Chief Compliance Officer of CSCM, the Cohen & Steers funds, Cohen & Steers Asia Limited and CSSL since 2007, 2006, 2005 and 2004, respectively. | | Since 2006 | |
Heather Kaden
Age: 39 | | Deputy Chief Compliance Officer | | Vice President of CSCM since 2010 and Compliance Officer of Cohen & Steers UK, Limited since 2013. Prior to that, Senior Compliance Associate since 2007. | | Since 2014 | |
Tina M. Payne
Age: 40 | | Assistant Secretary | | Senior Vice President and Associate General Counsel of CSCM since 2010. Prior to that, Vice President and Associate General Counsel since July 2007. | | Since 2007 | |
Neil Bloom
Age: 44 | | Assistant Treasurer | | Vice President of CSCM since August 2008. | | Since 2009 | |
1 The address of each officer is 280 Park Avenue, New York, NY 10017.
2 Officers serve one-year terms. The length of time served represents the year in which the officer was first elected to that position in any fund in the Cohen & Steers fund complex. All of the officers listed above are officers of one or more of the other funds in the complex.
43
COHEN & STEERS GLOBAL INFRASTRUCTURE FUND, INC.
Cohen & Steers Privacy Policy
Facts | | What Does Cohen & Steers Do With Your Personal Information? | |
Why? | | Financial companies choose how they share your personal information. Federal law gives consumers the right to limit some but not all sharing. Federal law also requires us to tell you how we collect, share, and protect your personal information. Please read this notice carefully to understand what we do. | |
What? | | The types of personal information we collect and share depend on the product or service you have with us. This information can include:
• Social Security number and account balances
• Transaction history and account transactions
• Purchase history and wire transfer instructions | |
How? | | All financial companies need to share customers' personal information to run their everyday business. In the section below, we list the reasons financial companies can share their customers' personal information; the reasons Cohen & Steers chooses to share; and whether you can limit this sharing. | |
Reasons we can share your personal information | | Does Cohen & Steers
share? | | Can you limit this
sharing? | |
For our everyday business purposes—
such as to process your transactions, maintain your account(s), respond to court orders and legal investigations, or reports to credit bureaus | | Yes | | No | |
For our marketing purposes—
to offer our products and services to you | | Yes | | No | |
For joint marketing with other financial companies— | | No | | We don't share | |
For our affiliates' everyday business purposes—
information about your transactions and experiences | | No | | We don't share | |
For our affiliates' everyday business purposes—
information about your creditworthiness | | No | | We don't share | |
For our affiliates to market to you— | | No | | We don't share | |
For non-affiliates to market to you— | | No | | We don't share | |
Questions? Call 800-330-7348
44
COHEN & STEERS GLOBAL INFRASTRUCTURE FUND, INC.
Cohen & Steers Privacy Policy—(Continued)
Who we are | | | |
Who is providing this notice? | | Cohen & Steers Capital Management, Inc., Cohen & Steers Asia Limited, Cohen & Steers UK Limited, Cohen & Steers Securities, LLC, Cohen & Steers Private Funds and Cohen & Steers Open- and Closed-End Funds (collectively, Cohen & Steers). | |
What we do | | | |
How does Cohen & Steers protect my personal information? | | To protect your personal information from unauthorized access and use, we use security measures that comply with federal law. These measures include computer safeguards and secured files and buildings. We restrict access to your information to those employees who need it to perform their jobs, and also require companies that provide services on our behalf to protect your information. | |
How does Cohen & Steers collect my personal information? | | We collect your personal information, for example, when you:
• Open an account or buy securities from us
• Provide account information or give us your contact information
• Make deposits or withdrawals from your account
We also collect your personal information from other companies. | |
Why can't I limit all sharing? | | Federal law gives you the right to limit only:
• sharing for affiliates' everyday business purposes—information about your creditworthiness
• affiliates from using your information to market to you
• sharing for non-affiliates to market to you
State law and individual companies may give you additional rights to limit sharing. | |
Definitions | | | |
Affiliates | | Companies related by common ownership or control. They can be financial and nonfinancial companies.
• Cohen & Steers does not share with affiliates. | |
Non-affiliates | | Companies not related by common ownership or control. They can be financial and nonfinancial companies.
• Cohen & Steers does not share with non-affiliates. | |
Joint marketing | | A formal agreement between non-affiliated financial companies that together market financial products or services to you.
• Cohen & Steers does not jointly market. | |
45
COHEN & STEERS GLOBAL INFRASTRUCTURE FUND, INC.
Cohen & Steers Investment Solutions
COHEN & STEERS GLOBAL REALTY SHARES
• Designed for investors seeking total return, investing primarily in global real estate equity securities
• Symbols: CSFAX, CSFBX*, CSFCX, CSSPX, GRSRX, CSFZX
COHEN & STEERS INSTITUTIONAL REALTY SHARES
• Designed for institutional investors seeking total return, investing primarily in U.S. real estate securities
• Symbol: CSRIX
COHEN & STEERS REAL ESTATE SECURITIES FUND
• Designed for investors seeking total return, investing primarily in U.S. real estate securities
• Symbols: CSEIX, CSBIX*, CSCIX, CSDIX, CIRRX, CSZIX
COHEN & STEERS INTERNATIONAL REALTY FUND
• Designed for investors seeking total return, investing primarily in international real estate securities
• Symbols: IRFAX, IRFCX, IRFIX
COHEN & STEERS REALTY SHARES
• Designed for investors seeking total return, investing primarily in U.S. real estate securities
• Symbol: CSRSX
COHEN & STEERS
INSTITUTIONAL GLOBAL REALTY SHARES
• Designed for institutional investors seeking total return, investing primarily in global real estate securities
• Symbol: GRSIX
COHEN & STEERS GLOBAL INFRASTRUCTURE FUND
• Designed for investors seeking total return, investing primarily in global infrastructure securities
• Symbols: CSUAX, CSUBX*, CSUCX, CSUIX, CSURX, CSUZX
COHEN & STEERS DIVIDEND VALUE FUND
• Designed for investors seeking long-term growth of income and capital appreciation, investing primarily in dividend paying common stocks and preferred stocks
• Symbols: DVFAX, DVFCX, DVFIX, DVFRX, DVFZX
COHEN & STEERS
PREFERRED SECURITIES AND INCOME FUND
• Designed for investors seeking total return (high current income and capital appreciation), investing primarily in preferred and debt securities
• Symbols: CPXAX, CPXCX, CPXIX, CPRRX, CPXZX
COHEN & STEERS REAL ASSETS FUND
• Designed for investors seeking total return and the maximization of real returns during inflationary environments by investing primarily in real assets
• Symbols: RAPAX, RAPCX, RAPIX, RAPRX, RAPZX
COHEN & STEERS
MLP & ENERGY OPPORTUNITY FUND
• Designed for investors seeking total return, investing primarily in midstream energy master limited partnership (MLP) units and related stocks
• Symbols: MLOAX, MLOCX, MLOIX, MLORX, MLOZX
COHEN & STEERS
ACTIVE COMMODITIES STRATEGY FUND
• Designed for investors seeking total return, investing primarily in a diversified portfolio of exchange-traded commodity future contracts and other commodity-related derivative instruments
• Symbols: CDFAX, CDFCX, CDFIX, CDFRX, CDFZX
Distributed by Cohen & Steers Securities, LLC.
COHEN & STEERS GLOBAL REALTY MAJORS ETF
• Designed for investors who seek a relatively low-cost passive approach for investing in a portfolio of real estate equity securities of companies in a specified index
• Symbol: GRI
Distributed by ALPS Distributors, Inc.
ISHARES COHEN & STEERS
REALTY MAJORS INDEX FUND
• Designed for investors who seek a relatively low-cost passive approach for investing in a portfolio of real estate equity securities of companies in a specified index
• Symbol: ICF
Distributed by SEI Investments Distribution Co.
* Class B shares are no longer offered except through dividend reinvestment and permitted exchanges by existing Class B shareholders.
Please consider the investment objectives, risks, charges and expenses of the fund carefully before investing. A summary prospectus and prospectus containing this and other information can be obtained by calling 800-330-7348 or by visiting cohenandsteers.com. Please read the summary prospectus and prospectus carefully before investing.
46
COHEN & STEERS GLOBAL INFRASTRUCTURE FUND, INC.
OFFICERS AND DIRECTORS
Robert H. Steers
Director and Chairman
Michael G. Clark
Director
Bonnie Cohen
Director
George Grossman
Director
Richard E. Kroon
Director
Richard J. Norman
Director
Frank K. Ross
Director
C. Edward Ward, Jr.
Director
Adam M. Derechin
President and Chief Executive Officer
Joseph M. Harvey
Vice President
Robert S. Becker
Vice President
Francis C. Poli
Secretary
James Giallanza
Treasurer and Chief Financial Officer
Lisa D. Phelan
Chief Compliance Officer
Heather Kaden
Deputy Chief Compliance Officer
Tina M. Payne
Assistant Secretary
Neil Bloom
Assistant Treasurer
KEY INFORMATION
Investment Advisor
Cohen & Steers Capital Management, Inc.
280 Park Avenue
New York, NY 10017
(212) 832-3232
Co-administrator and Custodian
State Street Bank and Trust Company
One Lincoln Street
Boston, MA 02111
Transfer Agent
Boston Financial Data Services, Inc.
30 Dan Road
Canton, MA 02021
(800) 437-9912
Legal Counsel
Ropes & Gray LLP
1211 Avenue of the Americas
New York, NY 10036
Distributor
Cohen & Steers Securities, LLC
280 Park Avenue
New York, NY 10017
Nasdaq Symbol: Class A—CSUAX
B—CSUBX
C—CSUCX
I—CSUIX
R—CSURX
Z—CSUZX
Website: cohenandsteers.com
This report is authorized for delivery only to shareholders of Cohen & Steers Global Infrastructure Fund, Inc. unless accompanied or preceded by the delivery of a currently effective prospectus setting forth details of the Fund. Performance data quoted represent past performance. Past performance is no guarantee of future results and your investment may be worth more or less at the time you sell your shares.
47
COHEN & STEERS
GLOBAL INFRASTRUCTURE FUND
280 PARK AVENUE
NEW YORK, NY 10017
eDelivery NOW AVAILABLE
Stop traditional mail delivery; receive your shareholder reports and prospectus online.
Sign up at cohenandsteers.com

Annual Report December 31, 2014
Cohen & Steers Global Infrastructure Fund
Item 2. Code of Ethics.
The Registrant has adopted an Amended and Restated Code of Ethics that applies to its Principal Executive Officer and Principal Financial Officer. The Code of Ethics was in effect during the reporting period. The Registrant has not amended the Code of Ethics as described in Form N-CSR during the reporting period. The Registrant has not granted any waiver, including an implicit waiver, from a provision of the Code of Ethics as described in Form N-CSR during the reporting period. A current copy of the Code of Ethics is available on the Registrant’s website at www.cohenandsteers.com/assets/content/uploads/code_of_ethics_exec_and_senior.pdf. Upon request, a copy of the Code of Ethics can be obtained free of charge by calling 800-330-7348 or writing to the Secretary of the Registrant, 280 Park Avenue, 10th floor, New York, NY 10017.
Item 3. Audit Committee Financial Expert.
The registrant’s board has determined that Michael G. Clark and Frank K. Ross, each a member of the board’s audit committee, are each an “audit committee financial expert”. Mr. Clark and Mr. Ross are each “independent,” as such term is defined in Form N-CSR.
Item 4. Principal Accountant Fees and Services.
(a) — (d) Aggregate fees billed to the registrant for the last two fiscal years for professional services rendered by the registrant’s principal accountant were as follows:
| | 2014 | | 2013 | |
Audit Fees | | $ | 46,200 | | $ | 44,910 | |
Audit-Related Fees | | $ | 0 | | $ | 0 | |
Tax Fees | | $ | 15,100 | | $ | 14,700 | |
All Other Fees | | $ | 0 | | $ | 0 | |
Tax fees were billed in connection with the preparation of tax returns, calculation and designation of dividends and other miscellaneous tax services.
(e)(1) The audit committee is required to pre-approve audit and non-audit services performed for the registrant by the principal accountant. The audit committee also is required to pre-approve non-audit services performed by the registrant’s principal accountant for the registrant’s investment advisor and any sub-advisor (not including any sub-advisor whose role is primarily portfolio management and is subcontracted with or overseen by another investment advisor) and/or to any entity controlling, controlled by or under common control with the registrant’s investment advisor that provides ongoing services to the registrant, if the engagement for services relates directly to the operations and financial reporting of the registrant.
The audit committee may delegate pre-approval authority to one or more of its members who are independent members of the board of directors of the registrant. The member or members to whom such authority is delegated shall report any pre-approval decisions to the audit committee at its next scheduled meeting. The audit committee may not delegate its responsibility to pre-
approve services to be performed by the registrant’s principal accountant to the investment advisor.
(e)(2) No services included in (b) — (d) above were approved by the audit committee pursuant to paragraphs (c)(7)(i)(C) of Rule 2-01 of Regulation S-X.
(f) Not applicable.
(g) For the fiscal years ended December 31, 2014 and December 31, 2013, the aggregate fees billed by the registrant’s principal accountant for non-audit services rendered to the registrant and for non-audit services rendered to the registrant’s investment advisor (not including any sub-advisor whose role is primarily portfolio management and is subcontracted with or overseen by another investment advisor) and/or to any entity controlling, controlled by or under common control with the registrant’s investment advisor that provides ongoing services to the registrant were:
| | 2013 | | 2013 | |
| | | | | |
Registrant | | $ | 15,100 | | $ | 14,700 | |
Investment Advisor | | $ | 15,000 | | $ | 15,000 | |
(h) The registrant’s audit committee considered whether the provision of non-audit services that were rendered to the registrant’s investment advisor (not including any sub-advisor whose role is primarily portfolio management and is subcontracted with or overseen by another investment advisor) and/or to any entity controlling, controlled by or under common control with the registrant’s investment advisor that provides ongoing services to the registrant that were not required to be pre-approved pursuant to paragraph (c)(7)(ii) of Rule 2-01 of Regulation S-X was compatible with maintaining the principal accountant’s independence.
Item 5. Audit Committee of Listed Registrants.
Not applicable.
Item 6. Schedule of Investments.
Included in Item 1 above.
Item 7. Disclosure of Proxy Voting Policies and Procedures for Closed-End Management Investment Companies.
Not applicable.
Item 8. Portfolio Managers of Closed-End Investment Companies.
Not applicable.
Item 9. Purchases of Equity Securities by Closed-End Management Investment Company and Affiliated Purchasers.
Not applicable.
Item 10. Submission of Matters to a Vote of Security Holders.
None.
Item 11. Controls and Procedures.
(a) The registrant’s principal executive officer and principal financial officer have concluded that the registrant’s disclosure controls and procedures are reasonably designed to ensure that information required to be disclosed by the registrant in this Form N-CSR was recorded, processed, summarized and reported within the time periods specified in the Securities and Exchange Commission’s rules and forms, based upon such officers’ evaluation of these controls and procedures as of a date within 90 days of the filing date of this report.
(b) There were no changes in the registrant’s internal control over financial reporting that occurred during the second fiscal quarter of the period covered by this report that have materially affected, or are reasonably likely to materially affect, the registrant’s internal control over financial reporting.
Item 12. Exhibits.
(a)(1) Not Applicable.
(a)(2) Certifications of principal executive officer and principal financial officer as required by Rule 30a-2(a) under the Investment Company Act of 1940.
(a)(3) Not applicable.
(b) Certifications of chief executive officer and chief financial officer as required by Rule 30a- 2(b) under the Investment Company Act of 1940.
SIGNATURES
Pursuant to the requirements of the Securities Exchange Act of 1934 and the Investment Company Act of 1940, the registrant has duly caused this report to be signed on its behalf by the undersigned, thereunto duly authorized.
COHEN & STEERS GLOBAL INFRASTRUCTURE FUND, INC.
By: | /s/ Adam M. Derechin | |
| | Name: Adam M. Derechin | |
| | Title: President and Chief Executive Officer | |
| |
Date: March 2, 2015 | |
Pursuant to the requirements of the Securities Exchange Act of 1934 and the Investment Company Act of 1940, this report has been signed below by the following persons on behalf of the registrant and in the capacities and on the dates indicated.
By: | /s/ Adam M. Derechin | |
| | Name: | Adam M. Derechin | |
| | Title: | President and Chief Executive Officer | |
| (Principal Executive Officer) | |
By: | /s/ James Giallanza | |
| | Name: | James Giallanza | |
| | Title: | Treasurer and Chief Financial Officer | |
| (Principal Financial Officer) | |
| | |
| | |
Date: March 2, 2015 | |