UNITED STATES
SECURITIES AND EXCHANGE COMMISSION
Washington, D.C. 20549
FORM N-CSR
CERTIFIED SHAREHOLDER REPORT OF REGISTERED
MANAGEMENT INVESTMENT COMPANIES
Investment Company Act file number 811-21503
The FBR Funds
(Exact name of registrant as specified in charter)
1001 Nineteenth Street North
Arlington, VA 22209
(Address of principal executive offices) (Zip code)
Registrant’s telephone number, including area code: 703.469.1040
William Ginivan
General Counsel
FBR & Co.
Potomac Tower
1001 Nineteenth Street North
Arlington, VA 22209
(Name and address of agent for service)
Date of fiscal year end: October 31, 2011
Date of reporting period: October 31, 2011
Form N-CSR is to be used by management investment companies to file reports with the Commission not later than 10 days after the transmission to stockholders of any report that is required to be transmitted to stockholders under Rule 30e-1 under the Investment Company Act of 1940 (17 CFR 270.30e-1). The Commission may use the information provided on Form N-CSR in its regulatory, disclosure review, inspection and policymaking roles.
A registrant is required to disclose the information specified by Form N-CSR, and the Commission will make this information public. A registrant is not required to respond to the collection of information contained in Form N-CSR unless the Form displays a currently valid Office of Management and Budget (“OMB”) control number. Please direct comments concerning the accuracy of the information collection burden estimate and any suggestions for reducing the burden to Secretary, Securities and Exchange Commission, 100 F Street, NE, Washington, DC 20549-0609. The OMB has reviewed this collection of information under the clearance requirements of 44 U.S.C. § 3507.
ITEM 1. REPORT TO SHAREHOLDERS.
The following is a copy of the report transmitted to shareholders pursuant to Rule 30e-1 under the Investment Company Act of 1940 (17CRF 270.30e-1).
 |
| |
| |
| THE FBR FUNDS |
| |
| FBR Large Cap Fund |
| FBR Mid Cap Fund |
| FBR Small Cap Fund |
| FBR Focus Fund |
| FBR Large Cap Financial Fund |
| FBR Small Cap Financial Fund |
| FBR Technology Fund |
| FBR Gas Utility Index Fund |
| FBR Balanced Fund |
| FBR Core Bond Fund |
| |
Annual Report
October 31, 2011 |
[THIS PAGE INTENTIONALLY LEFT BLANK]
Annual Letter to Shareholders
Dear Shareholder:
We are pleased to present The FBR Funds’ Annual Report for the twelve-month period ended October 31, 2011. U.S. equity markets performed reasonably well during the twelve-month period. The Dow Jones Industrial Average rose 10.39%. The S&P 500 gained 8.09%, and the small capitalization Russell 2000 Index rose 6.71%. The best performing industry groups during the period were energy, real estate investment trusts and utilities. The worst performing industry groups during the period were industrials, basic materials and financial services. Finally, the S&P 500 remains 25% off its high reached on October 2007, before the financial crisis hit.
The last twelve months have been much the same as the previous twelve months before them. The investment roller coaster that began in 2007, when the financial bubble burst, continues. We believe that the economy remains over-leveraged and the growth headwinds of deleveraging will continue into 2012. The big, but not surprising, development in the last twelve months is that Europe has debt troubles too. Europe appears more over-leveraged than the U.S. and has, adding to concerns, a tenuous economic union among its common market members. Finally, it appears the new revelation in 2012 will be that China is over-leveraged as well.
After many years of borrowing prosperity, we are now in a worldwide effort to cut leverage and expenses to service the debt that produced the prosperity. Both strategies were brought about by central banks and politicians across the world. With governments over-leveraged, the outlook for growth will be muted as governments implement austerity programs. How long this period persists will depend on many things. Continued volatility is expected.
While our outlook is for difficult investment conditions, we believe our investment process is well suited to weather the storm(s). We believe our focus on well-constructed balance sheets and businesses with stable and longer term earnings potential will protect the downside and give our investors the best chance for positive returns. We remain buyers of companies, not traders of stocks.
As in prior years, what follows is a commentary from each portfolio manager or team regarding fund performance and their outlook. We believe this commentary is an important part of our semi-annual communication to you. We encourage you to read their comments to gain a better understanding of their current thinking.
All of us at The FBR Funds want to thank you for your continued support, and we look forward to serving your investment needs in the years ahead. As always, we welcome your questions and comments. You can reach us via e-mail at fbrfundsinfo@fbr.com or toll free at 888.888.0025. If you would like more timely updates, www.fbrfunds.com provides quarterly performance data as well as other important information.
Sincerely,

David H. Ellison
President, Chief Investment Officer and Trustee
The FBR Funds
2
Past performance is no guarantee of future results. The performance data quoted represents past performance and the current performance may be lower or higher than the performance data quoted. The investment return and principal will fluctuate so that investors’ shares, when redeemed, may be worth more or less than their original cost. The performance data does not reflect the deduction of taxes that a shareholder would pay on fund distributions or redemption fees. If reflected, the redemption fee would reduce the performance quoted. To obtain performance data current to the most recent month-end please call 888.200.4710.
Investors should consider the investment objectives, risks, charges and expenses carefully before investing. This and other important information can be found in the Funds’ prospectus. To obtain a free prospectus, please call 888.200.4710 or visit www.fbrfunds.com. Please read the prospectus carefully before investing.
The FBR Funds are distributed by FBR Investment Services, Inc., member FINRA/SIPC.
3
FBR Large Cap Fund
Management Overview
Portfolio Managers: Robert Barringer, CFA® and Ryan Kelley, CFA®
Over the previous 12 months, how did the Fund perform and what factors contributed to this performance?
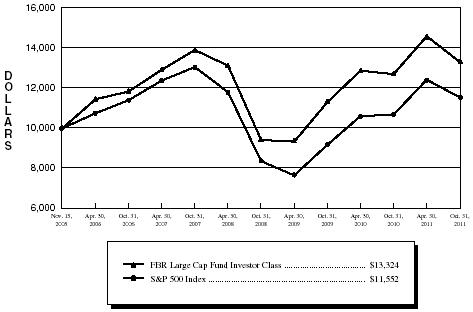
For the twelve-month period ended October 31, 2011, the Investor Class Shares of the FBR Large Cap Fund returned 4.80%. This compares to the S&P 500 Index and the Morningstar Large Blend Category Average which over the same time period returned 8.09% and 5.33%, respectively.
During our fiscal year, the S&P 500 Index’s total return of 8.09% was a strong continuation of the positive momentum which began after the stock market bottom in March 2009. However, while the S&P 500 Index’s return of over 16% in the first half of the fiscal year was impressive, every major sector (except utilities) of the domestic equity market declined or was flat in the second half, and the S&P 500 Index had a total return of negative 7%. Among the issues that caused this erosion of investor confidence were: the continued European crisis; the unprecedented downgrade of the U.S. credit rating by Standard & Poor’s; and the continued weakness in the U.S. economy, including the struggling housing market and weak employment trends.
For the year, the Fund lagged both its benchmark index and Morningstar category, although it lagged its category by a small amount. While we are disappointed by our relative performance, we are encouraged that we outperformed the category during the weak second half of the year by approximately 38 basis points. One of the goals of the Fund is to outperform during weak markets, as we believe that strong returns are achieved over the long term by losing less value when the market is in decline.
During the fiscal year, technology, industrial, consumer, and energy related stocks performed exceptionally well and contributed the majority of our positive returns. Conversely, the Fund continued to suffer from its exposure to financial services companies, which was the only sector that showed negative returns for the fiscal year in both the Fund and the S&P 500 Index.
On a relative basis, industrial and technology investments performed best compared to our benchmark. Additionally, both in the industrial and consumer cyclical space, our stock selection drove the relative outperformance, as we were invested in stocks that performed significantly better on average than the general index. Conversely, our relative performance was most negatively affected by our investments in energy and financials.
Portfolio Managers’ comments on the Fund and the related investment outlook.
The Fund generally performs better than its benchmark in difficult environments but may lag as stocks rise rapidly, due to our portfolio management philosophy and style. We focus on high quality companies with strong balance sheets and consistent, high profitability, which means we may not be invested in some of the more volatile, cyclical stocks that soar during economic recoveries. We continue to position the portfolio in such a way as to seek
4
FBR Large Cap Fund
Management Overview (continued)
to outperform in difficult times while striving to keep pace during market upswings. We are disappointed by our relative performance for the entire fiscal year, despite beating our category for the second half.
We strive to invest in companies trading at attractive valuations that exhibit strong returns on equity with low volatility, low financial leverage and debt levels, good management teams, and compelling prospects of continued strong profitability. As of October 31, 2011, we are currently close to fully invested, and, of the major sectors, the Fund is slightly overweight technology and energy and underweight the consumer sector.
The stock market continues to be negatively impacted by both global issues as well as domestic economic and political problems. These issues are persistent, and we believe it will take some time for conditions to improve, despite unprecedented efforts on a global scale among many countries’ governments and monetary policy makers to find solutions for many of our economic problems. During this time of continued economic difficulties, we have positioned the Fund in a diverse array of companies that exhibit strong balance sheets, strong profitability, and less cyclicality.
The opinions expressed in this commentary reflect those of the Portfolio Managers as of the date written. Any such opinions are subject to change based on market or other conditions. These opinions may not be relied upon as investment advice. Investment decisions for The FBR Funds are based on several factors, and may not be relied upon as an indication of trading intent on behalf of any FBR Fund. Security positions can and do change.
5
FBR Large Cap Fund
Comparison of Changes in Value of $10,000 Investment in
Investor Class Shares(1)(2) vs. S&P 500 Index(1)(3)
| Total Returns—For the Periods Ended October 31, 2011(4) | |
| | | | | | | Annualized | |
| | | | | Annualized | | Since | |
| | | One Year | | Five Year | | Inception(5) | |
| | |
| |
| |
| |
| FBR Large Cap Fund Investor Class(1)(2) | | 4.80% | | 2.38% | | 4.93% | |
| FBR Large Cap Fund Institutional Class(2)(6) | | 5.08% | | 2.51% | | 5.05% | |
| S&P 500 Index(1)(3) | | 8.09% | | 0.25% | | 2.45% | |
| |
PAST PERFORMANCE IS NO GUARANTEE OF FUTURE RESULTS.
The performance data quoted represents past performance and the current performance may be lower or higher than the performance data quoted. The investment return and principal will fluctuate so that investors’ shares, when redeemed, may be worth more or less than their original cost. The performance data does not reflect the deduction of taxes that a shareholder would pay on Fund distributions or redemption fees. The Fund charges a redemption fee of 1.00% on shares redeemed or exchanged within 90 days; if reflected, the redemption fee would reduce the performance data quoted. To obtain performance data current to the most recent month-end, please call 888.200.4710.
| |
|
| (1) | The graph assumes a hypothetical $10,000 initial investment in the Fund and reflects the reinvestment of dividends and all Fund expenses. Investors should note that the Fund is a professionally managed mutual fund while the index is unmanaged, does not incur expenses and is not available for investment. The performance of the index includes reinvested dividends, and does not reflect sales charges or expenses. |
| (2) | FBR Fund Advisers, Inc. waived a portion of its advisory fees and agreed to contractually reimburse a portion of the Fund’s operating expenses, as necessary, to maintain existing expense limitations, as set forth in the notes to the financial statements. Total returns shown include fee waivers and expense reimbursements, if any; total returns would have been lower had there been no waiver of fees and/or reimbursement of expenses in excess of expense limitations. |
| (3) | The S&P 500 Index is a capitalization-weighted index of 500 stocks. The index is designed to represent the broad domestic economy through changes in aggregate market value of 500 stocks representing all major industries. |
| (4) | The total returns shown do not reflect the deduction of taxes that a shareholder would pay on fund distributions or the redemption of fund shares. |
| (5) | For the period November 15, 2005 (commencement of operations) through October 31, 2011. |
| (6) | Represents the performance of the Institutional Class shares after May 30, 2008 (inception of the share class) and Investor Class for periods prior to that date. |
6
FBR Large Cap Fund
Portfolio Summary
October 31, 2011
The following provides a breakdown of the Fund by industry sectors. The underlying securities represent a percentage of the portfolio investments.
| Industry Sector | % of Total Investments |
|
|
| Technology | | 18.2 | % |
| Consumer, Non-Cyclical | | 18.1 | % |
| Financial | | 13.4 | % |
| Energy | | 12.6 | % |
| Consumer, Cyclical | | 10.6 | % |
| Industrial | | 10.1 | % |
| Communications | | 6.6 | % |
| Basic Materials | | 4.4 | % |
| Utilities | | 1.9 | % |
| | | | |
| Cash | | 4.1 | % |
7
FBR Large Cap Fund
Portfolio of Investments
October 31, 2011
|
| | | | | VALUE |
| SHARES | | | | (NOTE 2) |
|
| | | COMMON STOCKS — 95.9% | | | | |
| | | Basic Materials — 4.4% | | | | |
| 6,000 | | E.I. du Pont de Nemours and Co. | | $ | 288,420 | |
| 13,500 | | Freeport-McMoRan Copper & Gold, Inc. | | | 543,510 | |
| 3,000 | | Monsanto Co. | | | 218,250 | |
| 7,000 | | Newmont Mining Corp. | | | 467,810 | |
| 10,600 | | Ternium S.A. ADR | | | 260,124 | |
| | | | |
| |
| | | | | | 1,778,114 | |
| | | | |
| |
| | | Communications — 6.6% | | | | |
| 1,000 | | Amazon.com, Inc.* | | | 213,510 | |
| 33,600 | | Cisco Systems, Inc. | | | 622,608 | |
| 1,600 | | Google, Inc., Class A* | | | 948,224 | |
| 900 | | LinkedIn Corp., Class A* | | | 80,910 | |
| 6,500 | | Rackspace Hosting, Inc.* | | | 269,035 | |
| 30,800 | | Yahoo, Inc.* | | | 481,712 | |
| | | | |
| |
| | | | | | 2,615,999 | |
| | | | |
| |
| | | Consumer, Cyclical — 10.6% | | | | |
| 8,900 | | Bed Bath & Beyond, Inc.* | | | 550,376 | |
| 2,970 | | C.R. Bard, Inc. | | | 255,271 | |
| 9,400 | | Coach, Inc. | | | 611,658 | |
| 3,500 | | Deckers Outdoor Corp.* | | | 403,340 | |
| 11,700 | | Genuine Parts Co. | | | 671,931 | |
| 11,700 | | Kohl’s Corp. | | | 620,217 | |
| 2,000 | | Panera Bread Co., Class A* | | | 267,380 | |
| 7,500 | | Tiffany & Co. | | | 597,975 | |
| 1,400 | | W.W. Grainger, Inc. | | | 239,834 | |
| | | | |
| |
| | | | | | 4,217,982 | |
| | | | |
| |
| | | Consumer, Non-Cyclical — 18.1% | | | | |
| 8,640 | | Abbott Laboratories | | | 465,437 | |
| 7,000 | | Automatic Data Processing, Inc. | | | 366,310 | |
| 8,475 | | Baxter International, Inc. | | | 465,956 | |
| 9,400 | | Forest Laboratories, Inc.* | | | 294,220 | |
| 6,700 | | Gilead Sciences, Inc.* | | | 279,122 | |
| 14,900 | | Hormel Foods Corp. | | | 439,103 | |
| 14,400 | | Merck & Company, Inc. | | | 496,800 | |
| 12,000 | | Paychex, Inc. | | | 349,680 | |
8
FBR Large Cap Fund
Portfolio of Investments (continued)
October 31, 2011
|
| | | | | VALUE |
| SHARES | | | | (NOTE 2) |
|
| | | Consumer, Non-Cyclical — 18.1% (continued) | | | | |
| 6,800 | | PepsiCo, Inc. | | $ | 428,060 | |
| 8,500 | | ResMed, Inc.* | | | 240,550 | |
| 10,700 | | Stryker Corp. | | | 512,637 | |
| 26,500 | | Sysco Corp. | | | 734,580 | |
| 9,200 | | The Coca-Cola Co. | | | 628,544 | |
| 4,800 | | The Estee Lauder Companies, Inc., Class A | | | 472,560 | |
| 22,450 | | Unilever PLC ADR | | | 755,443 | |
| 5,800 | | United Therapeutics Corp.* | | | 253,634 | |
| | | | |
| |
| | | | | | 7,182,636 | |
| | | | |
| |
| | | Energy — 12.6% | | | | |
| 4,202 | | Apache Corp. | | | 418,645 | |
| 10,000 | | Ensco PLC ADR | | | 496,600 | |
| 11,000 | | Halliburton Co. | | | 410,960 | |
| 9,000 | | Hess Corp. | | | 563,040 | |
| 14,700 | | Marathon Oil Corp. | | | 382,641 | |
| 7,350 | | Marathon Petroleum Corp. | | | 263,865 | |
| 10,400 | | Murphy Oil Corp. | | | 575,848 | |
| 30,800 | | Nexen, Inc. | | | 522,984 | |
| 18,000 | | Petroleo Brasileiro S.A. ADR | | | 486,180 | |
| 8,000 | | Range Resources Corp. | | | 550,720 | |
| 9,000 | | Rowan Companies, Inc.* | | | 310,410 | |
| | | | |
| |
| | | | | | 4,981,893 | |
| | | | |
| |
| | | Financial — 13.4% | | | | |
| 2,900 | | BlackRock, Inc. | | | 457,591 | |
| 10,000 | | Capital One Financial Corp. | | | 456,600 | |
| 14,600 | | Citigroup, Inc. | | | 461,214 | |
| 18,000 | | Discover Financial Services | | | 424,080 | |
| 3,575 | | Franklin Resources, Inc. | | | 381,202 | |
| 16,725 | | JPMorgan Chase & Co. | | | 581,361 | |
| 13,000 | | Morgan Stanley | | | 229,320 | |
| 8,100 | | Prudential Financial, Inc. | | | 439,020 | |
| 10,575 | | T. Rowe Price Group, Inc. | | | 558,783 | |
| 27,000 | | U.S. Bancorp | | | 690,930 | |
| 24,000 | | Wells Fargo & Co. | | | 621,840 | |
| | | | |
| |
| | | | | | 5,301,941 | |
| | | | |
| |
9
FBR Large Cap Fund
Portfolio of Investments (continued)
October 31, 2011
|
| | | | | VALUE |
| SHARES | | | | (NOTE 2) |
|
| | | Industrial — 10.1% | | | | |
| 15,615 | | 3M Co. | | $ | 1,233,897 | |
| 7,100 | | Cummins, Inc. | | | 705,953 | |
| 14,800 | | Norfolk Southern Corp. | | | 1,095,052 | |
| 13,700 | | PerkinElmer, Inc. | | | 283,179 | |
| 6,950 | | Union Pacific Corp. | | | 692,012 | |
| | | | |
| |
| | | | | | 4,010,093 | |
| | | | |
| |
| | | Technology — 18.2% | | | | |
| 4,000 | | Apple, Inc.* | | | 1,619,120 | |
| 11,000 | | Cerner Corp.* | | | 697,730 | |
| 7,000 | | Check Point Software Technologies Ltd.* | | | 403,410 | |
| 3,600 | | Citrix Systems, Inc.* | | | 262,188 | |
| 27,000 | | Intel Corp. | | | 662,580 | |
| 3,000 | | International Business Machines Corp. | | | 553,890 | |
| 10,000 | | MICROS Systems, Inc.* | | | 492,200 | |
| 18,350 | | Microsoft Corp. | | | 488,660 | |
| 14,000 | | NetApp, Inc.* | | | 573,440 | |
| 25,500 | | Oracle Corp. | | | 835,635 | |
| 1,800 | | salesforce.com, Inc.* | | | 239,706 | |
| 3,000 | | SAP AG ADR | | | 181,080 | |
| 8,100 | | Western Digital Corp.* | | | 215,784 | |
| | | | |
| |
| | | | | | 7,225,423 | |
| | | | |
| |
| | | Utilities — 1.9% | | | | |
| 9,000 | | Exelon Corp. | | | 399,510 | |
| 8,500 | | PG&E Corp. | | | 364,650 | |
| | | | |
| |
| | | | | | 764,160 | |
| | | | |
| |
| | | | | | | |
| | | Total Common Stocks (Cost $36,040,585) | | | 38,078,241 | |
| | | | |
| |
10
FBR Large Cap Fund
Portfolio of Investments (continued)
October 31, 2011
|
| | | | | VALUE |
| SHARES | | | | (NOTE 2) |
|
| | | SHORT-TERM INVESTMENT — 4.2% | | | | |
| 1,681,837 | | Fidelity Institutional Money Market Government Portfolio, Class I, 0.01%^ (Cost $1,681,837) | | $ | 1,681,837 | |
| | | | |
| |
| | | | | | | |
| | | Total Investments — 100.1% (Cost $37,722,422) | | | 39,760,078 | |
| | | | | | | |
| | | Liabilities Less Other Assets — (0.1)% | | | (52,056 | ) |
| | | | |
| |
| | | | | | | |
| | | Net Assets — 100.0% | | $ | 39,708,022 | |
| | | | |
| |
|
| * | Non-income producing security |
| ADR | American Depositary Receipts |
| PLC | Public Liability Company |
| ^ | 7-day yield as of October 31, 2011 |
| Note: | For presentation purposes, the Fund has grouped some of the industry categories. For purposes of categorizing securities for compliance with Section 8(b)(1) of the Investment Company Act of 1940, the Fund uses more specific industry classifications. |
The accompanying notes are an integral part of the financial statements.
11
FBR Mid Cap Fund
Management Overview
Portfolio Manager: Ryan Kelley, CFA®
Over the previous 12 months, how did the Fund perform and what factors contributed to this performance?
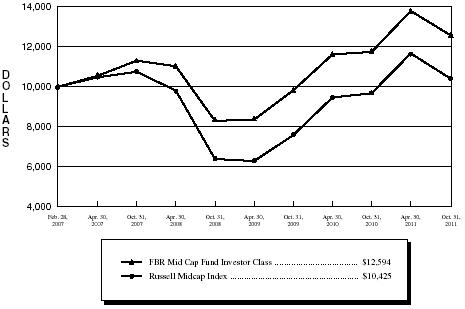
For the twelve-month period ended October 31, 2011, the Investor Class of the FBR Mid Cap Fund returned 7.30%. This compares to the Russell Midcap Index and the Morningstar Mid Cap Blend Category Average which over the same time period returned 7.85% and 5.61%, respectively.
During our fiscal year, the Russell Midcap Index’s total return of 7.85% was a strong continuation of the positive momentum which began after the stock market bottom in March 2009. In the first half of the fiscal year, the index performed exceptionally well with a total return of 21%, but in the second half of the year the index fell close to 11% on a total return basis as every sector, excluding utilities, showed negative returns. Among the issues that caused this erosion of investor confidence were: the continued European crisis; the unprecedented downgrade of the U.S. credit rating by Standard & Poor’s; and the continued weakness in the U.S. economy including the struggling housing market and weak employment trends.
The Fund beat its Morningstar category average by 169 basis points for the year, despite slightly lagging its benchmark index. During the second half of the fiscal year as the markets dropped precipitously, the Fund outperformed the index by approximately 191 basis points and its Morningstar category by approximately 403 basis points. One of the goals of the Fund is to outperform during weak markets, as we believe that strong returns are achieved over the long term by losing less value when the market is in decline.
During the fiscal year, consumer, energy, and utilities stocks performed exceptionally well and contributed the majority of our positive returns. Conversely, the Fund continued to suffer from its exposure to financial services companies, which was one of two sectors that showed negative returns for the fiscal year in both the Fund and the Russell Midcap Index.
On a relative basis, consumer, industrial and technology investments performed best compared to the Fund’s benchmark. In all three of these sectors, our stock selection drove the relative outperformance, as we were invested in stocks that performed significantly better on average than the general index. Conversely, our relative performance was most negatively affected by our investments in energy and financials.
Portfolio Manager comments on the Fund and the related investment outlook.
Our goal is to provide better than average risk-adjusted returns over a complete market cycle. We strive to participate in the upside while protecting against the downside. We focus on high quality companies with strong balance sheets and consistent, high
12
FBR Mid Cap Fund
Management Overview (continued)
profitability, which means we may not be invested in some of the more volatile, cyclical stocks that outperform during economic recoveries. Certainly this year, we lagged during the first half as stocks soared yet outperformed in the second half as stocks dropped, and we ended the year significantly ahead of our Morningstar category.
The stock market continues to be negatively impacted by both global issues as well as domestic economic and political problems. These issues are persistent, and we believe it will take some time for conditions to improve, despite unprecedented efforts on a global scale among many countries’ governments and monetary policy makers to find solutions for many of our economic problems. During this time of continued economic difficulties, we currently have slightly higher than normal cash levels as we are looking for opportunities in this weak market. Additionally, we are slightly overweight technology, energy and consumer discretionary stocks while underweight financials and materials. Our goal is to remain invested in a diverse array of companies that exhibit strong balance sheets, strong profitability, and less cyclicality.
The opinions expressed in this commentary reflect those of the Portfolio Manager as of the date written. Any such opinions are subject to change based on market or other conditions. These opinions may not be relied upon as investment advice. Investment decisions for The FBR Funds are based on several factors, and may not be relied upon as an indication of trading intent on behalf of any FBR Fund. Security positions can and do change.
13
FBR Mid Cap Fund
Comparison of Changes in Value of $10,000 Investment in
Investor Class Shares(1)(2) vs. Russell Midcap Index(1)(3)
| Total Returns—For the Periods Ended October 31, 2011(4) | |
| | | | | Annualized | |
| | | | | Since | |
| | | One Year | | Inception(5) | |
| | |
| |
| |
| FBR Mid Cap Fund Investor Class(1)(2) | | 7.30% | | 5.06% | |
| FBR Mid Cap Fund Institutional Class(2)(6) | | 7.43% | | 5.15% | |
| Russell Midcap Index(1)(3) | | 7.85% | | 0.90% | |
| |
PAST PERFORMANCE IS NO GUARANTEE OF FUTURE RESULTS.
The performance data quoted represents past performance and the current performance may be lower or higher than the performance data quoted. The investment return and principal will fluctuate so that investors’ shares, when redeemed, may be worth more or less than their original cost. The performance data does not reflect the deduction of taxes that a shareholder would pay on Fund distributions or redemption fees. The Fund charges a redemption fee of 1.00% on shares redeemed or exchanged within 90 days; if reflected, the redemption fee would reduce the performance data quoted. To obtain performance data current to the most recent month-end, please call 888.200.4710.
|
| (1) | The graph assumes a hypothetical $10,000 initial investment in the Fund and reflects the reinvestment of dividends and all Fund expenses. Investors should note that the Fund is a professionally managed mutual fund while the index is unmanaged, does not incur expenses and is not available for investment. The performance of the index includes reinvested dividends, and does not reflect sales charges or expenses. |
| (2) | FBR Fund Advisers, Inc. waived a portion of its advisory fees and agreed to contractually reimburse a portion of the Fund’s operating expenses, as necessary, to maintain existing expense limitations, as set forth in the notes to the financial statements. Total returns shown include fee waivers and expense reimbursements, if any; total returns would have been lower had there been no waiver of fees and/or reimbursement of expenses in excess of expense limitations. |
| (3) | The Russell Midcap Index measures the performance of the 800 smallest companies in the Russell 1000 Index, which represents approximately 31% of the total market capitalization of the Russell 1000 Index. |
| (4) | The total returns shown do not reflect the deduction of taxes that a shareholder would pay on fund distributions or the redemption of fund shares. |
| (5) | For the period February 28, 2007 (commencement of operations) through October 31, 2011. |
| (6) | Represents the performance of the Institutional Class shares after May 30, 2008 (inception of the share class) and Investor Class for periods prior to that date. |
14
FBR Mid Cap Fund
Portfolio Summary
October 31, 2011
The following provides a breakdown of the Fund by industry sectors. The underlying securities represent a percentage of the portfolio investments.
| Industry Sector | % of Total Investments |
|
|
| Consumer, Cyclical | | 19.3 | % |
| Consumer, Non-Cyclical | | 17.1 | % |
| Financial | | 14.5 | % |
| Industrial | | 10.8 | % |
| Technology | | 10.7 | % |
| Energy | | 8.2 | % |
| Utilities | | 4.5 | % |
| Communications | | 3.3 | % |
| Basic Materials | | 3.1 | % |
| | | | |
| Cash | | 8.5 | % |
15
FBR Mid Cap Fund
Portfolio of Investments
October 31, 2011
|
| | | | | VALUE |
| SHARES | | | | (NOTE 2) |
|
| | | COMMON STOCKS — 91.5% | | | | |
| | | Basic Materials — 3.1% | | | | |
| 8,000 | | Gold Fields Ltd. ADR | | $ | 139,440 | |
| 3,984 | | Sigma-Aldrich Corp. | | | 260,872 | |
| 11,800 | | Yamana Gold, Inc. | | | 176,646 | |
| | | | |
| |
| | | | | | 576,958 | |
| | | | |
| |
| | | Communications — 3.3% | | | | |
| 3,797 | | FactSet Research Systems, Inc. | | | 377,498 | |
| 10,450 | | Telephone & Data Systems, Inc. | | | 242,231 | |
| | | | |
| |
| | | | | | 619,729 | |
| | | | |
| |
| | | Consumer, Cyclical — 19.3% | | | | |
| 4,515 | | Abercrombie & Fitch Co., Class A | | | 335,916 | |
| 3,900 | | Bed Bath & Beyond, Inc.* | | | 241,176 | |
| 9,080 | | Big Lots, Inc.* | | | 342,225 | |
| 9,485 | | Copart, Inc.* | | | 413,072 | |
| 1,600 | | Deckers Outdoor Corp.* | | | 184,384 | |
| 3,400 | | Genuine Parts Co. | | | 195,262 | |
| 2,700 | | Guess?, Inc. | | | 89,073 | |
| 8,130 | | Magna International, Inc. | | | 310,159 | |
| 12,824 | | Mattel, Inc. | | | 362,150 | |
| 2,800 | | MSC Industrial Direct Company, Inc., Class A | | | 190,428 | |
| 6,535 | | Tiffany & Co. | | | 521,036 | |
| 2,229 | | V.F. Corp. | | | 308,092 | |
| 3,700 | | Williams-Sonoma, Inc. | | | 138,898 | |
| | | | |
| |
| | | | | | 3,631,871 | |
| | | | |
| |
| | | Consumer, Non-Cyclical — 17.1% | | | | |
| 2,122 | | Bunge Ltd. | | | 131,076 | |
| 2,446 | | C.R. Bard, Inc. | | | 210,234 | |
| 2,600 | | Covance, Inc.* | | | 131,898 | |
| 9,050 | | Endo Pharmaceuticals Holdings, Inc.* | | | 292,406 | |
| 6,438 | | Forest Laboratories, Inc.* | | | 201,509 | |
| 5,750 | | Hansen Natural Corp.* | | | 512,267 | |
| 2,100 | | Humana, Inc. | | | 178,269 | |
| 6,995 | | Lincare Holdings, Inc. | | | 164,732 | |
| 9,575 | | Paychex, Inc. | | | 279,015 | |
16
FBR Mid Cap Fund
Portfolio of Investments (continued)
October 31, 2011
|
| | | | | VALUE |
| SHARES | | | | (NOTE 2) |
|
| | | Consumer, Non-Cyclical — 17.1% (continued) | | | | |
| 16,850 | | SEI Investments Co. | | $ | 272,801 | |
| 3,385 | | Techne Corp. | | | 232,888 | |
| 1,650 | | Tupperware Brands Corp. | | | 93,291 | |
| 13,275 | | Tyson Foods, Inc., Class A | | | 256,208 | |
| 4,444 | | Varian Medical Systems, Inc.* | | | 260,952 | |
| | | | |
| |
| | | | | | 3,217,546 | |
| | | | |
| |
| | | Energy — 8.2% | | | | |
| 4,677 | | Energen Corp. | | | 229,454 | |
| 3,285 | | Ensco PLC ADR | | | 163,133 | |
| 1,200 | | First Solar, Inc.* | | | 59,724 | |
| 2,640 | | Helmerich & Payne, Inc. | | | 140,395 | |
| 7,800 | | Nabors Industries Ltd.* | | | 142,974 | |
| 2,925 | | Newfield Exploration Co.* | | | 117,760 | |
| 3,825 | | Pioneer Natural Resources Co. | | | 320,918 | |
| 5,800 | | Plains Exploration & Production Co.* | | | 182,700 | |
| 5,550 | | Rowan Companies, Inc.* | | | 191,420 | |
| | | | |
| |
| | | | | | 1,548,478 | |
| | | | |
| |
| | | Financial — 14.5% | | | | |
| 9,495 | | Capitol Federal Financial | | | 105,300 | |
| 6,375 | | Comerica, Inc. | | | 162,881 | |
| 17,900 | | Fifth Third Bancorp | | | 214,979 | |
| 25,225 | | Hudson City Bancorp, Inc. | | | 157,656 | |
| 26,950 | | KeyCorp | | | 190,267 | |
| 2,546 | | M&T Bank Corp. | | | 193,776 | |
| 8,185 | | New York Community Bancorp, Inc. | | | 108,942 | |
| 10,250 | | People’s United Financial, Inc. | | | 130,688 | |
| 8,700 | | Raymond James Financial, Inc. | | | 264,219 | |
| 33,600 | | Regions Financial Corp. | | | 132,048 | |
| 4,500 | | Reinsurance Group of America, Inc. | | | 235,035 | |
| 6,821 | | T. Rowe Price Group, Inc. | | | 360,422 | |
| 8,900 | | W. R. Berkley Corp. | | | 309,809 | |
| 9,600 | | Zions Bancorp | | | 166,656 | |
| | | | |
| |
| | | | | | 2,732,678 | |
| | | | |
| |
17
FBR Mid Cap Fund
Portfolio of Investments (continued)
October 31, 2011
|
| | | | | VALUE |
| SHARES | | | | (NOTE 2) |
|
| | | Industrial — 10.8% | | | | |
| 6,625 | | Dolby Laboratories, Inc., Class A* | | $ | 193,715 | |
| 6,075 | | FLIR Systems, Inc. | | | 159,772 | |
| 6,200 | | Kansas City Southern | | | 391,654 | |
| 3,700 | | Kirby Corp.* | | | 227,698 | |
| 7,295 | | Pall Corp. | | | 373,285 | |
| 4,692 | | Roper Industries, Inc. | | | 380,521 | |
| 7,500 | | Spirit AeroSystems Holdings, Inc., Class A* | | | 128,025 | |
| 3,500 | | Tidewater, Inc. | | | 172,305 | |
| | | | |
| |
| | | | | | 2,026,975 | |
| | | | |
| |
| | | Technology — 10.7% | | | | |
| 32,168 | | Activision Blizzard, Inc. | | | 430,730 | |
| 8,403 | | Check Point Software Technologies Ltd.* | | | 484,265 | |
| 4,900 | | Microchip Technology, Inc. | | | 177,184 | |
| 3,400 | | SanDisk Corp.* | | | 172,278 | |
| 15,500 | | Seagate Technology PLC | | | 250,325 | |
| 30,900 | | Siliconware Precision Industries Co. Ltd. ADR | | | 160,680 | |
| 4,900 | | Western Digital Corp.* | | | 130,536 | |
| 6,200 | | Xilinx, Inc. | | | 207,452 | |
| | | | |
| |
| | | | | | 2,013,450 | |
| | | | |
| |
| | | Utilities — 4.5% | | | | |
| 8,800 | | Ameren Corp. | | | 280,544 | |
| 13,100 | | NRG Energy, Inc.* | | | 280,602 | |
| 10,650 | | Westar Energy, Inc. | | | 290,319 | |
| | | | |
| |
| | | | | | 851,465 | |
| | | | |
| |
| | | | | | | |
| | | Total Common Stocks (Cost $15,605,555) | | | 17,219,150 | |
| | | | |
| |
18
FBR Mid Cap Fund
Portfolio of Investments (continued)
October 31, 2011
|
| | | | | VALUE |
| SHARES | | | | (NOTE 2) |
|
| | | SHORT-TERM INVESTMENT — 8.5% | | | | |
| 1,592,751 | | Fidelity Institutional Money Market Government Portfolio, Class I, 0.01%^ (Cost $1,592,751) | | $ | 1,592,751 | |
| | | | |
| |
| | | | | | | |
| | | Total Investments — 100.0% (Cost $17,198,306) | | | 18,811,901 | |
| | | | | | | |
| | | Other Assets Less Liabilities — 0.0% | | | 8,782 | |
| | | | |
| |
| | | | | | | |
| | | Net Assets — 100.0% | | $ | 18,820,683 | |
| | | | |
| |
|
| * | Non-income producing security |
| ADR | American Depositary Receipts |
| PLC | Public Liability Company |
| ^ | 7-day yield as of October 31, 2011 |
| Note: | For presentation purposes, the Fund has grouped some of the industry categories. For purposes of categorizing securities for compliance with Section 8(b)(1) of the Investment Company Act of 1940, the Fund uses more specific industry classifications. |
The accompanying notes are an integral part of the financial statements.
19
FBR Small Cap Fund
Management Overview
Portfolio Manager: Robert Barringer, CFA®
Over the previous 12 months, how did the Fund perform and what factors contributed to this performance?
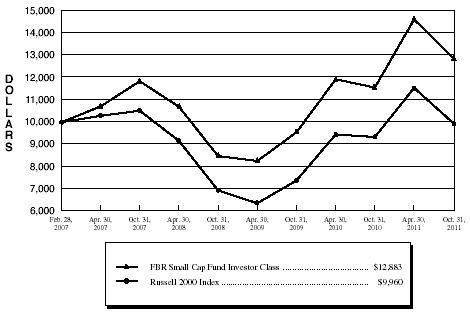
For the twelve-month period ended October 31, 2011, the Investor Class of the FBR Small Cap Fund returned 11.40%. This compares to the Russell 2000 Index and the Morningstar Small Growth Category, which returned 6.71% and 8.84% for the same period, respectively.
The industry groups that helped the most were energy, healthcare and basic materials with the technology group being the main detractor from performance. A fair number of takeovers happened with respect to companies held by the Fund and this helped to boost performance as well. The performance was characterized once again by outperformance being generated by specific stock selections within the sectors and not from over or underweighting particular sectors. We believe this type of outperformance is indicative that our process can identify good investments within sectors and believe that it can provide for more consistent performance versus trying to outperform through large sector bets.
Portfolio Manager comments on the Fund and the related investment outlook.
The past year has been characterized by continued volatility in the markets amid uncertainty about the speed and durability of the recovery in the U.S. economy as well as the trouble that emerged in a number of the weaker European countries. In early December 2011, it is unclear as to a solution to the European financial problems and that solution’s related impact on the future economies in Europe, the United States and the other parts of the world. However, there are a number of attributes that our approach to investing possesses that should allow us to navigate this uncertain time with more confidence.
As we have previously stated, our investment approach tends to select those companies with low or below average debt, a company characteristic which allows much greater flexibility and stability in uncertain times. While the companies selected are small cap by nature, our approach emphasizes companies that have economic moats, with strong competitive positions and above average margins. As the past year has shown, these companies can succeed in more difficult times and are some of those most sought after for acquisition by larger companies and private equity.
We believe that the future will be a relatively volatile one as well, as Europe addresses its problems and deals with implementing a plan which will involve austerity and deleveraging. In addition, there are some lingering questions about Chinese economic growth as well. In this environment, we believe the U.S. will provide a relatively safe haven for investing as we are further along in addressing our problems. And while companies in small cap can be more volatile and perceived to be more risky, small cap has
20
FBR Small Cap Fund
Management Overview (continued)
the characteristic, unlike large cap, of being mainly concentrated in the relatively safer economy, the United States. As always, we will try to use any large volatility to our advantage in buying attractive companies for less and paring companies that have become extended in valuation.
The opinions expressed in this commentary reflect those of the Portfolio Manager as of the date written. Any such opinions are subject to change based on market or other conditions. These opinions may not be relied upon as investment advice. Investment decisions for The FBR Funds are based on several factors, and may not be relied upon as an indication of trading intent on behalf of any FBR Fund. Security positions can and do change.
21
FBR Small Cap Fund
Comparison of Changes in Value of $10,000 Investment in
Investor Class Shares(1)(2) vs. Russell 2000 Index(1)(3)
| Total Returns—For the Periods Ended October 31, 2011(4) | |
| | | | | Annualized | |
| | | | | Since | |
| | | One Year | | Inception(5) | |
| | |
| |
| |
| FBR Small Cap Fund Investor Class(1)(2) | | 11.40% | | 5.57 | % | |
| FBR Small Cap Fund Institutional Class(2)(6) | | 11.82% | | 5.72 | % | |
| Russell 2000 Index(1)(3) | | 6.71% | | (0.09 | )% | |
| |
PAST PERFORMANCE IS NO GUARANTEE OF FUTURE RESULTS.
The performance data quoted represents past performance and the current performance may be lower or higher than the performance data quoted. The investment return and principal will fluctuate so that investors’ shares, when redeemed, may be worth more or less than their original cost. The performance data does not reflect the deduction of taxes that a shareholder would pay on Fund distributions or redemption fees. The Fund charges a redemption fee of 1.00% on shares redeemed or exchanged within 90 days; if reflected, the redemption fee would reduce the performance data quoted. To obtain performance data current to the most recent month-end, please call 888.200.4710.
|
| (1) | The graph assumes a hypothetical $10,000 initial investment in the Fund and reflects the reinvestment of dividends and all Fund expenses. Investors should note that the Fund is a professionally managed mutual fund while the index is unmanaged, does not incur expenses and is not available for investment. The performance of the index includes reinvested dividends, and does not reflect sales charges or expenses. |
| (2) | FBR Fund Advisers, Inc. waived a portion of its advisory fees and agreed to contractually reimburse a portion of the Fund’s operating expenses, as necessary, to maintain existing expense limitations, as set forth in the notes to the financial statements. Total returns shown include fee waivers and expense reimbursements, if any; total returns would have been lower had there been no waiver of fees and/or reimbursement of expenses in excess of expense limitations. |
| (3) | The Russell 2000 Index is comprised of the smallest of the 2000 companies of the Russell 3000 Index, representing approximately 8% of the Russell 3000’s total market capitalization. |
| (4) | The total returns shown do not reflect the deduction of taxes that a shareholder would pay on fund distributions or the redemption of fund shares. |
| (5) | For the period February 28, 2007 (commencement of operations) through October 31, 2011. |
| (6) | Represents the performance of the Institutional Class shares after May 30, 2008 (inception of the share class) and Investor Class for periods prior to that date. |
22
FBR Small Cap Fund
Portfolio Summary
October 31, 2011
The following provides a breakdown of the Fund by industry sectors. The underlying securities represent a percentage of the portfolio investments.
| Industry Sector | % of Total Investments |
|
|
| Financial | | 21.1 | % |
| Technology | | 17.8 | % |
| Consumer, Cyclical | | 16.8 | % |
| Industrial | | 13.9 | % |
| Consumer, Non-Cyclical | | 10.9 | % |
| Energy | | 8.4 | % |
| Basic Materials | | 5.2 | % |
| Communications | | 1.6 | % |
| Utilities | | 1.1 | % |
| Real Estate Investment Trust | | 0.6 | % |
| | | | |
| Cash | | 2.6 | % |
23
FBR Small Cap Fund
Portfolio of Investments
October 31, 2011
|
| | | | | VALUE |
| SHARES | | | | (NOTE 2) |
|
| | | COMMON STOCKS — 97.4% | | | | |
| | | Basic Materials — 5.2% | | | | |
| 34,000 | | Hecla Mining Co.* | | $ | 213,180 | |
| 10,000 | | Innospec, Inc.* | | | 302,000 | |
| 8,000 | | Kraton Performance Polymers, Inc.* | | | 157,440 | |
| 1,500 | | NewMarket Corp. | | | 291,210 | |
| 20,000 | | PolyOne Corp. | | | 223,800 | |
| 5,000 | | Schnitzer Steel Industries, Inc., Class A | | | 234,000 | |
| 14,000 | | W.R. Grace & Co.* | | | 585,060 | |
| | | | |
| |
| | | | | | 2,006,690 | |
| | | | |
| |
| | | Communications — 1.6% | | | | |
| 2,000 | | Acme Packet, Inc.* | | | 72,420 | |
| 3,500 | | ADTRAN, Inc. | | | 117,600 | |
| 6,500 | | Aruba Networks, Inc.* | | | 153,985 | |
| 7,600 | | Sourcefire, Inc.* | | | 209,380 | |
| 3,600 | | Vocus, Inc.* | | | 73,368 | |
| | | | |
| |
| | | | | | 626,753 | |
| | | | |
| |
| | | Consumer, Cyclical — 16.8% | | | | |
| 44,000 | | American Axle & Manufacturing Holdings, Inc.* | | | 426,360 | |
| 13,000 | | Ascena Retail Group, Inc.* | | | 375,700 | |
| 9,500 | | Bally Technologies, Inc.* | | | 344,565 | |
| 19,000 | | Big Lots, Inc.* | | | 716,110 | |
| 13,000 | | Chico’s FAS, Inc. | | | 160,680 | |
| 7,000 | | Columbia Sportswear Co. | | | 376,180 | |
| 10,700 | | Crocs, Inc.* | | | 189,069 | |
| 70,000 | | JetBlue Airways Corp.* | | | 313,600 | |
| 15,000 | | Meritor, Inc.* | | | 142,800 | |
| 20,300 | | Modine Manufacturing Co.* | | | 214,571 | |
| 9,754 | | Owens & Minor, Inc. | | | 291,840 | |
| 20,200 | | Penn National Gaming, Inc.* | | | 727,200 | |
| 27,000 | | Pier 1 Imports, Inc.* | | | 337,770 | |
| 6,000 | | Steven Madden Ltd.* | | | 221,400 | |
| 5,600 | | The Buckle, Inc. | | | 249,536 | |
| 4,500 | | The Children’s Place Retail Stores, Inc.* | | | 211,275 | |
| 6,300 | | The Toro Co. | | | 340,452 | |
| 24,000 | | US Airways Group, Inc.* | | | 138,480 | |
24
FBR Small Cap Fund
Portfolio of Investments (continued)
October 31, 2011
|
| | | | | VALUE |
| SHARES | | | | (NOTE 2) |
|
| | | Consumer, Cyclical — 16.8% (continued) | | | | |
| 8,000 | | Westport Innovations, Inc.* | | $ | 242,000 | |
| 14,500 | | Wolverine World Wide, Inc. | | | 549,985 | |
| | | | |
| |
| | | | | | 6,569,573 | |
| | | | |
| |
| | | Consumer, Non-Cyclical — 10.9% | | | | |
| 8,000 | | ImmunoGen, Inc.* | | | 108,640 | |
| 9,000 | | Impax Laboratories, Inc.* | | | 170,190 | |
| 10,000 | | InterMune, Inc.* | | | 255,000 | |
| 3,000 | | Jazz Pharmaceuticals, Inc.* | | | 116,880 | |
| 8,000 | | Optimer Pharmaceuticals, Inc.* | | | 114,160 | |
| 10,000 | | Par Pharmaceutical Companies, Inc.* | | | 306,000 | |
| 21,000 | | RSC Holdings, Inc.* | | | 204,960 | |
| 4,500 | | Seattle Genetics, Inc.* | | | 99,000 | |
| 47,000 | | SEI Investments Co. | | | 760,930 | |
| 15,150 | | Sirona Dental Systems, Inc.* | | | 725,685 | |
| 4,800 | | Sotheby’s | | | 169,056 | |
| 5,400 | | SuccessFactors, Inc.* | | | 144,180 | |
| 7,000 | | ViroPharma, Inc.* | | | 141,680 | |
| 20,110 | | Wright Express Corp.* | | | 942,757 | |
| | | | |
| |
| | | | | | 4,259,118 | |
| | | | |
| |
| | | Energy — 8.4% | | | | |
| 8,612 | | Atwood Oceanics, Inc.* | | | 368,077 | |
| 10,000 | | Brigham Exploration Co.* | | | 364,150 | |
| 16,500 | | Complete Production Services, Inc.* | | | 541,200 | |
| 12,000 | | Energy XXI (Bermuda) Ltd.* | | | 352,440 | |
| 22,200 | | Key Energy Services, Inc.* | | | 287,046 | |
| 92,000 | | Kodiak Oil & Gas Corp.* | | | 635,720 | |
| 15,000 | | Oasis Petroleum, Inc.* | | | 440,100 | |
| 6,000 | | Rosetta Resources, Inc.* | | | 266,040 | |
| | | | |
| |
| | | | | | 3,254,773 | |
| | | | |
| |
| | | Financial — 21.1% | | | | |
| 30,000 | | Associated Banc-Corp. | | | 334,500 | |
| 22,500 | | Astoria Financial Corp. | | | 186,750 | |
| 2,700 | | Bancorp Rhode Island, Inc. | | | 117,720 | |
| 10,000 | | Berkshire Hills Bancorp, Inc. | | | 200,200 | |
| 53,700 | | Brookline Bancorp, Inc. | | | 448,932 | |
25
FBR Small Cap Fund
Portfolio of Investments (continued)
October 31, 2011
|
| | | | | VALUE |
| SHARES | | | | (NOTE 2) |
|
| | | Financial — 21.1% (continued) | | | | |
| 20,000 | | Brown & Brown, Inc. | | $ | 441,600 | |
| 29,454 | | Capitol Federal Financial | | | 326,645 | |
| 18,660 | | Chicopee Bancorp, Inc.* | | | 259,561 | |
| 28,500 | | CNO Financial Group, Inc.* | | | 178,125 | |
| 8,000 | | Encore Capital Group, Inc.* | | | 216,720 | |
| 28,253 | | First Horizon National Corp. | | | 197,488 | |
| 32,200 | | Fulton Financial Corp. | | | 303,968 | |
| 2,300 | | Hingham Institution for Savings | | | 110,308 | |
| 65,000 | | Horace Mann Educators Corp. | | | 874,250 | |
| 16,000 | | Independent Bank Corp. | | | 414,720 | |
| 3,407 | | Investors Title Co. | | | 123,231 | |
| 6,000 | | Newport Bancorp, Inc.* | | | 74,460 | |
| 9,000 | | Peoples Federal Bancshares, Inc.* | | | 117,900 | |
| 7,300 | | SI Financial Group, Inc. | | | 64,605 | |
| 40,800 | | Susquehanna Bancshares, Inc. | | | 296,208 | |
| 14,000 | | Tower Group, Inc. | | | 332,220 | |
| 34,550 | | United Financial Bancorp, Inc. | | | 557,637 | |
| 27,000 | | Waddell & Reed Financial, Inc. | | | 748,710 | |
| 11,400 | | Washington Federal, Inc. | | | 155,610 | |
| 2,700 | | White Mountainns Insurance Group Ltd. | | | 1,134,000 | |
| | | | |
| |
| | | | | | 8,216,068 | |
| | | | |
| |
| | | Industrial — 13.9% | | | | |
| 20,337 | | A.O. Smith Corp. | | | 755,723 | |
| 7,100 | | Armstrong World Industries, Inc. | | | 302,389 | |
| 8,000 | | Atlas Air Worldwide Holdings, Inc.* | | | 308,160 | |
| 3,000 | | Cymer, Inc.* | | | 130,350 | |
| 12,800 | | Genesee & Wyoming, Inc., Class A* | | | 757,888 | |
| 15,000 | | GrafTech International Ltd.* | | | 235,650 | |
| 12,100 | | Heartland Express, Inc. | | | 162,261 | |
| 9,000 | | Lennox International, Inc. | | | 289,710 | |
| 8,200 | | PerkinElmer, Inc. | | | 169,494 | |
| 8,000 | | Roadrunner Transportation Systems, Inc.* | | | 133,520 | |
| 25,860 | | Sauer-Danfoss, Inc.* | | | 1,001,299 | |
| 10,000 | | Simpson Manufacturing Company, Inc. | | | 306,600 | |
| 6,915 | | Sun Hydraulics Corp. | | | 198,875 | |
26
FBR Small Cap Fund
Portfolio of Investments (continued)
October 31, 2011
|
| | | | | VALUE |
| SHARES | | | | (NOTE 2) |
|
| | | Industrial — 13.9% (continued) | | | | |
| 7,000 | | Twin Disc, Inc. | | $ | 272,300 | |
| 17,250 | | Werner Enterprises, Inc. | | | 408,825 | |
| | | | |
| |
| | | | | | 5,433,044 | |
| | | | |
| |
| | | Real Estate Investment Trust — 0.6% | | | | |
| 34,800 | | Sunstone Hotel Investors, Inc.* | | | 241,860 | |
| | | | |
| |
| | | | | | | |
| | | Technology — 17.8% | | | | |
| 16,000 | | Allscripts Healthcare Solutions, Inc.* | | | 306,400 | |
| 45,100 | | Brocade Communications Systems, Inc.* | | | 197,538 | |
| 11,000 | | Cirrus Logic, Inc.* | | | 183,040 | |
| 8,000 | | CommVault Systems, Inc.* | | | 340,640 | |
| 22,000 | | Compuware Corp.* | | | 185,900 | |
| 3,000 | | Concur Technologies, Inc.* | | | 139,560 | |
| 20,000 | | Emulex Corp.* | | | 167,600 | |
| 24,777 | | Jack Henry & Associates, Inc. | | | 803,023 | |
| 18,000 | | MedAssets, Inc.* | | | 191,880 | |
| 35,000 | | Medidata Solutions, Inc.* | | | 629,300 | |
| 10,500 | | Mellanox Technologies Ltd.* | | | 339,780 | |
| 5,000 | | MicroStrategy, Inc., Class A* | | | 658,850 | |
| 8,000 | | NetSuite, Inc.* | | | 304,320 | |
| 8,175 | | Open Text Corp.* | | | 498,838 | |
| 10,000 | | QLogic Corp.* | | | 139,700 | |
| 5,000 | | Quest Software, Inc.* | | | 87,950 | |
| 23,400 | | Radware Ltd.* | | | 618,696 | |
| 8,400 | | RightNow Technologies, Inc.* | | | 361,284 | |
| 8,000 | | Synchronoss Technologies, Inc.* | | | 240,480 | |
| 6,400 | | Taleo Corp., Class A* | | | 207,360 | |
| 1,800 | | The Ultimate Software Group, Inc.* | | | 108,324 | |
| 27,000 | | TriQuint Semiconductor, Inc.* | | | 143,640 | |
| 3,000 | | Veeco Instruments, Inc.* | | | 80,070 | |
| | | | |
| |
| | | | | | 6,934,173 | |
| | | | |
| |
| | | Utilities — 1.1% | | | | |
| 17,400 | | Portland General Electric Co. | | | 426,996 | |
| | | | |
| |
| | | | | | | |
| | | Total Common Stocks (Cost $38,797,992) | | | 37,969,048 | |
| | | | |
| |
27
FBR Small Cap Fund
Portfolio of Investments (continued)
October 31, 2011
|
| NO. OF | | | | | VALUE | |
| RIGHTS | | | | | (NOTE 2) | |
|
| | | RIGHTS — 0.0% | | | | |
| 5,500 | | Forest Laboraties, Inc., Contingent Value Rights* | | $ | 5,225 | |
| | | | |
| |
|
| SHARES | | | | | | |
|
| | | SHORT-TERM INVESTMENT — 2.6% | | | | |
| 1,030,168 | | Fidelity Institutional Money Market Government Portfolio, Class I, 0.01%^ (Cost $1,030,168) | | | 1,030,168 | |
| | | | |
| |
| | | | | | | |
| | | Total Investments — 100.0% (Cost $39,828,160) | | | 39,004,441 | |
| | | | | | | |
| | | Other Assets Less Liabilities — 0.0% | | | (125 | ) |
| | | | |
| |
| | | | | | | |
| | | Net Assets — 100.0% | | $ | 39,004,316 | |
| | | | |
| |
|
| * | Non-income producing security |
| ^ | 7-day yield as of October 31, 2011 |
| Note: | For presentation purposes, the Fund has grouped some of the industry categories. For purposes of categorizing securities for compliance with Section 8(b)(1) of the Investment Company Act of 1940, the Fund uses more specific industry classifications. |
The accompanying notes are an integral part of the financial statements.
28
FBR Focus Fund
Management Overview
Portfolio Managers: David Rainey, CFA®, Brian Macauley, CFA® and Ira Rothberg, CFA®
Over the previous 12 months, how did the Fund perform and what factors contributed to this performance?
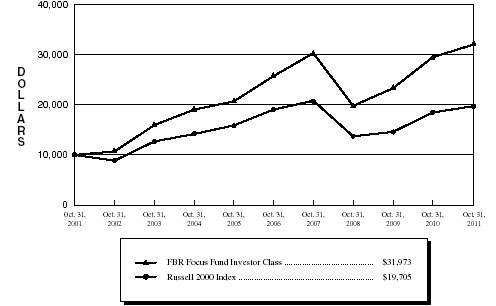
For the twelve-month period ended October 31, 2011, the Investor Class of the FBR Focus Fund returned 8.35% compared to 6.71% for the Russell 2000 Index, 8.09% for the S&P 500 Index, and 7.65% for the Morningstar Mid Cap Growth Category.
On average, the Fund’s portfolio companies produced growing earnings and improving earnings power over the period, with stable valuations. While economic conditions remain difficult and the recovery gradual, there was sufficient stability to allow the portfolio companies to invest in their businesses and increase their intrinsic value.
There were two major contributors to performance during the year- O’Reilly Automotive and 99 Cents Only Stores:
| | • | | O’Reilly Automotive completed a three year integration of its CSK Auto acquisition while continuing to extract value by growing commercial parts programs at those acquired stores. The company also struck new financing arrangements enabling it to improve its working capital efficiency and implement an aggressive share repurchase program. |
| | • | | 99 Cents Only Stores received a buyout offer organized by its founding family. We considered the $19.09 per share offer that was made on March 13, 2011 to be inadequate so we lobbied actively for a robust auction process and higher price (our letters to the board and special committee are a matter of public record available at www.sec.gov). Our demands were met, and on October 11, 2011 the company announced the acceptance of a more equitable buyout deal at $22.00 per share. |
The only major detractor from performance was Lamar Advertising. Demand for billboard advertising from Lamar’s core mid-market customers has lagged the broader advertising recovery seen over the last year. Lamar stock significantly underperformed during the year as this divergence in performance became apparent.
Capital gains tax distributions of $5.24 per share this year were somewhat high in relation to the Fund’s Investor Class ending share NAV on October 31, 2011 of $49.80. In general, the Fund’s investment approach has been, and should continue to be relatively tax efficient since capital gains tend to be realized at lower long-term tax rates rather than higher short-term rates (note that 100% of this year’s capital gain was characterized as long-term). However, the Fund’s investment approach can also lead to lumpiness in the timing of capital gains distributions – such as was the case this year – as gains are realized irregularly and often in large size when we exit a long term position.
We invest with a long-term time horizon and encourage Fund shareholders to do the same. Despite the discussion of one-year results referenced above, we encourage our shareholders to evaluate the Fund’s performance over three-, five-, and ten-year periods
29
FBR Focus Fund
Management Overview (continued)
since shorter time frames can be influenced by many transitory issues unrelated to the intrinsic worth of the Fund’s holdings. Long-term performance metrics for the Fund can be found in the table below.
Portfolio Manager comments on the Fund and the related investment outlook.
Over the past year, and particularly in the past six months, the financial headlines have been dominated by stories about macroeconomic risks and uncertainty. The European sovereign debt crisis, slowing GDP growth, lingering housing market distress, political rancor, and the U.S. credit downgrade have made for a very unsettled stock market.
While today’s problems do seem troubling, the reality is that the world is always an uncertain place. There are routinely macroeconomic or geopolitical concerns that flare up causing significant investor angst. Consider today’s concerns compared to those following the collapse of Lehman Brothers in 2008, after the attacks on September 11, 2001, during the emerging markets crisis in 1997/98, the “Japanese invasion”in the 1980s, a 20% prime rate in 1980, stagflation in the 1970s, or the 1973 oil embargo.
As investors, we are faced with the challenge of how to react to these various macroeconomic concerns. Most often these concerns prove inconsequential with the passage of time, but occasionally they manifest in damage to the real economy and corporate profits. Our general viewpoint is that it is extraordinarily difficult to make money by placing bets on macroeconomic events. Just observe the terrible track record of the full-time Wall Street economists in forecasting important turning points in the economy. The world is too complicated with too many moving parts to have this be a consistently profitable exercise. Experience has taught us that we are most effective when building the portfolio one security at a time.
As long-term investors, we fully expect that our portfolio will face turbulent economic times at various points during our investment horizon. So we prepare for this eventuality, not by selling all our stocks at the first signs of trouble, nor by rotating our portfolio into more conservative sectors, but rather by owning durable companies with a wide “margin of safety”. By this we mean companies with the business model and balance sheet to survive and thrive in many economic environments, owned at attractive prices so that our long-term investment is well protected against unfavorable company specific and macroeconomic developments.
Today, we think the Fund’s portfolio is composed of durable companies with a good margin of safety. In fact, we think that many of the Fund’s largest holdings are well positioned to grow cash earnings per share at a double digit clip over the next several years regardless of the rate of economic recovery. These companies have their own profit drivers that are largely independent of the overall economy, i.e. American Tower (9.3% of assets*) is driven by the adoption of data intensive smart phones, O’Reilly (11.0% of assets*) is driven by its ability to further improve acquired CSK stores, and Markel (8.0% of assets*)
* As of October 31, 2011.
30
FBR Focus Fund
Management Overview (continued)
is driven by the insurance pricing cycle and success of insurance and non insurance acquisitions.
We attempt to use stock market swoons to our advantage by purchasing shares in companies that we admire at discount prices. Over the last twelve months, we added six new holdings to the portfolio and increased the size of several other positions. Most of these changes took place during the market turmoil over the summer and fall. This is a lot of activity for us considering that the Fund has 22 total positions and a history of low turnover. However, this is also consistent with our historical pattern of long periods of portfolio inactivity when we believe that bargains are few, interspersed by a flurry of portfolio activity during periods when we believe that bargains are plentiful. While we often find ourselves in extended periods of portfolio inactivity, it is during these periods that we build and refine our list of investment prospects so that we are prepared for market opportunity when it arrives.
Whenever we add a new position to the portfolio, we carefully weigh its merit against the positions that we already have in the portfolio. We only add a new position if we believe that it is as good as, or better than what we already own. This comparison methodology helps us maintain a high standard for new purchases, and avoid complacency with existing positions. We are encouraged by these recent portfolio additions since they took the place of less favorable investment allocations in the Fund. Further, several of these new investments are in industries that did not have representation in the portfolio (i.e. health care, energy, and transportation) adding an increased level of overall diversification. Through this process of gradually, and sometimes not so gradually, layering new investment ideas into the portfolio, we achieve a process of continuous portfolio improvement. While in the short term the Fund may rise and fall with the overall market, over a period of years we think that the Fund’s carefully selected portfolio of companies should produce quite satisfactory overall investment results.
We thank you for entrusting your capital to us. We take this responsibility very seriously, and we will do our best to protect and grow your investment.
The opinions expressed in this commentary reflect those of the Portfolio Managers as of the date written. Any such opinions are subject to change based on market or other conditions. These opinions may not be relied upon as investment advice. Investment decisions for The FBR Funds are based on several factors, and may not be relied upon as an indication of trading intent on behalf of any FBR Fund. Security positions can and do change.
31
FBR Focus Fund
Comparison of Changes in Value of $10,000 Investment in
Investor Class Shares(1)(2) vs. Russell 2000 Index(1)(3)
| Total Returns—For the Periods Ended October 31, 2011(4) | |
| | | | | Annualized | | Annualized | |
| | | One Year | | Five Year | | Ten Year |
| | |
| |
| |
|
FBR Focus Fund Investor Class(1)(2) | | 8.35% | | 4.42% | | 12.33% |
FBR Focus Fund Institutional Class(2)(5) | | 8.53% | | 4.67% | | 12.46% |
Russell 2000 Index(1)(3) | | 6.71% | | 0.68% | | 7.02% |
| |
PAST PERFORMANCE IS NO GUARANTEE OF FUTURE RESULTS.
The performance data quoted represents past performance and the current performance may be lower or higher than the performance data quoted. The investment return and principal will fluctuate so that investors’ shares, when redeemed, may be worth more or less than their original cost. The performance data does not reflect the deduction of taxes that a shareholder would pay on Fund distributions or redemption fees. The Fund charges a redemption fee of 1.00% on shares redeemed or exchanged within 90 days; if reflected, the redemption fee would reduce the performance data quoted. To obtain performance data current to the most recent month-end, please call 888.200.4710.
|
| (1) | | The graph assumes a hypothetical $10,000 initial investment in the Fund and reflects the reinvestment of dividends and all Fund expenses. Investors should note that the Fund is a professionally managed mutual fund while the index is unmanaged, does not incur expenses and is not available for investment. The performance of the index includes reinvested dividends, and does not reflect sales charges or expenses. |
| (2) | | FBR Fund Advisers, Inc. waived a portion of its advisory fees and agreed to contractually reimburse a portion of the Fund’s operating expenses, as necessary, to maintain existing expense limitations, as set forth in the notes to the financial statements. Total returns shown include fee waivers and expense reimbursements, if any; total returns would have been lower had there been no waiver of fees and/or reimbursement of expenses in excess of expense limitations. |
| (3) | | The Russell 2000 Index is comprised of the smallest of the 2000 companies of the Russell 3000 Index, representing approximately 8% of the Russell 3000’s total market capitalization. |
| (4) | | The total returns shown do not reflect the deduction of taxes that a shareholder would pay on fund distributions or the redemption of fund shares. |
| (5) | | Represents the performance of the Institutional Class shares after May 30, 2008 (inception of share class) and Investor Class for periods prior to that date. |
32
FBR Focus Fund
Portfolio Summary
October 31, 2011
The following provides a breakdown of the Fund by industry sectors. The underlying securities represent a percentage of the portfolio investments.
| Industry Sector | | % of Total Investments |
| |
|
| Retail | | 32.1 | % |
| Entertainment | | 14.0 | % |
| Insurance | | 13.7 | % |
| Telecommunications | | 9.3 | % |
| Diversified Financial Services | | 7.1 | % |
| Internet | | 4.3 | % |
| Building Materials | | 3.8 | % |
| Media | | 3.4 | % |
| Advertising | | 2.1 | % |
| Home Furnishings | | 1.8 | % |
| Transportation | | 1.3 | % |
| Healthcare Products | | 1.0 | % |
| | | | |
| Cash | | 6.1 | % |
33
FBR Focus Fund
Portfolio of Investments
October 31, 2011
|
| | | | | | VALUE |
| | SHARES | | | | (NOTE 2) |
|
| | | | COMMON STOCKS — 93.9% | | | | |
| | | | Advertising — 2.1% | | | | |
| | 630,000 | | Lamar Advertising Co., Class A* | | $ | 14,168,700 | |
| | | | | |
| |
| | | | Building Materials — 3.8% | | | | |
| | 825,000 | | Simpson Manufacturing Company, Inc. | | | 25,294,500 | |
| | | | | |
| |
| | | | Diversified Financial Services — 7.1% | | | | |
| | 94,910 | | Diamond Hill Investment Group, Inc. | | | 7,144,825 | |
| | 503,756 | | Encore Capital Group, Inc.* | | | 13,646,750 | |
| | 401,508 | | Marlin Business Services Corp.* | | | 4,733,779 | |
| | 125,000 | | T. Rowe Price Group, Inc. | | | 6,605,000 | |
| | 912,000 | | The Charles Schwab Corp. | | | 11,199,360 | |
| | 173,137 | | White River Capital, Inc. | | | 3,331,156 | |
| | | | | |
| |
| | | | | | | 46,660,870 | |
| | | | | |
| |
| | | | Entertainment — 14.0% | | | | |
| | 1,169,000 | | Bally Technologies, Inc.* | | | 42,399,630 | |
| | 1,393,670 | | Penn National Gaming, Inc.* | | | 50,172,120 | |
| | | | | |
| |
| | | | | | | 92,571,750 | |
| | | | | |
| |
| | | | Healthcare Products — 1.0% | | | | |
| | 98,733 | | Henry Schein, Inc.* | | | 6,844,172 | |
| | | | | |
| |
| | | | Home Furnishings — 1.8% | | | | |
| | 680,160 | | American Woodmark Corp. | | | 11,569,522 | |
| | | | | |
| |
| | | | Insurance — 13.7% | | | | |
| | 805,750 | | Aon Corp. | | | 37,564,065 | |
| | 136,640 | | Markel Corp.* | | | 52,811,360 | |
| | | | | |
| |
| | | | | | | 90,375,425 | |
| | | | | |
| |
| | | | Internet — 4.3% | | | | |
| | 47,800 | | Google, Inc., Class A* | | | 28,328,192 | |
| | | | | |
| |
| | | | Media — 3.4% | | | | |
| | 1,303,000 | | News Corp., Class A | | | 22,828,560 | |
| | | | | |
| |
34
FBR Focus Fund
Portfolio of Investments (continued)
October 31, 2011
|
| | | | | | VALUE |
| | SHARES | | | | (NOTE 2) |
|
| | | | Retail — 32.1% | | | | |
| | 3,527,235 | | 99¢ Only Stores*† | | $ | 76,893,723 | |
| | 1,840,088 | | CarMax, Inc.* | | | 55,313,045 | |
| | 954,843 | | O’Reilly Automotive, Inc.* | | | 72,615,810 | |
| | 185,000 | | World Fuel Services Corp. | | | 7,372,250 | |
| | | | | |
| |
| | | | | | | 212,194,828 | |
| | | | | |
| |
| | | | Telecommunications — 9.3% | | | | |
| | 1,110,595 | | American Tower Corp., Class A* | | | 61,193,784 | |
| | | | | |
| |
| | | | Transportation — 1.3% | | | | |
| | 504,200 | | Roadrunner Transportation Systems, Inc.* | | | 8,415,098 | |
| | | | | |
| |
| | | | | | | | |
| | | | Total Common Stocks (Cost $327,154,110) | | | 620,445,401 | |
| | | | | |
| |
| | | | | | | | |
| | | | SHORT-TERM INVESTMENT — 6.1% | | | | |
| | 40,057,250 | | Fidelity Institutional Money Market Government Portfolio, Class I, 0.01%^ (Cost $40,057,250) | | | 40,057,250 | |
| | | | | |
| |
| | | | | | | | |
| | | | Total Investments — 100.0% (Cost $367,211,360) | | | 660,502,651 | |
| | | | | | | | |
| | | | Liabilities Less Other Assets — 0.0% | | | (160,006 | ) |
| | | | | |
| |
| | | | | | | | |
| | | | Net Assets — 100.0% | | $ | 660,342,645 | |
| | | | | |
| |
|
| * | | Non-income producing security |
| † | | Affiliated issuer as defined in the Investment Company Acto fo 1940 (ownership of at least 5% of the outstanding voting securities of the issuer) |
| ^ | | 7-day yield as of October 31, 2011 |
| | | |
| Note: | | For presentation purposes, the Fund has grouped some of the industry categories. For purposes of categorizing securities for compliance with Section 8(b)(1) of the Investment Company Act of 1940, the Fund uses more specific industry classifications. |
The accompanying notes are an integral part of the financial statements.
35
FBR Large Cap Financial Fund
Management Overview
Portfolio Manager: David Ellison
Over the previous 12 months, how did the Fund perform and what factors contributed to this performance?
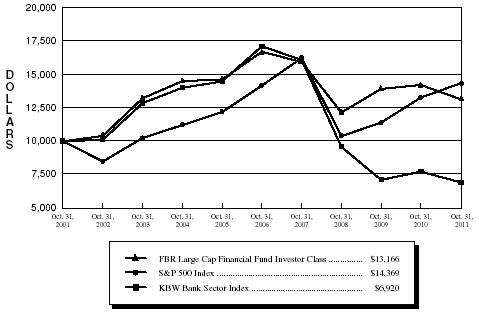
For the twelve-month period ended October 31, 2011, the Investor Class of the FBR Large Cap Financial Fund returned -7.53%. This compares to the KBW Bank Index, the S&P 500 Index and the Morningstar Financial Category Average, which returned -10.39%, 8.09% and -6.80% for the same period, respectively.
The Fund performed in line with the Morningstar Financial Category during the period. Positions in the largest banks hurt performance during the period. Investments in credit card and insurance companies helped performance during the period. Large banks continue to fight the headwinds of weak labor and housing markets. Also, recent concerns with European debt and the impacts on world growth have provided additional headwinds for the big diversified banks. Credit card and insurance companies have seen improved delinquency rates and modest growth and are doing better in the current environment.
The Fund continues to be concentrated in the largest domestic commercial banks. We believe they offer the best upside when the U.S. economy improves. Also, these financials are not exposed to the debt troubles in Europe and related economic slowdown that appears to be developing.
Portfolio Manager comments on the Fund and the related investment outlook.
The industry continues to battle many earnings headwinds. Employment and housing remain weak. Investment banking activity is slow. Stock and bond trading volumes are light. Nonperforming assets have declined but recent declines have slowed. Loan demand is weak and some have seen their loan books decline. Low interest rates are helping borrowers somewhat, but are hurting lending spreads. European debt troubles and related economic weakness in Europe is hurting growth prospects in that region. Finally, public opinion of banks is right up there with Congress, i.e. not helping investor sentiment.
These negative operating conditions have been with the industry for over three years now. Investors in this space are weary and tired. As a result, there is little investor interest. Reduced investor interest is being reflected in low historical valuations as measured by earnings per share multiples and price to book ratios.
The good news, yes we have some, is that while macro conditions are difficult, the industry is working very hard to improve on a micro level. We are seeing improved capital ratios, loan loss reserves, liquidity levels, realistic loan write-downs, cost containment and reduction programs, regulatory compliance, internal loan review, credit risk controls and generally a much improved attention to detail. They are, in sum, getting back to the basic principles of sound banking abandoned some years ago.
36
FBR Large Cap Financial Fund
Management Overview (continued)
We believe the industry is “on the mend” and will gradually show improved earnings that will be more stable and predictable than what we have experienced the last five years. This improved earnings quality should lead to higher valuations as measured by earnings multiples and price to book ratios.
Investing in financial service stocks remains a challenge. We are doing our best to avoid the downside and having to rethink our positions, at times, almost daily. Finally, we remain mindful that investing is never ALWAYS about making the most, but is ALWAYS about preserving the MOST over the long run.
The opinions expressed in this commentary reflect those of the Portfolio Manager as of the date written. Any such opinions are subject to change based on market or other conditions. These opinions may not be relied upon as investment advice. Investment decisions for The FBR Funds are based on several factors, and may not be relied upon as an indication of trading intent on behalf of any FBR Fund. Security positions can and do change.
37
FBR Large Cap Financial Fund
Comparison of Changes in Value of $10,000 Investment in
Investor Class Shares(1)(2) vs. Various Indices(1)(3)
| Total Returns—For the Periods Ended October 31, 2011(4) | |
| | | | | | | Annualized | | Annualized | |
| | | | One Year | | Five Year | | Ten Year | |
| | | |
| |
| |
| |
FBR Large Cap Financial Fund Investor Class(1)(2) | | | (7.53)% | | (4.68)% | | 2.79% | |
S&P 500 Index(1)(3) | | | 8.09% | | 0.25% | | 3.69% | |
KBW Bank Sector Index(1)(3) | | | (10.39)% | | (16.60)% | | (3.61)% | |
| |
PAST PERFORMANCE IS NO GUARANTEE OF FUTURE RESULTS.
The performance data quoted represents past performance and the current performance may be lower or higher than the performance data quoted. The investment return and principal will fluctuate so that investors’ shares, when redeemed, may be worth more or less than their original cost. The performance data does not reflect the deduction of taxes that a shareholder would pay on Fund distributions or redemption fees. The Fund charges a redemption fee of 1.00% on shares redeemed or exchanged within 90 days; if reflected, the redemption fee would reduce the performance data quoted. To obtain performance data current to the most recent month-end, please call 888.200.4710.
| (1) | | The graph assumes a hypothetical $10,000 initial investment in the Fund and reflects the reinvestment of dividends and all Fund expenses. Investors should note that the Fund is a professionally managed mutual fund while the index is unmanaged, does not incur expenses and is not available for investment. The performance of the index includes reinvested dividends, and does not reflect sales charges or expenses. |
| (2) | | FBR Fund Advisers, Inc. waived a portion of its advisory fees and agreed to contractually reimburse a portion of the Fund’s operating expenses, as necessary, to maintain existing expense limitations, as set forth in the notes to the financial statements. Total returns shown include fee waivers and expense reimbursements, if any; total returns would have been lower had there been no waiver of fees and/or reimbursement of expenses in excess of expense limitations. |
| (3) | | The S&P 500 Index is a capitalization-weighted index of 500 stocks. The index is designed to represent the broad domestic ecomony through changes in aggregate market value of 500 stocks representing all major industries. The KBW Bank Sector Index is a capitalization-weighted index composed of 24 geographically diverse stocks representing national money center banks and leading regional institutions. |
| (4) | | The total returns shown do not reflect the deduction of taxes that a shareholder would pay on fund distributions or the redemption of fund shares. |
38
FBR Large Cap Financial Fund
Portfolio Summary
October 31, 2011
The following provides a breakdown of the Fund by industry sectors. The underlying securities represent a percentage of the portfolio investments.
| Industry Sector | | % of Total Investments |
| |
|
| Banks | | 63.6 | % |
| Insurance | | 19.8 | % |
| Diversified Financial Services | | 6.8 | % |
| Commercial Services | | 2.9 | % |
| Savings & Loans | | 1.6 | % |
| Real Estate Investment Trust | | 1.2 | % |
| | | | |
| Cash | | 4.1 | % |
39
FBR Large Cap Financial Fund
Portfolio of Investments
October 31, 2011
|
| | | | | | VALUE |
| | SHARES | | | | (NOTE 2) |
|
| | | | COMMON STOCKS — 95.9% | | | | |
| | | | Banks — 63.6% | | | | |
| | 370,000 | | Bank of America Corp. | | $ | 2,527,100 | |
| | 45,000 | | BB&T Corp. | | | 1,050,300 | |
| | 60,000 | | Capital One Financial Corp. | | | 2,739,600 | |
| | 100,000 | | Citigroup, Inc. | | | 3,159,000 | |
| | 110,000 | | Comerica, Inc. | | | 2,810,500 | |
| | 230,000 | | Fifth Third Bancorp | | | 2,762,300 | |
| | 200,000 | | Huntington Bancshares, Inc. | | | 1,036,000 | |
| | 85,000 | | JPMorgan Chase & Co. | | | 2,954,600 | |
| | 400,000 | | KeyCorp | | | 2,824,000 | |
| | 20,000 | | M&T Bank Corp. | | | 1,522,200 | |
| | 158,000 | | Morgan Stanley | | | 2,787,120 | |
| | 42,000 | | Principal Financial Group, Inc. | | | 1,082,760 | |
| | 20,000 | | The Bank of New York Mellon Corp. | | | 425,600 | |
| | 13,000 | | The Goldman Sachs Group, Inc. | | | 1,424,150 | |
| | 50,000 | | The PNC Financial Services Group, Inc. | | | 2,685,500 | |
| | 65,000 | | U.S. Bancorp | | | 1,663,350 | |
| | 75,000 | | Wells Fargo & Co. | | | 1,943,250 | |
| | | | | |
| |
| | | | | | | 35,397,330 | |
| | | | | |
| |
| | | | Commercial Services — 2.9% | | | | |
| | 2,000 | | MasterCard, Inc., Class A | | | 694,480 | |
| | 10,000 | | Visa, Inc., Class A | | | 932,600 | |
| | | | | |
| |
| | | | | | | 1,627,080 | |
| | | | | |
| |
| | | | Diversified Financial Services — 6.8% | | | | |
| | 20,000 | | American Express Co. | | | 1,012,400 | |
| | 30,000 | | Ameriprise Financial, Inc. | | | 1,400,400 | |
| | 2,000 | | BlackRock, Inc. | | | 315,580 | |
| | 45,000 | | Discover Financial Services | | | 1,060,200 | |
| | | | | |
| |
| | | | | | | 3,788,580 | |
| | | | | |
| |
| | | | Insurance — 19.8% | | | | |
| | 20,000 | | ACE Ltd. | | | 1,443,000 | |
| | 25,000 | | Aflac, Inc. | | | 1,127,250 | |
| | 90,000 | | American International Group, Inc.* | | | 2,222,100 | |
| | 50,000 | | Genworth Financial, Inc., Class A* | | | 319,000 | |
40
FBR Large Cap Financial Fund
Portfolio of Investments (continued)
October 31, 2011
|
| | | | | | | VALUE | |
| | SHARES | | | | | (NOTE 2) | |
|
| | | | Insurance — 19.8% (continued) | | | | |
| | 55,000 | | MetLife, Inc. | | $ | 1,933,800 | |
| 15,000 | | Prudential Financial, Inc. | | | 813,000 | |
| 135,000 | | SunTrust Banks, Inc. | | | 2,663,550 | |
| 25,000 | | The Hartford Financial Services Group, Inc. | | | 481,250 | |
| | | | |
| |
| | | | | | 11,002,950 | |
| | | | |
| |
| | | Real Estate Investment Trust — 1.2% | | | | |
| 40,000 | | Annaly Capital Management, Inc. | | | 674,000 | |
| | | | |
| |
| | | Savings & Loans — 1.6% | | | | |
| 60,000 | | Hudson City Bancorp, Inc. | | | 375,000 | |
| 40,000 | | New York Community Bancorp, Inc. | | | 532,400 | |
| | | | |
| |
| | | | | | 907,400 | |
| | | | |
| |
| | | | | | | |
| | | Total Common Stocks (Cost $58,872,114) | | | 53,397,340 | |
| | | | |
| |
| | | | | | | |
| | | SHORT-TERM INVESTMENT — 4.0% | | | | |
| 2,227,955 | | Fidelity Institutional Money Market Government Portfolio, Class I, 0.01%^ (Cost $2,227,955) | | | 2,227,955 | |
| | | | |
| |
| | | | | | | |
| | | Total Investments — 99.9% (Cost $61,100,069) | | | 55,625,295 | |
| | | | | | | |
| | | Other Assets Less Liabilities — 0.1% | | | 58,349 | |
| | | | |
| |
| | | | | | | |
| | | Net Assets — 100.0% | | $ | 55,683,644 | |
| | | | |
| |
|
| * | | Non-income producing security |
| ^ | | 7-day yield as of October 31, 2011 |
The accompanying notes are an integral part of the financial statements.
41
FBR Small Cap Financial Fund
Management Overview
Portfolio Manager: David Ellison
Over the previous 12 months, how did the Fund perform and what factors contributed to this performance?
For the twelve-month period ended October 31, 2011, the Investor Class of the FBR Small Cap Financial Fund returned -8.12%. This compares to the NASDAQ Bank Index and the Morningstar Financial Category Average which returned -3.91% and -6.80% for the same period, respectively. The Fund trailed the more broadly diversified Russell 2000 Index which returned 6.71% for the period.
The Fund did not perform well in the second half of the fiscal year. Investments in mortgage insurers and small cap banks located in weak economic markets in the U.S. hurt investment performance. On the other hand, small banks in healthy markets helped performance. We continue to position most of the Fund in small capitalization banks. We believe that these companies will be big beneficiaries of improved employment and housing markets. Currently, the economy is simply not strong enough yet to improve employment or housing. The housing market is one of the weakest sectors in the economy and small cap banks are very susceptible to conditions in this market. Also, any economic momentum that was building this year was lost over the summer to the developing debt crisis in Europe. We believe the portfolio is positioned to perform well when U.S. housing and employment recover.
Portfolio manager comments on the Fund and the related investment outlook.
The industry continues to battle many negative forces. Employment and housing remain frustratingly weak. Nonperforming assets have improved but the pace of improvement has slowed. Regulatory oversight is growing and the cost and profit impacts are uncertain. Loan demand remains slow and many banks are seeing their loan books decline. Low interest rates are helping debt holders somewhat, but are hurting lending spreads for banks. Debt concerns in Europe, while not an investment problem for small banks, are making investors concerned about economic growth in the U.S. Finally, public opinion of banks is right up there with Congress, i.e. not helping investor confidence in the group.
These negative operating conditions have been with the industry for over three years now. Investors are becoming wary of these seemingly unending headwinds. As a result, the industry is seeing little investor interest. Reduced investor interest is being reflected in low historical valuations as measured by earning per share multiples and price to book ratios.
The good news, yes there is some, is that while the macro conditions are difficult, the industry is working very hard to improve their own fundamentals. These improvements include higher capital ratios, loan loss reserves, liquidity levels, cost containment and reduction programs, regulatory compliance, internal loan review, credit risk controls and finally a much improved attention to detail. They are, in sum, getting back to the basic principles of sound banking abandoned some years ago.
42
FBR Small Cap Financial Fund
Management Overview (continued)
We believe the industry is “on the mend” and will eventually show improved earnings that will be more stable and predictable. These improved earnings should lead to higher valuations over time as measured by earnings per share multiples and price to book ratios.
We are in the “lonely vigil” period for this industry as we wait for the good fundamental work being done today to show up in the earnings and valuations tomorrow.
The opinions expressed in this commentary reflect those of the Portfolio Manager as of the date written. Any such opinions are subject to change based on market or other conditions. These opinions may not be relied upon as investment advice. Investment decisions for The FBR Funds are based on several factors, and may not be relied upon as an indication of trading intent on behalf of any FBR Fund. Security positions can and do change.
43
FBR Small Cap Financial Fund
Comparison of Changes in Value of $10,000 Investment in
Investor Class Shares(1)(2) vs. Russell 2000 Index(1)(3)
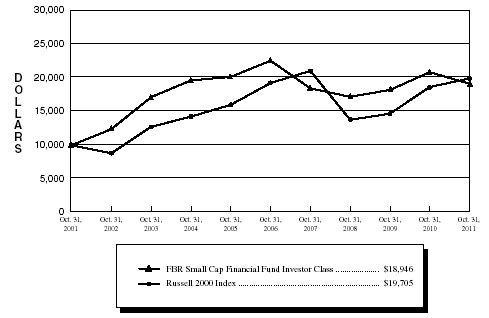
| Total Returns—For the Periods Ended October 31, 2011(4) | |
| | | | | | | Annualized | | Annualized | |
| | | | One Year | | Five Year | | Ten Year | |
| | | |
| |
| |
| |
FBR Small Cap Financial Fund Investor Class(1)(2) | | | (8.12)% | | (3.20)% | | 6.60% | |
FBR Small Cap Financial Fund Institutional Class(2)(5) | | | (8.00)% | | (3.05)% | | 6.68% | |
Russell 2000 Index(1)(3) | | | 6.71% | | 0.68% | | 7.02% | |
| |
PAST PERFORMANCE IS NO GUARANTEE OF FUTURE RESULTS.
The performance data quoted represents past performance and the current performance may be lower or higher than the performance data quoted. The investment return and principal will fluctuate so that investors’ shares, when redeemed, may be worth more or less than their original cost. The performance data does not reflect the deduction of taxes that a shareholder would pay on Fund distributions or redemption fees. The Fund charges a redemption fee of 1.00% on shares redeemed or exchanged within 90 days; if reflected, the redemption fee would reduce the performance data quoted. To obtain performance data current to the most recent month-end, please call 888.200.4710.
|
| (1) | | The graph assumes a hypothetical $10,000 initial investment in the Fund and reflects the reinvestment of dividends and all Fund expenses. Investors should note that the Fund is a professionally managed mutual fund while the index is unmanaged, does not incur expenses and is not available for investment. The performance of the index includes reinvested dividends, and does not reflect sales charges or expenses. |
| (2) | | FBR Fund Advisers, Inc. waived a portion of its advisory fees and agreed to contractually reimburse a portion of the Fund’s operating expenses, as necessary, to maintain existing expense limitations, as set forth in the notes to the financial statements. Total returns shown include fee waivers and expense reimbursements, if any; total returns would have been lower had there been no waiver of fees and/or reimbursement of expenses in excess of expense limitations. |
| (3) | | The Russell 2000 Index is comprised of the smallest of the 2000 companies of the Russell 3000 Index, representing approximately 8% of the Russell 3000’s total market capitalization. |
| (4) | | The total returns shown do not reflect the deduction of taxes that a shareholder would pay on fund distributions or the redemption of fund shares. |
| (5) | | Represents the performance of the Institutional Class shares after May 30, 2008 (inception of share class) and Investor Class for periods prior to that date. |
44
FBR Small Cap Financial Fund
Portfolio Summary
October 31, 2011
The following provides a breakdown of the Fund by industry sectors. The underlying securities represent a percentage of the portfolio investments.
| Industry Sector | | % of Total Investments |
| |
|
| Savings & Loans | | 36.5 | % |
| Banks | | 29.4 | % |
| Real Estate Investment Trust | | 11.3 | % |
| Diversified Financial Services | | 6.0 | % |
| Investment Companies | | 4.0 | % |
| Insurance | | 2.1 | % |
| Home Builders | | 1.8 | % |
| Commercial Services | | 1.7 | % |
| | | | |
| Cash | | 7.2 | % |
45
FBR Small Cap Financial Fund
Portfolio of Investments
October 31, 2011
|
| | | | | | VALUE |
| | SHARES | | | | (NOTE 2) |
|
| | | | COMMON STOCKS — 88.8% | | | | |
| | | | Banks — 29.4% | | | | |
| | 220,000 | | Associated Banc-Corp. | | $ | 2,453,000 | |
| | 80,000 | | Bancorp Rhode Island, Inc. | | | 3,488,000 | |
| | 150,000 | | Banner Corp. | | | 2,635,500 | |
| | 35,000 | | City National Corp. | | | 1,484,700 | |
| | 100,000 | | Fifth Third Bancorp | | | 1,201,000 | |
| | 228,009 | | First Connecticut Bancorp, Inc.* | | | 2,681,386 | |
| | 415,000 | | First Horizon National Corp. | | | 2,900,850 | |
| | 75,000 | | First Midwest Bancorp, Inc. | | | 675,750 | |
| | 80,000 | | FirstMerit Corp. | | | 1,120,800 | |
| | 250,000 | | Fulton Financial Corp. | | | 2,360,000 | |
| | 65,000 | | Glacier Bancorp, Inc. | | | 737,750 | |
| | 30,000 | | IBERIABANK Corp. | | | 1,551,600 | |
| | 160,000 | | Independent Bank Corp. | | | 4,147,200 | |
| | 190,000 | | KeyCorp | | | 1,341,400 | |
| | 300,000 | | Nara Bancorp, Inc.* | | | 2,544,000 | |
| | 430,000 | | National Penn Bancshares, Inc. | | | 3,354,000 | |
| | 280,000 | | State Bancorp, Inc. | | | 3,312,400 | |
| | 263,000 | | Sterling Financial Corp.* | | | 3,947,630 | |
| | 730,000 | | Susquehanna Bancshares, Inc. | | | 5,299,800 | |
| | 160,000 | | TCF Financial Corp. | | | 1,702,400 | |
| | 100,000 | | United Community Banks* | | | 739,000 | |
| | 60,000 | | Webster Financial Corp. | | | 1,178,400 | |
| | 100,000 | | Wilshire Bancorp, Inc.* | | | 342,000 | |
| | | | | |
| |
| | | | | | | 51,198,566 | |
| | | | | |
| |
| | | | Commercial Services — 1.7% | | | | |
| | 91,900 | | Green Dot Corp., Class A* | | | 3,002,373 | |
| | | | | |
| |
| | | | Diversified Financial Services — 6.0% | | | | |
| | 185,000 | | Encore Capital Group, Inc.* | | | 5,011,650 | |
| | 470,000 | | Netspend Holdings, Inc.* | | | 2,702,500 | |
| | 40,000 | | Portfolio Recovery Associates, Inc.* | | | 2,805,600 | |
| | | | | |
| |
| | | | | | | 10,519,750 | |
| | | | | |
| |
46
FBR Small Cap Financial Fund
Portfolio of Investments (continued)
October 31, 2011
|
| | | | | | VALUE |
| | SHARES | | | | (NOTE 2) |
|
| | | | Home Builders — 1.8% | | | | |
| | 450,000 | | KB Home | | $ | 3,136,500 | |
| | | | | |
| |
| | | | Insurance — 2.1% | | | | |
| | 410,000 | | CNO Financial Group, Inc.* | | | 2,562,500 | |
| | 400,000 | | MGIC Investment Corp.* | | | 1,064,000 | |
| | | | | |
| |
| | | | | | | 3,626,500 | |
| | | | | |
| |
| | | | Real Estate Investment Trust — 11.3% | | | | |
| | 65,000 | | American Capital Agency Corp.* | | | 1,788,150 | |
| | 130,000 | | Colony Financial, Inc. | | | 1,907,100 | |
| | 100,000 | | CommonWealth REIT | | | 1,935,000 | |
| | 120,000 | | CYS Investments, Inc. | | | 1,521,600 | |
| | 70,000 | | Hatteras Financial Corp. | | | 1,799,000 | |
| | 130,000 | | Invesco Mortgage Capital, Inc. | | | 2,051,400 | |
| | 200,000 | | MFA Financial, Inc. | | | 1,350,000 | |
| | 725,000 | | NorthStar Realty Finance Corp. | | | 2,863,750 | |
| | 500,000 | | RAIT Financial Trust | | | 2,600,000 | |
| | 190,000 | | Two Harbors Investment Corp. | | | 1,776,500 | |
| | | | | |
| |
| | | | | | | 19,592,500 | |
| | | | | |
| |
| | | | Savings & Loans — 36.5% | | | | |
| | 530,000 | | Astoria Financial Corp. | | | 4,399,000 | |
| | 97,993 | | Bank Mutual Corp. | | | 326,317 | |
| | 161,326 | | BankUnited, Inc. | | | 3,515,293 | |
| | 525,000 | | Brookline Bancorp, Inc. | | | 4,389,000 | |
| | 400,000 | | Capitol Federal Financial | | | 4,436,000 | |
| | 13,840 | | First Financial Holdings, Inc. | | | 103,108 | |
| | 395,000 | | First Niagara Financial Group, Inc. | | | 3,630,050 | |
| | 400,000 | | Flushing Financial Corp. | | | 4,904,000 | |
| | 94,331 | | Hingham Institution for Savings | | | 4,524,115 | |
| | 278,300 | | Northwest Bancshares, Inc. | | | 3,470,401 | |
| | 354,671 | | OceanFirst Financial Corp. | | | 4,624,910 | |
| | 175,000 | | People’s United Financial, Inc. | | | 2,231,250 | |
| | 60,000 | | Provident Financial Services, Inc. | | | 777,000 | |
| | 233,402 | | Rockville Financial, Inc. | | | 2,345,690 | |
47
FBR Small Cap Financial Fund
Portfolio of Investments (continued)
October 31, 2011
|
| | | | | | VALUE |
| | SHARES | | | | (NOTE 2) |
|
| | | | Savings & Loans — 36.5% (continued) | | | | |
| | 225,000 | | Territorial Bancorp, Inc. | | $ | 4,421,250 | |
| | 400,000 | | TFS Financial Corp.* | | | 3,684,000 | |
| | 176,505 | | United Financial Bancorp, Inc. | | | 2,848,791 | |
| | 390,000 | | Washington Federal, Inc. | | | 5,323,500 | |
| | 90,000 | | WSFS Financial Corp. | | | 3,577,500 | |
| | | | | |
| |
| | | | | | | 63,531,175 | |
| | | | | |
| |
| | | | | | | | |
| | | | Total Common Stocks (Cost $161,445,227) | | | 154,607,364 | |
| | | | | |
| |
| | | | | | | | |
| | | | INVESTMENT COMPANIES — 4.0% | | | | |
| | 275,000 | | American Capital Ltd. | | | 2,136,750 | |
| | 225,000 | | Fortress Investment Group LLC* | | | 803,250 | |
| | 490,000 | | KKR Financial Holdings LLC | | | 4,091,500 | |
| | | | | |
| |
| | | | | | | | |
| | | | Total Investment Companies (Cost $6,886,226) | | | 7,031,500 | |
| | | | | |
| |
| | | | | | | | |
| | | | SHORT-TERM INVESTMENT — 7.3% | | | | |
| | 12,691,744 | | Fidelity Institutional Money Market Government Portfolio, Class I, 0.01%^ (Cost $12,691,744) | | | 12,691,744 | |
| | | | | |
| |
| | | | | | | | |
| | | | Total Investments — 100.1% (Cost $181,023,197) | | | 174,330,608 | |
| | | | | | | | |
| | | | Liabilities Less Other Assets — (0.1)% | | | (229,768 | ) |
| | | | | |
| |
| | | | | | | | |
| | | | Net Assets — 100.0% | | $ | 174,100,840 | |
| | | | | |
| |
|
| * | | Non-income producing security |
| LLC | | Limited Liability Company |
| ^ | | 7-day yield as of October 31, 2011 |
The accompanying notes are an integral part of the financial statements.
48
FBR Technology Fund
Management Overview
Portfolio Manager: David Ellison and Winsor Aylesworth
Over the previous 12 months, how did the Fund perform and what factors contributed to this performance?
For the twelve-month period ended October 31, 2011, the Investor Class of the FBR Technology Fund returned -1.27%. This compares to the S&P 500 Index, the NASDAQ Composite Index and the Morningstar Technology Category Average, which returned 8.09%, 7.06% and 3.76% for the same period, respectively.
For the twelve-month period, the Fund underperformed its various benchmarks. The Fund’s investment philosophy remained consistent in that we owned technology companies that had strong balance sheets with little debt and a history of growing sales and tangible book value. This approach tends to avoid those companies that are more leveraged and that generally have a more volatile stock price. Over the last year, these types of investments rewarded investors more than our conservative strategy. We think over time, investors will appreciate a more conservative approach. We, of course, hope that the market will too.
During the last twelve months, major contributors to the Fund’s performance were Apple (NASDAQ Symbol: AAPL), Intuitive Surgical, Inc. (NASDAQ Symbol: ISRG) and Alexion Pharmaceuticals, Inc. (NASDAQ Symbol: ALXN). Apple continues to be the “Gold Standard” of technology. They continue to bring out new products that are beautifully designed and with features consumers want and it is one of the Fund’s longest held investments. Intuitive Surgical is a medical equipment manufacturer that makes high tech surgical equipment. They are a leader in surgical robotics. Alexion Pharmaceuticals is a biotechnology company that creates and produces products to treat life-threatening diseases. They have recently been successful in getting FDA approval for new products that treat various blood disorders.
Although Apple is an example of a successful conventional technology company, the other two show how technology can be successfully used in other Industries such as healthcare. The three companies had an average one-year return (thru 10/31/11) of 65.72% and comprised approximately 8.23% of the portfolio.
With a slightly negative return for the twelve-month period there were definitely some detractors to performance. The three largest were NetApp (NYSE Symbol: NTAP), Corning (NYSE Symbol: GLW) and NII Holdings (NASDAQ Symbol: NIHD). NetApp is a provider of data storage and management solutions. Its stock price has ebbed and flowed with the popularity of “Cloud” computing. We continue to own NetApp as we believe storage companies will continue to be a major component of the technology space. Corning is a technology company involved in display, telecommunications and glass technologies. Recent stock performance has been tied to the slowdown in worldwide orders for its products. It is the leader in its area and should rebound nicely as the world’s economy improves. Finally NII Holdings is a provider of wireless communications in
49
FBR Technology Fund
Management Overview (continued)
Central and South America. Although located in high growth developing economies, near term growth has diminished. This has resulted in the stock pulling back. These three companies represent good examples of the Fund philosophy of investing in industry leaders with strong balance sheets and history of growth. However, when their growth pauses sometimes the stocks do retreat. These three companies had an average twelve-month return (thru 10/31/11) of -21.51 and comprised 5.81% of the Fund’s portfolio.
Portfolio Managers comments on the Fund and the related investment outlook.
The global issues mentioned in the last shareholder letter (April 2011) continue to run their course. The Middle East has evolved from Egypt and Libya to Syria and Iran. The European debt issues draw daily headlines that seem to control overseas markets and many days the U.S. market as well. Although Japan is quietly recovering from its natural disaster, Thailand has just had record setting floods which have disrupted several supply chains in the technology sector. We all await the next “CNN” headline to see how changes in the world will impact us here in the U.S. And finally we have the 2012 elections now less than a year away. The results will certainly impact our economic future. The net result of all this is that various economies around the world, including the U.S., are on “Hold” awaiting elections or resolution of the issues at hand. It is hard to predict the future when you don’t know what the rules are going to be.
However, technology is one of the investment sectors that seems to move forward. New discoveries and new products make the workforce more efficient and the consumer desirous of the product. This all bodes well for those companies that have the financial strength to whether the economic uncertainties. The Fund’s approach to own strong balance sheet companies serves us well in that we are comfortable that these companies have the flexibility to control their own destiny and not be under the gun from their lenders. It may not allow them to avoid stock declines but they should be around to flourish another day.
We think the Fund provides a conservative way to invest in the sector and sleep well at night. We will remain consistent with our philosophy and not change to catch a “Fad”. We remind investors that these types of companies generally command a price multiple premium and are subject to periods of price correction.
We continue to appreciate your support and we look confidently to the future.
The opinions expressed in this commentary reflect those of the Portfolio Managers as of the date written. Any such opinions are subject to change based on market or other conditions. These opinions may not be relied upon as investment advice. Investment decisions for The FBR Funds are based on several factors, and may not be relied upon as an indication of trading intent on behalf of any FBR Fund. Security positions can and do change.
50
FBR Technology Fund
Comparison of Changes in Value of $10,000 Investment in
Investor Class Shares(1)(2) vs. Various Indices(1)(3)
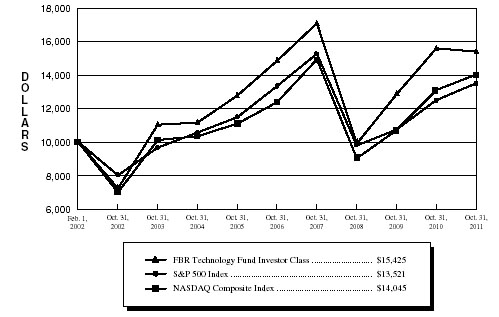
| | Total Returns—For the Periods Ended October 31, 2011(4) | |
| | | | | | | | | | Annualized | |
| | | | | | | Annualized | | Since | |
| | | | One Year | | Five Year | | Inception(5) | |
| | | |
| |
| |
| |
| FBR Technology Fund Investor Class(1)(2) | | | (1.27)% | | 0.73% | | 4.55% | |
| FBR Technology Fund Institutional Class(2)(6) | | | (1.00)% | | 0.78% | | 4.58% | |
| S&P 500 Index(1)(3) | | | 8.09% | | 0.25% | | 3.14% | |
| NASDAQ Composite Index(1)(3) | | | 7.06% | | 2.55% | | 3.55% | |
| |
PAST PERFORMANCE IS NO GUARANTEE OF FUTURE RESULTS.
The performance data quoted represents past performance and the current performance may be lower or higher than the performance data quoted. The investment return and principal will fluctuate so that investors’ shares, when redeemed, may be worth more or less than their original cost. The performance data does not reflect the deduction of taxes that a shareholder would pay on Fund distributions or redemption fees. The Fund charges a redemption fee of 1.00% on shares redeemed or exchanged within 90 days; if reflected, the redemption fee would reduce the performance data quoted. To obtain performance data current to the most recent month-end, please call 888.200.4710.
| (1) | | The graph assumes a hypothetical $10,000 initial investment in the Fund and reflects the reinvestment of dividends and all Fund expenses. Investors should note that the Fund is a professionally managed mutual fund while the indices are unmanaged, do not incur expenses and are not available for investment. The performance of the indices includes reinvested dividends, and does not reflect sales charges or expenses. |
| (2) | | FBR Fund Advisers, Inc. waived a portion of its advisory fees and agreed to contractually reimburse a portion of the Fund’s operating expenses, as necessary, to maintain existing expense limitations, as set forth in the notes to the financial statements. Total returns shown include fee waivers and expense reimbursements, if any; total returns would have been lower had there been no waiver of fees and/or reimbursement of expenses in excess of expense limitations. |
| (3) | | The S&P 500 Index is a capitalization-weighted index of 500 stocks. The index is designed to represent the broad domestic economy through changes in aggregate market value of 500 stocks representing all major industries. The NASDAQ Composite Index is a broad-based capitalization-weighted index of all NASDAQ National Market and Small Cap stocks. |
| (4) | | The total returns shown do not reflect the deduction of taxes that a shareholder would pay on fund distributions or the redemption of fund shares. |
| (5) | | For the period February 1, 2002 (commencement of investment operations) through October 31, 2011. |
| (6) | | Represents the performance of the Institutional Class shares after March 12, 2010 (inception of the share class) and Investor Class for periods prior to that date. |
51
FBR Technology Fund
Portfolio Summary
October 31, 2011
The following provides a breakdown of the Fund by industry sectors. The underlying securities represent a percentage of the portfolio investments.
| Industry Sector | | % of Total Investments |
| |
|
| Semiconductors | | 26.9 | % |
| Software | | 17.0 | % |
| Computers | | 14.8 | % |
| Telecommunications | | 10.7 | % |
| Internet | | 10.4 | % |
| Biotechnology | | 5.5 | % |
| Auto Parts & Equipment | | 4.0 | % |
| Health Care Products | | 2.9 | % |
| Electronics | | 1.5 | % |
| Electrical Components & Equipments | | 0.8 | % |
| Manufacturing | | 0.6 | % |
| Commercial Services | | 0.2 | % |
| | | | |
| Cash | | 4.7 | % |
52
FBR Technology Fund
Portfolio of Investments
October 31, 2011
|
| | | | | | VALUE |
| | SHARES | | | | (NOTE 2) |
|
| | | | COMMON STOCKS — 95.3% | | | | |
| | | | Auto Parts & Equipment — 4.0% | | | | |
| | 8,225 | | Johnson Controls, Inc. | | $ | 270,849 | |
| | | | | |
| |
| | | | Biotechnology — 5.5% | | | | |
| | 1,860 | | Alexion Pharmaceuticals, Inc.* | | | 125,569 | |
| | 2,375 | | AVEO Pharmaceuticals, Inc.* | | | 38,143 | |
| | 2,730 | | Celgene Corp.* | | | 176,986 | |
| | 8,600 | | Harvard Bioscience, Inc.* | | | 39,216 | |
| | | | | |
| |
| | | | | | | 379,914 | |
| | | | | |
| |
| | | | Comercial Services — 0.2% | | | | |
| | 415 | | SuccessFactors, Inc.* | | | 11,081 | |
| | | | | |
| |
| | | | Computers — 14.8% | | | | |
| | 2,700 | | 3D Systems Corp.* | | | 43,929 | |
| | 713 | | Apple, Inc.* | | | 288,608 | |
| | 3,657 | | Cognizant Technology Solutions Corp., Class A* | | | 266,047 | |
| | 1,840 | | Fortinet, Inc.* | | | 42,430 | |
| | 2,025 | | Mercury Computer Systems, Inc.* | | | 29,565 | |
| | 900 | | MICROS Systems, Inc.* | | | 44,298 | |
| | 3,545 | | NetApp, Inc.* | | | 145,203 | |
| | 1,395 | | Riverbed Technology, Inc.* | | | 38,474 | |
| | 600 | | Syntel, Inc. | | | 29,340 | |
| | 740 | | VanceInfo Technologies, Inc. ADR* | | | 8,591 | |
| | 2,825 | | Western Digital Corp.* | | | 75,258 | |
| | | | | |
| |
| | | | | | | 1,011,743 | |
| | | | | |
| |
| | | | Electrical Components & Equipments — 0.8% | | | | |
| | 1,365 | | General Cable Corp.* | | | 38,275 | |
| | 17,953 | | Satcon Technology Corp.* | | | 19,030 | |
| | | | | |
| |
| | | | | | | 57,305 | |
| | | | | |
| |
| | | | Electronics — 1.5% | | | | |
| | 1,000 | | Cymer, Inc.* | | | 43,450 | |
| | 2,575 | | TTM Technologies, Inc.* | | | 28,763 | |
| | 825 | | Woodward, Inc. | | | 27,951 | |
| | | | | |
| |
| | | | | | | 100,164 | |
| | | | | |
| |
53
FBR Technology Fund
Portfolio of Investments (continued)
October 31, 2011
|
| | | | | | | VALUE |
| | SHARES | | | | | (NOTE 2) |
|
| | | | Health Care Products — 2.9% | | | | | |
| | 460 | | Intuitive Surgical, Inc.* | | | $ | 199,576 | |
| | | | | | |
| |
| | | | Internet — 10.4% | | | | | |
| | 620 | | Amazon.com, Inc.* | | | | 132,376 | |
| | 465 | | Baidu, Inc. ADR* | | | | 65,184 | |
| | 930 | | F5 Networks, Inc.* | | | | 96,673 | |
| | 480 | | Google, Inc., Class A* | | | | 284,467 | |
| | 1,050 | | Liquidity Services, Inc.* | | | | 34,188 | |
| | 160 | | MercadoLibre, Inc. | | | | 10,432 | |
| | 425 | | NetEase.com, Inc. ADR* | | | | 20,132 | |
| | 2,881 | | Tencent Holdings Ltd. ADR | | | | 66,724 | |
| | | | | | |
| |
| | | | | | | | 710,176 | |
| | | | | | |
| |
| | | | Manufacturing — 0.6% | | | | | |
| | 800 | | Polypore International, Inc.* | | | | 41,960 | |
| | | | | | |
| |
| | | | Semiconductors — 26.9% | | | | | |
| | 3,890 | | Altera Corp. | | | | 147,509 | |
| | 3,900 | | Amtech Systems, Inc.* | | | | 39,858 | |
| | 3,525 | | Analog Devices, Inc. | | | | 128,909 | |
| | 15,950 | | Applied Materials, Inc. | | | | 196,504 | |
| | 4,010 | | ARM Holdings PLC ADR | | | | 112,641 | |
| | 2,605 | | ASML Holding N.V. ADR | | | | 109,228 | |
| | 6,275 | | Atmel Corp.* | | | | 66,264 | |
| | 820 | | Avago Technologies Ltd. | | | | 27,691 | |
| | 10,400 | | AXT, Inc.* | | | | 48,880 | |
| | 1,460 | | Cavium, Inc.* | | | | 47,727 | |
| | 1,575 | | Ceva, Inc.* | | | | 48,935 | |
| | 1,460 | | Cirrus Logic, Inc.* | | | | 24,294 | |
| | 810 | | Hittite Microwave Corp.* | | | | 42,606 | |
| | 11,895 | | Intel Corp. | | | | 291,903 | |
| | 2,005 | | KLA-Tencor Corp. | | | | 94,416 | |
| | 4,400 | | Kulicke & Soffa Industries, Inc.* | | | | 42,460 | |
| | 835 | | Lam Research Corp.* | | | | 35,896 | |
| | 2,625 | | Nanometrics, Inc.* | | | | 44,310 | |
54
FBR Technology Fund
Portfolio of Investments (continued)
October 31, 2011
|
| | | | | | | VALUE |
| | SHARES | | | | | (NOTE 2) |
|
| | | | Semiconductors — 26.9% (continued) | | | | | |
| | 2,460 | | Omnivision Technologies, Inc.* | | | $ | 40,123 | |
| | 6,860 | | ON Semiconductor Corp.* | | | | 51,930 | |
| | 4,360 | | Rubicon Technology, Inc.* | | | | 45,431 | |
| | 1,600 | | Semtech Corp.* | | | | 39,072 | |
| | 1,675 | | Skyworks Solutions, Inc.* | | | | 33,182 | |
| | 2,910 | | Teradyne, Inc.* | | | | 41,671 | |
| | 2,050 | | Ultratech, Inc.* | | | | 44,690 | |
| | | | | | |
| |
| | | | | | | | 1,846,130 | |
| | | | | | |
| |
| | | | Software — 17.0% | | | | | |
| | 845 | | ANSYS, Inc.* | | | | 45,934 | |
| | 2,140 | | Cerner Corp.* | | | | 135,740 | |
| | 695 | | Check Point Software Technologies Ltd.* | | | | 40,053 | |
| | 750 | | hiSoft Technology International Ltd. ADR* | | | | 9,285 | |
| | 940 | | Informatica Corp.* | | | | 42,770 | |
| | 10,600 | | Microsoft Corp. | | | | 282,278 | |
| | 8,825 | | Oracle Corp. | | | | 289,195 | |
| | 2,605 | | Red Hat, Inc.* | | | | 129,338 | |
| | 1,970 | | VMware, Inc., Class A* | | | | 192,568 | |
| | | | | | |
| |
| | | | | | | | 1,167,161 | |
| | | | | | |
| |
| | | | Telecommunications — 10.7% | | | | | |
| | 1,150 | | Acme Packet, Inc.* | | | | 41,642 | |
| | 15,865 | | Cisco Systems, Inc. | | | | 293,979 | |
| | 18,035 | | Corning, Inc. | | | | 257,720 | |
| | 895 | | Finisar Corp.* | | | | 18,339 | |
| | 660 | | IPG Photonics Corp.* | | | | 34,888 | |
| | 1,240 | | Netgear, Inc.* | | | | 43,970 | |
| | 1,965 | | NII Holdings, Inc.* | | | | 46,236 | |
| | | | | | |
| |
| | | | | | | | 736,774 | |
| | | | | | |
| |
| | | | | | | | | |
| | | | Total Common Stocks (Cost $6,346,644) | | | | 6,532,833 | |
| | | | | | |
| |
55
FBR Technology Fund
Portfolio of Investments (continued)
October 31, 2011
|
| | | | | | | VALUE |
| | SHARES | | | | | (NOTE 2) |
|
| | | | SHORT-TERM INVESTMENT — 5.1% | | | | | |
| | 348,846 | | Fidelity Institutional Money Market Government Portfolio, Class I, 0.01%^ (Cost $348,846) | | | $ | 348,846 | |
| | | | | | |
| |
| | | | | | | | | |
| | | | Total Investments — 100.4% (Cost $6,695,490) | | | | 6,881,679 | |
| | | | | | | | | |
| | | | Liabilities Less Other Assets — (0.4)% | | | | (26,761 | ) |
| | | | | | |
| |
| | | | | | | | | |
| | | | Net Assets — 100.0% | | | $ | 6,854,918 | |
| | | | | | |
| |
|
| * | | Non-income producing security |
| ADR | | American Depositary Receipts |
| PLC | | Public Liability Company |
| ^ | | 7-day yield as of October 31, 2011 |
The accompanying notes are an integral part of the financial statements.
56
FBR Gas Utility Index Fund
Management Overview
Portfolio Manager: Winsor Aylesworth
Over the previous 12 months, how did the Fund perform and what factors contributed to this performance?
For the twelve-months ended October 31, 2011, the Investor Class of the FBR Gas Utility Index Fund returned 23.54%. This compares to the S&P 500 Index, the American Gas Association (AGA) Stock Index, and the Morningstar Utilities Category Average which returned 8.09%, 22.92% and 10.31% for the same period, respectively.
Beginning with our last Shareholder letter, the Fund continued its run of outperformance. For the year ending October 31, 2011, the Fund beat both of its referenced benchmarks above. As previously mentioned, it is highly unusual that an index fund beats its index benchmark, even with taking into account the Fund’s expenses. This was indeed the case for the Fund. This was due to the timing of selling certain investments and the management of shareholder’s purchases or redemptions of the Fund. Although I am pleased and take pride that this has occurred, investors should not expect this to continue. The investment goal of the Fund is to provide the Investor the return of the AGA Stock Index less expenses.
The Fund’s outperformance to the overall market and to its peer Utility Funds ties to the Fund’s emphasis on the natural gas industry. This is an Industry that has undergone a transformation in recent years with vast discoveries of natural gas. With these discoveries, U.S. reserves for natural gas stand at all time highs which has kept prices at historic lows. With the expectation that this will continue along with natural gas’s environmental advantages, demand is expected to increase which has made this a very attractive Industry for investment. With this background, the stocks of the Industry and, hence, your Fund, have had a good year.
The AGA Stock Index and therefore the Fund added two new names and deleted one name over the last twelve months. Added were Berkshire Hathaway (NYSE Symbol: BRK.A) and NV Energy Inc (NYSE Symbol: NVE). BRK.A owns Mid American Energy Holdings which is a diversified utility business while NVE is a diversified utility that services Nevada. Eliminated was E.ON AG (NASDAQ Symbol: EONGY) a German utility holding company that had sold its American holdings.
The Fund continued its history of quarterly distributions with the total for the year equaling $0.5115. This was a 7.1% decrease over the corresponding twelve month period ending 9/30/10. This decrease was a result of dropping EONGY, which had an above average dividend, from the Index and subsequently the Fund and the large amount of inflows coming into the Fund and the subsequent timing of investing these inflows. The decrease had nothing to do with the health of the industry as many of the Fund’s investments increased dividends throughout the year.
57
FBR Gas Utility Index Fund
Management Overview (continued)
For the twelve-month period major contributors to the Fund’s performance were El Paso Corp (NYSE Symbol: EP), ONEOK, Inc. (NYSE Symbol: OKE) and Southern Union (NYSE Symbol: SUG). These three companies had a collective average twelve-month return of over 70%. EP and SUG were M&A candidates and have agreed to be acquired. The stocks and, hence, the Fund were benefactors to the premiums announced as part of the transactions. OKE is a diversified energy company involved in most facets of the natural gas industry and has benefitted from the renewed investor interest in the industry. These three companies comprised about 12.2% of the Fund.
The only holding that had any significant negative impact was PG&E Corp. (NYSE Symbol: PCG). This West Coast diversified electric and gas utility had issues over pipeline safety which resulted in a one-year return of a negative 6.5% as of October 31, 2011. Fortunately, this company was less than 4% of the Fund’s portfolio.
Portfolio Manager comments on the Fund and the related investment outlook.
We believe that we have entered the golden age for natural gas. Using new technologies and drilling techniques, new sources of natural gas have been discovered. It is projected that we now have an over 100 year supply of this viable, clean energy source. With these ample reserves, prices are low and projected to be stable for the foreseeable future. This provides the perfect scenario for increasing demand for this clean, available and affordable fuel. The utility industry, currently faced with an aging fleet of coal power plants, is projected to build new natural gas fueled systems as their replacements. Transportation uses of natural gas for commercial fleets and cross country trucking will also add to new demand. Finally we are now in a position to export gas to other countries as our wholesale price is far below prices in Europe and Asia. We have the potential to be the new “Saudi Arabia” of natural gas!
These good fortunes are all positives for the companies that make up your Fund. Increased supplies bode well for pipeline, storage and distributors. Increased exports should be a positive for shippers, pipelines, storage and LNG companies. Power generators will have stable costs and an ability to rebuild their fleets using a clean and available source of energy. All good news for the Fund’s prospects.
This new emphasis on Natural Gas doesn’t come without challenges. Natural gas is inherently explosive and hence makes safety and infrastructure maintenance a continuing issue. Drilling to unlock these vast new resources comes with environmental hazards and responsibilities for the Industry. No one wants a “Gulf of Mexico” incident. Regulators are expected to add to the regulations to ensure public safety which will add to costs. Finally, the prudence of exporting a clean cheap fuel while importing expensive and dirtier fuels (i.e. oil) raises the issue of National Energy Policy which unfortunately is not currently high on the political debate.
In previous shareholder communications, I have mentioned that all energy producers remain subject to geo-political, economic and weather related issues. The advent of US
58
FBR Gas Utility Index Fund
Management Overview (continued)
self-sufficiency in natural gas supply minimizes international politics. The outlook for the US economy now appears mixed with further downturns a real possibility. It is now the time of year to worry about the winter heating season and how severe the cold outbreaks will be. We are reminded that weather events can have short-term impacts on supply and/or demand but are not long lasting.
So in summary, your Fund continues to invest in a sector that has high investor interest and is comprised of companies that find, transport and distribute natural gas. We hope and expect the future to continue to be bright and hence rewarding for you and me as shareholders.
|
The opinions expressed in this commentary reflect those of the Portfolio Manager as of the date written. Any such opinions are subject to change based on market or other conditions. These opinions may not be relied upon as investment advice. Investment decisions for The FBR Funds are based on several factors, and may not be relied upon as an indication of trading intent on behalf of any FBR Fund. Security positions can and do change. |
59
FBR Gas Utility Index Fund
Comparison of Changes in Value of $10,000 Investment in
Investor Class Shares(1)(2) vs. Various Indices(1)(3)
Total Returns—For the Periods Ended October 31, 2011(4)(5) |
| | | | | | Annualized | | Annualized | |
| | | One Year | | Five Year | | Ten Year | |
| | |
| |
| |
| |
| FBR Gas Utility Index Fund Investor Class(1)(2) | | 23.54 | % | | 7.76 | % | | 8.40 | % | |
| S&P 500 Index(1)(3) | | 8.09 | % | | 0.25 | % | | 3.69 | % | |
| AGA Stock Index(1)(3) | | 22.92 | % | | 7.84 | % | | 9.03 | % | |
| |
PAST PERFORMANCE IS NO GUARANTEE OF FUTURE RESULTS.
The performance data quoted represents past performance and the current performance may be lower or higher than the performance data quoted. The investment return and principal will fluctuate so that investors’ shares, when redeemed, may be worth more or less than their original cost. The performance data does not reflect the deduction of taxes that a shareholder would pay on Fund distributions or redemption fees. The Fund charges a redemption fee of 1.00% on shares redeemed or exchanged within 90 days; if reflected, the redemption fee would reduce the performance data quoted. To obtain performance data current to the most recent month-end, please call 888.200.4710.
|
| (1) | | The graph assumes a hypothetical $10,000 initial investment in the Fund and reflects the reinvestment of dividends and all Fund expenses. Investors should note that the Fund is a professionally managed mutual fund while the indices are unmanaged, do not incur expenses and are not available for investment. The performance of the indices includes reinvested dividends, and does not reflect sales charges or expenses. |
| (2) | | FBR Fund Advisers, Inc. waived a portion of its advisory fees and agreed to contractually reimburse a portion of the Fund’s operating expenses, as necessary, to maintain existing expense limitations, as set forth in the notes to the financial statements. Total returns shown include fee waivers and expense reimbursements, if any; total returns would have been lower had there been no waiver of fees and/or reimbursement of expenses in excess of expense limitations. |
| (3) | | The S&P 500 Index is a capitalization-weighted index of 500 stocks. The index is designed to represent the broad domestic economy through changes in aggregate market value of 500 stocks representing all major industries. The AGA Stock Index is a market capitalization-weighted index, adjusted monthly, consisting of member companies of the American Gas Association. |
| (4) | | The total returns shown do not reflect the deduction of taxes that a shareholder would pay on fund distributions or the redemption of fund shares. |
| (5) | | Effective April 1, 2003, the Fund changed its fiscal year-end from March 31 to October 31. |
60
FBR Gas Utility Index Fund
Portfolio Summary
October 31, 2011
The following provides a breakdown of the Fund by industry sectors. The underlying securities represent a percentage of the portfolio investments.
| Industry Sector | | % of Total Investments |
| |
|
| Gas | | | 39.2 | % |
| Pipelines | | | 28.5 | % |
| Electric | | | 25.3 | % |
| Oil & Gas | | | 2.4 | % |
| Insurance | | | 0.5 | % |
| | | | | |
| Cash | | | 4.1 | % |
61
FBR Gas Utility Index Fund
Portfolio of Investments
October 31, 2011
|
| | | | | | VALUE |
| | SHARES | | | | (NOTE 2) |
|
| | | | COMMON STOCKS — 95.9% | | | | |
| | | | Electric — 25.3% | | | | |
| | 1,500 | | ALLETE, Inc. | | $ | 59,265 | |
| | 35,853 | | Alliant Energy Corp. | | | 1,462,085 | |
| | 53,090 | | Ameren Corp. | | | 1,692,509 | |
| | 40,230 | | Avista Corp. | | | 1,023,854 | |
| | 27,100 | | Black Hills Corp. | | | 913,541 | |
| | 8,925 | | CH Energy Group, Inc. | | | 492,749 | |
| | 256,368 | | CMS Energy Corp. | | | 5,337,582 | |
| | 159,770 | | Consolidated Edison, Inc. | | | 9,245,890 | |
| | 46,820 | | Constellation Energy Group, Inc. | | | 1,858,754 | |
| | 376,973 | | Dominion Resources, Inc. | | | 19,448,037 | |
| | 98,715 | | DTE Energy Co. | | | 5,144,039 | |
| | 141,912 | | Duke Energy Corp. | | | 2,897,843 | |
| | 1,825 | | Empire District Electric Co. | | | 36,445 | |
| | 5,200 | | Entergy Corp. | | | 359,684 | |
| | 95,075 | | Exelon Corp. | | | 4,220,379 | |
| | 118,021 | | Integrys Energy Group, Inc. | | | 6,244,491 | |
| | 222,425 | | MDU Resources Group, Inc. | | | 4,584,179 | |
| | 12,023 | | MGE Energy, Inc. | | | 524,684 | |
| | 44,875 | | Northeast Utilities | | | 1,551,329 | |
| | 10,100 | | NV Energy, Inc. | | | 162,004 | |
| | 27,604 | | Pepco Holdings, Inc. | | | 546,559 | |
| | 347,466 | | PG&E Corp. | | | 14,906,292 | |
| | 40,235 | | PPL Corp. | | | 1,181,702 | |
| | 376,405 | | Public Service Enterprise Group, Inc. | | | 12,684,849 | |
| | 92,890 | | TECO Energy, Inc. | | | 1,724,967 | |
| | 81,704 | | UIL Holdings Corp. | | | 2,784,472 | |
| | 7,930 | | UniSource Energy Corp. | | | 295,630 | |
| | 18,383 | | Unitil Corp. | | | 490,275 | |
| | 90,760 | | Wisconsin Energy Corp. | | | 2,943,347 | |
| | 191,296 | | Xcel Energy, Inc. | | | 4,945,002 | |
| | | | | |
| |
| | | | | | | 109,762,438 | |
| | | | | |
| |
62
FBR Gas Utility Index Fund
Portfolio of Investments (continued)
October 31, 2011
|
| | | | | | VALUE |
| | SHARES | | | | (NOTE 2) |
|
| | | | Gas — 39.2% | | | | |
| | 199,138 | | AGL Resources, Inc. | | $ | 8,351,848 | |
| | 284,091 | | Atmos Energy Corp. | | | 9,750,003 | |
| | 521,273 | | CenterPoint Energy, Inc. | | | 10,863,329 | |
| | 15,940 | | Chesapeake Utilities Corp. | | | 675,697 | |
| | 6,552 | | Corning Natural Gas Corp. | | | 111,384 | |
| | 11,672 | | Delta Natural Gas, Inc. | | | 376,422 | |
| | 17,918 | | Gas Natural, Inc. | | | 197,098 | |
| | 176,532 | | National Fuel Gas Co. | | | 10,819,646 | |
| | 418,332 | | National Grid PLC ADR | | | 20,945,883 | |
| | 117,542 | | New Jersey Resources Corp. | | | 5,526,825 | |
| | 147,050 | | Nicor, Inc. | | | 8,271,562 | |
| | 561,400 | | NiSource, Inc. | | | 12,401,326 | |
| | 90,725 | | Northwest Natural Gas Co. | | | 4,238,672 | |
| | 249,281 | | Piedmont Natural Gas Company, Inc. | | | 8,148,996 | |
| | 470,309 | | Questar Corp. | | | 9,062,854 | |
| | 16,508 | | RGC Resources, Inc. | | | 296,484 | |
| | 340,570 | | Sempra Energy | | | 18,298,826 | |
| | 75,685 | | South Jersey Industries, Inc. | | | 4,261,822 | |
| | 338,370 | | Southern Union Co. | | | 14,221,691 | |
| | 155,462 | | Southwest Gas Corp. | | | 6,137,640 | |
| | 79,275 | | The Laclede Group, Inc. | | | 3,180,513 | |
| | 121,375 | | UGI Corp. | | | 3,479,821 | |
| | 130,330 | | Vectren Corp. | | | 3,698,765 | |
| | 161,887 | | WGL Holdings, Inc. | | | 6,930,382 | |
| | | | | |
| |
| | | | | | | 170,247,489 | |
| | | | | |
| |
| | | | Insurance — 0.5% | | | | |
| | 18 | | Berkshire Hathaway, Inc., Class A* | | | 2,105,100 | |
| | | | | |
| |
| | | | Oil & Gas — 2.4% | | | | |
| | 270,824 | | Cheniere Energy, Inc.* | | | 3,103,643 | |
| | 69,429 | | Energen Corp. | | | 3,406,187 | |
| | 59,910 | | EQT Corp. | | | 3,804,285 | |
| | | | | |
| |
| | | | | | | 10,314,115 | |
| | | | | |
| |
63
FBR Gas Utility Index Fund
Portfolio of Investments (continued)
October 31, 2011
|
| | | | | | VALUE |
| | SHARES | | | | (NOTE 2) |
|
| | | | Pipelines — 28.5% | | | | |
| | 825,816 | | El Paso Corp. | | $ | 20,653,658 | |
| | 609,284 | | Enbridge, Inc. | | | 21,148,248 | |
| | 258,250 | | ONEOK, Inc. | | | 19,639,913 | |
| | 723,277 | | Spectra Energy Corp. | | | 20,707,421 | |
| | 478,657 | | TransCanada Corp. | | | 20,601,397 | |
| | 691,185 | | The Williams Companies, Inc. | | | 20,811,580 | |
| | | | | |
| |
| | | | | | | 123,562,217 | |
| | | | | |
| |
| | | | | | | | |
| | | | Total Common Stocks (Cost $256,662,264) | | | 415,991,359 | |
| | | | | |
| |
| | | | SHORT-TERM INVESTMENT — 3.1% | | | | |
| | 13,361,801 | | Fidelity Institutional Money Market Government Portfolio, Class I, 0.01%^ (Cost $13,361,801) | | | 13,361,801 | |
| | | | | |
| |
| | | | Total Investments — 99.0% (Cost $270,024,065) | | | 429,353,160 | |
| | | | | | | | |
| | | | Other Assets Less Liabilities — 1.0% | | | 4,428,608 | |
| | | | | |
| |
| | | | | | | | |
| | | | Total Net Assets — 100.0% | | $ | 433,781,768 | |
| | | | | |
| |
|
| * | | Non-income producing security |
| ADR | | American Depositary Receipt |
| PLC | | Public Liability Company |
| ^ | | 7-day yield as of October 31, 2011 |
The accompanying notes are an integral part of the financial statements.
64
FBR Balanced Fund
Management Overview
For the twelve-months ended October 31, 2011, the Investor Class of the FBR Balanced Fund returned 11.30%. This compares to the S&P 500 Index and the Morningstar Moderate Allocation Category Average which returned 8.09% and 3.97% for the same period, respectively.
The London Company: Managers of the Equity Portion of the Fund
Portfolio Managers: Stephen M. Goddard, CFA®, Jonathan T. Moody, CFA®, and J. Wade Stinnette, Jr., CFA®
What factors contributed to the performance of the equity portion of the FBR Balanced Fund?
The London Company sleeve of the FBR fund has performed very well over the past twelve months, returning 18.09% versus 8.09% for the S&P 500. Despite increased economic uncertainty and the ever-present swings of market volatility, The London Company has been steadfast in understanding the value proposition within our portfolio holdings and avoiding poor investment opportunities. Our outperformance to the S&P 500 is directly a result of strong stock selection. The ability to find attractive investment opportunities with less risk has enabled us to beat the index.
Generally speaking, the best performing sectors in the S&P 500 over the past twelve months have been Energy, Utilities, and Consumer Discretionary. The worst performing sectors have been Financials, Materials, and Industrials. Our underweight in Energy and Consumer Discretionary had a negative effect on performance, while our positioning within Utilities was slightly positive. Our strong stock selection within Financials and Materials more than offset our poor selection in Industrials. The limited number of large-cap banks within our portfolio continues to be a benefit. The most value additive sector, Technology, resulted from positive stock selection as well. The addition of some very attractively priced mega-cap Technology companies (Intel, IBM, Cisco, Visa and EMC) over the past few years has contributed nicely to performance. The best single performing security was our largest position too; NewMarket Corp., a well-positioned fuel additive company with favorable industry dynamics. Rounding out the top five contributors were Chevron, Alexander & Baldwin, Lorillard, and Intel Corp. The bottom five contributors were MeadWestvaco, Corrections Corp of America, FedEx, Universal Corp, and Hatteras Financial.
Portfolio Managers comments on the equity portion of the Fund and the related investment outlook.
Looking ahead, our positive outlook remains unchanged. Continued fears over the resolution of the European sovereign debt situation have contributed to elevated volatility which has done nothing to make equities appear more attractive. In addition, budgetary problems and the lack luster labor market in the U.S. don’t appear to have quick solutions.
65
FBR Balanced Fund
Management Overview (continued)
However, the market is aware of these issues and has already discounted them. The most recent earnings period was fairly robust, signaling that Corporate America is still doing okay. That said, the forward outlooks issued by reporting companies have been somewhat mixed and earnings growth estimates for 2012 have been revised down 5% to 10%. In typical fashion, a more conservative level of expectations results from a general increase in economic uncertainty. Fortunately, we pay more attention to the actual actions and behavior of consumers and companies rather than headline risks and consensus fears. Our lower risk approach and focus on downside protection should continue to do well while the markets gain comfort that it can climb the existing ‘wall of worry’ despite the structural headwinds we face.
We believe the foundation for outsized equity returns over the next decade is in place. We would cite the spread between the cost of equity and the cost of debt which is greater than two standard deviations above the mean†, already high and growing cash balances on corporate balance sheets, and dividend payout ratios that are at multi-decade lows as attractive long-term characteristics for equities. Moreover, we believe that equities should perform relatively well in the years to come given low institutional and individual equity allocations, historically attractive valuations, and recent evidence that the stock performance of companies whose management teams are actually allocating capital is better than those who simply hoarding cash. In sum, all of these make us optimistic for the outlook on equities and our style in particular.
Financial Counselors, Inc.: Managers of the Fixed Income Portion of the Fund
Portfolio Managers: Gary Cloud, CFA® and Peter Greig, CFA®
What factors contributed to the performance of the fixed income portion of the FBR Balanced Fund?
The fixed income portion of the FBR Balanced Fund trailed the Barclays Capital Intermediate U.S. Government/Credit Index for the period as Treasury yields plunged to levels last seen since the late 1940’s. The combination of aggressive Federal Reserve quantitative easing, mixed with a European sovereign debt crisis, brought 10–Year Treasury yields to an incredible 1.67% during the month of September 2011. Corporate bond performance for the year ending October 31, 2011 trailed Treasuries with U.S. Financial bonds leading the sector lower, lagging Treasuries by about 2.00%.
A pro-cyclical asset allocation in the Fund hurt performance due to an underweight in U.S. Treasuries and an overweight in U.S. Corporate bonds. However, the Fund’s holdings in higher yielding fixed income investments did boost the interest income component of total
† Standard deviation is a widely used measure of how much variation there is in a data set from the “average”. A low standard deviation indicates the data points tend to be very close to the average and a high standard deviation indicates that the data is spread out over a wide range of outcomes.
66
FBR Balanced Fund
Management Overview (continued)
return, adding to performance. The biggest detractor to relative performance for the year was the Fund’s duration positioning and the largest enhancer to relative performance was individual security selection and sector/quality positioning. In summary, a defensive interest rate profile combined with a pro-growth security selection could not keep up with a flight-to-safety rally in U.S government securities.
Portfolio Managers comments on the fixed income portion of the Fund and related investment outlook.
The investment climate during the summer and fall of 2011 closely resembled the months that followed the Lehman Brothers bankruptcy. Although conditions in the U.S. credit markets were nowhere near the dreadful state that existed then, the European sovereign and corporate debt markets were close to 2008 levels. Systemically large banking institutions in Europe saw their access to funding impeded and their borrowing costs rise dramatically. This, in turn, caused U.S. bank and other financial intermediaries’ funding costs to rise while their share prices fell noticeably.
With fears of the last financial crisis fresh on investors’ minds, it was a “shoot first and ask questions later” trading environment. In hindsight, many of today’s market fears and challenges are legacy issues from an overleveraged public and private sector that has yet to right size itself. European sovereign debt financing issues have to be dealt with first before their banking system can settle down and function as lending intermediaries.
Looking forward, we expect a number of comprehensive initiatives in dealing with the European crisis to be forthcoming soon. On the domestic front, the Federal Reserve may unleash another round of quantitative easing and keep short term rates anchored for another year or two. There continues to be a very large valuation disparity in the high grade bond market as investors have focused on the return of and not on their principal.
The Fund continues to find attractive investment opportunities in senior debt corporate obligations in general and U.S. bank and insurance companies in particular. High yield bonds, preferred stocks, REITs and business development company securities are also very attractive income producers for the Fund, on a tactical basis. The economy should recover slowly in 2012 and risk markets ought to outperform risk-free assets during the coming year and the Fund is positioned accordingly.
The opinions expressed in this commentary reflect those of the Portfolio Managers as of the date written. Any such opinions are subject to change based on market or other conditions. These opinions may not be relied upon as investment advice. Investment decisions for The FBR Funds are based on several factors, and may not be relied upon as an indication of trading intent on behalf of any FBR Fund. Security positions can and do change.
67
FBR Balanced FundComparison of Changes in Value of $10,000 Investment in
Investor Class Shares(1)(2)(5) vs. S&P 500 Index(1)(3)
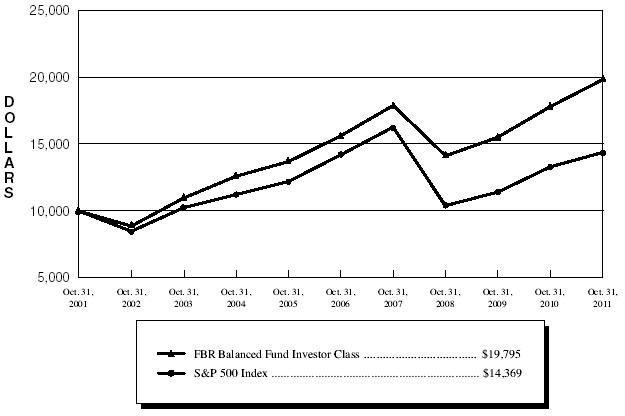
Total Returns—For the Periods Ended October 31, 2011(4) |
| | | | | | Annualized | | Annualized | |
| | | One Year | | Five Year | | Ten Year | |
| | |
| |
| |
| |
| FBR Balanced Fund Investor Class(1)(2)(5) | | 11.30 | % | | 4.87 | % | | 7.07 | % | |
| FBR Balanced Fund Institutional Class(2)(5) | | 11.62 | % | | 5.13 | % | | 7.27 | % | |
| S&P 500 Index(1)(3) | | 8.09 | % | | 0.25 | % | | 3.69 | % | |
| |
PAST PERFORMANCE IS NO GUARANTEE OF FUTURE RESULTS.
The performance data quoted represents past performance and the current performance may be lower or higher than the performance data quoted. The investment return and principal will fluctuate so that investors’ shares, when redeemed, may be worth more or less than their original cost. The performance data does not reflect the deduction of taxes that a shareholder would pay on Fund distributions or redemption fees. The Fund charges a redemption fee of 1.00% on shares redeemed or exchanged within 90 days; if reflected, the redemption fee would reduce the performance data quoted. To obtain performance data current to the most recent month-end, please call 888.200.4710.
| (1) | | The graph assumes a hypothetical $10,000 initial investment in the Fund and reflects the reinvestment of dividends and all Fund expenses. Investors should note that the Fund is a professionally managed mutual fund while the index is unmanaged, does not incur expenses and is not available for investment. The performance of the index includes reinvested dividends, and does not reflect sales charges or expenses. |
| (2) | | FBR Fund Advisers, Inc. waived a portion of its advisory fees and agreed to contractually reimburse a portion of the Fund’s operating expenses, as necessary, to maintain existing expense limitations, as set forth in the notes to the financial statements. Total returns shown include fee waivers and expense reimbursements, if any; total returns would have been lower had there been no waiver of fees and/or reimbursement of expenses in excess of expense limitations. |
| (3) | | The S&P 500 Index is a capitalization-weighted index of 500 stocks. The index is designed to represent the broad domestic economy through changes in aggregate market value of 500 stocks representing all major industries. |
| (4) | | The total returns shown do not reflect the deduction of taxes that a shareholder would pay on fund distributions or the redemption of fund shares. |
| (5) | | The Fund is the investment successor to the AFBA 5Star Balanced Fund which commenced operations on June 3, 1997. On March 12, 2010, the AFBA 5Star Balanced Fund was reorganized into the Fund. The performance presented for the Investor Class of the Fund for the period prior to March 12, 2010 reflects the performance of the Advisor Class shares of the AFBA 5Star Balanced Fund and the performance presented for the Institutional Class of the Fund for the period prior to March 12, 2010 reflects the performance of the Class I shares of the AFBA 5Star Balanced Fund. |
68
FBR Balanced Fund
Portfolio Summary
October 31, 2011
The following provides a breakdown of the Fund by industry sectors. The underlying securities represent a percentage of the portfolio investments.
| Industry Sectors | | % of Total Investments |
| |
|
| Common Stocks | | 61.6 | % |
Consumer, Non-Cyclical | | 14.8 | % |
Basic Materials | | 8.5 | % |
Financial | | 8.3 | % |
Technology | | 8.1 | % |
Communications | | 4.3 | % |
Consumer, Cyclical | | 4.2 | % |
Energy | | 4.1 | % |
Utilities | | 3.8 | % |
Real Estate Investment Trust | | 2.8 | % |
Industrial | | 2.7 | % |
| Corporate Bonds | | 18.6 | % |
Financial | | 11.0 | % |
Communications | | 1.6 | % |
Basic Materials | | 1.4 | % |
Consumer, Cyclical | | 1.3 | % |
Consumer, Non-Cyclical | | 1.1 | % |
Technology | | 1.1 | % |
Industrial | | 0.5 | % |
Utilities | | 0.3 | % |
Energy | | 0.3 | % |
| U.S. Treasury Obligations | | 12.1 | % |
| U.S. Government Agency Obligations | | 3.3 | % |
| Investment Companies | | 2.1 | % |
| | | | |
| Cash | | 2.3 | % |
69
FBR Balanced Fund
Portfolio of Investments
October 31, 2011
|
| | | | | | VALUE |
| | SHARES | | | | (NOTE 2) |
|
| | | | COMMON STOCKS — 61.6% | | | | |
| | | | Basic Materials — 8.5% | | | | |
| | 64,748 | | Albemarle Corp. | | $ | 3,450,421 | |
| | 86,343 | | MeadWestvaco Corp. | | | 2,409,833 | |
| | 18,714 | | NewMarket Corp. | | | 3,633,136 | |
| | | | | |
| |
| | | | | | | 9,493,390 | |
| | | | | |
| |
| | | | Communications — 4.3% | | | | |
| | 128,466 | | Cisco Systems, Inc. | | | 2,380,475 | |
| | 66,682 | | Verizon Communications, Inc. | | | 2,465,900 | |
| | | | | |
| |
| | | | | | | 4,846,375 | |
| | | | | |
| |
| | | | Consumer, Cyclical — 4.2% | | | | |
| | 73,714 | | CarMax, Inc.* | | | 2,215,843 | |
| | 28,851 | | Lowes Companies, Inc. | | | 606,448 | |
| | 33,012 | | Wal-Mart Stores, Inc. | | | 1,872,441 | |
| | | | | |
| |
| | | | | | | 4,694,732 | |
| | | | | |
| |
| | | | Consumer, Non-Cyclical — 14.8% | | | | |
| | 71,503 | | Altria Group, Inc. | | | 1,969,908 | |
| | 92,024 | | Bristol-Myers Squibb Co. | | | 2,907,038 | |
| | 13,440 | | Brown-Forman Corp., Class B | | | 1,004,371 | |
| | 9,993 | | Johnson & Johnson | | | 643,449 | |
| | 11,317 | | Lorillard, Inc. | | | 1,252,339 | |
| | 67,334 | | Pfizer, Inc. | | | 1,296,853 | |
| | 17,947 | | Philip Morris International, Inc. | | | 1,253,957 | |
| | 44,491 | | Reynolds American, Inc. | | | 1,720,912 | |
| | 29,318 | | The Coca-Cola Co. | | | 2,003,006 | |
| | 21,844 | | The Hershey Co. | | | 1,250,132 | |
| | 14,142 | | Visa, Inc., Class A | | | 1,318,883 | |
| | | | | |
| |
| | | | | | | 16,620,848 | |
| | | | | |
| |
| | | | Diversified — 0.0% | | | | |
| | 53 | | Leucadia National Corp. | | | 1,422 | |
| | | | | |
| |
| | | | | | | | |
| | | | Energy — 4.1% | | | | |
| | 25,006 | | Chevron Corp. | | | 2,626,880 | |
| | 22,747 | | ConocoPhillips | | | 1,584,329 | |
| | 4,500 | | Hugoton Royalty Trust | | | 97,740 | |
70
FBR Balanced Fund
Portfolio of Investments (continued)
October 31, 2011
|
| | | | | | VALUE |
| | SHARES | | | | (NOTE 2) |
|
| | | | Energy — 4.1% (continued) | | | | |
| | 3,250 | | Linn Energy LLC | | $ | 125,840 | |
| | 4,500 | | San Juan Basin Royalty Trust | | | 109,980 | |
| | | | | |
| |
| | | | | | | 4,544,769 | |
| | | | | |
| |
| | | | Financial — 8.3% | | | | |
| | 44,906 | | Berkshire Hathaway, Inc., Class B* | | | 3,496,380 | |
| | 94,048 | | Eaton Vance Corp. | | | 2,472,522 | |
| | 2,500 | | Hercules Technology Growth Capital, Inc. | | | 24,200 | |
| | 4,500 | | Starwood Property Trust, Inc. | | | 84,555 | |
| | 89,805 | | Wells Fargo & Co. | | | 2,326,847 | |
| | 2,121 | | White Mountainns Insurance Group Ltd. | | | 890,820 | |
| | | | | |
| |
| | | | | | | 9,295,324 | |
| | | | | |
| |
| | | | Industrial — 2.7% | | | | |
| | 39,207 | | Alexander & Baldwin, Inc. | | | 1,627,483 | |
| | 17,208 | | FedEx Corp. | | | 1,408,131 | |
| | | | | |
| |
| | | | | | | 3,035,614 | |
| | | | | |
| |
| | | | Real Estate Investment Trust — 2.8% | | | | |
| | 7,000 | | Apollo Commercial Real Estate Finance, Inc. | | | 98,070 | |
| | 27,500 | | Chimera Investment Corp. | | | 82,775 | |
| | 50,980 | | Hatteras Financial Corp. | | | 1,310,186 | |
| | 65,175 | | UDR, Inc. | | | 1,624,813 | |
| | 1,500 | | Winthrop Realty Trust | | | 13,575 | |
| | | | | |
| |
| | | | | | | 3,129,419 | |
| | | | | |
| |
| | | | Technology — 8.1% | | | | |
| | 114,135 | | EMC Corp.* | | | 2,797,449 | |
| | 106,261 | | Intel Corp. | | | 2,607,645 | |
| | 9,235 | | International Business Machines Corp. | | | 1,705,058 | |
| | 72,414 | | Microsoft Corp. | | | 1,928,385 | |
| | | | | |
| |
| | | | | | | 9,038,537 | |
| | | | | |
| |
| | | | Utilities — 3.8% | | | | |
| | 57,314 | | Dominion Resources, Inc. | | | 2,956,829 | |
| | 64,870 | | Duke Energy Corp. | | | 1,324,646 | |
| | | | | |
| |
| | | | | | | 4,281,475 | |
| | | | | |
| |
| | | | | | | | |
| | | | Total Common Stocks (Cost $57,817,885) | | | 68,981,905 | |
| | | | | |
| |
71
FBR Balanced Fund
Portfolio of Investments (continued)
October 31, 2011
|
| | | | | | | | | | | | | VALUE | |
| | SHARES | | | | | | | | | | | (NOTE 2) | |
|
| | | | PREFERRED STOCK — 0.0% | | | | | | | | | | | |
| | 13,600 | | Federal National Mortgage Association, Perpetual, Series S, 8.25%, due 12/31/15* (Cost $340,000) | | $ | 26,656 | |
| | | | | | | | | | | | |
|
| |
|
| | | | | | | | | | MATURITY | | | | |
| | PAR | | | | RATE | | | DATE | | | | |
|
| | | | CORPORATE BONDS — 18.6% | | | | | | | | | | | |
| | | | Basic Materials — 1.4% | | | | | | | | | | | |
| $ | 350,000 | | Barrick Gold Financeco LLC | | | 6.125 | % | | | 09/15/13 | | | 382,832 | |
| | 250,000 | | BHP Billiton Finance USA Ltd. | | | 6.750 | | | | 11/01/13 | | | 277,857 | |
| | 315,000 | | EI du Pont de Nemours & Co. | | | 4.750 | | | | 03/15/15 | | | 350,294 | |
| | 150,000 | | International Paper Co. | | | 9.375 | | | | 05/15/19 | | | 192,622 | |
| | 300,000 | | The Dow Chemical Co. | | | 4.250 | | | | 11/15/20 | | | 309,658 | |
| | | | | | | | | | | | |
|
| |
| | | | | | | | | | | | | | 1,513,263 | |
| | | | | | | | | | | | |
|
| |
| | | | Communications — 1.6% | | | | | | | | | | | |
| | 300,000 | | Deutsche Telekom International Finance BV | | | 5.875 | | | | 08/20/13 | | | 321,310 | |
| | 250,000 | | eBay, Inc. | | | 3.250 | | | | 10/15/20 | | | 251,893 | |
| | 250,000 | | Juniper Networks, Inc. | | | 4.600 | | | | 03/15/21 | | | 261,611 | |
| | 300,000 | | Telefonica Emisiones SAU | | | 5.877 | | | | 07/15/19 | | | 311,761 | |
| | 350,000 | | Verizon Communications, Inc. | | | 5.250 | | | | 04/15/13 | | | 372,475 | |
| | 150,000 | | Verizon Communications, Inc. | | | 8.750 | | | | 11/01/18 | | | 202,925 | |
| | | | | | | | | | | | |
|
| |
| | | | | | | | | | | | | | 1,721,975 | |
| | | | | | | | | | | | |
|
| |
| | | | Consumer, Cyclical — 1.3% | | | | | | | | | | | |
| | 300,000 | | Best Buy Company, Inc. | | | 6.750 | | | | 07/15/13 | | | 319,590 | |
| | 150,000 | | Marriott International, Inc., Series J | | | 5.625 | | | | 02/15/13 | | | 155,612 | |
| | 300,000 | | Starbucks Corp. | | | 6.250 | | | | 08/15/17 | | | 360,483 | |
| | 200,000 | | The Home Depot, Inc. | | | 5.400 | | | | 03/01/16 | | | 228,453 | |
| | 300,000 | | Wal-Mart Stores, Inc. | | | 5.000 | | | | 10/25/40 | | | 342,423 | |
| | | | | | | | | | | | |
|
| |
| | | | | | | | | | | | | | 1,406,561 | |
| | | | | | | | | | | | |
|
| |
| | | | Consumer, Non-cyclical — 1.1% | | | | | | | | | | | |
| | 150,000 | | Anheuser-Busch Inbev Worldwide, Inc. | | | 7.750 | | | | 01/15/19 | | | 196,388 | |
| | 350,000 | | Diageo Capital PLC | | | 7.375 | | | | 01/15/14 | | | 398,655 | |
| | 325,000 | | GlaxoSmithKline Capital, Inc. | | | 4.850 | | | | 05/15/13 | | | 346,375 | |
| | 250,000 | | UnitedHealth Group, Inc. | | | 5.375 | | | | 03/15/16 | | | 288,560 | |
| | | | | | | | | | | | |
|
| |
| | | | | | | | | | | | | | 1,229,978 | |
| | | | | | | | | | | | |
|
| |
72
FBR Balanced Fund
Portfolio of Investments (continued)
October 31, 2011
|
| | | | | | | | | | MATURITY | | VALUE | |
| | PAR | | | | RATE | | | DATE | | (NOTE 2) | |
|
| | | | Energy — 0.3% | | | | | | | | | | | |
| $ | 200,000 | | Devon Energy Corp. | | | 5.625 | % | | | 01/15/14 | | $ | 220,135 | |
| | 150,000 | | Husky Energy, Inc. | | | 5.900 | | | | 06/15/14 | | | 164,668 | |
| | | | | | | | | | | | |
|
| |
| | | | | | | | | | | | | | 384,803 | |
| | | | | | | | | | | | |
|
| |
| | | | Financial — 11.0% | | | | | | | | | | | |
| | 250,000 | | Aflac, Inc. | | | 8.500 | | | | 05/15/19 | | | 313,835 | |
| | 250,000 | | American Express Credit Corp. | | | 2.750 | | | | 09/15/15 | | | 253,347 | |
| | 60,000 | | American Express Credit Corp., Series C | | | 7.300 | | | | 08/20/13 | | | 65,710 | |
| | 275,000 | | American International Group, Inc. | | | 5.850 | | | | 01/16/18 | | | 277,460 | |
| | 300,000 | | Amgen, Inc. | | | 4.100 | | | | 06/15/21 | | | 323,481 | |
| | 300,000 | | Associates Corporation of North America | | | 6.950 | | | | 11/01/18 | | | 337,371 | |
| | 275,000 | | AT&T, Inc. | | | 2.950 | | | | 05/15/16 | | | 287,667 | |
| | 200,000 | | AT&T, Inc. | | | 5.350 | | | | 09/01/40 | | | 219,189 | |
| | 79,000 | | Boston Properties LP | | | 6.250 | | | | 01/15/13 | | | 82,923 | |
| | 325,000 | | Caterpillar Financial Services Corp. | | | 4.900 | | | | 08/15/13 | | | 348,021 | |
| | 705,000 | | Citigroup, Inc. | | | 6.125 | | | | 11/21/17 | | | 777,418 | |
| | 375,000 | | CME Group, Inc. | | | 5.750 | | | | 02/15/14 | | | 413,023 | |
| | 275,000 | | Credit Suisse USA, Inc. | | | 5.125 | | | | 08/15/15 | | | 291,142 | |
| | 275,000 | | Discover Financial Services | | | 10.250 | | | | 07/15/19 | | | 330,726 | |
| | 250,000 | | Fifth Third Bancorp | | | 6.250 | | | | 05/01/13 | | | 265,311 | |
| | 240,000 | | First Niagara Financial Group, Inc. | | | 6.750 | | | | 03/19/20 | | | 264,131 | |
| | 125,000 | | General Electric Capital Corp. | | | 5.400 | | | | 02/15/17 | | | 139,325 | |
| | 250,000 | | General Electric Capital Corp. | | | 5.500 | | | | 06/04/14 | | | 272,723 | |
| | 160,000 | | Jefferies Group, Inc. | | | 8.500 | | | | 07/15/19 | | | 172,593 | |
| | 346,000 | | JPMorgan Chase & Co. | | | 5.750 | | | | 01/02/13 | | | 364,024 | |
| | 300,000 | | KeyCorp | | | 6.500 | | | | 05/14/13 | | | 320,968 | |
| | 320,000 | | Lazard Group | | | 6.850 | | | | 06/15/17 | | | 345,006 | |
| | 300,000 | | Manulife Financial Corp. | | | 3.400 | | | | 09/17/15 | | | 303,307 | |
| | 230,000 | | Merrill Lynch & Company, Inc.(a) | | | 6.875 | | | | 04/25/18 | | | 236,572 | |
| | 250,000 | | Merrill Lynch & Company, Inc., Series MTNC(a) | | | 0.863 | | | | 01/15/15 | | | 215,969 | |
| | 100,000 | | MetLife, Inc., Series A | | | 6.817 | | | | 08/15/18 | | | 119,335 | |
| | 250,000 | | Morgan Stanley | | | 6.625 | | | | 04/01/18 | | | 260,896 | |
| | 250,000 | | Morgan Stanley | | | 4.750 | | | | 04/01/14 | | | 251,335 | |
73
FBR Balanced Fund
Portfolio of Investments (continued)
October 31, 2011
|
| | | | | | | | | | MATURITY | | VALUE | |
| | PAR | | | | RATE | | | DATE | | (NOTE 2) | |
|
| | | | Financial — 11.0% (continued) | | | | | | | | | | | |
| $ | 350,000 | | New York Life Global Funding(b) | | | 5.250 | % | | | 10/16/12 | | $ | 365,143 | |
| | 310,000 | | Prudential Financial, Inc. | | | 5.500 | | | | 03/15/16 | | | 335,322 | |
| | 285,000 | | Prudential Financial, Inc., Series MTNB | | | 5.100 | | | | 09/20/14 | | | 307,012 | |
| | 275,000 | | St. Paul Travelers, Inc. | | | 5.500 | | | | 12/01/15 | | | 313,375 | |
| | 375,000 | | SunTrust Banks, Inc. | | | 5.250 | | | | 11/05/12 | | | 386,690 | |
| | 250,000 | | SunTrust Banks, Inc. | | | 6.000 | | | | 09/11/17 | | | 276,063 | |
| | 150,000 | | Swiss Re Solutions Holding Corp. | | | 7.000 | | | | 02/15/26 | | | 163,933 | |
| | 350,000 | | The Allstate Corp. | | | 5.000 | | | | 08/15/14 | | | 384,856 | |
| | 475,000 | | The Goldman Sachs Group, Inc. | | | 5.375 | | | | 03/15/20 | | | 482,482 | |
| | 300,000 | | The Hartford Financial Services Group, Inc. | | | 5.375 | | | | 03/15/17 | | | 309,704 | |
| | 300,000 | | Toyota Motor Credit Corp. | | | 5.170 | | | | 01/11/12 | | | 302,310 | |
| | 300,000 | | Wachovia Corp. | | | 5.250 | | | | 08/01/14 | | | 320,158 | |
| | 550,000 | | Wells Fargo & Co. | | | 5.250 | | | | 10/23/12 | | | 571,509 | |
| | | | | | | | | | | | |
|
| |
| | | | | | | | | | | | | | 12,371,365 | |
| | | | | | | | | | | | |
|
| |
| | | | Industrial — 0.5% | | | | | | | | | | | |
| | 300,000 | | FedEx Corp. | | | 7.375 | | | | 01/15/14 | | | 339,133 | |
| | 220,000 | | The Boeing Co. | | | 5.000 | | | | 03/15/14 | | | 241,552 | |
| | | | | | | | | | | | |
|
| |
| | | | | | | | | | | | | | 580,685 | |
| | | | | | | | | | | | |
|
| |
| | | | Technology — 1.1% | | | | | | | | | | | |
| | 300,000 | | Dell, Inc. | | | 4.625 | | | | 04/01/21 | | | 330,649 | |
| | 150,000 | | Dell, Inc. | | | 4.700 | | | | 04/15/13 | | | 158,333 | |
| | 150,000 | | Hewlett Packard Co. | | | 3.000 | | | | 09/15/16 | | | 154,562 | |
| | 125,000 | | Hewlett Packard Co. | | | 6.000 | | | | 09/15/41 | | | 143,078 | |
| | 250,000 | | Intel Corp. | | | 3.300 | | | | 10/01/21 | | | 258,553 | |
| | 200,000 | | KLA-Tencor Corp. | | | 6.900 | | | | 05/01/18 | | | 227,979 | |
| | | | | | | | | | | | |
|
| |
| | | | | | | | | | | | | | 1,273,154 | |
| | | | | | | | | | | | |
|
| |
| | | | Utilities — 0.3% | | | | | | | | | | | |
| | 275,000 | | Sempra Energy | | | 6.500 | | | | 06/01/16 | | | 321,841 | |
| | | | | | | | | | | | |
|
| |
| | | | | | | | | | | | | | | |
| | | | Total Corporate Bonds (Cost $19,441,612) | | | | | | | | | | 20,803,625 | |
| | | | | | | | | | | | |
|
| |
74
FBR Balanced Fund
Portfolio of Investments (continued)
October 31, 2011
|
| | | | | | | | | | MATURITY | | VALUE | |
| | PAR | | | | RATE | | | DATE | | (NOTE 2) | |
|
| | | | U.S. GOVERNMENT AGENCY OBLIGATIONS — 3.3% | | | | | | | | | | | |
| $ | 1,300,000 | | Federal Farm Credit Bank | | | 2.040 | % | | | 07/27/16 | | $ | 1,312,887 | |
| | 572,693 | | Federal Home Loan Mortgage Corp. | | | 5.500 | | | | 04/01/37 | | | 630,511 | |
| | 290,704 | | Federal Home Loan Mortgage Corp. | | | 5.000 | | | | 05/01/20 | | | 315,411 | |
| | 389,624 | | Federal National Mortgage Association | | | 6.000 | | | | 10/01/37 | | | 428,647 | |
| | 370,246 | | Federal National Mortgage Association | | | 4.500 | | | | 08/01/20 | | | 396,938 | |
| | 650,000 | | Federal National Mortgage Association | | | 2.000 | | | | 07/27/16 | | | 655,060 | |
| | | | | | | | | | | | |
|
| |
| | | | | | | | | | | | | | | |
| | | | Total U.S. Government Agency Obligations (Cost $3,569,255) | | | | | | | | | | 3,739,454 | |
| | | | | | | | | | | | |
|
| |
| | | | | | | | | | | | | | | |
| | | | U.S. TREASURY OBLIGATIONS — 12.1% | | | | | | | | | | | |
| | 1,700,000 | | U.S. Treasury Note | | | 3.875 | | | | 10/31/12 | | | 1,762,953 | |
| | 1,750,000 | | U.S. Treasury Note | | | 1.250 | | | | 09/30/15 | | | 1,789,648 | |
| | 1,655,000 | | U.S. Treasury Note | | | 3.125 | | | | 10/31/16 | | | 1,825,026 | |
| | 850,000 | | U.S. Treasury Note | | | 3.750 | | | | 11/15/18 | | | 972,586 | |
| | 1,820,000 | | U.S. Treasury Note | | | 3.500 | | | | 05/15/20 | | | 2,050,059 | |
| | 650,000 | | U.S. Treasury Note | | | 2.125 | | | | 08/15/21 | | | 647,261 | |
| | 950,000 | | U.S Treasury Bond | | | 6.250 | | | | 08/15/23 | | | 1,322,727 | |
| | 150,000 | | U.S Treasury Bond | | | 5.250 | | | | 02/15/29 | | | 198,492 | |
| | 2,225,000 | | U.S Treasury Bond | | | 5.000 | | | | 05/15/37 | | | 2,967,594 | |
| | | | | | | | | | | | |
|
| |
| | | | | | | | | | | | | | | |
| | | | Total U.S. Treasury Obligations (Cost $12,840,338 ) | | | | | | | | | | 13,536,346 | |
| | | | | | | | | | | | |
|
| |
75
FBR Balanced Fund
Portfolio of Investments (continued)
October 31, 2011
|
| | | | | | VALUE | |
| SHARES | | | | | (NOTE 2) | |
|
| | | INVESTMENT COMPANIES — 2.1% | | | | |
| 9,000 | | Ares Capital Corp. | | $ | 139,230 | |
| 10,000 | | Calamos Convertible Opportunities and Income Fund | | | 120,900 | |
| 9,900 | | iShares iBoxx $High Yield Corporate Bond Fund | | | 883,872 | |
| 9,000 | | MCG Capital Corp. | | | 41,760 | |
| 5,500 | | Morgan Stanley Emerging Markets Domestic Debt Fund, Inc. | | | 87,285 | |
| 11,000 | | NGP Capital Resources Co. | | | 81,730 | |
| 11,500 | | PennantPark Investment Corp. | | | 123,280 | |
| 19,500 | | SPDR Barclays Capital High Yield Bond | | | 759,915 | |
| 16,000 | | Wells Fargo Advantage Income Opportunities Fund | | | 156,480 | |
| | | | |
|
| |
| | | | | | | |
| | | Total Investment Companies (Cost $2,452,079) | | | 2,394,452 | |
| | | | |
|
| |
| | | | | | | |
| | | SHORT-TERM INVESTMENT — 2.1% | | | | |
| 2,317,550 | | Fidelity Institutional Money Market Government Portfolio, Class I, 0.01%^ (Cost $2,317,550) | | | 2,317,550 | |
| | | | |
|
| |
| | | | | | | |
| | | Total Investments — 99.8% (Cost $98,778,719) | | | 111,799,988 | |
| | | | | | | |
| | | Other Assets Less Liabilities — 0.2% | | | 233,467 | |
| | | | |
|
| |
| | | | | | | |
| | | Net Assets — 100.0% | | $ | 112,033,455 | |
| | | | |
|
| |
| * | | Non-income producing security |
| (a) | | Variable/floating rate security |
| (b) | | This security is a restricted security under Rule 144A of the Securities Act of 1933. These securities may be resold in transactions exempt from registration, normally to qualified institutional buyers. As of October 31, 2011, the total amount of 144A securities was $365,143 or 0.3% of total net assets. |
| LLC | | Limited Liability Company |
| LP | | Limited Partnership |
| PLC | | Public Liability Company |
| ^ | | 7-day yield as of October 31, 2011 |
| | | |
| Note: | | For presentation purposes, the Fund has grouped some of the industry categories. For purposes of categorizing securities for compliance with Section 8(b)(1) of the Investment Company Act of 1940, the Fund uses more specific industry classifications. |
The accompanying notes are an integral part of the financial statements.
76
FBR Core Bond Fund
Management Overview
Portfolio Managers: Gary Cloud, CFA® and Peter Greig, CFA®, Financial Counselors, Inc.
Over the previous twelve months, how did the Fund perform and what factors contributed to this performance?
For the twelve-months ended October 31, 2011, the Investor Class of the FBR Core Bond Fund returned 2.35%. This compares to the Barclays Capital Intermediate U.S. Government/Credit Index and the Morningstar Intermediate Term Bond Category Average which returned 3.22% and 3.75% for the same period, respectively.
The Fund trailed the Barclays Capital U.S. Government / Credit Index for the period as Treasury yields plunged to levels last seen since the late 1940’s. The combination of aggressive Federal Reserve quantitative easing, mixed with a European sovereign debt crisis, brought 10–Year Treasury yields to an incredible 1.67% during the month of September 2011. Corporate bond performance for the year ending October 31, 2011 trailed Treasuries with U.S. Financial bonds leading the sector lower, lagging Treasuries by about 2.00%.
A pro-cyclical asset allocation in the Fund hurt performance due to an underweight in U.S. Treasuries and an overweight in U.S. Corporate bonds. However, the Fund’s holdings in higher yielding fixed income investments did boost the interest income component of total return, adding to performance. The biggest detractor to relative performance for the year was the Fund’s duration positioning and the largest enhancer to relative performance was individual security selection and sector/quality positioning. In summary, a defensive interest rate profile combined with a pro-growth security selection could not keep up with a flight-to-safety rally in U.S government securities.
Portfolio Managers comments on the Fund and related investment outlook.
The investment climate during the summer and fall of 2011 closely resembled the months that followed the Lehman Brothers bankruptcy. Although conditions in the U.S. credit markets were nowhere near the dreadful state that existed then, the European sovereign and corporate debt markets were close to 2008 levels. Systemically large banking institutions in Europe saw their access to funding impeded and their borrowing costs rise dramatically. This, in turn, caused U.S. bank and other financial intermediaries’ funding costs to rise while their share prices fell noticeably.
With fears of the last financial crisis fresh on investors’ minds, it was a “shoot first and ask questions later” trading environment. In hindsight, many of today’s market fears and challenges are legacy issues from an overleveraged public and private sector that has yet to right size itself. European sovereign debt financing issues have to be dealt with first before their banking system can settle down and function as lending intermediaries.
Looking forward, we expect a number of comprehensive initiatives in dealing with the European crisis to be forthcoming soon. On the domestic front, the Federal Reserve may unleash another round of quantitative easing and keep short term rates anchored for
77
FBR Core Bond Fund
Management Overview (continued)
another year or two. There continues to be a very large valuation disparity in the high grade bond market as investors have focused on the return of and not on their principal.
The Fund continues to find attractive investment opportunities in senior debt corporate obligations in general and U.S. bank and insurance companies in particular. High yield bonds, preferred stocks, REITs and business development company securities are also very attractive income producers for the Fund, on a tactical basis. The economy should recover slowly in 2012 and risk markets ought to outperform risk-free assets during the coming year and the Fund is positioned accordingly.
The opinions expressed in this commentary reflect those of the Portfolio Managers as of the date written. Any such opinions are subject to change based on market or other conditions. These opinions may not be relied upon as investment advice. Investment decisions for The FBR Funds are based on several factors, and may not be relied upon as an indication of trading intent on behalf of any FBR Fund. Security positions can and do change.
78
FBR Core Bond Fund
Comparison of Changes in Value of $10,000 Investment in
Investor Class Shares(1)(2)(5) vs. Barclays Capital Intermediate U.S. Government/Credit Index(1)(3)

Total Returns—For the Periods Ended October 31, 2011(4) | |
| | | | | | | Annualized | | | Annualized | |
| | | One Year | | Five Year | | | Ten Year | |
| | |
| |
| | |
| |
FBR Core Bond Fund Investor Class(1)(2)(5) | | | 2.35 | % | | | 5.53 | % | | | | 6.60 | % | |
FBR Core Bond Fund Institutional Class(2)(5) | | | 2.62 | % | | | 5.80 | % | | | | 6.86 | % | |
| Barclays Capital Intermediate U.S. Government/Credit Index | | | 3.22 | % | | | 5.87 | % | | | | 4.98 | % | |
| |
PAST PERFORMANCE IS NO GUARANTEE OF FUTURE RESULTS.
The performance data quoted represents past performance and the current performance may be lower or higher than the performance data quoted. The investment return and principal will fluctuate so that investors’ shares, when redeemed, may be worth more or less than their original cost. The performance data does not reflect the deduction of taxes that a shareholder would pay on Fund distributions or redemption fees. The Fund charges a redemption fee of 1.00% on shares redeemed or exchanged within 90 days; if reflected, the redemption fee would reduce the performance data quoted. To obtain performance data current to the most recent month-end, please call 888.200.4710.
| (1) | | The graph assumes a hypothetical $10,000 initial investment in the Fund and reflects the reinvestment of dividends and all Fund expenses. Investors should note that the Fund is a professionally managed mutual fund while the index is unmanaged, does not incur expenses and is not available for investment. The performance of the index includes reinvested dividends, and does not reflect sales charges or expenses. |
| (2) | | FBR Fund Advisers, Inc. waived a portion of its advisory fees and agreed to contractually reimburse a portion of the Fund’s operating expenses, as necessary, to maintain existing expense limitations, as set forth in the notes to the financial statements. Total returns shown include fee waivers and expense reimbursements, if any; total returns would have been lower had there been no waiver of fees and/or reimbursement of expenses in excess of expense limitations. |
| (3) | | The Barclays Capital Intermediate U.S. Government/Credit Index measures performance of U.S. Dollar denominated U.S. Treasuries, government-related and investment grade U.S. corporate securities that have a remaining maturity of greater than or equal to 1 year and less than 10 years. Securities have $250 million or more of outstanding face value and must be fixed rate and non-convertible. |
| (4) | | The total returns shown do not reflect the deduction of taxes that a shareholder would pay on fund distributions or the redemption of fund shares. |
| (5) | | The Fund is the investment successor to the AFBA 5Star Total Return Bond Fund which commenced investment operations on June 3, 1997. On March 12, 2010, the AFBA 5Star Total Return Bond Fund was reorganized into the Fund. The performance presented for the Investor Class of the Fund for the period prior to March 12, 2010 reflects the performance of the Advisor Class shares of the AFBA 5Star Total Return Bond Fund and the performance presented for the Institutional Class of the Fund for the period prior to March 12, 2010 reflects the performance of the Class I shares of the AFBA 5Star Total Return Bond Fund. |
79
FBR Core Bond Fund
Portfolio Summary
October 31, 2011
The following provides a breakdown of the Fund by industry sectors. The underlying securities represent a percentage of the portfolio investments.
| Industry Sectors | | % of Total Investments |
| |
|
| Common Stocks | | | 3.0 | % |
Energy | | | 1.5 | % |
Real Estate Investment Trust | | | 0.9 | % |
Financial | | | 0.6 | % |
Diversified | | | 0.0 | % |
| Corporate Bonds | | | 55.0 | % |
Financial | | | 32.2 | % |
Consumer, Cyclical | | | 6.9 | % |
Communications | | | 4.3 | % |
Basic Materials | | | 3.0 | % |
Consumer, Non-Cyclical | | | 2.8 | % |
Industrial | | | 2.1 | % |
Technology | | | 1.4 | % |
Energy | | | 1.2 | % |
Utilities | | | 1.1 | % |
| U.S. Treasury Obligations | | | 18.3 | % |
| U.S. Government Agency Obligations | | | 12.0 | % |
| Investment Companies | | | 8.1 | % |
| Convertible Preferred Stock | | | 1.5 | % |
| Preferred Stock | | | 0.1 | % |
| | | | | |
| Cash | | | 2.0 | % |
80
FBR Core Bond Fund
Portfolio of Investments
October 31, 2011
|
| | | | | VALUE | |
| SHARES | | | | (NOTE 2) | |
|
| | | COMMON STOCKS — 3.0% | | | | |
| | | Diversified — 0.0% | | | | |
| 37 | | Leucadia National Corp. | | $ | 993 | |
| | | | |
|
| |
| | | | | | | |
| | | Energy — 1.5% | | | | |
| 5,500 | | Hugoton Royalty Trust | | | 119,460 | |
| 3,750 | | Linn Energy LLC | | | 145,200 | |
| 5,500 | | San Juan Basin Royalty Trust | | | 134,420 | |
| | | | |
|
| |
| | | | | | 399,080 | |
| | | | |
|
| |
| | | Financial — 0.6% | | | | |
| 5,000 | | Hercules Technology Growth Capital, Inc. | | | 48,400 | |
| 6,000 | | Starwood Property Trust, Inc. | | | 112,740 | |
| | | | |
|
| |
| | | | | | 161,140 | |
| | | | |
|
| |
| | | Real Estate Investment Trust — 0.9% | | | | |
| 8,500 | | Apollo Commercial Real Estate Finance, Inc. | | | 119,085 | |
| 37,500 | | Chimera Investment Corp. | | | 112,875 | |
| 1,500 | | Winthrop Realty Trust | | | 13,575 | |
| | | | |
|
| |
| | | | | | 245,535 | |
| | | | |
|
| |
| | | | | | | |
| | | Total Common Stocks (Cost $862,126) | | | 806,748 | |
| | | | |
|
| |
| | | | | | | |
| | | CONVERTIBLE PREFERRED STOCK — 1.5% | | | | |
| | | Finance — 1.5% | | | | |
| 13,350 | | Boston Private Capital Trust I, 4.88%, due 10/1/34 (Cost $638,782) | | | 408,009 | |
| | | | |
|
| |
| | | | | | | |
| | | PREFERRED STOCK — 0.1% | | | | |
| 10,400 | | Federal National Mortgage Association, Perpetual, Series S, 8.25%, due 12/31/15* (Cost $260,000) | | | 20,384 | |
| | | | |
|
| |
81
FBR Core Bond Fund
Portfolio of Investments (continued)
October 31, 2011
|
| | | | | | | | | | MATURITY | | VALUE | |
| | PAR | | | | RATE | | | DATE | | (NOTE 2) | |
|
| | | | CORPORATE BONDS — 55.0% | | | | | | | | | | | |
| | | | Basic Materials — 3.0% | | | | | | | | | | | |
| $ | 300,000 | | Barrick Gold Financeco LLC | | | 6.125 | % | | | 09/15/13 | | $ | 328,142 | |
| | 285,000 | | EI du Pont de Nemours & Co. | | | 4.750 | | | | 03/15/15 | | | 316,933 | |
| | 125,000 | | International Paper Co. | | | 9.375 | | | | 05/15/19 | | | 160,518 | |
| | | | | | | | | | | | |
|
| |
| | | | | | | | | | | | | | 805,593 | |
| | | | | | | | | | | | |
|
| |
| | | | Communications — 4.3% | | | | | | | | | | | |
| | 250,000 | | Comcast Corp. | | | 6.500 | | | | 01/15/17 | | | 295,190 | |
| | 275,000 | | Deutsche Telekom International Finance BV | | | 5.875 | | | | 08/20/13 | | | 294,534 | |
| | 280,000 | | Rogers Communications, Inc. | | | 7.500 | | | | 03/15/15 | | | 331,749 | |
| | 250,000 | | Telefonica Emisiones SAU | | | 5.877 | | | | 07/15/19 | | | 259,801 | |
| | | | | | | | | | | | |
|
| |
| | | | | | | | | | | | | | 1,181,274 | |
| | | | | | | | | | | | |
|
| |
| | | | Consumer, Cyclical — 6.9% | | | | | | | | | | | |
| | 275,000 | | Best Buy Company, Inc. | | | 6.750 | | | | 07/15/13 | | | 292,957 | |
| | 69,000 | | GameStop Corp. / GameStop, Inc. | | | 8.000 | | | | 10/01/12 | | | 69,179 | |
| | 150,000 | | Marriott International, Inc., Series J | | | 5.625 | | | | 02/15/13 | | | 155,613 | |
| | 325,000 | | PVH Corp. | | | 7.750 | | | | 11/15/23 | | | 340,013 | |
| | 575,000 | | Royal Caribbean Cruises Ltd. | | | 7.500 | | | | 10/15/27 | | | 559,187 | |
| | 275,000 | | Starbucks Corp. | | | 6.250 | | | | 08/15/17 | | | 330,442 | |
| | 120,000 | | The Home Depot, Inc. | | | 5.400 | | | | 03/01/16 | | | 137,072 | |
| | | | | | | | | | | | |
|
| |
| | | | | | | | | | | | | | 1,884,463 | |
| | | | | | | | | | | | |
|
| |
| | | | Consumer, Non-Cyclical — 2.8% | | | | | | | | | | | |
| | 125,000 | | Anheuser-Busch InBev Worldwide, Inc. | | | 7.750 | | | | 01/15/19 | | | 163,657 | |
| | 250,000 | | Diageo Cap PLC | | | 5.200 | | | | 01/30/13 | | | 263,666 | |
| | 325,000 | | GlaxoSmithKline Capital, Inc. | | | 4.850 | | | | 05/15/13 | | | 346,376 | |
| | | | | | | | | | | | |
|
| |
| | | | | | | | | | | | | | 773,699 | |
| | | | | | | | | | | | |
|
| |
| | | | Energy — 1.2% | | | | | | | | | | | |
| | 175,000 | | Devon Energy Corp. | | | 5.625 | | | | 01/15/14 | | | 192,618 | |
| | 125,000 | | Husky Energy, Inc. | | | 5.900 | | | | 06/15/14 | | | 137,224 | |
| | | | | | | | | | | | |
|
| |
| | | | | | | | | | | | | | 329,842 | |
| | | | | | | | | | | | |
|
| |
| | | | Financial — 32.2% | | | | | | | | | | | |
| | 250,000 | | Aflac, Inc. | | | 8.500 | | | | 05/15/19 | | | 313,835 | |
| | 60,000 | | American Express Credit Corp., Series C | | | 7.300 | | | | 08/20/13 | | | 65,710 | |
| | 140,000 | | American Express Travel Related Services Co.(b) | | | 5.250 | | | | 11/21/11 | | | 140,013 | |
| | 200,000 | | American International Group, Inc. | | | 5.850 | | | | 01/16/18 | | | 201,789 | |
82
FBR Core Bond Fund
Portfolio of Investments (continued)
October 31, 2011
|
| | | | | | | | | | MATURITY | | VALUE | |
| | PAR | | | | RATE | | | DATE | | (NOTE 2) | |
|
| | | | Financial — 32.2% (continued) | | | | | | | | | | | |
| $ | 250,000 | | Associates Corporation of North America | | | 6.950 | % | | | 11/01/18 | | $ | 281,142 | |
| | 200,000 | | Capital One Financial Corp. | | | 6.750 | | | | 09/15/17 | | | 233,212 | |
| | 325,000 | | Caterpillar Financial Services Corp. | | | 4.900 | | | | 08/15/13 | | | 348,021 | |
| | 250,000 | | Citigroup, Inc. | | | 6.125 | | | | 11/21/17 | | | 275,680 | |
| | 300,000 | | CME Group, Inc. | | | 5.750 | | | | 02/15/14 | | | 330,418 | |
| | 225,000 | | Credit Suisse USA, Inc. | | | 5.125 | | | | 08/15/15 | | | 238,207 | |
| | 175,000 | | Discover Financial Services | | | 10.250 | | | | 07/15/19 | | | 210,462 | |
| | 250,000 | | Fifth Third Bancorp | | | 6.250 | | | | 05/01/13 | | | 265,311 | |
| | 125,000 | | General Electric Capital Corp. | | | 5.400 | | | | 02/15/17 | | | 139,325 | |
| | 140,000 | | Jefferies Group, Inc. | | | 8.500 | | | | 07/15/19 | | | 151,019 | |
| | 250,000 | | JPMorgan Chase & Co. | | | 6.300 | | | | 04/23/19 | | | 283,711 | |
| | 235,000 | | JPMorgan Chase & Co. | | | 5.375 | | | | 10/01/12 | | | 245,091 | |
| | 300,000 | | KeyCorp | | | 6.500 | | | | 05/14/13 | | | 320,968 | |
| | 300,000 | | Lazard Group | | | 6.850 | | | | 06/15/17 | | | 323,443 | |
| | 300,000 | | Manulife Financial Corp. | | | 3.400 | | | | 09/17/15 | | | 303,308 | |
| | 170,000 | | Merrill Lynch & Company, Inc. | | | 6.875 | | | | 04/25/18 | | | 174,858 | |
| | 200,000 | | Merrill Lynch & Company, Inc., Series MTNC(a) | | | 0.863 | | | | 01/15/15 | | | 172,776 | |
| | 275,000 | | MetLife, Inc., Series A | | | 6.817 | | | | 08/15/18 | | | 328,171 | |
| | 250,000 | | Morgan Stanley | | | 6.625 | | | | 04/01/18 | | | 260,895 | |
| | 275,000 | | New York Life Global Funding(b) | | | 5.250 | | | | 10/16/12 | | | 286,898 | |
| | 288,000 | | Prudential Financial, Inc. | | | 5.500 | | | | 03/15/16 | | | 311,525 | |
| | 250,000 | | Prudential Financial, Inc., Series MTNB | | | 5.100 | | | | 09/20/14 | | | 269,309 | |
| | 300,000 | | SunTrust Banks, Inc. | | | 6.000 | | | | 09/11/17 | | | 331,276 | |
| | 215,000 | | SunTrust Banks, Inc. | | | 5.250 | | | | 11/05/12 | | | 221,702 | |
| | 125,000 | | Swiss Re Solutions Holding Corp. | | | 7.000 | | | | 02/15/26 | | | 136,611 | |
| | 270,000 | | The Allstate Corp. | | | 5.000 | | | | 08/15/14 | | | 296,889 | |
| | 500,000 | | The Goldman Sachs Group, Inc. | | | 5.375 | | | | 03/15/20 | | | 507,875 | |
| | 300,000 | | The Hartford Financial Services Group, Inc. | | | 5.375 | | | | 03/15/17 | | | 309,704 | |
| | 275,000 | | Toyota Motor Credit Corp. | | | 5.170 | | | | 01/11/12 | | | 277,117 | |
| | 200,000 | | Wachovia Corp. | | | 5.250 | | | | 08/01/14 | | | 213,439 | |
| | | | | | | | | | | | |
|
| |
| | | | | | | | | | | | | | 8,769,710 | |
| | | | | | | | | | | | |
|
| |
| | | | Industrial — 2.1% | | | | | | | | | | | |
| | 50,000 | | American Railcar Industries, Inc. | | | 7.500 | | | | 03/01/14 | | | 50,500 | |
| | 275,000 | | FedEx Corp. | | | 7.375 | | | | 01/15/14 | | | 310,872 | |
83
FBR Core Bond Fund
Portfolio of Investments (continued)
October 31, 2011
|
| | | | | | | | | | MATURITY | | VALUE | |
| | PAR | | | | RATE | | | DATE | | (NOTE 2) | |
|
| | | | Industrial — 2.1% (continued) | | | | | | | | | | | |
| $ | 200,000 | | The Boeing Co. | | | 5.000 | % | | | 03/15/14 | | $ | 219,593 | |
| | | | | | | | | | | | |
|
| |
| | | | | | | | | | | | | | 580,965 | |
| | | | | | | | | | | | |
|
| |
| | | | Technology — 1.4% | | | | | | | | | | | |
| | 125,000 | | Hewlett Packard Co. | | | 3.000 | | | | 09/15/16 | | | 128,802 | |
| | 100,000 | | Hewlett Packard Co. | | | 6.000 | | | | 09/15/41 | | | 114,462 | |
| | 130,000 | | KLA-Tencor Corp. | | | 6.900 | | | | 05/01/18 | | | 148,186 | |
| | | | | | | | | | | | |
|
| |
| | | | | | | | | | | | | | 391,450 | |
| | | | | | | | | | | | |
|
| |
| | | | Utilities — 1.1% | | | | | | | | | | | |
| | 250,000 | | Sempra Energy | | | 6.500 | | | | 06/01/16 | | | 292,583 | |
| | | | | | | | | | | | |
|
| |
| | | | | | | | | | | | | | | |
| | | | Total Corporate Bonds (Cost $13,864,033) | | | | | | | | | | 15,009,579 | |
| | | | | | | | | | | | |
|
| |
| | | | | | | | | | | | | | | |
| | | | U.S. GOVERNMENT AGENCY OBLIGATIONS — 12.0% | | | | | | | | | | | |
| | 1,000,000 | | Federal Farm Credit Bank | | | 2.040 | | | | 07/27/16 | | | 1,009,913 | |
| | 654,507 | | Federal Home Loan Mortgage Corp. | | | 5.500 | | | | 04/01/37 | | | 720,584 | |
| | 500,000 | | Federal National Mortgage Association | | | 2.000 | | | | 07/27/16 | | | 503,893 | |
| | 462,974 | | Federal National Mortgage Association | | | 4.500 | | | | 08/01/20 | | | 496,352 | |
| | 487,030 | | Federal National Mortgage Association | | | 6.000 | | | | 10/01/37 | | | 535,808 | |
| | | | | | | | | | | | |
|
| |
| | | | | | | | | | | | | | | |
| | | | Total U.S. Government Agency Obligations (Cost $3,097,594) | | | | | | | | | | 3,266,550 | |
| | | | | | | | | | | | |
|
| |
| | | | | | | | | | | | | | | |
| | | | U.S. TREASURY OBLIGATIONS — 18.3% | | | | | | | | | | | |
| | 175,000 | | U.S Treasury Bond | | | 6.250 | | | | 08/15/23 | | | 243,660 | |
| | 250,000 | | U.S Treasury Bond | | | 5.250 | | | | 02/15/29 | | | 330,820 | |
| | 1,350,000 | | U.S Treasury Bond | | | 5.000 | | | | 05/15/37 | | | 1,800,563 | |
| | 650,000 | | U.S. Treasury Note | | | 3.875 | | | | 10/31/12 | | | 674,070 | |
| | 175,000 | | U.S. Treasury Note | | | 1.250 | | | | 09/30/15 | | | 178,965 | |
| | 350,000 | | U.S. Treasury Note | | | 3.250 | | | | 05/31/16 | | | 387,488 | |
| | 400,000 | | U.S. Treasury Note | | | 3.750 | | | | 11/15/18 | | | 457,688 | |
| | 825,000 | | U.S. Treasury Note | | | 3.500 | | | | 05/15/20 | | | 929,285 | |
| | | | | | | | | | | | |
|
| |
| | | | | | | | | | | | | | | |
| | | | Total U.S. Treasury Obligations (Cost $4,584,164) | | | | | | | | | | 5,002,539 | |
| | | | | | | | | | | | |
|
| |
84
FBR Core Bond Fund
Portfolio of Investments (continued)
October 31, 2011
|
| | | | | VALUE | |
| SHARES | | | | (NOTE 2) | |
|
| | | INVESTMENT COMPANIES — 8.1% | | | | |
| 10,000 | | Ares Capital Corp. | | $ | 154,700 | |
| 12,500 | | Calamos Convertible Opportunities and Income Fund | | | 151,125 | |
| 8,000 | | iShares iBoxx $High Yield Corporate Bond Fund | | | 714,240 | |
| 9,000 | | MCG Capital Corp. | | | 41,760 | |
| 5,500 | | Morgan Stanley Emerging Markets Domestic Debt Fund, Inc. | | | 87,285 | |
| 11,000 | | NGP Capital Resources Co. | | | 81,730 | |
| 12,000 | | PennantPark Investment Corp. | | | 128,640 | |
| 18,000 | | SPDR Barclays Capital High Yield Bond | | | 701,460 | |
| 16,000 | | Wells Fargo Advantage Income Opportunities Fund | | | 156,481 | |
| | | | |
|
| |
| | | | | | | |
| | | Total Investment Companies (Cost $2,273,435) | | | 2,217,421 | |
| | | | |
|
| |
| | | | | | | |
| | | SHORT-TERM INVESTMENT — 1.4% | | | | |
| 394,146 | | Fidelity Institutional Money Market Government Portfolio, Class I, 0.01%^ (Cost $394,146) | | | 394,146 | |
| | | | |
|
| |
| | | | | | | |
| | | Total Investments — 99.4% (Cost $25,974,280) | | | 27,125,376 | |
| | | | | | | |
| | | Other Assets Less Liabilities — 0.6% | | | 168,822 | |
| | | | |
|
| |
| | | | | | | |
| | | Net Assets — 100.0% | | $ | 27,294,198 | |
| | | | |
|
| |
| * | | Non-income producing security |
| (a) | | Variable/floating rate security |
| (b) | | This security is a restricted security under Rule 144A of the Securities Act of 1933. These securities may be resold in transactions exempt from registration, normally to qualified institutional buyers. As of October 31, 2011, the total amount of 144A securities was $426,910 or 1.6% of total net assets. |
| LLC | | Limited Liability Company |
| LP | | Limited Partnership |
| PLC | | Public Liability Company |
| ^ | | 7-day yield as of October 31, 2011 |
| | | |
| Note: | | For presentation purposes, the Fund has grouped some of the industry categories. For purposes of categorizing securities for compliance with Section 8(b)(1) of the Investment Company Act of 1940, the Fund uses more specific industry classifications. |
The accompanying notes are an integral part of the financial statements.
85
Statements of Assets and Liabilities
October 31, 2011
| | FBR | | FBR | | FBR |
| | Large Cap Fund | | Mid Cap Fund | | Small Cap Fund |
| |
| |
| |
|
| ASSETS | | | | | | | | | | | | | | |
Investment Securities at Cost | | $ | 37,722,422 | | | | $ | 17,198,306 | | | | $ | 39,828,160 | |
| | |
|
| | | |
|
| | | |
|
| |
Investment Securities at Value (Note 2) | | $ | 39,760,078 | | | | $ | 18,811,901 | | | | $ | 39,004,441 | |
Receivable for Capital Shares Sold | | | 6,836 | | | | | 48,296 | | | | | 115,352 | |
Receivable for Investment Securities Sold | | | — | | | | | — | | | | | 146,080 | |
Dividends and Interest Receivable | | | 17,618 | | | | | 7,064 | | | | | 12,485 | |
Prepaid Expenses | | | 14,675 | | | | | 5,488 | | | | | 9,041 | |
| | |
|
| | | |
|
| | | |
|
| |
Total Assets | | | 39,799,207 | | | | | 18,872,749 | | | | | 39,287,399 | |
| | |
|
| | | |
|
| | | |
|
| |
| LIABILITIES | | | | | | | | | | | | | | |
Payable for Investment Securities Purchased | | | — | | | | | — | | | | | 180,643 | |
Payable for Capital Shares Redeemed | | | 8,147 | | | | | 124 | | | | | 9,558 | |
Investment Advisory Fee Payable, Net (Note 4) | | | 20,296 | | | | | 4,514 | | | | | 23,398 | |
Administration Fee Payable (Note 4) | | | 1,299 | | | | | 610 | | | | | 1,253 | |
Distribution and Service Fees Payable (Note 4) | | | 2,578 | | | | | 1,434 | | | | | 5,666 | |
Other Accrued Expenses | | | 58,865 | | | | | 45,384 | | | | | 62,565 | |
| | |
|
| | | |
|
| | | |
|
| |
Total Liabilities | | | 91,185 | | | | | 52,066 | | | | | 283,083 | |
| | |
|
| | | |
|
| | | |
|
| |
| NET ASSETS | | $ | 39,708,022 | | | | $ | 18,820,683 | | | | $ | 39,004,316 | |
| | |
|
| | | |
|
| | | |
|
| |
| Net Assets Consist of: | | | | | | | | | | | | | | |
Paid-in capital | | $ | 46,595,066 | | | | $ | 20,707,969 | | | | $ | 48,044,204 | |
Accumulated net investment income | | | 155,370 | | | | | 21,740 | | | | | — | |
Accumulated net realized loss on investments | | | (9,080,070 | ) | | | | (3,522,621 | ) | | | | (8,216,169 | ) |
Net unrealized appreciation (depreciation) on investments | | | 2,037,656 | | | | | 1,613,595 | | | | | (823,719 | ) |
| | |
|
| | | |
|
| | | |
|
| |
| NET ASSETS | | $ | 39,708,022 | | | | $ | 18,820,683 | | | | $ | 39,004,316 | |
| | |
|
| | | |
|
| | | |
|
| |
| Pricing of Investor Class Shares | | | | | | | | | | | | | | |
Net assets attributable to Investor Class shares | | $ | 12,470,408 | | | | $ | 7,130,413 | | | | $ | 28,186,300 | |
Shares of Beneficial Interest Outstanding | | | | | | | | | | | | | | |
(unlimited number of shares authorized, no par value) | | | 1,096,333 | | | | | 586,990 | | | | | 2,272,784 | |
| | |
|
| | | |
|
| | | |
|
| |
Net Asset Value Per Share | | $ | 11.37 | | | | $ | 12.15 | | | | $ | 12.40 | |
| | |
|
| | | |
|
| | | |
|
| |
| Pricing of Institutional Class Shares | | | | | | | | | | | | | | |
Net assets attributable to Institutional Class shares | | $ | 27,237,614 | | | | $ | 11,690,270 | | | | $ | 10,818,016 | |
Shares of Beneficial Interest Outstanding | | | | | | | | | | | | | | |
(unlimited number of shares authorized, no par value) | | | 2,764,367 | | | | | 1,109,266 | | | | | 967,492 | |
| | |
|
| | | |
|
| | | |
|
| |
Net Asset Value Per Share | | $ | 9.85 | | | | $ | 10.54 | | | | $ | 11.18 | |
| | |
|
| | | |
|
| | | |
|
| |
The accompanying notes are an integral part of the financial statements.
86
Statements of Assets and Liabilities (continued)
October 31, 2011
| | | | | | | FBR | | FBR |
| | | FBR | | Large Cap | | Small Cap |
| | | Focus Fund | | Financial Fund | | Financial Fund |
| | |
| |
| |
|
| ASSETS | | | | | | | | | | | | | | |
Investment Securities | | | | | | | | | | | | | | |
Securities at Cost: | | | | | | | | | | | | | | |
Unaffiliated Issuers | | $ | 332,888,855 | | | | $ | 61,100,069 | | | | $ | 181,023,197 | |
Affiliated Issuers | | | 34,322,505 | | | | | — | | | | | — | |
| | |
|
| | | |
|
| | | |
|
| |
Total Securities | | $ | 367,211,360 | | | | $ | 61,100,069 | | | | $ | 181,023,197 | |
| | |
|
| | | |
|
| | | |
|
| |
Securities at Value (Note 2): | | | | | | | | | | | | | | |
Unaffiliated Issuers | | $ | 583,608,928 | | | | $ | 55,625,295 | | | | $ | 174,330,608 | |
Affiliated Issuers | | | 76,893,723 | | | | | — | | | | | — | |
| | |
|
| | | |
|
| | | |
|
| |
Investment Securities at Value (Note 2) | | $ | 660,502,651 | | | | $ | 55,625,295 | | | | $ | 174,330,608 | |
Cash | | | | | | | | | | | | | | |
Receivable for Capital Shares Sold | | | 1,392,868 | | | | | 133,369 | | | | | 131,328 | |
Receivable for Investment Securities Sold | | | — | | | | | 363,698 | | | | | 1,506,941 | |
Dividends and Interest Receivable | | | 121,071 | | | | | 36,756 | | | | | 159,272 | |
Prepaid Expenses | | | 57,807 | | | | | 6,250 | | | | | 28,800 | |
| | |
|
| | | |
|
| | | |
|
| |
Total Assets | | | 662,074,397 | | | | | 56,165,368 | | | | | 176,156,949 | |
| | |
|
| | | |
|
| | | |
|
| |
| LIABILITIES | | | | | | | | | | | | | | |
Payable for Capital Shares Redeemed | | | 660,969 | | | | | 2,671 | | | | | 186,255 | |
Payable for Investment Securities Purchased | | | — | | | | | 364,205 | | | | | 1,507,576 | |
Investment Advisory Fee Payable, Net (Note 4) | | | 478,215 | | | | | 40,295 | | | | | 127,232 | |
Administration Fee Payable (Note 4) | | | 21,254 | | | | | 1,791 | | | | | 1,521 | |
Transfer Agent Fee Payable | | | 59,604 | | | | | 4,465 | | | | | 21,887 | |
Distribution and Service Fees Payable (Note 4) | | | 122,991 | | | | | 11,193 | | | | | 31,535 | |
Other Accrued Expenses | | | 388,719 | | | | | 57,104 | | | | | 180,103 | |
| | |
|
| | | |
|
| | | |
|
| |
Total Liabilities | | | 1,731,752 | | | | | 481,724 | | | | | 2,056,109 | |
| | |
|
| | | |
|
| | | |
|
| |
| NET ASSETS | | $ | 660,342,645 | | | | $ | 55,683,644 | | | | $ | 174,100,840 | |
| | |
|
| | | |
|
| | | |
|
| |
| Net Assets Consist of: | | | | | | | | | | | | | | |
Paid-in capital | | $ | 298,491,383 | | | | $ | 65,962,489 | | | | $ | 187,914,488 | |
Undistributed net investment income | | | — | | | | | — | | | | | 2,346,347 | |
Accumulated net realized gain (loss) on investments | | | | | | | | | | | | | | |
and foreign currency transactions | | | 68,559,971 | | | | | (4,804,071 | ) | | | | (9,467,406 | ) |
Net unrealized appreciation (depreciation) on investments | | | 293,291,291 | | | | | (5,474,774 | ) | | | | (6,692,589 | ) |
| | |
|
| | | |
|
| | | |
|
| |
| NET ASSETS | | $ | 660,342,645 | | | | $ | 55,683,644 | | | | $ | 174,100,840 | |
| | |
|
| | | |
|
| | | |
|
| |
| Pricing of Investor Class Shares | | | | | | | | | | | | | | |
Net assets attributable to Investor Class shares | | $ | 611,337,440 | | | | $ | 55,683,644 | | | | $ | 154,206,410 | |
Shares of Beneficial Interest Outstanding (unlimited | | | | | | | | | | | | | | |
number of shares authorized, no par value) | | | 12,274,936 | | | | | 4,675,405 | | | | | 9,357,951 | |
| | |
|
| | | |
|
| | | |
|
| |
Net Asset Value Per Share | | $ | 49.80 | | | | $ | 11.91 | | | | $ | 16.48 | |
| | |
|
| | | |
|
| | | |
|
| |
| Pricing of Institutional Class Shares | | | | | | | | | | | | | | |
Net assets attributable to Institutional Class shares | | $ | 49,005,205 | | | | $ | — | | | | $ | 19,894,430 | |
Shares of Beneficial Interest Outstanding (unlimited | | | | | | | | | | | | | |
number of shares authorized, no par value) | | | 979,647 | | | | | — | | | | | 1,885,584 | |
| | |
|
| | | |
|
| | | |
|
| |
Net Asset Value Per Share | | $ | 50.02 | | | | $ | — | | | | $ | 10.55 | |
| | |
|
| | | |
|
| | | |
|
| |
The accompanying notes are an integral part of the financial statements.
87
Statements of Assets and Liabilities (continued)
October 31, 2011
| | | | | | | FBR |
| | FBR | | Gas Utility |
| | Technology Fund | | Index Fund |
| |
| |
|
| ASSETS | | | | | | | | |
Investment Securities at Cost | | $ | 6,695,490 | | | $ | 270,024,065 | |
| | |
|
| | |
|
| |
Investment Securities at Value (Note 2) | | $ | 6,881,679 | | | $ | 429,353,160 | |
Cash | | | — | | | | 649 | |
Receivable for Capital Shares Sold | | | 838 | | | | 10,335,174 | |
Receivable for Investment Securities Sold | | | 46,910 | | | | 155,220 | |
Dividends and Interest Receivable | | | 3 | | | | 469,601 | |
Prepaid Expenses | | | 3,738 | | | | 43,746 | |
| | |
|
| | |
|
| |
Total Assets | | | 6,933,168 | | | | 440,357,550 | |
| | |
|
| | |
|
| |
| LIABILITIES | | | | | | | | |
Payable for Capital Shares Redeemed | | | — | | | | 274,891 | |
Payable for Investment Securities Purchased | | | 25,086 | | | | 5,996,519 | |
Investment Advisory Fee Payable, Net (Note 4) | | | 6,179 | | | | 130,564 | |
Administration Fee Payable (Note 4) | | | 223 | | | | 13,905 | |
Distribution and Service Fees Payable (Note 4) | | | 1,160 | | | | — | |
Other Accrued Expenses | | | 45,602 | | | | 159,903 | |
| | |
|
| | |
|
| |
Total Liabilities | | | 78,250 | | | | 6,575,782 | |
| | |
|
| | |
|
| |
| NET ASSETS | | $ | 6,854,918 | | | $ | 433,781,768 | |
| | |
|
| | |
|
| |
| Net Assets Consist of: | | | | | | | | |
Paid-in capital | | $ | 9,119,649 | | | $ | 286,301,730 | |
Undistributed net investment income | | | — | | | | 93,553 | |
Accumulated net realized loss on investments | | | (2,450,920 | ) | | | (11,946,196 | ) |
Net unrealized appreciation on investments and foreign currencies | | | 186,189 | | | | 159,332,681 | |
| | |
|
| | |
|
| |
| NET ASSETS | | $ | 6,854,918 | | | $ | 433,781,768 | |
| | |
|
| | |
|
| |
| Pricing of Investor Class Shares | | | | | | | | |
Net assets attributable to Investor Class shares | | $ | 5,698,422 | | | $ | 433,781,768 | |
Shares of Beneficial Interest Outstanding | | | | | | | | |
(unlimited number of shares authorized, no par value) | | | 524,786 | | | | 20,453,253 | |
| | |
|
| | |
|
| |
Net Asset Value Per Share | | $ | 10.86 | | | $ | 21.21 | |
| | |
|
| | |
|
| |
| Pricing of Institutional Class Shares | | | | | | | | |
Net assets attributable to Institutional Class shares | | $ | 1,156,496 | | | $ | — | |
Shares of Beneficial Interest Outstanding | | | | | | | | |
(unlimited number of shares authorized, no par value) | | | 106,167 | | | | — | |
| | |
|
| | |
|
| |
Net Asset Value Per Share | | $ | 10.89 | | | $ | — | |
| | |
|
| | |
|
| |
The accompanying notes are an integral part of the financial statements.
88
Statements of Assets and Liabilities (continued)
October 31, 2011
| | | | | | | FBR | |
| | FBR | | Core Bond | |
| | Balanced Fund | | Fund | |
| |
| |
| |
| ASSETS | | | | | | | | |
Investment Securities at Cost | | $ | 98,778,719 | | | $ | 25,974,280 | |
| | |
|
| | |
|
| |
Investment Securities at Value (Note 2) | | $ | 111,799,988 | | | $ | 27,125,376 | |
Receivable for Capital Shares Sold | | | 605,507 | | | | 1,389 | |
Receivable for Investment Securities Sold | | | — | | | | — | |
Dividends and Interest Receivable | | | 496,577 | | | | 285,547 | |
Prepaid Expenses | | | 27,860 | | | | 21,280 | |
| | |
|
| | |
|
| |
Total Assets | | | 112,929,932 | | | | 27,433,592 | |
| | |
|
| | |
|
| |
| LIABILITIES | | | | | | | | |
Due to Custodian | | | 30 | | | | — | |
Payable for Capital Shares Redeemed | | | 58,046 | | | | 470 | |
Payable for Investment Securities Purchased | | | 675,947 | | | | — | |
Distribution Payable | | | — | | | | 65,738 | |
Investment Advisory Fee Payable, Net (Note 4) | | | 65,537 | | | | 17,250 | |
Administration Fee Payable (Note 4) | | | 3,522 | | | | 918 | |
Distribution and Service Fees Payable (Note 4) | | | 10,656 | | | | 789 | |
Other Accrued Expenses | | | 82,739 | | | | 54,229 | |
| | |
|
| | |
|
| |
Total Liabilities | | | 896,477 | | | | 139,394 | |
| | |
|
| | |
|
| |
| NET ASSETS | | $ | 112,033,455 | | | $ | 27,294,198 | |
| | |
|
| | |
|
| |
| Net Assets Consist of: | | | | | | | | |
Paid-in capital | | $ | 103,196,337 | | | $ | 25,880,061 | |
Accumulated net investment income | | | 223,082 | | | | 8,277 | |
Accumulated net realized gain (loss) on investments | | | (4,407,233 | ) | | | 254,764 | |
Net unrealized appreciation on investments | | | 13,021,269 | | | | 1,151,096 | |
| | |
|
| | |
|
| |
| NET ASSETS | | $ | 112,033,455 | | | $ | 27,294,198 | |
| | |
|
| | |
|
| |
| Pricing of Investor Class Shares | | | | | | | | |
Net assets attributable to Investor Class shares | | $ | 56,750,132 | | | $ | 4,047,075 | |
Shares of Beneficial Interest Outstanding | | | | | | | | |
(unlimited number of shares authorized, no par value) | | | 4,367,737 | | | | 423,494 | |
| | |
|
| | |
|
| |
Net Asset Value Per Share | | $ | 12.99 | | | $ | 9.56 | |
| | |
|
| | |
|
| |
| Pricing of Institutional Class Shares | | | | | | | | |
Net assets attributable to Institutional Class shares | | $ | 55,283,323 | | | $ | 23,247,123 | |
Shares of Beneficial Interest Outstanding | | | | | | | | |
(unlimited number of shares authorized, no par value) | | | 4,466,885 | | | | 2,652,148 | |
| | |
|
| | |
|
| |
Net Asset Value Per Share | | $ | 12.38 | | | $ | 8.77 | |
| | |
|
| | |
|
| |
The accompanying notes are an integral part of the financial statements.
89
Statements of Operations
For the Year Ended October 31, 2011
| | FBR | | FBR | | FBR |
| | Large Cap Fund | | Mid Cap Fund | | Small Cap Fund |
| |
| |
| |
|
| Investment Income | | | | | | | | | | | | | | |
Dividends1 | | $ | 722,337 | | | | $ | 298,908 | | | | $ | 485,781 | |
Interest | | | — | | | | | 45 | | | | | — | |
| | |
|
| | | |
|
| | | |
|
| |
Total Investment Income | | | 722,337 | | | | | 298,953 | | | | | 485,781 | |
| | |
|
| | | |
|
| | | |
|
| |
| Expenses | | | | | | | | | | | | | | |
Investment Advisory fees (Note 4) | | | 414,870 | | | | | 185,145 | | | | | 377,419 | |
Administration fees (Note 4) | | | 30,772 | | | | | 13,643 | | | | | 27,935 | |
Distribution and Service fees – Investor Class (Note 4) | | | 41,952 | | | | | 20,772 | | | | | 75,588 | |
Professional fees | | | 38,820 | | | | | 39,864 | | | | | 29,270 | |
Transfer agent fees – Investor Class | | | 12,419 | | | | | 10,670 | | | | | 35,420 | |
Transfer agent fees – Institutional Class | | | 25,756 | | | | | 3,359 | | | | | 5,641 | |
Shareholder administrative fees – Investor Class | | | 23,429 | | | | | 15,923 | | | | | 34,687 | |
Shareholder administrative fees – Institutional Class | | | 4,344 | | | | | 2,147 | | | | | 5,900 | |
Registration fees – Investor Class | | | 19,174 | | | | | 21,157 | | | | | 21,157 | |
Registration fees – Institutional Class | | | 16,737 | | | | | 12,968 | | | | | 17,571 | |
Accounting services fees | | | 17,944 | | | | | 9,148 | | | | | 16,413 | |
Trustees’ fees | | | 14,650 | | | | | 14,649 | | | | | 14,649 | |
Compliance fees | | | 11,003 | | | | | 10,602 | | | | | 11,011 | |
Insurance fees | | | 9,152 | | | | | 3,910 | | | | | 5,155 | |
Reports to shareholders – Investor Class | | | 3,311 | | | | | 2,732 | | | | | 10,032 | |
Reports to shareholders – Institutional Class | | | 2,982 | | | | | 1,664 | | | | | 561 | |
Custodian fees | | | 2,318 | | | | | 984 | | | | | 2,058 | |
Other expenses | | | 9,628 | | | | | 3,469 | | | | | 3,736 | |
| | |
|
| | | |
|
| | | |
|
| |
Total expenses before waivers and related reimbursements | | | 699,261 | | | | | 372,806 | | | | | 694,203 | |
Less waivers and related reimbursements (Note 4) | | | (197,564 | ) | | | | (125,802 | ) | | | | (115,185 | ) |
| | |
|
| | | |
|
| | | |
|
| |
Total expenses after waivers and related reimbursements | | | 501,697 | | | | | 247,004 | | | | | 579,018 | |
| | |
|
| | | |
|
| | | |
|
| |
Net Investment Income (Loss) | | | 220,640 | | | | | 51,949 | | | | | (93,237 | ) |
| | |
|
| | | |
|
| | | |
|
| |
| Net Realized and Unrealized Gain (Loss) on Investments | | | | | | | | | | | | | | |
Net Realized Gain on Investment Transactions | | | 4,654,116 | | | | | 1,109,856 | | | | | 6,791,845 | |
Change in Net Unrealized Depreciation of Investments | | | (2,297,575 | ) | | | | (33,660 | ) | | | | (3,259,761 | ) |
| | |
|
| | | |
|
| | | |
|
| |
Net Gain on Investments | | | 2,356,541 | | | | | 1,076,196 | | | | | 3,532,084 | |
| | |
|
| | | |
|
| | | |
|
| |
| Net Increase in Net Assets Resulting from Operations | | $ | 2,577,181 | | | | $ | 1,128,145 | | | | $ | 3,438,847 | |
| | |
|
| | | |
|
| | | |
|
| |
| 1 | Net of foreign taxes withheld of $1,390, $1,154 and $0 for the FBR Large Cap Fund, FBR Mid Cap Fund and FBR Small Cap Fund, respectively. |
The accompanying notes are an integral part of the financial statements.
90
Statements of Operations (continued)
For the Year Ended October 31, 2011
| | | | | | | FBR | | FBR |
| | | | | | | Large Cap | | Small Cap |
| | | FBR | | Financial | | Financial |
| | | Focus Fund | | Fund | | Fund |
| | |
| |
| |
|
| Investment Income |
Dividends from Unaffiliated Issuers1 | | $ | 3,113,079 | | | $ | 758,963 | | | $ | 5,909,640 | |
Interest | | | 1,000 | | | | 148 | | | | 1,174 | |
| | |
|
| | |
|
| | |
|
| |
Total Investment Income | | | 3,114,079 | | | | 759,111 | | | | 5,910,814 | |
| | |
|
| | |
|
| | |
|
| |
| Expenses | | | | | | | | | | | | |
Investment Advisory fees (Note 4) | | | 6,543,033 | | | | 543,524 | | | | 2,287,766 | |
Administration fees (Note 4) | | | 462,727 | | | | 40,015 | | | | 171,569 | |
Distribution and Service fees – Investor Class (Note 4) | | | 1,698,636 | | | | 150,979 | | | | 565,934 | |
Shareholder administrative fees – Investor Class | | | 708,065 | | | | 82,937 | | | | 298,057 | |
Shareholder administrative fees – Institutional Class | | | 30,125 | | | | — | | | | 53,179 | |
Accounting services fees | | | 221,182 | | | | 19,397 | | | | 88,939 | |
Transfer agent fees – Investor Class | | | 202,599 | | | | 14,565 | | | | 75,486 | |
Transfer agent fees – Institutional Class | | | 3,862 | | | | — | | | | 3,584 | |
Insurance fees | | | 137,125 | | | | 9,501 | | | | 50,609 | |
Professional fees | | | 77,284 | | | | 40,639 | | | | 50,008 | |
Reports to shareholders – Investor Class | | | 62,666 | | | | 7,350 | | | | 37,041 | |
Reports to shareholders – Institutional Class | | | — | | | | — | | | | 1,866 | |
Compliance fees | | | 54,615 | | | | 12,778 | | | | 25,417 | |
Registration fees – Investor Class | | | 41,048 | | | | 25,031 | | | | 45,887 | |
Registration fees – Institutional Class | | | 18,147 | | | | — | | | | 19,005 | |
Custodian fees | | | 35,239 | | | | 3,120 | | | | 13,675 | |
Trustees’ fees | | | 14,650 | | | | 14,649 | | | | 14,652 | |
Other expenses | | | 24,665 | | | | 5,133 | | | | 7,138 | |
| | |
|
| | |
|
| | |
|
| |
Total expenses | | | 10,335,668 | | | | 969,618 | | | | 3,809,812 | |
| | |
|
| | |
|
| | |
|
| |
Less waivers and related reimbursements (Note 4) | | | — | | | | — | | | | (1,024 | ) |
| | |
|
| | |
|
| | |
|
| |
Total expenses after waivers and related reimbursements | | | 10,335,668 | | | | 969,618 | | | | 3,808,788 | |
| | |
|
| | |
|
| | |
|
| |
Net Investment Income (Loss) | | | (7,221,589 | ) | | | (210,507 | ) | | | 2,102,026 | |
| | |
|
| | |
|
| | |
|
| |
| Net Realized and Unrealized Gain (Loss) on Investments | | | | | | | | | | | | |
Net Realized Gain (Loss) on Investments | | | | | | | | | | | | |
Unaffiliated Issuers | | | 68,309,958 | | | | (2,300,974 | ) | | | (5,543,171 | ) |
Affiliated Issuers | | | 1,479,522 | | | | — | | | | — | |
Change in Net Unrealized Depreciation of Investments | | | (10,251,836 | ) | | | (4,407,932 | ) | | | (17,139,877 | ) |
| | |
|
| | |
|
| | |
|
| |
Net Gain (Loss) on Investments | | | 59,537,644 | | | | (6,708,906 | ) | | | (22,683,048 | ) |
| | |
|
| | |
|
| | |
|
| |
| Net Increase (Decrease) in Net Assets Resulting from Operations | | $ | 52,316,055 | | | $ | (6,919,413 | ) | | $ | (20,581,022 | ) |
| | |
|
| | |
|
| | |
|
| |
| 1 | Net of foreign taxes withheld of $0, $0 and $1,500 for the FBR Focus Fund, FBR Large Cap Financial Fund and FBR Small Cap Financial Fund, respectively. |
The accompanying notes are an integral part of the financial statements.
91
Statements of Operations (continued)
For the Year Ended October 31, 2011
| | | FBR | | FBR | |
| | | Technology | | Gas Utility | |
| | | Fund | | Index Fund | |
| | |
| |
| |
| Investment Income | | | | | | | | |
Dividends1 | | $ | 37,201 | | | $ | 10,166,988 | |
Interest | | | — | | | | 108 | |
| | |
|
| | |
|
| |
Total Investment Income | | | 37,201 | | | | 10,167,096 | |
| | |
|
| | |
|
| |
| Expenses | | | | | | | | |
Investment Advisory fees (Note 4) | | | 79,949 | | | | 1,199,584 | |
Administration fees (Note 4) | | | 5,900 | | | | 310,918 | |
Distribution and Service fees – Investor Class (Note 4) | | | 18,319 | | | | — | |
Professional fees | | | 45,655 | | | | 44,268 | |
Registration fees – Investor Class | | | 19,905 | | | | 25,139 | |
Registration fees – Institutional Class | | | 20,921 | | | | — | |
Shareholder administrative fees – Investor Class | | | 15,479 | | | | 224,570 | |
Shareholder administrative fees – Institutional Class | | | 675 | | | | — | |
Trustees’ fees | | | 12,095 | | | | 14,650 | |
Compliance fees | | | 10,039 | | | | 20,755 | |
Transfer agent fees – Investor Class | | | 9,017 | | | | 95,463 | |
Transfer agent fees – Institutional Class | | | 2,036 | | | | — | |
Accounting services fees | | | 5,186 | | | | 72,688 | |
Reports to shareholders – Investor Class | | | 4,305 | | | | 28,611 | |
Reports to shareholders – Institutional Class | | | 416 | | | | — | |
Insurance fees | | | 2777 | | | | 45,762 | |
Custodian fees | | | 375 | | | | 14,720 | |
Other expenses | | | 4,251 | | | | 27,503 | |
| | |
|
| | |
|
| |
Total expenses before waivers and related reimbursements | | | 257,300 | | | | 2,124,631 | |
Less waivers and related reimbursements (Note 4) | | | (88,239 | ) | | | — | |
| | |
|
| | |
|
| |
Total expenses after waivers and related reimbursements | | | 169,061 | | | | 2,124,631 | |
| | |
|
| | |
|
| |
Net Investment Income (Loss) | | | (131,860 | ) | | | 8,042,465 | |
| | |
|
| | |
|
| |
| Net Realized and Unrealized Gain (Loss) on Investments | | | | | | | | |
Net Realized Gain on Investment Transactions | | | 1,108,080 | | | | 3,417,370 | |
Change in Net Unrealized Appreciation (Depreciation) of Investments and Foreign Currencies | | | (909,888 | ) | | | 53,861,410 | |
| | |
|
| | |
|
| |
Net Gain on Investments | | | 198,192 | | | | 57,278,780 | |
| | |
|
| | |
|
| |
| Net Increase in Net Assets Resulting from Operations | | $ | 66,332 | | | $ | 65,321,245 | |
| | |
|
| | |
|
| |
1 Net of foreign taxes withheld of $0 and $160,780 for the FBR Technology Fund and FBR Gas Utility Index Fund, respectively.
The accompanying notes are an integral part of the financial statements.
92
Statements of Operations (continued)
For the Year Ended October 31, 2011
| | | FBR | | FBR |
| | | Balanced | | Core Bond |
| | | Fund | | Fund |
| | |
| |
|
| Investment Income | | | | | | | | |
Dividends | | $ | 1,969,723 | | | $ | 259,533 | |
Interest | | | 1,292,520 | | | | 1,099,185 | |
| | |
|
| | |
|
| |
Total Investment Income | | | 3,262,243 | | | | 1,358,718 | |
| | |
|
| | |
|
| |
| Expenses | | | | | | | | |
Investment Advisory fees (Note 4) | | | 721,246 | | | | 218,849 | |
Administration fees (Note 4) | | | 62,689 | | | | 19,487 | |
Distribution and Service fees – Investor Class (Note 4) | | | 108,055 | | | | 10,070 | |
Professional fees | | | 72,024 | | | | 73,693 | |
Transfer agent fees – Investor Class | | | 48,821 | | | | 5,284 | |
Transfer agent fees – Institutional Class | | | 9,271 | | | | 4,871 | |
Shareholder administrative fees – Investor Class | | | 31,128 | | | | 11,507 | |
Shareholder administrative fees – Institutional Class | | | 3,285 | | | | 2,109 | |
Accounting services fees | | | 30,542 | | | | 13,027 | |
Registration fees – Investor Class | | | 25,671 | | | | 17,434 | |
Registration fees – Institutional Class | | | 17,455 | | | | 16,180 | |
Insurance fees | | | 15,651 | | | | 5,032 | |
Compliance fees | | | 14,676 | | | | 11,023 | |
Trustees’ fees | | | 14,650 | | | | 14,650 | |
Custodian fees | | | 5,717 | | | | 1,792 | |
Reports to shareholders – Institutional Class | | | 2,212 | | | | 1,180 | |
Other expenses | | | 6,229 | | | | 3,678 | |
| | |
|
| | |
|
| |
Total expenses before waivers and related reimbursements | | | 1,189,322 | | | | 429,866 | |
Less waivers and related reimbursements (Note 4) | | | (188,312 | ) | | | (132,417 | ) |
| | |
|
| | |
|
| |
Total expenses after waivers and related reimbursements | | | 1,001,010 | | | | 297,449 | |
| | |
|
| | |
|
| |
Net Investment Income | | | 2,261,233 | | | | 1,061,269 | |
| | |
|
| | |
|
| |
| Net Realized and Unrealized Gain (Loss) on Investments | | | | | | | | |
Net Realized Gain on Investment Transactions | | | 3,679,665 | | | | 344,435 | |
Change in Net Unrealized Appreciation (Depreciation) of Investments | | | 4,044,861 | | | | (741,372 | ) |
| | |
|
| | |
|
| |
Net Gain (Loss) on Investments | | | 7,724,526 | | | | (396,937 | ) |
| | |
|
| | |
|
| |
| Net Increase in Net Assets Resulting from Operations | | $ | 9,985,759 | | | $ | 664,332 | |
| | |
|
| | |
|
| |
The accompanying notes are an integral part of the financial statements.
93
Statements of Changes in Net Assets
| | | FBR Large Cap Fund | | | FBR Mid Cap Fund | | | FBR Small Cap Fund | |
| | |
| | |
| | |
| |
| | | For the | | For the | | For the | | For the | | For the | | For the |
| | | Year | | Year | | Year | | Year | | Year | | Year |
| | | Ended | | Ended | | Ended | | Ended | | Ended | | Ended |
| | | October 31, | | October 31, | | October 31, | | October 31, | | October 31, | | October 31, |
| | | 2011 | | 2010 | | 2011 | | 2010 | | 2011 | | 2010 |
| | |
| |
| |
| |
| |
| |
|
| From Investment Activities | | | | | | | | | | | | | | | | | | | | | | | | |
Net Investment Income (Loss) | | $ | 220,640 | | | $ | 165,779 | | | $ | 51,949 | | | $ | 36,255 | | | $ | (93,237 | ) | | $ | 30,475 | |
Net Realized Gain on Investment Transactions | | | 4,654,116 | | | | 1,484,069 | | | | 1,109,856 | | | | 856,460 | | | | 6,791,845 | | | | 1,060,295 | |
Change in Net Unrealized Appreciation/Depreciation of Investments | | | (2,297,575 | ) | | | 287,938 | | | | (33,660 | ) | | | 450,331 | | | | (3,259,761 | ) | | | 3,646,786 | |
| | |
|
| | |
|
| | |
|
| | |
|
| | |
|
| | |
|
| |
Net Increase in Net Assets Resulting from Operations | | | 2,577,181 | | | | 1,937,786 | | | | 1,128,145 | | | | 1,343,046 | | | | 3,438,847 | | | | 4,737,556 | |
| | |
|
| | |
|
| | |
|
| | |
|
| | |
|
| | |
|
| |
| Distributions to Shareholders | | | | | | | | | | | | | | | | | | | | | | | | |
Distributions to Investor Class Shareholders: | | | | | | | | | | | | | | | | | | | | | | | | |
From Net Investment Income | | | (52,145 | ) | | | (93,740 | ) | | | (17,685 | ) | | | (26,340 | ) | | | (106,555 | ) | | | (34,316 | ) |
From Net Realized Gain on Investments | | | — | | | | — | | | | — | | | | — | | | | — | | | | (315,911 | ) |
Distributions to Institutional Class Shareholders: | | | | | | | | | | | | | | | | | | | | | | | | |
From Net Investment Income | | | (150,922 | ) | | | (818 | ) | | | (35,878 | ) | | | (451 | ) | | | (35,059 | ) | | | (629 | ) |
From Net Realized Gain on Investments | | | — | | | | — | | | | — | | | | — | | | | — | | | | (2,821 | ) |
| | |
|
| | |
|
| | |
|
| | |
|
| | |
|
| | |
|
| |
Total Distributions to Shareholders | | | (203,067 | ) | | | (94,558 | ) | | | (53,563 | ) | | | (26,791 | ) | | | (141,614 | ) | | | (353,677 | ) |
| | |
|
| | |
|
| | |
|
| | |
|
| | |
|
| | |
|
| |
| From Share Transactions | | | | | | | | | | | | | | | | | | | | | | | | |
Net Increase (Decrease) in Net Assets | | | | | | | | | | | | | | | | | | | | | | | | |
Resulting from Share Transactions | | | (9,457,471 | ) | | | 25,902,019 | | | | (685,991 | ) | | | 10,264,804 | | | | 211,128 | | | | 20,440,860 | |
| | |
|
| | |
|
| | |
|
| | |
|
| | |
|
| | |
|
| |
Total Increase (Decrease) in Net Assets | | | (7,083,357 | ) | | | 27,745,247 | | | | 388,591 | | | | 11,581,059 | | | | 3,508,361 | | | | 24,824,739 | |
Net Assets – Beginning of Year | | | 46,791,379 | | | | 19,046,132 | | | | 18,432,092 | | | | 6,851,033 | | | | 35,495,955 | | | | 10,671,216 | |
| | |
|
| | |
|
| | |
|
| | |
|
| | |
|
| | |
|
| |
Net Assets – End of Year | | $ | 39,708,022 | | | $ | 46,791,379 | | | $ | 18,820,683 | | | $ | 18,432,092 | | | $ | 39,004,316 | | | $ | 35,495,955 | |
| | |
|
| | |
|
| | |
|
| | |
|
| | |
|
| | |
|
| |
Undistributed Net Investment Income | | $ | 155,370 | | | $ | 137,874 | | | $ | 21,740 | | | $ | 23,354 | | | $ | — | | | $ | 3,083 | |
| | |
|
| | |
|
| | |
|
| | |
|
| | |
|
| | |
|
| |
94
Statements of Changes in Net Assets (continued)
| | | | | | FBR Large Cap | | | FBR Small Cap | |
| | | FBR Focus Fund | | | Financial Fund | | | Financial Fund | |
| | |
| | |
| | |
| |
| | | For the | | For the | | For the | | For the | | For the | | For the |
| | | Year | | Year | | Year | | Year | | Year | | Year |
| | | Ended | | Ended | | Ended | | Ended | | Ended | | Ended |
| | | October 31, | | October 31, | | October 31, | | October 31, | | October 31, | | October 31, |
| | | 2011 | | 2010 | | 2011 | | 2010 | | 2011 | | 2010 |
| | |
| |
| |
| |
| |
| |
|
| From Investment Activities | | | | | | | | | | | | | | | | | | | | | | | | |
Net Investment Income (Loss) | | $ | (7,221,589 | ) | | $ | (9,379,242 | ) | | $ | (210,507 | ) | | $ | (304,291 | ) | | $ | 2,102,026 | | | $ | 919,314 | |
Net Realized Gain (Loss) on Investments and Foreign Currency Transactions Unaffiliated Issuers | | | 68,309,958 | | | | 32,448,092 | | | | (2,300,974 | ) | | | 4,174,856 | | | | (5,543,171 | ) | | | 10,863,874 | |
Affiliated Issuers | | | 1,479,522 | | | | 2,772,242 | | | | — | | | | — | | | | — | | | | — | |
Change in Net Unrealized Appreciation/Depreciation of Investments | | | (10,251,836 | ) | | | 146,676,963 | | | | (4,407,932 | ) | | | (5,180,152 | ) | | | (17,139,877 | ) | | | 1,210,218 | |
| | |
|
| | |
|
| | |
|
| | |
|
| | |
|
| | |
|
| |
Net Increase (Decrease) in Net Assets Resulting from Operations | | | 52,316,055 | | | | 172,518,055 | | | | (6,919,413 | ) | | | (1,309,587 | ) | | | (20,581,022 | ) | | | 12,993,406 | |
| | |
|
| | |
|
| | |
|
| | |
|
| | |
|
| | |
|
| |
| Distributions to Shareholders | | | | | | | | | | | | | | | | | | | | | | | | |
Distributions to Investor Class Shareholders: | | | | | | | | | | | | | | | | | | | | | | | | |
From Net Investment Income | | | — | | | | — | | | | — | | | | — | | | | (725,603 | ) | | | (717,201 | ) |
From Net Realized Gain on Investments | | | (24,307,241 | ) | | | — | | | | — | | | | — | | | | (1,605,904 | ) | | | — | |
Distributions to Institutional Class Shareholders: | | | | | | | | | | | | | | | | | | | | | | | | |
From Net Investment Income | | | — | | | | (282,300 | ) | | | — | | | | — | | | | (256,185 | ) | | | (148,737 | ) |
From Net Realized Gain on Investments | | | (1,335,587 | ) | | | — | | | | — | | | | — | | | | (275,476 | ) | | | — | |
Distributions to R1 Class Shareholders: | | | | | | | | | | | | | | | | | | | | | | | | |
From Net Investment Income | | | — | | | | (314 | ) | | | — | | | | — | | | | — | | | | (486 | ) |
| | |
|
| | |
|
| | |
|
| | |
|
| | |
|
| | |
|
| |
Total Distributions to Shareholders | | | (25,642,828 | ) | | | (282,614 | ) | | | — | | | | — | | | | (2,863,168 | ) | | | (866,424 | ) |
| | |
|
| | |
|
| | |
|
| | |
|
| | |
|
| | |
|
| |
| From Share Transactions | | | | | | | | | | | | | | | | | | | | | | | | |
Net Increase (Decrease) in Net Assets Resulting from Share Transactions | | | (73,981,126 | ) | | | (258,749,901 | ) | | | 13,886,501 | | | | 12,831,056 | | | | (44,213,305 | ) | | | 31,305,688 | |
| | |
|
| | |
|
| | |
|
| | |
|
| | |
|
| | |
|
| |
Total Increase (Decrease) in Net Assets | | | (47,307,899 | ) | | | (86,514,460 | ) | | | 6,967,088 | | | | 11,521,469 | | | | (67,657,495 | ) | | | 43,432,670 | |
Net Assets – Beginning of Year | | | 707,650,544 | | | | 794,165,004 | | | | 48,716,556 | | | | 37,195,087 | | | | 241,758,335 | | | | 198,325,665 | |
| | |
|
| | |
|
| | |
|
| | |
|
| | |
|
| | |
|
| |
Net Assets – End of Year | | $ | 660,342,645 | | | $ | 707,650,544 | | | $ | 55,683,644 | | | $ | 48,716,556 | | | $ | 174,100,840 | | | $ | 241,758,335 | |
| | |
|
| | |
|
| | |
|
| | |
|
| | |
|
| | |
|
| |
Undistributed Net Investment Income | | $ | — | | | $ | — | | | $ | — | | | $ | 1,025 | | | $ | 2,346,347 | | | $ | 578,197 | |
| | |
|
| | |
|
| | |
|
| | |
|
| | |
|
| | |
|
| |
1 Effective after the close of business on October 22, 2010, R Class Shares merged into Investor Class (See Note 12).
95
Statements of Changes in Net Assets (continued)
| | | | FBR Technology Fund | | | | FBR Gas Utility Index Fund | |
| | | |
| | | |
| |
| | | | For the | | | | For the | | | | For the | | | | For the | |
| | | | Year | | | | Year | | | | Year | | | | Year | |
| | | | Ended | | | | Ended | | | | Ended | | | | Ended | |
| | | | October 31, | | | | October 31, | | | | October 31, | | | | October 31, | |
| | | | 2011 | | | | 2010 | | | | 2011 | | | | 2010 | |
| | | |
| | | |
| | | |
| | | |
| |
| From Investment Activities | | | | | | | | | | | | | | | | | | | | |
Net Investment Income (Loss) | | | $ | (131,860 | ) | | | $ | (136,272 | ) | | | $ | 8,042,465 | | | | $ | 7,779,537 | |
Net Realized Gain on Investment Transactions | | | | 1,108,080 | | | | | 1,562,671 | | | | | 3,417,370 | | | | | 2,250,847 | |
Change in Net Unrealized Appreciation/Depreciation of Investments | | | | (909,888 | ) | | | | 158,572 | | | | | 53,861,410 | | | | | 33,703,232 | |
| | | |
| | | |
| | | |
| | | |
| |
Net Increase in Net Assets Resulting from Operations | | | | 66,332 | | | | | 1,584,971 | | | | | 65,321,245 | | | | | 43,733,616 | |
| | | |
| | | |
| | | |
| | | |
| |
| Distributions to Shareholders | | | | | | | | | | | | | | | | | | | | |
Distributions to Investor Class Shareholders: | | | | | | | | | | | | | | | | | | | | |
From Net Investment Income | | | | — | | | | | — | | | | | (8,022,358 | ) | | | | (7,791,103 | ) |
From Net Realized Gain on Investments | | | | — | | | | | — | | | | | (2,818,013 | ) | | | | (248,764 | ) |
Distributions to R1 Class Shareholders: | | | | | | | | | | | | | | | | | | | | |
From Net Investment Income | | | | — | | | | | — | | | | | — | | | | | (9,158 | ) |
From Net Realized Gain on Investments | | | | — | | | | | — | | | | | — | | | | | (277 | ) |
| | | |
| | | |
| | | |
| | | |
| |
Total Distributions to Shareholders | | | | — | | | | | — | | | | | (10,840,371 | ) | | | | (8,049,302 | ) |
| | | |
| | | |
| | | |
| | | |
| |
| From Share Transactions | | | | | | | | | | | | | | | | | | | | |
Net Increase (Decrease) in Net Assets Resulting from Share Transactions | | | | (6,029,102 | ) | | | | 2,844,654 | | | | | 135,259,870 | | | | | 14,587,460 | |
| | | |
| | | |
| | | |
| | | |
| |
Total Increase (Decrease) in Net Assets | | | | (5,962,770 | ) | | | | 4,429,625 | | | | | 189,740,744 | | | | | 50,271,774 | |
| Net Assets – Beginning of Year | | | | 12,817,688 | | | | | 8,388,063 | | | | | 244,041,024 | | | | | 193,769,250 | |
| | | |
| | | |
| | | |
| | | |
| |
| Net Assets – End of Year | | | $ | 6,854,918 | | | | $ | 12,817,688 | | | | $ | 433,781,768 | | | | $ | 244,041,024 | |
| | | |
| | | |
| | | |
| | | |
| |
| Undistributed Net Investment Income | | | $ | — | | | | $ | — | | | | $ | 93,553 | | | | $ | 73,446 | |
| | | |
| | | |
| | | |
| | | |
| |
|
| 1 | Effective after the close of business on October 22, 2010, R Class Shares merged into Investor Class (See Note 12). |
96
| The FBR Funds |
|
| Statements of Changes in Net Assets (continued) |
| | | | FBR Balanced Fund | | | | FBR Core Bond Fund | |
| | | |
| | | |
| |
| | | | | | | | | For the | | | | | | | | | | | | | | For the | | | | | | |
| | | | For the | | | | Period | | | | For the | | | | For the | | | | Period | | | | For the | |
| | | | Year | | | | April 1, | | | | Year | | | | Year | | | | April 1, | | | | Year | |
| | | | Ended | | | | 2010 to | | | | Ended | | | | Ended | | | | 2010 to | | | | Ended | |
| | | | October 31, | | | | October 31, | | | | March 31, | | | | October 31, | | | | October 31, | | | | March 31, | |
| | | | 2011 | | | | 20101 | | | | 2010 | | | | 2011 | | | | 20101 | | | | 2010 | |
| | | |
| | | |
| | | |
| | | |
| | | |
| | | |
| |
| From Investment Activities | | | | | | | | | | | | | | | | | | | | | | | | | | | | | | |
Net Investment Income | | | $ | 2,261,233 | | | | $ | 1,273,013 | | | | $ | 2,197,290 | | | | $ | 1,061,269 | | | | $ | 739,060 | | | | $ | 1,203,372 | |
Net Realized Gain (Loss) on Investment Transactions | | | | 3,679,665 | | | | | 1,513,933 | | | | | (628,466 | ) | | | | 344,435 | | | | | 376,245 | | | | | 176,611 | |
Change in Net Unrealized Appreciation/Depreciation of Investments | | | | 4,044,861 | | | | | 1,253,137 | | | | | 20,623,773 | | | | | (741,372 | ) | | | | 857,643 | | | | | 1,897,143 | |
| | | |
| | | |
| | | |
| | | |
| | | |
| | | |
| |
Net Increase in Net Assets Resulting from Operations | | | | 9,985,759 | | | | | 4,040,083 | | | | | 22,192,597 | | | | | 664,332 | | | | | 1,972,948 | | | | | 3,277,126 | |
| | | |
| | | |
| | | |
| | | |
| | | |
| | | |
| |
| Distributions to Shareholders | | | | | | | | | | | | | | | | | | | | | | | | | | | | | | |
Net Investment Income | | | | | | | | | | | | | | | | | | | | | | | | | | | | | | |
Investor Class | | | | (938,298 | ) | | | | (567,219 | ) | | | | (733,712 | ) | | | | (137,452 | ) | | | | (102,123 | ) | | | | (124,609 | ) |
Institutional Class | | | | (1,201,869 | ) | | | | (613,557 | ) | | | | (1,172,404 | ) | | | | (925,575 | ) | | | | (636,626 | ) | | | | (1,092,527 | ) |
Class B | | | | — | | | | | — | | | | | (5,820 | ) | | | | — | | | | | — | | | | | (13,698 | ) |
Class C | | | | — | | | | | — | | | | | (394,015 | ) | | | | — | | | | | — | | | | | (46,655 | ) |
Net Realized Gains From Investment Transactions | | | | | | | | | | | | | | | | | | | | | | | | | | | | | | |
Investor Class | | | | — | | | | | — | | | | | — | | | | | (67,867 | ) | | | | — | | | | | (17,570 | ) |
Institutional Class | | | | — | | | | | — | | | | | — | | | | | (403,399 | ) | | | | — | | | | | (128,515 | ) |
Class B | | | | — | | | | | — | | | | | — | | | | | — | | | | | — | | | | | — | |
Class C | | | | — | | | | | — | | | | | — | | | | | — | | | | | — | | | | | (7,920 | ) |
| | | |
| | | |
| | | |
| | | |
| | | |
| | | |
| |
Total Distributions to Shareholders | | | | (2,140,167 | ) | | | | (1,180,776 | ) | | | | (2,305,951 | ) | | | | (1,534,293 | ) | | | | (738,749 | ) | | | | (1,431,494 | ) |
| | | |
| | | |
| | | |
| | | |
| | | |
| | | |
| |
| From Share Transactions | | | | | | | | | | | | | | | | | | | | | | | | | | | | | | |
Net Increase (Decrease) in Net Assets Resulting from Share Transactions | | | | 20,520,513 | | | | | (5,403,744 | ) | | | | 194,955 | | | | | (528,211 | ) | | | | (1,041,918 | ) | | | | (52,730 | ) |
| | | |
| | | |
| | | |
| | | |
| | | |
| | | |
| |
Total Increase (Decrease) in Net Assets | | | | 28,366,105 | | | | | (2,544,437 | ) | | | | 20,081,601 | | | | | (1,398,172 | ) | | | | 192,281 | | | | | 1,792,902 | |
| Net Assets – Beginning of Period | | | | 83,667,350 | | | | | 86,211,787 | | | | | 66,130,186 | | | | | 28,692,370 | | | | | 28,500,089 | | | | | 26,707,187 | |
| | | |
| | | |
| | | |
| | | |
| | | |
| | | |
| |
| Net Assets – End of Period | | | $ | 112,033,455 | | | | $ | 83,667,350 | | | | $ | 86,211,787 | | | | $ | 27,294,198 | | | | $ | 28,692,370 | | | | $ | 28,500,089 | |
| | | |
| | | |
| | | |
| | | |
| | | |
| | | |
| |
| Undistributed Net Investment Income | | | $ | 223,082 | | | | $ | 95,782 | | | | $ | — | | | | $ | 8,277 | | | | $ | 4,241 | | | | $ | (89 | ) |
| | | |
| | | | |
| | | |
| | | |
| | | |
| | | |
| |
|
| 1 | The Fund changed its fiscal year end from March 31 to October 31. |
The accompanying notes are an integral part of the financial statements.
97
| The FBR Funds |
|
| Financial Highlights |
The following tables provide per share data for a share outstanding throughout each period for each Fund. Other data includes investment performance, ratios to average net assets and other supplemental information.
| | | FBR Large Cap Fund — Investor Class | |
| | |
| |
| | | For the Years Ended October 31, | |
| | |
| |
| | | 2011 | | | 2010 | | | 2009 | | | 2008 | | | 2007 | |
| | |
| | |
| | |
| | |
| | |
| |
| Per Share Operating Performance: | | | | | | | | | | | | | | | | | | | | |
Net Asset Value – Beginning of Year | | $ | 10.88 | | | $ | 9.72 | | | $ | 8.14 | | | $ | 13.40 | | | $ | 11.84 | |
| | |
| | |
| | |
| | |
| | |
| |
Income (Loss) from Investment Operations: | | | | | | | | | | | | | | | | | | | | |
Net Investment Income (Loss)2 | | | 0.04 | 4 | | | 0.04 | 1 | | | 0.03 | 1 | | | 0.08 | 1 | | | (0.04 | )1 |
Net Realized and Unrealized Gain (Loss) on Investments3 | | | 0.48 | | | | 1.17 | | | | 1.60 | | | | (4.05 | ) | | | 2.05 | |
| | |
| | |
| | |
| | |
| | |
| |
Total from Investment Operations | | | 0.52 | | | | 1.21 | | | | 1.63 | | | | (3.97 | ) | | | 2.01 | |
| | |
| | |
| | |
| | |
| | |
| |
Distributions to Shareholders: | | | | | | | | | | | | | | | | | | | | |
From Net Investment Income | | | (0.03 | ) | | | (0.05 | ) | | | (0.05 | ) | | | — | | | | — | |
From Net Realized Gain | | | — | | | | — | | | | — | | | | (1.30 | ) | | | (0.45 | ) |
| | |
| | |
| | |
| | |
| | |
| |
Total Distributions | | | (0.03 | ) | | | (0.05 | ) | | | (0.05 | ) | | | (1.30 | ) | | | (0.45 | ) |
| | |
| | |
| | |
| | |
| | |
| |
Paid-in Capital from Redemption Fees4 | | | 0.00 | 5 | | | 0.00 | 5 | | | 0.00 | 5 | | | 0.01 | | | | 0.00 | 5 |
| | |
| | |
| | |
| | |
| | |
| |
Net Increase (Decrease) in Net Asset Value | | | 0.49 | | | | 1.16 | | | | 1.58 | | | | (5.26 | ) | | | 1.56 | |
| | |
| | |
| | |
| | |
| | |
| |
Net Asset Value – End of Year | | $ | 11.37 | | | $ | 10.88 | | | $ | 9.72 | | | $ | 8.14 | | | $ | 13.40 | |
| | |
| | |
| | |
| | |
| | |
| |
| Total Investment Return6 | | | 4.80% | | | | 12.43% | | | | 20.12% | | | | (32.37)% | | | | 17.52% | |
| Ratios to Average Net Assets: | | | | | | | | | | | | | | | | | | | | |
Expenses After Waivers and Related Reimbursements2,7 | | | 1.25% | | | | 1.25% | | | | 1.25% | | | | 1.71% | | | | 1.97% | |
Expenses Before Waivers and Related Reimbursements7 | | | 1.79% | | | | 1.84% | | | | 2.16% | | | | 2.55% | | | | 2.21% | |
Net Investment Income (Loss) After Waivers and Related Reimbursements2 | | | 0.32% | | | | 0.39% | | | | 0.61% | | | | 0.51% | | | | (0.30)% | |
Net Investment Loss Before Waivers and Related Reimbursements | | | (0.22)% | | | | (0.20)% | | | | (0.30)% | | | | (0.33)% | | | | (0.54)% | |
| Supplementary Data: | | | | | | | | | | | | | | | | | | | | |
Portfolio Turnover Rate | | | 65% | | | | 86% | (C) | | | 60% | | | | 39% | | | | 108% | |
Net Assets at End of Year (in thousands) | | $ | 12,470 | | | $ | 17,097 | | | $ | 18,947 | | | $ | 4,574 | | | $ | 13,037 | |
|
| 1 | | Calculated based on shares outstanding on the first and last day of the respective periods, except for dividends and distributions, if any, which are based on the actual shares outstanding on the dates of distributions. |
| 2 | | Prior to May 30, 2008, reflects fees waived and reimbursed by FBR Fund Advisers, Inc. pursuant to a contractual expense limitation of 1.95% (excluding interest, taxes, brokerage commissions, dividend expenses, acquired fund fees and expenses, extraordinary legal expenses, or any other extraordinary expenses). As of May 30, 2008, reflects fees waived and reimbursed by FBR Fund Advisers, Inc. pursuant to a contractual expense limitation of 1.25% (excluding interest, taxes, brokerage commissions, dividend expenses, acquired fund fees and expenses, extraordinary legal expenses, or any other extraordinary expenses). |
| 3 | | The amounts shown for a share outstanding throughout the period may not be in accordance with the changes in the aggregate gains and losses on investments during the period because of the timing of sales and repurchases of Fund shares in relation to fluctuating net asset values during the period. |
| 4 | | Calculated based on average shares outstanding. |
| 5 | | Less than $0.01 |
| 6 | | Total investment return is calculated assuming a purchase of shares on the first day and a sale on the last day of each period reported and will include reinvestment of dividends and distributions, if any. |
| 7 | | Does not include expenses of the funds in which the Fund invests. |
| (C) | | Excludes merger activity |
98
| The FBR Funds |
|
| Financial Highlights (continued) |
| | | FBR Large Cap Fund — Institutional Class | |
| | |
| |
| | | | | | | | | | | | | | | For the | |
| | | For the Years Ended October 31, | | | Period Ended | |
| | |
| | | October 31, | |
| | | 2011 | | | 2010 | | | 2009 | | | 2008* | |
| | |
| | |
| | |
| | |
| |
| Per Share Operating Performance: | | | | | | | | | | | | | | | | |
Net Asset Value – Beginning of Period | | $ | 9.42 | | | $ | 8.42 | | | $ | 7.07 | | | $ | 10.00 | |
| | |
| | |
| | |
| | |
| |
Income (Loss) from Investment Operations: | | | | | | | | | | | | | | | | |
Net Investment Income2 | | | 0.06 | 4 | | | 0.06 | 1 | | | 0.07 | 1 | | | 0.03 | 1 |
Net Realized and Unrealized Gain (Loss) on Investments3 | | | 0.42 | | | | 1.01 | | | | 1.34 | | | | (2.96 | ) |
| | |
| | |
| | |
| | |
| |
Total from Investment Operations | | | 0.48 | | | | 1.07 | | | | 1.41 | | | | (2.93 | ) |
| | |
| | |
| | |
| | |
| |
Distributions to Shareholders: | | | | | | | | | | | | | | | | |
From Net Investment Income | | | (0.05 | ) | | | (0.07 | ) | | | (0.06 | ) | | | — | |
| | |
| | |
| | |
| | |
| |
Paid-in Capital from Redemption Fees4 | | | 0.00 | 5 | | | 0.00 | 5 | | | — | | | | — | |
| | |
| | |
| | |
| | |
| |
Net Increase (Decrease) in Net Asset Value | | | 0.43 | | | | 1.00 | | | | 1.35 | | | | (2.93 | ) |
| | |
| | |
| | |
| | |
| |
Net Asset Value – End of Period | | $ | 9.85 | | | $ | 9.42 | | | $ | 8.42 | | | $ | 7.07 | |
| | |
| | |
| | |
| | |
| |
| Total Investment Return6 | | | 5.08% | | | | 12.71% | | | | 20.21% | | | | (29.30)% | (A) |
| Ratios to Average Net Assets: | | | | | | | | | | | | | | | | |
Expenses After Waivers and Related Reimbursements2,7 | | | 1.00% | | | | 1.00% | | | | 1.00% | | | | 1.01% | (B) |
Expenses Before Waivers and Related Reimbursements7 | | | 1.36% | | | | 1.49% | | | | 16.64% | | | | 4.11% | (B) |
Net Investment Income After Waivers and Related Reimbursements2 | | | 0.56% | | | | 0.50% | | | | 1.05% | | | | 0.88% | (B) |
Net Investment Income (Loss) Before Waivers and Related Reimbursements | | | 0.20% | | | | 0.01% | | | | (14.59)% | | | | (2.22)% | (B) |
| Supplementary Data: | | | | | | | | | | | | | | | | |
Portfolio Turnover Rate | | | 65% | | | | 86% | (C) | | | 60% | | | | 39% | |
Net Assets at End of Period (in thousands) | | $ | 27,238 | | | $ | 29,695 | | | $ | 99 | | | $ | 71 | |
|
| * | | Represents the period from inception of share class (May 30, 2008) through October 31, 2008. |
| 1 | | Calculated based on shares outstanding on the first and last day of the period, except for dividends and distributions, if any, which are based on the actual shares outstanding on the dates of distributions. |
| 2 | | Reflects fees waived and reimbursed by FBR Fund Advisers, Inc. pursuant to a contractual expense limitation of 1.00% (excluding interest, taxes, brokerage commissions, dividend expenses, acquired fund fees and expenses, extraordinary legal expenses, or any other extraordinary expenses). |
| 3 | | The amounts shown for a share outstanding throughout the period may not be in accordance with the changes in the aggregate gains and losses on investments during the period because of the timing of sales and repurchases of Fund shares in relation to fluctuating net asset values during the period. |
| 4 | | Calculated based on average shares outstanding. |
| 5 | | Less than $0.01 |
| 6 | | Total investment return is calculated assuming a purchase of shares on the first day and a sale on the last day of each period reported and will include reinvestment of dividends and distributions, if any. |
| 7 | | Does not include expenses of the funds in which the Fund invests. |
| (A) | | Not Annualized |
| (B) | | Annualized |
| (C) | | Excludes merger activity |
99
| The FBR Funds |
|
| Financial Highlights (continued) |
| | | FBR Mid Cap Fund — Investor Class |
| | |
|
| | | | | | | | | | | | | | | | | | | | | For the |
| | | For the Years Ended October 31, | | | Period Ended |
| | |
| | | October 31, |
| | | 2011 | | | | 2010 | | | | 2009 | | | 2008 | | | 2007* |
| | |
| | | |
| | | |
| | |
| | |
|
| Per Share Operating Performance: | | | | | | | | | | | | | | | | | | | | | | | |
Net Asset Value – Beginning of Period | | $ | 11.35 | | | | $ | 9.53 | | | | $ | 8.18 | | | $ | 11.30 | | | | $ | 10.00 | |
| | |
| | | |
| | | |
| | |
| | | |
| |
Income (Loss) from Investment Operations: | | | | | | | | | | | | | | | | | | | | | | | |
Net Investment Income (Loss)2 | | | 0.01 | 4 | | | | 0.04 | 1 | | | | 0.04 | 1 | | | (0.01 | )1 | | | | (0.02 | )1 |
Net Realized and Unrealized Gain (Loss) on Investments3 | | | 0.80 | | | | | 1.82 | | | | | 1.43 | | | | (3.00 | ) | | | | 1.32 | |
| | |
| | | |
| | | |
| | |
| | | |
| |
Total from Investment Operations | | | 0.81 | | | | | 1.86 | | | | | 1.47 | | | | (3.01 | ) | | | | 1.30 | |
| | |
| | | |
| | | |
| | |
| | | |
| |
Distributions to Shareholders: | | | | | | | | | | | | | | | | | | | | | | | |
From Net Investment Income | | | (0.03 | ) | | | | (0.04 | ) | | | | (0.01 | ) | | | — | | | | | — | |
From Net Realized Gain | | | — | | | | | — | | | | | (0.12 | ) | | | (0.13 | ) | | | | — | |
| | |
| | | |
| | | |
| | |
| | | |
| |
Total Distributions | | | (0.03 | ) | | | | (0.04 | ) | | | | (0.13 | ) | | | (0.13 | ) | | | | — | |
| | |
| | | |
| | | |
| | |
| | | |
| |
Paid-in Capital from Redemption Fees4 | | | 0.02 | | | | | 0.00 | 5 | | | | 0.01 | | | | 0.02 | | | | | 0.00 | 5 |
| | |
| | | |
| | | |
| | |
| | | |
| |
Net Increase (Decrease) in Net Asset Value | | | 0.80 | | | | | 1.82 | | | | | 1.35 | | | | (3.12 | ) | | | | 1.30 | |
| | |
| | | |
| | | |
| | |
| | | |
| |
Net Asset Value – End of Period | | $ | 12.15 | | | | $ | 11.35 | | | | $ | 9.53 | | | $ | 8.18 | | | | $ | 11.30 | |
| | |
| | | |
| | | |
| | |
| | | |
| |
| Total Investment Return6 | | | 7.30% | | | | | 19.58% | | | | | 18.51% | | | | (26.71 | )% | | | | 13.00% | (A) |
| Ratios to Average Net Assets: | | | | | | | | | | | | | | | | | | | | | | | |
Expenses After Waivers and Related Reimbursements2,7 | | | 1.35% | | | | | 1.36% | | | | | 1.35% | | | | 1.66% | | | | | 1.95% | (B) |
Expenses Before Waivers and Related Reimbursements7 | | | 2.19% | | | | | 2.54% | | | | | 2.95% | | | | 3.71% | | | | | 4.17% | (B) |
Net Investment Income (Loss) After Waivers and Related Reimbursements2 | | | 0.11% | | | | | 0.24% | | | | | 0.39% | | | | (0.13)% | | | | | (0.36)% | (B) |
Net Investment Loss Before Waivers and Related Reimbursements | | | (0.73)% | | | | | (0.94)% | | | | | (1.21)% | | | | (2.18)% | | | | | (2.58)% | (B) |
| Supplementary Data: | | | | | | | | | | | | | | | | | | | | | | | |
Portfolio Turnover Rate | | | 33% | | | | | 215% | (C) | | | | 128% | | | | 93% | | | | | 135% | (A) |
Net Assets at End of Period (in thousands) | | $ | 7,130 | | | | $ | 6,776 | | | | $ | 6,767 | | | $ | 4,108 | | | | $ | 3,873 | |
|
| * | | Represents the period from commencement of operations (February 28, 2007) through October 31, 2007. |
| 1 | | Calculated based on shares outstanding on the first and last day of the respective periods, except for dividends and distributions, if any, which are based on the actual shares outstanding on the dates of distributions. |
| 2 | | Prior to May 30, 2008, reflects fees waived and reimbursed by FBR Fund Advisers, Inc. pursuant to a contractual expense limitation of 1.95% (excluding interest, taxes, brokerage commissions, dividend expenses, acquired fund fees and expenses, extraordinary legal expenses, or any other extraordinary expenses). As of May 30, 2008, reflects fees waived and reimbursed by FBR Fund Advisers, Inc. pursuant to a contractual expense limitation of 1.35% (excluding interest, taxes, brokerage commissions, dividend expenses, acquired fund fees and expenses, extraordinary legal expenses, or any other extraordinary expenses). |
| 3 | | The amounts shown for a share outstanding throughout the period may not be in accordance with the changes in the aggregate gains and losses on investments during the period because of the timing of sales and repurchases of Fund shares in relation to fluctuating net asset values during the period. |
| 4 | | Calculated based on average shares outstanding. |
| 5 | | Less than $0.01 |
| 6 | | Total investment return is calculated assuming a purchase of shares on the first day and a sale on the last day of each period reported and will include reinvestment of dividends and distributions, if any. |
| 7 | | Does not include expenses of the funds in which the Fund invests. |
| (A) | | Not Annualized |
| (B) | | Annualized |
| (C) | | Excludes merger activity |
100
| The FBR Funds |
|
| Financial Highlights (continued) |
| | | FBR Mid Cap Fund — Institutional Class |
| | |
|
| | | | | | | | | | | | | | | | | For the |
| | | For the Years Ended October 31, | | | Period Ended |
| | |
| | | October 31, |
| | | 2011 | | | | 2010 | | | | 2009 | | | 2008* |
| | |
| | | |
| | | |
| | |
|
| Per Share Operating Performance: | | | | | | | | | | | | | | | | | | | |
Net Asset Value – Beginning of Period | | $ | 9.84 | | | | $ | 8.26 | | | | $ | 7.11 | | | | $ | 10.00 | |
| | |
| | | |
| | | |
| | | |
| |
Income (Loss) from Investment Operations: | | | | | | | | | | | | | | | | | | | |
Net Investment Income2 | | | 0.04 | 4 | | | | 0.03 | 1 | | | | 0.05 | 1 | | | | 0.02 | 1 |
Net Realized and Unrealized Gain (Loss) on Investments3 | | | 0.69 | | | | | 1.59 | | | | | 1.25 | | | | | (2.91 | ) |
| | |
| | | |
| | | |
| | | |
| |
Total from Investment Operations | | | 0.73 | | | | | 1.62 | | | | | 1.30 | | | | | (2.89 | ) |
| | |
| | | |
| | | |
| | | |
| |
Distributions to Shareholders: | | | | | | | | | | | | | | | | | | | |
From Net Investment Income | | | (0.03 | ) | | | | (0.04 | ) | | | | (0.03 | ) | | | | — | |
From Net Realized Gain | | | — | | | | | — | | | | | (0.12 | ) | | | | — | |
| | |
| | | |
| | | |
| | | |
| |
Total Distributions | | | (0.03 | ) | | | | (0.04 | ) | | | | (0.15 | ) | | | | — | |
| | |
| | | |
| | | |
| | | |
| |
Paid-in Capital from Redemption Fees4 | | | 0.00 | 5 | | | | 0.00 | 5 | | | | — | | | | | — | |
| | |
| | | |
| | | |
| | | |
| |
Net Increase (Decrease) in Net Asset Value | | | 0.70 | | | | | 1.58 | | | | | 1.15 | | | | | (2.89 | ) |
| | |
| | | |
| | | |
| | | |
| |
Net Asset Value – End of Period | | $ | 10.54 | | | | $ | 9.84 | | | | $ | 8.26 | | | | $ | 7.11 | |
| | |
| | | |
| | | |
| | | |
| |
| Total Investment Return6 | | | 7.43% | | | | | 19.72% | | | | | 18.78% | | | | | (28.90)% | (A) |
| Ratios to Average Net Assets: | | | | | | | | | | | | | | | | | | | |
Expenses After Waivers and Related Reimbursements2,7 | | | 1.10% | | | | | 1.11% | | | | | 1.10% | | | | | 1.10% | (B) |
Expenses Before Waivers and Related Reimbursements7 | | | 1.56% | | | | | 2.03% | | | | | 16.91% | | | | | 4.54% | (B) |
Net Investment Income After Waivers and Related Reimbursements2 | | | 0.35% | | | | | 0.26% | | | | | 0.69% | | | | | 0.47% | (B) |
Net Investment Loss Before Waivers and Related Reimbursements | | | (0.11)% | | | | | (0.66)% | | | | | (15.12)% | | | | | (2.97)% | (B) |
| Supplementary Data: | | | | | | | | | | | | | | | | | | | |
Portfolio Turnover Rate | | | 33% | | | | | 215% | (C) | | | | 128% | | | | | 93% | |
Net Assets at End of Period (in thousands) | | $ | 11,690 | | | | $ | 11,656 | | | | $ | 84 | | | | $ | 71 | |
|
| * | | Represents the period from inception of share class (May 30, 2008) through October 31, 2008. |
| 1 | | Calculated based on shares outstanding on the first and last day of the period, except for dividends and distributions, if any, which are based on the actual shares outstanding on the dates of distributions. |
| 2 | | Reflects fees waived and reimbursed by FBR Fund Advisers, Inc. pursuant to a contractual expense limitation of 1.10% (excluding interest, taxes, brokerage commissions, dividend expenses, acquired fund fees and expenses, extraordinary legal expenses, or any other extraordinary expenses). |
| 3 | | The amounts shown for a share outstanding throughout the period may not be in accordance with the changes in the aggregate gains and losses on investments during the period because of the timing of sales and repurchases of Fund shares in relation to fluctuating net asset values during the period. |
| 4 | | Calculated based on average shares outstanding. |
| 5 | | Less than $0.01 |
| 6 | | Total investment return is calculated assuming a purchase of shares on the first day and a sale on the last day of each period reported and will include reinvestment of dividends and distributions, if any. |
| 7 | | Does not include expenses of the funds in which the Fund invests. |
| (A) | | Not Annualized |
| (B) | | Annualized |
| (C) | | Excludes merger activity |
101
| | The FBR Funds | |
| |
| |
| Financial Highlights (continued) |
| | | FBR Small Cap Fund — Investor Class |
| | |
|
| | | | | | | | | | | | | | | | | | | For the |
| | | For the Years Ended October 31, | | Period Ended |
| | |
| | October 31, |
| | | 2011 | | | 2010 | | | 2009 | | | 2008 | | | 2007* |
| | |
| | |
| | |
| | |
| | |
|
| Per Share Operating Performance: | | | | | | | | | | | | | | | | | | | | |
Net Asset Value – Beginning of Period | | $ | 11.17 | | | $ | 9.51 | | | $ | 8.44 | | | $ | 11.85 | | | $ | 10.00 | |
| | |
| | |
| | |
| | |
| | |
| |
Income (Loss) from Investment Operations: | | | | | | | | | | | | | | | | | | | | |
Net Investment Income (Loss)2 | | | (0.03 | )4 | | | 0.02 | 1 | | | 0.01 | 1 | | | (0.03 | )1 | | | (0.04 | )1 |
Net Realized and Unrealized Gain (Loss) on Investments3 | | | 1.30 | | | | 1.95 | | | | 1.04 | | | | (3.35 | ) | | | 1.89 | |
Net Increase from Payments by Affiliates | | | — | | | | — | | | | 0.01 | | | | — | | | | — | |
| | |
| | |
| | |
| | |
| | |
| |
Total from Investment Operations | | | 1.27 | | | | 1.97 | | | | 1.06 | | | | (3.38 | ) | | | 1.85 | |
| | |
| | |
| | |
| | |
| | |
| |
Distributions to Shareholders: | | | | | | | | | | | | | | | | | | | | |
From Net Investment Income | | | (0.04 | ) | | | (0.03 | ) | | | — | | | | — | | | | — | |
From Net Realized Gains | | | — | | | | (0.28 | ) | | | — | | | | (0.04 | ) | | | — | |
| | |
| | |
| | |
| | |
| | |
| |
Total Distributions | | | (0.04 | ) | | | (0.31 | ) | | | — | | | | (0.04 | ) | | | — | |
| | |
| | |
| | |
| | |
| | |
| |
Paid-in Capital from Redemption Fees4 | | | 0.00 | 5 | | | 0.00 | 5 | | | 0.01 | | | | 0.01 | | | | 0.00 | 5 |
| | |
| | |
| | |
| | |
| | |
| |
Net Increase (Decrease) in Net Asset Value | | | 1.23 | | | | 1.66 | | | | 1.07 | | | | (3.41 | ) | | | 1.85 | |
| | |
| | |
| | |
| | |
| | |
| |
Net Asset Value – End of Period | | $ | 12.40 | | | $ | 11.17 | | | $ | 9.51 | | | $ | 8.44 | | | $ | 11.85 | |
| | |
| | |
| | |
| | |
| | |
| |
| Total Investment Return6 | | | 11.40% | | | | 21.13% | | | | 12.68% | 7 | | | (28.49)% | | | | 18.50% | (A) |
| Ratios to Average Net Assets: | | | | | �� | | | | | | | | | | | | | | | |
Expenses After Waivers and Related Reimbursements2,8 | | | 1.45% | | | | 1.45% | | | | 1.46% | | | | 1.74% | | | | 1.95% | (B) |
Expenses Before Waivers and Related Reimbursements8 | | | 1.74% | | | | 2.33% | | | | 2.73% | | | | 3.55% | | | | 3.77% | (B) |
Net Investment Income (Loss) After Waivers and Related Reimbursements2 | | | (0.28)% | | | | 0.18% | | | | 0.10% | | | | (0.36)% | | | | (0.61)% | (B) |
Net Investment Loss Before Waivers and Related Reimbursements | | | (0.57)% | | | | (0.70)% | | | | (1.17)% | | | | (2.17)% | | | | (2.43)% | (B) |
| Supplementary Data: | | | | | | | | | | | | | | | | | | | | |
Portfolio Turnover Rate | | | 124% | | | | 284% | (C) | | | 226% | | | | 207% | | | | 107% | (A) |
Net Assets at End of Period (in thousands) | | $ | 28,186 | | | $ | 26,841 | | | $ | 10,585 | | | $ | 3,998 | | | $ | 4,900 | |
|
| * | | Represents the period from commencement of operations (February 28, 2007) through October 31, 2007. |
| 1 | | Calculated based on shares outstanding on the first and last day of the respective periods, except for dividends and distributions, if any, which are based on the actual shares outstanding on the dates of distributions. |
| 2 | | Prior to May 30, 2008, reflects fees waived and reimbursed by FBR Fund Advisers, Inc. pursuant to a contractual expense limitation of 1.95% (excluding interest, taxes, brokerage commissions, dividend expenses, acquired fund fees and expenses, extraordinary legal expenses, or any other extraordinary expenses). As of May 30, 2008, reflects fees waived and reimbursed by FBR Fund Advisers, Inc. pursuant to a contractual expense limitation of 1.45% (excluding interest, taxes, brokerage commissions, dividend expenses, acquired fund fees and expenses, extraordinary legal expenses, or any other extraordinary expenses). |
| 3 | | The amounts shown for a share outstanding throughout the period may not be in accordance with the changes in the aggregate gains and losses on investments during the period because of the timing of sales and repurchases of Fund shares in relation to fluctuating net asset values during the period. |
| 4 | | Calculated based on average shares outstanding. |
| 5 | | Less than $0.01 |
| 6 | | Total investment return is calculated assuming a purchase of shares on the first day and a sale on the last day of each period reported and will include reinvestment of dividends and distributions, if any. |
| 7 | | The Fund’s total return consists of a voluntary reimbursement by the Adviser for a realized loss on a transaction not meeting the Fund’s investment guidelines. This item had an impact of 0.12%. If the Adviser had not made a capital contribution to the Fund, the total return would have been 12.56%. See Note 9. |
| 8 | | Does not include expenses of the funds in which the Fund invests. |
| (A) | | Not Annualized |
| (B) | | Annualized |
| (C) | | Excludes merger activity |
102
| | The FBR Funds | |
| |
| |
| Financial Highlights (continued) |
| | | FBR Small Cap Fund — Institutional Class |
| | |
|
| | | | | | | | | | | | | | | For the |
| | | For the Years Ended October 31, | | Period Ended |
| | |
| | October 31, |
| | | 2011 | | | 2010 | | | 2009 | | | 2008* |
| | |
| | |
| | |
| | |
|
| Per Share Operating Performance: | | | | | | | | | | | | | | | | |
Net Asset Value – Beginning of Period | | $ | 10.04 | | | $ | 8.59 | | | $ | 7.62 | | | $ | 10.00 | |
| | |
| | |
| | |
| | |
| |
Income (Loss) from Investment Operations: | | | | | | | | | | | | | | | | |
Net Investment Income (Loss)2 | | | (0.01 | )4 | | | 0.04 | 1 | | | 0.03 | 1 | | | 0.01 | 1 |
Net Realized and Unrealized Gain (Loss) on Investments3 | | | 1.20 | | | | 1.75 | | | | 0.93 | | | | (2.39 | ) |
Net Increase from Payments by Affiliates | | | — | | | | — | | | | 0.01 | | | | — | |
| | |
| | |
| | |
| | |
| |
Total from Investment Operations | | | 1.19 | | | | 1.79 | | | | 0.97 | | | | (2.38 | ) |
| | |
| | |
| | |
| | |
| |
Distributions to Shareholders: | | | | | | | | | | | | | | | | |
From Net Investment Income | | | (0.05 | ) | | | (0.06 | ) | | | — | | | | — | |
From Net Realized Gains | | | — | | | | (0.28 | ) | | | — | | | | — | |
| | |
| | |
| | |
| | |
| |
Total Distributions | | | (0.05 | ) | | | (0.34 | ) | | | — | | | | — | |
| | |
| | |
| | |
| | |
| |
Paid-in Capital from Redemption Fees4 | | | 0.00 | 5 | | | 0.00 | 5 | | | — | | | | — | |
| | |
| | |
| | |
| | |
| |
Net Increase (Decrease) in Net Asset Value | | | 1.14 | | | | 1.45 | | | | 0.97 | | | | (2.38 | ) |
| | |
| | |
| | |
| | |
| |
Net Asset Value – End of Period | | $ | 11.18 | | | $ | 10.04 | | | $ | 8.59 | | | $ | 7.62 | |
| | |
| | |
| | |
| | |
| |
| Total Investment Return6 | | | 11.82% | | | | 21.35% | | | | 12.73% | 7 | | | (23.80)% | (A) |
| Ratios to Average Net Assets: | | | | | | | | | | | | | | | | |
Expenses After Waivers and Related Reimbursements2,8 | | | 1.20% | | | | 1.19% | | | | 1.20% | | | | 1.20% | (B) |
Expenses Before Waivers and Related Reimbursements8 | | | 1.42% | | | | 2.94% | | | | 16.22% | | | | 4.56% | (B) |
Net Investment Income (Loss) After Waivers and Related Reimbursements2 | | | (0.09)% | | | | 0.41% | | | | 0.44% | | | | 0.23% | (B) |
Net Investment Loss Before Waivers and Related Reimbursements | | | (0.31)% | | | | (1.34)% | | | | (14.58)% | | | | (3.13)% | (B) |
| Supplementary Data: | | | | | | | | | | | | | | | | |
Portfolio Turnover Rate | | | 124% | | | | 284% | (C) | | | 226% | | | | 207% | |
Net Assets at End of Period (in thousands) | | $ | 10,818 | | | $ | 8,655 | | | $ | 86 | | | $ | 76 | |
|
| * | | Represents the period from inception of share class (May 30, 2008) through October 31, 2008. |
| 1 | | Calculated based on shares outstanding on the first and last day of the period, except for dividends and distributions, if any, which are based on the actual shares outstanding on the dates of distributions. |
| 2 | | Reflects fees waived and reimbursed by FBR Fund Advisers, Inc. pursuant to a contractual expense limitation of 1.20% (excluding interest, taxes, brokerage commissions, dividend expenses, acquired fund fees and expenses, extraordinary legal expenses, or any other extraordinary expenses). |
| 3 | | The amounts shown for a share outstanding throughout the period may not be in accordance with the changes in the aggregate gains and losses on investments during the period because of the timing of sales and repurchases of Fund shares in relation to fluctuating net asset values during the period. |
| 4 | | Calculated based on average shares outstanding. |
| 5 | | Less than $0.01 |
| 6 | | Total investment return is calculated assuming a purchase of shares on the first day and a sale on the last day of each period reported and will include reinvestment of dividends and distributions, if any. |
| 7 | | The Fund’s total return consists of a voluntary reimbursement by the Adviser for a realized loss on a transaction not meeting the Fund’s investment guidelines. This item had an impact of 0.13%. If the Adviser had not made a capital contribution to the Fund, the total return would have been 12.60%. See Note 9. |
| 8 | | Does not include expenses of the funds in which the Fund invests. |
| (A) | | Not Annualized |
| (B) | | Annualized |
| (C) | | Excludes merger activity |
103
| | The FBR Funds | |
| |
| |
| Financial Highlights (continued) |
| | | FBR Focus Fund — Investor Class |
| | |
|
| | | For the Years Ended October 31, |
| | |
|
| | | 2011 | | | 2010 | | | 2009 | | | 2008 | | | 2007 | |
| | |
| | |
| | |
| | |
| | |
| |
| Per Share Operating Performance: | | | | | | | | | | | | | | | | | | | | |
Net Asset Value – Beginning of Year | | $ | 47.57 | | | $ | 37.56 | | | $ | 37.40 | | | $ | 57.97 | | | $ | 49.36 | |
| | |
| | |
| | |
| | |
| | |
| |
Income (Loss) from Investment Operations: | | | | | | | | | | | | | | | | | | | | |
Net Investment Income (Loss) | | | (0.50 | )3 | | | (0.64 | )1 | | | (0.42 | )1 | | | (0.44 | )1 | | | 0.08 | 1 |
Net Realized and Unrealized Gain (Loss) on Investments2 | | | 4.44 | | | | 10.65 | | | | 5.76 | | | | (19.51 | ) | | | 8.63 | |
| | |
| | |
| | |
| | |
| | |
| |
Total from Investment Operations | | | 3.94 | | | | 10.01 | | | | 5.34 | | | | (19.95 | ) | | | 8.71 | |
| | |
| | |
| | |
| | |
| | |
| |
Distributions to Shareholders: | | | | | | | | | | | | | | | | | | | | |
From Net Investment Income | | | — | | | | — | | | | — | | | | (0.12 | ) | | | — | |
From Net Realized Gain | | | (1.72 | ) | | | — | | | | (5.19 | ) | | | (0.51 | ) | | | (0.12 | ) |
| | |
| | |
| | |
| | |
| | |
| |
Total Distributions | | | (1.72 | ) | | | — | | | | (5.19 | ) | | | (0.63 | ) | | | (0.12 | ) |
| | |
| | |
| | |
| | |
| | |
| |
Paid-in Capital from Redemption Fees3 | | | 0.01 | | | | 0.00 | 4 | | | 0.01 | | | | 0.01 | | | | 0.02 | |
| | |
| | |
| | |
| | |
| | |
| |
Net Increase (Decrease) in Net Asset Value | | | 2.23 | | | | 10.01 | | | | 0.16 | | | | (20.57 | ) | | | 8.61 | |
| | |
| | |
| | |
| | |
| | |
| |
Net Asset Value – End of Year | | $ | 49.80 | | | $ | 47.57 | | | $ | 37.56 | | | $ | 37.40 | | | $ | 57.97 | |
| | |
| | |
| | |
| | |
| | |
| |
| Total Investment Return5 | | | 8.35% | | | | 26.65% | | | | 17.74% | | | | (34.73)% | | | | 17.72% | |
| Ratios to Average Net Assets: | | | | | | | | | | | | | | | | | | | | |
Expenses After Waivers6 | | | 1.44% | | | | 1.51% | | | | 1.43% | | | | 1.42% | | | | 1.40% | |
Expenses Before Waivers6 | | | 1.44% | | | | 1.51% | | | | 1.43% | | | | 1.42% | | | | 1.40% | |
Net Investment Income (Loss) After Waivers | | | (1.01)% | | | | (1.31)% | | | | (1.16)% | | | | (0.67)% | | | | 0.14% | |
Net Investment Income (Loss) Before Waivers | | | (1.01)% | | | | (1.31)% | | | | (1.16)% | | | | (0.67)% | | | | 0.14% | |
| Supplementary Data: | | | | | | | | | | | | | | | | | | | | |
Portfolio Turnover Rate | | | 13% | | | | 5% | | | | 5% | | | | 17% | | | | 5% | |
Net Assets at End of Year (in thousands) | | $ | 611,337 | | | $ | 670,840 | | | $ | 759,774 | | | $ | 717,780 | | | $ | 1,556,339 | |
|
| 1 | | Calculated based on shares outstanding on the first and last day of the respective periods, except for dividends and distributions, if any, which are based on the actual shares outstanding on the dates of distributions. |
| 2 | | The amounts shown for a share outstanding throughout the respective periods may not be in accordance with the changes in the aggregate gains and losses on investments during the respective periods because of the timing of sales and repurchases of Fund shares in relation to fluctuating net asset values during the respective periods. |
| 3 | | Calculated based on average shares outstanding. |
| 4 | | Less than $0.01 |
| 5 | | Total investment return is calculated assuming a purchase of shares on the first day and a sale on the last day of each period reported and will include reinvestment of dividends and distributions, if any. |
| 6 | | Does not include expenses of the funds in which the Fund invests. |
| (A) | | Not Annualized |
| (B) | | Annualized |
104
| | The FBR Funds | |
| |
| |
| Financial Highlights (continued) |
| | | FBR Focus Fund — Institutional Class* |
| | |
|
| | | | | | | | | | | | | | | For the |
| | | For the Years Ended October 31, | | Period Ended |
| | |
| | October 31, |
| | | 2011 | | | 2010 | | | 2009 | | | 2008** |
| | |
| | |
| | |
| | |
| |
| Per Share Operating Performance: | | | | | | | | | | | | | | | | |
Net Asset Value – Beginning of Period | | $ | 47.64 | | | $ | 37.84 | | | $ | 130.93 | | | $ | 180.00 | |
| | |
| | |
| | |
| | |
| |
Income (Loss) from Investment Operations: | | | | | | | | | | | | | | | | |
Net Investment Loss | | | (0.37 | )3 | | | (0.41 | )1 | | | (0.25 | )1 | | | (0.20 | )1 |
Net Realized and Unrealized Gain (Loss) on Investments2 | | | 4.47 | | | | 10.58 | | | | 0.59 | | | | (49.05 | ) |
| | |
| | |
| | |
| | |
| |
Total from Investment Operations | | | 4.10 | | | | 10.17 | | | | 0.34 | | | | (49.25 | ) |
| | |
| | |
| | |
| | |
| |
Distributions to Shareholders: | | | | | | | | | | | | | | | | |
From Net Investment Income | | | — | | | | (0.37 | ) | | | — | | | | — | |
From Net Realized Gain | | | (1.72 | ) | | | — | | | | (93.45 | ) | | | — | |
| | |
| | |
| | |
| | |
| |
Paid-in Capital from Redemption Fees3 | | | 0.00 | 4 | | | 0.00 | 4 | | | 0.02 | | | | 0.18 | |
| | |
| | |
| | |
| | |
| |
Net Increase (Decrease) in Net Asset Value | | | 2.38 | | | | 9.80 | | | | (93.09 | ) | | | (49.07 | ) |
| | |
| | |
| | |
| | |
| |
Net Asset Value – End of Period | | $ | 50.02 | | | $ | 47.64 | | | $ | 37.84 | | | $ | 130.93 | |
| | |
| | |
| | |
| | |
| |
| Total Investment Return5 | | | 8.53% | | | | 27.32% | | | | 18.15% | | | | (27.30)% | (A) |
| Ratios to Average Net Assets: | | | | | | | | | | | | | | | | |
Expenses After Waivers6 | | | 1.15% | | | | 1.26% | | | | 1.15% | | | | 1.05% | (B) |
Expenses Before Waivers6 | | | 1.15% | | | | 1.26% | | | | 1.15% | | | | 1.05% | (B) |
Net Investment Loss After Waivers | | | (0.76)% | | | | (1.06)% | | | | (0.88)% | | | | (0.70)% | (B) |
Net Investment Loss Before Waivers | | | (0.76)% | | | | (1.06)% | | | | (0.88)% | | | | (0.70)% | (B) |
| Supplementary Data: | | | | | | | | | | | | | | | | |
Portfolio Turnover Rate | | | 13% | | | | 5% | | | | 5% | | | | 17% | |
Net Assets at End of Period (in thousands) | | $ | 49,005 | | | $ | 36,811 | | | $ | 34,225 | | | $ | 16,831 | |
|
| * | | Per share amounts have been restated on a retroactive basis to reflect a 1:18 reverse stock split effective December 10, 2010. |
| ** | | Represents the period from inception of share class (May 30, 2008) through October 31, 2008. |
| 1 | | Calculated based on shares outstanding on the first and last day of the period, except for dividends and distributions, if any, which are based on the actual shares outstanding on the dates of distributions. |
| 2 | | The amounts shown for a share outstanding throughout the period may not be in accordance with the changes in the aggregate gains and losses on investments during the period because of the timing of sales and repurchases of Fund shares in relation to fluctuating net asset values during the period. |
| 3 | | Calculated based on average shares outstanding. |
| 4 | | Less than $0.01 |
| 5 | | Total investment return is calculated assuming a purchase of shares on the first day and a sale on the last day of each period reported and will include reinvestment of dividends and distributions, if any. |
| 6 | | Does not include expenses of the funds in which the Fund invests. |
| (A) | | Not Annualized |
| (B) | | Annualized |
105
| | The FBR Funds | |
| |
| |
| Financial Highlights (continued) |
| | | FBR Large Cap Financial Fund — Investor Class |
| | |
|
| | | For the Years Ended October 31, |
| | |
|
| | | 2011 | | | 2010 | | | 2009 | | | 2008 | | | 2007 | |
| | |
| | |
| | |
| | |
| | |
| |
| Per Share Operating Performance: | | | | | | | | | | | | | | | | | | | | |
Net Asset Value – Beginning of Year | | $ | 12.88 | | | $ | 12.61 | | | $ | 11.14 | | | $ | 18.71 | | | $ | 21.67 | |
| | |
| | |
| | |
| | |
| | |
| |
Income (Loss) from Investment Operations: | | | | | | | | | | | | | | | | | | | | |
Net Investment Income (Loss)2 | | | (0.04 | )4 | | | (0.08 | )1 | | | 0.00 | 5,1 | | | 0.14 | 1 | | | 0.14 | 1 |
Net Realized and Unrealized Gain (Loss) on Investments3 | | | (0.93 | ) | | | 0.35 | | | | 1.58 | | | | (3.86 | ) | | | (0.97 | ) |
| | |
| | |
| | |
| | |
| | |
| |
Total from Investment Operations | | | (0.97 | ) | | | 0.27 | | | | 1.58 | | | | (3.72 | ) | | | (0.83 | ) |
| | |
| | |
| | |
| | |
| | |
| |
Distributions to Shareholders: | | | | | | | | | | | | | | | | | | | | |
From Net Investment Income | | | — | | | | — | | | | (0.10 | ) | | | (0.18 | ) | | | (0.11 | ) |
Distribution in Excess of Net | | | | | | | | | | | | | | | | | | | | |
Investment Income | | | — | | | | — | | | | (0.02 | ) | | | — | | | | — | |
From Net Realized Gain | | | — | | | | — | | | | — | | | | (3.68 | ) | | | (2.02 | ) |
| | |
| | |
| | |
| | |
| | |
| |
Total Distributions | | | — | | | | — | | | | (0.12 | ) | | | (3.86 | ) | | | (2.13 | ) |
| | |
| | |
| | |
| | |
| | |
| |
Paid-in Capital from Redemption Fees4 | | | 0.00 | 5 | | | 0.00 | 5 | | | 0.01 | | | | 0.01 | | | | 0.00 | 5 |
| | |
| | |
| | |
| | |
| | |
| |
Net Increase (Decrease) in Net Asset Value | | | (0.97 | ) | | | 0.27 | | | | 1.47 | | | | (7.57 | ) | | | (2.96 | ) |
| | |
| | |
| | |
| | |
| | |
| |
Net Asset Value – End of Year | | $ | 11.91 | | | $ | 12.88 | | | $ | 12.61 | | | $ | 11.14 | | | $ | 18.71 | |
| | |
| | |
| | |
| | |
| | |
| |
| Total Investment Return6 | | | (7.53)% | | | | 2.14% | | | | 14.52% | | | | (23.76)% | | | | (4.59)% | |
| Ratios to Average Net Assets: | | | | | | | | | | | | | | | | | | | | |
Expenses After Waivers2,7 | | | 1.61% | | | | 1.78% | | | | 1.81% | | | | 1.88% | | | | 1.89% | |
Expenses Before Waivers7 | | | 1.61% | | | | 1.78% | | | | 1.81% | | | | 2.01% | | | | 1.92% | |
Net Investment Income (Loss) After Waivers2 | | | (0.34)% | | | | (0.73)% | | | | (0.08)% | | | | 1.63% | | | | 0.59% | |
Net Investment Income (Loss) Before Waivers | | | (0.34)% | | | | (0.73)% | | | | (0.08)% | | | | 1.50% | | | | 0.56% | |
| Supplementary Data: | | | | | | | | | | | | | | | | | | | | |
Portfolio Turnover Rate | | | 97% | | | | 150% | | | | 220% | | | | 509% | | | | 95% | |
Net Assets at End of Year (in thousands) | | $ | 55,684 | | | $ | 48,717 | | | $ | 37,195 | | | $ | 24,272 | | | $ | 15,951 | |
|
| 1 | | Calculated based on shares outstanding on the first and last day of the respective periods, except for dividends and distributions, if any, which are based on the actual shares outstanding on the dates of distributions. |
| 2 | | Reflects fees waived by FBR Fund Advisers, Inc. pursuant to a contractual expense limitation of 1.95% (excluding interest, taxes, brokerage commissions, dividend expenses, acquired fund fees and expenses, extraordinary legal expenses, or any other extraordinary expenses) and effective May 30, 2008, the recoupment of certain previously waived fees. |
| 3 | | The amounts shown for a share outstanding throughout the respective periods may not be in accordance with the changes in the aggregate gains and losses on investments during the respective periods because of the timing of sales and repurchases of Fund shares in relation to fluctuating net asset values during the respective periods. |
| 4 | | Calculated based on average shares outstanding. |
| 5 | | Less than $0.01 |
| 6 | | Total investment return is calculated assuming a purchase of shares on the first day and a sale on the last day of each period reported and will include reinvestment of dividends and distributions, if any. |
| 7 | | Does not include expenses of the funds in which the Fund invests. |
106
| | The FBR Funds | |
| |
| |
| Financial Highlights (continued) |
| | | FBR Small Cap Financial Fund — Investor Class |
| | |
|
| | | For the Years Ended October 31, |
| | |
|
| | | 2011 | | | 2010 | | | 2009 | | | 2008 | | | 2007 | |
| | |
| | |
| | |
| | |
| | |
| |
| Per Share Operating Performance: | | | | | | | | | | | | | | | | | | | | |
Net Asset Value – Beginning of Year | | $ | 18.11 | | | $ | 15.91 | | | $ | 15.22 | | | $ | 23.18 | | | $ | 32.70 | |
| | |
| | |
| | |
| | |
| | |
| |
Income (Loss) from Investment Operations: | | | | | | | | | | | | | | | | | | | | |
Net Investment Income | | | 0.21 | 3 | | | 0.08 | 1 | | | 0.06 | 1 | | | 0.24 | 1 | | | 0.29 | 1 |
Net Realized and Unrealized Gain (Loss) on Investments2 | | | (1.66 | ) | | | 2.17 | | | | 0.81 | | | | (1.69 | ) | | | (5.31 | ) |
| | |
| | |
| | |
| | |
| | |
| |
Total from Investment Operations | | | (1.45 | ) | | | 2.25 | | | | 0.87 | | | | (1.45 | ) | | | (5.02 | ) |
| | |
| | |
| | |
| | |
| | |
| |
Distributions to Shareholders: | | | | | | | | | | | | | | | | | | | | |
From Net Investment Income | | | (0.06 | ) | | | (0.07 | ) | | | (0.19 | ) | | | (0.28 | ) | | | (0.15 | ) |
From Net Realized Gain | | | (0.13 | ) | | | — | | | | — | | | | (6.24 | ) | | | (4.35 | ) |
| | |
| | |
| | |
| | |
| | |
| |
Total Distributions | | | (0.19 | ) | | | (0.07 | ) | | | (0.19 | ) | | | (6.52 | ) | | | (4.50 | ) |
| | |
| | |
| | |
| | |
| | |
| |
Paid-in Capital from Redemption Fees3 | | | 0.01 | | | | 0.02 | | | | 0.01 | | | | 0.01 | | | | 0.00 | 4 |
| | |
| | |
| | |
| | |
| | |
| |
Net Increase (Decrease) in Net Asset Value | | | (1.63 | ) | | | 2.20 | | | | 0.69 | | | | (7.96 | ) | | | (9.52 | ) |
| | |
| | |
| | |
| | |
| | |
| |
Net Asset Value – End of Year | | $ | 16.48 | | | $ | 18.11 | | | $ | 15.91 | | | $ | 15.22 | | | $ | 23.18 | |
| | |
| | |
| | |
| | |
| | |
| |
| Total Investment Return5 | | | (8.12)% | | | | 14.27% | | | | 5.89% | | | | (6.76)% | | | | (18.02)% | |
| Ratios to Average Net Assets: | | | | | | | | | | | | | | | | | | | | |
Expenses After Waivers6 | | | 1.52% | | | | 1.51% | | | | 1.51% | | | | 1.49% | | | | 1.51% | |
Expenses Before Waivers6 | | | 1.52% | | | | 1.51% | | | | 1.51% | | | | 1.49% | | | | 1.51% | |
Net Investment Income After Waivers | | | 0.81% | | | | 0.35% | | | | 0.50% | | | | 1.48% | | | | 0.93% | |
Net Investment Income Before Waivers | | | 0.81% | | | | 0.35% | | | | 0.50% | | | | 1.48% | | | | 0.93% | |
| Supplementary Data: | | | | | | | | | | | | | | | | | | | | |
Portfolio Turnover Rate | | | 70% | | | | 89% | | | | 118% | | | | 147% | | | | 13% | |
Net Assets at End of Year (in thousands) | | $ | 154,206 | | | $ | 216,747 | | | $ | 187,561 | | | $ | 181,803 | | | $ | 144,214 | |
|
| 1 | | Calculated based on shares outstanding on the first and last day of the respective periods, except for dividends and distributions, if any, which are based on the actual shares outstanding on the dates of distributions. |
| 2 | | The amounts shown for a share outstanding throughout the respective periods may not be in accordance with the changes in the aggregate gains and losses on investments during the respective periods because of the timing of sales and repurchases of Fund shares in relation to fluctuating net asset values during the respective periods. |
| 3 | | Calculated based on average shares outstanding. |
| 4 | | Less than $0.01 |
| 5 | | Total investment return is calculated assuming a purchase of shares on the first day and a sale on the last day of each period reported and will include reinvestment of dividends and distributions, if any. |
| 6 | | Does not include expenses of the funds in which the Fund invests. |
107
| | The FBR Funds | |
| |
| |
| Financial Highlights (continued) |
| | | FBR Small Cap Financial Fund — Institutional Class |
| | |
|
| | | | | | | | | | | | | | | For the |
| | | For the Years Ended October 31, | | Period Ended |
| | |
| | October 31, |
| | | 2011 | | | 2010 | | | 2009 | | | 2008* |
| | |
| | |
| | |
| | |
|
| Per Share Operating Performance: | | | | | | | | | | | | | | | | |
Net Asset Value — Beginning of Period | | $ | 11.70 | | | $ | 10.34 | | | $ | 9.96 | | | $ | 10.00 | |
| | |
| | |
| | |
| | |
| |
Income (Loss) from Investment Operations: | | | | | | | | | | | | | | | | |
Net Investment Income2 | | | 0.19 | 4 | | | 0.09 | 1 | | | 0.19 | 1 | | | 0.02 | 1 |
Net Realized and Unrealized Gain (Loss) on Investments3 | | | (1.09 | ) | | | 1.40 | | | | 0.40 | | | | (0.06 | ) |
| | |
| | |
| | |
| | |
| |
Total from Investment Operations | | | (0.90 | ) | | | 1.49 | | | | 0.59 | | | | (0.04 | ) |
| | |
| | |
| | |
| | |
| |
Distributions to Shareholders: | | | | | | | | | | | | | | | | |
From Net Investment Income | | | (0.12 | ) | | | (0.13 | ) | | | (0.21 | ) | | | — | |
From Net Realized Gain | | | (0.13 | ) | | | — | | | | — | | | | — | |
| | |
| | |
| | |
| | |
| |
Total Distributions | | | (0.25 | ) | | | (0.13 | ) | | | (0.21 | ) | | | — | |
| | |
| | |
| | |
| | |
| |
Paid-in Capital from Redemption Fees4 | | | — | | | | 0.00 | 5 | | | — | | | | — | |
| | |
| | |
| | |
| | |
| |
Net Increase (Decrease) in Net Asset Value. | | | (1.15 | ) | | | 1.36 | | | | 0.38 | | | | (0.04 | ) |
| | |
| | |
| | |
| | |
| |
Net Asset Value – End of Period | | $ | 10.55 | | | $ | 11.70 | | | $ | 10.34 | | | $ | 9.96 | |
| | |
| | |
| | |
| | |
| |
| Total Investment Return6 | | | (8.00)% | | | | 14.52% | | | | 6.14% | | | | (0.40)% | (A) |
| Ratios to Average Net Assets: | | | | | | | | | | | | | | | | |
Expenses After Waivers and Related Reimbursements2,7 | | | 1.34% | | | | 1.23% | | | | 1.56% | | | | 1.31% | (B) |
Expenses Before Waivers and Related Reimbursements7 | | | 1.34% | | | | 1.23% | | | | 1.56% | | | | 1.31% | (B) |
Net Investment Income After Waivers and Related Reimbursements2 | | | 1.00% | | | | 0.61% | | | | 0.04% | | | | 1.49% | (B) |
Net Investment Income Before Waivers and Related Reimbursements | | | 1.00% | | | | 0.61% | | | | 0.04% | | | | 1.49% | (B) |
| Supplementary Data: | | | | | | | | | | | | | | | | |
Portfolio Turnover Rate | | | 70% | | | | 89% | | | | 118% | | | | 147% | |
Net Assets at End of Period (in thousands) | | $ | 19,894 | | | $ | 25,011 | | | $ | 10,638 | | | $ | 3,952 | |
|
| * | | Represents the period from inception of share class (May 30, 2008) through October 31, 2008. |
| 1 | | Calculated based on shares outstanding on the first and last day of the period, except for dividends and distributions, if any, which are based on the actual shares outstanding on the dates of distributions. |
| 2 | | Reflects fees waived and reimbursed by FBR Fund Advisers, Inc. pursuant to a contractual expense limitation of 1.70% (excluding interest, taxes, brokerage commissions, dividend expenses, acquiured fund fees and expenses, extraordinary legal expenses, or any other extraordinary expenses and effective May 30, 2008, the recoupment of certain previously waived fees. |
| 3 | | The amounts shown for a share outstanding throughout the period may not be in accordance with the changes in the aggregate gains and losses on investments during the period because of the timing of sales and repurchases of Fund shares in relation to fluctuating net asset values during the period. |
| 4 | | Calculated based on average shares outstanding. |
| 5 | | Less than $0.01 |
| 6 | | Total investment return is calculated assuming a purchase of shares on the first day and a sale on the last day of each period reported and will include reinvestment of dividends and distributions, if any. |
| 7 | | Does not include expenses of the funds in which the Fund invests. |
| (A) | | Not Annualized |
| (B) | | Annualized |
108
| | The FBR Funds | |
| |
| |
| Financial Highlights (continued) |
| | | FBR Technology Fund — Investor Class |
| | |
|
| | | For the Years Ended October 31, |
| | |
|
| | | 2011 | | | 2010 | | | 2009 | | | 2008 | | | 2007 | |
| | |
| | |
| | |
| | |
| | |
| |
| Per Share Operating Performance: | | | | | | | | | | | | | | | | | | | | |
Net Asset Value – Beginning of Year | | $ | 11.00 | | | $ | 9.05 | | | $ | 6.96 | | | $ | 13.34 | | | $ | 11.97 | |
| | |
| | |
| | |
| | |
| | |
| |
Income (Loss) from Investment Operations: | | | | | | | | | | | | | | | | | | | | |
Net Investment Loss2 | | | (0.17 | )4 | | | (0.14 | )1 | | | (0.08 | )1 | | | (0.12 | )1 | | | (0.05 | )1 |
Net Realized and Unrealized Gain (Loss) on Investments3 | | | 0.03 | | | | 2.08 | | | | 2.16 | | | | (5.03 | ) | | | 1.81 | |
| | |
| | |
| | |
| | |
| | |
| |
Total from Investment Operations | | | (0.14 | ) | | | 1.94 | | | | 2.08 | | | | (5.15 | ) | | | 1.76 | |
| | |
| | |
| | |
| | |
| | |
| |
Distributions to Shareholders: | | | | | | | | | | | | | | | | | | | | |
From Net Realized Gain | | | — | | | | — | | | | — | | | | (1.23 | ) | | | (0.39 | ) |
| | |
| | |
| | |
| | |
| | |
| |
Paid-in Capital from Redemption Fees4 | | | 0.00 | 5 | | | 0.01 | | | | 0.01 | | | | 0.00 | 5 | | | 0.00 | 5 |
| | |
| | |
| | |
| | |
| | |
| |
Net Increase (Decrease) in Net Asset Value | | | (0.14 | ) | | | 1.95 | | | | 2.09 | | | | (6.38 | ) | | | 1.37 | |
| | |
| | |
| | |
| | |
| | |
| |
Net Asset Value – End of Year | | $ | 10.86 | | | $ | 11.00 | | | $ | 9.05 | | | $ | 6.96 | | | $ | 13.34 | |
| | |
| | |
| | |
| | |
| | |
| |
| Total Investment Return6 | | | (1.27)% | | | | 21.55% | | | | 30.03% | | | | (42.30)% | | | | 15.18% | |
| Ratios to Average Net Assets: | | | | | | | | | | | | | | | | | | | | |
Expenses After Waivers and Related Reimbursements2,7 | | | 1.95% | | | | 1.95% | | | | 1.95% | | | | 1.84% | | | | 1.70% | |
Expenses Before Waivers and Related Reimbursements7 | | | 2.79% | | | | 2.50% | | | | 3.00% | | | | 1.92% | | | | 1.70% | |
Net Investment Loss After Waivers and Related Reimbursements2 | | | (1.54)% | | | | (1.10)% | | | | (1.05)% | | | | (0.60)% | | | | (0.41)% | |
Net Investment Loss Before Waivers and Related Reimbursements | | | (2.38)% | | | | (1.64)% | | | | (2.10)% | | | | (0.68)% | | | | (0.41)% | |
| Supplementary Data: | | | | | | | | | | | | | | | | | | | | |
Portfolio Turnover Rate | | | 141% | | | | 353% | (A) | | | 211% | | | | 175% | | | | 229% | |
Net Assets at End of Year (in thousands) | | $ | 5,698 | | | $ | 8,207 | | | $ | 8,388 | | | $ | 7,689 | | | $ | 40,935 | |
|
| 1 | | Calculated based on shares outstanding on the first and last day of the respective periods, except for dividends and distributions, if any, which are based on the actual shares outstanding on the dates of distributions. |
| 2 | | Reflects fees waived and reimbursed by FBR Fund Advisers, Inc. pursuant to a contractual expense limitation of 1.95% (excluding interest, taxes, brokerage commissions, dividend expenses, acquired fund fees and expenses, extraordinary legal expenses, or any other extraordinary expenses) and effective May 30, 2008, the recoupment of certain previously waived fees. |
| 3 | | The amounts shown for a share outstanding throughout the respective periods may not be in accordance with the changes in the aggregate gains and losses on investments during the respectiveperiods because of the timing of sales and repurchases of Fund shares in relation to fluctuating net asset values during the respective periods. |
| 4 | | Calculated based on average shares outstanding. |
| 5 | | Less than $0.01 |
| 6 | | Total investment return is calculated assuming a purchase of shares on the first day and a sale on the last day of each period reported and will include reinvestment of dividends and distributions, if any. |
| 7 | | Does not include expenses of the funds in which the Fund invests. |
| (A) | | Excludes merger activity |
109
| | The FBR Funds | |
| |
| |
| Financial Highlights (continued) |
| | | FBR Technology Fund — Institutional Class |
| | |
|
| | | For the | | For the |
| | | Year Ended | | Period Ended |
| | | October 31, 2011 | | October 31, 2010* |
| | |
| |
|
| Per Share Operating Performance: | | | | | | | | | | |
Net Asset Value – Beginning of Period | | | $ | 11.00 | | | | $ | 10.46 | |
| | | |
| | | |
| |
Income (Loss) from Investment Operations: | | | | | | | | | | |
Net Investment Loss2 | | | | (0.14 | )4 | | | | (0.07 | )1 |
Net Realized and Unrealized Gain on Investments3 | | | | 0.03 | | | | | 0.61 | |
| | | |
| | | |
| |
Total from Investment Operations | | | | (0.11 | ) | | | | 0.54 | |
| | | |
| | | |
| |
Paid-in Capital from Redemption Fees4 | | | | 0.00 | 5 | | | | 0.00 | 5 |
| | | |
| | | |
| |
Net Increase (Decrease) in Net Asset Value | | | | (0.11 | ) | | | | 0.54 | |
| | | |
| | | |
| |
Net Asset Value – End of Period | | | $ | 10.89 | | | | $ | 11.00 | |
| | | |
| | | |
| |
| Total Investment Return6 | | | | (1.00)% | | | | | 5.16% | (A) |
| Ratios to Average Net Assets: | | | | | | | | | | |
Expenses After Waivers and Related Reimbursements2,7 | | | | 1.70% | | | | | 1.70% | (B) |
Expenses Before Waivers and Related Reimbursements7 | | | | 3.45% | | | | | 2.34% | (B) |
Net Investment Loss After Waivers and Related Reimbursements2 | | | | (1.24)% | | | | | (0.77)% | (B) |
Net Investment Loss Before Waivers and Related Reimbursements | | | | (2.99)% | | | | | (1.41)% | (B) |
| Supplementary Data: | | | | | | | | | | |
Portfolio Turnover Rate | | | | 141% | | | | | 353% | (C) |
Net Assets at End of Period (in thousands) | | | $ | 1,156 | | | | $ | 4,611 | |
|
| * | | Represents the period from inception of share class (March 12, 2010) through October 31, 2010. |
| 1 | | Calculated based on shares outstanding on the first and last day of the respective periods, except for dividends and distributions, if any, which are based on the actual shares outstanding on the dates of distributions. |
| 2 | | Reflects fees waived and reimbursed by FBR Fund Advisers, Inc. pursuant to a contractual expense limitation of 1.70% (excluding interest, taxes, brokerage commissions, dividend expenses, acquired fund fees and expenses, extraordinary legal expenses, or any other extraordinary expenses) |
| 3 | | The amounts shown for a share outstanding throughout the respective periods may not be in accordance with the changes in the aggregate gains and losses on investments during the respective periods because of the timing of sales and repurchases of Fund shares in relation to fluctuating net asset values during the respective periods. |
| 4 | | Calculated based on average shares outstanding. |
| 5 | | Less than $0.01 |
| 6 | | Total investment return is calculated assuming a purchase of shares on the first day and a sale on the last day of each period reported and will include reinvestment of dividends and distributions, if any. |
| 7 | | Does not include expenses of the funds in which the Fund invests. |
| (A) | | Not Annualized |
| (B) | | Annualized |
| (C) | | Excludes merger activity |
110
| The FBR Funds |
|
| Financial Highlights (continued) |
| | | FBR Gas Utility Index Fund — Investor Class | |
| | |
| |
| | | For the Years Ended October 31, | |
| | |
| |
| | | 2011 | | | 2010 | | | 2009 | | | 2008 | | | 2007 | |
| | |
| | |
| | |
| | |
| | |
| |
| Per Share Operating Performance: | | | | | | | | | | | | | | | | | | | | |
Net Asset Value – Beginning of Year | | $ | 17.83 | | | $ | 15.13 | | | $ | 15.26 | | | $ | 23.14 | | | $ | 19.48 | |
| | |
| | |
| | |
| | |
| | |
| |
Income (Loss) from Investment Operations: | | | | | | | | | | | | | | | | | | | | |
Net Investment Income2 | | | 0.51 | 4 | | | 0.58 | 1 | | | 0.49 | 1 | | | 0.47 | 1 | | | 0.47 | 1 |
Net Realized and Unrealized Gain (Loss) on Investments3 | | | 3.59 | | | | 2.72 | | | | 0.60 | | | | (6.13 | ) | | | 3.67 | |
| | |
| | |
| | |
| | |
| | |
| |
Total from Investment Operations | | | 4.10 | | | | 3.30 | | | | 1.09 | | | | (5.66 | ) | | | 4.14 | |
| | |
| | |
| | |
| | |
| | |
| |
Distributions to Shareholders: | | | | | | | | | | | | | | | | | | | | |
From Net Investment Income | | | (0.51 | ) | | | (0.58 | ) | | | (0.49 | ) | | | (0.47 | ) | | | (0.48 | ) |
From Net Realized Gain | | | (0.21 | ) | | | (0.02 | ) | | | (0.74 | ) | | | (1.75 | ) | | | — | |
| | |
| | |
| | |
| | |
| | |
| |
Total Distributions | | | (0.72 | ) | | | (0.60 | ) | | | (1.23 | ) | | | (2.22 | ) | | | (0.48 | ) |
| | |
| | |
| | |
| | |
| | |
| |
Paid-in Capital from Redemption Fees4 | | | 0.00 | 5 | | | 0.00 | 5 | | | 0.01 | | | | 0.00 | 5 | | | 0.00 | 5 |
| | |
| | |
| | |
| | |
| | |
| |
Net Increase (Decrease) in Net Asset Value | | | 3.38 | | | | 2.70 | | | | (0.13 | ) | | | (7.88 | ) | | | 3.66 | |
| | |
| | |
| | |
| | |
| | |
| |
Net Asset Value – End of Year | | $ | 21.21 | | | $ | 17.83 | | | $ | 15.13 | | | $ | 15.26 | | | $ | 23.14 | |
| | |
| | |
| | |
| | |
| | |
| |
| Total Investment Return6 | | | | | | | | | | | | | | | | | | | | |
| | | | 23.54% | | | | 22.25% | | | | 8.18% | | | | (26.81 | )% | | | 21.51% | |
| Ratios to Average Net Assets: | | | | | | | | | | | | | | | | | | | | |
Expenses After Waivers2,7 | | | 0.71% | | | | 0.76% | | | | 0.76% | | | | 0.70% | | | | 0.75% | |
Expenses Before Waivers7 | | | 0.71% | | | | 0.77% | | | | 0.76% | | | | 0.70% | | | | 0.75% | |
Net Investment Income After Waivers2 | | | 2.68% | | | | 3.51% | | | | 3.51% | | | | 2.39% | | | | 2.21% | |
Net Investment Income Before Waivers | | | 2.68% | | | | 3.50% | | | | 3.51% | | | | 2.39% | | | | 2.21% | |
| Supplementary Data: | | | | | | | | | | | | | | | | | | | | |
Portfolio Turnover Rate | | | 17% | | | | 16% | | | | 26% | | | | 27% | | | | 22% | |
Net Assets at End of Year (in thousands) | | $ | 433,782 | | | $ | 244,041 | | | $ | 193,679 | | | $ | 198,569 | | | $ | 285,951 | |
| 1 | | Calculated based on shares outstanding on the first and last day of the respective periods, except for dividends and distributions, if any, which are based on the actual shares outstanding on the dates of distributions. |
| 2 | | Reflects fees waived by FBR Fund Advisers, Inc. pursuant to a contractual expense limitation of 0.85% (excluding interest, taxes, brokerage commissions, dividend expenses, acquired fund fees and expenses, extraordinary legal expenses, or any other extraordinary expenses) and effective May 30, 2008, the recoupment of certain previously waived fees. |
| 3 | | The amounts shown for a share outstanding throughout the respective periods may not be in accordance with the changes in the aggregate gains and losses on investments during the respective periods because of the timing of sales and repurchases of Fund shares in relation to fluctuating net asset values during the respective periods. |
| 4 | | Calculated based on average shares outstanding. |
| 5 | | Less than $0.01 |
| 6 | | Total investment return is calculated assuming a purchase of shares on the first day and a sale on the last day of each period reported and will include reinvestment of dividends and distributions, if any. |
| 7 | | Does not include expenses of the funds in which the Fund invests. |
111
| The FBR Funds |
|
| Financial Highlights (continued) |
| | | FBR Balanced Fund — Investor Class | |
| | |
| |
| | | | | | | For the | | | | | | | | | | | | | | | | | |
| | | For the | | | Period | | | | | | | | | | | | | | | | | |
| | | Year | | | April 1, | | | | | | | | | | | | | | | | | |
| | | Ended | | | 2010 to | | | For the Years Ended March 31, | |
| | | October 31, | | | October 31, | | |
| |
| | | 2011 | | | 20101 | | | 2010 | | | 2009 | | | 2008 | | | 2007 | |
| | |
| | |
| | |
| | |
| | |
| | |
| |
| Per Share Operating Performance: | | | | | | | | | | | | | | | | | | | | | | | | |
Net Asset Value – Beginning of Period | | $ | 11.93 | | | $ | 11.52 | | | $ | 8.92 | | | $ | 12.27 | | | $ | 14.48 | | | $ | 13.48 | |
| | |
| | |
| | |
| | |
| | |
| | |
| |
Income (Loss) from Investment Operations: | | | | | | | | | | | | | | | | | | | | | | | | |
Net Investment Income2 | | | 0.29 | 3 | | | 0.17 | 3 | | | 0.29 | | | | 0.32 | | | | 0.39 | | | | 0.36 | |
Net Realized and Unrealized Gain (Loss) on Investments2,4 | | | 1.04 | | | | 0.40 | | | | 2.61 | | | | (3.23 | ) | | | 0.34 | | | | 1.13 | |
| | |
| | |
| | |
| | |
| | |
| | |
| |
Total from Investment Operations | | | 1.33 | | | | 0.57 | | | | 2.90 | | | | (2.91 | ) | | | 0.73 | | | | 1.49 | |
| | |
| | |
| | |
| | |
| | |
| | |
| |
Distributions to Shareholders: | | | | | | | | | | | | | | | | | | | | | | | | |
From Net Investment Income | | | (0.27 | ) | | | (0.16 | ) | | | (0.30 | ) | | | (0.25 | ) | | | (0.37 | ) | | | (0.33 | ) |
From Net Realized Gain | | | — | | | | — | | | | — | | | | (0.17 | ) | | | (2.57 | ) | | | (0.16 | ) |
Return of Capital | | | — | | | | — | | | | — | | | | (0.03 | ) | | | — | | | | — | |
| | |
| | |
| | |
| | |
| | |
| | |
| |
Total Distributions | | | (0.27 | ) | | | (0.16 | ) | | | (0.30 | ) | | | (0.45 | ) | | | (2.94 | ) | | | (0.49 | ) |
| | |
| | |
| | |
| | |
| | |
| | |
| |
Paid-in Capital from Redemption Fees2 | | | 0.00 | 5 | | | 0.00 | 5 | | | 0.00 | 5 | | | 0.01 | | | | — | | | | — | |
| | |
| | |
| | |
| | |
| | |
| | |
| |
Net Increase (Decrease) in Net Asset Value | | | 1.06 | | | | 0.41 | | | | 2.60 | | | | (3.35 | ) | | | (2.21 | ) | | | 1.00 | |
| | |
| | |
| | |
| | |
| | |
| | |
| |
Net Asset Value – End of Period | | $ | 12.99 | | | $ | 11.93 | | | $ | 11.52 | | | $ | 8.92 | | | $ | 12.27 | | | $ | 14.48 | |
| | |
| | |
| | |
| | |
| | |
| | |
| |
| Total Investment Return6 | | | 11.30% | | | | 5.04% | (A) | | | 32.76% | | | | (24.28 | )% | | | 4.45% | | | | 11.19% | |
| Ratios to Average Net Assets: | | | | | | | | | | | | | | | | | | | | | | | | |
Expenses After Waivers and Related Reimbursements7 | | | 1.24% | 3 | | | 1.24%3 | (B) | | | 1.25% | | | | 1.32% | | | | 1.33% | | | | 1.33% | |
Expenses Before Waivers and Related Reimbursements7 | | | 1.54% | 3 | | | 1.60%3 | (B) | | | 1.69% | | | | 1.84% | | | | 1.66% | | | | 1.51% | |
Net Investment Income After Waivers and Related Reimbursements | | | 2.33% | | | | 2.56% | (B) | | | 2.70% | | | | 3.03% | | | | 2.75% | | | | 2.52% | |
Net Investment Income Before Waivers and Related Reimbursements | | | 2.03% | | | | 2.21% | (B) | | | 2.26% | | | | 2.50% | | | | 2.42% | | | | 2.34% | |
| Supplementary Data: | | | | | | | | | | | | | | | | | | | | | | | | |
Portfolio Turnover Rate | | | 35% | | | | 27% | (A) | | | 26% | | | | 32% | | | | 110% | | | | 28% | |
Net Assets at End of Period (in thousands) | | $ | 56,750 | | | $ | 41,499 | | | $ | 46,809 | | | $ | 18,858 | | | $ | 21,700 | | | $ | 24,260 | |
| 1 | | The Fund changed its fiscal year end from March 31 to October 31. |
| 2 | | Calculated based on average shares outstanding. |
| 3 | | Reflects fees waived by FBR Fund Advisers, Inc. pursuant to a contractual expense limitation of 1.08% (excluding brokerage costs, interest, taxes, acquired fund fees and expenses, dividend expenses,12b-1 fees and extraordinary expenses) and the recoupment of certain previously waived fees. Also reflects fees voluntarily waived by FBR Fund Advisers, Inc. to an expense limitation of 0.99% (excluding brokerage costs, interest, taxes, acquired fund fees and expenses, dividend expenses, 12b-1 fees and extraordinary expenses) and the recoupment of certain previously waived fees. |
| 4 | | The amounts shown for a share outstanding throughout the period may not be in accordance with the changes in the aggregate gains and losses on investments during the period because of the timing of sales and repurchases of Fund shares in relation to fluctuating net asset values during the period. |
| 5 | | Less than $0.01 |
| 6 | | Total investment return is calculated assuming a purchase of shares on the first day and a sale on the last day of each period reported and will include reinvestment of dividends and distributions, if any. |
| 7 | | Does not include expenses of the funds in which the Fund invests. |
| (A) | | Not Annualized |
| (B) | | Annualized |
112
| The FBR Funds |
|
| Financial Highlights (continued) |
| | | FBR Balanced Fund — Institutional Class | |
| | |
| |
| | | | | | | For the | | | | | | | | | | | | | | | | | |
| | | For the | | | Period | | | | | | | | | | | | | | | | | |
| | | Year | | | April 1, | | | | | | | | | | | | | | | | | |
| | | Ended | | | 2010 to | | | For the Years Ended March 31, | |
| | | October 31, | | | October 31, | | |
| |
| | | 2011 | | | 20101 | | | 2010 | | | 2009 | | | 2008 | | | 2007 | |
| | |
| | |
| | |
| | |
| | |
| | |
| |
| Per Share Operating Performance: | | | | | | | | | | | | | | | | | | | | | | | | |
Net Asset Value – Beginning of Period | | $ | 11.38 | | | $ | 10.99 | | | $ | 8.52 | | | $ | 11.75 | | | $ | 13.98 | | | $ | 13.04 | |
| | |
| | |
| | |
| | |
| | |
| | |
| |
Income (Loss) from Investment Operations: | | | | | | | | | | | | | | | | | | | | | | | | |
Net Investment Income2 | | | 0.32 | 3 | | | 0.18 | 3 | | | 0.30 | | | | 0.33 | | | | 0.42 | | | | 0.38 | |
Net Realized and Unrealized Gain (Loss) on Investments2,4 | | | 0.99 | | | | 0.38 | | | | 2.50 | | | | (3.10 | ) | | | 0.33 | | | | 1.10 | |
| | |
| | |
| | |
| | |
| | |
| | |
| |
Total from Investment Operations | | | 1.31 | | | | 0.56 | | | | 2.80 | | | | (2.77 | ) | | | 0.75 | | | | 1.48 | |
| | |
| | |
| | |
| | |
| | |
| | |
| |
Distributions to Shareholders: | | | | | | | | | | | | | | | | | | | | | | | | |
From Net Investment Income | | | (0.31 | ) | | | (0.17 | ) | | | (0.33 | ) | | | (0.26 | ) | | | (0.41 | ) | | | (0.38 | ) |
From Net Realized Gain | | | — | | | | — | | | | — | | | | (0.17 | ) | | | (2.57 | ) | | | (0.16 | ) |
Return of Capital | | | — | | | | — | | | | — | | | | (0.04 | ) | | | — | | | | — | |
| | |
| | |
| | |
| | |
| | |
| | |
| |
Total Distributions | | | (0.31 | ) | | | (0.17 | ) | | | (0.33 | ) | | | (0.47 | ) | | | (2.98 | ) | | | (0.54 | ) |
| | |
| | |
| | |
| | |
| | |
| | |
| |
Paid-in Capital from Redemption Fees2 | | | 0.00 | 5 | | | 0.00 | 5 | | | 0.00 | 5 | | | 0.01 | | | | — | | | | — | |
| | |
| | |
| | |
| | |
| | |
| | |
| |
Net Increase (Decrease) in Net Asset Value | | | 1.00 | | | | 0.39 | | | | 2.47 | | | | (3.23 | ) | | | (2.23 | ) | | | 0.94 | |
| | |
| | |
| | |
| | |
| | |
| | |
| |
Net Asset Value – End of Period | | $ | 12.38 | | | $ | 11.38 | | | $ | 10.99 | | | $ | 8.52 | | | $ | 11.75 | | | $ | 13.98 | |
| | |
| | |
| | |
| | |
| | |
| | |
| |
| Total Investment Return6 | | | 11.62% | | | | 5.19% | (A) | | | 33.10% | | | | (24.13 | )% | | | 4.75% | | | | 11.47% | |
| Ratios to Average Net Assets: | | | | | | | | | | | | | | | | | | | | | | | | |
Expenses After Waivers and Related Reimbursements7 | | | 0.99% | 3 | | | 0.99%3 | (B) | | | 0.99% | | | | 1.07% | | | | 1.08% | | | | 1.08% | |
Expenses Before Waivers and Related Reimbursements7 | | | 1.12% | 3 | | | 1.20%3 | (B) | | | 1.43% | | | | 1.58% | | | | 1.41% | | | | 1.25% | |
Net Investment Income After Waivers and Related Reimbursements | | | 2.69% | | | | 2.82% | (B) | | | 3.01% | | | | 3.24% | | | | 3.00% | | | | 2.76% | |
Net Investment Income Before Waivers and Related Reimbursements | | | 2.56% | | | | 2.60% | (B) | | | 2.57% | | | | 2.73% | | | | 2.67% | | | | 2.59% | |
| Supplementary Data: | | | | | | | | | | | | | | | | | | | | | | | | |
Portfolio Turnover Rate | | | 35% | | | | 27% | (A) | | | 26% | | | | 32% | | | | 110% | | | | 28% | |
Net Assets at End of Period (in thousands) | | $ | 55,283 | | | $ | 42,169 | | | $ | 39,403 | | | $ | 31,127 | | | $ | 41,206 | | | $ | 47,390 | |
| 1 | | The Fund changed its fiscal year end from March 31 to October 31. |
| 2 | | Calculated based on average shares outstanding. |
| 3 | | Reflects fees waived by FBR Fund Advisers, Inc. pursuant to a contractual expense limitation of 1.08% (excluding brokerage costs, interest, taxes, acquired fund fees and expenses, dividend expenses,12b-1 fees and extraordinary expenses) and the recoupment of certain previously waived fees. Also reflects fees voluntarily waived by FBR Fund Advisers, Inc. to an expense limitation of 0.99% (excluding brokerage costs, interest, taxes, acquired fund fees and expenses, dividend expenses, 12b-1 fees and extraordinary expenses) and the recoupment of certain previously waived fees. |
| 4 | | The amounts shown for a share outstanding throughout the period may not be in accordance with the changes in the aggregate gains and losses on investments during the period because of the timing of sales and repurchases of Fund shares in relation to fluctuating net asset values during the period. |
| 5 | | Less than $0.01 |
| 6 | | Total investment return is calculated assuming a purchase of shares on the first day and a sale on the last day of each period reported and will include reinvestment of dividends and distributions, if any. |
| 7 | | Does not include expenses of the funds in which the Fund invests. |
| (A) | | Not Annualized |
| (B) | | Annualized |
113
| The FBR Funds |
|
| Financial Highlights (continued) |
| | | FBR Core Bond Fund — Investor Class | |
| | |
| |
| | | | | | | For the | | | | | | | | | | | | | | | | |
| | | For the | | Period | | | | | | | | | | | | | | | | |
| | | Year | | April 1, | | | | | | | | | | | | | | | | |
| | | Ended | | 2010 to | | For the Years Ended March 31, | |
| | | October 31, | | October 31, | |
| |
| | | 2011 | | 20101 | | 2010 | | | 2009 | | | 2008 | | | 2007 | |
| | |
| | |
| | |
| | |
| | |
| | |
| |
| Per Share Operating Performance: | | | | | | | | | | | | | | | | | | | | | | | | |
Net Asset Value – Beginning of Period | | $ | 9.82 | | | $ | 9.39 | | | $ | 8.75 | | | $ | 9.16 | | | $ | 9.71 | | | $ | 9.77 | |
| | |
| | |
| | |
| | |
| | |
| | |
| |
Income (Loss) from Investment Operations: | | | | | | | | | | | | | | | | | | | | | | | | |
Net Investment Income2 | | | 0.35 | 3 | | | 0.23 | 3 | | | 0.38 | | | | 0.35 | | | | 0.42 | | | | 0.50 | |
Net Realized and Unrealized Gain (Loss) on Investments2,4 | | | (0.14 | ) | | | 0.42 | | | | 0.69 | | | | (0.44 | ) | | | — | | | | 0.05 | |
| | |
| | |
| | |
| | |
| | |
| | |
| |
Total from Investment Operations | | | 0.21 | | | | 0.65 | | | | 1.07 | | | | (0.09 | ) | | | 0.42 | | | | 0.55 | |
| | |
| | |
| | |
| | |
| | |
| | |
| |
Distributions to Shareholders: | | | | | | | | | | | | | | | | | | | | | | | | |
From Net Investment Income | | | (0.32 | ) | | | (0.22 | ) | | | (0.38 | ) | | | (0.32 | ) | | | (0.39 | ) | | | (0.51 | ) |
From Net Realized Gain | | | (0.15 | ) | | | — | | | | (0.05 | ) | | | — | | | | (0.58 | ) | | | (0.10 | ) |
| | |
| | |
| | |
| | |
| | |
| | |
| |
Total Distributions | | | (0.47 | ) | | | (0.22 | ) | | | (0.43 | ) | | | (0.32 | ) | | | (0.97 | ) | | | (0.61 | ) |
| | |
| | |
| | |
| | |
| | |
| | |
| |
Paid-in Capital from Redemption Fees2 | | | 0.00 | 5 | | | 0.00 | 5 | | | 0.00 | 5 | | | 0.00 | 5 | | | — | | | | — | |
| | |
| | |
| | |
| | |
| | |
| | |
| |
Net Increase (Decrease) in Net Asset Value | | | (0.26 | ) | | | 0.43 | | | | 0.64 | | | | (0.41 | ) | | | (0.55 | ) | | | (0.06 | ) |
| | |
| | |
| | |
| | |
| | |
| | |
| |
Net Asset Value – End of Period | | $ | 9.56 | | | $ | 9.82 | | | $ | 9.39 | | | $ | 8.75 | | | $ | 9.16 | | | $ | 9.71 | |
| | |
| | |
| | |
| | |
| | |
| | |
| |
| | | | | | | | | | | | | | | | | | | | | | | | | |
| Total Investment Return6 | | | 2.35% | | | | 6.98% | (A) | | | 12.33% | | | | (0.93 | )% | | | 4.48% | | | | 5.87% | |
| Ratios to Average Net Assets: | | | | | | | | | | | | | | | | | | | | | | | | |
Expenses After Waivers and Related Reimbursements7 | | | 1.30% | 3 | | | 1.30%3 | (B) | | | 1.31% | | | | 1.33% | | | | 1.33% | | | | 1.33% | |
Expenses Before Waivers and Related Reimbursements7 | | | 2.38% | 3 | | | 2.10%3 | (B) | | | 1.93% | | | | 2.14% | | | | 2.19% | | | | 1.97% | |
Net Investment Income After Waivers and Related Reimbursements | | | 3.66% | | | | 4.17% | (B) | | | 4.11% | | | | 4.02% | | | | 4.40% | | | | 5.18% | |
Net Investment Income Before Waivers and Related Reimbursements | | | 2.58% | | | | 3.37% | (B) | | | 3.49% | | | | 3.21% | | | | 3.53% | | | | 4.54% | |
| Supplementary Data: | | | | | | | | | | | | | | | | | | | | | | | | |
Portfolio Turnover Rate | | | 57% | | | | 46% | (A) | | | 28% | | | | 39% | | | | 102% | | | | 10% | |
Net Assets at End of Period (in thousands) | | $ | 4,047 | | | $ | 4,445 | | | $ | 4,615 | | | $ | 2,055 | | | $ | 2,030 | | | $ | 4,011 | |
| 1 | | The Fund changed its fiscal year end from March 31 to October 31. |
| 2 | | Calculated based on average shares outstanding. |
| 3 | | Reflects fees waived by FBR Fund Advisers, Inc. pursuant to a contractual expense limitation of 1.05% (excluding brokerage costs, interest, taxes, acquired fund fees and expenses, dividend expenses,12b-1 fees and extraordinary expenses) and the recoupment of certain previously waived fees. |
| 4 | | The amounts shown for a share outstanding throughout the period may not be in accordance with the changes in the aggregate gains and losses on investments during the period because of the timing of sales and repurchases of Fund shares in relation to fluctuating net asset values during the period. |
| 5 | | Less than $0.01 |
| 6 | | Total investment return is calculated assuming a purchase of shares on the first day and a sale on the last day of each period reported and will include reinvestment of dividends and distributions, if any. |
| 7 | | Does not include expenses of the funds in which the Fund invests. |
| (A) | | Not Annualized |
| (B) | | Annualized |
114
| The FBR Funds |
|
| Financial Highlights (continued) |
| | | FBR Core Bond Fund — Institutional Class | |
| | |
| |
| | | | | | | For the | | | | | | | | | | | | | | | | | |
| | | For the | | | Period | | | | | | | | | | | | | | | | | |
| | | Year | | | April 1, | | | | | | | | | | | | | | | | | |
| | | Ended | | | 2010 to | | | For the Years Ended March 31, | |
| | | October 31, | | | October 31, | | |
| |
| | | 2011 | | | 20101 | | | 2010 | | | 2009 | | | 2008 | | | 2007 | |
| | |
| | |
| | |
| | |
| | |
| | |
| |
| Per Share Operating Performance: | | | | | | | | | | | | | | | | | | | | | | | | |
Net Asset Value – Beginning of Period | | $ | 9.05 | | | $ | 8.67 | | | $ | 8.11 | | | $ | 8.52 | | | $ | 9.10 | | | $ | 9.15 | |
| | |
| | |
| | |
| | |
| | |
| | |
| |
Income (Loss) from Investment Operations: | | | | | | | | | | | | | | | | | | | | | | | | |
Net Investment Income2 | | | 0.34 | 3 | | | 0.23 | 3 | | | 0.37 | | | | 0.35 | | | | 0.39 | | | | 0.49 | |
Net Realized and Unrealized Gain (Loss) on Investments2,4 | | | (0.12 | ) | | | 0.38 | | | | 0.64 | | | | (0.42 | ) | | | 0.03 | | | | 0.05 | |
| | |
| | |
| | |
| | |
| | |
| | |
| |
Total from Investment Operations | | | 0.22 | | | | 0.61 | | | | 1.01 | | | | (0.07 | ) | | | 0.42 | | | | 0.54 | |
| | |
| | |
| | |
| | |
| | |
| | |
| |
Distributions to Shareholders: | | | | | | | | | | | | | | | | | | | | | | | | |
From Net Investment Income | | | (0.35 | ) | | | (0.23 | ) | | | (0.40 | ) | | | (0.34 | ) | | | (0.42 | ) | | | (0.49 | ) |
From Net Realized Gain | | | (0.15 | ) | | | — | | | | (0.05 | ) | | | — | | | | (0.58 | ) | | | (0.10 | ) |
| | |
| | |
| | |
| | |
| | |
| | |
| |
Total Distributions | | | (0.50 | ) | | | (0.23 | ) | | | (0.45 | ) | | | (0.34 | ) | | | (1.00 | ) | | | (0.59 | ) |
| | |
| | |
| | |
| | |
| | |
| | |
| |
Paid-in Capital from Redemption Fees2 | | | 0.00 | 5 | | | 0.00 | 5 | | | 0.00 | 5 | | | 0.00 | 5 | | | — | | | | — | |
| | |
| | |
| | |
| | |
| | |
| | |
| |
Net Increase (Decrease) in Net Asset Value | | | (0.28 | ) | | | 0.38 | | | | 0.56 | | | | (0.41 | ) | | | (0.58 | ) | | | (0.05 | ) |
| | |
| | |
| | |
| | |
| | |
| | |
| |
Net Asset Value – End of Period | | $ | 8.77 | | | $ | 9.05 | | | $ | 8.67 | | | $ | 8.11 | | | $ | 8.52 | | | $ | 9.10 | |
| | |
| | |
| | |
| | |
| | |
| | |
| |
| Total Investment Return6 | | | 2.62% | | | | 7.15% | (A) | | | 12.62% | | | | (0.74 | )% | | | 4.78% | | | | 6.11% | |
| Ratios to Average Net Assets: | | | | | | | | | | | | | | | | | | | | | | | | |
Expenses After Waivers and Related Reimbursements7 | | | 1.05% | | | | 1.05% | (B) | | | 1.06% | | | | 1.08% | | | | 1.08% | | | | 1.08% | |
Expenses Before Waivers and Related Reimbursements7 | | | 1.43% | | | | 1.47% | (B) | | | 1.69% | | | | 1.89% | | | | 1.94% | | | | 1.72% | |
Net Investment Income After Waivers and Related Reimbursements | | | 3.92% | | | | 4.41% | (B) | | | 4.37% | | | | 4.27% | | | | 4.46% | | | | 5.44% | |
Net Investment Income Before Waivers and Related Reimbursements | | | 3.54% | | | | 4.00% | (B) | | | 3.74% | | | | 3.46% | | | | 3.60% | | | | 4.80% | |
| Supplementary Data: | | | | | | | | | | | | | | | | | | | | | | | | |
Portfolio Turnover Rate | | | 57% | | | | 46% | (A) | | | 28% | | | | 39% | | | | 102% | | | | 10% | |
Net Assets at End of Period (in thousands) | | $ | 23,247 | | | $ | 24,248 | | | $ | 23,885 | | | $ | 22,053 | | | $ | 21,953 | | | $ | 13,234 | |
| 1 | | The Fund changed its fiscal year end from March 31 to October 31. |
| 2 | | Calculated based on average shares outstanding. |
| 3 | | Reflects fees waived by FBR Fund Advisers, Inc. pursuant to a contractual expense limitation of 1.05% (excluding brokerage costs, interest, taxes, acquired fund fees and expenses, dividend expenses,12b-1 fees and extraordinary expenses) and the recoupment of certain previously waived fees. |
| 4 | | The amounts shown for a share outstanding throughout the period may not be in accordance with the changes in the aggregate gains and losses on investments during the period because of the timing of sales and repurchases of Fund shares in relation to fluctuating net asset values during the period. |
| 5 | | Less than $0.01 |
| 6 | | Total investment return is calculated assuming a purchase of shares on the first day and a sale on the last day of each period reported and will include reinvestment of dividends and distributions, if any. |
| 7 | | Does not include expenses of the funds in which the Fund invests. |
| (A) | | Not Annualized |
| (B) | | Annualized |
115
The FBR Funds
Schedule of Shareholder Expenses
(unaudited)
As a shareholder of the Funds, you incur two types of costs: (1) transaction costs, including reinvested dividends or other distributions; redemption fees; and exchange fees; and (2) ongoing costs, including investment advisory fees; distribution (12b-1) fees; and other Fund expenses. This example is intended to help you understand your ongoing costs (in dollars) of investing in the Funds and to compare these costs with the ongoing costs of investing in other mutual funds.
The example is based on an investment of $1,000 invested at the beginning of the period and held for the entire period (May 1, 2011 through October 31, 2011).
Actual Expenses
The table on the following page provides information about actual account values and actual expenses. You may use the information in this line, together with the amount you invested, to estimate the expenses that you paid over the period. Simply divide your account value by $1,000 (for example, an $8,600 account value divided by $1,000 = 8.6), then multiply the result by the number in the first line under the heading entitled “Expenses Paid During the year ended October 31, 2011” to estimate the expenses you paid on your account during this period.
116
The FBR Funds
Schedule of Shareholder Expenses (contined)
(unaudited)
| | | | | | | | | | | | | | | | | | Expenses Paid |
| | | Net Expense | | Beginning | | Ending | | During the |
| | | Ratio | | Account | | Account | | Six Months |
| | | Annualized | | Value | | Value | | Ended |
| | | October 31, 2011 | | May 1, 2011 | | October 31, 2011 | | October 31, 2011* |
| | |
| |
| |
| |
|
| Large Cap Fund | | | | | | | | | | | | | | | | | | | | |
Investor Class | | | 1.25 | % | | | | $ | 1,000.00 | | | | $ | 911.80 | | | | $ | 6.02 | |
Institutional Class | | | 1.00 | | | | | | 1,000.00 | | | | | 912.90 | | | | | 4.82 | |
| Mid Cap Fund | | | | | | | | | | | | | | | | | | | | |
Investor Class | | | 1.35 | | | | | | 1,000.00 | | | | | 912.80 | | | | | 6.51 | |
Institutional Class | | | 1.10 | | | | | | 1,000.00 | | | | | 913.30 | | | | | 5.30 | |
| Small Cap Fund | | | | | | | | | | | | | | | | | | | | |
Investor Class | | | 1.45 | | | | | | 1,000.00 | | | | | 880.10 | | | | | 6.87 | |
Institutional Class | | | 1.20 | | | | | | 1,000.00 | | | | | 881.00 | | | | | 5.69 | |
| Focus Fund | | | | | | | | | | | | | | | | | | | | |
Investor Class | | | 1.45 | | | | | | 1,000.00 | | | | | 969.60 | | | | | 7.20 | |
Institutional Class | | | 1.17 | | | | | | 1,000.00 | | | | | 970.90 | | | | | 5.81 | |
| Large Cap Financial Fund | | | | | | | | | | | | | | | | | | | | |
Investor Class | | | 1.65 | | | | | | 1,000.00 | | | | | 845.30 | | | | | 7.67 | |
| Small Cap Financial Fund | | | | | | | | | | | | | | | | | | | | |
Investor Class | | | 1.56 | | | | | | 1,000.00 | | | | | 806.70 | | | | | 7.10 | |
Institutional Class | | | 1.45 | | | | | | 1,000.00 | | | | | 807.20 | | | | | 6.60 | |
| Technology Fund | | | | | | | | | | | | | | | | | | | | |
Investor Class | | | 1.95 | | | | | | 1,000.00 | | | | | 876.50 | | | | | 9.22 | |
Institutional Class | | | 1.70 | | | | | | 1,000.00 | | | | | 876.80 | | | | | 8.04 | |
| Gas Utility Index Fund | | | | | | | | | | | | | | | | | | | | |
Investor Class | | | 0.68 | | | | | | 1,000.00 | | | | | 1,055.60 | | | | | 3.52 | |
| Balanced Fund | | | | | | | | | | | | | | | | | | | | |
Investor Class | | | 1.24 | | | | | | 1,000.00 | | | | | 1,008.50 | | | | | 6.28 | |
Institutional Class | | | 0.99 | | | | | | 1,000.00 | | | | | 1,010.40 | | | | | 5.02 | |
| Core Bond Fund | | | | | | | | | | | | | | | | | | | | |
Investor Class | | | 1.30 | | | | | | 1,000.00 | | | | | 1,022.00 | | | | | 6.63 | |
Institutional Class | | | 1.05 | | | | | | 1,000.00 | | | | | 1,023.30 | | | | | 5.35 | |
| * | Expenses are equal to the Fund’s annualized expense ratio, multiplied by the average account value over the period, multiplied by the number of days in most recent fiscal half-year then divided by 365. |
117
The FBR Funds
Schedule of Shareholder Expenses (contined)
(unaudited)
Hypothetical Example for Comparison Purposes
The table on the following page provides information about hypothetical account values and hypothetical expenses based on the Funds’ actual expense ratio and an assumed rate of return of 5% per year before expenses, which was not the Funds’ actual return. The hypothetical account values and expenses may not be used to estimate the actual ending account balance or expenses you paid for the period. You may use this information to compare the ongoing costs of investing in the Funds and other funds. To do so, compare this 5% hypothetical example with the 5% hypothetical examples that appear in the shareholder reports of the other funds.
118
The FBR Funds
Schedule of Shareholder Expenses (contined)
(unaudited)
| | | | | | | | | | | | | | | | | | Expenses Paid |
| | | Net Expense | | Beginning | | Ending | | During the |
| | | Ratio | | Account | | Account | | Six Months |
| | | Annualized | | Value | | Value | | Ended |
| | | October 31, 2011 | | May 1, 2011 | | October 31, 2011 | | October 31, 2011* |
| | |
| |
| |
| |
|
| Large Cap Fund | | | | | | | | | | | | | | | | | | | | |
Investor Class | | | 1.25 | % | | | | $ | 1,000.00 | | | | $ | 1,018.90 | | | | $ | 6.36 | |
Institutional Class | | | 1.00 | | | | | | 1,000.00 | | | | | 1,020.16 | | | | | 5.09 | |
| Mid Cap Fund | | | | | | | | | | | | | | | | | | | | |
Investor Class | | | 1.35 | | | | | | 1,000.00 | | | | | 1,018.40 | | | | | 6.87 | |
Institutional Class | | | 1.10 | | | | | | 1,000.00 | | | | | 1,019.66 | | | | | 5.60 | |
| Small Cap Fund | | | | | | | | | | | | | | | | | | | | |
Investor Class | | | 1.45 | | | | | | 1,000.00 | | | | | 1,017.90 | | | | | 7.37 | |
Institutional Class | | | 1.20 | | | | | | 1,000.00 | | | | | 1,019.16 | | | | | 6.11 | |
| Focus Fund | | | | | | | | | | | | | | | | | | | | |
Investor Class | | | 1.45 | | | | | | 1,000.00 | | | | | 1,017.90 | | | | | 7.37 | |
Institutional Class | | | 1.17 | | | | | | 1,000.00 | | | | | 1,019.31 | | | | | 5.96 | |
| Large Cap Financial Fund | | | | | | | | | | | | | | | | | | | | |
Investor Class | | | 1.65 | | | | | | 1,000.00 | | | | | 1,016.89 | | | | | 8.39 | |
| Small Cap Financial Fund | | | | | | | | | | | | | | | | | | | | |
Investor Class | | | 1.56 | | | | | | 1,000.00 | | | | | 1,017.34 | | | | | 7.93 | |
Institutional Class | | | 1.45 | | | | | | 1,000.00 | | | | | 1,017.90 | | | | | 7.37 | |
| Technology Fund | | | | | | | | | | | | | | | | | | | | |
Investor Class | | | 1.95 | | | | | | 1,000.00 | | | | | 1,015.38 | | | | | 9.91 | |
Institutional Class | | | 1.70 | | | | | | 1,000.00 | | | | | 1,016.64 | | | | | 8.64 | |
| Gas Utility Index Fund | | | | | | | | | | | | | | | | | | | | |
Investor Class | | | 0.68 | | | | | | 1,000.00 | | | | | 1,021.78 | | | | | 3.47 | |
| Balanced Fund | | | | | | | | | | | | | | | | | | | | |
Investor Class | | | 1.24 | | | | | | 1,000.00 | | | | | 1,018.95 | | | | | 6.31 | |
Institutional Class | | | 0.99 | | | | | | 1,000.00 | | | | | 1,020.21 | | | | | 5.04 | |
| Core Bond Fund | | | | | | | | | | | | | | | | | | | | |
Investor Class | | | 1.30 | | | | | | 1,000.00 | | | | | 1,018.65 | | | | | 6.61 | |
Institutional Class | | | 1.05 | | | | | | 1,000.00 | | | | | 1019.91 | | | | | 5.35 | |
| * | Expenses are equal to the Fund’s annualized expense ratio, multiplied by the average account value over the period, multiplied by the number of days in most recent fiscal half-year then divided by 365. |
119
The FBR Funds
Notes to Financial Statements
1. Organization
The FBR Funds (the “Trust”) is registered under the Investment Company Act of 1940, as amended (“1940 Act”), as an open-end management investment company. The Trust was organized as a statutory trust under the laws of the State of Delaware on September 29, 2003. The Trust currently consists of the following ten series: FBR Large Cap Fund (“Large Cap Fund”), FBR Mid Cap Fund (“Mid Cap Fund”), FBR Small Cap Fund (“Small Cap Fund”), FBR Focus Fund (“Focus Fund”), FBR Large Cap Financial Fund (“Large Cap Financial Fund”), FBR Small Cap Financial Fund (“Small Cap Financial Fund”), FBR Technology Fund (“Technology Fund”), FBR Gas Utility Index Fund (“Gas Utility Index Fund”), FBR Balanced Fund (“Balanced Fund”) and FBR Core Bond Fund (“Core Bond Fund”) (each a “Fund” and collectively, the “Funds”). The Trust is authorized to issue an unlimited number of shares of beneficial interest with no par value which may be issued in more than one class or series. The Institutional Class (formerly, I Class) shares are intended for institutional investors. In all Funds, except the Balanced Fund and Core Bond Fund, the initial class of shares is now referred to as Investor Class.
The Large Cap Fund, a non-diversified fund, invests, under normal circumstances, at least 80% of its net assets plus the amount of any borrowings for investment purposes in securities of large capitalization (“large-cap”) companies. The investment objective of the Fund is capital appreciation.
The Mid Cap Fund, a non-diversified fund, invests, under normal circumstances, at least 80% of its net assets plus the amount of any borrowings for investment purposes in securities of mid capitalization (“mid-cap”) companies. The investment objective of the Fund is capital appreciation.
The Small Cap Fund, a non-diversified fund, invests, under normal circumstances, at least 80% of its net assets plus the amount of any borrowings for investment purposes in securities of small capitalization (“small-cap”) companies. The investment objective of the Fund is capital appreciation.
The Focus Fund, a non-diversified fund, invests, under normal circumstances, primarily in securities of companies traded in domestic markets. The investment objective of the Fund is capital appreciation.
The Large Cap Financial Fund, a non-diversified fund, invests, under normal circumstances, at least 80% of its net assets plus the amount of any borrowings for investment purposes in securities of large capitalization (“large-cap”) companies principally engaged in the business of financial services including, but not limited to, commercial banks, savings and loan associations, consumer and industrial finance companies, securities brokerage companies, insurance companies, real estate and leasing companies, holding companies for each of the foregoing types of business, or companies that combine some or all of these businesses. The investment objective of the Fund is capital appreciation.
The Small Cap Financial Fund, a non-diversified fund, invests, under normal circumstances, at least 80% of its net assets plus the amount of any borrowings for
120
The FBR Funds
Notes to Financial Statements (continued)
investment purposes in securities of small-cap companies principally engaged in the business of providing financial services to consumers and industry. The investment objective of the Fund is capital appreciation.
The Technology Fund, a non-diversified fund, invests, under normal circumstances, at least 80% of its net assets plus the amount of any borrowings for investment purposes in securities of companies that are principally engaged in the research, design, development, manufacturing or distributing products or services in the technology industry. The investment objective of the Fund is long-term capital appreciation.
The Gas Utility Index Fund, a non-diversified fund, invests, under normal circumstances, at least 85% of its net assets in the common stock of companies that have natural gas distribution and transmission operations. The investment objective of the Fund is income and capital appreciation.
The Balanced Fund, a diversified fund, invests in a blend of domestic common stocks, preferred stocks, convertible securities and core, high quality domestic corporate, agency and government bonds. The investment objective of the Fund is long-term capital growth and current income.
The Core Bond Fund, a diversified fund, invests, under normal circumstances, at least 80% of its net assets in fixed income securities, which include domestic investment grade corporate, agency and governmental bonds. The investment objective of the Fund is current income with capital growth as a secondary objective.
2. Significant Accounting Policies
The following is a summary of the Funds’ significant accounting policies:
Portfolio Valuation — The net asset value per share (“NAV”) of each Fund is determined as of the close of regular trading on the New York Stock Exchange (“NYSE”) (normally 4:00 p.m., Eastern Time) on each business day that the exchange is open for trading. Each Fund’s securities are valued at the last sale price on the securities exchange or national securities market on which such securities are primarily traded. Securities that are quoted by NASDAQ are valued at the NASDAQ Official Closing Price. Securities not listed on an exchange or national securities market, or securities in which there were no transactions, are valued at the average of the most recent bid and ask prices, except in the case of open short positions where the ask price is used for valuation purposes. The bid price is used when no ask price is available. Debt instruments and floating rate loans (other than short-term instruments), including restricted debt instruments, are generally valued at an evaluated or composite bid as provided by a third-party pricing service. Securities and other assets generally valued on the basis of information from a third-party pricing service may also be valued at a broker/dealer bid quotation. Values obtained from third-party pricing services can utilize both transaction data and market information such as yield, quality, coupon rate, maturity, type of issue, trading characteristics, and other market data. Short-term investments are carried at amortized cost, which approximates market value. Restricted securities, as well
121
The FBR Funds
Notes to Financial Statements (continued)
as securities or other assets for which market quotations are not readily available, or are not valued by a pricing service approved by the Funds’ Board of Trustees (the “Board”), are valued at fair value in good faith by, or at the direction of, the Board.
The Funds have adopted FASB 820 “Fair Value Measurements.” This standard establishes a single authoritative definition of fair value sets out a framework for measuring fair value and requires additional disclosures about fair value measurements.
Securities for which quotations are not readily available, are valued at their respective fair values as determined in good faith by the Board. When a security is “fair valued,” consideration is given to the facts and circumstances relevant to the particular situation, including a review of various factors set forth in the pricing procedures adopted by the Board. Fair value pricing is an inherently subjective process, and no single standard exists for determining fair value. Different funds could reasonably arrive at different values for the same security. The use of fair value pricing by a fund may cause the net asset value of its shares to differ significantly from the net asset value that would be calculated without regard to such considerations.
As described above, the Funds utilize various methods to measure the fair value of most of its investments on a recurring basis. U.S. GAAP establishes a hierarchy that prioritizes inputs to valuation methods. The three levels of inputs are:
| | • | Level 1 – Unadjusted quoted prices in active markets for identical assets or liabilities that the Funds have the ability to access. |
| | • | Level 2 – Observable inputs other than quoted prices included in Level 1 that are observable for the asset or liability, either directly or indirectly. These inputs may include quoted prices for the identical instrument on an inactive market, prices for similar instruments, interest rates, prepayment speeds, credit risk curves, default rates and similar data. |
| | • | Level 3 – Unobservable inputs for the asset or liability, to the extent observable inputs are not available, representing the Funds’ own assumptions about the assumptions a market participant would use in valuing the asset or liability, and would be based on the best information available. |
The availability of observable inputs can vary from security to security and is affected by a wide variety of factors, including, for example, the type of security, whether the security is new and not yet established in the market place, the liquidity of markets, and other characteristics particular to the security. To the extent that valuation is based on models or inputs that are less observable or unobservable in the market, the determination of fair value requires more judgment. Accordingly, the degree of judgment exercised in determining fair value is greatest for instruments categorized as Level 3.
The inputs used to measure fair value may fall into different levels of the fair value hierarchy. In such cases, for disclosure purposes, the level in the fair value hierarchy within which the fair value measurement falls in its entirety, is determined based on the lowest level input that is significant to the fair value measurement in its entirety.
122
The FBR Funds
Notes to Financial Statements (continued)
The following is a summary of the inputs used to value the Funds’ net assets as of October 31, 2011:
| | | Level 1 | | Level 2 | | Level 3 | | Total |
| | |
| |
| |
| |
|
| Large Cap Fund | | | | | | | | | | | | |
Common Stocks^ | | $ | 38,078,241 | | $ | — | | $ | — | | $ | 38,078,241 |
Short-Term Investment | | | 1,681,837 | | | — | | | — | | | 1,681,837 |
| | |
| |
| |
| |
|
| Total Investments in Securities | | | 39,760,078 | | | — | | | — | | | 39,760,078 |
| | |
| |
| |
| |
|
| Mid Cap Fund | | | | | | | | | | | | |
Common Stocks^ | | | 17,219,150 | | | — | | | — | | | 17,219,150 |
Short-Term Investment | | | 1,592,751 | | | — | | | — | | | 1,592,751 |
| | |
| |
| |
| |
|
| Total Investments in Securities | | | 18,811,901 | | | — | | | — | | | 18,811,901 |
| | |
| |
| |
| |
|
| Small Cap Fund | | | | | | | | | | | | |
Common Stocks^ | | | 37,969,048 | | | — | | | — | | | 37,969,048 |
Rights | | | — | | | — | | | 5,225 | | | 5,225 |
Short-Term Investment | | | 1,030,168 | | | — | | | — | | | 1,030,168 |
| | |
| |
| |
| |
|
| Total Investments in Securities | | | 38,999,216 | | | — | | | 5,225 | | | 39,004,441 |
| | |
| |
| |
| |
|
| Focus Fund | | | | | | | | | | | | |
Common Stocks^ | | | 620,445,401 | | | — | | | — | | | 620,445,401 |
Short-Term Investment | | | 40,057,250 | | | — | | | — | | | 40,057,250 |
| | |
| |
| |
| |
|
| Total Investments in Securities | | | 660,502,651 | | | — | | | — | | | 660,502,651 |
| | |
| |
| |
| |
|
| Large Cap Financial Fund | | | | | | | | | | | | |
Common Stocks^ | | | 53,397,340 | | | — | | | — | | | 53,397,340 |
Short-Term Investment | | | 2,227,955 | | | — | | | — | | | 2,227,955 |
| | |
| |
| |
| |
|
| Total Investments in Securities | | | 55,625,295 | | | — | | | — | | | 55,625,295 |
| | |
| |
| |
| |
|
| Small Cap Financial Fund | | | | | | | | | | | | |
Common Stocks^ | | | 154,607,364 | | | — | | | — | | | 154,607,364 |
Investment Companies | | | 7,031,500 | | | — | | | — | | | 7,031,500 |
Short-Term Investment | | | 12,691,744 | | | — | | | — | | | 12,691,744 |
| | |
| |
| |
| |
|
| Total Investments in Securities | | | 174,330,608 | | | — | | | — | | | 174,330,608 |
| | |
| |
| |
| |
|
| Technology Fund | | | | | | | | | | | | |
Common Stocks^ | | | 6,532,833 | | | — | | | — | | | 6,532,833 |
Short-Term Investment | | | 348,846 | | | — | | | — | | | 348,846 |
| | |
| |
| |
| |
|
| Total Investments in Securities | | $ | 6,881,679 | | | — | | | — | | $ | 6,881,679 |
| | |
| |
| |
| |
|
123
The FBR Funds
Notes to Financial Statements (continued)
| | | Level 1 | | Level 2 | | Level 3 | | Total |
| | |
| |
| |
| |
|
| Gas Utility Index Fund | | | | | | | | | | | | |
Common Stocks^ | | $ | 415,991,359 | | $ | — | | $ | — | | $ | 415,991,359 |
Short-Term Investment | | | 13,361,801 | | | — | | | — | | | 13,361,801 |
| | |
| |
| |
| |
|
| Total Investments in Securities | | | 429,353,160 | | | — | | | — | | | 429,353,160 |
| | |
| |
| |
| |
|
| Balanced Fund | | | | | | | | | | | | |
Common Stocks^ | | | 68,981,905 | | | — | | | — | | | 68,981,905 |
Corporate Bonds | | | — | | | 20,803,625 | | | — | | | 20,803,625 |
Investment Companies | | | 2,394,452 | | | — | | | — | | | 2,394,452 |
Preferred Stocks | | | 26,656 | | | — | | | — | | | 26,656 |
Short-Term Investment | | | 2,317,550 | | | — | | | — | | | 2,317,550 |
U.S. Government Agency Obligations | | | — | | | 3,739,454 | | | — | | | 3,739,454 |
U.S. Treasury Obligations | | | — | | | 13,536,346 | | | — | | | 13,536,346 |
| | |
| |
| |
| |
|
| Total Investments in Securities | | | 73,720,563 | | | 38,079,425 | | | — | | | 111,799,988 |
| | |
| |
| |
| |
|
| Core Bond Fund | | | | | | | | | | | | |
Common Stocks^ | | | 806,748 | | | — | | | — | | | 806,748 |
Convertible Preferred Stocks^ | | | 408,009 | | | — | | | — | | | 408,009 |
Corporate Bonds | | | — | | | 15,009,579 | | | — | | | 15,009,579 |
Investment Companies | | | 2,217,421 | | | — | | | — | | | 2,217,421 |
Preferred Stocks | | | 20,384 | | | — | | | — | | | 20,384 |
Short-Term Investment | | | 394,146 | | | — | | | — | | | 394,146 |
U.S. Government Agency Obligations | | | — | | | 3,266,550 | | | — | | | 3,266,550 |
U.S. Treasury Obligations | | | — | | | 5,002,539 | | | — | | | 5,002,539 |
| | |
| |
| |
| |
|
| Total Investments in Securities | | $ | 3,846,708 | | $ | 23,278,668 | $ | | — | | $ | 27,125,376 |
| | |
| |
| |
| |
|
| ^ | See Portfolio of Investments for industry breakout. |
There were no transfers into or out of Levels 1 and 2 during the year ended October 31, 2011 for the Fund.
The following table reconciles the valuation of the Small Cap Fund’s Level 3 investment securities and related transactions during the year ended October 31, 2011:
| Beginning value at 11/1/10 | | $ | — |
| Net purchases | | | — |
| Net realized loss | | | — |
| Net unrealized appreciation | | | 5,225 |
| Net transfers into Level 3 | | | — |
| | |
|
| Ending value at 10/31/11 | | | 5,225 |
| | |
|
| Market value at 10/31/11 | | | 5,225 |
| | |
|
| Net unrealized appreciation during the period on Level 3 securities held at 10/31/11 | | $ | 5,225 |
| | |
|
124
The FBR Funds
Notes to Financial Statements (continued)
New Accounting Pronouncements — In May 2011, the Financial Accounting Standards Board issued Accounting Standards Update (“ASU”) No. 2011-04 “Amendments to Achieve Common Fair Value Measurement and Disclosure Requirements in U.S. GAAP and International Financial Reporting Standards (“IFRS”)”. ASU 2011-04 includes common requirements for measurement of and disclosure about fair value between U.S. GAAP and IFRS. ASU 2011-04 will require reporting to entities to disclose the following information for fair value measurements categorized within Level 3 of the fair value hierarchy: quantitative information about the unobservable inputs used in the fair value measurement, the valuation processes used by the reporting entity, and a narrative description of the sensitivity of the fair value measurement to changes in observable inputs and the interrelationships between those unobservable inputs. In addition, ASU 2011-04 will require reporting to entities to make disclosures about amounts and reasons for all transfers in and out of Level 1 and Level 2 fair value measurements. The new and revised disclosures are effective for interim and annual reporting periods beginning after December 15, 2011. At this time, management is evaluating the implications of ASU 2011-04 and its impact on the financial statements.
Share Valuation — The NAV of each Fund is calculated by dividing the sum of the value of the securities held by each Fund, plus cash or other assets, minus all liabilities (including estimated accrued expenses) by the total number of shares outstanding of each Fund, rounded to the nearest cent. Each Fund’s shares will not be priced on the days on which the NYSE is closed for trading. The offering and redemption price per share of each Fund is equal to each Fund’s NAV. The Funds charge a 1% redemption fee on shares redeemed or exchanged within 90 days of purchase. These fees are deducted from the redemption proceeds otherwise payable to the shareholder. The Funds will retain the fee charged as paid-in capital and such fees become part of that Fund’s daily NAV calculation.
Investment Income — Dividend income is recorded on the ex-dividend date. Interest income, which includes the amortization of premium and accretion of discount, if any, is recorded on an accrual basis.
Expenses — The Funds pay all operational expenses, which are either charged directly to a Fund for which the expense is attributable or are allocated proportionately among the Funds based on allocation methods approved by the Board.
Allocations — Investment income earned, realized capital gains and losses, and unrealized appreciation and depreciation for the Funds are allocated daily to each class of shares based upon its proportionate share of total net assets of the Fund. Class specific expenses are charged directly to the class incurring the expense. Common expenses, which are not attributable to a specific class, are allocated daily to each class of shares based upon its proportionate share of total net assets of the Fund. Expenses not directly billed to a Fund are allocated proportionally among all Funds daily in relation to net assets of each Fund or another reasonable measure.
Dividends and Distributions to Shareholders — Each Fund, except the Gas Utility Index Fund, Balanced Fund and Core Bond Fund, declares and pays any dividends from its net investment income, if any, annually. The Gas Utility Index Fund and Balanced Fund declare and pay any such dividends quarterly. The Core Bond Fund declares and pays net investment income, if any, monthly. Distributions from net realized capital gains, if any,
125
The FBR Funds
Notes to Financial Statements (continued)
will be distributed at least annually for each Fund. Income and capital gain distributions are determined in accordance with U.S. federal income tax regulations.
Security Transactions — Security transactions are accounted for on the trade date. Securities sold are determined on a specific identification basis.
Estimates — The preparation of financial statements in accordance with U.S. generally accepted accounting principles requires management to make estimates and assumptions that may affect the reported amounts of assets and liabilities and disclosure of contingent assets and liabilities at the date of the financial statements and the reported amounts of income and expenses during the reporting period. Actual results could differ from those estimates.
Repurchase Agreements — The Funds have agreed to purchase securities from financial institutions subject to the seller’s agreement to repurchase them at an agreed-upon time and price (“repurchase agreement”). The financial institutions with whom each Fund enters into repurchase agreements are banks and broker/dealers which the adviser considers creditworthy pursuant to criteria approved by the Board. The seller under a repurchase agreement will be required to maintain the value of the securities as collateral, subject to the agreement at not less than the repurchase price plus accrued interest. The adviser marks to market daily the value of the collateral, and, if necessary, requires the seller to maintain additional securities, to ensure that the value is not less than the repurchase price. Default by or bankruptcy of the seller would, however, expose each Fund to possible loss because of adverse market action or delays in connection with the disposition of the underlying securities.
3. Risk Factors
Equity Investments — Because each of the Funds invests in equity securities, fluctuations in the stock market in general, as well as in the value of particular equity securities held by a Fund, can affect the Fund’s performance. The value of equity securities will fluctuate due to many factors, including the past and predicted earnings of the issuer, the quality of the issuer’s management, general market conditions, and forecasts for the issuer’s industry and the value of the issuer’s assets.
IPO Investments — IPO shares are subject to market risk and liquidity risk. The market value of IPO shares will fluctuate considerably due to facts such as the absence of a prior public market, unseasoned trading, the small number of shares available for trading and limited public information about the issuer. The purchase of IPO shares may involve high transaction costs. When a fund’s asset base is small, a significant portion of the fund’s performance could be attributable to investments in IPOs, because such investments would have a magnified impact on the fund.
Temporary Defensive Position — Each of the Funds may, from time to time, take temporary defensive positions in response to adverse market, economic, political or other conditions. To the extent the assets of a Fund are invested in temporary defensive positions, the Fund may not achieve its investment objective. For temporary defensive purposes, the Fund may invest in cash and/or short-term obligations.
Industry Concentration — Because of their narrow focus, the Large Cap Financial Fund and the Small Cap Financial Fund (“Financial Funds”), the Technology Fund and the Gas
126
The FBR Funds
Notes to Financial Statements (continued)
Utility Index Fund are tied closely to and affected by the financial services, technology, and natural gas distribution and transmission industries, respectively. The value of the Funds may be subject to greater volatility than funds with portfolios that are less concentrated.
Investments in Derivatives — Each Fund, except the Gas Utility Index Fund, Balanced Fund and Core Bond Fund, may engage in derivative instruments such as options, futures and forward foreign currency exchange contracts. Derivative instruments are instruments that derive their value from a different underlying security, index or financial indicator. A Fund may use derivatives for either hedging or non-hedging purposes, or for both purposes, including for purposes of enhancing return. Investing for non-hedging purposes may be considered speculative and involve additional risks.
Foreign Investments — Investing in foreign securities presents unique investment risks. The value of securities denominated in or indexed to foreign currencies, and of dividends and interest from such securities, can change significantly when foreign currencies strengthen or weaken relative to the U.S. dollar. Many foreign countries lack uniform accounting and disclosure standards comparable to those applicable to U.S. companies, and it may be more difficult to obtain reliable information regarding an issuer’s financial condition and operations. The Fund may invest in both sponsored and unsponsored ADRs which are receipts issued by a U.S. bank or trust company evidencing ownership of an indirect interest in underlying securities issued by a foreign issuer. In a sponsored ADR arrangement, the non-U.S. issuer assumes the obligation to pay some or all of the depositary’s transaction fees. Under an unsponsored ADR arrangement, the non-U.S. issuer assumes no obligations and the depositary’s transaction fees are paid directly by the ADR holders. Because unsponsored ADR arrangements are organized independently and without the cooperation of the issuer of the underlying securities, available information concerning the non-U.S. issuer may not be as current as for sponsored ADRs and voting rights with respect to the deposited securities are not passed through.
Debt Investments — The yields and principal values of debt securities will also fluctuate. Generally, values of debt securities change inversely with interest rates. That is, as interest rates go up, the values of debt securities tend to go down and vice versa. Furthermore, these fluctuations tend to increase as a bond’s maturity increases such that a longer term bond will increase or decrease more for a given change in interest rates than a shorter term bond.
High Yield Investments — The Funds may invest a small portion of their assets in lower-rated, high-yielding bonds (commonly known as “junk bonds”). These bonds have a greater degree of default risk than higher-rated bonds. Default risk is the possibility that the issuer of a debt security will fail to make timely payments of principal or interest to the Funds.
Mortgage-Backed and Asset-Backed Securities Investments — The Funds may invest in mortgage and asset-backed securities that are subject to prepayment risk, which is the risk that the borrower will prepay some or all of the principal owed to the issuer. If prepayment occurs, the Funds may have to replace the security by investing the proceeds in a less attractive security. This may reduce a Fund’s share price and income distribution.
Market Risks — Loss of money is a risk of investing in the Funds. The net asset value of the Funds can be expected to change daily and you may lose money. As with any mutual
127
The FBR Funds
Notes to Financial Statements (continued)
fund, there is no guarantee that the Funds’ performance will be positive over any period of time, either short-term or long-term. A Fund’s success depends largely on the Adviser’s ability to select favorable investments. Also, different types of investments shift in and out of favor depending on market and economic conditions. For example, at various times stocks will be more or less favorable than bonds and small-cap or mid-cap stocks will be more or less favorable than large-cap company stocks. Because of this, the Funds may perform better or worse than other types of funds depending on what is in “favor.”
Mid-Cap and Small-Cap Investments — Investing in the securities of mid-cap and small-cap companies generally involves greater risk than investing in larger, more established companies. This greater risk is, in part, attributable to the fact that the securities of mid-cap and small-cap companies usually have more limited marketability. Because mid-cap and small-cap companies have fewer shares outstanding than larger companies, it also may be more difficult to buy or sell significant amounts of such shares without unfavorable impact on prevailing prices. Additionally, securities of mid-cap and small-cap companies are typically subject to greater changes in earnings and business prospects than are larger, more established companies and typically there is less publicly available information concerning mid-cap and small-cap companies than for larger, more established companies. Although investing in securities of mid-cap and small-cap companies offers potential above-average returns if the companies are successful, there is a risk that companies will not succeed and the prices of the companies’ shares could significantly decline in value.
Securities of mid-cap and small-cap companies, especially those whose business involves emerging products or concepts, may be more volatile due to their limited product lines, markets or financial resources and may lack management depth. Securities of mid-cap and small-cap companies also may be more volatile than larger companies or the market averages in general because of their general susceptibility to economic downturns, especially in the financial services group of industries where changes in interest rates and demand for financial services are so closely tied to the economy.
Non-Diversification — The Funds, except the Balanced Fund and Core Bond Fund, are classified as a “non-diversified” investment companies under the 1940 Act, which means each Fund may own larger positions in a smaller number of securities. A fund that is less diversified may be more susceptible to adverse economic, political, or regulatory developments affecting a single issuer than a fund that is more broadly diversified. However, each Fund intends to qualify for treatment as a regulated investment company under the Internal Revenue Code of 1986, as amended, which requires that, among other things, at the close of each quarter of each Fund’s taxable year, a Fund may not (1) with respect to 50% of its total assets, invest more than 5% of its total assets in the securities of any one issuer or own more than 10% of outstanding voting securities of any one issuer, or (2) invest more than 25% of the value of its total assets in securities of any one issuer. These limits do not apply to U.S. Government securities or securities of other registered investment companies.
Real Estate-Related Risk — Because the Small Cap Financial Fund focuses on financial services companies that may invest in real estate, the Fund is subject to the risks associated with ownership of real estate and with the real estate industry in general. Real estate values (and the values of real estate-related securities) fluctuate with changes in general and local
128
The FBR Funds
Notes to Financial Statements (continued)
economic conditions and are particularly sensitive to economic downturns. Real estate values are also affected by changes in interest rates and governmental actions such as tax and zoning changes.
Index Tracking — While the Gas Utility Index Fund seeks to track the performance of the American Gas Association Index (“Index”) as closely as possible, the Fund’s return may not always be able to match or achieve a high correlation with the return of the Index due to such factors as the various expenses incurred by the Fund, such as management fees, transaction costs and other operating expenses which are not incurred by the Index. In addition, the Fund may not be fully invested at all times in the Index as a result of cash flows into the Fund or reserves of cash that are maintained in order to meet redemption requests and cover operating expenses.
4. Transactions with Affiliates
Investment Adviser — FBR Fund Advisers, Inc. (“Fund Advisers”) serves as investment adviser to the Funds. For its advisory services, Fund Advisers receives a monthly fee at an annual rate of 0.90% of the average daily net assets of the Large Cap Fund, Mid Cap Fund, Small Cap Fund, Focus Fund, Large Cap Financial Fund, Small Cap Financial Fund, and Technology Fund, at an annual rate of 0.40% of the average daily net assets of the Gas Utility Index Fund, and at an annual rate of 0.80% of the average daily net assets of the Balanced Fund and Core Bond Fund.
Fund Advisers has contractually agreed to limit each class of shares of each Fund’s total operating expenses and to maintain these limitations with regard to each class of shares of each Fund through February 28, 2015. The following are the limits for the Funds, based on average daily net assets (excluding interest, taxes, brokerage commissions, dividend expenses, acquired fund fees and expenses, extraordinary legal expenses, or any other extraordinary expenses, and for the Balanced Fund and Core Bond Fund, also excluding 12b-1 fees):
| | | Investor Class | | Institutional Class |
| | |
| |
|
| Large Cap Fund | | | 1.25 | % | | | | 1.00 | % | |
| Mid Cap Fund | | | 1.35 | % | | | | 1.10 | % | |
| Small Cap Fund | | | 1.45 | % | | | | 1.20 | % | |
| Focus Fund | | | 1.95 | % | | | | 1.70 | % | |
| Large Cap Financial Fund | | | 1.95 | % | | | | NA | | |
| Small Cap Financial Fund | | | 1.95 | % | | | | 1.70 | % | |
| Technology Fund | | | 1.95 | % | | | | 1.70 | % | |
| Gas Utility Index Fund | | | 0.85 | % | | | | NA | | |
| Balanced Fund | | | 1.08 | %* | | | | 1.08 | % | |
| Core Bond Fund | | | 1.05 | %* | | | | 1.05 | % | |
| * | | Amount shown excludes the 12b-1 fee. Including the 12b-1 fee, the amounts are 1.33% and 1.30% for the Balanced Fund and Core Bond Fund, respectively. |
In addition, with respect to the Balanced Fund, Fund Advisers has also agreed to voluntarily limit fees and/or pay expenses in amounts necessary in order to limit the total annual operating expenses of the Balanced Fund, after any such fee waivers and/or expense reimbursements, to 0.99% (excluding 12b-1 fees, brokerage costs, interest, taxes, acquired fund fees and
129
The FBR Funds
Notes to Financial Statements (continued)
expenses, dividend expenses, and extraordinary expenses such as litigation and merger or reorganization costs and other expenses not incurred in the ordinary course of such Fund’s business), for the period until February 28, 2013. Thereafter, Fund Advisers may either renew or terminate these voluntary arrangements at any time. The fee reductions and expenses reimbursed are reflected as a reduction of total expenses in the Statement of Operations.
Fund Advisers may recoup any waived amount from a Fund pursuant to this agreement if such reimbursement does not cause the Fund to exceed existing expense limitations and the reimbursement is made within three years after the year in which the Adviser incurred the expense.
As of October 31, 2011, the Funds had the following amounts (and year of expiration) subject to repayment to Fund Advisers:
| | | Year Fees | | Repayment | | | | |
| | | Waived | | Expires | | Balance |
| | |
| |
| |
|
| Large Cap Fund – Investor Class | | | 2009 | | | | 2012 | | | $ | 112,398 | |
| | | | 2010 | | | | 2013 | | | | 113,013 | |
| | | | 2011 | | | | 2014 | | | | 91,641 | |
| Large Cap Fund – Institutional Class | | | 2009 | | | | 2012 | | | | 11,563 | |
| | | | 2010 | | | | 2013 | | | | 90,332 | |
| | | | 2011 | | | | 2014 | | | | 105,923 | |
| Mid Cap Fund – Investor Class | | | 2009 | | | | 2012 | | | | 99,322 | |
| | | | 2010 | | | | 2013 | | | | 88,626 | |
| | | | 2011 | | | | 2014 | | | | 69,622 | |
| Mid Cap Fund – Institutional Class | | | 2009 | | | | 2012 | | | | 11,525 | |
| | | | 2010 | | | | 2013 | | | | 64,899 | |
| | | | 2011 | | | | 2014 | | | | 56,181 | |
| Small Cap Fund – Investor Class | | | 2009 | | | | 2012 | | | | 92,582 | |
| | | | 2010 | | | | 2013 | | | | 120,555 | |
| | | | 2011 | | | | 2014 | | | | 88,688 | |
| Small Cap Fund – Institutional Class | | | 2009 | | | | 2012 | | | | 11,387 | |
| | | | 2010 | | | | 2013 | | | | 26,712 | |
| | | | 2011 | | | | 2014 | | | | 26,497 | |
| Technology Fund – Investor Class | | | 2009 | | | | 2012 | | | | 72,289 | |
| | | | 2010 | | | | 2013 | | | | 53,589 | |
| | | | 2011 | | | | 2014 | | | | 61,168 | |
| Technology Fund – Institutional Class | | | 2010 | | | | 2013 | | | | 23,699 | |
| | | | 2011 | | | | 2014 | | | | 27,071 | |
| Gas Utility Index Fund – Investor Class | | | 2010 | | | | 2013 | | | | 16,893 | |
| Balanced Fund | | | 2009 | | | | 2012 | | | | 387,497 | |
| | | | 2010 | * | | | 2013 | | | | 356,740 | |
| | | | 2010 | ** | | | 2013 | | | | 136,427 | |
| | | | 2011 | | | | 2014 | | | | 188,312 | |
| Core Bond Fund | | | 2009 | | | | 2012 | | | | 210,127 | |
| | | | 2010 | * | | | 2013 | | | | 177,887 | |
| | | | 2010 | ** | | | 2013 | | | | 80,808 | |
| | | | 2011 | | | | 2014 | | | | 132,417 | |
| * | | Fund Advisers earned a total of $36,325 and $11,904 and of that they waived $7,103 and $2,441 in the Balanced and Core Bond Funds, respectively for the period from March 13, 2010 through March 31, 2010. |
| ** | | For the seven months ended October 31, 2010. |
130
| The FBR Funds |
| |
| |
| Notes to Financial Statements (continued) |
| |
Fee reductions and expenses reimbursed are reflected as a reduction of total expenses in the Statement of Operations. |
| |
In connection with certain expense limitation arrangements between the Balanced Fund, Core Bond Fund and Fund Advisers, these Funds have agreed to pay Fund Advisers for certain amounts waived and/or reimbursed by AFBA pursuant to an expense limitation agreement, as assigned, provided that such repayment does not cause the total fund operating expenses for a Fund to exceed certain specified limits and the repayment is made within three years after the year in which AFBA incurred the expense. |
| |
Fund Advisers has entered into an investment sub-advisory agreement with Financial Counselors whereby it pays the sub-advisor 0.27% per annum of the assets it manages. Fund Advisers has also entered into an investment sub-advisory agreement with London Company whereby it pays the sub-advisor 0.33% per annum of the assets it manages. |
| |
The Funds are not responsible for paying the sub-advisory fee. |
| |
Administrator — Effective September 16, 2011, U.S. Bancorp Fund Services, LLC (“USBFS”), serves as the Funds’ Administrator (the “Administrator”) and, in that capacity, performs various administrative services for the Funds. USBFS also serves as the Funds’ fund accountant, transfer agent, dividend disbursing agent and registrar. The Administrator prepares various federal and state regulatory filings, reports and returns for the Funds; prepares reports and materials to be supplied to the trustees; coordinates the preparation and payment of Fund expenses and reviews the Funds’ expense accruals. |
| |
For the period November 1, 2010 through September 15, 2011, JPMorgan Chase Bank N.A. (“JPMorgan”) served as the administrator to the Funds and provided pursuant to an Administration Agreement (“Agreement”) day-to-day administrative services including monitoring portfolio compliance, determining compliance with provisions of the Internal Revenue Code and preparing the Funds’ registration statements. Pursuant to the Agreement, JPMorgan received a monthly fee based on average daily net assets of the Trust. |
| |
Pursuant to the Administrative Services Agreement, Fund Advisers also provides administrative services to the Funds including oversight of service providers. For the year ended October 31, 2011, Fund Advisers received 0.04% of average daily net assets of the Trust. Fund Advisers also provides the Funds with office space, facilities and business equipment and generally administers the Funds’ business affairs and provides the services of executive and clerical personnel for administering the affairs of the Funds. Fund Advisers compensates all personnel, Officers and Trustees of the Funds if such persons are employees of Fund Advisers. For the year ended October 31, 2011, JPMorgan earned $310,813, USBFS earned $83,721 and Fund Advisers earned $630,600 in administration fees. |
| |
Plan of Distribution — The Trust, on behalf of the Investor Class shares of each Fund, except the Gas Utility Index Fund, has adopted a Distribution Plan (the “Plan”) pursuant to Rule 12b-1 under the 1940 Act. Under the Plan, each Fund pays FBR Investment Services, |
| |
| The FBR Funds |
| |
| |
| Notes to Financial Statements (continued) |
| |
Inc. (the “Distributor”) a fee at an annual rate of up to 0.25% of each Fund’s average daily net assets attributable to Investor Class shares. Fees paid to the Distributor under the Plan are payable without regard to actual expenses incurred. |
| |
Brokerage Commissions — For the year ended October 31, 2011, the Small Cap Financial Fund and the Large Cap Financial Fund paid $23,568 and $1,250, respectively, in brokerage commissions from portfolio transactions to FBR Capital Markets & Co. (“FBR & Co.”), an affiliate of Fund Advisers and the Distributor. No other Fund paid commissions to FBR & Co. during the year. |
| |
Trustees’ Fees — Each Trustee of the Trust who is not an employee or affiliate of Fund Advisers receives an annual retainer fee of $25,000 and an additional meeting fee of $2,500 for each regular meeting attended. In addition, each Trustee that serves on the Audit Committee or Nominating Committee receives a meeting fee of $1,000 for attendance at the meeting. If a Trustee participates by teleconference, the meeting fee is $1,000. The Chairman of the Board, an Independent Trustee, receives an additional $2,000 for each meeting attended, and the Audit Committee Chairman receives an additional $1,000 for each committee meeting attended. |
| |
| 5. Investment Transactions |
| |
For the year ended October 31, 2011, purchases and sales of investment securities (excluding short-term securities and U.S. government obligations) for each Fund were as follows: |
| |
| | | Purchases | | Sales |
| | |
| |
|
| | | | | | | | Investments | | | | | | | Investments |
| | | U.S. | | (non-U.S. | | U.S. | | (non-U.S. |
| | | Government | | Government | | Government | | Government |
| | | securities | | securities) | | securities | | securities) |
| | |
| |
| |
| |
|
| Large Cap Fund | | | $ | — | | | | $ | 28,572,174 | | | | $ | — | | | | $ | 39,961,522 | |
| Mid Cap Fund | | | | — | | | | | 6,284,963 | | | | | — | | | | | 7,637,522 | |
| Small Cap Fund | | | | — | | | | | 48,503,167 | | | | | — | | | | | 49,113,337 | |
| Focus Fund | | | | — | | | | | 87,771,406 | | | | | — | | | | | 203,440,280 | |
| Large Cap Financial Fund | | | | — | | | | | 67,754,422 | | | | | — | | | | | 53,499,942 | |
| Small Cap Financial Fund | | | | — | | | | | 158,372,560 | | | | | — | | | | | 172,704,369 | |
| Technology Fund | | | | — | | | | | 11,551,521 | | | | | — | | | | | 16,368,343 | |
| Gas Utility Index Fund | | | | — | | | | | 168,120,433 | | | | | — | | | | | 50,609,327 | |
| Balanced Fund | | | | 19,285,524 | | | | | 31,832,287 | | | | | 9,445,477 | | | | | 21,684,418 | |
| Core Bond Fund | | | | 11,048,690 | | | | | 4,190,968 | | | | | — | | | | | 16,173,234 | |
The FBR Funds
Notes to Financial Statements (continued)
| 6. Capital Share Transactions | | | | | | | | | | | | | | | | | | | | | | | | |
| | | | | | | | | | | | | | | | | | | | | | | | | |
| | | FBR Large Cap Fund | | FBR Mid Cap Fund | | FBR Small Cap Fund |
| | |
| |
| |
|
| | | For the | | For the | | For the | | For the | | For the | | For the |
| | | Year | | Year | | Year | | Year | | Year | | Year |
| | | Ended | | Ended | | Ended | | Ended | | Ended | | Ended |
| | | October 31, | | October 31, | | October 31, | | October 31, | | October 31, | | October 31, |
| | | 2011 | | 2010 | | 2011 | | 2010 | | 2011 | | 2010 |
| | |
| |
| |
| |
| |
| |
|
| | | | | | | | | | | | | | | | | | | | | | | | | |
| Capital Transactions: | | | | | | | | | | | | | | | | | | | | | | | | |
Investor Class | | | | | | | | | | | | | | | | | | | | | | | | |
Proceeds from Sale of Shares | | $ | 4,772,698 | | | $ | 7,328,586 | | | $ | 5,439,122 | | | $ | 2,685,688 | | | $ | 15,243,918 | | | $ | 3,925,758 | |
Reinvestment of Distributions | | | 49,419 | | | | 90,346 | | | | 16,440 | | | | 26,279 | | | | 97,256 | | | | 345,920 | |
Shares issued in connection with acquisition | | | — | | | | 1,621,780 | | | | — | | | | 3,045,738 | | | | — | | | | 14,556,430 | |
Cost of Shares Redeemed | | | (10,219,163 | ) | | | (12,614,455 | ) | | | (5,276,893 | ) | | | (6,568,277 | ) | | | (16,784,652 | ) | | | (5,996,292 | ) |
Redemption Fees | | | 1,433 | | | | 9,188 | | | | 7,101 | | | | 7,086 | | | | 7,595 | | | | 4,757 | |
| | |
| | |
| | |
| | |
| | |
| | |
| |
Investor Class Transactions | | $ | (5,395,613 | ) | | $ | (3,564,555 | ) | | $ | 185,770 | | | $ | (803,486 | ) | | $ | (1,435,883 | ) | | $ | 12,836,573 | |
| | |
| | |
| | |
| | |
| | |
| | |
| |
| Institutional Class | | | | | | | | | | | | | | | | | | | | | | | | |
Proceeds from Sale of Shares | | $ | 469,933 | | | $ | 475,689 | | | $ | 1,467,762 | | | $ | 266,105 | | | $ | 7,641,732 | | | $ | 514,320 | |
Reinvestment of Distributions | | | 38,467 | | | | 677 | | | | 6,088 | | | | 451 | | | | 14,633 | | | | 3,451 | |
Shares issued in connection with acquisition | | | — | | | | 30,273,086 | | | | — | | | | 11,321,429 | | | | — | | | | 7,405,298 | |
Cost of Shares Redeemed | | | (4,570,331 | ) | | | (1,283,059 | ) | | | (2,345,637 | ) | | | (519,721 | ) | | | (6,010,244 | ) | | | (319,530 | ) |
Redemption Fees | | | 73 | | | | 181 | | | | 26 | | | | 26 | | | | 890 | | | | 748 | |
| | |
| | |
| | |
| | |
| | |
| | |
| |
Institutional Class Transactions | | $ | (4,061,858 | ) | | $ | 29,466,574 | | | $ | (871,761 | ) | | $ | 11,068,290 | | | $ | 1,647,011 | | | $ | 7,604,287 | |
| | |
| | |
| | |
| | |
| | |
| | |
| |
| Net Increase (Decrease) from Capital Transactions | | $ | (9,457,471 | ) | | $ | 25,902,019 | | | $ | (685,991 | ) | | $ | 10,264,804 | | | $ | 211,128 | | | $ | 20,440,860 | |
| | |
| | |
| | |
| | |
| | |
| | |
| |
| Share Transactions: | | | | | | | | | | | | | | | | | | | | | | | | |
| Investor Class | | | | | | | | | | | | | | | | | | | | | | | | |
Sold | | | 409,996 | | | | 694,912 | | | | 432,462 | | | | 245,587 | | | | 1,178,980 | | | | 372,277 | |
Issued in Reinvestment of Distributions | | | 4,279 | | | | 8,654 | | | | 1,339 | | | | 2,559 | | | | 7,850 | | | | 34,573 | |
Shares issued in connection with acquisition | | | — | | | | 149,555 | | | | — | | | | 279,797 | | | | — | | | | 1,469,558 | |
Redeemed | | | (889,146 | ) | | | (1,232,179 | ) | | | (443,729 | ) | | | (640,740 | ) | | | (1,317,772 | ) | | | (585,767 | ) |
| | |
| | |
| | |
| | |
| | |
| | |
| |
Change in Investor Class Shares | | | (474,871 | ) | | | (379,058 | ) | | | (9,928 | ) | | | (112,797 | ) | | | (130,942 | ) | | | 1,290,641 | |
| | |
| | |
| | |
| | |
| | |
| | |
| |
| Institutional Class | | | | | | | | | | | | | | | | | | | | | | | | |
Sold | | | 46,595 | | | | 52,657 | | | | 133,364 | | | | 28,378 | | | | 643,639 | | | | 53,841 | |
Issued in Reinvestment of Distributions | | | 3,850 | | | | 75 | | | | 572 | | | | 51 | | | | 1,314 | | | | 382 | |
Shares issued in connection with acquisition | | | — | | | | 3,226,962 | | | | — | | | | 1,201,247 | | | | — | | | | 831,252 | |
Redeemed | | | (437,682 | ) | | | (139,807 | ) | | | (209,215 | ) | | | (55,355 | ) | | | (539,255 | ) | | | (33,681 | ) |
| | |
| | |
| | |
| | |
| | |
| | |
| |
Change in Institutional Class Shares | | | (387,237 | ) | | | 3,139,887 | | | | (75,279 | ) | | | 1,174,321 | | | | 105,698 | | | | 851,794 | |
| | |
| | |
| | |
| | |
| | |
| | |
| |
| Net Increase (Decrease) from Shares Transactions | | | (862,108 | ) | | | 2,760,829 | | | | (85,207 | ) | | | 1,061,524 | | | | (25,244 | ) | | | 2,142,435 | |
| | |
| | |
| | |
| | |
| | |
| | |
| |
133
The FBR Funds
Notes to Financial Statements (continued)
| | | | | | | | | | | FBR Large Cap | | FBR Small Cap |
| | | FBR Focus Fund | | Financial Fund | | Financial Fund |
| | |
| |
| |
|
| | | For the | | For the | | For the | | For the | | For the | | For the |
| | | Year | | Year | | Year | | Year | | Year | | Year |
| | | Ended | | Ended | | Ended | | Ended | | Ended | | Ended |
| | | October 31, | | October 31, | | October 31, | | October 31, | | October 31, | | October 31, |
| | | 2011 | | 2010 | | 2011 | | 2010 | | 2011 | | 2010 |
| | |
| |
| |
| |
| |
| |
|
| Capital Transactions: | | | | | | | | | | | | | | | | | | | | | | | | |
Investor Class | | | | | | | | | | | | | | | | | | | | | | | | |
Proceeds from Sale of Shares | | $ | 116,123,991 | | | $ | 75,470,810 | | | $ | 32,559,261 | | | $ | 35,422,624 | | | $ | 94,080,317 | | | $ | 165,188,776 | |
Reinvestment of Distributions | | | 23,268,243 | | | | — | | | | — | | | | — | | | | 2,253,869 | | | | 703,797 | |
Cost of Shares Redeemed | | | (224,540,946 | ) | | | (329,622,691 | ) | | | (18,686,609 | ) | | | (22,600,491 | ) | | | (139,356,467 | ) | | | (148,830,452 | ) |
Redemption Fees | | | 83,237 | | | | 38,689 | | | | 13,849 | | | | 8,923 | | | | 95,673 | | | | 285,317 | |
| | |
| | |
| | |
| | |
| | |
| | |
| |
Investor Class Transactions | | $ | (85,065,475 | ) | | $ | (254,113,192 | ) | | $ | 13,886,501 | | | $ | 12,831,056 | | | $ | (42,926,608 | ) | | $ | 17,347,438 | |
| | |
| | |
| | |
| | |
| | |
| | |
| |
| Institutional Class | | | | | | | | | | | | | | | | | | | | | | | | |
Proceeds from Sale of Shares | | $ | 28,327,587 | | | $ | 11,535,684 | | | $ | — | | | $ | — | | | $ | 12,177,273 | | | $ | 17,573,779 | |
Reinvestment of Distributions | | | 1,290,549 | | | | 280,878 | | | | — | | | | — | | | | 504,775 | | | | 117,589 | |
Cost of Shares Redeemed | | | (18,537,026 | ) | | | (16,248,644 | ) | | | — | | | | — | | | | (13,971,672 | ) | | | (3,593,187 | ) |
Redemption Fees | | | 3,239 | | | | 613 | | | | — | | | | — | | | | 2,927 | | | | 6,071 | |
| | |
| | |
| | |
| | |
| | |
| | |
| |
Institutional Class Transactions | | $ | 11,084,349 | | | $ | (4,431,469 | ) | | $ | — | | | $ | — | | | $ | (1,286,697 | ) | | $ | 14,104,252 | |
| | |
| | |
| | |
| | |
| | |
| | |
| |
| R Class1 | | | | | | | | | | | | | | | | | | | | | | | | |
Proceeds from Sale of Shares | | $ | — | | | $ | 8,438 | | | $ | — | | | $ | — | | | $ | — | | | $ | 32,324 | |
Reinvestment of Distributions | | | — | | | | 314 | | | | — | | | | — | | | | — | | | | 486 | |
Cost of Shares Redeemed | | | — | | | | (214,467 | ) | | | — | | | | — | | | | — | | | | (178,883 | ) |
Redemption Fees | | | — | | | | 475 | | | | — | | | | — | | | | — | | | | 71 | |
| | |
| | |
| | |
| | |
| | |
| | |
| |
R Class Transactions | | $ | — | | | $ | (205,240 | ) | | $ | — | | | $ | — | | | $ | — | | | $ | (146,002 | ) |
| | |
| | |
| | |
| | |
| | |
| | |
| |
| Net Increase (Decrease) from Capital Transactions | | $ | (73,981,126 | ) | | $ | (258,749,901 | ) | | $ | 13,886,501 | | | $ | 12,831,056 | | | $ | (44,213,305 | ) | | $ | 31,305,688 | |
| | |
| | |
| | |
| | |
| | |
| | |
| |
| Share Transactions: | | | | | | | | | | | | | | | | | | | | | | | | |
| Investor Class | | | | | | | | | | | | | | | | | | | | | | | | |
Sold | | | 2,351,234 | | | | 1,770,711 | | | | 2,347,452 | | | | 2,557,427 | | | | 4,827,202 | | | | 8,341,839 | |
Issued in Reinvestment of Distributions | | | 473,509 | | | | — | | | | — | | | | — | | | | 116,283 | | | | 41,158 | |
Redeemed | | | (4,651,789 | ) | | | (7,894,546 | ) | | | (1,455,102 | ) | | | (1,724,792 | ) | | | (7,556,513 | ) | | | (8,203,709 | ) |
| | |
| | |
| | |
| | |
| | |
| | |
| |
Change in Investor Class Shares | | | (1,827,046 | ) | | | (6,123,835 | ) | | | 892,350 | | | | 832,635 | | | | (2,613,028 | ) | | | 179,288 | |
| | |
| | |
| | |
| | |
| | |
| | |
| |
| Institutional Class | | | | | | | | | | | | | | | | | | | | | | | | |
Sold | | | 909,520 | | | | 4,845,377 | | | | — | | | | — | | | | 950,220 | | | | 1,407,327 | |
Issued in Reinvestment of Distributions | | | 26,215 | | | | 122,121 | | | | — | | | | — | | | | 40,309 | | | | 10,661 | |
Redeemed | | | (662,843 | ) | | | (7,337,675 | ) | | | — | | | | — | | | | (1,242,590 | ) | | | (309,180 | ) |
| | |
| | |
| | |
| | |
| | |
| | |
| |
Change in Institutional Class Shares2 | | | 272,892 | | | | (2,370,177 | ) | | | — | | | | — | | | | (252,061 | ) | | | 1,108,808 | |
| | |
| | |
| | |
| | |
| | |
| | |
| |
| R Class1 | | | | | | | | | | | | | | | | | | | | | | | | |
Sold | | | — | | | | 3,762 | | | | — | | | | — | | | | — | | | | 2,470 | |
Issued in Reinvestment of Distributions | | | — | | | | 141 | | | | — | | | | — | | | | — | | | | 44 | |
Redeemed | | | — | | | | (85,409 | ) | | | — | | | | — | | | | — | | | | (14,801 | ) |
| | |
| | |
| | |
| | |
| | |
| | |
| |
Change in R Class Shares | | | — | | | | (81,506 | ) | | | — | | | | — | | | | — | | | | (12,287 | ) |
| | |
| | |
| | |
| | |
| | |
| | |
| |
| Net Increase (Decrease) from | | | | | | | | | | | | | | | | | | | | | | | | |
Shares Transactions | | | (1,554,154 | ) | | | (8,575,518 | ) | | | 892,350 | | | | 832,635 | | | | (2,865,089 | ) | | | 1,275,809 | |
| | |
| | |
| | |
| | |
| | |
| | |
| |
|
| 1 | | As of the close of business on October 22, 2010, R Class Shares and dollars, as presented above, were converted to the Investor Class at the following rates: |
| Fund | | Shares | | Dollars | |
| |
| |
| |
| Focus | | 1,885 | | 88,385 | |
| Small Cap Financial | | 728 | | 13,302 | |
| 2 | | Change in shares does not include reverse stock split effective December 10, 2010 of 13.2 million shares. |
134
The FBR Funds
Notes to Financial Statements (continued)
| | | | | | | | | | | | FBR Gas Utility |
| | | | FBR Technology Fund | | Index Fund |
| | | |
| |
|
| | | | For the | | For the | | For the | | For the |
| | | | Year | | Year | | Year | | Year |
| | | | Ended | | Ended | | Ended | | Ended |
| | | | October 31, | | October 31, | | October 31, | | October 31, |
| | | | 2011 | | 2010 | | 2011 | | 2010 |
| | | |
| |
| |
| |
|
| Capital Transactions: | | | | | | | | | | | | | | | | | |
| Investor Class | | | | | | | | | | | | | | | | | |
Proceeds from Sale of Shares | | | $ | 933,790 | | | $ | 4,502,499 | | | $ | 174,605,319 | | | $ | 37,521,462 | |
Reinvestment of Distributions | | | | — | | | | — | | | | 10,114,130 | | | | 7,473,451 | |
Shares issued in connection with acquisition | | | | — | | | | 3,467,076 | | | | — | | | | — | |
Cost of Shares Redeemed | | | | (3,429,392 | ) | | | (9,466,250 | ) | | | (49,522,574 | ) | | | (30,322,875 | ) |
Redemption Fees | | | | 1,791 | | | | 9,864 | | | | 62,995 | | | | 18,301 | |
| | | |
| | |
| | |
| | |
| |
Investor Class Transactions | | | $ | (2,493,811 | ) | | $ | (1,486,811 | ) | | $ | 135,259,870 | | | $ | 14,690,339 | |
| | | |
| | |
| | |
| | |
| |
| Institutional Class1 | | | | | | | | | | | | | | | | | |
Proceeds from Sale of Shares | | | $ | 141,716 | | | $ | 136,186 | | | $ | — | | | $ | — | |
Reinvestment of Distributions | | | | — | | | | — | | | | — | | | | — | |
Cost of Shares Redeemed | | | | (3,677,027 | ) | | | (1,835,881 | ) | | | — | | | | — | |
Shares issued in connection with acquisition | | | | — | | | | 6,031,138 | | | | — | | | | — | |
Redemption Fees | | | | 20 | | | | 22 | | | | — | | | | — | |
| | | |
| | |
| | |
| | |
| |
Institutional Class Transactions | | | $ | (3,535,291 | ) | | $ | 4,331,465 | | | $ | — | | | $ | — | |
| | | |
| | |
| | |
| | |
| |
| R Class2 | | | | | | | | | | | | | | | | | |
Proceeds from Sale of Shares | | | $ | — | | | $ | — | | | $ | — | | | $ | 22,330 | |
Reinvestment of Distributions | | | | — | | | | — | | | | — | | | | 9,429 | |
Cost of Shares Redeemed | | | | — | | | | — | | | | — | | | | (134,638 | ) |
Redemption Fees | | | | — | | | | — | | | | — | | | | — | |
| | | |
| | |
| | |
| | |
| |
R Class Transactions | | | $ | — | | | $ | — | | | $ | — | | | $ | (102,879 | ) |
| | | |
| | |
| | |
| | |
| |
| Net Increase (Decrease) from Capital Transactions | | | $ | (6,029,102 | ) | | $ | 2,844,654 | | | $ | 135,259,870 | | | $ | 14,587,460 | |
| | | |
| | |
| | |
| | |
| |
| Share Transactions: | | | | | | | | | | | | | | | | | |
| Investor Class | | | | | | | | | | | | | | | | | |
Sold | | | | 80,830 | | | | 442,474 | | | | 8,918,950 | | | | 2,250,826 | |
Issued in Reinvestment of Distributions | | | | — | | | | — | | | | 396,830 | | | | 459,731 | |
Shares issued in connection with acquisition (Note 13) | | | | — | | | | 331,367 | | | | — | | | | — | |
Redeemed | | | | (302,424 | ) | | | (954,032 | ) | | | (2,550,055 | ) | | | (1,822,655 | ) |
| | | |
| | |
| | |
| | |
| |
Change in Investor Class Shares | | | | (221,594 | ) | | | (180,191 | ) | | | 6,765,725 | | | | 887,902 | |
| | | |
| | |
| | |
| | |
| |
| Institutional Class1 | | | | | | | | | | | | | | | | | |
Sold | | | | 12,475 | | | | 13,080 | | | | — | | | | — | |
Issued in Reinvestment of Distributions | | | | — | | | | — | | | | — | | | | — | |
Shares issued in connection with acquisition (Note 13) | | | | — | | | | 576,427 | | | | — | | | | — | |
Redeemed | | | | (325,462 | ) | | | (170,353 | ) | | | — | | | | — | |
| | | |
| | |
| | |
| | |
| |
Change in Institutional Class Shares | | | | (312,987 | ) | | | 419,154 | | | | — | | | | — | |
| | | |
| | |
| | |
| | |
| |
| R Class2 | | | | | | | | | | | | | | | | | |
Sold | | | | — | | | | — | | | | — | | | | 3,218 | |
Issued in Reinvestment of Distributions | | | | — | | | | — | | | | — | | | | 1,438 | |
Redeemed | | | | — | | | | — | | | | — | | | | (19,029 | ) |
| | | |
| | |
| | |
| | |
| |
Change in R Class Shares | | | | — | | | | — | | | | — | | | | (14,373 | ) |
| | | |
| | |
| | |
| | |
| |
| Net Increase (Decrease) from Shares Transactions | | | | (534,581 | ) | | | 238,963 | | | | 6,765,725 | | | | 873,529 | |
| | | |
| | |
| | |
| | |
| |
|
| 1 | | Represents the period from commencement of operation (March 12, 2010) through October 31, 2010. |
| 2 | | As of the close of business on October 22, 2010, R Class Shares and dollars, as presented above, were converted to the Investor Class at the following rates: |
| Fund | | Shares | | Dollars | |
| |
| |
| |
| Gas Utility Index | | 2,227 | | 39,647 | |
135
The FBR Funds
Notes to Financial Statements (continued)
| | | FBR Balanced Fund | | FBR Core Bond Fund |
| | |
| |
|
| | | For the | | For the Period | | For the | | For the | | For the Period | | For the |
| | | Year | | April 1, | | Year | | Year | | April 1, | | Year |
| | | Ended | | 2010 to | | Ended | | Ended | | 2010 to | | Ended |
| | | October 31, | | October 31, | | March 31, | | October 31, | | October 31, | | March 31, |
| | | 2011 | | 20101 | | 2010 | | 2011 | | 20101 | | 2010 |
| | |
| |
| |
| |
| |
| |
|
| Capital Transactions: | | | | | | | | | | | | | | | | | | | | | | | | |
| Investor Class | | | | | | | | | | | | | | | | | | | | | | | | |
Proceeds from Sale of Shares | | $ | 21,892,863 | | | $ | 4,484,381 | | | $ | 32,146,517 | | | $ | 1,121,100 | | | $ | 513,557 | | | $ | 3,653,595 | |
Reinvestment of Dividends | | | 799,608 | | | | 521,342 | | | | 633,192 | | | | 171,157 | | | | 85,007 | | | | 104,494 | |
Cost of Shares Redeemed | | | (11,363,173 | ) | | | (11,758,359 | ) | | | (9,773,718 | ) | | | (1,567,757 | ) | | | (968,404 | ) | | | (1,905,453 | ) |
Redemption Fees | | | 6,230 | | | | 3,433 | | | | 4,218 | | | | 606 | | | | 473 | | | | 595 | |
| | |
| | |
| | |
| | |
| | |
| | |
| |
Investor Class Transactions | | $ | 11,335,528 | | | $ | (6,749,203 | ) | | $ | 23,010,209 | | | $ | (274,894 | ) | | $ | (369,367 | ) | | $ | 1,853,231 | |
| | |
| | |
| | |
| | |
| | |
| | |
| |
| Institutional Class | | | | | | | | | | | | | | | | | | | | | | | | |
Proceeds from Sale of Shares | | $ | 11,344,367 | | | $ | 2,541,008 | | | $ | 1,841,926 | | | $ | 207,173 | | | $ | 118,540 | | | $ | 519,301 | |
Reinvestment of Dividends | | | 582,146 | | | | 302,152 | | | | 570,113 | | | | 201,570 | | | | 118,753 | | | | 227,059 | |
Cost of Shares Redeemed | | | (2,741,866 | ) | | | (1,497,600 | ) | | | (3,125,016 | ) | | | (662,080 | ) | | | (909,769 | ) | | | (432,948 | ) |
Redemption Fees | | | 338 | | | | (101 | ) | | | 6,396 | | | | 20 | | | | (75 | ) | | | 75 | |
| | |
| | |
| | |
| | |
| | |
| | |
| |
Institutional Class Transactions | | $ | 9,184,985 | | | $ | 1,345,459 | | | $ | (706,581 | ) | | $ | (253,317 | ) | | $ | (672,551 | ) | | $ | 313,487 | |
| | |
| | |
| | |
| | |
| | |
| | |
| |
| Class B | | | | | | | | | | | | | | | | | | | | | | | | |
Proceeds from Sale of Shares | | $ | — | | | $ | — | | | $ | 1,514 | | | $ | — | | | $ | — | | | $ | — | |
Reinvestment of Dividends | | | — | | | | — | | | | 5,250 | | | | — | | | | — | | | | 7,850 | |
Cost of Shares Redeemed2 | | | — | | | | — | | | | (1,559,965 | ) | | | — | | | | — | | | | (1,345,474 | ) |
Redemption Fees | | | — | | | | — | | | | 30 | | | | — | | | | — | | | | — | |
| | |
| | |
| | |
| | |
| | |
| | |
| |
Class B Transactions | | $ | — | | | $ | — | | | $ | (1,553,171 | ) | | $ | — | | | $ | — | | | $ | (1,337,624 | ) |
| | |
| | |
| | |
| | |
| | |
| | |
| |
| Class C | | | | | | | | | | | | | | | | | | | | | | | | |
Proceeds from Sale of Shares | | $ | — | | | $ | — | | | $ | 5,316,509 | | | $ | — | | | $ | — | | | $ | 383,435 | |
Reinvestment of Dividends | | | — | | | | — | | | | 341,418 | | | | — | | | | — | | | | 41,953 | |
Cost of Shares Redeemed3 | | | — | | | | — | | | | (26,216,819 | ) | | | — | | | | — | | | | (1,307,212 | ) |
Redemption Fees | | | — | | | | — | | | | 3,390 | | | | — | | | | — | | | | — | |
| | |
| | |
| | |
| | |
| | |
| | |
| |
Class C Transactions | | $ | — | | | $ | — | | | $ | (20,555,502 | ) | | $ | — | | | $ | — | | | $ | (881,824 | ) |
| | |
| | |
| | |
| | |
| | |
| | |
| |
| Net Increase (Decrease) from Capital Transactions | | $ | 20,520,513 | | | $ | (5,403,744 | ) | | $ | 194,955 | | | $ | (528,211 | ) | | $ | (1,041,918 | ) | | $ | (52,730 | ) |
| | |
| | |
| | |
| | |
| | |
| | |
| |
136
The FBR Funds
Notes to Financial Statements (continued)
| | | FBR Balanced Fund | | FBR Core Bond Fund |
| | |
| |
|
| | | For the | | For the Period | | For the | | For the | | For the Period | | For the |
| | | Year | | April 1, | | Year | | Year | | April 1, | | Year |
| | | Ended | | 2010 to | | Ended | | Ended | | 2010 to | | Ended |
| | | October 31, | | October 31, | | March 31, | | October 31, | | October 31, | | March 31, |
| | | 2011 | | 20101 | | 2010 | | 2011 | | 20101 | | 2010 |
| | |
| |
| |
| |
| |
| |
|
| Share Transactions: | | | | | | | | | | | | | | | | | | | | | | | | |
| Investor Class | | | | | | | | | | | | | | | | | | | | | | | | |
Sold | | | 1,737,714 | | | | 386,667 | | | | 2,792,865 | | | | 117,394 | | | | 53,515 | | | | 393,512 | |
Issued in Reinvestment of Distributions | | | 64,232 | | | | 46,160 | | | | 58,384 | | | | 18,179 | | | | 8,815 | | | | 11,269 | |
Redeemed | | | (913,207 | ) | | | (1,015,977 | ) | | | (904,179 | ) | | | (164,856 | ) | | | (101,005 | ) | | | (148,213 | ) |
| | |
| | |
| | |
| | |
| | |
| | |
| |
Investor Class Transactions | | | 888,739 | | | | (583,150 | ) | | | 1,947,070 | | | | (29,283 | ) | | | (38,675 | ) | | | 256,568 | |
| | |
| | |
| | |
| | |
| | |
| | |
| |
| Institutional Class | | | | | | | | | | | | | | | | | | | | | | | | |
Sold | | | 945,356 | | | | 226,162 | | | | 184,464 | | | | 23,618 | | | | 13,329 | | | | 60,904 | |
Issued in Reinvestment of Distributions | | | 49,108 | | | | 27,964 | | | | 55,198 | | | | 23,287 | | | | 13,358 | | | | 26,557 | |
Redeemed | | | (233,375 | ) | | | (134,274 | ) | | | (307,725 | ) | | | (75,253 | ) | | | (101,075 | ) | | | (50,693 | ) |
| | |
| | |
| | |
| | |
| | |
| | |
| |
Institutional Class Transactions | | | 761,089 | | | | 119,852 | | | | (68,063 | ) | | | (28,348 | ) | | | (74,388 | ) | | | 36,768 | |
| | |
| | |
| | |
| | |
| | |
| | |
| |
| Class B | | | | | | | | | | | | | | | | | | | | | | | | |
Sold | | | — | | | | — | | | | 163 | | | | — | | | | — | | | | — | |
Issued in Reinvestment of Distributions | | | — | | | | — | | | | 548 | | | | — | | | | — | | | | 891 | |
Redeemed2 | | | — | | | | — | | | | (123,582 | ) | | | — | | | | — | | | | (152,747 | ) |
| | |
| | |
| | |
| | |
| | |
| | |
| |
Class B Transactions | | | — | | | | — | | | | (122,871 | ) | | | — | | | | — | | | | (151,856 | ) |
| | |
| | |
| | |
| | |
| | |
| | |
| |
| Class C | | | | | | | | | | | | | | | | | | | | | | | | |
Sold | | | — | | | | — | | | | 527,911 | | | | — | | | | — | | | | 42,457 | |
Issued in Reinvestment of Distributions | | | — | | | | — | | | | 32,222 | | | | — | | | | — | | | | 4,689 | |
Redeemed3 | | | — | | | | — | | | | (2,280,810 | ) | | | — | | | | — | | | | (199,294 | ) |
| | |
| | |
| | |
| | |
| | |
| | |
| |
Class C Transactions | | | — | | | | — | | | | (1,720,677 | ) | | | — | | | | — | | | | (152,148 | ) |
| | |
| | |
| | |
| | |
| | |
| | |
| |
| Net Increase (Decrease) from Shares Transactions | | | 1,649,828 | | | | (463,298 | ) | | | 35,459 | | | | (57,631 | ) | | | (113,063 | ) | | | (10,668 | ) |
| | |
| | |
| | |
| | |
| | |
| | |
| |
|
| 1 | | The Funds changed their fiscal year end from March 31 to October 31. |
| 2 | | As of the close of business on July 31, 2009, Class B Shares and dollars, as presented above, were converted to the Advisor Class (name changed to Investor Class) at the following rates: |
| Fund | | Shares | | Dollars | |
| |
| |
| |
| Balanced | | 116,509 | | 1,194,212 | |
| Total Return Bond | | 141,233 | | 1,292,283 | |
| 3 | | As of the close of business on March 12, 2010, Class C Shares and dollars, as presented above, were converted to the Investor Class at the following rates: |
| Fund | | Shares | | Dollars | |
| |
| |
| |
| Balanced | | 1,752,189 | | 20,027,830 | |
| Total Return Bond | | 157,483 | | 1,482,408 | |
137
The FBR Funds
Notes to Financial Statements (continued)
7. Federal Income Taxes
It is each Fund’s policy to continue to comply with the special provisions of the Internal Revenue Code that are applicable to regulated investment companies. As provided therein, in any fiscal year in which a Fund so qualifies and distributes at least 90% of its taxable net income, the Fund (but not the shareholders) will be relieved of federal income tax on the income distributed. Accordingly, no provision for income taxes has been made.
In order to avoid imposition of the excise tax applicable to regulated investment companies, it is also each Fund’s intention to declare and pay as dividends in each calendar year at least 98% of its net investment income (earned during the calendar year) and 98% of its net realized capital gains (earned during the twelve months ending October 31) plus undistributed amounts from prior years.
Income and capital gain distributions are determined in accordance with income tax regulations that may differ from accounting principles that are generally accepted in the United States of America. As a result, the character of tax-basis distributions and the composition of net assets for tax purposes may differ from those reflected in the Funds’ financial statements. These book/tax differences may be temporary or permanent in nature. Temporary differences are primarily the result of wash sales. Reclassifications for permanent differences are made to components of capital. These reclassifications have no effect on net assets or net asset value per share.
The tax character of distributions paid for each Fund’s tax year was as follows:
| | | | | Long-Term |
| | Ordinary Income | | Capital Gains |
| |
| |
|
| | Dollar | | Dollar |
| | Amount | | Amount |
| |
| |
|
| Large Cap Fund | | | | | |
For the Year Ended October 31, 2011 | $ | 203,067 | | $ | — |
For the Year Ended October 31, 2010 | | 94,558 | | | — |
| Mid Cap Fund | | | | | |
For the Year Ended October 31, 2011 | | 53,563 | | | — |
For the Year Ended October 31, 2010 | | 26,791 | | | — |
| Small Cap Fund | | | | | |
For the Year Ended October 31, 2011 | | 141,614 | | | — |
For the Year Ended October 31, 2010 | | 353,677 | | | — |
| Focus Fund | | | | | |
For the Year Ended October 31, 2011 | | — | | | 25,642,828 |
For the Year Ended October 31, 2010 | | 282,614 | | | — |
| Large Cap Financial Fund | | | | | |
For the Year Ended October 31, 2011 | | — | | | — |
For the Year Ended October 31, 2010 | | — | | | — |
| Small Cap Financial Fund | | | | | |
For the Year Ended October 31, 2011 | | 2,863,168 | | | — |
For the Year Ended October 31, 2010 | | 866,424 | | | — |
138
The FBR Funds
Notes to Financial Statements (continued)
| | Ordinary Income | | Long-Term
Capital Gains |
| |
| |
|
| | | Dollar | | | | Dollar | |
| | | Amount | | | | Amount | |
| | |
| | | |
| |
| Technology Fund | | | | | | | | | |
For the Year Ended October 31, 2011 | | $ | — | | | | $ | — | |
For the Year Ended October 31, 2010 | | | — | | | | | — | |
| Gas Utility Index Fund | | | | | | | | | |
For the Year Ended October 31, 2011 | | | 8,228,128 | | | | | 2,612,243 | |
For the Year Ended October 31, 2010 | | | 7,800,261 | | | | | 249,041 | |
| Balanced Fund | | | | | | | | | |
For the Year Ended October 31, 2011 | | | 2,140,167 | | | | | — | |
For the Period Ended October 31, 2010 | | | 1,180,776 | | | | | — | |
For the Year Ended March 31, 2010 | | | 2,305,951 | | | | | — | |
| Core Bond Fund | | | | | | | | | |
For the Year Ended October 31, 2011 | | | 1,086,378 | | | | | 447,915 | |
For the Period Ended October 31, 2010 | | | 738,749 | | | | | — | |
For the Year Ended March 31, 2010 | | | 1,277,489 | | | | | 154,005 | |
The following information is computed on a tax basis for each item:
| | | As of October 31, 2011 |
| | |
|
| | | | | | | | | | | | | | | | | | | Large Cap | |
| | | Large Cap | | | Mid Cap | | | Small Cap | | | Focus | | | Financial | |
| | | Fund | | | Fund | | | Fund | | | Fund | | | Fund | |
| | |
| | |
| | |
| | |
| | |
| |
| Tax cost of investment securities | | $ | 37,730,892 | | | $ | 17,279,327 | | | $ | 39,982,270 | | | $ | 367,211,360 | | | $ | 63,857,952 | |
| | |
| | |
| | |
| | |
| | |
| |
| Gross unrealized appreciation | | | 4,853,142 | | | | 2,954,022 | | | | 3,404,659 | | | | 307,076,534 | | | | 2,864,872 | |
| Gross unrealized depreciation | | | (2,823,956 | ) | | | (1,421,448 | ) | | | (4,382,488 | ) | | | (13,785,243 | ) | | | (11,097,529 | ) |
| | |
| | |
| | |
| | |
| | |
| |
| Net unrealized appreciation (depreciation) | | | 2,029,186 | | | | 1,532,574 | | | | (977,829 | ) | | | 293,291,291 | | | | (8,232,657 | ) |
| Undistributed ordinary income | | | 155,370 | | | | 21,740 | | | | — | | | | — | | | | — | |
| Undistributed long-term capital gains | | | — | | | | — | | | | — | | | | 68,559,971 | | | | — | |
| Capital loss carryforward | | | (9,071,600 | ) | | | (3,441,600 | ) | | | (8,062,059 | ) | | | — | | | | (2,046,188 | ) |
| | |
| | |
| | |
| | |
| | |
| |
| Accumulated earnings (deficit) | | $ | (6,887,044 | ) | | $ | (1,887,286 | ) | | $ | (9,039,888 | ) | | $ | 361,851,262 | | | $ | (10,278,845 | ) |
| | |
| | |
| | |
| | |
| | |
| |
| | | | | | | | | | | | | | | | | | | | | |
| | | As of October 31, 2011 |
| | |
|
| | | Small Cap | | | | | | Gas Utility | | | | | | | | | |
| | | Financial | | | Technology | | | Index | | | Balanced | | | Core Bond | |
| | | Fund | | | Fund | | | Fund | | | Fund | | | Fund | |
| | |
| | |
| | |
| | |
| | |
| |
| Tax cost of investment securities | | $ | 184,049,837 | | | $ | 7,001,191 | | | $ | 285,807,440 | | | $ | 98,823,814 | | | $ | 25,976,153 | |
| | |
| | |
| | |
| | |
| | |
| |
| Gross unrealized appreciation | | | 15,114,905 | | | | 597,361 | | | | 160,432,681 | | | | 15,776,493 | | | | 1,827,015 | |
| Gross unrealized depreciation | | | (24,834,134 | ) | | | (716,873 | ) | | | (16,886,961 | ) | | | (2,800,319 | ) | | | (677,792 | ) |
| | |
| | |
| | |
| | |
| | |
| |
| Net unrealized appreciation (depreciation) | | | (9,719,229 | ) | | | (119,512 | ) | | | 143,545,720 | | | | 12,976,174 | | | | 1,149,223 | |
| Undistributed ordinary income | | | 2,346,347 | | | | — | | | | 2,027,426 | | | | 219,236 | | | | 123,722 | |
| Undistributed long-term capital gains | | | — | | | | — | | | | 1,903,306 | | | | — | | | | 141,192 | |
| Other Accumulated Gain | | | — | | | | — | | | | 3,586 | | | | — | | | | — | |
| Capital loss carryforward | | | (6,440,766 | ) | | | (2,145,219 | ) | | | — | | | | (4,358,292 | ) | | | — | |
| | |
| | |
| | |
| | |
| | |
| |
| Accumulated earnings (deficit) | | $ | (13,813,648 | ) | | $ | (2,264,731 | ) | | $ | 147,480,038 | | | $ | 8,837,118 | | | $ | 1,414,137 | |
| | |
| | |
| | |
| | |
| | |
| |
The FBR Funds
Notes to Financial Statements (continued)
Unused capital loss carryforwards as of October 31, 2011, were as follows:
| | | Amount | | Expires October 31, | |
| | |
| |
| |
| Large Cap Fund | | $ | 4,906,673 | | | 2016 | | |
| Large Cap Fund | | | 4,164,926 | | | 2017 | | |
| Mid Cap Fund | | | 3,441,600 | | | 2017 | | |
| Small Cap Fund | | | 3,462,951 | | | 2016 | | |
| Small Cap Fund | | | 4,599,108 | | | 2017 | | |
| Large Cap Financial Fund | | | 10,229 | | | 2016 | | |
| Large Cap Financial Fund | | | 1,162,148 | | | 2017 | | |
| Large Cap Financial Fund | | | 873,811 | | | 2019 | | |
| Small Cap Financial Fund | | | 6,440,766 | | | 2019 | | |
| Technology Fund | | | 237,174 | | | 2016 | | |
| Technology Fund | | | 1,908,045 | | | 2017 | | |
| Balanced Fund | | | 4,358,292 | | | 2017 | | |
During the year ended October 31, 2011, the Large Cap Fund, Mid Cap Fund, Small Cap Fund, Technology Fund and Balanced Fund utilized $4,594,569, $1,036,864, $6,816,034, $1,028,210 and $3,644,432 of capital loss carryforwards, respectively. The capital loss carryforwards may be utilized in future years to offset net realized capital gains, if any, prior to distributing such gains to shareholders.
The following reclassifications, the result of permanent differences between financial statement and income tax reporting requirements, have been made to the components of capital. These reclassifications have no impact on the net assets or net asset value per share of the Funds.
| | | | | | | Accumulated | | | | | |
| | | Undistributed | | | Net Realized | | | | |
| | | Income (Loss) | | | Gain (Loss) | | | Paid-In Capital | |
| | |
| | |
| | |
| |
| Large Cap Fund | | $ | (77 | ) | | $ | 77 | | | $ | — | |
| Mid Cap Fund | | | — | | | | — | | | | — | |
| Small Cap Fund | | | 231,768 | | | | (7,126 | ) | | | (224,642 | ) |
| Focus Fund | | | 7,221,589 | | | | (947,027 | ) | | | (6,274,562 | ) |
| Large Cap Financial Fund | | | 209,482 | | | | (155 | ) | | | (209,327 | ) |
| Small Cap Financial Fund | | | 647,912 | | | | (647,912 | ) | | | — | |
| Technology Fund | | | 131,860 | | | | (131,860 | ) | | | — | |
| Gas Utility Index Fund | | | — | | | | — | | | | — | |
| Balanced Fund | | | 6,234 | | | | (6,234) | | | | — | |
| Core Bond Fund | | | 5,794 | | | | (5,116 | ) | | | (678 | ) |
The Funds have analyzed their tax positions taken on Federal income tax returns for all open tax years (tax years ended March 31, 2008 through 2010) or expected to be taken in the Funds October 31, 2011 tax returns, and have concluded that no provision for income tax is required in their financial statements.
| The FBR Funds |
|
| Notes to Financial Statements (continued) |
| |
| 8. Investments in Affiliates |
| |
Affiliated issuers, as defined by the 1940 Act, are those in which a Fund’s holdings represent 5% or more of the outstanding voting securities of the issuer. A summary of each Fund’s investments in affiliates, if any, for the year ended October 31, 2011, is noted below: |
| |
| | | SHARE ACTIVITY | | | | | | | | | | | | | | | | |
| | |
| | | | | | | | | | |
| | | Balance | | | | | | Balance | | | Realized | | | | | | | Value | | | Acquisition |
| Affiliate | | 10/31/2010 | | Purchases | | Sales | | 10/31/2011 | | | Gain (Loss) | | | Dividends | | | 10/31/2011 | | | Cost |
|
| FBR Focus Fund 99¢ Only Stores | | 3,810,235 | | — | | 283,000 | | 3,527,235 | | | $ | 1,479,522 | | | $ | — | | | $ | 76,893,723 | | | $ | 34,322,505 |
| 9. Payment by Affiliate |
| |
During the fiscal year ended October 31, 2009, Fund Advisers voluntarily reimbursed the FBR Small Cap Fund $7,834, in connection with the Fund’s inadvertent investment in the shares of another investment company which was made by Fund Advisers in excess of applicable investment limitations. This reimbursement has been classified in the Fund’s Financial Highlights as “Net increase from payments by affiliates”. |
| |
| 10. Commitments and Contingencies |
| |
In the normal course of business, the Funds enter into contracts that contain a variety of representations and warranties and which provide general indemnifications. The Funds’ maximum exposure under these arrangements is unknown, as this would involve future claims that may be made against the Funds that have not yet occurred. However, based on experience, the Funds expect the risk of loss to be remote. |
| |
| 11. Subsequent Events |
| |
ASC Topic 855, “Subsequent events” occurring after October 31, 2011 have been evaluated for potential impact to this report through the date the financial statements were issued. There were no subsequent events to report that would have a material impact on the Funds’ financial statements. |
| |
| 12. Acquisition and Reorganization |
| |
On March 12, 2010, the FBR Large Cap Fund acquired all of the assets and liabilities of AFBA 5Star Large Cap Growth Fund. The acquisition was accomplished by a tax-free exchange of 149,555 shares of Investor Class and 3,226,962 shares of I Class of the fund (valued at $31,894,866) for all of the assets and liabilities of AFBA 5Star Large Cap Growth Fund. The acquired fund then distributed the shares it received from the fund to its shareholders. AFBA 5Star Large Cap Growth Fund’s net assets on that date were $31,889,385 including $2,287,467 of unrealized appreciation, and $(14,814,733) of accumulated net realized loss on investments. The aggregate net assets of the fund after the acquisition were $51,870,712. |
| |
| The FBR Funds |
|
| Notes to Financial Statements (continued) |
| |
On March 12, 2010, the FBR Mid Cap Fund acquired all of the assets and liabilities of AFBA 5Star Mid Cap Fund. The acquisition was accomplished by a tax-free exchange of 279,797 shares of Investor Class and 1,201,247 shares of I Class of the fund (valued at $14,367,167) for all of the assets and liabilities of AFBA 5Star Mid Cap Fund. The acquired fund then distributed the shares it received from the fund to its shareholders. AFBA 5Star Mid Cap Fund’s net assets on that date were $14,367,167 including $673,442 of unrealized appreciation, and $(5,068,954) of accumulated net realized loss on investments. The aggregate net assets of the fund after the acquisition were $21,225,730. |
| |
On March 12, 2010, the FBR Small Cap Growth Fund, formerly, FBR Pegasus Small Cap Growth Fund acquired all of the assets and liabilities of AFBA 5Star Small Cap Fund. The acquisition was accomplished by a tax-free exchange of 1,199,929 shares of Investor Class and 860,878 shares of I Class of the fund (valued at $21,761,430) for all of the assets and liabilities of AFBA 5Star Small Cap Fund. The acquired fund then distributed the shares it received from the fund to its shareholders. AFBA 5Star Small Cap Fund’s net assets on that date were $21,761,430 including $703,098 of unrealized appreciation. The aggregate net assets of the fund after the acquisition were $29,221,690. Effective as of the close of business on August 27, 2010, the FBR Pegasus Small Cap Growth FundTM (the “Acquired Fund”) was reorganized into the FBR Small Cap Fund (the “Acquiring Fund”) in a transaction pursuant to which all of the assets of the Acquired fund were transferred to the Acquiring Fund and shareholders of the Acquired Fund became shareholders of the Acquiring Fund. Accordingly, as of the closing date, shares of the Acquired Fund were no longer offered or sold. FBR Pegasus Small Cap GrowthTM net assets on that date were $21,961,696 including ($1,858,984) of unrealized depreciation and ($15,943,462) accumulated net realized loss on investments. The aggregate net assets of the fund after the reorganization was $31,347,737. |
| |
On March 12, 2010, the FBR Technology Fund acquired all of the assets and liabilities of AFBA 5Star Science & Technology Fund. The acquisition was accomplished by a tax-free exchange of 331,367 shares of Investor Class and 576,427 shares of I Class of the fund (valued at $9,498,214) for all of the assets and liabilities of AFBA 5Star Science & Technology Fund. The acquired fund then distributed the shares it received from the fund to its shareholders. AFBA 5Star Science & Technology Fund’s net assets on that date were $9,498,214 including $58,764 of unrealized appreciation. The aggregate net assets of the fund after the acquisition were $20,831,958. Immediately following this acquisition, the FBR Technology Fund I Class shares commenced operations. |
| |
Effective as of the close of business on October 22, 2010, the R Class shares of the FBR Focus Fund, FBR Small Cap Financial Fund and FBR Gas Utility Index Fund were closed. Outstanding shares were exchanged for Investor Class shares of the same Fund having an aggregate net asset value equal to the aggregate net asset value of the R Class shares so exchanged. |
| |
| The FBR Funds |
|
| Report of Independent Registered Public Accounting Firm |
| |
| To the Board of Trustees and Shareholders |
| The FBR Funds |
| Arlington, Virginia |
| |
We have audited the accompanying statements of assets and liabilities, including the portfolios of investments, of the FBR Large Cap Fund, FBR Mid Cap Fund, FBR Small Cap Fund, FBR Focus Fund, FBR Large Cap Financial Fund, FBR Small Cap Financial Fund, FBR Technology Fund, FBR Gas Utility Index Fund, FBR Core Bond Fund, and FBR Balanced Fund (the “Funds”), each a series of The FBR Funds as of October 31, 2011, and the related statements of operations for the year then ended, the statements of changes in net assets for each of the two years in the period then ended and the financial highlights for each of the five years in the period then ended, except for the FBR Balanced Fund and the FBR Core Bond Fund which includes the statements of operations for the year then ended and statements of changes in net assets and financial highlights for the year then ended, the seven month period ended October 31, 2010 and the year ended March 31, 2010. The financial highlights for each of the three years in the period ended March 31, 2009 have been audited by other auditors, whose reports dated May 27, 2009 expressed unqualified opinions on such financial statements and financial highlights. These financial statements and financial highlights are the responsibility of the Funds’ management. Our responsibility is to express an opinion on these financial statements and financial highlights based on our audits. |
| |
We conducted our audits in accordance with standards of the Public Company Accounting Oversight Board (United States). Those standards require that we plan and perform the audits to obtain reasonable assurance about whether the financial statements and financial highlights are free of material misstatement. The Funds are not required to have, nor were we engaged to perform, an audit of the Funds’ internal control over financial reporting. Our audits included consideration of internal control over financial reporting as a basis for designing audit procedures that are appropriate in the circumstances, but not for the purposes of expressing an opinion on the effectiveness of the Funds’ internal control over financial reporting. Accordingly, we express no such opinion. An audit includes examining, on a test basis, evidence supporting the amounts and disclosures in the financial statements. Our procedures included confirmation of securities owned as of October 31, 2011, by correspondence with the custodian and brokers or by other appropriate auditing procedures where replies from brokers were not received. An audit also includes assessing the accounting principles used and significant estimates made by management, as well as evaluating the overall financial statement presentation. We believe that our audits provide a reasonable basis for our opinion. |
| |
In our opinion, the financial statements and financial highlights referred to above present fairly, in all material respects, the financial position of the FBR Large Cap Fund, FBR Mid Cap Fund, FBR Small Cap Fund, FBR Focus Fund, FBR Large Cap Financial Fund, FBR Small Cap Financial Fund, FBR Technology Fund, FBR Gas Utility Index Fund, FBR Balanced Fund and FBR Core Bond Fund, as of October 31, 2011, the results of their operations, the changes in their net assets, and the financial highlights for the periods referred to above in conformity with accounting principles generally accepted in the United States of America. |
| |
| TAIT, WELLER & BAKER LLP |
| Philadelphia, Pennsylvania |
| December 28, 2011 |
| |
| |
| The FBR Funds |
|
| Important Supplemental Information (unaudited) |
| |
| Qualified Dividend Income |
| |
Under the Jobs and Growth Tax Relief Reconciliation Act of 2003 (the “Act”), the following percentages of ordinary dividends paid during the fiscal year ended October 31, 2011 are designated as “qualified dividend income.” |
| |
| Large Cap Fund | | 100.00 | % | |
| Mid Cap Fund | | 100.00 | % | |
| Small Cap Fund | | 36.56 | % | |
| Small Cap Financial Fund | | 100.00 | % | |
| Gas Utility Index Fund | | 85.79 | % | |
| Balanced Fund | | 66.12 | % | |
| Core Bond Fund | | 15.88 | % | |
| |
| Dividends Received Deduction |
| |
For corporate shareholders, the following ordinary dividends paid during the fiscal year ended October 31, 2011 qualify for the corporate dividends received deduction: |
| |
| Large Cap Fund | | 100.00 | % | |
| Mid Cap Fund | | 100.00 | % | |
| Small Cap Fund | | 36.56 | % | |
| Small Cap Financial Fund | | 100.00 | % | |
| Gas Utility Index Fund | | 69.50 | % | |
| Balanced Fund | | 68.40 | % | |
| Core Bond Fund | | 15.40 | % | |
| |
| Proxy Voting Guidelines |
| |
Fund Advisers is responsible for exercising the voting rights associated with the securities purchased and held by the Funds. A description of the policies and procedures Fund Advisers uses in fulfilling this responsibility is included in the Funds’ Statement of Additional Information and is available without charge, upon request, by calling 888.888.0025. The policies and procedures are also available on the Securities and Exchange Commission’s (“SEC”) website at http://www.sec.gov. Information on how the Funds voted proxies relating to portfolio securities during the most recent 12 month period ended June 30 is available without charge, upon request, by calling 888.888.0025 and is also available on the SEC’s website at http://www.sec.gov. |
| |
| Portfolio Holdings |
| |
The Funds file their complete schedule of holdings with the SEC for the first and third quarters of each fiscal year on Form N-Q. The Funds’ Form N-Q is available on the SEC’s website at http://www.sec.gov. You may review and make copies at the SEC’s Public Reference Room in Washington, D.C. You may also obtain copies after paying a duplicating fee by writing the SEC’s Public Reference Section, Washington, D.C. 20549-0102 or by electronic request to publicinfo@sec.gov. Information on the operation of the Public Reference Room may be obtained by calling 800.SEC.0330. A copy of the quarterly holdings report is available, without charge, upon request, by calling 888.888.0025. |
| |
| |
| The FBR Funds |
|
| Important Supplemental Information (continued) (unaudited) |
| |
Approval of the Continuation of the Investment Advisory and Sub-Advisory Agreements for the Funds |
| |
The Investment Company Act of 1940, as amended (the “1940 Act”), requires the Board of Trustees (the “Board” or the “Trustees”), at an in-person meeting of the Board called for such purpose, to consider the approval of any investment advisory agreement and any applicable sub-advisory agreement intended for use in connection with the Funds. The law requires the Board to request and evaluate such information as the Trustees determine is necessary to allow them to properly consider the approval of any such investment advisory and sub-advisory agreements. The law also requires each investment adviser and sub-adviser to furnish the Trustees with such information that is reasonably necessary for the Trustees to evaluate the terms of the investment advisory and sub-advisory agreements. |
| |
During the Funds’ most recent fiscal year ended October 31, 2011, the Board considered the renewal of the investment advisory and sub-advisory agreements for the Funds at an in-person meeting held on October 28, 2011, after having also met previously in order to review relevant materials and to discuss the contract renewal process. At its meeting on October 28, 2011, the Board considered the proposed continuation of each of the following agreements (collectively, the “Agreements”): (i) the investment advisory agreements with FBR Fund Advisers, Inc. (“Fund Advisers”) with respect to each of the Funds (the “Investment Advisory Agreements”); (ii) the sub-advisory agreement between Fund Advisers and The London Company (“London Company”) with respect to the equity portion of the Balanced Fund (the “London Company Sub-Advisory Agreement”); and (iii) the sub-advisory agreements between Fund Advisers and Financial Counselors, Inc. (“FCI” and together with London Company, the “Sub-Advisers”) with respect to the Core Bond Fund and the fixed income portion of the Balanced Fund (the “FCI Sub-Advisory Agreements”and together with the London Company Sub-Advisory Agreement, the “Sub-Advisory Agreements”). |
| |
In determining whether to renew the Agreements, the Board requested, and Fund Advisers and each of the Sub-Advisers provided, information and data relevant to the Board’s consideration. This request included information regarding the investment performance of the Funds and information regarding the fees and expenses of the Funds, as compared to other similar mutual funds, as well as information regarding the distribution, administration and operation of the Funds. |
| |
As part of its deliberations, the Board also considered and relied upon the information about the Funds, Fund Advisers and the Sub-Advisers that had been provided to them throughout the year in connection with their Board meetings at which they engage in the ongoing oversight of the Funds and their operations. The Independent Trustees were counseled during this process by independent legal counsel, as such term is defined in the rules under the 1940 Act, who reviewed with them their duties and responsibilities with respect to their consideration of the continuation of the Agreements. |
| |
During their meeting, the Board reviewed relevant information and data provided by Fund Advisers in response to written questions from the Independent Trustees and the Independent Trustees met with independent legal counsel to the Independent Trustees to |
| |
| |
| The FBR Funds |
|
| Important Supplemental Information (continued) (unaudited) |
| |
discuss their evaluation of the information provided by Fund Advisers. The Board met with representatives of Fund Advisers and discussed with them, among other things, the investment process used for the Funds, the investment results of the Funds, compensation arrangements for the portfolio managers, brokerage practices used for the Funds, the cost of providing the services and the profitability of the advisory arrangements to Fund Advisers, the extent to which Fund Advisers had achieved economies of scale, the extent to which shareholders participated in those economies of scale, and matters relating to the distribution and marketing of the Funds. |
| |
The Board first reviewed information and materials regarding the investment advisory and sub-advisory fees for the Funds under the Agreements. Representatives of Fund Advisers stated that the investment advisory fees for the Funds are not presently subject to any asset-based breakpoints, but it was also noted that Fund Advisers has in place with respect to each of the Funds an expense limitation agreement limiting the total annual operating expenses of each of the Funds. Fund Advisers indicated that it intended to continue maintaining the expense limitation arrangements for the Funds until February 28, 2015. The Board noted that Fund Advisers only provides investment advisory services to the FBR Funds and that Fund Advisers does not have any other clients or accounts. With respect to the Balanced and Core Bond Funds (the “Sub- Advised Funds”), representatives from Fund Advisers reviewed the services conducted by Fund Advisers to oversee the Sub-Advisers, including, but not limited to, supervising all aspects of the operations of the Sub-Advised Funds and monitoring and reporting to the Board regarding the compliance process, performance and investment processes of the Sub-Advisers. The Board considered the nature of the services that Fund Advisers provides in connection with the oversight of the management of the Sub-Advised Funds’ portfolios by each of the Sub-Advisers and determined that Fund Advisers provides useful and beneficial management and oversight services with respect to the sub-advisory services that are provided to the Sub-Advised Funds. |
| |
The Board received and considered performance and expense information, including total return performance information, for the applicable one-, three-, five-, and 10-year periods ended August 31, 2011, or for shorter periods, to the extent applicable. The Board considered information regarding each of the Funds separately and reviewed with the representatives of Fund Advisers various performance and expense information for each of the Funds, including each Fund’s performance against its benchmark and its peers, changes in total assets for each of the Funds, the costs of providing services, the profitability of the management of the Funds to Fund Advisers, and distribution arrangements for each of the Funds, as follows: |
| |
1. Large Cap Financial Fund. The Board first reviewed information and materials regarding the Large Cap Financial Fund, noting the Fund’s fees, expenses and performance results, and compared such information to comparable funds and to the Fund’s relevant benchmark index. The Board members reviewed the Large Cap Financial Fund’s investment performance for the one-, three-, five-and 10-year periods ended August 31, 2011. The Board noted that the Investor Class of the Fund underperformed its primary benchmark index, the S&P 500 Index, and its total universe group for the one-year |
| |
| |
| The FBR Funds |
|
| Important Supplemental Information (continued) (unaudited) |
| |
period ended August 31, 2011, but outperformed its total universe group for the three-, five- and 10-year periods. The Board also noted the fact that the Large Cap Financial Fund effected a limited amount of brokerage transactions through the Fund’s affiliate, FBR Capital Markets & Co., Inc. (“FBR & Co.”), and further noted that information concerning the nature and amount of these affiliated brokerage transactions is reported to the Board on a quarterly basis in accordance with the Fund’s Rule 17e-1 reporting requirements. The Board concluded that, in light of all the circumstances, the level of trades placed through FBR & Co. was reasonable, especially in light of the fact that FBR & Co. is active in the markets for many financial services stocks, thus making it reasonable for the Fund to utilize FBR & Co. for some of its portfolio brokerage transactions. The Board reviewed the Fund’s performance with the portfolio manager for the Large Cap Financial Fund and the investment process followed with respect to the Fund. |
| |
2. Small Cap Financial Fund. The Board reviewed information and materials regarding the Small Cap Financial Fund, noting the Fund’s fees, expenses and performance results, and compared such information to comparable funds and to the Fund’s relevant benchmark index. The Board reviewed the Small Cap Financial Fund’s investment performance for the one-, three-, five-and 10-year periods ended August 31, 2011. The Board noted that the Investor Class of the Fund underperformed its primary benchmark index, the Russell 2000 Index, and its total universe group for the one-year period ended August 31, 2011, but outperformed the total universe group for the three-, five-and 10-year periods. The Board also noted the fact that the Small Cap Financial Fund effected a limited amount of brokerage transactions through FBR & Co., and further noted that information concerning the nature and amount of these affiliated brokerage transactions is reported to the Board on a quarterly basis in accordance with the Fund’s Rule 17e-1 reporting requirements. The Board concluded that, in light of all the circumstances, the level of trades placed through FBR & Co. was reasonable, especially in light of the fact that FBR & Co. is active in the markets for many financial services stocks, thus making it reasonable for the Fund to utilize FBR & Co. for some of its portfolio brokerage transactions. The Board reviewed the Fund’s performance with the portfolio manager for the Small Cap Financial Fund and the investment process followed with respect to the Fund. |
| |
3. Focus Fund. The Board next reviewed information and materials regarding the Focus Fund, noting the Fund’s fees, expenses and performance results, and compared such information to comparable funds and to the Fund’s relevant benchmark index. The Board reviewed the Focus Fund’s investment performance for the one-, three-, five-and 10-year periods ended August 31, 2011. The Board noted that the Investor Class of the Fund underperformed its primary benchmark index, the Russell 2000 Index, and its total universe group for the one-year period ended August 31, 2011. The Board also noted that the Fund outperformed the total universe group for the three-, five- and 10-year periods. |
| |
4. Technology Fund. The Board next reviewed information and materials regarding the Technology Fund, noting the Fund’s fees, expenses and performance results, and then compared such information to comparable funds and to the Fund’s relevant benchmark |
| |
| |
| The FBR Funds |
|
| Important Supplemental Information (continued) (unaudited) |
| |
index. The Board reviewed the Technology Fund’s investment performance for the one-, three- and five-year periods ended August 31, 2011, noting that the commencement of the Fund’s investment operations was February 1, 2002. The Board noted that the Investor Class of the Fund underperformed its primary benchmark index, the S&P 500 Index, a secondary index, the Nasdaq Composite, and its total universe group for the one-year period ended August 31, 2011. The Board also noted that the Fund underperformed its total universe group for the three-year period, but had outperformed its peer universe group for the five-year period. The Board reviewed the Fund’s performance with representatives from Fund Advisers who discussed Fund Advisers’ plans for addressing the Fund’s performance results. The Board took into consideration Fund Advisers’ plans for addressing the Fund’s performance and the Board noted that it intended to continue to monitor the Fund’s performance on an ongoing basis and review with Fund Advisers possible ways to potentially enhance the performance of the Fund. |
| |
5. Gas Utility Index Fund. The Board then reviewed information and materials regarding the Gas Utility Index Fund, noting the Fund’s fees, expenses and performance results, and compared such information to comparable funds and to the Fund’s relevant benchmark index. The Board noted that this is the only Fund among the Equity Funds that is operated as an index fund. The Board members also reviewed the Gas Utility Index Fund’s investment performance for the one-, three-, five-and 10-year periods ended August 31, 2011. The Board noted that the Investor Class of the Fund outperformed its primary benchmark index, the S&P 500 Index, tracked but slightly outperformed its secondary benchmark index, the American Gas Association Stock Index, and outperformed its total universe group for each of the one-, three-, five-and 10-year periods ended August 31, 2011. The Board reviewed the Fund’s performance with the representatives of Fund Advisers and considered that because the Fund is not subject to any distribution fees, Fund Advisers bears all of the costs and expenses related to the sales, marketing and distribution of the Fund. |
| |
6. Large Cap Fund. The Board reviewed information and materials regarding the Large Cap Fund, noting the Fund’s fees, expenses and performance results, and then compared such information to comparable funds and to the Fund’s relevant benchmark index. The Board members noted the Large Cap Fund’s investment performance for the one-, three-and five-year periods ended August 31, 2011, noting that the commencement of the Fund’s investment operations was November 15, 2005. The Board also noted that the Investor Class of the Fund underperformed its benchmark, the S&P 500 Index, and its peers for the one-year period ended August 31, 2011, but outperformed the benchmark and its peers for the three-and five-year periods. The Board discussed the Fund’s performance with representatives of Fund Advisers and the investment process followed with respect to the Fund. |
| |
7. Small Cap Fund. The Board next reviewed information and materials regarding the Small Cap Fund, noting that Fund’s fees, expenses and performance results, then compared such information to comparable funds and the Fund’s relevant benchmark |
| |
| |
| The FBR Funds |
|
| Important Supplemental Information (continued) (unaudited) |
| |
index. The Board noted the Fund’s investment performance for the one-and three-year periods ended August 31, 2011, noting that the commencement of the Fund’s investment operations was February 28, 2007. The Board also noted that the Investor Class of the Fund outperformed its benchmark index, the Russell 2000 Index, but underperformed its total universe group for the one-year period ended August 31, 2011. The Board also noted that the Fund outperformed the benchmark and its peers for the three-year period ended August 31, 2011. The Board discussed the Fund’s performance with representatives of Fund Advisers and the investment process followed with respect to the Fund. |
| |
8. Mid Cap Fund. The Board reviewed information and materials regarding the Mid Cap Fund, noting that Fund’s fees, expenses and performance results, then compared such information to comparable funds and the Fund’s relevant benchmark index. The Board members noted the Fund’s investment performance for the one-and three-year periods ended August 31, 2011, noting that the commencement of the Fund’s investment operations was February 28, 2007. The Board also noted that the Investor Class of the Fund underperformed its benchmark, the Russell Midcap Index, and its total universe group for the one-year period ended August 31, 2011. The Board also noted that the Fund had outperformed the benchmark and its peers for the three-year period. The Board discussed the Fund’s performance with representatives of Fund Advisers and the investment process followed with respect to the Fund. |
| |
9. Balanced Fund. The Board then reviewed information and materials regarding the Balanced Fund, noting that Fund’s fees, expenses and performance results, and compared such information to the Fund’s relevant benchmark index. The Board members reviewed the Balanced Fund’s investment performance for the one-, three-, five- and 10-year periods ended August 31, 2011. In connection with its review of the performance results of the Fund, the Board took into account that the Balanced Fund had acquired all of the assets and assumed all of the liabilities of the AFBA 5Star Balanced Fund (the “Predecessor Balanced Fund”) in a reorganization transaction that was completed effective as of March 12, 2010, and the performance for the Balanced Fund for periods prior to March 12, 2010 therefore reflected the prior performance of the Predecessor Balanced Fund. The Board also took into consideration that each of the Sub-Advisers had only begun serving as sub-advisers to the Predecessor Balanced Fund effective as of July 16, 2007. The Board noted that the Institutional Class shares of the Balanced Fund underperformed its benchmark, the S&P 500 Index, but outperformed its total universe group for the one-year period ended August 31, 2011. The Board also noted that the Fund outperformed the total universe group for the three-, five-and 10-year periods ended August 31, 2011. The Board reviewed the Fund’s performance with representatives of Fund Advisers and considered that Fund Advisers had agreed to voluntarily waive fees and/or reimburse expenses of the Fund in addition to its agreement to contractually waive fees and/or reimburse expenses in order to maintain a limit on the Fund’s total operating expense ratio. The Board noted that the Investment Advisory Agreement provided for a 0.80% investment advisory fee, which was generally higher than other peer funds, although there were certain peer funds with |
| |
| |
| The FBR Funds |
|
| Important Supplemental Information (continued) (unaudited) |
| |
higher fee rates. The Board also noted that the total expenses of the Fund were also somewhat higher than other peer funds even after taking into effect the expense limitation agreement. |
| |
10. Core Bond Fund. The Board next reviewed information and materials regarding the Core Bond Fund, noting that Fund’s fees, expenses and performance results, and compared such information to the Fund’s relevant benchmark index. The Board also reviewed the Core Bond Fund’s investment performance for the one-, three-, five- and 10- year periods ended August 31, 2011. In connection with its review of the performance results of the Core Bond Fund, the Board took into account that the Fund had acquired all of the assets and assumed all of the liabilities of the AFBA Total Return Bond Fund (the “Predecessor Bond Fund”) in a reorganization transaction that was completed effective as of March 12, 2010, and the performance for the Core Bond Fund for periods prior to March 12, 2010 therefore reflected the prior performance of the Predecessor Bond Fund. The Board also took into consideration that FCI, the Sub-Adviser for the Fund, had only begun serving as sub-adviser to the Predecessor Bond Fund effective as of July 16, 2007. The Board noted that the Institutional Class shares of the Bond Fund underperformed its benchmark, the Barclays Capital Intermediate U.S. Government/Credit Index, and its total universe group for the one-year period ended August 31, 2011. The Board also noted that the Fund outperformed its total universe group for the five- and ten year periods, but underperformed its total universe group for the three-year period. The Board reviewed the Fund’s performance with the representatives of Fund Advisers and the investment process followed with respect to the Fund. The Board noted that the Investment Advisory Agreement provided for a 0.80% investment advisory fee, which was generally higher than other peer funds, although there were certain peer funds with higher fee rates. The Board also noted that the total expenses of the Fund were also somewhat higher than other peer funds even after taking into account of the expense limitation agreement. |
| |
The Board reviewed the proposed continuation of each of the Agreements. Among the factors the Board considered was the overall performance of the Funds relative to the performance of other mutual funds in each Fund’s peer group on a long-term basis and over shorter time periods (discussed above). In addition, the Board compared expenses of each Fund to the expenses of its peers, noting that the expenses for each of the Funds generally compared favorably with industry averages for other funds of similar size after the imposition of applicable expense limits and fee waivers. The Board also took note of the long-term relationship between Fund Advisers and the Funds and the efforts that have been undertaken by Fund Advisers to foster the ongoing growth and development of the Funds. |
| |
With respect to Fund Advisers, the Board noted the range of investment advisory and administrative services provided by Fund Advisers and its affiliates to the Funds and the level and quality of these services, and in particular, they noted the quality of the personnel providing these services. The Board took into account the background and experience of each of Fund Advisers’ senior management and expertise of, and the amount of attention given to each Fund by, Fund Advisers’ investment personnel. The Board also reviewed |
| |
| |
| The FBR Funds |
|
| Important Supplemental Information (continued) (unaudited) |
| |
financial information concerning Fund Advisers and its affiliates relating to the operation of the Funds, noting the overall profitability of the relationship with the Funds to Fund Advisers and the financial soundness of Fund Advisers as demonstrated by the financial information provided, and the level of profitability was determined to be reasonable and consistent with relevant industry averages. The Board considered the extent to which Fund Advisers and its affiliates utilize their own resources to support certain of the sales and marketing efforts related to the Funds, and in considering the profitability of Fund Advisers relating to its management of the Funds, the Board considered the level of profitability without taking into consideration the impact of these sales and marketing costs that are borne directly by Fund Advisers. |
| |
With respect to London Company and FCI, the Board noted the background and expertise of their portfolio managers and investment personnel. While the Board considered financial information regarding London Company and FCI, it did not consider information as to the profitability of each Sub-Advisory Agreement to the relevant sub-adviser, since the fees payable to London Company and FCI had been negotiated at arm’s length and were paid directly by Fund Advisers and not by the Funds. Nevertheless, the Board did consider the level of services that the London Company and FCI provided to the Funds with respect to the portion of the management fee that each Sub-Adviser retained, as compared to the portion of the management fee retained by Fund Advisers, and noted that the compensation provided was consistent with the level of services rendered. The Board then noted that FCI had agreed to voluntarily reduce the level of compensation payable to FCI by Fund Advisers with respect to the Core Bond Fund for the one-year period from November 1, 2011 through October 31, 2012. The Board considered the benefit to Fund Advisers resulting from this arrangement and the Board was informed by Fund Advisers that this arrangement had been mutually agreed to by the parties for the one-year period in recognition of the fees that had been previously waived and/or reimbursed by Fund Advisers in connection with the Core Bond Fund since Fund Advisers had assumed management of the Fund. |
| |
The Board further reviewed the Funds’ brokerage practices and best-execution procedures, and noted that these were reasonable and consistent with standard industry practice. The Board considered the receipt by Fund Advisers and the Sub-Advisers of research and execution services in exchange for payment of brokerage commissions. The Board noted that Fund Advisers and the Sub-Advisers may direct Fund brokerage in exchange for third party research, but that the amount of such brokerage was relatively limited relative to the Funds’ total trades and that Fund Advisers and the Sub-Advisers represented that trading done with various brokerage firms is done in a manner that is consistent with relevant requirements relating to the receipt of research in connection with fund brokerage transactions. The Board noted that Fund Advisers directed a limited amount of brokerage for the Funds to a brokerage affiliate of Fund Advisers, and the Board noted Fund Advisers’ representations that such brokerage is conducted in a manner consistent with applicable rules relating to brokerage placed through affiliated entities. The Board determined that the amount of affiliated brokerage was fair and reasonable and done in accordance with applicable regulatory requirements. The Board also reviewed information |
| |
| |
| The FBR Funds |
|
| Important Supplemental Information (continued) (unaudited) |
| |
regarding the manner in which the Funds’ affiliated broker utilizes certain electronic communications networks (“ECNs”) for purposes of effectuating portfolio trades for some of the Funds and the way in which the use of these ECNs can be beneficial to the affiliated brokerage firm when trading on behalf of the Funds. |
| |
The Board also noted the fact that an affiliate of Fund Advisers, FBR Investment Services, Inc. (“FBRIS”), serves as the distributor of the shares of the Funds and receives distribution fees from the Funds for serving in that role. The Board considered and discussed the activities routinely engaged in by FBRIS in order to distribute and market the Funds. The Board reviewed the distribution arrangements maintained by FBRIS for the Funds, noting the extensive sales arrangements for the Funds on various mutual fund sales platforms and the manner in which the distribution fees paid by those of the Funds that pay distribution fees are utilized in connection with these arrangements. The Board also noted with respect to the distribution arrangements of the Funds the distribution capabilities established by FBRIS. The Board took note of the fact that FBRIS has continued to seek distribution opportunities for the Funds through various distribution channels. The Board also took into consideration that Fund Advisers uses its own financial resources to support sales and marketing efforts on behalf of the Funds. In reviewing the profitability of Fund Advisers relating to its management of the Funds, the Board reviewed the level of profitability taking notice of these various marketing expenses that are borne directly by Fund Advisers in support of the distribution of the Funds and they considered the level of profitability before the impact of these marketing costs. |
| |
The Board also considered and reviewed information regarding the administrative services fees paid to Fund Advisers by the Funds for providing certain types of administrative and oversight services. The Board determined that the administrative fees paid to Fund Advisers are fair and reasonable in connection with the types of services provided by Fund Advisers to the Funds and that they are reasonable fees to be paid in addition to the investment advisory fees paid by the Funds to Fund Advisers given that the administrative services are separate and distinct services apart from the investment advisory services being provided to the Funds by Fund Advisers. |
| |
The Independent Trustees met separately with the independent legal counsel to the Independent Trustees during this process in order to consider the proposed continuation of the Agreements. At the conclusion of their review of these matters, the Independent Trustees had determined that they had received sufficient information to allow them to take action with respect to their consideration of the continuation of the Agreements. |
| |
In reaching their conclusion with respect to the continuation of the Agreements, the Trustees did not identify any one single factor as being controlling, rather, the Board took note of a combination of factors that influenced their decision making process. The Board did, however, identify the overall favorable investment performance of the Funds and management’s demonstrated commitment to the continued enhancement of investment performance, the commitment of Fund Advisers to the successful operation of the Funds, and the level of expenses of the Funds, as well as the continued use of expense limitation |
| |
| |
| The FBR Funds |
|
| Important Supplemental Information (continued) (unaudited) |
| |
agreements in order to reduce the overall operating expenses of the Funds, as being important elements of their consideration. The Board also considered the effectiveness of the compliance programs of the Funds, Fund Advisers and the Sub-Advisers in accordance with applicable requirements relating to mutual funds and their investment advisers. In conducting their review of these matters, the Board members considered each of the Funds separately, on a fund by fund basis. Based upon their review and consideration of these factors and other matters deemed relevant by the Board in reaching an informed business judgment, a majority of the Board of Trustees, including a majority of the Independent Trustees, concluded that the terms of the Agreements are fair and reasonable and the Board voted to renew the Agreements for an additional one-year period, subject to the applicable limitations on the total operating expenses of the Funds as considered and approved at the meeting. |
| |
| |
The FBR Funds
Important Supplemental Information (continued) (unaudited)
Information About Trustees and Officers
Information pertaining to the Trustees and Officers of the Trust is set forth below. The address for each Trustee and Officer is 1001 Nineteenth Street North, Arlington, Virginia, 22209 unless otherwise stated. The statement of additional information (SAI) includes additional information about the Trustees and is available without charge upon request by calling 888.888.0025.
| Name, Age, Address | Term of
Office*
and Length
of Time
Served** | Portfolios
Overseen in
the Trust
and Fund
Complex*** | Principal Occupation
During Past 5 Years | Other
Directorships |
| Michael A. Willner, 55 | Independent Board Chair; Trustee Since 1997 | 10 | CEO AlphaGrip, Inc. January 2001 to present. | None |
| Charles O. Heller, 75 | Trustee
Since 2003 | 10 | President, Annapolis Capital Group, since 2005; Athlone Global Security (venture capital firm), 2006-2008. | None |
| David B. Adcock, 60 | Trustee
Since 2011 | 10 | Consultant, since 2006; General Counsel, Duke University and Duke University Health System 1982-2006. | The Victory Portfolios
(23 portfolios) |
| William E. Cole, Jr., 62 | Trustee
Since 2006 | 10 | Retired, 2006. Partner, Ernst & Young LLP, 1972-2006. | None |
David Ellison, 53†
100 Federal Street
Boston, MA 02110 | Trustee
Since 2003 President
Since 2001 | 10 | Director, CIO and President, FBR Fund Advisers, Inc., since December 1999; Portfolio Manager, FBR Fund Advisers, Inc., since October 1996. | None |
Winsor H. Aylesworth, 64
100 Federal Street
Boston, MA 02110 | Executive Vice President
Since 1999 | 10 | Portfolio Manager, FBR Fund Advisers, Inc., since September 1998. | N/A |
| William B. Sanders III, 47 | Executive Vice President
Since 1999 | 10 | Senior Vice President of Fund Operations, FBR Fund Advisers, Inc., since August 1999 and Head Trader for FBR Fund Advisers, since January 1997. | N/A |
Guy F. Talarico, 56
150 Broadway
Suite 302
New York, NY 10038 | Chief Compliance Officer
Since 2006 | 10 | CEO of Alaric Compliance Services, LLC since January 2006. | N/A |
| Kimberly J. Bradshaw, 37 | Treasurer Since 2006 and Secretary
Since 2003 | 10 | Employee of FBR since August 1998 serving in various capacities, including Senior Vice President Fund Administration, and Chief Compliance Officer of FBR Investment Services, Inc. | N/A |
| Kristin E. Stelljes, 35 | Assistant Treasurer
Since 2006 | 10 | Employee of FBR since February 2002, serving in various capacities including Assistant Vice President Fund Administration, Supervisor Fund Administration, Accountant, and Customer Service Representative. | N/A |
| * | | Trustees serve until their resignation, removal or death. |
| ** | | Length of time served is measured from the earliest date of service as a Trustee of any of the Funds or the Predecessor Funds. |
| *** | | The “Fund Complex” consists of all mutual funds advised by FBR & Co., and its affiliate advisers. |
| † | | Mr. Ellison is considered to be an “Interested Trustee” of the Trust due to his position with FBR Fund Advisers, Inc. |
THE FBR FUNDS
888.888.0025
fbrfundsinfo@fbr.com
www.fbrfunds.com |
| |
Investment Adviser
FBR FUND ADVISERS, INC.
1001 NINETEENTH STREET NORTH
ARLINGTON, VIRGINIA 22209 |
| |
Distributor
FBR INVESTMENT SERVICES, INC.
1001 NINETEENTH STREET NORTH
ARLINGTON, VIRGINIA 22209 |
| |
Transfer Agent
U.S. BANCORP FUND SERVICES, LLC
615 EAST MICHIGAN STREET
MILWAUKEE, WISCONSIN 53202 |
| |
Independent Registered Public Accounting Firm
TAIT, WELLER, AND BAKER LLP
1818 MARKET STREET
PHILADELPHIA, PENNSYLVANIA 19103 |
| |
This report is not authorized
for distribution to prospective
investors unless it is preceded or
accompanied by a current prospectus. |
ITEM 2. CODE OF ETHICS.
As of the end of the period covered by this report, Registrant had adopted a code of ethics (the “Code”) that applies to Registrant’s principal executive officer (“PEO”) and principal financial officer (“PFO”). There were no amendments to the Code during the period covered by the report. The Registrant did not grant any waivers, including implicit waivers, from any provisions of the Code to the PEO or PFO during the period covered by this report. The Registrant undertakes to provide a copy of such code to any person upon request, without charge, by calling 888.888.0025.
ITEM 3. AUDIT COMMITTEE FINANCIAL EXPERT.
The Board of Trustees determined at a meeting held October 24, 2006 that William E. Cole, Jr. qualifies as an Audit Committee Financial Expert and he is “independent” as defined under the relevant Securities and Exchange Commission rules and releases.
| ITEM 4. PRINCIPAL ACCOUNTANT FEES AND SERVICES. |
| (a) | Audit Fees – The aggregate fees billed for the professional services rendered by the principal accountant for the audit of the Registrant’s annual financial statements, were $165,925 and $155,200 for the Registrant for the fiscal years ended October 31, 2011 and October 31, 2010 respectively. |
| (b) | Audit Related Fees –There were no fees billed for assurance and related services by the principal accountant for the fiscal years ended October 31, 2011 and October 31, 2010. |
| (c) | Tax Fees – The aggregate fees billed by the principal accountant for tax compliance, tax advice and tax planning for completing federal and excise tax returns were $32,000 and $31,000 for the Registrant for the fiscal years ended October 31, 2011 and October 31, 2010 respectively. |
| (d) | All Other Fees – There were no additional fees paid for audit and non-audit services other than those disclosed in (a) through (c) above. |
| (e) | (1) Pursuant to the Registrant’s Audit Committee Charter (“Charter”), the Audit Committee is responsible for approving in advance the firm to be employed as the Registrant’s independent auditor. In addition, the Charter provides that the Audit Committee is responsible for approving any and all proposals by the Registrant, its investment adviser or their affiliated persons or an entity controlling, controlled by, or under common control with the adviser that provides services to the Registrant to employ the independent auditor to render permissible non-audit services to such entity, provided those permissible non-audit services relate directly to the operations and financial reporting of the Registrant. In determining whether to approve non-audit services, the Audit Committee considers whether such services are consistent with the independent auditor’s independence.
(2) None of the services described in (b) through (d) above were approved by the audit committee pursuant to paragraph (c)(7)(i)(C) of Rule 2-01 of Regulation S-X. |
| (f) | Less than fifty percent of the hours expended on the principal accountant’s engagement to audit the Registrant’s financial statements for the most recent fiscal year were attributed to |
| | work performed by persons other than the principal accountant’s full-time, permanent employees. |
| (g) | There were no non-audit services fees billed by the Registrant’s accountant to the Registrant other than those described above. There were no non-audit services fees billed by the Registrant’s accountant to the Registrant’s investment adviser or to any entity controlling, controlled by, or under common control with the adviser that provides ongoing services to the Registrant over the past two years. |
| (h) | Not applicable as no non-audit services were provided to the Registrant’s investment adviser nor any entity controlling, controlled by, or under common control with the investment adviser that provides ongoing services to the Registrant that were not pre-approved pursuant to Rule 2-01©(7)(ii) of Regulation S-X. |
ITEMS 5. AUDIT COMMITTEE OF LISTED REGISTRANTS.
Not applicable.
ITEM 6. SCHEDULE OF INVESTMENTS.
Contained in Item 1.
ITEM 7. DISCLOSURE OF PROXY VOTING POLICIES AND PROCEDURES FOR CLOSED-END MANAGEMENT INVESTMENT COMPANIES.
Not applicable.
ITEM 8. PORTFOLIO MANAGERS OF CLOSED-END MANAGEMENT INVESTMENT COMPANIES.
Not applicable.
ITEM 9. PURCHASES OF EQUITY SECURITIES BY CLOSED-END MANAGEMENT INVESTMENT COMPANY AND AFFLIIATED PURCHASERS.
Not applicable.
ITEM 10. SUBMISSION OF MATTERS TO A VOTE OF SECURITY HOLDERS.
There have been no material changes to the procedures by which shareholders may recommend nominees to the Board.
| ITEM 11. CONTROLS AND PROCEDURES. |
| (a) | Based upon their evaluation of the Registrant’s disclosure controls and procedures as conducted within 90 days of the filing date of this Form N-CSR, the Registrant’s PFO and PEO have concluded that those disclosure controls and procedures provide reasonable assurance that the material information required to be disclosed by the Registrant in this Form N-CSR has been recorded, processed, summarized and reported within the time periods specified in the Securities and Exchange Commission’s rules and forms. |
| (b) | There were no changes in the Registrant’s internal controls over financial reporting as defined in Rule 30a-3(d) under the Act (17 CFR 270.30a-3(d)) that occurred during the second fiscal half-year of the period covered by this report that has materially affected, or is reasonably likely to materially affect, the Registrant’s internal control over financial reporting. |
| ITEM 12. EXHIBITS. |
| File the exhibits listed below as part of this Form. Letter or number the exhibits in the sequence indicated. |
| (a) | (1) Not applicable.
(2) A separate certification for each principal executive officer and principal financial officer of the Registrant as required by Rule 30a-2(a) under the Act (17 CFR 270.30a-2): Attached herewith.
(3) Not applicable. |
| (b) | (1) The certifications required by Rule 30a-2(b) of the Investment Company Act of 1940 and Section 906 of the Sarbanes-Oxley Act of 2002: Attached herewith. |
SIGNATURES
Pursuant to the requirements of the Securities Exchange Act of 1934 and the Investment Company Act of 1940, the registrant has duly caused this report to be signed on its behalf by the undersigned, thereunto duly authorized.
(Registrant) The FBR Funds
| By (Signature and Title)* | | /s/Kimberly J. Bradshaw | | 1/3/2012 |
| | |
|
| | | Kimberly J. Bradshaw | | Date |
| | | Treasurer, Secretary and Principal Financial Officer |
| | | The FBR Funds | | |
Pursuant to the requirements of the Securities Exchange Act of 1934 and the Investment Company Act of 1940, this report has been signed below by the following persons on behalf of the registrant and in the capacities and on the dates indicated.
| By (Signature and Title) | | /s/David H. Ellison | | 1/3/2012 |
| | |
|
| | | David H. Ellison | | Date |
| | | President and Principal Executive Officer |
| | | The FBR Funds | | |
| | | | | |
| | | | | |
| | | | | |
| By (Signature and Title) | | /s/Kimberly J. Bradshaw | | 1/3/2012 |
| | |
|
| | | Kimberly J. Bradshaw | | Date |
| | | Treasurer, Secretary and Principal Financial Officer |
| | | The FBR Funds | | |