UNITED STATES
SECURITIES AND EXCHANGE COMMISSION
Washington, D.C. 20549
FORM N-CSR
CERTIFIED SHAREHOLDER REPORT OF REGISTERED
MANAGEMENT INVESTMENT COMPANIES
Investment Company Act file number 811-21503
The FBR Funds
———————————–
(Exact name of registrant as specified in charter)
1001 Nineteenth Street North
Arlington, VA 22209
————————————————
(Address of principal executive offices) (Zip code)
Registrant’s telephone number, including area code: 703.469.1040
William Ginivan
General Counsel
FBR Capital Markets Corporation
Potomac Tower
1001 Nineteenth Street North
Arlington, VA 22209
—————————————————————————
(Name and address of agent for service)
Date of fiscal year end: October 31, 2010
Date of reporting period: October 31, 2010
Form N-CSR is to be used by management investment companies to file reports with the Commission not later than 10 days after the transmission to stockholders of any report that is required to be transmitted to stockholders under Rule 30e-1 under the Investment Company Act of 1940 (17 CFR 270.30e-1). The Commission may use the information provided on Form N-CSR in its regulatory, disclosure review, inspection and policymaking roles.
A registrant is required to disclose the information specified by Form N-CSR, and the Commission will make this information public. A registrant is not required to respond to the collection of information contained in Form N-CSR unless the Form displays a currently valid Office of Management and Budget (“OMB”) control number. Please direct comments concerning the accuracy of the information collection burden estimate and any suggestions for reducing the burden to Secretary, Securities and Exchange Commission, 100 F Street, NE, Washington, DC 20549-0609. The OMB has reviewed this collection of information under the clearance requirements of 44 U.S.C. § 3507.
ITEM 1. REPORT TO SHAREHOLDERS.
The following is a copy of the report transmitted to shareholders pursuant to Rule 30e-1 under the Investment Company Act of 1940 (17CRF 270.30e-1).

THE FBR FUNDS
FBR Large Cap Fund
FBR Mid Cap Fund
FBR Small Cap Fund
FBR Focus Fund
FBR Large Cap Financial Fund
FBR Small Cap Financial Fund
FBR Technology Fund
FBR Gas Utility Index Fund
Annual Report
October 31, 2010
[THIS PAGE INTENTIONALLY LEFT BLANK]
The FBR Funds
Annual Letter to Shareholders
Dear Shareholder:
We are pleased to present the FBR Funds’ Annual Report for the twelve-month period ended October 31, 2010.
The U.S. equity market extended its second-half of 2010 rally into October helping all market capitalization categories (large, mid, and small) deliver strong returns for the period. The S&P 500 Index rose 16.52% and the Dow Jones Industrial Average gained 17.6% during the period. Mid cap stocks lead the way generating the highest return of 27.71%1. Small cap stocks were close behind and returned 26.58%2. Growth stocks within each market cap segment significantly outperformed value stocks over the period.
All ten of the Global Industry Classification Standard (GICS) sectors represented in the S&P 500 Index posted positive returns for the period. Despite the historically high long-term unemployment rates, continued weakness in the housing market, and negative investor sentiment, the consumer discretionary sector lead the way outpacing the nine other sectors. Other top performing sectors included industrials, telecommunications and materials. The steady rise in commodity prices, especially precious metals, drove strong returns in material stocks. Not surprisingly, financials were the weakest performing sector as banks continue to struggle with numerous credit, regulatory and loan growth headwinds. Income-seeking investors, however, have been in a difficult place over the previous twelve-months with continuing low bond, bank CD and money market returns.
Overall, we believe the U.S. economy is healing and that better conditions for investing, employment and economic growth lie ahead. There is no doubt that this so called “great recession” has been very severe and will take time to heal. However, we see that companies are de-levering, de-risking and de-complicating their balance sheets and income statements. We see the consumer reducing debt and becoming more rational about the balance between spending and saving. We see governments and central banks globally looking to (or being forced to) be more efficient by reducing budget shortfalls and flooding the system with credit to ease liquidity issues. We see new products and services being invented or implemented that will create new industries and new jobs. We see well-run companies that are growing and improving profits despite the recession. We see companies in trouble that we believe will repair, recover and prosper. We see companies taking share from weakened competitors. In sum, we believe that attractive investment opportunities are available today despite the near-term “doom and gloom”. As stewards of your capital, we are working very hard to provide conservative exposure to these opportunities in accordance with our investment philosophy and process that drives all of our fund products.
During the year we accomplished two non-investment items that we believe make our products more efficient and easier to understand. First, during the fiscal year we merged the FBR Pegasus Small Cap Growth Fund into the FBR Small Cap Fund. The combined fund should provide a meaningful increase in assets which improves the cost efficiencies achieved by a larger shareholder base. More importantly, the merger allows Robert Barringer, portfolio manager of both small cap funds, to focus his time, attention and efforts on executing his investment process on a single small cap core strategy. We believe the FBR Small Cap Fund is a viable solution for any investor looking to gain diversified exposure to the small cap segment of the market. Second, we eliminated the “Pegasus” sub-brand from our product line
|
| 1 | 27.71% is the return for the Russell Mid Cap Index for the twelve month period ending October 31, 2010. |
| 2 | 26.58% is the return for the Russell 2000 Index for the twelve month period ending October 31, 2010. |
2
nomenclature. This was done to simplify and remove any confusion regarding the objective of each of our core equity products as they are increasingly being uncovered by professional and retail investors “screening” for strong performing funds.
As in prior years, what follows in this report is a discussion with each portfolio manager with respect to the performance of their fund(s) over the 2010 fiscal year. It also includes their thoughts on related industry or company conditions and their investment outlook. We believe the commentary from our fund managers is an important part of our communications to you. We encourage you to read them to gain a better understanding of the investment philosophy and process that drives our organization.
All of us at The FBR Funds want to thank you for your continued support, and we look forward to serving your investment needs in the years ahead. As always, we welcome your questions and comments. You can reach us via e-mail at fbrfundsinfo@fbr.com or toll free at 888.200.4710. If you would like more timely updates, www.fbrfunds.com provides quarterly performance data as well as other important information.
Sincerely,
David H. Ellison
President, Chief Investment Officer and Trustee
The FBR Funds
|
Past performance is no guarantee of future results. The performance data quoted represents past performance and the current performance may be lower or higher than the performance data quoted. The investment return and principal will fluctuate so that investors’ shares, when redeemed, may be worth more or less than their original cost. The performance data does not reflect the deduction of taxes that a shareholder would pay on fund distributions or redemption fees. The Funds charge a redemption fee of 1.00% on shares redeemed or exchanged within 90 days; if reflected, the redemption fee would reduce the performance quoted. To obtain performance data current to the most recent month-end please call 888.200.4710. |
| |
Investors should consider the investment objectives, risks, charges and expenses carefully before investing. This and other important information can be found in the Fund’s prospectus. To obtain a free prospectus, please call 888.200.4710 or visit www.fbrfunds.com. Please read the prospectus carefully before investing. The FBR Funds are distributed by FBR Investment Services, Inc., member FINRA/SIPC. |
3
The FBR Funds
FBR Large Cap Fund
Management Overview
Portfolio Managers: Robert Barringer, CFA® and Ryan Kelley, CFA®
Over the previous 12 months, how did the Fund perform and what factors contributed to this performance?
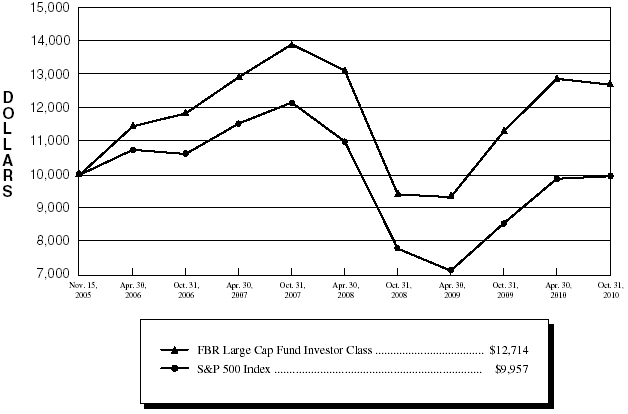
For the twelve-month period ended October 31, 2010, the Investor Class Shares of the FBR Large Cap Fund returned 12.43%. This compares to the S&P 500 Index and the Morningstar Large Blend Category Average which over the same time period returned 16.52% and 15.61%, respectively.
For each of the previous four fiscal years since inception, the FBR Large Cap Fund (previously the FBR Pegasus Fund™) outperformed both the S&P 500 Index and its peers, in most cases by a substantial amount. Regrettably, we did not fare as well for fiscal year 2010. While we are disappointed with our relative performance versus our peers, we believe that maintaining our disciplined investment process can mean underperformance during periods such as this when lower quality companies see more dramatic price appreciation than more stable ones. However, we also find that the Fund has outperformed in more difficult market environments as well as over a complete cycle.
We can attribute the majority of this fiscal year’s underperformance to two factors: first, carrying cash (albeit less than 5% average for the year) when the markets soared, and second, our relative exposure to different sectors relative to our benchmark. Specifically, we had very few investments in the telecommunications sector in a year in which those stocks saw significant appreciation, driven in part by increased usage and adoption of next generation smart phones, PDAs, and other telecommunications equipment. Conversely, our slight overweight in the financial sector also contributed to our relative underperformance, given financial stocks underperformed the broader market as large cap banks and other financial institutions continued to work through their asset quality, capital adequacy and earnings problems.
Throughout the life of the Fund (just over 5 years), our stock selection is what has driven our performance. This year, however, we saw mixed results as the Fund owned relatively outperforming stocks in the health care, technology, and energy sectors and relatively underperforming stocks in the consumer discretionary, consumer staples, and financial sectors.
Portfolio managers’ comments on the Fund and the related investment outlook.
The stock market performed exceptionally well for the second year in a row during our most recent fiscal year, after a dismal 2008. Specifically, the S&P 500 Index dropped 36% in fiscal year 2008, followed by a recovery of 10% in fiscal year 2009 and now close to a 17% return in fiscal year 2010. Overall, since October 31, 2007, the S&P 500 Index is down 18%, including dividends. Despite lagging the market in this most recent year, the FBR Large Cap Fund is down only half as much (-9%) as the benchmark during the same
4
The FBR Funds
FBR Large Cap Fund
Management Overview (continued)
time period. Our investment philosophy focuses on returns over longer time periods, and we are encouraged by our 3 and 5 year performance despite a tough fiscal year 2010.
Our investment process is designed to create a diversified portfolio of investments in companies with less leveraged balance sheets and historically strong business models trading at attractive valuations. Our philosophy tends to produce less volatile returns over a complete cycle, as is evidenced by our relative performance over the past three year and five year periods. We believe that the recent market volatility and tough economic times create opportunities to invest in companies that may do well over a longer time horizon.
|
The opinions expressed in this commentary reflect those of the Portfolio Managers as of the date written. Any such opinions are subject to change based on market or other conditions. These opinions may not be relied upon as investment advice. Investment decisions for The FBR Funds are based on several factors, and may not be relied upon as an indication of trading intent on behalf of any FBR Fund. Security positions can and do change. |
5
The FBR Funds
FBR Large Cap Fund
Comparison of Changes in Value of $10,000 Investment in
Investor Class Shares(1)(2) vs. S&P 500 Index(1)(3)
Total Returns—For the Periods Ended October 31, 2010(4) | |
| | | | | | | Annualized | |
| | | | | | | Since | |
| | | One Year | | Inception(5) | |
| | |
| |
| |
FBR Large Cap Fund Investor Class(1)(2) | | | 12.43 | % | | | 4.96 | % | |
FBR Large Cap Fund I Class(2) | | | 12.71 | % | | | (1.76 | )% | |
S&P 500 Index(1)(3) | | | 16.52 | % | | | (0.09 | )% | |
PAST PERFORMANCE IS NO GUARANTEE OF FUTURE RESULTS.
The performance data quoted represents past performance and the current performance may be lower or higher than the performance data quoted. The investment return and principal will fluctuate so that investors’ shares, when redeemed, may be worth more or less than their original cost. The performance data does not reflect the deduction of taxes that a shareholder would pay on Fund distributions or redemption fees. The Fund charges a redemption fee of 1.00% on shares redeemed or exchanged within 90 days; if reflected, the redemption fee would reduce the performance data quoted. To obtain performance data current to the most recent month-end, please call 888.200.4710.
|
(1) | | The graph assumes a hypothetical $10,000 initial investment in the Fund and reflects the reinvestment of dividends and all Fund expenses. Investors should note that the Fund is a professionally managed mutual fund while the index is unmanaged, does not incur expenses and is not available for investment. The performance of the index includes reinvested dividends, and does not reflect sales charges or expenses. |
| (2) | | FBR Fund Advisers, Inc. waived a portion of its advisory fees and agreed to contractually reimburse a portion of the Fund’s operating expenses, as necessary, to maintain existing expense limitations, as set forth in the notes to the financial statements. Total returns shown include fee waivers and expense reimbursements, if any; total returns would have been lower had there been no waiver of fees and/or reimbursement of expenses in excess of expense limitations. |
| (3) | | The S&P 500 Index is a capitalization-weighted index of 500 stocks. The index is designed to represent the broad domestic economy through changes in aggregate market value of 500 stocks representing all major industries. |
| (4) | | The total returns shown do not reflect the deduction of taxes that a shareholder would pay on fund distributions or the redemption of fund shares. |
| (5) | | The inception date for the Investor Class is November 15, 2005 and the inception date for the I Class is May 30, 2008. The index return is for the period beginning November 15, 2005. |
6
The FBR Funds
FBR Large Cap Fund
Portfolio Summary
October 31, 2010
The following provides a breakdown of the Fund by industry sectors. The underlying securities represent a percentage of the portfolio investments.
Industry Sector | | % of Total Investments |
| |
|
| Technology | | | 22.8 | % |
| Consumer, Non-cyclical | | | 21.4 | % |
| Financial | | | 15.9 | % |
| Consumer, Cyclical | | | 14.1 | % |
| Industrial | | | 10.5 | % |
| Energy | | | 6.5 | % |
| Communications | | | 4.1 | % |
| Basic Materials | | | 3.2 | % |
| | | | | |
| Cash | | | 1.5 | % |
7
The FBR Funds
FBR Large Cap Fund
Portfolio of Investments
October 31, 2010
|
| | | | | | VALUE |
| | SHARES | | | | (NOTE 2) |
|
| | | | COMMON STOCKS — 98.5% | | | | |
| | | | Basic Materials — 3.2% | | | | |
| | 7,050 | | BHP Billiton Ltd. ADR | | $ | 582,259 | |
| | 7,000 | | Freeport-McMoRan Copper & Gold, Inc. | | | 662,760 | |
| | 5,600 | | United States Steel Corp. | | | 239,624 | |
| | | | | |
| |
| | | | | | | 1,484,643 | |
| | | | | |
| |
| | | | Communications — 4.1% | | | | |
| | 4,200 | | Akamai Technologies, Inc.* | | | 217,014 | |
| | 1,000 | | Amazon.com, Inc.* | | | 165,140 | |
| | 33,600 | | Cisco Systems, Inc.* | | | 767,088 | |
| | 1,275 | | Google, Inc., Class A* | | | 781,562 | |
| | | | | |
| |
| | | | | | | 1,930,804 | |
| | | | | |
| |
| | | | Consumer, Cyclical — 14.1% | | | | |
| | 11,300 | | Coach, Inc. | | | 565,000 | |
| | 10,200 | | Fastenal Co. | | | 525,096 | |
| | 22,000 | | J. C. Penney Company, Inc. | | | 685,960 | |
| | 21,500 | | Lowe’s Companies, Inc. | | | 458,595 | |
| | 6,900 | | McDonald’s Corp. | | | 536,613 | |
| | 5,600 | | NIKE, Inc., Class B | | | 456,064 | |
| | 14,200 | | Target Corp. | | | 737,548 | |
| | 15,325 | | The Gap, Inc. | | | 291,328 | |
| | 13,100 | | The TJX Companies, Inc. | | | 601,159 | |
| | 4,800 | | V.F. Corp. | | | 399,552 | |
| | 12,700 | | Walgreen Co. | | | 430,276 | |
| | 17,150 | | Wal-Mart Stores, Inc. | | | 929,016 | |
| | | | | |
| |
| | | | | | | 6,616,207 | |
| | | | | |
| |
| | | | Consumer, Non-cyclical — 21.4% | | | | |
| | 8,640 | | Abbott Laboratories | | | 443,405 | |
| | 15,500 | | Automatic Data Processing, Inc. | | | 688,510 | |
| | 8,475 | | Baxter International, Inc. | | | 431,378 | |
| | 9,200 | | Biogen Idec, Inc.* | | | 576,932 | |
| | 2,970 | | C.R. Bard, Inc. | | | 246,866 | |
| | 5,275 | | Colgate-Palmolive Co. | | | 406,808 | |
| | 12,400 | | Forest Laboratories, Inc.* | | | 409,820 | |
| | 8,000 | | General Mills, Inc. | | | 300,320 | |
8
The FBR Funds
FBR Large Cap Fund
Portfolio of Investments (continued)
October 31, 2010
|
| | | | | | VALUE |
| | SHARES | | | | (NOTE 2) |
|
| | | | Consumer, Non-cyclical — 21.4% (continued) | | | | |
| | 6,700 | | Gilead Sciences, Inc.* | | $ | 265,789 | |
| | 11,000 | | Johnson & Johnson | | | 700,370 | |
| | 18,800 | | Merck & Company, Inc. | | | 682,064 | |
| | 6,520 | | Novo Nordisk A/S ADR | | | 683,296 | |
| | 12,000 | | Paychex, Inc. | | | 332,400 | |
| | 6,800 | | PepsiCo, Inc. | | | 444,040 | |
| | 13,700 | | Stryker Corp. | | | 678,013 | |
| | 28,000 | | Sysco Corp. | | | 824,880 | |
| | 9,200 | | The Coca-Cola Co. | | | 564,144 | |
| | 25,450 | | Unilever PLC ADR | | | 738,559 | |
| | 4,600 | | Visa Inc., Class A | | | 359,582 | |
| | 5,400 | | Zimmer Holdings, Inc.* | | | 256,176 | |
| | | | | |
| |
| | | | | | | 10,033,352 | |
| | | | | |
| |
| | | | Energy — 6.5% | | | | |
| | 10,502 | | Apache Corp. | | | 1,060,912 | |
| | 22,900 | | BP PLC ADR | | | 935,007 | |
| | 17,200 | | ConocoPhillips | | | 1,021,680 | |
| | | | | |
| |
| | | | | | | 3,017,599 | |
| | | | | |
| |
| | | | Financial — 15.9% | | | | |
| | 61,300 | | Bank of America Corp. | | | 701,272 | |
| | 200,000 | | Citigroup Inc.* | | | 834,000 | |
| | 25,000 | | Discover Financial Services | | | 441,250 | |
| | 7,025 | | Franklin Resources, Inc. | | | 805,767 | |
| | 57,300 | | Hudson City Bancorp, Inc. | | | 667,545 | |
| | 23,525 | | JPMorgan Chase & Co. | | | 885,246 | |
| | 85,400 | | KeyCorp | | | 699,426 | |
| | 31,600 | | People’s United Financial, Inc. | | | 388,996 | |
| | 13,100 | | Prudential Financial, Inc. | | | 688,798 | |
| | 17,075 | | T. Rowe Price Group, Inc. | | | 943,735 | |
| | 2,425 | | The Goldman Sachs Group, Inc. | | | 390,304 | |
| | | | | |
| |
| | | | | | | 7,446,339 | |
| | | | | |
| |
| | | | Industrial — 10.5% | | | | |
| | 15,615 | | 3M Co. | | | 1,315,095 | |
| | 11,500 | | Canadian Pacific Railway Ltd. | | | 749,110 | |
9
The FBR Funds
FBR Large Cap Fund
Portfolio of Investments (continued)
October 31, 2010
|
| | | | | | VALUE |
| | SHARES | | | | (NOTE 2) |
|
| | | | Industrial — 10.5% (continued) | | | | |
| | 59,300 | | General Electric Co. | | $ | 949,986 | |
| | 16,000 | | Norfolk Southern Corp. | | | 983,840 | |
| | 15,000 | | Spirit AeroSystems Holdings, Inc., Class A* | | | 324,600 | |
| | 6,950 | | Union Pacific Corp. | | | 609,376 | |
| | | | | |
| |
| | | | | | | 4,932,007 | |
| | | | | |
| |
| | | | Technology — 22.8% | | | | |
| | 4,900 | | Apple, Inc.* | | | 1,474,263 | |
| | 5,700 | | ARM Holdings PLC ADR | | | 100,776 | |
| | 9,000 | | Cerner Corp.* | | | 790,470 | |
| | 9,000 | | Check Point Software Technologies Ltd.* | | | 384,750 | |
| | 3,600 | | Citrix Systems, Inc.* | | | 230,652 | |
| | 46,800 | | Intel Corp. | | | 939,276 | |
| | 6,800 | | International Business Machines Corp. | | | 976,480 | |
| | 8,000 | | Lexmark International, Inc., Class A* | | | 304,240 | |
| | 33,050 | | Microsoft Corp. | | | 880,452 | |
| | 4,500 | | NetApp, Inc.* | | | 239,625 | |
| | 38,300 | | Oracle Corp. | | | 1,126,020 | |
| | 10,000 | | Research In Motion Ltd.* | | | 569,500 | |
| | 1,800 | | salesforce.com, Inc.* | | | 208,926 | |
| | 21,350 | | SAP AG ADR | | | 1,104,436 | |
| | 23,500 | | Teradata Corp.* | | | 924,960 | |
| | 13,400 | | Texas Instruments, Inc. | | | 396,238 | |
| | | | | |
| |
| | | | | | | 10,651,064 | |
| | | | | |
| |
| | | | Total Common Stocks (Cost $41,776,784) | | | 46,112,015 | |
| | | | | |
| |
10
The FBR Funds
FBR Large Cap Fund
Portfolio of Investments (continued)
October 31, 2010
|
| | | | | | VALUE |
| | SHARES | | | | (NOTE 2) |
|
| | | | SHORT-TERM INVESTMENT — 1.5% | | | | |
| | 706,944 | | JPMorgan 100% U.S. Treasury Securities Money Market Fund (Cost $706,944) | | $ | 706,944 | |
| | | | | |
| |
| | | | Total Investments — 100.0% (Cost $42,483,728) | | | 46,818,959 | |
| | | | | | | | |
| | | | Liabilities Less Other Assets — NM | | | (27,580 | ) |
| | | | | |
| |
| | | |
Net Assets — 100.0% | |
$ |
46,791,379 | |
| | | | | |
| |
|
| * | | Non-income producing security |
| ADR | | American Depositary Receipts |
| NM | | Not meaningful |
| PLC | | Public Liability Company |
| Note: | | For presentation purposes, the Fund has grouped some of the industry categories. For purposes of categorizing securities for compliance with Section 8(b)(1) of the Investment Company Act of 1940, the Fund uses more specific industry classifications. |
The accompanying notes are an integral part of the financial statements.
11
The FBR Funds
FBR Mid Cap Fund
Management Overview
Portfolio Manager: Ryan Kelley, CFA®
Over the previous 12 months, how did the Fund perform and what factors contributed to this performance?
For the twelve-month period ended October 31, 2010, the Investor Class of the FBR Mid Cap Fund returned 19.58%. This compares to the Russell Midcap Index and the Morningstar Mid Cap Blend Category Average which over the same time period returned 27.71% and 23.06%, respectively.
Despite a disappointing first half of this fiscal year, we are encouraged that our relative performance improved dramatically during the second half of the year. In fact, the Fund outperformed its peers during the second half while only underperforming the benchmark by approximately 1%. Past performance analysis shows that the Fund may lag the index and its peer group during strong market rallies where lesser quality securities can have more dramatic increases in value than more stable ones. While this was the case during the first half of this year, this same analysis shows the Fund has outperformed in more difficult market environments and over longer time periods.
We attribute the majority of this fiscal year’s underperformance to three factors: cash position, sector allocation and stock selection. First, carrying cash (albeit less than 5% average for the year) during certain time periods in which the markets soared led to relative underperformance. Second, our underexposure to consumer discretionary stocks and slight overexposure to financial stocks added to our underperformance. Third, we owned more conservative financial institutions and underperforming technology and consumer discretionary companies that all lagged the performance of their respective sectors.
Portfolio manager comments on the Fund and the related investment outlook.
During this fiscal year, mid-cap stocks and small-cap stocks performed significantly better when compared to large-cap stocks. While the Russell Midcap Index and the Russell 2000 Index (small-cap) returned 28% and 27%, respectively, the Russell Top 200 Index (large-cap) rose only 14%.
Mid cap stocks performed exceptionally well for the second year in a row, after a challenging 2008. Using our fiscal year end of October 31, the Russell Midcap Index had total returns of 19% and 28% in 2009 and 2010, respectively, after a dismal -41% in 2008. Overall, since October 31, 2007, the Russell Midcap Index is down 10%. Despite lagging in this most recent year, the FBR Mid Cap Fund is actually up 4% and is beating the benchmark by a significant amount since October 31, 2007.
Our goal is to provide better than average risk-adjusted returns over a complete market cycle. We strive to participate in the upside while protecting against the downside. While we are disappointed with the prior 12 month period’s return relative to the benchmark and our peers, we are encouraged by the more recent six month period and believe that the
12
The FBR Funds
FBR Mid Cap Fund
Management Overview (continued)
Fund is well positioned over the longer-term. Our investment philosophy, process and discipline remain intact, while we adapt to new opportunities and rapidly moving markets. We believe the Fund’s diversification, and quality stock investments will continue to provide solid returns for our shareholders with less volatility over a complete business cycle.
|
The opinions expressed in this commentary reflect those of the Portfolio Manager as of the date written. Any such opinions are subject to change based on market or other conditions. These opinions may not be relied upon as investment advice. Investment decisions for The FBR Funds are based on several factors, and may not be relied upon as an indication of trading intent on behalf of any FBR Fund. Security positions can and do change. |
13
The FBR Funds
FBR Mid Cap Fund
Comparison of Changes in Value of $10,000 Investment in
Investor Class Shares(1)(2) vs. Russell Midcap Index(1)(3)

Total Returns—For the Periods Ended October 31, 2010(4) |
| | | | | | | Annualized | |
| | | | | | | Since | |
| | | One Year | | Inception(5) | |
| | |
| |
| |
FBR Mid Cap Fund Investor Class(1)(2) | | | 19.58 | % | | | 4.46 | % | |
FBR Mid Cap Fund™ I Class(2) | | | 19.72 | % | | | 0.46 | % | |
Russell Midcap Index(1)(3) | | | 27.71 | % | | | (0.92 | )% | |
PAST PERFORMANCE IS NO GUARANTEE OF FUTURE RESULTS.
The performance data quoted represents past performance and the current performance may be lower or higher than the performance data quoted. The investment return and principal will fluctuate so that investors’ shares, when redeemed, may be worth more or less than their original cost. The performance data does not reflect the deduction of taxes that a shareholder would pay on Fund distributions or redemption fees. The Fund charges a redemption fee of 1.00% on shares redeemed or exchanged within 90 days; if reflected, the redemption fee would reduce the performance data quoted. To obtain performance data current to the most recent month-end, please call 888.200.4710.
|
| (1) | | The graph assumes a hypothetical $10,000 initial investment in the Fund and reflects the reinvestment of dividends and all Fund expenses. Investors should note that the Fund is a professionally managed mutual fund while the index is unmanaged, does not incur expenses and is not available for investment. The performance of the index includes reinvested dividends, and does not reflect sales charges or expenses. |
| (2) | | FBR Fund Advisers, Inc. waived a portion of its advisory fees and agreed to contractually reimburse a portion of the Fund’s operating expenses, as necessary, to maintain existing expense limitations, as set forth in the notes to the financial statements. Total returns shown include fee waivers and expense reimbursements, if any; total returns would have been lower had there been no waiver of fees and/or reimbursement of expenses in excess of expense limitations. |
| (3) | | The Russell Midcap Index measures the performance of the 800 smallest companies in the Russell 1000 Index, which represents approximately 31% of the total market capitalization of the Russell 1000 Index. |
| (4) | | The total returns shown do not reflect the deduction of taxes that a shareholder would pay on fund distributions or the redemption of fund shares. |
| (5) | | The inception date for the Investor Class is February 28, 2007 and the inception date for the I Class is May 30, 2008. The index return is for the period beginning February 28, 2007. |
14
The FBR Funds
FBR Mid Cap Fund
Portfolio Summary
October 31, 2010
The following provides a breakdown of the Fund by industry sectors. The underlying securities represent a percentage of the portfolio investments.
Industry Sector | | % of Total Investments |
| |
|
| Consumer, Non-cyclical | | | 17.3 | % |
| Consumer, Cyclical | | | 17.2 | % |
| Industrial | | | 12.1 | % |
| Financial | | | 11.5 | % |
| Energy | | | 6.5 | % |
| Technology | | | 6.2 | % |
| Basic Materials | | | 5.9 | % |
| Utilities | | | 5.9 | % |
| Communications | | | 3.9 | % |
| | | | | |
| Cash | | | 13.5 | % |
15
The FBR Funds
FBR Mid Cap Fund
Portfolio of Investments
October 31, 2010
|
| | | | | | VALUE |
| | SHARES | | | | (NOTE 2) |
|
| | | | COMMON STOCKS — 94.9% | | | | |
| | | | Basic Materials — 6.4% | | | | |
| | 8,500 | | Compania de Minas Buenaventura S.A.A. ADR | | $ | 450,840 | |
| | 6,075 | | Ecolab, Inc. | | | 299,619 | |
| | 8,000 | | Gold Fields Ltd. ADR | | | 126,160 | |
| | 4,934 | | Sigma-Aldrich Corp. | | | 312,914 | |
| | | | | |
| |
| | | | | | | 1,189,533 | |
| | | | | |
| |
| | | | Communications — 4.3% | | | | |
| | 6,250 | | Amdocs Ltd.* | | | 191,750 | |
| | 3,647 | | FactSet Research Systems, Inc. | | | 320,134 | |
| | 7,850 | | Telephone and Data Systems, Inc. | | | 273,415 | |
| | | | | |
| |
| | | | | | | 785,299 | |
| | | | | |
| |
| | | | Consumer, Cyclical — 18.9% | | | | |
| | 8,915 | | Abercrombie & Fitch Co., Class A | | | 382,097 | |
| | 11,039 | | American Eagle Outfitters, Inc. | | | 176,734 | |
| | 12,080 | | Big Lots, Inc.* | | | 378,950 | |
| | 6,100 | | BJ’s Wholesale Club, Inc.* | | | 254,553 | |
| | 9,485 | | Copart, Inc.* | | | 321,162 | |
| | 16,325 | | Ingram Micro, Inc., Class A* | | | 288,300 | |
| | 4,865 | | Magna International, Inc. | | | 440,477 | |
| | 15,924 | | Mattel, Inc. | | | 371,507 | |
| | 7,535 | | Tiffany & Co. | | | 399,355 | |
| | 4,229 | | V.F. Corp. | | | 352,022 | |
| | 3,700 | | Williams-Sonoma, Inc. | | | 119,769 | |
| | | | | |
| |
| | | | | | | 3,484,926 | |
| | | | | |
| |
| | | | Consumer, Non-cyclical — 19.0% | | | | |
| | 2,700 | | Brown-Forman Corp., Class B | | | 164,187 | |
| | 3,222 | | Bunge Ltd. | | | 193,546 | |
| | 3,196 | | C.R. Bard, Inc. | | | 265,652 | |
| | 9,050 | | Endo Pharmaceuticals Holdings, Inc.* | | | 332,497 | |
| | 6,850 | | Equifax, Inc. | | | 226,940 | |
| | 7,938 | | Forest Laboratories, Inc.* | | | 262,351 | |
| | 7,050 | | Hansen Natural Corp.* | | | 361,030 | |
| | 2,100 | | Humana, Inc.* | | | 122,409 | |
| | 6,995 | | Lincare Holdings, Inc. | | | 183,409 | |
16
The FBR Funds
FBR Mid Cap Fund
Portfolio of Investments (continued)
October 31, 2010
|
| | | | | | VALUE |
| | SHARES | | | | (NOTE 2) |
|
| | | | Consumer, Non-cyclical — 19.0% (continued) | | | | |
| | 7,275 | | Paychex, Inc. | | $ | 201,518 | |
| | 13,350 | | SEI Investments Co. | | | 295,702 | |
| | 4,785 | | Techne Corp. | | | 291,502 | |
| | 16,075 | | Tyson Foods, Inc., Class A | | | 249,966 | |
| | 5,644 | | Varian Medical Systems, Inc.* | | | 356,814 | |
| | | | | |
| |
| | | | | | | 3,507,523 | |
| | | | | |
| |
| | | | Energy — 7.1% | | | | |
| | 4,685 | | Ensco International PLC ADR | | | 217,103 | |
| | 4,540 | | Helmerich & Payne, Inc. | | | 194,221 | |
| | 7,800 | | Nabors Industries Ltd.* | | | 163,020 | |
| | 2,925 | | Newfield Exploration Co.* | | | 174,389 | |
| | 5,375 | | Pioneer Natural Resources Co. | | | 375,175 | |
| | 5,550 | | Rowan Companies, Inc.* | | | 182,595 | |
| | | | | |
| |
| | | | | | | 1,306,503 | |
| | | | | |
| |
| | | | Financial — 12.6% | | | | |
| | 5,520 | | Capitol Federal Financial | | | 129,168 | |
| | 7,725 | | Comerica, Inc. | | | 276,401 | |
| | 8,400 | | Hospitality Properties Trust | | | 191,604 | |
| | 21,825 | | Hudson City Bancorp, Inc. | | | 254,261 | |
| | 33,650 | | KeyCorp | | | 275,594 | |
| | 2,046 | | M&T Bank Corp. | | | 152,938 | |
| | 11,185 | | New York Community Bancorp, Inc. | | | 189,362 | |
| | 10,250 | | People’s United Financial, Inc. | | | 126,177 | |
| | 31,000 | | Regions Financial Corp. | | | 195,300 | |
| | 6,821 | | T. Rowe Price Group, Inc. | | | 376,997 | |
| | 5,800 | | W. R. Berkley Corp. | | | 159,616 | |
| | | | | |
| |
| | | | | | | 2,327,418 | |
| | | | | |
| |
| | | | Industrial — 13.3% | | | | |
| | 2,800 | | Alliant Techsystems, Inc.* | | | 213,472 | |
| | 4,153 | | Cummins, Inc. | | | 365,879 | |
| | 5,025 | | Dolby Laboratories, Inc., Class A* | | | 309,942 | |
| | 6,075 | | FLIR Systems, Inc.* | | | 169,128 | |
| | 3,050 | | Joy Global, Inc. | | | 216,397 | |
| | 3,700 | | Kansas City Southern* | | | 162,134 | |
17
The FBR Funds
FBR Mid Cap Fund
Portfolio of Investments (continued)
October 31, 2010
|
| | | | | | VALUE |
| | SHARES | | | | (NOTE 2) |
|
| | | | Industrial — 13.3% (continued) | | | | |
| | 7,295 | | Pall Corp. | | $ | 311,278 | |
| | 5,392 | | Roper Industries, Inc. | | | 374,367 | |
| | 7,500 | | Spirit AeroSystems Holdings, Inc., Class A* | | | 162,300 | |
| | 3,500 | | Tidewater, Inc. | | | 161,455 | |
| | | | | |
| |
| | | | | | | 2,446,352 | |
| | | | | |
| |
| | | | Technology — 6.8% | | | | |
| | 40,068 | | Activision Blizzard, Inc. | | | 459,580 | |
| | 11,103 | | Check Point Software Technologies Ltd.* | | | 474,653 | |
| | 10,500 | | Seagate Technology PLC* | | | 153,825 | |
| | 6,200 | | Xilinx, Inc. | | | 166,222 | |
| | | | | |
| |
| | | | | | | 1,254,280 | |
| | | | | |
| |
| | | | Utilities — 6.5% | | | | |
| | 8,600 | | Ameren Corp. | | | 249,228 | |
| | 5,777 | | Energen Corp. | | | 257,885 | |
| | 8,100 | | NRG Energy, Inc.* | | | 161,271 | |
| | 10,650 | | Westar Energy, Inc. | | | 269,445 | |
| | 10,723 | | Xcel Energy, Inc. | | | 255,851 | |
| | | | | |
| |
| | | | | | | 1,193,680 | |
| | | | | |
| |
| | | | Total Common Stocks (Cost $15,848,259) | | | 17,495,514 | |
| | | | | |
| |
| | | | | | | | |
| | | | SHORT-TERM INVESTMENT — 14.8% | | | | |
| | 2,726,179 | | JPMorgan 100% U.S. Treasury Securities Money Market Fund (Cost $2,726,179) | | | 2,726,179 | |
| | | | | |
| |
| | | | Total Investments — 109.7% (Cost $18,574,438) | | | 20,221,693 | |
| | | | | | | | |
| | | | Liabilities Less Other Assets — (9.7)% | | | (1,789,601 | ) |
| | | | | |
| |
| | | | Net Assets — 100.0% | |
$ |
18,432,092 | |
| | | | | |
| |
|
| * | | Non-income producing security |
| ADR | | American Depositary Receipts |
| PLC | | Public Liability Company |
| Note: | | For presentation purposes, the Fund has grouped some of the industry categories. For purposes of categorizing securities for compliance with Section 8(b)(1) of the Investment Company Act of 1940, the Fund uses more specific industry classifications. |
The accompanying notes are an integral part of the financial statements.
18
The FBR Funds
FBR Small Cap Fund
Management Overview
Portfolio Manager: Robert Barringer, CFA®
Over the previous 12 months, how did the Fund perform and what factors contributed to this performance?
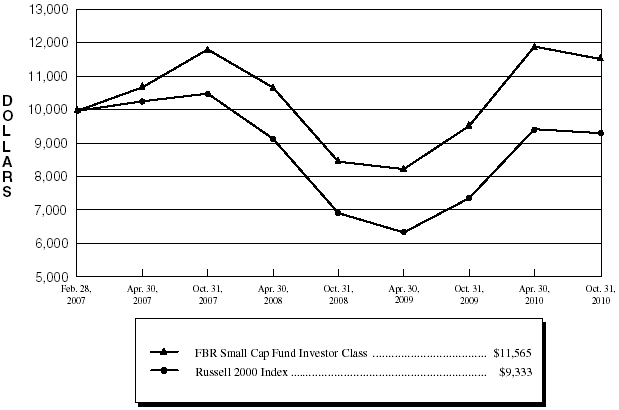
For the twelve-month period ended October 31, 2010, the Investor Class of the FBR Small Cap Fund returned 21.13%. This compares to the Russell 2000 Index and the Morningstar Small Growth Category, which returned 26.58% and 26.66% for the same period, respectively.
While the performance of the past year has been good, the Fund has lagged both its index and the peer group and this has been disappointing. Much of the discrepancy is attributed to specific stock selection, an area which has historically been a source of strength for us. Specific picks in the financial, technology, materials and energy sectors contributed to the shortfall.
The Fund tends to do less well when companies and sectors that are more cyclical or have more leverage are doing well, as has been the case during the past year. However, the Fund has continued to outperform its peers for the past three years.
Portfolio manager comments on the Fund and the related investment outlook.
The past year has been relatively volatile. The markets performed well until May, when the Greek debt crisis led to fears of a European and eventual global contagion. After moving up approximately 30% through the beginning of May from the end of October, 2009, the Russell 2000 Index then contracted 20% through August 2010 as global fears combined with U.S. data that was consistent with a sluggish and uneven recovery. Having said all of that, the U.S. markets have made an impressive recovery from the sell off through August, and are once again approaching their highs for the year.
With the dollar selling off, oil and other commodity prices rose, helping the earnings and those stocks of their producers, producing strong returns for energy and materials this year. Consumer discretionary stocks also had a good year as the earnings of those companies recovered in the face of skepticism on consumer spending. Lastly, technology companies performed well, with their earnings growing impressively, and their stocks accordingly. Importantly though, there were a large amount of takeovers in this sector as well as others, as larger companies and private equity buyers stepped up their investments.
As for the year ahead, we expect that we will continue to see volatility as the Euro zone attempts to work its way through the crises of its weaker members, potentially causing relative dollar strength. The Fed, through its quantitative easing, will attempt to keep interest rates low and keep the domestic economy in recovery mode.
19
The FBR Funds
FBR Small Cap Fund
Management Overview (continued)
As usual, we will attempt to select the stocks of above average companies with profitable margins, high returns on equity and low debt at reasonable prices. We find that these stocks provide the best risk adjusted returns over the long run, while at the same time being many times very attractive to a potential acquirer looking for a solid and growing franchise. With large companies holding large cash balances and in some cases, minimal growth prospects, and with private equity firms having access to low interest rate loans, we expect the flurry of mergers and acquisitions we have seen in the past year to continue.
|
The opinions expressed in this commentary reflect those of the Portfolio Manager as of the date written. Any such opinions are subject to change based on market or other conditions. These opinions may not be relied upon as investment advice. Investment decisions for The FBR Funds are based on several factors, and may not be relied upon as an indication of trading intent on behalf of any FBR Fund. Security positions can and do change. |
20
The FBR Funds
FBR Small Cap Fund
Comparison of Changes in Value of $10,000 Investment in
Investor Class Shares(1)(2) vs. Russell 2000 Index(1)(3)
Total Returns—For the Periods Ended October 31, 2010(4) | |
| | | | | | | Annualized | |
| | | | | | | Since | |
| | | One Year | | Inception(5) | |
| | |
| |
| |
FBR Small Cap Fund Investor Class(1)(2) | | | 21.13 | % | | | 4.04 | % | |
FBR Small Cap Fund I Class(2) | | | 21.35 | % | | | 1.73 | % | |
Russell 2000 Index(1)(3) | | | 26.58 | % | | | (1.86 | )% | |
PAST PERFORMANCE IS NO GUARANTEE OF FUTURE RESULTS.
The performance data quoted represents past performance and the current performance may be lower or higher than the performance data quoted. The investment return and principal will fluctuate so that investors’ shares, when redeemed, may be worth more or less than their original cost. The performance data does not reflect the deduction of taxes that a shareholder would pay on Fund distributions or redemption fees. The Fund charges a redemption fee of 1.00% on shares redeemed or exchanged within 90 days; if reflected, the redemption fee would reduce the performance data quoted. To obtain performance data current to the most recent month-end, please call 888.200.4710.
|
| (1) | | The graph assumes a hypothetical $10,000 initial investment in the Fund and reflects the reinvestment of dividends and all Fund expenses. Investors should note that the Fund is a professionally managed mutual fund while the index is unmanaged, does not incur expenses and is not available for investment. The performance of the index includes reinvested dividends, and does not reflect sales charges or expenses. |
| (2) | | FBR Fund Advisers, Inc. waived a portion of its advisory fees and agreed to contractually reimburse a portion of the Fund’s operating expenses, as necessary, to maintain existing expense limitations, as set forth in the notes to the financial statements. Total returns shown include fee waivers and expense reimbursements, if any; total returns would have been lower had there been no waiver of fees and/or reimbursement of expenses in excess of expense limitations. |
| (3) | | The Russell 2000 Index is comprised of the smallest of the 2000 companies of the Russell 3000 Index, representing approximately 8% of the Russell 3000’s total market capitalization. |
| (4) | | The total returns shown do not reflect the deduction of taxes that a shareholder would pay on fund distributions or the redemption of fund shares. |
| (5) | | The inception date for the Investor Class is February 28, 2007 and the inception date for the I Class is May 30, 2008. The index return is for the period beginning February 28, 2007. |
21
The FBR Funds
FBR Small Cap Fund
Portfolio Summary
October 31, 2010
The following provides a breakdown of the Fund by industry sectors. The underlying securities represent a percentage of the portfolio investments.
Industry Sector | | % of Total Investments |
| |
|
| Technology | | | 22.0 | % |
| Consumer, Cyclical | | | 21.5 | % |
| Financial | | | 16.5 | % |
| Consumer, Non-cyclical | | | 13.9 | % |
| Industrial | | | 10.6 | % |
| Energy | | | 4.4 | % |
| Basic Materials | | | 4.3 | % |
| Communications | | | 3.3 | % |
| Utilities | | | 1.5 | % |
| Investment Company | | | 1.0 | % |
| | | | | |
| Cash | | | 1.0 | % |
22
The FBR Funds
FBR Small Cap Fund
Portfolio of Investments
October 31, 2010
|
| | | | | | VALUE |
| | SHARES | | | | (NOTE 2) |
|
| | | | COMMON STOCKS — 97.7% | | | | |
| | | | Basic Materials — 4.2% | | | | |
| | 27,300 | | Harry Winston Diamond Corp.* | | $ | 348,894 | |
| | 24,000 | | Hecla Mining Co.* | | | 165,360 | |
| | 2,884 | | NewMarket Corp. | | | 341,812 | |
| | 7,750 | | Schnitzer Steel Industries, Inc., Class A | | | 400,597 | |
| | 8,000 | | The Valspar Corp. | | | 256,800 | |
| | | | | |
| |
| | | | | | | 1,513,463 | |
| | | | | |
| |
| | | | Communications — 3.3% | | | | |
| | 1,000 | | Acme Packet, Inc.* | | | 39,550 | |
| | 6,600 | | Blue Coat Systems, Inc.* | | | 178,002 | |
| | 8,000 | | SAVVIS, Inc.* | | | 191,920 | |
| | 7,600 | | Sourcefire, Inc.* | | | 179,284 | |
| | 29,900 | | TIBCO Software, Inc.* | | | 574,678 | |
| | | | | |
| |
| | | | | | | 1,163,434 | |
| | | | | |
| |
| | | | Consumer, Cyclical — 21.5% | | | | |
| | 19,800 | | Aèropostale, Inc.* | | | 482,724 | |
| | 34,000 | | American Eagle Outfitters, Inc. | | | 544,340 | |
| | 10,700 | | Bally Technologies, Inc.* | | | 386,056 | |
| | 12,100 | | BJ’s Wholesale Club, Inc.* | | | 504,933 | |
| | 10,000 | | Chico’s FAS, Inc. | | | 97,200 | |
| | 8,500 | | Deckers Outdoor Corp.* | | | 493,850 | |
| | 8,200 | | Foot Locker, Inc. | | | 130,626 | |
| | 6,300 | | Fossil, Inc.* | | | 371,637 | |
| | 8,060 | | J. Crew Group, Inc.* | | | 257,839 | |
| | 15,000 | | JetBlue Airways Corp.* | | | 104,700 | |
| | 2,375 | | Jos. A. Bank Clothiers, Inc.* | | | 103,550 | |
| | 2,000 | | Lululemon Athletica, Inc.* | | | 88,640 | |
| | 7,000 | | MSC Industrial Direct Company, Inc., Class A | | | 398,580 | |
| | 9,754 | | Owens & Minor, Inc. | | | 277,794 | |
| | 3,700 | | Panera Bread Co., Class A* | | | 331,187 | |
| | 19,200 | | Penn National Gaming, Inc.* | | | 638,592 | |
| | 6,200 | | Polaris Industries, Inc. | | | 440,758 | |
| | 10,000 | | Saks, Inc.* | | | 111,400 | |
| | 9,200 | | Signet Jewelers Ltd.* | | | 323,656 | |
| | 4,000 | | Steven Madden Ltd.* | | | 169,200 | |
23
The FBR Funds
FBR Small Cap Fund
Portfolio of Investments (continued)
October 31, 2010
|
| | | | | | VALUE |
| | SHARES | | | | (NOTE 2) |
|
| | | | Consumer, Cyclical — 21.5% (continued) | | | | |
| | 8,700 | | The Buckle, Inc. | | $ | 253,083 | |
| | 3,000 | | The Children’s Place Retail Stores, Inc.* | | | 132,180 | |
| | 13,700 | | The Dress Barn, Inc.* | | | 314,278 | |
| | 3,600 | | The Men’s Wearhouse, Inc. | | | 87,984 | |
| | 7,600 | | The Toro Co. | | | 431,376 | |
| | 5,000 | | Wolverine World Wide, Inc. | | | 145,600 | |
| | | | | |
| |
| | | | | | | 7,621,763 | |
| | | | | |
| |
| | | | Consumer, Non-cyclical — 13.8% | | | | |
| | 19,100 | | BioMarin Pharmaceutical, Inc.* | | | 499,656 | |
| | 40,100 | | Bruker Corp.* | | | 601,099 | |
| | 4,500 | | Catalyst Health Solutions, Inc.* | | | 170,325 | |
| | 3,700 | | Emergency Medical Services Corp., Class A* | | | 201,206 | |
| | 6,200 | | Gen-Probe, Inc.* | | | 300,266 | |
| | 9,400 | | Immunogen, Inc.* | | | 77,268 | |
| | 12,800 | | Impax Laboratories, Inc.* | | | 241,152 | |
| | 5,750 | | Kinetic Concepts, Inc.* | | | 218,672 | |
| | 10,000 | | Par Pharmaceutical Cos., Inc.* | | | 325,100 | |
| | 12,800 | | Pharmaceutical Product Development, Inc. | | | 330,368 | |
| | 10,800 | | Rollins, Inc. | | | 281,340 | |
| | 20,000 | | Schiff Nutrition International, Inc. | | | 161,600 | |
| | 4,500 | | Seattle Genetics, Inc.* | | | 73,755 | |
| | 16,350 | | Sirona Dental Systems, Inc.* | | | 615,578 | |
| | 1,200 | | Sotheby’s | | | 52,608 | |
| | 2,700 | | SuccessFactors, Inc.* | | | 73,224 | |
| | 4,375 | | Techne Corp. | | | 266,525 | |
| | 4,285 | | Transcend Services, Inc.* | | | 74,645 | |
| | 9,110 | | Wright Express Corp.* | | | 343,538 | |
| | | | | |
| |
| | | | | | | 4,907,925 | |
| | | | | |
| |
| | | | Energy — 4.4% | | | | |
| | 14,400 | | Atlas Energy, Inc.* | | | 419,328 | |
| | 9,312 | | Atwood Oceanics, Inc.* | | | 302,733 | |
| | 24,600 | | Brigham Exploration Co.* | | | 518,814 | |
| | 21,000 | | EXCO Resources, Inc. | | | 311,430 | |
| | | | | |
| |
| | | | | | | 1,552,305 | |
| | | | | |
| |
24
The FBR Funds
FBR Small Cap Fund
Portfolio of Investments (continued)
October 31, 2010
|
| | | | | | VALUE |
| | SHARES | | | | (NOTE 2) |
|
| | | | Financial — 16.5% | | | | |
| | 4,600 | | Affiliated Managers Group, Inc.* | | $ | 393,806 | |
| | 943 | | Alleghany Corp.* | | | 283,353 | |
| | 9,500 | | American Equity Investment Life Holding Co. | | | 103,075 | |
| | 4,435 | | American Financial Group, Inc. | | | 135,622 | |
| | 5,500 | | Arthur J. Gallagher & Co. | | | 154,880 | |
| | 2,700 | | Bancorp Rhode Island, Inc. | | | 78,543 | |
| | 57,000 | | Brookline Bancorp, Inc. | | | 555,180 | |
| | 19,100 | | Capitol Federal Financial | | | 446,940 | |
| | 58,500 | | CNO Financial Group, Inc.* | | | 318,240 | |
| | 36,700 | | Danvers Bancorp, Inc. | | | 551,601 | |
| | 15,800 | | East West Bancorp, Inc. | | | 278,554 | |
| | 8,170 | | Enterprise Bancorp, Inc. | | | 93,873 | |
| | 600 | | First Citizens BancShares, Inc., Class A | | | 112,068 | |
| | 14,000 | | First Horizon National Corp.* | | | 141,260 | |
| | 2,300 | | Hingham Institution for Savings | | | 92,000 | |
| | 3,407 | | Investors Title Co. | | | 110,353 | |
| | 16,000 | | Janus Capital Group, Inc. | | | 168,960 | |
| | 28,100 | | MGIC Investment Corp.* | | | 247,842 | |
| | 17,384 | | Montpelier Re Holdings Ltd. | | | 318,475 | |
| | 33,300 | | Sunstone Hotel Investors, Inc.* | | | 361,305 | |
| | 24,000 | | United Financial Bancorp, Inc. | | | 324,960 | |
| | 6,000 | | Waddell & Reed Financial, Inc., Class A | | | 174,420 | |
| | 9,000 | | Webster Financial Corp. | | | 154,080 | |
| | 827 | | White Mountains Insurance Group, Ltd. | | | 263,978 | |
| | | | | |
| |
| | | | | | | 5,863,368 | |
| | | | | |
| |
| | | | Industrial — 10.6% | | | | |
| | 9,625 | | A.O. Smith Corp. | | | 539,289 | |
| | 7,100 | | Armstrong World Industries, Inc.* | | | 296,425 | |
| | 3,000 | | Atlas Air Worldwide Holdings, Inc.* | | | 156,780 | |
| | 13,000 | | Dynamex, Inc.* | | | 274,820 | |
| | 9,800 | | Genesee & Wyoming, Inc., Class A* | | | 453,054 | |
| | 15,550 | | GrafTech International Ltd.* | | | 256,109 | |
| | 30,100 | | Heartland Express, Inc. | | | 448,791 | |
| | 15,150 | | Knight Transportation, Inc. | | | 270,730 | |
| | 3,000 | | Lennox International, Inc. | | | 123,030 | |
25
The FBR Funds
FBR Small Cap Fund
Portfolio of Investments (continued)
October 31, 2010
|
| | | | | | | VALUE | |
| | SHARES | | | | | (NOTE 2) | |
|
| | | | Industrial — 10.6% (continued) | | | | |
| | 8,000 | | Roadrunner Transportation Systems, Inc.* | | $ | 96,000 | |
| | 7,000 | | Simpson Manufacturing Company, Inc. | | | 186,060 | |
| | 3,600 | | Snap-On, Inc. | | | 183,600 | |
| | 22,250 | | Werner Enterprises, Inc. | | | 474,370 | |
| | | | | |
| |
| | | | | | | 3,759,058 | |
| | | | | |
| |
| | | | Technology — 21.9% | | | | |
| | 2,000 | | athenahealth, Inc.* | | | 79,940 | |
| | 67,100 | | Brocade Communications Systems, Inc.* | | | 424,072 | |
| | 19,200 | | CommVault Systems, Inc.* | | | 555,456 | |
| | 16,000 | | Compellent Technologies, Inc.* | | | 404,320 | |
| | 22,000 | | Compuware Corp.* | | | 220,220 | |
| | 1,500 | | Concur Technologies, Inc.* | | | 77,430 | |
| | 3,600 | | Ebix, Inc.* | | | 88,920 | |
| | 41,300 | | Emulex Corp.* | | | 470,820 | |
| | 7,200 | | Fortinet, Inc.* | | | 216,000 | |
| | 10,000 | | Isilon Systems, Inc.* | | | 284,700 | |
| | 24,377 | | Jack Henry & Associates, Inc. | | | 662,079 | |
| | 4,000 | | JDA Software Group, Inc.* | | | 101,200 | |
| | 7,900 | | Lexmark International, Inc., Class A* | | | 300,437 | |
| | 5,300 | | Medidata Solutions, Inc.* | | | 98,739 | |
| | 14,000 | | Mellanox Technologies Ltd.* | | | 322,280 | |
| | 8,015 | | MICROS Systems, Inc.* | | | 363,801 | |
| | 4,700 | | MicroStrategy, Inc., Class A* | | | 425,961 | |
| | 22,000 | | MIPS Technologies, Inc.* | | | 323,400 | |
| | 6,200 | | NetLogic Microsystems, Inc.* | | | 186,372 | |
| | 7,300 | | Netscout Systems, Inc.* | | | 171,331 | |
| | 8,000 | | NetSuite, Inc.* | | | 163,840 | |
| | 10,975 | | Open Text Corp.* | | | 485,424 | |
| | 24,575 | | QLogic Corp.* | | | 431,783 | |
| | 5,000 | | Quest Software, Inc.* | | | 130,850 | |
| | 4,500 | | RADWARE Ltd.* | | | 159,165 | |
| | 5,400 | | RightNow Technologies, Inc.* | | | 141,048 | |
| | 1,200 | | Riverbed Technology, Inc.* | | | 69,048 | |
| | 7,500 | | Solera Holdings, Inc. | | | 360,375 | |
| | 2,200 | | Taleo Corp., Class A* | | | 63,118 | |
| | | | | |
| |
| | | | | | | 7,782,129 | |
| | | | | |
| |
26
The FBR Funds
FBR Small Cap Fund
Portfolio of Investments (continued)
October 31, 2010
|
| | | | | | VALUE |
| | SHARES | | | | (NOTE 2) |
|
| | | | Utilities — 1.5% | | | | |
| | 25,700 | | Portland General Electric Co. | | $ | 537,130 | |
| | | | | |
| |
| | | | Total Common Stocks (Cost $32,269,406) | | |
34,700,575 | |
| | | | | |
| |
| | | | INVESTMENT COMPANY — 1.0% | | | | |
| | 10,100 | | Materials Select Sector SPDR Fund (Cost $346,910) | | | 351,783 | |
| | | | | |
| |
| | | | SHORT-TERM INVESTMENT — 0.5% | | | | |
| | 177,473 | | JPMorgan 100% U.S. Treasury Securities Money Market Fund (Cost $177,473) | | | 177,473 | |
| | | | | |
| |
| | | | Total Investments — 99.2% (Cost $32,793,789) | | | 35,229,831 | |
| | | | | | | | |
| | | | Other Assets Less Liabilities — 0.8% | | | 266,124 | |
| | | | | |
| |
| | | | Net Assets — 100.0% | |
$ |
35,495,955 | |
| | | | | |
| |
|
| * | | Non-income producing security |
| Note: | | For presentation purposes, the Fund has grouped some of the industry categories. For purposes of categorizing securities for compliance with Section 8(b)(1) of the Investment Company Act of 1940, the Fund uses more specific industry classifications. |
The accompanying notes are an integral part of the financial statements.
27
The FBR Funds
FBR Focus Fund
Management Overview
Portfolio Managers: David Rainey, CFA®, Brian Macauley, CFA® and Ira Rothberg, CFA®
Over the previous 12 months, how did the Fund perform and what factors contributed to this performance?
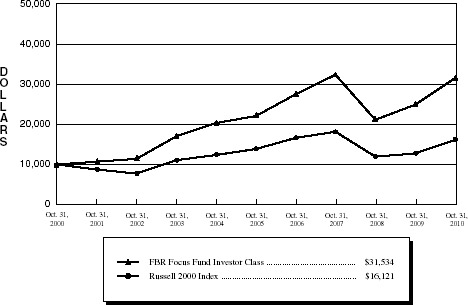
For the twelve-month period ended October 31, 2010, the Investor Class of the FBR Focus Fund returned 26.65% compared to 26.58% for the Russell 2000 Index, 25.94% for the Morningstar Mid Cap Growth Category Average and 16.52% for the S&P 500 Index.
On average, the Fund’s portfolio companies produced growing earnings and earnings power over the period, with some modest valuation expansion. While economic conditions remain difficult, there has been sufficient stability to allow the portfolio companies to increase their intrinsic value.
Major contributors to performance during the period included American Tower, CarMax, and O’Reilly Automotive.
| | • | | American Tower experienced growing rental income from its tower portfolio as wireless service providers (AT&T, Verizon, etc.) leased more space to meet the rapidly growing demand for data services. |
| | • | | CarMax benefited from a continued rebound in demand for used autos and an increase in the availability of auto financing from recessionary lows. Internal efficiency improvements enabled CarMax to set record earnings despite sales still well below pre-recession levels. |
| | • | | O’Reilly Automotive continued to make good progress integrating its acquisition of CSK Auto and extracting value from those formerly underperforming stores. We discuss O’Reilly in greater detail in the second section of this letter. |
The only major detractor from performance was Bally Technologies. Bally’s solid performance in casino information systems was overshadowed by disappointingly slow industry wide sales of slot machines. We expect capital budgets at casinos to improve over the next several years, freeing up cash to invest in new slot machines to Bally’s benefit.
We also had two portfolio companies accept buyout offers during the year: AmeriCredit and Dynamex. With modest valuations and interest rates at multi-decade lows, it is not surprising to see corporate and private equity buyout activity picking up.
We recycled some of the proceeds from the AmeriCredit buyout, along with selective pruning elsewhere in the portfolio, to add two new positions in the portfolio (Aon and Diamond Hill Investment Group) and to quadruple the size of our investment in Charles Schwab. We believe each of these companies has a strong franchise with a good growth opportunity at a very modest valuation.
28
The FBR Funds
FBR Focus Fund
Management Overview (continued)
We invest with a long-term time horizon and encourage Fund shareholders to do the same. Despite the discussion of one year results referenced above, we encourage investors to evaluate the Fund’s performance over three-, five-, and ten-year periods since shorter time frames can be influenced by many transitory issues unrelated to the intrinsic worth of the Fund’s holdings. Long-term performance metrics for the Fund can be found in the table below.
Portfolio managers’ comments on the Fund and the related investment outlook.
In the course of a generation, there has been a wholesale change in the nature of stock ownership in this country. Based on New York Stock Exchange data, from 1940 through the mid 1970s, the average holding period of a stock by U.S. investors fluctuated between four and ten years. Then, in 1975, the average holding period began a steady multi-decade march lower to its current level of about six months. The reasons for this change are numerous, but it is safe to say that the relationship between the typical U.S. investor and his investment in a public company has changed from “going-steady” to “speed dating”.
While we believe this short-term focus is pure folly, we do not protest too loudly. For it is this emphasis on the short-term by others that occasionally creates an opening for us to invest in exceptional businesses at discount prices.
Since inception, the Fund has had an average portfolio company holding period of about six years. While others spend their time trying to forecast share price movement over the next six months, we focus on building a deep understanding of a business and its long term value. We seek to identify well run, competitively advantaged companies that are likely to grow their per share intrinsic value at a mid teens or better rate per year over the next five or ten years. Our goal is to buy these high quality businesses at modest prices so that our long term investment return will approximate or exceed the growth in per share intrinsic value. Such gems are hard to find, especially with our disciplined valuation parameters. But occasionally the market loses sight of, or fails to appreciate the quality of a business and its growth prospects, giving us an investment opportunity. This concept is best illustrated with an example: O’Reilly Automotive.
O’Reilly Automotive is the second largest distributor and retailer of aftermarket auto parts in the U.S. with 3,535 locations across 38 states. The Company sells products ranging from spark plugs, windshield wipers, and motor oil, to alternators, transmissions, and cylinder heads.
The Fund first established a position in O’Reilly in January 2005 at $22 per share, or about 15x analysts’ expectations of 2005 earnings per share (a reasonable metric to track intrinsic value per share for this business). Additional large purchases were made opportunistically in early 2007 and early 2008 at lower valuations in comparison to earnings. Over the Fund’s nearly six year holding period, cash earnings per share have
29
The FBR Funds
FBR Focus Fund
Management Overview (continued)
grown 18% per annum, and the stock price has tracked closely behind, up 17% per annum. Today the shares at $61 still trade at about 15x analysts’ expectations of 2011 earnings per share.
During the same six year period, the S&P 500 grew operating earnings per share at just 2% per annum, so it was not a robust operating environment for businesses overall. The point we want to make is that occasionally you can find a needle in the haystack. There are businesses that can grow earnings at a rapid clip, available at conservative valuations that provide both downside protection and appreciation potential at least in line with mid teens growth in intrinsic value. The challenge is in identifying such opportunities.
In the case of O’Reilly, the company had a very successful history and had grown earnings per share at an 18% annual growth rate from 1999 to 2004 by acquiring competitors and gradually expanding its business from 571 stores in nine states to 1,249 stores in 19 states. So at the time of the Fund’s initial purchase in 2005, the obvious questions were why had the company been so successful in the past, and was this prosperity likely to continue in the future?
Since we typically hold an investment for many years, we conduct our research with an eye toward understanding the opportunity for a business over the course of the next decade. Most of our research is focused on evaluating those things that make a difference in the long term, i.e. the competitive structure of the industry, management quality, and the sustainability of pricing and margins.
To build this knowledge, we conduct industry standard research like reading annual reports, SEC filings, financial statements, attending presentations and meeting with senior management. But to really understand a business we find it is important to dig much deeper. So we often visit company facilities, meet with field level employees, talk to customers, interview former employees, attend industry trade shows, and speak with public and private competitors. While this is hard and time consuming work, we believe it gives us an edge over the more shallow practices common in the investment industry. It gives us an understanding of a company and its industry that often leads to unique investment insights.
As a product of our research, we learned that O’Reilly was advantaged versus its competition because its distribution model was configured to keep its inventory of auto parts closer to the end customer enabling better parts availability and faster delivery times. This was very important to commercial and heavy duty retail customers. Competitors had been unsuccessful replicating O’Reilly’s distribution model, so the company enjoyed a service advantage that had won market share in the past, and was likely to continue yielding benefits in the future.
Further, as one of the largest distributors in the industry, O’Reilly had substantial buying power compared to its many small competitors. So the company could secure parts inventory at a much better price than local and regional competitors enabling it to earn higher profit margins and good economic profits.
30
The FBR Funds
FBR Focus Fund
Management Overview (continued)
O’Reilly had a proven management team and a clear ambition to extend the company’s past regional success into a national franchise. Greg Henslee, CEO, and Ted Wise, COO, were best-in class operators with a combined 56 years experience at the company. And David O’Reilly, Chairman, was a skilled capital allocator who had successfully shepherded the company through a number of major acquisitions.
With a single digit market share in a huge industry and a number of sustainable competitive advantages, we believed O’Reilly had ample room to grow its business. Revenue growth would come from the same places in the future as it had in the past, namely buying and improving competing stores, building new stores in existing markets and expanding into new geographies. Profit growth would exceed revenue growth as O’Reilly harnessed its buying power and made better use of its existing distribution and store assets.
No single factor convinced us that O’Reilly had a high probability of future success. Rather, it was the combination of the favorable elements cited above, some obvious to anyone that studied the company’s history and public filings, others only revealed through diligent reading of industry trade publications and conversations with customers and regional competitors.
Of course not every investment we initiate performs as well as O’Reilly, but on balance the approach outlined above has worked well across the overall portfolio. We think it follows logically from the O’Reilly example that if the Fund’s portfolio companies are purchased at reasonable valuations, then our long-term investment outlook should be shaped by the prospects for growth in per share intrinsic value for each of the Fund’s individual holdings. We have a positive view on the long-term outlook for the Fund not because we expect a booming economic recovery or major bull, but rather because we have a favorable view of the fundamental outlook for each of the Fund’s individual portfolio companies.
We thank you for entrusting your capital to us. We take this responsibility very seriously, and we will do our best to protect and grow your investment.
The opinions expressed in this commentary reflect those of the Portfolio Manager(s) as of the date written. Any such opinions are subject to change based on market or other conditions. These opinions may not be relied upon as investment advice. Investment decisions for The FBR Funds are based on several factors, and may not be relied upon as an indication of trading intent on behalf of any FBR Fund. Security positions can and do change.
31
The FBR Funds
FBR Focus Fund
Comparison of Changes in Value of $10,000 Investment in
Investor Class Shares(1)(2) vs. Russell 2000 Index(1)(3)
| Total Returns—For the Periods Ended October 31, 2010(4) |
| | | | | | | | Annualized | | Annualized |
| | | | | One Year | | Five Year | | Ten Year |
| | | | |
| |
| |
|
| | FBR Focus Fund Investor Class(1)(2) | | | 26.65 | % | | 7.37 | % | | 12.17 | % |
| | FBR Focus Fund I Class(2)(5) | | | 27.32 | % | | N/A | | | N/A | |
| | Russell 2000 Index(1)(3) | | | 26.58 | % | | 3.07 | % | | 4.89 | % |
PAST PERFORMANCE IS NO GUARANTEE OF FUTURE RESULTS.
The performance data quoted represents past performance and the current performance may be lower or higher than the performance data quoted. The investment return and principal will fluctuate so that investors’ shares, when redeemed, may be worth more or less than their original cost. The performance data does not reflect the deduction of taxes that a shareholder would pay on Fund distributions or redemption fees. The Fund charges a redemption fee of 1.00% on shares redeemed or exchanged within 90 days; if reflected, the redemption fee would reduce the performance data quoted. To obtain performance data current to the most recent month-end, please call 888.200.4710.
|
| (1) | | The graph assumes a hypothetical $10,000 initial investment in the Fund and reflects the reinvestment of dividends and all Fund expenses. Investors should note that the Fund is a professionally managed mutual fund while the index is unmanaged, does not incur expenses and is not available for investment. The performance of the index includes reinvested dividends, and does not reflect sales charges or expenses. |
| (2) | | FBR Fund Advisers, Inc. waived a portion of its advisory fees and agreed to contractually reimburse a portion of the Fund’s operating expenses, as necessary, to maintain existing expense limitations, as set forth in the notes to the financial statements. Total returns shown include fee waivers and expense reimbursements, if any; total returns would have been lower had there been no waiver of fees and/or reimbursement of expenses in excess of expense limitations. |
| (3) | | The Russell 2000 Index is comprised of the smallest of the 2000 companies of the Russell 3000 Index, representing approximately 8% of the Russell 3000’s total market capitalization. |
| (4) | | The total returns shown do not reflect the deduction of taxes that a shareholder would pay on fund distributions or the redemption of fund shares. |
| (5) | | For the period May 30, 2008 (inception of share class) through October 31, 2010, the I Class returned 3.76% and the Russell 2000 Index returned (0.93)%. |
32
The FBR Funds
FBR Focus Fund
Portfolio Summary
October 31, 2010
The following provides a breakdown of the Fund by industry sectors. The underlying securities represent a percentage of the portfolio investments.
| Industry Sector | | % of Total Investments |
| |
|
| Retail | | 31.4 | % |
| Entertainment | | 17.3 | % |
| Telecommunications | | 13.1 | % |
| Insurance | | 11.7 | % |
| Advertising | | 8.5 | % |
| Diversified Financial Services | | 5.9 | % |
| Building Materials | | 3.1 | % |
| Transportation | | 2.7 | % |
| Home Furnishings | | 1.7 | % |
| | | | |
| Cash | | 4.6 | % |
33
The FBR Funds
FBR Focus Fund
Portfolio of Investments
October 31, 2010
|
| | | | | | VALUE |
| | SHARES | | | | (NOTE 2) |
|
| | | | COMMON STOCKS — 95.6% | | | | |
| | | | Advertising — 8.5% | | | | |
| | 1,771,440 | | Lamar Advertising Co., Class A* | | $ | 60,211,246 | |
| | | | | |
| |
| | | | Building Materials — 3.1% | | | | |
| | 825,000 | | Simpson Manufacturing Company, Inc. | | | 21,928,500 | |
| | | | | |
| |
| | | | Diversified Financial Services — 5.9% | | | | |
| | 53,520 | | Diamond Hill Investment Group, Inc. | | | 4,098,561 | |
| | 668,256 | | Encore Capital Group, Inc.* | | | 13,578,962 | |
| | 125,000 | | T. Rowe Price Group, Inc. | | | 6,908,750 | |
| | 912,000 | | The Charles Schwab Corp. | | | 14,044,800 | |
| | 173,137 | | White River Capital, Inc. | | | 3,331,156 | |
| | | | | |
| |
| | | | | | | 41,962,229 | |
| | | | | |
| |
| | | | Entertainment — 17.3% | | | | |
| | 1,549,000 | | Bally Technologies, Inc.* | | | 55,887,920 | |
| | 2,009,070 | | Penn National Gaming, Inc.* | | | 66,821,668 | |
| | | | | |
| |
| | | | | | | 122,709,588 | |
| | | | | |
| |
| | | | Home Furnishings — 1.7% | | | | |
| | 680,160 | | American Woodmark Corp. | | | 12,038,832 | |
| | | | | |
| |
| | | | Insurance — 11.7% | | | | |
| | 508,700 | | AON Corp. | | | 20,220,825 | |
| | 187,000 | | Markel Corp.* | | | 62,648,740 | |
| | | | | |
| |
| | | | | | | 82,869,565 | |
| | | | | |
| |
| | | | Retail — 31.5% | | | | |
| | 3,810,235 | | 99 Cents Only Stores*† | | | 58,753,824 | |
| | 2,737,088 | | CarMax, Inc.* | | | 84,822,357 | |
| | 1,352,076 | | O’Reilly Automotive, Inc.* | | | 79,096,446 | |
| | | | | |
| |
| | | | | | | 222,672,627 | |
| | | | | |
| |
| | | | Telecommunications — 13.2% | | | | |
| | 1,804,500 | | American Tower Corp., Class A* | | | 93,130,245 | |
| | | | | |
| |
| | | | Transportation — 2.7% | | | | |
| | 901,315 | | Dynamex, Inc.*† | | | 19,053,799 | |
| | | | | |
| |
| | | | | | | | |
| | | | Total Common Stocks (Cost $373,033,504) | | | 676,576,631 | |
| | | | | |
| |
34
The FBR Funds
FBR Focus Fund
Portfolio of Investments (continued)
October 31, 2010
|
| | | | | | VALUE |
| | SHARES | | | | (NOTE 2) |
|
| | | | SHORT-TERM INVESTMENT — 4.6% | | | | |
| | 32,167,489 | | JPMorgan 100% U.S. Treasury Securities Money Market Fund (Cost $32,167,489) | | $ | 32,167,489 | |
| | | | | |
| |
| | | | | | | | |
| | | | Total Investments — 100.2% (Cost $405,200,993) | | | 708,744,120 | |
| | | | | | | | |
| | | | Liabilities Less Other Assets — (0.2)% | | | (1,093,576 | ) |
| | | | | |
| |
| | | | | | | | |
| | | | Net Assets — 100.0% | | $ | 707,650,544 | |
| | | | | |
| |
|
| * | | Non-income producing security |
| † | | Affiliated issuer as defined in the Investment Company Act of 1940 (ownership of at least 5% of the outstanding voting securities of an issuer) |
| Note: | | For presentation purposes, the Fund has grouped some of the industry categories. For purposes of categorizing securities for compliance with Section 8(b)(1) of the Investment Company Act of 1940, the Fund uses more specific industry classifications. |
The accompanying notes are an integral part of the financial statements.
35
The FBR Funds
FBR Large Cap Financial Fund
Management Overview
Portfolio Manager: David Ellison
Over the previous 12 months, how did the Fund perform and what factors contributed to this performance?
For the twelve-month period ended October 31, 2010, the Investor Class of the FBR Large Cap Financial Fund returned 2.14%. This compares to the Philadelphia Bank Index, the S&P 500 Index and the Morningstar Financial Category Average, which returned 8.76%, 16.52% and 8.01% for the same period, respectively.
The Fund’s underperformance for the year was primarily due to conservative positioning in the second half of the year. In my last update to shareholders (April 2010) I was more constructive on the outlook for improved profits and stock performance. I have since become more conservative. The slowing recovery, continued rise in foreclosed homes, growing evidence of rising commercial delinquencies, a general lack of loan growth opportunities and cost impacts related to new regulatory mandates made me position the portfolio to protect gains achieved through mid year. What the Fund missed was the rally in late summer as aggressive Federal Reserve actions to promote recovery aided investor optimism.
The Fund remains concentrated in the large domestic depository franchises. I believe over the longer run these companies will benefit from a stable funding source (deposits), improved credit conditions and eventual return to loan growth. I expect cash balances will remain on the high side to take advantage of market opportunities and provide the Fund with cash to add new names as my conviction develops.
Portfolio manager comments on the Fund and the related investment outlook.
The industry continues to struggle with numerous profit and growth headwinds. This is, I guess, a fancy way of saying there is still much work to be done before investors see (and buy) earnings they can believe and trust. These headwinds are primarily credit related. We all have heard them – housing prices falling and foreclosures rising, commercial real estate in trouble, loan demand weak, new financial regulations will be costly, Federal Reserve actions to keep interest low will reduce lending spreads and general uncertainty about what the long term impacts of Federal Reserve policy and related interventions will have. Finally, the economic recovery we saw develop in 2009 and the first half of 2010 has lost some steam and pushed back the time line for this industry to recover from what has turned out to be a severe credit cycle. Credit cycles are the biggest value creators and value destroyers for this industry and we are working our way through the latter today.
Now for some better news on financial stocks. Underneath all the macro concerns we have an industry that is working very hard to get better. I expect the work being done NOW will bear fruit over the next three to five years. This fruit will be in the form of reduced risk, reduced leverage and reduced complexity for both the balance sheet and income statement.
36
The FBR Funds
FBR Large Cap Financial Fund
Management Overview (continued)
This industry is cyclical and the difficult conditions of today will cycle into better ones over time.
It remains my goal to invest the Fund in companies that will benefit from the upset that has ensnarled an entire industry. I have been doing this for over 27 years and today’s investment environment is challenging. I remain mindful that investing is never always about making the most, but is always about preserving the most over the long run.
The opinions expressed in this commentary reflect those of the Portfolio Manager as of the date written. Any such opinions are subject to change based on market or other conditions. These opinions may not be relied upon as investment advice. Investment decisions for The FBR Funds are based on several factors, and may not be relied upon as an indication of trading intent on behalf of any FBR Fund. Security positions can and do change.
37
The FBR Funds
FBR Large Cap Financial Fund
Comparison of Changes in Value of $10,000 Investment in
Investor Class Shares(1)(2) vs. S&P 500 Index(1)(3)
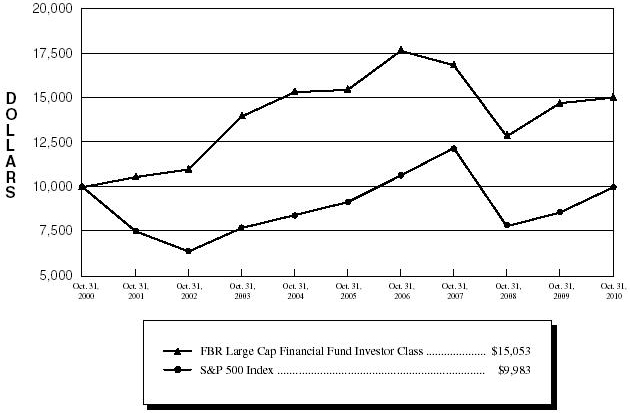
| Total Returns—For the Periods Ended October 31, 2010(4) |
| | | | | | | | Annualized | | Annualized | |
| | | | | One Year | | Five Year | | Ten Year | |
| | | | |
| |
| |
| |
| | FBR Large Cap Financial Fund Investor Class(1)(2) | | | 2.14 | % | | (0.57 | )% | | 4.18 | % | |
| | S&P 500 Index(1)(3) | | | 16.52 | % | | 1.73 | % | | (0.02 | )% | |
PAST PERFORMANCE IS NO GUARANTEE OF FUTURE RESULTS.
The performance data quoted represents past performance and the current performance may be lower or higher than the performance data quoted. The investment return and principal will fluctuate so that investors’ shares, when redeemed, may be worth more or less than their original cost. The performance data does not reflect the deduction of taxes that a shareholder would pay on Fund distributions or redemption fees. The Fund charges a redemption fee of 1.00% on shares redeemed or exchanged within 90 days; if reflected, the redemption fee would reduce the performance data quoted. To obtain performance data current to the most recent month-end, please call 888.200.4710.
|
| (1) | | The graph assumes a hypothetical $10,000 initial investment in the Fund and reflects the reinvestment of dividends and all Fund expenses. Investors should note that the Fund is a professionally managed mutual fund while the index is unmanaged, does not incur expenses and is not available for investment. The performance of the index includes reinvested dividends, and does not reflect sales charges or expenses. |
| (2) | | FBR Fund Advisers, Inc. waived a portion of its advisory fees and agreed to contractually reimburse a portion of the Fund’s operating expenses, as necessary, to maintain existing expense limitations, as set forth in the notes to the financial statements. Total returns shown include fee waivers and expense reimbursements, if any; total returns would have been lower had there been no waiver of fees and/or reimbursement of expenses in excess of expense limitations. |
| (3) | | The S&P 500 Index is a capitalization-weighted index of 500 stocks. The index is designed to represent the broad domestic economy through changes in aggregate market value of 500 stocks representing all major industries. |
| (4) | | The total returns shown do not reflect the deduction of taxes that a shareholder would pay on fund distributions or the redemption of fund shares. |
38
The FBR Funds
FBR Large Cap Financial Fund
Portfolio Summary
October 31, 2010
The following provides a breakdown of the Fund by industry sectors. The underlying securities represent a percentage of the portfolio investments.
| Industry Sector | | % of Total Investments |
| |
|
| Banks | | 65.0 | % |
| Commercial Services | | 10.0 | % |
| Diversified Financial Services | | 9.3 | % |
| Insurance | | 3.3 | % |
| Savings & Loans | | 2.8 | % |
| Lodging | | 2.3 | % |
| Real Estate Investment Trust (REIT) | | 1.8 | % |
| Warrant | | 0.1 | % |
| | | | |
| Cash | | 5.4 | % |
39
The FBR Funds
FBR Large Cap Financial Fund
Portfolio of Investments
October 31, 2010
|
| | | | | | VALUE |
| | SHARES | | | | (NOTE 2) |
|
| | | | COMMON STOCKS — 94.1% | | | | |
| | | | Banks — 64.6% | | | | |
| | 215,000 | | Bank of America Corp. | | $ | 2,459,600 | |
| | 65,000 | | Capital One Financial Corp. | | | 2,422,550 | |
| | 20,000 | | CIT Group, Inc.* | | | 866,600 | |
| | 620,000 | | Citigroup, Inc.* | | | 2,585,400 | |
| | 40,000 | | Comerica, Inc. | | | 1,431,200 | |
| | 90,000 | | Fifth Third Bancorp | | | 1,130,400 | |
| | 195,000 | | Huntington Bancshares, Inc. | | | 1,105,650 | |
| | 69,000 | | JPMorgan Chase & Co. | | | 2,596,470 | |
| | 140,000 | | KeyCorp. | | | 1,146,600 | |
| | 165,000 | | Marshall & Ilsley Corp. | | | 975,150 | |
| | 50,000 | | Morgan Stanley | | | 1,243,500 | |
| | 130,000 | | Regions Financial Corp. | | | 819,000 | |
| | 30,000 | | State Street Corp. | | | 1,252,800 | |
| | 60,000 | | SunTrust Banks, Inc. | | | 1,501,200 | |
| | 15,500 | | The Goldman Sachs Group, Inc. | | | 2,494,725 | |
| | 47,000 | | The PNC Financial Services Group, Inc. | | | 2,533,300 | |
| | 90,000 | | U.S. Bancorp | | | 2,176,200 | |
| | 90,000 | | Wells Fargo & Co. | | | 2,347,200 | |
| | 20,000 | | Zions Bancorp | | | 413,200 | |
| | | | | |
| |
| | | | | | | 31,500,745 | |
| | | | | |
| |
| | | | Commercial Services — 10.0% | | | | |
| | 10,500 | | MasterCard, Inc., Class A | | | 2,520,630 | |
| | 30,000 | | Visa Inc., Class A | | | 2,345,100 | |
| | | | | |
| |
| | | | | | | 4,865,730 | |
| | | | | |
| |
| | | | Diversified Financial Services — 9.3% | | | | |
| | 45,000 | | American Express Co. | | | 1,865,700 | |
| | 150,000 | | Discover Financial Services | | | 2,647,500 | |
| | | | | |
| |
| | | | | | | 4,513,200 | |
| | | | | |
| |
| | | | Insurance — 3.3% | | | | |
| | 40,000 | | MetLife, Inc. | | | 1,613,200 | |
| | | | | |
| |
| | | | Lodging — 2.3% | | | | |
| | 30,000 | | Marriott International, Inc., Class A | | | 1,111,500 | |
| | | | | |
| |
40
The FBR Funds
FBR Large Cap Financial Fund
Portfolio of Investments (continued)
October 31, 2010
|
| | | | | | VALUE |
| | SHARES | | | | (NOTE 2) |
|
| | | | Real Estate Investment Trust (REIT) — 1.8% | | | | |
| | 50,000 | | Annaly Capital Management, Inc. | | $ | 885,500 | |
| | | | | |
| |
| | | | Savings & Loans — 2.8% | | | | |
| | 115,000 | | Hudson City Bancorp, Inc. | | | 1,339,750 | |
| | | | | |
| |
| | | | | | | | |
| | | | Total Common Stocks (Cost $46,895,266) | | | 45,829,625 | |
| | | | | |
| |
|
| | NO. OF | | | | | | |
| | WARRANTS | | | | | | |
|
| | | | WARRANT — 0.1% | | | | |
| | 15,000 | | Bank of America Corp., expiring 10/28/18* (Cost $31,951) | | | 30,750 | |
| | | | | |
| |
|
| | SHARES | | | | | | |
|
| | | | SHORT-TERM INVESTMENT — 4.5% | | | | |
| | 2,205,104 | | JPMorgan 100% U.S. Treasury Securities Money Market Fund (Cost $2,205,104) | | | 2,205,104 | |
| | | | | |
| |
| | | | Total Investments — 98.7% (Cost $49,132,321) | | | 48,065,479 | |
| | | | | | | | |
| | | | Other Assets Less Liabilities — 1.3% | | | 651,077 | |
| | | | | |
| |
| | | | | | | | |
| | | | Net Assets — 100.0% | | $ | 48,716,556 | |
| | | | | |
| |
|
| * | | Non-income producing security |
The accompanying notes are an integral part of the financial statements.
41
The FBR Funds
FBR Small Cap Financial Fund
Management Overview
Portfolio Manager: David Ellison
Over the previous 12 months, how did the Fund perform and what factors contributed to this performance?
For the twelve-month period ended October 31, 2010, the Investor Class of the FBR Small Cap Financial Fund returned 14.27%. This compares favorably to the NASDAQ Bank Index and the Morningstar Financial Category Average which returned 4.60% and 8.01% for the same period, respectively. The Fund trailed the more broadly diversified Russell 2000 Index which retuned 26.58% for the period.
The Fund’s outperformance for the year was primarily due to conservative positioning in the second half of the year. In my last update to shareholders (April 2010) I was more constructive on the outlook for improved profits and stock performance. I have since become more conservative. The slowing recovery, continued rise in foreclosed homes, growing evidence of rising commercial delinquencies, a general lack of loan growth opportunities and cost impacts related to new regulatory mandates made me position the portfolio to protect gains achieved through mid year.
The Fund remains concentrated in the small domestic depository franchises. I believe over the longer run these companies will benefit from a stable funding source (deposits), improved credit conditions and eventual return to loan growth. I also expect consolidation to play a big role in the coming years. We have 6,500 banks in this country and most are quite small. If we were to cut the number in half over the next decade that would require about 30 mergers a month for ten years. That’s lots of deals and lots of opportunities to add value for shareholders. I expect cash balances will remain on the high side to take advantage of market opportunities and provide the Fund with cash to add new names as my conviction develops.
Portfolio manager comments on the Fund and the related investment outlook.
The industry continues to struggle with numerous profit and growth headwinds. This is, I guess, a fancy way of saying there is still much work to be done before investors see (and buy) earnings they can believe and trust. These headwinds are primarily credit related. We all have heard them – housing prices falling and foreclosures rising, commercial real estate in trouble, loan demand weak, new financial regulations will be costly, Federal Reserve actions to keep interest low will reduce lending spreads and general uncertainty about what the long term impacts of Federal Reserve policy and related interventions will have. Finally, the economic recovery we saw develop in 2009 and the first half of 2010 has lost some steam and pushed back the time line for this industry to recover from what has turned out to be a severe credit cycle. Credit cycles are the biggest value creators and value destroyers for this industry and we are working our way through the latter today.
42
The FBR Funds
FBR Small Cap Financial Fund
Management Overview (continued)
Now for some better news on financial stocks. Underneath all the macro concerns we have an industry that is working very hard to get better. I expect the work being done NOW will bear fruit over the next three to five years. This fruit will be in the form of reduced risk, reduced leverage and reduced complexity for both the balance sheet and income statement. This industry is cyclical and the difficult conditions of today will cycle into better ones over time.
It remains my goal to invest the fund in companies that will benefit from the upset that has ensnarled an entire industry. I have been doing this for over 27 years and today’s investment environment is challenging. I remain mindful that investing is never always about making the most, but is always about preserving the most over the long run.
The opinions expressed in this commentary reflect those of the Portfolio Manager as of the date written. Any such opinions are subject to change based on market or other conditions. These opinions may not be relied upon as investment advice. Investment decisions for The FBR Funds are based on several factors, and may not be relied upon as an indication of trading intent on behalf of any FBR Fund. Security positions can and do change.
43
The FBR Funds
FBR Small Cap Financial Fund
Comparison of Changes in Value of $10,000 Investment in
Investor Class Shares(1)(2) vs. Russell 2000 Index(1)(3)

| Total Returns—For the Periods Ended October 31, 2010(4) |
| | | | | | | | Annualized | | Annualized |
| | | | | One Year | | Five Year | | Ten Year |
| | | | |
| |
| |
|
| | FBR Small Cap Financial Fund Investor Class(1)(2) | | | 14.27 | % | | 0.67 | % | | 10.27 | % |
| | FBR Small Cap Financial Fund I Class(2)(5) | | | 14.52 | % | | N/A | | | N/A | |
| | Russell 2000 Index(1)(3) | | | 26.58 | % | | 3.07 | % | | 4.89 | % |
PAST PERFORMANCE IS NO GUARANTEE OF FUTURE RESULTS.
The performance data quoted represents past performance and the current performance may be lower or higher than the performance data quoted. The investment return and principal will fluctuate so that investors’ shares, when redeemed, may be worth more or less than their original cost. The performance data does not reflect the deduction of taxes that a shareholder would pay on Fund distributions or redemption fees. The Fund charges a redemption fee of 1.00% on shares redeemed or exchanged within 90 days; if reflected, the redemption fee would reduce the performance data quoted. To obtain performance data current to the most recent month-end, please call 888.200.4710.
|
| (1) | | The graph assumes a hypothetical $10,000 initial investment in the Fund and reflects the reinvestment of dividends and all Fund expenses. Investors should note that the Fund is a professionally managed mutual fund while the index is unmanaged, does not incur expenses and is not available for investment. The performance of the index includes reinvested dividends, and does not reflect sales charges or expenses. |
| (2) | | FBR Fund Advisers, Inc. waived a portion of its advisory fees and agreed to contractually reimburse a portion of the Fund’s operating expenses, as necessary, to maintain existing expense limitations, as set forth in the notes to the financial statements. Total returns shown include fee waivers and expense reimbursements, if any; total returns would have been lower had there been no waiver of fees and/or reimbursement of expenses in excess of expense limitations. |
| (3) | | The Russell 2000 Index is comprised of the smallest of the 2000 companies of the Russell 3000 Index, representing approximately 8% of the Russell 3000’s total market capitalization. |
| (4) | | The total returns shown do not reflect the deduction of taxes that a shareholder would pay on fund distributions or the redemption of fund shares. |
| (5) | | For the period May 30, 2008 (inception of share class) through October 31, 2010, the I Class returned 8.21% and the Russell 2000 Index returned (0.93)%. |
44
The FBR Funds
FBR Small Cap Financial Fund
Portfolio Summary
October 31, 2010
The following provides a breakdown of the Fund by industry sectors. The underlying securities represent a percentage of the portfolio investments.
| Industry Sector | | % of Total Investments |
| |
|
| Banks | | 35.0 | % |
| Savings & Loans | | 30.0 | % |
| Real Estate Investment Trust (REIT) | | 4.6 | % |
| Insurance | | 3.9 | % |
| Investment Companies | | 3.3 | % |
| Diversified Financial Services | | 2.9 | % |
| Commercial Services | | 0.9 | % |
| Home Builders | | 0.8 | % |
| | | | |
| Cash | | 18.6 | % |
45
The FBR Funds
FBR Small Cap Financial Fund
Portfolio of Investments
October 31, 2010
|
| | | | | | VALUE |
| | SHARES | | | | (NOTE 2) |
|
| | | | COMMON STOCKS — 82.2% | | | | |
| | | | Banks — 35.4% | | | | |
| | 380,000 | | Associated Banc-Corp. | | $ | 4,814,600 | |
| | 82,483 | | Bancorp Rhode Island, Inc. | | | 2,399,430 | |
| | 400,000 | | Banner Corp. | | | 664,000 | |
| | 390,000 | | Cathay General Bancorp | | | 5,304,000 | |
| | 262,000 | | Citizens Republic Bancorp, Inc.* | | | 180,780 | |
| | 15,000 | | City National Corp. | | | 773,550 | |
| | 20,000 | | Comerica, Inc. | | | 715,600 | |
| | 320,000 | | East West Bancorp, Inc. | | | 5,641,600 | |
| | 165,000 | | Fifth Third Bancorp | | | 2,072,400 | |
| | 550,000 | | First Horizon National Corp.* | | | 5,549,500 | |
| | 630,000 | | Fulton Financial Corp. | | | 5,884,200 | |
| | 243,900 | | Huntington Bancshares, Inc. | | | 1,382,913 | |
| | 95,000 | | IBERIABANK Corp. | | | 4,944,750 | |
| | 275,011 | | Independent Bank Corp. | | | 6,460,009 | |
| | 235,000 | | KeyCorp. | | | 1,924,650 | |
| | 100,000 | | MB Financial, Inc. | | | 1,489,000 | |
| | 425,000 | | Nara Bancorp, Inc.* | | | 3,332,000 | |
| | 760,000 | | National Penn Bancshares, Inc. | | | 4,932,400 | |
| | 675,000 | | Popular, Inc.* | | | 1,842,750 | |
| | 85,000 | | PrivateBancorp, Inc. | | | 1,002,150 | |
| | 490,940 | | State Bancorp, Inc. | | | 4,506,829 | |
| | 520,000 | | Susquehanna Bancshares, Inc. | | | 4,108,000 | |
| | 1,975,000 | | Synovus Financial Corp. | | | 4,266,000 | |
| | 165,000 | | TCF Financial Corp. | | | 2,171,400 | |
| | 200,000 | | Webster Financial Corp. | | | 3,424,000 | |
| | 275,000 | | Zions Bancorp | | | 5,681,500 | |
| | | | | |
| |
| | | | | | | 85,468,011 | |
| | | | | |
| |
| | | | Commercial Services — 0.9% | | | | |
| | 45,000 | | Green Dot Corp., Class A* | | | 2,286,000 | |
| | | | | |
| |
| | | | Diversified Financial Services — 2.9% | | | | |
| | 51,000 | | Netspend Holdings, Inc.* | | | 699,720 | |
| | 95,000 | | Portfolio Recovery Associates, Inc.* | | | 6,369,750 | |
| | | | | |
| |
| | | | | | | 7,069,470 | |
| | | | | |
| |
46
The FBR Funds
FBR Small Cap Financial Fund
Portfolio of Investments (continued)
October 31, 2010
|
| | | | | | VALUE |
| | SHARES | | | | (NOTE 2) |
|
| | | | Home Builders — 0.8% | | | | |
| | 175,000 | | KB Home | | $ | 1,839,250 | |
| | | | | |
| |
| | | | Insurance — 3.9% | | | | |
| | 47,999 | | Assured Guaranty Ltd. | | | 914,381 | |
| | 810,000 | | CNO Financial Group, Inc.* | | | 4,406,400 | |
| | 105,000 | | MBIA, Inc.* | | | 1,177,050 | |
| | 100,000 | | MGIC Investment Corp.* | | | 882,000 | |
| | 150,000 | | Radian Group, Inc. | | | 1,138,500 | |
| | 290,000 | | The PMI Group, Inc.* | | | 971,500 | |
| | | | | |
| |
| | | | | | | 9,489,831 | |
| | | | | |
| |
| | | | Investment Companies — 3.4% | | | | |
| | 225,000 | | American Capital Ltd.* | | | 1,570,500 | |
| | 750,000 | | KKR Financial Holdings LLC | | | 6,592,500 | |
| | | | | |
| |
| | | | | | | 8,163,000 | |
| | | | | |
| |
| | | | Real Estate Investment Trust (REIT) — 4.6% | | | | |
| | 225,000 | | First Industrial Realty Trust, Inc.* | | | 1,649,250 | |
| | 675,000 | | NorthStar Realty Finance Corp. | | | 3,024,000 | |
| | 179,811 | | PennyMac Mortgage Investment Trust | | | 3,103,538 | |
| | 250,000 | | RAIT Financial Trust* | | | 420,000 | |
| | 55,000 | | Redwood Trust, Inc. | | | 779,900 | |
| | 120,000 | | Walter Investment Management Corp. | | | 2,198,400 | |
| | | | | |
| |
| | | | | | | 11,175,088 | |
| | | | | |
| |
| | | | Savings & Loans — 30.3% | | | | |
| | 420,000 | | Astoria Financial Corp. | | | 5,216,400 | |
| | 505,000 | | Brookline Bancorp, Inc. | | | 4,918,700 | |
| | 150,000 | | Capitol Federal Financial | | | 3,510,000 | |
| | 180,000 | | Danvers Bancorp, Inc. | | | 2,705,400 | |
| | 320,000 | | Dime Community Bancshares, Inc. | | | 4,668,800 | |
| | 340,000 | | First Niagara Financial Group, Inc. | | | 4,029,000 | |
| | 520,000 | | Flushing Financial Corp. | | | 6,838,000 | |
| | 94,331 | | Hingham Institution for Savings | | | 3,773,240 | |
| | 190,000 | | Hudson City Bancorp, Inc. | | | 2,213,500 | |
| | 55,000 | | NewAlliance Bancshares, Inc. | | | 708,950 | |
| | 565,000 | | Northwest Bancshares, Inc. | | | 6,407,100 | |
47
The FBR Funds
FBR Small Cap Financial Fund
Portfolio of Investments (continued)
October 31, 2010
|
| | | | | | VALUE |
| | SHARES | | | | (NOTE 2) |
|
| | | | Savings & Loans — 30.3% (continued) | | | | |
| | 508,400 | | OceanFirst Financial Corp. | | $ | 6,070,296 | |
| | 445,000 | | Provident Financial Services, Inc. | | | 5,624,800 | |
| | 285,164 | | Territorial Bancorp, Inc. | | | 4,839,233 | |
| | 421,321 | | Washington Federal, Inc. | | | 6,332,455 | |
| | 138,000 | | WSFS Financial Corp. | | | 5,387,520 | |
| | | | | |
| |
| | | | | | | 73,243,394 | |
| | | | | |
| |
| | | | | | | | |
| | | | Total Common Stocks (Cost $188,286,756) | | | 198,734,044 | |
| | | | | |
| |
| | | | SHORT-TERM INVESTMENT — 18.1% | | | | |
| | 43,785,538 | | JPMorgan 100% U.S. Treasury Securities Money Market Fund (Cost $43,785,538) | | | 43,785,538 | |
| | | | | |
| |
| | | | Total Investments — 100.3% (Cost $232,072,294) | | | 242,519,582 | |
| | | | | | | | |
| | | | Liabilities Less Other Assets — (0.3)% | | | (761,247 | ) |
| | | | | |
| |
| | | | | | | | |
| | | | Net Assets — 100.0% | | $ | 241,758,335 | |
| | | | | |
| |
|
| * | | Non—income producing security |
| LLC | | Limited Liability Company |
The accompanying notes are an integral part of the financial statements.
48
The FBR Funds
FBR Technology Fund
Management Overview
Portfolio Manager: David Ellison and Winsor Aylesworth
Over the previous 12 months, how did the Fund perform and what factors contributed to this performance?
For the twelve-month period ended October 31, 2010, the Investor Class of the FBR Technology Fund returned 21.55%. This compares to the S&P 500 Index, the NASDAQ Composite Index and the Morningstar Technology Category Average which returned 16.52%, 23.88% and 26.84% for the same period respectively.
The Fund’s performance was comparable to the NASDAQ benchmark but fell short to the Morningstar Category Average. This can be attributed to the conservative nature of the Fund’s investments and the large percentage of large cap companies in the portfolio. In rising markets small cap companies tend to outperform large cap companies. And yes, finally, various investment decisions and their timing made throughout the period, in hindsight, might have been better.
Even with this underperformance, the Fund remained true to its investment process and invested in companies that exhibit profitable performance, were low in leverage, had a record of increased revenues and maintained a history of increasing tangible book value. This approach does sacrifice some upside potential in exchange for a more conservative downside profile. Looking at our major contributors and detractors will demonstrate this thesis.
Over the last year, major contributors to performance included MIPS Technology (NASDAQ Symbol: MIPS), Riverbed Technology, Inc. (NASDAQ Symbol: RVBD) and F5 Networks (NASDAQ Symbol: FFIV). MIPS Technology produces equipment for the semi-conductor industry. Riverbed Technology is a software company while F5 provides systems and software that helps manage internet traffic. All three companies appreciated well over 100%. The only problem is that these three companies were less than 5% of the portfolio.
On the downside, major detractors included Microsoft (NASDAQ Symbol: MSFT), Visa Corporation (NYSE Symbol: V) and Google (NASDAQ Symbol: GOOG). These three are common names to investors and are large, well run, diversified companies. The average return of the three was just slightly negative for the period but comprised approximately 15% of the portfolio.
We think these six companies just mentioned demonstrate the nature of the portfolio and the result of our investment process. In a rising market the small cap names tend to outperform while in a down market, the larger companies tend to outperform. The advantage of a investing in a Fund such as this one provides the investor a chance to own both in a diversified mix.
Portfolio manager comments on the Fund and the related investment outlook.
In our last shareholder letter (April 30, 2010), we proffered that the slogan for technology should be “Technology – The pause that refreshes”. In hindsight, the last six months
49
The FBR Funds
FBR Technology Fund
Management Overview (continued)
seemed to follow that idea as Technology returns lagged the general market, particularly for large cap technology companies. There was, of course, one major exception as Apple continued to meet or exceed expectations. The release of the iPad has been met with great customer demand which continues to make Apple’s future look good. The Fund has owned Apple from its beginning and we feel very fortunate that we have.
For most of the period, the U.S. and world economy continue to face challenges as debt issues in Europe and our country continue to cast a cloud on the future. Having said that, companies must continue to do business, consumers continue to want the latest tech gadgets and Governments want new innovative solutions to their problems and to do more with less. All of this cries out for technology solutions.
Markets will continue to move up and down many times in a frustrating way. We will continue to invest in technology companies, both large and small that have met our investment requirements of growth and profitability with minimal debt. Over the long term, we feel this approach provides the investor a way to participate in the Technology sector in a diversified conservative manner. We thank you for your support and as fellow shareholders we look forward to the future.
The opinions expressed in this commentary reflect those of the Portfolio Managers as of the date written. Any such opinions are subject to change based on market or other conditions. These opinions may not be relied upon as investment advice. Investment decisions for The FBR Funds are based on several factors, and may not be relied upon as an indication of trading intent on behalf of any FBR Fund. Security positions can and do change.
50
The FBR Funds
FBR Technology Fund
Comparison of Changes in Value of $10,000 Investment in
Investor Class Shares(1)(2) vs. Various Indices(1)(3)
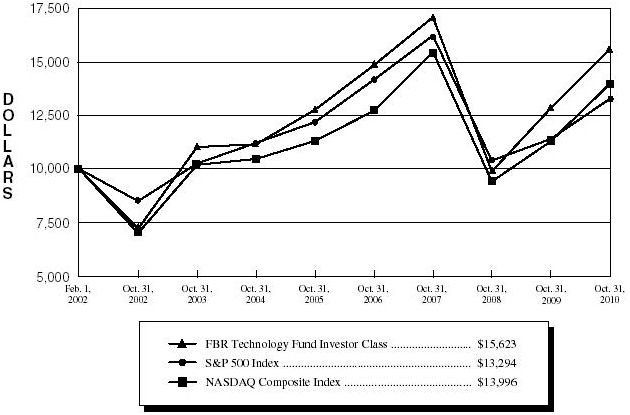
| Total Returns—For the Periods Ended October 31, 2010(4)(6) |
| | | | | | | | | | | Annualized |
| | | | | | | | Annualized | | Since |
| | | | | One Year | | Five Year | | Inception(5) |
| | | | |
| |
| |
|
| | FBR Technology Fund Investor Class(1)(2) | | | 21.55 | % | | 4.10 | % | | 5.23 | % |
| | S&P 500 Index(1)(3) | | | 16.52 | % | | 1.73 | % | | 3.31 | % |
| | NASDAQ Composite Index(1)(3) | | | 23.88 | % | | 4.34 | % | | 3.92 | % |
PAST PERFORMANCE IS NO GUARANTEE OF FUTURE RESULTS.
The performance data quoted represents past performance and the current performance may be lower or higher than the performance data quoted. The investment return and principal will fluctuate so that investors’ shares, when redeemed, may be worth more or less than their original cost. The performance data does not reflect the deduction of taxes that a shareholder would pay on Fund distributions or redemption fees. The Fund charges a redemption fee of 1.00% on shares redeemed or exchanged within 90 days; if reflected, the redemption fee would reduce the performance data quoted. To obtain performance data current to the most recent month-end, please call 888.200.4710.
|
| (1) | | The graph assumes a hypothetical $10,000 initial investment in the Fund and reflects the reinvestment of dividends and all Fund expenses. Investors should note that the Fund is a professionally managed mutual fund while the indices are unmanaged, do not incur expenses and are not available for investment. The performance of the indices includes reinvested dividends, and does not reflect sales charges or expenses. |
| (2) | | FBR Fund Advisers, Inc. waived a portion of its advisory fees and agreed to contractually reimburse a portion of the Fund’s operating expenses, as necessary, to maintain existing expense limitations, as set forth in the notes to the financial statements. Total returns shown include fee waivers and expense reimbursements, if any; total returns would have been lower had there been no waiver of fees and/or reimbursement of expenses in excess of expense limitations. |
| (3) | | The S&P 500 Index is a capitalization-weighted index of 500 stocks. The index is designed to represent the broad domestic economy through changes in aggregate market value of 500 stocks representing all major industries. The NASDAQ Composite Index is a broad-based capitalization-weighted index of all NASDAQ National Market and Small Cap stocks. |
| (4) | | The total returns shown do not reflect the deduction of taxes that a shareholder would pay on fund distributions or the redemption of fund shares. |
| (5) | | For the period February 1, 2002 (commencement of investment operations) through October 31, 2010. |
| (6) | | For the period March 12, 2010 (inception of share class) through October 31, 2010, the I Class returned 5.16%, the S&P 500 Index and NASDAQ Composite Index returned 4.11% and 6.53%, respectively. |
51
The FBR Funds
FBR Technology Fund
Portfolio Summary
October 31, 2010
The following provides a breakdown of the Fund by industry sectors. The underlying securities represent a percentage of the portfolio investments.
| Industry Sector | | % of Total Investments |
| |
|
| Internet | | 20.4 | % |
| Semiconductors | | 15.9 | % |
| Software | | 15.9 | % |
| Computers | | 8.5 | % |
| Pharmaceuticals | | 7.5 | % |
| Biotechnology | | 5.1 | % |
| Telecommunications | | 4.0 | % |
| Commercial Services | | 3.5 | % |
| Energy-Alternate Sources | | 1.3 | % |
| Healthcare-Products | | 1.1 | % |
| Electronics | | 1.0 | % |
| Electrical Components & Equipments | | 0.4 | % |
| Investment Companies | | 7.6 | % |
| | | | |
| Cash | | 7.8 | % |
52
The FBR Funds
FBR Technology Fund
Portfolio of Investments
October 31, 2010
|
| | | | | | VALUE |
| | SHARES | | | | (NOTE 2) |
|
| | | | COMMON STOCKS — 79.8% | | | | |
| | | | Biotechnology — 4.8% | | | | |
| | 1,275 | | Alexion Pharmaceuticals, Inc.* | | $ | 87,083 | |
| | 6,065 | | Celgene Corp.* | | | 376,454 | |
| | 1,625 | | Illumina, Inc.* | | | 88,254 | |
| | 1,025 | | United Therapeutics Corp.* | | | 61,500 | |
| | | | | |
| |
| | | | | | | 613,291 | |
| | | | | |
| |
| | | | Commercial Services — 3.3% | | | | |
| | 840 | | HMS Holdings Corp.* | | | 50,492 | |
| | 2,465 | | SuccessFactors, Inc.* | | | 66,851 | |
| | 3,945 | | Visa Inc., Class A | | | 308,380 | |
| | | | | |
| |
| | | | | | | 425,723 | |
| | | | | |
| |
| | | | Computers — 8.1% | | | | |
| | 1,478 | | Apple, Inc.* | | | 444,686 | |
| | 4,045 | | Cognizant Technology Solutions Corp., Class A* | | | 263,694 | |
| | 2,135 | | Isilon Systems, Inc.* | | | 60,783 | |
| | 3,065 | | RealD, Inc.* | | | 64,120 | |
| | 1,100 | | Riverbed Technology, Inc.* | | | 63,294 | |
| | 1,960 | | VanceInfo Technologies, Inc. ADR* | | | 71,285 | |
| | 26,106 | | Wave Systems Corp., Class A* | | | 61,610 | |
| | | | | |
| |
| | | | | | | 1,029,472 | |
| | | | | |
| |
| | | | Electrical Components & Equipments — 0.4% | | | | |
| | 1,400 | | American Superconductor Corp.* | | | 47,110 | |
| | | | | |
| |
| | | | Electronics — 1.0% | | | | |
| | 2,435 | | Amphenol Corp., Class A | | | 122,067 | |
| | | | | |
| |
| | | | Energy-Alternate Sources — 1.2% | | | | |
| | 1,110 | | First Solar, Inc.* | | | 152,825 | |
| | | | | |
| |
| | | | Healthcare-Products — 1.1% | | | | |
| | 515 | | Intuitive Surgical, Inc.* | | | 135,419 | |
| | | | | |
| |
53
The FBR Funds
FBR Technology Fund
Portfolio of Investments (continued)
October 31, 2010
|
| | | | | | VALUE |
| | SHARES | | | | (NOTE 2) |
|
| | | | Internet — 19.2% | | | | |
| | 2,390 | | Akamai Technologies, Inc.* | | $ | 123,491 | |
| | 2,695 | | Amazon.com, Inc.* | | | 445,052 | |
| | 4,230 | | Baidu.com, Inc. ADR* | | | 465,342 | |
| | 1,412 | | Ctrip.com International Ltd. ADR* | | | 73,523 | |
| | 590 | | Equinix, Inc.* | | | 49,702 | |
| | 1,025 | | F5 Networks, Inc.* | | | 120,643 | |
| | 730 | | Google, Inc., Class A* | | | 447,483 | |
| | 1,025 | | MercadoLibre, Inc.* | | | 67,783 | |
| | 1,700 | | NetEase.com, Inc. ADR* | | | 71,060 | |
| | 7,836 | | NIC, Inc. | | | 68,016 | |
| | 20,256 | | Tencent Holdings Ltd. ADR | | | 468,117 | |
| | 1,310 | | WebMD Health Corp.* | | | 68,487 | |
| | | | | |
| |
| | | | | | | 2,468,699 | |
| | | | | |
| |
| | | | Pharmaceuticals — 7.0% | | | | |
| | 4,030 | | Allergan, Inc. | | | 291,812 | |
| | 8,745 | | Teva Pharmaceutical Industries Ltd. ADR | | | 453,866 | |
| | 4,385 | | ViroPharma, Inc.* | | | 71,739 | |
| | 3,591 | | Warner Chilcott PLC, Class A | | | 86,328 | |
| | | | | |
| |
| | | | | | | 903,745 | |
| | | | | |
| |
| | | | Semiconductors — 15.0% | | | | |
| | 4,000 | | Altera Corp. | | | 124,840 | |
| | 17,675 | | Applied Materials, Inc. | | | 218,463 | |
| | 6,090 | | ARM Holdings PLC ADR | | | 107,671 | |
| | 5,725 | | ASML Holding N. V. | | | 190,012 | |
| | 3,135 | | Avago Technologies Ltd.* | | | 77,372 | |
| | 6,520 | | Broadcom Corp., Class A | | | 265,624 | |
| | 4,875 | | Cirrus Logic, Inc.* | | | 62,644 | |
| | 1,480 | | Cree, Inc.* | | | 75,909 | |
| | 1,325 | | Hittite Microwave Corp.* | | | 68,463 | |
| | 1,635 | | Lam Research Corp.* | | | 74,867 | |
| | 2,950 | | Linear Technology Corp. | | | 95,079 | |
| | 1,917 | | Microchip Technology, Inc. | | | 61,689 | |
| | 2,555 | | Microsemi Corp.* | | | 51,100 | |
| | 4,225 | | MIPS Technologies, Inc.* | | | 62,108 | |
| | 1,640 | | NetLogic Microsystems, Inc.* | | | 49,298 | |
54
The FBR Funds
FBR Technology Fund
Portfolio of Investments (continued)
October 31, 2010
|
| | | | | | VALUE |
| | SHARES | | | | (NOTE 2) |
|
| | | | Semiconductors — 15.0% (continued) | | | | |
| | 2,050 | | Power Integrations, Inc. | | $ | 70,028 | |
| | 1,320 | | Rovi Corp.* | | | 66,858 | |
| | 2,560 | | Rubicon Technology, Inc.* | | | 59,187 | |
| | 2,285 | | Varian Semiconductor Equipment Associates, Inc.* | | | 74,651 | |
| | 1,690 | | Veeco Instruments, Inc.* | | | 70,727 | |
| | | | | |
| |
| | | | | | | 1,926,590 | |
| | | | | |
| |
| | | | Software — 14.9% | | | | |
| | 1,495 | | ANSYS, Inc.* | | | 67,649 | |
| | 1,560 | | athenahealth, Inc.* | | | 62,353 | |
| | 2,430 | | Citrix Systems, Inc.* | | | 155,690 | |
| | 1,540 | | Informatica Corp.* | | | 62,663 | |
| | 17,380 | | Microsoft Corp. | | | 463,002 | |
| | 2,450 | | Red Hat, Inc.* | | | 103,537 | |
| | 1,287 | | salesforce.com, Inc.* | | | 149,382 | |
| | 8,570 | | SAP AG ADR | | | 443,326 | |
| | 5,445 | | VMware, Inc., Class A* | | | 416,325 | |
| | | | | |
| |
| | | | | | | 1,923,927 | |
| | | | | |
| |
| | | | Telecommunications — 3.8% | | | | |
| | 1,500 | | Atheros Communications, Inc.* | | | 46,560 | |
| | 20,660 | | Corning, Inc. | | | 377,664 | |
| | 3,520 | | Finisar Corp.* | | | 59,875 | |
| | | | | |
| |
| | | | | | | 484,099 | |
| | | | | |
| |
| | | | | | | | |
| | | | Total Common Stocks (Cost $9,197,684) | | | 10,232,967 | |
| | | | | |
| |
| | | | INVESTMENT COMPANIES — 7.1% | | | | |
| | 7,940 | | First Trust Dow Jones Internet Index Fund | | | 259,637 | |
| | 10,580 | | First Trust NASDAQ-100 Technology Index Fund | | | 258,787 | |
| | 4,720 | | iShares S&P North American Technology-Software Index Fund | | | 259,128 | |
| | 5,695 | | PowerShares Dynamic Networking Portfolio | | | 135,940 | |
| | | | | |
| |
| | | | | | | | |
| | | | Total Investment Companies (Cost $852,698) | | | 913,492 | |
| | | | | |
| |
55
The FBR Funds
FBR Technology Fund
Portfolio of Investments (continued)
October 31, 2010
|
| | | | | | VALUE |
| | SHARES | | | | (NOTE 2) |
|
| | | | SHORT-TERM INVESTMENT — 8.8% | | | | |
| | 1,124,428 | | JPMorgan 100% U.S. Treasury Securities Money Market Fund (Cost $1,124,428) | | $ | 1,124,428 | |
| | | | | |
| |
| | | | Total Investments — 95.7% (Cost $11,174,810) | | | 12,270,887 | |
| | | | | | | | |
| | | | Other Assets Less Liabilities — 4.3% | | | 546,801 | |
| | | | | |
| |
| | | | | | | | |
| | | | Net Assets — 100.0% | | $ | 12,817,688 | |
| | | | | |
| |
|
| * | | Non-income producing security |
| ADR | | American Depositary Receipts |
| PLC | | Public Liability Company |
The accompanying notes are an integral part of the financial statements.
56
The FBR Funds
FBR Gas Utility Index Fund
Management Overview
Portfolio Manager: Winsor Aylesworth
Over the previous 12 months, how did the Fund perform and what factors contributed to this performance?
For the twelve-months ended October 31, 2010, the Investor Class of the FBR Gas Utility Index Fund returned 22.25%. This compares to the American Gas Association (AGA) Stock Index, S&P 500 Index and the Morningstar Utilities Category Average which returned 22.50%, 16.52% and 17.75% for the same period, respectively.
For the twelve (12) month period ending October 31, 2010, your Fund performed favorably to the AGA Stock Index. When you take into account the expenses of the Fund, its overall performance was slightly superior. This outperformance is again due to timing issues tied to Fund cash flows (investor purchases and redemptions and subsequent investment purchases or sales) and not due to fundamental investment decisions. This is the benefit of an index fund such as this one. We would anticipate that slight variances, both positive and negative, to the Index will continue for the similar reasons. Shareholders may remember that at the time of the last semi-annual report (April 30, 2010) we were slightly underperforming against the Index taking account for expenses.
Certainly the Fund performed positively against its other benchmarks of the S&P 500 Index and the Morningstar Utilities Category Average. The S&P 500 Index is a broad based market benchmark used by investors. We are very proud of the fact that the Fund has delivered superior returns to this benchmark for various short, medium and long term periods. The superior return in relation to the Morningstar Utilities Category Average speaks to the type of Utilities that the Fund invests in. To this fact we are very fortunate in having our relationship with the American Gas Association who manage and run the Index. Their role as one of the leading spokesman for the natural gas industry provides us unique insights to the industry. As a result we are the only readily available investment product that uses their index to govern a readily available public investment. This Index’s components are all companies that are AGA members and involved in the Natural Gas distribution business as well as other segments of the utility business.
The Fund continued its history of paying out dividends quarterly. For the last twelve months ending October 31, 2010 the Fund paid $0.58 per Investor Class share.
For the twelve month period, major contributors to the Fund’s return included: Cheniere Energy (NYSE Symbol: LNG), El Paso Corporation (NYSE Symbol: EP) and South Jersey Industries (NYSE Symbol: SJI). Cheniere owns LNG ports and facilities to handle LNG imports and exports. El Paso is a major gas pipe line company while South Jersey is a conventional utility that generates electricity and distributes natural gas both residentially and commercially. As you can see, these three companies demonstrate the diversified nature of the companies that the Fund owns and are included in the Index.
On the downside, E.ON AG (Pink Sheet symbol: EONGY), National Grid Corp (NYSE Symbol: NGG) and Excelon (NYSE Symbol: EXC) all were major negative contributors to the Fund’s performance. Both E.ON AG and National Grid are international utilities based in Europe which is suffering economic issues. Excelon is a large diversified utility
57
The FBR Funds
FBR Gas Utility Index Fund
Management Overview (continued)
located in the upper Midwest that services Northern Illinois and SE Pennsylvania, both areas that have suffered during our country’s economic downturn. Each of these holdings demonstrates how energy suppliers are sensitive to macroeconomic issues.
Portfolio manager comments on the Fund and the related investment outlook.
In the last shareholder communication, the two major topics discussed were shale gas and the BP oil slick. The topic of shale gas continues to be a hot topic since if properly developed, will provide ample gas supplies for years to come. The techniques used to mine or find shale gas does have risks that the industry is just learning more about. How the industry balances the need for the product with the risks associated with developing the product will be one of the major challenges as we go forward with a national energy policy.
Fortunately the Gulf oil spill seems to be behind us. Issues of clean up and compensation remain but at least we are not leaking oil into the Gulf at the present time. It is now time to continue the clean-up and develop the “Lessons learned” to avoid such a disaster in the future. Although not immediately related, shale gas development will be impacted by whatever new rules and regulations emerge from the Gulf spill and hence are linked.
As always, the economy and the weather are more immediate cause and effect issues impacting the Fund’s companies in the near term. Economically, we seem to have stabilized and are on the road for a slow long-term recovery. This should mean a reasonable increase in demand for energy which should be good for growing earnings. With regards to weather, the hurricane season was uneventful to the continental U.S. and winter long-term forecasts are not calling for any prolonged unseasonable weather patterns. However, please keep in mind that predicting the economy and the weather are not exact sciences and are open to sudden changes.
Finally, the resolution of the tax issues by Congress will impact all of us as investors in the industry. First, how Congress handles the tax on dividends will be important. Currently 60 of the Fund’s 61 companies pay dividends that are currently taxed at a preferential rate. This rate is due to expire along with other tax rates at the end of the year. How Congress handles this immediate issue will be significant. We encourage shareholders to research the issue with their tax advisers and voice their opinion to their duly elected representatives. Irregardless of the outcome, the Fund will continue to be a good source of quarterly dividends.
I of course want to thank investors for their support. As a fellow investor, I continue to believe that the future for the companies that comprise the Fund is on solid ground. Gas supplies are ample and within our political control. The economy is stable and improving albeit slowly. As we develop a national energy policy, natural gas will play an ever increasing role. With all this, we are optimistic about the future.
The opinions expressed in this commentary reflect those of the Portfolio Manager as of the date written. Any such opinions are subject to change based on market or other conditions. These opinions may not be relied upon as investment advice. Investment decisions for The FBR Funds are based on several factors, and may not be relied upon as an indication of trading intent on behalf of any FBR Fund. Security positions can and do change.
58
The FBR Funds
FBR Gas Utility Index Fund
Comparison of Changes in Value of $10,000 Investment in
Investor Class Shares(1)(2) vs. Various Indices(1)(3)
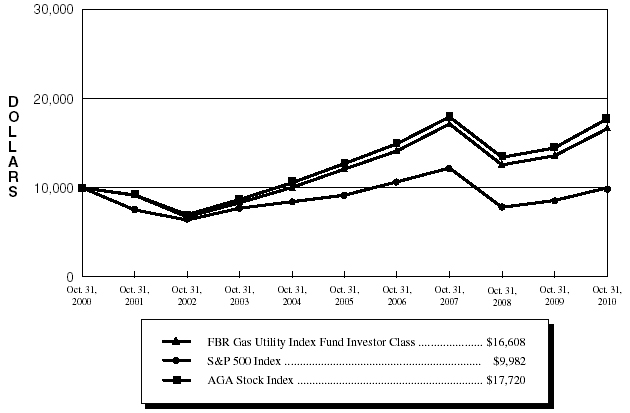
| Total Returns—For the Periods Ended October 31, 2010(4) |
| | | | | | | | Annualized | | Annualized | |
| | | | | One Year | | Five Year | | Ten Year | |
| | | | |
| |
| |
| |
| | FBR Gas Utility Index Fund Investor Class(1)(2) | | | 22.25 | % | | 6.56 | % | | 5.21 | % | |
| | S&P 500 Index(1)(3) | | | 16.52 | % | | 1.73 | % | | (0.02 | )% | |
| | AGA Stock Index(1)(3) | | | 22.50 | % | | 6.87 | % | | 5.89 | % | |
PAST PERFORMANCE IS NO GUARANTEE OF FUTURE RESULTS.
The performance data quoted represents past performance and the current performance may be lower or higher than the performance data quoted. The investment return and principal will fluctuate so that investors’ shares, when redeemed, may be worth more or less than their original cost. The performance data does not reflect the deduction of taxes that a shareholder would pay on Fund distributions or redemption fees. The Fund charges a redemption fee of 1.00% on shares redeemed or exchanged within 90 days; if reflected, the redemption fee would reduce the performance data quoted. To obtain performance data current to the most recent month-end, please call 888.200.4710.
|
| (1) | | The graph assumes a hypothetical $10,000 initial investment in the Fund and reflects the reinvestment of dividends and all Fund expenses. Investors should note that the Fund is a professionally managed mutual fund while the indices are unmanaged, do not incur expenses and are not available for investment. The performance of the indices includes reinvested dividends, and does not reflect sales charges or expenses. |
| (2) | | FBR Fund Advisers, Inc. waived a portion of its advisory fees and agreed to contractually reimburse a portion of the Fund’s operating expenses, as necessary, to maintain existing expense limitations, as set forth in the notes to the financial statements. Total returns shown include fee waivers and expense reimbursements, if any; total returns would have been lower had there been no waiver of fees and/or reimbursement of expenses in excess of expense limitations. |
| (3) | | The S&P 500 Index is a capitalization-weighted index of 500 stocks. The index is designed to represent the broad domestic economy through changes in aggregate market value of 500 stocks representing all major industries. The AGA Stock Index is a market capitalization-weighted index, adjusted monthly, consisting of member companies of the American Gas Association. |
| (4) | | The total returns shown do not reflect the deduction of taxes that a shareholder would pay on fund distributions or the redemption of fund shares. |
| (5) | | Effective April 1, 2003, the Fund changed its fiscal year-end from March 31 to October 31. |
59
The FBR Funds
FBR Gas Utility Index Fund
Portfolio Summary
October 31, 2010
The following provides a breakdown of the Fund by industry sectors. The underlying securities represent a percentage of the portfolio investments.
| Industry Sector | | % of Total Investments |
| |
|
| Electric | | 36.1 | % |
| Gas | | 34.9 | % |
| Pipelines | | 27.2 | % |
| Oil & Gas | | 0.9 | % |
| | | | |
| Cash | | 0.9 | % |
60
The FBR Funds
FBR Gas Utility Index Fund
Portfolio of Investments
October 31, 2010
|
| | | | | | VALUE |
| | SHARES | | | | (NOTE 2) |
|
| | | | COMMON STOCKS — 98.8% | | | | |
| | | | Electric — 35.9% | | | | |
| | 650 | | ALLETE, Inc. | | $ | 23,647 | |
| | 21,853 | | Alliant Energy Corp. | | | 798,290 | |
| | 32,090 | | Ameren Corp. | | | 929,968 | |
| | 24,080 | | Avista Corp. | | | 525,907 | |
| | 19,100 | | Black Hills Corp. | | | 608,144 | |
| | 7,550 | | CH Energy Group, Inc. | | | 343,148 | |
| | 158,118 | | CMS Energy Corp. | | | 2,906,209 | |
| | 104,170 | | Consolidated Edison, Inc. | | | 5,179,332 | |
| | 26,920 | | Constellation Energy Group, Inc. | | | 814,061 | |
| | 263,200 | | Dominion Resources, Inc. | | | 11,438,672 | |
| | 64,815 | | DTE Energy Co. | | | 3,030,749 | |
| | 91,212 | | Duke Energy Corp. | | | 1,660,971 | |
| | 392,340 | | E.ON AG ADR | | | 12,256,701 | |
| | 3,325 | | Entergy Corp. | | | 247,812 | |
| | 71,075 | | Exelon Corp. | | | 2,901,282 | |
| | 63,521 | | Integrys Energy Group, Inc. | | | 3,378,682 | |
| | 148,025 | | MDU Resources Group, Inc. | | | 2,950,138 | |
| | 7,523 | | MGE Energy, Inc. | | | 305,058 | |
| | 256,856 | | National Grid PLC ADR | | | 12,195,522 | |
| | 27,775 | | Northeast Utilities | | | 868,802 | |
| | 14,961 | | Pepco Holdings, Inc. | | | 288,149 | |
| | 222,775 | | PG&E Corp. | | | 10,653,101 | |
| | 235,025 | | Public Service Enterprise Group, Inc. | | | 7,603,059 | |
| | 56,690 | | TECO Energy, Inc. | | | 997,177 | |
| | 6,675 | | The Empire District Electric Co. | | | 140,442 | |
| | 5,305 | | UniSource Energy Corp. | | | 186,046 | |
| | 12,058 | | Unitil Corp. | | | 261,900 | |
| | 27,480 | | Wisconsin Energy Corp. | | | 1,636,159 | |
| | 111,775 | | Xcel Energy, Inc. | | | 2,666,952 | |
| | | | | |
| |
| | | | | | | 87,796,080 | |
| | | | | |
| |
| | | | Gas — 34.8% | | | | |
| | 126,957 | | AGL Resources, Inc. | | | 4,984,332 | |
| | 192,845 | | Atmos Energy Corp. | | | 5,679,284 | |
| | 338,935 | | CenterPoint Energy, Inc. | | | 5,612,764 | |
| | 9,840 | | Chesapeake Utilities Corp. | | | 361,030 | |
61
The FBR Funds
FBR Gas Utility Index Fund
Portfolio of Investments (continued)
October 31, 2010
|
| | | | | | VALUE |
| | SHARES | | | | (NOTE 2) |
|
| | | | Gas — 34.8% (continued) | | | | |
| | 2,380 | | Corning Natural Gas Corp. | | $ | 47,065 | |
| | 7,258 | | Delta Natural Gas Company, Inc. | | | 222,603 | |
| | 48,123 | | Energen Corp. | | | 2,148,211 | |
| | 8,618 | | Gas Natural, Inc. | | | 97,383 | |
| | 127,450 | | National Fuel Gas Co. | | | 7,032,690 | |
| | 70,165 | | New Jersey Resources Corp. | | | 2,840,981 | |
| | 98,550 | | Nicor, Inc. | | | 4,693,937 | |
| | 357,050 | | NiSource, Inc. | | | 6,180,535 | |
| | 58,600 | | Northwest Natural Gas Co. | | | 2,888,394 | |
| | 155,050 | | Piedmont Natural Gas Company, Inc. | | | 4,572,425 | |
| | 230,795 | | Questar Corp. | | | 3,916,591 | |
| | 5,111 | | RGC Resources, Inc. | | | 158,492 | |
| | 225,690 | | Sempra Energy | | | 12,069,900 | |
| | 49,785 | | South Jersey Industries, Inc. | | | 2,507,173 | |
| | 215,458 | | Southern Union Co. | | | 5,414,460 | |
| | 97,062 | | Southwest Gas Corp. | | | 3,373,875 | |
| | 49,350 | | The Laclede Group, Inc. | | | 1,732,679 | |
| | 77,875 | | UGI Corp. | | | 2,343,259 | |
| | 74,330 | | Vectren Corp. | | | 2,035,155 | |
| | 103,250 | | WGL Holdings, Inc. | | | 3,980,288 | |
| | | | | |
| |
| | | | | | | 84,893,506 | |
| | | | | |
| |
| | | | Oil & Gas — 0.9% | | | | |
| | 125,324 | | Cheniere Energy, Inc.* | | | 411,063 | |
| | 49,310 | | EQT Corp. | | | 1,846,166 | |
| | | | | |
| |
| | | | | | | 2,257,229 | |
| | | | | |
| |
| | | | Pipelines — 27.2% | | | | |
| | 917,892 | | El Paso Corp. | | | 12,171,248 | |
| | 220,992 | | Enbridge, Inc. | | | 12,242,956 | |
| | 177,000 | | ONEOK, Inc. | | | 8,818,140 | |
| | 509,693 | | Spectra Energy Corp. | | | 12,115,403 | |
| | 409,250 | | The Williams Companies, Inc. | | | 8,807,060 | |
| | 327,565 | | TransCanada Corp. | | | 12,103,527 | |
| | | | | |
| |
| | | | | | | 66,258,334 | |
| | | | | |
| |
| | | | | | | | |
| | | | Total Common Stocks (Cost $135,733,878) | | | 241,205,149 | |
| | | | | |
| |
62
The FBR Funds
FBR Gas Utility Index Fund
Portfolio of Investments (continued)
October 31, 2010
|
| | | | | | VALUE |
| | SHARES | | | | (NOTE 2) |
|
| | | | SHORT-TERM INVESTMENT — 1.1% | | | | |
| | 2,627,128 | | JPMorgan 100% U.S. Treasury Securities Money Market Fund (Cost $2,627,128) | | $ | 2,627,128 | |
| | | | | |
| |
| | | | Total Investments — 99.9% (Cost $138,361,006) | | | 243,832,277 | |
| | | | | | | | |
| | | | Other Assets Less Liabilities — 0.1% | | | 208,747 | |
| | | | | |
| |
| | | | | | | | |
| | | | Net Assets — 100.0% | | $ | 244,041,024 | |
| | | | | |
| |
|
| * | | Non-income producing security |
| ADR | | American Depositary Receipts |
| PLC | | Public Liability Company |
The accompanying notes are an integral part of the financial statements.
63
| The FBR Funds |
|
| Statements of Assets and Liabilities |
| October 31, 2010 |
| | | FBR | | FBR | | FBR |
| | | Large Cap Fund | | Mid Cap Fund | | Small Cap Fund |
| | |
| |
| |
|
| ASSETS | | | | | | | | | | | | | | | |
Investment Securities at Cost | | | $ | 42,483,728 | | | | $ | 18,574,438 | | | | $ | 32,793,789 | |
| | | |
| | | |
| | | |
| |
Investment Securities at Value (Note 2) | | | $ | 46,818,959 | | | | $ | 20,221,693 | | | | $ | 35,229,831 | |
Cash | | | | 1,176 | | | | | — | | | | | — | |
Receivable for Investment Securities Sold | | | | — | | | | | — | | | | | 557,696 | |
Receivable for Capital Shares Sold | | | | 892 | | | | | 984 | | | | | 106,467 | |
Dividends and Interest Receivable | | | | 41,391 | | | | | 12,680 | | | | | 33,753 | |
Receivable from Adviser | | | | 10,849 | | | | | 35,903 | | | | | — | |
Prepaid Expenses | | | | 23,024 | | | | | 9,086 | | | | | 11,346 | |
| | | |
| | | |
| | | |
| |
Total Assets | | | | 46,896,291 | | | | | 20,280,346 | | | | | 35,939,093 | |
| | | |
| | | |
| | | |
| |
| LIABILITIES | | | | | | | | | | | | | | | |
Payable for Investment Securities Purchased | | | | — | | | | | 1,792,683 | | | | | 323,726 | |
Payable for Capital Shares Redeemed | | | | 32,000 | | | | | 989 | | | | | 26,671 | |
Investment Advisory Fee Payable (Note 4) | | | | — | | | | | — | | | | | 1,682 | |
Administration Fee Payable (Note 4) | | | | 4,973 | | | | | 1,907 | | | | | 3,044 | |
Distribution and Service Fees Payable (Note 4) | | | | 3,605 | | | | | 1,433 | | | | | 5,615 | |
Other Accrued Expenses | | | | 64,334 | | | | | 51,242 | | | | | 82,400 | |
| | | |
| | | |
| | | |
| |
Total Liabilities | | | | 104,912 | | | | | 1,848,254 | | | | | 443,138 | |
| | | |
| | | |
| | | |
| |
| NET ASSETS | | | $ | 46,791,379 | | | | $ | 18,432,092 | | | | $ | 35,495,955 | |
| | | |
| | | |
| | | |
| |
| Net Assets Consist of: | | | | | | | | | | | | | | | |
Paid-in capital | | | $ | 56,052,537 | | | | $ | 21,393,960 | | | | $ | 48,057,718 | |
Accumulated net investment income | | | | 137,874 | | | | | 23,354 | | | | | 3,083 | |
Accumulated net realized loss on investments | | | | (13,734,263 | ) | | | | (4,632,477 | ) | | | | (15,000,888 | ) |
Net unrealized appreciation on investments | | | | 4,335,231 | | | | | 1,647,255 | | | | | 2,436,042 | |
| | | |
| | | |
| | | |
| |
| NET ASSETS | | | $ | 46,791,379 | | | | $ | 18,432,092 | | | | $ | 35,495,955 | |
| | | |
| | | |
| | | |
| |
| Pricing of Investor Class Shares | | | | | | | | | | | | | | | |
Net assets attributable to Investor Class shares | | | $ | 17,096,568 | | | | $ | 6,776,075 | | | | $ | 26,840,906 | |
Shares of Beneficial Interest Outstanding (unlimited number of shares authorized, no par value) | | | | 1,571,204 | | | | | 596,918 | | | | | 2,403,726 | |
| | | |
| | | |
| | | |
| |
Net Asset Value Per Share | | | $ | 10.88 | | | | $ | 11.35 | | | | $ | 11.17 | |
| | | |
| | | |
| | | |
| |
| Pricing of I Class Shares | | | | | | | | | | | | | | | |
Net assets attributable to I Class shares | | | $ | 29,694,811 | | | | $ | 11,656,017 | | | | $ | 8,655,049 | |
Shares of Beneficial Interest Outstanding (unlimited number of shares authorized, no par value) | | | | 3,151,604 | | | | | 1,184,545 | | | | | 861,794 | |
| | | |
| | | |
| | | |
| |
Net Asset Value Per Share | | | $ | 9.42 | | | | $ | 9.84 | | | | $ | 10.04 | |
| | | |
| | | |
| | | |
| |
64
| The FBR Funds |
|
| Statements of Assets and Liabilities (continued) |
| October 31, 2010 |
| | | | | | | | FBR | | FBR |
| | | FBR | | Large Cap | | Small Cap |
| | | Focus Fund | | Financial Fund | | Financial Fund |
| | |
| |
| |
|
| ASSETS | | | | | | | | | | | | | | | |
Investment Securities | | | | | | | | | | | | | | | |
Securities at Cost: | | | | | | | | | | | | | | | |
Unaffiliated Issuers | | | $ | 351,656,532 | | | | $ | 49,132,321 | | | | $ | 232,072,294 | |
Affiliated Issuers | | | | 53,544,461 | | | | | — | | | | | — | |
| | | |
| | | |
| | | |
| |
Total securities | | | $ | 405,200,993 | | | | $ | 49,132,321 | | | | $ | 232,072,294 | |
| | | |
| | | |
| | | |
| |
Securities at Value (Note 2): | | | | | | | | | | | | | | | |
Unaffiliated Issuers | | | $ | 630,936,497 | | | | $ | 48,065,479 | | | | $ | 242,519,582 | |
Affiliated Issuers | | | | 77,807,623 | | | | | — | | | | | — | |
| | | |
| | | |
| | | |
| |
Total securities | | | | 708,744,120 | | | | | 48,065,479 | | | | | 242,519,582 | |
Cash | | | | — | | | | | 3,450 | | | | | — | |
Receivable for Capital Shares Sold | | | | 491,744 | | | | | 13,496 | | | | | 203,477 | |
Receivable for Investment Securities Sold | | | | — | | | | | 2,178,030 | | | | | 3,446,811 | |
Dividends and Interest Receivable | | | | 77,500 | | | | | 8,177 | | | | | 297,918 | |
Prepaid Expenses | | | | 79,337 | | | | | 12,786 | | | | | 44,477 | |
| | | |
| | | |
| | | |
| |
Total Assets | | | | 709,392,701 | | | | | 50,281,418 | | | | | 246,512,265 | |
| | | |
| | | |
| | | |
| |
| LIABILITIES | | | | | | | | | | | | | | | |
Payable for Capital Shares Redeemed | | | | 395,970 | | | | | 28,018 | | | | | 2,385,346 | |
Payable for Investment Securities Purchased | | | | — | | | | | 1,421,188 | | | | | 1,929,746 | |
Investment Advisory Fee Payable (Note 4) | | | | 529,956 | | | | | 37,298 | | | | | 190,897 | |
Administration Fee Payable (Note 4) | | | | 85,019 | | | | | 5,061 | | | | | 24,990 | |
Transfer Agent Fee Payable | | | | 357,479 | | | | | 9,580 | | | | | 84,643 | |
Distribution and Service Fees Payable (Note 4) | | | | 139,966 | | | | | 10,361 | | | | | 48,354 | |
Other Accrued Expenses | | | | 233,767 | | | | | 53,356 | | | | | 89,954 | |
| | | |
| | | |
| | | |
| |
Total Liabilities | | | | 1,742,157 | | | | | 1,564,862 | | | | | 4,753,930 | |
| | | |
| | | |
| | | |
| |
| NET ASSETS | | | $ | 707,650,544 | | | | $ | 48,716,556 | | | | $ | 241,758,335 | |
| | | |
| | | |
| | | |
| |
| Net Assets Consist of: | | | | | | | | | | | | | | | |
Paid-in capital | | | $ | 378,747,071 | | | | $ | 52,285,315 | | | | $ | 232,127,793 | |
Accumulated net investment income | | | | — | | | | | 1,025 | | | | | 578,197 | |
Accumulated net realized gain (loss) on investments and foreign currency transactions | | | | 25,360,346 | | | | | (2,502,942 | ) | | | | (1,394,943 | ) |
Net unrealized appreciation on investments | | | | 303,543,127 | | | | | (1,066,842 | ) | | | | 10,447,288 | |
| | | |
| | | |
| | | |
| |
| NET ASSETS | | | $ | 707,650,544 | | | | $ | 48,716,556 | | | | $ | 241,758,335 | |
| | | |
| | | |
| | | |
| |
| Pricing of Investor Class Shares | | | | | | | | | | | | | | | |
Net assets attributable to Investor Class shares | | | $ | 670,839,893 | | | | $ | 48,716,556 | | | | $ | 216,746,946 | |
Shares of Beneficial Interest Outstanding (unlimited number of shares authorized, no par value) | | | | 14,101,982 | | | | | 3,783,055 | | | | | 11,970,979 | |
| | | |
| | | |
| | | |
| |
Net Asset Value Per Share | | | $ | 47.57 | | | | $ | 12.88 | | | | $ | 18.11 | |
| | | |
| | | |
| | | |
| |
| Pricing of I Class Shares | | | | | | | | | | | | | | | |
Net assets attributable to I Class shares | | | $ | 36,810,651 | | | | $ | — | | | | $ | 25,011,389 | |
Shares of Beneficial Interest Outstanding (unlimited number of shares authorized, no par value) | | | | 772,704 | | | | | — | | | | | 2,137,645 | |
| | | |
| | | |
| | | |
| |
Net Asset Value Per Share | | | $ | 47.64 | | | | $ | — | | | | $ | 11.70 | |
| | | |
| | | |
| | | |
| |
65
| The FBR Funds |
|
| Statements of Assets and Liabilities (continued) |
| October 31, 2010 |
| | | | | | | | FBR |
| | | FBR | | Gas Utility |
| | | Technology Fund | | Index Fund |
| | |
| |
|
| ASSETS | | | | | | | | | | |
Investment Securities at Cost | | | $ | 11,174,810 | | | | $ | 138,361,006 | |
| | | |
| | | |
| |
Investment Securities at Value (Note 2) | | | $ | 12,270,887 | | | | $ | 243,832,277 | |
Receivable for Capital Shares Sold | | | | 1,517 | | | | | 226,806 | |
Receivable for Investment Securities Sold | | | | 757,421 | | | | | 274,319 | |
Dividends and Interest Receivable | | | | 1,972 | | | | | 294,321 | |
Receivable from Adviser | | | | 22,685 | | | | | — | |
Prepaid Expenses | | | | 18,827 | | | | | 30,565 | |
| | | |
| | | |
| |
Total Assets | | | | 13,073,309 | | | | | 244,658,288 | |
| | | |
| | | |
| |
| LIABILITIES | | | | | | | | | | |
Bank Overdraft | | | | — | | | | | 1,180 | |
Payable for Capital Shares Redeemed | | | | — | | | | | 40,218 | |
Payable for Investment Securities Purchased | | | | 208,625 | | | | | 291,692 | |
Investment Advisory Fee Payable (Note 4) | | | | — | | | | | 80,919 | |
Administration Fee Payable (Note 4) | | | | 1,615 | | | | | 33,775 | |
Distribution and Service Fees Payable (Note 4) | | | | 1,695 | | | | | 44 | |
Other Accrued Expenses | | | | 43,686 | | | | | 169,436 | |
| | | |
| | | |
| |
Total Liabilities | | | | 255,621 | | | | | 617,264 | |
| | | |
| | | |
| |
| NET ASSETS | | | $ | 12,817,688 | | | | $ | 244,041,024 | |
| | | |
| | | |
| |
| Net Assets Consist of: | | | | | | | | | | |
Paid-in capital | | | $ | 15,280,611 | | | | $ | 151,041,860 | |
Accumulated net investment income | | | | — | | | | | 73,446 | |
Accumulated net realized loss on investments | | | | (3,559,000 | ) | | | | (12,545,553 | ) |
Net unrealized appreciation on investments | | | | 1,096,077 | | | | | 105,471,271 | |
| | | |
| | | |
| |
| NET ASSETS | | | $ | 12,817,688 | | | | $ | 244,041,024 | |
| | | |
| | | |
| |
| Pricing of Investor Class Shares | | | | | | | | | | |
Net assets attributable to Investor Class shares | | | $ | 8,206,780 | | | | | 244,041,024 | |
Shares of Beneficial Interest Outstanding (unlimited number of shares authorized, no par value) | | | | 746,380 | | | | | 13,687,528 | |
| | | |
| | | |
| |
Net Asset Value Per Share | | | $ | 11.00 | | | | $ | 17.83 | |
| | | |
| | | |
| |
| Pricing of I Class Shares | | | | | | | | | | |
Net assets attributable to I Class shares | | | $ | 4,610,908 | | | | $ | — | |
Shares of Beneficial Interest Outstanding (unlimited number of shares authorized, no par value) | | | | 419,154 | | | | | — | |
| | | |
| | | |
| |
Net Asset Value Per Share | | | $ | 11.00 | | | | $ | — | |
| | | |
| | | |
| |
The accompanying notes are an integral part of the financial statements.
66
| The FBR Funds |
|
| Statements of Operations |
| For the Year Ended October 31, 2010 |
| | | FBR | | FBR | | FBR |
| | | Large Cap Fund | | Mid Cap Fund | | Small Cap Fund |
| | |
| |
| |
|
| Investment Income | | | | | | | | | | | | | | | |
Dividends1 | | | $ | 590,876 | | | | $ | 216,352 | | | | $ | 248,678 | |
Interest | | | | 74 | | | | | 113 | | | | | 80 | |
| | | |
| | | |
| | | |
| |
Total Investment Income | | | | 590,950 | | | | | 216,465 | | | | | 248,758 | |
| | | |
| | | |
| | | |
| |
| Expenses | | | | | | | | | | | | | | | |
Investment Advisory fees (Note 4) | | | | 337,724 | | | | | 131,069 | | | | | 137,098 | |
Administration fees (Note 4) | | | | 22,709 | | | | | 9,309 | | | | | 9,196 | |
Distribution and Service fees – Investor Class (Note 4) | | | | 48,112 | | | | | 18,697 | | | | | 34,320 | |
Professional fees | | | | 76,520 | | | | | 76,627 | | | | | 72,885 | |
Registration fees – Investor Class | | | | 14,856 | | | | | 15,901 | | | | | 16,772 | |
Registration fees – I Class | | | | 14,274 | | | | | 15,295 | | | | | 15,432 | |
Transfer agent fees – Investor Class | | | | 10,421 | | | | | 6,433 | | | | | 14,454 | |
Transfer agent fees – I Class | | | | 17,551 | | | | | 2,469 | | | | | 1,412 | |
Shareholder administrative fees – Investor Class | | | | 26,051 | | | | | 14,877 | | | | | 19,719 | |
Shareholder administrative fees – I Class | | | | 697 | | | | | 519 | | | | | 333 | |
Trustees’ fees | | | | 15,994 | | | | | 15,995 | | | | | 15,992 | |
Accounting services fees | | | | 13,614 | | | | | 6,300 | | | | | 5,797 | |
Compliance fees | | | | 11,040 | | | | | 9,552 | | | | | 10,085 | |
Insurance fees | | | | 5,855 | | | | | 2,616 | | | | | 1,656 | |
Reports to shareholders – Investor Class | | | | 3,296 | | | | | 1,314 | | | | | 837 | |
Reports to shareholders – I Class | | | | 751 | | | | | 233 | | | | | 302 | |
Custodian fees | | | | 2,244 | | | | | 882 | | | | | 845 | |
Other expenses | | | | 6,807 | | | | | 5,647 | | | | | 8,415 | |
| | | |
| | | |
| | | |
| |
Total expenses before waivers and related reimbursements | | | | 628,516 | | | | | 333,735 | | | | | 365,550 | |
Less waivers and related reimbursements (Note 4) | | | | (203,345 | ) | | | | (153,525 | ) | | | | (147,267 | ) |
| | | |
| | | |
| | | |
| |
Total expenses after waivers and related reimbursements | | | | 425,171 | | | | | 180,210 | | | | | 218,283 | |
| | | |
| | | |
| | | |
| |
Net Investment Income | | | | 165,779 | | | | | 36,255 | | | | | 30,475 | |
| | | |
| | | |
| | | |
| |
| Net Realized and Unrealized Gain on Investments | | | | | | | | | | | | | | | |
Net Realized Gain on Investment Transactions | | | | 1,484,069 | | | | | 856,460 | | | | | 1,060,295 | |
Change in Net Unrealized Appreciation/Depreciation of Investments | | | | 287,938 | | | | | 450,331 | | | | | 3,646,786 | |
| | | |
| | | |
| | | |
| |
Net Gain on Investments | | | | 1,772,007 | | | | | 1,306,791 | | | | | 4,707,081 | |
| | | |
| | | |
| | | |
| |
| Net Increase in Net Assets Resulting from Operations | | | $ | 1,937,786 | | | | $ | 1,343,046 | | | | $ | 4,737,556 | |
| | | |
| | | |
| | | |
| |
|
| 1 | Net of foreign taxes withheld of $1,199, $382 and $160 for the FBR Large Cap Fund, FBR Mid Cap Fund and FBR Small Cap Fund, respectively. |
67
| The FBR Funds |
|
| Statements of Operations (continued) |
| For the Year Ended October 31, 2010 |
| | | | | | | | FBR | | FBR |
| | | | | | | | Large Cap | | Small Cap |
| | | FBR | | Financial | | Financial |
| | | Focus Fund | | Fund | | Fund |
| | |
| |
| |
|
| Investment Income | | | | | | | | | | | | | | | |
Dividends from Unaffiliated Issuers | | | $ | 1,500,146 | | | | $ | 440,730 | | | | $ | 4,669,029 | |
Interest | | | | 3,634 | | | | | 376 | | | | | 4,465 | |
| | | |
| | | |
| | | |
| |
Total Investment Income | | | | 1,503,780 | | | | | 441,106 | | | | | 4,673,494 | |
| | | |
| | | |
| | | |
| |
| Expenses | | | | | | | | | | | | | | | |
Investment Advisory fees (Note 4) | | | | 6,514,796 | | | | | 376,285 | | | | | 2,267,871 | |
Administration fees (Note 4) | | | | 460,047 | | | | | 26,324 | | | | | 147,047 | |
Distribution and Service fees – Investor Class (Note 4) | | | | 1,732,909 | | | | | 104,524 | | | | | 585,277 | |
Distribution and Service fees – R1 Class (Note 4) | | | | 924 | | | | | — | | | | | 700 | |
Shareholder administrative fees – Investor Class | | | | 1,017,982 | | | | | 54,435 | | | | | 314,641 | |
Shareholder administrative fees – I Class | | | | 20,262 | | | | | — | | | | | 11,547 | |
Transfer agent fees – Investor Class | | | | 270,601 | | | | | 27,667 | | | | | 84,197 | |
Transfer agent fees – I Class | | | | 1,126 | | | | | — | | | | | 1,055 | |
Transfer agent fees – R1 Class | | | | 650 | | | | | — | | | | | 772 | |
Accounting services fees | | | | 237,369 | | | | | 13,740 | | | | | 73,769 | |
Reports to shareholders – Investor Class | | | | 140,964 | | | | | 3,610 | | | | | 31,592 | |
Reports to shareholders – I Class | | | | 5,530 | | | | | — | | | | | 1,751 | |
Reports to shareholders – R1 Class | | | | 674 | | | | | — | | | | | 509 | |
Insurance fees | | | | 134,465 | | | | | 5,523 | | | | | 42,328 | |
Registration fees – Investor Class | | | | 65,311 | | | | | 19,152 | | | | | 37,792 | |
Registration fees – I Class | | | | 36,586 | | | | | — | | | | | 15,210 | |
Registration fees – R1 Class | | | | 15,244 | | | | | — | | | | | 14,727 | |
Professional fees | | | | 92,869 | | | | | 77,597 | | | | | 69,502 | |
Compliance fees | | | | 57,015 | | | | | 11,194 | | | | | 23,608 | |
Custodian fees | | | | 42,685 | | | | | 2,342 | | | | | 12,381 | |
Trustees’ fees | | | | 15,994 | | | | | 15,995 | | | | | 15,997 | |
Other expenses | | | | 34,382 | | | | | 7,009 | | | | | 17,011 | |
| | | |
| | | |
| | | |
| |
Total expenses before waivers and related reimbursements | | | | 10,898,385 | | | | | 745,397 | | | | | 3,769,284 | |
Less waivers and related reimbursements (Note 4)2 | | | | (15,363 | ) | | | | — | | | | | (15,104 | ) |
| | | |
| | | |
| | | |
| |
Total expenses after waivers and related reimbursements | | | | 10,883,022 | | | | | 745,397 | | | | | 3,754,180 | |
| | | |
| | | |
| | | |
| |
Net Investment Income (Loss) | | | | (9,379,242 | ) | | | | (304,291 | ) | | | | 919,314 | |
| | | |
| | | |
| | | |
| |
| Net Realized and Unrealized Gain (Loss) on Investments | | | | | | | | | | | | | | | |
Net Realized Gain on Investments
Unaffiliated Issuers | | | | 32,448,092 | | | | | 4,174,856 | | | | | 10,863,874 | |
Affiliated Issuers | | | | 2,772,242 | | | | | — | | | | | — | |
Change in Net Unrealized Appreciation/Depreciation of Investments | | | | 146,676,963 | | | | | (5,180,152 | ) | | | | 1,210,218 | |
| | | |
| | | |
| | | |
| |
Net Gain (Loss) on Investments | | | | 181,897,297 | | | | | (1,005,296 | ) | | | | 12,074,092 | |
| | | |
| | | |
| | | |
| |
| Net Increase (Decrease) in Net Assets Resulting from Operations | | | $ | 172,518,055 | | | | $ | (1,309,587 | ) | | | $ | 12,993,406 | |
| | | |
| | | |
| | | |
| |
| |
| 1 Effective after the close of business on October 22, 2010, R Class Shares merged into Investor Class (See Note 12). | |
| 2 All waivers and related reimbursements are applicable to the R Class. | |
68
| The FBR Funds |
|
| Statements of Operations (continued) |
| For the Year Ended October 31, 2010 |
| | | FBR | | FBR |
| | | Technology | | Gas Utility |
| | | Fund | | Index Fund |
| | |
| |
|
| Investment Income | | | | | | | | | | |
Dividends1 | | | $ | 117,948 | | | | $ | 9,457,410 | |
Interest (Note 2) | | | | 88 | | | | | 282 | |
| | | |
| | | |
| |
Total Investment Income | | | | 118,036 | | | | | 9,457,692 | |
| | | |
| | | |
| |
| Expenses | | | | | | | | | | |
Investment Advisory fees (Note 4) | | | | 120,287 | | | | | 886,056 | |
Administration fees (Note 4) | | | | 8,768 | | | | | 220,928 | |
Distribution and Service fees – Investor Class (Note 4) | | | | 24,567 | | | | | — | |
Distribution and Service fees – R Class2 (Note 4) | | | | — | | | | | 546 | |
Professional fees | | | | 79,092 | | | | | 69,502 | |
Registration fees – Investor Class | | | | 18,052 | | | | | 18,549 | |
Registration fees – I3 Class | | | | 5,553 | | | | | — | |
Registration fees – R2 Class | | | | — | | | | | 16,208 | |
Transfer agent fees – Investor Class | | | | 12,295 | | | | | 144,136 | |
Transfer agent fees – I3 Class | | | | 4,054 | | | | | — | |
Transfer agent fees – R2 Class | | | | — | | | | | 589 | |
Trustees’ fees | | | | 15,994 | | | | | 15,994 | |
Shareholder administrative fees – Investor Class | | | | 15,272 | | | | | 142,435 | |
Shareholder administrative fees – I3 Class | | | | 126 | | | | | — | |
Compliance fees | | | | 9,411 | | | | | 21,221 | |
Accounting services fees | | | | 6,238 | | | | | 63,288 | |
Insurance fees (Note 9) | | | | 2,719 | | | | | 40,319 | |
Reports to shareholders – Investor Class | | | | 1,617 | | | | | 26,104 | |
Reports to shareholders – I3 Class | | | | 778 | | | | | — | |
Reports to shareholders – R2 Class | | | | — | | | | | 363 | |
Custodian fees | | | | 786 | | | | | 11,235 | |
Other expenses | | | | 5,987 | | | | | 17,575 | |
| | | |
| | | |
| |
Total expenses before waivers and related reimbursements | | | | 331,596 | | | | | 1,695,048 | |
Less waivers and related reimbursements (Note 4) | | | | (77,288 | ) | | | | (16,893 | )4 |
| | | |
| | | |
| |
Total expenses after waivers and related reimbursements | | | | 254,308 | | | | | 1,678,155 | |
| | | |
| | | |
| |
Net Investment Income (Loss) | | | | (136,272 | ) | | | | 7,779,537 | |
| | | |
| | | |
| |
| Net Realized and Unrealized Gain (Loss) on Investments | | | | | | | | | | |
Net Realized Gain on Investment Transactions | | | | 1,562,671 | | | | | 2,250,847 | |
Change in Net Unrealized Appreciation/Depreciation of Investments | | | | 158,572 | | | | | 33,703,232 | |
| | | |
| | | |
| |
Net Gain on Investments | | | | 1,721,243 | | | | | 35,954,079 | |
| | | |
| | | |
| |
| Net Increase in Net Assets Resulting from Operations | | | $ | 1,584,971 | | | | $ | 43,733,616 | |
| | | |
| | | |
| |
|
| 1 | Net of foreign taxes withheld of $105, and $113,596 for the FBR Technology Fund and FBR Gas Utility Index Fund, respectively. |
| 2 | Effective after the close of business on October 22, 2010, R Class Shares merged into Investor Class (See Note 12). |
| 3 | I Class Shares commenced operations on March 12, 2010. |
| 4 | All waivers and related reimbursements are applicable to the R Class. |
The accompanying notes are an integral part of the financial statements.
69
| The FBR Funds |
|
| Statements of Changes in Net Assets |
| | | FBR Large Cap Fund | | FBR Mid Cap Fund | | FBR Small Cap Fund |
| | |
| |
| |
|
| | | For the | | For the | | For the | | For the | | For the | | For the |
| | | Year | | Year | | Year | | Year | | Year | | Year |
| | | Ended | | Ended | | Ended | | Ended | | Ended | | Ended |
| | | October 31, | | October 31, | | October 31, | | October 31, | | October 31, | | October 31, |
| | | 2010 | | 2009 | | 2010 | | 2009 | | 2010 | | 2009 |
| | |
| |
| |
| |
| |
| |
|
| From Investment Activities | | | | | | | | | | | | | | | | | | | | | | | | | | | | | | |
Net Investment Income | | | $ | 165,779 | | | | $ | 76,796 | | | | $ | 36,255 | | | | $ | 24,585 | | | | $ | 30,475 | | | | $ | 7,597 | |
Net Realized Gain (Loss) on Investment Transactions | | | | 1,484,069 | | | | | 480,306 | | | | | 856,460 | | | | | (240,244 | ) | | | | 1,060,295 | | | | | 460,160 | |
Net Increase from Payments by Affiliates | | | | — | | | | | — | | | | | — | | | | | — | | | | | — | | | | | 7,834 | |
Change in Net Unrealized Appreciation/Depreciation of Investments | | | | 287,938 | | | | | 2,799,062 | | | | | 450,331 | | | | | 1,527,785 | | | | | 3,646,786 | | | | | 1,334,877 | |
| | | |
| | | |
| | | |
| | | |
| | | |
| | | |
| |
Net Increase in Net Assets Resulting from Operations | | | | 1,937,786 | | | | | 3,356,164 | | | | | 1,343,046 | | | | | 1,312,126 | | | | | 4,737,556 | | | | | 1,810,468 | |
| | | |
| | | |
| | | |
| | | |
| | | |
| | | |
| |
| Distributions to Shareholders | | | | | | | | | | | | | | | | | | | | | | | | | | | | | | |
Distributions to Investor Class Shareholders: | | | | | | | | | | | | | | | | | | | | | | | | | | | | | | |
From Net Investment Income | | | | (93,740 | ) | | | | (37,990 | ) | | | | (26,340 | ) | | | | (7,042 | ) | | | | (34,316 | ) | | | | — | |
From Net Realized Gain on Investments | | | | — | | | | | — | | | | | — | | | | | (63,787 | ) | | | | (315,911 | ) | | | | — | |
Distributions to I Class Shareholders: | | | | | | | | | | | | | | | | | | | | | | | | | | | | | | |
From Net Investment Income | | | | (818 | ) | | | | (633 | ) | | | | (451 | ) | | | | (290 | ) | | | | (629 | ) | | | | — | |
From Net Realized Gain on Investments | | | | — | | | | | — | | | | | — | | | | | (1,220 | ) | | | | (2,821 | ) | | | | — | |
| | | |
| | | |
| | | |
| | | |
| | | |
| | | |
| |
Total Distributions to Shareholders | | | | (94,558 | ) | | | | (38,623 | ) | | | | (26,791 | ) | | | | (72,339 | ) | | | | (353,677 | ) | | | | — | |
| | | |
| | | |
| | | |
| | | |
| | | |
| | | |
| |
| From Share Transactions | | | | | | | | | | | | | | | | | | | | | | | | | | | | | | |
Net Increase in Net Assets Resulting from Share Transactions | | | | 25,902,019 | | | | | 11,083,718 | | | | | 10,264,804 | | | | | 1,432,525 | | | | | 20,440,860 | | | | | 4,786,292 | |
| | | |
| | | |
| | | |
| | | |
| | | |
| | | |
| |
Total Increase in Net Assets | | | | 27,745,247 | | | | | 14,401,259 | | | | | 11,581,059 | | | | | 2,672,312 | | | | | 24,824,739 | | | | | 6,596,760 | |
Net Assets – Beginning of Year | | | | 19,046,132 | | | | | 4,644,873 | | | | | 6,851,033 | | | | | 4,178,721 | | | | | 10,671,216 | | | | | 4,074,456 | |
| | | |
| | | |
| | | |
| | | |
| | | |
| | | |
| |
Net Assets – End of Year | | | $ | 46,791,379 | | | | $ | 19,046,132 | | | | $ | 18,432,092 | | | | $ | 6,851,033 | | | | $ | 35,495,955 | | | | $ | 10,671,216 | |
| | | |
| | | |
| | | |
| | | |
| | | |
| | | |
| |
Accumulated Net Investment Income | | | $ | 137,874 | | | | $ | 66,653 | | | | $ | 23,354 | | | | $ | 13,890 | | | | $ | 3,083 | | | | $ | 7,553 | |
| | | |
| | | |
| | | |
| | | |
| | | |
| | | |
| |
70
| The FBR Funds |
|
| Statements of Changes in Net Assets (continued) |
| | | | | | | | | | | | | FBR Large Cap | | FBR Small Cap |
| | | FBR Focus Fund | | Financial Fund | | Financial Fund |
| | |
| |
| |
|
| | | For the | | For the | | For the | | For the | | For the | | For the |
| | | Year | | Year | | Year | | Year | | Year | | Year |
| | | Ended | | Ended | | Ended | | Ended | | Ended | | Ended |
| | | October 31, | | October 31, | | October 31, | | October 31, | | October 31, | | October 31, |
| | | 2010 | | 2009 | | 2010 | | 2009 | | 2010 | | 2009 |
| | |
| |
| |
| |
| |
| |
|
| From Investment Activities | | | | | | | | | | | | | | | | | | | | | | | | | | | | | | |
Net Investment Income (Loss) | | | $ | (9,379,242 | ) | | | $ | (8,778,696 | ) | | | $ | (304,291 | ) | | | $ | (19,601 | ) | | | $ | 919,314 | | | | $ | 875,755 | |
Net Realized Gain (Loss) on Investments and Foreign Currency Transactions
Unaffiliated Issuers | | | | 32,448,092 | | | | | (8,245,318 | ) | | | | 4,174,856 | | | | | (2,227,359 | ) | | | | 10,863,874 | | | | | (2,794,592 | ) |
Affiliated Issuers | | | | 2,772,242 | | | | | (1,332,056 | ) | | | | — | | | | | — | | | | | — | | | | | — | |
Change in Net Unrealized Appreciation/Depreciation of Investments | | | | 146,676,963 | | | | | 151,576,458 | | | | | (5,180,152 | ) | | | | 4,061,503 | | | | | 1,210,218 | | | | | 6,960,944 | |
| | | |
| | | |
| | | |
| | | |
| | | |
| | | |
| |
Net Increase (Decrease) in Net Assets Resulting from Operations | | | | 172,518,055 | | | | | 133,220,388 | | | | | (1,309,587 | ) | | | | 1,814,543 | | | | | 12,993,406 | | | | | 5,042,107 | |
| | | |
| | | |
| | | |
| | | |
| | | |
| | | |
| |
| Distributions to Shareholders | | | | | | | | | | | | | | | | | | | | | | | | | | | | | | |
Distributions to Investor Class | | | | | | | | | | | | | | | | | | | | | | | | | | | | | | |
Shareholders: | | | | | | | | | | | | | | | | | | | | | | | | | | | | | | |
From Net Investment Income | | | | — | | | | | — | | | | | — | | | | | (201,208 | ) | | | | (717,201 | ) | | | | (2,340,676 | ) |
Distribution in Excess of Net Investment Income | | | | — | | | | | — | | | | | — | | | | | (42,309 | ) | | | | — | | | | | — | |
From Net Realized Gain on Investments | | | | — | | | | | (96,017,062 | ) | | | | — | | | | | — | | | | | — | | | | | — | |
Distributions to I Class Shareholders: | | | | | | | | | | | | | | | | | | | | | | | | | | | | | | |
From Net Investment Income | | | | (282,300 | ) | | | | — | | | | | — | | | | | — | | | | | (148,737 | ) | | | | (2,105 | ) |
From Net Realized Gain on Investments | | | | — | | | | | (10,311,502 | ) | | | | — | | | | | — | | | | | — | | | | | — | |
Distributions to R1 Class Shareholders: | | | | | | | | | | | | | | | | | | | | | | | | | | | | | | |
From Net Investment Income | | | | (314 | ) | | | | — | | | | | — | | | | | — | | | | | (486 | ) | | | | (1,617 | ) |
From Net Realized Gain on Investments | | | | — | | | | | (51,918 | ) | | | | — | | | | | — | | | | | — | | | | | — | |
| | | |
| | | |
| | | |
| | | |
| | | |
| | | |
| |
Total Distributions to Shareholders | | | | (282,614 | ) | | | | (106,380,482 | ) | | | | — | | | | | (243,517 | ) | | | | (866,424 | ) | | | | (2,344,398 | ) |
| | | |
| | | |
| | | |
| | | |
| | | |
| | | |
| |
| From Share Transactions | | | | | | | | | | | | | | | | | | | | | | | | | | | | | | |
Net Increase (Decrease) in Net Assets Resulting from Share Transactions | | | | (258,749,901 | ) | | | | 32,641,257 | | | | | 12,831,056 | | | | | 11,351,949 | | | | | 31,305,688 | | | | | 9,773,292 | |
| | | |
| | | |
| | | |
| | | |
| | | |
| | | |
| |
Total Increase (Decrease) in Net Assets | | | | (86,514,460 | ) | | | | 59,481,163 | | | | | 11,521,469 | | | | | 12,922,975 | | | | | 43,432,670 | | | | | 12,471,001 | |
Net Assets – Beginning of Year | | | | 794,165,004 | | | | | 734,683,841 | | | | | 37,195,087 | | | | | 24,272,112 | | | | | 198,325,665 | | | | | 185,854,664 | |
| | | |
| | | |
| | | |
| | | |
| | | |
| | | |
| |
Net Assets – End of Year | | | $ | 707,650,544 | | | | $ | 794,165,004 | | | | $ | 48,716,556 | | | | $ | 37,195,087 | | | | $ | 241,758,335 | | | | $ | 198,325,665 | |
| | | |
| | | |
| | | |
| | | |
| | | |
| | | |
| |
Accumulated Net Investment Income | | | $ | — | | | | $ | — | | | | $ | 1,025 | | | | $ | — | | | | $ | 578,197 | | | | $ | 537,355 | |
| | | |
| | | |
| | | |
| | | |
| | | |
| | | |
| |
|
| 1 Effective after the close of business on October 22, 2010, R Class Shares merged into Investor Class (See Note 12). |
71
| The FBR Funds |
|
| Statements of Changes in Net Assets (continued) |
| | | FBR Technology Fund | | FBR Gas Utility Index Fund |
| | |
| |
|
| | | For the | | For the | | For the | | For the |
| | | Year | | Year | | Year | | Year |
| | | Ended | | Ended | | Ended | | Ended |
| | | October 31, | | October 31, | | October 31, | | October 31, |
| | | 2010 | | 2009 | | 2010 | | 2009 |
| | |
| |
| |
| |
|
| From Investment Activities | | | | | | | | | | | | | | | | | | | | |
Net Investment Income (Loss) | | | $ | (136,272 | ) | | | $ | (72,307 | ) | | | $ | 7,779,537 | | | | $ | 6,316,147 | |
Net Realized Gain (Loss) on Investment Transactions | | | | 1,562,671 | | | | | (1,025,264 | ) | | | | 2,250,847 | | | | | (1,364,631 | ) |
Change in Net Unrealized Appreciation/Depreciation of Investments | | | | 158,572 | | | | | 2,748,938 | | | | | 33,703,232 | | | | | 7,802,219 | |
| | | |
| | | |
| | | |
| | | |
| |
Net Increase in Net Assets Resulting from Operations | | | | 1,584,971 | | | | | 1,651,367 | | | | | 43,733,616 | | | | | 12,753,735 | |
| | | |
| | | |
| | | |
| | | |
| |
| Distributions to Shareholders | | | | | | | | | | | | | | | | | | | | |
Distributions to Investor Class Shareholders: | | | | | | | | | | | | | | | | | | | | |
From Net Investment Income | | | | — | | | | | — | | | | | (7,791,103 | ) | | | | (6,295,985 | ) |
From Net Realized Gain on Investments | | | | — | | | | | — | | | | | (248,764 | ) | | | | (9,577,973 | ) |
Distributions to R1 Class Shareholders: | | | | | | | | | | | | | | | | | | | | |
From Net Investment Income | | | | — | | | | | — | | | | | (9,158 | ) | | | | (5,532 | ) |
From Net Realized Gain on Investments | | | | — | | | | | — | | | | | (277 | ) | | | | (7,498 | ) |
| | | |
| | | |
| | | |
| | | |
| |
Total Distributions to Shareholders | | | | — | | | | | — | | | | | (8,049,302 | ) | | | | (15,886,988 | ) |
| | | |
| | | |
| | | |
| | | |
| |
| From Share Transactions | | | | | | | | | | | | | | | | | | | | |
Net Increase (Decrease) in Net Assets Resulting from Share Transactions | | | | 2,844,654 | | | | | (952,425 | ) | | | | 14,587,460 | | | | | (1,738,294 | ) |
| | | |
| | | |
| | | |
| | | |
| |
Total Increase (Decrease) in Net Assets | | | | 4,429,625 | | | | | 698,942 | | | | | 50,271,774 | | | | | (4,871,547 | ) |
Net Assets – Beginning of Year | | | | 8,388,063 | | | | | 7,689,121 | | | | | 193,769,250 | | | | | 198,640,797 | |
| | | |
| | | |
| | | |
| | | |
| |
Net Assets – End of Year | | | $ | 12,817,688 | | | | $ | 8,388,063 | | | | $ | 244,041,024 | | | | $ | 193,769,250 | |
| | | |
| | | |
| | | |
| | | |
| |
Accumulated Net Investment Income | | | $ | — | | | | $ | — | | | | $ | 73,446 | | | | $ | 94,170 | |
| | | |
| | | |
| | | |
| | | |
| |
|
| 1 Effective after the close of business on October 22, 2010, R Class Shares merged into Investor Class (See Note 12). |
The accompanying notes are an integral part of the financial statements.
72
The FBR Funds
Financial Highlights
The following tables provide per share data for a share outstanding throughout each period for each Fund. Other data includes investment performance, ratios to average net assets and other supplemental information.
| | | FBR Large Cap Fund — Investor Class |
| | |
|
| | | | | | | | | | | | | | | | | | | For the |
| | | For the Years Ended October 31, | | Period Ended |
| | |
| | October 31, |
| | | | 2010 | | | | 2009 | | | | 2008 | | | | 2007 | | | 2006* |
| | |
| | |
| | |
| | |
| | |
|
| Per Share Operating Performance: | | | | | | | | | | | | | | | | | | | | |
Net Asset Value – Beginning of Period | | $ | 9.72 | | | $ | 8.14 | | | $ | 13.40 | | | $ | 11.84 | | | $ | 10.00 | |
| | |
| | |
| | |
| | |
| | |
| |
Income (Loss) from Investment Operations: | | | | | | | | | | | | | | | | | | | | |
Net Investment Income (Loss)1,2 | | | 0.04 | | | | 0.03 | | | | 0.08 | | | | (0.04 | ) | | | (0.01 | ) |
Net Realized and Unrealized Gain (Loss) on Investments1,3 | | | 1.17 | | | | 1.60 | | | | (4.05 | ) | | | 2.05 | | | | 1.84 | |
| | |
| | |
| | |
| | |
| | |
| |
Total from Investment Operations | | | 1.21 | | | | 1.63 | | | | (3.97 | ) | | | 2.01 | | | | 1.83 | |
| | |
| | |
| | |
| | |
| | |
| |
Distributions to Shareholders: | | | | | | | | | | | | | | | | | | | | |
From Net Investment Income | | | (0.05 | ) | | | (0.05 | ) | | | — | | | | — | | | | (0.00 | )5 |
From Net Realized Gain | | | — | | | | — | | | | (1.30 | ) | | | (0.45 | ) | | | — | |
| | |
| | |
| | |
| | |
| | |
| |
Total Distributions | | | (0.05 | ) | | | (0.05 | ) | | | (1.30 | ) | | | (0.45 | ) | | | (0.00 | )5 |
| | |
| | |
| | |
| | |
| | |
| |
Paid-in Capital from Redemption Fees4 | | | 0.00 | 5 | | | 0.00 | 5 | | | 0.01 | | | | 0.00 | 5 | | | 0.01 | |
| | |
| | |
| | |
| | |
| | |
| |
Net Increase (Decrease) in Net Asset Value | | | 1.16 | | | | 1.58 | | | | (5.26 | ) | | | 1.56 | | | | 1.84 | |
| | |
| | |
| | |
| | |
| | |
| |
Net Asset Value – End of Period | | $ | 10.88 | | | $ | 9.72 | | | $ | 8.14 | | | $ | 13.40 | | | $ | 11.84 | |
| | |
| | |
| | |
| | |
| | |
| |
| Total Investment Return6 | | | 12.43% | | | | 20.12% | | | | (32.37)% | | | | 17.52% | | | | 18.45% | (A) |
Ratios to Average Net Assets: | | | | | | | | | | | | | | | | | | | | |
Expenses After Waivers and Related Reimbursements2,7 | | | 1.25% | | | | 1.25% | | | | 1.71% | | | | 1.97% | | | | 1.94% | (B) |
Expenses Before Waivers and Related Reimbursements7 | | | 1.84% | | | | 2.16% | | | | 2.55% | | | | 2.21% | | | | 2.74% | (B) |
Net Investment Income (Loss) After Waivers and Related Reimbursements2 | | | 0.39% | | | | 0.61% | | | | 0.51% | | | | (0.30)% | | | | (0.23)% | (B) |
Net Investment Loss Before Waivers and Related Reimbursements | | | (0.20)% | | | | (0.30)% | | | | (0.33)% | | | | (0.54)% | | | | (1.03)% | (B) |
| Supplementary Data: | | | | | | | | | | | | | | | | | | | | |
Portfolio Turnover Rate | | | 86% | | | | 60% | | | | 39% | | | | 108% | | | | 166% | (A) |
Net Assets at End of Period (in thousands) | | $ | 17,097 | | | $ | 18,947 | | | $ | 4,574 | | | $ | 13,037 | | | $ | 13,349 | |
|
| * | | Represents the period from commencement of operations (November 15, 2005) through October 31, 2006. |
| 1 | | Calculated based on shares outstanding on the first and last day of the respective periods, except for dividends and distributions, if any, which are based on the actual shares outstanding on the dates of distributions. |
| 2 | | Prior to May 30, 2008, reflects fees waived and reimbursed by FBR Fund Advisers, Inc. pursuant to a contractual expense limitation of 1.95% (excluding interest, taxes, brokerage commissions, dividend expenses, acquired fund fees and expenses, extraordinary legal expenses, or any other extraordinary expenses). As of May 30, 2008, reflects fees waived and reimbursed by FBR Fund Advisers, Inc. pursuant to a contractual expense limitation of 1.25% (excluding interest, taxes, brokerage commissions, dividend expenses, acquired fund fees and expenses, extraordinary legal expenses, or any other extraordinary expenses). |
| 3 | | The amounts shown for a share outstanding throughout the period may not be in accordance with the changes in the aggregate gains and losses on investments during the period because of the timing of sales and repurchases of Fund shares in relation to fluctuating net asset values during the period. |
| 4 | | Calculated based on average shares outstanding. |
| 5 | | Less than $0.01 |
| 6 | | Total investment return is calculated assuming a purchase of shares on the first day and a sale on the last day of each period reported and will include reinvestment of dividends and distributions, if any. |
| 7 | | Does not include expenses of the funds in which the Fund invests. |
| (A) | | Not Annualized |
| (B) | | Annualized |
73
The FBR Funds
Financial Highlights (continued)
| | | FBR Large Cap Fund — I Class |
| | |
|
| | | | | | | | | | | For the |
| | | For the Years Ended October 31, | | Period Ended |
| | |
| | October 31, |
| | | 2010 | | | 2009 | | | 2008* |
| | |
| | |
| | |
|
| Per Share Operating Performance: | | | | | | | | | | | | | |
Net Asset Value – Beginning of Period | | $ | 8.42 | | | $ | 7.07 | | | | $ | 10.00 | |
| | |
| | |
| | | |
| |
Income (Loss) from Investment Operations: | | | | | | | | | | | | | |
Net Investment Income1,2 | | | 0.06 | | | | 0.07 | | | | | 0.03 | |
Net Realized and Unrealized Gain (Loss) on Investments1,3 | | | 1.01 | | | | 1.34 | | | | | (2.96 | ) |
| | |
| | |
| | | |
| |
Total from Investment Operations | | | 1.07 | | | | 1.41 | | | | | (2.93 | ) |
| | |
| | |
| | | |
| |
Distributions to Shareholders: | | | | | | | | | | | | | |
From Net Investment Income | | | (0.07 | ) | | | (0.06 | ) | | | | — | |
| | |
| | |
| | | |
| |
Paid-in Capital from Redemption Fees4 | | | 0.00 | 5 | | | — | | | | | — | |
| | |
| | |
| | | |
| |
Net Increase (Decrease) in Net Asset Value | | | 1.00 | | | | 1.35 | | | | | (2.93 | ) |
| | |
| | |
| | | |
| |
Net Asset Value – End of Period | | $ | 9.42 | | | $ | 8.42 | | | | $ | 7.07 | |
| | |
| | |
| | | |
| |
| Total Investment Return6 | | | 12.71% | | | | 20.21% | | | | | (29.30)% | (A) |
| Ratios to Average Net Assets: | | | | | | | | | | | | | |
Expenses After Waivers and Related Reimbursements2,7 | | | 1.00% | | | | 1.00% | | | | | 1.01% | (B) |
Expenses Before Waivers and Related Reimbursements7 | | | 1.49% | | | | 16.64% | | | | | 4.11% | (B) |
Net Investment Income After Waivers and Related Reimbursements2 | | | 0.50% | | | | 1.05% | | | | | 0.88% | (B) |
Net Investment Income (Loss) Before Waivers and Related Reimbursements | | | 0.01% | | | | (14.59)% | | | | | (2.22)% | (B) |
| Supplementary Data: | | | | | | | | | | | | | |
Portfolio Turnover Rate | | | 86% | | | | 60% | | | | | 39% | (A) |
Net Assets at End of Period (in thousands) | | $ | 29,695 | | | $ | 99 | | | | $ | 71 | |
|
| * | | Represents the period from inception of share class (May 30, 2008) through October 31, 2008. |
| 1 | | Calculated based on shares outstanding on the first and last day of the period, except for dividends and distributions, if any, which are based on the actual shares outstanding on the dates of distributions. |
| 2 | | Reflects fees waived and reimbursed by FBR Fund Advisers, Inc. pursuant to a contractual expense limitation of 1.00% (excluding interest, taxes, brokerage commissions, dividend expenses, acquired fund fees and expenses, extraordinary legal expenses, or any other extraordinary expenses). |
| 3 | | The amounts shown for a share outstanding throughout the period may not be in accordance with the changes in the aggregate gains and losses on investments during the period because of the timing of sales and repurchases of Fund shares in relation to fluctuating net asset values during the period. |
| 4 | | Calculated based on average shares outstanding. |
| 5 | | Less than $0.01 |
| 6 | | Total investment return is calculated assuming a purchase of shares on the first day and a sale on the last day of each period reported and will include reinvestment of dividends and distributions, if any. |
| 7 | | Does not include expenses of the funds in which the Fund invests. |
| (A) | | Not Annualized |
| (B) | | Annualized |
74
The FBR Funds
Financial Highlights (continued)
| | | FBR Mid Cap Fund — Investor Class |
| | |
|
| | | | | | | | | | | | | | For the |
| | | For the Years Ended October 31, | | Period Ended |
| | |
| | October 31, |
| | | 2010 | | | 2009 | | | 2008 | | 2007* |
| | |
| | |
| | |
| |
|
| Per Share Operating Performance: | | | | | | | | | | | | | | | | |
Net Asset Value – Beginning of Period | | $ | 9.53 | | | $ | 8.18 | | | $ | 11.30 | | | $ | 10.00 | |
| | |
| | |
| | |
| | |
| |
Income (Loss) from Investment Operations: | | | | | | | | | | | | | | | | |
Net Investment Income (Loss)1,2 | | | 0.04 | | | | 0.04 | | | | (0.01 | ) | | | (0.02 | ) |
Net Realized and Unrealized Gain (Loss) on Investments1,3 | | | 1.82 | | | | 1.43 | | | | (3.00 | ) | | | 1.32 | |
| | |
| | |
| | |
| | |
| |
Total from Investment Operations | | | 1.86 | | | | 1.47 | | | | (3.01 | ) | | | 1.30 | |
| | |
| | |
| | |
| | |
| |
Distributions to Shareholders: | | | | | | | | | | | | | | | | |
From Net Investment Income | | | (0.04 | ) | | | (0.01 | ) | | | — | | | | — | |
From Net Realized Gain | | | — | | | | (0.12 | ) | | | (0.13 | ) | | | — | |
| | |
| | |
| | |
| | |
| |
Total Distributions | | | (0.04 | ) | | | (0.13 | ) | | | (0.13 | ) | | | — | |
| | |
| | |
| | |
| | |
| |
Paid-in Capital from Redemption Fees4 | | | 0.00 | 5 | | | 0.01 | | | | 0.02 | | | | 0.00 | 5 |
| | |
| | |
| | |
| | |
| |
Net Increase (Decrease) in Net Asset Value | | | 1.82 | | | | 1.35 | | | | (3.12 | ) | | | 1.30 | |
| | |
| | |
| | |
| | |
| |
Net Asset Value – End of Period | | $ | 11.35 | | | $ | 9.53 | | | $ | 8.18 | | | $ | 11.30 | |
| | |
| | |
| | |
| | |
| |
| Total Investment Return6 | | | 19.58% | | | | 18.51% | | | | (26.71)% | | | | 13.00% | (A) |
| Ratios to Average Net Assets: | | | | | | | | | | | | | | | | |
Expenses After Waivers and Related Reimbursements2,7 | | | 1.36% | | | | 1.35% | | | | 1.66% | | | | 1.95% | (B) |
Expenses Before Waivers and Related Reimbursements7 | | | 2.54% | | | | 2.95% | | | | 3.71% | | | | 4.17% | (B) |
Net Investment Income (Loss) After Waivers and Related Reimbursements2 | | | 0.24% | | | | 0.39% | | | | (0.13)% | | | | (0.36)% | (B) |
Net Investment Loss Before Waivers and Related Reimbursements | | | (0.94)% | | | | (1.21)% | | | | (2.18)% | | | | (2.58)% | (B) |
| Supplementary Data: | | | | | | | | | | | | | | | | |
Portfolio Turnover Rate | | | 215% | | | | 128% | | | | 93% | | | | 135% | (A) |
Net Assets at End of Period (in thousands) | | $ | 6,776 | | | $ | 6,767 | | | $ | 4,108 | | | $ | 3,873 | |
|
| * | | Represents the period from commencement of operations (February 28, 2007) through October 31, 2007. |
| 1 | | Calculated based on shares outstanding on the first and last day of the respective periods, except for dividends and distributions, if any, which are based on the actual shares outstanding on the dates of distributions. |
| 2 | | Prior to May 30, 2008, reflects fees waived and reimbursed by FBR Fund Advisers, Inc. pursuant to a contractual expense limitation of 1.95% (excluding interest, taxes, brokerage commissions, dividend expenses, acquired fund fees and expenses, extraordinary legal expenses, or any other extraordinary expenses). As of May 30, 2008, reflects fees waived and reimbursed by FBR Fund Advisers, Inc. pursuant to a contractual expense limitation of 1.35% (excluding interest, taxes, brokerage commissions, dividend expenses, acquired fund fees and expenses, extraordinary legal expenses, or any other extraordinary expenses). |
| 3 | | The amounts shown for a share outstanding throughout the period may not be in accordance with the changes in the aggregate gains and losses on investments during the period because of the timing of sales and repurchases of Fund shares in relation to fluctuating net asset values during the period. |
| 4 | | Calculated based on average shares outstanding. |
| 5 | | Less than $0.01 |
| 6 | | Total investment return is calculated assuming a purchase of shares on the first day and a sale on the last day of each period reported and will include reinvestment of dividends and distributions, if any. |
| 7 | | Does not include expenses of the funds in which the Fund invests. |
| (A) | | Not Annualized |
| (B) | | Annualized |
75
The FBR Funds
Financial Highlights (continued)
| | | FBR Mid Cap Fund — I Class |
| | |
|
| | | | | | | | | | | For the |
| | | For the Years Ended October 31, | Period Ended |
| | |
| October 31, |
| | | 2010 | | | 2009 | | 2008* |
| | |
| | |
| |
|
Per Share Operating Performance: | | | | | | | | | | | | |
Net Asset Value – Beginning of Period | | $ | 8.26 | | | $ | 7.11 | | | $ | 10.00 | |
| | |
| | |
| | |
| |
Income (Loss) from Investment Operations: | | | | | | | | | | | | |
Net Investment Income1,2 | | | 0.03 | | | | 0.05 | | | | 0.02 | |
Net Realized and Unrealized Gain (Loss) on Investments1,3 | | | 1.59 | | | | 1.25 | | | | (2.91 | ) |
| | |
| | |
| | |
| |
Total from Investment Operations | | | 1.62 | | | | 1.30 | | | | (2.89 | ) |
| | |
| | |
| | |
| |
Distributions to Shareholders: | | | | | | | | | | | | |
From Net Investment Income | | | (0.04 | ) | | | (0.03 | ) | | | — | |
From Net Realized Gain | | | — | | | | (0.12 | ) | | | — | |
| | |
| | |
| | |
| |
Total Distributions | | | (0.04 | ) | | | (0.15 | ) | | | — | |
| | |
| | |
| | |
| |
Paid-in Capital from Redemption Fees4 | | | 0.00 | 5 | | | — | | | | — | |
| | |
| | |
| | |
| |
Net Increase (Decrease) in Net Asset Value | | | 1.58 | | | | 1.15 | | | | (2.89 | ) |
| | |
| | |
| | |
| |
Net Asset Value – End of Period | | $ | 9.84 | | | $ | 8.26 | | | $ | 7.11 | |
| | |
| | |
| | |
| |
| Total Investment Return6 | | | 19.72% | | | | 18.78% | | | | (28.90)% | (A) |
| Ratios to Average Net Assets: | | | | | | | | | | | | |
Expenses After Waivers and Related Reimbursements2,7 | | | 1.11% | | | | 1.10% | | | | 1.10% | (B) |
Expenses Before Waivers and Related Reimbursements7 | | | 2.03% | | | | 16.91% | | | | 4.54% | (B) |
Net Investment Income After Waivers and Related Reimbursements2 | | | 0.26% | | | | 0.69% | | | | 0.47% | (B) |
Net Investment Loss Before Waivers and Related Reimbursements | | | (0.66)% | | | | (15.12)% | | | | (2.97)% | (B) |
| Supplementary Data: | | | | | | | | | | | | |
Portfolio Turnover Rate | | | 215% | | | | 128% | | | | 93% | (A) |
Net Assets at End of Period (in thousands) | | $ | 11,656 | | | $ | 84 | | | $ | 71 | |
|
| * | | Represents the period from inception of share class (May 30, 2008) through October 31, 2008. |
| 1 | | Calculated based on shares outstanding on the first and last day of the period, except for dividends and distributions, if any, which are based on the actual shares outstanding on the dates of distributions. |
| 2 | | Reflects fees waived and reimbursed by FBR Fund Advisers, Inc. pursuant to a contractual expense limitation of 1.10% (excluding interest, taxes, brokerage commissions, dividend expenses, acquired fund fees and expenses, extraordinary legal expenses, or any other extraordinary expenses). |
| 3 | | The amounts shown for a share outstanding throughout the period may not be in accordance with the changes in the aggregate gains and losses on investments during the period because of the timing of sales and repurchases of Fund shares in relation to fluctuating net asset values during the period. |
| 4 | | Calculated based on average shares outstanding. |
| 5 | | Less than $0.01 |
| 6 | | Total investment return is calculated assuming a purchase of shares on the first day and a sale on the last day of each period reported and will include reinvestment of dividends and distributions, if any. |
| 7 | | Does not include expenses of the funds in which the Fund invests. |
| (A) | | Not Annualized |
(B) | | Annualized |
76
The FBR Funds
Financial Highlights (continued)
| | | FBR Small Cap Fund — Investor Class |
| | |
|
| | | | | | | | | | | | | | | For the |
| | | For the Years Ended October 31, | | Period Ended |
| | |
| | October 31, |
| | | 2010 | | | 2009 | | | 2008 | | 2007* |
| | |
| | |
| | |
| |
|
| Per Share Operating Performance: | | | | | | | | | | | | | | | | |
Net Asset Value – Beginning of Period | | $ | 9.51 | | | $ | 8.44 | | | $ | 11.85 | | | $ | 10.00 | |
| | |
| | |
| | |
| | |
| |
Income (Loss) from Investment Operations: | | | | | | | | | | | | | | | | |
Net Investment Income (Loss)1,2 | | | 0.02 | | | | 0.01 | | | | (0.03 | ) | | | (0.04 | ) |
Net Realized and Unrealized Gain (Loss) on Investments1,3 | | | 1.95 | | | | 1.04 | | | | (3.35 | ) | | | 1.89 | |
Net Increase from Payments by Affiliates | | | — | | | | 0.01 | | | | — | | | | — | |
| | |
| | |
| | |
| | |
| |
Total from Investment Operations | | | 1.97 | | | | 1.06 | | | | (3.38 | ) | | | 1.85 | |
| | |
| | |
| | |
| | |
| |
Distributions to Shareholders: | | | | | | | | | | | | | | | | |
From Net Investment Income | | | (0.03 | ) | | | — | | | | — | | | | — | |
From Net Realized Gains | | | (0.28 | ) | | | — | | | | (0.04 | ) | | | — | |
| | |
| | |
| | |
| | |
| |
Total Distributions | | | (0.31 | ) | | | — | | | | (0.04 | ) | | | — | |
| | |
| | |
| | |
| | |
| |
Paid-in Capital from Redemption Fees4 | | | 0.00 | 5 | | | 0.01 | | | | 0.01 | | | | 0.00 | 5 |
| | |
| | |
| | |
| | |
| |
Net Increase (Decrease) in Net Asset Value | | | 1.66 | | | | 1.07 | | | | (3.41 | ) | | | 1.85 | |
| | |
| | |
| | |
| | |
| |
Net Asset Value – End of Period | | $ | 11.17 | | | $ | 9.51 | | | $ | 8.44 | | | $ | 11.85 | |
| | |
| | |
| | |
| | |
| |
| Total Investment Return6 | | | 21.13% | | | | 12.68% | 7 | | | (28.49)% | | | | 18.50% | (A) |
| Ratios to Average Net Assets: | | | | | | | | | | | | | | | | |
Expenses After Waivers and Related Reimbursements2,8 | | | 1.45% | | | | 1.46% | | | | 1.74% | | | | 1.95% | (B) |
Expenses Before Waivers and Related Reimbursements8 | | | 2.33% | | | | 2.73% | | | | 3.55% | | | | 3.77% | (B) |
Net Investment Income (Loss) After Waivers and Related Reimbursements2 | | | 0.18% | | | | 0.10% | | | | (0.36)% | | | | (0.61)% | (B) |
Net Investment Loss Before Waivers and Related Reimbursements | | | (0.70)% | | | | (1.17)% | | | | (2.17)% | | | | (2.43)% | (B) |
| Supplementary Data: | | | | | | | | | | | | | | | | |
Portfolio Turnover Rate | | | 284% | | | | 226% | | | | 207% | | | | 107% | (A) |
Net Assets at End of Period (in thousands) | | $ | 26,841 | | | $ | 10,585 | | | $ | 3,998 | | | $ | 4,900 | |
|
| * | | Represents the period from commencement of operations (February 28, 2007) through October 31, 2007. |
| 1 | | Calculated based on shares outstanding on the first and last day of the respective periods, except for dividends and distributions, if any, which are based on the actual shares outstanding on the dates of distributions. |
| 2 | | Prior to May 30, 2008, reflects fees waived and reimbursed by FBR Fund Advisers, Inc. pursuant to a contractual expense limitation of 1.95% (excluding interest, taxes, brokerage commissions, dividend expenses, acquired fund fees and expenses, extraordinary legal expenses, or any other extraordinary expenses). As of May 30, 2008, reflects fees waived and reimbursed by FBR Fund Advisers, Inc. pursuant to a contractual expense limitation of 1.45% (excluding interest, taxes, brokerage commissions, dividend expenses, acquired fund fees and expenses, extraordinary legal expenses, or any other extraordinary expenses). |
| 3 | | The amounts shown for a share outstanding throughout the period may not be in accordance with the changes in the aggregate gains and losses on investments during the period because of the timing of sales and repurchases of Fund shares in relation to fluctuating net asset values during the period. |
| 4 | | Calculated based on average shares outstanding. |
| 5 | | Less than $0.01 |
| 6 | | Total investment return is calculated assuming a purchase of shares on the first day and a sale on the last day of each period reported and will include reinvestment of dividends and distributions, if any. |
| 7 | | The Fund’s total return consists of a voluntary reimbursement by the Adviser for a realized loss on a transaction not meeting the Fund’s investment guidelines. This item had an impact of 0.12%. If the Adviser had not made a capital contribution to the Fund, the total return would have been 12.56%. See Note 9. |
| 8 | | Does not include expenses of the funds in which the Fund invests. |
| (A) | | Not Annualized |
| (B) | | Annualized |
77
The FBR Funds
Financial Highlights (continued)
| | | FBR Small Cap Fund — I Class |
| | |
|
| | | | | | | | | | | For the |
| | | For the Years Ended October 31, | | Period Ended |
| | |
| | October 31, |
| | | 2010 | | | 2009 | | 2008* |
| | |
| | |
| |
|
| Per Share Operating Performance: | | | | | | | | | | | | |
Net Asset Value – Beginning of Period | | $ | 8.59 | | | $ | 7.62 | | | $ | 10.00 | |
| | |
| | |
| | |
| |
Income (Loss) from Investment Operations: | | | | | | | | | | | | |
Net Investment Income1,2 | | | 0.04 | | | | 0.03 | | | | 0.01 | |
Net Realized and Unrealized Gain (Loss) on Investments1,3 | | | 1.75 | | | | 0.93 | | | | (2.39 | ) |
Net Increase from Payments by Affiliates | | | — | | | | 0.01 | | | | — | |
| | |
| | |
| | |
| |
Total from Investment Operations | | | 1.79 | | | | 0.97 | | | | (2.38 | ) |
| | |
| | |
| | |
| |
Distributions to Shareholders: | | | | | | | | | | | | |
From Net Investment Income | | | (0.06 | ) | | | — | | | | — | |
From Net Realized Gains | | | (0.28 | ) | | | — | | | | — | |
| | |
| | |
| | |
| |
Total Distributions | | | (0.34 | ) | | | — | | | | — | |
| | |
| | |
| | |
| |
Paid-in Capital from Redemption Fees4 | | | 0.00 | 5 | | | — | | | | — | |
| | |
| | |
| | |
| |
Net Increase (Decrease) in Net Asset Value | | | 1.45 | | | | 0.97 | | | | (2.38 | ) |
| | |
| | |
| | |
| |
Net Asset Value – End of Period | | $ | 10.04 | | | $ | 8.59 | | | $ | 7.62 | |
| | |
| | |
| | |
| |
| Total Investment Return6 | | | 21.35% | | | | 12.73% | 7 | | | (23.80)% | (A) |
| Ratios to Average Net Assets: | | | | | | | | | | | | |
Expenses After Waivers and Related Reimbursements2,8 | | | 1.19% | | | | 1.20% | | | | 1.20% | (B) |
Expenses Before Waivers and Related Reimbursements8 | | | 2.94% | | | | 16.22% | | | | 4.56% | (B) |
Net Investment Income After Waivers and Related Reimbursements2 | | | 0.41% | | | | 0.44% | | | | 0.23% | (B) |
Net Investment Loss Before Waivers and Related Reimbursements | | | (1.34)% | | | | (14.58)% | | | | (3.13)% | (B) |
| Supplementary Data: | | | | | | | | | | | | |
Portfolio Turnover Rate | | | 284% | | | | 226% | | | | 207% | (A) |
Net Assets at End of Period (in thousands) | | $ | 8,655 | | | $ | 86 | | | $ | 76 | |
|
| * | | Represents the period from inception of share class (May 30, 2008) through October 31, 2008. |
| 1 | | Calculated based on shares outstanding on the first and last day of the period, except for dividends and distributions, if any, which are based on the actual shares outstanding on the dates of distributions. |
| 2 | | Reflects fees waived and reimbursed by FBR Fund Advisers, Inc. pursuant to a contractual expense limitation of 1.20% (excluding interest, taxes, brokerage commissions, dividend expenses, acquired fund fees and expenses, extraordinary legal expenses, or any other extraordinary expenses). |
| 3 | | The amounts shown for a share outstanding throughout the period may not be in accordance with the changes in the aggregate gains and losses on investments during the period because of the timing of sales and repurchases of Fund shares in relation to fluctuating net asset values during the period. |
| 4 | | Calculated based on average shares outstanding. |
| 5 | | Less than $0.01 |
| 6 | | Total investment return is calculated assuming a purchase of shares on the first day and a sale on the last day of each period reported and will include reinvestment of dividends and distributions, if any. |
| 7 | | The Fund’s total return consists of a voluntary reimbursement by the Adviser for a realized loss on a transaction not meeting the Fund’s investment guidelines. This item had an impact of 0.13%. If the Adviser had not made a capital contribution to the Fund, the total return would have been 12.60%. See Note 9. |
| 8 | | Does not include expenses of the funds in which the Fund invests. |
| (A) | | Not Annualized |
| (B) | | Annualized |
78
The FBR Funds
Financial Highlights (continued)
| | | FBR Focus Fund — Investor Class | |
| | |
| |
| | | For the Years Ended October 31, | |
| | |
| |
| | | 2010 | | | 2009 | | | 2008 | | | 2007 | | | 2006 | |
| | |
| | |
| | |
| | |
| | |
| |
| Per Share Operating Performance: | | | | | | | | | | | | | | | | | | | | |
Net Asset Value – Beginning of Year | | $ | 37.56 | | | $ | 37.40 | | | $ | 57.97 | | | $ | 49.36 | | | $ | 40.36 | |
| | |
| | |
| | |
| | |
| | |
| |
Income (Loss) from Investment Operations: | | | | | | | | | | | | | | | | | | | | |
Net Investment Income (Loss)1,2 | | | (0.64 | ) | | | (0.42 | ) | | | (0.44 | ) | | | 0.08 | | | | (0.43 | ) |
Net Realized and Unrealized Gain (Loss) on Investments1,3 | | | 10.65 | | | | 5.76 | | | | (19.51 | ) | | | 8.63 | | | | 10.20 | |
| | |
| | |
| | |
| | |
| | |
| |
Total from Investment Operations | | | 10.01 | | | | 5.34 | | | | (19.95 | ) | | | 8.71 | | | | 9.77 | |
| | |
| | |
| | |
| | |
| | |
| |
Distributions to Shareholders: | | | | | | | | | | | | | | | | | | | | |
From Net Investment Income | | | — | | | | — | | | | (0.12 | ) | | | — | | | | — | |
From Net Realized Gain | | | — | | | | (5.19 | ) | | | (0.51 | ) | | | (0.12 | ) | | | (0.77 | ) |
| | |
| | |
| | |
| | |
| | |
| |
Total Distributions | | | — | | | | (5.19 | ) | | | (0.63 | ) | | | (0.12 | ) | | | (0.77 | ) |
| | |
| | |
| | |
| | |
| | |
| |
Paid-in Capital from Redemption Fees4 | | | 0.00 | 5 | | | 0.01 | | | | 0.01 | | | | 0.02 | | | | 0.00 | 5 |
| | |
| | |
| | |
| | |
| | |
| |
Net Increase (Decrease) in Net Asset Value | | | 10.01 | | | | 0.16 | | | | (20.57 | ) | | | 8.61 | | | | 9.00 | |
| | |
| | |
| | |
| | |
| | |
| |
Net Asset Value – End of Year | | $ | 47.57 | | | $ | 37.56 | | | $ | 37.40 | | | $ | 57.97 | | | $ | 49.36 | |
| | |
| | |
| | |
| | |
| | |
| |
| Total Investment Return6 | | | 26.65% | | | | 17.74% | | | | (34.73)% | | | | 17.72% | | | | 24.53% | |
| Ratios to Average Net Assets: | | | | | | | | | | | | | | | | | | | | |
Expenses After Waivers2,7 | | | 1.51% | | | | 1.43% | | | | 1.42% | | | | 1.40% | | | | 1.38% | |
Expenses Before Waivers7 | | | 1.51% | | | | 1.43% | | | | 1.42% | | | | 1.40% | | | | 1.40% | |
Net Investment Income (Loss) After Waivers2 | | | (1.31)% | | | | (1.16)% | | | | (0.67)% | | | | 0.14% | | | | (0.94)% | |
Net Investment Income (Loss) Before Waivers | | | (1.31)% | | | | (1.16)% | | | | (0.67)% | | | | 0.14% | | | | (0.96)% | |
| Supplementary Data: | | | | | | | | | | | | | | | | | | | | |
Portfolio Turnover Rate | | | 5% | | | | 5% | | | | 17% | | | | 5% | | | | 3% | |
Net Assets at End of Year (in thousands) | | $ | 670,840 | | | $ | 759,774 | | | $ | 717,780 | | | $ | 1,556,339 | | | $ | 929,590 | |
|
| 1 | | Calculated based on shares outstanding on the first and last day of the respective periods, except for dividends and distributions, if any, which are based on the actual shares outstanding on the dates of distributions. |
| 2 | | Reflects fees waived and reimbursed by FBR Fund Advisers, Inc. pursuant to a contractual expense limitation of 1.70% (excluding interest, taxes, brokerage commissions, dividend expenses, acquired fund fees and expenses, extraordinary legal expenses, or any other extraordinary expenses). |
| 3 | | The amounts shown for a share outstanding throughout the respective periods may not be in accordance with the changes in the aggregate gains and losses on investments during the respective periods because of the timing of sales and repurchases of Fund shares in relation to fluctuating net asset values during the respective periods. |
| 4 | | Calculated based on average shares outstanding. |
| 5 | | Less than $0.01 |
| 6 | | Total investment return is calculated assuming a purchase of shares on the first day and a sale on the last day of each period reported and will include reinvestment of dividends and distributions, if any. |
| 7 | | Does not include expenses of the funds in which the Fund invests. |
79
The FBR Funds
Financial Highlights (continued)
| | | FBR Focus Fund — I Class* |
| | |
|
| | | | | | | | | | | For the |
| | | For the Years Ended October 31, | | Period Ended |
| | |
| | October 31, |
| | | 2010 | | | 2009 | | 2008** |
| | |
| | |
| |
|
| Per Share Operating Performance: | | | | | | | | | | | | |
Net Asset Value – Beginning of Period | | $ | 37.84 | | | $ | 130.93 | | | $ | 180.00 | |
| | |
| | |
| | |
| |
Income (Loss) from Investment Operations: | | | | | | | | | | | | |
Net Investment Loss1 | | | (0.41 | ) | | | (0.25 | ) | | | (0.20 | ) |
Net Realized and Unrealized Gain (Loss) on Investments1,2 | | | 10.58 | | | | 0.59 | | | | (49.05 | ) |
| | |
| | |
| | |
| |
Total from Investment Operations | | | 10.17 | | | | 0.34 | | | | (49.25 | ) |
| | |
| | |
| | |
| |
Distributions to Shareholders: | | | | | | | | | | | | |
From Net Investment Income | | | (0.37 | ) | | | — | | | | — | |
From Net Realized Gain | | | — | | | | (93.45 | ) | | | — | |
| | |
| | |
| | |
| |
Paid-in Capital from Redemption Fees3 | | | 0.00 | 4 | | | 0.02 | | | | 0.18 | |
| | |
| | |
| | |
| |
Net Increase (Decrease) in Net Asset Value | | | 9.80 | | | | (93.09 | ) | | | (49.07 | ) |
| | |
| | |
| | |
| |
Net Asset Value – End of Period | | $ | 47.64 | | | $ | 37.84 | | | $ | 130.93 | |
| | |
| | |
| | |
| |
| Total Investment Return5 | | | 27.32% | | | | 18.15% | | | | (27.30)% | (A) |
| Ratios to Average Net Assets: | | | | | | | | | | | | |
Expenses After Waivers6 | | | 1.26% | | | | 1.15% | | | | 1.05% | (B) |
Expenses Before Waivers6 | | | 1.26% | | | | 1.15% | | | | 1.05% | (B) |
Net Investment Loss After Waivers | | | (1.06)% | | | | (0.88)% | | | | (0.70)% | (B) |
Net Investment Loss Before Waivers | | | (1.06)% | | | | (0.88)% | | | | (0.70)% | (B) |
| Supplementary Data: | | | | | | | | | | | | |
Portfolio Turnover Rate | | | 5% | | | | 5% | | | | 17% | (A) |
Net Assets at End of Period (in thousands) | | $ | 36,811 | | | $ | 34,225 | | | $ | 16,831 | |
|
| * | | Per share amounts have been restated on a retroactive basis to reflect a 1:18 reverse stock split effective December 10, 2010. |
| ** | | Represents the period from inception of share class (May 30, 2008) through October 31, 2008. |
| 1 | | Calculated based on shares outstanding on the first and last day of the period, except for dividends and distributions, if any, which are based on the actual shares outstanding on the dates of distributions. |
| 2 | | The amounts shown for a share outstanding throughout the period may not be in accordance with the changes in the aggregate gains and losses on investments during the period because of the timing of sales and repurchases of Fund shares in relation to fluctuating net asset values during the period. |
| 3 | | Calculated based on average shares outstanding. |
| 4 | | Less than $0.01 |
| 5 | | Total investment return is calculated assuming a purchase of shares on the first day and a sale on the last day of each period reported and will include reinvestment of dividends and distributions, if any. |
| 6 | | Does not include expenses of the funds in which the Fund invests. |
| (A) | | Not Annualized |
| (B) | | Annualized |
80
The FBR Funds
Financial Highlights (continued)
| | | FBR Large Cap Financial Fund — Investor Class | |
| | |
| |
| | | For the Years Ended October 31, | |
| | |
| |
| | | 2010 | | | 2009 | | | 2008 | | | 2007 | | | 2006 | |
| | |
| | |
| | |
| | |
| | |
| |
| Per Share Operating Performance: | | | | | | | | | | | | | | | | | | | | |
Net Asset Value – Beginning of Year | | $ | 12.61 | | | $ | 11.14 | | | $ | 18.71 | | | $ | 21.67 | | | $ | 21.84 | |
| | |
| | |
| | |
| | |
| | |
| |
Income (Loss) from Investment Operations: | | | | | | | | | | | | | | | | | | | | |
Net Investment Income (Loss)1,2 | | | (0.08 | ) | | | 0.00 | 5 | | | 0.14 | | | | 0.14 | | | | 0.13 | |
Net Realized and Unrealized Gain (Loss) on Investments1,3 | | | 0.35 | | | | 1.58 | | | | (3.86 | ) | | | (0.97 | ) | | | 2.72 | |
| | |
| | |
| | |
| | |
| | |
| |
Total from Investment Operations | | | 0.27 | | | | 1.58 | | | | (3.72 | ) | | | (0.83 | ) | | | 2.85 | |
| | |
| | |
| | |
| | |
| | |
| |
Distributions to Shareholders: | | | | | | | | | | | | | | | | | | | | |
From Net Investment Income | | | — | | | | (0.10 | ) | | | (0.18 | ) | | | (0.11 | ) | | | (0.16 | ) |
Distribution in Excess of Net Investment Income | | | — | | | | (0.02 | ) | | | — | | | | — | | | | — | |
From Net Realized Gain | | | — | | | | — | | | | (3.68 | ) | | | (2.02 | ) | | | (2.86 | ) |
| | |
| | |
| | |
| | |
| | |
| |
Total Distributions | | | — | | | | (0.12 | ) | | | (3.86 | ) | | | (2.13 | ) | | | (3.02 | ) |
| | |
| | |
| | |
| | |
| | |
| |
Paid-in Capital from Redemption Fees4 | | | 0.00 | 5 | | | 0.01 | | | | 0.01 | | | | 0.00 | 5 | | | 0.00 | 5 |
| | |
| | |
| | |
| | |
| | | |
| |
Net Increase (Decrease) in Net Asset Value | | | 0.27 | | | | 1.47 | | | | (7.57 | ) | | | (2.96 | ) | | | (0.17 | ) |
| | |
| | |
| | |
| | |
| | |
| |
Net Asset Value – End of Year | | $ | 12.88 | | | $ | 12.61 | | | $ | 11.14 | | | $ | 18.71 | | | $ | 21.67 | |
| | |
| | |
| | |
| | |
| | |
| |
| Total Investment Return6 | | | 2.14% | | | | 14.52% | | | | (23.76)% | | | | (4.59)% | | | | 14.21% | |
| Ratios to Average Net Assets: | | | | | | | | | | | | | | | | | | | | |
Expenses After Waivers2,7 | | | 1.78% | | | | 1.81% | | | | 1.88% | | | | 1.89% | | | | 1.83% | |
Expenses Before Waivers7 | | | 1.78% | | | | 1.81% | | | | 2.01% | | | | 1.92% | | | | 1.84% | |
Net Investment Income (Loss) After Waivers2 | | | (0.73)% | | | | (0.08)% | | | | 1.63% | | | | 0.59% | | | | 0.68% | |
Net Investment Income (Loss) Before Waivers | | | (0.73)% | | | | (0.08)% | | | | 1.50% | | | | 0.56% | | | | 0.67% | |
| Supplementary Data: | | | | | | | | | | | | | | | | | | | | |
Portfolio Turnover Rate | | | 150% | | | | 220% | | | | 509% | | | | 95% | | | | 54% | |
Net Assets at End of Year (in thousands) | | $ | 48,717 | | | $ | 37,195 | | | $ | 24,272 | | | $ | 15,951 | | | $ | 26,313 | |
|
| 1 | | Calculated based on shares outstanding on the first and last day of the respective periods, except for dividends and distributions, if any, which are based on the actual shares outstanding on the dates of distributions. |
| 2 | | Reflects fees waived by FBR Fund Advisers, Inc. pursuant to a contractual expense limitation of 1.95% (excluding interest, taxes, brokerage commissions, dividend expenses, acquired fund fees and expenses, extraordinary legal expenses, or any other extraordinary expenses) and effective May 30, 2008, the recoupment of certain previously waived fees. |
| 3 | | The amounts shown for a share outstanding throughout the respective periods may not be in accordance with the changes in the aggregate gains and losses on investments during the respective periods because of the timing of sales and repurchases of Fund shares in relation to fluctuating net asset values during the respective periods. |
| 4 | | Calculated based on average shares outstanding. |
| 5 | | Less than $0.01 |
| 6 | | Total investment return is calculated assuming a purchase of shares on the first day and a sale on the last day of each period reported and will include reinvestment of dividends and distributions, if any. |
| 7 | | Does not include expenses of the funds in which the Fund invests. |
81
The FBR Funds
Financial Highlights (continued)
| | | FBR Small Cap Financial Fund — Investor Class | |
| | |
| |
| | | For the Years Ended October 31, | |
| | |
| |
| | | 2010 | | | 2009 | | | 2008 | | | 2007 | | | 2006 | |
| | |
| | |
| | |
| | |
| | |
| |
| Per Share Operating Performance: | | | | | | | | | | | | | | | | | | | | |
Net Asset Value – Beginning of Year | | $ | 15.91 | | | $ | 15.22 | | | $ | 23.18 | | | $ | 32.70 | | | $ | 32.96 | |
| | |
| | |
| | |
| | |
| | |
| |
Income (Loss) from Investment Operations: | | | | | | | | | | | | | | | | | | | | |
Net Investment Income1 | | | 0.08 | | | | 0.06 | | | | 0.24 | | | | 0.29 | | | | 0.14 | |
Net Realized and Unrealized Gain (Loss) on Investments1,2 | | | 2.17 | | | | 0.81 | | | | (1.69 | ) | | | (5.31 | ) | | | 3.44 | |
| | |
| | |
| | |
| | |
| | |
| |
Total from Investment Operations | | | 2.25 | | | | 0.87 | | | | (1.45 | ) | | | (5.02 | ) | | | 3.58 | |
| | |
| | |
| | |
| | |
| | |
| |
Distributions to Shareholders: | | | | | | | | | | | | | | | | | | | | |
From Net Investment Income | | | (0.07 | ) | | | (0.19 | ) | | | (0.28 | ) | | | (0.15 | ) | | | (0.14 | ) |
From Net Realized Gain | | | — | | | | — | | | | (6.24 | ) | | | (4.35 | ) | | | (3.70 | ) |
| | |
| | |
| | |
| | |
| | |
| |
Total Distributions | | | (0.07 | ) | | | (0.19 | ) | | | (6.52 | ) | | | (4.50 | ) | | | (3.84 | ) |
| | |
| | |
| | |
| | |
| | |
| |
Paid-in Capital from Redemption Fees3 | | | 0.02 | | | | 0.01 | | | | 0.01 | | | | 0.00 | 4 | | | 0.00 | 4 |
| | |
| | |
| | |
| | |
| | |
| |
Net Increase (Decrease) in Net Asset Value | | | 2.20 | | | | 0.69 | | | | (7.96 | ) | | | (9.52 | ) | | | (0.26 | ) |
| | |
| | |
| | |
| | |
| | |
| |
Net Asset Value – End of Year | | $ | 18.11 | | | $ | 15.91 | | | $ | 15.22 | | | $ | 23.18 | | | $ | 32.70 | |
| | |
| | |
| | |
| | | |
| | |
| |
| Total Investment Return5 | | | 14.27% | | | | 5.89% | | | | (6.76)% | | | | (18.02)% | | | | 11.81% | |
| Ratios to Average Net Assets: | | | | | | | | | | | | | | | | | | | | |
Expenses After Waivers6 | | | 1.51% | | | | 1.51% | | | | 1.49% | | | | 1.51% | | | | 1.46% | |
Expenses Before Waivers6 | | | 1.51% | | | | 1.51% | | | | 1.49% | | | | 1.51% | | | | 1.46% | |
Net Investment Income After Waivers | | | 0.35% | | | | 0.50% | | | | 1.48% | | | | 0.93% | | | | 0.45% | |
Net Investment Income Before Waivers | | | 0.35% | | | | 0.50% | | | | 1.48% | | | | 0.93% | | | | 0.45% | |
| Supplementary Data: | | | | | | | | | | | | | | | | | | | | |
Portfolio Turnover Rate | | | 89% | | | | 118% | | | | 147% | | | | 13% | | | | 8% | |
Net Assets at End of Year (in thousands) | | $ | 216,747 | | | $ | 187,561 | | | $ | 181,803 | | | $ | 144,214 | | | $ | 346,155 | |
|
| 1 | | Calculated based on shares outstanding on the first and last day of the respective periods, except for dividends and distributions, if any, which are based on the actual shares outstanding on the dates of distributions. |
| 2 | | The amounts shown for a share outstanding throughout the respective periods may not be in accordance with the changes in the aggregate gains and losses on investments during the respective periods because of the timing of sales and repurchases of Fund shares in relation to fluctuating net asset values during the respective periods. |
| 3 | | Calculated based on average shares outstanding. |
| 4 | | Less than $0.01 |
| 5 | | Total investment return is calculated assuming a purchase of shares on the first day and a sale on the last day of each period reported and will include reinvestment of dividends and distributions, if any. |
| 6 | | Does not include expenses of the funds in which the Fund invests. |
82
The FBR Funds
Financial Highlights (continued)
| | | FBR Small Cap Financial Fund — I Class |
| | |
|
| | | | | | | | | | | For the |
| | | For the Years Ended October 31, | | Period Ended |
| | |
| | October 31, |
| | | 2010 | | | 2009 | | 2008* |
| | |
| | |
| |
|
| Per Share Operating Performance: | | | | | | | | | | | | |
Net Asset Value – Beginning of Period | | $ | 10.34 | | | $ | 9.96 | | | $ | 10.00 | |
| | |
| | |
| | |
| |
Income (Loss) from Investment Operations: | | | | | | | | | | | | |
Net Investment Income1,2 | | | 0.09 | | | | 0.19 | | | | 0.02 | |
Net Realized and Unrealized Gain (Loss) on Investments1,3 | | | 1.40 | | | | 0.40 | | | | (0.06 | ) |
| | |
| | |
| | |
| |
Total from Investment Operations | | | 1.49 | | | | 0.59 | | | | (0.04 | ) |
| | |
| | |
| | |
| |
Distributions to Shareholders: | | | | | | | | | | | | |
From Net Investment Income | | | (0.13 | ) | | | (0.21 | ) | | | — | |
| | |
| | |
| | |
| |
Paid-in Capital from Redemption Fees4 | | | 0.00 | 5 | | | — | | | | — | |
| | |
| | |
| | |
| |
Net Increase (Decrease) in Net Asset Value | | | 1.36 | | | | 0.38 | | | | (0.04 | ) |
| | |
| | |
| | |
| |
Net Asset Value – End of Period | | $ | 11.70 | | | $ | 10.34 | | | $ | 9.96 | |
| | |
| | |
| | |
| |
| Total Investment Return6 | | | 14.52% | | | | 6.14% | | | | (0.40)% | (A) |
| Ratios to Average Net Assets: | | | | | | | | | | | | |
Expenses After Waivers and Related Reimbursements2,7 | | | 1.23% | | | | 1.56% | | | | 1.31% | (B) |
Expenses Before Waivers and Related Reimbursements7 | | | 1.23% | | | | 1.56% | | | | 1.31% | (B) |
Net Investment Income After Waivers and Related Reimbursements2 | | | 0.61% | | | | 0.04% | | | | 1.49% | (B) |
Net Investment Income Before Waivers and Related Reimbursements | | | 0.61% | | | | 0.04% | | | | 1.49% | (B) |
| Supplementary Data: | | | | | | | | | | | | |
Portfolio Turnover Rate | | | 89% | | | | 118% | | | | 147% | (A) |
Net Assets at End of Period (in thousands) | | $ | 25,011 | | | $ | 10,638 | | | $ | 3,952 | |
|
| * | | Represents the period from inception of share class (May 30, 2008) through October 31, 2008. |
| 1 | | Calculated based on shares outstanding on the first and last day of the period, except for dividends and distributions, if any, which are based on the actual shares outstanding on the dates of distributions. |
| 2 | | Reflects fees waived and reimbursed by FBR Fund Advisers, Inc. pursuant to a contractual expense limitation of 1.70% (excluding interest, taxes, brokerage commissions, dividend expenses, acquired fund fees and expenses, extraordinary legal expenses, or any other extraordinary expenses and effective May 30, 2008, the recoupment of certain previously waived fees. |
| 3 | | The amounts shown for a share outstanding throughout the period may not be in accordance with the changes in the aggregate gains and losses on investments during the period because of the timing of sales and repurchases of Fund shares in relation to fluctuating net asset values during the period. |
| 4 | | Calculated based on average shares outstanding. |
| 5 | | Less than $0.01 |
| 6 | | Total investment return is calculated assuming a purchase of shares on the first day and a sale on the last day of each period reported and will include reinvestment of dividends and distributions, if any. |
| 7 | | Does not include expenses of the funds in which the Fund invests. |
| (A) | | Not Annualized |
| (B) | | Annualized |
83
The FBR Funds
Financial Highlights (continued)
| | | FBR Technology Fund — Investor Class | |
| | |
| |
| | | For the Years Ended October 31, | |
| | |
| |
| | | 2010 | | | 2009 | | | 2008 | | | 2007 | | | 2006 | |
| | |
| | |
| | |
| | |
| | |
| |
| Per Share Operating Performance: | | | | | | | | | | | | | | | | | | | | |
Net Asset Value – Beginning of Year | | $ | 9.05 | | | $ | 6.96 | | | $ | 13.34 | | | $ | 11.97 | | | $ | 10.82 | |
| | |
| | |
| | |
| | |
| | |
| |
Income (Loss) from Investment Operations: | | | | | | | | | | | | | | | | | | | | |
Net Investment Loss1,2 | | | (0.14 | ) | | | (0.08 | ) | | | (0.12 | ) | | | (0.05 | ) | | | (0.04 | ) |
Net Realized and Unrealized Gain (Loss) on Investments1,3 | | | 2.08 | | | | 2.16 | | | | (5.03 | ) | | | 1.81 | | | | 1.77 | |
| | |
| | |
| | |
| | |
| | |
| |
Total from Investment Operations | | | 1.94 | | | | 2.08 | | | | (5.15 | ) | | | 1.76 | | | | 1.73 | |
| | |
| | |
| | |
| | |
| | |
| |
Distributions to Shareholders: | | | | | | | | | | | | | | | | | | | | |
From Net Realized Gain | | | — | | | | — | | | | (1.23 | ) | | | (0.39 | ) | | | (0.58 | ) |
| | |
| | |
| | |
| | |
| | |
| |
Paid-in Capital from Redemption Fees4 | | | 0.01 | | | | 0.01 | | | | 0.00 | 5 | | | 0.00 | 5 | | | 0.00 | 5 |
| | |
| | |
| | |
| | |
| | |
| |
Net Increase (Decrease) in Net Asset Value | | | 1.95 | | | | 2.09 | | | | (6.38 | ) | | | 1.37 | | | | 1.15 | |
| | |
| | |
| | |
| | |
| | |
| |
Net Asset Value – End of Year | | $ | 11.00 | | | $ | 9.05 | | | $ | 6.96 | | | $ | 13.34 | | | $ | 11.97 | |
| | |
| | |
| | |
| | |
| | |
| |
| Total Investment Return6 | | | 21.55% | | | | 30.03% | | | | (42.30)% | | | | 15.18% | | | | 16.40% | |
| Ratios to Average Net Assets: | | | | | | | | | | | | | | | | | | | | |
Expenses After Waivers and Related Reimbursements2,7 | | | 1.95% | | | | 1.95% | | | | 1.84% | | | | 1.70% | | | | 1.87% | |
Expenses Before Waivers and Related Reimbursements7 | | | 2.50% | | | | 3.00% | | | | 1.92% | | | | 1.70% | | | | 1.92% | |
Net Investment Loss After Waivers and Related Reimbursements2 | | | (1.10)% | | | | (1.05)% | | | | (0.60)% | | | | (0.41)% | | | | (0.60)% | |
Net Investment Loss Before Waivers and Related Reimbursements | | | (1.64)% | | | | (2.10)% | | | | (0.68)% | | | | (0.41)% | | | | (0.65)% | |
| Supplementary Data: | | | | | | | | | | | | | | | | | | | | |
Portfolio Turnover Rate | | | 353% | | | | 211% | | | | 175% | | | | 229% | | | | 108% | |
Net Assets at End of Year (in thousands) | | $ | 8,207 | | | $ | 8,388 | | | $ | 7,689 | | | $ | 40,935 | | | $ | 39,407 | |
|
| 1 | | Calculated based on shares outstanding on the first and last day of the respective periods, except for dividends and distributions, if any, which are based on the actual shares outstanding on the dates of distributions. |
| 2 | | Reflects fees waived and reimbursed by FBR Fund Advisers, Inc. pursuant to a contractual expense limitation of 1.95% (excluding interest, taxes, brokerage commissions, dividend expenses, acquired fund fees and expenses, extraordinary legal expenses, or any other extraordinary expenses) and effective May 30, 2008, the recoupment of certain previously waived fees. |
| 3 | | The amounts shown for a share outstanding throughout the respective periods may not be in accordance with the changes in the aggregate gains and losses on investments during the respective periods because of the timing of sales and repurchases of Fund shares in relation to fluctuating net asset values during the respective periods. |
| 4 | | Calculated based on average shares outstanding. |
| 5 | | Less than $0.01 |
| 6 | | Total investment return is calculated assuming a purchase of shares on the first day and a sale on the last day of each period reported and will include reinvestment of dividends and distributions, if any. |
| 7 | | Does not include expenses of the funds in which the Fund invests. |
84
The FBR Funds
Financial Highlights (continued)
| | | FBR Technology Fund |
| | I Class |
| |
|
| | For the |
| | Period Ended |
| | October 31, 2010* |
| |
|
| Per Share Operating Performance: | | | | |
Net Asset Value – Beginning of Period | | $ | 10.46 | |
| | |
| |
Income (Loss) from Investment Operations: | | | | |
Net Investment Loss1,2 | | | (0.07 | ) |
Net Realized and Unrealized Gain on Investments1,3 | | | 0.61 | |
| | |
| |
Total from Investment Operations | | | 0.54 | |
| | |
| |
Paid-in Capital from Redemption Fees4 | | | 0.00 | 5 |
| | |
| |
Net Increase in Net Asset Value | | | 0.54 | |
| | |
| |
Net Asset Value – End of Period | | $ | 11.00 | |
| | |
| |
| Total Investment Return6 | | | 5.16% | (A) |
| Ratios to Average Net Assets: | | | | |
Expenses After Waivers and Related Reimbursements2,7 | | | 1.70% | (B) |
Expenses Before Waivers and Related Reimbursements7 | | | 2.34% | (B) |
Net Investment Loss After Waivers and Related Reimbursements2 | | | (0.77)% | (B) |
Net Investment Loss Before Waivers and Related Reimbursements | | | (1.41)% | (B) |
| Supplementary Data: | | | | |
Portfolio Turnover Rate | | | 353% | (A) |
Net Assets at End of Period (in thousands) | | $ | 4,611 | |
|
| * | | Represents the period from inception of share class (March 12, 2010) through October 31, 2010. |
| 1 | | Calculated based on shares outstanding on the first and last day of the respective periods, except for dividends and distributions, if any, which are based on the actual shares outstanding on the dates of distributions. |
| 2 | | Reflects fees waived and reimbursed by FBR Fund Advisers, Inc. pursuant to a contractual expense limitation of 1.70% (excluding interest, taxes, brokerage commissions, dividend expenses, acquired fund fees and expenses, extraordinary legal expenses, or any other extraordinary expenses). |
| 3 | | The amounts shown for a share outstanding throughout the respective periods may not be in accordance with the changes in the aggregate gains and losses on investments during the respective periods because of the timing of sales and repurchases of Fund shares in relation to fluctuating net asset values during the respective periods. |
| 4 | | Calculated based on average shares outstanding. |
| 5 | | Less than $0.01 |
| 6 | | Total investment return is calculated assuming a purchase of shares on the first day and a sale on the last day of each period reported and will include reinvestment of dividends and distributions, if any. |
| 7 | | Does not include expenses of the funds in which the Fund invests. |
| (A) | | Not Annualized |
| (B) | | Annualized |
85
The FBR Funds
Financial Highlights (continued)
| | | FBR Gas Utility Index Fund — Investor Class | |
| | |
| |
| | | For the Years Ended October 31, | |
| | |
| |
| | | 2010 | | | 2009 | | | 2008 | | | 2007 | | | 2006 | |
| | |
| | |
| | |
| | |
| | |
| |
| Per Share Operating Performance: | | | | | | | | | | | | | | | | | | | | |
Net Asset Value – Beginning of Year | | $ | 15.13 | | | $ | 15.26 | | | $ | 23.14 | | | $ | 19.48 | | | $ | 17.25 | |
| | |
| | |
| | |
| | |
| | |
| |
Income (Loss) from Investment Operations: | | | | | | | | | | | | | | | | | | | | |
Net Investment Income1,2 | | | 0.58 | | | | 0.49 | | | | 0.47 | | | | 0.47 | | | | 0.50 | |
Net Realized and Unrealized Gain (Loss) on Investments1,3 | | | 2.72 | | | | 0.60 | | | | (6.13 | ) | | | 3.67 | | | | 2.34 | |
| | |
| | |
| | |
| | |
| | |
| |
Total from Investment Operations | | | 3.30 | | | | 1.09 | | | | (5.66 | ) | | | 4.14 | | | | 2.84 | |
| | |
| | |
| | |
| | |
| | |
| |
Distributions to Shareholders: | | | | | | | | | | | | | | | | | | | | |
From Net Investment Income | | | (0.58 | ) | | | (0.49 | ) | | | (0.47 | ) | | | (0.48 | ) | | | (0.61 | ) |
From Net Realized Gain | | | (0.02 | ) | | | (0.74 | ) | | | (1.75 | ) | | | — | | | | — | |
| | |
| | |
| | |
| | |
| | |
| |
Total Distributions | | | (0.60 | ) | | | (1.23 | ) | | | (2.22 | ) | | | (0.48 | ) | | | (0.61 | ) |
| | |
| | |
| | |
| | |
| | |
| |
Paid-in Capital from Redemption Fees4 | | | 0.00 | 5 | | | 0.01 | | | | 0.00 | 5 | | | 0.00 | 5 | | | 0.00 | 5 |
| | |
| | |
| | |
| | |
| | |
| |
Net Increase (Decrease) in Net Asset Value | | | 2.70 | | | | (0.13 | ) | | | (7.88 | ) | | | 3.66 | | | | 2.23 | |
| | |
| | |
| | |
| | |
| | |
| |
Net Asset Value – End of Year | | $ | 17.83 | | | $ | 15.13 | | | $ | 15.26 | | | $ | 23.14 | | | $ | 19.48 | |
| | |
| | |
| | |
| | |
| | |
| |
| Total Investment Return6 | | | 22.25% | | | | 8.18% | | | | (26.81)% | | | | 21.51% | | | | 16.84% | |
| Ratios to Average Net Assets: | | | | | | | | | | | | | | | | | | | | |
Expenses After Waivers2,7 | | | 0.76% | | | | 0.76% | | | | 0.70% | | | | 0.75% | | | | 0.80% | |
Expenses Before Waivers7 | | | 0.77% | | | | 0.76% | | | | 0.70% | | | | 0.75% | | | | 0.80% | |
Net Investment Income After Waivers2 | | | 3.51% | | | | 3.51% | | | | 2.39% | | | | 2.21% | | | | 2.69% | |
Net Investment Income Before Waivers | | | 3.50% | | | | 3.51% | | | | 2.39% | | | | 2.21% | | | | 2.69% | |
| Supplementary Data: | | | | | | | | | | | | | | | | | | | | |
Portfolio Turnover Rate | | | 16% | | | | 26% | | | | 27% | | | | 22% | | | | 16% | |
Net Assets at End of Year (in thousands) | | $ | 244,041 | | | $ | 193,679 | | | $ | 198,569 | | | $ | 285,951 | | | $ | 270,031 | |
|
| 1 | | Calculated based on shares outstanding on the first and last day of the respective periods, except for dividends and distributions, if any, which are based on the actual shares outstanding on the dates of distributions. |
| 2 | | Reflects fees waived by FBR Fund Advisers, Inc. pursuant to a contractual expense limitation of 0.85% (excluding interest, taxes, brokerage commissions, dividend expenses, acquired fund fees and expenses, extraordinary legal expenses, or any other extraordinary expenses) and effective May 30, 2008, the recoupment of certain previously waived fees. |
| 3 | | The amounts shown for a share outstanding throughout the respective periods may not be in accordance with the changes in the aggregate gains and losses on investments during the respective periods because of the timing of sales and repurchases of Fund shares in relation to fluctuating net asset values during the respective periods. |
| 4 | | Calculated based on average shares outstanding. |
| 5 | | Less than $0.01 |
| 6 | | Total investment return is calculated assuming a purchase of shares on the first day and a sale on the last day of each period reported and will include reinvestment of dividends and distributions, if any. |
| 7 | | Does not include expenses of the funds in which the Fund invests. |
86
The FBR Funds
Schedule of Shareholder Expenses
(unaudited)
As a shareholder of the Funds, you incur two types of costs: (1) transaction costs, including reinvested dividends or other distributions; redemption fees; and exchange fees; and (2) ongoing costs, including investment advisory fees; distribution (12b-1) fees; and other Fund expenses. This example is intended to help you understand your ongoing costs (in dollars) of investing in the Funds and to compare these costs with the ongoing costs of investing in other mutual funds.
The example is based on an investment of $1,000 invested at the beginning of the period and held for the entire period (May 1, 2010 through October 31, 2010).
Actual Expenses
The table on the following page provides information about actual account values and actual expenses. You may use the information in this line, together with the amount you invested, to estimate the expenses that you paid over the period. Simply divide your account value by $1,000 (for example, an $8,600 account value divided by $1,000 = 8.6), then multiply the result by the number in the first line under the heading entitled “Expenses Paid During the Six Months Ended October 31, 2010” to estimate the expenses you paid on your account during this period.
87
The FBR Funds
Schedule of Shareholder Expenses (continued)
(unaudited)
| | | | | | | | | | | | | | | Expenses Paid |
| | | Net Expense | | Beginning | | Ending | | During the |
| | | Ratio | | Account | | Account | | Six Months |
| | | Annualized | | Value | | Value | | Ended |
| | | October 31, 2010 | | May 1, 2010 | | October 31, 2010 | | October 31, 2010* |
| | |
| |
| |
| |
|
| Large Cap Fund | | | | | | | | | | | | | | | | |
Investor Class | | | 1.25 | % | | $ | 1,000.00 | | | | $ 986.40 | | | | $ 6.26 | |
I Class | | | 1.00 | | | | 1,000.00 | | | | 987.40 | | | | 5.01 | |
| Mid Cap Fund | | | | | | | | | | | | | | | | |
Investor Class | | | 1.35 | | | | 1,000.00 | | | | 1,010.70 | | | | 6.84 | |
I Class | | | 1.10 | | | | 1,000.00 | | | | 1,012.30 | | | | 5.58 | |
| Small Cap Fund | | | | | | | | | | | | | | | | |
Investor Class | | | 1.45 | | | | 1,000.00 | | | | 968.80 | | | | 7.20 | |
I Class | | | 1.19 | | | | 1,000.00 | | | | 969.10 | | | | 5.91 | |
| Focus Fund | | | | | | | | | | | | | | | | |
Investor Class | | | 1.51 | | | | 1,000.00 | | | | 1,025.20 | | | | 7.71 | |
I Class | | | 1.26 | | | | 1,000.00 | | | | 1,027.10 | | | | 6.44 | |
| Large Cap Financial Fund | | | | | | | | | | | | | | | | |
Investor Class | | | 1.95 | | | | 1,000.00 | | | | 862.70 | | | | 9.16 | |
| Small Cap Financial Fund | | | | | | | | | | | | | | | | |
Investor Class | | | 1.52 | | | | 1,000.00 | | | | 836.90 | | | | 7.04 | |
I Class | | | 1.29 | | | | 1,000.00 | | | | 836.90 | | | | 5.97 | |
| Technology Fund | | | | | | | | | | | | | | | | |
Investor Class | | | 1.96 | | | | 1,000.00 | | | | 1,034.80 | | | | 10.05 | |
I Class | | | 1.79 | | | | 1,000.00 | | | | 1,033.80 | | | | 9.18 | |
| Gas Utility Index Fund | | | | | | | | | | | | | | | | |
Investor Class | | | 0.78 | | | | 1,000.00 | | | | 1,055.90 | | | | 4.04 | |
|
| * | | Expenses are equal to the Fund’s annualized expense ratio, multiplied by the average account value over the period, multiplied by the number of days in most recent fiscal half-year then divided by 365. |
88
The FBR Funds
Schedule of Shareholder Expenses (continued)
(unaudited)
Hypothetical Example for Comparison Purposes
The table on the following page provides information about hypothetical account values and hypothetical expenses based on the Funds’ actual expense ratio and an assumed rate of return of 5% per year before expenses, which is not the Funds’ actual return. The hypothetical account values and expenses may not be used to estimate the actual ending account balance or expenses you paid for the period. You may use this information to compare the ongoing costs of investing in the Funds and other funds. To do so, compare this 5% hypothetical example with the 5% hypothetical examples that appear in the shareholder reports of the other funds.
89
The FBR Funds
Schedule of Shareholder Expenses (continued)
(unaudited)
| | | | | | | | | | | | | | | Expenses Paid |
| | | Net Expense | | Beginning | | Ending | | During the |
| | | Ratio | | Account | | Account | | Six Months |
| | | Annualized | | Value | | Value | | Ended |
| | | October 31, 2010 | | May 1, 2010 | | October 31, 2010 | | October 31, 2010* |
| | |
| |
| |
| |
|
| Large Cap Fund | | | | | | | | | | | | | | | | |
Investor Class | | | 1.25 | % | | $ | 1,000.00 | | | $ | 1,018.91 | | | $ | 6.36 | |
I Class | | | 1.00 | | | | 1,000.00 | | | | 1,020.17 | | | | 5.09 | |
| Mid Cap Fund | | | | | | | | | | | | | | | | |
Investor Class | | | 1.35 | | | | 1,000.00 | | | | 1,018.40 | | | | 6.87 | |
I Class | | | 1.10 | | | | 1,000.00 | | | | 1,019.66 | | | | 5.60 | |
| Small Cap Fund | | | | | | | | | | | | | | | | |
Investor Class | | | 1.45 | | | | 1,000.00 | | | | 1,017.90 | | | | 7.38 | |
I Class | | | 1.19 | | | | 1,000.00 | | | | 1,019.21 | | | | 6.06 | |
| Focus Fund | | | | | | | | | | | | | | | | |
Investor Class | | | 1.51 | | | | 1,000.00 | | | | 1,017.60 | | | | 7.68 | |
I Class | | | 1.26 | | | | 1,000.00 | | | | 1,018.86 | | | | 6.41 | |
| Large Cap Financial Fund | | | | | | | | | | | | | | | | |
Investor Class | | | 1.95 | | | | 1,000.00 | | | | 1,015.38 | | | | 9.91 | |
| Small Cap Financial Fund | | | | | | | | | | | | | | | | |
Investor Class | | | 1.52 | | | | 1,000.00 | | | | 1,017.55 | | | | 7.73 | |
I Class | | | 1.29 | | | | 1,000.00 | | | | 1,018.71 | | | | 6.56 | |
| Technology Fund | | | | | | | | | | | | | | | | |
Investor Class | | | 1.96 | | | | 1,000.00 | | | | 1,015.33 | | | | 9.96 | |
I Class | | | 1.79 | | | | 1,000.00 | | | | 1,016.19 | | | | 9.10 | |
| Gas Utility Index Fund | | | | | | | | | | | | | | | | |
Investor Class | | | 0.78 | | | | 1,000.00 | | | | 1,021.28 | | | | 3.97 | |
|
| * | | Expenses are equal to the Fund’s annualized expense ratio, multiplied by the average account value over the period, multiplied by the number of days in most recent fiscal half-year then divided by 365. |
90
The FBR Funds
Notes to Financial Statements
1. Organization
The FBR Funds (the “Trust”) is registered under the Investment Company Act of 1940, as amended (“1940 Act”), as an open-end management investment company. The Trust was organized as a statutory trust under the laws of the State of Delaware on September 29, 2003. The Trust currently consists of ten series. This report includes the following eight series: FBR Large Cap Fund (“Large Cap Fund”) (previously FBR Pegasus Fund™), FBR Mid Cap Fund (“Mid Cap Fund”) (previously FBR Pegasus Mid Cap Fund™), FBR Small Cap Fund (“Small Cap Fund”) (previously FBR Pegasus Small Cap Fund™), FBR Focus Fund (“Focus Fund”), FBR Large Cap Financial Fund (“Large Cap Financial Fund”), FBR Small Cap Financial Fund (“Small Cap Financial Fund”), FBR Technology Fund (“Technology Fund”) and FBR Gas Utility Index Fund (“Gas Utility Index Fund”) (each a “Fund” and collectively, the “Funds”). The Trust is authorized to issue an unlimited number of shares of beneficial interest with no par value which may be issued in more than one class or series. The I Class shares are intended for institutional investors. In all Funds the initial class of shares is now referred to as Investor Class.
On March 12, 2010, certain FBR Funds acquired substantially all the assets and assumed the liabilities of certain AFBA 5Star Funds, each a series of the AFBA 5Star Funds, a Delaware statutory trust, registered under the 1940 Act as an open end management investment company (see Note 12).
On March 12, 2010, following this acquisition, the FBR Technology Fund I Class shares commenced operations (see Note 12).
On August 27, 2010, the Small Cap Fund acquired substantially all the assets and assumed the liabilities of FBR Pegasus Small Cap Growth Fund™ (see Note 12).
The Large Cap Fund, a non-diversified fund, invests, under normal circumstances, at least 80% of its net assets plus the amount of any borrowings for investment purposes in securities of large capitalization (“large-cap”) companies. The investment objective of the Fund is capital appreciation.
The Mid Cap Fund, a non-diversified fund, invests, under normal circumstances, at least 80% of its net assets plus the amount of any borrowings for investment purposes in securities of mid capitalization (“mid-cap”) companies. The investment objective of the Fund is capital appreciation.
The Small Cap Fund, a non-diversified fund, invests, under normal circumstances, at least 80% of its net assets plus the amount of any borrowings for investment purposes in securities of small capitalization (“small-cap”) companies. The investment objective of the Fund is capital appreciation.
The Focus Fund, a non-diversified fund, invests, under normal circumstances, primarily in securities of companies traded in domestic markets. The investment objective of the Fund is capital appreciation.
The Large Cap Financial Fund, a non-diversified fund, invests, under normal circumstances, at least 80% of its net assets plus the amount of any borrowings for
91
The FBR Funds
Notes to Financial Statements (continued)
investment purposes in securities of large capitalization (“large-cap”) companies principally engaged in the business of financial services including, but not limited to, commercial banks, savings and loan associations, consumer and industrial finance companies, securities brokerage companies, insurance companies, real estate and leasing companies, holding companies for each of the foregoing types of business, or companies that combine some or all of these businesses. The investment objective of the Fund is capital appreciation.
The Small Cap Financial Fund, a non-diversified fund, invests, under normal circumstances, at least 80% of its net assets plus the amount of any borrowings for investment purposes in securities of small-cap companies principally engaged in the business of providing financial services to consumers and industry. The investment objective of the Fund is capital appreciation.
The Technology Fund, a non-diversified fund, invests, under normal circumstances, at least 80% of its net assets plus the amount of any borrowings for investment purposes in securities of companies that are principally engaged in the research, design, development, manufacturing or distributing products or services in the technology industry. The investment objective of the Fund is long-term capital appreciation.
The Gas Utility Index Fund, a non-diversified fund, invests, under normal circumstances, at least 85% of its net assets in the common stock of companies that have natural gas distribution and transmission operations. The investment objective of the Fund is income and capital appreciation.
2. Significant Accounting Policies
The following is a summary of the Funds’ significant accounting policies:
Portfolio Valuation — The net asset value per share (“NAV”) of each Fund is determined as of the close of regular trading on the New York Stock Exchange (“NYSE”) (normally 4:00 p.m., Eastern Time) on each business day that the exchange is open for trading. Each Fund’s securities are valued at the last sale price on the securities exchange or national securities market on which such securities are primarily traded. Securities that are quoted by NASDAQ are valued at the NASDAQ Official Closing Price. Securities not listed on an exchange or national securities market, or securities in which there were no transactions, are valued at the average of the most recent bid and ask prices, except in the case of open short positions where the ask price is used for valuation purposes. The bid price is used when no ask price is available. Short-term investments are carried at amortized cost, which approximates market value. Restricted securities, as well as securities or other assets for which market quotations are not readily available, or are not valued by a pricing service approved by the Funds’ Board of Trustees (the “Board”), are valued at fair value in good faith by, or at the direction of, the Board.
The Funds have adopted FASB 820 “Fair Value Measurements.” This standard establishes a single authoritative definition of fair value, sets out a framework for measuring fair value and requires additional disclosures about fair value measurements.
92
The FBR Funds
Notes to Financial Statements (continued)
Fair Value Measurements applies to fair value measurements already required or permitted by existing standards. The changes to current generally accepted accounting principles (GAAP) from the application of this Statement relate to the definition of fair value, the methods used to measure fair value, and the expanded disclosures about fair value measurements. Various inputs are used in determining the value of the Funds investments. These inputs are summarized in the three broad levels listed below:
| • | | Level 1 – Unadjusted quoted prices in active markets for identical assets or liabilities that the Fund has the ability to access. |
| • | | Level 2 – Observable inputs other than quoted prices included in Level 1 that are observable for the asset or liability, either directly or indirectly. These inputs may include quoted prices for the identical instrument on an inactive market, prices for similar instruments, interest rates, prepayment speeds, credit risk curves, default rates and similar data. |
| • | | Level 3 – Unobservable inputs for the asset or liability, to the extent observable inputs are not available, representing the Funds’ own assumptions about the assumptions a market participant would use in valuing the asset or liability, and would be based on the best information available. |
The inputs or methodology used for valuing securities are not necessarily an indication of the risk associated with investing in those securities. For example, securities maturing within 60 days of the filing are valued using amortized cost, in accordance with rules under the Investment Company Act of 1940. Generally, amortized cost approximates the current fair value of a security, but since the value is not obtained from a quoted price in an active market, such securities are reflected as Level 2.
The following is a summary of the inputs used to value the Funds’ net assets as of October 31, 2010, the Funds did not hold any Level 3 categorized securities during the year ended or at October 31, 2010:
| | | | | | Level 2 | | Level 3 | | | |
| | | Level 1 | | Other Significant | | Significant | | | |
| | | Quoted | | Observable | | Unobservable | | | |
| | | Prices | | Inputs | | Inputs | | Total |
| | |
| |
| |
| |
|
| Large Cap Fund | | | | | | | | | | | | |
Common Stocks* | | $ | 46,112,015 | | $ | — | | $ | — | | $ | 46,112,015 |
Short-Term Investment | | | 706,944 | | | — | | | — | | | 706,944 |
| | |
| |
| |
| |
|
| Total | | | 46,818,959 | | | — | | | — | | | 46,818,959 |
| | |
| |
| |
| |
|
| Mid Cap Fund | | | | | | | | | | | | |
Common Stocks* | | | 17,495,514 | | | — | | | — | | | 17,495,514 |
Short-Term Investment | | | 2,726,179 | | | — | | | — | | | 2,726,179 |
| | |
| |
| |
| |
|
| Total | | | 20,221,693 | | | — | | | — | | | 20,221,693 |
| | |
| |
| |
| |
|
93
The FBR Funds
Notes to Financial Statements (continued)
| | | | | | Level 2 | | Level 3 | | | |
| | | Level 1 | | Other Significant | | Significant | | | |
| | | Quoted | | Observable | | Unobservable | | | |
| | | Prices | | Inputs | | Inputs | | Total |
| | |
| |
| |
| |
|
| Small Cap Fund | | | | | | | | | | | | |
Common Stocks* | | $ | 34,700,575 | | $ | — | | $ | — | | $ | 34,700,575 |
Investment Companies | | | 351,783 | | | — | | | — | | | 351,783 |
Short-Term Investment | | | 177,473 | | | — | | | — | | | 177,473 |
| | |
| |
| |
| |
|
| Total | | | 35,229,831 | | | — | | | — | | | 35,229,831 |
| | |
| |
| |
| |
|
| Focus Fund | | | | | | | | | | | | |
Common Stocks* | | | 676,576,631 | | | — | | | — | | | 676,576,631 |
Short-Term Investment | | | 32,167,489 | | | — | | | — | | | 32,167,489 |
| | |
| |
| |
| |
|
| Total | | | 708,744,120 | | | — | | | — | | | 708,744,120 |
| | |
| |
| |
| |
|
| Large Cap Financial Fund | | | | | | | | | | | | |
Common Stocks* | | | 45,829,625 | | | — | | | — | | | 45,829,625 |
Short-Term Investment | | | 2,205,104 | | | — | | | — | | | 2,205,104 |
Warrants | | | 30,750 | | | — | | | — | | | 30,750 |
| | |
| |
| |
| |
|
| Total | | | 48,065,479 | | | — | | | — | | | 48,065,479 |
| | |
| |
| |
| |
|
| Small Cap Financial Fund | | | | | | | | | | | | |
Common Stocks* | | | 198,734,044 | | | — | | | — | | | 198,734,044 |
Short-Term Investment | | | 43,785,538 | | | — | | | — | | | 43,785,538 |
| | |
| |
| |
| |
|
| Total | | | 242,519,582 | | | — | | | — | | | 242,519,582 |
| | |
| |
| |
| |
|
| Technology Fund | | | | | | | | | | | | |
Common Stocks* | | | 10,232,967 | | | — | | | — | | | 10,232,967 |
Investment Companies | | | 913,492 | | | — | | | — | | | 913,492 |
Short-Term Investment | | | 1,124,428 | | | — | | | — | | | 1,124,428 |
| | |
| |
| |
| |
|
| Total | | | 12,270,887 | | | — | | | — | | | 12,270,887 |
| | |
| |
| |
| |
|
| Gas Utility Index Fund | | | | | | | | | | | | |
Common Stocks* | | | 241,205,149 | | | — | | | — | | | 241,205,149 |
Short-Term Investment | | | 2,627,128 | | | — | | | — | | | 2,627,128 |
| | |
| |
| |
| |
|
| Total | | | 243,832,277 | | | — | | | — | | | 243,832,277 |
| | |
| |
| |
| |
|
|
| * | Please refer to portfolio of investments for industry classifications of common stocks. |
New Accounting Pronouncements — In January 2010, the Financial Accounting Standards Board (“FASB”) issued new guidance as an amendment to fair value measurements and disclosures. The new guidance adds new requirements for disclosure about transfers into and out of Level 1 and Level 2 fair value measurements and separate disclosures about purchases, sales, issuances, and settlements relating to Level 3
94
The FBR Funds
Notes to Financial Statements (continued)
measurements. The guidance also clarifies existing fair value disclosures about the level of disaggregation and about inputs and valuation techniques in Level 2 and Level 3 fair value measurements. The amendment is effective for interim and annual reporting periods beginning after December 15, 2009, except for Level 3 reconciliation disclosures which are effective for interim and annual periods beginning after December 15, 2010. There were no significant transfers into and out of Level 1 and Level 2 during the current period. The Funds do not expect the implications of this guidance to have a material impact on its financial statements.
Share Valuation — The NAV of each Fund is calculated by dividing the sum of the value of the securities held by each Fund, plus cash or other assets, minus all liabilities (including estimated accrued expenses) by the total number of shares outstanding of each Fund, rounded to the nearest cent. Each Fund’s shares will not be priced on the days on which the NYSE is closed for trading. The offering and redemption price per share of each Fund is equal to each Fund’s NAV. The Funds charge a 1% redemption fee on shares redeemed or exchanged within 90 days of purchase. These fees are deducted from the redemption proceeds otherwise payable to the shareholder. The Funds will retain the fee charged as paid-in capital and such fees become part of that Fund’s daily NAV calculation.
Investment Income — Dividend income is recorded on the ex-dividend date. Interest income, which includes the amortization of premium and accretion of discount, if any, is recorded on an accrual basis.
Expenses — The Funds pay all operational expenses, which are either charged directly to a Fund for which the expense is attributable or are allocated proportionately among the Funds based on allocation methods approved by the Board.
Distributions to Shareholders — Each Fund, except the Gas Utility Index Fund, declares and pays any dividends from its net investment income, if any, annually. The Gas Utility Index Fund declares and pays any such dividends quarterly. Distributions from net realized capital gains, if any, will be distributed at least annually for each Fund. Income and capital gain distributions are determined in accordance with U.S. federal income tax regulations.
Allocations — Investment income earned, realized capital gains and losses, and unrealized appreciation and depreciation for the Funds are allocated daily to each class of shares based upon its proportionate share of total net assets of the Fund. Class specific expenses are charged directly to the class incurring the expense. Common expenses, which are not attributable to a specific class, are allocated daily to each class of shares based upon its proportionate share of total net assets of the Fund. Expenses not directly billed to a Fund are allocated proportionally among all Funds daily in relation to net assets of each Fund or another reasonable measure.
Security Transactions — Security transactions are accounted for on the trade date. Securities sold are determined on a specific identification basis.
Estimates — The preparation of financial statements in accordance with U.S. generally accepted accounting principles requires management to make estimates and assumptions
95
The FBR Funds
Notes to Financial Statements (continued)
that may affect the reported amounts of assets and liabilities and disclosure of contingent assets and liabilities at the date of the financial statements and the reported amounts of income and expenses during the reporting period. Actual results could differ from those estimates.
Repurchase Agreements — The Funds have agreed to purchase securities from financial Institutions subject to the seller’s agreement to repurchase them at an agreed-upon time and price (“repurchase agreement”). The financial institutions with whom each Fund enters into repurchase agreements are banks and broker/dealers which the adviser considers creditworthy pursuant to criteria approved by the Board. The seller under a repurchase agreement will be required to maintain the value of the securities as collateral, subject to the agreement at not less than the repurchase price plus accrued interest. The adviser marks to market daily the value of the collateral, and, if necessary, requires the seller to maintain additional securities, to ensure that the value is not less than the repurchase price. Default by or bankruptcy of the seller would, however, expose each Fund to possible loss because of adverse market action or delays in connection with the disposition of the underlying securities.
3. Risk Factors
Equity Investments — Because each of the Funds invests in equity securities, fluctuations in the stock market in general, as well as in the value of particular equity securities held by a Fund, can affect the Fund’s performance. The value of equity securities will fluctuate due to many factors, including the past and predicted earnings of the issuer, the quality of the issuer’s management, general market conditions, forecasts for the issuer’s industry and the value of the issuer’s assets.
IPO Investments — IPO shares are subject to market risk and liquidity risk. The market value of IPO shares will fluctuate considerably due to facts such as the absence of a prior public market, unseasoned trading, the small number of shares available for trading and limited public information about the issuer. The purchase of IPO shares may involve high transaction costs. When a fund’s asset base is small, a significant portion of the fund’s performance could be attributable to investments in IPOs, because such investments would have a magnified impact on the fund.
Temporary Defensive Position — Each of the Funds may, from time to time, take temporary defensive positions in response to adverse market, economic, political or other conditions. To the extent the assets of a Fund are invested in temporary defensive positions, the Fund may not achieve its investment objective. For temporary defensive purposes, the Fund may invest in cash and/or short-term obligations.
Industry Concentration — Because of their narrow focus, the Large Cap Financial Fund and the Small Cap Financial Fund (“Financial Funds”), the Technology Fund and the Gas Utility Index Fund are tied closely to and affected by the financial services, technology, and natural gas distribution and transmission industries, respectively. The value of the
96
The FBR Funds
Notes to Financial Statements (continued)
Funds may be subject to greater volatility than funds with portfolios that are less concentrated.
Investments in Derivatives — Each Fund, except the Gas Utility Index Fund, may engage in derivative instruments such as options, futures and forward foreign currency exchange contracts. Derivative instruments are instruments that derive their value from a different underlying security, index or financial indicator. A Fund may use derivatives for either hedging or non-hedging purposes, or for both purposes, including for purposes of enhancing return. Investing for non-hedging purposes may be considered speculative and involve additional risks.
Foreign Investments. Investing in foreign securities presents unique investment risks. The value of securities denominated in or indexed to foreign currencies, and of dividends and interest from such securities, can change significantly when foreign currencies strengthen or weaken relative to the U.S. dollar. Many foreign countries lack uniform accounting and disclosure standards comparable to those applicable to U.S. companies, and it may be more difficult to obtain reliable information regarding an issuer’s financial condition and operations. The Fund may invest in both sponsored and unsponsored ADRs which are receipts issued by a U.S. bank or trust company evidencing ownership of an indirect interest in underlying securities issued by a foreign issuer. In a sponsored ADR arrangement, the non-U.S. issuer assumes the obligation to pay some or all of the depositary’s transaction fees. Under an unsponsored ADR arrangement, the non-U.S. issuer assumes no obligations and the depositary’s transaction fees are paid directly by the ADR holders. Because unsponsored ADR arrangements are organized independently and without the cooperation of the issuer of the underlying securities, available information concerning the non-U.S. issuer may not be as current as for sponsored ADRs and voting rights with respect to the deposited securities are not passed through.
4. Transactions with Affiliates
Investment Adviser — FBR Fund Advisers, Inc. (“Fund Advisers”) serves as investment adviser to the Funds. For its advisory services, Fund Advisers receives a monthly fee at an annual rate of 0.90% of the average daily net assets of the Large Cap Fund, Mid Cap Fund, Small Cap Fund, Focus Fund, Large Cap Financial Fund, Small Cap Financial Fund, and Technology Fund, and at an annual rate of 0.40% of the average daily net assets of the Gas Utility Index Fund.
Fund Advisers has contractually agreed to limit each class of shares of each Fund’s total operating expenses and to maintain these limitations with regard to each class of shares of each Fund through February 28, 2013. The following are the limits for the Funds, based on average daily net assets (excluding interest, taxes, brokerage commissions, dividend
97
The FBR Funds
Notes to Financial Statements (continued)
expenses, acquired fund fees and expenses, extraordinary legal expenses, or any other extraordinary expenses):
| | | Investor Class | | | I Class |
| | |
| | |
|
| Large Cap Fund | | 1.25 | % | | | 1.00 | % |
| Mid Cap Fund | | 1.35 | % | | | 1.10 | % |
| Small Cap Fund | | 1.45 | % | | | 1.20 | % |
| Focus Fund | | 1.95 | % | | | 1.70 | % |
| Large Cap Financial Fund | | 1.95 | % | | | NA | |
| Small Cap Financial Fund | | 1.95 | % | | | 1.70 | % |
| Technology Fund | | 1.95 | % | | | 1.70 | % |
| Gas Utility Index Fund | | 0.85 | % | | | NA | |
Effective May 30, 2008, Fund Advisers may recoup any waived amount from a Fund pursuant to this agreement if such reimbursement does not cause the Fund to exceed existing expense limitations and the reimbursement is made within three years after the year in which the Adviser incurred the expense.
As of October 31, 2010, the Funds had the following amounts (and year of expiration) subject to repayment to Fund Advisers:
| | | Year Fees | | Repayment | | | | |
| | | Waived | | Expires | | Balance |
| | |
| |
| |
|
| Large Cap Fund – Investor Class | | 2008 | | | 2011 | | | $ | 42,645 | |
| | | 2009 | | | 2012 | | | | 112,398 | |
| | | 2010 | | | 2013 | | | | 113,013 | |
| Large Cap Fund – I Class | | 2008 | | | 2011 | | | | 1,153 | |
| | | 2009 | | | 2012 | | | | 11,563 | |
| | | 2010 | | | 2013 | | | | 90,332 | |
| Mid Cap Fund – Investor Class | | 2008 | | | 2011 | | | | 37,881 | |
| | | 2009 | | | 2012 | | | | 99,322 | |
| | | 2010 | | | 2013 | | | | 88,626 | |
| Mid Cap Fund – I Class | | 2008 | | | 2011 | | | | 1,295 | |
| | | 2009 | | | 2012 | | | | 11,525 | |
| | | 2010 | | | 2013 | | | | 64,899 | |
| Small Cap Fund – Investor Class | | 2008 | | | 2011 | | | | 36,709 | |
| | | 2009 | | | 2012 | | | | 92,582 | |
| | | 2010 | | | 2013 | | | | 120,555 | |
| Small Cap Fund – I Class | | 2008 | | | 2011 | | | | 1,298 | |
| | | 2009 | | | 2012 | | | | 11,387 | |
| | | 2010 | | | 2013 | | | | 26,712 | |
| Technology Fund – Investor Class | | 2008 | | | 2011 | | | | 7,400 | |
| | | 2009 | | | 2012 | | | | 72,289 | |
| | | 2010 | | | 2013 | | | | 53,589 | |
| Technology Fund – I Class | | 2010 | | | 2013 | | | | 23,699 | |
| Gas Utility Index Fund – Investor Class | | 2010 | | | 2013 | | | | 16,893 | |
98
The FBR Funds
Notes to Financial Statements (continued)
During the year ended October 31, 2010, the Large Cap Financial Fund – Investor Class and the Gas Utility Index Fund – Investor Class repaid Fund Advisers $104 and $78 for fees waived during the fiscal year ended October 31, 2009, respectively.
Administrator — JPMorgan Chase Bank N.A. (“JPMorgan”) serves as the administrator to the Funds and provides pursuant to an Administration Agreement (“Agreement”) day-to-day administrative services including monitoring portfolio compliance, determining compliance with provisions of the Internal Revenue Code and preparing the Funds’ registration statements. Pursuant to the Agreement, JPMorgan receives a monthly fee based on average daily net assets of the Trust.
Pursuant to an Administrative Services Agreement, Fund Advisers also provides administrative services to the Funds including oversight of service providers. For the year ended October 31, 2010, Fund Advisers received 0.04% of average daily net assets of the Trust. Prior to November 1, 2009, the Fund Advisers received 0.02% of average daily net assets of the Trust. Fund Advisers also provides the Funds with office space, facilities and business equipment and generally administers the Funds’ business affairs and provides the services of executive and clerical personnel for administering the affairs of the Funds. Fund Advisers compensates all personnel, Officers and Trustees of the Funds if such persons are employees of Fund Advisers. For the year ended October 31, 2010, JPMorgan earned $265,174 and Fund Advisers earned $639,154 in administration fees.
Plan of Distribution — The Trust, on behalf of the Investor Class shares of each Fund, except the Gas Utility Index Fund, has adopted a Distribution Plan (the “Plan”) pursuant to Rule 12b-1 under the 1940 Act. Under the Investor Class Plan, each Fund pays FBR Investment Services, Inc. (the “Distributor”) a fee at an annual rate of up to 0.25% of each Fund’s average daily net assets. Fees paid to the Distributor under the Plans are payable without regard to actual expenses incurred.
Brokerage Commissions — For the year ended October 31, 2010, the Small Cap Financial Fund and the Large Cap Financial Fund paid $22,342 and $1,000, respectively, in brokerage commissions from portfolio transactions to FBR Capital Markets & Co. (“FBR & Co.”), an affiliate of Fund Advisers and the Distributor. No other Fund paid commissions to FBR & Co. during the year.
Trustees’ Fees — Each Trustee of the Trust who is not an employee or affiliate of Fund Advisers receives an annual retainer fee of $25,000 and an additional meeting fee of $2,500 for each regular meeting attended. In addition, each Trustee that serves on the Audit Committee or Nominating Committee receives a meeting fee of $1,000 for attendance at the meeting. If a Trustee participates by teleconference, the meeting fee is $1,000. The Chairman of the Board, an independent Trustee, receives an additional $2,000 for each meeting attended, and the Audit Committee Chairman receives an additional $1,000 for each committee meeting attended.
99
The FBR Funds
Notes to Financial Statements (continued)
5. Investment Transactions
For the year ended October 31, 2010, purchases and sales of investment securities (excluding short-term securities and U.S. government obligations) for each Fund were as follows:
| | | Purchases | | Sales |
| | |
| |
|
| Large Cap Fund | | $ | 46,338,983 | | $ | 22,295,749 |
| Mid Cap Fund | | | 26,682,338 | | | 17,689,278 |
| Small Cap Fund | | | 53,069,180 | | | 30,940,895 |
| Focus Fund | | | 35,214,451 | | | 303,558,550 |
| Large Cap Financial Fund | | | 68,944,867 | | | 57,815,140 |
| Small Cap Financial Fund | | | 196,464,526 | | | 192,614,429 |
| Technology Fund | | | 32,688,017 | | | 31,419,036 |
| Gas Utility Index Fund | | | 48,511,307 | | | 33,862,853 |
100
The FBR Funds
Notes to Financial Statements (continued)
6. Capital Share Transactions
| | | FBR Large Cap Fund | | FBR Mid Cap Fund | | FBR Small Cap Fund |
| | |
| |
| |
|
| | | For the | | For the | | For the | | For the | | For the | | For the |
| | | Year | | Year | | Year | | Year | | Year | | Year |
| | | Ended | | Ended | | Ended | | Ended | | Ended | | Ended |
| | | October 31, | | October 31, | | October 31, | | October 31, | | October 31, | | October 31, |
| | | 2010 | | 2009 | | 2010 | | 2009 | | 2010 | | 2009 |
| | |
| |
| |
| |
| |
| |
|
| | | | | | | | | | | | | | | | | | | | | | | | | | | | | | | |
| Capital Transactions: | | | | | | | | | | | | | | | | | | | | | | | | | | | | | | |
| Investor Class | | | | | | | | | | | | | | | | | | | | | | | | | | | | | | |
Proceeds from Sale of Shares | | | $ | 7,328,586 | | | | $ | 17,513,723 | | | | $ | 2,685,688 | | | | $ | 5,938,063 | | | | $ | 3,925,758 | | | | $ | 7,550,993 | |
Reinvestment of Distributions | | | | 90,346 | | | | | 37,852 | | | | | 26,279 | | | | | 70,620 | | | | | 345,920 | | | | | — | |
Shares issued in connection with acquisition (Note 12) | | | | 1,621,780 | | | | | — | | | | | 3,045,738 | | | | | — | | | | | 14,556,430 | | | | | — | |
Cost of Shares Redeemed | | | | (12,614,455 | ) | | | | (6,489,882 | ) | | | | (6,568,277 | ) | | | | (4,584,753 | ) | | | | (5,996,292 | ) | | | | (2,773,221 | ) |
Redemption Fees | | | | 9,188 | | | | | 7,141 | | | | | 7,086 | | | | | 7,086 | | | | | 4,757 | | | | | 8,520 | |
| | | |
| | | |
| | | |
| | | |
| | | |
| | | |
| |
Investor Class Transactions | | | $ | (3,564,555 | ) | | | $ | 11,068,834 | | | | $ | (803,486 | ) | | | $ | 1,431,016 | | | | $ | 12,836,573 | | | | $ | 4,786,292 | |
| | | |
| | | |
| | | |
| | | |
| | | |
| | | |
| |
| I Class | | | | | | | | | | | | | | | | | | | | | | | | | | | | | | |
Proceeds from Sale of Shares | | | $ | 475,689 | | | | $ | 14,527 | | | | $ | 266,105 | | | | $ | — | | | | $ | 514,320 | | | | $ | — | |
Reinvestment of Distributions | | | | 677 | | | | | 633 | | | | | 451 | | | | | 1,509 | | | | | 3,451 | | | | | — | |
Shares issued in connection with acquisition (Note 12) | | | | 30,273,086 | | | | | — | | | | | 11,321,429 | | | | | — | | | | | 7,405,298 | | | | | — | |
Cost of Shares Redeemed | | | | (1,283,059 | ) | | | | (279 | ) | | | | (519,721 | ) | | | | — | | | | | (319,530 | ) | | | | — | |
Redemption Fees | | | | 181 | | | | | 3 | | | | | 26 | | | | | — | | | | | 748 | | | | | — | |
| | | |
| | | |
| | | |
| | | |
| | | |
| | | |
| |
I Class Transactions | | | $ | 29,466,574 | | | | $ | 14,884 | | | | $ | 11,068,290 | | | | $ | 1,509 | | | | $ | 7,604,287 | | | | $ | — | |
| | | |
| | | |
| | | |
| | | |
| | | |
| | | |
| |
| Net Increase from Capital Transactions | | | $ | 25,902,019 | | | | $ | 11,083,718 | | | | $ | 10,264,804 | | | | $ | 1,432,525 | | | | $ | 20,440,860 | | | | $ | 4,786,292 | |
| | | |
| | | |
| | | |
| | | |
| | | |
| | | |
| |
| | | | | | | | | | | | | | | | | | | | | | | | | | | | | | | |
| Share Transactions: | | | | | | | | | | | | | | | | | | | | | | | | | | | | | | |
| Investor Class | | | | | | | | | | | | | | | | | | | | | | | | | | | | | | |
Sold | | | | 694,912 | | | | | 2,091,570 | | | | | 245,587 | | | | | 727,540 | | | | | 372,277 | | | | | 969,637 | |
Issued in Reinvestment of Distributions | | | | 8,654 | | | | | 4,834 | | | | | 2,559 | | | | | 9,098 | | | | | 34,573 | | | | | — | |
Shares issued in connection with acquisition (Note 12) | | | | 149,555 | | | | | — | | | | | 279,797 | | | | | — | | | | | 1,469,558 | | | | | — | |
Redeemed | | | | (1,232,179 | ) | | | | (707,768 | ) | | | | (640,740 | ) | | | | (529,080 | ) | | | | (585,767 | ) | | | | (330,293 | ) |
| | | |
| | | |
| | | |
| | | |
| | | |
| | | |
| |
Change in Investor Class Shares | | | | (379,058 | ) | | | | 1,388,636 | | | | | (112,797 | ) | | | | 207,558 | | | | | 1,290,641 | | | | | 639,344 | |
| | | |
| | | |
| | | |
| | | |
| | | |
| | | |
| |
| | | | | | | | | | | | | | | | | | | | | | | | | | | | | | | |
| I Class | | | | | | | | | | | | | | | | | | | | | | | | | | | | | | |
Sold | | | | 52,657 | | | | | 1,655 | | | | | 28,378 | | | | | — | | | | | 53,841 | | | | | — | |
Issued in Reinvestment of Distributions | | | | 75 | | | | | 93 | | | | | 51 | | | | | 224 | | | | | 382 | | | | | — | |
Shares issued in connection with acquisition (Note 12) | | | | 3,226,962 | | | | | — | | | | | 1,201,247 | | | | | — | | | | | 831,252 | | | | | — | |
Redeemed | | | | (139,807 | ) | | | | (31 | ) | | | | (55,355 | ) | | | | — | | | | | (33,681 | ) | | | | — | |
| | | |
| | | |
| | | |
| | | |
| | | |
| | | |
| |
Change in I Class Shares | | | | 3,139,887 | | | | | 1,717 | | | | | 1,174,321 | | | | | 224 | | | | | 851,794 | | | | | — | |
| | | |
| | | |
| | | |
| | | |
| | | |
| | | |
| |
| Net Increase from Shares Transactions | | | | 2,760,829 | | | | | 1,390,353 | | | | | 1,061,524 | | | | | 207,782 | | | | | 2,142,435 | | | | | 639,344 | |
| | | |
| | | |
| | | |
| | | |
| | | |
| | | |
| |
101
The FBR Funds
Notes to Financial Statements (continued)
| | | | | | | | | | | FBR Large Cap | | | FBR Small Cap | |
| | | FBR Focus Fund | | | Financial Fund | | | Financial Fund | |
| | |
| | |
| | |
| |
| | | For the | | | For the | | | For the | | | For the | | | For the | | | For the | |
| | | Year | | | Year | | | Year | | | Year | | | Year | | | Year | |
| | | Ended | | | Ended | | | Ended | | | Ended | | | Ended | | | Ended | |
| | | October 31, | | | October 31, | | | October 31, | | | October 31, | | | October 31, | | | October 31, | |
| | | 2010 | | | 2009 | | | 2010 | | | 2009 | | | 2010 | | | 2009 | |
| | |
| | |
| | |
| | |
| | |
| | |
| |
| Capital Transactions: | | | | | | | | | | | | | | | | | | | | | | | | |
| Investor Class | | | | | | | | | | | | | | | | | | | | | | | | |
Proceeds from Sale of Shares | | $ | 75,470,810 | | | $ | 364,670,766 | | | $ | 35,422,624 | | | $ | 30,236,869 | | | $ | 165,188,776 | | | $ | 137,376,905 | |
Reinvestment of Distributions | | | — | | | | 93,731,941 | | | | — | | | | 237,972 | | | | 703,797 | | | | 2,289,047 | |
Cost of Shares Redeemed | | | (329,622,691 | ) | | | (447,111,728 | ) | | | (22,600,491 | ) | | | (19,147,301 | ) | | | (148,830,452 | ) | | | (137,859,395 | ) |
Redemption Fees | | | 38,689 | | | | 200,006 | | | | 8,923 | | | | 24,409 | | | | 285,317 | | | | 137,803 | |
| | |
| | |
| | |
| | |
| | |
| | |
| |
Investor Class Transactions | | $ | (254,113,192 | ) | | $ | 11,490,985 | | | $ | 12,831,056 | | | $ | 11,351,949 | | | $ | 17,347,438 | | | $ | 1,944,360 | |
| | |
| | |
| | |
| | |
| | |
| | |
| |
| I Class | | | | | | | | | | | | | | | | | | | | | | | | |
Proceeds from Sale of Shares | | $ | 11,535,684 | | | $ | 44,273,847 | | | $ | — | | | $ | — | | | $ | 17,573,779 | | | $ | 11,424,305 | |
Reinvestment of Distributions | | | 280,878 | | | | 10,311,502 | | | | — | | | | — | | | | 117,589 | | | | 2,105 | |
Cost of Shares Redeemed | | | (16,248,644 | ) | | | (33,573,561 | ) | | | — | | | | — | | | | (3,593,187 | ) | | | (3,617,293 | ) |
Redemption Fees | | | 613 | | | | 22,795 | | | | — | | | | — | | | | 6,071 | | | | — | |
| | |
| | |
| | |
| | |
| | |
| | |
| |
I Class Transactions | | $ | (4,431,469 | ) | | $ | 21,034,583 | | | $ | — | | | $ | — | | | $ | 14,104,252 | | | $ | 7,809,117 | |
| | |
| | |
| | |
| | |
| | |
| | |
| |
| R Class1 | | | | | | | | | | | | | | | | | | | | | | | | |
Proceeds from Sale of Shares | | $ | 8,438 | | | $ | 64,289 | | | $ | — | | | $ | — | | | $ | 32,324 | | | $ | 18,198 | |
Reinvestment of Distributions | | | 314 | | | | 51,918 | | | | — | | | | — | | | | 486 | | | | 1,617 | |
Cost of Shares Redeemed | | | (214,467 | ) | | | (518 | ) | | | — | | | | — | | | | (178,883 | ) | | | — | |
Redemption Fees | | | 475 | | | | — | | | | — | | | | — | | | | 71 | | | | — | |
| | |
| | |
| | |
| | |
| | |
| | |
| |
R Class Transactions | | $ | (205,240 | ) | | $ | 115,689 | | | $ | — | | | $ | — | | | $ | (146,002 | ) | | $ | 19,815 | |
| | |
| | |
| | |
| | |
| | |
| | |
| |
| Net Increase (Decrease) from Capital Transactions | | $ | (258,749,901 | ) | | $ | 32,641,257 | | | $ | 12,831,056 | | | $ | 11,351,949 | | | $ | 31,305,688 | | | $ | 9,773,292 | |
| | |
| | |
| | |
| | |
| | |
| | |
| |
| Share Transactions: | | | | | | | | | | | | | | | | | | | | | | | | |
| Investor Class | | | | | | | | | | | | | | | | | | | | | | | | |
Sold | | | 1,770,711 | | | | 10,780,019 | | | | 2,557,427 | | | | 2,543,639 | | | | 8,341,839 | | | | 9,258,210 | |
Issued in Reinvestment of Distributions | | | — | | | | 3,112,984 | | | | — | | | | 24,258 | | | | 41,158 | | | | 160,185 | |
Redeemed | | | (7,894,546 | ) | | | (12,858,602 | ) | | | (1,724,792 | ) | | | (1,796,661 | ) | | | (8,203,709 | ) | | | (9,568,535 | ) |
| | |
| | |
| | |
| | |
| | |
| | |
| |
Change in Investor Class Shares | | | (6,123,835 | ) | | | 1,034,401 | | | | 832,635 | | | | 771,236 | | | | 179,288 | | | | (150,140 | ) |
| | |
| | |
| | |
| | |
| | |
| | |
| |
| I Class | | | | | | | | | | | | | | | | | | | | | | | | |
Sold | | | 4,845,377 | | | | 23,893,265 | | | | — | | | | — | | | | 1,407,327 | | | | 1,020,701 | |
Issued in Reinvestment of Distributions | | | 122,121 | | | | 6,137,799 | | | | — | | | | — | | | | 10,661 | | | | 226 | |
Redeemed | | | (7,337,675 | ) | | | (16,066,151 | ) | | | — | | | | — | | | | (309,180 | ) | | | (388,919 | ) |
| | |
| | |
| | |
| | |
| | |
| | |
| |
Change in I Class Shares | | | (2,370,177 | ) | | | 13,964,913 | | | | — | | | | — | | | | 1,108,808 | | | | 632,008 | |
| | |
| | |
| | |
| | |
| | |
| | |
| |
| R Class1 | | | | | | | | | | | | | | | | | | | | | | | | |
Sold | | | 3,762 | | | | 40,104 | | | | — | | | | — | | | | 2,470 | | | | 2,112 | |
Issued in Reinvestment of Distributions | | | 141 | | | | 31,657 | | | | — | | | | — | | | | 44 | | | | 174 | |
Redeemed | | | (85,409 | ) | | | (255 | ) | | | — | | | | — | | | | (14,801 | ) | | | — | |
| | |
| | |
| | |
| | |
| | |
| | |
| |
Change in R Class Shares | | | (81,506 | ) | | | 71,506 | | | | — | | | | — | | | | (12,287 | ) | | | 2,286 | |
| | |
| | |
| | |
| | |
| | |
| | |
| |
| Net Increase (Decrease) from Shares Transactions | | | (8,575,518 | ) | | | 15,070,820 | | | | 832,635 | | | | 771,236 | | | | 1,275,809 | | | | 484,154 | |
| | |
| | |
| | |
| | |
| | |
| | |
| |
|
| 1 | | As of the close of business on October 22, 2010, R Class Shares and dollars, as presented above, were converted to the Investor Class at the following rates: |
| Fund | | Shares | | Dollars |
| |
| |
|
| Focus | | 1,885 | | | 88,385 |
| Small Cap Financial | | 728 | | | 13,302 |
102
The FBR Funds
Notes to Financial Statements (continued)
| | | | | | | | | | | FBR Gas Utility | |
| | | FBR Technology Fund | | | Index Fund | |
| | |
| | |
| |
| | | For the | | | For the | | | For the | | | For the | |
| | | Year | | | Year | | | Year | | | Year | |
| | | Ended | | | Ended | | | Ended | | | Ended | |
| | | October 31, | | | October 31, | | | October 31, | | | October 31, | |
| | | 2010 | | | 2009 | | | 2010 | | | 2009 | |
| | |
| | |
| | |
| | |
| |
| Capital Transactions: | | | | | | | | | | | | | | | | |
Investor Class | | | | | | | | | | | | | | | | |
Proceeds from Sale of Shares | | $ | 4,502,499 | | | $ | 4,117,170 | | | $ | 37,521,462 | | | $ | 18,915,536 | |
Reinvestment of Distributions | | | — | | | | — | | | | 7,473,451 | | | | 14,885,034 | |
Shares issued in connection with acquisition (Note 12) | | | 3,467,076 | | | | — | | | | — | | | | — | |
Cost of Shares Redeemed | | | (9,466,250 | ) | | | (5,077,936 | ) | | | (30,322,875 | ) | | | (35,657,897 | ) |
Redemption Fees | | | 9,864 | | | | 8,341 | | | | 18,301 | | | | 92,002 | |
| | |
| | |
| | |
| | |
| |
Investor Class Transactions | | $ | (1,486,811 | ) | | $ | (952,425 | ) | | $ | 14,690,339 | | | $ | (1,765,325 | ) |
| | |
| | |
| | |
| | |
| |
| I Class1 | | | | | | | | | | | | | | | | |
Proceeds from Sale of Shares | | $ | 136,186 | | | $ | — | | | $ | — | | | $ | — | |
Reinvestment of Distributions | | | — | | | | — | | | | — | | | | — | |
Cost of Shares Redeemed | | | (1,835,881 | ) | | | — | | | | — | | | | — | |
Shares issued in connection with acquisition (Note 12) | | | 6,031,138 | | | | — | | | | — | | | | — | |
Redemption Fees | | | 22 | | | | — | | | | — | | | | — | |
| | |
| | |
| | |
| | |
| |
I Class Transactions | | $ | 4,331,465 | | | $ | — | | | $ | — | | | $ | — | |
| | |
| | |
| | |
| | |
| |
| R Class2 | | | | | | | | | | | | | | | | |
Proceeds from Sale of Shares | | $ | — | | | $ | — | | | $ | 22,330 | | | $ | 14,001 | |
Reinvestment of Distributions | | | — | | | | — | | | | 9,429 | | | | 13,030 | |
Cost of Shares Redeemed | | | — | | | | — | | | | (134,638 | ) | | | — | |
Redemption Fees | | | — | | | | — | | | | — | | | | — | |
| | |
| | |
| | |
| | |
| |
R Class Transactions | | $ | — | | | $ | — | | | $ | (102,879 | ) | | $ | 27,031 | |
| | |
| | |
| | |
| | |
| |
| Net Increase (Decrease) from Capital Transactions | | $ | 2,844,654 | | | $ | (952,425 | ) | | $ | 14,587,460 | | | $ | (1,738,294 | ) |
| | |
| | |
| | |
| | |
| |
| Share Transactions: | | | | | | | | | | | | | | | | |
| Investor Class | | | | | | | | | | | | | | | | |
Sold | | | 442,474 | | | | 519,303 | | | | 2,250,826 | | | | 1,341,857 | |
Issued in Reinvestment of Distributions | | | — | | | | — | | | | 459,731 | | | | 1,070,887 | |
Shares issued in connection with acquisition (Note 12) | | | 331,367 | | | | — | | | | — | | | | — | |
Redeemed | | | (954,032 | ) | | | (697,970 | ) | | | (1,822,655 | ) | | | (2,625,507 | ) |
| | |
| | |
| | |
| | |
| |
Change in Investor Class Shares | | | (180,191 | ) | | | (178,667 | ) | | | 887,902 | | | | (212,763 | ) |
| | |
| | |
| | |
| | |
| |
| I Class1 | | | | | | | | | | | | | | | | |
Sold | | | 13,080 | | | | — | | | | — | | | | — | |
Issued in Reinvestment of Distributions | | | — | | | | — | | | | — | | | | — | |
Shares issued in connection with acquisition (Note 12) | | | 576,427 | | | | — | | | | — | | | | — | |
Redeemed | | | (170,353 | ) | | | — | | | | — | | | | — | |
| | |
| | |
| | |
| | |
| |
Change in I Class Shares | | | 419,154 | | | | — | | | | — | | | | — | |
| | |
| | |
| | |
| | |
| |
| R Class2 | | | | | | | | | | | | | | | | |
Sold | | | — | | | | — | | | | 3,218 | | | | 2,142 | |
Issued in Reinvestment of Distributions | | | — | | | | — | | | | 1,438 | | | | 2,152 | |
Redeemed | | | — | | | | — | | | | (19,029 | ) | | | — | |
| | |
| | |
| | |
| | |
| |
Change in R Class Shares | | | — | | | | — | | | | (14,373 | ) | | | 4,294 | |
| | |
| | |
| | |
| | |
| |
| Net Increase (Decrease) from Shares Transactions | | | 238,963 | | | | (178,667 | ) | | | 873,529 | | | | (208,469 | ) |
| | |
| | |
| | |
| | |
| |
|
| 1 | | Represents the period from commencement of operation (March 12, 2010) through October 31, 2010. |
| 2 | | As of the close of business on October 22, 2010, R Class Shares and dollars, as presented above, were converted to the Investor Class at the following rates: |
| Fund | | Shares | | Dollars |
| |
| |
|
| Gas Utility Index | | 2,227 | | | 39,647 |
103
The FBR Funds
Notes to Financial Statements (continued)
7. Federal Income Taxes
It is each Fund’s policy to continue to comply with the special provisions of the Internal Revenue Code that are applicable to regulated investment companies. As provided therein, in any fiscal year in which a Fund so qualifies and distributes at least 90% of its taxable net income, the Fund (but not the shareholders) will be relieved of federal income tax on the income distributed. Accordingly, no provision for income taxes has been made.
In order to avoid imposition of the excise tax applicable to regulated investment companies, it is also each Fund’s intention to declare and pay as dividends in each calendar year at least 98% of its net investment income (earned during the calendar year) and 98% of its net realized capital gains (earned during the twelve months ending October 31) plus undistributed amounts from prior years.
Income and capital gain distributions are determined in accordance with income tax regulations that may differ from accounting principles that are generally accepted in the United States of America. As a result, the character of tax-basis distributions and the composition of net assets for tax purposes may differ from those reflected in the Funds’ financial statements. These book/tax differences may be temporary or permanent in nature. Temporary differences are primarily the result of wash sales.
The tax character of distributions paid for each Fund’s tax year was as follows:
| | Ordinary Income | | Long-Term Capital Gains |
| |
| |
|
| | | Dollar | | | | Dollar | |
| | | Amount | | | | Amount | |
| | |
| | | |
| |
| Large Cap Fund | | | | | | | | | |
For the Year Ended October 31, 2010 | | $ | 94,558 | | | | $ | — | |
For the Year Ended October 31, 2009 | | | 38,623 | | | | | — | |
| Mid Cap Fund | | | | | | | | | |
For the Year Ended October 31, 2010 | | | 26,791 | | | | | — | |
For the Year Ended October 31, 2009 | | | 72,339 | | | | | — | |
| Small Cap Fund | | | | | | | | | |
For the Year Ended October 31, 2010 | | | 353,677 | | | | | — | |
For the Year Ended October 31, 2009 | | | — | | | | | — | |
| Focus Fund | | | | | | | | | |
For the Year Ended October 31, 2010 | | | 282,614 | | | | | — | |
For the Year Ended October 31, 2009 | | | — | | | | | 106,380,482 | |
| Large Cap Financial Fund | | | | | | | | | |
For the Year Ended October 31, 2010 | | | — | | | | | — | |
For the Year Ended October 31, 2009 | | | 243,517 | | | | | — | |
| Small Cap Financial Fund | | | | | | | | | |
For the Year Ended October 31, 2010 | | | 866,424 | | | | | — | |
For the Year Ended October 31, 2009 | | | 2,344,398 | | | | | — | |
104
The FBR Funds
Notes to Financial Statements (continued)
| | Ordinary Income | | Long-Term Capital Gains |
| |
| |
|
| | | Dollar | | | | Dollar | |
| | | Amount | | | | Amount | |
| | |
| | | |
| |
| Technology Fund | | | | | | | | | |
For the Year Ended October 31, 2010 | | $ | — | | | | $ | — | |
For the Year Ended October 31, 2009 | | | — | | | | | — | |
| Gas Utility Index Fund | | | | | | | | | |
For the Year Ended October 31, 2010 | | | 7,800,261 | | | | | 249,041 | |
For the Year Ended October 31, 2009 | | | 6,301,517 | | | | | 9,585,471 | |
The following information is computed on a tax basis for each item:
| | | As of October 31, 2010 | |
| | |
| |
| | | Large Cap | | | Mid Cap | | | Small Cap | | | Focus | |
| | | Fund | | | Fund | | | Fund | | | Fund | |
| | |
| | |
| | |
| | |
| |
| Tax cost of investment securities | | $ | 42,551,823 | | | $ | 18,728,450 | | | $ | 32,923,713 | | | $ | 405,200,861 | |
| | |
| | |
| | |
| | |
| |
| Gross unrealized appreciation | | | 4,267,136 | | | | 1,493,243 | | | | 3,389,707 | | | | 314,922,365 | |
| Gross unrealized depreciation | | | — | | | | — | | | | (1,083,589 | ) | | | (11,379,106 | ) |
| | |
| | |
| | |
| | |
| |
| Net unrealized appreciation | | | 4,267,136 | | | | 1,493,243 | | | | 2,306,118 | | | | 303,543,259 | |
| Undistributed ordinary income | | | 137,874 | | | | 23,354 | | | | 10,212 | | | | — | |
| Undistributed long-term capital gains | | | — | | | | — | | | | — | | | | 25,360,214 | |
| Capital loss carryforward | | | (13,666,168 | ) | | | (4,478,465 | ) | | | (14,878,093 | ) | | | — | |
| | |
| | |
| | |
| | |
| |
| Accumulated earnings (deficit) | | $ | (9,261,158 | ) | | $ | (2,961,868 | ) | | $ | (12,561,763 | ) | | $ | 328,903,473 | |
| | |
| | |
| | |
| | |
| |
| | | | | | | | | | | | | | | | | |
| | | As of October 31, 2010 | |
| | |
| |
| | | Large Cap | | | Small Cap | | | | | | | Gas Utility | |
| | | Financial | | | Financial | | | Technology | | | Index | |
| | | Fund | | | Fund | | | Fund | | | Fund | |
| | |
| | |
| | |
| | |
| |
| Tax cost of investment securities | | $ | 50,461,861 | | | $ | 235,356,681 | | | $ | 11,550,070 | | | $ | 153,724,545 | |
| | |
| | |
| | |
| | |
| |
| Gross unrealized appreciation | | | 1,136,250 | | | | 20,588,897 | | | | 976,715 | | | | 91,515,344 | |
| Gross unrealized depreciation | | | (3,532,632 | ) | | | (13,425,996 | ) | | | (255,898 | ) | | | (1,407,612 | ) |
| | |
| | |
| | |
| | |
| |
| Net unrealized appreciation | | | (2,396,382 | ) | | | 7,162,901 | | | | 720,817 | | | | 90,107,732 | |
| Undistributed ordinary income | | | — | | | | 2,467,641 | | | | — | | | | 279,208 | |
| Undistributed long-term capital gains | | | — | | | | — | | | | — | | | | 2,612,224 | |
| Capital loss carryforward | | | (1,172,377 | ) | | | — | | | | (3,183,740 | ) | | | — | |
| | |
| | |
| | |
| | |
| |
| Accumulated earnings (deficit) | | $ | (3,568,759 | ) | | $ | 9,630,542 | | | $ | (2,462,923 | ) | | $ | 92,999,164 | |
| | |
| | |
| | |
| | |
| |
Unused capital loss carryforwards as of October 31, 2010, were as follows:
| | | Amount | | Expires October 31, |
| | |
| |
|
| Large Cap Fund | | $ | 683,175 | | | 2015 | |
| Large Cap Fund | | | 8,818,067 | | | 2016 | |
| Large Cap Fund | | | 4,164,926 | | | 2017 | |
| Mid Cap Fund | | | 958,128 | | | 2016 | |
| Mid Cap Fund | | | 3,520,337 | | | 2017 | |
| Small Cap Fund | | | 10,278,985 | | | 2016 | |
| Small Cap Fund | | | 4,599,108 | | | 2017 | |
105
The FBR Funds
Notes to Financial Statements (continued)
| | | Amount | | Expires October 31, |
| | |
| |
|
| Large Cap Financial Fund | | $ | 10,229 | | | 2016 | |
| Large Cap Financial Fund | | | 1,162,148 | | | 2017 | |
| Technology Fund | | | 1,275,695 | | | 2016 | |
| Technology Fund | | | 1,908,045 | | | 2017 | |
During the year ended October 31, 2010, the Large Cap Fund, Mid Cap Fund, Small Cap Fund, Focus Fund, Large Cap Financial Fund, Small Cap Financial Fund and the Technology Fund utilized $1,461,832, $703,394, $1,065,369, $9,577,506, $2,235,403, $6,355,292, and $1,406,135 of capital loss carryforwards, respectively. The capital loss carryforwards may be utilized in future years to offset net realized capital gains, if any, prior to distributing such gains to shareholders.
The following reclassifications, the result of permanent differences between financial statement and income tax reporting requirements, have been made to the components of capital. These reclassifications have no impact on the net assets or net asset value per share of the Funds.
| | | | | | Accumulated | | | | | |
| | | Undistributed | | Net Realized | | | Paid-In | |
| | | Income (Loss) | | Gain (Loss) | | | Capital | |
| | |
| |
| | |
| |
| Large Cap Fund | | $ | — | | $ | (14,814,773 | ) | | $ | 14,814,773 | |
| Mid Cap Fund | | | — | | | (5,068,954 | ) | | | 5,068,954 | |
| Small Cap Fund | | | — | | | (15,990,745 | ) | | | 15,990,745 | |
| Focus Fund | | | 9,661,856 | | | (282,614 | ) | | | (9,379,242 | ) |
| Large Cap Financial Fund | | | 305,316 | | | 7,370 | | | | (312,686 | ) |
| Small Cap Financial Fund | | | (12,048 | ) | | (1,882 | ) | | | 13,930 | |
| Technology Fund | | | 136,272 | | | — | | | | (136,272 | ) |
The Funds have analyzed their tax positions taken on Federal income tax returns for all open tax years (tax years ended March 31, 2007 through 2009) or expected to be taken in the Funds October 31, 2010 tax returns, and have concluded that no provision for income tax is required in their financial statements.
8. Investments in Affiliates
Affiliated issuers, as defined by the 1940 Act, are those in which a Fund’s holdings represent 5% or more of the outstanding voting securities of the issuer. A summary of each Fund’s investments in affiliates, if any, for the year ended October 31, 2010, is noted below:
| | | SHARE ACTIVITY | | | | | | | | | | | |
| | |
| | | | | | | | | | | |
| | | Balance | | | | | | | Balance | | Realized | | | | Value | | Acquisition |
| Affiliate | | 10/31/09 | | Purchases | | Sales | | | 10/31/10 | | Gain (Loss) | | Dividends | | 10/31/10 | | Cost |
|
| FBR Focus Fund | | | | | | | | | | | | | | | | | |
99 Cents Only Stores | | 5,690,974 | | — | | (1,880,739 | ) | | 3,810,235 | | $2,772,242 | $ | — | | $58,753,824 | | $38,109,786 |
Dynamex, Inc. | | 811,824 | | 89,491 | | — | | | 901,315 | | — | | — | | 19,053,799 | | 15,434,675 |
106
The FBR Funds
Notes to Financial Statements (continued)
9. Payment by Affiliate
During the fiscal year ended October 31, 2009, Fund Advisers voluntarily reimbursed the FBR Small Cap Fund $7,834, in connection with the Fund’s inadvertent investment in the shares of another investment company which was made by Fund Adviser in excess of applicable investment limitations. This reimbursement has been classified in the Fund’s Statement of Operations, Statement of Changes in Net Assets and the Financial Highlights as “Net increase from payments by affiliates”.
10. Commitments and Contingencies
In the normal course of business, the Funds enter into contracts that contain a variety of representations and warranties and which provide general indemnifications. The Funds’ maximum exposure under these arrangements is unknown, as this would involve future claims that may be made against the Funds that have not yet occurred. However, based on experience, the Funds expect the risk of loss to be remote.
11. Subsequent Events
ASC Topic 855, “Subsequent events” occurring after October 31, 2010 have been evaluated for potential impact to this report through the date the financial statements were issued. There were no subsequent events to report that would have a material impact on the Funds’ financial statements other than a reverse stock split of 1:18 with respect to the I Class shares of the Focus Fund which was effective as of the close of business on December 10, 2010.
12. Acquisition and Reorganization
On March 12, 2010, the FBR Large Cap Fund acquired all of the assets and liabilities of AFBA 5Star Large Cap Growth Fund. The acquisition was accomplished by a tax-free exchange of 149,555 shares of Investor Class and 3,226,962 shares of I Class of the fund (valued at $31,894,866) for all of the assets and liabilities of AFBA 5Star Large Cap Growth Fund. The acquired fund then distributed the shares it received from the fund to its shareholders. AFBA 5Star Large Cap Growth Fund’s net assets on that date were $31,889,385 including $2,287,467 of unrealized appreciation, and $(14,814,733) of accumulated net realized loss on investments. The aggregate net assets of the fund after the acquisition were $51,870,712.
On March 12, 2010, the FBR Mid Cap Fund acquired all of the assets and liabilities of AFBA 5Star Mid Cap Fund. The acquisition was accomplished by a tax-free exchange of 279,797 shares of Investor Class and 1,201,247 shares of I Class of the fund (valued at $14,367,167) for all of the assets and liabilities of AFBA 5Star Mid Cap Fund. The acquired fund then distributed the shares it received from the fund to its shareholders. AFBA 5Star Mid Cap Fund’s net assets on that date were $14,367,167 including $673,442 of unrealized appreciation, and $(5,068,954) of accumulated net realized loss on investments. The aggregate net assets of the fund after the acquisition were $21,225,730.
107
The FBR Funds
Notes to Financial Statements (continued)
On March 12, 2010, the FBR Small Cap Growth Fund, formerly, FBR Pegasus Small Cap Growth Fund acquired all of the assets and liabilities of AFBA 5Star Small Cap Fund. The acquisition was accomplished by a tax-free exchange of 1,199,929 shares of Investor Class and 860,878 shares of I Class of the fund (valued at $21,761,430) for all of the assets and liabilities of AFBA 5Star Small Cap Fund. The acquired fund then distributed the shares it received from the fund to its shareholders. AFBA 5Star Small Cap Fund’s net assets on that date were $21,761,430 including $703,098 of unrealized appreciation. The aggregate net assets of the fund after the acquisition were $29,221,690. Effective as of the close of business on August 27, 2010, the FBR Pegasus Small Cap Growth Fund™ (the “Acquired Fund”) was reorganized into the FBR Small Cap Fund (the “Acquiring Fund”) in a transaction pursuant to which all of the assets of the Acquired Fund were transferred to the Acquiring Fund and shareholders of the Acquired Fund became shareholders of the Acquiring Fund. Accordingly, as of the closing date, shares of the Acquired Fund were no longer offered or sold. FBR Pegasus Small Cap Growth™ net assets on that date were $21,961,696 including ($1,858,984) of unrealized depreciation and ($15,943,462) accumulated net realized loss on investments. The aggregate net assets of the fund after the reorganization was $31,347,737.
On March 12, 2010, the FBR Technology Fund acquired all of the assets and liabilities of AFBA 5Star Science & Technology Fund. The acquisition was accomplished by a tax-free exchange of 331,367 shares of Investor Class and 576,427 shares of I Class of the fund (valued at $9,498,214) for all of the assets and liabilities of AFBA 5Star Science & Technology Fund. The acquired fund then distributed the shares it received from the fund to its shareholders. AFBA 5Star Science & Technology Fund’s net assets on that date were $9,498,214 including $58,764 of unrealized appreciation. The aggregate net assets of the fund after the acquisition were $20,831,958. The aggregate net assets of the fund after the acquisition were $20,831,958. Immediately following this acquisition, the FBR Technology Fund I Class shares commenced operations.
Effective as of the close of business on October 22, 2010, the R Class shares of the FBR Focus Fund, FBR Small Cap Financial Fund and FBR Gas Utility Index Fund were closed. Outstanding shares were exchanged for Investor Class shares of the same Fund having an aggregate net asset value equal to the aggregate net asset value of the R Class shares so exchanged.
108
The FBR Funds
Report of Independent Registered Public Accounting Firm
To the Board of Trustees and Shareholders
The FBR Funds
Arlington, Virginia
We have audited the accompanying statements of assets and liabilities, including the portfolios of investments, of the FBR Large Cap Fund, FBR Mid Cap Fund, FBR Small Cap Fund, FBR Focus Fund, FBR Large Cap Financial Fund, FBR Small Cap Financial Fund, FBR Technology Fund, and FBR Gas Utility Index Fund (the “Funds”), each a series of The FBR Funds as of October 31, 2010, and the related statements of operations of the Funds for the year then ended, the statements of changes in net assets for each of the two years in the period then ended and financial highlights of the Funds for the period indicated thereon. These financial statements and financial highlights are the responsibility of the Funds’ management. Our responsibility is to express an opinion on these financial statements and financial highlights based on our audits.
We conducted our audits in accordance with standards of the Public Company Accounting Oversight Board (United States). Those standards require that we plan and perform the audits to obtain reasonable assurance about whether the financial statements and financial highlights are free of material misstatement. The Funds are not required to have, nor were we engaged to perform, an audit of the Funds’ internal control over financial reporting. Our audits included consideration of internal control over financial reporting as a basis for designing audit procedures that are appropriate in the circumstances, but not for the purposes of expressing an opinion on the effectiveness of the Funds’ internal control over financial reporting. Accordingly, we express no such opinion. An audit includes examining, on a test basis, evidence supporting the amounts and disclosures in the financial statements. Our procedures included confirmation of securities owned as of October 31, 2010, by correspondence with the custodian and brokers or by other appropriate auditing procedures where replies from brokers were not received. An audit also includes assessing the accounting principles used and significant estimates made by management, as well as evaluating the overall financial statement presentation. We believe that our audits provide a reasonable basis for our opinion.
In our opinion, the financial statements and financial highlights referred to above present fairly, in all material respects, the financial position of the FBR Large Cap Fund, FBR Mid Cap Fund, FBR Small Cap Fund, FBR Focus Fund, FBR Large Cap Financial Fund, FBR Small Cap Financial Fund, FBR Technology Fund, and FBR Gas Utility Index Fund as of October 31, 2010, the results of their operations, the changes in their net assets, and the financial highlights for the periods referred to above in conformity with accounting principles generally accepted in the United States of America.
TAIT, WELLER & BAKER LLP
Philadelphia, Pennsylvania
December 29, 2010
109
The FBR Funds
Important Supplemental Information (unaudited)
Dividends Received Deduction
For corporate shareholders, the following ordinary dividends paid during the fiscal year ended October 31, 2010 qualify for the corporate dividends received deduction:
| Large Cap Fund | | 100.00 | % |
| Mid Cap Fund | | 100.00 | % |
| Small Cap Fund | | 36.56 | % |
| Small Cap Financial Fund | | 100.00 | % |
| Gas Utility Index Fund | | 82.53 | % |
Proxy Voting Guidelines
Fund Advisers is responsible for exercising the voting rights associated with the securities purchased and held by the Funds. A description of the policies and procedures Fund Advisers uses in fulfilling this responsibility is included in the Funds’ Statement of Additional Information and is available without charge, upon request, by calling 888.888.0025. The policies and procedures are also available on the Securities and Exchange Commission’s (“SEC”) website at http://www.sec.gov. Information on how the Funds voted proxies relating to portfolio securities during the most recent 12 month period ended June 30 is available without charge, upon request, by calling 888.888.0025 and is also available on the SEC’s website at http://www.sec.gov.
Portfolio Holdings
The Funds file their complete schedule of holdings with the SEC for the first and third quarters of each fiscal year on Form N-Q. The Funds’ Form N-Q is available on the SEC’s website at http://www.sec.gov. You may review and make copies at the SEC’s Public Reference Room in Washington, D.C. You may also obtain copies after paying a duplicating fee by writing the SEC’s Public Reference Section, Washington, D.C. 20549-0102 or by electronic request to publicinfo@sec.gov. Information on the operation of the Public Reference Room may be obtained by calling 800.SEC.0330. A copy of the quarterly holdings report is available, without charge, upon request, by calling 888.888.0025.
Approval of the Continuation of the Investment Advisory Agreements for the Funds
The Investment Company Act of 1940, as amended (the “1940 Act”) requires the Board of Trustees (the “Board” or the “Trustees”), at an in-person meeting of the Board called for such purpose, to consider the approval of any investment advisory agreement intended for use in connection with the Funds. The law requires the Board to request and evaluate such information as the Trustees determine is necessary to allow them to properly consider the approval of any investment advisory agreements. The law also requires each investment adviser to furnish the Trustees with such information that is reasonably necessary for the Trustees to evaluate the terms of the investment advisory agreements.
During the Funds’ most recent fiscal year ended October 31, 2010, the Board considered the renewal of the investment advisory agreements for the Funds on two separate occasions. The Board initially met on October 20, 2010, prior to their required in-person meeting, in order to review the materials and to discuss the proposed contract renewal
110
The FBR Funds
Important Supplemental Information (unaudited) (continued)
process with representatives of FBR Fund Advisers, Inc. (“Fund Advisers”). Then, at an in-person meeting held on October 21, 2010, the Board engaged in a thorough review process in order to determine whether or not to continue the investment advisory agreements with Fund Advisers with respect to each of the Funds (the “Advisory Agreements”).
In determining whether to renew the Advisory Agreements, the Board requested, and Fund Advisers provided, information and data relevant to the Board’s consideration. This included information regarding the investment performance of the Funds and information regarding the fees and expenses of the Funds, as compared to other similar mutual funds, as well as information regarding the administration and operation of the Funds and their distribution and marketing.
As part of its deliberations, the Board also considered and relied upon the information about the Funds and Fund Advisers that had been provided to them throughout the year in connection with their regular Board meetings at which they engage in the ongoing oversight of the Funds and their operations. The Independent Trustees were counseled during this process by independent legal counsel, as such term is defined in the rules under the 1940 Act, who reviewed with them their duties and responsibilities with respect to their consideration of the continuation of the Advisory Agreements.
During their meeting, the Board reviewed relevant information and data provided by Fund Advisers in response to written questions from the Independent Trustees and the Independent Trustees met with independent legal counsel to the Independent Trustees to discuss their evaluation of the information provided by Fund Advisers. The Board met with representatives of Fund Advisers and discussed with them, among other things, their investment process, the investment results of the Funds, compensation arrangements for the portfolio managers, brokerage practices used for the Funds, the cost of providing the services and the profitability of the advisory arrangements to Fund Advisers, the extent to which Fund Advisers had achieved economies of scale, the extent to which shareholders participated in those economies of scale, and matters relating to the distribution and marketing of the Funds.
The Board reviewed matters with respect to the proposed continuation of the Advisory Agreements with Fund Advisers and the Board reviewed information and materials regarding the investment advisory fees. Representatives of Fund Advisers stated that the investment advisory fees for the Funds are not presently subject to any asset-based breakpoints, but that Fund Advisers has in place with respect to each of the Funds an expense limitation agreement limiting total annual operating expenses of each of the Funds. Fund Advisers indicated that it intended to continue maintaining the expense limitation for the Funds until February 28, 2013. The Board noted that Fund Advisers only provides investment advisory services to the FBR Funds and that Fund Advisers does not have any other clients or accounts.
The Board received and considered performance and expense information, including total return performance information, for applicable one-, three-, five-, and 10-year periods. The Board then considered information regarding each of the Funds separately and
111
The FBR Funds
Important Supplemental Information (unaudited) (continued)
reviewed with the representatives of Fund Advisers various performance and expense information for each of the Funds, including each Fund’s performance against its benchmark and its peers, changes in total assets for each of the Funds, the costs of providing services, the profitability of the management of the Funds to Fund Advisers, and distribution arrangements for each of the Funds, as follows:
1. Large Cap Financial Fund. The Board first reviewed information and materials regarding the Large Cap Financial Fund, noting the Fund’s fees, expenses and performance results, and compared such information to comparable funds and to the Fund’s relevant benchmark index. The Board members reviewed the Large Cap Financial Fund’s investment performance for the one-, three-, five- and 10-year periods. The Board noted that the Investor Class of the Fund underperformed its primary benchmark index, the S&P 500 Index, a secondary index, the Philadelphia Bank Index, and its total universe group for the one-year period ended August 31, 2010, but outperformed its total universe group for the 3-, 5- and 10-year periods. The Board also noted the fact that the Large Cap Financial Fund effected a limited amount of brokerage transactions through the Fund’s affiliate, FBR Capital Markets & Co., Inc. (“FBR & Co.”), and further noted that information concerning the nature and amount of these affiliated brokerage transactions is reported to the Board on a quarterly basis in accordance with the Fund’s Rule 17e-1 reporting requirements. The Board concluded that, in light of all the circumstances, the level of trades placed through FBR & Co. was reasonable, especially in light of the fact that FBR & Co. is active in the markets for many financial services stocks, thus making it reasonable for the Fund to utilize FBR & Co. for some of its portfolio brokerage transactions. The Board reviewed the Fund’s performance with the portfolio manager for the Large Cap Financial Fund.
2. Small Cap Financial Fund. The Board reviewed information and materials regarding the Small Cap Financial Fund, noting the Fund’s fees, expenses and performance results, and compared such information to comparable funds and to the Fund’s relevant benchmark index. The Board reviewed the Small Cap Financial Fund’s investment performance for the one-, three-, five- and 10-year periods. The Board noted that the Investor Class of the Fund underperformed its primary benchmark index, the Russell 2000 Index, and a secondary index, the NASDAQ Bank Index, but outperformed its total universe group for the one-year period ended August 31, 2010. The Board also noted that the Fund outperformed the total universe group for the three-, five- and 10-year periods. The Board also noted the fact that the Small Cap Financial Fund effected a limited amount of brokerage transactions through FBR & Co., and further noted that information concerning the nature and amount of these affiliated brokerage transactions is reported to the Board on a quarterly basis in accordance with the Fund’s Rule 17e-1 reporting requirements. The Board concluded that, in light of all the circumstances, the level of trades placed through FBR & Co. was reasonable, especially in light of the fact that FBR & Co. is active in the markets for many financial services stocks, thus making it reasonable for the Fund to utilize FBR & Co. for some of its portfolio brokerage transactions. The Board reviewed the Fund’s performance with the portfolio manager for the Small Cap Financial Fund.
112
The FBR Funds
Important Supplemental Information (unaudited) (continued)
3. Focus Fund. The Board next reviewed information and materials regarding the Focus Fund, noting the Fund’s fees, expenses and performance results, and compared such information to comparable funds and to the Fund’s relevant benchmark index. The Board reviewed the Focus Fund’s investment performance for the one-, three-, five- and 10-year periods. The Board noted that the Investor Class of the Fund outperformed its primary benchmark index, the Russell 2000 Index, but underperformed its total universe group for the one-year period ended August 31, 2010. The Board also noted that the Fund outperformed the total universe group for the three-, five- and 10-year periods. The Board noted that the research team consisting of the analysts who had assisted in managing the Focus Fund in their previous positions with the Fund’s previous investment sub-adviser had joined Fund Advisers as the portfolio managers to the Fund and the Board reviewed the Focus Fund’s performance since the portfolio managers had joined Fund Advisers, noting that the performance has been favorable as compared to the Fund’s benchmark index during this period.
4. Technology Fund. The Board next reviewed information and materials regarding the Technology Fund, noting the Fund’s fees, expenses and performance results, and then compared such information to comparable funds and to the Fund’s relevant benchmark index. The Board reviewed the Technology Fund’s investment performance for the one-, three- and five-year periods, noting that the commencement of the Fund’s investment operations was February 1, 2002. The Board noted that the Investor Class of the Fund outperformed its primary benchmark index, the S&P 500 Index, and tracked, but underperformed a secondary index, the PSE Technology Index, and its total universe group for the one-year period ended August 31, 2010, as well as the three- and five- year periods. The Board reviewed the Fund’s performance with the co-portfolio managers for the Technology Fund and the Board took into consideration Fund Advisers’ plans for addressing the Fund’s performance results.
5. Gas Utility Index Fund. The Board then reviewed information and materials regarding the Gas Utility Index Fund, noting the Fund’s fees, expenses and performance results, and compared such information to comparable funds and to the Fund’s relevant benchmark index. The Board noted that only this Fund among the Equity Funds operated as an index fund. The Board members also reviewed the Gas Utility Index Fund’s investment performance for the one-, three-, five- and 10-year periods. The Board noted that the Investor Class of the Fund out performed its primary benchmark index, the S&P 500 Index, and tracked but slightly underperformed its secondary benchmark index, the American Gas Association Stock Index, and outperformed its total universe group for the one-, three-, five- and 10-year periods ended August 31, 2010. The Board reviewed the Fund’s performance with the portfolio manager for the Gas Utility Index Fund and discussed the applicable indexes being utilized.
6. Large Cap Fund. The Board reviewed information and materials regarding the Large Cap Fund, noting the Fund’s fees, expenses and performance results, and then compared such information to comparable funds and to the Fund’s relevant benchmark index. The Board members noted the Large Cap Fund’s investment performance for the one- and three-year periods, noting that the commencement of the Fund’s investment operations
113
The FBR Funds
Important Supplemental Information (unaudited) (continued)
was November 14, 2005. The Board also noted that the Investor Class of the Fund underperformed its benchmark, the S&P 500 Index, and its peers for the one-year period ended August 31, 2010, but outperformed the benchmark and its peers for the three-year period. The Board discussed the Fund’s performance with representatives of Fund Advisers.
7. Small Cap Fund. The Board next reviewed information and materials regarding the Small Cap Fund, noting that Fund’s fees, expenses and performance results, then compared such information to comparable funds and the Fund’s relevant benchmark index. The Board noted the Fund’s investment performance for the one- and three- year periods, noting that the commencement of the Fund’s investment operations was February 28, 2007. The Board also noted that the Investor Class of the Fund underperformed its benchmark index, the Russell 2000 Index, and its total universe group for the one-year period ended August 31, 2010, but outperformed the benchmark and its peers for the three-year period. The Board also noted that the Pegasus Small Cap Growth Fund, a fund with the same portfolio manager, had been reorganized into the Small Cap Fund, effective August 27, 2010, which resulted in an increase in the amount of assets in the Fund. The Board discussed the Fund’s performance with representatives of Fund Advisers.
8. Mid Cap Fund. The Board reviewed information and materials regarding the Mid Cap Fund, noting that Fund’s fees, expenses and performance results, then compared such information to comparable funds and the Fund’s relevant benchmark index. The Board members noted the Fund’s investment performance for the one- and three-year periods, noting that the commencement of the Fund’s investment operations was February 28, 2007. The Board also noted that the Investor Class of the Fund outperformed its benchmark, the Russell Midcap Index, but underperformed its total universe group for the one-year period ended August 31, 2010. The Board also noted that the Fund had outperformed the benchmark and its peers for the three-year period. The Board discussed the Fund’s performance with representatives of Fund Advisers.
The Board reviewed the proposed continuation of each of the Advisory Agreements. Among the factors the Board considered was the overall performance of the Funds relative to the performance of other mutual funds in each Fund’s peer group on a long-term basis and over shorter time periods (discussed above). The Board noted the long-term relationship between Fund Advisers and the Funds and the efforts that have been undertaken by Fund Advisers to foster the growth and development of the Funds since the inception of each of the Funds. In addition, the Board compared expenses of each Fund to the expenses of its peers, noting that the expenses for each of the Funds compared favorably with industry averages for other funds of similar size after the imposition of applicable expense limits. They noted the range of investment advisory and administrative services provided by Fund Advisers and its affiliates to the Funds and the level and quality of these services, and in particular, they noted the quality of the personnel providing these services. The Board took into account the background and experience of each of Fund Advisers’ senior management and expertise of, and the amount of attention given to each Fund by, Fund Advisers’ investment personnel. The Board also reviewed financial
114
The FBR Funds
Important Supplemental Information (unaudited) (continued)
information concerning Fund Advisers and its affiliates relating to the operation of the Funds, noting the overall profitability of the relationship with the Funds to Fund Advisers and the financial soundness of Fund Advisers as demonstrated by the financial information provided, and the level of profitability was determined to be reasonable and consistent with relevant industry averages. The Board considered the extent to which Fund Advisers and its affiliates utilize their own resources to support certain of the sales and marketing efforts related to the Funds, and in considering the profitability of Fund Advisers relating to its management of the Funds, the Board considered the level of profitability without taking into consideration the impact of these sales marketing and marketing costs that are borne directly by Fund Advisers.
The Board further reviewed the Funds’ brokerage practices and best-execution procedures, and noted that these were reasonable and consistent with standard industry practice. The Board considered the receipt by Fund Advisers of research and execution services in exchange for payment of brokerage commissions. The Board noted that Fund Advisers maintains arrangements to direct Fund brokerage in exchange for third party research, but that the amount of such brokerage was relatively limited relative the Funds’ total trades and that Fund Advisers represented that trading done with various brokerage firms is done in a manner that is consistent with relevant requirements relating to the receipt of research in connection with brokerage transactions. The Board took note of the fact that a certain amount of brokerage for the Funds is handled by a brokerage affiliate of Fund Advisers, and the Board noted Fund Advisers’ representations that such brokerage is conducted in a manner consistent with applicable rules relating to brokerage placed through affiliated entities. The Board determined that the amount of affiliated brokerage was fair and reasonable and done in accordance with the applicable regulatory requirements. The Board also reviewed information regarding the manner in which the Funds’ affiliated broker utilizes certain electronic communications networks (“ECNs”) for purposes of effectuating portfolio trades for some of the Funds and the way in which the use of these ECNs can be beneficial to the affiliated brokerage firm when trading on behalf of the Funds.
The Board also noted the fact that an affiliate of Fund Advisers, FBR Investment Services, Inc. (“FBRIS”), serves as the distributor of the shares of the Funds and receives distribution fees from the Funds for serving in that role. The Board considered and discussed the activities routinely engaged in by FBRIS in order to distribute and market the Funds. The Board reviewed the distribution arrangements maintained by FBRIS for the Funds, noting the extensive sales arrangements for the Funds on various mutual fund sales platforms and the manner in which the distribution fees paid by those of the Funds that pay distribution fees are utilized in connection with these arrangements. The Board also noted with respect to the distribution arrangements of the Funds the distribution capabilities for the Funds.
The Board also considered and reviewed information regarding the administrative services fees paid to Fund Advisers by the Funds for providing certain types of administrative and oversight services. The Board determined that the administrative fees paid to Fund Advisers are fair and reasonable in connection with the types of services provided by Fund
115
The FBR Funds
Important Supplemental Information (unaudited) (continued)
Advisers to the Funds and that they are reasonable fees to be paid in addition to the investment advisory fees paid by the Funds to Fund Advisers given that the administrative services are separate and distinct services apart from the investment advisory services being provided to the Funds by Fund Advisers.
The Independent Trustees met separately with the independent legal counsel to the Independent Trustees in order to consider the proposed continuation of the Advisory Agreements. At the conclusion of their sessions, the Independent Trustees had determined that they had received sufficient information to allow them to take action with respect to their consideration of the continuation of the Advisory Agreements.
In reaching their conclusion with respect to the continuation of the Agreements, the Trustees did not identify any one single factor as being controlling, rather, the Board took note of a combination of factors that influenced their decision making process. The Board did, however, identify the overall favorable investment performance of the Funds and management’s demonstrated commitment to the continued enhancement of investment performance, the commitment of Fund Advisers to the successful operation of the Funds, and the level of expenses of the Funds, as well as the continued use of expense limitation agreements in order to reduce the overall operating expenses of the Funds, as being important elements of their consideration. The Board also considered the effectiveness of the compliance programs of the Funds and Fund Advisers in accordance with applicable requirements relating to mutual funds and their investment advisers. In conducting their review of these matters, the Board members considered each of the Funds separately, on a fund by fund basis. Based upon their review and consideration of these factors and other matters deemed relevant by the Board in reaching an informed business judgment, a majority of the Board of Trustees, including a majority of the Independent Trustees, concluded that the terms of the Advisory Agreements are fair and reasonable and the Board voted to renew the Advisory Agreements for an additional one-year period, subject to the applicable limitations on the total operating expenses of the Funds as considered and approved at the meeting.
116
The FBR Funds
Important Supplemental Information (unaudited) (continued)
Information About Trustees and Officers
Information pertaining to the Trustees and Officers of the Trust is set forth below. The address for each Trustee and Officer is 1001 Nineteenth Street North, Arlington, Virginia, 22209 unless otherwise stated. The statement of additional information (SAI) includes additional information about the Trustees and is available without charge upon request by calling 888.888.0025.
| Name, Age, Address | Term of
Office*
and Length
of Time
Served** | Portfolios
Overseen in
the Trust
and Fund
Complex*** | Principal Occupation
During Past 5 Years | Other
Directorships |
| Michael A. Willner, 54 | Independent Board Chair; Trustee Since 1997 | 10 | CEO AlphaGrip, Inc. January 2001 to present. | None |
| Charles O. Heller, 74 | Trustee Since 2003 | 10 | President, Annapolis Capital Group, since 2005; Athlone Global Security (venture capital firm), 2006-2008; Beacon Global LLC (venture capital firm), 2003-2005. | None |
| Reena Aggarwal, 53 | Trustee Since 2006 | 10 | Professor, Georgetown University, 2000 to present; Deputy Dean, McDonough School of Business, Georgetown University, 2006-2008; Interim Dean, 2004-2005; Visiting Professor MIT Sloan School of Management, 2005-2006. | IndexIQ Trust |
| William E. Cole, Jr., 61 | Trustee Since 2006 | 10 | Retired, 2006. Partner, Ernst & Young LLP, 1972-2006. | None |
David Ellison, 52†
100 Federal Street
Boston, MA 02110 | Trustee Since 2003 President Since 2001 | 10 | Director, CIO and President, FBR Fund Advisers, Inc., since December 1999; Portfolio Manager, FBR Fund Advisers, Inc., since October 1996. | None |
Winsor H. Aylesworth, 63
100 Federal Street
Boston, MA 02110 | Executive Vice President Since 1999 | 10 | Portfolio Manager, FBR Fund Advisers, Inc., since September 1998. | N/A |
| William B. Sanders III, 46 | Executive Vice President Since 1999 | 10 | Senior Vice President of Fund Operations, FBR Fund Advisers, Inc., since August 1999 and Head Trader for FBR Fund Advisers, Inc., since January 1997. | N/A |
Guy F. Talarico, 55
150 Broadway
Suite 302
New York, NY 10038 | Chief Compliance Officer Since 2006 | 10 | CEO of Alaric Compliance Services, LLC since January 2006. Co-Chief Executive Officer of EOS Compliance Services, LLC June 2004 - December 2005. | N/A |
| Kimberly J. Bradshaw, 36 | Treasurer Since 2006 and Secretary Since 2003 | 10 | Employee of FBR since August 1998 serving in various capacities, including Senior Vice President Fund Administration, Chief Compliance Officer of FBR Investment Services, Inc., Transfer Agent Operations Manager, Fund Accounting Supervisor and Vice President and Secretary of Money Management Advisers, Inc., November 2003-March 2006. | N/A |
| Kristin E. Stelljes, 34 | Assistant Treasurer Since 2006 | 10 | Employee of FBR since February 2002, serving in various capacities including Assistant Vice President Fund Administration, Supervisor Fund Administration, Accountant, and Customer Service Representative. | N/A |
| * | | Trustees serve until their resignation, removal or death. |
| ** | | Length of time served is measured from the earliest date of service as a Trustee of any of the Funds or the Predecessor Funds. |
| *** | | The “Fund Complex” consists of all mutual funds advised by FBR Capital Markets Corporation, and its affiliate advisers. |
| † | | Mr. Ellison is considered to be an “Interested Trustee” of the Trust due to his position with FBR Fund Advisers, Inc. |
117
[THIS PAGE INTENTIONALLY LEFT BLANK]
THE FBR FUNDS
888.888.0025
fbrfundsinfo@fbr.com
www.fbrfunds.com |
| |
Investment Adviser
FBR FUND ADVISERS, INC.
1001 NINETEENTH STREET NORTH
ARLINGTON, VIRGINIA 22209 |
| |
Distributor
FBR INVESTMENT SERVICES, INC.
1001 NINETEENTH STREET NORTH
ARLINGTON, VIRGINIA 22209 |
| |
Transfer Agent
JPMORGAN CHASE BANK, N.A.
P.O. BOX 5354
CINCINNATI, OHIO 45201 |
| |
Independent Registered Public Accounting Firm
TAIT, WELLER, AND BAKER LLP
1818 MARKET STREET
PHILADELPHIA, PENNSYLVANIA 19103 |
| |
This report is not authorized
for distribution to prospective
investors unless it is preceded or
accompanied by a current prospectus. |
ITEM 2. CODE OF ETHICS.
As of the end of the period covered by this report, Registrant had adopted a code of ethics (the “Code”) that applies to Registrant’s principal executive officer (“PEO”) and principal financial officer (“PFO”). There were no amendments to the Code during the period covered by the report. The Registrant did not grant any waivers, including implicit waivers, from any provisions of the Code to the PEO or PFO during the period covered by this report. The Registrant undertakes to provide a copy of such code to any person upon request, without charge, by calling 888.888.0025.
ITEM 3. AUDIT COMMITTEE FINANCIAL EXPERT.
The Board of Trustees determined at a meeting held October 24, 2006 that William E. Cole, Jr. qualifies as an Audit Committee Financial Expert and he is “independent” as defined under the relevant Securities and Exchange Commission rules and releases. The Board of Trustees also determined at a meeting held July 23, 2008 that Reena Aggarwal qualifies as an Audit Committee Financial Expert and she is “independent” as defined under the relevant Securities and Exchange Commission rules and releases.
ITEM 4. PRINCIPAL ACCOUNTANT FEES AND SERVICES.
| (a) | | Audit Fees – The aggregate fees billed for the professional services rendered by Tait, Weller & Baker, Registrant’s principal accountant for the audit of the Registrant’s annual financial statements, were $128,200 and $160,500 for all series of the Registrant for the fiscal year ended October 31, 2010 and 2009 respectively. |
| (b) | | Audit Related Fees –There were no fees billed for assurance and related services by Tait, Weller & Baker for the fiscal years ended October 31, 2010 and 2009. |
| (c) | | Tax Fees – The aggregate fees billed by Tait, Weller & Baker, Registrant’s principal accountant for tax compliance, tax advice and tax planning for completing federal and excise tax returns were $24,800 and $30,000 for all series of the Registrant for the fiscal year ended October 31, 2010 and 2009 respectively. |
| (d) | | All Other Fees – There were no additional fees paid for audit and non-audit services other than those disclosed in (a) through (c) above. |
| (e) | | (1) Pursuant to the Registrant’s Audit Committee Charter (“Charter”), the Audit Committee is responsible for approving in advance the firm to be employed as the Registrant’s independent auditor. In addition, the Charter provides that the Audit Committee is responsible for approving any and all proposals by the Registrant, its investment adviser or their affiliated persons or an entity controlling, controlled by, or under common control with the adviser that provides services to the Registrant to employ the independent auditor to render permissible non-audit services to such entity, provided those permissible non-audit services relate directly to the operations and financial reporting of the Registrant. In determining whether to approve non-audit services, the Audit Committee considers whether such services are consistent with the independent auditor’s independence. (2) None of the services described in (b) through (d) above were approved by the audit committee pursuant to paragraph (c)(7)(i)(C) of Rule 2-01 of Regulation S-X. |
| (f) | | Less than fifty percent of the hours expended on the principal accountant’s engagement to audit the Registrant’s financial statements for the most recent fiscal year were attributed to work performed by persons other than the principal accountant’s full-time, permanent employees. |
| (g) | | There were no non-audit services fees billed by the Registrant’s accountant to the Registrant other than those described above. There were no non-audit services fees billed by the Registrant’s accountant to the Registrant’s investment adviser or to any entity controlling, controlled by, or under common control with the adviser that provides ongoing services to the Registrant over the past two years. |
| (h) | | Not applicable as no non-audit services were provided to the Registrant’s investment adviser nor any entity controlling, controlled by, or under common control with the investment adviser that provides ongoing services to the Registrant that were not pre-approved pursuant to Rule 2-01©(7)(ii) of Regulation S-X. |
ITEMS 5. AUDIT COMMITTEE OF LISTED REGISTRANTS.
Not applicable.
ITEM 6. SCHEDULE OF INVESTMENTS.
Contained in Item 1.
ITEM 7. DISCLOSURE OF PROXY VOTING POLICIES AND PROCEDURES FOR CLOSED-END MANAGEMENT INVESTMENT COMPANIES.
Not applicable.
ITEM 8. PORTFOLIO MANAGERS OF CLOSED-END MANAGEMENT INVESTMENT COMPANIES.
Not applicable.
ITEM 9. PURCHASES OF EQUITY SECURITIES BY CLOSED-END MANAGEMENT INVESTMENT COMPANY AND AFFLIIATED PURCHASERS.
Not applicable.
ITEM 10. SUBMISSION OF MATTERS TO A VOTE OF SECURITY HOLDERS.
There have been no material changes to the procedures by which shareholders may recommend nominees to the Board.
ITEM 11. CONTROLS AND PROCEDURES.| (a) | | Based upon their evaluation of the Registrant’s disclosure controls and procedures as conducted within 90 days of the filing date of this Form N-CSR, the Registrant’s PFO and PEO have concluded that those disclosure controls and procedures provide reasonable assurance that the material information required to be disclosed by the Registrant in this Form N-CSR has been recorded, processed, summarized and reported within the time periods specified in the Securities and Exchange Commission’s rules and forms. |
| (b) | | There were no changes in the Registrant’s internal controls over financial reporting as defined in Rule 30a-3(d) under the Act (17 CFR 270.30a-3(d)) that occurred during the second fiscal half-year of the period covered by this report that has materially affected, or is reasonably likely to materially affect, the Registrant’s internal control over financial reporting. |
ITEM 12. EXHIBITS.
File the exhibits listed below as part of this Form. Letter or number the exhibits in the sequence indicated.| (a) | | (1) Not applicable. |
| | | (2) A separate certification for each principal executive officer and principal financial officer of the Registrant as required by Rule 30a-2(a) under the Act (17 CFR 270.30a-2): Attached herewith. |
| | | (3) Not applicable. |
| (b) | | (1) The certifications required by Rule 30a-2(b) of the Investment Company Act of 1940 and Section 906 of the Sarbanes-Oxley Act of 2002: Attached herewith. |
SIGNATURES
Pursuant to the requirements of the Securities Exchange Act of 1934 and the Investment Company Act of 1940, the registrant has duly caused this report to be signed on its behalf by the undersigned, thereunto duly authorized.
(Registrant) The FBR Funds
| | | | | |
| By (Signature and Title)* | | /s/Kimberly J. Bradshaw | | 12/30/2010 |
| | |
|
| | | Kimberly J. Bradshaw | | Date |
| | | Treasurer, Secretary and Principal Financial Officer |
| | | The FBR Funds | | |
| | | | | |
Pursuant to the requirements of the Securities Exchange Act of 1934 and the Investment Company Act of 1940, this report has been signed below by the following persons on behalf of the registrant and in the capacities and on the dates indicated.
| By (Signature and Title) | | /s/David H. Ellison | | 12/30/2010 |
| | |
|
| | | | | |
| | | David H. Ellison | | Date |
| | | President and Principal Executive Officer | | |
| | | The FBR Funds | | |
| | | | | |
| | | | | |
| | | | | |
| By (Signature and Title) | | /s/Kimberly J. Bradshaw | | 12/30/2010 |
| | |
|
| | | Kimberly J. Bradshaw | | Date |
| | | Treasurer, Secretary and Principal Financial Officer | | |
| | | The FBR Funds | | |
| | | | | |