UNITED STATES
SECURITIES AND EXCHANGE COMMISSION
Washington, D.C. 20549
FORM N-CSR
CERTIFIED SHAREHOLDER REPORT OF REGISTERED
MANAGEMENT INVESTMENT COMPANIES
Investment Company Act file number 811-21503
The FBR Funds
———————————–
(Exact name of registrant as specified in charter)
1001 Nineteenth Street North
Arlington, VA 22209
————————————————
(Address of principal executive offices) (Zip code)
Registrant’s telephone number, including area code: 703.469.1040
William Ginivan
General Counsel
FBR Capital Markets Corp.
Potomac Tower
1001 Nineteenth Street North
Arlington, VA 22209
—————————————————————————
(Name and address of agent for service)
Date of fiscal year end: March 31, 2010
Date of reporting period: March 31, 2010
Form N-CSR is to be used by management investment companies to file reports with the Commission not later than 10 days after the transmission to stockholders of any report that is required to be transmitted to stockholders under Rule 30e-1 under the Investment Company Act of 1940 (17 CFR 270.30e-1). The Commission may use the information provided on Form N-CSR in its regulatory, disclosure review, inspection and policymaking roles.
A registrant is required to disclose the information specified by Form N-CSR, and the Commission will make this information public. A registrant is not required to respond to the collection of information contained in Form N-CSR unless the Form displays a currently valid Office of Management and Budget (“OMB”) control number. Please direct comments concerning the accuracy of the information collection burden estimate and any suggestions for reducing the burden to Secretary, Securities and Exchange Commission, 100 F Street, NE, Washington, DC 20549-0609. The OMB has reviewed this collection of information under the clearance requirements of 44 U.S.C. § 3507.
ITEM 1. REPORT TO SHAREHOLDERS.
The following is a copy of the report transmitted to shareholders pursuant to Rule 30e-1 under the Investment Company Act of 1940 (17CRF 270.30e-1).

THE FBR FUNDS
FBR Balanced Fund
FBR Core Bond Fund
Annual Report
March 31, 2010
[THIS PAGE INTENTIONALLY LEFT BLANK]
The FBR Funds
Annual Letter to Shareholders
Dear Shareholder,
We are pleased to present the Annual Report for the FBR Balanced Fund and FBR Core Bond Fund for the fiscal year ended March 31, 2010.
To investors’ delight, the equity market staged one of the strongest advances in history over the past fiscal year. During the period, the equity market as measured by the S&P 500, a large company index, returned an impressive 49.77%. Since the market hit its low on March 9, 2009, the advance has been extraordinary with the S&P 500 advancing 56.89%. While short-term movements in either direction must be taken into perspective, the strong rebound has started to lift the confidence of investors. Money flow, dominated of late into the fixed income market, is starting to once again return to equities. Investors, who executed the flight to quality in late 2008 and early 2009, are no longer being rewarded with capital appreciation and income streams are difficult at best. During our current environment of historically low interest rates, the yield on fixed income securities, particularly short-term maturities, has been minimal. As of March 31, the yield on a two year Treasury note was only 1.02%. Money market fund returns have been even less with returns barely in positive territory primarily supported by management fee waivers.
As the American economy begins to rebound from one of the worst recessions in decades, the path to recovery may be more extended. High unemployment continues to persist, housing prices are just starting to firm after a period of substantial declines, deficits exist not only at the national level but at many state and local levels as well and tax burdens are rising. Globally, sovereign debt has become troublesome, with Greece, Spain and Portugal experiencing large deficits and downgrades. While the healing process is underway, many systemic issues need to be addressed and government intervention is becoming more commonplace. Rightfully so, many investors remain cautious and more conscious than ever of the trade-off between risk and return.
Against this backdrop, we believe the conservative investment philosophy employed at The FBR Funds bodes well for our shareholders. We strive to manage your money with the objective of protecting principal in declining markets while participating in rising ones. Our motto, Respecting Your Money®, guides all that we do. While short-term performance results can be extreme in both directions, as demonstrated over the past two years, our goal is to deliver out-performance over the long-term with less risk. By reducing volatility, we believe investors are well served. We are pleased to report that The FBR Funds continue to perform well on an absolute and relative basis. By focusing on an investment philosophy that emphasizes companies with strong balance sheets, low debt levels, quality management and sustainable financial results, shareholders of The FBR Funds have been rewarded over time. Each actively managed Fund continues to exceed the return of its benchmark since its inception and peer rankings have been impressive. In fact, 10 of the 11 FBR Funds were awarded a four or five star designation, the top two levels, as of March 31, 2010 by Morningstar, a leading independent mutual fund rating service*. Performance information on both Funds is included in this annual report. Comments and thoughts from each of our portfolio managers are found on the accompanying pages. We hope you find their insight to be informative.
We are pleased to report that the previously announced acquisition of the AFBA 5Star Funds has been completed. As a result, The FBR Funds have expanded in size and breadth. Two AFBA 5Star Funds were renamed and are now part of the FBR family of Funds. The two Funds include the FBR Balanced Fund, a portfolio that includes a blend of large company stocks and high-quality intermediate term fixed
2
income securities and the FBR Core Bond Fund, a high-quality fixed income offering. The equity portion of the FBR Balanced Fund is sub-advised by The London Company and the fixed income portion of the FBR Balanced Fund and FBR Core Bond Fund are sub-advised by Financial Counselors, Inc. We welcome the thousands of shareholders of the former AFBA 5Star Funds to The FBR Funds and look forward to serving your diversified investment needs.
All of us at The FBR Funds want to thank you for your continued support, and we look forward to serving your investment needs in the years ahead. While none of us can predict the future direction and magnitude of the financial markets with any degree of certainty, you have our assurance that we will manage your money according to our time-tested, risk mitigating investment process. Please feel free to contact us at 888.200.4710 with your questions or comments. We also welcome you to visit www.fbrfunds.com for additional information on the Funds.
Sincerely,
David Ellison
President, Chief Investment Officer and Trustee
The FBR Funds
Past performance is no guarantee of future results. The performance data quoted represents past performance and the current performance may be lower or higher than the performance data quoted. The investment return and principal will fluctuate so that investors’ shares, when redeemed, may be worth more or less than their original cost. The performance data does not reflect the deduction of taxes that a shareholder would pay on fund distributions or redemption fees. If reflected, the redemption fee would reduce the performance quoted. To obtain performance data current to the most recent quarter-end please call 888.200.4710 or visit www.fbrfunds.com.
Investors should consider the investment objectives, risks, charges and expenses carefully before investing. This and other important information can be found in the Fund’s prospectus. To obtain a free prospectus, please call 888.200.4710 or visit www.fbrfunds.com. Please read the prospectus carefully before investing.
*The Overall Morningstar RatingTM for a fund is derived from a weighted average of the performance figures associated with its 3-, 5- and 10-yr (if applicable) Morningstar Rating metrics. Morningstar proprietary ratings reflect risk-adjusted performance as of the period stated above. For each fund with at least a 3-yr history, Morningstar calculates a Morningstar RatingTM based on a Morningstar risk-adjusted return measure that accounts for variation in a fund’s monthly performance placing more emphasis on downward variations and rewarding consistent performance. The top 10% of funds in each category receive 5 stars, the next 22.5% receive 4 stars, the next 35% receive 3 stars, the next 22.5% receive 2 stars and the bottom 10% receive 1 star.
3
The FBR Funds
FBR Balanced Fund*
Management Overview; Equity Portfolio
For the fiscal year ended March 31, 2010, the Investor Class of the FBR Balanced Fund returned 32.76% and the I Class returned 33.10%, lagging the S&P 500 Index, which returned 49.77% over the same time period.
Portfolio Manager: Stephen M. Goddard, CFA, Jonathan T. Moody, CFA, and J. Wade Stinnette, Jr., The London Company
Over the past 12 months, how did the equity sleeve of the Balanced Fund perform and what factors contributed to this performance?
The strong performance of our equity sleeve for the one-year period ended March 31st was in spite of the fact that the market’s positive performance was dominated by lower quality securities, an under-exposed area of our portfolio. The market had legitimate concerns about the viability of many over-leveraged companies at the bottom of the recent credit crisis and had accordingly priced many of these lower quality companies for bankruptcy. As the credit crisis passed, and concerns over the viability of these issues eased, the stocks of these companies reacted favorably.
We attribute the relative outperformance of the equity portfolio of the Fund to attractive stock selection during the period. Our investment horizon is three to five years, focusing on our best, undervalued, investment opportunities in higher quality, sustainable franchises. Our investment process is long-term oriented, with a goal of delivering excess, low risk returns over full market cycles.
In the first quarter of 2010, we sold or reduced our position in Altria Group, Berkshire Hathaway, Burlington Northern, IBM, Johnson and Johnson, Markel Preferred, Merck, Novartis, UDR, Inc. and Vulcan Materials. We added to or established positions in Brinks Company, Corrections Corporation of America, Hershey, Verizon,Wells Fargo, and White Mountains Insurance Group. The top five contributors to performance during the quarter were Berkshire Hathaway, Albemarle, Wells Fargo, Universal Corporation, and Intel. Conversely, the top five detractors to performance for the quarter were New Market, Vulcan Materials, Microsoft, Pfizer, and Coca Cola.
To give you a glimpse into the bottom-up selection process, we recently added to Hershey, a dominant, highly profitable franchise in the North American confectionary market. It has basically been forgotten by analysts, due to an ongoing feud between management and the Hershey Trust, hindering its flexibility to maximize shareholder value. It currently trades at a significant discount to its private market value and we believe the takeover probability has increased with the recent mergers of some of its main competitors. The company has had several premium offers over the past decade, and we would not be surprised if another offer surfaces over the next few years and is likely to be successful, due to the limited options remaining to fill the void in the company franchise international distribution.
Our focus on capital preservation and lower downside market participation benefitted overall performance. As a result of our more conservative approach, it is not unusual for the portfolio to lag somewhat during strong bull market moves, but outperform in down markets. Our goal is to outperform the index over the long-term, and importantly, to do that with less risk, as measured by the volatility of the portfolio’s returns.
4
The FBR Funds
FBR Balanced Fund*
Management Overview; Equity Portfolio (continued)
Portfolio managers comments on the Fund and the related investment outlook.
In July of last year, Mohamed El-Erian, co-Chief Executive Officer of Pacific Investment Management Co. (“PIMCO”), currently the largest bond fund manager in the world, compared the stock market rally to being on a “sugar high.” “It feels good for a while but is unsustainable,” El-Erian said. Less than six months later, PIMCO started a stock mutual fund that can also invest in bank loans, junk bonds and distressed securities. “PIMCO is a bond shop, but I think they have a view that bonds will under-perform stocks on a pretty regular basis in the future,” A. Michael Lipper, the head of Lipper Advisory Services Inc., said. We agree and reiterate our belief that stocks will outperform both bonds and cash.
Stocks have continued to outperform through the first quarter of 2010—but why? For starters, the long-term outlook for bonds is not strong. Interest rates are extremely low. For example, buyers of a 10-year U.S. Treasury bond today will receive an average annual return of less than 4% if the bond is held to maturity. Buyers of shorter-term Treasuries would receive even less: 2.7% for five years and less than 2% for three years. With the dividend yield on the S&P 500 Stock Index around 2%, it does not take much in the way of stock price appreciation for the total return of stocks to outperform government bonds. Furthermore, interest rates in our opinion are heading higher. High government fiscal deficits lead to higher debt issuance and ultimately higher interest rates. As rates rise, holders of existing bonds will see their prices decline and principal values erode.
Meanwhile, the ingredients are in place for stocks to continue to outperform. Real Gross Domestic Product, a measure of economic activity, expanded 5.6% in the final quarter of 2009. The largest advance since the third quarter of 2003, and the Index of Leading Economic Indicators continues to point toward sustained economic recovery. Temporary employment, usually a precursor to permanent hiring, has improved along with demand for products and services. Corporate profits rose 8% in the fourth quarter of 2009, and cash flows advanced 4.4%, the most in over a year. As we have stated in the past, many US companies have excess cash on the balance sheet and are in a position to use it to improve shareholder returns through dividend increases, stock repurchases, and M&A activity.
Investors are gradually returning to equities, but at a very cautious pace. Loose monetary policy, generous fiscal stimulus, and positive earnings trends have all contributed to a more stable financial environment and reduced stress in the stock market.
We view the current environment as one of broadening economic recovery marked by improved corporate earnings and accelerated consolidation. While additional short-term corrections cannot be ruled out, we believe the path of least resistance for stocks continues to be up. The prospect for higher returns plus lower volatility will cause investors to put more money in stocks.
5
The FBR Funds
FBR Balanced Fund*
Management Overview; Fixed Income Portfolio
Portfolio Manager: Gary Cloud, CFA and Peter Greig, CFA, Financial Counselors, Inc.
Over the past 12 months, how did the fixed income sleeve of the Balanced Fund perform and what factors contributed to this performance?
Our straightforward approach to fixed income investment management is focused on preserving principal and generating income. We are not managers who leverage client funds to amplify returns. We have a well-defined investment process that emphasizes fundamental credit analysis. We employ a risk-conscious approach that aims to identify attractive opportunities with prudent risk and return, rather than exposing the portfolio to the unpredictability of exotic trading strategies using currency bets and short sales. We seek to invest in high quality, intermediate-term, investment-grade securities that are generally transparent, liquid, and dollar-denominated. And despite our more conservative approach, our relative performance compares well against other managers who may utilize riskier tools to pursue greater yield. That is because, above all, protecting against downside risk is just as important as participating on the upside.
After enduring a difficult recessionary period, economic barometers are starting to show signs of recovery. Corporate America has strengthened its balance sheet, core inflation has been contained and domestic GDP posted 3-4% growth in the first quarter of 2010 and is likely to continue apace into the second quarter of this year. That said, we continue to believe that the economy will face headwinds in the second half of the year, but we do not anticipate anything worse than slowed growth. We believe consumer demand has been largely supported by the top 25% of wage earners, many of whom face the risk of rising tax levels next year and may find it increasingly difficult to sustain their current pace of consumption. State and local governments struggle with the challenge of falling tax revenues and higher expenditures, and the Federal budget picture continues to worsen. Our country’s employment picture is improving, but needs to strengthen further in order to offset the reduction in stimulus programs and the expiration of housing tax credit in order to support sustainable economic growth.
Late last year there was heightened concern for the impending impact that a cessation of the Federal Reserve’s quantitative easing would have on the market, but as it turns out, it was a non-event. Interest rates continue to be at historically low levels, though they cannot stay at these levels indefinitely. U.S. Treasury securities have traded in a tight band in 2010 and we expect the market to have a negative reaction when the Federal Reserve begins to tighten monetary policy. Given the backdrop of a potentially rising interest rate environment, we have found the greatest opportunity for appreciation in high quality, intermediate-term corporate bonds, and have been overweight in the 3-year and 5-year range. The fixed income portion of the Fund has roughly 70% of its holdings in high quality, corporate credit, which includes a slight 8% exposure in high yield exchange-traded funds and preferred securities. This yield-focused and generally high quality blended corporate mix provides additional interest income that can help supplement incremental return if rates begin to move higher.
Portfolio managers comments on the Fund and the related investment outlook.
A change in the forward-looking statement contained within the minutes of the Federal Open Market Committee may be the single biggest market driver to occur over the balance
6
The FBR Funds
FBR Balanced Fund*
Management Overview; Fixed Income Portfolio (continued)
of this year. U.S. Treasury securities have traded in a tight band year-to-date, and we expect the market to have a negative response when the Federal Reserve begins to tighten monetary policy.
European deficit problems have also ignited pressure on global fixed income markets and have served to drive our domestic market rates lower. The potential bailout of Greece by other members of the European Union and the International Monetary Fund was called into question, and fears of contagion rapidly spread. Riskier asset classes were sold off indiscriminately, and investors sought shelter in safer securities, such as U.S. dollar-denominated fixed-income instruments. This will likely help to keep market rates low in the near term, but within a broad trading range based on fears of contagion from the sovereign debt problems in Europe.
In the near-term, we will continue to pursue greater yield opportunities in high quality, intermediate-term corporate bonds. We anticipate maintaining this intermediate-term core strategy as it allows us to pursue attractive yield opportunities in high quality, investment-grade securities. This yield-focused and generally high quality blended corporate mix should also provide additional interest income that can help provide incremental return in a potentially rising rate environment.
* The FBR Balanced Fund is the successor to the AFBA 5Star Balanced Fund. On March 12, 2010, the FBR Balanced Fund acquired all of the assets and all of the liabilities of the AFBA 5Star Balanced Fund in a reorganization transaction that was approved by shareholders of the AFBA 5Star Balanced Fund. The performance presented for the FBR Balanced Fund for the period prior to March 12, 2010 reflects the performance of the applicable classes of shares of the AFBA 5Star Balanced Fund.
The opinions expressed in this commentary reflect those of the Portfolio Manager as of the date written. Any such opinions are subject to change based on market or other conditions. These opinions may not be relied upon as investment advice. Investment decisions for The FBR Funds are based on several factors, and may not be relied upon as an indication of trading intent on behalf of any FBR Fund. Security positions can and do change.
7
The FBR Funds
FBR Balanced Fund
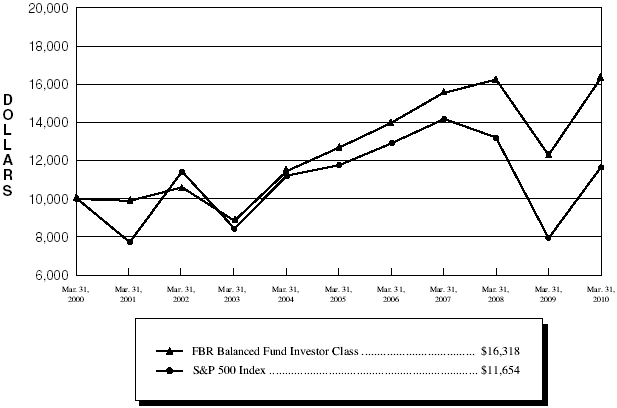
Comparison of Changes in Value of $10,000 Investment in
Investor Class Shares(1)(2)(5) vs. S&P 500 Index(1)(3)
| Total Returns—For the Periods Ended March 31, 2010(4) |
| | | | | | | Annualized | | Annualized | |
| | | | One Year | | Five Year | | Ten Year | |
| | | |
| |
| |
| |
FBR Balanced Fund Investor Class(1)(2)(5) | | | 32.76 | % | | 5.17 | % | | 5.02 | % | |
FBR Balanced Fund I Class(2)(5) | | | 33.10 | % | | 5.42 | % | | 5.18 | % | |
S&P 500 Index(1)(3) | | | 49.77 | % | | 1.92 | % | | (0.65 | )% | |
PAST PERFORMANCE IS NO GUARANTEE OF FUTURE RESULTS.
The performance data quoted represents past performance and the current performance may be lower or higher than the performance data quoted. The investment return and principal will fluctuate so that investors’ shares, when redeemed, may be worth more or less than their original cost. The performance data does not reflect the deduction of taxes that a shareholder would pay on Fund distributions or redemption fees. If reflected, the redemption fee would reduce the performance data quoted. To obtain performance data current to the most recent month-end, please call 888.200.4710 or visit www.fbrfunds.com.
|
| (1) | | The graph assumes a hypothetical $10,000 initial investment in the Investor Class shares of the Fund and reflects the reinvestment of dividends and all Fund expenses. Investors should note that the Fund is a professionally managed mutual fund while the index is unmanaged, does not incur expenses and is not available for investment. The performance of the index includes reinvested dividends, and does not reflect sales charges or expenses. |
| (2) | | FBR Fund Advisers, Inc. and the Fund’s predecessor investment adviser each waived a portion of its advisory fees and agreed to contractually reimburse a portion of the Fund’s operating expenses, as necessary, to maintain existing expense limitations, as set forth in the notes to the financial statements. Total returns shown include fee waivers and expense reimbursements, if any; total returns would have been lower had there been no waiver of fees and/or reimbursement of expenses in excess of expense limitations. |
| (3) | | The S&P 500 Index is a capitalization-weighted index of 500 stocks. The index is designed to represent the broad domestic ecomony through changes in aggregate market value of 500 stocks representing all major industries. |
| (4) | | The total returns shown do not reflect the deduction of taxes that a shareholder would pay on fund distributions or the redemption of fund shares. |
| (5) | | The Fund is the investment successor to the AFBA 5Star Balanced Fund which commenced investment operations on June 3, 1997. On March 12, 2010, the AFBA 5Star Balanced Fund was reorganized into the Fund. The performance presented for the Investor Class of the Fund for the period prior to March 12, 2010 reflects the performance of the Advisor Class shares of the AFBA 5Star Balanced Fund and the performance presented for the I Class of the Fund for the period prior to March 12, 2010 reflects the performance of the Class I shares of the AFBA 5Star Balanced Fund. The performance of the Advisor Class shares of the AFBA 5Star Balanced Fund for the period prior to September 24, 2001 includes the performance of the Class I shares of the AFBA 5Star Balanced Fund. |
8
The FBR Funds
FBR Balanced Fund
Portfolio Summary
March 31, 2010
The following provides a breakdown of the Fund by industry sectors. The underlying securities represent a percentage of the portfolio investments.
| Industry Sector | | % of Total Investments |
| |
|
| Common Stocks | | 60.6 | % |
Consumer Non-Durables | 12.3 | % |
Finance | | 6.7 | % |
Health Technology | | 6.3 | % |
Process Industries | | 6.2 | % |
Technology Services | | 4.3 | % |
Energy Minerals | | 4.1 | % |
Retail Trade | | 4.0 | % |
Transportation | | 3.8 | % |
Utilities | | 3.7 | % |
Commercial Services | | 3.2 | % |
Electronic Technology | | 2.6 | % |
Miscellaneous | | 3.4 | % |
| Corporate Bonds | | 22.2 | % |
Finance | | 10.3 | % |
Communications | | 2.0 | % |
Consumer Non-Durables | 1.3 | % |
Electronic Technology | | 1.3 | % |
Producer Manufacturing | | 1.1 | % |
Non-Energy Minerals | | 0.8 | % |
Consumer Services | | 0.7 | % |
Miscellaneous | | 4.7 | % |
| U.S. Treasury Obligations | 6.8 | % |
| U.S. Government Agency Obligations | 4.6 | % |
| Exchange Traded Funds | 3.3 | % |
| Asset-Backed Securities | 1.4 | % |
| | | | |
| Cash | | 1.1 | % |
9
The FBR Funds
FBR Balanced Fund
Portfolio of Investments
March 31, 2010
|
| | | | | | VALUE |
| | SHARES | | | | (NOTE 2) |
|
| | | | COMMON STOCKS — 60.4% | | | | |
| | | | Commercial Services — 3.2% | | | | |
| | 57,000 | | Corrections Corporation of America* | | $ | 1,132,020 | |
| | 57,000 | | The Brink’s Co. | | | 1,609,110 | |
| | | | | |
| |
| | | | | | | 2,741,130 | |
| | | | | |
| |
| | | | Communications — 2.2% | | | | |
| | 62,000 | | Verizon Communications, Inc. | | | 1,923,240 | |
| | | | | |
| |
| | | | | | | | |
| | | | Consumer Non-Durables — 12.2% | | | | |
| | 78,539 | | Altria Group, Inc. | | | 1,611,620 | |
| | 26,242 | | Brown-Forman Corp., Class B | | | 1,560,087 | |
| | 12,822 | | Lorillard, Inc. | | | 964,728 | |
| | 19,782 | | Philip Morris International, Inc. | | | 1,031,829 | |
| | 40,000 | | The Coca-Cola Co. | | | 2,200,000 | |
| | 35,000 | | The Hershey Co. | | | 1,498,350 | |
| | 30,893 | | Universal Corp. | | | 1,627,752 | |
| | | | | |
| |
| | | | | | | 10,494,366 | |
| | | | | |
| |
| | | | Electronic Technology — 2.6% | | | | |
| | 100,000 | | Intel Corp. | | | 2,226,000 | |
| | | | | |
| |
| | | | | | | | |
| | | | Energy Minerals — 4.1% | | | | |
| | 23,400 | | Chevron Corp. | | | 1,774,422 | |
| | 35,000 | | ConocoPhillips | | | 1,790,950 | |
| | | | | |
| |
| | | | | | | 3,565,372 | |
| | | | | |
| |
| | | | Finance — 6.6% | | | | |
| | 24,795 | | Berkshire Hathaway, Inc., Class B* | | | 2,015,090 | |
| | 83,500 | | Wells Fargo & Co. | | | 2,598,520 | |
| | 3,100 | | White Mountains Insurance Group Ltd. | | | 1,100,500 | |
| | | | | |
| |
| | | | | | | 5,714,110 | |
| | | | | |
| |
| | | | Health Technology — 6.3% | | | | |
| | 50,000 | | Bristol-Myers Squibb Co. | | | 1,335,000 | |
| | 24,700 | | Johnson & Johnson | | | 1,610,440 | |
| | 19,475 | | Novartis AG ADR | | | 1,053,597 | |
| | 83,000 | | Pfizer, Inc. | | | 1,423,450 | |
| | | | | |
| |
| | | | | | | 5,422,487 | |
| | | | | |
| |
10
The FBR Funds
FBR Balanced Fund
Portfolio of Investments (continued)
March 31, 2010
|
| | | | | | | | | | | | | | VALUE | |
| | SHARES | | | | | | | | | | | | (NOTE 2) | |
|
| | | | Process Industries — 6.2% | | | | | | | | | | | |
| | 61,500 | | Albemarle Corp. | | | | | | | | | $ | 2,621,745 | |
| | 26,070 | | NewMarket Corp. | | | | | | | | | | 2,684,949 | |
| | | | | | | | | | | | |
| |
| | | | | | | | | | | | | | 5,306,694 | |
| | | | | | | | | | | | |
| |
| | | | Real Estate Investment Trust — 1.2% | | | | | | | | | | | |
| | 60,599 | | UDR, Inc. | | | | | | | | | | 1,068,966 | |
| | | | | | | | | | | | |
| |
| | | | | | | | | | | | | | | |
| | | | Retail Trade — 4.0% | | | | | | | | | | | |
| | 69,853 | | Lowe’s Companies, Inc. | | | | | | | | | | 1,693,237 | |
| | 31,838 | | Wal-Mart Stores, Inc. | | | | | | | | | | 1,770,193 | |
| | | | | | | | | | | | |
| |
| | | | | | | | | | | | | | 3,463,430 | |
| | | | | | | | | | | | |
| |
| | | | Technology Services — 4.3% | | | | | | | | | | | |
| | 12,300 | | International Business Machines Corp. | | | | | | | | | | 1,577,475 | |
| | 72,248 | | Microsoft Corp. | | | | | | | | | | 2,114,699 | |
| | | | | | | | | | | | |
| |
| | | | | | | | | | | | | | 3,692,174 | |
| | | | | | | | | | | | |
| |
| | | | Transportation — 3.8% | | | | | | | | | | | |
| | 53,500 | | Alexander & Baldwin, Inc. | | | | | | | | | | 1,768,175 | |
| | 16,000 | | FedEx Corp. | | | | | | | | | | 1,494,400 | |
| | | | | | | | | | | | |
| |
| | | | | | | | | | | | | | 3,262,575 | |
| | | | | | | | | | | | |
| |
| | | | Utilities — 3.7% | | | | | | | | | | | |
| | 54,000 | | Dominion Resources, Inc. | | | | | | | | | | 2,219,940 | |
| | 60,315 | | Duke Energy Corp. | | | | | | | | | | 984,341 | |
| | | | | | | | | | | | |
| |
| | | | | | | | | | | | | | 3,204,281 | |
| | | | | | | | | | | | |
| |
| | | | Total Common Stocks (Cost $45,996,802) | | | | | | | | | | 52,084,825 | |
| | | | | | | | | | | | |
| |
| | | | PREFERRED STOCK — N.M. | | | | | | | | | | | |
| | | | Finance — N.M. | | | | | | | | | | | |
| | 13,600 | | Federal National Mortgage Association, Perpetual, Series S, | | | | | | | | | | | |
| | | | 8.25%, due 12/31/10 (Cost $340,000)*(a) | | | | | | | | | | 17,272 | |
| | | | | | | | | | | | |
| |
| | | | | | | | | | | | | | | |
| | | | | | | | | MATURITY | | | | | |
| | PAR | | | | RATE | | | DATE | | | | | |
| |
| | | |
| | |
| | | | | |
| | | | | | | | | | | | | | | |
| | | | ASSET-BACKED SECURITIES — 1.4% | | | | | | | | | | | |
| $ | 1,150,000 | | Chase Issuance Trust, Series 2007-A15, Class A | | 4.960 | % | | 9/17/12 | | | | 1,174,929 | |
| | 37,551 | | Capital Auto Receivables Asset Trust, Series 2006-2, | | | | | | | | | | | |
| | | | Class A3B(a) | | 0.290 | | | 5/15/11 | | | | 37,542 | |
| | | | | | | | | | | | |
| |
| | | | Total Asset-Backed Securities (Cost $1,169,097) | | | | | | | | | | 1,212,471 | |
| | | | | | | | | | | | |
| |
11
The FBR Funds
FBR Balanced Fund
Portfolio of Investments (continued)
March 31, 2010
|
| | | | | | | | | MATURITY | | VALUE | |
| | PAR | | | | RATE | | | DATE | | (NOTE 2) | |
|
| | | | CORPORATE BONDS — 22.2% | | | | | | | | | | | |
| | | | Communications — 2.0% | | | | | | | | | | | |
| $ | 250,000 | | AT&T, Inc. | | 6.700 | % | | | 11/15/13 | | | $ | 285,504 | |
| | 225,000 | | AT&T, Inc. | | 4.950 | | | | 1/15/13 | | | | 241,851 | |
| | 300,000 | | Deutsche Telekom International Finance BV | | 5.875 | | | | 8/20/13 | | | | 327,415 | |
| | 150,000 | | Verizon Communications, Inc. | | 8.750 | | | | 11/1/18 | | | | 188,474 | |
| | 350,000 | | Verizon Communications, Inc. | | 5.250 | | | | 4/15/13 | | | | 382,643 | |
| | 275,000 | | Vodafone Group PLC | | 5.350 | | | | 2/27/12 | | | | 293,342 | |
| | | | | | | | | | | | |
| |
| | | | | | | | | | | | | | 1,719,229 | |
| | | | | | | | | | | | |
| |
| | | | Consumer Durables — 0.4% | | | | | | | | | | | |
| | 300,000 | | Toyota Motor Credit Corp. | | 5.170 | | | | 1/11/12 | | | | 302,274 | |
| | | | | | | | | | | | |
| |
| | | | | | | | | | | | | | | |
| | | | Consumer Non-Durables — 1.3% | | | | | | | | | | | |
| | 150,000 | | Anheuser-Busch InBev Worldwide, Inc.(b) | | 7.750 | | | | 1/15/19 | | | | 178,701 | |
| | 350,000 | | Diageo Capital PLC | | 7.375 | | | | 1/15/14 | | | | 407,367 | |
| | 450,000 | | The Coca-Cola Co. | | 5.350 | | | | 11/15/17 | | | | 495,846 | |
| | | | | | | | | | | | |
| |
| | | | | | | | | | | | | | 1,081,914 | |
| | | | | | | | | | | | |
| |
| | | | Consumer Services — 0.7% | | | | | | | | | | | |
| | 400,000 | | Comcast Corp. | | 5.500 | | | | 3/15/11 | | | | 416,251 | |
| | 150,000 | | Marriott International, Inc., Series J | | 5.625 | | | | 2/15/13 | | | | 159,700 | |
| | | | | | | | | | | | |
| |
| | | | | | | | | | | | | | 575,951 | |
| | | | | | | | | | | | |
| |
| | | | Electronic Technology — 1.3% | | | | | | | | | | | |
| | 275,000 | | Corning, Inc. | | 6.050 | | | | 6/15/15 | | | | 276,501 | |
| | 350,000 | | Dell, Inc. | | 4.700 | | | | 4/15/13 | | | | 376,232 | |
| | 250,000 | | Hewlett-Packard Co. | | 4.500 | | | | 3/1/13 | | | | 267,858 | |
| | 220,000 | | The Boeing Co. | | 5.000 | | | | 3/15/14 | | | | 238,374 | |
| | | | | | | | | | | | |
| |
| | | | | | | | | | | | | | 1,158,965 | |
| | | | | | | | | | | | |
| |
| | | | Energy Minerals — 0.4% | | | | | | | | | | | |
| | 200,000 | | Devon Energy Corp. | | 5.625 | | | | 1/15/14 | | | | 218,918 | |
| | 150,000 | | Husky Energy, Inc. | | 5.900 | | | | 6/15/14 | | | | 163,394 | |
| | | | | | | | | | | | |
| |
| | | | | | | | | | | | | | 382,312 | |
| | | | | | | | | | | | |
| |
| | | | Finance — 10.3% | | | | | | | | | | | |
| | 250,000 | | Aflac, Inc. | | 8.500 | | | | 5/15/19 | | | | 301,509 | |
| | 60,000 | | American Express Credit Corp., Series C | | 7.300 | | | | 8/20/13 | | | | 67,396 | |
| | 275,000 | | American Express Travel Related Services | | | | | | | | | | | |
| | | | Company, Inc.(b) | | 5.250 | | | | 11/21/11 | | | | 287,516 | |
12
The FBR Funds
FBR Balanced Fund
Portfolio of Investments (continued)
March 31, 2010
|
| | | | | | | | | MATURITY | | VALUE | |
| | PAR | | | | RATE | | | DATE | | (NOTE 2) | |
|
| | | | Finance — 10.3% (continued) | | | | | | | | | | | |
| $ | 300,000 | | Associates Corporation of North America | | 6.950 | % | | | 11/1/18 | | | $ | 316,665 | |
| | 250,000 | | Bank of America Corp. | | 5.375 | | | | 9/11/12 | | | | 265,673 | |
| | 300,000 | | Citigroup, Inc. | | 6.000 | | | | 2/21/12 | | | | 318,322 | |
| | 175,000 | | Citigroup, Inc. | | 6.125 | | | | 11/21/17 | | | | 180,290 | |
| | 375,000 | | CME Group, Inc. | | 5.750 | | | | 2/15/14 | | | | 412,040 | |
| | 225,000 | | Credit Suisse USA, Inc. | | 6.125 | | | | 11/15/11 | | | | 241,811 | |
| | 275,000 | | Credit Suisse USA, Inc. | | 5.125 | | | | 8/15/15 | | | | 294,848 | |
| | 250,000 | | Fifth Third Bancorp | | 6.250 | | | | 5/1/13 | | | | 269,049 | |
| | 160,000 | | Jefferies Group, Inc. | | 8.500 | | | | 7/15/19 | | | | 177,785 | |
| | 346,000 | | JPMorgan Chase & Co. | | 5.750 | | | | 1/2/13 | | | | 375,743 | |
| | 300,000 | | KeyCorp | | 6.500 | | | | 5/14/13 | | | | 320,598 | |
| | 325,000 | | Merrill Lynch & Company, Inc. | | 5.770 | | | | 7/25/11 | | | | 343,453 | |
| | 250,000 | | Merrill Lynch & Company, Inc., Series MTNC(a) | | 0.711 | | | | 1/15/15 | | | | 233,127 | |
| | 100,000 | | MetLife, Inc., Series A | | 6.817 | | | | 8/15/18 | | | | 111,109 | |
| | 222,000 | | MetLife, Inc. | | 6.125 | | | | 12/1/11 | | | | 237,603 | |
| | 250,000 | | Morgan Stanley | | 4.750 | | | | 4/1/14 | | | | 255,500 | |
| | 250,000 | | Nationwide Life Global Funding I(a)(b) | | 0.451 | | | | 5/19/10 | | | | 249,626 | |
| | 350,000 | | New York Life Global Funding(b) | | 5.250 | | | | 10/16/12 | | | | 377,851 | |
| | 285,000 | | Prudential Financial, Inc., Series MTNB | | 5.100 | | | | 9/20/14 | | | | 301,325 | |
| | 150,000 | | Regions Financial Corp. | | 7.750 | | | | 11/10/14 | | | | 157,973 | |
| | 375,000 | | SunTrust Banks, Inc. | | 5.250 | | | | 11/5/12 | | | | 395,754 | |
| | 250,000 | | SunTrust Banks, Inc. | | 6.000 | | | | 9/11/17 | | | | 253,603 | |
| | 150,000 | | Swiss Re Solutions Holding Corp. | | 7.000 | | | | 2/15/26 | | | | 152,396 | |
| | 350,000 | | The Allstate Corp. | | 5.000 | | | | 8/15/14 | | | | 374,377 | |
| | 125,000 | | The Goldman Sachs Group, Inc. | | 5.700 | | | | 9/1/12 | | | | 135,645 | |
| | 125,000 | | The Goldman Sachs Group, Inc. | | 6.600 | | | | 1/15/12 | | | | 135,688 | |
| | 300,000 | | The Hartford Financial Services Group, Inc. | | 5.375 | | | | 3/15/17 | | | | 300,653 | |
| | 250,000 | | The Progressive Corp. | | 6.375 | | | | 1/15/12 | | | | 270,377 | |
| | 300,000 | | Wachovia Corp. | | 5.250 | | | | 8/1/14 | | | | 315,420 | |
| | 400,000 | | Wells Fargo & Co. | | 5.250 | | | | 10/23/12 | | | | 431,202 | |
| | | | | | | | | | | | |
| |
| | | | | | | | | | | | | | 8,861,927 | |
| | | | | | | | | | | | |
| |
| | | | Health Services — 0.5% | | | | | | | | | | | |
| | 150,000 | | CIGNA Corp. | | 8.500 | | | | 5/1/19 | | | | 182,137 | |
| | 250,000 | | UnitedHealth Group, Inc. | | 5.375 | | | | 3/15/16 | | | | 263,834 | |
| | | | | | | | | | | | |
| |
| | | | | | | | | | | | | | 445,971 | |
| | | | | | | | | | | | |
| |
13
The FBR Funds
FBR Balanced Fund
Portfolio of Investments (continued)
March 31, 2010
|
| | | | | | | | | MATURITY | | VALUE | |
| | PAR | | | | RATE | | | DATE | | (NOTE 2) | |
|
| | | | Health Technology — 0.7% | | | | | | | | | | | |
| $ | 325,000 | | GlaxoSmithKline Capital, Inc. | | 4.850 | % | | | 5/15/13 | | | $ | 352,524 | |
| | 220,000 | | Pfizer, Inc. | | 5.350 | | | | 3/15/15 | | | | 242,673 | |
| | | | | | | | | | | | |
| |
| | | | | | | | | | | | | | 595,197 | |
| | | | | | | | | | | | |
| |
| | | | Non-Energy Minerals — 0.8% | | | | | | | | | | | |
| | 350,000 | | Barrick Gold Financeco LLC | | 6.125 | | | | 9/15/13 | | | | 390,227 | |
| | 250,000 | | BHP Billiton Finance USA Ltd. | | 6.750 | | | | 11/1/13 | | | | 282,372 | |
| | | | | | | | | | | | |
| |
| | | | | | | | | | | | | | 672,599 | |
| | | | | | | | | | | | |
| |
| | | | Process Industries — 0.6% | | | | | | | | | | | |
| | 315,000 | | EI du Pont de Nemours & Co. | | 4.750 | | | | 3/15/15 | | | | 337,371 | |
| | 150,000 | | International Paper Co. | | 9.375 | | | | 5/15/19 | | | | 187,817 | |
| | | | | | | | | | | | |
| |
| | | | | | | | | | | | | | 525,188 | |
| | | | | | | | | | | | |
| |
| | | | Producer Manufacturing — 1.1% | | | | | | | | | | | |
| | 325,000 | | Caterpillar Financial Services Corp. | | 4.900 | | | | 8/15/13 | | | | 351,245 | |
| | 250,000 | | General Electric Capital Corp. | | 5.500 | | | | 6/4/14 | | | | 270,323 | |
| | 125,000 | | General Electric Capital Corp. | | 4.800 | | | | 5/1/13 | | | | 132,936 | |
| | 150,000 | | Tyco International Finance SA | | 8.500 | | | | 1/15/19 | | | | 186,325 | |
| | | | | | | | | | | | |
| |
| | | | | | | | | | | | | | 940,829 | |
| | | | | | | | | | | | |
| |
| | | | Real Estate Investment Trust — 0.4% | | | | | | | | | | | |
| | 325,000 | | Boston Properties LP | | 6.250 | | | | 1/15/13 | | | | 352,474 | |
| | | | | | | | | | | | |
| |
| | | | | | | | | | | | | | | |
| | | | Retail Trade — 0.6% | | | | | | | | | | | |
| | 300,000 | | Best Buy Company, Inc. | | 6.750 | | | | 7/15/13 | | | | 336,032 | |
| | 200,000 | | The Home Depot, Inc. | | 5.400 | | | | 3/1/16 | | | | 216,394 | |
| | | | | | | | | | | | |
| |
| | | | | | | | | | | | | | 552,426 | |
| | | | | | | | | | | | |
| |
| | | | Technology Services — 0.3% | | | | | | | | | | | |
| | 250,000 | | International Business Machines Corp. | | 6.500 | | | | 10/15/13 | | | | 287,192 | |
| | | | | | | | | | | | |
| |
| | | | | | | | | | | | | | | |
| | | | Transportation — 0.4% | | | | | | | | | | | |
| | 300,000 | | FedEx Corp. | | 7.375 | | | | 1/15/14 | | | | 344,795 | |
| | | | | | | | | | | | |
| |
| | | | | | | | | | | | | | | |
| | | | Utilities — 0.4% | | | | | | | | | | | |
| | 275,000 | | Sempra Energy | | 6.500 | | | | 6/1/16 | | | | 307,620 | |
| | | | | | | | | | | | |
| |
| | | | Total Corporate Bonds (Cost $17,441,585) | | | | | | | | | | 19,106,863 | |
| | | | | | | | | | | | |
| |
14
The FBR Funds
FBR Balanced Fund
Portfolio of Investments (continued)
March 31, 2010
|
| | | | | | | | | MATURITY | | | VALUE | |
| | PAR | | | | RATE | | | DATE | | | (NOTE 2) | |
|
| | | | U.S. GOVERNMENT AGENCY OBLIGATIONS — 4.6% | | | | | | | | | | | |
| $ | 449,327 | | Federal Home Loan Mortgage Corp. | | 5.000 | % | | | 5/1/20 | | | $ | 478,591 | |
| | 886,094 | | Federal Home Loan Mortgage Corp. | | 5.500 | | | | 4/1/37 | | | | 937,611 | |
| | 205,000 | | Federal National Mortgage Association | | 4.625 | | | | 10/15/14 | | | | 222,874 | |
| | 400,000 | | Federal National Mortgage Association*(c) | | 3.000 | | | | 12/28/16 | | | | 401,749 | |
| | 250,000 | | Federal National Mortgage Association | | 5.375 | | | | 6/12/17 | | | | 277,247 | |
| | 679,059 | | Federal National Mortgage Association | | 4.500 | | | | 8/1/20 | | | | 705,591 | |
| | 858,867 | | Federal National Mortgage Association | | 6.000 | | | | 10/1/37 | | | | 913,365 | |
| | | | | | | | | | | | |
| |
| | | | Total U.S. Government Agency Obligations (Cost $3,738,732) | | | | | | | | | | 3,937,028 | |
| | | | | | | | | | | | |
| |
| | | | | | | | | | | | | | | |
| | | | U.S. TREASURY OBLIGATIONS — 6.8% | | | | | | | | | | | |
| | 1,620,000 | | U.S. Treasury Bond | | 5.000 | | | | 5/15/37 | | | | 1,706,317 | |
| | 300,000 | | U.S. Treasury Inflation Indexed Note(d) | | 2.500 | | | | 1/15/29 | | | | 320,755 | |
| | 1,150,000 | | U.S. Treasury Note | | 2.250 | | | | 1/31/15 | | | | 1,137,872 | |
| | 2,095,000 | | U.S. Treasury Note | | 4.750 | | | | 8/15/17 | | | | 2,292,225 | |
| | 400,000 | | U.S. Treasury Note | | 3.750 | | | | 11/15/18 | | | | 403,157 | |
| | | | | | | | | | | | |
| |
| | | | Total U.S. Treasury Obligations (Cost $5,891,068) | | | | | | | | | | 5,860,326 | |
| | | | | | | | | | | | |
| |
| | | | | | | | | | | | | | | |
| | SHARES | | | | | | | | | | | | | |
| |
| | | | | | | | | | | | | |
| | | | EXCHANGE TRADED FUNDS — 3.2% | | | | | | | | | | | |
| | 13,625 | | iShares iBoxx $High Yield Corporate Bond Fund | | | | | | | | | | 1,204,041 | |
| | 11,050 | | iShares S&P U.S. Preferred Stock Index Fund | | | | | | | | | | 427,856 | |
| | 29,450 | | SPDR Barclays Capital High Yield Bond Fund | | | | | | | | | | 1,171,816 | |
| | | | | | | | | | | | |
| |
| | | | Total Exchange Traded Funds (Cost $2,721,943) | | | | | | | | | | 2,803,713 | |
| | | | | | | | | | | | |
| |
| | | | | | | | | | | | | | | |
| | | | MONEY MARKET FUND — 1.1% | | | | | | | | | | | |
| | 937,937 | | JPMorgan 100% U.S. Treasury Securities Money Market Fund | | | | | | | | | | | |
| | | | (Cost $937,937) | | | | | | | | | | 937,937 | |
| | | | | | | | | | | | |
| |
| | | | | | | | | | | | | | | |
| | | | Total Investments — 99.7% (Cost $78,237,164) | | | | | | | | | | 85,960,435 | |
| | | | | | | | | | | | | | | |
| | | | Other Assets Less Liabilities — 0.3% | | | | | | | | | | 251,352 | |
| | | | | | | | | | | | |
| |
| | | | | | | | | | | | | | | |
| | | | Net Assets — 100.0% | | | | | | | | | $ | 86,211,787 | |
| | | | | | | | | | | | |
| |
15
The FBR Funds
FBR Balanced Fund
Portfolio of Investments (continued)
March 31, 2010
|
| * | | Non-income producing security |
| (a) | | Variable/floating rate security |
| (b) | | This security is a restricted security under Rule 144A of the Securities Act of 1933. These securities may be resold in transactions exempt from registration, normally to qualified institutional buyers. As of March 31, 2010, the total amount of 144A securities was $1,093,694, or 1.3% of total net assets. |
| (c) | | Stepped coupon bond - the rate shown is the rate in effect on March 31, 2010. |
| (d) | | Treasury Inflation Protected Security |
| | | |
| ADR | | American Depositary Receipts |
| LLC | | Limited Liability Company |
| LP | | Limited Partnership |
| N.M. | | Not meaningful |
| PLC | | Public Liability Company |
The accompanying notes are an integral part of the financial statements.
16
The FBR Funds
FBR Core Bond Fund*
Management Overview
Portfolio Manager: Gary Cloud, CFA and Peter Greig, CFA, Financial Counselors, Inc.
Over the past 12 months, how did the Core Bond Fund perform and what factors contributed to this performance?
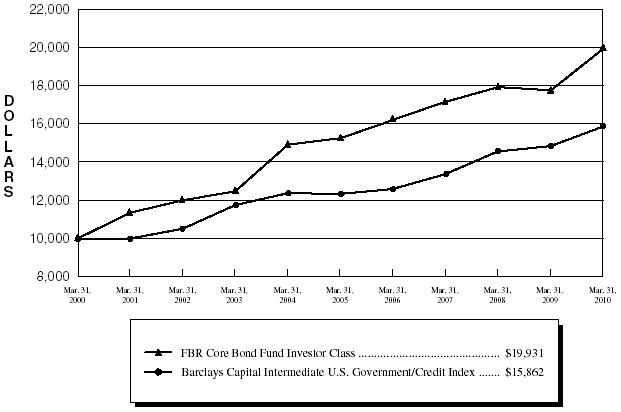
For the fiscal year ended March 31, 2010, the Investor Class of the FBR Core Bond Fund returned 12.33% and the I Class returned 12.62%. This compares favorably to the Fund’s benchmark, the Barclays Capital Intermediate U.S. Government/Credit Index, which returned 6.92% over the same period.
Our straightforward approach to fixed income investment management is focused on preserving principal and generating income. We are not managers who leverage client funds to amplify returns. We have a well-defined investment process that emphasizes fundamental credit analysis. We employ a risk-conscious approach that aims to identify attractive opportunities with prudent risk and return, rather than exposing the portfolio to the unpredictability of exotic trading strategies using currency bets and short sales. We seek to invest in high quality, intermediate-term, investment-grade securities that are generally transparent, liquid, and dollar-denominated. And despite our more conservative approach, our relative performance compares well against other managers who may utilize riskier tools to pursue greater yield. That is because, above all, protecting against downside risk is just as important as participating on the upside.
After enduring a difficult recessionary period, economic barometers are starting to show signs of recovery. Corporate America has strengthened its balance sheet, core inflation has been contained and domestic GDP posted 3-4% growth in the first quarter of 2010 and is likely to continue apace into the second quarter of this year. That said, we continue to believe that the economy will face headwinds in the second half of the year, but we do not anticipate anything worse than slowed growth. We believe consumer demand has been largely supported by the top 25% of wage earners, many of whom face the risk of rising tax levels next year and may find it increasingly difficult to sustain their current pace of consumption. State and local governments struggle with the challenge of falling tax revenues and higher expenditures, and the Federal budget picture continues to worsen. Our country’s employment picture is improving, but needs to strengthen further in order to offset the reduction in stimulus programs and the expiration of housing tax credit in order to support sustainable economic growth.
Late last year there was heightened concern for the impending impact that a cessation of the Federal Reserve’s quantitative easing would have on the market, but as it turns out, it was a non-event. Interest rates continue to be at historically low levels, though they cannot stay at these levels indefinitely. U.S. Treasury securities have traded in a tight band in 2010 and we expect the market to have a negative reaction when the Federal Reserve begins to tighten monetary policy. Given the backdrop of a potentially rising rate environment, we have found the greatest opportunity for appreciation in high quality, intermediate-term corporate bonds, and have been overweight in the 3-year and 5-year range. The Fund has roughly 70% of its holdings in high quality, corporate credit, which includes a slight 8% exposure in high yield exchange-traded funds and preferred securities. This yield-focused
17
The FBR Funds
FBR Core Bond Fund*
Management Overview (continued)
and generally high quality blended corporate mix provides additional interest income that can help supplement incremental return if rates begin to move higher.
Portfolio managers comments on the Fund and the related investment outlook.
A change in the forward-looking statement contained within the minutes of the Federal Open Market Committee may be the single biggest market driver to occur over the balance of this year. U.S. Treasury securities have traded in a tight band year-to-date, and we expect the market to have a negative response when the Federal Reserve begins to tighten monetary policy.
European deficit problems have also ignited pressure on global fixed income markets and have served to drive our domestic market rates lower. The potential bailout of Greece by other members of the European Union and the International Monetary Fund was called into question, and fears of contagion rapidly spread. Riskier asset classes were sold off indiscriminately, and investors sought shelter in safer securities, such as U.S. dollar-denominated fixed-income instruments. This will likely help to keep market rates low in the near term, but within a broad trading range based on fears of contagion from the sovereign debt problems in Europe.
In the near-term, we will continue to pursue greater yield opportunities in high quality, intermediate-term corporate bonds. We anticipate maintaining this intermediate-term core strategy as it allows us to pursue attractive yield opportunities in high quality, investment-grade securities. This yield-focused and generally high quality blended corporate mix should also provide additional interest income that can help provide incremental return in a potentially rising rate environment.
* The FBR Core Bond Fund is the successor to the AFBA 5Star Total Return Bond Fund. On March 12, 2010, the FBR Core Bond Fund acquired all of the assets and all of the liabilities of the AFBA 5Star Total Return Bond Fund in a reorganization transaction that was approved by shareholders of the AFBA 5Star Total Return Bond Fund. The performance presented for the FBR Core Bond Fund for the period prior to March 12, 2010 reflects the performance of the applicable classes of shares of the AFBA 5Star Total Return Bond Fund.
The opinions expressed in this commentary reflect those of the Portfolio Manager as of the date written. Any such opinions are subject to change based on market or other conditions. These opinions may not be relied upon as investment advice. Investment decisions for The FBR Funds are based on several factors, and may not be relied upon as an indication of trading intent on behalf of any FBR Fund. Security positions can and do change.
18
The FBR Funds
FBR Core Bond Fund
Comparison of Changes in Value of $10,000 Investment in
Investor Class Shares(1)(2)(5) vs. Barclays Capital Intermediate U.S. Government/Credit Index(1)(3)
| Total Returns—For the Periods Ended March 31, 2010(4) |
| | | | | | | Annualized | | Annualized | |
| | | | One Year | | Five Year | | Ten Year | |
| | | |
| |
| |
| |
FBR Core Bond Fund Investor Class(1)(2)(5) | | | 12.33 | % | | 5.51 | % | | 7.14 | % | |
FBR Core Bond Fund I Class(2)(5) | | | 12.62 | % | | 5.76 | % | | 7.18 | % | |
Barclays Capital Intermediate U.S. Government/Credit Index(1)(3) | | | 6.92 | % | | 5.16 | % | | 5.93 | % | |
PAST PERFORMANCE IS NO GUARANTEE OF FUTURE RESULTS.
The performance data quoted represents past performance and the current performance may be lower or higher than the performance data quoted. The investment return and principal will fluctuate so that investors’ shares, when redeemed, may be worth more or less than their original cost. The performance data does not reflect the deduction of taxes that a shareholder would pay on Fund distributions or redemption fees. If reflected, the redemption fee would reduce the performance data quoted. To obtain performance data current to the most recent month-end, please call 888.200.4710 or visit www.fbrfunds.com.
|
| (1) | | The graph assumes a hypothetical $10,000 initial investment in the Investor Class shares of the Fund and reflects the reinvestment of dividends and all Fund expenses. Investors should note that the Fund is a professionally managed mutual fund while the index is unmanaged, does not incur expenses and is not available for investment. The performance of the index includes reinvested dividends, and does not reflect sales charges or expenses. |
| (2) | | FBR Fund Advisers, Inc. and the Fund’s predecessor investment adviser each waived a portion of its advisory fees and agreed to contractually reimburse a portion of the Fund’s operating expenses, as necessary, to maintain existing expense limitations, as set forth in the notes to the financial statements. Total returns shown include fee waivers and expense reimbursements, if any; total returns would have been lower had there been no waiver of fees and/or reimbursement of expenses in excess of expense limitations. |
| (3) | | The Barclays Capital Intermediate U.S. Government/Credit Index measures the performance of U.S. dollar denominated U.S. Treasuries, government-related and investment grade U.S. corporate securities that have a remaining maturity of greater than or equal to 1 year and less than 10 years. Securities have $250 million or more of outstanding face value and must be fixed rate and non-convertible. |
| (4) | | The total returns shown do not reflect the deduction of taxes that a shareholder would pay on fund distributions or the redemption of fund shares. |
| (5) | | The Fund is the investment successor to the AFBA 5Star Total Return Bond Fund which commenced investment operations on June 3, 1997. On March 12, 2010, the AFBA 5Star Total Return Bond Fund was reorganized into the Fund. The performance presented for the Investor Class of the Fund for the period prior to March 12, 2010 reflects the performance of the Advisor Class shares of the AFBA 5Star Total Return Bond Fund and the performance presented for the I Class of the Fund for the period prior to March 12, 2010 reflects the performance of the Class I shares of the AFBA 5Star Total Return Bond Fund. The performance of the Advisor Class shares of the AFBA 5Star Total Return Bond Fund for the period prior to September 24, 2001 includes the performance of the Class I shares of the AFBA 5Star Total Return Bond Fund. |
19
The FBR Funds
FBR Core Bond Fund
Portfolio Summary
March 31, 2010
The following provides a breakdown of the Fund by industry sector. The underlying securities represent a percentage of the portfolio investments.
| Industry Sectors | | % of Total Investments |
| |
|
| Corporate Bonds | | 57.6 | % |
Finance | | 25.3 | % |
Communications | | 4.5 | % |
Consumer Non-Durables | | 3.9 | % |
Electronic Technology | | 3.8 | % |
Retail Trade | | 3.6 | % |
Producer Manufacturing | | 3.5 | % |
Consumer Services | | 3.4 | % |
Health Technology | | 2.1 | % |
Process Industries | | 1.7 | % |
Energy Minerals | | 1.2 | % |
Miscellaneous | | 4.6 | % |
| U.S. Treasury Obligations | | 16.1 | % |
| U.S. Government Agency Obligations | | 12.7 | % |
| Exchange Traded Funds | | 8.2 | % |
| Asset-Backed Securities | | 3.8 | % |
| Convertible Preferred Stock | | 1.5 | % |
| Preferred Stock | | 0.1 | % |
20
The FBR Funds
FBR Core Bond Fund
Portfolio of Investments
March 31, 2010
|
| | | | | | | | | | | | | VALUE | |
| | SHARES | | | | | | | | | | | (NOTE 2) | |
|
| | | | CONVERTIBLE PREFERRED STOCK — 1.4% | | | | | | | | | | | |
| | | | Finance — 1.4% | | | | | | | | | | | |
| | 13,350 | | Boston Private Capital Trust I, 4.875%, due 10/1/3 (Cost $638,782) | | | | | | | | | $ | 409,678 | |
| | | | | | | | | | | | |
| |
| | | | | | | | | | | | | | | |
| | | | PREFERRED STOCK — 0.1% | | | | | | | | | | | |
| | | | Finance — 0.1% | | | | | | | | | | | |
| | 10,400 | | Federal National Mortgage Association, Perpetual, Series S, 8.25%, due 12/31/10 | | | | | | | | | | | |
| | | | (Cost $260,000)*(a) | | | | | | | | | | 13,208 | |
| | | | | | | | | | | | |
| |
| | | | | | | | | | | | | | | |
| | | | | | | | | MATURITY | | | | |
| | PAR | | | | RATE | | | DATE | | | | |
| |
| | | |
| | |
| | | | |
| | | | ASSET-BACKED SECURITIES — 3.7% | | | | | | | | | | | |
| $ | 1,000,000 | | Chase Issuance Trust, | | | | | | | | | | | |
| | | | Series 2007-A15, Class A | | 4.960 | % | | | 9/17/12 | | | | 1,021,541 | |
| | 33,796 | | Capital Auto Receivables Asset Trust, | | | | | | | | | | | |
| | | | Series 2006-2, Class A3B(a) | | 0.290 | | | | 5/15/11 | | | | 33,788 | |
| | | | | | | | | | | | |
| |
| | | | Total Asset-Backed Securities (Cost $1,018,133) | | | | | | | | | | 1,055,329 | |
| | | | | | | | | | | | |
| |
| | | | | | | | | | | | | | | |
| | | | CORPORATE BONDS — 56.6% | | | | | | | | | | | |
| | | | Communications — 4.4% | | | | | | | | | | | |
| | 360,000 | | AT&T, Inc. | | 5.875 | | | | 8/15/12 | | | | 393,723 | |
| | 275,000 | | Deutsche Telekom International Finance BV | | 5.875 | | | | 8/20/13 | | | | 300,130 | |
| | 280,000 | | Rogers Communications, Inc. | | 7.500 | | | | 3/15/15 | | | | 327,160 | |
| | 212,000 | | Vodafone Group PLC | | 5.500 | | | | 6/15/11 | | | | 222,364 | |
| | | | | | | | | | | | |
| |
| | | | | | | | | | | | | | 1,243,377 | |
| | | | | | | | | | | | |
| |
| | | | Consumer Durables — 1.0% | | | | | | | | | | | |
| | 275,000 | | Toyota Motor Credit Corp. | | 5.170 | | | | 1/11/12 | | | | 277,085 | |
| | | | | | | | | | | | |
| |
| | | | | | | | | | | | | | | |
| | | | Consumer Non-Durables — 3.8% | | | | | | | | | | | |
| | 125,000 | | Anheuser-Busch InBev Worldwide, Inc.(b) | | 7.750 | | | | 1/15/19 | | | | 148,918 | |
| | 250,000 | | Diageo Capital PLC | | 5.200 | | | | 1/30/13 | | | | 270,693 | |
| | 325,000 | | Phillips-Van Heusen Corp. | | 7.750 | | | | 11/15/23 | | | | 324,824 | |
| | 300,000 | | The Coca-Cola Co. | | 5.350 | | | | 11/15/17 | | | | 330,564 | |
| | | | | | | | | | | | |
| |
| | | | | | | | | | | | | | 1,074,999 | |
| | | | | | | | | | | | |
| |
21
The FBR Funds
FBR Core Bond Fund
Portfolio of Investments (continued)
March 31, 2010
|
| | | | | | | | | MATURITY | | VALUE | |
| | PAR | | | | RATE | | | DATE | | (NOTE 2) | |
|
| | | | Consumer Services — 3.3% | | | | | | | | | | | |
| $ | 250,000 | | Comcast Corp. | | 6.500 | % | | | 1/15/17 | | | $ | 278,313 | |
| | 150,000 | | Marriott International, Inc., Series J | | 5.625 | | | | 2/15/13 | | | | 159,700 | |
| | 575,000 | | Royal Caribbean Cruises Ltd. | | 7.500 | | | | 10/15/27 | | | | 510,312 | |
| | | | | | | | | | | | |
| |
| | | | | | | | | | | | | | 948,325 | |
| | | | | | | | | | | | |
| |
| | | | Electronic Technology — 3.7% | | | | | | | | | | | |
| $ | 250,000 | | Corning, Inc. | | 6.050 | | | | 6/15/15 | | | | 251,365 | |
| | 300,000 | | Dell, Inc. | | 4.700 | | | | 4/15/13 | | | | 322,485 | |
| | 250,000 | | Hewlett-Packard Co. | | 4.500 | | | | 3/1/13 | | | | 267,857 | |
| | 200,000 | | The Boeing Co. | | 5.000 | | | | 3/15/14 | | | | 216,703 | |
| | | | | | | | | | | | |
| |
| | | | | | | | | | | | | | 1,058,410 | |
| | | | | | | | | | | | |
| |
| | | | Energy Minerals — 1.1% | | | | | | | | | | | |
| | 175,000 | | Devon Energy Corp. | | 5.625 | | | | 1/15/14 | | | | 191,553 | |
| | 125,000 | | Husky Energy, Inc. | | 5.900 | | | | 6/15/14 | | | | 136,162 | |
| | | | | | | | | | | | |
| |
| | | | | | | | | | | | | | 327,715 | |
| | | | | | | | | | | | |
| |
| | | | Finance — 24.8% | | | | | | | | | | | |
| | 250,000 | | Aflac, Inc. | | 8.500 | | | | 5/15/19 | | | | 301,510 | |
| | 60,000 | | American Express Credit Corp., Series C | | 7.300 | | | | 8/20/13 | | | | 67,396 | |
| | 140,000 | | American Express Travel Related Services | | | | | | | | | | | |
| | | | Company, Inc.(b) | | 5.250 | | | | 11/21/11 | | | | 146,372 | |
| | 250,000 | | Associates Corporation of North America | | 6.950 | | | | 11/1/18 | | | | 263,887 | |
| | 175,000 | | Bank of America Corp. | | 5.375 | | | | 9/11/12 | | | | 185,971 | |
| | 200,000 | | Capital One Financial Corp. | | 6.750 | | | | 9/15/17 | | | | 221,329 | |
| | 300,000 | | CME Group, Inc. | | 5.750 | | | | 2/15/14 | | | | 329,632 | |
| | 225,000 | | Credit Suisse USA, Inc. | | 6.125 | | | | 11/15/11 | | | | 241,811 | |
| | 225,000 | | Credit Suisse USA, Inc. | | 5.125 | | | | 8/15/15 | | | | 241,239 | |
| | 250,000 | | Fifth Third Bancorp | | 6.250 | | | | 5/1/13 | | | | 269,049 | |
| | 140,000 | | Jefferies Group, Inc. | | 8.500 | | | | 7/15/19 | | | | 155,562 | |
| | 235,000 | | JPMorgan Chase & Co. | | 5.375 | | | | 10/1/12 | | | | 254,446 | |
| | 300,000 | | KeyCorp | | 6.500 | | | | 5/14/13 | | | | 320,598 | |
| | 200,000 | | Merrill Lynch & Company, Inc., Series MTNC(a) | | 0.711 | | | | 1/15/15 | | | | 186,502 | |
| | 150,000 | | Merrill Lynch & Company, Inc. | | 5.770 | | | | 7/25/11 | | | | 158,517 | |
| | 275,000 | | MetLife, Inc., Series A | | 6.817 | | | | 8/15/18 | | | | 305,549 | |
| | 225,000 | | Nationwide Life Global Funding I(a)(b) | | 0.451 | | | | 5/19/10 | | | | 224,663 | |
22
The FBR Funds
FBR Core Bond Fund
Portfolio of Investments (continued)
March 31, 2010
|
| | | | | | | | | MATURITY | | VALUE | |
| | PAR | | | | RATE | | | DATE | | (NOTE 2) | |
|
| | | | Finance — 24.8% (continued) | | | | | | | | | | | |
| $ | 275,000 | | New York Life Global Funding(b) | | 5.250 | % | | | 10/16/12 | | | $ | 296,883 | |
| | 250,000 | | Prudential Financial, Inc., Series MTNB | | 5.100 | | | | 9/20/14 | | | | 264,321 | |
| | 125,000 | | Regions Financial Corp. | | 7.750 | | | | 11/10/14 | | | | 131,644 | |
| | 300,000 | | SunTrust Banks, Inc. | | 6.000 | | | | 9/11/17 | | | | 304,324 | |
| | 215,000 | | SunTrust Banks, Inc. | | 5.250 | | | | 11/5/12 | | | | 226,899 | |
| | 125,000 | | Swiss Re Solutions Holding Corp. | | 7.000 | | | | 2/15/26 | | | | 126,997 | |
| | 270,000 | | The Allstate Corp. | | 5.000 | | | | 8/15/14 | | | | 288,805 | |
| | 125,000 | | The Goldman Sachs Group, Inc. | | 5.700 | | | | 9/1/12 | | | | 135,645 | |
| | 150,000 | | The Goldman Sachs Group, Inc. | | 6.600 | | | | 1/15/12 | | | | 162,826 | |
| | 300,000 | | The Hartford Financial Services Group, Inc. | | 5.375 | | | | 3/15/17 | | | | 300,652 | |
| | 240,000 | | The Progressive Corp. | | 6.375 | | | | 1/15/12 | | | | 259,562 | |
| | 166,000 | | Union Planters Corp. | | 4.375 | | | | 12/1/10 | | | | 166,860 | |
| | 200,000 | | Wachovia Corp. | | 5.250 | | | | 8/1/14 | | | | 210,280 | |
| | 300,000 | | Wells Fargo & Co. | | 5.250 | | | | 10/23/12 | | | | 323,401 | |
| | | | | | | | | | | | |
| |
| | | | | | | | | | | | | | 7,073,132 | |
| | | | | | | | | | | | |
| |
| | | | Health Services — 0.5% | | | | | | | | | | | |
| | 125,000 | | CIGNA Corp. | | 8.500 | | | | 5/1/19 | | | | 151,781 | |
| | | | | | | | | | | | |
| |
| | | | | | | | | | | | | | | |
| | | | Health Technology — 2.0% | | | | | | | | | | | |
| | 325,000 | | GlaxoSmithKline Capital, Inc. | | 4.850 | | | | 5/15/13 | | | | 352,523 | |
| | 200,000 | | Pfizer, Inc. | | 5.350 | | | | 3/15/15 | | | | 220,612 | |
| | | | | | | | | | | | |
| |
| | | | | | | | | | | | | | 573,135 | |
| | | | | | | | | | | | |
| |
| | | | Non-Energy Minerals — 1.2% | | | | | | | | | | | |
| | 300,000 | | Barrick Gold Financeco LLC | | 6.125 | | | | 9/15/13 | | | | 334,480 | |
| | | | | | | | | | | | |
| |
| | | | | | | | | | | | | | | |
| | | | Process Industries — 1.6% | | | | | | | | | | | |
| | 285,000 | | EI du Pont de Nemours & Co. | | 4.750 | | | | 3/15/15 | | | | 305,240 | |
| | 125,000 | | International Paper Co. | | 9.375 | | | | 5/15/19 | | | | 156,515 | |
| | | | | | | | | | | | |
| |
| | | | | | | | | | | | | | 461,755 | |
| | | | | | | | | | | | |
| |
| | | | Producer Manufacturing — 3.5% | | | | | | | | | | | |
| | 50,000 | | American Railcar Industries, Inc. | | 7.500 | | | | 3/1/14 | | | | 48,000 | |
| | 325,000 | | Caterpillar Financial Services Corp. | | 4.900 | | | | 8/15/13 | | | | 351,245 | |
| | 281,000 | | General Electric Capital Corp. | | 5.000 | | | | 4/10/12 | | | | 298,141 | |
23
The FBR Funds
FBR Core Bond Fund
Portfolio of Investments (continued)
March 31, 2010
|
| | | | | | | | | MATURITY | | | VALUE | |
| | PAR | | | | RATE | | | DATE | | | (NOTE 2) | |
|
| | | | Producer Manufacturing — 3.5% (continued) | | | | | | | | | | | |
| $ | 125,000 | | General Electric Capital Corp. | | 4.800 | % | | | 5/1/13 | | | $ | 132,936 | |
| | 125,000 | | Tyco International Finance SA | | 8.500 | | | | 1/15/19 | | | | 155,272 | |
| | | | | | | | | | | | |
| |
| | | | | | | | | | | | | | 985,594 | |
| | | | | | | | | | | | |
| |
| | | | Retail Trade — 3.6% | | | | | | | | | | | |
| | 275,000 | | Best Buy Company, Inc. | | 6.750 | | | | 7/15/13 | | | | 308,029 | |
| | 235,000 | | GameStop Corp. / GameStop, Inc. | | 8.000 | | | | 10/1/12 | | | | 244,988 | |
| | 300,000 | | Lowe’s Companies, Inc. | | 5.600 | | | | 9/15/12 | | | | 331,140 | |
| | 120,000 | | The Home Depot, Inc. | | 5.400 | | | | 3/1/16 | | | | 129,836 | |
| | | | | | | | | | | | |
| |
| | | | | | | | | | | | | | 1,013,993 | |
| | | | | | | | | | �� | | |
| |
| | | | Transportation — 1.1% | | | | | | | | | | | |
| | 275,000 | | FedEx Corp. | | 7.375 | | | | 1/15/14 | | | | 316,062 | |
| | | | | | | | | | | | |
| |
| | | | | | | | | | | | | | | |
| | | | Utilities — 1.0% | | | | | | | | | | | |
| | 250,000 | | Sempra Energy | | 6.500 | | | | 6/1/16 | | | | 279,654 | |
| | | | | | | | | | | | |
| |
| | | | Total Corporate Bonds (Cost $14,758,025) | | | | | | | | | | 16,119,497 | |
| | | | | | | | | | | | |
| |
| | | | | | | | | | | | | | | |
| | | | U.S. GOVERNMENT AGENCY OBLIGATIONS — 12.4% | | | | | | | | | | | |
| | 1,012,678 | | Federal Home Loan Mortgage Corp. | | 5.500 | | | | 4/1/37 | | | | 1,071,556 | |
| | 350,000 | | Federal National Mortgage Association*(c) | | 3.000 | | | | 12/28/16 | | | | 351,530 | |
| | 90,000 | | Federal National Mortgage Association | | 5.375 | | | | 6/12/17 | | | | 99,809 | |
| | 849,129 | | Federal National Mortgage Association | | 4.500 | | | | 8/1/20 | | | | 882,306 | |
| $ | 1,073,584 | | Federal National Mortgage Association | | 6.000 | | | | 10/1/37 | | | | 1,141,706 | |
| | | | | | | | | | | | |
| |
| | | | Total U.S. Government Agency Obligations (Cost $3,368,178) | | | | | | | | | | 3,546,907 | |
| | | | | | | | | | | | |
| |
| | | | | | | | | | | | | | | |
| | | | U.S. TREASURY OBLIGATIONS — 15.8% | | | | | | | | | | | |
| | 1,725,000 | | U.S. Treasury Bond | | 5.000 | | | | 5/15/37 | | | | 1,816,912 | |
| | 300,000 | | U.S. Treasury Inflation Indexed Note(d) | | 2.500 | | | | 1/15/29 | | | | 320,755 | |
| | 750,000 | | U.S. Treasury Note | | 2.250 | | | | 1/31/15 | | | | 742,090 | |
| | 885,000 | | U.S. Treasury Note | | 4.750 | | | | 8/15/17 | | | | 968,315 | |
| | 650,000 | | U.S. Treasury Note | | 3.750 | | | | 11/15/18 | | | | 655,129 | |
| | | | | | | | | | | | |
| |
| | | | Total U.S. Treasury Obligations (Cost $4,632,859) | | | | | | | | | | 4,503,201 | |
| | | | | | | | | | | | |
| |
24
The FBR Funds
FBR Core Bond Fund
Portfolio of Investments (continued)
March 31, 2010
|
| | | | | | | VALUE | |
| | SHARES | | | | | (NOTE 2) | |
|
| | | | EXCHANGE TRADED FUNDS — 8.1% | | | | |
| | 10,900 | | iShares iBoxx $ High Yield Corporate Bond Fund | | $ | 963,233 | |
| | 9,650 | | iShares S&P U.S. Preferred Stock Index Fund | | | 373,648 | |
| | 24,400 | | SPDR Barclays Capital High Yield Bond Fund | | | 970,876 | |
| | | | | |
| |
| | | | Total Exchange Traded Funds (Cost $2,244,775) | | | 2,307,757 | |
| | | | | |
| |
| | | | | | | | |
| | | | Total Investments — 98.1% (Cost $26,920,752) | | | 27,955,577 | |
| | | | | |
| |
| | | | | | | | |
| | | | Other Assets Less Liabilities — 1.9% | | | 544,512 | |
| | | | | |
| |
| | | | | | | | |
| | | | Net Assets — 100.0% | | $ | 28,500,089 | |
| | | | | |
| |
|
| * | | Non-income producing security |
| (a) | | Variable/floating rate security |
| (b) | | This security is a restricted security under Rule 144A of the Securities Act of 1933. These securities may be resold in transactions exempt from registration, normally to qualified institutional buyers. As of March 31, 2010, the total amount of 144A securities was $816,836, or 2.9% of total net assets. |
| (c) | | Stepped coupon bond - the rate shown is the rate in effect on March 31, 2010. |
| (d) | | Treasury Inflation Protected Security |
| | | |
| LLC | | Limited Liability Company |
| PLC | | Public Liability Company |
The accompanying notes are an integral part of the financial statements.
25
| The FBR Funds |
|
| Statements of Assets and Liabilities |
| March 31, 2010 |
| | | FBR | | FBR |
| | | Balanced Fund | | Core Bond Fund |
| | |
| |
|
| ASSETS | | | | | | | | | | |
Investment Securities at Cost | | | $ | 78,237,164 | | | | $ | 26,920,752 | |
| | | |
| | | |
| |
Investment Securities at Value (Note 2) | | | $ | 85,960,435 | | | | $ | 27,955,577 | |
Receivable for Capital Shares Sold | | | | 57,303 | | | | | 14,769 | |
Receivable for Investment Securities Sold | | | | 642,641 | | | | | 477,085 | |
Dividends and Interest Receivable | | | | 499,632 | | | | | 290,559 | |
Prepaid Expenses | | | | 13,467 | | | | | 11,925 | |
| | | |
| | | |
| |
Total Assets | | | | 87,173,478 | | | | | 28,749,915 | |
| | | |
| | | |
| |
| LIABILITIES | | | | | | | | | | |
Due to Custodian | | | | 736,927 | | | | | 158,163 | |
Payable for Capital Shares Redeemed | | | | 91,723 | | | | | 63 | |
Distribution Payable | | | | 18,025 | | | | | 40,353 | |
Investment Advisory Fee Payable (Note 4) | | | | 45,044 | | | | | 16,780 | |
Administration Fee Payable (Note 4) | | | | 9,410 | | | | | 3,093 | |
Distribution and Service Fees Payable (Note 4) | | | | 15,055 | | | | | 1,351 | |
Other Accrued Expenses | | | | 45,507 | | | | | 30,023 | |
| | | |
| | | |
| |
Total Liabilities | | | | 961,691 | | | | | 249,826 | |
| | | |
| | | |
| |
| NET ASSETS | | | $ | 86,211,787 | | | | $ | 28,500,089 | |
| | | |
| | | |
| |
| Net Assets Consist of: | | | | | | | | | | |
Paid-in capital | | | $ | 88,079,568 | | | | $ | 27,450,868 | |
Accumulated net investment income (loss) | | | | — | | | | | (89 | ) |
Accumulated net realized gain (loss) on investments | | | | (9,591,052 | ) | | | | 14,485 | |
Net unrealized appreciation on investments | | | | 7,723,271 | | | | | 1,034,825 | |
| | | |
| | | |
| |
| NET ASSETS | | | $ | 86,211,787 | | | | $ | 28,500,089 | |
| | | |
| | | |
| |
| Pricing of Investor Class Shares | | | | | | | | | | |
Net assets attributable to Investor Class shares | | | $ | 46,809,263 | | | | $ | 4,614,698 | |
Shares of Beneficial Interest Outstanding | | | | | | | | | | |
(unlimited number of shares authorized, no par value) | | | | 4,062,148 | | | | | 491,452 | |
| | | |
| | | |
| |
Net Asset Value Per Share | | | $ | 11.52 | | | | $ | 9.39 | |
| | | |
| | | |
| |
| Pricing of I Class Shares | | | | | | | | | | |
Net assets attributable to I Class shares | | | $ | 39,402,524 | | | | $ | 23,885,391 | |
Shares of Beneficial Interest Outstanding | | | | | | | | | | |
(unlimited number of shares authorized, no par value) | | | | 3,585,943 | | | | | 2,754,884 | |
| | | |
| | | |
| |
Net Asset Value Per Share | | | $ | 10.99 | | | | $ | 8.67 | |
| | | |
| | | |
| |
The accompanying notes are an integral part of the financial statements.
26
| The FBR Funds |
|
| Statements of Operations |
| For the Year Ended March 31, 2010 |
| | | FBR | | FBR |
| | | Balanced Fund | | Core Bond Fund |
| | |
| |
|
| Investment Income | | | | | | | | | | |
Dividends1 | | | $ | 1,497,826 | | | | $ | 42,104 | |
Interest | | | | 1,754,136 | | | | | 1,484,671 | |
| | | |
| | | |
| |
Total Investment Income | | | | 3,251,962 | | | | | 1,526,775 | |
| | | |
| | | |
| |
| Expenses | | | | | | | | | | |
Investment Advisory fees (Note 4) | | | | 649,450 | | | | | 225,182 | |
Administration fees (Note 4) | | | | 190,023 | | | | | 66,236 | |
Distribution and Service fees – Investor Class (Note 4) | | | | 65,401 | | | | | 7,616 | |
Distribution and Service fees – Class B2 (Note 4) | | | | 3,808 | | | | | 4,318 | |
Distribution and Service fees – Class C3 (Note 4) | | | | 181,800 | | | | | 13,190 | |
Transfer agent fees (Note 4) | | | | 122,110 | | | | | 27,746 | |
Transfer agent fees – Investor Class | | | | 1,044 | | | | | 192 | |
Transfer agent fees – I Class | | | | 1,002 | | | | | 327 | |
Professional fees | | | | 46,636 | | | | | 48,720 | |
Blue Sky fees | | | | 42,730 | | | | | 41,620 | |
Registration fees – Investor Class | | | | 97 | | | | | 97 | |
Registration fees – I Class | | | | 97 | | | | | 97 | |
Printing fees | | | | 23,993 | | | | | 9,440 | |
Reports to shareholders – Investor Class | | | | 618 | | | | | 173 | |
Reports to shareholders – I Class | | | | 607 | | | | | 293 | |
Trustees’ fees | | | | 15,453 | | | | | 15,453 | |
Custodian fees | | | | 11,145 | | | | | 7,442 | |
Accounting services fees | | | | 8,597 | | | | | 543 | |
Shareholder administrative fees – Investor Class | | | | 2,704 | | | | | 97 | |
Shareholder administrative fees – I Class | | | | 2,183 | | | | | 485 | |
Insurance fees | | | | 2,239 | | | | | 2,069 | |
Compliance fees | | | | 155 | | | | | 121 | |
Other expenses | | | | 39,520 | | | | | 29,833 | |
| | | |
| | | |
| |
Total expenses before waivers and related reimbursements | | | | 1,411,412 | | | | | 501,290 | |
Less waivers and related reimbursements (Note 4) | | | | (356,740 | ) | | | | (177,887 | ) |
| | | |
| | | |
| |
Total expenses after waivers and related reimbursements | | | | 1,054,672 | | | | | 323,403 | |
| | | |
| | | |
| |
Net Investment Income | | | | 2,197,290 | | | | | 1,203,372 | |
| | | |
| | | |
| |
| Net Realized and Unrealized Gain (Loss) on Investments | | | | | | | | | | |
Net Realized Gain (Loss) on Investment Transactions | | | | (628,466 | ) | | | | 176,611 | |
Change in Net Unrealized Appreciation/Depreciation of Investments | | | | 20,623,773 | | | | | 1,897,143 | |
| | | |
| | | |
| |
Net Gain on Investments | | | | 19,995,307 | | | | | 2,073,754 | |
| | | |
| | | |
| |
| Net Increase in Net Assets Resulting from Operations | | | $ | 22,192,597 | | | | $ | 3,277,126 | |
| | | |
| | | |
| |
|
| 1 | Net of foreign taxes withheld of $9,195 for the FBR Balanced Fund. |
| 2 | Class B Shares closed on July 31, 2009. |
| 3 | Effective after the close of business on March 12, 2010, Class C Shares merged into Investor Class (see Note 9). |
The accompanying notes are an integral part of the financial statements.
27
| The FBR Funds |
|
| Statements of Changes in Net Assets |
| | | FBR Balanced Fund | | FBR Core Bond Fund |
| | |
| |
|
| | | For the | | For the | | For the | | For the |
| | | Year | | Year | | Year | | Year |
| | | Ended | | Ended | | Ended | | Ended |
| | | March 31, | | March 31, | | March 31, | | March 31, |
| | | 2010 | | 2009* | | 2010 | | 2009* |
| | |
| |
| |
| |
|
| From Investment Activities | | | | | | | | | | | | | | | | | | | | |
Net Investment Income | | | $ | 2,197,290 | | | | $ | 2,205,519 | | | | $ | 1,203,372 | | | | $ | 1,074,470 | |
Net Realized Gain (Loss) on | | | | | | | | | | | | | | | | | | | | |
Investment Transactions | | | | (628,466 | ) | | | | (9,435,280 | ) | | | | 176,611 | | | | | 129,360 | |
Change in Net Unrealized | | | | | | | | | | | | | | | | | | | | |
Appreciation/Depreciation of | | | | | | | | | | | | | | | | | | | | |
Investments | | | | 20,623,773 | | | | | (13,446,704 | ) | | | | 1,897,143 | | | | | (1,443,066 | ) |
| | | |
| | | |
| | | |
| | | |
| |
Net Increase (Decrease) in Net Assets | | | | | | | | | | | | | | | | | | | | |
Resulting from Operations | | | | 22,192,597 | | | | | (20,676,465 | ) | | | | 3,277,126 | | | | | (239,236 | ) |
| | | |
| | | |
| | | |
| | | |
| |
| Distributions to Shareholders | | | | | | | | | | | | | | | | | | | | |
Net Investment Income | | | | | | | | | | | | | | | | | | | | |
Investor Class (Advisor Class) | | | | (733,712 | ) | | | | (495,150 | ) | | | | (124,609 | ) | | | | (71,827 | ) |
I Class | | | | (1,172,404 | ) | | | | (952,198 | ) | | | | (1,092,527 | ) | | | | (887,322 | ) |
Class B | | | | (5,820 | ) | | | | (23,655 | ) | | | | (13,698 | ) | | | | (40,382 | ) |
Class C | | | | (394,015 | ) | | | | (256,602 | ) | | | | (46,655 | ) | | | | (38,129 | ) |
Net Realized Gains From Investment Transactions | | | | | | | | | | | | | | | | | | | | |
Investor Class (Advisor Class) | | | | — | | | | | (321,582 | ) | | | | (17,570 | ) | | | | — | |
I Class | | | | — | | | | | (590,686 | ) | | | | (128,515 | ) | | | | — | |
Class B | | | | — | | | | | (22,969 | ) | | | | — | | | | | — | |
Class C | | | | — | | | | | (225,817 | ) | | | | (7,920 | ) | | | | — | |
Return of Capital | | | | | | | | | | | | | | | | | | | | |
Investor Class (Advisor Class) | | | | — | | | | | (68,828 | ) | | | | — | | | | | — | |
I Class | | | | — | | | | | (131,516 | ) | | | | — | | | | | — | |
Class B | | | | — | | | | | (2,792 | ) | | | | — | | | | | — | |
Class C | | | | — | | | | | (40,062 | ) | | | | — | | | | | — | |
| | | |
| | | |
| | | |
| | | |
| |
Total Distributions to Shareholders | | | | (2,305,951 | ) | | | | (3,131,857 | ) | | | | (1,431,494 | ) | | | | (1,037,660 | ) |
| | | |
| | | |
| | | |
| | | |
| |
| From Share Transactions | | | | | | | | | | | | | | | | | | | | |
Net Increase (Decrease) in Net Assets | | | | | | | | | | | | | | | | | | | | |
Resulting from Share Transactions | | | | 194,955 | | | | | 8,909,205 | | | | | (52,730 | ) | | | | 868,316 | |
| | | |
| | | |
| | | |
| | | |
| |
Total Increase (Decrease) in | | | | | | | | | | | | | | | | | | | | |
Net Assets | | | | 20,081,601 | | | | | (14,899,117 | ) | | | | 1,792,902 | | | | | (408,580 | ) |
| Net Assets – Beginning of Year | | | | 66,130,186 | | | | | 81,029,303 | | | | | 26,707,187 | | | | | 27,115,767 | |
| | | |
| | | |
| | | |
| | | |
| |
| Net Assets – End of Year | | | $ | 86,211,787 | | | | $ | 66,130,186 | | | | $ | 28,500,089 | | | | $ | 26,707,187 | |
| | | |
| | | |
| | | |
| | | |
| |
| Accumulated Net Investment Income | | | $ | — | | | | $ | 236,153 | | | | $ | (89 | ) | | | $ | 61,766 | |
| | | |
| | | |
| | | |
| | | |
| |
|
| * Audited by other Independent Registered Public Accounting Firm. (Note 10) |
The accompanying notes are an integral part of the financial statements.
28
| The FBR Funds |
|
| Financial Highlights |
The following tables provide per share data for a share outstanding throughout each period for each Fund. Other data includes investment performance, ratios to average net assets and other supplemental information.
| | | | Balanced Fund — Investor Class | |
| | | |
| |
| | | | For the Years Ended March 31, | |
| | | |
| |
| | | | 2010 | | | | 20094 | | | | 20084 | | | | 20074 | | | | 20064 | |
| | | |
| | | |
| | | |
| | | |
| | | |
| |
| Per Share Operating Performance: | | | | | | | | | | | | | | | | | | | | | | | | | |
Net Asset Value – Beginning of Year | | | $ | 8.92 | | | | $ | 12.27 | | | | $ | 14.48 | | | | $ | 13.48 | | | | $ | 12.58 | |
| | | |
| | | |
| | | |
| | | |
| | | |
| |
Income (Loss) from Investment Operations: | | | | | | | | | | | | | | | | | | | | | | | | | |
Net Investment Income1 | | | | 0.29 | | | | | 0.32 | | | | | 0.39 | | | | | 0.36 | | | | | 0.37 | |
Net Realized and Unrealized Gain (Loss) on | | | | | | | | | | | | | | | | | | | | | | | | | |
Investments1,2 | | | | 2.61 | | | | | (3.23 | ) | | | | 0.34 | | | | | 1.13 | | | | | 0.89 | |
| | | |
| | | |
| | | |
| | | |
| | | |
| |
Total from Investment Operations | | | | 2.90 | | | | | (2.91 | ) | | | | 0.73 | | | | | 1.49 | | | | | 1.26 | |
| | | |
| | | |
| | | |
| | | |
| | | |
| |
Distributions to Shareholders: | | | | | | | | | | | | | | | | | | | | | | | | | |
From Net Investment Income | | | | (0.30 | ) | | | | (0.25 | ) | | | | (0.37 | ) | | | | (0.33 | ) | | | | (0.36 | ) |
From Net Realized Gain | | | | — | | | | | (0.17 | ) | | | | (2.57 | ) | | | | (0.16 | ) | | | | — | |
Return of Capital | | | | — | | | | | (0.03 | ) | | | | — | | | | | — | | | | | — | |
| | | |
| | | |
| | | |
| | | |
| | | |
| |
Total Distributions | | | | (0.30 | ) | | | | (0.45 | ) | | | | (2.94 | ) | | | | (0.49 | ) | | | | (0.36 | ) |
| | | |
| | | |
| | | |
| | | |
| | | |
| |
Paid-in Capital from Redemption Fees1 | | | | 0.00 | 5 | | | | 0.01 | | | | | — | | | | | — | | | | | — | |
| | | |
| | | |
| | | |
| | | |
| | | |
| |
Net Increase (Decrease) in Net Asset Value | | | | 2.60 | | | | | (3.35 | ) | | | | (2.21 | ) | | | | 1.00 | | | | | 0.90 | |
| | | |
| | | |
| | | |
| | | |
| | | |
| |
Net Asset Value – End of Year | | | $ | 11.52 | | | | $ | 8.92 | | | | $ | 12.27 | | | | $ | 14.48 | | | | $ | 13.48 | |
| | | |
| | | |
| | | |
| | | |
| | | |
| |
| Total Investment Return3 | | | | 32.76% | | | | | (24.28) | % | | | | 4.45% | | | | | 11.19% | | | | | 10.18% | |
| Ratios to Average Net Assets: | | | | | | | | | | | | | | | | | | | | | | | | | |
Expenses After Waivers and Related Reimbursements6 | | | | 1.25% | | | | | 1.32% | | | | | 1.33% | | | | | 1.33% | | | | | 1.33% | |
Expenses Before Waivers and Related Reimbursements6 | | | | 1.69% | | | | | 1.84% | | | | | 1.66% | | | | | 1.51% | | | | | 1.69% | |
Net Investment Income After Waivers and Related | | | | | | | | | | | | | | | | | | | | | | | | | |
Reimbursements | | | | 2.70% | | | | | 3.03% | | | | | 2.75% | | | | | 2.52% | | | | | 2.82% | |
Net Investment Income Before Waivers and Related | | | | | | | | | | | | | | | | | | | | | | | | | |
Reimbursements | | | | 2.26% | | | | | 2.50% | | | | | 2.42% | | | | | 2.34% | | | | | 2.46% | |
| Supplementary Data: | | | | | | | | | | | | | | | | | | | | | | | | | |
Portfolio Turnover Rate | | | | 26% | | | | | 32% | | | | | 110% | | | | | 28% | | | | | 18% | |
Net Assets at End of Year (in thousands) | | | $ | 46,809 | | | | $ | 18,858 | | | | $ | 21,700 | | | | $ | 24,260 | | | | $ | 13,413 | |
|
| 1 | | Calculated based on average shares outstanding |
| 2 | | The amounts shown for a share outstanding throughout the period may not be in accordance with the changes in the aggregate gains and losses on investments during the period because of the timing of sales and repurchases of Fund shares in relation to fluctuating net asset values during the period. |
| 3 | | Total investment return is calculated assuming a purchase of shares on the first day and a sale on the last day of each period reported and will include reinvestment of dividends and distributions, if any. |
| 4 | | Audited by other Independent Public Accounting Firm (Note 10) |
| 5 | | Less than $0.01 |
| 6 | | Does not include expenses of the funds in which the Fund invests. |
29
| The FBR Funds |
|
| Financial Highlights (continued) |
| | | | Balanced Fund — I Class | |
| | | |
| |
| | | | For the Years Ended March 31, | |
| | | |
| |
| | | | 2010 | | | | 20094 | | | | 20084 | | | | 20074 | | | | 20064 | |
| | | |
| | | |
| | | |
| | | |
| | | |
| |
| Per Share Operating Performance: | | | | | | | | | | | | | | | | | | | | | | | | | |
Net Asset Value – Beginning of Year | | | $ | 8.52 | | | | $ | 11.75 | | | | $ | 13.98 | | | | $ | 13.04 | | | | $ | 12.19 | |
| | | |
| | | |
| | | |
| | | |
| | | |
| |
Income (Loss) from Investment Operations: | | | | | | | | | | | | | | | | | | | | | | | | | |
Net Investment Income1 | | | | 0.30 | | | | | 0.33 | | | | | 0.42 | | | | | 0.38 | | | | | 0.39 | |
Net Realized and Unrealized Gain (Loss) on | | | | | | | | | | | | | | | | | | | | | | | | | |
Investments1,2 | | | | 2.50 | | | | | (3.10 | ) | | | | 0.33 | | | | | 1.10 | | | | | 0.86 | |
| | | |
| | | |
| | | |
| | | |
| | | |
| |
Total from Investment Operations | | | | 2.80 | | | | | (2.77 | ) | | | | 0.75 | | | | | 1.48 | | | | | 1.25 | |
| | | |
| | | |
| | | |
| | | |
| | | |
| |
Distributions to Shareholders: | | | | | | | | | | | | | | | | | | | | | | | | | |
From Net Investment Income | | | | (0.33 | ) | | | | (0.26 | ) | | | | (0.41 | ) | | | | (0.38 | ) | | | | (0.40 | ) |
From Net Realized Gain | | | | — | | | | | (0.17 | ) | | | | (2.57 | ) | | | | (0.16 | ) | | | | — | |
Return of Capital | | | | — | | | | | (0.04 | ) | | | | — | | | | | — | | | | | — | |
| | | |
| | | |
| | | |
| | | |
| | | |
| |
Total Distributions | | | | (0.33 | ) | | | | (0.47 | ) | | | | (2.98 | ) | | | | (0.54 | ) | | | | (0.40 | ) |
| | | |
| | | |
| | | |
| | | |
| | | |
| |
Paid-in Capital from Redemption Fees1 | | | | 0.005 | | | | | 0.01 | | | | | — | | | | | — | | | | | — | |
| | | |
| | | |
| | | |
| | | |
| | | |
| |
Net Increase (Decrease) in Net Asset Value | | | | 2.47 | | | | | (3.23 | ) | | | | (2.23 | ) | | | | 0.94 | | | | | 0.85 | |
| | | |
| | | |
| | | |
| | | |
| | | |
| |
Net Asset Value – End of Year | | | $ | 10.99 | | | | $ | 8.52 | | | | $ | 11.75 | | | | $ | 13.98 | | | | $ | 13.04 | |
| | | |
| | | |
| | | |
| | | |
| | | |
| |
| Total Investment Return3 | | | | 33.10% | | | | | (24.13) | % | | | | 4.75% | | | | | 11.47% | | | | | 10.42% | |
| Ratios to Average Net Assets: | | | | | | | | | | | | | | | | | | | | | | | | | |
Expenses After Waivers and Related Reimbursements6 | | | | 0.99% | | | | | 1.07% | | | | | 1.08% | | | | | 1.08% | | | | | 1.08% | |
Expenses Before Waivers and Related Reimbursements6 | | | | 1.43% | | | | | 1.58% | | | | | 1.41% | | | | | 1.25% | | | | | 1.45% | |
Net Investment Income After Waivers and Related | | | | | | | | | | | | | | | | | | | | | | | | | |
Reimbursements | | | | 3.01% | | | | | 3.24% | | | | | 3.00% | | | | | 2.76% | | | | | 3.06% | |
Net Investment Income Before Waivers and Related | | | | | | | | | | | | | | | | | | | | | | | | | |
Reimbursements | | | | 2.57% | | | | | 2.73% | | | | | 2.67% | | | | | 2.59% | | | | | 2.69% | |
| Supplementary Data: | | | | | | | | | | | | | | | | | | | | | | | | | |
Portfolio Turnover Rate | | | | 26% | | | | | 32% | | | | | 110% | | | | | 28% | | | | | 18% | |
Net Assets at End of Year (in thousands) | | | $ | 39,403 | | | | $ | 31,127 | | | | $ | 41,206 | | | | $ | 47,390 | | | | $ | 51,757 | |
|
| 1 | | Calculated based on average shares outstanding |
| 2 | | The amounts shown for a share outstanding throughout the period may not be in accordance with the changes in the aggregate gains and losses on investments during the period because of the timing of sales and repurchases of Fund shares in relation to fluctuating net asset values during the period. |
| 3 | | Total investment return is calculated assuming a purchase of shares on the first day and a sale on the last day of each period reported and will include reinvestment of dividends and distributions, if any. |
| 4 | | Audited by other Independent Public Accounting Firm (Note 10) |
| 5 | | Less than $0.01 |
| 6 | | Does not include expenses of the funds in which the Fund invests. |
30
| The FBR Funds |
|
| Financial Highlights (continued) |
| | | | Core Bond Fund — Investor Class | |
| | | |
| |
| | | �� | For the Years Ended March 31, | |
| | | |
| |
| | | | 2010 | | | | 20095 | | | | 20085 | | | | 20075 | | | | 20065 | |
| | | |
| | | |
| | | |
| | | |
| | | |
| |
| Per Share Operating Performance: | | | | | | | | | | | | | | | | | | | | | | | | | |
Net Asset Value – Beginning of Year | | | $ | 8.75 | | | | $ | 9.16 | | | | $ | 9.71 | | | | $ | 9.77 | | | | $ | 9.76 | |
| | | |
| | | |
| | | |
| | | |
| | | |
| |
Income (Loss) from Investment Operations: | | | | | | | | | | | | | | | | | | | | | | | | | |
Net Investment Income1 | | | | 0.38 | | | | | 0.35 | | | | | 0.42 | | | | | 0.50 | | | | | 0.43 | |
Net Realized and Unrealized Gain (Loss) on | | | | | | | | | | | | | | | | | | | | | | | | | |
Investments1,2 | | | | 0.69 | | | | | (0.44 | ) | | | | — | | | | | 0.05 | | | | | 0.16 | |
| | | |
| | | |
| | | |
| | | |
| | | |
| |
Total from Investment Operations | | | | 1.07 | | | | | (0.09 | ) | | | | 0.42 | | | | | 0.55 | | | | | 0.59 | |
| | | |
| | | |
| | | |
| | | |
| | | |
| |
Distributions to Shareholders: | | | | | | | | | | | | | | | | | | | | | | | | | |
From Net Investment Income | | | | (0.38 | ) | | | | (0.32 | ) | | | | (0.39 | ) | | | | (0.51 | ) | | | | (0.48 | ) |
From Net Realized Gain | | | | (0.05 | ) | | | | — | | | | | (0.58 | ) | | | | (0.10 | ) | | | | (0.10 | ) |
| | | |
| | | |
| | | |
| | | |
| | | |
| |
Total Distributions | | | | (0.43 | ) | | | | (0.32 | ) | | | | (0.97 | ) | | | | (0.61 | ) | | | | (0.58 | ) |
| | | |
| | | |
| | | |
| | | |
| | | |
| |
Paid-in Capital from Redemption Fees1 | | | | 0.003 | | | | | 0.003 | | | | | — | | | | | — | | | | | — | |
| | | |
| | | |
| | | |
| | | |
| | | |
| |
Net Increase (Decrease) in Net Asset Value | | | | 0.64 | | | | | (0.41 | ) | | | | (0.55 | ) | | | | (0.06 | ) | | | | 0.01 | |
| | | |
| | | |
| | | |
| | | |
| | | |
| |
Net Asset Value – End of Year | | | $ | 9.39 | | | | $ | 8.75 | | | | $ | 9.16 | | | | $ | 9.71 | | | | $ | 9.77 | |
| | | |
| | | |
| | | |
| | | |
| | | |
| |
| Total Investment Return4 | | | | 12.33% | | | | | (0.93) | % | | | | 4.48% | | | | | 5.87% | | | | | 6.22% | |
| Ratios to Average Net Assets: | | | | | | | | | | | | | | | | | | | | | | | | | |
Expenses After Waivers and Related Reimbursements6 | | | | 1.31% | | | | | 1.33% | | | | | 1.33% | | | | | 1.33% | | | | | 1.33% | |
Expenses Before Waivers and Related Reimbursements6 | | | | 1.93% | | | | | 2.14% | | | | | 2.19% | | | | | 1.97% | | | | | 2.09% | |
Net Investment Income After Waivers and Related | | | | | | | | | | | | | | | | | | | | | | | | | |
Reimbursements | | | | 4.11% | | | | | 4.02% | | | | | 4.40% | | | | | 5.18% | | | | | 4.41% | |
Net Investment Income Before Waivers and Related | | | | | | | | | | | | | | | | | | | | | | | | | |
Reimbursements | | | | 3.49% | | | | | 3.21% | | | | | 3.53% | | | | | 4.54% | | | | | 3.65% | |
| Supplementary Data: | | | | | | | | | | | | | | | | | | | | | | | | | |
Portfolio Turnover Rate | | | | 28% | | | | | 39% | | | | | 102% | | | | | 10% | | | | | 28% | |
Net Assets at End of Year (in thousands) | | | $ | 4,615 | | | | $ | 2,055 | | | | $ | 2,030 | | | | $ | 4,011 | | | | $ | 7,563 | |
|
| 1 | | Calculated based on average shares outstanding |
| 2 | | The amounts shown for a share outstanding throughout the period may not be in accordance with the changes in the aggregate gains and losses on investments during the period because of the timing of sales and repurchases of Fund shares in relation to fluctuating net asset values during the period. |
| 3 | | Less than $0.01 |
| 4 | | Total investment return is calculated assuming a purchase of shares on the first day and a sale on the last day of each period reported and will include reinvestment of dividends and distributions, if any. |
| 5 | | Audited by other Independent Public Accounting Firm (Note 10) |
| 6 | | Does not include expenses of the funds in which the Fund invests. |
31
| The FBR Funds |
|
| Financial Highlights (continued) |
| | | | Core Bond Fund — I Class | |
| | | |
| |
| | | | For the Years Ended March 31, | |
| | | |
| |
| | | | 2010 | | | | 20095 | | | | 20085 | | | | 20075 | | | | 20065 | |
| | | |
| | | |
| | | |
| | | |
| | | |
| |
| Per Share Operating Performance: | | | | | | | | | | | | | | | | | | | | | | | | | |
Net Asset Value – Beginning of Year | | | $ | 8.11 | | | | $ | 8.52 | | | | $ | 9.10 | | | | $ | 9.15 | | | | $ | 9.13 | |
| | | |
| | | |
| | | |
| | | |
| | | |
| |
Income (Loss) from Investment Operations: | | | | | | | | | | | | | | | | | | | | | | | | | |
Net Investment Income1 | | | | 0.37 | | | | | 0.35 | | | | | 0.39 | | | | | 0.49 | | | | | 0.45 | |
Net Realized and Unrealized Gain (Loss) on | | | | | | | | | | | | | | | | | | | | | | | | | |
Investments1,2 | | | | 0.64 | | | | | (0.42 | ) | | | | 0.03 | | | | | 0.05 | | | | | 0.12 | |
| | | |
| | | |
| | | |
| | | |
| | | |
| |
Total from Investment Operations | | | | 1.01 | | | | | (0.07 | ) | | | | 0.42 | | | | | 0.54 | | | | | 0.57 | |
| | | |
| | | |
| | | |
| | | |
| | | |
| |
Distributions to Shareholders: | | | | | | | | | | | | | | | | | | | | | | | | | |
From Net Investment Income | | | | (0.40 | ) | | | | (0.34 | ) | | | | (0.42 | ) | | | | (0.49 | ) | | | | (0.45 | ) |
From Net Realized Gain | | | | (0.05 | ) | | | | — | | | | | (0.58 | ) | | | | (0.10 | ) | | | | (0.10 | ) |
| | | |
| | | |
| | | |
| | | |
| | | |
| |
Total Distributions | | | | (0.45 | ) | | | | (0.34 | ) | | | | (1.00 | ) | | | | (0.59 | ) | | | | (0.55 | ) |
| | | |
| | | |
| | | |
| | | |
| | | |
| |
Paid-in Capital from Redemption Fees1 | | | | 0.003 | | | | | 0.003 | | | | | — | | | | | — | | | | | — | |
| | | |
| | | |
| | | |
| | | |
| | | |
| |
Net Increase (Decrease) in Net Asset Value | | | | 0.56 | | | | | (0.41 | ) | | | | (0.58 | ) | | | | (0.05 | ) | | | | 0.02 | |
| | | |
| | | |
| | | |
| | | |
| | | |
| |
Net Asset Value – End of Year | | | $ | 8.67 | | | | $ | 8.11 | | | | $ | 8.52 | | | | $ | 9.10 | | | | $ | 9.15 | |
| | | |
| | | |
| | | |
| | | |
| | | |
| |
| Total Investment Return4 | | | | 12.62% | | | | | (0.74) | % | | | | 4.78% | | | | | 6.11% | | | | | 6.47% | |
| Ratios to Average Net Assets: | | | | | | | | | | | | | | | | | | | | | | | | | |
Expenses After Waivers and Related Reimbursements6 | | | | 1.06% | | | | | 1.08% | | | | | 1.08% | | | | | 1.08% | | | | | 1.08% | |
Expenses Before Waivers and Related Reimbursements6 | | | | 1.69% | | | | | 1.89% | | | | | 1.94% | | | | | 1.72% | | | | | 1.79% | |
Net Investment Income After Waivers and Related | | | | | | | | | | | | | | | | | | | | | | | | | |
Reimbursements | | | | 4.37% | | | | | 4.27% | | | | | 4.46% | | | | | 5.44% | | | | | 4.95% | |
Net Investment Income Before Waivers and Related | | | | | | | | | | | | | | | | | | | | | | | | | |
Reimbursements | | | | 3.74% | | | | | 3.46% | | | | | 3.60% | | | | | 4.80% | | | | | 4.24% | |
| Supplementary Data: | | | | | | | | | | | | | | | | | | | | | | | | | |
Portfolio Turnover Rate | | | | 28% | | | | | 39% | | | | | 102% | | | | | 10% | | | | | 28% | |
Net Assets at End of Year (in thousands) | | | $ | 23,885 | | | | $ | 22,053 | | | | $ | 21,953 | | | | $ | 13,234 | | | | $ | 12,663 | |
|
| 1 | | Calculated based on average shares outstanding |
| 2 | | The amounts shown for a share outstanding throughout the period may not be in accordance with the changes in the aggregate gains and losses on investments during the period because of the timing of sales and repurchases of Fund shares in relation to fluctuating net asset values during the period. |
| 3 | | Less than $0.01 |
| 4 | | Total investment return is calculated assuming a purchase of shares on the first day and a sale on the last day of each period reported and will include reinvestment of dividends and distributions, if any. |
| 5 | | Audited by other Independent Public Accounting Firm (Note 10) |
| 6 | | Does not include expenses of the funds in which the Fund invests. |
The accompanying notes are an integral part of the financial statements.
32
| The FBR Funds |
|
| Schedule of Shareholder Expenses |
| (unaudited) |
As a shareholder of the Funds, you incur two types of costs: (1) transaction costs, including reinvested dividends or other distributions; redemption fees; and exchange fees; and (2) ongoing costs, including investment advisory fees; distribution (12b-1) fees; and other Fund expenses. This example is intended to help you understand your ongoing costs (in dollars) of investing in the Funds and to compare these costs with the ongoing costs of investing in other mutual funds.
The example is based on an investment of $1,000 invested at the beginning of the period and held for the entire period (October 1, 2009 through March 31, 2010).
Actual Expenses
The table below provides information about actual account values and actual expenses. You may use the information in this line, together with the amount you invested, to estimate the expenses that you paid over the period. Simply divide your account value by $1,000 (for example, an $8,600 account value divided by $1,000 = 8.6), then multiply the result by the number in the first line under the heading entitled “Expenses Paid During the Six Months Ended March 31, 2010” to estimate the expenses you paid on your account during this period.
| | | | | | | | | | | | | | | | | | Expenses Paid |
| | | Net Expense | | Beginning | | Ending | | During the |
| | | Ratio | | Account | | Account | | Six Months |
| | | Annualized | | Value | | Value | | Ended |
| | | March 31, 2010 | | October 1, 2009 | | March 31, 2010 | | March 31, 2010* |
| | |
| |
| |
| |
|
| Balanced Fund | | | | | | | | | | | | | | | | | | | | |
Investor Class | | | | 1.25 | % | | | $ | 1,000.00 | | | | $ | 1,090.10 | | | | $ | 6.51 | |
I Class | | | | 1.00 | | | | | 1,000.00 | | | | | 1,090.80 | | | | | 5.21 | |
| Core Bond Fund | | | | | | | | | | | | | | | | | | | | |
Investor Class | | | | 1.31 | | | | | 1,000.00 | | | | | 1,026.60 | | | | | 6.62 | |
I Class | | | | 1.06 | | | | | 1,000.00 | | | | | 1,027.80 | | | | | 5.36 | |
|
| * | | Expenses are equal to the Fund’s annualized expense ratio, multiplied by the average account value over the period, multiplied by the number of days in most recent fiscal half-year then divided by 365. |
33
| The FBR Funds |
|
| Schedule of Shareholder Expenses (continued) |
| (unaudited) |
Hypothetical Example for Comparison Purposes
The table below provides information about hypothetical account values and hypothetical expenses based on the Funds’ actual expense ratio and an assumed rate of return of 5% per year before expenses, which is not the Funds’ actual return. The hypothetical account values and expenses may not be used to estimate the actual ending account balance or expenses you paid for the period. You may use this information to compare the ongoing costs of investing in the Funds and other funds. To do so, compare this 5% hypothetical example with the 5% hypothetical examples that appear in the shareholder reports of the other funds.
| | | | | | | | | | | | | | | | Expenses Paid |
| | | | Net Expense | | Beginning | | Ending | | During the |
| | | | Ratio | | Account | | Account | | Six Months |
| | | | Annualized | | Value | | Value | | Ended |
| | | | March 31, 2010 | | October 1, 2009 | | March 31, 2010 | | March 31, 2010* |
| | | |
| |
| |
| |
|
| Balanced Fund | | | | | | | | | | | | | | | | | |
Investor Class | | | | 1.25 | % | | $ | 1,000.00 | | | $ | 1,018.70 | | | $ | 6.29 | |
I Class | | | | 1.00 | | | | 1,000.00 | | | | 1,019.95 | | | | 5.04 | |
| Core Bond Fund | | | | | | | | | | | | | | | | | |
Investor Class | | | | 1.31 | | | | 1,000.00 | | | | 1,018.40 | | | | 6.59 | |
I Class | | | | 1.06 | | | | 1,000.00 | | | | 1,019.65 | | | | 5.34 | |
|
| * | | Expenses are equal to the Fund’s annualized expense ratio, multiplied by the average account value over the period, multiplied by the number of days in most recent fiscal half-year then divided by 365. |
34
| The FBR Funds |
|
| Notes to Financial Statements |
The FBR Funds (the “Trust”), is registered under the Investment Company Act of 1940, as amended (“1940 Act”), as an open-end investment management company. The Trust was organized as a statutory trust under the laws of the State of Delaware on September 29, 2003. As of March 31, 2010 the Trust consisted of 11 series. This report includes the following two series: FBR Balanced Fund (“Balanced Fund”) and FBR Core Bond Fund (“Core Bond Fund”) (each a “Fund” and collectively, the “Funds”). The Trust is authorized to issue an unlimited number of shares of beneficial interest with no par value which may be issued in more than one class or series, the I Class and Investor Class shares are currently offerred.
On March 12, 2010, the Balanced Fund and the Core Bond Fund acquired substantially all the assets and assumed the liabilities of the AFBA 5Star Balanced Fund and the AFBA 5Star Total Return Bond Fund (the “predecessor funds”), respectively, each a series of the AFBA 5Star Funds, a Delaware statutory trust, registered under the 1940 Act as an openend management investment company (Note 9).
On March 12, 2010, following this aquisition, Class I and Advisor Class shares were renamed I Class and Investor Class, respectively (see Note 9). In addition, Class C shares converted into the Investor Class (see Note 9).
The Balanced Fund, a diversified fund, invests in a blend of domestic common stocks, preferred stocks, convertible securities and core, high quality domestic corporate, agency and government bonds. The investment objective of the Fund is long-term capital growth and current income.
The Core Bond Fund, a diversified fund, invests at least 80% of its net assets in fixed income securities, which primarily include domestic investment grade corporate, agency and governmental bonds. The investment objective of the Fund is current income with capital growth as a secondary objective.
| 2. | Significant Accounting Policies |
The following is a summary of the Funds’ significant accounting policies:
Portfolio Valuation — The net asset value per share (“NAV”) of each Fund is determined as of the close of regular trading on the New York Stock Exchange (“NYSE”) (normally 4:00 p.m., Eastern Time) on each business day that the exchange is open for trading. Each Fund’s securities are valued at the last sale price on the securities exchange or national securities market on which such securities are primarily traded. Securities that are quoted by NASDAQ are valued at the NASDAQ Official Closing Price. Securities not listed on an exchange or national securities market, or securities in which there were no transactions, are valued at the average of the most recent bid and ask prices, except in the case of open short positions where the ask price is used for valuation purposes. The bid price is used when no ask price is available. Debt instruments and floating rate loans (other than
35
| The FBR Funds |
|
| Notes to Financial Statements (continued) |
short-term instruments), including restricted debt instruments, are generally valued at an evaluated or composite bid as provided by a third-party pricing service. Securities and other assets generally valued on the basis of information from a third-party pricing service may also be valued at a broker/dealer bid quotation. Values obtained from third-party pricing services can utilize both transaction data and market information such as yield, quality, coupon rate, maturity, type of issue, trading characteristics, and other market data. Short-term investments are carried at amortized cost, which approximates market value. Restricted securities, as well as securities or other assets for which market quotations are not readily available, or are not valued by a pricing service approved by the Funds’ Board of Trustees (the “Board”), are valued at fair value in good faith by, or at the direction of, the Board.
The Funds have adopted FASB ASC 820 “Fair Value Measurements”. This standard establishes a single authoritative definition of fair value, sets out a framework for measuring fair value and requires additional disclosures about fair value measurements. Fair Value Measurements applies to fair value measurements already required or permitted by existing standards. The changes to current generally accepted accounting principles (GAAP) from the application of this Statement relate to the definition of fair value, the methods used to measure fair value, and the expanded disclosures about fair value measurements. Various inputs are used in determining the value of the Funds’ investments. These inputs are summarized in the three broad levels listed below:
| • | | Level 1 – Unadjusted quoted prices in active markets for identical assets or liabilities that the Fund has the ability to access. |
| • | | Level 2 – Observable inputs other than quoted prices included in Level 1 that are observable for the asset or liability, either directly or indirectly. These inputs may include quoted prices for the identical instrument on an inactive market, prices for similar instruments, interest rates, prepayment speeds, credit risk curves, default rates and similar data. |
| • | | Level 3 – Unobservable inputs for the asset or liability, to the extent observable inputs are not available, representing the Funds’ own assumptions about the assumptions a market participant would use in valuing the asset or liability, and would be based on the best information available. |
The inputs or methodology used for valuing securities are not necessarily an indication of the risk associated with investing in those securities. For example, securities maturing within 60 days of the filing are valued using amortized cost, in accordance with rules under the Investment Company Act of 1940. Generally, amortized cost approximates the current fair value of a security, but since the value is not obtained from a quoted price in an active market, such securities are reflected as Level 2.
36
| The FBR Funds |
|
| Notes to Financial Statements (continued) |
The following is a summary of inputs used to value the Funds’ net assets as of March 31, 2010, the Funds did not hold any Level 3 categorized securities during the year ended or at March 31, 2010,
| | | | | | | | Level 2 – Other | | | | | | | | | | |
| | | | | | | | Significant | | Level 3 – Significant | | | | | |
| | | Level 1 – Quoted | | Observable | | Unobservable | | | | | |
| | | Prices | | Inputs | | Inputs | | | Total | |
| | |
| |
| |
| | |
| |
| | | | | | | | | | | | | | | | | | | | | |
| Balanced Fund | | | | | | | | | | | | | | | | | | | | |
Asset-Backed Securities | | | $ | — | | | | $ | 1,212,471 | | | | $ | — | | | | $ | 1,212,471 | |
Common Stocks* | | | | 52,084,825 | | | | | — | | | | | — | | | | | 52,084,825 | |
Corporate Bonds | | | | — | | | | | 19,106,863 | | | | | — | | | | | 19,106,863 | |
Exchange Traded Funds | | | | 2,803,713 | | | | | — | | | | | — | | | | | 2,803,713 | |
Preferred Stocks | | | | 17,272 | | | | | — | | | | | — | | | | | 17,272 | |
Mutual Fund | | | | 937,937 | | | | | — | | | | | — | | | | | 937,937 | |
U.S. Government and | | | | | | | | | | | | | | | | | | | | |
Agency Obligations | | | | — | | | | | 3,937,028 | | | | | — | | | | | 3,937,028 | |
U.S. Treasury Obligations | | | | — | | | | | 5,860,326 | | | | | — | | | | | 5,860,326 | |
| | | |
| | | |
| | | |
| | | |
| |
| | | | $ | 55,843,747 | | | | $ | 30,116,688 | | | | $ | — | | | | $ | 85,960,435 | |
| | | |
| | | |
| | | |
| | | |
| |
| | | | | | | |
Level 2 – Other | | | | | | | | | | |
| | | | | | | | Significant | | Level 3 – Significant | | | | | |
| | | Level 1 – Quoted | | Observable | | Unobservable | | | | | |
| | | Prices | | Inputs | | Inputs | | | Total | |
| | |
| |
| |
| | |
| |
| Core Bond Fund | | | | | | | | | | | | | | | | | | | | |
Asset-Backed Securities | | | $ | — | | | | $ | 1,055,329 | | | | $ | — | | | | $ | 1,055,329 | |
Corporate Bonds | | | | — | | | | | 16,119,497 | | | | | — | | | | | 16,119,497 | |
Exchange Traded Funds | | | | 2,307,757 | | | | | — | | | | | — | | | | | 2,307,757 | |
Preferred Stocks | | | | 13,208 | | | | | 409,678 | | | | | — | | | | | 422,886 | |
U.S. Government and | | | | | | | | | | | | | | | | | | | | |
Agency Obligations | | | | — | | | | | 3,546,907 | | | | | — | | | | | 3,546,907 | |
U.S. Treasury Obligations | | | | — | | | | | 4,503,201 | | | | | — | | | | | 4,503,201 | |
| | | |
| | | |
| | | |
| | | |
| |
| | | | $ | 2,320,965 | | | | $ | 25,634,612 | | | | $ | — | | | | $ | 27,955,577 | |
| | | |
| | | |
| | | |
| | | |
| |
|
| * | | Please refer to portfolio of investment for industry classifications of common stocks. |
New Accounting Pronouncements — In January 2010, the Financial Accounting Standards Board (“FASB”) issued new guidance as an amendment to fair value measurements and disclosures. The new guidance adds new requirements for disclosure about transfers into and out of Level 1 and Level 2 fair value measurements and separate disclosures about purchases, sales, issuances, and settlements relating to Level 3 measurements. The guidance also clarifies existing fair value disclosures about the Level of disaggregation and about inputs and valuation techniques in Level 2 and Level 3 fair value measurements. The amendment is effective for interim and annual reporting periods beginning after
37
| The FBR Funds |
|
| Notes to Financial Statements (continued) |
December 15, 2009, except for Level 3 reconciliation disclosures which are effective for interim and annual periods beginning after December 15, 2010. The Funds do not expect the implications of this guidance to have a material impact on its financial statements.
Share Valuation — The NAV of each Fund is calculated by dividing the sum of the value of the securities held by each Fund, plus cash or other assets, minus all liabilities (including estimated accrued expenses) by the total number of shares outstanding of each Fund, rounded to the nearest cent. Each Fund’s shares will not be priced on the days on which the NYSE is closed for trading. The offering and redemption price per share of each Fund is equal to each Fund’s NAV. The Funds charge a 1% redemption fee on shares redeemed or exchanged within 90 days of purchase. These fees are deducted from the redemption proceeds otherwise payable to the shareholder. The Funds will retain the fee charged as paid-in capital and such fees become part of that Fund’s daily NAV calculation.
Investment Income — Dividend income is recorded on the ex-dividend date. Interest income, which includes the amortization of premium and accretion of discount, if any, is recorded on an accrual basis.
Expenses — The Funds pay all operational expenses, which are either charged directly to a Fund for which the expense is attributable or are allocated proportionately among the Funds based on allocation methods approved by the Board. Certain expenses of the predecessor funds were allocated among the predecessor Funds’ respective series based on relative net assets (see Note 9).
Dividends and Distribution to Shareholders — Dividends from the Balanced Fund’s net investment income, if any, are declared and paid quarterly. Dividends from the Core Bond Fund’s net investment income, if any, are declared and paid monthly. Distributions from net realized capital gains, if any, will be distributed at least annually for each Fund.
Allocations — Investment income earned, realized capital gains and losses, and unrealized appreciation and depreciation for the Funds are allocated daily to each class of shares based upon its proportionate share of total net assets of the Fund. Class specific expenses are charged directly to the class incurring the expense. Common expenses, which are not attributable to a specific class, are allocated daily to each class of shares based upon its proportionate share of total net assets of the Fund. Expenses not directly billed to a Fund are allocated proportionally among all Funds daily in relation to net assets of each Fund or another reasonable measure.
Security Transactions — Security transactions are accounted for on the trade date. Securities sold are determined on a specific identification basis.
Estimates — The preparation of financial statements in accordance with U.S. generally accepted accounting principles requires management to make estimates and assumptions that may affect the reported amounts of assets and liabilities and disclosure of contingent assets and liabilities at the date of the financial statements and the reported amounts of income and expenses during the reporting period. Actual results could differ from those estimates.
38
| The FBR Funds |
|
| Notes to Financial Statements (continued) |
Indemnification Arrangements — In the normal course of business, the Trust enters into contracts that provide general indemnifications. The Funds’ maximum exposure under these arrangements is dependent on claims that may be made against the Trust in the future and, therefore, cannot be estimated; however, based on experience, the risk of material loss from such claims is considered remote.
3. Risk Factors
Equity Investments — Because the Balanced Fund invests in equity securities, fluctuations in the stock market in general, as well as in the value of particular equity securities held by the Fund, can affect the Fund’s performance. The value of equity securities will fluctuate due to many factors, including the past and predicted earnings of the issuer, the quality of the issuer’s management, general market conditions, forecasts for the issuer’s industry and the value of the issuer’s assets.
Debt Investments — The yields and principal values of debt securities will also fluctuate. Generally, values of debt securities change inversely with interest rates. That is, as interest rates go up, the values of debt securities tend to go down and vice versa. Furthermore, these fluctuations tend to increase as a bond’s maturity increases such that a longer term bond will increase or decrease more for a given change in interest rates than a shorter term bond.
Foreign Investments — Investing in foreign securities presents unique investment risks. The value of securities denominated in or indexed to foreign currencies, and of dividends and interest from such securities, can change significantly when foreign currencies strengthen or weaken relative to the U.S. dollar. Many foreign countries lack uniform accounting and disclosure standards comparable to those applicable to U.S. companies, and it may be more difficult to obtain reliable information regarding an issuer’s financial condition and operations. The Funds may invest in both sponsored and unsponsored ADRs which are receipts issued by a U.S. bank or trust company evidencing ownership of an indirect interest in underlying securities issued by a foreign issuer. In a sponsored ADR arrangement, the non-U.S. issuer assumes the obligation to pay some or all of the depositary’s transaction fees. Under an unsponsored ADR arrangement, the non-U.S. issuer assumes no obligations and the depositary’s transaction fees are paid directly by the ADR holders. Because unsponsored ADR arrangements are organized independently and without the cooperation of the issuer of the underlying securities, available information concerning the non-U.S. issuer may not be as current as for sponsored ADRs and voting rights with respect to the deposited securities are not passed through.
High Yield Investments — The Funds may invest a small portion of their assets in lower-rated, high-yielding bonds (commonly known as “junk bonds”). These bonds have a greater degree of default risk than higher-rated bonds. Default risk is the possibility that the issuer of a debt security will fail to make timely payments of principal or interest to the Funds.
IPO Investments — IPO shares are subject to market risk and liquidity risk. The market value of IPO shares will fluctuate considerably due to facts such as the absence of a prior public market, unseasoned trading, the small number of shares available for trading and limited public information about the issuer. The purchase of IPO shares may involve high
39
| The FBR Funds |
|
| Notes to Financial Statements (continued) |
transaction costs. When a fund’s asset base is small, a significant portion of the fund’s performance could be attributable to investments in IPOs, because such investments would have a magnified impact on the fund.
Mortgage-Backed and Asset-Backed Securities Investments — Mortgage and asset-backed securities are subject to prepayment risk, which is the risk that the borrower will prepay some or all of the principal owed to the issuer. If prepayment occurs, the Funds may have to replace the security by investing the proceeds in a less attractive security. This may reduce a Fund’s share price and income distribution.
Temporary Defensive Positions — The Funds may, from time to time, take temporary defensive positions in response to adverse market, economic, political or other conditions. To the extent the assets of the Funds are invested in temporary defensive positions, the Funds may not achieve their investment objectives. For temporary defensive purposes, the Funds may invest in cash and/or short-term obligations.
4. Transactions with Affiliates
Information in the Funds’ financial statements regarding expenses includes expenses paid by the AFBA 5Star Balanced and Total Return Bond Funds (the “predecessor funds”) through March 12, 2010.
Investment Adviser — FBR Fund Advisers, Inc. (“Fund Advisers”) serves as investment adviser to the Funds. For its advisory services, Fund Advisers receives a monthly fee at an annual rate of 0.80% of the average daily net assets of the Funds.
Through March 12, 2010 management fees were paid to AFBA 5Star Investment Management Company, the predecessor advisors (“AFBA”) at the rate of 0.80% per annum of the average daily net asset values of the Funds.
Effective March 13, 2010, Fund Advisers has agreed in writing to continue to waive a portion of its investment advisory fees and assume certain expenses for each Fund to the extent annual fund operating expenses exceed 1.08% and 1.05% of the Balanced Fund and Core Bond Fund’s average daily net assets (excluding 12b-1 fees, brokerage costs, interest, taxes, acquired fund fees and expenses, dividend expenses, and extraordinary expenses such as litigation and merger or reorganization costs and other expenses not incurred in the ordinary course of such Fund’s business), respectively. Fund Advisers has agreed to maintain these expense limitations with regard to each Fund through February 28, 2013. In addition, with respect to the Balanced Fund, Fund Advisers has also agreed to voluntarily limit fees and/or pay expenses in amounts necessary in order to limit the total annual operating expenses of the Balanced Fund, after any such fee waivers and/or expense reimbursements, to 0.99% (excluding 12b-1 fees, brokerage costs, interest, taxes, acquired fund fees and expenses, dividend expenses, and extraordinary expenses such as litigation and merger or reorganization costs and other expenses not incurred in the ordinary course of such Fund’s business), for the period until March 12, 2012. Thereafter, Fund Advisers may either renew or terminate these voluntary arrangements at any time. The fee reductions and expenses reimbursed are reflected as a reduction of total expenses in the Statement of Operations.
40
| The FBR Funds |
|
| Notes to Financial Statements (continued) |
Fund Advisers may recoup any waived amount from a Fund pursuant to this agreement and any prior agreements to which the Fund’s predecessor advisor was subject if such reimbursement does not cause the Fund to exceed existing expense limitations and the reimbursement is made within three years after the year in which the Advisers reimbursed the expense.
For the period April 1, 2009 through July 31, 2009, AFBA Investment Management Company (AFBA), had entered into a contractual agreement to limit fees and/or pay expenses in amounts necessary to limit the total annual fund operating expenses of the AFBA 5Star Balanced and AFBA 5Star Total Return Bond Funds (excluding Rule 12b-1 and shareholder service fees and extraordinary expenses) to 1.08% and 1.08%, respectively. For the period August 1, 2009 through March 12, 2010, AFBA entered into a new contractual agreement to limit fees and/or pay expenses in amounts necessary to limit the total annual fund operating expenses of the AFBA 5Star Balanced and AFBA 5Star Total Return Bond Funds (excluding Rule 12b-1 and shareholder service fees and extraordinary expenses) to 1.08% and 1.05%, respectively. AFBA also voluntarily agreed to limit fees and/or pay expenses in amounts necessary to limit the total annual fund operating expenses of the Balanced Fund to 0.99% (from 1.08%) effective as of February 2, 2009.
As of March 31, 2010, the Funds have paid the following investment advisory fees, received fee reductions and have the following reimbursement of expenses subject to repayment to Fund Advisers:
| | | | | | | | | | | | | | | | Fees | | | | | | | | |
| | | | Year Fees | | Repayment | | Advisory | | Waived/Expense | | | | | | Subject to |
| | | | Waived | | Expires | | Fees Paid | | Reimbursed | | Net Fees | | Repayment |
| | | |
| |
| |
| |
| |
| |
|
| Balanced Fund | | | | 2008 | | | | 2011 | | | | $696,495 | | | | $(285,218 | ) | | | $411,277 | | | | $285,218 | |
| | | | | 2009 | | | | 2012 | | | | 596,752 | | | | (387,497 | ) | | | 209,255 | | | | 387,497 | |
| | | | | 2010 | * | | | 2013 | | | | 649,450 | | | | (356,740 | ) | | | 292,710 | | | | 356,740 | |
| Core Bond Fund | | | | 2008 | | | | 2011 | | | | 174,006 | | | | (188,342 | ) | | | (14,336 | ) | | | 188,342 | |
| | | | | 2009 | | | | 2012 | | | | 207,071 | | | | (210,127 | ) | | | (3,056 | ) | | | 210,127 | |
| | | | | 2010 | * | | | 2013 | | | | 225,182 | | | | (177,887 | ) | | | 47,295 | | | | 177,887 | |
|
| * | | Fund Advisers earned a total of $36,325 and $11,904 and of that they waived $7,103 and $2,441 in the Balanced and Core Bond Funds, respectively for the period from March 13, 2010 through March 31, 2010. |
Fee reductions and expenses reimbursed are reflected as a reduction of total expenses in the Statement of Operations.
In connection with certain expense limitation arrangements between the Funds and Fund Advisers, the Funds have agreed to pay Fund Advisers for certain amounts waived and/or reimbursed by AFBA pursuant to an expense limitation agreement, as assigned, provided that such repayment does not cause the total fund operating expenses for a Fund to exceed certain specified limits and the repayment is made within three years after the year in which AFBA incurred the expense.
41
| The FBR Funds |
|
| Notes to Financial Statements (continued) |
Fund Advisers has entered into an investment sub-advisory agreement with Financial Counselors whereby it pays the sub-advisor 0.27% per annum of the assets it manages. Fund Advisers has also entered into an investment sub-advisory agreement with London Company whereby it pays the sub-advisor 0.33% per annum of the assets it manages.
The Funds are not responsible for paying the sub-advisory fee.
Administrator — JPMorgan Chase Bank N.A. (“JPMorgan”) serves as the administrator to the Funds and provides pursuant to an Administration Agreement (“Agreement”) day-to-day administrative services including monitoring portfolio compliance, determining compliance with provisions of the Internal Revenue Code and preparing the Funds’ registration statements. Pursuant to the Agreement, JPMorgan receives a monthly fee based on average daily net assets of the Trust.
Pursuant to the Administrative Services Agreement, the Adviser also provides administrative services to the Funds including oversight of service providers. For the period March 13, 2010 through March 31, 2010, Fund Advisers received 0.04% of average daily net assets of the Trust. Fund Advisers also provides the Funds with office space, facilities and business equipment and generally administers the Funds’ business affairs and provides the services of executive and clerical personnel for administering the affairs of the Funds. The Adviser compensates all personnel, Officers and Trustees of the Funds if such persons are employees of the Adviser. For the period March 13, 2010 through March 31, 2010, JPMorgan earned $1,213 and Fund Advisers earned $2,412 in Administrator fees.
Effective the close of business on March 12, 2010, a new agreement became effective between JPMorgan and the Funds for custody and fund accounting services.
Through March 12, 2010, PNC Global Investment Servicing (U.S.) Inc. (“PNC”), an indirect majority-owned subsidiary of the PNC Financial Services Group, Inc., provided the Funds with administrative services pursuant to an administration agreement. PNC also served as transfer agent for the Funds and received reimbursement of certain expenses plus a fee for related services pursuant to a transfer agency agreement with the Trust. For the period April 1, 2009 through March 12, 2010, PNC earned $252,634 in Administrator fees and $149,856 in transfer agent fees. For the period April 1, 2009 through March 12, 2010, no fees were waived.
Prior to March 12, 2010, PFPC Trust Company served as the custody agent for the Funds and received reimbursement of certain expenses plus a fee for related services pursuant to a custodian agreement.
Plan of Distribution — The Trust, on behalf of the Investor Class shares of each Fund has adopted a Distribution Plan (the “Plan”) pursuant to Rule 12b-1 under the 1940 Act. Under the Investor Class Plan, each Fund may pay FBR Investment Services, Inc. (the “Distributor”) a fee at an annual rate of up to 0.25% of each Fund’s average daily net assets of Investor Class shares. Fees paid to the Distributor under the Plans are payable without regard to actual expenses incurred. For the period March 13, 2010 through
42
| The FBR Funds |
|
| Notes to Financial Statements (continued) |
March 31, 2010 the Distributor received distribution fees of $6,204 and $606 from the Balanced and Core Bond Funds, respectively.
Through March 12, 2010, PFPC Distributors, Inc. (the “Predecessor Distributor”) served as the underwriter and distributor of the Predecessor Funds’ shares. Through March 12, 2010, pursuant to a Shareholder Service Plan, the Funds paid certain shareholder service providers a monthly fee not to exceed per annum 0.25% of each Predecessor Fund’s average daily net assets for the Advisor Class and a monthly fee not to exceed per annum 1.00% of each Predecessor Fund’s average daily net assets for Class B and Class C shares. Under the Shareholder Service Plan, the AFBA 5Star Balanced Fund paid $59,197 for the Advisor Class, $3,808 for Class B and $181,800 for Class C and AFBA 5Star Total Return Bond Fund paid $7,010 for the Advisor Class, $4,318 for Class B and $13,190 for Class C.
Brokerage Commissions — For the period ended March 31, 2010, no brokerage commissions were paid from portfolio transactions to FBR Capital Markets & Co. (“FBR & Co.”), an affiliate of Fund Advisers and the Distributor.
Trustees’ Fees — Each Trustee of the Trust who is not an employee or affiliate of Fund Advisers receives an annual retainer fee of $25,000 and an additional meeting fee of $2,500 for each regular meeting attended. In addition, each Trustee that serves on the Audit Committee or Nominating Committee receives a meeting fee of $1,000 for attendance at the meeting. If a Trustee participates by teleconference, the meeting fee is $1,000. The Chairman of the Board, an independent Trustee, receives an additional $2,000 for each meeting attended, and the Audit Committee Chairman receives an additional $1,000 for each committee meeting attended.
Through March 12, 2010 the Funds were a series of the AFBA 5Star Funds, a Delaware statutory trust, and were reorganized into the corresponding FBR Fund. Through March 12, 2010, each Trustee of the Board of Trustees of the AFBA 5Star Funds received a fee payable by the AFBA 5Star Funds.
5. Investment Transactions
For the fiscal year ended March 31, 2010, purchases and sales of investments (excluding short-term securities) for each Fund were as follows:
| | | | Purchases | | | Sales | |
| | | |
| | |
| |
| | | | | | | Investments | | | | | | Investments | |
| | | | U.S. | | | (non-U.S. | | | U.S. | | | (non-U.S. | |
| | | | Government | | | Government | | | Government | | | Government | |
| | | | securities | | | securities) | | | securities | | | securities) | |
| | | |
| | |
| | |
| | |
| |
| Balanced Fund | | | $4,021,668 | | | $21,857,261 | | | $4,404,331 | | | $15,579,287 | |
| Core Bond Fund | | | 3,111,805 | | | 5,807,148 | | | 4,940,890 | | | 2,835,518 | |
43
| The FBR Funds |
|
| Notes to Financial Statements (continued) |
| 6. Capital Share Transactions | | | | | | | | | | | | | | | | | | | | |
| | | | | | | | | | | | | | | | | | | | | |
| | | | FBR Balanced Fund | | | | FBR Core Bond Fund | |
| | | |
| | | |
| |
| | | | For the | | | | For the | | | | For the | | | | For the | |
| | | | Year | | | | Year | | | | Year | | | | Year | |
| | | | Ended | | | | Ended | | | | Ended | | | | Ended | |
| | | | March 31, | | | | March 31, | | | | March 31, | | | | March 31, | |
| | | | 2010 | | | | 2009* | | | | 2010 | | | | 2009* | |
| | | |
| | | |
| | | |
| | | |
| |
| Capital Transactions: | | | | | | | | | | | | | | | | | | | | |
| Investor Class | | | | | | | | | | | | | | | | | | | | |
Proceeds from Sale of Shares | | | $ | 32,146,517 | | | | $ | 2,454,845 | | | | $ | 3,653,595 | | | | $ | 1,692,206 | |
Reinvestment of Dividends | | | | 633,192 | | | | | 360,281 | | | | | 104,494 | | | | | 127,249 | |
Cost of Shares Redeemed | | | | (9,773,718 | ) | | | | (1,337,128 | ) | | | | (1,905,453 | ) | | | | (661,023 | ) |
Redemption Fees | | | | 4,218 | | | | | 18,622 | | | | | 595 | | | | | 259 | |
| | | |
| | | |
| | | |
| | | |
| |
Investor Class Transactions | | | $ | 23,010,209 | | | | $ | 1,496,620 | | | | $ | 1,853,231 | | | | $ | 1,158,691 | |
| | | |
| | | |
| | | |
| | | |
| |
| I Class | | | | | | | | | | | | | | | | | | | | |
Proceeds from Sale of Shares | | | $ | 1,841,926 | | | | $ | 14,711,352 | | | | $ | 519,301 | | | | $ | 1,216,189 | |
Reinvestment of Dividends | | | | 570,113 | | | | | 730,158 | | | | | 227,059 | | | | | 52,988 | |
Cost of Shares Redeemed | | | | (3,125,016 | ) | | | | (11,315,381 | ) | | | | (432,948 | ) | | | | (1,165,945 | ) |
Redemption Fees | | | | 6,396 | | | | | 30,448 | | | | | 75 | | | | | 2,457 | |
| | | |
| | | |
| | | |
| | | |
| |
I Class Transactions | | | $ | (706,581 | ) | | | $ | 4,156,577 | | | | $ | 313,487 | | | | $ | 105,689 | |
| | | |
| | | |
| | | |
| | | |
| |
| Class B | | | | | | | | | | | | | | | | | | | | |
Proceeds from Sale of Shares | | | $ | 1,514 | | | | $ | 21,416 | | | | $ | — | | | | $ | 48,861 | |
Reinvestment of Dividends | | | | 5,250 | | | | | 45,443 | | | | | 7,850 | | | | | 23,198 | |
Cost of Shares Redeemed1 | | | | (1,559,965 | ) | | | | (211,572 | ) | | | | (1,345,474 | ) | | | | (351,204 | ) |
Redemption Fees | | | | 30 | | | | | 1,172 | | | | | — | | | | | 167 | |
| | | |
| | | |
| | | |
| | | |
| |
Class B Transactions | | | $ | (1,553,171 | ) | | | $ | (143,541 | ) | | | $ | (1,337,624 | ) | | | $ | (278,978 | ) |
| | | |
| | | |
| | | |
| | | |
| |
| Class C | | | | | | | | | | | | | | | | | | | | |
Proceeds from Sale of Shares | | | $ | 5,316,509 | | | | $ | 7,506,307 | | | | $ | 383,435 | | | | $ | 282,586 | |
Reinvestment of Dividends | | | | 341,418 | | | | | 483,346 | | | | | 41,953 | | | | | 26,821 | |
Cost of Shares Redeemed2 | | | | (26,216,819 | ) | | | | (4,652,150 | ) | | | | (1,307,212 | ) | | | | (417,826 | ) |
Redemption Fees | | | | 3,390 | | | | | 12,997 | | | | | — | | | | | 182 | |
| | | |
| | | |
| | | |
| | | |
| |
Class C Transactions | | | $ | (20,555,502 | ) | | | $ | 3,350,500 | | | | $ | (881,824 | ) | | | $ | (108,237 | ) |
| | | |
| | | |
| | | |
| | | |
| |
| Class R | | | | | | | | | | | | | | | | | | | | |
Proceeds from Sale of Shares | | | $ | — | | | | | — | | | | $ | — | | | | | — | |
Reinvestment of Dividends | | | | — | | | | | — | | | | | — | | | | | — | |
Cost of Shares Redeemed3 | | | | — | | | | $ | (14,188 | ) | | | | — | | | | $ | (11,914 | ) |
Redemption Fees | | | | — | | | | | — | | | | | — | | | | | — | |
| | | |
| | | |
| | | |
| | | |
| |
Class R Transactions | | | $ | — | | | | $ | (14,188 | ) | | | $ | — | | | | $ | (11,914 | ) |
| | | |
| | | |
| | | |
| | | |
| |
| Net Increase (Decrease) from | | | | | | | | | | | | | | | | | | | | |
Capital Transactions | | | $ | 194,955 | | | | $ | 8,845,968 | | | | $ | (52,730 | ) | | | $ | 865,251 | |
| | | |
| | | |
| | | |
| | | |
| |
|
| * | | Audited by other Independent Public Accounting Firm (Note 10) |
44
| The FBR Funds |
|
| Notes to Financial Statements (continued) |
| | | | FBR Balanced Fund | | | | FBR Core Bond Fund | |
| | | |
| | | |
| |
| | | | For the | | | | For the | | | | For the | | | | For the | |
| | | | Year | | | | Year | | | | Year | | | | Year | |
| | | | Ended | | | | Ended | | | | Ended | | | | Ended | |
| | | | March 31, | | | | March 31, | | | | March 31, | | | | March 31, | |
| | | | 2010 | | | | 2009* | | | | 2010 | | | | 2009* | |
| | | |
| | | |
| | | |
| | | |
| |
| Share Transactions: | | | | | | | | | | | | | | | | | | | | |
| Investor Class | | | | | | | | | | | | | | | | | | | | |
Sold | | | | 2,792,865 | | | | | 244,787 | | | | | 393,512 | | | | | 207,467 | |
Issued in Reinvestment of Distributions | | | | 58,384 | | | | | 35,138 | | | | | 11,269 | | | | | 15,633 | |
Redeemed | | | | (904,179 | ) | | | | (133,724 | ) | | | | (148,213 | ) | | | | (81,311 | ) |
| | | |
| | | |
| | | |
| | | |
| |
Investor Class Transactions | | | | 1,947,070 | | | | | 146,201 | | | | | 256,568 | | | | | 141,789 | |
| | | |
| | | |
| | | |
| | | |
| |
| I Class | | | | | | | | | | | | | | | | | | | | |
Sold | | | | 184,464 | | | | | 1,389,385 | | | | | 60,904 | | | | | 138,776 | |
Issued in Reinvestment of Distributions | | | | 55,198 | | | | | 67,996 | | | | | 26,557 | | | | | 6,037 | |
Redeemed | | | | (307,725 | ) | | | | (1,110,982 | ) | | | | (50,693 | ) | | | | (131,498 | ) |
| | | |
| | | |
| | | |
| | | |
| |
I Class Transactions | | | | (68,063 | ) | | | | 346,399 | | | | | 36,768 | | | | | 13,315 | |
| | | |
| | | |
| | | |
| | | |
| |
| Class B | | | | | | | | | | | | | | | | | | | | |
Sold | | | | 163 | | | | | 2,035 | | | | | — | | | | | 5,753 | |
Issued in Reinvestment of Distributions | | | | 548 | | | | | 4,219 | | | | | 891 | | | | | 2,681 | |
Redeemed1 | | | | (123,582 | ) | | | | (22,104 | ) | | | | (152,747 | ) | | | | (40,026 | ) |
| | | |
| | | |
| | | |
| | | |
| |
Class B Class Transactions | | | | (122,871 | ) | | | | (15,850 | ) | | | | (151,856 | ) | | | | (31,592 | ) |
| | | |
| | | |
| | | |
| | | |
| |
| Class C | | | | | | | | | | | | | | | | | | | | |
Sold | | | | 527,911 | | | | | 754,540 | | | | | 42,457 | | | | | 33,561 | |
Issued in Reinvestment of Distributions | | | | 32,222 | | | | | 45,369 | | | | | 4,689 | | | | | 3,152 | |
Redeemed2 | | | | (2,280,810 | ) | | | | (441,678 | ) | | | | (199,294 | ) | | | | (49,219 | ) |
| | | |
| | | |
| | | |
| | | |
| |
Class C Transactions | | | | (1,720,677 | ) | | | | 358,231 | | | | | (152,148 | ) | | | | (12,506 | ) |
| | | |
| | | |
| | | |
| | | |
| |
| Class R | | | | | | | | | | | | | | | | | | | | |
Sold | | | | — | | | | | — | | | | | — | | | | | — | |
Issued in Reinvestment of Distributions | | | | — | | | | | — | | | | | — | | | | | — | |
Redeemed3 | | | | — | | | | | (1,211 | ) | | | | — | | | | | (1,432 | ) |
| | | |
| | | |
| | | |
| | | |
| |
Class R Transactions | | | | — | | | | | (1,211 | ) | | | | — | | | | | (1,432 | ) |
| | | |
| | | |
| | | |
| | | |
| |
| Net Increase (Decrease) from | | | | | | | | | | | | | | | | | | | | |
Shares Transactions | | | | 35,459 | | | | | 833,770 | | | | | (10,668 | ) | | | | 109,574 | |
| | | |
| | | |
| | | |
| | | |
| |
|
| * | Audited by other Independent Public Accounting Firm (Note 10) |
1 | As of the close of business on July 31, 2009, Class B Shares and dollars, as presented above, were converted to the Advisor Class at the following rates: |
| | Fund | | Shares | | Dollars |
| |
| |
| |
|
| | Balanced | | 116,509 | | | | 1,194,212 | |
| | Total Return Bond | | 141,233 | | | | 1,292,283 | |
| 2 | As of the close of business on March 12, 2010, Class C Shares and dollars, as presented above, were converted to the Investor Class at the following rates: |
| | Fund | | Shares | | Dollars |
| |
| |
| |
|
| | Balanced | | 1,752,189 | | | | 20,027,830 | |
| | Total Return Bond | | 157,483 | | | | 1,482,408 | |
| 3 | As of the close of business on April 1, 2008, Class R Shares and dollars, as presented above, were converted to the Advisor Class at the following rates: |
| | Fund | | Shares | | Dollars |
| |
| |
| |
|
| | Balanced | | 1,140 | | | | 14,188 | |
| | Total Return Bond | | 1,306 | | | | 11,914 | |
45
| The FBR Funds |
|
| Notes to Financial Statements (continued) |
7. Federal Income Taxes
It is each Fund’s policy to continue to comply with the special provisions of the Internal Revenue Code that are applicable to regulated investment companies. As provided therein, in any fiscal year in which a Fund so qualifies and distributes at least 90% of its taxable net income, the Fund (but not the shareholders) will be relieved of federal income tax on the income distributed. Accordingly, no provision for income taxes has been made.
In order to avoid imposition of the excise tax applicable to regulated investment companies, it is also each Fund’s intention to declare and pay as dividends in each calendar year at least 98% of its net investment income (earned during the calendar year) and 98% of its net realized capital gains (earned during the twelve months ending October 31) plus undistributed amounts from prior years.
Income and capital gain distributions are determined in accordance with income tax regulations that may differ from accounting principles that are generally accepted in the United States of America. As a result, the character of tax-basis distributions and the composition of net assets for tax purposes may differ from those reflected in the Funds’ financial statements. These book/tax differences may be temporary or permanent in nature. Temporary differences are primarily the result of wash sales. Reclassifications for permanent differences are made to components of capital. These reclassifications have no effect on net assets or net asset value per share.
The tax character of distributions paid for each Fund’s tax year was as follows:
| | | Ordinary Income | | Long-Term Capital Gains | | Return of Capital |
| | |
| |
| |
|
| | | | Dollar | | | | Dollar | | | | Dollar | |
| | | | Amount | | | | Amount | | | | Amount | |
| | | |
| | | |
| | | |
| |
| Balanced Fund | | | | | | | | | | | | | | | | | | |
For the Year Ended March 31, 2010 | | | $ | 2,305,951 | | | | | | — | | | | | | — | | |
For the Year Ended March 31, 2009 | | | | 2,392,955 | | | | | $ | 495,704 | | | | | $ | 243,198 | | |
| Core Bond Fund | | | | | | | | | | | | | | | | | | |
For the Year Ended March 31, 2010 | | | | 1,277,489 | | | | | | 154,005 | | | | | | — | | |
For the Year Ended March 31, 2009 | | | | 1,037,660 | | | | | | — | | | | | | — | | |
The following information is computed on a tax basis for each item:
| | | | FBR | | | FBR |
| | | | Balanced | | | | Core Bond | |
| | | | Fund | | | Fund |
| | | | |
| | | | |
| |
| Tax cost of investment securities | | | | $78,237,206 | | | | | $26,920,752 | |
| | | | |
| | | | |
| |
| Gross unrealized appreciation | | | | 9,993,144 | | | | | 1,692,002 | |
| Gross unrealized depreciation | | | | (2,269,915 | ) | | | | (657,855 | ) |
| | | | |
| | | | |
| |
| Net unrealized appreciation | | | | 7,723,229 | | | | | 1,034,147 | |
| Undistributed ordinary income | | | | — | | | | | — | |
| Undistributed long-term capital gains | | | | — | | | | | 15,074 | |
| Capital loss carryforward | | | | (9,513,014 | ) | | | | — | |
| Post October losses | | | | (77,996 | ) | | | | — | |
| | | | |
| | | | |
| |
| Accumulated earnings (deficit) | | | | $(1,867,781 | ) | | | | $ 1,049,221 | |
| | | | |
| | | | |
| |
46
| The FBR Funds |
|
| Notes to Financial Statements (continued) |
Unused capital loss carryforwards as of March 31, 2010, were as follows:
| | | Amount | | Expires March 31, |
| | |
| |
|
| Balanced Fund | | $ | 5,099,913 | | 2017 |
| | | | 4,413,101 | | 2018 |
| | |
| | |
| | | $ | 9,513,014 | | |
| | |
| | |
During the year ended March 31, 2010, the Core Bond Fund utilized $4,101 of capital loss carryforwards. The capital loss carryforwards may be utilized in future years to offset net realized capital gains, if any, prior to distributing such gains to shareholders.
The following reclassifications, the result of permanent differences between financial statement and income tax reporting requirements, have been made to the components of capital. These reclassifications have no impact on the net assets or net asset value per share of the Funds.
| | | | | | | | Accumulated | | | | |
| | | | Undistributed | | Net Realized | | Paid-In |
| | | | Income (Loss) | | Gain (Loss) | | Capital |
| | | |
| |
| |
|
| Balanced Fund | | | $ | (127,492 | ) | | $ | 133,534 | | | $ | (6,042 | ) |
| Core Bond Fund | | | | 12,262 | | | | (4,398 | ) | | | (7,864 | ) |
The Funds have analyzed their tax positions taken on Federal income tax returns for all open tax years (tax years ended March 31, 2007 through 2009) or expected to be taken in the Funds March 31, 2010 tax return, and have concluded that no provision for income tax is required in their financial statements.
8. Concentration of Ownership
At any time, the Funds may have concentrations of shareholders holding a significant percentage of shares outstanding in their respective share classes. Investment activities of these shareholders could have a material impact on the class.
At March 31, 2010, each share class had the following number of shareholders who held in the aggregate the following percent of shares:
| Fund | | | Number of Shareholders | | Percentage of Outstanding Shares |
| | |
| |
|
| Balanced Fund – Investor Class | | 2 | | | 22 | % |
| Balanced Fund – I Class | | 2 | | | 76 | % |
| Core Bond Fund – Investor Class | | 1 | | | 5 | % |
| Core Bond Fund – I Class | | 1 | | | 81 | % |
9. Acquisition
On March 12, 2010, the FBR Balanced Fund acquired all of the assets and liabilities of AFBA 5Star Balanced Fund. The acquisition was accomplished by a tax-free exchange of 3,608,573 shares of Class I, 2,455,190 shares of Advisor Class and 1,785,103 shares of Class C, 7,848,866 shares of the fund (valued at $87,446,514) for all of the assets and liabilities of AFBA 5Star Balanced Fund. The predecessor fund then distributed the shares
47
| The FBR Funds |
|
| Notes to Financial Statements (continued) |
it received from the fund to its shareholders. AFBA 5Star Balanced Fund’s net assets on that date were $87,446,514 including $7,334,238 of unrealized appreciation, $209,267 of accumulated net investment income, and $(10,073,393) of accumulated net realized loss on investments. The aggregate net assets of the fund after the acquisition were $87,446,514.
On March 12, 2010, the FBR Core Bond Fund acquired all of the assets and liabilities of AFBA 5Star Total Return Bond Fund. The acquisition was accomplished by a tax-free exchange of 2,752,016 shares of Class I, 337,649 shares of Advisor Class and 162,853 shares of Class C, 3,252,518 shares of the fund (valued at $28,581,182) for all of the assets and liabilities of AFBA 5Star Total Return Bond Fund. The predecessor fund then distributed the shares it received from the fund to its shareholders. AFBA 5Star Total Return Bond Fund’s net assets on that date were $28,581,182 including $1,121,992 of unrealized appreciation, $(21,023) of accumulated net investment income, and $12,340 of accumulated net realized gain on investments. The aggregate net assets of the fund after the acquisition were $28,581,182.
All accounting and performance history of the predecessor funds were carried forward to FBR Balanced Fund and FBR Core Bond Fund.
10. Change of Independent Registered Public Accounting Firm
Based on the recommendation of the Audit Committee of the Funds, the Board of Trustees determined not to retain Cohen Fund Audit Services, Ltd. (“Cohen”) as the Funds’ Independent Auditor, and voted to appoint Tait, Weller & Baker LLP as the Funds’ Independent Auditor for the fiscal year ended March 31, 2010, effective March 12, 2010. Cohen’s audit reports contained no adverse opinion or disclaimer of opinion; nor were their reports qualified as to uncertainty, audit scope or accounting principles. Further, there were no disagreements between the Funds and Cohen on accounting principles, financial statements disclosure or audit scope, which, if not resolved to the satisfaction of Cohen, would have caused them to make reference to the disagreement in their reports.
11. Commitments and Contingencies
In the normal course of business, the Funds enter into contracts that contain a variety of representations and warranties and which provide general indemnifications. The Funds’ maximum exposure under these arrangements is unknown, as this would involve future claims that may be made against the Funds that have not yet occurred. However, based on experience, the Funds expect the risk of loss to be remote.
12. Subsequent Events
Subsequent events occurring after March 31, 2010 have been evaluated for potential impact to this report through the date the financial statements were issued. There were no subsequent events to report that would have a material impact on the Funds’ financial statements.
48
| The FBR Funds |
|
| Report of Independent Registered Public Accounting Firm |
To the Board of Trustees and Shareholders
The FBR Funds
Arlington, Virginia
We have audited the accompanying statements of assets and liabilities, including the portfolios of investments, of the FBR Balanced Fund and the FBR Core Bond Fund (formerly AFBA 5Star Balanced Fund and AFBA 5Star Total Return Bond Fund) (the “Funds”), each a series of The FBR Funds as of March 31, 2010, and the related statements of operations, changes in net assets and financial highlights for the year then ended. The statements of changes in net assets for the year ended March 31, 2009 and the financial highlights for each of the four years in the period then ended have been audited by other auditors, whose reports dated May 27, 2009 and May 12, 2006 expressed unqualified opinions on such financial statements and financial highlights. These financial statements and financial highlights are the responsibility of the Funds’ management. Our responsibility is to express an opinion on these financial statements and financial highlights based on our audits.
We conducted our audits in accordance with standards of the Public Company Accounting Oversight Board (United States). Those standards require that we plan and perform the audits to obtain reasonable assurance about whether the financial statements and financial highlights are free of material misstatement. The Funds are not required to have, nor were we engaged to perform, an audit of the Funds’ internal control over financial reporting. Our audits included consideration of internal control over financial reporting as a basis for designing audit procedures that are appropriate in the circumstances, but not for the purposes of expressing an opinion on the effectiveness of the Funds’ internal control over financial reporting. Accordingly, we express no such opinion. An audit includes examining, on a test basis, evidence supporting the amounts and disclosures in the financial statements. Our procedures included confirmation of securities owned as of March 31, 2010, by correspondence with the custodian. An audit also includes assessing the accounting principles used and significant estimates made by management, as well as evaluating the overall financial statement presentation. We believe that our audits provide a reasonable basis for our opinion.
In our opinion, the financial statements and financial highlights referred to above present fairly, in all material respects, the financial position of the FBR Balanced Fund and the FBR Core Bond Fund as of March 31, 2010, the results of their operations, the changes in their net assets, and the financial highlights for the year ended March 31, 2010, in conformity with accounting principles generally accepted in the United States of America.
TAIT, WELLER & BAKER LLP
Philadelphia, Pennsylvania
June 1, 2010
49
| The FBR Funds |
|
| Important Supplemental Information (unaudited) |
Qualified Dividend Income
Under the Jobs and Growth Tax Relief Reconciliation Act of 2003 (the “Act”), the following percentages of ordinary dividends paid during the fiscal year ended March 31, 2010 are designed as “qualified dividend income,” as defined in the Act, and are subject to reduced tax rates in 2009.
| Balanced Fund | | 44.10 | % |
| Core Bond Fund | | 0.00 | % |
Dividends Received Deduction
For corporate shareholders, the following ordinary dividends paid during the fiscal year ended March 31, 2010 qualify for the corporate dividends received deduction:
| Balanced Fund | | 44.10 | % |
| Core Bond Fund | | 0.00 | % |
Long-Term Capital Gain Distributions
For the Core Bond Fund, distribution to shareholders from long-term capital gains, subject to the 15% capital gains rate, during the fiscal year ended March 31, 2010 was $154,005.
Proxy Voting Guidelines
Fund Advisers is responsible for exercising the voting rights associated with the securities purchased and held by the Funds. A description of the policies and procedures Fund Advisers uses in fulfilling this responsibility is included in the Funds’ Statement of Additional Information and is available without charge, upon request, by calling 888.888.0025. The policies and procedures are also available on the Securities and Exchange Commission’s (“SEC”) website at http://www.sec.gov. Information on how the Funds voted proxies relating to portfolio securities during the most recent 12 month period ended June 30 is available without charge, upon request, by calling 888.888.0025 and is also available on the SEC’s website at http://www.sec.gov.
Portfolio Holdings
The Funds file their complete schedule of holdings with the SEC for the first and third quarters of each fiscal year on Form N-Q. The Funds’ Form N-Q is available on the SEC’s website at http://www.sec.gov. You may review and make copies at the SEC’s Public Reference Room in Washington, D.C. You may also obtain copies after paying a duplicating fee by writing the SEC’s Public Reference Section, Washington, D.C. 20549-0102 or by electronic request to publicinfo@sec.gov. Information on the operation of the Public Reference Room may be obtained by calling 800.SEC.0330. A copy of the quarterly holdings report is available, without charge, upon request, by calling 888.888.0025.
50
| The FBR Funds |
|
| Important Supplemental Information (unaudited) (continued) |
Approval of New Investment Advisory and Sub-Advisory Agreements for the FBR Balanced Fund (the “Balanced Fund”) and the FBR Core Bond Fund (the “Core Bond Fund”) (together, the “Funds”)
The Investment Company Act of 1940, as amended (the “1940 Act”) requires the Board of Trustees (the “Board” or the “Trustees”) at an in-person meeting of the Board called for such purpose, to consider the approval of any investment advisory agreement and any applicable sub-advisory agreement intended for use in connection with the Funds. The law requires the Board to request and evaluate such information as the Trustees determine is necessary to allow them to properly consider the approval of any investment advisory and sub-advisory agreements. The law also requires each investment adviser and sub-adviser to furnish the Trustees with such information that is reasonably necessary for the Trustees to evaluate the terms of the investment advisory and sub-advisory agreements.
During the Fund’s most recent fiscal year ended March 31, 2010, the Board considered approval of the investment advisory and sub-advisory agreements for the Funds. At an in-person meeting held on October 26, 2009, the Board considered and approved the following agreements (the “Agreements”): (i) new investment advisory agreements with FBR Fund Advisers, Inc. (“Fund Advisers”) with respect to each of the Funds (the “New Investment Advisory Agreements”); (ii) a new sub-advisory agreement between Fund Advisers and The London Company (“London Company”) with respect to the equity portion of the Balanced Fund (the “London Company Sub-Advisory Agreement”); and (iii) new sub-advisory agreements between Fund Advisers and Financial Counselors, Inc. (“FCI”) with respect to the Core Bond Fund and the fixed-income portion of the Balanced Fund (the “FCI Sub-Advisory Agreements” and together with the London Company Sub-Advisory Agreement, the “Sub-Advisory Agreements”).
In determining whether to approve the Agreements, the Board requested, and was provided with, information and data relevant to the Board’s consideration. In addition, the Board took into account the fact that the Board had approved a proposal to reorganize the AFBA 5Star Balanced Fund (the “Predecessor Balanced Fund”) and the AFBA 5Star Total Return Fund (the “Predecessor Bond Fund”), each a separate series of AFBA 5Star Funds (collectively, the “Predecessor Funds”), with and into the Balanced Fund and Core Bond Fund, respectively (the “Reorganizations”). The Board noted that, under the Reorganizations, it was proposed that Fund Advisers would serve as the investment adviser to the Funds, and London Company and FCI would serve as sub-advisers, as applicable. The Board noted that the Reorganizations had been approved by the Board of Trustees of AFBA 5Star Funds, subject to shareholder approval, and that the Reorganizations were expected to close in the first quarter of 2010.
As part of its deliberations, the Board also considered and relied upon the information about the other FBR Funds and Fund Advisers that had been provided to them throughout the year in connection with their regular Board meetings at which they engage in the ongoing oversight of the FBR Funds and their operations. The Independent Trustees were counseled during this process by independent legal counsel, as such term is defined in the rules under the 1940 Act, who reviewed with them their duties and responsibilities with
51
| The FBR Funds |
|
| Important Supplemental Information (unaudited) (continued) |
respect to their consideration of the Agreements. During this meeting, the Board reviewed relevant information and data provided by Fund Advisers and the Independent Trustees held separate discussions with independent legal counsel to the Independent Trustees concerning the same.
The Board first reviewed information and materials regarding the proposed investment advisory and sub-advisory fees for the Funds under the Advisory and Sub-Advisory Agreements. Representatives of Fund Advisers stated that the proposed investment advisory and sub-advisory fees for the Funds are not presently subject to any asset-based breakpoints, but that the proposed fees were the same as those being charged to the Predecessor Funds and that Fund Advisers proposed an Expense Limitation Agreement (and voluntary expense limitation agreement with respect to the Balanced Fund) that is intended to limit the total operating expenses of each of the Funds to the same levels as were applicable to the Predecessor Funds. The Board noted that Fund Advisers only provides investment advisory services to the FBR Funds and that Fund Advisers does not have any other clients or accounts.
The Board received and considered performance and expense information with respect to the Predecessor Funds, including total return performance information for the one-, three-, five-, and 10-year periods. The Board then considered information regarding each of the Funds separately and reviewed with the representatives of Fund Advisers various performance and estimated expense information, including each Predecessor Fund’s performance against its peer group, and distribution arrangements for each of the Funds, as follows:
1. Balanced Fund. The Board first reviewed information and materials regarding the Balanced Fund, noting that the Fund’s proposed advisory and sub-advisory fees under the Agreements would remain the same as the advisory and sub-advisory fees charged with respect to the Predecessor Balanced Fund. The Board noted that the proposed Investment Advisory Agreement provided for a 0.80% investment advisory fee, which was generally comparable to the Balanced Fund’s peer group. The Board also noted that Fund Advisers proposed an Expense Limitation Agreement and voluntary expense limitation agreement that would limit the total operating expenses of the Fund to the same level as the Predecessor Balanced Fund. The Board members reviewed the Predecessor Balanced Fund’s investment performance for the one-, three-, five- and 10-year periods. The Board noted that the Class I shares of the Predecessor Balanced Fund (which would be reorganized into the I Class shares of the Balanced Fund), underperformed its total universe group for the one-year period ended September 30, 2009, but outperformed over the three-, five- and 10-year periods. The Board considered the fact that the investment performance of the Predecessor Balanced Fund reflected the performance of London Company and FCI in sub-advising their respective portions of the Predecessor Balanced Fund and that the Balanced Fund would have the same investment mandate as the Predecessor Balanced Fund with London Company and FCI continuing to serve as the investment sub-advisers to the Balanced Fund with the same portfolio managers that sub-advised the Predecessor Balanced Fund.
52
| The FBR Funds |
|
| Important Supplemental Information (unaudited) (continued) |
2. Core Bond Fund. The Board next reviewed information and materials regarding the Core Bond Fund, noting that the Fund’s proposed advisory and sub-advisory fees under the Agreements would remain the same as the advisory and sub-advisory fees charged with respect to the Predecessor Bond Fund. The Board noted that the proposed Investment Advisory Agreement provided for a 0.80% investment advisory fee, which was generally higher than other peer funds, although there were certain peer funds with higher fee rates. The Board also noted that Fund Advisers proposed an Expense Limitation Agreement that would limit the total operating expenses of the Fund to the same level as the Predecessor Bond Fund. The Board noted that, although the advisory fees charged under the Investment Advisory Agreement were somewhat higher than the Core Bond Fund’s peer group, the total expenses of the Fund compared favorably to such funds as a result of the implementation of the Expense Limitation Agreement. The Board also reviewed the Predecessor Bond Fund’s investment performance for the one-, three-, five- and 10-year periods. The Board noted that the Class I shares of the Predecessor Bond Fund (which would be reorganized into the I Class shares of the Core Bond Fund), outperformed its total universe group for the one-year period ended September 30, 2009, as well as over the three-, five- and 10-year periods. The Board considered the fact that the investment performance of the Predecessor Bond Fund reflected the performance of FCI in sub-advising the Predecessor Bond Fund and that the Core Bond Fund would have the same investment mandate as the Predecessor Bond Fund with FCI continuing to serve as the investment sub-adviser to the Core Bond Fund with the same portfolio managers that sub-advised the Predecessor Bond Fund.
Among the factors the Board considered was the overall performance of the Predecessor Funds relative to the performance of other mutual funds in each Fund’s peer group on a long-term basis and over shorter time periods. In addition, the Board compared expenses of each Fund after taking into effect the Expense Limitation Agreements (and voluntary expense limitation agreement with respect to the Balanced Fund) to the expenses of its peers, noting that the expenses for each of the Funds compared favorably with industry averages for other funds of similar size after the imposition of the fee waivers. The Board also took note of the long-term relationship between Fund Advisers and the FBR Funds and the efforts that have been undertaken by Fund Advisers to foster the growth and development of the FBR Funds since the inception of the FBR Funds.
With respect to Fund Advisers, the Trustees noted the range of investment advisory and administrative services to be provided by Fund Advisers and its affiliates to the Funds and the level and quality of the services that Fund Advisers provides to the other FBR Funds, and in particular, the Trustees noted the quality of the personnel providing these services. The Board took into account the background and experience of each of Fund Advisers’ senior management and expertise of, and the amount of attention that will be given to each Fund by, Fund Advisers. The Board also reviewed financial information concerning Fund Advisers and its affiliates relating to the operation of the FBR Funds and the financial soundness of Fund Advisers as demonstrated by the financial information provided.
53
| The FBR Funds |
|
| Important Supplemental Information (unaudited) (continued) |
With respect to London Company and FCI, the Board noted the background and expertise of their portfolio managers and investment personnel. The Trustees also took into consideration the fact that London Company and FCI had successfully managed the Predecessor Funds, as applicable. The Board reviewed London Company’s and FCI’s portfolio trading policies and practices, including their best execution and trade allocation policies, and noted that they were reasonable and consistent with standard industry practice. The Board considered the receipt of research and execution services in exchange for payment of brokerage commissions. The Board noted that London Company may direct Fund brokerage in exchange for third party research and that London Company has represented that trading done with various brokerage firms is done in a manner that is consistent with relevant requirements relating to the receipt of research in connection with brokerage transactions.
The Board also noted the fact that an affiliate of Fund Advisers, FBR Investment Services, Inc. (“FBRIS”), would be serving as the distributor of the shares of the Funds and would be entitled to receive distribution fees from the Funds for serving in that role. The Board considered and discussed the activities in which FBRIS would be engaging in order to distribute and market the Funds. The Board reviewed the distribution arrangements intended to be used by FBRIS for the Funds, noting the extensive sales arrangements for the FBR Funds on various mutual fund sales platforms and the manner in which the distribution fees paid by those of the FBR Funds that pay distribution fees are utilized in connection with these arrangements. The Board also noted with respect to the anticipated distribution arrangements of the Funds the distribution capabilities established by FBRIS. The Board took note of the fact that FBRIS will seek to enhance the distribution of the Funds through a growing number of distribution channels and will seek to build upon the distribution relationships already in place with respect to the Predecessor Funds.
The Board also considered and reviewed information regarding the proposed administrative services fees to be paid to Fund Advisers by the Funds for providing certain types of administrative and oversight services. The Board determined that the proposed administrative fees to be paid to Fund Advisers are fair and reasonable in connection with the types of services to be provided by Fund Advisers to the Funds and that they are reasonable fees to be paid in addition to the investment advisory fees paid by the Funds to Fund Advisers given that the administrative services are separate and distinct services apart from the investment advisory services being provided to the Funds by Fund Advisers.
In reaching their conclusion with respect to the approval of the Agreements, the Trustees did not identify any one single factor as being controlling, rather, the Trustees took note of a combination of factors that influenced their decision making process. The Board did, however, identify the overall favorable investment performance of the Predecessor Funds and management’s demonstrated commitment to the continued enhancement of investment performance, the commitment of Fund Advisers, London Company and FCI to the successful operation of the Funds, and the level of expenses of the Funds as a result of the continued use of expense limitation agreements in order to reduce the overall operating
54
| The FBR Funds |
|
| Important Supplemental Information (unaudited) (continued) |
expenses of the Funds, as being important elements of their consideration. Based upon their review and consideration of these factors and other matters deemed relevant by the Board in reaching an informed business judgment, a majority of the Board of Trustees, including a majority of the Independent Trustees, concluded that the terms of the Agreements are fair and reasonable and the Board voted to approve the Agreements, subject to the applicable limitations on the total operating expenses of the Funds as considered and approved at the meeting. The Independent Trustees met separately with the independent legal counsel to the Independent Trustees in order to consider the approval of the Agreements.
Information About Trustees and Officers
Information pertaining to the Trustees and Officers of the Trust is set forth on the next page. The address for each Trustee and Officer is 1001 Nineteenth Street North, Arlington, Virginia, 22209 unless otherwise stated. The statement of additional information (SAI) includes additional information about the Trustees and is available without charge upon request by calling 888.888.0025.
55
| The FBR Funds |
|
| Important Supplemental Information (unaudited) (continued) |
| | Term of | Portfolios | | |
| | Office* | Overseen in | | |
| | and Length | the Trust | | |
| | of Time | and Fund | Principal Occupation | Other |
| Name, Age, Address | Served** | Complex*** | During Past 5 Years | Directorships |
| Michael A. Willner, 53 | Independent Board Chair; Trustee Since 1997 | 11 | President AlphaGrip, Inc. January 2001 to present. | None |
| Charles O. Heller, 74 | Trustee Since 2003 | 11 | President, Annapolis Capital Group, since 2005; Athlone Global Security (venture capital firm), 2006-2008; Beacon Global LLC (venture capital firm), 2003-2005. | None |
| Reena Aggarwal, 52 | Trustee Since 2006 | 11 | Professor, Georgetown University, 2000 to present; Deputy Dean, McDonough School of Business, Georgetown University, 2006-2008; Interim Dean, 2004-2005; Visiting Professor MIT Sloan School of Management, 2005-2006. | IndexIQ Trust |
| William E. Cole, Jr., 60 | Trustee Since 2006 | 11 | Retired, 2006. Partner, Ernst & Young LLP, 1972-2006. | None |
David Ellison, 52†
100 Federal Street
Boston, MA 02110 | Trustee Since 2003 | 11 | Director, CIO and President, FBR Fund Advisers, Inc., since December 1999; Portfolio Manager for Equity Funds, since October 1996. | None |
Winsor H. Aylesworth, 62
100 Federal Street
Boston, MA 02110 | Executive Vice President Since
1999 | 11 | Executive Vice President and Portfolio Manager, FBR Fund Advisers, Inc. since September 1998. | N/A |
| William B. Sanders III, 46 | Executive Vice President Since 1999 | 11 | Senior Vice President of Fund Operations, FBR Fund Advisers, Inc. since August 1999 and Head Trader for FBR Fund Advisers, Inc., since January 1997. | N/A |
Guy F. Talarico, 54
150 Broadway
Suite 302
New York, NY 10038 | Chief Compliance Officer Since 2006 | 11 | CEO of Alaric Compliance Services, LLC since January 2006. Co-Chief Executive Officer of EOS Compliance Services, LLC June 2004 - December 2005. Senior Director of Investors Bank & Trust Institutional Custody Division February 2001-June 2004. | N/A |
| Kimberly J. Bradshaw, 35 | Treasurer Since 2006 and Secretary Since 2003 | 11 | Employee of FBR since August 1998 serving in various capacities, including Senior Vice President Fund Administration, Chief Compliance Officer of FBR Investment Services, Inc., Transfer Agent Operations Manager, Fund Accounting Supervisor and Vice President and Secretary of Money Management Advisers, Inc., November 2003-March 2006. | N/A |
| Kristin E. Stelljes, 34 | Assistant Treasurer Since 2006 | 11 | Employee of FBR since February 2002, serving in various capacities including Assistant Vice President Fund Administration, Supervisor Fund Administration, Accountant, and Customer Service Representative. | N/A |
| * | | Trustees serve until their resignation, removal or death. |
| ** | | Length of time served is measured from the earliest date of service as a Trustee of any of the Funds or the Predecessor Funds. |
| *** | | The “Fund Complex” consists of all mutual funds advised by FBR Capital Markets Corporation, and its affiliate advisers. |
| † | | Mr. Ellison is considered to be an “Interested Trustee” of the Trust due to his position with FBR Fund Advisers, Inc. |
56
[THIS PAGE INTENTIONALLY LEFT BLANK]
[THIS PAGE INTENTIONALLY LEFT BLANK]
[THIS PAGE INTENTIONALLY LEFT BLANK]
[THIS PAGE INTENTIONALLY LEFT BLANK]
[THIS PAGE INTENTIONALLY LEFT BLANK]
[THIS PAGE INTENTIONALLY LEFT BLANK]
| THE FBR FUNDS |
| 888.888.0025 |
| fbrfundsinfo@fbr.com |
| www.fbrfunds.com |
| |
| Investment Adviser |
| FBR FUND ADVISERS, INC. |
| 1001 NINETEENTH STREET NORTH |
| ARLINGTON, VIRGINIA 22209 |
| |
| Distributor |
| FBR INVESTMENT SERVICES, INC. |
| 1001 NINETEENTH STREET NORTH |
| ARLINGTON, VIRGINIA 22209 |
| |
| Transfer Agent |
| JPMORGAN CHASE BANK, N.A. |
| P.O. BOX 5354 |
| CINCINNATI, OHIO 45201 |
| |
| Independent Registered Public Accounting Firm |
| TAIT, WELLER, AND BAKER LLP |
| 1818 MARKET STREET |
| PHILADELPHIA, PENNSYLVANIA 19103 |
| |
| |
| This report is not authorized |
| for distribution to prospective |
| investors unless it is preceded or |
| accompanied by a current prospectus. |
ITEM 2. CODE OF ETHICS.
As of the end of the period covered by this report, Registrant had adopted a code of ethics (the “Code”) that applies to Registrant’s principal executive officer (“PEO”) and principal financial officer (“PFO”). There were no amendments to the Code during the period covered by the report. The Registrant did not grant any waivers, including implicit waivers, from any provisions of the Code to the PEO or PFO during the period covered by this report. The Registrant undertakes to provide a copy of such code to any person upon request, without charge, by calling 888.888.0025.
ITEM 3. AUDIT COMMITTEE FINANCIAL EXPERT.
The Board of Trustees determined at a meeting held October 24, 2006 that William E. Cole, Jr. qualifies as an Audit Committee Financial Expert and he is “independent” as defined under the relevant Securities and Exchange Commission rules and releases. The Board of Trustees also determined at a meeting held July 23, 2008 that Reena Aggarwal qualifies as an Audit Committee Financial Expert and she is “independent” as defined under the relevant Securities and Exchange Commission rules and releases.
ITEM 4. PRINCIPAL ACCOUNTANT FEES AND SERVICES.
| (a) | | Audit Fees – The aggregate fees billed for the professional services rendered by the principal accountant for the audit of the Registrant’s annual financial statements, were $33,000 and $27,400 for the Balanced and Core Bond Funds of the Registrant for the fiscal year ended March 31, 2010 and 2009 respectively. |
| (b) | | Audit Related Fees –There were no fees billed for assurance and related services by the principal accountant for the fiscal years ended March 31, 2010 and 2009. |
| (c) | | Tax Fees – The aggregate fees billed by the principal accountant for tax compliance, tax advice and tax planning for completing federal and excise tax returns were $6,000 and $5,832 for the Balanced and Core Bond of the Registrant for the fiscal year ended March 31, 2010 and 2009 respectively. |
| (d) | | All Other Fees – There were no additional fees paid for audit and non-audit services other than those disclosed in (a) through (c) above. |
| (e) | | (1) Pursuant to the Registrant’s Audit Committee Charter (“Charter”), the Audit Committee is responsible for approving in advance the firm to be employed as the Registrant’s independent auditor. In addition, the Charter provides that the Audit Committee is responsible for approving any and all proposals by the Registrant, its investment adviser or their affiliated persons or an entity controlling, controlled by, or under common control with the adviser that provides services to the Registrant to employ the independent auditor to render permissible non-audit services to such entity, provided those permissible non-audit services relate directly to the operations and financial reporting of the Registrant. In determining whether to approve non-audit services, the Audit Committee considers whether such services are consistent with the independent auditor’s independence. (2) None of the services described in (b) through (d) above were approved by the audit committee pursuant to paragraph (c)(7)(i)(C) of Rule 2-01 of Regulation S-X. |
| (f) | | Less than fifty percent of the hours expended on the principal accountant’s engagement to audit the Registrant’s financial statements for the most recent fiscal year were attributed to work performed by persons other than the principal accountant’s full-time, permanent employees. |
| (g) | | There were no non-audit services fees billed by the Registrant’s accountant to the Registrant other than those described above. There were no non-audit services fees billed by the Registrant’s accountant to the Registrant’s investment adviser or to any entity controlling, controlled by, or under common control with the adviser that provides ongoing services to the Registrant over the past two years. |
| (h) | | Not applicable as no non-audit services were provided to the Registrant’s investment adviser nor any entity controlling, controlled by, or under common control with the investment adviser that provides ongoing services to the Registrant that were not pre-approved pursuant to Rule 2-01(c)(7)(ii) of Regulation S-X. |
ITEMS 5. AUDIT COMMITTEE OF LISTED REGISTRANTS.
Not applicable.
ITEM 6. SCHEDULE OF INVESTMENTS.
Contained in Item 1.
ITEM 7. DISCLOSURE OF PROXY VOTING POLICIES AND PROCEDURES FOR CLOSED-END MANAGEMENT INVESTMENT COMPANIES.
Not applicable.
ITEM 8. PORTFOLIO MANAGERS OF CLOSED-END MANAGEMENT INVESTMENT COMPANIES.
Not applicable.
ITEM 9. PURCHASES OF EQUITY SECURITIES BY CLOSED-END MANAGEMENT INVESTMENT COMPANY AND AFFLIIATED PURCHASERS.
Not applicable.
ITEM 10. SUBMISSION OF MATTERS TO A VOTE OF SECURITY HOLDERS.
There have been no material changes to the procedures by which shareholders may recommend nominees to the Board.
ITEM 11. CONTROLS AND PROCEDURES.
| (a) | | Based upon their evaluation of the Registrant’s disclosure controls and procedures as conducted within 90 days of the filing date of this Form N-CSR, the Registrant’s PFO and PEO have concluded that those disclosure controls and procedures provide reasonable assurance that the material information required to be disclosed by the Registrant in this Form N-CSR has been recorded, processed, summarized and reported within the time periods specified in the Securities and Exchange Commission’s rules and forms. |
| (b) | | There were no changes in the Registrant’s internal controls over financial reporting as defined in Rule 30a-3(d) under the Act (17 CFR 270.30a-3(d)) that occurred during the second fiscal |
| | | half-year of the period covered by this report that has materially affected, or is reasonably likely to materially affect, the Registrant’s internal control over financial reporting. |
ITEM 12. EXHIBITS.
File the exhibits listed below as part of this Form. Letter or number the exhibits in the sequence indicated.
| (a) | | (1) Not applicable. |
| | | (2) A separate certification for each principal executive officer and principal financial officer of the Registrant as required by Rule 30a-2(a) under the Act (17 CFR 270.30a-2): Attached herewith. |
| | | (3) Not applicable. |
| (b) | | (1) The certifications required by Rule 30a-2(b) of the Investment Company Act of 1940 and Section 906 of the Sarbanes-Oxley Act of 2002: Attached herewith. |
SIGNATURES
Pursuant to the requirements of the Securities Exchange Act of 1934 and the Investment Company Act of 1940, the registrant has duly caused this report to be signed on its behalf by the undersigned, thereunto duly authorized.
(Registrant) The FBR Funds
——————————————————————
| By (Signature and Title)* | | /s/ Kimberly J Bradshaw | | June 1, 2010 |
| | |
|
| | | | | |
| | | Kimberly J. Bradshaw | | Date |
| | | Treasurer, Secretary and Principal Financial Officer |
| | | The FBR Funds |
Pursuant to the requirements of the Securities Exchange Act of 1934 and the Investment Company Act of 1940, this report has been signed below by the following persons on behalf of the registrant and in the capacities and on the dates indicated.
| By (Signature and Title) | | /s/ David H Ellison | | June 1, 2010 |
| | |
|
| | | | | |
| | | David H. Ellison | | Date |
| | | President and Principal Executive Officer |
| | | The FBR Funds | | |
| | | | | |
| | | | | |
| By (Signature and Title) | | /s/ Kimberly J Bradshaw | | June 1, 2010 |
| | |
|
| | | | | |
| | | Kimberly J. Bradshaw | | Date |
| | | Treasurer, Secretary and Principal Financial Officer |
| | | The FBR Funds | | |