| UNITED STATES |
| SECURITIES AND EXCHANGE COMMISSION |
| Washington, D.C. 20549 |
| |
| FORM N-CSR |
| |
| CERTIFIED SHAREHOLDER REPORT OF REGISTERED |
| MANAGEMENT INVESTMENT COMPANIES |
| |
| Investment Company Act file number 811-21503 |
| |
| The FBR Funds |
|
| (Exact name of registrant as specified in charter) |
| |
| 1001 Nineteenth Street North |
| Arlington, VA 22209 |
|
| (Address of principal executive offices) (Zip code) |
| |
| Registrant’s telephone number, including area code: 703.469.1040 |
| |
| |
| William Ginivan |
| General Counsel |
| FBR Capital Markets, Inc. |
| Potomac Tower |
| 1001 Nineteenth Street North |
| Arlington, VA 22209 |
|
| (Name and address of agent for service) |
| |
| |
| Date of fiscal year end: October 31, 2009 |
| |
| Date of reporting period: October 31, 2009 |
Form N-CSR is to be used by management investment companies to file reports with the Commission not later than 10 days after the transmission to stockholders of any report that is required to be transmitted to stockholders under Rule 30e-1 under the Investment Company Act of 1940 (17 CFR 270.30e-1). The Commission may use the information provided on Form N-CSR in its regulatory, disclosure review, inspection and policymaking roles.
A registrant is required to disclose the information specified by Form N-CSR, and the Commission will make this information public. A registrant is not required to respond to the collection of information contained in Form N-CSR unless the Form displays a currently valid Office of Management and Budget (“OMB”) control number. Please direct comments concerning the accuracy of the information collection burden estimate and any suggestions for reducing the burden to Secretary, Securities and Exchange Commission, 100 F Street, NE, Washington, DC 20549-0609. The OMB has reviewed this collection of information under the clearance requirements of 44 U.S.C. § 3507.
ITEM 1. REPORT TO SHAREHOLDERS.
The following is a copy of the report transmitted to shareholders pursuant to Rule 30e-1 under the Investment Company Act of 1940 (17CRF 270.30e-1).

THE FBR FUNDS
FBR Pegasus FundTM
FBR Pegasus Mid Cap FundTM
FBR Pegasus Small Cap FundTM
FBR Pegasus Small Cap Growth FundTM
FBR Focus Fund
FBR Large Cap Financial Fund
FBR Small Cap Financial Fund
FBR Technology Fund
FBR Gas Utility Index Fund
Annual Report
October 31, 2009
[THIS PAGE INTENTIONALLY LEFT BLANK]
The FBR Funds
Annual Letter to Shareholders
Dear Shareholder,
We are pleased to present The FBR Funds’ Annual Report for the twelve-month period ended October 31, 2009.
As we have outlined in previous communications, for each of our actively managed mutual funds our objective is to strive for downside protection in volatile markets while participating in rising ones. We firmly believe that on a relative and absolute basis, outperformance in difficult markets is one of the key drivers to creating long-term wealth for our clients.
The 2009 fiscal year can certainly be characterized as the tale of two markets coupled with emotional volatility. Over the course of the period, investors were subject to a volatile and intense nosedive from September 2008 through February 2009 and subsequent explosive and manic rally off the March lows which lasted through August before cooling in late September 2009. This type of extreme downside and upside volatility, even though it is a small sample of observations relative to our long-term prospective, provides an appropriate backdrop for investors to examine whether we have in fact delivered upon our objectives.
Did we manage to achieve our stated objectives in the face of such short-term market extremes? The answer is a resounding “yes”. I am proud to report that all of our actively managed funds, regardless of capitalization and style, outperformed their benchmarks and peers during the drawdown period, which subjected investors to less volatility. As you would expect, when the market began its rally, our funds generally performed in-line on the way back up. Examining the entire reporting period, which encompasses both extremes, we are fortunate to be able to report that all of our actively managed funds outperformed their benchmark and peers on a relative basis. Detailed performance information on each of our funds can be found within the enclosed Annual Report.
Given our long-term orientation as investors, a single twelve month period should not be the sole basis for the complete evaluation of our investment philosophy and the processes that drive our performance. At the close of our fiscal year, we offered three (3) funds with performance records exceeding ten-years and five (5) funds with a performance record exceeding five-years. During those two time frames, which incorporated asset bubbles and disappointments, bear markets, and optimism, all of these funds across the longer-term horizons outperformed their respective category average on an absolute and relative basis. We are proud of this fact and have every bit of confidence that our newer funds will deliver similar results as they continue to build long-term track records.
The difficult capital markets environment not only presented challenges for investors, it also had a major impact on the entire asset management industry. Post crisis, investors turned to the defensive fixed-income asset class, in search of yield, or to money markets funds for preservation. The flows to these conservative asset classes left many equity funds with significantly smaller assets than in prior years forcing many asset managers to evaluate and rationalize their business strategies and practice.
At The FBR Funds, we were not immune to this trend but managed to successfully navigate the turmoil primarily because of enhanced distribution and client retention efforts. We re-examined our business in light of the changing industry landscape and executed several steps to ensure we remain in the best position to capitalize on current dislocation and stress permeating our industry today. All of the actions being taken, such as exiting the money market business and internalizing the management of our largest product, though difficult, are necessary to ensure we have a solid foundation in place to continue to
2
grow our business organically as well as strategically while remaining focused and committed to delivering the highest quality solutions to our clients.
As in prior years, what follows in this report is a discussion with each portfolio manager with respect to the performance of their fund(s) over the 2009 fiscal year. It also includes their thoughts on related industry conditions and their investment outlook. We believe the comments and thoughts from our seven (7) fund managers are an important part of our annual and semi-annual communications to our shareholder. We encourage you to read them and hopefully better understand our investment process and current thinking.
All of us at The FBR Funds want to thank you for your continued support, and we look forward to serving your investment needs in the years ahead. As always, we welcome your questions and comments. You can reach us via e-mail at fbrfundsinfo@fbr.com or toll free at 888.200.4710.
Sincerely,
David Ellison
President, Chief Investment Officer and Trustee
The FBR Funds
Past performance is not guarantee of future results. The performance data quoted represents past performance and the current performance may be lower or higher than the data quoted. Investment return and principal will fluctuate so that investors’ shares, when redeemed may be worth more or less than their original value. The performance data does not reflect the deduction of redemption fees and if reflected, the redemption fee would reduce the performance quoted. To obtain performance data current to the most recent month-end call 888.888.0025.
Investors should consider the investment objectives, risks, charges and expenses carefully before investing. This and other information can be found in the Fund’s prospectus. To obtain a free prospectus please call 888.888.0025 of visit fbrfunds.com. Please read the prospectus carefully before investing. The FBR Funds are distributed by FBR Investment Services, Inc., member FINRA/SIPC.
3
The FBR Funds
FBR Pegasus FundTM
Management Overview
Portfolio Managers: Robert Barringer, CFA and Ryan Kelley, CFA
Over the last 12 months, how did the Fund perform and what factors contributed to this performance?
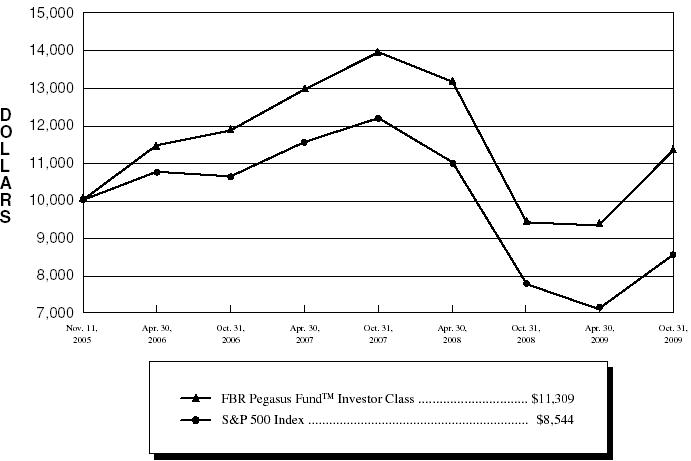
For the one-year period ended October 31, 2009, the Investor Class of the FBR Pegasus FundTM returned 20.12%. This compares favorably to the S&P 500 Index and the Morningstar Large Blend category average which over the same time period returned 9.80% and 11.86%, respectively.
The Fund’s strong total return of over 20% masks the extreme volatility that we experienced in the stock market over the course of the fiscal year. The credit market crisis and financial meltdown that began in the fall of 2008 caused the stock market to drop precipitously, as evidenced by the S&P 500 Index’s negative 29% return from October 31, 2008 to its low closing price on March 9, 2009. During this dramatic market drawdown, the FBR Pegasus FundTM held up better than the index, only dropping approximately 23%. Subsequently, from March 9, 2009 through the end of our reporting period, the Fund matched the extremely strong recovery of the market, as both the S&P 500 Index and the Fund soared 55%. One of our primary investment objectives is to outperform the index with less volatility, and we believe this past year’s performance is a testament to our disciplined investment process.
We are encouraged by the Fund’s relative outperformance and attribute that to two primary factors: stock selection and selective exposure to high-quality stocks in the financial sector.
First, the Fund’s performance was driven primarily by the stocks we owned, rather than by our exposure to any particular industry. According to portfolio analysis provided by Morningstar, over 93% of our outperformance versus the S&P 500 Index was attributable to our ability to chose and weight individual securities within each sector, regardless of a sector’s overall performance. To further highlight this, the Fund’s average material, telecommunication services, and energy stock returns were 59% (versus the index’s 16%), 44% (versus the index’s 5%), and 30% (versus the index’s 8%), respectively. Our stock selection process and long-term orientation worked well during the reporting period.
Second, our exposure to the financial sector helped provide better returns for our shareholders. Throughout the first half of the fiscal year, the Fund was underexposed on average to the financial sector, which performed abysmally during that time period. As financial stocks began roaring back in March 2009, we opportunistically invested in certain companies that fit our investment criteria for financials and that we felt were dramatically under-valued on a long-term basis. In fact, we became heavily over-exposed to financials in the second part of the year. For the entire fiscal year, financials performed the worst within the S&P 500, returning on average -6%, while the Fund’s financial stocks returned on average 9%. Our stock selection and timing worked well, as almost one-fourth of our overall outperformance versus the index came from owning the right financial stocks at the right time.
During this volatile fiscal year, every sector posted overall positive returns for our Fund. Materials and energy were two sectors other than financials that contributed substantially to the Fund’s outperformance versus the index. Only the information technology sector
4
The FBR Funds
FBR Pegasus FundTM
Management Overview (continued)
underperformed relative to the benchmark, as the average S&P 500 information technology stock was up 31% during the reporting period versus the Fund’s average of 28%.
Portfolio managers comments on the Fund and the related investment outlook.
The past year’s events shook many of the world’s markets and economies to the core, including, in particular, the US. The economic consequences of the bursting of the property market bubble, with all of its attendant aftershocks, are still being felt today. The leverage that was lurking in the financial system was revealed, along with the “virtuous circle” that the leverage had created, namely inflated property values in every category. Then came the other end of the spectrum, the “vicious cycle” of vastly constrained credit and lower property values, causing financing and refinancing problems, leading to further declines in values. One of the few bright spots on the economic front was continued growth in emerging markets, such as in China, which prevented the economic crisis from becoming even worse than it could have been.
The good news is that liquidity has returned to a large degree in the public credit markets as well as in the equity market, allowing companies access to needed capital in order to shore up weakened balance sheets. The stock market has recovered quite nicely from the March 2009 lows and seems to be anticipating a slow, steady recovery in the year ahead. Many of the top performing sectors were those that the market had been concerned about: those with high operating leverage and high balance sheet leverage.
There are now fundamental signs that the economy may be stabilizing, with recent trends in consumer sentiment, employment, and housing showing signs of bottoming. In addition, companies have acted quickly to maintain lean cost structures, helping to mitigate lower revenues and helping the bottom line. These moves have allowed earnings to come in ahead of expectations and should provide greater upside when revenue growth returns.
We continue to position the portfolio to benefit from a slow, steady recovery in the US and globally, and as such, we have overweight positions in the financials, materials, and technology spaces. The wild card is consumers, who have had to deal with declining values of their major asset, their home, and who are concerned about their job, and their retirement nest egg. Thus, while things may get better on the employment front, consumer spending, two thirds of GDP, may continue to be muted.
As always, we focus on picking the best run companies that are selling at reasonable valuations with solid balance sheets, a strategy which has helped us to do well in this uncertain environment.While the market has come back strongly, we believe that there are many opportunities that should perform well in the coming year as the recovery proves to be on more solid ground.
The opinions expressed in this commentary reflect those of the Portfolio Manager as of the date written. Any such opinions are subject to change based on market or other conditions. These opinions may not be relied upon as investment advice. Investment decisions for The FBR Funds are based on several factors, and may not be relied upon as an indication of trading intent on behalf of any FBR Fund. Security positions can and do change.
5
The FBR Funds
FBR Pegasus FundTM
Comparison of Changes in Value of $10,000 Investment in
Investor Class Shares(1)(2) vs. S&P 500 Index(1)(3)
| Total Returns—For the Periods Ended October 31, 2009(4) | |
| | | | | | Annualized | |
| | | | | | Since | |
| | | One Year | | Inception(5) | |
| | |
| |
| |
FBR Pegasus FundTM Investor Class(1)(2) | | 20.12 | % | | 3.16 | % | |
FBR Pegasus FundTM I Class(2) | | 20.21 | % | | (10.81 | )% | |
S&P 500 Index(1)(3) | | 9.80 | % | | (3.89 | )% | |
PAST PERFORMANCE IS NO GUARANTEE OF FUTURE RESULTS.
The performance data quoted represents past performance and the current performance may be lower or higher than the performance data quoted. The investment return and principal will fluctuate so that investors’ shares, when redeemed, may be worth more or less than their original cost. The performance data does not reflect the deduction of taxes that a shareholder would pay on Fund distributions or redemption fees. If reflected, the redemption fee would reduce the performance data quoted. To obtain performance data current to the most recent month-end, please call 888.200.4710 or visit www.fbrfunds.com.
|
| (1) | | The graph assumes a hypothetical $10,000 initial investment in the Fund and reflects the reinvestment of dividends and all Fund expenses. Investors should note that the Fund is a professionally managed mutual fund while the index is unmanaged, does not incur expenses and is not available for investment. The performance of the index includes reinvested dividends, and does not reflect sales charges or expenses. |
| (2) | | FBR Fund Advisers, Inc. waived a portion of its advisory fees and agreed to contractually reimburse a portion of the Fund’s operating expenses, as necessary, to maintain existing expense limitations, as set forth in the notes to the financial statements. Total returns shown include fee waivers and expense reimbursements, if any; total returns would have been lower had there been no waiver of fees and/or reimbursement of expenses in excess of expense limitations. |
| (3) | | The S&P 500 Index is a capitalization-weighted index of 500 stocks. The index is designed to represent the broad domestic economy through changes in aggregate market value of 500 stocks representing all major industries. |
| (4) | | The total returns shown do not reflect the deduction of taxes that a shareholder would pay on fund distributions or the redemption of fund shares. |
| (5) | | The inception date for the Investor Class is November 15, 2005 and the inception date for the I Class is May 30, 2008. The index return is for the period beginning November 15, 2005. |
6
The FBR Funds
FBR Pegasus FundTM
Portfolio Summary
October 31, 2009
The following provides a breakdown of the Fund by industry sectors. The underlying securities represent a percentage of the portfolio investments.
| Industry Sector | | % of Total Investments |
| |
|
| Finance | | 23.3 | % |
| Technology Services | 15.2 | % |
| Retail Trade | | 11.1 | % |
| Health Technology | 9.7 | % |
| Electronic Technology | 9.4 | % |
| Energy Minerals | 9.3 | % |
| Producer Manufacturing | 6.5 | % |
| Consumer Non-Durables | 5.3 | % |
| Non-Energy Minerals | 3.2 | % |
| Transportation | | 3.0 | % |
| Consumer Services | 1.0 | % |
| Communications | | 0.4 | % |
| | | | |
| Cash | | 2.6 | % |
7
The FBR Funds
FBR Pegasus FundTM
Portfolio of Investments
October 31, 2009
|
| | | | | | VALUE |
| | SHARES | | | | (NOTE 2) |
|
| | | | COMMON STOCKS — 94.5% | | | | |
| | | | Communications — 0.4% | | | | |
| | 1,850 | | America Movil S.A.B. de C.V., Series L ADR | | $ | 81,641 | |
| | | | | |
| |
| | | | Consumer Non-Durables — 5.1% | | | | |
| | 1,475 | | Colgate-Palmolive Co. | | | 115,979 | |
| | 5,000 | | Ralcorp Holdings, Inc.* | | | 268,500 | |
| | 3,502 | | The J.M. Smucker Co. | | | 184,660 | |
| | 13,800 | | Unilever PLC ADR | | | 411,655 | |
| | | | | |
| |
| | | | | | | 980,794 | |
| | | | | |
| |
| | | | Consumer Services — 1.0% | | | | |
| | 6,550 | | Carnival Corp. | | | 190,736 | |
| | | | | |
| |
| | | | Electronic Technology — 9.3% | | | | |
| | 2,200 | | Apple, Inc.* | | | 414,700 | |
| | 4,000 | | Canon, Inc. ADR | | | 150,640 | |
| | 19,100 | | Cisco Systems, Inc.* | | | 436,435 | |
| | 27,500 | | Intel Corp. | | | 525,525 | |
| | 3,900 | | Research In Motion Ltd.* | | | 229,047 | |
| | | | | |
| |
| | | | | | | 1,756,347 | |
| | | | | |
| |
| | | | Energy Minerals — 9.0% | | | | |
| | 7,252 | | Apache Corp. | | | 682,559 | |
| | 7,200 | | ConocoPhillips | | | 361,296 | |
| | 2,885 | | Occidental Petroleum Corp. | | | 218,914 | |
| | 1,830 | | PetroChina Company Ltd. ADR | | | 219,673 | |
| | 1,498 | | Royal Dutch Shell PLC, Class A ADR | | | 88,996 | |
| | 4,608 | | Suncor Energy, Inc. | | | 152,156 | |
| | | | | |
| |
| | | | | | | 1,723,594 | |
| | | | | |
| |
| | | | Finance — 22.5% | | | | |
| | 4,900 | | Ameriprise Financial, Inc. | | | 169,883 | |
| | 21,300 | | Bank of America Corp. | | | 310,554 | |
8
The FBR Funds
FBR Pegasus FundTM
Portfolio of Investments (continued)
October 31, 2009
|
| | | | | | VALUE |
| | SHARES | | | | (NOTE 2) |
|
| | | | Finance — 22.5% (continued) | | | | |
| | 37,000 | | Citigroup, Inc. | | $ | 151,330 | |
| | 3,525 | | Franklin Resources, Inc. | | | 368,821 | |
| | 15,300 | | Hudson City Bancorp, Inc. | | | 201,042 | |
| | 1,900 | | IntercontinentalExchange, Inc.* | | | 190,361 | |
| | 9,825 | | JPMorgan Chase & Co. | | | 410,390 | |
| | 76,400 | | KeyCorp. | | | 411,796 | |
| | 6,900 | | Manulife Financial Corp. | | | 128,271 | |
| | 7,000 | | MetLife, Inc. | | | 238,210 | |
| | 5,600 | | Morgan Stanley | | | 179,872 | |
| | 17,600 | | People’s United Financial, Inc. | | | 282,128 | |
| | 3,100 | | Prudential Financial, Inc. | | | 140,213 | |
| | 8,600 | | SunTrust Banks, Inc. | | | 164,346 | |
| | 11,975 | | T. Rowe Price Group, Inc. | | | 583,541 | |
| | 2,125 | | The Goldman Sachs Group, Inc. | | | 361,611 | |
| | | | | |
| |
| | | | | | | 4,292,369 | |
| | | | | |
| |
| | | | Health Technology — 9.5% | | | | |
| | 2,240 | | Abbott Laboratories | | | 113,277 | |
| | 4,775 | | Baxter International, Inc. | | | 258,137 | |
| | 3,325 | | Becton, Dickinson and Co. | | | 227,297 | |
| | 2,020 | | C.R. Bard, Inc. | | | 151,641 | |
| | 6,500 | | Johnson & Johnson | | | 383,825 | |
| | 11,600 | | Merck & Company, Inc. | | | 358,788 | |
| | 3,220 | | Novo Nordisk A/S ADR | | | 200,123 | |
| | 6,304 | | Pfizer, Inc. | | | 107,357 | |
| | | | | |
| |
| | | | | | | 1,800,445 | |
| | | | | |
| |
| | | | Non-Energy Minerals — 3.1% | | | | |
| | 6,000 | | BHP Billiton Ltd. ADR | | | 393,480 | |
| | 2,750 | | Freeport-McMoRan Copper & Gold, Inc.* | | | 201,740 | |
| | | | | |
| |
| | | | | | | 595,220 | |
| | | | | |
| |
9
The FBR Funds
FBR Pegasus FundTM
Portfolio of Investments (continued)
October 31, 2009
|
| | | | | | VALUE |
| | SHARES | | | | (NOTE 2) |
|
| | | | Producer Manufacturing — 6.4% | | | | |
| | 11,115 | | 3M Co. | | $ | 817,730 | |
| | 27,700 | | General Electric Co. | | | 395,002 | |
| | | | | |
| |
| | | | | | | 1,212,732 | |
| | | | | |
| |
| | | | Retail Trade — 10.7% | | | | |
| | 11,600 | | American Eagle Outfitters, Inc. | | | 202,884 | |
| | 3,000 | | Fastenal Co. | | | 103,500 | |
| | 4,500 | | Kohl’s Corp.* | | | 257,490 | |
| | 19,600 | | Lowe’s Companies, Inc. | | | 383,572 | |
| | 9,600 | | Target Corp. | | | 464,928 | |
| | 15,325 | | The Gap, Inc. | | | 327,036 | |
| | 4,900 | | Walgreen Co. | | | 185,367 | |
| | 2,350 | | Wal-Mart Stores, Inc. | | | 116,748 | |
| | | | | |
| |
| | | | | | | 2,041,525 | |
| | | | | |
| |
| | | | Technology Services — 14.6% | | | | |
| | 4,450 | | Accenture PLC, Class A | | | 165,006 | |
| | 3,600 | | Adobe Systems, Inc.* | | | 118,584 | |
| | 3,700 | | Automatic Data Processing, Inc. | | | 147,260 | |
| | 675 | | Google, Inc., Class A* | | | 361,881 | |
| | 3,800 | | International Business Machines Corp. | | | 458,318 | |
| | 17,650 | | Microsoft Corp. | | | 489,434 | |
| | 21,800 | | Oracle Corp. | | | 459,980 | |
| | 9,200 | | SAP AG ADR | | | 416,484 | |
| | 10,400 | | Total System Services, Inc. | | | 166,088 | |
| | | | | |
| |
| | | | | | | 2,783,035 | |
| | | | | |
| |
| | | | Transportation — 2.9% | | | | |
| | 4,350 | | Burlington Northern Santa Fe Corp. | | | 327,642 | |
| | 4,050 | | Union Pacific Corp. | | | 223,317 | |
| | | | | |
| |
| | | | | | | 550,959 | |
| | | | | |
| |
| | | | Total Common Stocks (Cost $16,249,571) | | | 18,009,397 | |
| | | | | |
| |
10
The FBR Funds
FBR Pegasus FundTM
Portfolio of Investments (continued)
October 31, 2009
|
| | | | | | VALUE |
| | SHARES | | | | (NOTE 2) |
|
| | | | MONEY MARKET FUND — 2.6% | | | | |
| | 486,364 | | JPMorgan 100% U.S. Treasury Securities Money Market Fund | | $ | 486,364 | |
| | | | | |
| |
| | | | | | | | |
| | | | Total Investments — 97.1% (Cost $16,735,935) | | | 18,495,761 | |
| | | | | | | | |
| | | | Other Assets Less Liabilities — 2.9% | | | 550,371 | |
| | | | | |
| |
| | | | | | | | |
| | | | Net Assets — 100.0% | | $ | 19,046,132 | |
| | | | | |
| |
|
| * | | Non-income producing security |
| ADR | | American Depositary Receipts |
| PLC | | Public Liability Company |
| Note: | | For presentation purposes, the Fund has grouped some of the industry categories. For purposes of categorizing securities for compliance with Section 8(b)(1) of the Investment Company Act of 1940, the Fund uses more specific industry classifications. |
The accompanying notes are an integral part of the financial statements.
11
The FBR Funds
FBR Pegasus Mid Cap FundTM
Management Overview
Portfolio Manager: Ryan Kelley, CFA
Over the last 12 months, how did the Fund perform and what factors contributed to this performance?
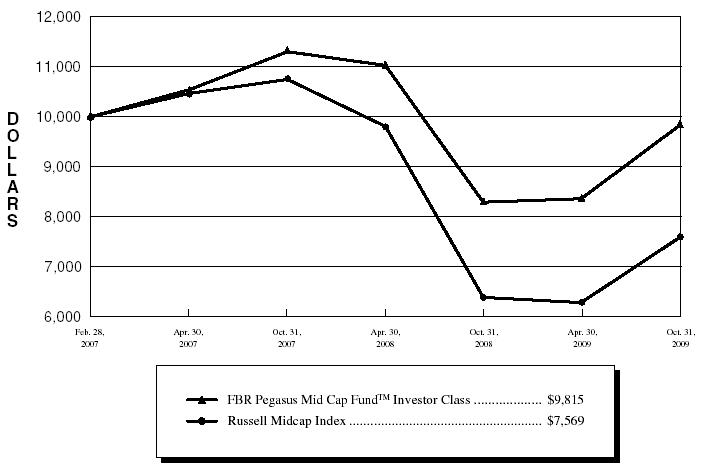
For the one-year period ended October 31, 2009, the Investor Class of the FBR Pegasus Mid Cap FundTM returned 18.51%. This compares to the Russell Midcap Index and the Morningstar Mid Cap Blend category average, which over the same time period returned 18.75% and 18.21%, respectively.
During this fiscal year, mid-cap stocks performed the best when compared to large-cap and small-cap stocks. Indeed, while the Russell Midcap Index returned almost 19%, the Russell 1000 Index (large-cap) and the Russell 2000 Index (small-cap) rose only 11% and 6%, respectively.
We are encouraged by the Fund’s strong total return of almost 19% coupled with its low volatility. The credit market and financial crisis that began in the fall of 2008 caused the stock market to drop precipitously, and the Russell Midcap Index posted a negative 29% return from October 31, 2008 to its low closing price on March 9, 2009. During this dramatic drop, the Fund showed substantially less volatility, only dropping approximately 21%. Subsequently, from March 9, 2009 through the end of our reporting period, the Fund lagged the extremely strong recovery of the market but ended the fiscal year essentially in-line with its benchmark and its peers.
Despite an extremely volatile market, every sector in the Russell Midcap Index posted positive average returns over our fiscal year. According to Morningstar, leading sectors included information technology and consumer discretionary, posting average returns of 33% and 32%, respectively. While the Fund slightly lagged by less than 2% in each of these sectors, they were the two largest contributors to the Fund’s performance. The two sectors in which the Fund outperformed the benchmark by the greatest margin were consumer staples and materials, with the latter posting average returns of 74% versus the index’s 25%. The healthcare sector, however, was the largest detractor from the Fund’s performance as certain medical equipment producers performed poorly during the fiscal year.
Although performance is primarily driven by a fund’s investments, cash levels can both add and subtract from a fund’s relative performance. The Fund experienced some of both this year. High cash levels as the market was falling helped the Fund outperform the benchmark. However, this larger cash position caused the Fund to lag as the market soared in March and April. Additionally, in late April of 2009, a large cash inflow of approximately 33% (well above our normal level of less than 10%) of the Fund’s overall assets under management caused continued underperformance as the markets continued their strong upward trend.
Portfolio manager comments on the Fund and the related investment outlook.
We strive to provide strong long-term returns for our shareholders while protecting against the downside. We are encouraged by this year’s performance, as the Fund posted a total return of almost 19% and did so with significantly less volatility than our benchmark.
12
The FBR Funds
FBR Pegasus Mid Cap FundTM
Management Overview (continued)
The volatility in both the economy and the financial markets was dramatic, if not unprecedented, to say the least. Two issues became apparent in this turbulent market. First, fear and panic are extremely strong drivers in our modern market of instantaneous access to information, low-cost trading, and rapidly shifting money flows. Second, we believe economic resilience coupled with worldwide governmental intervention is a powerful force for stock market recovery. These two factors, when working in succession, helped to cause the extreme decline and inspiring recovery that we saw this past year.
We believe that the economic recovery has begun in earnest, although there is still much uncertainty in the market and continued mixed fundamental data flow makes it difficult for investors to become comfortable with the overall direction of the market. We continue to seek good entry points for new portfolio holdings and re-evaluate both those stocks that have done well and those that have not. Our investment philosophy, process, and discipline remain intact while we adapt to new opportunities and rapidly moving markets. We believe the Fund’s diversification and mix of low valuation stocks and higher growth stocks will continue to provide solid returns for our shareholders with less volatility over a complete business cycle.
The opinions expressed in this commentary reflect those of the Portfolio Manager as of the date written. Any such opinions are subject to change based on market or other conditions. These opinions may not be relied upon as investment advice. Investment decisions for The FBR Funds are based on several factors, and may not be relied upon as an indication of trading intent on behalf of any FBR Fund. Security positions can and do change.
13
The FBR Funds
FBR Pegasus Mid Cap FundTM
Comparison of Changes in Value of $10,000 Investment in
Investor Class Shares(1)(2) vs. Russell Midcap Index(1)(3)
| Total Returns—For the Periods Ended October 31, 2009(4) | |
| | | | | | Annualized | |
| | | | | | Since | |
| | | One Year | | Inception(5) | |
| | |
| |
| |
FBR Pegasus Mid Cap FundTM Investor Class(1)(2) | | 18.51 | % | | (0.70 | )% | |
FBR Pegasus Mid Cap FundTM I Class(2) | | 18.78 | % | | (11.20 | )% | |
Russell Midcap Index(1)(3) | | 18.75 | % | | (9.88 | )% | |
PAST PERFORMANCE IS NO GUARANTEE OF FUTURE RESULTS.
The performance data quoted represents past performance and the current performance may be lower or higher than the performance data quoted. The investment return and principal will fluctuate so that investors’ shares, when redeemed, may be worth more or less than their original cost. The performance data does not reflect the deduction of taxes that a shareholder would pay on Fund distributions or redemption fees. If reflected, the redemption fee would reduce the performance data quoted. To obtain performance data current to the most recent month-end, please call 888.200.4710 or visit www.fbrfunds.com.
|
| (1) | | The graph assumes a hypothetical $10,000 initial investment in the Fund and reflects the reinvestment of dividends and all Fund expenses. Investors should note that the Fund is a professionally managed mutual fund while the index is unmanaged, does not incur expenses and is not available for investment. The performance of the index includes reinvested dividends, and does not reflect sales charges or expenses. |
| (2) | | FBR Fund Advisers, Inc. waived a portion of its advisory fees and agreed to contractually reimburse a portion of the Fund’s operating expenses, as necessary, to maintain existing expense limitations, as set forth in the notes to the financial statements. Total returns shown include fee waivers and expense reimbursements, if any; total returns would have been lower had there been no waiver of fees and/or reimbursement of expenses in excess of expense limitations. |
| (3) | | The Russell Midcap Index measures the performance of the 800 smallest companies in the Russell 1000 Index, which represents approximately 31% of the total market capitalization of the Russell 1000 Index. |
| (4) | | The total returns shown do not reflect the deduction of taxes that a shareholder would pay on fund distributions or the redemption of fund shares. |
| (5) | | The inception date for the Investor Class is February 28, 2007 and the inception date for the I Class is May 30, 2008. The index return is for the period beginning February 28, 2007. |
14
The FBR Funds
FBR Pegasus Mid Cap FundTM
Portfolio Summary
October 31, 2009
The following provides a breakdown of the Fund by industry sectors. The underlying securities represent a percentage of the portfolio investments.
| Industry Sector | | % of Total Investments |
| |
|
| Finance | | 19.8 | % |
| Health Technology | 9.8 | % |
| Technology Services | 9.4 | % |
| Retail Trade | | 8.2 | % |
| Producer Manufacturing | 7.5 | % |
| Commercial Services | 7.0 | % |
| Consumer Non-Durables | 6.0 | % |
| Utilities | | 5.0 | % |
| Process Industries | 4.7 | % |
| Industrial Services | 4.6 | % |
| Electronic Technology | 3.7 | % |
| Consumer Durables | 3.3 | % |
| Non-Energy Minerals | 3.1 | % |
| Distribution Services | 1.8 | % |
| Energy Minerals | 1.7 | % |
| Communications | | 1.4 | % |
| Consumer Services | 1.4 | % |
| Health Services | 0.5 | % |
| | | | |
| Cash | | 1.1 | % |
15
The FBR Funds
FBR Pegasus Mid Cap FundTM
Portfolio of Investments
October 31, 2009
|
| | | | | | VALUE |
| | SHARES | | | | (NOTE 2) |
|
| | | | COMMON STOCKS — 95.2% | | | | |
| | | | Commercial Services — 6.7% | | | | |
| | 3,660 | | Copart, Inc.* | | $ | 117,742 | |
| | 1,550 | | Equifax, Inc. | | | 42,439 | |
| | 2,172 | | FactSet Research Systems, Inc. | | | 139,117 | |
| | 3,525 | | Ritchie Bros. Auctioneers, Inc. | | | 77,268 | |
| | 4,850 | | SEI Investments Co. | | | 84,730 | |
| | | | | |
| |
| | | | | | | 461,296 | |
| | | | | |
| |
| | | | Communications — 1.3% | | | | |
| | 3,050 | | Telephone and Data Systems, Inc. | | | 90,341 | |
| | | | | |
| |
| | | | Consumer Durables — 3.2% | | | | |
| | 12,293 | | Activision Blizzard, Inc.* | | | 133,133 | |
| | 4,699 | | Mattel, Inc. | | | 88,952 | |
| | | | | |
| |
| | | | | | | 222,085 | |
| | | | | |
| |
| | | | Consumer Non-Durables — 5.8% | | | | |
| | 2,812 | | Alberto-Culver Co. | | | 75,418 | |
| | 3,500 | | Hansen Natural Corp.* | | | 126,525 | |
| | 5,825 | | Tyson Foods, Inc., Class A | | | 72,929 | |
| | 1,729 | | VF Corp. | | | 122,828 | |
| | | | | |
| |
| | | | | | | 397,700 | |
| | | | | |
| |
| | | | Consumer Services — 1.3% | | | | |
| | 775 | | Apollo Group, Inc., Class A* | | | 44,253 | |
| | 500 | | ITT Educational Services, Inc.* | | | 45,175 | |
| | | | | |
| |
| | | | | | | 89,428 | |
| | | | | |
| |
| | | | Distribution Services — 1.7% | | | | |
| | 6,575 | | Ingram Micro, Inc., Class A* | | | 116,049 | |
| | | | | |
| |
| | | | Electronic Technology — 3.6% | | | | |
| | 3,325 | | Dolby Laboratories, Inc., Class A* | | | 139,450 | |
| | 3,875 | | FLIR Systems, Inc.* | | | 107,764 | |
| | | | | |
| |
| | | | | | | 247,214 | |
| | | | | |
| |
| | | | Energy Minerals — 1.7% | | | | |
| | 1,077 | | Energen Corp. | | | 47,259 | |
| | 1,675 | | Pioneer Natural Resources Co. | | | 68,859 | |
| | | | | |
| |
| | | | | | | 116,118 | |
| | | | | |
| |
16
The FBR Funds
FBR Pegasus Mid Cap FundTM
Portfolio of Investments (continued)
October 31, 2009
|
| | | | | | VALUE |
| | SHARES | | | | (NOTE 2) |
|
| | | | Finance — 19.1% | | | | |
| | 4,470 | | Annaly Capital Management, Inc. | | $ | 75,588 | |
| | 3,040 | | Capitol Federal Financial | | | 92,203 | |
| | 3,325 | | Comerica, Inc. | | | 92,268 | |
| | 1,975 | | Commerce Bancshares, Inc. | | | 75,761 | |
| | 10,725 | | Hudson City Bancorp, Inc. | | | 140,926 | |
| | 16,900 | | Huntington Bancshares, Inc. | | | 64,389 | |
| | 15,350 | | KeyCorp. | | | 82,737 | |
| | 1,446 | | M&T Bank Corp. | | | 90,880 | |
| | 7,285 | | New York Community Bancorp, Inc. | | | 78,678 | |
| | 7,950 | | People’s United Financial, Inc. | | | 127,439 | |
| | 16,000 | | Regions Financial Corp. | | | 77,440 | |
| | 4,886 | | T. Rowe Price Group, Inc. | | | 238,094 | |
| | 1,725 | | The Hanover Insurance Group, Inc. | | | 72,554 | |
| | | | | |
| |
| | | | | | | 1,308,957 | |
| | | | | |
| |
| | | | Health Services — 0.5% | | | | |
| | 1,030 | | Lincare Holdings, Inc.* | | | 32,352 | |
| | | | | |
| |
| | | | Health Technology — 9.3% | | | | |
| | 380 | | Bio-Rad Laboratories, Inc., Class A* | | | 33,968 | |
| | 1,546 | | C.R. Bard, Inc. | | | 116,058 | |
| | 4,100 | | Endo Pharmaceuticals Holdings, Inc.* | | | 91,840 | |
| | 3,738 | | Forest Laboratories, Inc.* | | | 103,430 | |
| | 2,445 | | Pall Corp. | | | 77,604 | |
| | 1,685 | | Techne Corp. | | | 105,330 | |
| | 2,839 | | Varian Medical Systems, Inc.* | | | 116,343 | |
| | | | | |
| |
| | | | | | | 644,573 | |
| | | | | |
| |
| | | | Industrial Services — 4.4% | | | | |
| | 2,285 | | ENSCO International, Inc. | | | 104,630 | |
| | 3,340 | | Helmerich & Payne, Inc. | | | 126,986 | |
| | 1,087 | | Pride International, Inc.* | | | 32,132 | |
| | 1,550 | | Rowan Companies, Inc. | | | 36,038 | |
| | | | | |
| |
| | | | | | | 299,786 | |
| | | | | |
| |
| | | | Non-Energy Minerals — 3.0% | | | | |
| | 3,375 | | Compania de Minas Buenaventura S.A.A. ADR | | | 113,299 | |
| | 2,627 | | United States Steel Corp. | | | 90,605 | |
| | | | | |
| |
| | | | | | | 203,904 | |
| | | | | |
| |
17
The FBR Funds
FBR Pegasus Mid Cap FundTM
Portfolio of Investments (continued)
October 31, 2009
|
| | | | | | VALUE |
| | SHARES | | | | (NOTE 2) |
|
| | | | Process Industries — 4.4% | | | | |
| | 1,472 | | Bunge Ltd. | | $ | 83,992 | |
| | 2,475 | | Ecolab, Inc. | | | 108,801 | |
| | 2,134 | | Sigma-Aldrich Corp. | | | 110,819 | |
| | | | | |
| |
| | | | | | | 303,612 | |
| | | | | |
| |
| | | | Producer Manufacturing — 7.3% | | | | |
| | 2,953 | | Cummins, Inc. | | | 127,157 | |
| | 2,235 | | Kubota Corp. ADR | | | 85,846 | |
| | 3,580 | | Magna International, Inc., Class A | | | 141,875 | |
| | 2,712 | | Roper Industries, Inc. | | | 137,092 | |
| | | | | |
| |
| | | | | | | 491,970 | |
| | | | | |
| |
| | | | Retail Trade — 8.1% | | | | |
| | 3,690 | | Abercrombie & Fitch Co., Class A | | | 121,106 | |
| | 7,249 | | American Eagle Outfitters, Inc. | | | 126,785 | |
| | 2,525 | | BJ’s Wholesale Club, Inc.* | | | 88,451 | |
| | 2,350 | | Fastenal Co. | | | 81,075 | |
| | 3,485 | | Tiffany & Co. | | | 136,926 | |
| | | | | |
| |
| | | | | | | 554,343 | |
| | | | | |
| |
| | | | Technology Services — 9.0% | | | | |
| | 5,133 | | Check Point Software Technologies Ltd.* | | | 159,482 | |
| | 3,350 | | Cognizant Technology Solutions Corp., Class A* | | | 129,478 | |
| | 2,700 | | Global Payments, Inc. | | | 132,920 | |
| | 950 | | NetEase.com, Inc. ADR* | | | 36,689 | |
| | 4,375 | | Paychex, Inc. | | | 124,294 | |
| | 600 | | Sohu.com, Inc.* | | | 33,360 | |
| | | | | |
| |
| | | | | | | 616,223 | |
| | | | | |
| |
| | | | Utilities — 4.8% | | | | |
| | 1,816 | | Pinnacle West Capital Corp. | | | 56,877 | |
| | 1,473 | | Questar Corp. | | | 58,684 | |
| | 1,675 | | SCANA Corp. | | | 56,682 | |
| | 1,100 | | Sempra Energy | | | 56,595 | |
18
The FBR Funds
FBR Pegasus Mid Cap FundTM
Portfolio of Investments (continued)
October 31, 2009
|
| | | | | | VALUE |
| | SHARES | | | | (NOTE 2) |
|
| | | | Utilities — 4.8% (continued) | | | | |
| | 2,950 | | Westar Energy, Inc. | | $ | 56,493 | |
| | 2,173 | | Xcel Energy, Inc. | | | 40,939 | |
| | | | | |
| |
| | | | | | | 326,270 | |
| | | | | |
| |
| | | | Total Common Stocks (Cost $5,998,739) | | | 6,522,221 | |
| | | | | |
| |
| | | | | | | | |
| | | | MONEY MARKET FUND — 1.1% | | | | |
| | 75,655 | | JPMorgan 100% U.S. Treasury Securities Money Market Fund | | | 75,655 | |
| | | | | |
| |
| | | | | | | | |
| | | | Total Investments — 96.3% (Cost $6,074,394) | | | 6,597,876 | |
| | | | | | | | |
| | | | Other Assets Less Liabilities — 3.7% | | | 253,157 | |
| | | | | |
| |
| | | | | | | | |
| | | | Net Assets — 100.0% | | $ | 6,851,033 | |
| | | | | |
| |
|
| * | | Non-income producing security |
| ADR | | American Depositary Receipts |
| Note: | | For presentation purposes, the Fund has grouped some of the industry categories. For purposes of categorizing securities for compliance with Section 8(b)(1) of the Investment Company Act of 1940, the Fund uses more specific industry classifications. |
The accompanying notes are an integral part of the financial statements.
19
The FBR Funds
FBR Pegasus Small Cap FundTM
Management Overview
Portfolio Manager: Robert Barringer, CFA
Over the last 12 months, how did the Fund perform and what factors contributed to this performance?
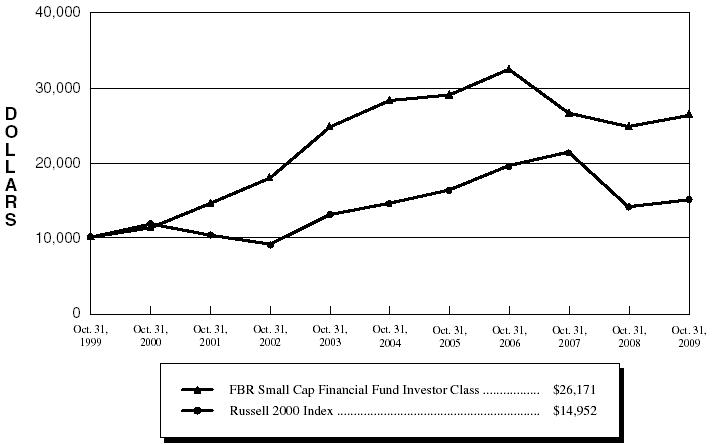
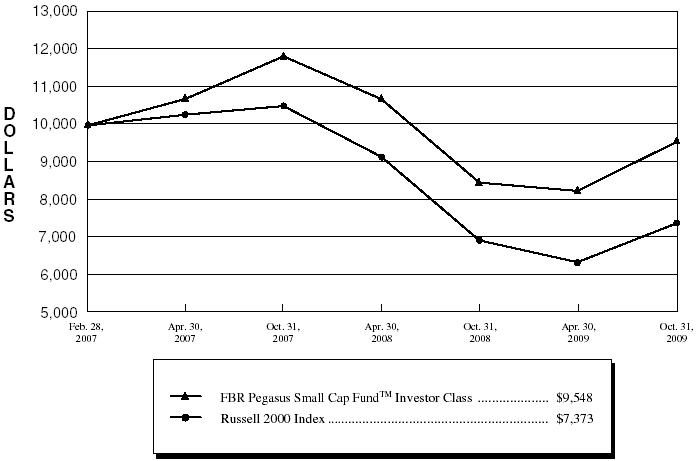
For the one-year period ended October 31, 2009, the Investor Class of the FBR Pegasus Small Cap FundTM returned 12.68%. This compares to the Russell 2000 Index and the Morningstar Small Cap Blend category average, which returned 6.46% and 11.74%, respectively.
Specific stock selection accounted for the vast majority (94%) of the overall return of the Fund versus overweighting specific sectors, which attributed approximately 6%. In particular, the Fund’s selections of individual high-quality financial stocks were the largest drivers of outperformance. Relative to the Russell 2000 Index, the Fund maintained overweight positions in savings banks and asset managers while remaining materially underweight in very hard hit regional banks during the reporting period. Individual selection in the consumer discretionary sector was the second best contributor to the Fund’s outperformance, where specific stock picks well outperformed the buoyant category.
Over the course of the reporting period, almost every single economic sector represented in the Fund’s portfolio experienced a positive return relative to its index, with one minor exception, consumer staples. Our goal is to provide investors with diversified exposure to the small-cap asset class while delivering above average risk-adjusted returns over a full market cycle. Our investment process allows us to identify companies offering what we believe are the most attractive risk/return profiles within each sector and acquire them at reasonable prices. The previous twelve months highlighted the merits of our process as we continued to achieve our stated objective.
Portfolio manager comments on the Fund and the related investment outlook.
The stock market and the economy of the US in the past year have been hit hard by the popping of the real estate bubble and all of its associated implications. Intuitively, investors would have assumed that large-cap companies would outperform in this scenario, but the large-cap asset class was severely impacted by the negative performance of large financial institutions. These financial institutions relied more heavily on complex investments and unregulated funding sources embedded in their “more sophisticated” balance sheet structure to continue to drive growth. This stance ultimately proved to be extremely risky, especially as locating adequate short-term funding became nearly impossible as a result of the credit crisis and higher capital requirements were mandated by the government. Indeed, the smaller cap companies in the financial area, by virtue of their “plain vanilla” profiles, with relatively straightforward businesses of making loans and taking in deposits from their branch network, were, with some exceptions, less impacted and performed far better than their larger brethren. Other major large-cap companies that were impacted by the credit crisis were auto companies and their manufacturers, and some other major companies with complex financial subsidiaries, such as General Electric.
20
The FBR Funds
FBR Pegasus Small Cap FundTM
Management Overview (continued)
We are now in the process of healing across the global financial system, as companies are now able to access the public debt and equity markets. Increasingly, companies across the market cap spectrum have been able to raise capital either through an initial public offering or a secondary issue, and I believe that through this healing process the stronger players will be able to acquire assets or entire companies at attractive prices. Examples of this include recent very attractive deals that a number of banks have completed with the assistance of the FDIC, in effect making them the consolidators of the banking space. Investors also seem to be looking at public real estate investment trusts to act in a similar capacity, being able to access the public markets while the private players are having more difficulty raising capital.
In the year ahead, I have positioned the portfolio to take advantage of the viewpoint that the US economy will gradually improve, and that we will move from a phase of survival to a focus on growth. One of the wildcards is how quickly we will see employment growth return or whether, as many people have voiced, we will have a “jobless recovery”. Two key issues are how and when will the government manage to back away from its aggressive stimulus program. Also important is the timing of a decision by the fed to raise interest rates and the impact of dang so on a fragile recovery.
As always, I will be looking for the best companies in each sector, with solid business models, good management, prudent balance sheets, selling at the most reasonable prices. I will tilt the portfolio towards those areas that can take advantage of a cyclical upturn in the economy, such as certain parts of industrials, material, financials, and technology. Further, I will attempt to position the portfolio to participate and capitalize on what I believe are some of the most significant and powerful, secular growth trends developing today.
The opinions expressed in this commentary reflect those of the Portfolio Manager as of the date written. Any such opinions are subject to change based on market or other conditions. These opinions may not be relied upon as investment advice. Investment decisions for The FBR Funds are based on several factors, and may not be relied upon as an indication of trading intent on behalf of any FBR Fund. Security positions can and do change.
21
The FBR Funds
FBR Pegasus Small Cap FundTM
Comparison of Changes in Value of $10,000 Investment in
Investor Class Shares(1)(2) vs. Russell 2000 Index(1)(3)
| Total Returns—For the Periods Ended October 31, 2009(4) | |
| | | | | | Annualized | |
| | | | | | Since | |
| | | One Year | | Inception(5) | |
| | |
| |
| |
FBR Pegasus Small Cap FundTM Investor Class(1)(2) | | 12.68 | % | | (1.72 | )% | |
FBR Pegasus Small Cap FundTM I Class(2) | | 12.73 | % | | (10.14 | )% | |
Russell 2000 Index(1)(3) | | 6.46 | % | | (10.76 | )% | |
PAST PERFORMANCE IS NO GUARANTEE OF FUTURE RESULTS.
The performance data quoted represents past performance and the current performance may be lower or higher than the performance data quoted. The investment return and principal will fluctuate so that investors’ shares, when redeemed, may be worth more or less than their original cost. The performance data does not reflect the deduction of taxes that a shareholder would pay on Fund distributions or redemption fees. If reflected, the redemption fee would reduce the performance data quoted. To obtain performance data current to the most recent month-end, please call 888.200.4710 or visit www.fbrfunds.com.
|
| (1) | | The graph assumes a hypothetical $10,000 initial investment in the Fund and reflects the reinvestment of dividends and all Fund expenses. Investors should note that the Fund is a professionally managed mutual fund while the index is unmanaged, does not incur expenses and is not available for investment. The performance of the index includes reinvested dividends, and does not reflect sales charges or expenses. |
| (2) | | FBR Fund Advisers, Inc. waived a portion of its advisory fees and agreed to contractually reimburse a portion of the Fund’s operating expenses, as necessary, to maintain existing expense limitations, as set forth in the notes to the financial statements. Total returns shown include fee waivers and expense reimbursements, if any; total returns would have been lower had there been no waiver of fees and/or reimbursement of expenses in excess of expense limitations. |
| (3) | | The Russell 2000 Index is comprised of the smallest of the 2000 companies of the Russell 3000 Index, representing approximately 8% of the Russell 3000’s total market capitalization. |
| (4) | | The total returns shown do not reflect the deduction of taxes that a shareholder would pay on fund distributions or the redemption of fund shares. |
| (5) | | The inception date for the Investor Class is February 28, 2007 and the inception date for the I Class is May 30, 2008. The index return is for the period beginning February 28, 2007. |
22
The FBR Funds
FBR Pegasus Small Cap FundTM
Portfolio Summary
October 31, 2009
The following provides a breakdown of the Fund by industry sectors. The underlying securities represent a percentage of the portfolio investments.
| Industry Sector | | % of Total Investments |
| |
|
| Finance | | 31.8 | % |
| Electronic Technology | 11.2 | % |
| Retail Trade | | 8.0 | % |
| Technology Services | 7.3 | % |
| Producer Manufacturing | 7.3 | % |
| Energy Minerals | | 5.5 | % |
| Health Technology | 5.3 | % |
| Distribution Services | 4.7 | % |
| Process Industries | 3.1 | % |
| Transportation | | 2.8 | % |
| Commercial Services | 2.6 | % |
| Consumer Durables | 2.5 | % |
| Utilities | | 2.0 | % |
| Consumer Services | 1.9 | % |
| Industrial Services | 1.7 | % |
| Non-Energy Minerals | 1.4 | % |
| Health Services | | 0.9 | % |
23
The FBR Funds
FBR Pegasus Small Cap FundTM
Portfolio of Investments
October 31, 2009
|
| | | | | | VALUE |
| | SHARES | | | | (NOTE 2) |
|
| | | | COMMON STOCKS — 94.4% | | | | |
| | | | Commercial Services — 2.5% | | | | |
| | 4,075 | | Lender Processing Services, Inc. | | $ | 162,185 | |
| | 5,910 | | SEI Investments Co. | | | 103,248 | |
| | | | | |
| |
| | | | | | | 265,433 | |
| | | | | |
| |
| | | | Consumer Durables — 2.3% | | | | |
| | 5,400 | | Lennar Corp., Class A | | | 68,040 | |
| | 2,450 | | Snap-On, Inc. | | | 89,499 | |
| | 1,900 | | The Black & Decker Corp. | | | 89,718 | |
| | | | | |
| |
| | | | | | | 247,257 | |
| | | | | |
| |
| | | | Consumer Services — 1.7% | | | | |
| | 2,500 | | DreamWorks Animation SKG, Inc., Class A* | | | 80,000 | |
| | 6,070 | | Rollins, Inc. | | | 109,746 | |
| | | | | |
| |
| | | | | | | 189,746 | |
| | | | | |
| |
| | | | Distribution Services — 4.4% | | | | |
| | 2,100 | | MSC Industrial Direct Company, Inc., Class A | | | 90,405 | |
| | 6,380 | | Patterson Companies, Inc.* | | | 162,881 | |
| | 11,500 | | Pool Corp. | | | 225,170 | |
| | | | | |
| |
| | | | | | | 478,456 | |
| | | | | |
| |
| | | | Electronic Technology — 10.6% | | | | |
| | 8,450 | | ADTRAN, Inc. | | | 194,688 | |
| | 1,850 | | Comtech Telecommunications Corp.* | | | 59,422 | |
| | 2,300 | | Cymer, Inc.* | | | 78,752 | |
| | 16,800 | | Emulex Corp.* | | | 169,680 | |
| | 8,900 | | International Rectifier Corp.* | | | 162,692 | |
| | 4,500 | | Microchip Technology, Inc. | | | 107,820 | |
| | 5,700 | | Polycom, Inc.* | | | 122,379 | |
| | 9,950 | | QLogic Corp.* | | | 174,523 | |
| | 6,300 | | Skyworks Solutions, Inc.* | | | 65,709 | |
| | | | | |
| |
| | | | | | | 1,135,665 | |
| | | | | |
| |
| | | | Energy Minerals — 5.2% | | | | |
| | 3,900 | | Arena Resources, Inc.* | | | 145,314 | |
| | 3,200 | | Concho Resources, Inc.* | | | 121,952 | |
| | 1,980 | | Energen Corp. | | | 86,882 | |
24
The FBR Funds
FBR Pegasus Small Cap FundTM
Portfolio of Investments (continued)
October 31, 2009
|
| | | | | | VALUE |
| | SHARES | | | | (NOTE 2) |
|
| | | | Energy Minerals — 5.2% (continued) | | | | |
| | 3,150 | | Goodrich Petroleum Corp.* | | $ | 80,861 | |
| | 2,000 | | Whiting Petroleum Corp.* | | | 112,800 | |
| | | | | |
| |
| | | | | | | 547,809 | |
| | | | | |
| |
| | | | Finance — 29.8% | | | | |
| | 3,475 | | Affiliated Managers Group, Inc.* | | | 220,628 | |
| | 6,835 | | American Financial Group, Inc. | | | 168,140 | |
| | 10,000 | | AmeriCredit Corp.* | | | 176,500 | |
| | 7,500 | | Arthur J. Gallagher & Co. | | | 167,325 | |
| | 21,800 | | Astoria Financial Corp. | | | 217,564 | |
| | 12,500 | | Cathay General Bancorp | | | 110,375 | |
| | 14,000 | | DiamondRock Hospitality Co.* | | | 106,540 | |
| | 13,400 | | First Horizon National Corp.* | | | 158,522 | |
| | 25,300 | | First Niagara Financial Group, Inc. | | | 324,852 | |
| | 23,300 | | Fulton Financial Corp. | | | 192,458 | |
| | 4,600 | | Knight Capital Group, Inc., Class A* | | | 77,510 | |
| | 5,275 | | optionsXpress Holdings, Inc. | | | 82,448 | |
| | 4,700 | | Platinum Underwriters Holdings Ltd. | | | 168,119 | |
| | 3,700 | | Raymond James Financial, Inc. | | | 87,357 | |
| | 4,550 | | StanCorp Financial Group, Inc. | | | 167,031 | |
| | 15,400 | | Susquehanna Bancshares, Inc. | | | 84,854 | |
| | 1,950 | | The Hanover Insurance Group, Inc. | | | 82,017 | |
| | 1,965 | | Torchmark Corp. | | | 79,779 | |
| | 5,900 | | UDR, Inc. | | | 84,842 | |
| | 7,500 | | Waddell & Reed Financial, Inc., Class A | | | 210,450 | |
| | 13,900 | | Webster Financial Corp. | | | 157,209 | |
| | 4,750 | | Zions Bancorp | | | 67,260 | |
| | | | | |
| |
| | | | | | | 3,191,780 | |
| | | | | |
| |
| | | | Health Services — 0.8% | | | | |
| | 2,100 | | Computer Programs and Systems, Inc. | | | 88,704 | |
| | | | | |
| |
| | | | Health Technology — 5.1% | | | | |
| | 12,200 | | STERIS Corp. | | | 356,973 | |
| | 1,897 | | Techne Corp. | | | 118,581 | |
| | 7,700 | | VIVUS, Inc.* | | | 60,830 | |
| | | | | |
| |
| | | | | | | 536,384 | |
| | | | | |
| |
25
The FBR Funds
FBR Pegasus Small Cap FundTM
Portfolio of Investments (continued)
October 31, 2009
|
| | | | | | VALUE |
| | SHARES | | | | (NOTE 2) |
|
| | | | Industrial Services — 1.6% | | | | |
| | 7,500 | | Rowan Companies, Inc. | | $ | 174,375 | |
| | | | | |
| |
| | | | Non-Energy Minerals — 1.3% | | | | |
| | 8,400 | | Century Aluminum Co.* | | | 72,828 | |
| | 5,000 | | Steel Dynamics, Inc. | | | 66,950 | |
| | | | | |
| |
| | | | | | | 139,778 | |
| | | | | |
| |
| | | | Process Industries — 2.9% | | | | |
| | 9,650 | | GrafTech International Ltd.* | | | 130,275 | |
| | 3,030 | | Sensient Technologies Corp. | | | 76,629 | |
| | 4,200 | | The Valspar Corp. | | | 106,554 | |
| | | | | |
| |
| | | | | | | 313,458 | |
| | | | | |
| |
| | | | Producer Manufacturing — 7.0% | | | | |
| | 1,525 | | A.O. Smith Corp. | | | 60,436 | |
| | 1,700 | | Armstrong World Industries, Inc.* | | | 63,325 | |
| | 2,210 | | Carlisle Companies, Inc. | | | 68,598 | |
| | 4,580 | | Graco, Inc. | | | 126,132 | |
| | 2,750 | | Lennox International, Inc. | | | 92,593 | |
| | 2,300 | | Lincoln Electric Holdings, Inc. | | | 109,112 | |
| | 3,400 | | Simpson Manufacturing Company, Inc. | | | 79,526 | |
| | 2,075 | | The Toro Co. | | | 76,817 | |
| | 875 | | Valmont Industries, Inc. | | | 63,236 | |
| | | | | |
| |
| | | | | | | 739,775 | |
| | | | | |
| |
| | | | Retail Trade — 7.7% | | | | |
| | 5,225 | | Abercrombie & Fitch Co., Class A | | | 171,484 | |
| | 9,000 | | American Eagle Outfitters, Inc. | | | 157,410 | |
| | 3,050 | | Jos. A. Bank Clothiers, Inc.* | | | 124,989 | |
| | 2,900 | | The Buckle, Inc. | | | 87,029 | |
| | 2,625 | | The Gymboree Corp.* | | | 111,746 | |
| | 8,500 | | Williams-Sonoma, Inc. | | | 159,630 | |
| | | | | |
| |
| | | | | | | 812,288 | |
| | | | | |
| |
| | | | Technology Services — 6.9% | | | | |
| | 4,000 | | Broadridge Financial Solutions, Inc. | | | 83,240 | |
| | 8,700 | | Jack Henry & Associates, Inc. | | | 200,709 | |
| | 3,020 | | MICROS Systems, Inc.* | | | 81,298 | |
26
The FBR Funds
FBR Pegasus Small Cap FundTM
Portfolio of Investments (continued)
October 31, 2009
|
| | | | | | VALUE |
| | SHARES | | | | (NOTE 2) |
|
| | | | Technology Services — 6.9% (continued) | | | | |
| | 5,900 | | Sybase, Inc.* | | $ | 233,404 | |
| | 14,900 | | TIBCO Software, Inc.* | | | 130,375 | |
| | | | | |
| |
| | | | | | | 729,026 | |
| | | | | |
| |
| | | | Transportation — 2.7% | | | | |
| | 6,400 | | Genessee & Wyoming, Inc., Class A* | | | 185,664 | |
| | 5,250 | | Werner Enterprises, Inc. | | | 98,438 | |
| | | | | |
| |
| | | | | | | 284,102 | |
| | | | | |
| |
| | | | Utilities — 1.9% | | | | |
| | 6,300 | | Great Plains Energy, Inc. | | | 108,990 | |
| | 5,000 | | Portland General Electric Co. | | | 92,950 | |
| | | | | |
| |
| | | | | | | 201,940 | |
| | | | | |
| |
| | | | Total Common Stocks (Cost $9,427,736) | | | 10,075,976 | |
| | | | | |
| |
| | | | | | | | |
| | | | Total Investments — 94.4% (Cost $9,427,736) | | | 10,075,976 | |
| | | | | | | | |
| | | | Other Assets Less Liabilities — 5.6% | | | 595,240 | |
| | | | | |
| |
| | | | | | | | |
| | | | Net Assets — 100.0% | | $ | 10,671,216 | |
| | | | | |
| |
|
| * | | Non-income producing security |
| Note: | | For presentation purposes, the Fund has grouped some of the industry categories. For purposes of categorizing securities for compliance with Section 8(b)(1) of the Investment Company Act of 1940, the Fund uses more specific industry classifications. |
The accompanying notes are an integral part of the financial statements.
27
The FBR Funds
FBR Pegasus Small Cap Growth FundTM
Management Overview
Portfolio Manager: Robert Barringer, CFA
Over the last 12 months, how did the Fund perform and what factors contributed to this performance?
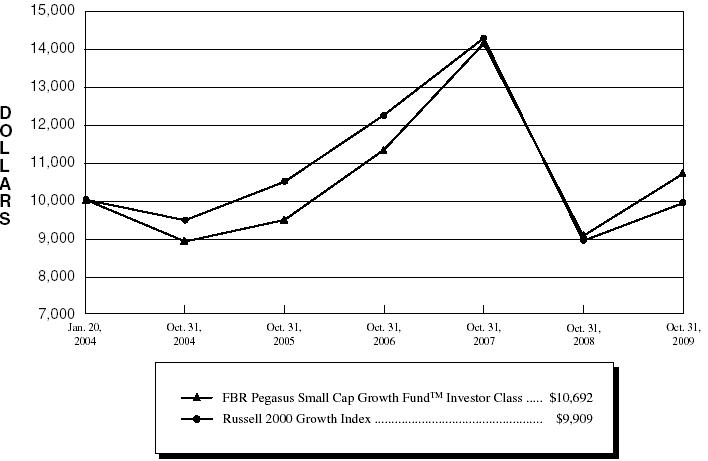
For the one-year period ended October 31, 2009, the Investor Class of the FBR Pegasus Small Cap Growth FundTM returned 18.39%. This compares to the Russell 2000 Growth Index and the Morningstar Small Cap Growth category average, which returned 11.34% and 13.17%, respectively.
Nearly all of the Fund’s outperformance against its benchmark was attributable to specific stock selection in the various economic sectors represented in the portfolio rather than its relative over- or underweight positions. The main areas of outperformance were individual selections in select high-quality healthcare, industrials, consumer discretionary and technology companies. The single largest detractor to the Fund’s performance during the reporting period was a combination of individual selection and an underweight position to the energy minerals sector relative to the Russell 2000 Growth Index.
During this time frame, our investment process continued to allow us to identify high-quality small-cap companies with solid fundamentals, outsized prospects for growth and durable business models that we were able to acquire at reasonable valuations. This allowed the Fund to expose investors to less volatility than its benchmark. Over the course of the last twelve months, the Fund delivered almost 90% of the upside performance while subjecting investors to only 72% of the downside. This lower volatility is attributable to the Fund’s tighter standard deviation band of 24.40% relative to the Russell 2000 Growth Index���s 29.68%. During this tumultuous period, it was heartening to see the market recognize the lower-risk higher-return potential inherent in the types of companies we seek to own regardless of market environment and reward them accordingly.
Portfolio manager comments on the Fund and the related investment outlook.
Over the past year, the small-cap growth style more than doubled the performance of the small-cap value style largely because of its lower exposure to the harder hit segments of the market including financials, industrials and materials. Technology, in particular, was a strong performer over the Fund’s fiscal year, as hardware, semiconductor and software earnings held up a lot better than anticipated, certainly relative to expectations set by previous cycles. Technology and innovation is increasingly relied upon as a strategic asset to save money and time, and, without access to implementing the best tools available, a company can be at a competitive disadvantage. Over the past few years, individuals have been coming to view technology as essential to their personal lives and spending has remained strong and should continue for the foreseeable future.
In addition, the consumer discretionary segment performed well, in spite of what was happening to employment and the economy. While perhaps taking fewer vacations and trips to hotels, consumers continued to buy apparel and visit restaurants as eating out has
28
The FBR Funds
FBR Pegasus Small Cap Growth FundTM
Management Overview (continued)
become a regular feature of the American lifestyle. The death of the consumer was predicted, but it did not happen, even with all of the troubles with personal balance sheets, and high unemployment.
Looking ahead, I expect that the economy will slowly improve as signs of stability have shown themselves in a number of key economic statistics. The Fund’s investment style heavily emphasizes quality growth and will continue to invest in those market segments which afford the highest growth characteristics. I will continue to attempt to take advantage of those areas that have been hardest hit over the past year, such as the industrials, financials, and materials sectors. Those cyclical areas also should perform well as economic growth resumes.
As always, I will look for the best run companies with solid balance sheets, good management, and above average growth potential. In addition, I will attempt to identify and capitalize on those key secular growth stories that should provide high growth and returns over a multi-year period.
The opinions expressed in this commentary reflect those of the Portfolio Manager as of the date written. Any such opinions are subject to change based on market or other conditions. These opinions may not be relied upon as investment advice. Investment decisions for The FBR Funds are based on several factors, and may not be relied upon as an indication of trading intent on behalf of any FBR Fund. Security positions can and do change.
29
The FBR Funds
FBR Pegasus Small Cap Growth FundTM
Comparison of Changes in Value of $10,000 Investment in
Investor Class Shares(1)(2) vs. Russell 2000 Growth Index(1)(3)
| Total Returns—For the Periods Ended October 31, 2009(4) | |
| | | | | | | | | | Annualized | |
| | | | | | | Annualized | | Since | |
| | | | One Year | | Five Year | | Inception(5) | |
| | | |
| |
| |
| |
FBR Pegasus Small Cap Growth FundTM Investor Class(1)(2) | | | 18.39 | % | | 3.78 | % | | 1.16 | % | |
FBR Pegasus Small Cap Growth FundTM I Class(2) | | | 18.50 | % | | N/A | | | (10.65 | )% | |
FBR Pegasus Small Cap Growth FundTM R Class(2) | | | 17.99 | % | | N/A | | | (11.10 | )% | |
Russell 2000 Growth Index(1)(3) | | | 11.34 | % | | 0.95 | % | | (0.16 | )% | |
PAST PERFORMANCE IS NO GUARANTEE OF FUTURE RESULTS.
The performance data quoted represents past performance and the current performance may be lower or higher than the performance data quoted. The investment return and principal will fluctuate so that investors’ shares, when redeemed, may be worth more or less than their original cost. The performance data does not reflect the deduction of taxes that a shareholder would pay on Fund distributions or redemption fees. If reflected, the redemption fee would reduce the performance data quoted. To obtain performance data current to the most recent month-end, please call 888.200.4710 or visit www.fbrfunds.com.
|
| (1) | | The graph assumes a hypothetical $10,000 initial investment in the Fund and reflects the reinvestment of dividends and all Fund expenses. Investors should note that the Fund is a professionally managed mutual fund while the indices are unmanaged, do not incur expenses and are not available for investment. The performance of the index includes reinvested dividends, and does not reflect sales charges or expenses. |
| (2) | | FBR Fund Advisers, Inc. waived a portion of its advisory fees and agreed to contractually reimburse a portion of the Fund’s operating expenses, as necessary, to maintain existing expense limitations, as set forth in the notes to the financial statements. Total returns shown include fee waivers and expense reimbursements, if any; total returns would have been lower had there been no waiver of fees and/or reimbursement of expenses in excess of expense limitations. |
| (3) | | The Russell 2000 Growth Index measures the performance of the small-cap growth segment of the U.S. equity universe. It includes those Russell 2000 companies with higher price-to-value ratios and higher forecasted growth values. |
| (4) | | The total returns shown do not reflect the deduction of taxes that a shareholder would pay on fund distributions or the redemption of fund shares. |
| (5) | | The inception date for the Investor Class is January 20, 2004 and the inception date for the I Class and R Class is May 30, 2008. The index return is for the period beginning January 20, 2004. |
30
The FBR Funds
FBR Pegasus Small Cap Growth FundTM
Portfolio Summary
October 31, 2009
The following provides a breakdown of the Fund by industry sectors. The underlying securities represent a percentage of the portfolio investments.
| Industry Sector | | % of Total Investments |
| |
|
| Technology Services | | 19.2 | % |
| Finance | | 12.5 | % |
| Commercial Services | | 10.3 | % |
| Health Technology | | 8.9 | % |
| Health Services | | 7.7 | % |
| Electronic Technology | | 6.8 | % |
| Consumer Non-Durables | | 5.9 | % |
| Consumer Services | | 5.9 | % |
| Producer Manufacturing | | 4.8 | % |
| Transportation | | 4.0 | % |
| Energy Minerals | | 3.1 | % |
| Industrial Services | | 2.4 | % |
| Retail Trade | | 2.3 | % |
| Consumer Durables | | 2.3 | % |
| Non-Energy Minerals | | 1.5 | % |
| Distribution Services | | 1.4 | % |
| Communications | | 0.7 | % |
| | | | |
| Cash | | 0.3 | % |
31
The FBR Funds
FBR Pegasus Small Cap Growth FundTM
Portfolio of Investments
October 31, 2009
|
| | | | | | VALUE |
| | SHARES | | | | (NOTE 2) |
|
| | | | COMMON STOCKS — 99.0% | | | | |
| | | | Commercial Services — 10.1% | | | | |
| | 1,825 | | Copart, Inc.* | | $ | 58,710 | |
| | 1,738 | | CoStar Group, Inc.* | | | 67,469 | |
| | 1,825 | | FactSet Research Systems, Inc. | | | 116,891 | |
| | 1,490 | | Morningstar, Inc.* | | | 76,020 | |
| | 3,900 | | SEI Investments Co. | | | 68,133 | |
| | 2,300 | | Watson Wyatt Worldwide, Inc., Class A | | | 100,234 | |
| | 3,000 | | Wright Express Corp.* | | | 83,730 | |
| | | | | |
| |
| | | | | | | 571,187 | |
| | | | | |
| |
| | | | Communications — 0.7% | | | | |
| | 6,000 | | Terremark Worldwide, Inc.* | | | 38,340 | |
| | | | | |
| |
| | | | Consumer Durables — 2.3% | | | | |
| | 3,200 | | Fossil, Inc.* | | | 85,535 | |
| | 1,100 | | Polaris Industries, Inc. | | | 46,277 | |
| | | | | |
| |
| | | | | | | 131,812 | |
| | | | | |
| |
| | | | Consumer Non-Durables — 5.8% | | | | |
| | 1,700 | | Guess?, Inc. | | | 62,135 | |
| | 2,500 | | Hansen Natural Corp.* | | | 90,375 | |
| | 3,650 | | True Religion Apparel, Inc.* | | | 94,060 | |
| | 3,175 | | Under Armour, Inc., Class A* | | | 85,249 | |
| | | | | |
| |
| | | | | | | 331,819 | |
| | | | | |
| |
| | | | Consumer Services — 6.0% | | | | |
| | 940 | | Capella Education Co.* | | | 64,766 | |
| | 450 | | Chipotle Mexican Grill, Inc., Class A* | | | 36,671 | |
| | 445 | | ITT Educational Services, Inc.* | | | 40,206 | |
| | 3,800 | | Penn National Gaming, Inc.* | | | 95,494 | |
| | 5,000 | | Rollins, Inc. | | | 90,400 | |
| | | | | |
| |
| | | | | | | 327,537 | |
| | | | | |
| |
| | | | Distribution Services — 1.3% | | | | |
| | 3,050 | | Patterson Companies, Inc.* | | | 77,867 | |
| | | | | |
| |
| | | | Electronic Technology — 6.8% | | | | |
| | 1,000 | | Hittite Microwave Corp.* | | | 36,800 | |
| | 3,100 | | Palm, Inc.* | | | 35,991 | |
32
The FBR Funds
FBR Pegasus Small Cap Growth FundTM
Portfolio of Investments (continued)
October 31, 2009
|
| | | | | | VALUE |
| | SHARES | | | | (NOTE 2) |
|
| | | | Electronic Technology — 6.8% (continued) | | | | |
| | 3,725 | | Polycom, Inc.* | | $ | 79,976 | |
| | 7,725 | | QLogic Corp.* | | | 135,497 | |
| | 4,100 | | Skyworks Solutions, Inc.* | | | 42,763 | |
| | 2,000 | | Supertex, Inc.* | | | 48,500 | |
| | | | | |
| |
| | | | | | | 379,527 | |
| | | | | |
| |
| | | | Energy Minerals — 3.1% | | | | |
| | 1,840 | | Comstock Resources, Inc.* | | | 75,606 | |
| | 3,675 | | Goodrich Petroleum Corp.* | | | 94,337 | |
| | | | | |
| |
| | | | | | | 169,943 | |
| | | | | |
| |
| | | | Finance — 12.4% | | | | |
| | 7,600 | | AmeriCredit Corp.* | | | 134,140 | |
| | 1,200 | | Comerica, Inc. | | | 33,300 | |
| | 11,000 | | Conseco, Inc.* | | | 57,310 | |
| | 850 | | Ebix, Inc.* | | | 52,360 | |
| | 16,400 | | Huntington Bancshares, Inc. | | | 62,484 | |
| | 4,000 | | Janus Capital Group, Inc. | | | 52,480 | |
| | 4,600 | | Legg Mason, Inc. | | | 133,906 | |
| | 4,825 | | Marshall & Ilsley Corp. | | | 25,669 | |
| | 1,275 | | Stifel Financial Corp.* | | | 66,249 | |
| | 4,700 | | TradeStation Group, Inc.* | | | 36,284 | |
| | 1,625 | | Waddell & Reed Financial, Inc., Class A | | | 45,598 | |
| | | | | |
| |
| | | | | | | 699,780 | |
| | | | | |
| |
| | | | Health Services — 7.6% | | | | |
| | 600 | | athenahealth, Inc.* | | | 22,566 | |
| | 1,380 | | Cerner Corp.* | | | 104,935 | |
| | 11,400 | | Health Grades, Inc.* | | | 49,476 | |
| | 1,640 | | Lincare Holdings, Inc.* | | | 51,512 | |
| | 650 | | MEDNAX, Inc.* | | | 33,748 | |
| | 3,900 | | VCA Antech, Inc.* | | | 92,897 | |
| | 2,825 | | WellCare Health Plans, Inc.* | | | 73,817 | |
| | | | | |
| |
| | | | | | | 428,951 | |
| | | | | |
| |
| | | | Health Technology — 8.9% | | | | |
| | 2,300 | | Crucell N.V. ADR* | | | 45,425 | |
| | 2,050 | | Dendreon Corp.* | | | 51,804 | |
| | 800 | | Human Genome Sciences, Inc.* | | | 14,952 | |
33
The FBR Funds
FBR Pegasus Small Cap Growth FundTM
Portfolio of Investments (continued)
October 31, 2009
|
| | | | | | VALUE |
| | SHARES | | | | (NOTE 2) |
|
| | | | Health Technology — 8.9% (continued) | | | | |
| | 1,165 | | IDEXX Laboratories, Inc.* | | $ | 59,555 | |
| | 2,700 | | Kinetic Concepts, Inc.* | | | 89,613 | |
| | 2,175 | | Techne Corp. | | | 135,959 | |
| | 1,000 | | United Therapeutics Corp.* | | | 42,540 | |
| | 7,000 | | VIVUS, Inc.* | | | 55,300 | |
| | | | | |
| |
| | | | | | | 495,148 | |
| | | | | |
| |
| | | | Industrial Services — 2.4% | | | | |
| | 750 | | Core Laboratories N.V. | | | 78,225 | |
| | 2,700 | | Superior Energy Services, Inc.* | | | 58,347 | |
| | | | | |
| |
| | | | | | | 136,572 | |
| | | | | |
| |
| | | | Non-Energy Minerals — 1.5% | | | | |
| | 3,000 | | Century Aluminum Co.* | | | 26,010 | |
| | 1,350 | | Schnitzer Steel Industries, Inc., Class A | | | 58,374 | |
| | | | | |
| |
| | | | | | | 84,384 | |
| | | | | |
| |
| | | | Producer Manufacturing — 4.8% | | | | |
| | 1,850 | | A123 Systems, Inc.* | | | 36,371 | |
| | 1,425 | | Mettler-Toledo International, Inc.* | | | 138,938 | |
| | 1,500 | | Westinghouse Air Brake Technologies Corp. | | | 55,140 | |
| | 1,525 | | Woodward Governor Co. | | | 35,853 | |
| | | | | |
| |
| | | | | | | 266,302 | |
| | | | | |
| |
| | | | Retail Trade — 2.3% | | | | |
| | 1,800 | | Aeropostale, Inc.* | | | 67,554 | |
| | 1,460 | | J. Crew Group, Inc.* | | | 59,539 | |
| | | | | |
| |
| | | | | | | 127,093 | |
| | | | | |
| |
| | | | Technology Services — 19.1% | | | | |
| | 3,400 | | Blackbaud, Inc. | | | 75,446 | |
| | 4,600 | | CommVault Systems, Inc.* | | | 90,620 | |
| | 5,045 | | Fidelity National Information Services, Inc. | | | 109,779 | |
| | 2,800 | | Global Payments, Inc. | | | 137,844 | |
| | 3,877 | | Jack Henry & Associates, Inc. | | | 89,442 | |
| | 1,500 | | JDA Software Group, Inc.* | | | 29,760 | |
| | 2,095 | | MICROS Systems, Inc.* | | | 56,397 | |
| | 700 | | MicroStrategy, Inc., Class A* | | | 61,089 | |
| | 2,575 | | Open Text Corp.* | | | 95,378 | |
34
The FBR Funds
FBR Pegasus Small Cap Growth FundTM
Portfolio of Investments (continued)
October 31, 2009
|
| | | | | | VALUE |
| | SHARES | | | | (NOTE 2) |
|
| | | | Technology Services — 19.1% (continued) | | | | |
| | 950 | | Quality Systems, Inc. | | $ | 57,969 | |
| | 5,025 | | Quest Software, Inc.* | | | 84,269 | |
| | 3,100 | | Solera Holdings, Inc. | | | 99,882 | |
| | 1,400 | | Sybase, Inc.* | | | 55,384 | |
| | 885 | | Syntel, Inc. | | | 31,710 | |
| | | | | |
| |
| | | | | | | 1,074,969 | |
| | | | | |
| |
| | | | Transportation — 3.9% | | | | |
| | 1,875 | | Genessee & Wyoming, Inc., Class A* | | | 54,394 | |
| | 8,400 | | Heartland Express, Inc. | | | 114,240 | |
| | 3,550 | | Knight Transportation, Inc. | | | 56,942 | |
| | | | | |
| |
| | | | | | | 225,576 | |
| | | | | |
| |
| | | | | | | | |
| | | | Total Common Stocks (Cost $5,082,672) | | | 5,566,807 | |
| | | | | |
| |
| | | | MONEY MARKET FUND — 0.3% | | | | |
| | 14,692 | | JPMorgan 100% U.S. Treasury Securities Money Market Fund | | | 14,692 | |
| | | | | |
| |
| | | | | | | | |
| | | | Total Investments — 99.3% (Cost $5,097,364) | | | 5,581,499 | |
| | | | | | | | |
| | | | Other Assets Less Liabilities — 0.7% | | | 41,014 | |
| | | | | |
| |
| | | | Net Assets — 100.0% | | $ | 5,622,513 | |
| | | | | |
| |
|
| * | | Non-income producing security |
| ADR | | American Depositary Receipts |
The accompanying notes are an integral part of the financial statements.
35
The FBR Funds
FBR Focus Fund
Management Overview
Portfolio Managers: David Rainey, CFA, Brian Macauley, CFA and Ira Rothberg, CFA
Over the last 12 months, how did the Fund perform and what factors contributed to this performance?
For the one-year period ending October 31, 2009, the Investor Class of the FBR Focus Fund returned 17.74%. This compares to the Russell 2000 Index and the S&P 500 Index, which returned 6.46% and 9.80% for the same period, respectively.
The Fund’s favorable absolute and relative returns were a result of improved business prospects for its key holdings, owing to a better overall economic outlook and company-specific developments. Leading contributors to the Fund’s performance were AmeriCredit, Bally Technologies, CarMax, Penn National Gaming, and O’Reilly Automotive. Leading detractors from the Fund’s performance were Markel, Alimentation Couche-Tard, and 99 Cents Only Stores.
Portfolio managers comments on the Fund and the related investment outlook.
We are just a few weeks away from closing the books on the first decade of the new millennium. It has been a wild ride for the stock market and economy and this seems like a good time to reflect upon the period.
In many ways this has been a remarkable decade with the economy stricken by not one, but two massive asset bubbles: the internet-telecom bubble and the real estate-credit bubble. The net result of these experiences is that the decade will be the worst for stock market performance since the Depression-era 1930s.
$10,000 invested in the S&P 500 ten years ago is now worth $9,090, a negative 0.95% annualized return. Thankfully, the Focus Fund can look back at a more favorable result – $10,000 invested 10 years ago is now worth $29,279, a positive 11.34% annualized return.
So the important questions are why did the Fund achieve this performance and does this provide any insight into future prospects?
One might assume that a better investment result is the product of a better work ethic or IQ, but this is not the case. Investing is a competitive field populated by thousands of smart and ambitious professionals and while these traits are helpful to getting into the field, they provide limited advantage once there.
We think that the Fund’s results are a product of playing in the same investment game as the competitors, but with a different, and what we believe to be a better, playbook.
While the economy and market indices have languished, some individual businesses have flourished. The Fund does not own the overall stock market; it owns about 25 carefully selected individual businesses. It has the flexibility to avoid unattractive companies or sectors and instead focus its assets in the most compelling prospects. We believe both of these factors – playing defense by avoiding troublesome areas, then offense by concentrating in winning stocks – were key in the Fund’s favorable outcome for the decade.
36
The FBR Funds
FBR Focus Fund
Management Overview (continued)
Defense first
The accomplished 19th century mathematician, Carl Jacobi, solved many problems by applying the maxim, “invert, always invert”. Jacobi believed that the solution to many difficult problems could be found by expressing them in inverse form. His maxim has application in mathematics, but can also be adapted to investing.
While the objective of the Fund is capital appreciation, or “making money”, this goal is best advanced by first applying the Jacobi maxim and asking “how do you avoid losing money?”
In practice this means that emphasis is placed on first understanding an investment’s downside risk, which is defined simply as the potential that a stock bought or owned today will be worth less in several years. This happens when a business suffers a sustained deterioration in fundamentals, such as a decline in demand or increase in competition, or if simply too high a price was paid for the stock. Only by understanding these risks can the risk-return profile be assessed and the most promising investment prospects identified.
If a business and its risks are not understood then the downside potential cannot be handicapped, and consequently the Fund will avoid that stock. Many prospects fall in this category, either because of company specific risks or concerns about the overall industry sector. While this decade’s bubbles were not clearly evident at the time, this defense first approach revealed sufficient warning signs for the Fund to steer clear of significant involvement in the most devastated sectors (internet, telecom, real estate, and banks).
It seems ludicrous that new excesses could be brewing when the turmoil from the real estate-credit bubble remains unsettled. But one would have thought the same thing in 2003 in the aftermath of the internet-telecom bubble. In fact, you may recall a popular San Francisco Bay area bumper sticker from that era that said, “Please God, just one more bubble”...it seemed pretty funny at the time. The reality is that financial history is full of bubbles, frauds, misperceptions, and excesses. Businesses are never stable. Competition is fierce, technology is continuously evolving, and creative destruction can ruin even blue-chip companies. Prudence and risk control are timeless investment principles and central to long term value creation.
Then offense
Avoiding bad investments is just one-half of the Fund’s investment equation. The other half is finding stocks that are attractively priced and can grow intrinsic value at a good rate over the long term. Companies that meet this profile tend to have the following characteristics:
| • | | Strong competitive position – a favorable industry structure and sustainable competitive edge that enables the company to maintain pricing power and earn outsized profits. |
37
The FBR Funds
FBR Focus Fund
Management Overview (continued)
| • | | Superb management – leadership that runs the business for the long-term, makes prudent decisions investing the company’s profits, and acts with integrity in all dealings. |
| • | | Large growth opportunity – a revenue growth, acquisition, or operating leverage opportunity that allows for a mid teens per share average annual growth in intrinsic value over a decade. |
This method of picking long-term winning stocks has been used since the Fund’s inception with good success. One such example is Penn National Gaming (“Penn”). Penn owns or operates 19 regional gambling casinos across the country. Penn’s business meets the three criteria outlined above and its stock has often traded at a price that allowed for purchase at a reasonable valuation. Many states restrict the number of regional casinos licenses limiting new entrants and direct competition. Penn’s management has done a superb job of growing its business through new construction, expansions, and acquisitions. Penn began the decade with three locations and has 19 today. Revenue has grown from $171 million to $2.4 billion and EBITDA from $27 million to $577 million. The net result is that the stock rose from $2.17 to $25.13 (27.8% per annum) over the last ten years and the Fund participated the entire time.
Penn is just one example of the individual success stories that have helped produce the Fund’s results over the last decade. We think that the portfolio today is stocked with businesses – some long-term holdings, some relatively new – that meet the Fund’s investment criteria and have very good potential to chart their own unique success stories over the next decade.
We hope that this review helps you to better understand the past results and investment process of the Focus Fund. We believe that it is important as an investor – in stocks or mutual funds – to focus not only on reported investment results, but the fundamental process producing those results. As the asset bubbles over the last decade have illustrated, gauging an investment by just looking at recent price performance can be hazardous to your wealth.
We invest with a long-term time horizon and encourage our shareholders to do the same. Despite the mandatory discussion of one-year results referenced above, we encourage our investors to evaluate our performance over three-, five-, and ten-year periods since shorter time frames can be influenced by many transitory issues unrelated to the intrinsic worth of the Fund’s holdings.
Finally, we are pleased to be writing this letter to you in our expanded role as the Fund’s co-Portfolio Managers. We assumed this position on August 22, 2009, after working a cumulative 23 years as the analysts responsible for day to day research and management of the Fund’s investments. We take pride in our Fund’s history, and we will continue to apply the same common sense investment process, emphasizing risk control and capital appreciation – defense first, then offense – that has worked so well in the past.
38
The FBR Funds
FBR Focus Fund
Management Overview (continued)
We thank you for entrusting your capital to us. We take this responsibility very seriously, and we will do our best to protect and grow your investment.
The opinions expressed in this commentary reflect those of the Portfolio Manager(s) as of the date written. Any such opinions are subject to change based on market or other conditions. These opinions may not be relied upon as investment advice. Investment decisions for The FBR Funds are based on several factors, and may not be relied upon as an indication of trading intent on behalf of any FBR Fund. Security positions can and do change.
39
The FBR Funds
FBR Focus Fund
Comparison of Changes in Value of $10,000 Investment in
Investor Class Shares(1)(2) vs. Russell 2000 Index(1)(3)
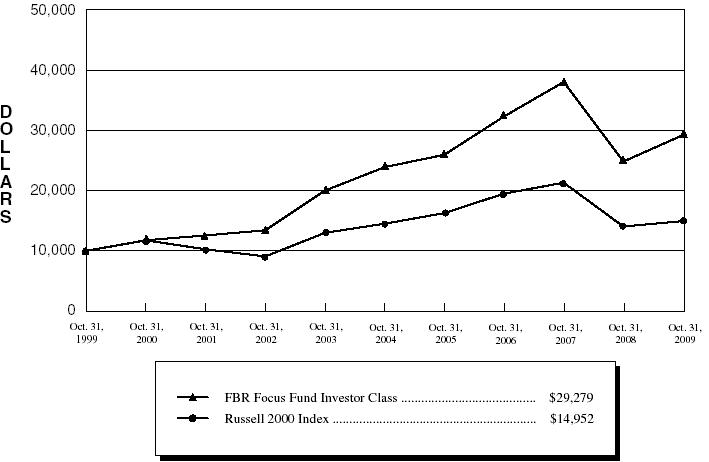
| Total Returns—For the Periods Ended October 31, 2009(4) |
| | | | | | | | | | | | | Annualized | |
| | | | | | | Annualized | | Annualized | | Since | |
| | | | One Year | | Five Year | | Ten Year | | Inception(5) | |
| | | |
| |
| |
| |
| |
FBR Focus Fund Investor Class(1)(2) | | | 17.74 | % | | 4.12 | % | | 11.34 | % | | N/A | | |
FBR Focus Fund I Class(2)(5) | | | 18.15 | % | | N/A | | | N/A | | | (10.14 | )% | |
FBR Focus Fund R Class(2)(5) | | | 16.80 | % | | N/A | | | N/A | | | (11.12 | )% | |
Russell 2000 Index(1)(3) | | | 6.46 | % | | 0.59 | % | | 4.11 | % | | (16.61 | )% | |
PAST PERFORMANCE IS NO GUARANTEE OF FUTURE RESULTS.
The performance data quoted represents past performance and the current performance may be lower or higher than the performance data quoted. The investment return and principal will fluctuate so that investors’ shares, when redeemed, may be worth more or less than their original cost. The performance data does not reflect the deduction of taxes that a shareholder would pay on Fund distributions or redemption fees. If reflected, the redemption fee would reduce the performance data quoted. To obtain performance data current to the most recent month-end, please call 888.200.4710 or visit www.fbrfunds.com.
|
| (1) | | The graph assumes a hypothetical $10,000 initial investment in the Fund and reflects the reinvestment of dividends and all Fund expenses. Investors should note that the Fund is a professionally managed mutual fund while the index is unmanaged, does not incur expenses and is not available for investment. The performance of the index includes reinvested dividends, and does not reflect sales charges or expenses. |
| (2) | | FBR Fund Advisers, Inc. waived a portion of its advisory fees and agreed to contractually reimburse a portion of the Fund’s operating expenses, as necessary, to maintain existing expense limitations, as set forth in the notes to the financial statements. Total returns shown include fee waivers and expense reimbursements, if any; total returns would have been lower had there been no waiver of fees and/or reimbursement of expenses in excess of expense limitations. |
| (3) | | The Russell 2000 Index is comprised of the smallest of the 2000 companies of the Russell 3000 Index, representing approximately 8% of the Russell 3000’s total market capitalization. |
| (4) | | The total returns shown do not reflect the deduction of taxes that a shareholder would pay on fund distributions or the redemption of fund shares. |
| (5) | | For the period May 30, 2008 (inception of share class) through October 31, 2009. |
40
The FBR Funds
FBR Focus Fund
Portfolio Summary
October 31, 2009
The following provides a breakdown of the Fund by industry sectors. The underlying securities represent a percentage of the portfolio investments.
| Industry Sector | | % of Total Investments |
| |
|
| Retail Trade | | 23.5 | % |
| Finance | | 22.5 | % |
| Consumer Services | | 18.8 | % |
| Communications | | 14.2 | % |
| Commercial Services | | 6.2 | % |
| Distribution Services | | 4.7 | % |
| Producer Manufacturing | | 4.1 | % |
| Transportation | | 1.9 | % |
| | | | |
| Cash | | 4.1 | % |
41
The FBR Funds
FBR Focus Fund
Portfolio of Investments
October 31, 2009
|
| | | | | | VALUE |
| | SHARES | | | | (NOTE 2) |
|
| | | | COMMON STOCKS — 96.1% | | | | |
| | | | Commercial Services — 6.2% | | | | |
| | 183,200 | | Iron Mountain, Inc.* | | $ | 4,475,576 | |
| | 1,830,000 | | Lamar Advertising Co., Class A* | | | 44,469,000 | |
| | 4,990 | | Morningstar, Inc.* | | | 254,590 | |
| | | | | |
| |
| | | | | | | 49,199,166 | |
| | | | | |
| |
| | | | Communications — 14.3% | | | | |
| | 3,074,000 | | American Tower Corp., Class A* | | | 113,184,680 | |
| | | | | |
| |
| | | | Consumer Services — 18.8% | | | | |
| | 1,600,000 | | Bally Technologies, Inc.* | | | 63,024,000 | |
| | 119,410 | | Choice Hotels International, Inc. | | | 3,560,806 | |
| | 346,673 | | Monarch Casino & Resort, Inc.* | | | 2,405,911 | |
| | 2,881,420 | | Penn National Gaming, Inc.* | | | 72,410,084 | |
| | 896,730 | | Pinnacle Entertainment, Inc.* | | | 7,577,369 | |
| | | | | |
| |
| | | | | | | 148,978,170 | |
| | | | | |
| |
| | | | Distribution Services — 4.7% | | | | |
| | 1,923,000 | | Pool Corp. | | | 37,652,340 | |
| | | | | |
| |
| | | | Finance — 22.6% | | | | |
| | 2,091,512 | | AmeriCredit Corp.* | | | 36,915,187 | |
| | 80 | | Berkshire Hathaway, Inc., Class B* | | | 262,640 | |
| | 776,913 | | Encore Capital Group, Inc.* | | | 11,630,388 | |
| | 291,434 | | Enstar Group Ltd.* | | | 17,777,474 | |
| | 1,637,860 | | Flagstone Reinsurance Holdings Ltd. | | | 17,934,567 | |
| | 158,024 | | HFF, Inc., Class A* | | | 869,132 | |
| | 255,400 | | Markel Corp.* | | | 82,417,579 | |
| | 125,000 | | T. Rowe Price Group, Inc. | | | 6,091,250 | |
| | 185,200 | | The Charles Schwab Corp. | | | 3,211,368 | |
| | 173,137 | | White River Capital, Inc.* | | | 2,094,958 | |
| | | | | |
| |
| | | | | | | 179,204,543 | |
| | | | | |
| |
| | | | Producer Manufacturing — 4.1% | | | | |
| | 730,160 | | American Woodmark Corp.† | | | 14,362,247 | |
| | 800,000 | | Simpson Manufacturing Company, Inc. | | | 18,712,000 | |
| | | | | |
| |
| | | | | | | 33,074,247 | |
| | | | | |
| |
42
The FBR Funds
FBR Focus Fund
Portfolio of Investments (continued)
October 31, 2009
|
| | | | | | VALUE |
| | SHARES | | | | (NOTE 2) |
|
| | | | Retail Trade — 23.5% | | | | |
| | 5,690,974 | | 99 Cents Only Stores* † | | $ | 64,706,374 | |
| | 3,127,088 | | CarMax, Inc.* | | | 61,509,821 | |
| | 1,622,076 | | O’Reilly Automotive, Inc.* | | | 60,470,993 | |
| | | | | |
| |
| | | | | | | 186,687,188 | |
| | | | | |
| |
| | | | Transportation — 1.9% | | | | |
| | 811,824 | | Dynamex, Inc.* † | | | 15,043,099 | |
| | | | | |
| |
| | | | | | | | |
| | | | Total Common Stocks (Cost $606,157,269) | | | 763,023,433 | |
| | | | | |
| |
| | | | MONEY MARKET FUND — 4.1% | | | | |
| | 32,857,222 | | JPMorgan 100% U.S. Treasury Securities Money Market Fund | | | 32,857,222 | |
| | | | | |
| |
| | | | | | | | |
| | | | Total Investments — 100.2% (Cost $639,014,491) | | | 795,880,655 | |
| | | | | | | | |
| | | | Liabilities Less Other Assets — (0.2)% | | | (1,715,651 | ) |
| | | | | |
| |
| | | | | | | | |
| | | | Net Assets — 100.0% | | $ | 794,165,004 | |
| | | | | |
| |
|
| * | | Non-income producing security |
| † | | Affiliated issuer as defined in the Investment Company Act of 1940 (ownership of at least 5% of the outstanding voting securities of an issuer) |
| Note: | | For presentation purposes, the Fund has grouped some of the industry categories. For purposes of categorizing securities for compliance with Section 8(b)(1) of the Investment Company Act of 1940, the Fund uses more specific industry classifications. |
The accompanying notes are an integral part of the financial statements.
43
The FBR Funds
FBR Large Cap Financial Fund
Management Overview
Portfolio Manager: David Ellison
How did the Fund perform during the period and what factors contributed to this performance?
For the one-year period ended October 31, 2009, the Investor Class of the FBR Large Cap Financial Fund returned 14.52%. This compares to the S&P 500 Index, the Philadelphia Bank Index, and the Morningstar Specialty-Financial category average, which returned 9.80%, -25.96, and 8.41% for the same period, respectively.
The Fund has been positioned conservatively over the last 12 months and we have seen favorable results relative to industry benchmarks during this period. Conservative positioning was taken in light of deteriorating industry conditions most notably seen in the rise in troubled assets throughout the entire financial services industry. The Fund has been concentrated in the most conservatively run institutions and the portfolio has, at times, carried high cash balances. I would describe conservative companies as those with lower risk lending profiles, stable funding sources, uncomplicated business models, and a history of managing through difficult macro conditions.
Cash balances ended the period at 4.8% and, at times, was much higher during the reporting period. Security positions held in the Fund ended the period at 32, which is similar to previous periods.
Portfolio manager comments on the Fund and the related investment outlook.
It is my belief that better times are ahead for the financial sector and the related equities. The last 18-24 months have been quite shocking to even the most seasoned financial services investors. I have observed, studied, and invested in this industry for over 26 years and have been at times astonished by how quickly and how severely conditions deteriorated in late 2008.
I believe the bad news is that industry practices in the past were stretched to the extremes of risk, leverage, complexity, and growth to satisfy the needs of investors demanding faster EPS growth and company executives seeking ever higher bonuses. The good news today is that all such practices are in the process of changing. Companies are now looking to reduce risk, leverage, complexity, and growth to satisfy the needs of regulators and the desire of managers to keep their jobs and recapitalize the company.
Overall economic conditions are showing some improvement. Short-term lending rates have declined, credit spreads have narrowed, housing prices and activity has picked up in some of the hardest hit regions of the country, housing inventories have declined, new capital has been raised and government programs to improve liquidity and stabilize certain markets are showing some success.
While there is good news on the economy, I believe the negative impact of reduced home prices, lower commercial real estate values and high unemployment will continue to put
44
The FBR Funds
FBR Large Cap Financial Fund
Management Overview (continued)
pressure on industry fundamentals. Reduced collateral values increase the loss content of repossessed assets and job losses make it harder for those with debt to service it. I believe stock selection will be vital to outperformance in the years ahead. My goal is to populate the portfolio with companies that will benefit and thrive in the Darwinian environment unfolding in this industry.
Over the course of my career, I have made the most investing in financial stocks during periods when industry conditions go from ugly to okay to good to great. The last time we had conditions similar to today was the 1989 to 1995 period. Conditions today are ugly and this reality has been well-documented in the financial press and reflected in negative financial stock returns. I believe that a well-researched portfolio of financial companies will benefit as operating conditions improve from ugly to great over the next 3 to 5 years. Research efforts will focus on identifying the winners in the weeding out process now underway.
I believe good fund management needs three primary attributes - flexibility, balance, and measured optimism. I need the flexibility to change course or opinion and not get trapped in a fixed position or attitude. I need the balance to not over commit to one idea or investment. And finally, I need the measured optimism to stay in the game and not give up. I expect to use all of these in the days ahead.
The opinions expressed in this commentary reflect those of the Portfolio Manager as of the date written. Any such opinions are subject to change based on market or other conditions. These opinions may not be relied upon as investment advice. Investment decisions for The FBR Funds are based on several factors, and may not be relied upon as an indication of trading intent on behalf of any FBR Fund. Security positions can and do change.
45
The FBR Funds
FBR Large Cap Financial Fund
Comparison of Changes in Value of $10,000 Investment in
Investor Class Shares(1)(2) vs. S&P 500 Index(1)(3)
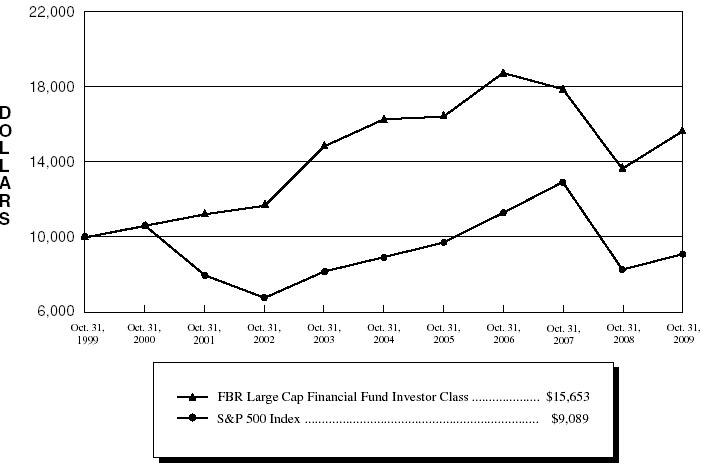
| Total Returns—For the Periods Ended October 31, 2009(4) |
| | | | | | | Annualized | | Annualized | |
| | | | One Year | | Five Year | | Ten Year | |
| | | |
| |
| |
| |
FBR Large Cap Financial Fund Investor Class(1)(2) | | | 14.52 | % | | (0.82 | )% | | 4.58 | % | |
S&P 500 Index(1)(3) | | | 9.80 | % | | 0.33 | % | | (0.95 | )% | |
PAST PERFORMANCE IS NO GUARANTEE OF FUTURE RESULTS.
The performance data quoted represents past performance and the current performance may be lower or higher than the performance data quoted. The investment return and principal will fluctuate so that investors’ shares, when redeemed, may be worth more or less than their original cost. The performance data does not reflect the deduction of taxes that a shareholder would pay on Fund distributions or redemption fees. If reflected, the redemption fee would reduce the performance data quoted. To obtain performance data current to the most recent month-end, please call 888.200.4710 or visit www.fbrfunds.com.
|
| (1) | | The graph assumes a hypothetical $10,000 initial investment in the Fund and reflects the reinvestment of dividends and all Fund expenses. Investors should note that the Fund is a professionally managed mutual fund while the index is unmanaged, does not incur expenses and is not available for investment. The performance of the index includes reinvested dividends, and does not reflect sales charges or expenses. |
| (2) | | FBR Fund Advisers, Inc. waived a portion of its advisory fees and agreed to contractually reimburse a portion of the Fund’s operating expenses, as necessary, to maintain existing expense limitations, as set forth in the notes to the financial statements. Total returns shown include fee waivers and expense reimbursements, if any; total returns would have been lower had there been no waiver of fees and/or reimbursement of expenses in excess of expense limitations. |
| (3) | | The S&P 500 Index is a capitalization-weighted index of 500 stocks. The index is designed to represent the broad domestic ecomony through changes in aggregate market value of 500 stocks representing all major industries. |
| (4) | | The total returns shown do not reflect the deduction of taxes that a shareholder would pay on fund distributions or the redemption of fund shares. |
46
The FBR Funds
FBR Large Cap Financial Fund
Portfolio Summary
October 31, 2009
The following provides a breakdown of the Fund by industry sectors. The underlying securities represent a percentage of the portfolio investments.
| Industry Sector | | % of Total Investments |
| |
|
| Finance | | 49.5 | % |
| Major Banks | | 15.6 | % |
| Property/Casualty Insurance | | 12.7 | % |
| Finance/Rental/Leasing | | 6.9 | % |
| Multi-Line Insurance | | 4.6 | % |
| Life/Health Insurance | | 3.8 | % |
| Investment Banks/Brokers | | 3.4 | % |
| Regional Banks | | 1.3 | % |
| Financial Conglomerates | | 1.0 | % |
| Investment Managers | | 0.8 | % |
| Specialty Insurance | | 0.4 | % |
47
The FBR Funds
FBR Large Cap Financial Fund
Portfolio of Investments
October 31, 2009
|
| | | | | | VALUE |
| | SHARES | | | | (NOTE 2) |
|
| | | | COMMON STOCKS — 96.1% | | | | |
| | | | Finance — 47.8% | | | | |
| | 157,000 | | Bank of America Corp. | | $ | 2,289,060 | |
| | 175,000 | | Citigroup, Inc. | | | 715,750 | |
| | 75,000 | | Comerica, Inc. | | | 2,081,250 | |
| | 135,000 | | Hudson City Bancorp, Inc. | | | 1,773,900 | |
| | 57,000 | | JPMorgan Chase & Co. | | | 2,380,890 | |
| | 370,000 | | KeyCorp. | | | 1,994,300 | |
| | 16,000 | | M&T Bank Corp. | | | 1,005,600 | |
| | 43,000 | | MetLife, Inc. | | | 1,463,290 | |
| | 25,000 | | Prudential Financial, Inc. | | | 1,130,750 | |
| | 75,000 | | Regions Financial Corp. | | | 363,000 | |
| | 57,000 | | SunTrust Banks, Inc. | | | 1,089,270 | |
| | 8,500 | | The Goldman Sachs Group, Inc. | | | 1,446,445 | |
| | | | | |
| |
| | | | | | | 17,733,505 | |
| | | | | |
| |
| | | | Finance/Rental/Leasing — 6.5% | | | | |
| | 39,000 | | Capital One Financial Corp. | | | 1,427,400 | |
| | 35,000 | | Discover Financial Services | | | 494,900 | |
| | 7,000 | | Visa, Inc., Class A | | | 530,320 | |
| | | | | |
| |
| | | | | | | 2,452,620 | |
| | | | | |
| |
| | | | Financial Conglomerates — 0.9% | | | | |
| | 10,000 | | American Express Co. | | | 348,400 | |
| | | | | |
| |
| | | | Investment Banks/Brokers — 3.3% | | | | |
| | 38,000 | | Morgan Stanley | | | 1,220,560 | |
| | | | | |
| |
| | | | Investment Managers — 0.7% | | | | |
| | 20,000 | | The Blackstone Group LP | | | 268,400 | |
| | | | | |
| |
| | | | Life/Health Insurance — 3.6% | | | | |
| | 61,000 | | Genworth Financial Inc., Class A* | | | 647,820 | |
| | 30,000 | | Lincoln National Corp. | | | 714,900 | |
| | | | | |
| |
| | | | | | | 1,362,720 | |
| | | | | |
| |
48
The FBR Funds
FBR Large Cap Financial Fund
Portfolio of Investments (continued)
October 31, 2009
|
| | | | | | VALUE |
| | SHARES | | | | (NOTE 2) |
|
| | | | Major Banks — 15.0% | | | | |
| | 31,000 | | BB&T Corp. | | $ | 741,210 | |
| | 48,000 | | PNC Financial Services Group, Inc. | | | 2,349,120 | |
| | 15,000 | | U.S. Bancorp | | | 348,300 | |
| | 78,000 | | Wells Fargo & Co. | | | 2,146,560 | |
| | | | | |
| |
| | | | | | | 5,585,190 | |
| | | | | |
| |
| | | | Multi-Line Insurance — 4.5% | | | | |
| | 40,000 | | Hartford Financial Services Group, Inc. | | | 980,800 | |
| | 9,000 | | PartnerRe Ltd. | | | 688,320 | |
| | | | | |
| |
| | | | | | | 1,669,120 | |
| | | | | |
| |
| | | | Property/Casualty Insurance — 12.2% | | | | |
| | 13,000 | | ACE Ltd.* | | | 667,680 | |
| | 60,000 | | Allstate Corp. | | | 1,774,200 | |
| | 35,000 | | The Travelers Companies, Inc. | | | 1,742,650 | |
| | 20,000 | | XL Capital Ltd., Class A | | | 328,200 | |
| | | | | |
| |
| | | | | | | 4,512,730 | |
| | | | | |
| |
| | | | Regional Banks — 1.2% | | | | |
| | 50,000 | | Fifth Third Bancorp | | | 447,000 | |
| | | | | |
| |
| | | | Specialty Insurance — 0.4% | | | | |
| | 10,000 | | Fidelity National Financial, Inc., Class A | | | 135,700 | |
| | | | | |
| |
| | | | | | | | |
| | | | Total Common Stocks (Cost $31,622,635) | | | 35,735,945 | |
| | | | | | | | |
| | | | Other Assets Less Liabilities — 3.9% | | | 1,459,142 | |
| | | | | |
| |
| | | | | | | | |
| | | | Net Assets — 100.0% | | $ | 37,195,087 | |
| | | | | |
| |
| * | | Non-income producing security |
The accompanying notes are an integral part of the financial statements.
49
The FBR Funds
FBR Small Cap Financial Fund
Management Overview
Portfolio Manager: David Ellison
How did the Fund perform during the period and what factors contributed to this performance?
For the one year period ended October 31, 2009, the Investor Class of the FBR Small Cap Financial Fund returned 5.89%. This compares to the Russell 2000 Index, the NASDAQ Bank Index, and the Morningstar Specialty-Financial category average, which returned 6.46%, -30.01%, and 8.41% for the same period, respectively.
The Fund has been positioned conservatively over the last 12 months and we have seen favorable results relative to industry benchmarks during this period. Conservative positioning was taken in light of deteriorating industry conditions most notably seen in the rise in troubled assets throughout the entire financial services industry. The Fund has been concentrated in the most conservatively run institutions and the portfolio has, at times, carried high cash balances. I would describe conservative companies as those with lower risk lending profiles, stable funding sources, uncomplicated business models, and a history of managing through difficult macro conditions.
Cash balances ended the period at 8.2% and, at times, was much higher during the reporting period. Security positions held in the Fund ended the period at 77 which was higher than in prior periods. The high position count was to facilitate smaller individual position size, more geographic diversity, and greater fund liquidity.
Portfolio manager comments on the Fund and the related investment outlook.
It is my belief that better times are ahead for the financial sector and the related equities. The last 18-24 months have been quite shocking to even the most seasoned financial services investors. I have observed, studied, and invested in this industry for over 26 years and have been at times astonished at how quickly and how severely conditions deteriorated in late 2008.
I believe the bad news is that industry practices in the past were stretched to the extremes of risk, leverage, complexity, and growth to satisfy the needs of investors demanding faster EPS growth and company executives seeking ever higher bonuses. The good news today is that all such practices are in the process of changing. Companies are now looking to reduce risk, leverage, complexity, and growth to satisfy the needs of regulators and the desire of managers to keep their jobs and recapitalize the company.
Overall economic conditions are showing some improvement. Short-term lending rates have declined, credit spreads have narrowed, housing prices and activity has picked up in some of the hardest hit regions of the country, housing inventories have declined, new capital has been raised and government programs to improve liquidity and stabilize certain markets are showing some success.
50
The FBR Funds
FBR Small Cap Financial Fund
Management Overview (continued)
While there is good news on the economy, I believe the negative impact of reduced home prices, lower commercial real estate values and high unemployment will continue to put pressure on industry fundamentals. Reduced collateral values increase the losses content of repossessed assets and job loses make it harder for those with debt to service it. I believe stock selection will be vital to outperformance in the years ahead. My goal is to populate the portfolio with companies that will benefit and thrive in the Darwinian environment unfolding in this industry.
Over the course of my career I have made the most investing in financial stocks during periods when industry conditions go from ugly to okay to good to great. The last time we had conditions similar to today was the 1989 to 1995 period. Conditions today are ugly and this reality has been well-documented in the financial press and reflected in negative financial stock returns. I believe that a well-researched portfolio of financial companies will benefit as operating conditions improve from ugly to great over the next 3 to 5 years. Research efforts will focus on identifying the winners in the weeding out process now underway.
I believe good fund management needs three primary attributes - flexibility, balance, and measured optimism. I need the flexibility to change course or opinion and not get trapped in a fixed position or attitude. I need the balance to not over commit to one idea or investment. And finally, I need the measured optimism to stay in the game and not give up. I expect to use all of these in the days ahead.
|
The opinions expressed in this commentary reflect those of the Portfolio Manager as of the date written. Any such opinions are subject to change based on market or other conditions. These opinions may not be relied upon as investment advice. Investment decisions for The FBR Funds are based on several factors, and may not be relied upon as an indication of trading intent on behalf of any FBR Fund. Security positions can and do change. |
51
The FBR Funds
FBR Small Cap Financial Fund
Comparison of Changes in Value of $10,000 Investment in
Investor Class Shares(1)(2) vs. Russell 2000 Index(1)(3)
| | Total Returns—For the Periods Ended October 31, 2009(4) |
| | | | | | | | | | | | | | | | Annualized | |
| | | | | | | | | Annualized | | | Annualized | | Since | |
| | | | | One Year | | | Five Year | | | Ten Year | | Inception(5) | |
| | | | |
| | |
| | |
| |
| |
| | FBR Small Cap Financial Fund Investor Class(1)(2) | | | 5.89 | % | | | (1.47 | )% | | | 10.10 | % | | N/A | | |
| | FBR Small Cap Financial Fund I Class(2)(5) | | | 6.14 | % | | | N/A | | | | N/A | | | 3.99 | % | |
| | FBR Small Cap Financial Fund R Class(2)(5) | | | 5.02 | % | | | N/A | | | | N/A | | | 3.00 | % | |
| | Russell 2000 Index(1)(3) | | | 6.46 | % | | | 0.59 | % | | | 4.11 | % | | (16.61 | )% | |
| |
PAST PERFORMANCE IS NO GUARANTEE OF FUTURE RESULTS.
The performance data quoted represents past performance and the current performance may be lower or higher than the performance data quoted. The investment return and principal will fluctuate so that investors’ shares, when redeemed, may be worth more or less than their original cost. The performance data does not reflect the deduction of taxes that a shareholder would pay on Fund distributions or redemption fees. If reflected, the redemption fee would reduce the performance data quoted. To obtain performance data current to the most recent month-end, please call 888.200.4710 or visit www.fbrfunds.com.
|
| (1) | | The graph assumes a hypothetical $10,000 initial investment in the Fund and reflects the reinvestment of dividends and all Fund expenses. Investors should note that the Fund is a professionally managed mutual fund while the index is unmanaged, does not incur expenses and is not available for investment. The performance of the index includes reinvested dividends, and does not reflect sales charges or expenses. |
| (2) | | FBR Fund Advisers, Inc. waived a portion of its advisory fees and agreed to contractually reimburse a portion of the Fund’s operating expenses, as necessary, to maintain existing expense limitations, as set forth in the notes to the financial statements. Total returns shown include fee waivers and expense reimbursements, if any; total returns would have been lower had there been no waiver of fees and/or reimbursement of expenses in excess of expense limitations. |
| (3) | | The Russell 2000 Index is comprised of the smallest of the 2000 companies of the Russell 3000 Index, representing approximately 8% of the Russell 3000’s total market capitalization. |
| (4) | | The total returns shown do not reflect the deduction of taxes that a shareholder would pay on fund distributions or the redemption of fund shares. |
| (5) | | For the period May 30, 2008 (inception of share class) through October 31, 2009. |
52
| The FBR Funds |
|
| FBR Small Cap Financial Fund |
| Portfolio Summary |
| October 31, 2009 |
The following provides a breakdown of the Fund by industry sectors. The underlying securities represent a percentage of the portfolio investments.
| Industry Sector | | % of Total Investments |
| |
|
| Regional Banks | | 31.1 | % |
| Finance | | | 28.0 | % |
| Savings Banks | | 22.4 | % |
| Homebuilding | | 2.6 | % |
| Specialty Insurance | | 2.5 | % |
| Finance/Rental/Leasing | | 1.9 | % |
| Property/Casualty Insurance | | 1.9 | % |
| Investment Managers | | 1.1 | % |
| Real Estate Investment Trusts | | 0.8 | % |
| Financial Conglomerates | | 0.7 | % |
| Consumer Durables | | 0.7 | % |
| Major Banks | | | 0.4 | % |
| Real Estate Development | | 0.3 | % |
| Investment Banks/Brokers | | 0.3 | % |
| | | | | |
| Cash | | | 5.3 | % |
53
| The FBR Funds |
|
| FBR Small Cap Financial Fund |
| Portfolio of Investments |
| October 31, 2009 |
| |
|
| | | | | | VALUE | |
| SHARES | | | | | (NOTE 2) | |
|
| | | COMMON STOCKS — 92.2% | | | | |
| | | Consumer Durables — 0.7% | | | | |
| 110,000 | | Lennar Corp., Class A | | $ | 1,386,000 | |
| | | | |
| |
| | | Finance — 27.4% | | | | |
| 630,000 | | Astoria Financial Corp. | | | 6,287,400 | |
| 20,000 | | Capitol Federal Financial | | | 606,600 | |
| 213,200 | | Cathay General Bancorp | | | 1,882,556 | |
| 171,900 | | Comerica, Inc. | | | 4,770,225 | |
| 55,000 | | Commerce Bancshares, Inc. | | | 2,109,800 | |
| 443,614 | | First Horizon National Corp.* | | | 5,247,954 | |
| 201,300 | | First Niagara Financial Group, Inc. | | | 2,584,692 | |
| 750,000 | | Fulton Financial Corp. | | | 6,195,001 | |
| 210,000 | | Hudson City Bancorp, Inc. | | | 2,759,400 | |
| 975,000 | | Huntington Bancshares, Inc. | | | 3,714,750 | |
| 775,000 | | KeyCorp | | | 4,177,250 | |
| 360,000 | | Marshall & Ilsley Corp. | | | 1,915,200 | |
| 496,800 | | Susquehanna Bancshares, Inc. | | | 2,737,368 | |
| 530,000 | | Webster Financial Corp. | | | 5,994,300 | |
| 255,000 | | Zions Bancorp | | | 3,610,800 | |
| | | | |
| |
| | | | | | 54,593,296 | |
| | | | |
| |
| | | Finance/Rental/Leasing — 1.8% | | | | |
| 185,000 | | Assured Guaranty Ltd. | | | 3,067,300 | |
| 150,000 | | MCG Capital Corp.* | | | 598,500 | |
| | | | |
| |
| | | | | | 3,665,800 | |
| | | | |
| |
| | | Financial Conglomerates — 0.7% | | | | |
| 55,000 | | Principal Financial Group, Inc. | | | 1,377,200 | |
| | | | |
| |
| | | Homebuilding — 2.5% | | | | |
| 235,000 | | KB Home | | | 3,332,300 | |
| 180,000 | | Pulte Homes, Inc. | | | 1,621,800 | |
| | | | |
| |
| | | | | | 4,954,100 | |
| | | | |
| |
| | | Investment Banks/Brokers — 0.3% | | | | |
| 20,000 | | KBW, Inc.* | | | 560,000 | |
| | | | |
| |
54
| The FBR Funds |
|
| FBR Small Cap Financial Fund |
| Portfolio of Investments (continued) |
| October 31, 2009 |
| |
|
| | | | | | VALUE | |
| SHARES | | | | | (NOTE 2) | |
|
| | | Investment Managers — 1.1% | | | | |
| 475,000 | | KKR Financial Holdings LLC* | | $ | 2,175,500 | |
| | | | |
| |
| | | Major Banks — 0.4% | | | | |
| 74,500 | | Eagle Bancorp, Inc.* | | | 696,575 | |
| | | | |
| |
| | | Property/Casualty Insurance — 1.8% | | | | |
| 221,030 | | XL Capital Ltd., Class A | | | 3,627,102 | |
| | | | |
| |
| | | Real Estate Development — 0.3% | | | | |
| 65,000 | | CB Richard Ellis Group, Inc., Class A* | | | 672,750 | |
| | | | |
| |
| | | Real Estate Investment Trusts — 0.8% | | | | |
| 70,000 | | Anworth Mortgage Asset Corp. | | | 499,100 | |
| 90,000 | | Chimera Investment Corp. | | | 314,100 | |
| 60,000 | | MFA Financial, Inc. | | | 445,200 | |
| 20,000 | | Redwood Trust, Inc. | | | 278,800 | |
| | | | |
| |
| | | | | | 1,537,200 | |
| | | | |
| |
| | | Regional Banks — 30.3% | | | | |
| 90,934 | | 1st Source Corp. | | | 1,347,642 | |
| 400,000 | | Associated Banc-Corp | | | 5,124,000 | |
| 58,295 | | Bancorp Rhode Island, Inc. | | | 1,487,688 | |
| 200,000 | | Citizens Republic Bancorp, Inc.* | | | 120,400 | |
| 115,000 | | City National Corp. | | | 4,332,050 | |
| 145,000 | | CVB Financial Corp. | | | 1,161,450 | |
| 510,000 | | East West Bancorp, Inc. | | | 4,605,300 | |
| 595,000 | | Fifth Third Bancorp | | | 5,319,299 | |
| 45,000 | | First Commonwealth Financial Corp. | | | 236,250 | |
| 168,974 | | FirstMerit Corp. | | | 3,202,057 | |
| 150,000 | | Glacier Bancorp, Inc. | | | 1,963,500 | |
| 206,345 | | Independent Bank Corp. | | | 4,388,958 | |
| 140,000 | | Investors Bancorp, Inc.* | | | 1,517,600 | |
| 645,000 | | Nara Bancorp, Inc. | | | 4,747,200 | |
| 425,000 | | National Penn Bancshares, Inc. | | | 2,388,500 | |
| 135,000 | | Old National Bancorp | | | 1,399,950 | |
| 6,000 | | PrivateBancorp, Inc. | | | 54,780 | |
| 600,000 | | Seacoast Banking Corporation of Florida | | | 894,000 | |
55
| The FBR Funds |
|
| FBR Small Cap Financial Fund |
| Portfolio of Investments (continued) |
| October 31, 2009 |
| |
|
| | | | | | VALUE | |
| SHARES | | | | | (NOTE 2) | |
|
| | | Regional Banks — 30.3% (continued) | | | | |
| 394,068 | | State Bancorp, Inc. | | $ | 3,010,680 | |
| 1,300,000 | | Synovus Financial Corp. | | | 2,886,000 | |
| 330,000 | | TCF Financial Corp. | | | 3,903,900 | |
| 158,186 | | Territorial Bancorp, Inc.* | | | 2,608,487 | |
| 647,587 | | The South Financial Group, Inc. | | | 518,070 | |
| 110,000 | | Trustmark Corp. | | | 2,084,500 | |
| 28,769 | | United Financial Bancorp, Inc. | | | 369,682 | |
| | | | |
| |
| | | | | | 59,671,943 | |
| | | | |
| |
| | | Savings Banks — 21.7% | | | | |
| 190,000 | | Bank Mutual Corp. | | | 1,333,800 | |
| 230,000 | | Brookline Bancorp, Inc. | | | 2,251,700 | |
| 158,421 | | Cape Bancorp, Inc.* | | | 1,124,789 | |
| 70,000 | | Danvers Bancorp, Inc. | | | 961,100 | |
| 436,664 | | Dime Community Bancshares | | | 4,798,937 | |
| 407,539 | | Flushing Financial Corp. | | | 4,576,663 | |
| 94,331 | | Hingham Institution for Savings | | | 2,794,556 | |
| 115,000 | | IBERIABANK Corp. | | | 4,980,650 | |
| 130,000 | | MB Financial, Inc. | | | 2,324,400 | |
| 15,000 | | NewAlliance Bancshares, Inc. | | | 166,200 | |
| 20,000 | | Northwest Bancorp, Inc. | | | 440,000 | |
| 207,142 | | OceanFirst Financial Corp. | | | 1,967,849 | |
| 170,738 | | Parkvale Financial Corp. | | | 1,538,349 | |
| 504,400 | | Provident Financial Services, Inc. | | | 5,422,300 | |
| 270,000 | | Washington Federal, Inc. | | | 4,630,500 | |
| 26,100 | | Westfield Financial, Inc. | | | 210,105 | |
| 131,848 | | WSFS Financial Corp. | | | 3,639,005 | |
| | | | |
| |
| | | | | | 43,160,903 | |
| | | | |
| |
| | | Specialty Insurance — 2.4% | | | | |
| 44,278 | | Assurant, Inc. | | | 1,325,241 | |
| 215,000 | | MBIA, Inc.* | | | 872,900 | |
| 111,700 | | MGIC Investment Corp.* | | | 481,427 | |
| 125,000 | | Radian Group, Inc. | | | 723,750 | |
| 550,000 | | The PMI Group, Inc. | | | 1,331,000 | |
| | | | |
| |
| | | | | | 4,734,318 | |
| | | | |
| |
| | | Total Common Stocks (Cost $173,570,745) | | | 182,812,687 | |
| | | | |
| |
56
| The FBR Funds |
|
| FBR Small Cap Financial Fund |
| Portfolio of Investments (continued) |
| October 31, 2009 |
| |
|
| | | | | | VALUE | |
| SHARES | | | | | (NOTE 2) | |
|
| | | MONEY MARKET FUND — 5.1% | | | | |
| 10,201,252 | | JPMorgan 100% U.S. Treasury Securities Money Market Fund | | $ | 10,201,252 | |
| | | | |
| |
| | | Total Investments — 97.3% (Cost $183,771,997) | | | 193,013,939 | |
| | | | | | | |
| | | Other Assets Less Liabilities — 2.7% | | | 5,311,726 | |
| | | | |
| |
| | | Net Assets — 100.0% | | $ | 198,325,665 | |
| | | | |
| |
|
| * | | Non-income producing security |
The accompanying notes are an integral part of the financial statements.
57
| The FBR Funds |
|
| FBR Technology Fund |
| Management Overview |
Portfolio Managers: David Ellison and Winsor Aylesworth
Over the last 12 months, how did the Fund perform and what factors contributed to this performance?
For the one-year period ended October 31, 2009, the FBR Technology Fund returned 30.03%. This compares to the S&P 500 Index, NASDAQ Composite Index and Morningstar Specialty Technology category average which returned 9.80%, 20.07% and 31.89% for the same period, respectively.
After such a disappointing 2008, it was certainly reassuring to see the Fund perform in line with its peers and outperform the broader NASDAQ market in 2009.
We have remained consistent in our investment philosophy and continue to hold profitable technology companies that exhibit low leverage, a history of increasing tangible book value, and increasing revenues. We feel this approach continues to protect shareholders against the credit issues that currently exist in the market.
Major contributors to the Fund’s performance included Apple Corporation (Symbol: APPL), Amazon Corp, (Symbol: AMZN) and Cognizant Technology Solutions Corp. (Symbol: CTSH). Apple and Amazon, both well known and large technology companies, did well by offering great consumer oriented products (e.g., iPhones, iMacs and iPods) or offering both a good retail product (Kindle) as well as a top rated on-line experience. Cognizant Technology Solutions Corp. is a mid-size technology consultant that has prospered by helping various industries become more efficient by using technology solutions. These three companies all have virtually no debt and have grown tangible book value and revenues in excess of 10% over the last 12 months.
Major detractors to the Fund’s performance included Genzyme Corporation (Symbol: GENZ), Energy Conversion Devices, Inc. (Symbol: ENER) and MEMC Electronic Materials (Symbol: WFR). All three companies saw a decrease in revenues and were generally impacted by the economic downturn which resulted in less demand for their products. Currently, all three are no longer in the portfolio, but we anticipate considering them for repurchase in the future as their business outlooks improve.
Portfolio managers comments on the Fund and the related investment outlook.
“Technology will lead the way.” This has become a common mantra of many investment professionals. We believe this makes sense in that most companies will probably first spend new dollars on technologies that will make them more efficient and more productive without adding new employees. In addition, we, as a society, must continue to address the major issues and challenges of our generation (e.g., global warming, healthcare, and energy). In the process, we will look towards the technology sector for the necessary innovation to uncover new solutions. We would expect much of the money from the various worldwide stimulus programs will be spent on such solutions. Finally, as
58
| The FBR Funds |
|
| FBR Technology Fund |
| Management Overview (continued) |
consumers, we are always desirous of the “latest, fastest, smallest” tech products. So what discretionary dollars individuals have will generally go to technology products.
With all of this, it is easy to see why we believe that technology will lead the way for the economy and why an allocation to the sector makes sense in the context of a balanced portfolio. We believe that our job continues to be to provide exposure to the sector in companies that can take advantage of these opportunities and trends. Doing this in a conservative and diversified manner provides the investor with a means of participating in the sector’s upside while minimizing downside risk.
We continue to be an investor in the Fund and want to thank you for your support.
|
The opinions expressed in this commentary reflect those of the Portfolio Manager as of the date written. Any such opinions are subject to change based on market or other conditions. These opinions may not be relied upon as investment advice. Investment decisions for The FBR Funds are based on several factors, and may not be relied upon as an indication of trading intent on behalf of any FBR Fund. Security positions can and do change. |
59
The FBR Funds
FBR Technology Fund
Comparison of Changes in Value of $10,000 Investment in
Investor Class Shares(1)(2) vs. Various Indices(1)(3)
| Total Returns—For the Periods Ended October 31, 2009(4) |
| | | | | | | | | | | | | Annualized | |
| | | | | | | | | Annualized | | | Since | |
| | | | | One Year | | | Five Year | | | Inception(5) | |
| | | | |
| | |
| | |
| |
| | FBR Technology Fund Investor Class(1)(2) | | | 30.03 | % | | | 2.87 | % | | | 3.29 | % | |
| | S&P 500 Index(1)(3) | | | 9.80 | % | | | 0.33 | % | | | 0.92 | % | |
| | NASDAQ Composite Index(1)(3) | | | 20.09 | % | | | 1.54 | % | | | 1.59 | % | |
| |
PAST PERFORMANCE IS NO GUARANTEE OF FUTURE RESULTS.
The performance data quoted represents past performance and the current performance may be lower or higher than the performance data quoted. The investment return and principal will fluctuate so that investors’ shares, when redeemed, may be worth more or less than their original cost. The performance data does not reflect the deduction of taxes that a shareholder would pay on Fund distributions or redemption fees. If reflected, the redemption fee would reduce the performance data quoted. To obtain performance data current to the most recent month-end, please call 888.200.4710 or visit www.fbrfunds.com.
|
| (1) | | The graph assumes a hypothetical $10,000 initial investment in the Fund and reflects the reinvestment of dividends and all Fund expenses. Investors should note that the Fund is a professionally managed mutual fund while the index is unmanaged, does not incur expenses and is not available for investment. The performance of the index includes reinvested dividends, and does not reflect sales charges or expenses. |
| (2) | | FBR Fund Advisers, Inc. waived a portion of its advisory fees and agreed to contractually reimburse a portion of the Fund’s operating expenses, as necessary, to maintain existing expense limitations, as set forth in the notes to the financial statements. Total returns shown include fee waivers and expense reimbursements, if any; total returns would have been lower had there been no waiver of fees and/or reimbursement of expenses in excess of expense limitations. |
| (3) | | The S&P 500 Index is a capitalization-weighted index of 500 stocks. The index is designed to represent the broad domestic economy through changes in aggregate market value of 500 stocks representing all major industries. The NASDAQ Composite Index is a broad-based capitalization-weighted index of all NASDAQ National Market and Small Cap stocks. |
| (4) | | The total returns shown do not reflect the deduction of taxes that a shareholder would pay on fund distributions or the redemption of fund shares. |
| (5) | | For the period February 1, 2002 (commencement of investment operations) through October 31, 2009. |
60
| The FBR Funds |
|
| FBR Technology Fund |
| Portfolio Summary |
| October 31, 2009 |
The following provides a breakdown of the Fund by industry sectors. The underlying securities represent a percentage of the portfolio investments.
| Industry Sector | | % of Total Investments |
| |
|
| Technology Services | | 29.1 | % |
| Electronic Technology | | 23.6 | % |
| Health Technology | | 22.5 | % |
| Producer Manufacturing | | 5.4 | % |
| Retail Trade | | 4.7 | % |
| Finance/Rental/Leasing | | 3.9 | % |
| Communications | | | 2.8 | % |
| Consumer Services | | 1.6 | % |
| Health Services | | 1.5 | % |
| Industrial Services | | 0.5 | % |
| Commercial Services | | 0.4 | % |
| Consumer Durables | | 0.4 | % |
| | | | | |
| Cash | | | 3.6 | % |
61
| The FBR Funds |
|
| FBR Technology Fund |
| Portfolio of Investments |
| October 31, 2009 |
| |
|
| | | | | | VALUE | |
| SHARES | | | | | (NOTE 2) | |
|
| | | COMMON STOCKS — 96.5% | | | | |
| | | Commercial Services — 0.4% | | | | |
| 735 | | MAXIMUS, Inc. | | $ | 34,001 | |
| | | | |
| |
| | | Communications — 2.8% | | | | |
| 1,455 | | Neutral Tandem, Inc.* | | | 30,686 | |
| 1,595 | | NII Holdings, Inc.* | | | 42,953 | |
| 2,400 | | tw telecom, inc.* | | | 30,240 | |
| 965 | | United States Cellular Corp.* | | | 35,329 | |
| 3,900 | | Vivo Partcipacoes S.A. ADR | | | 94,575 | |
| | | | |
| |
| | | | | | 233,783 | |
| | | | |
| |
| | | Consumer Durables — 0.4% | | | | |
| 2,860 | | TiVo, Inc.* | | | 31,117 | |
| | | | |
| |
| | | Consumer Services — 1.6% | | | | |
| 1,475 | | Liberty Media Corp., Series A* | | | 30,518 | |
| 3,300 | | Net Servicos de Comunicacao S.A. ADR* | | | 40,557 | |
| 415 | | priceline.com, Inc.* | | | 65,483 | |
| | | | |
| |
| | | | | | 136,558 | |
| | | | |
| |
| | | Electronic Technology — 23.6% | | | | |
| 1,713 | | Apple, Inc.* | | | 322,900 | |
| 1,430 | | Applied Signal Technology, Inc. | | | 29,301 | |
| 3,135 | | Arris Group, Inc.* | | | 32,165 | |
| 14,425 | | Cisco Systems, Inc.* | | | 329,611 | |
| 14,845 | | Corning, Inc. | | | 216,885 | |
| 1,120 | | Dolby Laboratories, Inc., Class A* | | | 46,973 | |
| 15,070 | | EMC Corp.* | | | 248,203 | |
| 810 | | First Solar, Inc.* | | | 98,763 | |
| 975 | | Harris Corp. | | | 40,677 | |
| 6,135 | | Marvell Technology Group Ltd.* | | | 84,173 | |
| 4,815 | | ON Semiconductor Corp.* | | | 32,212 | |
| 3,710 | | PMC-Sierra, Inc.* | | | 31,609 | |
| 5,430 | | Research In Motion Ltd.* | | | 318,904 | |
| 1,570 | | STEC, Inc.* | | | 33,472 | |
| 1,490 | | Tessera Technologies, Inc.* | | | 32,944 | |
| 2,435 | | Western Digital Corp.* | | | 82,011 | |
| | | | |
| |
| | | | | | 1,980,803 | |
| | | | |
| |
62
| The FBR Funds |
|
| FBR Technology Fund |
| Portfolio of Investments (continued) |
| October 31, 2009 |
| |
|
| | | | | | VALUE | |
| SHARES | | | | | (NOTE 2) | |
|
| | | Finance/Rental/Leasing — 3.8% | | | | |
| 4,315 | | Visa, Inc., Class A | | $ | 326,904 | |
| | | | |
| |
| | | Health Services — 1.5% | | | | |
| 800 | | Cerner Corp.* | | | 60,832 | |
| 780 | | HMS Holdings Corp.* | | | 33,485 | |
| 1,020 | | WebMD Health Corp., Class A* | | | 34,741 | |
| | | | |
| |
| | | | | | 129,058 | |
| | | | |
| |
| | | Health Technology — 22.6% | | | | |
| 875 | | Alexion Pharmaceuticals, Inc.* | | | 38,859 | |
| 2,920 | | Allergan, Inc. | | | 164,250 | |
| 2,775 | | Biogen Idec, Inc.* | | | 116,911 | |
| 11,058 | | Bristol-Myers Squibb Co. | | | 241,064 | |
| 1,500 | | CONMED Corp.* | | | 31,785 | |
| 2,985 | | Forest Laboratories, Inc.* | | | 82,595 | |
| 604 | | IDEXX Laboratories, Inc.* | | | 30,876 | |
| 410 | | Intuitive Surgical, Inc.* | | | 101,004 | |
| 2,440 | | Isis Pharmaceuticals, Inc.* | | | 30,915 | |
| 5,210 | | Johnson & Johnson | | | 307,651 | |
| 1,690 | | Life Technologies Corp.* | | | 79,716 | |
| 9,085 | | Medtronic, Inc. | | | 324,334 | |
| 570 | | Millipore Corp.* | | | 38,196 | |
| 2,995 | | Thermo Fisher Scientific, Inc.* | | | 134,775 | |
| 745 | | United Therapeutics Corp.* | | | 31,692 | |
| 1,210 | | Varian Medical Systems, Inc.* | | | 49,586 | |
| 920 | | Waters Corp.* | | | 52,836 | |
| 1,045 | | Watson Pharmaceuticals, Inc.* | | | 35,969 | |
| | | | |
| |
| | | | | | 1,893,014 | |
| | | | |
| |
| | | Industrial Services — 0.5% | | | | |
| 1,910 | | Quanta Services, Inc.* | | | 40,492 | |
| | | | |
| |
| | | Producer Manufacturing — 5.4% | | | | |
| 4,360 | | 3M Co. | | | 320,765 | |
| 1,080 | | American Superconductor Corp.* | | | 36,202 | |
| 1,010 | | General Cable Corp.* | | | 31,451 | |
63
| The FBR Funds |
|
| FBR Technology Fund |
| Portfolio of Investments (continued) |
| October 31, 2009 |
| |
|
| | | | | | VALUE | |
| SHARES | | | | | (NOTE 2) | |
|
| | | Producer Manufacturing — 5.4% (continued) | | | | |
| 335 | | Mettler-Toledo International, Inc.* | | $ | 32,663 | |
| 1,307 | | SunPower Corp., Class B* | | | 28,310 | |
| | | | |
| |
| | | | | | 449,391 | |
| | | | |
| |
| | | Retail Trade — 4.7% | | | | |
| 2,730 | | Amazon.com, Inc.* | | | 324,351 | |
| 645 | | Ctrip.com International Ltd. ADR* | | | 34,533 | |
| 1,810 | | IAC/InterActiveCorp* | | | 34,281 | |
| | | | |
| |
| | | | | | 393,165 | |
| | | | |
| |
| | | Technology Services — 29.2% | | | | |
| 3,790 | | Adobe Systems, Inc.* | | | 124,843 | |
| 1,940 | | Amdocs Ltd.* | | | 48,888 | |
| 330 | | Baidu.com, Inc. ADR* | | | 124,714 | |
| 3,095 | | CGI Group, Inc., Class A* | | | 37,790 | |
| 2,045 | | Check Point Software Technologies Ltd.* | | | 63,538 | |
| 1,880 | | Citrix Systems, Inc.* | | | 69,109 | |
| 2,810 | | Cognizant Technology Solutions Corp., Class A* | | | 108,607 | |
| 2,135 | | Cybersource Corp.* | | | 34,971 | |
| 1,415 | | Digital River, Inc.* | | | 32,304 | |
| 425 | | Equinix, Inc.* | | | 36,261 | |
| 625 | | Global Payments, Inc. | | | 30,769 | |
| 610 | | Google, Inc., Class A* | | | 327,033 | |
| 1,550 | | JDA Software Group, Inc.* | | | 30,752 | |
| 5,660 | | LivePerson, Inc.* | | | 28,470 | |
| 1,510 | | McAfee, Inc.* | | | 63,239 | |
| 850 | | MercadoLibre, Inc.* | | | 30,422 | |
| 11,610 | | Microsoft Corp. | | | 321,944 | |
| 365 | | MicroStrategy, Inc., Class A* | | | 31,854 | |
| 1,515 | | NeuStar, Inc., Class A* | | | 34,997 | |
| 3,630 | | NIC, Inc | | | 31,799 | |
| 2,160 | | Parametric Technology Corp.* | | | 32,206 | |
| 3,990 | | PROS Holdings, Inc.* | | | 35,870 | |
| 1,212 | | Salesforce.com, Inc.* | | | 68,781 | |
| 5,310 | | SAP AG ADR | | | 240,383 | |
| 575 | | Sohu.com, Inc.* | | | 31,970 | |
| 820 | | Sybase, Inc.* | | | 32,439 | |
64
| The FBR Funds |
|
| FBR Technology Fund |
| Portfolio of Investments (continued) |
| October 31, 2009 |
| |
|
| | | | | | VALUE | |
| SHARES | | | | | (NOTE 2) | |
|
| | | Technology Services — 29.2% (continued) | | | | |
| 1,760 | | Teradata Corp.* | | $ | 49,069 | |
| 5,022 | | VASCO Data Security International, Inc.* | | | 30,534 | |
| 1,910 | | VeriSign, Inc.* | | | 43,567 | |
| 2,820 | | VMware, Inc., Class A* | | | 108,373 | |
| 10,295 | | Yahoo!, Inc.* | | | 163,691 | |
| | | | |
| |
| | | | | | 2,449,187 | |
| | | | |
| |
| | | Total Common Stocks (Cost $7,218,732) | | | 8,097,473 | |
| | | | |
| |
| | | MONEY MARKET FUND — 3.6% | | | | |
| 302,960 | | JPMorgan 100% U.S. Treasury Securities Money Market Fund | | | 302,960 | |
| | | | |
| |
| | | Total Investments — 100.1% (Cost $7,521,692) | | | 8,400,433 | |
| | | | | | | |
| | | Liabilities Less Other Assets — (0.1)% | | | (12,370 | ) |
| | | | |
| |
| | | Net Assets — 100.0% | | $ | 8,388,063 | |
| | | | |
| |
|
| * | | Non-income producing security |
| ADR | | American Depositary Receipts |
The accompanying notes are an integral part of the financial statements.
65
| The FBR Funds |
|
| FBR Gas Utility Index Fund |
| Management Overview |
Portfolio Manager: Winsor Aylesworth
Over the last 12 months, how did the Fund perform and what factors contributed to this performance?
For the twelve months ended October 31, 2009, the Investor Class of the FBR Gas Utility Index Fund returned 8.18%. This compares to the S&P 500 Index, the American Gas Association (AGA) Stock Index, and the Morningstar Specialty Utilities category average, which returned 9.80%, 7.88% and 7.55% for the same period respectively.
For the twelve month period, the Fund tracked and slightly outperformed its index and the Morningstar Specialty Utilities category average while the Fund underperformed against the broader market S&P 500 Index. Since it is the Fund’s strategy is to track the AGA Index (less Fund expenses), the short-term comparisons to other measures may vary over different time periods.
The Fund’s outperformance to its index continues to be a function of the various cash levels being held for redemptions. It is not from the stock selection process. This is the nature of an index fund as the Fund’s holdings tend to replicate the index in composition and weightings. In the future, these same cash positions might generate some slight underperformance.
The Fund continued its tradition of paying quarterly dividends with a payout totaling $0.489 per share for the year. We feel that this provides shareholders with a reliable source of income as well as opportunities for capital appreciation, which is one of the main thesis’s for owning utility shares.
Following last year’s significant negative return, this year’s performance reverted back to a more traditional range for utility securities. Major contributors to the Fund’s return included Sempra Energy (Symbol: SRE), Enbridge (Symbol: ENB), and PG&E Corp. (Symbol: PCG). Both Sempre Energy and PG&E Corp. are major California based diversified utility companies that produce and distribute electricity and distribute natural gas. Enbridge owns one of the largest North American natural gas pipelines and is a major distributor of natural gas in Canada. All three companies benefited from a stabilizing economy both in Canada and the western United States.
Significant detractors to the Fund’s performance included Piedmont Natural Gas (Symbol: PNY), Laclede Group Inc. (Symbol: LG), and Integrys Energy Group Inc. (Symbol: TEG). Natural gas distribution is the primary business of all three companies, which are located from the upper Midwest throughout the middle part of the United States, an area that was particularly hard hit by economic issues which resulted in lower demand for natural gas and lower revenues for theses firms.
The economy and the weather are the two most important factors that have a near-term impact on the earnings of the companies held in the Fund. Last year’s weather was near average ranges for most regions of the country. On the other hand, the economic downturn either continued or stabilized at or near historic lows. The resulting lower demand for energy was the
66
| The FBR Funds |
|
| FBR Gas Utility Index Fund |
| Management Overview (continued) |
biggest challenge for the industry. One can only wonder if the current energy demand levels are the new “normal” or just a temporary lull before returning to more historic levels or if we have further declines to come. These are the big questions that the industry ponders.
Portfolio manager comments on the Fund and the related investment outlook.
As I have previously mentioned, the immediate outlook for the sector is contingent on the direction of the economy and the weather. Much has been done by the countries of the world to try to stem the downfall and reinvigorate their economic engines. The general consensus is that things have stabilized and the long, slow process to recovery has begun. If this is true, then demand for the various forms of energy will increase and result in higher revenues for the Fund’s companies. We will wait and see if governments have done enough or too much.
The inexact science of predicting the economic future leads us to the inexact science of weather predicting. The weather discussion also leads us to the “global warming” debate, which could have a significant impact on the industry. If we are truly under a long-term warming trend as most people think, the science tells us we can expect more extremes in weather. However, does this explain why it is a cold winter or a warm summer? This is why forecasting the weather is considered inexact. So, as it can be seen, the weather part of the demand equation is at best an educated guess. In the discussion about greenhouse gases and clean energy, natural gas continues to be considered the most viable and clean energy source that is readily available. Ultimately, this should improve demand for companies that are associated with this fuel. These are the type of companies that are in the Fund’s portfolio.
We believe the overall supply of natural gas remains in good shape. The wholesale price of natural gas is at historic lows and most storage facilities are at or near capacity. We await Mother Nature to see how winter will impact the situation.
All this uncertainty makes planning for the utility sector difficult and leads to many questions. Will decreases in demand continue? What will be the capital costs tied to the various green issues? How will the regulators handle rate requests in this environment? Have governments done enough or too much to stabilize their economies. Are we headed for high inflation due to government spending? With all these issues in a state of flux, the companies of the Fund will continue to be challenged. We continue to expect some will handle these issues better than others, and there will be some who find M&A activity as a potential solution.
We continue to believe that natural gas is the fuel of choice for the foreseeable future as it is readily available, within our political control, and has minimal global warming and other environmental impacts. Companies that are involved in the distribution and use of this fuel, while not immune to issues, should do well as the economy goes forward. As a fellow shareholder, I am optimistic and want to thank you for your support.
|
The opinions expressed in this commentary reflect those of the Portfolio Manager as of the date written. Any such opinions are subject to change based on market or other conditions. These opinions may not be relied upon as investment advice. Investment decisions for The FBR Funds are based on several factors, and may not be relied upon as an indication of trading intent on behalf of any FBR Fund. Security positions can and do change. |
67
The FBR Funds
FBR Gas Utility Index Fund
Comparison of Changes in Value of $10,000 Investment in
Investor Class Shares(1)(2) vs. Various Indices(1)(3)
| Total Returns—For the Periods Ended October 31, 2009(4)(5) |
| | | | | | | | | | | | | | | | | Annualized | |
| | | | | | | | | Annualized | | | Annualized | | | Since | |
| | | | | One Year | | | Five Year | | | Ten Year | | | Inception(6) | |
| | | | |
| | |
| | |
| | |
| |
| | FBR Gas Utility Index Fund Investor Class(1)(2) | | | 8.18 | % | | | 6.25 | % | | | 6.07 | % | | | N/A | | |
| | FBR Gas Utility Index Fund R Class(2)(6) | | | 7.52 | % | | | N/A | | | | N/A | | | | (16.34 | )% | |
| | S&P 500 Index(1)(3) | | | 9.80 | % | | | 0.33 | % | | | (0.95 | )% | | | (17.03 | )% | |
| | AGA Stock Index(1)(3) | | | 7.88 | % | | | 6.51 | % | | | 6.88 | % | | | N/A | | |
| |
PAST PERFORMANCE IS NO GUARANTEE OF FUTURE RESULTS.
The performance data quoted represents past performance and the current performance may be lower or higher than the performance data quoted. The investment return and principal will fluctuate so that investors’ shares, when redeemed, may be worth more or less than their original cost. The performance data does not reflect the deduction of taxes that a shareholder would pay on Fund distributions or redemption fees. If reflected, the redemption fee would reduce the performance data quoted. To obtain performance data current to the most recent month-end, please call 888.200.4710 or visit www.fbrfunds.com.
|
| (1) | | The graph assumes a hypothetical $10,000 initial investment in the Fund and reflects the reinvestment of dividends and all Fund expenses. Investors should note that the Fund is a professionally managed mutual fund while the index is unmanaged, does not incur expenses and is not available for investment. The performance of the index includes reinvested dividends, and does not reflect sales charges or expenses. |
| (2) | | FBR Fund Advisers, Inc. waived a portion of its advisory fees and agreed to contractually reimburse a portion of the Fund’s operating expenses, as necessary, to maintain existing expense limitations, as set forth in the notes to the financial statements. Total returns shown include fee waivers and expense reimbursements, if any; total returns would have been lower had there been no waiver of fees and/or reimbursement of expenses in excess of expense limitations. |
| (3) | | The S&P 500 Index is a capitalization-weighted index of 500 stocks. The index is designed to represent the broad domestic economy through changes in aggregate market value of 500 stocks representing all major industries. The AGA Stock Index is a market capitalization-weighted index, adjusted monthly, consisting of member companies of the American Gas Association. |
| (4) | | The total returns shown do not reflect the deduction of taxes that a shareholder would pay on fund distributions or the redemption of fund shares. |
| (5) | | Effective April 1, 2003, the Fund changed its fiscal year-end from March 31 to October 31. |
| (6) | | For the period May 30, 2008 (inception of share class) through October 31, 2009. |
68
| The FBR Funds |
|
| FBR Gas Utility Index Fund |
| Portfolio Summary |
| October 31, 2009 |
The following provides a breakdown of the Fund by industry sectors. The underlying securities represent a percentage of the portfolio investments.
| Industry Sector | | % of Total Investments |
| |
|
| Electric Utilities | | 37.1 | % |
| Gas Distributors | | 33.6 | % |
| Oil & Gas Pipelines | | 18.2 | % |
| Utilities | | | 8.2 | % |
| Oil & Gas Production | | 1.1 | % |
| Oilfield Services/Equipment | | 0.1 | % |
| | | | | |
| Cash | | | 1.7 | % |
69
| The FBR Funds |
|
| FBR Gas Utility Index Fund |
| Portfolio of Investments |
| October 31, 2009 |
| |
|
| | | | | | VALUE | |
| SHARES | | | | | (NOTE 2) | |
|
| | | COMMON STOCKS — 98.3% | | | | |
| | | Electric Utilities — 37.1% | | | | |
| 800 | | Allete, Inc. | | $ | 27,080 | |
| 24,350 | | Alliant Energy Corp. | | | 646,736 | |
| 30,100 | | Ameren Corp. | | | 732,634 | |
| 23,080 | | Avista Corp. | | | 437,597 | |
| 17,800 | | Black Hills Corp. | | | 433,786 | |
| 320,300 | | Centerpoint Energy, Inc. | | | 4,035,780 | |
| 7,550 | | CH Energy Group, Inc. | | | 312,646 | |
| 148,968 | | CMS Energy Corp. | | | 1,981,274 | |
| 96,245 | | Consolidated Edison, Inc. | | | 3,915,247 | |
| 25,195 | | Constellation Energy Group, Inc. | | | 779,029 | |
| 253,400 | | Dominion Resources, Inc. | | | 8,638,406 | |
| 55,390 | | DTE Energy Co. | | | 2,048,322 | |
| 85,512 | | Duke Energy Corp. | | | 1,352,800 | |
| 245,565 | | E.ON AG ADR | | | 9,429,695 | |
| 3,325 | | Entergy Corp. | | | 255,094 | |
| 67,425 | | Exelon Corp. | | | 3,166,278 | |
| 108,400 | | Iberdrola S.A. ADR | | | 3,906,736 | |
| 54,171 | | Integrys Energy Group, Inc. | | | 1,874,317 | |
| 8,498 | | MGE Energy, Inc. | | | 297,600 | |
| 194,286 | | National Grid PLC ADR | | | 9,638,528 | |
| 28,375 | | Northeast Utilities | | | 654,044 | |
| 13,735 | | NV Energy, Inc. | | | 157,403 | |
| 13,976 | | Pepco Holdings, Inc. | | | 208,662 | |
| 198,825 | | PG&E Corp. | | | 8,129,954 | |
| 220,500 | | Public Service Enterprise Group, Inc. | | | 6,570,900 | |
| 61,340 | | TECO Energy, Inc. | | | 879,616 | |
| 5,675 | | The Empire District Electric Co. | | | 102,491 | |
| 4,980 | | Unisource Energy Corp. | | | 143,822 | |
| 26,980 | | Wisconsin Energy Corp. | | | 1,178,217 | |
| | | | |
| |
| | | | | | 71,934,694 | |
| | | | |
| |
| | | Gas Distributors — 33.6% | | | | |
| 122,582 | | AGL Resources, Inc. | | | 4,285,467 | |
| 179,150 | | Atmos Energy Corp. | | | 4,989,327 | |
| 11,385 | | Chesapeake Utilities Corp. | | | 360,677 | |
70
| The FBR Funds |
|
| FBR Gas Utility Index Fund |
| Portfolio of Investments (continued) |
| October 31, 2009 |
| |
|
| | | | | | VALUE | |
| SHARES | | | | | (NOTE 2) | |
|
| | | Gas Distributors — 33.6% (continued) | | | | |
| 2,145 | | Corning Natural Gas Corp. | | $ | 33,462 | |
| 6,593 | | Delta Natural Gas Company, Inc. | | | 180,516 | |
| 5,753 | | Energy, Inc. | | | 51,087 | |
| 49,560 | | EQT Corp | | | 2,074,582 | |
| 91,950 | | MDU Resources Group, Inc. | | | 1,907,963 | |
| 102,600 | | National Fuel Gas Co. | | | 4,651,884 | |
| 52,580 | | New Jersey Resources Corp. | | | 1,850,816 | |
| 89,050 | | Nicor, Inc. | | | 3,301,974 | |
| 335,250 | | NiSource, Inc. | | | 4,331,430 | |
| 55,825 | | Northwest Natural Gas Co. | | | 2,334,043 | |
| 22,751 | | NorthWestern Corp. | | | 549,437 | |
| 159,700 | | Oneok, Inc. | | | 5,782,736 | |
| 142,850 | | Piedmont Natural Gas Company, Inc. | | | 3,325,548 | |
| 4,741 | | RGC Resources, Inc. | | | 133,696 | |
| 46,485 | | South Jersey Industries, Inc. | | | 1,640,456 | |
| 199,257 | | Southern Union Co. | | | 3,899,459 | |
| 91,775 | | Southwest Gas Corp. | | | 2,293,457 | |
| 499,318 | | Spectra Energy Corp. | | | 9,546,960 | |
| 39,350 | | The Laclede Group, Inc. | | | 1,208,439 | |
| 69,200 | | UGI Corp | | | 1,652,496 | |
| 71,405 | | Vectren Corp. | | | 1,609,469 | |
| 96,350 | | WGL Holdings, Inc. | | | 3,185,331 | |
| | | | |
| |
| | | | | | 65,180,712 | |
| | | | |
| |
| | | Oil & Gas Pipelines — 18.2% | | | | |
| 936,750 | | El Paso Corp. | | | 9,189,518 | |
| 249,654 | | Enbridge, Inc. | | | 9,696,561 | |
| 345,150 | | The Williams Companies, Inc. | | | 6,506,078 | |
| 316,500 | | TransCanada Corp. | | | 9,665,910 | |
| | | | |
| |
| | | | | | 35,058,067 | |
| | | | |
| |
| | | Oil & Gas Production — 1.1% | | | | |
| 47,223 | | Energen Corp. | | | 2,072,145 | |
| | | | |
| |
| | | Oilfield Services/Equipment — 0.1% | | | | |
| 115,125 | | Cheniere Energy, Inc.* | | | 268,241 | |
| | | | |
| |
71
| The FBR Funds |
|
| FBR Gas Utility Index Fund |
| Portfolio of Investments (continued) |
| October 31, 2009 |
| |
|
| | | | | | VALUE | |
| SHARES | | | | | (NOTE 2) | |
|
| | | Utilities — 8.2% | | | | |
| 114,270 | | Questar Corp. | | $ | 4,552,517 | |
| 187,425 | | Sempra Energy | | | 9,643,015 | |
| 98,000 | | Xcel Energy, Inc. | | | 1,846,320 | |
| | | | |
| |
| | | | | | 16,041,852 | |
| | | | |
| |
| | | Total Common Stocks (Cost $118,787,672) | | | 190,555,711 | |
| | | | |
| |
| | | MONEY MARKET FUND — 1.7% | | | | |
| 3,220,208 | | JPMorgan 100% U.S. Treasury Securities Money Market Fund | | | 3,220,208 | |
| | | | |
| |
| | | Total Investments — 100.0% (Cost $122,007,880) | | | 193,775,919 | |
| | | | | | | |
| | | Liabilities Less Other Assets — 0.0% | | | (6,669 | ) |
| | | | |
| |
| | | Net Assets — 100.0% | | $ | 193,769,250 | |
| | | | |
| |
|
| * | | Non-income producing security |
| ADR | | American Depositary Receipts |
| PLC | | Public Liability Company |
The accompanying notes are an integral part of the financial statements.
72
The FBR Funds
Statements of Assets and Liabilities
October 31, 2009
| | | | | | | | FBR |
| | | FBR | | Pegasus Mid Cap |
| | | Pegasus FundTM | | FundTM |
| | |
| |
|
| ASSETS | | | | | | | | | | |
Investment Securities at Cost | | | $ | 16,735,935 | | | | $ | 6,074,394 | |
| | | |
| | | |
| |
Investment Securities at Value (Note 2) | | | $ | 18,495,761 | | | | $ | 6,597,876 | |
Receivable for Capital Shares Sold | | | | 4,414 | | | | | 410 | |
Receivable for Investment Securities Sold | | | | 2,119,356 | | | | | 297,314 | |
Dividends and Interest Receivable | | | | 16,821 | | | | | 3,819 | |
Receivable from Adviser | | | | — | | | | | 3,316 | |
Prepaid Expenses | | | | 6,075 | | | | | 9,095 | |
| | | |
| | | |
| |
Total Assets | | | | 20,642,427 | | | | | 6,911,830 | |
| | | |
| | | |
| |
| LIABILITIES | | | | | | | | | | |
Payable for Capital Shares Redeemed | | | | 1,533,343 | | | | | 12,685 | |
Investment Advisory Fee Payable (Note 3) | | | | 6,473 | | | | | — | |
Administration Fee Payable (Note 3) | | | | 390 | | | | | 129 | |
Distribution and Service Fees Payable (Note 3) | | | | 4,850 | | | | | 1,594 | |
Other Accrued Expenses | | | | 51,239 | | | | | 46,389 | |
| | | |
| | | |
| |
Total Liabilities | | | | 1,596,295 | | | | | 60,797 | |
| | | |
| | | |
| |
| NET ASSETS | | | $ | 19,046,132 | | | | $ | 6,851,033 | |
| | | |
| | | |
| |
| Net Assets Consist of: | | | | | | | | | | |
Paid-in capital | | | $ | 17,623,212 | | | | $ | 6,733,644 | |
Accumulated net investment income | | | | 66,653 | | | | | 13,890 | |
Accumulated net realized loss on investments | | | | (403,559 | ) | | | | (419,983 | ) |
Net unrealized appreciation on investments | | | | 1,759,826 | | | | | 523,482 | |
| | | |
| | | |
| |
| NET ASSETS | | | $ | 19,046,132 | | | | $ | 6,851,033 | |
| | | |
| | | |
| |
| Pricing of Investor Class Shares | | | | | | | | | | |
Net assets attributable to Investor Class shares | | | $ | 18,947,485 | | | | $ | 6,766,627 | |
Shares of Beneficial Interest Outstanding | | | | | | | | | | |
(unlimited number of shares authorized, no par value) | | | | 1,950,262 | | | | | 709,715 | |
| | | |
| | | |
| |
Net Asset Value Per Share | | | $ | 9.72 | | | | $ | 9.53 | |
| | | |
| | | |
| |
| Pricing of I Class Shares | | | | | | | | | | |
Net assets attributable to I Class shares | | | $ | 98,647 | | | | $ | 84,406 | |
Shares of Beneficial Interest Outstanding | | | | | | | | | | |
(unlimited number of shares authorized, no par value) | | | | 11,717 | | | | | 10,224 | |
| | | |
| | | |
| |
Net Asset Value Per Share | | | $ | 8.42 | | | | $ | 8.26 | |
| | | |
| | | |
| |
73
The FBR Funds
Statements of Assets and Liabilities (continued)
October 31, 2009
| | | FBR | | FBR |
| | | Pegasus Small Cap | | Pegasus Small Cap |
| | | FundTM | | Growth FundTM |
| | |
| |
|
| ASSETS | | | | | | | | | | |
Investment Securities at Cost | | | $ | 9,427,736 | | | | $ | 5,097,364 | |
| | | |
| | | |
| |
Investment Securities at Value (Note 2) | | | $ | 10,075,976 | | | | $ | 5,581,499 | |
Receivable for Capital Shares Sold | | | | 4,250 | | | | | 8,626 | |
Receivable for Investment Securities Sold | | | | 1,592,993 | | | | | 364,168 | |
Dividends and Interest Receivable | | | | 7,091 | | | | | 969 | |
Receivable from Adviser | | | | — | | | | | 4,407 | |
Prepaid Expenses | | | | 9,464 | | | | | 10,599 | |
| | | |
| | | |
| |
Total Assets | | | | 11,689,774 | | | | | 5,970,268 | |
| | | |
| | | |
| |
| LIABILITIES | | | | | | | | | | |
Bank overdraft | | | | 118,300 | | | | | — | |
Payable for Capital Shares Redeemed | | | | 7,920 | | | | | 275,684 | |
Payable for Investment Securities Purchased | | | | 841,438 | | | | | 21,586 | |
Investment Advisory Fee Payable (Note 3) | | | | 396 | | | | | — | |
Administration Fee Payable (Note 3) | | | | 198 | | | | | 115 | |
Distribution and Service Fees Payable (Note 3) | | | | 2,457 | | | | | 1,422 | |
Other Accrued Expenses | | | | 47,849 | | | | | 48,948 | |
| | | |
| | | |
| |
Total Liabilities | | | | 1,018,558 | | | | | 347,755 | |
| | | |
| | | |
| |
| NET ASSETS | | | $ | 10,671,216 | | | | $ | 5,622,513 | |
| | | |
| | | |
| |
| Net Assets Consist of: | | | | | | | | | | |
Paid-in capital | | | $ | 9,767,129 | | | | $ | 5,587,216 | |
Accumulated net investment income | | | | 7,553 | | | | | — | |
Accumulated net realized gain (loss) on investments | | | | 248,294 | | | | | (448,838 | ) |
Net unrealized appreciation on investments | | | | 648,240 | | | | | 484,135 | |
| | | |
| | | |
| |
| NET ASSETS | | | $ | 10,671,216 | | | | $ | 5,622,513 | |
| | | |
| | | |
| |
| Pricing of Investor Class Shares | | | | | | | | | | |
Net assets attributable to Investor Class shares | | | $ | 10,585,271 | | | | $ | 5,386,545 | |
Shares of Beneficial Interest Outstanding (unlimited number of shares authorized, no par value) | | | | 1,113,085 | | | | | 546,840 | |
| | | |
| | | |
| |
Net Asset Value Per Share | | | $ | 9.51 | | | | $ | 9.85 | |
| | | |
| | | |
| |
| Pricing of I Class Shares | | | | | | | | | | |
Net assets attributable to I Class shares | | | $ | 85,945 | | | | $ | 151,392 | |
Shares of Beneficial Interest Outstanding (unlimited number of shares authorized, no par value) | | | | 10,000 | | | | | 17,770 | |
| | | |
| | | |
| |
Net Asset Value Per Share | | | $ | 8.59 | | | | $ | 8.52 | |
| | | |
| | | |
| |
| Pricing of R Class Shares | | | | | | | | | | |
Net assets attributable to R Class shares | | | $ | — | | | | $ | 84,576 | |
Shares of Beneficial Interest Outstanding (unlimited number of shares authorized, no par value) | | | | — | | | | | 10,000 | |
| | | |
| | | |
| |
Net Asset Value Per Share | | | $ | — | | | | $ | 8.46 | |
| | | |
| | | |
| |
74
The FBR Funds
Statements of Assets and Liabilities (continued)
October 31, 2009
| | | | | | | | FBR | | FBR |
| | | FBR | | Large Cap | | Small Cap |
| | | Focus Fund | | Financial Fund | | Financial Fund |
| | |
| |
| |
|
| ASSETS | | | | | | | | | | | | | | | |
Investment Securities | | | | | | | | | | | | | | | |
Securities at Cost: | | | | | | | | | | | | | | | |
Unaffiliated Issuers | | | $ | 535,476,247 | | | | $ | 31,622,635 | | | | $ | 183,776,869 | |
Affiliated Issuers | | | | 103,538,244 | | | | | — | | | | | — | |
| | | |
| | | |
| | | |
| |
Total securities | | | $ | 639,014,491 | | | | $ | 31,622,635 | | | | $ | 183,776,869 | |
| | | |
| | | |
| | | |
| |
Securities at Value (Note 2): | | | | | | | | | | | | | | | |
Unaffiliated Issuers | | | $ | 701,768,935 | | | | $ | 35,735,945 | | | | $ | 193,013,939 | |
Affiliated Issuers | | | | 94,111,720 | | | | | — | | | | | — | |
| | | |
| | | |
| | | |
| |
Total securities | | | | 795,880,655 | | | | | 35,735,945 | | | | | 193,013,939 | |
Receivable for Capital Shares Sold | | | | 544,426 | | | | | 206,938 | | | | | 227,939 | |
Receivable for Investment Securities Sold | | | | 87,081 | | | | | 2,628,597 | | | | | 6,585,925 | |
Dividends and Interest Receivable | | | | 65,515 | | | | | 14,290 | | | | | 166,761 | |
Prepaid Expenses | | | | 100,398 | | | | | 4,976 | | | | | 32,516 | |
| | | |
| | | |
| | | |
| |
Total Assets | | | | 796,678,075 | | | | | 38,590,746 | | | | | 200,027,080 | |
| | | |
| | | |
| | | |
| |
| LIABILITIES | | | | | | | | | | | | | | | |
Bank overdraft | | | | — | | | | | 122,974 | | | | | — | |
Payable for Capital Shares Redeemed | | | | 1,009,108 | | | | | 537,830 | | | | | 795,807 | |
Payable for Investment Securities Purchased | | | | — | | | | | 633,174 | | | | | 501,000 | |
Investment Advisory Fee Payable (Note 3) | | | | 653,189 | | | | | 35,167 | | | | | 165,519 | |
Administration Fee Payable (Note 3) | | | | 14,541 | | | | | 781 | | | | | 3,626 | |
Distribution and Service Fees Payable (Note 3) | | | | 174,912 | | | | | 9,769 | | | | | 42,945 | |
Other Accrued Expenses | | | | 661,321 | | | | | 55,964 | | | | | 192,518 | |
| | | |
| | | |
| | | |
| |
Total Liabilities | | | | 2,513,071 | | | | | 1,395,659 | | | | | 1,701,415 | |
| | | |
| | | |
| | | |
| |
| NET ASSETS | | | $ | 794,165,004 | | | | $ | 37,195,087 | | | | $ | 198,325,665 | |
| | | |
| | | |
| | | |
| |
| Net Assets Consist of: | | | | | | | | | | | | | | | |
Paid-in capital | | | $ | 646,876,214 | | | | $ | 39,766,945 | | | | $ | 200,808,175 | |
Accumulated net investment income | | | | — | | | | | — | | | | | 537,355 | |
Accumulated net realized loss on investments and foreign currency transactions | | | | (9,577,374 | ) | | | | (6,685,168 | ) | | | | (12,256,935 | ) |
Net unrealized appreciation on investments | | | | 156,866,164 | | | | | 4,113,310 | | | | | 9,237,070 | |
| | | |
| | | |
| | | |
| |
| NET ASSETS | | | $ | 794,165,004 | | | | $ | 37,195,087 | | | | $ | 198,325,665 | |
| | | |
| | | |
| | | |
| |
| Pricing of Investor Class Shares | | | | | | | | | | | | | | | |
Net assets attributable to Investor Class shares | | | $ | 759,773,812 | | | | $ | 37,195,087 | | | | $ | 187,561,224 | |
Shares of Beneficial Interest Outstanding (unlimited number of shares authorized, no par value) | | | | 20,225,817 | | | | | 2,950,420 | | | | | 11,791,691 | |
| | | |
| | | |
| | | |
| |
Net Asset Value Per Share | | | $ | 37.56 | | | | $ | 12.61 | | | | $ | 15.91 | |
| | | |
| | | |
| | | |
| |
| Pricing of I Class Shares | | | | | | | | | | | | | | | |
Net assets attributable to I Class shares | | | $ | 34,225,500 | | | | $ | — | | | | $ | 10,638,495 | |
Shares of Beneficial Interest Outstanding (unlimited number of shares authorized, no par value) | | | | 16,278,848 | | | | | — | | | | | 1,028,837 | |
| | | |
| | | |
| | | |
| |
Net Asset Value Per Share | | | $ | 2.10 | | | | $ | — | | | | $ | 10.34 | |
| | | |
| | | |
| | | |
| |
| Pricing of R Class Shares | | | | | | | | | | | | | | | |
Net assets attributable to R Class shares | | | $ | 165,692 | | | | $ | — | | | | $ | 125,946 | |
Shares of Beneficial Interest Outstanding (unlimited number of shares authorized, no par value) | | | | 81,506 | | | | | — | | | | | 12,287 | |
| | | |
| | | |
| | | |
| |
Net Asset Value Per Share | | | $ | 2.03 | | | | $ | — | | | | $ | 10.25 | |
| | | |
| | | |
| | | |
| |
75
The FBR Funds
Statements of Assets and Liabilities (continued)
October 31, 2009
| | | | | FBR |
| | | FBR | | Gas Utility |
| | | Technology Fund | | Index Fund |
| | |
| |
|
| ASSETS | | | | | | | | | | |
Investment Securities at Cost | | | $ | 7,521,692 | | | | $ | 122,007,880 | |
| | | |
| | | |
| |
Investment Securities at Value (Note 2) | | | $ | 8,400,433 | | | | $ | 193,775,919 | |
Receivable for Investment Securities Sold | | | | 534,208 | | | | | 423,221 | |
Receivable for Capital Shares Sold | | | | 1,113 | | | | | 32,790 | |
Dividends and Interest Receivable | | | | 3,700 | | | | | 256,902 | |
Prepaid Expenses | | | | 5,527 | | | | | 28,564 | |
| | | |
| | | |
| |
Total Assets | | | | 8,944,981 | | | | | 194,517,396 | |
| | | |
| | | |
| |
| LIABILITIES | | | | | | | | | | |
Payable for Capital Shares Redeemed | | | | 19,280 | | | | | 140,849 | |
Payable for Investment Securities Purchased | | | | 483,252 | | | | | 357,395 | |
Investment Advisory Fee Payable (Note 3) | | | | 3,475 | | | | | 65,986 | |
Administration Fee Payable (Note 3) | | | | 147 | | | | | 3,364 | |
Distribution and Service Fees Payable (Note 3) | | | | 1,839 | | | | | 37 | |
Other Accrued Expenses | | | | 48,925 | | | | | 180,515 | |
| | | |
| | | |
| |
Total Liabilities | | | | 556,918 | | | | | 748,146 | |
| | | |
| | | |
| |
| NET ASSETS | | | $ | 8,388,063 | | | | $ | 193,769,250 | |
| | | |
| | | |
| |
| Net Assets Consist of: | | | | | | | | | | |
Paid-in capital | | | $ | 12,630,993 | | | | $ | 136,454,400 | |
Accumulated net investment income | | | | — | | | | | 94,170 | |
Accumulated net realized loss on investments | | | | (5,121,671 | ) | | | | (14,547,359 | ) |
Net unrealized appreciation on investments | | | | 878,741 | | | | | 71,768,039 | |
| | | |
| | | |
| |
| NET ASSETS | | | $ | 8,388,063 | | | | $ | 193,769,250 | |
| | | |
| | | |
| |
| Pricing of Investor Class Shares | | | | | | | | | | |
Net assets attributable to Investor Class shares | | | $ | 8,388,063 | | | | $ | 193,678,020 | |
Shares of Beneficial Interest Outstanding (unlimited number of shares authorized, no par value) | | | | 926,571 | | | | | 12,799,626 | |
| | | |
| | | |
| |
Net Asset Value Per Share | | | $ | 9.05 | | | | $ | 15.13 | |
| | | |
| | | |
| |
| Pricing of R Class Shares | | | | | | | | | | |
Net assets attributable to R Class shares | | | $ | — | | | | $ | 91,230 | |
Shares of Beneficial Interest Outstanding (unlimited number of shares authorized, no par value) | | | | — | | | | | 14,373 | |
| | | |
| | | |
| |
Net Asset Value Per Share | | | $ | — | | | | $ | 6.35 | |
| | | |
| | | |
| |
| The accompanying notes are an integral part of the financial statements. |
76
The FBR Funds
Statements of Operations
For the Year Ended October 31, 2009
| | | | | FBR |
| | | FBR | | Pegasus Mid Cap |
| | | Pegasus FundTM | | FundTM |
| | |
| |
|
| Investment Income | | | | | | | | | | |
Dividends1 | | | $ | 232,375 | | | | $ | 108,785 | |
Interest | | | | 385 | | | | | 375 | |
| | | |
| | | |
| |
Total Investment Income | | | | 232,760 | | | | | 109,160 | |
| | | |
| | | |
| |
| Expenses | | | | | | | | | | |
Investment Advisory fees (Note 3) | | | | 112,281 | | | | | 56,505 | |
Administration fees (Note 3) | | | | 4,809 | | | | | 2,273 | |
Distribution and Service fees – Investor Class (Note 3) | | | | 31,004 | | | | | 15,514 | |
Professional fees | | | | 45,834 | | | | | 45,833 | |
Shareholder administrative fees – Investor Class | | | | 19,813 | | | | | 12,049 | |
Trustees’fees | | | | 15,800 | | | | | 15,800 | |
Registration fees – Investor Class | | | | 14,582 | | | | | 14,842 | |
Registration fees – I Class | | | | 10,208 | | | | | 9,829 | |
Compliance fees | | | | 9,016 | | | | | 8,734 | |
Transfer agent fees – Investor Class | | | | 3,862 | | | | | 3,062 | |
Transfer agent fees – I Class | | | | 342 | | | | | 343 | |
Accounting services fees | | | | 4,010 | | | | | 3,296 | |
Reports to shareholders – Investor Class | | | | 2,899 | | | | | 2,600 | |
Reports to shareholders – I Class | | | | 445 | | | | | 506 | |
Insurance fees | | | | 1,340 | | | | | 699 | |
Custodian fees | | | | 467 | | | | | 389 | |
Other expenses | | | | 3,213 | | | | | 3,148 | |
| | | |
| | | |
| |
Total expenses before waivers and related reimbursements | | | | 279,925 | | | | | 195,422 | |
Less waivers and related reimbursements (Note 3) | | | | (123,961 | ) | | | | (110,847 | ) |
| | | |
| | | |
| |
Total expenses after waivers and related reimbursements | | | | 155,964 | | | | | 84,575 | |
| | | |
| | | |
| |
Net Investment Income | | | | 76,796 | | | | | 24,585 | |
| | | |
| | | |
| |
| Net Realized and Unrealized Gain (Loss) on Investments | | | | | | | | | | |
Net Realized Gain (Loss) on Investment Transactions | | | | 480,306 | | | | | (240,244 | ) |
Change in Net Unrealized Appreciation/Depreciation of Investments | | | | 2,799,062 | | | | | 1,527,785 | |
| | | |
| | | |
| |
Net Gain on Investments | | | | 3,279,368 | | | | | 1,287,541 | |
| | | |
| | | |
| |
| Net Increase in Net Assets Resulting from Operations | | | $ | 3,356,164 | | | | $ | 1,312,126 | |
| | | |
| | | |
| |
|
| 1 | | Net of foreign taxes withheld of $1,121 and $408 for the FBR Pegasus FundTM and FBR Pegasus Mid Cap FundTM, respectively. |
77
The FBR Funds
Statements of Operations (continued)
For the Year Ended October 31, 2009
| | | FBR | | FBR |
| | | Pegasus Small Cap | | Pegasus Small Cap |
| | | FundTM | | Growth FundTM |
| | |
| |
|
| Investment Income | | | | | | | | | | |
Dividends1 | | | $ | 114,006 | | | | $ | 21,185 | |
Interest | | | | 855 | | | | | 116 | |
| | | |
| | | |
| |
Total Investment Income | | | | 114,861 | | | | | 21,301 | |
| | | |
| | | |
| |
| Expenses | | | | | | | | | | |
Investment Advisory fees (Note 3) | | | | 66,439 | | | | | 38,063 | |
Administration fees (Note 3) | | | | 2,466 | | | | | 1,420 | |
Distribution and Service fees – Investor Class (Note 3) | | | | 18,266 | | | | | 10,183 | |
Distribution and Service fees – R Class (Note 3) | | | | — | | | | | 364 | |
Professional fees | | | | 45,833 | | | | | 48,633 | |
Registration fees – Investor Class | | | | 15,065 | | | | | 14,335 | |
Registration fees – I Class | | | | 9,801 | | | | | 9,062 | |
Registration fees – R Class | | | | — | | | | | 9,147 | |
Trustees’fees | | | | 15,800 | | | | | 15,800 | |
Shareholder administrative fees – Investor Class | | | | 14,325 | | | | | 12,001 | |
Compliance fees | | | | 8,772 | | | | | 8,715 | |
Accounting services fees | | | | 3,839 | | | | | 3,460 | |
Transfer agent fees – Investor Class | | | | 2,829 | | | | | 3,240 | |
Transfer agent fees – I Class | | | | 344 | | | | | 343 | |
Transfer agent fees – R Class | | | | — | | | | | 344 | |
Reports to shareholders – Investor Class | | | | 2,515 | | | | | 2,466 | |
Reports to shareholders – I Class | | | | 472 | | | | | 462 | |
Reports to shareholders – R Class | | | | — | | | | | 467 | |
Insurance fees | | | | 667 | | | | | 549 | |
Custodian fees | | | | 658 | | | | | 248 | |
Other expenses | | | | 3,142 | | | | | 3,164 | |
| | | |
| | | |
| |
Total expenses before waivers and related reimbursements | | | | 211,233 | | | | | 182,466 | |
Less waivers and related reimbursements (Note 3) | | | | (103,969 | ) | | | | (121,148 | ) |
| | | |
| | | |
| |
Total expenses after waivers and related reimbursements | | | | 107,264 | | | | | 61,318 | |
| | | |
| | | |
| |
Net Investment Income (Loss) | | | | 7,597 | | | | | (40,017 | ) |
| | | |
| | | |
| |
| Net Realized and Unrealized Gain (Loss) on Investments | | | | | | | | | | |
Net Realized Gain (Loss) on Investment Transactions | | | | 460,160 | | | | | (323,681 | ) |
Net Increase from Payments by Affiliates | | | | 7,834 | | | | | — | |
Change in Net Unrealized Appreciation/Depreciation of Investments | | | | 1,334,877 | | | | | 1,205,060 | |
| | | |
| | | |
| |
Net Gain on Investments | | | | 1,802,871 | | | | | 881,379 | |
| | | |
| | | |
| |
| Net Increase in Net Assets Resulting from Operations | | | $ | 1,810,468 | | | | $ | 841,362 | |
| | | |
| | | |
| |
|
| 1 | Net of foreign taxes withheld of $0 and $63 for the FBR Pegasus Small Cap FundTM and FBR Pegasus Small Cap Growth FundTM, respectively. |
78
The FBR Funds
Statements of Operations (continued)
For the Year Ended October 31, 2009
| | | | | | | | FBR | | FBR |
| | | | | | | | Large Cap | | Small Cap |
| | | FBR | | Financial | | Financial |
| | | Focus Fund | | Fund | | Fund |
| | |
| |
| |
|
| Investment Income | | | | | | | | | | | | | | | |
Dividends from Unaffiliated Issuers1 | | | $ | 1,772,456 | | | | $ | 417,956 | | | | $ | 3,484,234 | |
Dividends from Affiliated Issuers | | | | 281,475 | | | | | — | | | | | — | |
Interest | | | | 46,597 | | | | | 7,259 | | | | | 71,791 | |
| | | |
| | | |
| | | |
| |
Total Investment Income | | | | 2,100,528 | | | | | 425,215 | | | | | 3,556,025 | |
| | | |
| | | |
| | | |
| |
| Expenses | | | | | | | | | | | | | | | |
Investment Advisory fees (Note 3) | | | | 6,876,176 | | | | | 221,101 | | | | | 1,594,107 | |
Administration fees (Note 3) | | | | 274,804 | | | | | 8,973 | | | | | 69,900 | |
Distribution and Service fees – Investor Class (Note 3) | | | | 1,846,767 | | | | | 61,417 | | | | | 436,613 | |
Distribution and Service fees – R Class (Note 3) | | | | 598 | | | | | — | | | | | 547 | |
Shareholder administrative fees – Investor Class | | | | 889,618 | | | | | 20,294 | | | | | 215,950 | |
Shareholder administrative fees – I Class | | | | 12,627 | | | | | — | | | | | — | |
Transfer agent fees – Investor Class | | | | 289,051 | | | | | 17,316 | | | | | 91,430 | |
Transfer agent fees – I Class | | | | 955 | | | | | — | | | | | 428 | |
Transfer agent fees – R Class | | | | 408 | | | | | — | | | | | 404 | |
Accounting services fees | | | | 184,801 | | | | | 6,942 | | | | | 54,069 | |
Insurance fees | | | | 145,330 | | | | | 2,789 | | | | | 26,110 | |
Reports to shareholders – Investor Class | | | | 112,771 | | | | | 8,771 | | | | | 43,574 | |
Reports to shareholders – I Class | | | | 977 | | | | | — | | | | | 402 | |
Reports to shareholders – R Class | | | | 397 | | | | | — | | | | | 425 | |
Registration fees – Investor Class | | | | 46,631 | | | | | 19,656 | | | | | 32,984 | |
Registration fees – I Class | | | | 22,264 | | | | | — | | | | | 10,444 | |
Registration fees – R Class | | | | 10,861 | | | | | — | | | | | 11,479 | |
Compliance fees | | | | 64,480 | | | | | 11,171 | | | | | 22,538 | |
Professional fees | | | | 49,830 | | | | | 45,633 | | | | | 48,633 | |
Custodian fees | | | | 31,217 | | | | | 1,084 | | | | | 8,664 | |
Trustees’fees | | | | 15,800 | | | | | 15,800 | | | | | 15,800 | |
Other expenses | | | | 13,686 | | | | | 3,765 | | | | | 6,323 | |
| | | |
| | | |
| | | |
| |
Total expenses before waivers and related reimbursements | | | | 10,890,049 | | | | | 444,712 | | | | | 2,690,824 | |
Recoupment of Fund expenses paid by Adviser (Note 3) | | | | — | | | | | 104 | | | | | — | |
Less waivers and related reimbursements (Note 3) | | | | (10,825 | ) | | | | — | | | | | (10,554 | ) |
| | | |
| | | |
| | | |
| |
Total expenses after waivers and related reimbursements | | | | 10,879,224 | | | | | 444,816 | | | | | 2,680,270 | |
| | | |
| | | |
| | | |
| |
Net Investment Income (Loss) | | | | (8,778,696 | ) | | | | (19,601 | ) | | | | 875,755 | |
| | | |
| | | |
| | | |
| |
| Net Realized and Unrealized Gain (Loss) on Investments | | | | | | | | | | | | | | | |
Net Realized Loss on Investments | | | | | | | | | | | | | | | |
Unaffiliated Issuers | | | | (8,245,318 | ) | | | | (2,227,359 | ) | | | | (2,794,592 | ) |
Affiliated Issuers | | | | (1,332,056 | ) | | | | — | | | | | — | |
Change in Net Unrealized Appreciation/Depreciation of Investments | | | | 151,576,458 | | | | | 4,061,503 | | | | | 6,960,944 | |
| | | |
| | | |
| | | |
| |
Net Gain on Investments | | | | 141,999,084 | | | | | 1,834,144 | | | | | 4,166,352 | |
| | | | |
| | | |
| | | |
| |
| Net Increase in Net Assets Resulting from Operations | | | $ | 133,220,388 | | | | $ | 1,814,543 | | | | $ | 5,042,107 | |
| | | |
| | | |
| | | |
| |
|
| 1 | Net of foreign taxes withheld of $10,828, $0 and $0 for the FBR Focus Fund, FBR Large Cap Financial Fund and FBR Small Cap Financial Fund, respectively. |
79
The FBR Funds
Statements of Operations (continued)
For the Year Ended October 31, 2009
| | | FBR | | FBR |
| | | Technology | | Gas Utility |
| | | Fund | | Index Fund |
| | |
| |
|
| Investment Income | | | | | | | | | | |
Dividends1 | | | $ | 61,873 | | | | $ | 7,667,459 | |
Interest (Note 2) | | | | 648 | | | | | 8,892 | |
| | | |
| | | |
| |
Total Investment Income | | | | 62,521 | | | | | 7,676,351 | |
| | | |
| | | |
| |
Expenses | | | | | | | | | | |
Investment Advisory fees (Note 3) | | | | 62,228 | | | | | 719,637 | |
Administration fees (Note 3) | | | | 2,221 | | | | | 141,189 | |
Distribution and Service fees – Investor Class (Note 3) | | | | 17,286 | | | | | — | |
Distribution and Service fees – R Class (Note 3) | | | | — | | | | | 354 | |
Professional fees | | | | 47,284 | | | | | 47,134 | |
Registration fees – Investor Class | | | | 18,768 | | | | | 20,109 | |
Registration fees – R Class | | | | — | | | | | 10,004 | |
Trustees’ fees | | | | 15,800 | | | | | 15,800 | |
Shareholder administrative fees – Investor Class | | | | 14,182 | | | | | 103,627 | |
Compliance fees | | | | 10,065 | | | | | 22,030 | |
Transfer agent fees – Investor Class | | | | 6,609 | | | | | 153,842 | |
Transfer agent fees – R Class | | | | — | | | | | 341 | |
Reports to shareholders – Investor Class | | | | 4,220 | | | | | 30,027 | |
Reports to shareholders – R Class | | | | — | | | | | 402 | |
Insurance fees (Note 9) | | | | 2,529 | | | | | 35,854 | |
Accounting services fees | | | | 2,348 | | | | | 51,644 | |
Custodian fees | | | | 344 | | | | | 8,491 | |
Other expenses | | | | 3,233 | | | | | 10,200 | |
| | | |
| | | |
| |
Total expenses before waivers and related reimbursements | | | | 207,117 | | | | | 1,370,685 | |
Recoupment of Fund expenses paid by Adviser (Note 3) | | | | — | | | | | 78 | |
Less waivers and related reimbursements (Note 3) | | | | (72,289 | ) | | | | (10,559 | ) |
| | | |
| | | |
| |
Total expenses after waivers and related reimbursements | | | | 134,828 | | | | | 1,360,204 | |
| | | |
| | | |
| |
Net Investment Income (Loss) | | | | (72,307 | ) | | | | 6,316,147 | |
| | | |
| | | |
| |
| Net Realized and Unrealized Gain (Loss) on Investments | | | | | | | | | | |
Net Realized Loss on Investment Transactions | | | | (1,025,264 | ) | | | | (1,364,631 | ) |
Change in Net Unrealized Appreciation/Depreciation of Investments | | | | 2,748,938 | | | | | 7,802,219 | |
| | | |
| | | |
| |
Net Gain on Investments | | | | 1,723,674 | | | | | 6,437,588 | |
| | | |
| | | |
| |
| Net Increase in Net Assets Resulting from Operations | | | $ | 1,651,367 | | | | $ | 12,753,735 | |
| | | |
| | | |
| |
| | |
|
| 1 | Net of foreign taxes withheld of $0 and $127,740 for the FBR Technology Fund and FBR Gas Utility Index Fund, respectively. |
| | |
| The accompanying notes are an integral part of the financial statements. |
80
The FBR Funds
Statements of Changes in Net Assets
| | | FBR Pegasus FundTM | | FBR Pegasus Mid Cap FundTM |
| | |
| |
|
| | | For the | | For the | | For the | | For the |
| | | Year | | Year | | Year | | Year |
| | | Ended | | Ended | | Ended | | Ended |
| | | October 31, | | October 31, | | October 31, | | October 31, |
| | | 2009 | | 2008 | | 2009 | | 2008 |
| | |
| |
| |
| |
|
| From Investment Activities | | | | | | | | | | | | | | | | | | | | |
Net Investment Income (Loss) | | | $ | 76,796 | | | | $ | 45,953 | | | | $ | 24,585 | | | | $ | (5,243 | ) |
Net Realized Gain (Loss) on Investment Transactions | | | | 480,306 | | | | | (865,416 | ) | | | | (240,244 | ) | | | | (104,237 | ) |
Change in Net Unrealized Appreciation/Depreciation of Investments | | | | 2,799,062 | | | | | (2,374,702 | ) | | | | 1,527,785 | | | | | (1,370,588 | ) |
| | | |
| | | |
| | | |
| | | |
| |
Net Increase (Decrease) in Net Assets Resulting from Operations | | | | 3,356,164 | | | | | (3,194,165 | ) | | | | 1,312,126 | | | | | (1,480,068 | ) |
| | | |
| | | |
| | | |
| | | |
| |
| Distributions to Shareholders | | | | | | | | | | | | | | | | | | | | |
Distributions to Investor Class Shareholders: | | | | | | | | | | | | | | | | | | | | |
From Net Investment Income | | | | (37,990 | ) | | | | — | | | | | (7,042 | ) | | | | — | |
From Net Realized Gain on Investments | | | | — | | | | | (1,227,692 | ) | | | | (63,787 | ) | | | | (45,373 | ) |
Distributions to I Class Shareholders: | | | | | | | | | | | | | | | | | | | | |
From Net Investment Income | | | | (633 | ) | | | | — | | | | | (290 | ) | | | | — | |
From Net Realized Gain on Investments | | | | — | | | | | — | | | | | (1,220 | ) | | | | — | |
| | | |
| | | |
| | | |
| | | |
| |
Total Distributions to Shareholders | | | | (38,623 | ) | | | | (1,227,692 | ) | | | | (72,339 | ) | | | | (45,373 | ) |
| | | |
| | | |
| | | |
| | | |
| |
| From Share Transactions | | | | | | | | | | | | | | | | | | | | |
Net Increase (Decrease) in Net Assets | | | | | | | | | | | | | | | | | | | | |
Resulting from Share Transactions | | | | 11,083,718 | | | | | (3,970,132 | ) | | | | 1,432,525 | | | | | 1,831,335 | |
| | | |
| | | |
| | | |
| | | |
| |
Total Increase (Decrease) in Net Assets | | | | 14,401,259 | | | | | (8,391,989 | ) | | | | 2,672,312 | | | | | 305,894 | |
| Net Assets – Beginning of Year | | | | 4,644,873 | | | | | 13,036,862 | | | | | 4,178,721 | | | | | 3,872,827 | |
| | | |
| | | |
| | | |
| | | |
| |
| Net Assets – End of Year | | | $ | 19,046,132 | | | | $ | 4,644,873 | | | | $ | 6,851,033 | | | | $ | 4,178,721 | |
| | | |
| | | |
| | | |
| | | |
| |
| Accumulated Net Investment Income | | | $ | 66,653 | | | | $ | 28,480 | | | | $ | 13,890 | | | | $ | — | |
| | | |
| | | |
| | | |
| | | |
| |
81
The FBR Funds
Statements of Changes in Net Assets (continued)
| | | FBR Pegasus | | FBR Pegasus |
| | | Small Cap FundTM | | Small Cap Growth FundTM |
| | |
| |
|
| | | For the | | For the | | For the | | For the |
| | | Year | | Year | | Year | | Year |
| | | Ended | | Ended | | Ended | | Ended |
| | | October 31, | | October 31, | | October 31, | | October 31, |
| | | 2009 | | 2008 | | 2009 | | 2008 |
| | |
| |
| |
| |
|
| From Investment Activities | | | | | | | | | | | | | | | | | | | | |
Net Investment Income (Loss) | | | $ | 7,597 | | | | $ | (16,895 | ) | | | $ | (40,017 | ) | | | $ | (50,863 | ) |
Net Realized Gain (Loss) on Investment Transactions | | | | 460,160 | | | | | (215,521 | ) | | | | (323,681 | ) | | | | (113,150 | ) |
Net Increase from Payments by Affiliates | | | | 7,834 | | | | | — | | | | | — | | | | | — | |
Change in Net Unrealized Appreciation/Depreciation of Investments | | | | 1,334,877 | | | | | (1,305,323 | ) | | | | 1,205,060 | | | | | (1,745,044 | ) |
| | | |
| | | |
| | | |
| | | |
| |
Net Increase (Decrease) in Net Assets Resulting from Operations | | | | 1,810,468 | | | | | (1,537,739 | ) | | | | 841,362 | | | | | (1,909,057 | ) |
| | | |
| | | |
| | | |
| | | |
| |
| Distributions to Investor Class Shareholders | | | | | | | | | | | | | | | | | | | | |
From Net Realized Gain on Investments | | | | — | | | | | (18,282 | ) | | | | — | | | | | (184,307 | ) |
| | | |
| | | |
| | | |
| | | |
| |
| From Share Transactions | | | | | | | | | | | | | | | | | | | | |
Net Increase (Decrease) in Net Assets Resulting from Share Transactions | | | | 4,786,292 | | | | | 730,763 | | | | | 1,806,900 | | | | | (383,014 | ) |
| | | |
| | | |
| | | |
| | | |
| |
Total Increase (Decrease) in Net Assets | | | | 6,596,760 | | | | | (825,258 | ) | | | | 2,648,262 | | | | | (2,476,378 | ) |
| Net Assets – Beginning of Year | | | | 4,074,456 | | | | | 4,899,714 | | | | | 2,974,251 | | | | | 5,450,629 | |
| | | |
| | | |
| | | |
| | | |
| |
| Net Assets – End of Year | | | $ | 10,671,216 | | | | $ | 4,074,456 | | | | $ | 5,622,513 | | | | $ | 2,974,251 | |
| | | |
| | | |
| | | |
| | | |
| |
| Accumulated Net Investment Income | | | $ | 7,553 | | | | $ | — | | | | $ | — | | | | $ | — | |
| | | |
| | | |
| | | |
| | | |
| |
82
The FBR Funds
Statements of Changes in Net Assets (continued)
| | | | | | | | | | | FBR Large Cap | | FBR Small Cap |
| | | FBR Focus Fund | | Financial Fund | | Financial Fund |
| | |
| |
| |
|
| | | For the | | For the | | For the | | For the | | For the | | For the |
| | | Year | | Year | | Year | | Year | | Year | | Year |
| | | Ended | | Ended | | Ended | | Ended | | Ended | | Ended |
| | | October 31, | | October 31, | | October 31, | | October 31, | | October 31, | | October 31, |
| | | 2009 | | 2008 | | 2009 | | 2008 | | 2009 | | 2008 |
| | |
| |
| |
| |
| |
| |
|
| From Investment Activities | | | | | | | | | | | | | | | | | | | | | | | | |
Net Investment Income (Loss) | | $ | (8,778,696 | ) | | $ | (7,451,904 | ) | | $ | (19,601 | ) | | $ | 263,207 | | | $ | 875,755 | | | $ | 2,926,458 | |
Net Realized Gain (Loss) on Investments and Foreign Currency Transactions | | | | | | | | | | | | | | | | | | | | | | | | |
Unaffiliated Issuers | | | (8,245,318 | ) | | | 107,376,971 | | | | (2,227,359 | ) | | | (4,360,933 | ) | | | (2,794,592 | ) | | | (8,683,919 | ) |
Affiliated Issuers | | | (1,332,056 | ) | | | 306,220 | | | | — | | | | — | | | | — | | | | — | |
Change in Net Unrealized Appreciation/Depreciation of Investments | | | 151,576,458 | | | | (561,328,510 | ) | | | 4,061,503 | | | | (144,204 | ) | | | 6,960,944 | | | | (6,492,140 | ) |
| | |
| | |
| | |
| | |
| | |
| | |
| |
Net Increase (Decrease) in Net Assets Resulting from Operations | | | 133,220,388 | | | | (461,097,223 | ) | | | 1,814,543 | | | | (4,241,930 | ) | | | 5,042,107 | | | | (12,249,601 | ) |
| | |
| | |
| | |
| | |
| | |
| | |
| |
| Distributions to Shareholders | | | | | | | | | | | | | | | | | | | | | | | | |
Distributions to Investor Class Shareholders: | | | | | | | | | | | | | | | | | | | | | | | | |
From Net Investment Income | | | — | | | | (3,048,132 | ) | | | (201,208 | ) | | | (177,807 | ) | | | (2,340,676 | ) | | | (2,225,546 | ) |
Distribution in Excess of Net Investment Income | | | — | | | | — | | | | (42,309 | ) | | | — | | | | — | | | | — | |
From Net Realized Gain on Investments | | | (96,017,062 | ) | | | (13,064,697 | ) | | | — | | | | (2,910,983 | ) | | | — | | | | (36,692,651 | ) |
Distributions to I Class Shareholders: | | | | | | | | | | | | | | | | | | | | | | | | |
From Net Investment Income | | | — | | | | — | | | | — | | | | — | | | | (2,105 | ) | | | — | |
From Net Realized Gain on Investments | | | (10,311,502 | ) | | | — | | | | — | | | | — | | | | — | | | | — | |
Distributions to R Class Shareholders: | | | | | | | | | | | | | | | | | | | | | | | | |
From Net Investment Income | | | — | | | | — | | | | — | | | | — | | | | (1,617 | ) | | | — | |
From Net Realized Gain on Investments | | | (51,918 | ) | | | — | | | | — | | | | — | | | | — | | | | — | |
| | |
| | |
| | |
| | |
| | |
| | |
| |
Total Distributions to Shareholders | | | (106,380,482 | ) | | | (16,112,829 | ) | | | (243,517 | ) | | | (3,088,790 | ) | | | (2,344,398 | ) | | | (38,918,197 | ) |
| | |
| | |
| | |
| | |
| | |
| | |
| |
| From Share Transactions | | | | | | | | | | | | | | | | | | | | | | | | |
Net Increase (Decrease) in Net Assets Resulting from Share Transactions | | | 32,641,257 | | | | (344,445,550 | ) | | | 11,351,949 | | | | 15,651,691 | | | | 9,773,292 | | | | 92,808,229 | |
| | |
| | |
| | |
| | |
| | |
| | |
| |
Total Increase (Decrease) in Net Assets | | | 59,481,163 | | | | (821,655,602 | ) | | | 12,922,975 | | | | 8,320,971 | | | | 12,471,001 | | | | 41,640,431 | |
| Net Assets – Beginning of Year | | | 734,683,841 | | | | 1,556,339,443 | | | | 24,272,112 | | | | 15,951,141 | | | | 185,854,664 | | | | 144,214,233 | |
| | |
| | |
| | |
| | |
| | |
| | |
| |
| Net Assets – End of Year | | $ | 794,165,004 | | | $ | 734,683,841 | | | $ | 37,195,087 | | | $ | 24,272,112 | | | $ | 198,325,665 | | | $ | 185,854,664 | |
| | |
| | |
| | |
| | |
| | |
| | |
| |
| Accumulated Net Investment Income | | $ | — | | | $ | — | | | $ | — | | | $ | 201,208 | | | $ | 537,355 | | | $ | 2,020,677 | |
| | |
| | |
| | |
| | |
| | |
| | |
| |
83
The FBR Funds
Statements of Changes in Net Assets (continued)
| | | | | FBR Gas Utility |
| | | FBR Technology Fund | | Index Fund |
| | |
| |
|
| | | For the | | For the | | For the | | For the |
| | | Year | | Year | | Year | | Year |
| | | Ended | | Ended | | Ended | | Ended |
| | | October 31, | | October 31, | | October 31, | | October 31, |
| | | 2009 | | 2008 | | 2009 | | 2008 |
| | |
| |
| |
| |
|
| From Investment Activities | | | | | | | | | | | | | | | | | | | | |
Net Investment Income (Loss) | | | $ | (72,307 | ) | | | $ | (129,045 | ) | | | $ | 6,316,147 | | | | $ | 6,280,430 | |
Net Realized Gain (Loss) on Investment Transactions | | | | (1,025,264 | ) | | | | (4,038,866 | ) | | | | (1,364,631 | ) | | | | 7,401,347 | |
Change in Net Unrealized Appreciation/Depreciation of Investments | | | | 2,748,938 | | | | | (5,504,400 | ) | | | | 7,802,219 | | | | | (90,938,539 | ) |
| | | |
| | | |
| | | |
| | | |
| |
Net Increase (Decrease) in Net Assets Resulting from Operations | | | | 1,651,367 | | | | | (9,672,311 | ) | | | | 12,753,735 | | | | | (77,256,762 | ) |
| | | |
| | | |
| | | |
| | | |
| |
| Distributions to Shareholders | | | | | | | | | | | | | | | | | | | | |
Distributions to Investor Class Shareholders: | | | | | | | | | | | | | | | | | | | | |
From Net Investment Income | | | | — | | | | | — | | | | | (6,295,985 | ) | | | | (6,287,721 | ) |
From Net Realized Gain on Investments | | | | — | | | | | (3,527,911 | ) | | | | (9,577,973 | ) | | | | (21,582,320 | ) |
Distributions to R Class Shareholders: | | | | | | | | | | | | | | | | | | | | |
From Net Investment Income | | | | — | | | | | — | | | | | (5,532 | ) | | | | (703 | ) |
From Net Realized Gain on Investments | | | | — | | | | | — | | | | | (7,498 | ) | | | | — | |
| | | |
| | | |
| | | |
| | | |
| |
Total Distributions to Shareholders | | | | — | | | | | (3,527,911 | ) | | | | (15,886,988 | ) | | | | (27,870,744 | ) |
| | | |
| | | |
| | | |
| | | |
| |
| From Share Transactions | | | | | | | | | | | | | | | | | | | | |
Net Increase (Decrease) in Net Assets Resulting from Share Transactions | | | | (952,425 | ) | | | | (20,045,495 | ) | | | | (1,738,294 | ) | | | | 17,817,133 | |
| | | |
| | | |
| | | |
| | | |
| |
Total Decrease in Net Assets | | | | 698,942 | | | | | (33,245,717 | ) | | | | (4,871,547 | ) | | | | (87,310,373 | ) |
| Net Assets – Beginning of Year | | | | 7,689,121 | | | | | 40,934,838 | | | | | 198,640,797 | | | | | 285,951,170 | |
| | | |
| | | |
| | | |
| | | |
| |
| Net Assets – End of Year | | | $ | 8,388,063 | | | | $ | 7,689,121 | | | | $ | 193,769,250 | | | | $ | 198,640,797 | |
| | | |
| | | |
| | | |
| | | |
| |
| Accumulated Net Investment Income | | | $ | — | | | | $ | — | | | | $ | 94,170 | | | | $ | 79,540 | |
| | | |
| | | |
| | | |
| | | |
| |
The accompanying notes are an integral part of the financial statements.
84
The FBR Funds
Financial Highlights
The following tables provide per share data for a share outstanding throughout each period for each Fund. Other data includes investment performance, ratios to average net assets and other supplemental information.
| | | FBR Pegasus FundTM — Investor Class |
| | |
|
| | | | | | | | | | | | | For the |
| | | | | | | Period |
| | | For the Years Ended October 31, | | Ended |
| | |
| | October 31, |
| | | 2009 | | 2008 | | 2007 | | 2006* |
| | |
| |
| |
| |
|
| Per Share Operating Performance: | | | | | | | | | | | | | | | | |
Net Asset Value – Beginning of Period | | $ | 8.14 | | | $ | 13.40 | | | $ | 11.84 | | | $ | 10.00 | |
| | |
| | |
| | |
| | |
| |
Income (Loss) from Investment Operations: | | | | | | | | | | | | | | | | |
Net Investment Income (Loss)1,2 | | | 0.03 | | | | 0.08 | | | | (0.04 | ) | | | (0.01 | ) |
Net Realized and Unrealized Gain (Loss) on Investments1,3 | | | 1.60 | | | | (4.05 | ) | | | 2.05 | | | | 1.84 | |
| | |
| | |
| | |
| | |
| |
Total from Investment Operations | | | 1.63 | | | | (3.97 | ) | | | 2.01 | | | | 1.83 | |
| | |
| | |
| | |
| | |
| |
Distributions to Shareholders: | | | | | | | | | | | | | | | | |
From Net Investment Income | | | (0.05 | ) | | | — | | | | — | | | | (0.00 | )4 |
From Net Realized Gain | | | — | | | | (1.30 | ) | | | (0.45 | ) | | | — | |
| | |
| | |
| | |
| | |
| |
Total Distributions | | | (0.05 | ) | | | (1.30 | ) | | | (0.45 | ) | | | (0.00 | )4 |
| | |
| | |
| | |
| | |
| |
Paid-in Capital from Redemption Fees5 | | | 0.00 | 4 | | | 0.01 | | | | 0.00 | 4 | | | 0.01 | |
| | |
| | |
| | |
| | |
| |
Net Increase (Decrease) in Net Asset Value | | | 1.58 | | | | (5.26 | ) | | | 1.56 | | | | 1.84 | |
| | |
| | |
| | |
| | |
| |
Net Asset Value – End of Period | | $ | 9.72 | | | $ | 8.14 | | | $ | 13.40 | | | $ | 11.84 | |
| | |
| | |
| | |
| | |
| |
| Total Investment Return6 | | | 20.12% | | | | (32.37)% | | | | 17.52% | | | | 18.45% | (A) |
| Ratios to Average Net Assets: | | | | | | | | | | | | | | | | |
Expenses After Waivers and Related Reimbursements2 | | | 1.25% | | | | 1.71% | | | | 1.97% | | | | 1.94% | (B) |
Expenses Before Waivers and Related Reimbursements | | | 2.16% | | | | 2.55% | | | | 2.21% | | | | 2.74% | (B) |
Net Investment Income (Loss) After Waivers and Related | | | | | | | | | | | | | | | | |
Reimbursements2 | | | 0.61% | | | | 0.51% | | | | (0.30)% | | | | (0.23)% | (B) |
Net Investment Loss Before Waivers and Related Reimbursements | | | (0.30)% | | | | (0.33)% | | | | (0.54)% | | | | (1.03)% | (B) |
| Supplementary Data: | | | | | | | | | | | | | | | | |
Portfolio Turnover Rate | | | 60% | | | | 39% | | | | 108% | | | | 166% | (A) |
Net Assets at End of Period (in thousands) | | $ | 18,947 | | | $ | 4,574 | | | $ | 13,037 | | | $ | 13,349 | |
|
| * | | Represents the period from commencement of operations (November 15, 2005) through October 31, 2006. |
| 1 | | Calculated based on shares outstanding on the first and last day of the respective periods, except for dividends and distributions, if any, which are based on the actual shares outstanding on the dates of distributions. |
| 2 | | Prior to May 30, 2008, reflects fees waived and reimbursed by FBR Fund Advisers, Inc. pursuant to a contractual expense limitation of 1.95% (excluding interest, taxes, brokerage commissions, dividend expenses, acquired fund fees and expenses, extraordinary legal expenses, or any other extraordinary expenses). As of May 30, 2008, reflects fees waived and reimbursed by FBR Fund Advisers, Inc. pursuant to a contractual expense limitation of 1.25% (excluding interest, taxes, brokerage commissions, dividend expenses, acquired fund fees and expenses, extraordinary legal expenses, or any other extraordinary expenses). |
| 3 | | The amounts shown for a share outstanding throughout the period may not be in accordance with the changes in the aggregate gains and losses on investments during the period because of the timing of sales and repurchases of Fund shares in relation to fluctuating net asset values during the period. |
| 4 | | Less than $0.01 |
| 5 | | Calculated based on average shares outstanding. |
| 6 | | Total investment return is calculated assuming a purchase of shares on the first day and a sale on the last day of each period reported and will include reinvestment of dividends and distributions, if any. |
| (A) | | Not Annualized |
| (B) | | Annualized |
85
The FBR Funds
Financial Highlights (continued)
| | | FBR Pegasus FundTM — I Class |
| | |
|
| | | For the | | For the |
| | | Year Ended | | Period Ended |
| | | October 31, 2009 | | October 31, 2008* |
| | |
| |
|
| Per Share Operating Performance: | | | | | | | | | | |
Net Asset Value – Beginning of Period | | | $ | 7.07 | | | | $ | 10.00 | |
| | | |
| | | |
| |
Income (Loss) from Investment Operations: | | | | | | | | | | |
Net Investment Income1,2 | | | | 0.07 | | | | | 0.03 | |
Net Realized and Unrealized Gain (Loss) on Investments1,3 | | | | 1.34 | | | | | (2.96 | ) |
| | | |
| | | |
| |
Total from Investment Operations | | | | 1.41 | | | | | (2.93 | ) |
| | | |
| | | |
| |
Distributions to Shareholders: | | | | | | | | | | |
From Net Investment Income | | | | (0.06 | ) | | | | — | |
| | | |
| | | |
| |
Net Increase (Decrease) in Net Asset Value | | | | 1.35 | | | | | (2.93 | ) |
| | | |
| | | |
| |
Net Asset Value – End of Period | | | $ | 8.42 | | | | $ | 7.07 | |
| | | |
| | | |
| |
| Total Investment Return4 | | | | 20.21% | | | | | (29.30)% | (A) |
| Ratios to Average Net Assets: | | | | | | | | | | |
Expenses After Waivers and Related Reimbursements2 | | | | 1.00% | | | | | 1.01% | (B) |
Expenses Before Waivers and Related Reimbursements | | | | 16.64% | | | | | 4.11% | (B) |
Net Investment Income After Waivers and Related Reimbursements2 | | | | 1.05% | | | | | 0.88% | (B) |
Net Investment Loss Before Waivers and Related Reimbursements | | | | (14.59)% | | | | | (2.22)% | (B) |
| Supplementary Data: | | | | | | | | | | |
Portfolio Turnover Rate | | | | 60% | | | | | 39% | |
Net Assets at End of Period (in thousands) | | | $ | 99 | | | | $ | 71 | |
|
| * | | Represents the period from inception of share class (May 30, 2008) through October 31, 2008. |
| 1 | | Calculated based on shares outstanding on the first and last day of the period, except for dividends and distributions, if any, which are based on the actual shares outstanding on the dates of distributions. |
| 2 | | Reflects fees waived and reimbursed by FBR Fund Advisers, Inc. pursuant to a contractual expense limitation of 1.00% (excluding interest, taxes, brokerage commissions, dividend expenses, acquired fund fees and expenses, extraordinary legal expenses, or any other extraordinary expenses). |
| 3 | | The amounts shown for a share outstanding throughout the period may not be in accordance with the changes in the aggregate gains and losses on investments during the period because of the timing of sales and repurchases of Fund shares in relation to fluctuating net asset values during the period. |
| 4 | | Total investment return is calculated assuming a purchase of shares on the first day and a sale on the last day of each period reported and will include reinvestment of dividends and distributions, if any. |
| (A) | | Not Annualized |
| (B) | | Annualized |
86
The FBR Funds
Financial Highlights (continued)
| | | FBR Pegasus Mid Cap FundTM — Investor Class |
| | |
|
| | | For the Years Ended October 31, | | For the |
| | |
| | Period Ended |
| | | 2009 | | 2008 | | October 31, 2007* |
| | |
| |
| |
|
| Per Share Operating Performance: | | | | | | | | | | | | | | | |
Net Asset Value – Beginning of Period | | | $ | 8.18 | | | | $ | 11.30 | | | | $ | 10.00 | |
| | | |
| | | |
| | | |
| |
Income (Loss) from Investment Operations: | | | | | | | | | | | | | | | |
Net Investment Income (Loss)1,2 | | | | 0.04 | | | | | (0.01 | ) | | | | (0.02 | ) |
Net Realized and Unrealized Gain (Loss) on Investments1,3 | | | | 1.43 | | | | | (3.00 | ) | | | | 1.32 | |
| | | |
| | | |
| | | |
| |
Total from Investment Operations | | | | 1.47 | | | | | (3.01 | ) | | | | 1.30 | |
| | | |
| | | |
| | | |
| |
Distributions to Shareholders: | | | | | | | | | | | | | | | |
From Net Investment Income | | | | (0.01 | ) | | | | — | | | | | — | |
From Net Realized Gain | | | | (0.12 | ) | | | | (0.13 | ) | | | | — | |
| | | |
| | | |
| | | |
| |
Total Distributions | | | | (0.13 | ) | | | | (0.13 | ) | | | | — | |
| | | |
| | | |
| | | |
| |
Paid-in Capital from Redemption Fees4 | | | | 0.01 | | | | | 0.02 | | | | | 0.00 | 5 |
| | | |
| | | |
| | | |
| |
Net Increase (Decrease) in Net Asset Value | | | | 1.35 | | | | | (3.12 | ) | | | | 1.30 | |
| | | |
| | | |
| | | |
| |
Net Asset Value – End of Period | | | $ | 9.53 | | | | $ | 8.18 | | | | $ | 11.30 | |
| | | |
| | | |
| | | |
| |
| Total Investment Return6 | | | | 18.51% | | | | | (26.71)% | | | | | 13.00% | (A) |
| Ratios to Average Net Assets: | | | | | | | | | | | | | | | |
Expenses After Waivers and Related Reimbursements2 | | | | 1.35% | | | | | 1.66% | | | | | 1.95% | (B) |
Expenses Before Waivers and Related Reimbursements | | | | 2.95% | | | | | 3.71% | | | | | 4.17% | (B) |
Net Investment Income (Loss) After Waivers and Related | | | | | | | | | | | | | | | |
Reimbursements2 | | | | 0.39% | | | | | (0.13)% | | | | | (0.36)% | (B) |
Net Investment Loss Before Waivers and Related Reimbursements | | | | (1.21)% | | | | | (2.18)% | | | | | (2.58)% | (B) |
| Supplementary Data: | | | | | | | | | | | | | | | |
Portfolio Turnover Rate | | | | 128% | | | | | 93% | | | | | 135% | (A) |
Net Assets at End of Period (in thousands) | | | $ | 6,767 | | | | $ | 4,108 | | | | $ | 3,873 | |
|
| * | | Represents the period from commencement of operations (February 28, 2007) through October 31, 2007. |
| 1 | | Calculated based on shares outstanding on the first and last day of the respective periods, except for dividends and distributions, if any, which are based on the actual shares outstanding on the dates of distributions. |
| 2 | | Prior to May 30, 2008, reflects fees waived and reimbursed by FBR Fund Advisers, Inc. pursuant to a contractual expense limitation of 1.95% (excluding interest, taxes, brokerage commissions, dividend expenses, acquired fund fees and expenses, extraordinary legal expenses, or any other extraordinary expenses). As of May 30, 2008, reflects fees waived and reimbursed by FBR Fund Advisers, Inc. pursuant to a contractual expense limitation of 1.35% (excluding interest, taxes, brokerage commissions, dividend expenses, acquired fund fees and expenses, extraordinary legal expenses, or any other extraordinary expenses). |
| 3 | | The amounts shown for a share outstanding throughout the period may not be in accordance with the changes in the aggregate gains and losses on investments during the period because of the timing of sales and repurchases of Fund shares in relation to fluctuating net asset values during the period. |
| 4 | | Calculated based on average shares outstanding. |
| 5 | | Less than $0.01 |
| 6 | | Total investment return is calculated assuming a purchase of shares on the first day and a sale on the last day of each period reported and will include reinvestment of dividends and distributions, if any. |
| (A) | | Not Annualized |
| (B) | | Annualized |
87
The FBR Funds
Financial Highlights (continued)
| | | FBR Pegasus Mid Cap FundTM — I Class |
| | |
|
| | | For the | | For the |
| | | Year Ended | | Period Ended |
| | | October 31, 2009 | | October 31, 2008* |
| | |
| |
|
| Per Share Operating Performance: | | | | | | | | | | |
Net Asset Value – Beginning of Period | | | $ | 7.11 | | | | $ | 10.00 | |
| | | |
| | | |
| |
Income (Loss) from Investment Operations: | | | | | | | | | | |
Net Investment Income1,2 | | | | 0.05 | | | | | 0.02 | |
Net Realized and Unrealized Gain (Loss) on Investments1,3 | | | | 1.25 | | | | | (2.91 | ) |
| | | |
| | | |
| |
Total from Investment Operations | | | | 1.30 | | | | | (2.89 | ) |
| | | |
| | | |
| |
Distributions to Shareholders: | | | | | | | | | | |
From Net Investment Income | | | | (0.03 | ) | | | | — | |
From Net Realized Gain | | | | (0.12 | ) | | | | — | |
| | | |
| | | |
| |
Total Distributions | | | | (0.15 | ) | | | | — | |
| | | |
| | | |
| |
Net Increase (Decrease) in Net Asset Value | | | | 1.15 | | | | | (2.89 | ) |
| | | |
| | | |
| |
Net Asset Value – End of Period | | | $ | 8.26 | | | | $ | 7.11 | |
| | | |
| | | |
| |
| Total Investment Return4 | | | | 18.78% | | | | | (28.90)% | (A) |
| Ratios to Average Net Assets: | | | | | | | | | | |
Expenses After Waivers and Related Reimbursements2 | | | | 1.10% | | | | | 1.10% | (B) |
Expenses Before Waivers and Related Reimbursements | | | | 16.91% | | | | | 4.54% | (B) |
Net Investment Income After Waivers and Related Reimbursements2 | | | | 0.69% | | | | | 0.47% | (B) |
Net Investment Loss Before Waivers and Related Reimbursements | | | | (15.12)% | | | | | (2.97)% | (B) |
| Supplementary Data: | | | | | | | | | | |
Portfolio Turnover Rate | | | | 128% | | | | | 93% | |
Net Assets at End of Period (in thousands) | | | $ | 84 | | | | $ | 71 | |
|
| * | | Represents the period from inception of share class (May 30, 2008) through October 31, 2008. |
| 1 | | Calculated based on shares outstanding on the first and last day of the period, except for dividends and distributions, if any, which are based on the actual shares outstanding on the dates of distributions. |
| 2 | | Reflects fees waived and reimbursed by FBR Fund Advisers, Inc. pursuant to a contractual expense limitation of 1.10% (excluding interest, taxes, brokerage commissions, dividend expenses, acquired fund fees and expenses, extraordinary legal expenses, or any other extraordinary expenses). |
| 3 | | The amounts shown for a share outstanding throughout the period may not be in accordance with the changes in the aggregate gains and losses on investments during the period because of the timing of sales and repurchases of Fund shares in relation to fluctuating net asset values during the period. |
| 4 | | Total investment return is calculated assuming a purchase of shares on the first day and a sale on the last day of each period reported and will include reinvestment of dividends and distributions, if any. |
| (A) | | Not Annualized |
| (B) | | Annualized |
88
The FBR Funds
Financial Highlights (continued)
| | | FBR Pegasus Small Cap FundTM — Investor Class |
| | |
|
| | | For the Years Ended October 31, | | For the |
| | |
| | Period Ended |
| | | 2009 | | 2008 | | October 31, 2007* |
| | |
| |
| |
|
| Per Share Operating Performance: | | | | | | | | | | | | | | | |
Net Asset Value – Beginning of Period | | | $ | 8.44 | | | | $ | 11.85 | | | | $ | 10.00 | |
| | | |
| | | |
| | | |
| |
Income (Loss) from Investment Operations: | | | | | | | | | | | | | | | |
Net Investment Income (Loss)1,2 | | | | 0.01 | | | | | (0.03 | ) | | | | (0.04 | ) |
Net Realized and Unrealized Gain (Loss) on Investments1,3 | | | | 1.04 | | | | | (3.35 | ) | | | | 1.89 | |
Net Increase from Payments by Affiliates | | | | 0.01 | | | | | — | | | | | — | |
| | | |
| | | |
| | | |
| |
Total from Investment Operations | | | | 1.06 | | | | | (3.38 | ) | | | | 1.85 | |
| | | |
| | | |
| | | |
| |
Distributions to Shareholders: | | | | | | | | | | | | | | | |
From Net Realized Gain | | | | — | | | | | (0.04 | ) | | | | — | |
| | | |
| | | |
| | | |
| |
Paid-in Capital from Redemption Fees4 | | | | 0.01 | | | | | 0.01 | | | | | 0.00 | 5 |
| | | |
| | | |
| | | |
| |
Net Increase (Decrease) in Net Asset Value | | | | 1.07 | | | | | (3.41 | ) | | | | 1.85 | |
| | | |
| | | |
| | | |
| |
Net Asset Value – End of Period | | | $ | 9.51 | | | | $ | 8.44 | | | | $ | 11.85 | |
| | | |
| | | |
| | | |
| |
| Total Investment Return6 | | | | 12.68% | 7 | | | | (28.49)% | | | | | 18.50% | (A) |
| Ratios to Average Net Assets: | | | | | | | | | | | | | | | |
Expenses After Waivers and Related Reimbursements2 | | | | 1.46% | | | | | 1.74% | | | | | 1.95% | (B) |
Expenses Before Waivers and Related Reimbursements | | | | 2.73% | | | | | 3.55% | | | | | 3.77% | (B) |
Net Investment Income (Loss) After Waivers and Related Reimbursements2 | | | | 0.10% | | | | | (0.36)% | | | | | (0.61)% | (B) |
Net Investment Loss Before Waivers and Related Reimbursements | | | | (1.17)% | | | | | (2.17)% | | | | | (2.43)% | (B) |
| Supplementary Data: | | | | | | | | | | | | | | | |
Portfolio Turnover Rate | | | | 226% | | | | | 207% | | | | | 107% | (A) |
Net Assets at End of Period (in thousands) | | | $ | 10,585 | | | | $ | 3,998 | | | | $ | 4,900 | |
|
| * | | Represents the period from commencement of operations (February 28, 2007) through October 31, 2007. |
| 1 | | Calculated based on shares outstanding on the first and last day of the respective periods, except for dividends and distributions, if any, which are based on the actual shares outstanding on the dates of distributions. |
| 2 | | Prior to May 30, 2008, reflects fees waived and reimbursed by FBR Fund Advisers, Inc. pursuant to a contractual expense limitation of 1.95% (excluding interest, taxes, brokerage commissions, dividend expenses, acquired fund fees and expenses, extraordinary legal expenses, or any other extraordinary expenses). As of May 30, 2008, reflects fees waived and reimbursed by FBR Fund Advisers, Inc. pursuant to a contractual expense limitation of 1.45% (excluding interest, taxes, brokerage commissions, dividend expenses, acquired fund fees and expenses, extraordinary legal expenses, or any other extraordinary expenses). |
| 3 | | The amounts shown for a share outstanding throughout the period may not be in accordance with the changes in the aggregate gains and losses on investments during the period because of the timing of sales and repurchases of Fund shares in relation to fluctuating net asset values during the period. |
| 4 | | Calculated based on average shares outstanding. |
| 5 | | Less than $0.01 |
| 6 | | Total investment return is calculated assuming a purchase of shares on the first day and a sale on the last day of each period reported and will include reinvestment of dividends and distributions, if any. |
| 7 | | The Fund’s total return consists of a voluntary reimbursement by the Adviser for a realized loss on a transaction not meeting the Fund’s investment guidelines. This item had an impact of 0.12%. If the Adviser had not made a capital contribution to the Fund, the total return would have been 12.56%. See Note 8. |
| (A) | | Not Annualized |
| (B) | | Annualized |
89
The FBR Funds
Financial Highlights (continued)
| | | FBR Pegasus Small Cap FundTM — I Class |
| | |
|
| | | For the | | For the |
| | | Year Ended | | Period Ended |
| | | October 31, 2009 | | October 31, 2008* |
| | |
| |
|
| Per Share Operating Performance: | | | | | | | | | | |
Net Asset Value – Beginning of Period | | | $ | 7.62 | | | | $ | 10.00 | |
| | | |
| | | |
| |
Income (Loss) from Investment Operations: | | | | | | | | | | |
Net Investment Income1,2 | | | | 0.03 | | | | | 0.01 | |
Net Realized and Unrealized Gain (Loss) on Investments1,3 | | | | 0.93 | | | | | (2.39 | ) |
Net Increase from Payments by Affiliates | | | | 0.01 | | | | | — | |
| | | |
| | | |
| |
Total from Investment Operations | | | | 0.97 | | | | | (2.38 | ) |
| | | |
| | | |
| |
Net Asset Value – End of Period | | | $ | 8.59 | | | | $ | 7.62 | |
| | | |
| | | |
| |
| Total Investment Return4 | | | | 12.73% | 5 | | | | (23.80)% | (A) |
| Ratios to Average Net Assets: | | | | | | | | | | |
Expenses After Waivers and Related Reimbursements2 | | | | 1.20% | | | | | 1.20% | (B) |
Expenses Before Waivers and Related Reimbursements | | | | 16.22% | | | | | 4.56% | (B) |
Net Investment Income After Waivers and Related Reimbursements2 | | | | 0.44% | | | | | 0.23% | (B) |
Net Investment Loss Before Waivers and Related Reimbursements | | | | (14.58)% | | | | | (3.13)% | (B) |
| Supplementary Data: | | | | | | | | | | |
Portfolio Turnover Rate | | | | 226% | | | | | 207% | |
Net Assets at End of Period (in thousands) | | | $ | 86 | | | | $ | 76 | |
|
| * | | Represents the period from inception of share class (May 30, 2008) through October 31, 2008. |
| 1 | | Calculated based on shares outstanding on the first and last day of the period, except for dividends and distributions, if any, which are based on the actual shares outstanding on the dates of distributions. |
| 2 | | Reflects fees waived and reimbursed by FBR Fund Advisers, Inc. pursuant to a contractual expense limitation of 1.20% (excluding interest, taxes, brokerage commissions, dividend expenses, acquired fund fees and expenses, extraordinary legal expenses, or any other extraordinary expenses). |
| 3 | | The amounts shown for a share outstanding throughout the period may not be in accordance with the changes in the aggregate gains and losses on investments during the period because of the timing of sales and repurchases of Fund shares in relation to fluctuating net asset values during the period. |
| 4 | | Total investment return is calculated assuming a purchase of shares on the first day and a sale on the last day of each period reported and will include reinvestment of dividends and distributions, if any. |
| 5 | | The Fund’s total return consists of a voluntary reimbursement by the Adviser for a realized loss on a transaction not meeting the Fund’s investment guidelines. This item had an impact of 0.13%. If the Adviser had not made a capital contribution to the Fund, the total return would have been 12.60%. See Note 8. |
| (A) | | Not Annualized |
| (B) | | Annualized |
90
The FBR Funds
Financial Highlights (continued)
| | | | FBR Pegasus Small Cap Growth FundTM — Investor Class |
| | | |
|
| | | | For the Years Ended October 31, |
| | | |
|
| | | | 2009 | | 2008 | | 2007 | | 2006 | | 2005 |
| | | |
| |
| |
| |
| |
|
| Per Share Operating Performance: | | | | | | | | | | | | | | | | | | | | | |
Net Asset Value – Beginning of Year | | | $ | 8.32 | | | $ | 13.56 | | | $ | 11.34 | | | $ | 9.46 | | | $ | 8.88 | |
| | | |
| | |
| | |
| | |
| | |
| |
Income (Loss) from Investment Operations: | | | | | | | | | | | | | | | | | | | | | |
Net Investment Loss1,2 | | | | (0.07 | ) | | | (0.15 | ) | | | (0.19 | ) | | | (0.15 | ) | | | (0.16 | ) |
Net Realized and Unrealized Gain (Loss) on Investments1,3 | | | | 1.59 | | | | (4.64 | ) | | | 2.92 | | | | 2.02 | | | | 0.70 | |
| | | |
| | |
| | |
| | |
| | |
| |
Total from Investment Operations | | | | 1.52 | | | | (4.79 | ) | | | 2.73 | | | | 1.87 | | | | 0.54 | |
| | | |
| | |
| | |
| | |
| | |
| |
Distributions to Shareholders: | | | | | | | | | | | | | | | | | | | | | |
From Net Realized Gain | | | | — | | | | (0.47 | ) | | | (0.52 | ) | | | — | | | | — | |
| | | |
| | |
| | |
| | |
| | |
| |
Paid-in Capital from Redemption Fees4 | | | | 0.01 | | | | 0.02 | | | | 0.01 | | | | 0.01 | | | | 0.04 | |
| | | |
| | |
| | |
| | |
| | |
| |
Net Increase (Decrease) in Net Asset Value | | | | 1.53 | | | | (5.24 | ) | | | 2.22 | | | | 1.88 | | | | 0.58 | |
| | | |
| | |
| | |
| | |
| | |
| |
Net Asset Value – End of Year | | | $ | 9.85 | | | $ | 8.32 | | | $ | 13.56 | | | $ | 11.34 | | | $ | 9.46 | |
| | | |
| | |
| | |
| | |
| | |
| |
| Total Investment Return5 | | | | 18.39% | | | | (36.32)% | | | | 25.06% | | | | 19.87% | | | | 6.53% | |
| Ratios to Average Net Assets: | | | | | | | | | | | | | | | | | | | | | |
Expenses After Waivers and Related Reimbursements2 | | | | 1.45% | | | | 1.76% | | | | 1.95% | | | | 1.95% | | | | 1.95% | |
Expenses Before Waivers and Related Reimbursements | | | | 3.87% | | | | 4.29% | | | | 3.81% | | | | 5.45% | | | | 9.14% | |
Net Investment Loss After Waivers and Related Reimbursements2 | | | | (0.95)% | | | | (1.28)% | | | | (1.65)% | | | | (1.65)% | | | | (1.68)% | |
Net Investment Loss Before Waivers and Related Reimbursements | | | | (3.37)% | | | | (3.81)% | | | | (3.51)% | | | | (5.15)% | | | | (8.87)% | |
| Supplementary Data: | | | | | | | | | | | | | | | | | | | | | |
Portfolio Turnover Rate | | | | 102% | | | | 139% | | | | 108% | | | | 152% | | | | 246% | |
Net Assets at End of Year (in thousands) | | | $ | 5,387 | | | $ | 2,831 | | | $ | 5,451 | | | $ | 3,592 | | | $ | 1,759 | |
|
| 1 | | Calculated based on shares outstanding on the first and last day of the respective periods, except for dividends and distributions, if any, which are based on the actual shares outstanding on the date of distributions. |
| 2 | | Prior to May 30, 2008, reflects fees waived and reimbursed by FBR Fund Advisers, Inc. pursuant to a contractual expense limitation of 1.95% (excluding interest, taxes, brokerage commissions, dividend expenses, acquired fund fees and expenses, extraordinary legal expenses, or any other extraordinary expenses). As of May 30, 2008, reflects fees waived and reimbursed by FBR Fund Advisers, Inc. pursuant to a contractual expense limitation of 1.45% (excluding interest, taxes, brokerage commissions, dividend expenses, acquired fund fees and expenses, extraordinary legal expenses, or any other extraordinary expenses). |
| 3 | | The amounts shown for a share outstanding throughout the respective periods may not be in accordance with the changes in the aggregate gains and losses on investments during the respective periods because of the timing of sales and repurchases of Fund shares in relation to fluctuating net asset values during the respective periods. |
| 4 | | Calculated based on average shares outstanding. |
| 5 | | Total investment return is calculated assuming a purchase of shares on the first day and a sale on the last day of each period reported and will include reinvestment of dividends and distributions, if any. |
91
The FBR Funds
Financial Highlights (continued)
| | | FBR Pegasus Small Cap Growth FundTM — I Class |
| | |
|
| | | For the | | | For the | |
| | | Year Ended | | | Period Ended | |
| | | October 31, 2009 | | | October 31, 2008* | |
| | |
| | |
| |
| Per Share Operating Performance: | | | | | | | | | | | | |
Net Asset Value – Beginning of Period | | | $ | 7.19 | | | | | $ | 10.00 | | |
| | | |
| | | | |
| | |
Income (Loss) from Investment Operations: | | | | | | | | | | | | |
Net Investment Loss1,2 | | | | (0.03 | ) | | | | | (0.03 | ) | |
Net Realized and Unrealized Gain (Loss) on Investments1,3 | | | | 1.36 | | | | | | (2.78 | ) | |
| | | |
| | | | |
| | |
Total from Investment Operations | | | | 1.33 | | | | | | (2.81 | ) | |
| | | |
| | | | |
| | |
Net Asset Value – End of Period | | | $ | 8.52 | | | | | $ | 7.19 | | |
| | | |
| | | | |
| | |
| Total Investment Return4 | | | | 18.50% | | | | | | (28.10)% | (A) | |
| Ratios to Average Net Assets: | | | | | | | | | | | | |
Expenses After Waivers and Related Reimbursements2 | | | | 1.20% | | | | | | 1.20% | (B) | |
Expenses Before Waivers and Related Reimbursements | | | | 14.78% | | | | | | 4.98% | (B) | |
Net Investment Loss After Waivers and Related Reimbursements2 | | | | (0.68)% | | | | | | (0.74)% | (B) | |
Net Investment Loss Before Waivers and Related Reimbursements | | | | (14.26)% | | | | | | (4.52)% | (B) | |
| Supplementary Data: | | | | | | | | | | | | |
Portfolio Turnover Rate | | | | 102% | | | | | | 139% | | |
Net Assets at End of Period (in thousands) | | | $ | 151 | | | | | $ | 72 | | |
|
| * | | Represents the period from inception of share class (May 30, 2008) through October 31, 2008. |
| 1 | | Calculated based on shares outstanding on the first and last day of the period, except for dividends and distributions, if any, which are based on the actual shares outstanding on the dates of distributions. |
| 2 | | Reflects fees waived and reimbursed by FBR Fund Advisers, Inc. pursuant to a contractual expense limitation of 1.20% (excluding interest, taxes, brokerage commissions, dividend expenses, acquired fund fees and expenses, extraordinary legal expenses, or any other extraordinary expenses). |
| 3 | | The amounts shown for a share outstanding throughout the period may not be in accordance with the changes in the aggregate gains and losses on investments during the period because of the timing of sales and repurchases of Fund shares in relation to fluctuating net asset values during the period. |
| 4 | | Total investment return is calculated assuming a purchase of shares on the first day and a sale on the last day of each period reported and will include reinvestment of dividends and distributions, if any. |
| (A) | | Not Annualized |
| (B) | | Annualized |
92
The FBR Funds
Financial Highlights (continued)
| | | FBR Pegasus Small Cap Growth FundTM — R Class |
| | |
|
| | | For the | | | For the | |
| | | Year Ended | | | Period Ended | |
| | | October 31, 2009 | | | October 31, 2008* | |
| | |
| | |
| |
| Per Share Operating Performance: | | | | | | | | | | | | |
Net Asset Value – Beginning of Period | | | $ | 7.17 | | | | | $ | 10.00 | | |
| | | |
| | | | |
| | |
Income (Loss) from Investment Operations: | | | | | | | | | | | | |
Net Investment Loss1,2 | | | | (0.08 | ) | | | | | (0.05 | ) | |
Net Realized and Unrealized Gain (Loss) on Investments1,3 | | | | 1.37 | | | | | | (2.78 | ) | |
| | | |
| | | | |
| | |
Total from Investment Operations | | | | 1.29 | | | | | | (2.83 | ) | |
| | | |
| | | | |
| | |
Net Asset Value – End of Period | | | $ | 8.46 | | | | | $ | 7.17 | | |
| | | |
| | | | |
| | |
| Total Investment Return4 | | | | 17.99% | | | | | | (28.30)% | (A) | |
| Ratios to Average Net Assets: | | | | | | | | | | | | |
Expenses After Waivers and Related Reimbursements2 | | | | 1.70% | | | | | | 1.70% | (B) | |
Expenses Before Waivers and Related Reimbursements | | | | 17.22% | | | | | | 5.51% | (B) | |
Net Investment Loss After Waivers and Related Reimbursements2 | | | | (1.16)% | | | | | | (1.24)% | (B) | |
Net Investment Loss Before Waivers and Related Reimbursements | | | | (16.68)% | | | | | | (5.05)% | (B) | |
| Supplementary Data: | | | | | | | | | | | | |
Portfolio Turnover Rate | | | | 102% | | | | | | 139% | | |
Net Assets at End of Period (in thousands) | | | $ | 85 | | | | | $ | 72 | | |
|
| * | | Represents the period from inception of share class (May 30, 2008) through October 31, 2008. |
| 1 | | Calculated based on shares outstanding on the first and last day of the period, except for dividends and distributions, if any, which are based on the actual shares outstanding on the dates of distributions. |
| 2 | | Reflects fees waived and reimbursed by FBR Fund Advisers, Inc. pursuant to a contractual expense limitation of 1.70% (excluding interest, taxes, brokerage commissions, dividend expenses, acquired fund fees and expenses, extraordinary legal expenses, or any other extraordinary expenses). |
| 3 | | The amounts shown for a share outstanding throughout the period may not be in accordance with the changes in the aggregate gains and losses on investments during the period because of the timing of sales and repurchases of Fund shares in relation to fluctuating net asset values during the period. |
| 4 | | Total investment return is calculated assuming a purchase of shares on the first day and a sale on the last day of each period reported and will include reinvestment of dividends and distributions, if any. |
| (A) | | Not Annualized |
| (B) | | Annualized |
| | | |
93
The FBR Funds
Financial Highlights (continued)
| | | FBR Focus Fund — Investor Class | |
| | |
| |
| | | For the Years Ended October 31, | |
| | |
| |
| | | 2009 | | 2008 | | 2007 | | 2006 | | 2005 | |
| | |
| |
| |
| |
| |
| |
| Per Share Operating Performance: | | | | | | | | | | | | | | | | | | | | | | |
Net Asset Value – Beginning of Year | | | $ | 37.40 | | | | $ | 57.97 | | | $ | 49.36 | | | $ | 40.36 | | | $ | 37.68 | |
| | | |
| | | |
| | |
| | |
| | |
| |
Income (Loss) from Investment Operations: | | | | | | | | | | | | | | | | | | | | | | |
Net Investment Income (Loss)1,2 | | | | (0.42 | ) | | | | (0.44 | ) | | | 0.08 | | | | (0.43 | ) | | | (0.27 | ) |
Net Realized and Unrealized Gain (Loss) on Investments1,3 | | | | 5.76 | | | | | (19.51 | ) | | | 8.63 | | | | 10.20 | | | | 3.51 | |
| | | |
| | | |
| | |
| | |
| | |
| |
Total from Investment Operations | | | | 5.34 | | | | | (19.95 | ) | | | 8.71 | | | | 9.77 | | | | 3.24 | |
| | | |
| | | |
| | |
| | |
| | |
| |
Distributions to Shareholders: | | | | | | | | | | | | | | | | | | | | | | |
From Net Investment Income | | | | — | | | | | (0.12 | ) | | | — | | | | — | | | | — | |
From Net Realized Gain | | | | (5.19 | ) | | | | (0.51 | ) | | | (0.12 | ) | | | (0.77 | ) | | | (0.57 | ) |
| | | |
| | | |
| | |
| | |
| | |
| |
Total Distributions | | | | (5.19 | ) | | | | (0.63 | ) | | | (0.12 | ) | | | (0.77 | ) | | | (0.57 | ) |
| | | |
| | | |
| | |
| | |
| | |
| |
Paid-in Capital from Redemption Fees4 | | | | 0.01 | | | | | 0.01 | | | | 0.02 | | | | 0.00 | 5 | | | 0.01 | |
| | | |
| | | |
| | |
| | |
| | |
| |
Net Increase (Decrease) in Net Asset Value | | | | 0.16 | | | | | (20.57 | ) | | | 8.61 | | | | 9.00 | | | | 2.68 | |
| | | |
| | | |
| | |
| | |
| | |
| |
Net Asset Value – End of Year | | | $ | 37.56 | | | | $ | 37.40 | | | $ | 57.97 | | | $ | 49.36 | | | $ | 40.36 | |
| | | |
| | | |
| | |
| | |
| | |
| |
| Total Investment Return6 | | | | 17.74% | | | | | (34.73)% | | | | 17.72% | | | | 24.53% | | | | 8.63% | |
| Ratios to Average Net Assets: | | | | | | | | | | | | | | | | | | | | | | |
Expenses After Waivers2 | | | | 1.43% | | | | | 1.42% | | | | 1.40% | | | | 1.38% | | | | 1.50% | |
Expenses Before Waivers | | | | 1.43% | | | | | 1.42% | | | | 1.40% | | | | 1.40% | | | | 1.53% | |
Net Investment Income (Loss) After Waivers2 | | | | (1.16) | | | | | (0.67)% | | | | 0.14% | | | | (0.94)% | | | | (0.56)% | |
Net Investment Income (Loss) Before Waivers | | | | (1.16) | | | | | (0.67)% | | | | 0.14% | | | | (0.96)% | | | | (0.59)% | |
| Supplementary Data: | | | | | | | | | | | | | | | | | | | | | | |
Portfolio Turnover Rate | | | | 5% | | | | | 17% | | | | 5% | | | | 3% | | | | 20% | |
Net Assets at End of Year (in thousands) | | | $ | 759,774 | | | | $ | 717,780 | | | $ | 1,556,339 | | | $ | 929,590 | | | $ | 805,858 | |
|
| 1 | | Calculated based on shares outstanding on the first and last day of the respective periods, except for dividends and distributions, if any, which are based on the actual shares outstanding on the dates of distributions. |
| 2 | | Reflects fees waived by FBR Fund Advisers, Inc. pursuant to a contractual expense limitation of 1.95% (excluding interest, taxes, brokerage commissions, dividend expenses, acquired fund fees and expenses, extraordinary legal expenses, or any other extraordinary expenses) and fees voluntarily waived by the Distributor in an amount attributable to marketing expenses for the Fund while closed to new investors. |
| 3 | | The amounts shown for a share outstanding throughout the respective periods may not be in accordance with the changes in the aggregate gains and losses on investments during the respective periods because of the timing of sales and repurchases of Fund shares in relation to fluctuating net asset values during the respective periods. |
| 4 | | Calculated based on average shares outstanding. |
| 5 | | Less than $0.01 |
| 6 | | Total investment return is calculated assuming a purchase of shares on the first day and a sale on the last day of each period reported and will include reinvestment of dividends and distributions, if any. |
94
The FBR Funds
Financial Highlights (continued)
| | | FBR Focus Fund — I Class |
| | |
|
| | | For the | | | For the |
| | | Year Ended | | | Period Ended |
| | | October 31, 2009 | | | October 31, 2008* |
| | |
| | |
|
| Per Share Operating Performance: | | | | | | | | | | | |
Net Asset Value – Beginning of Period | | | $ | 7.27 | | | | | $ | 10.00 | |
| | | |
| | | | |
| |
Loss from Investment Operations: | | | | | | | | | | | |
Net Investment Loss1 | | | | (0.01 | ) | | | | | (0.01 | ) |
Net Realized and Unrealized Gain (Loss) on Investments1,2 | | | | 0.03 | | | | | | (2.73 | ) |
| | | |
| | | | |
| |
Total from Investment Operations | | | | 0.02 | | | | | | (2.74 | ) |
| | | |
| | | | |
| |
Distributions to Shareholders: | | | | | | | | | | | |
From Net Realized Gain | | | | (5.19 | ) | | | | | — | |
| | | |
| | | | |
| |
Paid-in Capital from Redemption Fees3 | | | | 0.00 | 5 | | | | | 0.01 | |
| | | |
| | | | |
| |
Net Decrease in Net Asset Value | | | | (5.17 | ) | | | | | (2.73 | ) |
| | | |
| | | | |
| |
Net Asset Value – End of Period | | | $ | 2.10 | | | | | $ | 7.27 | |
| | | |
| | | | |
| |
| Total Investment Return4 | | | | 18.15% | | | | | | (27.30)% | (A) |
| Ratios to Average Net Assets: | | | | | | | | | | | |
Expenses After Waivers | | | | 1.15% | | | | | | 1.05% | (B) |
Expenses Before Waivers | | | | 1.15% | | | | | | 1.05% | (B) |
Net Investment Loss After Waivers | | | | (0.88)% | | | | | | (0.70)% | (B) |
Net Investment Loss Before Waivers | | | | (0.88)% | | | | | | (0.70)% | (B) |
| Supplementary Data: | | | | | | | | | | | |
Portfolio Turnover Rate | | | | 5% | | | | | | 17% | |
Net Assets at End of Period (in thousands) | | | $ | 34,225 | | | | | $ | 16,831 | |
|
| * | | Represents the period from inception of shares (May 30, 2008) through October 31, 2008. |
| 1 | | Calculated based on shares outstanding on the first and last day of the period, except for dividends and distributions, if any, which are based on the actual shares outstanding on the dates of distributions. |
| 2 | | The amounts shown for a share outstanding throughout the period may not be in accordance with the changes in the aggregate gains and losses on investments during the period because of the timing of sales and repurchases of Fund shares in relation to fluctuating net asset values during the period. |
| 3 | | Calculated based on average shares outstanding. |
| 4 | | Total investment return is calculated assuming a purchase of shares on the first day and a sale on the last day of each period reported and will include reinvestment of dividends and distributions, if any. |
| 5 | | Less than $0.01 |
| (A) | | Not Annualized |
| (B) | | Annualized |
95
The FBR Funds
Financial Highlights (continued)
| | | FBR Focus Fund — R Class |
| | |
|
| | | For the | | For the |
| | | Year Ended | | | Period Ended |
| | | October 31, 2009 | | | October 31, 2008* |
| | |
| | |
|
| Per Share Operating Performance: | | | | | | | | | | | |
Net Asset Value – Beginning of Period | | | $ | 7.24 | | | | | $ | 10.00 | |
| | | |
| | | | |
| |
Loss from Investment Operations: | | | | | | | | | | | |
Net Investment Loss1,2 | | | | (0.03 | ) | | | | | (0.05 | ) |
Net Realized and Unrealized Gain (Loss) on Investments1,3 | | | | 0.01 | | | | | | (2.71 | ) |
| | | |
| | | | |
| |
Total from Investment Operations | | | | (0.02 | ) | | | | | (2.76 | ) |
| | | |
| | | | |
| |
Distributions to Shareholders: | | | | | | | | | | | |
From Net Realized Gain | | | | (5.19 | ) | | | | | — | |
| | | |
| | | | |
| |
Paid-in Capital from Redemption Fees3 | | | | 0.00 | 5 | | | | | — | |
| | | |
| | | | |
| |
Net Decrease in Net Asset Value | | | | (5.21 | ) | | | | | (2.76 | ) |
| | | |
| | | | |
| |
Net Asset Value – End of Period | | | $ | 2.03 | | | | | $ | 7.24 | |
| | | |
| | | | |
| |
| Total Investment Return4 | | | | 16.80% | | | | | | (27.60)% | (A) |
| Ratios to Average Net Assets: | | | | | | | | | | | |
Expenses After Waivers and Related Reimbursements2 | | | | 2.20% | | | | | | 1.80% | (B) |
Expenses Before Waivers and Related Reimbursements | | | | 11.24% | | | | | | 3.79% | (B) |
Net Investment Loss After Waivers and Related Reimbursements2 | | | | (1.94)% | | | | | | (1.36)% | (B) |
Net Investment Loss Before Waivers and Related Reimbursements | | | | (10.98)% | | | | | | (3.35)% | (B) |
| Supplementary Data: | | | | | | | | | | | |
Portfolio Turnover Rate | | | | 5% | | | | | | 17% | |
Net Assets at End of Period (in thousands) | | | $ | 166 | | | | | $ | 72 | |
|
| * | | Represents the period from inception of shares (May 30, 2008) through October 31, 2008. |
| 1 | | Calculated based on shares outstanding on the first and last day of the period, except for dividends and distributions, if any, which are based on the actual shares outstanding on the dates of distributions. |
| 2 | | Reflects fees waived and reimbursed by FBR Fund Advisers, Inc. pursuant to a contractual expense limitation of 2.20% (excluding interest, taxes, brokerage commissions, dividend expenses, acquired fund fees and expenses, extraordinary legal expenses, or any other extraordinary expenses). |
| 3 | | The amounts shown for a share outstanding throughout the period may not be in accordance with the changes in the aggregate gains and losses on investments during the period because of the timing of sales and repurchases of Fund shares in relation to fluctuating net asset values during the period. |
| 4 | | Total investment return is calculated assuming a purchase of shares on the first day and a sale on the last day of each period reported and will include reinvestment of dividends and distributions, if any. |
| 5 | | Less than $0.01 |
| (A) | | Not Annualized |
| (B) | | Annualized |
96
The FBR Funds
Financial Highlights (continued)
| | | FBR Large Cap Financial Fund — Investor Class |
| | |
|
| | | For the Years Ended October 31, |
| | |
|
| | | 2009 | | 2008 | | 2007 | | 2006 | | 2005 |
| | |
| |
| |
| |
| |
|
| Per Share Operating Performance: | | | | | | | | | | | | | | | | | | | | | | |
Net Asset Value – Beginning of Year | | | $ | 11.14 | | | | $ | 18.71 | | | $ | 21.67 | | | $ | 21.84 | | | $ | 24.46 | |
| | | |
| | | |
| | |
| | |
| | |
| |
Income (Loss) from Investment Operations: | | | | | | | | | | | | | | | | | | | | | | |
Net Investment Income1,2 | | | | 0.00 | 5 | | | | 0.14 | | | | 0.14 | | | | 0.13 | | | | 0.13 | |
Net Realized and Unrealized Gain (Loss) on Investments1,3 | | | | 1.58 | | | | | (3.86 | ) | | | (0.97 | ) | | | 2.72 | | | | 0.15 | |
| | | |
| | | |
| | |
| | |
| | |
| |
Total from Investment Operations | | | | 1.58 | | | | | (3.72 | ) | | | (0.83 | ) | | | 2.85 | | | | 0.28 | |
| | | |
| | | |
| | |
| | |
| | |
| |
Distributions to Shareholders: | | | | | | | | | | | | | | | | | | | | | | |
From Net Investment Income | | | | (0.10 | ) | | | | (0.18 | ) | | | (0.11 | ) | | | (0.16 | ) | | | (0.08 | ) |
Distribution in Excess of Net Investment Income | | | | (0.02 | ) | | | | — | | | | — | | | | — | | | | — | |
From Net Realized Gain | | | | — | | | | | (3.68 | ) | | | (2.02 | ) | | | (2.86 | ) | | | (2.82 | ) |
| | | |
| | | |
| | |
| | |
| | |
| |
Total Distributions | | | | (0.12 | ) | | | | (3.86 | ) | | | (2.13 | ) | | | (3.02 | ) | | | (2.90 | ) |
| | | |
| | | |
| | |
| | |
| | |
| |
Paid-in Capital from Redemption Fees4 | | | | 0.01 | | | | | 0.01 | | | | 0.00 | 5 | | | 0.00 | 5 | | | 0.00 | 5 |
| | | |
| | | |
| | |
| | |
| | |
| |
Net Increase (Decrease) in Net Asset Value | | | | 1.47 | | | | | (7.57 | ) | | | (2.96 | ) | | | (0.17 | ) | | | (2.62 | ) |
| | | |
| | | |
| | |
| | |
| | |
| |
Net Asset Value – End of Year | | | $ | 12.61 | | | | $ | 11.14 | | | $ | 18.71 | | | $ | 21.67 | | | $ | 21.84 | |
| | | |
| | | |
| | |
| | |
| | |
| |
| Total Investment Return6 | | | | 14.52% | | | | | (23.76)% | | | | (4.59)% | | | | 14.21% | | | | 0.86% | |
| Ratios to Average Net Assets: | | | | | | | | | | | | | | | | | | | | | | |
Expenses After Waivers2 | | | | 1.81% | | | | | 1.88% | | | | 1.89% | | | | 1.83% | | | | 1.95% | |
Expenses Before Waivers | | | | 1.81% | | | | | 2.01% | | | | 1.92% | | | | 1.84% | | | | 1.96% | |
Net Investment Income (Loss) After Waivers2 | | | | (0.08)% | | | | | 1.63% | | | | 0.59% | | | | 0.68% | | | | 0.62% | |
Net Investment Income (Loss) Before Waivers | | | | (0.08)% | | | | | 1.50% | | | | 0.56% | | | | 0.67% | | | | 0.61% | |
| Supplementary Data: | | | | | | | | | | | | | | | | | | | | | | |
Portfolio Turnover Rate | | | | 220% | | | | | 509% | | | | 95% | | | | 54% | | | | 41% | |
Net Assets at End of Year (in thousands) | | | $ | 37,195 | | | | $ | 24,272 | | | $ | 15,951 | | | $ | 26,313 | | | $ | 29,037 | |
|
| 1 | | Calculated based on shares outstanding on the first and last day of the respective periods, except for dividends and distributions, if any, which are based on the actual shares outstanding on the dates of distributions. |
| 2 | | Reflects fees waived by FBR Fund Advisers, Inc. pursuant to a contractual expense limitation of 1.95% (excluding interest, taxes, brokerage commissions, dividend expenses, acquired fund fees and expenses, extraordinary legal expenses, or any other extraordinary expenses) and effective May 30, 2008, the recoupment of certain previously waived fees. |
| 3 | | The amounts shown for a share outstanding throughout the respective periods may not be in accordance with the changes in the aggregate gains and losses on investments during the respective periods because of the timing of sales and repurchases of Fund shares in relation to fluctuating net asset values during the respective periods. |
| 4 | | Calculated based on average shares outstanding. |
| 5 | | Less than $0.01 |
| 6 | | Total investment return is calculated assuming a purchase of shares on the first day and a sale on the last day of each period reported and will include reinvestment of dividends and distributions, if any. |
97
The FBR Funds
Financial Highlights (continued)
| | | FBR Small Cap Financial Fund — Investor Class |
| | |
|
| | | For the Years Ended October 31, |
| | |
|
| | | 2009 | | 2008 | | 2007 | | 2006 | | 2005 |
| | |
| |
| |
| |
| |
|
| | | | | | | | | | | | | | | | | | | | | | | |
| Per Share Operating Performance: | | | | | | | | | | | | | | | | | | | | | | |
Net Asset Value – Beginning of Year | | | $ | 15.22 | | | | $ | 23.18 | | | $ | 32.70 | | | $ | 32.96 | | | $ | 36.41 | |
| | | |
| | | |
| | |
| | |
| | |
| |
Income (Loss) from Investment Operations: | | | | | | | | | | | | | | | | | | | | | | |
Net Investment Income1 | | | | 0.06 | | | | | 0.24 | | | | 0.29 | | | | 0.14 | | | | 0.23 | |
Net Realized and Unrealized Gain (Loss) on Investments1,2 | | | | 0.81 | | | | | (1.69 | ) | | | (5.31 | ) | | | 3.44 | | | | 0.85 | |
| | | |
| | | |
| | |
| | |
| | |
| |
Total from Investment Operations | | | | 0.87 | | | | | (1.45 | ) | | | (5.02 | ) | | | 3.58 | | | | 1.08 | |
| | | |
| | | |
| | |
| | |
| | |
| |
Distributions to Shareholders: | | | | | | | | | | | | | | | | | | | | | | |
From Net Investment Income | | | | (0.19 | ) | | | | (0.28 | ) | | | (0.15 | ) | | | (0.14 | ) | | | (0.18 | ) |
From Net Realized Gain | | | | — | | | | | (6.24 | ) | | | (4.35 | ) | | | (3.70 | ) | | | (4.36 | ) |
| | | |
| | | |
| | |
| | |
| | |
| |
Total Distributions | | | | (0.19 | ) | | | | (6.52 | ) | | | (4.50 | ) | | | (3.84 | ) | | | (4.54 | ) |
| | | |
| | | |
| | |
| | |
| | |
| |
Paid-in Capital from Redemption Fees3 | | | | 0.01 | | | | | 0.01 | | | | 0.00 | 4 | | | 0.00 | 4 | | | 0.01 | |
| | | |
| | | |
| | |
| | |
| | |
| |
Net Increase (Decrease) in Net Asset Value | | | | 0.69 | | | | | (7.96 | ) | | | (9.52 | ) | | | (0.26 | ) | | | (3.45 | ) |
| | | |
| | | |
| | |
| | |
| | |
| |
Net Asset Value – End of Year | | | $ | 15.91 | | | | $ | 15.22 | | | $ | 23.18 | | | $ | 32.70 | | | $ | 32.96 | |
| | | |
| | | |
| | |
| | |
| | |
| |
| Total Investment Return5 | | | | 5.89% | | | | | (6.76)% | | | | (18.02)% | | | | 11.81% | | | | 2.63% | |
| Ratios to Average Net Assets: | | | | | | | | | | | | | | | | | | | | | | |
Expenses After Waivers | | | | 1.51% | | | | | 1.49% | | | | 1.51% | | | | 1.46% | | | | 1.55% | |
Expenses Before Waivers | | | | 1.51% | | | | | 1.49% | | | | 1.51% | | | | 1.46% | | | | 1.55% | |
Net Investment Income After Waivers | | | | 0.50% | | | | | 1.48% | | | | 0.93% | | | | 0.45% | | | | 0.69% | |
Net Investment Income Before Waivers | | | | 0.50% | | | | | 1.48% | | | | 0.93% | | | | 0.45% | | | | 0.69% | |
| Supplementary Data: | | | | | | | | | | | | | | | | | | | | | | |
Portfolio Turnover Rate | | | | 118% | | | | | 147% | | | | 13% | | | | 8% | | | | 15% | |
Net Assets at End of Year (in thousands) | | | $ | 187,561 | | | | $ | 181,803 | | | $ | 144,214 | | | $ | 346,155 | | | $ | 463,333 | |
|
| 1 | | Calculated based on shares outstanding on the first and last day of the respective periods, except for dividends and distributions, if any, which are based on the actual shares outstanding on the dates of distributions. |
| 2 | | The amounts shown for a share outstanding throughout the respective periods may not be in accordance with the changes in the aggregate gains and losses on investments during the respective periods because of the timing of sales and repurchases of Fund shares in relation to fluctuating net asset values during the respective periods. |
| 3 | | Calculated based on average shares outstanding. |
| 4 | | Less than $0.01 |
| 5 | | Total investment return is calculated assuming a purchase of shares on the first day and a sale on the last day of each period reported and will include reinvestment of dividends and distributions, if any. |
98
The FBR Funds
Financial Highlights (continued)
| | | FBR Small Cap Financial Fund — I Class |
| | |
|
| | | For the | | For the |
| | | Year Ended | | Period Ended |
| | | October 31, 2009 | | October 31, 2008* |
| | |
| |
|
| Per Share Operating Performance: | | | | | | | | | | |
Net Asset Value – Beginning of Period | | | $ | 9.96 | | | | $ | 10.00 | |
| | | |
| | | |
| |
Income (Loss) from Investment Operations: | | | | | | | | | | |
Net Investment Income1,2 | | | | 0.19 | | | | | 0.02 | |
Net Realized and Unrealized Gain (Loss) on Investments1,3 | | | | 0.40 | | | | | (0.06 | ) |
| | | |
| | | |
| |
Total from Investment Operations | | | | 0.59 | | | | | (0.04 | ) |
| | | |
| | | |
| |
Distributions to Shareholders: | | | | | | | | | | |
From Net Investment Income | | | | (0.21 | ) | | | | — | |
| | | |
| | | |
| |
Net Increase (Decrease) in Net Asset Value | | | | 0.38 | | | | | (0.04 | ) |
| | | |
| | | |
| |
Net Asset Value – End of Period | | | $ | 10.34 | | | | $ | 9.96 | |
| | | |
| | | |
| |
| Total Investment Return4 | | | | 6.14% | | | | | (0.40)% | (A) |
| Ratios to Average Net Assets: | | | | | | | | | | |
Expenses After Waivers and Related Reimbursements2 | | | | 1.56% | | | | | 1.31% | (B) |
Expenses Before Waivers and Related Reimbursements | | | | 1.56% | | | | | 1.31% | (B) |
Net Investment Income After Waivers and Related Reimbursements2 | | | | 0.04% | | | | | 1.49% | (B) |
Net Investment Income Before Waivers and Related Reimbursements | | | | 0.04% | | | | | 1.49% | (B) |
| Supplementary Data: | | | | | | | | | | |
Portfolio Turnover Rate | | | | 118% | | | | | 147% | |
Net Assets at End of Period (in thousands) | | | $ | 10,638 | | | | $ | 3,952 | |
|
| * | | Represents the period from inception of share class (May 30, 2008) through October 31, 2008. |
| 1 | | Calculated based on shares outstanding on the first and last day of the period, except for dividends and distributions, if any, which are based on the actual shares outstanding on the dates of distributions. |
| 2 | | Reflects fees waived and reimbursed by FBR Fund Advisers, Inc. pursuant to a contractual expense limitation of 1.70% (excluding interest, taxes, brokerage commissions, dividend expenses, acquiured fund fees and expenses, extraordinary legal expenses, or any other extraordinary expenses and effective May 30, 2008, the recoupment of certain previously waived fees. |
| 3 | | The amounts shown for a share outstanding throughout the period may not be in accordance with the changes in the aggregate gains and losses on investments during the period because of the timing of sales and repurchases of Fund shares in relation to fluctuating net asset values during the period. |
| 4 | | Total investment return is calculated assuming a purchase of shares on the first day and a sale on the last day of each period reported and will include reinvestment of dividends and distributions, if any. |
| (A) | | Not Annualized |
| (B) | | Annualized |
99
The FBR Funds
Financial Highlights (continued)
| | | FBR Small Cap Financial Fund — R Class |
| | |
|
| | | For the | | For the |
| | | Year Ended | | Period Ended |
| | | October 31, 2009 | | October 31, 2008* |
| | |
| |
|
| Per Share Operating Performance: | | | | | | | | | | |
Net Asset Value – Beginning of Period | | | $ | 9.93 | | | | $ | 10.00 | |
| | | |
| | | |
| |
Income (Loss) from Investment Operations: | | | | | | | | | | |
Net Investment Income1,2 | | | | (0.00 | )4 | | | | 0.08 | |
Net Realized and Unrealized Gain (Loss) on Investments1,3 | | | | 0.48 | | | | | (0.15 | ) |
| | | |
| | | |
| |
Total from Investment Operations | | | | 0.48 | | | | | (0.07 | ) |
| | | |
| | | |
| |
Distributions to Shareholders: | | | | | | | | | | |
From Net Investment Income | | | | (0.16 | ) | | | | — | |
| | | |
| | | |
| |
Net Increase (Decrease) in Net Asset Value | | | | 0.32 | | | | | (0.07 | ) |
| | | |
| | | |
| |
Net Asset Value – End of Period | | | $ | 10.25 | | | | $ | 9.93 | |
| | | |
| | | |
| |
| Total Investment Return5 | | | | 5.02% | | | | | (0.70)% | (A) |
| Ratios to Average Net Assets: | | | | | | | | | | |
Expenses After Waivers and Related Reimbursements2 | | | | 2.20% | | | | | 1.86% | (B) |
Expenses Before Waivers and Related Reimbursements | | | | 11.85% | | | | | 3.54% | (B) |
Net Investment Income (Loss) After Waivers and Related Reimbursements2 | | | | (0.18)% | | | | | 1.83% | (B) |
Net Investment Income (Loss) Before Waivers and Related Reimbursements | | | | (9.83)% | | | | | 0.15% | (B) |
| Supplementary Data: | | | | | | | | | | |
Portfolio Turnover Rate | | | | 118% | | | | | 147% | |
Net Assets at End of Period (in thousands) | | | $ | 126 | | | | $ | 99 | |
|
| * | | Represents the period from inception of share class (May 30, 2008) through October 31, 2008. |
| 1 | | Calculated based on shares outstanding on the first and last day of the period, except for dividends and distributions, if any, which are based on the actual shares outstanding on the dates of distributions. |
| 2 | | Reflects fees waived and reimbursed by FBR Fund Advisers, Inc. pursuant to a contractual expense limitation of 2.20% (excluding interest, taxes, brokerage commissions, dividend expenses, acquiured fund fees and expenses, extraordinary legal expenses, or any other extraordinary expenses). |
| 3 | | The amounts shown for a share outstanding throughout the period may not be in accordance with the changes in the aggregate gains and losses on investments during the period because of the timing of sales and repurchases of Fund shares in relation to fluctuating net asset values during the period. |
| 4 | | Less than $0.01 |
| 5 | | Total investment return is calculated assuming a purchase of shares on the first day and a sale on the last day of each period reported and will include reinvestment of dividends and distributions, if any. |
| (A) | | Not Annualized |
| (B) | | Annualized |
100
The FBR Funds
Financial Highlights (continued)
| | | FBR Technology Fund — Investor Class |
| | |
|
| | | For the Years Ended October 31, |
| | |
|
| | | 2009 | | | 2008 | | | 2007 | | | 2006 | | | 2005 | |
| | |
| | |
| | |
| | |
| | |
| |
Per Share Operating Performance: | | | | | | | | | | | | | | | | | | | | |
Net Asset Value – Beginning of Year | | $ | 6.96 | | | $ | 13.34 | | | $ | 11.97 | | | $ | 10.82 | | | $ | 10.96 | |
| | |
| | |
| | |
| | |
| | |
| |
Income (Loss) from Investment Operations: | | | | | | | | | | | | | | | | | | | | |
Net Investment Loss1,2 | | | (0.08 | ) | | | (0.12 | ) | | | (0.05 | ) | | | (0.04 | ) | | | (0.05 | ) |
Net Realized and Unrealized Gain (Loss) on Investments1,3 | | | 2.16 | | | | (5.03 | ) | | | 1.81 | | | | 1.77 | | | | 1.53 | |
| | |
| | |
| | |
| | |
| | |
| |
Total from Investment Operations | | | 2.08 | | | | (5.15 | ) | | | 1.76 | | | | 1.73 | | | | 1.48 | |
| | |
| | |
| | |
| | |
| | |
| |
Distributions to Shareholders: | | | | | | | | | | | | | | | | | | | | |
From Net Realized Gain | | | — | | | | (1.23 | ) | | | (0.39 | ) | | | (0.58 | ) | | | (1.62 | ) |
| | |
| | |
| | |
| | |
| | |
| |
Paid-in Capital from Redemption Fees4 | | | 0.01 | | | | 0.00 | 5 | | | 0.00 | 5 | | | 0.00 | 5 | | | 0.00 | 5 |
| | |
| | |
| | |
| | |
| | |
| |
Net Increase (Decrease) in Net Asset Value | | | 2.09 | | | | (6.38 | ) | | | 1.37 | | | | 1.15 | | | | (0.14 | ) |
| | |
| | |
| | |
| | |
| | |
| |
Net Asset Value – End of Year | | $ | 9.05 | | | $ | 6.96 | | | $ | 13.34 | | | $ | 11.97 | | | $ | 10.82 | |
| | |
| | |
| | |
| | |
| | |
| |
Total Investment Return6 | | | 30.03% | | | | (42.30)% | | | | 15.18% | | | | 16.40% | | | | 14.51% | |
Ratios to Average Net Assets: | | | | | | | | | | | | | | | | | | | | |
Expenses After Waivers and Related Reimbursements2 | | | 1.95% | | | | 1.84% | | | | 1.70% | | | | 1.87% | | | | 1.94% | |
Expenses Before Waivers and Related Reimbursements | | | 3.00% | | | | 1.92% | | | | 1.70% | | | | 1.92% | | | | 2.74% | |
Net Investment Loss After Waivers and Related Reimbursements2 | | | (1.05)% | | | | (0.60)% | | | | (0.41)% | | | | (0.60)% | | | | (0.77)% | |
Net Investment Loss Before Waivers and Related Reimbursements | | | (2.10)% | | | | (0.68)% | | | | (0.41)% | | | | (0.65)% | | | | (1.57)% | |
Supplementary Data: | | | | | | | | | | | | | | | | | | | | |
Portfolio Turnover Rate | | | 211% | | | | 175% | | | | 229% | | | | 108% | | | | 100% | |
Net Assets at End of Year (in thousands) | | $ | 8,388 | | | $ | 7,689 | | | $ | 40,935 | | | $ | 39,407 | | | $ | 14,810 | |
|
| 1 | | Calculated based on shares outstanding on the first and last day of the respective periods, except for dividends and distributions, if any, which are based on the actual shares outstanding on the dates of distributions. |
| 2 | | Reflects fees waived and reimbursed by FBR Fund Advisers, Inc. pursuant to a contractual expense limitation of 1.95% (excluding interest, taxes, brokerage commissions, dividend expenses, acquired fund fees and expenses, extraordinary legal expenses, or any other extraordinary expenses) and effective May 30, 2008, the recoupment of certain previously waived fees. |
| 3 | | The amounts shown for a share outstanding throughout the respective periods may not be in accordance with the changes in the aggregate gains and losses on investments during the respective periods because of the timing of sales and repurchases of Fund shares in relation to fluctuating net asset values during the respective periods. |
| 4 | | Calculated based on average shares outstanding. |
| 5 | | Less than $0.01 |
| 6 | | Total investment return is calculated assuming a purchase of shares on the first day and a sale on the last day of each period reported and will include reinvestment of dividends and distributions, if any. |
101
The FBR Funds
Financial Highlights (continued)
| | | FBR Gas Utility Index Fund — Investor Class |
| | |
|
| | | For the Years Ended October 31, |
| | |
|
| | | 2009 | | | 2008 | | | 2007 | | | 2006 | | | 2005 | |
| | |
| | |
| | |
| | |
| | |
| |
Per Share Operating Performance: | | | | | | | | | | | | | | | | | | | | |
Net Asset Value – Beginning of Year | | $ | 15.26 | | | $ | 23.14 | | | $ | 19.48 | | | $ | 17.25 | | | $ | 14.67 | |
| | |
| | |
| | |
| | |
| | |
| |
Income (Loss) from Investment Operations: | | | | | | | | | | | | | | | | | | | | |
Net Investment Income1,2 | | | 0.49 | | | | 0.47 | | | | 0.47 | | | | 0.50 | | | | 0.52 | |
Net Realized and Unrealized Gain (Loss) on Investments1,3 | | | 0.60 | | | | (6.13 | ) | | | 3.67 | | | | 2.34 | | | | 2.47 | |
| | |
| | |
| | |
| | |
| | |
| |
Total from Investment Operations | | | 1.09 | | | | (5.66 | ) | | | 4.14 | | | | 2.84 | | | | 2.99 | |
| | |
| | |
| | |
| | |
| | |
| |
Distributions to Shareholders: | | | | | | | | | | | | | | | | | | | | |
From Net Investment Income | | | (0.49 | ) | | | (0.47 | ) | | | (0.48 | ) | | | (0.61 | ) | | | (0.41 | ) |
From Net Realized Gain | | | (0.74 | ) | | | (1.75 | ) | | | — | | | | — | | | | — | |
| | |
| | |
| | |
| | |
| | |
| |
Total Distributions | | | (1.23 | ) | | | (2.22 | ) | | | (0.48 | ) | | | (0.61 | ) | | | (0.41 | ) |
| | |
| | |
| | |
| | |
| | |
| |
Paid-in Capital from Redemption Fees4 | | | 0.01 | | | | 0.00 | 5 | | | 0.00 | 5 | | | 0.00 | 5 | | | 0.00 | 5 |
| | |
| | |
| | |
| | |
| | |
| |
Net Increase (Decrease) in Net Asset Value | | | (0.13 | ) | | | (7.88 | ) | | | 3.66 | | | | 2.23 | | | | 2.58 | |
| | |
| | |
| | |
| | |
| | |
| |
Net Asset Value – End of Year | | $ | 15.13 | | | $ | 15.26 | | | $ | 23.14 | | | $ | 19.48 | | | $ | 17.25 | |
| | |
| | |
| | |
| | |
| | |
| |
Total Investment Return6 | | | 8.18% | | | | (26.81)% | | | | 21.51% | | | | 16.84% | | | | 20.48% | |
Ratios to Average Net Assets: | | | | | | | | | | | | | | | | | | | | |
Expenses After Waivers2 | | | 0.76% | | | | 0.70% | | | | 0.75% | | | | 0.80% | | | | 0.80% | |
Expenses Before Waivers | | | 0.76% | | | | 0.70% | | | | 0.75% | | | | 0.80% | | | | 0.80% | |
Net Investment Income After Waivers2 | | | 3.51% | | | | 2.39% | | | | 2.21% | | | | 2.69% | | | | 3.18% | |
Net Investment Income Before Waivers | | | 3.51% | | | | 2.39% | | | | 2.21% | | | | 2.69% | | | | 3.18% | |
Supplementary Data: | | | | | | | | | | | | | | | | | | | | |
Portfolio Turnover Rate | | | 26% | | | | 27% | | | | 22% | | | | 16% | | | | 20% | |
Net Assets at End of Year (in thousands) | | $ | 193,679 | | | $ | 198,569 | | | $ | 285,951 | | | $ | 270,031 | | | $ | 295,804 | |
|
| 1 | | Calculated based on shares outstanding on the first and last day of the respective periods, except for dividends and distributions, if any, which are based on the actual shares outstanding on the dates of distributions. |
| 2 | | Reflects fees waived by FBR Fund Advisers, Inc. pursuant to a contractual expense limitation of 0.85% (excluding interest, taxes, brokerage commissions, dividend expenses, acquired fund fees and expenses, extraordinary legal expenses, or any other extraordinary expenses) and effective May 30, 2008, the recoupment of certain previously waived fees. |
| 3 | | The amounts shown for a share outstanding throughout the respective periods may not be in accordance with the changes in the aggregate gains and losses on investments during the respective periods because of the timing of sales and repurchases of Fund shares in relation to fluctuating net asset values during the respective periods. |
| 4 | | Calculated based on average shares outstanding. |
| 5 | | Less than $0.01 |
| 6 | | Total investment return is calculated assuming a purchase of shares on the first day and a sale on the last day of each period reported and will include reinvestment of dividends and distributions, if any. |
102
The FBR Funds
Financial Highlights (continued)
| | | FBR Gas Utility Index Fund — R Class |
| | |
|
| | | For the | | For the |
| | | Year Ended | | Period Ended |
| | | October 31, 2009 | | October 31, 2008* |
| | |
| |
|
Per Share Operating Performance: | | | | | | | | | | | | | |
Net Asset Value – Beginning of Period | | | | $ | 7.16 | | | | | $ | 10.00 | | |
| | | | |
| | | | |
| | |
Income (Loss) from Investment Operations: | | | | | | | | | | | | | |
Net Investment Income1,2 | | | | | 0.22 | | | | | | 0.07 | | |
Net Realized and Unrealized Gain (Loss) on Investments1,3 | | | | | 0.18 | | | | | | (2.84 | ) | |
| | | | |
| | | | |
| | |
Total from Investment Operations | | | | | 0.40 | | | | | | (2.77 | ) | |
| | | | |
| | | | |
| | |
Distributions to Shareholders: | | | | | | | | | | | | | |
From Net Investment Income | | | | | (0.47 | ) | | | | | (0.07 | ) | |
From Net Realized Gain | | | | | (0.74 | ) | | | | | — | | |
| | | | |
| | | | |
| | |
Total Distributions | | | | | (1.21 | ) | | | | | (0.07 | ) | |
| | | | |
| | | | |
| | |
Net Decrease in Net Asset Value | | | | | (0.81 | ) | | | | | (2.84 | ) | |
| | | | |
| | | | |
| | |
Net Asset Value – End of Period | | | | $ | 6.35 | | | | | $ | 7.16 | | |
| | | | |
| | | | |
| | |
Total Investment Return4 | | | | | 7.52% | | | | | | (27.84)% | (A) | |
Ratios to Average Net Assets: | | | | | | | | | | | | | |
Expenses After Waivers and Related Reimbursements2 | | | | | 1.35% | | | | | | 1.19% | (B) | |
Expenses Before Waivers and Related Reimbursements | | | | | 16.26% | | | | | | 3.39% | (B) | |
Net Investment Income After Waivers and Related Reimbursements2 | | | | | 2.80% | | | | | | 1.87% | (B) | |
Net Investment Loss Before Waivers and Related Reimbursements | | | | | (12.11)% | | | | | | (0.33)% | (B) | |
Supplementary Data: | | | | | | | | | | | | | |
Portfolio Turnover Rate | | | | | 26% | | | | | | 27% | | |
Net Assets at End of Period (in thousands) | | | | $ | 91 | | | | | $ | 72 | | |
|
| * | | Represents the period from inception of share class (May 30, 2008) through October 31, 2008. |
| 1 | | Calculated based on shares outstanding on the first and last day of the period, except for dividends and distributions, if any, which are based on the actual shares outstanding on the dates of distributions. |
| 2 | | Reflects fees waived by FBR Fund Advisers, Inc. pursuant to a contractual expense limitation of 1.35% (excluding interest, taxes, brokerage commissions, dividend expenses, acquired fund fees and expenses, extraordinary legal expenses, or any other extraordinary expenses). |
| 3 | | The amounts shown for a share outstanding throughout the period may not be in accordance with the changes in the aggregate gains and losses on investments during the period because of the timing of sales and repurchases of Fund shares in relation to fluctuating net asset values during the period. |
| 4 | | Total investment return is calculated assuming a purchase of shares on the first day and a sale on the last day of each period reported and will include reinvestment of dividends and distributions, if any. |
| (A) | | Not Annualized |
| (B) | | Annualized |
The accompanying notes are an integral part of the financial statements.
103
The FBR Funds
Schedule of Shareholder Expenses
(unaudited)
As a shareholder of the Funds, you incur two types of costs: (1) transaction costs, including reinvested dividends or other distributions; redemption fees; and exchange fees; and (2) ongoing costs, including investment advisory fees; distribution (12b-1) fees; and other Fund expenses. This example is intended to help you understand your ongoing costs (in dollars) of investing in the Funds and to compare these costs with the ongoing costs of investing in other mutual funds.
The example is based on an investment of $1,000 invested at the beginning of the period and held for the entire period (May 1, 2009 through October 31, 2009).
Actual Expenses
The table on the following page provides information about actual account values and actual expenses. You may use the information in this line, together with the amount you invested, to estimate the expenses that you paid over the period. Simply divide your account value by $1,000 (for example, an $8,600 account value divided by $1,000 = 8.6), then multiply the result by the number in the first line under the heading entitled “Expenses Paid During the Six Months Ended October 31, 2009” to estimate the expenses you paid on your account during this period.
104
The FBR Funds
Schedule of Shareholder Expenses (continued)
(unaudited)
| | | | | | | | | | | | | | | Expenses Paid |
| | | Net Expense | | Beginning | | Ending | | During the |
| | | Ratio | | Account | | Account | | Six Months |
| | | Annualized | | Value | | Value | | Ended |
| | | October 31, 2009 | | May 1, 2009 | | October 31, 2009 | | October 31, 2009* |
| | |
| |
| |
| |
|
| Pegasus Fund | | | | | | | | | | | | | | | | |
Investor Class | | | 1.25 | % | | $ | 1,000.00 | | | $ | 1,212.00 | | | $ | 6.95 | |
I Class | | | 1.00 | | | | 1,000.00 | | | | 1,213.30 | | | | 5.55 | |
| Pegasus Mid Cap Fund | | | | | | | | | | | | | | | | |
Investor Class | | | 1.35 | | | | 1,000.00 | | | | 1,175.10 | | | | 7.40 | |
I Class | | | 1.10 | | | | 1,000.00 | | | | 1,176.60 | | | | 6.01 | |
| Pegasus Small Cap Fund | | | | | | | | | | | | | | | | |
Investor Class | | | 1.46 | | | | 1,000.00 | | | | 1,156.90 | | | | 7.90 | |
I Class | | | 1.20 | | | | 1,000.00 | | | | 1,157.70 | | | | 6.51 | |
| Pegasus Small Cap Growth Fund | | | | | | | | | | | | | | | | |
Investor Class | | | 1.45 | | | | 1,000.00 | | | | 1,156.10 | | | | 7.86 | |
I Class | | | 1.19 | | | | 1,000.00 | | | | 1,157.60 | | | | 6.49 | |
R Class | | | 1.69 | | | | 1,000.00 | | | | 1,154.20 | | | | 9.19 | |
| Focus Fund | | | | | | | | | | | | | | | | |
Investor Class | | | 1.41 | | | | 1,000.00 | | | | 1,083.00 | | | | 7.42 | |
I Class | | | 1.14 | | | | 1,000.00 | | | | 1,082.50 | | | | 5.96 | |
R Class | | | 2.20 | | | | 1,000.00 | | | | 1,079.80 | | | | 11.53 | |
| Large Cap Financial Fund | | | | | | | | | | | | | | | | |
Investor Class | | | 1.73 | | | | 1,000.00 | | | | 1,268.60 | | | | 9.87 | |
| Small Cap Financial Fund | | | | | | | | | | | | | | | | |
Investor Class | | | 1.50 | | | | 1,000.00 | | | | 1,140.50 | | | | 8.08 | |
I Class | | | 1.62 | | | | 1,000.00 | | | | 1,138.80 | | | | 8.68 | |
R Class | | | 2.20 | | | | 1,000.00 | | | | 1,136.40 | | | | 11.84 | |
| Technology Fund | | | | | | | | | | | | | | | | |
Investor Class | | | 1.95 | | | | 1,000.00 | | | | 1,208.30 | | | | 10.85 | |
| Gas Utility Index Fund | | | | | | | | | | | | | | | | |
Investor Class | | | 0.75 | | | | 1,000.00 | | | | 1,196.90 | | | | 4.16 | |
R Class | | | 1.35 | | | | 1,000.00 | | | | 1,193.50 | | | | 7.46 | |
|
| * | | Expenses are equal to the Fund’s annualized expense ratio, multiplied by the average account value over the period, multiplied by the number of days in most recent fiscal half-year then divided by 365. |
105
The FBR Funds
Schedule of Shareholder Expenses (continued)
(unaudited)
Hypothetical Example for Comparison Purposes
The table on the following page provides information about hypothetical account values and hypothetical expenses based on the Funds’ actual expense ratio and an assumed rate of return of 5% per year before expenses, which is not the Funds’ actual return. The hypothetical account values and expenses may not be used to estimate the actual ending account balance or expenses you paid for the period. You may use this information to compare the ongoing costs of investing in the Funds and other funds. To do so, compare this 5% hypothetical example with the 5% hypothetical examples that appear in the shareholder reports of the other funds.
106
The FBR Funds
Schedule of Shareholder Expenses (continued)
(unaudited)
| | | | | | | | | | | | | | | | Expenses Paid |
| | | | Net Expense | | Beginning | | Ending | | During the |
| | | | Ratio | | Account | | Account | | Six Months |
| | | | Annualized | | Value | | Value | | Ended |
| | | | October 31, 2009 | | May 1, 2009 | | October 31, 2009 | | October 31, 2009* |
| | | |
| |
| |
| |
|
| Pegasus Fund | | | | | | | | | | | | | | | | | |
Investor Class | | | | 1.25 | % | | $ | 1,000.00 | | | $ | 1,018.92 | | | $ | 6.35 | |
I Class | | | | 1.00 | | | | 1,000.00 | | | | 1,020.19 | | | | 5.07 | |
| Pegasus Mid Cap Fund | | | | | | | | | | | | | | | | | |
Investor Class | | | | 1.35 | | | | 1,000.00 | | | | 1,018.40 | | | | 6.86 | |
I Class | | | | 1.10 | | | | 1,000.00 | | | | 1,019.68 | | | | 5.58 | |
| Pegasus Small Cap Fund | | | | | | | | | | | | | | | | | |
Investor Class | | | | 1.46 | | | | 1,000.00 | | | | 1,017.88 | | | | 7.40 | |
I Class | | | | 1.20 | | | | 1,000.00 | | | | 1,019.18 | | | | 6.09 | |
| Pegasus Small Cap Growth Fund | | | | | | | | | | | | | | | | | |
Investor Class | | | | 1.45 | | | | 1,000.00 | | | | 1,017.91 | | | | 7.36 | |
I Class | | | | 1.19 | | | | 1,000.00 | | | | 1,019.19 | | | | 6.07 | |
R Class | | | | 1.69 | | | | 1,000.00 | | | | 1,016.68 | | | | 8.60 | |
| Focus Fund | | | | | | | | | | | | | | | | | |
Investor Class | | | | 1.41 | | | | 1,000.00 | | | | 1,018.08 | | | | 7.19 | |
I Class | | | | 1.14 | | | | 1,000.00 | | | | 1,019.48 | | | | 5.78 | |
R Class | | | | 2.20 | | | | 1,000.00 | | | | 1,014.12 | | | | 11.17 | |
| Large Cap Financial Fund | | | | | | | | | | | | | | | | | |
Investor Class | | | | 1.73 | | | | 1,000.00 | | | | 1,016.50 | | | | 8.78 | |
| Small Cap Financial Fund | | | | | | | | | | | | | | | | | |
Investor Class | | | | 1.50 | | | | 1,000.00 | | | | 1,017.65 | | | | 7.62 | |
I Class | | | | 1.62 | | | | 1,000.00 | | | | 1,017.09 | | | | 8.18 | |
R Class | | | | 2.20 | | | | 1,000.00 | | | | 1,014.12 | | | | 11.17 | |
| Technology Fund | | | | | | | | | | | | | | | | | |
Investor Class | | | | 1.95 | | | | 1,000.00 | | | | 1,015.38 | | | | 9.90 | |
| Gas Utility Index Fund | | | | | | | | | | | | | | | | | |
Investor Class | | | | 0.75 | | | | 1,000.00 | | | | 1,021.41 | | | | 3.83 | |
R Class | | | | 1.35 | | | | 1,000.00 | | | | 1,018.40 | | | | 6.86 | |
|
| * | | Expenses are equal to the Fund’s annualized expense ratio, multiplied by the average account value over the period, multiplied by the number of days in most recent fiscal half-year then divided by 365. |
107
The FBR Funds
Notes to Financial Statements
1. Organization
The FBR Funds (the “Trust”) is registered under the Investment Company Act of 1940, as amended (“1940 Act”), as an open-end management investment company. The Trust was organized as a business trust under the laws of the State of Delaware on September 29, 2003. As of October 31, 2009 the Trust consisted of ten series. This report includes the following nine series: FBR Pegasus FundTM (“Pegasus Fund”), FBR Pegasus Mid Cap FundTM (“Pegasus Mid Cap Fund”), FBR Pegasus Small Cap FundTM (“Pegasus Small Cap Fund”), FBR Pegasus Small Cap Growth FundTM (“Pegasus Small Cap Growth Fund”), FBR Focus Fund (“Focus Fund”), FBR Large Cap Financial Fund (“Large Cap Financial Fund”), FBR Small Cap Financial Fund (“Small Cap Financial Fund”), FBR Technology Fund (“Technology Fund”) and FBR Gas Utility Index Fund (“Gas Utility Index Fund”) (each a “Fund” and collectively, the “Funds”). The Trust is authorized to issue an unlimited number of shares of beneficial interest with no par value which may be issued in more than one class or series. Effective May 30, 2008, certain of the Funds began offering new share classes: R Class shares intended for retirement investors and I Class shares intended for institutional investors. In all Funds the initial class of shares is now referred to as Investor Class.
The Pegasus Fund, a non-diversified fund, invests in the stocks of companies of any size without regard to market capitalization. The investment objective of the Fund is capital appreciation.
The Pegasus Mid Cap Fund, a non-diversified fund, invests, under normal circumstances, at least 80% of its net assets plus the amount of any borrowings for investment purposes in securities of mid capitalization (“mid-cap”) companies. The investment objective of the Fund is capital appreciation.
The Pegasus Small Cap Fund, a non-diversified fund, invests, under normal circumstances, at least 80% of its net assets plus the amount of any borrowings for investment purposes in securities of small capitalization (“small-cap”) companies. The investment objective of the Fund is capital appreciation.
The Pegasus Small Cap Growth Fund, a non-diversified fund, invests, under normal circumstances, at least 80% of its net assets plus the amount of any borrowings for investment purposes in securities of small-cap companies. The investment objective of the Fund is long-term capital appreciation.
The Focus Fund, a non-diversified fund, invests, under normal circumstances, primarily in securities of companies traded in domestic markets. The investment objective of the Fund is capital appreciation.
The Large Cap Financial Fund, a non-diversified fund, invests, under normal circumstances, at least 80% of its net assets plus the amount of any borrowings for investment purposes in securities of large capitalization (“large-cap”) companies principally engaged in the business of financial services including, but not limited to, commercial banks, savings and loan associations, consumer and industrial finance companies, securities brokerage companies, insurance companies, real estate and leasing companies, holding companies for each of the foregoing types of business, or companies
108
The FBR Funds
Notes to Financial Statements (continued)
that combine some or all of these businesses. The investment objective of the Fund is capital appreciation.
The Small Cap Financial Fund, a non-diversified fund, invests, under normal circumstances, at least 80% of its net assets plus the amount of any borrowings for investment purposes in securities of small-cap companies principally engaged in the business of providing financial services to consumers and industry. The investment objective of the Fund is capital appreciation.
The Technology Fund, a non-diversified fund, invests, under normal circumstances, at least 80% of its net assets plus the amount of any borrowings for investment purposes in securities of companies that are principally engaged in the research, design, development, manufacturing or distributing products or services in the technology industry. The investment objective of the Fund is long-term capital appreciation.
The Gas Utility Index Fund invests, under normal circumstances, at least 85% of its net assets in the common stock of companies that have natural gas distribution and transmission operations. As of the date of this report, the Fund was a diversified fund. However, at a meeting held on November 13, 2009, shareholders of the Fund approved the reclassification of the Fund as a non-diversified fund. The investment objective of the Fund is income and capital appreciation.
2. Significant Accounting Policies
The following is a summary of the Funds’ significant accounting policies:
Portfolio Valuation — The net asset value per share (“NAV”) of each Fund is determined as of the close of regular trading on the New York Stock Exchange (“NYSE”) (normally 4:00 p.m., Eastern Time) on each business day that the exchange is open for trading. Each Fund’s securities are valued at the last sale price on the securities exchange or national securities market on which such securities are primarily traded. Securities that are quoted by NASDAQ are valued at the NASDAQ Official Closing Price. Securities not listed on an exchange or national securities market, or securities in which there were no transactions, are valued at the average of the most recent bid and ask prices, except in the case of open short positions where the ask price is used for valuation purposes. The bid price is used when no ask price is available. Short-term investments are carried at amortized cost, which approximates market value. Restricted securities, as well as securities or other assets for which market quotations are not readily available, or are not valued by a pricing service approved by the Funds’ Board of Trustees (the “Board”), are valued at fair value in good faith by, or at the direction of, the Board.
The Funds have adopted “Fair Value Measurements.” Fair Value Measurements establishes a single authoritative definition of fair value, sets out a framework for measuring fair value and requires additional disclosures about fair value measurements.
Under Fair Value Measurements various inputs are used in determining the value of the Funds’ investments. These inputs are summarized in the three broad levels listed below:
| • | | Level 1 – Unadjusted quoted prices in active markets for identical assets or liabilities that the Fund has the ability to access. |
109
The FBR Funds
Notes to Financial Statements (continued)
| • | | Level 2 – Observable inputs other than quoted prices included in Level 1 that are observable for the asset or liability, either directly or indirectly. These inputs may include quoted prices for the identical instrument on an inactive market, prices for similar instruments, interest rates, prepayment speeds, credit risk curves, default rates and similar data. |
| • | | Level 3 – Unobservable inputs for the asset or liability, to the extent observable inputs are not available, representing the Funds’ own assumptions about the assumptions a market participant would use in valuing the asset or liability, and would be based on the best information available. |
The inputs or methodology used for valuing securities are not necessarily an indication of the risk associated with investing in those securities. For example, securities maturing within 60 days of the filing are valued using amortized cost, in accordance with rules under the Investment Company Act of 1940. Generally, amortized cost approximates the current fair value of a security, but since the value is not obtained from a quoted price in an active market, such securities are reflected as Level 2.
The following is a summary of the inputs used to value the Funds’ net assets as of October 31, 2009:
| | | | | | | Level 2 – Other | | Level 3 – Significant |
| | | Level 1 – Quoted | | Significant | | Unobservable |
| | | Prices | | Observable Inputs | | Inputs |
| | |
| |
| |
|
| Pegasus Fund | | | | | | | | | | | | |
Common Stock | | $ | 18,009,397 | | | $ | — | | | $ | — | |
Mutual Fund | | | 486,364 | | | | — | | | | — | |
| Pegasus Mid Cap Fund | | | | | | | | | | | | |
Common Stock | | | 6,522,221 | | | | — | | | | — | |
Mutual Fund | | | 75,655 | | | | — | | | | — | |
| Pegasus Small Cap Fund | | | | | | | | | | | | |
Common Stock | | | 10,075,976 | | | | — | | | | — | |
| Pegasus Small Cap Growth Fund | | | | | | | | | | | | |
Common Stock | | | 5,566,807 | | | | — | | | | — | |
Mutual Fund | | | 14,692 | | | | — | | | | — | |
| Focus Fund | | | | | | | | | | | | |
Common Stock | | | 763,023,433 | | | | — | | | | — | |
Mutual Fund | | | 32,857,222 | | | | — | | | | — | |
| Large Cap Financial Fund | | | | | | | | | | | | |
Common Stock | | | 35,735,945 | | | | — | | | | — | |
| Small Cap Financial Fund | | | | | | | | | | | | |
Common Stock | | | 182,812,687 | | | | — | | | | — | |
Mutual Fund | | | 10,201,252 | | | | — | | | | — | |
| Technology Fund | | | | | | | | | | | | |
Common Stock | | | 8,097,473 | | | | — | | | | — | |
Mutual Fund | | | 302,960 | | | | — | | | | — | |
| Gas Utility Index Fund | | | | | | | | | | | | |
Common Stock | | | 190,555,711 | | | | — | | | | — | |
Mutual Fund | | | 3,220,208 | | | | — | | | | — | |
110
The FBR Funds
Notes to Financial Statements (continued)
Share Valuation — The NAV of each Fund is calculated by dividing the sum of the value of the securities held by each Fund, plus cash or other assets, minus all liabilities (including estimated accrued expenses) by the total number of shares outstanding of each Fund, rounded to the nearest cent. Each Fund’s shares will not be priced on the days on which the NYSE is closed for trading. The offering and redemption price per share of each Fund is equal to each Fund’s NAV. The Funds charge a 1% redemption fee on shares redeemed or exchanged within 90 days of purchase. These fees are deducted from the redemption proceeds otherwise payable to the shareholder. The Funds will retain the fee charged as paid-in capital and such fees become part of that Fund’s daily NAV calculation.
Investment Income — Dividend income is recorded on the ex-dividend date. Interest income, which includes the amortization of premium and accretion of discount, if any, is recorded on an accrual basis.
Expenses — The Funds pay all operational expenses, which are either charged directly to a Fund for which the expense is attributable or are allocated proportionately among the Funds based on allocation methods approved by the Board.
Distributions to Shareholders — Each Fund, except the Gas Utility Index Fund, declares and pays any dividends from its net investment income, if any, annually. The Gas Utility Index Fund declares and pays any such dividends quarterly. Distributions from net realized capital gains, if any, will be distributed at least annually for each Fund. Income and capital gain distributions are determined in accordance with U.S. federal income tax regulations.
Allocations — Investment income earned, realized capital gains and losses, and unrealized appreciation and depreciation for the Funds are allocated daily to each class of shares based upon its proportionate share of total net assets of the Fund. Class specific expenses are charged directly to the class incurring the expense. Common expenses, which are not attributable to a specific class, are allocated daily to each class of shares based upon its proportionate share of total net assets of the Fund. Expenses not directly billed to a Fund are allocated proportionally among all Funds daily in relation to net assets of each Fund or another reasonable measure.
Security Transactions — Security transactions are accounted for on the trade date. Securities sold are determined on a specific identification basis.
Estimates — The preparation of financial statements in accordance with U.S. generally accepted accounting principles requires management to make estimates and assumptions that may affect the reported amounts of assets and liabilities and disclosure of contingent assets and liabilities at the date of the financial statements and the reported amounts of income and expenses during the reporting period. Actual results could differ from those estimates.
Repurchase Agreements — The Funds have agreed to purchase securities from financial institutions subject to the seller’s agreement to repurchase them at an agreed-upon time and price (“repurchase agreement”). The financial institutions with whom each Fund
111
The FBR Funds
Notes to Financial Statements (continued)
enters into repurchase agreements are banks and broker/dealers which the adviser considers creditworthy pursuant to criteria approved by the Board. The seller under a repurchase agreement will be required to maintain the value of the securities as collateral, subject to the agreement at not less than the repurchase price plus accrued interest. The adviser marks to market daily the value of the collateral, and, if necessary, requires the seller to maintain additional securities, to ensure that the value is not less than the repurchase price. Default by or bankruptcy of the seller would, however, expose each Fund to possible loss because of adverse market action or delays in connection with the disposition of the underlying securities.
3. Transactions with Affiliates
Investment Adviser — FBR Fund Advisers, Inc. (“Fund Advisers”) serves as investment adviser to the Funds. For its advisory services, Fund Advisers receives a monthly fee at an annual rate of 0.90% of the average daily net assets of the Pegasus Fund, Pegasus Mid Cap Fund, Pegasus Small Cap Fund, Pegasus Small Cap Growth Fund, Focus Fund, Large Cap Financial Fund, Small Cap Financial Fund, and Technology Fund, and at an annual rate of 0.40% of the average daily net assets of the Gas Utility Index Fund.
Fund Advisers has contractually agreed to limit each class of shares of each Fund’s total operating expenses and to maintain these limitations with regard to each class of shares of each Fund through February 28, 2013. The following are the limits for the Funds, based on average daily net assets (excluding interest, taxes, brokerage commissions, dividend expenses, acquired fund fees and expenses, extraordinary legal expenses, or any other extraordinary expenses).
| | | | | | Investor Class | | | | | | | |
| | | | | | Prior to May 30, | | | | | | | |
| | | Investor Class | | | 2008 | | | I Class | | | R Class | |
| | |
| | |
| | |
| | |
| |
| Pegasus Fund | | 1.25% | | | 1.95% | | | 1.00% | | | NA | |
| Pegasus Mid Cap Fund | | 1.35% | | | 1.95% | | | 1.10% | | | NA | |
| Pegasus Small Cap Fund | | 1.45% | | | 1.95% | | | 1.20% | | | NA | |
| Pegasus Small Cap Growth Fund | | 1.45% | | | 1.95% | | | 1.20% | | | 1.70% | |
| Focus Fund | | 1.95% | | | 1.95% | | | 1.70% | | | 2.20% | |
| Large Cap Financial Fund | | 1.95% | | | 1.95% | | | NA | | | NA | |
| Small Cap Financial Fund | | 1.95% | | | 1.95% | | | 1.70% | | | 2.20% | |
| Technology Fund | | 1.95% | | | 1.95% | | | NA | | | NA | |
| Gas Utility Index Fund | | 0.85% | | | 0.85% | | | NA | | | 1.35% | |
Effective May 30, 2008, Fund Advisers may recoup any waived amount from a Fund pursuant to this agreement if such reimbursement does not cause the Fund to exceed existing expense limitations and the reimbursement is made within three years after the year in which the Adviser incurred the expense.
112
The FBR Funds
Notes to Financial Statements (continued)
As of October 31, 2009, the Funds had the following amounts (and year of expiration) subject to repayment to Fund Advisers:
| | | Year Fees | | | Repayment | | | | |
| | | Waived | | | Expires | | Balance |
| | |
| | |
| |
|
| Pegasus Fund - Investor Class | | 2008 | | | 2011 | | $ | 42,645 | |
| | | 2009 | | | 2012 | | | 112,398 | |
| Pegasus Fund - I Class | | 2008 | | | 2011 | | | 1,153 | |
| | | 2009 | | | 2012 | | | 11,563 | |
| Pegasus Mid Cap Fund - Investor Class | | 2008 | | | 2011 | | | 37,881 | |
| | | 2009 | | | 2012 | | | 99,322 | |
| Pegasus Mid Cap Fund - I Class | | 2008 | | | 2011 | | | 1,295 | |
| | | 2009 | | | 2012 | | | 11,525 | |
| Pegasus Small Cap Fund - Investor Class | | 2008 | | | 2011 | | | 36,709 | |
| | | 2009 | | | 2012 | | | 92,582 | |
| Pegasus Small Cap Fund - I Class | | 2008 | | | 2011 | | | 1,298 | |
| | | 2009 | | | 2012 | | | 11,387 | |
| Pegasus Small Cap Growth Fund - Investor Class | | 2008 | | | 2011 | | | 44,078 | |
| | | 2009 | | | 2012 | | | 98,547 | |
| Pegasus Small Cap Growth Fund - I Class | | 2008 | | | 2011 | | | 1,436 | |
| | | 2009 | | | 2012 | | | 11,301 | |
| Pegasus Small Cap Growth Fund - R Class | | 2008 | | | 2011 | | | 1,450 | |
| | | 2009 | | | 2012 | | | 11,300 | |
| Focus Fund - R Class | | 2008 | | | 2011 | | | 709 | |
| | | 2009 | | | 2012 | | | 10,825 | |
| Small Cap Financial Fund - R Class | | 2008 | | | 2011 | | | 687 | |
| | | 2009 | | | 2012 | | | 10,554 | |
| Technology Fund - Investor Class | | 2008 | | | 2011 | | | 7,400 | |
| | | 2009 | | | 2012 | | | 72,289 | |
| Gas Utility Index Fund - R Class | | 2008 | | | 2011 | | | 823 | |
| | | 2009 | | | 2012 | | | 10,559 | |
During the year ended October 31, 2009, the Large Cap Financial Fund - Investor Class and the Gas Utility Index Fund - Investor Class repaid Fund Advisers $104 and $78 for fees waived during the fiscal year ended October 31, 2008, respectively.
Administrator — JPMorgan Chase Bank N.A. (“JPMorgan”) serves as the administrator to the Funds and provides pursuant to an Administration Agreement (“Agreement”) day-to-day administrative services including monitoring portfolio compliance, determining compliance with provisions of the Internal Revenue Code and preparing the Funds’ registration statements. Pursuant to the Agreement, JPMorgan receives a monthly fee based on average daily net assets of the Trust.
Pursuant to the Administrative Services Agreement, Fund Advisers also provides administrative services to the Funds including oversight of service providers. For the period ended October 31, 2009, Fund Advisers received 0.02% of average daily net assets of the Trust. Effective November 1, 2009, the Fund Advisers receives 0.04% of average daily net
113
The FBR Funds
Notes to Financial Statements (continued)
assets of the Trust. Fund Advisers also provides the Funds with office space, facilities and business equipment and generally administers the Funds’ business affairs and provides the services of executive and clerical personnel for administering the affairs of the Funds. Fund Advisers compensates all personnel, Officers and Trustees of the Funds if such persons are employees of Fund Advisers. For the fiscal year ended October 31, 2009, JPMorgan earned $199,536 and Fund Advisers earned $308,518 in Administrator fees.
Plan of Distribution — The Trust, on behalf of the Investor Class shares of each Fund, except the Gas Utility Index Fund, has adopted a Distribution Plan (the “Plan”) pursuant to Rule 12b-1 under the 1940 Act. Under the Investor Class Plan, each Fund may pay FBR Investment Services, Inc. (the “Distributor”) a fee at an annual rate of up to 0.25% of each Fund’s average daily net assets. The Trust has also adopted a Distribution Plan for R Class shareholders of certain Funds that pays a fee at an annual rate of up to 0.50% of each Fund’s average daily net assets. Fees paid to the Distributor under the Plans are payable without regard to actual expenses incurred.
Brokerage Commissions — For the fiscal year ended October 31, 2009, the Small Cap Financial Fund and the Large Cap Financial Fund paid $52,942 and $3,410, respectively, in brokerage commissions from portfolio transactions to FBR Capital Markets & Co. (“FBR & Co.”), an affiliate of Fund Advisers and the Distributor. No other Fund paid commissions to FBR & Co. during the year.
Trustees’ Fees — Each Trustee of the Trust who is not an employee or affiliate of Fund Advisers receives an annual retainer fee of $25,000 and an additional meeting fee of $2,500 for each regular meeting attended. In addition, each Trustee that serves on the Audit Committee or Nominating Committee receives a meeting fee of $1,000 for attendance at the meeting. If a Trustee participates by teleconference, the meeting fee is $1,000. The Chairman of the Board, an independent Trustee, receives an additional $2,000 for each meeting attended, and the Audit Committee Chairman receives an additional $1,000 for each committee meeting attended.
4. Investment Transactions
For the fiscal year ended October 31, 2009, purchases and sales of investment securities (excluding short-term securities and U.S. government obligations) for each Fund were as follows:
| | | Purchases | | Sales |
| | |
| |
|
| Pegasus Fund | | $ | 17,348,342 | | $ | 6,836,725 |
| Pegasus Mid Cap Fund | | | 9,017,650 | | | 7,449,357 |
| Pegasus Small Cap Fund | | | 20,517,582 | | | 16,150,770 |
| Pegasus Small Cap Growth Fund | | | 5,997,687 | | | 4,185,114 |
| Focus Fund | | | 31,478,416 | | | 61,977,888 |
| Large Cap Financial Fund | | | 61,382,404 | | | 44,684,913 |
| Small Cap Financial Fund | | | 233,833,656 | | | 150,133,166 |
| Technology Fund | | | 12,945,517 | | | 13,183,609 |
| Gas Utility Index Fund | | | 46,984,516 | | | 45,510,102 |
114
The FBR Funds
Notes to Financial Statements (continued)
5. Capital Share Transactions
| | FBR Pegasus FundTM | | FBR Pegasus Mid Cap FundTM |
| |
| |
|
| | For the | | For the | | For the | | For the |
| | Year | | Year | | Year | | Year |
| | Ended | | Ended | | Ended | | Ended |
| | October 31, | | October 31, | | October 31, | | October 31, |
| | 2009 | | 2008(A) | | 2009 | | 2008(A) |
| |
| |
| |
| |
|
| Capital Transactions: | | | | | | | | | | | | | | | | | | | |
| Investor Class | | | | | | | | | | | | | | | | | | | |
Proceeds from Sale of Shares | | $ | 17,513,723 | | | | $ | 1,161,675 | | | | $ | 5,938,063 | | | | $ | 2,480,431 | |
Reinvestment of Distributions | | | 37,852 | | | | | 1,222,454 | | | | | 70,620 | | | | | 45,373 | |
Cost of Shares Redeemed | | | (6,489,882 | ) | | | | (6,458,569 | ) | | | | (4,584,753 | ) | | | | (800,665 | ) |
Redemption Fees | | | 7,141 | | | | | 4,308 | | | | | 7,086 | | | | | 6,196 | |
| | |
| | | |
| | | |
| | | |
| |
Investor Class Transactions | | $ | 11,068,834 | | | | $ | (4,070,132 | ) | | | $ | 1,431,016 | | | | $ | 1,731,335 | |
| | |
| | | |
| | | |
| | | |
| |
| I Class | | | | | | | | | | | | | | | | | | | |
Proceeds from Sale of Shares | | $ | 14,527 | | | | $ | 100,000 | | | | $ | — | | | | $ | 100,000 | |
Reinvestment of Distributions | | | 633 | | | | | — | | | | | 1,509 | | | | | — | |
Cost of Shares Redeemed | | | (279 | ) | | | | — | | | | | — | | | | | — | |
Redemption Fees | | | 3 | | | | | — | | | | | — | | | | | — | |
| | |
| | | |
| | | |
| | | |
| |
I Class Transactions | | $ | 14,884 | | | | $ | 100,000 | | | | $ | 1,509 | | | | $ | 100,000 | |
| | |
| | | |
| | | |
| | | |
| |
| Net Increase (Decrease) from | | | | | | | | | | | | | | | | | | | |
Capital Transactions | | $ | 11,083,718 | | | | $ | (3,970,132 | ) | | | $ | 1,432,525 | | | | $ | 1,831,335 | |
| | |
| | | |
| | | |
| | | |
| |
| Share Transactions: | | | | | | | | | | | | | | | | | | | |
| Investor Class | | | | | | | | | | | | | | | | | | | |
Sold | | | 2,091,570 | | | | | 109,163 | | | | | 727,540 | | | | | 233,519 | |
Issued in Reinvestment of Distributions | | | 4,834 | | | | | 106,208 | | | | | 9,098 | | | | | 4,248 | |
Redeemed | | | (707,768 | ) | | | | (626,810 | ) | | | | (529,080 | ) | | | | (78,303 | ) |
| | |
| | | |
| | | |
| | | |
| |
Change in Investor Class Shares | | | 1,388,636 | | | | | (411,439 | ) | | | | 207,558 | | | | | 159,464 | |
| | |
| | | |
| | | |
| | | |
| |
| I Class | | | | | | | | | | | | | | | | | | | |
Sold | | | 1,655 | | | | | 10,000 | | | | | — | | | | | 10,000 | |
Issued in Reinvestment of Distributions | | | 93 | | | | | — | | | | | 224 | | | | | — | |
Redeemed | | | (31 | ) | | | | — | | | | | — | | | | | — | |
| | |
| | | |
| | | |
| | | |
| |
Change in I Class Shares | | | 1,717 | | | | | 10,000 | | | | | 224 | | | | | 10,000 | |
| | |
| | | |
| | | |
| | | |
| |
| Net Increase (Decrease) from | | | | | | | | | | | | | | | | | | | |
Share Transactions | | | 1,390,353 | | | | | (401,439 | ) | | | | 207,782 | | | | | 169,464 | |
| | |
| | | |
| | | |
| | | |
| |
|
| (A) I Class represents the period from commencement of operations (May 30, 2008) through October 31, 2008. |
115
The FBR Funds
Notes to Financial Statements (continued)
| | FBR Pegasus | | FBR Pegasus Small |
| | Small Cap FundTM | | Cap Growth FundTM |
| |
| |
|
| | For the | | For the | | For the | | For the |
| | Year | | Year | | Year | | Year |
| | Ended | | Ended | | Ended | | Ended |
| | October 31, | | October 31, | | October 31, | | October 31, |
| | 2009 | | 2008(A) | | 2009 | | 2008(A) |
| |
| |
| | |
| | |
|
| Capital Transactions: | | | | | | | | | | | | | | | | | | | |
| Investor Class | | | | | | | | | | | | | | | | | | | |
Proceeds from Sale of Shares | | $ | 7,550,993 | | | | $ | 1,521,957 | | | | $ | 4,836,172 | | | | $ | 1,422,406 | |
Reinvestment of Distributions | | | — | | | | | 18,282 | | | | | — | | | | | 182,969 | |
Cost of Shares Redeemed | | | (2,773,221 | ) | | | | (913,849 | ) | | | | (3,101,762 | ) | | | | (2,194,149 | ) |
Redemption Fees | | | 8,520 | | | | | 4,373 | | | | | 6,715 | | | | | 5,760 | |
| | |
| | | |
| | | |
| | | |
| |
Investor Class Transactions | | $ | 4,786,292 | | | | $ | 630,763 | | | | $ | 1,741,125 | | | | $ | (583,014 | ) |
| | |
| | | |
| | | |
| | | |
| |
| I Class | | | | | | | | | | | | | | | | | | | |
Proceeds from Sale of Shares | | $ | — | | | | $ | 100,000 | | | | $ | 65,775 | | | | $ | 100,000 | |
| | |
| | | |
| | | |
| | | |
| |
| R Class | | | | | | | | | | | | | | | | | | | |
Proceeds from Sale of Shares | | $ | — | | | | $ | — | | | | $ | — | | | | $ | 100,000 | |
| | |
| | | |
| | | |
| | | |
| |
| Net Increase (Decrease) from | | | | | | | | | | | | | | | | | | | |
Capital Transactions | | $ | 4,786,292 | | | | $ | 730,763 | | | | $ | 1,806,900 | | | | $ | (383,014 | ) |
| | |
| | | |
| | | |
| | | |
| |
| Share Transactions: | | | | | | | | | | | | | | | | | | | |
| Investor Class | | | | | | | | | | | | | | | | | | | |
Sold | | | 969,637 | | | | | 147,259 | | | | | 564,085 | | | | | 128,491 | |
Issued in Reinvestment of Distributions | | | — | | | | | 1,647 | | | | | — | | | | | 14,864 | |
Redeemed | | | (330,293 | ) | | | | (88,720 | ) | | | | (357,540 | ) | | | | (204,934 | ) |
| | |
| | | |
| | | |
| | | |
| |
Change in Investor Class Shares | | | 639,344 | | | | | 60,186 | | | | | 206,545 | | | | | (61,579 | ) |
| | |
| | | |
| | | |
| | | |
| |
| I Class | | | | | | | | | | | | | | | | | | | |
Sold | | | — | | | | | 10,000 | | | | | 7,770 | | | | | 10,000 | |
| | |
| | | |
| | | |
| | | |
| |
| R Class | | | | | | | | | | | | | | | | | | | |
Sold | | | — | | | | | — | | | | | — | | | | | 10,000 | |
| | |
| | | |
| | | |
| | | |
| |
| Net Increase (Decrease) from | | | | | | | | | | | | | | | | | | | |
Share Transactions | | | 639,344 | | | | | 70,186 | | | | | 214,315 | | | | | (41,579 | ) |
| | |
| | | |
| | | |
| | | |
| |
|
| (A) I and R Classes represent the period from commencement of operations (May 30, 2008) through October 31, 2008. | |
116
The FBR Funds
Notes to Financial Statements (continued)
| | | | | | | | | | | | FBR Large Cap | | FBR Small Cap |
| | FBR Focus Fund | | Financial Fund | | Financial Fund |
| |
| |
| |
|
| | For the | | For the | | For the | | For the | | For the | | For the |
| | Year | | Year | | Year | | Year | | Year | | Year |
| | Ended | | Ended | | Ended | | Ended | | Ended | | Ended |
| | October 31, | | October 31, | | October 31, | | October 31, | | October 31, | | October 31, |
| | 2009 | | 2008(A) | | 2009 | | 2008 | | 2009 | | 2008(A) |
| |
| |
| |
| |
| |
| |
|
| Capital Transactions: | | | | | | | | | | | | | | | | | | | | | | | | | | | | |
| Investor Class | | | | | | | | | | | | | | | | | | | | | | | | | | | | |
Proceeds from Sale of Shares | | $ | 364,670,766 | | | | $ | 242,764,089 | | | | $ | 30,236,869 | | | $ | 19,045,180 | | | | $ | 137,376,905 | | | | $ | 120,651,140 | |
Reinvestment of Distributions | | | 93,731,941 | | | | | 15,739,960 | | | | | 237,972 | | | | 3,006,657 | | | | | 2,289,047 | | | | | 38,016,471 | |
Cost of Shares Redeemed | | | (447,111,728 | ) | | | | (623,446,112 | ) | | | | (19,147,301 | ) | | | (6,416,743 | ) | | | | (137,859,395 | ) | | | | (70,151,653 | ) |
Redemption Fees | | | 200,006 | | | | | 199,536 | | | | | 24,409 | | | | 16,597 | | | | | 137,803 | | | | | 88,771 | |
| | |
| | | |
| | | |
| | |
| | | |
| | | |
| |
Investor Class Transactions | | $ | 11,490,985 | | | | $ | (364,742,527 | ) | | | $ | 11,351,949 | | | $ | 15,651,691 | | | | $ | 1,944,360 | | | | $ | 88,604,729 | |
| | |
| | | |
| | | |
| | |
| | | |
| | | |
| |
| I Class | | | | | | | | | | | | | | | | | | | | | | | | | | | | |
Proceeds from Sale of Shares | | $ | 44,273,847 | | | | $ | 21,017,714 | | | | $ | — | | | $ | — | | | | $ | 11,424,305 | | | | $ | 4,103,500 | |
Reinvestment of Distributions | | | 10,311,502 | | | | | — | | | | | — | | | | — | | | | | 2,105 | | | | | — | |
Cost of Shares Redeemed | | | (33,573,561 | ) | | | | (826,926 | ) | | | | — | | | | — | | | | | (3,617,293 | ) | | | | — | |
Redemption Fees | | | 22,795 | | | | | 6,189 | | | | | — | | | | — | | | | | — | | | | | — | |
| | |
| | | |
| | | |
| | |
| | | |
| | | |
| |
I Class Transactions | | $ | 21,034,583 | | | | $ | 20,196,977 | | | | $ | — | | | $ | — | | | | $ | 7,809,117 | | | | $ | 4,103,500 | |
| | |
| | | |
| | | |
| | |
| | | |
| | | |
| |
| R Class | | | | | | | | | | | | | | | | | | | | | | | | | | | | |
Proceeds from Sale of Shares | | $ | 64,289 | | | | $ | 100,000 | | | | $ | — | | | $ | — | | | | $ | 18,198 | | | | $ | 100,000 | |
Reinvestment of Distributions | | | 51,918 | | | | | — | | | | | — | | | | — | | | | | 1,617 | | | | | — | |
Cost of Shares Redeemed | | | (518 | ) | | | | — | | | | | — | | | | — | | | | | — | | | | | — | |
Redemption Fees | | | — | | | | | — | | | | | — | | | | — | | | | | — | | | | | — | |
| | |
| | | |
| | | |
| | |
| | | |
| | | |
| |
R Class Transactions | | $ | 115,689 | | | | $ | 100,000 | | | | $ | — | | | $ | — | | | | $ | 19,815 | | | | $ | 100,000 | |
| | |
| | | |
| | | |
| | |
| | | |
| | | |
| |
| Net Increase (Decrease) from | | | | | | | | | | | | | | | | | | | | | | | | | | | | |
Capital Transactions | | $ | 32,641,257 | | | | $ | (344,445,550 | ) | | | $ | 11,351,949 | | | $ | 15,651,691 | | | | $ | 9,773,292 | | | | $ | 92,808,229 | |
| | |
| | | |
| | | |
| | |
| | | |
| | | |
| |
| Share Transactions: | | | | | | | | | | | | | | | | | | | | | | | | | | | | |
| Investor Class | | | | | | | | | | | | | | | | | | | | | | | | | | | | |
Sold | | | 10,780,019 | | | | | 5,020,713 | | | | | 2,543,639 | | | | 1,601,744 | | | | | 9,258,210 | | | | | 7,680,706 | |
Issued in Reinvestment of Distributions | | | 3,112,984 | | | | | 292,791 | | | | | 24,258 | | | | 215,340 | | | | | 160,185 | | | | | 2,408,457 | |
Redeemed | | | (12,858,602 | ) | | | | (12,970,312 | ) | | | | (1,796,661 | ) | | | (490,236 | ) | | | | (9,568,535 | ) | | | | (4,369,117 | ) |
| | |
| | | |
| | | |
| | |
| | | |
| | | |
| |
Change in Investor Class Shares | | | 1,034,401 | | | | | (7,656,808 | ) | | | | 771,236 | | | | 1,326,848 | | | | | (150,140 | ) | | | | 5,720,046 | |
| | |
| | | |
| | | |
| | |
| | | |
| | | |
| |
| I Class | | | | | | | | | | | | | | | | | | | | | | | | | | | | |
Sold | | | 23,893,265 | | | | | 2,432,067 | | | | | — | | | | — | | | | | 1,020,701 | | | | | 396,829 | |
Issued in Reinvestment of Distributions | | | 6,137,799 | | | | | — | | | | | — | | | | — | | | | | 226 | | | | | — | |
Redeemed | | | (16,066,151 | ) | | | | (118,131 | ) | | | | — | | | | — | | | | | (388,919 | ) | | | | — | |
| | |
| | | |
| | | |
| | |
| | | |
| | | |
| |
Change in I Class Shares | | | 13,964,913 | | | | | 2,313,936 | | | | | — | | | | — | | | | | 632,008 | | | | | 396,829 | |
| | |
| | | |
| | | |
| | |
| | | |
| | | |
| |
| R Class | | | | | | | | | | | | | | | | | | | | | | | | | | | | |
Sold | | | 40,104 | | | | | 10,000 | | | | | — | | | | — | | | | | 2,112 | | | | | 10,000 | |
Issued in Reinvestment of Distributions | | | 31,657 | | | | | — | | | | | — | | | | — | | | | | 174 | | | | | — | |
Redeemed | | | (255 | ) | | | | — | | | | | — | | | | — | | | | | — | | | | | — | |
| | |
| | | |
| | | |
| | |
| | | |
| | | |
| |
Change in R Class Shares | | | 71,506 | | | | | 10,000 | | | | | — | | | | — | | | | | 2,286 | | | | | 10,000 | |
| | |
| | | |
| | | |
| | |
| | | |
| | | |
| |
| Net Increase (Decrease) from | | | | | | | | | | | | | | | | | | | | | | | | | | | | |
Share Transactions | | | 15,070,820 | | | | | (5,332,872 | ) | | | | 771,236 | | | | 1,326,848 | | | | | 484,154 | | | | | 6,126,875 | |
| | |
| | | |
| | | |
| | |
| | | |
| | | |
| |
|
| (A) I and R Classes represent the period from commencement of operations (May 30, 2008) through October 31, 2008. |
117
The FBR Funds
Notes to Financial Statements (continued)
| | | | | | | | | | | | FBR Gas Utility |
| | FBR Technology Fund | | Index Fund |
| |
| |
|
| | For the | | For the | | For the | | For the |
| | Year | | Year | | Year | | Year |
| | Ended | | Ended | | Ended | | Ended |
| | October 31, | | October 31, | | October 31, | | October 31, |
| | 2009 | | 2008 | | 2009 | | 2008(A) |
| |
| |
| |
| |
|
| Capital Transactions: | | | | | | | | | | | | | | | | | | | |
| Investor Class | | | | | | | | | | | | | | | | | | | |
Proceeds from Sale of Shares | | $ | 4,117,170 | | | | $ | 3,374,900 | | | | $ | 18,915,536 | | | | $ | 42,282,293 | |
Reinvestment of Distributions | | | — | | | | | 3,499,542 | | | | | 14,885,034 | | | | | 26,128,693 | |
Cost of Shares Redeemed | | | (5,077,936 | ) | | | | (26,928,727 | ) | | | | (35,657,897 | ) | | | | (50,729,541 | ) |
Redemption Fees | | | 8,341 | | | | | 8,790 | | | | | 92,002 | | | | | 34,985 | |
| | |
| | | |
| | | |
| | | |
| |
Investor Class Transactions | | $ | (952,425 | ) | | | $ | (20,045,495 | ) | | | $ | (1,765,325 | ) | | | $ | 17,716,430 | |
| | |
| | | |
| | | |
| | | |
| |
| R Class | | | | | | | | | | | | | | | | | �� | | |
Proceeds from Sale of Shares | | $ | — | | | | $ | — | | | | $ | 14,001 | | | | $ | 100,000 | |
Reinvestment of Distributions | | | — | | | | | — | | | | | 13,030 | | | | | 703 | |
Cost of Shares Redeemed | | | — | | | | | — | | | | | — | | | | | — | |
Redemption Fees | | | — | | | | | — | | | | | — | | | | | — | |
| | |
| | | |
| | | |
| | | |
| |
R Class Transactions | | $ | — | | | | $ | — | | | | $ | 27,031 | | | | $ | 100,703 | |
| | |
| | | |
| | | |
| | | |
| |
| Net Increase (Decrease) from | | | | | | | | | | | | | | | | | | | |
Capital Transactions | | $ | (952,425 | ) | | | $ | (20,045,495 | ) | | | $ | (1,738,294 | ) | | | $ | 17,817,133 | |
| | |
| | | |
| | | |
| | | |
| |
| Share Transactions: | | | | | | | | | | | | | | | | | | | |
| Investor Class | | | | | | | | | | | | | | | | | | | |
Sold | | | 519,303 | | | | | 317,798 | | | | | 1,341,857 | | | | | 2,162,416 | |
Issued in Reinvestment of Distributions | | | — | | | | | 301,686 | | | | | 1,070,887 | | | | | 1,264,848 | |
Redeemed | | | (697,970 | ) | | | | (2,582,759 | ) | | | | (2,625,507 | ) | | | | (2,770,992 | ) |
| | |
| | | |
| | | |
| | | |
| |
Change in Investor Class Shares | | | (178,667 | ) | | | | (1,963,275 | ) | | | | (212,763 | ) | | | | 656,272 | |
| | |
| | | |
| | | |
| | | |
| |
| R Class | | | | | | | | | | | | | | | | | | | |
Sold | | | — | | | | | — | | | | | 2,142 | | | | | 10,000 | |
Issued in Reinvestment of Distributions | | | — | | | | | — | | | | | 2,152 | | | | | 78 | |
Redeemed | | | — | | | | | — | | | | | — | | | | | — | |
| | |
| | | |
| | | |
| | | |
| |
Change in R Class Shares | | | — | | | | | — | | | | | 4,294 | | | | | 10,078 | |
| | |
| | | |
| | | |
| | | |
| |
| Net Increase (Decrease) from | | | | | | | | | | | | | | | | | | | |
Share Transactions | | | (178,667 | ) | | | | (1,963,275 | ) | | | | (208,469 | ) | | | | 666,350 | |
| | |
| | | |
| | | |
| | | |
| |
|
| (A) R Class represents the period from commencement of operations (May 30, 2008) through October 31, 2008. |
6. Federal Income Taxes
It is each Fund’s policy to continue to comply with the special provisions of the Internal Revenue Code that are applicable to regulated investment companies. As provided therein, in any fiscal year in which a Fund so qualifies and distributes at least 90% of its taxable net income, the Fund (but not the shareholders) will be relieved of federal income tax on the income distributed. Accordingly, no provision for income taxes has been made.
In order to avoid imposition of the excise tax applicable to regulated investment companies, it is also each Fund’s intention to declare and pay as dividends in each calendar
118
The FBR Funds
Notes to Financial Statements (continued)
year at least 98% of its net investment income (earned during the calendar year) and 98% of its net realized capital gains (earned during the twelve months ending October 31) plus undistributed amounts from prior years.
Income and capital gain distributions are determined in accordance with income tax regulations that may differ from accounting principles that are generally accepted in the United States of America. As a result, the character of tax-basis distributions and the composition of net assets for tax purposes may differ from those reflected in the Funds’ financial statements. These book/tax differences may be temporary or permanent in nature. Temporary differences are primarily the result of wash sales. Reclassifications for permanent differences are made to components of capital. These reclassifications have no effect on net assets or net asset value per share.
The tax character of distributions paid for each Fund’s tax year was as follows:
| | Ordinary Income | | Long-Term Capital Gains |
| |
| |
|
| | | Dollar | | | | | Dollar | |
| | | Amount | | | | | Amount | |
| | |
| | | | |
| |
| Pegasus Fund | | | | | | | | | |
For the Year Ended October 31, 2009 | | $ | 38,623 | | | | $ | — | |
For the Year Ended October 31, 2008 | | | 1,227,692 | | | | | 238 | |
| Pegasus Mid Cap Fund | | | | | | | | | |
For the Year Ended October 31, 2009 | | | 72,339 | | | | | — | |
For the Year Ended October 31, 2008 | | | 45,373 | | | | | — | |
| Pegasus Small Cap Fund | | | | | | | | | |
For the Year Ended October 31, 2009 | | | — | | | | | — | |
For the Year Ended October 31, 2008 | | | 18,282 | | | | | — | |
| Pegasus Small Cap Growth Fund | | | | | | | | | |
For the Year Ended October 31, 2009 | | | — | | | | | — | |
For the Year Ended October 31, 2008 | | | 184,307 | | | | | 18,288 | |
| Focus Fund | | | | | | | | | |
For the Year Ended October 31, 2009 | | | — | | | | | 106,380,482 | |
For the Year Ended October 31, 2008 | | | 2,637,313 | | | | | 13,475,516 | |
| Large Cap Financial Fund | | | | | | | | | |
For the Year Ended October 31, 2009 | | | 243,517 | | | | | — | |
For the Year Ended October 31, 2008 | | | 177,807 | | | | | 2,910,983 | |
| Small Cap Financial Fund | | | | | | | | | |
For the Year Ended October 31, 2009 | | | 2,344,398 | | | | | — | |
For the Year Ended October 31, 2008 | | | 2,225,546 | | | | | 36,692,650 | |
| Technology Fund | | | | | | | | | |
For the Year Ended October 31, 2009 | | | — | | | | | — | |
For the Year Ended October 31, 2008 | | | 2,491,355 | | | | | 1,036,556 | |
| Gas Utility Index Fund | | | | | | | | | |
For the Year Ended October 31, 2009 | | | 6,301,517 | | | | | 9,585,471 | |
For the Year Ended October 31, 2008 | | | 6,995,329 | | | | | 20,875,415 | |
119
The FBR Funds
Notes to Financial Statements (continued)
The following information is computed on a tax basis for each item:
| | As of October 31, 2009 |
| |
|
| | | | | | | | | | | | | | | | | Pegasus | | | | | |
| | | Pegasus | | Pegasus | | Pegasus | | Small Cap | | | Focus |
| | | Fund | | Mid Cap Fund | | Small Cap Fund | | Growth Fund | | | Fund |
| | |
| | |
| |
| |
| | |
|
| Tax cost of investment securities | | $ | 16,826,267 | | | | $ | 6,381,471 | | | | $ | 9,505,303 | | | | $ | 5,178,360 | | | | $ | 639,014,491 | |
| | |
| | | |
| | | |
| | | |
| | | |
| |
| Gross unrealized appreciation | | | 2,394,168 | | | | | 541,654 | | | | | 924,548 | | | | | 656,466 | | | | | 262,833,944 | |
| Gross unrealized depreciation | | | (724,674 | ) | | | | (325,249 | ) | | | | (353,875 | ) | | | | (253,327 | ) | | | | (105,967,780 | ) |
| | |
| | | |
| | | |
| | | |
| | | |
| |
| Net unrealized appreciation | | | 1,669,494 | | | | | 216,405 | | | | | 570,673 | | | | | 403,139 | | | | | 156,866,164 | |
| Undistributed ordinary income | | | 66,653 | | | | | 13,890 | | | | | 333,414 | | | | | — | | | | | — | |
| Capital loss carryforward | | | (313,227 | ) | | | | (112,906 | ) | | | | — | | | | | (367,842 | ) | | | | (9,577,374 | ) |
| | |
| | | |
| | | |
| | | |
| | | |
| |
| Accumulated earnings | | $ | 1,422,920 | | | | $ | 117,389 | | | | $ | 904,087 | | | | $ | 35,297 | | | | $ | 147,288,790 | |
| | |
| | | |
| | | |
| | | |
| | | |
| |
| | As of October 31, 2009 |
| |
|
| | Large Cap | | | Small Cap | | Technology | | Gas Utility |
| | Financial Fund | | | Financial Fund | | Fund | | Index Fund |
| | |
| | |
| |
| |
|
| Tax cost of investment securities | | $ | 34,900,022 | | | | $ | 189,680,394 | | | $ | 8,053,488 | | | $ | 136,804,267 | |
| | |
| | | |
| | |
| | |
| |
| Gross unrealized appreciation | | | 3,321,447 | | | | | 25,370,865 | | | | 811,098 | | | | 69,814,427 | |
| Gross unrealized depreciation | | | (2,485,524 | ) | | | | (22,037,320 | ) | | | (464,153 | ) | | | (12,842,775 | ) |
| | |
| | | |
| | |
| | |
| |
| Net unrealized appreciation | | | 835,923 | | | | | 3,333,545 | | | | 346,945 | | | | 56,971,652 | |
| Undistributed ordinary income | | | — | | | | | 537,355 | | | | — | | | | 94,170 | |
| Undistributed long-term capital gains | | | — | | | | | — | | | | — | | | | 249,028 | |
| Capital loss carryforward | | | (3,407,781 | ) | | | | (6,353,410 | ) | | | (4,589,875 | ) | | | — | |
| | |
| | | |
| | |
| | |
| |
| Accumulated earnings (deficit) | | $ | (2,571,858 | ) | | | $ | (2,482,510 | ) | | $ | (4,242,930 | ) | | $ | 57,314,850 | |
| | |
| | | |
| | |
| | |
| |
Unused capital loss carryforwards as of October 31, 2009, were as follows:
| | Amount | | | Expires October 31, |
| |
| | |
|
| Pegasus Fund | $ | 313,227 | | | 2016 |
| Pegasus Mid Cap Fund | | 112,906 | | | 2017 |
| Pegasus Small Cap Growth Fund | | 41,215 | | | 2016 |
| Pegasus Small Cap Growth Fund | | 326,627 | | | 2017 |
| Focus Fund | | 9,577,374 | | | 2017 |
| Large Cap Financial Fund | | 2,245,633 | | | 2016 |
| Large Cap Financial Fund | | 1,162,148 | | | 2017 |
| Small Cap Financial Fund | | 6,107,039 | | | 2016 |
| Small Cap Financial Fund | | 246,371 | | | 2017 |
| Technology Fund | | 2,681,830 | | | 2016 |
| Technology Fund | | 1,908,045 | | | 2017 |
During the year ended October 31, 2009, the Pegasus Fund and the Pegasus Small Cap Fund utilized $407,371 and $188,174 of capital loss carryforwards, respectively. The capital loss carryforwards may be utilized in future years to offset net realized capital gains, if any, prior to distributing such gains to shareholders.
120
The FBR Funds
Notes to Financial Statements (continued)
The following reclassifications, the result of permanent differences between financial statement and income tax reporting requirements, have been made to the components of capital. These reclassifications have no impact on the net assets or net asset value per share of the Funds.
| | | | | | | Accumulated | | | | |
| | | Undistributed | | Net Realized | | Paid-In |
| | | Income (Loss) | | Gain (Loss) | | Capital |
| | |
| |
| |
|
| Pegasus Mid Cap Fund | | $ | (3,363 | ) | | $ | 3,363 | | | $ | — | |
| Pegasus Small Cap Fund | | | (44 | ) | | | 4,614 | | | | (4,570 | ) |
| Pegasus Small Cap Growth Fund | | | 40,017 | | | | — | | | | (40,017 | ) |
| Focus Fund | | | 8,778,696 | | | | (1,301 | ) | | | (8,777,395 | ) |
| Large Cap Financial Fund | | | 61,910 | | | | — | | | | (61,910 | ) |
| Small Cap Financial Fund | | | (14,679 | ) | | | 17,699 | | | | (3,020 | ) |
| Technology Fund | | | 72,307 | | | | — | | | | (72,307 | ) |
On July 13, 2006, the FASB released FASB Interpretation No. 48 “Accounting for Uncertainty in Income Taxes” (FIN 48). FIN 48 provides guidance for how uncertain tax positions should be recognized, measured, presented and disclosed in the financial statements. FIN 48 requires the evaluation of tax positions taken or expected to be taken in the course of preparing the Funds’ tax returns to determine whether the tax positions are “more-likely-than-not” of being sustained by the applicable tax authority. Tax positions not deemed to meet the more-likely-than-not threshold will be required to be recorded as a tax benefit or expense in the current year. Adoption of FIN 48 is required for fiscal years beginning after December 15, 2006 and is to be applied to all open tax years as of the effective date. The Funds have analyzed their tax positions taken on Federal income tax returns for all open tax years (tax years ended December 31, 2006 through 2009) for purposes of implementing FIN 48 and have concluded that no provision for income tax is required in their financial statements.
7. Investments in Affiliates
Affiliated issuers, as defined by the 1940 Act, are those in which a Fund’s holdings represent 5% or more of the outstanding voting securities of the issuer. A summary of each Fund’s investments in affiliates, if any, for the year ended October 31, 2009, is noted below:
| | | SHARE ACTIVITY | | | | | | | | | | | | | |
| | |
| | | | | | | | | | | | | |
| | | Balance | | | | | | Balance | | | Realized | | | | | | Value | | Acquisition |
| Affiliate | | 10/31/08 | | Purchases | | Sales | | 10/31/09 | | | Gain(Loss) | | | Dividends | | 10/31/09 | | Cost |
|
| FBR Focus Fund | | | | | | | | | | | | | | | | | | | | | | |
99 Cents Only Stores | | 5,791,474 | | — | | — | | 5,791,474 | | | $ | — | | | $ | — | | $ | 64,706,374 | | $ | 65,421,302 |
American Woodmark Corp. | | 850,000 | | — | | 119,840 | | 730,160 | | | | (1,514,645 | ) | | | 281,475 | | | 14,362,247 | | | 24,162,041 |
Dynamex, Inc. | | 598,610 | | 213,214 | | — | | 811,824 | | | | — | | | | — | | | 15,043,099 | | | 13,954,901 |
8. Payment by Affiliate
During the fiscal year ended October 31, 2009, Fund Advisers voluntarily reimbursed the FBR Pegasus Small Cap FundTM $7,834, in connection with the Fund’s inadvertent investment in the shares of another investment company which was made by Fund
121
The FBR Funds
Notes to Financial Statements (continued)
Adviser in excess of applicable investment limitations. This reimbursement has been classified in the Fund’s Statement of Operations, Statement of Changes in Net Assets and the Financial Highlights as “Net increase from payments by affiliates’’.
9. Commitments and Contingencies
In the normal course of business, the Funds enter into contracts that contain a variety of representations and warranties and which provide general indemnifications. The Funds’ maximum exposure under these arrangements is unknown, as this would involve future claims that may be made against the Funds that have not yet occurred. However, based on experience, the Funds expect the risk of loss to be remote.
10. Subsequent Events
The Funds evaluated subsequent events from October 31, 2009, the date of this report, through December 30, 2009, the date this report was issued and available. There were no subsequent events to report that would have a material impact on this report.
11. Results of Special Meeting of Shareholders (unaudited)
A special meeting of the shareholders of the Funds (the “Meeting”), which was initially scheduled for October 23, 2009, was reconvened, following adjournment, on November 13, 2009 (and reconvened on November 20, 2009 with respect to the FBR Technology Fund). The Meeting was held for the purpose of providing shareholders with the opportunity to vote on several proposals as set forth in the proxy materials for the Meeting. Information regarding the details of the results of each of the shareholder votes is set forth below.
Proposal 1: To approve new Investment Advisory Agreements between the Trust, on behalf of each of the Funds, and FBR Fund Advisers, Inc.
| | | For | | Against | | Abstain | | Broker Non-Votes |
| | |
| |
| |
| |
|
| FBR Pegasus FundTM | | 1,524,601 | | | 2,881 | | | 2,799 | | | 563,467 | |
| FBR Pegasus Mid Cap FundTM | | 566,397 | | | 0 | | | 4,880 | | | 149,586 | |
| FBR Pegasus Small Cap FundTM | | 611,123 | | | 4,936 | | | 10,886 | | | 459,611 | |
| FBR Pegasus Small Cap Growth FundTM | | 431,771 | | | 3,426 | | | 0 | | | 124,566 | |
| FBR Focus Fund | | 19,417,660 | | | 684,133 | | | 521,987 | | | 7,277,299 | |
| FBR Large Cap Financial Fund | | 1,120,833 | | | 14,131 | | | 46,569 | | | 440,854 | |
| FBR Small Cap Financial Fund | | 5,389,151 | | | 262,982 | | | 241,353 | | | 1,706,040 | |
| FBR Technology Fund | | 426,758 | | | 24,231 | | | 25,579 | | | 207,525 | |
| FBR Gas Utility Index Fund | | 5,861,895 | | | 514,430 | | | 273,361 | | | 1,456,098 | |
122
The FBR Funds
Notes to Financial Statements (continued)
Proposal 2: To approve a manager-of-managers arrangement that would allow FBR Fund Advisers, Inc. and each FBR Fund to enter into and materially amend subadvisory agreements relating to such FBR Fund without obtaining shareholder approval.
| | | For | | Against | | Abstain | | Broker Non-Votes |
| | |
| |
| |
| |
|
| FBR Pegasus FundTM | | 1,521,955 | | | 3,995 | | | 4,331 | | | 563,467 | |
| FBR Pegasus Mid Cap FundTM | | 563,865 | | | 2,532 | | | 4,880 | | | 149,586 | |
| FBR Pegasus Small Cap FundTM | | 611,227 | | | 4,832 | | | 10,886 | | | 459,611 | |
| FBR Pegasus Small Cap Growth FundTM | | 423,580 | | | 11,617 | | | 0 | | | 124,566 | |
| FBR Focus Fund | | 19,066,330 | | | 1,058,578 | | | 498,872 | | | 7,277,299 | |
| FBR Large Cap Financial Fund | | 662,591 | | | 473,843 | | | 45,099 | | | 440,854 | |
| FBR Small Cap Financial Fund | | 5,198,384 | | | 460,251 | | | 234,851 | | | 1,706,040 | |
| FBR Technology Fund | | 427,224 | | | 21,647 | | | 27,698 | | | 207,525 | |
| FBR Gas Utility Index Fund | | 5,594,340 | | | 699,979 | | | 355,368 | | | 1,456,098 | |
Proposal 3(a): To eliminate FBR Pegasus Small Cap Growth Fund’sTM fundamental investment restriction regarding concentration in the technology industry.
| | | For | | Against | | Abstain | | Broker Non-Votes |
| | |
| |
| |
| |
|
| FBR Pegasus Small Cap Growth FundTM | | 422,188 | | 13,009 | | 0 | | 124,566 |
Proposal 3(b): To reclassify the FBR Gas Utility Index Fund as a non-diversified fund.
| | | For | | Against | | Abstain | | Broker Non-Votes |
| | |
| |
| |
| |
|
| FBR Gas Utility Index Fund | | 5,587,014 | | 819,182 | | 243,491 | | 1,456,098 |
Proposal (4): To elect Trustees of the Trust.
| | | For | | | Withhold | |
| | |
| | |
| |
| Michael A. Willner | | 48,740,249 | | | 1,661,104 | |
| Reena Aggarwal | | 48,702,784 | | | 1,698,570 | |
| William E. Cole, Jr. | | 48,748,126 | | | 1,653,228 | |
| Charles O. Heller | | 48,713,233 | | | 1,688,120 | |
| David H. Ellison | | 48,736,215 | | | 1,665,138 | |
123
The FBR Funds
Report of Independent Registered Public Accounting Firm
To the Board of Trustees and Shareholders
The FBR Funds
Arlington, Virginia
We have audited the accompanying statements of assets and liabilities, including the portfolios of investments of the FBR Pegasus Fund, FBR Pegasus Mid Cap Fund, FBR Pegasus Small Cap Fund, FBR Pegasus Small Cap Growth Fund, FBR Focus Fund, FBR Large Cap Financial Fund, FBR Small Cap Financial Fund, FBR Technology Fund and FBR Gas Utility Index Fund (the “Funds”), each a series of The FBR Funds as of October 31, 2009, and the related statements of operations of the Funds for the year then ended, the statements of changes in net assets for each of the two years in the period then ended and financial highlights of the Funds for the period indicated thereon. These financial statements and financial highlights are the responsibility of the Funds’ management. Our responsibility is to express an opinion on these financial statements and financial highlights based on our audits.
We conducted our audits in accordance with standards of the Public Company Accounting Oversight Board (United States). Those standards require that we plan and perform the audit to obtain reasonable assurance about whether the financial statements and financial highlights are free of material misstatement. The Funds are not required to have, nor were we engaged to perform, an audit of the Funds’ internal control over financial reporting. Our audits included consideration of internal control over financial reporting as a basis for designing audit procedures that are appropriate in the circumstances, but not for the purposes of expressing an opinion on the effectiveness of the Funds’ internal control over financial reporting. Accordingly, we express no such opinion. An audit includes examining, on a test basis, evidence supporting the amounts and disclosures in the financial statements. Our procedures included confirmation of securities owned as of October 31, 2009, by correspondence with the custodian and brokers or by other appropriate auditing procedures where brokers did not reply to our confirmation requests. An audit also includes assessing the accounting principles used and significant estimates made by management, as well as evaluating the overall financial statement presentation. We believe that our audits provide a reasonable basis for our opinion.
In our opinion, the financial statements and financial highlights referred to above present fairly, in all material respects, the financial position of the FBR Pegasus Fund, FBR Pegasus Mid Cap Fund, FBR Pegasus Small Cap Fund, FBR Pegasus Small Cap Growth Fund, FBR Focus Fund, FBR Large Cap Financial Fund, FBR Small Cap Financial Fund, FBR Technology Fund and FBR Gas Utility Index Fund as of October 31, 2009, the results of their operations, the changes in their net assets, and the financial highlights for the periods referred to above, in conformity with accounting principles generally accepted in the United States of America.
TAIT, WELLER & BAKER LLP
Philadelphia, Pennsylvania
December 30, 2009
124
The FBR Funds
Important Supplemental Information (unaudited)
Dividends Received Deduction
For corporate shareholders, the following ordinary dividends paid during the fiscal year ended October 31, 2009 qualify for the corporate dividends received deduction:
| Pegasus Fund | | 39.27 | % |
| Pegasus Mid Cap Fund | | 14.78 | % |
| Large Cap Financial Fund | | 50.63 | % |
| Small Cap Financial Fund | | 90.59 | % |
| Gas Utility Index Fund | | 100.00 | % |
Proxy Voting Guidelines
Fund Advisers is responsible for exercising the voting rights associated with the securities purchased and held by the Funds. A description of the policies and procedures Fund Advisers uses in fulfilling this responsibility is included in the Funds’ Statement of Additional Information and is available without charge, upon request, by calling 888.888.0025. The policies and procedures are also available on the Securities and Exchange Commission’s (“SEC”) website at http://www.sec.gov. Information on how the Funds voted proxies relating to portfolio securities during the most recent 12 month period ended June 30 is available without charge, upon request, by calling 888.888.0025 and is also available on the SEC’s website at http://www.sec.gov.
Portfolio Holdings
The Funds file their complete schedule of holdings with the SEC for the first and third quarters of each fiscal year on Form N-Q. The Funds’ Form N-Q is available on the SEC’s website at http://www.sec.gov. You may review and make copies at the SEC’s Public Reference Room in Washington, D.C. You may also obtain copies after paying a duplicating fee by writing the SEC’s Public Reference Section, Washington, D.C. 20549-0102 or by electronic request to publicinfo@sec.gov. Information on the operation of the Public Reference Room may be obtained by calling 800.SEC.0330. A copy of the quarterly holdings report is available, without charge, upon request, by calling 888.888.0025.
Approval of Interim and New Investment Advisory Agreements for the Funds
In accordance with the Investment Company Act of 1940, as amended (the “1940 Act”), the Board of Trustees (the “Board” or “Trustees”) is required, at an in-person meeting of the Board called for such purpose, to consider the approval of any investment advisory agreement and any applicable sub-advisory agreement intended for use in connection with the Funds. The relevant provisions of the 1940 Act specifically provide that it is the duty of the Board to request and evaluate such information as the Trustees determine is necessary to allow them to properly consider the approval of any investment advisory and sub-advisory agreements, and it is the duty of any investment adviser and sub-adviser to furnish the Trustees with such information that is reasonably necessary for the Trustees to evaluate the terms of the investment advisory and sub-advisory agreements.
During the Fund’s most recent fiscal year ended October 31, 2009, the Board took action on two separate occasions in connection with the consideration and approval of the
125
The FBR Funds
Important Supplemental Information (unaudited) (continued)
investment advisory agreements of the Funds. At in-person meetings held on June 30, 2009 and October 26, 2009, the Board considered, approved and, as applicable, ratified and re-approved the applicable investment advisory and sub-advisory agreements with respect to the Funds. At its meeting held on June 30, 2009, which was called as a result of the change in control of FBR Capital Markets, Inc. (“FBR Capital Markets”), the parent of FBR Fund Advisers, Inc. (“Fund Advisers”), the investment adviser to the Funds, the Board considered and approved the following: (i) new investment advisory agreements with Fund Advisers with respect to each of the Funds (the “New Investment Advisory Agreements”), subject to shareholder approval; (ii) interim investment advisory agreements with Fund Advisers with respect to each of the Funds (the “Interim Investment Advisory Agreements”); (iii) a new sub-advisory agreement between Fund Advisers and Akre Capital Management, LLC (“ACM”) (the then sub-investment adviser to the Focus Fund) with respect to the Focus Fund (the “New Sub-Advisory Agreement”); and (iv) an interim investment sub-advisory agreement between Fund Advisers and ACM with respect to the Focus Fund (the “Interim Sub-Advisory Agreement”). At its meeting held on October 26, 2009, the Board ratified and re-approved the New Investment Advisory Agreements.
1. Action Taken by the Board at its Meeting Held on June 30, 2009
As a result of the change in control of FBR Capital Markets, which occurred during June, 2009, the Board was asked to consider and approve the New Investment Advisory Agreements, the Interim Investment Advisory Agreements, the New Sub-Advisory Agreement and the Interim Sub-Advisory Agreement in connection with the change of control event. This is because in accordance with the 1940 Act and provisions of the investment advisory agreements between the Funds and Fund Advisers, the change of control of FBR Capital Markets resulted in an “assignment” and, therefore, the automatic termination, of the then-existing investment advisory agreements between the Funds and Fund Advisers and, in the case of the Focus Fund, the termination of the then existing investment sub-advisory agreement between Fund Advisers and ACM (the “Prior Advisory Agreements”). The Board noted that all of the material terms of the New Investment Advisory Agreements and the New Sub-Advisory Agreement were substantially the same as the terms under the Prior Advisory Agreements. The Board was also assured by Fund Advisers that there would be no reduction in the nature or quality of the services provided by Fund Advisers due to the change in control transaction, and the Board received similar assurances from ACM with respect to the Focus Fund.
At its meeting held on June 30, 2009, the Board approved Interim Investment Advisory Agreements with Fund Advisers on behalf of each of the Funds and an Interim Investment Sub-Advisory Agreement with ACM with respect to the Focus Fund pursuant to Rule 15a-4 under the 1940 Act. Rule 15a-4 permits an investment adviser to provide services to a fund without shareholder approval of the agreement so long as the Board of the fund approves the “interim” contract and the interim agreement terminates upon the earlier of (i) shareholder approval of the final agreement or (ii) 150 days from the termination of the prior investment advisory agreements. At the June 30, 2009 meeting, the Board also approved the New Investment Advisory Agreements for each Fund and the New Sub-Advisory Agreement on behalf of the Focus Fund, subject to shareholder
126
The FBR Funds
Important Supplemental Information (unaudited) (continued)
approval and a complete annual review and re-approval of the New Investment Advisory Agreements and the New Sub-Advisory Agreement at its October 26, 2009 meeting.
At the June 30, 2009 Board meeting, the Board considered the similarity of the New Investment Advisory Agreements to the respective Prior Advisory Agreements. In determining whether or not it was appropriate to approve the New Investment Advisory Agreements and to recommend approval to shareholders, the Board considered various materials and representations provided by Fund Advisers with respect to each applicable Fund separately, including information relating to the following factors: (1) each Fund’s requirements; (2) the level of fees, looking at the percentage of fees that comparable funds pay; (3) whether the Adviser had waived any fees; (4) the profitability of the Funds to the Adviser; (5) the scope of any “fall-out benefits,” that is, whether Fund Advisers received other benefits from its relationship with the Funds, such as soft dollars; (6) the capabilities and financial soundness of Fund Advisers; (7) current economic and industry trends; (8) historical factors involving Fund Advisers; (9) the responsiveness of management to the Board Members’ concerns and requests for information; and (10) such other factors deemed relevant by the Board.
After considering these factors, the Board, including all of the Trustees who were not considered “interested” as that term is defined under the 1940 Act (the “Independent Trustees”), who were counseled by independent legal counsel to the Independent Trustees, concluded that the New Investment Advisory Agreements would benefit each Fund and its shareholders. In reaching their conclusion with respect to the approval of the New Investment Advisory Agreements, the Board members did not identify any one single factor as being controlling, rather, the Board took note of a combination of factors that influenced their decision making process. The Board did, however, identify the overall favorable investment performance of the Funds and management’s demonstrated commitment to the continued enhancement of investment performance, the commitment of the Adviser to the successful operation of the Funds, and the level of expenses of the Funds, as well as the continued use of expense limitation agreements in order to reduce the overall operating expenses of the Funds, as being important elements of their consideration. The Board also considered the effectiveness of the compliance programs of the Funds and the Adviser in accordance with applicable requirements relating to mutual funds and their investment advisers. Based upon their review and consideration of these factors and other matters deemed relevant by the Board in reaching an informed business judgment, a majority of the Board of Trustees, including a majority of the Independent Trustees, concluded that the terms of the New Advisory Agreements are fair and reasonable and the Board voted to approve the New Advisory Agreements.
On July 24, 2009, ACM provided the Board with a notice of termination of the Interim Sub-Advisory Agreement with respect to the Focus Fund. As a result, effective August 22, 2009, the Interim Sub-Advisory Agreement with ACM was terminated by the Board and Fund Advisers assumed responsibility for the day-to-day management of the Focus Fund. In making its determination in connection with these matters, the Board took into consideration the fact that shortly after ACM had tendered its resignation as sub-adviser to the Focus Fund, the research staff of ACM, whose members had been
127
The FBR Funds
Important Supplemental Information (unaudited) (continued)
serving the Focus Fund for many years, had joined Fund Advisers and therefore, Fund Advisers was able to continue to provide the Focus Fund with ongoing portfolio management services with the research team that had been serving the Focus Fund over the past several years.
On November 13, 2009, shareholders of the Funds approved the New Investment Advisory Agreements with Fund Advisers (except in the case of the Technology Fund, which received shareholder approval effective as of November 20, 2009). As a result, the Funds’ Interim Investment Advisory Agreements with Fund Advisers terminated and the New Investment Advisory Agreements, approved by the Board at its June 30, 2009 meeting, took effect.
2. Action Taken by the Board at its Meeting Held on October 26, 2009
Prior to the approval of the New Investment Advisory Agreements by shareholders at a reconvened shareholder meeting held on November 13, 2009, the Board held an in-person meeting on October 26, 2009, at which time it ratified and approved the New Investment Advisory Agreements. During this meeting, the Board reviewed relevant information and data provided by Fund Advisers in response to written questions from the Independent Trustees and the Independent Trustees met with independent legal counsel to the Independent Trustees to discuss their evaluation of the information provided by the Fund Advisers. The Board met with representatives of Fund Advisers and discussed with them, among other things, their investment process, the investment results of the Funds, compensation arrangements for the portfolio managers, brokerage practices used for the Funds, the cost of providing the services and the profitability of the advisory arrangements to Fund Advisers, the extent to which Fund Advisers had achieved economies of scale, the extent to which shareholders participated in those economies of scale, and matters relating to the distribution and marketing of the Funds.
In determining whether to ratify and re-approve the New Investment Advisory Agreements, the Board requested, and was provided with, information and data relevant to the Board’s consideration. This included information regarding the investment performance of the Funds and information regarding the fees and expenses of the Funds, as compared to other similar mutual funds.
As part of its deliberations, the Board also considered and relied upon the information about the Funds and Fund Advisers that had been provided to them throughout the year in connection with their regular Board meetings at which they engage in the ongoing oversight of the Funds and their operations. The Independent Trustees were counseled during this process by independent legal counsel, as such term is defined in the rules under the 1940 Act, who reviewed with them their duties and responsibilities with respect to their consideration of the New Investment Advisory Agreements.
The Board reviewed information and materials regarding the investment advisory fees for the Funds. Representatives of Fund Advisers stated that the investment advisory fees for the Funds are not presently subject to any asset-based breakpoints, but that Fund Advisers has in place with respect to each of the Funds an expense limitation agreement
128
The FBR Funds
Important Supplemental Information (unaudited) (continued)
limiting total annual operating expenses of each of the Funds. Fund Advisers indicated that it intended to continue maintaining the expense limitation for the Funds until February 28, 2013.
The Board received and considered relative performance and expense information, including total return performance information for applicable one-, three-, five-, and 10-year periods. The Board then considered information regarding each of the Funds separately and reviewed with the representatives of Fund Advisers various performance and expense information for each of the Funds, including each Fund’s performance against its benchmark, changes in total assets for each of the Funds, the costs of providing services, the profitability of each of the Funds to Fund Advisers, and distribution arrangements for each of the Funds, as follows:
1. Large Cap Financial Fund. The Board first reviewed information and materials regarding the Large Cap Financial Fund, noting the Fund’s fees, expenses and performance results, and compared such information to comparable funds and to the Fund’s relevant benchmark index. The Board members reviewed the Large Cap Financial Fund’s investment performance for the one-, three-, five- and 10-year periods and since inception. The Board noted that the Investor Class of the Fund outperformed its benchmark, the Philadelphia Bank Index, and its total universe group for the one-year period ended August 31, 2009, as well as the three-, five- and 10-year periods. The Board also noted the fact that the Large Cap Financial Fund effected a small amount of brokerage transactions through the Fund’s affiliate, FBR Capital Markets & Co., Inc. (“FBR & Co.”), and further noted that information concerning the nature and amount of these affiliated brokerage transactions is reported to the Board on a quarterly basis in accordance with the Fund’s Rule 17e-1 reporting requirements. The Board concluded that, in light of all the circumstances, the level of trades placed through FBR & Co. was reasonable, especially in light of the fact that FBR & Co. is active in the markets for many financial services stocks, thus making it reasonable for the Fund to utilize FBR & Co. for some of its portfolio brokerage transactions. The Board reviewed the Fund’s performance with the portfolio manager for the Large Cap Financial Fund.
2. Small Cap Financial Fund. The Board reviewed information and materials regarding the Small Cap Financial Fund, noting the Fund’s fees, expenses and performance results, and compared such information to comparable funds and to the Fund’s relevant benchmark indexes. The Board reviewed the Small Cap Financial Fund’s investment performance for the one-, three-, five- and 10-year periods and since inception. The Board noted that the Investor Class of the Fund outperformed its benchmark, the NASDAQ Bank Index, and its total universe group for the one-year period ended August 31, 2009, as well as the three-, five- and 10-year periods. The Board also noted the fact that the Small Cap Financial Fund effected a small amount of brokerage transactions through FBR & Co., and further noted that information concerning the nature and amount of these affiliated brokerage transactions is reported to the Board on a quarterly basis in accordance with the Fund’s Rule 17e-1 reporting requirements. The Board concluded that, in light of all the circumstances, the level of trades placed through FBR & Co. was reasonable, especially in light of the fact that FBR & Co. is active in the
129
The FBR Funds
Important Supplemental Information (unaudited) (continued)
markets for many financial services stocks, thus making it reasonable for the Fund to utilize FBR & Co. for some of its portfolio brokerage transactions. The Board reviewed the Fund’s performance with the portfolio manager for the Small Cap Financial Fund.
3. Focus Fund. The Board next reviewed information and materials regarding the Focus Fund, noting the Fund’s fees, expenses and performance results, and then compared such information to comparable funds and to the Fund’s relevant benchmark index. The Board noted the performance results of the Focus Fund, and the investment strategies employed by ACM in connection with its sub-investment management of the Focus Fund prior to ACM’s resignation as investment sub-adviser to the Focus Fund. The Board noted that the research team consisting of the analysts who had assisted in managing the Focus Fund in their positions with ACM had joined Fund Advisers as the portfolio managers to the Fund in their new positions with Fund Advisers. The Board reviewed the Focus Fund’s overall investment performance for the one-, three-, five- and 10-year periods and since inception. The Board noted that the Investor Class of the Fund outperformed its benchmark, the S&P 500 Index, and its total universe group for the one-year period ended August 31, 2009, as well as the three-, five- and 10-year periods. The Board noted that, because the portfolio managers of the Fund had significant experience managing the assets of the Fund in their previous positions with ACM, the advisory services provided to Fund were not expected to be subject to any material changes.
4. Technology Fund. The Board next reviewed information and materials regarding the Technology Fund, noting the Fund’s fees, expenses and performance results, and then compared such information to comparable funds and to the Fund’s relevant benchmark index. The Board reviewed the Technology Fund’s investment performance for the one-, three- and five-year periods and for the period since the commencement of the Fund’s investment operations on February 1, 2002. The Board also noted that the Investor Class of the Fund tracked, but underperformed its benchmark, the PSE Technology Index, and its total universe group for the one-year period ended August 31, 2009, as well as the three- and five-year periods. The Board reviewed the Fund’s performance with representatives of Fund Advisers and the Board took into consideration Fund Advisers’ plans for addressing the Fund’s performance results.
5. Pegasus Small Cap Growth Fund. The Board next reviewed information and materials regarding the Pegasus Small Cap Growth Fund, noting the Fund’s fees, expenses and performance results, and then compared such information to comparable funds and to the Fund’s relevant benchmark index. The Board noted the Pegasus Small Cap Growth Fund’s investment performance for the one-, three- and five-year periods and for the period since the commencement of Fund’s investment operations on January 20, 2004. The Board noted that the Investor Class of the Fund outperformed its benchmark, the Russell 2000 Growth Index, and its total universe group for the one-year period ended August 31, 2009, as well as the three- and five-year periods. The Board reviewed the Fund’s performance with representatives of Fund Advisers.
6. Gas Utility Index Fund. The Board then reviewed information and materials regarding the Gas Utility Index Fund, noting the Fund’s fees, expenses and performance results, and compared such information to comparable funds and to the Fund’s relevant
130
The FBR Funds
Important Supplemental Information (unaudited) (continued)
benchmark index. The Board noted that only this Fund among the Equity Funds operated as an index fund. The Board members also reviewed the Gas Utility Index Fund’s investment performance for the one-, three-, five- and 10-year periods and since inception. The Board noted the Investor Class of the Fund outperformed its benchmark, the American Gas Association Stock Index, and its total universe group for the one-year period ended August 31, 2009, but underperformed its benchmark for the three-, five- and 10-year periods. The Board further noted that the Fund’s performance generally compared favorably to that of the funds in its peer universe. The Board reviewed the Fund’s performance with representatives of Fund Advisers and the Board took into consideration Fund Advisers’ plans for addressing the Fund’s performance results.
7. Pegasus Fund. The Board reviewed information and materials regarding the Pegasus Fund, noting the Fund’s fees, expenses and performance results, and then compared such information to comparable funds and to the Fund’s relevant benchmark index. The Board members noted the Pegasus Fund’s investment performance for the one- and three-year periods and for the period since the Fund’s commencement of investment operations on November 14, 2005. The Board also noted that the Investor Class of the Fund outperformed its benchmark, the S&P 500 Index, and its total universe group for the one-year period ended August 31, 2009, as well as the three-year period. The Board discussed the Fund’s performance with representatives of Fund Advisers.
8. Pegasus Small Cap Fund. The Board next reviewed information and materials regarding the Pegasus Small Cap Fund, noting that Fund’s fees, expenses and performance results, then compared such information to comparable funds and the Fund’s relevant benchmark index. The Board noted the Fund’s investment performance for the one-year period and for the period since its commencement of investment operations on February 28, 2007. The Board also noted that the Investor Class of the Fund outperformed its benchmark, the Russell 2000 Index, and its total universe group for the one-year period ended August 31, 2009. The Board discussed the Fund’s performance with representatives of Fund Advisers.
9. Pegasus Mid Cap Fund. The Board reviewed information and materials regarding the Pegasus Mid Cap Fund, noting that Fund’s fees, expenses and performance results, then compared such information to comparable funds and the Fund’s relevant benchmark index. The Board members noted the Fund’s investment performance for one-year period and for the period since its commencement of investment operations on February 28, 2007. The Board also noted that the Investor Class of the Fund outperformed its benchmark, the Russell Midcap Index and its total universe group for the one-year period ended August 31, 2009. The Board discussed the Fund’s performance with representatives of Fund Advisers.
Among the factors the Board considered was the overall performance of the Funds relative to the performance of other mutual funds in each Fund’s peer group on a long-term basis and over shorter time periods (discussed above). The Board noted the long-term relationship between Fund Advisers and the Funds and the efforts that had been undertaken by Fund Advisers to foster the growth and development of the Funds since the inception of each of the Funds. In addition, the Board compared expenses of each
131
The FBR Funds
Important Supplemental Information (unaudited) (continued)
Fund to the expenses of its peers, noting that the expenses for each of the Funds compared favorably with industry averages for other funds of similar size. They noted the range of investment advisory and administrative services provided by Fund Advisers and its affiliates to the Funds and the level and quality of these services, and in particular, they noted the quality of the personnel providing these services. The Board took into account the background and experience of each of Fund Advisers’senior management and expertise of, and the amount of attention given to each Fund by, Fund Advisers’ investment personnel. The Board also reviewed financial information concerning Fund Advisers and its affiliates relating to the operation of the Funds, noting the overall profitability of the relationship with the Funds to Fund Advisers and the financial soundness of Fund Advisers as demonstrated by the financial information provided.
The Board further reviewed the Funds’ brokerage practices and best-execution procedures, and noted that these were reasonable and consistent with standard industry practice. The Board considered the receipt by Fund Advisers of research and execution services in exchange for payment of brokerage commissions. The Board noted that Fund Advisers does not maintain any formal agreements with firms to direct Fund brokerage in exchange for third party research and that Fund Advisers represented that trading done with various brokerage firms is done in a manner that is consistent with relevant requirements relating to the receipt of research in connection with brokerage transactions. The Board took note of the fact that a certain amount of brokerage for the Funds is handled by a brokerage affiliate of Fund Advisers, and the Board noted Fund Advisers’ representations that such brokerage is conducted in a manner consistent with applicable rules relating to brokerage placed through affiliated entities. The Board determined that the amount of affiliated brokerage was fair and reasonable and done in accordance with the applicable regulatory requirements. The Board also reviewed information regarding the manner in which the Funds’ affiliated broker utilizes certain electronic communications networks (“ECNs”) for purposes of effectuating portfolio trades for some of the Funds and the way in which the use of these ECNs can be beneficial to the affiliated brokerage firm when trading on behalf of the Funds.
The Board also noted the fact that an affiliate of Fund Advisers, FBR Investment Services, Inc. (“FBRIS”), serves as the distributor of the shares of the Funds and receives distribution fees from the Funds for serving in that role. The Board considered and discussed the activities routinely engaged in by FBRIS in order to distribute and market the Funds. The Board reviewed the distribution arrangements maintained by FBRIS for the Funds, noting the extensive sales arrangements for the Funds on various mutual fund sales platforms and the manner in which the distribution fees paid by those of the Funds that pay distribution fees are utilized in connection with these arrangements. The Board also noted with respect to the distribution arrangements of the Funds the enhanced distribution capabilities established by FBRIS. The Board took note of the fact that FBRIS has continued to seek wider distribution of the Funds through a growing number of distribution channels.
132
The FBR Funds
Important Supplemental Information (unaudited) (continued)
The Board also considered and reviewed information regarding the administrative services fees paid to Fund Advisers by the Funds for providing certain types of administrative and oversight services. The Board determined that the administrative fees paid to Fund Advisers are fair and reasonable in connection with the types of services provided by Fund Advisers to the Funds and that they are reasonable fees to be paid in addition to the investment advisory fees paid by the Funds to Fund Advisers given that the administrative services are separate and distinct services apart from the investment advisory services being provided to the Funds by Fund Advisers. In connection with its consideration of these matters, the Board considered and approved Fund Advisers’ request for an increase in the level of administrative fees payable to Fund Advisers based upon the level and quality of the services provided, the personnel providing the services, and Fund Advisers’ continued use of expense limitation arrangements that are intended to limit the amount of the overall operating expenses of the Funds.
The Independent Trustees met separately with the independent legal counsel to the Independent Trustees in order to consider the ratification and re-approval of the New Investment Advisory Agreements. At the conclusion of their sessions, the Independent Trustees had determined that they had received sufficient information to allow them to take action with respect to their consideration of the ratification and re-approval of the New Investment Advisory Agreements.
In reaching their conclusion with respect to the ratification and re-approval of the New Investment Advisory Agreements, the Trustees did not identify any one single factor as being controlling, rather, the Board took note of a combination of factors that influenced their decision making process. The Board did, however, identify the overall favorable investment performance of the Funds and management’s demonstrated commitment to the continued enhancement of investment performance, the commitment of Fund Advisers to the successful operation of the Funds, and the level of expenses of the Funds, as well as the continued use of expense limitation agreements in order to reduce the overall operating expenses of the Funds, as being important elements of their consideration. The Board also considered the effectiveness of the compliance programs of the Funds and Fund Advisers in accordance with applicable requirements relating to mutual funds and their investment advisers. Based upon their review and consideration of these factors and other matters deemed relevant by the Board in reaching an informed business judgment, a majority of the Board of Trustees, including a majority of the Independent Trustees, concluded that the terms of the New Investment Advisory Agreements are fair and reasonable and the Board voted to ratify and re-approve the New Investment Advisory Agreements for a one-year period, subject to approval by shareholders and the applicable limitations on the total operating expenses of the Funds as considered and approved at the meeting.
133
The FBR Funds
Important Supplemental Information (unaudited) (continued)
Information About Trustees and Officers
Information pertaining to the Trustees and Officers of the Trust is set forth below. The address for each Trustee and Officer is 1001 Nineteenth Street North, Arlington, Virginia, 22209 unless otherwise stated. The statement of additional information (SAI) includes additional information about the Trustees and is available without charge upon request by calling 888.888.0025.
| Name, Age, Address, | Position Held* and Tenure** | Portfolios Overseen in the Trust and Fund Complex*** | Principal Occupation(s)
during past 5 years | Other Trusteeships/ Directorships by Trustee |
| |
| Michael A. Willner, 53 | Independent Board Chair; Trustee Since 1997 | 10 | President, AlphaGrip, Inc., January 2001 to present. | None |
| Charles O. Heller, 73 | Trustee Since 2003 | 10 | President, Annapolis Capital Group, since 2005; Beacon Global LLC (venture capital firm), 2003-2005. | None |
| Reena Aggarwal, 52 | Trustee Since 2006 | 10 | Professor at Georgetown, 2000 to present; Deputy Dean, McDonough School of Business, Georgetown University 2006-2008; Interim Dean, 2004-2005; Visiting Professor, MIT Sloan School of Management, 2005-2006. | Index IQ Trust |
| William E. Cole, Jr., 60 | Trustee Since 2006 | 10 | Retired, 2006. Partner, Ernst & Young LLP, 1972-2006. | None |
David H. Ellison†, 51
100 Federal Street
Boston, MA 02110 | Trustee Since 2003 President Since 2001 | 10 | Director, CIO and President, FBR Fund Advisers, Inc., since December 1999; Portfolio Manager for Equity Funds since October 1996. | None |
Winsor H. Aylesworth, 62
100 Federal Street
Boston, MA 02110 | Executive Vice President Since 1999 | 10 | Portfolio Manager, FBR Fund Advisers, Inc. since September 1998. | N/A |
| William B. Sanders III, 45 | Executive Vice President Since 1999 | 10 | Senior Vice President of Fund Operations, FBR Fund Advisers, Inc. since August 1999 and Head Trader for FBR Fund Advisers, Inc., since January 1997. | N/A |
| Kimberly J. Bradshaw, 35 | Treasurer Since 2006 Secretary Since 2003 | 10 | Employee of FBR since August 1998, serving in various capacities, including Vice President Fund Administration, AVP of Fund Administration, Transfer Agent Operations Manager and Fund Accounting Supervisor, Vice President and Secretary of Money Management Advisers, Inc. November 2003 to March 2006. | N/A |
134
The FBR Funds
Important Supplemental Information (unaudited) (continued) Information About Trustees and Officers (continued)
| Name, Age, Address, | Position Held* and Tenure** | Portfolios Overseen in the Trust and Fund Complex*** | Principal Occupation(s)
during past 5 years | Other Trusteeships/ Directorships by Trustee |
| |
| Kristin E. Stelljes, 33 | Assistant Treasurer Since 2006 | 10 | Employee of FBR since February 2002, serving in various capacities including Assistant Vice President Fund Administration, Supervisor of Fund Administration, Accountant and Customer Service Representative. | N/A |
Guy F. Talarico, 54
800 Third Avenue
11th Floor New York, NY 10022 | Chief Compliance Officer Since 2006 | 10 | CEO of Alaric Compliance Services, LLC since January 2006. Co-Chief Executive Officer of EOS Compliance Services, LLC from June 2004 to December 2005. Senior Director of Investors Bank & Trust Institutional Custody Division From February 2001 to June 2004. | N/A |
| * | | Trustees serve until their resignation, removal, or death. The Trust’s President, Treasurer, and Secretary serve until their successor is chosen and qualified. The other Officers of the Trust serve at the pleasure of the Trustees. |
| ** | | Length of time served is measured from the earliest date of service as a Trustee or Officer of any of the Funds or the Predecessor Funds. |
| *** | | The “Fund Complex” consists of all mutual funds advised by FBR Capital Markets, Inc. (“FBR Capital Markets”) and its affiliate advisers. |
| † | | Mr. Ellison is considered to be an “Interested Trustee” of the Trust due to his position with FBR Fund Advisers. |
135
[THIS PAGE INTENTIONALLY LEFT BLANK]
[THIS PAGE INTENTIONALLY LEFT BLANK]
[THIS PAGE INTENTIONALLY LEFT BLANK]
[THIS PAGE INTENTIONALLY LEFT BLANK]
[THIS PAGE INTENTIONALLY LEFT BLANK]
[THIS PAGE INTENTIONALLY LEFT BLANK]
[THIS PAGE INTENTIONALLY LEFT BLANK]
THE FBR FUNDS
888.888.0025
fbrfundsinfo@fbr.com
www.fbrfunds.com
Investment Adviser
FBR FUND ADVISERS, INC.
1001 NINETEENTH STREET NORTH
ARLINGTON, VIRGINIA 22209
Distributor
FBR INVESTMENT SERVICES, INC.
1001 NINETEENTH STREET NORTH
ARLINGTON, VIRGINIA 22209
Transfer Agent
JPMORGAN CHASE BANK, N.A.
P.O. BOX 5354
CINCINNATI, OHIO 45201
Independent Registered Public Accounting Firm
TAIT, WELLER, AND BAKER LLP
1818 MARKET STREET
PHILADELPHIA, PENNSYLVANIA 19103
This report is not authorized
for distribution to prospective
investors unless it is preceded or
accompanied by a current prospectus.

THE FBR FUNDS
FBR Fund for Government Investors
Annual Report
October 31, 2009
[THIS PAGE INTENTIONALLY LEFT BLANK]
The FBR Funds
Annual Letter to Shareholders
Dear Shareholder:
We are pleased to present The FBR Funds’ Annual Report for the twelve-month period ended October 31, 2009.
As we have outlined in previous communications, for each of our actively managed mutual funds our objective is to strive for downside protection in volatile markets while participating in rising ones. We firmly believe that on a relative and absolute basis, outperformance in difficult markets is one of the key drivers to creating long-term wealth for our clients.
The 2009 fiscal year can certainly be characterized as the tale of two markets coupled with emotional volatility. Over the course of the period, investors were subject to a volatile and intense nosedive from September 2008 through February 2009 and subsequent explosive and manic rally off the March lows which lasted through August before cooling in late September 2009. This type of extreme downside and upside volatility, even though it is a small sample of observations relative to our long-term prospective, provides an appropriate backdrop for investors to examine whether we have in fact delivered upon our objectives.
Did we manage to achieve our stated objectives in the face of such short-term market extremes? The answer is a resounding “yes”. I am proud to report that all of our actively managed funds, regardless of capitalization and style, outperformed their benchmarks and peers during the drawdown period, which subjected investors to less volatility. As you would expect, when the market began its rally, our funds generally performed in-line on the way back up. Examining the entire reporting period, which encompasses both extremes, we are fortunate to be able to report that all of our actively managed funds outperformed their benchmark and peers on a relative basis. Detailed performance information on each of our funds can be found within the enclosed Annual Report.
Given our long-term orientation as investors, a single twelve month period should not be the sole basis for the complete evaluation of our investment philosophy and the processes that drive our performance. At the close of our fiscal year, we offered three (3) funds with performance records exceeding ten-years and five (5) funds with a performance record exceeding five-years. During those two time frames, which incorporated asset bubbles and disappointments, bear markets, and optimism, all of these funds across the longer-term horizons outperformed their respective category average on an absolute and relative basis. We are proud of this fact and have every bit of confidence that our newer funds will deliver similar results as they continue to build long-term track records.
The difficult capital markets environment not only presented challenges for investors, it also had a major impact on the entire asset management industry. Post crisis, investors turned to the defensive fixed-income asset class, in search of yield, or to money markets funds for preservation. The flows to these conservative asset classes left many equity funds with significantly smaller assets than in prior years forcing many asset managers to evaluate and rationalize their business strategies and practice.
At The FBR Funds, we were not immune to this trend but managed to successfully navigate the turmoil primarily because of enhanced distribution and client retention efforts. We re-examined our business in light of the changing industry landscape and executed several steps to ensure we remain in the best position to capitalize on current dislocation and stress permeating our industry today. All of the actions being taken, such as exiting the money market business and internalizing the management of our largest product, though difficult, are necessary to ensure we have a solid foundation in place to continue to grow our business organically as well as strategically while remaining focused and committed to
2
delivering the highest quality solutions to our clients.
As in prior years, what follows in this report is a discussion with each portfolio manager with respect to the performance of their fund(s) over the 2009 fiscal year. It also includes their thoughts on related industry conditions and their investment outlook. We believe the comments and thoughts from our seven (7) fund managers are an important part of our annual and semi-annual communications to our shareholder. We encourage you to read them and hopefully better understand our investment process and current thinking.
All of us at The FBR Funds want to thank you for your continued support, and we look forward to serving your investment needs in the years ahead. As always, we welcome your questions and comments. You can reach us via e-mail at fbrfundsinfo@fbr.com or toll free at 888.200.4710.
Sincerely,
| David Ellison |
| President, Chief Investment Officer and Trustee |
| The FBR Funds |
| |
|
Past performance is not guarantee of future results. The performance data quoted represents past performance and the current performance may be lower or higher than the data quoted. Investment return and principal will fluctuate so that investors’ shares, when redeemed may be worth more or less than their original value. The performance data does not reflect the deduction of redemption fees and if reflected, the redemption fee would reduce the performance quoted. To obtain performance data current to the most recent month-end call 888.888.0025.
Investors should consider the investment objectives, risks, charges and expenses carefully before investing. This and other information can be found in the Fund’s prospectus. To obtain a free prospectus please call 888.888.0025 of visit fbrfunds.com. Please read the prospectus carefully before investing. The FBR Funds are distributed by FBR Investment Services, Inc., member FINRA/SIPC.
3
The FBR Funds
FBR Fund for Government Investors
Management Overview
Portfolio Manager: William B. Sanders, III
Over the last 12 months, how did the Fund perform and what factors contributed to this performance?
For the one year period ended October 31, 2009 the FBR Fund for Government Investors appreciated 0.20%. The negligible return is directly attributable to the near zero Fed Funds target range of 0 - 0.25%.
Portfolio manager comments on the Fund and the related investment outlook.
During the last fiscal year, the Federal Open Market Committee (the “Fed”) met seven times and maintained the near zero (0 - 0.25%) Fed Funds target rate for the entire twelve month period. The Fed’s commentary from the last meeting of the fiscal period held on September 23, 2009 stated that economic activity has picked up but to stay weak for a time. The Fed has clearly telegraphed that it intends to keep rates low for a while as there is still a tremendous amount of slack in the economy — a high unemployment rate, weak consumer spending, continued credit contraction and a still shaky housing market. We believe the good news is that the economy is in the process of stabilizing/bottoming but the bad news is economists are not predicting a typical post-recession rapid “V” shaped recovery but rather a sluggish “U” shaped one. This suggests that any recovery will be anemic and inflation will likely remain subdued for some time (i.e. no need to start moving rates higher).
Much of the economy’s support continues to come from the government’s smorgasbord of special stimulus programs. Some economists think the government should start unwinding its involvement and begin raising rates now but Chairman Bernanke and others are determined not to start these actions prematurely and risk the economy double dipping back into a recession. Not pulling support too early was one of the many lessons learned from the Great Depression. Still some fear the low/near zero interest rates and a system awash in liquidity may be fueling additional asset bubbles in equities and commodities.
The economy still has a long way to go before the private sector starts to demonstrate sustainable job growth, but for now, we have to be thankful that we are emerging from the great recession and not mired in a depression. The performance of the Fund will remain linked to the movements of the Fed Funds target rate.
The opinions expressed in this commentary reflect those of the Portfolio Manager as of the date written. Any such opinions are subject to change based on market or other conditions. These opinions may not be relied upon as investment advice. Investment decisions for The FBR Funds are based on several factors, and may not be relied upon as an indication of trading intent on behalf of any FBR Fund. Security positions can and do change.
4
| The FBR Funds |
|
| FBR Fund for Government Investors |
| Portfolio Summary |
| October 31, 2009 |
The following provides a breakdown of the Fund by maturity schedule1. The underlying securities represent a percentage of the portfolio investments.
| | Time to Maturity | | % of Total Investments |
| |
| |
|
| | Greater than 90 days | | | 52.0 | % |
| | 61 to 90 days | | | 27.8 | % |
| | 30 days or Less | | | 20.2 | % |
|
| 1 | The maturity date used for each security in the portfolio to determine the schedule is the shorter of the next interest rate reset date or the final maturity date. |
5
| The FBR Funds |
|
| FBR Fund for Government Investors |
| Portfolio of Investments |
| October 31, 2009 |
|
| | | | | | | | | | MATURITY | | | |
| PAR | | | | | RATE | | DATE | | VALUE |
|
| | | | U.S. GOVERNMENT AND AGENCY OBLIGATIONS — 89.9% | | | | | | | | | | | |
| | | | Federal Home Loan Mortgage Corporation — 10.1% | | | | | | | | | | | |
| $7,300,000 | | | FHLMC | | | 4.75 | % | | | 11/3/09 | | | $ | 7,301,761 |
| | | | | | | | | | | | | |
|
| | | | | | | | | | | | | | | |
| | | | UNITED STATES TREASURY BILLS — 79.8% | | | | | | | | | | | |
| 20,000,000 | | | U.S. Treasury Bill | | | 0.12 | | | | 12/31/09 | | | | 19,996,000 |
| 17,500,000 | | | U.S. Treasury Bill | | | 0.07 | | | | 2/18/10 | | | | 17,496,291 |
| 20,000,000 | | | U.S. Treasury Bill | | | 0.175 | | | | 4/1/10 | | | | 19,985,318 |
| | | | | | | | | | | | | |
|
| | | | | | | | | | | | | | | 57,477,609 |
| | | | | | | | | | | | | |
|
| | | | MONEY MARKET FUND — 10.0% | | | | | | | | | | | |
| 7,241,022 | | | JPMorgan 100% U.S. Treasury Securities Money Market Fund | | | | | | | | | | | 7,241,022 |
| | | | | | | | | | | | | |
|
| | | | | | | | | | | | | | | |
| | | | Total Investments — 99.9% (Amortized Cost $72,020,392)† | | | | | | | | | | | 72,020,392 |
| | | | | | | | | | | | | | | |
| | | | Other Assets Less Liabilities — 0.1% | | | | | | | | | | | 115,845 |
| | | | | | | | | | | | | |
|
| | | | | | | | | | | | | | | |
| | | | Net Assets — 100.0% | | | | | | | | | | $ | 72,136,237 |
| | | | | | | | | | | | | |
|
|
| * | Interest rates for the discount notes represent the yield to maturity at the date of purchase. |
| † | Same cost is used for federal income tax purposes. |
| | |
| | Weighted Average Maturity of Portfolio: 86 Days |
The accompanying notes are an integral part of the financial statements.
6
| The FBR Funds |
|
| FBR Fund for Government Investors |
| Statement of Assets and Liabilities |
| October 31, 2009 |
| ASSETS | | | | |
Investment Securities at Cost* | | $ | 72,020,392 | |
| | |
| |
Investment Securities at Value* (Note 2) | | $ | 72,020,392 | |
Receivable for Capital Shares Sold | | | 124,554 | |
Dividends and Interest Receivable | | | 171,495 | |
Receivable from Adviser | | | 24,339 | |
Prepaid Expenses | | | 19,457 | |
| | |
| |
Total Assets | | | 72,360,237 | |
| | |
| |
| LIABILITIES | | | | |
Payable for Capital Shares Redeemed | | | 122,502 | |
Administration Fee Payable (Note 3) | | | 6,504 | |
Other Accrued Expenses | | | 94,994 | |
| | |
| |
Total Liabilities | | | 224,000 | |
| | |
| |
| NET ASSETS | | $ | 72,136,237 | |
| | |
| |
| Net Assets Consist of: | | | | |
Paid-in capital | | $ | 72,322,932 | |
Accumulated net realized loss on investments | | | (186,695 | ) |
| | |
| |
| NET ASSETS | | $ | 72,136,237 | |
| | |
| |
| Pricing of Shares | | | | |
Shares of Beneficial Interest Outstanding | | | | |
(unlimited number of shares authorized, no par value) | | | 72,318,249 | |
| | |
| |
Net Asset Value Per Share | | $ | 1.00 | |
| | |
| |
|
| * | Securities are reported at amortized cost. |
The accompanying notes are an integral part of the financial statements.
7
| The FBR Funds |
|
| FBR Fund for Government Investors |
| Statement of Operations |
| For the Year Ended October 31, 2009 |
| Investment Income | | | | |
Interest (Note 2) | | $ | 700,176 | |
| | |
| |
| Expenses | | | | |
Investment Advisory fees (Note 3) | | | 436,360 | |
Transfer agent fees | | | 135,903 | |
Professional fees | | | 60,890 | |
Insurance fees (Note 9) | | | 59,566 | |
Administration fees (Note 3) | | | 35,343 | |
Accounting services fees | | | 27,593 | |
Registration fees | | | 23,784 | |
Trustees’fees | | | 15,800 | |
Compliance fees | | | 15,382 | |
Reports to shareholders | | | 12,282 | |
Custodian fees | | | 4,719 | |
Other expenses | | | 5,237 | |
| | |
| |
Total expenses before waivers and related reimbursements | | | 832,859 | |
Less waivers and related reimbursements | | | (345,052 | ) |
| | |
| |
Total expenses after waivers and related reimbursements | | | 487,807 | |
| | |
| |
Net Investment Income | | | 212,369 | |
| | |
| |
| Net Realized Loss on Investment Transactions | | | (28 | ) |
| | |
| |
| Net Increase in Net Assets Resulting from Operations | | $ | 212,341 | |
| | |
| |
The accompanying notes are an integral part of the financial statements.
8
| The FBR Funds |
|
| FBR Fund for Government Investors |
| Statement of Changes in Net Assets |
| | | For the | | | For the | |
| | | Year | | | Year | |
| | | Ended | | | Ended | |
| | | October 31, | | | October 31, | |
| | | 2009 | | | 2008 | |
| | |
| | |
| |
| From Investment Activities | | | | | | | | |
Net Investment Income | | $ | 212,369 | | | $ | 3,449,163 | |
Net Realized Gain (Loss) on Investment Transactions | | | (28 | ) | | | 3,286 | |
| | |
| | |
| |
Net Increase in Net Assets Resulting from Operations | | | 212,341 | | | | 3,452,449 | |
| | |
| | |
| |
| Distributions to Shareholders | | | | | | | | |
From Net Investment Income | | | (212,369 | ) | | | (3,449,161 | ) |
| | |
| | |
| |
| From Share Transactions | | | | | | | | |
Net Decrease in Net Assets Resulting from Share Transactions | | | (32,930,014 | ) | | | (75,976,982 | ) |
| | |
| | |
| |
Total Decrease in Net Assets | | | (32,930,042 | ) | | | (75,973,694 | ) |
| Net Assets – Beginning of Year | | | 105,066,279 | | | | 181,039,973 | |
| | |
| | |
| |
| Net Assets – End of Year | | $ | 72,136,237 | | | $ | 105,066,279 | |
| | |
| | |
| |
| Accumulated Net Investment Income | | $ | — | | | $ | — | |
| | |
| | |
| |
The accompanying notes are an integral part of the financial statements.
9
| The FBR Funds |
|
| FBR Fund for Government Investors |
| Financial Highlights |
The following tables provide per share data for a share outstanding throughout each year for the Fund. Other data includes investment performance, ratios to average net assets and other supplemental information.
| | | For the Years Ended October 31, | |
| | |
| |
| | | 2009 | | | | 2008 | | | 2007 | | | 2006 | | | 2005 | |
| | |
| | | |
| | |
| | |
| | |
| |
| Per Share Operating Performance: | | | | | | | | | | | | | | | | | | | | | |
Net Asset Value – Beginning of Year | | $ | 1.00 | | | | $ | 1.00 | | | $ | 1.00 | | | $ | 1.00 | | | $ | 1.00 | |
| | |
| | | |
| | |
| | |
| | |
| |
Income (Loss) from Investment Operations: | | | | | | | | | | | | | | | | | | | | | |
Net Investment Income1,2 | | | 0.00 | 3 | | | | 0.02 | | | | 0.04 | | | | 0.04 | | | | 0.02 | |
Net Realized Loss on Investments1 | | | — | | | | | — | | | | — | | | | (0.00 | )3 | | | (0.00 | )3 |
| | |
| | | |
| | |
| | |
| | |
| |
Total from Investment Operations | | | 0.00 | 3 | | | | 0.02 | | | | 0.04 | | | | 0.04 | | | | 0.02 | |
| | |
| | | |
| | |
| | |
| | |
| |
Distributions to Shareholders: | | | | | | | | | | | | | | | | | | | | | |
From Net Investment Income | | | (0.00 | )3 | | | | (0.02 | ) | | | (0.04 | ) | | | (0.04 | ) | | | (0.02 | ) |
| | |
| | | |
| | |
| | |
| | |
| |
Net Asset Value – End of Year | | $ | 1.00 | | | | $ | 1.00 | | | $ | 1.00 | | | $ | 1.00 | | | $ | 1.00 | |
| | |
| | | |
| | |
| | |
| | |
| |
| Total Investment Return4 | | | 0.20 | % | | | | 2.31 | % | | | 4.46 | % | | | 3.89 | % | | | 1.96 | % |
| Ratios to Average Net Assets: | | | | | | | | | | | | | | | | | | | | | |
Expenses After Waivers2 | | | 0.56 | % | | | | 0.79 | % | | | 0.83 | % | | | 0.85 | % | | | 0.76 | % |
Expenses Before Waivers | | | 0.95 | % | | | | 0.79 | % | | | 0.83 | % | | | 0.85 | % | | | 0.86 | % |
Net Investment Income After Waivers2 | | | 0.24 | % | | | | 2.48 | % | | | 4.37 | % | | | 3.81 | % | | | 1.92 | % |
Net Investment Income Before Waivers | | | (0.15 | )% | | | | 2.48 | % | | | 4.37 | % | | | 3.81 | % | | | 1.82 | % |
| Supplementary Data: | | | | | | | | | | | | | | | | | | | | | |
Net Assets at End of Period (in thousands) | | $ | 72,136 | | | | $ | 105,066 | | | $ | 181,040 | | | $ | 211,171 | | | $ | 251,675 | |
|
| 1 | Calculated based on shares outstanding on the first and last day of the respective periods, except for dividends and distributions, if any, which are based on the actual shares outstanding on the dates of distributions. |
| 2 | Prior to November 1, 2005, reflects fees waived by FBR Fund Advisers, Inc. pursuant to a contractual advisory fee waiver of 0.10% (excluding interest, taxes, brokerage commissions, dividend expenses, acquired fund fees and expenses, extraordinary legal expenses, or any other extraordinary expenses). For the period ended October 31, 2009, Fund Advisers voluntarily absorbed expenses that were otherwise payable by the Fund. |
| 3 | Less than $0.01 |
| 4 | Total investment return is calculated assuming a purchase of shares on the first day and a sale on the last day of each year reported and will include reinvestment of dividends and distributions, if any. |
The accompanying notes are an integral part of the financial statements.
10
| The FBR Funds |
|
| FBR Fund for Government Investors |
| Schedule of Shareholder Expenses (unaudited) |
As a shareholder of the Fund, you incur two types of costs: (1) transaction costs, including reinvested dividends or other distributions; and (2) ongoing costs, including investment advisory fees; distribution (12b-1) fees; and other Fund expenses. This example is intended to help you understand your ongoing costs (in dollars) of investing in the Fund and to compare these costs with the ongoing costs of investing in other mutual funds.
The example is based on an investment of $1,000 invested at the beginning of the period and held for the entire period (May 1, 2009 through October 31, 2009).
Actual Expenses
The first line of the table below provides information about actual account values and actual expenses. You may use the information in this line, together with the amount you invested, to estimate the expenses that you paid over the period. Simply divide your account value by $1,000 (for example, an $8,600 account value divided by $1,000 = 8.6), then multiply the result by the number in the first line under the heading entitled “Expenses Paid During the Six Months Ended October 31, 2009” to estimate the expenses you paid on your account during this period.
Hypothetical Example for Comparison Purposes
The second line of the table below provides information about hypothetical account values and hypothetical expenses based on the Fund’s actual expense ratio and an assumed rate of return of 5% per year before expenses, which is not the Fund’s actual return. The hypothetical account values and expenses may not be used to estimate the actual ending account balance or expenses you paid for the period. You may use this information to compare the ongoing costs of investing in the Fund’s and other funds. To do so, compare this 5% hypothetical example with the 5% hypothetical examples that appear in the shareholder reports of the other funds.
| | | | | | | | | | | | | | | Expenses Paid |
| | | Net Expense | | Beginning | | Ending | | During the |
| | | Ratio | | Account | | Account | | Six Months |
| | | Annualized | | Value | | Value | | Ended |
| | | October 31, 2009 | | May 1, 2009 | | October 31, 2009 | | October 31, 2009* |
| | |
| |
| |
| |
|
Actual | | | 0.30 | % | | | $1,000.00 | | | | $1,000.00 | | | | $1.50 | |
Hypothetical | | | 0.30 | | | | 1,000.00 | | | | 1,023.71 | | | | 1.51 | |
|
| * | | Expenses are equal to the Fund’s annualized expense ratio, multiplied by the average account value over the period, multiplied by the number of days in most recent fiscal half-year then divided by 365. |
11
| The FBR Funds |
|
| FBR Fund for Government Investors |
| Notes to Financial Statements |
1. Organization
The FBR Funds (the “Trust”) is registered under the Investment Company Act of 1940, as amended, (“1940 Act”) as an open-end management investment company. The Trust was organized as a business trust under the laws of the State of Delaware on September 29, 2003. As of October 31, 2009, the Trust consisted of ten series. This report includes only the FBR Fund for Government Investors (“Money Market Fund”). The Trust is authorized to issue an unlimited number of shares of beneficial interest with no par value which may be issued in more than one class or series.
The Money Market Fund, a diversified fund, invests, under normal circumstances, at least 95% of its total assets in fixed-rate and floating-rate short-term instruments issued or guaranteed by the U.S. Government, its agencies or instrumentalities and in repurchase agreements secured by such instruments. The investment objective of the Fund is current income consistent with liquidity and preservation of capital.
2. Significant Accounting Policies
The following is a summary of the Fund’s significant accounting policies:
Portfolio Valuation — The net asset value per share (“NAV”) of the Fund is determined as of the close of regular trading on the New York Stock Exchange (“NYSE”) (normally 4:00 p.m., Eastern Time) on each business day that the exchange is open for trading. Short-term investments are carried at amortized cost, which approximates market value.
The Fund has adopted “Fair Value Measurements”. Fair Value Measurements establishes a single authoritative definition of fair value, sets out a framework for measuring fair value and requires additional disclosures about fair value measurements.
Under Fair Value Measurements, various inputs are used in determining the value of the Fund’s investments. These inputs are summarized in the three broad levels listed below:
| | • | | Level 1 – Unadjusted quoted prices in active markets for identical assets or liabilities that the Fund has the ability to access. |
| | • | | Level 2 – Observable inputs other than quoted prices included in Level 1 that are observable for the asset or liability, either directly or indirectly. These inputs may include quoted prices for the identical instrument on an inactive market, prices for similar instruments, interest rates, prepayment speeds, credit risk curves, default rates and similar data. |
| | • | | Level 3 – Unobservable inputs for the asset or liability, to the extent observable inputs are not available, representing the Fund’s own assumptions about the assumptions a market participant would use in valuing the asset or liability, and would be based on the best information available. |
The inputs or methodology used for valuing securities are not necessarily an indication of the risk associated with investing in those securities. For example, securities maturing within 60 days of the filing are valued using amortized cost, in accordance with rules under the Investment Company Act of 1940. Generally, amortized cost approximates the
12
| The FBR Funds |
|
| FBR Fund for Government Investors |
| Notes to Financial Statements (continued) |
current fair value of a security, but since the value is not obtained from a quoted price in an active market, such securities are reflected as Level 2.
The following is a summary of the inputs used to value the Fund’s net assets as of October 31, 2009:
| | | | Level 2 – Other | | Level 3 – Significant |
| | Level 1 – Quoted | | Significant | | Unobservable |
| | Prices | | Observable Inputs | | Inputs |
| |
| |
| |
|
| | $7,241,022 | | $64,779,370 | | $— |
Share Valuation — The NAV of the Fund is calculated by dividing the sum of the value of the securities held by the Fund, plus cash or other assets, minus all liabilities (including estimated accrued expenses) by the total number of shares outstanding of the Fund, rounded to the nearest cent. The Fund’s shares will not be priced on the days on which the NYSE is closed for trading. The offering and redemption price per share of the Fund is equal to the Fund’s NAV.
Investment Income — Interest income, which includes the amortization of premium and accretion of discount, if any, is recorded on an accrual basis.
Expenses — The Fund pays all operational expenses, which are either charged directly to the Fund for which the expense is attributable or are allocated proportionately among the Funds in the Trust based on allocation methods approved by the Board.
Distributions to Shareholders — The Fund declares dividends each day the Fund is open for business and pays monthly. Distributions from net realized capital gains, if any, will be distributed at least annually. Income and capital gain distributions are determined in accordance with U.S. federal income tax regulations.
Allocations — Investment income earned and realized capital gains and losses, for the Fund, are recorded daily to the Fund. Expenses not directly billed to a Fund are allocated proportionally among all Funds in the Trust daily in relation to net assets of each Fund or another reasonable measure.
Security Transactions — Security transactions are accounted for on the trade date. Securities sold are determined on a specific identification basis.
Estimates — The preparation of financial statements in accordance with U.S. generally accepted accounting principles requires management to make estimates and assumptions that may affect the reported amounts of assets and liabilities and disclosure of contingent assets and liabilities at the date of the financial statements and the reported amounts of income and expenses during the reporting period. Actual results could differ from those estimates.
Repurchase Agreements — The Fund has agreed to purchase securities from financial institutions subject to the seller’s agreement to repurchase them at an agreed-upon time and price (“repurchase agreement”). The financial institutions with whom the Fund enters
13
| The FBR Funds |
|
| FBR Fund for Government Investors |
| Notes to Financial Statements (continued) |
into repurchase agreements are banks and broker/dealers which the adviser considers creditworthy pursuant to criteria approved by the Board. The seller under a repurchase agreement will be required to maintain the value of the securities as collateral, subject to the agreement at not less than the repurchase price plus accrued interest. The adviser marks to market daily the value of the collateral, and, if necessary, requires the seller to maintain additional securities, to ensure that the value is not less than the repurchase price. Default by or bankruptcy of the seller would, however, expose the Fund to possible loss because of adverse market action or delays in connection with the disposition of the underlying securities.
3. Transactions with Affiliates
Investment Adviser — FBR Fund Advisers, Inc. (“Fund Advisers”) serves as investment adviser to the Fund. The Fund pays a management fee at an annual rate based on the Fund’s average daily net assets of 0.50% on the first $500 million, 0.45% on the next $250 million, 0.40% on the next $250 million, and 0.35% on net assets over $1 billion.
Fund Advisers has contractually agreed to limit the Fund’s total operating expenses and to maintain these limitations with regard to the Fund through October 31, 2011. The Fund has a limitation of 1.00% of the Fund’s average daily net assets, (excluding interest, taxes, brokerage commissions, dividend expenses, acquired fund fees and expenses, extraordinary legal expenses, or any other extraordinary expenses). During the year ended October 31, 2009, the Adviser waived and/or reimbursed operating expenses of the Fund in the amount of $345,052.
Administrator — JPMorgan Chase Bank N.A. (“JPMorgan”) serves as the administrator to the Fund and provides pursuant to an Administration Agreement (“Agreement”) day-to-day administrative services including monitoring portfolio compliance, determining compliance with provisions of the Internal Revenue Code and preparing the Fund’s registration statements. Pursuant to the Agreement, JPMorgan receives a monthly fee based on average daily net assets of the Trust.
Pursuant to the Administrative Services Agreement, the Adviser also provides administrative services to the Fund including oversight of service providers. For the period ended October 31, 2009, Fund Advisers received 0.02% of average daily net assets of the Trust. Effective November 1, 2009, Fund Advisers receives 0.04% of average daily net assets of the Trust. Fund Advisers also provides the Fund with office space, facilities and business equipment and generally administers the Fund’s business affairs and provides the services of executive and clerical personnel for administering the affairs of the Fund. The Adviser compensates all personnel, Officers and Trustees of the Fund if such persons are employees of the Adviser. For the year ended October 31, 2009, JPMorgan earned $17,890 and Fund Advisers earned $17,453 in Administrator fees.
Trustees’ Fees — Each Trustee of the Trust who is not an employee or affiliate of Fund Advisers receives an annual retainer fee of $25,000 and an additional meeting fee of $2,500 for each regular meeting attended. In addition, each Trustee that serves on the
14
| The FBR Funds |
|
| FBR Fund for Government Investors |
| Notes to Financial Statements (continued) |
Audit Committee or Nominating Committee receives a meeting fee of $1,000 for attendance at the meeting. If a Trustee participates by teleconference, the meeting fee is $1,000. The Chairman of the Board, an independent Trustee, receives an additional $2,000 for each meeting attended, and the Audit Committee Chairman receives an additional $1,000 for each committee meeting attended.
4. Capital Share Transactions
| | | FBR Fund for Government Investors |
| | |
|
| | | For the | | | For the | |
| | | Year | | | Year | |
| | | Ended | | | Ended | |
| | | October 31, | | | October 31, | |
| | | 2009 | | | 2008 | |
| | |
| | |
| |
| Capital Transactions: | | | | | | | | |
Proceeds from Sale of Shares | | $ | 68,617,195 | | | $ | 362,869,090 | |
Reinvestment of Distributions | | | 199,741 | | | | 3,317,780 | |
Cost of Shares Redeemed | | | (101,746,950 | ) | | | (442,163,852 | ) |
Redemption Fees | | | — | | | | — | |
| | |
| | |
| |
Transactions | | $ | (32,930,014 | ) | | $ | (75,976,982 | ) |
| | |
| | |
| |
Net Decrease from Capital Transactions | | $ | (32,930,014 | ) | | $ | (75,976,982 | ) |
| | |
| | |
| |
| Share Transactions: | | | | | | | | |
Sold | | | 68,612,517 | | | | 362,869,090 | |
Issued in Reinvestment of Distributions | | | 199,736 | | | | 3,317,780 | |
Redeemed | | | (101,746,950 | ) | | | (442,163,852 | ) |
| | |
| | |
| |
Change in Shares | | | (32,934,697 | ) | | | (75,976,982 | ) |
| | |
| | |
| |
| Net Decrease from Share Transactions | | | (32,934,697 | ) | | | (75,976,982 | ) |
| | |
| | |
| |
5. Federal Income Taxes
It is the Fund’s policy to continue to comply with the special provisions of the Internal Revenue Code that are applicable to regulated investment companies. As provided therein, in any fiscal year in which the Fund so qualifies and distributes at least 90% of its taxable net income, the Fund (but not the shareholders) will be relieved of federal income tax on the income distributed. Accordingly, no provision for income taxes has been made.
In order to avoid imposition of the excise tax applicable to regulated investment companies, it is also the Fund’s intention to declare and pay as dividends in each calendar year at least 98% of its net investment income (earned during the calendar year) and 98% of its net realized capital gains (earned during the twelve months ending October 31) plus undistributed amounts from prior years.
Income and capital gain distributions are determined in accordance with income tax regulations that may differ from accounting principles that are generally accepted in the United States of America. As a result, the character of tax-basis distributions and the composition of net assets for tax purposes may differ from those reflected in the Fund’s
15
| The FBR Funds |
|
| FBR Fund for Government Investors |
| Notes to Financial Statements (continued) |
financial statements. These book/tax differences may be temporary or permanent in nature. Temporary differences are primarily the result of wash sales. Reclassifications for permanent differences are made to components of capital. These reclassifications have no effect on net assets or net asset value per share. The Fund recognizes the tax benefits of uncertain tax positions only where the position is “more likely than not” to be sustained assuming examination by tax authorities. The Fund has analyzed its tax positions, and has concluded that no liability for unrecognized tax benefits should be recorded related to uncertain tax positions taken on returns filed for open tax years (2005-2008), or expected to be taken in the Fund’s 2009 tax returns.
The tax character of distributions paid for the tax year was as follows:
| | | Ordinary Income | | | Long-Term Capital Gains |
| | |
| | |
|
| | | Dollar | | Per share | | | Dollar | | Per share |
| | | Amount | | Amount | | | Amount | | Amount |
| | |
| |
| | |
| |
|
| Fund for Government Investors | | | | | | | | | | | | | | | |
For the Year Ended October 31, 2009 | | $ | 212,369 | | $ | 0.002038 | | | $ | — | | | $ | — | |
For the Year Ended October 31, 2008 | | | 3,449,161 | | | 0.022910 | | | | — | | | | — | |
The following information is computed on a tax basis for each item:
| | As of October 31, 2009 |
| |
|
| | Fund for |
| | Government Investors |
| |
|
| Tax cost of investment securities | | $ | 72,020,392 | |
| | |
| |
| Gross unrealized appreciation | | | — | |
| Gross unrealized depreciation | | | — | |
| | |
| |
| Net unrealized appreciation | | | — | |
| Capital loss carryforward | | | (186,695 | ) |
| | |
| |
| Accumulated deficit | | $ | (186,695 | ) |
| | |
| |
Unused capital loss carryforwards as of October 31, 2009, were as follows:
| | | Amount | | | Expires October 31, |
| | |
| | |
|
| Fund for Government Investors | | $ | 20,568 | | | 2011 |
| Fund for Government Investors | | | 165,106 | | | 2012 |
| Fund for Government Investors | | | 970 | | | 2013 |
| Fund for Government Investors | | | 23 | | | 2014 |
| Fund for Government Investors | | | 28 | | | 2017 |
6. Commitments and Contingencies
In the normal course of business, the Fund enters into contracts that contain a variety of representations and warranties and which provide general indemnifications. The Fund’s maximum exposure under these arrangements is unknown, as this would involve future claims that may be made against the Fund that have not yet occurred. However, based on experience, the Fund expects the risk of loss to be remote.
16
| The FBR Funds |
|
| FBR Fund for Government Investors |
| Notes to Financial Statements (continued) |
7. Subsequent Events
Effective December 4, 2009, the FBR Fund for Government Investors was reorganized into the Western Asset Government Money Market Fund, which is a separate investment series of the Legg Mason Partners Money Market Trust. Accordingly, shares of the FBR Fund for Government Investors are no longer offered and the Fund has been terminated.
17
| The FBR Funds |
|
| Report of Independent Registered Public Accounting Firm |
To the Board of Trustees and Shareholders
The FBR Funds
Arlington, Virginia
We have audited the accompanying statement of assets and liabilities, including the portfolio of investments of the FBR Fund for Government Investors (the “Fund”), a series of The FBR Funds as of October 31, 2009, and the related statement of operations of the Fund for the year then ended, statements of changes in net assets for each of the two years in the period then ended, and the financial highlights of the Fund for the periods indicated thereon. These financial statements and financial highlights are the responsibility of the Funds’ management. Our responsibility is to express an opinion on these financial statements and financial highlights based on our audit.
We conducted our audit in accordance with standards of the Public Company Accounting Oversight Board (United States). Those standards require that we plan and perform the audit to obtain reasonable assurance about whether the financial statements and financial highlights are free of material misstatement. The Fund is not required to have, nor were we engaged to perform, an audit of the Funds’ internal control over financial reporting. Our audit included consideration of internal control over financial reporting as a basis for designing audit procedures that are appropriate in the circumstances, but not for the purposes of expressing an opinion on the effectiveness of the Funds’ internal control over financial reporting. Accordingly, we express no such opinion. An audit includes examining, on a test basis, evidence supporting the amounts and disclosures in the financial statements. Our procedures included confirmation of securities owned as of October 31, 2009, by correspondence with the custodian and brokers. An audit also includes assessing the accounting principles used and significant estimates made by management, as well as evaluating the overall financial statement presentation. We believe that our audit provides a reasonable basis for our opinion.
In our opinion, the financial statements and financial highlights referred to above present fairly, in all material respects, the financial position of the FBR Fund for Government Investors as of October 31, 2009, the results of its operations, the changes in its net assets, and the financial highlights for the periods referred to above, in conformity with accounting principles generally accepted in the United States of America.
TAIT, WELLER & BAKER LLP
Philadelphia, Pennsylvania
December 30, 2009
18
| The FBR Funds |
|
| FBR Fund for Government Investors |
| Important Supplemental Information (unaudited) |
Proxy Voting Guidelines
Fund Advisers is responsible for exercising the voting rights associated with the securities purchased and held by the Funds. A description of the policies and procedures Fund Advisers uses in fulfilling this responsibility is included in the Funds’ Statement of Additional Information and is available without charge, upon request, by calling 888.888.0025. The policies and procedures are also available on the Securities and Exchange Commission’s (“SEC”) website at http://www.sec.gov. Information on how the Funds voted proxies relating to portfolio securities during the most recent 12 month period ended June 30 is available without charge, upon request, by calling 888.888.0025 and is also available on the SEC’s website at http://www.sec.gov.
Portfolio Holdings
The Funds file their complete schedule of holdings with the SEC for the first and third quarters of each fiscal year on Form N-Q. The Funds’ Form N-Q is available on the SEC’s website at http://www.sec.gov. You may review and make copies at the SEC’s Public Reference Room in Washington, D.C. You may also obtain copies after paying a duplicating fee by writing the SEC’s Public Reference Section, Washington, D.C. 20549-0102 or by electronic request to publicinfo@sec.gov. Information on the operation of the Public Reference Room may be obtained by calling 800.SEC.0330. A copy of the quarterly holdings report is available, without charge, upon request, by calling 888.888.0025.
Approval of Interim and New Investment Advisory Agreements for the Fund and Approval of the Reorganization of the Fund
In accordance with the Investment Company Act of 1940, as amended (the “1940 Act”), the Board of Trustees (the “Board”or “Trustees”) is required, at an in-person meeting of the Board called for such purpose, to consider the approval of any investment advisory agreement intended for use in connection with the FBR Fund for Government Investors (the “Fund”). The relevant provisions of the 1940 Act specifically provide that it is the duty of the Trustees to request and evaluate such information as the Trustees determine is necessary to allow them to properly consider the approval of any investment advisory agreement, and it is the duty of any investment adviser to furnish the Trustees with such information that is reasonably necessary for the Trustees to evaluate the terms of the investment advisory agreement.
During the Fund’s most recent fiscal year ended October 31, 2009, the Board took action on one occasion in connection with the consideration and approval of the investment advisory agreement of the Fund. At a special meeting of the Board held on June 30, 2009, which was called as a result of the change in control of FBR Capital Markets, Inc. (“FBR Capital Markets”), the parent of FBR Fund Advisers, Inc. (“Fund Advisers”), the investment adviser to the Fund, the Board considered and approved the following: (i) an interim investment advisory agreement with Fund Advisers with respect to the Fund (the “Interim Investment Advisory Agreement”); and (ii) a new investment advisory
19
| The FBR Funds |
|
| FBR Fund for Government Investors |
| Important Supplemental Information (unaudited) (continued) |
agreement with Fund Advisers with respect to the Fund (the “New Investment Advisory Agreement”), subject to shareholder approval.
As a result of the change in control of FBR Capital Markets, which occurred during June, 2009, the Board was asked to consider and approve the New Investment Advisory Agreement and the Interim Investment Advisory Agreement (together, the “Advisory Agreements”) in connection with the change of control event. This is because, in accordance with the 1940 Act and provisions of the then existing investment advisory agreement between the Fund and Fund Advisers (the “Prior Advisory Agreement”), the change of control of FBR Capital Markets resulted in an “assignment” and, therefore, the automatic termination, of the Prior Advisory Agreement. The Board noted that all of the material terms of the Advisory Agreements were substantially the same as the terms under the Prior Advisory Agreement. The Board was also assured by Fund Advisers that there would be no reduction in the nature or quality of the services provided by Fund Advisers to the Fund due to the change in control transaction.
At its meeting held on June 30, 2009, the Board approved the Interim Investment Advisory Agreement with Fund Advisers on behalf of the Fund pursuant to Rule 15a-4 under the 1940 Act. Rule 15a-4 permits an investment adviser to provide services to a fund without shareholder approval of the agreement so long as the Board of the fund approves the “interim”contract and the interim agreement terminates upon the earlier of (i) shareholder approval of the final agreement or (ii) 150 days from the termination of the prior investment advisory agreements. At the June 30, 2009 meeting, the Board also approved the New Investment Advisory Agreement for the Fund, subject to shareholder approval and a complete review and re-approval of the New Investment Advisory Agreement at its October 26, 2009 meeting.
At the June 30, 2009 Board meeting, the Board considered the similarity of the New Investment Advisory Agreement to the Prior Advisory Agreement. In determining whether or not it was appropriate to approve the Advisory Agreements and to recommend approval of the New Investment Advisory Agreement to shareholders, the Board considered various materials and representations provided by Fund Advisers with respect to the Fund, including information relating to the following factors: (1) the Fund’s requirements; (2) the level of fees, looking at the percentage of fees that comparable funds pay; (3) whether Fund Advisers had waived any fees; (4) the profitability of the Fund to Fund Advisers; (5) the scope of any “fall-out benefits,”that is, whether Fund Advisers received other benefits from its relationship with the Fund, such as soft dollars; (6) the capabilities and financial soundness of Fund Advisers; (7) current economic and industry trends; (8) historical factors involving Fund Advisers; (9) the responsiveness of management to the Trustees’ concerns and requests for information; and (10) such other factors deemed relevant by the Board.
After considering these factors, the Board, including all of the Trustees who were not considered “interested”as that term is defined under the 1940 Act (the “Independent Trustees”), who were counseled by independent legal counsel to the Independent
20
| The FBR Funds |
|
| FBR Fund for Government Investors |
| Important Supplemental Information (unaudited) (continued) |
Trustees, concluded that the Advisory Agreements would benefit the Fund and its shareholders. In reaching their conclusion with respect to the approval of the Advisory Agreements, the Board did not identify any one single factor as being controlling, rather, the Board took note of a combination of factors that influenced their decision making process. The Board did, however, identify the overall favorable investment performance of the Fund and management’s demonstrated commitment to the continued enhancement of investment performance, the commitment of Fund Advisers to the successful operation of the Fund, and the level of expenses of the Fund, as well as the continued use of an expense limitation agreement in order to reduce the overall operating expenses of the Fund, as being important elements of their consideration. The Board also considered the effectiveness of the compliance programs of the Fund and Fund Advisers in accordance with applicable requirements relating to mutual funds and their investment advisers. Based upon their review and consideration of these factors and other matters deemed relevant by the Board in reaching an informed business judgment, a majority of the Board, including a majority of the Independent Trustees, concluded that the terms of the Advisory Agreements are fair and reasonable and the Board voted to approve the Advisory Agreements.
Prior to submitting the New Investment Advisory Agreement to shareholders for approval, Fund Advisers recommended, and the Board considered and approved, a reorganization transaction between the Fund and the Western Asset Government Money Market Fund (the “Acquiring Fund”), which is a separate investment series of the Legg Mason Partners Money Market Trust. At a special meeting of the Board held on September 21, 2009, the Board approved an Agreement and Plan of Reorganization (the “Plan”) relating to the proposed reorganization transaction pursuant to which the Fund would be reorganized into the Acquiring Fund. Shareholders of the Fund were provided with an Information Statement describing the Plan and the proposed reorganization transaction in advance of the completion of the transaction. As a result of these developments, the New Investment Advisory Agreement was not submitted to shareholders for approval and the Interim Investment Advisory Agreement terminated in accordance with the applicable provisions of Rule 15a-4. On December 4, 2009, the Fund was reorganized with and into the Acquiring Fund and effective as of that date the assets of the Fund were transferred to the Acquiring Fund in complete liquidation of the Fund.
21
| The FBR Funds |
|
| FBR Fund for Government Investors |
| Important Supplemental Information (unaudited) (continued) |
Information About Trustees and Officers
Information pertaining to the Trustees and Officers of the Trust is set forth below. The address for each Trustee and Officer is 1001 Nineteenth Street North, Arlington, Virginia, 22209 unless otherwise stated. The statement of additional information (SAI) includes additional information about the Trustees and is available without charge upon request by calling 888.888.0025.
| | | Portfolios | | |
| | | Overseen in | | Other |
| | Position | the Trust | | Trusteeships/ |
| | Held* and | and Fund | Principal Occupation(s) | Directorships |
| Name, Age, Address, | Tenure** | Complex*** | during past 5 years | by Trustee |
| Michael A. Willner, 53 | Independent Board Chair; Trustee Since 1997 | 10 | President, Alpharip, Inc., January 2001 to present. | None |
| Charles O. Heller, 73 | Trustee Since 2003 | 10 | President, Annapolis Capital Group, since 2005; Beacon Global LLC (venture capital firm), 2003-2005. | None |
| Reena Aggarwal, 52 | Trustee Since 2006 | 10 | Professor at Georgetown, 2000 to present; Deputy Dean, McDonough School of Business, Georgetown University 2006-2008; Interim Dean, 2004-2005; Visiting Professor, MIT Sloan School of Management, 2005-2006. | Index IQ Trust |
| William E. Cole, Jr., 60 | Trustee Since 2006 | 10 | Retired, 2006. Partner, Ernst & Young LLP, 1972-2006. | None |
David H. Ellison†, 51
100 Federal Street
Boston, MA 02110 | Trustee Since 2003 President Since 2001 | 10 | Director, CIO and President, FBR Fund Advisers, Inc., since December 1999; Portfolio Manager for Equity Funds since October 1996. | None |
Winsor H. Aylesworth, 62
100 Federal Street
Boston, MA 02110 | Executive Vice President Since 1999 | 10 | Portfolio Manager, FBR Fund Advisers, Inc. since September 1998. | N/A |
| William B. Sanders III, 45 | Executive Vice President Since 1999 | 10 | Senior Vice President of Fund Operations, FBR Fund Advisers, Inc. since August 1999 and Head Trader for FBR Fund Advisers, Inc., since January 1997. | N/A |
| Kimberly J. Bradshaw, 35 | Treasurer Since 2006 Secretary Since 2003 | 10 | Employee of FBR since August 1998, serving in various capacities, including Vice President Fund Administration, AVP of Fund Administration, Transfer Agent Operations Manager and Fund Accounting Supervisor, Vice President and Secretary of Money Management Advisers, Inc. November 2003 to March 2006. | N/A |
22
| The FBR Funds |
|
| FBR Fund for Government Investors |
| Important Supplemental Information (unaudited) (continued) |
Information About Trustees and Officers (continued)
| | | Portfolios | | |
| | | Overseen in | | Other |
| | Position | the Trust | | Trusteeships/ |
| | Held* and | and Fund | Principal Occupation(s) | Directorships |
| Name, Age, Address, | Tenure** | Complex*** | during past 5 years | by Trustee |
| Kristin E. Stelljes, 33 | Assistant Treasurer Since 2006 | 10 | Employee of FBR since February 2002, serving in various capacities including Assistant Vice President Fund Administration, Supervisor of Fund Administration, Accountant and Customer Service Representative. | N/A |
Guy F. Talarico, 54
800 Third Avenue
11th Floor
New York, NY 10022 | Chief Compliance Officer Since 2006 | 10 | CEO of Alaric Compliance Services, LLC since January 2006. Co-Chief Executive Officer of EOS Compliance Services, LLC from June 2004 to December 2005. Senior Director of Investors Bank & Trust Institutional Custody Division From February 2001 to June 2004. | N/A |
| * | | Trustees serve until their resignation, removal, or death. The Trust’s President, Treasurer, and Secretary serve until their successor is chosen and qualified. The other Officers of the Trust serve at the pleasure of the Trustees. |
| ** | | Length of time served is measured from the earliest date of service as a Trustee or Officer of any of the Funds or the Predecessor Funds. |
| *** | | The “Fund Complex” consists of all mutual funds advised by FBR Capital Markets, Inc. (“FBR Capital Markets”) and its affiliate advisers. |
| † | | Mr. Ellison is considered to be an “Interested Trustee” of the Trust due to his position with FBR Fund Advisers. |
23
[THIS PAGE INTENTIONALLY LEFT BLANK]
[THIS PAGE INTENTIONALLY LEFT BLANK]
[THIS PAGE INTENTIONALLY LEFT BLANK]
THE FBR FUNDS
888.888.0025
fbrfundsinfo@fbr.com
www.fbrfunds.com
Investment Adviser
FBR FUND ADVISERS, INC.
1001 NINETEENTH STREET NORTH
ARLINGTON, VIRGINIA 22209
Distributor
FBR INVESTMENT SERVICES, INC.
1001 NINETEENTH STREET NORTH
ARLINGTON, VIRGINIA 22209
Transfer Agent
JPMORGAN CHASE BANK, N.A.
P.O. BOX 5354
CINCINNATI, OHIO 45201
Independent Registered Public Accounting Firm
TAIT, WELLER, AND BAKER LLP
1818 MARKET STREET
PHILADELPHIA, PENNSYLVANIA 19103
This report is not authorized
for distribution to prospective
investors unless it is preceded or
accompanied by a current prospectus.
ITEM 2. CODE OF ETHICS.
As of the end of the period covered by this report, Registrant had adopted a code of ethics (the “Code”) that applies to Registrant’s principal executive officer (“PEO”) and principal financial officer (“PFO”). There were no amendments to the Code during the period covered by the report. The Registrant did not grant any waivers, including implicit waivers, from any provisions of the Code to the PEO or PFO during the period covered by this report. The Registrant undertakes to provide a copy of such code to any person upon request, without charge, by calling 888.888.0025.
ITEM 3. AUDIT COMMITTEE FINANCIAL EXPERT.
The Board of Trustees determined at a meeting held October 24, 2006 that William E. Cole, Jr. qualifies as an Audit Committee Financial Expert and he is “independent” as defined under the relevant Securities and Exchange Commission rules and releases. The Board of Trustees also determined at a meeting held July 23, 2008 that Reena Aggarwal qualifies as an Audit Committee Financial Expert and she is “independent” as defined under the relevant Securities and Exchange Commission rules and releases.
| ITEM 4. PRINCIPAL ACCOUNTANT FEES AND SERVICES. |
| (a) | | Audit Fees – The aggregate fees billed for the professional services rendered by Tait, Weller & Baker, Registrant’s principal accountant for the audit of the Registrant’s annual financial statements, were $160,500 and $150,500 for all series of the Registrant for the fiscal year ended October 31, 2009 and 2008 respectively. |
| (b) | | Audit Related Fees –There were no fees billed for assurance and related services by Tait, Weller & Baker for the fiscal years ended October 31, 2009 and 2008. |
| (c) | | Tax Fees – The aggregate fees billed by Tait, Weller & Baker, Registrant’s principal accountant for tax compliance, tax advice and tax planning for completing federal and excise tax returns were $30,000 and $29,000 for all series of the Registrant for the fiscal year ended October 31, 2009 and 2008 respectively. |
| (d) | | All Other Fees – There were no additional fees paid for audit and non-audit services other than those disclosed in (a) through (c) above. |
| (e) | | (1) Pursuant to the Registrant’s Audit Committee Charter (“Charter”), the Audit Committee is responsible for approving in advance the firm to be employed as the Registrant’s independent auditor. In addition, the Charter provides that the Audit Committee is responsible for approving any and all proposals by the Registrant, its investment adviser or their affiliated persons or an entity controlling, controlled by, or under common control with the adviser that provides services to the Registrant to employ the independent auditor to render permissible non-audit services to such entity, provided those permissible non-audit services relate directly to the operations and financial reporting of the Registrant. In determining whether to approve non-audit services, the Audit Committee considers whether such services are consistent with the independent auditor’s independence. |
| | | (2) None of the services described in (b) through (d) above were approved by the audit committee pursuant to paragraph (c)(7)(i)(C) of Rule 2-01 of Regulation S-X. |
| (f) | | Less than fifty percent of the hours expended on the principal accountant’s engagement to audit the Registrant’s financial statements for the most recent fiscal year were attributed to work performed by persons other than the principal accountant’s full-time, permanent employees. |
| (g) | | There were no non-audit services fees billed by the Registrant’s accountant to the Registrant other than those described above. There were no non-audit services fees billed by the Registrant’s accountant to the Registrant’s investment adviser or to any entity controlling, controlled by, or under common control with the adviser that provides ongoing services to the Registrant over the past two years. |
| (h) | | Not applicable as no non-audit services were provided to the Registrant’s investment adviser nor any entity controlling, controlled by, or under common control with the investment adviser that provides ongoing services to the Registrant that were not pre-approved pursuant to Rule 2-01(c)(7)(ii) of Regulation S-X. |
ITEMS 5. AUDIT COMMITTEE OF LISTED REGISTRANTS.
Not applicable.
ITEM 6. SCHEDULE OF INVESTMENTS.
Contained in Item 1.
ITEM 7. DISCLOSURE OF PROXY VOTING POLICIES AND PROCEDURES FOR CLOSED-END MANAGEMENT INVESTMENT COMPANIES.
Not applicable.
ITEM 8. PORTFOLIO MANAGERS OF CLOSED-END MANAGEMENT INVESTMENT COMPANIES.
Not applicable.
ITEM 9. PURCHASES OF EQUITY SECURITIES BY CLOSED-END MANAGEMENT INVESTMENT COMPANY AND AFFLIIATED PURCHASERS.
Not applicable.
ITEM 10. SUBMISSION OF MATTERS TO A VOTE OF SECURITY HOLDERS.
There have been no material changes to the procedures by which shareholders may recommend nominees to the Board.
| ITEM 11. CONTROLS AND PROCEDURES. |
| (a) | | Based upon their evaluation of the Registrant’s disclosure controls and procedures as conducted within 90 days of the filing date of this Form N-CSR, the Registrant’s PFO and PEO have concluded that those disclosure controls and procedures provide reasonable assurance that the material information required to be disclosed by the Registrant in this Form N-CSR has been recorded, processed, summarized and reported within the time periods specified in the Securities and Exchange Commission’s rules and forms. |
| (b) | | There were no changes in the Registrant’s internal controls over financial reporting as defined in Rule 30a-3(d) under the Act (17 CFR 270.30a-3(d)) that occurred during the second fiscal |
| | | half-year of the period covered by this report that has materially affected, or is reasonably likely to materially affect, the Registrant’s internal control over financial reporting. |
| | | |
| ITEM 12. EXHIBITS. |
| File the exhibits listed below as part of this Form. Letter or number the exhibits in the sequence indicated. |
| (a) | | (1) Not applicable. |
| | | (2) A separate certification for each principal executive officer and principal financial officer of the Registrant as required by Rule 30a-2(a) under the Act (17 CFR 270.30a-2): Attached herewith. |
| | | (3) Not applicable. |
| (b) | | (1) The certifications required by Rule 30a-2(b) of the Investment Company Act of 1940 and Section 906 of the Sarbanes-Oxley Act of 2002: Attached herewith. |
SIGNATURES
Pursuant to the requirements of the Securities Exchange Act of 1934 and the Investment Company Act of 1940, the registrant has duly caused this report to be signed on its behalf by the undersigned, thereunto duly authorized.
| (Registrant) | | The FBR Funds |
|
| By (Signature and Title)* | | /s/ Kimberly J. Bradshaw | | 01/05/2010 | |
| | |
| |
| | | Kimberly J. Bradshaw | | Date | |
| | | Treasurer, Secretary and Principal Financial Officer | | | |
| | | The FBR Funds | | | |
Pursuant to the requirements of the Securities Exchange Act of 1934 and the Investment Company Act of 1940, this report has been signed below by the following persons on behalf of the registrant and in the capacities and on the dates indicated.
| By (Signature and Title) | | /s/ David H. Ellison | | 01/05/2010 | |
| | |
| |
| | | David H. Ellison | | Date | |
| | | President and Principal Executive Officer | | | |
| | | The FBR Funds | | | |
| | | | | | |
| | | | | | |
| By (Signature and Title) | | /s/ Kimberly J. Bradshaw | | 01/05/2010 | |
| | |
| |
| | | Kimberly J. Bradshaw | | Date | |
| | | Treasurer, Secretary and Principal Financial Officer | | | |
| | | The FBR Funds | | | |