| UNITED STATES |
| SECURITIES AND EXCHANGE COMMISSION |
| Washington, D.C. 20549 |
| |
| FORM N-CSR |
| |
| CERTIFIED SHAREHOLDER REPORT OF REGISTERED |
| MANAGEMENT INVESTMENT COMPANIES |
| |
| Investment Company Act file number 811-21503 |
| |
| The FBR Funds |
|
| (Exact name of registrant as specified in charter) |
| |
| 1001 Nineteenth Street North |
| Arlington, VA 22209 |
|
| (Address of principal executive offices) (Zip code) |
| |
| Registrant’s telephone number, including area code: 703.469.1040 |
| |
| |
| William Ginivan |
| General Counsel |
| Friedman, Billings, Ramsey Group, Inc. |
| Potomac Tower |
| 1001 Nineteenth Street North |
| Arlington, VA 22209 |
|
| (Name and address of agent for service) |
| |
| |
| Date of fiscal year end: October 31, 2006 |
| |
| Date of reporting period: October 31, 2006 |
| |
ITEM 1. REPORT TO SHAREHOLDERS
The following is a copy of the report transmitted to shareholders pursuant to Rule 30e-1 under the Investment Company Act of 1940 (17CRF 270.30e-1).
THE FBR FUNDS
FBR Pegasus FundTM
FBR Large Cap Financial Fund
FBR Large Cap Technology Fund
FBR Small Cap Fund
FBR Small Cap Financial Fund
FBR Small Cap Technology Fund
FBR Gas Utility Index Fund
FBR Fund for Government Investors
Annual Report
October 31, 2006
[THIS PAGE INTENTIONALLY LEFT BLANK]
The FBR Funds
Annual Letter to Shareholders
Dear Shareholder,
The stock market ended our 2006 fiscal year on a high note amid speculation that the economy is headed for a ‘soft landing’. Investors showed a preference for the old-economy large-cap stocks as the Dow Jones Industrial Average surpassed and ultimately closed above 12,000, setting a new all-time high. The broader market, as measured by the S&P 500, hovered near multi-year highs. We are pleased that each of our equity funds provided investors with double-digit returns and that seventy percent were able to outperform the market over the time period in review1,2.
The biggest event internally for us this year was the expected retirement of long time Chairman of the Board of Trustees, F. David Fowler. Mr. Fowler had been an FBR Funds Trustee since our inception and was elevated to Chairman in 2003. Under his leadership, the Board has acted on behalf of shareholders with the utmost integrity and sense of fiduciary responsibility. We have complete confidence in our new Chairman, Michael Willner, who will continue the long standing tradition of acting in the best interest of our fellow shareholders. We will miss Mr. Fowler‘s leadership, but his legacy will continue on with The FBR Funds. It is also important to note that we added two new independent trustees, William Cole - a former Ernst & Young Partner, and Reena Aggarwal - the Deputy Dean of the Georgetown University Business School. We are pleased that your Board of Trustees remains eighty percent independent and look forward to working with them as we continue to grow our business.
Almost ten years ago The FBR Funds began providing investors with highly specialized and focused mutual funds. Our three original funds will celebrate their ten-year anniversary at the start of 2007. Over the years, we have expanded our offerings organically and through acquisition to reach our current fund line-up. We are continually evaluating new opportunities that will allow us to strengthen our fund product offerings and enhance our intellectual talent pool. We are excited to share with you that our Board of Trustees unanimously voted to allow us to move forward with plans to launch two new traditional asset class funds in the first quarter of the new year. Details about the new offerings will be available shortly.
As in prior years, what follows is a discussion from each of the portfolio managers with respect to their funds’ performance and outlook. In general, The FBR Funds are about respecting your money. Our goal is to achieve attractive returns that are balanced, focused on the long-term and ever mindful of the downside risks associated with investing. If you would like more timely updates, fbrfunds.com provides daily prices, monthly performance data, portfolio holdings and other important fund information.
2
All of us at The FBR Funds want to thank you for your continued support, and we look forward to serving your investment needs in the years ahead. As always, we welcome your questions and comments. You can reach us via e-mail at funds@fbr.com or toll free at 888.200.4710.
Sincerely,

David Ellison
President and Trustee
The FBR Funds
1 The FBR Pegasus FundTM commenced operations on November 15, 2005.
2 Past Performance is No Guarantee of Future Results. The current performance may be lower or higher than performance data quoted. To obtain performance data current to the most recent month-end please call 888.200.4710 or visit www.fbrfunds.com. Investment return and principal will fluctuate so that investors’ shares, when redeemed, may be worth more or less than their original cost.
3
The FBR Funds
FBR Pegasus FundTM
Management Overview
Co-Portfolio Managers: Robert C. Barringer, CFA, Ryan Kelley, CFA and Winsor Aylesworth
Over the recent fiscal year, how did the Fund perform?
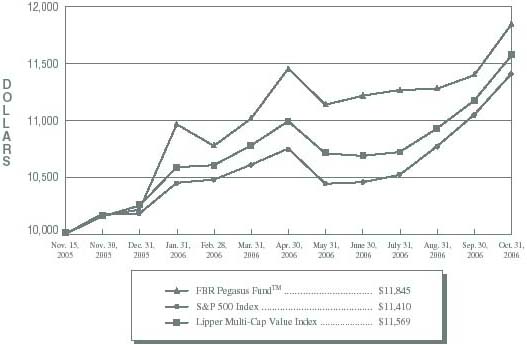
The Pegasus Fund appreciated 18.45% from its inception on November 15, 2005 through October 31, 2006. During this time period, the S&P 500 Index and the Lipper Multi-Cap Value Index returned 14.10% and 15.69%, respectively.
What factors contributed to the Fund’s performance?
The Fund benefited from overweight positions in energy, basic materials and utilities which contributed positively to performance. Underweight positions in healthcare, consumer staples and technology helped minimize exposure to the sectors that detracted the most from performance relative to the benchmarks. During the Fund’s first fiscal year, our investment process led us to overweight beneficial sectors as they contained the highest number of companies with the combination of financial strength, attractive valuation and proven records of consistent growth that we seek.
What is the outlook for the Fund?
We believe the outlook for the Fund is bright, and remain confident in the consistent and disciplined investment process we employ to manage the Fund. A beneficial aspect of our investment process is that we are able to identify the companies and sectors on an ongoing basis that have the most attractive investment characteristics. At any one point in the market, there are usually numerous investment opportunities, such as these, that are being overlooked or misunderstood by the market. Our process affords us the confidence to position the Fund to take advantage of these opportunities when they present themselves.
Currently, we continue to believe that the sectors and companies in which we are invested are attractively valued, even though they have provided solid performance. Financial services, energy, industrials, basic materials and utilities are a few of the areas in which we are most optimistic. It is within these sectors that we are finding the most opportunities to own companies with better than average balance sheets, reasonable valuations and track records of creating value for shareholders over time.
|
The opinions expressed in this commentary reflect those of the Portfolio Manager as of the date written. Any such opinions are subject to change based on market or other conditions. These opinions may not be relied upon as investment advice. Investment decisions for The FBR Funds are based on several factors, and may not be relied upon as an indication of trading intent on behalf of any FBR Fund. Security positions can and do change. |
4
The FBR Funds
FBR Pegasus FundTM
Comparison of Changes in Value of $10,000 Investment in
Fund Shares(1)(2) vs. Various Indices(1)(3)
| | | | | | | | | | | |
| Total Returns—For the Periods Ended October 31, 2006(4) |
| | | | | | | | | Cumulative
Since
Inception(5) | | |
| | | | | | | | |
| | |
FBR Pegasus FundTM(1)(2) | | | | | | | | 18.45% | | |
S&P 500 Index(1)(3) | | | | | | | | 14.10% | | |
Lipper Multi-Cap Value Index(1)(3) | | | | | | | | 15.69% | | |
| | | | | | | | | | | |
PAST PERFORMANCE IS NO GUARANTEE OF FUTURE RESULTS.
The performance data quoted represents past performance and the current performance may be lower or higher. The investment return and principal will fluctuate so that investors’ shares, when redeemed, may be worth more or less than their original cost. To obtain performance data curernt to the most recent month-end, please call 888.200.4710 or visit www.fbrfunds.com.
|
| (1) | The graph assumes a hypothetical $10,000 initial investment in the Fund and reflects the reinvestment of dividends and all Fund expenses. Investors should note that the Fund is a professionally managed mutual fund while the indices are unmanaged, do not incur expenses and are not available for investment. The performance of the indices includes reinvested dividends, and does not reflect sales charges or expenses, except for the Lipper Multi-Cap Value Index which reflects fund expenses. |
| (2) | FBR Fund Advisers, Inc. waived a portion of its advisory fees and agreed to contractually reimburse a portion of the Fund’s operating expenses, as necessary, to maintain existing expense limitations, as set forth in the notes to the financial statements. Total returns shown include fee waivers and expense reimbursements; total returns would have been lower had there been no waiver of fees and/or reimbursement of expenses in excess of expense limitations. |
| (3) | S&P 500 Index is a capitalization-weighted index of 500 stocks. The index is designed to represent the broad domestic economy through changes in aggregate market value of 500 stocks representing all major industries. The Lipper Multi-Cap Value Index is an equally weighted index of the largest thirty funds within the multi-cap value fund classification as defined by Lipper Inc. The index is rebalanced quarterly. Lipper Analytical Services, Inc., is a nationally recognized organization that reports on mutual fund total return performance and calculates fund rankings. Each Lipper Average is based on a universe of funds with similar investment objectives. |
| (4) | The total returns shown do not reflect the deduction of taxes that a shareholder would pay on fund distributions or the redemption of fund shares. |
| (5) | For the period November 15, 2005 (commencement of investment operations) through October 31, 2006. |
5
The FBR Funds
FBR Pegasus FundTM
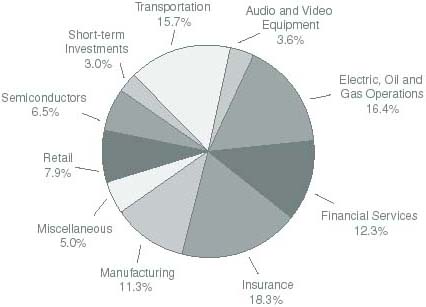
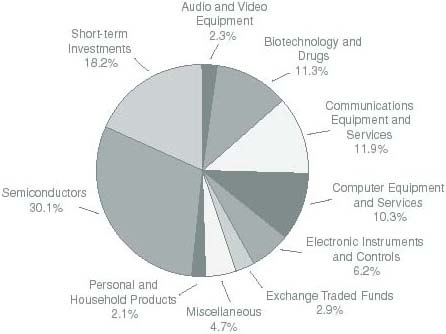
Portfolio Summary
October 31, 2006
The following chart provides a visual breakdown of the Fund by industry sectors. The underlying securities represent a percentage of the portfolio investments.
6
The FBR Funds
FBR Pegasus FundTM
Portfolio of Investments
October 31, 2006
|
| | | | | | VALUE | |
| | SHARES | | | | (NOTE 2) | |
|
| | | | COMMON STOCKS — 97.3% | | | | |
| | | | Airlines — 1.5% | | | | |
| | 13,417 | | Southwest Airlines Co. | | $ | 201,658 | |
| | | | | |
| |
| | | | Audio and Video Equipment — 3.6% | | | | |
| | 11,667 | | Sony Corp. ADR | | | 478,114 | |
| | | | | |
| |
| | | | Auto and Truck Parts — 2.0% | | | | |
| | 3,000 | | Genuine Parts Co. | | | 136,560 | |
| | 1,815 | | Magna International, Inc., Class A | | | 135,762 | |
| | | | | |
| |
| | | | | | | 272,322 | |
| | | | | |
| |
| | | | Banks - Regional — 6.9% | | | | |
| | 3,400 | | Allied Irish Banks PLC ADR | | | 185,776 | |
| | 2,956 | | Bank of Montreal | | | 183,272 | |
| | 1,110 | | Comerica, Inc. | | | 64,591 | |
| | 2,630 | | KeyCorp | | | 97,678 | |
| | 7,300 | | The Bank of Nova Scotia | | | 320,543 | |
| | 1,100 | | UnionBanCal Corp. | | | 63,338 | |
| | | | | |
| |
| | | | | | | 915,198 | |
| | | | | |
| |
| | | | Biotechnology and Drugs — 3.2% | | | | |
| | 4,900 | | Novartis AG ADR | | | 297,577 | |
| | 6,000 | | Schering-Plough Corp. | | | 132,840 | |
| | | | | |
| |
| | | | | | | 430,417 | |
| | | | | |
| |
| | | | Capital Goods - Miscellaneous — 0.8% | | | | |
| | 1,400 | | W.W. Grainger, Inc. | | | 101,892 | |
| | | | | |
| |
| | | | Chemicals - Plastics and Rubber — 1.5% | | | | |
| | 5,000 | | The Dow Chemical Co. | | | 203,950 | |
| | | | | |
| |
| | | | Communications Equipment — 1.1% | | | | |
| | 125 | | Research in Motion Ltd.* | | | 14,685 | |
| | 12,300 | | Tellabs, Inc.* | | | 129,642 | |
| | | | | |
| |
| | | | | | | 144,327 | |
| | | | | |
| |
| | | | Communications Services — 1.1% | | | | |
| | 1,100 | | America Movil S.A. de C.V. ADR, Series L | | | 47,157 | |
| | 1,439 | | AT&T, Inc. | | | 49,286 | |
7
The FBR Funds
FBR Pegasus FundTM
Portfolio of Investments (continued)
October 31, 2006
|
| | | | | | VALUE | |
| | SHARES | | | | (NOTE 2) | |
|
| | | | Communications Services — 1.1% (continued) | | | | |
| | 1,800 | | Nippon Telegraph and Telephone Corp. ADR | | $ | 45,234 | |
| | | | | |
| |
| | | | | | | 141,677 | |
| | | | | |
| |
| | | | Construction Services — 1.0% | | | | |
| | 2,679 | | Lennar Corp., Class A | | | 127,199 | |
| | | | | |
| |
| | | | Electric Utilities — 2.6% | | | | |
| | 3,876 | | Edison International | | | 172,249 | |
| | 4,100 | | PG&E Corp. | | | 176,874 | |
| | | | | |
| |
| | | | | | | 349,123 | |
| | | | | |
| |
| | | | Electronic Instruments and Controls — 1.8% | | | | |
| | 3,133 | | TDK Corp. ADR | | | 245,001 | |
| | | | | |
| |
| | | | Food Processing — 1.0% | | | | |
| | 2,000 | | Bunge Ltd. | | | 128,220 | |
| | | | | |
| |
| | | | Insurance - Accident and Health — 1.1% | | | | |
| | 2,500 | | Aetna, Inc. | | | 103,050 | |
| | 2,400 | | UnumProvident Corp. | | | 47,472 | |
| | | | | |
| |
| | | | | | | 150,522 | |
| | | | | | |
| |
| | | | Insurance - Life — 3.3% | | | | |
| | 3,397 | | Prudential Financial, Inc. | | | 261,331 | |
| | 4,300 | | Sun Life Financial, Inc. | | | 180,815 | |
| | | | | |
| |
| | | | | | | 442,146 | |
| | | | | |
| |
| | | | Insurance - Property and Casualty — 13.8% | | | | |
| | 2,354 | | ACE Ltd. | | | 134,767 | |
| | 143 | | Berkshire Hathaway, Inc., Class B* | | | 502,644 | |
| | 457 | | Everest Re Group Ltd. | | | 45,325 | |
| | 4,770 | | Loews Corp. | | | 185,648 | |
| | 845 | | Safeco Corp. | | | 49,171 | |
| | 4,000 | | The Allstate Corp. | | | 245,440 | |
| | 3,098 | | The Chubb Corp. | | | 164,659 | |
| | 2,269 | | The Hartford Financial Services Group, Inc. | | | 197,789 | |
| | 5,354 | | The St. Paul Travelers Companies, Inc. | | | 273,749 | |
| | 1,500 | | W.R. Berkley Corp. | | | 55,290 | |
| | | | | |
| |
| | | | | | | 1,854,482 | |
| | | | | |
| |
8
The FBR Funds
FBR Pegasus FundTM
Portfolio of Investments (continued)
October 31, 2006
|
| | | | | | VALUE | |
| | SHARES | | | | (NOTE 2) | |
|
| | | | Investment Services — 5.5% | | | | |
| | 1,750 | | Ameriprise Financial, Inc. | | $ | 90,125 | |
| | 6,276 | | Morgan Stanley | | | 479,675 | |
| | 1,098 | | The Bear Stearns Companies, Inc. | | | 166,182 | |
| | | | | |
| |
| | | | | | | 735,982 | |
| | | | | |
| |
| | | | Iron and Steel — 1.7% | | | | |
| | 4,038 | | Mittal Steel Company N.V., Class A NYS | | | 172,625 | |
| | 755 | | United States Steel Corp. | | | 51,038 | |
| | | | | |
| |
| | | | | | | 223,663 | |
| | | | | |
| |
| | | | Metal Mining — 0.8% | | | | |
| | 2,200 | | Alcan, Inc. | | | 103,642 | |
| | | | | |
| |
| | | | Oil and Gas Operations — 13.4% | | | | |
| | 1,077 | | Apache Corp. | | | 70,350 | |
| | 1,800 | | Canadian Natural Resources Ltd. | | | 93,870 | |
| | 3,400 | | Chevron Corp. | | | 228,480 | |
| | 1,200 | | CNOOC Ltd. ADR | | | 100,584 | |
| | 3,475 | | ConocoPhillips | | | 209,334 | |
| | 1,225 | | Devon Energy Corp. | | | 81,879 | |
| | 2,600 | | EnCana Corp. | | | 123,474 | |
| | 950 | | Hess Corp. | | | 40,280 | |
| | 1,200 | | Marathon Oil Corp. | | | 103,680 | |
| | 900 | | Murphy Oil Corp. | | | 42,444 | |
| | 425 | | Newfield Exploration Co.* | | | 17,336 | |
| | 2,360 | | Occidental Petroleum Corp. | | | 110,778 | |
| | 1,000 | | Questar Corp. | | | 81,480 | |
| | 2,973 | | Royal Dutch Shell PLC, Class A ADR | | | 206,980 | |
| | 3,142 | | Sempra Energy | | | 166,652 | |
| | 2,100 | | Valero Energy Corp. | | | 109,893 | |
| | | | | |
| |
| | | | | | | 1,787,494 | |
| | | | | |
| |
| | | | Oil Well Services and Equipment — 0.4% | | | | |
| | 500 | | ENSCO International, Inc. | | | 24,485 | |
| | 500 | | Noble Corp. | | | 35,050 | |
| | | | | |
| |
| | | | | | | 59,535 | |
| | | | | |
| |
9
The FBR Funds
FBR Pegasus FundTM
Portfolio of Investments (continued)
October 31, 2006
|
| | | | | | VALUE | |
| | SHARES | | | | (NOTE 2) | |
|
| | | | Photography — 2.4% | | | | |
| | 8,500 | | FUJIFILM Holdings Corp. ADR | | $ | 316,115 | |
| | | | | |
| |
| | | | Railroads — 12.2% | | | | |
| | 5,850 | | Burlington Northern Santa Fe Corp. | | | 453,551 | |
| | 2,155 | | Canadian Pacific Railway Ltd. | | | 121,736 | |
| | 7,822 | | CSX Corp. | | | 279,011 | |
| | 7,164 | | Norfolk Southern Corp. | | | 376,611 | |
| | 4,388 | | Union Pacific Corp. | | | 397,684 | |
| | | | | |
| |
| | | | | | | 1,628,593 | |
| | | | | |
| |
| | | | Retail - Drugs — 3.6% | | | | |
| | 11,000 | | Walgreen Co. | | | 480,480 | |
| | | | | |
| |
| | | | Retail - Grocery — 1.2% | | | | |
| | 2,500 | | Whole Foods Market, Inc. | | | 159,600 | |
| | | | | |
| |
| | | | Retail - Specialty — 3.2% | | | | |
| | 7,904 | | Costco Wholesale Corp. | | | 421,916 | |
| | | | | |
| |
| | | | Semiconductors — 6.6% | | | | |
| | 4,935 | | Kyocera Corp. ADR | | | 443,212 | |
| | 24,950 | | STMicroelectronics N.V. NYS | | | 433,132 | |
| | | | | |
| |
| | | | | | | 876,344 | |
| | | | | |
| |
| | | | Total Common Stocks (Cost $12,342,215) | | | 12,979,612 | |
| | | | | |
| |
10
The FBR Funds
FBR Pegasus FundTM
Portfolio of Investments (continued)
October 31, 2006
|
| | | | | | VALUE | |
| | PAR | | | | (NOTE 2) | |
|
| | | | REPURCHASE AGREEMENTS — 3.0% | | | | |
| | $403,000 | | With Mizuho Securities, Inc. dated 10/31/06 at 5.25% to be repurchased at $403,059 on 11/1/06, collateralized by U.S. Treasury Note, 5.125% due 5/15/16, value $413,592 (Cost $403,000) | | $ | 403,000 | |
| | | | | |
| |
| | | | Total Investments — 100.3% (Cost $12,745,215) | | | 13,382,612 | |
| | | | | | | | |
| | | | Liabilities Less Other Assets — (0.3%) | | | (33,420 | ) |
| | | | | |
| |
| | | | | | | | |
| | | | Net Assets — 100.0% | | $ | 13,349,192 | |
| | | | | |
| |
|
| * | | Non-income producing security |
| ADR | | American Depositary Receipts |
| NYS | | New York Shares |
| Note: | | For presentation purposes, the Fund has grouped some of the industry categories. For purposes of categorizing securities for compliance with Section 8(b)(1) of the Investment Company Act of 1940, the Fund uses more specific industry classifications. |
The accompanying notes are an integral part of the financial statements.
11
| The FBR Funds |
|
| FBR Large Cap Financial Fund |
| Management Overview |
Portfolio Manager: David Ellison
Over the recent fiscal year, how did the Fund perform?
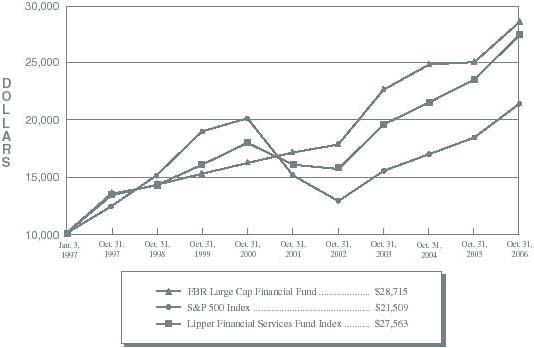
For the one-year period ended October 31, 2006, the FBR Large Cap Financial Fund appreciated 14.21%. This compares to the Lipper Financial Services Fund Index and the S&P 500 Index, which returned 16.70% and 16.34% for the same period, respectively.
What factors contributed to the Fund’s performance?
We believe that the overall positive performance of the Fund was primarily due to investor confidence in the constancy of financial institutions. Despite a difficult operating environment, industry fundamentals remained relatively stable, which led to continued strong valuations for the financial sector.
During fiscal year 2006, the Fund slightly underperformed the relevant indices. The positive performance of the financial services sector as a whole can be primarily attributed to brokerages, asset management companies and REITs. Historically, the Fund has underweighted these sub-sectors in favor of the more conventional bank and thrift business models providing less exposure to capital markets activities. In 2006, we broadened the Fund’s exposure to these sectors. The Fund lagged the financial services sector, which in turn lagged the broader market, as telecommunication services, energy, and utilities outperformed.
What is the outlook for the Fund and the financial services sector?
We believe the outlook for financial institutions is positive despite a difficult operating environment. A number of concerns surrounding the financial services industry have weighed heavily on valuations over the last couple of years. These include 1) rising short-term interest rates, 2) an inverted yield curve (the difference between long and short dated debt securities), 3) possible credit problems associated with a slow down and softening in the residential housing market, 4) pricing pressure in capital market activities, most noticeably on stock trading commission rates, 5) sluggish commercial loan demand, and finally 6) anemic merger and acquisition activity. In spite of this backdrop, we believe the financial services sector will perform well as these concerns are addressed or resolved by the management teams at each company, industry regulators and the Federal Reserve.
The Fund will continue to own financial stocks that follow low-risk business strategies and trade below average peer valuations. This strict attention to relative and absolute valuation has the intended effect of reducing the overall downside volatility associated with macro changes in the capital markets, such as the direction of interest rates and the deterioration of credit quality. It will also provide the best opportunity for solid performance over the long-term, as these companies are generally managed well and continue to deliver consistent earnings growth.
The opinions expressed in this commentary reflect those of the Portfolio Manager as of the date written. Any such opinions are subject to change based on market or other conditions. These opinions may not be relied upon as investment advice. Investment decisions for The FBR Funds are based on several factors, and may not be relied upon as an indication of trading intent on behalf of any FBR Fund. Security positions can and do change.
12
| The FBR Funds |
|
| FBR Large Cap Financial Fund |
| |
| Comparison of Changes in Value of $10,000 Investment in |
| Fund Shares(1)(2) vs. Various Indices(1)(3) |
| Total Returns—For the Periods Ended October 31, 2006(4) |
| | | | | | | | | Annualized | |
| | | | | | Annualized | | Since | |
| | | One Year | | Five Year | | Inception(5) | |
| | |
| |
| |
| |
FBR Large Cap Financial Fund(1)(2) | | 14.21 | % | | 10.85 | % | | 11.33 | % | |
S&P 500 Index(1)(3) | | 16.34 | % | | 7.24 | % | | 8.10 | % | |
Lipper Financial Services Fund Index(1)(3) | | 16.70 | % | | 11.38 | % | | 10.86 | % | |
PAST PERFORMANCE IS NO GUARANTEE OF FUTURE RESULTS.
The performance data quoted represents past performance and the current performance may be lower or higher. The investment return and principal will fluctuate so that investors' shares, when redeemed, may be worth more or less than their original cost. To obtain performance data current to the most recent month-end please call 888.200.4710 or visit www.fbrfunds.com.
| (1) | | The graph assumes a hypothetical $10,000 initial investment in the Fund and reflects the reinvestment of dividends and all Fund expenses. Investors should note that the Fund is a professionally managed mutual fund while the indices are unmanaged, do not incur expenses and are not available for investment. The performance of the indices includes reinvested dividends, and does not reflect sales charges or expenses, except for the Lipper Financial Services Fund Index which reflects fund expenses. |
| (2) | | FBR Fund Advisers, Inc. waived a portion of its advisory fees and agreed to contractually reimburse a portion of the Fund’s operating expenses, as necessary, to maintain existing expense limitations, as set forth in the notes to the financial statements. Total returns shown include fee waivers and expense reimbursements, if any; total returns would have been lower had there been no waiver of fees and/or reimbursement of expenses in excess of expense limitations. |
| (3) | | S&P 500 Index is a capitalization-weighted index of 500 stocks. The index is designed to represent the broad domestic economy through changes in aggregate market value of 500 stocks representing all major industries. The Lipper Financial Services Fund Index is an equally weighted index of the largest thirty funds within the financial services fund classification as defined by Lipper Inc. The index is rebalanced quarterly. Lipper Analytical Services, Inc., is a nationally recognized organization that reports on mutual fund total return performance and calculates fund rankings. Each Lipper Average is based on a universe of funds with similar investment objectives. |
| (4) | | The total returns shown do not reflect the deduction of taxes that a shareholder would pay on fund distributions or the redemption of fund shares. |
| (5) | | For the period January 3, 1997 (commencement of investment operations) through October 31, 2006. Certain purchases made by shareholders within this period would have been subject to an initial maximum sales charge of up to 5.50%. As a result, total returns for such shareholders would have been lower. |
13
| The FBR Funds |
|
| FBR Large Cap Financial Fund |
| Portfolio Summary |
| October 31, 2006 |
The following chart provides a visual breakdown of the Fund by industry sectors. The underlying securities represent a percentage of the portfolio investments.
14
| The FBR Funds |
|
| FBR Large Cap Financial Fund |
| Portfolio of Investments |
| October 31, 2006 |
|
| | | | | | VALUE |
| | SHARES | | | | (NOTE 2) |
|
| | | | COMMON STOCKS — 98.0% | | | | |
| | | | Banks - Money Centers — 14.0% | | | | |
| | 22,000 | | Bank of America Corp. | | $ | 1,185,140 | |
| | 18,000 | | Citigroup, Inc. | | | 902,880 | |
| | 25,000 | | JP Morgan Chase & Co. | | | 1,186,000 | |
| | 7,357 | | Wachovia Corp. | | | 408,314 | |
| | | | | |
| |
| | | | | | | 3,682,334 | |
| | | | | |
| |
| | | | Banks - Regional — 21.1% | | | | |
| | 8,000 | | Capital One Financial Corp. | | | 634,640 | |
| | 17,000 | | Comerica, Inc. | | | 989,230 | |
| | 30,000 | | KeyCorp. | | | 1,114,200 | |
| | 80,000 | | Mitsubishi UFJ Financial Group, Inc. ADR | | | 1,020,000 | |
| | 27,000 | | National City Corp. | | | 1,005,750 | |
| | 10,000 | | SunTrust Banks, Inc. | | | 789,900 | |
| | | | | |
| |
| | | | | | | 5,553,720 | |
| | | | | |
| |
| | | | Consumer Financial Services — 10.9% | | | | |
| | 19,000 | | CIT Group, Inc. | | | 988,950 | |
| | 12,000 | | Fannie Mae (Federal National Mortgage) | | | 711,120 | |
| | 17,000 | | Freddie Mac (Federal Home Loan) | | | 1,172,830 | |
| | | | | |
| |
| | | | | | | 2,872,900 | |
| | | | | |
| |
| | | | Insurance - Accident and Health — 2.6% | | | | |
| | 35,000 | | UnumProvident Corp. | | | 692,300 | |
| | | | | |
| |
| | | | Insurance - Life — 13.1% | | | | |
| | 19,000 | | Genworth Financial, Inc., Class A | | | 635,360 | |
| | 8,000 | | Lincoln National Corp. | | | 506,480 | |
| | 16,000 | | MetLife, Inc. | | | 914,080 | |
| | 15,000 | | Principal Financial Group, Inc. | | | 847,350 | |
| | 7,000 | | Prudential Financial, Inc. | | | 538,510 | |
| | | | | |
| |
| | | | | | | 3,441,780 | |
| | | | | |
| |
| | | | Insurance - Property and Casualty — 8.2% | | | | |
| | 9,000 | | American International Group, Inc. | | | 604,530 | |
| | 24,000 | | CNA Financial Corp.* | | | 898,800 | |
| | 1,000 | | Everest Re Group Ltd. | | | 99,180 | |
| | 1,000 | | MBIA, Inc. | | | 62,020 | |
15
| The FBR Funds |
|
| FBR Large Cap Financial Fund |
| Portfolio of Investments (continued) |
| October 31, 2006 |
|
| | | | | | VALUE |
| | SHARES | | | | (NOTE 2) |
|
| | | | Insurance - Property and Casualty — 8.2% (continued) | | | | |
| | 1,000 | | MGIC Investment Corp. | | $ | 58,760 | |
| | 5,000 | | The Hartford Financial Services Group, Inc. | | | 435,850 | |
| | | | | |
| |
| | | | | | | 2,159,140 | |
| | | | | |
| |
| | | | Investment Services — 23.4% | | | | |
| | 18,000 | | Ameriprise Financial, Inc. | | | 927,000 | |
| | 11,000 | | Lehman Brothers Holdings, Inc. | | | 856,240 | |
| | 11,000 | | Merrill Lynch & Company, Inc. | | | 961,620 | |
| | 16,000 | | Morgan Stanley | | | 1,222,880 | |
| | 7,000 | | The Bear Stearns Companies, Inc. | | | 1,059,450 | |
| | 6,000 | | The Goldman Sachs Group, Inc. | | | 1,138,740 | |
| | | | | |
| |
| | | | | | | 6,165,930 | |
| | | | | |
| |
| | | | Savings and Loans - Savings Banks — 4.7% | | | | |
| | 20,000 | | Astoria Financial Corp. | | | 580,200 | |
| | 20,000 | | Sovereign Bancorp, Inc. | | | 477,200 | |
| | 4,000 | | Washington Mutual, Inc. | | | 169,200 | |
| | | | | |
| |
| | | | | | | 1,226,600 | |
| | | | | |
| |
| | | | Total Common Stocks (Cost $22,090,284) | | | 25,794,704 | |
| | | | | |
| |
| | | | | | | | |
| | PAR | | | | | | |
| | | | | | |
| | | | REPURCHASE AGREEMENT — 3.6% | | | | |
| | $941,000 | | With Mizuho Securities, Inc. dated 10/31/06 at 5.25% to be repurchased at $941,137 on 11/1/06, collateralized by U.S. Treasury Note, 5.125% due 5/15/16, value $965,733 (Cost $941,000) | | | 941,000 | |
| | | | | |
| |
| | | | Total Investments — 101.6% (Cost $23,031,284) | | | 26,735,704 | |
| | | | | | | | |
| | | | Liabilities Less Other Assets — (1.6%) | | | (422,524 | ) |
| | | | | |
| |
| | | | Net Assets — 100.0% | | $ | 26,313,180 | |
| | | | | |
| |
| * | | Non-income producing security |
| ADR | | American Depositary Receipts |
| | | |
| | | |
| The accompanying notes are an integral part of the financial statements. |
| | | |
| | | 16 |
| The FBR Funds |
|
| FBR Large Cap Technology Fund |
| Management Overview |
Portfolio Managers: David Ellison and Winsor Aylesworth
Over the recent fiscal year, how did the Fund perform?
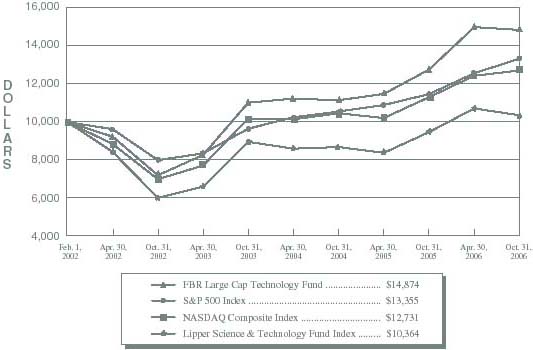
For the one-year period ended October 31, 2006, the FBR Large Cap Technology Fund appreciated 16.40%. This compares to the Lipper Science & Technology Fund Index, the S&P 500 Index, and the NASDAQ Composite Index which returned 9.43%, 16.34%, and 12.49% for the same period respectively.
What factors contributed to the Fund’s performance?
Investors enjoyed a successful year as the Fund earned double digit returns and outpaced its peer group and benchmarks over the course of our fiscal year. The Fund’s investments continue to mirror our belief that reasonably valued technology companies with minimal debt, a history of profitability and a track record of consistent growth in book value will serve us best over the long term.
The technology sector continues to act as a good surrogate for the domestic and global economy. The year is ending with generally growing economies as interest rates have stabilized and energy prices have eased throughout the world. The success of the iPod, the desirability of hi-definition televisions, the digital camera revolution and the new gaming consoles by Microsoft, Sony and Nintendo has stimulated much of the consumer demand in this sector.
What is the outlook for the Fund and the technology sector?
As we look towards 2007, the consumer will be offered newer, better, faster and cheaper technology solutions for all the things that may have caught his or her eye in 2006. As hi-definition televisions continue to proliferate, we expect to see another round of upgrades for DVD players, HD Camcorders and other peripheral products and devices.
Corporately, the new Microsoft operating system due out in early 2007 will drive new spending. As the world economies expand and interact, corporations and governments will be faced with increasingly complex challenges that can only be solved and effectively addressed by upgraded technology solutions. So, by most measures, the demand for technology should remain strong. Companies that are capable of meeting this demand and that have the capital available to invest in innovation should benefit. Of course, the markets don’t move in just one direction. Hence, we can expect the market to correct or pause over the course of the next fiscal year. By following the Fund’s proven strategy of buying large, low leveraged, growing companies at “value” prices, we are able to provide the downside protection we strive for during turbulent market conditions. Our outlook for the Fund
17
| The FBR Funds |
|
| FBR Large Cap Technology Fund |
| Management Overview (continued) |
in 2007 is positive knowing we are positioned to participate in any technology rally that may occur, and that we are somewhat insulated from the downside volatility that accompanies the sector because of our strict attention to valuation.
The opinions expressed in this commentary reflect those of the Portfolio Manager as of the date written. Any such opinions are subject to change based on market or other conditions. These opinions may not be relied upon as investment advice. Investment decisions for The FBR Funds are based on several factors, and may not be relied upon as an indication of trading intent on behalf of any FBR Fund. Security positions can and do change.
18
| The FBR Funds |
|
| FBR Large Cap Technology Fund |
| |
| Comparison of Changes in Value of $10,000 Investment in |
| Fund Shares(1)(2) vs. Various Indices(1)(3) |
Total Returns—For the Periods Ended October 31, 2006(4) |
| | | | | | Annualized | | |
| | | | | | Since | | |
| | | One Year | | | Inception(5) | | |
| | |
| |
| |
FBR Large Cap Technology Fund(1)(2) | | 16.40 | % | | 8.73 | % | |
S&P 500 Index(1)(3) | | 16.34 | % | | 6.28 | % | |
NASDAQ Composite Index(1)(3) | | 12.49 | % | | 5.21 | % | |
Lipper Science & Technology Fund Index(1)(3) | | 9.43 | % | | 0.76 | % | |
PAST PERFORMANCE IS NO GUARANTEE OF FUTURE RESULTS.
The performance data quoted represents past performance and the current performance may be lower or higher. The investment return and principal will fluctuate so that investors’ shares, when redeemed, may be worth more or less than their original cost. To obtain performance data curernt to the most recent month-end, please call 888.200.4710 or visit www.fbrfunds.com.
| (1) | | The graph assumes a hypothetical $10,000 initial investment in the Fund and reflects the reinvestment of dividends and all Fund expenses. Investors should note that the Fund is a professionally managed mutual fund while the indices are unmanaged, do not incur expenses and are not available for investment. The performance of the indices includes reinvested dividends, and does not reflect sales charges or expenses, except for the Lipper Science & Technology Fund Index which reflects fund expenses. |
| (2) | | FBR Fund Advisers, Inc. waived a portion of its advisory fees and agreed to contractually reimburse a portion of the Fund’s operating expenses, as necessary, to maintain existing expense limitations, as set forth in the notes to the financial statements. Total returns shown include fee waivers and expense reimbursements, if any; total returns would have been lower had there been no waiver of fees and/or reimbursement of expenses in excess of expense limitations. |
| (3) | | S&P 500 Index is a capitalization-weighted index of 500 stocks. The index is designed to represent the broad domestic economy through changes in aggregate market value of 500 stocks representing all major industries. The NASDAQ Composite Index is a broad-based capitalization-weighted index of all NASDAQ National Market and Small Cap stocks. The Lipper Technology & Science Fund Index is an equally weighted index of the largest thirty funds within the science and technology fund classification as defined by Lipper Inc. The index is rebalanced quarterly. Lipper Analytical Services, Inc., is a nationally recognized organization that reports on mutual fund total return performance and calculates fund rankings. Each Lipper Average is based on a universe of funds with similar investment objectives. |
| (4) | | The total returns shown do not reflect the deduction of taxes that a shareholder would pay on fund distributions or the redemption of fund shares. |
| (5) | | For the period February 1, 2002 (commencement of investment operations) through October 31, 2006. |
19
| The FBR Funds |
|
| FBR Large Cap Technology Fund |
| Portfolio Summary |
| October 31, 2006 |
The following chart provides a visual breakdown of the Fund by industry sectors. The underlying securities represent a percentage of the portfolio investments.
20
| The FBR Funds |
|
| FBR Large Cap Technology Fund |
| Portfolio of Investments |
| October 31, 2006 |
|
| | | | | | VALUE | |
| | SHARES | | | | (NOTE 2) | |
|
| | | | COMMON STOCKS — 81.8% | | | | |
| | | | Audio and Video Equipment — 2.4% | | | | |
| | 23,000 | | Sony Corp. ADR | | $ | 942,540 | |
| | | | | |
| |
| | | | Biotechnology and Drugs — 11.7% | | | | |
| | 6,375 | | ALTANA AG ADR | | | 355,406 | |
| | 2,600 | | AmerisourceBergen Corp. | | | 122,720 | |
| | 7,700 | | Biogen Idec, Inc.* | | | 366,520 | |
| | 15,800 | | Merck & Company, Inc. | | | 717,636 | |
| | 18,405 | | Novartis AG ADR | | | 1,117,736 | |
| | 65,175 | | Schering-Plough Corp. | | | 1,442,974 | |
| | 13,900 | | Serono S.A. ADR | | | 302,881 | |
| | 7,000 | | Watson Pharmaceuticals, Inc.* | | | 188,370 | |
| | | | | |
| |
| | | | | | | 4,614,243 | |
| | | | | |
| |
| | | | Business Services — 0.8% | | | | |
| | 3,600 | | International Business Machines Corp. | | | 332,388 | |
| | | | | |
| |
| | | | Capital Goods - Miscellaneous — 1.3% | | | | |
| | 4,000 | | Cummins, Inc. | | | 507,920 | |
| | | | | |
| |
| | | | Communications Equipment — 8.5% | | | | |
| | 10,150 | | Comverse Technology, Inc.* | | | 220,966 | |
| | 4,500 | | Garmin Ltd. | | | 240,345 | |
| | 28,167 | | LM Ericsson Telephone Co. ADR | | | 1,065,276 | |
| | 68,500 | | Motorola, Inc. | | | 1,579,609 | |
| | 24,700 | | Tellabs, Inc.* | | | 260,338 | |
| | | | | |
| |
| | | | | | | 3,366,534 | |
| | | | | |
| |
| | | | Communications Services — 3.8% | | | | |
| | 43,325 | | AT&T, Inc. | | | 1,483,881 | |
| | | | | |
| |
| | | | Computer Hardware — 0.4% | | | | |
| | 2,000 | | Apple Computer, Inc.* | | | 162,160 | |
| | | | | |
| |
| | | | Computer Peripherals — 4.5% | | | | |
| | 29,675 | | Canon, Inc. ADR | | | 1,584,348 | |
| | 5,000 | | Hewlett-Packard Co. | | | 193,700 | |
| | | | | |
| |
| | | | | | | 1,778,048 | |
| | | | | |
| |
21
| The FBR Funds |
|
| FBR Large Cap Technology Fund |
| Portfolio of Investments (continued) |
| October 31, 2006 |
|
| | | | | | VALUE | |
| | SHARES | | | | (NOTE 2) | |
|
| | | | Computer Services — 2.2% | | | | |
| | 9,800 | | Computer Sciences Corp.* | | $ | 517,930 | |
| | 8,500 | | NCR Corp.* | | | 352,920 | |
| | | | | |
| |
| | | | | | | 870,850 | |
| | | | | |
| |
| | | | Computer Storage Devices — 2.7% | | | | |
| | 17,575 | | EMC Corp.* | | | 215,294 | |
| | 13,200 | | SanDisk Corp.* | | | 634,920 | |
| | 9,500 | | Seagate Technology | | | 214,510 | |
| | | | | |
| |
| | | | | | | 1,064,724 | |
| | | | | |
| |
| | | | Electronic Instruments and Controls — 6.4% | | | | |
| | 7,500 | | Agilent Technologies, Inc.* | | | 267,000 | |
| | 12,425 | | American Power Conversion Corp. | | | 375,608 | |
| | 5,400 | | Arrow Electronics, Inc.* | | | 161,190 | |
| | 35,265 | | AU Optronics Corp. ADR | | | 478,899 | |
| | 9,375 | | Jabil Circuit, Inc. | | | 269,156 | |
| | 9,600 | | Molex, Inc. | | | 335,040 | |
| | 8,025 | | TDK Corp. ADR | | | 627,555 | |
| | | | | |
| |
| | | | | | | 2,514,448 | |
| | | | | |
| |
| | | | Office Equipment — 0.9% | | | | |
| | 20,000 | | Xerox Corp.* | | | 340,000 | |
| | | | | |
| |
| | | | Personal and Household Products — 2.2% | | | | |
| | 17,375 | | McKesson Corp. | | | 870,314 | |
| | | | | |
| |
| | | | Photography — 1.2% | | | | |
| | 12,390 | | FUJIFILM Holdings Corp. ADR | | | 460,784 | |
| | | | | |
| |
| | | | Retail - Catalog and Mail Order — 0.7% | | | | |
| | 4,100 | | CDW Corp. | | | 269,247 | |
| | | | | |
| |
| | | | Semiconductors — 31.1% | | | | |
| | 8,950 | | Advanced Micro Devices, Inc.* | | | 190,367 | |
| | 8,000 | | Analog Devices, Inc. | | | 254,560 | |
| | 31,950 | | Applied Materials, Inc. | | | 555,611 | |
| | 40,400 | | Flextronics International Ltd.* | | | 468,640 | |
| | 11,442 | | Freescale Semiconductor, Inc., Class B* | | | 450,014 | |
22
| The FBR Funds |
|
| FBR Large Cap Technology Fund |
| Portfolio of Investments (continued) |
| October 31, 2006 |
|
| | | | | | VALUE | |
| | SHARES | | | | (NOTE 2) | |
|
| | | | Semiconductors — 31.1% (continued) | | | | |
| | 48,100 | | Infineon Technologies AG ADR* | | $ | 584,896 | |
| | 51,800 | | Intel Corp. | | | 1,105,412 | |
| | 9,500 | | Intersil Corp. | | | 222,775 | |
| | 11,775 | | KLA-Tencor Corp. | | | 578,977 | |
| | 11,800 | | Kyocera Corp. ADR | | | 1,059,758 | |
| | 8,600 | | Lam Research Corp.* | | | 425,270 | |
| | 11,700 | | Marvell Technology Group Ltd.* | | | 213,876 | |
| | 17,900 | | Maxim Integrated Products, Inc. | | | 537,179 | |
| | 11,200 | | Microchip Technology, Inc. | | | 368,816 | |
| | 40,650 | | Micron Technology, Inc.* | | | 587,393 | |
| | 16,875 | | National Semiconductor Corp. | | | 409,894 | |
| | 8,700 | | Novellus Systems, Inc.* | | | 240,555 | |
| | 53,000 | | STMicroelectronics N.V. NYS | | | 920,080 | |
| | 114,004 | | Taiwan Semiconductor Manufacturing Company Ltd. ADR | | | 1,105,838 | |
| | 52,800 | | Texas Instruments, Inc. | | | 1,593,503 | |
| | 16,900 | | Xilinx, Inc. | | | 431,119 | |
| | | | | |
| |
| | | | | | | 12,304,533 | |
| | | | | |
| |
| | | | Software and Programming — 1.0% | | | | |
| | 10,500 | | Check Point Software Technologies Ltd.* | | | 217,560 | |
| | 5,800 | | Microsoft Corp. | | | 166,518 | |
| | | | | |
| |
| | | | | | | 384,078 | |
| | | | | |
| |
| | | | Total Common Stocks (Cost $30,120,170) | | | 32,266,692 | |
| | | | | |
| |
| | | | | | | | |
| | | | EXCHANGE TRADED FUNDS — 3.0% | | | | |
| | 16,000 | | PowerShares Dynamic Biotechnology & Genome Portfolio* | | | 296,800 | |
| | 16,000 | | streetTRACKS® Morgan Stanley Technology ETF | | | 880,160 | |
| | | | | |
| |
| | | | Total Exchange Traded Funds (Cost $1,087,973) | | | 1,176,960 | |
| | | | | |
| |
23
| The FBR Funds |
|
| FBR Large Cap Technology Fund |
| Portfolio of Investments (continued) |
| October 31, 2006 |
|
| | | | | | VALUE | |
| | PAR | | | | (NOTE 2) | |
|
| | | | REPURCHASE AGREEMENT — 18.9% | | | | |
| $ | 7,440,000 | | With Mizuho Securities, Inc. dated 10/31/06 at 5.25% to be repurchased at $7,441,085 on 11/1/06, collateralized by U.S. Treasury Note, 5.125% due 5/15/16, value $7,635,552 (Cost $7,440,000) | | $ | 7,440,000 | |
| | | | | |
| |
| | | | Total Investments — 103.7% (Cost $38,648,143) | | | 40,883,652 | |
| | | | | | | | |
| | | | Liabilities Less Other Assets — (3.7%) | | | (1,476,359 | ) |
| | | | | |
| |
| | | | Net Assets — 100.0% | | $ | 39,407,293 | |
| | | | | |
| |
| * | | Non-income producing security |
| ADR | | American Depositary Receipts |
| NYS | | New York Shares |
| | | |
| | | |
| | | |
| The accompanying notes are an integral part of the financial statements. |
| | | |
| | | 24 |
The FBR Funds
FBR Small Cap Fund
Management Overview
Investment Sub Adviser: Akre Capital Management, LLC
Portfolio Manager: Charles T. Akre, Jr.
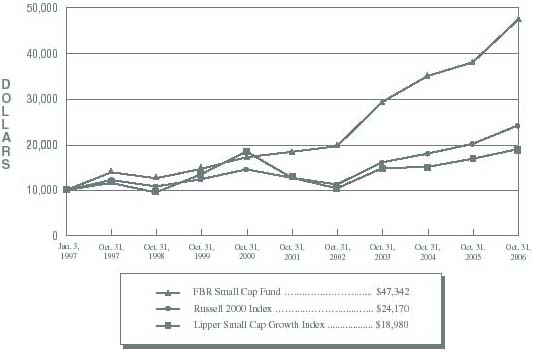
As I write this 2006 year end report, I have the occasion to think about it in terms of our nearly ten years of operation. Our achievement has been significant. We have compounded shareholders capital (per share) at an annual rate of 17.50% from inception1 through November 30, 2006. This of course is in no way predictive of future results, but is significant because of a) its very high absolute rate, and b) the Fund’s return relative to many different indices. For example, during the same time period, the S&P 500 Index (“S&P”) compounded at 8.34%, the Russell 2000 Index at 9.56%, and the Lipper Small Cap Growth Index at 9.56%.
The FBR Small Cap Fund returned 24.53%, 20.83% and 17.15% for the one-year, five-years and since inception time periods ended October 31, 2006, respectively2.
Recently, the financial media has compared fund managers based on the number of years they “beat” the S&P. The case of Bill Miller at Legg Mason is the most notable. When I examined what their compound annual returns had been, I found it significantly below our returns. By way of comparison during our first four calendar years of operation, we provided investors with returns that lagged the S&P twice, and over our entire nine year history, we bested the S&P merely six years.
The focus on beating the market on a calendar basis is, I believe, both misleading and wrong focused. My question is “Which would you rather have over the course of nearly ten years? A 17+% average annual return or a low teens annual return where the Fund has “beat” the S&P for a long string of consecutive years?”
For me the answer is obvious both on its face and because I understand well the level of risk undertaken in achieving our results.
In all of the nine prior years’ reports to shareholders, I have spent some time sharing with you our investment process and style. Briefly, we look for high returns on capital businesses, run by honest, diligent and fair managers, where an opportunity exists to reinvest excess profits to continue to earn above average returns on capital. When we find one of these, we describe it as our “little compounding machines.”
We then add that we are unwilling to pay very much for these opportunities, which is our way of saying that valuation at purchase is very important.
|
| 1 | The FBR Small Cap Fund commenced operations on January 3, 1997 |
| |
| 2 | Past Performance is No Guarantee of Future Results. The current performance may be lower or higher than performance data quoted. To obtain performance data current to the most recent month-end please call 888.200.4710 or visit www.fbrfunds.com. Investment return and principal will fluctuate so that investors’ shares, when redeemed, may be worth more or less than their original cost. |
25
The FBR Funds
FBR Small Cap Fund
Management Overview (continued)
On average, the outcome of our process has produced investments with more growth, higher returns on capital, more often than not stronger balance sheets and lower valuations, than the overall “market”.
We believe it is intuitive that with these characteristics our returns are more likely to be above market (on average) with below market levels of risk.
This in essence is our risk profile. When we identify these outstanding businesses we want to own lots of them, and accordingly our portfolio doesn’t resemble the run of the mill mutual fund with 50 or 100 separate holdings. You can expect it never will.
I read in academic studies that fully 90% of the value added by diversification is achieved with only nine holdings. We are very comfortable with our process and say again, “examine the results.”
It has been traditional to comment on the market outlook in general and small-cap stocks in particular. As we have shared with you in the past, we have no-clue where the market is headed, or how small-cap stocks will perform in the coming year. You can be certain that we will remain true to the process which has caused the over nine years of results we spoke of at the outset.
Several months ago the Trustees of the Fund asked us if we would consider reopening the Fund. Our response then was that we believe we are likely to have some opportunities in the next year or two, and therefore agree that reopening the Fund makes sense. This remains our view today.
The opinions expressed in this commentary reflect those of the Portfolio Manager as of the date written. Any such opinions are subject to change based on market or other conditions. These opinions may not be relied upon as investment advice. Investment decisions for The FBR Funds are based on several factors and may not be relied upon as an indication of trading intent on behalf of any FBR Fund. Security positions can and do change.
26
The FBR Funds
FBR Small Cap Fund
Comparison of Changes in Value of $10,000 Investment in
Fund Shares(1)(2) vs. Various Indices(1)(3)
| | Total Returns—For the Periods Ended October 31, 2006(4) | |
| | | | | | | | | | | | Annualized | |
| | | | | | | | Annualized | | Since | |
| | | | One Year | | Five Year | | Inception(5) | |
| | | |
| |
| |
| |
| | FBR Small Cap Fund(1)(2) | | | 24.53 | % | | | 20.83 | % | | | 17.15 | % | |
| | Russell 2000 Index(1)(3) | | | 19.98 | % | | | 13.75 | % | | | 9.39 | % | |
| | Lipper Small Cap Growth Index(1)(3) | | | 12.57 | % | | | 8.36 | % | | | 6.73 | % | |
PAST PERFORMANCE IS NO GUARANTEE OF FUTURE RESULTS.
The performance data quoted represents past performance and the current performance may be lower or higher. The investment return and principal will fluctuate so that investors’ shares, when redeemed, may be worth more or less than their original cost. To obtain performance data current to the most recent month-end please call 888.200.4710 or visit www.fbrfunds.com.
|
| (1) | | The graph assumes a hypothetical $10,000 initial investment in the Fund and reflects the reinvestment of dividends and all Fund expenses. Investors should note that the Fund is a professionally managed mutual fund while the indices are umanaged, do not incur expenses and are not available for investment. The performance of the indices includes reinvested dividends, and does not reflect sales charges or expenses, except for the Lipper Small Cap Growth Fund Index which reflects fund expenses. |
| (2) | | FBR Fund Advisers, Inc. waived a portion of its advisory fees and agreed to contractually reimburse a portion of the Fund’s operating expenses, as necessary, to maintain existing expense limitations, as set forth in the notes to the financial statements. Total returns shown include fee waivers and expense reimbursements, if any; total returns would have been lower had there been no waiver of fees and/or reimbursement of expenses in excess of expense limitations. |
| (3) | | Russell 2000 Index is comprised of the smallest of the 2000 companies of the Russell 3000 Index, representing approximately 8% of the Russell 3000’s total market-capitalization. The Lipper Small Cap Growth Fund Index is an equally weighted index of the largest thirty funds within the small-cap fund classification as defined by Lipper Inc. The index is rebalanced quarterly. Lipper Analytical Services, Inc., is a nationally recognized organization that reports on mutual fund total return performance and calculates fund rankings. Each Lipper Average is based on a universe of funds with similar investment objectives. |
| (4) | | The total returns shown do not reflect the deduction of taxes that a shareholder would pay on fund distributions or the redemption of fund shares. |
| (5) | | For the period January 3, 1997 (commencement of investment operations) through October 31, 2006. Certain purchases made by shareholders within this period would have been subject to an initial maximum sales charge of up to 5.50%. As a result, total returns for such shareholders would have been lower. |
27
The FBR Funds
FBR Small Cap Fund
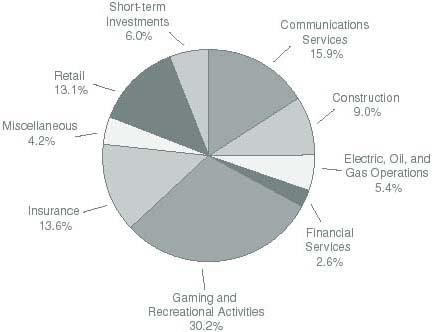
Portfolio Summary
October 31, 2006
The following chart provides a visual breakdown of the Fund by industry sectors. The underlying securities represent a percentage of the portfolio investments.
28
The FBR Funds
FBR Small Cap Fund
Portfolio of Investments
October 31, 2006
|
| | | | | | VALUE | |
| | SHARES | | | | (NOTE 2) | |
|
| | | | COMMON STOCKS — 93.6% | | | | |
| | | | Banks - Regional — 0.1% | | | | |
| | 50,000 | | Bancshares of Florida, Inc.* | | $ | 1,044,500 | |
| | | | | |
| |
| | | | | | | | |
| | | | Biotechnology and Drugs — 0.4% | | | | |
| | 228,100 | | Bradley Pharmaceuticals, Inc.* | | | 3,968,940 | |
| | | | | |
| |
| | | | | | | | |
| | | | Casinos and Gaming — 29.5% | | | | |
| | 1,600,000 | | Bally Technologies, Inc.* | | | 31,760,000 | |
| | 42,822 | | Florida Gaming Corp.* | | | 541,698 | |
| | 20,000 | | International Game Technology | | | 850,200 | |
| | 212,300 | | Isle of Capri Casinos, Inc.* | | | 5,328,730 | |
| | 992,000 | | Monarch Casino & Resort, Inc.*† | | | 22,002,560 | |
| | 4,100,000 | | Penn National Gaming, Inc.* | | | 149,937,001 | |
| | 1,471,407 | | Pinnacle Entertainment, Inc.* | | | 44,524,776 | |
| | 157,500 | | Shuffle Master, Inc.* | | | 4,406,850 | |
| | 234,861 | | Station Casinos, Inc. | | | 14,162,118 | |
| | | | | |
| |
| | | | | | | 273,513,933 | |
| | | | | |
| |
| | | | | | | | |
| | | | Communications Services — 15.9% | | | | |
| | 4,107,256 | | American Tower Corp., Class A* | | | 147,943,361 | |
| | | | | |
| |
| | | | | | | | |
| | | | Construction - Supplies and Fixtures — 5.7% | | | | |
| | 730,850 | | American Woodmark Corp. | | | 27,034,142 | |
| | 902,300 | | Simpson Manufacturing Company, Inc. | | | 25,616,297 | |
| | | | | |
| |
| | | | | | | 52,650,439 | |
| | | | | |
| |
| | | | Construction Services — 3.3% | | | | |
| | 566,666 | | D.R. Horton, Inc. | | | 13,276,984 | |
| | 600,000 | | Toll Brothers, Inc.* | | | 17,346,000 | |
| | | | | |
| |
| | | | | | | 30,622,984 | |
| | | | | |
| |
| | | | Consumer Financial Services — 2.5% | | | | |
| | 873,000 | | AmeriCredit Corp.* | | | 22,322,610 | |
| | 28,200 | | White River Capital, Inc.* | | | 517,470 | |
| | | | | |
| |
| | | | | | | 22,840,080 | |
| | | | | |
| |
| | | | Electric Utilities — 2.4% | | | | |
| | 1,000,000 | | The AES Corp.* | | | 21,990,000 | |
| | | | | |
| |
29
The FBR Funds
FBR Small Cap Fund
Portfolio of Investments (continued)
October 31, 2006
|
| | | | | | VALUE | |
| | SHARES | | | | (NOTE 2) | |
|
| | | | Insurance - Miscellaneous — 1.8% | | | | |
| | 50,000 | | Brown & Brown, Inc. | | $ | 1,463,000 | |
| | 393,500 | | Hilb Rogal and Hobbs Co. | | | 15,708,520 | |
| | | | | |
| |
| | | | | | | 17,171,520 | |
| | | | | |
| |
| | | | Insurance - Property and Casualty — 11.3% | | | | |
| | 80 | | Berkshire Hathaway, Inc., Class B* | | | 281,200 | |
| | 61,000 | | Investors Title Co. | | | 3,127,165 | |
| | 255,400 | | Markel Corp.* | | | 102,032,300 | |
| | | | | |
| |
| | | | | | | 105,440,665 | |
| | | | | |
| |
| | | | Office Equipment — 2.5% | | | | |
| | 1,085,400 | | Global Imaging Systems, Inc.* | | | 23,629,158 | |
| | | | | |
| |
| | | | | | | | |
| | | | Oil and Gas Operations — 3.0% | | | | |
| | 397,890 | | MarkWest Hydrocarbon, Inc. | | | 13,062,729 | |
| | 211,800 | | Penn Virginia Corp. | | | 15,154,290 | |
| | | | | |
| |
| | | | | | | 28,217,019 | |
| | | | | |
| |
| | | | Recreational Activities — 0.8% | | | | |
| | 603,800 | | Dover Motorsports, Inc. | | | 3,188,064 | |
| | 60,000 | | International Speedway Corp., Class A | | | 3,114,600 | |
| | 19,000 | | International Speedway Corp., Class B | | | 986,100 | |
| | | | | |
| |
| | | | | | | 7,288,764 | |
| | | | | |
| |
| | | | Retail - Specialty — 13.1% | | | | |
| | 3,445,336 | | 99 Cents Only Stores* | | | 41,309,579 | |
| | 107,900 | | Big 5 Sporting Goods Corp. | | | 2,593,916 | |
| | 1,500,000 | | CarMax, Inc.* | | | 66,450,000 | |
| | 356,508 | | O’Reilly Automotive, Inc.* | | | 11,511,643 | |
| | | | | |
| |
| | | | | | | 121,865,138 | |
| | | | | |
| |
| | | | Software and Programming — 0.2% | | | | |
| | 32,000 | | MICROS Systems, Inc.* | | | 1,589,760 | |
| | | | | |
| |
| | | | | | | | |
| | | | Transportation Services — 1.1% | | | | |
| | 464,997 | | Dynamex, Inc.* | | | 9,853,286 | |
| | | | | |
| |
| | | | Total Common Stocks (Cost $476,369,650) | | | 869,629,547 | |
| | | | | |
| |
30
The FBR Funds
FBR Small Cap Fund
Portfolio of Investments (continued)
October 31, 2006
|
| | | | | | VALUE | |
| | SHARES | | | | (NOTE 2) | |
|
| | | | PREFERRED STOCK — 0.5% | | | | |
| | | | Insurance - Life — 0.5% | | | | |
| | 200,000 | | ING Groep N.V., 6.125% (Cost $5,000,000) | | $ | 4,996,000 | |
| | | | | |
| |
| | | | | | | | |
| PAR | | | | | | |
| | | | | | |
| | | | REPURCHASE AGREEMENT — 6.0% | | | | |
| $ | 56,217,000 | | With Mizuho Securities, Inc. dated 10/31/06 at 5.25% to be repurchased at $56,225,198 on 11/1/06, collateralized by U.S. Treasury Note, 5.125% due 5/15/16, value $57,694,597 (Cost $56,217,000) | | | 56,217,000 | |
| | | | | |
| |
| | | | | | | | |
| | | | Total Investments — 100.1% (Cost $537,586,650) | | | 930,842,547 | |
| | | | | | | | |
| | | | Liabilities Less Other Assets — (0.1%) | | | (1,252,417 | ) |
| | | | | |
| |
| | | | | | | | |
| | | | Net Assets — 100.0% | | $ | 929,590,130 | |
| | | | | |
| |
|
| * | | Non-income producing security |
| † | | Affiliated issuer as defined in the Investment Company Act of 1940 (ownership of at least 5% of the outstanding voting securities of an issuer) |
| Note: | | For presentation purposes, the Fund has grouped some of the industry categories. For purposes of categorizing securities for compliance with Section 8(b)(1) of the Investment Company Act of 1940, the Fund uses more specific industry classifications. |
The accompanying notes are an integral part of the financial statements.
31
The FBR Funds
FBR Small Cap Financial Fund
Management Overview
Portfolio Manager: David Ellison
Over the recent fiscal year, how did the Fund perform?
For the one-year period ended October 31, 2006, the FBR Small Cap Financial Fund appreciated 11.81%. This compares to the Lipper Financial Services Fund Index and the Russell 2000 Index, which returned 16.70% and 19.98% for the same period respectively.
What factors contributed to the Fund’s performance?
We believe that the overall positive performance of the Fund was primarily due to investor confidence in the constancy of financial institutions. Despite a difficult operating environment, industry fundamentals remained relatively stable, which led to continued strong valuations for the financial sector.
During fiscal year 2006, the Fund underperformed the relevant indices. The positive performance of the financial services sector as a whole can be primarily attributed to brokerages, asset management companies and REITs. Although less than in fiscal year 2005, the Fund was underweight in these sub-sectors in fiscal year 2006 in favor of the traditional small-cap banking business model. This was a major reason why the Fund lagged its financial services peer group, which in turn lagged the broader market, as telecommunication services, energy, and utilities outperformed.
The environment was characterized by a further flattening and eventual inversion of the yield curve, the unraveling of an inflated housing market, and doubts about the ability of the consumer to meet debt obligations. Certain fundamentals held up better than expected, illustrated by: stable asset quality, lower yet still positive core deposit and loan growth, and only slightly lower returns on average assets and average equity. However, the inverted yield curve placed downward pressure on the net interest incomes of small banks, resulting in decreasing sequential earnings per share (“EPS”) growth. The rise in short-term interest rates also increased liability costs, while the lack of similar increases in yielding assets strained lending profit margins. Small financial companies typically generate the bulk of their profits from their loans, while their larger counterparts have more diversified profit sources, including brokerage, trading, money management and investment banking.
What is the outlook for the Fund and the financial services sector?
Despite the current difficult operating environment, we believe the outlook for small-cap financial services companies is positive as industry fundamentals remain favorable. While there continues to be near-term pressure on profits, we expect these will abate and more normalized EPS growth rates will return. We believe that negative trends in interest rates have been the primary contributor to slower EPS growth over the last year. When this negative trend slows or reverses, EPS growth will improve and stock prices should follow. Finally, acquisition activity, which has been below historical levels, could also increase, resulting in a noticeable benefit to smaller banks and thrifts.
32
The FBR Funds
FBR Small Cap Financial Fund
Management Overview (continued)
We will continue to concentrate the Fund’s assets in small-cap financial companies that have a history of effective capital management, adhere to low-risk business strategies, and trade at below average valuations. This strategy has the intended effect of reducing the downside risk associated with investing in the financial sector over the long-term.
The opinions expressed in this commentary reflect those of the Portfolio Manager as of the date written. Any such opinions are subject to change based on market or other conditions. These opinions may not be relied upon as investment advice. Investment decisions for The FBR Funds are based on several factors, and may not be relied upon as an indication of trading intent on behalf of any FBR Fund. Security positions can and do change.
33
The FBR Funds
FBR Small Cap Financial Fund
Comparison of Changes in Value of $10,000 Investment in
Fund Shares(1)(2) vs. Various Indices(1)(3)

| | Total Returns—For the Periods Ended October 31, 2006(4) | |
| | | | | | | | | | | | Annualized | |
| | | | | | | | Annualized | | Since | |
| | | | One Year | | Five Year | | Inception(5) | |
| | | |
| |
| |
| |
| | FBR Small Cap Financial Fund(1)(2) | | | 11.81 | % | | | 17.39 | % | | | 16.36 | % | |
| | Russell 2000 Index(1)(3) | | | 19.98 | % | | | 13.75 | % | | | 9.39 | % | |
| | Lipper Financial Services Fund Index(1)(3) | | | 16.70 | % | | | 11.38 | % | | | 10.86 | % | |
PAST PERFORMANCE IS NO GUARANTEE OF FUTURE RESULTS.
The performance data quoted represents past performance and the current performance may be lower or higher. The investment return and principal will fluctuate so that investors’ shares, when redeemed, may be worth more or less than their original cost. To obtain performance data current to the most recent month-end please call 888.200.4710 or visit www.fbrfunds.com.
|
| (1) | | The graph assumes a hypothetical $10,000 initial investment in the Fund and reflects the reinvestment of dividends and all Fund expenses. Investors should note that the Fund is a professionally managed mutual fund while the indices are unmanaged, do not incur expenses and are not available for investment. The performance of the indices includes reinvested dividends, and does not reflect sales charges or expenses, except for the Lipper Financial Services Fund Index which reflects fund expenses. |
| (2) | | FBR Fund Advisers, Inc. waived a portion of its advisory fees and agreed to contractually reimburse a portion of the Fund’s operating expenses, as necessary, to maintain existing expense limitations, as set forth in the notes to the financial statements. Total returns shown include fee waivers and expense reimbursements, if any; total returns would have been lower had there been no waiver of fees and/or reimbursement of expenses in excess of expense limitations. |
| (3) | | Russell 2000 Index is comprised of the smallest of the 2000 companies of the Russell 3000 Index, representing approximately 8% of the Russell 3000’s total market-capitalization. The Lipper Financial Services Fund index is an equally weighted index of the largest thirty funds within the financial services fund classification as defined by Lipper Inc. The index is rebalanced quarterly. Lipper Analytical Services, Inc., is a nationally recognized organization that reports on mutual fund total return performance and calculates fund rankings. Each Lipper Average is based on a universe of funds with similar investment objectives. |
| (4) | | The total returns shown do not reflect the deduction of taxes that a shareholder would pay on fund distributions or the redemption of fund shares. |
| (5) | | For the period January 3, 1997 (commencement of investment operations) through October 31, 2006. Certain purchases made by shareholders within this period would have been subject to an initial maximum sales charge of up to 5.50%. As a result, total returns for such shareholders would have been lower. |
34
The FBR Funds
FBR Small Cap Financial Fund
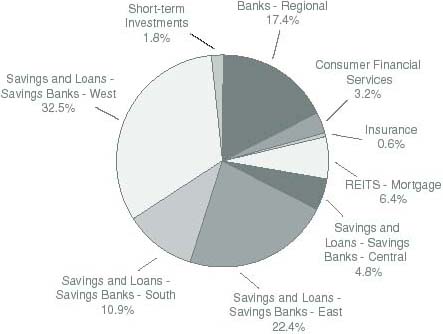
Portfolio Summary
October 31, 2006
The following chart provides a visual breakdown of the Fund by industry sectors. The underlying securities represent a percentage of the portfolio investments.
35
The FBR Funds
FBR Small Cap Financial Fund
Portfolio of Investments
October 31, 2006
|
| | | | | | VALUE |
| | SHARES | | | | (NOTE 2) |
|
| | | | COMMON STOCKS — 98.2% | | | |
| | | | Banks - Regional — 17.4% | | | |
| | 183,113 | | Bancorp Rhode Island, Inc. | | $ | 7,813,432 |
| | 662,895 | | Bank Mutual Corp. | | | 8,034,287 |
| | 234,328 | | Banner Corp. | | | 10,183,895 |
| | 35,000 | | Beverly National Corp. | | | 822,500 |
| | 42,727 | | Greenville First Bancshares, Inc.* | | | 894,703 |
| | 235,770 | | ITLA Capital Corp. | | | 13,467,183 |
| | 70,000 | | Patriot National Bancorp, Inc. | | | 1,722,000 |
| | 303,123 | | Taylor Capital Group, Inc. | | | 10,563,837 |
| | 169,118 | | Yardville National Bancorp | | | 6,741,043 |
| | | | | |
|
| | | | | | | 60,242,880 |
| | | | | |
|
| | | | Consumer Financial Services — 3.2% | | | |
| | 61,569 | | Advanta Corp., Class B | | | 2,415,968 |
| | 125,000 | | AmeriCredit Corp.* | | | 3,196,250 |
| | 162,391 | | ASTA Funding, Inc. | | | 5,527,789 |
| | | | | |
|
| | | | | | | 11,140,007 |
| | | | | |
|
| | | | Insurance - Life — 0.4% | | | |
| | 27,000 | | Stancorp Financial Group, Inc. | | | 1,233,630 |
| | | | | |
|
| | | | | | | |
| | | | Insurance - Property and Casualty — 0.2% | | | |
| | 50,000 | | Affirmative Insurance Holdings, Inc. | | | 830,500 |
| | | | | |
|
| | | | | | | |
| | | | REITs - Mortgage — 6.4% | | | |
| | 10,000 | | Affordable Residential Communities, Inc.* | | | 109,800 |
| | 280,000 | | Annaly Mortgage Management, Inc. | | | 3,673,600 |
| | 295,000 | | Anworth Mortgage Asset Corp. | | | 2,678,600 |
| | 65,000 | | Impac Mortgage Holdings, Inc. | | | 615,550 |
| | 30,000 | | KKR Financial Corp. | | | 804,900 |
| | 275,600 | | Luminent Mortgage Capital, Inc. | | | 2,924,116 |
| | 440,000 | | MFA Mortgage Investments, Inc. | | | 3,484,800 |
| | 25,000 | | New Century Financial Corp. | | | 984,500 |
| | 28,650 | | New York Mortgage Trust, Inc. | | | 110,876 |
| | 133,800 | | Opteum, Inc., Class A | | | 1,109,202 |
| | 225,000 | | Thornburg Mortgage, Inc. | | | 5,778,000 |
| | | | | |
|
| | | | | | | 22,273,944 |
| | | | | |
|
36
The FBR Funds
FBR Small Cap Financial Fund
Portfolio of Investments (continued)
October 31, 2006
|
| | | | | | VALUE |
| | SHARES | | | | (NOTE 2) |
|
| | | | Savings and Loans - Savings Banks - Central — 4.8% | | | |
| | 86,000 | | Capitol Federal Financial | | $ | 3,259,400 |
| | 125,000 | | Flagstar Bancorp, Inc. | | | 1,878,750 |
| | 101,698 | | HMN Financial, Inc. | | | 3,395,696 |
| | 184,679 | | MAF Bancorp, Inc. | | | 7,957,818 |
| | | | | |
|
| | | | | | | 16,491,664 |
| | | | | |
|
| | | | Savings and Loans - Savings Banks - East — 22.4% | | | |
| | 566,497 | | Dime Community Bancshares, Inc. | | | 7,902,633 |
| | 172,461 | | Flushing Financial Corp. | | | 3,033,589 |
| | 30,740 | | Harleysville Savings Financial Corp. | | | 537,950 |
| | 99,308 | | Hingham Institution for Savings | | | 3,600,412 |
| | 2,213,156 | | Hudson City Bancorp, Inc. | | | 30,386,632 |
| | 105,000 | | Investors Bancorp, Inc.* | | | 1,562,400 |
| | 106,745 | | MASSBANK Corp. | | | 3,558,878 |
| | 271,675 | | Parkvale Financial Corp. | | | 9,101,113 |
| | 130,439 | | PennFed Financial Services, Inc. | | | 2,394,860 |
| | 158,250 | | People’s Bank | | | 6,440,775 |
| | 36,000 | | Provident Financial Services, Inc. | | | 660,240 |
| | 78,688 | | TF Financial Corp. | | | 2,536,901 |
| | 91,748 | | WSFS Financial Corp. | | | 5,912,241 |
| | | | | |
|
| | | | | | | 77,628,624 |
| | | | | |
|
| | | | Savings and Loans - Savings Banks - South — 10.9% | | | |
| | 960,163 | | BankUnited Financial Corp., Class A | | | 25,895,596 |
| | 578,693 | | Franklin Bank Corp.* | | | 11,695,386 |
| | | | | |
|
| | | | | | | 37,590,982 |
| | | | | |
|
| | | | Savings and Loans - Savings Banks - West — 32.5% | | | |
| | 72,000 | | Beverly Hills Bancorp, Inc. | | | 604,080 |
| | 325,900 | | Downey Financial Corp. | | | 22,447,992 |
| | 470,000 | | FirstFed Financial Corp.* | | | 29,031,899 |
| | 80,335 | | Harrington West Financial Group, Inc. | | | 1,364,088 |
| | 270,471 | | Pacific Premier Bancorp, Inc.* † | | | 3,286,223 |
| | 311,100 | | PFF Bancorp, Inc. | | | 9,647,211 |
| | 596,000 | | Sterling Financial Corp. | | | 19,822,960 |
| | 1,124,734 | | Washington Federal, Inc. | | | 26,138,818 |
| | | | | |
|
| | | | | | | 112,343,271 |
| | | | | |
|
| | | | Total Common Stocks (Cost $252,066,057) | | | 339,775,502 |
| | | | | |
|
37
The FBR Funds
FBR Small Cap Financial Fund
Portfolio of Investments (continued)
October 31, 2006
|
| | | | | | VALUE |
| PAR | | | | (NOTE 2) |
|
| | | | REPURCHASE AGREEMENT — 1.8% | | | |
| $ | 6,367,000 | | With Mizuho Securities, Inc. dated 10/31/06 at 5.25% to be repurchased at $6,367,929 on 11/1/06, collateralized by U.S. Treasury Note, 5.125% due 5/15/16, value $6,534,349 (Cost $6,367,000) | | $ | 6,367,000 |
| | | | | |
|
| | | | | | | |
| | | | Total Investments — 100.0% (Cost $258,433,057) | | | 346,142,502 |
| | | | | | | |
| | | | Other Assets Less Liabilities — N.M. | | | 12,244 |
| | | | | |
|
| | | | | | | |
| | | | Net Assets — 100.0% | | $ | 346,154,746 |
| | | | | |
|
|
| * | | Non-income producing security |
| † | | Affiliated issuer as defined in the Investment Company Act of 1940 (ownership of at least 5% of the outstanding voting securities of an issuer) |
| N.M. | | Not meaningful |
The accompanying notes are an integral part of the financial statements.
38
The FBR Funds
FBR Small Cap Technology Fund
Management Overview
Portfolio Manager: Robert C. Barringer, CFA
Over the recent fiscal year, how did the Fund perform?
For the one-year period ended October 31, 2006, the FBR Small Cap Technology Fund appreciated 19.87%. This compares to the Lipper Science & Technology Fund Index, the NASDAQ Composite Index, and the Russell 2500 Technology Index which returned 9.43%, 12.49%, and 18.28% for the same period, respectively.
What factors contributed to the Fund’s performance?
The Fund performed well this year, particularly relative to the Lipper Science & Technology Fund Index and the NASDAQ Composite Index. In a reversal of the trend from the previous year, small-cap technology stocks outperformed their larger peers, just as small-caps outperformed their large-cap peers in the overall market. We believe the small-cap indices performed better in the face of a rising short-term interest rate environment because most investors are anticipating a relatively soft landing for the economy and a possible rate cut by the Federal Reserve.
Over the course of the fiscal year, our investment process identified the semiconductor sector, more specifically the semi-cap equipment manufacturing group, as reaching near peak valuations. As a result, we captured some of the gains and decreased our overall exposure to the sector. The same disciplined process led us to overweight the software and programming sector, where we were able to purchase companies with terrific business models that have virtually no debt, and generate high levels of free cash flow at very attractive valuations.
What is the outlook for the Fund and the technology sector?
The outlook for the sector remains bright as consumers and corporations continue to adopt the use of technology solutions across all areas of life. We believe this trend will continue to drive demand for the foreseeable future. Technology spending is increasingly a business necessity, and failure to stay on the leading edge can create competitive disadvantages. Corporate spending on technology should remain robust as healthy balance sheets with ample cash and operational earnings are invested to support business models.
Consumers also appear to be approaching their technology purchases as more of a necessity than in the past, choosing other purchase categories to cut for discretionary purposes. The long awaited computing and communication convergence is a reality and consumers believe that being connected is an important lifestyle choice. While some are questioning the sustainability of consumer spending at this time, consumers have shown a continued desire to spend in this area.
39
The FBR Funds
FBR Small Cap Technology Fund
Management Overview (continued)
As always, we will continue to search for well-run conservatively financed small-cap technology companies with large business opportunities and a sustainable competitive advantage that we are able to purchase at a reasonable price.
The opinions expressed in this commentary reflect those of the Portfolio Manager as of the date written. Any such opinions are subject to change based on market or other conditions. These opinions may not be relied upon as investment advice. Investment decisions for The FBR Funds are based on several factors, and may not be relied upon as an indication of trading intent on behalf of any FBR Fund. Security positions can and do change.
40
The FBR Funds
FBR Small Cap Technology Fund
Comparison of Changes in Value of $10,000 Investment in
Fund Shares(1)(2) vs. Various Indices(1)(3)
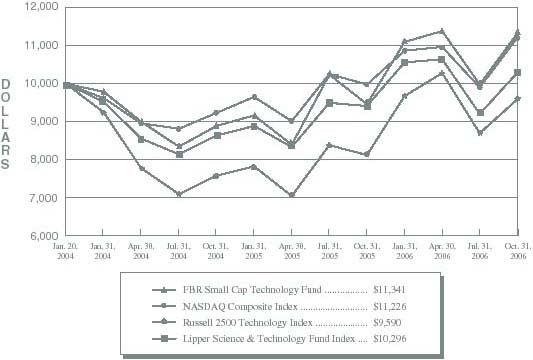
| Total Returns—For the Periods Ended October 31, 2006(4) |
| | | One Year | | Since
Inception(5) | |
| | |
| |
| |
| FBR Small Cap Technology Fund(1)(2) | | 19.87 | % | | 4.63 | % | |
| NASDAQ Composite Index(1)(3) | | 12.49 | % | | 4.24 | % | |
| Russell 2500 Technology Index(1)(3) | | 18.28 | % | | (1.49 | %) | |
| Lipper Science & Technology Fund Index(1)(3) | | 9.43 | % | | 1.06 | % | |
PAST PERFORMANCE IS NO GUARANTEE OF FUTURE RESULTS.
The performance data quoted represents past performance and the current performance may be lower or higher. The investment return and principal will fluctuate so that investors’ shares, when redeemed, may be worth more or less than their original cost. To obtain performance data current to the most recent month-end please call 888.200.4710 or visit www.fbrfunds.com.
|
| (1) | | The graph assumes a hypothetical $10,000 initial investment in the Fund and reflects the reinvestment of dividends and all Fund expenses. Investors should note that the Fund is a professionally managed mutual fund while the indices are unmanaged, do not incur expenses and are not available for investment. The performance of the indices includes reinvested dividends, and does not reflect sales charges or expenses, except for the Lipper Science & Technology Fund Index which reflects fund expenses. |
| (2) | | FBR Fund Advisers, Inc. waived a portion of its advisory fees and agreed to contractually reimburse a portion of the Fund’s operating expenses, as necessary, to maintain existing expense limitations, as set forth in the notes to the financial statements. Total returns shown includes fee waivers and expense reimbursements, if any; total returns would have been lower had there been no waiver of fees and/or reimbursement of expenses in excess of expense limitations. |
| (3) | | The NASDAQ Composite Index is a broad-based capitalization-weighted index of all NASDAQ National Market and Small Cap stocks. The Russell 2500 Technology Index is a capitalization-weighted index of companies that serve the electronics and computer industries or that manufacture products based on the latest applied science. The Lipper Science & Technology Fund Index is an equally weighted index of the largest thirty funds within the science and technology fund classification as defined by Lipper Inc. The index is rebalanced quarterly. Lipper Analytical Services, Inc., is a nationally recognized organization that reports on mutual fund total return performance and calculates fund rankings. Each Lipper Average is based on a universe of funds with similar investment objectives. |
| (4) | | The total returns shown do not reflect the deduction of taxes that a shareholder would pay on fund distributions or the redemption of fund shares. |
| (5) | | For the period January 20, 2004 (commencement of investment operations) through October 31, 2006. |
41
The FBR Funds
FBR Small Cap Technology Fund
Portfolio Summary
October 31, 2006
The following chart provides a visual breakdown of the Fund by industry sectors. The underlying securities represent a percentage of the portfolio investments.
42
The FBR Funds
FBR Small Cap Technology Fund
Portfolio of Investments
October 31, 2006
|
| | | | | | VALUE | |
| | SHARES | | | | (NOTE 2) | |
|
| | | | COMMON STOCKS — 101.4% | | | | |
| | | | Biotechnology and Drugs — 0.9% | | | | |
| | 1,300 | | Martek Biosciences Corp.* | | $ | 30,836 | |
| | | | | |
| |
| | | | | | | | |
| | | | Capital Goods - Miscellaneous — 4.2% | | | | |
| | 5,175 | | Intermec, Inc.* | | | 116,955 | |
| | 900 | | Zebra Technologies Corp., Class A* | | | 33,543 | |
| | | | | |
| |
| | | | | | | 150,498 | |
| | | | | |
| |
| | | | Chemical Manufacturing — 1.0% | | | | |
| | 1,200 | | Cabot Microelectronics Corp.* | | | 34,260 | |
| | | | | |
| |
| | | | | | | | |
| | | | Communications Equipment — 6.3% | | | | |
| | 5,250 | | Andrew Corp.* | | | 48,615 | |
| | 2,000 | | Arris Group, Inc.* | | | 26,800 | |
| | 8,375 | | Foundry Networks, Inc.* | | | 106,028 | |
| | 1,100 | | NETGEAR, Inc.* | | | 29,480 | |
| | 1,000 | | Redback Networks, Inc.* | | | 15,820 | |
| | | | | |
| |
| | | | | | | 226,743 | |
| | | | | |
| |
| | | | Communications Services — 0.6% | | | | |
| | 3,250 | | @Road, Inc.* | | | 20,443 | |
| | | | | |
| |
| | | | | | | | |
| | | | Computer Hardware and Services — 11.0% | | | | |
| | 1,200 | | Agilysys, Inc. | | | 17,796 | |
| | 1,500 | | CyberSource Corp.* | | | 15,375 | |
| | 2,500 | | Epicor Software Corp.* | | | 35,075 | |
| | 4,800 | | Ingram Micro, Inc., Class A* | | | 98,928 | |
| | 2,300 | | MIPS Technologies, Inc.* | | | 16,951 | |
| | 1,700 | | Online Resources Corp.* | | | 17,782 | |
| | 2,850 | | Palm, Inc.* | | | 43,748 | |
| | 3,500 | | Perot Systems Corp., Class A* | | | 51,625 | |
| | 1,300 | | SYNNEX Corp.* | | | 29,185 | |
| | 1,700 | | Tech Data Corp.* | | | 66,895 | |
| | | | | |
| |
| | | | | | | 393,360 | |
| | | | | |
| |
| | | | Computer Networks — 8.6% | | | | |
| | 8,700 | | 3Com Corp.* | | | 42,282 | |
| | 1,300 | | Broadwing Corp.* | | | 19,474 | |
43
The FBR Funds
FBR Small Cap Technology Fund
Portfolio of Investments (continued)
October 31, 2006
|
| | | | | | VALUE | |
| | SHARES | | | | (NOTE 2) | |
|
| | | | Computer Networks — 8.6% (continued) | | | | |
| | 5,475 | | Convergys Corp.* | | $ | 116,125 | |
| | 600 | | F5 Networks, Inc.* | | | 39,714 | |
| | 1,200 | | RADWARE Ltd.* | | | 17,520 | |
| | 3,700 | | Sykes Enterprises, Inc.* | | | 75,073 | |
| | | | | |
| |
| | | | | | | 310,188 | |
| | | | | |
| |
| | | | Computer Peripherals — 3.2% | | | | |
| | 2,000 | | ScanSource, Inc.* | | | 62,780 | |
| | 3,550 | | Symbol Technologies, Inc. | | | 53,002 | |
| | | | | |
| |
| | | | | | | 115,782 | |
| | | | | |
| |
| | | | Computer Storage Devices — 4.4% | | | | |
| | 5,850 | | Brocade Communications Systems, Inc.* | | | 47,444 | |
| | 2,525 | | Emulex Corp.* | | | 47,469 | |
| | 850 | | Imation Corp. | | | 38,905 | |
| | 1,250 | | Western Digital Corp.* | | | 22,850 | |
| | | | | |
| |
| | | | | | | 156,668 | |
| | | | | |
| |
| | | | Electronic Instruments and Controls — 12.9% | | | | |
| | 2,550 | | Arrow Electronics, Inc.* | | | 76,117 | |
| | 2,900 | | Avnet, Inc.* | | | 68,671 | |
| | 1,862 | | Benchmark Electronics, Inc.* | | | 49,436 | |
| | 4,000 | | KEMET Corp.* | | | 29,400 | |
| | 1,600 | | Methode Electronics, Inc. | | | 17,712 | |
| | 8,000 | | MRV Communications, Inc.* | | | 27,360 | |
| | 1,800 | | Nam Tai Electronics, Inc. | | | 28,062 | |
| | 2,450 | | Plexus Corp.* | | | 53,704 | |
| | 17,950 | | Solectron Corp.* | | | 59,953 | |
| | 4,050 | | Vishay Intertechnology, Inc.* | | | 54,635 | |
| | | | | |
| |
| | | | | | | 465,050 | |
| | | | | |
| |
| | | | Medical Equipment and Supplies — 0.6% | | | | |
| | 850 | | Wright Medical Group, Inc.* | | | 21,004 | |
| | | | | |
| |
| | | | | | | | |
| | | | Scientific and Technical Instruments — 3.5% | | | | |
| | 1,150 | | Analogic Corp. | | | 64,182 | |
| | 800 | | Coherent, Inc.* | | | 25,784 | |
| | 1,800 | | OSI Systems, Inc.* | | | 37,260 | |
| | | | | |
| |
| | | | | | | 127,226 | |
| | | | | |
| |
44
The FBR Funds
FBR Small Cap Technology Fund
Portfolio of Investments (continued)
October 31, 2006
|
| | | | | | VALUE | |
| | SHARES | | | | (NOTE 2) | |
|
| | | | Security Systems and Services — 0.5% | | | | |
| | 1,000 | | Checkpoint Systems, Inc.* | | $ | 18,210 | |
| | | | | |
| |
| | | | | | | | |
| | | | Semiconductors — 17.0% | | | | |
| | 3,000 | | Aeroflex, Inc.* | | | 32,400 | |
| | 12,775 | | Atmel Corp.* | | | 73,455 | |
| | 800 | | ATMI, Inc.* | | | 25,352 | |
| | 3,000 | | Axcelis Technologies, Inc.* | | | 20,700 | |
| | 2,050 | | Cirrus Logic, Inc.* | | | 14,473 | |
| | 1,000 | | Cypress Semiconductor Corp.* | | | 16,790 | |
| | 4,005 | | Entegris, Inc.* | | | 44,896 | |
| | 1,000 | | Fairchild Semiconductor International, Inc.* | | | 16,110 | |
| | 2,425 | | International Rectifier Corp.* | | | 87,226 | |
| | 1,775 | | MKS Instruments, Inc.* | | | 38,429 | |
| | 1,150 | | Photronics, Inc.* | | | 16,089 | |
| | 4,500 | | RF Micro Devices, Inc.* | | | 32,850 | |
| | 400 | | Silicon Laboratories, Inc.* | | | 13,052 | |
| | 2,600 | | Silicon Storage Technology, Inc.* | | | 10,894 | |
| | 4,000 | | SimpleTech, Inc.* | | | 34,640 | |
| | 1,950 | | Standard Microsystems Corp.* | | | 60,119 | |
| | 1,475 | | Teradyne, Inc.* | | | 20,680 | |
| | 4,500 | | TriQuint Semiconductor, Inc.* | | | 20,250 | |
| | 400 | | Varian Semiconductor Equipment Associates, Inc.* | | | 14,596 | |
| | 1,200 | | Zoran Corp.* | | | 16,704 | |
| | | | | |
| |
| | | | | | | 609,705 | |
| | | | | |
| |
| | | | Software and Programming — 26.7% | | | | |
| | 1,000 | | Aladdin Knowledge Systems Ltd.* | | | 17,860 | |
| | 750 | | Altiris, Inc.* | | | 16,883 | |
| | 1,600 | | Business Objects S.A. ADR* | | | 59,264 | |
| | 500 | | Cognos, Inc.* | | | 18,240 | |
| | 10,800 | | Compuware Corp.* | | | 86,831 | |
| | 800 | | GSI Commerce, Inc.* | | | 14,424 | |
| | 2,900 | | Hyperion Solutions Corp.* | | | 108,459 | |
| | 2,200 | | Interwoven, Inc.* | | | 27,984 | |
| | 1,200 | | JDA Software Group, Inc.* | | | 17,652 | |
| | 3,100 | | Lawson Software, Inc.* | | | 23,622 | |
45
The FBR Funds
FBR Small Cap Technology Fund
Portfolio of Investments (continued)
October 31, 2006
|
| | | | | | VALUE | |
| | SHARES | | | | (NOTE 2) | |
|
| | | | Software and Programming — 26.7% (continued) | | | | |
| | 1,300 | | Open Text Corp.* | | $ | 23,504 | |
| | 1,200 | | Progress Software Corp.* | | | 34,548 | |
| | 2,000 | | Quest Software, Inc.* | | | 29,460 | |
| | 1,850 | | RightNow Technologies, Inc.* | | | 30,562 | |
| | 1,300 | | salesforce.com, Inc.* | | | 50,726 | |
| | 1,650 | | SPSS, Inc.* | | | 45,656 | |
| | 1,500 | | Stellent, Inc. | | | 16,755 | |
| | 2,400 | | Sybase, Inc.* | | | 58,440 | |
| | 4,000 | | Take-Two Interactive Software, Inc.* | | | 55,960 | |
| | 2,625 | | THQ, Inc.* | | | 78,934 | |
| | 12,850 | | TIBCO Software, Inc.* | | | 118,862 | |
| | 1,800 | | webMethods, Inc.* | | | 13,536 | |
| | 1,300 | | Website Pros, Inc.* | | | 13,962 | |
| | | | | |
| |
| | | | | | | 962,124 | |
| | | | | |
| |
| | | | Total Common Stocks (Cost $3,413,741) | | | 3,642,097 | |
| | | | | |
| |
| | | | | | | | |
| PAR | | | | | | |
| | | | | | |
| | | | REPURCHASE AGREEMENT — 3.2% | | | | |
| | $114,000 | | With Mizuho Securities, Inc. dated 10/31/06 at 5.25% to be repurchased at $114,017 on 11/1/06, collateralized by U.S. Treasury Note, 5.125% due 5/15/16, value $116,996 (Cost $114,000) | | | 114,000 | |
| | | | | |
| |
| | | | | | | | |
| | | | Total Investments — 104.6% (Cost $3,527,741) | | | 3,756,097 | |
| | | | | | | | |
| | | | Liabilities Less Other Assets — (4.6%) | | | (164,578 | ) |
| | | | | |
| |
| | | | | | | | |
| | | | Net Assets — 100.0% | | $ | 3,591,519 | |
| | | | | |
| |
|
| * | | Non-Income producing security |
| ADR | | American Depositary Receipts |
The accompanying notes are an integral part of the financial statements.
46
The FBR Funds
FBR Gas Utility Index Fund
Management Overview
Portfolio Manager: Winsor Aylesworth
Over the recent fiscal year, how did the Fund perform?
For the one-year period ended October 31, 2006, the FBR Gas Utility Index Fund appreciated 16.84%. This compares to the American Gas Association Stock Index (“AGA Stock Index”), the Lipper Utility Index and the S&P 500 Index (“S&P”) which returned 17.53%, 22.29% and 16.34% for the same period respectively.
What factors contributed to the Fund’s performance?
By most measures, your Fund had a good year. It had double digit returns, outperformed the S&P and marginally outperformed its benchmark (less expenses), the AGA Stock Index. The one blip on the performance screen was an underperformance versus the Lipper Utility Index, which measures a more broadly defined Utility sector, including water and telephone utilities. As we mentioned in the semi-annual letter, these two types of companies are not part of the mandate for the Fund.
In recent annual reports, I have indicated that the companies of the Fund are dependent on numerous “macro” influences. A quick review of two of these major factors reveals an environment that was generally positive for utilities.
The Weather: After the devastating 2005 hurricane season,2006 was generally a non-event, with no major hurricanes impacting the United States. This reinforces how tough it is to predict weather events, and shows that weather usually reverts to the long-term average patterns. Although various parts of the country had weather anomalies in temperature that impacted energy demand, there were no “disastrous”events that could have had a negative impact on earnings.
The Economy: 2006 was a year reflecting a slowly growing economy. Wholesale prices for energy, natural gas and oil peaked and then receded during the year. The Federal Reserve paused its steady discount rate increases, which has had a positive impact on utilities stocks.
With weather under control and the economy on a slow steady growth pattern, and wholesale costs for oil and gas down from their highs, 2006 was, in general, an operating “sweet spot” for the companies of your Fund.
What is the outlook for the Fund and the utility sector?
So can 2007 be a repeat of 2006? Much like the weather, utility stocks usually perform within the range of their “long-term” averages. Where this expectation fits in relation to other investments, only time will tell. Time has rewarded patient Fund investors. Over the almost eighteen year history of the Fund, investors have enjoyed total returns in excess of the S&P, a broad based measure of the markets.
47
The FBR Funds
FBR Gas Utility Index Fund
Management Overview (continued)
The impact of the weather can not be predicted, but keep in mind, if we experience above average winter temperatures across the densely populated areas of the country, we could see a negative impact on utility earnings, while below average winter temperatures should have a positive effect. In the summer months, the opposite tends to hold true. On a more personal level, when the electric or gas meter is spinning at your home, this is good for your utility company even if it is expensive for you and your family.
Predicting the future direction of the economy is much like predicting the weather, an inexact science. Nonetheless, we can identify some trends. Housing appears to be softening around the country. If fewer houses are built, then one source of growth, new utility connections, is reduced for your Fund’s companies. Interest rates appear to be stable or heading lower. This should be a positive for Fund investments as investors seek out sources of dividend income, a utility trademark.
Energy prices seem to have peaked. Although we all (corporately and personally) appreciate lower prices, understand that recent price declines could quickly go away with one international “event” or one cold snap for example. Corporations including utility companies work best in stable energy price environments.
While we hope 2007 brings such an environment, we are comforted to know that FBR Gas Utility Index Fund continues to provide investors with a well diversified way to invest in a generally conservative sector, with the opportunity for capital appreciation and a consistent dividend component.
The opinions expressed in this commentary reflect those of the Portfolio Manager as of the date written. Any such opinions are subject to change based on market or other conditions. These opinions may not be relied upon as investment advice. Investment decisions for The FBR Funds are based on several factors, and may not be relied upon as an indication of trading intent on behalf of any FBR Fund. Security positions can and do change.
48
The FBR Funds
FBR Gas Utility Index Fund
Comparison of Changes in Value of $10,000 Investment in
Fund Shares(1)(2) vs. Various Indices(1)(3)

| Total Returns—For the Periods Ended October 31, 2006(4)(5) |
| | | | | | | | Annualized | | Annualized | |
| | | | One Year | | Five Year | | Ten Year | |
| | | |
| |
| |
| |
| | FBR Gas Utility Index Fund(1)(2) | | | 16.84 | % | | | 9.05 | % | | | 10.09 | % | |
| | S&P 500 Index(1)(3) | | | 16.34 | % | | | 7.24 | % | | | 8.64 | % | |
| | A.G.A. Stock Index(1)(3) | | | 17.53 | % | | | 9.19 | % | | | 10.58 | % | |
| | Lipper Utility Fund Index(1)(3) | | | 22.29 | % | | | 10.34 | % | | | 9.40 | % | |
PAST PERFORMANCE IS NO GUARANTEE OF FUTURE RESULTS.
The performance data quoted represents past performance and the current performance may be lower or higher. The investment return and principal will fluctuate so that investors’ shares, when redeemed, may be worth more or less than their original cost. To obtain performance data current to the most recent month-end please call 888.200.4710 or visit www.fbrfunds.com.
| (1) | | The graph assumes a hypothetical $10,000 initial investment in the Fund and reflects the reinvestment of dividends and all Fund expenses. The indices are unmanaged, do not incur expenses and are not available for investment. The performance of the indices includes reinvested dividends, and does not reflect sales charges or expenses. |
| (2) | | FBR Fund Advisers, Inc. waived a portion of its advisory fees and agreed to contractually reimburse a portion of the Fund’s operating expenses, as necessary, to maintain existing expense limitations, as set forth in the notes to the financial statements. Total returns shown include fee waivers and expense reimbursements, if any; total returns would have been lower had there been no waiver of fees and/or reimbursement of expenses in excess of expense limitations. |
| (3) | | S&P 500 Index is a capitalization-weighted index of 500 stocks. The index is designed to represent the broad domestic economy through changes in aggregate market value of 500 stocks representing all major industries. The A.G.A. Stock Index is a market capitalization weighted index, adjusted monthly, consisting of member companies of the American Gas Association. The Lipper Utility Fund Index is an equally weighted index of the largest ten funds within the utility fund classification as defined by the Lipper Inc. The index is rebalanced quarterly. Lipper Analytical Services, Inc., is a nationally recognized organization that reports on mutual fund total return performance and calculates fund rankings. Each Lipper Average is based on a universe of funds with similar objectives. |
| (4) | | The total returns shown do not reflect the deduction of taxes that a shareholder would pay on fund distributions or the redemption of fund shares. |
| (5) | | Effective April 1, 2003, the Fund changed its fiscal year-end from March 31 to October 31. |
49
The FBR Funds
FBR Gas Utility Index Fund
Portfolio Summary
October 31, 2006
The following chart provides a visual breakdown of the Fund by industry sectors. The underlying securities represent a percentage of the portfolio investments.
50
The FBR Funds
FBR Gas Utility Index Fund
Portfolio of Investments
October 31, 2006
|
| | | | | | VALUE | | PERCENT OF | |
| | SHARES | | | | (NOTE 2) | | NET ASSETS | |
|
| | | | COMMON STOCKS — 98.4% | | | | | | | |
| | 402,710 | | Enbridge, Inc. | | $ | 13,651,868 | | 5.0 | % | |
| | 417,950 | | TransCanada Corp. | | | 13,524,861 | | 5.0 | | |
| | 334,940 | | E.ON AG ADR | | | 13,441,141 | | 5.0 | | |
| | 421,987 | | Duke Energy Corp. | | | 13,351,668 | | 5.0 | | |
| | 207,676 | | National Grid PLC ADR | | | 13,177,041 | | 4.9 | | |
| | 310,400 | | KeySpan Corp. | | | 12,596,031 | | 4.7 | | |
| | 897,000 | | El Paso Corp. | | | 12,288,899 | | 4.6 | | |
| | 140,550 | | Dominion Resources, Inc. | | | 11,383,144 | | 4.2 | | |
| | 236,325 | | PG&E Corp. | | | 10,195,060 | | 3.8 | | |
| | 378,400 | | The Williams Companies, Inc. | | | 9,244,312 | | 3.4 | | |
| | 375,450 | | NiSource, Inc. | | | 8,736,722 | | 3.2 | | |
| | 130,700 | | Public Service Enterprise Group, Inc. | | | 7,979,235 | | 3.0 | | |
| | 95,225 | | Questar Corp. | | | 7,758,933 | | 2.9 | | |
| | 261,457 | | Southern Union Co. | | | 7,237,130 | | 2.7 | | |
| | 182,550 | | Atmos Energy Corp. | | | 5,609,762 | | 2.1 | | |
| | 146,750 | | AGL Resources, Inc. | | | 5,503,125 | | 2.0 | | |
| | 123,950 | | Equitable Resources, Inc. | | | 5,022,454 | | 1.9 | | |
| | 80,525 | | Exelon Corp. | | | 4,990,940 | | 1.8 | | |
| | 181,900 | | Piedmont Natural Gas Company, Inc. | | | 4,911,300 | | 1.8 | | |
| | 103,350 | | Nicor, Inc. | | | 4,749,966 | | 1.8 | | |
| | 96,175 | | Consolidated Edison, Inc. | | | 4,650,061 | | 1.7 | | |
| | 118,200 | | National Fuel Gas Co. | | | 4,420,680 | | 1.6 | | |
| | 281,300 | | CenterPoint Energy, Inc. | | | 4,354,524 | | 1.6 | | |
| | 103,700 | | ONEOK, Inc. | | | 4,317,031 | | 1.6 | | |
| | 111,900 | | WGL Holdings, Inc. | | | 3,631,155 | | 1.3 | | |
| | 94,050 | | Southwest Gas Corp. | | | 3,374,514 | | 1.2 | | |
| | 134,650 | | Energy East Corp. | | | 3,273,342 | | 1.2 | | |
| | 73,975 | | Peoples Energy Corp. | | | 3,231,968 | | 1.2 | | |
| | 100,805 | | Vectren Corp. | | | 2,929,393 | | 1.1 | | |
| | 62,225 | | DTE Energy Co. | | | 2,826,882 | | 1.0 | | |
| | 65,000 | | Northwest Natural Gas Co. | | | 2,689,050 | | 1.0 | | |
| | 62,625 | | Energen Corp. | | | 2,681,603 | | 1.0 | | |
| | 47,500 | | New Jersey Resources Corp. | | | 2,463,350 | | 0.9 | | |
| | 89,700 | | Cheniere Energy, Inc.* | | | 2,360,904 | | 0.9 | | |
| | 106,350 | | Xcel Energy, Inc. | | | 2,347,145 | | 0.9 | | |
| | 74,025 | | UGI Corp. | | | 1,961,663 | | 0.7 | | |
| | 59,110 | | South Jersey Industries, Inc. | | | 1,828,272 | | 0.7 | | |
51
The FBR Funds
FBR Gas Utility Index Fund
Portfolio of Investments (continued)
October 31, 2006
|
| | | | | | VALUE | | PERCENT OF | |
| | SHARES | | | | (NOTE 2) | | NET ASSETS | |
|
| | | | COMMON STOCKS — 98.4% (continued) | | | | | | | |
| | 70,850 | | MDU Resources Group, Inc. | | $ | 1,819,428 | | 0.7 | % | |
| | 38,825 | | Wisconsin Energy Corp. | | | 1,783,621 | | 0.7 | | |
| | 73,100 | | Puget Energy, Inc. | | | 1,745,628 | | 0.6 | | |
| | 32,125 | | Ameren Corp. | | | 1,737,963 | | 0.6 | | |
| | 116,650 | | CMS Energy Corp.* | | | 1,736,919 | | 0.6 | | |
| | 47,650 | | The Laclede Group, Inc. | | | 1,697,770 | | 0.6 | | |
| | 46,150 | | Southwestern Energy Co.* | | | 1,642,017 | | 0.6 | | |
| | 23,850 | | Constellation Energy Group, Inc. | | | 1,488,240 | | 0.6 | | |
| | 30,675 | | Alliant Energy Corp. | | | 1,176,386 | | 0.4 | | |
| | 228,550 | | Aquila, Inc.* | | | 1,049,045 | | 0.4 | | |
| | 28,416 | | NorthWestern Corp. | | | 1,005,358 | | 0.4 | | |
| | 27,500 | | NSTAR | | | 956,725 | | 0.4 | | |
| | 36,450 | | Northeast Utilities | | | 911,615 | | 0.3 | | |
| | 50,975 | | TECO Energy, Inc. | | | 840,578 | | 0.3 | | |
| | 29,200 | | Cascade Natural Gas Corp. | | | 751,608 | | 0.3 | | |
| | 19,189 | | EnergySouth, Inc. | | | 744,533 | | 0.3 | | |
| | 20,450 | | PPL Corp. | | | 705,934 | | 0.3 | | |
| | 12,980 | | WPS Resources Corp. | | | 690,666 | | 0.3 | | |
| | 24,375 | | PNM Resources, Inc. | | | 686,400 | | 0.3 | | |
| | 22,375 | | Avista Corp. | | | 575,933 | | 0.2 | | |
| | 80,125 | | SEMCO Energy, Inc.* | | | 456,713 | | 0.2 | | |
| | 13,028 | | MGE Energy, Inc. | | | 445,558 | | 0.2 | | |
| | 8,250 | | CH Energy Group, Inc. | | | 429,165 | | 0.2 | | |
| | 12,065 | | Chesapeake Utilities Corp. | | | 375,222 | | 0.1 | | |
| | 14,116 | | Pepco Holdings, Inc. | | | 358,829 | | 0.1 | | |
| | 17,325 | | Sierra Pacific Resources* | | | 262,647 | | 0.1 | | |
| | 6,305 | | UniSource Energy Corp. | | | 224,332 | | 0.1 | | |
| | 8,307 | | Delta Natural Gas Company, Inc. | | | 210,998 | | 0.1 | | |
| | 5,500 | | The Empire District Electric Co. | | | 130,570 | | N.M. | | |
| | 4,743 | | RGC Resources, Inc. | | | 120,875 | | N.M. | | |
| | 1,300 | | Entergy Corp. | | | 111,579 | | N.M. | | |
| | 1,575 | | Black Hills Corp. | | | 54,353 | | N.M. | | |
| | 4,789 | | Energy West, Inc. | | | 53,062 | | N.M. | | |
| | 1,000 | | ALLETE, Inc. | | | 45,100 | | N.M. | | |
| | | | | |
| |
| | |
| | | | | | | | | | | |
| | | | Total Common Stocks (Cost $135,670,156) | | $ | 265,720,499 | | 98.4 | | |
| | | | | |
| |
| | |
52
The FBR Funds
FBR Gas Utility Index Fund
Portfolio of Investments (continued)
October 31, 2006
|
| | | | | | VALUE | | PERCENT OF | |
| | PAR | | | | (NOTE 2) | | NET ASSETS | |
|
| | | | REPURCHASE AGREEMENT — 1.4% | | | | | | | |
| $ | 3,675,000 | | With Mizuho Securities, Inc. dated 10/31/06 at 5.25% to be repurchased at $3,675,536 on 11/1/06, collateralized by U.S. Treasury Note, 5.125% due 5/15/16, value $3,771,593 (Cost $3,675,000) | | $ | 3,675,000 | | 1.4 | % | |
| | | | | |
| |
| | |
| | | | | | | | | | | |
| | | | Total Investments (Cost $139,345,156) | | | 269,395,499 | | 99.8 | | |
| | | | | | | | | | | |
| | | | Other Assets Less Liabilities | | | 635,219 | | 0.2 | | |
| | | | | |
| |
| | |
| | | | | | | | | | | |
| | | | Net Assets | | $ | 270,030,718 | | 100.0 | % | |
| | | | | |
| |
| | |
|
| * | | Non-income producing security |
| ADR | | American Depositary Receipts |
| N.M. | | Not Meaningful |
The accompanying notes are an integral part of the financial statements.
53
The FBR Funds
FBR Fund for Government Investors
Management Overview
Portfolio Manager: William B. Sanders, III
Over the recent fiscal year, how did the Fund perform?
For the one-year period ended October 31, 2006, the FBR Fund for Government Investors appreciated 3.89%.
What factors contributed to the Fund’s performance?
The Federal Open Market Committee (the “Fed”) met nine times over the course of the 2006 fiscal year and raised the Fed Funds target rate from 3.75% to 5.25%. At each of their last three meetings the Fed, based on available information, decided no more rate increases were necessary and elected to maintain the target rate at 5.25%.
Clearly, the Fed is in a holding pattern and hoping they have taken the necessary steps to engineer a soft landing for the economy. So far, it appears they have successfully slowed down the overheated housing market enough to curtail the speculative activities that were becoming a potential danger to the economy. The disaster scenario of a complete meltdown of the housing market, as predicted by some, has not materialized. Some of the factors that contributed to increased inflationary pressures have recently backed off a bit, as energy and other commodity prices have receded from their highs. American consumers continue to demonstrate resilience in the face of these macroeconomic issues by paring their spending only moderately.
Some, including myself, believe the Fed’s next move will be to reduce its target rate as the economy continues to show signs of slowing. Even after a 425 basis point increase, the Fed Funds target rate remains at levels still considered low by historical standards. The Fed’s “measured” pace during its tightening campaign has helped slow economic growth to more sustainable levels and, so far, has avoided shocking the economy into a recession.
In anticipation of the Fed’s next possible move to reduce the target rate, we have slightly extended the Fund’s average weighted maturity while continuing to invest in the same high quality U.S. Government and Agency debt instruments.
What is the outlook for the Fund?
With much of the key economic indicators sending mixed messages, there is still a good bit of uncertainty within the Fed and among economists about exactly where the U.S. economy is headed. There is a lag between the time the Fed increases its target rate and the period when the full effects of such action actually materialize in qualitative data. As a result, we are still waiting for the complete outcome of the tightening campaign to work its way through the various segments of our economy. So far, it appears as though Fed Chairman Ben Bernanke has done a fine job managing the delicate balance between investor’s expectations and the factual reality of economic data. The performance of the
54
The FBR Funds
FBR Fund for Government Investors
Management Overview (continued)
Fund will remain directly linked to the movements of the Fed Funds target rate, consistent with our conservative investment style of owning only the highest quality and most liquid government issued securities.
The opinions expressed in this commentary reflect those of the Portfolio Manager as of the date written. Any such opinions are subject to change based on market or other conditions. These opinions may not be relied upon as investment advice. Investment decisions for The FBR Funds are based on several factors, and may not be relied upon as an indication of trading intent on behalf of any FBR Fund. Security positions can and do change.
55
The FBR Funds
FBR Fund for Government Investors
Portfolio Summary
October 31, 2006
The following chart provides a visual breakdown of the Fund by maturity schedule1. The underlying securities represent a percentage of the portfolio investments.
|
| 1 | | The maturity date used for each security in the portfolio to determine the schedule is the shorter of the next interest rate reset date or the final maturity date. |
56
The FBR Funds
FBR Fund for Government Investors
Portfolio of Investments
October 31, 2006
|
| | | | | | | | | MATURITY | | VALUE |
| | PAR | | | | RATE | | | DATE | | (NOTE 2) |
|
| | | | U.S. GOVERNMENT AND AGENCY OBLIGATIONS — 91.4% | | | | | | | | | | |
| | | | Federal Home Loan Bank — 8.5% | | | | | | | | |
| $ | 8,000,000 | | FHLB | | 5.4 | % | | 11/30/06 | | $ | 7,999,335 |
| | 10,000,000 | | FHLB Discount Note* | | 5.105 | | | 12/22/06 | | | 9,927,679 |
| | | | | | | | | | |
|
| | | | | | | | | | | | 17,927,014 |
| | | | | | | | | | |
|
| | | | Federal Home Loan Mortgage Corporation — 40.7% | | | | | | | | |
| | 10,000,000 | | Freddie Mac | | 2.875 | | | 12/15/06 | | | 9,968,439 |
| | 8,000,000 | | Freddie Mac Discount Note* | | 5.21 | | | 11/7/06 | | | 7,993,053 |
| | 8,000,000 | | Freddie Mac Discount Note* | | 5.27 | | | 12/5/06 | | | 7,960,182 |
| | 8,000,000 | | Freddie Mac Discount Note* | | 5.25 | | | 1/9/07 | | | 7,919,500 |
| | 9,000,000 | | Freddie Mac Discount Note* | | 5.25 | | | 1/23/07 | | | 8,891,063 |
| | 8,000,000 | | Freddie Mac Discount Note* | | 5.23 | | | 1/30/07 | | | 7,895,400 |
| | 9,000,000 | | Freddie Mac Discount Note* | | 5.135 | | | 2/13/07 | | | 8,866,490 |
| | 7,000,000 | | Freddie Mac Discount Note* | | 5.135 | | | 2/20/07 | | | 6,889,170 |
| | 10,000,000 | | Freddie Mac Discount Note* | | 5.04 | | | 3/7/07 | | | 9,823,600 |
| | 10,000,000 | | Freddie Mac Discount Note* | | 5.09 | | | 3/20/07 | | | 9,803,469 |
| | | | | | | | | | |
|
| | | | | | | | | | | | 86,010,366 |
| | | | | | | | | | |
|
| | | | Federal National Mortgage Association — 42.2% | | | | | | | | |
| | 8,000,000 | | Fannie Mae | | 2.625 | | | 11/15/06 | | | 7,991,178 |
| | 8,000,000 | | Fannie Mae | | 3.0 | | | 11/22/06 | | | 7,988,785 |
| | 10,000,000 | | Fannie Mae | | 3.625 | | | 3/15/07 | | | 9,940,168 |
| | 10,000,000 | | Fannie Mae Discount Note* | | 5.25 | | | 11/3/06 | | | 9,997,083 |
| | 7,000,000 | | Fannie Mae Discount Note* | | 5.29 | | | 12/27/06 | | | 6,942,398 |
| | 9,000,000 | | Fannie Mae Discount Note* | | 5.14 | | | 1/16/07 | | | 8,902,340 |
| | 8,000,000 | | Fannie Mae Discount Note* | | 5.165 | | | 2/7/07 | | | 7,887,518 |
| | 10,000,000 | | Fannie Mae Discount Note* | | 5.13 | | | 2/27/07 | | | 9,831,850 |
| | 10,000,000 | | Fannie Mae Discount Note* | | 5.03 | | | 3/28/07 | | | 9,794,608 |
| | 10,000,000 | | Fannie Mae Discount Note* | | 5.05 | | | 4/11/07 | | | 9,774,153 |
| | | | | | | | | | |
|
| | | | | | | | | | | | 89,050,081 |
| | | | | | | | | | |
|
57
The FBR Funds
FBR Fund for Government Investors
Portfolio of Investments (continued)
October 31, 2006
|
| | | | | VALUE |
| PAR | | | | (NOTE 2) |
|
| | | REPURCHASE AGREEMENT — 8.5% | | | |
| $17,906,125 | | With Mizuho Securities, Inc. dated 10/31/06 at 5.39% to be repurchased at $17,908,737 on 11/1/06, collateralized by U.S. Treasury Bill, 5.072% due 2/8/07, value $18,155,000 | | $ | 17,906,125 |
| | | | |
|
| | | Total Investments — 99.9% (Amortized Cost $210,893,586)† | | | 210,893,586 |
| | | | | | |
| | | Other Assets Less Liabilities — 0.1% | | | 277,100 |
| | | | |
|
| | | | | | |
| | | Net Assets — 100.0% | | $ | 211,170,686 |
| | | | |
|
|
| * | | Interest rates for the discount notes represent the yield to maturity at the date of purchase. |
| † | | Same cost is used for federal income tax purposes. |
Weighted Average Maturity of Portfolio: 74 Days
The accompanying notes are an integral part of the financial statements.
58
The FBR Funds
Statements of Assets and Liabilities
October 31, 2006
| | | | | FBR | | FBR |
| | | FBR | | Large Cap | | Large Cap |
| | | Pegasus FundTM | | Financial Fund | | Technology Fund |
| | |
| |
| |
|
| ASSETS | | | | | | | | | | | | | | | | | |
Investment Securities | | | | | | | | | | | | | | | | | |
Securities at Cost: | | | | | | | | | | | | | | | | | |
Unaffiliated Issuers | | | $ | 12,342,215 | | | | | $ | 22,090,284 | | | | | $ | 31,208,143 | |
Repurchase Agreements | | | | 403,000 | | | | | | 941,000 | | | | | | 7,440,000 | |
| | | |
| | | | |
| | | | |
| |
Total securities | | | $ | 12,745,215 | | | | | $ | 23,031,284 | | | | | $ | 38,648,143 | |
| | | |
| | | | |
| | | | |
| |
Securities at Value (Note 2): | | | | | | | | | | | | | | | | | |
Unaffiliated Issuers | | | $ | 12,979,612 | | | | | $ | 25,794,704 | | | | | $ | 33,443,652 | |
Repurchase Agreements | | | | 403,000 | | | | | | 941,000 | | | | | | 7,440,000 | |
| | | |
| | | | |
| | | | |
| |
Total securities | | | | 13,382,612 | | | | | | 26,735,704 | | | | | | 40,883,652 | |
Cash | | | | 311 | | | | | | 283 | | | | | | 268 | |
Receivable for Capital Shares Sold | | | | — | | | | | | 52,535 | | | | | | 67,815 | |
Receivable for Investment Securities Sold | | | | 279,482 | | | | | | 86,796 | | | | | | 243,862 | |
Dividends and Interest Receivable | | | | 9,009 | | | | | | 27,621 | | | | | | 24,224 | |
Prepaid Expenses | | | | 10,972 | | | | | | 5,756 | | | | | | 7,199 | |
| | | |
| | | | |
| | | | |
| |
Total Assets | | | | 13,682,386 | | | | | | 26,908,695 | | | | | | 41,227,020 | |
| | | |
| | | | |
| | | | |
| |
| LIABILITIES | | | | | | | | | | | | | | | | | |
Payable for Capital Shares Redeemed | | | | 288,755 | | | | | | 3,326 | | | | | | 2,490 | |
Payable for Investment Securities Purchased | | | | — | | | | | | 522,810 | | | | | | 1,732,725 | |
Investment Advisory Fee Payable (Note 3) | | | | 1,158 | | | | | | 18,464 | | | | | | 29,093 | |
Administration Fee Payable (Note 3) | | | | 718 | | | | | | 1,338 | | | | | | 1,940 | |
Distribution Fees Payable (Note 3) | | | | 2,994 | | | | | | 5,575 | | | | | | 8,082 | |
Trustees’ Fees Payable | | | | 4,344 | | | | | | 4,344 | | | | | | 4,344 | |
Other Accrued Expenses | | | | 35,225 | | | | | | 39,658 | | | | | | 41,053 | |
| | | |
| | | | |
| | | | |
| |
Total Liabilities | | | | 333,194 | | | | | | 595,515 | | | | | | 1,819,727 | |
| | | |
| | | | |
| | | | |
| |
| NET ASSETS | | | $ | 13,349,192 | | | | | $ | 26,313,180 | | | | | $ | 39,407,293 | |
| | | |
| | | | |
| | | | |
| |
| Shares of Beneficial Interest Outstanding | | | | | | | | | | | | | | | | | |
(unlimited number of shares authorized, no par value) | | | | 1,127,657 | | | | | | 1,214,020 | | | | | | 3,292,935 | |
| | | |
| | | | |
| | | | |
| |
| Net Asset Value Per Share | | | $ | 11.84 | | | | | $ | 21.67 | | | | | $ | 11.97 | |
| | | |
| | | | |
| | | | |
| |
| Net Assets Consist of: | | | | | | | | | | | | | | | | | |
Paid-in capital | | | $ | 12,186,582 | | | | | $ | 20,194,662 | | | | | $ | 36,307,907 | |
Accumulated net investment income | | | | — | | | | | | 122,823 | | | | | | — | |
Accumulated net realized gain on investments | | | | 525,213 | | | | | | 2,291,275 | | | | | | 863,877 | |
Net unrealized appreciation on investments | | | | 637,397 | | | | | | 3,704,420 | | | | | | 2,235,509 | |
| | | |
| | | | |
| | | | |
| |
| NET ASSETS | | | $ | 13,349,192 | | | | | $ | 26,313,180 | | | | | $ | 39,407,293 | |
| | | |
| | | | |
| | | | |
| |
59
| The FBR Funds |
|
| Statements of Assets and Liabilities (continued) |
| October 31, 2006 |
| | | | | FBR | | FBR |
| | | FBR | | Small Cap | | Small Cap |
| | | Small Cap Fund | | Financial Fund | | Technology Fund |
| | |
| |
| |
|
| ASSETS | | | | | | | | | | | | | | | |
Investment Securities | | | | | | | | | | | | | | | |
Securities at Cost: | | | | | | | | | | | | | | | |
Unaffiliated issuers | | | $ | 476,857,683 | | | | $ | 249,287,068 | | | | $ | 3,413,741 | |
Affiliated issuers | | | | 4,511,967 | | | | | 2,778,989 | | | | | — | |
Repurchase Agreements | | | | 56,217,000 | | | | | 6,367,000 | | | | | 114,000 | |
| | | |
| | | |
| | | |
| |
Total securities | | | $ | 537,586,650 | | | | $ | 258,433,057 | | | | $ | 3,527,741 | |
| | | |
| | | |
| | | |
| |
Securities at Value (Note 2): | | | | | | | | | | | | | | | |
Unaffiliated issuers | | | $ | 852,622,987 | | | | $ | 336,489,279 | | | | $ | 3,642,097 | |
Affiliated issuers | | | | 22,002,560 | | | | | 3,286,223 | | | | | — | |
Repurchase Agreements | | | | 56,217,000 | | | | | 6,367,000 | | | | | 114,000 | |
| | | |
| | | |
| | | |
| |
Total securities | | | | 930,842,547 | | | | | 346,142,502 | | | | | 3,756,097 | |
Cash | | | | 584 | | | | | 292 | | | | | 472 | |
Receivable for Capital Shares Sold | | | | 1,277,463 | | | | | 455,655 | | | | | 100 | |
Dividends and Interest Receivable | | | | 93,198 | | | | | 325,891 | | | | | 53 | |
Receivable from Adviser | | | | — | | | | | — | | | | | 9,602 | |
Prepaid Expenses | | | | 32,356 | | | | | 17,094 | | | | | 3,046 | |
| | | |
| | | |
| | | |
| |
Total Assets | | | | 932,246,148 | | | | | 346,941,434 | | | | | 3,769,370 | |
| | | |
| | | |
| | | |
| |
| LIABILITIES | | | | | | | | | | | | | | | |
Payable for Capital Shares Redeemed | | | | 1,438,682 | | | | | 217,314 | | | | | — | |
Payable for Investment Securities Purchased | | | | — | | | | | 54,640 | | | | | 140,384 | |
Investment Advisory Fee Payable (Note 3) | | | | 705,589 | | | | | 263,438 | | | | | — | |
Administration Fee Payable (Note 3) | | | | 47,038 | | | | | 17,562 | | | | | 177 | |
Distribution Fees Payable (Note 3) | | | | 185,807 | | | | | 73,177 | | | | | 738 | |
Trustees’ Fees Payable | | | | 4,344 | | | | | 4,344 | | | | | 4,344 | |
Other Accrued Expenses | | | | 274,558 | | | | | 156,213 | | | | | 32,208 | |
| | | |
| | | |
| | | |
| |
Total Liabilities | | | | 2,656,018 | | | | | 786,688 | | | | | 177,851 | |
| | | |
| | | |
| | | |
| |
| NET ASSETS | | | $ | 929,590,130 | | | | $ | 346,154,746 | | | | $ | 3,591,519 | |
| | | |
| | | |
| | | |
| |
| Shares of Beneficial Interest Outstanding | | | | | | | | | | | | | | | |
(unlimited number of shares authorized, no par value) | | | | 18,834,087 | | | | | 10,586,981 | | | | | 316,748 | |
| | | |
| | | |
| | | |
| |
| Net Asset Value Per Share | | | $ | 49.36 | | | | $ | 32.70 | | | | $ | 11.34 | |
| | | |
| | | |
| | | |
| |
| Net Assets Consist of: | | | | | | | | | | | | | | | |
Paid-in capital | | | $ | 533,951,214 | | | | $ | 214,057,227 | | | | $ | 3,216,687 | |
Accumulated net investment income | | | | — | | | | | 776,653 | | | | | — | |
Accumulated net realized gain on investments | | | | 2,383,019 | | | | | 43,611,421 | | | | | 146,476 | |
Net unrealized appreciation on investments | | | | 393,255,897 | | | | | 87,709,445 | | | | | 228,356 | |
| | | |
| | | |
| | | |
| |
| NET ASSETS | | | $ | 929,590,130 | | | | $ | 346,154,746 | | | | $ | 3,591,519 | |
| | | |
| | | |
| | | |
| |
60
| The FBR Funds |
|
| Statements of Assets and Liabilities (continued) |
| October 31, 2006 |
| | | | | | | FBR | |
| | | | FBR | | | Fund for | |
| | | | Gas Utility | | | Government | |
| | | | Index Fund | | | Investors | |
| | | |
| | |
| |
| ASSETS | | | | | | | | | |
Investment Securities | | | | | | | | | |
Securities at Cost:* | | | | | | | | | |
Unaffiliated Issuers | | | $ | 135,670,156 | | | $ | 192,987,461 | |
Repurchase Agreements | | | | 3,675,000 | | | | 17,906,125 | |
| | | |
| | |
| |
Total securities | | | $ | 139,345,156 | | | $ | 210,893,586 | |
| | | |
| | |
| |
Securities at Value (Note 2): | | | | | | | | | |
Unaffiliated Issuers | | | $ | 265,720,499 | | | $ | 192,987,461 | |
Repurchase Agreements | | | | 3,675,000 | | | | 17,906,125 | |
| | | |
| | |
| |
Total securities | | | | 269,395,499 | | | | 210,893,586 | |
Cash | | | | 980 | | | | 874 | |
Receivable for Capital Shares Sold | | | | 39,794 | | | | — | |
Receivable for Investment Securities Sold | | | | 563,427 | | | | — | |
Dividends and Interest Receivable | | | | 467,365 | | | | 508,216 | |
Prepaid Expenses | | | | 14,606 | | | | 13,768 | |
| | | |
| | |
| |
Total Assets | | | | 270,481,671 | | | | 211,416,444 | |
| | | |
| | |
| |
| LIABILITIES | | | | | | | | | |
Payable for Capital Shares Redeemed | | | | 67,840 | | | | — | |
Payable for Investment Securities Purchased | | | | 146,335 | | | | — | |
Dividends and Income Payable | | | | — | | | | 21,902 | |
Investment Advisory Fee Payable (Note 3) | | | | 90,281 | | | | 95,455 | |
Administration Fee Payable (Note 3) | | | | 13,542 | | | | 11,454 | |
Trustees’ Fees Payable | | | | 4,344 | | | | 4,344 | |
Other Accrued Expenses | | | | 128,611 | | | | 112,603 | |
| | | |
| | |
| |
Total Liabilities | | | | 450,953 | | | | 245,758 | |
| | | |
| | |
| |
| NET ASSETS | | | $ | 270,030,718 | | | $ | 211,170,686 | |
| | | |
| | |
| |
| Shares of Beneficial Interest Outstanding | | | | | | | | | |
(unlimited number of shares authorized, no par value) | | | | 13,859,023 | | | | 211,360,639 | |
| | | |
| | |
| |
| Net Asset Value Per Share | | | $ | 19.48 | | | $ | 1.00 | |
| | | |
| | |
| |
| Net Assets Consist of: | | | | | | | | | |
Paid-in capital | | | $ | 151,364,857 | | | $ | 211,360,639 | |
Accumulated net investment income | | | | 269,784 | | | | — | |
Accumulated net realized loss on investments | | | | (11,654,266 | ) | | | (189,953 | ) |
Net unrealized appreciation on investments | | | | 130,050,343 | | | | — | |
| | | |
| | |
| |
| NET ASSETS | | | $ | 270,030,718 | | | $ | 211,170,686 | |
| | | |
| | |
| |
|
| *For the FBR Fund for Government Investors, securities are reported at amortized cost. |
| The accompanying notes are an integral part of the financial statements. |
61
| The FBR Funds |
|
| Statements of Operations |
| For the Year Ended October 31, 2006 |
| | | | | | FBR | | | FBR | |
| | | | FBR | | | Large Cap | | | Large Cap | |
| | | | Pegasus | | | Financial | | | Technology | |
| | | | FundTM 1 | | | Fund | | | Fund | |
| | | |
| | |
| | |
| |
| Investment Income | | | | | | | | | | | | | |
Dividends2 | | | $ | 98,267 | | | $ | 577,863 | | | $ | 209,779 | |
Interest | | | | 41,344 | | | | 109,703 | | | | 83,989 | |
| | | |
| | |
| | |
| |
Total Investment Income | | | | 139,611 | | | | 687,566 | | | | 293,768 | |
| | | |
| | |
| | |
| |
| Expenses | | | | | | | | | | | | | |
Investment Advisory fees (Note 3) | | | | 73,282 | | | | 246,877 | | | | 207,128 | |
Administration fees (Note 3) | | | | 4,885 | | | | 16,458 | | | | 13,808 | |
Distribution fees (Note 3) | | | | 20,356 | | | | 68,577 | | | | 57,535 | |
Professional fees | | | | 49,366 | | | | 51,866 | | | | 51,866 | |
Custodian fees | | | | 23,633 | | | | 16,484 | | | | 22,657 | |
Trustees’ fees | | | | 13,950 | | | | 13,950 | | | | 13,950 | |
Shareholder servicing fees | | | | 11,603 | | | | 19,093 | | | | 25,440 | |
Compliance fees | | | | 8,702 | | | | 10,868 | | | | 10,532 | |
Registration fees | | | | 6,103 | | | | 13,755 | | | | 16,132 | |
Accounting services fees | | | | 4,871 | | | | 11,238 | | | | 9,735 | |
Reports to shareholders | | | | 3,624 | | | | 6,747 | | | | 5,786 | |
Transfer agent fees | | | | 3,165 | | | | 24,971 | | | | 8,944 | |
Insurance fees | | | | 45 | | | | 967 | | | | 565 | |
Other expenses | | | | 563 | | | | 853 | | | | 729 | |
| | | |
| | |
| | |
| |
Total expenses before waivers and related reimbursements | | | | 224,148 | | | | 502,704 | | | | 444,807 | |
Less waivers and related reimbursements | | | | (65,370 | ) | | | (1,606 | ) | | | (12,386 | ) |
| | | |
| | |
| | |
| |
Total expenses after waivers and related reimbursements | | | | 158,778 | | | | 501,098 | | | | 432,421 | |
| | | |
| | |
| | |
| |
Net Investment Income (Loss) | | | | (19,167 | ) | | | 186,468 | | | | (138,653 | ) |
| | | |
| | |
| | |
| |
| Net Realized and Unrealized Gain on Investments | | | | | | | | | | | | | |
Net Realized Gain on Investment Transactions | | | | 545,511 | | | | 2,610,208 | | | | 1,103,903 | |
Change in Net Unrealized Appreciation/Depreciation of Investments | | | | 637,397 | | | | 840,507 | | | | 1,815,071 | |
| | | |
| | |
| | |
| |
Net Gain on Investments | | | | 1,182,908 | | | | 3,450,715 | | | | 2,918,974 | |
| | | |
| | |
| | |
| |
| Net Increase in Net Assets Resulting from Operations | | | $ | 1,163,741 | | | $ | 3,637,183 | | | $ | 2,780,321 | |
| | | |
| | |
| | |
| |
|
| 1 | | Represents the period from commencement of operations (November 15, 2005) through October 31, 2006. |
| 2 | | Net of foreign taxes withheld of $2,191, $285 and $10,972 for the FBR Pegasus FundTM, FBR Large Cap Financial Fund and FBR Large Cap Technology Fund, respectively. |
62
| The FBR Funds |
|
| Statements of Operations (continued) |
| For the Year Ended October 31, 2006 |
| | | | | | | FBR | | FBR |
| | | | FBR | | | Small Cap | | Small Cap |
| | | | Small Cap | | | Financial | | Technology |
| | | | Fund | | | Fund | | Fund |
| | | |
| | |
| |
|
| Investment Income | | | | | | | | | | | | | |
Dividends1 | | | $ | 2,196,195 | | | $ | 6,452,627 | | | $ | 3,163 | |
Interest | | | | 1,551,790 | | | | 880,822 | | | | 5,650 | |
| | | |
| | |
| | |
| |
Total Investment Income | | | | 3,747,985 | | | | 7,333,449 | | | | 8,813 | |
| | | |
| | |
| | |
| |
| Expenses | | | | | | | | | | | | | |
Investment Advisory fees (Note 3) | | | | 7,648,402 | | | | 3,458,235 | | | | 26,222 | |
Administration fees (Note 3) | | | | 509,883 | | | | 230,544 | | | | 1,748 | |
Distribution fees (Note 3) | | | | 1,942,826 | 2 | | | 960,620 | | | | 7,284 | |
Shareholder servicing fees | | | | 750,269 | | | | 358,300 | | | | 10,326 | |
Accounting services fees | | | | 290,139 | | | | 133,921 | | | | 4,285 | |
Transfer agent fees | | | | 235,858 | | | | 211,079 | | | | 4,299 | |
Reports to shareholders | | | | 107,420 | | | | 69,141 | | | | 3,537 | |
Custodian fees | | | | 63,279 | | | | 45,413 | | | | 17,699 | |
Professional fees | | | | 58,673 | | | | 51,866 | | | | 49,366 | |
Compliance fees | | | | 53,254 | | | | 29,751 | | | | 9,608 | |
Registration fees | | | | 31,902 | | | | 25,894 | | | | 9,980 | |
Insurance fees | | | | 27,260 | | | | 15,099 | | | | 64 | |
Trustees’ fees | | | | 13,950 | | | | 13,950 | | | | 13,950 | |
Other expenses | | | | 22,622 | | | | 3,452 | | | | 593 | |
| | | |
| | |
| | |
| |
Total expenses before waivers and related reimbursements | | | | 11,755,737 | | | | 5,607,265 | | | | 158,961 | |
Less waivers and related reimbursements | | | | — | | | | — | | | | (102,125 | ) |
| | | |
| | |
| | |
| |
Total expenses after waivers and related reimbursements | | | | 11,755,737 | | | | 5,607,265 | | | | 56,836 | |
| | | |
| | |
| | |
| |
Net Investment Income (Loss) | | | | (8,007,752 | ) | | | 1,726,184 | | | | (48,023 | ) |
| | | |
| | |
| | |
| |
| Net Realized and Unrealized Gain on Investments | | | | | | | | | | | | | |
Net Realized Gain on Investment Transactions | | | | 3,833,930 | | | | 43,905,032 | | | | 206,694 | |
Change in Net Unrealized Appreciation/Depreciation of Investments | | | | 185,777,592 | | | | (1,497,455 | ) | | | 243,617 | |
| | | |
| | |
| | |
| |
Net Gain on Investments | | | | 189,611,522 | | | | 42,407,577 | | | | 450,311 | |
| | | |
| | |
| | |
| |
| Net Increase in Net Assets Resulting from Operations | | | $ | 181,603,770 | | | $ | 44,133,761 | | | $ | 402,288 | |
| | | |
| | |
| | |
| |
|
| 1 | Net of foreign taxes withheld of $12,180, $0 and $0 for the FBR Small Cap Fund, FBR Small Cap Financial Fund, and FBR Small Cap Technology Fund, respectively. |
| 2 | Distribution fees are net waivers of $181,741. The Distributor has agreed to voluntarily waive a portion of the FBR Small Cap Fund’s distribution fees until such time as the Fund is reopened to new investors. Had the Distributor not waived any fees, the distribution expense would have been $2,124,567. |
63
| The FBR Funds |
|
| Statements of Operations (continued) |
| For the Year Ended October 31, 2006 |
| | | | | | | FBR | |
| | | | FBR | | | Fund for | |
| | | | Gas Utility | | | Government | |
| | | | Index Fund | | | Investors | |
| | | |
| | |
| |
| Investment Income | | | | | | | | | |
Dividends1 | | | $ | 8,880,584 | | | $ | — | |
Interest (Note 2) | | | | 545,619 | | | | 11,063,385 | |
| | | |
| | |
| |
Total Investment Income | | | | 9,426,203 | | | | 11,063,385 | |
| | | |
| | |
| |
| Expenses | | | | | | | | | |
Investment Advisory fees (Note 3) | | | | 1,081,039 | | | | 1,186,068 | |
Administration fees (Note 3) | | | | 378,362 | | | | 142,325 | |
Transfer agent fees | | | | 234,524 | | | | 383,986 | |
Shareholder servicing fees | | | | 153,641 | | | | 60,768 | |
Accounting services fees | | | | 94,945 | | | | 82,462 | |
Professional fees | | | | 51,866 | | | | 51,866 | |
Reports to shareholders | | | | 40,362 | | | | 22,759 | |
Custodian fees | | | | 38,770 | | | | 24,138 | |
Compliance fees | | | | 23,620 | | | | 21,677 | |
Registration fees | | | | 21,138 | | | | 18,382 | |
Trustees’ fees | | | | 13,950 | | | | 13,950 | |
Insurance fees | | | | 9,415 | | | | 8,010 | |
Other expenses | | | | 12,001 | | | | 4,389 | |
| | | |
| | |
| |
Total expenses | | | | 2,153,633 | | | | 2,020,780 | |
| | | |
| | |
| |
Net Investment Income | | | | 7,272,570 | | | | 9,042,605 | |
| | | |
| | |
| |
| Net Realized and Unrealized Gain (Loss) on Investments | | | | | | | | | |
Net Realized Gain (Loss) on Investment Transactions | | | | 19,047,484 | | | | (23 | ) |
Change in Net Unrealized Appreciation/Depreciation of Investments | | | | 15,168,791 | | | | — | |
| | | |
| | |
| |
Net Gain (Loss) on Investments | | | | 34,216,275 | | | | (23 | ) |
| | | |
| | |
| |
| Net Increase in Net Assets Resulting from Operations | | | $ | 41,488,845 | | | $ | 9,042,582 | |
| | | |
| | |
| |
|
| 1 | Net of foreign taxes withheld of $259,742 and $0 for the FBR Gas Utility Index Fund and FBR Fund for Government Investors, respectively. |
The accompanying notes are an integral part of the financial statements.
64
| The FBR Funds |
|
| Statements of Changes in Net Assets |
| | FBR | | FBR Large Cap | | | FBR Large Cap | |
| | Pegasus FundTM | | Financial Fund | | | Technology Fund | |
| |
| |
| | |
| |
| | For the
Period
Ended | | For the Years Ended
October 31, | | | For the Years Ended
October 31, | |
| | October 31, | |
| | |
| |
| | 2006(A) | | 2006 | | | 2005 | | | 2006 | | | 2005 | |
| | |
| | |
| | |
| | |
| | |
| |
| From Investment Activities | | | | | | | | | | | | | | | | | | | | |
Net Investment Income (Loss) | | $ | (19,167 | ) | | $ | 186,468 | | | $ | 188,656 | | | $ | (138,653 | ) | | $ | (73,240 | ) |
Net Realized Gain on Investment Transctions | | | 545,511 | | | | 2,610,208 | | | | 3,792,950 | | | | 1,103,903 | | | | 1,087,384 | |
Change in Net Unrealized Appreciation/Depreciation of Investments | | | 637,397 | | | | 840,507 | | | | (3,757,400 | ) | | | 1,815,071 | | | | 154,824 | |
| | |
| | |
| | |
| | |
| | |
| |
Net Increase in Net Assets Resulting from Operations | | | 1,163,741 | | | | 3,637,183 | | | | 224,206 | | | | 2,780,321 | | | | 1,168,968 | |
| | |
| | |
| | |
| | |
| | |
| |
| Distributions to Shareholders | | | | | | | | | | | | | | | | | | | | |
From Net Investment Income | | | (1,131 | ) | | | (231,630 | ) | | | (111,605 | ) | | | — | | | | — | |
From Net Realized Gain on Investments | | | — | | | | (3,691,188 | ) | | | (3,530,704 | ) | | | (932,291 | ) | | | (964,430 | ) |
| | |
| | |
| | |
| | |
| | |
| |
Total Distributions to Shareholders | | | (1,131 | ) | | | (3,922,818 | ) | | | (3,642,309 | ) | | | (932,291 | ) | | | (964,430 | ) |
| | |
| | |
| | |
| | |
| | |
| |
| From Share Transactions | | | | | | | | | | | | | | | | | | | | |
Net Proceeds from Sales of Shares | | | 19,873,808 | | | | 1,711,344 | | | | 5,740,994 | | | | 27,826,230 | | | | 9,338,571 | |
Reinvestment of Distributions | | | 1,129 | | | | 3,834,060 | | | | 3,514,554 | | | | 912,545 | | | | 955,283 | |
Cost of Shares Redeemed(B) | | | (7,688,355 | ) | | | (7,983,348 | ) | | | (7,184,823 | ) | | | (5,989,960 | ) | | | (2,295,680 | ) |
| | |
| | |
| | |
| | |
| | |
| |
Net Increase (Decrease) in Net Assets Resulting from Share Tranactions | | | 12,186,582 | | | | (2,437,944 | ) | | | 2,070,725 | | | | 22,748,815 | | | | 7,998,174 | |
| | |
| | |
| | |
| | |
| | |
| |
Total Increase (Decrease) in Net Assets | | | 13,349,192 | | | | (2,723,579 | ) | | | (1,347,378 | ) | | | 24,596,845 | | | | 8,202,712 | |
| Net Assets – Beginning of Period | | | — | | | | 29,036,759 | | | | 30,384,137 | | | | 14,810,448 | | | | 6,607,736 | |
| | |
| | |
| | |
| | |
| | |
| |
| Net Assets – End of Period | | $ | 13,349,192 | | | $ | 26,313,180 | | | $ | 29,036,759 | | | $ | 39,407,293 | | | $ | 14,810,448 | |
| | |
| | |
| | |
| | |
| | |
| |
| Accumulated Net Investment Income | | $ | — | | | $ | 122,823 | | | $ | 167,985 | | | $ | — | | | $ | — | |
| Shares Issued and Redeemed | | | | | | | | | | | | | | | | | | | | |
Sold | | | 1,807,008 | | | | 83,184 | | | | 256,060 | | | | 2,370,140 | | | | 891,160 | |
Issued in Reinvestment of Distributions | | | 111 | | | | 190,616 | | | | 156,411 | | | | 82,211 | | | | 94,117 | |
Redeemed | | | (679,462 | ) | | | (389,141 | ) | | | (325,549 | ) | | | (527,882 | ) | | | (219,699 | ) |
| | |
| | |
| | |
| | |
| | |
| |
Net Increase (Decrease) in Shares | | | 1,127,657 | | | | (115,341 | ) | | | 86,922 | | | | 1,924,469 | | | | 765,578 | |
| | |
| | |
| | |
| | |
| | |
| |
|
| (A) | Represents the period from commencement of operations (November 15, 2005) through October 31, 2006. |
| (B) | The cost of shares redeemed is net of the 1% redemption fee on fund shares which have been held 90 days or less. For the period ended October 31, 2006, these fees were $8,813, $1,291 and $6,940 for the FBR Pegasus FundTM, FBR Large Cap Financial Fund, and FBR Large Cap Technology Fund, respectively. For the year ended October 31, 2005, these fees were $5,664 and $3,490 for the FBR Large Cap Financial Fund and FBR Large Cap Technology Fund, respectively. |
65
| The FBR Funds |
|
| Statements of Changes in Net Assets (continued) |
| | | | | | | FBR Small Cap | | | | FBR Small Cap | |
| | | | FBR Small Cap Fund | | | | Financial Fund | | | | Technology Fund | |
| | | |
| | | |
| | | |
| |
| | | | For the Years Ended | | | | For the Years Ended | | | | For the Years Ended | |
| | | | October 31, | | | | October 31, | | | | October 31, | |
| | | |
| | | |
| | | |
| |
| | | | 2006 | | | | 2005 | | | | 2006 | | | | 2005 | | | | 2006 | | | | 2005 | |
| | | |
| | | |
| | | |
| | | |
| | | |
| | | |
| |
| From Investment Activities | | | | | | | | | | | | | | | | | | | | | | | | | | | | | | |
Net Investment Income (Loss) | | | $ | (8,007,752 | ) | | | $ | (5,368,162 | ) | | | $ | 1,726,184 | | | | $ | 3,951,710 | | | | $ | (48,023 | ) | | | $ | (29,575 | ) |
Net Realized Gain on Investment Transctions from: | | | | | | | | | | | | | | | | | | | | | | | | | | | | | | |
Unaffiliated Issuers | | | | 3,833,930 | | | | | 16,780,143 | | | | | 43,905,032 | | | | | 47,073,636 | | | | | 206,694 | | | | | 144,518 | |
Affiliated Issuers | | | | — | | | | | 593,237 | | | | | — | | | | | 2,164,689 | | | | | — | | | | | — | |
Change in Net Unrealized Appreciation/Depreciation of Investments | | | | 185,777,592 | | | | | 60,327,673 | | | | | (1,497,455 | ) | | | | (39,705,446 | ) | | | | 243,617 | | | | | (13,158 | ) |
| | | |
| | | |
| | | |
| | | |
| | | |
| | | |
| |
Net Increase in Net Assets Resulting from Operations | | | | 181,603,770 | | | | | 72,332,891 | | | | | 44,133,761 | | | | | 13,484,589 | | | | | 402,288 | | | | | 101,785 | |
| | | |
| | | |
| | | |
| | | |
| | | |
| | | |
| |
| Distributions to Shareholders | | | | | | | | | | | | | | | | | | | | | | | | | | | | | | |
From Net Investment Income | | | | — | | | | | — | | | | | (2,080,797 | ) | | | | (3,545,129 | ) | | | | — | | | | | — | |
From Net Realized Gain on Investments | | | | (14,760,977 | ) | | | | (13,532,432 | ) | | | | (49,145,199 | ) | | | | (74,859,808 | ) | | | | — | | | | | — | |
| | | |
| | | |
| | | |
| | | |
| | | |
| | | |
| |
Total Distributions to Shareholders | | | | (14,760,977 | ) | | | | (13,532,432 | ) | | | | (51,225,996 | ) | | | | (78,404,937 | ) | | | | — | | | | | — | |
| | | |
| | | |
| | | |
| | | |
| | | |
| | | |
| |
| From Share Transactions | | | | | | | | | | | | | | | | | | | | | | | | | | | | | | |
Net Proceeds from Sales of Shares | | | | 209,187,431 | | | | | 372,773,336 | | | | | 59,440,939 | | | | | 230,368,255 | | | | | 2,155,372 | | | | | 1,661,709 | |
Reinvestment of Distributions | | | | 14,446,856 | | | | | 12,761,278 | | | | | 50,058,935 | | | | | 72,660,032 | | | | | — | | | | | — | |
Cost of Shares Redeemed(A) | | | | (266,745,027 | ) | | | | (463,973,882 | ) | | | | (219,586,101 | ) | | | | (369,400,035 | ) | | | | (724,777 | ) | | | | (1,444,969 | ) |
| | | |
| | | |
| | | |
| | | |
| | | |
| | | |
| |
Net Increase (Decrease) in Net Assets Resulting from Share Tranactions | | | | (43,110,740 | ) | | | | (78,439,268 | ) | | | | (110,086,227 | ) | | | | (66,371,748 | ) | | | | 1,430,595 | | | | | 216,740 | |
| | | |
| | | |
| | | |
| | | |
| | | |
| | | |
| |
Total Increase (Decrease) in Net Assets | | | | 123,732,053 | | | | | (19,638,809 | ) | | | | (117,178,462 | ) | | | | (131,292,096 | ) | | | | 1,832,883 | | | | | 318,525 | |
| Net Assets – Beginning of Year | | | | 805,858,077 | | | | | 825,496,886 | | | | | 463,333,208 | | | | | 594,625,304 | | | | | 1,758,636 | | | | | 1,440,111 | |
| | | |
| | | |
| | | |
| | | |
| | | |
| | | |
| |
| Net Assets – End of Year | | | $ | 929,590,130 | | | | $ | 805,858,077 | | | | $ | 346,154,746 | | | | $ | 463,333,208 | | | | $ | 3,591,519 | | | | $ | 1,758,636 | |
| | | |
| | | |
| | | |
| | | |
| | | |
| | | |
| |
| Accumulated Net Investment Income | | | $ | — | | | | $ | — | | | | $ | 776,653 | | | | $ | 1,258,468 | | | | $ | — | | | | $ | — | |
| Shares Issued and Redeemed | | | | | | | | | | | | | | | | | | | | | | | | | | | | | | |
Sold | | | | 4,514,344 | | | | | 9,065,029 | | | | | 1,892,561 | | | | | 6,667,142 | | | | | 199,392 | | | | | 176,223 | |
Issued in Reinvestment of Distributions | | | | 342,577 | | | | | 313,867 | | | | | 1,643,878 | | | | | 2,125,106 | | | | | — | | | | | — | |
Redeemed | | | | (5,991,888 | ) | | | | (11,318,509 | ) | | | | (7,007,379 | ) | | | | (11,066,207 | ) | | | | (68,535 | ) | | | | (152,499 | ) |
| | | |
| | | |
| | | |
| | | |
| | | |
| | | |
| |
Net Increase (Decrease) in Shares | | | | (1,134,967 | ) | | | | (1,939,613 | ) | | | | (3,470,940 | ) | | | | (2,273,959 | ) | | | | 130,857 | | | | | 23,724 | |
| | | |
| | | |
| | | |
| | | |
| | | |
| | | |
| |
|
| (A) | The cost of shares redeemed is net of the 1% redemption fee on fund shares which have been held 90 days or less. For the year ended October 31, 2006, these fees were $58,201, $39,251 and $2,203 for the FBR Small Cap Fund, FBR Small Cap Financial Fund, and FBR Small Cap Technology Fund, respectively. For the year ended October 31, 2005, these fees were $178,577, $201,249 and $7,127 for the FBR Small Cap Fund, FBR Small Cap Financial Fund, and FBR Small Cap Technology Fund, respectively. |
66
| The FBR Funds |
|
| Statements of Changes in Net Assets (continued) |
| | | | FBR Gas Utility | | | FBR Fund for |
| | | | Index Fund | | | Government Investors |
| | | |
| | |
|
| | | | For the Years Ended | | | For the Years Ended |
| | | | October 31, | | | October 31, |
| | | |
| | |
|
| | | | 2006 | | | 2005 | | | 2006 | | | 2005 |
| | | |
| | |
| | |
| | |
|
| From Investment Activities | | | | | | | | | | | | | | | | | | | | |
Net Investment Income | | | $ | 7,272,570 | | | | $ | 8,487,815 | | | | $ | 9,042,605 | | | | $ | 5,300,978 | |
Net Realized Gain (Loss) on Investment Transctions | | | | 19,047,484 | | | | | 6,544,433 | | | | | (23 | ) | | | | (970 | ) |
Change in Net Unrealized Appreciation/Depreciation of Investments | | | | 15,168,791 | | | | | 29,725,143 | | | | | — | | | | | — | |
| | | |
| | | |
| | | |
| | | |
| |
Net Increase in Net Assets Resulting from Operations | | | | 41,488,845 | | | | | 44,757,391 | | | | | 9,042,582 | | | | | 5,300,008 | |
| | | |
| | | |
| | | |
| | | |
| |
| Distributions to Shareholders | | | | | | | | | | | | | | | | | | | | |
From Net Investment Income | | | | (9,174,877 | ) | | | | (6,644,316 | ) | | | | (9,042,605 | ) | | | | (5,300,978 | ) |
| | | |
| | | |
| | | |
| | | |
| |
| From Share Transactions | | | | | | | | | | | | | | | | | | | | |
Net Proceeds from Sales of Shares | | | | 37,112,389 | | | | | 101,624,953 | | | | | 1,190,953,823 | | | | | 1,297,731,352 | |
Reinvestment of Distributions | | | | 8,437,169 | | | | | 6,155,740 | | | | | 8,812,307 | | | | | 5,142,132 | |
Cost of Shares Redeemed(A) | | | | (103,636,356 | ) | | | | (70,635,065 | ) | | | | (1,240,270,272 | ) | | | | (1,339,958,443 | ) |
| | | |
| | | |
| | | |
| | | |
| |
Net Increase (Decrease) in Net Assets Resulting from Share Tranactions | | | | (58,086,798 | ) | | | | 37,145,628 | | | | | (40,504,142 | ) | | | | (37,084,959 | ) |
| | | |
| | | |
| | | |
| | | |
| |
Total Increase (Decrease) in Net Assets | | | | (25,772,830 | ) | | | | 75,258,703 | | | | | (40,504,165 | ) | | | | (37,085,929 | ) |
| Net Assets – Beginning of Year | | | | 295,803,548 | | | | | 220,544,845 | | | | | 251,674,851 | | | | | 288,760,780 | |
| | | |
| | | |
| | | |
| | | |
| |
| Net Assets – End of Year | | | $ | 270,030,718 | | | | $ | 295,803,548 | | | | $ | 211,170,686 | | | | $ | 251,674,851 | |
| | | |
| | | |
| | | |
| | | |
| |
| Accumulated Net Investment Income | | | $ | 269,784 | | | | $ | 2,172,091 | | | | $ | — | | | | $ | — | |
| Shares Issued and Redeemed | | | | | | | | | | | | | | | | | | | | |
Sold | | | | 2,065,235 | | | | | 6,017,006 | | | | | 1,190,953,823 | | | | | 1,297,731,352 | |
Issued in Reinvestment of Distributions | | | | 474,683 | | | | | 364,364 | | | | | 8,812,307 | | | | | 5,142,132 | |
Redeemed | | | | (5,828,607 | ) | | | | (4,265,038 | ) | | | | (1,240,270,272 | ) | | | | (1,339,958,443 | ) |
| | | |
| | | |
| | | |
| | | |
| |
Net Increase (Decrease) in Shares | | | | (3,288,689 | ) | | | | 2,116,332 | | | | | (40,504,142 | ) | | | | (37,084,959 | ) |
| | | |
| | | |
| | | |
| | | |
| |
|
| (A) | The cost of shares redeemed is net of the 1% redemption fee on fund shares which have been held 90 days or less. For the FBR Gas Utility Index Fund, these fees for the years ended October 31, 2006 and October 31, 2005 were $31,687 and $73,199, respectively. The FBR Fund for Government Investors does not charge a redemption fee. |
The accompanying notes are an integral part of the financial statements.
67
| The FBR Funds |
|
| Financial Highlights |
The following tables provide per share data for a share outstanding throughout each period for each Fund. Other data includes investment performance, ratios to average net assets and other supplemental information.
| | | FBR Pegasus FundTM |
| | |
|
| | | For the Period |
| | | Ended |
| | | October 31, 2006* |
| | |
|
| Per Share Operating Performance: | | | | | | |
Net Asset Value – Beginning of Period | | | $ | 10.00 | | |
| | | |
| | |
Income (Loss) from Investment Operations: | | | | | | |
Net Investment Loss1,3 | | | | (0.01 | ) | |
Net Realized and Unrealized Gain on Investments1,4 | | | | 1.84 | | |
| | | |
| | |
Total from Investment Operations | | | | 1.83 | | |
| | | |
| | |
Distributions to Shareholders: | | | | | | |
From Net Investment Income | | | | (0.00 | )2 | |
| | | |
| | |
Paid-in Capital from Redemption Fees | | | | 0.01 | | |
| | | |
| | |
Net Increase in Net Asset Value | | | | 1.84 | | |
| | | |
| | |
Net Asset Value – End of Period | | | $ | 11.84 | | |
| | | |
| | |
| Total Investment Return5 | | | | 18,45% | (A) | |
| Ratios to Average Net Assets: | | | | | | |
Expenses After Waivers and Related Reimbursements3 | | | | 1.94% | (B) | |
Expenses Before Waivers and Related Reimbursements | | | | 2.74% | (B) | |
Net Investment Loss After Waivers and Related Reimbursements3 | | | | (0.23)% | (B) | |
Net Investment Loss Before Waivers and Related Reimbursements | | | | (1.03)% | (B) | |
| Supplementary Data: | | | | | | |
Portfolio Turnover Rate | | | | 166% | (A) | |
Net Assets at End of Period (in thousands) | | | $ | 13,349 | | |
|
| * | | For the period November 15, 2005 (commencement of operations) to October 31, 2006. |
| 1 | | Calculated based on shares outstanding on the first and last day of the respective periods, except for dividends and distributions, if any, which are based on the actual shares outstanding on the dates of distributions. |
| 2 | | Less than $0.01 |
| 3 | | Reflects fees waived and reimbursed by FBR Fund Advisers, Inc. pursuant to a contractual expense limitation of 1.95%. |
| 4 | | The amounts shown for a share outstanding throughout the period may not be in accordance with the changes in the aggregate gains and losses on investments during the period because of the timing of sales and repurchases of Fund shares in relation to fluctuating net asset values during the period. |
| 5 | | Total investment return is calculated assuming a purchase of shares on the first day and a sale on the last day of each period reported and will include reinvestment of dividends and distributions, if any. |
| (A) | | Not Annualized |
| (B) | | Annualized |
68
| The FBR Funds |
|
| Financial Highlights (continued) |
| | | FBR Large Cap Financial Fund | | |
| | |
| | |
| | | For the Years Ended October 31, | | |
| | |
| | |
| | | | | | | | | | | | | | | | | | | | | | | | | | |
| | | 2006 | | | | 2005 | | | | 2004 | | | | 2003 | | | | 2002 | | |
| | |
| | | |
| | | |
| | | |
| | | |
| | |
| Per Share Operating Performance: | | | | | | | | | | | | | | | | | | | | | | | | | |
Net Asset Value – Beginning of Year | | $ | 21.84 | | | | $ | 24.46 | | | | $ | 22.43 | | | | $ | 17.73 | | | | $ | 18.18 | | |
| | |
| | | |
| | | |
| | | |
| | | |
| | |
Income from Investment Operations: | | | | | | | | | | | | | | | | | | | | | | | | | |
Net Investment Income1,3 | | | 0.13 | | | | | 0.13 | | | | | 0.08 | | | | | 0.10 | | | | | 0.07 | | |
Net Realized and Unrealized Gain on Investments1,4 | | | 2.72 | | | | | 0.15 | | | | | 2.08 | | | | | 4.69 | | | | | 0.70 | | |
| | |
| | | |
| | | |
| | | |
| | | |
| | |
Total from Investment Operations | | | 2.85 | | | | | 0.28 | | | | | 2.16 | | | | | 4.79 | | | | | 0.77 | | |
| | |
| | | |
| | | |
| | | |
| | | |
| | |
Distributions to Shareholders: | | | | | | | | | | | | | | | | | | | | | | | | | |
From Net Investment Income | | | (0.16 | ) | | | | (0.08 | ) | | | | (0.07 | ) | | | | (0.09 | ) | | | | (0.08 | ) | |
From Net Realized Gain | | | (2.86 | ) | | | | (2.82 | ) | | | | (0.08 | ) | | | | — | | | | | (1.15 | ) | |
| | |
| | | |
| | | |
| | | |
| | | |
| | |
Total Distributions | | | (3.02 | ) | | | | (2.90 | ) | | | | (0.15 | ) | | | | (0.09 | ) | | | | (1.23 | ) | |
| | |
| | | |
| | | |
| | | |
| | | |
| | |
Paid-in Capital from Redemption Fees | | | 0.00 | 2 | | | | 0.00 | 2 | | | | 0.02 | | | | | 0.00 | 2 | | | | 0.01 | | |
| | |
| | | |
| | | |
| | | |
| | | |
| | |
Net Increase (Decrease) in Net Asset Value | | | (0.17 | ) | | | | (2.62 | ) | | | | 2.03 | | | | | 4.70 | | | | | (0.45 | ) | |
| | |
| | | |
| | | |
| | | |
| | | |
| | |
Net Asset Value – End of Year | | $ | 21.67 | | | | $ | 21.84 | | | | $ | 24.46 | | | | $ | 22.43 | | | | $ | 17.73 | | |
| | |
| | | |
| | | |
| | | |
| | | |
| | |
| Total Investment Return5 | | | 14.21% | | | | | 0.86% | | | | | 9.76% | | | | | 27.13% | | | | | 4.11% | | |
| Ratios to Average Net Assets: | | | | | | | | | | | | | | | | | | | | | | | | | |
Expenses After Waivers3 | | | 1.83% | | | | | 1.95% | | | | | 1.91% | | | | | 1.92% | | | | | 1.95% | | |
Expenses Before Waivers | | | 1.84% | | | | | 1.96% | | | | | 1.94% | | | | | 1.98% | | | | | 2.03% | | |
Net Investment Income After Waivers3 | | | 0.68% | | | | | 0.62% | | | | | 0.28% | | | | | 0.53% | | | | | 0.36% | | |
Net Investment Income Before Waivers | | | 0.67% | | | | | 0.61% | | | | | 0.25% | | | | | 0.47% | | | | | 0.28% | | |
| Supplementary Data: | | | | | | | | | | | | | | | | | | | | | | | | | |
Portfolio Turnover Rate | | | 54% | | | | | 41% | | | | | 42% | | | | | 67% | | | | | 97% | | |
Net Assets at End of Year (in thousands) | | $ | 26,313 | | | | $ | 29,037 | | | | $ | 30,384 | | | | $ | 35,459 | | | | $ | 26,541 | | |
|
| 1 | | Calculated based on shares outstanding on the first and last day of the respective periods, except for dividends and distributions, if any, which are based on the actual shares outstanding on the dates of distributions. |
| 2 | | Less than $0.01 |
| 3 | | Reflects fees waived by FBR Fund Advisers, Inc. pursuant to a contractual expense limitation of 1.95%. |
| 4 | | The amounts shown for a share outstanding throughout the respective periods may not be in accordance with the changes in the aggregate gains and losses on investments during the respective periods because of the timing of sales and repurchases of Fund shares in relation to fluctuating net asset values during the respective periods. |
| 5 | | Total investment return is calculated assuming a purchase of shares on the first day and a sale on the last day of each period reported and will include reinvestment of dividends and distributions, if any. |
69
| The FBR Funds |
|
| Financial Highlights (continued) |
| | | FBR Large Cap Technology Fund |
| | |
|
| | | | | | | | | | | | | | | | | | | | | | | | For the | |
| | | | | | | | | | | | | | | | | | | | | | | | Period | |
| | | For the Years Ended October 31, | | | Ended | |
| | |
| | | | October 31, | |
| | | 2006 | | | | 2005 | | | | 2004 | | | | | 2003 | | | | 2002* | |
| Per Share Operating Performance: | |
| | | |
| | | |
| | | | |
| | | |
| |
Net Asset Value – Beginning of Period | | $ | 10.82 | | | | $ | 10.96 | | | | $ | 11.03 | | | | | $ | 7.19 | | | | | $ | 10.00 | | |
| | |
| | | |
| | | |
| | | | |
| | | | |
| | |
Income (Loss) from Investment Operations: | | | | | | | | | | | | | | | | | | | | | | | | | | | |
Net Investment Loss1,3 | | | (0.04 | ) | | | | (0.05 | ) | | | | (0.14 | ) | | | | | (0.08 | ) | | | | | (0.05 | ) | |
Net Realized and Unrealized Gain (Loss) on Investments1,4 | | | 1.77 | | | | | 1.53 | | | | | 0.24 | | | | | | 3.92 | | | | | | (2.76 | ) | |
| | |
| | | |
| | | |
| | | | |
| | | | |
| | |
Total from Investment Operations | | | 1.73 | | | | | 1.48 | | | | | 0.10 | | | | | | 3.84 | | | | | | (2.81 | ) | |
| | |
| | | |
| | | |
| | | | |
| | | | |
| | |
Distributions to Shareholders: | | | | | | | | | | | | | | | | | | | | | | | | | | | |
From Net Realized Gain | | | (0.58 | ) | | | | (1.62 | ) | | | | (0.20 | ) | | | | | — | | | | | | — | | |
| | |
| | | |
| | | |
| | | | |
| | | | |
| | |
Paid-in Capital from Redemption Fees | | | 0.00 | 2 | | | | 0.00 | 2 | | | | 0.03 | | | | | | 0.00 | 2 | | | | | 0.00 | 2 | |
| | |
| | | |
| | | |
| | | | |
| | | | |
| | |
Net Increase (Decrease) in Net Asset Value | | | 1.15 | | | | | (0.14 | ) | | | | (0.07 | ) | | | | | 3.84 | | | | | | (2.81 | ) | |
| | |
| | | |
| | | |
| | | | |
| | | | |
| | |
Net Asset Value – End of Period | | $ | 11.97 | | | | $ | 10.82 | | | | $ | 10.96 | | | | | $ | 11.03 | | | | | $ | 7.19 | | |
| | |
| | | |
| | | |
| | | | |
| | | | |
| | |
| Total Investment Return5 | | | 16.40% | | | | | 14.51% | | | | | 1.17% | | | | | | 53.41% | | | | | | (28.10)% | (A) | |
| Ratios to Average Net Assets: | | | | | | | | | | | | | | | | | | | | | | | | | | | |
Expenses After Waivers and Related Reimbursements3 | | | 1.87% | | | | | 1.94% | | | | | 1.95% | | | | | | 1.94% | | | | | | 1.94% | (B) | |
Expenses Before Waivers and Related Reimbursements | | | 1.92% | | | | | 2.74% | | | | | 3.21% | | | | | | 4.61% | | | | | | 4.43% | (B) | |
Net Investment Loss After Waivers and Related Reimbursements3 | | | (0.60)% | | | | | (0.77)% | | | | | (1.23)% | | | | | | (1.11)% | | | | | | (1.37)% | (B) | |
Net Investment Loss Before Waivers and Related Reimbursements | | | (0.65)% | | | | | (1.57)% | | | | | (2.49)% | | | | | | (3.78)% | | | | | | (3.86)% | (B) | |
| Supplementary Data: | | | | | | | | | | | | | | | | | | | | | | | | | | | |
Portfolio Turnover Rate | | | 108% | | | | | 100% | | | | | 99% | | | | | | 146% | | | | | | 165% | (A) | |
Net Assets at End of Period (in thousands) | | $ | 39,407 | | | | $ | 14,810 | | | | $ | 6,608 | | | | | $ | 6,170 | | | | | $ | 2,485 | | |
|
| * | | From the period February 1, 2002 (commencement of operations) to October 31, 2002. |
| 1 | | Calculated based on shares outstanding on the first and last day of the respective periods, except for dividends and distributions, if any, which are based on the actual shares outstanding on the dates of distributions. |
| 2 | | Less than $0.01 |
| 3 | | Reflects fees waived by FBR Fund Advisers, Inc. pursuant to a contractual expense limitation of 1.95%. |
| 4 | | The amounts shown for a share outstanding throughout the respective periods may not be in accordance with the changes in the aggregate gains and losses on investments during the respective periods because of the timing of sales and repurchases of Fund shares in relation to fluctuating net asset values during the respective periods. |
| 5 | | Total investment return is calculated assuming a purchase of shares on the first day and a sale on the last day of each period reported and will include reinvestment of dividends and distributions, if any. |
| (A) | | Not Annualized |
| (B) | | Annualized |
70
| The FBR Funds |
|
| Financial Highlights (continued) |
| | | FBR Small Cap Fund |
| | |
|
| | | For the Years Ended October 31, |
| | |
|
| | | 2006 | | | | 2005 | | | | 2004 | | | | 2003 | | | | 2002 | |
| | |
| | | |
| | | |
| | | |
| | | |
| |
| Per Share Operating Performance: | | | | | | | | | | | | | | | | | | | | | | | | |
Net Asset Value – Beginning of Year | | $ | 40.36 | | | | $ | 37.68 | | | | $ | 31.57 | | | | $ | 21.15 | | | | $ | 19.97 | |
| | |
| | | |
| | | |
| | | |
| | | |
| |
Income (Loss) from Investment Operations: | | | | | | | | | | | | | | | | | | | | | | | | |
Net Investment Loss1,3 | | | (0.43 | ) | | | | (0.27 | ) | | | | (0.17 | ) | | | | (0.11 | ) | | | | (0.25 | ) |
Net Realized and Unrealized Gain on Investments1,4 | | | 10.20 | | | | | 3.51 | | | | | 6.30 | | | | | 10.50 | | | | | 1.50 | |
| | |
| | | |
| | | |
| | | |
| | | |
| |
Total from Investment Operations | | | 9.77 | | | | | 3.24 | | | | | 6.13 | | | | | 10.39 | | | | | 1.25 | |
| | |
| | | |
| | | |
| | | |
| | | |
| |
Distributions to Shareholders: | | | | | | | | | | | | | | | | | | | | | | | | |
From Net Realized Gain | | | (0.77 | ) | | | | (0.57 | ) | | | | (0.03 | ) | | | | — | | | | | (0.17 | ) |
| | |
| | | |
| | | |
| | | |
| | | |
| |
Paid-in Capital from Redemption Fees | | | 0.00 | 2 | | | | 0.01 | | | | | 0.01 | | | | | 0.03 | | | | | 0.10 | |
| | |
| | | |
| | | |
| | | |
| | | |
| |
Net Increase in Net Asset Value | | | 9.00 | | | | | 2.68 | | | | | 6.11 | | | | | 10.42 | | | | | 1.18 | |
| | |
| | | |
| | | |
| | | |
| | | |
| |
Net Asset Value – End of Year | | $ | 49.36 | | | | $ | 40.36 | | | | $ | 37.68 | | | | $ | 31.57 | | | | $ | 21.15 | |
| | |
| | | |
| | | |
| | | |
| | | |
| |
| Total Investment Return5 | | | 24.53% | | | | | 8.63% | | | | | 19.46% | | | | | 49.27% | | | | | 6.76% | |
| Ratios to Average Net Assets: | | | | | | | | | | | | | | | | | | | | | | | | |
Expenses After Waivers3 | | | 1.38% | | | | | 1.50% | | | | | 1.59% | | | | | 1.60% | | | | | 1.94% | |
Expenses Before Waivers | | | 1.40% | | | | | 1.53% | | | | | 1.59% | | | | | 1.60% | | | | | 2.07% | |
Net Investment Loss After Waivers3 | | | (0.94)% | | | | | (0.56)% | | | | | (0.75)% | | | | | (0.75)% | | | | | (1.39)% | |
Net Investment Loss Before Waivers | | | (0.96)% | | | | | (0.59)% | | | | | (0.75)% | | | | | (0.75)% | | | | | (1.52)% | |
| Supplementary Data: | | | | | | | | | | | | | | | | | | | | | | | | |
Portfolio Turnover Rate | | | 3% | | | | | 20% | | | | | 19% | | | | | 16% | | | | | 13% | |
Net Assets at End of Year (in thousands) | | $ | 929,590 | | | | $ | 805,858 | | | | $ | 825,497 | | | | $ | 343,824 | | | | $ | 28,803 | |
|
| 1 | | Calculated based on shares outstanding on the first and last day of the respective periods, except for dividends and distributions, if any, which are based on the actual shares outstanding on the dates of distributions. |
| 2 | | Less than $0.01 |
| 3 | | Reflects fees waived by FBR Fund Advisers, Inc. pursuant to a contractual expense limitation of 1.95% and fees voluntarily waived by the Distributor in an amount attributable to marketing expenses for the Fund while closed to new investors. |
| 4 | | The amounts shown for a share outstanding throughout the respective periods may not be in accordance with the changes in the aggregate gains and losses on investments during the respective periods because of the timing of sales and repurchases of Fund shares in relation to fluctuating net asset values during the respective periods. |
| 5 | | Total investment return is calculated assuming a purchase of shares on the first day and a sale on the last day of each period reported and will include reinvestment of dividends and distributions, if any. |
71
| The FBR Funds |
|
| Financial Highlights (continued) |
| | | | FBR Small Cap Financial Fund |
| | | |
|
| | | | For the Years Ended October 31, |
| | | |
|
| | | | 2006 | | | | 2005 | | | | 2004 | | | | 2003 | | | | 2002 | |
| | | |
| | | |
| | | |
| | | |
| | | |
| |
| Per Share Operating Performance: | | | | | | | | | | | | | | | | | | | | | | | | | |
Net Asset Value – Beginning of Year | | | $ | 32.96 | | | | $ | 36.41 | | | | $ | 32.56 | | | | $ | 24.38 | | | | $ | 20.53 | |
| | | |
| | | |
| | | |
| | | |
| | | |
| |
Income from Investment Operations: | | | | | | | | | | | | | | | | | | | | | | | | | |
Net Investment Income1,3 | | | | 0.14 | | | | | 0.23 | | | | | 0.13 | | | | | 0.05 | | | | | 0.15 | |
Net Realized and Unrealized Gain on Investments1,4 | | | | 3.44 | | | | | 0.85 | | | | | 4.40 | | | | | 8.88 | | | | | 4.35 | |
| | | |
| | | |
| | | |
| | | |
| | | |
| |
Total from Investment Operations | | | | 3.58 | | | | | 1.08 | | | | | 4.53 | | | | | 8.93 | | | | | 4.50 | |
| | | |
| | | |
| | | |
| | | |
| | | |
| |
Distributions to Shareholders: | | | | | | | | | | | | | | | | | | | | | | | | | |
From Net Investment Income | | | | (0.14 | ) | | | | (0.18 | ) | | | | (0.07 | ) | | | | (0.13 | ) | | | | (0.47 | ) |
From Net Realized Gain | | | | (3.70 | ) | | | | (4.36 | ) | | | | (0.65 | ) | | | | (0.64 | ) | | | | (0.34 | ) |
| | | |
| | | |
| | | |
| | | |
| | | |
| |
Total Distributions | | | | (3.84 | ) | | | | (4.54 | ) | | | | (0.72 | ) | | | | (0.77 | ) | | | | (0.81 | ) |
| | | |
| | | |
| | | |
| | | |
| | | |
| |
Paid-in Capital from Redemption Fees | | | | 0.00 | 2 | | | | 0.01 | | | | | 0.04 | | | | | 0.02 | | | | | 0.16 | |
| | | |
| | | |
| | | |
| | | |
| | | |
| |
Net Increase (Decrease) in Net Asset Value | | | | (0.26 | ) | | | | (3.45 | ) | | | | 3.85 | | | | | 8.18 | | | | | 3.85 | |
| | | |
| | | |
| | | |
| | | |
| | | |
| |
Net Asset Value – End of Year | | | $ | 32.70 | | | | $ | 32.96 | | | | $ | 36.41 | | | | $ | 32.56 | | | | $ | 24.38 | |
| | | |
| | | |
| | | |
| | | |
| | | |
| |
| Total Investment Return5 | | | | 11.81% | | | | | 2.63% | | | | | 14.29% | | | | | 37.80% | | | | | 23.37% | |
| Ratios to Average Net Assets: | | | | | | | | | | | | | | | | | | | | | | | | | |
Expenses After Waivers3 | | | | 1.46% | | | | | 1.55% | | | | | 1.59% | | | | | 1.57% | | | | | 1.56% | |
Expenses Before Waivers | | | | 1.46% | | | | | 1.55% | | | | | 1.59% | | | | | 1.57% | | | | | 1.56% | |
Net Investment Income After Waivers3 | | | | 0.45% | | | | | 0.69% | | | | | 0.40% | | | | | 0.26% | | | | | 0.54% | |
Net Investment Income Before Waivers | | | | 0.45% | | | | | 0.69% | | | | | 0.40% | | | | | 0.26% | | | | | 0.54% | |
| Supplementary Data: | | | | | | | | | | | | | | | | | | | | | | | | | |
Portfolio Turnover Rate | | | | 8% | | | | | 15% | | | | | 36% | | | | | 16% | | | | | 44% | |
Net Assets at End of Year (in thousands) | | | $ | 346,155 | | | | $ | 463,333 | | | | $ | 594,625 | | | | $ | 513,808 | | | | $ | 319,762 | |
|
| 1 | | Calculated based on shares outstanding on the first and last day of the respective periods, except for dividends and distributions, if any, which are based on the actual shares outstanding on the dates of distributions. |
| 2 | | Less than $0.01 |
| 3 | | Reflects fees waived by FBR Fund Advisers, Inc. pursuant to a contractual expense limitation of 1.95%. |
| 4 | | The amounts shown for a share outstanding throughout the respective periods may not be in accordance with the changes in the aggregate gains and losses on investments during the respective periods because of the timing of sales and repurchases of Fund shares in relation to fluctuating net asset values during the respective periods. |
| 5 | | Total investment return is calculated assuming a purchase of shares on the first day and a sale on the last day of each period reported and will include reinvestment of dividends and distributions, if any. |
72
| The FBR Funds |
|
| Financial Highlights (continued) |
| | | FBR Small Cap Technology Fund |
| | |
| |
| | | | | | | | | | | | For the Period | |
| | | For the Years Ended October 31, | | | Ended | |
| | |
| | | October 31, | |
| | | 2006 | | | | 2005 | | | 2004* | |
| | |
| | | |
| | |
| |
| Per Share Operating Performance: | | | | | | | | | | | | | | | |
Net Asset Value – Beginning of Period | | $ | 9.46 | | | | $ | 8.88 | | | | $ | 10.00 | | |
| | |
| | | |
| | | |
| | |
Income (Loss) from Investment Operations: | | | | | | | | | | | | | | | |
Net Investment Loss1,3 | | | (0.15 | ) | | | | (0.16 | ) | | | | (0.11 | ) | |
Net Realized and Unrealized Gain (Loss) on Investments1,4 | | | 2.02 | | | | | 0.70 | | | | | (1.06 | ) | |
| | |
| | | |
| | | |
| | |
Total from Investment Operations | | | 1.87 | | | | | 0.54 | | | | | (1.17 | ) | |
| | |
| | | |
| | | |
| | |
Paid-in Capital from Redemption Fees | | | 0.01 | | | | | 0.04 | | | | | 0.05 | | |
| | |
| | | |
| | | |
| | |
Net Increase (Decrease) in Net Asset Value | | | 1.88 | | | | | 0.58 | | | | | (1.12 | ) | |
| | |
| | | |
| | | |
| | |
Net Asset Value – End of Period | | $ | 11.34 | | | | $ | 9.46 | | | | $ | 8.88 | | |
| | |
| | | |
| | | |
| | |
| Total Investment Return5 | | | 19.87% | | | | | 6.53% | | | | | (11.20)% | (A) | |
| Ratios to Average Net Assets: | | | | | | | | | | | | | | | |
Expenses After Waivers and Related Reimbursements3 | | | 1.95% | | | | | 1.95% | | | | | 1.95% | (B) | |
Expenses Before Waivers and Related Reimbursements | | | 5.45% | | | | | 9.14% | | | | | 6.43% | (B) | |
Net Investment Loss After Waivers and Related Reimbursements3 | | | (1.65)% | | | | | (1.68)% | | | | | (1.79)% | (B) | |
Net Investment Loss Before Waivers and Related Reimbursements | | | (5.15)% | | | | | (8.87)% | | | | | (6.27)% | (B) | |
| Supplementary Data: | | | | | | | | | | | | | | | |
Portfolio Turnover Rate | | | 152% | | | | | 246% | | | | | 150% | (A) | |
Net Assets at End of Period (in thousands) | | $ | 3,592 | | | | $ | 1,759 | | | | $ | 1,440 | | |
|
| * | | For the period January 20, 2004 (commencement of operations) to October 31, 2004. |
| 1 | | Calculated based on shares outstanding on the first and last day of the respective periods, except for dividends and distributions, if any, which are based on the actual shares outstanding on the dates of distributions. |
| 2 | | Less than $0.01 |
| 3 | | Reflects fees waived by FBR Fund Advisers, Inc. pursuant to a contractual expense limitation of 1.95%. |
| 4 | | The amounts shown for a share outstanding throughout the respective periods may not be in accordance with the changes in the aggregate gains and losses on investments during the respective periods because of the timing of sales and repurchases of Fund shares in relation to fluctuating net asset values during the respective periods. |
| 5 | | Total investment return is calculated assuming a purchase of shares on the first day and a sale on the last day of each period reported and will include reinvestment of dividends and distributions, if any. |
| (A) | | Not Annualized |
| (B) | | Annualized |
73
| The FBR Funds |
|
| Financial Highlights (continued) |
| | | | FBR Gas Utility Index Fund | | |
| | | |
| | |
| | | | | | | | | | | | | | | | | | For the | | | | | | | | | | | |
| | | | | | | | | | | | | | | | | | Period | | | For the Years Ended | | |
| | | | For the Years Ended October 31, | | | Ended | | | March 31, | | |
| | | |
| | | October 31, | | |
| | |
| | | | 2006 | | | | 2005 | | | | 2004 | | | 2003* | | | 2003 | | | | 2002 | | |
| | | |
| | | |
| | | |
| | |
| | |
| | | |
| | |
| Per Share Operating Performance: | | | | | | | | | | | | | | | | | | | | | | | | | | | | | | | |
Net Asset Value – Beginning of Period | | | $ | 17.25 | | | | $ | 14.67 | | | | $ | 12.51 | | | | $ | 10.41 | | | | $ | 15.53 | | | | $ | 19.42 | | |
| | | |
| | | |
| | | |
| | | |
| | | |
| | | |
| | |
Income (Loss) from Investment Operations: | | | | | | | | | | | | | | | | | | | | | | | | | | | | | | | |
Net Investment Income1,3 | | | | 0.50 | | | | | 0.52 | | | | | 0.38 | | | | | 0.20 | | | | | 0.43 | | | | | 0.49 | | |
Net Realized and Unrealized Gain (Loss) on Investments1,4 | | | | 2.34 | | | | | 2.47 | | | | | 2.17 | | | | | 2.08 | | | | | (5.12 | ) | | | | (1.86 | ) | |
| | | |
| | | |
| | | |
| | | |
| | | |
| | | |
| | |
Total from Investment Operations | | | | 2.84 | | | | | 2.99 | | | | | 2.55 | | | | | 2.28 | | | | | (4.69 | ) | | | | (1.37 | ) | |
| | | |
| | | |
| | | |
| | | |
| | | |
| | | |
| | |
Distributions to Shareholders: | | | | | | | | | | | | | | | | | | | | | | | | | | | | | | | |
From Net Investment Income | | | | (0.61 | ) | | | | (0.41 | ) | | | | (0.39 | ) | | | | (0.18 | ) | | | | (0.43 | ) | | | | (0.49 | ) | |
From Net Realized Gain | | | | — | | | | | — | | | | | — | | | | | — | | | | | — | | | | | (2.03 | ) | |
| | | |
| | | |
| | | |
| | | |
| | | |
| | | |
| | |
Total Distributions | | | | (0.61 | ) | | | | (0.41 | ) | | | | (0.39 | ) | | | | (0.18 | ) | | | | (0.43 | ) | | | | (2.52 | ) | |
| | | |
| | | |
| | | |
| | | |
| | | |
| | | |
| | |
Paid-in Capital from Redemption Fees | | | | 0.00 | 2 | | | | 0.00 | 2 | | | | 0.00 | 2 | | | | 0.00 | 2 | | | | — | | | | | — | | |
| | | |
| | | |
| | | |
| | | |
| | | |
| | | |
| | |
Net Increase (Decrease) in Net Asset Value | | | | 2.23 | | | | | 2.58 | | | | | 2.16 | | | | | 2.10 | | | | | (5.12 | ) | | | | (3.89 | ) | |
| | | |
| | | |
| | | |
| | | |
| | | |
| | | |
| | |
Net Asset Value – End of Period | | | $ | 19.48 | | | | $ | 17.25 | | | | $ | 14.67 | | | | $ | 12.51 | | | | $ | 10.41 | | | | $ | 15.53 | | |
| | | |
| | | |
| | | |
| | | |
| | | |
| | | |
| | |
| Total Investment Return5 | | | | 16.84% | | | | | 20.48% | | | | | 20.63% | | | | | 21.98% | (A) | | | | (30.40)% | | | | | ( 5.90)% | | |
| Ratios to Average Net Assets: | | | | | | | | | | | | | | | | | | | | | | | | | | | | | | | |
Expenses After Waivers3 | | | | 0.80% | | | | | 0.80% | | | | | 0.85% | | | | | 0.85% | (B) | | | | 0.85% | | | | | 0.85% | | |
Expenses Before Waivers | | | | 0.80% | | | | | 0.80% | | | | | 0.88% | | | | | 0.87% | (B) | | | | 0.86% | | | | | 0.85% | | |
Net Investment Income After Waivers3 | | | | 2.69% | | | | | 3.18% | | | | | 2.90% | | | | | 3.02% | (B) | | | | 3.58% | | | | | 2.88% | | |
Net Investment Income Before Waivers | | | | 2.69% | | | | | 3.18% | | | | | 2.87% | | | | | 3.00% | (B) | | | | 3.57% | | | | | 2.88% | | |
| Supplementary Data: | | | | | | | | | | | | | | | | | | | | | | | | | | | | | | | |
Portfolio Turnover Rate | | | | 16% | | | | | 20% | | | | | 34% | | | | | 5% | (A) | | | | 39% | | | | | 29% | | |
Net Assets at End of Period (in thousands) | | | $ | 270,031 | | | | $ | 295,804 | | | | $ | 220,545 | | | | $ | 184,818 | | | | $ | 145,663 | | | | $ | 224,681 | | |
|
| * | | Effective April 1, 2003, the Fund’s fiscal year end was changed to October 31. |
| 1 | | Calculated based on shares outstanding on the first and last day of the respective periods, except for dividends and distributions, if any, which are based on the actual shares outstanding on the dates of distributions. |
| 2 | | Less than $0.01 |
| 3 | | Reflects fees waived by FBR Fund Advisers, Inc. pursuant to a contractual expense limitation of 0.85%. |
| 4 | | The amounts shown for a share outstanding throughout the respective periods may not be in accordance with the changes in the aggregate gains and losses on investments during the respective periods because of the timing of sales and repurchases of Fund shares in relation to fluctuating net asset values during the respective periods. |
| 5 | | Total investment return is calculated assuming a purchase of shares on the first day and a sale on the last day of each period reported and will include reinvestment of dividends and distributions, if any. |
| (A) | | Not Annualized |
| (B) | | Annualized |
74
| The FBR Funds |
|
| Financial Highlights (continued) |
| | | | FBR Fund for Government Investors | | |
| | | |
| | |
| | | | | | | | | | | | | For the | | | | | | | | | | | | | | | | |
| | | | For the Years Ended | | | Period | | | For the Years Ended | | |
| | | | October 31, | | | Ended | | | December 31, | | |
| | | |
| | | October 31, | | |
| | |
| | | | 2006 | | | | 2005 | | | 2004* | | | 2003 | | | | 2002 | | | | 2001 | | |
| | | |
| | | |
| | |
| | |
| | | |
| | | |
| | |
| Per Share Operating Performance: | | | | | | | | | | | | | | | | | | | | | | | | | | | | | | | |
Net Asset Value – Beginning of Period | | | $ | 1.00 | | | | $ | 1.00 | | | | $ | 1.00 | | | | $ | 1.00 | | | | $ | 1.00 | | | | $ | 1.00 | | |
| | | |
| | | |
| | | |
| | | |
| | | |
| | | |
| | |
Income (Loss) from Investment Operations: | | | | | | | | | | | | | | | | | | | | | | | | | | | | | | | |
Net Investment Income1,3 | | | | 0.04 | | | | | 0.02 | | | | | 0.00 | 2 | | | | 0.00 | 2 | | | | 0.01 | | | | | 0.03 | | |
Net Realized Loss on Investments1,4 | | | | (0.00 | )2 | | | | (0.00 | )2 | | | | (0.00 | )2 | | | | (0.00 | )2 | | | | — | | | | | — | | |
| | | |
| | | |
| | | |
| | | |
| | | |
| | | |
| | |
Total From Investment Operations | | | | 0.04 | | | | | 0.02 | | | | | 0.00 | 2 | | | | 0.002 | | | | | 0.01 | | | | | 0.03 | | |
| | | |
| | | |
| | | |
| | | |
| | | |
| | | |
| | |
Distributions to Shareholders: | | | | | | | | | | | | | | | | | | | | | | | | | | | | | | | |
From Net Investment Income | | | | (0.04 | ) | | | | (0.02 | ) | | | | (0.00 | )2 | | | | (0.00 | )2 | | | | (0.01 | ) | | | | (0.03 | ) | |
| | | |
| | | |
| | | |
| | | |
| | | |
| | | |
| | |
Net Asset Value – End of Period | | | $ | 1.00 | | | | $ | 1.00 | | | | $ | 1.00 | | | | $ | 1.00 | | | | $ | 1.00 | | | | $ | 1.00 | | |
| | | |
| | | |
| | | |
| | | |
| | | |
| | | |
| | |
| Total Investment Return5 | | | | 3.89% | | | | | 1.96% | | | | | 0.42% | (A) | | | | 0.42% | | | | | 1.03% | | | | | 3.25% | | |
| Ratios to Average Net Assets: | | | | | | | | | | | | | | | | | | | | | | | | | | | | | | | |
Expenses After Waivers3 | | | | 0.85% | | | | | 0.76% | | | | | 0.75% | (B) | | | | 0.75% | | | | | 0.75% | | | | | 0.75% | | |
Expenses Before Waivers | | | | 0.85% | | | | | 0.86% | | | | | 0.85% | (B) | | | | 0.82% | | | | | 0.75% | | | | | 0.75% | | |
Net Investment Income After Waivers3 | | | | 3.81% | | | | | 1.92% | | | | | 0.50% | (B) | | | | 0.43% | | | | | 1.03% | | | | | 3.25% | | |
Net Investment Income Before Waivers | | | | 3.81% | | | | | 1.82% | | | | | 0.40% | (B) | | | | 0.36% | | | | | 1.03% | | | | | 3.25% | | |
| Supplementary Data: | | | | | | | | | | | | | | | | | | | | | | | | | | | | | | | |
Net Assets at End of Period (in thousands) | | | $ | 211,171 | | | | $ | 251,675 | | | | $ | 288,761 | | | | $ | 341,413 | | | | $ | 454,247 | | | | $ | 484,682 | | |
|
| * | | Effective March 1, 2004, the Fund’s fiscal year end changed to October 31. |
| 1 | | Calculated based on shares outstanding on the first and last day of the respective periods, except for dividends and distributions, if any, which are based on the actual shares outstanding on the dates of distributions. |
| 2 | | Less than $0.01 |
| 3 | | Prior to November 1, 2005, reflects fees waived by the Adviser pursuant to a contractual advisory fee waiver of 0.10%. |
| 4 | | The amounts shown for a share outstanding throughout the respective periods may not be in accordance with the changes in the aggregate gains and losses in investments during the respective periods because of the timing of sales and repurchases of Fund shares in relation to fluctuating net asset values during the respective periods. |
| 5 | | Total investment return is calculated assuming a purchase of shares on the first day and a sale on the last day of each period reported and will include reinvestment of dividends and distributions, if any. |
| (A) | | Not Annualized |
| (B) | | Annualized |
The accompanying notes are an integral part of the financial statements.
75
| The FBR Funds |
|
Schedule of Shareholder Expenses
(unaudited) |
As a shareholder of the Funds, you incur two types of costs: (1) transaction costs, including reinvested dividends or other distributions; redemption fees; and exchange fees; and (2) ongoing costs, including investment advisory fees; distribution (12b-1) fees; and other Fund expenses. This example is intended to help you understand your ongoing costs (in dollars) of investing in the Funds and to compare these costs with the ongoing costs of investing in other mutual funds.
The example is based on an investment of $1,000 invested at the beginning of the period and held for the entire period (May 1, 2006 through October 31, 2006).
Actual Expenses
The first line of the table on the following page provides information about actual account values and actual expenses. You may use the information in this line, together with the amount you invested, to estimate the expenses that you paid over the period. Simply divide your account value by $1,000 (for example, an $8,600 account value divided by $1,000 = 8.6), then multiply the result by the number in the first line under the heading entitled “Expenses Paid During the Six Months Ended October 31, 2006” to estimate the expenses you paid on your account during this period.
Hypothetical Example for Comparison Purposes
The second line of the table on the following page provides information about hypothetical account values and hypothetical expenses based on the Funds’ actual expense ratio and an assumed rate of return of 5% per year before expenses, which is not the Funds’ actual return. The hypothetical account values and expenses may not be used to estimate the actual ending account balance or expenses you paid for the period. You may use this information to compare the ongoing costs of investing in the Funds and other funds. To do so, compare this 5% hypothetical example with the 5% hypothetical examples that appear in the shareholder reports of the other funds.
76
| The FBR Funds |
|
Schedule of Shareholder Expenses (continued)
(unaudited) |
| | | | | | | | | Expenses Paid |
| | | Net Expense | | Beginning | | Ending | | During the |
| | | Ratio | | Account | | Account | | Six Months |
| | | Annualized | | Value | | Value | | Ended |
| | | October 31, 2006 | | May 1, 2006 | | October 31, 2006 | | October 31, 2006* |
| | |
| |
| |
| |
|
| Pegasus Fund | | | | | | | | |
Actual | | 1.94% | | $1,000.00 | | $1,034.10 | | $9.95 |
Hypothetical | | 1.94 | | 1,000.00 | | 1,015.42 | | 9.86 |
| Large Cap Financial Fund | | | | | | | | |
Actual | | 1.83 | | 1,000.00 | | 1,039.30 | | 9.41 |
Hypothetical | | 1.83 | | 1,000.00 | | 1,015.98 | | 9.30 |
| Large Cap Technology Fund | | | | | | | | |
Actual | | 1.87 | | 1,000.00 | | 990.10 | | 9.38 |
Hypothetical | | 1.87 | | 1,000.00 | | 1,015.78 | | 9.50 |
| Small Cap Fund | | | | | | | | |
Actual | | 1.38 | | 1,000.00 | | 1,009.80 | | 6.99 |
Hypothetical | | 1.38 | | 1,000.00 | | 1,018.25 | | 7.02 |
| Small Cap Financial Fund | | | | | | | | |
Actual | | 1.46 | | 1,000.00 | | 1,010.10 | | 7.40 |
Hypothetical | | 1.46 | | 1,000.00 | | 1,017.85 | | 7.43 |
| Small Cap Technology Fund | | | | | | | | |
Actual | | 1.95 | | 1,000.00 | | 994.70 | | 9.80 |
Hypothetical | | 1.95 | | 1,000.00 | | 1,015.38 | | 9.91 |
| Gas Utility Index Fund | | | | | | | | |
Actual | | 0.80 | | 1,000.00 | | 1,110.00 | | 4.25 |
Hypothetical | | 0.80 | | 1,000.00 | | 1,021.17 | | 4.08 |
| Fund for Government Investors | | | | | | | | |
Actual | | 0.85 | | 1,000.00 | | 1,021.70 | | 4.33 |
Hypothetical | | 0.85 | | 1,000.00 | | 1,020.92 | | 4.33 |
|
| * | Expenses are equal to the Fund’s annualized expense ratio, multiplied by the average account value over the period, multiplied by the number of days in most recent fiscal half-year then divided by 365. |
77
| The FBR Funds |
|
| Notes to Financial Statements |
1. Organization
The FBR Funds (the “Trust”) is registered under the Investment Company Act of 1940, as amended, (“1940 Act”) as an open-end management investment company. The Trust was organized as a business trust under the laws of the State of Delaware on September 29, 2003. The Trust currently consists of eight series which represent interests in one of the following investment portfolios: FBR Pegasus FundTM (“Pegasus Fund”), FBR Large Cap Financial Fund (“Large Cap Financial Fund”), FBR Large Cap Technology Fund (“Large Cap Technology Fund”), FBR Small Cap Fund (“Small Cap Fund”), FBR Small Cap Financial Fund (“Small Cap Financial Fund”), FBR Small Cap Technology Fund (“Small Cap Technology Fund”), FBR Gas Utility Index Fund (“Gas Utility Index Fund”) and FBR Fund for Government Investors (“Money Market Fund”), (each a “Fund” and collectively, the “Funds”). The Trust is authorized to issue an unlimited number of shares of beneficial interest with no par value which may be issued in more than one class or series. Each Fund offers one class of shares, which is offered as no-load shares.
The Pegasus Fund, a non-diversified fund, intends to invest in the stocks of companies of any size without regard to market capitalization. The investment objective of the Fund is capital appreciation.
The Large Cap Financial Fund, a non-diversified fund, intends to invest, under normal circumstances, at least 80% of its total assets in securities of large capitalization (“large-cap”) companies principally engaged in the business of financial services including, but not limited to, commercial banks, savings and loan associations, consumer and industrial finance companies, securities brokerage companies, insurance companies, real estate and leasing companies, holding companies for each of the foregoing types of business, or companies that combine some or all of these businesses. The investment objective of the Fund is capital appreciation.
The Large Cap Technology Fund, a non-diversified fund, intends to invest, under normal circumstances, at least 80% of its total assets in securities of large-cap companies that are principally engaged in the research, design, development, manufacturing or distributing products or services in the technology industry. The investment objective of the Fund is long-term capital appreciation.
The Small Cap Fund, a non-diversified fund, intends to invest, under normal circumstances, at least 80% of its total assets in securities of small capitalization (“small-cap”) companies. The investment objective of the Fund is capital appreciation.
The Small Cap Financial Fund, a non-diversified fund, intends to invest, under normal circumstances, at least 80% of its total assets in securities of small-cap companies principally engaged in the business of providing financial services to consumers and industry. The investment objective of the Fund is capital appreciation.
The Small Cap Technology Fund, a non-diversified fund, intends to invest, under normal circumstances, at least 80% of its total assets in securities of small-cap companies that are principally engaged in the research, design, development, manufacturing or distributing
78
| The FBR Funds |
|
| Notes to Financial Statements (continued) |
products or services in the technology industry. The investment objective of the Fund is long-term capital appreciation.
The Gas Utility Index Fund, a diversified fund, intends to invest, under normal circumstances, at least 85% of its net assets in the common stock of companies that have natural gas distribution and transmission operations. The investment objective of the Fund is income and capital appreciation.
The Money Market Fund, a diversified fund, intends to invest, under normal circumstances, at least 95% of its total assets in fixed-rate and floating-rate short-term instruments issued or guaranteed by the U.S. Government, its agencies or instrumentalities and in repurchase agreements secured by such instruments. The investment objective of the Fund is current income consistent with liquidity and preservation of capital.
2. Significant Accounting Policies
The following is a summary of the Funds’ significant accounting policies:
Portfolio Valuation — The net asset value per share (“NAV”) of each Fund is determined as of the close of regular trading on the New York Stock Exchange (“NYSE”) (normally 4:00 p.m., Eastern Time) on each business day that the exchange is open for trading. Each Fund’s securities are valued at the last sale price on the securities exchange or national securities market on which such securities are primarily traded. Securities that are quoted by NASDAQ are valued at the NASDAQ Official Closing Price. Securities not listed on an exchange or national securities market, or securities in which there were no transactions, are valued at the average of the most recent bid and ask prices, except in the case of open short positions where the ask price is used for valuation purposes. The bid price is used when no ask price is available. Short-term investments are carried at amortized cost, which approximates market value. Restricted securities, as well as securities or other assets for which market quotations are not readily available, or are not valued by a pricing service approved by the Funds’ Board of Trustees (the “Board”), are valued at fair value in good faith by, or at the direction of, the Board.
In September 2006, the Financial Accounting Standards Board (FASB) issued Statement on Financial Accounting Standards (SFAS) No. 157, “Fair Value Measurements.” This standard establishes a single authoritative definition of fair value, sets out a framework for measuring fair value and requires additional disclosures about fair value measurements. SFAS No. 157 applies to fair value measurements already required or permitted by existing standards. SFAS No. 157 is effective for financial statements issued for fiscal years beginning after November 15, 2007 and interim periods within those fiscal years. The changes to current generally accepted accounting principles from the application of this Statement relate to the definition of fair value, the methods used to measure fair value, and the expanded disclosures about fair value measurements. As of October 31, 2006, the Funds do not believe the adoption of SFAS No. 157 will impact the amounts reported in the financial statements, however, additional disclosures may be required about the inputs used to develop the measurements and the effect of certain of the measurements reported on the statement of changes in net assets for a fiscal period.
79
| The FBR Funds |
|
| Notes to Financial Statements (continued) |
Share Valuation — The NAV of each Fund is calculated by dividing the sum of the value of the securities held by each Fund, plus cash or other assets, minus all liabilities (including estimated accrued expenses) by the total number of shares outstanding of each Fund, rounded to the nearest cent. Each Fund’s shares will not be priced on the days on which the NYSE is closed for trading. The offering and redemption price per share of each Fund is equal to each Fund’s NAV. The Funds, except for the Money Market Fund, charge a 1% redemption fee on shares redeemed or exchanged within 90 days of purchase. These fees are deducted from the redemption proceeds otherwise payable to the shareholder. The Funds will retain the fee charged as paid-in capital and such fees become part of that Fund’s daily NAV calculation.
Investment Income — Dividend income is recorded on the ex-dividend date. Interest income, which includes the amortization of premium and accretion of discount, if any, is recorded on an accrual basis.
Expenses — The Funds pay all operational expenses, which are either charged directly to a Fund for which the expense is attributable or are allocated proportionately among the Funds based on allocation methods approved by the Board.
Distributions to Shareholders — Each Fund, except the Gas Utility Index Fund and Money Market Fund, declares and pays any dividends from its net investment income, if any, annually. The Gas Utility Index Fund declares and pays any such dividends quarterly. The Money Market Fund declares dividends each day the Fund is open for business and pays monthly. Distributions from net realized capital gains, if any, will be distributed at least annually for each Fund. Income and capital gain distributions are determined in accordance with U.S. federal income tax regulations.
Security Transactions — Security transactions are accounted for on the trade date. Securities sold are determined on a specific identification basis.
Estimates — The preparation of financial statements in accordance with U.S. generally accepted accounting principles requires management to make estimates and assumptions that may affect the reported amounts of assets and liabilities and disclosure of contingent assets and liabilities at the date of the financial statements and the reported amounts of income and expenses during the reporting period. Actual results could differ from those estimates.
Options — Each Fund, except the Gas Utility Index Fund and Money Market Fund, may buy and sell call and put options to hedge against changes in net asset value or to attempt to realize a greater current return. The risk associated with purchasing an option is that a Fund pays a premium whether or not the option is exercised. Additionally, a Fund bears the risk of loss of premium and change in market value should the counterparty not perform under the contract. Put and call options purchased are accounted for in the same manner as portfolio securities. The cost of securities acquired through the exercise of call options is increased by the premiums paid. The proceeds from securities sold through the exercise of put options are decreased by the premiums paid. When a Fund writes an option, an amount equal to the premium received by the Fund is recorded as a liability and is subsequently adjusted to the current market value of the option written. Premiums received from writing
80
| The FBR Funds |
|
| Notes to Financial Statements (continued) |
options which expire unexercised are recorded by a Fund on the expiration date as realized gains from options transactions.
The difference between the premium and the amount paid on effecting a closing purchase transaction, including brokerage commissions, is also treated as a realized gain, or if the premium is less than the amount paid for the closing purchase transaction, as a realized loss. If a call option is exercised, the premium is added to the proceeds from the sale of the underlying securities in determining whether a Fund has a realized gain or loss. If a put option is exercised, the premium reduces the cost basis of the securities purchased by a Fund. Each Fund’s use of written options involves, to varying degrees, elements of market risk in excess of the amount recognized in the Statement of Assets and Liabilities. The contract or notional amounts reflect the extent of a Fund’s involvement in these financial instruments. In writing an option, a Fund bears the market risk of an unfavorable change in the price of the security underlying the written option. Exercise of an option written by a Fund could result in a Fund selling or buying a security at a price different from the current market value. A Fund’s activities in written options are conducted through regulated exchanges, which do not result in counterparty credit risks. The Funds had no outstanding options at October 31, 2006.
Repurchase Agreements — The Pegasus Fund, Large Cap Financial Fund, Large Cap Technology Fund, Small Cap Fund, Small Cap Financial Fund, Small Cap Technology Fund and Gas Utility Index Fund (collectively the “Equity Funds”) and the Money Market Fund have agreed to purchase securities from financial institutions subject to the seller’s agreement to repurchase them at an agreed-upon time and price (“repurchase agreement”). The financial institutions with whom each Fund enters into repurchase agreements are banks and broker/dealers which the adviser considers creditworthy pursuant to criteria approved by the Board. The seller under a repurchase agreement will be required to maintain the value of the securities as collateral, subject to the agreement at not less than the repurchase price plus accrued interest. The adviser marks to market daily the value of the collateral, and, if necessary, requires the seller to maintain additional securities, to ensure that the value is not less than the repurchase price. Default by or bankruptcy of the seller would, however, expose each Fund to possible loss because of adverse market action or delays in connection with the disposition of the underlying securities.
Securities Lending — Each Fund may lend its portfolio securities to broker-dealers, banks or institutional borrowers of securities. Loans of securities are required at all times to be secured by collateral equal to at least 100% of the market value of the securities on loan. However, in the event of default or bankruptcy by the other party to the agreement, realization and/or retention of the collateral may be subject to legal proceedings. In the event that the borrower fails to return securities, and cash collateral being maintained by the borrower is insufficient to cover the value of loaned securities and provided such collateral insufficiency is not the result of investment losses, the lending agent has agreed to pay the amount of the shortfall to the Funds. The Funds had no securities on loan to brokers at October 31, 2006.
81
| The FBR Funds |
|
| Notes to Financial Statements (continued) |
Line of Credit — The Trust has a line of credit (“Credit Agreement”) with Custodial Trust Company (“CTC”) for temporary or emergency purposes. Under the Credit Agreement, CTC provides a line of credit in an amount up to the maximum amount permitted under the 1940 Act and each Fund’s prospectus. Pursuant to the Credit Agreement, each participating Fund is liable only for principal and interest payments related to borrowings made by that Fund. Borrowings under the Credit Agreement bear interest at 100 basis points (100 basis points = 1%) over the LIBOR (London Inter-Bank Offer Rate). The Funds had no borrowings outstanding at October 31, 2006.
3. Transactions with Affiliates
Investment Adviser — FBR Fund Advisers, Inc. (“Fund Advisers”) serves as investment adviser to the Funds. For its advisory services, Fund Advisers receives a monthly fee at an annual rate of 0.90% of the average daily net assets of the Pegasus Fund, Large Cap Financial Fund, Large Cap Technology Fund, Small Cap Fund, Small Cap Financial Fund and Small Cap Technology Fund, and at an annual rate of 0.40% of the average daily net assets of the Gas Utility Index Fund. The Money Market Fund pays a management fee at an annual rate based on the Fund’s average daily net assets of 0.50% on the first $500 million, 0.45% on the next $250 million, 0.40% on the next $250 million, and 0.35% on net assets over $1 billion.
Fund Advisers has contractually agreed to limit each Fund’s total operating expenses to 1.95% of each Fund’s average daily net assets, except for the Gas Utility Index Fund and Money Market Fund, which Fund Advisers has contractually agreed to limit total operating expenses to 0.85% and 1.00% of average daily net assets, respectively. Fund Advisers has agreed to maintain these limitations with regard to each Fund through November 1, 2007.
Fund Advisers has retained Akre Capital Management, LLC (“ACM”) as investment sub-adviser to the Small Cap Fund. In this capacity, subject to the supervision of Fund Advisers and the Board, ACM directs the investments of the Small Cap Fund’s assets, continually conducts investment research and supervision for the Small Cap Fund, and is responsible for the purchase and sale of the Small Cap Fund’s investments. For these services, Fund Advisers (and not the Fund) pays ACM a fee out of the Adviser’s advisory fee.
Administrator — Fund Advisers provides day-to-day administrative services including monitoring portfolio compliance, determining compliance with provisions of the Internal Revenue Code, oversight of the service providers and preparing the Funds’ registration statements. Pursuant to the Administration Agreement, Fund Advisers receives a fee of 0.06% on the first $2 billion of total average daily net assets of the Funds, 0.05% on the next $1 billion of total average daily net assets of the Funds and 0.035% on the Funds’ average daily net assets in excess of $3 billion. Fund Advisers also provides the Funds with office space, facilities and business equipment and generally administers the Funds’ business affairs and provides the services of executive and clerical personnel for administering the affairs of the Funds. Fund Advisers compensates all personnel, Officers, and Trustees of the Funds if such persons are employees of the Investment Adviser or Administrator. As of November 1, 2005, the Funds have contracted directly with a third
82
| The FBR Funds |
|
| Notes to Financial Statements (continued) |
party, Integrated Investment Services, Inc. (formerly Integrated Fund Services, Inc.), for transfer agency and fund accounting services, and the Funds pay for all operating costs.
Plan of Distribution — The Trust, on behalf of each Fund, except the Gas Utility Index Fund and Money Market Fund, has adopted a Distribution Plan (the “Plan”) pursuant to Rule 12b-1 under the 1940 Act. Under the Plan, each Fund may pay FBR Investment Services, Inc. (the “Distributor”) a fee at an annual rate of up to 0.25% of each Fund’s average daily net assets. Fees paid to the Distributor under the Plan are payable without regard to actual expenses incurred. The Distributor has voluntarily agreed to waive a portion of the distribution fees payable by the Small Cap Fund in an amount attributable to marketing expenses for the Fund until such time as the Fund is reopened to new investors.
Brokerage Commissions — For the year ended October 31, 2006, the Small Cap Financial Fund paid $17,704 in brokerage commissions from portfolio transactions to Friedman, Billings, Ramsey and Co., Inc. (FBR & Co.), an affiliate of Fund Advisers and the Distributor. No other Fund paid commissions to FBR & Co. during the period.
Trustees’ Fees — Each Trustee of the Trust who is not an employee of the Adviser or affiliate of the Adviser receives an annual retainer fee of $14,000 and an additional meeting fee of $2,250 for each quarterly meeting attended. In addition, each Trustee that serves on the Audit Committee or Nominating Committee receives a meeting fee of $1,000 for attendance at the meeting. If a Trustee participates by teleconference, the meeting fee is 50% of the respective in-person meeting fee. The Chairman of the Board, an independent Trustee, receives an additional $1,000 for each meeting attended.
4. Investment Transactions
For the year ended October 31, 2006, purchases and sales of investment securities (excluding short-term securities and U.S. government obligations) for each Fund were as follows:
| | | Purchases | | Sales |
| | |
| |
|
| Pegasus Fund | | $23,995,197 | | $ | 12,198,493 |
| Large Cap Financial Fund | | 15,912,341 | | | 13,548,842 |
| Large Cap Technology Fund | | 39,251,667 | | | 23,326,004 |
| Small Cap Fund | | 21,692,560 | | | 111,990,504 |
| Small Cap Financial Fund | | 29,492,232 | | | 118,899,531 |
| Small Cap Technology Fund | | 5,803,598 | | | 4,343,917 |
| Gas Utility Index Fund | | 42,081,672 | | | 103,741,840 |
5. Federal Income Taxes
It is each Fund’s policy to comply with the special provisions of the Internal Revenue Code of 1986, as amended, applicable to regulated investment companies. As provided therein, in any fiscal year in which a Fund so qualifies and distributes at least 90% of its taxable net income, the Fund (but not the shareholders) will be relieved of federal income tax on the income distributed. Accordingly, no provision for income taxes has been made.
83
| The FBR Funds |
|
| Notes to Financial Statements (continued) |
In order to avoid imposition of the excise tax applicable to regulated investment companies, it is also each Fund’s intention to declare and pay as dividends in each calendar year at least 98% of its net investment income (earned during the calendar year) and 98% of its net realized capital gains (earned during the twelve months ending October 31) plus undistributed amounts from prior years.
Income and capital gain distributions are determined in accordance with income tax regulations that may differ from accounting principles that are generally accepted in the United States of America. As a result, the character of tax-basis distributions and the composition of net assets for tax purposes may differ from those reflected in the Funds’ financial statements. These book/tax differences may be temporary or permanent in nature. Temporary differences are primarily the result of wash sales. Reclassifications for permanent differences are made to components of capital. These reclassifications have no effect on net assets or net asset value per share.
| The tax character of distributions paid for each Fund’s tax year was as follows: | | | | | | | | | | | | |
| | | | Ordinary Income | | | Long-Term Capital Gains |
| | |
| |
|
| | | Dollar | | Per share | | Dollar | | Per share |
| | | Amount | | Amount | | Amount | | Amount |
| | |
| |
| |
| |
|
| Pegasus Fund | | | | | | | | | | | | |
For the Year Ended October 31, 2006 | | $ | 1,131 | | $ | 0.004657 | | $ | — | | $ | — |
For the Year Ended October 31, 2005 | | | — | | | — | | | — | | — |
| Large Cap Financial Fund | | | | | | | | | | | |
For the Year Ended October 31, 2006 | | | 231,630 | | | 0.158660 | | | 3,691,188 | | 2.856242 |
For the Year Ended October 31, 2005 | | | 1,139,465 | | | 0.900999 | | | 2,502,844 | | 2.000403 |
| Large Cap Technology Fund | | | | | | | | | | | |
For the Year Ended October 31, 2006 | | | 278,046 | | | 0.172572 | | | 654,245 | | 0.406063 |
For the Year Ended October 31, 2005 | | | 456,981 | | | 0.769208 | | | 507,449 | | 0.854158 |
| Small Cap Fund | | | | | | | | | | | |
For the Year Ended October 31, 2006 | | | — | | | — | | | 14,760,977 | | 0.769867 |
For the Year Ended October 31, 2005 | | | 7,424,560 | | | 0.342813 | | | 6,107,872 | | 0.232018 |
| Small Cap Financial Fund | | | | | | | | | | | |
For the Year Ended October 31, 2006 | | | 2,080,797 | | | 0.144159 | | | 49,145,199 | | 3.703541 |
For the Year Ended October 31, 2005 | | | 5,438,732 | | | 0.294938 | | | 72,966,205 | | 4.253542 |
| Small Cap Technology Fund | | | | | | | | | | | |
For the Year Ended October 31, 2006 | | | — | | | — | | | — | | — |
For the Year Ended October 31, 2005 | | | — | | | — | | | — | | — |
| Gas Utility Index Fund | | | | | | | | | | | |
For the Year Ended October 31, 2006 | | | 9,174,876 | | | 0.609932 | | | — | | — |
For the Year Ended October 31, 2005 | | | 6,644,316 | | | 0.410258 | | | — | | — |
| Fund for Government Investors | | | | | | | | | | | |
For the Year Ended October 31, 2006 | | | 9,042,605 | | | 0.038269 | | | — | | — |
For the Year Ended October 31, 2005 | | | 5,300,978 | | | 0.019400 | | | — | | — |
84
| The FBR Funds |
|
| Notes to Financial Statements (continued) |
The following information is computed on a tax basis for each item:
| | | As of October 31, 2006 |
| | |
|
| | | Pegasus | | Large Cap | | Large Cap | | Small Cap |
| | | Fund | | Financial Fund | | Technology Fund | | Fund |
| | |
| |
| |
| |
|
| Tax cost of investment securities | | | $ | 12,805,230 | | | | $ | 23,156,495 | | | | $ | 39,180,312 | | | | $ | 537,586,650 | |
| | | |
| | | |
| | | |
| | | |
| |
| Gross unrealized appreciation | | | | 740,264 | | | | | 3,767,072 | | | | | 2,492,927 | | | | | 402,228,397 | |
| Gross unrealized depreciation | | | | (162,882 | ) | | | | (187,863 | ) | | | | (789,587 | ) | | | | (8,972,500 | ) |
| | | |
| | | |
| | | |
| | | |
| |
| Net unrealized appreciation | | | | 577,382 | | | | | 3,579,209 | | | | | 1,703,340 | | | | | 393,255,897 | |
| Undistributed ordinary income | | | | 585,228 | | | | | 122,823 | | | | | 718,645 | | | | | — | |
| Undistributed long-term capital gains | | | | — | | | | | 2,416,486 | | | | | 677,401 | | | | | 2,383,019 | |
| Capital loss carryforward | | | | — | | | | | — | | | | | — | | | | | — | |
| Other temporary differences | | | | — | | | | | — | | | | | — | | | | | — | |
| | | |
| | | |
| | | |
| | | |
| |
| Accumulated earnings | | | $ | 1,162,610 | | | | $ | 6,118,518 | | | | $ | 3,099,386 | | | | $ | 395,638,916 | |
| | | |
| | | |
| | | |
| | | |
| |
| | | | | | | | | | | | | | | | | | | | | |
| | | As of October 31, 2006 | |
| | |
|
| | | | | | | | | | | | | | | | | | Fund for |
| | | Small Cap | | Small Cap | | Gas Utility | | | Government |
| | | Financial Fund | | Technology Fund | | Index Fund | | Investors |
| | |
| |
| |
| |
|
| Tax cost of investment securities | | | $ | 258,850,194 | | | | $ | 3,548,006 | | | | $ | 149,944,396 | | | | $ | 210,893,586 | |
| | | |
| | | |
| | | |
| | | |
| |
| Gross unrealized appreciation | | | | 93,220,240 | | | | | 304,469 | | | | | 126,060,527 | | | | | — | |
| Gross unrealized depreciation | | | | (5,927,932 | ) | | | | (96,378 | ) | | | | (6,609,424 | ) | | | | — | |
| | | |
| | | |
| | | |
| | | |
| |
| Net unrealized appreciation | | | | 87,292,308 | | | | | 208,091 | | | | | 119,451,103 | | | | | — | |
| Undistributed ordinary income | | | | 1,573,107 | | | | | 124,829 | | | | | 269,784 | | | | | — | |
| Undistributed long-term capital gains | | | | 43,232,104 | | | | | 41,912 | | | | | — | | | | | — | |
| Capital loss carryforward | | | | — | | | | | — | | | | | (1,055,026 | ) | | | | (189,953 | ) |
| | | |
| | | |
| | | |
| | | |
| |
| Accumulated earnings | | | $ | 132,097,519 | | | | $ | 374,832 | | | | $ | 118,665,861 | | | | $ | (189,953 | ) |
| | | |
| | | |
| | | |
| | | |
| |
Unused capital loss carryforwards as of October 31, 2006, were as follows:
| | | Gas Utility | | Fund for | |
| | | Index Fund | | Government Investors | |
| | |
| |
| |
| October 31, 2011 | | $ | — | | | $ | 23,854 | | |
| October 31, 2012 | | | 1,055,026 | | | | 165,106 | | |
| October 31, 2013 | | | — | | | | 970 | | |
| October 31, 2014 | | | — | | | | 23 | | |
The capital loss carryforwards may be utilized in the current and future years to offset net realized capital gains, if any, prior to distributing such gains to shareholders.
85
| The FBR Funds |
|
| Notes to Financial Statements (continued) |
The following reclassifications, the result of permanent differences between financial statement and income tax reporting requirements, have been made to the components of capital.
| | | | | | | | Accumulated | | | | |
| | | Undistributed | | Net Realized | | Paid-In |
| | | Income (Loss) | | Gain (Loss) | | Capital |
| | |
| |
| |
|
| Pegasus Fund | | | $ | 20,298 | | | | $ | (20,298 | ) | | $ | — | |
| Large Cap Technology Fund | | | | 138,653 | | | | | (138,653 | ) | | | — | |
| Small Cap Fund | | | | 8,007,752 | | | | | (274,415 | ) | | | (7,733,337 | ) |
| Small Cap Financial Fund | | | | (127,202 | ) | | | | 94,904 | | | | 32,298 | |
| Small Cap Technology Fund | | | | 48,023 | | | | | (48,023 | ) | | | — | |
On July 13, 2006, the Financial Accounting Standards Board (FASB) released FASB Interpretation No. 48 “Accounting for Uncertainty in Income Taxes” (FIN 48). FIN 48 provides guidance for how uncertain tax positions should be recognized, measured, presented and disclosed in the financial statements. FIN 48 requires the evaluation of tax positions taken or expected to be taken in the course of preparing the Funds’ tax returns to determine whether the tax positions are “more-likely-than-not” of being sustained by the applicable tax authority. Tax positions not deemed to meet the more-likely-than-not threshold would be recorded as a tax benefit or expense in the current year. Adoption of FIN 48 is required for fiscal years beginning after December 15, 2006 and is to be applied to all open tax years as of the effective date. Management is in the process of determining the impact of adoption.
6. Investments in Affiliates
Affiliated issuers, as defined by the 1940 Act, are those in which a Fund’s holdings represent 5% or more of the outstanding voting securities of the issuer. A summary of each Fund’s investments in affiliates, if any, for the year ended October 31, 2006, is noted below:
| | | SHARE ACTIVITY | | | | | | | | | | |
| | |
| | | | | | | | | | |
| | | Balance | | | | | | Balance | | | Realized | | | | | Value | | Acquisition |
| Affiliate | | 10/31/05 | | Purchases | | Sales | | 10/31/06 | | | Gain | | | Dividends | | 10/31/06 | | Cost |
|
| FBR Small Cap Fund | | | | | | | | | | | | | | | | | | |
Monarch Casino & Resort, Inc. | | 992,000 | | — | | — | | 992,000 | | | — | | | — | | $22,002,560 | | $4,511,967 |
| FBR Small Cap Financial Fund | | | | | | | | | | | | | | | | | | |
Pacific Premier Bancorp. Inc. | | 248,571 | | 21,900 | | — | | 270,471 | | | — | | | — | | 3,286,223 | | 2,778,989 |
7. Commitments and Contingencies
In the normal course of business, the Funds enter into contracts that contain a variety of representations and warranties and which provide general indemnifications. The Funds’ maximum exposure under these arrangements is unknown, as this would involve future claims that may be made against the Funds that have not yet occurred. However, based on experience, the Funds expect the risk of loss to be remote.
86
| The FBR Funds |
|
| Report of Independent Registered Public Accounting Firm |
To the Board of Trustees and Shareholders
The FBR Funds
Arlington, Virginia
We have audited the accompanying statements of assets and liabilities, including the portfolios of investments of the FBR Large Cap Financial Fund, FBR Small Cap Financial Fund, FBR Small Cap Fund, FBR Large Cap Technology Fund, FBR Small Cap Technology Fund, FBR Gas Utility Index Fund, FBR Pegasus FundTM, and FBR Fund for Government Investors (collectively the “Funds”), each a series of The FBR Funds as of October 31, 2006, and the related statements of operations of the Funds for the periods indicated thereon, the related statements of changes in net assets of the Funds for the periods indicated thereon, and the financial highlights of the Funds, except for FBR Gas Utility Index Fund and the FBR Fund For Government Investors, for the periods indicated thereon, the financial highlights of the FBR Gas Utility Index Fund for each of the three years in the period ended October 31, 2006, for the period from April 1, 2003 to October 31, 2003 and for the year ended March 31, 2003, and financial highlights of the FBR Fund for Government Investors for each of the two years in the period ended October 31, 2006 and for the period from January 1, 2004 to October 31, 2004. These financial statements and financial highlights are the responsibility of the Funds’ management. Our responsibility is to express an opinion on these financial statements and financial highlights based on our audits. The financial highlights of the FBR Fund for Government Investors for each of the two years in the period ended December 31, 2003 were audited by other auditors whose report dated February 20, 2004 expressed an unqualified opinion on such financial highlights. The financial highlights of FBR Gas Utility Index Fund for each of the two years in the period ended March 31, 2002 were audited by other auditors whose report dated April 19, 2002 expressed an unqualified opinion on such financial highlights.
We conducted our audits in accordance with standards of the Public Company Accounting Oversight Board (United States). Those standards require that we plan and perform the audit to obtain reasonable assurance about whether the financial statements and financial highlights are free of material misstatement. The Funds are not required to have, nor were we engaged to perform, an audit of the Funds’ internal control over financial reporting. Our audits included consideration of internal control over financial reporting as a basis for designing audit procedures that are appropriate in the circumstances, but not for the purposes of expressing an opinion on the effectiveness of the Funds’ internal control over financial reporting. Accordingly, we express no such opinion. An audit includes examining, on a test basis, evidence supporting the amounts and disclosures in the financial statements. Our procedures included confirmation of securities owned as of October 31, 2006, by correspondence with the custodian and brokers or by other appropriate auditing procedures where brokers did not reply to our confirmation requests. An audit also includes assessing the accounting principles used and significant estimates made by management, as well as evaluating the overall financial statement presentation. We believe that our audits provide a reasonable basis for our opinion.
87
| The FBR Funds |
|
Report of Independent Registered Public Accounting Firm
(continued) |
In our opinion, the financial statements and financial highlights referred to above present fairly, in all material respects, the financial position of the FBR Large Cap Financial Fund, FBR Small Cap Financial Fund, FBR Small Cap Fund, FBR Large Cap Technology Fund, FBR Small Cap Technology Fund, FBR Gas Utility Index Fund, FBR Pegasus FundTM and FBR Fund for Government Investors as of October 31, 2006, the results of their operations, the changes in their net assets, and the financial highlights for the periods referred to above, in conformity with accounting principles generally accepted in the United States of America.
TAIT, WELLER & BAKER LLP
Philadelphia, Pennsylvania
December 8, 2006
88
| The FBR Funds |
|
| Important Supplemental Information (unaudited) |
Dividends Received Deduction
For corporate shareholders, the following ordinary dividends paid during the year ended March 31, 2006 qualify for the corporate dividends received deduction:
| Pegasus Fund | | 16.45% | |
| Large Cap Financial Fund | | 28.79% | |
| Small Cap Financial Fund | | 71.70% | |
| Gas Utility Index Fund | | 98.83% | |
Proxy Voting Guidelines
Fund Advisers is responsible for exercising the voting rights associated with the securities purchased and held by the Funds. A description of the policies and procedures Fund Advisers uses in fulfilling this responsibility is included in the Funds’ Statement of Additional Information and is available without charge, upon request, by calling 888.888.0025. The policies and procedures are also available on the Securities and Exchange Commission’s website at http://www.sec.gov. Information on how the Funds voted proxies relating to portfolio securities during the most recent 12 month period ended June 30 is available without charge, upon request, by calling 888.888.0025 and is also available on the SEC’s website at http://www.sec.gov.
Portfolio Holdings
The Funds file their complete schedule of holdings with the SEC for the first and third quarters of each fiscal year on Form N-Q. The Funds’ Form N-Q is available on the SEC’s website, beginning with the July 31, 2004 report, at http://www.sec.gov. You may review and make copies at the SEC’s Public Reference Room in Washington, D.C. You may also obtain copies after paying a duplicating fee by writing the SEC’s Public Reference Room, Washington, D.C. 20549-0102 or by electronic request to publicinfo@sec.gov. Information on the operation of the Public Reference Room may be obtained by calling 800.SEC.0330. A copy of the quarterly holdings report is available, without charge, upon request, by calling 888.888.0025.
Approval of the Continuation of the Investment Advisory Agreements for the Funds
In accordance with the 1940 Act, the Board is required, on an annual basis, at an in-person meeting of the Board called for such purpose, to consider: (i) the continuation of the Investment Advisory Agreement with Fund Advisers with respect to each of the Funds and (ii) the continuation of the Sub-Investment Advisory Agreement with ACM with respect to the Small Cap Fund (collectively, the “Advisory Agreements”).
The relevant provisions of the 1940 Act specifically provide that it is the duty of the Board to request and evaluate such information as the Board determines is necessary to allow them to properly consider the continuation of the Advisory Agreements, and it is the duty of each of the Advisers to furnish the Trustees with such information that is reasonably necessary for the Trustees to evaluate the terms of the Advisory Agreements.
89
| The FBR Funds |
|
| Important Supplemental Information (unaudited) (continued) |
Accordingly, in determining whether to renew the Advisory Agreements, the Board requested, and the Advisers provided, information and data relevant to the Board’s consideration. This included information regarding the investment performance of the Funds and information regarding the fees and expenses of the Funds, as compared to other similar mutual funds.
As part of its deliberations, the Board also considered and relied upon the information about the Funds and the Advisers that had been provided to them throughout the year in connection with their regular Board meetings at which they engage in the ongoing oversight of the Funds and their operations. The Independent Trustees were counseled during this process by independent legal counsel, as such term is defined in the rules under the 1940 Act, who reviewed with them their duties and responsibilities with respect to their consideration of the continuation of the Advisory Agreements.
The Board held an in-person meeting on October 24, 2006, at which they considered the renewal of the Advisory Agreements and the Board engaged in a thorough review process to determine whether or not to continue the Advisory Agreements. During this meeting, the Board reviewed relevant information and data provided by the Advisers in response to written questions from the Independent Trustees and met with independent legal counsel to the Independent Trustees to discuss their evaluation of the information provided by the Advisers. The Board met with representatives of Fund Advisers and discussed with them, among other things, their investment process, the investment results of the Funds, compensation arrangements for the portfolio managers, brokerage practices used for the Funds, the cost of providing the services and the profitability of the advisory arrangements to the Advisers, the extent to which the Advisers had achieved economies of scale, the extent to which shareholders participated in those economies of scale, and matters relating to the distribution and marketing of the Funds.
The Board first reviewed matters with respect to the proposed continuation of the Investment Advisory Agreement with Fund Advisers in connection with the Equity Funds and the Money Market Fund. The Board reviewed information and materials regarding the investment advisory fees for the Equity Funds. Representatives of Fund Advisers stated that the investment advisory fees for the Equity Funds are not presently subject to any asset-based breakpoints, but that Fund Advisers has in place with respect to each of the Equity Funds an expense limitation agreement limiting total annual operating expenses of each of the Equity Funds which it indicated that it intended to continue maintaining for the Equity Funds for another year. The Board was also informed by representatives of Fund Advisers that the Money Market Fund is subject to asset-based breakpoints and that Fund Advisers also maintains an expense limitation agreement with respect to the Money Market Fund in order to limit the total annual operating expenses of the Money Market Fund and that it also intended to continue maintaining the expense limitation arrangement for the Money Market Fund for another year.
The Board then considered information regarding each of the Funds separately and reviewed with the representatives of Fund Advisers various performance and expense
90
| The FBR Funds |
|
| Important Supplemental Information (unaudited) (continued) |
information for each of the Funds, changes in total assets for each of the Funds, the costs of providing services, the profitability of each of the Funds to Fund Advisers, and distribution arrangements for each of the Funds, as follows:
1. Large Cap Financial Fund. The Board first reviewed information and materials regarding the Large Cap Financial Fund, noting the Fund’s fees, expenses and performance results, and compared such information to comparable funds and to the Fund’s relevant benchmark indexes. The Board members took note of the Large Cap Financial Fund’s investment performance for the one, three and five year periods and since inception. The Board then engaged in discussions with the portfolio manager for the Large Cap Financial Fund in order to review the investment operations of the Fund and he responded to questions from the Board regarding investment matters with respect to the Large Cap Financial Fund.
2. Small Cap Financial Fund. The Board next reviewed information and materials regarding the Small Cap Financial Fund, noting the Fund’s fees, expenses and performance results, and compared such information to comparable funds and to the Fund’s relevant benchmark indexes. The Board members took note of the Small Cap Financial Fund’s investment performance for the one, three and five year periods and since inception. The Board also took note of the fact that the Small Cap Financial Fund does a certain amount of brokerage transactions through FBR, and it was noted that information concerning the nature and amount of these affiliated brokerage transactions is reported to the Board on a quarterly basis in accordance with the Fund’s Rule 17e-1 reporting requirements. The Board concluded that, in light of all the circumstances, the level of trades placed through FBR was reasonable, especially in light of the fact that FBR is active in the markets for many financial services stocks, thus making it reasonable for the Fund to utilize FBR for some of its portfolio brokerage transactions. The Board then met with the portfolio manager for the Small Cap Financial Fund to discuss the investment operations of the Fund and he responded to questions from the Board regarding investment matters with respect to the Small Cap Financial Fund.
3. Small Cap Fund. The Board next reviewed information and materials regarding the Small Cap Fund, noting the Fund’s fees, expenses and performance results, and then compared such information to comparable funds and to the Fund’s relevant benchmark indexes. The Board reviewed information and material that had been submitted to them by ACM concerning ACM’s expenses in connection with managing the Small Cap Fund and the profitability of ACM’s relationship to the Fund. The Board took note of the performance results of the Small Cap Fund, the growth in assets of the Fund, and the investment strategies employed by ACM in connection with its sub-investment management of the Small Cap Fund. The Board considered the fact that the Fund has been closed to new investors since October 2004 and the Board re-opened the Small Cap Fund to new investors effective as of January 2, 2007 based upon a determination by ACM that sufficient investment opportunities currently exist for purposes of the investment of additional Fund assets. The Board members took note of the Small Cap Fund’s overall
91
| The FBR Funds |
|
| Important Supplemental Information (unaudited) (continued) |
investment performance for the one, three and five year periods and since inception. The Board also reviewed information regarding the terms of the Sub-Advisory Agreement and the amount of the sub-advisory fees paid to ACM by Fund Advisers pursuant to the Sub-Advisory Agreement.
4. Large Cap Technology Fund. The Board next reviewed information and materials regarding the Large Cap Technology Fund, noting the Fund’s fees, expenses and performance results, and then compared such information to comparable funds and to the Fund’s relevant benchmark indexes. The Board members took note of the Large Cap Technology Fund’s investment performance for the one year and three year periods and since the commencement of the Fund’s investment operations on February 1, 2002. The Board then engaged in discussions with the co-portfolio manager for the Large Cap Technology Fund in order to review the investment operations of the Fund and he responded to questions from the Board regarding investment matters with respect to the Large Cap Technology Fund.
5. Small Cap Technology Fund. The Board next reviewed information and materials regarding the Small Cap Technology Fund, noting the Fund’s fees, expenses and performance results, and then compared such information to comparable funds and to the Fund’s relevant benchmark indexes. The Board members took note of the Small Cap Technology Fund’s investment performance for the one year period and for the period since the Fund’s commencement of investment operations on January 20, 2004. The Board met with representatives of Fund Advisers to discuss the investment operations of the Fund and they responded to questions from the Board regarding investment matters with respect to the Small Cap Technology Fund.
6. Gas Utility Index Fund. The Board then reviewed information and materials regarding the Gas Utility Index Fund, noting the Fund’s fees, expenses and performance results, and compared such information to comparable funds and to the Fund’s relevant benchmark indexes. The Board took note of the fact that this is the only Fund among the Equity Funds that is operated as an index fund. The Board members also took note of the Gas Utility Index Fund’s investment performance for the one, three, five and 10-year periods and since inception. The Board then engaged in discussions with the portfolio manager for the Gas Utility Index Fund in order to review the investment operations of the Fund and he responded to questions from the Board regarding investment matters with respect to the Gas Utility Index Fund.
7. Pegasus Fund. The Board next reviewed information and materials regarding the Pegasus Fund, noting the Fund’s fees, expenses and performance results, and then compared such information to comparable funds and to the Fund’s relevant benchmark indexes. The Board members took note of the Pegasus Fund’s investment performance for the period since the Fund’s commencement of investment operations on November 15, 2005. The Board met with representatives of Fund Advisers to discuss the investment operations of the Fund and they responded to questions from the Board regarding investment matters with respect to the Pegasus Fund.
92
| The FBR Funds |
|
| Important Supplemental Information (unaudited) (continued) |
8. Fund for Government Investors (the Money Market Fund). The Board then considered matters with respect to the continuation of the Investment Advisory Agreement with Fund Advisers in connection with the Money Market Fund. The Board reviewed information and material that had been submitted to them by Fund Advisers and the Board discussed various matters with respect to the Money Market Fund with representatives of Fund Advisers, noting that the Money Market Fund is subject to an expense limitation agreement which limits the total annual operating expenses of the Money Market Fund and also noting that the Money Market Fund is subject to asset based breakpoints which provide for reduced investment advisory fees as assets in the Fund increase.
The Board reviewed the proposed continuation of each of the Advisory Agreements. Among the factors the Board considered was the overall performance of the Funds relative to the performance of other mutual funds in each Fund’s peer group on a long-term basis and over shorter time periods. The Board also took note of the long-term relationship between Fund Advisers and the Funds and the efforts that had been undertaken by Fund Advisers to foster the growth and development of the Funds since the inception of each of the Funds. In addition, the Board compared expenses of each Fund to the expenses of its peers, noting that the expenses for each of the Funds compared favorably with industry averages for other funds of similar size. They noted the range of investment advisory and administrative services provided by Fund Advisers and its affiliates to the Funds and the level and quality of these services, and in particular, they noted the quality of the personnel providing these services. The Board also reviewed financial information concerning Fund Advisers and its affiliates relating to the operation of the Funds, noting the overall profitability of the relationship with the Funds to Fund Advisers and the financial soundness of Fund Advisers as demonstrated by the financial information provided.
The Board further reviewed the Funds’ brokerage practices and best-execution procedures, and noted that these were reasonable and consistent with standard industry practice. The Board considered the receipt by the Advisers of research and execution services in exchange for payment of brokerage commissions. The Board noted that the Advisers do not maintain any formal agreements with firms to direct Fund brokerage in exchange for third party research and that the Advisers represented that trading done with various brokerage firms is done in a manner that is consistent with relevant requirements relating to the receipt of research in connection with brokerage transactions. The Board took note of the fact that a certain amount of brokerage for one of the Funds is handled by a brokerage affiliate of Fund Advisers, and the Board noted the Advisers’ representations that such brokerage is conducted in a manner consistent with applicable rules relating to brokerage placed through affiliated entities. The Board determined that the amount of affiliated brokerage was fair and reasonable and done in accordance with the applicable regulatory requirements. The Board also reviewed information regarding the manner in which the Funds’ affiliated broker utilizes certain electronic communications networks (“ECNs”) for purposes of effectuating portfolio trades for some of the Funds and the way in which the use of these ECNs can be beneficial to the brokerage firm when trading on behalf of the Funds.
93
| The FBR Funds |
|
| Important Supplemental Information (unaudited) (continued) |
The Board also took note of the fact that an affiliate of Fund Advisers, FBR Investment Services, Inc. (“FBRIS”), serves as the distributor of the shares of the Funds and receives distribution fees from the Funds for serving in that role. The Board considered and discussed the activities routinely engaged in by FBRIS in order to distribute and market the Funds. The Board reviewed the distribution arrangements maintained by FBRIS for the Funds, noting the extensive sales arrangements for the Funds on various mutual fund supermarket platforms and the manner in which the distribution fees paid by those of the Funds that pay distribution fees are utilized in connection with these arrangements.
The Board also considered and reviewed information regarding the administrative services fees paid to Fund Advisers by the Funds for providing certain types of administrative services. The Board determined that these administrative fees were fair and reasonable in connection with the types of services provided by Fund Advisers to the Funds and that they were reasonable fees to be paid in addition to the investment advisory fees paid by the Funds to Fund Advisers given that the administrative services are separate and distinct services apart from the investment advisory services being provided to the Funds by Fund Advisers.
The Independent Trustees then met separately with the independent legal counsel to the Independent Trustees in order to consider the proposed continuation of the Advisory Agreements. At the conclusion of their session, the Independent Trustees had determined that they had received sufficient information to allow them to take action with respect to their consideration of the continuation of the Advisory Agreements.
In reaching their conclusion with respect to the continuation of the Agreements, the Trustees did not identify any one single factor as being controlling, rather, the Board took note of a combination of factors that influenced their decision making process. The Board did, however, identify the overall favorable investment performance of the Funds, the commitment of Fund Advisers to the successful operation of the Funds, and the level of expenses of the Funds, as well as the continued use of expense limitation agreements in order to reduce the overall operating expenses of the Funds, as being important elements of their consideration. The Board also considered the effectiveness of the compliance programs of the Funds and the Advisers in accordance with applicable requirements relating to mutual funds and their investment advisers. Based upon their review and consideration of these factors and other matters deemed relevant by the Board in reaching an informed business judgment, a majority of the Board of Trustees, including a majority of the Independent Trustees, concluded that the terms of the Investment Advisory Agreements are fair and reasonable and the Board voted to renew the Agreements for an additional one-year period, subject to the applicable limitations on the total operating expenses of the Funds as considered and approved at the meeting.
94
| The FBR Funds |
|
| Important Supplemental Information (unaudited) (continued) |
Information About Trustees and Officers
Information pertaining to the Trustees and Officers of the Trust is set forth below. The address for each Trustee and Officer is 1001 Nineteenth Street North, Arlington, Virginia, 22209 unless otherwise stated. The statement of additional information (SAI) includes additional information about the Trustees and is available without charge upon request by calling 888.888.0025.
| | | Portfolios | | |
| | | Overseen in | | Other |
| | Position | the Trust | | Trusteeships/ |
| | Held* and | and Fund | Principal Occupation(s) | Directorships |
| Name, Age, Address, | Tenure** | Complex*** | during past 5 years | by Trustee |
| Michael A. Willner, 50 | Trustee
Since 1997
Chairman
Since 2006 | 8 | CEO AlphaGrip, Inc. January 2001 to present; President, New Traders, Inc. from September 1996 to December 2000. | AlphaGrip, Inc. |
| Charles O. Heller, 70 | Trustee
Since 2003 | 8 | Managing Director, Beacon Global Private Equity (venture capital firm), since 2003; Charles Heller Associates (management consulting), 1986 to present; Gabriel Venture Partners (venture capital firm), 2000-2003. | Walden University |
| Reena Aggarwal, 48 | Trustee
Since 2006 | 8 | Deputy Dean, McDonough School of Business, Georgetown University since 2005; Professor at Georgetown, 2000 to present. | None |
| William E. Cole, Jr., 56 | Trustee
Since 2006 | 8 | Retired, 2006. Partner, Ernst & Young LLP, 1972-2006. | None |
David Ellison†, 48
100 Federal Street
Boston, MA02110 | Trustee
Since 2003
President
Since 2001 | 8 | Director, CEO and President, FBR Fund Advisers, Inc., since December 1999; Portfolio Manager for Equity Funds since October 1996; and President Money Management Advisers, Inc., April 2001 - March 2002. | None |
Winsor H. Aylesworth, 59
100 Federal Street
Boston, MA 02110 | Executive Vice
President
Since 1999 | 8 | Portfolio Manager, FBR Fund Advisers, Inc. since September 1998; Vice President, Money Management Advisers, Inc., April 2001 - March 2002. | None |
| Bart Sanders, 42 | Executive Vice
President
Since 1999 | 8 | Senior Vice President of Fund Operations, FBR Fund Advisers, Inc. since August 1999. Head Trader for FBR Fund Advisers, Inc., since January 1997; and Vice President, Money Management Advisers, Inc. April 2001 - March 2002. | None |
| Kimberly J. Bradshaw, 32 | Treasurer
Since 2006
Secretary
Since 2003 | 8 | Secretary of The FBR Funds since July 2003. Treasurer of The FBR Funds since August 2006. Vice President and Secretary of Money Management Advisers, Inc. November 2003 to March 2006. Employee of FBR since August 1998, serving in various capacities, including Vice President Fund Administration, AVP of Fund Administration, Transfer Agent Operations Manager and Fund Accounting Supervisor. | None |
95
| The FBR Funds |
|
| Important Supplemental Information (unaudited) (continued) |
Information About Trustees and Officers (continued)
| | | Portfolios | | |
| | | Overseen in | | Other |
| | Position | the Trust | | Trusteeships/ |
| | Held* and | and Fund | Principal Occupation(s) | Directorships |
| Name, Age, Address, | Tenure** | Complex*** | during past 5 years | by Trustee |
| Kristin E. Swiderski, 30 | Assistant
Treasurer
Since 2006 | 8 | Assistant Treasurer of The FBR Funds since August 2006. Employee of FBR since February 2002, serving in various capacities including Assistant Vice President Fund Administration, Supervisor of Fund Administration, Accountant and Customer Service Representative. Prior to February 2002 Manager with Target. | None |
Guy F. Talarico, 51
41 Madison Avenue
30th Floor New York,
NY 10010 | Chief Compliance
Officer
Since 2006 | 8 | Chief Compliance Officer of the Trust since August 2006. CEO of ALARIC Compliance Services, LLC since January 2006. Co-Chief Executive Officer of EOS Compliance Services, LLC from June 2004 to December 2005. Senior Director of Investors Bank & Trust Institutional Custody Division From February 2001 to June 2004. | None |
| * | | Trustees serve until their resignation, removal, or death, or until they reach the mandatory retirement age of 75 established by the Board. The Trust’s President, Treasurer, and Secretary serve until their successor is chosen and qualified. The other Officers of the Trust serve at the pleasure of the Trustees. |
| ** | | Length of time served is measured from the earliest date of service as a Trustee or Officer of any of the Funds or the Predecessor Funds. |
| *** | | The “Fund Complex” consists of all mutual funds advised by Friedman, Billings Ramsey Group, Inc., (“FBR Group”) and its affiliate advisers. |
| † | | Mr. Ellison is considered to be an “Interested Trustee” of the Trust due to his position with FBR Fund Advisers. |
96
[THIS PAGE INTENTIONALLY LEFT BLANK]
[THIS PAGE INTENTIONALLY LEFT BLANK]
THE FBR FUNDS
888.888.0025
funds@fbr.com
www.fbrfunds.com
Investment Adviser and Administrator
FBR FUND ADVISERS, INC.
1001 NINETEENTH STREET NORTH
ARLINGTON, VIRGINIA 22209
Distributor
FBR INVESTMENT SERVICES, INC.
1001 NINETEENTH STREET NORTH
ARLINGTON, VIRGINIA 22209
Custodian
CARDINAL BANK
8270 GREENSBORO DRIVE
McLEAN, VIRGINIA 22102
Transfer Agent
INTEGRATED INVESTMENT SERVICES, INC.
P.O. BOX 5354
CINCINNATI, OHIO 45201
Independent Registered Public Accounting firm
TAIT, WELLER, AND BAKER LLP
1818 MARKET STREET
PHILADELPHIA, PENNSYLVANIA 19103
This report is not authorized
for distribution to prospective
investors unless it is preceded or
accompanied by a current prospectus.
ITEM 2. CODE OF ETHICS.
As of the end of the period covered by this report, Registrant had adopted a code of ethics (the “Code”) that applies to Registrant’s principal executive officer (“PEO”) and principal financial officer (“PFO”). There were no amendments to the Code during the period covered by the report. The Registrant did not grant any waivers, including implicit waivers, from any provisions of the Code to the PEO or PFO during the period covered by this report. The Registrant undertakes to provide a copy of such code to any person upon request, without charge, by calling 888.888.0025.
ITEM 3. AUDIT COMMITTEE FINANCIAL EXPERT.
The Board of Trustees determined at a meeting held October 24, 2006 that William E. Cole, Jr. qualifies as an Audit Committee Financial Expert and he is “independent” as defined under the relevant Securities and Exchange Commission rules and releases.
| ITEM 4. PRINCIPAL ACCOUNTANT FEES AND SERVICES. |
| (a) | Audit Fees – The aggregate fees billed for the professional services rendered by Tait, Weller & Baker, Registrant’s principal accountant for the audit of the Registrant’s annual financial statements, were $96,000 and $105,500 for all series of the Registrant for the fiscal year ended October 31, 2006 and 2005 respectively. |
| (b) | Audit Related Fees – The aggregate fees billed for assurance and related services rendered by Tait, Weller & Baker, Registrant’s principal accountant that are reasonably related to the performance of the audit of the Registrant’s financial statements and are not reported under paragraph (a) were $13,500 for all series of the Registrant for the fiscal year ended October 31, 2005. The Audit Related Fees pertain to services performed in connection with Rule 17f-2 of the Investment Company Act of 1940. In compliance with this rule the principal accountant performed three examinations during the year. There were no fees billed for assurance and related services by Tait Weller & Baker for the fiscal year ended October 31, 2006. |
| (c) | Tax Fees – The aggregate fees billed by Tait, Weller & Baker, Registrant’s principal accountant for tax compliance, tax advice and tax planning for completing federal and excise tax returns, were $21,600 in 2006 and $23,400 in 2005 for all series of the Registrant for the fiscal year ended October 31. |
| (d) | All Other Fees – There were no additional fees paid for audit and non-audit services other than those disclosed in (a) through (c) above. |
| (e) | (1) Pursuant to the Registrant’s Audit Committee Charter (“Charter”), the Audit Committee is responsible for approving in advance the firm to be employed as the Registrant’s independent auditor. In addition, the Charter provides that the Audit Committee is responsible for approving any and all proposals by the Registrant, its investment adviser or their affiliated persons or an entity controlling, controlled by, or under common control with the adviser that provides services to the Registrant to employ the independent auditor to render permissible non-audit services to such entity, provided those permissible non-audit services relate directly to the operations and financial reporting of the Registrant. In determining whether to approve non-audit services, the Audit Committee considers whether such services are consistent with the independent auditor’s independence.
(2) None of the services described in (b) through (d) above were approved by the audit committee pursuant to paragraph (c)(7)(i)(C) of Rule 2-01 of Regulation S-X. |
| (f) | Less than fifty percent of the hours expended on the principal accountant’s engagement to audit the Registrant’s financial statements for the most recent fiscal year were attributed to work performed by persons other than the principal accountant’s full-time, permanent employees. |
| (g) | There were no non-audit services fees billed by the Registrant’s accountant to the Registrant other than those described above. There were no non-audit services fees billed by the Registrant’s accountant to the Registrant’s investment adviser or to any entity controlling, controlled by, or under common control with the adviser that provides ongoing services to the Registrant over the past two years. |
| (h) | Not applicable as no non-audit services were provided to the Registrant’s investment adviser nor any entity controlling, controlled by, or under common control with the investment adviser that provides ongoing services to the Registrant that were not pre-approved pursuant to Rule 2-01(c)(7)(ii) of Regulation S-X. |
ITEMS 5. AUDIT COMMITTEE OF LISTED REGISTRANTS
Not applicable.
ITEM 6. SCHEDULE OF INVESTMENTS
Contained in Item 1.
ITEM 7. DISCLOSURE OF PROXY VOTING POLICIES AND PROCEDURES FOR CLOSED-END MANAGEMENT INVESTMENT COMPANIES.
Not applicable.
ITEM 8. PORTFOLIO MANAGERS OF CLOSED-END MANAGEMENT INVESTMENT COMPANIES.
Not applicable.
ITEM 9. PURCHASES OF EQUITY SECURITIES BY CLOSED-END MANAGEMENT INVESTMENT COMPANY AND AFFLIIATED PURCHASERS.
Not applicable.
ITEM 10. SUBMISSION OF MATTERS TO A VOTE OF SECURITY HOLDERS.
The Board of Trustees of the Trust has adopted Policies for Consideration of Board Member Candidates (the “Policies”). Generally, the Policies provide that, while the Nominating Committee (the “Committee”) is solely responsible for evaluating, selecting and nominating candidates to serve on the Board, the Committee may consider nominations from shareholders. Such nominations must be submitted by eligible shareholders and satisfy certain requirements as set forth in the Policies.
Among other requirements, each eligible shareholder may submit a candidate so long as it is received by the Committee within one year immediately preceding the Committee’s consideration of Board member candidates and such recommendation is delivered to the Trust’s Secretary, at 1001 Nineteenth Street North, Arlington, VA 22209. Additionally, any shareholder submitting a candidate must beneficially own securities of the Trust and must be eligible to vote both at the time of submission of the candidate and at the time of the Board member election. Such securities must continue to be held through the date of the meeting.
A shareholder’s submission to the Secretary of the Trust must include, among other information: (a) contact information for the nominating shareholder; (b) a certification from the nominating shareholder which provides the number of shares which the person or group has: (i) sole power to vote or direct the vote; (ii)shared power to vote or direct the vote; (iii) sole power to dispose or direct the disposition of such shares; and (iv) shared power to dispose or direct the disposition of such shares; (c) the candidate’s contact information and the number of applicable Trust shares owned by the candidate; (d) all information regarding the candidate that would be required to be disclosed in solicitations of proxies for elections of directors required by Regulation 14A under the Securities Exchange Act of 1934, as amended; and (e) a notarized letter executed by the candidate, stating his or her intention to serve as a candidate and be named in the Trust’s proxy statement, if so designated by the Committee and the Trust’s Board. It shall be in the Committee’s sole discretion whether to seek corrections of a deficient submission or to exclude a candidate for consideration.
For additional information, please contact the Trust at 888.888.0025.
| ITEM 11. CONTROLS AND PROCEDURES. |
| (a) | Based upon their evaluation of the Registrant’s disclosure controls and procedures as conducted within 90 days of the filing date of this Form N-CSR, the Registrant’s PFO and PEO have concluded that those disclosure controls and procedures provide reasonable assurance that the material information required to be disclosed by the Registrant in this Form N-CSR has been recorded, processed, summarized and reported within the time periods specified in the Securities and Exchange Commission’s rules and forms. |
| (b) | There were no changes in the Registrant’s internal controls over financial reporting as defined in Rule 30a-3(d) under the Act (17 CFR 270.30a-3(d)) that occurred during the second fiscal half-year of the period covered by this report that has materially affected, or is reasonably likely to materially affect, the Registrant’s internal control over financial reporting. |
| | |
| ITEM 12. EXHIBITS. |
| File the exhibits listed below as part of this Form. Letter or number the exhibits in the sequence indicated. |
| (a) | (1) Not applicable. |
| | (2) A separate certification for each principal executive officer and principal financial officer of the Registrant as required by Rule 30a-2(a) under the Act (17 CFR 270.30a-2): Attached herewith. |
| | (3) Not applicable. |
| (b) | (1) The certifications required by Rule 30a-2(b) of the Investment Company Act of 1940 and Section 906 of the Sarbanes-Oxley Act of 2002: Attached herewith. |
SIGNATURES
Pursuant to the requirements of the Securities Exchange Act of 1934 and the Investment Company Act of 1940, the registrant has duly caused this report to be signed on its behalf by the undersigned, thereunto duly authorized.
| (Registrant) | | The FBR Funds |
|
| By (Signature and Title)* | | /s/ Kimberly J. Bradshaw | 1/3/2007 | |
| | |
| |
| | | Kimberly J. Bradshaw | Date | |
| | | Treasurer, Secretary and Principal Financial Officer | | |
| | | The FBR Funds | | |
Pursuant to the requirements of the Securities Exchange Act of 1934 and the Investment Company Act of 1940, this report has been signed below by the following persons on behalf of the registrant and in the capacities and on the dates indicated.
| By (Signature and Title) | | /s/ David H. Ellison | 1/3/2007 | |
| | |
| |
| | | David H. Ellison | Date | |
| | | President and Principal Executive Officer | | |
| | | The FBR Funds | | |
| By (Signature and Title) | | /s/ Kimberly J. Bradshaw | 1/3/2007 | |
| | |
| |
| | | Kimberly J. Bradshaw | Date | |
| | | Treasurer, Secretary and Principal Financial Officer | | |
| | | The FBR Funds | | |