| UNITED STATES |
| SECURITIES AND EXCHANGE COMMISSION |
| Washington, D.C. 20549 |
| |
| FORM N-CSR |
| |
| CERTIFIED SHAREHOLDER REPORT OF REGISTERED |
| MANAGEMENT INVESTMENT COMPANIES |
| |
| Investment Company Act file number 811-21503 |
| |
| The FBR Funds |
|
| (Exact name of registrant as specified in charter) |
| |
| 1001 Nineteenth Street North |
| Suite 1100 |
| Arlington, VA 22209 |
|
| (Address of principal executive offices) (Zip code) |
| |
| Registrant’s telephone number, including area code: 703.312.9568 |
| |
| |
| Gavin Beske |
| General Counsel |
| FBR & Co. |
| 1001 Nineteenth Street North |
| Suite 1100 |
| Arlington, VA 22209 |
|
| (Name and address of agent for service) |
Date of fiscal year end: October 31, 2012
Date of reporting period: April 30, 2012
Form N-CSR is to be used by management investment companies to file reports with the Commission not later than 10 days after the transmission to stockholders of any report that is required to be transmitted to stockholders under Rule 30e-1 under the Investment Company Act of 1940 (17 CFR 270.30e-1). The Commission may use the information provided on Form N-CSR in its regulatory, disclosure review, inspection and policymaking roles.
A registrant is required to disclose the information specified by Form N-CSR, and the Commission will make this information public. A registrant is not required to respond to the collection of information contained in Form N-CSR unless the Form displays a currently valid Office of Management and Budget (“OMB”) control number. Please direct comments concerning the accuracy of the information collection burden estimate and any suggestions for reducing the burden to Secretary, Securities and Exchange Commission, 100 F Street, NE, Washington, DC 20549-0609. The OMB has reviewed this collection of information under the clearance requirements of 44 U.S.C. § 3507.
ITEM 1. REPORT TO SHAREHOLDERS.
The following is a copy of the report transmitted to shareholders pursuant to Rule 30e-1 under the Investment Company Act of 1940 (17CRF 270.30e-1).

| THE FBR FUNDS |
| |
| |
| FBR Large Cap Fund |
| FBR Mid Cap Fund |
| FBR Small Cap Fund |
| FBR Focus Fund |
| FBR Large Cap Financial Fund |
| FBR Small Cap Financial Fund |
| FBR Technology Fund |
| FBR Gas Utility Index Fund |
| FBR Balanced Fund |
| FBR Core Bond Fund |
| |
| |
| Semi-Annual Report |
| April 30, 2012 |
[THIS PAGE INTENTIONALLY LEFT BLANK]
Semi-Annual Letter to Shareholders
Dear Shareholder:
We are pleased to present The FBR Funds’ semi-annual report covering the six month period ending April 30, 2012. During the reporting period the Dow Jones Industrial Average rose 12.02%, the S&P 500 Index gained 12.77% and the smaller capitalization Russell 2000 Index rose 11.02%. The top three performing groups during the reporting period were Consumer Cyclical, Technology, and Communication Services. The three worst performing groups during the reporting period were Utilities, Energy and Basic Materials.
We continue to see the investment environment as challenging. Overall, the U.S. economy is looking better. Unemployment is falling, auto sales are strong, tech startup and IPO activity is improved, housing is perking up and banks are looking to lend money again. On the less positive side, we see federal and state governments with tight budgets, growing national debt levels, fragile consumer confidence and renewed fear of European economic austerity impacting the world economy. How things play out in Europe over the next couple years may have significant implications for the U.S. economy and the stock market. We are, like most everyone in the business, following developments there closely.
While the outlook may be challenging, we believe our investment process is well suited to weather the storm(s). Our investment process looks for companies with strong balance sheets and favorable earnings trends. Companies with these characteristics allow them to continue investing in the businesses they have and take share from their weaker or weakened competitors. We believe that companies that invest their profits the best are the best investments. Finally, we look to buy these companies cheap to give us some valuation protection.
We remain buyers of companies, not traders or renters of stocks. We remain mindful of the downside risks inherent in equity investing and look to protect against this downside with our process.
As in prior years, what follows is a commentary from each portfolio manager regarding fund performance and their outlook. This commentary is an important part of our communication to you from the portfolio managers. It is intended to give you a better understanding of their current thinking about the markets and/or individual companies.
All of us at The FBR Funds want to thank you for your continued support, and we look forward to serving your investment needs in the years ahead. As always, we welcome your questions and comments. You can reach us via e-mail at fbrfundsinfo@fbr.com or toll free at 888.200.4710. If you would like more timely updates, www.fbrfunds.com provides quarterly performance data as well as other important information.
Sincerely,
David H. Ellison
President, Chief Investment Officer and Trustee
The FBR Funds
2
Past performance is no guarantee of future results. The performance data quoted represents past performance and the current performance may be lower or higher than the performance data quoted. The investment return and principal will fluctuate so that investors’ shares, when redeemed, may be worth more or less than their original cost. The performance data does not reflect the deduction of taxes that a shareholder would pay on fund distributions or redemption fees. If reflected, the redemption fees would reduce the performance quoted. To obtain performance data current to the most recent month-end please call 888.200.4710.
Investors should consider the investment objectives, risks, charges and expenses carefully before investing. This and other important information can be found in the Fund’s prospectus. To obtain a free prospectus, please call 888.200.4710 or visit www.fbrfunds.com. Please read the prospectus carefully before investing.
The FBR Funds are distributed by FBR Investment Services, Inc., member FINRA/SIPC.
3
FBR Large Cap Fund
Management Overview
Portfolio Managers: Robert Barringer, CFA® and Ryan Kelley, CFA®
Over the previous six months, how did the Fund perform and what factors contributed to this performance?
For the six-month period ended April 30, 2012, the Investor Class Shares of the FBR Large Cap Fund returned 9.01%. This compares to the S&P 500 Index and the Morningstar Large Blend Category Average which over the same time period returned 12.77% and 11.28%, respectively.
During this six month period, the domestic equity markets rose steadily throughout most of the period until leveling off in April. Stocks that typically do well in an improving economy led the way, including consumer cyclical and technology stocks. Financials, which were some of the worst performing stocks in 2011, surged in the beginning of this year only to retreat more recently as continued worries about capital losses and growth prevailed. Conversely, two sectors that performed relatively well in 2011 retrenched, namely materials and energy.
On a relative basis, the Fund lagged its benchmark in this rapidly rising stock market environment. We generally do not have a large exposure to cyclical stocks, but prefer to own steadily growing companies that are less sensitive to economic cycles. During this period, our underexposure to highly cyclical consumer stocks caused the majority of our relative underperformance, while materials and industrials also lagged.
On a positive note, we maintained an overweight position in financials, and in the aggregate the financial stocks we owned outperformed the benchmark. Technology also contributed strongly on a relative basis, primarily due to our overexposure compared to our benchmark.
Portfolio managers’ comments on the Fund and the related investment outlook.
We invest in companies trading at attractive valuations that exhibit high and consistent returns on equity, low financial leverage and debt levels, strong management teams, and compelling prospects of future profitability. We are currently fully invested, and, of the major sectors, we are slightly overweight technology and financials while underweight energy and materials.
Our outlook on the domestic equity market can be characterized as cautiously optimistic heading into the second half of the year. While the market surged from October of last year through most of April, recently it has given up most of its gains. While many headwinds persist including high unemployment and housing worries, domestic equities continue to benefit from low interest rates, political and economic unrest abroad, and generally
4
FBR Large Cap Fund
Management Overview (continued)
improving company earnings. We continue to look for investment opportunities to take advantage of what we believe to be an improving outlook for domestic markets.
The opinions expressed in this commentary reflect those of the Portfolio Managers as of the date written. Any such opinions are subject to change based on market or other conditions. These opinions may not be relied upon as investment advice. Investment decisions for The FBR Funds are based on several factors, and may not be relied upon as an indication of trading intent on behalf of any FBR Fund. Security positions can and do change.
5
FBR Large Cap Fund
Comparison of Changes in Value of $10,000 Investment in
Investor Class Shares(1)(2) vs. S&P 500 Index(1)(3)
(unaudited)
Total Returns—For the Periods Ended April 30, 2012(4) |
| | | | | | | | | | Annualized | |
| | | | | One Year | | Annualized
Five Year | | Since
Inception(5) | |
| | | | |
| |
| |
| |
| | FBR Large Cap Fund Investor Class(1)(2) | | | (0.61) | % | | 2.35 | % | | 5.95 | % | |
| | FBR Large Cap Fund Institutional Class(2)(6) | | | (0.37) | % | | 2.51 | % | | 6.08 | % | |
| | S&P 500 Index(1)(3) | | | 4.76 | % | | 1.01 | % | | 4.18 | % | |
| |
| PAST PERFORMANCE IS NO GUARANTEE OF FUTURE RESULTS. |
| The performance data quoted represents past performance and the current performance may be lower or higher than the performance data quoted. The investment return and principal will fluctuate so that investors’ shares, when redeemed, may be worth more or less than their original cost. The performance data does not reflect the deduction of taxes that a shareholder would pay on Fund distributions or redemption fees. The Fund charges a redemption fee of 1.00% on shares redeemed or exchanged within 90 days; if reflected, the redemption fee would reduce the performance data quoted. To obtain performance data current to the most recent month-end, please call 888.200.4710. |
|
| (1) | | The graph assumes a hypothetical $10,000 initial investment in the Fund and reflects the reinvestment of dividends and all Fund expenses. Investors should note that the Fund is a professionally managed mutual fund while the index is unmanaged, does not incur expenses and is not available for investment. The performance of the index includes reinvested dividends, and does not reflect sales charges or expenses. |
| (2) | | FBR Fund Advisers, Inc. waived a portion of its advisory fees and agreed to contractually reimburse a portion of the Fund’s operating expenses, as necessary, to maintain existing expense limitations, as set forth in the notes to the financial statements. Total returns shown include fee waivers and expense reimbursements, if any; total returns would have been lower had there been no waiver of fees and/or reimbursement of expenses in excess of expense limitations. |
| (3) | | The S&P 500 Index is a capitalization-weighted index of 500 stocks. The index is designed to represent the broad domestic economy through changes in aggregate market value of 500 stocks representing all major industries. |
| (4) | | The total returns shown do not reflect the deduction of taxes that a shareholder would pay on fund distributions or the redemption of fund shares. |
| (5) | | For the period November 15, 2005 (commencement of operations) through April 30, 2012. |
| (6) | | Represents the performance of the Institutional Class shares after May 30, 2008 (inception of the share class) and Investor Class for periods prior to that date. |
6
FBR Large Cap Fund
Portfolio Summary
April 30, 2012
(unaudited)
The following provides a breakdown of the Fund by industry sectors. The underlying securities represent a percentage of the portfolio investments.
Industry Sector | | % of Total Investments |
| |
|
| Technology | | | 19.9 | % |
| Consumer, Non-Cyclical | | | 19.8 | % |
| Financial | | | 17.9 | % |
| Industrial | | | 10.8 | % |
| Consumer, Cyclical | | | 9.6 | % |
| Communications | | | 8.0 | % |
| Energy | | | 7.4 | % |
| Utilities | | | 3.4 | % |
| Basic Materials | | | 2.4 | % |
| | | | | |
| Cash | | | 0.8 | % |
| | | | | |
7
FBR Large Cap Fund
Portfolio of Investments
April 30, 2012
(unaudited)
|
| | | | | | VALUE |
| | SHARES | | | | (NOTE 2) |
|
| | | | COMMON STOCKS — 99.2% | | | | |
| | | | Basic Materials — 2.4% | | | | |
| | 6,000 | | E.I. du Pont de Nemours and Co. | | $ | 320,760 | |
| | 10,000 | | Freeport-McMoRan Copper & Gold, Inc. | | | 383,000 | |
| | 3,000 | | Monsanto Co. | | | 228,540 | |
| | | | | |
| |
| | | | | | | 932,300 | |
| | | | | |
| |
| | | | Communications — 8.0% | | | | |
| | 1,000 | | Amazon.com, Inc.* | | | 231,900 | |
| | 15,000 | | AT&T, Inc. | | | 493,650 | |
| | 30,000 | | Cisco Systems, Inc. | | | 604,500 | |
| | 1,300 | | Google, Inc., Class A* | | | 786,799 | |
| | 900 | | LinkedIn Corp., Class A* | | | 97,605 | |
| | 6,000 | | Rackspace Hosting, Inc.* | | | 348,540 | |
| | 9,000 | | Verizon Communications, Inc. | | | 363,420 | |
| | 12,300 | | Yahoo, Inc.* | | | 191,142 | |
| | | | | |
| |
| | | | | | | 3,117,556 | |
| | | | | |
| |
| | | | Consumer, Cyclical — 9.6% | | | | |
| | 7,000 | | Bed Bath & Beyond, Inc.* | | | 492,730 | |
| | 8,000 | | Coach, Inc. | | | 585,280 | |
| | 3,500 | | Deckers Outdoor Corp.* | | | 178,535 | |
| | 11,700 | | Genuine Parts Co. | | | 757,926 | |
| | 9,400 | | Guess?, Inc. | | | 275,232 | |
| | 11,700 | | Kohl’s Corp. | | | 586,521 | |
| | 7,500 | | Tiffany & Co. | | | 513,450 | |
| | 10,000 | | Walgreen Co. | | | 350,600 | |
| | | | | |
| |
| | | | | | | 3,740,274 | |
| | | | | |
| |
| | | | Consumer, Non-cyclical — 19.8% | | | | |
| | 8,640 | | Abbott Laboratories | | | 536,198 | |
| | 7,000 | | Automatic Data Processing, Inc. | | | 389,340 | |
| | 8,475 | | Baxter International, Inc. | | | 469,600 | |
| | 2,970 | | C.R. Bard, Inc. | | | 293,911 | |
| | 13,500 | | Eli Lilly and Co. | | | 558,765 | |
| | 6,700 | | Gilead Sciences, Inc.* | | | 348,467 | |
| | 14,900 | | Hormel Foods Corp. | | | 432,994 | |
| | 14,400 | | Merck & Company, Inc. | | | 565,056 | |
8
FBR Large Cap Fund
Portfolio of Investments (continued)
April 30, 2012
(unaudited)
|
| | | | | | VALUE |
| | SHARES | | | | (NOTE 2) |
|
| | | | Consumer, Non-cyclical — 19.8% (continued) | | | | |
| | 10,700 | | Novartis AG | | $ | 590,319 | |
| | 12,000 | | Paychex, Inc. | | | 371,760 | |
| | 5,800 | | PepsiCo, Inc. | | | 382,800 | |
| | 10,700 | | Stryker Corp. | | | 583,899 | |
| | 7,000 | | The Coca-Cola Co. | | | 534,240 | |
| | 9,600 | | The Estee Lauder Companies, Inc., Class A | | | 627,360 | |
| | 7,800 | | The Procter & Gamble Co. | | | 496,392 | |
| | 15,000 | | Unilever PLC ADR | | | 514,800 | |
| | | | | |
| |
| | | | | | | 7,695,901 | |
| | | | | |
| |
| | | | Energy — 7.4% | | | | |
| | 4,202 | | Apache Corp. | | | 403,140 | |
| | 8,800 | | Devon Energy Corp. | | | 614,680 | |
| | 11,000 | | Halliburton Co. | | | 376,420 | |
| | 9,000 | | Hess Corp. | | | 469,260 | |
| | 8,200 | | Murphy Oil Corp. | | | 450,754 | |
| | 8,900 | | Patterson-UTI Energy, Inc. | | | 143,913 | |
| | 6,000 | | Range Resources Corp. | | | 399,960 | |
| | | | | |
| |
| | | | | | | 2,858,127 | |
| | | | | |
| |
| | | | Financial — 17.9% | | | | |
| | 60,000 | | Bank of America Corp. | | | 486,600 | |
| | 10,000 | | Capital One Financial Corp. | | | 554,800 | |
| | 12,000 | | Citigroup, Inc. | | | 396,480 | |
| | 18,000 | | Discover Financial Services | | | 610,200 | |
| | 3,575 | | Franklin Resources, Inc. | | | 448,698 | |
| | 16,725 | | JPMorgan Chase & Co. | | | 718,841 | |
| | 13,000 | | Morgan Stanley | | | 224,640 | |
| | 6,200 | | Prudential Financial, Inc. | | | 375,348 | |
| | 9,000 | | T. Rowe Price Group, Inc. | | | 568,035 | |
| | 7,800 | | The Chubb Corp. | | | 569,946 | |
| | 6,000 | | The PNC Financial Services Group, Inc. | | | 397,920 | |
| | 4,400 | | Torchmark Corp. | | | 214,324 | |
| | 18,500 | | U.S. Bancorp | | | 595,145 | |
| | 24,000 | | Wells Fargo & Co. | | | 802,320 | |
| | | | | |
| |
| | | | | | | 6,963,297 | |
| | | | | |
| |
9
FBR Large Cap Fund
Portfolio of Investments (continued)
April 30, 2012
(unaudited)
|
| | | | | | VALUE |
| | SHARES | | | | (NOTE 2) |
|
| | | | Industrial — 10.8% | | | | |
| | 11,500 | | 3M Co. | | $ | 1,027,640 | |
| | 6,000 | | Cummins, Inc. | | | 694,980 | |
| | 6,100 | | FedEx Corp. | | | 538,264 | |
| | 43,600 | | General Electric Co. | | | 853,688 | |
| | 8,600 | | Norfolk Southern Corp. | | | 627,198 | |
| | 4,000 | | Union Pacific Corp. | | | 449,760 | |
| | | | | |
| |
| | | | | | | 4,191,530 | |
| | | | | |
| |
| | | | Technology — 19.9% | | | | |
| | 3,550 | | Apple, Inc.* | | | 2,074,052 | |
| | 29,400 | | Applied Materials, Inc. | | | 352,506 | |
| | 9,200 | | Cerner Corp.* | | | 746,028 | |
| | 7,000 | | Check Point Software Technologies Ltd.* | | | 406,910 | |
| | 3,600 | | Citrix Systems, Inc.* | | | 308,196 | |
| | 27,000 | | Intel Corp. | | | 766,800 | |
| | 3,000 | | International Business Machines Corp. | | | 621,240 | |
| | 8,000 | | MICROS Systems, Inc.* | | | 454,640 | |
| | 18,350 | | Microsoft Corp. | | | 587,567 | |
| | 9,900 | | NetApp, Inc.* | | | 384,417 | |
| | 20,000 | | Oracle Corp. | | | 587,800 | |
| | 1,800 | | salesforce.com, Inc.* | | | 280,314 | |
| | 3,800 | | SanDisk Corp.* | | | 140,638 | |
| | | | | |
| |
| | | | | | | 7,711,108 | |
| | | | | |
| |
| | | | Utilities — 3.4% | | | | |
| | 4,800 | | Edison International | | | 211,248 | |
| | 14,000 | | Exelon Corp. | | | 546,140 | |
| | 8,500 | | PG&E Corp. | | | 375,530 | |
| | 6,100 | | Public Service Enterprise Group, Inc. | | | 190,015 | |
| | | | | |
| |
| | | | | | | 1,322,933 | |
| | | | | |
| |
| | | | | | | | |
| | | | Total Common Stocks (Cost $32,943,831) | | | 38,533,026 | |
| | | | | |
| |
10
FBR Large Cap Fund
Portfolio of Investments (continued)
April 30, 2012
(unaudited)
|
| | | | | | VALUE |
| | SHARES | | | | (NOTE 2) |
|
| | | | SHORT-TERM INVESTMENT — 1.0% | | | | |
| | 397,333 | | Fidelity Institutional Money Market Government Portfolio, Class I , 0.01%^ (Cost $397,333) | | $ | 397,333 | |
| | | | | |
| |
| | | | | | | | |
| | | | Total Investments — 100.2% (Cost $33,341,164) | | | 38,930,359 | |
| | | | | | | | |
| | | | Liabilities Less Other Assets — (0.2)% | | | (75,450 | ) |
| | | | | |
| |
| | | | | | | | |
| | | | Net Assets — 100.0% | | $ | 38,854,909 | |
| | | | | |
| |
|
| * | | Non-income producing security | |
| ADR | | American Depositary Receipts | |
| PLC | | Public Liability Company | |
| ^ | | 7-day yield as of April 30, 2012 | |
| | | | |
| Note: | | For presentation purposes, the Fund has grouped some of the industry categories. For purposes of categorizing securities for compliance with Section 8(b)(1) of the Investment Company Act of 1940, the Fund uses more specific industry classifications. | |
The accompanying notes are an integral part of the financial statements.
11
FBR Mid Cap Fund
Management Overview
Portfolio Manager: Ryan Kelley, CFA®
Over the previous six months, how did the Fund perform and what factors contributed to this performance?
For the six-month period ended April 30, 2012, the Investor Class of the FBR Mid Cap Fund returned 8.58%. This compares to the Russell Midcap Index and the Morningstar Mid Cap Blend Category Average which over the same time period returned 11.87% and 10.92%, respectively.
During this six month period, the domestic equity markets rose steadily throughout most of the period until leveling off in April with large cap stocks leading the way. In the mid cap space, consumer cyclical stocks performed exceptionally well, while healthcare also contributed strongly. Financials, which were some of the worst performing stocks in 2011, surged in the beginning of this year only to retreat more recently as continued worries about capital losses and growth prevailed. Conversely, two sectors that performed fairly well in 2011 lagged the market this year, namely energy and technology.
On a relative basis, the Fund underperformed its benchmark in this rapidly rising stock market environment. While we were in-line with our consumer cyclical exposure, the stocks we owned did not perform as well in the aggregate. Similarly, the healthcare companies that we owned caused a good portion of our underperformance.
On a positive note, we maintained an overweight position in financials, and in the aggregate the financial stocks we owned outperformed the benchmark. Technology and consumer defensive equities also contributed strongly on a relative basis, primarily due to our stock selection.
Portfolio manager comments on the Fund and the related investment outlook.
We are cautiously optimistic about the domestic equity market heading into the second half of the year. While the market surged from October of last year through most of April, recently it has retrenched. While many headwinds persist including high unemployment and housing worries, domestic equities continue to benefit from low interest rates, generally improving company earnings, and political and economic unrest abroad.
We invest in companies trading at attractive valuations that exhibit high and consistent returns on equity, low financial leverage and debt levels, strong management teams, and compelling prospects of future profitability. We are currently fully invested, and, of the major sectors, we are slightly overweight technology while underweight telecommunication
12
FBR Mid Cap Fund
Management Overview (continued)
stocks, utilities and materials. We continue to look for investment opportunities to take advantage of what we believe to be a relatively good outlook for domestic markets.
The opinions expressed in this commentary reflect those of the Portfolio Manager as of the date written. Any such opinions are subject to change based on market or other conditions. These opinions may not be relied upon as investment advice. Investment decisions for The FBR Funds are based on several factors, and may not be relied upon as an indication of trading intent on behalf of any FBR Fund. Security positions can and do change.
13
FBR Mid Cap Fund
Comparison of Changes in Value of $10,000 Investment in
Investor Class Shares(1)(2) vs. Russell Midcap Index(1)(3)
(unaudited)
Total Returns—For the Periods Ended April 30, 2012(4) |
| | | | | | | | | | | Annualized | |
| | | | | | | Annualized | | Since | |
| | | One Year | | Five Year | | Inception(5) | |
| | |
| |
| |
| |
FBR Mid Cap Fund Investor Class(1)(2) | | | (0.89) | % | | | 5.34 | % | | | 6.24 | % | |
FBR Mid Cap Fund Institutional Class(2)(6) | | | (0.70) | % | | | 5.46 | % | | | 6.35 | % | |
Russell Midcap Index(1)(3) | | | (0.03) | % | | | 2.19 | % | | | 3.02 | % | |
| |
| PAST PERFORMANCE IS NO GUARANTEE OF FUTURE RESULTS. |
| The performance data quoted represents past performance and the current performance may be lower or higher than the performance data quoted. The investment return and principal will fluctuate so that investors’ shares, when redeemed, may be worth more or less than their original cost. The performance data does not reflect the deduction of taxes that a shareholder would pay on Fund distributions or redemption fees. The Fund charges a redemption fee of 1.00% on shares redeemed or exchanged within 90 days; if reflected, the redemption fee would reduce the performance data quoted. To obtain performance data current to the most recent month-end, please call 888.200.4710. |
|
| (1) | | The graph assumes a hypothetical $10,000 initial investment in the Fund and reflects the reinvestment of dividends and all Fund expenses. Investors should note that the Fund is a professionally managed mutual fund while the index is unmanaged, does not incur expenses and is not available for investment. The performance of the index includes reinvested dividends, and does not reflect sales charges or expenses. |
| (2) | | FBR Fund Advisers, Inc. waived a portion of its advisory fees and agreed to contractually reimburse a portion of the Fund’s operating expenses, as necessary, to maintain existing expense limitations, as set forth in the notes to the financial statements. Total returns shown include fee waivers and expense reimbursements, if any; total returns would have been lower had there been no waiver of fees and/or reimbursement of expenses in excess of expense limitations. |
| (3) | | The Russell Midcap Index measures the performance of the 800 smallest companies in the Russell 1000 Index, which represents approximately 31% of the total market capitalization of the Russell 1000 Index. |
| (4) | | The total returns shown do not reflect the deduction of taxes that a shareholder would pay on fund distributions or the redemption of fund shares. |
| (5) | | For the period February 28, 2007 (commencement of operations) through April 30, 2012. |
| (6) | | Represents the performance of the Institutional Class shares after May 30, 2008 (inception of the share class) and Investor Class for periods prior to that date. |
14
FBR Mid Cap Fund
Portfolio Summary
April 30, 2012
(unaudited)
The following provides a breakdown of the Fund by industry sectors. The underlying securities represent a percentage of the portfolio investments.
| Industry Sector | | % of Total Investments |
| |
|
| Consumer, Cyclical | | | 20.4 | % |
| Consumer, Non-Cyclical | | | 19.5 | % |
| Financial | | | 16.5 | % |
| Industrial | | | 13.3 | % |
| Technology | | | 11.1 | % |
| Energy | | | 7.9 | % |
| Utilities | | | 4.7 | % |
| Communications | | | 3.1 | % |
| Basic Materials | | | 1.5 | % |
| | | | | |
| Cash | | | 2.0 | % |
15
FBR Mid Cap Fund
Portfolio of Investments
April 30, 2012
(unaudited)
|
| | | | | | VALUE |
| | SHARES | | | | (NOTE 2) |
|
| | | | COMMON STOCKS — 98.0% | | | | |
| | | | Basic Materials — 1.5% | | | | |
| | 3,984 | | Sigma-Aldrich Corp. | | $ | 282,466 | |
| | | | | |
| |
| | | | Communications — 3.1% | | | | |
| | 3,797 | | FactSet Research Systems, Inc. | | | 398,154 | |
| | 7,880 | | Telephone & Data Systems, Inc. | | | 191,405 | |
| | | | | |
| |
| | | | | | | 589,559 | |
| | | | | |
| |
| | | | Consumer, Cyclical — 20.4% | | | | |
| | 6,615 | | Abercrombie & Fitch Co., Class A | | | 331,875 | |
| | 3,900 | | Bed Bath & Beyond, Inc.* | | | 274,521 | |
| | 9,080 | | Big Lots, Inc.* | | | 332,691 | |
| | 14,970 | | Copart, Inc.* | | | 395,358 | |
| | 2,250 | | Deckers Outdoor Corp.* | | | 114,773 | |
| | 3,400 | | Genuine Parts Co. | | | 220,252 | |
| | 2,700 | | Guess?, Inc. | | | 79,056 | |
| | 10,930 | | Magna International, Inc. | | | 479,062 | |
| | 12,824 | | Mattel, Inc. | | | 430,886 | |
| | 2,800 | | MSC Industrial Direct Company, Inc., Class A | | | 206,388 | |
| | 7,735 | | Tiffany & Co. | | | 529,538 | |
| | 2,229 | | V.F. Corp. | | | 338,919 | |
| | 3,700 | | Williams-Sonoma, Inc. | | | 143,153 | |
| | | | | |
| |
| | | | | | | 3,876,472 | |
| | | | | |
| |
| | | | Consumer, Non-cyclical — 19.5% | | | | |
| | 3,022 | | Bunge Ltd. | | | 194,919 | |
| | 2,446 | | C.R. Bard, Inc. | | | 242,056 | |
| | 2,600 | | Covance, Inc.* | | | 121,576 | |
| | 9,050 | | Endo Pharmaceuticals Holdings, Inc.* | | | 318,017 | |
| | 6,438 | | Forest Laboratories, Inc.* | | | 224,236 | |
| | 1,400 | | Humana, Inc. | | | 112,952 | |
| | 6,995 | | Lincare Holdings, Inc. | | | 170,678 | |
| | 11,500 | | Monster Beverage Corp.* | | | 747,040 | |
| | 9,575 | | Paychex, Inc. | | | 296,634 | |
| | 20,450 | | SEI Investments Co. | | | 412,885 | |
| | 3,385 | | Techne Corp. | | | 226,592 | |
16
FBR Mid Cap Fund
Portfolio of Investments (continued)
April 30, 2012
(unaudited)
|
| | | | | | VALUE |
| | SHARES | | | | (NOTE 2) |
|
| | | | Consumer, Non-cyclical — 19.5% (continued) | | | | |
| | 1,650 | | Tupperware Brands Corp. | | $ | 102,778 | |
| | 13,275 | | Tyson Foods, Inc., Class A | | | 242,269 | |
| | 4,444 | | Varian Medical Systems, Inc.* | | | 281,838 | |
| | | | | |
| |
| | | | | | | 3,694,470 | |
| | | | | |
| |
| | | | Energy — 7.9% | | | | |
| | 4,677 | | Energen Corp. | | | 244,981 | |
| | 3,285 | | Ensco PLC ADR | | | 179,525 | |
| | 2,640 | | Helmerich & Payne, Inc. | | | 135,670 | |
| | 7,800 | | Nabors Industries Ltd.* | | | 129,870 | |
| | 2,925 | | Newfield Exploration Co.* | | | 105,008 | |
| | 2,975 | | Pioneer Natural Resources Co. | | | 344,564 | |
| | 3,900 | | Plains Exploration & Production Co.* | | | 159,315 | |
| | 5,550 | | Rowan Companies, Inc.* | | | 191,642 | |
| | | | | |
| |
| | | | | | | 1,490,575 | |
| | | | | |
| |
| | | | Financial — 16.5% | | | | |
| | 6,375 | | Comerica, Inc. | | | 204,128 | |
| | 17,900 | | Fifth Third Bancorp | | | 254,717 | |
| | 20,000 | | First Niagara Financial Group, Inc. | | | 178,800 | |
| | 26,950 | | KeyCorp | | | 216,678 | |
| | 2,546 | | M&T Bank Corp. | | | 219,643 | |
| | 11,785 | | New York Community Bancorp, Inc. | | | 158,980 | |
| | 10,250 | | People’s United Financial, Inc. | | | 126,485 | |
| | 8,700 | | Raymond James Financial, Inc. | | | 318,594 | |
| | 47,200 | | Regions Financial Corp. | | | 318,128 | |
| | 4,500 | | Reinsurance Group of America, Inc. | | | 261,630 | |
| | 6,821 | | T. Rowe Price Group, Inc. | | | 430,507 | |
| | 6,800 | | W. R. Berkley Corp. | | | 256,088 | |
| | 9,600 | | Zions Bancorp | | | 195,744 | |
| | | | | |
| |
| | | | | | | 3,140,122 | |
| | | | | |
| |
| | | | Industrial — 13.3% | | | | |
| | 6,625 | | Dolby Laboratories, Inc., Class A* | | | 259,899 | |
| | 9,075 | | FLIR Systems, Inc. | | | 203,824 | |
| | 5,950 | | Kansas City Southern | | | 458,269 | |
17
FBR Mid Cap Fund
Portfolio of Investments (continued)
April 30, 2012
(unaudited)
|
| | | | | | VALUE |
| | SHARES | | | | (NOTE 2) |
|
| | | | Industrial — 13.3% (continued) | | | | |
| | 3,700 | | Kirby Corp.* | | $ | 245,569 | |
| | 7,195 | | Pall Corp. | | | 428,894 | |
| | 4,592 | | Roper Industries, Inc. | | | 467,925 | |
| | 10,300 | | Spirit AeroSystems Holdings, Inc., Class A* | | | 257,500 | |
| | 3,500 | | Tidewater, Inc. | | | 192,605 | |
| | | | | |
| |
| | | | | | | 2,514,485 | |
| | | | | |
| |
| | | | Technology — 11.1% | | | | |
| | 32,168 | | Activision Blizzard, Inc. | | | 414,002 | |
| | 8,403 | | Check Point Software Technologies Ltd.* | | | 488,466 | |
| | 4,900 | | Microchip Technology, Inc. | | | 173,166 | |
| | 3,400 | | SanDisk Corp.* | | | 125,834 | |
| | 9,700 | | Seagate Technology PLC | | | 298,372 | |
| | 30,900 | | Siliconware Precision Industries Co. Ltd. ADR | | | 180,147 | |
| | 4,900 | | Western Digital Corp.* | | | 190,169 | |
| | 6,200 | | Xilinx, Inc. | | | 225,556 | |
| | | | | |
| |
| | | | | | | 2,095,712 | |
| | | | | |
| |
| | | | Utilities — 4.7% | | | | |
| | 8,800 | | Ameren Corp. | | | 288,552 | |
| | 17,700 | | NRG Energy, Inc.* | | | 300,900 | |
| | 10,650 | | Westar Energy, Inc. | | | 305,548 | |
| | | | | |
| |
| | | | | | | 895,000 | |
| | | | | |
| |
| | | | | | | | |
| | | | Total Common Stocks (Cost $15,276,026) | | | 18,578,861 | |
| | | | | |
| |
18
FBR Mid Cap Fund
Portfolio of Investments (continued)
April 30, 2012
(unaudited)
|
| | | | | | VALUE |
| | SHARES | | | | (NOTE 2) |
|
| | | | SHORT-TERM INVESTMENT — 2.0% | | | | |
| | 374,927 | | Fidelity Institutional Money Market Government Portfolio, Class I , 0.01%^ (Cost $374,927) | | $ | 374,927 | |
| | | | | |
| |
| | | | | | | | |
| | | | Total Investments — 100.0% (Cost $15,650,953) | | | 18,953,788 | |
| | | | | | | | |
| | | | Liabilities Less Other Assets — 0.0% | | | (2,176 | ) |
| | | | | |
| |
| | | | | | | | |
| | | | Net Assets — 100.0% | | $ | 18,951,612 | |
| | | | | |
| |
|
| * | | Non-income producing security |
| ADR | | American Depositary Receipts |
| PLC | | Public Liability Company |
| ^ | | 7-day yield as of April 30, 2012 |
| | | |
| Note: | | For presentation purposes, the Fund has grouped some of the industry categories. For purposes of categorizing securities for compliance with Section 8(b)(1) of the Investment Company Act of 1940, the Fund uses more specific industry classifications. |
The accompanying notes are an integral part of these financial statements.
19
FBR Small Cap Fund
Management Overview
Portfolio Manager: Robert Barringer, CFA®
Over the previous six months, how did the Fund perform and what factors contributed to this performance?
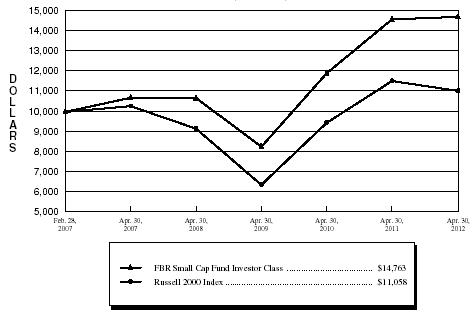
For the six-month period ended April 30, 2012, the Investor Class of the FBR Small Cap Fund returned 14.60%. This compares to the Russell 2000 Index and the Morningstar Small Growth Category, which returned 11.02% and 11.58% for the same period, respectively.
The Fund’s outperformance relative to its benchmark is due to particular stock selection in a few sectors that outperformed their peers over the past six months. Much of the outperformance came from selections within the technology, financial services and industrial sectors. In particular, some of the top holdings of the Fund performed particularly well, such as White Mountains Insurance Group Ltd. and Horace Mann Educators Corp., two insurance company stocks. Two sectors whose performance hurt the Fund’s performance were healthcare and consumer cyclicals, although not by a significant amount. One stock that hurt performance was Allscripts Healthcare Solutions, Inc., which declined approximately 43% for the period after management changes were announced and the firm lowered its outlook.
Portfolio manager comments on the Fund and the related investment outlook.
The Fund did well due to the selections as identified by the investment process, which emphasizes profitable, well-run companies selling at reasonable prices. The outlook at this time is uncertain as Europe attempts to deal with deteriorating conditions in a number of countries’ fiscal situations and financial systems, generally. However, small caps are usually more focused on the U.S. markets and, as such, should be able to weather the economics storm clouds relatively well, unless the U.S. starts to feel more of an impact.
The opinions expressed in this commentary reflect those of the Portfolio Manager as of the date written. Any such opinions are subject to change based on market or other conditions. These opinions may not be relied upon as investment advice. Investment decisions for The FBR Funds are based on several factors, and may not be relied upon as an indication of trading intent on behalf of any FBR Fund. Security positions can and do change.
20
FBR Small Cap Fund
Comparison of Changes in Value of $10,000 Investment in
Investor Class Shares(1)(2) vs. Russell 2000 Index(1)(3)
(unaudited)
Total Returns—For the Periods Ended April 30, 2012(4) |
| | | | | | | | | | | Annualized | |
| | | | | | | Annualized | | Since | |
| | | One Year | | Five Year | | Inception(5) | |
| | |
| |
| |
| |
FBR Small Cap Fund Investor Class(1)(2) | | | 0.85 | % | | | 6.63 | % | | | 7.83 | % | |
FBR Small Cap Fund Institutional Class(2)(6) | | | 1.10 | % | | | 6.80 | % | | | 7.99 | % | |
Russell 2000 Index(1)(3) | | | (4.25) | % | | | 1.45 | % | | | 1.96 | % | |
| |
| PAST PERFORMANCE IS NO GUARANTEE OF FUTURE RESULTS. |
| The performance data quoted represents past performance and the current performance may be lower or higher than the performance data quoted. The investment return and principal will fluctuate so that investors’ shares, when redeemed, may be worth more or less than their original cost. The performance data does not reflect the deduction of taxes that a shareholder would pay on Fund distributions or redemption fees. The Fund charges a redemption fee of 1.00% on shares redeemed or exchanged within 90 days; if reflected, the redemption fee would reduce the performance data quoted. To obtain performance data current to the most recent month-end, please call 888.200.4710. |
| | | |
|
| (1) | | The graph assumes a hypothetical $10,000 initial investment in the Fund and reflects the reinvestment of dividends and all Fund expenses. Investors should note that the Fund is a professionally managed mutual fund while the index is unmanaged, does not incur expenses and is not available for investment. The performance of the index includes reinvested dividends, and does not reflect sales charges or expenses. |
| (2) | | FBR Fund Advisers, Inc. waived a portion of its advisory fees and agreed to contractually reimburse a portion of the Fund’s operating expenses, as necessary, to maintain existing expense limitations, as set forth in the notes to the financial statements. Total returns shown include fee waivers and expense reimbursements, if any; total returns would have been lower had there been no waiver of fees and/or reimbursement of expenses in excess of expense limitations. |
| (3) | | The Russell 2000 Index is comprised of the smallest of the 2000 companies of the Russell 3000 Index, representing approximately 8% of the Russell 3000’s total market capitalization. |
| (4) | | The total returns shown do not reflect the deduction of taxes that a shareholder would pay on fund distributions or the redemption of fund shares. |
| (5) | | For the period February 28, 2007 (commencement of operations) through April 30, 2012. |
| (6) | | Represents the performance of the Institutional Class shares after May 30, 2008 (inception of the share class) and Investor Class for periods prior to that date. |
21
FBR Small Cap Fund
Portfolio Summary
April 30, 2012
(unaudited)
The following provides a breakdown of the Fund by industry sectors. The underlying securities represent a percentage of the portfolio investments.
| Industry Sector | | % of Total Investments |
| |
|
| Financial | | | 19.7 | % |
| Technology | | | 18.1 | % |
| Consumer, Cyclical | | | 14.7 | % |
| Consumer, Non-Cyclical | | | 14.5 | % |
| Industrial | | | 11.0 | % |
| Energy | | | 8.3 | % |
| Basic Materials | | | 4.9 | % |
| Utilities | | | 2.1 | % |
| Communications | | | 1.9 | % |
| Real Estate Investment Trust | | | 0.9 | % |
| | | | | |
| Cash | | | 3.9 | % |
22
FBR Small Cap Fund
Portfolio of Investments
April 30, 2012
(unaudited)
|
| | | | | | VALUE |
| | SHARES | | | | (NOTE 2) |
|
| | | | COMMON STOCKS — 96.1% | | | | |
| | | | Basic Materials — 4.9% | | | | |
| | 12,000 | | Huntsman Corp. | | $ | 169,920 | |
| | 10,000 | | Innospec, Inc.* | | | 302,300 | |
| | 8,000 | | Kraton Performance Polymers, Inc.* | | | 208,000 | |
| | 6,000 | | Kronos Worldwide, Inc. | | | 142,440 | |
| | 1,500 | | NewMarket Corp. | | | 334,830 | |
| | 20,000 | | PolyOne Corp. | | | 277,200 | |
| | 5,000 | | Schnitzer Steel Industries, Inc., Class A | | | 199,350 | |
| | 4,000 | | W.R. Grace & Co.* | | | 238,440 | |
| | | | | |
| |
| | | | | | | 1,872,480 | |
| | | | | |
| |
| | | | Communications — 1.9% | | | | |
| | 2,000 | | Acme Packet, Inc.* | | | 56,140 | |
| | 3,500 | | ADTRAN, Inc. | | | 106,820 | |
| | 6,500 | | Aruba Networks, Inc.* | | | 137,280 | |
| | 1,000 | | Bazaarvoice, Inc.* | | | 19,810 | |
| | 7,000 | | Sourcefire, Inc.* | | | 356,930 | |
| | 3,000 | | Yelp, Inc.* | | | 68,580 | |
| | | | | |
| |
| | | | | | | 745,560 | |
| | | | | |
| |
| | | | Consumer, Cyclical — 14.7% | | | | |
| | 6,000 | | Alaska Air Group, Inc.* | | | 202,800 | |
| | 34,000 | | American Axle & Manufacturing Holdings, Inc.* | | | 329,460 | |
| | 18,000 | | Ascena Retail Group, Inc.* | | | 368,640 | |
| | 7,000 | | Bally Technologies, Inc.* | | | 339,850 | |
| | 10,000 | | Big Lots, Inc.* | | | 366,400 | |
| | 13,000 | | Chico’s FAS, Inc. | | | 199,680 | |
| | 4,000 | | Columbia Sportswear Co. | | | 188,400 | |
| | 9,000 | | Crocs, Inc.* | | | 181,800 | |
| | 3,000 | | Deckers Outdoor Corp.* | | | 153,030 | |
| | 70,000 | | JetBlue Airways Corp.* | | | 332,500 | |
| | 10,000 | | Meritor, Inc.* | | | 65,100 | |
| | 15,300 | | Modine Manufacturing Co.* | | | 120,870 | |
| | 16,000 | | Penn National Gaming, Inc.* | | | 719,680 | |
| | 22,000 | | Pier 1 Imports, Inc. | | | 377,960 | |
| | 1,000 | | Red Robin Gourmet Burgers, Inc.* | | | 35,660 | |
23
FBR Small Cap Fund
Portfolio of Investments (continued)
April 30, 2012
(unaudited)
|
| | | | | | VALUE |
| | SHARES | | | | (NOTE 2) |
|
| | | | Consumer, Cyclical — 14.7% (continued) | | | | |
| | 4,000 | | Select Comfort Corp.* | | $ | 115,520 | |
| | 6,000 | | Steven Madden Ltd.* | | | 259,260 | |
| | 5,600 | | The Buckle, Inc. | | | 258,608 | |
| | 4,000 | | The Children’s Place Retail Stores, Inc.* | | | 183,920 | |
| | 20,000 | | US Airways Group, Inc.* | | | 205,200 | |
| | 7,000 | | Westport Innovations, Inc.* | | | 219,100 | |
| | 10,000 | | Wolverine World Wide, Inc. | | | 419,500 | |
| | | | | |
| |
| | | | | | | 5,642,938 | |
| | | | | |
| |
| | | | Consumer, Non-cyclical — 14.5% | | | | |
| | 4,000 | | Abiomed, Inc.* | | | 97,320 | |
| | 14,000 | | Dollar Thrifty Automotive Group, Inc.* | | | 1,132,040 | |
| | 2,000 | | Idenix Pharmaceuticals, Inc.* | | | 17,540 | |
| | 6,000 | | ImmunoGen, Inc.* | | | 76,500 | |
| | 3,000 | | Jazz Pharmaceuticals, Inc.* | | | 153,090 | |
| | 1,000 | | MAKO Surgical Corp.* | | | 41,310 | |
| | 500 | | Medivation, Inc.* | | | 40,440 | |
| | 8,000 | | Optimer Pharmaceuticals, Inc.* | | | 118,400 | |
| | 10,000 | | Par Pharmaceutical Companies, Inc.* | | | 423,400 | |
| | 1,000 | | Pharmacyclics, Inc.* | | | 27,560 | |
| | 12,000 | | RSC Holdings, Inc.* | | | 284,640 | |
| | 4,500 | | Seattle Genetics, Inc.* | | | 88,965 | |
| | 36,000 | | SEI Investments Co. | | | 726,840 | |
| | 15,150 | | Sirona Dental Systems, Inc.* | | | 765,227 | |
| | 4,800 | | Sotheby’s | | | 188,736 | |
| | 6,000 | | The Cooper Companies, Inc. | | | 529,020 | |
| | 7,000 | | ViroPharma, Inc.* | | | 152,250 | |
| | 3,000 | | VIVUS, Inc.* | | | 72,660 | |
| | 10,000 | | Wright Express Corp.* | | | 638,200 | |
| | | | | |
| |
| | | | | | | 5,574,138 | |
| | | | | |
| |
| | | | Energy — 8.3% | | | | |
| | 14,012 | | Atwood Oceanics, Inc.* | | | 621,152 | |
| | 13,000 | | C&J Energy Services, Inc.* | | | 245,050 | |
| | 6,000 | | Cheniere Energy, Inc.* | | | 109,860 | |
| | 4,000 | | Clean Energy Fuels Corp.* | | | 76,960 | |
24
FBR Small Cap Fund
Portfolio of Investments (continued)
April 30, 2012
(unaudited)
|
| | | | | | VALUE |
| | SHARES | | | | (NOTE 2) |
|
| | | | Energy — 8.3% (continued) | | | | |
| | 9,000 | | Energy XXI (Bermuda) Ltd.* | | $ | 339,120 | |
| | 19,000 | | Key Energy Services, Inc.* | | | 240,540 | |
| | 70,000 | | Kodiak Oil & Gas Corp.* | | | 619,500 | |
| | 10,000 | | Oasis Petroleum, Inc.* | | | 330,700 | |
| | 4,000 | | Rosetta Resources, Inc.* | | | 201,080 | |
| | 15,592 | | Superior Energy Services, Inc.* | | | 419,737 | |
| | | | | |
| |
| | | | | | | 3,203,699 | |
| | | | | |
| |
| | | | Financial — 19.7% | | | | |
| | 30,000 | | Associated Banc-Corp | | | 399,900 | |
| | 12,000 | | BankUnited, Inc. | | | 295,200 | |
| | 10,000 | | Berkshire Hills Bancorp, Inc. | | | 226,900 | |
| | 59,729 | | Brookline Bancorp, Inc. | | | 536,366 | |
| | 15,000 | | Brown & Brown, Inc. | | | 404,550 | |
| | 29,454 | | Capitol Federal Financial | | | 347,852 | |
| | 19,139 | | Chicopee Bancorp, Inc.* | | | 275,602 | |
| | 28,500 | | CNO Financial Group, Inc.* | | | 207,195 | |
| | 6,000 | | Encore Capital Group, Inc.* | | | 142,200 | |
| | 32,253 | | First Horizon National Corp. | | | 296,082 | |
| | 32,200 | | Fulton Financial Corp. | | | 337,778 | |
| | 1,771 | | Hingham Institution for Savings | | | 102,098 | |
| | 38,700 | | Horace Mann Educators Corp. | | | 679,185 | |
| | 14,000 | | Independent Bank Corp. | | | 392,980 | |
| | 3,407 | | Investors Title Co. | | | 173,655 | |
| | 6,000 | | Newport Bancorp, Inc.* | | | 82,500 | |
| | 9,000 | | Peoples Federal Bancshares, Inc.* | | | 148,320 | |
| | 7,300 | | SI Financial Group, Inc. | | | 83,950 | |
| | 34,000 | | Susquehanna Bancshares, Inc. | | | 352,580 | |
| | 18,000 | | Tower Group, Inc. | | | 388,440 | |
| | 44,877 | | United Financial Bancorp, Inc. | | | 719,827 | |
| | 23,000 | | Waddell & Reed Financial, Inc. | | | 735,540 | |
| | 15,400 | | Washington Federal, Inc. | | | 270,116 | |
| | | | | |
| |
| | | | | | | 7,598,816 | |
| | | | | |
| |
25
FBR Small Cap Fund
Portfolio of Investments (continued)
April 30, 2012
(unaudited)
|
| | | | | | VALUE |
| | SHARES | | | | (NOTE 2) |
|
| | | | Industrial — 11.0% | | | | |
| | 15,000 | | A.O. Smith Corp. | | $ | 714,000 | |
| | 8,000 | | Atlas Air Worldwide Holdings, Inc.* | | | 368,400 | |
| | 4,000 | | Cymer, Inc.* | | | 207,360 | |
| | 8,000 | | Genesee & Wyoming, Inc., Class A* | | | 431,280 | |
| | 12,100 | | Heartland Express, Inc. | | | 167,343 | |
| | 8,000 | | Lennox International, Inc. | | | 347,200 | |
| | 16,000 | | Roadrunner Transportation Systems, Inc.* | | | 277,600 | |
| | 8,000 | | Sauer-Danfoss, Inc.* | | | 346,480 | |
| | 8,000 | | Simpson Manufacturing Company, Inc. | | | 248,240 | |
| | 5,200 | | Snap-on, Inc. | | | 325,208 | |
| | 12,000 | | Sun Hydraulics Corp. | | | 300,360 | |
| | 8,000 | | Terex Corp.* | | | 181,120 | |
| | 13,250 | | Werner Enterprises, Inc. | | | 312,965 | |
| | | | | |
| |
| | | | | | | 4,227,556 | |
| | | | | |
| |
| | | | Real Estate Investment Trust — 0.9% | | | | |
| | 34,800 | | Sunstone Hotel Investors, Inc.* | | | 354,960 | |
| | | | | |
| |
| | | | | | | | |
| | | | Technology — 18.1% | | | | |
| | 16,000 | | Allscripts Healthcare Solutions, Inc.* | | | 177,280 | |
| | 40,100 | | Brocade Communications Systems, Inc.* | | | 222,154 | |
| | 11,000 | | Cirrus Logic, Inc.* | | | 301,180 | |
| | 5,000 | | Comm Vault Systems, Inc.* | | | 260,350 | |
| | 22,000 | | Compuware Corp.* | | | 191,840 | |
| | 3,000 | | Concur Technologies, Inc.* | | | 169,680 | |
| | 2,000 | | Demandware, Inc.* | | | 54,500 | |
| | 20,000 | | Emulex Corp.* | | | 173,600 | |
| | 1,000 | | Fusion-io, Inc.* | | | 25,650 | |
| | 8,000 | | Greenway Medical Technologies, Inc.* | | | 123,200 | |
| | 2,000 | | Guidewire Software, Inc.* | | | 54,440 | |
| | 22,000 | | Jack Henry & Associates, Inc. | | | 747,120 | |
| | 16,000 | | Jive Software, Inc.* | | | 380,960 | |
| | 1,000 | | LivePerson, Inc.* | | | 15,880 | |
| | 18,000 | | MedAssets, Inc.* | | | 226,980 | |
26
FBR Small Cap Fund
Portfolio of Investments (continued)
April 30, 2012
(unaudited)
|
| | | | | | VALUE |
| | SHARES | | | | (NOTE 2) |
|
| | | | Technology — 18.1% (continued) | | | | |
| | 14,000 | | Medidata Solutions, Inc.* | | $ | 362,740 | |
| | 4,000 | | Mellanox Technologies Ltd.* | | | 234,360 | |
| | 2,000 | | MicroStrategy, Inc., Class A* | | | 279,560 | |
| | 12,000 | | MKS Instruments, Inc. | | | 331,800 | |
| | 4,000 | | Nanometrics, Inc.* | | | 62,040 | |
| | 6,000 | | NetSuite, Inc.* | | | 266,280 | |
| | 2,000 | | OmniVision Technologies, Inc.* | | | 36,840 | |
| | 7,175 | | Open Text Corp.* | | | 401,728 | |
| | 4,600 | | Qlik Technologies, Inc.* | | | 132,526 | |
| | 10,000 | | QLogic Corp.* | | | 172,500 | |
| | 16,000 | | Quality Systems, Inc. | | | 598,400 | |
| | 12,000 | | Radware Ltd.* | | | 461,760 | |
| | 8,000 | | Synchronoss Technologies, Inc.* | | | 250,400 | |
| | 1,000 | | Tangoe, Inc.* | | | 20,480 | |
| | 1,800 | | The Ultimate Software Group, Inc.* | | | 138,888 | |
| | 20,000 | | TriQuint Semiconductor, Inc.* | | | 97,600 | |
| | | | | |
| |
| | | | | | | 6,972,716 | |
| | | | | |
| |
| | | | Utilities — 2.1% | | | | |
| | 10,400 | | ALLETE, Inc. | | | 428,584 | |
| | 15,400 | | Portland General Electric Co. | | | 397,782 | |
| | | | | |
| |
| | | | | | | 826,366 | |
| | | | | |
| |
| | | | | | | | |
| | | | Total Common Stocks (Cost $34,185,960) | | | 37,019,229 | |
| | | | | |
| |
|
| | NO. OF | | | | | | |
| | RIGHTS | | | | | | |
|
| | | | RIGHTS — 0.0% | | | | |
| | 5,500 | | Forest Laboratories, Inc., Contingent Value Rights* | | | 5,225 | |
| | | | | |
| |
27
FBR Small Cap Fund
Portfolio of Investments (continued)
April 30, 2012
(unaudited)
|
| | | | | | VALUE |
| | SHARES | | | | (NOTE 2) |
|
| | | | SHORT-TERM INVESTMENT — 3.5% | | | | |
| | 1,323,204 | | Fidelity Institutional Money Market Government Portfolio, Class I, 0.01%^ (Cost $1,323,204) | | $ | 1,323,204 | |
| | | | | |
| |
| | | | | | | | |
| | | | Total Investments — 99.6% (Cost $35,509,164) | | | 38,347,658 | |
| | | | | | | | |
| | | | Other Assets Less Liabilities — 0.4% | | | 168,471 | |
| | | | | |
| |
| | | | | | | | |
| | | | Net Assets — 100.0% | | $ | 38,516,129 | |
| | | | | |
| |
|
| * | | Non-income producing security |
| ^ | | 7-day yield as of April 30, 2012 |
| | | |
| Note: | | For presentation purposes, the Fund has grouped some of the industry categories. For purposes of categorizing securities for compliance with Section 8(b)(1) of the Investment Company Act of 1940, the Fund uses more specific industry classifications. |
The accompanying notes are an integral part of the financial statements.
28
FBR Focus Fund
Management Overview
Portfolio Managers: David Rainey, CFA®, Brian Macauley, CFA® and Ira Rothberg, CFA®
Over the previous six months, how did the Fund perform and what factors contributed to this performance?
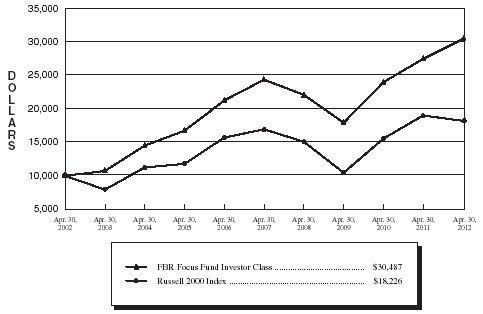
For the six-month period ended April 30, 2012, the Investor Class of the FBR Focus Fund returned 14.26% compared to 11.02% for the Russell 2000 Index, 12.77% for the S&P 500 Index, and 11.10% for the Morningstar Mid Cap Growth Category.
The Fund’s return during the period was the result of improved business prospects for its key holdings, owed to a better overall economic outlook and company specific developments. Leading contributors to the Fund’s performance were O’Reilly Automotive, Inc. (Nasdaq Symbol: ORLY), Bally Technologies, Inc. (Nasdaq Symbol: BYI), American Tower Corp. (NYSE Symbol: AMT), Penn National Gaming, Inc. (Nasdaq Symbol: PENN), and CarMax, Inc. (NYSE Symbol: KMX). The leading detractor from the Fund’s performance was Encore Capital Group, Inc. (Nasdaq Symbol: ECPG).
We invest with a long-term time horizon and encourage shareholders to do the same. Despite the discussion of six-month results referenced above, we encourage investors to evaluate the Fund’s performance over three-, five-, and ten-year periods since shorter time frames can be influenced by many transitory issues unrelated to the intrinsic worth of the Fund’s holdings. Long-term performance metrics for the Fund can be found in the table below.
Portfolio managers’ comments on the Fund and the related investment outlook.
We are pleased to report that during the six month period ended April 30, 2012, the Fund exited its position in 99 Cents Only Stores at a substantial profit. This sale eliminated a large and long-term holding from the portfolio. The Fund held the position for approximately seven years, and at various points during that time the position exceeded 10% of Fund assets. Please see the section below titled “99 Cents Only Stores - Shareholder Activism” for some details on our recent efforts to maximize value in this investment.
As we reflect upon this investment, it is interesting to note the stock’s price volatility during our holding period. The stock suffered eleven separate occasions of 20% or greater price declines, including gut wrenching declines of 41%, 62%, 51%, and 46%. And yet, despite these price declines, the company has gradually grown its intrinsic value, and the Fund has had a good overall investment experience! The Fund’s compound annual returns in 99 Cents Only Stores approximated 10% over the holding period which compares favorably to the low single digit returns from the major market indices.
We think that a key factor in making this a successful investment was the ability to hold onto the stock during these big price swoons, even adding to the position on several such occasions. This is not so easily done. When an investment declines significantly in market
29
FBR Focus Fund
Management Overview (continued)
price, it is human nature to have self doubts about your investment decision. A common response from some investors is to sell a stock that is down to avoid further price declines. Some firms even implement “stop loss” rules that mandate sale of a position that moves too far below initial purchase price. While this may provide some short-term psychological relief from an unpleasant situation, it is frequently the wrong long-term investment decision.
In our experience, the best way to manage the dramatic price swings in a stock is to take a long-term view, and to have a firm opinion of the stocks’ intrinsic value. It is only by knowing what a stock is worth (through diligent research and analysis), that you can determine if the current market price accurately reflects the company’s value. While intrinsic value cannot be calculated with precision, it is often possible to establish a reliable range. With this intrinsic value range in mind, an investor is equipped to make the proper response when confronted with significant stock price swings.
While the price moves in 99 Cents Only Stores stock might seem unusual, they are actually quite common for an individual security. Consider that Fund holding CarMax has had nine separate 20% or greater declines since initial purchase in 2002, including declines of 51%, 80%, and 38%. Fund holding Bally Technologies has had sixteen separate 20% or greater price declines since initial purchase in 2001, including declines of 74%, 43%, 44%, 67%, 52%, and 41%. Despite this stock price volatility, like 99 Cents Only Stores, these companies have gradually grown their intrinsic value driving their stock price higher and producing nice returns for the Fund.
Our experience with 99 Cents Only Stores and other portfolio companies has long convinced us that volatility is the friend of the value investor with staying power. It is our observation that stock prices are much more volatile than a company’s intrinsic value, and therein lies opportunity for the prepared investor. While the market swoons of the last several years are not enjoyable, they do create the environment in which great investment bargains can exist. We attempt to use the market volatility to the Fund’s advantage by purchasing shares in companies that we admire at discount prices.
During the six month period, we used the market’s volatility to add two new holdings (UTi Worldwide, Inc. and Dick’s Sporting Goods, Inc.) and increase the size of six existing positions at compelling purchase prices. While recent market conditions remain particularly volatile due to the continuing European sovereign debt crisis, European recession, and fear of slowing growth in Asia, we believe many of the Fund’s largest holdings are well positioned to continue to grow cash earnings per share at a double digit clip over the next several years even in a slow growth environment. Along the way, we plan to remain steadfast through the ebb and flow of fear and greed, allowing market volatility to serve us, not instruct us.
30
FBR Focus Fund
Management Overview (continued)
99 Cents Only Stores - Shareholder Activism
In March 2011, 99 Cents Only Stores received a buyout proposal from its founding family (“Schiffer/Gold Family”) and the private equity firm Leonard Green Partners. We thought that the $19.09 per share proposal significantly undervalued the company, and, because of the Schiffer/Gold Family’s involvement, we had serious concerns about the rigor that the company’s board would apply in evaluating their offer against other opportunities.
As a long time investor in the company, and one of the largest shareholders, we believed that we had the credibility to favorably influence the sales process, and thereby improve results for Fund shareholders. Soon after the announced receipt of the buyout proposal, we changed our regulatory filing status with the SEC to “13D”, enabling significantly more latitude to engage with, and potentially challenge, the company and board leadership.
We hired specialized legal counsel, and undertook a campaign to impress upon the board and other shareholders why the company was worth significantly more than $19.09 per share, and the importance of conducting a robust sales process to secure the best offer available. This campaign included a public letter to the board in April 2011, a public letter to the board’s special committee in May 2011 (both available on file at the SEC’s web site), numerous private communications with the special committee and its financial advisors, press releases, press interviews, and conversations with other large 99 Cents Only shareholders.
On October 11, 2011, the company announced that it had signed a binding agreement to be purchased by Ares Management, Canada Pension Plan Investment Board, and the Schiffer/Gold Family for $22.00 per share, which was a 15.2% premium to the initial proposal of $19.09 per share. While the precise impact of our 13D involvement cannot be known with certainty, we believe that these efforts were a significant influence in the process.
We thank you for entrusting your capital to us. We take this responsibility very seriously, and we will do our best to protect and grow your investment.
The opinions expressed in this commentary reflect those of the Portfolio Managers as of the date written. Any such opinions are subject to change based on market or other conditions. These opinions may not be relied upon as investment advice. Investment decisions for The FBR Funds are based on several factors, and may not be relied upon as an indication of trading intent on behalf of any FBR Fund. Security positions can and do change.
31
FBR Focus Fund
Comparison of Changes in Value of $10,000 Investment in
Investor Class Shares(1)(2) vs. Russell 2000 Index(1)(3)
(unaudited)
Total Returns—For the Periods Ended April 30, 2012(4) |
| | | | | One Year | | Annualized
Five Year | | Annualized
Ten Year | |
| | | | |
| |
| |
| |
| | FBR Focus Fund Investor Class(1)(2) | | | 10.79 | % | | 4.56 | % | | 11.79 | % | |
| | FBR Focus Fund Institutional Class(2)(5) | | | 11.08 | % | | 4.83 | % | | 11.94 | % | |
| | Russell 2000 Index(1)(3) | | | (4.25) | % | | 1.45 | % | | 6.19 | % | |
| |
| PAST PERFORMANCE IS NO GUARANTEE OF FUTURE RESULTS. |
| The performance data quoted represents past performance and the current performance may be lower or higher than the performance data quoted. The investment return and principal will fluctuate so that investors’ shares, when redeemed, may be worth more or less than their original cost. The performance data does not reflect the deduction of taxes that a shareholder would pay on Fund distributions or redemption fees. The Fund charges a redemption fee of 1.00% on shares redeemed or exchanged within 90 days; if reflected, the redemption fee would reduce the performance data quoted. To obtain performance data current to the most recent month-end, please call 888.200.4710. |
|
| (1) | | The graph assumes a hypothetical $10,000 initial investment in the Fund and reflects the reinvestment of dividends and all Fund expenses. Investors should note that the Fund is a professionally managed mutual fund while the index is unmanaged, does not incur expenses and is not available for investment. The performance of the index includes reinvested dividends, and does not reflect sales charges or expenses. |
| (2) | | FBR Fund Advisers, Inc. waived a portion of its advisory fees and agreed to contractually reimburse a portion of the Fund’s operating expenses, as necessary, to maintain existing expense limitations, as set forth in the notes to the financial statements. Total returns shown include fee waivers and expense reimbursements, if any; total returns would have been lower had there been no waiver of fees and/or reimbursement of expenses in excess of expense limitations. |
| (3) | | The Russell 2000 Index is comprised of the smallest of the 2000 companies of the Russell 3000 Index, representing approximately 8% of the Russell 3000’s total market capitalization. |
| (4) | | The total returns shown do not reflect the deduction of taxes that a shareholder would pay on fund distributions or the redemption of fund shares. |
| (5) | | Represents the performance of the Institutional Class shares after May 30, 2008 (inception of share class) and Investor Class for periods prior to that date. |
32
FBR Focus Fund
Portfolio Summary
April 30, 2012
(unaudited)
The following provides a breakdown of the Fund by industry sectors. The underlying securities represent a percentage of the portfolio investments.
| Industry Sector | | % of Total Investments |
| |
|
| Retail | | | 22.9 | % |
| Entertainment | | | 15.8 | % |
| Insurance | | | 13.1 | % |
| Telecommunications | | | 8.9 | % |
| Diversified Financial Services | | | 8.8 | % |
| Media | | | 4.9 | % |
| Internet | | | 4.6 | % |
| Building Materials | | | 3.4 | % |
| Advertising | | | 2.6 | % |
| Transportation | | | 2.4 | % |
| Healthcare Products | | | 1.8 | % |
| Home Furnishings | | | 1.6 | % |
| | | | | |
| Cash | | | 9.2 | % |
33
FBR Focus Fund
Portfolio of Investments
April 30, 2012
(unaudited)
|
| | | | | | VALUE |
| | SHARES | | | | (NOTE 2) |
|
| | | | COMMON STOCKS — 90.8% | | | | |
| | | | Advertising — 2.6% | | | | |
| | 630,000 | | Lamar Advertising Co., Class A* | | $ | 20,046,600 | |
| | | | | |
| |
| | | | Building Materials — 3.4% | | | | |
| | 825,000 | | Simpson Manufacturing Company, Inc. | | | 25,599,750 | |
| | | | | |
| |
| | | | Diversified Financial Services — 8.8% | | | | |
| | 94,910 | | Diamond Hill Investment Group, Inc. | | | 7,202,720 | |
| | 503,756 | | Encore Capital Group, Inc.* | | | 11,939,017 | |
| | 454,839 | | Marlin Business Services Corp. | | | 6,677,037 | |
| | 125,000 | | T. Rowe Price Group, Inc. | | | 7,889,375 | |
| | 2,017,000 | | The Charles Schwab Corp. | | | 28,843,100 | |
| | 173,137 | | White River Capital, Inc. | | | 3,912,896 | |
| | | | | |
| |
| | | | | | | 66,464,145 | |
| | | | | |
| |
| | | | Entertainment — 15.8% | | | | |
| | 1,169,000 | | Bally Technologies, Inc.* | | | 56,754,950 | |
| | 1,393,670 | | Penn National Gaming, Inc.* | | | 62,687,277 | |
| | | | | |
| |
| | | | | | | 119,442,227 | |
| | | | | |
| |
| | | | Healthcare Products — 1.8% | | | | |
| | 180,000 | | Henry Schein, Inc.* | | | 13,813,200 | |
| | | | | |
| |
| | | | Home Furnishings — 1.6% | | | | |
| | 680,160 | | American Woodmark Corp. | | | 12,208,872 | |
| | | | | |
| |
| | | | Insurance — 13.1% | | | | |
| | 755,000 | | Aon PLC | | | 39,109,000 | |
| | 136,640 | | Markel Corp.* | | | 60,159,859 | |
| | | | | |
| |
| | | | | | | 99,268,859 | |
| | | | | |
| |
| | | | Internet — 4.6% | | | | |
| | 57,500 | | Google, Inc., Class A* | | | 34,800,725 | |
| | | | | |
| |
| | | | Media — 4.9% | | | | |
| | 1,886,000 | | News Corp., Class A | | | 36,965,600 | |
| | | | | |
| |
34
FBR Focus Fund
Portfolio of Investments (continued)
April 30, 2012
(unaudited)
|
| | | | | | VALUE |
| | SHARES | | | | (NOTE 2) |
|
| | | | Retail — 22.9% | | | | |
| | 1,840,088 | | CarMax, Inc.* | | $ | 56,803,516 | |
| | 30,000 | | Dick’s Sporting Goods, Inc. | | | 1,518,000 | |
| | 730,000 | | O’Reilly Automotive, Inc.* | | | 76,985,800 | |
| | 859,150 | | World Fuel Services Corp. | | | 37,854,149 | |
| | | | | |
| |
| | | | | | | 173,161,465 | |
| | | | | |
| |
| | | | Telecommunications — 8.9% | | | | |
| | 1,034,000 | | American Tower Corp., Class A | | | 67,809,720 | |
| | | | | |
| |
| | | | Transportation — 2.4% | | | | |
| | 754,200 | | Roadrunner Transportation Systems, Inc.* | | | 13,085,370 | |
| | 328,277 | | UTi Worldwide, Inc. | | | 5,472,378 | |
| | | | | |
| |
| | | | | | | 18,557,748 | |
| | | | | |
| |
| | | | | | | | |
| | | | Total Common Stocks (Cost $363,114,295) | | | 688,138,911 | |
| | | | | |
| |
| | | | SHORT-TERM INVESTMENT — 9.5% | | | | |
| | 72,317,775 | | Fidelity Institutional Money Market Government Portfolio, Class I, 0.01%^ (Cost $72,317,775) | | | 72,317,775 | |
| | | | | |
| |
| | | | Total Investments — 100.3% (Cost $435,432,070) | | | 760,456,686 | |
| | | | | | | | |
| | | | Liabilities Less Other Assets — (0.3)% | | | (2,450,437 | ) |
| | | | | |
| |
| | | | | | | | |
| | | | Net Assets — 100.0% | | $ | 758,006,249 | |
| | | | | |
| |
|
| * | | Non-income producing security |
| PLC | | Public Liability Company |
| ^ | | 7-day yield as of April 30, 2012 |
| | | |
| Note: | | For presentation purposes, the Fund has grouped some of the industry categories. For purposes of categorizing securities for compliance with Section 8(b)(1) of the Investment Company Act of 1940, the Fund uses more specific industry classifications. |
The accompanying notes are an integral part of the financial statements.
35
| FBR Large Cap Financial Fund |
| Management Overview |
Portfolio Manager: David Ellison
Over the previous six months, how did the Fund perform and what factors contributed to this performance?
For the six-month period ended April 30, 2012, the Investor Class of the FBR Large Cap Financial Fund returned 16.88%. This compares to the KBW Bank Sector Index, the S&P 500 Index and the Morningstar Financial Category Average, which returned 21.67%, 12.77% and 13.03% for the same period, respectively.
The favorable performance was primarily driven by positions in the large domestic commercial banks. Insurance and brokerage companies were primary detractors from performance during the period. Improvements in credit, somewhat better housing activity and better loan demand helped the commercial banks during the period. Continued weakness in the capital markets, lower trading volumes and commissions, and lower investment returns hurt the brokerage and insurance stocks during the period.
The Fund continues to be concentrated in the mid to large domestic commercial banks. I believe these companies are best positioned for a better economy and have downside protection as they are not directly exposed to European economies. These companies have also built strong balance sheets as indicated by much improved capital, loss reserves and liquidity levels.
Portfolio manager comments on the Fund and the related investment outlook.
The U.S. financial services industry continues to recover from a deep recession. However, headwinds persist and the developing concerns out of Europe which began about a year ago are weighing on everyone. Macro concern about the global financial system is overwhelming improvements at the individual company level. I also believe the macro concerns are real and need to be taken into account when investing in this sector. I believe that a healthy banking system is a precondition to a better economy. I believe the strongest banking system is in the U.S., and should offer a basis for the U.S. being one of the better economies relative to the world going forward.
While the large capitalization financial stocks are cheap relative to history, I remain cautious and will look to protect the downside if macro risks inflate further.
|
The opinions expressed in this commentary reflect those of the Portfolio Manager as of the date written. Any such opinions are subject to change based on market or other conditions. These opinions may not be relied upon as investment advice. Investment decisions for The FBR Funds are based on several factors, and may not be relied upon as an indication of trading intent on behalf of any FBR Fund. Security positions can and do change. |
36
| FBR Large Cap Financial Fund |
Comparison of Changes in Value of $10,000 Investment in
Investor Class Shares(1)(2) vs. Various Indices(1)(3)
(unaudited)
Total Returns—For the Periods Ended April 30, 2011(4) |
| | | | | One Year | | Annualized
Five Year | | Annualized
Ten Year | |
| | | | |
| |
| |
| |
| | FBR Large Cap Financial Fund Investor Class(1)(2) | | | (1.21) | % | | (2.82) | % | | 2.88 | % | |
| | S&P 500 Index(1)(3) | | | 4.76 | % | | 1.01 | % | | 4.71 | % | |
| | KBW Bank Sector Index(1)(3) | | | (4.39) | % | | (13.91) | % | | (3.02) | % | |
| |
PAST PERFORMANCE IS NO GUARANTEE OF FUTURE RESULTS.
The performance data quoted represents past performance and the current performance may be lower or higher than the performance data quoted. The investment return and principal will fluctuate so that investors’ shares, when redeemed, may be worth more or less than their original cost. The performance data does not reflect the deduction of taxes that a shareholder would pay on Fund distributions or redemption fees. The Fund charges a redemption fee of 1.00% on shares redeemed or exchanged within 90 days; if reflected, the redemption fee would reduce the performance data quoted. To obtain performance data current to the most recent month-end, please call 888.200.4710.
|
| (1) | | The graph assumes a hypothetical $10,000 initial investment in the Fund and reflects the reinvestment of dividends and all Fund expenses. Investors should note that the Fund is a professionally managed mutual fund while the index is unmanaged, does not incur expenses and is not available for investment. The performance of the index includes reinvested dividends, and does not reflect sales charges or expenses. |
| (2) | | FBR Fund Advisers, Inc. waived a portion of its advisory fees and agreed to contractually reimburse a portion of the Fund’s operating expenses, as necessary, to maintain existing expense limitations, as set forth in the notes to the financial statements. Total returns shown include fee waivers and expense reimbursements, if any; total returns would have been lower had there been no waiver of fees and/or reimbursement of expenses in excess of expense limitations. |
| (3) | | The S&P 500 Index is a capitalization-weighted index of 500 stocks. The index is designed to represent the broad domestic ecomony through changes in aggregate market value of 500 stocks representing all major industries. The KBW Bank Sector Index is a capitalization-weighted index composed of 24 geographically diverse stocks representing national money center banks and leading regional institutions. |
| (4) | | The total returns shown do not reflect the deduction of taxes that a shareholder would pay on fund distributions or the redemption of fund shares. |
37
FBR Large Cap Financial Fund
Portfolio Summary
April 30, 2012
(unaudited)
The following provides a breakdown of the Fund by industry sectors. The underlying securities represent a percentage of the portfolio investments.
| Industry Sector | | % of Total Investments |
| |
|
| Banks | | | 68.5 | % |
| Insurance | | | 8.6 | % |
| Diversified Financial Services | | | 7.9 | % |
| Commercial Services | | | 7.1 | % |
| Home Builders | | | 3.4 | % |
| Savings & Loans | | | 0.9 | % |
| Financial | | | 0.7 | % |
| | | | | |
| Cash | | | 2.9 | % |
38
FBR Large Cap Financial Fund
Portfolio of Investments
April 30, 2012
(unaudited)
|
| | | | | | VALUE |
| | SHARES | | | | (NOTE 2) |
|
| | | | | | | | |
| | | | COMMON STOCKS — 97.1% | | | | |
| | | | Banks — 68.5% | | | | |
| | 380,000 | | Bank of America Corp. | | $ | 3,081,800 | |
| | 50,000 | | BB&T Corp. | | | 1,602,000 | |
| | 62,000 | | Capital One Financial Corp. | | | 3,439,760 | |
| | 30,000 | | CIT Group, Inc.* | | | 1,135,500 | |
| | 100,000 | | Citigroup, Inc. | | | 3,304,000 | |
| | 100,000 | | Comerica, Inc. | | | 3,202,000 | |
| | 225,000 | | Fifth Third Bancorp | | | 3,201,750 | |
| | 340,000 | | Huntington Bancshares, Inc. | | | 2,274,600 | |
| | 80,000 | | JPMorgan Chase & Co. | | | 3,438,400 | |
| | 390,000 | | KeyCorp | | | 3,135,600 | |
| | 25,000 | | M&T Bank Corp. | | | 2,156,750 | |
| | 130,000 | | Morgan Stanley | | | 2,246,400 | |
| | 65,000 | | The Bank of New York Mellon Corp. | | | 1,537,250 | |
| | 11,000 | | The Goldman Sachs Group, Inc. | | | 1,266,650 | |
| | 50,000 | | The PNC Financial Services Group, Inc. | | | 3,316,000 | |
| | 105,000 | | U.S. Bancorp | | | 3,377,850 | |
| | 100,000 | | Wells Fargo & Co. | | | 3,343,000 | |
| | 35,808 | | Zions Bancorp | | | 730,125 | |
| | | | | |
| |
| | | | | | | 45,789,435 | |
| | | | | |
| |
| | | | Commercial Services — 7.1% | | | | |
| | 2,000 | | Alliance Data Systems Corp.* | | | 256,980 | |
| | 3,000 | | MasterCard, Inc., Class A | | | 1,356,810 | |
| | 65,000 | | Total System Services, Inc. | | | 1,528,800 | |
| | 13,000 | | Visa, Inc., Class A | | | 1,598,740 | |
| | | | | |
| |
| | | | | | | 4,741,330 | |
| | | | | |
| |
| | | | Diversified Financial Services — 7.9% | | | | |
| | 35,000 | | American Express Co. | | | 2,107,350 | |
| | 15,000 | | Ameriprise Financial, Inc. | | | 813,150 | |
| | 33,000 | | Discover Financial Services | | | 1,118,700 | |
| | 85,000 | | The Charles Schwab Corp. | | | 1,215,500 | |
| | | | | |
| |
| | | | | | | 5,254,700 | |
| | | | | |
| |
39
FBR Large Cap Financial Fund
Portfolio of Investments (continued)
April 30, 2012
(unaudited)
|
| | | | | | VALUE |
| | SHARES | | | | (NOTE 2) |
|
| | | | Financial — 0.7% | | | | |
| | 75,000 | | Regions Financial Corp. | | $ | 505,500 | |
| | | | | |
| |
| | | | | | | | |
| | | | Home Builders — 3.4% | | | | |
| | 40,000 | | Lennar Corp. | | | 1,109,600 | |
| | 45,000 | | Toll Brothers, Inc.* | | | 1,143,000 | |
| | | | | |
| |
| | | | | | | 2,252,600 | |
| | | | | |
| |
| | | | Insurance — 8.6% | | | | |
| | 5,000 | | American International Group, Inc.* | | | 170,150 | |
| | 35,000 | | MetLife, Inc. | | | 1,261,050 | |
| | 15,000 | | Prudential Financial, Inc. | | | 908,100 | |
| | 140,000 | | SunTrust Banks, Inc. | | | 3,399,200 | |
| | | | | |
| |
| | | | | | | 5,738,500 | |
| | | | | |
| |
| | | | Savings & Loans — 0.9% | | | | |
| | 5,000 | | Hudson City Bancorp, Inc. | | | 35,300 | |
| | 40,000 | | New York Community Bancorp, Inc. | | | 539,600 | |
| | | | | |
| |
| | | | | | | 574,900 | |
| | | | | |
| |
| | | | | | | | |
| | | | Total Common Stocks (Cost $57,966,016) | | | 64,856,965 | |
| | | | | |
| |
| | | | SHORT-TERM INVESTMENT — 2.8% | | | | |
| | 1,896,355 | | Fidelity Institutional Money Market Government Portfolio, Class I, 0.01%^ (Cost $1,896,355) | | | 1,896,355 | |
| | | | | |
| |
| | | | | | | | |
| | | | Total Investments — 99.9% (Cost $59,862,371) | | | 66,753,320 | |
| | | | | | | | |
| | | | Other Assets Less Liabilities — 0.1% | | | 31,335 | |
| | | | | |
| |
| | | | | | | | |
| | | | Net Assets — 100.0% | | $ | 66,784,655 | |
| | | | | |
| |
| * | | Non-income producing security |
| ^ | | 7-day yield as of April 30, 2012 |
The accompanying notes are an integral part of the financial statements.
40
FBR Small Cap Financial Fund
Management Overview
Portfolio Manager: David Ellison
Over the previous six months, how did the Fund perform and what factors contributed to this performance?
For the six-month period ended April 30, 2012, the Investor Class of the FBR Small Cap Financial Fund returned 12.50%. This lags the NASDAQ Bank Index and the Morningstar Financial Category Average which returned 14.84% and 13.03% for the same period, respectively. The Fund outperformed the more broadly diversified Russell 2000 Index which returned 11.02% for the period.
Performance was favorably impacted by positions in traditional small cap banks and thrifts. Underperformance was driven by positions in small cap mortgage insurers and consumer credit companies.
The Fund remains predominantly invested in small cap banks and thrifts. These companies have stable funding sources (insured deposits) and the majority of their assets in U.S. home mortgages. Lower deposit costs have been a positive while the U.S. housing market is showing signs of stability.
Portfolio manager comments on the Fund and the related investment outlook.
Small cap banks and thrifts in the U.S. are slowly getting better. Lower rates have reduced funding costs. The struggling housing market, which began four years ago, is showing signs of life. They have built capital ratios, improved liquidity, reserved for credit costs and reestablished prudent credit standards. Finally, these companies have no European exposure and have some of the best balance sheets in the U.S. banking industry.
I believe the industry is “on the mend” and will eventually show improved earnings that will be more stable and predictable. These improved earnings should lead to higher valuations over time. I also expect consolidation activity to come back as regulatory and competitive costs force this process.
The opinions expressed in this commentary reflect those of the Portfolio Manager as of the date written. Any such opinions are subject to change based on market or other conditions. These opinions may not be relied upon as investment advice. Investment decisions for The FBR Funds are based on several factors, and may not be relied upon as an indication of trading intent on behalf of any FBR Fund. Security positions can and do change.
41
FBR Small Cap Financial Fund
Comparison of Changes in Value of $10,000 Investment in
Investor Class Shares(1)(2) vs. Russell 2000 Index(1)(3)
(unaudited)
Total Returns—For the Periods Ended April 30, 2012(4) |
| | | | | | | | Annualized | | Annualized | |
| | | | | One Year | | Five Year | | Ten Year | |
| | | | |
| |
| |
| |
| | FBR Small Cap Financial Fund Investor Class(1)(2) | | | (9.25 | )% | | 0.19 | % | | 5.53 | % | |
| | FBR Small Cap Financial Fund Institutional Class(2)(5) | | | (9.09 | )% | | 0.37 | % | | 5.62 | % | |
| | Russell 2000 Index(1)(3) | | | (4.25 | )% | | 1.45 | % | | 6.19 | % | |
| |
PAST PERFORMANCE IS NO GUARANTEE OF FUTURE RESULTS.
The performance data quoted represents past performance and the current performance may be lower or higher than the performance data quoted. The investment return and principal will fluctuate so that investors’ shares, when redeemed, may be worth more or less than their original cost. The performance data does not reflect the deduction of taxes that a shareholder would pay on Fund distributions or redemption fees. The Fund charges a redemption fee of 1.00% on shares redeemed or exchanged within 90 days; if reflected, the redemption fee would reduce the performance data quoted. To obtain performance data current to the most recent month-end, please call 888.200.4710.
|
| (1) | | The graph assumes a hypothetical $10,000 initial investment in the Fund and reflects the reinvestment of dividends and all Fund expenses. Investors should note that the Fund is a professionally managed mutual fund while the index is unmanaged, does not incur expenses and is not available for investment. The performance of the index includes reinvested dividends, and does not reflect sales charges or expenses. |
| (2) | | FBR Fund Advisers, Inc. waived a portion of its advisory fees and agreed to contractually reimburse a portion of the Fund’s operating expenses, as necessary, to maintain existing expense limitations, as set forth in the notes to the financial statements. Total returns shown include fee waivers and expense reimbursements, if any; total returns would have been lower had there been no waiver of fees and/or reimbursement of expenses in excess of expense limitations. |
| (3) | | The Russell 2000 Index is comprised of the smallest of the 2000 companies of the Russell 3000 Index, representing approximately 8% of the Russell 3000’s total market capitalization. |
| (4) | | The total returns shown do not reflect the deduction of taxes that a shareholder would pay on fund distributions or the redemption of fund shares. |
| (5) | | Represents the performance of the Institutional Class shares after May 30, 2008 (inception of share class) and Investor Class for periods prior to that date. |
42
FBR Small Cap Financial Fund
Portfolio Summary
April 30, 2012
(unaudited)
The following provides a breakdown of the Fund by industry sectors. The underlying securities represent a percentage of the portfolio investments.
| Industry Sector | | % of Total Investments |
| |
|
| Banks | | | 40.3 | % |
| Savings & Loans | | | 37.4 | % |
| Diversified Financial Services | | | 6.5 | % |
| Investment Companies | | | 4.2 | % |
| Insurance | | | 3.9 | % |
| Real Estate Investment Trust | | | 2.6 | % |
| Home Builders | | | 2.1 | % |
| Commercial Services | | | 1.6 | % |
| | | | | |
| Cash | | | 1.4 | % |
43
FBR Small Cap Financial Fund
Portfolio of Investments
April 30, 2012
(unaudited)
|
| | | | | | VALUE |
| | SHARES | | | | (NOTE 2) |
|
| | | | COMMON STOCKS — 94.4% | | | | |
| | | | Banks — 40.3% | | | | |
| | 150,000 | | Associated Banc-Corp | | $ | 1,999,500 | |
| | 160,000 | | BancorpSouth, Inc. | | | 2,155,200 | |
| | 185,000 | | Banner Corp. | | | 4,060,750 | |
| | 250,000 | | BBCN Bancorp, Inc.* | | | 2,745,000 | |
| | 580,000 | | CapitalSource, Inc. | | | 3,741,000 | |
| | 45,000 | | City National Corp. | | | 2,396,700 | |
| | 100,000 | | Fifth Third Bancorp | | | 1,423,000 | |
| | 220,000 | | First Commonwealth Financial Corp. | | | 1,414,600 | |
| | 263,067 | | First Connecticut Bancorp, Inc. | | | 3,469,854 | |
| | 450,000 | | First Horizon National Corp. | | | 4,131,000 | |
| | 80,000 | | FirstMerit Corp. | | | 1,344,000 | |
| | 410,000 | | Fulton Financial Corp. | | | 4,300,900 | |
| | 35,000 | | Glacier Bancorp, Inc. | | | 521,500 | |
| | 30,000 | | IBERIABANK Corp. | | | 1,532,100 | |
| | 130,307 | | Independent Bank Corp. | | | 3,657,717 | |
| | 190,000 | | KeyCorp | | | 1,527,600 | |
| | 110,000 | | MB Financial, Inc. | | | 2,273,700 | |
| | 160,000 | | National Penn Bancshares, Inc. | | | 1,475,200 | |
| | 300,000 | | Popular, Inc.* | | | 534,000 | |
| | 110,000 | | Privatebancorp, Inc. | | | 1,730,300 | |
| | 260,000 | | Sterling Financial Corp.* | | | 5,049,200 | |
| | 565,000 | | Susquehanna Bancshares, Inc. | | | 5,859,050 | |
| | 430,000 | | TCF Financial Corp. | | | 4,932,100 | |
| | 204,043 | | United Community Banks* | | | 1,920,045 | |
| | 180,000 | | Valley National Bancorp | | | 2,268,000 | |
| | 45,000 | | Webster Financial Corp. | | | 1,022,850 | |
| | 150,000 | | Wintrust Financial Corp. | | | 5,419,500 | |
| | 100,000 | | Zions Bancorporation | | | 2,039,000 | |
| | | | | |
| |
| | | | | | | 74,943,366 | |
| | | | | |
| |
| | | | Commercial Services — 1.6% | | | | |
| | 115,000 | | Green Dot Corp., Class A* | | | 3,034,850 | |
| | | | | |
| |
44
FBR Small Cap Financial Fund
Portfolio of Investments (continued)
April 30, 2012
(unaudited)
|
| | | | | | VALUE |
| | SHARES | | | | (NOTE 2) |
|
| | | | Diversified Financial Services — 6.5% | | | | |
| | 210,000 | | Encore Capital Group, Inc.* | | $ | 4,977,000 | |
| | 510,000 | | Netspend Holdings, Inc.* | | | 3,891,300 | |
| | 45,000 | | Portfolio Recovery Associates, Inc.* | | | 3,096,900 | |
| | | | | |
| |
| | | | | | | 11,965,200 | |
| | | | | |
| |
| | | | Home Builders — 2.1% | | | | |
| | 450,000 | | KB Home | | | 3,906,000 | |
| | | | | |
| |
| | | | | | | | |
| | | | Insurance — 3.9% | | | | |
| | 90,000 | | CNO Financial Group, Inc.* | | | 654,300 | |
| | 370,000 | | MBIA, Inc.* | | | 3,729,600 | |
| | 825,000 | | MGIC Investment Corp.* | | | 2,854,500 | |
| | | | | |
| |
| | | | | | | 7,238,400 | |
| | | | | |
| |
| | | | Real Estate Investment Trust — 2.6% | | | | |
| | 460,000 | | NorthStar Realty Finance Corp. | | | 2,622,000 | |
| | 460,000 | | RAIT Financial Trust | | | 2,226,400 | |
| | | | | |
| |
| | | | | | | 4,848,400 | |
| | | | | |
| |
| | | | Savings & Loans — 37.4% | | | | |
| | 560,000 | | Astoria Financial Corp. | | | 5,426,400 | |
| | 210,000 | | BankUnited, Inc. | | | 5,166,000 | |
| | 610,000 | | Brookline Bancorp, Inc. | | | 5,477,800 | |
| | 290,000 | | Capitol Federal Financial | | | 3,424,900 | |
| | 360,000 | | First Niagara Financial Group, Inc. | | | 3,218,400 | |
| | 239,795 | | Flagstar Bancorp, Inc.* | | | 208,718 | |
| | 355,000 | | Flushing Financial Corp. | | | 4,625,650 | |
| | 94,331 | | Hingham Institution for Savings | | | 5,438,182 | |
| | 30,000 | | HomeStreet, Inc.* | | | 1,047,600 | |
| | 60,000 | | Investors Bancorp, Inc.* | | | 926,400 | |
| | 200,000 | | Northwest Bancshares, Inc. | | | 2,464,000 | |
| | 320,000 | | OceanFirst Financial Corp. | | | 4,662,400 | |
| | 105,000 | | People’s United Financial, Inc. | | | 1,295,700 | |
| | 120,000 | | Provident Financial Services, Inc. | | | 1,764,000 | |
| | 320,000 | | Rockville Financial, Inc. | | | 3,747,200 | |
45
FBR Small Cap Financial Fund
Portfolio of Investments (continued)
April 30, 2012
(unaudited)
|
| | | | | | VALUE |
| | SHARES | | | | (NOTE 2) |
|
| | | | Savings & Loans — 37.4% (continued) | | | | |
| | 200,000 | | Territorial Bancorp, Inc. | | $ | 4,344,000 | |
| | 350,000 | | TFS Financial Corp.* | | | 3,440,500 | |
| | 210,013 | | United Financial Bancorp, Inc. | | | 3,368,608 | |
| | 360,000 | | Washington Federal, Inc. | | | 6,314,400 | |
| | 80,000 | | WSFS Financial Corp. | | | 3,192,800 | |
| | | | | |
| |
| | | | | | | 69,553,658 | |
| | | | | |
| |
| | | | | | | | |
| | | | Total Common Stocks (Cost $164,687,881) | | | 175,489,874 | |
| | | | | |
| |
| | | | | | | | |
| | | | INVESTMENT COMPANIES — 4.2% | | | | |
| | 235,000 | | American Capital Ltd.* | | | 2,333,550 | |
| | 125,000 | | Fortress Investment Group LLC* | | | 447,500 | |
| | 560,000 | | KKR Financial Holdings LLC | | | 5,084,800 | |
| | | | | |
| |
| | | | | | | | |
| | | | Total Investment Companies (Cost $7,042,689) | | | 7,865,850 | |
| | | | | |
| |
| | | | | | | | |
| | | | SHORT-TERM INVESTMENT — 1.3% | | | | |
| | 2,450,044 | | Fidelity Institutional Money Market Government Portfolio, Class I, 0.01%^ (Cost $2,450,044) | | | 2,450,044 | |
| | | | | |
| |
| | | | | | | | |
| | | | Total Investments — 99.9% (Cost $174,180,614) | | | 185,805,768 | |
| | | | | | | | |
| | | | Other Assets Less Liabilities — 0.1% | | | 77,426 | |
| | | | | |
| |
| | | | | | | | |
| | | | Net Assets — 100.0% | | $ | 185,883,194 | |
| | | | | |
| |
|
| * | | Non-income producing security |
| LLC | | Limited Liability Company |
| ^ | | 7-day yield as of April 30, 2012 |
The accompanying notes are an integral part of the financial statements.
46
FBR Technology Fund
Management Overview
Portfolio Managers: David Ellison and Winsor Aylesworth
Over the previous six months, how did the Fund perform and what factors contributed to this performance?
For the six-month period ended April 30, 2012, the Investor Class of the FBR Technology Fund returned 9.48%. This compares to the S&P 500 Index, the NASDAQ Composite Index and the Morningstar Technology Category Average which returned 12.77%, 14.16% and 10.91% for the same period, respectively.
The Fund provided a good return for the six month period but continued to underperform its various benchmarks. The investment approach did not change as the Fund remained invested in technology companies that exhibit growing revenues, and increasing tangible book value with minimal debt. We acknowledge that this approach is conservative but is the correct one for long term performance with minimal risk.
For the last six months the major contributors to performance were familiar names. Apple, Inc. (NASDAQ Symbol: AAPL), priceline.com, Inc. (NASDAQ Symbol: PCLN) and Intuitive Surgical, Inc. (Nasdaq Symbol: ISRG) combined for an average return for the period of 46.44% and comprised 9.94% of the portfolio. All three are leaders in their respective segments of technology—Apple in retail devices, Priceline in on-line travel services and Intuitive Surgical in computerized surgical devices.
Major detractrors included Cognizant Technology Solutions Corp. (NASDAQ Symbol: CTSH), Riverbed Technology, Inc. (NASDAQ Symbol: RVBD) and Altera Corp. (NASDAQ Symbol: ALTR). The three had an average return of -15.25% and comprised 6.89% of the portfolio. Cognizant is a provider of information technology and heavily involved in cloud computing. Riverbed Technology is a software company involved in data handling and cloud computing while Altera is a semiconductor manufacturer. All three companies have little if any debt and are growing tangible book value. We continue to hold these names and trust the market will reward us over the long term.
Portfolio managers comments on the Fund and the related investment outlook.
In the last two shareholder letters, we have mentioned how the global economy appears to be in turmoil with Europe particularly under duress. Unfortunately, it appears that this continues and clouds the outlook and makes investing difficult. Asian markets appear to be in a slowdown, too. Even though the U.S. is not without its problems, it appears to be one of the safest places for capital and for innovation with the least amount of upheaval. In other words, in a world filled with uncertainty, the U.S. may be the best of the worst.
The good news is that technology plays a key role in making the world a better place, putting people to work and providing solutions to today’s problems. We continue to invest in technology companies that have minimal debt, a history growing revenues and growing tangible book value. In addition, until the European and Asian outlooks appear more
47
FBR Technology Fund
Management Overview (continued)
stable, we have limited the portfolio to those technology companies that are based in North America. We understand that we may miss some opportunities but we think this is the more conservative approach during this period of time.
We continue to appreciate your support as fellow investors in the Fund.
The opinions expressed in this commentary reflect those of the Portfolio Managers as of the date written. Any such opinions are subject to change based on market or other conditions. These opinions may not be relied upon as investment advice. Investment decisions for The FBR Funds are based on several factors, and may not be relied upon as an indication of trading intent on behalf of any FBR Fund. Security positions can and do change.
48
FBR Technology Fund
Comparison of Changes in Value of $10,000 Investment in
Investor Class Shares(1)(2) vs. Various Indices(1)(3)
(unaudited)

Total Returns—For the Periods Ended April 30, 2012(4) |
| | | | | | | | Annualized | | Annualized | |
| | | | | One Year | | Five Year | | Ten Year | |
| | | | |
| |
| |
| |
| | FBR Technology Fund Investor Class(1)(2) | | | (4.04) | % | | 1.41 | % | | 6.23 | % | |
| | FBR Technology Fund Institutional Class(2)(5) | | | (3.70) | % | | 1.53 | % | | 6.29 | % | |
| | S&P 500 Index(1)(3) | | | 4.76 | % | | 1.01 | % | | 4.71 | % | |
| | NASDAQ Composite Index(1)(3) | | | 7.17 | % | | 4.85 | % | | 6.92 | % | |
| |
PAST PERFORMANCE IS NO GUARANTEE OF FUTURE RESULTS.
The performance data quoted represents past performance and the current performance may be lower or higher than the performance data quoted. The investment return and principal will fluctuate so that investors’ shares, when redeemed, may be worth more or less than their original cost. The performance data does not reflect the deduction of taxes that a shareholder would pay on Fund distributions or redemption fees. The Fund charges a redemption fee of 1.00% on shares redeemed or exchanged within 90 days; if reflected, the redemption fee would reduce the performance data quoted. To obtain performance data current to the most recent month-end, please call 888.200.4710.
|
| (1) | | The graph assumes a hypothetical $10,000 initial investment in the Fund and reflects the reinvestment of dividends and all Fund expenses. Investors should note that the Fund is a professionally managed mutual fund while the indices are unmanaged, do not incur expenses and are not available for investment. The performance of the indices includes reinvested dividends, and does not reflect sales charges or expenses. |
| (2) | | FBR Fund Advisers, Inc. waived a portion of its advisory fees and agreed to contractually reimburse a portion of the Fund’s operating expenses, as necessary, to maintain existing expense limitations, as set forth in the notes to the financial statements. Total returns shown include fee waivers and expense reimbursements, if any; total returns would have been lower had there been no waiver of fees and/or reimbursement of expenses in excess of expense limitations. |
| (3) | | The S&P 500 Index is a capitalization-weighted index of 500 stocks. The index is designed to represent the broad domestic economy through changes in aggregate market value of 500 stocks representing all major industries. The NASDAQ Composite Index is a broad-based capitalization-weighted index of all NASDAQ National Market and Small Cap stocks. |
| (4) | | The total returns shown do not reflect the deduction of taxes that a shareholder would pay on fund distributions or the redemption of fund shares. |
| (5) | | Represents the performance of the Institutional Class shares after March 12, 2010 (inception of the share class) and Investor Class for periods prior to that date. |
49
FBR Technology Fund
Portfolio Summary
April 30, 2012
(unaudited)
The following provides a breakdown of the Fund by industry sectors. The underlying securities represent a percentage of the portfolio investments.
| Industry Sector | | % of Total Investments |
| |
|
| Semiconductors | | | 25.2 | % |
| Computers | | | 16.4 | % |
| Software | | | 16.2 | % |
| Telecommunications | | | 11.4 | % |
| Internet | | | 9.6 | % |
| Machinery-Diversified | | | 5.1 | % |
| Auto Parts & Equipment | | | 4.1 | % |
| Health Care Products | | | 4.0 | % |
| Electronics | | | 2.7 | % |
| Biotechnology | | | 1.5 | % |
| Manufacuturing | | | 0.6 | % |
| Energy | | | 0.6 | % |
| Electrical Components & Equipments | | | 0.2 | % |
| | | | | |
| Cash | | | 2.4 | % |
50
FBR Technology Fund
Portfolio of Investments
April 30, 2012
(unaudited)
|
| | | | | | VALUE |
| | SHARES | | | | (NOTE 2) |
|
| | | | COMMON STOCKS — 97.6% | | | | |
| | | | Auto Parts & Equipment — 4.1% | | | | |
| | 8,910 | | Johnson Controls, Inc. | | $ | 284,853 | |
| | 625 | | Westport Innovations, Inc.* | | | 19,562 | |
| | | | | |
| |
| | | | | | | 304,415 | |
| | | | | |
| |
| | | | Biotechnology — 1.5% | | | | |
| | 1,650 | | Acorda Therapeutics, Inc.* | | | 41,646 | |
| | 620 | | Alexion Pharmaceuticals, Inc.* | | | 55,998 | |
| | 1,000 | | AVEO Pharmaceuticals, Inc.* | | | 11,500 | |
| | | | | |
| |
| | | | | | | 109,144 | |
| | | | | |
| |
| | | | Computers — 16.4% | | | | |
| | 543 | | Apple, Inc.* | | | 317,242 | |
| | 3,972 | | Cognizant Technology Solutions Corp., Class A* | | | 291,227 | |
| | 2,165 | | Fortinet, Inc.* | | | 56,550 | |
| | 2,510 | | LivePerson, Inc.* | | | 39,859 | |
| | 3,435 | | Mercury Computer Systems, Inc.* | | | 45,342 | |
| | 1,140 | | MICROS Systems, Inc.* | | | 64,786 | |
| | 4,745 | | NetApp, Inc.* | | | 184,248 | |
| | 2,395 | | Riverbed Technology, Inc.* | | | 47,253 | |
| | 739 | | Syntel, Inc. | | | 44,259 | |
| | 3,280 | | Western Digital Corp.* | | | 127,297 | |
| | | | | |
| |
| | | | | | | 1,218,063 | |
| | | | | |
| |
| | | | Electrical Components & Equipment — 0.2% | | | | |
| | 390 | | General Cable Corp.* | | | 11,481 | |
| | | | | |
| |
| | | | | | | | |
| | | | Electronics — 2.7% | | | | |
| | 930 | | Cymer, Inc.* | | | 48,211 | |
| | 790 | | ROFIN-SINAR Technologies, Inc.* | | | 19,908 | |
| | 4,050 | | TTM Technologies, Inc.* | | | 41,836 | |
| | 1,145 | | Woodward, Inc. | | | 47,621 | |
| | 2,325 | | Zygo Corp.* | | | 46,012 | |
| | | | | |
| |
| | | | | | | 203,588 | |
| | | | | |
| |
| | | | Energy — 0.6% | | | | |
| | 2,275 | | Clean Energy Fuels Corp.* | | | 43,771 | |
| | | | | |
| |
51
FBR Technology Fund
Portfolio of Investments (continued)
April 30, 2012
(unaudited)
|
| | | | | | VALUE |
| | SHARES | | | | (NOTE 2) |
|
| | | | Health Care Products — 4.0% | | | | |
| | 515 | | Intuitive Surgical, Inc.* | | $ | 297,773 | |
| | | | | |
| |
| | | | | | | | |
| | | | Internet — 9.6% | | | | |
| | 800 | | F5 Networks, Inc.* | | | 107,144 | |
| | 535 | | Google, Inc., Class A* | | | 323,798 | |
| | 200 | | Liquidity Services, Inc.* | | | 10,666 | |
| | 290 | | priceline.com, Inc.* | | | 220,638 | |
| | 925 | | Sourcefire, Inc.* | | | 47,166 | |
| | | | | |
| |
| | | | | | | 709,412 | |
| | | | | |
| |
| | | | Machinery-Diversified — 5.1% | | | | |
| | 2,515 | | Cummins, Inc. | | | 291,312 | |
| | 3,125 | | CVD Equipment Corp.* | | | 43,500 | |
| | 10,250 | | Flow International Corp.* | | | 42,128 | |
| | | | | |
| |
| | | | | | | 376,940 | |
| | | | | |
| |
| | | | Manufacturing — 0.6% | | | | |
| | 1,185 | | Polypore International, Inc.* | | | 44,260 | |
| | | | | |
| |
| | | | | | | | |
| | | | Semiconductors — 25.2% | | | | |
| | 4,355 | | Altera Corp. | | | 154,907 | |
| | 2,960 | | Amtech Systems, Inc.* | | | 20,661 | |
| | 3,770 | | Analog Devices, Inc. | | | 146,955 | |
| | 12,685 | | Applied Materials, Inc. | | | 152,093 | |
| | 3,225 | | Atmel Corp.* | | | 28,606 | |
| | 8,470 | | AXT, Inc.* | | | 43,112 | |
| | 1,485 | | Cavium, Inc.* | | | 43,451 | |
| | 1,675 | | Ceva, Inc.* | | | 37,001 | |
| | 1,635 | | Cirrus Logic, Inc.* | | | 44,766 | |
| | 810 | | Hittite Microwave Corp.* | | | 43,367 | |
| | 11,550 | | Intel Corp. | | | 328,020 | |
| | 2,185 | | KLA-Tencor Corp. | | | 113,948 | |
| | 3,300 | | Kulicke & Soffa Industries, Inc.* | | | 43,230 | |
| | 1,315 | | Nanometrics, Inc.* | | | 20,396 | |
| | 2,158 | | OmniVision Technologies, Inc.* | | | 39,750 | |
52
FBR Technology Fund
Portfolio of Investments (continued)
April 30, 2012
(unaudited)
|
| | | | | | VALUE |
| | SHARES | | | | (NOTE 2) |
|
| | | | Semiconductors — 25.2% (continued) | | | | |
| | 1,585 | | ON Semiconductor Corp.* | | $ | 13,092 | |
| | 5,100 | | QUALCOMM, Inc. | | | 325,584 | |
| | 1,875 | | Rubicon Technology, Inc.* | | | 17,719 | |
| | 1,600 | | Semtech Corp.* | | | 43,616 | |
| | 2,805 | | Skyworks Solutions, Inc.* | | | 76,128 | |
| | 2,495 | | Teradyne, Inc.* | | | 42,939 | |
| | 1,300 | | Ultratech, Inc.* | | | 41,522 | |
| | 1,350 | | Volterra Semiconductor Corp.* | | | 44,402 | |
| | | | | |
| |
| | | | | | | 1,865,265 | |
| | | | | |
| |
| | | | Software — 16.2% | | | | |
| | 2,215 | | Cerner Corp.* | | | 179,614 | |
| | 1,400 | | Informatica Corp.* | | | 64,428 | |
| | 2,600 | | Mediware Information Systems, Inc.* | | | 38,090 | |
| | 9,810 | | Microsoft Corp. | | | 314,116 | |
| | 7,620 | | Oracle Corp. | | | 223,952 | |
| | 2,125 | | PROS Holdings, Inc.* | | | 41,841 | |
| | 1,200 | | Radware Ltd.* | | | 46,176 | |
| | 1,275 | | Red Hat, Inc.* | | | 76,003 | |
| | 1,955 | | VMware, Inc., Class A* | | | 218,413 | |
| | | | | |
| |
| | | | | | | 1,202,633 | |
| | | | | |
| |
| | | | Telecommunications — 11.4% | | | | |
| | 1,650 | | Acme Packet, Inc.* | | | 46,316 | |
| | 1,615 | | Aruba Networks, Inc.* | | | 34,109 | |
| | 15,920 | | Cisco Systems, Inc. | | | 320,788 | |
| | 20,460 | | Corning, Inc. | | | 293,601 | |
| | 2,370 | | Finisar Corp.* | | | 39,152 | |
| | 785 | | IPG Photonics Corp.* | | | 37,994 | |
| | 1,115 | | Netgear, Inc.* | | | 42,927 | |
| | 815 | | NeuStar, Inc.* | | | 29,625 | |
| | | | | |
| |
| | | | | | | 844,512 | |
| | | | | |
| |
| | | | | | | | |
| | | | Total Common Stocks (Cost $6,461,001) | | | 7,231,257 | |
| | | | | |
| |
53
FBR Technology Fund
Portfolio of Investments (continued)
April 30, 2012
(unaudited)
|
| | | | | | VALUE |
| | SHARES | | | | (NOTE 2) |
|
| | | | SHORT-TERM INVESTMENT — 3.2% | | | | |
| | 236,759 | | Fidelity Institutional Money Market Government Portfolio, Class I, 0.01%^ (Cost $236,759) | | $ | 236,759 | |
| | | | | |
| |
| | | | | | | | |
| | | | Total Investments — 100.8% (Cost $6,697,760) | | | 7,468,016 | |
| | | | | | | | |
| | | | Liabilities Less Other Assets — (0.8)% | | | (57,865 | ) |
| | | | | |
| |
| | | | | | | | |
| | | | Net Assets — 100.0% | | $ | 7,410,151 | |
| | | | | |
| |
|
| * | | Non-income producing security |
| ^ | | 7-day yield as of April 30, 2012 |
The accompanying notes are an integral part of the financial statements.
54
FBR Gas Utility Index Fund
Management Overview
Portfolio Manager: Winsor Aylesworth
Over the previous six months, how did the Fund perform and what factors contributed to this performance?
For the six-months ended April 30, 2012, the Investor Class of the FBR Gas Utility Index Fund returned 7.39%. This compares to the American Gas Association (AGA) Stock Index, the S&P 500 Index and the Morningstar Utilities Category Average which returned 6.81%, 12.77% and 5.44% for the same period, respectively.
The Fund continued its outperformance versus its benchmark and the Morningstar Utilities Category Average. This shows the market’s favor to the Fund’s investments and its emphasis on natural gas distribution companies. As an index fund, the Fund’s positive variation to the Fund’s benchmark continues to be an exception. Investors should not expect this to be the norm going forward as expectations should be slightly less than the benchmark due to fund expenses. The current positive variation is a function of the Fund’s cash flows and the timing of investments. The overall stock market had a better six month period as measured by the S&P 500 Index. This was a result of investors willing to invest in other asset classes than utilities as the economy seemed to be improving ever so slightly.
The AGA Stock Index and hence the Fund had three changes for the period. Southern Union Co. (NYSE Symbol: SUG) was acquired by Energy Transfer Equity, LP (NYSE Symbol: ETE). ETE operates natural gas pipelines, storage and processing facilities as well as a retail propane business. ETE was added to the Index as a result of their acquisition. Constellation Energy Group, Inc. (NYSE Symbol: CEG) was acquired by Exelon Corp. (NYSE Symbol: EXC). Exelon is a Chicago based diversified energy company with electric generating facilities and a retail gas distribution business. EXC was and continues to be a component of the index. Finally Nicor, Inc. (NYSE Symbol: GAS) was acquired by AGL Resources, Inc. (NYSE Symbol: AGL). Nicor was a Midwest diversified Gas utility while AGL had historically been the local gas distributor in Atlanta. The combined company is now known as AGL Resources, Inc. (NYSE Symbol: GAS) based in Atlanta and provides gas distribution, transmission, electrical generation services throuout the southeast and Midwest.
For the six month period, the Fund paid dividends totaling $0.268678 per share. This is a 12.77% increase from the same period a year ago and is a good indicator of the health of the natural gas industry.
For the six month period, major contributors to performance were The Williams Companies, Inc. (NYSE Symbol: WMB,), Enbridge, Inc. (NYSE Symbol: ENB) and Sempra Energy (NYSE Symbol: SRE). Williams and Enbridge are major pipeline
55
FBR Gas Utility Index Fund
Management Overview (continued)
companies in North America while Sempra is a diversified utility based in Southern California and is a leader in providing wind, solar and geothermal generated electricity to the consumer. The average return for these three companies for the six month period was 26.6% and the three companies combined to make up 14.7% of the portfolio.
Major detractors to performance were National Fuel Gas Co. (NTSE Symbol: NFG), Nicor, Inc. (NYSE Symbol: GAS) and AGL Resources, Inc. (NYSE Symbol:AGL). NFG is one of our few holdings that has exposure to the E&P (Exploration and Production) sector of the industry and was impacted by the record low prices for natural gas. The historic warm winter weather impacted both Nicor and AGL which as previously stated merged in late 2011. The three companies had an average return for the period of -18.5% and combined to make up approximately 6.7% of the portfolio.
Portfolio manager comments on the Fund and the related investment outlook.
What a difference six months makes in the returns for your Fund and for the companies that make up the AGA Stock Index. It was just in the last shareholder report that we mentioned we were in the “Golden Age” of natural gas. What has happened?
Well, I also mentioned that the short-term performance is subject to the impact of weather. Much of the country experienced a record warm winter. This resulted in lower revenues for most of the companies in the Fund’s portfolio as the heating needs were lower than normal. Whether the warm winter was the first of many and more proof of “Global Warming”, only time will tell. We are now about to enter the summer cooling season and if we continue to have record warmth, this should be a positive impact for the Fund’s investments.
The “Golden Age” of natural gas continues to be alive and well. Supplies are at record levels, prices are near record lows and many initiatives to build demand have begun. Infrastructure to support natural gas vehicles (NGV’s) continues and auto makers will begin to have available to the public more vehicle options. Base load electric generation is being converted from coal to gas when possible to take advantage of the low price. Steel and chemical manufacturers who went overseas to avoid high energy costs are returning due to the low price of natural gas. All of these factors should build the demand for gas and be a favorable development for the gas distribution and transmission companies which make up the bulk of the portfolio.
So we continue to think that this is the right fund in the right industry at the right time. Barring the short-term impact of weather (both good and bad) and the health of the overall
56
FBR Gas Utility Index Fund
Management Overview (continued)
economy, the companies in the Fund’s portfolio should show growth and hence increased stock prices as the previously mentioned demand factors kick in.
As always I want to thank you in joining me as an investor in the Fund.
The opinions expressed in this commentary reflect those of the Portfolio Manager as of the date written. Any such opinions are subject to change based on market or other conditions. These opinions may not be relied upon as investment advice. Investment decisions for The FBR Funds are based on several factors, and may not be relied upon as an indication of trading intent on behalf of any FBR Fund. Security positions can and do change.
57
FBR Gas Utility Index Fund
Comparison of Changes in Value of $10,000 Investment in
Investor Class Shares(1)(2) vs. Various Indices(1)(3)
(unaudited)
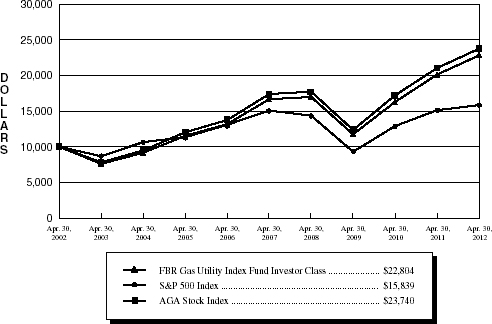
Total Returns—For the Periods Ended April 30, 2012(4)(5) |
| | | | | | | | Annualized | | Annualized | |
| | | | | One Year | | Five Year | | Ten Year | |
| | | | |
| | |
| | |
| | |
| | FBR Gas Utility Index Fund Investor Class(1)(2) | | | 13.35 | % | | 6.48 | % | | 8.59 | % | |
| | S&P 500 Index(1)(3) | | | 4.76 | % | | 1.01 | % | | 4.71 | % | |
| | AGA Stock Index(1)(3) | | | 12.85 | % | | 6.43 | % | | 9.03 | % | |
| |
PAST PERFORMANCE IS NO GUARANTEE OF FUTURE RESULTS.
The performance data quoted represents past performance and the current performance may be lower or higher than the performance data quoted. The investment return and principal will fluctuate so that investors’ shares, when redeemed, may be worth more or less than their original cost. The performance data does not reflect the deduction of taxes that a shareholder would pay on Fund distributions or redemption fees. The Fund charges a redemption fee of 1.00% on shares redeemed or exchanged within 90 days; if reflected, the redemption fee would reduce the performance data quoted. To obtain performance data current to the most recent month-end, please call 888.200.4710.
|
| (1) | | The graph assumes a hypothetical $10,000 initial investment in the Fund and reflects the reinvestment of dividends and all Fund expenses. Investors should note that the Fund is a professionally managed mutual fund while the indices are unmanaged, do not incur expenses and are not available for investment. The performance of the indices includes reinvested dividends, and does not reflect sales charges or expenses. |
| (2) | | FBR Fund Advisers, Inc. waived a portion of its advisory fees and agreed to contractually reimburse a portion of the Fund’s operating expenses, as necessary, to maintain existing expense limitations, as set forth in the notes to the financial statements. Total returns shown include fee waivers and expense reimbursements, if any; total returns would have been lower had there been no waiver of fees and/or reimbursement of expenses in excess of expense limitations. |
| (3) | | The S&P 500 Index is a capitalization-weighted index of 500 stocks. The index is designed to represent the broad domestic economy through changes in aggregate market value of 500 stocks representing all major industries. The AGA Stock Index is a market capitalization-weighted index, adjusted monthly, consisting of member companies of the American Gas Association. |
| (4) | | The total returns shown do not reflect the deduction of taxes that a shareholder would pay on fund distributions or the redemption of fund shares. |
| (5) | | Effective April 1, 2003, the Fund changed its fiscal year-end from March 31 to October 31. |
58
FBR Gas Utility Index Fund
Portfolio Summary
April 30, 2012
(unaudited)
The following provides a breakdown of the Fund by industry sectors. The underlying securities represent a percentage of the portfolio investments.
| Industry Sector | | % of Total Investments |
| |
|
| Gas | | | 35.0 | % |
| Pipelines | | | 34.4 | % |
| Electric | | | 25.3 | % |
| Oil & Gas | | | 3.5 | % |
| Insurance | | | 0.5 | % |
| | | | | |
| Cash | | | 1.3 | % |
59
FBR Gas Utility Index Fund
Portfolio of Investments
April 30, 2012
(unaudited)
|
| | | | | | VALUE |
| | SHARES | | | | (NOTE 2) |
|
| | | | COMMON STOCKS — 98.7% | | | | |
| | | | Electric — 25.3% | | | | |
| | 2,400 | | ALLETE, Inc. | | $ | 98,904 | |
| | 45,692 | | Alliant Energy Corp. | | | 2,067,106 | |
| | 76,890 | | Ameren Corp. | | | 2,521,223 | |
| | 58,199 | | Avista Corp. | | | 1,538,782 | |
| | 43,100 | | Black Hills Corp. | | | 1,422,731 | |
| | 12,325 | | CH Energy Group, Inc. | | | 808,766 | |
| | 355,148 | | CMS Energy Corp. | | | 8,164,853 | |
| | 211,670 | | Consolidated Edison, Inc. | | | 12,583,781 | |
| | 504,957 | | Dominion Resources, Inc. | | | 26,353,706 | |
| | 135,215 | | DTE Energy Co. | | | 7,623,422 | |
| | 191,012 | | Duke Energy Corp. | | | 4,093,387 | |
| | 7,600 | | Entergy Corp. | | | 498,256 | |
| | 184,682 | | Exelon Corp. | | | 7,204,445 | |
| | 164,021 | | Integrys Energy Group, Inc. | | | 8,962,107 | |
| | 312,285 | | MDU Resources Group, Inc. | | | 7,163,818 | |
| | 17,411 | | MGE Energy, Inc. | | | 796,379 | |
| | 64,875 | | Northeast Utilities | | | 2,385,454 | |
| | 14,750 | | NV Energy, Inc. | | | 245,587 | |
| | 41,604 | | Pepco Holdings, Inc. | | | 787,148 | |
| | 504,409 | | PG&E Corp. | | | 22,284,790 | |
| | 55,735 | | PPL Corp. | | | 1,524,352 | |
| | 493,825 | | Public Service Enterprise Group, Inc. | | | 15,382,649 | |
| | 134,890 | | TECO Energy, Inc. | | | 2,430,718 | |
| | 2,350 | | The Empire District Electric Co. | | | 48,222 | |
| | 109,704 | | UIL Holdings Corp. | | | 3,770,526 | |
| | 12,480 | | UniSource Energy Corp. | | | 454,272 | |
| | 26,283 | | Unitil Corp. | | | 695,448 | |
| | 123,460 | | Wisconsin Energy Corp. | | | 4,548,266 | |
| | 266,397 | | Xcel Energy, Inc. | | | 7,208,703 | |
| | | | | |
| |
| | | | | | | 153,667,801 | |
| | | | | |
| |
60
FBR Gas Utility Index Fund
Portfolio of Investments (continued)
April 30, 2012
(unaudited)
|
| | | | | | VALUE |
| | SHARES | | | | (NOTE 2) |
|
| | | | Gas — 35.0% | | | | |
| | 497,270 | | AGL Resources, Inc. | | $ | 19,607,356 | |
| | 384,545 | | Atmos Energy Corp. | | | 12,528,476 | |
| | 714,673 | | CenterPoint Energy, Inc. | | | 14,443,541 | |
| | 24,387 | | Chesapeake Utilities Corp. | | | 1,024,742 | |
| | 10,192 | | Corning Natural Gas Corp. | | | 173,264 | |
| | 15,846 | | Delta Natural Gas Company, Inc. | | | 681,378 | |
| | 24,599 | | Gas Natural, Inc. | | | 281,659 | |
| | 241,493 | | National Fuel Gas Co. | | | 11,427,449 | |
| | 545,669 | | National Grid PLC ADR | | | 29,515,236 | |
| | 154,342 | | New Jersey Resources Corp. | | | 6,673,748 | |
| | 768,635 | | NiSource, Inc. | | | 18,946,853 | |
| | 121,516 | | Northwest Natural Gas Co. | | | 5,553,281 | |
| | 338,164 | | Piedmont Natural Gas Company, Inc. | | | 10,307,239 | |
| | 651,334 | | Questar Corp. | | | 12,863,846 | |
| | 23,118 | | RGC Resources, Inc. | | | 423,059 | |
| | 460,506 | | Sempra Energy | | | 29,813,158 | |
| | 98,049 | | South Jersey Industries, Inc. | | | 4,828,913 | |
| | 212,858 | | Southwest Gas Corp. | | | 8,944,293 | |
| | 109,149 | | The Laclede Group, Inc. | | | 4,298,288 | |
| | 162,375 | | UGI Corp. | | | 4,738,103 | |
| | 176,916 | | Vectren Corp. | | | 5,210,176 | |
| | 230,332 | | WGL Holdings, Inc. | | | 9,238,617 | |
| | | | | |
| |
| | | | | | | 211,522,675 | |
| | | | | |
| |
| | | | Insurance — 0.5% | | | | |
| | 27 | | Berkshire Hathaway, Inc., Class A* | | | 3,261,600 | |
| | | | | |
| |
| | | | | | | | |
| | | | Oil & Gas — 3.5% | | | | |
| | 667,024 | | Cheniere Energy, Inc.* | | | 12,213,210 | |
| | 97,629 | | Energen Corp. | | | 5,113,807 | |
| | 81,910 | | EQT Corp. | | | 4,080,756 | |
| | | | | |
| |
| | | | | | | 21,407,773 | |
| | | | | |
| |
61
FBR Gas Utility Index Fund
Portfolio of Investments (continued)
April 30, 2012
(unaudited)
|
| | | | | | VALUE |
| | SHARES | | | | (NOTE 2) |
|
| | | | Pipelines — 34.4% | | | | |
| | 998,580 | | El Paso Corp. | | $ | 29,627,869 | |
| | 723,001 | | Enbridge, Inc. | | | 30,286,512 | |
| | 719,972 | | Energy Transfer Equity, LP | | | 30,210,025 | |
| | 337,148 | | ONEOK, Inc. | | | 28,957,642 | |
| | 964,997 | | Spectra Energy Corp. | | | 29,664,008 | |
| | 885,185 | | The Williams Companies, Inc. | | | 30,122,845 | |
| | 670,707 | | TransCanada Corp. | | | 29,497,694 | |
| | | | | |
| |
| | | | | | | 208,366,595 | |
| | | | | |
| |
| | | | | | | | |
| | | | Total Common Stocks (Cost $408,768,835) | | | 598,226,444 | |
| | | | | |
| |
| | | | | | | | |
| | | | SHORT-TERM INVESTMENT — 0.8% | | | | |
| | 5,054,678 | | Fidelity Institutional Money Market Government Portfolio, Class I, 0.01%^ (Cost $5,054,678) | | | 5,054,678 | |
| | | | | |
| |
| | | | | | | | |
| | | | Total Investments — 99.5% (Cost $413,823,513) | | | 603,281,122 | |
| | | | | | | | |
| | | | Other Assets Less Liabilities — 0.5% | | | 2,870,352 | |
| | | | | |
| |
| | | | | | | | |
| | | | Net Assets — 100.0% | | $ | 606,151,474 | |
| | | | | |
| |
|
| * | | Non-income producing security |
| ADR | | American Depositary Receipt |
| PLC | | Public Liability Company |
| LP | | Limited Partnership |
| ^ | | 7-day yield as of April 30, 2012 |
The accompanying notes are an integral part of the financial statements.
62
FBR Balanced Fund
Management Overview
For the six-months ended April 30, 2012, the Investor Class of the FBR Balanced Fund returned 8.11%. This compares to the S&P 500 Index, the Morningstar Moderate Allocation Category Average and the Blended Balanced Index1 which returned 12.77%, 7.40% and 2.08% for the same period, respectively.
The London Company
Portfolio Managers: Stephen M. Goddard, CFA®, Jonathan T. Moody, CFA®, J. Wade Stinnette, Jr., J. Brian Campbell, CFA®, and Mark E. DeVaul, CFA®, CPA
Over the previous six months, how did the equity portion of the Fund perform and what factors contributed to this performance?
Equity returns were strong for the six months ending April 30, 2012. The S&P 500 Index was up 12.77%, led by the more cyclical, higher beta segments of the market. In a reversal from 2011, the bulk of the gains were in the cyclical Technology, Consumer Discretionary, and Financial sectors. Unsurprisingly, defensive sectors Consumer Staples, Utilities, and Energy trailed the market.
With our ‘Defense First’ investment philosophy, we expect to lag when equity markets appreciate sharply. This is especially true when the results for higher quality, high ROC (return on capital) companies trail those of lower quality, low ROC companies, as they have for these six months.
Portfolio manager comments on the equity portion of the Fund and the related investment outlook.
There is enough economic improvement to conclude things are heading in the right direction. Corporate earnings are robust and jobless claims have fallen considerably since their peak. Business and consumer confidence are escalating and there have been 3.5 million people added to the workforce over the past two years, slowly reducing the unemployment rate to 8.3%.
The bull market which began in March 2009 has been built on a dual foundation of Fed liquidity and the exceptional profitability of Corporate America. Across all industries, companies are producing more with less. While this inhibits job growth, it has increased earnings growth and cash flow. Corporate per share earnings are up nearly 95% since the market bottom while per share revenues are up only 1%, resulting in record profit margins. Peak margins may be able to carry-on at higher levels for as long as management teams sit on excess cash and delay capital spending. Investment and employment growth are still being restrained by uncertainty on taxes, healthcare costs, and other regulatory risks. Many
|
| 1 | | The Blended Balanced Index consists of 60% common stocks represented by the S&P 500 Index and 40% bonds represented by the Barclays Capital Intermediate U.S. Government/Credit Index. |
63
FBR Balanced Fund
Management Overview (continued)
of these issues are gaining clarity, but likely won’t be resolved until the November election. With profit margins peaking and revenue growth hard to come by, management teams are seeking alternate routes to value creation. One of the most prevalent actions of late has been a surge in companies initiating divestitures and spin-offs. These transactions typically create shareholder value by reducing the conglomerate discount and allowing new companies easier access to capital to grow the business.
The outlook is favorable considering the challenges we faced three years ago. Economic data is strengthening, corporate America is in relatively good health, volatility has been temporarily subdued, and the better management teams are recognizing opportunities to create value for shareholders. We believe this environment is favorable to active managers who can uncover predictable, highly profitable business models that have limited downside risk.
Financial Counselors, Inc.
Portfolio Manager: Gary Cloud, CFA® and Peter Greig, CFA®
Over the previous six months, how did the fixed income portion of the FBR Balanced Fund perform and what factors contributed to this performance?
The FBR Balanced Fund’s bond allocation performed in line with a representative mix of Intermediate Term Bond Indices over the previous six months. A factor contributing to this performance was the modest overweight position in investment grade credit. Corporate bond spreads to Treasuries narrowed moderately over this time period resulting in a notable excess return on these holdings compared to Treasuries. For example, the six month total return for the Barclays U.S. Treasury Index ending April 30, 2012 was 1.87% compared to 3.64% for the Barclays Corporate Index.
The sector overweight in Corporates combined with the higher income component from these securities were the two largest positive factors impacting relative performance. Security premium amortization and bond paydown characteristics were two negative factors impacting performance compared to the benchmark.
Elevated fears of an unruly financial and economic outcome in Europe subsided over the reporting period as the European Central Bank injected $1.3 trillion dollars into their banking system. These developments encouraged a desire for higher levels of risk taking and Corporate yield spreads narrowed while Treasury yields declined close to historic lows. The net result was a very good return on investment grade bonds.
Portfolio manager comments on the fixed income portion of the Fund and related investment outlook.
Looking forward, it seems you cannot read any investment strategy report or watch any financial news station without some economist, analyst, strategist, or high-profile portfolio
64
FBR Balanced Fund
Management Overview (continued)
manager voicing concern about the European debt crisis and how it will impact U.S. markets. The Fund has been boosting its holding in Treasuries and currently has a small overweight duration position, expecting that market rates can move lower.
Our investment team continues to take a cautious view of the politically charged situation in Europe and is concerned about further market and economic fallout. It is our belief that market rates in the U.S. are likely to remain low for an extended period of time as funding issues for peripheral sovereign nations and their banking systems persist for the foreseeable future.
While many measures indicate that the U.S. economy is on a more stable footing, we have concerns about the second half of 2012 as employers and investors assess the uncertainty of changed tax rates and automatic federal spending cuts. That being said, the U.S. economy and markets have been the primary beneficiary of global risk aversion. Therefore, our financial markets should continue to be some of the best relative performers on a global basis as we approach year end 2012.
The opinions expressed in this commentary reflect those of the Portfolio Managers as of the date written. Any such opinions are subject to change based on market or other conditions. These opinions may not be relied upon as investment advice. Investment decisions for The FBR Funds are based on several factors, and may not be relied upon as an indication of trading intent on behalf of any FBR Fund. Security positions can and do change.
65
FBR Balanced Fund
Comparison of Changes in Value of $10,000 Investment in
Investor Class Shares(1)(2)(5) vs. Various Indices(1)(3)(6)
(unaudited)

Total Returns—For the Periods Ended April 30, 2012(4) |
| | | | | | | | Annualized | | Annualized | |
| | | | | One Year | | Five Year | | Ten Year | |
| | | | |
| |
| |
| |
| | FBR Balanced Fund Investor Class(1)(2)(5) | | | 9.03 | % | | 5.14 | % | | 7.17 | % | |
| | FBR Balanced Fund Institutional Class(2)(5) | | | 9.29 | % | | 5.38 | % | | 7.37 | % | |
| | S&P 500 Index(1)(3) | | | 4.76 | % | | 1.01 | % | | 4.71 | % | |
| | Blended Balanced Index(6) | | | 5.53 | % | | 3.34 | % | | 5.25 | % | |
| |
PAST PERFORMANCE IS NO GUARANTEE OF FUTURE RESULTS.
The performance data quoted represents past performance and the current performance may be lower or higher than the performance data quoted. The investment return and principal will fluctuate so that investors’ shares, when redeemed, may be worth more or less than their original cost. The performance data does not reflect the deduction of taxes that a shareholder would pay on Fund distributions or redemption fees. The Fund charges a redemption fee of 1.00% on shares redeemed or exchanged within 90 days; if reflected, the redemption fee would reduce the performance data quoted. To obtain performance data current to the most recent month-end, please call 888.200.4710.
|
| (1) | | The graph assumes a hypothetical $10,000 initial investment in the Fund and reflects the reinvestment of dividends and all Fund expenses. Investors should note that the Fund is a professionally managed mutual fund while the index is unmanaged, does not incur expenses and is not available for investment. The performance of the index includes reinvested dividends, and does not reflect sales charges or expenses. |
| (2) | | FBR Fund Advisers, Inc. waived a portion of its advisory fees and agreed to contractually reimburse a portion of the Fund’s operating expenses, as necessary, to maintain existing expense limitations, as set forth in the notes to the financial statements. Total returns shown include fee waivers and expense reimbursements, if any; total returns would have been lower had there been no waiver of fees and/or reimbursement of expenses in excess of expense limitations. |
| (3) | | The S&P 500 Index is a capitalization-weighted index of 500 stocks. The index is designed to represent the broad domestic economy through changes in aggregate market value of 500 stocks representing all major industries. |
| (4) | | The total returns shown do not reflect the deduction of taxes that a shareholder would pay on fund distributions or the redemption of fund shares. |
| (5) | | The Fund is the investment successor to the AFBA 5Star Balanced Fund which commenced operations on June 3, 1997. On March 12, 2010, the AFBA 5Star Balanced Fund was reorganized into the Fund. The performance presented for the Investor Class of the Fund for the period prior to March 12, 2010 reflects the performance of the Advisor Class shares of the AFBA 5Star Balanced Fund and the performance presented for the Institutional Class of the Fund for the period prior to March 12, 2010 reflects the performance of the Class I shares of the AFBA 5Star Balanced Fund. |
| (6) | | The Blended Balanced Index consists of an unmanaged portfolio of 60% common stocks represented by the S&P 500 Index and 40% bonds represented by the Barclays Capital Intermediate U.S. Government/Credit Index. |
66
FBR Balanced Fund
Portfolio Summary
April 30, 2012
(unaudited)
The following provides a breakdown of the Fund by industry sectors. The underlying securities represent a percentage of the portfolio investments.
| Industry Sectors | | % of Total Investments |
| |
|
| Common Stocks | | | 58.4 | % |
Consumer, Non-Cyclical | | | 12.9 | % |
Technology | | | 8.9 | % |
Basic Materials | | | 7.4 | % |
Financial | | | 6.8 | % |
Communications | | | 5.8 | % |
Industrial | | | 4.1 | % |
Consumer, Cyclical | | | 3.9 | % |
Energy | | | 3.2 | % |
Utilities | | | 2.9 | % |
Real Estate Investment Trust | | | 2.5 | % |
| Corporate Bonds | | | 17.7 | % |
Financial | | | 10.3 | % |
Communications | | | 2.0 | % |
Basic Materials | | | 1.6 | % |
Technology | | | 1.3 | % |
Consumer, Cyclical | | | 0.9 | % |
Industrial | | | 0.6 | % |
Consumer, Non-Cyclical | | | 0.6 | % |
Energy | | | 0.2 | % |
Utilities | | | 0.2 | % |
| U.S. Treasury Obligations | | | 16.2 | % |
| U.S. Government Agency Obligations | | | 4.4 | % |
| Investment Companies | | | 1.4 | % |
| | | | | |
| Cash | | | 1.9 | % |
67
FBR Balanced Fund
Portfolio of Investments
April 30, 2012
(unaudited)
|
| | | | | | VALUE |
| | SHARES | | | | (NOTE 2) |
|
| | | | COMMON STOCKS — 58.4% | | | | |
| | | | Basic Materials — 7.4% | | | | |
| | 83,940 | | Albemarle Corp. | | $ | 5,481,282 | |
| | 130,120 | | MeadWestvaco Corp. | | | 4,140,419 | |
| | 24,888 | | NewMarket Corp. | | | 5,555,499 | |
| | | | | |
| |
| | | | | | | 15,177,200 | |
| | | | | |
| |
| | | | Communications — 5.8% | | | | |
| | 193,879 | | Cisco Systems, Inc. | | | 3,906,662 | |
| | 263,789 | | Corning, Inc. | | | 3,785,372 | |
| | 100,297 | | Verizon Communications, Inc. | | | 4,049,993 | |
| | | | | |
| |
| | | | | | | 11,742,027 | |
| | | | | |
| |
| | | | Consumer, Cyclical — 3.9% | | | | |
| | 110,897 | | CarMax, Inc.* | | | 3,423,391 | |
| | 49,339 | | Lowes Companies, Inc. | | | 1,552,698 | |
| | 49,653 | | Wal-Mart Stores, Inc. | | | 2,925,058 | |
| | | | | |
| |
| | | | | | | 7,901,147 | |
| | | | | |
| |
| | | | Consumer, Non-Cyclical — 12.9% | | | | |
| | 107,948 | | Altria Group, Inc. | | | 3,477,005 | |
| | 138,548 | | Bristol-Myers Squibb Co. | | | 4,623,347 | |
| | 14,354 | | Brown-Forman Corp., Class B | | | 1,239,468 | |
| | 16,971 | | Lorillard, Inc. | | | 2,296,006 | |
| | 101,272 | | Pfizer, Inc. | | | 2,322,167 | |
| | 26,974 | | Philip Morris International, Inc. | | | 2,414,443 | |
| | 66,867 | | Reynolds American, Inc. | | | 2,730,179 | |
| | 44,019 | | The Coca-Cola Co. | | | 3,359,530 | |
| | 19,294 | | The Hershey Co. | | | 1,292,891 | |
| | 21,165 | | Visa, Inc., Class A | | | 2,602,872 | |
| | | | | |
| |
| | | | | | | 26,357,908 | |
| | | | | |
| |
| | | | Energy — 3.2% | | | | |
| | 37,611 | | Chevron Corp. | | | 4,007,828 | |
| | 34,257 | | ConocoPhillips | | | 2,453,829 | |
| | 1,750 | | Linn Energy LLC | | | 70,438 | |
| | | | | |
| |
| | | | | | | 6,532,095 | |
| | | | | |
| |
68
FBR Balanced Fund
Portfolio of Investments (continued)
April 30, 2012
(unaudited)
|
| | | | | | VALUE |
| | SHARES | | | | (NOTE 2) |
|
| | | | Financial — 6.8% | | | | |
| | 47,092 | | Berkshire Hathaway, Inc., Class B* | | $ | 3,788,551 | |
| | 141,564 | | Eaton Vance Corp. | | | 3,723,133 | |
| | 4,500 | | Starwood Property Trust, Inc. | | | 93,915 | |
| | 135,113 | | Wells Fargo & Co. | | | 4,516,828 | |
| | 3,202 | | White Mountains Insurance Group Ltd. | | | 1,674,646 | |
| | | | | |
| |
| | | | | | | 13,797,073 | |
| | | | | |
| |
| | | | Industrial — 4.1% | | | | |
| | 59,012 | | Alexander & Baldwin, Inc. | | | 3,019,054 | |
| | 43,165 | | Energizer Holdings, Inc.* | | | 3,078,959 | |
| | 25,870 | | FedEx Corp. | | | 2,282,769 | |
| | | | | |
| |
| | | | | | | 8,380,782 | |
| | | | | |
| |
| | | | Real Estate Investment Trust — 2.5% | | | | |
| | 7,000 | | Apollo Commercial Real Estate Finance, Inc. | | | 112,910 | |
| | 27,500 | | Chimera Investment Corp. | | | 79,475 | |
| | 90,356 | | Hatteras Financial Corp. | | | 2,632,070 | |
| | 88,479 | | UDR, Inc. | | | 2,329,652 | |
| | | | | |
| |
| | | | | | | 5,154,107 | |
| | | | | |
| |
| | | | Technology — 8.9% | | | | |
| | 144,504 | | Dell, Inc.* | | | 2,365,530 | |
| | 171,930 | | EMC Corp.* | | | 4,850,145 | |
| | 160,004 | | Intel Corp. | | | 4,544,114 | |
| | 13,869 | | International Business Machines Corp. | | | 2,871,993 | |
| | 109,035 | | Microsoft Corp. | | | 3,491,301 | |
| | | | | |
| |
| | | | | | | 18,123,083 | |
| | | | | |
| |
| | | | Utilities — 2.9% | | | | |
| | 86,226 | | Dominion Resources, Inc. | | | 4,500,135 | |
| | 69,415 | | Duke Energy Corp. | | | 1,487,563 | |
| | | | | |
| |
| | | | | | | 5,987,698 | |
| | | | | |
| |
| | | | | | | | |
| | | | Total Common Stocks (Cost $98,295,864) | | | 119,153,120 | |
| | | | | |
| |
| | | | | | | | |
| | | | PREFERRED STOCK — 0.0% | | | | |
| | 13,600 | | Federal National Mortgage Association, Perpetual, Series S, 8.25%, due 12/31/15* (Cost $340,000) | | | 16,728 | |
| | | | | |
| |
69
FBR Balanced Fund
Portfolio of Investments (continued)
April 30, 2012
(unaudited)
|
| | | | | | | | | | | MATURITY | | | VALUE | |
| PAR | | | | | RATE | | | | DATE | | | (NOTE 2) | |
|
| | | | CORPORATE BONDS — 17.7% | | | | | | | | | | | | |
| | | | Basic Materials — 1.6% | | | | | | | | | | | | |
| $ | 625,000 | | Alcoa, Inc. | | | 6.150 | % | | | 08/15/20 | | | $ | 682,503 | |
| | 350,000 | | Barrick Gold Financeco LLC | | | 6.125 | | | | 09/15/13 | | | | 374,695 | |
| | 250,000 | | BHP Billiton Finance USA Ltd. | | | 6.750 | | | | 11/01/13 | | | | 272,498 | |
| | 315,000 | | EI du Pont de Nemours & Co. | | | 4.750 | | | | 03/15/15 | | | | 350,637 | |
| | 250,000 | | International Paper Co. | | | 9.375 | | | | 05/15/19 | | | | 334,576 | |
| | 640,000 | | Rio Tinto Finance USA PLC | | | 2.000 | | | | 03/22/17 | | | | 647,878 | |
| | 550,000 | | The Dow Chemical Co. | | | 4.250 | | | | 11/15/20 | | | | 585,839 | |
| | | | | | | | | | | | | |
| |
| | | | | | | | | | | | | | | 3,248,626 | |
| | | | | | | | | | | | | |
| |
| | | | Communications — 2.0% | | | | | | | | | | | | |
| | 400,000 | | CenturyLink, Inc. | | | 5.150 | | | | 06/15/17 | | | | 416,641 | |
| | 600,000 | | Comcast Corp. | | | 4.950 | | | | 06/15/16 | | | | 678,838 | |
| | 275,000 | | Corning, Inc. | | | 6.850 | | | | 03/01/29 | | | | 326,687 | |
| | 400,000 | | Deutsche Telekom International Finance BV | | | 5.875 | | | | 08/20/13 | | | | 424,328 | |
| | 250,000 | | eBay, Inc. | | | 3.250 | | | | 10/15/20 | | | | 259,683 | |
| | 400,000 | | Juniper Networks, Inc. | | | 4.600 | | | | 03/15/21 | | | | 430,433 | |
| | 350,000 | | Symantec Corp. | | | 4.200 | | | | 09/15/20 | | | | 366,589 | |
| | 300,000 | | Telefonica Emisiones SAU | | | 3.992 | | | | 02/16/16 | | | | 290,310 | |
| | 300,000 | | Telefonica Emisiones SAU | | | 5.877 | | | | 07/15/19 | | | | 296,288 | |
| | 450,000 | | Verizon Communications, Inc. | | | 8.750 | | | | 11/01/18 | | | | 615,497 | |
| | | | | | | | | | | | | |
| |
| | | | | | | | | | | | | | | 4,105,294 | |
| | | | | | | | | | | | | |
| |
| | | | Consumer, Cyclical — 0.9% | | | | | | | | | | | | |
| | 300,000 | | Best Buy Company, Inc. | | | 6.750 | | | | 07/15/13 | | | | 314,101 | |
| | 400,000 | | CVS Caremark Corp. | | | 4.750 | | | | 05/18/20 | | | | 454,578 | |
| | 150,000 | | Marriott International, Inc., Series J | | | 5.625 | | | | 02/15/13 | | | | 155,353 | |
| | 300,000 | | Starbucks Corp. | | | 6.250 | | | | 08/15/17 | | | | 363,010 | |
| | 200,000 | | The Home Depot, Inc. | | | 5.400 | | | | 03/01/16 | | | | 231,038 | |
| | 300,000 | | Wal-Mart Stores, Inc. | | | 5.000 | | | | 10/25/40 | | | | 343,244 | |
| | | | | | | | | | | | | |
| |
| | | | | | | | | | | | | | | 1,861,324 | |
| | | | | | | | | | | | | |
| |
| | | | Consumer, Non-Cyclical — 0.6% | | | | | | | | | | | | |
| | 150,000 | | Anheuser-Busch InBev Worldwide, Inc. | | | 7.750 | | | | 01/15/19 | | | | 198,731 | |
| | 350,000 | | Diageo Capital PLC | | | 7.375 | | | | 01/15/14 | | | | 389,362 | |
| | 325,000 | | GlaxoSmithKline Capital, Inc. | | | 4.850 | | | | 05/15/13 | | | | 340,062 | |
| | 250,000 | | UnitedHealth Group, Inc. | | | 5.375 | | | | 03/15/16 | | | | 287,415 | |
| | | | | | | | | | | | | |
| |
| | | | | | | | | | | | | | | 1,215,570 | |
| | | | | | | | | | | | | |
| |
70
FBR Balanced Fund
Portfolio of Investments (continued)
April 30, 2012
(unaudited)
|
| | | | | | | | | | | MATURITY | | | VALUE | |
| PAR | | | | | RATE | | | | DATE | | | (NOTE 2) | |
|
| | | | Energy — 0.2% | | | | | | | | | | | | |
| $ | 200,000 | | Devon Energy Corp. | | | 5.625 | % | | | 01/15/14 | | | $ | 216,483 | |
| | 150,000 | | Husky Energy, Inc. | | | 5.900 | | | | 06/15/14 | | | | 164,765 | |
| | | | | | | | | | | | | |
| |
| | | | | | | | | | | | | | | 381,248 | |
| | | | | | | | | | | | | |
| |
| | | | Financial — 10.3% | | | | | | | | | | | | |
| | 650,000 | | Aflac, Inc. | | | 8.500 | | | | 05/15/19 | | | | 860,121 | |
| | 650,000 | | American Express Credit Corp. | | | 2.750 | | | | 09/15/15 | | | | 674,984 | |
| | 60,000 | | American Express Credit Corp., Series C | | | 7.300 | | | | 08/20/13 | | | | 64,788 | |
| | 270,000 | | American International Group, Inc. | | | 4.250 | | | | 09/15/14 | | | | 282,041 | |
| | 575,000 | | American International Group, Inc. | | | 5.850 | | | | 01/16/18 | | | | 633,930 | |
| | 700,000 | | Associated Banc-Corp | | | 5.125 | | | | 03/28/16 | | | | 741,721 | |
| | 300,000 | | Associates Corporation of North America | | | 6.950 | | | | 11/01/18 | | | | 339,984 | |
| | 275,000 | | AT&T, Inc. | | | 2.950 | | | | 05/15/16 | | | | 292,260 | |
| | 250,000 | | AT&T, Inc. | | | 3.000 | | | | 02/15/22 | | | | 251,260 | |
| | 200,000 | | AT&T, Inc. | | | 5.350 | | | | 09/01/40 | | | | 219,428 | |
| | 400,000 | | Bank of Montreal | | | 2.500 | | | | 01/11/17 | | | | 411,330 | |
| | 79,000 | | Boston Properties LP | | | 6.250 | | | | 01/15/13 | | | | 81,798 | |
| | 325,000 | | Caterpillar Financial Services Corp. | | | 4.900 | | | | 08/15/13 | | | | 342,511 | |
| | 705,000 | | Citigroup, Inc. | | | 6.125 | | | | 11/21/17 | | | | 783,107 | |
| | 375,000 | | CME Group, Inc. | | | 5.750 | | | | 02/15/14 | | | | 408,239 | |
| | 575,000 | | Credit Suisse USA, Inc. | | | 5.125 | | | | 08/15/15 | | | | 631,559 | |
| | 275,000 | | Discover Financial Services | | | 5.200 | | | | 04/27/22 | | | | 284,873 | |
| | 700,000 | | Fifth Third Bancorp | | | 3.625 | | | | 01/25/16 | | | | 743,087 | |
| | 240,000 | | First Niagara Financial Group, Inc. | | | 6.750 | | | | 03/19/20 | | | | 267,882 | |
| | 250,000 | | General Electric Capital Corp. | | | 5.500 | | | | 06/04/14 | | | | 271,716 | |
| | 450,000 | | General Electric Capital Corp. | | | 5.400 | | | | 02/15/17 | | | | 515,773 | |
| | 700,000 | | HSBC Finance Corp. | | | 5.000 | | | | 06/30/15 | | | | 751,415 | |
| | 650,000 | | JPMorgan Chase & Co. | | | 5.125 | | | | 09/15/14 | | | | 698,477 | |
| | 400,000 | | KeyCorp | | | 3.750 | | | | 08/13/15 | | | | 425,329 | |
| | 450,000 | | KeyCorp | | | 5.100 | | | | 03/24/21 | | | | 506,790 | |
| | 320,000 | | Lazard Group | | | 6.850 | | | | 06/15/17 | | | | 353,762 | |
| | 780,000 | | Lincoln National Corp. | | | 6.250 | | | | 02/15/20 | | | | 894,084 | |
| | 300,000 | | Manulife Financial Corp. | | | 3.400 | | | | 09/17/15 | | | | 311,604 | |
| | 455,000 | | Merrill Lynch & Company, Inc.(a) | | | 6.875 | | | | 04/25/18 | | | | 507,653 | |
| | 250,000 | | Merrill Lynch & Company, Inc., Series MTNC(a) | | | 0.927 | | | | 01/15/15 | | | | 232,398 | |
| | 100,000 | | MetLife, Inc., Series A | | | 6.817 | | | | 08/15/18 | | | | 123,733 | |
71
FBR Balanced Fund
Portfolio of Investments (continued)
April 30, 2012
(unaudited)
|
| | | | | | | | | | | MATURITY | | | VALUE | |
| PAR | | | | | RATE | | | | DATE | | | (NOTE 2) | |
|
| | | | Financial — 10.3% (continued) | | | | | | | | | | | | |
| $ | 250,000 | | Morgan Stanley | | | 4.750 | % | | | 04/01/14 | | | $ | 252,093 | |
| | 250,000 | | Morgan Stanley | | | 6.625 | | | | 04/01/18 | | | | 261,630 | |
| | 250,000 | | Morgan Stanley | | | 5.750 | | | | 01/25/21 | | | | 247,277 | |
| | 350,000 | | New York Life Global Funding(b) | | | 5.250 | | | | 10/16/12 | | | | 357,458 | |
| | 310,000 | | Prudential Financial, Inc. | | | 5.500 | | | | 03/15/16 | | | | 346,053 | |
| | 285,000 | | Prudential Financial, Inc., Series MTNB | | | 5.100 | | | | 09/20/14 | | | | 307,946 | |
| | 700,000 | | Raymond James Financial, Inc. | | | 5.625 | | | | 04/01/24 | | | | 723,607 | |
| | 275,000 | | St. Paul Travelers, Inc. | | | 5.500 | | | | 12/01/15 | | | | 313,971 | |
| | 375,000 | | SunTrust Banks, Inc. | | | 5.250 | | | | 11/05/12 | | | | 383,041 | |
| | 250,000 | | SunTrust Banks, Inc. | | | 3.600 | | | | 04/15/16 | | | | 260,092 | |
| | 250,000 | | SunTrust Banks, Inc. | | | 6.000 | | | | 09/11/17 | | | | 280,450 | |
| | 150,000 | | Swiss Re Solutions Holding Corp. | | | 7.000 | | | | 02/15/26 | | | | 177,296 | |
| | 450,000 | | The Bear Stearns Companies, Inc. | | | 6.400 | | | | 10/02/17 | | | | 525,770 | |
| | 600,000 | | The Goldman Sachs Group, Inc. | | | 5.375 | | | | 03/15/20 | | | | 623,542 | |
| | 300,000 | | The Hartford Financial Services Group, Inc. | | | 5.375 | | | | 03/15/17 | | | | 320,717 | |
| | 400,000 | | The Royal Bank of Scotland PLC | | | 4.375 | | | | 03/16/16 | | | | 408,442 | |
| | 300,000 | | Wachovia Corp. | | | 5.250 | | | | 08/01/14 | | | | 322,748 | |
| | 550,000 | | Wells Fargo & Co. | | | 5.250 | | | | 10/23/12 | | | | 561,471 | |
| | 450,000 | | Westpac Banking Corp. | | | 4.875 | | | | 11/19/19 | | | | 490,261 | |
| | | | | | | | | | | | | |
| |
| | | | | | | | | | | | | | | 21,071,502 | |
| | | | | | | | | | | | | |
| |
| | | | Industrial — 0.6% | | | | | | | | | | | | |
| | 650,000 | | Agilent Technologies, Inc. | | | 5.000 | | | | 07/15/20 | | | | 737,783 | |
| | 300,000 | | FedEx Corp. | | | 7.375 | | | | 01/15/14 | | | | 332,005 | |
| | 220,000 | | The Boeing Co. | | | 5.000 | | | | 03/15/14 | | | | 238,555 | |
| | | | | | | | | | | | | |
| |
| | | | | | | | | | | | | | | 1,308,343 | |
| | | | | | | | | | | | | |
| |
| | | | Technology — 1.3% | | | | | | | | | | | | |
| | 300,000 | | Applied Materials, Inc. | | | 4.300 | | | | 06/15/21 | | | | 332,413 | |
| | 550,000 | | Dell, Inc. | | | 4.625 | | | | 04/01/21 | | | | 620,795 | |
| | 250,000 | | Hewlett Packard Co. | | | 2.650 | | | | 06/01/16 | | | | 254,794 | |
| | 150,000 | | Hewlett Packard Co. | | | 3.000 | | | | 09/15/16 | | | | 154,614 | |
| | 250,000 | | Hewlett Packard Co. | | | 6.000 | | | | 09/15/41 | | | | 277,335 | |
| | 250,000 | | Intel Corp. | | | 3.300 | | | | 10/01/21 | | | | 264,737 | |
| | 650,000 | | KLA-Tencor Corp. | | | 6.900 | | | | 05/01/18 | | | | 787,498 | |
| | | | | | | | | | | | | |
| |
| | | | | | | | | | | | | | | 2,692,186 | |
| | | | | | | | | | | | | |
| |
72
FBR Balanced Fund
Portfolio of Investments (continued)
April 30, 2012
(unaudited)
|
| | | | | | | | | | | MATURITY | | | VALUE | |
| PAR | | | | | RATE | | | | DATE | | | (NOTE 2) | |
|
| | | | Utilities — 0.2% | | | | | | | | | | | | |
| $ | 275,000 | | Sempra Energy | | | 6.500 | % | | | 06/01/16 | | | $ | 327,552 | |
| | | | | | | | | | | | | |
| |
| | | | | | | | | | | | | | | | |
| | | | Total Corporate Bonds (Cost $34,503,458) | | | | | | | | | | | 36,211,645 | |
| | | | | | | | | | | | | |
| |
| | | | | | | | | | | | | | | | |
| | | | U.S. GOVERNMENT AGENCY OBLIGATIONS — 4.4% | | | | | | | | | | | | |
| | 1,300,000 | | Federal Farm Credit Bank | | | 2.040 | | | | 07/27/16 | | | | 1,305,893 | |
| | 249,274 | | Federal Home Loan Mortgage Corp. | | | 5.000 | | | | 05/01/20 | | | | 271,880 | |
| | 490,556 | | Federal Home Loan Mortgage Corp. | | | 5.500 | | | | 04/01/37 | | | | 544,306 | |
| | 650,000 | | Federal National Mortgage Association | | | 2.000 | | | | 07/27/16 | | | | 652,471 | |
| | 306,118 | | Federal National Mortgage Association | | | 4.500 | | | | 08/01/20 | | | | 329,963 | |
| | 357,305 | | Federal National Mortgage Association | | | 6.000 | | | | 10/01/37 | | | | 396,456 | |
| | 1,384,506 | | Federal National Mortgage Association | | | 3.500 | | | | 01/01/42 | | | | 1,439,643 | |
| | 1,825,469 | | Federal National Mortgage Association | | | 4.000 | | | | 10/01/41 | | | | 1,934,177 | |
| | 1,919,521 | | Federal National Mortgage Association | | | 4.000 | | | | 12/01/41 | | | | 2,033,830 | |
| | | | | | | | | | | | | |
| |
| | | | | | | | | | | | | | | | |
| | | | Total U.S. Government Agency Obligations (Cost $8,725,649) | | | | | | | | | | | 8,908,619 | |
| | | | | | | | | | | | | |
| |
| | | | | | | | | | | | | | | | |
| | | | U.S. TREASURY OBLIGATIONS — 16.2% | | | | | | | | | | | | |
| | 1,700,000 | | U.S. Treasury Bond | | | 6.250 | | | | 08/15/23 | | | | 2,414,797 | |
| | 1,500,000 | | U.S. Treasury Bond | | | 5.250 | | | | 02/15/29 | | | | 2,036,720 | |
| | 3,360,000 | | U.S. Treasury Bond | | | 5.000 | | | | 05/15/37 | | | | 4,586,924 | |
| | 1,300,000 | | U.S. Treasury Bond | | | 3.125 | | | | 02/15/42 | | | | 1,303,860 | |
| | 5,150,000 | | U.S. Treasury Note | | | 2.250 | | | | 05/31/14 | | | | 5,360,022 | |
| | 2,450,000 | | U.S. Treasury Note | | | 1.250 | | | | 09/30/15 | | | | 2,514,504 | |
| | 2,305,000 | | U.S. Treasury Note | | | 3.125 | | | | 10/31/16 | | | | 2,550,448 | |
| | 800,000 | | U.S. Treasury Note | | | 4.500 | | | | 05/15/17 | | | | 945,062 | |
| | 2,050,000 | | U.S. Treasury Note | | | 3.750 | | | | 11/15/18 | | | | 2,384,406 | |
| | 250,000 | | U.S. Treasury Note | | | 3.625 | | | | 08/15/19 | | | | 289,434 | |
| | 2,885,000 | | U.S. Treasury Note | | | 3.500 | | | | 05/15/20 | | | | 3,315,722 | |
| | 5,250,000 | | U.S. Treasury Note | | | 2.125 | | | | 08/15/21 | | | | 5,385,350 | |
| | | | | | | | | | | | | |
| |
| | | | | | | | | | | | | | | | |
| | | | Total U.S. Treasury Obligations (Cost $32,650,841) | | | | | | | | | | | 33,087,249 | |
| | | | | | | | | | | | | |
| |
73
FBR Balanced Fund
Portfolio of Investments (continued)
April 30, 2012
(unaudited)
|
| | | | | | VALUE |
| | SHARES | | | | (NOTE 2) |
|
| | | | INVESTMENT COMPANIES — 1.4% | | | | |
| | 21,600 | | iShares iBoxx $High Yield Corporate Bond Fund | | $ | 1,969,920 | |
| | 8,000 | | NGP Capital Resources Co. | | | 48,720 | |
| | 11,500 | | PennantPark Investment Corp. | | | 120,175 | |
| | 17,500 | | SPDR Barclays Capital High Yield Bond | | | 695,275 | |
| | 8,000 | | Wells Fargo Advantage Income Opportunities Fund | | | 82,320 | |
| | | | | |
| |
| | | | | | | | |
| | | | Total Investment Companies (Cost $2,925,184) | | | 2,916,410 | |
| | | | | |
| |
| | | | | | | | |
| | | | SHORT-TERM INVESTMENT — 1.0% | | | | |
| | 2,000,234 | | Fidelity Institutional Money Market Government Portfolio, Class I, 0.01%^ (Cost $2,000,234) | | | 2,000,234 | |
| | | | | |
| |
| | | | | | | | |
| | | | Total Investments — 99.1% (Cost $179,441,230) | | | 202,294,005 | |
| | | | | | | | |
| | | | Other Assets Less Liabilities — 0.9% | | | 1,876,978 | |
| | | | | |
| |
| | | | | | | | |
| | | | Net Assets — 100.0% | | $ | 204,170,983 | |
| | | | | |
| |
|
| * | | Non-income producing security |
| (a) | | Variable/floating rate security |
| (b) | | This security is a restricted security under Rule 144A of the Securities Act of 1933. These securities may be resold in transactions exempt from registration, normally to qualified institutional buyers. As of April 30, 2012, the total amount of 144A securities was $357,458 or 0.2% of total net assets. |
| LLC | | Limited Liability Company |
| LP | | Limited Partnership |
| PLC | | Public Liability Company |
| ^ | | 7-day yield as of April 30, 2012 |
| Note: | | For presentation purposes, the Fund has grouped some of the industry categories. For purposes of categorizing securities for compliance with Section 8(b)(1) of the Investment Company Act of 1940, the Fund uses more specific industry classifications. |
The accompanying notes are an integral part of the financial statements.
74
FBR Core Bond Fund
Management Overview
Portfolio Manager: Gary Cloud, CFA® and Peter Greig, CFA®, Financial Counselors, Inc.
For the six-months ended April 30, 2012, the Investor Class of the FBR Core Bond Fund returned 3.40%. This compares to the Barclays Capital Intermediate U.S. Government/Credit Total Return Index and the Morningstar Intermediate Term Bond Category Average which returned 2.08% and 3.20% for the same period, respectively.
Over the previous six months, how did the Fund perform and what factors contributed to this performance?
The Fund performed well over the previous six months compared to a representative mix of Intermediate Term Bond Indices. The main contributor to this outperformance was the overweight position in investment grade credit. Corporate bond spreads to Treasuries narrowed moderately over this time period resulting in a notable excess return on these holdings compared to Treasuries. For example, the six month total return for the Barclays U.S. Treasury Index ending April 30, 2012 was 1.87% compared to 3.64% for the Barclays Corporate Index.
The sector overweight in Corporates combined with the higher income component from these securities were the two largest positive factors impacting relative performance. Security premium amortization and bond paydown characteristics were two negative factors impacting performance compared to the benchmark.
Elevated fears of an unruly financial and economic outcome in Europe subsided over the reporting period as the European Central Bank injected $1.3 trillion dollars into their banking system. These developments encouraged a desire for higher levels of risk taking and Corporate yield spreads narrowed while Treasury yields declined close to historic lows. The net result was a very good return on investment grade bonds.
Portfolio manager comments on the Fund and related investment outlook.
Looking forward, it seems you cannot read any investment strategy report or watch any financial news station without some economist, analyst, strategist, or high-profile portfolio manager voicing concern about the European debt crisis and how it will impact U.S. markets. The Fund has been boosting its holding in Treasuries and currently has a small overweight duration position, expecting that market rates can move lower.
Our investment team continues to take a cautious view of the politically charged situation in Europe and is concerned about further market and economic fallout. It is our belief that market rates in the U.S. are likely to remain low for an extended period of time as funding issues for peripheral sovereign nations and their banking systems persist for the foreseeable future.
While many measures indicate that the U.S. economy is on a more stable footing, we have concerns about the second half of 2012 as employers and investors assess the uncertainty of changed tax rates and automatic federal spending cuts. That being said, the U.S.
75
FBR Core Bond Fund
Management Overview (continued)
economy and markets have been the primary beneficiary of global risk aversion. Therefore, our financial markets should continue to be some of the best relative performers on a global basis as we approach year end 2012.
The opinions expressed in this commentary reflect those of the Portfolio Managers as of the date written. Any such opinions are subject to change based on market or other conditions. These opinions may not be relied upon as investment advice. Investment decisions for The FBR Funds are based on several factors, and may not be relied upon as an indication of trading intent on behalf of any FBR Fund. Security positions can and do change.
76
FBR Core Bond Fund
Comparison of Changes in Value of $10,000 Investment in
Investor Class Shares(1)(2)(5) vs. Barclays Capital Intermediate U.S. Government/Credit Index(1)(3)
(unaudited)

Total Returns—For the Periods Ended April 30, 2012(4) |
| | | | | | | Annualized | | Annualized | |
| | | | One Year | | Five Year | | Ten Year | |
| | | |
| |
| |
| |
| | FBR Core Bond Fund Investor Class(1)(2)(5) | | 5.67 | % | | 5.48 | % | | 6.43 | % | |
| | FBR Core Bond Fund Institutional Class(2)(5) | | 5.93 | % | | 5.74 | % | | 6.70 | % | |
| | Barclays Capital Intermediate U.S. Government/Credit Index(1)(3) | | 5.86 | % | | 5.76 | % | | 5.21 | % | |
| |
PAST PERFORMANCE IS NO GUARANTEE OF FUTURE RESULTS.
The performance data quoted represents past performance and the current performance may be lower or higher than the performance data quoted. The investment return and principal will fluctuate so that investors’ shares, when redeemed, may be worth more or less than their original cost. The performance data does not reflect the deduction of taxes that a shareholder would pay on Fund distributions or redemption fees. The Fund charges a redemption fee of 1.00% on shares redeemed or exchanged within 90 days; if reflected, the redemption fee would reduce the performance data quoted. To obtain performance data current to the most recent month-end, please call 888.200.4710.
| (1) | The graph assumes a hypothetical $10,000 initial investment in the Fund and reflects the reinvestment of dividends and all Fund expenses. Investors should note that the Fund is a professionally managed mutual fund while the index is unmanaged, does not incur expenses and is not available for investment. The performance of the index includes reinvested dividends, and does not reflect sales charges or expenses. |
| (2) | FBR Fund Advisers, Inc. waived a portion of its advisory fees and agreed to contractually reimburse a portion of the Fund’s operating expenses, as necessary, to maintain existing expense limitations, as set forth in the notes to the financial statements. Total returns shown include fee waivers and expense reimbursements, if any; total returns would have been lower had there been no waiver of fees and/or reimbursement of expenses in excess of expense limitations. |
| (3) | The Barclays Capital Intermediate U.S. Government/Credit Index measures performance of U.S. Dollar denominated U.S. Treasuries, government-related and investment grade U.S. corporate securities that have a remaining maturity of greater than or equal to 1 year and less than 10 years. Securities have $250 million or more of outstanding face value and must be fixed rate and non-convertible. |
| (4) | The total returns shown do not reflect the deduction of taxes that a shareholder would pay on funddistributions or the redemption of fund shares. |
| (5) | The Fund is the investment successor to the AFBA 5Star Total Return Bond Fund which commenced investment operations on June 3, 1997. On March 12, 2010, the AFBA 5Star Total Return Bond Fund was reorganized into the Fund. The performance presented for the Investor Class of the Fund for the period prior to March 12, 2010 reflects the performance of the Advisor Class shares of the AFBA 5Star Total Return Bond Fund and the performance presented for the Institutional Class of the Fund for the period prior to March 12, 2010 reflects the performance of the Class I shares of the AFBA 5Star Total Return Bond Fund. |
77
| FBR Core Bond Fund |
| Portfolio Summary |
| April 30, 2012 |
| (unaudited) |
The following provides a breakdown of the Fund by industry sectors. The underlying securities represent a percentage of the portfolio investments.
| Industry Sectors | | % of Total Investments |
| |
|
| Corporate Bonds | | 46.9 | % |
| Financial | | 27.7 | % |
| Consumer, Cyclical | | 5.2 | % |
| Communications | | 4.2 | % |
| Industrial | | 2.6 | % |
| Basic Materials | | 2.5 | % |
| Consumer, Non-Cyclical | | 1.6 | % |
| Technology | | 1.2 | % |
| Energy | | 1.0 | % |
| Utilities | | 0.9 | % |
| U.S. Treasury Obligations | | 33.3 | % |
| U.S. Government Agency Obligations | | 10.2 | % |
| Investment Companies | | 3.1 | % |
| Common Stocks | | 1.4 | % |
| Real Estate Investment Trust | | 0.7 | % |
| Financial | | 0.4 | % |
| Energy | | 0.3 | % |
| Convertible Preferred Stock | | 1.4 | % |
| | | | |
| Cash | | 3.7 | % |
78
| FBR Core Bond Fund |
| Portfolio of Investments |
| April 30, 2012 |
| (unaudited) |
| | | | | | | | |
|
| | | | | | VALUE |
| | SHARES | | | | (NOTE 2) |
|
| | | | COMMON STOCKS — 1.4% | | | | |
| | | | Energy — 0.3% | | | | |
| | 2,250 | | Linn Energy LLC | | $ | 90,563 | |
| | | | | |
| |
| | | | | | | | |
| | | | Financial — 0.4% | | | | |
| | 6,000 | | Starwood Property Trust, Inc. | | | 125,220 | |
| | | | | |
| |
| | | | | | | | |
| | | | Real Estate Investment Trust — 0.7% | | | | |
| | 8,500 | | Apollo Commercial Real Estate Finance, Inc. | | | 137,105 | |
| | 37,500 | | Chimera Investment Corp. | | | 108,375 | |
| | | | | |
| |
| | | | | | | 245,480 | |
| | | | | |
| |
| | | | | | | | |
| | | | Total Common Stocks (Cost $486,374) | | | 461,263 | |
| | | | | |
| |
| | | | | | | | |
| | | | CONVERTIBLE PREFERRED STOCK — 1.4% | | | | |
| | | | Financial — 1.4% | | | | |
| | 13,350 | | Boston Private Capital Trust I, 4.88%, due 10/1/34 (Cost $638,782) | | | 461,409 | |
| | | | | |
| |
| | | | | | | | |
| | | | PREFERRED STOCK — 0.0% | | | | |
| | 10,400 | | Federal National Mortgage Association, Perpetual, Series S, 8.25%, due 12/31/15* (Cost $260,000) | | | 12,792 | |
| | | | | |
| |
| | | | | | | | | | | | | |
|
| | | | | | | | | MATURITY | | | | |
| PAR | | | | RATE | | | DATE | | | | |
|
| | | | CORPORATE BONDS — 46.9% | | | | | | | | | |
| | | | Basic Materials — 2.5% | | | | | | | | | |
| $ | 300,000 | | Barrick Gold Financeco LLC | | 6.125 | % | | 09/15/13 | | | 321,168 | |
| | 285,000 | | EI du Pont de Nemours & Co. | | 4.750 | | | 03/15/15 | | | 317,243 | |
| | 125,000 | | International Paper Co. | | 9.375 | | | 05/15/19 | | | 167,288 | |
| | | | | | | | | | |
| |
| | | | | | | | | | | | 805,699 | |
| | | | | | | | | | |
| |
| | | | Communications — 4.2% | | | | | | | | | |
| | 250,000 | | Comcast Corp. | | 6.500 | | | 01/15/17 | | | 301,015 | |
| | 275,000 | | Deutsche Telekom International Finance BV | | 5.875 | | | 08/20/13 | | | 291,725 | |
| | 280,000 | | Rogers Communications, Inc. | | 7.500 | | | 03/15/15 | | | 328,662 | |
79
| FBR Core Bond Fund |
| Portfolio of Investments (continued) |
| April 30, 2012 |
| (unaudited) |
| | | | | | | | | | | | | |
|
| | | | | | | | | MATURITY | | | VALUE | |
| PAR | | | | RATE | | | DATE | | | (NOTE 2) | |
|
| | | | Communications — 4.2% (continued) | | | | | | | | | |
| $ | 200,000 | | Symantec Corp. | | 4.200 | % | | 09/15/20 | | $ | 209,479 | |
| | 250,000 | | Telefonica Emisiones SAU | | 5.877 | | | 07/15/19 | | | 246,907 | |
| | | | | | | | | | |
| |
| | | | | | | | | | | | 1,377,788 | |
| | | | | | | | | | |
| |
| | | | Consumer, Cyclical — 5.2% | | | | | | | | | |
| | 275,000 | | Best Buy Company, Inc. | | 6.750 | | | 07/15/13 | | | 287,926 | |
| | 575,000 | | Royal Caribbean Cruises Ltd. | | 7.500 | | | 10/15/27 | | | 582,906 | |
| | 275,000 | | Starbucks Corp. | | 6.250 | | | 08/15/17 | | | 332,759 | |
| | 120,000 | | The Home Depot, Inc. | | 5.400 | | | 03/01/16 | | | 138,623 | |
| | 300,000 | | YUM! Brands, Inc. | | 5.300 | | | 09/15/19 | | | 342,310 | |
| | | | | | | | | | |
| |
| | | | | | | | | | | | 1,684,524 | |
| | | | | | | | | | |
| |
| | | | Consumer, Non-Cyclical — 1.6% | | | | | | | | | |
| | 250,000 | | Altria Group, Inc. | | 9.250 | | | 08/06/19 | | | 341,607 | |
| | 125,000 | | Anheuser-Busch InBev Worldwide, Inc. | | 7.750 | | | 01/15/19 | | | 165,609 | |
| | | | | | | | | | |
| |
| | | | | | | | | | | | 507,216 | |
| | | | | | | | | | |
| |
| | | | Energy — 1.0% | | | | | | | | | |
| | 175,000 | | Devon Energy Corp. | | 5.625 | | | 01/15/14 | | | 189,423 | |
| | 125,000 | | Husky Energy, Inc. | | 5.900 | | | 06/15/14 | | | 137,304 | |
| | | | | | | | | | |
| |
| | | | | | | | | | | | 326,727 | |
| | | | | | | | | | |
| |
| | | | Financial — 27.7% | | | | | | | | | |
| | 250,000 | | Aflac, Inc. | | 8.500 | | | 05/15/19 | | | 330,816 | |
| | 60,000 | | American Express Credit Corp., Series C | | 7.300 | | | 08/20/13 | | | 64,788 | |
| | 275,000 | | American Express Credit Corp., Series C | | 5.125 | | | 08/25/14 | | | 298,624 | |
| | 350,000 | | American International Group, Inc. | | 5.850 | | | 01/16/18 | | | 385,870 | |
| | 250,000 | | Associated Banc-Corp | | 5.125 | | | 03/28/16 | | | 264,900 | |
| | 250,000 | | Associates Corporation of North America | | 6.950 | | | 11/01/18 | | | 283,320 | |
| | 200,000 | | Capital One Financial Corp. | | 6.750 | | | 09/15/17 | | | 239,919 | |
| | 250,000 | | Citigroup, Inc. | | 6.125 | | | 11/21/17 | | | 277,698 | |
| | 300,000 | | CME Group, Inc. | | 5.750 | | | 02/15/14 | | | 326,591 | |
| | 300,000 | | Credit Suisse New York | | 5.300 | | | 08/13/19 | | | 335,230 | |
| | 225,000 | | Credit Suisse USA, Inc. | | 5.125 | | | 08/15/15 | | | 247,132 | |
| | 175,000 | | Discover Financial Services | | 5.200 | | | 04/27/22 | | | 181,283 | |
| | 250,000 | | Fifth Third Bancorp | | 6.250 | | | 05/01/13 | | | 263,006 | |
80
| FBR Core Bond Fund |
| Portfolio of Investments (continued) |
| April 30, 2012 |
| (unaudited) |
| | | | | | | | | | | | | |
|
| | | | | | | | | MATURITY | | | VALUE | |
| PAR | | | | RATE | | | DATE | | | (NOTE 2) | |
|
| | | | Financial — 27.7% (continued) | | | | | | | | | |
| $ | 125,000 | | General Electric Capital Corp. | | 5.400 | % | | 02/15/17 | | $ | 143,270 | |
| | 250,000 | | JPMorgan Chase & Co. | | 6.300 | | | 04/23/19 | | | 293,141 | |
| | 300,000 | | KeyCorp | | 6.500 | | | 05/14/13 | | | 316,790 | |
| | 300,000 | | Lazard Group | | 6.850 | | | 06/15/17 | | | 331,651 | |
| | 300,000 | | Manulife Financial Corp. | | 3.400 | | | 09/17/15 | | | 311,604 | |
| | 420,000 | | Merrill Lynch & Company, Inc. | | 6.875 | | | 04/25/18 | | | 468,603 | |
| | 275,000 | | MetLife, Inc., Series A | | 6.817 | | | 08/15/18 | | | 340,265 | |
| | 250,000 | | Morgan Stanley | | 6.625 | | | 04/01/18 | | | 261,630 | |
| | 275,000 | | New York Life Global Funding(a) | | 5.250 | | | 10/16/12 | | | 280,860 | |
| | 288,000 | | Prudential Financial, Inc. | | 5.500 | | | 03/15/16 | | | 321,494 | |
| | 250,000 | | Prudential Financial, Inc., Series MTNB | | 5.100 | | | 09/20/14 | | | 270,128 | |
| | 215,000 | | SunTrust Banks, Inc. | | 5.250 | | | 11/05/12 | | | 219,610 | |
| | 300,000 | | SunTrust Banks, Inc. | | 6.000 | | | 09/11/17 | | | 336,540 | |
| | 125,000 | | Swiss Re Solutions Holding Corp. | | 7.000 | | | 02/15/26 | | | 147,747 | |
| | 500,000 | | The Goldman Sachs Group, Inc. | | 5.375 | | | 03/15/20 | | | 519,619 | |
| | 300,000 | | The Hartford Financial Services Group, Inc. | | 5.375 | | | 03/15/17 | | | 320,717 | |
| | 300,000 | | The Royal Bank of Scotland PLC | | 4.375 | | | 03/16/16 | | | 306,332 | |
| | 300,000 | | Westpac Banking Corp. | | 4.875 | | | 11/19/19 | | | 326,841 | |
| | | | | | | | | | |
| |
| | | | | | | | | | | | 9,016,019 | |
| | | | | | | | | | |
| |
| | | | Industrial — 2.6% | | | | | | | | | |
| | 250,000 | | Agilent Technologies, Inc. | | 5.000 | | | 07/15/20 | | | 283,763 | |
| | 50,000 | | American Railcar Industries, Inc. | | 7.500 | | | 03/01/14 | | | 50,875 | |
| | 275,000 | | FedEx Corp. | | 7.375 | | | 01/15/14 | | | 304,338 | |
| | 200,000 | | The Boeing Co. | | 5.000 | | | 03/15/14 | | | 216,868 | |
| | | | | | | | | | |
| |
| | | | | | | | | | | | 855,844 | |
| | | | | | | | | | |
| |
| | | | Technology — 1.2% | | | | | | | | | |
| | 125,000 | | Hewlett Packard Co. | | 3.000 | | | 09/15/16 | | | 128,845 | |
| | 100,000 | | Hewlett Packard Co. | | 6.000 | | | 09/15/41 | | | 110,934 | |
| | 130,000 | | KLA-Tencor Corp. | | 6.900 | | | 05/01/18 | | | 157,499 | |
| | | | | | | | | | |
| |
| | | | | | | | | | | | 397,278 | |
| | | | | | | | | | |
| |
| | | | Utilities — 0.9% | | | | | | | | | |
| | 250,000 | | Sempra Energy | | 6.500 | | | 06/01/16 | | | 297,775 | |
| | | | | | | | | | |
| |
| | | | | | | | | | | | | |
| | | | Total Corporate Bonds (Cost $14,017,041) | | | | | | | | 15,268,870 | |
| | | | | | | | | | |
| |
81
| FBR Core Bond Fund |
| Portfolio of Investments (continued) |
| April 30, 2012 |
| (unaudited) |
| | | | | | | | | | | | | |
|
| | | | | | | | | MATURITY | | | VALUE | |
| PAR | | | | RATE | | | DATE | | | (NOTE 2) | |
|
| | | | U.S. GOVERNMENT AGENCY OBLIGATIONS — 10.2% | | | | | | | | | |
| $ | 560,635 | | Federal Home Loan Mortgage Corp. | | 5.500 | % | | 04/01/37 | | $ | 622,064 | |
| | 500,000 | | Federal National Mortgage Association | | 2.000 | | | 07/27/16 | | | 501,901 | |
| | 382,785 | | Federal National Mortgage Association | | 4.500 | | | 08/01/20 | | | 412,603 | |
| | 446,632 | | Federal National Mortgage Association | | 6.000 | | | 10/01/37 | | | 495,569 | |
| | 719,820 | | Federal National Mortgage Association | | 4.000 | | | 12/01/41 | | | 762,686 | |
| | 494,467 | | Federal National Mortgage Association | | 3.500 | | | 01/01/42 | | | 514,158 | |
| | | | | | | | | | |
| |
| | | | | | | | | | | | | |
| | | | Total U.S. Government Agency Obligations | | | | | | | | | |
| | | | (Cost $3,152,763) | | | | | | | | 3,308,981 | |
| | | | | | | | | | |
| |
| | | | | | | | | | | | | |
| | | | U.S. TREASURY OBLIGATIONS — 33.3% | | | | | | | | | |
| | 500,000 | | U.S. Treasury Bond | | 6.250 | | | 08/15/23 | | | 710,235 | |
| | 300,000 | | U.S. Treasury Bond | | 5.250 | | | 02/15/29 | | | 407,344 | |
| | 1,525,000 | | U.S. Treasury Bond | | 5.000 | | | 05/15/37 | | | 2,081,863 | |
| | 1,550,000 | | U.S. Treasury Bond | | 3.125 | | | 02/15/42 | | | 1,554,602 | |
| | 2,250,000 | | U.S. Treasury Note | | 4.125 | | | 05/15/15 | | | 2,501,368 | |
| | 565,000 | | U.S. Treasury Note | | 3.250 | | | 05/31/16 | | | 624,678 | |
| | 800,000 | | U.S. Treasury Note | | 3.875 | | | 05/15/18 | | | 932,125 | |
| | 100,000 | | U.S. Treasury Note | | 3.625 | | | 08/15/19 | | | 115,773 | |
| | 1,475,000 | | U.S. Treasury Note | | 3.500 | | | 05/15/20 | | | 1,695,213 | |
| | 225,000 | | U.S. Treasury Note | | 2.125 | | | 08/15/21 | | | 230,801 | |
| | | | | | | | | | |
| |
| | | | | | | | | | | | | |
| | | | Total U.S. Treasury Obligations (Cost $10,715,629) | | | | | | | | 10,854,002 | |
| | | | | | | | | | |
| |
| | | | | | | | |
|
| SHARES | | | | | | |
|
| | | | INVESTMENT COMPANIES — 3.1% | | | | |
| | 4,100 | | iShares iBoxx $High Yield Corporate Bond Fund | | | 373,920 | |
| | 7,000 | | NGP Capital Resources Co. | | | 42,630 | |
| | 12,000 | | PennantPark Investment Corp. | | | 125,400 | |
| | 10,000 | | SPDR Barclays Capital High Yield Bond | | | 397,300 | |
| | 8,000 | | Wells Fargo Advantage Income Opportunities Fund | | | 82,320 | |
| | | | | |
| |
| | | | | | | | |
| | | | Total Investment Companies (Cost $1,027,219) | | | 1,021,570 | |
| | | | | |
| |
82
| FBR Core Bond Fund |
| Portfolio of Investments (continued) |
| April 30, 2012 |
| (unaudited) |
| | | | | | | | |
|
| | | | | | | VALUE | |
| | SHARES | | | | | (NOTE 2) | |
|
| | | | SHORT-TERM INVESTMENT — 1.6% | | | | |
| | 509,808 | | Fidelity Institutional Money Market Government Portfolio, Class I, 0.01%^ | | | | |
| | | | (Cost $509,808) | | $ | 509,808 | |
| | | | | |
| |
| | | | | | | | |
| | | | Total Investments — 97.9% (Cost $30,807,616) | | | 31,898,695 | |
| | | | | | | | |
| | | | Other Assets Less Liabilities — 2.1% | | | 669,339 | |
| | | | | |
| |
| | | | | | | | |
| | | | Net Assets — 100.0% | | $ | 32,568,034 | |
| | | | | |
| |
| * | | Non-income producing security |
| (a) | | This security is a restricted security under Rule 144A of the Securities Act of 1933. These securities may be resold in transactions exempt from registration, normally to qualified institutional buyers. As of April 30, 2012, the total amount of 144A securities was $280,860 or 0.9% of total net assets |
| LLC | | Limited Liability Company |
| PLC | | Public Liability Company |
| ^ | | 7-day yield as of April 30, 2012 |
| | | |
| Note: | | For presentation purposes, the Fund has grouped some of the industry categories. For purposes of categorizing securities for compliance with Section 8(b)(1) of the Investment Company Act of 1940, the Fund uses more specific industry classifications. |
The accompanying notes are an integral part of the financial statements.
83
| Statements of Assets and Liabilities |
| April 30, 2012 |
| (unaudited) |
| | | FBR | | FBR | | FBR |
| | | Large Cap Fund | | Mid Cap Fund | | Small Cap Fund |
| | |
| |
| |
|
| ASSETS | | | | | | | | | | | | | | | |
Investment Securities at Cost | | | $ | 33,341,164 | | | | $ | 15,650,953 | | | | $ | 35,509,164 | |
| | | |
| | | |
| | | |
| |
Investment Securities at Value (Note 2) | | | $ | 38,930,359 | | | | $ | 18,953,788 | | | | $ | 38,347,658 | |
Receivable for Capital Shares Sold | | | | 12,769 | | | | | 13,291 | | | | | 220,468 | |
Receivable for Investment Securities Sold | | | | — | | | | | — | | | | | 172,075 | |
Dividends and Interest Receivable | | | | 32,160 | | | | | 11,137 | | | | | 13,687 | |
Prepaid Expenses | | | | 13,676 | | | | | 14,749 | | | | | 14,632 | |
| | | |
| | | |
| | | |
| |
Total Assets | | | | 38,988,964 | | | | | 18,992,965 | | | | | 38,768,520 | |
| | | |
| | | |
| | | |
| |
| LIABILITIES | | | | | | | | | | | | | | | |
Payable for Capital Shares Redeemed | | | | 70,736 | | | | | 10,383 | | | | | 174,960 | |
Investment Advisory Fee Payable, Net (Note 4) | | | | 15,111 | | | | | 1,246 | | | | | 17,586 | |
Administration Fee Payable (Note 4) | | | | 1,278 | | | | | 620 | | | | | 1,268 | |
Distribution and Service Fees Payable (Note 4) | | | | 2,379 | | | | | 1,479 | | | | | 6,538 | |
Other Accrued Expenses | | | | 44,551 | | | | | 27,625 | | | | | 52,039 | |
| | | |
| | | |
| | | |
| |
Total Liabilities | | | | 134,055 | | | | | 41,353 | | | | | 252,391 | |
| | | |
| | | |
| | | |
| |
| NET ASSETS | | | $ | 38,854,909 | | | | $ | 18,951,612 | | | | $ | 38,516,129 | |
| | | |
| | | |
| | | |
| |
| Net Assets Consist of: | | | | | | | | | | | | | | | |
Paid-in capital | | | $ | 42,586,161 | | | | $ | 19,264,264 | | | | $ | 42,365,212 | |
Accumulated net investment income (loss) | | | | 117,897 | | | | | 3,063 | | | | | (98,062 | ) |
Accumulated net realized loss on investments | | | | (9,438,344 | ) | | | | (3,618,550 | ) | | | | (6,589,515 | ) |
Net unrealized appreciation on investments | | | | 5,589,195 | | | | | 3,302,835 | | | | | 2,838,494 | |
| | | |
| | | |
| | | |
| |
| NET ASSETS | | | $ | 38,854,909 | | | | $ | 18,951,612 | | | | $ | 38,516,129 | |
| | | |
| | | |
| | | |
| |
| Pricing of Investor Class Shares | | | | | | | | | | | | | | | |
Net assets attributable to Investor Class shares | | | $ | 11,331,795 | | | | $ | 7,263,640 | | | | $ | 31,639,194 | |
Shares of Beneficial Interest Outstanding | | | | | | | | | | | | | | | |
(unlimited number of shares authorized, no par value) | | | | 915,484 | | | | | 550,894 | | | | | 2,226,088 | |
| | | |
| | | |
| | | |
| |
Net Asset Value Per Share | | | $ | 12.38 | | | | $ | 13.19 | | | | $ | 14.21 | |
| | | |
| | | |
| | | |
| |
| Pricing of Institutional Class Shares | | | | | | | | | | | | | | | |
Net assets attributable to Institutional Class shares | | | $ | 27,523,114 | | | | $ | 11,687,972 | | | | $ | 6,876,935 | |
Shares of Beneficial Interest Outstanding | | | | | | | | | | | | | | |
(unlimited number of shares authorized, no par value) | | | | 2,582,577 | | | | | 1,023,786 | | | | | 535,889 | |
| | | |
| | | |
| | | |
| |
Net Asset Value Per Share | | | $ | 10.66 | | | | $ | 11.42 | | | | $ | 12.83 | |
| | | |
| | | |
| | | |
| |
The accompanying notes are an integral part of the financial statements.
84
| Statements of Assets and Liabilities (continued) |
| April 30, 2012 |
| (unaudited) |
| | | | | | | | FBR | | FBR |
| | | FBR | | Large Cap | | Small Cap |
| | | Focus Fund | | Financial Fund | | Financial Fund |
| | |
| |
| |
|
| ASSETS | | | | | | | | | | | | |
Investment Securities at Cost | | | $ | 435,432,070 | | | | $ | 59,862,371 | | | | $ | 174,180,614 | |
| | | |
| | | |
| | | |
| |
Investment Securities at Value (Note 2) | | | $ | 760,456,686 | | | | $ | 66,753,320 | | | | $ | 185,805,768 | |
Receivable for Capital Shares Sold | | | | 822,434 | | | | | 100,060 | | | | | 112,225 | |
Receivable for Investment Securities Sold | | | | — | | | | | — | | | | | 256,387 | |
Dividends and Interest Receivable | | | | 119,516 | | | | | 54,462 | | | | | 152,523 | |
Prepaid Expenses | | | | 30,147 | | | | | 14,028 | | | | | 24,997 | |
| | | |
| | | |
| | | |
| |
Total Assets | | | | 761,428,783 | | | | | 66,921,870 | | | | | 186,351,900 | |
| | | |
| | | |
| | | |
| |
| LIABILITIES | | | | | | | | | | | | | | | |
Payable for Capital Shares Redeemed | | | | 783,300 | | | | | 26,977 | | | | | 150,663 | |
Payable for Investment Securities Purchased | | | | 1,501,338 | | | | | — | | | | | — | |
Investment Advisory Fee Payable, Net (Note 4) | | | | 549,321 | | | | | 48,531 | | | | | 137,836 | |
Administration Fee Payable (Note 4) | | | | 24,414 | | | | | 2,157 | | | | | 6,126 | |
Transfer Agent Fee Payable | | | | 89,473 | | | | | 8,343 | | | | | 28,290 | |
Distribution and Service Fees Payable (Note 4) | | | | 139,893 | | | | | 13,481 | | | | | 32,598 | |
Other Accrued Expenses | | | | 334,795 | | | | | 37,726 | | | | | 113,193 | |
| | | |
| | | |
| | | |
| |
Total Liabilities | | | | 3,422,534 | | | | | 137,215 | | | | | 468,706 | |
| | | |
| | | |
| | | |
| |
| NET ASSETS | | | $ | 758,006,249 | | | | $ | 66,784,655 | | | | $ | 185,883,194 | |
| | | |
| | | |
| | | |
| |
| Net Assets Consist of: | | | | | | | | | | | | | | | |
Paid-in capital | | | $ | 371,562,694 | | | | $ | 67,714,725 | | | | $ | 182,370,750 | |
Accumulated net investment income (loss) | | | | (1,981,958 | ) | | | | 110,842 | | | | | 232,193 | |
Accumulated net realized gain (loss) on investments | | | | | | | | | | | | | | | |
and foreign currency transactions | | | | 63,400,897 | | | | | (7,931,861 | ) | | | | (8,344,903 | ) |
Net unrealized appreciation on investments | | | | 325,024,616 | | | | | 6,890,949 | | | | | 11,625,154 | |
| | | |
| | | |
| | | |
| |
| NET ASSETS | | | $ | 758,006,249 | | | | $ | 66,784,655 | | | | $ | 185,883,194 | |
| | | |
| | | |
| | | |
| |
| Pricing of Investor Class Shares | | | | | | | | | | | | | | | |
Net assets attributable to Investor Class shares | | | $ | 694,457,119 | | | | $ | 66,784,655 | | | | $ | 157,834,797 | |
Shares of Beneficial Interest Outstanding | | | | | | | | | | | | | | | |
(unlimited number of shares authorized, no par value) | | | | 13,636,677 | | | | | 4,797,972 | | | | | 8,663,758 | |
| | | |
| | | |
| | | |
| |
Net Asset Value Per Share | | | $ | 50.93 | | | | $ | 13.92 | | | | $ | 18.22 | |
| | | |
| | | |
| | | |
| |
| Pricing of Institutional Class Shares | | | | | | | | | | | | | | | |
Net assets attributable to Institutional Class shares | | | $ | 63,549,130 | | | | $ | — | | | | $ | 28,048,397 | |
Shares of Beneficial Interest Outstanding | | | | | | | | | | | | | | | |
(unlimited number of shares authorized, no par value) | | | | 1,239,909 | | | | | — | | | | | 2,440,780 | |
| | | |
| | | |
| | | |
| |
Net Asset Value Per Share | | | $ | 51.25 | | | | $ | — | | | | $ | 11.49 | |
| | | |
| | | |
| | | |
| |
The accompanying notes are an integral part of the financial statements.
85
| Statements of Assets and Liabilities (continued) |
| April 30, 2012 |
| (unaudited) |
| | | | | | | | FBR |
| | | FBR | | Gas Utility |
| | | Technology Fund | | Index Fund |
| | |
| |
|
| ASSETS | | | | | | | | | | |
Investment Securities at Cost | | | $ | 6,697,760 | | | | $ | 413,823,513 | |
| | | |
| | | |
| |
Investment Securities at Value (Note 2) | | | $ | 7,468,016 | | | | $ | 603,281,122 | |
Cash | | | | — | | | | | 264,240 | |
Receivable for Capital Shares Sold | | | | 2,602 | | | | | 1,965,030 | |
Receivable for Investment Securities Sold | | | | 39,917 | | | | | 1,809,076 | |
Dividends and Interest Receivable | | | | 460 | | | | | 570,844 | |
Receivable from Adviser | | | | 9,115 | | | | | — | |
Prepaid Expenses | | | | 9,026 | | | | | 48,228 | |
| | | |
| | | |
| |
Total Assets | | | | 7,529,136 | | | | | 607,938,540 | |
| | | |
| | | |
| |
| LIABILITIES | | | | | | | | | | |
Payable for Capital Shares Redeemed | | | | 10,405 | | | | | 789,195 | |
Payable for Investment Securities Purchased | | | | 75,614 | | | | | 581,054 | |
Investment Advisory Fee Payable, Net (Note 4) | | | | — | | | | | 195,421 | |
Administration Fee Payable (Note 4) | | | | 245 | | | | | 39,084 | |
Distribution and Service Fees Payable (Note 4) | | | | 1,278 | | | | | — | |
Other Accrued Expenses | | | | 31,443 | | | | | 182,312 | |
| | | |
| | | |
| |
Total Liabilities | | | | 118,985 | | | | | 1,787,066 | |
| | | |
| | | |
| |
| NET ASSETS | | | $ | 7,410,151 | | | | $ | 606,151,474 | |
| | | |
| | | |
| |
| Net Assets Consist of: | | | | | | | | | | |
Paid-in capital | | | $ | 9,022,139 | | | | $ | 429,065,171 | |
Accumulated net investment income (loss) | | | | (42,172 | ) | | | | 210,199 | |
Accumulated net realized loss on investments | | | | (2,340,072 | ) | | | | (12,581,505 | ) |
Net unrealized appreciation on investments | | | | 770,256 | | | | | 189,457,609 | |
| | | |
| | | |
| |
| NET ASSETS | | | $ | 7,410,151 | | | | $ | 606,151,474 | |
| | | |
| | | |
| |
| Pricing of Investor Class Shares | | | | | | | | | | |
Net assets attributable to Investor Class shares | | | $ | 6,204,561 | | | | $ | 606,151,474 | |
Shares of Beneficial Interest Outstanding | | | | | | | | | | |
(unlimited number of shares authorized, no par value) | | | | 521,745 | | | | | 27,155,389 | |
| | | |
| | | |
| |
Net Asset Value Per Share | | | $ | 11.89 | | | | $ | 22.32 | |
| | | |
| | | |
| |
| Pricing of Institutional Class Shares | | | | | | | | | | |
Net assets attributable to Institutional Class shares | | | $ | 1,205,590 | | | | $ | — | |
Shares of Beneficial Interest Outstanding | | | | | | | | | | |
(unlimited number of shares authorized, no par value) | | | | 100,772 | | | | | — | |
| | | |
| | | |
| |
Net Asset Value Per Share | | | $ | 11.96 | | | | $ | — | |
| | | |
| | | |
| |
The accompanying notes are an integral part of the financial statements.
86
| Statements of Assets and Liabilities (continued) |
| April 30, 2012 |
| (unaudited) |
| | | | | | | | FBR |
| | | FBR | | Core Bond |
| | | Balanced Fund | | Fund |
| | |
| |
|
| ASSETS | | | | | | | | | | |
Investment Securities at Cost | | | $ | 179,441,230 | | | | $ | 30,807,616 | |
| | | |
| | | |
| |
Investment Securities at Value (Note 2) | | | $ | 202,294,005 | | | | $ | 31,898,695 | |
Receivable for Capital Shares Sold | | | | 1,196,094 | | | | | — | |
Receivable for Investment Securities Sold | | | | — | | | | | 438,864 | |
Dividends and Interest Receivable | | | | 897,046 | | | | | 344,963 | |
Prepaid Expenses | | | | 43,585 | | | | | 25,824 | |
| | | |
| | | |
| |
Total Assets | | | | 204,430,730 | | | | | 32,708,346 | |
| | | |
| | | |
| |
| LIABILITIES | | | | | | | | | | |
Distributions Payable | | | | — | | | | | 77,649 | |
Payable for Capital Shares Redeemed | | | | 36,079 | | | | | 11,098 | |
Investment Advisory Fee Payable, Net (Note 4) | | | | 125,858 | | | | | 7,286 | |
Administration Fee Payable (Note 4) | | | | 6,523 | | | | | 933 | |
Distribution and Service Fees Payable (Note 4) | | | | 25,609 | | | | | 781 | |
Other Accrued Expenses | | | | 65,678 | | | | | 42,565 | |
| | | |
| | | |
| |
Total Liabilities | | | | 259,747 | | | | | 140,312 | |
| | | |
| | | |
| |
| NET ASSETS | | | $ | 204,170,983 | | | | $ | 32,568,034 | |
| | | |
| | | |
| |
| Net Assets Consist of: | | | | | | | | | | |
Paid-in capital | | | $ | 184,152,398 | | | | $ | 30,932,047 | |
Accumulated net investment income | | | | 175,910 | | | | | 5,614 | |
Accumulated net realized gain (loss) on investments | | | | (3,010,100 | ) | | | | 539,294 | |
Net unrealized appreciation on investments | | | | 22,852,775 | | | | | 1,091,079 | |
| | | |
| | | |
| |
| NET ASSETS | | | $ | 204,170,983 | | | | $ | 32,568,034 | |
| | | |
| | | |
| |
| Pricing of Investor Class Shares | | | | | | | | | | |
Net assets attributable to Investor Class shares | | | $ | 128,621,124 | | | | $ | 3,952,478 | |
Shares of Beneficial Interest Outstanding | | | | | | | | | | |
(unlimited number of shares authorized, no par value) | | | | 9,232,076 | | | | | 408,337 | |
| | | |
| | | |
| |
Net Asset Value Per Share | | | $ | 13.93 | | | | $ | 9.68 | |
| | | |
| | | |
| |
| Pricing of Institutional Class Shares | | | | | | | | | | |
Net assets attributable to Institutional Class shares | | | $ | 75,549,859 | | | | $ | 28,615,556 | |
Shares of Beneficial Interest Outstanding | | | | | | | | | | |
(unlimited number of shares authorized, no par value) | | | | 5,696,596 | | | | | 3,241,731 | |
| | | |
| | | |
| |
Net Asset Value Per Share | | | $ | 13.26 | | | | $ | 8.83 | |
| | | |
| | | |
| |
The accompanying notes are an integral part of the financial statements.
87
| Statements of Operations |
| For the Six Months Ended April 30, 2012 |
| (unaudited) |
| | | FBR | | FBR | | FBR |
| | | Large Cap Fund | | Mid Cap Fund | | Small Cap Fund |
| | |
| |
| |
|
| Investment Income | | | | | | | | | | | | | | | |
Dividends1 | | | $ | 402,890 | | | | $ | 134,595 | | | | $ | 170,539 | |
Interest | | | | 32 | | | | | 55 | | | | | 39 | |
| | | |
| | | |
| | | |
| |
Total Investment Income | | | | 402,922 | | | | | 134,650 | | | | | 170,578 | |
| | | |
| | | |
| | | |
| |
| Expenses | | | | | | | | | | | | | | | |
Investment Advisory fees (Note 4) | | | | 175,255 | | | | | 85,261 | | | | | 173,213 | |
Administration fees (Note 4) | | | | 13,954 | | | | | 6,952 | | | | | 14,237 | |
Distribution and Service fees – Investor Class (Note 4) | | | | 15,075 | | | | | 8,867 | | | | | 37,688 | |
Professional fees | | | | 30,625 | | | | | 30,025 | | | | | 30,318 | |
Transfer agent fees – Investor Class | | | | 3,442 | | | | | 2,560 | | | | | 10,789 | |
Transfer agent fees – Institutional Class | | | | 8,969 | | | | | 3,429 | | | | | 2,605 | |
Trustees’ fees | | | | 7,949 | | | | | 7,950 | | | | | 7,949 | |
Registration fees – Investor Class | | | | 7,440 | | | | | 8,279 | | | | | 10,114 | |
Registration fees – Institutional Class | | | | 7,064 | | | | | 7,328 | | | | | 7,909 | |
Shareholder administrative fees – Investor Class | | | | 5,332 | | | | | 6,081 | | | | | 13,666 | |
Shareholder administrative fees – Institutional Class | | | | 1,798 | | | | | 1,184 | | | | | 1,848 | |
Compliance fees | | | | 5,119 | | | | | 4,671 | | | | | 5,124 | |
Insurance fees | | | | 4,023 | | | | | 1,794 | | | | | 4,255 | |
Other expenses | | | | 1,892 | | | | | 1,327 | | | | | 2,237 | |
Reports to shareholders – Institutional Class | | | | 1,846 | | | | | 914 | | | | | 927 | |
Reports to shareholders – Investor Class | | | | 1,632 | | | | | 1,554 | | | | | 5,094 | |
Custodian fees | | | | 1,258 | | | | | 775 | | | | | 1,346 | |
Accounting services fees | | | | 509 | | | | | 2,145 | | | | | 2,727 | |
| | | |
| | | |
| | | |
| |
Total expenses before waivers and related reimbursements | | | | 293,182 | | | | | 181,096 | | | | | 332,046 | |
Less waivers and related reimbursements (Note 4) | | | | (83,162 | ) | | | | (68,021 | ) | | | | (63,406 | ) |
| | | |
| | | |
| | | |
| |
Total expenses after waivers and related reimbursements | | | | 210,020 | | | | | 113,075 | | | | | 268,640 | |
| | | |
| | | |
| | | |
| |
Net Investment Income (Loss) | | | | 192,902 | | | | | 21,575 | | | | | (98,062 | ) |
| | | |
| | | |
| | | |
| |
| Net Realized and Unrealized Gain (Loss) on Investments | | | | | | | | | | | | | | | |
Net Realized Gain (Loss) on Investment Transactions | | | | (358,274 | ) | | | | (95,929 | ) | | | | 1,626,654 | |
Change in Net Unrealized Appreciation of Investments | | | | 3,551,539 | | | | | 1,689,240 | | | | | 3,662,213 | |
| | | |
| | | |
| | | |
| |
Net Gain on Investments | | | | 3,193,265 | | | | | 1,593,311 | | | | | 5,288,867 | |
| | | |
| | | |
| | | |
| |
| Net Increase in Net Assets Resulting from Operations | | | $ | 3,386,167 | | | | $ | 1,614,886 | | | | $ | 5,190,805 | |
| | | |
| | | |
| | | |
| |
| 1 | Net of foreign taxes withheld of $5,606, $949 and $0 for the FBR Large Cap Fund, FBR Mid Cap Fund and FBR Small Cap Fund, respectively. |
The accompanying notes are an integral part of the financial statements.
88
| Statements of Operations (continued) |
| For the Six Months Ended April 30, 2012 |
| (unaudited) |
| | | | | | | FBR | | | FBR |
| | | | | | | Large Cap | | | Small Cap |
| | | FBR | | | Financial | | | Financial |
| | | Focus Fund | | | Fund | | | Fund |
| | |
| | |
| | |
|
| Investment Income | | | | | | | | | | | | |
Dividends | | $ | 2,801,969 | | | $ | 571,010 | | | $ | 2,325,498 | |
Interest | | | 3,681 | | | | 107 | | | | 358 | |
| | |
| | |
| | |
| |
Total Investment Income | | | 2,805,650 | | | | 571,117 | | | | 2,325,856 | |
| | |
| | |
| | |
| |
| Expenses | | | | | | | | | | | | |
Investment Advisory fees (Note 4) | | | 3,131,477 | | | | 264,072 | | | | 805,942 | |
Administration fees (Note 4) | | | 255,349 | | | | 20,749 | | | | 57,513 | |
Distribution and Service fees – Investor Class (Note 4) | | | 800,573 | | | | 73,354 | | | | 194,784 | |
Shareholder administrative fees – Investor Class | | | 334,651 | | | | 33,689 | | | | 46,982 | |
Shareholder administrative fees – Institutional Class | | | 14,911 | | | | — | | | | 5,600 | |
Transfer agent fees – Investor Class | | | 94,928 | | | | 8,886 | | | | 27,744 | |
Transfer agent fees – Institutional Class | | | 5,543 | | | | — | | | | 2,593 | |
Insurance fees | | | 38,420 | | | | 6,225 | | | | 7,084 | |
Professional fees | | | 26,277 | | | | 30,075 | | | | 29,569 | |
Reports to shareholders – Investor Class | | | 22,462 | | | | 4,244 | | | | 23,061 | |
Reports to shareholders – Institutional Class | | | 981 | | | | — | | | | 1,989 | |
Registration fees – Investor Class | | | 20,666 | | | | 3,760 | | | | 23,587 | |
Registration fees – Institutional Class | | | 7,371 | | | | — | | | | 8,314 | |
Compliance fees | | | 14,255 | | | | 5,490 | | | | 8,555 | |
Custodian fees | | | 8,992 | | | | 1,712 | | | | 3,891 | |
Trustees’ fees | | | 7,949 | | | | 7,949 | | | | 7,945 | |
Other expenses | | | 2,782 | | | | 37 | | | | 2,010 | |
Accounting services fees | | | 21 | | | | 33 | | | | 198 | |
| | |
| | |
| | |
| |
Total expenses before waivers and related | | | | | | | | | | | | |
reimbursements | | | 4,787,608 | | | | 460,275 | | | | 1,257,361 | |
Add recoupment and related reimbursements (Note 4) | | | — | | | | — | | | | 1,024 | |
| | |
| | |
| | |
| |
Total expenses after waivers and related | | | | | | | | | | | | |
reimbursements | | | 4,787,608 | | | | 460,275 | | | | 1,258,385 | |
| | |
| | |
| | |
| |
Net Investment Income (Loss) | | | (1,981,958 | ) | | | 110,842 | | | | 1,067,471 | |
| | |
| | |
| | |
| |
| Net Realized and Unrealized Gain (Loss) on Investments | | | | | | | | | | | | |
Net Realized Gain (Loss) on Investment Transactions | | | 63,683,117 | | | | (3,127,790 | ) | | | 1,122,503 | |
Change in Net Unrealized Appreciation of Investments | | | 31,733,325 | | | | 12,365,723 | | | | 18,317,743 | |
| | |
| | |
| | |
| |
Net Gain on Investments | | | 95,416,442 | | | | 9,237,933 | | | | 19,440,246 | |
| | |
| | |
| | |
| |
| Net Increase in Net Assets Resulting from Operations | | $ | 93,434,484 | | | $ | 9,348,775 | | | $ | 20,507,717 | |
| | |
| | |
| | |
| |
The accompanying notes are an integral part of the financial statements.
89
| Statements of Operations (continued) |
| For the Six Months Ended April 30, 2012 |
| (unaudited) |
| | FBR | | FBR | |
| | Technology | | Gas Utility | |
| | Fund | | Index Fund | |
| |
| |
|
| Investment Income | | | | | | | | |
Dividends1 | | $ | 24,299 | | | $ | 9,114,186 | |
Interest | | | 24 | | | | 384 | |
| | |
| | |
| |
Total Investment Income | | | 24,323 | | | | 9,114,570 | |
| | |
| | |
| |
| Expenses (Note 4) | | | | | | | | |
Investment Advisory fees (Note 4) | | | 31,338 | | | | 1,097,768 | |
Administration fees (Note 4) | | | 2,332 | | | | 311,968 | |
Distribution and Service fees – Investor Class (Note 4) | | | 7,275 | | | | — | |
Professional fees | | | 29,790 | | | | 27,329 | |
Registration fees – Investor Class | | | 8,838 | | | | 36,024 | |
Registration fees – Institutional Class | | | 9,904 | | | | — | |
Trustees’ fees | | | 7,949 | | | | 7,949 | |
Shareholder administrative fees – Investor Class | | | 5,568 | | | | 222,594 | |
Shareholder administrative fees – Institutional Class | | | 350 | | | | — | |
Transfer agent fees – Investor Class | | | 2,808 | | | | 61,781 | |
Transfer agent fees – Institutional Class | | | 1,596 | | | | — | |
Compliance fees | | | 4,350 | | | | 15,733 | |
Accounting services fees | | | 2,628 | | | | — | |
Reports to shareholders – Investor Class | | | 1,642 | | | | 17,089 | |
Reports to shareholders – Institutional Class | | | 298 | | | | — | |
Other expenses | | | 1,333 | | | | 1,111 | |
Insurance fees | | | 601 | | | | 24,131 | |
Custodian fees | | | 407 | | | | 16,517 | |
| | |
| | |
| |
Total expenses before waivers and related reimbursements | | | 119,007 | | | | 1,839,994 | |
Less waivers and related reimbursements (Note 4) | | | (52,512 | ) | | | — | |
| | |
| | |
| |
Total expenses after waivers and related reimbursements | | | 66,495 | | | | 1,839,994 | |
| | |
| | |
| |
Net Investment Income (Loss) | | | (42,172 | ) | | | 7,274,576 | |
| | |
| | |
| |
| Net Realized and Unrealized Gain on Investments | | | | | | | | |
Net Realized Gain on Investment Transactions | | | 110,848 | | | | 3,202,236 | |
Change in Net Unrealized Appreciation of Investments | | | 584,067 | | | | 30,124,928 | |
| | |
| | |
| |
Net Gain on Investments | | | 694,915 | | | | 33,327,164 | |
| | |
| | |
| |
| Net Increase in Net Assets Resulting from Operations | | $ | 652,743 | | | $ | 40,601,740 | |
| | |
| | |
| |
| 1 | Net of foreign taxes withheld of $0 and $137,808 for the FBR Technology Fund and FBR Gas Utility Index Fund, respectively. |
The accompanying notes are an integral part of the financial statements.
90
Statements of Operations (continued)
For the Six Months Ended April 30, 2012
(unaudited)
| | | FBR | | FBR |
| | | Balanced | | Core Bond |
| | | Fund | | Fund |
| | |
| |
|
| Investment Income | | | | | | | | |
Dividends | | $ | 1,371,034 | | | $ | 112,057 | |
Interest | | | 876,427 | | | | 516,660 | |
| | |
| | |
| |
Total Investment Income | | | 2,247,461 | | | | 628,717 | |
| | |
| | |
| |
| Expenses | | | | | | | | |
Investment Advisory fees (Note 4) | | | 624,868 | | | | 109,414 | |
Administration fees (Note 4) | | | 52,842 | | | | 10,354 | |
Distribution and Service fees – Investor Class (Note 4) | | | 114,994 | | | | 4,978 | |
Professional fees | | | 30,483 | | | | 30,366 | |
Shareholder administrative fees – Investor Class | | | 23,817 | | | | 5,275 | |
Shareholder administrative fees – Institutional Class | | | 6,470 | | | | 1,026 | |
Registration fees – Investor Class | | | 14,019 | | | | 8,949 | |
Registration fees – Institutional Class | | | 8,425 | | | | 7,626 | |
Transfer agent fees – Investor Class | | | 13,841 | | | | 1,233 | |
Transfer agent fees – Institutional Class | | | 11,773 | | | | 4,072 | |
Trustees’ fees | | | 7,949 | | | | 7,949 | |
Compliance fees | | | 7,266 | | | | 4,618 | |
Insurance fees | | | 6,905 | | | | 2,127 | |
Accounting services fees | | | 4,762 | | | | 5,953 | |
Custodian fees | | | 4,192 | | | | 1,066 | |
Reports to shareholders – Investor Class | | | 3,191 | | | | 348 | |
Reports to shareholders – Institutional Class | | | 1,554 | | | | 1,251 | |
Other expenses | | | 1,867 | | | | 1,696 | |
| | |
| | |
| |
Total expenses before waivers and related reimbursements | | | 939,218 | | | | 208,301 | |
Less waivers and related reimbursements (Note 4) | | | (50,949 | ) | | | (59,714 | ) |
| | |
| | |
| |
Total expenses after waivers and related reimbursements | | | 888,269 | | | | 148,587 | |
| | |
| | |
| |
Net Investment Income | | | 1,359,192 | | | | 480,130 | |
| | |
| | |
| |
| Net Realized and Unrealized Gain (Loss) on Investments | | | | | | | | |
Net Realized Gain on Investment Transactions | | | 1,393,832 | | | | 542,141 | |
Capital Gain Distributions from Regulated Investment Companies | | | 3,301 | | | | 2,640 | |
Change in Net Unrealized Appreciation (Depreciation) of Investments | | | 9,831,506 | | | | (60,017 | ) |
| | |
| | |
| |
Net Gain on Investments | | | 11,228,639 | | | | 484,764 | |
| | |
| | |
| |
| Net Increase in Net Assets Resulting from Operations | | $ | 12,587,831 | | | $ | 964,894 | |
| | |
| | |
| |
| The accompanying notes are an integral part of the financial statements. |
| |
| 91 |
Statements of Changes in Net Assets
| | | FBR Large Cap Fund | | | FBR Mid Cap Fund | | | FBR Small Cap Fund | |
| | |
| | |
| | |
| |
| | | For the | | | | | | For the | | | | | | For the | | | | |
| | | Six Months | | For the | | Six Months | | For the | | Six Months | | For the |
| | | Ended | | Year | | Ended | | Year | | Ended | | Year |
| | | April 30, | | Ended | | April 30, | | Ended | | April 30, | | Ended |
| | | 2012 | | October 31, | | 2012 | | October 31, | | 2012 | | October 31, |
| | | (unaudited) | | 2011 | | (unaudited) | | 2011 | | (unaudited) | | 2011 |
| | |
| |
| |
| |
| |
| |
|
| | | | | | | | | | | | | | | | | | | | | | | | | |
| From Investment Activities | | | | | | | | | | | | | | | | | | | | | | | | |
Net Investment Income (Loss) | | $ | 192,902 | | | $ | 220,640 | | | $ | 21,575 | | | $ | 51,949 | | | $ | (98,062 | ) | | $ | (93,237 | ) |
Net Realized Gain (Loss) on | | | | | | | | | | | | | | | | | | | | | | | | |
Investment Transactions | | | (358,274 | ) | | | 4,654,116 | | | | (95,929 | ) | | | 1,109,856 | | | | 1,626,654 | | | | 6,791,845 | |
Change in Net Unrealized | | | | | | | | | | | | | | | | | | | | | | | | |
Appreciation (Depreciation) of | | | | | | | | | | | | | | | | | | | | | | | | |
Investments | | | 3,551,539 | | | | (2,297,575 | ) | | | 1,689,240 | | | | (33,660 | ) | | | 3,662,213 | | | | (3,259,761 | ) |
| | |
| | |
| | |
| | |
| | |
| | |
| |
Net Increase in Net Assets | | | | | | | | | | | | | | | | | | | | | | | | |
Resulting from Operations | | | 3,386,167 | | | | 2,577,181 | | | | 1,614,886 | | | | 1,128,145 | | | | 5,190,805 | | | | 3,438,847 | |
| | |
| | |
| | |
| | |
| | |
| | |
| |
| | | | | | | | | | | | | | | | | | | | | | | | | |
| Distributions to Shareholders | | | | | | | | | | | | | | | | | | | | | | | | |
Distributions to Investor Class Shareholders: | | | | | | | | | | | | | | | | | | | | | | | | |
From Net Investment Income | | | (13,269 | ) | | | (52,145 | ) | | | (1,020 | ) | | | (17,685 | ) | | | — | | | | (106,555 | ) |
From Net Realized Gain on Investments | | | — | | | | — | | | | — | | | | — | | | | — | | | | — | |
Distributions to Institutional Class Shareholders: | | | | | | | | | | | | | | | | | | | | | | | | |
From Net Investment Income | | | (217,106 | ) | | | (150,922 | ) | | | (39,232 | ) | | | (35,878 | ) | | | — | | | | (35,059 | ) |
From Net Realized Gain on Investments | | | — | | | | — | | | | — | | | | — | | | | — | | | | — | |
| | |
| | |
| | |
| | |
| | |
| | |
| |
Total Distributions to Shareholders | | | (230,375 | ) | | | (203,067 | ) | | | (40,252 | ) | | | (53,563 | ) | | | — | | | | (141,614 | ) |
| | |
| | |
| | |
| | |
| | |
| | |
| |
| From Share Transactions | | | | | | | | | | | | | | | | | | | | | | | | |
Net Increase (Decrease) in Net Assets | | | | | | | | | | | | | | | | | | | | | | | | |
Resulting from Share Transactions | | | (4,008,905 | ) | | | (9,457,471 | ) | | | (1,443,705 | ) | | | (685,991 | ) | | | (5,678,992 | ) | | | 211,128 | |
| | |
| | |
| | |
| | |
| | |
| | |
| |
Total Increase (Decrease) in | | | | | | | | | | | | | | | | | | | | | | | | |
Net Assets | | | (853,113 | ) | | | (7,083,357 | ) | | | 130,929 | | | | 388,591 | | | | (488,187 | ) | | | 3,508,361 | |
Net Assets – Beginning of Period | | | 39,708,022 | | | | 46,791,379 | | | | 18,820,683 | | | | 18,432,092 | | | | 39,004,316 | | | | 35,495,955 | |
| | |
| | |
| | |
| | |
| | |
| | |
| |
Net Assets – End of Period | | $ | 38,854,909 | | | $ | 39,708,022 | | | $ | 18,951,612 | | | $ | 18,820,683 | | | $ | 38,516,129 | | | $ | 39,004,316 | |
| | |
| | |
| | |
| | |
| | |
| | |
| |
Accumulated Net Investment | | | | | | | | | | | | | | | | | | | | | | | | |
Income (Loss) | | $ | 117,897 | | | $ | 155,370 | | | $ | 3,063 | | | $ | 21,740 | | | $ | (98,602 | ) | | $ | — | |
| | |
| | |
| | |
| | |
| | |
| | |
| |
| The accompanying notes are an integral part of the financial statements. |
| |
| 92 |
Statements of Changes in Net Assets (continued)
| | | | | | | | | | | FBR Large Cap | | | FBR Small Cap | |
| | | FBR Focus Fund | | | Financial Fund | | | Financial Fund | |
| | |
| | |
| | |
| |
| | | For the | | | | | | For the | | | | | | For the | | | | |
| | | Six Months | | For the | | Six Months | | For the | | Six Months | | For the |
| | | Ended | | Year | | Ended | | Year | | Ended | | Year |
| | | April 30, | | Ended | | April 30, | | Ended | | April 30, | | Ended |
| | | 2012 | | October 31, | | 2012 | | October 31, | | 2012 | | October 31, |
| | | (unaudited) | | 2011 | | (unaudited) | | 2011 | | (unaudited) | | 2011 |
| | |
| |
| |
| |
| |
| |
|
| From Investment Activities | | | | | | | | | | | | | | | | | | | | | | | | |
Net Investment Income (Loss) | | $ | (1,981,958 | ) | | $ | (7,221,589 | ) | | $ | 110,842 | | | $ | (210,507 | ) | | $ | 1,067,471 | | | $ | 2,102,026 | |
Net Realized Gain (Loss) on | | | | | | | | | | | | | | | | | | | | | | | | |
Investments and Foreign | | | | | | | | | | | | | | | | | | | | | | | | |
Currency Transactions | | | | | | | | | | | | | | | | | | | | | | | | |
Unaffiliated Issuers | | | 63,683,117 | | | | 68,309,958 | | | | (3,127,790 | ) | | | (2,300,974 | ) | | | 1,122,503 | | | | (5,543,171 | ) |
Affiliated Issuers | | | — | | | | 1,479,522 | | | | — | | | | — | | | | — | | | | — | |
Change in Net Unrealized | | | | | | | | | | | | | | | | | | | | | | | | |
Appreciation (Depreciation) of | | | | | | | | | | | | | | | | | | | | | | | | |
Investments | | | 31,733,325 | | | | (10,251,836 | ) | | | 12,365,723 | | | | (4,407,932 | ) | | | 18,317,743 | | | | (17,139,877 | ) |
| | |
| | |
| | |
| | |
| | |
| | |
| |
Net Increase (Decrease) in | | | | | | | | | | | | | | | | | | | | | | | | |
Net Assets Resulting | | | | | | | | | | | | | | | | | | | | | | | | |
from Operations | | | 93,434,484 | | | | 52,316,055 | | | | 9,348,775 | | | | (6,919,413 | ) | | | 20,507,717 | | | | (20,581,022 | ) |
| | |
| | |
| | |
| | |
| | |
| | |
| |
| Distributions to Shareholders | | | | | | | | | | | | | | | | | | | | | | | | |
Distributions to Investor Class | | | | | | | | | | | | | | | | | | | | | | | | |
Shareholders: | | | | | | | | | | | | | | | | | | | | | | | | |
From Net Investment Income | | | — | | | | — | | | | — | | | | — | | | | (2,581,344 | ) | | | (725,603 | ) |
From Net Realized Gain on | | | | | | | | | | | | | | | | | | | | | | | | |
Investments | | | (63,544,132 | ) | | | (24,307,241 | ) | | | — | | | | — | | | | — | | | | (1,605,904 | ) |
Distributions to Institutional Class | | | | | | | | | | | | | | | | | | | | | | | | |
Shareholders: | | | | | | | | | | | | | | | | | | | | | | | | |
From Net Investment Income | | | — | | | | — | | | | — | | | | — | | | | (600,281 | ) | | | (256,185 | ) |
From Net Realized Gain on | | | | | | | | | | | | | | | | | | | | | | | | |
Investments | | | (5,298,059 | ) | | | (1,335,587 | ) | | | — | | | | — | | | | — | | | | (275,476 | ) |
| | |
| | |
| | |
| | |
| | |
| | |
| |
Total Distributions to | | | | | | | | | | | | | | | | | | | | | | | | |
Shareholders | | | (68,842,191 | ) | | | (25,642,828 | ) | | | — | | | | — | | | | (3,181,625 | ) | | | (2,863,168 | ) |
| | |
| | |
| | |
| | |
| | |
| | |
| |
| From Share Transactions | | | | | | | | | | | | | | | | | | | | | | | | |
Net Increase (Decrease) in | | | | | | | | | | | | | | | | | | | | | | | | |
Net Assets Resulting from | | | | | | | | | | | | | | | | | | | | | | | | |
Share Transactions | | | 73,071,311 | | | | (73,981,126 | ) | | | 1,752,236 | | | | 13,886,501 | | | | (5,543,738 | ) | | | (44,213,305 | ) |
| | |
| | |
| | |
| | |
| | |
| | |
| |
Total Increase (Decrease) in | | | | | | | | | | | | | | | | | | | | | | | | |
Net Assets | | | 97,663,604 | | | | (47,307,899 | ) | | | 11,101,011 | | | | 6,967,088 | | | | 11,782,354 | | | | (67,657,495 | ) |
Net Assets – Beginning of Period | | | 660,342,645 | | | | 707,650,544 | | | | 55,683,644 | | | | 48,716,556 | | | | 174,100,840 | | | | 241,758,335 | |
| | |
| | |
| | |
| | |
| | |
| | |
| |
Net Assets – End of Period | | $ | 758,006,249 | | | $ | 660,342,645 | | | $ | 66,784,655 | | | $ | 55,683,644 | | | $ | 185,883,194 | | | $ | 174,100,840 | |
| | |
| | |
| | |
| | |
| | |
| | |
| |
Accumulated Net Investment | | | | | | | | | | | | | | | | | | | | | | | | |
Income (Loss) | | $ | (1,981,958 | ) | | $ | — | | | $ | 110,842 | | | $ | — | | | $ | 232,193 | | | $ | 2,346,347 | |
| | |
| | |
| | |
| | |
| | |
| | |
| |
Statements of Changes in Net Assets (continued)
| | | FBR Technology Fund | | | FBR Gas Utility Index Fund | |
| | |
| | |
| |
| | | For the | | | | | | For the | | | | |
| | | Six Months | | For the | | Six Months | | For the |
| | | Ended | | Year | | Ended | | Year |
| | | April 30, | | Ended | | April 30, | | Ended |
| | | 2012 | | October 31, | | 2012 | | October 31, |
| | | (unaudited) | | 2011 | | (unaudited) | | 2011 |
| | |
| |
| |
| |
|
| From Investment Activities | | | | | | | | | | | | | | | | |
Net Investment Income (Loss) | | $ | (42,172 | ) | | $ | (131,860 | ) | | $ | 7,274,576 | | | $ | 8,042,465 | |
Net Realized Gain on Investment | | | | | | | | | | | | | | | | |
Transactions | | | 110,848 | | | | 1,108,080 | | | | 3,202,236 | | | | 3,417,370 | |
Change in Net Unrealized | | | | | | | | | | | | | | | | |
Appreciation (Depreciation) of | | | | | | | | | | | | | | | | |
Investments | | | 584,067 | | | | (909,888 | ) | | | 30,124,928 | | | | 53,861,410 | |
| | |
| | |
| | |
| | |
| |
Net Increase in Net Assets | | | | | | | | | | | | | | | | |
Resulting from Operations | | | 652,743 | | | | 66,332 | | | | 40,601,740 | | | | 65,321,245 | |
| | |
| | |
| | |
| | |
| |
| Distributions to Shareholders | | | | | | | | | | | | | | | | |
Distributions to Investor Class | | | | | | | | | | | | | | | | |
Shareholders: | | | | | | | | | | | | | | | | |
From Net Investment Income | | | — | | | | — | | | | (7,157,930 | ) | | | (8,022,358 | ) |
From Net Realized Gain on | | | | | | | | | | | | | | | | |
Investments | | | — | | | | — | | | | (3,837,545 | ) | | | (2,818,013 | ) |
| | |
| | |
| | |
| | |
| |
Total Distributions to Shareholders | | | — | | | | — | | | | (10,995,475 | ) | | | (10,840,371 | ) |
| | |
| | |
| | |
| | |
| |
| From Share Transactions | | | | | | | | | | | | | | | | |
Net Increase (Decrease) in | | | | | | | | | | | | | | | | |
Net Assets Resulting from | | | | | | | | | | | | | | | | |
Share Transactions | | | (97,510 | ) | | | (6,029,102 | ) | | | 142,763,441 | | | | 135,259,870 | |
| | |
| | |
| | |
| | |
| |
Total Increase (Decrease) in | | | | | | | | | | | | | | | | |
Net Assets | | | 555,233 | | | | (5,962,770 | ) | | | 172,369,706 | | | | 189,740,744 | |
Net Assets – Beginning of Period | | | 6,854,918 | | | | 12,817,688 | | | | 433,781,768 | | | | 244,041,024 | |
| | |
| | |
| | |
| | |
| |
Net Assets – End of Period | | $ | 7,410,151 | | | $ | 6,854,918 | | | $ | 606,151,474 | | | $ | 433,781,768 | |
| | |
| | |
| | |
| | |
| |
Accumulated Net Investment | | | | | | | | | | | | | | | | |
Income (Loss) | | $ | (42,172 | ) | | $ | — | | | $ | 210,199 | | | $ | 93,553 | |
| | |
| | |
| | |
| | |
| |
| The accompanying notes are an integral part of the financial statements. |
| |
| 94 |
Statements of Changes in Net Assets (continued)
| | | FBR Balanced Fund | | | FBR Core Bond Fund | |
| | |
| | |
| |
| | | For the | | | | | | For the | | | | |
| | | Six Months | | For the | | Six Months | | For the |
| | | Ended | | Year | | Ended | | Year |
| | | April 30, | | Ended | | April 30, | | Ended |
| | | 2012 | | October 31, | | 2012 | | October 31, |
| | | (unaudited) | | 2011 | | (unaudited) | | 2011 |
| | |
| |
| |
| |
|
| From Investment Activities | | | | | | | | | | | | | | | | |
Net Investment Income | | $ | 1,359,192 | | | $ | 2,261,233 | | | $ | 480,130 | | | $ | 1,061,269 | |
Net Realized Gain on | | | | | | | | | | | | | | | | |
Investment Transactions | | | 1,393,832 | | | | 3,679,665 | | | | 542,141 | | | | 344,435 | |
Capital Gain Distributions from | | | | | | | | | | | | | | | | |
Regulated Investment Companies | | | 3,301 | | | | — | | | | 2,640 | | | | — | |
Change in Net Unrealized | | | | | | | | | | | | | | | | |
Appreciation (Depreciation) of | | | | | | | | | | | | | | | | |
Investments | | | 9,831,506 | | | | 4,044,861 | | | | (60,017 | ) | | | (741,372 | ) |
| | |
| | |
| | |
| | |
| |
Net Increase in Net Assets | | | | | | | | | | | | | | | | |
Resulting from Operations | | | 12,587,831 | | | | 9,985,759 | | | | 964,894 | | | | 664,332 | |
| | |
| | |
| | |
| | |
| |
| Distributions to Shareholders | | | | | | | | | | | | | | | | |
Distributions to Investor Class | | | | | | | | | | | | | | | | |
Shareholders: | | | | | | | | | | | | | | | | |
Investor Class | | | (767,574 | ) | | | (938,298 | ) | | | (48,166 | ) | | | (137,452 | ) |
Institutional Class | | | (638,790 | ) | | | (1,201,869 | ) | | | (434,627 | ) | | | (925,575 | ) |
Net Realized Gains From Investment | | | | | | | | | | | | | | | | |
Transactions | | | | | | | | | | | | | | | | |
Investor Class | | | — | | | | — | | | | (35,520 | ) | | | (67,867 | ) |
Institutional Class | | | — | | | | — | | | | (224,731 | ) | | | (403,399 | ) |
| | |
| | |
| | |
| | |
| |
Total Distributions to Shareholders | | | (1,406,364 | ) | | | (2,140,167 | ) | | | (743,044 | ) | | | (1,534,293 | ) |
| | |
| | |
| | |
| | |
| |
| From Share Transactions | | | | | | | | | | | | | | | | |
Net Increase (Decrease) in Net Assets | | | | | | | | | | | | | | | | |
Resulting from Share Transactions | | | 80,956,061 | | | | 20,520,513 | | | | 5,051,986 | | | | (528,211 | ) |
| | |
| | |
| | |
| | |
| |
Total Increase (Decrease) in | | | | | | | | | | | | | | | | |
Net Assets | | | 92,137,528 | | | | 28,366,105 | | | | 5,273,836 | | | | (1,398,172 | ) |
Net Assets – Beginning of Period | | | 112,033,455 | | | | 83,667,350 | | | | 27,294,198 | | | | 28,692,370 | |
| | |
| | |
| | |
| | |
| |
Net Assets – End of Period | | $ | 204,170,983 | | | $ | 112,033,455 | | | $ | 32,568,034 | | | $ | 27,294,198 | |
| | |
| | |
| | |
| | |
| |
Accumulated Net Investment Income | | $ | 175,910 | | | $ | 223,082 | | | $ | 5,614 | | | $ | 8,277 | |
| | |
| | |
| | |
| | |
| |
| The accompanying notes are an integral part of the financial statements. |
| |
| 95 |
The following tables provide per share data for a share outstanding throughout each period for each Fund. Other data includes investment performance, ratios to average net assets and other supplemental information.
| | FBR Large Cap Fund — Investor Class |
| |
|
| | For the | | | | | | | | | | | | | | | | | | | |
| | Six Months | | | | | | | | | | | | | | | | | | | |
| | Ended | | | For the Years Ended October 31, |
| | April 30, 2012 | | |
|
| | (unaudited) | | | 2011 | | | 2010 | | | 2009 | | | 2008 | | | 2007 |
| |
| | |
| | |
| | |
| | |
| | |
|
| Per Share Operating Performance: | | | | | | | | | | | | | | | | | | | | | | | | | |
Net Asset Value – Beginning of Period | | $ | 11.37 | | | | $ | 10.88 | | | $ | 9.72 | | | $ | 8.14 | | | $ | 13.40 | | | $ | 11.84 | |
| | |
| | | |
| | |
| | |
| | |
| | |
| |
Income (Loss) from Investment Operations: | | | | | | | | | | | | | | | | | | | | | | | | | |
Net Investment Income (Loss)2 | | | 0.05 | 4 | | | | 0.04 | 4 | | | 0.04 | 1 | | | 0.03 | 1 | | | 0.08 | 1 | | | (0.04 | )1 |
Net Realized and Unrealized Gain (Loss) | | | | | | | | | | | | | | | | | | | | | | | | | |
on Investments3 | | | 0.97 | | | | | 0.48 | | | | 1.17 | | | | 1.60 | | | | (4.05 | ) | | | 2.05 | |
| | |
| | | |
| | |
| | |
| | |
| | |
| |
Total from Investment Operations | | | 1.02 | | | | | 0.52 | | | | 1.21 | | | | 1.63 | | | | (3.97 | ) | | | 2.01 | |
| | |
| | | |
| | |
| | |
| | |
| | |
| |
Distributions to Shareholders: | | | | | | | | | | | | | | | | | | | | | | | | | |
From Net Investment Income | | | (0.01 | ) | | | | (0.03 | ) | | | (0.05 | ) | | | (0.05 | ) | | | — | | | | — | |
From Net Realized Gain | | | — | | | | | — | | | | — | | | | — | | | | (1.30 | ) | | | (0.45 | ) |
| | |
| | | |
| | |
| | |
| | |
| | |
| |
Total Distributions | | | (0.01 | ) | | | | (0.03 | ) | | | (0.05 | ) | | | (0.05 | ) | | | (1.30 | ) | | | (0.45 | ) |
| | |
| | | |
| | |
| | |
| | |
| | |
| |
Paid-in Capital from Redemption Fees4 | | | 0.00 | 5 | | | | 0.00 | 5 | | | 0.00 | 5 | | | 0.00 | 5 | | | 0.01 | | | | 0.00 | 5 |
| | |
| | | |
| | |
| | |
| | |
| | |
| |
Net Increase (Decrease) in Net Asset Value | | | 1.01 | | | | | 0.49 | | | | 1.16 | | | | 1.58 | | | | (5.26 | ) | | | 1.56 | |
| | |
| | | |
| | |
| | |
| | |
| | |
| |
Net Asset Value – End of Period | | $ | 12.38 | | | | $ | 11.37 | | | $ | 10.88 | | | $ | 9.72 | | | $ | 8.14 | | | $ | 13.40 | |
| | |
| | | |
| | |
| | |
| | |
| | |
| |
| Total Investment Return6 | | | 9.01% | (A) | | | | 4.80% | | | | 12.43% | | | | 20.12% | | | | (32.37)% | | | | 17.52% | |
| Ratios to Average Net Assets: | | | | | | | | | | | | | | | | | | | | | | | | | |
Expenses After Waivers and Related | | | | | | | | | | | | | | | | | | | | | | | | | |
Reimbursements2,7 | | | 1.25% | (B) | | | | 1.25% | | | | 1.25% | | | | 1.25% | | | | 1.71% | | | | 1.97% | |
Expenses Before Waivers and Related | | | | | | | | | | | | | | | | | | | | | | | | | |
Reimbursements7 | | | 1.78% | (B) | | | | 1.79% | | | | 1.84% | | | | 2.16% | | | | 2.55% | | | | 2.21% | |
Net Investment Income (Loss) After Waivers and | | | | | | | | | | | | | | | | | | | | | | | | | |
Related Reimbursements2 | | | 0.82% | (B) | | | | 0.32% | | | | 0.39% | | | | 0.61% | | | | 0.51% | | | | (0.30)% | |
Net Investment Income (Loss) Before Waivers | | | | | | | | | | | | | | | | | | | | | | | | | |
and Related Reimbursements | | | 0.29% | (B) | | | | (0.22)% | | | | (0.20)% | | | | (0.30)% | | | | (0.33)% | | | | (0.54)% | |
| Supplementary Data: | | | | | | | | | | | | | | | | | | | | | | | | | |
Portfolio Turnover Rate | | | 24% | (A) | | | | 65% | | | | 86% | (C) | | | 60% | | | | 39% | | | | 108% | |
Net Assets at End of Period (in thousands) | | $ | 11,332 | | | | $ | 12,470 | | | $ | 17,097 | | | $ | 18,947 | | | $ | 4,574 | | | $ | 13,037 | |
|
| 1 | | Calculated based on shares outstanding on the first and last day of the respective periods, except for dividends and distributions, if any, which are based on the actual shares outstanding on the dates of distributions. |
| 2 | | Prior to May 30, 2008, reflects fees waived and reimbursed by FBR Fund Advisers, Inc. pursuant to a contractual expense limitation of 1.95% (excluding interest, taxes, brokerage commissions, dividend expenses, acquired fund fees and expenses, extraordinary legal expenses, or any other extraordinary expenses). As of May 30, 2008, reflects fees waived and reimbursed by FBR Fund Advisers, Inc. pursuant to a contractual expense limitation of 1.25% (excluding interest, taxes, brokerage commissions, dividend expenses, acquired fund fees and expenses, extraordinary legal expenses, or any other extraordinary expenses). |
| 3 | | The amounts shown for a share outstanding throughout the period may not be in accordance with the changes in the aggregate gains and losses on investments during the period because of the timing of sales and repurchases of Fund shares in relation to fluctuating net asset values during the period. |
| 4 | | Calculated based on average shares outstanding. |
| 5 | | Less than $0.01 |
| 6 | | Total investment return is calculated assuming a purchase of shares on the first day and a sale on the last day of each period reported and will include reinvestment of dividends and distributions, if any. |
| 7 | | Does not include expenses of the funds in which the Fund invests. |
| (A) | | Not Annualized |
| (B) | | Annualized |
| (C) | | Excludes merger activity |
96
| Financial Highlights (continued) |
| | | FBR Large Cap Fund — Institutional Class |
| | |
|
| | | For the | | | | | | | | | | | | | | |
| | | Six Months | | | | | | | | | | | | | | For the |
| | | Ended | | For the Years Ended October 31, | | | Period Ended |
| | | April 30, 2012 | |
| | | October 31, |
| | | (unaudited) | | 2011 | | | 2010 | | | 2009 | | | 2008* |
| | |
| |
| | |
| | |
| | |
|
| Per Share Operating Performance: | | | | | | | | | | | | | | | | | | | | |
Net Asset Value – Beginning of Period | | $ | 9.85 | | | $ | 9.42 | | | $ | 8.42 | | | $ | 7.07 | | | $ | 10.00 | |
| | |
| | |
| | |
| | |
| | |
| |
Income (Loss) from Investment Operations: | | | | | | | | | | | | | | | | | | | | |
Net Investment Income2 | | | 0.05 | 4 | | | 0.06 | 4 | | | 0.06 | 1 | | | 0.07 | 1 | | | 0.03 | 1 |
Net Realized and Unrealized Gain (Loss) | | | | | | | | | | | | | | | | | | | | |
on Investments3 | | | 0.84 | | | | 0.42 | | | | 1.01 | | | | 1.34 | | | | (2.96 | ) |
| | |
| | |
| | |
| | |
| | |
| |
Total from Investment Operations | | | 0.89 | | | | 0.48 | | | | 1.07 | | | | 1.41 | | | | (2.93 | ) |
| | |
| | |
| | |
| | |
| | |
| |
Distributions to Shareholders: | | | | | | | | | | | | | | | | | | | | |
From Net Investment Income | | | (0.08 | ) | | | (0.05 | ) | | | (0.07 | ) | | | (0.06 | ) | | | — | |
| | |
| | |
| | |
| | |
| | |
| |
Paid-in Capital from Redemption Fees4 | | | 0.00 | 5 | | | 0.00 | 5 | | | 0.00 | 5 | | | — | | | | — | |
| | |
| | |
| | |
| | |
| | |
| |
Net Increase (Decrease) in Net Asset Value | | | 0.81 | | | | 0.43 | | | | 1.00 | | | | 1.35 | | | | (2.93 | ) |
| | |
| | |
| | |
| | |
| | |
| |
Net Asset Value – End of Period | | $ | 10.66 | | | $ | 9.85 | | | $ | 9.42 | | | $ | 8.42 | | | $ | 7.07 | |
| | |
| | |
| | |
| | |
| | |
| |
| Total Investment Return6 | | | 9.14% | (A) | | | 5.08% | | | | 12.71% | | | | 20.21% | | | | (29.30)% | (A) |
| Ratios to Average Net Assets: | | | | | | | | | | | | | | | | | | | | |
Expenses After Waivers and Related | | | | | | | | | | | | | | | | | | | | |
Reimbursements2,7 | | | 1.00% | (B) | | | 1.00% | | | | 1.00% | | | | 1.00% | | | | 1.01% | (B) |
Expenses Before Waivers and Related | | | | | | | | | | | | | | | | | | | | |
Reimbursements7 | | | 1.38% | (B) | | | 1.36% | | | | 1.49% | | | | 16.64% | | | | 4.11% | (B) |
Net Investment Income After Waivers and | | | | | | | | | | | | | | | | | | | | |
Related Reimbursements2 | | | 1.07% | (B) | | | 0.56% | | | | 0.50% | | | | 1.05% | | | | 0.88% | (B) |
Net Investment Income (Loss) Before Waivers and | | | | | | | | | | | | | | | | | | | | |
Related Reimbursements | | | 0.69% | (B) | | | 0.20% | | | | 0.01% | | | | (14.59)% | | | | (2.22)% | (B) |
| Supplementary Data: | | | | | | | | | | | | | | | | | | | | |
Portfolio Turnover Rate | | | 24% | (A) | | | 65% | | | | 86% | (C) | | | 60% | | | | 39% | (A) |
Net Assets at End of Period (in thousands) | | $ | 27,523 | | | $ | 27,238 | | | $ | 29,695 | | | $ | 99 | | | $ | 71 | |
|
| * | | Represents the period from inception of share class (May 30, 2008) through October 31, 2008. |
| 1 | | Calculated based on shares outstanding on the first and last day of the period, except for dividends and distributions, if any, which are based on the actual shares outstanding on the dates of distributions. |
| 2 | | Reflects fees waived and reimbursed by FBR Fund Advisers, Inc. pursuant to a contractual expense limitation of 1.00% (excluding interest, taxes, brokerage commissions, dividend expenses, acquired fund fees and expenses, extraordinary legal expenses, or any other extraordinary expenses). |
| 3 | | The amounts shown for a share outstanding throughout the period may not be in accordance with the changes in the aggregate gains and losses on investments during the period because of the timing of sales and repurchases of Fund shares in relation to fluctuating net asset values during the period. |
| 4 | | Calculated based on average shares outstanding. |
| 5 | | Less than $0.01 |
| 6 | | Total investment return is calculated assuming a purchase of shares on the first day and a sale on the last day of each period reported and will include reinvestment of dividends and distributions, if any. |
| 7 | | Does not include expenses of the funds in which the Fund invests. |
| (A) | | Not Annualized |
| (B) | | Annualized |
| (C) | | Excludes merger activity |
97
| Financial Highlights (continued) |
| | | FBR Mid Cap Fund — Investor Class |
| | |
|
| | | For the | | | | | | | | | | | | | | | | | | | |
| | | Six Months | | | | | | | | | | | | | | | | | | | For the |
| | | Ended | | | For the Years Ended October 31, | | | Period Ended |
| | | April 30, 2012 | | |
| | | October 31, |
| | | (unaudited) | | | 2011 | | | 2010 | | | 2009 | | | 2008 | | | 2007* |
| | |
| | |
| | |
| | |
| | |
| | |
|
| Per Share Operating Performance: | | | | | | | | | | | | | | | | | | | | | | | | | |
Net Asset Value – Beginning of Period | | $ | 12.15 | | | | $ | 11.35 | | | $ | 9.53 | | | $ | 8.18 | | | $ | 11.30 | | | $ | 10.00 | |
| | |
| | | |
| | |
| | |
| | |
| | |
| |
Income (Loss) from Investment Operations: | | | | | | | | | | | | | | | | | | | | | | | | | |
Net Investment Income (Loss)2 | | | 0.00 | 4,5 | | | | 0.01 | 4 | | | 0.04 | 1 | | | 0.04 | 1 | | | (0.01 | )1 | | | (0.02 | )1 |
Net Realized and Unrealized Gain (Loss) | | | | | | | | | | | | | | | | | | | | | | | | | |
on Investments3 | | | 1.04 | | | | | 0.80 | | | | 1.82 | | | | 1.43 | | | | (3.00 | ) | | | 1.32 | |
| | |
| | | |
| | |
| | |
| | |
| | |
| |
Total from Investment Operations | | | 1.04 | | | | | 0.81 | | | | 1.86 | | | | 1.47 | | | | (3.01 | ) | | | 1.30 | |
| | |
| | | |
| | |
| | |
| | |
| | |
| |
Distributions to Shareholders: | | | | | | | | | | | | | | | | | | | | | | | | | |
From Net Investment Income | | | 0.00 | 5 | | | | (0.03 | ) | | | (0.04 | ) | | | (0.01 | ) | | | — | | | | — | |
From Net Realized Gain | | | — | | | | | — | | | | — | | | | (0.12 | ) | | | (0.13 | ) | | | — | |
| | |
| | | |
| | |
| | |
| | |
| | |
| |
Total Distributions | | | 0.00 | 5 | | | | (0.03 | ) | | | (0.04 | ) | | | (0.13 | ) | | | (0.13 | ) | | | — | |
| | |
| | | |
| | |
| | |
| | |
| | |
| |
Paid-in Capital from Redemption Fees4 | | | 0.00 | 5 | | | | 0.02 | | | | 0.00 | 5 | | | 0.01 | | | | 0.02 | | | | 0.00 | 5 |
| | |
| | | |
| | |
| | |
| | |
| | |
| |
Net Increase (Decrease) in Net Asset Value | | | 1.04 | | | | | 0.80 | | | | 1.82 | | | | 1.35 | | | | (3.12 | ) | | | 1.30 | |
| | |
| | | |
| | |
| | |
| | |
| | |
| |
Net Asset Value – End of Period | | $ | 13.19 | | | | $ | 12.15 | | | $ | 11.35 | | | $ | 9.53 | | | $ | 8.18 | | | $ | 11.30 | |
| | |
| | | |
| | |
| | |
| | |
| | |
| |
| Total Investment Return6 | | | 8.58% | (A) | | | | 7.30% | | | | 19.58% | | | | 18.51% | | | | (26.71)% | | | | 13.00% | (A) |
| Ratios to Average Net Assets: | | | | | | | | | | | | | | | | | | | | | | | | | |
Expenses After Waivers and Related | | | | | | | | | | | | | | | | | | | | | | | | | |
Reimbursements2,7 | | | 1.35% | (B) | | | | 1.35% | | | | 1.36% | | | | 1.35% | | | | 1.66% | | | | 1.95% | (B) |
Expenses Before Waivers and Related | | | | | | | | | | | | | | | | | | | | | | | | | |
Reimbursements7 | | | 2.28% | (B) | | | | 2.19% | | | | 2.54% | | | | 2.95% | | | | 3.71% | | | | 4.17% | (B) |
Net Investment Income (Loss) After Waivers and | | | | | | | | | | | | | | | | | | | | | | | | | |
Related Reimbursements2 | | | 0.06% | (B) | | | | 0.11% | | | | 0.24% | | | | 0.39% | | | | (0.13)% | | | | (0.36)% | (B) |
Net Investment Loss Before Waivers and | | | | | | | | | | | | | | | | | | | | | | | | | |
Related Reimbursements | | | (0.87)% | (B) | | | | (0.73)% | | | | (0.94)% | | | | (1.21)% | | | | (2.18)% | | | | (2.58)% | (B) |
| Supplementary Data: | | | | | | | | | | | | | | | | | | | | | | | | | |
Portfolio Turnover Rate | | | 7% | (A) | | | | 33% | | | | 215% | (C) | | | 128% | | | | 93% | | | | 135% | (A) |
Net Assets at End of Period (in thousands) | | $ | 7,264 | | | | $ | 7,130 | | | $ | 6,776 | | | $ | 6,767 | | | $ | 4,108 | | | $ | 3,873 | |
|
| * | | Represents the period from commencement of operations (February 28, 2007) through October 31, 2007. |
| 1 | | Calculated based on shares outstanding on the first and last day of the respective periods, except for dividends and distributions, if any, which are based on the actual shares outstanding on the dates of distributions. |
| 2 | | Prior to May 30, 2008, reflects fees waived and reimbursed by FBR Fund Advisers, Inc. pursuant to a contractual expense limitation of 1.95% (excluding interest, taxes, brokerage commissions, dividend expenses, acquired fund fees and expenses, extraordinary legal expenses, or any other extraordinary expenses). As of May 30, 2008, reflects fees waived and reimbursed by FBR Fund Advisers, Inc. pursuant to a contractual expense limitation of 1.35% (excluding interest, taxes, brokerage commissions, dividend expenses, acquired fund fees and expenses, extraordinary legal expenses, or any other extraordinary expenses). |
| 3 | | The amounts shown for a share outstanding throughout the period may not be in accordance with the changes in the aggregate gains and losses on investments during the period because of the timing of sales and repurchases of Fund shares in relation to fluctuating net asset values during the period. |
| 4 | | Calculated based on average shares outstanding. |
| 5 | | Less than $0.01 |
| 6 | | Total investment return is calculated assuming a purchase of shares on the first day and a sale on the last day of each period reported and will include reinvestment of dividends and distributions, if any. |
| 7 | | Does not include expenses of the funds in which the Fund invests. |
| (A) | | Not Annualized |
| (B) | | Annualized |
| (C) | | Excludes merger activity |
98
| Financial Highlights (continued) |
| | | FBR Mid Cap Fund — Institutional Class |
| | |
|
| | | For the | | | | | | | | | | | | | | |
| | | Six Months | | | | | | | | | | | | | | For the |
| | | Ended | | For the Years Ended October 31, | | | Period Ended |
| | | April 30, 2012 | |
| | | October 31, |
| | | (unaudited) | | 2011 | | | 2010 | | | 2009 | | | 2008* |
| | |
| |
| | |
| | |
| | |
|
| Per Share Operating Performance: | | | | | | | | | | | | | | | | | | | | |
Net Asset Value – Beginning of Period | | $ | 10.54 | | | $ | 9.84 | | | $ | 8.26 | | | $ | 7.11 | | | $ | 10.00 | |
| | |
| | |
| | |
| | |
| | |
| |
Income (Loss) from Investment Operations: | | | | | | | | | | | | | | | | | | | | |
Net Investment Income2 | | | 0.02 | 4 | | | 0.04 | 4 | | | 0.03 | 1 | | | 0.05 | 1 | | | 0.02 | 1 |
Net Realized and Unrealized Gain (Loss) | | | | | | | | | | | | | | | | | | | | |
on Investments3 | | | 0.90 | | | | 0.69 | | | | 1.59 | | | | 1.25 | | | | (2.91 | ) |
| | |
| | |
| | |
| | |
| | |
| |
Total from Investment Operations | | �� | 0.92 | | | | 0.73 | | | | 1.62 | | | | 1.30 | | | | (2.89 | ) |
| | |
| | |
| | |
| | |
| | |
| |
Distributions to Shareholders: | | | | | | | | | | | | | | | | | | | | |
From Net Investment Income | | | (0.04 | ) | | | (0.03 | ) | | | (0.04 | ) | | | (0.03 | ) | | | — | |
From Net Realized Gain | | | — | | | | — | | | | — | | | | (0.12 | ) | | | — | |
| | |
| | |
| | |
| | |
| | |
| |
Total Distributions | | | (0.04 | ) | | | (0.03 | ) | | | (0.04 | ) | | | (0.15 | ) | | | — | |
| | |
| | |
| | |
| | |
| | |
| |
Paid-in Capital from Redemption Fees4 | | | 0.00 | 5 | | | 0.00 | 5 | | | 0.00 | 5 | | | — | | | | — | |
| | |
| | |
| | |
| | |
| | |
| |
Net Increase (Decrease) in Net Asset Value | | | 0.88 | | | | 0.70 | | | | 1.58 | | | | 1.15 | | | | (2.89 | ) |
| | |
| | |
| | |
| | |
| | |
| |
Net Asset Value – End of Period | | $ | 11.42 | | | $ | 10.54 | | | $ | 9.84 | | | $ | 8.26 | | | $ | 7.11 | |
| | |
| | |
| | |
| | |
| | |
| |
| Total Investment Return6 | | | 8.72% | (A) | | | 7.43% | | | | 19.72% | | | | 18.78% | | | | (28.90)% | (A) |
| Ratios to Average Net Assets: | | | | | | | | | | | | | | | | | | | | |
Expenses After Waivers and Related | | | | | | | | | | | | | | | | | | | | |
Reimbursements2,7 | | | 1.10% | (B) | | | 1.10% | | | | 1.11% | | | | 1.10% | | | | 1.10% | (B) |
Expenses Before Waivers and Related | | | | | | | | | | | | | | | | | | | | |
Reimbursements7 | | | 1.69% | (B) | | | 1.56% | | | | 2.03% | | | | 16.91% | | | | 4.54% | (B) |
Net Investment Income After Waivers and Related | | | | | | | | | | | | | | | | | | | | |
Reimbursements2 | | | 0.32% | (B) | | | 0.35% | | | | 0.26% | | | | 0.69% | | | | 0.47% | (B) |
Net Investment Loss Before Waivers | | | | | | | | | | | | | | | | | | | | |
and Related Reimbursements | | | (0.27)% | (B) | | | (0.11)% | | | | (0.66)% | | | | (15.12)% | | | | (2.97)% | (B) |
| Supplementary Data: | | | | | | | | | | | | | | | | | | | | |
Portfolio Turnover Rate | | | 7% | (A) | | | 33% | | | | 215% | (C) | | | 128% | | | | 93% | (A) |
Net Assets at End of Period (in thousands) | | $ | 11,688 | | | $ | 11,690 | | | $ | 11,656 | | | $ | 84 | | | $ | 71 | |
|
| * | | Represents the period from inception of share class (May 30, 2008) through October 31, 2008. |
| 1 | | Calculated based on shares outstanding on the first and last day of the period, except for dividends and distributions, if any, which are based on the actual shares outstanding on the dates of distributions. |
| 2 | | Reflects fees waived and reimbursed by FBR Fund Advisers, Inc. pursuant to a contractual expense limitation of 1.10% (excluding interest, taxes, brokerage commissions, dividend expenses, acquired fund fees and expenses, extraordinary legal expenses, or any other extraordinary expenses). |
| 3 | | The amounts shown for a share outstanding throughout the period may not be in accordance with the changes in the aggregate gains and losses on investments during the period because of the timing of sales and repurchases of Fund shares in relation to fluctuating net asset values during the period. |
| 4 | | Calculated based on average shares outstanding. |
| 5 | | Less than $0.01 |
| 6 | | Total investment return is calculated assuming a purchase of shares on the first day and a sale on the last day of each period reported and will include reinvestment of dividends and distributions, if any. |
| 7 | | Does not include expenses of the funds in which the Fund invests. |
| (A) | | Not Annualized |
| (B) | | Annualized |
| (C) | | Excludes merger activity |
99
| Financial Highlights (continued) |
| | FBR Small Cap Fund — Investor Class |
| |
|
| | For the | | | | | | | | | | | | | | | | | | | | | | |
| | Six Months | | | | | | | | | | | | | | | | | | | For the |
| | Ended | | | For the Years Ended October 31, | | | Period Ended |
| | April 30, 2012 | | |
| | | October 31, |
| | (unaudited) | | | 2011 | | | 2010 | | | 2009 | | | 2008 | | | 2007* |
| |
| | |
| | |
| | |
| | |
| | |
|
| Per Share Operating Performance: | | | | | | | | | | | | | | | | | | | | | | | | | | |
Net Asset Value – Beginning of Period | | $ | 12.40 | | | | $ | 11.17 | | | $ | 9.51 | | | $ | 8.44 | | | $ | 11.85 | | | | $ | 10.00 | |
| | |
| | | |
| | |
| | |
| | |
| | | |
| |
Income (Loss) from Investment Operations: | | | | | | | | | | | | | | | | | | | | | | | | | | |
Net Investment Income (Loss)2 | | | (0.04 | )4 | | | | (0.03 | )4 | | | 0.02 | 1 | | | 0.01 | 1 | | | (0.03 | )1 | | | | (0.04 | )1 |
Net Realized and Unrealized Gain (Loss) | | | | | | | | | | | | | | | | | | | | | | | | | | |
on Investments3 | | | 1.85 | | | | | 1.30 | | | | 1.95 | | | | 1.04 | | | | (3.35 | ) | | | | 1.89 | |
Net Increase from Payments by Affiliates | | | — | | | | | — | | | | — | | | | 0.01 | | | | — | | | | | — | |
| | |
| | | |
| | |
| | |
| | |
| | | |
| |
Total from Investment Operations | | | 1.81 | | | | | 1.27 | | | | 1.97 | | | | 1.06 | | | | (3.38 | ) | | | | 1.85 | |
| | |
| | | |
| | |
| | |
| | |
| | | |
| |
Distributions to Shareholders: | | | | | | | | | | | | | | | | | | | | | | | | | | |
From Net Investment Income | | | — | | | | | (0.04 | ) | | | (0.03 | ) | | | — | | | | — | | | | | — | |
From Net Realized Gains | | | — | | | | | — | | | | (0.28 | ) | | | — | | | | (0.04 | ) | | | | — | |
| | |
| | | |
| | |
| | |
| | |
| | | |
| |
Total Distributions | | | — | | | | | (0.04 | ) | | | (0.31 | ) | | | — | | | | (0.04 | ) | | | | — | |
| | |
| | | |
| | |
| | |
| | |
| | | |
| |
Paid-in Capital from Redemption Fees4 | | | 0.00 | 5 | | | | 0.00 | 5 | | | 0.00 | 5 | | | 0.01 | | | | 0.01 | | | | | 0.00 | 5 |
| | |
| | | |
| | |
| | |
| | |
| | | |
| |
Net Increase (Decrease) in Net Asset Value | | | 1.81 | | | | | 1.23 | | | | 1.66 | | | | 1.07 | | | | (3.41 | ) | | | | 1.85 | |
| | |
| | | |
| | |
| | |
| | |
| | | |
| |
Net Asset Value – End of Period | | $ | 14.21 | | | | $ | 12.40 | | | $ | 11.17 | | | $ | 9.51 | | | $ | 8.44 | | | | $ | 11.85 | |
| | |
| | | |
| | |
| | |
| | |
| | | |
| |
| Total Investment Return6 | | | 14.60% | (A) | | | | 11.40% | | | | 21.13% | | | | 12.68% | 7 | | | (28.49)% | | | | | 18.50% | (A) |
| Ratios to Average Net Assets: | | | | | | | | | | | | | | | | | | | | | | | | | | |
Expenses After Waivers and Related | | | | | | | | | | | | | | | | | | | | | | | | | | |
Reimbursements2,8 | | | 1.45% | (B) | | | | 1.45% | | | | 1.45% | | | | 1.46% | | | | 1.74% | | | | | 1.95% | (B) |
Expenses Before Waivers and | | | | | | | | | | | | | | | | | | | | | | | | | | |
Related Reimbursements8 | | | 1.77% | (B) | | | | 1.74% | | | | 2.33% | | | | 2.73% | | | | 3.55% | | | | | 3.77% | (B) |
Net Investment Income (Loss) After Waivers and | | | | | | | | | | | | | | | | | | | | | | | | | | |
Related Reimbursements2 | | | (0.58)% | (B) | | | | (0.28)% | | | | 0.18% | | | | 0.10% | | | | (0.36)% | | | | | (0.61)% | (B) |
Net Investment Loss Before Waivers and Related | | | | | | | | | | | | | | | | | | | | | | | | | | |
Reimbursements | | | (0.90)% | (B) | | | | (0.57)% | | | | (0.70)% | | | | (1.17)% | | | | (2.17)% | | | | | (2.43)% | (B) |
| Supplementary Data: | | | | | | | | | | | | | | | | | | | | | | | | | | |
Portfolio Turnover Rate | | | 23% | (A) | | | | 124% | | | | 284% | (C) | | | 226% | | | | 207% | | | | | 107% | (A) |
Net Assets at End of Period (in thousands) | | $ | 31,639 | | | | $ | 28,186 | | | $ | 26,841 | | | $ | 10,585 | | | $ | 3,998 | | | | $ | 4,900 | |
|
| * | | Represents the period from commencement of operations (February 28, 2007) through October 31, 2007. |
| 1 | | Calculated based on shares outstanding on the first and last day of the respective periods, except for dividends and distributions, if any, which are based on the actual shares outstanding on the dates of distributions. |
| 2 | | Prior to May 30, 2008, reflects fees waived and reimbursed by FBR Fund Advisers, Inc. pursuant to a contractual expense limitation of 1.95% (excluding interest, taxes, brokerage commissions, dividend expenses, acquired fund fees and expenses, extraordinary legal expenses, or any other extraordinary expenses). As of May 30, 2008, reflects fees waived and reimbursed by FBR Fund Advisers, Inc. pursuant to a contractual expense limitation of 1.45% (excluding interest, taxes, brokerage commissions, dividend expenses, acquired fund fees and expenses, extraordinary legal expenses, or any other extraordinary expenses). |
| 3 | | The amounts shown for a share outstanding throughout the period may not be in accordance with the changes in the aggregate gains and losses on investments during the period because of the timing of sales and repurchases of Fund shares in relation to fluctuating net asset values during the period. |
| 4 | | Calculated based on average shares outstanding. |
| 5 | | Less than $0.01 |
| 6 | | Total investment return is calculated assuming a purchase of shares on the first day and a sale on the last day of each period reported and will include reinvestment of dividends and distributions, if any. |
| 7 | | The Fund’s total return consists of a voluntary reimbursement by the Adviser for a realized loss on a transaction not meeting the Fund’s investment guidelines. This item had an impact of 0.12%. If the Adviser had not made a capital contribution to the Fund, the total return would have been 12.56%. See Note 9. |
| 8 | | Does not include expenses of the funds in which the Fund invests. |
| (A) | | Not Annualized |
| (B) | | Annualized |
| (C) | | Excludes merger activity |
100
Financial Highlights (continued)
| | FBR Small Cap Fund — Institutional Class |
| |
|
| | For the | | | | | | | | | | | | | | | | | |
| | Six Months | | | | | | | | | | | | | | For the |
| | Ended | | For the Years Ended October 31, | | | Period Ended |
| | April 30, 2012 | |
| | | October 31, |
| | (unaudited) | | 2011 | | | 2010 | | | 2009 | | | 2008* |
| |
| |
| | |
| | |
| | |
|
| Per Share Operating Performance: | | | | | | | | | | | | | | | | | | | | | |
Net Asset Value – Beginning of Period | | $ | 11.18 | | | $ | 10.04 | | | $ | 8.59 | | | $ | 7.62 | | | | $ | 10.00 | |
| | |
| | |
| | |
| | |
| | | |
| |
Income (Loss) from Investment Operations: | | | | | | | | | | | | | | | | | | | | | |
Net Investment Income (Loss)2 | | | (0.02 | )4 | | | (0.01 | )4 | | | 0.04 | 1 | | | 0.03 | 1 | | | | 0.01 | 1 |
Net Realized and Unrealized Gain (Loss) | | | | | | | | | | | | | | | | | | | | | |
on Investments3 | | | 1.67 | | | | 1.20 | | | | 1.75 | | | | 0.93 | | | | | (2.39 | ) |
Net Increase from Payments by Affiliates | | | — | | | | — | | | | — | | | | 0.01 | | | | | — | |
| | |
| | |
| | |
| | |
| | | |
| |
Total from Investment Operations | | | 1.65 | | | | 1.19 | | | | 1.79 | | | | 0.97 | | | | | (2.38 | ) |
| | |
| | |
| | |
| | |
| | | |
| |
Distributions to Shareholders: | | | | | | | | | | | | | | | | | | | | | |
From Net Investment Income | | | — | | | | (0.05 | ) | | | (0.06 | ) | | | — | | | | | — | |
From Net Realized Gains | | | — | | | | — | | | | (0.28 | ) | | | — | | | | | — | |
| | |
| | |
| | |
| | |
| | | |
| |
Total Distributions | | | — | | | | (0.05 | ) | | | (0.34 | ) | | | — | | | | | — | |
| | |
| | |
| | |
| | |
| | | |
| |
Paid-in Capital from Redemption Fees4 | | | 0.00 | 5 | | | 0.00 | 5 | | | 0.00 | 5 | | | — | | | | | — | |
| | |
| | |
| | |
| | |
| | | |
| |
Net Increase (Decrease) in Net Asset Value | | | 1.65 | | | | 1.14 | | | | 1.45 | | | | 0.97 | | | | | (2.38 | ) |
| | |
| | |
| | |
| | |
| | | |
| |
Net Asset Value – End of Period | | $ | 12.83 | | | $ | 11.18 | | | $ | 10.04 | | | $ | 8.59 | | | | $ | 7.62 | |
| | |
| | |
| | |
| | |
| | | |
| |
| Total Investment Return6 | | | 14.76% | (A) | | | 11.82% | | | | 21.35% | | | | 12.73% | 7 | | | | (23.80)% | (A) |
| Ratios to Average Net Assets: | | | | | | | | | | | | | | | | | | | | | |
Expenses After Waivers and Related | | | | | | | | | | | | | | | | | | | | | |
Reimbursements2,8 | | | 1.20% | (B) | | | 1.20% | | | | 1.19% | | | | 1.20% | | | | | 1.20% | (B) |
Expenses Before Waivers and Related | | | | | | | | | | | | | | | | | | | | | |
Reimbursements8 | | | 1.56% | (B) | | | 1.42% | | | | 2.94% | | | | 16.22% | | | | | 4.56% | (B) |
Net Investment Income (Loss) After Waivers | | | | | | | | | | | | | | | | | | | | | |
and Related Reimbursements2 | | | (0.26)% | (B) | | | (0.09)% | | | | 0.41% | | | | 0.44% | | | | | 0.23% | (B) |
Net Investment Loss Before Waivers | | | | | | | | | | | | | | | | | | | | | |
and Related Reimbursements | | | (0.62)% | (B) | | | (0.31)% | | | | (1.34)% | | | | (14.58)% | | | | | (3.13)% | (B) |
| Supplementary Data: | | | | | | | | | | | | | | | | | | | | | |
Portfolio Turnover Rate | | | 23% | (A) | | | 124% | | | | 284% | (C) | | | 226% | | | | | 207% | (A) |
Net Assets at End of Period (in thousands) | | $ | 6,877 | | | $ | 10,818 | | | $ | 8,655 | | | $ | 86 | | | | $ | 76 | |
|
| * | | Represents the period from inception of share class (May 30, 2008) through October 31, 2008. |
| 1 | | Calculated based on shares outstanding on the first and last day of the period, except for dividends and distributions, if any, which are based on the actual shares outstanding on the dates of distributions. |
| 2 | | Reflects fees waived and reimbursed by FBR Fund Advisers, Inc. pursuant to a contractual expense limitation of 1.20% (excluding interest, taxes, brokerage commissions, dividend expenses, acquired fund fees and expenses, extraordinary legal expenses, or any other extraordinary expenses). |
| 3 | | The amounts shown for a share outstanding throughout the period may not be in accordance with the changes in the aggregate gains and losses on investments during the period because of the timing of sales and repurchases of Fund shares in relation to fluctuating net asset values during the period. |
| 4 | | Calculated based on average shares outstanding. |
| 5 | | Less than $0.01. |
| 6 | | Total investment return is calculated assuming a purchase of shares on the first day and a sale on the last day of each period reported and will include reinvestment of dividends and distributions, if any. |
| 7 | | The Fund’s total return consists of a voluntary reimbursement by the Adviser for a realized loss on a transaction not meeting the Fund’s investment guidelines. This item had an impact of 0.13%. If the Adviser had not made a capital contribution to the Fund, the total return would have been 12.60%. See Note 9. |
| 8 | | Does not include expenses of the funds in which the Fund invests. |
| (A) | | Not Annualized |
| (B) | | Annualized |
| (C) | | Excludes merger activity |
101
Financial Highlights (continued)
| | FBR Focus Fund — Investor Class | |
| |
| |
| | | | | | | | | | | | | | | | | | | | | | | | | |
| | For the | | | | | | | | | | | | | | | | | | | | |
| | Six Months | | | | | | | | | | | | | | | | | | | | |
| | Ended | | For the Years Ended October 31, | |
| | April 30, 2012 | |
| |
| | (unaudited) | | 2011 | | | 2010 | | | 2009 | | | 2008 | | | 2007 | |
| |
| |
| | |
| | |
| | |
| | |
| |
| Per Share Operating Performance: | | | | | | | | | | | | | | | | | | | | | | | | |
Net Asset Value – Beginning of Period | | $ | 49.80 | | | $ | 47.57 | | | $ | 37.56 | | | $ | 37.40 | | | $ | 57.97 | | | $ | 49.36 | |
| | |
| | |
| | |
| | |
| | |
| | |
| |
Income (Loss) from Investment Operations: | | | | | | | | | | | | | | | | | | | | | | | | |
Net Investment Income (Loss) | | | (0.14 | )3 | | | (0.50 | )3 | | | (0.64 | )1 | | | (0.42 | )1 | | | (0.44 | )1 | | | 0.08 | 1 |
Net Realized and Unrealized Gain (Loss) | | | | | | | | | | | | | | | | | | | | | | | | |
on Investments2 | | | 6.51 | | | | 4.44 | | | | 10.65 | | | | 5.76 | | | | (19.51 | ) | | | 8.63 | |
| | |
| | |
| | |
| | |
| | |
| | |
| |
Total from Investment Operations | | | 6.37 | | | | 3.94 | | | | 10.01 | | | | 5.34 | | | | (19.95 | ) | | | 8.71 | |
| | |
| | |
| | |
| | |
| | |
| | |
| |
Distributions to Shareholders: | | | | | | | | | | | | | | | | | | | | | | | | |
From Net Investment Income | | | — | | | | — | | | | — | | | | — | | | | (0.12 | ) | | | — | |
From Net Realized Gain | | | (5.24 | ) | | | (1.72 | ) | | | — | | | | (5.19 | ) | | | (0.51 | ) | | | (0.12 | ) |
| | |
| | |
| | |
| | |
| | |
| | |
| |
Total Distributions | | | (5.24 | ) | | | (1.72 | ) | | | — | | | | (5.19 | ) | | | (0.63 | ) | | | (0.12 | ) |
| | |
| | |
| | |
| | |
| | |
| | |
| |
Paid-in Capital from Redemption Fees3 | | | 0.00 | 4 | | | 0.01 | | | | 0.00 | 4 | | | 0.01 | | | | 0.01 | | | | 0.02 | |
| | |
| | |
| | |
| | |
| | |
| | |
| |
Net Increase (Decrease) in Net Asset Value | | | 1.13 | | | | 2.23 | | | | 10.01 | | | | 0.16 | | | | (20.57 | ) | | | 8.61 | |
| | |
| | |
| | |
| | |
| | |
| | |
| |
Net Asset Value – End of Period | | $ | 50.93 | | | $ | 49.80 | | | $ | 47.57 | | | $ | 37.56 | | | $ | 37.40 | | | $ | 57.97 | |
| | |
| | |
| | |
| | |
| | |
| | |
| |
| Total Investment Return5 | | | 14.26% | (A) | | | 8.35% | | | | 26.65% | | | | 17.74% | | | | (34.73)% | | | | 17.72% | |
| Ratios to Average Net Assets: | | | | | | | | | | | | | | | | | | | | | | | | |
Expenses After Waivers6 | | | 1.40% | (B) | | | 1.44% | | | | 1.51% | | | | 1.43% | | | | 1.42% | | | | 1.40% | |
Expenses Before Waivers6 | | | 1.40% | (B) | | | 1.44% | | | | 1.51% | | | | 1.43% | | | | 1.42% | | | | 1.40% | |
Net Investment Income (Loss) After Waivers | | | (0.59)% | (B) | | | (1.01)% | | | | (1.31)% | | | | (1.16)% | | | | (0.67)% | | | | 0.14% | |
Net Investment Income (Loss) Before Waivers | | | (0.59)% | (B) | | | (1.01)% | | | | (1.31)% | | | | (1.16)% | | | | (0.67)% | | | | 0.14% | |
| Supplementary Data: | | | | | | | | | | | | | | | | | | | | | | | | |
Portfolio Turnover Rate | | | 12% | (A) | | | 13% | | | | 5% | | | | 5% | | | | 17% | | | | 5% | |
Net Assets at End of Period (in thousands) | | $ | 694,457 | | | $ | 611,337 | | | $ | 670,840 | | | $ | 759,774 | | | $ | 717,780 | | | $ | 1,556,339 | |
|
| 1 | | Calculated based on shares outstanding on the first and last day of the respective periods, except for dividends and distributions, if any, which are based on the actual shares outstanding on the dates of distributions. |
| 2 | | The amounts shown for a share outstanding throughout the respective periods may not be in accordance with the changes in the aggregate gains and losses on investments during the respective periods because of the timing of sales and repurchases of Fund shares in relation to fluctuating net asset values during the respective periods. |
| 3 | | Calculated based on average shares outstanding. |
| 4 | | Less than $0.01 |
| 5 | | Total investment return is calculated assuming a purchase of shares on the first day and a sale on the last day of each period reported and will include reinvestment of dividends and distributions, if any. |
| 6 | | Does not include expenses of the funds in which the Fund invests. |
| (A) | | Not Annualized |
| (B) | | Annualized |
102
Financial Highlights (continued)
| | | FBR Focus Fund — Institutional Class | |
| | |
| |
| | | For the | | | | | | | | | | | | | | | | |
| | | Six Months | | | | | | | | | | | | | | For the |
| | | Ended | | For the Years Ended October 31, | | Period Ended |
| | | April 30, 2012 | |
| | October 31, |
| | | (unaudited) | | 2011 | | 2010* | | 2009 | | 2008** |
| | |
| |
| |
| |
| |
|
| Per Share Operating Performance: | | | | | | | | | | | | | | | | | | | | |
Net Asset Value – Beginning of Period | | $ | 50.02 | | | $ | 47.64 | | | $ | 37.84 | | | $ | 130.93 | | | $ | 180.00 | |
| | |
| | |
| | |
| | |
| | |
| |
Income (Loss) from Investment Operations: | | | | | | | | | | | | | | | | | | | | |
Net Investment Loss | | | (0.08 | )3 | | | (0.37 | )3 | | | (0.41 | )1 | | | (0.25 | )1 | | | (0.20 | )1 |
Net Realized and Unrealized Gain (Loss) | | | | | | | | | | | | | | | | | | | | |
on Investments2 | | | 6.55 | | | | 4.47 | | | | 10.58 | | | | 0.59 | | | | (49.05 | ) |
| | |
| | |
| | |
| | |
| | |
| |
Total from Investment Operations | | | 6.47 | | | | 4.10 | | | | 10.17 | | | | 0.34 | | | | (49.25 | ) |
| | |
| | |
| | |
| | |
| | |
| |
Distributions to Shareholders: | | | | | | | | | | | | | | | | | | | | |
From Net Investment Income | | | — | | | | — | | | | (0.37 | ) | | | — | | | | — | |
From Net Realized Gain | | | (5.24 | ) | | | (1.72 | ) | | | — | | | | (93.45 | ) | | | — | |
| | |
| | |
| | |
| | |
| | |
| |
Paid-in Capital from Redemption Fees3 | | | 0.00 | 4 | | | 0.00 | 4 | | | 0.00 | 4 | | | 0.02 | | | | 0.18 | |
| | |
| | |
| | |
| | |
| | |
| |
Net Increase (Decrease) in Net Asset Value | | | 1.23 | | | | 2.38 | | | | 9.80 | | | | (93.09 | ) | | | (49.07 | ) |
| | |
| | |
| | |
| | |
| | |
| |
Net Asset Value – End of Period | | $ | 51.25 | | | $ | 50.02 | | | $ | 47.64 | | | $ | 37.84 | | | $ | 130.93 | |
| | |
| | |
| | |
| | |
| | |
| |
| Total Investment Return5 | | | 14.41% | (A) | | | 8.53% | | | | 27.32% | | | | 18.15% | | | | (27.30)% | (A) |
| Ratios to Average Net Assets: | | | | | | | | | | | | | | | | | | | | |
Expenses After Waivers6 | | | 1.11% | (B) | | | 1.15% | | | | 1.26% | | | | 1.15% | | | | 1.05% | (B) |
Expenses Before Waivers6 | | | 1.11% | (B) | | | 1.15% | | | | 1.26% | | | | 1.15% | | | | 1.05% | (B) |
Net Investment Loss After Waivers | | | (0.31)% | (B) | | | (0.76)% | | | | (1.06)% | | | | (0.88)% | | | | (0.70)% | (B) |
Net Investment Loss Before Waivers | | | (0.31)% | (B) | | | (0.76)% | | | | (1.06)% | | | | (0.88)% | | | | (0.70)% | (B) |
| Supplementary Data: | | | | | | | | | | | | | | | | | | | | |
Portfolio Turnover Rate | | | 12% | (A) | | | 13% | | | | 5% | | | | 5% | | | | 17% | (A) |
Net Assets at End of Period (in thousands) | | $ | 63,549 | | | $ | 49,005 | | | $ | 36,811 | | | $ | 34,225 | | | $ | 16,831 | |
|
| * | | Per share amounts have been restated on a retroactive basis to reflect a 1:18 reverse stock split effective December 10, 2010. |
| ** | | Represents the period from inception of share class (May 30, 2008) through October 31, 2008. |
| 1 | | Calculated based on shares outstanding on the first and last day of the period, except for dividends and distributions, if any, which are based on the actual shares outstanding on the dates of distributions. |
| 2 | | The amounts shown for a share outstanding throughout the period may not be in accordance with the changes in the aggregate gains and losses on investments during the period because of the timing of sales and repurchases of Fund shares in relation to fluctuating net asset values during the period. |
| 3 | | Calculated based on average shares outstanding. |
| 4 | | Less than $0.01 |
| 5 | | Total investment return is calculated assuming a purchase of shares on the first day and a sale on the last day of each period reported and will include reinvestment of dividends and distributions, if any. |
| 6 | | Does not include expenses of the funds in which the Fund invests. |
| (A) | | Not Annualized |
| (B) | | Annualized |
103
Financial Highlights (continued)
| | | FBR Large Cap Financial Fund — Investor Class | |
| | |
| |
| | | For the | | | | | | | | | | | | | | | | | | | | |
| | | Six Months | | | | | | | | | | | | | | | | | | | | |
| | | Ended | | For the Years Ended October 31, |
| | | April 30, 2012 | |
| |
| | | (unaudited) | | 2011 | | 2010 | | 2009 | | 2008 | | 2007 |
| | |
| |
| |
| |
| |
| |
|
| Per Share Operating Performance: | | | | | | | | | | | | | | | | | | | | | | | | |
Net Asset Value – Beginning of Period | | $ | 11.91 | | | $ | 12.88 | | | $ | 12.61 | | | $ | 11.14 | | | $ | 18.71 | | | $ | 21.67 | |
| | |
| | |
| | |
| | |
| | |
| | |
| |
Income (Loss) from Investment Operations: | | | | | | | | | | | | | | | | | | | | | | | | |
Net Investment Income (Loss)2 | | | 0.02 | 4 | | | (0.04 | )4 | | | (0.08 | )1 | | | 0.00 | 1,5 | | | 0.14 | 1 | | | 0.14 | 1 |
Net Realized and Unrealized Gain (Loss) | | | | | | | | | | | | | | | | | | | | | | | | |
on Investments3 | | | 1.99 | | | | (0.93 | ) | | | 0.35 | | | | 1.58 | | | | (3.86 | ) | | | (0.97 | ) |
| | |
| | |
| | |
| | |
| | |
| | |
| |
Total from Investment Operations | | | 2.01 | | | | (0.97 | ) | | | 0.27 | | | | 1.58 | | | | (3.72 | ) | | | (0.83 | ) |
| | |
| | |
| | |
| | |
| | |
| | |
| |
Distributions to Shareholders: | | | | | | | | | | | | | | | | | | | | | | | | |
From Net Investment Income | | | — | | | | — | | | | — | | | | (0.10 | ) | | | (0.18 | ) | | | (0.11 | ) |
Distribution in Excess of Net | | | | | | | | | | | | | | | | | | | | | | | | |
Investment Income | | | — | | | | — | | | | — | | | | (0.02 | ) | | | — | | | | — | |
From Net Realized Gain | | | — | | | | — | | | | — | | | | — | | | | (3.68 | ) | | | (2.02 | ) |
| | |
| | |
| | |
| | |
| | |
| | |
| |
Total Distributions | | | — | | | | — | | | | — | | | | (0.12 | ) | | | (3.86 | ) | | | (2.13 | ) |
| | |
| | |
| | |
| | |
| | |
| | |
| |
Paid-in Capital from Redemption Fees4 | | | 0.00 | 5 | | | 0.00 | 5 | | | 0.00 | 5 | | | 0.01 | | | | 0.01 | | | | 0.00 | 5 |
| | |
| | |
| | |
| | |
| | |
| | |
| |
Net Increase (Decrease) in Net Asset Value | | | 2.01 | | | | (0.97 | ) | | | 0.27 | | | | 1.47 | | | | (7.57 | ) | | | (2.96 | ) |
| | |
| | |
| | |
| | |
| | |
| | |
| |
Net Asset Value – End of Period | | $ | 13.92 | | | $ | 11.91 | | | $ | 12.88 | | | $ | 12.61 | | | $ | 11.14 | | | $ | 18.71 | |
| | |
| | |
| | |
| | |
| | |
| | |
| |
| Total Investment Return6 | | | 16.88% | (A) | | | (7.53)% | | | | 2.14% | | | | 14.52% | | | | (23.76)% | | | | (4.59)% | |
| Ratios to Average Net Assets: | | | | | | | | | | | | | | | | | | | | | | | | |
Expenses After Waivers2,7 | | | 1.56% | (B) | | | 1.61% | | | | 1.78% | | | | 1.81% | | | | 1.88% | | | | 1.89% | |
Expenses Before Waivers7 | | | 1.56% | (B) | | | 1.61% | | | | 1.78% | | | | 1.81% | | | | 2.01% | | | | 1.92% | |
Net Investment Income (Loss) After Waivers2 | | | 0.38% | (B) | | | (0.34)% | | | | (0.73)% | | | | (0.08)% | | | | 1.63% | | | | 0.59% | |
Net Investment Income (Loss) Before Waivers | | | 0.38% | (B) | | | (0.34)% | | | | (0.73)% | | | | (0.08)% | | | | 1.50% | | | | 0.56% | |
| Supplementary Data: | | | | | | | | | | | | | | | | | | | | | | | | |
Portfolio Turnover Rate | | | 32% | (A) | | | 97% | | | | 150% | | | | 220% | | | | 509% | | | | 95% | |
Net Assets at End of Period (in thousands) | | $ | 66,785 | | | $ | 55,684 | | | $ | 48,717 | | | $ | 37,195 | | | $ | 24,272 | | | $ | 15,951 | |
|
| 1 | | Calculated based on shares outstanding on the first and last day of the respective periods, except for dividends and distributions, if any, which are based on the actual shares outstanding on the dates of distributions. |
| 2 | | Reflects fees waived by FBR Fund Advisers, Inc. pursuant to a contractual expense limitation of 1.95% (excluding interest, taxes, brokerage commissions, dividend expenses, acquired fund fees and expenses, extraordinary legal expenses, or any other extraordinary expenses) and effective May 30, 2008, the recoupment of certain previously waived fees. |
| 3 | | The amounts shown for a share outstanding throughout the respective periods may not be in accordance with the changes in the aggregate gains and losses on investments during the respective periods because of the timing of sales and repurchases of Fund shares in relation to fluctuating net asset values during the respective periods. |
| 4 | | Calculated based on average shares outstanding. |
| 5 | | Less than $0.01 |
| 6 | | Total investment return is calculated assuming a purchase of shares on the first day and a sale on the last day of each period reported and will include reinvestment of dividends and distributions, if any. |
| 7 | | Does not include expenses of the funds in which the Fund invests. |
| (A) | | Not Annualized |
| (B) | | Annualized |
104
Financial Highlights (continued)
| | FBR Small Cap Financial Fund — Investor Class |
| |
|
| | For the | | | | | | | | | | | | | | | | | | | | |
| | Six Months | | | | | | | | | | | | | | | | | | | | |
| | Ended | | For the Years Ended October 31, |
| | April 30, 2012 | |
| |
| | (unaudited) | | 2011 | | 2010 | | 2009 | | 2008 | | 2007 |
| |
| |
| |
| |
| |
| |
|
| Per Share Operating Performance: | | | | | | | | | | | | | | | | | | | | | | | | |
Net Asset Value – Beginning of Period | | $ | 16.48 | | | $ | 18.11 | | | $ | 15.91 | | | $ | 15.22 | | | $ | 23.18 | | | $ | 32.70 | |
| | |
| | |
| | |
| | |
| | |
| | |
| |
Income (Loss) from Investment Operations: | | | | | | | | | | | | | | | | | | | | | | | | |
Net Investment Income | | | 0.10 | 3 | | | 0.21 | 3 | | | 0.08 | 1 | | | 0.06 | 1 | | | 0.24 | 1 | | | 0.29 | 1 |
Net Realized and Unrealized Gain (Loss) | | | | | | | | | | | | | | | | | | | | | | | | |
on Investments2 | | | 1.93 | | | | (1.66 | ) | | | 2.17 | | | | 0.81 | | | | (1.69 | ) | | | (5.31 | ) |
| | |
| | |
| | |
| | |
| | |
| | |
| |
Total from Investment Operations | | | 2.03 | | | | (1.45 | ) | | | 2.25 | | | | 0.87 | | | | (1.45 | ) | | | (5.02 | ) |
| | |
| | |
| | |
| | |
| | |
| | |
| |
Distributions to Shareholders: | | | | | | | | | | | | | | | | | | | | | | | | |
From Net Investment Income | | | (0.29 | ) | | | (0.06 | ) | | | (0.07 | ) | | | (0.19 | ) | | | (0.28 | ) | | | (0.15 | ) |
From Net Realized Gain | | | — | | | | (0.13 | ) | | | — | | | | — | | | | (6.24 | ) | | | (4.35 | ) |
| | |
| | |
| | |
| | |
| | |
| | |
| |
Total Distributions | | | (0.29 | ) | | | (0.19 | ) | | | (0.07 | ) | | | (0.19 | ) | | | (6.52 | ) | | | (4.50 | ) |
| | |
| | |
| | |
| | |
| | |
| | |
| |
Paid-in Capital from Redemption Fees3 | | | 0.00 | 4 | | | 0.01 | | | | 0.02 | | | | 0.01 | | | | 0.01 | | | | 0.00 | 4 |
| | |
| | |
| | |
| | |
| | |
| | |
| |
Net Increase (Decrease) in Net Asset Value | | | 1.74 | | | | (1.63 | ) | | | 2.20 | | | | 0.69 | | | | (7.96 | ) | | | (9.52 | ) |
| | |
| | |
| | |
| | |
| | |
| | |
| |
Net Asset Value – End of Period | | $ | 18.22 | | | $ | 16.48 | | | $ | 18.11 | | | $ | 15.91 | | | $ | 15.22 | | | $ | 23.18 | |
| | |
| | |
| | |
| | |
| | |
| | |
| |
| Total Investment Return5 | | | 12.50% | (A) | | | (8.12)% | | | | 14.27% | | | | 5.89% | | | | (6.76)% | | | | (18.02)% | |
| Ratios to Average Net Assets: | | | | | | | | | | | | | | | | | | | | | | | | |
Expenses After Waivers6 | | | 1.44% | (B) | | | 1.52% | | | | 1.51% | | | | 1.51% | | | | 1.49% | | | | 1.51% | |
Expenses Before Waivers6 | | | 1.44% | (B) | | | 1.52% | | | | 1.51% | | | | 1.51% | | | | 1.49% | | | | 1.51% | |
Net Investment Income After Waivers | | | 1.17% | (B) | | | 0.81% | | | | 0.35% | | | | 0.50% | | | | 1.48% | | | | 0.93% | |
Net Investment Income Before Waivers | | | 1.17% | (B) | | | 0.81% | | | | 0.35% | | | | 0.50% | | | | 1.48% | | | | 0.93% | |
| Supplementary Data: | | | | | | | | | | | | | | | | | | | | | | | | |
Portfolio Turnover Rate | | | 24% | (A) | | | 70% | | | | 89% | | | | 118% | | | | 147% | | | | 13% | |
Net Assets at End of Period (in thousands) | | $ | 157,835 | | | $ | 154,206 | | | $ | 216,747 | | | $ | 187,561 | | | $ | 181,803 | | | $ | 144,214 | |
|
| 1 | | Calculated based on shares outstanding on the first and last day of the respective periods, except for dividends and distributions, if any, which are based on the actual shares outstanding on the dates of distributions. |
| 2 | | The amounts shown for a share outstanding throughout the respective periods may not be in accordance with the changes in the aggregate gains and losses on investments during the respective periods because of the timing of sales and repurchases of Fund shares in relation to fluctuating net asset values during the respective periods. |
| 3 | | Calculated based on average shares outstanding. |
| 4 | | Less than $0.01 |
| 5 | | Total investment return is calculated assuming a purchase of shares on the first day and a sale on the last day of each period reported and will include reinvestment of dividends and distributions, if any. |
| 6 | | Does not include expenses of the funds in which the Fund invests. |
| (A) | | Not Annualized |
| (B) | | Annualized |
105
| Financial Highlights (continued) |
| | FBR Small Cap Financial Fund — Institutional Class |
| |
|
| | For the | | | | | | | | | | | | | | | | |
| | Six Months | | | | | | | | | | | | | | For the |
| | Ended | | | | | | | | | | | | | | Period |
| | April 30, | | For the Years Ended October 31, | | Ended |
| | 2012 | |
| | October 31, |
| | (unaudited) | | 2011 | | 2010 | | 2009 | | 2008* |
| |
| |
| |
| |
| |
|
| Per Share Operating Performance: | | | | | | | | | | | | | | | | | | | | |
Net Asset Value – Beginning of Period | | $ | 10.55 | | | $ | 11.70 | | | $ | 10.34 | | | $ | 9.96 | | | $ | 10.00 | |
| | |
| | |
| | |
| | |
| | |
| |
Income (Loss) from Investment Operations: | | | | | | | | | | | | | | | | | | | | |
Net Investment Income2 | | | 0.07 | 4 | | | 0.19 | 4 | | | 0.09 | 1 | | | 0.19 | 1 | | | 0.02 | 1 |
Net Realized and Unrealized Gain (Loss) | | | | | | | | | | | | | | | | | | | | |
on Investments3 | | | 1.22 | | | | (1.09 | ) | | | 1.40 | | | | 0.40 | | | | (0.06 | ) |
| | |
| | |
| | |
| | |
| | |
| |
Total from Investment Operations | | | 1.29 | | | | (0.90 | ) | | | 1.49 | | | | 0.59 | | | | (0.04 | ) |
| | |
| | |
| | |
| | |
| | |
| |
Distributions to Shareholders: | | | | | | | | | | | | | | | | | | | | |
From Net Investment Income | | | (0.35 | ) | | | (0.12 | ) | | | (0.13 | ) | | | (0.21 | ) | | | — | |
From Net Realized Gain | | | — | | | | (0.13 | ) | | | — | | | | — | | | | — | |
| | |
| | |
| | |
| | |
| | |
| |
Total Distributions | | | (0.35 | ) | | | (0.25 | ) | | | (0.13 | ) | | | (0.21 | ) | | | — | |
| | |
| | |
| | |
| | |
| | |
| |
Paid-in Capital from Redemption Fees4 | | | 0.00 | 5 | | | — | | | | 0.00 | 5 | | | — | | | | — | |
| | |
| | |
| | |
| | |
| | |
| |
Net Increase (Decrease) in Net Asset Value | | | 0.94 | | | | (1.15 | ) | | | 1.36 | | | | 0.38 | | | | (0.04 | ) |
| | |
| | |
| | |
| | |
| | |
| |
Net Asset Value – End of Period | | $ | 11.49 | | | $ | 10.55 | | | $ | 11.70 | | | $ | 10.34 | | | $ | 9.96 | |
| | |
| | |
| | |
| | |
| | |
| |
| Total Investment Return6 | | | 12.62% | (A) | | | (8.00)% | | | | 14.52% | | | | 6.14% | | | | (0.40)% | (A) |
| Ratios to Average Net Assets: | | | | | | | | | | | | | | | | | | | | |
Expenses After Waivers and Related | | | | | | | | | | | | | | | | | | | | |
Reimbursements2,7 | | | 1.19% | (B) | | | 1.34% | | | | 1.23% | | | | 1.56% | | | | 1.31% | (B) |
Expenses Before Waivers and Related | | | | | | | | | | | | | | | | | | | | |
Reimbursements7 | | | 1.19% | (B) | | | 1.34% | | | | 1.23% | | | | 1.56% | | | | 1.31% | (B) |
Net Investment Income After Waivers and | | | | | | | | | | | | | | | | | | | | |
Related Reimbursements2 | | | 1.34% | (B) | | | 1.00% | | | | 0.61% | | | | 0.04% | | | | 1.49% | (B) |
Net Investment Income Before Waivers and | | | | | | | | | | | | | | | | | | | | |
Related Reimbursements | | | 1.34% | (B) | | | 1.00% | | | | 0.61% | | | | 0.04% | | | | 1.49% | (B) |
| Supplementary Data: | | | | | | | | | | | | | | | | | | | | |
Portfolio Turnover Rate | | | 24% | (A) | | | 70% | | | | 89% | | | | 118% | | | | 147% | (A) |
Net Assets at End of Period (in thousands) | | $ | 28,048 | | | $ | 19,894 | | | $ | 25,011 | | | $ | 10,638 | | | $ | 3,952 | |
|
| * | | Represents the period from inception of share class (May 30, 2008) through October 31, 2008. |
| 1 | | Calculated based on shares outstanding on the first and last day of the period, except for dividends and distributions, if any, which are based on the actual shares outstanding on the dates of distributions. |
| 2 | | Reflects fees waived and reimbursed by FBR Fund Advisers, Inc. pursuant to a contractual expense limitation of 1.70% (excluding interest, taxes, brokerage commissions, dividend expenses, acquiured fund fees and expenses, extraordinary legal expenses, or any other extraordinary expenses and effective May 30, 2008, the recoupment of certain previously waived fees. |
| 3 | | The amounts shown for a share outstanding throughout the period may not be in accordance with the changes in the aggregate gains and losses on investments during the period because of the timing of sales and repurchases of Fund shares in relation to fluctuating net asset values during the period. |
| 4 | | Calculated based on average shares outstanding. |
| 5 | | Less than $0.01 |
| 6 | | Total investment return is calculated assuming a purchase of shares on the first day and a sale on the last day of each period reported and will include reinvestment of dividends and distributions, if any. |
| 7 | | Does not include expenses of the funds in which the Fund invests. |
| (A) | | Not Annualized |
| (B) | | Annualized |
| Financial Highlights (continued) |
| | FBR Technology Fund — Investor Class |
| |
|
| | For the | | | | | | | | | | | | | | | | | | | | |
| | Six Months | | | | | | | | | | | | | | | | | | | | |
| | Ended | | For the Years Ended October 31, |
| | April 30, 2012 | |
|
| | (unaudited) | | 2011 | | 2010 | | 2009 | | 2008 | | 2007 |
| |
| |
| |
| |
| |
| |
|
| Per Share Operating Performance: | | | | | | | | | | | | | | | | | | | | | | | | |
Net Asset Value – Beginning of Period | | $ | 10.86 | | | $ | 11.00 | | | $ | 9.05 | | | $ | 6.96 | | | $ | 13.34 | | | $ | 11.97 | |
| | |
| | |
| | |
| | |
| | |
| | |
| |
Income (Loss) from Investment Operations: | | | | | | | | | | | | | | | | | | | | | | | | |
Net Investment Loss2 | | | (0.07 | )4 | | | (0.17 | )4 | | | (0.14 | )1 | | | (0.08 | )1 | | | (0.12 | )1 | | | (0.05 | )1 |
Net Realized and Unrealized Gain (Loss) | | | | | | | | | | | | | | | | | | | | | | | | |
on Investments3 | | | 1.10 | | | | 0.03 | | | | 2.08 | | | | 2.16 | | | | (5.03 | ) | | | 1.81 | |
| | |
| | |
| | |
| | |
| | |
| | |
| |
Total from Investment Operations | | | 1.03 | | | | (0.14 | ) | | | 1.94 | | | | 2.08 | | | | (5.15 | ) | | | 1.76 | |
| | |
| | |
| | |
| | |
| | |
| | |
| |
Distributions to Shareholders: | | | | | | | | | | | | | | | | | | | | | | | | |
From Net Realized Gain | | | — | | | | — | | | | — | | | | — | | | | (1.23 | ) | | | (0.39 | ) |
| | |
| | |
| | |
| | |
| | |
| | |
| |
Paid-in Capital from Redemption Fees4 | | | 0.00 | 5 | | | 0.00 | 5 | | | 0.01 | | | | 0.01 | | | | 0.00 | 5 | | | 0.00 | 5 |
| | |
| | |
| | |
| | |
| | |
| | |
| |
Net Increase (Decrease) in Net Asset Value | | | 1.03 | | | | (0.14 | ) | | | 1.95 | | | | 2.09 | | | | (6.38 | ) | | | 1.37 | |
| | |
| | |
| | |
| | |
| | |
| | |
| |
Net Asset Value – End of Period | | $ | 11.89 | | | $ | 10.86 | | | $ | 11.00 | | | $ | 9.05 | | | $ | 6.96 | | | $ | 13.34 | |
| | |
| | |
| | |
| | |
| | |
| | |
| |
| Total Investment Return6 | | | 9.48% | (A) | | | (1.27)% | | | | 21.55% | | | | 30.03% | | | | (42.30)% | | | | 15.18% | |
| Ratios to Average Net Assets: | | | | | | | | | | | | | | | | | | | | | | | | |
Expenses After Waivers and Related | | | | | | | | | | | | | | | | | | | | | | | | |
Reimbursements2,7 | | | 1.95% | (B) | | | 1.95% | | | | 1.95% | | | | 1.95% | | | | 1.84% | | | | 1.70% | |
Expenses Before Waivers and Related | | | | | | | | | | | | | | | | | | | | | | | | |
Reimbursements7 | | | 3.22% | (B) | | | 2.79% | | | | 2.50% | | | | 3.00% | | | | 1.92% | | | | 1.70% | |
Net Investment Loss After Waivers and | | | | | | | | | | | | | | | | | | | | | | | | |
Related Reimbursements2 | | | (1.25)% | (B) | | | (1.54)% | | | | (1.10)% | | | | (1.05)% | | | | (0.60)% | | | | (0.41)% | |
Net Investment Loss Before Waivers and | | | | | | | | | | | | | | | | | | | | | | | | |
Related Reimbursements | | | (2.52)% | (B) | | | (2.38)% | | | | (1.64)% | | | | (2.10)% | | | | (0.68)% | | | | (0.41)% | |
| Supplementary Data: | | | | | | | | | | | | | | | | | | | | | | | | |
Portfolio Turnover Rate | | | 62% | (A) | | | 141% | | | | 353% | (C) | | | 211% | | | | 175% | | | | 229% | |
Net Assets at End of Period (in thousands) | | $ | 6,205 | | | $ | 5,698 | | | $ | 8,207 | | | $ | 8,388 | | | $ | 7,689 | | | $ | 40,935 | |
|
| 1 | | Calculated based on shares outstanding on the first and last day of the respective periods, except for dividends and distributions, if any, which are based on the actual shares outstanding on the dates of distributions. |
| 2 | | Reflects fees waived and reimbursed by FBR Fund Advisers, Inc. pursuant to a contractual expense limitation of 1.95% (excluding interest, taxes, brokerage commissions, dividend expenses, acquired fund fees and expenses, extraordinary legal expenses, or any other extraordinary expenses) and effective May 30, 2008, the recoupment of certain previously waived fees. |
| 3 | | The amounts shown for a share outstanding throughout the respective periods may not be in accordance with the changes in the aggregate gains and losses on investments during the respective periods because of the timing of sales and repurchases of Fund shares in relation to fluctuating net asset values during the respective periods. |
| 4 | | Calculated based on average shares outstanding. |
| 5 | | Less than $0.01 |
| 6 | | Total investment return is calculated assuming a purchase of shares on the first day and a sale on the last day of each period reported and will include reinvestment of dividends and distributions, if any. |
| 7 | | Does not include expenses of the funds in which the Fund invests. |
| (A) | | Not Annualized |
| (B) | | Annualized |
| (c) | | Excludes merger activity |
| Financial Highlights (continued) |
| | | FBR Technology Fund — Institutional Class |
| | |
|
| | | For the | | | | | | | | |
| | | Six Months Ended | | For the | | For the |
| | | April 30, 2012 | | Year Ended | | Period Ended |
| | | (unaudited) | | October 31, 2011 | | October 31, 2010* |
| | |
| |
| |
|
| Per Share Operating Performance: | | | | | | | | | | | | |
Net Asset Value – Beginning of Period | | $ | 10.89 | | | $ | 11.00 | | | $ | 10.46 | |
| | |
| | |
| | |
| |
Income (Loss) from Investment Operations: | | | | | | | | | | | | |
Net Investment Loss2 | | | (0.06 | )4 | | | (0.14 | )4 | | | (0.07 | )1 |
Net Realized and Unrealized Gain on Investments3 | | | 1.13 | | | | 0.03 | | | | 0.61 | |
| | |
| | |
| | |
| |
Total from Investment Operations | | | 1.07 | | | | (0.11 | ) | | | 0.54 | |
| | |
| | |
| | |
| |
Paid-in Capital from Redemption Fees4 | | | 0.00 | 5 | | | 0.00 | 5 | | | 0.00 | 5 |
| | |
| | |
| | |
| |
Net Increase (Decrease) in Net Asset Value | | | 1.07 | | | | (0.11 | ) | | | 0.54 | |
| | |
| | |
| | |
| |
Net Asset Value – End of Period | | $ | 11.96 | | | $ | 10.89 | | | $ | 11.00 | |
| | |
| | |
| | |
| |
| Total Investment Return6 | | | 9.83% | (A) | | | (1.00)% | | | | 5.16% | (A) |
| Ratios to Average Net Assets: | | | | | | | | | | | | |
Expenses After Waivers and Related | | | | | | | | | | | | |
Reimbursements2,7 | | | 1.70% | (B) | | | 1.70% | | | | 1.70% | (B) |
Expenses Before Waivers and Related | | | | | | | | | | | | |
Reimbursements7 | | | 4.44% | (B) | | | 3.45% | | | | 2.34% | (B) |
Net Investment Loss After Waivers and Related | | | | | | | | | | | | |
Reimbursements2 | | | (1.00)% | (B) | | | (1.24)% | | | | (0.77)% | (B) |
Net Investment Loss Before Waivers and Related | | | | | | | | | | | | |
Reimbursements | | | (3.74)% | (B) | | | (2.99)% | | | | (1.41)% | (B) |
| Supplementary Data: | | | | | | | | | | | | |
Portfolio Turnover Rate | | | 62% | (A) | | | 141% | | | | 353% | (C) |
Net Assets at End of Period (in thousands) | | $ | 1,206 | | | $ | 1,156 | | | $ | 4,611 | |
|
| * | | Represents the period from inception of share class (March 12, 2010) through October 31, 2010. |
| 1 | | Calculated based on shares outstanding on the first and last day of the respective periods, except for dividends and distributions, if any, which are based on the actual shares outstanding on the dates of distributions. |
| 2 | | Reflects fees waived and reimbursed by FBR Fund Advisers, Inc. pursuant to a contractual expense limitation of 1.70% (excluding interest, taxes, brokerage commissions, dividend expenses, acquired fund fees and expenses, extraordinary legal expenses, or any other extraordinary expenses) |
| 3 | | The amounts shown for a share outstanding throughout the respective periods may not be in accordance with the changes in the aggregate gains and losses on investments during the respective periods because of the timing of sales and repurchases of Fund shares in relation to fluctuating net asset values during the respective periods. |
| 4 | | Calculated based on average shares outstanding. |
| 5 | | Less than $0.01 |
| 6 | | Total investment return is calculated assuming a purchase of shares on the first day and a sale on the last day of each period reported and will include reinvestment of dividends and distributions, if any. |
| 7 | | Does not include expenses of the funds in which the Fund invests. |
| (A) | | Not Annualized |
| (B) | | Annualized |
| (c) | | Excludes merger activity |
| Financial Highlights (continued) |
| | | FBR Gas Utility Index Fund — Investor Class |
| | |
|
| | | For the | | | | | | | | | | | | | | | | | | | | |
| | | Six Months | | | | | | | | | | | | | | | | | | | | |
| | | Ended | | For the Years Ended October 31, |
| | | April 30, 2012 | |
|
| | | (unaudited) | | 2011 | | 2010 | | 2009 | | 2008 | | 2007 |
| | |
| |
| |
| |
| |
| |
|
| Per Share Operating Performance: | | | | | | | | | | | | | | | | | | | | | | | | |
Net Asset Value – Beginning of Period | | $ | 21.21 | | | $ | 17.83 | | | $ | 15.13 | | | $ | 15.26 | | | $ | 23.14 | | | $ | 19.48 | |
| | |
| | |
| | |
| | |
| | |
| | |
| |
Income (Loss) from Investment Operations: | | | | | | | | | | | | | | | | | | | | | | | | |
Net Investment Income2 | | | 0.28 | 4 | | | 0.51 | 4 | | | 0.58 | 1 | | | 0.49 | 1 | | | 0.47 | 1 | | | 0.47 | 1 |
Net Realized and Unrealized Gain (Loss) | | | | | | | | | | | | | | | | | | | | | | | | |
on Investments3 | | | 1.25 | | | | 3.59 | | | | 2.72 | | | | 0.60 | | | | (6.13 | ) | | | 3.67 | |
| | |
| | |
| | |
| | |
| | |
| | |
| |
Total from Investment Operations | | | 1.53 | | | | 4.10 | | | | 3.30 | | | | 1.09 | | | | (5.66 | ) | | | 4.14 | |
| | |
| | |
| | |
| | |
| | |
| | |
| |
Distributions to Shareholders: | | | | | | | | | | | | | | | | | | | | | | | | |
From Net Investment Income | | | (0.27 | ) | | | (0.51 | ) | | | (0.58 | ) | | | (0.49 | ) | | | (0.47 | ) | | | (0.48 | ) |
From Net Realized Gain | | | (0.16 | ) | | | (0.21 | ) | | | (0.02 | ) | | | (0.74 | ) | | | (1.75 | ) | | | — | |
| | |
| | |
| | |
| | |
| | |
| | |
| |
Total Distributions | | | (0.43 | ) | | | (0.72 | ) | | | (0.60 | ) | | | (1.23 | ) | | | (2.22 | ) | | | (0.48 | ) |
| | |
| | |
| | |
| | |
| | |
| | |
| |
Paid-in Capital from Redemption Fees4 | | | 0.01 | | | | 0.00 | 5 | | | 0.00 | 5 | | | 0.01 | | | | 0.00 | 5 | | | 0.00 | 5 |
| | |
| | |
| | |
| | |
| | |
| | |
| |
Net Increase (Decrease) in Net Asset Value | | | 1.11 | | | | 3.38 | | | | 2.70 | | | | (0.13 | ) | | | (7.88 | ) | | | 3.66 | |
| | |
| | |
| | |
| | |
| | |
| | |
| |
Net Asset Value – End of Period | | $ | 22.32 | | | $ | 21.21 | | | $ | 17.83 | | | $ | 15.13 | | | $ | 15.26 | | | $ | 23.14 | |
| | |
| | |
| | |
| | |
| | |
| | |
| |
| Total Investment Return6 | | | 7.39% | (A) | | | 23.54% | | | | 22.25% | | | | 8.18% | | | | (26.81)% | | | | 21.51% | |
| Ratios to Average Net Assets: | | | | | | | | | | | | | | | | | | | | | | | | |
Expenses After Waivers2,7 | | | 0.67% | (B) | | | 0.71% | | | | 0.76% | | | | 0.76% | | | | 0.70% | | | | 0.75% | |
Expenses Before Waivers7 | | | 0.67% | (B) | | | 0.71% | | | | 0.77% | | | | 0.76% | | | | 0.70% | | | | 0.75% | |
Net Investment Income After Waivers2 | | | 2.64% | (B) | | | 2.68% | | | | 3.51% | | | | 3.51% | | | | 2.39% | | | | 2.21% | |
Net Investment Income Before Waivers | | | 2.64% | (B) | | | 2.68% | | | | 3.50% | | | | 3.51% | | | | 2.39% | | | | 2.21% | |
| Supplementary Data: | | | | | | | | | | | | | | | | | | | | | | | | |
Portfolio Turnover Rate | | | 11% | (A) | | | 17% | | | | 16% | | | | 26% | | | | 27% | | | | 22% | |
Net Assets at End of Period (in thousands) | | $ | 606,151 | | | $ | 433,782 | | | $ | 244,041 | | | $ | 193,679 | | | $ | 198,569 | | | $ | 285,951 | |
|
| 1 | | Calculated based on shares outstanding on the first and last day of the respective periods, except for dividends and distributions, if any, which are based on the actual shares outstanding on the dates of distributions. |
| 2 | | Reflects fees waived by FBR Fund Advisers, Inc. pursuant to a contractual expense limitation of 0.85% (excluding interest, taxes, brokerage commissions, dividend expenses, acquired fund fees and expenses, extraordinary legal expenses, or any other extraordinary expenses) and effective May 30, 2008, the recoupment of certain previously waived fees. |
| 3 | | The amounts shown for a share outstanding throughout the respective periods may not be in accordance with the changes in the aggregate gains and losses on investments during the respective periods because of the timing of sales and repurchases of Fund shares in relation to fluctuating net asset values during the respective periods. |
| 4 | | Calculated based on average shares outstanding. |
| 5 | | Less than $0.01 |
| 6 | | Total investment return is calculated assuming a purchase of shares on the first day and a sale on the last day of each period reported and will include reinvestment of dividends and distributions, if any. |
| 7 | | Does not include expenses of the funds in which the Fund invests. |
| (A) | | Not Annualized |
| (B) | | Annualized |
| Financial Highlights (continued) |
| | | FBR Balanced Fund — Investor Class |
| | |
|
| | | For the | | | | | | For the | | | | | | | | | | | | | | | | |
| | | Six Months | | For the | | Period | | | | | | | | | | | | | | | | |
| | | Ended | | Year | | April 1, | | | | | | | | | | | | | | | | |
| | | April 30, | | Ended | | 2010 to | | For the Years Ended March 31, |
| | | 2012 | | October 31, | | October 31, | |
|
| | | (unaudited) | | 2011 | | 20101 | | 2010 | | 2009 | | 2008 | | 2007 |
| | |
| |
| |
| |
| |
| |
| |
|
| Per Share Operating Performance: | | | | | | | | | | | | | | | | | | | | | | | | | | | | |
Net Asset Value – Beginning of Period | | $ | 12.99 | | | $ | 11.93 | | | $ | 11.52 | | | $ | 8.92 | | | $ | 12.27 | | | $ | 14.48 | | | $ | 13.48 | |
| | |
| | |
| | |
| | |
| | |
| | |
| | |
| |
Income (Loss) from Investment Operations: | | | | | | | | | | | | | | | | | | | | | | | | | | | | |
Net Investment Income2 | | | 0.11 | 3 | | | 0.29 | 3 | | | 0.17 | 3 | | | 0.29 | | | | 0.32 | | | | 0.39 | | | | 0.36 | |
Net Realized and Unrealized Gain (Loss) | | | | | | | | | | | | | | | | | | | | | | | | | | | | |
on Investments2,4 | | | 0.94 | | | | 1.04 | | | | 0.40 | | | | 2.61 | | | | (3.23 | ) | | | 0.34 | | | | 1.13 | |
| | |
| | |
| | |
| | |
| | |
| | |
| | |
| |
Total from Investment Operations | | | 1.05 | | | | 1.33 | | | | 0.57 | | | | 2.90 | | | | (2.91 | ) | | | 0.73 | | | | 1.49 | |
| | |
| | |
| | |
| | |
| | |
| | |
| | |
| |
Distributions to Shareholders: | | | | | | | | | | | | | | | | | | | | | | | | | | | | |
From Net Investment Income | | | (0.11 | ) | | | (0.27 | ) | | | (0.16 | ) | | | (0.30 | ) | | | (0.25 | ) | | | (0.37 | ) | | | (0.33 | ) |
From Net Realized Gain | | | — | | | | — | | | | — | | | | — | | | | (0.17 | ) | | | (2.57 | ) | | | (0.16 | ) |
Return of Capital | | | — | | | | — | | | | — | | | | — | | | | (0.03 | ) | | | — | | | | — | |
| | |
| | |
| | |
| | |
| | |
| | |
| | |
| |
Total Distributions | | | (0.11 | ) | | | (0.27 | ) | | | (0.16 | ) | | | (0.30 | ) | | | (0.45 | ) | | | (2.94 | ) | | | (0.49 | ) |
| | |
| | |
| | |
| | |
| | |
| | |
| | |
| |
Paid-in Capital from Redemption Fees2 | | | 0.00 | 5 | | | 0.00 | 5 | | | 0.00 | 5 | | | 0.00 | 5 | | | 0.01 | | | | — | | | | — | |
| | |
| | |
| | |
| | |
| | |
| | |
| | |
| |
Net Increase (Decrease) in Net Asset Value | | | 0.94 | | | | 1.06 | | | | 0.41 | | | | 2.60 | | | | (3.35 | ) | | | (2.21 | ) | | | 1.00 | |
| | |
| | |
| | |
| | |
| | |
| | |
| | |
| |
Net Asset Value – End of Period | | $ | 13.93 | | | $ | 12.99 | | | $ | 11.93 | | | $ | 11.52 | | | $ | 8.92 | | | $ | 12.27 | | | $ | 14.48 | |
| | |
| | |
| | |
| | |
| | |
| | |
| | |
| |
| Total Investment Return6 | | | 8.11% | (A) | | | 11.30% | | | | 5.04% | (A) | | | 32.76% | | | | (24.28)% | | | | 4.45 | % | | | 11.19 | % |
| Ratios to Average Net Assets: | | | | | | | | | | | | | | | | | | | | | | | | | | | | |
Expenses After Waivers and Related | | | | | | | | | | | | | | | | | | | | | | | | | | | | |
Reimbursements7 | | | 1.24% | 3(B) | | | 1.24% | 3 | | | 1.24% | 3(B) | | | 1.25% | | | | 1.32% | | | | 1.33 | % | | | 1.33 | % |
Expenses Before Waivers and Related | | | | | | | | | | | | | | | | | | | | | | | | | | | | |
Reimbursements7 | | | 1.32% | (B) | | | 1.54% | | | | 1.60% | (B) | | | 1.69% | | | | 1.84% | | | | 1.66 | % | | | 1.51 | % |
Net Investment Income After Waivers and | | | | | | | | | | | | | | | | | | | | | | | | | | | | |
Related Reimbursements | | | 1.62% | 3(B) | | | 2.33% | 3 | | | 2.56% | 3(B) | | | 2.70% | | | | 3.03% | | | | 2.75 | % | | | 2.52 | % |
Net Investment Income Before Waivers and | | | | | | | | | | | | | | | | | | | | | | | | | | | | |
Related Reimbursements | | | 1.54% | (B) | | | 2.03% | | | | 2.21% | (B) | | | 2.26% | | | | 2.50% | | | | 2.42 | % | | | 2.34 | % |
| Supplementary Data: | | | | | | | | | | | | | | | | | | | | | | | | | | | | |
Portfolio Turnover Rate | | | 15% | (A) | | | 35% | | | | 27% | (A) | | | 26% | | | | 32% | | | | 110 | % | | | 28 | % |
Net Assets at End of Period (in thousands) | | $ | 128,621 | | | $ | 56,750 | | | $ | 41,499 | | | $ | 46,809 | | | $ | 18,858 | | | $ | 21,700 | | | $ | 24,260 | |
|
| 1 | | The Fund changed its fiscal year end from March 31 to October 31. |
| 2 | | Calculated based on shares outstanding. |
| 3 | | Reflects fees waived by FBR Fund Advisers, Inc. pursuant to a contractual expense limitation of 1.08% (excluding brokerage costs, interest, taxes, acquired fund fees and expenses, dividend expenses, 12b-1 fees and extraordinary expenses) and the recoupment of certain previously waived fees. Also reflects fees voluntarily waived by FBR Fund Advisers, Inc. to an expense limitation of 0.99% (excluding brokerage costs, interest, interest, taxes, acquired fund fees and expenses, dividend expenses, 12b-1 fees and extraordinary expenses) and the recoupment of certain previously waived fees. |
| 4 | | The amounts shown for a share outstanding throughout the period may not be in accordance with the changes in the aggregate gains and losses on investments during the period because of the timing of sales and repurchases of Fund shares in relation to fluctuating net asset values during the period. |
| 5 | | Less than $0.01 |
| 6 | | Total investment return is calculated assuming a purchase of shares on the first day and a sale on the last day of each period reported and will include reinvestment of dividends and distributions, if any. |
| 7 | | Does not include expenses of the funds in which the Fund invests. |
| (A) | | Not Annualized |
| (B) | | Annualized |
| Financial Highlights (continued) |
| | | FBR Balanced Fund — Institutional Class |
| | |
|
| | | For the | | | | | | For the | | | | | | | | | | | | | | | | |
| | | Six Months | | For the | | Period | | | | | | | | | | | | | | | | |
| | | Ended | | Year | | April 1, | | | | | | | | | | | | | | | | |
| | | April 30, | | Ended | | 2010 to | | For the Years Ended March 31, |
| | | 2012 | | October 31, | | October 31, | |
|
| | | (unaudited) | | 2011 | | 20101 | | 2010 | | 2009 | | 2008 | | 2007 |
| | |
| |
| |
| |
| |
| |
| |
|
| Per Share Operating Performance: | | | | | | | | | | | | | | | | | | | | | | | | | | | | |
Net Asset Value – Beginning of Period | | $ | 12.38 | | | $ | 11.38 | | | $ | 10.99 | | | $ | 8.52 | | | $ | 11.75 | | | $ | 13.98 | | | $ | 13.04 | |
| | |
| | |
| | |
| | |
| | |
| | |
| | |
| |
Income (Loss) from Investment Operations: | | | | | | | | | | | | | | | | | | | | | | | | | | | | |
Net Investment Income2 | | | 0.12 | 3 | | | 0.32 | 3 | | | 0.18 | 3 | | | 0.30 | | | | 0.33 | | | | 0.42 | | | | 0.38 | |
Net Realized and Unrealized Gain (Loss) | | | | | | | | | | | | | | | | | | | | | | | | | | | | |
on Investments2,4 | | | 0.89 | | | | 0.99 | | | | 0.38 | | | | 2.50 | | | | (3.10 | ) | | | 0.33 | | | | 1.10 | |
| | |
| | |
| | |
| | |
| | |
| | |
| | |
| |
Total from Investment Operations | | | 1.01 | | | | 1.31 | | | | 0.56 | | | | 2.80 | | | | (2.77 | ) | | | 0.75 | | | | 1.48 | |
| | |
| | |
| | |
| | |
| | |
| | |
| | |
| |
Distributions to Shareholders: | | | | | | | | | | | | | | | | | | | | | | | | | | | | |
From Net Investment Income | | | (0.13 | ) | | | (0.31 | ) | | | (0.17 | ) | | | (0.33 | ) | | | (0.26 | ) | | | (0.41 | ) | | | (0.38 | ) |
From Net Realized Gain | | | — | | | | — | | | | — | | | | — | | | | (0.17 | ) | | | (2.57 | ) | | | (0.16 | ) |
Return of Capital | | | — | | | | — | | | | — | | | | — | | | | (0.04 | ) | | | — | | | | — | |
| | |
| | |
| | |
| | |
| | |
| | |
| | |
| |
Total Distributions | | | (0.13 | ) | | | (0.31 | ) | | | (0.17 | ) | | | (0.33 | ) | | | (0.47 | ) | | | (2.98 | ) | | | (0.54 | ) |
| | |
| | |
| | |
| | |
| | |
| | |
| | |
| |
Paid-in Capital from Redemption Fees2 | | | 0.00 | 5 | | | 0.00 | 5 | | | 0.00 | 5 | | | 0.00 | 5 | | | 0.01 | | | | — | | | | — | |
| | |
| | |
| | |
| | |
| | |
| | |
| | |
| |
Net Increase (Decrease) in Net Asset Value | | | 0.88 | | | | 1.00 | | | | 0.39 | | | | 2.47 | | | | (3.23 | ) | | | (2.23 | ) | | | 0.94 | |
| | |
| | |
| | |
| | |
| | |
| | |
| | |
| |
Net Asset Value – End of Period | | $ | 13.26 | | | $ | 12.38 | | | $ | 11.38 | | | $ | 10.99 | | | $ | 8.52 | | | $ | 11.75 | | | $ | 13.98 | |
| | |
| | |
| | |
| | |
| | |
| | |
| | |
| |
| Total Investment Return6 | | | 8.17% | (A) | | | 11.62% | | | | 5.19% | (A) | | | 33.10% | | | | (24.13)% | | | | 4.75% | | | | 11.47% | |
| Ratios to Average Net Assets: | | | | | | | | | | | | | | | | | | | | | | | | | | | | |
Expenses After Waivers and Related | | | | | | | | | | | | | | | | | | | | | | | | | | | | |
Reimbursements7 | | | 0.99% | 3(B) | | | 0.99% | 3 | | | 0.99% | 3(B) | | | 0.99% | | | | 1.07% | | | | 1.08% | | | | 1.08% | |
Expenses Before Waivers and Related | | | | | | | | | | | | | | | | | | | | | | | | | | | | |
Reimbursements7 | | | 1.03% | (B) | | | 1.12% | | | | 1.20% | (B) | | | 1.43% | | | | 1.58% | | | | 1.41% | | | | 1.25% | |
Net Investment Income After Waivers | | | | | | | | | | | | | | | | | | | | | | | | | | | | |
and Related Reimbursements | | | 1.91% | 3(B) | | | 2.69% | 3 | | | 2.82% | 3(B) | | | 3.01% | | | | 3.24% | | | | 3.00% | | | | 2.76% | |
Net Investment Income Before Waivers | | | | | | | | | | | | | | | | | | | | | | | | | | | | |
and Related Reimbursements | | | 1.87% | (B) | | | 2.56% | | | | 2.60% | (B) | | | 2.57% | | | | 2.73% | | | | 2.67% | | | | 2.59% | |
| Supplementary Data: | | | | | | | | | | | | | | | | | | | | | | | | | | | | |
Portfolio Turnover Rate | | | 15% | (A) | | | 35% | | | | 27% | (A) | | | 26% | | | | 32% | | | | 110% | | | | 28% | |
Net Assets at End of Period (in thousands) | | $ | 75,550 | | | $ | 55,283 | | | $ | 42,169 | | | $ | 39,403 | | | $ | 31,127 | | | $ | 41,206 | | | $ | 47,390 | |
|
| 1 | | The Fund changed its fiscal year end from March 31 to October 31. |
| 2 | | Calculated based on shares outstanding. |
| 3 | | Reflects fees waived by FBR Fund Advisers, Inc. pursuant to a contractual expense limitation of 1.08% (excluding brokerage costs, interest, taxes, acquired fund fees and expenses, dividend expenses, 12b-1 fees and extraordinary expenses) and the recoupment of certain previously waived fees. Also reflects fees voluntarily waived by FBR Fund Advisers, Inc. to an expense limitation of 0.99% (excluding brokerage costs, interest, interest, taxes, acquired fund fees and expenses, dividend expenses, 12b-1 fees and extraordinary expenses) and the recoupment of certain previously waived fees. |
| 4 | | The amounts shown for a share outstanding throughout the period may not be in accordance with the changes in the aggregate gains and losses on investments during the period because of the timing of sales and repurchases of Fund shares in relation to fluctuating net asset values during the period. |
| 5 | | Less than $0.01 |
| 6 | | Total investment return is calculated assuming a purchase of shares on the first day and a sale on the last day of each period reported and will include reinvestment of dividends and distributions, if any. |
| 7 | | Does not include expenses of the funds in which the Fund invests. |
| (A) | | Not Annualized |
| (B) | | Annualized |
| Financial Highlights (continued) |
| | | FBR Core Bond Fund — Investor Class |
| | |
|
| | | For the | | | | | | For the | | | | | | | | | | | | | | | | |
| | | Six Months | | For the | | Period | | | | | | | | | | | | | | | | |
| | | Ended | | Year | | April 1, | | | | | | | | | | | | | | | | |
| | | April 30, | | Ended | | 2010 to | | For the Years Ended March 31, |
| | | 2012 | | October 31, | | October 31, | |
|
| | | (unaudited) | | 2011 | | 20101 | | 2010 | | 2009 | | 2008 | | 2007 |
| | |
| |
| |
| |
| |
| |
| |
|
| Per Share Operating Performance: | | | | | | | | | | | | | | | | | | | | | | | | | | | | |
Net Asset Value – Beginning of Period | | $ | 9.56 | | | $ | 9.82 | | | $ | 9.39 | | | $ | 8.75 | | | $ | 9.16 | | | $ | 9.71 | | | $ | 9.77 | |
| | |
| | |
| | |
| | |
| | |
| | |
| | |
| |
Income (Loss) from Investment Operations: | | | | | | | | | | | | | | | | | | | | | | | | | | | | |
Net Investment Income2 | | | 0.16 | 3 | | | 0.35 | 3 | | | 0.23 | 3 | | | 0.38 | | | | 0.35 | | | | 0.42 | | | | 0.50 | |
Net Realized and Unrealized Gain (Loss) | | | | | | | | | | | | | | | | | | | | | | | | | | | | |
on Investments2,4 | | | 0.16 | | | | (0.14 | ) | | | 0.42 | | | | 0.69 | | | | (0.44 | ) | | | — | | | | 0.05 | |
| | |
| | |
| | |
| | |
| | |
| | |
| | |
| |
Total from Investment Operations | | | 0.32 | | | | 0.21 | | | | 0.65 | | | | 1.07 | | | | (0.09 | ) | | | 0.42 | | | | 0.55 | |
| | |
| | |
| | |
| | |
| | |
| | |
| | |
| |
Distributions to Shareholders: | | | | | | | | | | | | | | | | | | | | | | | | | | | | |
From Net Investment Income | | | (0.12 | ) | | | (0.32 | ) | | | (0.22 | ) | | | (0.38 | ) | | | (0.32 | ) | | | (0.39 | ) | | | (0.51 | ) |
From Net Realized Gain | | | (0.08 | ) | | | (0.15 | ) | | | — | | | | (0.05 | ) | | | — | | | | (0.58 | ) | | | (0.10 | ) |
| | |
| | |
| | |
| | |
| | |
| | |
| | |
| |
Total Distributions | | | (0.20 | ) | | | (0.47 | ) | | | (0.22 | ) | | | (0.43 | ) | | | (0.32 | ) | | | (0.97 | ) | | | (0.61 | ) |
| | |
| | |
| | |
| | |
| | |
| | |
| | |
| |
Paid-in Capital from Redemption Fees2 | | | 0.00 | 5 | | | 0.00 | 5 | | | 0.00 | 5 | | | 0.00 | 5 | | | 0.00 | 5 | | | — | | | | — | |
| | |
| | |
| | |
| | |
| | |
| | |
| | |
| |
Net Increase (Decrease) in Net Asset Value | | | 0.12 | | | | (0.26 | ) | | | 0.43 | | | | 0.64 | | | | (0.41 | ) | | | (0.55 | ) | | | (0.06 | ) |
| | |
| | |
| | |
| | |
| | |
| | |
| | |
| |
Net Asset Value – End of Period | | $ | 9.68 | | | $ | 9.56 | | | $ | 9.82 | | | $ | 9.39 | | | $ | 8.75 | | | $ | 9.16 | | | $ | 9.71 | |
| | |
| | |
| | |
| | |
| | |
| | |
| | |
| |
| Total Investment Return6 | | | 3.40% | (A) | | | 2.35% | | | | 6.98% | (A) | | | 12.33% | | | | (0.93)% | | | | 4.48% | | | | 5.87% | |
| Ratios to Average Net Assets: | | | | | | | | | | | | | | | | | | | | | | | | | | | | |
Expenses After Waivers and Related | | | | | | | | | | | | | | | | | | | | | | | | | | | | |
Reimbursements7 | | | 1.30% | 3(B) | | | 1.30% | 3 | | | 1.30% | 3(B) | | | 1.31% | | | | 1.33% | | | | 1.33% | | | | 1.33% | |
Expenses Before Waivers and Related | | | | | | | | | | | | | | | | | | | | | | | | | | | | |
Reimbursements7 | | | 2.31% | (B) | | | 2.38% | | | | 2.10% | (B) | | | 1.93% | | | | 2.14% | | | | 2.19% | | | | 1.97% | |
Net Investment Income After Waivers and | | | | | | | | | | | | | | | | | | | | | | | | | | | | |
Related Reimbursements7 | | | 3.30% | 3(B) | | | 3.66% | 3 | | | 4.17% | 3(B) | | | 4.11% | | | | 4.02% | | | | 4.40% | | | | 5.18% | |
Net Investment Income Before Waivers and | | | | | | | | | | | | | | | | | | | | | | | | | | | | |
Related Reimbursements | | | 2.29% | (B) | | | 2.58% | | | | 3.37% | (B) | | | 3.49% | | | | 3.21% | | | | 3.53% | | | | 4.54% | |
| Supplementary Data: | | | | | | | | | | | | | | | | | | | | | | | | | | | | |
Portfolio Turnover Rate | | | 47% | (A) | | | 57% | | | | 46% | (A) | | | 28% | | | | 39% | | | | 102% | | | | 10% | |
Net Assets at End of Period (in thousands) | | $ | 3,952 | | | $ | 4,047 | | | $ | 4,445 | | | $ | 4,615 | | | $ | 2,055 | | | $ | 2,030 | | | $ | 4,011 | |
|
| 1 | | The Fund changed its fiscal year end from March 31 to October 31. |
| 2 | | Calculated based on shares outstanding. |
| 3 | | Reflects fees waived by FBR Fund Advisers, Inc. pursuant to a contractual expense limitation of 1.05% (excluding brokerage costs, interest, taxes, acquired fund fees and expenses, dividend expenses,12b-1 fees and extraordinary expenses) and the recoupment of certain previously waived fees. |
| 4 | | The amounts shown for a share outstanding throughout the period may not be in accordance with the changes in the aggregate gains and losses on investments during the period because of the timing of sales and repurchases of Fund shares in relation to fluctuating net asset values during the period. |
| 5 | | Less than $0.01 |
| 6 | | Total investment return is calculated assuming a purchase of shares on the first day and a sale on the last day of each period reported and will include reinvestment of dividends and distributions, if any. |
| 7 | | Does not include expenses of the funds in which the Fund invests. |
| (A) | | Not Annualized |
| (B) | | Annualized |
| Financial Highlights (continued) |
| | | FBR Core Bond Fund — Institutional Class |
| | |
|
| | | For the | | | | | | For the | | | | | | | | | | | | | | | | |
| | | Six Months | | For the | | Period | | | | | | | | | | | | | | | | |
| | | Ended | | Year | | April 1, | | | | | | | | | | | | | | | | |
| | | April 30, | | Ended | | 2010 to | | For the Years Ended March 31, |
| | | 2012 | | October 31, | | October 31, | |
|
| | | (unaudited) | | 2011 | | 20101 | | 2010 | | 2009 | | 2008 | | 2007 |
| | |
| |
| |
| |
| |
| |
| |
|
| Per Share Operating Performance: | | | | | | | | | | | | | | | | | | | | | | | | | | | | |
Net Asset Value – Beginning of Period | | $ | 8.77 | | | $ | 9.05 | | | $ | 8.67 | | | $ | 8.11 | | | $ | 8.52 | | | $ | 9.10 | | | $ | 9.15 | |
| | |
| | |
| | |
| | |
| | |
| | |
| | |
| |
Income (Loss) from Investment Operations: | | | | | | | | | | | | | | | | | | | | | | | | | | | | |
Net Investment Income2 | | | 0.15 | 3 | | | 0.34 | 3 | | | 0.23 | 3 | | | 0.37 | | | | 0.35 | | | | 0.39 | | | | 0.49 | |
Net Realized and Unrealized Gain (Loss) | | | | | | | | | | | | | | | | | | | | | | | | | | | | |
on Investments2,4 | | | 0.15 | | | | (0.12 | ) | | | 0.38 | | | | 0.64 | | | | (0.42 | ) | | | 0.03 | | | | 0.05 | |
| | |
| | |
| | |
| | |
| | |
| | |
| | |
| |
Total from Investment Operations | | | 0.30 | | | | 0.22 | | | | 0.61 | | | | 1.01 | | | | (0.07 | ) | | | 0.42 | | | | 0.54 | |
| | |
| | |
| | |
| | |
| | |
| | |
| | |
| |
Distributions to Shareholders: | | | | | | | | | | | | | | | | | | | | | | | | | | | | |
From Net Investment Income | | | (0.16 | ) | | | (0.35 | ) | | | (0.23 | ) | | | (0.40 | ) | | | (0.34 | ) | | | (0.42 | ) | | | (0.49 | ) |
From Net Realized Gain | | | (0.08 | ) | | | (0.15 | ) | | | — | | | | (0.05 | ) | | | — | | | | (0.58 | ) | | | (0.10 | ) |
| | |
| | |
| | |
| | |
| | |
| | |
| | |
| |
Total Distributions | | | (0.24 | ) | | | (0.50 | ) | | | (0.23 | ) | | | (0.45 | ) | | | (0.34 | ) | | | (1.00 | ) | | | (0.59 | ) |
| | |
| | |
| | |
| | |
| | |
| | |
| | |
| |
Paid-in Capital from Redemption Fees2 | | | 0.00 | 5 | | | 0.00 | 5 | | | 0.00 | 5 | | | 0.00 | 5 | | | 0.00 | 5 | | | — | | | | — | |
| | |
| | |
| | |
| | |
| | |
| | |
| | |
| |
Net Increase (Decrease) in Net Asset Value | | | 0.06 | | | | (0.28 | ) | | | 0.38 | | | | 0.56 | | | | (0.41 | ) | | | (0.58 | ) | | | (0.05 | ) |
| | |
| | |
| | |
| | |
| | |
| | |
| | |
| |
Net Asset Value – End of Period | | $ | 8.83 | | | $ | 8.77 | | | $ | 9.05 | | | $ | 8.67 | | | $ | 8.11 | | | $ | 8.52 | | | $ | 9.10 | |
| | |
| | |
| | |
| | |
| | |
| | |
| | |
| |
| Total Investment Return6 | | | 3.52% | (A) | | | 2.62% | | | | 7.15% | (A) | | | 12.62% | | | | (0.74)% | | | | 4.78% | | | | 6.11% | |
| Ratios to Average Net Assets: | | | | | | | | | | | | | | | | | | | | | | | | | | | | |
Expenses After Waivers and Related | | | | | | | | | | | | | | | | | | | | | | | | | | | | |
Reimbursements7 | | | 1.05% | 3(B) | | | 1.05% | 3 | | | 1.05% | 3(B) | | | 1.06% | | | | 1.08% | | | | 1.08% | | | | 1.08% | |
Expenses Before Waivers and Related | | | | | | | | | | | | | | | | | | | | | | | | | | | | |
Reimbursements7 | | | 1.39% | (B) | | | 1.43% | | | | 1.47% | (B) | | | 1.69% | | | | 1.89% | | | | 1.94% | | | | 1.72% | |
Net Investment Income After Waivers and | | | | | | | | | | | | | | | | | | | | | | | | | | | | |
Related Reimbursements | | | 3.55% | 3(B) | | | 3.92% | 3 | | | 4.41% | 3(B) | | | 4.37% | | | | 4.27% | | | | 4.46% | | | | 5.44% | |
Net Investment Income Before Waivers and | | | | | | | | | | | | | | | | | | | | | | | | | | | | |
Related Reimbursements | | | 3.21% | (B) | | | 3.54% | | | | 4.00% | (B) | | | 3.74% | | | | 3.46% | | | | 3.60% | | | | 4.80% | |
| Supplementary Data: | | | | | | | | | | | | | | | | | | | | | | | | | | | | |
Portfolio Turnover Rate | | | 47% | (A) | | | 57% | | | | 46% | (A) | | | 28% | | | | 39% | | | | 102% | | | | 10% | |
Net Assets at End of Period (in thousands) | | $ | 28,616 | | | $ | 23,247 | | | $ | 24,248 | | | $ | 23,885 | | | $ | 22,053 | | | $ | 21,953 | | | $ | 13,234 | |
|
| 1 | | The Fund changed its fiscal year end from March 31 to October 31. |
| 2 | | Calculated based on average shares outstanding. |
| 3 | | Reflects fees waived by FBR Fund Advisers, Inc. pursuant to a contractual expense limitation of 1.05% (excluding brokerage costs, interest, taxes, acquired fund fees and expenses, dividend expenses,12b-1 fees and extraordinary expenses) and the recoupment of certain previously waived fees. |
| 4 | | The amounts shown for a share outstanding throughout the period may not be in accordance with the changes in the aggregate gains and losses on investments during the period because of the timing of sales and repurchases of Fund shares in relation to fluctuating net asset values during the period. |
| 5 | | Less than $0.01 |
| 6 | | Total investment return is calculated assuming a purchase of shares on the first day and a sale on the last day of each period reported and will include reinvestment of dividends and distributions, if any. |
| 7 | | Does not include expenses of the funds in which the Fund invests. |
| (A) | | Not Annualized |
| (B) | | Annualized |
| Schedule of Shareholder Expenses |
| (unaudited) |
| As a shareholder of the Funds, you incur two types of costs: (1) transaction costs, including reinvested dividends or other distributions; redemption fees; and exchange fees; and (2) ongoing costs, including investment advisory fees; distribution (12b-1) fees; and other Fund expenses. This example is intended to help you understand your ongoing costs (in dollars) of investing in the Funds and to compare these costs with the ongoing costs of investing in other mutual funds. |
| |
| The example is based on an investment of $1,000 invested at the beginning of the period and held for the entire period (November 1, 2011 through April 30, 2012). |
| |
Actual Expenses |
| |
| The table on the following page provides information about actual account values and actual expenses. You may use the information in this line, together with the amount you invested, to estimate the expenses that you paid over the period. Simply divide your account value by $1,000 (for example, an $8,600 account value divided by $1,000 = 8.6), then multiply the result by the number in the first line under the heading entitled “Expenses Paid During the Six Months Ended April 30, 2012” to estimate the expenses you paid on your account during this period. |
| Schedule of Shareholder Expenses (continued) |
| (unaudited) |
| | | | | | | | | | | | | | | Expenses Paid |
| | | Net Expense | | Beginning | | Ending | | During the |
| | | Ratio | | Account | | Account | | Six Months |
| | | Annualized | | Value | | Value | | Ended |
| | | April 30, 2012 | | November 1, 2011 | | April 30, 2012 | | April 30, 2012 |
| | |
| |
| |
| |
|
| Large Cap Fund | | | | | | | | | | | | | | | | |
Investor Class | | | 1.25 | % | | $ | 1,000.00 | | | $ | 1,090.10 | | | $ | 6.50 | |
Institutional Class | | | 1.00 | | | | 1,000.00 | | | | 1,091.40 | | | | 5.20 | |
| Mid Cap Fund | | | | | | | | | | | | | | | | |
Investor Class | | | 1.35 | | | | 1,000.00 | | | | 1,085.80 | | | | 7.00 | |
Institutional Class | | | 1.10 | | | | 1,000.00 | | | | 1,087.20 | | | | 5.71 | |
| Small Cap Fund | | | | | | | | | | | | | | | | |
Investor Class | | | 1.45 | | | | 1,000.00 | | | | 1,146.00 | | | | 7.74 | |
Institutional Class | | | 1.20 | | | | 1,000.00 | | | | 1,147.60 | | | | 6.41 | |
| Focus Fund | | | | | | | | | | | | | | | | |
Investor Class | | | 1.40 | | | | 1,000.00 | | | | 1,142.60 | | | | 7.46 | |
Institutional Class | | | 1.11 | | | | 1,000.00 | | | | 1,144.10 | | | | 5.92 | |
| Large Cap Financial Fund | | | | | | | | | | | | | | | | |
Investor Class | | | 1.56 | | | | 1,000.00 | | | | 1,168.80 | | | | 8.41 | |
| Small Cap Financial Fund | | | | | | | | | | | | | | | | |
Investor Class | | | 1.44 | | | | 1,000.00 | | | | 1,125.00 | | | | 7.61 | |
Institutional Class | | | 1.19 | | | | 1,000.00 | | | | 1,126.20 | | | | 6.29 | |
| Technology Fund | | | | | | | | | | | | | | | | |
Investor Class | | | 1.95 | | | | 1,000.00 | | | | 1,094.80 | | | | 10.16 | |
Institutional Class | | | 1.70 | | | | 1,000.00 | | | | 1,098.30 | | | | 8.87 | |
| Gas Utility Index Fund | | | | | | | | | | | | | | | | |
Investor Class | | | 0.67 | | | | 1,000.00 | | | | 1,073.90 | | | | 3.45 | |
| Balanced Fund | | | | | | | | | | | | | | | | |
Investor Class | | | 1.24 | | | | 1,000.00 | | | | 1,081.10 | | | | 6.42 | |
Institutional Class | | | 0.99 | | | | 1,000.00 | | | | 1,081.70 | | | | 5.12 | |
| Core Bond Fund | | | | | | | | | | | | | | | | |
Investor Class | | | 1.30 | | | | 1,000.00 | | | | 1,034.00 | | | | 6.57 | |
Institutional Class | | | 1.05 | | | | 1,000.00 | | | | 1,035.20 | | | | 5.31 | |
|
| * | | Expenses are equal to the Fund’s annualized expense ratio, multiplied by the average account value over the period, multiplied by the number of days in most recent fiscal half-year then divided by 366. |
| Schedule of Shareholder Expenses (continued) |
| (unaudited) |
| Hypothetical Example for Comparison Purposes |
| The table on the following page provides information about hypothetical account values and hypothetical expenses based on the Funds’ actual expense ratio and an assumed rate of return of 5% per year before expenses, which was not the Funds’ actual return. The hypothetical account values and expenses may not be used to estimate the actual ending account balance or expenses you paid for the period. You may use this information to compare the ongoing costs of investing in the Funds and other funds. To do so, compare this 5% hypothetical example with the 5% hypothetical examples that appear in the shareholder reports of the other funds. |
| Schedule of Shareholder Expenses (continued) |
| (unaudited) |
| | | | | | | | | | | | | | | Expenses Paid |
| | | Net Expense | | Beginning | | Ending | | During the |
| | | Ratio | | Account | | Account | | Six Months |
| | | Annualized | | Value | | Value | | Ended |
| | | April 30, 2012 | | November 1, 2011 | | April 30, 2012 | | April 30, 2012 |
| | |
| |
| |
| |
|
| Large Cap Fund | | | | | | | | | | | | | | | | |
Investor Class | | | 1.25 | % | | $ | 1,000.00 | | | $ | 1,018.65 | | | $ | 6.27 | |
Institutional Class | | | 1.00 | | | | 1,000.00 | | | | 1,019.89 | | | | 5.02 | |
| Mid Cap Fund | | | | | | | | | | | | | | | | |
Investor Class | | | 1.35 | | | | 1,000.00 | | | | 1,018.15 | | | | 6.77 | |
Institutional Class | | | 1.10 | | | | 1,000.00 | | | | 1,019.39 | | | | 5.52 | |
| Small Cap Fund | | | | | | | | | | | | | | | | |
Investor Class | | | 1.45 | | | | 1,000.00 | | | | 1,017.65 | | | | 7.27 | |
Institutional Class | | | 1.20 | | | | 1,000.00 | | | | 1,018.90 | | | | 6.02 | |
| Focus Fund | | | | | | | | | | | | | | | | |
Investor Class | | | 1.40 | | | | 1,000.00 | | | | 1,017.90 | | | | 7.02 | |
Institutional Class | | | 1.11 | | | | 1,000.00 | | | | 1,019.34 | | | | 5.57 | |
| Large Cap Financial Fund | | | | | | | | | | | | | | | | |
Investor Class | | | 1.56 | | | | 1,000.00 | | | | 1,017.11 | | | | 7.82 | |
| Small Cap Financial Fund | | | | | | | | | | | | | | | | |
Investor Class | | | 1.44 | | | | 1,000.00 | | | | 1,017.70 | | | | 7.22 | |
Institutional Class | | | 1.19 | | | | 1,000.00 | | | | 1,018.95 | | | | 5.97 | |
| Technology Fund | | | | | | | | | | | | | | | | |
Investor Class | | | 1.95 | | | | 1,000.00 | | | | 1,015.17 | | | | 9.77 | |
Institutional Class | | | 1.70 | | | | 1,000.00 | | | | 1,016.41 | | | | 8.52 | |
| Gas Utility Index Fund | | | | | | | | | | | | | | | | |
Investor Class | | | 0.67 | | | | 1,000.00 | | | | 1,021.53 | | | | 3.37 | |
| Balanced Fund | | | | | | | | | | | | | | | | |
Investor Class | | | 1.24 | | | | 1,000.00 | | | | 1,018.70 | | | | 6.22 | |
Institutional Class | | | 0.99 | | | | 1,000.00 | | | | 1,019.94 | | | | 4.97 | |
| Core Bond Fund | | | | | | | | | | | | | | | | |
Investor Class | | | 1.30 | | | | 1,000.00 | | | | 1,018.40 | | | | 6.52 | |
Institutional Class | | | 1.05 | | | | 1,000.00 | | | | 1,019.64 | | | | 5.27 | |
|
| * | | Expenses are equal to the Fund’s annualized expense ratio, multiplied by the average account value over the period, multiplied by the number of days in most recent fiscal half-year then divided by 366. |
| Notes to Financial Statements (unaudited) |
1. Organization |
| |
| The FBR Funds (the “Trust”) is registered under the Investment Company Act of 1940, as amended (“1940 Act”), as an open-end management investment company. The Trust was organized as a statutory trust under the laws of the State of Delaware on September 29, 2003. The Trust currently consists of the following ten series: FBR Large Cap Fund (“Large Cap Fund”), FBR Mid Cap Fund (“Mid Cap Fund”), FBR Small Cap Fund (“Small Cap Fund”), FBR Focus Fund (“Focus Fund”), FBR Large Cap Financial Fund (“Large Cap Financial Fund”), FBR Small Cap Financial Fund (“Small Cap Financial Fund”), FBR Technology Fund (“Technology Fund”), FBR Gas Utility Index Fund (“Gas Utility Index Fund”), FBR Balanced Fund (“Balanced Fund”) and FBR Core Bond Fund (“Core Bond Fund”) (each a “Fund” and collectively, the “Funds”). The Trust is authorized to issue an unlimited number of shares of beneficial interest with no par value which may be issued in more than one class or series. The Institutional Class (formerly, I Class) shares are intended for institutional investors. In all Funds, except the Balanced Fund and Core Bond Fund, the initial class of shares is now referred to as Investor Class. |
| |
| The Large Cap Fund, a non-diversified fund, invests, under normal circumstances, at least 80% of its net assets plus the amount of any borrowings for investment purposes in securities of large capitalization (“large-cap”) companies. The investment objective of the Fund is capital appreciation. |
| |
| The Mid Cap Fund, a non-diversified fund, invests, under normal circumstances, at least 80% of its net assets plus the amount of any borrowings for investment purposes in securities of mid capitalization (“mid-cap”) companies. The investment objective of the Fund is capital appreciation. |
| |
| The Small Cap Fund, a non-diversified fund, invests, under normal circumstances, at least 80% of its net assets plus the amount of any borrowings for investment purposes in securities of small capitalization (“small-cap”) companies. The investment objective of the Fund is capital appreciation. |
| |
| The Focus Fund, a non-diversified fund, invests, under normal circumstances, primarily in securities of companies traded in domestic markets. The investment objective of the Fund is capital appreciation. |
| |
| The Large Cap Financial Fund, a non-diversified fund, invests, under normal circumstances, at least 80% of its net assets plus the amount of any borrowings for investment purposes in securities of large-cap companies principally engaged in the business of financial services including, but not limited to, commercial banks, savings and loan associations, consumer and industrial finance companies, securities brokerage companies, insurance companies, real estate and leasing companies, holding companies for each of the foregoing types of business, or companies that combine some or all of these businesses. The investment objective of the Fund is capital appreciation. |
| |
| The Small Cap Financial Fund, a non-diversified fund, invests, under normal circumstances, at least 80% of its net assets plus the amount of any borrowings for |
| Notes to Financial Statements (continued) (unaudited) |
| investment purposes in securities of small-cap companies principally engaged in the business of providing financial services to consumers and industry. The investment objective of the Fund is capital appreciation. |
| |
| The Technology Fund, a non-diversified fund, invests, under normal circumstances, at least 80% of its net assets plus the amount of any borrowings for investment purposes in securities of companies that are principally engaged in the research, design, development, manufacturing or distributing products or services in the technology industry. The investment objective of the Fund is long-term capital appreciation. |
| |
| The Gas Utility Index Fund, a non-diversified fund, invests, under normal circumstances, at least 85% of its net assets in the common stock of companies that have natural gas distribution and transmission operations. The investment objective of the Fund is income and capital appreciation. |
| |
| The Balanced Fund, a diversified fund, invests in a blend of domestic common stocks, preferred stocks, convertible securities and core, high quality domestic corporate, agency and government bonds. The investment objective of the Fund is long-term capital growth and current income. |
| |
| The Core Bond Fund, a diversified fund, invests, under normal circumstances, at least 80% of its net assets in fixed income securities, which include domestic investment grade corporate, agency and governmental bonds. The investment objective of the Fund is current income with capital growth as a secondary objective. |
| |
2. Significant Accounting Policies |
| |
| The following is a summary of the Funds’ significant accounting policies: |
| |
Portfolio Valuation — The net asset value per share (“NAV”) of each Fund is determined as of the close of regular trading on the New York Stock Exchange (“NYSE”) (normally 4:00 p.m., Eastern Time) on each business day that the exchange is open for trading. Each Fund’s securities are valued at the last sale price on the securities exchange or national securities market on which such securities are primarily traded. Securities that are quoted by NASDAQ are valued at the NASDAQ Official Closing Price. Securities not listed on an exchange or national securities market, or securities in which there were no transactions, are valued at the average of the most recent bid and ask prices, except in the case of open short positions where the ask price is used for valuation purposes. The bid price is used when no ask price is available. Debt instruments and floating rate loans (other than short-term instruments), including restricted debt instruments, are generally valued at an evaluated or composite bid as provided by a third-party pricing service. Securities and other assets generally valued on the basis of information from a third-party pricing service may also be valued at a broker/dealer bid quotation. Values obtained from third-party pricing services can utilize both transaction data and market information such as yield, quality, coupon rate, maturity, type of issue, trading characteristics, and other market data. Short-term investments are carried at amortized cost, which approximates market value. Restricted securities, as well as securities or other assets for which market quotations are not readily available, or are not valued by a pricing service approved by the Funds’ Board |
| Notes to Financial Statements (continued) (unaudited) |
| of Trustees (the “Board”), are valued at fair value in good faith by, or at the direction of, the Board. |
| |
| The Funds have adopted ASC 820 “Fair Value Measurements.” This standard establishes a single authoritative definition of fair value sets out a framework for measuring fair value and requires additional disclosures about fair value measurements. |
| |
| Securities for which quotations are not readily available, are valued at their respective fair values as determined in good faith by the Board. When a security is “fair valued,” consideration is given to the facts and circumstances relevant to the particular situation, including a review of various factors set forth in the pricing procedures adopted by the Board. Fair value pricing is an inherently subjective process, and no single standard exists for determining fair value. Different funds could reasonably arrive at different values for the same security. The use of fair value pricing by a fund may cause the net asset value of its shares to differ significantly from the net asset value that would be calculated without regard to such considerations. |
| |
| As described above, the Funds utilize various methods to measure the fair value of most of its investments on a recurring basis. U.S. GAAP establishes a hierarchy that prioritizes inputs to valuation methods. The three levels of inputs are: |
| • | Level 1 – Unadjusted quoted prices in active markets for identical assets or liabilities that the Funds have the ability to access. |
| • | Level 2 – Observable inputs other than quoted prices included in Level 1 that are observable for the asset or liability, either directly or indirectly. These inputs may include quoted prices for the identical instrument on an inactive market, prices for similar instruments, interest rates, prepayment speeds, credit risk curves, default rates and similar data. |
| • | Level 3 – Unobservable inputs for the asset or liability, to the extent observable inputs are not available, representing the Funds’ own assumptions about the assumptions a market participant would use in valuing the asset or liability, and would be based on the best information available. |
| The availability of observable inputs can vary from security to security and is affected by a wide variety of factors, including, for example, the type of security, whether the security is new and not yet established in the market place, the liquidity of markets, and other characteristics particular to the security. To the extent that valuation is based on models or inputs that are less observable or unobservable in the market, the determination of fair value requires more judgment. Accordingly, the degree of judgment exercised in determining fair value is greatest for instruments categorized as Level 3. |
| |
| The inputs used to measure fair value may fall into different levels of the fair value hierarchy. In such cases, for disclosure purposes, the level in the fair value hierarchy within which the fair value measurement falls in its entirety, is determined based on the lowest level input that is significant to the fair value measurement in its entirety. |
| Notes to Financial Statements (continued) (unaudited) |
The following is a summary of the inputs used to value the Funds’ net assets as of April 30, 2012:
| | | Level 1 | | Level 2 | | Level 3 | | Total |
| | |
| |
| |
| |
|
| Large Cap Fund | | | | | | | | | | | | |
Common Stocks^ | | $ | 38,533,026 | | $ | — | | $ | — | | $ | 38,533,026 |
Short-Term Investment | | | 397,333 | | | — | | | — | | | 397,333 |
| | |
| |
| |
| |
|
| Total Investments in Securities | | | 38,930,359 | | | — | | | — | | | 38,930,359 |
| | |
| |
| |
| |
|
| Mid Cap Fund | | | | | | | | | | | | |
Common Stocks^ | | | 18,578,861 | | | — | | | — | | | 18,578,861 |
Short-Term Investment | | | 374,927 | | | — | | | — | | | 374,927 |
| | |
| |
| |
| |
|
| Total Investments in Securities | | | 18,953,788 | | | — | | | — | | | 18,953,788 |
| | |
| |
| |
| |
|
| Small Cap Fund | | | | | | | | | | | | |
Common Stocks^ | | | 37,019,229 | | | — | | | — | | | 37,019,229 |
Rights | | | — | | | — | | | 5,225 | | | 5,225 |
Short-Term Investment | | | 1,323,204 | | | — | | | — | | | 1,323,204 |
| | |
| |
| |
| |
|
| Total Investments in Securities | | | 38,342,433 | | | — | | | 5,225 | | | 38,347,658 |
| | |
| |
| |
| |
|
| Focus Fund | | | | | | | | | | | | |
Common Stocks^ | | | 688,138,911 | | | — | | | — | | | 688,138,911 |
Short-Term Investment | | | 72,317,775 | | | — | | | — | | | 72,317,775 |
| | |
| |
| |
| |
|
| Total Investments in Securities | | | 760,456,686 | | | — | | | — | | | 760,456,686 |
| | |
| |
| |
| |
|
| Large Cap Financial Fund | | | | | | | | | | | | |
Common Stocks^ | | | 64,856,965 | | | — | | | — | | | 64,856,965 |
Short-Term Investment | | | 1,896,355 | | | — | | | — | | | 1,896,355 |
| | |
| |
| |
| |
|
| Total Investments in Securities | | | 66,753,320 | | | — | | | — | | | 66,753,320 |
| | |
| |
| |
| |
|
| Small Cap Financial Fund | | | | | | | | | | | | |
Common Stocks^ | | | 175,489,874 | | | — | | | — | | | 175,489,874 |
Investment Companies | | | 7,865,850 | | | — | | | — | | | 7,865,850 |
Short-Term Investment | | | 2,450,044 | | | — | | | — | | | 2,450,044 |
| | |
| |
| |
| |
|
| Total Investments in Securities | | | 185,805,768 | | | — | | | — | | | 185,805,768 |
| | |
| |
| |
| |
|
| Technology Fund | | | | | | | | | | | | |
Common Stocks^ | | | 7,231,257 | | | — | | | — | | | 7,231,257 |
Short-Term Investment | | | 236,759 | | | — | | | — | | | 236,759 |
| | |
| |
| |
| |
|
| Total Investments in Securities | | | 7,468,016 | | | — | | | — | | | 7,468,016 |
| | |
| |
| |
| |
|
| Notes to Financial Statements (continued) (unaudited) |
| | | Level 1 | | Level 2 | | Level 3 | | Total |
| | |
| |
| |
| |
|
| Gas Utility Index Fund | | | | | | | | | | | | |
Common Stocks^ | | $ | 598,226,444 | | $ | — | | $ | — | | $ | 598,226,444 |
Short-Term Investment | | | 5,054,678 | | | — | | | — | | | 5,054,678 |
| | |
| |
| |
| |
|
| Total Investments in Securities | | | 603,281,122 | | | — | | | — | | | 603,281,122 |
| | |
| |
| |
| |
|
| Balanced Fund | | | | | | | | | | | | |
Common Stocks^ | | | 119,153,120 | | | — | | | — | | | 119,153,120 |
Corporate Bonds | | | — | | | 36,211,645 | | | — | | | 36,211,645 |
Investment Companies | | | 2,916,410 | | | — | | | — | | | 2,916,410 |
Preferred Stocks | | | 16,728 | | | — | | | — | | | 16,728 |
Short-Term Investment | | | 2,000,234 | | | — | | | — | | | 2,000,234 |
U.S. Government Agency Obligations | | | — | | | 8,908,619 | | | — | | | 8,908,619 |
U.S. Treasury Obligations | | | — | | | 33,087,249 | | | — | | | 33,087,249 |
| | |
| |
| |
| |
|
| Total Investments in Securities | | | 124,086,492 | | | 78,207,513 | | | — | | | 202,294,005 |
| | |
| |
| |
| |
|
| Core Bond Fund | | | | | | | | | | | | |
Common Stocks^ | | | 461,263 | | | — | | | — | | | 461,263 |
Convertible Preferred Stocks^ | | | 461,409 | | | — | | | — | | | 461,409 |
Corporate Bonds | | | — | | | 15,268,870 | | | — | | | 15,268,870 |
Investment Companies | | | 1,021,570 | | | — | | | — | | | 1,021,570 |
Preferred Stocks | | | 12,792 | | | — | | | — | | | 12,792 |
Short-Term Investment | | | 509,808 | | | — | | | — | | | 509,808 |
U.S. Government Agency Obligations | | | — | | | 3,308,981 | | | — | | | 3,308,981 |
U.S. Treasury Obligations | | | — | | | 10,854,002 | | | — | | | 10,854,002 |
| | |
| |
| |
| |
|
| Total Investments in Securities | | $ | 2,466,842 | | $ | 29,431,853 | | $ | — | | $ | 31,898,695 |
| | |
| |
| |
| |
|
|
| ^ | See Portfolio of Investments for industry breakout. |
There were no transfers into or out of Levels 1 and 2 during the six months ended April 30, 2012 for the Fund.
The following table reconciles the valuation of the Small Cap Fund’s Level 3 investment securities and related transactions during the six months ended April 30, 2012:
| Beginning value at 11/1/11 | | $ | 5,225 |
| Net purchases | | | — |
| Net realized loss | | | — |
| Net unrealized appreciation | | | — |
| Net transfers into Level 3 | | | — |
| | |
|
| Ending value at 4/30/12 | | | 5,225 |
| | |
|
| Market value at 4/30/12 | | | 5,225 |
| | |
|
| Net unrealized appreciation during the period on Level 3 securities held at 4/30/12 | | $ | — |
| | |
|
| Notes to Financial Statements (continued) (unaudited) |
New Accounting Pronouncements — In May 2011, the Financial Accounting Standards Board issued Accounting Standards Update (“ASU”) No. 2011-04 “Amendments to Achieve Common Fair Value Measurement and Disclosure Requirements in U.S. GAAP and International Financial Reporting Standards (“IFRS”)”. ASU 2011-04 includes common requirements for measurement of and disclosure about fair value between U.S. GAAP and IFRS. ASU 2011-04 will require reporting to entities to disclose the following information for fair value measurements categorized within Level 3 of the fair value hierarchy: quantitative information about the unobservable inputs used in the fair value measurement, the valuation processes used by the reporting entity, and a narrative description of the sensitivity of the fair value measurement to changes in observable inputs and the interrelationships between those unobservable inputs. In addition, ASU 2011-04 will require reporting to entities to make disclosures about amounts and reasons for all transfers in and out of Level 1 and Level 2 fair value measurements. The new and revised disclosures are effective for interim and annual reporting periods beginning after December 15, 2011. At this time, management is evaluating the implications of ASU 2011-04 and its impact on the financial statements.
Share Valuation — The NAV of each Fund is calculated by dividing the sum of the value of the securities held by each Fund, plus cash or other assets, minus all liabilities (including estimated accrued expenses) by the total number of shares outstanding of each Fund, rounded to the nearest cent. Each Fund’s shares will not be priced on the days on which the NYSE is closed for trading. The offering and redemption price per share of each Fund is equal to each Fund’s NAV. The Funds charge a 1% redemption fee on shares redeemed or exchanged within 90 days of purchase. These fees are deducted from the redemption proceeds otherwise payable to the shareholder. The Funds will retain the fee charged as paid-in capital and such fees become part of that Fund’s daily NAV calculation.
Investment Income — Dividend income is recorded on the ex-dividend date. Interest income, which includes the amortization of premium and accretion of discount, if any, is recorded on an accrual basis.
Expenses — The Funds pay all operational expenses, which are either charged directly to a Fund for which the expense is attributable or are allocated proportionately among the Funds based on allocation methods approved by the Board.
Allocations — Investment income earned, realized capital gains and losses, and unrealized appreciation and depreciation for the Funds are allocated daily to each class of shares based upon its proportionate share of total net assets of the Fund. Class specific expenses are charged directly to the class incurring the expense. Common expenses, which are not attributable to a specific class, are allocated daily to each class of shares based upon its proportionate share of total net assets of the Fund. Expenses not directly billed to a Fund are allocated proportionally among all Funds daily in relation to net assets of each Fund or another reasonable measure.
Dividends and Distributions to Shareholders — Each Fund, except the Gas Utility Index Fund, Balanced Fund and Core Bond Fund, declares and pays any dividends from its net investment income, if any, annually. The Gas Utility Index Fund and Balanced Fund
| Notes to Financial Statements (continued) (unaudited) |
declare and pay any such dividends quarterly. The Core Bond Fund declares and pays net investment income, if any, monthly. Distributions from net realized capital gains, if any, will be distributed at least annually for each Fund. Income and capital gain distributions are determined in accordance with U.S. federal income tax regulations.
Security Transactions — Security transactions are accounted for on the trade date. Securities sold are determined on a specific identification basis.
Estimates — The preparation of financial statements in accordance with U.S. generally accepted accounting principles requires management to make estimates and assumptions that may affect the reported amounts of assets and liabilities and disclosure of contingent assets and liabilities at the date of the financial statements and the reported amounts of income and expenses during the reporting period. Actual results could differ from those estimates.
Repurchase Agreements — The Funds have agreed to purchase securities from financial institutions subject to the seller’s agreement to repurchase them at an agreed-upon time and price (“repurchase agreement”). The financial institutions with whom each Fund enters into repurchase agreements are banks and broker/dealers which the adviser considers creditworthy pursuant to criteria approved by the Board. The seller under a repurchase agreement will be required to maintain the value of the securities as collateral, subject to the agreement at not less than the repurchase price plus accrued interest. The adviser marks to market daily the value of the collateral, and, if necessary, requires the seller to maintain additional securities, to ensure that the value is not less than the repurchase price. Default by or bankruptcy of the seller would, however, expose each Fund to possible loss because of adverse market action or delays in connection with the disposition of the underlying securities.
3. Risk Factors
Equity Investments — Because each of the Funds invests in equity securities, fluctuations in the stock market in general, as well as in the value of particular equity securities held by a Fund, can affect the Fund’s performance. The value of equity securities will fluctuate due to many factors, including the past and predicted earnings of the issuer, the quality of the issuer’s management, general market conditions, and forecasts for the issuer’s industry and the value of the issuer’s assets.
IPO Investments — IPO shares are subject to market risk and liquidity risk. The market value of IPO shares will fluctuate considerably due to facts such as the absence of a prior public market, unseasoned trading, the small number of shares available for trading and limited public information about the issuer. The purchase of IPO shares may involve high transaction costs. When a fund’s asset base is small, a significant portion of the fund’s performance could be attributable to investments in IPOs, because such investments would have a magnified impact on the fund.
Temporary Defensive Position — Each of the Funds may, from time to time, take temporary defensive positions in response to adverse market, economic, political or other
| Notes to Financial Statements (continued) (unaudited) |
conditions. To the extent the assets of a Fund are invested in temporary defensive positions, the Fund may not achieve its investment objective. For temporary defensive purposes, the Fund may invest in cash and/or short-term obligations.
Industry Concentration — Because of their narrow focus, the Large Cap Financial Fund and the Small Cap Financial Fund (“Financial Funds”), the Technology Fund and the Gas Utility Index Fund are tied closely to and affected by the financial services, technology, and natural gas distribution and transmission industries, respectively. The value of the Funds may be subject to greater volatility than funds with portfolios that are less concentrated.
Investments in Derivatives — Each Fund, except the Gas Utility Index Fund, Balanced Fund and Core Bond Fund, may engage in derivative instruments such as options, futures and forward foreign currency exchange contracts. Derivative instruments are instruments that derive their value from a different underlying security, index or financial indicator. A Fund may use derivatives for either hedging or non-hedging purposes, or for both purposes, including for purposes of enhancing return. Investing for non-hedging purposes may be considered speculative and involve additional risks.
Foreign Investments — Investing in foreign securities presents unique investment risks. The value of securities denominated in or indexed to foreign currencies, and of dividends and interest from such securities, can change significantly when foreign currencies strengthen or weaken relative to the U.S. dollar. Many foreign countries lack uniform accounting and disclosure standards comparable to those applicable to U.S. companies, and it may be more difficult to obtain reliable information regarding an issuer’s financial condition and operations. The Fund may invest in both sponsored and unsponsored ADRs which are receipts issued by a U.S. bank or trust company evidencing ownership of an indirect interest in underlying securities issued by a foreign issuer. In a sponsored ADR arrangement, the non-U.S. issuer assumes the obligation to pay some or all of the depositary’s transaction fees. Under an unsponsored ADR arrangement, the non-U.S. issuer assumes no obligations and the depositary’s transaction fees are paid directly by the ADR holders. Because unsponsored ADR arrangements are organized independently and without the cooperation of the issuer of the underlying securities, available information concerning the non-U.S. issuer may not be as current as for sponsored ADRs and voting rights with respect to the deposited securities are not passed through.
Debt Investments — The yields and principal values of debt securities will also fluctuate. Generally, values of debt securities change inversely with interest rates. That is, as interest rates go up, the values of debt securities tend to go down and vice versa. Furthermore, these fluctuations tend to increase as a bond’s maturity increases such that a longer term bond will increase or decrease more for a given change in interest rates than a shorter term bond.
High Yield Investments — The Funds may invest a small portion of their assets in lower-rated, high-yielding bonds (commonly known as “junk bonds”). These bonds have a greater degree of default risk than higher-rated bonds. Default risk is the possibility that the issuer of a debt security will fail to make timely payments of principal or interest to the Funds.
| Notes to Financial Statements (continued) (unaudited) |
Mortgage-Backed and Asset-Backed Securities Investments — The Balanced Fund and Core Bond Fund may invest in mortgage and asset-backed securities that are subject to prepayment risk, which is the risk that the borrower will prepay some or all of the principal owed to the issuer. If prepayment occurs, the Funds may have to replace the security by investing the proceeds in a less attractive security. This may reduce a Fund’s share price and income distribution.
Market Risks — Loss of money is a risk of investing in the Funds. The net asset value of the Funds can be expected to change daily and you may lose money. As with any mutual fund, there is no guarantee that the Funds’ performance will be positive over any period of time, either short-term or long-term. A Fund’s success depends largely on the Adviser’s ability to select favorable investments. Also, different types of investments shift in and out of favor depending on market and economic conditions. For example, at various times stocks will be more or less favorable than bonds and small-cap or mid-cap stocks will be more or less favorable than large-cap company stocks. Because of this, the Funds may perform better or worse than other types of funds depending on what is in “favor.”
Mid-Cap and Small-Cap Investments — Investing in the securities of mid-cap and small-cap companies generally involves greater risk than investing in larger, more established companies. This greater risk is, in part, attributable to the fact that the securities of mid-cap and small-cap companies usually have more limited marketability. Because mid-cap and small-cap companies have fewer shares outstanding than larger companies, it also may be more difficult to buy or sell significant amounts of such shares without unfavorable impact on prevailing prices. Additionally, securities of mid-cap and small-cap companies are typically subject to greater changes in earnings and business prospects than are larger, more established companies and typically there is less publicly available information concerning mid-cap and small-cap companies than for larger, more established companies. Although investing in securities of mid-cap and small-cap companies offers potential above-average returns if the companies are successful, there is a risk that companies will not succeed and the prices of the companies’ shares could significantly decline in value.
Securities of mid-cap and small-cap companies, especially those whose business involves emerging products or concepts, may be more volatile due to their limited product lines, markets or financial resources and may lack management depth. Securities of mid-cap and small-cap companies also may be more volatile than larger companies or the market averages in general because of their general susceptibility to economic downturns, especially in the financial services group of industries where changes in interest rates and demand for financial services are so closely tied to the economy.
Non-Diversification — The Funds, except the Balanced Fund and Core Bond Fund, are classified as a “non-diversified” investment companies under the 1940 Act, which means each Fund may own larger positions in a smaller number of securities. A fund that is less diversified may be more susceptible to adverse economic, political, or regulatory developments affecting a single issuer than a fund that is more broadly diversified. However, each Fund intends to qualify for treatment as a regulated investment company under the Internal Revenue Code of 1986, as amended, which requires that, among other things, at the close of each quarter of each Fund’s taxable year, a Fund may not (1) with
| Notes to Financial Statements (continued) (unaudited) |
respect to 50% of its total assets, invest more than 5% of its total assets in the securities of any one issuer or own more than 10% of outstanding voting securities of any one issuer, or (2) invest more than 25% of the value of its total assets in securities of any one issuer. These limits do not apply to U.S. Government securities or securities of other registered investment companies.
Real Estate-Related Risk — Because the Small Cap Financial Fund focuses on financial services companies that may invest in real estate, the Fund is subject to the risks associated with ownership of real estate and with the real estate industry in general. Real estate values (and the values of real estate-related securities) fluctuate with changes in general and local economic conditions and are particularly sensitive to economic downturns. Real estate values are also affected by changes in interest rates and governmental actions such as tax and zoning changes.
Index Tracking — While the Gas Utility Index Fund seeks to track the performance of the American Gas Association Index (“Index”) as closely as possible, the Fund’s return may not always be able to match or achieve a high correlation with the return of the Index due to such factors as the various expenses incurred by the Fund, such as management fees, transaction costs and other operating expenses which are not incurred by the Index. In addition, the Fund may not be fully invested at all times in the Index as a result of cash flows into the Fund or reserves of cash that are maintained in order to meet redemption requests and cover operating expenses.
4. Credit Facility
U.S. Bank, N.A. (the “Bank”) has made available to The FBR Funds a credit facility pursuant to a separate Loan and Security Agreement for temporary or extraordinary purposes. For the six months ended April 30, 2012, the average interest rate on the outstanding principal amount was 3.25%. Advances are not collateralized by a first lien against each Fund’s assets. During the six months ended April 30, 2012, the Large Cap Fund, Large Cap Financial Fund, and Gas Utility Index Fund had an outstanding average daily loan balance of $3,071, $1,093, and $8,027, respectively. Interest expense amounted to $67 for the Large Cap Fund, $18 for Large Cap Financial Fund, and $132 for Gas Utility Index Fund. At April 30, 2012, The FBR Funds did not have a loan payable balance.
5. Transactions with Affiliates
Investment Adviser — FBR Fund Advisers, Inc. (“Fund Advisers”) serves as investment adviser to the Funds. For its advisory services, Fund Advisers receives a monthly fee at an annual rate of 0.90% of the average daily net assets of the Large Cap Fund, Mid Cap Fund, Small Cap Fund, Focus Fund, Large Cap Financial Fund, Small Cap Financial Fund, and Technology Fund, at an annual rate of 0.40% of the average daily net assets of the Gas Utility Index Fund, and at an annual rate of 0.80% of the average daily net assets of the Balanced Fund and Core Bond Fund.
Fund Advisers has contractually agreed to limit each class of shares of each Fund’s total operating expenses and to maintain these limitations with regard to each class of shares of each Fund through February 28, 2015. The following are the limits for the Funds, based on
| Notes to Financial Statements (continued) (unaudited) |
average daily net assets (excluding interest, taxes, brokerage commissions, dividend expenses, acquired fund fees and expenses, extraordinary legal expenses, or any other extraordinary expenses, and for the Balanced Fund and Core Bond Fund, also excluding 12b-1 fees):
| | | Investor Class | | Institutional Class |
| | |
| |
|
| Large Cap Fund | | | 1.25 | % | | | 1.00 | % |
| Mid Cap Fund | | | 1.35 | % | | | 1.10 | % |
| Small Cap Fund | | | 1.45 | % | | | 1.20 | % |
| Focus Fund | | | 1.95 | % | | | 1.70 | % |
| Large Cap Financial Fund | | | 1.95 | % | | | NA | |
| Small Cap Financial Fund | | | 1.95 | % | | | 1.70 | % |
| Technology Fund | | | 1.95 | % | | | 1.70 | % |
| Gas Utility Index Fund | | | 0.85 | % | | | NA | |
| Balanced Fund | | | 1.08 | %* | | | 1.08 | % |
| Core Bond Fund | | | 1.05 | %* | | | 1.05 | % |
|
| * | Amount shown excludes the 12b-1 fee. Including the 12b-1 fee, the amounts are 1.33% and 1.30% for the Balanced Fund and Core Bond Fund, respectively. |
In addition, with respect to the Balanced Fund, Fund Advisers has also agreed to voluntarily limit fees and/or pay expenses in amounts necessary in order to limit the total annual operating expenses of the Balanced Fund, after any such fee waivers and/or expense reimbursements, to 0.99% (excluding 12b-1 fees, brokerage costs, interest, taxes, acquired fund fees and expenses, dividend expenses, and extraordinary expenses such as litigation and merger or reorganization costs and other expenses not incurred in the ordinary course of such Fund’s business), for the period until February 28, 2013. Thereafter, Fund Advisers may either renew or terminate these voluntary arrangements at any time. The fee reductions and expenses reimbursed are reflected as a reduction of total expenses in the Statement of Operations.
Fund Advisers may recoup any waived amount from a Fund pursuant to this agreement if such reimbursement does not cause the Fund to exceed existing expense limitations and the reimbursement is made within three years after the year in which the Adviser incurred the expense.
As of April 30, 2012, the Funds had the following amounts (and year of expiration) subject to repayment to Fund Advisers:
| | | Year Fees | | | Repayment | | | |
| | | Waived | | | Expires | | Balance |
| | |
| | |
| |
|
| Large Cap Fund - Investor Class | | 2009 | | | 2012 | | $ | 112,398 |
| | | 2010 | | | 2013 | | | 113,013 |
| | | 2011 | | | 2014 | | | 91,641 |
| | | 2012 | | | 2015 | | | 31,924 |
| Large Cap Fund - Institutional Class | | 2009 | | | 2012 | | | 11,563 |
| | | 2010 | | | 2013 | | | 90,332 |
| | | 2011 | | | 2014 | | | 105,923 |
| | | 2012 | | | 2015 | | | 51,238 |
| Notes to Financial Statements (continued) (unaudited) |
| | Year Fees | | | Repayment | | | |
| | Waived | | | Expires | | Balance |
| |
| | |
| |
|
| Mid Cap Fund - Investor Class | | 2009 | | | 2012 | | $ | 99,322 |
| | | 2010 | | | 2013 | | | 88,626 |
| | | 2011 | | | 2014 | | | 69,622 |
| | | 2012 | | | 2015 | | | 33,066 |
| Mid Cap Fund - Institutional Class | | 2009 | | | 2012 | | | 11,525 |
| | | 2010 | | | 2013 | | | 64,899 |
| | | 2011 | | | 2014 | | | 56,181 |
| | | 2012 | | | 2015 | | | 34,955 |
| Small Cap Fund - Investor Class | | 2009 | | | 2012 | | | 92,582 |
| | | 2010 | | | 2013 | | | 120,555 |
| | | 2011 | | | 2014 | | | 88,688 |
| | | 2012 | | | 2015 | | | 48,384 |
| Small Cap Fund - Institutional Class | | 2009 | | | 2012 | | | 11,387 |
| | | 2010 | | | 2013 | | | 26,712 |
| | | 2011 | | | 2014 | | | 26,497 |
| | | 2012 | | | 2015 | | | 15,022 |
| Technology Fund - Investor Class | | 2009 | | | 2012 | | | 72,289 |
| | | 2010 | | | 2013 | | | 53,589 |
| | | 2011 | | | 2014 | | | 61,168 |
| | | 2012 | | | 2015 | | | 36,851 |
| Technology Fund - Institutional Class | | 2010 | | | 2013 | | | 23,699 |
| | | 2011 | | | 2014 | | | 27,071 |
| | | 2012 | | | 2015 | | | 15,661 |
| Balanced Fund | | 2009 | | | 2012 | | | 387,497 |
| | | 2010* | | | 2013 | | | 356,740 |
| | | 2010** | | | 2013 | | | 136,427 |
| | | 2011 | | | 2014 | | | 188,312 |
| | | 2012 | | | 2015 | | | 50,949 |
| Core Bond Fund | | 2009 | | | 2012 | | | 210,127 |
| | | 2010* | | | 2013 | | | 177,887 |
| | | 2010** | | | 2013 | | | 80,808 |
| | | 2011 | | | 2014 | | | 132,417 |
| | | 2012 | | | 2015 | | | 59,714 |
|
| * | Fund Advisers earned a total of $36,325 and $11,904 and of that they waived $7,103 and $2,441 in the Balanced and Core Bond Funds, respectively for the period from March 13, 2010 through March 31, 2010. |
| ** | For the seven months ended October 31, 2010. |
Fee reductions and expenses reimbursed are reflected as a reduction of total expenses in the Statement of Operations.
In connection with certain expense limitation arrangements between the Balanced Fund, Core Bond Fund and Fund Advisers, these Funds have agreed to pay Fund Advisers for certain amounts waived and/or reimbursed by AFBA pursuant to an expense limitation agreement, as assigned, provided that such repayment does not cause the total fund operating expenses for a Fund to exceed certain specified limits and the repayment is made within three years after the year in which AFBA incurred the expense.
| Notes to Financial Statements (continued) (unaudited) |
Fund Advisers has entered into an investment sub-advisory agreement with Financial Counselors whereby it pays the sub-advisor 0.27% per annum of the assets it manages in the Balanced Fund and the Core Bond Fund. For the fiscal year ended October 31, 2012, Financial Counselors has voluntarily agreed to reduce its sub-advisory fee with respect to the Core Bond Fund to 0.15% of that Fund’s average daily net assets. Fund Advisers has also entered into an investment sub-advisory agreement with London Company whereby it pays the sub-advisor 0.33% per annum of the assets it manages.
The Funds are not responsible for paying the sub-advisory fee.
Administrator — U.S. Bancorp Fund Services, LLC (“USBFS”), serves as the Funds’ Administrator (the “Administrator”) and, in that capacity, performs various administrative services for the Fund. USBFS also serves as the Funds’ fund accountant, transfer agent, dividend disbursing agent and registrar. The Administrator prepares various federal and state regulatory filings, reports and returns for the Funds; prepares reports and materials to be supplied to the trustees; monitors the activities of the Funds’ custodian, transfer agent and accountants; coordinates the preparation and payment of Fund expenses and reviews the Funds’ expense accruals.
Pursuant to the Administrative Services Agreement, Fund Advisers also provides administrative services to the Funds including oversight of service providers. For the six months ended April 30, 2012, Fund Advisers received 0.04% of average daily net assets of the Trust. Fund Advisers also provides the Funds with office space, facilities and business equipment and generally administers the Funds’ business affairs and provides the services of executive and clerical personnel for administering the affairs of the Funds. Fund Advisers compensates all personnel, Officers and Trustees of the Funds if such persons are employees of Fund Advisers. For the six months ended April 30, 2012, USBFS earned $282,579 and Fund Advisers earned $353,894 in administration fees.
Plan of Distribution — The Trust, on behalf of the Investor Class shares of each Fund, except the Gas Utility Index Fund, has adopted a Distribution Plan (the “Plan”) pursuant to Rule 12b-1 under the 1940 Act. Under the Plan, each Fund pays FBR Investment Services, Inc. (the “Distributor”) a fee at an annual rate of up to 0.25% of each Fund’s average daily net assets attributable to Investor Class shares. Fees paid to the Distributor under the Plan are payable without regard to actual expenses incurred.
Brokerage Commissions — For the six months ended April 30, 2012, the Small Cap Financial Fund and the Large Cap Financial Fund paid $10,440 and $1,450, respectively, in brokerage commissions from portfolio transactions to FBR Capital Markets & Co. (“FBR & Co.”), an affiliate of Fund Advisers and the Distributor. No other Fund paid commissions to FBR & Co. during the year.
Trustees’ Fees — Each Trustee of the Trust who is not an employee or affiliate of Fund Advisers receives an annual retainer fee of $25,000 and an additional meeting fee of $2,500 for each regular meeting attended. In addition, each Trustee that serves on the Audit Committee or Nominating Committee receives a meeting fee of $1,000 for attendance at the meeting. If a Trustee participates by teleconference, the meeting fee is
| Notes to Financial Statements (continued) (unaudited) |
$1,000. The Chairman of the Board, an Independent Trustee, receives an additional $2,000 for each meeting attended, and the Audit Committee Chairman receives an additional $1,000 for each committee meeting attended.
6. Investment Transactions
For the six months ended April 30, 2012, purchases and sales of investment securities (excluding short-term securities and U.S. government obligations) for each Fund were as follows:
| | | Purchases | | Sales |
| | |
| |
|
| | | | | | | Investments | | | | | | Investments |
| | | U.S. | | (non-U.S. | | U.S. | | (non-U.S. |
| | | Government | | Government | | Government | | Government |
| | | securities | | securities) | | securities | | securities) |
| | |
| |
| |
| |
|
| Large Cap Fund | | $ | — | | | $ | 9,399,269 | | | $ | — | | | $ | 12,137,730 | |
| Mid Cap Fund | | | — | | | | 1,192,614 | | | | — | | | | 1,426,215 | |
| Small Cap Fund | | | — | | | | 8,729,747 | | | | — | | | | 14,784,739 | |
| Focus Fund | | | — | | | | 77,678,437 | | | | — | | | | 105,401,370 | |
| Large Cap Financial Fund | | | — | | | | 20,560,151 | | | | — | | | | 18,338,460 | |
| Small Cap Financial Fund | | | — | | | | 44,625,943 | | | | — | | | | 41,339,030 | |
| Technology Fund | | | — | | | | 4,142,530 | | | | — | | | | 4,139,021 | |
| Gas Utility Index Fund | | | — | | | | 211,461,500 | | | | — | | | | 58,888,930 | |
| Balanced Fund | | | 43,602,256 | | | | 59,724,095 | | | | 17,686,845 | | | | 5,725,437 | |
| Core Bond Fund | | | 15,301,373 | | | | 1,706,549 | | | | 9,498,515 | | | | 3,220,482 | |
| Notes to Financial Statements (continued) (unaudited) |
| |
| 7. Capital Share Transactions |
| | | FBR Large Cap Fund | | FBR Mid Cap Fund | | FBR Small Cap Fund |
| | |
| |
| |
|
| | | For the | | For the | | For the | | For the | | For the | | For the |
| | | Six Months | | Year | | Six Months | | Year | | Six Months | | Year |
| | | Ended | | Ended | | Ended | | Ended | | Ended | | Ended |
| | | April 30, | | October 31, | | April 30, | | October 31, | | April 30, | | October 31, |
| | | 2012 | | 2011 | | 2012 | | 2011 | | 2012 | | 2011 |
| | |
| |
| |
| |
| |
| |
|
| | | | | | | | | | | | | | | | | | | | | | | | | | | | | | | |
| Capital Transactions: | | | | | | | | | | | | | | | | | | | | | | | | | | | | | | |
| Investor Class | | | | | | | | | | | | | | | | | | | | | | | | | | | | | | |
Proceeds from Sale of Shares | | | $ | 916,153 | | | | $ | 4,772,698 | | | | $ | 1,001,346 | | | | $ | 5,439,122 | | | | $ | 6,323,091 | | | | $ | 15,243,918 | |
Reinvestment of Distributions | | | | 11,848 | | | | | 49,419 | | | | | 929 | | | | | 16,440 | | | | | — | | | | | 97,256 | |
Cost of Shares Redeemed | | | | (3,090,070 | ) | | | | (10,219,163 | ) | | | | (1,450,210 | ) | | | | (5,276,893 | ) | | | | (6,940,386 | ) | | | | (16,784,652 | ) |
Redemption Fees | | | | 269 | | | | | 1,433 | | | | | 169 | | | | | 7,101 | | | | | 500 | | | | | 7,595 | |
| | | |
| | | |
| | | |
| | | |
| | | |
| | | |
| |
Investor Class Transactions | | | $ | (2,161,800 | ) | | | $ | (5,395,613 | ) | | | $ | (447,766 | ) | | | $ | 185,770 | | | | $ | (616,795 | ) | | | $ | (1,435,883 | ) |
| | | |
| | | |
| | | |
| | | |
| | | |
| | | |
| |
| Institutional Class | | | | | | | | | | | | | | | | | | | | | | | | | | | | | | |
Proceeds from Sale of Shares | | | $ | 257,091 | | | | $ | 469,933 | | | | $ | 173,718 | | | | $ | 1,467,762 | | | | $ | 283,813 | | | | $ | 7,641,732 | |
Reinvestment of Distributions | | | | 53,582 | | | | | 38,467 | | | | | 9,427 | | | | | 6,088 | | | | | — | | | | | 14,633 | |
Cost of Shares Redeemed | | | | (2,157,843 | ) | | | | (4,570,331 | ) | | | | (1,179,084 | ) | | | | (2,345,637 | ) | | | | (5,346,013 | ) | | | | (6,010,244 | ) |
Redemption Fees | | | | 65 | | | | | 73 | | | | | — | | | | | 26 | | | | | 3 | | | | | 890 | |
| | | |
| | | |
| | | |
| | | |
| | | |
| | | |
| |
Institutional Class Transactions | | | $ | (1,847,105 | ) | | | $ | (4,061,858 | ) | | | $ | (995,939 | ) | | | $ | (871,761 | ) | | | $ | (5,062,197 | ) | | | $ | 1,647,011 | |
| | | |
| | | |
| | | |
| | | |
| | | |
| | | |
| |
| Net Increase (Decrease) from | | | | | | | | | | | | | | | | | | | | | | | | | | | | | | |
Capital Transactions | | | $ | (4,008,905 | ) | | | $ | (9,457,471 | ) | | | $ | (1,443,705 | ) | | | $ | (685,991 | ) | | | $ | (5,678,992 | ) | | | $ | 211,128 | |
| | | |
| | | |
| | | |
| | | |
| | | |
| | | |
| |
| Share Transactions: | | | | | | | | | | | | | | | | | | | | | | | | | | | | | | |
| Investor Class | | | | | | | | | | | | | | | | | | | | | | | | | | | | | | |
Sold | | | | 79,098 | | | | | 409,996 | | | | | 78,998 | | | | | 432,462 | | | | | 484,126 | | | | | 1,178,980 | |
Issued in Reinvestment of Distributions | | | | 1,065 | | | | | 4,279 | | | | | 77 | | | | | 1,339 | | | | | — | | | | | 7,850 | |
Redeemed | | | | (261,012 | ) | | | | (889,146 | ) | | | | (115,171 | ) | | | | (443,729 | ) | | | | (530,822 | ) | | | | (1,317,772 | ) |
| | | |
| | | |
| | | |
| | | |
| | | |
| | | |
| |
Change in Investor Class Shares | | | | (180,849 | ) | | | | (474,871 | ) | | | | (36,096 | ) | | | | (9,928 | ) | | | | (46,696 | ) | | | | (130,942 | ) |
| | | |
| | | |
| | | |
| | | |
| | | |
| | | |
| |
| Institutional Class | | | | | | | | | | | | | | | | | | | | | | | | | | | | | | |
Sold | | | | 25,535 | | | | | 46,595 | | | | | 15,929 | | | | | 133,364 | | | | | 23,165 | | | | | 643,639 | |
Issued in Reinvestment of | | | | | | | | | | | | | | | | | | | | | | | | | | | | | | |
Distributions | | | | 5,605 | | | | | 3,850 | | | | | 904 | | | | | 572 | | | | | — | | | | | 1,314 | |
Redeemed | | | | (212,930 | ) | | | | (437,682 | ) | | | | (102,313 | ) | | | | (209,215 | ) | | | | (454,768 | ) | | | | (539,255 | ) |
| | | |
| | | |
| | | |
| | | |
| | | |
| | | |
| |
Change in Institutional Class Shares | | | | (181,790 | ) | | | | (387,237 | ) | | | | (85,480 | ) | | | | (75,279 | ) | | | | (431,603 | ) | | | | 105,698 | |
| | | |
| | | |
| | | |
| | | |
| | | |
| | | |
| |
| Net Increase (Decrease) from | | | | | | | | | | | | | | | | | | | | | | | | | | | | | | |
Shares Transactions | | | | (362,639 | ) | | | | (862,108 | ) | | | | (121,576 | ) | | | | (85,207 | ) | | | | (478,299 | ) | | | | (25,244 | ) |
| | | |
| | | |
| | | |
| | | |
| | | |
| | | |
| |
132
| Notes to Financial Statements (continued) (unaudited) |
| | | | | | | | | | | | | FBR Large Cap | | FBR Small Cap |
| | | FBR Focus Fund | | Financial Fund | | Financial Fund |
| | |
| |
| |
|
| | | For the | | For the | | For the | | For the | | For the | | For the |
| | | Six Months | | Year | | Six Months | | Year | | Six Months | | Year |
| | | Ended | | Ended | | Ended | | Ended | | Ended | | Ended |
| | | April 30, | | October 31, | | April 30, | | October 31, | | April 30, | | October 31, |
| | | 2012 | | 2011 | | 2012 | | 2011 | | 2012 | | 2011 |
| | |
| |
| |
| |
| |
| |
|
| | | | | | | | | | | | | | | | | | | | | | | | | | | | | | | |
| Capital Transactions: | | | | | | | | | | | | | | | | | | | | | | | | | | | | | | |
| Investor Class | | | | | | | | | | | | | | | | | | | | | | | | | | | | | | |
Proceeds from Sale of Shares | | | $ | 76,290,270 | | | | $ | 116,123,991 | | | | $ | 12,247,787 | | | | $ | 32,559,261 | | | | $ | 15,379,219 | | | | $ | 94,080,317 | |
Reinvestment of Distributions | | | | 61,703,733 | | | | | 23,268,243 | | | | | — | | | | | — | | | | | 2,505,214 | | | | | 2,253,869 | |
Cost of Shares Redeemed | | | | (77,145,943 | ) | | | | (224,540,946 | ) | | | | (10,502,433 | ) | | | | (18,686,609 | ) | | | | (29,734,589 | ) | | | | (139,356,467 | ) |
Redemption Fees | | | | 16,407 | | | | | 83,237 | | | | | 6,882 | | | | | 13,849 | | | | | 12,532 | | | | | 95,673 | |
| | | |
| | | |
| | | |
| | | |
| | | |
| | | |
| |
Investor Class Transactions | | | $ | 60,864,467 | | | | $ | (85,065,475 | ) | | | $ | 1,752,236 | | | | $ | 13,886,501 | | | | $ | (11,837,624 | ) | | | $ | (42,926,608 | ) |
| | | |
| | | |
| | | |
| | | |
| | | |
| | | |
| |
| Institutional Class | | | | | | | | | | | | | | | | | | | | | | | | | | | | | | |
Proceeds from Sale of Shares | | | $ | 14,535,432 | | | | $ | 28,327,587 | | | | $ | — | | | | $ | — | | | | $ | 8,854,546 | | | | $ | 12,177,273 | |
Reinvestment of Distributions | | | | 4,808,848 | | | | | 1,290,549 | | | | | — | | | | | — | | | | | 541,245 | | | | | 504,775 | |
Cost of Shares Redeemed | | | | (7,137,869 | ) | | | | (18,537,026 | ) | | | | — | | | | | — | | | | | (3,102,179 | ) | | | | (13,971,672 | ) |
Redemption Fees | | | | 433 | | | | | 3,239 | | | | | — | | | | | — | | | | | 274 | | | | | 2,927 | |
| | | |
| | | |
| | | |
| | | |
| | | |
| | | |
| |
Institutional Class Transactions | | | $ | 12,206,844 | | | | $ | 11,084,349 | | | | $ | — | | | | $ | — | | | | $ | 6,293,886 | | | | $ | (1,286,697 | ) |
| | | |
| | | |
| | | |
| | | |
| | | |
| | | |
| |
| Net Increase (Decrease) from | | | | | | | | | | | | | | | | | | | | | | | | | | | | | | |
Capital Transactions | | | $ | 73,071,311 | | | | $ | (73,981,126 | ) | | | $ | 1,752,236 | | | | $ | 13,886,501 | | | | $ | (5,543,738 | ) | | | $ | (44,213,305 | ) |
| | | |
| | | |
| | | |
| | | |
| | | |
| | | |
| |
| Share Transactions: | | | | | | | | | | | | | | | | | | | | | | | | | | | | | | |
| Investor Class | | | | | | | | | | | | | | | | | | | | | | | | | | | | | | |
Sold | | | | 1,576,805 | | | | | 2,351,234 | | | | | 957,913 | | | | | 2,347,452 | | | | | 880,904 | | | | | 4,827,202 | |
Issued in Reinvestment of | | | | | | | | | | | | | | | | | | | | | | | | | | | | | | |
Distributions | | | | 1,379,779 | | | | | 473,509 | | | | | — | | | | | — | | | | | 151,831 | | | | | 116,283 | |
Redeemed | | | | (1,594,843 | ) | | | | (4,651,789 | ) | | | | (835,346 | ) | | | | (1,455,102 | ) | | | | (1,726,928 | ) | | | | (7,556,513 | ) |
| | | |
| | | |
| | | |
| | | |
| | | |
| | | |
| |
Change in Investor Class Shares | | | | 1,361,741 | | | | | (1,827,046 | ) | | | | 122,567 | | | | | 892,350 | | | | | (694,193 | ) | | | | (2,613,028 | ) |
| | | |
| | | |
| | | |
| | | |
| | | |
| | | |
| |
| Institutional Class | | | | | | | | | | | | | | | | | | | | | | | | | | | | | | |
Sold | | | | 300,849 | | | | | 909,520 | | | | | — | | | | | — | | | | | 793,689 | | | | | 950,220 | |
Issued in Reinvestment of | | | | | | | | | | | | | | | | | | | | | | | | | | | | | | |
Distributions | | | | 106,958 | | | | | 26,215 | | | | | — | | | | | — | | | | | 52,043 | | | | | 40,309 | |
Redeemed | | | | (147,545 | ) | | | | (662,843 | ) | | | | — | | | | | — | | | | | (290,536 | ) | | | | (1,242,590 | ) |
| | | |
| | | |
| | | |
| | | |
| | | |
| | | |
| |
Change in Institutional | | | | | | | | | | | | | | | | | | | | | | | | | | | | | | |
Class Shares | | | | 260,262 | | | | | 272,892 | | | | | — | | | | | — | | | | | 555,196 | | | | | (252,061 | ) |
| | | |
| | | |
| | | |
| | | |
| | | |
| | | |
| |
| Net Increase (Decrease) from | | | | | | | | | | | | | | | | | | | | | | | | | | | | | | |
Shares Transactions | | | | 1,622,003 | | | | | (1,554,154 | ) | | | | 122,567 | | | | | 892,350 | | | | | (138,997 | ) | | | | (2,865,089 | ) |
| | | |
| | | |
| | | |
| | | |
| | | |
| | | |
| |
133
| Notes to Financial Statements (continued) (unaudited) |
| | | | | | | | | | | | | FBR Gas Utility |
| | | FBR Technology Fund | | Index Fund |
| | |
| |
|
| | | For the | | For the | | For the | | For the |
| | | Six Months | | Year | | Six Months | | Year |
| | | Ended | | Ended | | Ended | | Ended |
| | | April 30, | | October 31, | | April 30, | | October 31, |
| | | 2012 | | 2011 | | 2012 | | 2011 |
| | |
| |
| |
| |
|
| | | | | | | | | | | | | | | | | | | | | |
| Capital Transactions: | | | | | | | | | | | | | | | | | | | | |
| Investor Class | | | | | | | | | | | | | | | | | | | | |
Proceeds from Sale of Shares | | | $ | 922,861 | | | | $ | 933,790 | | | | $ | 272,186,478 | | | | $ | 174,605,319 | |
Reinvestment of Distributions | | | | — | | | | | — | | | | | 10,306,467 | | | | | 10,114,130 | |
Cost of Shares Redeemed | | | | (963,136 | ) | | | | (3,429,392 | ) | | | | (139,982,210 | ) | | | | (49,522,574 | ) |
Redemption Fees | | | | 46 | | | | | 1,791 | | | | | 252,706 | | | | | 62,995 | |
| | | |
| | | |
| | | |
| | | |
| |
Investor Class Transactions | | | $ | (40,229 | ) | | | $ | (2,493,811 | ) | | | $ | 142,763,441 | | | | $ | 135,259,870 | |
| | | |
| | | |
| | | |
| | | |
| |
| Institutional Class | | | | | | | | | | | | | | | | | | | | |
Proceeds from Sale of Shares | | | $ | 63,318 | | | | $ | 141,716 | | | | $ | — | | | | $ | — | |
Reinvestment of Distributions | | | | — | | | | | — | | | | | — | | | | | — | |
Cost of Shares Redeemed | | | | (120,607 | ) | | | | (3,677,027 | ) | | | | — | | | | | — | |
Redemption Fees | | | | 8 | | | | | 20 | | | | | — | | | | | — | |
| | | |
| | | |
| | | |
| | | |
| |
Institutional Class Transactions | | | $ | (57,281 | ) | | | $ | (3,535,291 | ) | | | $ | — | | | | $ | — | |
| | | |
| | | |
| | | |
| | | |
| |
| Net Increase (Decrease) from Capital Transactions | | | $ | (97,510 | ) | | | $ | (6,029,102 | ) | | | $ | 142,763,441 | | | | $ | 135,259,870 | |
| | | |
| | | |
| | | |
| | | |
| |
| Share Transactions: | | | | | | | | | | | | | | | | | | | | |
| Investor Class | | | | | | | | | | | | | | | | | | | | |
Sold | | | | 83,555 | | | | | 80,830 | | | | | 12,717,745 | | | | | 8,918,950 | |
Issued in Reinvestment of Distributions | | | | — | | | | | — | | | | | 482,200 | | | | | 396,830 | |
Redeemed | | | | (86,596 | ) | | | | (302,424 | ) | | | | (6,497,809 | ) | | | | (2,550,055 | ) |
| | | |
| | | |
| | | |
| | | |
| |
Change in Investor Class Shares | | | | (3,041 | ) | | | | (221,594 | ) | | | | 6,702,136 | | | | | 6,765,725 | |
| | | |
| | | |
| | | |
| | | |
| |
| Institutional Class | | | | | | | | | | | | | | | | | | | | |
Sold | | | | 5,557 | | | | | 12,475 | | | | | — | | | | | — | |
Issued in Reinvestment of Distributions | | | | — | | | | | — | | | | | — | | | | | — | |
Redeemed | | | | (10,952 | ) | | | | (325,462 | ) | | | | — | | | | | — | |
| | | |
| | | |
| | | |
| | | |
| |
Change in Institutional Class Shares | | | | (5,395 | ) | | | | (312,987 | ) | | | | — | | | | | — | |
| | | |
| | | |
| | | |
| | | |
| |
| Net Increase (Decrease) from Shares Transactions | | | | (8,436 | ) | | | | (534,581 | ) | | | | 6,702,136 | | | | | 6,765,725 | |
| | | |
| | | |
| | | |
| | | |
| |
134
| Notes to Financial Statements (continued) (unaudited) |
| | | FBR Balanced Fund | | FBR Core Bond Fund |
| | |
| |
|
| | | For the | | For the | | For the | | For the |
| | | Six Months | | Year | | Six Months | | Year |
| | | Ended | | Ended | | Ended | | Ended |
| | | April 30, | | October 31, | | April 30, | | | October 31, |
| | | 2012 | | 2011 | | 2012 | | 2011 |
| | |
| |
| |
| |
|
| | | | | | | | | | | | | | | | | | | | | |
| Capital Transactions: | | | | | | | | | | | | | | | | | | | | |
| Investor Class | | | | | | | | | | | | | | | | | | | | |
Proceeds from Sale of Shares | | | $ | 73,540,227 | | | | $ | 21,892,863 | | | | $ | 464,801 | | | | $ | 1,121,100 | |
Reinvestment of Dividends | | | | 697,937 | | | | | 799,608 | | | | | 73,073 | | | | | 171,157 | |
Cost of Shares Redeemed | | | | (9,045,683 | ) | | | | (11,363,173 | ) | | | | (683,192 | ) | | | | (1,567,757 | ) |
Redemption Fees | | | | 17,292 | | | | | 6,230 | | | | | 310 | | | | | 606 | |
| | | |
| | | |
| | | |
| | | |
| |
Investor Class Transactions | | | $ | 65,209,773 | | | | $ | 11,335,528 | | | | $ | (145,008 | ) | | | $ | (274,894 | ) |
| | | |
| | | |
| | | |
| | | |
| |
| Institutional Class | | | | | | | | | | | | | | | | | | | | |
Proceeds from Sale of Shares | | | $ | 16,770,217 | | | | $ | 11,344,367 | | | | $ | 5,263,165 | | | | $ | 207,173 | |
Reinvestment of Dividends | | | | 359,571 | | | | | 582,146 | | | | | 119,534 | | | | | 201,570 | |
Cost of Shares Redeemed | | | | (1,384,853 | ) | | | | (2,741,866 | ) | | | | (185,714 | ) | | | | (662,080 | ) |
Redemption Fees | | | | 1,353 | | | | | 338 | | | | | 9 | | | | | 20 | |
| | | |
| | | |
| | | |
| | | |
| |
Institutional Class Transactions | | | $ | 15,746,288 | | | | $ | 9,184,985 | | | | $ | 5,196,994 | | | | $ | (253,317 | ) |
| | | |
| | | |
| | | |
| | | |
| |
| Net Increase (Decrease) from Capital Transactions | | | $ | 80,956,061 | | | | $ | 20,520,513 | | | | $ | 5,051,986 | | | | $ | (528,211 | ) |
| | | |
| | | |
| | | |
| | | |
| |
| Share Transactions: | | | | | | | | | | | | | | | | | | | | |
| Investor Class | | | | | | | | | | | | | | | | | | | | |
Sold | | | | 5,480,116 | | | | | 1,737,714 | | | | | 48,669 | | | | | 117,394 | |
Issued in Reinvestment of Distributions | | | | 51,612 | | | | | 64,232 | | | | | 7,682 | | | | | 18,179 | |
Redeemed | | | | (667,389 | ) | | | | (913,207 | ) | | | | (71,508 | ) | | | | (164,856 | ) |
| | | |
| | | |
| | | |
| | | |
| |
Investor Class Transactions | | | | 4,864,339 | | | | | 888,739 | | | | | (15,157 | ) | | | | (29,283 | ) |
| | | |
| | | |
| | | |
| | | |
| |
| Institutional Class | | | | | | | | | | | | | | | | | | | | |
Sold | | | | 1,309,731 | | | | | 945,356 | | | | | 597,098 | | | | | 23,618 | |
Issued in Reinvestment of Distributions | | | | 28,047 | | | | | 49,108 | | | | | 13,714 | | | | | 23,287 | |
Redeemed | | | | (108,067 | ) | | | | (233,375 | ) | | | | (21,229 | ) | | | | (75,253 | ) |
| | | |
| | | |
| | | |
| | | |
| |
Institutional Class Transactions | | | | 1,229,711 | | | | | 761,089 | | | | | 589,583 | | | | | (28,348 | ) |
| | | |
| | | |
| | | |
| | | |
| |
| Net Increase (Decrease) from Shares Transactions | | | | 6,094,050 | | | | | 1,649,828 | | | | | 574,426 | | | | | (57,631 | ) |
| | | |
| | | |
| | | |
| | | |
| |
8. Federal Income Taxes
It is each Fund’s policy to continue to comply with the special provisions of the Internal Revenue Code that are applicable to regulated investment companies. As provided therein, in any fiscal year in which a Fund so qualifies and distributes at least 90% of its taxable net income, the Fund (but not the shareholders) will be relieved of federal income tax on the income distributed. Accordingly, no provision for income taxes has been made.
In order to avoid imposition of the excise tax applicable to regulated investment companies, it is also each Fund’s intention to declare and pay as dividends in each calendar year at least 98% of its net investment income (earned during the calendar year) and 98% of its net realized capital gains (earned during the twelve months ending October 31) plus undistributed amounts from prior years.
135
| Notes to Financial Statements (continued) (unaudited) |
Income and capital gain distributions are determined in accordance with income tax regulations that may differ from accounting principles that are generally accepted in the United States of America. As a result, the character of tax-basis distributions and the composition of net assets for tax purposes may differ from those reflected in the Funds’ financial statements. These book/tax differences may be temporary or permanent in nature. Temporary differences are primarily the result of wash sales. Reclassifications for permanent differences are made to components of capital. These reclassifications have no effect on net assets or net asset value per share.
The tax character of distributions paid for each Fund’s tax year was as follows:
| | | | | | | | Long-Term |
| | | Ordinary Income | | | Capital Gains |
| | |
| | |
|
| | | Dollar | | | Dollar |
| | | Amount | | | Amount |
| | |
| | |
|
| Large Cap Fund | | | | | | | | | |
For the Year Ended October 31, 2011 | | $ | 203,067 | | | | $ | — | |
For the Year Ended October 31, 2010 | | | 94,558 | | | | | — | |
Mid Cap Fund | | | | | | | | | |
For the Year Ended October 31, 2011 | | | 53,563 | | | | | — | |
For the Year Ended October 31, 2010 | | | 26,791 | | | | | — | |
Small Cap Fund | | | | | | | | | |
For the Year Ended October 31, 2011 | | | 141,614 | | | | | — | |
For the Year Ended October 31, 2010 | | | 353,677 | | | | | — | |
Focus Fund | | | | | | | | | |
For the Year Ended October 31, 2011 | | | — | | | | | 25,642,828 | |
For the Year Ended October 31, 2010 | | | 282,614 | | | | | — | |
Large Cap Financial Fund | | | | | | | | | |
For the Year Ended October 31, 2011 | | | — | | | | | — | |
For the Year Ended October 31, 2010 | | | — | | | | | — | |
Small Cap Financial Fund | | | | | | | | | |
For the Year Ended October 31, 2011 | | | 2,863,168 | | | | | — | |
For the Year Ended October 31, 2010 | | | 866,424 | | | | | — | |
Technology Fund | | | | | | | | | |
For the Year Ended October 31, 2011 | | | — | | | | | — | |
For the Year Ended October 31, 2010 | | | — | | | | | — | |
Gas Utility Index Fund | | | | | | | | | |
For the Year Ended October 31, 2011 | | | 8,228,128 | | | | | 2,612,243 | |
For the Year Ended October 31, 2010 | | | 7,800,261 | | | | | 249,041 | |
Balanced Fund | | | | | | | | | |
For the Year Ended October 31, 2011 | | | 2,140,167 | | | | | — | |
For the Period Ended October 31, 2010 | | | 1,180,776 | | | | | — | |
For the Year Ended March 31, 2010 | | | 2,305,951 | | | | | — | |
Core Bond Fund | | | | | | | | | |
For the Year Ended October 31, 2011 | | | 1,086,378 | | | | | 447,915 | |
For the Period Ended October 31, 2010 | | | 738,749 | | | | | — | |
For the Year Ended March 31, 2010 | | | 1,277,489 | | | | | 154,005 | |
136
| Notes to Financial Statements (continued) (unaudited) |
| The following information is computed on a tax basis for each item: | | | | | | |
| | | | As of October 31, 2011 |
| | | |
|
| | | | | | | | | | | | | | | | | | | | | | | | Large Cap | |
| | | | Large Cap | | | | Mid Cap | | | | Small Cap | | | | Focus | | | | Financial | |
| | | | Fund | | | | Fund | | | | Fund | | | | Fund | | | | Fund | |
| | | |
| | | |
| | | |
| | | |
| | | |
| |
| Tax cost of investment securities | | | $ | 37,730,892 | | | | $ | 17,279,327 | | | | $ | 39,982,270 | | | | $ | 367,211,360 | | | | $ | 63,857,952 | |
| | | |
| | | |
| | | |
| | | |
| | | |
| |
| Gross unrealized appreciation | | | | 4,853,142 | | | | | 2,954,022 | | | | | 3,404,659 | | | | | 307,076,534 | | | | | 2,864,872 | |
| Gross unrealized depreciation | | | | (2,823,956 | ) | | | | (1,421,448 | ) | | | | (4,382,488 | ) | | | | (13,785,243 | ) | | | | (11,097,529 | ) |
| | | |
| | | |
| | | |
| | | |
| | | |
| |
| Net unrealized appreciation (depreciation) | | | | 2,029,186 | | | | | 1,532,574 | | | | | (977,829 | ) | | | | 293,291,291 | | | | | (8,232,657 | ) |
| Undistributed ordinary income | | | | 155,370 | | | | | 21,740 | | | | | — | | | | | — | | | | | — | |
| Undistributed long-term capital gains | | | | — | | | | | — | | | | | — | | | | | 68,559,971 | | | | | — | |
| Capital loss carryforward | | | | (9,071,600 | ) | | | | (3,441,600 | ) | | | | (8,062,059 | ) | | | | — | | | | | (2,046,188 | ) |
| | | |
| | | |
| | | |
| | | |
| | | |
| |
| Accumulated earnings (deficit) | | | $ | (6,887,044 | ) | | | $ | (1,887,286 | ) | | | $ | (9,039,888 | ) | | | $ | 361,851,262 | | | | $ | (10,278,845 | ) |
| | | |
| | | |
| | | |
| | | |
| | | |
| |
| | | | | | | | | | | | | | | | | | | | | | | | | | |
| | | | As of October 31, 2011 |
| | | |
|
| | | | Small Cap
Financial
Fund | | | | Technology
Fund | | | | Gas Utility
Index
Fund | | | | Balanced
Fund | | | | Core Bond
Fund | |
| | | |
| | | |
| | | |
| | | |
| | | |
| |
| Tax cost of investment securities | | | $ | 184,049,837 | | | | $ | 7,001,191 | | | | $ | 285,807,440 | | | | $ | 98,823,814 | | | | $ | 25,976,153 | |
| | | |
| | | |
| | | |
| | | |
| | | |
| |
| Gross unrealized appreciation | | | | 15,114,905 | | | | | 597,361 | | | | | 160,432,681 | | | | | 15,776,493 | | | | | 1,827,015 | |
| Gross unrealized depreciation | | | | (24,834,134 | ) | | | | (716,873 | ) | | | | (16,886,961 | ) | | | | (2,800,319 | ) | | | | (677,792 | ) |
| | | |
| | | |
| | | |
| | | |
| | | |
| |
| Net unrealized appreciation (depreciation) | | | | (9,719,229 | ) | | | | (119,512 | ) | | | | 143,545,720 | | | | | 12,976,174 | | | | | 1,149,223 | |
| Undistributed ordinary income | | | | 2,346,347 | | | | | — | | | | | 2,027,426 | | | | | 219,236 | | | | | 123,722 | |
| Undistributed long-term capital gains | | | | — | | | | | — | | | | | 1,903,306 | | | | | — | | | | | 141,192 | |
| Other Accumulated Gain | | | | — | | | | | — | | | | | 3,586 | | | | | — | | | | | — | |
| Capital loss carryforward | | | | (6,440,766 | ) | | | | (2,145,219 | ) | | | | — | | | | | (4,358,292 | ) | | | | — | |
| | | |
| | | |
| | | |
| | | |
| | | |
| |
| Accumulated earnings (deficit) | | | $ | (13,813,648 | ) | | | $ | (2,264,731 | ) | | | $ | 147,480,038 | | | | $ | 8,837,118 | | | | $ | 1,414,137 | |
| | | |
| | | |
| | | |
| | | |
| | | |
| |
| Unused capital loss carryforwards as of October 31, 2011, were as follows: |
| | | Amount | | | Expires October 31, |
| | |
| | |
|
| Large Cap Fund | | $ | 4,906,673 | | | | 2016 |
| Large Cap Fund | | | 4,164,926 | | | | 2017 |
| Mid Cap Fund | | | 3,441,600 | | | | 2017 |
| Small Cap Fund | | | 3,462,951 | | | | 2016 |
| Small Cap Fund | | | 4,599,108 | | | | 2017 |
| Large Cap Financial Fund | | | 10,229 | | | | 2016 |
| Large Cap Financial Fund | | | 1,162,148 | | | | 2017 |
| Large Cap Financial Fund | | | 873,811 | | | | 2019 |
| Small Cap Financial Fund | | | 6,440,766 | | | | 2019 |
| Technology Fund | | | 237,174 | | | | 2016 |
| Technology Fund | | | 1,908,045 | | | | 2017 |
| Balanced Fund | | | 4,358,292 | | | | 2017 |
137
| Notes to Financial Statements (continued) (unaudited) |
During the year ended October 31, 2011, the Large Cap Fund, Mid Cap Fund, Small Cap Fund, Technology Fund and Balanced Fund utilized $4,594,569, $1,036,864, $6,816,034, $1,028,210 and $3,644,432 of capital loss carryforwards, respectively. The capital loss carryforwards may be utilized in future years to offset net realized capital gains, if any, prior to distributing such gains to shareholders. The following reclassifications, the result of permanent differences between financial statement and income tax reporting requirements, have been made to the components of capital. These reclassifications have no impact on the net assets or net asset value per share of the Funds.
9. Investments in Affiliates
Affiliated issuers, as defined by the 1940 Act, are those in which a Fund’s holdings represent 5% or more of the outstanding voting securities of the issuer. For the six months ended April 30, 2012, there were no affiliate issuers for the Funds.
10. Payment by Affiliate
During the fiscal year ended October 31, 2009, Fund Advisers voluntarily reimbursed the FBR Small Cap Fund $7,834, in connection with the Fund’s inadvertent investment in the shares of another investment company which was made by Fund Advisers in excess of applicable investment limitations. This reimbursement has been classified in the Fund’s Financial Highlights as “Net increase from payments by affiliates”.
11. Commitments and Contingencies
In the normal course of business, the Funds enter into contracts that contain a variety of representations and warranties and which provide general indemnifications. The Funds’ maximum exposure under these arrangements is unknown, as this would involve future claims that may be made against the Funds that have not yet occurred. However, based on experience, the Funds expect the risk of loss to be remote.
12. Subsequent Events
In preparing these financial statements, management has evaluated events and transactions for potential recognition or disclosure through the date the financial statements were issued. Subsequent to the close of the fiscal period, the Board of Trustees of the Funds approved Agreements and Plans of Reorganization (the “Plans”) that would provide for the reorganization of each Fund into a corresponding fund advised by Hennessy Advisors, Inc. (the “Hennessy Funds”). The Plans set forth the terms by which the Funds would transfer their assets and liabilities to their corresponding Hennessy Fund in exchange for shares of the corresponding Hennessy Fund, and subsequently distribute those Hennessy Fund shares to the Funds’ shareholders (the “Reorganization Transaction”). If the Reorganization Transaction is approved by shareholders of the Funds, shareholders of the Funds will then become shareholders of their corresponding Hennessy Fund upon the closing of the Reorganization Transaction. The Reorganization Transaction must be approved by shareholders of the Funds, who will be asked to vote, in person or by proxy, at a special meeting of shareholders currently scheduled to be held in October 2012.
138
| Important Supplemental Information (unaudited) |
Proxy Voting Guidelines
Fund Advisers is responsible for exercising the voting rights associated with the securities purchased and held by the Funds. A description of the policies and procedures Fund Advisers uses in fulfilling this responsibility is included in the Funds’ Statement of Additional Information and is available without charge, upon request, by calling 888.888.0025. The policies and procedures are also available on the Securities and Exchange Commission’s (“SEC”) website at http://www.sec.gov. Information on how the Funds voted proxies relating to portfolio securities during the most recent 12 month period ended June 30 is available without charge, upon request, by calling 888.888.0025 and is also available on the SEC’s website at http://www.sec.gov.
Portfolio Holdings
The Funds file their complete schedule of holdings with the SEC for the first and third quarters of each fiscal year on Form N-Q. The Funds’ Form N-Q is available on the SEC’s website at http://www.sec.gov. You may review and make copies at the SEC’s Public Reference Room in Washington, D.C. You may also obtain copies after paying a duplicating fee by writing the SEC’s Public Reference Section, Washington, D.C. 20549-0102 or by electronic request to publicinfo@sec.gov. Information on the operation of the Public Reference Room may be obtained by calling 800.SEC.0330. A copy of the quarterly holdings report is available, without charge, upon request, by calling 888.888.0025.
139
[THIS PAGE INTENTIONALLY LEFT BLANK]
[THIS PAGE INTENTIONALLY LEFT BLANK]
[THIS PAGE INTENTIONALLY LEFT BLANK]
| THE FBR FUNDS |
| 888.888.0025 |
| fbrfundsinfo@fbr.com |
| www.fbrfunds.com |
| |
| Investment Adviser |
| FBR FUND ADVISERS, INC. |
| 1001 NINETEENTH STREET NORTH |
| SUITE 1100 |
| ARLINGTON, VIRGINIA 22209 |
| |
| Distributor |
| FBR INVESTMENT SERVICES, INC. |
| 1001 NINETEENTH STREET NORTH |
| SUITE 1100 |
| ARLINGTON, VIRGINIA 22209 |
| |
| Transfer Agent |
| U.S. BANCORP FUND SERVICES, LLC |
| 615 EAST MICHIGAN STREET |
| MILWAUKEE, WISCONSIN 53202 |
| |
| Independent Registered Public Accounting Firm |
| TAIT, WELLER, AND BAKER LLP |
| 1818 MARKET STREET |
| PHILADELPHIA, PENNSYLVANIA 19103 |
| |
| |
| This report is not authorized |
| for distribution to prospective |
| investors unless it is preceded or |
| accompanied by a current prospectus. |
ITEM 2. CODE OF ETHICS.
Not applicable for semiannual reports.
ITEM 3. AUDIT COMMITTEE FINANCIAL EXPERT.
Not applicable for semiannual reports.
ITEM 4. PRINCIPAL ACCOUNTANT FEES AND SERVICES.
Not applicable for semiannual reports.
ITEMS 5. AUDIT COMMITTEE OF LISTED REGISTRANTS.
Not applicable.
ITEM 6. SCHEDULE OF INVESTMENTS.
Contained in Item 1.
ITEM 7. DISCLOSURE OF PROXY VOTING POLICIES AND PROCEDURES FOR CLOSED-END MANAGEMENT INVESTMENT COMPANIES.
Not applicable.
ITEM 8. PORTFOLIO MANAGERS OF CLOSED-END MANAGEMENT INVESTMENT COMPANIES.
Not applicable.
ITEM 9. PURCHASES OF EQUITY SECURITIES BY CLOSED-END MANAGEMENT INVESTMENT COMPANY AND AFFLIIATED PURCHASERS.
Not applicable.
ITEM 10. SUBMISSION OF MATTERS TO A VOTE OF SECURITY HOLDERS.
There have been no material changes to the procedures by which shareholders may recommend nominees to the Board.
| ITEM 11. CONTROLS AND PROCEDURES. |
| (a) | Based upon their evaluation of the Registrant’s disclosure controls and procedures as conducted within 90 days of the filing date of this Form N-CSR, the Registrant’s PFO and PEO have concluded that those disclosure controls and procedures provide reasonable assurance that the material information required to be disclosed by the Registrant in this Form N-CSR has been recorded, processed, summarized and reported within the time periods specified in the Securities and Exchange Commission’s rules and forms. |
| (b) | There were no changes in the Registrant’s internal controls over financial reporting as defined in Rule 30a-3(d) under the Act (17 CFR 270.30a-3(d)) that occurred during the second fiscal half-year of the period covered by this report that has materially affected, or is reasonably likely to materially affect, the Registrant’s internal control over financial reporting. |
| | |
| ITEM 12. EXHIBITS. |
| File the exhibits listed below as part of this Form. Letter or number the exhibits in the sequence indicated. |
| (a) | (1) Not applicable. |
| | (2) A separate certification for each principal executive officer and principal financial officer of the Registrant as required by Rule 30a-2(a) under the Act (17 CFR 270.30a-2): Attached herewith. |
| | (3) Not applicable. |
| (b) | (1) The certifications required by Rule 30a-2(b) of the Investment Company Act of 1940 and Section 906 of the Sarbanes-Oxley Act of 2002: Attached herewith. |
SIGNATURES
Pursuant to the requirements of the Securities Exchange Act of 1934 and the Investment Company Act of 1940, the registrant has duly caused this report to be signed on its behalf by the undersigned, thereunto duly authorized.
(Registrant) The FBR Funds
| By (Signature and Title)* | | | /s/ Kimberly J. Bradshaw | | 6/29/12 |
| | | |
|
| | | | Kimberly J. Bradshaw | | Date |
| | | | Treasurer, Secretary and Principal Financial Officer | |
| | | | The FBR Funds | | |
Pursuant to the requirements of the Securities Exchange Act of 1934 and the Investment Company Act of 1940, this report has been signed below by the following persons on behalf of the registrant and in the capacities and on the dates indicated.
| By (Signature and Title) | | | /s/ David H. Ellison | | 6/29/12 |
| | | |
|
| | | | David H. Ellison | | Date |
| | | | President and Principal Executive Officer | |
| | | | The FBR Funds | | |
| | | | | | |
| By (Signature and Title) | | | /s/ Kimberly J. Bradshaw | | 6/29/12 |
| | | |
|
| | | | Kimberly J. Bradshaw | | Date |
| | | | Treasurer, Secretary and Principal Financial Officer | |
| | | | The FBR Funds | | |
| | | | | | |